UNITED STATES
SECURITIES AND EXCHANGE COMMISSION
Washington, D.C. 20549
FORMN-CSR
CERTIFIED SHAREHOLDER REPORT OF REGISTERED MANAGEMENT
INVESTMENT COMPANIES
Investment Company Act file number 811-05309
Nuveen Investment Funds, Inc.
(Exact name of registrant as specified in charter)
Nuveen Investments
333 West Wacker Drive, Chicago, IL 60606
(Address of principal executive offices) (Zip code)
Christopher M. Rohrbacher
Vice President and Secretary
333 West Wacker Drive,
Chicago, IL 60606
(Name and address of agent for service)
Registrant’s telephone number, including area code:(312) 917-7700
Date of fiscal year end: June 30
Date of reporting period: June 30, 2019
FormN-CSR is to be used by management investment companies to file reports with the Commission not later than 10 days after the transmission to stockholders of any report that is required to be transmitted to stockholders under Rule30e-1 under the Investment Company Act of 1940 (17 CFR270.30e-1). The Commission may use the information provided on FormN-CSR in its regulatory, disclosure review, inspection, and policy making roles.
A registrant is required to disclose the information specified by FormN-CSR, and the Commission will make this information public. A registrant is not required to respond to the collection of information contained in FormN-CSR unless the Form displays a currently valid Office of Management and Budget (“OMB”) control number. Please direct comments concerning the accuracy of the information collection burden estimate and any suggestions for reducing the burden to Secretary, Securities and Exchange Commission, 450 Fifth Street, NW, Washington, DC 20549-0609. The OMB has reviewed this collection of information under the clearance requirements of 44 U.S.C. ss.3507.
ITEM 1. REPORTS TO STOCKHOLDERS.

Mutual Funds
30 June
2019
Nuveen Income Funds
| | | | | | | | | | |
| Fund Name | | Class A | | Class C | | Class R3 | | Class R6 | | Class I |
| Nuveen High Income Bond Fund | | FJSIX | | FCSIX | | FANSX | | — | | FJSYX |
| Nuveen Strategic Income Fund | | FCDDX | | FCBCX | | FABSX | | FSFRX | | FCBYX |
Beginning on January 1, 2021, as permitted by regulations adopted by the Securities and Exchange Commission, paper copies of the Funds’ annual and semi-annual shareholder reports will no longer be sent by mail, unless you specifically request paper copies of the reports. Instead, the reports will be made available on the Funds’ website (www.nuveen.com), and you will be notified by mail each time a report is posted and provided with a website link to access the report.
If you have already elected to receive shareholder reports electronically, you will not be affected by this change and you need not take any action. You may elect to receive shareholder reports and other communications from the Funds electronically anytime by contacting the financial intermediary (such as a broker-dealer or bank) through which you hold your Fund shares or, if you are a direct investor, by enrolling at www.nuveen.com/e-reports.
You may elect to receive all future shareholder reports in paper free of charge at any time by contacting your financial intermediary or, if you are a direct investor, by calling 800-257-8787 and selecting option #1. Your election to receive reports in paper will apply to all funds held in your account with your financial intermediary or, if you are a direct investor, to all your directly held Nuveen Funds and any other directly held funds within the same group of related investment companies.
Annual Report
Life is Complex.
Nuveen makes things e-simple.
It only takes a minute to sign up fore-Reports. Once enrolled, you’ll receive ane-mail as soon as your Nuveen Fund information is ready. No more waiting for delivery by regular mail. Just click on the link within thee-mail to see the report and save it on your computer if you wish.
Free e-Reports right to your email!
www.investordelivery.com
If you receive your Nuveen Fund distributions and statements from your financial advisor or brokerage account.
or
www.nuveen.com/client-access
If you receive your Nuveen Fund distributions and statements directly from Nuveen.
Must be preceded by or accompanied by a prospectus.
NOT FDIC INSURED MAY LOSE VALUE NO BANK GUARANTEE
Table
of Contents
3
Chairman’s Letter to Shareholders

Dear Shareholders,
The worries weighing on markets at the end of 2018 appeared to dissipate in early 2019 as positive economic and corporate earnings news, more dovish signals from central banks and trade progress boosted investor confidence. However, political noise and trade disputes continue to drive short-term market volatility and weigh on longer-term outlooks. Investors are concerned that increased tariffs and a protracted stalemate between the U.S. and its trading partners could dampen business and consumer sentiment, weakening spending and potentially impacting the global economy. Acknowledging similar concerns, the U.S. Federal Reserve recently lowered its benchmark interest rate 0.25% for the first time in a decade and will stop reducing its bond portfolio sooner than planned to help stimulate the U.S. economy. As the current U.S. economic expansion has reached the10-year mark this summer, it’s important to note that economic expansions don’t die of old age, but mature economic cycles can be more vulnerable to an exogenous shock.
Until a clearer picture on trade emerges, more bouts of market turbulence are likely in the meantime. While the downside risks warrant careful monitoring, we believe the likelihood of a near-term recession remains low. Global economic growth is moderating but still expanding, with demand driven by the historically low unemployment in the U.S., Japan and across Europe. Some central banks have begun to adjust monetary policy to help sustain growth and others continue to emphasize their readiness to act, while China’s authorities remain committed to keeping economic growth rates steady with fiscal and monetary policy.
The opportunity set may be narrower, but we believe there is still scope for gains in this environment. Patience and maintaining perspective can help you weather periodic market volatility. We encourage you to work with your financial advisor to assess short-term market movements in the context of your time horizon, risk tolerance and investment goals. On behalf of the other members of the Nuveen Fund Board, we look forward to continuing to earn your trust in the months and years ahead.
Sincerely,

Terence J. Toth
Chairman of the Board
August 23, 2019
4
Portfolio Managers’
Comments
Nuveen High Income Bond Fund
Nuveen Strategic Income Fund
These Funds feature portfolio management by Nuveen Asset Management, LLC (NAM), an affiliate of Nuveen, LLC. Kevin Lorenz, CFA and Jean C. Lin, CFA, are portfolio managers for the Nuveen High Income Bond Fund. Portfolio managers for the Nuveen Strategic Income Fund include Timothy A. Palmer, CFA, Douglas M. Baker, CFA, Bill Martin, Kevin Lorenz, CFA, Katherine Renfrew and Nicholas Travaglino.
Effective July 31, 2019 (subsequent to the close of the reporting period), Timothy A. Palmer, CFA, is no longer a portfolio manager for the Fund.
Here the portfolio managers for the Funds discuss the economy and financial markets, key investment strategies and the Funds’ performance for the twelve-month reporting period ended June 30, 2019.
What factors affected the U.S. economy and the markets during the twelve-month reporting period ended June 30, 2019?
The U.S. economy reached the tenth year of expansion since the previous recession ended in June 2009, marking the longest expansion in U.S. history. The Bureau of Economic Analysis “advance” estimate of gross domestic product (GDP) growth came in at 2.1% (annualized) for the second quarter of 2019, a notable slowdown from 3.1% annualized growth in the first quarter of the year and below the 2.5% growth rate achieved in 2018. GDP measures the value of goods and services produced by the nation’s economy less the value of the goods and services used up in production, adjusted for price changes. Strong consumer and government spending in the April to June 2019 quarter helped sustain the economy’s growth trend, despite weaker exports and reduced business investment.
Consumer spending, the largest driver of the economy, remained well supported by low unemployment, wage gains and tax cuts. As reported by the Bureau of Labor Statistics, the unemployment rate fell to 3.7% in June 2019 from 4.0% in June 2018 and job gains averaged around 192,000 per month for the past twelve months. As the jobs market has tightened, average hourly earnings grew at an annualized rate of 3.1% in June 2019. However, falling energy prices dampened inflation over the past twelve months. The Bureau of Labor Statistics said the Consumer Price Index (CPI) increased 1.6% over the twelve-month reporting period ended June 30, 2019 before seasonal adjustment.
Low mortgage rates and low inventory drove home prices moderately higher in this reporting period, despite declining new home sales and housing starts. The S&P CoreLogic Case-Shiller U.S. National Home Price Index, which covers all nine U.S. census divisions, was up 3.4% year-over-year in May 2019 (most recent data available at the time this report was prepared). The10-City and20-City Composites reported year-over-year increases of 2.2% and 2.4%, respectively.
This material is not intended to be a recommendation or investment advice, does not constitute a solicitation to buy, sell or hold a security or an investment strategy and is not provided in a fiduciary capacity. The information provided does not take into account the specific objectives or circumstances of any particular investor, or suggest any specific course of action. Investment decisions should be made based on an investor’s objectives and circumstances and in consultation with his or her advisors.
Certain statements in this report are forward-looking statements. Discussions of specific investments are for illustration only and are not intended as recommendations of individual investments. The forward-looking statements and other views expressed herein are those of the portfolio managers as of the date of this report. Actual future results or occurrences may differ significantly from those anticipated in any forward-looking statements and the views expressed herein are subject to change at any time, due to numerous market and other factors. The Funds disclaim any obligation to update publicly or revise any forward-looking statements or views expressed herein.
For financial reporting purposes, the ratings disclosed are the highest rating given by one of the following national rating agencies: Standard & Poor’s (S&P), Moody’s Investors Service, Inc. (Moody’s) or Fitch, Inc. (Fitch). This treatment of split-rated securities may differ from that used for other purposes, such as for Fund investment policies. Credit ratings are subject to change. AAA, AA, A and BBB are investment grade ratings; BB, B, CCC, CC, C and D are below investment grade ratings. Holdings designated N/R are not rated by these national rating agencies.
Refer to the Glossary of Terms Used in this Report for further definition of the terms used within this section.
5
Portfolio Managers’ Comments(continued)
As data pointed to slower momentum in the overall economy, the Federal Reserve (Fed) notably shifted its stance. Although the Fed had indicated in December 2018 that there could be two more rate hikes in 2019, global growth concerns kept the central bank on the sidelines. As expected by the markets, the Fed left rates unchanged throughout the first half of 2019 while speculation increased that the Fed’s next move would be a rate cut. (Subsequent to the close of this reporting period, at the July policy committee meeting, the Fed announced a 0.25% cut to its main policy rate and that it will stop shrinking its bond portfolio sooner than scheduled.)
During the twelve-month reporting period, geopolitical news remained a prominent market driver. Tariff and trade policy topped the list of concerns, most prominently the U.S.-China relations. After several rounds of talks and a series of tariff increases, President Trump and President Xi agreed to another temporary trade truce in late June 2019 that halted additional tariff increases (although after the close of the period, the U.S. announced a new 10% tariff on $300 billion of Chinese goods). Additionally, the U.S. administration walked back its ban on U.S. companies doing business with Chinese tech giant Huawei. The agreed-upon trade deal between the U.S., Mexico and Canada has yet to be ratified by the national congresses, while President Trump rescinded the threat to impose tariffs on Mexico if the country didn’t take more action to curb illegal immigration. Meanwhile, as agreed in July 2018, the U.S. and the European Union continued to withhold further tariffs. Markets grew increasingly worried that trade conflicts would dampen already slowing global growth, as negative sentiment could inhibit business, consumer and investor confidence and spending.
In the U.K., Prime Minister Theresa May was unable to secure a Brexit deal before the original March 29, 2019 deadline. The European Union extended the deadline to October 31, 2019, and Prime Minister May resigned effective June 7, 2019. (Subsequent to the close of the reporting period, as widely expected, Brexit hardliner Boris Johnson assumed premiership.) Europe also contended with Italy’s eurosceptic coalition government and its challenging fiscal condition, the “yellow vest” protests in France, immigration policy concerns, Russian sanctions and political risk in Turkey. (Subsequent to the close of the reporting period, Italy’s Prime Minister unexpectedly resigned amid a growing rift with the coalition government over key domestic and fiscal policies.)
Elections around the world also remained a source of uncertainty. Markets continued to closely monitor the new administrations in Brazil and Mexico, as well as Argentina’s upcoming presidential election. (After the close of the reporting period, President Macri, who is considered the market-friendly candidate, suffered a surprising defeat in the August primary vote.) In the U.K., the possibility of ano-deal Brexit increased under new Prime Minister Boris Johnson. Europe’s traditional centrist parties lost seats in the Parliamentary elections and populist parties saw marginal gains. The ruling parties in India and South Africa maintained their majorities, where slower economic growth could complicate their respective reform mandates.
What strategies were used to manage the Funds during the twelve-month reporting period and how did these strategies influence performance?
The Funds continued to employ the same fundamental investment strategies and tactics used previously, although implementation of those strategies depended on the individual characteristics of the portfolios, as well as market conditions. The Funds’ management teams use a highly collaborative, research-driven approach that we believe offers the best opportunity to achieve consistent, superior long-term performance on a risk-adjusted basis across the full range of market environments. During the reporting period, the Funds were generally positioned for an environment of continued moderate economic growth. Nonetheless, during the reporting period we made smaller scaled shifts on an ongoing basis that were geared toward improving each Fund’s profile in response to changing conditions and valuations. These strategic moves are discussed in more detail within each Fund’s section of this report.
Nuveen High Income Bond Fund
The Fund’s Class A Shares at NAV underperformed both the Bloomberg Barclays High Yield 2% Issuer Capped Index and the Lipper Global High Yield Funds Classification Average for the twelve-month reporting period.
Over the twelve-month reporting period as a whole, Treasury yields increased for the shortest maturities at the front end of the yield curve, driven by the earlier Fed rate hikes. Three-monthT-bills ended the reporting period 19 basis points higher at 2.12%. However,
6
yields fell for all Treasury securities with maturities of six months or more with the greatest decline taking place in thethree-to-seven year maturity range, helping to drive an inversion at the front end of the Treasury yield curve (where short-term interest rates are higher than longer terms rates). The yield on five-year Treasury securities ended the reporting period at 1.76%, which was almost 100 basis points lower than a year ago, while the yield on10-year Treasuries fell by 85 basis points to end the reporting period at 2.00%.
In the first few months of the reporting period, high yield credit performed well as many of the same technical factors remained largely in place including strong demand for U.S. credit from overseas buyers, limited net new issue supply and stabilizing retail flows. Adding to the positive backdrop was a healthy earnings environment and continued supportive financing markets, which helped keep default rates well contained. At the end of 2018, however, the high yield market sold off sharply after risk sentiment turned negative amid concerns about economic growth, Fed rate hikes, trade tensions, a slowdown in the rate of earnings growth, and questions regarding the length of the credit cycle. The segment saw large investor outflows, accelerating into year end, which drove prices lower despite the positive technical of limited issuance. As 2019 got underway, high yield saw a swift reversal as the asset class benefited from the Fed’s policy pivot, which lowered the chances of a possible recession. More broadly speaking, the segment also continued to be supported by falling interest rates, healthy credit fundamentals and sustained low defaults, combined with technical support in the form of solid inflows back into the segment and no significant increase in new issue supply. In May 2019, the high yield market sold off briefly amid a spike in market volatility as U.S./China trade tensions intensified, but snapped back in June 2019 after policymakers signaled a readiness to actually cut interest rates later this year. Despite the significant amount of volatility throughout the reporting period, high yield spreads ended the reporting period only nine basis points wider at 391 basis points over Treasuries.
Much of the Fund’s underperformance during the reporting period was driven by our repositioning of the portfolio into higher quality, high yield credits, given our overallup-in-quality bias employed year to date in 2019. Security selection also hindered results in several high yieldsub-sectors, including an underweight exposure to the banking industry within financials. Also, in the industrial space, severalsub-sectors within the consumernon-cyclical area detracted, including health care, pharmaceuticals and tobacco. Security selection also hurt results in the technology and transportation areas of industrials. As a partial offset, an overweight and security selection in the energy sector, particularly among oil field services companies, proved beneficial to the Fund’s performance. In the communications area, the Fund saw strength from the wireline segment, while in basic industry the Fund benefited from holdings within the chemicals space.
The Fund’s allocation to preferred and contingent capital securities (CoCos) was a marginal drag on performance, particularly in the first half of the reporting period after the segments sold off in tandem with the broadrisk-off sentiment that also impacted other credit sectors. However, security selection within the preferred and CoCo segments offset most of the negative impact from the overweight positioning. Early on, securities in these sectors were pressured by geopolitical headlines concerning Brexit, negotiations between Italy and the European Union regarding the Italian budget, and a handful of idiosyncratic headlines impacting specific companies. As the reporting period progressed, however, preferred and CoCos generally benefited from lower rates and the Fed’s increasingly dovish tone. Strong credit fundamentals also supported the asset classes as bank stress tests during the reporting period again demonstrated the strength of U.S. banks. CoCos were further supported by lower global interest rates and dampening concerns about a disorderly Brexit toward the end of the reporting period.
The Fund’s performance benefited from our duration stance during the reporting period. We positioned the portfolio with a slightly longer duration than the benchmark, which increased its interest rate sensitivity. We made this shift as it became more apparent that the Fed’s next moves would likely be lowering rates instead of raising them. This positioning contributed favorably to relative performance because of the sharp drop in interest rates, especially in the latter half of the reporting period.
Also, exposure to leveraged loans in the Fund’s portfolio added to relative performance. Fundamentals remained strong in the leveraged loan market as the segment continued to experience historically low default rates given the overall strength of corporations.
7
Portfolio Managers’ Comments(continued)
At the end of the reporting period, the Fund remained diversified across BB and B rated credits, with strategic allocations in C to CCC+ credits andout-of-index holdings such as leveraged loans and preferred securities. Due to late-stage credit cycle dynamics, we shifted the portfolio to a more defensive stance by modestly expanding its CCC rated underweight and increasing cash. At the end of the reporting period, the Fund’s largest sector overweights were in energy, focused on service companies, and basic industry, focused on chemical producers. We continued to underweight the technology and telecommunications sectors. Duration remained moderately longer than the index.
During the reporting period, we also continued to use various derivative instruments. We used U.S. Treasury note and bond futures as part of an overall portfolio construction strategy to manage the Fund’s duration and yield curve exposure. The effect of these activities during the reporting period was negligible.
We used foreign currency exchange contracts to manage the Fund’s foreign currency exposures. During the reporting period, these instruments were used primarily for hedging purposes to reduce unwanted currency exposure from the Fund’s bond portfolio. These positions had a negligible impact on performance during the reporting period. The Fund also used credit default swaps to hedge the Fund’s high yield credit exposure. These positions had a negative impact on performance during the reporting period.
Nuveen Strategic Income Fund
The Fund’s Class A Shares at net asset value (NAV) outperformed both the Bloomberg Barclays Aggregate Bond Index and the Lipper Multi-Sector Income Funds Classification Average for the twelve-month reporting period.
Over the twelve-month reporting period as a whole, Treasury yields increased for the shortest maturities at the front end of the yield curve, driven by the earlier Fed rate hikes. Three-monthT-bills ended the reporting period 19 basis points higher at 2.12%. However, yields fell for all Treasury securities with maturities of six months or more with the greatest decline taking place in thethree-to-seven year maturity range, helping to drive an inversion at the front end of the Treasury yield curve (where short-term interest rates are higher than longer-terms rates). The yield on five-year Treasury securities ended the reporting period at 1.76%, which was almost 100 basis points lower than a year ago, while the yield on10-year Treasuries fell by 85 basis points to end the reporting period at 2.00%.
The most significant driver of the Fund’s outperformance was its overweight to credit spread sectors broadly as the credit markets were supported by positive market technicals and fundamentals. An allocation to preferred and contingent capital securities (CoCos) provided substantial excess returns, particularly during the second half of the reporting period. Despite continued political volatility in Europe, the preferred and CoCo segments benefited from strong relative value, lower U.S. interest rates, and optimism surrounding the Fed’s increasingly dovish tone as the period progressed. Strong credit fundamentals also supported the asset class as bank stress tests conducted in 2019 once again demonstrated the strength of the U.S. bank sector. CoCos were further supported by lower global interest rates and dampening concerns about a disorderly Brexit.
Investment grade exposures also helped, including overweight positions and security selection in both the investment-grade credit and the commercial mortgage-backed securities (CMBS) sectors. Across investment grade asset classes, net issuance was down and demand ramped up from international and domestic sources looking for income, providing technical support to the segments. After widening sharply at the end of 2018, investment grade spreads rallied throughout 2019 due to the dovish shifts by the Fed and European Central Bank, despite a sharp increase in volatility as the U.S./China trade discussions broke down. Excess returns for the twelve-month reporting period as a whole were strongly positive for investment-grade credit versus Treasuries with spreads reachingyear-to-date tights in April 2019. Within investment grade, the Fund’s overweight to BBB rated securities helped results because this lower-quality rating tier outperformed both the AA and single A rated credit categories as economic growth worries diminished. Also, the Fund benefited from select positions in the financial industry, particularly banks.
Likewise, the Fund’s overweight and security selection within CMBS helped as the sector posted positive excess returns over Treasuries, bouncing back from short-lived volatility at the end of 2018. As the broader markets recovered and the Fed became increasingly accommodative, investors moved down in quality to find attractive yields, leading higher beta securities in the segment to
8
outperform. The CMBS sector was supported further by a supply constraint due to a lack of existing mortgages reaching maturity in 2019 that need to be refinanced.
Allocations to high yield credit and leveraged loans also aided results. Early in 2019, the high yield market snapped back from itsyear-end 2018 selloff after the Fed’s policy pivot lowered the chances of a possible recession. More broadly speaking, the segment also continued to be supported by falling interest rates, healthy credit fundamentals and sustained low defaults, combined with technical support in the form of solid inflows back into the segment and no significant increase in new issue supply. In May 2019, the high yield market sold off briefly amid a spike in market volatility as U.S./China trade tensions intensified, but rebounded in June 2019 after policymakers signaled a readiness to cut interest rates. In the leveraged loan market, fundamentals also remained strong as the segment continued to experience historically low default rates given the overall strength of corporations.
The Fund’s performance also benefited from underweight exposure to both the mortgage-backed securities (MBS) sector and U.S. Treasury securities. We maintained the portfolio’s underweight in MBS given better relative values in other sectors and the risks associated with the Fed’s reduced investment in the segment. The agency MBS sector lagged other major sectors and generated negative excess returns versus Treasuries as investors sought out duration from Treasuries and investment-grade bonds. We also maintained a substantial underweight in Treasuries given our generally constructive economic view and income focus for the Fund.
The only significant detractor of note was the Fund’s modestly shorter duration relative to its benchmark throughout the reporting period. This defensive stance lessened the Fund’s interest rate sensitivity, creating a drag on relative performance given the dramatic move lower in interest rates. However, the negative impact was partially offset by the Fund’s yield curve positioning, which proved modestly beneficial to performance. We ended the reporting period with an overweighting in the middle (intermediate) section of the yield curve where rates fell the most.
During the reporting period, we also continued to use various derivative instruments. We used foreign currency exchange forward contracts to manage the Fund’s foreign currency exposure. For example, the Fund may reduce unwanted currency exposure from the Fund’s portfolio, or may take long forward positions in select currencies in an attempt to benefit from the potential price appreciation. These positions had a negligible impact on performance during the reporting period.
We used U.S. Treasury futures and Eurodollar futures as part of an overall portfolio construction strategy to manage portfolio duration and yield curve exposure and selected foreign bond futures to actively manage exposure to those markets. These positions had a positive impact on performance during the reporting period.
In addition, we entered into credit default swaps as a way to manage overall high yield exposure. The effect of these activities on performance was negligible during the reporting period.
The Fund also used interest rate swaps as part of an overall portfolio construction strategy to manage portfolio duration. The effect of these activities on performance was negative during the reporting period.
9
Risk Considerations
and Dividend Information
Risk Considerations
Nuveen High Income Bond Fund
Mutual fund investing involves risk; principal loss is possible. Debt or fixed income securities such as those held by the Fund, are subject to market risk, credit risk, interest rate risk, call risk, derivatives risk, income risk, and other investment company risk. As interest rates rise, bond prices fall. Below investment grade or high yield debt securities are subject to liquidity risk and heightened credit risk. Foreign investments involve additional risks, including currency fluctuation, political and economic instability, lack of liquidity and differing legal and accounting standards.
Nuveen Strategic Income Fund
Mutual fund investing involves risk; principal loss is possible. Debt or fixed income securities such as those held by the Fund, are subject to market risk, credit risk, interest rate risk, call risk, derivatives risk, dollar roll transaction risk, and income risk. As interest rates rise, bond prices fall. Below investment grade or high yield debt securities are subject to liquidity risk and heightened credit risk. Foreign investments involve additional risks, including currency fluctuation, political and economic instability, lack of liquidity and differing legal and accounting standards. The Fund gains additional exposure to currency rates, and therefore to the risk of currency fluctuation, through investment in foreign currency contracts. The risks of foreign investments are magnified in emerging markets. Asset-backed and mortgage-backed securities are subject to additional risks such as prepayment risk, liquidity risk, default risk and adverse economic developments.
Dividend Information
Each Fund seeks to pay regular monthly dividends out of its net investment income at a rate that reflects its past and projected net income performance. To permit each Fund to maintain a more stable monthly dividend, the Fund may pay dividends at a rate that may be more or less than the amount of net income actually earned by the Fund during the period. Distributions to shareholders are determined on a tax basis, which may differ from amounts recorded in the accounting records. In instances where the monthly dividend exceeds the earned net investment income, the Fund would report a negative undistributed net ordinary income. Refer to Note 6 – Income Tax Information for additional information regarding the amounts of undistributed net ordinary income and undistributed net long-term capital gains and the character of the actual distributions paid by the Fund during the period.
All monthly dividends paid by each Fund during the current reporting period were paid from net investment income. If a portion of the Fund’s monthly distributions is sourced or comprised of elements other than net investment income, including capital gains and/or a return of capital, shareholders will be notified of those sources. For financial reporting purposes, the per share amounts of each Fund’s distributions for the reporting period are presented in this report’s Financial Highlights. For income tax purposes, distribution information for each Fund as of its most recent tax year end is presented in Note 6 – Income Tax Information within the Notes to Financial Statements of this report.
10
Fund Performance
and Expense Ratios
The Fund Performance and Expense Ratios for each Fund are shown within this section of the report.
Returns quoted represent past performance, which is no guarantee of future results. Investment returns and principal value will fluctuate so that when shares are redeemed, they may be worth more or less than their original cost. Current performance may be higher or lower than the performance shown. Total returns for a period of less than one year are not annualized. Returns at net asset value (NAV) would be lower if the sales charge were included. Returns assume reinvestment of dividends and capital gains. For performance current to the most recent month-end visit nuveen.com or call(800) 257-8787.
Returns do not reflect the deduction of taxes that a shareholder would pay on Fund distributions or the redemption of Fund shares.
Returns may reflect fee waivers and/or expense reimbursements by the investment adviser during the periods presented. If any such waivers and/or reimbursements had not been in place, returns would have been reduced. See Notes to Financial Statements, Note 7—Management Fees and Other Transactions with Affiliates for more information.
Returns reflect differences in sales charges and expenses, which are primarily differences in distribution and service fees, and assume reinvestment of dividends and capital gains.
Comparative index and Lipper return information is provided for Class A Shares at NAV only.
The expense ratios shown reflect total operating expenses (before fee waivers and/or expense reimbursements, if any) as shown in the most recent prospectus. The expense ratios include management fees and other fees and expenses.
11
Fund Performance and Expense Ratios(continued)
Nuveen High Income Bond Fund
Refer to the first page of this Fund Performance and Expense Ratios section for further explanation of the information included within this section. Refer to the Glossary of Terms Used in this Report for definitions of terms used within this section.
Fund Performance
Average Annual Total Returns as of June 30, 2019
| | | | | | | | | | | | |
| | | Average Annual | |
| | | 1-Year | | | 5-Year | | | 10-Year | |
Class A Shares at NAV | | | 5.86% | | | | 2.60% | | | | 8.21% | |
Class A Shares at maximum Offering Price | | | 0.89% | | | | 1.62% | | | | 7.68% | |
Bloomberg Barclays High Yield 2% Issuer Capped Index | | | 7.48% | | | | 4.71% | | | | 9.22% | |
Lipper High Current Yield Funds Classification Average | | | 6.43% | | | | 3.30% | | | | 8.41% | |
| | | |
Class C Shares | | | 5.04% | | | | 1.84% | | | | 7.44% | |
Class R3 Shares | | | 5.56% | | | | 2.34% | | | | 7.93% | |
Class I Shares | | | 6.10% | | | | 2.88% | | | | 8.50% | |
Indexes and Lipper averages are not available for direct investment.
Class A Shares have a maximum 4.75% sales charge (Offering Price). Class A Share purchases of $1 million or more are sold at net asset value without an up-front sales charge but may be subject to a contingent deferred sales charge (CDSC) of 1%, if redeemed within eighteen months of purchase. Class C Shares have a 1% CDSC for redemptions within less than twelve months, which is not reflected in the total returns. Class C Shares automatically convert to Class A Shares ten years after purchase. Class R3 Shares have no sales charge and are only available for purchase by eligible retirement plans. Class I Shares have no sales charge and may be purchased under limited circumstances or by specified classes of investors.
Expense Ratios as of Most Recent Prospectus
| | | | | | | | | | | | | | | | |
| | | Share Class | |
| | | Class A | | | Class C | | | Class R3 | | | Class I | |
Expense Ratios | | | 1.09% | | | | 1.85% | | | | 1.35% | | | | 0.84% | |
Net Expense Ratios | | | 1.05% | | | | 1.80% | | | | 1.30% | | | | 0.80% | |
The Fund’s investment adviser has contractually agreed to waive fees and/or reimburse other Fund expenses through July 31, 2021 so that total annual Fund operating expenses (excluding 12b-1 distribution and/or service fees, interest expenses, taxes, acquired fund fees and expenses, fees incurred in acquiring and disposing of portfolio securities and extraordinary expenses) do not exceed 0.75% of the average daily net assets of any class of Fund shares. Fee waivers and/or expense reimbursements will not be terminated prior to that time without the approval of the Board of Directors of the Fund.
12
Growth of an Assumed $10,000 Investment as of June 30, 2019 – Class A Shares
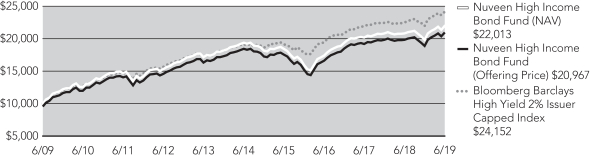
The graphs do not reflect the deduction of taxes that a shareholder may pay on Fund distributions or the redemption of Fund shares.
13
Fund Performance and Expense Ratios(continued)
Nuveen Strategic Income Fund
Refer to the first page of this Fund Performance and Expense Ratios section for further explanation of the information included within this section. Refer to the Glossary of Terms Used in this Report for definitions of terms used within this section.
Fund Performance
Average Annual Total Returns as of June 30, 2019
| | | | | | | | | | | | |
| | | Average Annual | |
| | | 1-Year | | | 5-Year | | | 10-Year | |
Class A Shares at NAV | | | 7.89% | | | | 2.69% | | | | 6.28% | |
Class A Shares at maximum Offering Price | | | 3.32% | | | | 1.81% | | | | 5.82% | |
Bloomberg Barclays U.S. Aggregate Bond Index | | | 7.87% | | | | 2.95% | | | | 3.90% | |
Lipper Multi-Sector Income Funds Classification Average | | | 6.28% | | | | 3.06% | | | | 6.04% | |
| | | |
Class C Shares | | | 7.11% | | | | 1.94% | | | | 5.49% | |
Class R3 Shares | | | 7.61% | | | | 2.45% | | | | 5.98% | |
Class I Shares | | | 8.15% | | | | 2.95% | | | | 6.54% | |
| | | | | | | | |
| | | Average Annual | |
| | | 1-Year | | | Since
Inception | |
Class R6 Shares | | | 8.24% | | | | 3.52% | |
Since inception return for Class R6 Shares is from 1/20/15. Indexes and Lipper averages are not available for direct investment.
Class A Shares have a maximum 4.25% sales charge (Offering Price). Class A Share purchases of $1 million or more are sold at net asset value without an up-front sales charge but may be subject to a contingent deferred sales charge (CDSC) of 1%, if redeemed within eighteen months of purchase. Class C Shares have a 1% CDSC for redemptions within less than twelve months, which is not reflected in the total returns. Class C Shares automatically convert to Class A Shares ten years after purchase. Class R3 Shares have no sales charge and are only available for purchase by eligible retirement plans. Class R6 Shares have no sales charge and are available only to certain limited categories of investors as described in the prospectus. Class I Shares have no sales charge and may be purchased under limited circumstances or by specified classes of investors.
Expense Ratios as of Most Recent Prospectus
| | | | | | | | | | | | | | | | | | | | |
| | | Share Class | |
| | | Class A | | | Class C | | | Class R3 | | | Class R6 | | | Class I | |
Gross Expense Ratios | | | 0.93% | | | | 1.68% | | | | 1.18% | | | | 0.60% | | | | 0.68% | |
Net Expense Ratios | | | 0.83% | | | | 1.58% | | | | 1.08% | | | | 0.50% | | | | 0.58% | |
The Fund’s investment adviser has contractually agreed to waive fees and/or reimburse other Fund expenses through July 31, 2021 so that total annual Fund operating expenses (excluding 12b-1 distribution and/or service fees, interest expenses, taxes, acquired fund fees and expenses, fees incurred in acquiring and disposing of portfolio securities and extraordinary expenses) do not exceed 0.59% of the average daily net assets of any class of Fund shares. However, because Class R6 shares are not subject to sub-transfer agent and similar fees, the total annual Fund operating expenses for the Class R6 shares will be less than the expense limitation. Fee waivers and/or expense reimbursements will not be terminated prior to that time without the approval of the Board of Directors of the Fund.
14
Growth of an Assumed $10,000 Investment as of June 30, 2019 – Class A Shares
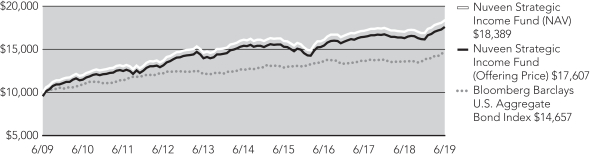
The graphs do not reflect the deduction of taxes that a shareholder may pay on Fund distributions or the redemption of Fund shares.
15
Yields as of June 30, 2019
Dividend Yield is the most recent dividend per share (annualized) divided by the offering price per share.
The SEC30-Day Yield is a standardized measure of a fund’s yield that accounts for the future amortization of premiums or discounts of bonds held in the fund’s portfolio. The SEC30-Day Yield is computed under an SEC standardized formula and is based on the maximum offer price per share. Subsidized yields reflect fee waivers and/or expense reimbursements from the investment adviser during the period. If any such waivers and/or reimbursements had not been in place, yields would have been reduced. Unsubsidized yields do not reflect waivers and/or reimbursements from the investment adviser during the period. If the fund did not receive a fee waiver/expense reimbursement during the period under its most recent agreement, subsidized and unsubsidized yields will be equal. Refer to the Notes to Financial Statements, Note 7 – Management Fees and Other Transactions with Affiliates for further details on the investment adviser’s most recent agreement with the Fund to waive fees and/or reimburse expenses, where applicable. Dividend Yield may differ from the SEC30-Day Yield because the fund may be paying out more or less than it is earning and it may not include the effect of amortization of bond premium.
Nuveen High Income Bond Fund
| | | | | | | | | | | | | | | | |
| | | Share Class | |
| | | Class A1 | | | Class C | | | Class R3 | | | Class I | |
Dividend Yield | | | 5.56% | | | | 5.41% | | | | 5.84% | | | | 6.35% | |
SEC30-Day Yield-Subsidized | | | 5.06% | | | | 4.84% | | | | 5.33% | | | | 5.79% | |
SEC30-Day Yield-Unsubsidized | | | 5.06% | | | | 4.83% | | | | 5.33% | | | | 5.79% | |
Nuveen Strategic Income Fund
| | | | | | | | | | | | | | | | | | | | |
| | | Share Class | |
| | | Class A1 | | | Class C | | | Class R3 | | | Class R6 | | | Class I | |
Dividend Yield | | | 3.06% | | | | 2.62% | | | | 3.10% | | | | 3.67% | | | | 3.57% | |
SEC30-Day Yield-Subsidized | | | 3.51% | | | | 3.08% | | | | 3.58% | | | | 4.11% | | | | 4.08% | |
SEC30-Day Yield-Unsubsidized | | | 3.51% | | | | 2.96% | | | | 3.46% | | | | 4.03% | | | | 3.96% | |
The SEC Yield for Class A Shares quoted in the table reflects the maximum sales load. Investors paying a reduced load because of volume discounts, investors paying no load because they qualify for one of the several exclusions from the load, and existing shareholders who previously paid a load but would like to know the SEC Yield applicable to their shares on a going-forward basis, should understand that the SEC Yield effectively applicable to them would be higher than the figure quoted in the table.
16
Holding Summaries as of June 30, 2019
This data relates to the securities held in each Fund’s portfolio of investments as of the end of this reporting period. It should not be construed as a measure of performance for the Fund itself. Holdings are subject to change.
For financial reporting purposes, the ratings disclosed are the highest rating given by one of the following national rating agencies: Standard & Poor’s, Moody’s Investors Service, Inc. or Fitch, Inc. This treatment of split-rated securities may differ from that used for other purposes, such as for Fund investment policies. Credit ratings are subject to change. AAA, AA, A and BBB are investment grade ratings; BB, B, CCC, CC, C and D are below investment grade ratings. Holdings designated N/R are not rated by these national rating agencies.
Refer to the Glossary of Terms Used in this Report for further definition of the terms used within this section.
Nuveen High Income Bond Fund
Fund Allocation
(% of net assets)
| | | | |
| | |
Corporate Bonds | | | 81.7% | |
| |
Exchange-Traded Funds | | | 4.8% | |
| |
Contingent Capital Securities | | | 1.8% | |
| |
Variable Rate Senior Loan
Interests | | | 1.4% | |
| |
$1,000 Par (or similar) Institutional Preferred | | | 1.1% | |
| |
$25 Par (or similar) Retail
Preferred | | | 0.8% | |
| |
Sovereign Debt | | | 0.4% | |
| |
Common Stocks | | | 0.0% | |
| |
Investments Purchased with Collateral from Securities Lending | | | 5.5% | |
| |
Money Market Funds | | | 8.1% | |
| |
Other Assets Less Liabilities | | | (5.6)% | |
| |
Net Assets | | | 100% | |
Corporate Bonds: Industries
(% of total corporate bonds)
| | | | |
| | |
Oil, Gas & Consumable Fuels | | | 16.0% | |
| |
Media | | | 10.6% | |
| |
Commercial Services & Supplies | | | 6.2% | |
| |
Health Care Providers & Services | | | 5.9% | |
| |
Diversified Telecommunication Services | | | 4.8% | |
| |
Chemicals | | | 4.6% | |
| |
Energy Equipment & Services | | | 4.1% | |
| |
Auto Components | | | 3.5% | |
| |
Specialty Retail | | | 3.4% | |
| |
Metals & Mining | | | 3.2% | |
| |
Consumer Finance | | | 3.1% | |
| |
Household Durables | | | 3.0% | |
| |
Gas Utilities | | | 2.6% | |
| |
Aerospace & Defense | | | 2.6% | |
| |
Electric Utilities | | | 2.5% | |
| |
Pharmaceuticals | | | 2.5% | |
| |
Machinery | | | 2.2% | |
| |
Other | | | 19.2% | |
| |
Total | | | 100% | |
Portfolio Credit Quality
(% of total long-term fixed-income investments)
| | | | |
| | |
BBB | | | 8.3% | |
| |
BB or Lower | | | 91.1% | |
| |
N/R (not rated) | | | 0.6% | |
| |
Total | | | 100% | |
17
Holding Summaries as of June 30, 2019 (continued)
Nuveen Strategic Income Fund
Fund Allocation
(% of net assets)
| | | | |
| | |
Corporate Bonds | | | 41.5% | |
| |
Asset-Backed and Mortgage-Backed Securities | | | 27.2% | |
| |
Variable Rate Senior Loan Interests | | | 8.6% | |
| |
$1,000 Par (or similar) Institutional Preferred | | | 7.0% | |
| |
Contingent Capital Securities | | | 5.1% | |
| |
U.S. Government and Agency Obligations | | | 4.0% | |
| |
Sovereign Debt | | | 2.6% | |
| |
$25 Par (or similar) Retail Preferred | | | 0.7% | |
| |
Municipal Bonds | | | 0.5% | |
| |
Convertible Bonds | | | 0.2% | |
| |
Common Stocks | | | 0.0% | |
| |
Investments Purchased with Collateral from Securities Lending | | | 1.7% | |
| |
Money Market Funds | | | 6.1% | |
| |
Other Assets Less Liabilities | | | (5.2)% | |
| |
Net Assets | | | 100% | |
Corporate Bonds: Industries
(% of total corporate bonds)
| | | | |
| | |
Banks | | | 13.9% | |
| |
Oil, Gas & Consumable Fuels | | | 10.5% | |
| |
Capital Markets | | | 5.4% | |
| |
Diversified Financial Services | | | 4.8% | |
| |
Diversified Telecommunication Services | | | 4.8% | |
| |
Insurance | | | 4.5% | |
| |
Media | | | 4.2% | |
| |
Consumer Finance | | | 3.9% | |
| |
Chemicals | | | 3.5% | |
| |
Electric Utilities | | | 3.2% | |
| |
Food & Staples Retailing | | | 3.0% | |
| |
Airlines | | | 2.6% | |
| |
Metals & Mining | | | 2.4% | |
| |
Road & Rail | | | 2.4% | |
| |
Wireless Telecommunication Services | | | 2.0% | |
| |
Specialty Retail | | | 2.0% | |
| |
Software | | | 1.9% | |
| |
Health Care Providers & Services | | | 1.8% | |
| |
Machinery | | | 1.7% | |
| |
Air Freight & Logistic | | | 1.6% | |
| |
Other | | | 19.9% | |
| |
Total | | | 100% | |
Portfolio Credit Quality
(% of total long-term fixed-income investments)
| | | | |
| | |
AAA | | | 19.2% | |
| |
AA | | | 2.9% | |
| |
A | | | 17.3% | |
| |
BBB | | | 26.4% | |
| |
BB or Lower | | | 33.0% | |
| |
N/R (not rated) | | | 1.2% | |
| |
Total | | | 100% | |
18
Expense Examples
As a shareholder of one or more of the Funds, you incur two types of costs: (1) transaction costs, includingup-front andback-end sales charges (loads) or redemption fees, where applicable; and (2) ongoing costs, including management fees; distribution and service(12b-1) fees, where applicable; and other Fund expenses. The Examples below are intended to help you understand your ongoing costs (in dollars) of investing in the Funds and to compare these costs with the ongoing costs of investing in other mutual funds.
The Examples below are based on an investment of $1,000 invested at the beginning of the period and held through the period ended June 30, 2019.
The beginning of the period for the funds is January 1, 2019.
The information under “Actual Performance,” together with the amount you invested, allows you to estimate actual expenses incurred over the reporting period. Simply divide your account value by $1,000 (for example, an $8,600 account value divided by $1,000 = 8.60) and multiply the result by the cost shown for your share class, in the row entitled “Expenses Incurred During Period” to estimate the expenses incurred on your account during this period.
The information under “Hypothetical Performance,” provides information about hypothetical account values and hypothetical expenses based on each Fund’s actual expense ratio and an assumed rate of return of 5% per year before expenses, which is not the Fund’s actual return. The hypothetical account values and expenses may not be used to estimate the actual ending account balance or expense you incurred for the period. You may use this information to compare the ongoing costs of investing in the Fund and other funds. To do so, compare this 5% hypothetical example with the 5% hypothetical examples that appear in the shareholder reports of the other funds.
Please note that the expenses shown in the tables are meant to highlight your ongoing costs only and do not reflect any transaction costs. Therefore, the hypothetical information is useful in comparing ongoing costs only, and will not help you determine the relative total costs of owning different funds or share classes. In addition, if these transaction costs were included, your costs would have been higher.
Nuveen High Income Bond Fund
| | | | | | | | | | | | | | | | |
| | | Share Class | |
| | | A Shares | | | C Shares | | | R3 Shares | | | I Shares | |
Actual Performance | | | | | | | | | | | | | | | | |
Beginning Account Value | | $ | 1,000.00 | | | $ | 1,000.00 | | | $ | 1,000.00 | | | $ | 1,000.00 | |
Ending Account Value | | $ | 1,109.30 | | | $ | 1,105.30 | | | $ | 1,107.50 | | | $ | 1,111.70 | |
Expenses Incurred During the Period | | $ | 5.23 | | | $ | 9.13 | | | $ | 6.58 | | | $ | 3.93 | |
Hypothetical Performance (5% annualized return before expenses) | | | | | | | | | | | | | | | | |
Beginning Account Value | | $ | 1,000.00 | | | $ | 1,000.00 | | | $ | 1,000.00 | | | $ | 1,000.00 | |
Ending Account Value | | $ | 1,019.84 | | | $ | 1,016.12 | | | $ | 1,018.55 | | | $ | 1,021.08 | |
Expenses Incurred During the Period | | $ | 5.01 | | | $ | 8.75 | | | $ | 6.31 | | | $ | 3.76 | |
For each class of the Fund, expenses are equal to the Fund’s annualized net expense ratio of 1.00%, 1.75%, 1.26% and 0.75% for Classes A, C, R3 and I, respectively, multiplied by the average account value over the period, multiplied by 181/365 (to reflect theone-half year period).
19
Expense Examples(continued)
Nuveen Strategic Income Fund
| | | | | | | | | | | | | | | | | | | | |
| | | Share Class | |
| | | A Shares | | | C Shares | | | R3 Shares | | | R6 Shares | | | I Shares | |
Actual Performance | | | | | | | | | | | | | | | | | | | | |
Beginning Account Value | | $ | 1,000.00 | | | $ | 1,000.00 | | | $ | 1,000.00 | | | $ | 1,000.00 | | | $ | 1,000.00 | |
Ending Account Value | | $ | 1,089.10 | | | $ | 1,085.50 | | | $ | 1,088.60 | | | $ | 1,091.30 | | | $ | 1,090.40 | |
Expenses Incurred During the Period | | $ | 4.35 | | | $ | 8.22 | | | $ | 5.64 | | | $ | 2.64 | | | $ | 3.06 | |
Hypothetical Performance (5% annualized return before expenses) | | | | | | | | | | | | | | | | | | | | |
Beginning Account Value | | $ | 1,000.00 | | | $ | 1,000.00 | | | $ | 1,000.00 | | | $ | 1,000.00 | | | $ | 1,000.00 | |
Ending Account Value | | $ | 1,020.63 | | | $ | 1,016.91 | | | $ | 1,019.39 | | | $ | 1,022.27 | | | $ | 1,021.87 | |
Expenses Incurred During the Period | | $ | 4.21 | | | $ | 7.95 | | | $ | 5.46 | | | $ | 2.56 | | | $ | 2.96 | |
For each class of the Fund, expenses are equal to the Fund’s annualized net expense ratio of 0.84%, 1.59%, 1.09%, 0.51%, 0.59% for Classes A, C, R3, R6 and I, respectively, multiplied by the average account value over the period, multiplied by 181/365 (to reflect theone-half year period).
20
Shareholder Meeting Report
A special meeting of shareholders was held in the offices of Nuveen on April 2, 2019 for the High Income Bond Fund; at this meeting the shareholders were asked to vote to approve the Agreement and Plan of Reorganization of the Fund. The meeting was subsequently adjourned to May 7, 2019 and additionally adjourned to June 7, 2019.
| | | | |
| | | High Income
Bond Fund | |
| | | Common
Shares | |
To approve the Agreement and Plan of Reorganization | | | | |
For | | | 19,745,696 | |
Against | | | 1,549,471 | |
Abstain | | | 2,783,988 | |
Total | | | 24,079,155 | |
21
Report of Independent Registered Public Accounting Firm
To the Board of Directors of Nuveen Investment Funds, Inc. and
Shareholders of Nuveen High Income Bond Fund and
Nuveen Strategic Income Fund
Opinions on the Financial Statements
We have audited the accompanying statements of assets and liabilities, including the portfolios of investments, of Nuveen High Income Bond Fund and Nuveen Strategic Income Fund (two of the Funds constituting Nuveen Investment Funds, Inc., hereafter collectively referred to as the “Funds”) as of June 30, 2019, the related statements of operations for the year ended June 30, 2019, the statements of changes in net assets for each of the two years in the period ended June 30, 2019, including the related notes, and the financial highlights for each of the periods indicated therein (collectively referred to as the “financial statements”). In our opinion, the financial statements present fairly, in all material respects, the financial position of each of the Funds as of June 30, 2019, the results of each of their operations for the year then ended, the changes in each of their net assets for each of the two years in the period ended June 30, 2019 and each of the financial highlights for each of the periods indicated therein in conformity with accounting principles generally accepted in the United States of America.
Basis for Opinions
These financial statements are the responsibility of the Funds’ management. Our responsibility is to express an opinion on the Funds’ financial statements based on our audits. We are a public accounting firm registered with the Public Company Accounting Oversight Board (United States) (PCAOB) and are required to be independent with respect to the Funds in accordance with the U.S. federal securities laws and the applicable rules and regulations of the Securities and Exchange Commission and the PCAOB.
We conducted our audits of these financial statements in accordance with the standards of the PCAOB. Those standards require that we plan and perform the audit to obtain reasonable assurance about whether the financial statements are free of material misstatement, whether due to error or fraud.
Our audits included performing procedures to assess the risks of material misstatement of the financial statements, whether due to error or fraud, and performing procedures that respond to those risks. Such procedures included examining, on a test basis, evidence regarding the amounts and disclosures in the financial statements. Our audits also included evaluating the accounting principles used and significant estimates made by management, as well as evaluating the overall presentation of the financial statements. Our procedures included confirmation of securities owned as of June 30, 2019 by correspondence with the custodian and brokers; when replies were not received from brokers, we performed other auditing procedures. We believe that our audits provide a reasonable basis for our opinions.
PricewaterhouseCoopers LLP
Chicago, Illinois
August 27, 2019
We have served as the auditor of one or more investment companies in Nuveen Funds since 2002.
22
Nuveen High Income Bond Fund
Portfolio of Investments June 30, 2019
| | | | | | | | | | | | | | | | | | | | | | | | | | | | |
Principal
Amount (000) | | | Description (1) | | | | | | | | Coupon | | | Maturity | | | Ratings (2) | | | Value | |
| | | |
| | | | LONG-TERM INVESTMENTS – 92.0% | | | | | | | | | |
| | | | | | | |
| | | | CORPORATE BONDS – 81.7% | | | | | | | | | | | | | | | | | | | | | | | | |
| | | | | | | |
| | | | Aerospace & Defense – 2.1% | | | | | | | | | | | | | | | | | | |
| | | | | | | |
| $ | 1,875 | | | Bombardier Inc., 144A | | | | | | | | | | | 7.875% | | | | 4/15/27 | | | | B | | | $ | 1,877,344 | |
| | | | | | | |
| | 3,000 | | | TransDigm Inc., 144A | | | | | | | | | | | 6.250% | | | | 3/15/26 | | | | Ba3 | | | | 3,138,750 | |
| | | | | | | |
| | 1,000 | | | TransDigm Inc., 144A | | | | | | | | | | | 7.500% | | | | 3/15/27 | | | | B– | | | | 1,043,750 | |
| | 5,875 | | | Total Aerospace & Defense | | | | | | | | | | | | | | | | | | | | | | | 6,059,844 | |
| | | | | | | |
| | | | Airlines – 0.4% | | | | | | | | | | | | | | | | | | |
| | | | | | | |
| | 1,000 | | | Virgin Australia Holdings Ltd, 144A | | | | | | | | | | | 7.875% | | | | 10/15/21 | | | | B | | | | 1,026,250 | |
| | | | | | | |
| | | | Auto Components – 2.8% | | | | | | | | | | | | | | | | | | |
| | | | | | | |
| | 1,000 | | | Adient Global Holdings Ltd, 144A | | | | | | | | | | | 4.875% | | | | 8/15/26 | | | | B | | | | 792,500 | |
| | | | | | | |
| | 1,000 | | | Icahn Enterprises LP / Icahn Enterprises Finance Corp | | | | | | | | | | | 6.375% | | | | 12/15/25 | | | | BB+ | | | | 1,020,800 | |
| | | | | | |
| | 1,125 | | | Icahn Enterprises LP / Icahn Enterprises Finance Corp, 144A | | | | | | | | 6.250% | | | | 5/15/26 | | | | BB+ | | | | 1,137,656 | |
| | | | | | |
| | 1,725 | | | IHO Verwaltungs GmbH, 144A, (cash 4.750%, PIK 5.500%) | | | | | | | | 4.750% | | | | 9/15/26 | | | | BB+ | | | | 1,679,719 | |
| | | | | | |
| | 1,000 | | | IHO Verwaltungs GmbH, (cash 6.375%, PIK 7.125%) | | | | | | | | 6.375% | | | | 5/15/29 | | | | BB+ | | | | 1,000,000 | |
| | | | | | |
| | 2,500 | | | Panther BF Aggregator 2 LP / Panther Finance Co Inc., 144A | | | | | | | | 8.500% | | | | 5/15/27 | | | | B | | | | 2,575,000 | |
| | 8,350 | | | Total Auto Components | | | | | | | | | | | | | | | | | | | | | | | 8,205,675 | |
| | | | | | | |
| | | | Banks – 0.9% | | | | | | | | | | | | | | | | | | |
| | | | | | | |
| | 2,500 | | | Quicken Loans Inc., 144A | | | | | | | | | | | 5.250% | | | | 1/15/28 | | | | Ba1 | | | | 2,487,500 | |
| | | | | | | |
| | | | Capital Markets – 1.3% | | | | | | | | | | | | | | | | | | |
| | | | | | | |
| | 1,500 | | | Donnelley Financial Solutions Inc. | | | | | | | | | | | 8.250% | | | | 10/15/24 | | | | B | | | | 1,552,500 | |
| | | | | | | |
| | 1,750 | | | Jefferies Finance LLC / JFINCo-Issuer Corp, 144A | | | | | | | | | | | 7.250% | | | | 8/15/24 | | | | BB– | | | | 1,718,797 | |
| | | | | | | |
| | 450 | | | Jefferies Finance LLC / JFINCo-Issuer Corp, 144A | | | | | | | | | | | 6.250% | | | | 6/03/26 | | | | Ba2 | | | | 453,938 | |
| | 3,700 | | | Total Capital Markets | | | | | | | | | | | | | | | | | | | | | | | 3,725,235 | |
| | | | | | | |
| | | | Chemicals – 3.7% | | | | | | | | | | | | | | | | | | |
| | | | | | | |
| | 1,500 | | | CF Industries Inc. | | | | | | | | | | | 5.375% | | | | 3/15/44 | | | | BB+ | | | | 1,406,700 | |
| | | | | | | |
| | 1,000 | | | Chemours Co | | | | | | | | | | | 5.375% | | | | 5/15/27 | | | | BB– | | | | 952,500 | |
| | | | | | | |
| | 1,000 | | | INEOS Group Holdings SA, 144A, (3) | | | | | | | | | | | 5.625% | | | | 8/01/24 | | | | BB | | | | 1,020,000 | |
| | | | | | | |
| | 2,000 | | | NOVA Chemicals Corp, 144A | | | | | | | | | | | 5.250% | | | | 8/01/23 | | | | BBB– | | | | 2,027,500 | |
| | | | | | | |
| | 1,500 | | | NOVA Chemicals Corp, 144A | | | | | | | | | | | 4.875% | | | | 6/01/24 | | | | BBB– | | | | 1,552,500 | |
| | | | | | | |
| | 1,750 | | | OCI NV, 144A | | | | | | | | | | | 6.625% | | | | 4/15/23 | | | | BB | | | | 1,820,000 | |
| | | | | | | |
| | 1,000 | | | Olin Corp | | | | | | | | | | | 5.125% | | | | 9/15/27 | | | | BB+ | | | | 1,026,250 | |
| | | | | |
| | 1,000 | | | Trinseo Materials Operating SCA / Trinseo Materials Finance Inc., 144A | | | | 5.375% | | | | 9/01/25 | | | | BB– | | | | 967,500 | |
| | 10,750 | | | Total Chemicals | | | | | | | | | | | | | | | | | | | | | | | 10,772,950 | |
| | | |
| | | | Commercial Services & Supplies – 5.1% | | | | | | | |
| | | | | | | |
| | 1,000 | | | ADT Security Corp, 144A | | | | | | | | | | | 4.875% | | | | 7/15/32 | | | | BB– | | | | 862,500 | |
| | | | | | | |
| | 550 | | | Allied Universal Holdco LLC, 144A, (WI/DD) | | | | | | | | | | | 6.625% | | | | 7/15/26 | | | | N/R | | | | 558,938 | |
23
Nuveen High Income Bond Fund(continued)
Portfolio of Investments June 30, 2019
| | | | | | | | | | | | | | | | | | | | | | | | | | | | |
Principal
Amount (000) | | | Description (1) | | | | | | | | Coupon | | | Maturity | | | Ratings (2) | | | Value | |
| | | | | | | |
| | | | Commercial Services & Supplies(continued) | | | | | | | | | | | | | | | | | | |
| | | | | | | |
| $ | 1,075 | | | Allied Universal Holdco LLC, 144A, (WI/DD) | | | | | | | | | | | 9.750% | | | | 7/15/27 | | | | CCC | | | $ | 1,075,000 | |
| | | | | | | |
| | 350 | | | Clean Harbors Inc., 144A, (WI/DD) | | | | | | | | | | | 4.875% | | | | 7/15/27 | | | | BB+ | | | | 355,723 | |
| | | | | | | |
| | 525 | | | GFL Environmental Inc., 144A | | | | | | | | | | | 8.500% | | | | 5/01/27 | | | | CCC+ | | | | 565,031 | |
| | | | | | | |
| | 2,000 | | | Iron Mountain Inc., 144A | | | | | | | | | | | 4.875% | | | | 9/15/27 | | | | BB– | | | | 1,982,500 | |
| | | | | | | |
| | 2,000 | | | James Hardie International Finance DAC, 144A | | | | | | | | | | | 5.000% | | | | 1/15/28 | | | | BBB– | | | | 1,990,000 | |
| | | | | | |
| | 775 | | | Prime Security Services Borrower LLC / Prime Finance Inc., 144A | | | | | | | | 5.250% | | | | 4/15/24 | | | | BB– | | | | 788,562 | |
| | | | | | |
| | 2,250 | | | Prime Security Services Borrower LLC / Prime Finance Inc., 144A | | | | | | | | 5.750% | | | | 4/15/26 | | | | BB– | | | | 2,323,125 | |
| | | | | | | |
| | 1,000 | | | Staples Inc., 144A | | | | | | | | | | | 7.500% | | | | 4/15/26 | | | | B+ | | | | 994,110 | |
| | | | | | | |
| | 2,600 | | | Staples Inc., 144A | | | | | | | | | | | 10.750% | | | | 4/15/27 | | | | B– | | | | 2,587,000 | |
| | | | | | | |
| | 600 | | | Stericycle Inc., 144A | | | | | | | | | | | 5.375% | | | | 7/15/24 | | | | BBB– | | | | 626,322 | |
| | 14,725 | | | Total Commercial Services & Supplies | | | | | | | | | | | | | | | | | | | | | | | 14,708,811 | |
| | | | | | | |
| | | | Communications Equipment – 1.1% | | | | | | | | | | | | | | | | | | |
| | | | | | | |
| | 500 | | | CommScope Inc., 144A | | | | | | | | | | | 5.500% | | | | 6/15/24 | | | | B1 | | | | 473,125 | |
| | | | | | | |
| | 2,225 | | | CommScope Inc., 144A, (3) | | | | | | | | | | | 8.250% | | | | 3/01/27 | | | | B1 | | | | 2,269,166 | |
| | | | | | | |
| | 425 | | | ViaSat Inc., 144A | | | | | | | | | | | 5.625% | | | | 4/15/27 | | | | BB+ | | | | 442,000 | |
| | 3,150 | | | Total Communications Equipment | | | | | | | | | | | | | | | | | | | | | | | 3,184,291 | |
| | | | | | | |
| | | | Construction & Engineering – 0.3% | | | | | | | | | | | | | | | | | | |
| | | | | | | |
| | 700 | | | AECOM | | | | | | | | | | | 5.125% | | | | 3/15/27 | | | | BB– | | | | 728,000 | |
| | | | | | | |
| | | | Construction Materials – 0.4% | | | | | | | | | | | | | | | | | | |
| | | | | | | |
| | 1,150 | | | Gates Global LLC / Gates Global Co, 144A | | | | | | | | | | | 6.000% | | | | 7/15/22 | | | | B | | | | 1,150,719 | |
| | | | | | | |
| | | | Consumer Finance – 2.5% | | | | | | | | | | | | | | | | | | |
| | | | | | | |
| | 1,000 | | | Curo Group Holdings Corp, 144A | | | | | | | | | | | 8.250% | | | | 9/01/25 | | | | B– | | | | 832,340 | |
| | | | | | | |
| | 2,000 | | | Enova International Inc., 144A | | | | | | | | | | | 8.500% | | | | 9/15/25 | | | | B2 | | | | 1,890,000 | |
| | | | | | | |
| | 1,500 | | | Refinitiv US Holdings Inc., 144A | | | | | | | | | | | 6.250% | | | | 5/15/26 | | | | BB+ | | | | 1,542,750 | |
| | | | | | | |
| | 1,500 | | | Refinitiv US Holdings Inc., 144A | | | | | | | | | | | 8.250% | | | | 11/15/26 | | | | B+ | | | | 1,542,750 | |
| | | | | | | |
| | 1,325 | | | Springleaf Finance Corp | | | | | | | | | | | 6.125% | | | | 3/15/24 | | | | BB– | | | | 1,424,375 | |
| | 7,325 | | | Total Consumer Finance | | | | | | | | | | | | | | | | | | | | | | | 7,232,215 | |
| | | | | | | |
| | | | Containers & Packaging – 0.1% | | | | | | | | | | | | | | | | | | |
| | | | | | | |
| | 125 | | | Berry Global Escrow Corp, 144A | | | | | | | | | | | 5.625% | | | | 7/15/27 | | | | BB | | | | 130,000 | |
| | | | | | | |
| | 250 | | | Graphic Packaging International LLC, 144A | | | | | | | | | | | 4.750% | | | | 7/15/27 | | | | BB+ | | | | 256,563 | |
| | 375 | | | Total Containers & Packaging | | | | | | | | | | | | | | | | | | | | | | | 386,563 | |
| | | | | | | |
| | | | Diversified Consumer Services – 0.4% | | | | | | | | | | | | | | | | | | |
| | | | | | | |
| | 1,000 | | | frontdoor Inc., 144A | | | | | | | | | | | 6.750% | | | | 8/15/26 | | | | B2 | | | | 1,065,000 | |
| | | |
| | | | Diversified Telecommunication Services – 3.9% | | | | | | | |
| | | | | | | |
| | 1,000 | | | CSC Holdings LLC, 144A | | | | | | | | | | | 10.875% | | | | 10/15/25 | | | | B | | | | 1,146,880 | |
| | | | | | | |
| | 2,000 | | | Embarq Corp | | | | | | | | | | | 7.995% | | | | 6/01/36 | | | | BB | | | | 1,935,640 | |
| | | | | | | |
| | 1,875 | | | Frontier Communications Corp, 144A | | | | | | | | | | | 8.500% | | | | 4/01/26 | | | | BB– | | | | 1,818,750 | |
| | | | | | | |
| | 1,200 | | | Frontier Communications Corp, 144A | | | | | | | | | | | 8.000% | | | | 4/01/27 | | | | BB– | | | | 1,248,000 | |
| | | | | | | |
| | 3,150 | | | Sprint Capital Corp | | | | | | | | | | | 6.875% | | | | 11/15/28 | | | | B+ | | | | 3,260,250 | |
24
| | | | | | | | | | | | | | | | | | | | | | | | | | | | |
Principal
Amount (000) | | | Description (1) | | | | | | | | Coupon | | | Maturity | | | Ratings (2) | | | Value | |
| | | | |
| | | | Diversified Telecommunication Services(continued) | | | | | | | | | | |
| | | | | | | |
| $ | 250 | | | Sprint Capital Corp | | | | | | | | | | | 8.750% | | | | 3/15/32 | | | | B+ | | | $ | 289,375 | |
| | | | | | | |
| | 1,600 | | | Telenet Finance Luxembourg Notes Sarl, 144A | | | | | | | | | | | 5.500% | | | | 3/01/28 | | | | BB+ | | | | 1,624,283 | |
| | | | | |
| | 11 | | | Xplornet Communications Inc., 144A, (cash 9.625%, PIK 10.625%) | | | | 9.625% | | | | 6/01/22 | | | | CCC | | | | 11,675 | |
| | | | | |
| | 11,086 | | | Total Diversified Telecommunication Services | | | | | | | | | | | | | | | | 11,334,853 | |
| | | | | | | |
| | | | Electric Utilities – 2.1% | | | | | | | | | | | | | | | | | | |
| | | | | | | |
| | 875 | | | NextEra Energy Operating Partners LP, 144A | | | | | | | | | | | 4.250% | | | | 7/15/24 | | | | Ba1 | | | | 878,828 | |
| | | | | | | |
| | 2,350 | | | Talen Energy Supply LLC | | | | | | | | | | | 6.500% | | | | 6/01/25 | | | | B | | | | 1,968,125 | |
| | | | | | | |
| | 1,500 | | | Tronox Finance PLC, 144A | | | | | | | | | | | 5.750% | | | | 10/01/25 | | | | B– | | | | 1,455,000 | |
| | | | | | | |
| | 1,575 | | | Vistra Operations Co LLC, 144A | | | | | | | | | | | 5.625% | | | | 2/15/27 | | | | BB | | | | 1,667,531 | |
| | 6,300 | | | Total Electric Utilities | | | | | | | | | | | | | | | | | | | | | | | 5,969,484 | |
| | | | | | | |
| | | | Energy Equipment & Services – 3.3% | | | | | | | | | | | | | | | | | | |
| | | | | | | |
| | 625 | | | Archrock Partners LP / Archrock Partners Finance Corp | | | | | | | | | | | 6.000% | | | | 10/01/22 | | | | B+ | | | | 632,813 | |
| | | | | |
| | 1,850 | | | Archrock Partners LP / Archrock Partners Finance Corp, 144A | | | | 6.875% | | | | 4/01/27 | | | | B+ | | | | 1,933,435 | |
| | | | | | | |
| | 620 | | | Bausch Health Cos Inc., 144A | | | | | | | | | | | 5.500% | | | | 3/01/23 | | | | B | | | | 624,960 | |
| | | | | | | |
| | 2,000 | | | Bausch Health Cos Inc., 144A | | | | | | | | | | | 6.125% | | | | 4/15/25 | | | | B | | | | 2,040,000 | |
| | | | | | | |
| | 750 | | | Ensco Rowan plc | | | | | | | | | | | 7.750% | | | | 2/01/26 | | | | B | | | | 558,750 | |
| | | | | | | |
| | 2,704 | | | Metro Exploration Holding Corp | | | | | | | | | | | 0.000% | | | | 12/31/49 | | | | N/R | | | | 270 | |
| | | | | | | |
| | 448 | | | Metro Exploration Holding Corp, (4) | | | | | | | | | | | 0.000% | | | | 12/31/49 | | | | N/R | | | | — | |
| | | | | | | |
| | 1,000 | | | Nabors Industries Inc., (3) | | | | | | | | | | | 5.500% | | | | 1/15/23 | | | | BB | | | | 935,000 | |
| | | | | | | |
| | 2,000 | | | Transocean Inc., 144A | | | | | | | | | | | 7.250% | | | | 11/01/25 | | | | B | | | | 1,895,000 | |
| | | | | | | |
| | 945 | | | Transocean Pontus Ltd, 144A | | | | | | | | | | | 6.125% | | | | 8/01/25 | | | | B+ | | | | 973,350 | |
| | 12,942 | | | Total Energy Equipment & Services | | | | | | | | | | | | | | | | | | | | | | | 9,593,578 | |
| | | | | | | |
| | | | Entertainment – 0.5% | | | | | | | | | | | | | | | | | | |
| | | | | | | |
| | 1,400 | | | Lions Gate Capital Holdings LLC, 144A | | | | | | | | | | | 6.375% | | | | 2/01/24 | | | | B2 | | | | 1,471,750 | |
| | | | | | | |
| | | | Food Products – 0.7% | | | | | | | | | | | | | | | | | | |
| | | | | | | |
| | 2,000 | | | Post Holdings Inc., 144A | | | | | | | | | | | 5.625% | | | | 1/15/28 | | | | B+ | | | | 2,055,000 | |
| | | | | | | |
| | | | Gas Utilities – 2.1% | | | | | | | | | | | | | | | | | | |
| | | | | | | |
| | 1,500 | | | AmeriGas Partners LP / AmeriGas Finance Corp | | | | | | | | | | | 5.625% | | | | 5/20/24 | | | | BB | | | | 1,597,500 | |
| | | | | | | |
| | 1,500 | | | AmeriGas Partners LP / AmeriGas Finance Corp | | | | | | | | | | | 5.750% | | | | 5/20/27 | | | | BB | | | | 1,575,000 | |
| | | | | | | |
| | 475 | | | EnLink Midstream LLC | | | | | | | | | | | 5.375% | | | | 6/01/29 | | | | BBB– | | | | 486,875 | |
| | | | | | | |
| | 1,000 | | | EnLink Midstream Partners LP | | | | | | | | | | | 4.400% | | | | 4/01/24 | | | | BBB– | | | | 1,011,230 | |
| | | | | | | |
| | 1,500 | | | Superior Plus LP / Superior General Partner Inc., 144A | | | | | | | | | | | 7.000% | | | | 7/15/26 | | | | BB | | | | 1,550,625 | |
| | 5,975 | | | Total Gas Utilities | | | | | | | | | | | | | | | | | | | | | | | 6,221,230 | |
| | | | |
| | | | Health Care Providers & Services – 4.9% | | | | | | | | | | |
| | | | | | | |
| | 2,000 | | | CHS/Community Health Systems Inc., 144A | | | | | | | | | | | 8.000% | | | | 3/15/26 | | | | B | | | | 1,922,060 | |
| | | | | | | |
| | 1,000 | | | DaVita Inc. | | | | | | | | | | | 5.000% | | | | 5/01/25 | | | | Ba3 | | | | 987,250 | |
| | | | | | | |
| | 1,000 | | | Envision Healthcare Corp, 144A, (3) | | | | | | | | | | | 8.750% | | | | 10/15/26 | | | | B– | | | | 692,500 | |
| | | | | | | |
| | 800 | | | HCA Inc. | | | | | | | | | | | 5.875% | | | | 2/01/29 | | | | Ba2 | | | | 877,000 | |
| | | | | | | |
| | 1,000 | | | HCA Inc. | | | | | | | | | | | 5.125% | | | | 6/15/39 | | | | BBB– | | | | 1,038,714 | |
25
Nuveen High Income Bond Fund(continued)
Portfolio of Investments June 30, 2019
| | | | | | | | | | | | | | | | | | | | | | | | | | | | |
Principal
Amount (000) | | | Description (1) | | | | | | | | Coupon | | | Maturity | | | Ratings (2) | | | Value | |
| | | | |
| | | | Health Care Providers & Services(continued) | | | | | | | | | | |
| | | | | | | |
| $ | 1,000 | | | HCA Inc. | | | | | | | | | | | 5.250% | | | | 6/15/49 | | | | BBB– | | | $ | 1,039,710 | |
| | | | | | | |
| | 225 | | | MEDNAX Inc., 144A | | | | | | | | | | | 6.250% | | | | 1/15/27 | | | | BBB– | | | | 221,344 | |
| | | | | | | |
| | 625 | | | RegionalCare Hospital Partners Holdings Inc., 144A | | | | | | | | | | | 8.250% | | | | 5/01/23 | | | | B+ | | | | 665,234 | |
| | | | | |
| | 1,150 | | | RegionalCare Hospital Partners Holdings Inc. / LifePoint Health Inc., 144A | | | | 9.750% | | | | 12/01/26 | | | | CCC+ | | | | 1,204,625 | |
| | | | | | | |
| | 2,000 | | | Tenet Healthcare Corp | | | | | | | | | | | 6.750% | | | | 6/15/23 | | | | B– | | | | 2,007,500 | |
| | | | | | | |
| | 2,000 | | | Tenet Healthcare Corp, (3) | | | | | | | | | | | 7.000% | | | | 8/01/25 | | | | CCC+ | | | | 1,992,500 | |
| | | | | | | |
| | 1,350 | | | Tenet Healthcare Corp, 144A | | | | | | | | | | | 6.250% | | | | 2/01/27 | | | | Ba3 | | | | 1,390,500 | |
| | 14,150 | | | Total Health Care Providers & Services | | | | | | | | | | | | | | | | | | | | | | | 14,038,937 | |
| | | | | | | |
| | | | Health Care Technology – 0.4% | | | | | | | | | | | | | | | | | | |
| | | | | | | |
| | 1,500 | | | Exela Intermediate LLC / Exela Finance Inc., 144A | | | | | | | | | | | 10.000% | | | | 7/15/23 | | | | B– | | | | 1,218,750 | |
| | | | | | | |
| | | | Hotels, Restaurants & Leisure – 1.5% | | | | | | | | | | | | | | | | | | |
| | | | | | | |
| | 1,250 | | | 1011778 BC ULC / New Red Finance Inc., 144A | | | | | | | | | | | 4.250% | | | | 5/15/24 | | | | BB– | | | | 1,264,063 | |
| | | | | | | |
| | 1,500 | | | Golden Nugget Inc., 144A | | | | | | | | | | | 8.750% | | | | 10/01/25 | | | | CCC+ | | | | 1,575,000 | |
| | | | | |
| | 1,500 | | | MGM Growth Properties Operating Partnership LP / MGP FinanceCo-Issuer Inc. | | | | 4.500% | | | | 1/15/28 | | | | BB+ | | | | 1,488,750 | |
| | 4,250 | | | Total Hotels, Restaurants & Leisure | | | | | | | | | | | | | | | | | | | | | | | 4,327,813 | |
| | | | | | | |
| | | | Household Durables – 2.4% | | | | | | | | | | | | | | | | | | |
| | | | | | | |
| | 1,790 | | | Beazer Homes USA Inc. | | | | | | | | | | | 5.875% | | | | 10/15/27 | | | | B– | | | | 1,552,288 | |
| | | | | | | |
| | 1,850 | | | KB Home | | | | | | | | | | | 6.875% | | | | 6/15/27 | | | | BB– | | | | 1,974,875 | |
| | | | | | | |
| | 2,000 | | | Lennar Corp | | | | | | | | | | | 4.750% | | | | 11/29/27 | | | | Baa2 | | | | 2,105,000 | |
| | | | | | | |
| | 1,400 | | | TRI Pointe Group Inc. | | | | | | | | | | | 5.250% | | | | 6/01/27 | | | | BB– | | | | 1,347,500 | |
| | 7,040 | | | Total Household Durables | | | | | | | | | | | | | | | | | | | | | | | 6,979,663 | |
| | |
| | | | Independent Power & Renewable Electricity Producers – 1.2% | | | | |
| | | | | | | |
| | 1,500 | | | Calpine Corp, 144A | | | | | | | | | | | 5.250% | | | | 6/01/26 | | | | BB+ | | | | 1,526,250 | |
| | | | | | | |
| | 2,000 | | | TerraForm Power Operating LLC, 144A | | | | | | | | | | | 5.000% | | | | 1/31/28 | | | | BB | | | | 2,007,500 | |
| | 3,500 | | | Total Independent Power & Renewable Electricity Producers | | | | | | | | 3,533,750 | |
| | | | | | | |
| | | | Insurance – 1.3% | | | | | | | | | | | | | | | | | | |
| | | | | | | |
| | 1,100 | | | Acrisure LLC / Acrisure Finance Inc., 144A | | | | | | | | | | | 8.125% | | | | 2/15/24 | | | | B | | | | 1,135,750 | |
| | | | | | | |
| | 2,000 | | | Genworth Holdings Inc., (3) | | | | | | | | | | | 4.800% | | | | 2/15/24 | | | | B | | | | 1,700,000 | |
| | | | | | | |
| | 1,000 | | | Nationstar Mortgage Holdings Inc., 144A | | | | | | | | | | | 9.125% | | | | 7/15/26 | | | | B | | | | 1,015,000 | |
| | 4,100 | | | Total Insurance | | | | | | | | | | | | | | | | | | | | | | | 3,850,750 | |
| | | | | | | |
| | | | Leisure Products – 1.1% | | | | | | | | | | | | | | | | | | |
| | | | | | | |
| | 3,000 | | | Mattel Inc., 144A | | | | | | | | | | | 6.750% | | | | 12/31/25 | | | | BB– | | | | 3,086,250 | |
| | | | | | | |
| | | | Machinery – 1.8% | | | | | | | | | | | | | | | | | | |
| | | | | | | |
| | 1,500 | | | Beacon Roofing Supply Inc., 144A | | | | | | | | | | | 4.875% | | | | 11/01/25 | | | | B+ | | | | 1,485,000 | |
| | | | | | | |
| | 1,000 | | | Cleaver-Brooks Inc., 144A | | | | | | | | | | | 7.875% | | | | 3/01/23 | | | | B | | | | 958,960 | |
| | | | | | | |
| | 1,000 | | | Cloud Crane LLC, 144A | | | | | | | | | | | 10.125% | | | | 8/01/24 | | | | B | | | | 1,075,000 | |
| | | | | | | |
| | 1,000 | | | Dana Financing Luxembourg Sarl, 144A | | | | | | | | | | | 6.500% | | | | 6/01/26 | | | | BB+ | | | | 1,051,250 | |
| | | | | |
| | 525 | | | USA Compression Partners LP / USA Compression Finance Corp, 144A | | | | 6.875% | | | | 9/01/27 | | | | BB– | | | | 551,308 | |
| | 5,025 | | | Total Machinery | | | | | | | | | | | | | | | | | | | | | | | 5,121,518 | |
26
| | | | | | | | | | | | | | | | | | | | | | | | | | | | |
Principal
Amount (000) | | | Description (1) | | | | | | | | Coupon | | | Maturity | | | Ratings (2) | | | Value | |
| | | | | | | |
| | | | Media – 8.7% | | | | | | | | | | | | | | | | | | |
| | | | | | | |
| $ | 1,000 | | | Altice France SA/France, 144A | | | | | | | | | | | 7.375% | | | | 5/01/26 | | | | B | | | $ | 1,025,000 | |
| | | | | | | |
| | 1,000 | | | Altice France SA/France, 144A | | | | | | | | | | | 8.125% | | | | 2/01/27 | | | | B | | | | 1,050,000 | |
| | | | | | | |
| | 100 | | | Altice Luxembourg SA, 144A | | | | | | | | | | | 7.750% | | | | 5/15/22 | | | | B– | | | | 101,625 | |
| | | | | | | |
| | 975 | | | Altice Luxembourg SA, 144A | | | | | | | | | | | 10.500% | | | | 5/15/27 | | | | B– | | | | 1,001,813 | |
| | | | | | | |
| | 500 | | | AMC Entertainment Holdings Inc. | | | | | | | | | | | 5.750% | | | | 6/15/25 | | | | B3 | | | | 463,150 | |
| | | | | | | |
| | 1,000 | | | AMC Entertainment Holdings Inc., (3) | | | | | | | | | | | 6.125% | | | | 5/15/27 | | | | B3 | | | | 890,000 | |
| | | | | | | |
| | 1,000 | | | CCO Holdings LLC / CCO Holdings Capital Corp | | | | | | | | | | | 5.750% | | | | 1/15/24 | | | | BB+ | | | | 1,022,375 | |
| | | | | |
| | 2,000 | | | CCO Holdings LLC / CCO Holdings Capital Corp, 144A | | | | 5.875% | | | | 4/01/24 | | | | BB+ | | | | 2,090,000 | |
| | | | | |
| | 1,000 | | | CCO Holdings LLC / CCO Holdings Capital Corp, 144A | | | | 5.875% | | | | 5/01/27 | | | | BB+ | | | | 1,055,000 | |
| | | | | | | |
| | 2,500 | | | CSC Holdings LLC, 144A | | | | | | | | | | | 7.500% | | | | 4/01/28 | | | | B | | | | 2,744,500 | |
| | | | | | | |
| | 1,450 | | | CSC Holdings LLC, 144A | | | | | | | | | | | 6.500% | | | | 2/01/29 | | | | BB | | | | 1,582,312 | |
| | | | | | | |
| | 3,500 | | | DISH DBS Corp | | | | | | | | | | | 7.750% | | | | 7/01/26 | | | | BB– | | | | 3,430,000 | |
| | | | | | | |
| | 2,000 | | | Entercom Media Corp, 144A, (3) | | | | | | | | | | | 7.250% | | | | 11/01/24 | | | | B– | | | | 2,107,500 | |
| | | | | | | |
| | 100 | | | Entercom Media Corp, 144A | | | | | | | | | | | 6.500% | | | | 5/01/27 | | | | B2 | | | | 104,000 | |
| | | | | | | |
| | 1,000 | | | Gray Television Inc., 144A | | | | | | | | | | | 5.125% | | | | 10/15/24 | | | | BB– | | | | 1,018,750 | |
| | | | | | | |
| | 1,000 | | | Gray Television Inc., 144A | | | | | | | | | | | 5.875% | | | | 7/15/26 | | | | BB– | | | | 1,037,500 | |
| | | | | | | |
| | 2,000 | | | Meredith Corp | | | | | | | | | | | 6.875% | | | | 2/01/26 | | | | B+ | | | | 2,122,260 | |
| | | | | | | |
| | 1,330 | | | Sirius XM Radio Inc., 144A | | | | | | | | | | | 5.375% | | | | 7/15/26 | | | | BB | | | | 1,378,212 | |
| | | | | | | |
| | 925 | | | Virgin Media Secured Finance PLC, 144A, (WI/DD) | | | | | | | | | | | 5.500% | | | | 5/15/29 | | | | BB+ | | | | 937,719 | |
| | 24,380 | | | Total Media | | | | | | | | | | | | | | | | | | | | | | | 25,161,716 | |
| | | | | | | |
| | | | Metals & Mining – 2.6% | | | | | | | | | | | | | | | | | | |
| | | | | | | |
| | 1,500 | | | Alcoa Nederland Holding BV, 144A | | | | | | | | | | | 6.125% | | | | 5/15/28 | | | | BB+ | | | | 1,567,500 | |
| | | | | | | |
| | 1,500 | | | First Quantum Minerals Ltd, 144A | | | | | | | | | | | 7.500% | | | | 4/01/25 | | | | B | | | | 1,428,750 | |
| | | | | | | |
| | 1,000 | | | FMG Resources August 2006 Pty Ltd, 144A | | | | | | | | | | | 4.750% | | | | 5/15/22 | | | | BB+ | | | | 1,033,150 | |
| | | | | | | |
| | 2,000 | | | Freeport-McMoRan Inc. | | | | | | | | | | | 3.875% | | | | 3/15/23 | | | | Ba1 | | | | 2,000,000 | |
| | | | | | | |
| | 1,500 | | | Tronox Inc., 144A, (3) | | | | | | | | | | | 6.500% | | | | 4/15/26 | | | | B– | | | | 1,484,565 | |
| | 7,500 | | | Total Metals & Mining | | | | | | | | | | | | | | | | | | | | | | | 7,513,965 | |
| | | | | | | |
| | | | Oil, Gas & Consumable Fuels – 13.0% | | | | | | | | | | | | | | | | | | |
| | | | | |
| | 2,150 | | | Antero Midstream Partners LP / Antero Midstream Finance Corp, 144A | | | | 5.750% | | | | 3/01/27 | | | | BBB– | | | | 2,150,000 | |
| | | | | |
| | 950 | | | Antero Midstream Partners LP / Antero Midstream Finance Corp, 144A | | | | 5.750% | | | | 1/15/28 | | | | BBB– | | | | 940,500 | |
| | | | | |
| | 2,834 | | | Armstrong Energy Inc., (5) | | | | 11.750% | | | | 12/15/19 | | | | N/R | | | | 28 | |
| | | | | |
| | 1,750 | | | Ascent Resources Utica Holdings LLC / ARU Finance Corp, 144A | | | | 7.000% | | | | 11/01/26 | | | | BB– | | | | 1,596,875 | |
| | | | | |
| | 1,350 | | | California Resources Corp, 144A | | | | 8.000% | | | | 12/15/22 | | | | B– | | | | 1,017,562 | |
| | | | | |
| | 1,000 | | | Calumet Specialty Products Partners LP / Calumet Finance Corp, (3) | | | | 6.500% | | | | 4/15/21 | | | | B– | | | | 995,000 | |
| | | | | |
| | 1,000 | | | Calumet Specialty Products Partners LP / Calumet Finance Corp, (3) | | | | 7.625% | | | | 1/15/22 | | | | B– | | | | 967,500 | |
| | | | | | | |
| | 1,000 | | | Cheniere Energy Partners LP, 144A | | | | | | | | | | | 5.625% | | | | 10/01/26 | | | | BB | | | | 1,055,000 | |
| | | | | | | |
| | 2,000 | | | Chesapeake Energy Corp, (3) | | | | | | | | | | | 7.500% | | | | 10/01/26 | | | | B+ | | | | 1,780,000 | |
| | | | | |
| | 1,900 | | | Crestwood Midstream Partners LP / Crestwood Midstream Finance Corp, 144A | | | | 5.625% | | | | 5/01/27 | | | | BB– | | | | 1,895,250 | |
| | | | | | | |
| | 1,500 | | | Denbury Resources Inc., 144A | | | | | | | | | | | 7.750% | | | | 2/15/24 | | | | B3 | | | | 1,245,000 | |
| | | | | | | |
| | 2,425 | | | Ensign Drilling Inc., 144A | | | | | | | | | | | 9.250% | | | | 4/15/24 | | | | BB– | | | | 2,388,625 | |
27
Nuveen High Income Bond Fund(continued)
Portfolio of Investments June 30, 2019
| | | | | | | | | | | | | | | | | | | | | | | | | | | | |
Principal
Amount (000) | | | Description (1) | | | | | | | | Coupon | | | Maturity | | | Ratings (2) | | | Value | |
| | | | | | | |
| | | | Oil, Gas & Consumable Fuels(continued) | | | | | | | | | | | | | | | | | | |
| | | | | | | |
| $ | 1,000 | | | Genesis Energy LP / Genesis Energy Finance Corp | | | | | | | | | | | 6.750% | | | | 8/01/22 | | | | B+ | | | $ | 1,008,750 | |
| | | | | | | |
| | 1,900 | | | Genesis Energy LP / Genesis Energy Finance Corp | | | | | | | | | | | 6.500% | | | | 10/01/25 | | | | B+ | | | | 1,857,250 | |
| | | | | | | |
| | 1,500 | | | Hilcorp Energy I LP / Hilcorp Finance Co, 144A | | | | | | | | | | | 6.250% | | | | 11/01/28 | | | | BB+ | | | | 1,509,375 | |
| | | | | | | |
| | 750 | | | Moss Creek Resources Holdings Inc., 144A | | | | | | | | | | | 10.500% | | | | 5/15/27 | | | | B+ | | | | 717,188 | |
| | | | | | | |
| | 1,000 | | | Murphy Oil Corp | | | | | | | | | | | 6.875% | | | | 8/15/24 | | | | BBB– | | | | 1,050,000 | |
| | | | | | | |
| | 1,000 | | | Murphy Oil Corp | | | | | | | | | | | 5.750% | | | | 8/15/25 | | | | BBB– | | | | 1,036,400 | |
| | | | | | | |
| | 325 | | | NuStar Logistics LP | | | | | | | | | | | 6.000% | | | | 6/01/26 | | | | Ba2 | | | | 336,375 | |
| | | | | | | |
| | 1,000 | | | Oasis Petroleum Inc. | | | | | | | | | | | 6.875% | | | | 1/15/23 | | | | BB– | | | | 1,000,000 | |
| | | | | | | |
| | 1,000 | | | Parkland Fuel Corp, 144A, (WI/DD) | | | | | | | | | | | 5.875% | | | | 7/15/27 | | | | BB | | | | 1,013,750 | |
| | | | | | | |
| | 1,500 | | | Peabody Energy Corp, 144A | | | | | | | | | | | 6.375% | | | | 3/31/25 | | | | BB | | | | 1,518,750 | |
| | | | | | | |
| | 1,000 | | | Range Resources Corp | | | | | | | | | | | 5.750% | | | | 6/01/21 | | | | BB+ | | | | 1,010,000 | |
| | | | | | | |
| | 38 | | | SanJel Corporation, (4), (5) | | | | | | | | | | | 0.000% | | | | N/A (7) | | | | N/R | | | | — | |
| | | | | | | |
| | 1,600 | | | SM Energy Co | | | | | | | | | | | 6.125% | | | | 11/15/22 | | | | BB– | | | | 1,588,000 | |
| | | | | | | |
| | 1,000 | | | SM Energy Co | | | | | | | | | | | 5.625% | | | | 6/01/25 | | | | BB– | | | | 910,000 | |
| | | | | | | |
| | 1,800 | | | Southwestern Energy Co | | | | | | | | | | | 7.500% | | | | 4/01/26 | | | | BB | | | | 1,705,284 | |
| | | | | | | |
| | 1,000 | | | Sunoco LP / Sunoco Finance Corp | | | | | | | | | | | 4.875% | | | | 1/15/23 | | | | BB | | | | 1,021,250 | |
| | | | | |
| | 1,500 | | | Targa Resources Partners LP / Targa Resources Partners Finance Corp | | | | 5.875% | | | | 4/15/26 | | | | BB | | | | 1,590,000 | |
| | | | | |
| | 425 | | | Targa Resources Partners LP / Targa Resources Partners Finance Corp, 144A | | | | 6.500% | | | | 7/15/27 | | | | BB | | | | 463,250 | |
| | | | | |
| | 1,250 | | | Targa Resources Partners LP / Targa Resources Partners Finance Corp, 144A | | | | 6.875% | | | | 1/15/29 | | | | BB | | | | 1,384,375 | |
| | | | | | | |
| | 1,000 | | | Whiting Petroleum Corp | | | | | | | | | | | 6.625% | | | | 1/15/26 | | | | BB | | | | 964,375 | |
| | 41,447 | | | Total Oil, Gas & Consumable Fuels | | | | | | | | | | | | | | | | | | | | | | | 37,715,712 | |
| | | | | | | |
| | | | Personal Products – 0.2% | | | | | | | | | | | | | | | | | | |
| | | | | | | |
| | 550 | | | First Quality Finance Co Inc., 144A | | | | | | | | | | | 5.000% | | | | 7/01/25 | | | | BB– | | | | 554,125 | |
| | | | | | | |
| | | | Pharmaceuticals – 2.0% | | | | | | | | | | | | | | | | | | |
| | | | | | | |
| | 200 | | | Bausch Health Americas Inc., 144A | | | | | | | | | | | 8.500% | | | | 1/31/27 | | | | B | | | | 219,904 | |
| | | | | | | |
| | 620 | | | Bausch Health Cos Inc., 144A | | | | | | | | | | | 5.875% | | | | 5/15/23 | | | | B | | | | 627,204 | |
| | | | | | | |
| | 200 | | | Bausch Health Cos Inc., 144A | | | | | | | | | | | 5.750% | | | | 8/15/27 | | | | Ba2 | | | | 210,196 | |
| | | | | | | |
| | 450 | | | Bausch Health Cos Inc., 144A | | | | | | | | | | | 7.000% | | | | 1/15/28 | | | | B | | | | 466,313 | |
| | | | | |
| | 550 | | | Eagle Holding Co II LLC, 144A, (cash 7.750%, PIK 7.750%) | | | | 7.750% | | | | 5/15/22 | | | | CCC+ | | | | 554,125 | |
| | | | | | | |
| | 2,475 | | | Par Pharmaceutical Inc., 144A | | | | | | | | | | | 7.500% | | | | 4/01/27 | | | | Ba3 | | | | 2,431,687 | |
| | | | | | | |
| | 1,000 | | | Teva Pharmaceutical Finance Netherlands III BV | | | | | | | | | | | 6.000% | | | | 4/15/24 | | | | BB | | | | 943,125 | |
| | | | | | | |
| | 500 | | | Teva Pharmaceutical Finance Netherlands III BV, (3) | | | | | | | | | | | 6.750% | | | | 3/01/28 | | | | BB | | | | 461,250 | |
| | 5,995 | | | Total Pharmaceuticals | | | | | | | | | | | | | | | | | | | | | | | 5,913,804 | |
| | | |
| | | | Real Estate Management & Development – 0.3% | | | | | | | |
| | | | | | | |
| | 1,000 | | | WeWork Cos Inc., 144A | | | | | | | | | | | 7.875% | | | | 5/01/25 | | | | BB– | | | | 986,600 | |
| | | | | | | |
| | | | Road & Rail – 0.7% | | | | | | | | | | | | | | | | | | |
| | | | | | | |
| | 2,000 | | | United Rentals North America Inc. | | | | | | | | | | | 6.500% | | | | 12/15/26 | | | | BB– | | | | 2,165,000 | |
| | | | | | | |
| | | | Software – 0.3% | | | | | | | | | | | | | | | | | | |
| | | | | | | |
| | 850 | | | SS&C Technologies Inc., 144A | | | | | | | | | | | 5.500% | | | | 9/30/27 | | | | B+ | | | | 881,875 | |
28
| | | | | | | | | | | | | | | | | | | | | | | | | | | | |
Principal
Amount (000) | | | Description (1) | | | | | | | | Coupon | | | Maturity | | | Ratings (2) | | | Value | |
| | | | | | | |
| | | | Specialty Retail – 2.8% | | | | | | | | | | | | | | | | | | |
| | | | | | | |
| $ | 2,000 | | | goeasy Ltd, 144A | | | | | | | | | | | 7.875% | | | | 11/01/22 | | | | BB– | | | $ | 2,095,000 | |
| | | | | | | |
| | 1,500 | | | JC Penney Corp Inc., 144A | | | | | | | | | | | 8.625% | | | | 3/15/25 | | | | BB– | | | | 735,000 | |
| | | | | | | |
| | 525 | | | KAR Auction Services Inc., 144A | | | | | | | | | | | 5.125% | | | | 6/01/25 | | | | B+ | | | | 534,187 | |
| | | | | | | |
| | 3,000 | | | L Brands Inc. | | | | | | | | | | | 6.875% | | | | 11/01/35 | | | | Ba1 | | | | 2,668,080 | |
| | | | | | | |
| | 2,000 | | | PetSmart Inc., 144A | | | | | | | | | | | 5.875% | | | | 6/01/25 | | | | B | | | | 1,940,000 | |
| | 9,025 | | | Total Specialty Retail | | | | | | | | | | | | | | | | | | | | | | | 7,972,267 | |
| | | | |
| | | | Technology Hardware, Storage & Peripherals – 0.7% | | | | | | | | | | |
| | | | | | | |
| | 2,000 | | | Western Digital Corp, (3) | | | | | | | | | | | 4.750% | | | | 2/15/26 | | | | Baa3 | | | | 1,962,100 | |
| | | | | | | |
| | | | Trading Companies & Distributors – 0.7% | | | | | | | | | | | | | | | | | | |
| | | | | | | |
| | 2,000 | | | H&E Equipment Services Inc. | | | | | | | | | | | 5.625% | | | | 9/01/25 | | | | BB– | | | | 2,057,000 | |
| | | |
| | | | Wireless Telecommunication Services – 1.4% | | | | | | | |
| | | | | | | |
| | 1,900 | | | Level 3 Financing Inc. | | | | | | | | | | | 5.250% | | | | 3/15/26 | | | | BB | | | | 1,966,500 | |
| | | | | | | |
| | 2,000 | | | Telecom Italia SpA/Milano, 144A | | | | | | | | | | | 5.303% | | | | 5/30/24 | | | | BB+ | | | | 2,070,000 | |
| | 3,900 | | | Total Wireless Telecommunication Services | | | | | | | | | | | | | | | | | | | | | | | 4,036,500 | |
| $ | 243,515 | | | Total Corporate Bonds (cost $234,268,499) | | | | | | | | | | | | | | | | | | | | | | | 236,457,043 | |
| | | | | | | |
| Shares | | | Description (1), (6) | | | | | | | | | | | | | | | | | Value | |
| | | | | | | |
| | | | EXCHANGE-TRADED FUNDS – 4.8% | | | | | | | | | | | | | | | | | | | | | | | | |
| | | | | | | |
| | 45,000 | | | iShares iBoxx High Yield Corporate Bond ETF | | | | | | | | | | | | | | | | | | | | | | $ | 3,923,100 | |
| | | | | | | |
| | 46,400 | | | SPDR Bloomberg Barclays High Yield Bond ETF | | | | | | | | | | | | | | | | | | | | | | | 5,054,816 | |
| | | | | |
| | 185,000 | | | SPDR Bloomberg Barclays Short Term High Yield Bond ETF | | | | | | | | | | | | | | | | 5,037,550 | |
| | | | Total Exchange-Traded Funds (cost $14,002,880) | | | | | | | | 14,015,466 | |
| | | | | | | |
Principal
Amount (000) | | | Description (1) | | | | | | | | Coupon | | | Maturity | | | Ratings (2) | | | Value | |
| | | |
| | | | CONTINGENT CAPITAL SECURITIES – 1.8% (7) | | | | | | | | | |
| | | | | | | |
| | | | Banks – 1.2% | | | | | | | | | | | | | | | | | | |
| | | | | | | |
| $ | 1,200 | | | Banco Bilbao Vizcaya Argentaria SA | | | | | | | | | | | 6.125% | | | | N/A (8) | | | | Ba2 | | | $ | 1,129,500 | |
| | | | | | | |
| | 1,000 | | | Royal Bank of Scotland Group PLC | | | | | | | | | | | 7.500% | | | | N/A (8) | | | | BB+ | | | | 1,025,000 | |
| | | | | | | |
| | 1,385 | | | Societe Generale SA, 144A | | | | | | | | | | | 6.750% | | | | N/A (8) | | | | BB+ | | | | 1,372,119 | |
| | 3,585 | | | Total Banks | | | | | | | | | | | | | | | | | | | | | | | 3,526,619 | |
| | | | | | | |
| | | | Capital Markets – 0.6% | | | | | | | | | | | | | | | | | | |
| | | | | | | |
| | 1,500 | | | Credit Suisse Group AG, 144A | | | | | | | | | | | 7.500% | | | | N/A (8) | | | | BB | | | | 1,610,355 | |
| $ | 5,085 | | | Total Contingent Capital Securities (cost $4,961,976) | | | | | | | | 5,136,974 | |
29
Nuveen High Income Bond Fund(continued)
Portfolio of Investments June 30, 2019
| | | | | | | | | | | | | | | | | | | | | | | | | | | | |
Principal
Amount (000) | | | Description (1) | | Coupon (9) | | | Reference
Rate (9) | | | Spread (9) | | | Maturity (10) | | | Ratings (2) | | | Value | |
| | | |
| | | | VARIABLE RATE SENIOR LOAN INTERESTS – 1.4% (9) | | | | | | | | | |
| | | | |
| | | | Professional Services – 1.4% | | | | | | | | | | |
| | | | | | | |
| $ | 4,000 | | | Dun & Bradstreet Corp., Initial Term Loan | | | 7.404% | | | | 1-Month LIBOR | | | | 5.000% | | | | 3/31/26 | | | | BB | | | $ | 4,006,260 | |
| $ | 4,000 | | | Total Variable Rate Senior Loan Interests (cost $3,941,290) | | | | | | | | | | | | 4,006,260 | |
| | | | | | | |
Principal
Amount (000) | | | Description (1) | | | | | | | | Coupon | | | Maturity | | | Ratings (2) | | | Value | |
| | | | |
| | | | $1,000 PAR (OR SIMILAR) INSTITUTIONAL PREFERRED – 1.1% | | | | | | | | | | |
| | | | |
| | | | Commercial Services & Supplies – 0.5% | | | | | | | | | | |
| | | | | | |
| $ | 1,250 | | | AerCap Global Aviation Trust | | | | | | | | 6.500% | | | | 6/15/45 | | | | Ba1 | | | $ | 1,306,250 | |
| | | | |
| | | | Wireless Telecommunication Services – 0.6% | | | | | | | | | | |
| | | | | | | |
| | 1,500 | | | Vodafone Group PLC | | | | | | | | | | | 7.000% | | | | 4/04/79 | | | | BBB– | | | | 1,619,017 | |
| $ | 2,750 | | | Total $1,000 Par (or similar) Institutional Preferred (cost $2,774,127) | | | | | | | | | | | | 2,925,267 | |
| | | | | | | |
| Shares | | | Description (1) | | | | | | | | Coupon | | | | | | Ratings (2) | | | Value | |
| | | | | |
| | | | $25 PAR (OR SIMILAR) RETAIL PREFERRED – 0.8% | | | | | | | | | | | | | | | | | |
| | | | | | | |
| | | | Food Products – 0.3% | | | | | | | | | | | | | | | | | | |
| | | | | | | |
| | 34,685 | | | CHS Inc. | | | | | | | | | | | 6.750% | | | | | | | | N/R | | | $ | 895,914 | |
| | | | |
| | | | Oil, Gas & Consumable Fuels – 0.5% | | | | | | | | | | |
| | | | | | | |
| | 60,000 | | | NuStar Energy LP | | | | | | | | | | | 8.500% | | | | | | | | B1 | | | | 1,376,400 | |
| | | | Total $25 Par (or similar) Retail Preferred (cost $2,168,792) | | | | | | | | | | | | | | | | 2,272,314 | |
| | | | | | | |
Principal
Amount (000) | | | Description (1) | | | | | | | | Coupon | | | Maturity | | | Ratings (2) | | | Value | |
| | | | |
| | | | SOVEREIGN DEBT – 0.4% | | | | | | | | | | | | | |
| | | | | | | |
| | | | Nigeria – 0.4% | | | | | | | | | | | | | | | | | | |
| | | | | | | |
| $ | 1,000 | | | Nigeria Government International Bond, 144A | | | | | | | | | | | 7.625% | | | | 11/21/25 | | | | B+ | | | $ | 1,091,288 | |
| $ | 1,000 | | | Total Sovereign Debt (cost $1,000,000) | | | | | | | | | | | | 1,091,288 | |
| | | | | | | |
| Shares | | | Description (1) | | | | | | | | | | | | | | | | | Value | |
| | | | |
| | | | COMMON STOCKS – 0.0% | | | | | | | | | | | | | |
| | | | |
| | | | Building Products – 0.0% | | | | | | | | | | |
| | | | | | |
| | 527 | | | Dayton Superior Corp, (4), (11) | | | | | | | | | | | | | | | | | | | $ | 5 | |
| | | | | | | |
| | 585 | | | Dayton Superior Corp, (4) | | | | | | | | | | | | | | | | | | | | | | | 6 | |
| | | | Total Building Products | | | | | | | | | | | | | | | | | | | | | | | 11 | |
| | | | | | | |
| | | | Metals & Mining – 0.0% | | | | | | | | | | | | | | | | | | |
| | | | | | |
| | 499,059 | | | Northland Resources SE, (4), (11) | | | | | | | | | | | | | | | | | | | | 4,991 | |
| | | | |
| | | | Oil, Gas & Consumable Fuels – 0.0% | | | | | | | | | | |
| | | | | | |
| | 50,119 | | | Connacher Oil and Gas Ltd, (11), (12) | | | | | | | | | | | | | | | | | | | | 5 | |
| | | | Total Common Stocks (cost $1,156,869) | | | | | | | | | | | | | | | | | | | | | | | 5,007 | |
| | | | Total Long-Term Investments (cost $264,274,433) | | | | | | | | | | | | 265,909,619 | |
30
| | | | | | | | | | | | | | | | | | | | | | | | | | | | |
| Shares | | | Description (1) | | | | | | | | Coupon | | | | | | | | | Value | |
| |
| | | | INVESTMENTS PURCHASED WITH COLLATERAL FROM SECURITIES LENDING – 5.5% | |
| | | | | | | |
| | | | Money Market Funds – 5.5% | | | | | | | | | | | | | | | | | | |
| | | | | | | |
| | 15,958,678 | | | First American Government Obligations Fund, Class X, (13) | | | | | | | | | | | 2.305% (14) | | | | | | | | | | | $ | 15,958,678 | |
| | | | Total Investments Purchased with Collateral from Securities Lending (cost $15,958,678) | | | | 15,958,678 | |
| | | | | | | |
| Shares | | | Description (1) | | | | | | | | Coupon | | | | | | | | | Value | |
| | | | | | | |
| | | | SHORT-TERM INVESTMENTS – 8.1% | | | | | | | | | | | | | | | | | | | | | | | | |
| | | | | | | |
| | | | MONEY MARKET FUNDS – 8.1% | | | | | | | | | | | | | | | | | | |
| | | | | | | |
| | 23,516,566 | | | First American Treasury Obligation Fund, Class Z | | | | | | | | | | | 2.228% (14) | | | | | | | | | | | $ | 23,516,566 | |
| | | | Total Short-Term Investments (cost $23,516,566) | | | | | | | | | | | | 23,516,566 | |
| | | | Total Investments (cost $303,749,677) – 105.6% | | | | | | | | | | | | 305,384,863 | |
| | | | Other Assets Less Liabilities – (5.6)% (15) | | | | | | | | | | | | | | | | | | | | | | | (16,199,948) | |
| | | | Net Assets – 100% | | | | | | | | | | | | | | | | | | | | | | $ | 289,184,915 | |
Investments in Derivatives
Credit Default Swaps – OTC Cleared
| | | | | | | | | | | | | | | | | | | | | | | | | | | | | | | | | | |
| Referenced Entity | | Buy/Sell
Protection (16) | | Notional
Amount | | | Fixed Rate
(Annualized) | | | Fixed Rate
Payment
Frequency | | | Maturity
Date | | | Premiums
Paid
(Received) | | | Value | | | Unrealized
Appreciation
(Depreciation) | | | Variation
Margin
Receivable
(Payable) | |
CDX.NA.HY.32 | | Sell | | $ | 10,000,000 | | | | 5.000 | % | | | Quarterly | | | | 6/20/24 | | | $ | 742,723 | | | $ | 768,365 | | | $ | 25,642 | | | $ | 15,045 | |
31
Nuveen High Income Bond Fund(continued)
Portfolio of Investments June 30, 2019
For Fund portfolio compliance purposes, the Fund’s industry classifications refer to any one or more of the industry sub–classifications used by one or more widely recognized market indexes or ratings group indexes, and/or as defined by Fund management. This definition may not apply for purposes of this report, which may combine industry sub–classifications into sectors for reporting ease.
| (1) | All percentages shown in the Portfolio of Investments are based on net assets. |
| (2) | For financial reporting purposes, the ratings disclosed are the highest of Standard & Poor’s Group (“Standard & Poor’s”), Moody’s Investors Service, Inc. (“Moody’s”) or Fitch, Inc. (“Fitch”) rating. This treatment of split-rated securities may differ from that used for other purposes, such as for Fund investment policies. Ratings below BBB by Standard & Poor’s, Baa by Moody’s or BBB by Fitch are considered to be below investment grade. Holdings designated N/R are not rated by any of these national rating agencies. Ratings are not covered by the report of independent registered public accounting firm. |
| (3) | Investment, or a portion of investment, is out on loan for securities lending. The total value of the securities out on loan as of the end of the reporting period was $15,321,715. |
| (4) | Investment valued at fair value using methods determined in good faith by, or at the discretion of, the Board. For fair value measurement disclosure purposes, investment classified as Level 3. See Notes to Financial Statements, Note 2 – Investment Valuation and Fair Value Measurements for more information. |
| (5) | Defaulted security. A security whose issuer has failed to fully pay principal and/or interest when due, or is under the protection of bankruptcy. |
| (6) | A copy of the most recent financial statements for the exchange-traded funds can be obtained directly from the Securities and Exchange Commission on its website at the http://www.sec.gov. |
| (7) | Contingent Capital Securities (“CoCos”) are hybrid securities with loss absorption characteristics built into the terms of the security for the benefit of the issuer. For example, the terms may specify an automatic write-down of principal or a mandatory conversion into the issuer’s common stock under certain adverse circumstances, such as the issuer’s capital ratio falling below a specified level. |
| (8) | Perpetual security. Maturity date is not applicable. |
| (9) | Senior loans generally pay interest at rates which are periodically adjusted by reference to a base short-term, floating lending rate (Reference Rate) plus an assigned fixed rate (Spread). These floating lending rates are generally (i) the lending rate referenced by the London Inter-Bank Offered Rate (“LIBOR”), or (ii) the prime rate offered by one or more major United States banks. Senior loans may be considered restricted in that the Fund ordinarily is contractually obligated to receive approval from the agent bank and/or borrower prior to the disposition of a senior loan. The rate shown is the coupon as of the end of the reporting period. |
| (10) | Senior loans generally are subject to mandatory and/or optional prepayment. Because of these mandatory prepayment conditions and because there may be significant economic incentives for a borrower to prepay, prepayments of senior loans may occur. As a result, the actual remaining maturity of senior loans held may be substantially less than the stated maturities shown. |
| (11) | Non-income producing; issuer has not declared a dividend within the past twelve months. |
| (12) | For fair value measurement disclosure purposes, investment classified as Level 2. See Notes to Financial Statements, Note 2 – Investment Valuation and Fair Value Measurements for more information. |
| (13) | The Fund may loan securities representing up to one third of the fair value of its total assets (which includes collateral for securities on loan) to broker dealers, banks, and other institutions. The Fund maintains collateral equal to at least 100% of the fair value of the securities loaned. The cash collateral received by the Fund is invested in this money market fund. See Notes to Financial Statements, Note 3 – Portfolio Securities and Investments in Derivatives, Securities Lending for more information. |
| (14) | The rate shown is the annualizedseven-day subsidized yield as of the end of the reporting period. |
| (15) | Other assets less liabilities includes the unrealized appreciation (depreciation) of certainover-the-counter (“OTC”) derivatives as presented on the Statement of Assets and Liabilities, when applicable. The unrealized appreciation (depreciation) of OTC cleared and exchange-traded derivatives is recognized as part of the cash collateral at brokers and/or receivable or payable for variation margin as presented on the Statement of Assets and Liabilities, when applicable. |
| (16) | The Fund entered into the credit default swaps to gain investment exposure to the referenced entity. Selling protection has a similar credit risk position to owning the referenced entity. Buying protection has a similar credit risk position to selling the referenced entity short. |
| 144A | Investment is exempt from registration under Rule 144A of the Securities Act of 1933, as amended. These investments may only be resold in transactions exempt from registration, which are normally those transactions with qualified institutional buyers. |
| LIBOR | London Inter-Bank Offered Rate |
| PIK | Payment-in-kind (“PIK”) security. Depending on the terms of the security, income may be received in the form of cash, securities, or a combination of both. The PIK rate shown, where applicable, represents the annualized rate of the last PIK payment made by the issuer as of the end of the reporting period. |
| SPDR | Standard & Poor’s Depositary Receipt |
| WI/DD | Purchased on a when-issued or delayed delivery basis. |
See accompanying notes to financial statements.
32
Nuveen Strategic Income Fund
Portfolio of Investments June 30, 2019
| | | | | | | | | | | | | | | | | | | | | | | | | | | | |
Principal
Amount (000) | | | Description (1) | | | | | | | | Coupon | | | Maturity | | | Ratings (2) | | | Value | |
| | |
| | | | LONG-TERM INVESTMENTS – 97.4% | | | | | |
| | |
| | | | CORPORATE BONDS – 41.5% | | | | | |
| | | | | | | |
| | | | Aerospace & Defense – 0.5% | | | | | | | | | | | | | | | | | | |
| | | | | | | |
| $ | 930 | | | Bombardier Inc., 144A | | | | | | | | | | | 7.500% | | | | 3/15/25 | | | | B | | | $ | 932,604 | |
| | | | | | | |
| | 400 | | | Bombardier Inc., 144A | | | | | | | | | | | 7.875% | | | | 4/15/27 | | | | B | | | | 400,500 | |
| | | | | | | |
| | 1,500 | | | General Dynamics Corp | | | | | | | | | | | 2.625% | | | | 11/15/27 | | | | A+ | | | | 1,514,186 | |
| | 2,830 | | | Total Aerospace & Defense | | | | | | | | | | | | | | | | | | | | | | | 2,847,290 | |
| | | | | | | |
| | | | Air Freight & Logistics – 0.7% | | | | | | | | | | | | | | | | | | |
| | | | | | | |
| | 2,280 | | | FedEx Corp | | | | | | | | | | | 3.300% | | | | 3/15/27 | | | | BBB | | | | 2,336,590 | |
| | | | | | | |
| | 1,500 | | | XPO Logistics Inc., 144A | | | | | | | | | | | 6.500% | | | | 6/15/22 | | | | BB– | | | | 1,530,000 | |
| | 3,780 | | | Total Air Freight & Logistics | | | | | | | | | | | | | | | | | | | | | | | 3,866,590 | |
| | | | | | | |
| | | | Airlines – 1.1% | | | | | | | | | | | | | | | | | | |
| | | | | |
| | 893 | | | American Airlines2013-2 Class B Pass Through Trust, 144A | | | | 5.600% | | | | 7/15/20 | | | | BBB– | | | | 908,805 | |
| | | | | |
| | 880 | | | American Airlines2016-1 Class AA Pass Through Trust | | | | 3.575% | | | | 1/15/28 | | | | AA+ | | | | 912,542 | |
| | | | | | | |
| | 2,000 | | | American Airlines Group Inc., 144A | | | | | | | | | | | 4.625% | | | | 3/01/20 | | | | BB– | | | | 2,012,500 | |
| | | | | |
| | 2,298 | | | Northwest Airlines2007-1 Class A Pass Through Trust | | | | 7.027% | | | | 11/01/19 | | | | A+ | | | | 2,329,190 | |
| | 6,071 | | | Total Airlines | | | | | | | | | | | | | | | | | | | | | | | 6,163,037 | |
| | | | | | | |
| | | | Auto Components – 0.5% | | | | | | | | | | | | | | | | | | |
| | | | | | | |
| | 600 | | | Adient Global Holdings Ltd, 144A | | | | | | | | | | | 4.875% | | | | 8/15/26 | | | | B | | | | 475,500 | |
| | | | | | | |
| | 1,180 | | | American Axle & Manufacturing Inc. | | | | | | | | | | | 6.625% | | | | 10/15/22 | | | | B | | | | 1,200,650 | |
| | | | | |
| | 1,000 | | | Panther BF Aggregator 2 LP / Panther Finance Co Inc., 144A | | | | 8.500% | | | | 5/15/27 | | | | B | | | | 1,030,000 | |
| | 2,780 | | | Total Auto Components | | | | | | | | | | | | | | | | | | | | | | | 2,706,150 | |
| | | | | | | |
| | | | Automobiles – 0.6% | | | | | | | | | | | | | | | | | | |
| | | | | | | |
| | 1,425 | | | Ford Motor Credit Co LLC | | | | | �� | | | | | | 5.584% | | | | 3/18/24 | | | | BBB | | | | 1,526,310 | |
| | | | | | | |
| | 2,065 | | | General Motors Co | | | | | | | | | | | 4.000% | | | | 4/01/25 | | | | BBB | | | | 2,102,489 | |
| | 3,490 | | | Total Automobiles | | | | | | | | | | | | | | | | | | | | | | | 3,628,799 | |
| | | | | | | |
| | | | Banks – 5.7% | | | | | | | | | | | | | | | | | | |
| | | | | | | |
| | 2,435 | | | Banco Santander SA | | | | | | | | | | | 3.800% | | | | 2/23/28 | | | | A | | | | 2,486,308 | |
| | | | | | | |
| | 1,105 | | | Bank of America Corp | | | | | | | | | | | 3.248% | | | | 10/21/27 | | | | A+ | | | | 1,131,702 | |
| | | | | | | |
| | 3,662 | | | Bank of America Corp | | | | | | | | | | | 3.419% | | | | 12/20/28 | | | | A+ | | | | 3,771,028 | |
| | | | | |
| | 850 | | | Banque Ouest Africaine de Developpement, 144A | | | | 5.000% | | | | 7/27/27 | | | | Baa1 | | | | 875,500 | |
| | | | | | | |
| | 2,865 | | | Barclays PLC | | | | | | | | | | | 3.650% | | | | 3/16/25 | | | | A | | | | 2,879,439 | |
| | | | | | | |
| | 2,010 | | | BNP Paribas SA, 144A | | | | | | | | | | | 4.375% | | | | 5/12/26 | | | | A | | | | 2,106,767 | |
| | | | | | | |
| | 1,895 | | | Citigroup Inc. | | | | | | | | | | | 3.200% | | | | 10/21/26 | | | | A | | | | 1,933,537 | |
| | | | | | | |
| | 2,995 | | | Citigroup Inc. | | | | | | | | | | | 4.300% | | | | 11/20/26 | | | | A– | | | | 3,179,342 | |
| | | | | | | |
| | 1,250 | | | Export-Import Bank of India, 144A | | | | | | | | | | | 3.875% | | | | 2/01/28 | | | | Baa2 | | | | 1,282,911 | |
| | | | | | | |
| | 3,360 | | | Goldman Sachs Group Inc. | | | | | | | | | | | 4.000% | | | | 3/03/24 | | | | A | | | | 3,563,593 | |
| | | | | | | |
| | 2,375 | | | HSBC Holdings PLC | | | | | | | | | | | 4.375% | | | | 11/23/26 | | | | A+ | | | | 2,509,797 | |
33
Nuveen Strategic Income Fund(continued)
Portfolio of Investments June 30, 2019
| | | | | | | | | | | | | | | | | | | | | | | | | | | | |
Principal
Amount (000) | | | Description (1) | | | | | | | | Coupon | | | Maturity | | �� | Ratings (2) | | | Value | |
| | | | | | | |
| | | | Banks(continued) | | | | | | | | | | | | | | | | | | |
| | | | | | | |
| $ | 2,100 | | | ING Groep NV | | | | | | | | | | | 3.950% | | | | 3/29/27 | | | | A+ | | | $ | 2,207,193 | |
| | | | | | | |
| | 1,100 | | | JPMorgan Chase & Co | | | | | | | | | | | 3.875% | | | | 9/10/24 | | | | A+ | | | | 1,155,883 | |
| | | | | | | |
| | 2,425 | | | PNC Financial Services Group Inc. | | | | | | | | | | | 3.150% | | | | 5/19/27 | | | | A+ | | | | 2,503,343 | |
| | | | | | | |
| | 2,000 | | | Quicken Loans Inc., 144A | | | | | | | | | | | 5.250% | | | | 1/15/28 | | | | Ba1 | | | | 1,990,000 | |
| | 32,427 | | | Total Banks | | | | | | | | | | | | | | | | | | | | | | | 33,576,343 | |
| | | | | | | |
| | | | Building Products – 0.2% | | | | | | | | | | | | | | | | | | |
| | | | | | | |
| | 930 | | | American Woodmark Corp, 144A | | | | | | | | | | | 4.875% | | | | 3/15/26 | | | | BB | | | | 918,375 | |
| | | | | | | |
| | | | Capital Markets – 2.2% | | | | | | | | | | | | | | | | | | |
| | | | | | | |
| | 1,125 | | | Donnelley Financial Solutions Inc. | | | | | | | | | | | 8.250% | | | | 10/15/24 | | | | B | | | | 1,164,375 | |
| | | | | | | |
| | 1,375 | | | Goldman Sachs Group Inc. | | | | | | | | | | | 5.250% | | | | 7/27/21 | | | | A | | | | 1,452,186 | |
| | | | | | | |
| | 900 | | | Goldman Sachs Group Inc. | | | | | | | | | | | 5.750% | | | | 1/24/22 | | | | A | | | | 972,230 | |
| | | | | | | |
| | 2,295 | | | Goldman Sachs Group Inc. | | | | | | | | | | | 4.250% | | | | 10/21/25 | | | | A– | | | | 2,433,661 | |
| | | | | | | |
| | 1,930 | | | Morgan Stanley | | | | | | | | | | | 4.000% | | | | 7/23/25 | | | | A | | | | 2,066,034 | |
| | | | | | | |
| | 4,635 | | | Morgan Stanley | | | | | | | | | | | 3.950% | | | | 4/23/27 | | | | A– | | | | 4,845,990 | |
| | 12,260 | | | Total Capital Markets | | | | | | | | | | | | | | | | | | | | | | | 12,934,476 | |
| | | | | | | |
| | | | Chemicals – 1.5% | | | | | | | | | | | | | | | | | | |
| | | | | | | |
| | 3,000 | | | Agrium Inc. | | | | | | | | | | | 3.375% | | | | 3/15/25 | | | | BBB | | | | 2,990,548 | |
| | | | | | | |
| | 995 | | | Chemours Co | | | | | | | | | | | 5.375% | | | | 5/15/27 | | | | BB– | | | | 947,738 | |
| | | | | | | |
| | 1,465 | | | DuPont de Nemours Inc. | | | | | | | | | | | 4.493% | | | | 11/15/25 | | | | A– | | | | 1,620,159 | |
| | | | | | | |
| | 1,500 | | | NOVA Chemicals Corp, 144A | | | | | | | | | | | 5.250% | | | | 8/01/23 | | | | BBB– | | | | 1,520,625 | |
| | | | | | | |
| | 1,350 | | | NOVA Chemicals Corp, 144A | | | | | | | | | | | 5.000% | | | | 5/01/25 | | | | BBB– | | | | 1,410,750 | |
| | 8,310 | | | Total Chemicals | | | | | | | | | | | | | | | | | | | | | | | 8,489,820 | |
| | |
| | | | Commercial Services & Supplies – 0.5% | | | | |
| | | | | | | |
| | 1,575 | | | ADT Security Corp, 144A | | | | | | | | | | | 4.875% | | | | 7/15/32 | | | | BB– | | | | 1,358,437 | |
| | | | | | | |
| | 275 | | | GFL Environmental Inc., 144A | | | | | | | | | | | 8.500% | | | | 5/01/27 | | | | CCC+ | | | | 295,969 | |
| | | | | | | |
| | 1,300 | | | Staples Inc., 144A | | | | | | | | | | | 10.750% | | | | 4/15/27 | | | | B– | | | | 1,293,500 | |
| | 3,150 | | | Total Commercial Services & Supplies | | | | | | | | 2,947,906 | |
| | |
| | | | Communications Equipment – 0.1% | | | | |
| | | | | | | |
| | 600 | | | CommScope Inc., 144A, (3) | | | | | | | | | | | 8.250% | | | | 3/01/27 | | | | B1 | | | | 611,910 | |
| | |
| | | | Construction Materials – 0.1% | | | | |
| | | | | | |
| | 675 | | | Gates Global LLC / Gates Global Co, 144A | | | | | | | | 6.000% | | | | 7/15/22 | | | | B | | | | 675,422 | |
| | | |
| | | | Consumer Finance – 1.6% | | | | | | | |
| | | | | | | |
| | 1,780 | | | Capital One Financial Corp | | | | | | | | | | | 3.750% | | | | 3/09/27 | | | | A– | | | | 1,836,714 | |
| | | | | | | |
| | 1,000 | | | Curo Group Holdings Corp | | | | | | | | | | | 8.250% | | | | 9/01/25 | | | | B– | | | | 832,340 | |
| | | | | | | |
| | 3,310 | | | Discover Bank | | | | | | | | | | | 4.250% | | | | 3/13/26 | | | | BBB+ | | | | 3,506,150 | |
| | | | | | | |
| | 745 | | | Navient Corp, (3) | | | | | | | | | | | 6.750% | | | | 6/15/26 | | | | BB | | | | 772,938 | |
| | | | | | | |
| | 1,500 | | | Refinitiv US Holdings Inc., 144A | | | | | | | | | | | 8.250% | | | | 11/15/26 | | | | B+ | | | | 1,542,750 | |
| | | | | | |
| | 1,000 | | | TMX Finance LLC / TitleMax Finance Corp, 144A | | | | | | | | 11.125% | | | | 4/01/23 | | | | B– | | | | 945,000 | |
| | 9,335 | | | Total Consumer Finance | | | | | | | | 9,435,892 | |
34
| | | | | | | | | | | | | | | | | | | | | | | | | | | | |
Principal
Amount (000) | | | Description (1) | | | | | | | | Coupon | | | Maturity | | | Ratings (2) | | | Value | |
| | | |
| | | | Diversified Consumer Services – 0.3% | | | | | | | |
| | | | | | | |
| $ | 1,500 | | | frontdoor Inc., 144A | | | | | | | | | | | 6.750% | | | | 8/15/26 | | | | B2 | | | $ | 1,597,500 | |
| | | |
| | | | Diversified Financial Services – 2.0% | | | | | | | |
| | | | | | | |
| | 1,060 | | | Bank of America Corp | | | | | | | | | | | 3.559% | | | | 4/23/27 | | | | A+ | | | | 1,104,159 | |
| | | | | | | |
| | 3,075 | | | Citigroup Inc. | | | | | | | | | | | 3.980% | | | | 3/20/30 | | | | A | | | | 3,285,639 | |
| | | | | |
| | 2,545 | | | GE Capital International Funding Co Unlimited Co | | | | 4.418% | | | | 11/15/35 | | | | BBB+ | | | | 2,509,776 | |
| | | | | | | |
| | 4,410 | | | JPMorgan Chase & Co | | | | | | | | | | | 3.702% | | | | 5/06/30 | | | | AA– | | | | 4,647,830 | |
| | 11,090 | | | Total Diversified Financial Services | | | | | | | | 11,547,404 | |
| | |
| | | | Diversified Telecommunication Services – 2.0% | | | | |
| | | | | | | |
| | 3,215 | | | AT&T Inc. | | | | | | | | | | | 3.400% | | | | 5/15/25 | | | | A– | | | | 3,303,245 | |
| | | | | | | |
| | 1,805 | | | AT&T Inc. | | | | | | | | | | | 3.875% | | | | 1/15/26 | | | | A– | | | | 1,886,677 | |
| | | | | | | |
| | 883 | | | Frontier Communications Corp, (3) | | | | | | | | | �� | | 8.500% | | | | 4/15/20 | | | | B– | | | | 719,645 | |
| | | | | | | |
| | 500 | | | Sprint Capital Corp | | | | | | | | | | | 6.875% | | | | 11/15/28 | | | | B+ | | | | 517,500 | |
| | | | | | | |
| | 2,650 | | | Telefonica Emisiones SA | | | | | | | | | | | 4.103% | | | | 3/08/27 | | | | BBB | | | | 2,813,943 | |
| | | | | |
| | 2,200 | | | Telenet Finance Luxembourg Notes Sarl, 144A | | | | 5.500% | | | | 3/01/28 | | | | BB+ | | | | 2,233,389 | |
| | 11,253 | | | Total Diversified Telecommunication Services | | | | | | | | 11,474,399 | |
| | | | |
| | | | Electric Utilities – 1.4% | | | | | | | | | | |
| | | | | |
| | 2,250 | | | Adani Green Energy UP Ltd / Prayatna Developers Pvt Ltd / Parampujya Solar Energy, 144A | | | | 6.250% | | | | 12/10/24 | | | | BB+ | | | | 2,297,385 | |
| | | | | | | |
| | 1,262 | | | Berkshire Hathaway Energy Co | | | | | | | | | | | 6.125% | | | | 4/01/36 | | | | A– | | | | 1,687,292 | |
| | | | | | | |
| | 1,000 | | | Perusahaan Listrik Negara PT, 144A | | | | | | | | | | | 6.150% | | | | 5/21/48 | | | | Baa2 | | | | 1,186,648 | |
| | | | | | | |
| | 1,000 | | | Talen Energy Supply LLC | | | | | | | | | | | 6.500% | | | | 6/01/25 | | | | B | | | | 837,500 | |
| | | | | | | |
| | 1,725 | | | Vistra Operations Co LLC, 144A | | | | | | | | | | | 5.625% | | | | 2/15/27 | | | | BB | | | | 1,826,344 | |
| | 7,237 | | | Total Electric Utilities | | | | | | | | 7,835,169 | |
| | |
| | | | Energy Equipment & Services – 0.4% | | | | |
| | | | | |
| | 1,100 | | | Archrock Partners LP / Archrock Partners Finance Corp, 144A | | | | 6.875% | | | | 4/01/27 | | | | B+ | | | | 1,149,610 | |
| | | | | | | |
| | 1,500 | | | Ensco Rowan plc, (3) | | | | | | | | | | | 5.200% | | | | 3/15/25 | | | | B | | | | 1,100,625 | |
| | 2,600 | | | Total Energy Equipment & Services | | | | 2,250,235 | |
| |
| | | | Equity Real Estate Investment Trust – 0.4% | |
| | | | | | | |
| | 2,070 | | | American Tower Corp | | | | | | | | | | | 5.000% | | | | 2/15/24 | | | | BBB | | | | 2,277,920 | |
| | |
| | | | Food & Staples Retailing – 1.2% | | | | |
| | | | | | | |
| | 2,990 | | | CVS Health Corp | | | | | | | | | | | 4.300% | | | | 3/25/28 | | | | BBB | | | | 3,151,251 | |
| | | | | | | |
| | 1,000 | | | JBS USA LUX SA / JBS USA Finance Inc., 144A | | | | | | | | | | | 6.750% | | | | 2/15/28 | | | | BB– | | | | 1,086,250 | |
| | | | | | | |
| | 2,975 | | | Sysco Corp | | | | | | | | | | | 3.300% | | | | 7/15/26 | | | | A3 | | | | 3,052,715 | |
| | 6,965 | | | Total Food & Staples Retailing | | | | | | | | | | | | | | | | | | | | | | | 7,290,216 | |
| | | | | | | |
| | | | Food Products – 0.1% | | | | | | | | | | | | | | | | | | |
| | | | | | | |
| | 800 | | | Post Holdings Inc., 144A | | | | | | | | | | | 5.625% | | | | 1/15/28 | | | | B+ | | | | 822,000 | |
35
Nuveen Strategic Income Fund(continued)
Portfolio of Investments June 30, 2019
| | | | | | | | | | | | | | | | | | | | | | | | | | | | |
Principal
Amount (000) | | | Description (1) | | | | | | | | Coupon | | | Maturity | | | Ratings (2) | | | Value | |
| | | | | | | |
| | | | Gas Utilities – 0.3% | | | | | | | | | | | | | | | | | | |
| | | | | | | |
| $ | 250 | | | EnLink Midstream LLC | | | | | | | | | | | 5.375% | | | | 6/01/29 | | | | BBB– | | | $ | 256,250 | |
| | | | | |
| | 1,250 | | | Suburban Propane Partners LP/Suburban Energy Finance Corp | | | | 5.500% | | | | 6/01/24 | | | | BB– | | | | 1,256,250 | |
| | 1,500 | | | Total Gas Utilities | | | | | | | | | | | | | | | | | | | | | | | 1,512,500 | |
| | |
| | | | Health Care Providers & Services – 0.7% | | | | |
| | | | | | | |
| | 1,515 | | | Centene Corp, 144A | | | | | | | | | | | 5.375% | | | | 6/01/26 | | | | BB+ | | | | 1,592,644 | |
| | | | | | | |
| | 715 | | | CHS/Community Health Systems Inc. | | | | | | | | | | | 6.250% | | | | 3/31/23 | | | | BB | | | | 688,187 | |
| | | | | | | |
| | 100 | | | HCA Inc. | | | | | | | | | | | 5.625% | | | | 9/01/28 | | | | Ba2 | | | | 108,250 | |
| | | | | | | |
| | 250 | | | HCA Inc. | | | | | | | | | | | 5.875% | | | | 2/01/29 | | | | Ba2 | | | | 274,063 | |
| | | | | | | |
| | 1,525 | | | Tenet Healthcare Corp, 144A | | | | | | | | | | | 6.250% | | | | 2/01/27 | | | | Ba3 | | | | 1,570,750 | |
| | 4,105 | | | Total Health Care Providers & Services | | | | | | | | 4,233,894 | |
| | | | | |
| | | | Hotels, Restaurants & Leisure – 0.2% | | | | | | | | | | | | | |
| | | | | | | |
| | 1,230 | | | Hilton Domestic Operating Co Inc. | | | | | | | | | | | 5.125% | | | | 5/01/26 | | | | BB+ | | | | 1,283,812 | |
| | | | | | | |
| | | | Household Durables – 0.5% | | | | | | | | | | | | | | | | | | |
| | | | | | | |
| | 1,940 | | | Harman International Industries Inc. | | | | | | | | | | | 4.150% | | | | 5/15/25 | | | | BBB+ | | | | 2,059,764 | |
| | | | | | | |
| | 1,000 | | | TRI Pointe Group Inc. | | | | | | | | | | | 5.250% | | | | 6/01/27 | | | | BB– | | | | 962,500 | |
| | 2,940 | | | Total Household Durables | | | | | | | | | | | | | | | | | | | | | | | 3,022,264 | |
| | | | | | | |
| | | | Household Products – 0.2% | | | | | | | | | | | | | | | | | | |
| | | | | |
| | 1,300 | | | Kimberly-Clark de Mexico SAB de CV, 144A | | | | 3.250% | | | | 3/12/25 | | | | A | | | | 1,255,721 | |
| |
| | | | Independent Power & Renewable Electricity Producers – 0.2% | |
| | | | | | | |
| | 1,000 | | | Calpine Corp, 144A | | | | | | | | | | | 5.250% | | | | 6/01/26 | | | | BB+ | | | | 1,017,500 | |
| | | | | | | |
| | | | Insurance – 1.9% | | | | | | | | | | | | | | | | | | |
| | | | | | | |
| | 1,230 | | | Genworth Holdings Inc., (3) | | | | | | | | | | | 4.800% | | | | 2/15/24 | | | | B | | | | 1,045,500 | |
| | | | | | | |
| | 1,940 | | | Liberty Mutual Group Inc., 144A | | | | | | | | | | | 4.569% | | | | 2/01/29 | | | | BBB | | | | 2,131,290 | |
| | | | | | | |
| | 2,535 | | | Lincoln National Corp | | | | | | | | | | | 4.000% | | | | 9/01/23 | | | | A– | | | | 2,680,713 | |
| | | | | | | |
| | 750 | | | Nationstar Mortgage Holdings Inc., 144A | | | | | | | | | | | 8.125% | | | | 7/15/23 | | | | B | | | | 765,000 | |
| | | | | | | |
| | 1,805 | | | Willis North America Inc. | | | | | | | | | | | 3.600% | | | | 5/15/24 | | | | BBB | | | | 1,865,340 | |
| | | | | | | |
| | 2,225 | | | XLIT Ltd | | | | | | | | | | | 4.450% | | | | 3/31/25 | | | | BBB+ | | | | 2,402,212 | |
| | 10,485 | | | Total Insurance | | | | | | | | | | | | | | | | | | | | | | | 10,890,055 | |
| | | | | | | |
| | | | IT Services – 0.3% | | | | | | | | | | | | | | | | | | |
| | | | | | | |
| | 1,680 | | | Fidelity National Information Services Inc. | | | | | | | | | | | 3.750% | | | | 5/21/29 | | | | BBB | | | | 1,783,694 | |
| | | | | | | |
| | | | Leisure Products – 0.1% | | | | | | | | | | | | | | | | | | |
| | | | | | | |
| | 750 | | | Mattel Inc., 144A | | | | | | | | | | | 6.750% | | | | 12/31/25 | | | | BB– | | | | 771,563 | |
| | | | | | | |
| | | | Machinery – 0.7% | | | | | | | | | | | | | | | | | | |
| | | | | | | |
| | 1,000 | | | Cleaver-Brooks Inc., 144A | | | | | | | | | | | 7.875% | | | | 3/01/23 | | | | B | | | | 958,960 | |
| | | | | | | |
| | 700 | | | Cloud Crane LLC, 144A | | | | | | | | | | | 10.125% | | | | 8/01/24 | | | | B | | | | 752,500 | |
| | | | | | | |
| | 1,405 | | | Ingersoll-Rand Luxembourg Finance SA | | | | | | | | | | | 3.800% | | | | 3/21/29 | | | | BBB | | | | 1,473,457 | |
| | | | | |
| | 975 | | | USA Compression Partners LP / USA Compression Finance Corp, 144A | | | | 6.875% | | | | 9/01/27 | | | | BB– | | | | 1,023,857 | |
| | 4,080 | | | Total Machinery | | | | | | | | | | | | | | | | | | | | | | | 4,208,774 | |
36
| | | | | | | | | | | | | | | | | | | | | | | | | | | | |
Principal
Amount (000) | | | Description (1) | | | | | | | | Coupon | | | Maturity | | | Ratings (2) | | | Value | |
| | | | | | | |
| | | | Marine – 0.2% | | | | | | | | | | | | | | | | | | |
| | | | | | | |
| $ | 1,000 | | | Stena International SA, 144A | | | | | | | | | | | 5.750% | | | | 3/01/24 | | | | BB– | | | $ | 980,000 | |
| | | | | | | |
| | | | Media – 1.8% | | | | | | | | | | | | | | | | | | |
| | | | | |
| | 1,820 | | | Charter Communications Operating LLC / Charter Communications Operating Capital, (WI/DD) | | | | 5.125% | | | | 7/01/49 | | | | BBB– | | | | 1,844,349 | |
| | | | | | | |
| | 1,790 | | | Comcast Corp | | | | | | | | | | | 6.400% | | | | 5/15/38 | | | | A– | | | | 2,417,439 | |
| | | | | | | |
| | 1,200 | | | CSC Holdings LLC, 144A | | | | | | | | | | | 6.500% | | | | 2/01/29 | | | | BB | | | | 1,309,500 | |
| | | | | | | |
| | 100 | | | Entercom Media Corp, 144A | | | | | | | | | | | 6.500% | | | | 5/01/27 | | | | B2 | | | | 104,000 | |
| | | | | | | |
| | 1,900 | | | Grupo Televisa SAB | | | | | | | | | | | 5.250% | | | | 5/24/49 | | | | BBB+ | | | | 1,969,143 | |
| | | | | | | |
| | 1,000 | | | Meredith Corp | | | | | | | | | | | 6.875% | | | | 2/01/26 | | | | B+ | | | | 1,061,130 | |
| | | | | | | |
| | 1,450 | | | VTR Finance BV, 144A | | | | | | | | | | | 6.875% | | | | 1/15/24 | | | | BB– | | | | 1,500,750 | |
| | 9,260 | | | Total Media | | | | | | | | | | | | | | | | | | | | | | | 10,206,311 | |
| | | | | | | |
| | | | Metals & Mining – 1.0% | | | | | | | | | | | | | | | | | | |
| | | | | | | |
| | 1,250 | | | First Quantum Minerals Ltd, 144A | | | | | | | | | | | 6.500% | | | | 3/01/24 | | | | B | | | | 1,168,750 | |
| | | | | |
| | 1,000 | | | FMG Resources August 2006 Pty Ltd, 144A | | | | 5.125% | | | | 5/15/24 | | | | BB+ | | | | 1,036,250 | |
| | | | | | | |
| | 875 | | | MMK International Capital DAC, 144A | | | | | | | | | | | 4.375% | | | | 6/13/24 | | | | Baa2 | | | | 886,340 | |
| | | | | | | |
| | 1,000 | | | Novelis Corp, 144A | | | | | | | | | | | 6.250% | | | | 8/15/24 | | | | B+ | | | | 1,048,460 | |
| | | | | | | |
| | 1,750 | | | Tronox Inc., 144A, (3) | | | | | | | | | | | 6.500% | | | | 4/15/26 | | | | B– | | | | 1,731,992 | |
| | 5,875 | | | Total Metals & Mining | | | | | | | | | | | | | | | | | | | | | | | 5,871,792 | |
| | |
| | | | Oil, Gas & Consumable Fuels – 4.3% | | | | |
| | | | | |
| | 1,250 | | | Calumet Specialty Products Partners LP / Calumet Finance Corp, (3) | | | | 6.500% | | | | 4/15/21 | | | | B– | | | | 1,243,750 | |
| | | | | | | |
| | 1,000 | | | Denbury Resources Inc., 144A | | | | | | | | | | | 9.000% | | | | 5/15/21 | | | | B | | | | 985,000 | |
| | | | | | | |
| | 600 | | | Denbury Resources Inc., 144A | | | | | | | | | | | 7.750% | | | | 2/15/24 | | | | B3 | | | | 498,000 | |
| | | | | | | |
| | 1,250 | | | Ecopetrol SA | | | | | | | | | | | 5.875% | | | | 5/28/45 | | | | BBB | | | | 1,382,375 | |
| | | | | | | |
| | 1,625 | | | Ensign Drilling Inc., 144A | | | | | | | | | | | 9.250% | | | | 4/15/24 | | | | BB– | | | | 1,600,625 | |
| | | | | | | |
| | 1,125 | | | KazMunayGas National Co JSC, 144A | | | | | | | | | | | 5.375% | | | | 4/24/30 | | | | Baa3 | | | | 1,245,600 | |
| | | | | | | |
| | 750 | | | Medco Oak Tree Pte Ltd, 144A | | | | | | | | | | | 7.375% | | | | 5/14/26 | | | | B+ | | | | 752,154 | |
| | | | | |
| | 2,000 | | | Moss Creek Resources Holdings Inc., 144A | | | | 10.500% | | | | 5/15/27 | | | | B+ | | | | 1,912,500 | |
| | | | | | | |
| | 3,795 | | | MPLX LP | | | | | | | | | | | 4.875% | | | | 6/01/25 | | | | BBB | | | | 4,122,285 | |
| | | | | | | |
| | 1,000 | | | Peabody Energy Corp, 144A | | | | | | | | | | | 6.375% | | | | 3/31/25 | | | | BB | | | | 1,012,500 | |
| | | | | | | |
| | 1,000 | | | Petrobras Global Finance BV | | | | | | | | | | | 7.375% | | | | 1/17/27 | | | | Ba2 | | | | 1,148,500 | |
| | | | | | | |
| | 1,275 | | | Petro-Canada | | | | | | | | | | | 6.800% | | | | 5/15/38 | | | | A– | | | | 1,741,894 | |
| | | | | | | |
| | 2,200 | | | Petroleos Mexicanos | | | | | | | | | | | 6.500% | | | | 3/13/27 | | | | BBB+ | | | | 2,169,640 | |
| | | | | | | |
| | 1,345 | | | Sabine Pass Liquefaction LLC | | | | | | | | | | | 5.875% | | | | 6/30/26 | | | | BBB– | | | | 1,536,436 | |
| | | | | | | |
| | 1,000 | | | Sunoco LP / Sunoco Finance Corp | | | | | | | | | | | 4.875% | | | | 1/15/23 | | | | BB | | | | 1,021,250 | |
| | | | | | | |
| | 500 | | | Sunoco LP / Sunoco Finance Corp, 144A | | | | | | | | | | | 6.000% | | | | 4/15/27 | | | | BB | | | | 525,000 | |
| | | | | |
| | 670 | | | Targa Resources Partners LP / Targa Resources Partners Finance Corp | | | | 4.250% | | | | 11/15/23 | | | | BB | | | | 669,581 | |
| | | | | |
| | 150 | | | Targa Resources Partners LP / Targa Resources Partners Finance Corp, 144A | | | | 6.500% | | | | 7/15/27 | | | | BB | | | | 163,500 | |
| | | | | | | |
| | 1,515 | | | WPX Energy Inc. | | | | | | | | | | | 5.750% | | | | 6/01/26 | | | | BB– | | | | 1,568,025 | |
| | 24,050 | | | Total Oil, Gas & Consumable Fuels | | | | | | | | 25,298,615 | |
37
Nuveen Strategic Income Fund(continued)
Portfolio of Investments June 30, 2019
| | | | | | | | | | | | | | | | | | | | | | | | | | | | |
Principal
Amount (000) | | | Description (1) | | | | | | | | Coupon | | | Maturity | | | Ratings (2) | | | Value | |
| | | |
| | | | Paper & Forest Products – 0.4% | | | | | | | |
| | | | | | | |
| $ | 850 | | | Inversiones CMPC SA, 144A | | | | | | | | | | | 4.375% | | | | 4/04/27 | | | | BBB | | | $ | 888,750 | |
| | | | | | | |
| | 1,500 | | | Suzano Austria GmbH, 144A | | | | | | | | | | | 5.000% | | | | 1/15/30 | | | | BBB– | | | | 1,521,075 | |
| | 2,350 | | | Total Paper & Forest Products | | | | | | | | 2,409,825 | |
| | | |
| | | | Personal Products – 0.1% | | | | | | | |
| | | | | | | |
| | 825 | | | First Quality Finance Co Inc., 144A | | | | | | | | | | | 5.000% | | | | 7/01/25 | | | | BB– | | | | 831,188 | |
| | | | | | | |
| | | | Pharmaceuticals – 0.2% | | | | | | | | | | | | | | | | | | |
| | | | | | | |
| | 1,050 | | | Bausch Health Americas Inc., 144A | | | | | | | | | | | 8.500% | | | | 1/31/27 | | | | B | | | | 1,154,496 | |
| | | |
| | | | Professional Services – 0.3% | | | | | | | |
| | | | | | | |
| | 1,635 | | | Verisk Analytics Inc. | | | | | | | | | | | 4.125% | | | | 3/15/29 | | | | BBB+ | | | | 1,757,511 | |
| | |
| | | | Real Estate Management & Development – 0.5% | | | | |
| | | | | | | |
| | 1,250 | | | Country Garden Holdings Co Ltd | | | | | | | | | | | 4.750% | | | | 9/28/23 | | | | BBB– | | | | 1,219,081 | |
| | | | | | | |
| | 1,500 | | | Hunt Cos Inc., 144A | | | | | | | | | | | 6.250% | | | | 2/15/26 | | | | BB– | | | | 1,417,500 | |
| | 2,750 | | | Total Real Estate Management & Development | | | | 2,636,581 | |
| | | | | | | |
| | | | Road & Rail – 1.0% | | | | | | | | | | | | | | | | | | |
| | | | | | | |
| | 2,280 | | | CSX Corp | | | | | | | | | | | 3.800% | | | | 11/01/46 | | | | BBB+ | | | | 2,308,368 | |
| | | | | | | |
| | 1,500 | | | Union Pacific Corp | | | | | | | | | | | 4.500% | | | | 9/10/48 | | | | A– | | | | 1,701,359 | |
| | | | | | | |
| | 750 | | | United Rentals North America Inc. | | | | | | | | | | | 6.500% | | | | 12/15/26 | | | | BB– | | | | 811,875 | |
| | | | | | | |
| | 1,000 | | | United Rentals North America Inc. | | | | | | | | | | | 4.875% | | | | 1/15/28 | | | | BB– | | | | 1,020,000 | |
| | 5,530 | | | Total Road & Rail | | | | | | | | | | | | | | | | | | | | | | | 5,841,602 | |
| | |
| | | | Semiconductors & Semiconductor Equipment – 0.5% | | | | |
| | | | | | | |
| | 2,655 | | | Intel Corp | | | | | | | | | | | 3.150% | | | | 5/11/27 | | | | A+ | | | | 2,762,919 | |
| | | | | | | |
| | | | Software – 0.8% | | | | | | | | | | | | | | | | | | |
| | | | | | | |
| | 875 | | | CDK Global Inc. | | | | | | | | | | | 5.875% | | | | 6/15/26 | | | | BB+ | | | | 926,406 | |
| | | | | | | |
| | 2,450 | | | Microsoft Corp | | | | | | | | | | | 3.300% | | | | 2/06/27 | | | | AAA | | | | 2,596,103 | |
| | | | | | | |
| | 925 | | | SS&C Technologies Inc., 144A | | | | | | | | | | | 5.500% | | | | 9/30/27 | | | | B+ | | | | 959,688 | |
| | 4,250 | | | Total Software | | | | 4,482,197 | |
| | | | | | | |
| | | | Specialty Retail – 0.8% | | | | | | | | | | | | | | | | | | |
| | | | | | | |
| | 2,000 | | | AutoNation Inc. | | | | | | | | | | | 4.500% | | | | 10/01/25 | | | | BBB– | | | | 2,070,646 | |
| | | | | | | |
| | 1,500 | | | L Brands Inc. | | | | | | | | | | | 6.875% | | | | 11/01/35 | | | | Ba1 | | | | 1,334,040 | |
| | | | | | | |
| | 1,250 | | | PGT Escrow Issuer Inc., 144A | | | | | | | | | | | 6.750% | | | | 8/01/26 | | | | B | | | | 1,320,312 | |
| | 4,750 | | | Total Specialty Retail | | | | | | | | 4,724,998 | |
| |
| | | | Trading Companies & Distributors – 0.5% | |
| | | | | | | |
| | 515 | | | Ashtead Capital Inc., 144A | | | | | | | | | | | 4.125% | | | | 8/15/25 | | | | BBB– | | | | 521,437 | |
| | | | | | | |
| | 600 | | | Ashtead Capital Inc., 144A | | | | | | | | | | | 5.250% | | | | 8/01/26 | | | | BBB– | | | | 625,500 | |
| | | | | |
| | 900 | | | Fortress Transportation & Infrastructure Investors LLC, 144A | | | | 6.750% | | | | 3/15/22 | | | | B+ | | | | 934,875 | |
| | | | | | | |
| | 1,000 | | | H&E Equipment Services Inc. | | | | | | | | | | | 5.625% | | | | 9/01/25 | | | | BB– | | | | 1,028,500 | |
| | 3,015 | | | Total Trading Companies & Distributors | | | | 3,110,312 | |
38
| | | | | | | | | | | | | | | | | | | | | | | | | | | | |
Principal
Amount (000) | | | Description (1) | | | | | | | | Coupon | | | Maturity | | | Ratings (2) | | | Value | |
| | |
| | | | Transportation Infrastructure – 0.1% | | | | |
| | | | | |
| $ | 750 | | | Adani Ports & Special Economic Zone Ltd, 144A | | | | 4.000% | | | | 7/30/27 | | | | BBB– | | | $ | 747,585 | |
| |
| | | | Wireless Telecommunication Services – 0.8% | |
| | | | | | | |
| | 1,000 | | | Hughes Satellite Systems Corp | | | | | | | | | | | 6.625% | | | | 8/01/26 | | | | BB– | | | | 1,051,250 | |
| | | | | | | |
| | 1,040 | | | Millicom International Cellular SA, 144A | | | | | | | | | | | 5.125% | | | | 1/15/28 | | | | BB+ | | | | 1,053,000 | |
| | | | | | | |
| | 1,250 | | | MTN Mauritius Investments Ltd, 144A | | | | | | | | | | | 4.755% | | | | 11/11/24 | | | | BB+ | | | | 1,252,988 | |
| | | | | | | |
| | 1,350 | | | Telecom Italia SpA/Milano, 144A | | | | | | | | | | | 5.303% | | | | 5/30/24 | | | | BB+ | | | | 1,397,250 | |
| | 4,640 | | | Total Wireless Telecommunication Services | | | | 4,754,488 | |
| $ | 233,608 | | | Total Corporate Bonds (cost $232,167,181) | | | | 241,447,050 | |
| | | | | | | |
Principal
Amount (000) | | | Description (1) | | | | | | | | Coupon | | | Maturity | | | Ratings (2) | | | Value | |
| | |
| | | | ASSET-BACKED AND MORTGAGE-BACKED SECURITIES – 27.2% | | | | |
| | | | | | | |
| $ | 2,150 | | | Aaset2019-1 Trust, 144A, (4) | | | | | | | | | | | 3.844% | | | | 5/15/39 | | | | A | | | $ | 2,149,995 | |
| | | | | | | |
| | 11 | | | Alternative Loan Trust 2004-24CB | | | | | | | | | | | 5.000% | | | | 11/25/19 | | | | BB+ | | | | 10,537 | |
| | | | | |
| | 2,220 | | | American Homes 4 Rent 2014-SFR2 Trust, 144A | | | | 3.786% | | | | 10/17/36 | | | | Aaa | | | | 2,323,349 | |
| | | | | |
| | 1,000 | | | Apidos CLO XXIX, 144A,(3-Month LIBOR reference rate + 1.550% spread), (5) | | | | 4.130% | | | | 7/25/30 | | | | AA | | | | 986,819 | |
| | | | | |
| | 667 | | | Apollo Aviation Securitization Equity Trust2016-2 | | | | 4.212% | | | | 11/15/41 | | | | A | | | | 674,379 | |
| | | | | |
| | 1,350 | | | Applebee’s Funding LLC / IHOP Funding LLC, 144A | | | | 4.194% | | | | 6/07/49 | | | | BBB | | | | 1,364,209 | |
| | | | | |
| | 2,100 | | | Avis Budget Rental Car Funding AESOP LLC, 144A | | | | 4.150% | | | | 9/20/23 | | | | BBB | | | | 2,148,511 | |
| | | | | |
| | 1,200 | | | Banc of America Commercial Mortgage Trust 2015-UBS7 | | | | 4.506% | | | | 9/15/48 | | | | A– | | | | 1,261,874 | |
| | | | | |
| | 2,400 | | | BBCMS Trust2015-STP, 144A | | | | 4.427% | | | | 9/10/28 | | | | BBB– | | | | 2,411,352 | |
| | | | | |
| | 537 | | | CHL Mortgage Pass-Through Trust2005-27 | | | | 5.500% | | | | 12/25/35 | | | | Caa1 | | | | 516,182 | |
| | | | | |
| | 1,000 | | | CIFC Funding2013-III-R Ltd, 144A,(3-Month LIBOR reference rate + 2.900% spread), (5) | | | | 5.481% | | | | 4/24/31 | | | | Baa3 | | | | 969,724 | |
| | | | | |
| | 1,690 | | | Citigroup Commercial Mortgage Trust 2015-GC29 | | | | 4.280% | | | | 4/10/48 | | | | A– | | | | 1,758,902 | |
| | | | | |
| | 2,750 | | | Citigroup Commercial Mortgage Trust 2015-GC29 | | | | 3.758% | | | | 4/10/48 | | | | AA– | | | | 2,830,305 | |
| | | | | |
| | 3,940 | | | COMM 2015-CCRE22 Mortgage Trust | | | | 4.255% | | | | 3/10/48 | | | | A– | | | | 4,120,342 | |
| | | | | |
| | 3,260 | | | COMM 2015-CCRE26 Mortgage Trust | | | | 4.632% | | | | 10/10/48 | | | | A– | | | | 3,417,188 | |
| | | | | |
| | 93 | | | Credit Suisse First Boston Mortgage Securities Corp | | | | 5.750% | | | | 9/25/33 | | | | AAA | | | | 97,795 | |
| | | | | |
| | 1,420 | | | DB Master Finance LLC, 144A | | | | 3.787% | | | | 5/20/49 | | | | BBB | | | | 1,450,274 | |
| | | | | |
| | 661 | | | DB Master Finance LLC, 144A | | | | 4.021% | | | | 5/20/49 | | | | BBB | | | | 680,367 | |
| | | | | |
| | 3,616 | | | Domino’s Pizza Master Issuer LLC, 144A | | | | 3.082% | | | | 7/25/47 | | | | BBB+ | | | | 3,621,060 | |
| | | | | |
| | 750 | | | Dryden 50 Senior Loan Fund, 144A,(3-Month LIBOR reference rate + 6.260% spread), (5) | | | | 8.857% | | | | 7/15/30 | | | | Ba3 | | | | 735,223 | |
| | | | | |
| | 618 | | | Fannie Mae Connecticut Avenue Securities,(1-Month LIBOR reference rate + 3.000% spread), (5) | | | | 5.404% | | | | 7/25/24 | | | | Aaa | | | | 648,398 | |
| | | | | |
| | 5,000 | | | Fannie Mae Connecticut Avenue Securities,(1-Month LIBOR reference rate + 2.200% spread), (5) | | | | 4.604% | | | | 1/25/30 | | | | AAA | | | | 5,071,475 | |
| | | | | |
| | 24 | | | Fannie Mae Interest Strip | | | | 5.000% | | | | 9/25/24 | | | | Aaa | | | | 584 | |
| | | | | |
| | 2 | | | Fannie Mae Pool | | | | 5.500% | | | | 7/01/24 | | | | N/R | | | | 1,587 | |
| | | | | |
| | 36 | | | Fannie Mae Pool | | | | 6.000% | | | | 4/01/32 | | | | Aaa | | | | 39,003 | |
39
Nuveen Strategic Income Fund(continued)
Portfolio of Investments June 30, 2019
| | | | | | | | | | | | | | | | | | | | | | | | |
| | | | | | | |
Principal
Amount (000) | | | Description (1) | | | | | | Coupon | | | Maturity | | | Ratings (2) | | | Value | |
| | |
| | | | ASSET-BACKED AND MORTGAGE-BACKED SECURITIES(continued) | | | | |
| | | | | |
| $ | 168 | | | Fannie Mae Pool | | | 6.000% | | | | 3/01/34 | | | | N/R | | | $ | 183,731 | |
| | | | | |
| | 1 | | | Fannie Mae Pool,(12-Month LIBOR reference rate +1.875% spread), (5) | | | 4.875% | | | | 12/01/36 | | | | N/R | | | | 905 | |
| | | | | |
| | 251 | | | Fannie Mae Pool | | | 6.500% | | | | 8/01/37 | | | | Aaa | | | | 293,388 | |
| | | | | |
| | 35 | | | Fannie Mae Pool | | | 6.000% | | | | 9/01/37 | | | | Aaa | | | | 38,733 | |
| | | | | |
| | 23 | | | Fannie Mae Pool,(12-Month LIBOR reference rate + 1.546% spread), (5) | | | 4.296% | | | | 9/01/37 | | | | N/R | | | | 23,692 | |
| | | | | |
| | 367 | | | Fannie Mae Pool | | | 5.500% | | | | 3/01/39 | | | | Aaa | | | | 407,681 | |
| | | | | |
| | 70 | | | Fannie Mae Pool | | | 6.000% | | | | 9/01/39 | | | | Aaa | | | | 79,374 | |
| | | | | |
| | 65 | | | Fannie Mae Pool | | | 5.000% | | | | 11/01/44 | | | | Aaa | | | | 70,564 | |
| | | | | |
| | 1,237 | | | Fannie Mae Pool | | | 3.000% | | | | 11/01/47 | | | | Aaa | | | | 1,237,686 | |
| | | | | |
| | 2,702 | | | Fannie Mae Pool | | | 3.500% | | | | 8/01/48 | | | | Aaa | | | | 2,771,256 | |
| | | | | |
| | 1,420 | | | Fannie Mae Pool | | | 4.000% | | | | 9/01/48 | | | | Aaa | | | | 1,468,054 | |
| | | | | |
| | 730 | | | Fannie Mae Pool | | | 4.000% | | | | 10/01/48 | | | | Aaa | | | | 754,695 | |
| | | | | |
| | 1,264 | | | Fannie Mae Pool | | | 3.000% | | | | 11/01/48 | | | | Aaa | | | | 1,276,755 | |
| | | | | |
| | 2,311 | | | Fannie Mae Pool | | | 4.000% | | | | 11/01/48 | | | | Aaa | | | | 2,388,129 | |
| | | | | |
| | 7,971 | | | Fannie Mae Pool, (DD1) | | | 4.000% | | | | 12/01/48 | | | | Aaa | | | | 8,241,761 | |
| | | | | |
| | 3,249 | | | Fannie Mae Pool | | | 4.500% | | | | 12/01/48 | | | | Aaa | | | | 3,399,363 | |
| | | | | |
| | 17,079 | | | Fannie Mae Pool, (DD1) | | | 3.500% | | | | 6/01/49 | | | | Aaa | | | | 17,479,019 | |
| | | | | |
| | 512 | | | Fannie Mae REMICS,(1-Month LIBOR reference rate + 5.950% spread), (5) | | | 3.546% | | | | 9/25/43 | | | | Aaa | | | | 90,583 | |
| | | | | |
| | 1,486 | | | Fifth Third Auto Trust2017-1 | | | 1.800% | | | | 2/15/22 | | | | AAA | | | | 1,482,581 | |
| | | | | |
| | 2,850 | | | Flagstar Mortgage Trust2017-2, 144A | | | 3.500% | | | | 10/25/47 | | | | Aaa | | | | 2,891,567 | |
| | | | | |
| | 2,472 | | | Flagstar Mortgage Trust2018-4, 144A | | | 4.000% | | | | 7/25/48 | | | | Aaa | | | | 2,495,576 | |
| | | | | |
| | 2,950 | | | FOCUS Brands Funding LLC, 144A | | | 5.093% | | | | 4/30/47 | | | | BBB | | | | 3,080,683 | |
| | | | | |
| | 600 | | | Freddie Mac Structured Agency Credit Risk Debt Notes, 144A | | | 4.460% | | | | 11/25/48 | | | | Aaa | | | | 597,140 | |
| | | | | |
| | 2,500 | | | GS Mortgage Securities Corp Trust 2019-SOHO, 144A, (WI/DD),(1-Month LIBOR reference rate + 0.900% spread), (5) | | | 3.350% | | | | 6/15/36 | | | | Aaa | | | | 2,500,013 | |
| | | | | |
| | 2,465 | | | GS Mortgage Securities Trust 2015-GC32 | | | 3.345% | | | | 7/10/48 | | | | BBB– | | | | 2,280,448 | |
| | | | | |
| | 1,500 | | | GS Mortgage Securities Trust 2019-GC40, 144A, (WI/DD) | | | 3.668% | | | | 7/10/52 | | | | N/R | | | | 1,534,813 | |
| | | | | |
| | 2,000 | | | Hertz Vehicle Financing II LP, 144A | | | 4.260% | | | | 5/25/25 | | | | BBB | | | | 2,038,561 | |
| | | | | |
| | 2,500 | | | Horizon Aircraft Finance II Ltd, 144A, (WI/DD) | | | 3.721% | | | | 7/15/39 | | | | N/R | | | | 2,499,989 | |
| | | | | |
| | 500 | | | Horizon Aircraft Finance II Ltd, 144A, (WI/DD) | | | 6.900% | | | | 7/15/39 | | | | N/R | | | | 499,994 | |
| | | | | |
| | 2,000 | | | Hudson Yards 2019-30HY Mortgage Trust, 144A, (WI/DD) | | | 3.557% | | | | 7/10/39 | | | | N/R | | | | 2,011,312 | |
| | | | | |
| | 1,067 | | | Impac Secured Assets CMN Owner Trust | | | 8.000% | | | | 10/25/30 | | | | CCC | | | | 1,015,588 | |
| | | | | |
| | 3,141 | | | Invitation Homes 2018-SFR2 Trust, 144A,(1-Month LIBOR reference rate + 0.900% spread), (5) | | | 3.294% | | | | 6/17/37 | | | | Aaa | | | | 3,134,440 | |
| | | | | |
| | 3,467 | | | Invitation Homes 2018-SFR3 Trust, 144A,(1-Month LIBOR reference rate + 1.000% spread), (5) | | | 3.394% | | | | 7/17/37 | | | | Aaa | | | | 3,457,018 | |
| | | | | |
| | 487 | | | JP Morgan Alternative Loan Trust2007-S1,(1-Month LIBOR reference rate + 0.280% spread), (5) | | | 2.684% | | | | 4/25/47 | | | | BBB+ | | | | 471,693 | |
40
| | | | | | | | | | | | | | | | | | | | | | | | |
Principal
Amount (000) | | | Description (1) | | | | | | Coupon | | | Maturity | | | Ratings (2) | | | Value | |
| | |
| | | | ASSET-BACKED AND MORTGAGE-BACKED SECURITIES(continued) | | | | |
| | | | | |
| $ | 1,500 | | | JPMCC Commercial Mortgage Securities Trust2017-JP5 | | | 3.723% | | | | 3/15/50 | | | | Aaa | | | $ | 1,603,701 | |
| | | | | |
| | 1,838 | | | MASTR Reperforming Loan Trust2005-1, 144A | | | 7.500% | | | | 8/25/34 | | | | D | | | | 1,877,371 | |
| | | | | |
| | 2,000 | | | MVW Owner Trust2019-1, 144A | | | 3.330% | | | | 11/20/36 | | | | BBB | | | | 2,023,308 | |
| | | | | |
| | 1,000 | | | Myers Park CLO Ltd, 144A,(3-Month LIBOR reference rate + 1.600% spread), (5) | | | 4.192% | | | | 10/20/30 | | | | AA | | | | 989,951 | |
| | | | | |
| | 1,000 | | | Neuberger Berman Loan Advisers CLO 27 Ltd, 144A,(3-Month LIBOR reference rate + 1.400% spread), (5) | | | 3.997% | | | | 1/15/30 | | | | AA | | | | 978,667 | |
| | | | | |
| | 2,445 | | | New Residential Mortgage Loan Trust2017-6, 144A | | | 4.000% | | | | 8/27/57 | | | | Aaa | | | | 2,537,499 | |
| | | | | |
| | 1,000 | | | Octagon Investment Partners 38 Ltd, 144A,(3-Month LIBOR reference rate + 1.670% spread), (5) | | | 4.262% | | | | 7/20/30 | | | | AA | | | | 987,063 | |
| | | | | |
| | 1,625 | | | Octagon Investment Partners XVII Ltd, 144A,(3-Month LIBOR reference rate + 2.500% spread), (5) | | | 5.080% | | | | 1/25/31 | | | | BBB– | | | | 1,541,524 | |
| | | | | |
| | 3,900 | | | Ocwen Master Advance Receivables Trust, 144A | | | 4.446% | | | | 8/16/49 | | | | BBB | | | | 3,902,563 | |
| | | | | |
| | 1,500 | | | Pioneer Aircraft Finance Ltd, 144A | | | 3.967% | | | | 6/15/44 | | | | A | | | | 1,522,954 | |
| | | | | |
| | 2,084 | | | Planet Fitness Master Issuer LLC, 144A | | | 4.262% | | | | 9/05/48 | | | | BBB– | | | | 2,147,173 | |
| | | | | |
| | 68 | | | RALI Series 2005-QS12 Trust | | | 5.500% | | | | 8/25/35 | | | | Caa2 | | | | 66,250 | |
| | | | | |
| | 984 | | | Sequoia Mortgage Trust2017-CH2, 144A | | | 4.000% | | | | 12/25/47 | | | | Aaa | | | | 995,300 | |
| | | | | |
| | 1,942 | | | Sequoia Mortgage Trust2018-CH4, 144A | | | 4.500% | | | | 10/25/48 | | | | Aaa | | | | 1,994,249 | |
| | | | | |
| | 3,692 | | | ShellpointCo-Originator Trust2017-2, 144A | | | 3.500% | | | | 10/25/47 | | | | Aaa | | | | 3,753,675 | |
| | | | | |
| | 1,353 | | | Sierra Timeshare Conduit Receivables Funding LLC, 144A | | | 3.200% | | | | 3/20/34 | | | | BBB | | | | 1,361,028 | |
| | | | | |
| | 377 | | | S-Jets2017-1 Ltd, 144A | | | 3.967% | | | | 8/15/42 | | | | A | | | | 385,056 | |
| | | | | |
| | 2,092 | | | Spruce Hill Mortgage Loan Trust2019-SH1, 144A | | | 3.395% | | | | 4/29/49 | | | | AAA | | | | 2,111,117 | |
| | | | | |
| | 1,166 | | | Start Ltd/Bermuda, 144A | | | 4.089% | | | | 5/15/43 | | | | A | | | | 1,188,273 | |
| | | | | |
| | 3,068 | | | Starwood Waypoint Homes2017-1 Trust, 144A,(1-Month LIBOR reference rate + 0.950% spread), (5) | | | 3.344% | | | | 1/17/35 | | | | Aaa | | | | 3,066,366 | |
| | | | | |
| | 1,813 | | | Taco Bell Funding LLC, 144A | | | 4.377% | | | | 5/25/46 | | | | BBB | | | | 1,842,226 | |
| | | | | |
| | 746 | | | Taco Bell Funding LLC, 144A | | | 4.318% | | | | 11/25/48 | | | | BBB | | | | 774,078 | |
| | | | | |
| | 1,000 | | | UBS-Barclays Commercial Mortgage Trust2013-C5, 144A | | | 4.212% | | | | 3/10/46 | | | | A3 | | | | 1,022,748 | |
| | | | | |
| | 2,100 | | | Volkswagen Auto Loan Enhanced | | | 2.810% | | | | 7/20/21 | | | | AAA | | | | 2,104,811 | |
| | | | | |
| | 620 | | | Voya CLO2017-3 Ltd, 144A,(3-Month LIBOR reference rate + 2.350% spread), (5) | | | 4.942% | | | | 7/20/30 | | | | A | | | | 619,993 | |
| | | | | |
| | 134 | | | Wachovia Mortgage Loan Trust LLC Series2005-B Trust | | | 4.552% | | | | 10/20/35 | | | | Aaa | | | | 133,018 | |
| | | | | |
| | 113 | | | Washington Mutual MSC Mortgage Pass-Through CertificatesSeries 2004-RA3 Trust | | | 6.082% | | | | 8/25/38 | | | | AA | | | | 118,626 | |
| | | | | |
| | 7 | | | Wells Fargo Mortgage Backed Securities 2005-AR16 Trust | | | 4.994% | | | | 3/25/35 | | | | AAA | | | | 7,053 | |
| | | | | |
| | 2,241 | | | Wendy’s Funding LLC, 144A | | | 3.573% | | | | 3/15/48 | | | | BBB | | | | 2,253,738 | |
| | | | | |
| | 2,630 | | | WFRBS Commercial Mortgage Trust2011-C3, 144A | | | 5.335% | | | | 3/15/44 | | | | A1 | | | | 2,722,940 | |
| $ | 155,973 | | | Total Asset-Backed and Mortgage-Backed Securities (cost $156,188,453) | | | | 158,118,538 | |
41
Nuveen Strategic Income Fund(continued)
Portfolio of Investments June 30, 2019
| | | | | | | | | | | | | | | | | | | | | | | | | | | | |
Principal
Amount (000) | | | Description (1) | | Coupon (6) | | | Reference
Rate (6) | | | Spread (6) | | | Maturity (7) | | | Ratings (2) | | | Value | |
| | |
| | | | VARIABLE RATE SENIOR LOAN INTERESTS – 8.6% (6) | | | | | |
| | |
| | | | Aerospace & Defense – 0.4% | | | | |
| | | | | | | |
| $ | 2,488 | | | Transdigm, Inc., Term Loan E | | | 4.830% | | | | 3-Month LIBOR | | | | 2.500% | | | | 5/30/25 | | | | Ba3 | | | $ | 2,434,287 | |
| | | | | | | |
| | | | Building Products – 0.3% | | | | | | | | | | | | | | | | | | |
| | | | | | | |
| | 2,000 | | | Quikrete Holdings, Inc., Term Loan B | | | 5.152% | | | | 1-Month LIBOR | | | | 2.750% | | | | 11/15/23 | | | | BB– | | | | 1,968,060 | |
| | |
| | | | Chemicals – 1.3% | | | | |
| | | | | | | |
| | 2,494 | | | Messer Industries USA Inc. | | | 5.101% | | | | 3-Month LIBOR | | | | 2.500% | | | | 3/2/26 | | | | BB– | | | | 2,463,364 | |
| | | | | | | |
| | 2,493 | | | PolyOne Corp | | | 4.161% | | | | 1-Month LIBOR | | | | 1.750% | | | | 1/30/26 | | | | BB+ | | | | 2,490,440 | |
| | | | | | | |
| | 2,500 | | | PQ Corp | | | 5.083% | | | | 3-Month LIBOR | | | | 2.500% | | | | 2/8/25 | | | | BB– | | | | 2,494,275 | |
| | 7,487 | | | Total Chemicals | | | | 7,448,079 | |
| | |
| | | | Commercial Services & Supplies – 1.8% | | | | |
| | | | | | | |
| | 2,487 | | | ADS Waste Holdings, Inc., Term Loan B | | | 4.635% | | | | 1-Week LIBOR | | | | 2.250% | | | | 11/10/23 | | | | BB+ | | | | 2,486,648 | |
| | | | | | | |
| | 1,990 | | | Filtration Group Corp | | | 5.402% | | | | 1-Month LIBOR | | | | 3.000% | | | | 3/31/25 | | | | B | | | | 1,989,029 | |
| | | | | | | |
| | 1,490 | | | Granite Acquisition Inc. | | | 6.092% | | | | 3-Month LIBOR | | | | 3.500% | | | | 12/17/21 | | | | B+ | | | | 1,493,172 | |
| | | | | | | |
| | 1,492 | | | Packers Holdings LLC | | | 5.318% | | | | 3-Month LIBOR | | | | 3.000% | | | | 12/4/24 | | | | B+ | | | | 1,473,299 | |
| | | | | | | |
| | 2,000 | | | Staples Inc., Term Loan B1 | | | 7.601% | | | | 3-Month LIBOR | | | | 5.000% | | | | 4/12/26 | | | | B+ | | | | 1,924,680 | |
| | | | | | | |
| | 1,492 | | | Universal Services of America, Initial Term Loan, First Lien | | | 6.152% | | | | 1-Month LIBOR | | | | 3.750% | | | | 7/28/22 | | | | BB | | | | 1,491,668 | |
| | 10,951 | | | Total Commercial Services & Supplies | | | | 10,858,496 | |
| | |
| | | | Containers & Packaging – 0.3% | | | | |
| | | | | | | |
| | 1,492 | | | Pregis Holding I Corp | | | 6.101% | | | | 3-Month LIBOR | | | | 3.500% | | | | 5/20/21 | | | | B | | | | 1,493,435 | |
| | | | | | | |
| | 120 | | | Tank Holding Corp | | | 6.787% | | | | 12-Month LIBOR | | | | 4.00% | | | | 4/30/26 | | | | B | | | | 120,188 | |
| | | | | | | |
| | 40 | | | Tank Holding Corp | | | 6.402% | | | | 3-Month LIBOR | | | | 4.00% | | | | 4/30/26 | | | | B | | | | 40,062 | |
| | | | | | | |
| | 40 | | | Tank Holding Corp | | | 6.402% | | | | 1-Month LIBOR | | | | 4.00% | | | | 4/30/26 | | | | B | | | | 40,062 | |
| | 1,692 | | | Total Containers & Packaging | | | | 1,693,747 | |
| | |
| | | | Entertainment – 0.3% | | | | |
| | | | | | | |
| | 1,496 | | | SESAC Holdco II LLC | | | 9.652% | | | | 1-Month LIBOR | | | | 7.250% | | | | 2/23/24 | | | | B+ | | | | 1,469,065 | |
| | |
| | | | Food Products – 0.3% | | | | |
| | | | | | | |
| | 548 | | | Hostess Brands LLC | | | 4.689% | | | | 1-Month LIBOR | | | | 2.250% | | | | 8/3/22 | | | | BB– | | | | 545,617 | |
| | | | | | | |
| | 1,058 | | | Hostess Brands LLC | | | 4.833% | | | | 3-Month LIBOR | | | | 2.250% | | | | 8/3/22 | | | | BB– | | | | 1,052,779 | |
| | | | | | | |
| | 183 | | | Hostess Brands LLC | | | 4.595% | | | | 2-Month LIBOR | | | | 2.250% | | | | 8/3/22 | | | | BB– | | | | 181,873 | |
| | 1,789 | | | Total Food Products | | | | | | | | | | | | | | | | | | | | | | | 1,780,269 | |
| |
| | | | Health Care Providers & Services – 1.4% | |
| | | | | | | |
| | 2,000 | | | Concentra, Inc., Term Loan B | | | 5.210% | | | | 3-Month LIBOR | | | | 2.750% | | | | 6/1/22 | | | | B+ | | | | 2,005,000 | |
| | | | | | | |
| | 1,692 | | | Kindred at Home Hospice, Term Loan B | | | 6.188% | | | | 1-Month LIBOR | | | | 3.750% | | | | 7/2/25 | | | | B1 | | | | 1,695,183 | |
| | | | | | | |
| | 1,990 | | | Lifepoint Health, Inc., Term Loan | | | 6.904% | | | | 1-Month LIBOR | | | | 4.500% | | | | 11/14/25 | | | | B+ | | | | 1,981,642 | |
| | | | | | | |
| | 2,487 | | | Pharmaceutical Product Development, Inc., Term Loan B | | | 4.902% | | | | 1-Month LIBOR | | | | 2.500% | | | | 8/18/22 | | | | Ba3 | | | | 2,476,315 | |
| | 8,169 | | | Total Health Care Providers & Services | | | | 8,158,140 | |
| |
| | | | Internet & Direct Marketing Retail – 0.4% | |
| | | | | | | |
| | 1,990 | | | Shutterfly Inc. | | | 4.910% | | | | 1-Month LIBOR | | | | 2.500% | | | | 8/19/24 | | | | BB– | | | | 1,991,505 | |
42
| | | | | | | | | | | | | | | | | | | | | | | | | | | | |
Principal
Amount (000) | | | Description (1) | | Coupon (6) | | | Reference
Rate (6) | | | Spread (6) | | | Maturity (7) | | | Ratings (2) | | | Value | |
| | | | | | | |
| | | | IT Services – 0.3% | | | | | | | | | | | | | | | | | | |
| | | | | | | |
| $ | 1,995 | | | NuStar Inc. | | | 6.902% | | | | 1-Month LIBOR | | | | 4.500% | | | | 8/8/24 | | | | BB– | | | $ | 1,971,938 | |
| | | | | | | |
| | | | Machinery – 0.3% | | | | | | | | | | | | | | | | | | |
| | | | | | | |
| | 2,000 | | | Milacron LLC | | | 4.902% | | | | 1-Month LIBOR | | | | 2.500% | | | | 9/28/23 | | | | B+ | | | | 1,950,000 | |
| | | | | | | |
| | | | Pharmaceuticals – 0.3% | | | | | | | | | | | | | | | | | | |
| | | | | | | |
| | 995 | | | Endo International PLC | | | 6.750% | | | | 1-Month LIBOR | | | | 4.250% | | | | 4/29/24 | | | | Ba3 | | | | 936,890 | |
| | | | | | | |
| | 956 | | | Valeant Pharmaceuticals International, Inc., Term Loan, First Lien | | | 5.412% | | | | 1-Month LIBOR | | | | 3.000% | | | | 6/2/25 | | | | Ba2 | | | | 956,846 | |
| | 1,951 | | | Total Pharmaceuticals | | | | 1,893,736 | |
| | |
| | | | Professional Services – 0.3% | | | | |
| | | | | | | |
| | 1,700 | | | Dun & Bradstreet Corp., Initial Term Loan | | | 7.404% | | | | 1-Month LIBOR | | | | 5.000% | | | | 3/31/26 | | | | BB | | | | 1,702,660 | |
| | |
| | | | Semiconductors & Semiconductor Equipment – 0.2% | | | | |
| | | | | | | |
| | 1,150 | | | Ultra Clean Holdings Inc. | | | 6.902% | | | | 1-Month LIBOR | | | | 4.500% | | | | 8/27/25 | | | | B+ | | | | 1,092,884 | |
| | |
| | | | Software – 0.2% | | | | |
| | | | | | | |
| | 999 | | | Infor (US), Inc., Term Loan B | | | 5.080% | | | | 3-Month LIBOR | | | | 2.750% | | | | 2/1/22 | | | | Ba3 | | | | 998,146 | |
| | |
| | | | Specialty Retail – 0.1% | | | | |
| | | | | | | |
| | 500 | | | Petsmart Inc., Term Loan B, First Lien, (WI/DD) | | | TBD | | | | TBD | | | | TBD | | | | TBD | | | | B | | | | 488,047 | |
| | |
| | | | Textiles, Apparel & Luxury Goods – 0.3% | | | | |
| | | | | | | |
| | 1,990 | | | Samsonite IP Holdings Sarl | | | 4.152% | | | | 1-Month LIBOR | | | | 1.750% | | | | 4/25/25 | | | | Ba1 | | | | 1,950,151 | |
| | |
| | | | Trading Companies & Distributors – 0.1% | | | | |
| | | | | | | |
| | 494 | | | Univar, Inc., Term Loan B | | | 4.652% | | | | 1-Month LIBOR | | | | 2.250% | | | | 7/1/24 | | | | BB+ | | | | 492,917 | |
| $ | 50,841 | | | Total Variable Rate Senior Loan Interests (cost $50,299,560) | | | | 50,342,127 | |
| | | | | | | |
Principal
Amount (000) | | | Description (1) | | | | | | | | Coupon | | | Maturity | | | Ratings (2) | | | Value | |
| |
| | | | $1,000 PAR (OR SIMILAR) INSTITUTIONAL PREFERRED – 7.0% | |
| | | | | | | |
| | | | Automobiles – 0.4% | | | | | | | | | | | | | | | | | | |
| | | | | | | |
| $ | 2,470 | | | General Motors Financial Co Inc. | | | | | | | | | | | 5.750% | | | | N/A (8) | | | | BB+ | | | $ | 2,301,941 | |
| | | | | | | |
| | | | Banks – 3.5% | | | | | | | | | | | | | | | | | | |
| | | | | | | |
| | 1,195 | | | Bank of America Corp | | | | | | | | | | | 6.300% | | | | N/A (8) | | | | BBB– | | | | 1,333,979 | |
| | | | | | | |
| | 2,830 | | | Bank of America Corp | | | | | | | | | | | 6.100% | | | | N/A (8) | | | | BBB– | | | | 3,056,400 | |
| | | | | | | |
| | 2,000 | | | Citigroup Inc. | | | | | | | | | | | 5.950% | | | | N/A (8) | | | | BB+ | | | | 2,090,000 | |
| | | | | | | |
| | 2,000 | | | CoBank ACB | | | | | | | | | | | 6.250% | | | | N/A (8) | | | | BBB+ | | | | 2,105,000 | |
| | | | | | | |
| | 4,000 | | | JPMorgan Chase & Co | | | | | | | | | | | 6.750% | | | | N/A (8) | | | | Baa2 | | | | 4,420,920 | |
| | | | | | | |
| | 2,797 | | | KeyCorp | | | | | | | | | | | 5.000% | | | | N/A (8) | | | | Baa3 | | | | 2,823,683 | |
| | | | | | | |
| | 1,000 | | | M&T Bank Corp | | | | | | | | | | | 5.125% | | | | N/A (8) | | | | Baa2 | | | | 1,035,000 | |
| | | | | | | |
| | 2,570 | | | SunTrust Banks Inc. | | | | | | | | | | | 5.050% | | | | N/A (8) | | | | Baa3 | | | | 2,544,454 | |
| | | | | | | |
| | 1,000 | | | Wachovia Capital Trust III | | | | | | | | | | | 5.570% | | | | N/A (8) | | | | Baa2 | | | | 1,000,460 | |
| | 19,392 | | | Total Banks | | | | | | | | | | | | | | | | | | | | | | | 20,409,896 | |
43
Nuveen Strategic Income Fund(continued)
Portfolio of Investments June 30, 2019
| | | | | | | | | | | | | | | | | | | | | | | | | | | | |
Principal
Amount (000) | | | Description (1) | | | | | | | | Coupon | | | Maturity | | | Ratings (2) | | | Value | |
| | | | | | | |
| | | | Capital Markets – 0.7% | | | | | | | | | | | | | | | | | | |
| | | | | | | |
| $ | 2,840 | | | Goldman Sachs Group Inc. | | | | | | | | | | | 5.500% | | | | N/A (8) | | | | Ba1 | | | $ | 2,907,450 | |
| | | | | | | |
| | 1,000 | | | Morgan Stanley | | | | | | | | | | | 5.550% | | | | N/A (8) | | | | BB+ | | | | 1,011,000 | |
| | 3,840 | | | Total Capital Markets | | | | | | | | | | | | | | | | | | | | | | | 3,918,450 | |
| | | | | |
| | | | Consumer Finance – 0.7% | | | | | | | | | | | | | |
| | | | | | | |
| | 3,920 | | | Capital One Financial Corp | | | | | | | | | | | 5.550% | | | | N/A (8) | | | | Baa3 | | | | 3,977,114 | |
| | | | | | | |
| | | | Diversified Financial Services – 0.3% | | | | | | | | | | | | | | | | | | |
| | | | | | | |
| | 1,710 | | | Voya Financial Inc., (3) | | | | | | | | | | | 6.125% | | | | N/A (8) | | | | BBB– | | | | 1,804,050 | |
| | | | | | | |
| | | | Food Products – 0.5% | | | | | | | | | | | | | | | | | | |
| | | | | | | |
| | 2,780 | | | Land O’ Lakes Inc., 144A | | | | | | | | | | | 8.000% | | | | N/A (8) | | | | BB | | | | 2,856,450 | |
| | | | | | | |
| | | | Insurance – 0.6% | | | | | | | | | | | | | | | | | | |
| | | | | | | |
| | 3,730 | | | MetLife Inc. | | | | | | | | | | | 5.250% | | | | N/A (8) | | | | BBB | | | | 3,753,313 | |
| | | | | | |
| | | | Wireless Telecommunication Services – 0.3% | | | | | | | | | | | | | | | | |
| | | | | | | |
| | 1,500 | | | Vodafone Group PLC | | | | | | | | | | | 7.000% | | | | 4/04/79 | | | | BBB– | | | | 1,619,017 | |
| $ | 39,342 | | | Total $1,000 Par (or similar) Institutional Preferred (cost $39,960,683) | | | | 40,640,231 | |
| | | | | | | |
Principal
Amount (000) | | | Description (1) | | | | | | | | Coupon | | | Maturity | | | Ratings (2) | | | Value | |
| |
| | | | CONTINGENT CAPITAL SECURITIES – 5.1% (9) | |
| | | | | | | |
| | | | Banks – 3.7% | | | | | | | | | | | | | | | | | | |
| | | | | |
| $ | 1,030 | | | Australia & New Zealand Banking Group Ltd/United Kingdom, 144A | | | | 6.750% | | | | N/A (8) | | | | Baa2 | | | $ | 1,136,863 | |
| | | | | | | |
| | 1,400 | | | Banco Bilbao Vizcaya Argentaria SA, (3) | | | | | | | | | | | 6.125% | | | | N/A (8) | | | | Ba2 | | | | 1,317,750 | |
| | | | | |
| | 1,180 | | | Banco Mercantil del Norte SA/Grand Cayman, 144A | | | | 6.750% | | | | N/A (8) | | | | Ba2 | | | | 1,177,050 | |
| | | | | | | |
| | 2,000 | | | Barclays PLC | | | | | | | | | | | 7.750% | | | | N/A (8) | | | | BB+ | | | | 2,050,000 | |
| | | | | | | |
| | 2,500 | | | BNP Paribas SA, 144A | | | | | | | | | | | 6.625% | | | | N/A (8) | | | | BBB– | | | | 2,603,125 | |
| | | | | | | |
| | 2,000 | | | Credit Agricole SA, 144A | | | | | | | | | | | 8.125% | | | | N/A (8) | | | | BBB– | | | | 2,312,968 | |
| | | | | | | |
| | 1,195 | | | Intesa Sanpaolo SpA, 144A | | | | | | | | | | | 7.700% | | | | N/A (8) | | | | BB– | | | | 1,174,087 | |
| | | | | | | |
| | 1,500 | | | Lloyds Banking Group PLC | | | | | | | | | | | 7.500% | | | | N/A (8) | | | | Baa3 | | | | 1,576,875 | |
| | | | | | | |
| | 1,999 | | | Royal Bank of Scotland Group PLC | | | | | | | | | | | 7.500% | | | | N/A (8) | | | | BB+ | | | | 2,048,975 | |
| | | | | | | |
| | 3,020 | | | Societe Generale SA, 144A | | | | | | | | | | | 6.750% | | | | N/A (8) | | | | BB+ | | | | 2,991,914 | |
| | | | | | | |
| | 1,880 | | | Standard Chartered PLC, 144A | | | | | | | | | | | 7.500% | | | | N/A (8) | | | | Ba1 | | | | 1,988,100 | |
| | | | | | | |
| | 950 | | | UniCredit SpA | | | | | | | | | | | 8.000% | | | | N/A (8) | | | | B+ | | | | 916,750 | |
| | 20,654 | | | Total Banks | | | | 21,294,457 | |
| | | | | | | |
| | | | Capital Markets – 1.4% | | | | | | | | | | | | | | | | | | |
| | | | | | | |
| | 2,860 | | | Credit Suisse Group AG, 144A | | | | | | | | | | | 7.500% | | | | N/A (8) | | | | BB | | | | 3,070,410 | |
| | | | | | | |
| | 2,000 | | | Credit Suisse Group AG, 144A | | | | | | | | | | | 7.500% | | | | N/A (8) | | | | BB | | | | 2,200,000 | |
| | | | | | | |
| | 2,000 | | | Macquarie Bank Ltd/London, 144A | | | | | | | | | | | 6.125% | | | | N/A (8) | | | | Ba1 | | | | 1,976,240 | |
| | | | | | |
| | 1,000 | | | UBS Group Funding Switzerland AG, 144A | | | | | | | | 7.000% | | | | N/A (8) | | | | BBB– | | | | 1,061,250 | |
| | 7,860 | | | Total Capital Markets | | | | | | | | | | | | | | | | | | | | | | | 8,307,900 | |
| $ | 28,514 | | | Total Contingent Capital Securities (cost $28,946,120) | | | | 29,602,357 | |
44
| | | | | | | | | | | | | | | | | | | | | | | | | | | | |
Principal
Amount (000) | | | Description (1) | | | | | | | | Coupon | | | Maturity | | | Ratings (2) | | | Value | |
| |
| | | | U.S. GOVERNMENT AND AGENCY OBLIGATIONS – 4.0% | |
| | | | | | | |
| $ | 1,060 | | | U.S. Treasury Bonds | | | | | | | | | | | 3.000% | | | | 2/15/49 | | | | Aaa | | | $ | 1,162,522 | |
| | | | | |
| | 2,906 | | | U.S. Treasury Inflation Indexed Bonds | | | | 0.500% | | | | 1/15/28 | | | | Aaa | | | | 2,953,606 | |
| | | | | | | |
| | 6,125 | | | U.S. Treasury Notes | | | | | | | | | | | 2.250% | | | | 4/30/24 | | | | Aaa | | | | 6,261,138 | |
| | | | | |
| | 7,500 | | | U.S. Treasury Notes, (WI/DD) | | | | 1.750% | | | | 6/30/24 | | | | Aaa | | | | 7,493,262 | |
| | | | | | | |
| | 3,030 | | | U.S. Treasury Notes | | | | | | | | | | | 2.625% | | | | 2/15/29 | | | | Aaa | | | | 3,193,454 | |
| | | | | | | |
| | 2,200 | | | U.S. Treasury Notes | | | | | | | | | | | 2.375% | | | | 5/15/29 | | | | Aaa | | | | 2,272,187 | |
| $ | 22,821 | | | Total U.S. Government and Agency Obligations (cost $22,992,383) | | | | 23,336,169 | |
| | | | | | | |
Principal
Amount (000) | | | Description (1) | | | | | | | | Coupon | | | Maturity | | | Ratings (2) | | | Value | |
| | |
| | | | SOVEREIGN DEBT – 2.6% | | | | | |
| | |
| | | | Bermuda – 0.1% | | | | |
| | | | | |
| $ | 850 | | | Bermuda Government International Bond, 144A | | | | 3.717% | | | | 1/25/27 | | | | A+ | | | $ | 865,946 | |
| | | | | | | |
| | | | Colombia – 0.1% | | | | | | | | | | | | | | | | | | |
| | | | | | | |
| | 850 | | | Colombia Government International Bond | | | | | | | | | | | 5.000% | | | | 6/15/45 | | | | Baa2 | | | | 937,975 | |
| | |
| | | | Dominican Republic – 0.2% | | | | |
| | | | | |
| | 1,000 | | | Dominican Republic International Bond, 144A | | | | 6.875% | | | | 1/29/26 | | | | BB– | | | | 1,128,760 | |
| | | | | | | |
| | | | Egypt – 0.8% | | | | | | | | | | | | | | | | | | |
| | | | | | | |
| | 4,400 | | | Egypt Government International Bond, 144A | | | | | | | | | | | 5.577% | | | | 2/21/23 | | | | B+ | | | | 4,468,904 | |
| | | | | | | |
| | | | Ghana – 0.4% | | | | | | | | | | | | | | | | | | |
| | | | | |
| | 2,200 | | | Ghana Government International Bond, 144A | | | | 8.125% | | | | 3/26/32 | | | | B | | | | 2,233,475 | |
| | | | | | | |
| | | | Indonesia – 0.1% | | | | | | | | | | | | | | | | | | |
| | | | | |
| | 850 | | | Perusahaan Penerbit SBSN Indonesia III, 144A | | | | 4.400% | | | | 3/01/28 | | | | BBB | | | | 905,624 | |
| | | | | | | |
| | | | Kazakhstan – 0.2% | | | | | | | | | | | | | | | | | | |
| | | | | |
| | 850 | | | Kazakhstan Government International Bond, 144A | | | | 4.875% | | | | 10/14/44 | | | | BBB | | | | 978,350 | |
| | | | | | | |
| | | | Kenya – 0.2% | | | | | | | | | | | | | | | | | | |
| | | | | |
| | 1,000 | | | Kenya Government International Bond, 144A | | | | 7.000% | | | | 5/22/27 | | | | B+ | | | | 1,043,950 | |
| | | | | | | |
| | | | Mexico – 0.1% | | | | | | | | | | | | | | | | | | |
| | | | | | | |
| | 850 | | | Mexico Government International Bond | | | | | | | | | | | 3.750% | | | | 1/11/28 | | | | A3 | | | | 865,938 | |
| | | | | | | |
| | | | Morocco – 0.2% | | | | | | | | | | | | | | | | | | |
| | | | | |
| | 850 | | | Morocco Government International Bond, 144A | | | | 5.500% | | | | 12/11/42 | | | | BBB– | | | | 965,714 | |
| | | | | | | |
| | | | Qatar – 0.2% | | | | | | | | | | | | | | | | | | |
| | | | | |
| | 850 | | | Qatar Government International Bond, 144A | | | | 4.817% | | | | 3/14/49 | | | | AA– | | | | 974,134 | |
| $ | 14,550 | | | Total Sovereign Debt (cost $14,815,974) | | | | 15,368,770 | |
45
Nuveen Strategic Income Fund(continued)
Portfolio of Investments June 30, 2019
| | | | | | | | | | | | | | | | | | | | | | | | | | | | |
| | | | | | | |
| Shares | | | Description (1) | | | | | | | | Coupon | | | | | | Ratings (2) | | | Value | |
| |
| | | | $25 PAR (OR SIMILAR) RETAIL PREFERRED – 0.7% | |
| |
| | | | Diversified Financial Services – 0.4% | |
| | | | | | | |
| | 20,600 | | | AgriBank FCB, (10) | | | | | | | | | | | 6.875% | | | | | | | | BBB+ | | | $ | 2,193,900 | |
| | | | | | | |
| | | | Insurance – 0.3% | | | | | | | | | | | | | | | | | | |
| | | | | | | |
| | 70,000 | | | Enstar Group Ltd | | | | | | | | | | | 7.000% | | | | | | | | BB+ | | | | 1,800,400 | |
| | | | Total $25 Par (or similar) Retail Preferred (cost $3,810,000) | | | | 3,994,300 | |
| | | | | | | |
Principal
Amount (000) | | | Description (1) | | | | | | | | | | | Optional Call
Provision (11) | | | Ratings (2) | | | Value | |
| | |
| | | | MUNICIPAL BONDS – 0.5% | | | | | |
| | |
| | | | Michigan – 0.2% | | | | |
| | | | | |
| $ | 1,500 | | | Michigan Finance Authority, Local Government Loan Program Revenue Bonds, Detroit Distributable State Aid First Lien LTGO Local Project, Refunding Taxable Series2016C-1, 2.244%, 11/01/22 | | | | | | | | No Opt. Call | | | | Aa2 | | | $ | 1,491,810 | |
| | | | | | | |
| | | | Oregon – 0.3% | | | | | | | | | | | | | | | | | | |
| | | | | |
| | 1,468 | | | Oregon State Local Governments, Limited Tax Pension Obligation Bonds, Taxable Series 2005, 4.859%, 6/01/20 – AMBAC Insured | | | | | | | | No Opt. Call | | | | Aa3 | | | | 1,502,086 | |
| $ | 2,968 | | | Total Municipal Bonds (cost $2,994,539) | | | | 2,993,896 | |
| | | | | | | |
Principal
Amount (000) | | | Description (1) | | | | | | | | Coupon | | | Maturity | | | Ratings (2) | | | Value | |
| | |
| | | | CONVERTIBLE BONDS – 0.2% | | | | | |
| | |
| | | | Media – 0.2% | | | | |
| | | | | | | |
| $ | 1,300 | | | DISH Network Corp | | | | | | | | | | | 2.375% | | | | 3/15/24 | | | | Ba3 | | | $ | 1,200,895 | |
| $ | 1,300 | | | Total Convertible Bonds (cost $1,094,931) | | | | 1,200,895 | |
| | | | | | | |
| Shares | | | Description (1) | | | | | | | | | | | | | | | | | Value | |
| | | | | | | |
| | | | COMMON STOCKS – 0.0% | | | | | | | | | | | | | | | | | | | | | | | | |
| | | | | | | |
| | | | Building Products – 0.0% | | | | | | | | | | | | | | | | | | |
| | | | | | | |
| | 50 | | | Dayton Superior Corp, (4), (12) | | | | | | | | | | | | | | | | | | | | | | $ | — | |
| | | | | | | |
| | 55 | | | Dayton Superior Corp, (4) | | | | | | | | | | | | | | | | | | | | | | | 1 | |
| | | | Total Common Stocks (cost $20,079) | | | | 1 | |
| | | | Total Long-Term Investments (cost $553,289,903) | | | | 567,044,334 | |
| | | | | | | |
| Shares | | | Description (1) | | | | | | | | Coupon | | | | | | | | | Value | |
| |
| | | | INVESTMENTS PURCHASED WITH COLLATERAL FROM SECURITIES LENDING – 1.7% | |
| |
| | | | Money Market Funds – 1.7% | |
| | | | | |
| | 9,809,003 | | | First American Government Obligations Fund, Class X, (13) | | | | 2.305% (14) | | | | | | | | | | | $ | 9,809,003 | |
| | | | Total Investments Purchased with Collateral from Securities Lending (cost $9,809,003) | | | | 9,809,003 | |
46
| | | | | | | | | | | | | | | | | | | | | | | | |
| | | | | | | |
| Shares | | | Description (1) | | | | | | Coupon | | | | | | | | | Value | |
| | |
| | | | SHORT-TERM INVESTMENTS – 6.1% | | | | | |
| | |
| | | | MONEY MARKET FUNDS – 6.1% | | | | |
| | | | | |
| $ | 35,633,140 | | | First American Treasury Obligation Fund, Class Z | | | 2.228% (14) | | | | | | | | | | | $ | 35,633,140 | |
| | | | Total Short-Term Investments (cost $35,633,140) | | | | 35,633,140 | |
| | | | Total Investments (cost $598,732,046) – 105.2% | | | | 612,486,477 | |
| | | | Other Assets Less Liabilities – (5.2)% (15) | | | | (30,400,997 | ) |
| | | | Net Assets – 100% | | | $ | 582,085,480 | |
Investments in Derivatives
Credit Default Swaps – OTC Cleared
| | | | | | | | | | | | | | | | | | | | | | | | | | | | | | | | | | |
| Referenced Entity | | Buy/Sell
Protection (16) | | Notional
Amount | | | Fixed Rate
(Annualized) | | | Fixed Rate
Payment
Frequency | | | Maturity
Date | | | Premiums
Paid
(Received) | | | Value | | | Unrealized
Appreciation
(Depreciation) | | | Variation
Margin
Receivable
(Payable) | |
CDX.NA.HY.32 | | Buy | | $ | 30,000,000 | | | | 5.000 | % | | | Quarterly | | | | 6/20/24 | | | $ | (2,062,277 | ) | | $ | (2,305,095 | ) | | $ | (242,818 | ) | | $ | (45,260 | ) |
Futures Contracts
| | | | | | | | | | | | | | | | | | | | | | | | | | |
| Description | | Contract
Position | | Number of
Contracts | | | Expiration
Date | | | Notional
Amount* | | | Value | | | Unrealized
Appreciation
(Depreciation) | | | Variation
Margin
Receivable/
(Payable) | |
U.S. Treasury5-Year Note | | Short | | | (148 | ) | | | 9/19 | | | $ | (17,375,446 | ) | | $ | (17,487,125 | ) | | $ | (111,679 | ) | | $ | — | |
U.S. Treasury10-Year Note | | Short | | | (190 | ) | | | 9/19 | | | | (23,856,951 | ) | | | (24,314,063 | ) | | | (457,112 | ) | | | (5,939 | ) |
U.S. Treasury Long Bond | | Long | | | 176 | | | | 9/19 | | | | 26,554,452 | | | | 27,384,500 | | | | 830,048 | | | | (22,000 | ) |
U.S. Treasury Ultra10-Year Note | | Short | | | (221 | ) | | | 9/19 | | | | (29,782,646 | ) | | | (30,525,625 | ) | | | (742,979 | ) | | | (6,907 | ) |
U.S. Treasury Ultra Bond | | Long | | | 200 | | | | 9/19 | | | | 34,247,173 | | | | 35,512,500 | | | | 1,265,327 | | | | (37,500 | ) |
Total | | | | | | | | | | | | $ | (10,213,418 | ) | | $ | (9,429,813 | ) | | $ | 783,605 | | | $ | (72,346 | ) |
Total receivable for variation margin on futures contracts | | | | | | | | | | | | | | | $ | — | |
Total payable for variation margin on futures contracts | | | | | | | | | | | | | | | $ | (72,346 | ) |
| * | The aggregate notional amount of long and short-positions is $60,801,625 and $(71,015,043), respectively. |
47
Nuveen Strategic Income Fund(continued)
Portfolio of Investments June 30, 2019
For Fund portfolio compliance purposes, the Fund’s industry classifications refer to any one or more of the industry sub – classifications used by one or more widely recognized market indexes or ratings group indexes, and/or as defined by Fund management. This definition may not apply for purposes of this report, which may combine industry sub – classifications into sectors for reporting ease.
| (1) | All percentages shown in the Portfolio of Investments are based on net assets. |
| (2) | For financial reporting purposes, the ratings disclosed are the highest of Standard & Poor’s Group (“Standard & Poor’s”), Moody’s Investors Service, Inc. (“Moody’s”) or Fitch, Inc. (“Fitch”) rating. This treatment of split-rated securities may differ from that used for other purposes, such as for Fund investment policies. Ratings below BBB by Standard & Poor’s, Baa by Moody’s or BBB by Fitch are considered to be below investment grade. Holdings designated N/R are not rated by any of these national rating agencies. Ratings are not covered by the report of independent registered public accounting firm. |
| (3) | Investment, or a portion of investment, is out on loan for securities lending. The total value of the securities out on loan as of the end of the reporting period was $9,469,873. |
| (4) | Investment valued at fair value using methods determined in good faith by, or at the discretion of, the Board. For fair value measurement disclosure purposes, investment classified as Level 3. See Notes to Financial Statements, Note 2 – Investment Valuation and Fair Value Measurements for more information. |
| (5) | Variable rate security. The rate shown is the coupon as of the end of the reporting period. |
| (6) | Senior loans generally pay interest at rates which are periodically adjusted by reference to a base short-term, floating lending rate (Reference Rate) plus an assigned fixed rate (Spread). These floating lending rates are generally (i) the lending rate referenced by the London Inter-Bank Offered Rate (“LIBOR”), or (ii) the prime rate offered by one or more major United States banks. Senior loans may be considered restricted in that the Fund ordinarily is contractually obligated to receive approval from the agent bank and/or borrower prior to the disposition of a senior loan. The rate shown is the coupon as of the end of the reporting period. |
| (7) | Senior loans generally are subject to mandatory and/or optional prepayment. Because of these mandatory prepayment conditions and because there may be significant economic incentives for a borrower to prepay, prepayments of senior loans may occur. As a result, the actual remaining maturity of senior loans held may be substantially less than the stated maturities shown. |
| (8) | Perpetual security. Maturity date is not applicable. |
| (9) | Contingent Capital Securities (“CoCos”) are hybrid securities with loss absorption characteristics built into the terms of the security for the benefit of the issuer. For example, the terms may specify an automatic write-down of principal or a mandatory conversion into the issuer’s common stock under certain adverse circumstances, such as the issuer’s capital ratio falling below a specified level. |
| (10) | For fair value measurement disclosure purposes, investment classified as Level 2. See Notes to Financial Statements, Note 2 – Investment Valuation and Fair Value Measurements for more information. |
| (11) | Optional Call Provisions: Dates (month and year) and prices of the earliest optional call or redemption. There may be other call provisions at varying prices at later dates. Certain mortgage-backed securities may be subject to periodic principal paydowns. Optional Call Provisions are not covered by the report of independent registered public accounting firm. |
| (12) | Non-income producing; issuer has not declared a dividend within the past twelve months. |
| (13) | The Fund may loan securities representing up to one third of the fair value of its total assets (which includes collateral for securities on loan) to broker dealers, banks, and other institutions. The Fund maintains collateral equal to at least 100% of the fair value of the securities loaned. The cash collateral received by the Fund is invested in this money market fund. See Notes to Financial Statements, Note 3 – Portfolio Securities and Investments in Derivatives, Securities Lending for more information. |
| (14) | The rate shown is the annualizedseven-day subsidized yield as of the end of the reporting period. |
| (15) | Other assets less liabilities includes the unrealized appreciation (depreciation) of certain over-the-counter (“OTC”) derivatives as presented on the Statement of Assets and Liabilities, when applicable. The unrealized appreciation (depreciation) of OTC cleared and exchange-traded derivatives is recognized as part of cash collateral at brokers and/or the receivable or payable for variation margin as presented on the Statement of Assets and Liabilities, when applicable. |
| (16) | The Fund entered into the credit default swaps to gain investment exposure to the referenced entity. Selling protection has a similar credit risk position to owning the referenced entity. Buying protection has a similar credit risk position to selling the referenced entity short. |
| 144A | Investment is exempt from registration under Rule 144A of the Securities Act of 1933, as amended. These investments may only be resold in transactions exempt from registration, which are normally those transactions with qualified institutional buyers. |
| DD1 | Portion of investment purchased on delayed delivery basis. |
| LIBOR | London Inter-Bank Offered Rate |
| TBD | Senior loan purchased on a when-issued or delayed-delivery basis. Certain details associated with this purchase are not known prior to the settlement date of the transaction. In addition, senior loans typically trade without accrued interest and therefore a coupon rate is not available prior to settlement. At settlement, if still unknown, the borrower or counterparty will provide the Fund with the final coupon rate and maturity date. |
| WI/DD | Purchased on a when-issued or delayed delivery basis. |
See accompanying notes to financial statements.
48
Statement of Assets and Liabilities
June 30, 2019
| | | | | | | | |
| | | High Income
Bond | | | Strategic
Income | |
| | | |
Assets | | | | | | | | |
| | |
Long-term investments, at value (cost $264,274,433 and $553,289,903, respectively) | | $ | 265,909,619 | | | $ | 567,044,334 | |
| | |
Investments purchased with collateral from securities lending, at value (cost approximates value) | | | 15,958,678 | | | | 9,809,003 | |
| | |
Short-term investments, at value (cost approximates value) | | | 23,516,566 | | | | 35,633,140 | |
| | |
Cash denominated in foreign currencies (cost $38 and $28,672, respectively) | | | 38 | | | | 29,280 | |
| | |
Cash collateral at brokers for investments in futures contracts(1) | | | — | | | | 774,000 | |
| | |
Cash collateral at brokers for investments in swaps(1) | | | — | | | | 3,097,071 | |
| | |
Credit default swap premiums paid | | | 742,723 | | | | — | |
| | |
Receivable for: | | | | | | | | |
| | |
Dividends | | | — | | | | 35,407 | |
| | |
Due from broker | | | — | | | | 5,050 | |
| | |
Interest | | | 4,255,814 | | | | 5,017,815 | |
| | |
Investments sold | | | 942,688 | | | | 2,682,408 | |
| | |
Shares sold | | | 735,626 | | | | 2,691,818 | |
| | |
Variation margin on swap contracts | | | 15,045 | | | | — | |
| | |
Other assets | | | 55,775 | | | | 80,450 | |
| | |
Total assets | | | 312,132,572 | | | | 626,899,776 | |
| | |
Liabilities | | | | | | | | |
| | |
Credit default swaps premiums received | | | — | | | | 2,062,277 | |
| | |
Payable for: | | | | | | | | |
| | |
Collateral from securities lending program | | | 15,958,678 | | | | 9,809,003 | |
| | |
Dividends | | | 154,205 | | | | 640,738 | |
| | |
Due to broker(1) | | | 217,522 | | | | — | |
| | |
Investments purchased | | | 4,886,218 | | | | 29,103,408 | |
| | |
Shares redeemed | | | 1,357,398 | | | | 2,474,190 | |
| | |
Variation margin on futures contracts | | | — | | | | 72,346 | |
| | |
Variation margin on swap contracts | | | — | | | | 45,260 | |
| | |
Accrued expenses: | | | | | | | | |
| | |
Management fees | | | 131,702 | | | | 203,336 | |
| | |
Directors fees | | | 34,968 | | | | 50,628 | |
| | |
12b-1 distribution and service fees | | | 59,545 | | | | 53,996 | |
| | |
Other | | | 147,421 | | | | 299,114 | |
| | |
Total liabilities | | | 22,947,657 | | | | 44,814,296 | |
| | |
Net assets | | $ | 289,184,915 | | | $ | 582,085,480 | |
| (1) | Cash pledged to collateralize the net payment obligations for investments in derivatives. |
See accompanying notes to financial statements.
49
Statement of Assets and Liabilities(continued)
| | | | | | | | |
| | | High Income
Bond | | | Strategic
Income | |
| | |
Class A Shares | | | | | | | | |
| | |
Net assets | | $ | 151,672,692 | | | $ | 87,083,732 | |
| | |
Shares outstanding | | | 20,384,268 | | | | 8,212,517 | |
| | |
Net asset value (“NAV”) per share | | $ | 7.44 | | | $ | 10.60 | |
| | |
Offering price per share (NAV per share plus maximum sales charge of 4.75% and 4.25%, respectively, of offering price) | | $ | 7.81 | | | $ | 11.07 | |
| | |
Class C Shares | | | | | | | | |
| | |
Net assets | | $ | 35,654,540 | | | $ | 42,024,476 | |
| | |
Shares outstanding | | | 4,796,607 | | | | 3,983,830 | |
| | |
NAV and offering price per share | | $ | 7.43 | | | $ | 10.55 | |
| | |
Class R3 Shares | | | | | | | | |
| | |
Net assets | | $ | 297,835 | | | $ | 2,791,637 | |
| | |
Shares outstanding | | | 39,174 | | | | 262,364 | |
| | |
NAV and offering price per share | | $ | 7.60 | | | $ | 10.64 | |
| | |
Class R6 Shares | | | | | | | | |
| | |
Net assets | | $ | — | | | $ | 50,126,719 | |
| | |
Shares outstanding | | | — | | | | 4,709,930 | |
| | |
NAV and offering price per share | | $ | — | | | $ | 10.64 | |
| | |
Class I Shares | | | | | | | | |
| | |
Net assets | | $ | 101,559,848 | | | $ | 400,058,916 | |
| | |
Shares outstanding | | | 13,603,829 | | | | 37,732,532 | |
| | |
NAV and offering price per share | | $ | 7.47 | | | $ | 10.60 | |
| | |
Fund level net assets consist of: | | | | | | | | |
| | |
Capitalpaid-in | | $ | 415,478,490 | | | $ | 628,283,155 | |
| | |
Total distributable earnings | | | (126,293,575 | ) | | | (46,197,675 | ) |
| | |
Fund level net assets | | $ | 289,184,915 | | | $ | 582,085,480 | |
| | |
Authorized shares – per class | | | 2 billion | | | | 2 billion | |
| | |
Par value per share | | | 0.0001 | | | | 0.0001 | |
See accompanying notes to financial statements.
50
Statement of Operations
Year Ended June 30, 2019
| | | | | | | | |
| | | High Income
Bond | | | Strategic
Income | |
| | |
Investment Income | | | | | | | | |
| | |
Dividend income | | $ | 403,107 | | | $ | 255,962 | |
| | |
Interest income | | | 20,095,734 | | | | 29,050,141 | |
| | |
Securities lending income | | | 231,456 | | | | 77,335 | |
| | |
Total investment income | | | 20,730,297 | | | | 29,383,438 | |
| | |
Expenses | | | | | | | | |
| | |
Management fees | | | 1,703,175 | | | | 3,334,326 | |
| | |
12b-1 service fees – Class A Shares | | | 326,421 | | | | 227,922 | |
| | |
12b-1 distribution and service fees – Class C Shares | | | 366,134 | | | | 493,517 | |
| | |
12b-1 distribution and service fees – Class R3 Shares | | | 2,082 | | | | 21,888 | |
| | |
12b-1 distribution and service fees – Class I Shares | | | 26 | | | | 26 | |
| | |
Shareholder servicing agent fees | | | 183,900 | | | | 518,978 | |
| | |
Custodian fees | | | 96,131 | | | | 180,973 | |
| | |
Directors fees | | | 9,018 | | | | 18,858 | |
| | |
Professional fees | | | 57,698 | | | | 87,777 | |
| | |
Shareholder reporting expenses | | | 31,685 | | | | 81,325 | |
| | |
Federal and state registration fees | | | 84,194 | | | | 90,723 | |
| | |
Other | | | 36,692 | | | | 21,946 | |
| | |
Total expenses before fee waiver/expense reimbursement | | | 2,897,156 | | | | 5,078,259 | |
| | |
Fee waiver/expense reimbursement | | | (35,376 | ) | | | (730,332 | ) |
| | |
Net expenses | | | 2,861,780 | | | | 4,347,927 | |
| | |
Net investment income (loss) | | | 17,868,517 | | | | 25,035,511 | |
| | |
Realized and Unrealized Gain (Loss) | | | | | | | | |
| | |
Net realized gain (loss) from: | | | | | | | | |
| | |
Investments and foreign currency | | | (20,215,073 | ) | | | (9,877,394 | ) |
| | |
Forward foreign currency contracts | | | (5,032 | ) | | | 1,216,818 | |
| | |
Futures contracts | | | (23,672 | ) | | | 3,038,432 | |
| | |
Swaps | | | (653,663 | ) | | | (2,961,696 | ) |
| | |
Change in net unrealized appreciation (depreciation) of: | | | | | | | | |
| | |
Investments and foreign currency | | | 19,540,305 | | | | 29,005,871 | |
| | |
Forward foreign currency contracts | | | 4,044 | | | | (273,576 | ) |
| | |
Futures contracts | | | (9,710 | ) | | | (267,668 | ) |
| | |
Swaps | | | 25,642 | | | | 306,212 | |
| | |
Net realized and unrealized gain (loss) | | | (1,337,159 | ) | | | 20,186,999 | |
| | |
Net increase (decrease) in net assets from operations | | $ | 16,531,358 | | | $ | 45,222,510 | |
See accompanying notes to financial statements.
51
Statement of Changes in Net Assets
| | | | | | | | | | | | | | | | | | | | |
| | | High Income Bond | | | | | | Strategic Income | |
| | | Year Ended
6/30/19 | | | Year Ended(1) 6/30/18 | | | | | | Year Ended
6/30/19 | | | Year Ended(1) 6/30/18 | |
| | | | | |
Operations | | | | | | | | | | | | | | | | | | | | |
| | | | | |
Net investment income (loss) | | $ | 17,868,517 | | | $ | 23,182,827 | | | | | | | $ | 25,035,511 | | | $ | 27,614,759 | |
| | | | | |
Net realized gain (loss) from: | | | | | | | | | | | | | | | | | | | | |
| | | | | |
Investments and foreign currency | | | (20,215,073 | ) | | | (11,134,618 | ) | | | | | | | (9,877,394 | ) | | | (312,181 | ) |
| | | | | |
Forward foreign currency contracts | | | (5,032 | ) | | | (180,664 | ) | | | | | | | 1,216,818 | | | | 281,199 | |
| | | | | |
Futures contracts | | | (23,672 | ) | | | (84,799 | ) | | | | | | | 3,038,432 | | | | 2,768,614 | |
| | | | | |
Options purchased | | | — | | | | — | | | | | | | | — | | | | (174,197 | ) |
| | | | | |
Swaps | | | (653,663 | ) | | | (78,738 | ) | | | | | | | (2,961,696 | ) | | | (2,912,985 | ) |
| | | | | |
Change in net unrealized appreciation (depreciation) of: | | | | | | | | | | | | | | | | | | | | |
| | | | | |
Investments and foreign currency | | | 19,540,305 | | | | (1,990,985 | ) | | | | | | | 29,005,871 | | | | (33,436,656 | ) |
| | | | | |
Forward foreign currency contracts | | | 4,044 | | | | 178,031 | | | | | | | | (273,576 | ) | | | 1,217,587 | |
| | | | | |
Futures contracts | | | (9,710 | ) | | | 12,573 | | | | | | | | (267,668 | ) | | | 33,519 | |
| | | | | |
Options purchased | | | — | | | | — | | | | | | | | — | | | | 58,501 | |
| | | | | |
Swaps | | | 25,642 | | | | — | | | | | | | | 306,212 | | | | (8,602 | ) |
| | | | | |
Net increase (decrease) in net assets from operations | | | 16,531,358 | | | | 9,903,627 | | | | | | | | 45,222,510 | | | | (4,870,442 | ) |
| | | | | |
Distributions to Shareholders(2) | | | | | | | | | | | | | | | | | | | | |
| | | | | |
Dividends(3) | | | | | | | | | | | | | | | | | | | | |
| | | | | |
Class A Shares | | | (8,619,031 | ) | | | (8,890,635 | ) | | | | | | | (3,158,669 | ) | | | (2,624,560 | ) |
| | | | | |
Class C Shares | | | (2,145,516 | ) | | | (2,854,928 | ) | | | | | | | (1,340,031 | ) | | | (911,063 | ) |
| | | | | |
Class R3 Shares | | | (26,455 | ) | | | (40,945 | ) | | | | | | | (140,232 | ) | | | (122,444 | ) |
| | | | | |
Class R6 Shares | | | — | | | | — | | | | | | | | (1,664,530 | ) | | | (833,771 | ) |
| | | | | |
Class I Shares | | | (8,246,406 | ) | | | (11,881,293 | ) | | | | | | | (15,894,859 | ) | | | (12,250,306 | ) |
| | | | | |
Class T Shares(4) | | | — | | | | (1,688 | ) | | | | | | | — | | | | (504 | ) |
| | | | | |
Return of capital: | | | | | | | | | | | | | | | | | | | | |
| | | | | |
Class A Shares | | | — | | | | — | | | | | | | | — | | | | (2,364,360 | ) |
| | | | | |
Class C Shares | | | — | | | | — | | | | | | | | — | | | | (1,310,645 | ) |
| | | | | |
Class R3 Shares | | | — | | | | — | | | | | | | | — | | | | (125,534 | ) |
| | | | | |
Class R6 Shares | | | — | | | | — | | | | | | | | — | | | | (728,959 | ) |
| | | | | |
Class I Shares | | | — | | | | — | | | | | | | | — | | | | (10,039,433 | ) |
| | | | | |
Class T Shares(4) | | | — | | | | — | | | | | | | | — | | | | (459 | ) |
| | | | | |
Decrease in net assets from distributions to shareholders | | | (19,037,408 | ) | | | (23,669,489 | ) | | | | | | | (22,198,321 | ) | | | (31,312,038 | ) |
| | | | | |
Fund Share Transactions | | | | | | | | | | | | | | | | | | | | |
| | | | | |
Proceeds from sale of shares | | | 241,052,827 | | | | 320,649,681 | | | | | | | | 108,017,741 | | | | 234,165,148 | |
| | | | | |
Proceeds from shares issued to shareholders due to reinvestment of distributions | | | 16,637,176 | | | | 20,124,847 | | | | | | | | 13,540,440 | | | | 18,990,554 | |
| | | | | |
| | | 257,690,003 | | | | 340,774,528 | | | | | | | | 121,558,181 | | | | 253,155,702 | |
| | | | | |
Cost of shares redeemed | | | (273,769,766 | ) | | | (405,002,409 | ) | | | | | | | (274,492,861 | ) | | | (275,270,261 | ) |
| | | | | |
Net increase (decrease) in net assets from Fund share transactions | | | (16,079,763 | ) | | | (64,227,881 | ) | | | | | | | (152,934,680 | ) | | | (22,114,559 | ) |
| | | | | |
Net increase (decrease) in net assets | | | (18,585,813 | ) | | | (77,993,743 | ) | | | | | | | (129,910,491 | ) | | | (58,297,039 | ) |
| | | | | |
Net assets at the beginning of period | | | 307,770,728 | | | | 385,764,471 | | | | | | | | 711,995,971 | | | | 770,293,010 | |
| | | | | |
Net assets at the end of period | | $ | 289,184,915 | | | $ | 307,770,728 | | | | | | | $ | 582,085,480 | | | $ | 711,995,971 | |
| (1) | Prior period amounts have been conformed to current year presentation. See Notes to Financial Statements, Note 9 – New Accounting Pronouncements for further details. |
| (2) | The composition and per share amounts of the Funds’ distributions are presented in the Financial Highlights. The distribution information for the Funds as of their most recent tax year end is presented within the Notes to Financial Statements, Note 6 – Income Tax Information. |
| (3) | For the fiscal year ended June 30, 2018, the Funds’ distributions to shareholders were paid from net investment income. |
| (4) | Class T Shares were not available for public offering. |
See accompanying notes to financial statements.
52
THIS PAGE INTENTIONALLY LEFT BLANK
53
Financial Highlights
High Income Bond
Selected data for a share outstanding throughout each period:
| | | | | | | | | | | | | | | | | | | | | | | | | | | | | | | | | | | | |
| | | | | |
| | | | | | Investment Operations | | | | | | Less Distributions | | | | |
| | | | | | | | | |
| Year Ended June 30, | | Beginning
NAV | | | Net
Investment
Income
(Loss)(a) | | | Net
Realized/
Unrealized
Gain (Loss) | | | Total | | | | | | Net
Investment
Income | | | From
Accumulated
Net Realized
Gains | | | Total | | | Ending
Net
Asset
Value | |
| | | | | | | | | |
Class A (8/01) | | | | | | | | | | | | | | | | | | | | | | | | | | | | | | | | | | | | |
| | | | | | | | | |
2019 | | $ | 7.51 | | | $ | 0.46 | | | $ | (0.04 | ) | | $ | 0.42 | | | | | | | $ | (0.49 | ) | | $ | — | | | $ | (0.49 | ) | | $ | 7.44 | |
| | | | | | | | | |
2018 | | | 7.80 | | | | 0.52 | | | | (0.28 | ) | | | 0.24 | | | | | | | | (0.53 | ) | | | — | | | | (0.53 | ) | | | 7.51 | |
| | | | | | | | | |
2017 | | | 7.22 | | | | 0.54 | | | | 0.57 | | | | 1.11 | | | | | | | | (0.53 | ) | | | — | | | | (0.53 | ) | | | 7.80 | |
| | | | | | | | | |
2016 | | | 8.23 | | | | 0.57 | | | | (1.05 | ) | | | (0.48 | ) | | | | | | | (0.53 | ) | | | — | | | | (0.53 | ) | | | 7.22 | |
| | | | | | | | | |
2015 | | | 9.29 | | | | 0.55 | | | | (1.00 | ) | | | (0.45 | ) | | | | | | | (0.54 | ) | | | (0.07 | ) | | | (0.61 | ) | | | 8.23 | |
| | | | | | | | | |
Class C (8/01) | | | | | | | | | | | | | | | | | | | | | | | | | | | | | | | | | | | | |
| | | | | | | | | |
2019 | | | 7.50 | | | | 0.40 | | | | (0.04 | ) | | | 0.36 | | | | | | | | (0.43 | ) | | | — | | | | (0.43 | ) | | | 7.43 | |
| | | | | | | | | |
2018 | | | 7.79 | | | | 0.46 | | | | (0.28 | ) | | | 0.18 | | | | | | | | (0.47 | ) | | | — | | | | (0.47 | ) | | | 7.50 | |
| | | | | | | | | |
2017 | | | 7.21 | | | | 0.49 | | | | 0.57 | | | | 1.06 | | | | | | | | (0.48 | ) | | | — | | | | (0.48 | ) | | | 7.79 | |
| | | | | | | | | |
2016 | | | 8.22 | | | | 0.53 | | | | (1.07 | ) | | | (0.54 | ) | | | | | | | (0.47 | ) | | | — | | | | (0.47 | ) | | | 7.21 | |
| | | | | | | | | |
2015 | | | 9.27 | | | | 0.49 | | | | (0.99 | ) | | | (0.50 | ) | | | | | | | (0.48 | ) | | | (0.07 | ) | | | (0.55 | ) | | | 8.22 | |
| | | | | | | | | |
Class R3 (9/01) | | | | | | | | | | | | | | | | | | | | | | | | | | | | | | | | | | | | |
| | | | | | | | | |
2019 | | | 7.67 | | | | 0.45 | | | | (0.04 | ) | | | 0.41 | | | | | | | | (0.48 | ) | | | — | | | | (0.48 | ) | | | 7.60 | |
| | | | | | | | | |
2018 | | | 7.96 | | | | 0.52 | | | | (0.29 | ) | | | 0.23 | | | | | | | | (0.52 | ) | | | — | | | | (0.52 | ) | | | 7.67 | |
| | | | | | | | | |
2017 | | | 7.37 | | | | 0.54 | | | | 0.58 | | | | 1.12 | | | | | | | | (0.53 | ) | | | — | | | | (0.53 | ) | | | 7.96 | |
| | | | | | | | | |
2016 | | | 8.40 | | | | 0.57 | | | | (1.08 | ) | | | (0.51 | ) | | | | | | | (0.52 | ) | | | — | | | | (0.52 | ) | | | 7.37 | |
| | | | | | | | | |
2015 | | | 9.48 | | | | 0.53 | | | | (1.01 | ) | | | (0.48 | ) | | | | | | | (0.53 | ) | | | (0.07 | ) | | | (0.60 | ) | | | 8.40 | |
| | | | | | | | | |
Class I (8/01) | | | | | | | | | | | | | | | | | | | | | | | | | | | | | | | | | | | | |
| | | | | | | | | |
2019 | | | 7.54 | | | | 0.48 | | | | (0.04 | ) | | | 0.44 | | | | | | | | (0.51 | ) | | | — | | | | (0.51 | ) | | | 7.47 | |
| | | | | | | | | |
2018 | | | 7.82 | | | | 0.54 | | | | (0.27 | ) | | | 0.27 | | | | | | | | (0.55 | ) | | | — | | | | (0.55 | ) | | | 7.54 | |
| | | | | | | | | |
2017 | | | 7.24 | | | | 0.56 | | | | 0.57 | | | | 1.13 | | | | | | | | (0.55 | ) | | | — | | | | (0.55 | ) | | | 7.82 | |
| | | | | | | | | |
2016 | | | 8.26 | | | | 0.60 | | | | (1.07 | ) | | | (0.47 | ) | | | | | | | (0.55 | ) | | | — | | | | (0.55 | ) | | | 7.24 | |
| | | | | | | | | |
2015 | | | 9.31 | | | | 0.57 | | | | (0.98 | ) | | | (0.41 | ) | | | | | | | (0.57 | ) | | | (0.07 | ) | | | (0.64 | ) | | | 8.26 | |
54
| | | | | | | | | | | | | | | | | | | | | | | | | | | | | | | | | | |
| | | | Ratios/Supplemental Data | |
| | | | | | | | | | Ratios to Average
Net Assets Before
Waiver/Reimbursement | | | | | | Ratios to Average
Net Assets After
Waiver/Reimbursement(c) | | | | |
| | | | | | | | |
Total
Return(b) | | | Ending
Net
Assets
(000) | | | | | | Expenses | | | Net
Investment
Income
(Losss) | | | | | | Expenses | | | Net
Investment
Income
(Losss) | | | Portfolio
Turnover
Rate(d) | |
| | | | | | | | |
| | | | | | | | | | | | | | | | | | | | | | | | | | | | | | | | | | |
| | | | | | | | |
| | 5.86 | % | | $ | 151,673 | | | | | | | | 1.01 | % | | | 6.17 | % | | | | | | | 1.00 | % | | | 6.19 | % | | | 113 | % |
| | | | | | | | |
| | 3.16 | | | | 126,376 | | | | | | | | 1.04 | | | | 6.66 | | | | | | | | 1.00 | | | | 6.70 | | | | 126 | |
| | | | | | | | |
| | 15.75 | | | | 136,977 | | | | | | | | 1.01 | | | | 7.03 | | | | | | | | 1.01 | | | | 7.03 | | | | 155 | |
| | | | | | | | |
| | 5.48 | | | | 114,537 | | | | | | | | 1.03 | | | | 7.99 | | | | | | | | 1.03 | | | | 7.99 | | | | 91 | |
| | | | | | | | |
| | (4.82 | ) | | | 119,535 | | | | | | | | 0.97 | | | | 6.31 | | | | | | | | 0.97 | | | | 6.31 | | | | 80 | |
| | | | | | | | |
| | | | | | | | | | | | | | | | | | | | | | | | | | | | | | | | | | |
| | | | | | | | |
| | 5.04 | | | | 35,655 | | | | | | | | 1.77 | | | | 5.44 | | | | | | | | 1.75 | | | | 5.46 | | | | 113 | |
| | | | | | | | |
| | 2.37 | | | | 41,121 | | | | | | | | 1.80 | | | | 5.96 | | | | | | | | 1.75 | | | | 6.00 | | | | 126 | |
| | | | | | | | |
| | 14.93 | | | | 47,698 | | | | | | | | 1.76 | | | | 6.32 | | | | | | | | 1.76 | | | | 6.32 | | | | 155 | |
| | | | | | | | |
| | (6.27 | ) | | | 41,663 | | | | | | | | 1.79 | | | | 7.26 | | | | | | | | 1.79 | | | | 7.26 | | | | 91 | |
| | | | | | | | |
| | (5.45 | ) | | | 55,409 | | | | | | | | 1.72 | | | | 5.62 | | | | | | | | 1.72 | | | | 5.62 | | | | 80 | |
| | | | | | | | |
| | | | | | | | | | | | | | | | | | | | | | | | | | | | | | | | | | |
| | | | | | | | |
| | 5.56 | | | | 298 | | | | | | | | 1.27 | | | | 5.95 | | | | | | | | 1.26 | | | | 5.96 | | | | 113 | |
| | | | | | | | |
| | 2.94 | | | | 473 | | | | | | | | 1.30 | | | | 6.48 | | | | | | | | 1.25 | | | | 6.52 | | | | 126 | |
| | | | | | | | |
| | 15.46 | | | | 756 | | | | | | | | 1.26 | | | | 6.80 | | | | | | | | 1.26 | | | | 6.81 | | | | 155 | |
| | | | | | | | |
| | (5.76 | ) | | | 834 | | | | | | | | 1.29 | | | | 7.78 | | | | | | | | 1.29 | | | | 7.78 | | | | 91 | |
| | | | | | | | |
| | (5.07 | ) | | | 995 | | | | | | | | 1.21 | | | | 6.03 | | | | | | | | 1.21 | | | | 6.03 | | | | 80 | |
| | | | | | | | |
| | | | | | | | | | | | | | | | | | | | | | | | | | | | | | | | | | |
| | | | | | | | |
| | 6.10 | | | | 101,560 | | | | | | | | 0.76 | | | | 6.44 | | | | | | | | 0.75 | | | | 6.45 | | | | 113 | |
| | | | | | | | |
| | 3.52 | | | | 139,777 | | | | | | | | 0.79 | | | | 6.91 | | | | | | | | 0.75 | | | | 6.95 | | | | 126 | |
| | | | | | | | |
| | 15.97 | | | | 200,310 | | | | | | | | 0.75 | | | | 7.31 | | | | | | | | 0.76 | | | | 7.31 | | | | 155 | |
| | | | | | | | |
| | (5.21 | ) | | | 208,009 | | | | | | | | 0.78 | | | | 8.12 | | | | | | | | 0.78 | | | | 8.12 | | | | 91 | |
| | | | | | | | |
| | (4.55) | | | | 446,406 | | | | | | | | 0.72 | | | | 6.56 | | | | | | | | 0.72 | | | | 6.56 | | | | 80 | |
| (a) | Per share Net Investment Income (Loss) is calculated using the average daily shares method. | |
| (b) | Total return is the combination of changes in NAV without any sales charge, reinvested dividend income at NAV and reinvested capital gains distributions at NAV, if any. Total returns are not annualized. | |
| (c) | After fee waiver and/or expense reimbursement from the Adviser, where applicable. See Note 7 – Management Fees and Other Transactions with Affiliates, Management Fees for more information. For the period October 31, 2014 through June 29, 2016, the Adviser did not reimburse the Fund for any fees and expenses. | |
| (d) | Portfolio Turnover Rate is calculated based on the lesser of long-term purchases or sales (as disclosed in Note 5 – Investment Transactions) divided by the average long-term market value during the period. | |
See accompanying notes to financial statements.
55
Financial Highlights(continued)
Strategic Income
Selected data for a share outstanding throughout each period:
| | | | | | | | | | | | | | | | | | | | | | | | | | | | | | | | | | | | | | | | |
| | | | | |
| | | | | | Investment Operations | | | | | | Less Distributions | | | | |
| | | | | | | | | | |
Class (Commencement Date) Year Ended June 30, | | Beginning
NAV | | | Net
Investment
Income
(Loss)(a) | | | Net
Realized/
Unrealized
Gain (Loss) | | | Total | | | | | | Net
Investment
Income | | | From
Accumulated
Net Realized
Gains | | | Return
of
Capital | | | Total | | | Ending
NAV | |
| | | | | | | | | | |
Class A (2/00) | | | | | | | | | | | | | | | | | | | | | | | | | | | | | | | | | | | | | | | | |
| | | | | | | | | | |
2019 | | $ | 10.17 | | | $ | 0.40 | | | $ | 0.38 | | | $ | 0.78 | | | | | | | $ | (0.35 | ) | | $ | — | | | $ | — | | | $ | (0.35 | ) | | $ | 10.60 | |
| | | | | | | | | | |
2018 | | | 10.65 | | | | 0.36 | | | | (0.43 | ) | | | (0.07 | ) | | | | | | | (0.21 | ) | | | — | | | | (0.20 | ) | | | (0.41 | ) | | | 10.17 | |
| | | | | | | | | | |
2017 | | | 10.52 | | | | 0.44 | | | | 0.22 | | | | 0.66 | | | | | | | | (0.29 | ) | | | — | | | | (0.24 | ) | | | (0.53 | ) | | | 10.65 | |
| | | | | | | | | | |
2016 | | | 10.97 | | | | 0.50 | | | | (0.42 | ) | | | 0.08 | | | | | | | | (0.53 | ) | | | — | | | | — | | | | (0.53 | ) | | | 10.52 | |
| | | | | | | | | | |
2015 | | | 11.60 | | | | 0.49 | | | | (0.58 | ) | | | (0.09 | ) | | | | | | | (0.54 | ) | | | — | | | | — | | | | (0.54 | ) | | | 10.97 | |
| | | | | | | | | | |
Class C (2/00) | | | | | | | | | | | | | | | | | | | | | | | | | | | | | | | | | | | | | | | | |
| | | | | | | | | | |
2019 | | | 10.12 | | | | 0.32 | | | | 0.39 | | | | 0.71 | | | | | | | | (0.28 | ) | | | — | | | | — | | | | (0.28 | ) | | | 10.55 | |
| | | | | | | | | | |
2018 | | | 10.59 | | | | 0.28 | | | | (0.42 | ) | | | (0.14 | ) | | | | | | | (0.13 | ) | | | — | | | | (0.20 | ) | | | (0.33 | ) | | | 10.12 | |
| | | | | | | | | | |
2017 | | | 10.46 | | | | 0.35 | | | | 0.23 | | | | 0.58 | | | | | | | | (0.21 | ) | | | — | | | | (0.24 | ) | | | (0.45 | ) | | | 10.59 | |
| | | | | | | | | | |
2016 | | | 10.90 | | | | 0.42 | | | | (0.41 | ) | | | 0.01 | | | | | | | | (0.45 | ) | | | — | | | | — | | | | (0.45 | ) | | | 10.46 | |
| | | | | | | | | | |
2015 | | | 11.52 | | | | 0.40 | | | | (0.57 | ) | | | (0.17 | ) | | | | | | | (0.45 | ) | | | — | | | | — | | | | (0.45 | ) | | | 10.90 | |
| | | | | | | | | | |
Class R3 (9/01) | | | | | | | | | | | | | | | | | | | | | | | | | | | | | | | | | | | | | | | | |
| | | | | | | | | | |
2019 | | | 10.21 | | | | 0.37 | | | | 0.39 | | | | 0.76 | | | | | | | | (0.33 | ) | | | — | | | | — | | | | (0.33 | ) | | | 10.64 | |
| | | | | | | | | | |
2018 | | | 10.69 | | | | 0.33 | | | | (0.42 | ) | | | (0.09 | ) | | | | | | | (0.19 | ) | | | — | | | | (0.20 | ) | | | (0.39 | ) | | | 10.21 | |
| | | | | | | | | | |
2017 | | | 10.56 | | | | 0.41 | | | | 0.23 | | | | 0.64 | | | | | | | | (0.27 | ) | | | — | | | | (0.24 | ) | | | (0.51 | ) | | | 10.69 | |
| | | | | | | | | | |
2016 | | | 11.01 | | | | 0.48 | | | | (0.42 | ) | | | 0.06 | | | | | | | | (0.51 | ) | | | — | | | | — | | | | (0.51 | ) | | | 10.56 | |
| | | | | | | | | | |
2015 | | | 11.64 | | | | 0.46 | | | | (0.57 | ) | | | (0.11 | ) | | | | | | | (0.52 | ) | | | — | | | | — | | | | (0.52 | ) | | | 11.01 | |
| | | | | | | | | | |
Class R6 (1/15) | | | | | | | | | | | | | | | | | | | | | | | | | | | | | | | | | | | | | | | | |
| | | | | | | | | | |
2019 | | | 10.20 | | | | 0.44 | | | | 0.38 | | | | 0.82 | | | | | | | | (0.38 | ) | | | — | | | | — | | | | (0.38 | ) | | | 10.64 | |
| | | | | | | | | | |
2018 | | | 10.67 | | | | 0.39 | | | | (0.42 | ) | | | (0.03 | ) | | | | | | | (0.24 | ) | | | — | | | | (0.20 | ) | | | (0.44 | ) | | | 10.20 | |
| | | | | | | | | | |
2017 | | | 10.52 | | | | 0.48 | | | | 0.23 | | | | 0.71 | | | | | | | | (0.32 | ) | | | — | | | | (0.24 | ) | | | (0.56 | ) | | | 10.67 | |
| | | | | | | | | | |
2016 | | | 10.96 | | | | 0.53 | | | | (0.41 | ) | | | 0.12 | | | | | | | | (0.56 | ) | | | — | | | | — | | | | (0.56 | ) | | | 10.52 | |
| | | | | | | | | | |
2015(e) | | | 11.22 | | | | 0.24 | | | | (0.25 | ) | | | (0.01 | ) | | | | | | | (0.25 | ) | | | — | | | | — | | | | (0.25 | ) | | | 10.96 | |
| | | | | | | | | | |
Class I (2/00) | | | | | | | | | | | | | | | | | | | | | | | | | | | | | | | | | | | | | | | | |
| | | | | | | | | | |
2019 | | | 10.17 | | | | 0.42 | | | | 0.39 | | | | 0.81 | | | | | | | | (0.38 | ) | | | — | | | | — | | | | (0.38 | ) | | | 10.60 | |
| | | | | | | | | | |
2018 | | | 10.65 | | | | 0.38 | | | | (0.42 | ) | | | (0.04 | ) | | | | | | | (0.24 | ) | | | — | | | | (0.20 | ) | | | (0.44 | ) | | | 10.17 | |
| | | | | | | | | | |
2017 | | | 10.51 | | | | 0.46 | | | | 0.24 | | | | 0.70 | | | | | | | | (0.32 | ) | | | — | | | | (0.24 | ) | | | (0.56 | ) | | | 10.65 | |
| | | | | | | | | | |
2016 | | | 10.96 | | | | 0.53 | | | | (0.42 | ) | | | 0.11 | | | | | | | | (0.56 | ) | | | — | | | | — | | | | (0.56 | ) | | | 10.51 | |
| | | | | | | | | | |
2015 | | | 11.59 | | | | 0.52 | | | | (0.58 | ) | | | (0.06 | ) | | | | | | | (0.57 | ) | | | — | | | | — | | | | (0.57 | ) | | | 10.96 | |
56
| | | | | | | | | | | | | | | | | | | | | | | | | | | | | | | | | | |
| | | | Ratios/Supplemental Data | |
| | | | | | | | | | Ratios to Average
Net Assets Before
Waive/Reimbursement | | | | | | Ratios to Average
Net Assets After
Waive/Reimbursement(c) | | | | |
| | | | | | | | |
Total
Return(b) | | | Ending
Net
Assets
(000) | | | | | | Expenses | | |
Net
Investment
Income
(Loss) | | | | | | Expenses | | | Net
Investment
Income
(Loss) | | | Portfolio
Turnover
Rate(d) | |
| | | | | | | | |
| | | | | | | | | | | | | | | | | | | | | | | | | | | | | | | | | | |
| | | | | | | | |
| | 7.89 | % | | $ | 87,084 | | | | | | | | 0.96 | % | | | 3.79 | % | | | | | | | 0.84 | % | | | 3.90 | % | | | 54 | % |
| | | | | | | | |
| | (0.70 | ) | | | 106,805 | | | | | | | | 0.93 | | | | 3.31 | | | | | | | | 0.83 | | | | 3.41 | | | | 124 | |
| | | | | | | | |
| | 6.43 | | | | 137,072 | | | | | | | | 0.93 | | | | 4.02 | | | | | | | | 0.83 | | | | 4.12 | | | | 135 | |
| | | | | | | | |
| | 0.94 | | | | 187,052 | | | | | | | | 0.92 | | | | 4.71 | | | | | | | | 0.83 | | | | 4.80 | | | | 56 | |
| | | | | | | | |
| | (0.80 | ) | | | 288,080 | | | | | | | | 0.92 | | | | 4.25 | | | | | | | | 0.82 | | | | 4.34 | | | | 47 | |
| | | | | | | | |
| | | | | | | | | | | | | | | | | | | | | | | | | | | | | | | | | | |
| | | | | | | | |
| | 7.11 | | | | 42,024 | | | | | | | | 1.71 | | | | 3.03 | | | | | | | | 1.59 | | | | 3.15 | | | | 54 | |
| | | | | | | | |
| | (1.40 | ) | | | 59,612 | | | | | | | | 1.68 | | | | 2.56 | | | | | | | | 1.58 | | | | 2.66 | | | | 124 | |
| | | | | | | | |
| | 5.63 | | | | 76,513 | | | | | | | | 1.68 | | | | 3.25 | | | | | | | | 1.58 | | | | 3.35 | | | | 135 | |
| | | | | | | | |
| | 0.20 | | | | 89,173 | | | | | | | | 1.67 | | | | 3.97 | | | | | | | | 1.58 | | | | 4.06 | | | | 56 | |
| | | | | | | | |
| | (1.50 | ) | | | 110,660 | | | | | | | | 1.67 | | | | 3.51 | | | | | | | | 1.57 | | | | 3.60 | | | | 47 | |
| | | | | | | | |
| | | | | | | | | | | | | | | | | | | | | | | | | | | | | | | | | | |
| | | | | | | | |
| | 7.61 | | | | 2,792 | | | | | | | | 1.20 | | | | 3.52 | | | | | | | | 1.09 | | | | 3.64 | | | | 54 | |
| | | | | | | | |
| | (0.92 | ) | | | 5,869 | | | | | | | | 1.18 | | | | 3.06 | | | | | | | | 1.08 | | | | 3.16 | | | | 124 | |
| | | | | | | | |
| | 6.17 | | | | 7,320 | | | | | | | | 1.18 | | | | 3.74 | | | | | | | | 1.08 | | | | 3.83 | | | | 135 | |
| | | | | | | | |
| | 0.70 | | | | 7,647 | | | | | | | | 1.17 | | | | 4.44 | | | | | | | | 1.08 | | | | 4.54 | | | | 56 | |
| | | | | | | | |
| | (1.01 | ) | | | 12,272 | | | | | | | | 1.17 | | | | 4.00 | | | | | | | | 1.07 | | | | 4.09 | | | | 47 | |
| | | | | | | | |
| | | | | | | | | | | | | | | | | | | | | | | | | | | | | | | | | | |
| | | | | | | | |
| | 8.24 | | | | 50,127 | | | | | | | | 0.62 | | | | 4.14 | | | | | | | | 0.50 | | | | 4.26 | | | | 54 | |
| | | | | | | | |
| | (0.38 | ) | | | 46,588 | | | | | | | | 0.60 | | | | 3.65 | | | | | | | | 0.50 | | | | 3.75 | | | | 124 | |
| | | | | | | | |
| | 6.86 | | | | 8,995 | | | | | | | | 0.60 | | | | 4.35 | | | | | | | | 0.51 | | | | 4.45 | | | | 135 | |
| | | | | | | | |
| | 1.28 | | | | 33,372 | | | | | | | | 0.60 | | | | 5.07 | | | | | | | | 0.50 | | | | 5.17 | | | | 56 | |
| | | | | | | | |
| | (0.10 | ) | | | 20,498 | | | | | | | | 0.61 | * | | | 4.70 | * | | | | | | | 0.50 | * | | | 4.81 | * | | | 47 | |
| | | | | | | | |
| | | | | | | | | | | | | | | | | | | | | | | | | | | | | | | | | | |
| | | | | | | | |
| | 8.15 | | | | 400,059 | | | | | | | | 0.71 | | | | 4.04 | | | | | | | | 0.59 | | | | 4.15 | | | | 54 | |
| | | | | | | | |
| | (0.47 | ) | | | 493,098 | | | | | | | | 0.68 | | | | 3.56 | | | | | | | | 0.58 | | | | 3.67 | | | | 124 | |
| | | | | | | | |
| | 6.77 | | | | 540,368 | | | | | | | | 0.68 | | | | 4.22 | | | | | | | | 0.58 | | | | 4.32 | | | | 135 | |
| | | | | | | | |
| | 1.19 | | | | 475,536 | | | | | | | | 0.67 | | | | 4.95 | | | | | | | | 0.58 | | | | 5.05 | | | | 56 | |
| | | | | | | | |
| | (0.54) | | | | 773,719 | | | | | | | | 0.67 | | | | 4.48 | | | | | | | | 0.57 | | | | 4.57 | | | | 47 | |
| (a) | Per share Net Investment Income (Loss) is calculated using the average daily shares method. | |
| (b) | Total return is the combination of changes in NAV without any sales charge, reinvested dividend income at NAV and reinvested capital gains distributions at NAV, if any. Total returns are not annualized. | |
| (c) | After fee waiver and/or expense reimbursement from the Adviser, where applicable. See Note 7 – Management Fees and Other Transactions with Affiliates, Management Fees for more information. | |
| (d) | Portfolio Turnover Rate is calculated based on the lesser of long-term purchases or sales (as disclosed in Note 5 – Investment Transactions) divided by the average long-term market value during the period. | |
| (e) | For the period January 20, 2015 (commencement of operations) through June 30, 2015. | |
See accompanying notes to financial statements.
57
Notes to Financial Statements
1. General Information and Significant Accounting Policies
General Information
Trust and Fund Information
Nuveen Investment Funds, Inc. (the “Trust”) is an open-end management investment company registered under the Investment Company Act of 1940 (the “1940 Act”), as amended. The Trust is comprised of Nuveen High Income Bond Fund (“High Income Bond”) and Nuveen Strategic Income Fund (“Strategic Income”) (each a “Fund” and collectively, the “Funds”), as diversified funds, among others. The Trust was incorporated in the State of Maryland on August 20, 1987.
The end of the reporting period for the Funds is June 30, 2019, and the period covered by these Notes to Financial Statements is the fiscal year ended June 30, 2019 (the “current fiscal period”).
Investment Adviser
The Funds’ investment adviser is Nuveen Fund Advisors, LLC (the “Adviser”), a subsidiary of Nuveen, LLC (“Nuveen”). Nuveen is the investment management arm of Teachers Insurance and Annuity Association of America (TIAA). The Adviser has overall responsibility for management of the Funds, overseas the management of the Funds’ portfolios, manages the Funds’ business affairs and provides certain clerical, bookkeeping and other administrative services, and, if necessary, asset allocation decisions. The Adviser has entered into sub-advisory agreements with Nuveen Asset Management, LLC (the “Sub-Adviser”), a subsidiary of the Adviser, under which the Sub-Adviser manages the investment portfolios of the Funds.
Investment Objectives
High Income Bond’s investment objective is to provide investors with a high level of current income. Strategic Income’s investment objective is to provide investors with total return.
The Funds’ most recent prospectus provides further descriptions of each Fund’s investment objective, principal investment strategies and principal risks.
Fund Reorganizations
In December 2018, the Board of Trustees of the Trust and the Board of Trustees of TIAA-CREF Funds (“TC Funds”) each approved the reorganization of High Income Bond into TIAA-CREF High-Yield Fund, a series of TC Funds, subject to approval of the shareholders of High Income Bond. At a special meeting held on June 7, 2019, shareholders of High Income Bond did not approve the proposed reorganization.
As described in the proxy materials provided to shareholders in connection with the proposed reorganization, the Board of Trustees of the Trust will review and take such action as it deems to be in the best interests of the High Income Bond, including continuing to operate the Fund as described in the prospectus, liquidating the Fund, or such other options the Board may consider. Fund shareholders will be notified when the Board approves a course of action for the Fund.
Significant Accounting Policies
Each Fund is an investment company and follows accounting and reporting guidance under Financial Accounting Standards Board (“FASB”) Accounting Standards Codification (ASC) Topic 946 “Financial Services – Investment Companies.” The following is a summary of significant accounting policies followed by the Funds in the preparation of their financial statements in accordance with accounting principles generally accepted in the United States of America (“U.S. GAAP”).
Investment Transactions
Investment transactions are recorded on a trade date basis. Realized gains and losses from investment transactions are determined on the specific identification method, which is the same basis used for federal income tax purposes. Investments purchased on a when-issued/delayed delivery basis may have extended settlement periods. Any investments so purchased are subject to market fluctuation during this period. The Funds have earmarked securities in their portfolios with a current value at least equal to the amount of the when-issued/delayed delivery purchase commitments.
As of the end of the reporting period, the following Funds’ outstanding when-issued/delayed delivery purchase commitments were as follows:
| | | | | | | | |
| | | High Income | | | Strategic Income | |
| Outstanding when-issued/delayed delivery purchase commitments | | $ | 3,913,659 | | | $ | 29,103,408 | |
Investment Income
Dividend income is recorded on theex-dividend date or, for foreign securities, when information is available. Interest income, which reflects the amortization of premiums and includes accretion of discounts for financial reporting purposes, is recorded on an accrual basis. Interest income also reflects payment-in-kind (“PIK”) interest and paydown gains and losses, if any. PIK interest represents income received in the form of securities in lieu of cash. Securities lending income is comprised of fees earned from borrowers and income earned on cash collateral investments.
58
Professional Fees
Professional fees presented on the Statement of Operations consist of legal fees incurred in the normal course of operations, audit fees, tax consulting fees and, in some cases, workout expenditures. Workout expenditures are incurred in an attempt to protect or enhance an investment or to pursue other claims or legal actions on behalf of Fund shareholders. If a refund is received for workout expenditures paid in a prior reporting period, such amounts will be recognized as “Legal fee refund” on the Statement of Operations.
Dividends and Distributions to Shareholders
Dividends from net investment income, if any, are declared daily and distributed to shareholders monthly. Fund shares begin to accrue dividends on the business day after the day when the monies used to purchase Fund shares are collected by the transfer agent.
Net realized capital gains from investment transactions, if any, are declared and distributed to shareholders at least annually. Furthermore, capital gains are distributed only to the extent they exceed available capital loss carryforwards.
Distributions to shareholders are recorded on theex-dividend date. The amount and timing of distributions are determined in accordance with federal income tax regulations, which may differ from U.S. GAAP.
Share Classes and Sales Charges
Class A Shares are generally sold with an up-front sales charge and incur a 0.25% annual 12b-1 service fee. Class A Share purchases of the Funds of $1 million or more are sold at net asset value (“NAV”) without an up-front sales charge. Class A Share purchases may be subject to a contingent deferred sales charge (“CDSC”) equal to 1% if redeemed within twelve months of purchase. Class C Shares are sold without an up-front sales charge but incur a 0.75% annual 12b-1 distribution fee and a 0.25% annual 12b-1 service fee. Class C Shares are subject to a CDSC of 1% if redeemed within twelve months of purchase. Class C Shares automatically convert to Class A Shares ten years after purchase. Class R3 Shares are sold without an up-front sales charge but incur a 0.25% annual 12b-1 distribution fee and a 0.25% annual 12b-1 service fee. Class R6 Shares and Class I Shares are not subject to any sales charge or 12b-1 distribution or service fees.
Multiclass Operations and Allocations
Income and expenses of the Funds that are not directly attributable to a specific class of shares are prorated among the classes based on the relative settled shares of each class. Expenses directly attributable to a class of shares are recorded to the specific class. Currently, the only expenses that are allocated on a class-specific basis are 12b-1 distribution and service fees.
Sub-transfer agent fees and similar fees, which are recognized as a component of “Shareholder servicing agent fees” on the Statement of Operations, are not charged to Class R6 Shares and are prorated among the other classes based on their relative net assets.
Realized and unrealized capital gains and losses of the Funds are prorated among the classes based on the relative net assets of each class.
Compensation
The Trust pays no compensation directly to those of its trustees who are affiliated with the Adviser or to its officers, all of whom receive remuneration for their services to the Trust from the Adviser or its affiliates. The Funds’ Board of Directors (the “Board”) has adopted a deferred compensation plan for independent directors that enables directors to elect to defer receipt of all or a portion of the annual compensation they are entitled to receive from certain Nuveen-advised funds. Under the plan, deferred amounts are treated as though equal dollar amounts had been invested in shares of select Nuveen-advised funds.
Indemnifications
Under the Trust’s organizational documents, its officers and directors are indemnified against certain liabilities arising out of the performance of their duties to the Trust. In addition, in the normal course of business, the Trust enters into contracts that provide general indemnifications to other parties. The Trust’s maximum exposure under these arrangements is unknown as this would involve future claims that may be made against the Trust that have not yet occurred. However, the Trust has not had prior claims or losses pursuant to these contracts and expects the risk of loss to be remote.
Netting Agreements
In the ordinary course of business, the Funds may enter into transactions subject to enforceable International Swaps and Derivative Association, Inc. (ISDA) master agreements or other similar arrangements (“netting agreements”). Generally, the right to offset in netting agreements allows each Fund to offset certain securities and derivatives with a specific counterparty, when applicable, as well as any collateral received or delivered to that counterparty based on the terms of the agreements. Generally, each Fund manages its cash collateral and securities collateral on a counterparty basis.
The Funds’ investments subject to netting agreements as of the end of the reporting period, if any, are further described in Note 3 – Portfolio Securities and Investments in Derivatives.
59
Notes to Financial Statements(continued)
Use of Estimates
The preparation of financial statements in conformity with U.S. GAAP requires management to make estimates and assumptions that affect the reported amounts of assets and liabilities at the date of the financial statements and the reported amounts of increases and decreases in net assets from operations during the current fiscal period. Actual results may differ from those estimates.
2. Investment Valuation and Fair Value Measurements
The fair valuation input levels as described below are for fair value measurement purposes.
Fair value is defined as the price that would be received upon selling an investment or transferring a liability in an orderly transaction to an independent buyer in the principal or most advantageous market for the investment. A three-tier hierarchy is used to maximize the use of observable market data and minimize the use of unobservable inputs and to establish classification of fair value measurements for disclosure purposes. Observable inputs reflect the assumptions market participants would use in pricing the asset or liability. Observable inputs are based on market data obtained from sources independent of the reporting entity. Unobservable inputs reflect the reporting entity’s own assumptions about the assumptions market participants would use in pricing the asset or liability. Unobservable inputs are based on the best information available in the circumstances. The following is a summary of the three-tiered hierarchy of valuation input levels.
| | |
| Level 1 – | | Inputs are unadjusted and prices are determined using quoted prices in active markets for identical securities. |
| Level 2 – | | Prices are determined using other significant observable inputs (including quoted prices for similar securities, interest rates, credit spreads, etc.). |
| Level 3 – | | Prices are determined using significant unobservable inputs (including management’s assumptions in determining the fair value of investments). |
Common stocks and other equity-type securities are valued at the last sales price on the securities exchange on which such securities are primarily traded and are generally classified as Level 1. Securities primarily traded on the Nasdaq National Market (“Nasdaq”) are valued at the Nasdaq Official Closing Price and are generally classified as Level 1. However, securities traded on a securities exchange or Nasdaq for which there were no transactions on a given day or securities not listed on a securities exchange or Nasdaq are valued at the quoted bid price and are generally classified as Level 2.
Prices of fixed-income securities are provided by an independent pricing service (“pricing service”) approved by the Board. The pricing service establishes a security’s fair value using methods that may include consideration of the following: yields or prices of investments of comparable quality, type of issue, coupon, maturity and rating, market quotes or indications of value from security dealers, evaluations of anticipated cash flows or collateral, general market conditions and other information and analysis, including the obligor’s credit characteristics considered relevant. These securities are generally classified as Level 2. In pricing certain securities, particularly less liquid and lower quality securities, the pricing service may consider information about a security, its issuer or market activity, provided by the Adviser. These securities are generally classified as Level 2 or Level 3 depending on the observability of the significant inputs.
Like most fixed-income securities, the senior and subordinated loans in which the Fund invests are not listed on an organized exchange. The secondary market of such investments may be less liquid relative to markets for other fixed-income securities. Consequently, the value of senior and subordinated loans, determined as described above, may differ significantly from the value that would have been determined had there been an active market for that senior loan. These securities are generally classified as Level 2.
Investments in investment companies are valued at their respective NAVs on the valuation date and are generally classified as Level 1.
Prices of forward foreign currency contracts and swap contracts are also provided by a pricing service approved by the Board using the same methods as described above and are generally classified as Level 2.
Futures contracts are valued using the closing settlement price or, in the absence of such a price, the last traded price and are generally classified as Level 1.
Investments initially valued in currencies other than the U.S. dollar are converted to the U.S. dollar using exchange rates obtained from pricing services. As a result, the NAV of the Funds’ shares may be affected by changes in the value of currencies in relation to the U.S. dollar. The value of securities traded in markets outside the United States or denominated in currencies other than the U.S. dollar may be affected significantly on a day that the New York Stock Exchange is closed and an investor is not able to purchase, redeem or exchange shares. If significant market events occur between the time of determination of the closing price of a foreign security on an exchange and the time that the Funds’ NAV is determined, or if under the Funds’ procedures, the closing price of a foreign security is not deemed to be reliable, the security would be valued at fair value as determined in accordance with procedures established in good faith by the Board. These securities are generally classified as Level 2 or Level 3 depending on the observability of the significant inputs.
Certain securities may not be able to be priced by thepre-established pricing methods as described above. Such securities may be valued by the Board and/or its appointee at fair value. These securities generally include, but are not limited to, restricted securities (securities which may not be publicly sold without registration under the Securities Act of 1933, as amended) for which a pricing service is unable to provide a market price; securities whose trading has been formally suspended; debt securities that have gone into default and for which there is no current market quotation; a security whose market price is not available from apre-established pricing source; a security with respect to which an event has occurred that is likely to
60
materially affect the value of the security after the market has closed but before the calculation of a Fund’s NAV (as may be the case innon-U.S. markets on which the security is primarily traded) or make it difficult or impossible to obtain a reliable market quotation; and a security whose price, as provided by the pricing service, is not deemed to reflect the security’s fair value. As a general principle, the fair value of a security would appear to be the amount that the owner might reasonably expect to receive for it in a current sale. A variety of factors may be considered in determining the fair value of such securities, which may include consideration of the following: yields or prices of investments of comparable quality, type of issue, coupon, maturity and rating, market quotes or indications of value from security dealers, evaluations of anticipated cash flows or collateral, general market conditions and other information and analysis, including the obligor’s credit characteristics considered relevant. These securities are generally classified as Level 2 or Level 3 depending on the observability of the significant inputs. Regardless of the method employed to value a particular security, all valuations are subject to review by the Board and/or its appointee.
The inputs or methodologies used for valuing securities are not an indication of the risks associated with investing in those securities. The following is a summary of each Fund’s fair value measurements as of the end of the reporting period:
| | | | | | | | | | | | | | | | |
| High Income Bond | | Level 1 | | | Level 2 | | | Level 3 | | | Total | |
| Long-Term Investments*: | | | | | | | | | | | | | | | | |
Corporate Bonds | | $ | — | | | $ | 236,457,043 | | | $ | — | **** | | $ | 236,457,043 | |
Exchange-Traded Funds | | | 14,015,466 | | | | — | | | | — | | | | 14,015,466 | |
Contingent Capital Securities | | | — | | | | 5,136,974 | | | | — | | | | 5,136,974 | |
Variable Rate Senior Loans Interests | | | — | | | | 4,006,260 | | | | — | | | | 4,006,260 | |
$1,000 Par (or similar) Institutional Preferred | | | — | | | | 2,925,267 | | | | — | | | | 2,925,267 | |
$25 Par (or similar) Retail Preferred | | | 2,272,314 | | | | — | | | | — | | | | 2,272,314 | |
Sovereign Debt | | | — | | | | 1,091,288 | | | | — | | | | 1,091,288 | |
Common Stocks | | | — | | | | 5 | *** | | | 5,002 | *** | | | 5,007 | |
| Investments Purchased with Collateral from Securities Lending | | | 15,958,678 | | | | — | | | | — | | | | 15,958,678 | |
| Short-Term Investments: | | | | | | | | | | | | | | | | |
Money Market Funds | | | 23,516,566 | | | | — | | | | — | | | | 23,516,566 | |
| Investments in Derivatives: | | | | | | | | | | | | | | | | |
Credit Default Swaps** | | | — | | | | 25,642 | | | | — | | | | 25,642 | |
| Total | | $ | 55,763,024 | | | $ | 249,642,479 | | | $ | 5,002 | | | $ | 305,410,505 | |
| | | | |
| Strategic Income | | | | | | | | | | | | |
| Long-Term Investments*: | | | | | | | | | | | | | | | | |
Corporate Bonds | | $ | — | | | $ | 241,447,050 | | | $ | — | | | $ | 241,447,050 | |
Asset-Backed and Mortgage-Backed Securities | | | — | | | | 155,968,543 | | | | 2,149,995 | *** | | | 158,118,538 | |
Variable Rate Senior Loan Interests | | | — | | | | 50,342,127 | | | | — | | | | 50,342,127 | |
$1,000 Par (or similar) Institutional Preferred | | | — | | | | 40,640,231 | | | | — | | | | 40,640,231 | |
Contingent Capital Securities | | | — | | | | 29,602,357 | | | | — | | | | 29,602,357 | |
U.S. Government and Agency Obligations | | | — | | | | 23,336,169 | | | | — | | | | 23,336,169 | |
Sovereign Debt | | | — | | | | 15,368,770 | | | | — | | | | 15,368,770 | |
$25 Par (or similar) Retail Preferred | | | 1,800,400 | | | | 2,193,900 | *** | | | — | | | | 3,994,300 | |
Municipal Bonds | | | — | | | | 2,993,896 | | | | — | | | | 2,993,896 | |
Convertible Bonds | | | — | | | | 1,200,895 | | | | — | | | | 1,200,895 | |
Common Stocks | | | — | | | | — | | | | 1 | *** | | | 1 | |
| Investments Purchased with Collateral from Securities Lending | | | 9,809,003 | | | | — | | | | — | | | | 9,809,003 | |
| Short-Term Investments: | | | | | | | | | | | | | | | | |
Money Market Funds | | | 35,633,140 | | | | — | | | | — | | | | 35,633,140 | |
| Investments in Derivatives: | | | | | | | | | | | | | | | | |
Futures Contracts** | | | 783,605 | | | | — | | | | — | | | | 783,605 | |
Credit Default Swaps** | | | — | | | | (242,818 | ) | | | — | | | | (242,818 | ) |
| Total | | $ | 48,026,148 | | | $ | 562,851,120 | | | $ | 2,149,996 | | | $ | 613,027,264 | |
| * | Refer to the Fund’s Portfolio of Investments for industry, state and country classifications, where applicable. |
| ** | Represents net unrealized appreciation (depreciation) as reported in the Fund’s Portfolio of Investments. |
| *** | Refer to the Fund’s Portfolio of Investments for securities classified as Level 2 and/or Level 3, where applicable. |
| **** | Refer to Fund’s Portfolio of Investments for securities classified as Level 3. Value equals zero as of the end of the reporting period. |
61
Notes to Financial Statements(continued)
3. Portfolio Securities and Investments in Derivatives
Portfolio Securities
Foreign Currency Transactions
To the extent that the Funds may invest in securities and/or contracts that are denominated in a currency other than U.S. dollars, the Funds will be subject to currency risk, which is the risk that an increase in the U.S. dollar relative to the foreign currency will reduce returns or portfolio value. Generally, when the U.S. dollar rises in value against a foreign currency, the Funds’ investments denominated in that currency will lose value because their currency is worth fewer U.S. dollars; the opposite effect occurs if the U.S. dollar falls in relative value. Investments and other assets and liabilities denominated in foreign currencies are converted into U.S. dollars on a spot (i.e. cash) basis at the spot rate prevailing in the foreign currency exchange market at the time of valuation. Purchases and sales of investments and income denominated in foreign currencies are translated into U.S. dollars on the respective dates of such transactions.
The books and records of the Funds are maintained in U.S. dollars. Foreign currencies, assets and liabilities are translated into U.S. dollars at 4:00 p.m. Eastern Time. Investment transactions, income and expenses are translated on the respective dates of such transactions. Net realized foreign currency gains and losses resulting from changes in exchange rates include foreign currency gains and losses between trade date and settlement date of the transactions, foreign currency transactions and the difference between the amounts of interest and dividends recorded on the books of the Funds and the amounts actually received.
The realized gains and losses resulting from changes in foreign currency exchange rates and changes in foreign exchange rates associated with (i) foreign currency, (ii) investments, (iii) investments in derivatives and (iv) other assets and liabilities are recognized as a component of “Net realized gain (loss) from investments and foreign currency” on the Statement of Operations, when applicable.
The unrealized gains and losses resulting from changes in foreign currency exchange rates and changes in foreign exchange rates associated with (i) investments and (ii) other assets and liabilities are recognized as a component of “Change in net unrealized appreciation (depreciation) of investments and foreign currency” on the Statement of Operations, when applicable. The unrealized gains and losses resulting from changes in foreign exchange rates associated with investments in derivatives are recognized as a component of the respective derivative’s related “Change in net unrealized appreciation (depreciation)” on the Statement of Operations, when applicable.
Securities Lending
In order to generate additional income, each Fund may lend securities representing up to one-third of the value of its total assets (which includes collateral for securities on loan) to broker-dealers, banks or other institutions. When loaning securities, the Funds retain the benefits of owning the securities, including the economic equivalent of dividends or interest generated by the security. The Funds also have the ability to recall the securities on loan at any time.
Each Fund’s policy is to receive, at the inception of a loan, cash collateral equal to at least 102% of the value of securities loaned, which is recognized as “Payable for collateral from securities lending program” on the Statement of Assets and Liabilities. Collateral for securities on loan is invested in a money market fund, which is recognized as “Investments purchased with collateral from securities lending, at value” on the Statement of Assets and Liabilities. The market value of the securities loaned is determined at the close of each business day in order to determine the adequacy of the collateral. If the value of the securities on loan increases such that the level of collateralization falls below 100%, additional collateral is received from the borrower on the next business day, which is recognized as “Due from broker” on the Statement of Assets and Liabilities.
Securities out on loan are subject to termination at any time at the option of the borrower or the Fund. Upon termination, the borrower is required to return to the Fund securities identical to the securities loaned. Generally, in the event the borrower defaults on its obligation to return the loaned securities, the Fund has the right to use the collateral to acquire identical securities. In the event the Fund is delayed or prevented from exercising its right to dispose of the collateral, there may be a loss to the Fund. Under each Fund’s securities lending agreement, however, the securities lending agent has indemnified the Fund against losses resulting from borrower default, except to the extent that those losses result from a decrease in the value of the collateral due to its investment by the Fund. The Fund bears the risk of loss with respect to the investment of collateral.
The Funds’ custodian, U.S. Bank National Association, serves as its securities lending agent. Income earned from the securities lending program is paid to the Funds. Income from securities lending is recognized as “Securities lending income” on the Statement of Operations.
62
The following table presents the securities out on loan for the Funds, and the collateral delivered related to those securities, as of the end of the reporting period.
| | | | | | | | | | | | | | |
| Fund | | Asset Class out on Loan | | Long-Term Investments, at Value | | | Collateral Pledged (From) Counterparty* | | | Net Exposure | |
| High Income Bond | | | | | | | | | | | | | | |
| | | Corporate Bonds | | $ | 15,321,715 | | | $ | (15,321,715 | ) | | $ | — | |
| Strategic Income | | | | | | | | | | | | | | |
| | Corporate Bonds | | $ | 7,816,823 | | | $ | (7,816,823 | ) | | $ | — | |
| | $1,000 Par (or Similar) Institutional Preferred | | | 1,276,550 | | | | (1,276,550 | ) | | | — | |
| | | Contingent Capital Securities | | | 376,500 | | | | (376,500 | ) | | | — | |
Total | | | | $ | 9,469,873 | | | $ | (9,469,873 | ) | | $ | — | |
| * | As of the end of the reporting period, the value of the collateral pledged from the counterparty exceeded the value of the securities out on loan. Refer to the Fund's Portfolio of Investments for details on the securities out on loan. |
Zero Coupon Securities
A zero coupon security does not pay a regular interest coupon to its holders during the life of the security. Income to the holder of the security comes from accretion of the difference between the original purchase price of the security at issuance and the par value of the security at maturity and is effectively paid at maturity. The market prices of zero coupon securities generally are more volatile than the market prices of securities that pay interest periodically.
Investments in Derivatives
Each Fund is authorized to invest in certain derivative instruments. The Funds record derivative instruments at fair value, with changes in fair value recognized on the Statement of Operations, when applicable. Even though the Funds’ investments in derivatives may represent economic hedges, they are not considered to be hedge transactions for financial reporting purposes.
Forward Foreign Currency Contracts
Each Fund is authorized to enter into forward foreign currency contracts (“forward contracts”) under two circumstances: (i) when a Fund enters into a contract for the purchase or sale of a security denominated in a foreign currency to “lock in” the U.S. exchange rate of the transaction, with such period being a short-dated contract covering the period between transaction date and settlement date; or (ii) when the Sub-Adviser believes that the currency of a particular foreign country may experience a substantial movement against the U.S. dollar or against another foreign currency.
A forward contract is an agreement between two parties to purchase or sell a specified quantity of a currency at or before a specified date in the future at a specified price. Forward contracts are typically traded in the over-the-counter (“OTC”) markets and all details of the contract are negotiated between the counterparties to the agreement. Accordingly, the forward contracts are valued by reference to the contracts traded in the OTC markets. The contractual obligations of a buyer or seller may generally be satisfied by taking or making physical delivery of the underlying currency, establishing an opposite position in the contract and recognizing the profit or loss on both positions simultaneously on the delivery date or, in some instances, paying a cash settlement before the designated date of delivery.
Forward contracts are valued daily at the forward rate. The net amount recorded on these transactions for each counterparty is recognized as a component of “Unrealized appreciation and/or depreciation on forward foreign currency contracts” on the Statement of Assets and Liabilities. The change in value of the forward contracts during the reporting period is recognized as a component of “Change in net unrealized appreciation (depreciation) of forward foreign currency contracts” on the Statement of Operations. When the contract is closed or offset with the same counterparty, a Fund recognizes the difference between the value of the contract at the time it was entered and the value at the time it was closed or offset as a component of “Net realized gain (loss) from forward foreign currency contracts” on the Statement of Operations.
Forward contracts will generally not be entered into for terms greater than three months, but may have maturities of up to six months or more. The use of forward contracts does not eliminate fluctuations in the underlying prices of a Fund’s investment securities; however, it does establish a rate of exchange that can be achieved in the future. The use of forward contracts involves the risk that anticipated currency movements will not be accurately predicted. A forward contract would limit the risk of loss due to a decline in the value of a particular currency; however, it also would limit any potential gain that might result should the value of the currency increase instead of decrease. These contracts may involve market risk in excess of the unrealized appreciation or depreciation reflected on the Statement of Assets and Liabilities. Forward contracts are subject to counterparty risk if the counterparty fails to perform as specified in the contract due to financial impairment or other reason.
During the current fiscal period, High Income Bond and Strategic Income invested in forward foreign currency contracts to manage foreign currency exposure. For example, the Fund may reduce unwanted currency exposure from its bond portfolio, or it may take long forward positions in select currencies in an attempt to benefit from the potential price appreciation.
63
Notes to Financial Statements(continued)
The average notional amount of forward foreign currency contracts outstanding during the current fiscal period was as follows:
| | | | | | | | |
| | | High Income
Bond | | | Strategic
Income | |
| Average notional amount of forward foreign currency contracts outstanding* | | $ | 659,001 | | | $ | 46,254,328 | |
| * | The average notional amount is calculated based on the outstanding notional at the beginning of the current fiscal period and at the end of each fiscal quarter within the current fiscal period. |
The following table presents the amount of net realized gain (loss) and change in net unrealized appreciation (depreciation) recognized on forward foreign currency contracts on the Statement of Operations during the current fiscal period, and the primary underlying risk exposure.
| | | | | | | | | | | | |
| Fund | | Underlying
Risk Exposure | | Derivative
Instrument | | Net Realized
Gain (Loss) from
Forward Foreign
Currency Contracts | | | Change in Net Unrealized
Appreciation (Depreciation) of
Forward Foreign Currency
Contracts | |
| High Income Bond | | Foreign currency exchange rate | | Forward contracts | | $ | (5,032 | ) | | $ | 4,044 | |
| Strategic Income | | Foreign currency exchange rate | | Forward contracts | | | 1,216,818 | | | | (273,576 | ) |
Futures Contracts
Upon execution of a futures contract, a Fund is obligated to deposit cash or eligible securities, also known as “initial margin,” into an account at its clearing broker equal to a specified percentage of the contract amount. Cash held by the broker to cover initial margin requirements on open futures contracts, if any, is recognized as “Cash collateral at brokers for investments in futures contracts” on the Statement of Assets and Liabilities. Investments in futures contracts obligate a Fund and the clearing broker to settle monies on a daily basis representing changes in the prior days “mark-to-market” of the open contracts. If a Fund has unrealized appreciation the clearing broker would credit the Fund’s account with an amount equal to appreciation and conversely if a Fund has unrealized depreciation the clearing broker would debit the Fund’s account with an amount equal to depreciation. These daily cash settlements are also known as “variation margin.” Variation margin is recognized as a receivable and/or payable for “Variation margin on futures contracts” on the Statement of Assets and Liabilities.
During the period the futures contract is open, changes in the value of the contract are recognized as an unrealized gain or loss by “marking-to-market” on a daily basis to reflect the changes in market value of the contract, which is recognized as a component of “Change in net unrealized appreciation (depreciation) of futures contracts” on the Statement of Operations. When the contract is closed or expired, a Fund records a realized gain or loss equal to the difference between the value of the contract on the closing date and value of the contract when originally entered into, which is recognized as a component of “Net realized gain (loss) from futures contracts” on the Statement of Operations.
Risks of investments in futures contracts include the possible adverse movement in the price of the securities or indices underlying the contracts, the possibility that there may not be a liquid secondary market for the contracts and/or that a change in the value of the contract may not correlate with a change in the value of the underlying securities or indices.
During the current fiscal period, each Fund used U.S. Treasury futures as part of their overall portfolio construction strategy to manage portfolio duration and yield curve exposure. Strategic Income also used Eurodollar futures; selecting foreign bond futures to actively manage exposure to those markets.
The average notional amount of futures contracts outstanding during the current fiscal period was as follows:
| | | | | | | | |
| | | High Income
Bond | | | Strategic
Income | |
| Average notional amount of futures contracts outstanding* | | $ | 767,451 | | | $ | 181,864,365 | |
| * | The average notional amount is calculated based on the absolute aggregate notional amount of contracts outstanding at the beginning of the current fiscal period and at the end of each fiscal quarter within the current fiscal period. |
The following table presents the fair value of all futures contracts held by the Funds as of the end of the reporting period, the location of these instruments on the Statement of Assets and Liabilities and the primary underlying risk exposure.
| | | | | | | | | | | | | | |
| | | | | Location on the Statement of Assets and Liabilities | |
| | | | | Asset Derivatives | | | (Liability) Derivatives | |
Underlying
Risk Exposure | | Derivative Instrument | | Location | | Value | | | Location | | Value | |
Strategic Income | | | | | | | | | | | | |
| | | | — | | $ | — | | | Payable for variation margin
on futures contracts* | | $ | 2,095,375 | |
Interest Rate | | Futures contracts | | — | | | — | | | Payable for variation margin
on futures contracts* | | | (1,311,770 | ) |
Total | | | | | | $ | — | | | | | $ | 783,605 | |
| * | Value represents unrealized appreciation (depreciation) of futures contracts as reported in the Fund’s Portfolio of Investments and not the asset and/or liability derivatives location as described in the table above. |
64
The following table presents the amount of net realized gain (loss) and change in net unrealized appreciation (depreciation) recognized on futures contracts on the Statement of Operations during the current fiscal period, and the primary underlying risk exposure.
| | | | | | | | | | | | |
| Fund | | Underlying
Risk Exposure | | Derivative
Instrument | | Net Realized
Gain (Loss) from
Futures Contracts | | | Change in Net
Unrealized Appreciation
(Depreciation) of
Futures Contracts | |
| High Income Bond | | Interest rate | | Futures contracts | | $ | (23,672 | ) | | $ | (9,710 | ) |
| Strategic Income | | Interest rate | | Futures contracts | | | 3,038,432 | | | | (267,668 | ) |
Interest Rate Swap Contracts
Interest rate swap contracts involve a Fund’s agreement with the counterparty to pay or receive a fixed rate payment in exchange for the counterparty receiving or paying a variable rate payment. Forward interest rate swap contracts involve a Fund’s agreement with a counterparty to pay, in the future, a fixed or variable rate payment in exchange for the counterparty paying the Fund a variable or fixed rate payment, the accruals for which begin at a specified date in the future (the “effective date”).
The amount of the payment obligation for an interest rate swap is based on the notional amount and the termination date of the contract. Interest rate swap contracts do not involve the delivery of securities or other underlying assets or principal. Accordingly, the risk of loss with respect to the swap counterparty on such transactions is limited to the net amount of interest payments that the Fund is to receive.
Interest rate swap contracts are valued daily. Upon entering into an interest rate swap contract (and beginning on the effective date for a forward interest rate swap contract), the Fund accrues the fixed rate payment expected to be paid or received and the variable rate payment expected to be received or paid on the interest rate swap contracts on a daily basis, and recognizes the daily change in the fair value of the Fund’s contractual rights and obligations under the contracts. For an OTC swap that is not cleared through a clearing house (“OTC Uncleared”), the amount recorded on these transactions is recognized on the Statement of Assets and Liabilities as a component of “Unrealized appreciation or depreciation on interest rate swaps.”
Upon the execution of an OTC swap cleared through a clearing house (“OTC Cleared”), the Fund is obligated to deposit cash or eligible securities, also known as “initial margin,” into an account at its clearing broker equal to a specified percentage of the contract amount. Cash deposited by the Fund to cover initial margin requirements on open swap contracts, if any, is recognized as a component of “Cash collateral at brokers for investments in swaps” on the Statement of Assets and Liabilities. Investments in OTC Cleared swaps obligate the Fund and the clearing broker to settle monies on a daily basis representing changes in the prior day’s“mark-to-market” of the swap contract. If the Fund has unrealized appreciation, the clearing broker will credit the Fund’s account with an amount equal to the appreciation. Conversely, if the Fund has unrealized depreciation, the clearing broker will debit the Fund’s account with an amount equal to the depreciation. These daily cash settlements are also known as “variation margin.” Variation margin for OTC Cleared swaps is recognized as a receivable and/or payable for “Variation margin on swap contracts” on the Statement of Assets and Liabilities. Upon the execution of an OTC Uncleared swap, neither the Fund nor the counterparty is required to deposit initial margin as the trades are recorded bilaterally between both parties to the swap contract, and the terms of the variation margin are subject to a predetermined threshold negotiated by the Fund and the counterparty. Variation margin for OTC Uncleared swaps is recognized as a component of “Unrealized appreciation or depreciation on interest rate swaps” as described in the preceding paragraph.
The net amount of periodic payments settled in cash are recognized as a component of “Net realized gain (loss) from swaps” on the Statement of
Operations, in addition to the net realized gain or loss recorded upon the termination of the swap contract. For tax purposes, payments expected to be received or paid on the swap contracts are treated as ordinary income or expense, respectively. Changes in the value of the swap contracts during the fiscal period are recognized as a component of “Change in net unrealized appreciation (depreciation) of swaps” on the Statement of Operations. In certain instances, payments are made or received upon entering into the swap contract to compensate for differences between the stated terms of the swap agreements and prevailing market conditions (credit spreads, currency exchange rates, interest rates, and other relevant factors). Payments received or made at the beginning of the measurement period, if any, are recognized as “Interest rate swaps premiums paid and/or received” on the Statement of Assets and Liabilities.
During the current fiscal period, Strategic Income used interest rate swap contracts as part of an overall portfolio construction strategy to manage portfolio duration.
The average notional amount of interest rate swap contracts outstanding during the current fiscal period was as follows:
| | | | |
| | | Strategic
Income | |
| Average notional amount of interest rate swap contracts outstanding* | | $ | 48,000,000 | |
| * | The average notional amount is calculated based on the outstanding notional at the beginning of the current fiscal period and at the end of each fiscal quarter within the current fiscal period. |
65
Notes to Financial Statements(continued)
Credit Default Swap Contracts
A Fund may enter into a credit default swap contract to seek to maintain a total return on a particular investment or portion of its portfolio, or to take an active long or short position with respect to the likelihood of a particular issuer’s default. Credit default swap contracts involve one party making a stream of payments to another party in exchange for the right to receive a specified return if/when there is a credit event by a third party. Generally, a credit event means bankruptcy, failure to pay, or restructuring. The specific credit events applicable for each credit default swap are stated in the terms of the particular swap agreement. When a Fund has bought (sold) protection in a credit default swap upon occurrence of a specific credit event with respect to the underlying referenced entity, the Fund will either (i) deliver (receive) that security, or an equivalent amount of cash, from the counterparty
in exchange for receipt (payment) of the notional amount to the counterparty, or (ii) receive (pay) a net settlement amount of the credit default swap contract less the recovery value of the referenced obligation or underlying securities comprising the referenced index. The difference between the value of the security received (delivered) and the notional amount delivered (received) is recorded as a realized gain or loss. Payments paid (received) at the beginning of the measurement period are recognized as a component of “Credit default swaps premiums paid and/or received” on the Statement of Assets and Liabilities, when applicable.
Credit default swap contracts are valued daily. Changes in the value of a credit default swap during the fiscal period are recognized as a component of “Change in net unrealized appreciation (depreciation) of swaps” and realized gains and losses are recognized as a component of “Net realized gain (loss) from swaps” on the Statement of Operations.
For OTC swaps not cleared through a clearing house (“OTC Uncleared”), the daily change in the market value of the swap contract, along with any daily interest fees accrued, are recognized as components of “Unrealized appreciation or depreciation on credit default swaps” on the Statement of Assets and Liabilities.
Upon the execution of an OTC swap cleared through a clearing house (“OTC Cleared”), a Fund is obligated to deposit cash or eligible securities, also known as “initial margin,” into an account at its clearing broker equal to a specified percentage of the contract amount. Cash held by the broker to cover initial margin requirements on open swap contracts, if any, is recognized as “Cash collateral at brokers for investments in swaps” on the Statement of Assets and Liabilities. Investments in OTC Cleared swaps obligate a Fund and the clearing broker to settle monies on a daily basis representing changes in the prior day’s“mark-to-market” of the swap. If a Fund has unrealized appreciation, the clearing broker would credit the Fund’s account with an amount equal to the appreciation and conversely if a Fund has unrealized depreciation, the clearing broker will debit a Fund’s account with an amount equal to the depreciation. These daily cash settlements are also known as “variation margin.” Variation margin for OTC Cleared swaps is recognized as a receivable and/or payable for “Variation margin on swap contracts” on the Statement of Assets and Liabilities. Upon the execution of an OTC Uncleared swap, neither the Fund nor the counterparty is required to deposit initial margin as the trades are recorded bilaterally between both parties to the swap contract, and the terms of the variation margin are subject to a predetermined threshold negotiated by the Fund and the counterparty. Variation margin for OTC Uncleared swaps is recognized as a component of “Unrealized appreciation or depreciation on credit default swaps” as described in the preceding paragraph. The maximum potential amount of future payments the Fund could incur as a buyer or seller of protection in a credit default swap contract is limited to the notional amount of the contract. The maximum potential amount would be offset by the recovery value, if any, of the respective referenced entity.
During the current fiscal period, High Income used to hedge a portion of the Fund’s high yield credit exposure. Strategic Income used credit default swaps as a way to take on broad high yield exposure amid some repositioning in the portfolio.
The average notional amount of credit default swap contacts outstanding during the current fiscal period was as follows:
| | | | | | | | |
| | | High Income Bond | | | Strategic Income | |
| Average notional amount of credit default swap contracts outstanding* | | $ | 2,000,000 | | | $ | 6,000,000 | |
| * | The average notional amount is calculated based on the outstanding notional at the beginning of the current fiscal period and at the end of each fiscal quarter within the current fiscal period. The Funds did not have any credit default swaps at the beginning of the fiscal period and at the end of each fiscal quarter within the current fiscal period. |
The following table presents the fair value of all swap contracts held by the Funds as of the end of the reporting period, the location of these instruments on the Statement of Assets and Liabilities and the primary underlying risk exposure.
| | | | | | | | | | | | | | |
| | | | | Location on the Statement of Assets and Liabilities | |
| | | | | Asset Derivatives | | | (Liability) Derivatives | |
Underlying
Risk Exposure | | Derivative Instrument | | Location | | Value | | | Location | | Value | |
High Income Bond | | | | | | | | | | | | |
| | | | | |
Interest Rate | | Swaps (OTC Cleared) | | Receivable for variation margin on swap contracts* | | $ | 25,642 | | | — | | $ | — | |
| | | | | |
Strategic Income | | | | | | | | | | | | | | |
| | | | | |
Interest Rate | | Swaps (OTC Cleared) | | — | | $ | — | | | Payable for variation margin
on swap contracts* | | $ | (242,818 | ) |
| * | Value represents unrealized appreciation (depreciation) of swaps as reported in the Fund’s Portfolio of Investments and not the asset and/or liability amount as described in the table above. |
66
The following table presents the amount of net realized gain (loss) and change in net unrealized appreciation (depreciation) recognized on swap contracts on the Statement of Operations during the current fiscal period, and the primary underlying risk exposure.
| | | | | | | | | | | | |
| Fund | | Underlying
Risk Exposure | | Derivative
Instrument | | Net Realized
Gain (Loss)
from Swaps | | | Change in Net
Unrealized Appreciation
(Depreciation) of Swaps | |
| High Income Bond | | Credit | | Swaps | | $ | (653,663 | ) | | $ | 25,642 | |
| Strategic Income | | Credit | | Swaps | | $ | (109,061 | ) | | $ | (242,818 | ) |
| | | Interest | | Swaps | | | (2,852,635 | ) | | | 549,030 | |
| Total | | | | | | $ | (2,961,696 | ) | | $ | 306,212 | |
Market and Counterparty Credit Risk
In the normal course of business each Fund may invest in financial instruments and enter into financial transactions where risk of potential loss exists due to changes in the market (market risk) or failure of the other party to the transaction to perform (counterparty credit risk). The potential loss could exceed the value of the financial assets recorded on the financial statements. Financial assets, which potentially expose each Fund to counterparty credit risk, consist principally of cash due from counterparties on forward, option and swap transactions, when applicable. The extent of each Fund’s exposure to counterparty credit risk in respect to these financial assets approximates their carrying value as recorded on the Statement of Assets and Liabilities.
Each Fund helps manage counterparty credit risk by entering into agreements only with counterparties the Adviser believes have the financial resources to honor their obligations and by having the Adviser monitor the financial stability of the counterparties. Additionally, counterparties may be required to pledge collateral daily (based on the daily valuation of the financial asset) on behalf of each Fund with a value approximately equal to the amount of any unrealized gain above a pre-determined threshold. Reciprocally, when each Fund has an unrealized loss, the Funds have instructed the custodian to pledge assets of the Funds as collateral with a value approximately equal to the amount of the unrealized loss above apre-determined threshold. Collateral pledges are monitored and subsequently adjusted if and when the valuations fluctuate, either up or down, by at least thepre-determined threshold amount.
4. Fund Shares
On December 12, 2018, Class T Shares were liquidated.
Transactions in Fund shares during the current and prior fiscal period were as follows:
| | | | | | | | | | | | | | | | |
| | | Year Ended
6/30/19 | | | Year Ended
6/30/18 | |
| High Income Bond | | Shares | | | Amount | | | Shares | | | Amount | |
| Shares sold: | | | | | | | | | | | | | | | | |
Class A | | | 14,857,337 | | | $ | 108,487,700 | | | | 17,652,996 | | | $ | 136,868,692 | |
Class A – automatic conversion of Class C Shares | | | 3,891 | | | | 28,291 | | | | — | | | | — | |
Class C | | | 1,010,630 | | | | 7,430,289 | | | | 1,187,622 | | | | 9,211,820 | |
Class R3 | | | 7,620 | | | | 57,202 | | | | 10,132 | | | | 80,205 | |
Class I | | | 16,978,120 | | | | 125,049,345 | | | | 22,389,571 | | | | 174,488,964 | |
| Shares issued to shareholders due to reinvestment of distributions: | | | | | | | | | | | | | | | | |
Class A | | | 1,111,439 | | | | 8,167,919 | | | | 1,074,495 | | | | 8,295,860 | |
Class C | | | 271,745 | | | | 1,992,842 | | | | 341,483 | | | | 2,633,531 | |
Class R3 | | | 3,260 | | | | 24,443 | | | | 4,177 | | | | 32,969 | |
Class I | | | 875,450 | | | | 6,451,972 | | | | 1,181,098 | | | | 9,162,487 | |
| | | | 35,119,492 | | | | 257,690,003 | | | | 43,841,574 | | | | 340,774,528 | |
| Shares redeemed: | | | | | | | | | | | | | | | | |
Class A | | | (12,411,998 | ) | | | (91,239,124 | ) | | | (19,461,487 | ) | | | (150,787,002 | ) |
Class C | | | (1,962,557 | ) | | | (14,460,897 | ) | | | (2,170,940 | ) | | | (16,699,860 | ) |
Class C – automatic conversion of Class A Shares | | | (3,896 | ) | | | (28,291 | ) | | | — | | | | — | |
Class R3 | | | (33,371 | ) | | | (251,879 | ) | | | (47,517 | ) | | | (377,065 | ) |
Class I | | | (22,794,940 | ) | | | (167,766,977 | ) | | | (30,624,226 | ) | | | (237,138,482 | ) |
Class T | | | (3,161 | ) | | | (22,598 | ) | | | — | | | | — | |
| | | | (37,209,923 | ) | | | (273,769,766 | ) | | | (52,304,170 | ) | | | (405,002,409 | ) |
| Net increase (decrease) | | | (2,090,431 | ) | | $ | (16,079,763 | ) | | | (8,462,596 | ) | | $ | (64,227,881 | ) |
67
Notes to Financial Statements(continued)
| | | | | | | | | | | | | | | | |
| | | Year Ended
6/30/19 | | | Year Ended
6/30/18 | |
| Strategic Income | | Shares | | | Amount | | | Shares | | | Amount | |
| Shares sold: | | | | | | | | | | | | | | | | |
Class A | | | 1,864,425 | | | $ | 19,087,479 | | | | 2,683,588 | | | $ | 28,377,306 | |
Class A – automatic conversion of Class C Shares | | | 9,521 | | | | 97,015 | | | | — | | | | — | |
Class C | | | 243,747 | | | | 2,473,021 | | | | 803,487 | | | | 8,466,196 | |
Class R3 | | | 177,043 | | | | 1,813,886 | | | | 206,541 | | | | 2,172,121 | |
Class R6 | | | 934,679 | | | | 9,637,881 | | | | 4,457,391 | | | | 47,737,747 | |
Class I | | | 7,319,706 | | | | 74,908,459 | | | | 14,005,431 | | | | 147,411,778 | |
| Shares issued to shareholders due to reinvestment of distributions: | | | | | | | | | | | | | | | | |
Class A | | | 265,623 | | | | 2,714,756 | | | | 416,049 | | | | 4,374,046 | |
Class C | | | 114,832 | | | | 1,166,653 | | | | 184,713 | | | | 1,932,280 | |
Class R3 | | | 9,027 | | | | 92,765 | | | | 12,106 | | | | 127,754 | |
Class R6 | | | 156,686 | | | | 1,608,403 | | | | 132,372 | | | | 1,386,723 | |
Class I | | | 778,897 | | | | 7,957,863 | | | | 1,063,993 | | | | 11,169,751 | |
| | | | 11,874,186 | | | | 121,558,181 | | | | 23,965,671 | | | | 253,155,702 | |
| Shares redeemed: | | | | | | | | | | | | | | | | |
Class A | | | (4,428,723 | ) | | | (44,937,856 | ) | | | (5,467,652 | ) | | | (57,434,163 | ) |
Class C | | | (2,256,628 | ) | | | (22,892,717 | ) | | | (2,319,234 | ) | | | (24,188,687 | ) |
Class C – automatic conversion of Class A Shares | | | (9,568 | ) | | | (97,015 | ) | | | — | | | | — | |
Class R3 | | | (498,671 | ) | | | (5,162,337 | ) | | | (328,430 | ) | | | (3,453,562 | ) |
Class R6 | | | (949,406 | ) | | | (9,731,682 | ) | | | (865,131 | ) | | | (9,161,916 | ) |
Class I | | | (18,860,199 | ) | | | (191,647,964 | ) | | | (17,331,712 | ) | | | (181,031,933 | ) |
Class T | | | (2,343 | ) | | | (23,290 | ) | | | — | | | | — | |
| | | | (27,005,538 | ) | | | (274,492,861 | ) | | | (26,312,159 | ) | | | (275,270,261 | ) |
| Net increase (decrease) | | | (15,131,352 | ) | | $ | (152,934,680 | ) | | | (2,346,488 | ) | | $ | (22,114,559 | ) |
5. Investment Transactions
Long-term purchases and sales (including maturities but excluding investments purchased with collateral from securities lending and derivative transactions) during the current fiscal period were as follows:
| | | | | | | | |
| | | High Income
Bond | | | Strategic
Income | |
| Purchases: | | | | | | | | |
Investment securities | | $ | 307,633,613 | | | $ | 295,562,059 | |
U.S. Government and agency obligations | | | 1,000,000 | | | | 33,584,176 | |
| Sales and maturities: | | | | | | | | |
Investment securities | | | 337,953,247 | | | | 408,551,668 | |
U.S. Government and agency obligations | | | 2,270,000 | | | | 40,590,017 | |
6. Income Tax Information
Each Fund is a separate taxpayer for federal income tax purposes. Each Fund intends to distribute substantially all of its net investment income and net capital gains to shareholders and to otherwise comply with the requirements of Subchapter M of the Internal Revenue Code applicable to regulated investment companies. Therefore, no federal income tax provision is required.
For all open tax years and all major taxing jurisdictions, management of the Funds has concluded that there are no significant uncertain tax positions that would require recognition in the financial statements. Open tax years are those that are open for examination by taxing authorities (i.e., generally the last four tax year ends and the interim tax period since then). Furthermore, management of the Funds is also not aware of any tax positions for which it is reasonably possible that the total amounts of unrecognized tax benefits will significantly change in the next twelve months.
The following information is presented on an income tax basis. Differences between amounts for financial statement and federal income tax purposes are primarily due to timing differences in recognizing certain gains and losses on investment transactions. To the extent that differences arise that are permanent in nature, such amounts are reclassified within the capital accounts as detailed below. Temporary differences do not require reclassification. Temporary and permanent differences do not impact the NAVs of the Funds.
The tables below present the cost and unrealized appreciation (depreciation) of each Fund’s investment portfolio, as determined on a federal income tax basis, as of June 30, 2019.
For purposes of this disclosure, derivative tax cost is generally the sum of any upfront fees or premiums exchanged and any amounts unrealized for income statement reporting but realized in income and/or capital gains for tax reporting. If a particular derivative category does not disclose any tax unrealized appreciation or depreciation, the change in value of those derivatives have generally been fully realized for tax purposes.
68
| | | | | | | | |
| | | High Income
Bond | | | Strategic
Income | |
| Tax cost of investments | | $ | 303,925,234 | | | $ | 597,998,963 | |
| Gross unrealized: | | | | | | | | |
Appreciation | | $ | 8,710,233 | | | $ | 16,581,142 | |
Depreciation | | | (7,250,604 | ) | | | (2,093,628 | ) |
| Net unrealized appreciation (depreciation) of investments | | $ | 1,459,629 | | | $ | 14,487,514 | |
| | | | | | | | |
| | | | | | Strategic
Income | |
| Tax cost of futures contracts | | | | | | $ | 783,605 | |
| Net unrealized appreciation (depreciation) of futures contracts | | | | | | | — | |
| | | | | | | | |
| | | High Income
Bond | | | Strategic
Income | |
| Tax cost of swaps | | $ | 768,365 | | | $ | (2,305,095 | ) |
| Net unrealized appreciation (depreciation) of swaps | | | — | | | | — | |
Permanent differences, primarily due to federal taxes paid, investments in passive foreign investment companies, foreign currency transactions, complex security character adjustments, investments in partnerships and treatment of notional principal contracts, resulted in reclassifications among the Funds’ components of net assets as of June 30, 2019, the Funds’ tax year end.
The tax components of undistributed net ordinary income and net long-term capital gains as of June 30, 2019, the Funds’ tax year end, were as follows:
| | | | | | | | |
| | | High Income
Bond | | | Strategic
Income | |
| Undistributed net ordinary income1 | | $ | 639,462 | | | $ | 1,521,363 | |
| Undistributed net long-term capital gains | | | — | | | | — | |
| 1 | Undistributed net ordinary income (on a tax basis) has not been reduced for the dividend declared during the period June 1, 2019 through June 30, 2019 and paid on July 1, 2019. Net ordinary income consists of net taxable income derived from dividends, interest and net short-term capital gains, if any. |
The tax character of distributions paid during the Funds’ tax years ended June 30, 2019 and June 30, 2018 was designated for purposes of the dividends paid deduction as follows:
| | | | | | | | |
| 2019 | | High Income
Bond | | | Strategic
Income | |
| Distributions from net ordinary income2 | | $ | 19,524,783 | | | $ | 22,669,921 | |
| Distributions from net long-term capital gains | | | — | | | | — | |
| Return of capital | | | — | | | | — | |
| | | | | | | | |
| 2018 | | High Income
Bond | | | Strategic
Income | |
| Distributions from net ordinary income2 | | $ | 24,114,668 | | | $ | 17,866,927 | |
| Distributions from net long-term capital gains | | | — | | | | — | |
| Return of capital | | | — | | | | 14,569,390 | |
| 2 | Net ordinary income consists of net taxable income derived from dividends, interest and net short-term capital gains, if any. |
As of June 30, 2019, the Funds’ tax year end, the Funds had unused capital losses carrying forward available for federal income tax purposes to be applied against future capital gains, if any. The capital losses are not subject to expiration.
| | | | | | | | |
| | | High Income
Bond | | | Strategic
Income | |
| Not subject to expiration: | | | | | | | | |
Short-term | | $ | 45,922,573 | | | $ | 27,322,257 | |
Long-term | | | 80,054,914 | | | | 32,824,222 | |
| Total | | $ | 125,977,487 | | | $ | 60,146,479 | |
The Funds have elected to defer late-year losses in accordance with federal income tax rules. These losses are treated as having arisen on the first day of the following fiscal year. The following Fund has elected to defer losses as follows:
| | | | | | | | |
| | | | | | High Income
Bond | |
| Post-October capital losses3 | | | | | | $ | — | |
| Late-year ordinary losses4 | | | | | | | 1,000,771 | |
| 3 | Capital losses incurred from November 1, 2018 through June 30, 2019, the Funds’ tax year end. |
| 4 | Ordinary losses incurred from January 1, 2019 through June 30, 2019 and/or specified losses incurred from November 1, 2018 through June 30, 2019. |
69
Notes to Financial Statements(continued)
7. Management Fees and Other Transactions with Affiliates
Management Fees
Each Fund’s management fee compensates the Adviser for the overall investment advisory and administrative services and general office facilities. The Sub-Adviser is compensated for its services to the Funds from the management fees paid to the Adviser.
Each Fund’s management fee consists of two components – a fund-level fee, based only on the amount of assets within each individual Fund, and a complex-level fee, based on the aggregate amount of all eligible fund assets managed by the Adviser. This pricing structure enables each Fund’s shareholders to benefit from growth in the assets within their respective Fund as well as from growth in the amount of complex-wide assets managed by the Adviser.
The annual fund-level fee, payable monthly, for each Fund is calculated according to the following schedule:
| | | | | | | | |
| Average Daily Net Assets | | High Income Bond | | | Strategic Income | |
| For the first $125 million | | | 0.4000 | % | | | 0.3600 | % |
| For the next $125 million | | | 0.3875 | | | | 0.3475 | |
| For the next $250 million | | | 0.3750 | | | | 0.3350 | |
| For the next $500 million | | | 0.3625 | | | | 0.3225 | |
| For the next $1 billion | | | 0.3500 | | | | 0.3100 | |
| For the next $3 billion | | | 0.3250 | | | | 0.2850 | |
| For the next $5 billion | | | 0.3000 | | | | 0.2600 | |
| For net assets over $10 billion | | | 0.2875 | | | | 0.2475 | |
The annual complex-level fee, payable monthly, for each Fund is determined by taking the complex-level fee rate, which is based on the aggregate amount of “eligible assets” of all Nuveen funds as set forth in the schedule below, and making, as appropriate, an upward adjustment to that rate based upon the percentage of the particular fund’s assets that are not “eligible assets.” The complex-level fee schedule for each Fund is as follows:
| | | | |
| Complex-Level Eligible Asset Breakpoint Level* | | Effective Complex-Level Fee Rate at Breakpoint Level | |
| $55 billion | | | 0.2000 | % |
| $56 billion | | | 0.1996 | |
| $57 billion | | | 0.1989 | |
| $60 billion | | | 0.1961 | |
| $63 billion | | | 0.1931 | |
| $66 billion | | | 0.1900 | |
| $71 billion | | | 0.1851 | |
| $76 billion | | | 0.1806 | |
| $80 billion | | | 0.1773 | |
| $91 billion | | | 0.1691 | |
| $125 billion | | | 0.1599 | |
| $200 billion | | | 0.1505 | |
| $250 billion | | | 0.1469 | |
| $300 billion | | | 0.1445 | |
| * | The complex-level fee is calculated based upon the aggregate daily “eligible assets” of all Nuveen open-end and closed-end funds. Eligible assets do not include assets attributable to investments in other Nuveen funds or assets in excess of a determined amount (originally $2 billion) added to the Nuveen fund complex in connection with the Adviser’s assumption of the management of the former First American Funds effective January 1, 2011. Eligible assets includeclosed-end fund assets managed by the Adviser that are attributable to certain types of leverage. For these purposes, leverage includes theclosed-end funds’ use of preferred stock and borrowings and certain investments in the residual interest certificates (also called inverse floating rate securities) in tender option bond (TOB) trusts, including the portion of assets held by the TOB trust that has been effectively financed by the trust’s issuance of floating rate securities, subject to an agreement by the Adviser as to certain funds to limit the amount of such assets for determining eligible assets in certain circumstances. As of June 30, 2019, the complex-level fee for each Fund was 0.2000%. |
The Adviser has agreed to waive fees and/or reimburse expenses (“Expense Cap”) of each Fund so that total annual Fund operating expenses (excluding 12b-1 distribution and/or service fees, interest expenses, taxes, acquired fund fees and expenses, fees occurred in acquiring and disposing of portfolio securities and extraordinary expenses) do not exceed the average daily net assets of any class of Fund shares in the amounts and for the time periods stated in the following table. However, because Class R6 Shares are not subject to sub-transfer agent and similar fees, the total annual Fund operating expenses for the Class R6 Shares will be less than the expense limitation. The expense limitation in effect thereafter may be terminated or modified only with the approval of the Board.
| | | | | | |
| Fund | | Expense Cap | | | Expense Cap
Expiration Date |
High Income Bond | | | 0.75 | % | | July 31, 2021 |
Strategic Income | | | 0.59 | | | July 31, 2021 |
70
Other Transactions with Affiliates
During the current fiscal period, Nuveen Securities, LLC, (the “Distributor”), a wholly-owned subsidiary of Nuveen, collected sales charges on purchases of Class A Shares, the majority of which were paid out as concessions to financial intermediaries as follows:
| | | | | | | | |
| | | High Income
Bond | | | Strategic
Income | |
| Sales charges collected (Unaudited) | | $ | 412,277 | | | $ | 76,137 | |
| Paid to financial intermediaries (Unaudited) | | | 368,427 | | | | 68,761 | |
The Distributor also received12b-1 service fees on Class A Shares, substantially all of which were paid to compensate financial intermediaries for providing services to shareholders relating to their investments.
During the current fiscal period, the Distributor compensated financial intermediaries directly with commission advances at the time of purchase as follows:
| | | | | | | | |
| | | High Income
Bond | | | Strategic
Income | |
| Commission advances (Unaudited) | | $ | 93,972 | | | $ | 32,194 | |
To compensate for commissions advanced to financial intermediaries, all12b-1 service and distribution fees collected on Class C Shares during the first year following a purchase are retained by the Distributor. During the current fiscal period, the Distributor retained such12b-1 fees as follows:
| | | | | | | | |
| | | High Income
Bond | | | Strategic
Income | |
| 12b-1 fees retained (Unaudited) | | $ | 60,112 | | | $ | 32,085 | |
The remaining12b-1 fees charged to the Funds were paid to compensate financial intermediaries for providing services to shareholders relating to their investments.
The Distributor also collected and retained CDSC on share redemptions during the current fiscal period, as follows:
| | | | | | | | |
| | | High Income
Bond | | | Strategic
Income | |
| CDSC retained (Unaudited) | | $ | 8,753 | | | $ | 8,059 | |
8. Borrowing Arrangements
Committed Line of Credit
The Funds, along with certain other funds managed by the Adviser (“Participating Funds”), have established a 364-day, $2.65 billion standby credit facility with a group of lenders, under which the Participating Funds may borrow for various purposes other than leveraging for investment purposes. Each Participating Fund is allocated a designated proportion of the facility’s capacity (and its associated costs, as described below) based upon a multi-factor assessment of the likelihood and frequency of its need to draw on the facility, the size of the Fund and its anticipated draws, and the potential importance of such draws to the operations and well-being of the Fund, relative to those of the other Funds. A Fund may effect draws on the facility in excess of its designated capacity if and to the extent that other Participating Funds have undrawn capacity. The credit facility expires in June 2020 unless extended or renewed.
The credit facility has the following terms: a fee of 0.15% per annum on unused commitment amounts, and interest at a rate equal to the higher of (a) one-month LIBOR (London Inter-Bank Offered Rate) plus 1.00% per annum or (b) the Fed Funds rate plus 1.00% per annum on amounts borrowed. Participating Funds paid administration, legal and arrangement fees, which are recognized as a component of “Other expenses” on the Statement of Operations, and along with commitment fees, have been allocated among such Participating Funds based upon the relative proportions of the facility’s aggregate capacity reserved for them and other factors deemed relevant by the Adviser and the Board of each Participating Fund.
During the current fiscal period, High Income Bond utilized this facility. The Fund’s average daily balance outstanding and average annual interest rate during the utilization period was $13,980,000 and 3.32%, respectively. The Fund’s maximum outstanding daily balance during the utilization period was $17,300,000. Borrowings outstanding as of the end of the reporting period are recognized as “Borrowings” on the Statement of Assets and Liabilities. Strategic Income did not utilize this facility during the current fiscal period.
9. New Accounting Pronouncements
Disclosure Update and Simplification
During August 2018, the Securities and Exchange Commission (the “SEC”) issued Final Rule ReleaseNo. 33-10532,Disclosure Update and Simplification (“Final Rule ReleaseNo. 33-10532”). Final Rule ReleaseNo. 33-10532 amends certain financial statement disclosure requirements to conform to U.S. GAAP. The amendments to Rule6-04.17 of RegulationS-X (balance sheet) remove the requirement to separately state the book basis
71
Notes to Financial Statements(continued)
components of net assets: undistributed (over-distribution of) net investment income (“UNII”), accumulated undistributed net realized gains (losses), and net unrealized appreciation (depreciation) at the balance sheet date. Instead, consistent with U.S. GAAP, funds will be required to disclose total distributable earnings. The amendments to Rule6-09 of RegulationS-X (statement of changes in net assets) remove the requirement to separately state the sources of distributions paid. Instead, consistent with U.S. GAAP, funds will be required to disclose the total amount of distributions paid, except that any tax return of capital must be separately disclosed. The amendments also remove the requirement to parenthetically state the book basis amount of UNII on the statement of changes in net assets.
The requirements of Final Rule ReleaseNo. 33-10532 were effective November 5, 2018, and the Funds’ Statement of Assets and Liabilities and Statement of Changes in Net Assets for the current reporting period have been modified accordingly. In addition, certain amounts within each Fund’s Statement of Changes in Net Assets for the prior fiscal period have been modified to conform to Final Rule ReleaseNo. 33-10532. For the prior fiscal period, the total amount of distributions paid to shareholders from net investment income and from accumulated net realized gains, if any, are recognized as “Dividends” on the Statement of Changes in Net Assets.
As of June 30, 2018, the Funds’ Statement of Changes in Net Assets reflected the following UNII balances.
| | | | | | | | |
| | | High Income
Bond | | | Strategic
Income | |
| UNII at the end of period | | $ | 445,111 | | | $ | (2,198,975 | ) |
FASB Accounting Standards Update (“ASU”) 2017-08 (“ASU 2017-08”) Premium Amortization on Purchased Callable Debt Securities
The FASB has issued ASU 2017-08, which shortens the premium amortization period for purchased non-contingently callable debt securities. ASU 2017-08 specifies that the premium amortization period ends at the earliest call date, for purchased non-contingently callable debt securities. ASU 2017-08 is effective for fiscal years, and interim periods within those fiscal years, beginning after December 15, 2018. Management is currently evaluating the implications of ASU 2017-08, if any.
Fair Value Measurement: Disclosure Framework
During August 2018, the FASB issued ASU 2018-13 (“ASU2018-13”),Fair Value Measurement: Disclosure Framework – Changes to the Disclosure Requirements for Fair Value Measurements.ASU2018-13 modifies the disclosures required by Topic 820,Fair Value Measurements. The amendments in ASU 2018-13 are effective for all entities for fiscal years, and interim periods within those fiscal years, beginning after December 15, 2019. During the current reporting period, management early implemented this guidance. This implementation did not have a material impact on the Funds’ financial statements.
10. Subsequent Events
Complex-Level Management Fee
Effective August 1, 2019 (subsequent to the close of the reporting period), “eligible assets” of the complex-level management fee will include certain assets of certain Nuveen funds that were reorganized into funds advised by an affiliate of the Adviser during the 2019 calendar year.
72
Additional Fund
Information(Unaudited)
| | | | | | | | | | |
| | | | | |
| | Fund Manager Nuveen Fund Advisors, LLC 333 West Wacker Drive Chicago, IL 60606 Sub-Adviser Nuveen Asset Management, LLC 333 West Wacker Drive Chicago, IL 60606 | | Independent Registered
Public Accounting Firm PricewaterhouseCoopers LLP One North Wacker Drive Chicago, IL 60606 Custodian U.S. Bank National Association 1555 North RiverCenter Drive Suite 302 Milwaukee, WI 53202 | | Legal Counsel Chapman and Cutler LLP Chicago, IL 60603 | | Transfer Agent and
Shareholder Services DST Asset Manager
Solutions, Inc. (DST) P.O. Box 219140 Kansas City, MO 64121-9140 (800) 257-8787 | | |
| | | | | | | | | | | | | | | | | | |
| | | | | |
| | | | | | | | | | | | | | |
| | |
| | Distribution Information: The Funds hereby designate their percentages of dividends paid from net ordinary income as dividends qualifying as Interest-Related Dividends and/or short-term capital gain dividends as defined in Internal Revenue Code Section 871(k) for the taxable year ended June 30, 2019: | | | |
| | | | | | | |
| | | | | | | | | | | High Income
Bond | | | Strategic
Income | | | |
| | % of Interest-Related Dividends | | | 86.8% | | | | 73.5% | | | |
| | |
| | Distribution Information: The Funds hereby designate their percentages of dividends paid from net ordinary income as dividends qualifying for the 70% dividends received deduction (“DRD”) for corporations and their percentages of qualified dividend income (“QDI”) for individuals under Section 1(h)(11) of the Internal Revenue Code as shown in the accompanying table. The actual qualified dividend income distributions will be reported to shareholders on Form1099-DIV which will be sent to shareholders shortly after calendar year end. | | | |
| | | | | | | |
| | | | | | | | | | | High Income
Bond | | | Strategic
Income | | | |
| | % QDI | | | 4.2% | | | | 20.6% | | | |
| | % DRD | | | 2.1% | | | | 10.2% | | | |
| | | | | | | | | | | | | | | | |
| | | |
| | | | | | |
| | |
| | Portfolio of Investments Information: Each Fund is required to file its complete schedule of portfolio holdings with the Securities and Exchange Commission (SEC) for the first and third quarters of each fiscal year as an exhibit to its report on Form N-PORT. You may obtain this information on the SEC’s website at http://www.sec.gov. | | |
| | | |
| | | | | | |
| | |
| | Nuveen Funds’ Proxy Voting Information: You may obtain (i) information regarding how each fund voted proxies relating to portfolio securities held during the most recent twelve-month period ended June 30, without charge, upon request, by calling Nuveen toll-free at (800) 257-8787 or on Nuveen’s website at www.nuveen.com and (ii) a description of the policies and procedures that each fund used to determine how to vote proxies relating to portfolio securities without charge, upon request, by calling Nuveen toll-free at(800) 257-8787. You may also obtain this information directly from the SEC. Visit the SEC on-line at http://www.sec.gov. | | |
| | | |
| | | | | | |
| | |
| | FINRA BrokerCheck: The Financial Industry Regulatory Authority (FINRA) provides information regarding the disciplinary history of FINRA member firms and associated investment professionals. This information as well as an investor brochure describing FINRA BrokerCheck is available to the public by calling the FINRA BrokerCheck Hotline number at (800) 289-9999 or by visiting www.FINRA.org. | | |
73
Glossary of Terms
Used in this Report
(Unaudited)
Asset-Backed Securities (ABS): Securities whose value and income payments are derived from and collateralized by a specific pool of underlying assets. The pool of assets typically is a group of small and/or illiquid assets that may be difficult to sell individually. The underlying pools of asset-backed securities often include payments from credit cards, auto loans or mortgage loans.
Average Annual Total Return: This is a commonly used method to express an investment’s performance over a particular, usually multi-year time period. It expresses the return that would have been necessary each year to equal the investment’s actual cumulative performance (including change in NAV or offer price and reinvested dividends and capital gains distributions, if any) over the time period being considered.
Basis Point: One one-hundredth of one percentage point, or 0.01%. For example, 25 basis points equals 0.25%.
Beta: A measure of the variability of the change in the share price for a fund in relation to a change in the value of the fund’s market benchmark. Securities with betas higher than 1.0 have been, and are expected to be, more volatile than the benchmark; securities with betas lower than 1.0 have been, and are expected to be, less volatile than the benchmark.
Bloomberg Barclays U.S. Aggregate Bond Index: An unmanaged index that includes all investment-grade, publicly issued,fixed-rate, dollar denominated, nonconvertible debt issues and commercial mortgage-backed securities with maturities of at least one year and outstanding par values of $150 million or more. Index returns assume reinvestment of distributions, but do not include the effects of any applicable sales charges or management fees.
Bloomberg Barclays High Yield 2% Issuer Capped Index: An issuer-constrained version of the U.S. Corporate High-Yield Index that covers the U.S. dollar denominated, non-investment grade, fixed-rate, taxable corporate bond market. Index returns assume reinvestment of distributions, but do not include the effects of any applicable sales charges or management fees.
Commercial Mortgage-Backed Securities (CMBS): Commercial mortgage-backed securities are backed by cash flows of a mortgage or pool of mortgages on commercial real estate. CMBS generally are structured to provide protection to the senior class investors against potential losses on the underlying mortgage loans. CMBS are typically characterized by the following: i) loans on multi-family housing,non-residential property, ii) payments based on the amortization schedule of25-30 years with a balloon payment due usually after 10 years, and iii) restrictions on prepayments.
Contingent Capital Securities (CoCos): CoCos are debt or capital securities of primarily non-U.S. issuers with loss absorption contingency mechanisms built into the terms of the security, for example a mandatory conversion into common stock of the issuer, or a principal write-down, which if triggered would likely cause the CoCo investment to lose value. Loss absorption mechanisms would become effective upon the occurrence of a specified contingency event, or at the discretion of a regulatory body. Specified contingency events, as identified in the CoCo’s governing documents, usually reference a decline in the issuer’s capital below a specified threshold level, and/or certain regulatory events. A loss absorption contingency event for CoCos would likely be the result of, or related to, the deterioration of the issuer’s financial condition and/or its status as a going concern. In such a case, with respect to CoCos that provide for conversion into common stock upon the occurrence of the contingency event, the market price of the issuer’s common stock received by the Acquiring Fund will have likely declined, perhaps substantially, and may continue to decline after conversion. CoCos rated below investment grade should be considered high yield securities, or “junk,” but often are issued by entities whose more senior securities are rated investment grade. CoCos are a relatively new type of security; and there is a risk that CoCo security issuers may suffer the sort of future financial distress that could materially increase the likelihood (or the market’s perception of the likelihood) that an automatic write-down or conversion event on those
74
issuers’ CoCos will occur. Additionally, the trading behavior of a given issuer’s CoCo may be strongly impacted by the trading behavior of other issuers’ CoCos, such that negative information from an unrelated CoCo security may cause a decline in value of one or more CoCos held by the Fund. Accordingly, the trading behavior of CoCos may not follow the trading behavior of other types of debt and preferred securities. Despite these concerns, the prospective reward vs. risk characteristics of at least certain CoCos may be very attractive relative to other fixed-income alternatives.
Duration: Duration is a measure of the expected period over which a bond’s principal and interest will be paid, and consequently is a measure of the sensitivity of a bond’s or bond fund’s value to changes when market interest rates change. Generally, the longer a bond’s or fund’s duration, the more the price of the bond or fund will change as interest rates change.
Gross Domestic Product (GDP): The total market value of all final goods and services produced in a country/region in a given year, equal to total consumer, investment and government spending, plus the value of exports, minus the value of imports.
Lipper High Current Yield Funds Classification Average: Represents the average annualized returns for all reporting funds in the Lipper High Current Yield Funds Classification. Lipper returns account for the effects of management fees and assume reinvestment of distributions, but do not reflect any applicable sales charge.
Lipper Multi-Sector Income Funds Classification Average: Represents the average annualized returns for all reporting funds in the Lipper Multi-Sector Income Funds Classification. Lipper returns account for the effects of management fees and assume reinvestment of distributions, but do not reflect any applicable sales charge.
Mortgage-Backed Securities (MBS): Mortgage-backed securities (MBS) are bonds backed by pools of mortgages, usually with similar characteristics, and which return principal and interest in each payment. MBS are composed of residential mortgages (RMBS) or commercial mortgages (CMBS). RMBS are further divided into agency RMBS andnon-agency RMBS, depending on the issuer.
Net Asset Value (NAV) Per Share: A fund’s Net Assets is equal to its total assets (securities, cash and accrued earnings) less its total liabilities. For funds with multiple classes, Net Assets are determined separately for each share class. NAV per share is equal to the fund’s (or share class’) Net Assets divided by its number of shares outstanding.
Tax Equalization: The practice of treating a portion of the distribution made to a redeeming shareholder, which represents his proportionate part of undistributed net investment income and capital gain as a distribution for tax purposes. Such amounts are referred to as the equalization debits (or payments) and will be considered a distribution to the shareholder of net investment income and capital gain for calculation of the fund’s dividends paid deduction.
75
Annual Investment Management Agreement Approval Process
(Unaudited)
At a meeting held onMay 21-23, 2019 (the“May Meeting”), the Board of Directors (the“Board” and each Director, a“Board Member”) of the Funds, including the Board Members who are not “interested persons” (as defined under the Investment Company Act of 1940 (the“1940 Act”)) (the“Independent Board Members”), approved, for each Fund, the renewal of the management agreement (each, an“Investment Management Agreement”) with Nuveen Fund Advisors, LLC (the“Adviser”) pursuant to which the Adviser serves as investment adviser to such Fund and thesub-advisory agreement (each, a“Sub-Advisory Agreement”) with Nuveen Asset Management, LLC (the“Sub-Adviser”) pursuant to which theSub-Adviser serves as thesub-adviser to such Fund. Following an initialtwo-year period, the Board, including the Independent Board Members, is required under the 1940 Act to review and approve each Investment Management Agreement andSub-Advisory Agreement on behalf of the applicable Fund on an annual basis. The Investment Management Agreements andSub-Advisory Agreements are collectively referred to as the“Advisory Agreements”and the Adviser and theSub-Adviser are collectively, the“Fund Advisers” and each, a“Fund Adviser.”1
In response to a request on behalf of the Independent Board Members by independent legal counsel, the Board received and reviewed prior to the May Meeting extensive materials specifically prepared for the annual review of Advisory Agreements by the Adviser as well as by Broadridge Financial Solutions, Inc. (“Broadridge”), an independent provider of investment company data. The materials provided in connection with the annual review covered a breadth of subject matter including, but not limited to, a description of the nature, extent and quality of services provided by the Fund Advisers; a review of theSub-Adviser and investment team; an analysis of fund performance in absolute terms and as compared to the performance of certain peer funds and benchmarks with a focus on any performance outliers; an analysis of the fees and expense ratios of the Nuveen funds in absolute terms and as compared to those of certain peer funds with a focus on any expense outliers; a description of portfolio manager compensation; a review of the performance of various service providers; a description of various initiatives Nuveen had undertaken or continued during the year for the benefit of particular fund(s) and/or the complex; a description of the profitability or financial data of Nuveen and theSub-Adviser; and a description of indirect benefits received by the Fund Advisers as a result of their relationships with the Nuveen funds. The Board Members held anin-person meeting onApril 17-18, 2019 (the“April Meeting”), in part, to review and discuss the performance of the Nuveen funds and the Adviser’s evaluation of the varioussub-advisers to the Nuveen funds. The Independent Board Members asked questions and requested additional information that was provided for the May Meeting.
The information prepared specifically for the annual review of the Advisory Agreements supplemented the information provided to the Board and its committees throughout the year. The Board and its committees met regularly during the year and the information provided and topics discussed were relevant to the review of the Advisory Agreements. Some of these reports and other data included, among other things, materials that outlined the investment performance of the Nuveen funds; strategic plans of the Adviser which may impact the services it provides to the Nuveen funds; the review of the Nuveen funds and applicable investment teams; compliance, regulatory and risk management matters; the trading practices of the varioussub-advisers; valuation of securities; fund expenses; payments to financial intermediaries, including12b-1 fees andsub-transfer agency fees; and overall market and regulatory developments. The Board further continued its practice of seeking to meet periodically with the varioussub-advisers to the Nuveen funds and their investment teams, when feasible. The Independent Board Members considered the review of the Advisory Agreements to be an ongoing process and employed the accumulated information, knowledge, and experience the Board Members had gained during their tenure on the boards governing the Nuveen funds and working with the Fund Advisers in their review of the Advisory Agreements. The contractual arrangements are a result of multiple years of review, negotiation and information provided in connection with the boards’ annual review of the Nuveen funds’ advisory arrangements and oversight of the Nuveen funds.
The Independent Board Members were advised by independent legal counsel during the annual review process as well as throughout the year, including meeting in executive sessions with such counsel at which no representatives from the Adviser or theSub-Adviser were present. In connection with their annual review, the Independent Board Members also received a memorandum from independent legal counsel outlining their fiduciary duties and legal standards in reviewing the Advisory Agreements.
In deciding to renew the Advisory Agreements, the Independent Board Members did not identify a particular factor or information as determinative or controlling, but rather the decision reflected the comprehensive consideration of all the information provided, and each Board Member may have
| 1 | With respect to Nuveen High Income Bond Fund (the“High Income Bond Fund”), at a special meeting held on December 13, 2018, the Board approved the reorganization of such Fund into TIAA-CREF High-Yield Fund, a series of TIAA-CREF Funds (the“Proposed High Income Bond Fund Reorganization”), subject to shareholder approval. To avoid any disruption of services if the Proposed High Income Bond Fund Reorganization was not completed, the Board considered and approved the renewal of the Advisory Agreements for the High Income Bond Fund at the May Meeting. At a special meeting held on June 7, 2019, shareholders of the High Income Bond Fund did not approve the Proposed High Income Bond Fund Reorganization. |
76
attributed different levels of importance to the various factors and information considered in connection with the approval process. The following summarizes the principal factors and information, but not all the factors, the Board considered in deciding to renew the Advisory Agreements and its conclusions.
A. Nature, Extent and Quality of Services
In evaluating the renewal of the Advisory Agreements, the Independent Board Members received and considered information regarding the nature, extent and quality of the applicable Fund Adviser’s services provided to the respective Fund with particular focus on the services and enhancements to such services provided during the last year. The Board recognized that the Adviser provides a comprehensive set of services necessary to operate the Nuveen funds in a highly regulated industry and noted that the scope of such services has expanded over the years as a result of regulatory, market and other developments, such as the development of the liquidity management program and expanded compliance programs. Some of the functions the Adviser is responsible for include, but are not limited to: product management (such as analyzing a fund’s position in the marketplace, setting dividends, preparing shareholder and intermediary communications and other due diligence support); investment oversight (such as analyzing fund performance,sub-advisers and investment teams and analyzing trade executions of portfolio transactions, soft dollar practices and securities lending activities); securities valuation services (such as executing the daily valuation process for portfolio securities and developing and recommending changes to valuation policies and procedures); risk management (such as overseeing operational and investment risks, including stress testing); fund administration (such as preparing fund tax returns and other tax compliance services, overseeing the Nuveen funds’ independent public accountants and other service providers; managing fund budgets and expenses; and helping to fulfill the funds’ regulatory filing requirements); oversight of shareholder services and transfer agency functions (such as oversight and liaison of transfer agent service providers which include registered shareholder customer service and transaction processing); Board relations services (such as organizing and administering Board and committee meetings, preparing various reports to the Board and committees and providing other support services); compliance and regulatory oversight services (such as developing and maintaining a compliance program to ensure compliance with applicable laws and regulations, monitoring compliance with applicable fund policies and procedures and adherence to investment restrictions, and evaluating the compliance programs of the Nuveen fundsub-advisers and certain other service providers); and legal support and oversight of outside law firms (such as with respect to filing and updating registration statements; maintaining various regulatory registrations; and providing legal interpretations regarding fund activities, applicable regulations and implementation of policies and procedures). In reviewing the scope and quality of services, the Board recognized the continued efforts and resources the Adviser and its affiliates have employed to continue to enhance their services for the benefit of the complex as well as particular Nuveen funds over recent years. Such service enhancements have included, but are not limited to:
| | • | | Fund Improvements and Product Management Initiatives – continuing to proactively manage the Nuveen fund complex as a whole and at the individual fund level with an aim to enhance the shareholder outcomes through, among other things, repositioning funds, merging funds, introducing additional share classes, reviewing and updating investment policies and benchmarks, modifying the composition of certain portfolio management teams and analyzing various data to help devise such improvements; |
| | • | | Capital Initiatives – continuing to invest capital to support new funds with initial capital as well as to facilitate modifications to the strategies or structure of existing funds; |
| | • | | Compliance Program Initiatives – continuing efforts to enhance the compliance program through, among other things, internally integrating various portfolio management teams and aligning compliance support accordingly, completing a comprehensive review of existing policies and procedures and revising such policies and procedures as appropriate, enhancingcompliance-related technologies and workflows, and optimizing compliance shared services across the organization and affiliates; |
| | • | | Risk Management and Valuation Services – continuing efforts to strengthen the risk management functions, including through, among other things, enhancing the interaction and reporting between the investment risk management team and various affiliates, increasing the efficiency of risk monitoring performed on the Nuveen funds through improved reporting, continuing to implement risk programs designed to provide a more disciplined and consistent approach to identifying and mitigating operational risks, continuing progress on implementing a liquidity program that complies with the new liquidity regulatory requirements and continuing to oversee the daily valuation process; |
| | • | | Additional Compliance Services – continuing investment of time and resources necessary to develop the compliance policies and procedures and other related tools necessary to meet the various new regulatory requirements affecting the Nuveen funds that have been adopted over recent years; |
| | • | | Government Relations – continuing efforts of various Nuveen teams and affiliates to advocate and communicate their positions with lawmakers and other regulatory bodies on issues that will impact the Nuveen funds; |
| | • | | Business Continuity, Disaster Recovery and Information Services – establishing an information security program to help identify and manage information security risks, periodically testing disaster recovery plans, maintaining and updating business continuity plans and providing reports to the Board, at least annually, addressing, among other things, management’s security risk assessment, cyber risk profile, incident tracking and other relevant information technology risk-related reports; and |
77
Annual Investment Management Agreement Approval Process(Unaudited) (continued)
| | • | | Expanded Dividend Management Services – continuing to expand the services necessary to manage the dividends among the varying types of Nuveen funds that have developed as the Nuveen complex has grown in size and scope. |
In addition to the services provided by the Adviser, the Board also considered the risks borne by the Adviser and its affiliates in managing the Nuveen funds, including entrepreneurial, operational, reputational, regulatory and litigation risks.
The Board further considered the division of responsibilities between the Adviser and theSub-Adviser and recognized that theSub-Adviser and its investment personnel generally are responsible for the management of each Fund’s portfolio. The Board noted that the Adviser oversees theSub-Adviser and considered an analysis of theSub-Adviser provided by the Adviser which included, among other things, theSub-Adviser’s assets under management and changes thereto, a summary of the investment team and changes thereto, the investment approach of the team and the performance of the fundssub-advised by theSub-Adviser over various periods. The Board further considered at the May Meeting or prior meetings evaluations of theSub-Adviser’s compliance program and trade execution. The Board noted that the Adviser recommended the renewal of theSub-Advisory Agreements.
Based on its review, the Board determined, in the exercise of its reasonable business judgment, that it was satisfied with the nature, extent and quality of services provided to the respective Funds under each applicable Advisory Agreement.
B. The Investment Performance of the Funds and Fund Advisers
In evaluating the quality of the services provided by the Fund Advisers, the Board also received and considered the investment performance of the Nuveen funds they advise. In this regard, the Board reviewed Fund performance over the quarter,one-,three- andfive-year periods ending December 31, 2018 as well as performance data for the first quarter of 2019 ending March 29, 2019. The performance data was based on Class A shares; however, the performance of other classes should be substantially similar as they invest in the same portfolio of securities and differences in performance among the classes would be principally attributed to the variations in the expense structures of the classes. Unless otherwise indicated, the performance data referenced below reflects the periods ended December 31, 2018. The Board considered the Adviser’s analysis of each fund’s performance, with particular focus on funds that were considered performance outliers and the factors contributing to their performance. The Board also noted that it received performance data of the Nuveen funds during its quarterly meetings throughout the year and took into account the discussions that occurred at these Board meetings regarding fund performance. In this regard, in its evaluation of Nuveen fund performance at meetings throughout the year, the Board considered performance information for the funds for different time periods, both absolute and relative to appropriate benchmarks and peers, with particular attention to information indicating underperformance of the respective funds and discussed with the Adviser the reasons for such underperformance.
The Board reviewed both absolute and relative fund performance during the annual review. With respect to the latter, the Board considered fund performance in comparison to the performance of peer funds (the“Performance Peer Group”) and recognized and/or customized benchmarks (i.e., generally benchmarks derived from multiple recognized benchmarks). In considering performance data, the Board is aware of certain inherent limitations with such data, including that differences between the objective(s), strategies and other characteristics of the Nuveen funds compared to the respective Performance Peer Group and/or benchmark(s) (such as differences in the use of leverage) will necessarily contribute to differences in performance results and limit the value of the comparative information. To assist the Board in its review of the comparability of the relative performance, the Adviser has ranked the relevancy of the peer group to the funds as low, medium or high. Depending on the facts and circumstances, however, the Board may be satisfied with a fund’s performance notwithstanding that its performance may be below its benchmark or peer group for certain periods. In addition, the performance data may vary significantly depending on the end date selected, and shareholders may evaluate fund performance based on their own holding period which may differ from the performance periods reviewed by the Board leading to different results. Further, the Board considered a fund’s performance in light of the overall financial market conditions during the respective periods. As noted above, the Board reviewed, among other things, Nuveen fund performance over various periods ended December 31, 2018, and the Board was aware of the market decline in the fourth quarter of 2018 and considered performance from the first quarter of 2019 as well. The Board also noted that a shorter period of underperformance may significantly impact longer term performance.
In their review of performance, the Independent Board Members focused, in particular, on the Adviser’s analysis of Nuveen funds determined to be underperforming performance outliers. The Board recognized that some periods of underperformance may only be temporary while other periods of underperformance may indicate a broader issue that may require a corrective action. Accordingly, with respect to any Nuveen funds for which the Board had identified performance issues, the Board monitors such funds closely until performance improves, discusses with the Adviser the reasons for such results, considers whether any steps are necessary or appropriate to address such issues, and reviews the results of any efforts undertaken.
The Board’s determinations with respect to each Fund are summarized below.
For Nuveen Strategic Income Fund, the Board noted that although the Fund ranked in the fourth quartile of its Performance Peer Group for theone-year period, the Fund ranked in the third quartile for the three- andfive-year periods. Although the Fund’s performance was below the performance of its benchmark for theone- and five-year periods, the Fund outperformed its benchmark for the three-year period. The Board considered the Adviser’s explanation of the factors that detracted from the Fund’s performance and was satisfied with the explanation.
78
For the High Income Bond Fund, the Board noted that although the Fund’s performance was below its benchmark and ranked in the fourth quartile of its Performance Peer Group for theone- andfive-year periods, the Fund ranked in the first quartile of its Performance Peer Group and outperformed its benchmark for thethree-year period. The Board was satisfied with the Fund’s overall performance.
C. Fees, Expenses and Profitability
1. Fees and Expenses
In its annual review, the Board considered the fees paid to the Fund Advisers and the total operating expense ratio of each Nuveen fund, before and after any undertaking by Nuveen to limit the fund’s total annual operating expenses to certain levels. More specifically, the Independent Board Members reviewed, among other things, each fund’s gross and net management fee rates (i.e., before and after expense reimbursements and/or fee waivers, if any) and net total expense ratio in relation to those of a comparable universe of funds (the“Peer Universe”) and to a more focused subset of comparable funds (the“Peer Group”) established by Broadridge. The Independent Board Members reviewed the methodology Broadridge employed to establish its Peer Universe and Peer Group and recognized that differences between the applicable fund and its respective Peer Universe and/or Peer Group as well as changes to the composition of the Peer Group and/or Peer Universe from year to year may limit some of the value of the comparative data. The Independent Board Members also considered a fund’s operating expense ratio as it more directly reflected the shareholder’s costs in investing in the respective fund.
In their review, the Independent Board Members considered, in particular, each fund with a net expense ratio of six basis points or higher compared to that of its peer average (each, an“Expense Outlier Fund”), and an analysis as to the factors contributing to each such fund’s higher relative net expense ratio. Accordingly, in reviewing the comparative data between a fund and its peers, the Board generally considered the fund’s net expense ratio and fees to be higher if they were over 10 basis points higher, slightly higher if they were 6 to 10 basis points higher, in line if they were within approximately 5 basis points higher than the peer average and below if they were below the peer average of the Peer Group. The Independent Board Members also considered, in relevant part, a fund’s net management fee and net total expense ratio in light of its performance history.
In their review of the fee arrangements for the Nuveen funds, the Independent Board Members considered the management fee schedules, including thecomplex-wide andfund-level breakpoint schedules, and the expense reimbursements and/or fee waivers provided by Nuveen for each fund, as applicable. The Board noted that across the Nuveen fund complex, the complex-wide fee breakpoints reduced fees by $51.5 million and fund-level breakpoints reduced fees by $55.1 million in 2018. Further, fee caps and waivers for all applicable Nuveen funds saved an additional $15 million in fees for shareholders in 2018.
With respect to theSub-Adviser, the Board considered thesub-advisory fee paid to theSub-Adviser, including any breakpoint schedule, and as described below, comparative data of the fees theSub-Adviser charges to other clients, if any.
The Independent Board Members noted that each Fund had a net management fee and a net expense ratio that were below the respective peer averages. Based on its review of the information provided, the Board determined that each Fund’s management fees (as applicable) to a Fund Adviser were reasonable in light of the nature, extent and quality of services provided to the Fund.
2. Comparisons with the Fees of Other Clients
In determining the appropriateness of fees, the Board also reviewed information regarding the fee rates the respective Fund Advisers charged to certain other types of clients and the type of services provided to these other clients. For the Adviser and/or theSub-Adviser, such other clients may include retail and institutional managed accounts;sub-advised funds outside the Nuveen family; foreign investment companies offered by Nuveen; and collective investment trusts. The Board further noted that the Adviser also advised certain exchange-traded funds (“ETFs”) sponsored by Nuveen.
The Board recognized that each Fund had an affiliatedsub-adviser and, with respect to affiliatedsub-advisers, reviewed, among other things, the range of fees assessed for managed accounts and foreign investment companies offered by Nuveen. The Board also reviewed the fee range and average fee rate of certain selected investment strategies offered in retail and institutional managed accounts by theSub-Adviser and of thenon-Nuveen investment companiessub-advised by affiliatedsub-advisers.
In addition to the comparative fee data, the Board also reviewed, among other things, a description of the different levels of services provided to certain other clients compared to the services provided to the Nuveen funds as well as the differences in portfolio investment policies, investor profiles, account sizes and regulatory requirements, all of which contribute to the variations in the fee schedules. The Board noted, among other things, the wide range of services in addition to investment management services provided to the Nuveen funds when the Adviser is principally responsible for all aspects of operating the funds, including the increased regulatory requirements that must be met in managing the funds, the larger account sizes of managed accounts and the increased entrepreneurial, legal and regulatory risks that the Adviser incurs in sponsoring and managing the funds. Further, with respect to ETFs, the Board considered that Nuveen ETFs are passively managed compared to the active management of other Nuveen funds which contributed to the differences in fee levels between the Nuveen ETFs and other Nuveen funds. In general, higher fee levels reflect higher levels of service provided by the Adviser, increased investment management complexity, greater product management requirements, and higher levels of business risk or some combination of these factors. The Board further considered that the
79
Annual Investment Management Agreement Approval Process(Unaudited) (continued)
Sub-Adviser’s fee is essentially for portfolio management services and therefore more comparable to the fees it receives for retail wrap accounts and other externalsub-advisory mandates. The Board concluded the varying levels of fees were justified given, among other things, the inherent differences in the products and the level of services provided to the Nuveen funds versus other clients, the differing regulatory requirements and legal liabilities and the entrepreneurial, legal and regulatory risks incurred in sponsoring and advising a registered investment company.
3. Profitability of Fund Advisers
In conjunction with their review of fees, the Independent Board Members considered information regarding Nuveen’s level of profitability for its advisory services to the Nuveen funds for the calendar years 2018 and 2017. The Board reviewed, among other things, Nuveen’s net margins(pre-tax) (both including and excluding distribution expenses); gross and net revenue margins(pre- andpost-tax); revenues, expenses, and net income(pre-tax andafter-tax and before distribution) of Nuveen for fund advisory services; and comparative profitability data comparing the adjusted margins of Nuveen compared to the adjusted margins of certain peers with publicly available data and with the most comparable assets under management (based on asset size and asset composition) for each of the last two calendar years. The Board also reviewed the revenues and expenses the Adviser derived from its ETF product line that was launched in 2016. The Independent Board Members noted that Nuveen’s net margins were higher in 2018 than the previous year and considered the key drivers behind the revenue and expense changes that impacted Nuveen’s net margins between the years. The Board considered the costs of investments in the Nuveen business, including the investment of seed capital in certain Nuveen funds and additional investments in infrastructure and technology. The Independent Board Members also noted that Nuveen’s adjusted margins from its relationships with the Nuveen funds were on the low range compared to the adjusted margins of the peers; however, the Independent Board Members recognized the inherent limitations of the comparative data of other publicly traded peers given that the calculation of profitability is rather subjective and numerous factors (such as types of funds, business mix, cost of capital, methodology to allocate expenses and other factors) can have a significant impact on the results.
The Independent Board Members also reviewed a description of the expense allocation methodology employed to develop the financial information and a summary of the history of changes to the methodology over theten-year period from 2008 to 2018, and recognized that other reasonable allocation methodologies could be employed and lead to significantly different results. The Board noted that two Independent Board Members, along with independent counsel, serve as the Board’s liaisons to review profitability and discuss any proposed changes to the methodology prior to the full Board’s review.
Aside from Nuveen’s profitability, the Board recognized that the Adviser is a subsidiary of Nuveen, LLC, the investment management arm of Teachers Insurance and Annuity Association of America (“TIAA”). As such, the Board also reviewed a balance sheet for TIAA reflecting its assets, liabilities and capital and contingency reserves for the 2018 and 2017 calendar years to consider the financial strength of TIAA having recognized the importance of having an adviser with significant resources.
In addition to Nuveen, the Independent Board Members also considered the profitability of theSub-Adviser from its relationships with the Nuveen funds. In this regard, the Independent Board Members reviewed theSub-Adviser’s revenues, expenses and revenue margins(pre- andpost-tax) for its advisory activities for the calendar year ended December 31, 2018. The Independent Board Members also reviewed a profitability analysis reflecting the revenues, expenses and revenue margin(pre- andpost-tax) by asset type for theSub-Adviser for the calendar year ending December 31, 2018 and thepre- andpost-tax revenue margin from 2018 and 2017.
In evaluating the reasonableness of the compensation, the Independent Board Members also considered any other ancillary benefits derived by the respective Fund Adviser from its relationship with the Nuveen funds as discussed in further detail below.
Based on a consideration of all the information provided, the Board noted that Nuveen’s and theSub-Adviser’s level of profitability was acceptable and not unreasonable in light of the services provided.
D. Economies of Scale and Whether Fee Levels Reflect These Economies of Scale
With respect to economies of scale, the Independent Board Members noted that although economies of scale are difficult to measure, the Adviser shares the benefits of economies of scale in various ways including breakpoints in the management fee schedule (subject to limited exceptions), fee waivers and/or expense limitations, the pricing of Nuveen funds at scale at inception and investments in its business which can enhance the services provided to the funds for the fees paid. With respect to breakpoint schedules, because the Board had previously recognized that economies of scale may occur not only when the assets of a particular Nuveen fund grow but also when the assets in the complex grow, the Nuveen funds generally pay the Adviser a management fee comprised of afund-level component and acomplex-level component each with its own breakpoint schedule, subject to certain exceptions. In general terms, the breakpoint schedule at the fund level reduces fees as assets in the particular fund pass certain thresholds and the breakpoint schedule at the complex level reduces fees on the Nuveen funds as the eligible assets in the complex pass certain thresholds. The Independent Board Members reviewed, among other things, the fund-level and complex-level fee schedules and the temporary and/or permanent expense caps applicable to certain Nuveen funds (including the amounts of fees waived or amounts reimbursed to the respective funds in 2017 and 2018), including the temporary expense cap applicable to each Fund. The Independent Board Members noted that as a result of fund-level management fee changes implemented in June 2017, none of the Nuveenopen-end funds were above their top level fee breakpoint.
80
In addition, the Independent Board Members recognized the Adviser’s continued reinvestment in its business through, among other things, investments in its business infrastructure and information technology, portfolio accounting system as well as other systems and platforms that will, among other things, support growth, simplify and enhance information sharing, and enhance the investment process to the benefit of all of the Nuveen funds.
Based on its review, the Board concluded that the current fee arrangements together with the Adviser’s reinvestment in its business appropriately shared any economies of scale with shareholders.
E. Indirect Benefits
The Independent Board Members received and considered information regarding other benefits the respective Fund Adviser or its affiliates may receive as a result of their relationship with the Nuveen funds. The Independent Board Members recognized that an affiliate of the Adviser serves as principal underwriter providing distribution and/or shareholder services to theopen-end funds. The Independent Board Members further noted that the Nuveenopen-end funds pay12b-1 fees and while a majority of such fees were paid to third party broker-dealers, the Board reviewed the amount retained by the Adviser’s affiliate as a result of serving as principal underwriter. In addition, the Independent Board Members also noted that theSub-Adviser engages in soft dollar transactions pursuant to which it may receive the benefit of research products and other services provided by broker-dealers executing portfolio transactions on behalf of the applicable Nuveen funds.
The Board, however, noted that the benefits for theSub-Adviser when transacting in fixed-income securities may be more limited as such securities generally trade on a principal basis and therefore do not generate brokerage commissions. Further, the Board noted that although theSub-Adviser may benefit from the receipt of research and other services that it may otherwise have to pay for out of its own resources, the research may also benefit the Nuveen funds to the extent it enhances the ability of theSub-Adviser to manage such funds or is acquired through the commissions paid on portfolio transactions of other clients.
Based on their review, the Board concluded that any indirect benefits received by a Fund Adviser as a result of its relationship with the Funds were reasonable and within acceptable parameters.
F. Other Considerations
The Board Members did not identify any single factor discussed previously asall-important or controlling. The Board Members, including the Independent Board Members, concluded that the terms of each Advisory Agreement were fair and reasonable, that the respective Fund Adviser’s fees were reasonable in light of the services provided to each Fund and that the Advisory Agreements be renewed.
81
Trustees and Officers
(Unaudited)
The management of the Funds, including general supervision of the duties performed for the Funds by the Adviser, is the responsibility of the Board of Trustees of the Funds. The number of Trustees of the Funds is currently set at ten. None of the Trustees who are not “interested” persons of the Funds (referred to herein as “Independent Trustees”) has ever been a Trustee or employee of, or consultant to, Nuveen or its affiliates. The names and business addresses of the Trustees and officers of the Funds, their principal occupations and other affiliations during the past five years, the number of portfolios each oversees and other directorships they hold are set forth below.
The Funds’ Statement of Additional Information (“SAI”) includes more information about the Trustees. To request a free copy, call Nuveen Investments at(800) 257-8787 or visit the Funds’ website at www.nuveen.com.
| | | | | | | | |
Name, Year of Birth & Address | | Position(s) Held with the Funds | | Year First Elected or Appointed (1) | | Principal Occupation(s) Including other Directorships During Past 5 Years | | Number of Portfolios in Fund Complex Overseen by Trustee |
| | | |
| Independent Trustees: | | | | |
Terence J. Toth 1959 333 W. Wacker Drive Chicago, IL 60606 | | Chairman and Trustee | | 2008 | | Formerly, aCo-Founding Partner, Promus Capital (2008-2017); Director, Fulcrum IT Service LLC (since 2010) and Quality Control Corporation (since 2012); member: Catalyst Schools of Chicago Board (since 2008) and Mather Foundation Board (since 2012), and chair of its investment committee; formerly, Director, Legal & General Investment Management America, Inc. (2008-2013); formerly, CEO and President, Northern Trust Global Investments (2004-2007); Executive Vice President, Quantitative Management & Securities Lending (2000-2004); prior thereto, various positions with Northern Trust Company (since 1994); formerly, Member, Northern Trust Mutual Funds Board (2005-2007), Northern Trust Global Investments Board (2004-2007), Northern Trust Japan Board (2004-2007), Northern Trust Securities Inc. Board (2003-2007) and Northern Trust Hong Kong Board (1997-2004). | | 163 |
Jack B. Evans 1948 333 W. Wacker Drive Chicago, IL 60606 | | Trustee | | 1999 | | Chairman (since 2019), formerly, President (1996-2019), The Hall-Perrine Foundation, a private philanthropic corporation; Director and Chairman, United Fire Group, a publicly held company; Director, Public member, American Board of Orthopaedic Surgery (since 2015); Life Trustee of Coe College and the Iowa College Foundation; formerly, President Pro-Tem of the Board of Regents for the State of Iowa University System; formerly, Director, Alliant Energy and The Gazette Company; formerly, Director, Federal Reserve Bank of Chicago; formerly, President and Chief Operating Officer, SCI Financial Group, Inc., a regional financial services firm. | | 163 |
William C. Hunter 1948 333 W. Wacker Drive Chicago, IL 60606 | | Trustee | | 2003 | | Dean Emeritus, formerly, Dean, Tippie College of Business, University of Iowa (2006-2012); Director of Wellmark, Inc. (since 2009); past Director (2005-2015), and past President (2010-2014) Beta Gamma Sigma, Inc., The International Business Honor Society; formerly, Director (2004-2018) of Xerox Corporation; Dean and Distinguished Professor of Finance, School of Business at the University of Connecticut (2003-2006); previously, Senior Vice President and Director of Research at the Federal Reserve Bank of Chicago (1995-2003); formerly, Director (1997-2007), Credit Research Center at Georgetown University. | | 163 |
82
| | | | | | | | |
Name, Year of Birth & Address | | Position(s) Held with the Funds | | Year First Elected or Appointed (1) | | Principal Occupation(s) Including other Directorships During Past 5 Years | | Number of Portfolios in Fund Complex Overseen by Trustee |
Albin F. Moschner 1952 333 W. Wacker Drive Chicago, IL 60606 | | Trustee | | 2016 | | Founder and Chief Executive Officer, Northcroft Partners, LLC, a management consulting firm (since 2012); Chairman (since 2019), and Director (since 2012), USA Technologies, Inc., a provider of solutions and services to facilitate electronic payment transactions (since 2012); formerly, Director, Wintrust Financial Corporation (1996-2016); previously, held positions at Leap Wireless International, Inc., including Consultant (2011-2012), Chief Operating Officer (2008-2011), and Chief Marketing Officer (2004-2008); formerly, President, Verizon Card Services division of Verizon Communications, Inc. (2000-2003); formerly, President, One Point Services at One Point Communications (1999-2000); formerly, Vice Chairman of the Board, Diba, Incorporated (1996-1997); formerly, various executive positions (1991-1996) and Chief Executive Officer (1995-1996) of Zenith Electronics Corporation. | | 163 |
John K. Nelson 1962 333 W. Wacker Drive Chicago, IL 60606 | | Trustee | | 2013 | | Member of Board of Directors of Core12 LLC (since 2008), a private firm which develops branding, marketing and communications strategies for clients; serves on The President’s Council, Fordham University (since 2010); and previously was a Director of The Curran Center for Catholic American Studies (2009-2018) formerly, senior external advisor to the financial services practice of Deloitte Consulting LLP (2012-2014); formerly, Chairman of the Board of Trustees of Marian University (2010 as trustee, 2011-2014 as Chairman); formerly, Chief Executive Officer of ABN AMRO N.V. North America, and Global Head of its Financial Markets Division (2007-2008); prior senior positions held at ABN AMRO include Corporate Executive Vice President and Head of GlobalMarkets-the Americas (2006-2007), CEO of Wholesale Banking-North America and Global Head of Foreign Exchange and Futures Markets (2001-2006), and Regional Commercial Treasurer and Senior Vice President Trading-North America (1996-2001); formerly, Trustee at St. Edmund Preparatory School in New York City. | | 163 |
Judith M. Stockdale 1947 333 W. Wacker Drive Chicago, IL 60606 | | Trustee | | 1977 | | Board Member, Land Trust Alliance (since 2013) and U.S. Endowment for Forestry and Communities (since 2013); formerly, Executive Director (1994-2012), Gaylord and Dorothy Donnelley Foundation; prior thereto, Executive Director, Great Lakes Protection Fund (1990-1994). | | 163 |
Carole E. Stone 1947 333 W. Wacker Drive Chicago, IL 60606 | | Trustee | | 2007 | | Former Director, Chicago Board Options Exchange (2006-2017), and C2 Options Exchange, Incorporated (2009-2017); Director, Cboe L.C. Global Markets, Inc., formerly, CBOE Holdings, Inc. (since 2010); formerly, Commissioner, New York State Commission on Public Authority Reform (2005-2010). | | 163 |
Margaret L. Wolff 1955 333 W. Wacker Drive Chicago, IL 60606 | | Trustee | | 2016 | | Formerly, member of the Board of Directors (2013-2017) of Travelers Insurance Company of Canada and The Dominion of Canada General Insurance Company (each, a part of Travelers Canada, the Canadian operation of The Travelers Companies, Inc.); formerly, Of Counsel, Skadden, Arps, Slate, Meagher & Flom LLP (Mergers & Acquisitions Group) (2005-2014); Member of the Board of Trustees of New York-Presbyterian Hospital (since 2005); Member (since 2004) and Chair (since 2015) of the Board of Trustees of The John A. Hartford Foundation (a philanthropy dedicated to improving the care of older adults); formerly, Member (2005-2015) and Vice Chair (2011-2015) of the Board of Trustees of Mt. Holyoke College. | | 163 |
83
Trustees and Officers(Unaudited) (continued)
| | | | | | | | |
Name, Year of Birth & Address | | Position(s)
Held with
the Funds | | Year First Elected or Appointed (1) | | Principal Occupation(s) Including other Directorships During Past 5 Years | | Number of
Portfolios in
Fund Complex
Overseen by Trustee |
Robert L. Young(2) 1963 333 W. Wacker Drive Chicago, IL 60606 | | Trustee | | 2017 | | Formerly, Chief Operating Officer and Director, J.P. Morgan Investment Management Inc. (2010-2016); formerly, President and Principal Executive Officer (2013-2016), and Senior Vice President and Chief Operating Officer (2005-2010), of J.P. Morgan Funds; formerly, Director and various officer positions for J.P. Morgan Investment Management Inc. (formerly, JPMorgan Funds Management, Inc. and formerly, One Group Administrative Services) and JPMorgan Distribution Services, Inc. (formerly, One Group Dealer Services, Inc.) (1999-2017). | | 161 |
| | | |
| Interested Trustee: | | | | |
Margo L. Cook(3) 1964 333 W. Wacker Drive Chicago, IL 60606 | | Trustee | | 2016 | | President (since 2017), formerly,Co-Chief Executive Officer andCo-President (2016-2017), formerly, Senior Executive Vice President of Nuveen Investments, Inc; Executive Vice President (since 2017) of Nuveen, LLC; President, Global Products and Solutions (since 2017), andCo-Chief Executive Officer (since 2015), formerly, Executive Vice President (2013-2015) of Nuveen Securities, LLC; President (since 2017), formerly,Co-President (2016-2017), formerly Senior Executive Vice President (2015-2016) of Nuveen Fund Advisors, LLC (Executive Vice President 2011-2015); President (since 2017), Nuveen Alternative Investments, LLC; Chartered Financial Analyst. | | 163 |
| | | | | | | | |
Name, Year of Birth & Address | | Position(s)
Held with
the Funds | | Year First Elected or Appointed (4) | | Principal Occupation(s)
During Past 5 Years | | |
| | | |
| Officers of the Funds: | | | | |
Greg A. Bottjer 1971 333 W. Wacker Drive Chicago, IL 60606 | | Chief Administrative Officer | | 2016 | | Senior (since 2017) Managing Director (since 2011), formerly, Senior Vice President (2007-2010) of Nuveen; Senior (since 2017) Managing Director (since 2016) of Nuveen Fund Advisors, LLC; Chartered Financial Analyst. | | |
Mark J. Czarniecki 1979 901 Marquette Avenue Minneapolis, MN 55402 | | Vice President and Assistant Secretary | | 2013 | | Vice President and Assistant Secretary of Nuveen Securities, LLC (since 2016) and Nuveen Fund Advisors (since 2017); Vice President and Associate General Counsel of Nuveen (since 2013) and Vice President, Assistant Secretary and Associate General Counsel of Nuveen Asset Management (since March 2018). | | |
Diana R. Gonzalez 1978 333 W. Wacker Drive Chicago, IL 60606 | | Vice President and Assistant Secretary | | 2017 | | Vice President and Assistant Secretary of Nuveen Fund Advisors, LLC (since 2017); Vice President and Associate General Counsel of Nuveen (since 2017); Associate General Counsel of Jackson National Asset Management (2012-2017). | | |
Nathaniel T. Jones 1979 333 W. Wacker Drive Chicago, IL 60606 | | Vice President and Treasurer | | 2016 | | Managing Director (since 2017), formerly, Senior Vice President (2016-2017), formerly, Vice President (2011-2016) of Nuveen; Managing Director of Nuveen Fund Advisors, LLC; Chartered Financial Analyst. | | |
Walter M. Kelly 1970 333 W. Wacker Drive Chicago, IL 60606 | | Chief Compliance Officer and Vice President | | 2003 | | Managing Director (since 2017), formerly, Senior Vice President (2008-2017) of Nuveen Investments Holdings, Inc. | | |
Tina M. Lazar 1961 333 W. Wacker Drive Chicago, IL 60606 | | Vice President | | 2002 | | Managing Director (since 2017), formerly, Senior Vice President (2014-2017) of Nuveen Securities, LLC. | | |
84
| | | | | | | | |
Name, Year of Birth & Address | | Position(s)
Held with
the Funds | | Year First Elected or Appointed (4) | | Principal Occupation(s)
During Past 5 Years | | |
Brian J. Lockhart 1974 333 W. Wacker Drive Chicago, IL 60606 | | Vice President | | 2019 | | Managing Director (since January 2017), formerly, Vice President (2010-2017) of Nuveen; Head of Investment Oversight (since September 2017), formerly, Team Leader of Manager Oversight (2015-2017); Chartered Financial Analyst and Certified Financial Risk Manager. | | |
Jacques M. Longerstaey 1963 8500 Carnegie Blvd. Charlotte, NC 28262 | | Vice President | | 2019 | | Senior Managing Director, Chief Risk Officer, Nuveen, LLC (since May 2019); Senior Managing Director (since May 2019) of Nuveen Fund Advisors, LLC; formerly, Chief Investment and Model Risk Officer, Wealth & Investment Management Division, Wells Fargo Bank (NA) (from 2013–2019). | | |
Kevin J. McCarthy 1966 333 W. Wacker Drive Chicago, IL 60606 | | Vice President and Assistant Secretary | | 2007 | | Senior Managing Director (since 2017) and Secretary and General Counsel (since 2016) of Nuveen Investments, Inc., formerly, Executive Vice President (2016-2017) and Managing Director and Assistant Secretary (2008-2016); Senior Managing Director (since 2017) and Assistant Secretary (since 2008) of Nuveen Securities, LLC, formerly Executive Vice President (2016-2017) and Managing Director (2008-2016); Senior Managing Director (since 2017), Secretary (since 2016) andCo-General Counsel (since 2011) of Nuveen Fund Advisors, LLC, formerly, Executive Vice President (2016-2017), Managing Director (2008-2016) and Assistant Secretary (2007-2016); Senior Managing Director (since 2017), Secretary (since 2016) and Associate General Counsel (since 2011) of Nuveen Asset Management, LLC, formerly Executive Vice President (2016-2017) and Managing Director and Assistant Secretary (2011-2016); Senior Managing Director (since 2017) and Secretary (since 2016) of Nuveen Investments Advisers, LLC, formerly Executive Vice President (2016-2017); Vice President (since 2007) and Secretary (since 2016), formerly, Assistant Secretary, of NWQ Investment Management Company, LLC, Symphony Asset Management, LLC, Santa Barbara Asset Management, LLC and Winslow Capital Management, LLC (since 2010). Senior Managing Director (since 2017) and Secretary (since 2016) of Nuveen Alternative Investments, LLC. | | |
Christopher M. Rohrbacher 1971 333 W. Wacker Drive Chicago, IL 60606 | | Vice President and Secretary | | 2008 | | Managing Director (since 2017) and Assistant Secretary of Nuveen Securities, LLC; Managing Director (since 2017), formerly, Senior Vice President (2016-2017) and Assistant Secretary (since 2016) of Nuveen Fund Advisors, LLC. | | |
William A. Siffermann 1975 333 W. Wacker Drive Chicago, IL 60606 | | Vice President | | 2017 | | Managing Director (since 2017), formerly Senior Vice President(2016-2017) and Vice President (2011-2016) of Nuveen. | | |
Joel T. Slager 1978 333 W. Wacker Drive Chicago, IL 60606 | | Vice President and Assistant Secretary | | 2013 | | Fund Tax Director for Nuveen Funds (since 2013); previously, Vice President of Morgan Stanley Investment Management, Inc., Assistant Treasurer of the Morgan Stanley Funds (from 2010 to 2013). | | |
E. Scott Wickerham 1973 TIAA 730 Third Avenue New York, NY 10017 | | Vice President and Controller | | 2019 | | Senior Managing Director, Head of Fund Administration at Nuveen, LLC (since 2019), formerly, Managing Director; Senior Managing Director (since 2019), Nuveen Fund Advisors, LLC; Principal Financial Officer, Principal Accounting Officer and Treasurer (since 2017) to the TIAA-CREF Funds, the TIAA-CREF Life Funds, the TIAA Separate AccountVA-1 and the Treasurer (since 2017) to the CREF Accounts; Senior Director, TIAA-CREF Fund Administration (2014-2015); has held various positions with TIAA since 2006. | | |
85
Trustees and Officers(Unaudited) (continued)
| | | | | | | | |
Name, Year of Birth & Address | | Position(s)
Held with
the Funds | | Year First Elected or Appointed (4) | | Principal Occupation(s)
During Past 5 Years | | |
Gifford R. Zimmerman 1956 333 W. Wacker Drive Chicago, IL 60606 | | Vice President and Assistant Secretary | | 1988 | | Managing Director (since 2002), and Assistant Secretary of Nuveen Securities, LLC; Managing Director (since 2004) and Assistant Secretary (since 1994) of Nuveen Investments, Inc.; Managing Director (since 2002), Assistant Secretary (since 1997) andCo-General Counsel (since 2011) of Nuveen Fund Advisors, LLC; Managing Director, Assistant Secretary and Associate General Counsel of Nuveen Asset Management, LLC (since 2011); Vice President (since 2017), formerly, Managing Director (2003-2017) and Assistant Secretary (since 2003) of Symphony Asset Management LLC ; Managing Director and Assistant Secretary (since 2002) of Nuveen Investments Advisers, LLC; Vice President and Assistant Secretary of NWQ Investment Management Company, LLC (since 2002), Santa Barbara Asset Management, LLC (since 2006) and of Winslow Capital Management, LLC, (since 2010); Chartered Financial Analyst. | | |
| (1) | Trustees serve an indefinite term until his/her successor is elected or appointed. The year first elected or appointed represents the year in which the director was first elected or appointed to any fund in the Nuveen Fund Complex. |
| (2) | On May 25, 2017, Mr. Young was appointed as a Board Member, effective July 1, 2017. He is a Board Member of each of the Nuveen Funds, except Nuveen Diversified Dividend and Income Fund and Nuveen Real Estate Income Fund. |
| (3) | “Interested person” of the Trust, as defined in the 1940 Act, by reason of her position with Nuveen, LLC. and certain of its subsidiaries. |
| (4) | Officers serve one year terms through August of each year. The year first elected or appointed represents the year in which the officer was first elected or appointed to any fund in the Nuveen Fund Complex. |
86
Notes
87
Nuveen:
Serving Investors for Generations
Since 1898, financial advisors and their clients have relied on Nuveen to provide dependable investment solutions through continued adherence to proven, long-term investing principles. Today, we offer a range of high quality solutions designed to be integral components of a well-diversified core portfolio.
Focused on meeting investor needs.
Nuveen is the investment manager of TIAA. We have grown into one of the world’s premier global asset managers, with specialist knowledge across all major asset classes and particular strength in solutions that provide income for investors and that draw on our expertise in alternatives and responsible investing. Nuveen is driven not only by the independent investment processes across the firm, but also the insights, risk management, analytics and other tools and resources that a truly world-class platform provides. As a global asset manager, our mission is to work in partnership with our clients to create solutions which help them secure their financial future.
Find out how we can help you.
To learn more about how the products and services of Nuveen may be able to help you meet your financial goals, talk to your financial advisor, or call us at(800) 257-8787. Please read the information
provided carefully before you invest. Investors should consider the investment objective and policies, risk considerations, charges and expenses of any investment carefully. Where applicable, be sure to obtain a prospectus, which contains this and other relevant information. To obtain a prospectus, please contact your securities representative or Nuveen, 333 W. Wacker Dr., Chicago, IL 60606. Please read the prospectus carefully before you invest or send money.
Learn more about Nuveen Funds at:www.nuveen.com/mutual-funds
| | |
Nuveen Securities, LLC, member FINRA and SIPC |
333 West Wacker Drive | Chicago, IL 60606 | www.nuveen.com | | MAN-FINC-0619D 915362-INV-Y-08/20 |
ITEM 2. CODE OF ETHICS.
As of the end of the period covered by this report, the registrant has adopted a code of ethics that applies to the registrant’s principal executive officer, principal financial officer, principal accounting officer or controller, or persons performing similar functions. There were no amendments to or waivers from the code during the period covered by this report. The registrant has posted the code of ethics on its website at www.nuveen.com/MutualFunds/ShareholderResources/FundGovernance.aspx. (To view the code, click on Code of Conduct.)
ITEM 3. AUDIT COMMITTEE FINANCIAL EXPERT.
As of the end of the period covered by this report, the registrant’s Board of Directors or Trustees (“Board”) determined that the registrant has at least one “audit committee financial expert” (as defined in Item 3 of Form N-CSR) serving on its Audit Committee. The registrant’s audit committee financial experts are Carole E. Stone, Jack B. Evans and William C. Hunter, who are “independent” for purposes of Item 3 of Form N-CSR.
Ms. Stone served for five years as Director of the New York State Division of the Budget. As part of her role as Director, Ms. Stone was actively involved in overseeing the development of the State’s operating, local assistance and capital budgets, its financial plan and related documents; overseeing the development of the State’s bond-related disclosure documents and certifying that they fairly presented the State’s financial position; reviewing audits of various State and local agencies and programs; and coordinating the State’s system of internal audit and control. Prior to serving as Director, Ms. Stone worked as a budget analyst/examiner with increasing levels of responsibility over a 30 year period, including approximately five years as Deputy Budget Director. Ms. Stone has also served as Chair of the New York State Racing Association Oversight Board, as Chair of the Public Authorities Control Board, as a Commissioner on the New York State Commission on Public Authority Reform and as a member of the Boards of Directors of several New York State public authorities. These positions have involved overseeing operations and finances of certain entities and assessing the adequacy of project/entity financing and financial reporting. Currently, Ms. Stone is on the Board of Directors of CBOE Holdings, Inc., of the Chicago Board Options Exchange, and of C2 Options Exchange. Ms. Stone’s position on the boards of these entities and as a member of both CBOE Holdings’ Audit Committee and its Finance Committee has involved, among other things, the oversight of audits, audit plans and preparation of financial statements.
Mr. Evans was formerly President and Chief Operating Officer of SCI Financial Group, Inc., a full service registered broker-dealer and registered investment adviser (“SCI”). As part of his role as President and Chief Operating Officer, Mr. Evans actively supervised the Chief Financial Officer (the “CFO”) and actively supervised the CFO’s preparation of financial statements and other filings with various regulatory authorities. In such capacity, Mr. Evans was actively involved in the preparation of SCI’s financial statements and the resolution of issues raised in connection therewith. Mr. Evans has also served on the audit committee of various reporting companies. At such companies, Mr. Evans was involved in the oversight of audits, audit plans, and the preparation of financial statements. Mr. Evans also formerly chaired the audit committee of the Federal Reserve Bank of Chicago.
Mr. Hunter was formerly a Senior Vice President at the Federal Reserve Bank of Chicago. As part of his role as Senior Vice President, Mr. Hunter was the senior officer responsible for all operations of each of the Economic Research, Statistics, and Community and Consumer Affairs units at the Federal Reserve Bank of Chicago. In such capacity, Mr. Hunter oversaw the subunits of the Statistics and Community and Consumer Affairs divisions responsible for the analysis and evaluation of bank and bank holding company financial statements and financial filings. Prior to serving as Senior Vice President at the Federal Reserve Bank of Chicago, Mr. Hunter was the Vice President of the Financial Markets unit at the Federal Reserve Bank of Atlanta where he supervised financial staff and bank holding company analysts who analyzed and evaluated bank and bank holding company financial statements. Mr. Hunter also currently serves on the Boards of Directors of Xerox Corporation and Wellmark, Inc. as well as on the Audit Committees of such Boards. As an Audit Committee member, Mr. Hunter’s responsibilities include, among other things, reviewing financial statements, internal audits and internal controls over financial reporting. Mr. Hunter also formerly was a Professor of Finance at the University of Connecticut School of Business and has authored numerous scholarly articles on the topics of finance, accounting and economics.
ITEM 4. PRINCIPAL ACCOUNTANT FEES AND SERVICES.
The following tables show the amount of fees that PricewaterhouseCoopers LLP, the Funds’ auditor, billed to the Funds’ during the Funds’ last two full fiscal years. The Audit Committee approved in advance all audit services and non-audit services that PricewaterhouseCoopers LLP, provided to the Funds, except for those non-audit services that were subject to the pre-approval exception under Rule 2-01 of Regulation S-X (the “pre-approval exception”). The preapproval exception for services provided directly to the Funds waives the pre-approval requirement for services other than audit, review or attest services if: (A) the aggregate amount of all such services provided constitutes no more than 5% of the total amount of revenues paid by the Funds during the fiscal year in which the services are provided; (B) the Funds did not recognize the services as non-audit services at the time of the engagement; and (C) the services are promptly brought to the Audit Committee’s attention, and the Committee (or its delegate) approves the services before the audit is completed.
The Audit Committee has delegated certain pre-approval responsibilities to its Chairman (or, in his absence, any other member of the Audit Committee).
| | | | | | | | | | | | | | | | |
Fiscal Year Ended June 30, 2019 | | Audit Fees Billed
to Funds1 | | | Audit-Related Fees
Billed to Funds 2 | | | Tax Fees Billed
to Funds 3 | | | All Other Fees
Billed to Funds 4 | |
Fund Name | | | | | | | | | | | | | | | | |
Nuveen High Income Bond Fund | | | 33,590 | | | | - | | | | 0 | | | | 0 | |
Nuveen Strategic Income Fund | | | 46,015 | | | | - | | | | 0 | | | | 0 | |
| | | | | | | | | | | | | | | | |
Total | | $ | 79,605 | | | $ | - | | | $ | 0 | | | $ | 0 | |
| 1 | | “Audit Fees” are the aggregate fees billed for professional services for the audit of the Fund’s annual financial statements and services provided in connection with statutory and regulatory filings or engagements. |
| 2 | | “Audit-Related Fees” are the aggregate fees billed for assurance and related services reasonably related to the performance of the audit or review of financial statements that are not reported under “Audit Fees”. These fees include offerings related to the Fund’s common shares and leverage. |
| 3 | | “Tax Fees” are the aggregate fees billed for professional services for tax advice, tax compliance, and tax planning. These fees include: all global withholding tax services; excise and state tax reviews; capital gain, tax equalization and taxable basis calculations performed by the principal accountant. |
| 4 | | “All Other Fees” are the aggregate fees billed for products and services other than “Audit Fees”, “Audit-Related Fees” and “Tax Fees”. These fees represent all “Agreed-Upon Procedures” engagements pertaining to the Fund’s use of leverage. |
| | | | | | | | | | | | | | | | |
| | | Percentage Approved Pursuant to Pre-approval Exception | |
| | | Audit Fees Billed
to Funds | | | Audit-Related Fees
Billed to Funds | | | Tax Fees
Billed to Funds | | | All Other Fees
Billed to Funds | |
Fund Name | | | | | | | | | | | | | | | | |
Nuveen High Income Bond Fund | | | 0 | % | | | 0 | % | | | 0 | % | | | 0 | % |
Nuveen Strategic Income Fund | | | 0 | % | | | 0 | % | | | 0 | % | | | 0 | % |
| | | | |
Fiscal Year Ended June 30, 2018 | | Audit Fees Billed
to Funds1 | | | Audit-Related Fees
Billed to Funds2 | | | Tax Fees
Billed to Funds 3 | | | All Other Fees
Billed to Funds 4 | |
Fund Name | | | | | | | | | | | | | | | | |
Nuveen High Income Bond Fund | | | 34,825 | | | | 0 | | | | 0 | | | | 0 | |
Nuveen Strategic Income Fund | | | 46,864 | | | | 0 | | | | 0 | | | | 0 | |
| | | | | | | | | | | | | | | | |
Total | | $ | 81,689 | | | $ | 0 | | | $ | 0 | | | $ | 0 | |
| 1 | | “Audit Fees” are the aggregate fees billed for professional services for the audit of the Fund’s annual financial statements and services provided in connection with statutory and regulatory filings or engagements. |
| 2 | | “Audit-Related Fees” are the aggregate fees billed for assurance and related services reasonably related to the performance of the audit or review of financial statements that are not reported under “Audit Fees”. These fees include offerings related to the Fund’s common shares and leverage. |
| 3 | | “Tax Fees” are the aggregate fees billed for professional services for tax advice, tax compliance, and tax planning. These fees include: all global withholding tax services; excise and state tax reviews; capital gain, tax equalization and taxable basis calculations performed by the principal accountant. |
| 4 | | “All Other Fees” are the aggregate fees billed for products and services other than “Audit Fees”, “Audit-Related Fees” and “Tax Fees”. These fees represent all “Agreed-Upon Procedures” engagements pertaining to the Fund’s use of leverage. |
| | | | | | | | | | | | | | | | |
| | | Percentage Approved Pursuant to Pre-approval Exception | |
| | | Audit Fees Billed
to Funds | | | Audit-Related Fees
Billed to Funds | | | Tax Fees
Billed to Funds | | | All Other Fees
Billed to Funds | |
Fund Name | | | | | | | | | | | | | | | | |
Nuveen High Income Bond Fund | | | 0 | % | | | 0 | % | | | 0 | % | | | 0 | % |
Nuveen Strategic Income Fund | | | 0 | % | | | 0 | % | | | 0 | % | | | 0 | % |
| | | | | | | | | | | | |
Fiscal Year Ended June 30, 2019 | | Audit-Related Fees
Billed to Adviser and
Affiliated Fund
June 30, 2019 | | | Tax Fees Billed to
Adviser and
Affiliated Fund
Service Providers | | | All Other Fees
Billed to Adviser
and Affiliated Fund
Service Providers | |
Nuveen Investment Funds, Inc. | | $ | 0 | | | $ | 0 | | | $ | 0 | |
| |
| | | Percentage Approved Pursuant to Pre-approval Exception | |
| | | Audit-Related Fees
Billed to Adviser and
Affiliated Fund
Service Providers | | | Tax Fees Billed to
Adviser and
Affiliated Fund
Service Providers | | | All Other Fees
Billed to Adviser
and Affiliated Fund
Service Providers | |
| | | 0 | % | | | 0 | % | | | 0 | % |
| | | |
Fiscal Year Ended June 30, 2018 | | Audit-Related Fees
Billed to Adviser and
Affiliated Fund
Service Providers | | | Tax Fees Billed to
Adviser and
Affiliated Fund
Service Providers
| | | All Other Fees
Billed to Adviser
and Affiliated Fund
Service Providers | |
Nuveen Investment Funds, Inc. | | $ | 0 | | | $ | 0 | | | $ | 0 | |
| |
| | | Percentage Approved Pursuant to Pre-approval Exception | |
| | | Affiliated Fund
Service Providers | | | Affiliated Fund
Service Providers | | | and Affiliated Fund
Service Providers | |
| | | 0 | % | | | 0 | % | | | 0 | % |
| | | | | | | | | | | | | | | | |
Fiscal Year Ended June 30, 2019 | | Total Non-Audit Fees
Billed to Trust | | | Total Non-Audit Fees
billed to Adviser and
Affiliated Fund Service
Providers (engagements
related directly to the
operations and financial
reporting of the Trust) | | | Total Non-Audit Fees
billed to Adviser and
Affiliated Fund Service
Providers (all other
engagements) | | | Total | |
Fund Name | | | | | | | | | | | | | | | | |
Nuveen High Income Bond Fund | | | 0 | | | | 0 | | | | 0 | | | | 0 | |
Nuveen Strategic Income Fund | | | 0 | | | | 0 | | | | 0 | | | | 0 | |
| | | | | | | | | | | | | | | | |
Total | | $ | 0 | | | $ | 0 | | | $ | 0 | | | $ | 0 | |
“Non-Audit Fees billed to Fund” for both fiscal year ends represent “Tax Fees” and “All Other Fees” billed to Fund in their respective amounts from the previous table.
Less than 50 percent of the hours expended on the principal accountant’s engagement to audit the registrant’s financial statements for the most recent fiscal year were attributed to work performed by persons other than the principal accountant’s full-time, permanent employees.
| | | | | | | | | | | | | | | | |
Fiscal Year Ended June 30, 2018 | | Total Non-Audit Fees
Billed to Trust | | | Total Non-Audit Fees
billed to Adviser and
related directly to the
operations and financial
reporting of the Trust) | | | Affiliated Fund Service
Providers (all other
engagements) | | | Total | |
Fund Name | | | | | | | | | | | | | | | | |
Nuveen High Income Bond Fund | | | 0 | | | | 0 | | | | 0 | | | | 0 | |
Nuveen Strategic Income Fund | | | 0 | | | | 0 | | | | 0 | | | | 0 | |
| | | | | | | | | | | | | | | | |
Total | | $ | 0 | | | $ | 0 | | | $ | 0 | | | $ | 0 | |
“Non-Audit Fees billed to Fund” for both fiscal year ends represent “Tax Fees” and “All Other Fees” billed to Fund in their respective amounts from the previous table.
Audit Committee Pre-Approval Policies and Procedures. Generally, the Audit Committee must approve (i) all non-audit services to be performed for the Funds by the Funds’ independent accountant and (ii) all audit and non-audit services to be performed by the Funds’ independent accountant for the Affiliated Fund Service Providers with respect to the operations and financial reporting of the Funds. Regarding tax and research projects conducted by the independent accountant for the Funds and Affiliated Fund Service Providers (with respect to operations and financial reports of the Trust), such engagements will be (i) pre-approved by the Audit Committee if they are expected to be for amounts greater than $10,000; (ii) reported to the Audit Committee Chairman for his verbal approval prior to engagement if they are expected to be for amounts under $10,000 but greater than $5,000; and (iii) reported to the Audit Committee at the next Audit Committee meeting if they are expected to be for an amount under $5,000.
ITEM 5. AUDIT COMMITTEE OF LISTED REGISTRANTS.
Not applicable to this registrant.
ITEM 6. SCHEDULE OF INVESTMENTS.
| a) | | See Portfolio of Investments in Item 1. |
ITEM 7. DISCLOSURE OF PROXY VOTING POLICIES AND PROCEDURES FORCLOSED-END
MANAGEMENT INVESTMENT COMPANIES.
Not applicable to this registrant.
ITEM 8. PORTFOLIO MANAGERS OFCLOSED-END MANAGEMENT INVESTMENT COMPANIES.
Not applicable to this registrant.
ITEM 9. PURCHASES OF EQUITY SECURITIES BYCLOSED-END MANAGEMENT INVESTMENT COMPANY AND AFFILIATED PURCHASERS.
Not applicable to this registrant.
ITEM 10. SUBMISSION OF MATTERS TO A VOTE OF SECURITY HOLDERS.
There have been no material changes to the procedures by which shareholders may recommend nominees to the registrant’s Board of Trustees implemented after the registrant last provided disclosure in response to this Item.
ITEM 11. CONTROLS AND PROCEDURES.
| | (a) | | The registrant’s principal executive and principal financial officers, or persons performing similar functions, have concluded that the registrant’s disclosure controls and procedures (as defined in Rule30a-3(c) under the Investment Company Act of 1940, as amended (the “1940 Act”) (17 CFR 270.30a-3(c))) are effective, as of a date within 90 days of the filing date of this report that includes the disclosure required by this paragraph, based on their evaluation of the controls and procedures required by Rule30a-3(b) under the 1940 Act (17 CFR 270.30a-3(b)) and Rules13a-15(b) or15d-15(b) under the Securities Exchange Act of 1934, as amended (the “Exchange Act”) (17 CFR 240.13a-15(b) or 240.15d-15(b)). |
| | (b) | | There were no changes in the registrant’s internal control over financial reporting (as defined in Rule30a-3(d) under the 1940 Act (17 CFR 270.30a-3(d)) that occurred during the period covered by this report that has materially affected, or is reasonably likely to materially affect, the registrant’s internal control over financial reporting. |
ITEM 12. DISCLOSURE OF SECURITIES LENDING ACTIVITIES FOR CLOSED-END MANAGEMENT INVESTMENT COMPANIES.
Not applicable.
ITEM 13. EXHIBITS.
File the exhibits listed below as part of this Form.
| | |
| (a)(1) | | Any code of ethics, or amendment thereto, that is the subject of the disclosure required by Item 2, to the extent that the registrant intends to satisfy the Item 2 requirements through filing of an exhibit: Not applicable because the code is posted on registrant’s website at www.nuveen.com/MutualFunds/ShareholderResources/FundGovernance.aspx and there were no amendments during the period covered by this report. (To view the code, click on Code of Conduct.) |
| |
| (a)(2) | | A separate certification for each principal executive officer and principal financial officer of the registrant as required byRule 30a-2(a) under the 1940 Act (17 CFR 270.30a-2(a)) in the exact form set forth below: SeeEX-99.CERT attached hereto. |
| |
| (a)(3) | | Any written solicitation to purchase securities under Rule23c-1 under the 1940 Act (17 CFR270.23c-1) sent or given during the period covered by the report by or on behalf of the registrant to 10 or more persons: Not applicable to this registrant. |
| |
| (a)(4) | | Change in the registrant’s independent public accountant. Not applicable. |
| |
| (b) | | If the report is filed under Section 13(a) or 15(d) of the Exchange Act, provide the certifications required by Rule30a-2(b) under the 1940 Act (17 CFR 270.30a-2(b)), Rule13a-14(b) or Rule15d-14(b) under the Exchange Act (17 CFR 240.13a-14(b) or 240.15d-14(b)), and Section 1350 of Chapter 63 of Title 18 of the United States Code (18 U.S.C. 1350) as an Exhibit. A certification furnished pursuant to this paragraph will not be deemed “filed” for purposes of Section 18 of the Exchange Act (15 U.S.C. 78r), or otherwise subject to the liability of that section. Such certification will not be deemed to be incorporated by reference into any filing under the Securities Act of 1933 or the Exchange Act, except to the extent that the registration specifically incorporates it by reference: SeeEX-99.906 CERT attached hereto. |
SIGNATURES
Pursuant to the requirements of the Securities Exchange Act of 1934 and the Investment Company Act of 1940, the registrant has duly caused this report to be signed on its behalf by the undersigned, thereunto duly authorized.
(Registrant) Nuveen Investment Funds, Inc.
| | |
| |
| By (Signature and Title) | | /s/ Christopher M. Rohrbacher |
| | Christopher M. Rohrbacher |
| | Vice President and Secretary |
Date: September 5, 2019
Pursuant to the requirements of the Securities Exchange Act of 1934 and the Investment Company Act of 1940, this report has been signed below by the following persons on behalf of the registrant and in the capacities and on the dates indicated.
| | |
| |
| By (Signature and Title) | | /s/ Greg A. Bottjer |
| | Greg A. Bottjer |
| | Chief Administrative Officer |
| | (principal executive officer) |
Date: September 5, 2019
| | |
| |
| By (Signature and Title) | | /s/ E. Scott Wickerham |
| | E. Scott Wickerham |
| | Vice President and Controller |
| | (principal financial officer) |
Date: September 5, 2019