UNITED STATES
SECURITIES AND EXCHANGE COMMISSION
Washington, D.C. 20549
FORM N‑CSR
CERTIFIED SHAREHOLDER REPORT OF REGISTERED
MANAGEMENT INVESTMENT COMPANIES
| | |
| Investment Company Act file number | | 811-05309 |
Nuveen Investment Funds, Inc.
(Exact name of registrant as specified in charter)
Nuveen Investments
333 West Wacker Drive
Chicago, Illinois 60606
(Address of principal executive offices) (Zip code)
Mark J. Czarniecki
Nuveen Investments
333 West Wacker Drive
Chicago, Illinois 60606
(Name and address of agent for service)
Registrant’s telephone number, including area code: (312) 917‑7700
Date of fiscal year end: May 31
Date of reporting period: May 31, 2024
| Item 1. | Reports to Stockholders. |
| | |
 | |
Annual Shareholder Report
May 31, 2024 |
Nuveen Minnesota Intermediate Municipal Bond Fund
Class A Shares/FAMAX
Annual Shareholder Report
This annual shareholder report contains important information about the Class A Shares of the Nuveen Minnesota Intermediate Municipal Bond Fund for the period of June 1, 2023 to May 31, 2024. You can find additional information at https://www.nuveen.com/en‑us/mutual‑funds/prospectuses. You can also request this information by contacting us at (800) 257‑8787.
This report describes changes to the Fund that occurred during the reporting period.
What were the Fund costs for the last year? (based on a hypothetical $10,000 investment)
| | | | |
| | | Cost of a $10,000 investment | | Costs paid as a percentage of $10,000 investment |
| Class A Shares | | $81 | | 0.81% |
How did the Fund perform last year? What affected the Fund’s performance?
| | |
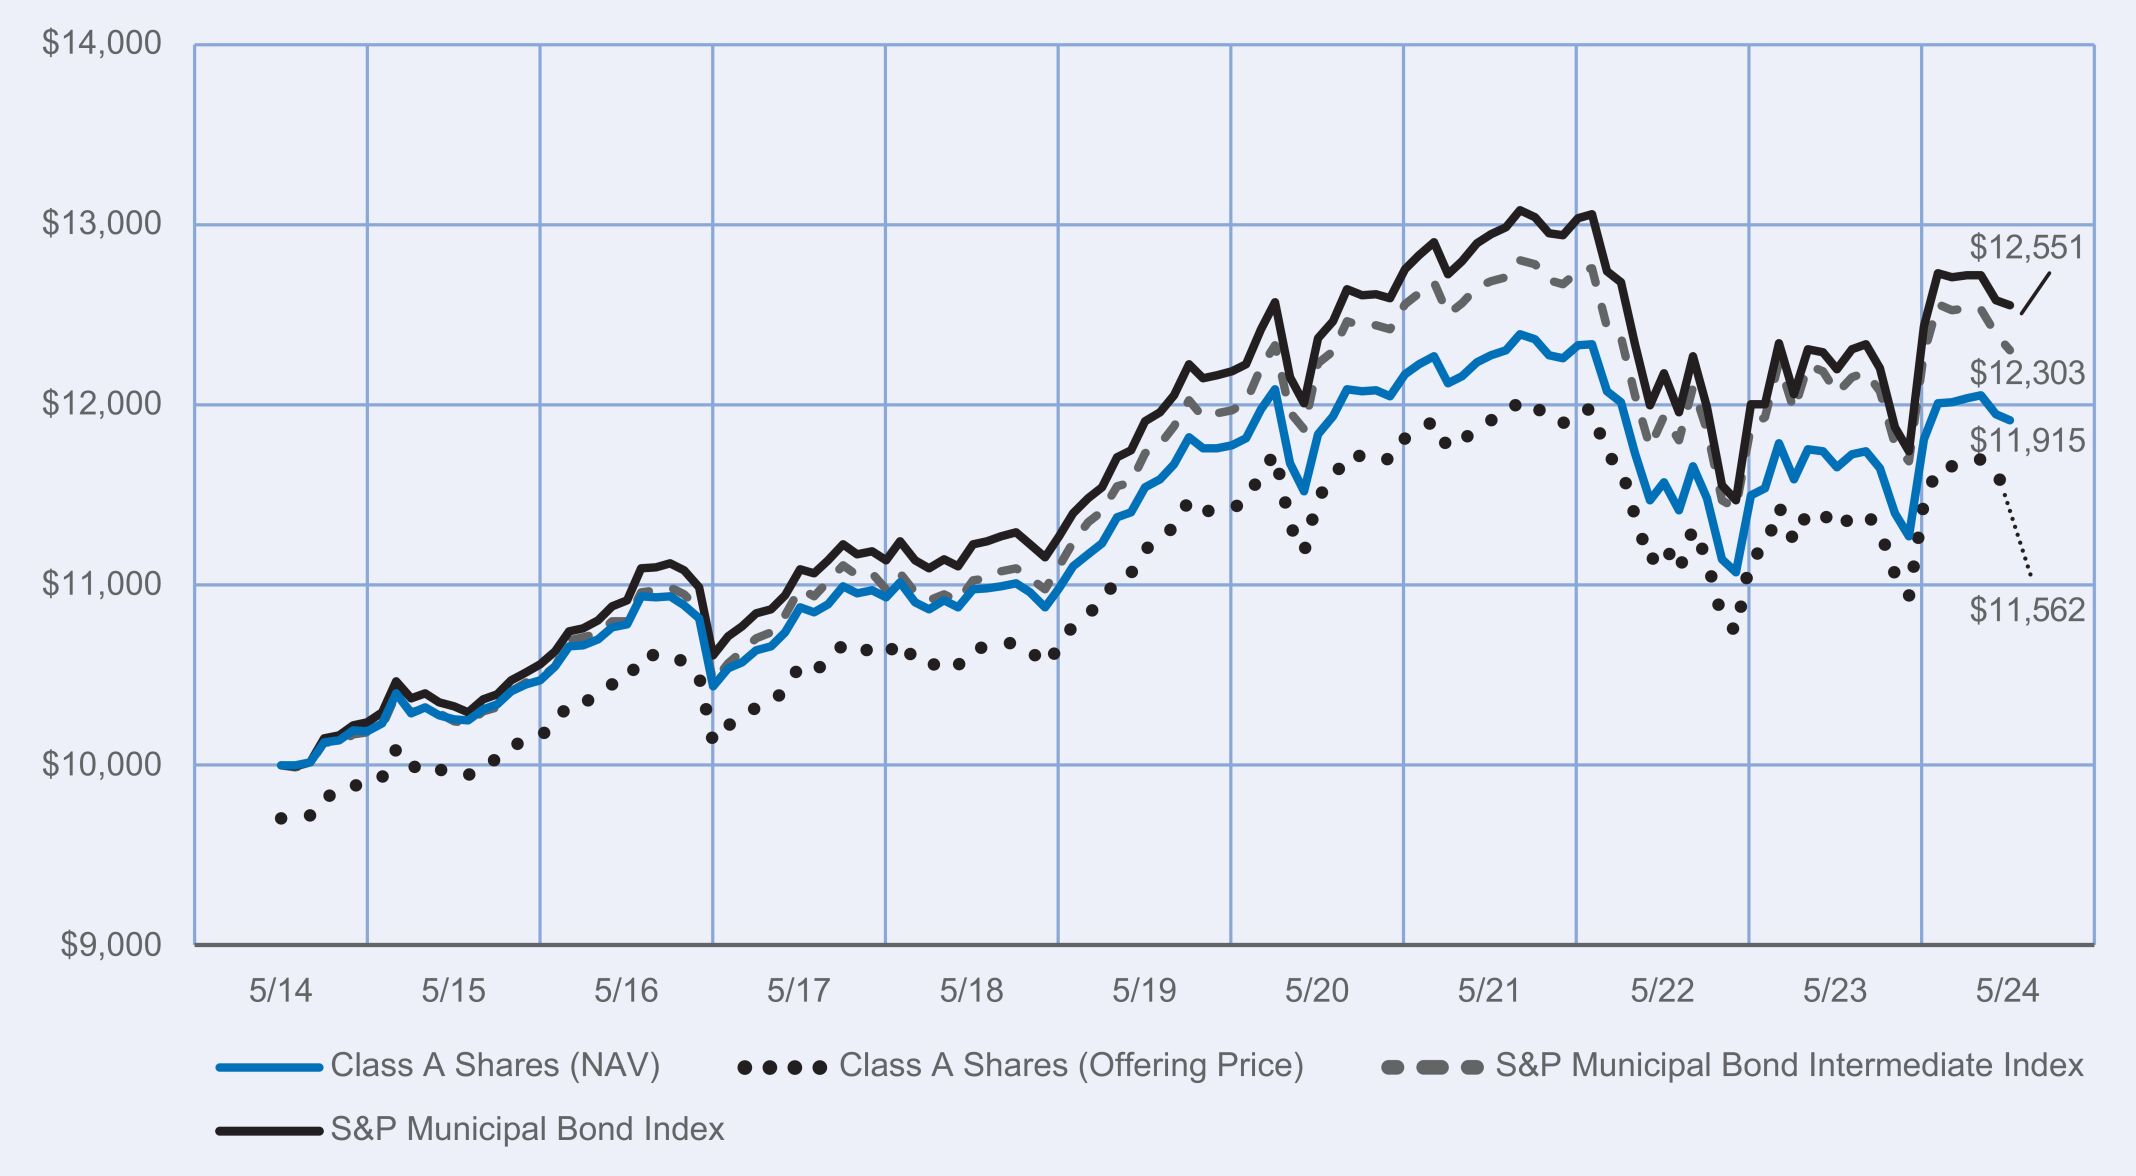
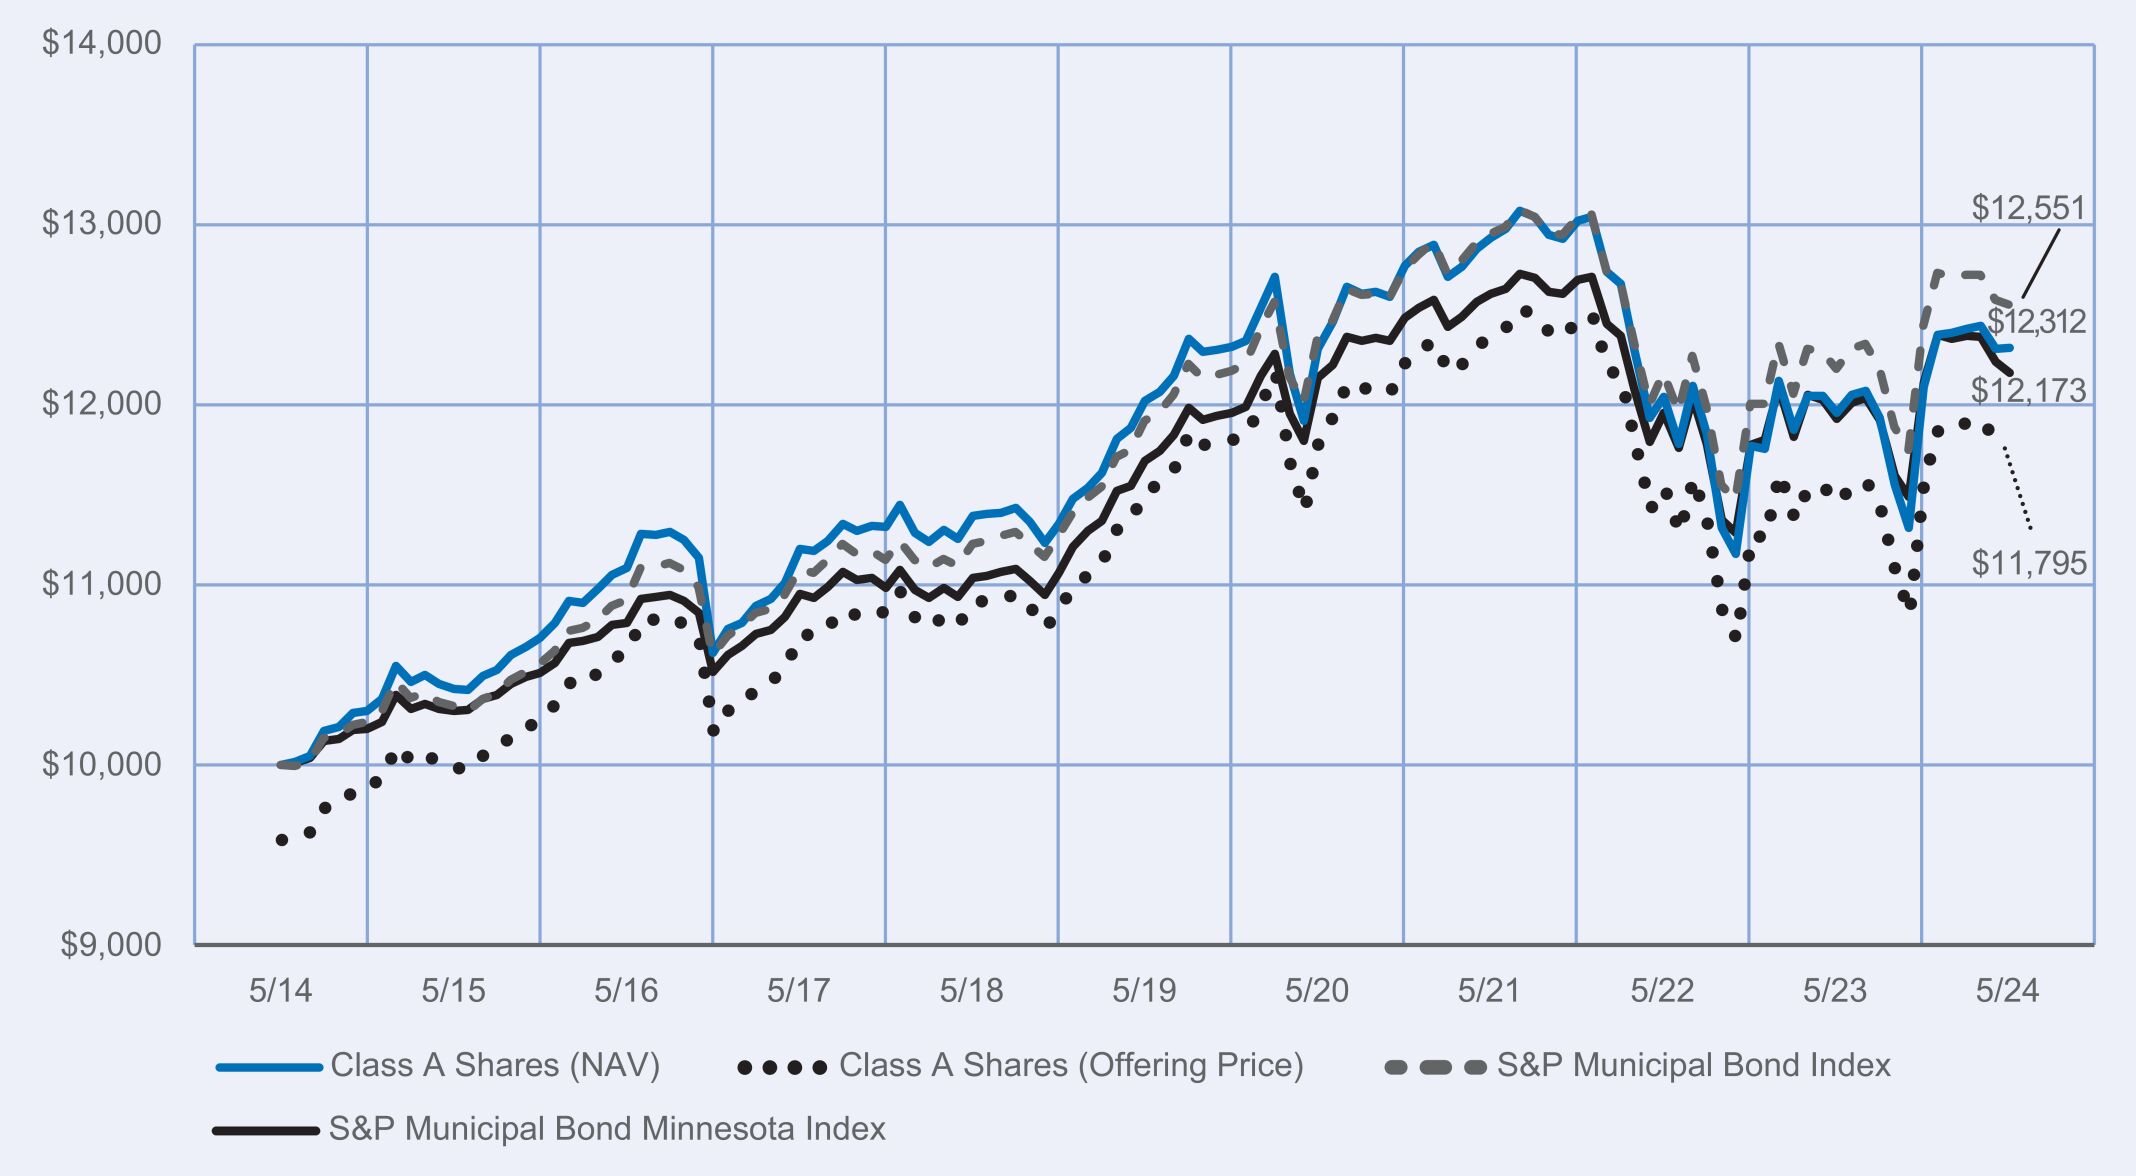
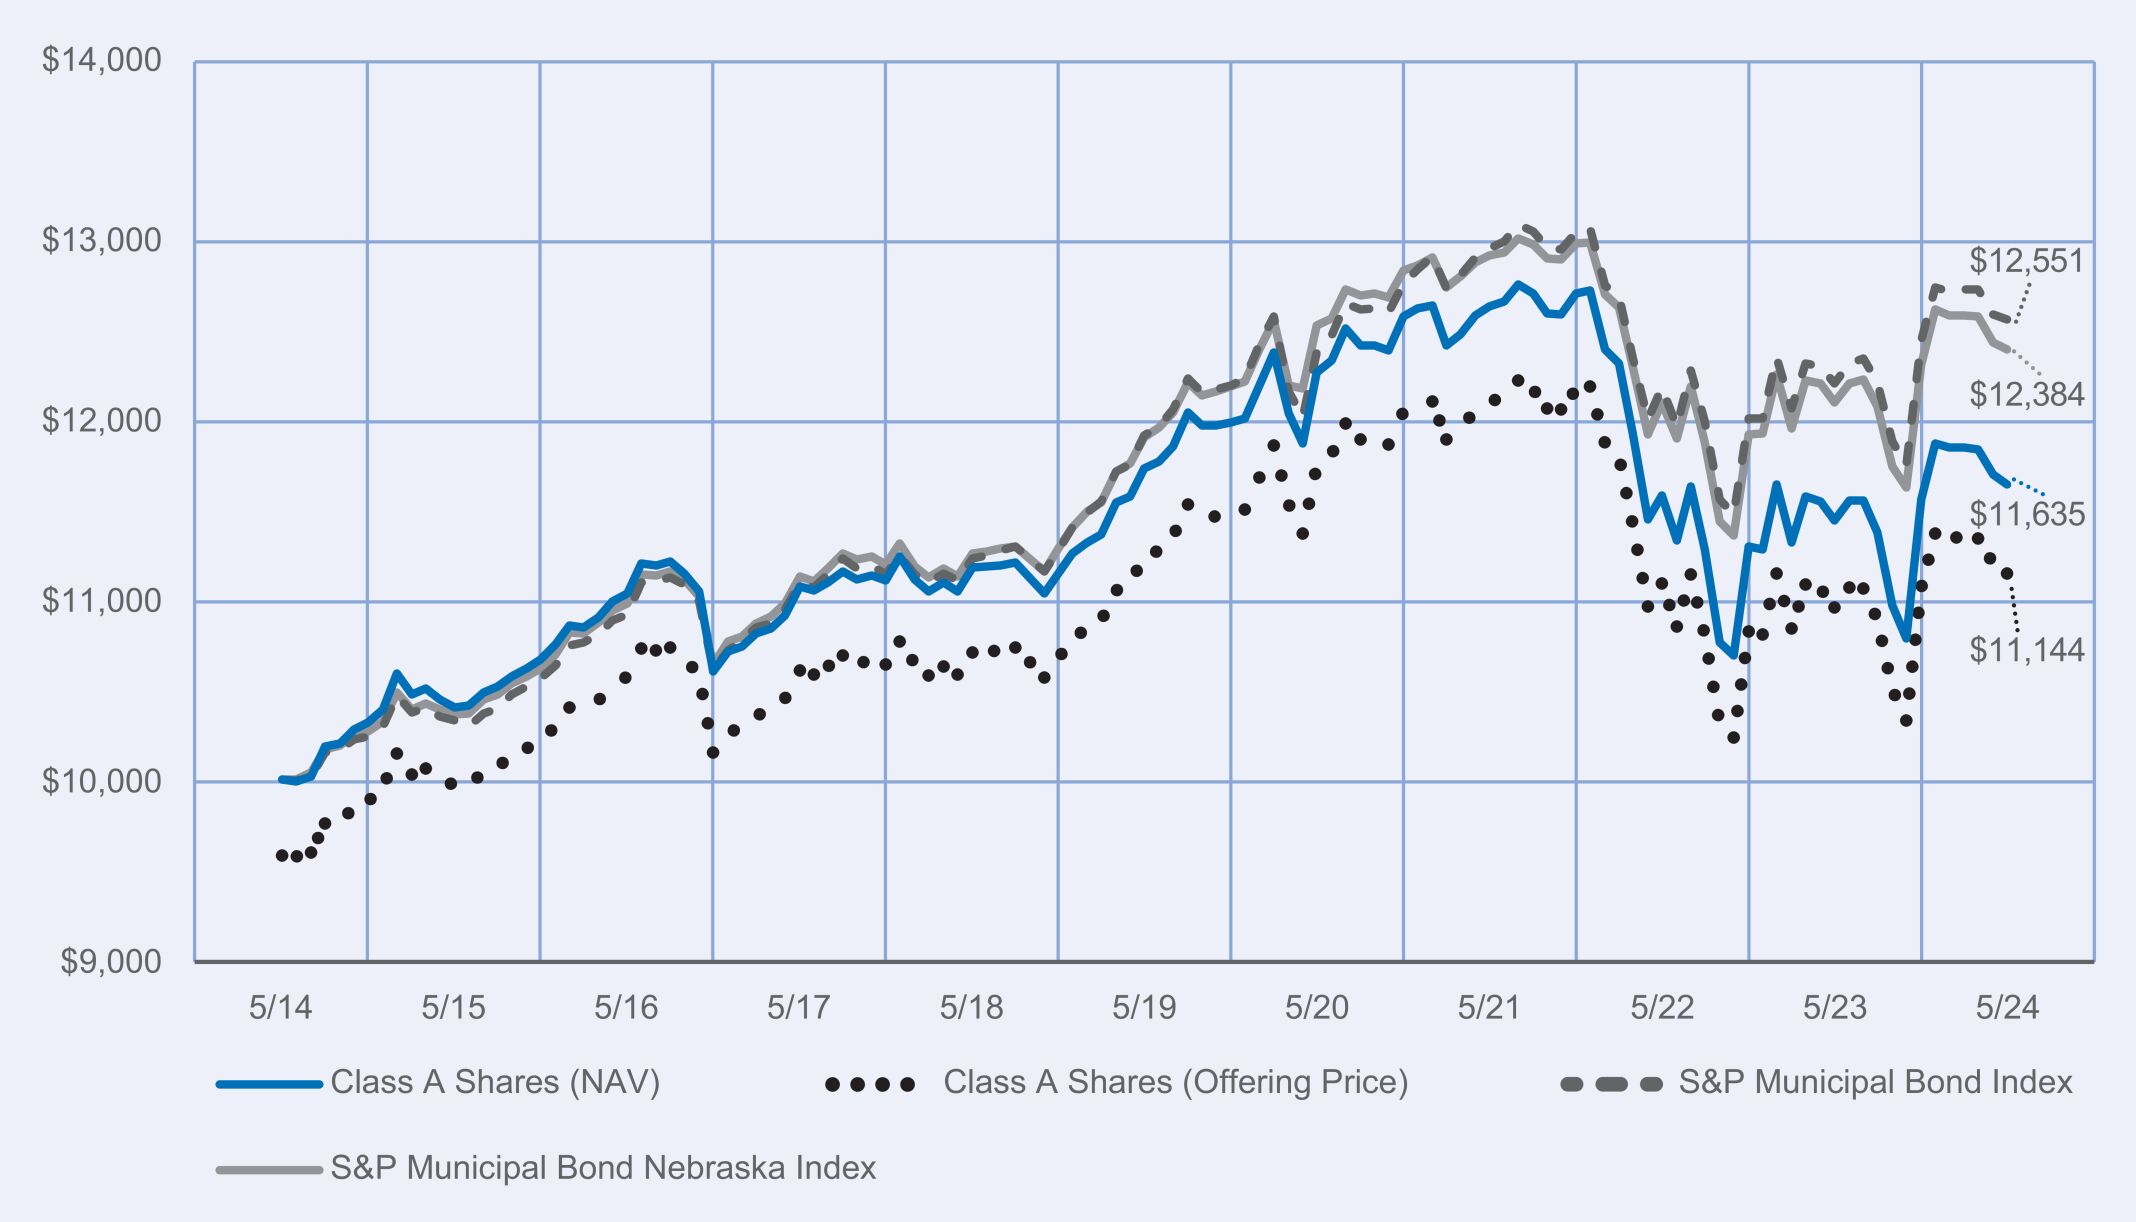
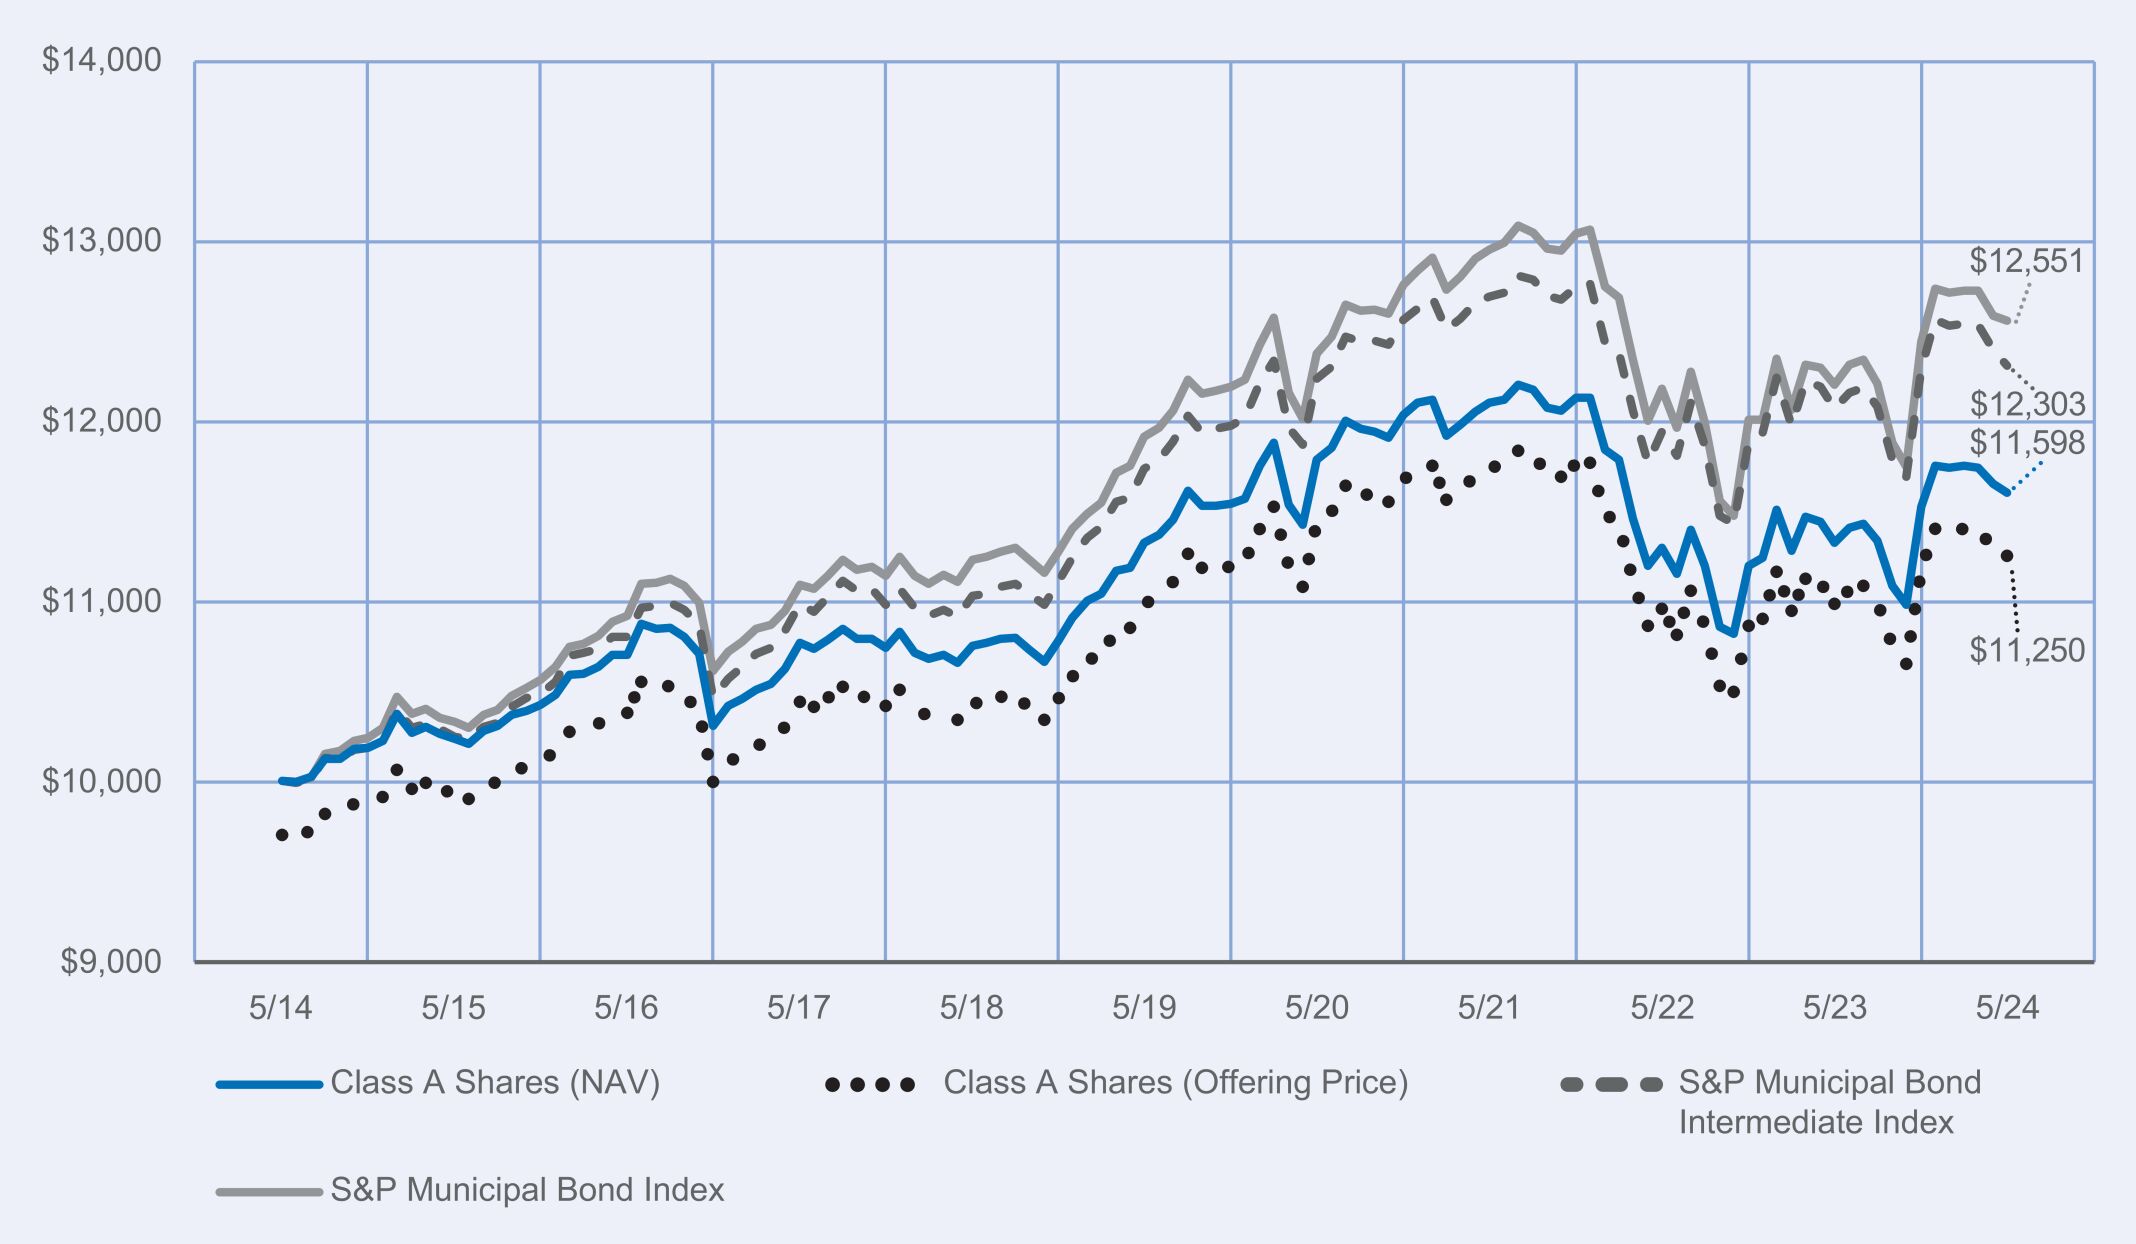
Performance Highlights • The Nuveen Minnesota Intermediate Municipal Bond Fund returned 2.27% for Class A shares at net asset value (NAV) for the 12 months ended May 31, 2024. The Fund outperformed the S&P Municipal Bond Intermediate Index, which returned 1.99%. • Top contributors to relative performance » Credit ratings allocation, specifically an underweight to the highest credit quality (AAA and AA rated) bonds, which underperformed, and an overweight to bonds rated A and below, which benefited from narrowing credit spreads. » Duration positioning, especially an overweight exposure to bonds with the shortest (zero to two years) and longest (10 years and longer) durations, which benefited from the yield curve flattening, and an underweight to bonds with two- to eight-year durations, which lagged. • Top detractors from relative performance » Allocation to state general obligation (GO) bonds with six- to eight-year durations, a segment that underperformed. » Overweight to appropriation-backed bonds, which underperformed. » Security selection across a range of holdings. | | Performance Attribution  Credit ratings allocation Short- and long-duration bonds  State GOs Appropriation-backed bonds Security selection |
How did the Fund perform over the last 10 years?
Performance data shown represents past performance and does not predict or guarantee future results. The graph and table do not reflect the deduction of taxes that a shareholder would pay on Fund distributions or redemption of Fund Shares.
Fund Performance (June 1, 2014 through May 31, 2024) Initial Investment of $10,000
Average Annual Total Returns
| | | | | | | | | | | | |
| | | 1‑Year | | | 5‑Year | | | 10‑Year | |
| Class A Shares at NAV (excluding maximum sales charge) | | | 2.27 | % | | | 0.64 | % | | | 1.77 | % |
| Class A Shares at maximum sales charge (Offering Price) | | | (0.81 | )% | | | 0.04 | % | | | 1.46 | % |
| S&P Municipal Bond Index | | | 2.88 | % | | | 1.06 | % | | | 2.30 | % |
| S&P Municipal Bond Intermediate Index | | | 1.99 | % | | | 0.96 | % | | | 2.09 | % |
| Lipper Other States Intermediate Municipal Debt Funds Classification Average | | | 1.84 | % | | | 0.31 | % | | | 1.29 | % |
Investment return and principal value will fluctuate, and you may have a gain or loss when you sell your shares. Current performance may differ from figures shown. For most recent month‑end performance, go to https://www.nuveen.com/en‑us/mutual‑funds/prospectuses or call (800) 257‑8787.
Fund Statistics (as of May 31, 2024)
| | | | |
| Fund net assets | | $ | 321,326,007 | |
| Total number of portfolio holdings | | | 286 | |
| Portfolio turnover (%) | | | 21% | |
| Total advisory fees paid for the year | | $ | 1,721,106 | |
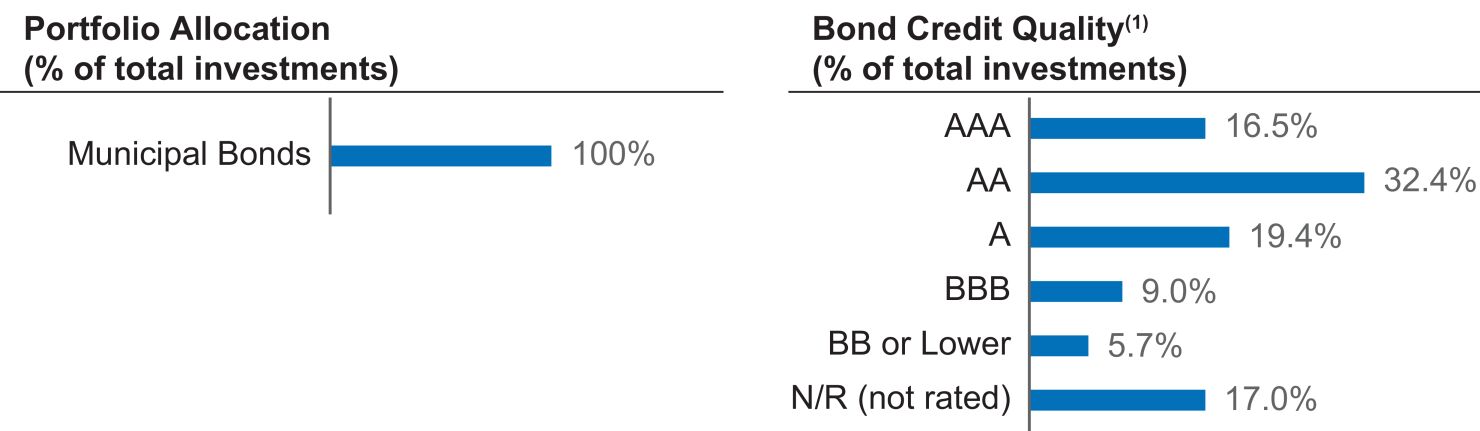
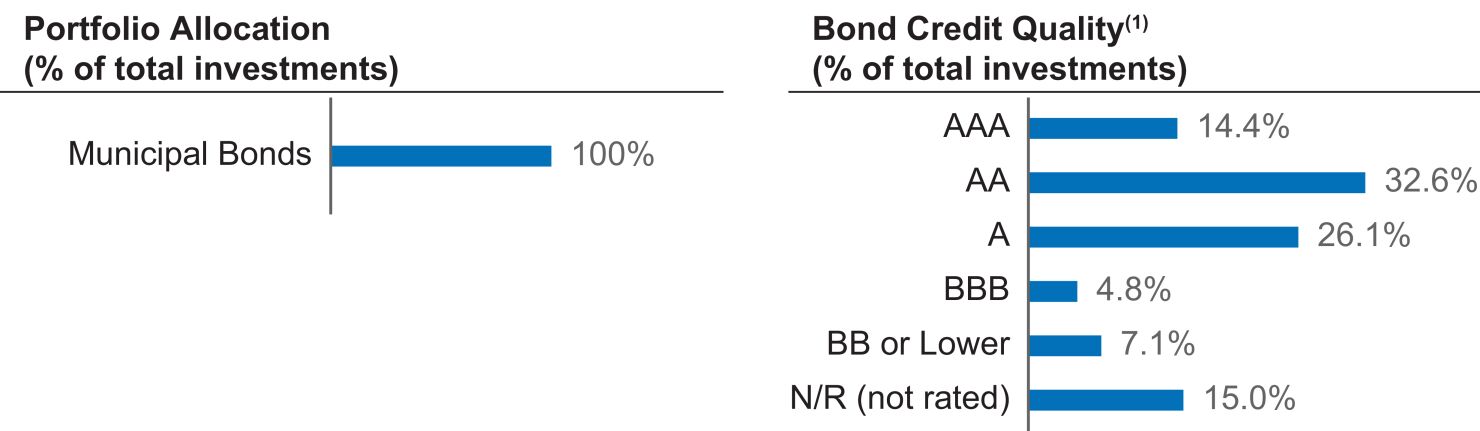
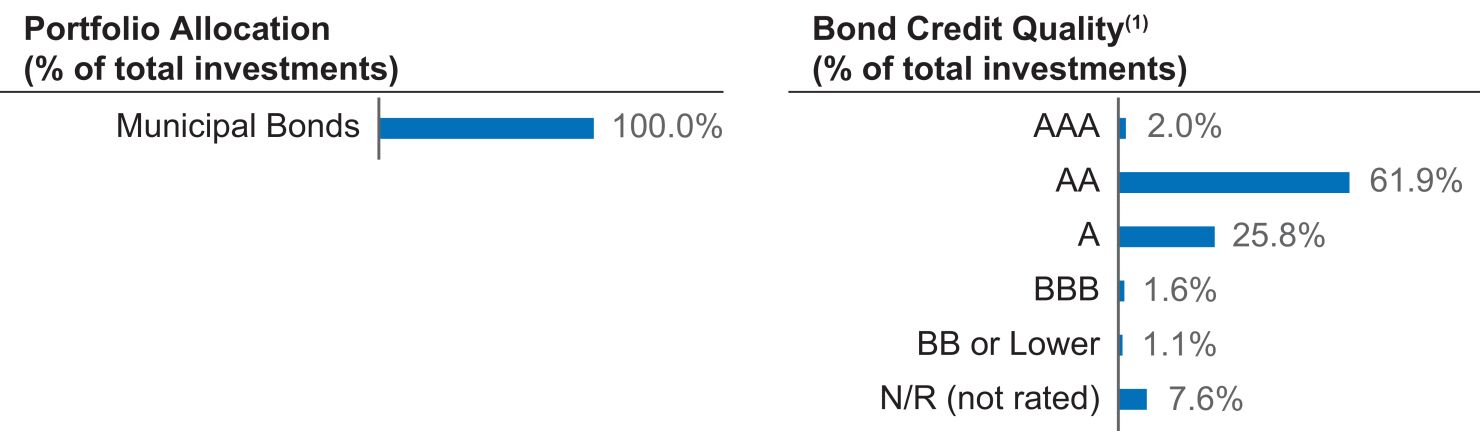
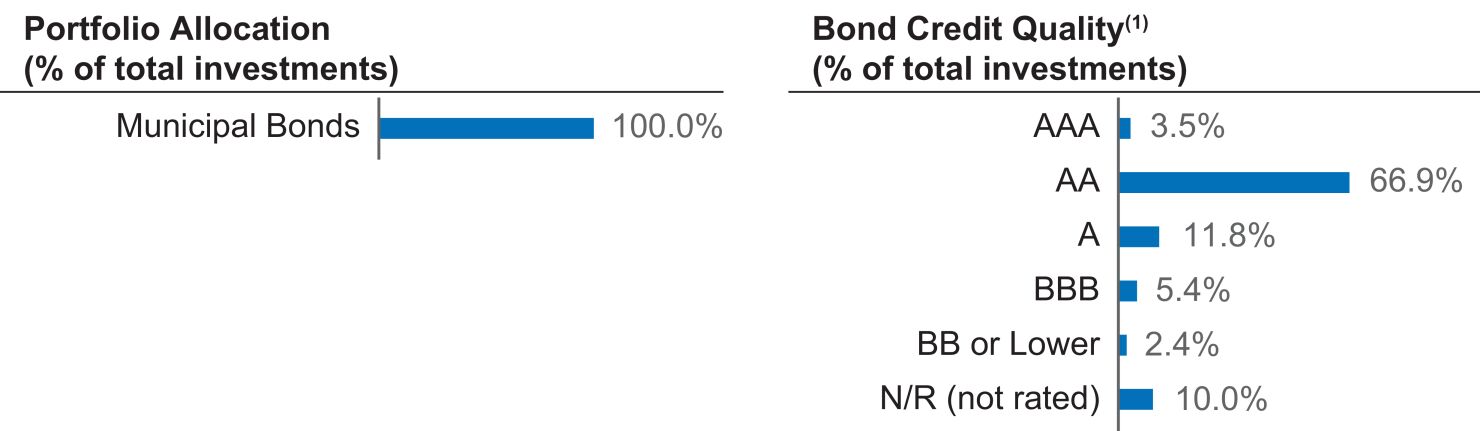
What did the Fund invest in? (as of May 31, 2024)
(1) The ratings disclosed are the highest rating given by one of the following national rating agencies: Standard & Poor’s (S&P), Moody’s Investors Service, Inc. (Moody’s) or Fitch, Inc (Fitch). This treatment of split-rated securities may differ from that used for other purposes, such as for Fund investment policies. Credit ratings are subject to change. AAA, AA, A, and BBB are investment grade ratings; BB, B, CCC, CC, C and D are below-investment grade ratings. Holdings designated N/R are not rated by these national ratings agencies.
How has the Fund changed?
| | • | | Portfolio manager updates: Effective October 13, 2023, Michael Hamilton and Stephen Candido, CFA were added as portfolio managers of the Fund. Effective April 1, 2024, Christopher Drahn retired from Nuveen Asset Management, LLC and no longer serves as a portfolio manager of the Fund. | |
| | • | | Management fees: As of May 1, 2024, the Fund’s overall complex-level fee begins at a maximum rate of 0.1600% of the Fund’s average daily net assets, with breakpoints for eligible complex-level assets above $124.3 billion. | |
For more complete information, you may review the Fund’s next prospectus, which is expected to be available by October 1, 2024 at https://www.nuveen.com/en‑us/mutual‑funds/prospectuses or upon request at (800) 257‑8787.
Availability of additional information about the Fund
You can find additional information about the Fund at https://www.nuveen.com/en‑us/mutual‑funds/prospectuses, including its:
| | • | | prospectus • financial statements and other information • fund holdings • proxy voting information |
You can also request this information at (800) 257‑8787.
| | |
670678713_AR_0524 3668789-INV-Y-07/25 (A, C, I) | |  |
| | |
| |
Annual Shareholder Report
May 31, 2024 |
Nuveen Minnesota Intermediate Municipal Bond Fund
Class I Shares/FAMTX
Annual Shareholder Report
This annual shareholder report contains important information about the Class I Shares of the Nuveen Minnesota Intermediate Municipal Bond Fund for the period of June 1, 2023 to May 31, 2024. You can find additional information at https://www.nuveen.com/en‑us/mutual‑funds/prospectuses. You can also request this information by contacting us at (800) 257‑8787.
This report describes changes to the Fund that occurred during the reporting period.
What were the Fund costs for the last year? (based on a hypothetical $10,000 investment)
| | | | |
| | | Cost of a
$10,000 investment | | Costs paid as a percentage of
$10,000 investment |
| Class I Shares | | $61 | | 0.61% |
How did the Fund perform last year? What affected the Fund’s performance?
| | |
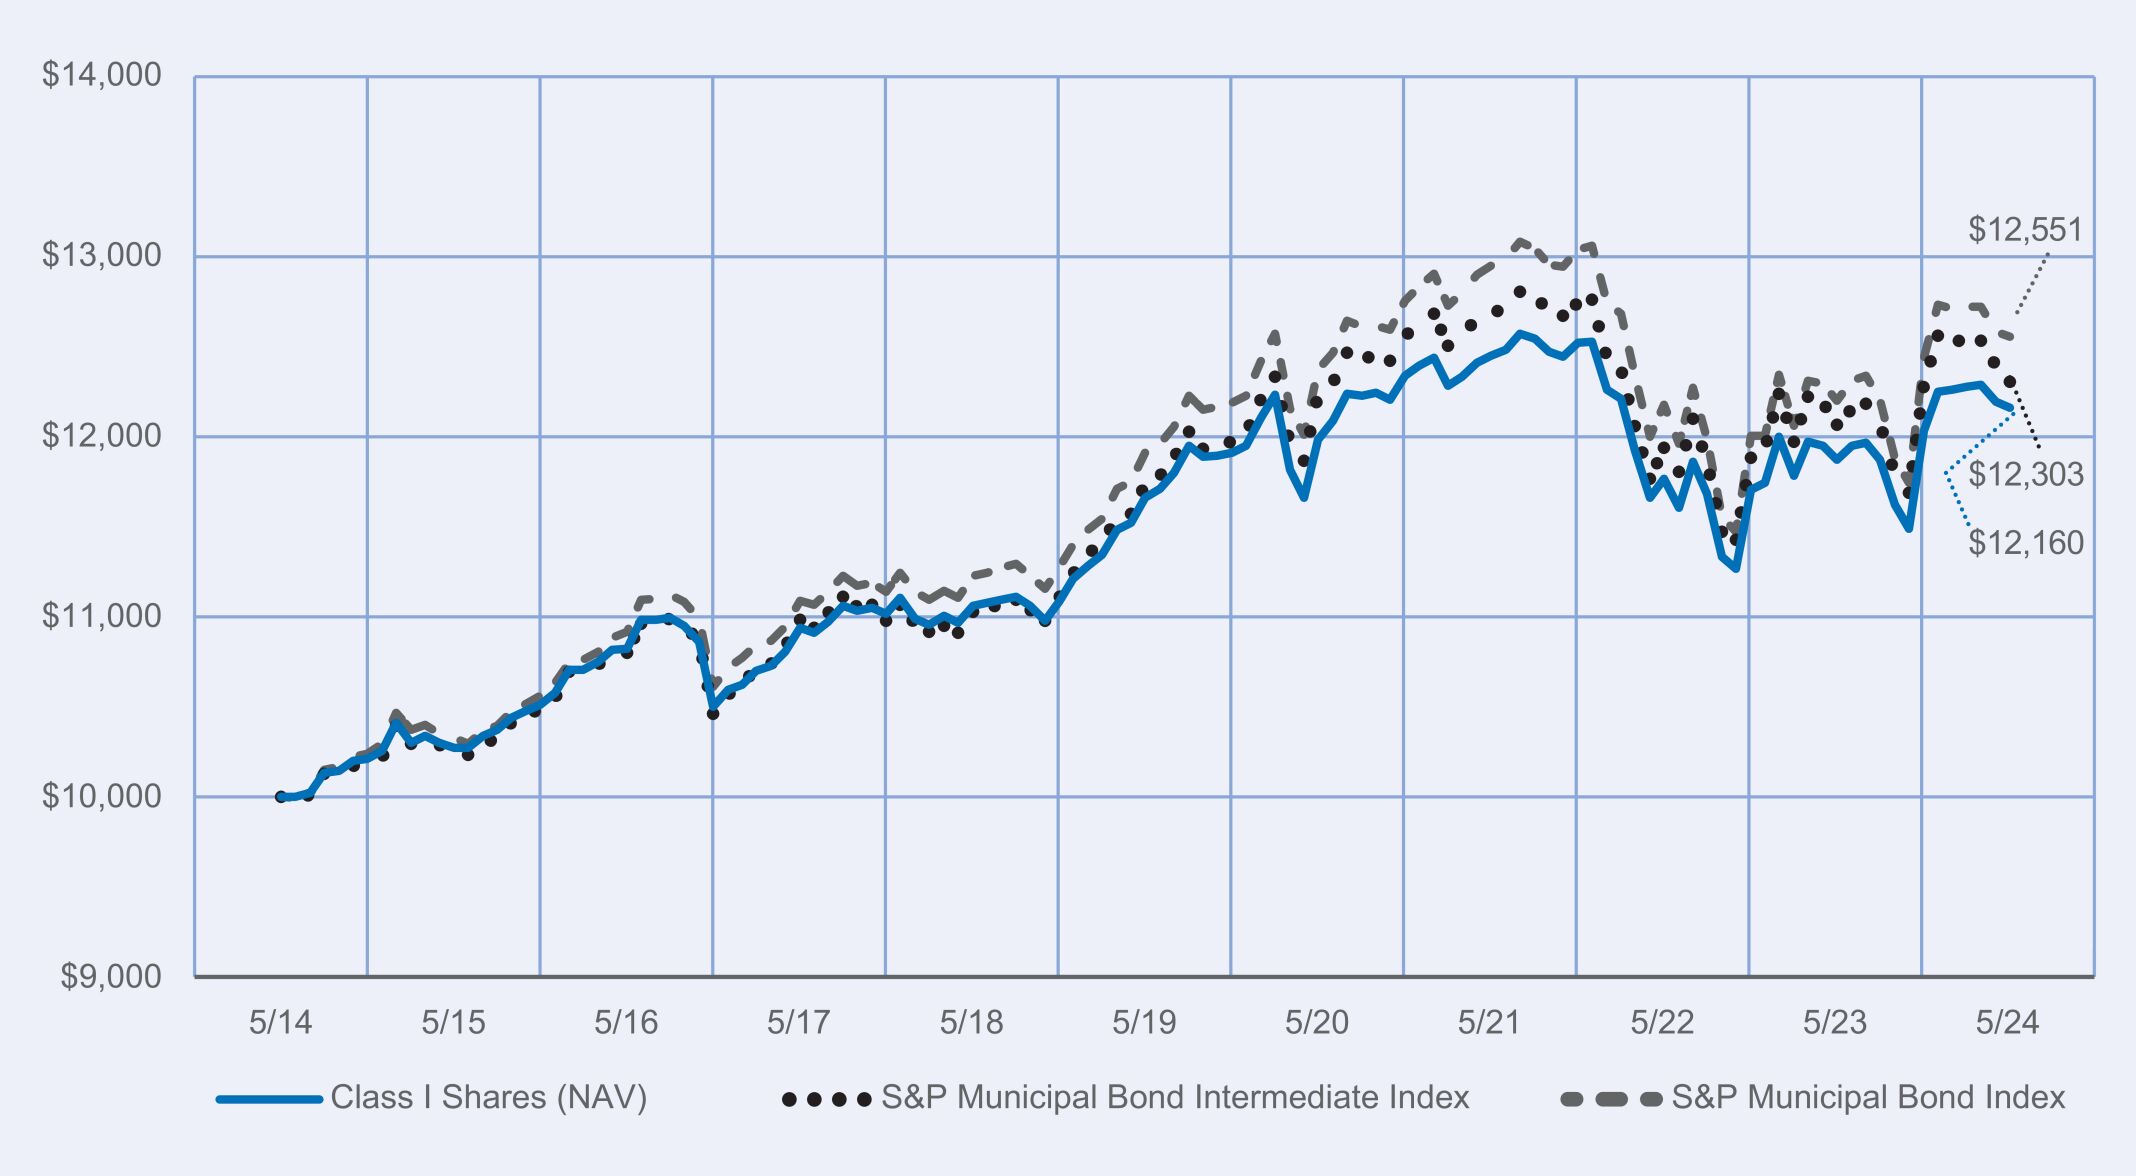
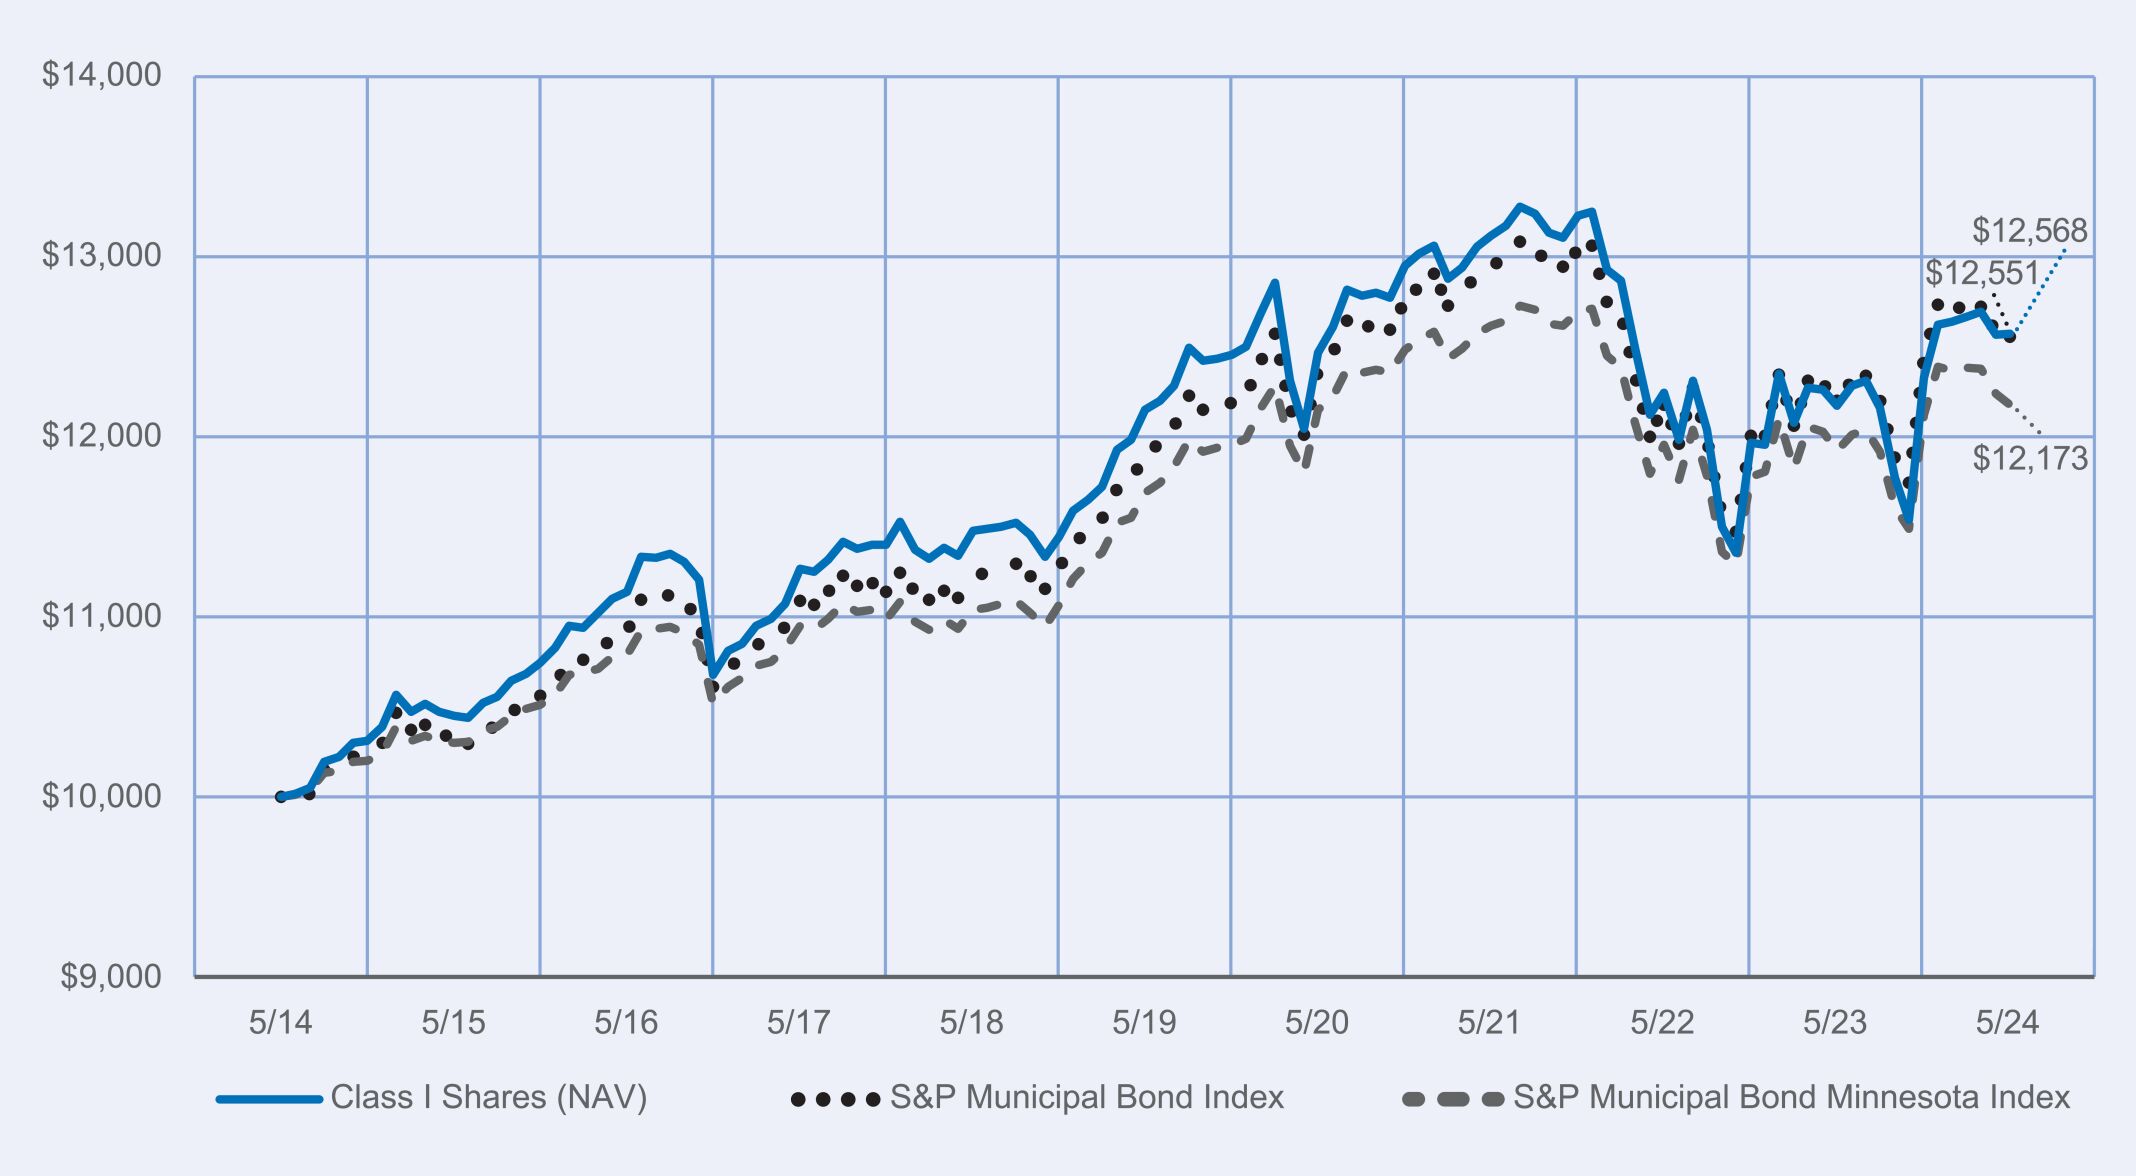
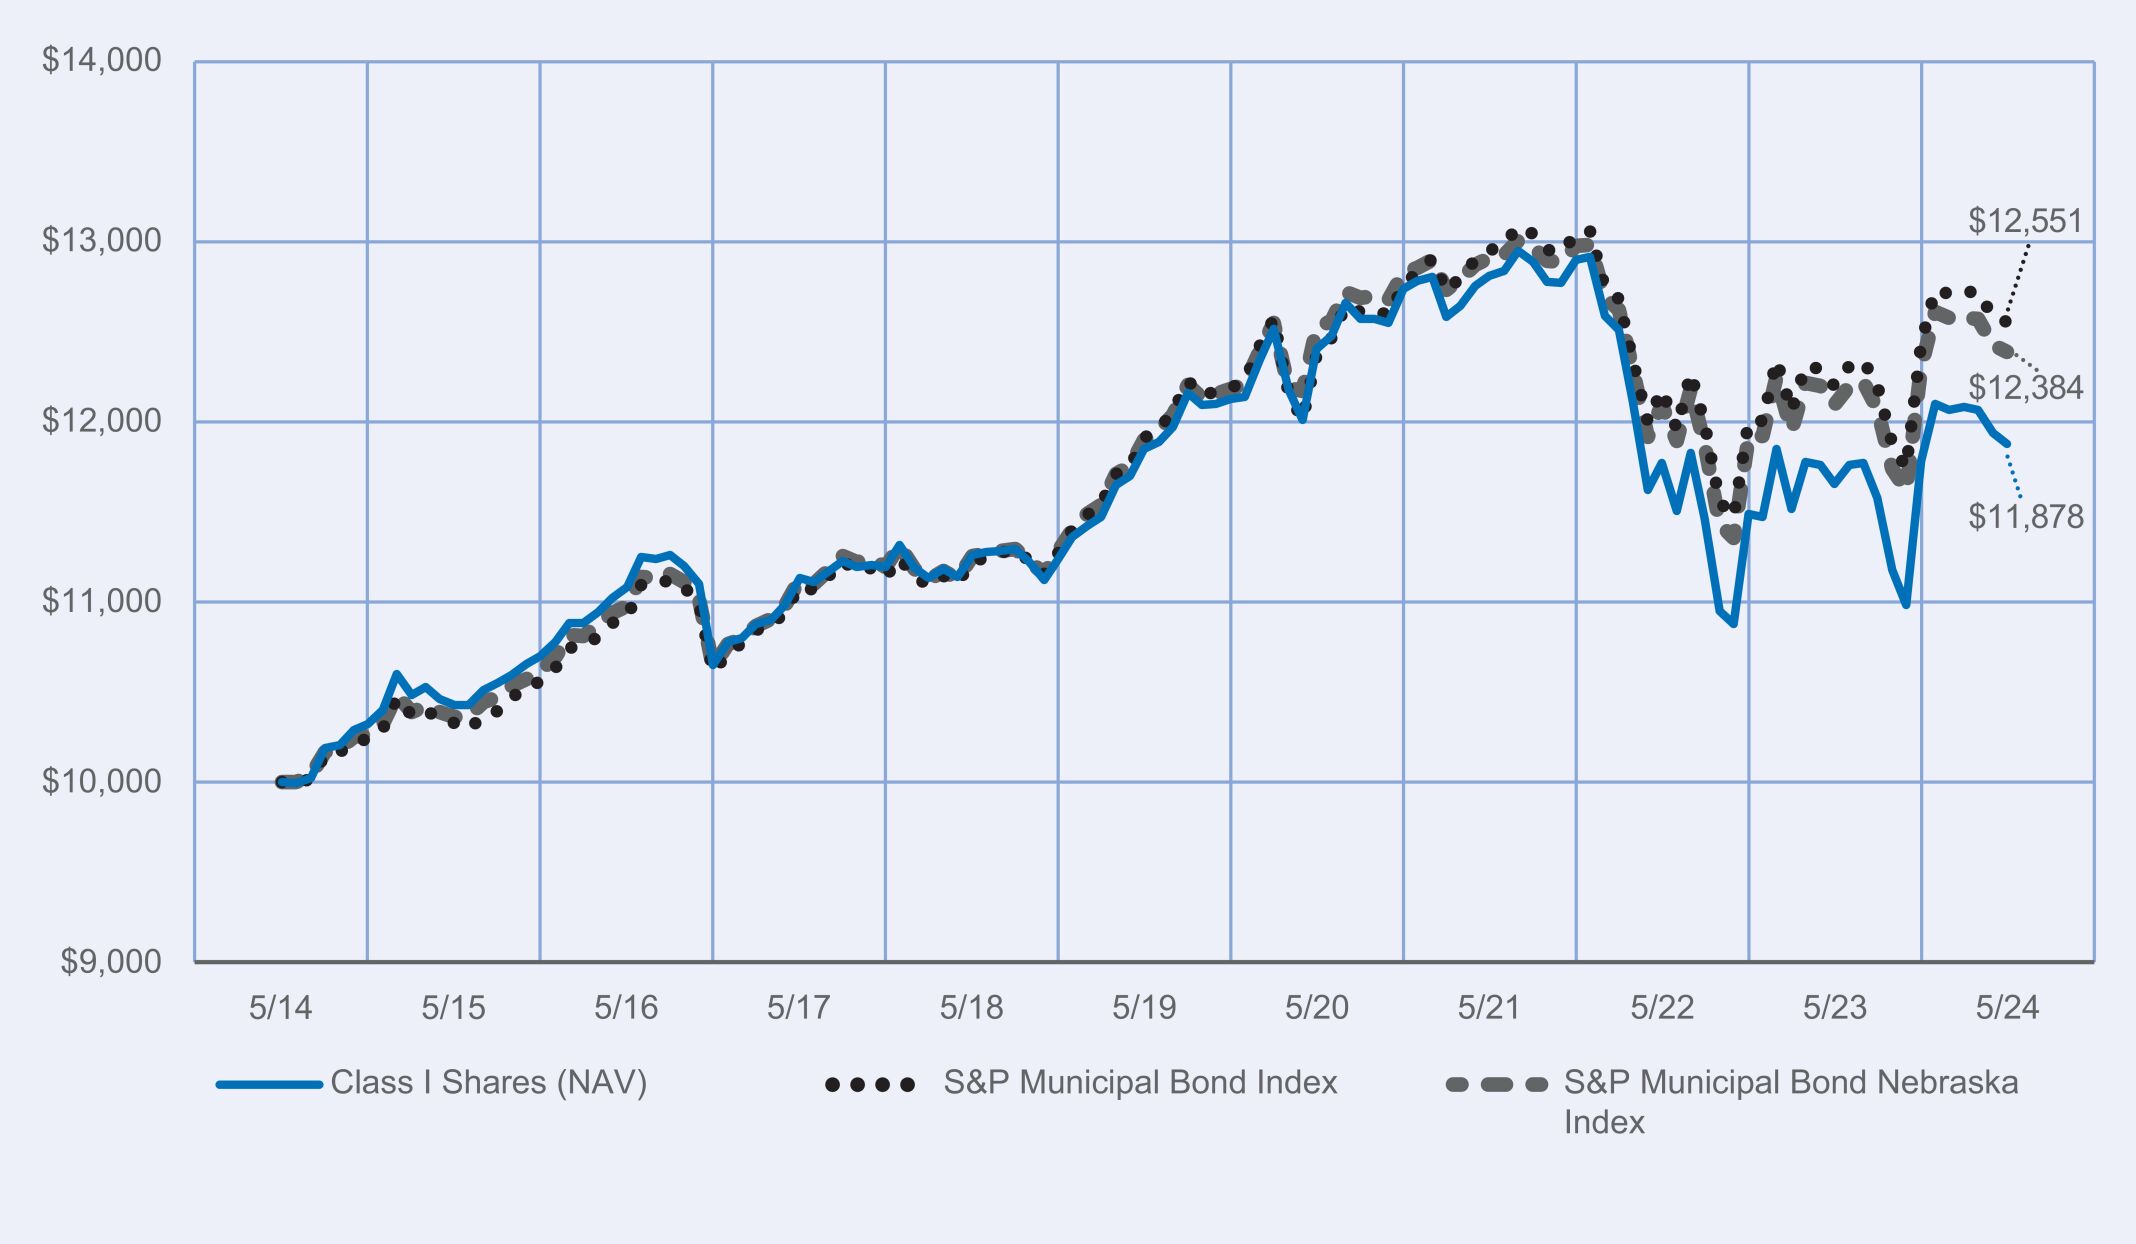
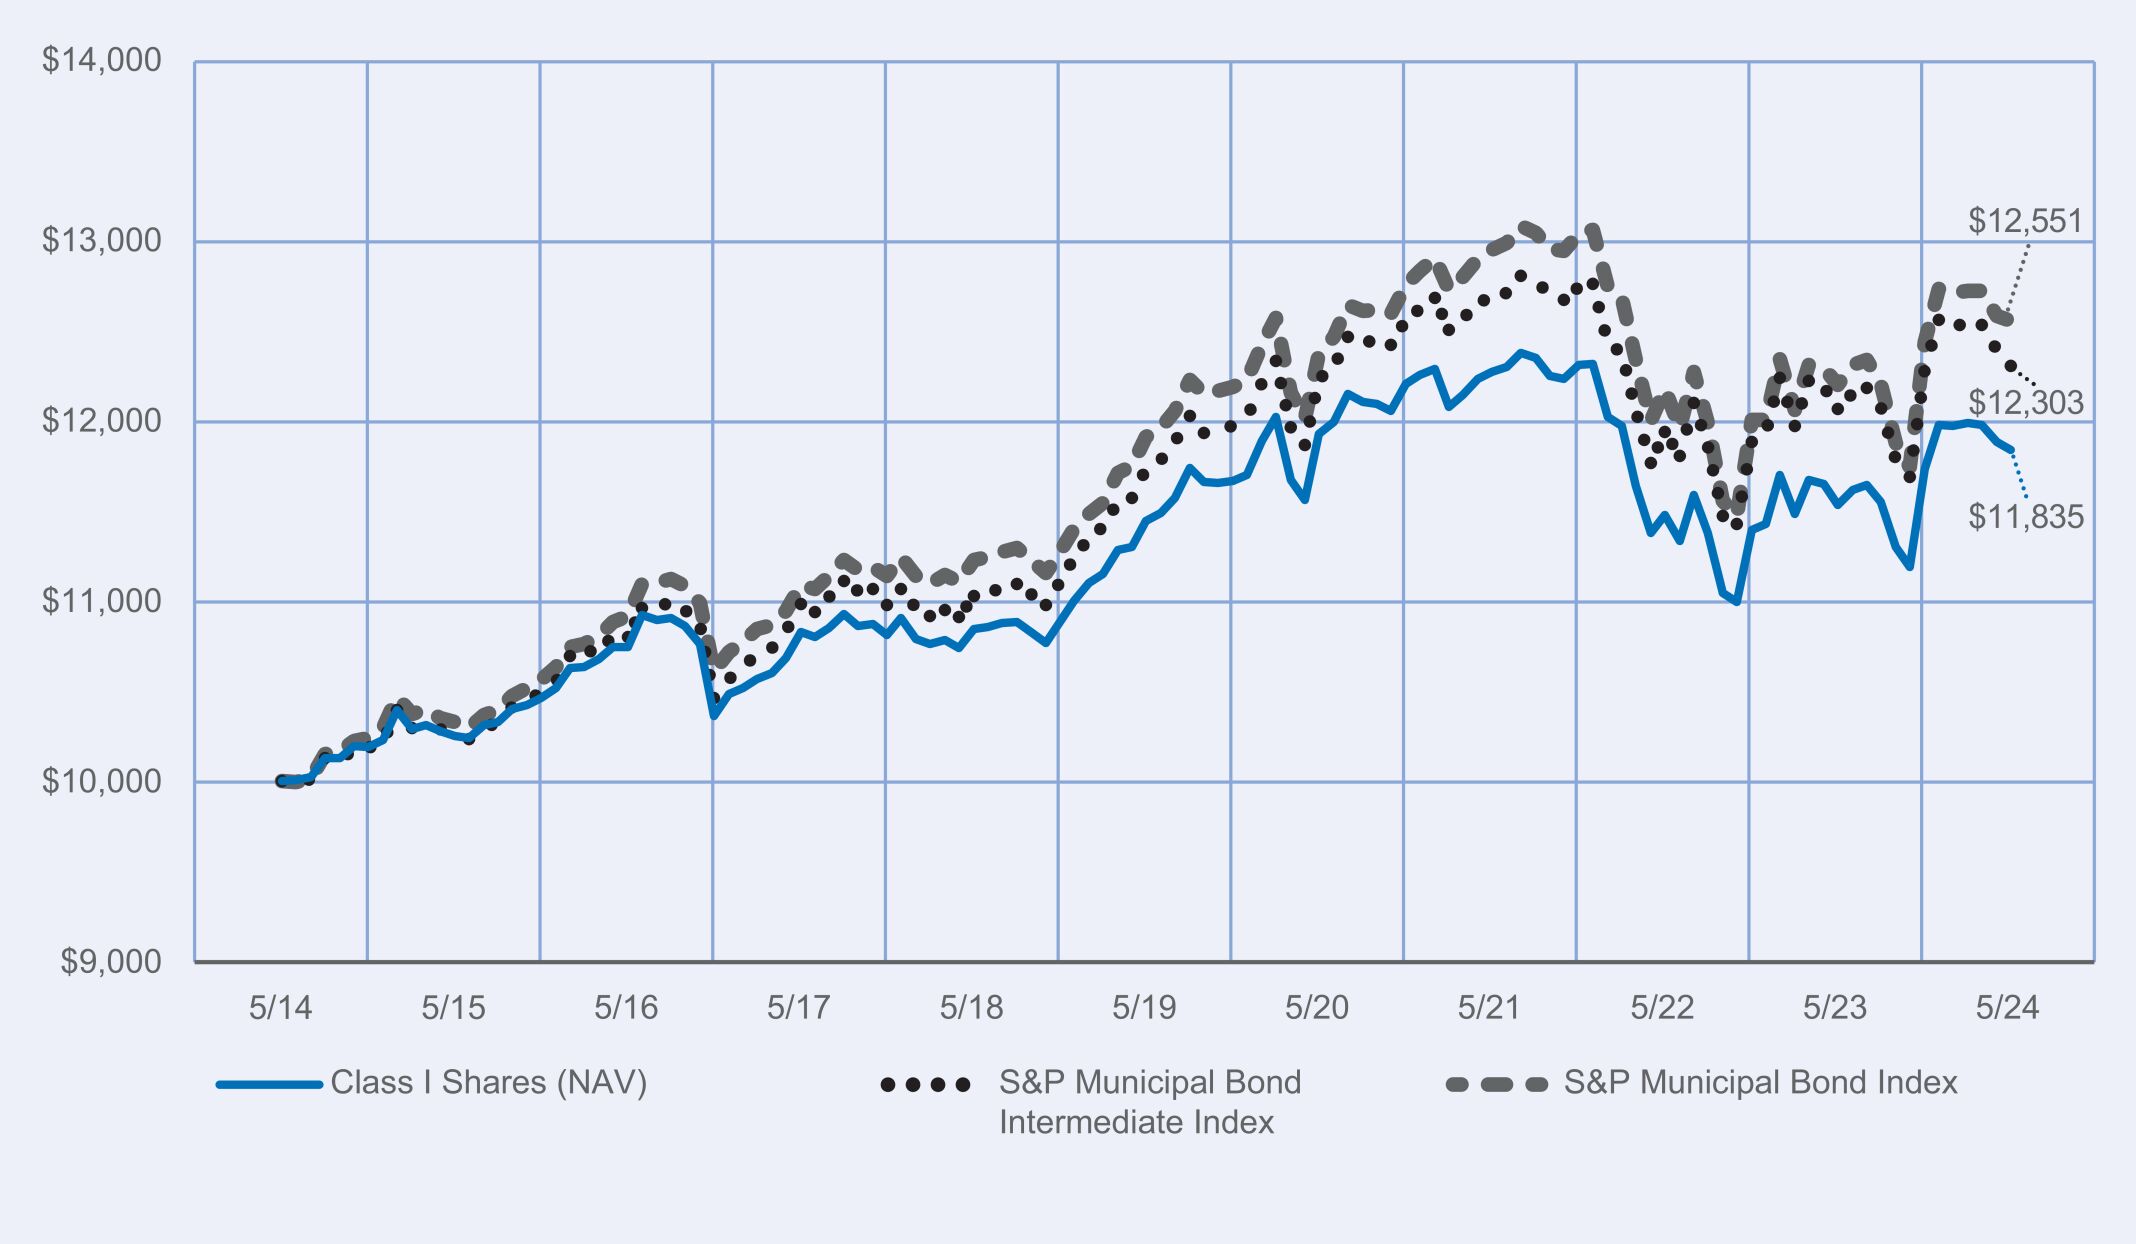
Performance Highlights • The Nuveen Minnesota Intermediate Municipal Bond Fund returned 2.47% for Class I shares at net asset value (NAV) for the 12 months ended May 31, 2024. The Fund outperformed the S&P Municipal Bond Intermediate Index, which returned 1.99%. • Top contributors to relative performance » Credit ratings allocation, specifically an underweight to the highest credit quality (AAA and AA rated) bonds, which underperformed, and an overweight to bonds rated A and below, which benefited from narrowing credit spreads. » Duration positioning, especially an overweight exposure to bonds with the shortest (zero to two years) and longest (10 years and longer) durations, which benefited from the yield curve flattening, and an underweight to bonds with two- to eight-year durations, which lagged. • Top detractors from relative performance » Allocation to state general obligation (GO) bonds with six- to eight-year durations, a segment that underperformed. » Overweight to appropriation-backed bonds, which underperformed. » Security selection across a range of holdings. | | Performance Attribution Credit ratings allocation Short- and long-duration bonds State GOs Appropriation-backed bonds Security selection |
How did the Fund perform over the last 10 years?
Performance data shown represents past performance and does not predict or guarantee future results. The graph and table do not reflect the deduction of taxes that a shareholder would pay on Fund distributions or redemption of Fund Shares.
Fund Performance (June 1, 2014 through May 31, 2024) Initial Investment of $10,000
Average Annual Total Returns
| | | | | | | | | | | | |
| | | 1‑Year | | | 5‑Year | | | 10‑Year | |
| Class I Shares at NAV | | | 2.47 | % | | | 0.84 | % | | | 1.98 | % |
| S&P Municipal Bond Index | | | 2.88 | % | | | 1.06 | % | | | 2.30 | % |
| S&P Municipal Bond Intermediate Index | | | 1.99 | % | | | 0.96 | % | | | 2.09 | % |
| Lipper Other States Intermediate Municipal Debt Funds Classification Average | | | 1.84 | % | | | 0.31 | % | | | 1.29 | % |
Investment return and principal value will fluctuate, and you may have a gain or loss when you sell your shares. Current performance may differ from figures shown. For most recent month‑end performance, go to https://www.nuveen.com/en‑us/mutual‑funds/prospectuses or call (800) 257‑8787.
Fund Statistics (as of May 31, 2024)
| | | | |
| Fund net assets | | $ | 321,326,007 | |
| Total number of portfolio holdings | | | 286 | |
| Portfolio turnover (%) | | | 21% | |
| Total advisory fees paid for the year | | $ | 1,721,106 | |
What did the Fund invest in? (as of May 31, 2024)
(1) The ratings disclosed are the highest rating given by one of the following national rating agencies: Standard & Poor’s (S&P), Moody’s Investors Service, Inc. (Moody’s) or Fitch, Inc (Fitch). This treatment of split-rated securities may differ from that used for other purposes, such as for Fund investment policies. Credit ratings are subject to change. AAA, AA, A, and BBB are investment grade ratings; BB, B, CCC, CC, C and D are below-investment grade ratings. Holdings designated N/R are not rated by these national ratings agencies.
How has the Fund changed?
| | • | | Portfolio manager updates: Effective October 13, 2023, Michael Hamilton and Stephen Candido, CFA were added as portfolio managers of the Fund. Effective April 1, 2024, Christopher Drahn retired from Nuveen Asset Management, LLC and no longer serves as a portfolio manager of the Fund. | |
| | • | | Management fees: As of May 1, 2024, the Fund’s overall complex-level fee begins at a maximum rate of 0.1600% of the Fund’s average daily net assets, with breakpoints for eligible complex-level assets above $124.3 billion. | |
For more complete information, you may review the Fund’s next prospectus, which is expected to be available by October 1, 2024 at https://www.nuveen.com/en‑us/mutual‑funds/prospectuses or upon request at (800) 257‑8787.
Availability of additional information about the Fund
You can find additional information about the Fund at https://www.nuveen.com/en‑us/mutual‑funds/prospectuses, including its:
| | • | | prospectus • financial statements and other information • fund holdings • proxy voting information |
You can also request this information at (800) 257‑8787.
| | |
670678689_AR_0524 3668789-INV-Y-07/25 (A, C, I) | | |
| | |
| |
Annual Shareholder Report
May 31, 2024 |
Nuveen Minnesota Intermediate Municipal Bond Fund
Class C Shares/NIBCX
Annual Shareholder Report
This annual shareholder report contains important information about the Class C Shares of the Nuveen Minnesota Intermediate Municipal Bond Fund for the period of June 1, 2023 to May 31, 2024. You can find additional information at https://www.nuveen.com/en‑us/mutual‑funds/prospectuses. You can also request this information by contacting us at (800) 257‑8787.
This report describes changes to the Fund that occurred during the reporting period.
What were the Fund costs for the last year? (based on a hypothetical $10,000 investment)
| | | | |
| | | Cost of a
$10,000 investment | | Costs paid as a percentage of
$10,000 investment |
| Class C Shares | | $161 | | 1.61% |
How did the Fund perform last year? What affected the Fund’s performance?
| | |
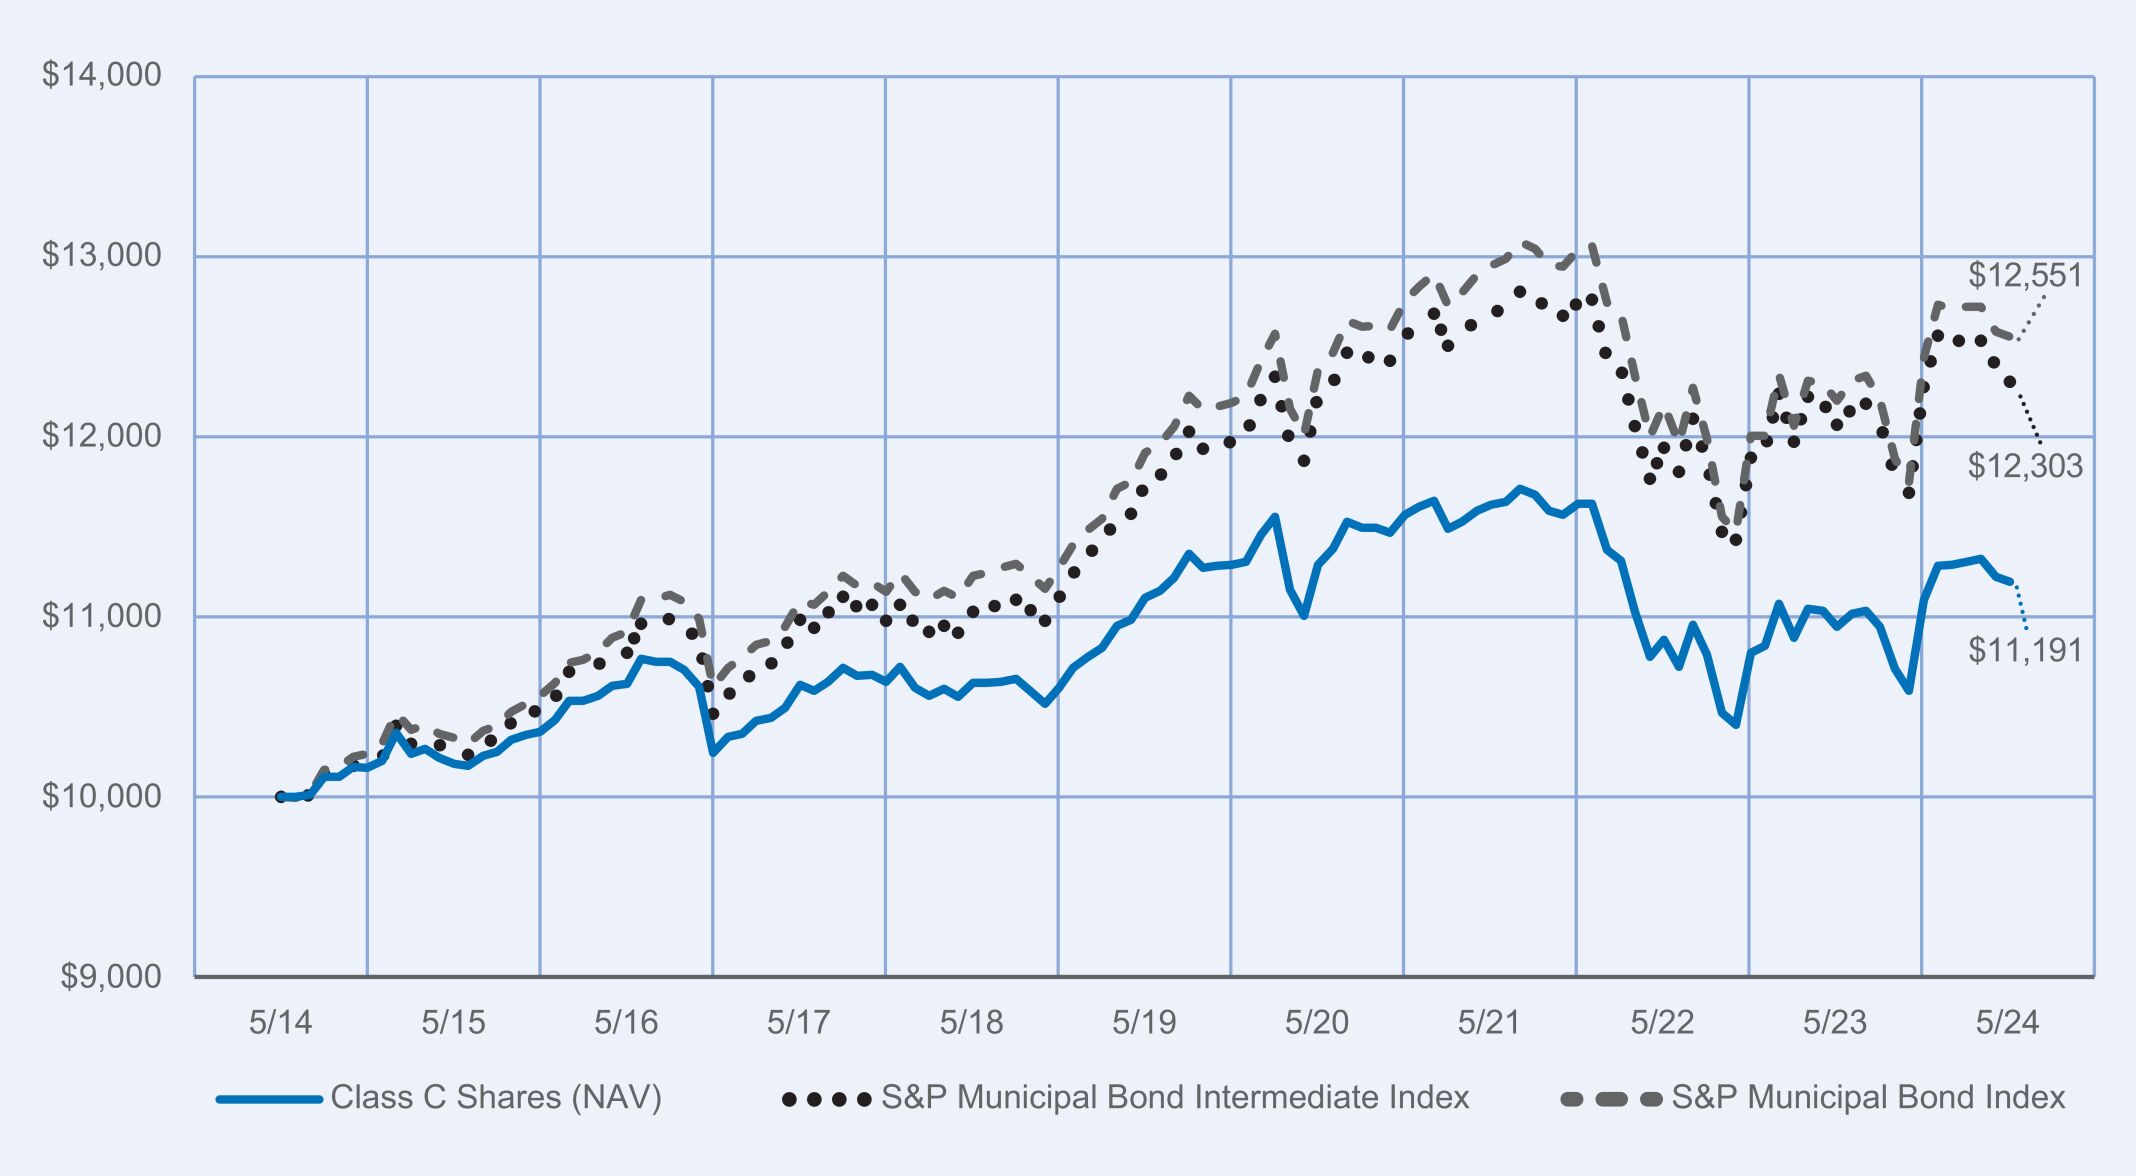
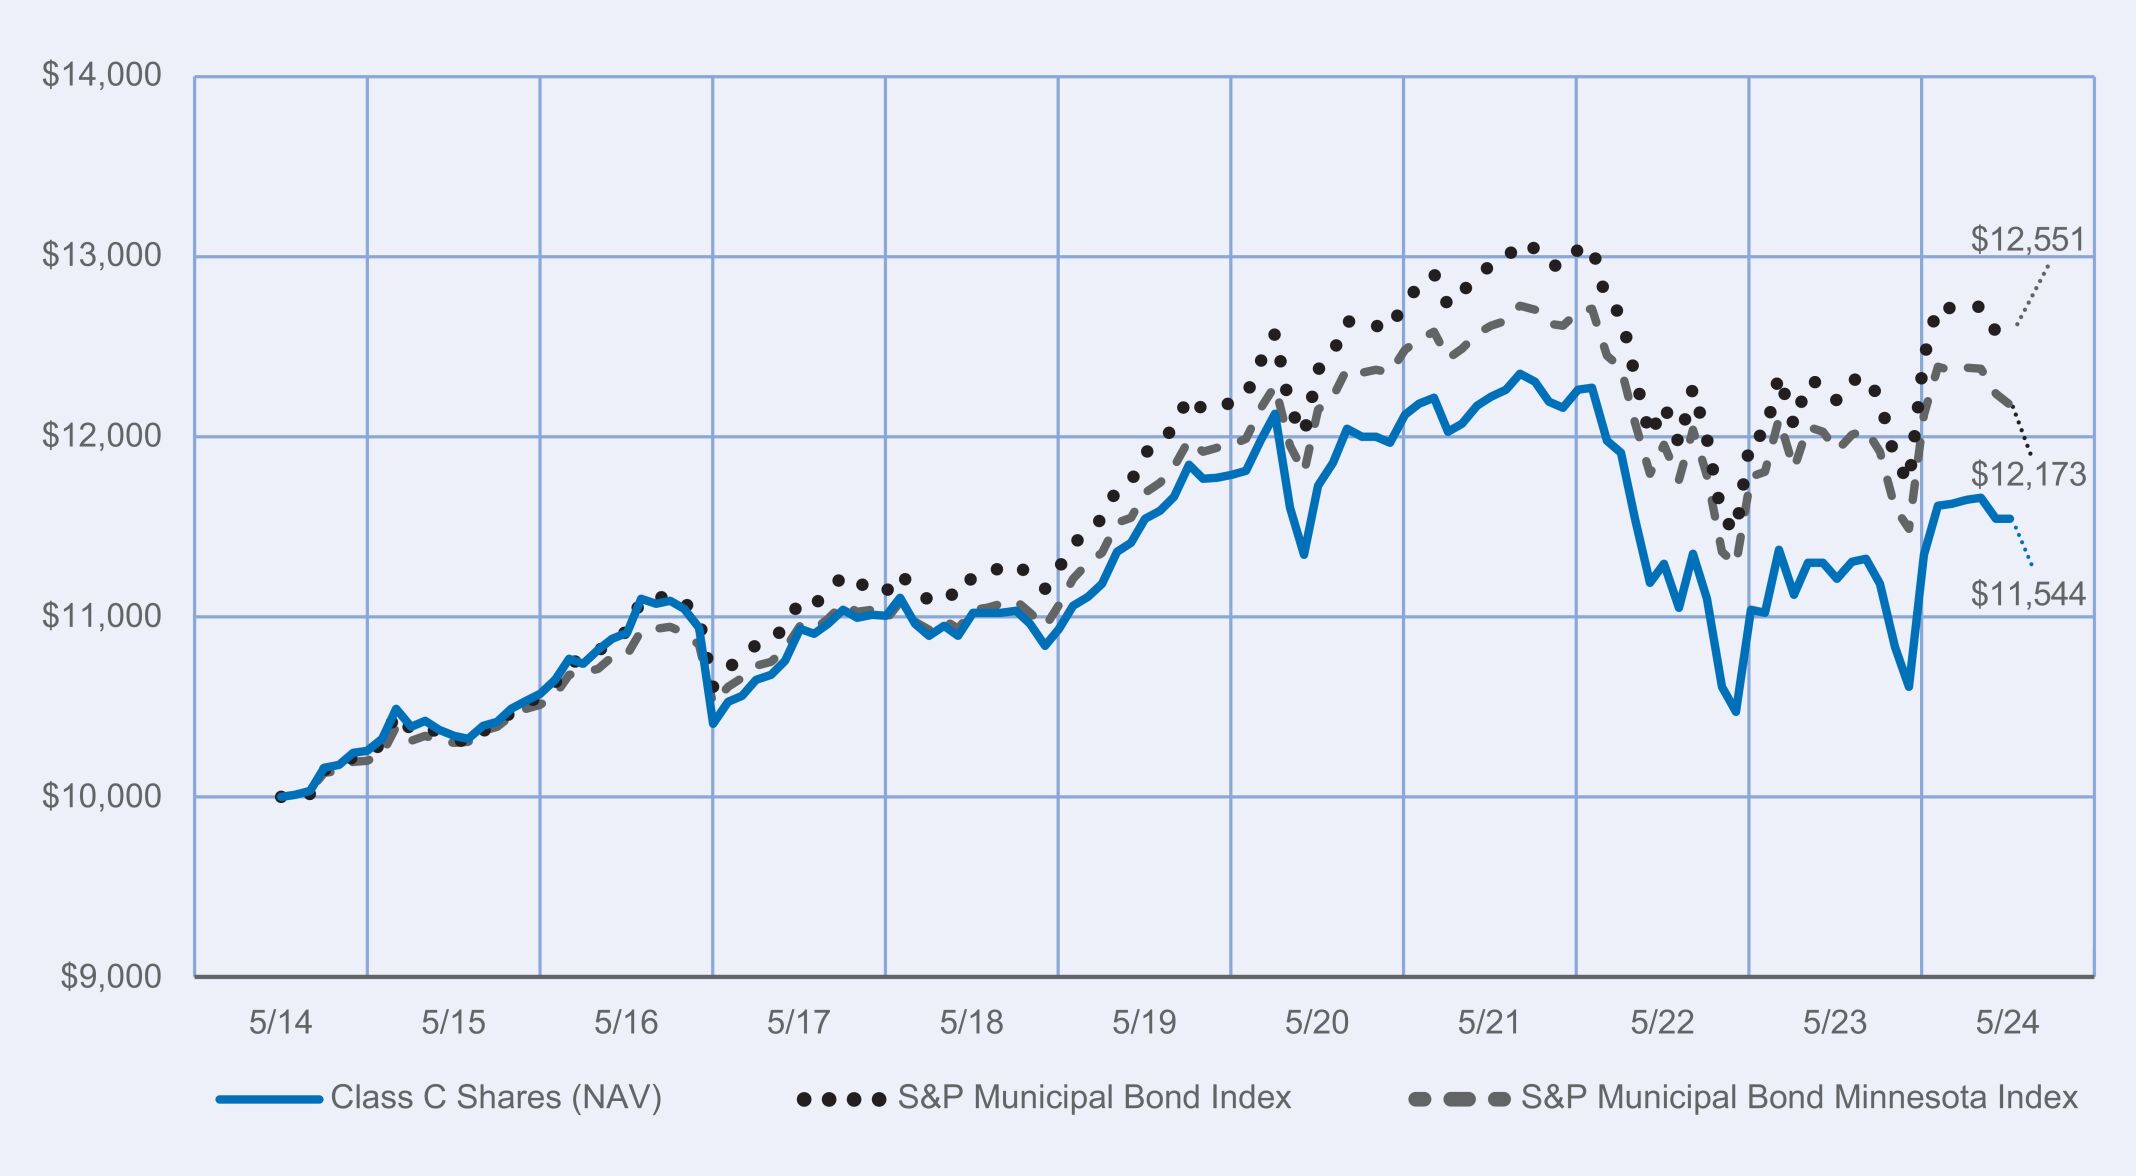
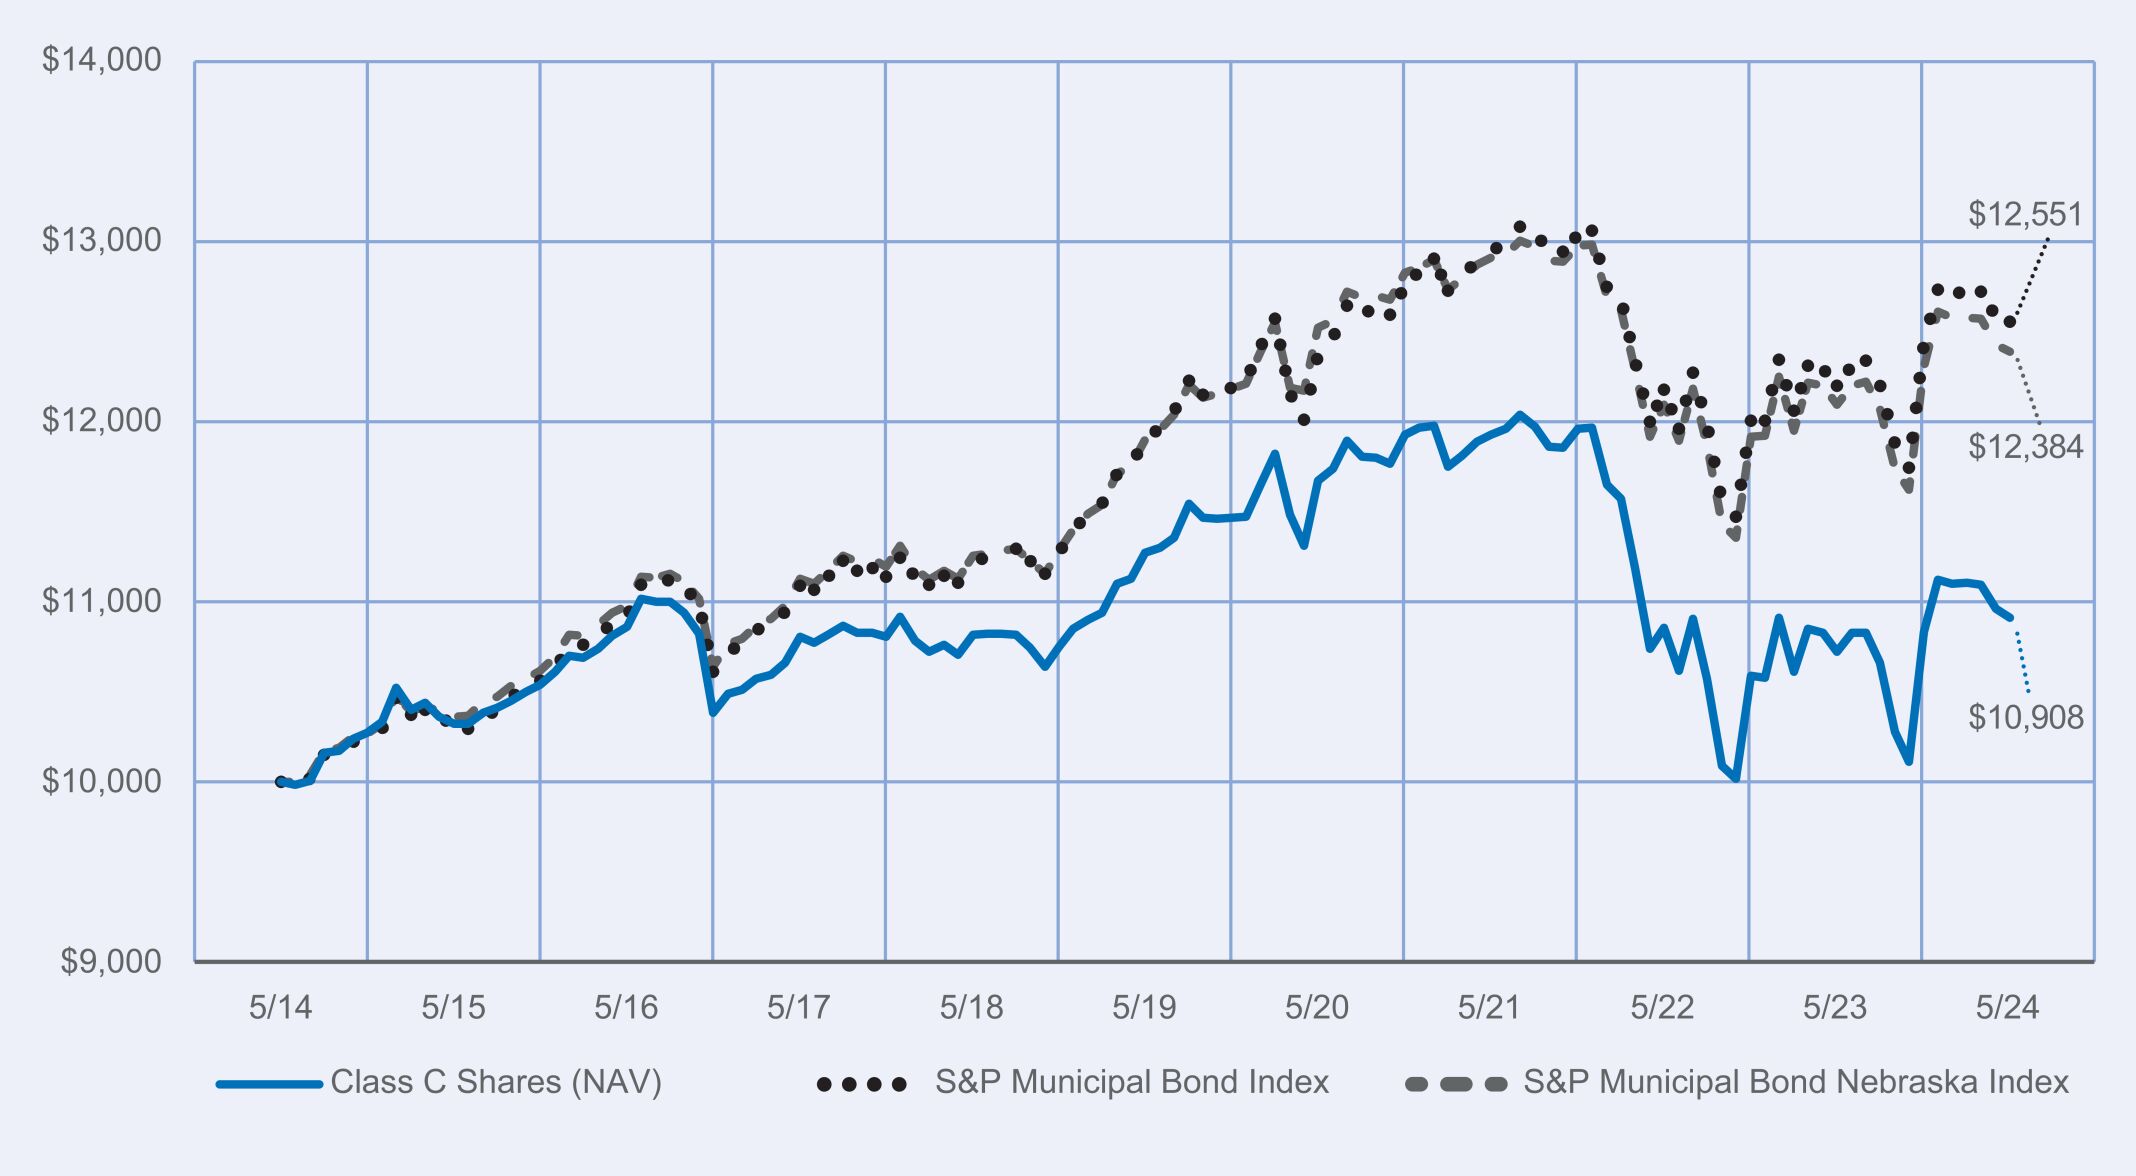
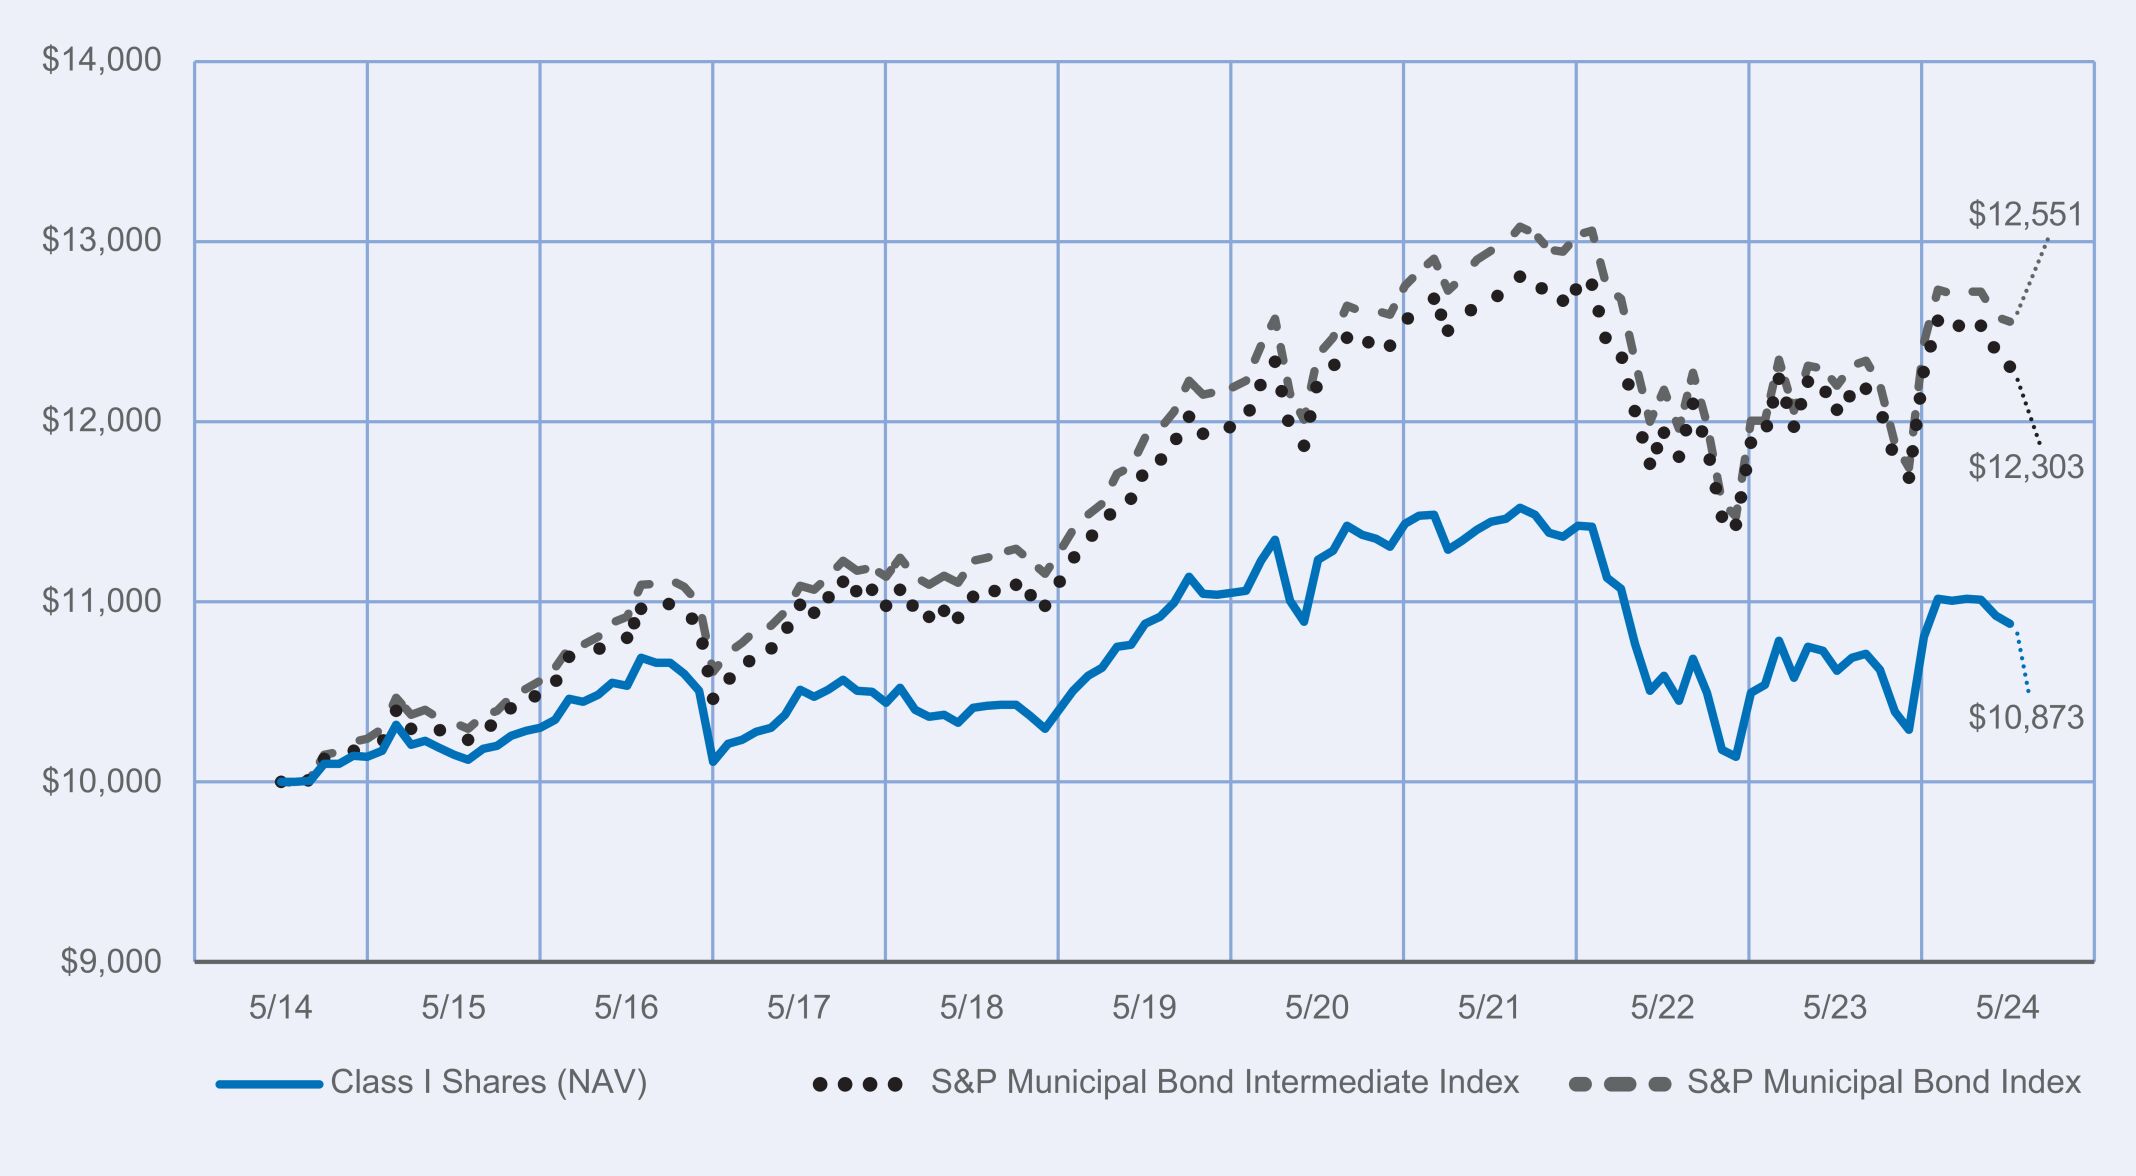
Performance Highlights • The Nuveen Minnesota Intermediate Municipal Bond Fund returned 1.45% for Class C shares at net asset value (NAV) for the 12 months ended May 31, 2024. The Fund underperformed the S&P Municipal Bond Intermediate Index, which returned 1.99%. • Top detractors from relative performance » Allocation to state general obligation (GO) bonds with six- to eight-year durations, a segment that underperformed. » Overweight to appropriation-backed bonds, which underperformed. » Security selection across a range of holdings. • Top contributors to relative performance » Credit ratings allocation, specifically an underweight to the highest credit quality (AAA and AA rated) bonds, which underperformed, and an overweight to bonds rated A and below, which benefited from narrowing credit spreads. » Duration positioning, especially an overweight exposure to bonds with the shortest (zero to two years) and longest (10 years and longer) durations, which benefited from the yield curve flattening, and an underweight to bonds with two- to eight-year durations, which lagged. | | Performance Attribution State GOs Appropriation-backed bonds Security selection Credit ratings allocation Short- and long-duration bonds |
How did the Fund perform over the last 10 years?
Performance data shown represents past performance and does not predict or guarantee future results. The graph and table do not reflect the deduction of taxes that a shareholder would pay on Fund distributions or redemption of Fund Shares.
Fund Performance (June 1, 2014 through May 31, 2024) Initial Investment of $10,000
Average Annual Total Returns
| | | | | | | | | | | | |
| | | 1‑Year | | | 5‑Year | | | 10‑Year | |
| Class C Shares at NAV (excluding maximum sales charge) | | | 1.45 | % | | | (0.16 | )% | | | 1.13 | % |
| S&P Municipal Bond Index | | | 2.88 | % | | | 1.06 | % | | | 2.30 | % |
| S&P Municipal Bond Intermediate Index | | | 1.99 | % | | | 0.96 | % | | | 2.09 | % |
| Lipper Other States Intermediate Municipal Debt Funds Classification Average | | | 1.84 | % | | | 0.31 | % | | | 1.29 | % |
Class C Shares are subject to a contingent deferred sales charge if redeemed within 12 months of purchase, which will be reflected in total returns presented for less than one year.
Investment return and principal value will fluctuate, and you may have a gain or loss when you sell your shares. Current performance may differ from figures shown. For most recent month‑end performance, go to https://www.nuveen.com/en‑us/mutual‑funds/prospectuses or call (800) 257‑8787.
Fund Statistics (as of May 31, 2024)
| | | | |
| Fund net assets | | $ | 321,326,007 | |
| Total number of portfolio holdings | | | 286 | |
| Portfolio turnover (%) | | | 21% | |
| Total advisory fees paid for the year | | $ | 1,721,106 | |
What did the Fund invest in? (as of May 31, 2024)
(1) The ratings disclosed are the highest rating given by one of the following national rating agencies: Standard & Poor’s (S&P), Moody’s Investors Service, Inc. (Moody’s) or Fitch, Inc (Fitch). This treatment of split-rated securities may differ from that used for other purposes, such as for Fund investment policies. Credit ratings are subject to change. AAA, AA, A, and BBB are investment grade ratings; BB, B, CCC, CC, C and D are below-investment grade ratings. Holdings designated N/R are not rated by these national ratings agencies.
How has the Fund changed?
| | • | | Portfolio manager updates: Effective October 13, 2023, Michael Hamilton and Stephen Candido, CFA were added as portfolio managers of the Fund. Effective April 1, 2024, Christopher Drahn retired from Nuveen Asset Management, LLC and no longer serves as a portfolio manager of the Fund. | |
| | • | | Management fees: As of May 1, 2024, the Fund’s overall complex-level fee begins at a maximum rate of 0.1600% of the Fund’s average daily net assets, with breakpoints for eligible complex-level assets above $124.3 billion. | |
For more complete information, you may review the Fund’s next prospectus, which is expected to be available by October 1, 2024 at https://www.nuveen.com/en‑us/mutual‑funds/prospectuses or upon request at (800) 257‑8787.
Availability of additional information about the Fund
You can find additional information about the Fund at https://www.nuveen.com/en‑us/mutual‑funds/prospectuses, including its:
| | • | | prospectus • financial statements and other information • fund holdings • proxy voting information |
You can also request this information at (800) 257‑8787.
| | |
670693100_AR_0524 3668789-INV-Y-07/25 (A, C, I) | | |
| | |
| |
Annual Shareholder Report
May 31, 2024 |
Nuveen Minnesota Municipal Bond Fund
Class A Shares/FJMNX
Annual Shareholder Report
This annual shareholder report contains important information about the Class A Shares of the Nuveen Minnesota Municipal Bond Fund for the period of June 1, 2023 to May 31, 2024. You can find additional information at https://www.nuveen.com/en‑us/mutual‑funds/prospectuses. You can also request this information by contacting us at (800) 257‑8787.
This report describes changes to the Fund that occurred during the reporting period.
What were the Fund costs for the last year? (based on a hypothetical $10,000 investment)
| | | | |
| | | Cost of a $10,000 investment | | Costs paid as a percentage of $10,000 investment |
| Class A Shares | | $79 | | 0.79% |
How did the Fund perform last year? What affected the Fund’s performance?
| | |
Performance Highlights • The Nuveen Minnesota Municipal Bond Fund returned 2.99% for Class A shares at net asset value (NAV) for the 12 months ended May 31, 2024. The Fund outperformed the S&P Municipal Bond Minnesota Index, which returned 2.10%. • Top contributors to relative performance » Duration positioning, particularly an underweight to bonds with four- to eight-year durations and an overweight to the longest-duration bonds. » Credit ratings allocation, specifically an underweight to the highest credit quality (AAA and AA rated) bonds, which underperformed, and overweight to bonds rated A and lower (especially non-rated), which benefited from narrowing credit spreads. » Sector and security selection across a diverse group of positions. • Top detractors from relative performance » Underweight to zero to two-year duration bonds, a segment that performed well. » Hospital bonds in the six- to eight-year duration range, which underperformed. | | Performance Attribution Four- to eight-year bonds and long-duration bonds Credit ratings allocation Sector and security selection Zero to two-year bonds Hospital bonds |
How did the Fund perform over the last 10 years?
Performance data shown represents past performance and does not predict or guarantee future results. The graph and table do not reflect the deduction of taxes that a shareholder would pay on Fund distributions or redemption of Fund Shares.
Fund Performance (June 1, 2014 through May 31, 2024) Initial Investment of $10,000
Average Annual Total Returns
| | | | | | | | | | | | |
| | | 1‑Year | | | 5‑Year | | | 10‑Year | |
| Class A Shares at NAV (excluding maximum sales charge) | | | 2.99 | % | | | 0.48 | % | | | 2.10 | % |
| Class A Shares at maximum sales charge (Offering Price) | | | (1.35 | )% | | | (0.38 | )% | | | 1.66 | % |
| S&P Municipal Bond Index | | | 2.88 | % | | | 1.06 | % | | | 2.30 | % |
| S&P Municipal Bond Minnesota Index | | | 2.10 | % | | | 0.82 | % | | | 1.99 | % |
| Lipper Minnesota Municipal Debt Funds Classification Average | | | 2.45 | % | | | 0.25 | % | | | 1.57 | % |
Investment return and principal value will fluctuate, and you may have a gain or loss when you sell your shares. Current performance may differ from figures shown. For most recent month‑end performance, go to https://www.nuveen.com/en‑us/mutual‑funds/prospectuses or call (800) 257‑8787.
Fund Statistics (as of May 31, 2024)
| | | | |
| Fund net assets | | $ | 603,793,151 | |
| Total number of portfolio holdings | | | 375 | |
| Portfolio turnover (%) | | | 26% | |
| Total advisory fees paid for the year | | $ | 2,827,072 | |
What did the Fund invest in? (as of May 31, 2024)
(1) The ratings disclosed are the highest rating given by one of the following national rating agencies: Standard & Poor’s (S&P), Moody’s Investors Service, Inc. (Moody’s) or Fitch, Inc (Fitch). This treatment of split-rated securities may differ from that used for other purposes, such as for Fund investment policies. Credit ratings are subject to change. AAA, AA, A, and BBB are investment grade ratings; BB, B, CCC, CC, C and D are below-investment grade ratings. Holdings designated N/R are not rated by these national ratings agencies.
How has the Fund changed?
| | • | | Portfolio manager updates: Effective October 13, 2023, Michael Hamilton and Stephen Candido, CFA were added as portfolio managers of the Fund. Effective April 1, 2024, Christopher Drahn retired from Nuveen Asset Management, LLC and no longer serves as a portfolio manager of the Fund. | |
| | • | | Management fees: As of May 1, 2024, the Fund’s overall complex-level fee begins at a maximum rate of 0.1600% of the Fund’s average daily net assets, with breakpoints for eligible complex-level assets above $124.3 billion. | |
For more complete information, you may review the Fund’s next prospectus, which is expected to be available by October 1, 2024 at https://www.nuveen.com/en‑us/mutual‑funds/prospectuses or upon request at (800) 257‑8787.
Availability of additional information about the Fund
You can find additional information about the Fund at https://www.nuveen.com/en‑us/mutual‑funds/prospectuses, including its:
| | • | | prospectus • financial statements and other information • fund holdings • proxy voting information |
You can also request this information at (800) 257‑8787.
| | |
670678184_AR_0524 3668803-INV-Y-07/25 (A, C, I) | | |
| | |
| | Annual Shareholder Report May 31, 2024 |
Nuveen Minnesota Municipal Bond Fund
Class I Shares/FYMNX
Annual Shareholder Report
This annual shareholder report contains important information about the Class I Shares of the Nuveen Minnesota Municipal Bond Fund for the period of June 1, 2023 to May 31, 2024. You can find additional information at https://www.nuveen.com/en‑us/mutual‑funds/prospectuses. You can also request this information by contacting us at (800) 257‑8787.
This report describes changes to the Fund that occurred during the reporting period.
What were the Fund costs for the last year? (based on a hypothetical $10,000 investment)
| | | | |
| | | Cost of a $10,000 investment | | Costs paid as a percentage of $10,000 investment |
| Class I Shares | | $59 | | 0.59% |
How did the Fund perform last year? What affected the Fund’s performance?
| | |
Performance Highlights • The Nuveen Minnesota Municipal Bond Fund returned 3.29% for Class I shares at net asset value (NAV) for the 12 months ended May 31, 2024. The Fund outperformed the S&P Municipal Bond Minnesota Index, which returned 2.10%. • Top contributors to relative performance » Duration positioning, particularly an underweight to bonds with four- to eight-year durations and an overweight to the longest-duration bonds. » Credit ratings allocation, specifically an underweight to the highest credit quality (AAA and AA rated) bonds, which underperformed, and overweight to bonds rated A and lower (especially non-rated), which benefited from narrowing credit spreads. » Sector and security selection across a diverse group of positions. • Top detractors from relative performance » Underweight to zero to two-year duration bonds, a segment that performed well. » Hospital bonds in the six- to eight-year duration range, which underperformed. | | Performance Attribution Four- to eight-year bonds and long-duration bonds Credit ratings allocation Sector and security selection Zero to two-year bonds Hospital bonds |
How did the Fund perform over the last 10 years?
Performance data shown represents past performance and does not predict or guarantee future results. The graph and table do not reflect the deduction of taxes that a shareholder would pay on Fund distributions or redemption of Fund Shares.
Fund Performance (June 1, 2014 through May 31, 2024) Initial Investment of $10,000
Average Annual Total Returns
| | | | | | | | | | | | |
| | | 1‑Year | | | 5‑Year | | | 10‑Year | |
| Class I Shares at NAV | | | 3.29 | % | | | 0.69 | % | | | 2.31 | % |
| S&P Municipal Bond Index | | | 2.88 | % | | | 1.06 | % | | | 2.30 | % |
| S&P Municipal Bond Minnesota Index | | | 2.10 | % | | | 0.82 | % | | | 1.99 | % |
| Lipper Minnesota Municipal Debt Funds Classification Average | | | 2.45 | % | | | 0.25 | % | | | 1.57 | % |
Investment return and principal value will fluctuate, and you may have a gain or loss when you sell your shares. Current performance may differ from figures shown. For most recent month‑end performance, go to https://www.nuveen.com/en‑us/mutual‑funds/prospectuses or call (800) 257‑8787.
Fund Statistics (as of May 31, 2024)
| | | | |
| Fund net assets | | $ | 603,793,151 | |
| Total number of portfolio holdings | | | 375 | |
| Portfolio turnover (%) | | | 26% | |
| Total advisory fees paid for the year | | $ | 2,827,072 | |
What did the Fund invest in? (as of May 31, 2024)
(1) The ratings disclosed are the highest rating given by one of the following national rating agencies: Standard & Poor’s (S&P), Moody’s Investors Service, Inc. (Moody’s) or Fitch, Inc (Fitch). This treatment of split-rated securities may differ from that used for other purposes, such as for Fund investment policies. Credit ratings are subject to change. AAA, AA, A, and BBB are investment grade ratings; BB, B, CCC, CC, C and D are below-investment grade ratings. Holdings designated N/R are not rated by these national ratings agencies.
How has the Fund changed?
| | • | | Portfolio manager updates: Effective October 13, 2023, Michael Hamilton and Stephen Candido, CFA were added as portfolio managers of the Fund. Effective April 1, 2024, Christopher Drahn retired from Nuveen Asset Management, LLC and no longer serves as a portfolio manager of the Fund. | |
| | • | | Management fees: As of May 1, 2024, the Fund’s overall complex-level fee begins at a maximum rate of 0.1600% of the Fund’s average daily net assets, with breakpoints for eligible complex-level assets above $124.3 billion. | |
For more complete information, you may review the Fund’s next prospectus, which is expected to be available by October 1, 2024 at https://www.nuveen.com/en‑us/mutual‑funds/prospectuses or upon request at (800) 257‑8787.
Availability of additional information about the Fund
You can find additional information about the Fund at https://www.nuveen.com/en‑us/mutual‑funds/prospectuses, including its:
| | • | | prospectus • financial statements and other information • fund holdings • proxy voting information |
You can also request this information at (800) 257‑8787.
| | |
670678192_AR_0524 3668803-INV-Y-07/25 (A, C, I) | | |
| | |
| |
Annual Shareholder Report
May 31, 2024 |
Nuveen Minnesota Municipal Bond Fund
Class C Shares/NTCCX
Annual Shareholder Report
This annual shareholder report contains important information about the Class C Shares of the Nuveen Minnesota Municipal Bond Fund for the period of June 1, 2023 to May 31, 2024. You can find additional information at https://www.nuveen.com/en‑us/mutual‑funds/prospectuses. You can also request this information by contacting us at (800) 257‑8787.
This report describes changes to the Fund that occurred during the reporting period.
What were the Fund costs for the last year? (based on a hypothetical $10,000 investment)
| | | | |
| | | Cost of a
$10,000 investment | | Costs paid as a percentage of
$10,000 investment |
| Class C Shares | | $159 | | 1.59% |
How did the Fund perform last year? What affected the Fund’s performance?
| | |
Performance Highlights • The Nuveen Minnesota Municipal Bond Fund returned 2.16% for Class C shares at net asset value (NAV) for the 12 months ended May 31, 2024. The Fund performed in line with the S&P Municipal Bond Minnesota Index, which returned 2.10%. • Top contributors to relative performance » Duration positioning, particularly an underweight to bonds with four- to eight-year durations and an overweight to the longest-duration bonds. » Credit ratings allocation, specifically an underweight to the highest credit quality (AAA and AA rated) bonds, which underperformed, and overweight to bonds rated A and lower (especially non-rated), which benefited from narrowing credit spreads. » Sector and security selection across a diverse group of positions. • Top detractors from relative performance » Underweight to zero to two-year duration bonds, a segment that performed well. » Hospital bonds in the six- to eight-year duration range, which underperformed. | | Performance Attribution Four- to eight-year bonds and long-duration bonds Credit ratings allocation Sector and security selection Zero to two-year bonds Hospital bonds |
How did the Fund perform over the last 10 years?
Performance data shown represents past performance and does not predict or guarantee future results. The graph and table do not reflect the deduction of taxes that a shareholder would pay on Fund distributions or redemption of Fund Shares.
Fund Performance (June 1, 2014 through May 31, 2024) Initial Investment of $10,000
Average Annual Total Returns
| | | | | | | | | | | | |
| | | 1‑Year | | | 5‑Year | | | 10‑Year | |
| Class C Shares at NAV (excluding maximum sales charge) | | | 2.16 | % | | | (0.32 | )% | | | 1.45 | % |
| S&P Municipal Bond Index | | | 2.88 | % | | | 1.06 | % | | | 2.30 | % |
| S&P Municipal Bond Minnesota Index | | | 2.10 | % | | | 0.82 | % | | | 1.99 | % |
| Lipper Minnesota Municipal Debt Funds Classification Average | | | 2.45 | % | | | 0.25 | % | | | 1.57 | % |
Class C Shares are subject to a contingent deferred sales charge if redeemed within 12 months of purchase, which will be reflected in total returns presented for less than one year.
Investment return and principal value will fluctuate, and you may have a gain or loss when you sell your shares. Current performance may differ from figures shown. For most recent month‑end performance, go to https://www.nuveen.com/en‑us/mutual‑funds/prospectuses or call (800) 257‑8787.
Fund Statistics (as of May 31, 2024)
| | | | |
| Fund net assets | | $ | 603,793,151 | |
| Total number of portfolio holdings | | | 375 | |
| Portfolio turnover (%) | | | 26% | |
| Total advisory fees paid for the year | | $ | 2,827,072 | |
What did the Fund invest in? (as of May 31, 2024)
(1) The ratings disclosed are the highest rating given by one of the following national rating agencies: Standard & Poor’s (S&P), Moody’s Investors Service, Inc. (Moody’s) or Fitch, Inc (Fitch). This treatment of split-rated securities may differ from that used for other purposes, such as for Fund investment policies. Credit ratings are subject to change. AAA, AA, A, and BBB are investment grade ratings; BB, B, CCC, CC, C and D are below-investment grade ratings. Holdings designated N/R are not rated by these national ratings agencies.
How has the Fund changed?
| | • | | Portfolio manager updates: Effective October 13, 2023, Michael Hamilton and Stephen Candido, CFA were added as portfolio managers of the Fund. Effective April 1, 2024, Christopher Drahn retired from Nuveen Asset Management, LLC and no longer serves as a portfolio manager of the Fund. | |
| | • | | Management fees: As of May 1, 2024, the Fund’s overall complex-level fee begins at a maximum rate of 0.1600% of the Fund’s average daily net assets, with breakpoints for eligible complex-level assets above $124.3 billion. | |
For more complete information, you may review the Fund’s next prospectus, which is expected to be available by October 1, 2024 at https://www.nuveen.com/en‑us/mutual‑funds/prospectuses or upon request at (800) 257‑8787.
Availability of additional information about the Fund
You can find additional information about the Fund at https://www.nuveen.com/en‑us/mutual‑funds/prospectuses, including its:
| | • | | prospectus • financial statements and other information • fund holdings • proxy voting information |
You can also request this information at (800) 257‑8787.
| | |
670693209_AR_0524 3668803-INV-Y-07/25 (A, C, I) | | |
| | |
| |
Annual Shareholder Report
May 31, 2024 |
Nuveen Nebraska Municipal Bond Fund
Class A Shares/FNTAX
Annual Shareholder Report
This annual shareholder report contains important information about the Class A Shares of the Nuveen Nebraska Municipal Bond Fund for the period of June 1, 2023 to May 31, 2024. You can find additional information at https://www.nuveen.com/en‑us/mutual‑funds/prospectuses. You can also request this information by contacting us at (800) 257‑8787.
This report describes changes to the Fund that occurred during the reporting period.
What were the Fund costs for the last year? (based on a hypothetical $10,000 investment)
| | | | |
| | | Cost of a
$10,000 investment | | Costs paid as a percentage of
$10,000 investment |
| Class A Shares | | $81 | | 0.81% |
How did the Fund perform last year? What affected the Fund’s performance?
| | |
Performance Highlights • The Nuveen Nebraska Municipal Bond Fund returned 1.75% for Class A shares at net asset value (NAV) for the 12 months ended May 31, 2024. The Fund underperformed the S&P Municipal Bond Nebraska Index, which returned 2.41%. • Top detractors from relative performance » Overweight to long-duration life care bonds, which underperformed. » Underweight to the industrial development revenue (IDR) sector, which outperformed. » Overweight to six- to eight-year duration bonds, which underperformed as the yield curve flattened. • Top contributors to relative performance » Duration positioning, especially an overweight to bonds with eight years and longer durations, which benefited from the yield curve flattening. » Credit ratings allocation, primarily an underweight to the highest credit quality (AAA and AA rated) bonds, which underperformed, and an overweight to bonds rated A and below, including non-rated, which benefited from narrowing credit spreads. | | Performance Attribution Long-duration life care bonds IDR sector Six- to eight-year duration bonds Eight+ year duration bonds Credit ratings allocation |
How did the Fund perform over the last 10 years?
Performance data shown represents past performance and does not predict or guarantee future results. The graph and table do not reflect the deduction of taxes that a shareholder would pay on Fund distributions or redemption of Fund Shares.
Fund Performance (June 1, 2014 through May 31, 2024) Initial Investment of $10,000
Average Annual Total Returns
| | | | | | | | | | | | |
| | | 1‑Year | | | 5‑Year | | | 10‑Year | |
| Class A Shares at NAV (excluding maximum sales charge) | | | 1.75 | % | | | (0.16 | )% | | | 1.53 | % |
| Class A Shares at maximum sales charge (Offering Price) | | | (2.56 | )% | | | (1.01 | )% | | | 1.09 | % |
| S&P Municipal Bond Index | | | 2.88 | % | | | 1.06 | % | | | 2.30 | % |
| S&P Municipal Bond Nebraska Index | | | 2.41 | % | | | 0.80 | % | | | 2.16 | % |
| Lipper Other States Municipal Debt Funds Classification Average | | | 2.59 | % | | | 0.29 | % | | | 1.56 | % |
Investment return and principal value will fluctuate, and you may have a gain or loss when you sell your shares. Current performance may differ from figures shown. For most recent month‑end performance, go to https://www.nuveen.com/en‑us/mutual‑funds/prospectuses or call (800) 257‑8787.
Fund Statistics (as of May 31, 2024)
| | | | |
| Fund net assets | | $ | 73,612,168 | |
| Total number of portfolio holdings | | | 90 | |
| Portfolio turnover (%) | | | 20% | |
| Total advisory fees paid for the year | | $ | 447,722 | |
What did the Fund invest in? (as of May 31, 2024)
(1) The ratings disclosed are the highest rating given by one of the following national rating agencies: Standard & Poor’s (S&P), Moody’s Investors Service, Inc. (Moody’s) or Fitch, Inc (Fitch). This treatment of split-rated securities may differ from that used for other purposes, such as for Fund investment policies. Credit ratings are subject to change. AAA, AA, A, and BBB are investment grade ratings; BB, B, CCC, CC, C and D are below-investment grade ratings. Holdings designated N/R are not rated by these national ratings agencies.
How has the Fund changed?
| | • | | Portfolio manager update: Effective October 13, 2023, Stephen Candido, CFA was added as a portfolio manager of the Fund. | |
| | • | | Management fees: As of May 1, 2024, the Fund’s overall complex-level fee begins at a maximum rate of 0.1600% of the Fund’s average daily net assets, with breakpoints for eligible complex-level assets above $124.3 billion. | |
For more complete information, you may review the Fund’s next prospectus, which is expected to be available by October 1, 2024 at https://www.nuveen.com/en‑us/mutual‑funds/prospectuses or upon request at (800) 257‑8787.
Availability of additional information about the Fund
You can find additional information about the Fund at https://www.nuveen.com/en‑us/mutual‑funds/prospectuses, including its:
| | • | | prospectus • financial statements and other information • fund holdings • proxy voting information |
You can also request this information at (800) 257‑8787.
| | |
670678499_AR_0524 3668816-INV-Y-07/25 (A, C, I) | | |
| | |
| |
Annual Shareholder Report
May 31, 2024 |
Nuveen Nebraska Municipal Bond Fund
Class I Shares/FNTYX
Annual Shareholder Report
This annual shareholder report contains important information about the Class I Shares of the Nuveen Nebraska Municipal Bond Fund for the period of June 1, 2023 to May 31, 2024. You can find additional information at https://www.nuveen.com/en‑us/mutual‑funds/prospectuses. You can also request this information by contacting us at (800) 257‑8787.
This report describes changes to the Fund that occurred during the reporting period.
What were the Fund costs for the last year? (based on a hypothetical $10,000 investment)
| | | | |
| | | Cost of a
$10,000 investment | | Costs paid as a percentage of
$10,000 investment |
| Class I Shares | | $61 | | 0.61% |
How did the Fund perform last year? What affected the Fund’s performance?
| | |
Performance Highlights • The Nuveen Nebraska Municipal Bond Fund returned 1.95% for Class I shares at net asset value (NAV) for the 12 months ended May 31, 2024. The Fund underperformed the S&P Municipal Bond Nebraska Index, which returned 2.41%. • Top detractors from relative performance » Overweight to long-duration life care bonds, which underperformed. » Underweight to the industrial development revenue (IDR) sector, which outperformed. » Overweight to six- to eight-year duration bonds, which underperformed as the yield curve flattened. • Top contributors to relative performance » Duration positioning, especially an overweight to bonds with eight years and longer durations, which benefited from the yield curve flattening. » Credit ratings allocation, primarily an underweight to the highest credit quality (AAA and AA rated) bonds, which underperformed, and an overweight to bonds rated A and below, including non-rated, which benefited from narrowing credit spreads. | | Performance Attribution Long-duration life care bonds IDR sector Six- to eight-year duration bonds Eight+ year duration bonds Credit ratings allocation |
How did the Fund perform over the last 10 years?
Performance data shown represents past performance and does not predict or guarantee future results. The graph and table do not reflect the deduction of taxes that a shareholder would pay on Fund distributions or redemption of Fund Shares.
Fund Performance (June 1, 2014 through May 31, 2024) Initial Investment of $10,000
Average Annual Total Returns
| | | | | | | | | | | | |
| | | 1‑Year | | | 5‑Year | | | 10‑Year | |
| Class I Shares at NAV | | | 1.95 | % | | | 0.05 | % | | | 1.74 | % |
| S&P Municipal Bond Index | | | 2.88 | % | | | 1.06 | % | | | 2.30 | % |
| S&P Municipal Bond Nebraska Index | | | 2.41 | % | | | 0.80 | % | | | 2.16 | % |
| Lipper Other States Municipal Debt Funds Classification Average | | | 2.59 | % | | | 0.29 | % | | | 1.56 | % |
Investment return and principal value will fluctuate, and you may have a gain or loss when you sell your shares. Current performance may differ from figures shown. For most recent month‑end performance, go to https://www.nuveen.com/en‑us/mutual‑funds/prospectuses or call (800) 257‑8787.
Fund Statistics (as of May 31, 2024)
| | | | |
| Fund net assets | | $ | 73,612,168 | |
| Total number of portfolio holdings | | | 90 | |
| Portfolio turnover (%) | | | 20% | |
| Total advisory fees paid for the year | | $ | 447,722 | |
What did the Fund invest in? (as of May 31, 2024)
(1) The ratings disclosed are the highest rating given by one of the following national rating agencies: Standard & Poor’s (S&P), Moody’s Investors Service, Inc. (Moody’s) or Fitch, Inc (Fitch). This treatment of split-rated securities may differ from that used for other purposes, such as for Fund investment policies. Credit ratings are subject to change. AAA, AA, A, and BBB are investment grade ratings; BB, B, CCC, CC, C and D are below-investment grade ratings. Holdings designated N/R are not rated by these national ratings agencies.
How has the Fund changed?
| | • | | Portfolio manager update: Effective October 13, 2023, Stephen Candido, CFA was added as a portfolio manager of the Fund. | |
| | • | | Management fees: As of May 1, 2024, the Fund’s overall complex-level fee begins at a maximum rate of 0.1600% of the Fund’s average daily net assets, with breakpoints for eligible complex-level assets above $124.3 billion. | |
For more complete information, you may review the Fund’s next prospectus, which is expected to be available by October 1, 2024 at https://www.nuveen.com/en‑us/mutual‑funds/prospectuses or upon request at (800) 257‑8787.
Availability of additional information about the Fund
You can find additional information about the Fund at https://www.nuveen.com/en‑us/mutual‑funds/prospectuses, including its:
| | • | | prospectus • financial statements and other information • fund holdings • proxy voting information |
You can also request this information at (800) 257‑8787.
| | |
670678523_AR_0524 3668816-INV-Y-07/25 (A, C, I) | | |
| | |
| |
Annual Shareholder Report
May 31, 2024 |
Nuveen Nebraska Municipal Bond Fund
Class C Shares/NAAFX
Annual Shareholder Report
This annual shareholder report contains important information about the Class C Shares of the Nuveen Nebraska Municipal Bond Fund for the period of June 1, 2023 to May 31, 2024. You can find additional information at https://www.nuveen.com/en‑us/mutual‑funds/prospectuses. You can also request this information by contacting us at (800) 257‑8787.
This report describes changes to the Fund that occurred during the reporting period.
What were the Fund costs for the last year? (based on a hypothetical $10,000 investment)
| | | | |
| | | Cost of a
$10,000 investment | | Costs paid as a percentage of
$10,000 investment |
| Class C Shares | | $161 | | 1.61% |
How did the Fund perform last year? What affected the Fund’s performance?
| | |
Performance Highlights • The Nuveen Nebraska Municipal Bond Fund returned 0.93% for Class C shares at net asset value (NAV) for the 12 months ended May 31, 2024. The Fund underperformed the S&P Municipal Bond Nebraska Index, which returned 2.41%. • Top detractors from relative performance » Overweight to long-duration life care bonds, which underperformed. » Underweight to the industrial development revenue (IDR) sector, which outperformed. » Overweight to six- to eight-year duration bonds, which underperformed as the yield curve flattened. • Top contributors to relative performance » Duration positioning, especially an overweight to bonds with eight years and longer durations, which benefited from the yield curve flattening. » Credit ratings allocation, primarily an underweight to the highest credit quality (AAA and AA rated) bonds, which underperformed, and an overweight to bonds rated A and below, including non-rated, which benefited from narrowing credit spreads. | | Performance Attribution Long-duration life care bonds IDR sector Six- to eight-year duration bonds Eight+ year duration bonds Credit ratings allocation |
How did the Fund perform over the last 10 years?
Performance data shown represents past performance and does not predict or guarantee future results. The graph and table do not reflect the deduction of taxes that a shareholder would pay on Fund distributions or redemption of Fund Shares.
Fund Performance (June 1, 2014 through May 31, 2024) Initial Investment of $10,000
Average Annual Total Returns
| | | | | | | | | | | | |
| | | 1‑Year | | | 5‑Year | | | 10‑Year | |
| Class C Shares at NAV (excluding maximum sales charge) | | | 0.93 | % | | | (0.95 | )% | | | 0.87 | % |
| S&P Municipal Bond Index | | | 2.88 | % | | | 1.06 | % | | | 2.30 | % |
| S&P Municipal Bond Nebraska Index | | | 2.41 | % | | | 0.80 | % | | | 2.16 | % |
| Lipper Other States Municipal Debt Funds Classification Average | | | 2.59 | % | | | 0.29 | % | | | 1.56 | % |
Class C Shares are subject to a contingent deferred sales charge if redeemed within 12 months of purchase, which will be reflected in total returns presented for less than one year.
Investment return and principal value will fluctuate, and you may have a gain or loss when you sell your shares. Current performance may differ from figures shown. For most recent month‑end performance, go to https://www.nuveen.com/en‑us/mutual‑funds/prospectuses or call (800) 257‑8787.
Fund Statistics (as of May 31, 2024)
| | | | |
| Fund net assets | | $ | 73,612,168 | |
| Total number of portfolio holdings | | | 90 | |
| Portfolio turnover (%) | | | 20% | |
| Total advisory fees paid for the year | | $ | 447,722 | |
What did the Fund invest in? (as of May 31, 2024)
(1) The ratings disclosed are the highest rating given by one of the following national rating agencies: Standard & Poor’s (S&P), Moody’s Investors Service, Inc. (Moody’s) or Fitch, Inc (Fitch). This treatment of split-rated securities may differ from that used for other purposes, such as for Fund investment policies. Credit ratings are subject to change. AAA, AA, A, and BBB are investment grade ratings; BB, B, CCC, CC, C and D are below-investment grade ratings. Holdings designated N/R are not rated by these national ratings agencies.
How has the Fund changed?
For more complete information, you may review the Fund’s next prospectus, which is expected to be available by October 1, 2024 at https://www.nuveen.com/en‑us/mutual‑funds/prospectuses or upon request at (800) 257‑8787.
Availability of additional information about the Fund
You can find additional information about the Fund at https://www.nuveen.com/en‑us/mutual‑funds/prospectuses, including its:
| | • | | prospectus • financial statements and other information • fund holdings • proxy voting information |
You can also request this information at (800) 257‑8787.
| | |
670693308_AR_0524 3668816-INV-Y-07/25 (A, C, I) | | |
| | |
| |
Annual Shareholder Report
May 31, 2024 |
Nuveen Oregon Intermediate Municipal Bond Fund
Class A Shares/FOTAX
Annual Shareholder Report
This annual shareholder report contains important information about the Class A Shares of the Nuveen Oregon Intermediate Municipal Bond Fund for the period of June 1, 2023 to May 31, 2024. You can find additional information at https://www.nuveen.com/en‑us/mutual‑funds/prospectuses. You can also request this information by contacting us at (800) 257‑8787.
This report describes changes to the Fund that occurred during the reporting period.
What were the Fund costs for the last year? (based on a hypothetical $10,000 investment)
| | | | |
| | | Cost of a $10,000 investment | | Costs paid as a percentage of
$10,000 investment |
| Class A Shares | | $84 | | 0.84% |
How did the Fund perform last year? What affected the Fund’s performance?
| | |
Performance Highlights • The Nuveen Oregon Intermediate Municipal Bond Fund returned 2.45% for Class A shares at net asset value (NAV) for the 12 months ended May 31, 2024. The Fund outperformed the S&P Municipal Bond Intermediate Index, which returned 1.99%. • Top contributors to relative performance » Security selection across a diverse group of holdings. » Duration positioning, particularly an overweight to bonds with zero to two-year durations and an underweight to bonds with six- to eight-year durations. » Underweight allocation to AAA rated bonds, which underperformed, and an overweight allocation to non-rated bonds, which outperformed as credit spreads narrowed. • Top detractors from relative performance » Overweight to AA rated bonds, which underperformed, and underweight allocation to A rated bonds, which outperformed as credit spreads contracted. » Overweight to the local general obligation (GO) sector, which underperformed. | | Performance Attribution Security selection Duration positioning AAA rated bonds and non-rated bonds AA rated bonds and A rated bonds Local GO sector |
How did the Fund perform over the last 10 years?
Performance data shown represents past performance and does not predict or guarantee future results. The graph and table do not reflect the deduction of taxes that a shareholder would pay on Fund distributions or redemption of Fund Shares.
Fund Performance (June 1, 2014 through May 31, 2024) Initial Investment of $10,000
Average Annual Total Returns
| | | | | | | | | | | | |
| | | 1‑Year | | | 5‑Year | | | 10‑Year | |
| Class A Shares at NAV (excluding maximum sales charge) | | | 2.45 | % | | | 0.48 | % | | | 1.49 | % |
| Class A Shares at maximum sales charge (Offering Price) | | | (0.64 | )% | | | (0.12 | )% | | | 1.18 | % |
| S&P Municipal Bond Index | | | 2.88 | % | | | 1.06 | % | | | 2.30 | % |
| S&P Municipal Bond Intermediate Index | | | 1.99 | % | | | 0.96 | % | | | 2.09 | % |
| Lipper Other States Intermediate Municipal Debt Funds Classification Average | | | 1.84 | % | | | 0.31 | % | | | 1.29 | % |
Investment return and principal value will fluctuate, and you may have a gain or loss when you sell your shares. Current performance may differ from figures shown. For most recent month‑end performance, go to https://www.nuveen.com/en‑us/mutual‑funds/prospectuses or call (800) 257‑8787.
Fund Statistics (as of May 31, 2024)
| | | | |
| Fund net assets | | $ | 182,137,946 | |
| Total number of portfolio holdings | | | 153 | |
| Portfolio turnover (%) | | | 20% | |
| Total advisory fees paid for the year | | $ | 964,313 | |
What did the Fund invest in? (as of May 31, 2024)
(1) The ratings disclosed are the highest rating given by one of the following national rating agencies: Standard & Poor’s (S&P), Moody’s Investors Service, Inc. (Moody’s) or Fitch, Inc (Fitch). This treatment of split-rated securities may differ from that used for other purposes, such as for Fund investment policies. Credit ratings are subject to change. AAA, AA, A, and BBB are investment grade ratings; BB, B, CCC, CC, C and D are below-investment grade ratings. Holdings designated N/R are not rated by these national ratings agencies.
How has the Fund changed?
For more complete information, you may review the Fund’s next prospectus, which is expected to be available by October 1, 2024 at https://www.nuveen.com/en‑us/mutual‑funds/prospectuses or upon request at (800) 257‑8787.
Availability of additional information about the Fund
You can find additional information about the Fund at https://www.nuveen.com/en‑us/mutual‑funds/prospectuses, including its:
| | • | | prospectus • financial statements and other information • fund holdings • proxy voting information |
You can also request this information at (800) 257‑8787.
| | |
670678242_AR_0524 3668824-INV-Y-07/25 (A, C, I) | | |
| | |
| | Annual Shareholder Report May 31, 2024 |
Nuveen Oregon Intermediate Municipal Bond Fund
Class I Shares/FORCX
Annual Shareholder Report
This annual shareholder report contains important information about the Class I Shares of the Nuveen Oregon Intermediate Municipal Bond Fund for the period of June 1, 2023 to May 31, 2024. You can find additional information at https://www.nuveen.com/en‑us/mutual‑funds/prospectuses. You can also request this information by contacting us at (800) 257‑8787.
This report describes changes to the Fund that occurred during the reporting period.
What were the Fund costs for the last year? (based on a hypothetical $10,000 investment)
| | | | |
| | | Cost of a $10,000 investment | | Costs paid as a percentage of $10,000 investment |
| Class I Shares | | $64 | | 0.64% |
How did the Fund perform last year? What affected the Fund’s performance?
| | |
Performance Highlights • The Nuveen Oregon Intermediate Municipal Bond Fund returned 2.64% for Class I shares at net asset value (NAV) for the 12 months ended May 31, 2024. The Fund outperformed the S&P Municipal Bond Intermediate Index, which returned 1.99%. • Top contributors to relative performance » Security selection across a diverse group of holdings. » Duration positioning, particularly an overweight to bonds with zero to two-year durations and an underweight to bonds with six- to eight-year durations. » Underweight allocation to AAA rated bonds, which underperformed, and an overweight allocation to non-rated bonds, which outperformed as credit spreads narrowed. • Top detractors from relative performance » Overweight to AA rated bonds, which underperformed, and underweight allocation to A rated bonds, which outperformed as credit spreads contracted. » Overweight to the local general obligation (GO) sector, which underperformed. | | Performance Attribution Security selection Duration positioning AAA rated bonds and non-rated bonds AA rated bonds and A rated bonds Local GO sector |
How did the Fund perform over the last 10 years?
Performance data shown represents past performance and does not predict or guarantee future results. The graph and table do not reflect the deduction of taxes that a shareholder would pay on Fund distributions or redemption of Fund Shares.
Fund Performance (June 1, 2014 through May 31, 2024) Initial Investment of $10,000
Average Annual Total Returns
| | | | | | | | | | | | |
| | | 1‑Year | | | 5‑Year | | | 10‑Year | |
| Class I Shares at NAV | | | 2.64 | % | | | 0.68 | % | | | 1.70 | % |
| S&P Municipal Bond Index | | | 2.88 | % | | | 1.06 | % | | | 2.30 | % |
| S&P Municipal Bond Intermediate Index | | | 1.99 | % | | | 0.96 | % | | | 2.09 | % |
| Lipper Other States Intermediate Municipal Debt Funds Classification Average | | | 1.84 | % | | | 0.31 | % | | | 1.29 | % |
Investment return and principal value will fluctuate, and you may have a gain or loss when you sell your shares. Current performance may differ from figures shown. For most recent month‑end performance, go to https://www.nuveen.com/en‑us/mutual‑funds/prospectuses or call (800) 257‑8787.
Fund Statistics (as of May 31, 2024)
| | | | |
| Fund net assets | | $ | 182,137,946 | |
| Total number of portfolio holdings | | | 153 | |
| Portfolio turnover (%) | | | 20% | |
| Total advisory fees paid for the year | | $ | 964,313 | |
What did the Fund invest in? (as of May 31, 2024)
(1) The ratings disclosed are the highest rating given by one of the following national rating agencies: Standard & Poor’s (S&P), Moody’s Investors Service, Inc. (Moody’s) or Fitch, Inc (Fitch). This treatment of split-rated securities may differ from that used for other purposes, such as for Fund investment policies. Credit ratings are subject to change. AAA, AA, A, and BBB are investment grade ratings; BB, B, CCC, CC, C and D are below-investment grade ratings. Holdings designated N/R are not rated by these national ratings agencies.
How has the Fund changed?
For more complete information, you may review the Fund’s next prospectus, which is expected to be available by October 1, 2024 at https://www.nuveen.com/en‑us/mutual‑funds/prospectuses or upon request at (800) 257‑8787.
Availability of additional information about the Fund
You can find additional information about the Fund at https://www.nuveen.com/en‑us/mutual‑funds/prospectuses, including its:
| | • | | prospectus • financial statements and other information • fund holdings • proxy voting information |
You can also request this information at (800) 257‑8787.
| | |
670678408_AR_0524 3668824-INV-Y-07/25 (A, C, I) | | |
| | |
| |
Annual Shareholder Report
May 31, 2024 |
Nuveen Oregon Intermediate Municipal Bond Fund
Class C Shares/NAFOX
Annual Shareholder Report
This annual shareholder report contains important information about the Class C Shares of the Nuveen Oregon Intermediate Municipal Bond Fund for the period of June 1, 2023 to May 31, 2024. You can find additional information at https://www.nuveen.com/en‑us/mutual‑funds/prospectuses. You can also request this information by contacting us at (800) 257‑8787.
This report describes changes to the Fund that occurred during the reporting period.
What were the Fund costs for the last year? (based on a hypothetical $10,000 investment)
| | | | |
| | | Cost of a
$10,000 investment | | Costs paid as a percentage of
$10,000 investment |
| Class C Shares | | $164 | | 1.64% |
How did the Fund perform last year? What affected the Fund’s performance?
| | |
Performance Highlights • The Nuveen Oregon Intermediate Municipal Bond Fund returned 1.52% for Class C shares at net asset value (NAV) for the 12 months ended May 31, 2024. The Fund underperformed the S&P Municipal Bond Intermediate Index, which returned 1.99%. • Top detractors from relative performance » Overweight to AA rated bonds, which underperformed, and underweight allocation to A rated bonds, which outperformed as credit spreads contracted. » Overweight to the local general obligation (GO) sector, which underperformed. • Top contributors to relative performance » Security selection across a diverse group of holdings. » Duration positioning, particularly an overweight to bonds with zero to two-year durations and an underweight to bonds with six- to eight-year durations. » Underweight allocation to AAA rated bonds, which underperformed, and an overweight allocation to non-rated bonds, which outperformed as credit spreads narrowed. | | Performance Attribution AA rated bonds and A rated bonds Local GO sector Security selection Duration positioning AAA rated bonds and non-rated bonds |
How did the Fund perform over the last 10 years?
Performance data shown represents past performance and does not predict or guarantee future results. The graph and table do not reflect the deduction of taxes that a shareholder would pay on Fund distributions or redemption of Fund Shares.
Fund Performance (June 1, 2014 through May 31, 2024) Initial Investment of $10,000
Average Annual Total Returns
| | | | | | | | | | | | |
| | | 1‑Year | | | 5‑Year | | | 10‑Year | |
| Class C Shares at NAV (excluding maximum sales charge) | | | 1.52 | % | | | (0.32 | )% | | | 0.84 | % |
| S&P Municipal Bond Index | | | 2.88 | % | | | 1.06 | % | | | 2.30 | % |
| S&P Municipal Bond Intermediate Index | | | 1.99 | % | | | 0.96 | % | | | 2.09 | % |
| Lipper Other States Intermediate Municipal Debt Funds Classification Average | | | 1.84 | % | | | 0.31 | % | | | 1.29 | % |
Class C Shares are subject to a contingent deferred sales charge if redeemed within 12 months of purchase, which will be reflected in total returns presented for less than one year.
Investment return and principal value will fluctuate, and you may have a gain or loss when you sell your shares. Current performance may differ from figures shown. For most recent month‑end performance, go to https://www.nuveen.com/en‑us/mutual‑funds/prospectuses or call (800) 257‑8787.
Fund Statistics (as of May 31, 2024)
| | | | |
| Fund net assets | | $ | 182,137,946 | |
| Total number of portfolio holdings | | | 153 | |
| Portfolio turnover (%) | | | 20% | |
| Total advisory fees paid for the year | | $ | 964,313 | |
What did the Fund invest in? (as of May 31, 2024)
(1) The ratings disclosed are the highest rating given by one of the following national rating agencies: Standard & Poor’s (S&P), Moody’s Investors Service, Inc. (Moody’s) or Fitch, Inc (Fitch). This treatment of split-rated securities may differ from that used for other purposes, such as for Fund investment policies. Credit ratings are subject to change. AAA, AA, A, and BBB are investment grade ratings; BB, B, CCC, CC, C and D are below-investment grade ratings. Holdings designated N/R are not rated by these national ratings agencies.
How has the Fund changed?
For more complete information, you may review the Fund’s next prospectus, which is expected to be available by October 1, 2024 at https://www.nuveen.com/en‑us/mutual‑funds/prospectuses or upon request at (800) 257‑8787.
Availability of additional information about the Fund
You can find additional information about the Fund at https://www.nuveen.com/en‑us/mutual‑funds/prospectuses, including its:
| | • | | prospectus • financial statements and other information • fund holdings • proxy voting information |
You can also request this information at (800) 257‑8787.
| | |
670693407_AR_0524 3668824-INV-Y-07/25 (A, C, I) | | |
As of the end of the period covered by this report, the registrant has adopted a code of ethics that applies to the registrant’s principal executive officer, principal financial officer, principal accounting officer or controller, or persons performing similar functions. There were no amendments to or waivers from the code during the period covered by this report. Upon request, a copy of the registrant’s code of ethics is available without charge by calling 800-257-8787.
| Item 3. | Audit Committee Financial Expert. |
As of the end of the period covered by this report, the registrant’s Board of Directors or Trustees (“Board”) had determined that the registrant has at least one “audit committee financial expert” (as defined in Item 3 of Form N-CSR) serving on its Audit Committee. The members of the registrant’s audit committee that have been designated as audit committee financial experts are Joseph A. Boateng, Albin F. Moschner, John K. Nelson, Loren M. Starr and Robert L. Young, who are “independent” for purposes of Item 3 of Form N-CSR.
Mr. Boateng has served as the Chief Investment Officer for Casey Family Programs since 2007. He was previously Director of U.S. Pension Plans for Johnson & Johnson from 2002-2006. Mr. Boateng is a board member of the Lumina Foundation and Waterside School, an emeritus board member of Year Up Puget Sound, member of the Investment Advisory Committee and former Chair for the Seattle City Employees’ Retirement System, and an Investment Committee Member for The Seattle Foundation. Mr. Boateng previously served on the Board of Trustees for the College Retirement Equities Fund (2018-2023) and on the Management Committee for TIAA Separate Account VA-1 (2019-2023).
Mr. Moschner is a consultant in the wireless industry and, in July 2012, founded Northcroft Partners, LLC, a management consulting firm that provides operational, management and governance solutions. Prior to founding Northcroft Partners, LLC, Mr. Moschner held various positions at Leap Wireless International, Inc., a provider of wireless services, where he was as a consultant from February 2011 to July 2012, Chief Operating Officer from July 2008 to February 2011, and Chief Marketing Officer from August 2004 to June 2008. Before he joined Leap Wireless International, Inc., Mr. Moschner was President of the Verizon Card Services division of Verizon Communications, Inc. from 2000 to 2003, and President of One Point Services at One Point Communications from 1999 to 2000. Mr. Moschner also served at Zenith Electronics Corporation as Director, President and Chief Executive Officer from 1995 to 1996, and as Director, President and Chief Operating Officer from 1994 to 1995.
Mr. Nelson formerly served on the Board of Directors of Core12, LLC from 2008 to 2023, a private firm which develops branding, marketing, and communications strategies for clients. Mr. Nelson has extensive experience in global banking and markets, having served in several senior executive positions with ABN AMRO Holdings N.V. and its affiliated entities and predecessors, including LaSalle Bank Corporation from 1996 to 2008, ultimately serving as Chief Executive Officer of ABN AMRO N.V. North America. During his tenure at the bank, he also served as Global Head of its Financial Markets Division, which encompassed the bank’s Currency, Commodity, Fixed Income, Emerging Markets, and Derivatives businesses. He was a member of the Foreign Exchange Committee of the Federal Reserve Bank of the United States and during his tenure with ABN AMRO served as the bank’s representative on various committees of The Bank of Canada, European Central Bank, and The Bank of England. Mr. Nelson previously served as a senior, external advisor to the financial services practice of Deloitte Consulting LLP. (2012-2014).
Mr. Starr was Vice Chair, Senior Managing Director from 2020 to 2021, and Chief Financial Officer, Senior Managing Director from 2005 to 2020, for Invesco Ltd. Mr. Starr is also a Director and member of the Audit Committee for AMG. He is former Chair and member of the Board of Directors, Georgia Leadership Institute for School Improvement (GLISI); former Chair and member of the Board of Trustees, Georgia Council on Economic Education (GCEE). Mr. Starr previously served on the Board of Trustees for the College Retirement Equities Fund and on the Management Committee for TIAA Separate Account VA-1 (2022-2023).
Mr. Young has more than 30 years of experience in the investment management industry. From 1997 to 2017, he held various positions with J.P. Morgan Investment Management Inc. (“J.P. Morgan Investment”) and its affiliates (collectively, “J.P. Morgan”). Most recently, he served as Chief Operating Officer and Director of J.P. Morgan Investment (from 2010 to 2016) and as President and Principal Executive Officer of the J.P. Morgan Funds (from 2013 to 2016). As Chief Operating Officer of J.P. Morgan Investment, Mr. Young led service, administration and business platform support activities for J.P. Morgan’s domestic retail mutual fund and institutional commingled and separate account businesses and co-led these activities for J.P. Morgan’s global retail and institutional
investment management businesses. As President of the J.P. Morgan Funds, Mr. Young interacted with various service providers to these funds, facilitated the relationship between such funds and their boards, and was directly involved in establishing board agendas, addressing regulatory matters, and establishing policies and procedures. Before joining J.P. Morgan, Mr. Young, a former Certified Public Accountant (CPA), was a Senior Manager (Audit) with Deloitte & Touche LLP (formerly, Touche Ross LLP), where he was employed from 1985 to 1996. During his tenure there, he actively participated in creating, and ultimately led, the firm’s midwestern mutual fund practice.
| Item 4. | Principal Accountant Fees and Services. |
The following tables show the amount of fees that PricewaterhouseCoopers, the Funds’ auditor, billed to the Funds during the Funds’ last two full fiscal years. The Audit Committee approved in advance all audit services and non-audit services that PricewaterhouseCoopers provided to the Funds, except for those non-audit services that were subject to the pre-approval exception under Rule 2-01 of Regulation S-X (the “pre-approval exception”). The pre-approval exception for services provided directly to the Funds waives the pre-approval requirement for services other than audit, review or attest services if: (A) the aggregate amount of all such services provided constitutes no more than 5% of the total amount of revenues paid by the Funds during the fiscal year in which the services are provided; (B) the Funds did not recognize the services as non-audit services at the time of the engagement; and (C) the services are promptly brought to the Audit Committee’s attention, and the Committee (or its delegate) approves the services before the audit is completed.
The Audit Committee has delegated certain pre-approval responsibilities to its Chair (or, in his absence, any other member of the Audit Committee).
| | | | | | | | | | | | | | | | |
| Fiscal Year Ended May 31, 2024 | | Audit Fees Billed to Funds1 | | | Audit-Related Fees Billed to Funds2 | | | Tax Fees Billed to Funds3 | | | All Other Fees Billed to Funds4 | |
| Nuveen Minnesota Municipal Bond Fund | | | $32,259 | | | | $0 | | | | $0 | | | | $0 | |
| | | | | | | | | | | | | | | | |
| Nuveen Minnesota Intermediate Municipal Bond Fund | | | $32,259 | | | | $0 | | | | $0 | | | | $0 | |
| | | | | | | | | | | | | | | | |
| Nuveen Nebraska Municipal Bond Fund | | | $32,259 | | | | $0 | | | | $0 | | | | $0 | |
| | | | | | | | | | | | | | | | |
| Nuveen Oregon Intermediate Municipal Bond Fund | | | $32,259 | | | | $0 | | | | $0 | | | | $0 | |
| | | | | | | | | | | | | | | | |
Total | | | $129,036 | | | | $0 | | | | $0 | | | | $0 | |
| 1 | “Audit Fees” are the aggregate fees billed for professional services for the audit of the Fund’s annual financial statements and services provided in connection with statutory and regulatory filings or engagements. |
| 2 | “Audit-Related Fees” are the aggregate fees billed for assurance and related services reasonably related to the performance of the audit or review of financial statements that are not reported under “Audit Fees”. These fees include offerings related to the Fund’s common shares and leverage. |
| 3 | “Tax Fees” are the aggregate fees billed for professional services for tax advice, tax compliance, and tax planning. These fees include: all global withholding tax services; excise and state tax reviews; capital gain, tax equalization and taxable basis calculations performed by the principal accountant. |
| 4 | “All Other Fees” are the aggregate fees billed for products and services other than “Audit Fees”, “Audit-Related Fees” and “Tax Fees”. These fees represent all “Agreed-Upon Procedures” engagements pertaining to the Fund’s use of leverage. |
| | | | | | | | | | | | | | | | |
| Fiscal Year Ended May 31, 2024 | | Percentage Approved Pursuant to Pre-approval Exception | |
| | Audit Fees Billed to Funds | | | Audit-Related Fees Billed to Funds | | | Tax Fees Billed to Funds | | | All Other Fees Billed to Funds | |
| Nuveen Minnesota Municipal Bond Fund | | | 0 | % | | | 0 | % | | | 0 | % | | | 0 | % |
| | | | | | | | | | | | | | | | |
| Nuveen Minnesota Intermediate Municipal Bond Fund | | | 0 | % | | | 0 | % | | | 0 | % | | | 0 | % |
| | | | | | | | | | | | | | | | |
| Nuveen Nebraska Municipal Bond Fund | | | 0 | % | | | 0 | % | | | 0 | % | | | 0 | % |
| | | | | | | | | | | | | | | | |
| Nuveen Oregon Intermediate Municipal Bond Fund | | | 0 | % | | | 0 | % | | | 0 | % | | | 0 | % |
| | | | | | | | | | | | | | | | |
| Fiscal Year Ended May 31, 2023 | | Audit Fees Billed to Funds1 | | | Audit-Related Fees Billed to Funds2 | | | Tax Fees Billed to Funds3 | | | All Other Fees Billed to Funds4 | |
| Nuveen Minnesota Municipal Bond Fund | | | $37,988 | | | | $0 | | | | $0 | | | | $0 | |
| | | | | | | | | | | | | | | | |
| Fiscal Year Ended May 31, 2023 | | Audit Fees Billed to Funds1 | | | Audit-Related Fees Billed to Funds2 | | | Tax Fees Billed to Funds3 | | | All Other Fees Billed to Funds4 | |
| Nuveen Minnesota Intermediate Municipal Bond Fund | | | $37,988 | | | | $0 | | | | $0 | | | | $0 | |
| | | | | | | | | | | | | | | | |
| Nuveen Nebraska Municipal Bond Fund | | | $37,988 | | | | $0 | | | | $0 | | | | $0 | |
| | | | | | | | | | | | | | | | |
| Nuveen Oregon Intermediate Municipal Bond Fund | | | $37,988 | | | | $0 | | | | $0 | | | | $0 | |
| | | | | | | | | | | | | | | | |
Total | | | $151,952 | | | | $0 | | | | $0 | | | | $0 | |
| 1 | “Audit Fees” are the aggregate fees billed for professional services for the audit of the Fund’s annual financial statements and services provided in connection with statutory and regulatory filings or engagements. |
| 2 | “Audit-Related Fees” are the aggregate fees billed for assurance and related services reasonably related to the performance of the audit or review of financial statements that are not reported under “Audit Fees”. These fees include offerings related to the Fund’s common shares and leverage. |
| 3 | “Tax Fees” are the aggregate fees billed for professional services for tax advice, tax compliance, and tax planning. These fees include: all global withholding tax services; excise and state tax reviews; capital gain, tax equalization and taxable basis calculations performed by the principal accountant. |
| 4 | “All Other Fees” are the aggregate fees billed for products and services other than “Audit Fees”, “Audit-Related Fees” and “Tax Fees”. These fees represent all “Agreed-Upon Procedures” engagements pertaining to the Fund’s use of leverage. |
| | | | | | | | | | | | | | | | |
| Fiscal Year Ended May 31, 2023 | | Percentage Approved Pursuant to Pre-approval Exception | |
| | Audit Fees
Billed to Funds | | | Audit-Related Fees Billed to Funds | | | Tax Fees Billed to Funds | | | All Other Fees
Billed to Funds | |
| Nuveen Minnesota Municipal Bond Fund | | | 0 | % | | | 0 | % | | | 0 | % | | | 0 | % |
| | | | | | | | | | | | | | | | |
| Nuveen Minnesota Intermediate Municipal Bond Fund | | | 0 | % | | | 0 | % | | | 0 | % | | | 0 | % |
| | | | | | | | | | | | | | | | |
| Nuveen Nebraska Municipal Bond Fund | | | 0 | % | | | 0 | % | | | 0 | % | | | 0 | % |
| | | | | | | | | | | | | | | | |
| Nuveen Oregon Intermediate Municipal Bond Fund | | | 0 | % | | | 0 | % | | | 0 | % | | | 0 | % |
| | | | | | | | |
| Fiscal Year Ended May 31, 2024 | | Audit-Related Fees Billed to Adviser and Affiliated Fund Service Providers | | | Tax Fees Billed to Adviser and Affiliated Fund Service Providers | | All Other Fees Billed to Adviser and Affiliated Fund Service Providers |
Nuveen Investment Funds, Inc. | | | $0 | | | $0 | | $0 |
| | | | | | | | |
| | | Percentage Approved Pursuant to Pre-approval Exception |
| |
| Audit-Related Fees
Billed to Adviser
and Affiliated Fund Service Providers |
| | Tax Fees Billed to Adviser and Affiliated Fund Service Providers | | All Other Fees Billed to Adviser and Affiliated Fund Service Providers |
| | | 0% | | | 0% | | 0% |
| | | | | | | | |
| Fiscal Year Ended May 31, 2023 | | Audit-Related Fees Billed to Adviser and Affiliated Fund Service Providers | | | Tax Fees Billed to Adviser and Affiliated Fund Service Providers | | All Other Fees
Billed to Adviser and Affiliated Fund Service Providers |
Nuveen Investment Funds, Inc. | | | $0 | | | $0 | | $0 |
| | | | | | | | |
| | | Percentage Approved Pursuant to Pre-approval Exception |
| |
| Audit-Related Fees
Billed to Adviser and Affiliated Fund Service Providers |
| | Tax Fees Billed to Adviser and Affiliated Fund Service Providers | | All Other Fees Billed to Adviser and Affiliated Fund Service Providers |
| | | 0% | | | 0% | | 0% |
| | | | | | | | | | | | | | | | |
| Fiscal Year Ended May 31, 2024 | | Total Non-Audit Fees Billed to Fund | | | Total Non-Audit Fees Billed to Adviser and Affiliated Fund Service Providers (engagements related directly to the operations and financial reporting of the Trust) | | | Total Non-Audit Fees Billed to Adviser and Affiliated Fund Service Providers (all other engagements) | | | Total | |
| Nuveen Minnesota Municipal Bond Fund | | | $0 | | | | $0 | | | | $0 | | | | $0 | |
| | | | | | | | | | | | | | | | |
| Nuveen Minnesota Intermediate Municipal Bond Fund | | | $0 | | | | $0 | | | | $0 | | | | $0 | |
| | | | | | | | | | | | | | | | |
| Nuveen Nebraska Municipal Bond Fund | | | $0 | | | | $0 | | | | $0 | | | | $0 | |
| | | | | | | | | | | | | | | | |
| Nuveen Oregon Intermediate Municipal Bond Fund | | | $0 | | | | $0 | | | | $0 | | | | $0 | |
| | | | | | | | | | | | | | | | |
Total | | | $0 | | | | $0 | | | | $0 | | | | $0 | |
“Non-Audit Fees billed to Fund” for both fiscal year ends represent “Tax Fees” and “All Other Fees” billed to Fund in their respective amounts from the previous table.
Less than 50 percent of the hours expended on the principal accountant’s engagement to audit the registrant’s financial statements for the most recent fiscal year were attributed to work performed by persons other than the principal accountant’s full-time, permanent employees.
| | | | | | | | | | | | | | | | |
| Fiscal Year Ended May 31, 2023 | | Total Non-Audit Fees Billed to Fund | | | Total Non-Audit Fees Billed to Adviser and Affiliated Fund Service Providers (engagements related directly to the operations and financial reporting of the Trust) | | | Total Non-Audit Fees Billed to Adviser and Affiliated Fund Service Providers (all other engagements) | | | Total | |
| Nuveen Minnesota Municipal Bond Fund | | | $0 | | | | $0 | | | | $0 | | | | $0 | |
| | | | | | | | | | | | | | | | |
| Nuveen Minnesota Intermediate Municipal Bond Fund | | | $0 | | | | $0 | | | | $0 | | | | $0 | |
| | | | | | | | | | | | | | | | |
| Nuveen Nebraska Municipal Bond Fund | | | $0 | | | | $0 | | | | $0 | | | | $0 | |
| | | | | | | | | | | | | | | | |
| Nuveen Oregon Intermediate Municipal Bond Fund | | | $0 | | | | $0 | | | | $0 | | | | $0 | |
| | | | | | | | | | | | | | | | |
Total | | | $0 | | | | $0 | | | | $0 | | | | $0 | |
“Non-Audit Fees billed to Fund” for both fiscal year ends represent “Tax Fees” and “All Other Fees” billed to Fund in their respective amounts from the previous table.
Audit Committee Pre-Approval Policies and Procedures. Generally, the Audit Committee must approve (i) all non-audit services to be performed for the Funds by the Funds’ independent accountant and (ii) all audit and non-audit services to be performed by the Funds’ independent accountant for the Affiliated Fund Service Providers with respect to the operations and financial reporting of the Funds. Regarding tax and research projects conducted by the independent accountant for the Funds and Affiliated Fund Service Providers (with respect to operations and financial reports of the Trust), such engagements will be (i) pre-approved by the Audit Committee if they are expected to be for amounts greater than $10,000; (ii) reported to the Audit Committee Chair for his verbal approval prior to engagement if they are expected to be for amounts under $10,000 but greater than $5,000; and (iii) reported to the Audit Committee at the next Audit Committee meeting if they are expected to be for an amount under $5,000.
Item 4(i) and Item 4(j) are not applicable to the registrant.
| Item 5. | Audit Committee of Listed Registrants. |
Not applicable to this registrant.
| (a) | Schedule of Investments is included as part of the financial statements filed under Item 7 of this Form N-CSR. |
| Item 7. | Financial Statements and Financial Highlights for Open-End Management Investment Companies. |
Item
7.
Financial
Statements
and
Financial
Highlights
for
Open-End
Management
Investment
Companies
Report
of
Independent
Registered
Public
Accounting
Firm
To
the
Board
of
Directors
of
Nuveen
Investment
Funds,
Inc.
and
Shareholders
of
Nuveen
Minnesota
Intermediate
Municipal
Bond
Fund,
Nuveen
Minnesota
Municipal
Bond
Fund,
Nuveen
Nebraska
Municipal
Bond
Fund
and
Nuveen
Oregon
Intermediate
Municipal
Bond
Fund
Opinions
on
the
Financial
Statements
We
have
audited
the
accompanying
statements
of
assets
and
liabilities,
including
the
portfolios
of
investments,
of
Nuveen
Minnesota
Intermediate
Municipal
Bond
Fund,
Nuveen
Minnesota
Municipal
Bond
Fund,
Nuveen
Nebraska
Municipal
Bond
Fund
and
Nuveen
Oregon
Intermediate
Municipal
Bond
Fund
(four
of
the
funds
constituting
Nuveen
Investment
Funds,
Inc.,
hereafter
collectively
referred
to
as
the
"Funds")
as
of
May
31,
2024,
the
related
statements
of
operations
for
the
year
ended
May
31,
2024,
the
statements
of
changes
in
net
assets
for
each
of
the
two
years
in
the
period
ended
May
31,
2024,
including
the
related
notes,
and
the
financial
highlights
for
each
of
the
five
years
in
the
period
ended
May
31,
2024
(collectively
referred
to
as
the
“financial
statements”).
In
our
opinion,
the
financial
statements
present
fairly,
in
all
material
respects,
the
financial
position
of
each
of
the
Funds
as
of
May
31,
2024,
the
results
of
each
of
their
operations
for
the
year
then
ended,
the
changes
in
each
of
their
net
assets
for
each
of
the
two
years
in
the
period
ended
May
31,
2024
and
each
of
the
financial
highlights
for
each
of
the
five
years
in
the
period
ended
May
31,
2024
in
conformity
with
accounting
principles
generally
accepted
in
the
United
States
of
America.
Basis
for
Opinions
These
financial
statements
are
the
responsibility
of
the
Funds’
management.
Our
responsibility
is
to
express
an
opinion
on
the
Funds’
financial
statements
based
on
our
audits.
We
are
a
public
accounting
firm
registered
with
the
Public
Company
Accounting
Oversight
Board
(United
States)
(PCAOB)
and
are
required
to
be
independent
with
respect
to
the
Funds
in
accordance
with
the
U.S.
federal
securities
laws
and
the
applicable
rules
and
regulations
of
the
Securities
and
Exchange
Commission
and
the
PCAOB.
We
conducted
our
audits
of
these
financial
statements
in
accordance
with
the
standards
of
the
PCAOB.
Those
standards
require
that
we
plan
and
perform
the
audit
to
obtain
reasonable
assurance
about
whether
the
financial
statements
are
free
of
material
misstatement,
whether
due
to
error
or
fraud.
Our
audits
included
performing
procedures
to
assess
the
risks
of
material
misstatement
of
the
financial
statements,
whether
due
to
error
or
fraud,
and
performing
procedures
that
respond
to
those
risks.
Such
procedures
included
examining,
on
a
test
basis,
evidence
regarding
the
amounts
and
disclosures
in
the
financial
statements.
Our
audits
also
included
evaluating
the
accounting
principles
used
and
significant
estimates
made
by
management,
as
well
as
evaluating
the
overall
presentation
of
the
financial
statements.
Our
procedures
included
confirmation
of
securities
owned
as
of
May
31,
2024
by
correspondence
with
the
custodian
and
brokers;
when
replies
were
not
received
from
the
brokers,
we
performed
other
auditing
procedures.
We
believe
that
our
audits
provide
a
reasonable
basis
for
our
opinions.
/s/
PricewaterhouseCoopers
LLP
Chicago,
Illinois
July
25,
2024
We
have
served
as
the
auditor
of
one
or
more
investment
companies
in
Nuveen
Funds
since
2002.
Nuveen
Minnesota
Intermediate
Municipal
Bond
Fund
Portfolio
of
Investments
May
31,
2024
Principal
Amount
(000)
Description
(a)
Optional
Call
Provisions
(b)
Value
LONG-TERM
INVESTMENTS
-
97.9%
X
314,794,043
MUNICIPAL
BONDS
-
97.9%
X
314,794,043
Education
and
Civic
Organizations
-
19.0%
Baytown
Township,
Minnesota
Charter
School
Lease
Revenue
Bonds,
Saint
Croix
Preparatory
Academy,
Refunding
Series
2016A:
$
720
3.500%,
8/01/25
No
Opt.
Call
$
710,155
130
4.000%,
8/01/28
8/26
at
100.00
127,649
1,160
Brooklyn
Center,
Minnesota,
Charter
School
Lease
Revenue
Bonds,
Tesfa
International
dba
Twin
Lakes
STEM
Academy
Project,
Series
2021A,
5.000%,
6/15/37
6/29
at
100.00
925,532
City
of
Ham
Lake,
Minnesota,
Charter
School
Lease
Revenue
Bonds,
DaVinci
Academy
Project,Series
2016A:
100
5.000%,
7/01/31
7/24
at
102.00
98,824
1,000
5.000%,
7/01/36
7/24
at
102.00
952,438
Deephaven,
Minnesota,
Charter
School
Lease
Revenue
Bonds,
Eagle
Ridge
Academy
Project,
Series
2015A:
190
5.000%,
7/01/30
7/25
at
100.00
191,081
710
5.250%,
7/01/37
7/25
at
100.00
713,510
Deephaven,
Minnesota,
Charter
School
Lease
Revenue
Bonds,
Eagle
Ridge
Academy
Project,
Series
2016A:
300
4.000%,
7/01/24
No
Opt.
Call
299,812
135
4.000%,
7/01/25
No
Opt.
Call
134,042
195
4.000%,
7/01/26
7/25
at
100.00
192,701
300
4.000%,
7/01/27
7/25
at
100.00
295,555
370
4.000%,
7/01/28
7/25
at
100.00
363,031
225
Deephaven,
Minnesota,
Charter
School
Lease
Revenue
Bonds,
Seven
Hills
Preparatory
Academy
Project,
Series
2017A,
4.375%,
10/01/27
7/24
at
100.00
225,065
645
Forest
Lake,
Minnesota,
Charter
School
Lease
Revenue
Bonds,
Lakes
International
Language
Academy,
Series
2014A,
5.500%,
8/01/36
7/24
at
101.00
645,640
Greenwood,
Minnesota,
Charter
School
Lease
Revenue
Bonds,
Main
Street
School
of
Performing
Arts
Project,
Series
2016A:
450
4.500%,
7/01/26
No
Opt.
Call
441,173
40
5.000%,
7/01/36
7/26
at
100.00
37,115
1,135
Ham
Lake,
Minnesota
Charter
School
Lease
Revenue
Bonds,
Parnassus
Preparatory
School
Project,
Series
2016A,
4.000%,
11/01/26
No
Opt.
Call
1,112,246
975
Hugo,
Minnesota,
Charter
School
Lease
Revenue
Bonds,
Noble
Academy
Project,
Series
2014A,
5.000%,
7/01/44
7/24
at
100.00
926,912
Independence,
Minnesota,
Charter
School
Lease
Revenue
Bonds,
Beacon
Academy
Project,
Series
2016A:
1,000
4.750%,
7/01/31
7/26
at
100.00
954,781
500
5.000%,
7/01/36
7/26
at
100.00
473,479
1,405
(c)
Minneapolis,
Minnesota,
Charter
School
Lease
Revenue
Bonds,
Twin
Cities
International
Schools
Project,
Series
2017A,
5.000%,
12/01/32
12/27
at
100.00
1,422,496
1,380
Minneapolis,
Minnesota,
Charter
School
Lease
Revenue
Bonds,
Yinghua
Academy
Project,
Series
2013A,
6.000%,
7/01/33
7/24
at
100.00
1,381,109
1,040
Minneapolis,
Minnesota,
Revenue
Bonds,
University
Gateway
Project,
Refunding
Series
2015,
4.000%,
12/01/28
12/24
at
100.00
1,042,269
1,260
Minnesota
Department
of
Iron
Range
Resource
and
Rehabilitation,
Educational
Facilities
Revenue
Bonds,
Series
2023A,
5.000%,
10/01/41
10/33
at
100.00
1,383,058
Minnesota
Higher
Education
Facilities
Authority,
Revenue
Bonds,
Bethel
University,
Refunding
Series
2017:
2,800
5.000%,
5/01/32
5/27
at
100.00
2,780,033
655
5.000%,
5/01/37
5/27
at
100.00
625,314
1,600
Minnesota
Higher
Education
Facilities
Authority,
Revenue
Bonds,
Carleton
College,
Refunding
Series
2017,
4.000%,
3/01/33
3/27
at
100.00
1,608,981
2,380
Minnesota
Higher
Education
Facilities
Authority,
Revenue
Bonds,
Carleton
College,
Series
2023,
5.000%,
3/01/41
3/33
at
100.00
2,563,470
105
Minnesota
Higher
Education
Facilities
Authority,
Revenue
Bonds,
College
of
Saint
Scholastica,
Inc.,
Refunding
Series
2019,
4.000%,
12/01/24
No
Opt.
Call
104,449
Nuveen
Minnesota
Intermediate
Municipal
Bond
Fund
(continued)
Portfolio
of
Investments
May
31,
2024
Principal
Amount
(000)
Description
(a)
Optional
Call
Provisions
(b)
Value
Education
and
Civic
Organizations
(continued)
$
1,000
Minnesota
Higher
Education
Facilities
Authority,
Revenue
Bonds,
Gustavus
Adolfus
College,
Series
2013-7W,
4.250%,
10/01/28
6/24
at
100.00
$
1,000,177
160
Minnesota
Higher
Education
Facilities
Authority,
Revenue
Bonds,
Macalester
College,
Refunidng
Series
2021,
4.000%,
3/01/31
No
Opt.
Call
164,811
1,250
Minnesota
Higher
Education
Facilities
Authority,
Revenue
Bonds,
Macalester
College,
Series
201528J,
3.250%,
3/01/29
3/25
at
100.00
1,225,588
1,235
Minnesota
Higher
Education
Facilities
Authority,
Revenue
Bonds,
Saint
Catherine
University,
Refunding
Series
2018A,
5.000%,
10/01/31
10/28
at
100.00
1,267,119
200
Minnesota
Higher
Education
Facilities
Authority,
Revenue
Bonds,
Saint
John's
University,
Refunding
Series
2021,
4.000%,
10/01/34
10/30
at
100.00
201,663
700
Minnesota
Higher
Education
Facilities
Authority,
Revenue
Bonds,
Saint
John's
University,
Series
2015-8I,
3.375%,
10/01/30
10/25
at
100.00
661,754
1,000
Minnesota
Higher
Education
Facilities
Authority,
Revenue
Bonds,
Saint
Olaf
College,
Series
2015-8-G,
5.000%,
12/01/28
12/25
at
100.00
1,018,348
1,000
Minnesota
Higher
Education
Facilities
Authority,
Revenue
Bonds,
Saint
Olaf
College,
Series
2021,
3.000%,
10/01/38
10/30
at
100.00
839,547
825
Minnesota
Higher
Education
Facilities
Authority,
Revenue
Bonds,
University
of
Saint
Thomas,
Green
Series
2022A,
4.000%,
10/01/38
10/30
at
100.00
812,581
Minnesota
Higher
Education
Facilities
Authority,
Revenue
Bonds,
University
of
Saint
Thomas,
Series
2013-7U:
2,000
4.000%,
4/01/25
6/24
at
100.00
2,000,134
775
4.000%,
4/01/26
6/24
at
100.00
775,092
300
4.000%,
4/01/27
6/24
at
100.00
300,048
Minnesota
Higher
Education
Facilities
Authority,
Revenue
Bonds,
University
of
Saint
Thomas,
Series
2017A:
750
4.000%,
10/01/34
10/27
at
100.00
751,282
850
4.000%,
10/01/36
10/27
at
100.00
850,140
1,250
Minnesota
Higher
Education
Facilities
Authority,
Revenue
Bonds,
University
of
Saint
Thomas,
Series
2019,
5.000%,
10/01/40
10/29
at
100.00
1,300,866
Minnesota
Higher
Education
Facilities
Authority,
Revenue
Bonds,
University
of
Saint
Thomas,
Series
2022B:
1,000
4.125%,
10/01/41
10/30
at
100.00
986,578
1,000
5.000%,
10/01/47
10/30
at
100.00
1,037,442
450
Minnesota
Office
of
Higher
Education,
Supplemental
Student
Loan
Program
Revenue
Bonds,
2020
Senior
Series,
5.000%,
11/01/26,
(AMT)
No
Opt.
Call
456,321
705
Minnesota
Office
of
Higher
Education,
Supplemental
Student
Loan
Program
Revenue
Bonds,
Senior
Series
2018,
5.000%,
11/01/26,
(AMT)
No
Opt.
Call
714,580
1,185
Minnesota
State
Colleges
and
University,
General
Fund
Revenue
Bonds,
Series
2015A,
3.000%,
10/01/26
4/25
at
100.00
1,169,160
Moorhead,
Minnesota,
Educational
Facilities
Revenue
Bonds,
The
Concordia
College
Corporation
Project,
Series
2016:
980
4.000%,
12/01/30
12/25
at
100.00
958,180
1,060
4.000%,
12/01/32
12/25
at
100.00
1,026,162
935
Otsego,
Minnesota,
Charter
School
Lease
Revenue
Bonds,
Kaleidoscope
Charter
School
Project,
Series
2014A,
5.000%,
9/01/34
9/24
at
100.00
902,935
70
Saint
Cloud,
Minnesota,
Charter
School
Lease
Revenue
Bonds,
Stride
Academy
Project,
Series
2016A,
5.000%,
4/01/36
4/26
at
100.00
63,573
710
(c)
Saint
Paul
Housing
&
Redevelopment
Authority,
Minnesota,
Charter
School
Lease
Revenue
Bonds,
Great
River
School
Project,
Series
2017A,
5.500%,
7/01/38
7/27
at
100.00
717,963
3,005
Saint
Paul
Housing
&
Redevelopment
Authority,
Minnesota,
Charter
School
Lease
Revenue
Bonds,
Hmong
College
Prep
Academy
Project,
Series
2016A,
5.250%,
9/01/31
9/26
at
100.00
3,047,260
200
(c)
Saint
Paul
Housing
&
Redevelopment
Authority,
Minnesota,
Charter
School
Lease
Revenue
Bonds,
Metro
Deaf
School
Project,
Series
2018A,
5.000%,
6/15/38
6/25
at
100.00
195,852
325
Saint
Paul
Housing
&
Redevelopment
Authority,
Minnesota,
Charter
School
Lease
Revenue
Bonds,
Nova
Classical
Academy,
Series
2016A,
4.000%,
9/01/31
9/24
at
102.00
314,055
885
Saint
Paul
Housing
&
Redevelopment
Authority,
Minnesota,
Charter
School
Lease
Revenue
Bonds,
Twin
Cities
Academy
Project,
Series
2015A,
5.000%,
7/01/35
7/25
at
100.00
867,283
Principal
Amount
(000)
Description
(a)
Optional
Call
Provisions
(b)
Value
Education
and
Civic
Organizations
(continued)
$
700
Saint
Paul
Housing
&
Redevelopment
Authority,
Minnesota,
Charter
School
Lease
Revenue
Bonds,
Twin
Cities
German
Immersion
School,
Series
2013A,
5.000%,
7/01/33
7/24
at
100.00
$
700,065
210
Saint
Paul
Housing
and
Redevelopment
Authority,
Minnesota,
Lease
Revenue
Bonds,
Saint
Paul
Conservatory
for
Performing
Artists
Charter
School
Project,
Series
2013A,
4.000%,
3/01/28
7/24
at
100.00
201,443
2,770
Savage,
Minnesota
Charter
School
Lease
Revenue
Bonds,
Aspen
Academy
Project,
Series
2016A,
5.000%,
10/01/36
10/26
at
100.00
2,663,756
500
St.
Paul
Housing
and
Redevelopment
Authority,
Minnesota,
Charter
School
Revenue
Bonds,
Higher
Ground
Academy
Charter
School,
Series
2018,
5.000%,
12/01/43
12/26
at
102.00
492,048
975
Todd
Morrison
Stearns
Counties
Independent
School
District
No
2753,
5.000%,
2/01/35
2/32
at
100.00
1,076,368
700
University
of
Minnesota,
General
Obligation
Bonds,
Refunding
Series
2024A,
5.000%,
1/01/39
1/34
at
100.00
785,173
5,460
University
of
Minnesota,
General
Obligation
Bonds,
Series
2019A,
5.000%,
4/01/44
4/29
at
100.00
5,701,291
Winona
Port
Authority,
Minnesota,
Charter
School
Lease
Revenue
Bonds,
Bluffview
Montessori
School
Project,
Refunding
Series
2016:
60
3.750%,
6/01/26
7/24
at
100.00
58,129
10
4.500%,
6/01/36
7/24
at
100.00
8,676
200
Woodbury,
Minnesota,
Charter
School
Lease
Revenue
Bonds,
Math
and
Science
Academy
Building
Company,
Refunding
Series
2020A,
3.000%,
12/01/30
12/25
at
102.50
178,049
1,015
Woodbury,
Minnesota,
Charter
School
Lease
Revenue
Bonds,
Woodbury
Leadership
Academy,
Series
2021A,
4.000%,
7/01/31
7/28
at
103.00
941,331
Total
Education
and
Civic
Organizations
61,164,743
Government
-
0.2%
815
Minneapolis,
Minnesota,
Limited
Tax
Supported
Development
Revenue
Bonds, Common
Bond
Fund
Series
2013-1,
4.000%,
6/01/28
12/24
at
100.00
787,916
Total
Government
787,916
Health
Care
-
17.1%
3,370
Chippewa
County,
Minnesota,
Gross
Revenue
Hospital
Bonds,
Montevideo
Hospital
Project,
Refunding
Series
2016,
4.000%,
3/01/29
3/26
at
100.00
3,263,153
City
of
Plato,
Minnesota,
Health
Care
Facilities
Revenue
Bonds,
Glencoe
Regional
Health
Services
Project,
Series
2017:
1,140
4.000%,
4/01/29
4/27
at
100.00
1,102,390
1,040
4.000%,
4/01/32
4/27
at
100.00
987,864
1,150
Crookston,
Minnesota,
Health
Care
Facilities
Revenue
Bonds,
RiverView
Health
Project,
Refunding
Series
2017A,
4.000%,
5/01/32
5/25
at
100.00
921,903
1,045
Duluth
Economic
Development
Authority,
Minnesota,
Health
Care
Facilities
Revenue
Bonds,
Essentia
Health
Obligated
Group,
Series
2018A,
5.000%,
2/15/33
2/28
at
100.00
1,078,574
675
Duluth
Economic
Development
Authority,
Minnesota,
Health
Care
Facilities
Revenue
Bonds,
Saint
Luke's
Hospital
of
Duluth
Obligated
Group,
Series
2021A,
4.000%,
6/15/37
6/31
at
100.00
682,597
240
Duluth
Economic
Development
Authority,
Minnesota,
Health
Care
Facilities
Revenue
Bonds,
Saint
Luke's
Hospital
of
Duluth
Obligated
Group,
Series
2022A, Forward
Delivery,
4.000%,
6/15/35
6/32
at
100.00
245,083
1,400
Duluth
Economic
Development
Authority,
Minnesota,
Health
Care
Facilities
Revenue
Bonds,
Saint
Luke's
Hospital
of
Duluth
Obligated
Group,
Series
2022B,
5.250%,
6/15/42
6/32
at
100.00
1,516,618
Glencoe,
Minnesota,
Health
Care
Facilities
Revenue
Bonds,
Glencoe
Regional
Health
Services
Project,
Series
2013:
660
4.000%,
4/01/25
7/24
at
100.00
652,722
400
4.000%,
4/01/26
7/24
at
100.00
391,857
2,000
Maple
Grove,
Minnesota,
Health
Care
Facilities
Revenue
Refunding
Bonds,
North
Memorial
Health
Care,
Series
2015,
5.000%,
9/01/28
9/25
at
100.00
2,015,514
Nuveen
Minnesota
Intermediate
Municipal
Bond
Fund
(continued)
Portfolio
of
Investments
May
31,
2024
Principal
Amount
(000)
Description
(a)
Optional
Call
Provisions
(b)
Value
Health
Care
(continued)
Maple
Grove,
Minnesota,
Health
Care
Facility
Revenue
Bonds,
North
Memorial
Health
Care,
Series
2017:
$
495
5.000%,
5/01/31
5/27
at
100.00
$
503,513
405
5.000%,
5/01/32
5/27
at
100.00
410,844
Minneapolis,
Minnesota,
Health
Care
System
Revenue
Bonds,
Allina
Health
System,
Series
2021:
470
4.000%,
11/15/37
11/31
at
100.00
468,945
1,500
4.000%,
11/15/38
11/31
at
100.00
1,484,028
3,000
4.000%,
11/15/39
11/31
at
100.00
2,931,783
595
Minneapolis,
Minnesota,
Health
Care
System
Revenue
Bonds,
Allina
Health
System,
Series
2023A,
5.000%,
11/15/52,
(Mandatory
Put
11/15/28)
5/28
at
100.91
623,107
Minneapolis,
Minnesota,
Health
Care
System
Revenue
Bonds,
Fairview
Health
Services,
Series
2015A:
1,100
5.000%,
11/15/29
11/25
at
100.00
1,109,471
1,000
5.000%,
11/15/30
11/25
at
100.00
1,008,479
2,200
5.000%,
11/15/33
11/25
at
100.00
2,215,908
Minneapolis,
Minnesota,
Health
Care
System
Revenue
Bonds,
Fairview
Health
Services,
Series
2018A:
2,390
5.000%,
11/15/35
11/28
at
100.00
2,464,054
2,850
5.000%,
11/15/36
11/28
at
100.00
2,932,013
Rochester,
Minnesota,
Health
Care
Facilities
Revenue
Bonds,
Mayo
Clinic,
Refunding
Series
2016B:
2,060
5.000%,
11/15/29
No
Opt.
Call
2,235,596
1,000
5.000%,
11/15/33
No
Opt.
Call
1,137,244
1,000
Saint
Cloud,
Minnesota,
Health
Care
Revenue
Bonds,
CentraCare
Health
System,
Series
2016A,
5.000%,
5/01/46
5/26
at
100.00
1,006,944
1,575
Saint
Cloud,
Minnesota,
Health
Care
Revenue
Bonds,
CentraCare
Health
System,
Series
2019,
5.000%,
5/01/48
5/29
at
100.00
1,610,272
Saint
Paul
Housing
and
Redevelopment
Authority,
Minnesota,
Health
Care
Facility
Revenue
Bonds,
HealthPartners
Obligated
Group,
Refunding
Series
2015A:
3,225
5.000%,
7/01/28
7/25
at
100.00
3,251,818
6,200
5.000%,
7/01/29
7/25
at
100.00
6,240,627
1,000
5.000%,
7/01/32
7/25
at
100.00
1,006,345
1,000
4.000%,
7/01/35
7/25
at
100.00
968,238
Saint
Paul
Housing
and
Redevelopment
Authority,
Minnesota,
Health
Care
Revenue
Bonds,
Fairview
Health
Services,
Series
2017A:
1,560
5.000%,
11/15/26
No
Opt.
Call
1,584,215
1,000
5.000%,
11/15/28
11/27
at
100.00
1,025,272
1,000
5.000%,
11/15/34
11/27
at
100.00
1,025,744
1,745
4.000%,
11/15/35
11/27
at
100.00
1,648,370
1,000
4.000%,
11/15/37
11/27
at
100.00
927,810
Shakopee,
Minnesota,
Health
Care
Facilities
Revenue
Bonds,
Saint
Francis
Regional
Medical
Center,
Refunding
Series
2014:
1,200
5.000%,
9/01/27
9/24
at
100.00
1,200,473
1,140
5.000%,
9/01/29
9/24
at
100.00
1,140,145
Total
Health
Care
55,019,533
Housing/Multifamily
-
0.5%
500
Anoka
Housing
and
Redevelopment
Authority,
Minnesota,
Multifamily
Housing
Revenue
Bonds,
Woodland
Park
Apartments
Project,
Series
2011A,
5.000%,
4/01/27
7/24
at
100.00
500,394
500
Mounds
View,
Minnesota,
Multifamily
Housing
Revenue
Bonds,
Sherman
Forbes
Project
Series
2023A,
4.050%,
11/01/26,
(Mandatory
Put
11/01/24)
6/24
at
100.00
498,578
500
Mounds
View,
Minnesota,
Multifamily
Housing
Revenue
Bonds,
Sherman
Forbes
Project
Series
2023B,
5.375%,
5/01/27,
(Mandatory
Put
5/01/25)
1/25
at
100.00
497,324
Total
Housing/Multifamily
1,496,296
Principal
Amount
(000)
Description
(a)
Optional
Call
Provisions
(b)
Value
Housing/Single
Family
-
0.4%
$
80
Dakota
County
Community
Development
Agency,
Minnesota,
Single
Family
Mortgage
Revenue
Bonds,
Mortgage
Backed
Securities
Program,
Series
2011A,
4.400%,
12/01/26
6/24
at
100.00
$
80,002
120
Minnesota
Housing
Finance
Agency,
Residential
Housing
Finance
Bonds,
Series
2014C,
3.100%,
7/01/26
7/24
at
100.00
116,588
Minnesota
Housing
Finance
Agency,
Residential
Housing
Finance
Bonds,
Series
2020E:
670
1.850%,
1/01/29
No
Opt.
Call
577,694
400
1.900%,
7/01/29
No
Opt.
Call
340,969
Total
Housing/Single
Family
1,115,253
Long-Term
Care
-
9.6%
250
Anoka,
Minnesota,
Housing
Revenue
Bonds,
The
Homestead
at
Anoka,
Inc.
Project,
Refunding
Series
2017,
5.000%,
11/01/46
11/24
at
103.00
216,357
1,000
Apple
Valley,
Minnesota,
Senior
Housing
Revenue
Bonds,
PHS
Apple
Valley
Senior
Housing,
Inc.
Orchard
Path
Project,
Refunding
Series
2018,
4.250%,
9/01/38
7/24
at
102.00
945,633
750
Bethel,
Minnesota,
Housing
and
Health
Care
Facilities
Revenue
Bonds,
Ecumen
Obligated
Group
Series
2024A,
5.250%,
3/01/34
3/31
at
103.00
751,943
1,000
Center
City,
Minnesota,
Health
Care
Facilities
Revenue
Bonds,
Hazelden
Betty
Ford
Foundation
Project,
Series
2014,
5.000%,
11/01/25
11/24
at
100.00
1,004,177
Chatfield,
Minnesota,
Healthcare
and
Housing
Facilities
Revenue
Bonds,
Chosen
Valley
Care
Center
Project,
Refunding
Series
2019:
100
4.000%,
9/01/29
9/26
at
102.00
93,067
100
4.000%,
9/01/30
9/26
at
102.00
92,106
100
4.000%,
9/01/31
9/26
at
102.00
91,129
100
4.000%,
9/01/32
9/26
at
102.00
90,157
155
4.000%,
9/01/33
9/26
at
102.00
138,212
100
4.000%,
9/01/34
9/26
at
102.00
88,220
815
Chisago
City,
Minnesota,
Housing
and
Health
Care
Revenue
Bonds,
CDL
Homes,
LLC
Project,
Series
2013B,
6.000%,
8/01/33
7/24
at
100.00
815,176
325
City
of
Vergas,
Minnesota,
Housing
and
Health
Care
Revenue
Bonds,
CDL
Homes,
LLC
Project,
Refunding
Series
2016,
4.000%,
8/01/31
8/24
at
100.00
288,809
235
Cold
Spring,
Minnesota,
Health
Care
Facilities
Revenue
Bonds,
Assumption
Home,
Inc.,
Refunding
Series
2017,
4.450%,
3/01/31
7/24
at
100.00
211,748
200
Cold
Spring,
Minnesota,
Health
Care
Facilities
Revenue
Bonds,
Assumption
Home,
Inc.,
Refunding
Series
2018,
4.500%,
9/01/33
7/24
at
100.00
174,153
Columbus,
Minnesota,
Senior
Housing
Revenue
Bonds,
Richfield
Senior
Housing,
Inc.,
Refunding
Series
2015:
1,000
4.600%,
1/01/27
7/24
at
100.00
953,926
500
5.000%,
1/01/34
7/24
at
100.00
435,141
1,000
Cuyuna
Range
Hospital
District,
Minnesota,
Health
Care
Facilities
Revenue
Bonds,
Crosby
Senior
Service
Care
Center,
Series
2023,
5.500%,
5/01/43
5/30
at
101.00
1,018,341
Dakota
County
Community
Development
Agency,
Minnesota,
Senior
Housing
Revenue
Bonds,
Walker
Highview
Hills
LLC
Project,
Refunding
Series
2016A:
2,385
(c)
3.875%,
8/01/29
7/24
at
100.00
2,307,308
1,100
(c)
5.000%,
8/01/36
7/24
at
100.00
1,100,006
500
Dennison,
Minnesota,
Senior
Housing
Revenue
Bonds,
Villages
of
Lonsdale,
LLC
Project,
Series
2019,
4.200%,
5/01/35
7/24
at
101.00
426,875
200
Maple
Plain,
Minnesota
Senior
Housing
and
Healthcare
Revenue
Bonds,
Haven
Homes,
Inc.
Project,
Series
2019,
4.000%,
7/01/32
7/25
at
102.00
186,582
100
Mapleton,
Minnesota,
Healthcare
Facility
Revenue
Bonds,
Mapleton
Community
Home,
Refunding
Series
2019,
3.750%,
5/01/34
7/24
at
101.00
82,709
Minneapolis,
Minnesota,
Senior
Housing
and
Healthcare
Revenue
Bonds,
Ecumen
Abiitan
Mill
City
Project, Series
2015:
425
4.750%,
11/01/28
7/24
at
100.00
409,747
750
5.250%,
11/01/45
7/24
at
100.00
672,667
100
Morris,
Minnesota,
Health
Care
Facilities
Revenue
Bonds,
Farmington
Health
Services
Project,
Refunding
Series
2019,
3.100%,
8/01/25
8/24
at
101.00
97,233
Nuveen
Minnesota
Intermediate
Municipal
Bond
Fund
(continued)
Portfolio
of
Investments
May
31,
2024
Principal
Amount
(000)
Description
(a)
Optional
Call
Provisions
(b)
Value
Long-Term
Care
(continued)
Rochester,
Minnesota,
Health
Care
and
Housing
Revenue
Bonds,
Samaritan
Bethany,
Inc.
Project,
Refunding
Series
2017A:
$
775
3.875%,
8/01/26
8/25
at
100.00
$
750,691
805
4.000%,
8/01/27
8/25
at
100.00
770,799
2,000
4.000%,
8/01/30
8/25
at
100.00
1,832,126
405
Saint
Joseph,
Minnesota,
Senior
Housing
and
Healthcare
Revenue
Bonds,
Woodcrest
of
Country
Manor
Project,
Series
2019
A,
4.000%,
7/01/33
7/24
at
102.00
364,718
1,000
Saint
Louis
Park,
Minnesota,
Health
Care
Facilities
Revenue
Bonds,
Mount
Olivet
Careview
Home
Project,
Series
2016B,
4.350%,
6/01/36
6/26
at
100.00
916,462
2,415
Saint
Paul
Housing
and
Redevelopment
Authority
Minnesota,
Senior
Housing
and
Health
Care
Revenue
Bonds,
Episcopal
Homes
Project,
Series
2013,
5.000%,
5/01/33
7/24
at
100.00
2,288,336
Saint
Paul
Housing
and
Redevelopment
Authority,
Minnesota,
Revenue
Bonds,
Amherst
H.
Wilder
Foundation
Project,
Refunding
Series
2020A:
500
5.000%,
12/01/25
No
Opt.
Call
503,501
1,015
5.000%,
12/01/26
No
Opt.
Call
1,027,802
Saint
Paul
Housing
and
Redevelopment
Authority,
Minnesota,
Senior
Housing
and
Health
Care
Revenue
Bonds,
Episcopal
Church
Homes
Project,
Refunding
Senior
Series
2021A:
160
(c)
3.100%,
11/01/31
11/26
at
102.00
140,981
625
(c)
3.150%,
11/01/32
11/26
at
102.00
542,792
Saint
Paul
Park,
Minnesota,
Senior
Housing
and
Health
Care
Revenue
Bonds,
Presbyterian
Homes
Bloomington
Project,
Refunding
Series
2017:
500
3.250%,
9/01/26
9/24
at
100.00
486,671
550
3.700%,
9/01/28
9/24
at
100.00
531,698
350
3.800%,
9/01/29
9/24
at
100.00
337,381
565
3.900%,
9/01/30
9/24
at
100.00
544,010
320
4.125%,
9/01/34
9/24
at
100.00
305,407
1,300
Sartell,
Minnesota,
Health
Care
Facilities
Revenue
Bonds,
Country
Manor
Campus
LLC
Project,
Refunding
Series
2017,
5.000%,
9/01/27
No
Opt.
Call
1,305,305
2,395
Sauk
Rapids,
Minnesota,
Health
Care
and
Housing
Facilities
Revenue
Bonds,
Good
Shepherd
Luthran
Home,
Refunding
Series
2013,
5.125%,
1/01/39
7/24
at
100.00
2,057,273
Scanlon,
Minnesota,
Health
Care
Facilities
Revenue
Bonds,
Duluth
Health
Services
Project,
Refunding
Series
2020:
120
2.700%,
3/01/26
3/25
at
101.00
114,899
335
2.950%,
3/01/28
3/25
at
101.00
307,706
Wayzata,
Minnesota
Senior
Housing
Revenue
Bonds,
Folkestone
Senior
Living
Community,
Refunding
Series
2019:
175
3.000%,
8/01/27
8/24
at
102.00
170,099
300
3.125%,
8/01/28
8/24
at
102.00
290,019
300
3.250%,
8/01/29
8/24
at
102.00
288,912
225
3.375%,
8/01/30
8/24
at
102.00
216,189
600
5.000%,
8/01/31
8/24
at
102.00
610,405
450
5.000%,
8/01/32
8/24
at
102.00
457,338
250
5.000%,
8/01/33
8/24
at
102.00
253,819
555
5.000%,
8/01/34
8/24
at
102.00
562,904
250
5.000%,
8/01/35
8/24
at
102.00
253,406
Total
Long-Term
Care
30,923,071
Tax
Obligation/General
-
27.6%
1,355
Anoka-Hennepin
Independent
School
District
11,
Coon
Rapids,
Minnesota,
General
Obligation
Bonds,
School
Building
Series
2020A,
3.000%,
2/01/34
2/28
at
100.00
1,222,024
1,405
Benson
Independent
School
District
777,
Minnesota,
General
Olibation
Bonds,
School
Building
Series
2018A,
4.000%,
2/01/32
2/27
at
100.00
1,430,626
Brainerd
Independent
School
District
181,
Crow
Wing
County,
Minnesota,
General
Obligation
Bonds,
School
Building
Series
2018A:
3,280
4.000%,
2/01/30
2/27
at
100.00
3,323,032
1,000
4.000%,
2/01/33
2/27
at
100.00
1,016,062
Principal
Amount
(000)
Description
(a)
Optional
Call
Provisions
(b)
Value
Tax
Obligation/General
(continued)
Brooklyn
Center
Independent
School
District
286,
Minnesota,
General
Obligation
Bonds,
Series
2018A:
$
2,145
4.000%,
2/01/35
2/27
at
100.00
$
2,167,023
1,720
4.000%,
2/01/37
2/27
at
100.00
1,736,180
2,000
Buffalo,
Minnesota,
Water
and
Sewer
Revenue
Bonds,
Refunding
Series
2014A,
4.000%,
11/01/28
-
BAM
Insured
7/24
at
100.00
1,931,640
2,380
City
of
Rosemount,
Minnesota,
General
Obligation
Bonds,
Street
Reconstruction
and
Capital
Improvement
Plan
Series
2023A,
4.000%,
2/01/45
2/32
at
100.00
2,366,264
1,000
Cloquet
Independent
School
District
94,
Carlton
and
Sant
Louis
Counties,
Minnesota,
General
Obligation
Bonds,
School
Building
Series
2015B,
4.000%,
2/01/36
2/25
at
100.00
1,000,457
1,250
Detroit
Lakes
Independent
School
District
22,
Becker
and
Otter
Tail
Counties,
Minnesota,
General
Obligation
Bonds,
School
Building
Series
2019A,
4.000%,
2/01/30
2/27
at
100.00
1,278,866
Dover-Eyota
Independent
School
District
533,
Minnesota,
General
Obligation
Bonds,
School
Building
Facilities
Maintenance
Series
2023A:
1,515
4.000%,
2/01/42
2/31
at
100.00
1,485,988
1,450
4.000%,
2/01/45
2/31
at
100.00
1,398,255
1,270
Duluth
Independent
School
District
709,
Saint
Louis
County,
Minnesota,
General
Obligation
Bonds,
Capital
Appreciation
Series
2021C,
0.000%,
2/01/30
2/28
at
96.61
966,480
3,150
Elk
River
Independent
School
District
728,
Minnesota,
General
Obligation
Bonds,
Facilities
Maintenance
Series
2019A,
4.000%,
2/01/31
2/27
at
100.00
3,209,119
2,460
Forest
Lake,
Washington
County,
Minnesota,
General
Obligation
Bonds,
Series
2019A,
4.000%,
2/01/32
2/29
at
100.00
2,527,616
1,725
GFW
Independent
School
District
No.
2365,
Sibley,
Renville,
McLeod
and
Nicollet
Counties,
Minnesota,
General
Obligation
School
Building
Bonds,
Series
2023A,
5.000%,
2/01/43
2/31
at
100.00
1,843,694
1,485
Goodhue
Independent
School
District
253,
Minnesota,
General
Obligation
Bonds,
School
Building
Series
2019A,
4.000%,
2/01/30
2/28
at
100.00
1,520,624
1,345
Greenway
Independent
School
District
316,
Itasca
County,
Minnesota,
General
Obligation
Bonds,
Facilities
Maintenance
Series
2019F,
0.000%,
2/01/28
2/26
at
95.70
1,158,153
2,000
Hennepin
County
Regional
Railroad
Authority,
Minnesota,
General
Obligation
Bonds,
Limited
Tax
Series
2019A,
5.000%,
12/01/37
12/28
at
100.00
2,122,466
5,295
Hennepin
County,
Minnesota,
General
Obligation
Bonds,
Series
2021A,
5.000%,
12/01/33
12/31
at
100.00
5,933,983
1,555
Independent
School
District
No.
2397
(Le
Sueur-Henderson),
Minnesota,
General
Obligation
School
Building
Bonds,
Series
2022A,
5.000%,
2/01/35
2/31
at
100.00
1,719,318
Jordan
Independent
School
District
717,
Scott
County,
Minnesota,
General
Obligation
Bonds,
School
Building
Series
2023A:
1,200
5.000%,
2/01/37
2/31
at
100.00
1,307,974
1,000
5.000%,
2/01/39
2/31
at
100.00
1,072,902
Medicine
Lake,
Minnesota,
General
Obligation
Bonds,
Series
2024A:
210
5.000%,
2/01/35
2/32
at
100.00
217,593
330
5.000%,
2/01/39
2/32
at
100.00
336,101
1,430
Minneapolis
Special
School
District
1,
Hennepin
County,
Minnesota,
General
Obligation
Bonds,
Building
Series
2023A,
5.000%,
2/01/43
2/33
at
100.00
1,551,071
2,595
Minneapolis
Special
School
District
1,
Hennepin
County,
Minnesota,
General
Obligation
Bonds,
Long-Term
Facilities
Maintenance
Series
2017B,
4.000%,
2/01/32
2/28
at
100.00
2,636,992
Minneapolis,
Minnesota,
General
Obligation
Bonds,
Improvement
&
Various
Purpose
Series
2018:
1,480
4.000%,
12/01/33
12/26
at
100.00
1,500,788
500
4.000%,
12/01/35
12/26
at
100.00
505,924
5,100
Minnesota
State,
General
Obligation
Bonds,
Various
Purpose
Series
2021A,
4.000%,
9/01/38
9/31
at
100.00
5,186,663
Nuveen
Minnesota
Intermediate
Municipal
Bond
Fund
(continued)
Portfolio
of
Investments
May
31,
2024
Principal
Amount
(000)
Description
(a)
Optional
Call
Provisions
(b)
Value
Tax
Obligation/General
(continued)
Minnetonka
Independent
School
District
276,
Hennepin
County,
Minnesota,
General
Obligation
Bonds,
Facilities
Maintenance
Series
2023B:
$
210
5.000%,
2/01/38
2/32
at
100.00
$
227,581
500
5.000%,
2/01/44
2/32
at
100.00
531,389
500
Montgomery
Independent
School
District
2905,
Minnesota,
General
Obligation
Bonds,
School
Building
Series
2018A,
4.000%,
2/01/34
2/25
at
100.00
500,264
1,475
Moose
Lake
Independent
School
District
97,
Carlton
and
Pine
Counties,
Minnesota,
General
Obligation
Bonds,
School
Buidling
Series
2015A,
4.000%,
2/01/30
2/25
at
100.00
1,480,477
2,050
North
Branch
Independent
School
District
138,
Chisago
County,
Minnesota,
General
Obligation
Bonds,
School
Building
Series
2017A,
4.000%,
2/01/30
2/27
at
100.00
2,085,254
850
North
Saint
Paul-Maplewood-Oakdale
Independent
School
District
622,
Ramsey
County,
Minnesota,
General
Obligation
Bonds,
Facilities
Maintenance
Series
2018A,
3.375%,
2/01/35
2/27
at
100.00
806,049
1,185
Northland
Independent
School
District
118,
Minnesota,
General
Obligation
Bonds,
Series
2016A,
3.000%,
2/01/29
7/24
at
100.00
1,119,822
1,500
Osseo
Independent
School
District
279
Hennepin
County,
Minnesota,
General
Obligation
Bonds,
Facilities
Maintenance
Series
2018B,
4.000%,
2/01/34
2/27
at
100.00
1,516,244
1,035
Perham
Dent
Independent
School
District
549,
Minnesota,
General
Obligation
Bonds,
School
Building
Series
2016A,
3.000%,
2/01/30
7/24
at
100.00
971,586
880
Plainview-Elgin-Millville
Independent
School
District
2899,
Minnesota,
General
Obligation
Bonds,
School
Building
Series
2019A,
4.000%,
2/01/32
2/28
at
100.00
903,684
2,665
Ramsey
County,
Minnesota,
General
Obligation
Bonds,
Capital
Improvement
Plan,
Series
2023B,
4.000%,
2/01/41
2/32
at
100.00
2,686,290
1,250
Robbinsdale
Independent
School
District
281,
Hennepin
County,
Minnesota,
General
Obligation
Bonds,
Facilities
Maintenance
Series
2018A,
3.000%,
2/01/30
8/26
at
100.00
1,202,486
4,535
Roseville
Independent
School
District
623,
Ramsey
County,
Minnesota,
General
Obligation
Bonds,
School
Building
Series
2018A,
4.000%,
2/01/34
2/27
at
100.00
4,599,087
1,070
Round
Lake-Brewster
Independent
School
District
2907,
Minnesota,
General
Obligation
Bonds,
School
Building
Series
2023A,
5.000%,
2/01/40
2/32
at
100.00
1,150,798
1,100
Saint
Cloud
Independent
School
District
742,
Stearns
County,
Minnesota,
General
Obligation
Bonds,
Series
2015A,
4.000%,
2/01/30
2/25
at
100.00
1,100,868
1,075
Saint
Louis
Park
Independent
School
District
283,
Hennepin
County,
Minnesota,
General
Obligation
Bonds,
School
Building
Series
2022A,
5.000%,
2/01/37
2/31
at
100.00
1,171,059
1,225
Saint
Michael
Independent
School
District
885,
Wright
County,
Minnesota,
General
Obligation
Bonds,
School
Building
Series
2017A,
3.200%,
2/01/32
2/26
at
100.00
1,183,874
1,700
Sartell,
Minnesota,
General
Obligation
Bonds,
Series
2022A,
4.000%,
2/01/39
2/30
at
100.00
1,707,164
1,330
South
Washington
County
Independent
School
District
833,
Minnesota,
General
Obligation
Bonds,
Facilities
Maintenance
Series
2018A,
4.000%,
2/01/31
2/27
at
100.00
1,337,066
2,000
South
Washington
County
Independent
School
District
833,
Minnesota,
General
Obligation
Bonds,
Facilities
Maintenance
Series
2022A,
4.000%,
2/01/35
2/30
at
100.00
2,023,117
2,000
South
Washington
County
Independent
School
District
833,
Minnesota,
General
Obligation
Bonds,
School
Building
Series
2016A,
4.000%,
2/01/29
2/26
at
100.00
2,008,073
915
Southland
Independent
School
District
500,
Minnesota,
General
Obligation
Bonds,
School
Building
Series
2019A,
4.000%,
2/01/31
2/27
at
100.00
926,417
2,415
Watertown-Mayer
Independent
School
District
111,
Carver,
Hennepin
and
Wright
Counties,
Minnesota,
General
Obligation
Bonds,
School
Building
Series
2020A,
0.000%,
2/01/31
2/28
at
94.63
1,798,301
Total
Tax
Obligation/General
88,710,828
Principal
Amount
(000)
Description
(a)
Optional
Call
Provisions
(b)
Value
Tax
Obligation/Limited
-
11.1%
$
55
Elbow
Lake
Economic
Development
Authority,
Minnesota,
Lease
Revenue
Bonds,
Grant
County
Public
Project,
Series
2017A,
4.000%,
12/15/37
12/27
at
100.00
$
50,297
2,570
Marshall,
Minnesota,
Education
Services
Facility,
Lease
Revenue
Bonds,
Southwest
West
Central
Service
Cooperatives,
Series
2024A,
5.000%,
2/01/37
2/32
at
100.00
2,595,156
1,475
Minneapolis
Special
School
District
1,
Hennepin
County,
Minnesota,
Certificates
of
Participation,
Full
Term
Series
2015D,
3.000%,
2/01/29
7/24
at
100.00
1,416,073
1,000
Minneapolis
Special
School
District
1,
Hennepin
County,
Minnesota,
Certificates
of
Participation,
Full
Term
Series
2017C,
4.000%,
2/01/30
2/28
at
100.00
1,014,667
Minneapolis,
Minnesota,
Tax
Incriment
Revenue
Bonds,
Ivy
Tower
Project,
Series
2015:
360
4.000%,
3/01/25
7/24
at
100.00
357,754
500
5.000%,
3/01/29
7/24
at
100.00
494,942
1,170
Minnesota
Housing
Finance
Agency,
Housing
Infrastructure
State
Appropriation
Bonds,
Series
2015C,
4.000%,
8/01/27
8/24
at
100.00
1,138,340
960
Minnesota
Housing
Finance
Agency,
Housing
Infrastructure
State
Appropriation
Bonds,
Series
2018D,
4.000%,
8/01/34
8/28
at
100.00
975,625
3,105
Minnesota
Housing
Finance
Agency,
Housing
Infrastructure
State
Appropriation
Bonds,
Series
2020B,
4.000%,
8/01/32
8/30
at
100.00
3,197,496
205
Minnesota
Housing
Finance
Agency,
Housing
Infrastructure
State
Appropriation
Bonds,
Series
2021B,
3.000%,
8/01/37
8/31
at
100.00
183,587
Minnesota
Housing
Finance
Agency,
Housing
Infrastructure
State
Appropriation
Bonds,
Series
2021C:
3,295
4.000%,
8/01/39
8/31
at
100.00
3,229,558
2,385
4.000%,
8/01/40
8/31
at
100.00
2,309,586
2,000
Minnesota
Housing
Finance
Agency,
Housing
Infrastructure
State
Appropriation
Bonds,
Series
2022C,
5.000%,
8/01/42
8/32
at
100.00
2,140,825
1,375
Minnesota
Housing
Finance
Agency,
Housing
Infrastructure
State
Appropriation
Bonds,
Series
2023A,
5.000%,
8/01/43
8/33
at
100.00
1,467,466
1,185
Minnesota
Housing
Finance
Agency,
Nonprofit
Housing
Bonds,
State
Appropriation
Series
2011,
5.250%,
8/01/27
7/24
at
100.00
1,186,368
New
London
Economic
Development
Authority,
Minnesota,
Lease
Revenue
Bonds,
SWWC
Service
Cooperative
Lease
With
Option
to
Purchase
Project,
Public
Series
2023:
445
5.000%,
2/01/27
No
Opt.
Call
456,444
470
5.000%,
2/01/28
No
Opt.
Call
484,703
Northeast
Metropolitan
Intermediate
School
District
916,
White
Bear
Lake,
Minnesota,
Certificates
of
Particpation,
Series
2015B:
605
3.125%,
2/01/29
2/25
at
100.00
584,456
350
3.250%,
2/01/30
2/25
at
100.00
336,347
1,215
Roseville
Independent
School
District
623,
Ramsey
County,
Minnesota,
Certificates
of
Participation,
Series
2021A,
5.000%,
4/01/30
No
Opt.
Call
1,264,187
Saint
Cloud
Independent
School
District
742,
Stearns
County,
Minnesota,
Certificates
of
Participation,
Saint
Cloud
Area
Public
Schools,
Series
2017A:
630
5.000%,
2/01/30
2/25
at
100.00
634,992
725
4.000%,
2/01/38
2/25
at
100.00
722,498
1,685
Saint
Paul
Independent
School
District
625,
Ramsey
County,
Minnesota,
Certificates
of
Participation,
Series
2018B,
3.250%,
2/01/33
2/27
at
100.00
1,610,236
290
Saint
Paul
Independent
School
District
625,
Ramsey
County,
Minnesota,
Certificates
of
Participation,
Series
2020C,
3.000%,
2/01/36
2/28
at
100.00
257,816
Saint
Paul
Independent
School
District
625,
Ramsey
County,
Minnesota,
Certificates
of
Participation,
Series
2024A:
1,000
5.000%,
2/01/37
2/34
at
100.00
1,127,465
500
5.000%,
2/01/38
2/34
at
100.00
559,738
1,000
5.000%,
2/01/39
2/34
at
100.00
1,111,279
735
Saint
Paul,
Minnesota,
Sales
Tax
Revenue
Bonds,
Series
2014G,
5.000%,
11/01/29
11/24
at
100.00
739,009
3,500
Virginia
Housing
and
Redevelopment
Authority,
Minnesota,
Health
Care
Facility
Lease
Revenue
Bonds,
Refunding
Series
2018A,
4.000%,
10/01/29
10/25
at
100.00
3,391,542
Nuveen
Minnesota
Intermediate
Municipal
Bond
Fund
(continued)
Portfolio
of
Investments
May
31,
2024
Principal
Amount
(000)
Description
(a)
Optional
Call
Provisions
(b)
Value
Tax
Obligation/Limited
(continued)
Zumbro
Education
District
6012,
Minnesota,
Certificates
of
Participation
Series
2021A:
$
280
4.000%,
2/01/32
2/31
at
100.00
$
267,953
250
4.000%,
2/01/34
2/31
at
100.00
236,929
175
4.000%,
2/01/38
2/31
at
100.00
160,107
Total
Tax
Obligation/Limited
35,703,441
Transportation
-
6.8%
1,000
Minneapolis-St.
Paul
Metropolitan
Airports
Commission,
Minnesota,
Airport
Revenue
Bonds,
Refunding
Subordinate
Lien
Series
2019A,
5.000%,
1/01/33
7/29
at
100.00
1,065,101
Minneapolis-St.
Paul
Metropolitan
Airports
Commission,
Minnesota,
Airport
Revenue
Bonds,
Refunding
Subordinate
Lien
Series
2019B:
1,250
5.000%,
1/01/28,
(AMT)
No
Opt.
Call
1,290,361
1,735
5.000%,
1/01/30,
(AMT)
7/29
at
100.00
1,820,028
1,000
5.000%,
1/01/32,
(AMT)
7/29
at
100.00
1,050,031
1,000
5.000%,
1/01/44,
(AMT)
7/29
at
100.00
1,024,633
3,580
5.000%,
1/01/49,
(AMT)
7/29
at
100.00
3,646,388
Minneapolis-St.
Paul
Metropolitan
Airports
Commission,
Minnesota,
Airport
Revenue
Bonds,
Senior
Lien
Series
2016C:
1,050
5.000%,
1/01/34
1/27
at
100.00
1,089,313
1,130
5.000%,
1/01/41
1/27
at
100.00
1,159,084
Minneapolis-St.
Paul
Metropolitan
Airports
Commission,
Minnesota,
Airport
Revenue
Bonds,
Subordinate
Lien
Series
2022B:
2,980
5.000%,
1/01/29,
(AMT)
No
Opt.
Call
3,107,606
1,000
5.000%,
1/01/32,
(AMT)
No
Opt.
Call
1,071,295
2,325
5.000%,
1/01/33,
(AMT)
1/32
at
100.00
2,490,440
855
5.000%,
1/01/35,
(AMT)
1/32
at
100.00
915,568
2,000
5.250%,
1/01/47,
(AMT)
1/32
at
100.00
2,106,463
Total
Transportation
21,836,311
U.S.
Guaranteed
-
1.2%
(d)
St.
Paul
Housing
and
Redevelopment
Authority,
Minnesota,
Hospital
Revenue
Bonds,
HealthEast
Inc.,
Series
2015A:
1,100
5.000%,
11/15/29,
(Pre-refunded
11/15/25)
11/25
at
100.00
1,119,566
2,285
5.000%,
11/15/30,
(Pre-refunded
11/15/25)
11/25
at
100.00
2,325,645
500
Worthington
Independent
School
District
518,
Nobles
County,
Minnesota,
Certificates
of
Participation,
Series
2017A,
4.000%,
2/01/30,
(Pre-refunded
2/01/26)
2/26
at
100.00
503,508
Total
U.S.
Guaranteed
3,948,719
Utilities
-
4.4%
Brainerd,
Minnesota,
Electric
Utility
Revenue
Bonds,
Series
2014A:
475
4.000%,
12/01/28
12/24
at
100.00
476,222
495
4.000%,
12/01/29
12/24
at
100.00
496,299
Hutchinson,
Minnesota,
Public
Utility
Revenue
Bonds,
Refunding
Series
2012A:
580
5.000%,
12/01/25
7/24
at
100.00
580,591
670
5.000%,
12/01/26
7/24
at
100.00
670,571
100
Luverne,
Minnesota,
Electric
Revenue
Bonds,
Series
2018A,
4.000%,
12/01/33
12/28
at
100.00
101,199
665
Minnesota
Municipal
Gas
Agency,
Commodity
Supply
Revenue
Bonds,
Series
2022A,
4.000%,
12/01/52,
(Mandatory
Put
12/01/27)
9/27
at
100.37
666,162
Minnesota
Municipal
Power
Agency,
Electric
Revenue
Bonds,
Refunding
Series
2014:
500
5.000%,
10/01/29
10/24
at
100.00
501,616
500
5.000%,
10/01/30
10/24
at
100.00
501,943
1,000
Minnesota
Municipal
Power
Agency,
Electric
Revenue
Bonds,
Refunding
Series
2014A,
3.500%,
10/01/28
10/24
at
100.00
971,960
1,430
Northern
Municipal
Power
Agency,
Minnesota,
Electric
System
Revenue
Bonds,
Series
2013A,
5.000%,
1/01/30
7/24
at
100.00
1,431,095
750
Rochester,
Minnesota,
Electric
Utility
Revenue
Bonds,
Refunding
Series
2015E,
3.000%,
12/01/29
12/25
at
100.00
723,066
Principal
Amount
(000)
Description
(a)
Optional
Call
Provisions
(b)
Value
Utilities
(continued)
$
1,000
Rochester,
Minnesota,
Electric
Utility
Revenue
Bonds,
Refunding
Series
2017A,
5.000%,
12/01/33
12/26
at
100.00
$
1,030,432
1,070
Saint
Paul
Port
Authority,
Minnesota,
District
Energy
Revenue
Bonds,
Series
2017-4,
4.000%,
10/01/40,
(AMT)
10/27
at
100.00
938,891
100
Saint
Paul
Port
Authority,
Minnesota,
District
Energy
Revenue
Bonds,
Series
2021-1.
501
C3,
3.000%,
10/01/27
No
Opt.
Call
94,766
2,500
Southern
Minnesota
Municipal
Power
Agency
Power
Supply
System
Revenue
Bonds,
Series
2015A,
4.000%,
1/01/30
1/26
at
100.00
2,521,508
Western
Minnesota
Municipal
Power
Agency,
Minnesota,
Power
Supply
Revenue
Bonds,
Refunding
Series
2015A:
1,335
5.000%,
1/01/31
1/26
at
100.00
1,362,882
1,000
5.000%,
1/01/33
1/26
at
100.00
1,018,729
Total
Utilities
14,087,932
Total
Municipal
Bonds
(cost
$321,663,804)
314,794,043
Total
Long-Term
Investments
(cost
$321,663,804)
314,794,043
Principal
Amount
(000)
Description
(a)
Optional
Call
Provisions
(b)
Value
SHORT-TERM
INVESTMENTS
-
1.0%
X
3,150,000
MUNICIPAL
BONDS
-
1.0%
X
3,150,000
Education
and
Civic
Organizations
-
1.0%
$
3,150
(e)
Minneapolis,
Minnesota,
Revenue
Bonds,
University
Gateway
Project,
Refunding
Series
2009,
3.300%,
12/01/40
6/24
at
100.00
$
3,150,000
Total
Education
and
Civic
Organizations
3,150,000
Total
Municipal
Bonds
(cost
$3,150,000)
3,150,000
Total
Short-Term
Investments
(cost
$3,150,000)
3,150,000
Total
Investments
(cost
$324,813,804)
-
98.9%
317,944,043
Other
Assets
&
Liabilities,
Net
-
1.1%
3,381,964
Net
Assets
-
100%
$
321,326,007
(a)
All
percentages
shown
in
the
Portfolio
of
Investments
are
based
on
net
assets.
(b)
Optional
Call
Provisions:
Dates
(month
and
year)
and
prices
of
the
earliest
optional
call
or
redemption.
There
may
be
other
call
provisions
at
varying
prices
at
later
dates.
Certain
mortgage-backed
securities
may
be
subject
to
periodic
principal
paydowns.
Optional
Call
Provisions
are
not
covered
by
the
report
of
independent
registered
public
accounting
firm.
(c)
Security
is
exempt
from
registration
under
Rule
144A
of
the
Securities
Act
of
1933,
as
amended.
These
securities
are
deemed
liquid
and
may
be
resold
in
transactions
exempt
from
registration,
which
are
normally
those
transactions
with
qualified
institutional
buyers.
As
of
the
end
of
the
reporting
period,
the
aggregate
value
of
these
securities
is
$6,427,398
or
2.0%
of
Total
Investments.
(d)
Backed
by
an
escrow
or
trust
containing
sufficient
U.S.
Government
or
U.S.
Government
agency
securities,
which
ensure
the
timely
payment
of
principal
and
interest.
(e)
Investment
has
a
maturity
of
greater
than
one
year,
but
has
variable
rate
and/or
demand
features
which
qualify
it
as
a
short-term
investment.
The
rate
disclosed,
as
well
as
the
reference
rate
and
spread,
where
applicable,
is
that
in
effect
as
of
the
end
of
the
reporting
period.
This
rate
changes
periodically
based
on
market
conditions
or
a
specified
market
index.
AMT
Alternative
Minimum
Tax
See
Notes
to
Financial
Statements.
Nuveen
Minnesota
Municipal
Bond
Fund
Portfolio
of
Investments
May
31,
2024
a
Principal
Amount
(000)
Description
(a)
Optional
Call
Provisions
(b)
Value
LONG-TERM
INVESTMENTS
-
94.3%
X
569,593,975
MUNICIPAL
BONDS
-
94.3%
X
569,593,975
Education
and
Civic
Organizations
-
19.4%
$
130
Baytown
Township,
Minnesota
Charter
School
Lease
Revenue
Bonds,
Saint
Croix
Preparatory
Academy,
Refunding
Series
2016A,
4.250%,
8/01/46
8/26
at
100.00
$
109,618
3,500
Brooklyn
Center,
Minnesota,
Charter
School
Lease
Revenue
Bonds,
Tesfa
International
dba
Twin
Lakes
STEM
Academy
Project,
Series
2021A,
5.250%,
6/15/56
6/29
at
100.00
2,472,791
City
of
Ham
Lake,
Minnesota,
Charter
School
Lease
Revenue
Bonds,
DaVinci
Academy
Project,Series
2016A:
100
5.000%,
7/01/36
7/24
at
102.00
95,244
2,000
5.000%,
7/01/47
7/24
at
102.00
1,744,997
Deephaven,
Minnesota,
Charter
School
Lease
Revenue
Bonds,
Eagle
Ridge
Academy
Project,
Series
2015A:
675
5.250%,
7/01/37
7/25
at
100.00
678,337
250
5.250%,
7/01/40
7/25
at
100.00
250,585
500
5.500%,
7/01/50
7/25
at
100.00
500,493
3,000
(c)
Deephaven,
Minnesota,
Charter
School
Lease
Revenue
Bonds,
Seven
Hills
Preparatory
Academy
Project,
Series
2024A,
6.125%,
6/15/61
6/31
at
103.00
2,950,304
1,025
Forest
Lake,
Minnesota,
Charter
School
Lease
Revenue
Bonds,
Lakes
International
Language
Academy,
Series
2014A,
5.750%,
8/01/44
7/24
at
101.00
1,025,584
1,000
Forest
Lake,
Minnesota,
Charter
School
Lease
Revenue
Bonds,
Lakes
International
Language
Academy,
Series
2019A,
5.375%,
8/01/50
8/27
at
102.00
986,786
100
Greenwood,
Minnesota,
Charter
School
Lease
Revenue
Bonds,
Main
Street
School
of
Performing
Arts
Project,
Series
2016A,
5.000%,
7/01/36
7/26
at
100.00
92,788
5,350
Ham
Lake,
Minnesota
Charter
School
Lease
Revenue
Bonds,
Parnassus
Preparatory
School
Project,
Series
2016A,
5.000%,
11/01/47
11/26
at
100.00
5,032,164
Hugo,
Minnesota,
Charter
School
Lease
Revenue
Bonds,
Noble
Academy
Project,
Series
2014A:
600
5.000%,
7/01/29
7/24
at
100.00
600,013
1,000
5.000%,
7/01/34
7/24
at
100.00
1,000,009
525
5.000%,
7/01/44
7/24
at
100.00
499,106
4,150
Independence,
Minnesota,
Charter
School
Lease
Revenue
Bonds,
Beacon
Academy
Project,
Series
2016A,
5.000%,
7/01/46
7/26
at
100.00
3,609,090
1,415
Independence,
Minnesota,
Charter
School
Lease
Revenue
Bonds,
Paladin
Career
&
Technical
High
School
Project,
Series
2021A,
4.000%,
6/01/51
6/29
at
102.00
1,009,496
1,585
Kerkhoven
Murdock
Sunburg
Independent
School
District
No
775,
5.000%,
2/01/41
2/34
at
100.00
1,730,967
1,450
Minneapolis,
Minnesota,
Charter
School
Lease
Revenue
Bonds,
Hiawatha
Academies
Project,
Series
2022A,
5.375%,
7/01/42
7/32
at
100.00
1,401,944
Minneapolis,
Minnesota,
Charter
School
Lease
Revenue
Bonds,
Northeast
College
Prep
Project,
Series
2020A:
410
5.000%,
7/01/40
7/30
at
100.00
363,798
100
5.000%,
7/01/55
7/30
at
100.00
79,193
Minneapolis,
Minnesota,
Charter
School
Lease
Revenue
Bonds,
Yinghua
Academy
Project,
Series
2013A:
500
6.000%,
7/01/33
7/24
at
100.00
500,402
3,815
6.000%,
7/01/43
7/24
at
100.00
3,816,702
1,260
6.125%,
7/01/48
7/24
at
100.00
1,260,632
Minnesota
Department
of
Iron
Range
Resource
and
Rehabilitation,
Educational
Facilities
Revenue
Bonds,
Series
2023A:
1,970
5.000%,
10/01/40
10/33
at
100.00
2,174,459
2,740
5.000%,
10/01/42
10/33
at
100.00
2,988,007
2,880
5.000%,
10/01/43
10/33
at
100.00
3,125,373
Minnesota
Higher
Education
Facilities
Authority,
Revenue
Bonds,
Bethel
University,
Refunding
Series
2017:
2,345
5.000%,
5/01/37
5/27
at
100.00
2,238,720
4,700
5.000%,
5/01/47
5/27
at
100.00
4,166,616
Principal
Amount
(000)
Description
(a)
Optional
Call
Provisions
(b)
Value
Education
and
Civic
Organizations
(continued)
$
1,000
Minnesota
Higher
Education
Facilities
Authority,
Revenue
Bonds,
Carleton
College,
Refunding
Series
2017,
4.000%,
3/01/37
3/27
at
100.00
$
1,003,331
Minnesota
Higher
Education
Facilities
Authority,
Revenue
Bonds,
Carleton
College,
Series
2023:
5,135
5.000%,
3/01/48
3/33
at
100.00
5,424,897
3,000
5.000%,
3/01/53
3/33
at
100.00
3,164,504
500
Minnesota
Higher
Education
Facilities
Authority,
Revenue
Bonds,
College
of
Saint
Scholastica,
Inc.,
Refunding
Series
2019,
4.000%,
12/01/40
12/29
at
100.00
436,358
Minnesota
Higher
Education
Facilities
Authority,
Revenue
Bonds,
Macalester
College,
Refunidng
Series
2021:
125
4.000%,
3/01/35
3/31
at
100.00
127,565
155
4.000%,
3/01/36
3/31
at
100.00
158,032
100
4.000%,
3/01/37
3/31
at
100.00
101,300
1,000
Minnesota
Higher
Education
Facilities
Authority,
Revenue
Bonds,
Macalester
College,
Series
201528J,
3.250%,
3/01/30
3/25
at
100.00
974,216
675
Minnesota
Higher
Education
Facilities
Authority,
Revenue
Bonds,
Saint
Catherine
University,
Refunding
Series
2018A,
5.000%,
10/01/45
10/28
at
100.00
667,036
Minnesota
Higher
Education
Facilities
Authority,
Revenue
Bonds,
Saint
John's
University,
Refunding
Series
2021:
435
4.000%,
10/01/24
No
Opt.
Call
434,504
500
4.000%,
10/01/32
10/30
at
100.00
504,659
Minnesota
Higher
Education
Facilities
Authority,
Revenue
Bonds,
Saint
John's
University,
Series
2015-8I:
350
5.000%,
10/01/33
10/25
at
100.00
355,398
385
5.000%,
10/01/34
10/25
at
100.00
391,375
Minnesota
Higher
Education
Facilities
Authority,
Revenue
Bonds,
Saint
Olaf
College,
Series
2016-8-N:
2,300
4.000%,
10/01/34
10/26
at
100.00
2,305,827
975
4.000%,
10/01/35
10/26
at
100.00
977,029
Minnesota
Higher
Education
Facilities
Authority,
Revenue
Bonds,
Saint
Olaf
College,
Series
2021:
1,000
3.000%,
10/01/38
10/30
at
100.00
839,547
2,820
4.000%,
10/01/50
10/30
at
100.00
2,639,763
Minnesota
Higher
Education
Facilities
Authority,
Revenue
Bonds,
University
of
Saint
Thomas,
Green
Series
2022A:
1,000
4.000%,
10/01/38
10/30
at
100.00
984,947
575
4.125%,
10/01/41
10/30
at
100.00
567,282
1,000
Minnesota
Higher
Education
Facilities
Authority,
Revenue
Bonds,
University
of
Saint
Thomas,
Series
2016-8L,
5.000%,
4/01/27
4/26
at
100.00
1,020,198
100
Minnesota
Higher
Education
Facilities
Authority,
Revenue
Bonds,
University
of
Saint
Thomas,
Series
2017A,
4.000%,
10/01/36
10/27
at
100.00
100,016
Minnesota
Higher
Education
Facilities
Authority,
Revenue
Bonds,
University
of
Saint
Thomas,
Series
2019:
1,000
4.000%,
10/01/31
10/29
at
100.00
1,003,304
2,000
5.000%,
10/01/40
10/29
at
100.00
2,081,385
Minnesota
Higher
Education
Facilities
Authority,
Revenue
Bonds,
University
of
Saint
Thomas,
Series
2022B:
2,125
5.000%,
10/01/39
10/30
at
100.00
2,254,279
500
4.000%,
10/01/40
10/30
at
100.00
487,484
1,490
4.125%,
10/01/42
10/30
at
100.00
1,461,847
500
4.125%,
10/01/42
10/30
at
100.00
490,553
4,170
Minnesota
Higher
Education
Facilities
Authority,
Revenue
Bonds,
University
of
Saint
Thomas,
Series
2024A,
5.000%,
10/01/49
10/32
at
100.00
4,358,710
Minnesota
Office
of
Higher
Education,
Supplemental
Student
Loan
Program
Revenue
Bonds,
2020
Senior
Series:
325
5.000%,
11/01/24,
(AMT)
No
Opt.
Call
325,606
645
2.650%,
11/01/38,
(AMT)
11/27
at
100.00
546,619
1,130
Otsego,
Minnesota,
Charter
School
Lease
Revenue
Bonds,
Kaleidoscope
Charter
School
Project,
Series
2014A,
5.000%,
9/01/44
9/24
at
100.00
1,003,314
155
Saint
Cloud,
Minnesota,
Charter
School
Lease
Revenue
Bonds,
Stride
Academy
Project,
Series
2016A,
5.000%,
4/01/46
4/26
at
100.00
126,671
Nuveen
Minnesota
Municipal
Bond
Fund
(continued)
Portfolio
of
Investments
May
31,
2024
Principal
Amount
(000)
Description
(a)
Optional
Call
Provisions
(b)
Value
Education
and
Civic
Organizations
(continued)
$
1,000
Saint
Paul
Housing
&
Redevelopment
Authority,
Minnesota,
Charter
School
Lease
Revenue
Bonds,
Community
of
Peace
Academy
Project,
Refunding
Series
2015A,
5.000%,
12/01/46
12/24
at
100.00
$
917,191
1,600
Saint
Paul
Housing
&
Redevelopment
Authority,
Minnesota,
Charter
School
Lease
Revenue
Bonds,
Community
of
Peace
Academy
Project,
Series
2019,
4.000%,
12/01/49
12/29
at
100.00
1,216,305
Saint
Paul
Housing
&
Redevelopment
Authority,
Minnesota,
Charter
School
Lease
Revenue
Bonds,
Great
River
School
Project,
Series
2017A:
240
(c)
5.500%,
7/01/38
7/27
at
100.00
242,692
685
(c)
5.500%,
7/01/52
7/27
at
100.00
685,541
2,500
Saint
Paul
Housing
&
Redevelopment
Authority,
Minnesota,
Charter
School
Lease
Revenue
Bonds,
Hmong
College
Prep
Academy
Project,
Refunding
Series
2020A,
5.000%,
9/01/55
9/30
at
100.00
2,283,047
Saint
Paul
Housing
&
Redevelopment
Authority,
Minnesota,
Charter
School
Lease
Revenue
Bonds,
Hmong
College
Prep
Academy
Project,
Series
2016A:
1,000
5.750%,
9/01/46
9/26
at
100.00
1,007,210
500
6.000%,
9/01/51
9/26
at
100.00
504,951
4,000
Saint
Paul
Housing
&
Redevelopment
Authority,
Minnesota,
Charter
School
Lease
Revenue
Bonds,
Hope
Community
Academy
Project,
Series
2020A,
5.000%,
12/01/55
12/28
at
102.00
2,924,917
Saint
Paul
Housing
&
Redevelopment
Authority,
Minnesota,
Charter
School
Lease
Revenue
Bonds,
Metro
Deaf
School
Project,
Series
2018A:
1,000
(c)
5.000%,
6/15/48
6/25
at
100.00
937,544
1,615
(c)
5.000%,
6/15/53
6/25
at
100.00
1,494,135
730
Saint
Paul
Housing
&
Redevelopment
Authority,
Minnesota,
Charter
School
Lease
Revenue
Bonds,
Nova
Classical
Academy,
Refunding
Series
2021A,
4.000%,
9/01/31
9/24
at
102.00
703,668
2,000
Saint
Paul
Housing
&
Redevelopment
Authority,
Minnesota,
Charter
School
Lease
Revenue
Bonds,
Nova
Classical
Academy,
Series
2016A,
4.125%,
9/01/47
9/24
at
102.00
1,678,488
Saint
Paul
Housing
&
Redevelopment
Authority,
Minnesota,
Charter
School
Lease
Revenue
Bonds,
Twin
Cities
Academy
Project,
Series
2015A:
625
5.300%,
7/01/45
7/25
at
100.00
607,966
1,030
5.375%,
7/01/50
7/25
at
100.00
998,368
Saint
Paul
Housing
&
Redevelopment
Authority,
Minnesota,
Charter
School
Lease
Revenue
Bonds,
Twin
Cities
German
Immersion
School
Project,
Series
2019:
1,230
5.000%,
7/01/49
7/27
at
102.00
1,117,311
2,620
5.000%,
7/01/55
7/27
at
102.00
2,319,631
Saint
Paul
Housing
&
Redevelopment
Authority,
Minnesota,
Charter
School
Lease
Revenue
Bonds,
Twin
Cities
German
Immersion
School,
Series
2013A:
500
5.000%,
7/01/33
7/24
at
100.00
500,046
1,450
5.000%,
7/01/44
7/24
at
100.00
1,347,483
Savage,
Minnesota
Charter
School
Lease
Revenue
Bonds,
Aspen
Academy
Project,
Series
2016A:
2,135
5.000%,
10/01/41
10/26
at
100.00
1,973,860
380
5.125%,
10/01/48
10/26
at
100.00
344,456
1,595
Spring
Lake
Park,
Minnesota,
Charter
School
Lease
Revenue
Bonds,
Excell
Academy
for
Higher
Learning
Inc.,
Series
2019A,
5.000%,
6/15/54
6/27
at
100.00
1,463,091
St.
Paul
Housing
and
Redevelopment
Authority,
Minnesota,
Charter
School
Revenue
Bonds,
Higher
Ground
Academy
Charter
School,
Series
2018:
500
5.000%,
12/01/43
12/26
at
102.00
492,048
500
5.125%,
12/01/49
12/26
at
102.00
487,839
1,750
University
of
Minnesota,
General
Obligation
Bonds,
Refunding
Series
2024A,
5.000%,
1/01/43
1/34
at
100.00
1,927,434
3,505
University
of
Minnesota,
General
Obligation
Bonds,
Series
2019A,
5.000%,
4/01/44
4/29
at
100.00
3,659,894
20
Winona
Port
Authority,
Minnesota,
Charter
School
Lease
Revenue
Bonds,
Bluffview
Montessori
School
Project,
Refunding
Series
2016,
4.750%,
6/01/46
7/24
at
100.00
16,544
Principal
Amount
(000)
Description
(a)
Optional
Call
Provisions
(b)
Value
Education
and
Civic
Organizations
(continued)
Woodbury,
Minnesota,
Charter
School
Lease
Revenue
Bonds,
Math
and
Science
Academy
Building
Company,
Refunding
Series
2020A:
$
390
4.000%,
12/01/40
12/25
at
102.50
$
335,477
450
4.000%,
12/01/50
12/25
at
102.50
355,366
Woodbury,
Minnesota,
Charter
School
Lease
Revenue
Bonds,
Woodbury
Leadership
Academy,
Series
2021A:
340
4.000%,
7/01/31
7/28
at
103.00
315,322
660
4.000%,
7/01/51
7/28
at
103.00
473,991
Total
Education
and
Civic
Organizations
117,153,590
Health
Care
-
17.4%
Chippewa
County,
Minnesota,
Gross
Revenue
Hospital
Bonds,
Montevideo
Hospital
Project,
Refunding
Series
2016:
500
4.000%,
3/01/32
3/26
at
100.00
470,826
2,000
4.000%,
3/01/37
3/26
at
100.00
1,833,633
City
of
Plato,
Minnesota,
Health
Care
Facilities
Revenue
Bonds,
Glencoe
Regional
Health
Services
Project,
Series
2017:
550
3.000%,
4/01/26
No
Opt.
Call
525,501
485
5.000%,
4/01/41
4/27
at
100.00
487,518
Duluth
Economic
Development
Authority,
Minnesota,
Health
Care
Facilities
Revenue
Bonds,
Essentia
Health
Obligated
Group,
Series
2018A:
500
5.000%,
2/15/37
2/28
at
100.00
515,131
580
4.250%,
2/15/43
2/28
at
100.00
549,745
13,115
5.000%,
2/15/48
2/28
at
100.00
13,215,735
3,000
5.000%,
2/15/53
2/28
at
100.00
3,018,728
1,000
5.250%,
2/15/53
2/28
at
100.00
1,011,918
2,590
5.250%,
2/15/58
2/28
at
100.00
2,621,837
Duluth
Economic
Development
Authority,
Minnesota,
Health
Care
Facilities
Revenue
Bonds,
Saint
Luke's
Hospital
of
Duluth
Obligated
Group,
Series
2021A:
400
4.000%,
6/15/34
6/31
at
100.00
408,382
175
4.000%,
6/15/38
6/31
at
100.00
175,634
175
4.000%,
6/15/39
6/31
at
100.00
174,334
570
3.000%,
6/15/44
6/31
at
100.00
465,009
450
Duluth
Economic
Development
Authority,
Minnesota,
Health
Care
Facilities
Revenue
Bonds,
Saint
Luke's
Hospital
of
Duluth
Obligated
Group,
Series
2022A, Forward
Delivery,
4.000%,
6/15/38
6/32
at
100.00
451,827
1,250
Duluth
Economic
Development
Authority,
Minnesota,
Health
Care
Facilities
Revenue
Bonds,
Saint
Luke's
Hospital
of
Duluth
Obligated
Group,
Series
2022B,
5.250%,
6/15/47
6/32
at
100.00
1,339,991
Glencoe,
Minnesota,
Health
Care
Facilities
Revenue
Bonds,
Glencoe
Regional
Health
Services
Project,
Series
2013:
500
4.000%,
4/01/27
7/24
at
100.00
484,872
760
4.000%,
4/01/31
7/24
at
100.00
726,028
1,000
Maple
Grove,
Minnesota,
Health
Care
Facilities
Revenue
Refunding
Bonds,
North
Memorial
Health
Care,
Series
2015,
4.000%,
9/01/35
9/25
at
100.00
923,672
Maple
Grove,
Minnesota,
Health
Care
Facility
Revenue
Bonds,
North
Memorial
Health
Care,
Series
2017:
425
5.000%,
5/01/31
5/27
at
100.00
432,310
430
5.000%,
5/01/32
5/27
at
100.00
436,204
Minneapolis,
Minnesota,
Health
Care
System
Revenue
Bonds,
Allina
Health
System,
Series
2021:
2,725
4.000%,
11/15/37
11/31
at
100.00
2,718,882
10,360
4.000%,
11/15/39
11/31
at
100.00
10,124,424
1,000
4.000%,
11/15/40
11/31
at
100.00
964,873
Minneapolis,
Minnesota,
Health
Care
System
Revenue
Bonds,
Fairview
Health
Services,
Series
2015A:
525
5.000%,
11/15/26
11/25
at
100.00
529,260
485
4.000%,
11/15/40
11/25
at
100.00
437,864
Nuveen
Minnesota
Municipal
Bond
Fund
(continued)
Portfolio
of
Investments
May
31,
2024
Principal
Amount
(000)
Description
(a)
Optional
Call
Provisions
(b)
Value
Health
Care
(continued)
Minneapolis,
Minnesota,
Health
Care
System
Revenue
Bonds,
Fairview
Health
Services,
Series
2018A:
$
1,000
5.000%,
11/15/35
11/28
at
100.00
$
1,030,985
3,465
4.000%,
11/15/48
11/28
at
100.00
2,919,171
1,000
Minneapolis-Saint
Paul
Housing
and
Redevelopment
Authority,
Minnesota,
Health
Care
System
Revenue
Bonds,
Allina
Health
System,
Refunding
Series
2017A,
5.000%,
11/15/24
No
Opt.
Call
1,003,431
3,365
Minnesota
Agricultural
and
Economic
Development
Board,
Health
Care
Facilities
Revenue
Bonds,
Essentia
Health
Obligated
Group,
Series
2024A,
5.250%,
1/01/54
1/34
at
100.00
3,594,061
2,600
Rochester,
Minnesota,
Health
Care
Facilities
Revenue
Bonds,
Mayo
Clinic,
Refunding
Series
2016B,
5.000%,
11/15/36
No
Opt.
Call
3,021,569
2,500
Rochester,
Minnesota,
Health
Care
Facilities
Revenue
Bonds,
Mayo
Clinic,
Series
2022,
5.000%,
11/15/57
11/32
at
100.00
2,670,206
4,895
Saint
Cloud,
Minnesota,
Health
Care
Revenue
Bonds,
CentraCare
Health
System,
Series
2016A,
5.000%,
5/01/46
5/26
at
100.00
4,928,992
9,410
Saint
Cloud,
Minnesota,
Health
Care
Revenue
Bonds,
CentraCare
Health
System,
Series
2019,
5.000%,
5/01/48
5/29
at
100.00
9,620,739
Saint
Paul
Housing
and
Redevelopment
Authority,
Minnesota,
Health
Care
Facility
Revenue
Bonds,
HealthPartners
Obligated
Group,
Refunding
Series
2015A:
8,660
5.000%,
7/01/30
7/25
at
100.00
8,717,492
3,825
5.000%,
7/01/31
7/25
at
100.00
3,849,806
4,075
4.000%,
7/01/35
7/25
at
100.00
3,945,571
Saint
Paul
Housing
and
Redevelopment
Authority,
Minnesota,
Health
Care
Revenue
Bonds,
Fairview
Health
Services,
Series
2017A:
2,135
5.000%,
11/15/27
No
Opt.
Call
2,185,380
600
4.000%,
11/15/36
11/27
at
100.00
561,694
640
4.000%,
11/15/37
11/27
at
100.00
593,798
2,830
4.000%,
11/15/43
11/27
at
100.00
2,467,471
2,500
5.000%,
11/15/47
11/27
at
100.00
2,513,667
1,245
Saint
Paul
Port
Authority,
Minnesota,
Lease
Revenue
Bonds,
Regions
Hospital
Parking
Ramp
Project,
Series
2007-1,
5.000%,
8/01/36
7/24
at
100.00
1,245,380
Shakopee,
Minnesota,
Health
Care
Facilities
Revenue
Bonds,
Saint
Francis
Regional
Medical
Center,
Refunding
Series
2014:
1,980
4.000%,
9/01/31
9/24
at
100.00
1,871,989
1,410
5.000%,
9/01/34
9/24
at
100.00
1,410,267
1,900
Wadena,
Minnesota,
Revenue
Bonds,
Wadena
Cancer
Center
Project,
Series
2024A,
5.000%,
12/01/45
6/34
at
100.00
1,983,882
Total
Health
Care
105,179,689
Housing/Multifamily
-
0.5%
1,000
Mounds
View,
Minnesota,
Multifamily
Housing
Revenue
Bonds,
Sherman
Forbes
Project
Series
2023B,
5.375%,
5/01/27,
(Mandatory
Put
5/01/25)
1/25
at
100.00
994,648
2,360
Rochester,
Minnesota,
Multifamily
Housing
Revenue
Bonds,
Essex
Place
Apartments
Project,
Series
2012A,
3.750%,
6/01/29
6/24
at
100.00
2,316,737
Total
Housing/Multifamily
3,311,385
Housing/Single
Family
-
0.7%
5
Minneapolis-Saint
Paul
Housing
Finance
Board,
Minnesota,
Single
Family
Mortgage
Revenue
Bonds,
City
Living
Home
Program,
Market
Series
2011B,
4.100%,
12/01/29
6/24
at
100.00
4,791
35
Minneapolis-Saint
Paul
Housing
Finance
Board,
Minnesota,
Single
Family
Mortgage
Revenue
Bonds,
City
Living
Series
2007A-2,
5.520%,
3/01/41,
(AMT)
6/24
at
100.00
34,520
365
Minnesota
Housing
Finance
Agency,
Residential
Housing
Finance
Bonds,
Series
2016A,
3.200%,
1/01/33,
(AMT)
7/25
at
100.00
314,556
Minnesota
Housing
Finance
Agency,
Residential
Housing
Finance
Bonds,
Series
2020A:
460
1.550%,
7/01/25,
(AMT)
No
Opt.
Call
443,067
370
1.700%,
7/01/26,
(AMT)
No
Opt.
Call
344,329
Principal
Amount
(000)
Description
(a)
Optional
Call
Provisions
(b)
Value
Housing/Single
Family
(continued)
Minnesota
Housing
Finance
Agency,
Residential
Housing
Finance
Bonds,
Series
2020D:
$
220
1.625%,
1/01/26,
(AMT)
No
Opt.
Call
$
208,105
205
1.650%,
7/01/26,
(AMT)
No
Opt.
Call
190,479
Minnesota
Housing
Finance
Agency,
Residential
Housing
Finance
Bonds,
Series
2020H:
460
1.100%,
7/01/26,
(AMT)
No
Opt.
Call
420,066
460
1.350%,
7/01/27,
(AMT)
No
Opt.
Call
406,864
Minnesota
Housing
Finance
Agency,
Residential
Housing
Finance
Bonds,
Series
2021A:
380
1.550%,
1/01/28,
(AMT)
No
Opt.
Call
333,879
390
1.600%,
7/01/28,
(AMT)
No
Opt.
Call
338,512
485
1.750%,
1/01/29,
(AMT)
No
Opt.
Call
410,628
485
1.800%,
7/01/29,
(AMT)
No
Opt.
Call
405,250
245
1.900%,
1/01/30,
(AMT)
No
Opt.
Call
201,846
240
1.950%,
7/01/30,
(AMT)
No
Opt.
Call
195,702
Total
Housing/Single
Family
4,252,594
Industrials
-
0.4%
2,250
(c)
Saint
Paul
Port
Authority,
Minnesota,
Solid
Waste
Disposal
Revenue
Bonds,
Gerdau
Saint
Paul
Steel
Mill
Project,
Series
2012-7,
4.500%,
10/01/37,
(AMT)
7/24
at
100.00
2,183,655
Total
Industrials
2,183,655
Long-Term
Care
-
7.3%
2,090
Anoka,
Minnesota,
Health
Care
and
Housing
Facility
Revenue
Bonds,
The
Homestead
at
Anoka,
Inc.
Project,
Series
2014,
5.125%,
11/01/49
11/24
at
100.00
1,809,076
Apple
Valley,
Minnesota
Senior
Housing
Revenue
Bonds,
PHS
Apple
Valley
Senior
Housing,
Inc.
Orchard
Path
Phase
II
Project,
Series
2021:
225
4.000%,
9/01/26
No
Opt.
Call
224,893
240
4.000%,
9/01/28
No
Opt.
Call
238,877
270
4.000%,
9/01/31
9/28
at
102.00
264,660
1,000
Apple
Valley,
Minnesota,
Senior
Housing
Revenue
Bonds,
PHS
Apple
Valley
Senior
Housing,
Inc.
Orchard
Path
Project,
Refunding
Series
2018,
5.000%,
9/01/43
7/24
at
102.00
997,473
1,000
Bethel,
Minnesota,
Housing
and
Health
Care
Facilities
Revenue
Bonds,
Ecumen
Obligated
Group
Series
2024A,
6.125%,
3/01/49
3/31
at
103.00
974,424
Center
City,
Minnesota,
Health
Care
Facilities
Revenue
Bonds,
Hazelden
Betty
Ford
Foundation
Project,
Series
2014:
375
4.000%,
11/01/39
11/24
at
100.00
347,990
500
5.000%,
11/01/44
11/24
at
100.00
500,563
Chatfield,
Minnesota,
Healthcare
and
Housing
Facilities
Revenue
Bonds,
Chosen
Valley
Care
Center
Project,
Refunding
Series
2019:
500
5.000%,
9/01/44
9/26
at
102.00
434,409
1,500
5.000%,
9/01/52
9/26
at
102.00
1,227,099
1,500
Chisago
City,
Minnesota,
Housing
and
Health
Care
Revenue
Bonds,
CDL
Homes,
LLC
Project,
Series
2013B,
6.000%,
8/01/43
7/24
at
100.00
1,499,966
1,500
City
of
West
Saint
Paul,
Minnesota
Housing
and
Health
Care
Facilities
Revenue
Refunding
Bonds,
Walker
Westwood
Ridge
Campus
Project,
Series
2017,
5.000%,
11/01/49
11/25
at
100.00
1,367,363
Cloquet,
Minnesota,
Housing
Facilities
Revenue
Bonds,
HADC
Cloquet
LLC
Project,
Refunding
Series
2021:
250
3.400%,
8/01/36
8/28
at
102.00
198,151
700
4.000%,
8/01/41
8/28
at
102.00
538,675
200
4.000%,
8/01/48
8/28
at
102.00
140,974
1,180
Cold
Spring,
Minnesota,
Health
Care
Facilities
Revenue
Bonds,
Assumption
Home,
Inc.,
Refunding
Series
2013,
5.200%,
3/01/43
7/24
at
100.00
980,408
Columbus,
Minnesota,
Senior
Housing
Revenue
Bonds,
Richfield
Senior
Housing,
Inc.,
Refunding
Series
2015:
575
5.250%,
1/01/40
7/24
at
100.00
478,047
1,175
5.250%,
1/01/46
7/24
at
100.00
936,709
1,250
Cuyuna
Range
Hospital
District,
Minnesota,
Health
Care
Facilities
Revenue
Bonds,
Crosby
Senior
Service
Care
Center,
Series
2023,
5.500%,
5/01/48
5/30
at
101.00
1,262,086
Nuveen
Minnesota
Municipal
Bond
Fund
(continued)
Portfolio
of
Investments
May
31,
2024
Principal
Amount
(000)
Description
(a)
Optional
Call
Provisions
(b)
Value
Long-Term
Care
(continued)
$
1,195
(c)
Dakota
County
Community
Development
Agency,
Minnesota,
Senior
Housing
Revenue
Bonds,
Walker
Highview
Hills
LLC
Project,
Refunding
Series
2016A,
5.000%,
8/01/46
7/24
at
100.00
$
1,124,747
500
Dennison,
Minnesota,
Senior
Housing
Revenue
Bonds,
Villages
of
Lonsdale,
LLC
Project,
Series
2019,
4.600%,
5/01/44
7/24
at
101.00
388,197
Maple
Plain,
Minnesota
Senior
Housing
and
Healthcare
Revenue
Bonds,
Haven
Homes,
Inc.
Project,
Series
2019:
400
4.100%,
7/01/34
7/25
at
102.00
369,663
1,250
5.000%,
7/01/54
7/25
at
102.00
1,105,186
200
Mapleton,
Minnesota,
Healthcare
Facility
Revenue
Bonds,
Mapleton
Community
Home,
Refunding
Series
2019,
4.000%,
5/01/39
7/24
at
101.00
157,577
1,500
Minneapolis,
Minnesota,
Senior
Housing
and
Healthcare
Revenue
Bonds,
Ecumen
Abiitan
Mill
City
Project, Series
2015,
5.250%,
11/01/45
7/24
at
100.00
1,345,334
300
Morris,
Minnesota,
Health
Care
Facilities
Revenue
Bonds,
Farmington
Health
Services
Project,
Refunding
Series
2019,
3.400%,
8/01/28
8/24
at
101.00
273,804
2,000
North
Oaks,
Minnesota,
Senior
Housing
Revenue
Bonds,
Waverly
Gardens
Project,
Refunding
Series
2016,
5.000%,
10/01/47
10/24
at
102.00
1,970,073
1,285
Saint
Joseph,
Minnesota,
Senior
Housing
and
Healthcare
Revenue
Bonds,
Woodcrest
of
Country
Manor
Project,
Series
2019
A,
5.000%,
7/01/55
7/24
at
102.00
1,084,333
2,000
Saint
Louis
Park,
Minnesota,
Health
Care
Facilities
Revenue
Bonds,
Mount
Olivet
Careview
Home
Project,
Series
2016B,
4.900%,
6/01/49
6/26
at
100.00
1,752,065
50
Saint
Louis
Park,
Minnesota,
Health
Care
Facilities
Revenue
Bonds,
Mount
Olivet
Careview
Home
Project,
Series
2016C,
3.150%,
6/01/28
7/24
at
100.00
46,877
1,000
Saint
Paul
Housing
&
Redevelopment
Authority,
Minnesota,
Revenue
Bonds,
Rossy
&
Richard
Shaller
Family
Sholom
East
Campus,
Series
2018,
5.000%,
10/01/43
7/24
at
100.00
831,360
4,000
Saint
Paul
Housing
and
Redevelopment
Authority,
Minnesota
Senior
Housing
and
Health
Care
Revenue
Bonds,
Carondelet
Village
Project,
Series
2016A,
5.000%,
12/01/41
12/24
at
102.00
3,917,614
Saint
Paul
Housing
and
Redevelopment
Authority,
Minnesota,
Revenue
Bonds,
Amherst
H.
Wilder
Foundation
Project,
Refunding
Series
2020A:
1,175
5.000%,
12/01/29
No
Opt.
Call
1,213,707
300
5.000%,
12/01/30
No
Opt.
Call
311,962
1,750
5.000%,
12/01/36
12/30
at
100.00
1,804,763
Saint
Paul
Housing
and
Redevelopment
Authority,
Minnesota,
Senior
Housing
and
Health
Care
Revenue
Bonds,
Episcopal
Church
Homes
Project,
Refunding
Senior
Series
2021A:
450
(c)
4.000%,
11/01/34
11/26
at
102.00
407,665
1,015
(c)
4.000%,
11/01/42
11/26
at
102.00
830,876
Saint
Paul
Park,
Minnesota,
Senior
Housing
and
Health
Care
Revenue
Bonds,
Presbyterian
Homes
Bloomington
Project,
Refunding
Series
2017:
400
4.000%,
9/01/32
9/24
at
100.00
383,399
500
4.100%,
9/01/33
9/24
at
100.00
480,224
315
4.200%,
9/01/36
9/24
at
100.00
296,519
300
4.250%,
9/01/37
9/24
at
100.00
280,866
1,000
5.000%,
9/01/42
9/24
at
100.00
983,474
600
Sartell,
Minnesota,
Health
Care
and
Housing
Facilities
Revenue
Bonds,
Country
Manor
Campus
LLC
Project,
Series
2022A,
5.000%,
9/01/35
9/27
at
100.00
594,360
2,390
Sauk
Rapids,
Minnesota,
Health
Care
and
Housing
Facilities
Revenue
Bonds,
Good
Shepherd
Luthran
Home,
Refunding
Series
2013,
5.125%,
1/01/39
7/24
at
100.00
2,052,978
Wayzata,
Minnesota
Senior
Housing
Revenue
Bonds,
Folkestone
Senior
Living
Community,
Refunding
Series
2019:
650
5.000%,
8/01/49
8/24
at
102.00
648,110
5,000
5.000%,
8/01/54
8/24
at
102.00
4,930,662
Total
Long-Term
Care
44,008,238
Principal
Amount
(000)
Description
(a)
Optional
Call
Provisions
(b)
Value
Tax
Obligation/General
-
21.4%
$
1,355
Anoka-Hennepin
Independent
School
District
11,
Coon
Rapids,
Minnesota,
General
Obligation
Bonds,
School
Building
Series
2020A,
3.000%,
2/01/43
2/28
at
100.00
$
1,075,162
2,105
Bemidji,
Minnesota,
General
Obligation
Bonds,
Refunding
Sales
Tax
Series
2017A,
4.000%,
2/01/29
-
AGM
Insured
2/28
at
100.00
2,140,230
5,630
Bird
Island-Olivia-Lake
Lillian
Independent
School
District
2534,
Minnesota,
General
Obligation
Bonds,
School
Building
Series
2024A,
5.000%,
2/01/54
2/34
at
100.00
5,947,394
Brainerd
Independent
School
District
181,
Crow
Wing
County,
Minnesota,
General
Obligation
Bonds,
School
Building
Series
2018A:
200
4.000%,
2/01/42
2/27
at
100.00
194,706
3,600
4.000%,
2/01/43
2/27
at
100.00
3,495,535
Brooklyn
Center
Independent
School
District
286,
Minnesota,
General
Obligation
Bonds,
Series
2018A:
1,090
4.000%,
2/01/36
2/27
at
100.00
1,101,129
1,880
4.000%,
2/01/38
2/27
at
100.00
1,889,071
2,715
4.000%,
2/01/41
2/27
at
100.00
2,718,890
2,260
4.000%,
2/01/42
2/27
at
100.00
2,261,772
1,160
Chisago
Lakes,
Minnesota,
Independent
School
District
2144,
General
Obligation
Bonds,
School
Building
Series
2017A,
3.000%,
2/01/32
2/27
at
100.00
1,102,783
Cloquet
Independent
School
District
94,
Carlton
and
Sant
Louis
Counties,
Minnesota,
General
Obligation
Bonds,
School
Building
Series
2015B:
1,000
5.000%,
2/01/27
2/25
at
100.00
1,008,969
1,000
4.000%,
2/01/36
2/25
at
100.00
1,000,457
Corcoran,
Minnesota,
General
Obligation
Bonds,
Series
2023A:
625
4.000%,
2/01/40
-
BAM
Insured
2/31
at
100.00
624,374
3,605
4.000%,
2/01/48
-
BAM
Insured
2/31
at
100.00
3,436,193
Dawson-Boyd
Independent
School
District
378,
Yellow
Medicine
County,
Minnesota,
General
Obligation
Bonds,
School
Building
Series
2019A:
1,145
4.000%,
2/01/31
2/28
at
100.00
1,167,897
1,145
4.000%,
2/01/32
2/28
at
100.00
1,169,059
Dover-Eyota
Independent
School
District
533,
Minnesota,
General
Obligation
Bonds,
School
Building
Facilities
Maintenance
Series
2023A:
1,225
4.000%,
2/01/44
2/31
at
100.00
1,187,861
500
4.000%,
2/01/45
2/31
at
100.00
482,157
Duluth
Independent
School
District
709,
Saint
Louis
County,
Minnesota,
General
Obligation
Bonds,
Capital
Appreciation
Series
2021C:
1,325
0.000%,
2/01/31
2/28
at
94.48
958,792
1,480
0.000%,
2/01/32
2/28
at
92.24
1,016,538
535
0.000%,
2/01/33
2/28
at
89.86
348,349
3,000
Farmington
Independent
School
District
192,
Dakota
County,
Minnesota,
General
Obligation
Bonds,
Refunding
School
Building
Series
2023A,
5.000%,
2/01/25
No
Opt.
Call
3,027,410
480
Fridley,
Minnesota,
General
Obligation
Bonds,
Capital
Improvement
Plan,
Series
2017,
3.250%,
2/01/34
2/26
at
100.00
440,876
GFW
Independent
School
District
No.
2365,
Sibley,
Renville,
McLeod
and
Nicollet
Counties,
Minnesota,
General
Obligation
School
Building
Bonds,
Series
2023A:
1,090
5.000%,
2/01/41
2/31
at
100.00
1,173,518
2,450
5.000%,
2/01/48
2/31
at
100.00
2,583,462
700
Greenway
Independent
School
District
316,
Itasca
County,
Minnesota,
General
Obligation
Bonds,
Facilities
Maintenance
Series
2019F,
0.000%,
2/01/30
2/26
at
90.86
555,290
705
Hawley
Independent
School
District
150,
Clay
County,
Minnesota,
General
Obligation
Bonds,
School
Building
Series
2023A,
5.000%,
2/01/39
2/30
at
100.00
750,081
2,000
Hennepin
County,
Minnesota,
General
Obligation
Bonds,
Refunding
Series
2022B,
5.000%,
12/01/39
12/32
at
100.00
2,221,942
3,000
Hennepin
County,
Minnesota,
General
Obligation
Bonds,
Sales
Tax
Series
2020C,
5.000%,
12/15/38
12/29
at
100.00
3,234,222
1,000
Hennepin
County,
Minnesota,
General
Obligation
Bonds,
Series
2020A,
5.000%,
12/01/36
12/30
at
100.00
1,101,380
1,250
Independent
School
District
621,
Mounds
View,
Minnesota,
General
Obligation
Bonds,
School
Building
Series
2018A,
4.000%,
2/01/42
2/27
at
100.00
1,239,987
Nuveen
Minnesota
Municipal
Bond
Fund
(continued)
Portfolio
of
Investments
May
31,
2024
Principal
Amount
(000)
Description
(a)
Optional
Call
Provisions
(b)
Value
Tax
Obligation/General
(continued)
$
1,935
Independent
School
District
No.
115,
Cass
Lake-Bena
Public
Schools,
Minnesota,
Cass
Beltrami
and
Hubbard
Counties,
General
Obligation
School
Building
Bonds,
Series
2023A,
5.000%,
2/01/37
2/31
at
100.00
$
2,121,161
1,145
Independent
School
District
No.
2397
(Le
Sueur-Henderson),
Minnesota,
General
Obligation
School
Building
Bonds,
Series
2022A,
5.000%,
2/01/36
2/31
at
100.00
1,264,148
600
Jordan
Independent
School
District
717,
Scott
County,
Minnesota,
General
Obligation
Bonds,
School
Building
Series
2023A,
5.000%,
2/01/38
2/31
at
100.00
648,123
500
La
Crescent-Hokah
Independent
School
District
300,
Houston
and
Winona
Counties,
Minnesota,
General
Obligation
Bonds,
School
Building
&
Maintenance
Series
2019A,
4.000%,
2/01/30
2/27
at
100.00
509,706
Madison,
Minnesota,
General
Obligation
Bonds,
Refunding
Series
2015A:
660
3.600%,
1/01/35
-
AGM
Insured
7/24
at
100.00
634,181
500
4.000%,
1/01/45
-
AGM
Insured
7/24
at
100.00
499,237
Maple
River
Independent
School
District
2135,
Minnesota,
General
Obligation
Bonds,
School
Building
Series
2020A:
1,315
4.000%,
2/01/38
2/30
at
100.00
1,328,713
3,500
4.000%,
2/01/50
2/30
at
100.00
3,326,187
1,590
Medicine
Lake,
Minnesota,
General
Obligation
Bonds,
Series
2024A,
5.000%,
2/01/54
2/32
at
100.00
1,537,009
Minneapolis
Special
School
District
1,
Hennepin
County,
Minnesota,
General
Obligation
Bonds,
Long
Term
Facilities
Maintenance
Series
2023B:
2,645
5.000%,
2/01/43
2/33
at
100.00
2,868,939
2,780
5.000%,
2/01/44
2/33
at
100.00
3,006,652
1,430
Minneapolis
Special
School
District
1,
Hennepin
County,
Minnesota,
General
Obligation
Bonds,
School
Building
Series
2022A,
5.000%,
2/01/43
2/32
at
100.00
1,539,183
2,195
Minneapolis,
Minnesota,
General
Obligation
Bonds,
Improvement
&
Various
Purpose
Series
2018,
4.000%,
12/01/35
12/26
at
100.00
2,221,005
2,000
Minneapolis,
Minnesota,
General
Obligation
Bonds,
Series
2023,
5.000%,
12/01/39
12/31
at
100.00
2,197,679
2,975
Minnesota
State,
General
Obligation
Bonds,
Various
Purpose
Series
2018A,
5.000%,
8/01/35
8/28
at
100.00
3,157,233
4,705
Minnesota
State,
General
Obligation
Bonds,
Various
Purpose
Series
2021A,
5.000%,
9/01/30
No
Opt.
Call
5,180,492
2,000
Minnesota
State,
General
Obligation
Bonds,
Various
Purpose
Series
2023A,
5.000%,
8/01/41
8/33
at
100.00
2,216,945
Minnetonka
Independent
School
District
276,
Hennepin
County,
Minnesota,
General
Obligation
Bonds,
Facilities
Maintenance
Series
2023B:
325
5.000%,
2/01/40
2/32
at
100.00
349,765
500
5.000%,
2/01/42
2/32
at
100.00
534,946
1,000
Minnetonka
Independent
School
District
276,
Hennepin
County,
Minnesota,
General
Obligation
Bonds,
Refunding
Alternative
Facilities
Series
2018E,
5.000%,
2/01/35
2/25
at
100.00
1,007,663
Montgomery
Independent
School
District
2905,
Minnesota,
General
Obligation
Bonds,
School
Building
Series
2018A:
250
4.000%,
2/01/32
2/25
at
100.00
250,132
500
4.000%,
2/01/36
2/25
at
100.00
500,264
Moorhead
Independent
School
District
152,
Clay
County,
Minnesota,
General
Obligation
Bonds,
School
Building
Series
2020A:
1,290
3.000%,
2/01/43
2/28
at
100.00
1,035,085
1,100
3.000%,
2/01/44
2/28
at
100.00
871,331
2,000
North
Saint
Paul-Maplewood-Oakdale
Independent
School
District
622,
Ramsey
County,
Minnesota,
General
Obligation
Bonds,
Facilities
Maintenance
Series
2018A,
3.375%,
2/01/35
2/27
at
100.00
1,896,585
530
Pillager
Independent
School
District
116,
Cass
and
Morrison
Counties,
Minnesota,
General
Obligation
Bonds,
School
Building
Series
2019A,
3.000%,
2/01/33
2/28
at
100.00
490,612
1,245
Ramsey
County,
Minnesota,
General
Obligation
Bonds,
Capital
Improvement
Plan,
Series
2023B,
4.000%,
2/01/40
2/32
at
100.00
1,262,882
Principal
Amount
(000)
Description
(a)
Optional
Call
Provisions
(b)
Value
Tax
Obligation/General
(continued)
$
1,795
Red
Lake
County,
Minnesota,
General
Obligation
School
Building
Bonds,
Independent
School
District
No.
2906,
Series
2022A,
4.000%,
2/01/38
2/33
at
100.00
$
1,819,519
4,000
Richfield
Independent
School
District
280,
Hennepin
County,
Minnesota,
General
Obligation
Bonds,
School
Buildings
Series
2018A,
4.000%,
2/01/40
2/27
at
100.00
3,994,471
1,250
Robbinsdale
Independent
School
District
281,
Hennepin
County,
Minnesota,
General
Obligation
Bonds,
Facilities
Maintenance
Series
2018A,
3.000%,
2/01/30
8/26
at
100.00
1,202,486
4,000
Roseville
Independent
School
District
623,
Ramsey
County,
Minnesota,
General
Obligation
Bonds,
School
Building
Series
2018A,
4.000%,
2/01/34
2/27
at
100.00
4,056,526
Round
Lake-Brewster
Independent
School
District
2907,
Minnesota,
General
Obligation
Bonds,
School
Building
Series
2023A:
1,020
5.000%,
2/01/39
2/32
at
100.00
1,105,911
1,285
4.000%,
2/01/42
2/32
at
100.00
1,254,101
1,700
Russell-Tyler-Ruthton
Public
Schools
Independent
School
District
2902,
Minnesota,
General
Obligation
Bonds,
Series
2019A,
4.000%,
2/01/31
2/29
at
100.00
1,754,436
800
Saint
Cloud
Independent
School
District
742,
Stearns
County,
Minnesota,
General
Obligation
Bonds,
Facilities
Maintenance
Series
2022B,
4.000%,
2/01/43
2/30
at
100.00
786,936
1,000
Saint
James
Independent
School
District
840,
Minnesota,
General
Obligation
Bonds,
School
Building
Series
2015B,
4.000%,
2/01/45
2/26
at
100.00
1,000,895
Saint
Michael
Independent
School
District
885,
Wright
County,
Minnesota,
General
Obligation
Bonds,
School
Building
Series
2017A:
1,340
4.000%,
2/01/28
2/26
at
100.00
1,350,294
1,400
4.000%,
2/01/30
2/26
at
100.00
1,412,243
1,885
3.200%,
2/01/32
2/26
at
100.00
1,821,716
Sartell,
Minnesota,
General
Obligation
Bonds,
Series
2022A:
1,840
4.000%,
2/01/41
2/30
at
100.00
1,814,705
1,180
4.000%,
2/01/43
2/30
at
100.00
1,165,270
Shakopee
Independent
School
District
720,
Scott
County,
Minnesota,
General
Obligation
Bonds,
Capital
Facilities
Series
2020A:
250
4.000%,
2/01/33
2/27
at
100.00
253,761
425
4.000%,
2/01/34
2/27
at
100.00
431,547
2,500
Sibley
East
Independent
School
District
2310,
Sibley,
Minnesota,
General
Obligation
Bonds,
School
Building
Series
2015A,
4.000%,
2/01/40
2/25
at
100.00
2,500,190
South
Washington
County
Independent
School
District
833,
Minnesota,
General
Obligation
Bonds,
Facilities
Maintenance
Series
2018A:
1,330
4.000%,
2/01/31
2/27
at
100.00
1,337,066
670
4.000%,
2/01/33
2/27
at
100.00
672,112
South
Washington
County
Independent
School
District
833,
Minnesota,
General
Obligation
Bonds,
Facilities
Maintenance
Series
2022A:
1,000
4.000%,
2/01/34
2/30
at
100.00
1,011,842
2,030
4.000%,
2/01/35
2/30
at
100.00
2,053,464
1,000
South
Washington
County
Independent
School
District
833,
Minnesota,
General
Obligation
Bonds,
School
Building
Series
2016A,
4.000%,
2/01/29
2/26
at
100.00
1,004,037
825
Waconia
Independent
School
District,
Minnesota,
General
Obligation
Bonds,
School
Building
Series
2015B,
3.000%,
2/01/28
2/25
at
100.00
787,477
1,315
Waseca
Independent
School
District
829,
Steele,
Rice,
and
Waseca
Counties,
Minnesota,
General
Obligation
Bonds,
School
Buidling
Series
2015A,
4.000%,
2/01/27
2/26
at
100.00
1,324,980
Total
Tax
Obligation/General
129,027,329
Tax
Obligation/Limited
-
10.2%
750
Duluth
Independent
School
District
709,
Minnesota,
Certificates
of
Participation,
Refunding
Full
Term
Series
2019B,
5.000%,
2/01/25
No
Opt.
Call
756,362
325
Elbow
Lake
Economic
Development
Authority,
Minnesota,
Lease
Revenue
Bonds,
Grant
County
Public
Project,
Series
2017A,
4.200%,
12/15/43
12/27
at
100.00
290,942
Elbow
Lake
Economic
Development
Authority,
Minnesota,
Lease
Revenue
Bonds,
Grant
County
Public
Project,
Series
2023A:
1,000
4.875%,
12/15/42
12/32
at
100.00
996,819
500
5.000%,
12/15/44
12/32
at
100.00
500,391
Nuveen
Minnesota
Municipal
Bond
Fund
(continued)
Portfolio
of
Investments
May
31,
2024
Principal
Amount
(000)
Description
(a)
Optional
Call
Provisions
(b)
Value
Tax
Obligation/Limited
(continued)
$
1,000
Hennepin
County,
Minnesota,
Sales
Tax
Revenue
Bonds,
Ballpark
Project,
Refunding
First
Lien
Series
2017A,
5.000%,
12/15/30
12/26
at
100.00
$
1,031,576
Marshall,
Minnesota,
Education
Services
Facility,
Lease
Revenue
Bonds,
Southwest
West
Central
Service
Cooperatives,
Series
2024A:
675
5.125%,
2/01/41
2/32
at
100.00
672,494
725
5.375%,
2/01/45
2/32
at
100.00
724,688
425
Minneapolis,
Minnesota,
Tax
Increment
Revenue
Bonds,
Village
at
St.
Anthony
Falls
Project,
Refunding
Series
2015,
4.000%,
3/01/27
7/24
at
100.00
417,326
1,090
Minnesota
Housing
Finance
Agency,
Housing
Infrastructure
State
Appropriation
Bonds,
Series
2015C,
3.250%,
8/01/30
8/24
at
100.00
1,048,862
Minnesota
Housing
Finance
Agency,
Housing
Infrastructure
State
Appropriation
Bonds,
Series
2017A:
200
4.000%,
8/01/30
8/27
at
100.00
198,180
475
4.000%,
8/01/34
8/27
at
100.00
471,277
325
4.000%,
8/01/35
8/27
at
100.00
323,417
1,125
Minnesota
Housing
Finance
Agency,
Housing
Infrastructure
State
Appropriation
Bonds,
Series
2018D,
4.000%,
8/01/38
8/28
at
100.00
1,121,069
Minnesota
Housing
Finance
Agency,
Housing
Infrastructure
State
Appropriation
Bonds,
Series
2021B:
500
3.000%,
8/01/38
8/31
at
100.00
438,192
500
3.000%,
8/01/39
8/31
at
100.00
429,583
500
3.000%,
8/01/40
8/31
at
100.00
416,755
Minnesota
Housing
Finance
Agency,
Housing
Infrastructure
State
Appropriation
Bonds,
Series
2021C:
2,810
4.000%,
8/01/35
8/31
at
100.00
2,856,442
2,925
4.000%,
8/01/36
8/31
at
100.00
2,956,824
3,045
4.000%,
8/01/37
8/31
at
100.00
3,056,153
3,165
4.000%,
8/01/38
8/31
at
100.00
3,127,019
1,000
4.000%,
8/01/43
8/31
at
100.00
955,256
1,780
Minnesota
Housing
Finance
Agency,
Housing
Infrastructure
State
Appropriation
Bonds,
Series
2022A,
5.000%,
8/01/40
8/32
at
100.00
1,936,075
2,000
Minnesota
Housing
Finance
Agency,
Housing
Infrastructure
State
Appropriation
Bonds,
Series
2022C,
5.000%,
8/01/42
8/32
at
100.00
2,140,824
Minnesota
Housing
Finance
Agency,
Housing
Infrastructure
State
Appropriation
Bonds,
Series
2023A:
1,280
5.000%,
8/01/42
8/33
at
100.00
1,381,806
1,200
5.000%,
8/01/44
8/33
at
100.00
1,276,837
New
London
Economic
Development
Authority,
Minnesota,
Lease
Revenue
Bonds,
SWWC
Service
Cooperative
Lease
With
Option
to
Purchase
Project,
Public
Series
2023:
1,480
5.000%,
2/01/38
2/28
at
100.00
1,488,748
2,790
5.125%,
2/01/43
2/28
at
100.00
2,804,122
Northeast
Metropolitan
Intermediate
School
District
916,
White
Bear
Lake,
Minnesota,
Certificates
of
Particpation,
Series
2015A:
1,470
3.625%,
2/01/34
2/25
at
100.00
1,427,854
580
3.750%,
2/01/36
2/25
at
100.00
571,028
4,600
Northeast
Metropolitan
Intermediate
School
District
916,
White
Bear
Lake,
Minnesota,
Certificates
of
Particpation,
Series
2015B,
4.000%,
2/01/42
2/25
at
100.00
4,413,536
1,000
Plymouth
Intermediate
District
287,
Minnesota,
Certificates
of
Participation,
Refunding
Series
2017A,
4.000%,
2/01/36
2/27
at
100.00
1,004,573
Plymouth
Intermediate
District
287,
Minnesota,
Facilities
Maintence
Bonds,
Series
2017B:
175
4.000%,
5/01/29
5/27
at
100.00
176,942
200
4.000%,
5/01/32
5/27
at
100.00
202,447
100
4.000%,
5/01/33
5/27
at
100.00
101,247
Puerto
Rico
Sales
Tax
Financing
Corporation,
Sales
Tax
Revenue
Bonds,
Restructured
2018A-1:
4,500
4.500%,
7/01/34
7/25
at
100.00
4,509,709
6,077
5.000%,
7/01/58
7/28
at
100.00
6,078,971
1,155
Roseville
Independent
School
District
623,
Ramsey
County,
Minnesota,
Certificates
of
Participation,
Series
2021A,
5.000%,
4/01/29
No
Opt.
Call
1,192,794
Principal
Amount
(000)
Description
(a)
Optional
Call
Provisions
(b)
Value
Tax
Obligation/Limited
(continued)
Saint
Cloud
Independent
School
District
742,
Stearns
County,
Minnesota,
Certificates
of
Participation,
Saint
Cloud
Area
Public
Schools,
Series
2017A:
$
355
5.000%,
2/01/32
2/25
at
100.00
$
357,743
520
5.000%,
2/01/34
2/25
at
100.00
523,985
Saint
Paul
Housing
and
Redevelopment
Authority,
Minnesota,
Multifamily
Housing
Revenue
Bonds,
2700
University
at
Westgate
Station,
Series
2015B:
55
4.250%,
4/01/25
7/24
at
100.00
54,719
430
4.875%,
4/01/30
7/24
at
100.00
430,009
1,405
5.250%,
4/01/43
7/24
at
100.00
1,370,449
2,670
Saint
Paul
Independent
School
District
625,
Ramsey
County,
Minnesota,
Certificates
of
Participation,
Series
2018B,
3.375%,
2/01/35
2/27
at
100.00
2,556,030
Saint
Paul
Independent
School
District
625,
Ramsey
County,
Minnesota,
Certificates
of
Participation,
Series
2019B:
5
4.000%,
2/01/36
2/29
at
100.00
5,102
1,000
4.000%,
2/01/37
2/29
at
100.00
1,023,839
500
Saint
Paul
Independent
School
District
625,
Ramsey
County,
Minnesota,
Certificates
of
Participation,
Series
2024A,
5.000%,
2/01/43
2/34
at
100.00
545,962
Zumbro
Education
District
6012,
Minnesota,
Certificates
of
Participation
Series
2021A:
375
4.000%,
2/01/26
No
Opt.
Call
370,428
320
4.000%,
2/01/28
No
Opt.
Call
312,558
330
4.000%,
2/01/30
No
Opt.
Call
319,366
435
4.000%,
2/01/41
2/31
at
100.00
381,744
Total
Tax
Obligation/Limited
61,749,074
Transportation
-
7.7%
Minneapolis-St.
Paul
Metropolitan
Airports
Commission,
Minnesota,
Airport
Revenue
Bonds,
Refunding
Subordinate
Lien
Series
2019A:
1,000
5.000%,
1/01/33
7/29
at
100.00
1,065,101
1,560
5.000%,
1/01/49
7/29
at
100.00
1,611,035
Minneapolis-St.
Paul
Metropolitan
Airports
Commission,
Minnesota,
Airport
Revenue
Bonds,
Refunding
Subordinate
Lien
Series
2019B:
1,540
5.000%,
1/01/31,
(AMT)
7/29
at
100.00
1,616,811
1,500
5.000%,
1/01/32,
(AMT)
7/29
at
100.00
1,575,046
1,000
5.000%,
1/01/35,
(AMT)
7/29
at
100.00
1,048,777
1,235
5.000%,
1/01/39,
(AMT)
7/29
at
100.00
1,280,066
5,600
5.000%,
1/01/44,
(AMT)
7/29
at
100.00
5,737,943
7,370
5.000%,
1/01/49,
(AMT)
7/29
at
100.00
7,506,671
8,145
Minneapolis-St.
Paul
Metropolitan
Airports
Commission,
Minnesota,
Airport
Revenue
Bonds,
Senior
Lien
Series
2016C,
5.000%,
1/01/46
1/27
at
100.00
8,311,307
475
Minneapolis-St.
Paul
Metropolitan
Airports
Commission,
Minnesota,
Airport
Revenue
Bonds,
Subordinate
Lien
Series
2016D,
5.000%,
1/01/34,
(AMT)
1/27
at
100.00
483,503
2,000
Minneapolis-St.
Paul
Metropolitan
Airports
Commission,
Minnesota,
Airport
Revenue
Bonds,
Subordinate
Lien
Series
2022A,
5.000%,
1/01/52
1/32
at
100.00
2,099,432
Minneapolis-St.
Paul
Metropolitan
Airports
Commission,
Minnesota,
Airport
Revenue
Bonds,
Subordinate
Lien
Series
2022B:
2,510
5.000%,
1/01/40,
(AMT)
1/32
at
100.00
2,629,958
11,300
5.000%,
1/01/47,
(AMT)
1/32
at
100.00
11,640,526
Total
Transportation
46,606,176
U.S.
Guaranteed
-
0.5%
(d)
1,600
St.
Paul
Housing
and
Redevelopment
Authority,
Minnesota,
Hospital
Revenue
Bonds,
HealthEast
Inc.,
Series
2015A,
5.000%,
11/15/40,
(Pre-
refunded
11/15/25)
11/25
at
100.00
1,628,460
1,530
Worthington
Independent
School
District
518,
Nobles
County,
Minnesota,
Certificates
of
Participation,
Series
2017A,
4.000%,
2/01/42,
(Pre-refunded
2/01/26)
2/26
at
100.00
1,540,735
Total
U.S.
Guaranteed
3,169,195
Nuveen
Minnesota
Municipal
Bond
Fund
(continued)
Portfolio
of
Investments
May
31,
2024
Principal
Amount
(000)
Description
(a)
Optional
Call
Provisions
(b)
Value
Utilities
-
8.8%
$
1,240
Guam
Government
Waterworks
Authority,
Water
and
Wastewater
System
Revenue
Bonds,
Series
2016,
5.000%,
1/01/46
7/26
at
100.00
$
1,254,940
135
Guam
Government
Waterworks
Authority,
Water
and
Wastewater
System
Revenue
Bonds,
Series
2020A,
5.000%,
1/01/50
7/30
at
100.00
137,472
3,610
Minnesota
Municipal
Gas
Agency,
Commodity
Supply
Revenue
Bonds,
Series
2022A,
4.000%,
12/01/52,
(Mandatory
Put
12/01/27)
9/27
at
100.37
3,616,310
Minnesota
Municipal
Power
Agency,
Electric
Revenue
Bonds,
Refunding
Series
2014A:
1,000
4.000%,
10/01/31
10/24
at
100.00
999,933
1,000
4.000%,
10/01/32
10/24
at
100.00
996,545
4,650
Minnesota
Municipal
Power
Agency,
Electric
Revenue
Bonds,
Series
2016,
5.000%,
10/01/47
10/26
at
100.00
4,671,718
5,555
Rochester,
Minnesota,
Electric
Utility
Revenue
Bonds,
Refunding
Series
2017A,
5.000%,
12/01/47
12/26
at
100.00
5,589,720
Saint
Paul
Housing
and
Redevelopment
Authority,
Minnesota,
District
Energy
Revenue
Bonds,
Refunding
Series
2017A:
390
4.000%,
10/01/28
10/27
at
100.00
393,098
1,610
4.000%,
10/01/33
10/27
at
100.00
1,614,213
Saint
Paul
Housing
and
Redevelopment
Authority,
Minnesota,
District
Energy
Revenue
Bonds,
Refunding
Series
2017B:
355
4.000%,
10/01/28
10/27
at
100.00
357,820
270
4.000%,
10/01/29
10/27
at
100.00
273,146
2,500
Saint
Paul
Port
Authority,
Minnesota,
District
Energy
Revenue
Bonds,
Series
2017-3,
4.000%,
10/01/42
10/27
at
100.00
2,276,433
1,180
Saint
Paul
Port
Authority,
Minnesota,
District
Energy
Revenue
Bonds,
Series
2017-4,
4.000%,
10/01/40,
(AMT)
10/27
at
100.00
1,035,413
300
Saint
Paul
Port
Authority,
Minnesota,
District
Energy
Revenue
Bonds,
Series
2021-1.
501
C3,
3.000%,
10/01/34
10/27
at
100.00
261,736
1,100
Saint
Paul
Port
Authority,
Minnesota,
District
Energy
Revenue
Bonds,
Series
2021-2,
4.000%,
10/01/40,
(AMT)
10/27
at
100.00
965,215
1,250
Saint
Paul
Port
Authority,
Minnesota,
District
Energy
Revenue
Bonds,
Series
2023-3,
5.250%,
10/01/42,
(AMT)
10/33
at
100.00
1,257,444
4,905
Saint
Paul,
Minnesota,
Water
Revenue
Bonds,
Series
2023A,
4.000%,
12/01/47
12/32
at
100.00
4,775,877
Southern
Minnesota
Municipal
Power
Agency,
Power
Supply
System
Revenue
Bonds,
Series
1994A:
4,770
0.000%,
1/01/25
-
NPFG
Insured
No
Opt.
Call
4,649,006
6,230
0.000%,
1/01/26
-
NPFG
Insured
No
Opt.
Call
5,820,600
Thief
River
Falls,
Minnesota,
Electric
Revenue
Bonds,
Series
2018A:
230
4.000%,
2/01/35
-
AGM
Insured
2/26
at
100.00
232,944
260
4.000%,
2/01/38
-
AGM
Insured
2/26
at
100.00
260,919
11,265
Western
Minnesota
Municipal
Power
Agency,
Minnesota,
Power
Supply
Revenue
Bonds,
Series
2018A,
5.000%,
1/01/49
7/28
at
100.00
11,512,548
Total
Utilities
52,953,050
Total
Municipal
Bonds
(cost
$586,631,694)
569,593,975
Total
Long-Term
Investments
(cost
$586,631,694)
569,593,975
Principal
Amount
(000)
Description
(a)
Optional
Call
Provisions
(b)
Value
SHORT-TERM
INVESTMENTS
-
3.5%
X
21,190,000
MUNICIPAL
BONDS
-
3.5%
X
21,190,000
Education
and
Civic
Organizations
-
0.9%
$
4,900
(e)
Minneapolis,
Minnesota,
Revenue
Bonds,
University
Gateway
Project,
Refunding
Series
2009,
3.300%,
12/01/40
6/24
at
100.00
$
4,900,000
775
(e)
Minneapolis,
Minnesota,
Revenue
Bonds,
University
Gateway
Project,
Variable
Rate
Demand
Obligation
Series
2002,
3.350%,
6/01/32
6/24
at
100.00
775,000
Total
Education
and
Civic
Organizations
5,675,000
Principal
Amount
(000)
Description
(a)
Optional
Call
Provisions
(b)
Value
Health
Care
-
2.2%
Minneapolis,
Minnesota,
Health
Care
System
Revenue
Bonds,
Fairview
Health
Services,
Series
2018A:
$
11,310
(e)
3.900%,
11/15/48
6/24
at
100.00
$
11,310,000
2,000
(e)
Rochester,
Minnesota,
Health
Care
Facilities
Revenue
Bonds,
Mayo
Clinic
Series
2008A,
3.160%,
11/15/38
6/24
at
100.00
2,000,000
Total
Health
Care
13,310,000
Tax
Obligation/General
-
0.4%
2,205
(e)
Hennepin
County,
Minnesota,
General
Obligation
Bonds,
Variable
Rate
Series
2018B,
3.300%,
12/01/38
6/24
at
100.00
2,205,000
Total
Tax
Obligation/General
2,205,000
Total
Municipal
Bonds
(cost
$21,190,000)
21,190,000
Total
Short-Term
Investments
(cost
$21,190,000)
21,190,000
Total
Investments
(cost
$607,821,694)
-
97.8%
590,783,975
Other
Assets
&
Liabilities,
Net
-
2.2%
13,009,176
Net
Assets
-
100%
$
603,793,151
(a)
All
percentages
shown
in
the
Portfolio
of
Investments
are
based
on
net
assets.
(b)
Optional
Call
Provisions:
Dates
(month
and
year)
and
prices
of
the
earliest
optional
call
or
redemption.
There
may
be
other
call
provisions
at
varying
prices
at
later
dates.
Certain
mortgage-backed
securities
may
be
subject
to
periodic
principal
paydowns.
Optional
Call
Provisions
are
not
covered
by
the
report
of
independent
registered
public
accounting
firm.
(c)
Security
is
exempt
from
registration
under
Rule
144A
of
the
Securities
Act
of
1933,
as
amended.
These
securities
are
deemed
liquid
and
may
be
resold
in
transactions
exempt
from
registration,
which
are
normally
those
transactions
with
qualified
institutional
buyers.
As
of
the
end
of
the
reporting
period,
the
aggregate
value
of
these
securities
is
$10,857,159
or
1.8%
of
Total
Investments.
(d)
Backed
by
an
escrow
or
trust
containing
sufficient
U.S.
Government
or
U.S.
Government
agency
securities,
which
ensure
the
timely
payment
of
principal
and
interest.
(e)
Investment
has
a
maturity
of
greater
than
one
year,
but
has
variable
rate
and/or
demand
features
which
qualify
it
as
a
short-term
investment.
The
rate
disclosed,
as
well
as
the
reference
rate
and
spread,
where
applicable,
is
that
in
effect
as
of
the
end
of
the
reporting
period.
This
rate
changes
periodically
based
on
market
conditions
or
a
specified
market
index.
AMT
Alternative
Minimum
Tax
See
Notes
to
Financial
Statements.
Nuveen
Nebraska
Municipal
Bond
Fund
Portfolio
of
Investments
May
31,
2024
Principal
Amount
(000)
Description
(a)
Optional
Call
Provisions
(b)
Value
LONG-TERM
INVESTMENTS
-
99.8%
X
73,443,040
MUNICIPAL
BONDS
-
99.8%
X
73,443,040
Education
and
Civic
Organizations
-
10.9%
$
1,500
Douglas
County,
Nebraska,
Educational
Facilities
Revenue
Bonds,
Creighton
University
Projects,
Refunding
Series
2017,
5.000%,
7/01/47
7/27
at
100.00
$
1,517,924
1,195
Nebraska
State
Colleges
Facilities
Corporation,
Nebraska,
Revenue
Bonds,
Facilities
Program
Series
2022B,
5.000%,
7/15/37
-
AGM
Insured
7/32
at
100.00
1,284,640
1,000
Nebraska
State
Colleges,
Student
Fees
and
Facilities
Revenue
Bonds,
Board
of
Trustees,
Wayne
State
College
Series
2023,
5.000%,
7/01/48
-
AGM
Insured
7/33
at
100.00
1,052,218
Saline
County,
Nebraska,
Educational
Facilities
Revenue
Bonds,
Doane
College
Project,
Refunding
Series
2020A:
360
3.000%,
2/15/34
2/29
at
100.00
322,257
445
3.000%,
2/15/35
2/29
at
100.00
394,655
500
Southeast
Community
College
Area,
Nebraska,
Facilities
Revenue
Bonds,
Series
2020,
3.000%,
3/15/45
-
AGM
Insured
7/25
at
100.00
357,751
1,000
University
of
Nebraska
Facilities
Corporation,
Nebraska,
Facilities
Bonds,
Refunding
Series
2017B,
4.000%,
5/15/37
11/27
at
100.00
1,001,629
2,000
University
of
Nebraska
Facilities
Corporation,
Nebraska,
Facilities
Program
Bonds,
Green
Series
2021B,
5.000%,
7/15/51
7/31
at
100.00
2,102,794
Total
Education
and
Civic
Organizations
8,033,868
Health
Care
-
9.3%
Douglas
County
Hospital
Authority
2,
Nebraska,
Health
Facilities
Revenue
Bonds,
Children's
Hospital
Obligated
Group,
Refunding
Series
2020A:
575
4.000%,
11/15/40
11/30
at
100.00
556,121
300
4.000%,
11/15/41
11/30
at
100.00
287,937
Douglas
County
Hospital
Authority
2,
Nebraska,
Health
Facilities
Revenue
Bonds,
Children's
Hospital
Obligated
Group,
Series
2017:
180
5.000%,
11/15/37
5/27
at
100.00
185,051
500
5.000%,
11/15/47
5/27
at
100.00
503,245
775
Douglas
County
Hospital
Authority
2,
Nebraska,
Hospital
Revenue
Bonds,
Madonna
Rehabilitation
Hospital
Project,
Series
2014,
5.000%,
5/15/44
7/24
at
100.00
766,126
Douglas
County
Hospital
Authority
3,
Nebraska,
Health
Facilities
Revenue
Bonds,
Nebraska
Methodist
Health
System,
Refunding
Series
2015:
500
4.125%,
11/01/36
11/25
at
100.00
500,431
2,000
5.000%,
11/01/45
11/25
at
100.00
2,012,446
250
Madison
County
Hospital
Authority
1,
Nebraska,
Hospital
Revenue
Bonds,
Faith
Regional
Health
Services
Project,
Refunding
Series
2017A,
5.000%,
7/01/30
7/27
at
100.00
254,390
Madison
County
Hospital
Authority
1,
Nebraska,
Hospital
Revenue
Bonds,
Faith
Regional
Health
Services
Project,
Series
2018:
500
5.000%,
7/01/34
7/25
at
100.00
502,326
435
5.000%,
7/01/35
7/25
at
100.00
436,864
875
Scotts
Bluff
County
Hospital
Authority
1,
Nebraska,
Hospital
Revenue
Bonds,
Regional
West
Medical
Center
Project,
Refunding
&
Improvement
Series
2016A,
5.250%,
2/01/37
2/27
at
100.00
826,362
Total
Health
Care
6,831,299
Housing/Single
Family
-
1.0%
660
Nebraska
Investment
Finance
Authority,
Single
Family
Housing
Revenue
Bonds,
Refunding
Series
2016A,
3.500%,
9/01/36
3/25
at
100.00
593,963
Nebraska
Investment
Finance
Authority,
Single
Family
Housing
Revenue
Bonds,
Series
2021A:
100
1.850%,
9/01/35
3/30
at
100.00
73,879
45
1.950%,
9/01/37
3/30
at
100.00
32,242
Total
Housing/Single
Family
700,084
Principal
Amount
(000)
Description
(a)
Optional
Call
Provisions
(b)
Value
Long-Term
Care
-
4.4%
$
3,700
Nebraska
Educational,
Health,
Cultural
and
Social
Services
Finance
Authority,
Revenue
Bonds,
Immanuel
Retirement
Communities
Obligated
Group,
Series
2019A,
4.000%,
1/01/49
1/26
at
102.00
$
3,213,466
Total
Long-Term
Care
3,213,466
Tax
Obligation/General
-
39.1%
60
Adams
County
School
District
18,
Nebraska,
General
Obligation
Bonds,
Hastings
Public
Schools,
Series
2019,
4.000%,
12/15/38
5/29
at
100.00
58,931
500
Adams
County,
Nebraska,
General
Obligation
Bonds,
Series
2023A,
5.000%,
12/15/42
1/28
at
100.00
513,998
500
Buffalo
County
School
District
007
Kearney
Public
Schools,
Nebraska,
General
Obligation
Bonds,
School
Building
Series
2016,
3.000%,
12/15/36
4/26
at
100.00
438,931
750
City
of
Omaha,
Nebraska,
Special
Tax
Revenue
Redevelopment
and
Refunding
Bonds,
Series
2024A,
5.000%,
4/15/44
4/34
at
100.00
822,031
1,000
Custer
County
School
District
025
Broken
Bow
Public
Schools,
Nebraska,
General
Obligation
Bonds,
School
Building
Series
2024,
5.000%,
12/15/41
-
BAM
Insured
3/29
at
100.00
1,040,304
750
Dodge
County
School
District
1
Fremont,
Nebraska,
General
Obligation
Bonds,
Series
2023,
5.000%,
12/15/48
-
AGM
Insured
12/33
at
100.00
794,439
1,090
Douglas
County
School
District
059,
Nebraska,
General
Obligation
Bonds,
Bennington
Public
Schools,
School
Building
Series
2019,
4.000%,
6/15/33
7/24
at
100.00
1,082,931
1,000
Douglas
County
School
District
059,
Nebraska,
General
Obligation
Bonds,
Bennington
Public
Schools,
Series
2016,
3.375%,
12/15/41
12/25
at
100.00
843,580
500
Douglas
County
School
District
059,
Nebraska,
General
Obligation
Bonds,
School
Building
Series
2020B,
3.000%,
12/15/45
8/25
at
100.00
372,164
1,500
Douglas
County
School
District
1,
Nebraska,
General
Obligation
Bonds,
Omaha
Public
Schools
Series
2020,
3.000%,
12/15/43
1/30
at
100.00
1,195,579
1,000
Douglas
County
School
District
10
Elkhorn,
Nebraska,
General
Obligation
Bonds,
Series
2018,
4.000%,
12/15/38
12/28
at
100.00
977,914
750
Douglas
County
School
District
10
Elkhorn,
Nebraska,
General
Obligation
Bonds,
Series
2019,
4.000%,
12/15/39
12/29
at
100.00
745,401
1,000
Douglas
County
School
District
10
Elkhorn,
Nebraska,
General
Obligation
Bonds,
Series
2024,
4.000%,
12/15/45
-
AGM
Insured
,
(WI/DD)
12/34
at
100.00
953,986
Douglas
County
School
District
54,
Ralston,
Nebraska,
General
Obligation
Bonds,
Series
2023:
405
5.000%,
12/15/43
12/32
at
100.00
434,984
1,500
5.000%,
12/15/48
12/32
at
100.00
1,589,951
635
Douglas
County
School
District
66,
Westside,
Nebraska,
General
Obligation
Bonds,
Series
2023,
5.000%,
12/01/41
12/31
at
100.00
683,538
1,000
Kearney
County,
Nebraska,
General
Obligation
Bonds,
Recreational
Facilities
Series
2022,
4.000%,
5/15/42
5/27
at
100.00
959,673
1,000
La
Vista,
Nebraska,
General
Obligation
Bonds,
Highway
Allocation
Pledge
Series
2023,
5.000%,
9/15/43
3/28
at
100.00
1,020,935
1,000
La
Vista,
Sarpy
County,
Nebraska,
Tax
Supported
Bonds,
Taxable
Refunding
Series
2022,
5.000%,
9/15/42
-
AGM
Insured
6/27
at
100.00
1,020,649
1,000
Lancaster
County
School
District
1,
Lincoln,
Nebraska,
General
Obligation
Bonds,
Series
2020,
3.000%,
1/15/43
7/30
at
100.00
790,203
500
Omaha,
Nebraska,
General
Obligation
Bonds,
Refunding
&
Various
Purpose
Series
2017A,
4.000%,
4/15/33
4/27
at
100.00
500,603
500
Omaha,
Nebraska,
General
Obligation
Bonds,
Refunding
&
Various
Purpose
Series
2018A,
4.000%,
1/15/37
1/27
at
100.00
502,673
500
Omaha,
Nebraska,
General
Obligation
Bonds,
Refunding
&
Various
Purpose
Series
2019,
4.000%,
4/15/37
4/29
at
100.00
504,370
1,000
Omaha,
Nebraska,
General
Obligation
Bonds,
Various
Purpose
Series
2022,
5.000%,
4/15/41
4/32
at
100.00
1,089,867
500
Omaha,
Nebraska,
Special
Tax
Redevelopment
Bonds,
Series
2018A,
5.000%,
1/15/33
1/27
at
100.00
523,033
1,000
Omaha,
Nebraska,
Special
Tax
Redevelopment
Bonds,
Series
2019A,
4.000%,
1/15/40
1/29
at
100.00
989,530
1,000
Otoe
County
School
District
0501
Palmyra
District
OR-1,
Nebraska,
General
Obligation
Bonds,
School
Building
Series
2022,
5.000%,
12/15/42
11/27
at
100.00
1,014,710
Nuveen
Nebraska
Municipal
Bond
Fund
(continued)
Portfolio
of
Investments
May
31,
2024
Principal
Amount
(000)
Description
(a)
Optional
Call
Provisions
(b)
Value
Tax
Obligation/General
(continued)
$
795
Papillion-LaVista
School
District
27,
Sarpy
County,
Nebraska,
General
Obligation
Bonds,
Refunding
Series
2020B,
3.000%,
12/01/40
12/30
at
100.00
$
652,524
1,000
Papillion-LaVista
School
District
27,
Sarpy
County,
Nebraska,
General
Obligation
Bonds,
Series
2023,
4.250%,
12/01/43
12/33
at
100.00
1,004,158
750
Sarpy
County
School
District
037
Gretna
Public
Schools,
Nebraska,
General
Obligation
Bonds,
Refunding
Series
2019C,
4.000%,
6/15/43
6/29
at
100.00
733,137
Sarpy
County
School
District
037
Gretna
Public
Schools,
Nebraska,
General
Obligation
Bonds,
Series
2019:
1,000
5.000%,
6/15/40
6/29
at
100.00
1,050,422
1,000
5.000%,
6/15/41
6/29
at
100.00
1,047,908
Southeast
Community
College
Area,
Nebraska,
Certificates
of
Participation,
Series
2018:
215
5.000%,
12/15/30
6/28
at
100.00
227,620
1,000
5.000%,
12/15/47
6/28
at
100.00
1,045,658
1,000
Wayne
County
School
District
17,
Nebraska,
General
Obligation
Bonds,
Wayne
Community
Schools,
School
Building
Series
2023,
4.250%,
12/15/48
7/28
at
100.00
981,556
530
Wayne
County
School
District
17,
Nebraska,
General
Obligation
Bonds,
Wayne
Community
Schools,
School
Building
Series
2024,
5.000%,
12/15/43
3/29
at
100.00
551,132
Total
Tax
Obligation/General
28,759,023
Tax
Obligation/Limited
-
7.7%
500
Blair,
Nebraska,
Highway
Allocation
Fund
Pledge
Bonds,
Series
2023,
4.000%,
6/15/43
7/28
at
100.00
480,490
500
Columbus,
Nebraska,
Sales
Tax
Revenue
Bonds,
Police
&
Fire
Project,
Series
2018,
4.000%,
9/15/27
7/24
at
100.00
500,161
1,250
Douglas
County
Nebraska,
Sanitary
and
Improvement,
District
Number
608,
General
Obligation
Bonds,
North
Streams,
Series
2022,
6.000%,
12/15/47
6/27
at
100.00
1,131,583
1,060
Matching
Fund
Special
Purpose
Securitization
Corporation,
Virgin
Islands,
Revenue
Bonds,
Series
2022A,
5.000%,
10/01/28
No
Opt.
Call
1,105,342
500
Omaha
Public
Facilities
Corporation,
Nebraska,
Lease
Revenue
Bonds,
Omaha
Baseball
Stadium
Project,
Refunding
Series
2016A,
4.000%,
6/01/36
6/26
at
100.00
503,543
1,200
Puerto
Rico
Sales
Tax
Financing
Corporation,
Sales
Tax
Revenue
Bonds,
Restructured
2018A-1,
5.000%,
7/01/58
7/28
at
100.00
1,200,389
750
Puerto
Rico
Sales
Tax
Financing
Corporation,
Sales
Tax
Revenue
Bonds,
Taxable
Restructured
Cofina
Project
Series
2019A-2,
4.784%,
7/01/58
7/28
at
100.00
743,366
Total
Tax
Obligation/Limited
5,664,874
Transportation
-
3.1%
825
Lincoln,
Nebraska,
Airport
Revenue
Bonds,
Series
2015A,
4.000%,
7/01/45
7/25
at
100.00
777,203
1,000
Lincoln,
Nebraska,
Airport
Revenue
Bonds,
Series
2021,
4.000%,
7/01/36,
(AMT)
7/31
at
100.00
981,515
Omaha
Airport
Authority,
Nebraska,
Airport
Facilities
Revenue
Bonds,
Series
2017A:
550
5.000%,
12/15/36,
(AMT)
12/26
at
100.00
559,821
Total
Transportation
2,318,539
U.S.
Guaranteed
-
3.8%
(c)
750
Douglas
County
School
District
10
Elkhorn,
Nebraska,
General
Obligation
Bonds,
Series
2016,
4.000%,
12/15/36,
(Pre-refunded
12/15/25)
12/25
at
100.00
756,426
Omaha
Airport
Authority,
Nebraska,
Airport
Facilities
Revenue
Bonds,
Series
2017A:
450
5.000%,
12/15/34,
(Pre-refunded
12/15/26),
(AMT)
12/26
at
100.00
463,569
450
5.000%,
12/15/36,
(Pre-refunded
12/15/26),
(AMT)
12/26
at
100.00
463,569
Sarpy
County
School
District
1,
Bellevue
Public
School,
Nebraska,
General
Obligation
Bonds,
School
Building
Series
2017:
550
5.000%,
12/15/29,
(Pre-refunded
12/15/27)
12/27
at
100.00
579,533
520
5.000%,
12/15/35,
(Pre-refunded
12/15/27)
12/27
at
100.00
547,922
Total
U.S.
Guaranteed
2,811,019
Principal
Amount
(000)
Description
(a)
Optional
Call
Provisions
(b)
Value
Utilities
-
20.5%
$
465
Central
Plains
Energy
Project,
Nebraska,
Gas
Project
3
Revenue
Bonds,
Refunding
Crossover
Series
2017A,
5.000%,
9/01/37
No
Opt.
Call
$
486,385
1,000
Central
Plains
Energy
Project,
Nebraska,
Gas
Project
4
Revenue
Bonds,
Refunding
Series
2023A-1,
5.000%,
5/01/54,
(Mandatory
Put
11/01/29)
8/29
at
100.13
1,042,428
450
Douglas
County
Sanitary
&
Improvement
District
607
North
Streams,
Nebraska,
General
Obligation
Bonds,
Series,
5.000%,
9/15/44
3/29
at
100.00
432,973
1,930
Guam
Government
Waterworks
Authority,
Water
and
Wastewater
System
Revenue
Bonds,
Refunding
Series
2017,
5.000%,
7/01/40
7/27
at
100.00
1,976,598
870
Lincoln,
Nebraska,
Electric
System
Revenue
Bonds,
Series
2018,
5.000%,
9/01/34
3/27
at
100.00
903,135
500
Metropolitan
Utilities
District
Omaha,
Nebraska,
Water
Revenue
Bonds,
Series
2015,
3.250%,
12/01/32
12/25
at
100.00
466,010
1,500
Nebraska
Public
Power
District,
General
Revenue
Bonds,
Series
2016A,
5.000%,
1/01/41
1/26
at
100.00
1,511,073
1,200
Nebraska
Public
Power
District,
General
Revenue
Bonds,
Series
2023A,
5.000%,
7/01/28
1/28
at
100.00
1,264,297
500
Omaha
Public
Power
District,
Nebraska,
Electric
System
Revenue
Bonds,
Refunding
Series
2015C,
4.000%,
2/01/38
2/25
at
100.00
494,479
1,000
Omaha
Public
Power
District,
Nebraska,
Electric
System
Revenue
Bonds,
Series
2017A,
5.000%,
2/01/42
12/27
at
100.00
1,037,252
1,000
Omaha
Public
Power
District,
Nebraska,
Electric
System
Revenue
Bonds,
Series
2018A,
5.000%,
2/01/39
2/28
at
100.00
1,044,592
Omaha
Public
Power
District,
Nebraska,
Electric
System
Revenue
Bonds,
Series
2022B:
750
5.000%,
2/01/47
2/32
at
100.00
798,425
790
5.250%,
2/01/52
2/32
at
100.00
850,436
320
Omaha
Public
Power
District,
Nebraska,
Separate
Electric
System
Revenue
Bonds,
Nebraska
City
2,
Refunding
Series
2015A,
3.500%,
2/01/42
2/25
at
100.00
277,150
1,000
Public
Power
Generation
Agency,
Nebraska,
Whelan
Energy
Center
Unit
2
Revenue
Bonds,
Refunding
Series
2015A,
5.000%,
1/01/31
1/25
at
100.00
1,006,151
1,500
Public
Power
Generation
Agency,
Nebraska,
Whelan
Energy
Center
Unit
2
Revenue
Bonds,
Refunding
Series
2016A,
5.000%,
1/01/40
7/26
at
100.00
1,519,484
Total
Utilities
15,110,868
Total
Municipal
Bonds
(cost
$76,067,219)
73,443,040
Total
Long-Term
Investments
(cost
$76,067,219)
73,443,040
Other
Assets
&
Liabilities,
Net
-
0.2%
169,128
Net
Assets
-
100%
$
73,612,168
(a)
All
percentages
shown
in
the
Portfolio
of
Investments
are
based
on
net
assets.
(b)
Optional
Call
Provisions:
Dates
(month
and
year)
and
prices
of
the
earliest
optional
call
or
redemption.
There
may
be
other
call
provisions
at
varying
prices
at
later
dates.
Certain
mortgage-backed
securities
may
be
subject
to
periodic
principal
paydowns.
Optional
Call
Provisions
are
not
covered
by
the
report
of
independent
registered
public
accounting
firm.
(c)
Backed
by
an
escrow
or
trust
containing
sufficient
U.S.
Government
or
U.S.
Government
agency
securities,
which
ensure
the
timely
payment
of
principal
and
interest.
AMT
Alternative
Minimum
Tax
WI/DD
When-issued
or
delayed
delivery
security.
See
Notes
to
Financial
Statements.
Nuveen
Oregon
Intermediate
Municipal
Bond
Fund
Portfolio
of
Investments
May
31,
2024
Principal
Amount
(000)
Description
(a)
Optional
Call
Provisions
(b)
Value
LONG-TERM
INVESTMENTS
-
96.8%
X
176,231,555
MUNICIPAL
BONDS
-
96.8%
X
176,231,555
Education
and
Civic
Organizations
-
3.9%
$
1,095
Forest
Grove,
Oregon,
Campus
Improvement
Revenue
Bonds,
Pacific
University
Project,
Refunding
Series
2015A,
5.000%,
5/01/30
5/25
at
100.00
$
1,100,510
505
Forest
Grove,
Oregon,
Student
Housing
Revenue
Bonds,
Oak
Tree
Foundation,
Inc.
Project,
Series
2017,
5.000%,
3/01/25
No
Opt.
Call
505,871
95
(c)
Oregon
Facilities
Authority,
Revenue
Bonds,
Howard
Street
Charter
School
Project,
Series
2019A,
5.000%,
6/15/29
6/27
at
102.00
94,664
920
(c)
Oregon
Facilities
Authority,
Revenue
Bonds,
Metro
East
Web
Academy
Project,
Series
2019A,
5.000%,
6/15/34
6/27
at
102.00
915,681
100
(c)
Oregon
Facilities
Authority,
Revenue
Bonds,
Redmond
Proficiency
Academy
Project,
Series
2015A,
5.500%,
6/15/35
6/25
at
100.00
100,465
600
Oregon
Facilities
Authority,
Revenue
Bonds,
Redmond
Proficiency
Academy
Project,
Series
2016A,
5.000%,
6/15/33
6/25
at
100.00
598,694
Oregon
Facilities
Authority,
Revenue
Bonds,
University
of
Portland
Projects,
Series
2015A:
450
5.000%,
4/01/29
4/25
at
100.00
455,001
800
5.000%,
4/01/30
4/25
at
100.00
809,232
490
(c)
Oregon
State
Facilities
Authority,
Oregon,
Charter
School
Revenue
Bonds,
Academy
for
Character
Education,
Series
2022A,
6.750%,
6/15/42
6/32
at
100.00
500,318
1,000
Yamhill
County,
Oregon,
Revenue
Bonds,
George
Fox
University
Project,
Refunding
Series
2021,
4.000%,
12/01/36
12/31
at
100.00
992,659
1,000
Yamhill
County,
Oregon,
Revenue
Bonds,
Linfield
University
Project,
Refunding
Series
2020A,
5.000%,
10/01/35
10/30
at
100.00
1,018,734
Total
Education
and
Civic
Organizations
7,091,829
Health
Care
-
13.5%
Astoria
Hospital
Facilities
Authority,
Oregon,
Hospital
Revenue
Bonds,
Columbia
Memorial
Hospital
Project,
Series
2024:
455
5.250%,
8/01/39
,
(WI/DD)
2/34
at
100.00
496,962
1,000
5.250%,
8/01/40
,
(WI/DD)
2/34
at
100.00
1,082,997
Deschutes
County
Hospital
Facility
Authority,
Oregon,
Hospital
Revenue
Bonds,
Saint
Charles
Health
System,
Inc.,
Series
2016A:
375
4.000%,
1/01/33
1/26
at
100.00
369,770
1,000
5.000%,
1/01/33
1/26
at
100.00
1,012,465
715
Deschutes
County
Hospital
Facility
Authority,
Oregon,
Hospital
Revenue
Bonds,
Saint
Charles
Health
System,
Inc.,
Series
2020A,
4.000%,
1/01/34
1/31
at
100.00
711,294
1,000
Oregon
Facilities
Authority,
Revenue
Bonds,
Legacy
Health
Project,
Series
2016A,
5.000%,
6/01/30
6/26
at
100.00
1,017,728
Oregon
Facilities
Authority,
Revenue
Bonds,
Peacehealth
System,
Refunding
Series
2014A:
690
5.000%,
11/15/25
6/24
at
100.00
690,305
4,155
4.125%,
11/15/32
6/24
at
100.00
4,154,862
600
Oregon
Facilities
Authority,
Revenue
Bonds,
Samaritan
Health
Services
Project,
Refunding
Series
2020A,
5.000%,
10/01/30
No
Opt.
Call
621,344
Oregon
Facilities
Authority,
Revenue
Bonds,
Samaritan
Health
Services,
Refunding
Series
2016A:
485
5.000%,
10/01/29
10/26
at
100.00
491,530
1,325
5.000%,
10/01/30
10/26
at
100.00
1,343,213
4,105
Oregon
Health
and
Science
University,
Revenue
Bonds,
Green
Series
2021B-1,
5.000%,
7/01/46,
(Mandatory
Put
2/01/30)
11/29
at
100.00
4,342,927
1,000
Oregon
Health
and
Science
University,
Revenue
Bonds,
Series
2019A,
5.000%,
7/01/29
No
Opt.
Call
1,066,347
Salem
Hospital
Facility
Authority,
Oregon,
Revenue
Bonds,
Salem
Health
Projects,
Refunding
Series
2016A:
560
5.000%,
5/15/30
5/26
at
100.00
571,413
1,000
5.000%,
5/15/31
5/26
at
100.00
1,020,062
1,200
5.000%,
5/15/46
5/26
at
100.00
1,209,615
Principal
Amount
(000)
Description
(a)
Optional
Call
Provisions
(b)
Value
Health
Care
(continued)
$
2,235
Salem
Hospital
Facility
Authority,
Oregon,
Revenue
Bonds,
Salem
Health
Projects,
Series
2019A,
5.000%,
5/15/32
5/29
at
100.00
$
2,367,999
Union
County
Oregon,
Hospital
Facility
Authority
Revenue
Bonds,
Grande
Ronde
Hospital
Incorporated,
Series
2022:
1,230
5.000%,
7/01/33
7/32
at
100.00
1,263,963
695
5.000%,
7/01/34
7/32
at
100.00
714,060
Total
Health
Care
24,548,856
Housing/Multifamily
-
0.2%
340
Home
Forward,
Oregon,
Multifamily
Housing
Revenue
Bonds,
Lovejoy
Station
Apartments,
Refunding
Series
2016,
4.000%,
7/15/29
7/26
at
100.00
341,207
Total
Housing/Multifamily
341,207
Housing/Single
Family
-
0.7%
Oregon
Housing
and
Community
Services
Department,
Single
Family
Mortgage
Program
Revenue
Bonds,
Series
2021A:
935
1.900%,
1/01/33
7/30
at
100.00
742,475
825
1.950%,
7/01/33
7/30
at
100.00
652,108
Total
Housing/Single
Family
1,394,583
Information
Technology
-
1.1%
2,000
Oregon
State Business
Development
Commission,
Recovery
Zone
Facility
Revenue
Bonds,
Intel
Corporation
Project,
232
Series
2010,
3.800%,
12/01/40,
(Mandatory
Put
6/15/28)
2/28
at
100.00
1,985,458
Total
Information
Technology
1,985,458
Long-Term
Care
-
5.9%
Clackamas
County
Hospital
Facility
Authority,
Oregon,
Revenue
Bonds,
Rose
Villa
Inc.,
Series
2020A:
285
5.000%,
11/15/27
11/25
at
102.00
288,592
300
5.000%,
11/15/28
11/25
at
102.00
303,304
315
5.000%,
11/15/29
11/25
at
102.00
317,969
330
5.000%,
11/15/30
11/25
at
102.00
332,588
Clackamas
County
Hospital
Facility
Authority,
Oregon,
Senior
Living
Revenue
Bonds,
Willamette
View
Project,
Series
2017A:
445
4.000%,
11/15/24
No
Opt.
Call
444,138
355
4.000%,
5/15/25
No
Opt.
Call
353,425
460
4.000%,
11/15/25
No
Opt.
Call
456,924
200
4.000%,
5/15/26
11/25
at
102.00
198,039
400
4.000%,
11/15/26
11/25
at
102.00
395,128
350
4.000%,
5/15/27
11/25
at
102.00
344,451
350
4.000%,
11/15/27
11/25
at
102.00
343,582
1,320
Multnomah
County
Hospital
Facilities
Authority,
Oregon,
Revenue
Bond,
Terwilliger
Plaza,
Inc.,
Refunding
Series
2012,
5.000%,
12/01/29
6/24
at
100.00
1,319,966
325
Multnomah
County
Hospital
Facilities
Authority,
Oregon,
Revenue
Bond,
Terwilliger
Plaza,
Inc.,
Refunding
Series
2016,
5.000%,
12/01/30
12/26
at
100.00
325,074
1,040
Polk
County
Hospital
Facility
Authority,
Oregon,
Revenue
Bonds,
Dallas
Retirement
Village
Project,
Series
2015A,
5.125%,
7/01/35
7/25
at
100.00
1,040,225
1,540
Salem
Hospital
Facility
Authority,
Oregon,
Revenue
Bonds,
Capital
Manor,
Inc.,
Refunding
Bonds,
Series
2022,
4.000%,
5/15/40
5/29
at
103.00
1,347,377
1,150
Yamhill
County
Hospital
Authority,
Oregon,
Revenue
Bonds,
Friendsview
Retirement
Community,
Refunding
Series
2016A,
5.000%,
11/15/31
11/24
at
102.00
1,109,758
1,940
Yamhill
County
Hospital
Authority,
Oregon,
Revenue
Bonds,
Friendsview
Retirement
Community,
Refunding
Series
2021A,
5.000%,
11/15/36
11/28
at
103.00
1,777,864
Total
Long-Term
Care
10,698,404
Nuveen
Oregon
Intermediate
Municipal
Bond
Fund
(continued)
Portfolio
of
Investments
May
31,
2024
Principal
Amount
(000)
Description
(a)
Optional
Call
Provisions
(b)
Value
Tax
Obligation/General
-
42.8%
$
2,400
Beaverton
School
District
48J,
Washington
and
Multnomah
Counties,
Oregon,
General
Obligation
Bonds,
Current
Interest
Series
2017C,
5.000%,
6/15/35
6/27
at
100.00
$
2,487,566
2,000
Beaverton
School
District
48J,
Washington
and
Multnomah
Counties,
Oregon,
General
Obligation
Bonds,
Deferred
Interest
Series
2017B,
0.000%,
6/15/33
6/27
at
78.57
1,361,060
1,380
Bend,
Oregon,
General
Obligation
Bonds,
Full
Faith
&
Credit
Series
2023,
5.000%,
6/01/36
,
(WI/DD)
6/34
at
100.00
1,578,440
Benton
and
Linn
Counties
District
School
District
509J
Corvallis,
Oregon,
General
Obligation
Bonds,
Series
2018A:
350
5.000%,
6/15/26
No
Opt.
Call
360,693
2,835
5.000%,
6/15/27
No
Opt.
Call
2,969,228
Benton
County,
Oregon,
Full
Faith
and
Credit
Obligations,
Series
2023:
350
5.000%,
6/01/37
6/33
at
100.00
391,004
250
5.000%,
6/01/38
6/33
at
100.00
277,549
1,000
Boardman,
Morrow
County,
Oregon,
General
Obligation
Bonds,
Series
2021,
4.000%,
6/15/35
-
BAM
Insured
6/29
at
100.00
1,017,583
200
Clackamas
and
Multnomah
Counties
School
District
7J
Lake
Oswego,
Oregon,
General
Obligation
Bonds,
Refunding
Series
2005,
5.250%,
6/01/25
-
AGM
Insured
No
Opt.
Call
203,475
1,665
Clackamas
and
Multnomah
Counties
School
District
7J
Lake
Oswego,
Oregon,
General
Obligation
Bonds,
Series
2017,
4.000%,
6/01/32
6/27
at
100.00
1,684,464
4,000
Clackamas
County
School
District
12,
North
Clackamas,
Oregon,
General
Obligation
Bonds,
Deferred
Interest
Series
2017A,
0.000%,
6/15/41
6/27
at
53.27
1,756,930
1,000
Clackamas
County
School
District
12,
North
Clackamas,
Oregon,
General
Obligation
Bonds,
Series
2017B,
5.000%,
6/15/30
6/27
at
100.00
1,044,663
Clackamas
County
School
District
12,
North
Clackamas,
Oregon,
General
Obligation
Bonds,
Series
2018:
585
5.000%,
6/15/31
6/28
at
100.00
622,875
550
5.000%,
6/15/32
6/28
at
100.00
584,282
605
Clackamas
County
School
District
62,
Oregon
City,
Oregon,
General
Obligation
Bonds,
Refunding
Series
2018B,
5.000%,
6/15/33
6/28
at
100.00
639,393
1,000
David
Douglas
School
District
40,
Multnomah
County,
Oregon,
General
Obligation
Bonds,
Series
2012B,
0.000%,
6/15/25
No
Opt.
Call
961,808
David
Douglas
School
District
40,
Multnomah
County,
Oregon,
General
Obligation
Bonds,
Series
2023A:
1,135
0.000%,
6/15/34
6/33
at
96.08
763,921
2,000
0.000%,
6/15/35
6/33
at
92.02
1,285,463
1,210
0.000%,
6/15/37
6/33
at
83.14
695,627
1,000
0.000%,
6/15/38
6/33
at
78.73
540,367
1,335
Deschutes
County
Administrative
School
District
1,
Bend-La
Pine,
Oregon,
General
Obligation
Bonds,
Series
2023,
5.000%,
6/15/36
6/33
at
100.00
1,510,843
2,825
Hood
River
County
School
District,
Oregon,
General
Obligation
Bonds,
Refunding
Series
2016,
4.000%,
6/15/29
6/26
at
100.00
2,842,728
1,845
Jackson
County
School
District
5
Ashland,
Oregon,
General
Obligation
Bonds,
Series
2019,
5.000%,
6/15/34
6/29
at
100.00
1,980,558
Jackson
County
School
District
6,
Central
Point,
Oregon,
General
Obligation
Bonds,
Series
2019A:
1,675
4.000%,
6/15/34
6/29
at
100.00
1,703,216
1,700
4.000%,
6/15/35
6/29
at
100.00
1,728,324
270
Keizer,
Oregon,
General
Obligation
Assessment
Bonds,
Keizer
Station
Area
A
Local
Improvement
District,
Series
2008,
5.200%,
6/01/31
7/24
at
100.00
271,153
Lane
Community
College,
Lane,
Linn,
Benton
and
Douglas
Counties,
Oregon,
General
Obligation
Bonds,
Series
2020A:
1,000
4.000%,
6/15/33
6/30
at
100.00
1,036,993
1,750
4.000%,
6/15/34
6/30
at
100.00
1,809,667
3,900
Lane
County
School
District
4J
Eugene,
Oregon,
General
Obligation
Bonds,
School
Bond
Guaranty
Series
2019,
4.000%,
6/15/35
6/29
at
100.00
3,963,182
Marion
and
Polk
Counties
School
District
24J,
Salem-Kreizer,
Oregon,
General
Obligation
Bonds,
Convertible
Deferred
Interest
Series
2020B:
2,000
5.000%,
6/15/34
6/30
at
100.00
2,184,695
2,145
5.000%,
6/15/35
6/30
at
100.00
2,337,640
Principal
Amount
(000)
Description
(a)
Optional
Call
Provisions
(b)
Value
Tax
Obligation/General
(continued)
Marion
and
Polk
Counties
School
District
24J,
Salem-Kreizer,
Oregon,
General
Obligation
Bonds,
Series
2018:
$
1,500
5.000%,
6/15/31
6/28
at
100.00
$
1,593,618
2,000
5.000%,
6/15/33
6/28
at
100.00
2,116,784
1,050
5.000%,
6/15/38
6/28
at
100.00
1,102,700
1,000
Marion
County
School
District
15
North
Marion,
Oregon,
General
Obligation
Bonds,
Series
2018B,
5.000%,
6/15/31
6/28
at
100.00
1,066,692
2,500
Metro,
Oregon,
General
Obligation
Bonds,
Series
2020A,
4.000%,
6/01/34
6/30
at
100.00
2,582,203
2,250
Multnomah
County
School
District
7,
Reynolds,
Oregon,
General
Obligation
Bonds,
Series
2015A,
5.000%,
6/15/30
6/25
at
100.00
2,282,870
1,190
Nestucca
Valley
School
District
101,
Tillamook
&
Yamhill
Counties,
Oregon,
General
Obligation
Bonds,
Series
2018B.
Current
Interest,
5.000%,
6/15/29
6/28
at
100.00
1,267,041
765
Oregon
City,
Oregon,
General
Obligation
Bonds,
Series
2018,
5.000%,
6/01/31
6/28
at
100.00
814,413
770
Oregon
State,
General
Obligation
Bonds,
Series
2024A,
5.000%,
5/01/37
5/34
at
100.00
878,742
1,210
Phoenix-Talent
School
District
4,
Jackson
County,
Oregon,
General
Obligation
Bonds,
Current
Interest
Series
2018B,
5.000%,
6/15/32
6/28
at
100.00
1,285,889
Port
of
Alsea,
Lincoln
County,
Oregon,
General
Obligation
Bonds,
Series
2018:
185
3.750%,
6/15/28
No
Opt.
Call
178,492
180
4.000%,
6/15/33
6/28
at
100.00
176,964
900
Portland
Community
College
District,
Multnomah
County,
Oregon,
General
Obligation
Bonds,
Refunding
Series
2016,
5.000%,
6/15/29
6/26
at
100.00
928,099
1,050
Portland
Community
College
District,
Multnomah
County,
Oregon,
General
Obligation
Bonds,
Series
2018,
5.000%,
6/15/30
6/26
at
100.00
1,082,573
500
Redmond
Area
Park
and
Recreation
District,
Deschutes
County,
Oregon,
General
Obligation
Bonds,
Series
2023,
5.000%,
6/15/34
6/33
at
100.00
563,459
350
Redmond,
Oregon,
Full
Faith
and
Credit
Obligations,
Series
2014A,
5.000%,
6/01/25
7/24
at
100.00
350,220
630
Redmond,
Oregon,
Full
Faith
and
Credit
Obligations,
Series
2019B-1,
5.000%,
6/01/36
12/28
at
100.00
676,344
2,285
Saint
Helens,
Oregon,
Full
Faith
and
Credit
Obligations,
Series
2021,
4.000%,
8/01/41
8/31
at
100.00
2,272,212
Umatilla
County
School
District
6R
Umatilla,
Oregon,
General
Obligation
Bonds,
Series
2017:
245
5.000%,
6/15/27
No
Opt.
Call
255,880
340
5.000%,
6/15/29
6/27
at
100.00
356,318
315
5.000%,
6/15/31
6/27
at
100.00
329,748
1,260
Washington
and
Clackamas
Counties
School
District
23J
Tigard-Tualatin,
Oregon,
General
Obligation
Bonds,
Series
2017,
5.000%,
6/15/30
6/27
at
100.00
1,315,167
965
Washington
County
School
District
15,
Forest
Grove,
Oregon,
General
Obligation
Bonds,
Series
2012B,
0.000%,
6/15/25
No
Opt.
Call
925,265
1,000
Washington
County
School
District
15,
Forest
Grove,
Oregon,
General
Obligation
Bonds,
Series
2023,
5.000%,
6/15/35
6/33
at
100.00
1,130,783
1,320
Washington
County,
Oregon,
General
Obligation
Bonds,
Full
Faith
&
Credit
Obligation
Series
2016B,
4.000%,
3/01/31
3/26
at
100.00
1,329,058
Washington
Multnomah
&
Yamhill
Counties
School
District
1J
Hillsboro,
Oregon,
General
Obligation
Bonds,
Series
2017:
3,750
5.000%,
6/15/32
6/27
at
100.00
3,908,695
1,450
5.000%,
6/15/34
6/27
at
100.00
1,509,242
1,000
Washington,
Clackamas
and
Yamhill
Counties
School
District
88J
Sherwood,
Oregon,
General
Obligation
Bonds,
Series
2017B,
5.000%,
6/15/30
6/27
at
100.00
1,038,523
Yamhill
County
School
District
40,
McMinnville,
Oregon,
General
Obligation
Bonds,
Refunding
Series
2016:
1,000
4.000%,
6/15/31
6/26
at
100.00
1,005,329
1,000
4.000%,
6/15/32
6/26
at
100.00
1,003,351
Total
Tax
Obligation/General
77,922,064
Nuveen
Oregon
Intermediate
Municipal
Bond
Fund
(continued)
Portfolio
of
Investments
May
31,
2024
Principal
Amount
(000)
Description
(a)
Optional
Call
Provisions
(b)
Value
Tax
Obligation/Limited
-
13.8%
$
1,000
Beaverton,
Oregon,
Special
Revenue
Bonds,
Series
2020A,
4.000%,
6/01/37
6/30
at
100.00
$
1,015,857
Government
of
Guam,
Business
Privilege
Tax
Bonds,
Refunding
Series
2015D:
2,260
5.000%,
11/15/28
11/25
at
100.00
2,285,929
500
5.000%,
11/15/29
11/25
at
100.00
505,707
300
Hermiston,
Umatilla
County,
Oregon,
Full
Faith
and
Credit
Obligation
Bonds,
Series
2024,
5.000%,
12/01/37
-
AGM
Insured
6/34
at
100.00
333,259
Matching
Fund
Special
Purpose
Securitization
Corporation,
Virgin
Islands,
Revenue
Bonds,
Series
2022A:
1,635
5.000%,
10/01/28
No
Opt.
Call
1,704,938
460
5.000%,
10/01/32
No
Opt.
Call
492,320
750
Metro,
Oregon,
Dedicated
Tax
Revenue
Bonds,
Oregon
Convention
Center
Hotel,
Series
2017,
5.000%,
6/15/30
6/27
at
100.00
778,892
2,000
Oregon
State
Department
of
Transportation,
Highway
User
Tax
Revenue
Bonds,
Refunding
Subordinate
Lien
Series
2019A,
5.000%,
11/15/35
11/29
at
100.00
2,170,631
750
Oregon
State
Department
of
Transportation,
Highway
User
Tax
Revenue
Bonds,
Senior
Lien
Series
2022A,
5.000%,
11/15/35
11/32
at
100.00
846,665
5,470
Oregon
State
Department
of
Transportation,
Highway
User
Tax
Revenue
Bonds,
Subordinate
Lien
Series
2020A,
4.000%,
11/15/39
11/30
at
100.00
5,509,718
11,300
Puerto
Rico
Sales
Tax
Financing
Corporation,
Sales
Tax
Revenue
Bonds,
Restructured
2018A-1,
0.000%,
7/01/46
7/28
at
41.38
3,619,422
1,000
Puerto
Rico
Sales
Tax
Financing
Corporation,
Sales
Tax
Revenue
Bonds,
Taxable
Restructured
Cofina
Project
Series
2019A-2,
4.329%,
7/01/40
7/28
at
100.00
996,871
1,600
Seaside,
Clatsop
County,
Oregon,
Transient
Lodgings
Tax
Revenue
Bonds,
Series
2018,
5.000%,
12/15/30
6/28
at
100.00
1,693,861
Tri-County
Metropolitan
Transportation
District,
Oregon,
Capital
Grant
Receipt
Revenue
Bonds,
Series
2018A:
1,000
5.000%,
10/01/31
4/28
at
100.00
1,047,784
2,060
4.000%,
10/01/33
4/28
at
100.00
2,074,172
Total
Tax
Obligation/Limited
25,076,026
Transportation
-
5.6%
Jackson
County,
Oregon,
Airport
Revenue
Bonds,
Refunding
Series
2016:
430
5.000%,
12/01/31
-
AGM
Insured
6/26
at
100.00
440,624
380
5.000%,
12/01/33
-
AGM
Insured
6/26
at
100.00
389,357
350
4.000%,
12/01/34
-
AGM
Insured
6/26
at
100.00
350,930
3,745
Port
of
Portland,
Oregon,
International
Airport
Revenue
Bonds,
Green
Series
2023-29,
5.000%,
7/01/29,
(AMT)
No
Opt.
Call
3,943,655
1,690
Port
of
Portland,
Oregon,
International
Airport
Revenue
Bonds,
Series
2017-24B,
5.000%,
7/01/35,
(AMT)
1/27
at
100.00
1,726,200
3,040
Port
of
Portland,
Oregon,
International
Airport
Revenue
Bonds,
Series
2022-28,
5.000%,
7/01/34,
(AMT)
7/32
at
100.00
3,289,570
Total
Transportation
10,140,336
U.S.
Guaranteed
-
0.1%
(d)
155
Multnomah
County
Hospital
Facilities
Authority,
Oregon,
Revenue
Bonds,
Mirabella
South
Waterfront,
Refunding
Series
2014A,
5.000%,
10/01/24,
(ETM)
No
Opt.
Call
155,432
Total
U.S.
Guaranteed
155,432
Utilities
-
9.2%
Beaverton,
Oregon,
Water
Revenue
Bonds,
Series
2022:
2,090
4.000%,
4/01/35
4/32
at
100.00
2,165,880
2,150
4.000%,
4/01/36
4/32
at
100.00
2,217,666
Central
Lincoln
Peoples
Utility
District,
Oregon,
Electric
Revenue
Bonds,
Series
2016:
500
3.500%,
12/01/29
12/25
at
100.00
495,575
350
5.000%,
12/01/33
12/25
at
100.00
355,505
350
5.000%,
12/01/34
12/25
at
100.00
355,505
Principal
Amount
(000)
Description
(a)
Optional
Call
Provisions
(b)
Value
Utilities
(continued)
Eugene,
Oregon,
Water
Utility
System
Revenue
Bonds,
Series
2023:
$
250
5.000%,
8/01/35
8/33
at
100.00
$
282,986
250
5.000%,
8/01/36
8/33
at
100.00
282,073
250
5.000%,
8/01/37
8/33
at
100.00
280,485
250
5.000%,
8/01/38
8/33
at
100.00
277,741
Guam
Government
Waterworks
Authority,
Water
and
Wastewater
System
Revenue
Bonds,
Series
2016:
1,065
5.000%,
7/01/28
7/26
at
100.00
1,088,400
1,120
5.000%,
7/01/29
7/26
at
100.00
1,145,460
1,180
5.000%,
7/01/30
7/26
at
100.00
1,206,987
2,500
Portland,
Oregon,
Water
System
Revenue
Bonds,
Refunding
First
Lien
Series
2016A,
4.000%,
4/01/33
4/26
at
100.00
2,519,665
2,000
Portland,
Oregon,
Water
System
Revenue
Bonds,
Refunding
First
Lien
Series
2022A,
4.000%,
4/01/35
10/31
at
100.00
2,055,479
1,000
(c)
Puerto
Rico
Aqueduct
and
Sewerage
Authority,
Revenue
Bonds,
Refunding
Senior
Lien
Series
2021B,
5.000%,
7/01/33
7/31
at
100.00
1,054,397
Warm
Springs
Reservation
Confederated
Tribes,
Oregon,
Hydroelectric
Revenue
Bonds,
Tribal
Economic
Development
Bond
Pelton
Round
Butte
Project,
Taxable
Refunding
Green
Series
2019B:
525
(c)
5.000%,
11/01/33
5/29
at
100.00
559,848
500
(c)
5.000%,
11/01/36
5/29
at
100.00
533,708
Total
Utilities
16,877,360
Total
Municipal
Bonds
(cost
$178,732,923)
176,231,555
Total
Long-Term
Investments
(cost
$178,732,923)
176,231,555
Principal
Amount
(000)
Description
(a)
Optional
Call
Provisions
(b)
Value
SHORT-TERM
INVESTMENTS
-
3.7%
X
6,800,000
MUNICIPAL
BONDS
-
3.7%
X
6,800,000
Health
Care
-
3.3%
$
6,000
(e)
Oregon
Facilities
Authority,
Revenue
Bonds,
Peacehealth
System,
Refunding
Series
2018B,
4.000%,
8/01/34
6/24
at
100.00
$
6,000,000
Total
Health
Care
6,000,000
Tax
Obligation/General
-
0.4%
800
(e)
Oregon
State,
General
Obligation
Bonds,
Veteran's
Welfare
Series
110
Series
2022E,
4.050%,
6/01/45
6/24
at
100.00
800,000
Total
Tax
Obligation/General
800,000
Total
Municipal
Bonds
(cost
$6,800,000)
6,800,000
Total
Short-Term
Investments
(cost
$6,800,000)
6,800,000
Total
Investments
(cost
$185,532,923)
-
100.5%
183,031,555
Other
Assets
&
Liabilities,
Net
-
(0.5)%
(893,609)
Net
Assets
-
100%
$
182,137,946
(a)
All
percentages
shown
in
the
Portfolio
of
Investments
are
based
on
net
assets.
(b)
Optional
Call
Provisions:
Dates
(month
and
year)
and
prices
of
the
earliest
optional
call
or
redemption.
There
may
be
other
call
provisions
at
varying
prices
at
later
dates.
Certain
mortgage-backed
securities
may
be
subject
to
periodic
principal
paydowns.
Optional
Call
Provisions
are
not
covered
by
the
report
of
independent
registered
public
accounting
firm.
(c)
Security
is
exempt
from
registration
under
Rule
144A
of
the
Securities
Act
of
1933,
as
amended.
These
securities
are
deemed
liquid
and
may
be
resold
in
transactions
exempt
from
registration,
which
are
normally
those
transactions
with
qualified
institutional
buyers.
As
of
the
end
of
the
reporting
period,
the
aggregate
value
of
these
securities
is
$3,759,081
or
2.1%
of
Total
Investments.
(d)
Backed
by
an
escrow
or
trust
containing
sufficient
U.S.
Government
or
U.S.
Government
agency
securities,
which
ensure
the
timely
payment
of
principal
and
interest.
(e)
Investment
has
a
maturity
of
greater
than
one
year,
but
has
variable
rate
and/or
demand
features
which
qualify
it
as
a
short-term
investment.
The
rate
disclosed,
as
well
as
the
reference
rate
and
spread,
where
applicable,
is
that
in
effect
as
of
the
end
of
the
reporting
period.
This
rate
changes
periodically
based
on
market
conditions
or
a
specified
market
index.
Nuveen
Oregon
Intermediate
Municipal
Bond
Fund
(continued)
Portfolio
of
Investments
May
31,
2024
AMT
Alternative
Minimum
Tax
ETM
Escrowed
to
maturity
WI/DD
When-issued
or
delayed
delivery
security.
See
Notes
to
Financial
Statements.
Statement
of
Assets
and
Liabilities
See
Notes
to
Financial
Statements.
May
31,
2024
Minnesota
Intermediate
Minnesota
Nebraska
Oregon
Intermediate
ASSETS
Long-term
investments,
at
value
†
$
314,794,043
$
569,593,975
$
73,443,040
$
176,231,555
Short-term
investments,
at
value
◊
3,150,000
21,190,000
–
6,800,000
Cash
–
–
–
57,224
Receivables:
Interest
4,100,972
8,002,418
1,190,921
2,425,965
Investments
sold
1,048,306
4,396,877
538,771
75,000
Reimbursement
from
Adviser
–
–
11,791
–
Shares
sold
25,647
3,309,658
2,612
119,951
Other
26,878
32,363
16,931
15,063
Total
assets
323,145,846
606,525,291
75,204,066
185,724,758
LIABILITIES
Cash
overdraft
1,035,437
791,570
425,717
–
Payables:
Management
fees
136,891
250,225
32,192
78,180
Dividends
285,273
290,223
22,333
124,182
Interest
293
—
219
365
Investments
purchased
-
when-issued/delayed-delivery
settlement
–
–
973,220
3,175,204
Shares
redeemed
239,214
1,184,771
94,824
142,733
Accrued
expenses:
Custodian
fees
41,917
55,711
21,863
28,695
Directors
fees
15,611
19,178
1,374
4,508
Professional
fees
10,213
16,687
2,514
5,264
Shareholder
reporting
expenses
9,928
18,377
3,897
5,224
Shareholder
servicing
agent
fees
25,057
57,595
6,668
16,659
12b-1
distribution
and
service
fees
20,005
47,803
7,077
5,798
Total
liabilities
1,819,839
2,732,140
1,591,898
3,586,812
Net
assets
$
321,326,007
$
603,793,151
$
73,612,168
$
182,137,946
NET
ASSETS
CONSIST
OF:
Paid-in
capital
$
345,466,031
$
672,646,256
$
89,175,417
$
198,400,215
Total
distributable
earnings
(loss)
(24,140,024)
(68,853,105)
(15,563,249)
(16,262,269)
Net
assets
$
321,326,007
$
603,793,151
$
73,612,168
$
182,137,946
†
Long-term
investments,
cost
$
321,663,804
$
586,631,694
$
76,067,219
$
178,732,923
◊
Short-term
investments,
cost
$
3,150,000
$
21,190,000
$
—
$
6,800,000
Statement
of
Assets
and
Liabilities
(continued)
See
Notes
to
Financial
Statements.
Minnesota
Intermediate
Minnesota
Nebraska
Oregon
Intermediate
CLASS
A:
Net
assets
$
87,300,515
$
214,252,348
$
35,596,580
$
25,292,841
Shares
outstanding
9,082,026
20,152,690
3,687,446
2,624,334
Net
asset
value
("NAV")
per
share
$
9.61
$
10.63
$
9.65
$
9.64
Maximum
sales
charge
3.00%
4.20%
4.20%
3.00%
Offering
price
per
share
(NAV
per
share
plus
maximum
sales
charge)
$
9.91
$
11.10
$
10.07
$
9.94
CLASS
C:
Net
assets
$
6,364,362
$
13,273,773
$
991,080
$
1,536,226
Shares
outstanding
666,392
1,249,642
102,831
160,296
NAV
and
offering
price
per
share
$
9.55
$
10.62
$
9.64
$
9.58
CLASS
I:
Net
assets
$
227,661,130
$
376,267,030
$
37,024,508
$
155,308,879
Shares
outstanding
23,786,214
35,437,789
3,829,012
16,081,698
NAV
and
offering
price
per
share
$
9.57
$
10.62
$
9.67
$
9.66
Authorized
shares
-
per
class
2
billion
2
billion
2
billion
2
billion
Par
value
per
share
$
0.0001
$
0.0001
$
0.0001
$
0.0001
See
Notes
to
Financial
Statements.
Year
Ended
May
31,
2024
Minnesota
Intermediate
Minnesota
Nebraska
Oregon
Intermediate
INVESTMENT
INCOME
Interest
$
12,310,668
$
23,446,609
$
2,959,450
$
6,131,577
Total
investment
income
12,310,668
23,446,609
2,959,450
6,131,577
EXPENSES
–
–
–
–
Management
fees
1,721,106
2,827,072
447,722
964,313
12b-1
service
fees
-
Class
A
166,335
410,476
79,506
52,172
12b-1
distribution
and
service
fees
-
Class
C
76,116
150,001
14,985
20,383
Shareholder
servicing
agent
fees
-
Class
A
27,183
81,265
14,632
9,197
Shareholder
servicing
agent
fees
-
Class
C
2,483
5,924
546
717
Shareholder
servicing
agent
fees
-
Class
I
78,028
136,191
15,996
53,722
Interest
expense
62,572
60,766
25,019
27,163
Directors
fees
12,045
20,889
3,144
6,628
Custodian
expenses,
net
47,086
52,118
13,482
19,402
Registration
fees
18,751
25,807
25,699
16,188
Professional
fees
70,408
87,617
51,779
58,452
Shareholder
reporting
expenses
27,384
47,698
14,036
17,529
Other
14,410
18,004
13,349
13,383
Total
expenses
before
fee
waiver/expense
reimbursement
2,323,907
3,923,828
719,895
1,259,249
Fee
waiver/expense
reimbursement
—
—
(
83,949
)
—
Net
expenses
2,323,907
3,923,828
635,946
1,259,249
Net
investment
income
(loss)
9,986,761
19,522,781
2,323,504
4,872,328
REALIZED
AND
UNREALIZED
GAIN
(LOSS)
Realized
gain
(loss)
from:
Investments
(
2,809,331
)
(
7,087,582
)
(
4,870,716
)
(
1,607,620
)
Net
realized
gain
(loss)
(
2,809,331
)
(
7,087,582
)
(
4,870,716
)
(
1,607,620
)
Change
in
unrealized
appreciation
(depreciation)
on:
Investments
766,350
4,027,752
3,195,950
491,186
Net
change
in
unrealized
appreciation
(depreciation)
766,350
4,027,752
3,195,950
491,186
Net
realized
and
unrealized
gain
(loss)
(
2,042,981
)
(
3,059,830
)
(
1,674,766
)
(
1,116,434
)
Net
increase
(decrease)
in
net
assets
from
operations
$
7,943,780
$
16,462,951
$
648,738
$
3,755,894
Statement
of
Changes
in
Net
Assets
See
Notes
to
Financial
Statements.
Minnesota
Intermediate
Minnesota
Year
Ended
5/31/24
Year
Ended
5/31/23
Year
Ended
5/31/24
Year
Ended
5/31/23
OPERATIONS
Net
investment
income
(loss)
$
9,986,761
$
9,817,146
$
19,522,781
$
17,457,132
Net
realized
gain
(loss)
(
2,809,331
)
(
5,023,204
)
(
7,087,582
)
(
19,871,482
)
Net
change
in
unrealized
appreciation
(depreciation)
766,350
(
3,229,831
)
4,027,752
(
5,454,547
)
Net
increase
(decrease)
in
net
assets
from
operations
7,943,780
1,564,111
16,462,951
(
7,868,897
)
DISTRIBUTIONS
TO
SHAREHOLDERS
Dividends:
Class
A
(
2,465,421
)
(
2,422,188
)
(
6,990,788
)
(
6,151,094
)
Class
C
(
164,725
)
(
175,594
)
(
389,330
)
(
449,484
)
Class
I
(
7,544,954
)
(
6,902,951
)
(
12,424,196
)
(
10,316,848
)
Total
distributions
(
10,175,100
)
(
9,500,733
)
(
19,804,314
)
(
16,917,426
)
FUND
SHARE
TRANSACTIONS
Subscriptions
123,522,905
198,176,296
237,553,251
249,103,974
Reinvestments
of
distributions
6,589,877
5,828,601
16,610,305
13,760,678
Redemptions
(
145,993,852
)
(
253,882,060
)
(
188,985,378
)
(
339,973,222
)
Net
increase
(decrease)
from
Fund
share
transactions
(
15,881,070
)
(
49,877,163
)
65,178,178
(
77,108,570
)
Net
increase
(decrease)
in
net
assets
(
18,112,390
)
(
57,813,785
)
61,836,815
(
101,894,893
)
Net
assets
at
the
beginning
of
period
339,438,397
397,252,182
541,956,336
643,851,229
Net
assets
at
the
end
of
period
$
321,326,007
$
339,438,397
$
603,793,151
$
541,956,336
See
Notes
to
Financial
Statements.
Nebraska
Oregon
Intermediate
Year
Ended
5/31/24
Year
Ended
5/31/23
Year
Ended
5/31/24
Year
Ended
5/31/23
OPERATIONS
Net
investment
income
(loss)
$
2,323,504
$
2,306,365
$
4,872,328
$
4,785,654
Net
realized
gain
(loss)
(
4,870,716
)
(
3,901,351
)
(
1,607,620
)
(
4,124,935
)
Net
change
in
unrealized
appreciation
(depreciation)
3,195,950
(
213,731
)
491,186
(
834,709
)
Net
increase
(decrease)
in
net
assets
from
operations
648,738
(
1,808,717
)
3,755,894
(
173,990
)
DISTRIBUTIONS
TO
SHAREHOLDERS
Dividends:
Class
A
(
968,358
)
(
920,535
)
(
658,194
)
(
625,245
)
Class
C
(
24,103
)
(
24,927
)
(
34,968
)
(
34,185
)
Class
I
(
1,142,879
)
(
1,220,820
)
(
4,121,443
)
(
3,858,764
)
Total
distributions
(
2,135,340
)
(
2,166,282
)
(
4,814,605
)
(
4,518,194
)
FUND
SHARE
TRANSACTIONS
Subscriptions
16,074,653
17,813,252
71,354,403
84,808,781
Reinvestments
of
distributions
1,903,483
1,957,345
3,236,518
2,722,809
Redemptions
(
44,210,417
)
(
37,063,131
)
(
74,660,602
)
(
126,314,973
)
Net
increase
(decrease)
from
Fund
share
transactions
(
26,232,281
)
(
17,292,534
)
(
69,681
)
(
38,783,383
)
Net
increase
(decrease)
in
net
assets
(
27,718,883
)
(
21,267,533
)
(
1,128,392
)
(
43,475,567
)
Net
assets
at
the
beginning
of
period
101,331,051
122,598,584
183,266,338
226,741,905
Net
assets
at
the
end
of
period
$
73,612,168
$
101,331,051
$
182,137,946
$
183,266,338
The
following
data
is
for
a
share outstanding
for
each
fiscal year
end
unless
otherwise
noted:
Investment
Operations
Less
Distributions
Net
Asset
Value,
Beginning
of
Period
Net
Investment
Income
(NII)
(Loss)(a)
Net
Realized/
Unrealized
Gain
(Loss)
Total
From
NII
From
Net
Realized
Gains
Total
Net
Asset
Value,
End
of
Period
Minnesota
Intermediate
Class
A
5/31/24
$
9.68
$
0.28
$
(
0.06
)
$
0.22
$
(
0.29
)
$
—
$
(
0.29
)
$
9.61
5/31/23
9.86
0.25
(
0.18
)
0.07
(
0.25
)
—
(
0.25
)
9.68
5/31/22
10.65
0.20
(
0.80
)
(
0.60
)
(
0.19
)
—
(
0.19
)
9.86
5/31/21
10.48
0.22
0.17
0.39
(
0.22
)
—
(
0.22
)
10.65
5/31/20
10.49
0.26
0.01
0.27
(
0.28
)
—
(
0.28
)
10.48
Class
C
5/31/24
9.62
0.20
(
0.06
)
0.14
(
0.21
)
—
(
0.21
)
9.55
5/31/23
9.80
0.18
(
0.19
)
(
0.01
)
(
0.17
)
—
(
0.17
)
9.62
5/31/22
10.58
0.12
(
0.80
)
(
0.68
)
(
0.10
)
—
(
0.10
)
9.80
5/31/21
10.41
0.13
0.17
0.30
(
0.13
)
—
(
0.13
)
10.58
5/31/20
10.43
0.17
—
0.17
(
0.19
)
—
(
0.19
)
10.41
Class
I
5/31/24
9.64
0.30
(
0.07
)
0.23
(
0.30
)
—
(
0.30
)
9.57
5/31/23
9.82
0.27
(
0.18
)
0.09
(
0.27
)
—
(
0.27
)
9.64
5/31/22
10.60
0.22
(
0.80
)
(
0.58
)
(
0.20
)
—
(
0.20
)
9.82
5/31/21
10.43
0.24
0.16
0.40
(
0.23
)
—
(
0.23
)
10.60
5/31/20
10.44
0.28
0.01
0.29
(
0.30
)
—
(
0.30
)
10.43
(a)
Based
on
average
shares
outstanding.
(b)
Total
returns
are
at
NAV
and
do
not
include
any
sales
charge.
Total
returns
are
not
annualized.
(c)
The
expense
ratios
reflect,
among
other
things,
the
interest
expense
deemed
to
have
been
paid
by
the
Fund
on
the
floating
rate
certificates
issued
by
the
special
purpose
trusts
for
the
self-deposited
inverse
floaters
held
by
the
Fund,
where
applicable,
as
described
in
Notes
to
Financial
Statements
and
the
interest
expense
and
fees
paid
on
borrowings,
as
described
in
Notes
to
Financial
Statements.
See
Notes
to
Financial
Statements.
Ratio/Supplemental
Data
Ratios
to
Average
Net
Assets
Total
Return(b)
Net
Assets,
End
of
Period
(000)
Expenses
Including
Interest(c)
Expenses
Excluding
Interest
NII
(Loss)
Portfolio
Turnover
Rate
2
.27
%
$
87,301
0
.83
%
0
.81
%
2
.91
%
21
%
0
.71
85,313
0
.81
0
.81
2
.62
13
(
5
.75
)
113,097
0
.80
0
.80
1
.96
28
3
.71
138,393
0
.79
0
.79
2
.05
6
2
.57
115,325
0
.80
0
.80
2
.43
12
1
.45
6,364
1
.63
1
.61
2
.10
21
(
0
.11
)
8,829
1
.61
1
.61
1
.82
13
(
6
.46
)
11,621
1
.60
1
.60
1
.16
28
2
.91
13,672
1
.59
1
.59
1
.25
6
1
.67
13,064
1
.60
1
.60
1
.64
12
2
.47
227,661
0
.63
0
.61
3
.10
21
0
.90
245,297
0
.61
0
.61
2
.82
13
(
5
.52
)
272,534
0
.60
0
.60
2
.16
28
3
.90
306,289
0
.59
0
.59
2
.25
6
2
.76
273,269
0
.60
0
.60
2
.64
12
Financial
Highlights
(continued)
The
following
data
is
for
a
share outstanding
for
each
fiscal year
end
unless
otherwise
noted:
Investment
Operations
Less
Distributions
Net
Asset
Value,
Beginning
of
Period
Net
Investment
Income
(NII)
(Loss)(a)
Net
Realized/
Unrealized
Gain
(Loss)
Total
From
NII
From
Net
Realized
Gains
Total
Net
Asset
Value,
End
of
Period
Minnesota
Class
A
5/31/24
$
10.68
$
0.36
$
(
0.05
)
$
0.31
$
(
0.36
)
$
—
$
(
0.36
)
$
10.63
5/31/23
11.08
0.33
(
0.41
)
(
0.08
)
(
0.32
)
—
(
0.32
)
10.68
5/31/22
12.11
0.24
(
1.06
)
(
0.82
)
(
0.21
)
—
(
0.21
)
11.08
5/31/21
11.78
0.25
0.34
0.59
(
0.26
)
—
(
0.26
)
12.11
5/31/20
11.84
0.32
(
0.04
)
0.28
(
0.34
)
—
(
0.34
)
11.78
Class
C
5/31/24
10.67
0.27
(
0.04
)
0.23
(
0.28
)
—
(
0.28
)
10.62
5/31/23
11.07
0.24
(
0.41
)
(
0.17
)
(
0.23
)
—
(
0.23
)
10.67
5/31/22
12.10
0.15
(
1.06
)
(
0.91
)
(
0.12
)
—
(
0.12
)
11.07
5/31/21
11.77
0.15
0.34
0.49
(
0.16
)
—
(
0.16
)
12.10
5/31/20
11.83
0.22
(
0.03
)
0.19
(
0.25
)
—
(
0.25
)
11.77
Class
I
5/31/24
10.66
0.38
(
0.04
)
0.34
(
0.38
)
—
(
0.38
)
10.62
5/31/23
11.07
0.34
(
0.41
)
(
0.07
)
(
0.34
)
—
(
0.34
)
10.66
5/31/22
12.10
0.26
(
1.05
)
(
0.79
)
(
0.24
)
—
(
0.24
)
11.07
5/31/21
11.77
0.27
0.34
0.61
(
0.28
)
—
(
0.28
)
12.10
5/31/20
11.83
0.34
(
0.03
)
0.31
(
0.37
)
—
(
0.37
)
11.77
(a)
Based
on
average
shares
outstanding.
(b)
Total
returns
are
at
NAV
and
do
not
include
any
sales
charge.
Total
returns
are
not
annualized.
(c)
The
expense
ratios
reflect,
among
other
things,
the
interest
expense
deemed
to
have
been
paid
by
the
Fund
on
the
floating
rate
certificates
issued
by
the
special
purpose
trusts
for
the
self-deposited
inverse
floaters
held
by
the
Fund,
where
applicable,
as
described
in
Notes
to
Financial
Statements
and
the
interest
expense
and
fees
paid
on
borrowings,
as
described
in
Notes
to
Financial
Statements.
See
Notes
to
Financial
Statements.
Ratio/Supplemental
Data
Ratios
to
Average
Net
Assets
Total
Return(b)
Net
Assets,
End
of
Period
(000)
Expenses
Including
Interest(c)
Expenses
Excluding
Interest
NII
(Loss)
Portfolio
Turnover
Rate
2
.99
%
$
214,252
0
.80
%
0
.79
%
3
.36
%
26
%
(
0
.73
)
206,858
0
.79
0
.79
3
.03
29
(
6
.83
)
225,930
0
.77
0
.77
2
.03
28
5
.02
277,598
0
.77
0
.77
2
.07
7
2
.40
236,237
0
.79
0
.79
2
.67
13
2
.16
13,274
1
.60
1
.59
2
.56
26
(
1
.51
)
17,824
1
.59
1
.59
2
.22
29
(
7
.58
)
25,848
1
.57
1
.57
1
.23
28
4
.19
33,134
1
.57
1
.57
1
.28
7
1
.58
33,110
1
.59
1
.59
1
.88
13
3
.29
376,267
0
.60
0
.59
3
.56
26
(
0
.61
)
317,275
0
.59
0
.59
3
.21
29
(
6
.64
)
392,073
0
.57
0
.57
2
.23
28
5
.23
421,865
0
.57
0
.57
2
.27
7
2
.61
315,275
0
.59
0
.59
2
.87
13
Financial
Highlights
(continued)
The
following
data
is
for
a
share outstanding
for
each
fiscal year
end
unless
otherwise
noted:
Investment
Operations
Less
Distributions
Net
Asset
Value,
Beginning
of
Period
Net
Investment
Income
(NII)
(Loss)(a)
Net
Realized/
Unrealized
Gain
(Loss)
Total
From
NII
From
Net
Realized
Gains
Total
Net
Asset
Value,
End
of
Period
Nebraska
Class
A
5/31/24
$
9.72
$
0.26
$
(0.09)
$
0.17
$
(0.24)
$
—
$
(0.24)
$
9.65
5/31/23
10.03
0.20
(0.32)
(0.12)
(0.19)
—
(0.19)
9.72
5/31/22
11.11
0.17
(1.09)
(0.92)
(0.16)
—
(0.16)
10.03
5/31/21
10.98
0.20
0.13
0.33
(0.20)
—
(0.20)
11.11
5/31/20
10.77
0.25
0.23
0.48
(0.27)
—
(0.27)
10.98
Class
C
5/31/24
9.71
0.18
(0.09)
0.09
(0.16)
—
(0.16)
9.64
5/31/23
10.01
0.12
(0.31)
(0.19)
(0.11)
—
(0.11)
9.71
5/31/22
11.08
0.08
(1.08)
(1.00)
(0.07)
—
(0.07)
10.01
5/31/21
10.95
0.11
0.13
0.24
(0.11)
—
(0.11)
11.08
5/31/20
10.75
0.16
0.22
0.38
(0.18)
—
(0.18)
10.95
Class
I
5/31/24
9.74
0.27
(0.08)
0.19
(0.26)
—
(0.26)
9.67
5/31/23
10.05
0.22
(0.32)
(0.10)
(0.21)
—
(0.21)
9.74
5/31/22
11.13
0.19
(1.09)
(0.90)
(0.18)
—
(0.18)
10.05
5/31/21
11.00
0.22
0.13
0.35
(0.22)
—
(0.22)
11.13
5/31/20
10.79
0.27
0.23
0.50
(0.29)
—
(0.29)
11.00
(a)
Based
on
average
shares
outstanding.
(b)
Total
returns
are
at
NAV
and
do
not
include
any
sales
charge.
Total
returns
are
not
annualized.
(c)
The
expense
ratios
reflect,
among
other
things,
the
interest
expense
deemed
to
have
been
paid
by
the
Fund
on
the
floating
rate
certificates
issued
by
the
special
purpose
trusts
for
the
self-deposited
inverse
floaters
held
by
the
Fund,
where
applicable,
as
described
in
Notes
to
Financial
Statements
and
the
interest
expense
and
fees
paid
on
borrowings,
as
described
in
Notes
to
Financial
Statements.
(d)
After
fee
waiver
and/or
expense
reimbursement
from
the
Adviser,
where
applicable.
See
Notes
to
Financial
Statements
for
more
information.
See
Notes
to
Financial
Statements.
Ratio/Supplemental
Data
Ratios
to
Average
Net
Assets
Total
Return(b)
Net
Assets,
End
of
Period
(000)
Gross
Expenses
Including
Interest(c)
Gross
Expenses
Excluding
Interest
Net
Expenses
Including
Interest(c),(d)
Net
Expenses
Excluding
Interest(d)
NII
(Loss)(d)
Portfolio
Turnover
Rate
1.75
%
$
35,597
0.94
%
0.91
%
0.84
%
0.81
%
2.66
%
20
%
(1.20)
44,057
0.89
0.89
0.82
0.82
2.05
18
(8.34)
55,101
0.88
0.88
0.87
0.87
1.57
26
3.03
62,259
0.88
0.88
0.87
0.87
1.79
4
4.50
47,070
0.89
0.89
0.88
0.88
2.31
12
0.93
991
1.74
1.71
1.64
1.61
1.83
20
(1.89)
1,985
1.69
1.69
1.62
1.62
1.25
18
(9.03)
2,650
1.68
1.68
1.67
1.67
0.77
26
2.20
3,110
1.68
1.68
1.67
1.67
1.00
4
3.58
2,833
1.69
1.69
1.68
1.68
1.51
12
1.95
37,025
0.74
0.71
0.64
0.61
2.82
20
(0.99)
55,289
0.69
0.69
0.62
0.62
2.25
18
(8.12)
64,848
0.68
0.68
0.67
0.67
1.77
26
3.24
66,647
0.68
0.68
0.67
0.67
1.99
4
4.71
47,500
0.69
0.69
0.68
0.68
2.51
12
Financial
Highlights
(continued)
The
following
data
is
for
a
share outstanding
for
each
fiscal year
end
unless
otherwise
noted:
Investment
Operations
Less
Distributions
Net
Asset
Value,
Beginning
of
Period
Net
Investment
Income
(NII)
(Loss)(a)
Net
Realized/
Unrealized
Gain
(Loss)
Total
From
NII
From
Net
Realized
Gains
Total
Net
Asset
Value,
End
of
Period
Oregon
Intermediate
Class
A
5/31/24
$
9.65
$
0.25
$
(
0.02
)
$
0.23
$
(
0.24
)
$
—
$
(
0.24
)
$
9.64
5/31/23
9.83
0.22
(
0.19
)
0.03
(
0.21
)
—
(
0.21
)
9.65
5/31/22
10.70
0.17
(
0.88
)
(
0.71
)
(
0.16
)
—
(
0.16
)
9.83
5/31/21
10.61
0.18
0.10
0.28
(
0.19
)
—
(
0.19
)
10.70
5/31/20
10.40
0.21
0.21
0.42
(
0.21
)
—
(
0.21
)
10.61
Class
C
5/31/24
9.60
0.17
(
0.02
)
0.15
(
0.17
)
—
(
0.17
)
9.58
5/31/23
9.77
0.14
(
0.18
)
(
0.04
)
(
0.13
)
—
(
0.13
)
9.60
5/31/22
10.64
0.09
(
0.88
)
(
0.79
)
(
0.08
)
—
(
0.08
)
9.77
5/31/21
10.55
0.10
0.10
0.20
(
0.11
)
—
(
0.11
)
10.64
5/31/20
10.34
0.12
0.22
0.34
(
0.13
)
—
(
0.13
)
10.55
Class
I
5/31/24
9.67
0.27
(
0.02
)
0.25
(
0.26
)
—
(
0.26
)
9.66
5/31/23
9.85
0.23
(
0.19
)
0.04
(
0.22
)
—
(
0.22
)
9.67
5/31/22
10.72
0.19
(
0.87
)
(
0.68
)
(
0.19
)
—
(
0.19
)
9.85
5/31/21
10.63
0.20
0.10
0.30
(
0.21
)
—
(
0.21
)
10.72
5/31/20
10.42
0.23
0.21
0.44
(
0.23
)
—
(
0.23
)
10.63
(a)
Based
on
average
shares
outstanding.
(b)
Total
returns
are
at
NAV
and
do
not
include
any
sales
charge.
Total
returns
are
not
annualized.
(c)
The
expense
ratios
reflect,
among
other
things,
the
interest
expense
deemed
to
have
been
paid
by
the
Fund
on
the
floating
rate
certificates
issued
by
the
special
purpose
trusts
for
the
self-deposited
inverse
floaters
held
by
the
Fund,
where
applicable,
as
described
in
Notes
to
Financial
Statements
and
the
interest
expense
and
fees
paid
on
borrowings,
as
described
in
Notes
to
Financial
Statements.
See
Notes
to
Financial
Statements.
Ratio/Supplemental
Data
Ratios
to
Average
Net
Assets
Total
Return(b)
Net
Assets,
End
of
Period
(000)
Expenses
Including
Interest(c)
Expenses
Excluding
Interest
NII
(Loss)
Portfolio
Turnover
Rate
2
.45
%
$
25,293
0
.86
%
0
.84
%
2
.54
%
20
%
0
.27
26,804
0
.83
0
.83
2
.22
18
(
6
.69
)
33,236
0
.81
0
.81
1
.65
21
2
.69
35,100
0
.80
0
.80
1
.69
4
4
.07
25,357
0
.81
0
.81
1
.97
13
1
.52
1,536
1
.66
1
.64
1
.74
20
(
0
.43
)
2,218
1
.63
1
.63
1
.43
18
(
7
.48
)
2,905
1
.61
1
.61
0
.84
21
1
.88
4,473
1
.60
1
.60
0
.90
4
3
.27
4,285
1
.61
1
.61
1
.16
13
2
.64
155,309
0
.66
0
.64
2
.74
20
0
.46
154,245
0
.63
0
.63
2
.42
18
(
6
.46
)
190,601
0
.61
0
.61
1
.84
21
2
.88
248,222
0
.60
0
.60
1
.90
4
4
.24
210,368
0
.61
0
.61
2
.16
13
Notes
to
Financial
Statements
1.
General
Information
Trust
and
Fund
Information:
Nuveen
Investment
Funds,
Inc.
(the
“Trust”),
is
an
open-end
management
investment
company
registered
under
the
Investment
Company
Act
of
1940
(the
“1940
Act”),
as
amended.
The
Trust
is
comprised
of
Nuveen
Minnesota
Intermediate
Municipal
Bond
Fund
(“Minnesota
Intermediate”),
Nuveen
Minnesota
Municipal
Bond
Fund
(“Minnesota”),
Nuveen
Nebraska
Municipal
Bond
Fund
(“Nebraska”)
and
Nuveen
Oregon
Intermediate
Municipal
Bond
Fund
(“Oregon
Intermediate”),
(each
a
“Fund”
and
collectively,
the
“Funds”),
among
others.
The
Trust
was
incorporated
in
the
State
of
Maryland
on
August
20,
1987.
Current
Fiscal
Period:
The
end
of
the
reporting
period
for
the
Funds
is
May
31,
2024,
and
the
period
covered
by
these
Notes
to
Financial
Statements
is
the
fiscal
year
ended
May
31,
2024
(the
"current
fiscal
period").
Investment
Adviser
and
Sub-Adviser:
The
Funds'
investment
adviser
is
Nuveen
Fund
Advisors,
LLC
(the
“Adviser”),
a
subsidiary
of
Nuveen,
LLC
(“Nuveen”).
Nuveen
is
the
investment
management
arm
of
Teachers
Insurance
and
Annuity
Association
of
America
(TIAA).
The
Adviser
has
overall
responsibility
for
management
of
the
Funds,
oversees
the
management
of
the
Funds'
portfolio,
manages
the
Funds'
business
affairs
and
provides
certain
clerical,
bookkeeping
and
other
administrative
services,
and,
if
necessary,
asset
allocation
decisions.
The
Adviser
has
entered
into sub-
advisory
agreements
with
Nuveen
Asset
Management,
LLC,
(the
“Sub-Adviser”),
a
subsidiary
of
the
Adviser,
under
which
the
Sub-Adviser
manages
the
investment
portfolios
of
the
Funds.
Share
Classes
and
Sales
Charges:
Class
A
Shares
are
generally
sold
with
an
up-front
sales
charge.
Class
A
Shares
purchases
of
$250,000
or
more
are
sold
at
net
asset
value
(“NAV”)
without
an
up-front
sales
charge
but
may
be
subject
to
a
contingent
deferred
sales
charge
(“CDSC”)
of
1%
if
redeemed
within
eighteen
months
of
purchase.
Class
C
Shares
are
sold
without
an
up-front
sales
charge
but
are
subject
to
a
CDSC
of
1%
if
redeemed
within
twelve
months
of
purchase.
Class
C
Shares
automatically
convert
to
Class
A
Shares
eight
years
after
purchase.
Class
I
Shares
are
sold
without
an
up-front
sales
charge.
2.
Significant
Accounting
Policies
The
accompanying
financial
statements
were
prepared
in
accordance
with
accounting
principles
generally
accepted
in
the
United
States
of
America
(“U.S.
GAAP”),
which
may
require
the
use
of
estimates
made
by
management
and
the
evaluation
of
subsequent
events.
Actual
results
may
differ
from
those
estimates.
Each
Fund
is
an
investment
company
and
follows
accounting
guidance
in
the
Financial
Accounting
Standards
Board
(“FASB”)
Accounting
Standards
Codification
946,
Financial
Services
—
Investment
Companies.
The
NAV
for
financial
reporting
purposes
may
differ
from
the
NAV
for
processing
security
and shareholder
transactions.
The
NAV
for
financial
reporting
purposes
includes
security
and
common
share
transactions
through
the
date
of
the
report.
Total
return
is
computed
based
on
the
NAV
used
for
processing
security
and
common
share
transactions.
The
following
is
a
summary
of
the
significant
accounting
policies
consistently
followed
by
the
Funds.
Compensation:
The
Trust
pays
no
compensation
directly
to
those
of its
officers,
all
of
whom
receive
remuneration
for
their
services
to
the
Trust
from
the
Adviser
or
its
affiliates.
The
Funds’
Board
of Directors
(the
"Board")
has
adopted
a
deferred
compensation
plan
for
independent directors that
enables directors
to
elect
to
defer
receipt
of
all
or
a
portion
of
the
annual
compensation
they
are
entitled
to
receive
from
certain
Nuveen-advised
funds.
Under
the
plan,
deferred
amounts
are
treated
as
though
equal
dollar
amounts
had
been
invested
in
shares
of
select
Nuveen-advised
funds.
Custodian
Fee
Credit:
As
an
alternative
to
overnight
investments,
each
Fund
has
an
arrangement
with
its
custodian
bank,
State
Street
Bank
and
Trust
Company,
(the
“Custodian”)
whereby
certain
custodian
fees
and
expenses
are
reduced
by
net
credits
earned
on
each
Fund’s
cash
on
deposit
with
the
bank.
Credits
for
cash
balances
may
be
offset
by
charges
for
any
days
on
which
a
Fund
overdraws
its
account
at
the
Custodian.
The
amount
of
custodian
fee
credit
earned
by
a
Fund
is
recognized
on
the
Statement
of
Operations
as
a
component
of
“Custodian
expenses,
net.”
During
the
current
reporting
period,
the
custodian
fee
credit
earned
by
each
Fund
was
as
follows:
Distributions
to
Shareholders:
Distributions
to
shareholders
are
recorded
on
the
ex-dividend
date.
The
amount,
character
and
timing
of
distributions
are
determined
in
accordance
with
federal
income
tax
regulations,
which
may
differ
from
U.S.
GAAP.
Indemnifications:
Under
the
Trust’s
organizational
documents,
its
officers
and directors
are
indemnified
against
certain
liabilities
arising
out
of
the
performance
of
their
duties
to
the
Trust.
In
addition,
in
the
normal
course
of
business,
the
Trust
enters
into
contracts
that
provide
general
indemnifications
to
other
parties.
The
Trust’s
maximum
exposure
under
these
arrangements
is
unknown
as
this
would
involve
future
claims
that
may
be
made
against
the
Trust
that
have
not
yet
occurred.
However,
the
Trust
has
not
had
prior
claims
or
losses
pursuant
to
these
contracts
and
expects
the
risk
of
loss
to
be
remote.
Fund
Gross
Custodian
Fee
Credits
Minnesota
Intermediate
$
4,072
Minnesota
11,425
Nebraska
13,465
Oregon
Intermediate
12,264
Investments
and
Investment
Income:
Securities
transactions
are
accounted
for
as
of
the
trade
date
for
financial
reporting
purposes.
Realized
gains
and
losses
on
securities
transactions
are
based
upon
the
specific
identification
method.
Investment
income
is
comprised
of
interest
income,
which
is
recorded
on
an
accrual
basis
and
includes
accretion
of
discounts
and
amortization
of
premiums
for
financial
reporting
purposes.
Investment
income
also
reflects
payment-in-kind
(
“
PIK
”
)
interest
and
paydown
gains
and
losses,
if
any.
PIK
interest
represents
income
received
in
the
form
of
securities
in
lieu
of
cash.
Multiclass
Operations
and
Allocations:
Income
and
expenses
of
the
Funds
that
are
not
directly
attributable
to
a
specific
class
of
shares
are
prorated
among
the
classes
based
on
the
relative
net
assets
of
each
class.
Expenses
directly
attributable
to
a
class
of
shares
are
recorded
to
the
specific
class.
12b-1
distribution
and
service
fees
are
allocated
on
a
class-specific
basis.
Realized
and
unrealized
capital
gains
and
losses
of
the
Funds
are
prorated
among
the
classes
based
on
the
relative
net
assets
of
each
class.
Netting
Agreements:
In
the
ordinary
course
of
business,
the
Funds
may
enter
into
transactions
subject
to
enforceable International
Swaps
and
Derivatives
Association,
Inc.
(ISDA)
master
agreements
or
other
similar
arrangements
(“netting
agreements”).
Generally,
the
right
to
offset
in
netting
agreements
allows
each
Fund
to
offset
certain
securities
and
derivatives
with
a
specific
counterparty,
when
applicable,
as
well
as
any
collateral
received
or
delivered
to
that
counterparty
based
on
the
terms
of
the
agreements.
Generally,
each
Fund
manages
its
cash
collateral
and
securities
collateral
on
a
counterparty
basis.
With
respect
to
certain
counterparties,
in
accordance
with
the
terms
of
the
netting
agreements,
collateral
posted
to
the
Funds
is
held
in
a
segregated
account
by
the
Funds’
custodian
and/or
with
respect
to
those
amounts
which
can
be
sold
or
repledged,
are
presented
in
the
Funds’
Portfolio
of
Investments
or
Statement
of
Assets
and
Liabilities.
The
Funds’
investments
subject
to
netting
agreements
as
of
the
end
of
the
reporting
period,
if
any,
are
further
described
later
in
these
Notes
to
Financial
Statements.
3.
Investment
Valuation
and
Fair
Value
Measurements
The
Funds’
investments
in
securities
are
recorded
at
their
estimated
fair
value
utilizing
valuation
methods
approved
by
the
Adviser,
subject
to
oversight
of
the Board.
Fair
value
is
defined
as
the
price
that
would
be
received
upon
selling
an
investment
or
transferring
a
liability
in
an
orderly
transaction
to
an
independent
buyer
in
the
principal
or
most
advantageous
market
for
the
investment.
U.S.
GAAP
establishes
the
three-tier
hierarchy
which
is
used
to
maximize
the
use
of
observable
market
data
and
minimize
the
use
of
unobservable
inputs
and
to
establish
classification
of
fair
value
measurements
for
disclosure
purposes.
Observable
inputs
reflect
the
assumptions
market
participants
would
use
in
pricing
the
asset
or
liability.
Observable
inputs
are
based
on
market
data
obtained
from
sources
independent
of
the
reporting
entity.
Unobservable
inputs
reflect
management’s
assumptions
about
the
assumptions
market
participants
would
use
in
pricing
the
asset
or
liability.
Unobservable
inputs
are
based
on
the
best
information
available
in
the
circumstances.
The
following
is
a
summary
of
the
three-tiered
hierarchy
of
valuation
input
levels.
Level
1
–
Inputs
are
unadjusted
and
prices
are
determined
using
quoted
prices
in
active
markets
for
identical
securities.
Level
2
–
Prices
are
determined
using
other
significant
observable
inputs
(including
quoted
prices
for
similar
securities,
interest
rates,
credit
spreads,
etc.).
Level
3
–
Prices
are
determined
using
significant
unobservable
inputs
(including
management’s
assumptions
in
determining
the
fair
value
of
investments).
A
description
of
the
valuation
techniques
applied
to
the
Funds’
major
classifications
of
assets
and
liabilities
measured
at
fair
value
follows:
Prices
of
fixed-income
securities
are
generally
provided
by
pricing
services
approved
by
the
Adviser,
which
is
subject
to
review
by
the
Adviser
and
oversight
of
the
Board. Pricing
services
establish
a
security’s
fair
value
using
methods
that
may
include
consideration
of
the
following:
yields
or
prices
of
investments
of
comparable
quality,
type
of
issue,
coupon,
maturity
and
rating,
market
quotes
or
indications
of
value
from
security
dealers,
evaluations
of
anticipated
cash
flows
or
collateral,
general
market
conditions
and
other
information
and
analysis,
including
the
obligor’s
credit
characteristics
considered
relevant.
In
pricing
certain
securities,
particularly
less
liquid
and
lower
quality
securities,
pricing
services
may
consider
information
about
a
security,
its
issuer
or
market
activity
provided
by
the
Adviser.
These
securities
are
generally
classified
as
Level
2.
For
any
portfolio
security
or
derivative
for
which
market
quotations
are
not
readily
available
or
for
which
the
Adviser
deems
the
valuations
derived
using
the
valuation
procedures
described
above
not
to
reflect
fair
value,
the
Adviser
will
determine
a
fair
value
in
good
faith
using
alternative
procedures
approved
by
the
Adviser,
subject
to
the
oversight
of
the
Board.
As
a
general
principle,
the
fair
value
of
a
security
is
the
amount
that
the
owner
might
reasonably
expect
to
receive
for
it
in
a
current
sale.
A
variety
of
factors
may
be
considered
in
determining
the
fair
value
of
such
securities,
which
may
include
consideration
of
the
following:
yields
or
prices
of
investments
of
comparable
quality,
type
of
issue,
coupon,
maturity
and
rating,
market
quotes
or
indications
of
value
from
security
dealers,
evaluations
of
anticipated
cash
flows
or
collateral,
general
market
conditions
and
other
information
and
analysis,
including
the
obligor’s
credit
characteristics
considered
relevant.
To
the
extent
the
inputs
are
observable
and
timely,
the
values
would
be
classified
as
Level
2;
otherwise
they
would
be
classified
as
Level
3.
The
following
table
summarizes
the
market
value
of
the
Funds’
investments
as
of
the
end
of
the
reporting
period,
based
on
the
inputs
used
to
value
them:
Notes
to
Financial
Statements
(continued)
The
Funds
hold
liabilities
in
floating
rate
obligations,
where
applicable,
which
are
not
reflected
in
the
tables
above.
The
fair
values
of
the
Funds'
liabilities
for
floating
rate
obligations
approximate
their
liquidation
values.
Floating
rate
obligations
are
generally
classified
as
Level
2
and
further
described
in
these
Notes
to
Financial
Statements.
4.
Portfolio
Securities
Inverse
Floating
Rate
Securities:
Each
Fund
is
authorized
to
invest
in
inverse
floating
rate
securities.
An
inverse
floating
rate
security
is
created
by
depositing
a
municipal
bond
(referred
to
as
an
“Underlying
Bond”),
typically
with
a
fixed
interest
rate,
into
a
special
purpose
tender
option
bond
(“TOB”)
trust
(referred
to
as
the
“TOB
Trust”)
created
by
or
at
the
direction
of
one
or
more
Funds.
In
turn,
the
TOB
Trust
issues
(a)
floating
rate
certificates
(referred
to
as
“Floaters”),
in
face
amounts
equal
to
some
fraction
of
the
Underlying
Bond’s
par
amount
or
market
value,
and
(b)
an
inverse
floating
rate
certificate
(referred
to
as
an
“Inverse
Floater”)
that
represents
all
remaining
or
residual
interest
in
the
TOB
Trust.
Floaters
typically
pay
short-term
tax-exempt
interest
rates
to
third
parties
who
are
also
provided
a
right
to
tender
their
certificate
and
receive
its
par
value,
which
may
be
paid
from
the
proceeds
of
a
remarketing
of
the
Floaters,
by
a
loan
to
the
TOB
Trust
from
a
third
party
liquidity
provider
(“Liquidity
Provider”),
or
by
the
sale
of
assets
from
the
TOB
Trust.
The
Inverse
Floater
is
issued
to
a
long
term
investor,
such
as
one
or
more
of
the
Funds.
The
income
received
by
the
Inverse
Floater
holder
varies
inversely
with
the
short-term
rate
paid
to
holders
of
the
Floaters,
and
in
most
circumstances
the
Inverse
Floater
holder
bears
substantially
all
of
the
Underlying
Bond’s
downside
investment
risk
and
also
benefits
disproportionately
from
any
potential
appreciation
of
the
Underlying
Bond’s
value.
The
value
of
an
Inverse
Floater
will
be
more
volatile
than
that
of
the
Underlying
Bond
because
the
interest
rate
is
dependent
on
not
only
the
fixed
coupon
rate
of
the
Underlying
Bond
but
also
on
the
short-term
interest
paid
on
the
Floaters,
and
because
the
Inverse
Floater
essentially
bears
the
risk
of
loss
(and
possible
gain)
of
the
greater
face
value
of
the
Underlying
Bond.
The
Inverse
Floater
held
by
a
Fund
gives
the
Fund
the
right
to
(a)
cause
the
holders
of
the
Floaters
to
tender
their
certificates
at
par
(or
slightly
more
than
par
in
certain
circumstances),
and
(b)
have
the
trustee
of
the
TOB
Trust
(the
“Trustee”)
transfer
the
Underlying
Bond
held
by
the
TOB
Trust
to
the
Fund,
thereby
collapsing
the
TOB
Trust.
The
Fund
may
acquire
an
Inverse
Floater
in
a
transaction
where
it
(a)
transfers
an
Underlying
Bond
that
it
owns
to
a
TOB
Trust
created
by
a
third
party
or
(b)
transfers
an
Underlying
Bond
that
it
owns,
or
that
it
has
purchased
in
a
secondary
market
transaction
for
the
purpose
of
creating
an
Inverse
Floater,
to
a
TOB
Trust
created
at
its
direction,
and
in
return
receives
the
Inverse
Floater
of
the
TOB
Trust
(referred
to
as
a
“self-deposited
Inverse
Floater”).
A
Fund
may
also
purchase
an
Inverse
Floater
in
a
secondary
market
transaction
from
a
third
party
creator
of
the
TOB
Trust
without
first
owning
the
Underlying
Bond
(referred
to
as
an
“externally-deposited
Inverse
Floater”).
An
investment
in
a
self-deposited
Inverse
Floater
is
accounted
for
as
a
“financing”
transaction
(i.e.,
a
secured
borrowing).
For
a
self-deposited
Inverse
Floater,
the
Underlying
Bond
deposited
into
the
TOB
Trust
is
identified
in
the
Fund’s
Portfolio
of
Investments
as
“(UB)
–
Underlying
bond
of
an
inverse
floating
rate
trust
reflected
as
a
financing
transaction,”
with
the
Fund
recognizing
as
liabilities,
labeled
“Floating
rate
obligations”
on
the
Statement
of
Assets
and
Liabilities,
(a)
the
liquidation
value
of
Floaters
issued
by
the
TOB
Trust,
and
(b)
the
amount
of
any
borrowings
by
the
TOB
Trust
from
a
Liquidity
Provider
to
enable
the
TOB
Trust
to
purchase
outstanding
Floaters
in
lieu
of
a
remarketing.
In
addition,
the
Fund
recognizes
in
“Investment
Income”
the
entire
earnings
of
the
Underlying
Bond,
and
recognizes
(a)
the
interest
paid
to
the
holders
of
the
Floaters
or
on
the
TOB
Minnesota
Intermediate
Level
1
Level
2
Level
3
Total
Long-Term
Investments:
Municipal
Bonds
$
–
$
314,794,043
$
–
$
314,794,043
Short-Term
Investments:
Municipal
Bonds
–
3,150,000
–
3,150,000
Total
$
–
$
317,944,043
$
–
$
317,944,043
Minnesota
Level
1
Level
2
Level
3
Total
Long-Term
Investments:
Municipal
Bonds
$
–
$
569,593,975
$
–
$
569,593,975
Short-Term
Investments:
Municipal
Bonds
–
21,190,000
–
21,190,000
Total
$
–
$
590,783,975
$
–
$
590,783,975
Nebraska
Level
1
Level
2
Level
3
Total
Long-Term
Investments:
Municipal
Bonds
$
–
$
73,443,040
$
–
$
73,443,040
Total
$
–
$
73,443,040
$
–
$
73,443,040
Oregon
Intermediate
Level
1
Level
2
Level
3
Total
Long-Term
Investments:
Municipal
Bonds
$
–
$
176,231,555
$
–
$
176,231,555
Short-Term
Investments:
Municipal
Bonds
–
6,800,000
–
6,800,000
Total
$
–
$
183,031,555
$
–
$
183,031,555
Trust’s
borrowings,
and
(b)
other
expenses
related
to
remarketing,
administration,
trustee,
liquidity
and
other
services
to
a
TOB
Trust,
as
a
component
of
“Interest
expense”
on
the
Statement
of
Operations.
Earnings
due
from
the
Underlying
Bond
and
interest
due
to
the
holders
of
the
Floaters
as
of
the
end
of
the
reporting
period
are
recognized
as
components
of
“Receivable
for
interest”
and
“Payable
for
interest”
on
the
Statement
of
Assets
and
Liabilities,
respectively.
In
contrast,
an
investment
in
an
externally-deposited
Inverse
Floater
is
accounted
for
as
a
purchase
of
the
Inverse
Floater
and
is
identified
in
the
Fund’s
Portfolio
of
Investments
as
“(IF)
–
Inverse
floating
rate
investment.”
For
an
externally-deposited
Inverse
Floater,
a
Fund’s
Statement
of
Assets
and
Liabilities
recognizes
the
Inverse
Floater
and
not
the
Underlying
Bond
as
an
asset,
and
the
Fund
does
not
recognize
the
Floaters,
or
any
related
borrowings
from
a
Liquidity
Provider,
as
a
liability.
Additionally,
the
Fund
reflects
in
“Investment
Income”
only
the
net
amount
of
earnings
on
the
Inverse
Floater
(net
of
the
interest
paid
to
the
holders
of
the
Floaters
or
the
Liquidity
Provider
as
lender,
and
the
expenses
of
the
Trust),
and
does
not
show
the
amount
of
that
interest
paid
or
the
expenses
of
the
TOB
Trust
as
described
above
as
interest
expense
on
the
Statement
of
Operations.
Fees
paid
upon
the
creation
of
a
TOB
Trust
for
self-deposited
Inverse
Floaters
and
externally-deposited
Inverse
Floaters
are
recognized
as
part
of
the
cost
basis
of
the
Inverse
Floater
and
are
capitalized
over
the
term
of
the
TOB
Trust.
During
the
current
fiscal
period,
the
Funds
did
not
have
any
transactions
in
self-deposited
Inverse
Floaters
and/or
externally-deposited
Inverse
Floaters.
Zero
Coupon
Securities:
A
zero
coupon
security
does
not
pay
a
regular
interest
coupon
to
its
holders
during
the
life
of
the
security.
Income
to
the
holder
of
the
security
comes
from
accretion
of
the
difference
between
the
original
purchase
price
of
the
security
at
issuance
and
the
par
value
of
the
security
at
maturity
and
is
effectively
paid
at
maturity.
The
market
prices
of
zero
coupon
securities
generally
are
more
volatile
than
the
market
prices
of
securities
that
pay
interest
periodically.
Purchases
and
Sales:
Long-term
purchases
and
sales
during
the
current
fiscal
period
were
as
follows:
The
Funds
may
purchase
securities
on
a
when-issued
or
delayed-delivery
basis.
Securities
purchased
on
a
when-issued
or
delayed-delivery
basis
may
have
extended
settlement
periods;
interest
income
is
not
accrued
until
settlement
date.
Any
securities
so
purchased
are
subject
to
market
fluctuation
during
this
period. If
a
Fund
has
outstanding
when-issued/delayed-delivery
purchases
commitments
as
of
the
end
of
the
reporting
period,
such
amounts
are
recognized
on
the
Statement
of
Assets
and
Liabilities.
5.
Derivative
Investments
Each
Fund
is
authorized
to
invest
in
certain
derivative
instruments.
As
defined
by
U.S.
GAAP,
a
derivative
is
a
financial
instrument
whose
value
is
derived
from
an
underlying
security
price,
foreign
exchange
rate,
interest
rate,
index
of
prices
or
rates,
or
other
variables.
Investments
in
derivatives
as
of
the
end
of
and/or
during
the
current
fiscal
period,
if
any,
are
included
within
the
Statement
of
Assets
and
Liabilities
and
the
Statement
of
Operations,
respectively.
Market
and
Counterparty
Credit
Risk:
In
the
normal
course
of
business
each
Fund
may
invest
in
financial
instruments
and
enter
into
financial
transactions
where
risk
of
potential
loss
exists
due
to
changes
in
the
market
(market
risk)
or
failure
of
the
other
party
to
the
transaction
to
perform
(counterparty
credit
risk).
The
potential
loss
could
exceed
the
value
of
the
financial
assets
recorded
on
the
financial
statements.
Financial
assets,
which
potentially
expose
each
Fund
to
counterparty
credit
risk,
consist
principally
of
cash
due
from
counterparties
on
forward,
option
and
swap
transactions,
when
applicable.
The
extent
of
each
Fund’s
exposure
to
counterparty
credit
risk
in
respect
to
these
financial
assets
approximates
their
carrying
value
as
recorded
on
the
Statement
of
Assets
and
Liabilities.
Each
Fund
helps
manage
counterparty
credit
risk
by
entering
into
agreements
only
with
counterparties
the
Adviser
believes
have
the
financial
resources
to
honor
their
obligations
and
by
having
the
Adviser
monitor
the
financial
stability
of
the
counterparties.
Additionally,
counterparties
may
be
required
to
pledge
collateral
daily
(based
on
the
daily
valuation
of
the
financial
asset)
on
behalf
of
each
Fund
with
a
value
approximately
equal
to
the
amount
of
any
unrealized
gain
above
a
pre-determined
threshold.
Reciprocally,
when
each
Fund
has
an
unrealized
loss,
the
Funds
have
instructed
the
custodian
to
pledge
assets
of
the
Funds
as
collateral
with
a
value
approximately
equal
to
the
amount
of
the
unrealized
loss
above
a
pre-determined
threshold.
Collateral
pledges
are
monitored
and
subsequently
adjusted
if
and
when
the
valuations
fluctuate,
either
up
or
down,
by
at
least
the
pre-determined
threshold
amount.
Fund
Non-U.S.
Government
Purchases
Non-U.S.
Government
Sales
and
Maturities
Minnesota
Intermediate
$
67,746,793
$
85,934,248
Minnesota
188,461,196
144,258,323
Nebraska
17,132,418
40,155,826
Oregon
Intermediate
36,108,687
36,239,236
Notes
to
Financial
Statements
(continued)
6.
Fund
Shares
Transactions
in Fund
shares
during
the
current
and
prior
fiscal
period
were
as
follows:
Year
Ended
5/31/24
Year
Ended
5/31/23
Minnesota
Intermediate
Shares
Amount
Shares
Amount
Subscriptions:
Class
A
2,328,262
$22,465,347
2,789,851
$27,013,440
Class
A
-
automatic
conversion
of
Class
C
771
7,440
8,242
80,450
Class
C
68,845
654,332
262,673
2,528,629
Class
I
10,495,977
100,395,786
17,440,833
168,553,777
Total
subscriptions
12,893,855
123,522,905
20,501,599
198,176,296
Reinvestments
of
distributions:
Class
A
237,324
2,289,705
232,020
2,246,644
Class
C
16,897
161,909
17,629
169,632
Class
I
430,917
4,138,263
353,580
3,412,325
Total
reinvestments
of
distributions
685,138
6,589,877
603,229
5,828,601
Redemptions:
Class
A
(2,298,901)
(22,137,569)
(5,685,631)
(54,937,767)
Class
C
(336,575)
(3,217,490)
(540,123)
(5,178,814)
Class
C
-
automatic
conversion
to
Class
A
(776)
(7,440)
(8,295)
(80,450)
Class
I
(12,593,914)
(120,631,353)
(20,100,859)
(193,685,029)
Total
redemptions
(15,230,166)
(145,993,852)
(26,334,908)
(253,882,060)
Net
increase
(decrease)
(1,651,173)
$(15,881,070)
(5,230,080)
$(49,877,163)
Year
Ended
5/31/24
Year
Ended
5/31/23
Minnesota
Shares
Amount
Shares
Amount
Subscriptions:
Class
A
4,709,617
$50,010,200
5,881,876
$63,049,418
Class
A
-
automatic
conversion
of
Class
C
2,704
27,891
10,380
110,932
Class
C
242,951
2,593,198
242,093
2,596,407
Class
I
17,406,199
184,921,962
17,074,413
183,347,217
Total
subscriptions
22,361,471
237,553,251
23,208,762
249,103,974
Reinvestments
of
distributions:
Class
A
632,041
6,712,317
554,479
5,932,614
Class
C
35,529
376,856
40,745
435,311
Class
I
897,129
9,521,132
692,034
7,392,753
Total
reinvestments
of
distributions
1,564,699
16,610,305
1,287,258
13,760,678
Redemptions:
Class
A
(4,562,203)
(48,218,143)
(7,468,397)
(79,838,129)
Class
C
(696,881)
(7,402,095)
(936,887)
(10,013,512)
Class
C
-
automatic
conversion
to
Class
A
(2,706)
(27,891)
(10,390)
(110,932)
Class
I
(12,618,035)
(133,337,249)
(23,447,084)
(250,010,649)
Total
redemptions
(17,879,825)
(188,985,378)
(31,862,758)
(339,973,222)
Net
increase
(decrease)
6,046,345
$65,178,178
(7,366,738)
$(77,108,570)
7.
Income
Tax
Information
Each
Fund
is
a
separate
taxpayer
for
federal
income
tax
purposes.
Each
Fund
intends
to
distribute
substantially
all
of
its
net
investment
income
and
net
capital
gains
to
shareholders
and
otherwise
comply
with
the
requirements
of
Subchapter
M
of
the
Internal
Revenue
Code
applicable
to
regulated
investment
companies.
Therefore,
no
federal
income
tax
provision
is
required.
Each
Fund
intends
to
satisfy
conditions
that
will
enable
interest
from
municipal
securities,
which
is
exempt
from
regular
federal
and
designated
state
income
taxes,
to
retain
such
tax-exempt
status
when
distributed
to
shareholders
of
the
Funds.
Net
realized
capital
gains
and
ordinary
income
distributions
paid
by
the
Funds
are
subject
to
federal
taxation.
Each
Fund
files
income
tax
returns
in
U.S.
federal
and
applicable
state
and
local
jurisdictions.
A
Fund's
federal
income
tax
returns
are
generally
subject
to
examination
for
a
period
of
three
fiscal
years
after
being
filed.
State
and
local
tax
returns
may
be
subject
to
examination
for
an
additional
period
of
time
depending
on
the
jurisdiction.
Management
has
analyzed
each
Fund's
tax
positions
taken
for
all
open
tax
years
and
has
concluded
that
no
provision
for
income
tax
is
required
in
the
Fund's
financial
statements.
Differences
between
amounts
for
financial
statement
and
federal
income
tax
purposes
are
primarily
due
to
timing
differences
in
recognizing
gains
and
losses
on
investment
transactions.
Temporary
differences
do
not
require
reclassification.
As
of
year
end,
permanent
differences
that
resulted
in
reclassifications
among
the
components
of
net
assets
relate
primarily
to
taxable
market
discount.
Temporary
and
permanent
differences
have
no
impact
on
a
Fund's
net
assets.
Year
Ended
5/31/24
Year
Ended
5/31/23
Nebraska
Shares
Amount
Shares
Amount
Subscriptions:
Class
A
277,481
$2,686,518
208,483
$2,024,223
Class
A
-
automatic
conversion
of
Class
C
—
—
399
3,953
Class
C
10,038
98,930
6,276
60,828
Class
I
1,366,474
13,289,205
1,608,194
15,724,248
Total
subscriptions
1,653,993
16,074,653
1,823,352
17,813,252
Reinvestments
of
distributions:
Class
A
96,720
936,783
92,243
894,307
Class
C
2,492
24,104
2,575
24,919
Class
I
97,276
942,596
106,868
1,038,119
Total
reinvestments
of
distributions
196,488
1,903,483
201,686
1,957,345
Redemptions:
Class
A
(1,218,369)
(11,787,797)
(1,262,121)
(12,231,169)
Class
C
(114,203)
(1,101,721)
(68,518)
(668,675)
Class
C
-
automatic
conversion
to
Class
A
—
—
(400)
(3,953)
Class
I
(3,312,435)
(31,320,899)
(2,490,881)
(24,159,334)
Total
redemptions
(4,645,007)
(44,210,417)
(3,821,920)
(37,063,131)
Net
increase
(decrease)
(2,794,526)
$(26,232,281)
(1,796,882)
$(17,292,534)
Year
Ended
5/31/24
Year
Ended
5/31/23
Oregon
Intermediate
Shares
Amount
Shares
Amount
Subscriptions:
Class
A
568,714
$5,521,250
495,926
$4,824,693
Class
C
26,668
255,785
32,843
310,824
Class
I
6,775,560
65,577,368
8,221,090
79,673,264
Total
subscriptions
7,370,942
71,354,403
8,749,859
84,808,781
Reinvestments
of
distributions:
Class
A
58,731
567,606
56,538
546,892
Class
C
3,593
34,554
3,466
33,349
Class
I
271,899
2,634,358
221,065
2,142,568
Total
reinvestments
of
distributions
334,223
3,236,518
281,069
2,722,809
Redemptions:
Class
A
(779,457)
(7,514,114)
(1,157,260)
(11,158,922)
Class
C
(101,027)
(974,263)
(102,432)
(986,891)
Class
I
(6,913,041)
(66,172,225)
(11,851,506)
(114,169,160)
Total
redemptions
(7,793,525)
(74,660,602)
(13,111,198)
(126,314,973)
Net
increase
(decrease)
(88,360)
$(69,681)
(4,080,270)
$(38,783,383)
Notes
to
Financial
Statements
(continued)
As
of
year
end,
the
aggregate
cost
and
the
net
unrealized
appreciation/(depreciation)
of
all
investments
for
federal
income
tax
purposes
were
as
follows:
For
purposes
of
this
disclosure,
tax
cost
generally
includes
the
cost
of
portfolio
investments
as
well
as
up-front
fees
or
premiums
exchanged
on
derivatives
and
any
amounts
unrealized
for
income
statement
reporting
but
realized
income
and/or
capital
gains
for
tax
reporting,
if
applicable.
As
of
year
end,
the
components
of
accumulated
earnings
on
a
tax
basis
were
as
follows:
The
tax
character
of
distributions
paid
was
as
follows:
As
of
year
end,
the
Funds
had
capital
loss
carryforwards,
which
will
not
expire:
8.
Management
Fees
and
Other
Transactions
with
Affiliates
Management
Fees:
Each
Fund’s
management
fee
compensates
the
Adviser
for
the
overall
investment
advisory
and
administrative
services
and
general
office
facilities.
The
Sub-Adviser
is
compensated
for
its
services
to
the
Funds
from
the
management
fees
paid
to
the
Adviser.
Fund
Tax
Cost
Gross
Unrealized
Appreciation
Gross
Unrealized
(Depreciation)
Net
Unrealized
Appreciation
(Depreciation)
Minnesota
Intermediate
$
324,758,712
$
1,237,766
$
(8,052,435)
$
(6,814,669)
Minnesota
607,795,412
4,181,981
(21,193,418)
(17,011,437)
Nebraska
76,048,159
313,753
(2,918,872)
(2,605,119)
Oregon
Intermediate
185,532,913
854,291
(3,355,649)
(2,501,358)
Fund
Undistributed
Tax-Exempt
Income
1
Undistributed
Ordinary
Income
Undistributed
Long-Term
Capital
Gains
Unrealized
Appreciation
(Depreciation)
Capital
Loss
Carryforwards
Late-Year
Loss
Deferrals
Other
Book-to-Tax
Differences
Total
Minnesota
Intermediate
$
1,234,560
$
—
$
—
$
(6,814,669)
$
(17,689,393)
$
—
$
(870,522)
$
(24,140,024)
Minnesota
2,542,135
37
—
(17,011,437)
(52,553,113)
—
(1,830,727)
(68,853,105)
Nebraska
372,975
—
—
(2,605,119)
(13,150,154)
—
(180,951)
(15,563,249)
Oregon
Intermediate
733,600
—
—
(2,501,358)
(14,072,482)
—
(422,029)
(16,262,269)
1
Undistributed
tax-exempt
income
(on
a
tax
basis)
has
not
been
reduced
for
the
dividends
declared
during
the
period
May
1,
2024
through
May
31,
2024
and
paid
on
June
3,
2024.
1
Each
Fund
designates
these
amounts
paid
during
the
period
as
Exempt
Interest
Dividends.
Fund
Short-Term
Long-Term
Total
Minnesota
Intermediate
$
9,187,153
$
8,502,240
$
17,689,393
Minnesota
22,818,369
29,734,744
52,553,113
Nebraska
3,315,168
9,834,986
13,150,154
Oregon
Intermediate
6,368,412
7,704,070
14,072,482
Each
Fund’s
management
fee
consists
of
two
components
–
a
fund-level
fee,
based
only
on
the
amount
of
assets
within
each
individual
Fund,
and
a
complex-level
fee,
based
on
the
aggregate
amount
of
all
eligible
fund
assets
managed
by
the
Adviser.
This
pricing
structure
enables
each
Fund’s
shareholders
to
benefit
from
growth
in
the
assets
within
their
respective
Fund
as
well
as
from
growth
in
the
amount
of
complex-wide
assets
managed
by
the
Adviser.
Annual
fund-level
fee,
payable
monthly,
for
each
Fund
was
calculated
according
to
the
following
schedule:
For
the
period
June
1,
2023
through
April
30,
2024,
the
annual
complex-level
fee,
payable
monthly,
for
each
Fund
was
calculated
according
to
the
following
schedule:
*
The
complex-level
fee
is
calculated
based
upon
the
aggregate
daily
“eligible
assets”
of
all
Nuveen
open-end
and
closed-end
funds.
Eligible
assets
do
not
include
assets
attributable
to
investments
in
other
Nuveen
funds
or
assets
in
excess
of
a
determined
amount
(originally
$2
billion)
added
to
the
Nuveen
fund
complex
in
connection
with
the
Adviser’s
assumption
of
the
management
of
the
former
First
American
Funds
effective
January
1,
2011,
but
do
include
certain
assets
of
certain
Nuveen
funds
that
were
reorganized
into
funds
advised
by
an
affiliate
of
the
Adviser
during
the
2019
calendar
year.
Eligible
assets
include
closed-end
fund
assets
managed
by
the
Adviser
that
are
attributable
to
certain
types
of
leverage.
For
these
purposes,
leverage
includes
the
closed-end
funds’
use
of
preferred
stock
and
borrowings
and
certain
investments
in
the
residual
interest
certificates
(also
called
inverse
floating
rate
securities)
in
tender
option
bond
(TOB)
trusts,
including
the
portion
of
assets
held
by
a
TOB
trust
that
has
been
effectively
financed
by
the
trust’s
issuance
of
floating
rate
securities,
subject
to
an
agreement
by
the
Adviser
as
to
certain
funds
to
limit
the
amount
of
such
assets
for
determining
eligible
assets
in
certain
circumstances.
Average
Daily
Net
Assets
Minnesota
Intermediate
Minnesota
Nebraska
Oregon
Intermediate
For
the
first
$125
million
0.3500
%
0.3500
%
0.3500
%
0.3500
%
For
the
next
$125
million
0.3375
0.3375
0.3375
0.3375
For
the
next
$250
million
0.3250
0.3250
0.3250
0.3250
For
the
next
$500
million
0.3125
0.3125
0.3125
0.3125
For
the
next
$1
billion
0.3000
0.3000
0.3000
0.3000
For
the
next
$3
billion
0.2750
0.2750
0.2750
0.2750
For
the
next
$5
billion
0.2500
0.2500
0.2500
0.2500
For
net
assets
over
$10
billion
0.2375
0.2375
0.2375
0.2375
Complex-Level
Eligible
Asset
Breakpoint
Level*
Effective
Complex-Level
Fee
Rate
at
Breakpoint
Level
$55
billion
0.2000
%
$56
billion
0.1996
$57
billion
0.1989
$60
billion
0.1961
$63
billion
0.1931
$66
billion
0.1900
$71
billion
0.1851
$76
billion
0.1806
$80
billion
0.1773
$91
billion
0.1691
$125
billion
0.1599
$200
billion
0.1505
$250
billion
0.1469
$300
billion
0.1445
Notes
to
Financial
Statements
(continued)
Effective
May
1,
2024,
the
annual
complex-level
fee,
payable
monthly,
for
each
Fund
is
calculated
according
to
the
following
schedule:
*
The
complex-level
fee
is
calculated
based
upon
the
aggregate
daily
“eligible
assets”
of
all
Nuveen-branded
closed-end
funds
and
Nuveen
branded
open-end
funds
(“Nuveen
Mutual
Funds”).
Except
as
described
below,
eligible
assets
include
the
assets
of
all
Nuveen-branded
closed-end
funds
and
Nuveen
Mutual
Funds
organized
in
the
United
States.
Eligible
assets
do
not
include
the
net
assets
of:
Nuveen
fund-of-funds,
Nuveen
money
market
funds,
Nuveen
index
funds,
Nuveen
Large
Cap
Responsible
Equity
Fund
or
Nuveen
Life
Large
Cap
Responsible
Equity
Fund.
In
addition,
eligible
assets
include
a
fixed
percentage
of
the
aggregate
net
assets
of
the
active
equity
and
fixed
income
Nuveen
Mutual
Funds
advised
by
the
Adviser’s
affiliate,
Teachers
Advisors,
LLC
(except
those
identified
above).
The
fixed
percentage
will
increase
annually
until
May
1,
2033,
at
which
time
eligible
assets
will
include
all
of
the
aggregate
net
assets
of
the
active
equity
and
fixed
income
Nuveen
Mutual
Funds
advised
by
Teachers
Advisors,
LLC
(except
those
identified
above).
Eligible
assets
include
closed-end
fund
assets
managed
by
the
Adviser
that
are
attributable
to
financial
leverage.
For
these
purposes,
financial
leverage
includes
the
closed-end
funds’
use
of
preferred
stock
and
borrowings
and
certain
investments
in
the
residual
interest
certificates
(also
called
inverse
floating
rate
securities)
in
tender
option
bond
(TOB)
trusts,
including
the
portion
of
assets
held
by
a
TOB
trust
that
has
been
effectively
financed
by
the
trust’s
issuance
of
floating
rate
securities,
subject
to
an
agreement
by
the
Adviser
as
to
certain
funds
to
limit
the
amount
of
such
assets
for
determining
eligible
assets
in
certain
circumstances.
As
of
May
31,
2024,
the
complex-level
fee
rate
for
each
Fund
was
as
follows:
The
Adviser
has
agreed
to
waive
fees
and/or
reimburse
expenses
(“Expense
Cap”)
of
the
following
Fund
so
that
the
total
annual
Fund
operating
expenses
(excluding
12b-1
distribution
and/or
service
fees,
interest
expenses,
taxes,
acquired
fund
fees
and
expenses,
fees
incurred
in
acquiring
and
disposing
of
portfolio
securities
and
extraordinary
expenses)
do
not
exceed
the
average
daily
net
assets
of
any
class
of
Fund
shares
in
the
amounts
and
for
the
time
periods
stated
in
the
following
table:
Distribution
and
Service
Fees:
Each
Fund
has
adopted
a
distribution
and
service
plan
under
rule
12b-1
under
the
1940
Act.
Class
A
Shares
incur
a
0.20%
annual
12b-1
service
fee.
Class
C
Shares
incur
a
0.75%
annual
12b-1
distribution
fee
and
a
0.25%
annual
12b-1
service
fee.
Class
I
Shares
are
not
subject
to
12b-1
distribution
or
service
fees.
The
fees
under
this
plan
compensate
Nuveen
Securities,
LLC,
(the
“Distributor”),
a
wholly-owned
subsidiary
of
Nuveen,
for
services
provided
and
expenses
incurred
in
distributing
shares
of
the
Funds
and
establishing
and
maintaining
shareholder
accounts.
Other
Transactions
with
Affiliates:
Each
Fund
is
permitted
to
purchase
or
sell
securities
from
or
to
certain
other
funds
or
accounts
managed
by
the
Sub-Adviser
or
by
an
affiliate
of
the
Adviser (each
an,
“Affiliated
Entity”)
under
specified
conditions
outlined
in
procedures
adopted
by
the
Board
("cross-trade").
These
procedures
have
been
designed
to
ensure
that
any
cross-trade
of
securities
by
the
Fund
from
or
to
an
Affiliated
Entity
by
virtue
of
having
a
common
investment
adviser
(or
affiliated
investment
adviser),
common
officer
and/or
common
trustee
complies
with
Rule
17a-7
under
the
1940
Act.
These
transactions
are
effected
at
the
current
market
price
(as
provided
by
an
independent
pricing
service)
without
incurring
broker
commissions.
During
the
current
fiscal
period,
the
Funds
engaged
in
cross-trades
pursuant
to
these
procedures
as
follows:
Complex-Level
Asset
Breakpoint
Level*
Complex-Level
Fee
For
the
first
$124.3
billion
0.1600
%
For
the
next
$75.7
billion
0.1350
For
the
next
$200
billion
0.1325
For
eligible
assets
over
$400
billion
0.1300
Fund
Complex-Level
Fee
Minnesota
Intermediate
0
.1577%
Minnesota
0
.1577%
Nebraska
0
.1577%
Oregon
Intermediate
0
.1577%
Fund
Expense
Cap
Expense
Cap
Expiration
Date
Nebraska
0.65%
July
31,
2026
During
the
current
fiscal
period,
the
Distributor,
collected
sales
charges
on
purchases
of
Class
A
Shares,
the
majority
of
which
were
paid
out
as
concessions
to
financial
intermediaries
as
follows:
The
Distributor
also
received
12b-1
service
fees
on
Class
A
Shares,
substantially
all
of
which
were
paid
to
compensate
financial
intermediaries
for
providing
services
to
shareholders
relating
to
their
investments.
During
the
current
fiscal
period,
the
Distributor
compensated
financial
intermediaries
directly
with
commission
advances
at
the
time
of
purchase
as
follows:
To
compensate
for
commissions
advanced
to
financial
intermediaries,
all
12b-1
service
and
distribution
fees
collected
on
Class
C
Shares
during
the
first
year
following
a
purchase
are
retained
by
the
Distributor.
During
the
current
fiscal
period,
the
Distributor
retained
such
12b-1
fees
as
follows:
The
remaining
12b-1
fees
charged
to
each
Fund
were
paid
to
compensate
financial
intermediaries
for
providing
services
to
shareholders
relating
to
their
investments.
The
Distributor
also
collected
and
retained
CDSC
on
share
redemptions
during
the
current
fiscal
period,
as
follows:
Fund
Purchases
Sales
Realized
Gain
(Loss)
Minnesota
Intermediate
$
30,577,853
$
34,596,483
$
(959,684)
Minnesota
58,630,077
58,534,654
(2,147,222)
Nebraska
2,111,090
—
—
Oregon
Intermediate
535,470
—
—
Fund
Sales
Charges
Collected
(Unaudited)
Paid
to
Financial
Intermediaries
(Unaudited)
Minnesota
Intermediate
$
80,274
$
76,772
Minnesota
281,067
270,198
Nebraska
29,248
27,254
Oregon
Intermediate
39,641
39,420
Fund
Commission
Advances
(Unaudited)
Minnesota
Intermediate
$
76,687
Minnesota
269,118
Nebraska
14,961
Oregon
Intermediate
39,857
Fund
12b-1
Fees
Retained
(Unaudited)
Minnesota
Intermediate
$
11,275
Minnesota
20,742
Nebraska
1,154
Oregon
Intermediate
—
Fund
CDSC
Retained
(Unaudited)
Minnesota
Intermediate
$
1,775
Minnesota
3,515
Nebraska
1,279
Oregon
Intermediate
—
Notes
to
Financial
Statements
(continued)
9.
Borrowing
Arrangements
Committed
Line
of
Credit:
The
Funds,
along
with
certain
other
funds
managed
by
the
Adviser
(“Participating
Funds”),
have
established
a
364-day,
$2.700
billion
standby
credit
facility
with
a
group
of
lenders,
under
which
the
Participating
Funds
may
borrow
for
temporary
purposes
(other
than
on-
going
leveraging
for
investment
purposes).
Each
Participating
Fund
is
allocated
a
designated
proportion
of
the
facility’s
capacity
(and
its
associated
costs,
as
described
below)
based
upon
a
multi-factor
assessment
of
the
likelihood
and
frequency
of
its
need
to
draw
on
the
facility,
the
size
of
the
Fund
and
its
anticipated
draws,
and
the
potential
importance
of
such
draws
to
the
operations
and
well-being
of
the
Fund,
relative
to
those
of
the
other
Funds.
A
Fund
may
effect
draws
on
the
facility
in
excess
of
its
designated
capacity
if
and
to
the
extent
that
other
Participating
Funds
have
undrawn
capacity.
The
credit
facility
expires
in
June
2025
unless
extended
or
renewed.
The
credit
facility
has
the
following
terms:
0.15%
per
annum
on
unused
commitment
amounts
and
a
drawn
interest
rate
equal
to
the
higher
of
(a)
OBFR
(Overnight
Bank
Funding
Rate)
plus
1.20%
per
annum
or
(b)
the
Fed
Funds
Effective
Rate
plus
1.20%
per
annum
on
amounts
borrowed. The
Participating
Funds
also
incurred
a
0.05%
upfront
fee
on
the
increased
commitments
from
select
lenders.
Interest
expense
incurred
by
the
Participating
Funds,
when
applicable,
is
recognized
as
a
component
of
“Interest
expense”
on
the
Statement
of
Operations.
Participating
Funds
paid
administration,
legal
and
arrangement
fees,
which
are
recognized
as
a
component
of
“Interest
expense”
on
the
Statement
of
Operations,
and
along
with
commitment
fees,
have
been
allocated
among
such
Participating
Funds
based
upon
the
relative
proportions
of
the
facility’s
aggregate
capacity
reserved
for
them
and
other
factors
deemed
relevant
by
the
Adviser
and
the
Board
of
each
Participating
Fund.
During
the
current
period,
the
following
Funds
utilized
this
facility.
The
Funds’
maximum
outstanding
balance
during
the
utilization
period
was
as
follows:
During
each
Fund’s
utilization
period(s)
during
the
current
fiscal
period,
the
average
daily
balance
outstanding
and
average
annual
interest
rate
on
the
Borrowings
were
as
follows:
Borrowings
outstanding
as
of
the
end
of
the
reporting
period,
if
any,
are
recognized
as
“Borrowings”
on
the
Statement
of
Assets
and
Liabilities.
Fund
Maximum
Outstanding
Balance
Minnesota
Intermediate
$
1,997,881
Minnesota
10,800,000
Nebraska
2,025,644
Oregon
Intermediate
—
Fund
Utilization
Period
(Days
Outstanding)
Average
Daily
Balance
Outstanding
Average
Annual
Interest
Rate
Minnesota
Intermediate
11
$
1,098,815
6.46
%
Minnesota
8
7,475,588
6.44
Nebraska
7
958,276
6.53
Oregon
Intermediate
—
—
—
Important
Tax
Information
(Unaudited)
As
required
by
the
Internal
Revenue
Code
and
Treasury
Regulations,
certain
tax
information,
as
detailed
below,
must
be
provided
to
shareholders.
Shareholders
are
advised
to
consult
their
tax
advisor
with
respect
to
the
tax
implications
of
their
investment.
The
amounts
listed
below
may
differ
from
the
actual
amounts
reported
on
Form
1099-DIV,
which
will
be
sent
to
shareholders
shortly
after
calendar
year
end.
Long-Term
Capital
Gains
As
of
year
end,
each
Fund
designates
the
following
distribution
amounts,
or
maximum
amount
allowable,
as
being
from
net
long-term
capital
gains
pursuant
to
Section
852(b)(3)
of
the
Internal
Revenue
Code:
Fund
Net
Long-Term
Capital
Gains
Minnesota
Intermediate
$
—
Minnesota
—
Nebraska
—
Oregon
Intermediate
—
| Item 8. | Changes in and Disagreements with Accountants for Open-End Management Investment Companies. |
Not applicable.
| Item 9. | Proxy Disclosures for Open-End Management Investment Companies. |
Not applicable.
| Item 10. | Remuneration Paid to Directors, Officers, and Others of Open-End Management Investment Companies. |
Remuneration paid to directors, officers and others is included in the Statement of Operations under the line items “Trustee Fees” and “Management Fees” as part of the financial statements filed under Item 7 of this Form N-CSR.
| Item 11. | Statement Regarding Basis for Approval of Investment Advisory Contract. |
Nuveen Minnesota Intermediate Municipal Bond Fund
Nuveen Minnesota Municipal Bond Fund
Nuveen Nebraska Municipal Bond Fund
Nuveen Oregon Intermediate Municipal Bond Fund
The Approval Process
At meetings held on April 18 and 19, 2024 (the “Meeting”), the Board of Directors (collectively, the “Board” and each Director, a “Board Member”) of Nuveen Investment Funds, Inc. approved, for each respective fund listed above (each a “Fund”), the renewal of the investment management agreement (each an “Investment Management Agreement”) with Nuveen Fund Advisors, LLC (“NFAL”; NFAL is an “Adviser”) pursuant to which NFAL serves as investment adviser to such Fund. Similarly, for each Fund, the Board approved the renewal of the sub-advisory agreement (each a “Sub-Advisory Agreement”) with Nuveen Asset Management, LLC (the “Sub-Adviser”) pursuant to which the Sub-Adviser serves as the sub-adviser to such Fund. The Board Members are not “interested persons” (as defined under the Investment Company Act of 1940 (the “1940 Act”)) and, therefore, the Board is deemed to be comprised of all disinterested Board Members. References to the Board and the Board Members are interchangeable. Below is a summary of the annual review process the Board undertook related to its most recent renewal of each Investment Management Agreement and Sub-Advisory Agreement on behalf of the applicable Fund.
In accordance with applicable law, following up to an initial two-year period, the Board considers the renewal of each Investment Management Agreement and Sub-Advisory Agreement on behalf of the applicable Fund on an annual basis. The Investment Management Agreements and Sub-Advisory Agreements are collectively referred to as the “Advisory Agreements,” and NFAL and the Sub-Adviser are collectively, the “Fund Advisers” and each a “Fund Adviser.” In addition, the fund complex consists of the group of funds advised by NFAL (collectively referred to as the “Nuveen funds”) and the group of funds advised by Teachers Advisors, LLC (“TAL” and such funds are collectively, the “TC funds”). For clarity, NFAL serves as Adviser to the Nuveen funds, including the Funds, and TAL serves as “Adviser” to the TC funds. The Board Members considered that the prior separate boards of the TC funds and Nuveen funds were consolidated effective in January 2024. Accordingly, at the Meeting, the Board Members considered the review of the advisory agreements for the Nuveen funds as well as reviewed the investment management agreements for the TC funds. Depending on the appropriate context, references to “the Adviser” may be to NFAL with respect to the Nuveen funds and/or TAL with respect to the TC funds.
The Board Members considered the review of the advisory agreements of the Nuveen funds and the TC funds to be an ongoing process. The Board Members therefore employed the accumulated information, knowledge and experience they had gained during their tenure on the respective board of the TC funds or Nuveen funds (as the case may be) governing the applicable funds and working with the respective investment advisers and sub-advisers, as applicable, in their review of the advisory agreements for the fund complex.
During the course of the year prior to the Meeting, the Board and/or its committees received a wide variety of materials that covered a range of topics relevant to the Board’s annual consideration of the renewal of the advisory agreements, including reports on fund investment results over various periods; product initiatives for various funds; fund expenses; compliance, regulatory and risk management matters; trading practices, including soft dollar arrangements (as applicable); the liquidity and derivatives risk management programs; management of distributions; valuation of securities; payments to financial intermediaries, including 12b-1 expenses (as applicable); securities lending (as applicable); and overall market and regulatory developments. The Board also met periodically with and/or received presentations by key investment professionals managing a fund’s portfolio. In particular, at the Board meeting held on February 27-29, 2024 (the “February Meeting”), the Board and/or its Investment Committee received the annual performance review of the funds as described in further detail below. The presentations, discussions and meetings throughout the year also provide a means for the Board to evaluate and consider the level, breadth and quality of services provided by the Adviser and sub-advisers, as applicable, and how such services have changed over time in light of new or modified regulatory requirements, changes to market conditions or other factors.
In connection with its annual consideration of the advisory agreements, the Board, through its independent legal counsel, requested and received extensive materials and information prepared specifically for its review of the advisory agreements. The materials provided at the Meeting and/or prior meetings covered a wide range of matters including, but not limited to, a description of the nature, extent and quality of services provided by the Fund Advisers; the consolidation of the Nuveen fund family and TC fund family; a review of product actions advanced in 2023 for the benefit of particular funds and/or the fund complex; a review of each sub-adviser, if applicable, and/or applicable investment team; an analysis of fund performance with a focus on funds considered to have met certain challenged performance measurements; an analysis of the fees and expense ratios of the funds with a focus on funds considered to have certain expense characteristics; a list of management fee and, if applicable, sub-advisory fee schedules; a review of temporary and permanent expense caps and fee waivers for open-end funds (as applicable); a description of portfolio manager compensation; a description of the profitability and/or financial data of Nuveen, TAL and the sub-advisers; and a description of indirect benefits received by the Adviser and the sub-advisers as a result of their relationships with the funds, as applicable. The Board also considered information provided by Broadridge Financial Solutions, Inc. (“Broadridge”), an independent provider of investment company data, comparing fee and expense levels of each respective fund to those of a peer universe and, with respect to open-end funds, also to a peer group of funds selected by Broadridge, subject to certain exceptions.
1
| Item 11. | Statement Regarding Basis for Approval of Investment Advisory Contract (continued) |
The information prepared specifically for the annual review supplemented the information provided to the Board and its committees and the evaluations of the funds by the Board and its committees during the year. The Board’s review of the advisory agreements for the fund complex is based on all the information provided to the Board and its committees over time. The performance, fee and expense data and other information provided by a Fund Adviser, Broadridge or other service providers were not independently verified by the Board Members.
As part of their review, the Board Members and independent legal counsel met by videoconference in executive session on April 10, 2024 (the “April Executive Session”) to review and discuss materials provided in connection with their annual review of the advisory agreements for the fund complex. After reviewing this information, the Board Members requested, directly or through independent legal counsel, additional information, and the Board subsequently reviewed and discussed the responses to these follow-up questions and requests.
The Board Members were advised by independent legal counsel during the annual review process as well as throughout the year, including meeting in executive sessions with such counsel at which no representatives of management were present. In connection with their annual review, the Board Members also received a memorandum from independent legal counsel outlining their fiduciary duties and legal standards in reviewing the Advisory Agreements, including guidance from court cases evaluating advisory fees.
The Board’s decisions to renew each Advisory Agreement were not based on a single identified factor, but rather each decision reflected the comprehensive consideration of all the information provided to the Board and its committees throughout the year as well as the materials prepared specifically in connection with the annual review process. The contractual arrangements may reflect the results of prior year(s) of review, negotiation and information provided in connection with the Board’s annual review of the funds’ advisory arrangements and oversight of the funds. Each Board Member may have attributed different levels of importance to the various factors and information considered in connection with the annual review process and may have placed different emphasis on the relevant information year to year in light of, among other things, changing market and economic conditions. A summary of the principal factors and information, but not all the factors, the Board considered in deciding to renew the Advisory Agreements is set forth below.
A. Nature, Extent and Quality of Services
In evaluating the renewal of the Advisory Agreements, the Board Members received and considered information regarding the nature, extent and quality of the applicable Fund Adviser’s services provided to each respective Fund with particular focus on the services and enhancements or changes to such services provided during the last year. The Board Members considered the Investment Management Agreements and the Sub-Advisory Agreements separately in the course of their review. With this approach, they considered the roles of NFAL and the Sub-Adviser in providing services to the Funds.
The Board considered that the Adviser provides a wide array of management, oversight and other services to manage and operate the applicable funds. The Board considered the Adviser’s and its affiliates’ dedication of resources, time, people and capital as well as continual program of improvement and innovation aimed at enhancing the funds and fund complex for investors and meeting the needs of an increasingly complex regulatory environment. In particular, over the past several years, the Board considered the significant resources, both financial and personnel, the Adviser and its affiliates have committed in working to consolidate the Nuveen fund family and TC fund family under one centralized umbrella. The Board considered that the organizational changes in bringing together Nuveen, its affiliates and TIAA’s (as defined below) asset management businesses, consolidating the Nuveen and TC fund families and other initiatives were anticipated to provide various benefits for the funds through, among other things, enhanced operating efficiencies, centralized investment leadership and a centralized shared resources and support model. As part of these efforts, the boards of the TC funds and Nuveen funds were consolidated effective in January 2024. In addition, in conjunction with these consolidation efforts, the Board approved at the Meeting changes to fee and breakpoint structures (as applicable) that could provide cost savings to participating funds, as described in further detail below.
The Board also reviewed information regarding other product actions undertaken or continued by management in the 2023 calendar year in seeking to improve the effectiveness of the organization, the product line-up as well as particular funds through, among other things, continuing to review and optimize the product line and gaining efficiencies through mergers and liquidations; reviewing and updating investment policies and benchmarks; implementing fee waivers and/or expense cap changes for certain funds; evaluating and adjusting portfolio management teams as appropriate for various funds; and developing policy positions on a broad range of regulatory proposals that may impact the funds and communicating with lawmakers and other regulatory authorities to help ensure these positions are considered. In its review, the Board considered that the funds operated in a highly regulated industry and the scope and complexity of the services and resources that the Adviser and its affiliates must provide to manage and operate the applicable funds have expanded over the years as a result of, among other things, regulatory, market and other developments, such as the adoption of the tailored shareholder report or the revised fund name rule.
In considering the breadth and quality of services the Adviser and its various teams provide, the Board considered that the Adviser provides investment advisory services. With respect to the Nuveen funds, such funds utilize sub-advisers to manage the portfolios of the funds subject to the supervision of NFAL. Accordingly, the Board considered that NFAL and its affiliates, among other things, oversee and review the performance of the respective sub-adviser and its investment team(s); evaluate Nuveen fund performance and market conditions; evaluate investment strategies and recommend changes thereto; set and manage distributions consistent with the respective Nuveen fund’s product design; oversee trade execution and, as applicable, securities lending; evaluate investment risks; and manage valuation matters. The Board further considered that over the course of the 2023 calendar year, the Nuveen global public product team which supports the funds in the fund complex and their shareholders assessed the investment personnel across the investment leadership teams which resulted in additions or other modifications to the portfolio management teams of various funds. The Board also reviewed a description of the compensation structure applicable to certain portfolio managers.
In addition to the above investment advisory services, the Board further considered the extensive compliance, regulatory, administrative and other services the Adviser and its various teams or affiliates provide to manage and operate the applicable funds. Given the highly regulated industry in which the funds operate, the Board considered the breadth of the Adviser’s compliance program and related policies and procedures. The Board reviewed various initiatives the Adviser’s compliance team undertook or continued in 2023, in part, to address new regulatory requirements, support
2
international business growth and product development, enhance international trading capabilities, enhance monitoring capabilities in light of the new regulatory requirements and guidance and maintain a comprehensive training program. The Board further considered, among other things, that other non-advisory services provided included, among other things, board support and reporting; establishing and reviewing the services provided by other fund service providers (such as a fund’s custodian, accountant, and transfer agent); risk management, including reviews of the liquidity risk management and derivatives risk management programs; legal support services; regulatory advocacy; and cybersecurity, business continuity and disaster recovery planning and testing.
Aside from the services provided, the Board considered the financial resources of the Adviser and/or its affiliates and their willingness to make investments in the technology, personnel and infrastructure to support the funds, including to enhance global talent, middle office systems, software and international and internal capabilities. The Board considered the access provided by the Adviser and its affiliates to a seed capital budget to support new or existing funds and/or facilitate changes for a respective fund. The Board considered the benefits to shareholders of investing in a fund that is a part of a large fund complex with a variety of investment disciplines, capabilities, expertise and resources available to navigate and support the funds including during stressed times. The Board considered the overall reputation and capabilities of the Adviser and its affiliates and the Adviser’s continuing commitment to provide high quality services.
In its review, the Board also considered the significant risks borne by the Adviser and its affiliates in connection with their services to the applicable funds, including entrepreneurial risks in sponsoring and supporting new funds and smaller funds and ongoing risks with managing the funds, such as investment, operational, reputational, regulatory, compliance and litigation risks.
With respect to the Funds, the Board considered the division of responsibilities between NFAL and the Sub-Adviser and considered that the Sub-Adviser and its investment personnel generally are responsible for the management of each Fund’s portfolio under the oversight of NFAL and the Board. The Board considered an analysis of the Sub-Adviser provided by NFAL which included, among other things, a summary of changes in the leadership teams and/or portfolio manager teams; the performance of the Nuveen funds sub-advised by the Sub-Adviser over various periods of time; and data reflecting product changes (if any) taken with respect to certain Nuveen funds. The Board considered that NFAL recommended the renewal of the Sub-Advisory Agreements.
Based on its review, the Board determined, in the exercise of its reasonable business judgment, that it was satisfied with the nature, extent and quality of services provided to the respective Funds under each applicable Advisory Agreement.
B. The Investment Performance of the Funds and Fund Advisers
In evaluating the quality of the services provided by the Fund Advisers, the Board also considered a variety of investment performance data of the Funds. In this regard, the Board and/or its Investment Committee reviewed, among other things, performance of the Funds over the quarter, one-, three- and five-year periods ending December 31, 2023 and March 31, 2024. For those Funds with multiple share classes, the performance data was based on Class I shares; however, the performance of other share classes was substantially similar as those other share classes invest in the same portfolio of securities and differences in performance among the classes would be principally attributed to the variations in the expense structures of the share classes. The Board performed its annual review of fund performance at its February Meeting and an additional review at the April Executive Session and also reviewed and discussed performance data at its other regularly scheduled quarterly meetings throughout the year. The Board therefore took into account the performance data, presentations and discussions (written and oral) that were provided at the Meeting and in prior meetings over time in evaluating fund performance, including management’s analysis of a fund’s performance with particular focus on funds that met certain challenged performance measurements as determined pursuant to a methodology approved by the Board or additional measurements as determined by management’s investment analysts. As various Nuveen funds have modified their portfolio teams and/or made significant changes to their portfolio strategies over time, the Board reviewed, among other things, certain tracking performance data over specific periods comparing performance before and after such changes.
The Board considered that performance data reflects performance over a specified period which may differ significantly depending on the ending dates selected, particularly during periods of market volatility. Further, the Board considered that shareholders may evaluate performance based on their own respective holding periods which may differ from the performance periods reviewed by the Board and lead to differing results.
In its evaluation, the Board reviewed fund performance results from different perspectives. In general, subject to certain exceptions, the Board reviewed both absolute and relative fund performance over the various time periods and considered performance results in light of a fund’s investment objective(s), strategies and risks. With respect to the relative performance, the Board considered fund performance in comparison to the performance of peer funds (the “Performance Peer Group”), subject to certain exceptions, and recognized and/or customized benchmarks (i.e., generally benchmarks derived from multiple recognized benchmarks). In reviewing such comparative performance, the Board was cognizant of the inherent limitations of such data which can make meaningful performance comparisons generally difficult. As an illustration, differences in the composition of the Performance Peer Group, the investment objective(s), strategies, dates of fund inception and other characteristics of the peers in the Performance Peer Group, the level, type and cost of leverage (if any) of the peers, and the varying sizes of peers all may contribute to differences in the performance results of a Performance Peer Group compared to the applicable fund. With respect to relative performance of a fund compared to a benchmark index, differences, among other things, in the investment objective(s) and strategies of a fund and the benchmark (particularly an actively managed fund that does not directly follow an index) as well as the costs of operating a fund would necessarily contribute to differences in performance results and limit the value of the comparative performance information. To assist the Board in its review of the comparability of the relative performance, management generally has ranked the relevancy of the Performance Peer Groups to the Funds as low, medium or high. In its review of relative performance, the Board considered a Fund’s performance relative to its Performance Peer Group, among other things, by evaluating its quartile ranking with the 1st quartile representing the top performing funds within the Performance Peer Group and the 4th quartile representing the lowest performing funds.
3
| Item 11. | Statement Regarding Basis for Approval of Investment Advisory Contract (continued) |
The Board evaluated performance in light of various relevant factors which may include, among other things, general market conditions, issuer-specific information, asset class information, leverage and fund cash flows. The Board considered that long-term performance could be impacted by even one period of significant outperformance or underperformance and that a single investment theme could disproportionately affect performance. Further, the Board considered that market and economic conditions may significantly impact a fund’s performance, particularly over shorter periods, and such performance may be more reflective of such economic or market events and not necessarily reflective of management skill. Although the Board reviews short-, intermediate- and longer-term performance data, the Board considered that longer periods of performance may reflect full market cycles.
In their review from year to year, the Board Members consider and may place different emphasis on the relevant information in light of changing circumstances in market and economic conditions. In evaluating performance, the Board focused particular attention on funds with less favorable performance records. However, depending on the facts and circumstances, including any differences between the respective fund and its benchmark and/or Performance Peer Group, the Board may be satisfied with a fund’s performance notwithstanding that its performance may be below that of its benchmark and/or peer group for certain periods. With respect to any funds for which the Board has identified performance issues, the Board seeks to monitor such funds more closely until performance improves, discuss with the Adviser the reasons for such results, consider whether any steps are necessary or appropriate to address such issues, discuss and evaluate the potential consequences of such steps and review the results of any steps undertaken.
The performance determinations with respect to each Fund are summarized below.
● For Nuveen Minnesota Intermediate Municipal Bond Fund, the Board considered that although the Fund’s performance was below the performance of its benchmark for the one-, three- and five-year periods ended December 31, 2023, the Fund ranked in the second quartile of its Performance Peer Group for the one-year period ended December 31, 2023 and first quartile for the three- and five-year periods ended December 31, 2023. In addition, although the Fund’s performance was below the performance of its benchmark for the three- and five-year periods ended March 31, 2024, the Fund outperformed its benchmark for the one-year period ended March 31, 2024 and ranked in the second quartile of its Performance Peer Group for the one-year period and first quartile for the three- and five-year periods ended March 31, 2024. On the basis of the Board’s ongoing review of investment performance and all relevant factors, including the relative market conditions during certain reporting periods, the Fund’s investment objective(s) and management’s discussion of performance, the Board concluded that the Fund’s performance supported renewal of the Advisory Agreements.
● For Nuveen Minnesota Municipal Bond Fund, the Board considered that although the Fund’s performance was below the performance of its benchmark for the three- and five-year periods ended December 31, 2023 and March 31, 2024, the Fund outperformed its benchmark for the one-year periods ended December 31, 2023 and March 31, 2024. In addition, the Fund ranked in the second quartile of its Performance Peer Group for the one-, three- and five-year periods ended December 31, 2023, the first quartile for the one-year period ended March 31, 2024 and the second quartile for the three- and five-year periods ended March 31, 2024. In its review, the Board considered that the Performance Peer Group was classified as low for relevancy. On the basis of the Board’s ongoing review of investment performance and all relevant factors, including the relative market conditions during certain reporting periods, the Fund’s investment objective(s) and management’s discussion of performance, the Board concluded that the Fund’s performance supported renewal of the Advisory Agreements.
● For Nuveen Nebraska Municipal Bond Fund, the Board considered that although the Fund’s performance was below the performance of its benchmark for the one-, three- and five-year periods ended December 31, 2023 and March 31, 2024 and the Fund ranked in the fourth quartile of its Performance Peer Group for the three- and five-year periods ended December 31, 2023 and March 31, 2024, the Fund ranked in the third quartile of its Performance Peer Group for the one-year periods ended December 31, 2023 and March 31, 2024. On the basis of the Board’s ongoing review of investment performance and all relevant factors, including the relative market conditions during certain reporting periods, the Fund’s investment objective(s) and management’s discussion of performance, the Board concluded that the Fund’s performance supported renewal of the Advisory Agreements.
● For Nuveen Oregon Intermediate Municipal Bond Fund, the Board considered that although the Fund’s performance was below the performance of its benchmark for the one-, three- and five-year periods ended December 31, 2023, the Fund ranked in the first quartile of its Performance Peer Group for the one-year period and second quartile for the three- and five-year periods ended December 31, 2023. In addition, although the Fund’s performance was below the performance of its benchmark for the three- and five-year periods ended March 31, 2024, the Fund outperformed its benchmark for the one-year period ended March 31, 2024 and ranked in the second quartile of its Performance Peer Group for the one- and three-year periods and first quartile for the five-year period ended March 31, 2024. On the basis of the Board’s ongoing review of investment performance and all relevant factors, including the relative market conditions during certain reporting periods, the Fund’s investment objective(s) and management’s discussion of performance, the Board concluded that the Fund’s performance supported renewal of the Advisory Agreements.
4
C. Fees, Expenses and Profitability
As part of its annual review, the Board generally reviewed, among other things, the contractual management fee and the net/actual management fee (i.e., the management fee after taking into consideration fee waivers and/or expense reimbursements, if any) paid by a Fund to the Adviser in light of the nature, extent and quality of the services provided. The Board also reviewed information about other expenses and the total operating expense ratio of each Fund (after any fee waivers and/or expense reimbursements). More specifically, the Board Members reviewed, among other things, each Fund’s management fee rates and net total expense ratio in relation to similar data for a comparable universe of funds (the “Expense Universe”) and for a more focused subset of comparable funds (the “Expense Group”) established by Broadridge (subject to certain exceptions). The Board Members reviewed the methodology Broadridge employed to establish its Expense Universe and Expense Group (as applicable) and considered that differences between the applicable fund and its respective Expense Universe and/or Expense Group, as well as changes to the composition of the Expense Universe and/or Expense Group from year to year, may limit some of the value of the comparative data. The Board Members also considered that it can be difficult to compare management fees among funds as there are variations in the services that are included for the fees paid. The Board Members took these limitations and differences into account when reviewing comparative peer data.
The Board Members also considered a Fund’s operating expense ratio as it more directly reflected a shareholder’s total costs in investing in the respective fund. In their review, the Board Members considered, in particular, each fund with a net total expense ratio meeting certain expense or fee criteria when compared to its Expense Universe and Expense Group (if any) and an analysis as to the factors contributing to each such fund’s relative net total expense ratio.
The Board Members also considered, in relevant part, a Fund’s management fee and net total expense ratio in light of the Fund’s performance history, including reviewing certain funds identified by management and/or the Board as having a higher net total expense ratio or management fee compared to their respective peers coupled with experiencing periods of challenged performance and considering the reasons for such comparative positions.
In their evaluation of the fee arrangements for the Funds, the Board Members also reviewed the management fee schedules and the expense reimbursements and/or fee waivers agreed to by the Adviser for the respective fund (if any). In its review, the Board considered that the management fees of the Nuveen funds were generally comprised of two components, a fund-level component and a complex-level component, each with its own breakpoint schedule, subject to certain exceptions. As indicated above, the Board approved a revised fee schedule which would reduce and streamline the asset thresholds necessary to meet breakpoints in the complex-level fee component. The Board considered that management anticipated approximately $50 million in savings for Nuveen fund shareholders as a result of the revised fee schedule as well as additional estimated savings over time. The Board further considered management’s representation that there will be no increase to any Nuveen fund’s respective advisory agreement fee rate as a result of the revised complex-level fee schedule.
In its review, the Board considered that across the Nuveen fund and TC fund complex, management estimated that fund-level breakpoints resulted in approximately $82.5 million in reduced fees overall in 2023 and expense caps and reimbursements generated approximately an additional $91 million in savings to shareholders. In addition, the Board considered that management determined that the Nuveen funds achieved additional fee reductions of approximately $49 million due to the complex-wide management fee structure in 2023.
With respect to the Sub-Adviser, the Board also considered, among other things, the sub-advisory fee schedule paid to the Sub-Adviser in light of the sub-advisory services provided to the respective Fund. In its review, the Board considered that the compensation paid to the Sub-Adviser is the responsibility of NFAL, not the Funds.
The Board’s considerations regarding the comparative fee data for each of the Funds are set forth below. With respect to the quartile rankings noted below, the first quartile represents the range of funds with the lowest management fee rate or net total expense ratio, as applicable, and the fourth quartile represents the range of funds with the highest management fee rate or net total expense ratio, as applicable. The Board considered that Broadridge only calculates quartiles if a minimum number of peers is available and therefore quartile rankings may not be available for certain Expense Groups and/or Expense Universes.
● For Nuveen Minnesota Intermediate Municipal Bond Fund, although the Fund’s actual management fee rate and net total expense ratio ranked in the fourth quartile of its Expense Group, the Fund’s contractual management fee rate ranked in the third quartile of its Expense Group. In addition, the Fund’s contractual management fee rate, actual management fee rate and net total expense ratio each ranked in the fourth quartile of its Expense Universe. Further, although the Fund’s actual management fee rate was above the Expense Group median, the Fund’s net total expense ratio was slightly above (approximately 5 basis points) the Expense Group median. The Board, however, considered that the limited number of and changes to the peers in the Expense Group limited the comparability of the peer data. The Board also considered that the Fund’s net total expense ratio was generally in-line with the median of the other intermediate funds within the Expense Group.
● For Nuveen Minnesota Municipal Bond Fund, although the Fund’s contractual management fee rate and actual management fee rate ranked in the fourth quartile of its Expense Group, the Fund’s net total expense ratio ranked in the second quartile of its Expense Group. In addition, although the Fund’s contractual management fee rate and actual management fee rate ranked in the fourth quartile of its Expense Universe, the Fund’s net total expense ratio ranked in the third quartile of its Expense Universe. Further, although the Fund’s actual management fee rate was above the Expense Group median, the Fund’s net total expense ratio matched the Expense Group median.
5
| Item 11. | Statement Regarding Basis for Approval of Investment Advisory Contract (continued) |
● For Nuveen Nebraska Municipal Bond Fund, the Fund’s contractual management fee rate, actual management fee rate and net total expense ratio ranked in the third quartile, fourth quartile and third quartile of its Expense Group, respectively. In addition, the Fund’s contractual management fee rate, actual management fee rate and net total expense ratio ranked in the third quartile, second quartile and third quartile of its Expense Universe, respectively. Further, although the Fund’s actual management fee rate was above the Expense Group median, the Fund’s net total expense ratio was generally in-line with the Expense Group median.
● For Nuveen Oregon Intermediate Municipal Bond Fund, the Fund’s contractual management fee rate, actual management fee rate and net total expense ratio ranked in the fourth quartile of its Expense Group and Expense Universe. In addition, the Fund’s actual management fee and net total expense ratio were above the Expense Group median. The Board, however, considered that the limited number of and changes to the peers in the Expense Group limited the comparability of the peer data. Further, the Board considered that the Fund’s net total expense ratio was generally in-line with the median of the other intermediate funds within the Expense Group.
Based on its review of the information provided, the Board determined that each Fund’s management fees (as applicable) to a Fund Adviser were reasonable in light of the nature, extent and quality of services provided to the Fund.
| | 2. | Comparisons with the Fees of Other Clients |
In evaluating the appropriateness of fees, the Board also considered that the Adviser, affiliated sub-advisers and/or their affiliate(s) provide investment management services to other types of clients which may include: separately managed accounts, retail managed accounts, foreign funds (UCITS), other investment companies (as sub-advisers), limited partnerships and collective investment trusts. The Board reviewed the equal weighted average fee or other fee data for the other types of clients managed in a similar manner to certain of the Nuveen funds and TC funds. The Board considered the Adviser’s rationale for the differences in the management fee rates of the funds compared to the management fee rates charged to these other types of clients. In this regard, the Board considered that differences, including but not limited to, the amount, type and level of services provided by the Adviser to the funds compared to that provided to other clients as well as differences in investment policies; regulatory, disclosure and governance requirements; servicing relationships with vendors; the manner of managing such assets; product structure; investor profiles; and account sizes all may contribute to variations in relative fee rates. Further, differences in the client base, governing bodies, distribution, jurisdiction and operational complexities also would contribute to variations in management fees assessed the funds compared to foreign fund clients. In addition, differences in the level of advisory services required for passively managed funds also contribute to differences in the management fee levels of such funds compared to actively managed funds. As a general matter, higher fee levels reflect higher levels of service provided by the Adviser, increased investment management complexity, greater product management requirements, and higher levels of business risk or some combination of these factors. The Board considered the wide range of services in addition to investment management that the Adviser had provided to the funds compared to other types of clients as well as the increased entrepreneurial, legal and regulatory risks that the Adviser incurs in sponsoring and managing the funds. The Board further considered that a sub-adviser’s fee is essentially for portfolio management services and therefore more comparable to the fees it receives for retail wrap accounts and other external sub-advisory mandates. The Board concluded that the varying levels of fees were reasonable given, among other things, the more extensive services, regulatory requirements and legal liabilities, and the entrepreneurial, legal and regulatory risks incurred in sponsoring and advising a registered investment company compared to that required in advising other types of clients.
| | 3. | Profitability of Fund Advisers |
In their review, the Board Members considered various profitability data relating to the Fund Advisers’ services to the Nuveen funds.
With respect to the Nuveen funds, the Board Members reviewed the estimated profitability information of Nuveen as a result of its advisory services to the Nuveen funds overall as well as profitability data of certain other asset management firms. Such profitability information included, among other things, gross and net revenue margins (excluding distribution) of Nuveen Investments, Inc. (“Nuveen Investments”) for services to the Nuveen funds on a pre-tax and after-tax basis for the 2023 and 2022 calendar years as well as the revenues earned (less any expense reimbursements/fee waivers) and expenses incurred by Nuveen Investments for its advisory activities to the Nuveen funds (excluding distribution) for the 2023 and 2022 calendar years. The Board Members also considered the rationale for the change in Nuveen’s profitability from 2022 to 2023. In addition, the Board reviewed the revenues, expenses and operating margin (pre- and after-tax) NFAL derived from its exchange-traded fund product line for the 2023 and 2022 calendar years.
In developing the profitability data, the Board Members considered the subjective nature of calculating profitability as the information is not audited and is necessarily dependent on cost allocation methodologies to allocate expenses throughout the complex and among the various advisory products. Given there is no single universally recognized expense allocation methodology and that other reasonable and valid allocation methodologies could be employed and could lead to significantly different results, the Board reviewed, among other things, a description of the cost allocation methodologies employed to develop the financial information, a summary of the refinements Nuveen had made to the methodology that had occurred over the years from 2010 through 2021 to provide Nuveen’s profitability analysis, and a historical expense analysis of Nuveen Investments’ revenues, expenses and pre-tax net revenue margins derived from its advisory services to the Nuveen funds (excluding distribution) for the calendar years from 2017 through 2023. The Board of the Nuveen funds had also appointed two Board Members to serve as the Board’s liaisons to meet with representatives of NFAL and review the development of the profitability data and to report to the full Board.
6
In addition, the Board considered certain comparative operating margin data. In this regard, the Board reviewed the operating margins of Nuveen Investments compared to the adjusted operating margins of a peer group of asset management firms with publicly available data and the most comparable assets under management (based on asset size and asset composition) to Nuveen. The Board considered that the operating margins of the peers were adjusted generally to address that certain services provided by the peers were not provided by Nuveen. The Board also reviewed, among other things, the net revenue margins (pre-tax) of Nuveen Investments on a company-wide basis and the net revenue margins (pre-tax) of Nuveen Investments derived from its services to the Nuveen funds only (including and excluding distribution) compared to the adjusted operating margins of the peer group for each calendar year from 2014 to 2023. In their review of the comparative data, the Board Members considered the limitations of the comparative data given that peer data is not generally public and the calculation of profitability is subjective and affected by numerous factors (such as types of funds a peer manages, its business mix, its cost of capital, the numerous assumptions underlying the methodology used to allocate expenses and other factors) that can have a significant impact on the results.
Aside from the profitability data, the Board considered that NFAL and TAL are affiliates of Teachers Insurance and Annuity Association of America (“TIAA”). NFAL is a subsidiary of Nuveen, LLC, the investment management arm of TIAA, and TAL is an indirect wholly owned subsidiary of TIAA. Accordingly, the Board also reviewed a balance sheet for TIAA reflecting its assets, liabilities and capital and contingency reserves for the 2023 and 2022 calendar years to consider the financial strength of TIAA. The Board considered the benefit of an investment adviser and its parent with significant resources, particularly during periods of market volatility. The Board also considered the reinvestments the Adviser, its parent and/or other affiliates made into their business through, among other things, the investment of seed capital in certain funds, initiatives in international expansion, investments in infrastructure and continued investments in enhancements to technological capabilities.
The Board Members considered the profitability of the Sub-Adviser from its relationships with the respective Nuveen funds. In this regard, the Board Members reviewed, among other things, the Sub-Adviser’s revenues, expenses and net revenue margins (pre- and after-tax) for its advisory activities to the respective Nuveen funds for the calendar years ended December 31, 2023 and December 31, 2022. The Board Members also reviewed a profitability analysis reflecting the revenues, expenses and revenue margin (pre- and after-tax) grouped by similar types of funds (such as municipal, taxable fixed income, equity, real assets and index/asset allocation) for the Sub-Adviser for the calendar years ending December 31, 2023 and December 31, 2022.
In evaluating the reasonableness of the compensation, the Board Members also considered the indirect benefits NFAL or the Sub-Adviser received that were directly attributable to the management of the applicable funds as discussed in further detail below. Based on its review, the Board was satisfied that each Fund Adviser’s level of profitability from its relationship with each Nuveen fund was not unreasonable over various time frames in light of the nature, extent and quality of services provided.
D. Economies of Scale and Whether Fee Levels Reflect These Economies of Scale
The Board considered whether there have been economies of scale with respect to the management of the funds in the fund complex, including the Funds, whether these economies of scale have been appropriately shared with such funds and whether there is potential for realization of further economies of scale. Although the Board considered that economies of scale are difficult to measure with any precision and the rates at which certain expenses are incurred may not decline with a rise in assets, the Board considered that there are various methods that may be employed to help share the benefits of economies of scale, including, among other things, through the use of breakpoints in the management fee schedule, fee waivers and/or expense limitations, the pricing of funds at scale at inception and investments in the Adviser’s business which can enhance the services provided to the applicable funds for the fees paid. The Board considered that the Adviser has generally employed one or more of these various methods among the applicable funds.
In this regard, the Board considered, as noted above, that the management fee of NFAL generally was comprised of a fund-level component and a complex-level component each with its own breakpoint schedule, subject to certain exceptions. With this structure, the Board considered that the complex-level breakpoint schedule was designed to deliver the benefits of economies of scale to shareholders when the assets of eligible funds in the complex pass certain thresholds even if the assets of a particular fund are unchanged or have declined, and the fund-level breakpoint schedules were designed to share economies of scale with shareholders if the particular fund grows. The Board reviewed the fund-level and complex-level fee schedules. As summarized above, the Board approved a new complex-level breakpoint schedule which would simplify and reduce the complex-level fee rates at various thresholds and expanded the eligible funds whose assets would be included in calculating the complex-level fee, effective May 1, 2024. Among other things, the assets of certain TC funds advised by TAL would be phased into the calculation of the complex-wide assets in determining the complex-level fee over a ten-year period. The Board considered the cost savings and additional potential sharing of economies of scale as a result of the reduced complex-level breakpoint schedule and the additional assets from more eligible funds in calculating the assets of the complex for determining the complex-level fee component. The Board reviewed the projected shareholder savings derived from such modifications over a ten-year period from 2024 to 2033. The Board considered management’s representation that there will be no increase to any fund’s respective advisory agreement fee rate.
In addition to the fund-level and complex-level fee schedules (if applicable), the Board Members considered the temporary and/or permanent expense caps (if any) applicable to a Fund. The Board considered that such waivers and reimbursements applicable to the respective funds are another means for potential economies of scale to be shared with shareholders of such funds and can provide a protection from an increase in expenses if the assets of the applicable funds decline.
The Board Members also considered the continued reinvestment in Nuveen/TIAA’s business to enhance its capabilities and services to the benefit of its various clients. The Board understood that many of these investments were not specific to individual funds, but rather incurred across a variety of products and services pursuant to which the family of funds as a whole may benefit. The Board further considered that the Adviser and its affiliates have provided certain additional services, including, but not limited to, services required by new regulations and regulatory interpretations,
7
| Item 11. | Statement Regarding Basis for Approval of Investment Advisory Contract (continued) |
without raising advisory fees to the funds, and this was also a means of sharing economies of scale with the funds and their shareholders. The Board considered the Adviser’s and/or its affiliates’ ongoing efforts to streamline the product line-up, among other things, to create more scaled funds which may help improve both expense and trading economies.
Based on its review, the Board was satisfied that the current fee arrangements together with the reinvestment in management’s business appropriately shared any economies of scale with shareholders.
E. Indirect Benefits
The Board Members received and considered information regarding various indirect benefits the respective Fund Adviser or its affiliates may receive as a result of their relationship with the funds in the fund complex, including the Funds. These benefits included, among other things, economies of scale to the extent the Adviser or its affiliates share investment resources and/or personnel with other clients of the Adviser. The funds may also be used as investment options for other products or businesses offered by the Adviser and/or its affiliates, such as variable products, fund of funds and 529 education savings plans, and affiliates of the Adviser may serve as sub-advisers to various funds in which case all advisory and sub-advisory fees generated by such funds stay within Nuveen.
Further, the funds may pay the Adviser and/or its affiliates for other services, such as distribution. In this regard, the Board Members considered that an affiliate of the Adviser serves as principal underwriter providing distribution and/or shareholder services to the open-end funds for which it may be compensated. The Board Members also considered that certain share classes of the open-end funds (subject to certain exceptions) pay 12b-1 fees, some of which may be retained by the Adviser’s affiliate. In addition, the Board Members considered that the Adviser and Sub-Adviser may utilize soft dollar brokerage arrangements attributable to the respective funds to obtain research and other services for any or all of their clients, although the Board Members also considered reimbursements of such costs by the Adviser and/or Sub-Adviser.
The Adviser and its affiliates may also benefit from the advisory relationships with the funds in the fund complex to the extent this relationship results in potential investors viewing the TIAA group of companies as a leading retirement plan provider in the academic and nonprofit market and a single source for all their financial service needs. The Adviser and/or its affiliates may further benefit to the extent that they have pricing or other information regarding vendors the funds utilize in establishing arrangements with such vendors for other products.
Based on its review, the Board concluded that any indirect benefits received by a Fund Adviser as a result of its relationship with the Funds were reasonable in light of the services provided.
F. Other Considerations
The Board Members did not identify any single factor discussed previously as all-important or controlling. The Board Members concluded that the terms of each Advisory Agreement were reasonable, that the respective Fund Adviser’s fees were reasonable in light of the services provided to each Fund and that the Advisory Agreements be renewed for an additional one-year period.
8
| Item 12. | Disclosure of Proxy Voting Policies and Procedures for Closed-End Management Investment Companies. |
Not applicable to open-end investment companies.
| Item 13. | Portfolio Managers of Closed-End Management Investment Companies. |
Not applicable to open-end investment companies.
| Item 14. | Purchases of Equity Securities by Closed-End Management Investment Company and Affiliated Purchasers. |
Not applicable to open-end investment companies.
| Item 15. | Submission of Matters to a Vote of Security Holders. |
There have been no material changes to the procedures by which shareholders may recommend nominees to the registrant’s Board of Trustees implemented after the registrant last provided disclosure in response to this Item.
| Item 16. | Controls and Procedures. |
| (a) | The registrant’s principal executive and principal financial officers, or persons performing similar functions, have concluded that the registrant’s disclosure controls and procedures (as defined in Rule 30a-3(c) under the Investment Company Act of 1940, as amended (the “1940 Act”) (17 CFR 270.30a-3(c))) are effective, as of a date within 90 days of the filing date of this report that includes the disclosure required by this paragraph, based on their evaluation of the controls and procedures required by Rule 30a-3(b) under the 1940 Act (17 CFR 270.30a-3(b)) and Rules 13a-15(b) or 15d-15(b) under the Securities Exchange Act of 1934, as amended (the “Exchange Act”) (17 CFR 240.13a-15(b) or 240.15d-15(b)). |
| (b) | There were no changes in the registrant’s internal control over financial reporting (as defined in Rule 30a-3(d) under the 1940 Act (17 CFR 270.30a-3(d)) that occurred during the period covered by this report that has materially affected, or is reasonably likely to materially affect, the registrant’s internal control over financial reporting. |
| Item 17. | Disclosure of Securities Lending Activities for Closed-End Management Investment Companies. |
| (a) | Not applicable to open-end investment companies. |
| (b) | Not applicable to open-end investment companies. |
| Item 18. | Recovery of Erroneously Awarded Compensation. |
| (a)(1) | Not applicable because the code of ethics is available, upon request and without charge, by calling 800-257-8787 and there were no amendments during the period covered by this report. |
SIGNATURES
Pursuant to the requirements of the Securities Exchange Act of 1934 and the Investment Company Act of 1940, the registrant has duly caused this report to be signed on its behalf by the undersigned, thereunto duly authorized.
Nuveen Investment Funds, Inc.
| | | | | | |
| Date: August 6, 2024 | | | | By: | | /s/ Jordan M. Farris |
| | | | | | Jordan M. Farris |
| | | | | | Chief Administrative Officer |
Pursuant to the requirements of the Securities Exchange Act of 1934 and the Investment Company Act of 1940, this report has been signed below by the following persons on behalf of the registrant and in the capacities and on the dates indicated.
| | | | | | |
| Date: August 6, 2024 | | | | By: | | /s/ Jordan M. Farris |
| | | | | | Jordan M. Farris |
| | | | | | Chief Administrative Officer (principal executive officer) |
| | | |
| Date: August 6, 2024 | | | | By: | | /s/ E. Scott Wickerham |
| | | | | | E. Scott Wickerham |
| | | | | | Vice President and Controller (principal financial officer) |