UNITED STATES
SECURITIES AND EXCHANGE COMMISSION
Washington, D.C. 20549
FORM N-CSR
CERTIFIED SHAREHOLDER REPORT
OF
REGISTERED MANAGEMENT INVESTMENT COMPANIES
| | |
| Investment Company Act file number: 811-5340 |
|
| Name of Registrant: | Vanguard New Jersey Tax-Free Funds |
| |
| Address of Registrant: | P.O. Box 2600 |
| | Valley Forge, PA 19482 |
| |
| Name and address of agent for service: | Heidi Stam, Esquire |
| | P.O. Box 876 |
| | Valley Forge, PA 19482 |
| | |
| Registrant’s telephone number, including area code: (610) 669-1000 |
|
| Date of fiscal year end: November 30 | |
| |
| Date of reporting period: December 1, 2010 – November 30, 2011 |
|
| Item 1: Reports to Shareholders | |

Annual Report | November 30, 2011
Vanguard New Jersey Tax-Exempt Funds
Vanguard New Jersey Tax-Exempt Money Market Fund
Vanguard New Jersey Long-Term Tax-Exempt Fund
> The municipal bond market slid lower in a tumultuous first quarter of the fiscal
year before snapping back vigorously in the ensuing nine months.
> For the year ended November 30, 2011, Vanguard New Jersey Tax-Exempt
Money Market Fund returned 0.06%, as the Federal Reserve extended its
near-0% target for the shortest-term interest rates until at least mid-2013.
> Investor Shares of Vanguard New Jersey Long-Term Tax-Exempt Fund returned
5.54% and Admiral Shares returned 5.62%, lagging the fund’s benchmark index
but slightly ahead of the average return of its peers.
| |
| Contents | |
| Your Fund’s Total Returns. | 1 |
| Chairman’s Letter. | 2 |
| Advisor’s Report. | 8 |
| New Jersey Tax-Exempt Money Market Fund. | 11 |
| New Jersey Long-Term Tax-Exempt Fund. | 27 |
| About Your Fund’s Expenses. | 55 |
| Glossary. | 57 |
Please note: The opinions expressed in this report are just that—informed opinions. They should not be considered promises or advice.
Also, please keep in mind that the information and opinions cover the period through the date on the front of this report. Of course, the
risks of investing in your fund are spelled out in the prospectus.
See the Glossary for definitions of investment terms used in this report.
About the cover: Vanguard was named for the HMS Vanguard, flagship of British Admiral Horatio Nelson. A ship—whose
performance and safety depend on the work of all hands—has served as a fitting metaphor for the Vanguard crew as we
strive to help clients reach their financial goals.
Your Fund’s Total Returns
| | | | | |
| Fiscal Year Ended November 30, 2011 | | | | | |
| | | Taxable- | | | |
| | SEC | Equivalent | Income | Capital | Total |
| | Yields | Yields | Returns | Returns | Returns |
| Vanguard New Jersey Tax-Exempt Money Market | | | | | |
| Fund | 0.03% | 0.05% | 0.06% | 0.00% | 0.06% |
| New Jersey Tax-Exempt Money Market Funds | | | | | |
| Average | | | | | 0.00 |
| New Jersey Tax-Exempt Money Market Funds Average: Derived from data provided by Lipper Inc. | | | |
| Vanguard New Jersey Long-Term Tax-Exempt Fund | | | | | |
| Investor Shares | 2.96% | 4.55% | 4.24% | 1.30% | 5.54% |
| Admiral™ Shares | 3.04 | 4.68 | 4.32 | 1.30 | 5.62 |
| Barclays Capital 10 Year Municipal Bond Index | | | | | 7.68 |
| New Jersey Municipal Debt Funds Average | | | | | 5.48 |
New Jersey Municipal Debt Funds Average: Derived from data provided by Lipper Inc.
7-day SEC yield for the New Jersey Tax-Exempt Money Market Fund; 30-day SEC yield for the New Jersey Long-Term Tax-Exempt Fund.
The calculation of taxable-equivalent yield assumes a typical itemized tax return and is based on the maximum federal tax rate of 35% and
the maximum income tax rate for the state. Local taxes were not considered. Please see the prospectus for a detailed explanation of the
calculation.
Admiral Shares carry lower expenses and are available to investors who meet certain account-balance requirements.
Your Fund’s Performance at a Glance
November 30, 2010 , Through November 30, 2011
| | | | |
| | | | Distributions Per Share |
| | Starting | Ending | Income | Capital |
| | Share Price | Share Price | Dividends | Gains |
| Vanguard New Jersey Tax-Exempt Money | | | | |
| Market Fund | $1.00 | $1.00 | $0.001 | $0.000 |
| Vanguard New Jersey Long-Term Tax-Exempt | | | | |
| Fund | | | | |
| Investor Shares | $11.58 | $11.73 | $0.471 | $0.000 |
| Admiral Shares | 11.58 | 11.73 | 0.480 | 0.000 |
1

Chairman’s Letter
Dear Shareholder,
Your fund’s fiscal year, which ended November 30, 2011, began inauspiciously. The turbulence in the municipal bond market that characterized the closing months of the 2010 fiscal year spilled over into the first quarter of this reporting period. By spring, however, the market had regained its footing, and it bounced back strongly for the remainder of the year.
For the 12 months, Investor Shares of Vanguard New Jersey Long-Term Tax-Exempt Fund returned 5.54%; Admiral Shares returned 5.62%. Even in the difficult first quarter, the fund’s income helped cushion the effects of declining bond prices. For the period as a whole, the fund’s income return accounted for around three-quarters of its total return.
As I noted in letter to you six months ago, a confluence of negative events affected the municipal bond market at the start of the year. Especially prominent were concerns that state and local governments’ fiscal straits might lead to large-scale defaults. Thankfully, that hasn’t happened—and in our view isn’t likely to happen—although they may continue to struggle for some time despite cautiously hopeful signs. It’s important to keep in mind that the recoveries of state and
2
local governments typically lag after a recession ends, and this one follows the worst national slump since the Great Depression. One measure of the fiscal challenges faced in New Jersey and elsewhere is the reduced issuance of bonds during the fiscal period as projects are rethought.
In response to the market strains earlier in the year that sent municipal bond prices lower, the fund’s yield rose (because bond prices and yields move in opposite directions). As muni prices rallied, yields reversed course by fiscal year-end, winding up slightly lower than where they started. By November 30, the SEC yield for the
Long-Term Tax-Exempt Fund stood at 2.96% (Investor Shares), compared with
3.22% a year earlier.
In contrast to the bond markets, money market fund yields were stable—or perhaps frozen is a better word. The Tax-Exempt Money Market Fund returned
0.06%, compared with the 0.00% average return of its peers. Money market funds, tax-exempt and taxable alike, continue to be affected by the Federal Reserve’s decision to keep its target for short-term interest rates near zero. In August, the
Fed said it planned to maintain that level until at least mid-2013.
Note: The funds are permitted to invest in securities whose income is subject to the alternative minimum tax (AMT). As of November 30, the Long-Term Fund owned no securities that would generate income distributions subject to the AMT, but the
Money Market Fund did.
| | | |
| Market Barometer | | | |
| | Average Annual Total Returns |
| | Periods Ended November 30, 2011 |
| | One | Three | Five |
| | Year | Years | Years |
| Bonds | | | |
| Barclays Capital U.S. Aggregate Bond Index (Broad | | | |
| taxable market) | 5.52% | 7.69% | 6.14% |
| Barclays Capital Municipal Bond Index (Broad tax-exempt | | | |
| market) | 6.53 | 8.41 | 4.75 |
| Citigroup Three-Month U.S. Treasury Bill Index | 0.09 | 0.12 | 1.44 |
| |
| Stocks | | | |
| Russell 1000 Index (Large-caps) | 7.38% | 15.10% | 0.07% |
| Russell 2000 Index (Small-caps) | 2.75 | 17.56 | 0.09 |
| Dow Jones U.S. Total Stock Market Index | 6.57 | 15.67 | 0.36 |
| MSCI All Country World Index ex USA (International) | -5.90 | 13.19 | -2.11 |
| |
| CPI | | | |
| Consumer Price Index | 3.39% | 2.12% | 2.34% |
3
Despite modest yields, bonds produced strong returns
Both municipal and taxable bonds performed strongly during the fiscal year as stock market volatility helped generate enthusiasm for the relative stability of fixed income securities. Municipal bonds returned 6.53% and the broad taxable investment-grade bond market returned 5.52%, as anxious investors bid up bond prices and drove already low yields lower still. At the start of the year, the yield of the 10-year U.S. Treasury note, a benchmark for longer-term interest rates, stood at 2.80%. At the end, the note yielded just 2.07%. As yields decline, of course, so do the prospective returns available from these interest-bearing investments.
Even as the Fed maintained its near-0% target for the shortest-term interest rates, the central bank instituted a bond-buying policy aimed at reducing long-term yields.
A tumultuous path to unremarkable returns
The broad U.S. stock market produced a single-digit gain for the 12 months ended November 30. International stocks recorded a single-digit loss. On the way to these unremarkable returns, however, global stock markets traversed dramatic highs and lows.
Stock prices surged through the first half of the period as the U.S. economy seemed to be grinding into gear. But investor optimism faded in the second
| | | |
| Expense Ratios | | | |
| Your Fund Compared With Its Peer Group | | | |
| | Investor | Admiral | Peer Group |
| | Shares | Shares | Average |
| New Jersey Tax-Exempt Money | | | |
| Market Fund | 0.17% | — | 0.48% |
| New Jersey Long-Term Tax-Exempt | | | |
| Fund | 0.20 | 0.12% | 1.00 |
The fund expense ratios shown are from the prospectus dated March 29, 2011, and represent estimated costs for the current fiscal year. For
the fiscal year ended November 30, 2011, the funds’ expense ratios were: for the New Jersey Tax-Exempt Money Market Fund, 0.17%; and
for the New Jersey Long-Term Tax-Exempt Fund, 0.20% for Investor Shares and 0.12% for Admiral Shares. Peer-group expense ratios are
derived from data provided by Lipper Inc. and capture information through year-end 2010.
Peer groups: For the New Jersey Tax-Exempt Money Market Fund, New Jersey Tax-Exempt Money Market Funds; for the New Jersey
Long-Term Tax-Exempt Fund, New Jersey Municipal Debt Funds.
4
half, as Europe’s sovereign-debt crisis took center stage and political gridlock led to high-stakes brinkmanship over a bill to raise the U.S. debt ceiling. The drama prompted Standard & Poor’s to downgrade the U.S. credit rating, a shock that reverberated through global financial markets. (Vanguard’s confidence in the full faith and credit of the U.S. Treasury remains unshaken.)
Although U.S. stocks tumbled through the summer, Treasury prices increased as fear of a disorderly European resolution spurred a flight to quality. U.S. stocks rebounded in the period’s final months.
International stock markets traced similar trajectories before finishing the year with a negative return.
After a difficult start, municipal bonds rallied
New Jersey and most other states continued their budget struggles in the aftermath of the Great Recession. Governments throughout the country have been closely reexamining their cost structures, a process aimed at closing immediate budget gaps that may also help address some difficult longer-term issues. On the income side of the equation, states’ tax revenue continued to recover for the seventh straight calendar quarter as of September, but at a more moderate pace, according to a preliminary report from The Nelson A. Rockefeller Institute of Government. New Jersey’s downshift was at a faster pace than the national
| |
| Total Returns | |
| Ten Years Ended November 30, 2011 | |
| | Average |
| | Annual Return |
| New Jersey Tax-Exempt Money Market Fund | 1.50% |
| New Jersey Tax-Exempt Money Market Funds Average | 1.15 |
| New Jersey Tax-Exempt Money Market Funds Average: Derived from data provided by Lipper Inc. | |
| New Jersey Long-Term Tax-Exempt Fund Investor Shares | 4.60% |
| Barclays Capital 10 Year Municipal Bond Index | 5.52 |
| New Jersey Municipal Debt Funds Average | 4.06 |
| New Jersey Municipal Debt Funds Average: Derived from data provided by Lipper Inc. |
The figures shown represent past performance, which is not a guarantee of future results. (Current performance may be
lower or higher than the performance data cited. For performance data current to the most recent month-end, visit our
website at vanguard.com/performance.) Note, too, that both investment returns and principal value can fluctuate widely, so
an investor’s shares, when sold, could be worth more or less than their original cost.
5
average (a 2.6% year-over-year increase in the third calendar quarter versus the national average of 7.3%).
At the start of the fiscal period, many investors viewed the fiscal challenges of state and local governments with deep pessimism, which contributed to an unusually deep plunge in municipal bond prices. Other factors included a rallying stock market, signs of a strengthening economy, rising interest rates, and the expiration of a popular subsidized taxable municipal bond program. Municipal market gloom persisted until the spring, when a strong rally began that lasted for the remainder of the New Jersey Long-Term Tax-Exempt Fund’s fiscal year.
The market upswing countered the year’s discouraging start. As I mentioned earlier, the fund’s Investor Shares returned a solid 5.54% for the 12 months ended November 30; Admiral Shares returned
5.62%. The fund outpaced the 5.48% average return of competing New Jersey funds, a consequence of its smaller loss in the opening months of the year.
The fund’s advisor, Vanguard Fixed Income Group, invests in higher-quality municipal bonds. This focus is a key reason for the fund’s better relative performance, because investors tend to prefer these kinds of investments in rough times. As the year continued and investors regained their appetite for risk, the higher quality of the fund’s assets compared with those of its peers held back returns somewhat. And as longer-term yields declined, peer funds
also got a boost from their typically longer average durations (the longer a fund’s duration, the more sensitive the fund is to interest rate changes). At root were the Federal Reserve’s actions at both ends of the yield spectrum. The Fed’s policy of keeping short-term interest rates low has driven many investors to intermediate-term bonds, thus raising prices and reducing yields, while its new bond-buying policy has pushed longer-term yields lower.
The advisor concentrated where possible on essential-service bonds, which typically generate relatively stable revenue streams from, for example, water, sewer, and electricity-generating facilities. The advisor also invested selectively in sectors such as health care.
The Advisor’s Report that follows this letter provides additional details about the
Fixed Income Group’s management of the funds during the year.
Skillful management helps produce solid returns over the long term
A key measure of a fund’s performance is its experience over the long term. That is why it’s gratifying to review the history of the New Jersey Tax-Exempt Funds.
For the ten years ended November 30, 2011, both funds produced competitive average annual returns that exceeded their respective peer-group average returns; the long-term fund trailed a broad nationwide index that serves as a reasonable if imperfect benchmark for a New Jersey fund.
6
The funds have benefited from their high-quality orientation and low costs. Especially important has been the skill of the Fixed Income Group—not only the portfolio managers and traders, but also its team of seasoned credit analysts, who provide stringent and objective evaluations of the fiscal strength of bond issuers.
The more markets change, the more they stay the same
Uncertainty—sometimes at elevated levels—is an integral part of the investment landscape. This latest fiscal year serves as a case in point, as concerns about the fiscal health of municipal bond issuers early in the period were overridden by a strong rally in municipal bonds even as the challenges for state and local governments continued unabated.
Whatever the market environment, we believe that an effective long-term investment approach is to select a mix of assets that is balanced between, and diversified among, stocks, bonds, and cash investments. By sticking with such a plan through the markets’ cycles of optimism and fear, you enhance your chances of investment success.
Thank you for entrusting your assets to Vanguard.
Sincerely,

F. William McNabb III
Chairman and Chief Executive Officer
December 15, 2011
7
Advisor’s Report
For the fiscal year ended November 30, 2011, Vanguard New Jersey Tax-Exempt Money Market Fund returned 0.06%, as the Federal Reserve maintained—and said it would extend until mid-2013—its policy of keeping short-term interest rates near zero. Vanguard New Jersey Long-Term Tax-Exempt Fund returned 5.54% for Investor Shares and 5.62% for Admiral
Shares, trailing the return of its national benchmark index but ahead of the average return of New Jersey peer-group funds.
The investment environment
The opening months of the funds’ fiscal year coincided with the high point of unease in the municipal bond market. Investor concern had started to rise in October 2010, but the December–January period (your fund’s fiscal year starts on December 1) was characterized by a brief and historically heavy spate of withdrawals from muni funds and a slump in bond prices.
The price decline has been attributed to an almost perfect storm of economic and market factors that we described in detail in our last report to you six months ago. One of these factors was the fear held by some investors of a systemic decline in the creditworthiness of municipal bonds as state and local government tax revenues plunged in the wake of the Great
Recession. After that disruptive start, more “normal” dynamics set in and municipal bonds returned a solid 6.53% for the fiscal year, ahead of the 5.52% return of taxable bonds, as measured by the Barclays Capital Municipal Bond Index and Barclays
Capital U.S. Aggregate Bond Index, respectively.
As we expected, the fear that large numbers of bond issuers would default turned out to be unwarranted. That said, they do face a challenging road ahead. Tax revenues have continued to rise
| | |
| Yields of Tax-Exempt Municipal Bonds | | |
| (AAA-Rated General-Obligation Issues) | | |
| | November 30, | November 30, |
| Maturity | 2010 | 2011 |
| 2 years | 0.60% | 0.42% |
| 5 years | 1.36 | 1.12 |
| 10 years | 2.79 | 2.22 |
| 30 years | 4.28 | 3.84 |
| Source: Vanguard. |
8
for almost two years, but not enough to make budget-balancing easy. The effect of a national recession on these revenues lingers well after its official trough; the deeper the slump, the longer the recovery—and, as you know, the most recent downturn was the deepest in decades.
State and local governments continued to react to the forced austerity programs that the Great Recession precipitated, issuing fewer bonds than investors had expected earlier in the year and being more selective in the process. Overall municipal bond issuance during fiscal 2011 was about 7% lower than a year earlier, although it began to pick up later in the year. The volume figures exclude the effect of subsidized bonds issued under the Build America Bonds (BABs) program, part of the federal government’s economic-crisis stimulus package. These taxable bonds diverted some potential volume from the market for tax-exempt bonds before the program’s expiration at year-end 2010.
Reflecting the fiscal restraint being exercised by New Jersey state and local governments, the volume of new New Jersey municipal bonds issued during the funds’ fiscal year (excluding BABs) decreased by 11% from the previous year, to almost $9 billion. The figure smooths over unusually low issuance in the funds’ second and third quarters (a drop of 34% and 29%, respectively, year-over-year) as well as higher issuance in the other quarters. With BABs included, however, the total amount of issuance during the funds’ fiscal year was down even more, by almost 17%.
At the same time, tax-exempt munis offered attractive yields compared with those of Treasury bonds. Muni bonds’ yields historically have been lower, a relationship that takes into account the federal tax-free nature of their income. During the latter part of the fiscal year, muni yields approached and then surpassed Treasury yields as investors sought “safe” assets in reaction to concerns about, among other things, Europe’s sovereign-debt problems. The flight to safety also fueled demand for higher-quality munis, even as state and local governments continued to struggle with their finances.
Given the unusual steepness of the yield curve during the year—that is, the difference in yields between the shortest-and longest-maturity bonds, as shown in the table on page 8—issuers sought to lower borrowing costs by favoring shorter maturities. They found a match with individual investors who were fleeing from the almost nonexistent yields offered by money market mutual funds to short-and medium-term bonds, a dynamic that pushed intermediate-term yields lower as demand and prices rose (bond prices and yields move inversely to each other). In choosing our investments during the year, we took advantage of the steepness in the yield curve to boost returns.
The low money market fund yields, of course, were a consequence of the
Federal Reserve’s policy, in place since December 2008, of keeping the shortest-term interest rates near zero. In August, the Fed said it would continue to do so until at least mid-2013, and one month
9
later it said it would also strive to lower longer-term interest rates. Under this new policy, informally known as Operation Twist, the Fed has begun purchasing Treasury bonds with remaining maturities of 6 to 30 years. The purchases have had the effect of lowering yields and raising prices of longer-term bonds.
Management of the funds
Bond fund returns during the fiscal year were helped substantially by our decision to redeploy certain assets from the shorter- to the longer-maturity regions of the yield curve.
We also sought to add value through careful, and diversified, selection of revenue-based bonds rather than focusing on state and local general obligation bonds. Some of the spreads between these bonds were among the highest we have seen. Among the sectors in which we benefited were essential services and A-rated hospital bonds.
We have been cautious in setting the
New Jersey bond fund’s duration, given the uncertainties hovering over both the U.S. and European economies as well as future U.S. tax policy. We have set the fund’s average weighted duration, which is a gauge of the sensitivity of its portfolio to changes in interest rates, at a neutral level compared with its benchmark index.
In managing the money market fund, we haven’t changed our strategy, even though we continue to operate in an investment environment shaped by the Federal Reserve’s anchoring of its target interest rate in the neighborhood of zero.
We remain focused on maintaining a diversified portfolio of high-quality short-term debt.
Going forward, credit concerns will continue to weigh on the municipal market—understandably, given the financial stresses that state and local governments will face for some time. Even so, our approach to muni bond investing hasn’t changed: As always, our dedicated and seasoned credit analysts, working together with traders and portfolio managers, will closely review the fiscal health of our borrowers as we choose issues to add to our portfolios and monitor those we have already purchased.
John M. Carbone, Principal,
Portfolio Manager
Michael G. Kobs, Portfolio Manager
Pamela Wisehaupt Tynan, Principal,
Head of Municipal Money Market Funds
Christopher W. Alwine, CFA, Principal,
Head of Municipal Bond Funds
Vanguard Fixed Income Group
December 20, 2011
10
New Jersey Tax-Exempt Money Market Fund
Fund Profile
As of November 30, 2011
| |
| Financial Attributes | |
| Ticker Symbol | VNJXX |
| Expense Ratio1 | 0.17% |
| 7-Day SEC Yield | 0.03% |
| Average Weighted | |
| Maturity | 41 days |
| |
| Distribution by Credit Quality (% of portfolio) |
| First Tier | 100.0% |
| For information about these ratings, see the Glossary entry for Credit Quality. |
1 The expense ratio shown is from the prospectus dated March 29, 2011, and represents estimated costs for the current fiscal year. For the
fiscal year ended November 30, 2011, the expense ratio was 0.17%.
11
New Jersey Tax-Exempt Money Market Fund
Performance Summary
Investment returns will fluctuate. All of the returns in this report represent past performance, which is not a guarantee of future results that may be achieved by the fund. (Current performance may be lower or higher than the performance data cited. For performance data current to the most recent month-end, visit our website at vanguard.com/performance.) The returns shown do not reflect taxes that a shareholder would pay on fund distributions. An investment in a money market fund is not insured or guaranteed by the Federal Deposit Insurance Corporation or any other government agency. Although the fund seeks to preserve the value of your investment at $1 per share, it is possible to lose money by investing in the fund. The fund’s 7-day SEC yield reflects its current earnings more closely than do the average annual returns.
Cumulative Performance: November 30, 2001, Through November 30, 2011
Initial Investment of $10,000
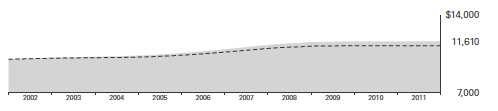
| | | | |
| | Average Annual Total Returns | |
| | Periods Ended November 30, 2011 | |
| | | | | Final Value |
| | One | Five | Ten | of a $10,000 |
| | Year | Years | Years | Investment |
| New Jersey Tax-Exempt Money | | | | |
| Market Fund | 0.06% | 1.29% | 1.50% | $11,610 |
| |
| – – – – New Jersey Tax-Exempt Money | | | | |
| Market Funds Average | 0.00 | 1.05 | 1.15 | 11,213 |
| New Jersey Tax-Exempt Money Market Funds Average: Derived from data provided by Lipper Inc. |
See Financial Highlights for dividend information.
12
New Jersey Tax-Exempt Money Market Fund
Fiscal-Year Total Returns (%): November 30, 2001, Through November 30, 2011
| | |
| | | NJ Tax-Exempt |
| | | Money Mkt |
| | | Funds Avg |
| Fiscal Year | Total Returns | Total Returns |
| 2002 | 1.29% | 0.88% |
| 2003 | 0.87 | 0.48 |
| 2004 | 1.03 | 0.55 |
| 2005 | 2.17 | 1.63 |
| 2006 | 3.25 | 2.74 |
| 2007 | 3.60 | 3.12 |
| 2008 | 2.27 | 1.90 |
| 2009 | 0.45 | 0.25 |
| 2010 | 0.11 | 0.01 |
| 2011 | 0.06 | 0.00 |
| 7-day SEC yield (11/30/2011): 0.03% |
| New Jersey Tax-Exempt Money Market Funds Average: Derived from data provided by Lipper Inc. |
Average Annual Total Returns: Periods Ended September 30, 2011
This table presents returns through the latest calendar quarter—rather than through the end of the fiscal period.
Securities and Exchange Commission rules require that we provide this information.
| | | | |
| | Inception | One | Five | Ten |
| | Date | Year | Years | Years |
| New Jersey Tax-Exempt Money | | | | |
| Market Fund | 2/3/1988 | 0.08% | 1.40% | 1.54% |
13
New Jersey Tax-Exempt Money Market Fund
Financial Statements
Statement of Net Assets
As of November 30, 2011
The fund reports a complete list of its holdings in various monthly and quarterly regulatory filings. The fund publishes its holdings on a monthly basis at vanguard.com and files them with the Securities and Exchange Commission on Form N-MFP. The fund’s Form N-MFP filings become public 60 days after the relevant month-end, and may be viewed at sec.gov or via a link on the “Portfolio Holdings” page on vanguard.com. For the second and fourth fiscal quarters, the lists appear in the fund’s semiannual and annual reports to shareholders. For the first and third fiscal quarters, the fund files the lists with the SEC on Form N-Q. Shareholders can look up the fund’s Forms N-Q on the SEC’s website at sec.gov. Forms N-Q may also be reviewed and copied at the SEC’s Public Reference Room (see the back cover of this report for further information).
| | | | |
| | | | Face | Market |
| | | Maturity | Amount | Value |
| | Coupon | Date | ($000) | ($000) |
| Tax-Exempt Municipal Bonds (92.8%) | | | | |
| New Jersey (83.7%) | | | | |
| Bergen County NJ BAN | 1.000% | 12/20/11 | 29,300 | 29,312 |
| 1 BlackRock MuniHoldings New Jersey | | | | |
| Quality Fund, Inc. VRDP VRDO | 0.320% | 12/7/11 LOC | 40,300 | 40,300 |
| 1 BlackRock MuniYield New Jersey | | | | |
| Quality Fund, Inc. VRDP VRDO | 0.280% | 12/7/11 LOC | 20,000 | 20,000 |
| 1 BlackRock MuniYield New Jersey | | | | |
| Quality Fund, Inc. VRDP VRDO | 0.320% | 12/7/11 LOC | 15,000 | 15,000 |
| Bridgewater Township NJ BAN | 1.500% | 4/19/12 | 9,675 | 9,711 |
| Burlington County NJ BAN | 1.500% | 9/7/12 | 26,088 | 26,332 |
| Camden County NJ Improvement Authority | | | | |
| Health Care Redevelopment Project Revenue | | | | |
| (Cooper Health System Obligated Group) VRDO | 0.090% | 12/7/11 LOC | 11,755 | 11,755 |
| Camden County NJ Improvement Authority | | | | |
| Lease Revenue (Parkview Redevelopment | | | | |
| Housing Project) VRDO | 0.100% | 12/7/11 LOC | 49,500 | 49,500 |
| Cape May County NJ BAN | 2.000% | 8/31/12 | 4,000 | 4,048 |
| Cape May County NJ Municipal Utilities | | | | |
| Authority Revenue | 5.750% | 1/1/12 | 2,000 | 2,009 |
| Delaware River & Bay Authority | | | | |
| New Jersey Revenue VRDO | 0.070% | 12/7/11 LOC | 4,300 | 4,300 |
| Delaware River Port Authority Pennsylvania & | | | | |
| New Jersey Revenue VRDO | 0.090% | 12/7/11 LOC | 35,895 | 35,895 |
| Delaware River Port Authority Pennsylvania & | | | | |
| New Jersey Revenue VRDO | 0.090% | 12/7/11 LOC | 35,975 | 35,975 |
| Delaware River Port Authority Pennsylvania & | | | | |
| New Jersey Revenue VRDO | 0.110% | 12/7/11 LOC | 15,500 | 15,500 |
| Essex County NJ Improvement Authority | | | | |
| Revenue (Fern Senior Housing Project) VRDO | 0.120% | 12/7/11 LOC | 7,300 | 7,300 |
| Essex County NJ Improvement Authority | | | | |
| Revenue (Jewish Community Center of | | | | |
| MetroWest Inc. Project) VRDO | 0.100% | 12/7/11 LOC | 11,540 | 11,540 |
| Essex County NJ Improvement Authority | | | | |
| Revenue (Pooled Government Loan) VRDO | 0.070% | 12/7/11 LOC | 5,500 | 5,500 |
14
New Jersey Tax-Exempt Money Market Fund
| | | | |
| | | | Face | Market |
| | | Maturity | Amount | Value |
| | Coupon | Date | ($000) | ($000) |
| 1 Garden State Preservation Trust | | | | |
| New Jersey Revenue (Open Space & | | | | |
| Farmland Preservation) TOB VRDO | 0.140% | 12/7/11 | 4,185 | 4,185 |
| 1 Garden State Preservation Trust | | | | |
| New Jersey Revenue (Open Space & | | | | |
| Farmland Preservation) TOB VRDO | 0.200% | 12/7/11 (4) | 6,105 | 6,105 |
| Gloucester County NJ Pollution Control Financing | | | | |
| Authority Revenue (ExxonMobil Project) VRDO | 0.020% | 12/1/11 | 37,585 | 37,585 |
| Hudson County NJ Improvement Authority BAN | 2.000% | 6/15/12 | 13,000 | 13,088 |
| Hudson County NJ Improvement Authority BAN | 2.000% | 6/15/12 | 6,086 | 6,127 |
| Lawrence Township NJ BAN | 2.000% | 7/27/12 | 5,315 | 5,368 |
| 1 Madison Borough NJ Board of Education | | | | |
| GO TOB VRDO | 0.130% | 12/7/11 LOC | 11,655 | 11,655 |
| Mahwah Township NJ BAN | 2.000% | 8/10/12 | 5,475 | 5,538 |
| Mahwah Township NJ BAN | 1.500% | 10/12/12 | 6,800 | 6,874 |
| Mercer County NJ BAN | 1.500% | 2/13/12 | 37,290 | 37,365 |
| Morris County NJ Improvement Authority BAN | 1.500% | 8/29/12 | 4,000 | 4,036 |
| New Jersey Building Authority Revenue | 5.250% | 12/15/12 (Prere.) | 1,000 | 1,052 |
| New Jersey Economic Development Authority | | | | |
| Industrial Development Revenue | | | | |
| (Ocean Spray Cranberries Inc. Project) VRDO | 0.250% | 12/7/11 LOC | 8,000 | 8,000 |
| New Jersey Economic Development Authority | | | | |
| Mortgage Revenue (Franciscan Oaks Project) | | | | |
| VRDO | 0.100% | 12/7/11 LOC | 1,150 | 1,150 |
| New Jersey Economic Development Authority | | | | |
| Natural Gas Facilities Revenue | | | | |
| (New Jersey Natural Gas) VRDO | 0.170% | 12/7/11 LOC | 8,500 | 8,500 |
| New Jersey Economic Development Authority | | | | |
| Natural Gas Facilities Revenue | | | | |
| (Nui Corp.) VRDO | 0.120% | 12/1/11 LOC | 5,000 | 5,000 |
| New Jersey Economic Development Authority | | | | |
| NaturalGas Facilities Revenue | | | | |
| (Pivotal Utility Holdings Inc. Project) VRDO | 0.120% | 12/1/11 LOC | 5,000 | 5,000 |
| New Jersey Economic Development Authority | | | | |
| Revenue (Applewood Estates Project) VRDO | 0.080% | 12/7/11 LOC | 20,180 | 20,180 |
| New Jersey Economic Development Authority | | | | |
| Revenue (Bayonne/IMTT Project) VRDO | 0.100% | 12/1/11 LOC | 7,800 | 7,800 |
| New Jersey Economic Development Authority | | | | |
| Revenue (Bayonne/IMTT Project) VRDO | 0.100% | 12/1/11 LOC | 3,200 | 3,200 |
| New Jersey Economic Development Authority | | | | |
| Revenue (Bayonne/IMTT Project) VRDO | 0.100% | 12/1/11 LOC | 10,000 | 10,000 |
| New Jersey Economic Development Authority | | | | |
| Revenue (Cooper Health System Project) VRDO | 0.090% | 12/7/11 LOC | 23,800 | 23,800 |
| 1 New Jersey Economic Development Authority | | | | |
| Revenue (Duke Farms Foundation Project) | | | | |
| TOB VRDO | 0.180% | 12/7/11 | 6,380 | 6,380 |
| New Jersey Economic Development Authority | | | | |
| Revenue (Duke Farms Foundation Project) | | | | |
| VRDO | 0.090% | 12/1/11 LOC | 17,600 | 17,600 |
| New Jersey Economic Development Authority | | | | |
| Revenue (El Dorado Terminals Co. Project) | | | | |
| VRDO | 0.100% | 12/1/11 LOC | 6,000 | 6,000 |
| 1 New Jersey Economic Development Authority | | | | |
| Revenue (Montclair Art Museum Project) VRDO | 0.150% | 12/7/11 LOC | 5,260 | 5,260 |
15
New Jersey Tax-Exempt Money Market Fund
| | | | |
| | | | Face | Market |
| | | Maturity | Amount | Value |
| | Coupon | Date | ($000) | ($000) |
| New Jersey Economic Development Authority | | | | |
| Revenue (Order of St. Benedict Project) VRDO | 0.100% | 12/7/11 LOC | 13,525 | 13,525 |
| New Jersey Economic Development Authority | | | | |
| Revenue (School Facilities Construction) | 5.000% | 3/1/12 (ETM) | 2,000 | 2,024 |
| New Jersey Economic Development Authority | | | | |
| Revenue (School Facilities Construction) | 5.000% | 6/15/12 (Prere.) | 2,300 | 2,358 |
| New Jersey Economic Development Authority | | | | |
| Revenue (School Facilities Construction) | 5.000% | 6/15/12 (Prere.) | 1,900 | 1,949 |
| New Jersey Economic Development Authority | | | | |
| Revenue (School Facilities Construction) | 5.000% | 6/15/12 (ETM) | 2,380 | 2,440 |
| 1 New Jersey Economic Development Authority | | | | |
| Revenue (School Facilities Construction) | | | | |
| TOB VRDO | 0.140% | 12/7/11 | 10,995 | 10,995 |
| New Jersey Economic Development Authority | | | | |
| Revenue Pollution Control Revenue | | | | |
| (Exxon Project) VRDO | 0.030% | 12/1/11 | 5,140 | 5,140 |
| New Jersey Economic Development Authority | | | | |
| School Revenue (Blair Academy Project) VRDO | 0.100% | 12/7/11 LOC | 13,640 | 13,640 |
| New Jersey Economic Development Authority | | | | |
| Special Facility Revenue | | | | |
| (Port Newark Container) VRDO | 0.120% | 12/7/11 LOC | 13,700 | 13,700 |
| New Jersey Educational Facilities Authority | | | | |
| Revenue (Caldwell College) VRDO | 0.100% | 12/7/11 LOC | 17,680 | 17,680 |
| New Jersey Educational Facilities Authority | | | | |
| Revenue (Higher Education Trust Fund) | 5.250% | 9/1/12 (Prere.) | 3,535 | 3,667 |
| New Jersey Educational Facilities Authority | | | | |
| Revenue (Higher Education Trust Fund) | 5.250% | 9/1/12 (Prere.) | 3,560 | 3,694 |
| 1 New Jersey Educational Facilities Authority | | | | |
| Revenue (Institute for Advanced Studies) VRDO | 0.100% | 12/7/11 | 25,000 | 25,000 |
| New Jersey Educational Facilities Authority | | | | |
| Revenue (Institute for Advanced Studies) VRDO | 0.100% | 12/7/11 | 13,325 | 13,325 |
| 1 New Jersey Educational Facilities Authority | | | | |
| Revenue (Institute for Defense Analyses) VRDO | 0.140% | 12/7/11 LOC | 8,885 | 8,885 |
| New Jersey Educational Facilities Authority | | | | |
| Revenue (Princeton Theological Seminary) | 3.000% | 7/1/12 | 1,000 | 1,016 |
| 1 New Jersey Educational Facilities Authority | | | | |
| Revenue (Princeton University) TOB VRDO | 0.140% | 12/7/11 | 10,900 | 10,900 |
| 1 New Jersey Educational Facilities Authority | | | | |
| Revenue (Princeton University) TOB VRDO | 0.140% | 12/7/11 | 2,165 | 2,165 |
| New Jersey Educational Facilities Authority | | | | |
| Revenue (Seton Hall University) VRDO | 0.080% | 12/7/11 LOC | 14,930 | 14,930 |
| New Jersey Environmental Infrastructure | | | | |
| Trust Revenue | 3.400% | 9/1/12 | 4,000 | 4,095 |
| New Jersey GO | 5.250% | 7/1/12 | 5,000 | 5,146 |
| New Jersey GO | 5.250% | 7/1/12 | 2,000 | 2,058 |
| New Jersey GO | 5.000% | 8/1/12 (Prere.) | 2,000 | 2,063 |
| 1 New Jersey Health Care Facilities | | | | |
| Financing Authority Revenue | | | | |
| (AHS Hospital Corp.) TOB VRDO | 0.160% | 12/7/11 LOC | 6,225 | 6,225 |
| New Jersey Health Care Facilities | | | | |
| Financing Authority Revenue | | | | |
| (AHS Hospital Corp.) VRDO | 0.130% | 12/7/11 LOC | 17,000 | 17,000 |
| New Jersey Health Care Facilities | | | | |
| Financing Authority Revenue | | | | |
| (Hospital Capital Asset Pooled Program) VRDO | 0.120% | 12/7/11 LOC | 19,700 | 19,700 |
16
New Jersey Tax-Exempt Money Market Fund
| | | | |
| | | | Face | Market |
| | | Maturity | Amount | Value |
| | Coupon | Date | ($000) | ($000) |
| New Jersey Health Care Facilities | | | | |
| Financing Authority Revenue | | | | |
| (Hospital Capital Asset Pooled Program) VRDO | 0.120% | 12/7/11 LOC | 18,900 | 18,900 |
| New Jersey Health Care Facilities | | | | |
| Financing Authority Revenue | | | | |
| (Hospital Capital Asset Pooled Program) VRDO | 0.120% | 12/7/11 LOC | 12,700 | 12,700 |
| New Jersey Health Care Facilities | | | | |
| Financing Authority Revenue | | | | |
| (Meridian III) VRDO | 0.170% | 12/7/11 (12) | 15,300 | 15,300 |
| New Jersey Health Care Facilities | | | | |
| Financing Authority Revenue | | | | |
| (Meridian IV) VRDO | 0.070% | 12/7/11 (12) | 9,500 | 9,500 |
| New Jersey Health Care Facilities | | | | |
| Financing Authority Revenue | | | | |
| (MHAC I LLC) VRDO | 0.100% | 12/7/11 LOC | 1,420 | 1,420 |
| New Jersey Health Care Facilities | | | | |
| Financing Authority Revenue | | | | |
| (Princeton Healthcare) VRDO | 0.090% | 12/7/11 LOC | 8,500 | 8,500 |
| New Jersey Health Care Facilities | | | | |
| Financing Authority Revenue | | | | |
| (Robert Wood Johnson University) VRDO | 0.100% | 12/7/11 LOC | 2,300 | 2,300 |
| New Jersey Health Care Facilities | | | | |
| Financing Authority Revenue | | | | |
| (South Jersey Hospital) | 5.875% | 7/1/12 (Prere.) | 9,860 | 10,187 |
| New Jersey Health Care Facilities | | | | |
| Financing Authority Revenue | | | | |
| (Virtua Health) VRDO | 0.050% | 12/7/11 LOC | 14,000 | 14,000 |
| New Jersey Health Care Facilities | | | | |
| Financing Authority Revenue | | | | |
| (Virtua Health) VRDO | 0.090% | 12/7/11 LOC | 12,650 | 12,650 |
| 1 New Jersey Higher Education Assistance | | | | |
| Authority Student Loan Revenue TOB VRDO | 0.140% | 12/7/11 | 5,435 | 5,435 |
| New Jersey Housing & Mortgage Finance | | | | |
| Agency Multi-Family Housing Revenue VRDO | 0.130% | 12/7/11 LOC | 6,830 | 6,830 |
| New Jersey Housing & Mortgage Finance | | | | |
| Agency Multi-Family Housing Revenue VRDO | 0.170% | 12/7/11 (4) | 11,560 | 11,560 |
| New Jersey Housing & Mortgage Finance | | | | |
| Agency Multi-Family Housing Revenue VRDO | 0.200% | 12/7/11 (4) | 20,135 | 20,135 |
| New Jersey Housing & Mortgage Finance | | | | |
| Agency Multi-Family Housing Revenue VRDO | 0.200% | 12/7/11 (4) | 13,570 | 13,570 |
| 1 New Jersey Housing & Mortgage Finance Agency | | | | |
| Single Family Housing Revenue TOB VRDO | 0.200% | 12/7/11 | 7,500 | 7,500 |
| 1 New Jersey Housing & Mortgage Finance | | | | |
| Agency Single Family Housing Revenue | | | | |
| TOB VRDO | 0.230% | 12/7/11 | 6,110 | 6,110 |
| New Jersey Housing & Mortgage Finance | | | | |
| Agency Single Family Housing Revenue VRDO | 0.100% | 12/7/11 | 9,000 | 9,000 |
| New Jersey Housing & Mortgage Finance | | | | |
| Agency Single Family Housing Revenue VRDO | 0.110% | 12/7/11 | 33,600 | 33,600 |
| New Jersey Transportation Trust Fund Authority | | | | |
| Transportation System Revenue | 5.000% | 12/15/11 (Prere.) | 10,000 | 10,018 |
| New Jersey Transportation Trust Fund Authority | | | | |
| Transportation System Revenue | 5.500% | 12/15/11 (4) | 20,000 | 20,040 |
| New Jersey Transportation Trust Fund Authority | | | | |
| Transportation System Revenue | 6.000% | 12/15/11 (Prere.) | 9,330 | 9,350 |
17
New Jersey Tax-Exempt Money Market Fund
| | | | |
| | | | Face | Market |
| | | Maturity | Amount | Value |
| | Coupon | Date | ($000) | ($000) |
| New Jersey Transportation Trust Fund Authority | | | | |
| Transportation System Revenue | 6.000% | 12/15/11 (Prere.) | 21,440 | 21,487 |
| New Jersey Transportation Trust Fund Authority | | | | |
| Transportation System Revenue | 6.000% | 12/15/11 (Prere.) | 2,185 | 2,190 |
| New Jersey Transportation Trust Fund Authority | | | | |
| Transportation System Revenue | 6.000% | 12/15/11 (Prere.) | 3,000 | 3,006 |
| New Jersey Transportation Trust Fund Authority | | | | |
| Transportation System Revenue | 6.000% | 12/15/11 (Prere.) | 13,035 | 13,064 |
| New Jersey Transportation Trust Fund Authority | | | | |
| Transportation System Revenue | 6.000% | 12/15/11 (Prere.) | 13,000 | 13,029 |
| New Jersey Transportation Trust Fund Authority | | | | |
| Transportation System Revenue | 5.250% | 6/15/12 (ETM) | 1,000 | 1,027 |
| New Jersey Transportation Trust Fund Authority | | | | |
| Transportation System Revenue | 5.250% | 6/15/12 (ETM) | 1,425 | 1,463 |
| 1 New Jersey Transportation Trust Fund Authority | | | | |
| Transportation System Revenue TOB VRDO | 0.140% | 12/7/11 (4) | 15,910 | 15,910 |
| 1 New Jersey Transportation Trust Fund Authority | | | | |
| Transportation System Revenue TOB VRDO | 0.160% | 12/7/11 LOC | 1,200 | 1,200 |
| New Jersey Transportation Trust Fund Authority | | | | |
| Transportation System Revenue VRDO | 0.090% | 12/7/11 LOC | 3,400 | 3,400 |
| New Jersey Turnpike Authority Revenue VRDO | 0.080% | 12/7/11 LOC | 15,900 | 15,900 |
| New Jersey Turnpike Authority Revenue VRDO | 0.090% | 12/7/11 LOC | 20,500 | 20,500 |
| 1 Nuveen New Jersey Investment Quality | | | | |
| Municipal Fund VRDP VRDO | 0.280% | 12/7/11 LOC | 30,000 | 30,000 |
| Passaic County NJ BAN | 1.500% | 4/11/12 | 23,156 | 23,236 |
| Port Authority of New York & | | | | |
| New Jersey Revenue CP | 0.180% | 2/1/12 | 5,845 | 5,845 |
| Port Authority of New York & | | | | |
| New Jersey Revenue CP | 0.160% | 3/8/12 | 9,710 | 9,710 |
| 1 Port Authority of New York & | | | | |
| New Jersey Revenue TOB VRDO | 0.140% | 12/7/11 | 1,200 | 1,200 |
| 1 Port Authority of New York & | | | | |
| New Jersey Revenue TOB VRDO | 0.150% | 12/7/11 | 7,000 | 7,000 |
| 1 Port Authority of New York & | | | | |
| New Jersey Revenue TOB VRDO | 0.150% | 12/7/11 | 6,200 | 6,200 |
| 1 Port Authority of New York & | | | | |
| New Jersey Revenue TOB VRDO | 0.150% | 12/7/11 | 5,000 | 5,000 |
| 1 Port Authority of New York & | | | | |
| New Jersey Revenue TOB VRDO | 0.150% | 12/7/11 | 7,770 | 7,770 |
| 1 Port Authority of New York & | | | | |
| New Jersey Revenue TOB VRDO | 0.180% | 12/7/11 | 3,500 | 3,500 |
| 1 Port Authority of New York & | | | | |
| New Jersey Revenue TOB VRDO | 0.190% | 12/7/11 | 23,210 | 23,210 |
| 1 Port Authority of New York & | | | | |
| New Jersey Revenue TOB VRDO | 0.190% | 12/7/11 | 5,600 | 5,600 |
| 1 Port Authority of New York & | | | | |
| New Jersey Revenue TOB VRDO | 0.200% | 12/7/11 | 5,555 | 5,555 |
| 1 Port Authority of New York & | | | | |
| New Jersey Revenue TOB VRDO | 0.200% | 12/7/11 | 3,335 | 3,335 |
| 1 Port Authority of New York & | | | | |
| New Jersey Revenue TOB VRDO | 0.220% | 12/7/11 | 7,320 | 7,320 |
| 1 Port Authority of New York & | | | | |
| New Jersey Revenue TOB VRDO | 0.220% | 12/7/11 | 4,050 | 4,050 |
18
New Jersey Tax-Exempt Money Market Fund
| | | | | |
| | | | | Face | Market |
| | | | Maturity | Amount | Value |
| | | Coupon | Date | ($000) | ($000) |
| 1 | Port Authority of New York & | | | | |
| | New Jersey Revenue TOB VRDO | 0.270% | 12/7/11 (4) | 3,580 | 3,580 |
| | Princeton NJ Regional School District GO | 3.000% | 2/1/12 | 2,500 | 2,511 |
| | Princeton University New Jersey CP | 0.100% | 12/15/11 | 2,800 | 2,800 |
| | Princeton University New Jersey CP | 0.110% | 2/8/12 | 12,530 | 12,530 |
| | Rockaway Township NJ BAN | 2.000% | 9/28/12 | 11,526 | 11,683 |
| | Rutgers State University New Jersey Revenue | | | | |
| | VRDO | 0.090% | 12/1/11 | 65,010 | 65,010 |
| | Rutgers State University New Jersey Revenue | | | | |
| | VRDO | 0.090% | 12/1/11 | 31,070 | 31,070 |
| | Scotch Plains Township NJ BAN | 1.500% | 1/20/12 | 9,150 | 9,163 |
| | South Jersey Transportation Authority | | | | |
| | New Jersey Transportation System Revenue | | | | |
| | VRDO | 0.100% | 12/7/11 LOC | 15,725 | 15,725 |
| | South Jersey Transportation Authority | | | | |
| | New Jersey Transportation System Revenue | | | | |
| | VRDO | 0.110% | 12/7/11 LOC | 16,000 | 16,000 |
| | Sparta Township NJ BAN | 2.000% | 5/25/12 | 6,270 | 6,313 |
| | Summit NJ School District GO | 2.000% | 1/1/12 | 1,085 | 1,087 |
| | Tobacco Settlement Financing Corp. | | | | |
| | New Jersey Revenue | 5.750% | 6/1/12 (Prere.) | 26,900 | 27,639 |
| | Tobacco Settlement Financing Corp. | | | | |
| | New Jersey Revenue | 6.000% | 6/1/12 (Prere.) | 7,890 | 8,116 |
| | Tobacco Settlement Financing Corp. | | | | |
| | New Jersey Revenue | 6.125% | 6/1/12 (Prere.) | 20,385 | 20,986 |
| | Union County NJ BAN | 1.500% | 6/29/12 | 15,000 | 15,110 |
| | Union County NJ Pollution Control Financing | | | | |
| | Authority Revenue (Exxon Project) VRDO | 0.020% | 12/1/11 | 27,625 | 27,625 |
| | Union County NJ Pollution Control Financing | | | | |
| | Authority Revenue (Exxon Project) VRDO | 0.030% | 12/1/11 | 12,700 | 12,700 |
| | VinelandNJ (Electric Utility) GO VRDO | 0.150% | 12/7/11 LOC | 8,400 | 8,400 |
| | | | | | 1,631,505 |
| Puerto Rico (9.1%) | | | | |
| 1 | Puerto Rico Aqueduct & Sewer Authority | | | | |
| | Revenue TOB VRDO | 0.340% | 12/7/11 (12) | 5,450 | 5,450 |
| | Puerto Rico Electric Power Authority Revenue | 5.125% | 7/1/12 (Prere.) | 1,000 | 1,038 |
| | Puerto Rico Electric Power Authority Revenue | 5.250% | 7/1/12 (Prere.) | 11,050 | 11,482 |
| | Puerto Rico Electric Power Authority Revenue | 5.250% | 7/1/12 (Prere.) | 2,000 | 2,079 |
| 1 | Puerto Rico GO TOB VRDO | 0.110% | 12/1/11 LOC | 39,900 | 39,900 |
| | Puerto Rico Highway & Transportation | | | | |
| | Authority Revenue | 5.000% | 7/1/12 (Prere.) | 2,845 | 2,924 |
| 1 | Puerto Rico Highway & Transportation | | | | |
| | Authority Revenue TOB VRDO | 0.160% | 12/7/11 (4) | 10,565 | 10,565 |
| 1,2 | Puerto Rico Industrial Medical & Environmental | | | | |
| | Pollution Control Facilities Financing Authority | | | | |
| | Revenue (Abbott Laboratories Project) PUT | 0.950% | 3/1/12 | 12,575 | 12,575 |
| | Puerto Rico Public Finance Corp. Revenue | 5.500% | 2/1/12 (Prere.) | 37,435 | 37,752 |
| | Puerto Rico Public Finance Corp. Revenue | 5.500% | 2/1/12 (Prere.) | 8,160 | 8,230 |
| | Puerto Rico Public Finance Corp. Revenue | 4.950% | 8/1/12 (ETM) | 2,000 | 2,062 |
| 1 | Puerto Rico Sales Tax Financing Corp. Revenue | | | | |
| | TOB VRDO | 0.140% | 12/7/11 | 7,325 | 7,325 |
| 1 | Puerto Rico Sales Tax Financing Corp. Revenue | | | | |
| | TOB VRDO | 0.140% | 12/7/11 | 4,875 | 4,875 |
19
New Jersey Tax-Exempt Money Market Fund
| | | | |
| | | | Face | Market |
| | | Maturity | Amount | Value |
| | Coupon | Date | ($000) | ($000) |
| 1 Puerto Rico Sales Tax Financing Corp. Revenue | | | | |
| TOB VRDO | 0.190% | 12/7/11 | 30,156 | 30,156 |
| | | | | 176,413 |
| Total Tax-Exempt Municipal Bonds (Cost $1,807,918) | | | 1,807,918 |
| Other Assets and Liabilities (7.2%) | | | | |
| Other Assets | | | | 156,199 |
| Liabilities | | | | (15,541) |
| | | | | 140,658 |
| Net Assets (100%) | | | | |
| Applicable to 1,948,294,013 outstanding $.001 par value shares of | | | |
| beneficial interest (unlimited authorization) | | | | 1,948,576 |
| Net Asset Value Per Share | | | | $1.00 |
| |
| Statement of Assets and Liabilities | | | | |
| Assets | | | | |
| Investments in Securities, at Value | | | | 1,807,918 |
| Receivables for Investment Securities Sold | | | | 141,520 |
| Other Assets | | | | 14,679 |
| Total Assets | | | | 1,964,117 |
| Liabilities | | | | |
| Payables for Investment Securities Purchased | | | | 8,395 |
| Other Liabilities | | | | 7,146 |
| Total Liabilities | | | | 15,541 |
| Net Assets | | | | 1,948,576 |
| |
| |
| At November 30, 2011, net assets consisted of: | | | | |
| | | | | Amount |
| | | | | ($000) |
| Paid-in Capital | | | | 1,948,575 |
| Undistributed Net Investment Income | | | | — |
| Accumulated Net Realized Gains | | | | 1 |
| Net Assets | | | | 1,948,576 |
See Note A in Notes to Financial Statements.
1 Security exempt from registration under Rule 144A of the Securities Act of 1933. Such securities may be sold in transactions exempt from
registration, normally to qualified institutional buyers. At November 30, 2011, the aggregate value of these securities was $433,376,000,
representing 22.2% of net assets.
2 Adjustable-rate security.
A key to abbreviations and other references follows the Statement of Net Assets.
See accompanying Notes, which are an integral part of the Financial Statements.
20
New Jersey Tax-Exempt Money Market Fund
Key to Abbreviations
ARS—Auction Rate Security.
BAN—Bond Anticipation Note.
COP—Certificate of Participation.
CP—Commercial Paper.
FR—Floating Rate.
GAN—Grant Anticipation Note.
GO—General Obligation Bond.
PUT—Put Option Obligation.
RAN—Revenue Anticipation Note.
TAN—Tax Anticipation Note.
TOB—Tender Option Bond.
TRAN—Tax Revenue Anticipation Note.
VRDO—Variable Rate Demand Obligation.
VRDP—Variable Rate Demand Preferred.
(ETM)—Escrowed to Maturity.
(Prere.)—Prerefunded.
Scheduled principal and interest payments are guaranteed by:
(1) MBIA (Municipal Bond Investors Assurance).
(2) AMBAC (Ambac Assurance Corporation).
(3) FGIC (Financial Guaranty Insurance Company).
(4) AGM (Assured Guaranty Municipal Corporation).
(5) BIGI (Bond Investors Guaranty Insurance).
(6) Connie Lee Inc.
(7) FHA (Federal Housing Authority).
(8) CapMAC (Capital Markets Assurance Corporation).
(9) American Capital Access Financial Guaranty Corporation.
(10) XL Capital Assurance Inc.
(11) CIFG (CDC IXIS Financial Guaranty).
(12) Assured Guaranty Corporation.
(13) Berkshire Hathaway Assurance Corporation.
(14) National Public Finance Guarantee Corporation.
The insurance does not guarantee the market value of the municipal bonds.
LOC—Scheduled principal and interest payments are guaranteed by bank letter of credit.
21
New Jersey Tax-Exempt Money Market Fund
Statement of Operations
| |
| | Year Ended |
| | November 30, 2011 |
| | ($000) |
| Investment Income | |
| Income | |
| Interest | 4,800 |
| Total Income | 4,800 |
| Expenses | |
| The Vanguard Group—Note B | |
| Investment Advisory Services | 615 |
| Management and Administrative | 2,146 |
| Marketing and Distribution | 635 |
| Custodian Fees | 30 |
| Auditing Fees | 23 |
| Shareholders’ Reports | 10 |
| Trustees’ Fees and Expenses | 2 |
| Total Expenses | 3,461 |
| Net Investment Income | 1,339 |
| Realized Net Gain (Loss) on Investment Securities Sold | 8 |
| Net Increase (Decrease) in Net Assets Resulting from Operations | 1,347 |
See accompanying Notes, which are an integral part of the Financial Statements.
22
New Jersey Tax-Exempt Money Market Fund
Statement of Changes in Net Assets
| | |
| | Year Ended November 30, |
| | 2011 | 2010 |
| | ($000) | ($000) |
| Increase (Decrease) in Net Assets | | |
| Operations | | |
| Net Investment Income | 1,339 | 2,567 |
| Realized Net Gain (Loss) | 8 | (3) |
| Net Increase (Decrease) in Net Assets Resulting from Operations | 1,347 | 2,564 |
| Distributions | | |
| Net Investment Income | (1,339) | (2,567) |
| Realized Capital Gain | — | — |
| Total Distributions | (1,339) | (2,567) |
| Capital Share Transactions (at $1.00) | | |
| Issued | 1,195,167 | 1,251,685 |
| Issued in Lieu of Cash Distributions | 1,288 | 2,473 |
| Redeemed | (1,453,849) | (1,594,393) |
| Net Increase (Decrease) from Capital Share Transactions | (257,394) | (340,235) |
| Total Increase (Decrease) | (257,386) | (340,238) |
| Net Assets | | |
| Beginning of Period | 2,205,962 | 2,546,200 |
| End of Period | 1,948,576 | 2,205,962 |
See accompanying Notes, which are an integral part of the Financial Statements.
23
New Jersey Tax-Exempt Money Market Fund
Financial Highlights
| | | | | |
| For a Share Outstanding | Year Ended November 30, |
| Throughout Each Period | 2011 | 2010 | 2009 | 2008 | 2007 |
| Net Asset Value, Beginning of Period | $1.00 | $1.00 | $1.00 | $1.00 | $1.00 |
| Investment Operations | | | | | |
| Net Investment Income | .001 | .001 | .005 | .022 | .035 |
| Net Realized and Unrealized Gain (Loss) | | | | | |
| on Investments | — | — | — | — | — |
| Total from Investment Operations | .001 | .001 | .005 | .022 | .035 |
| Distributions | | | | | |
| Dividends from Net Investment Income | (.001) | (.001) | (.005) | (.022) | (.035) |
| Distributions from Realized Capital Gains | — | — | — | — | — |
| Total Distributions | (.001) | (.001) | (.005) | (.022) | (.035) |
| Net Asset Value, End of Period | $1.00 | $1.00 | $1.00 | $1.00 | $1.00 |
| |
| Total Return1 | 0.06% | 0.11% | 0.45% | 2.27% | 3.60% |
| |
| Ratios/Supplemental Data | | | | | |
| Net Assets, End of Period (Millions) | $1,949 | $2,206 | $2,546 | $3,126 | $3,448 |
| Ratio of Total Expenses to | | | | | |
| Average Net Assets | 0.17% | 0.17% | 0.17%2 | 0.11%2 | 0.10% |
| Ratio of Net Investment Income to | | | | | |
| Average Net Assets | 0.07% | 0.11% | 0.46% | 2.24% | 3.53% |
1 Total returns do not include account service fees that may have applied in the periods shown. Fund prospectuses provide information about
any applicable account service fees.
2 Includes fees to participate in the Treasury Temporary Guarantee Program for Money Market Funds of 0.04% for 2009 and 0.01% for 2008.
See accompanying Notes, which are an integral part of the Financial Statements.
24
New Jersey Tax-Exempt Money Market Fund
Notes to Financial Statements
Vanguard New Jersey Tax-Exempt Money Market Fund is registered under the Investment Company Act of 1940 as an open-end investment company, or mutual fund. The fund invests in debt instruments of municipal issuers whose ability to meet their obligations may be affected by economic and political developments in the state.
A. The following significant accounting policies conform to generally accepted accounting principles for U.S. mutual funds. The fund consistently follows such policies in preparing its financial statements.
1. Security Valuation: Securities are valued at amortized cost, which approximates market value.
2. Federal Income Taxes: The fund intends to continue to qualify as a regulated investment company and distribute all of its income. Management has analyzed the fund’s tax positions taken for all open federal income tax years (November 30, 2008–2011), and has concluded that no provision for federal income tax is required in the fund’s financial statements.
3. Distributions: Distributions from net investment income are declared daily and paid on the first business day of the following month.
4. Other: Interest income is accrued daily. Premiums and discounts on debt securities purchased are amortized and accreted, respectively, to interest income over the lives of the respective securities. Security transactions are accounted for on the date securities are bought or sold. Costs used to determine realized gains (losses) on the sale of investment securities are those of the specific securities sold.
B. The Vanguard Group furnishes at cost investment advisory, corporate management, administrative, marketing, and distribution services. The costs of such services are allocated to the fund under methods approved by the board of trustees. The fund has committed to provide up to 0.40% of its net assets in capital contributions to Vanguard. At November 30, 2011, the fund had contributed capital of $319,000 to Vanguard (included in Other Assets), representing 0.02% of the fund’s net assets and 0.13% of Vanguard’s capitalization. The fund’s trustees and officers are also directors and officers of Vanguard. Vanguard and the board of trustees have agreed to temporarily limit certain net operating expenses in excess of the fund’s daily yield so as to maintain a zero or positive yield for the fund. Vanguard and the board of trustees may terminate the temporary expense limitation at any time.
C. Various inputs may be used to determine the value of the fund’s investments. These inputs are summarized in three broad levels for financial statement purposes. The inputs or methodologies used to value securities are not necessarily an indication of the risk associated with investing in those securities.
Level 1—Quoted prices in active markets for identical securities.
Level 2—Other significant observable inputs (including quoted prices for similar securities, interest rates, prepayment speeds, credit risk, etc.).
Level 3—Significant unobservable inputs (including the fund’s own assumptions used to determine the fair value of investments).
25
New Jersey Tax-Exempt Money Market Fund
At November 30, 2011, 100% of the market value of the fund’s investments were valued using amortized cost, in accordance with rules under the Investment Company Act of 1940. Amortized cost approximates the current fair value of a security, but since the value is not obtained from a quoted price in an active market, securities valued at amortized cost are considered to be valued using Level 2 inputs.
D. In preparing the financial statements as of November 30, 2011, management considered the impact of subsequent events for potential recognition or disclosure in these financial statements.
26
New Jersey Long-Term Tax-Exempt Fund
Fund Profile
As of November 30, 2011
| | |
| Share-Class Characteristics | |
| | Investor | Admiral |
| | Shares | Shares |
| Ticker Symbol | VNJTX | VNJUX |
| Expense Ratio1 | 0.20% | 0.12% |
| 30-Day SEC Yield | 2.96% | 3.04% |
| | | |
| Financial Attributes | | | |
| | | Barclays | Barclays |
| | | 10 Year | Municipal |
| | | Municipal | Bond |
| | Fund | Index | Index |
| Number of Bonds | 381 | 8,836 | 45,906 |
| Yield to Maturity | | | |
| (before expenses) | 3.0% | 2.8% | 3.1% |
| Average Coupon | 4.3% | 4.8% | 4.9% |
| Average Duration | 6.3 years | 6.6 years | 8.2 years |
| Average Effective | | | |
| Maturity | 6.9 years | 10.0 years | 13.5 years |
| Short-Term | | | |
| Reserves | 5.8% | — | — |
| | |
| Volatility Measures | | |
| | Barclays | Barclays |
| | 10 Year | Municipal |
| | Municipal | Bond |
| | Index | Index |
| R-Squared | 0.88 | 0.98 |
| Beta | 0.81 | 1.00 |
| These measures show the degree and timing of the fund’s |
| fluctuations compared with the indexes over 36 months. |
| |
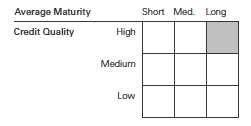
| Distribution by Maturity (% of portfolio) | |
| Under 1 Year | 13.3% |
| 1 - 3 Years | 14.0 |
| 3 - 5 Years | 13.6 |
| 5 - 10 Years | 41.9 |
| 10 - 20 Years | 12.8 |
| 20 - 30 Years | 4.0 |
| Over 30 Years | 0.4 |
| |
| Distribution by Credit Quality (% of portfolio) |
| AAA | 12.6% |
| AA | 27.6 |
| A | 48.5 |
| BBB | 8.8 |
| BB | 0.7 |
| B | 0.3 |
| Not Rated | 1.5 |
| For information about these ratings, see the Glossary entry for Credit Quality. |
Investment Focus
1 The expense ratios shown are from the prospectus dated March 29, 2011, and represent estimated costs for the current fiscal year. For the
fiscal year ended November 30, 2011, the expense ratios were 0.20% for Investor Shares and 0.12% for Admiral Shares.
27
New Jersey Long-Term Tax-Exempt Fund
Performance Summary
All of the returns in this report represent past performance, which is not a guarantee of future
results that may be achieved by the fund. (Current performance may be lower or higher than
the performance data cited. For performance data current to the most recent month-end, visit
our website at vanguard.com/performance.) Note, too, that both investment returns and principal
value can fluctuate widely, so an investor’s shares, when sold, could be worth more or less than
their original cost. The returns shown do not reflect taxes that a shareholder would pay on fund
distributions or on the sale of fund shares.
Cumulative Performance: November 30, 2001, Through November 30, 2011
Initial Investment of $10,000
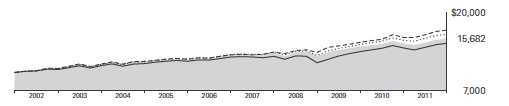
| | | | | |
| | | Average Annual Total Returns | |
| | | Periods Ended November 30, 2011 | |
| | | | | | Final Value |
| | | One | Five | Ten | of a $10,000 |
| | | Year | Years | Years | Investment |
| | New Jersey Long-Term Tax-Exempt | | | | |
| | Fund Investor Shares | 5.54% | 3.85% | 4.60% | $15,682 |
| •••••••• | Barclays Capital Municipal Bond Index | 6.53 | 4.75 | 5.08 | 16,411 |
| |
| – – – – | Barclays Capital 10 Year Municipal | | | | |
| | Bond Index | 7.68 | 5.70 | 5.52 | 17,113 |
| | New Jersey Municipal Debt Funds | | | | |
| | Average | 5.48 | 3.42 | 4.06 | 14,891 |
| New Jersey Municipal Debt Funds Average: Derived from data provided by Lipper Inc. |
| | | | |
| | | | | Final Value |
| | One | Five | Ten | of a $50,000 |
| | Year | Years | Years | Investment |
| New Jersey Long-Term Tax-Exempt Fund | | | | |
| Admiral Shares | 5.62% | 3.93% | 4.67% | $78,954 |
| Barclays Capital Municipal Bond Index | 6.53 | 4.75 | 5.08 | 82,057 |
| Barclays Capital 10 Year Municipal Bond | | | | |
| Index | 7.68 | 5.70 | 5.52 | 85,567 |
See Financial Highlights for dividend and capital gains information.
28
New Jersey Long-Term Tax-Exempt Fund
Fiscal-Year Total Returns (%): November 30, 2001, Through November 30, 2011
| | | | |
| | | | | Barclays |
| | | | | 10 Year |
| | | | | Municipal |
| | Investor Shares | Index |
| Fiscal Year | Income Returns | Capital Returns | Total Returns | Total Returns |
| 2002 | 4.95% | 1.47% | 6.42% | 6.67% |
| 2003 | 4.68 | 2.13 | 6.81 | 6.88 |
| 2004 | 4.56 | -1.23 | 3.33 | 4.03 |
| 2005 | 4.42 | -1.13 | 3.29 | 3.01 |
| 2006 | 4.61 | 2.40 | 7.01 | 6.17 |
| 2007 | 4.34 | -2.30 | 2.04 | 3.51 |
| 2008 | 4.11 | -7.60 | -3.49 | -0.42 |
| 2009 | 4.61 | 7.58 | 12.19 | 12.67 |
| 2010 | 4.11 | -0.52 | 3.59 | 5.51 |
| 2011 | 4.24 | 1.30 | 5.54 | 7.68 |
Average Annual Total Returns: Periods Ended September 30, 2011
This table presents returns through the latest calendar quarter—rather than through the end of the fiscal period.
Securities and Exchange Commission rules require that we provide this information.
| | | | | | |
| | | | | Ten Years |
| | Inception Date | One Year | Five Years | Income | Capital | Total |
| Investor Shares | 2/3/1988 | 2.63% | 4.16% | 4.47% | 0.11% | 4.58% |
| Admiral Shares | 5/14/2001 | 2.71 | 4.24 | 4.54 | 0.11 | 4.65 |
29
New Jersey Long-Term Tax-Exempt Fund
Financial Statements
Statement of Net Assets
As of November 30, 2011
The fund reports a complete list of its holdings in regulatory filings four times in each fiscal year, at the quarter-ends. For the second and fourth fiscal quarters, the lists appear in the fund’s semiannual and annual reports to shareholders. For the first and third fiscal quarters, the fund files the lists with the Securities and Exchange Commission on Form N-Q. Shareholders can look up the fund’s Forms N-Q on the SEC’s website at sec.gov. Forms N-Q may also be reviewed and copied at the SEC’s Public Reference Room (see the back cover of this report for further information).
| | | | |
| | | | Face | Market |
| | | Maturity | Amount | Value |
| | Coupon | Date | ($000) | ($000) |
| Tax-Exempt Municipal Bonds (99.3%) | | | | |
| New Jersey (97.5%) | | | | |
| Atlantic County NJ Public Facilities COP | 6.000% | 3/1/14 (14) | 3,685 | 4,071 |
| Atlantic County NJ Public Facilities COP | 6.000% | 3/1/15 (14) | 1,480 | 1,688 |
| Atlantic County NJ Utility Authority Sewer | | | | |
| Revenue | 6.875% | 1/1/12 (ETM) | 370 | 372 |
| Bayonne NJ TAN | 5.750% | 7/1/35 | 7,500 | 8,102 |
| Burlington County NJ Bridge Commission | | | | |
| Revenue | 5.250% | 12/15/21 (2) | 3,200 | 3,568 |
| Camden County NJ Improvement Authority | | | | |
| Lease Revenue (Cherry Hill Township | | | | |
| Library Project) | 5.500% | 5/1/12 (Prere.) | 1,140 | 1,165 |
| Camden County NJ Improvement Authority | | | | |
| Lease Revenue (Cherry Hill Township | | | | |
| Library Project) | 5.500% | 5/1/12 (Prere.) | 1,025 | 1,048 |
| Camden County NJ Improvement Authority | | | | |
| Lease Revenue (Cherry Hill Township | | | | |
| Library Project) | 5.500% | 5/1/12 (Prere.) | 1,265 | 1,293 |
| Camden County NJ Improvement Authority | | | | |
| Lease Revenue (Cherry Hill Township | | | | |
| Library Project) | 5.500% | 5/1/12 (Prere.) | 1,335 | 1,365 |
| Cape May County NJ Industrial Pollution | | | | |
| Control Financing Authority Revenue | | | | |
| (Atlantic City Electric Co. Project) | 6.800% | 3/1/21 (14) | 15,400 | 19,498 |
| Cape May County NJ Municipal Utilities | | | | |
| Authority Revenue | 5.250% | 1/1/12 (Prere.) | 2,165 | 2,174 |
| Delaware River Port Authority Pennsylvania & | | | | |
| New Jersey Revenue | 5.625% | 1/1/26 (4) | 2,500 | 2,503 |
| Delaware River Port Authority Pennsylvania & | | | | |
| New Jersey Revenue | 5.000% | 1/1/35 | 4,000 | 4,137 |
| Delaware River Port Authority Pennsylvania & | | | | |
| New Jersey Revenue | 5.000% | 1/1/40 (4) | 1,000 | 1,029 |
| Essex County NJ Improvement Authority | | | | |
| Revenue | 5.250% | 12/15/18 (2) | 7,500 | 8,876 |
| Essex County NJ Improvement Authority | | | | |
| Revenue | 5.250% | 12/15/20 (2) | 2,510 | 2,956 |
| Evesham NJ Utility Authority Revenue | 5.000% | 7/1/16 (2) | 3,435 | 3,518 |
| Evesham NJ Utility Authority Revenue | 5.000% | 7/1/18 (2) | 1,605 | 1,643 |
30
New Jersey Long-Term Tax-Exempt Fund
| | | | |
| | | | Face | Market |
| | | Maturity | Amount | Value |
| | Coupon | Date | ($000) | ($000) |
| Garden State Preservation Trust | | | | |
| New Jersey Revenue (Open Space & | | | | |
| Farmland Preservation) | 0.000% | 11/1/21 (4) | 9,825 | 6,843 |
| Garden State Preservation Trust | | | | |
| New Jersey Revenue (Open Space & | | | | |
| Farmland Preservation) | 5.250% | 11/1/21 (4) | 6,000 | 7,415 |
| Garden State Preservation Trust | | | | |
| New Jersey Revenue (Open Space & | | | | |
| Farmland Preservation) | 0.000% | 11/1/22 (4) | 31,190 | 20,468 |
| Garden State Preservation Trust | | | | |
| New Jersey Revenue (Open Space & | | | | |
| Farmland Preservation) | 5.750% | 11/1/28 (4) | 7,780 | 9,627 |
| Gloucester County NJ Improvement Authority | | | | |
| Lease Revenue | 5.000% | 7/15/13 (Prere.) | 1,000 | 1,074 |
| Gloucester County NJ Improvement Authority | | | | |
| Lease Revenue | 5.000% | 7/15/13 (Prere.) | 865 | 929 |
| Gloucester County NJ Improvement Authority | | | | |
| Lease Revenue | 5.000% | 7/15/13 (Prere.) | 1,150 | 1,235 |
| Gloucester County NJ Improvement Authority | | | | |
| Lease Revenue | 5.000% | 7/15/13 (Prere.) | 1,000 | 1,074 |
| Gloucester Township NJ Municipal Utility | | | | |
| Authority Revenue | 5.650% | 3/1/18 (2) | 2,250 | 2,533 |
| Hillsborough Township NJ School District GO | 5.375% | 10/1/13 (4) | 1,250 | 1,360 |
| Hillsborough Township NJ School District GO | 5.375% | 10/1/19 (4) | 1,720 | 2,137 |
| Hoboken-Union City-Weehawken NJ Sewerage | | | | |
| Authority Revenue | 6.250% | 8/1/13 (14) | 9,590 | 10,270 |
| Hudson County NJ Improvement Authority | | | | |
| Solid Waste Systems Revenue | 5.750% | 1/1/35 | 2,000 | 2,202 |
| Hudson County NJ Improvement Authority | | | | |
| Solid Waste Systems Revenue | 6.000% | 1/1/40 | 3,000 | 3,387 |
| Jackson Township NJ Board of Education GO | 5.375% | 4/15/12 (Prere.) | 6,885 | 7,018 |
| Jackson Township NJ Board of Education GO | 5.375% | 4/15/12 (Prere.) | 7,676 | 7,825 |
| Mercer County NJ Improvement Authority | | | | |
| Special Services School District Revenue | 5.950% | 12/15/12 | 1,325 | 1,362 |
| MiddlesexCounty NJ COP | 5.500% | 8/1/15 (14) | 1,195 | 1,200 |
| MiddlesexCounty NJ Improvement Authority | | | | |
| Lease Revenue (Perth Amboy Municipal | | | | |
| Complex Project) | 5.375% | 3/15/22 (14) | 1,825 | 1,858 |
| MiddlesexCounty NJ Improvement Authority | | | | |
| Lease Revenue (Perth Amboy Municipal | | | | |
| Complex Project) | 5.375% | 3/15/23 (14) | 1,925 | 1,955 |
| MiddlesexCounty NJ Improvement Authority | | | | |
| Revenue (Heldrich Center Hotel/ | | | | |
| Conference Project) | 5.000% | 1/1/15 | 365 | 215 |
| MiddlesexCounty NJ Improvement Authority | | | | |
| Revenue (Heldrich Center Hotel/ | | | | |
| Conference Project) | 5.000% | 1/1/20 | 500 | 293 |
| MiddlesexCounty NJ Improvement Authority | | | | |
| Revenue (Heldrich Center Hotel/ | | | | |
| Conference Project) | 5.000% | 1/1/32 | 5,100 | 2,985 |
| MiddlesexCounty NJ Improvement Authority | | | | |
| Revenue (Heldrich Center Hotel/ | | | | |
| Conference Project) | 5.125% | 1/1/37 | 3,500 | 2,048 |
| MiddlesexCounty NJ Improvement Authority | | | | |
| Revenue (Open Space Trust Fund) | 5.250% | 9/15/13 (Prere.) | 1,585 | 1,721 |
31
New Jersey Long-Term Tax-Exempt Fund
| | | | |
| | | | Face | Market |
| | | Maturity | Amount | Value |
| | Coupon | Date | ($000) | ($000) |
| MiddlesexCounty NJ Improvement Authority | | | | |
| Revenue (Open Space Trust Fund) | 5.250% | 9/15/13 (Prere.) | 1,600 | 1,737 |
| MiddlesexCounty NJ Improvement Authority | | | | |
| Revenue (Open Space Trust Fund) | 5.250% | 9/15/13 (Prere.) | 2,375 | 2,579 |
| Monmouth County NJ Improvement Authority | | | | |
| Lease Revenue (Brookdale Community College) | 5.875% | 8/1/31 | 1,000 | 1,155 |
| Monmouth County NJ Improvement Authority | | | | |
| Lease Revenue (Brookdale Community College) | 6.000% | 8/1/38 | 3,900 | 4,554 |
| Monmouth County NJ Improvement Authority | | | | |
| Revenue (Howell Township Board of Education) | 5.000% | 7/15/12 (Prere.) | 2,115 | 2,178 |
| Monmouth County NJ Improvement Authority | | | | |
| Revenue (Howell Township Board of Education) | 5.000% | 7/15/12 (Prere.) | 2,225 | 2,291 |
| Monmouth County NJ Improvement Authority | | | | |
| Revenue (Pooled Government Loan) | 5.000% | 12/1/13 (2) | 1,545 | 1,628 |
| Monmouth County NJ Improvement Authority | | | | |
| Revenue (Pooled Government Loan) | 5.000% | 12/1/14 (2) | 3,205 | 3,439 |
| Monmouth County NJ Improvement Authority | | | | |
| Revenue (Pooled Government Loan) | 5.000% | 12/1/16 (2) | 1,000 | 1,096 |
| New Brunswick NJ Housing Authority Lease | | | | |
| Revenue (Rutgers University | | | | |
| Easton Avenue Project) | 5.000% | 7/1/18 | 1,880 | 2,227 |
| New Jersey Casino Reinvestment Development | | | | |
| Authority Revenue (Hotel Room Fee) | 5.250% | 1/1/20 (2) | 2,945 | 3,088 |
| New Jersey Casino Reinvestment Development | | | | |
| Authority Revenue (Hotel Room Fee) | 5.250% | 1/1/21 (2) | 6,255 | 6,495 |
| New Jersey Casino Reinvestment Development | | | | |
| Authority Revenue (Hotel Room Fee) | 5.250% | 1/1/22 (2) | 5,585 | 5,761 |
| New Jersey Casino Reinvestment Development | | | | |
| Authority Revenue (Parking Fee) | 5.250% | 6/1/21 (14) | 3,000 | 3,078 |
| New Jersey Economic Development Authority | | | | |
| Revenue (Bayonne/IMTT Project) VRDO | 0.100% | 12/1/11 LOC | 1,800 | 1,800 |
| New Jersey Economic Development Authority | | | | |
| Revenue (Cigarette Tax) | 5.750% | 6/15/29 | 19,500 | 19,414 |
| New Jersey Economic Development Authority | | | | |
| Revenue (Hillcrest Health Service | | | | |
| System Project) | 0.000% | 1/1/12 (2) | 2,500 | 2,492 |
| New Jersey Economic Development Authority | | | | |
| Revenue (Hillcrest Health Service | | | | |
| System Project) | 0.000% | 1/1/13 (2) | 3,000 | 2,869 |
| New Jersey Economic Development Authority | | | | |
| Revenue (Motor Vehicle Surcharges) | 5.250% | 7/1/24 (14) | 6,000 | 6,664 |
| New Jersey Economic Development Authority | | | | |
| Revenue (Motor Vehicle Surcharges) | 5.250% | 7/1/25 (14) | 14,000 | 15,357 |
| New Jersey Economic Development Authority | | | | |
| Revenue (Motor Vehicle Surcharges) | 5.250% | 7/1/26 (14) | 2,500 | 2,752 |
| New Jersey Economic Development Authority | | | | |
| Revenue (Motor Vehicle Surcharges) | 5.250% | 7/1/31 (14) | 17,675 | 18,312 |
| New Jersey Economic Development Authority | | | | |
| Revenue (Provident Group-Montclair | | | | |
| Properties LLC - Montclair State University | | | | |
| Student Housing Project) | 5.375% | 6/1/25 | 1,340 | 1,353 |
| New Jersey Economic Development Authority | | | | |
| Revenue (Provident Group-Montclair | | | | |
| Properties LLC - Montclair State University | | | | |
| Student Housing Project) | 5.750% | 6/1/31 | 1,000 | 1,026 |
32
New Jersey Long-Term Tax-Exempt Fund
| | | | |
| | | | Face | Market |
| | | Maturity | Amount | Value |
| | Coupon | Date | ($000) | ($000) |
| New Jersey Economic Development Authority | | | | |
| Revenue (Provident Group-Montclair | | | | |
| Properties LLC - Montclair State University | | | | |
| Student Housing Project) | 5.875% | 6/1/42 | 8,000 | 8,147 |
| New Jersey Economic Development Authority | | | | |
| Revenue (School Facilities Construction) | 5.500% | 6/15/13 (ETM) | 1,200 | 1,294 |
| New Jersey Economic Development Authority | | | | |
| Revenue (School Facilities Construction) | 5.000% | 9/1/13 | 7,500 | 8,003 |
| New Jersey Economic Development Authority | | | | |
| Revenue (School Facilities Construction) | 5.000% | 9/1/14 | 10,000 | 10,959 |
| New Jersey Economic Development Authority | | | | |
| Revenue (School Facilities Construction) | 5.000% | 12/15/14 | 14,000 | 15,463 |
| New Jersey Economic Development Authority | | | | |
| Revenue (School Facilities Construction) | 5.250% | 12/15/15 (14) | 5,000 | 5,636 |
| New Jersey Economic Development Authority | | | | |
| Revenue (School Facilities Construction) | 5.000% | 9/1/13 (Prere.) | 4,000 | 4,319 |
| New Jersey Economic Development Authority | | | | |
| Revenue (School Facilities Construction) | 5.000% | 12/15/16 | 10,355 | 11,756 |
| New Jersey Economic Development Authority | | | | |
| Revenue (School Facilities Construction) | 5.000% | 9/1/17 | 2,000 | 2,292 |
| New Jersey Economic Development Authority | | | | |
| Revenue (School Facilities Construction) | 5.000% | 12/15/17 | 5,000 | 5,753 |
| New Jersey Economic Development Authority | | | | |
| Revenue (School Facilities Construction) | 5.000% | 3/1/18 | 2,650 | 2,858 |
| New Jersey Economic Development Authority | | | | |
| Revenue (School Facilities Construction) | 5.000% | 9/1/18 | 2,500 | 2,864 |
| New Jersey Economic Development Authority | | | | |
| Revenue (School Facilities Construction) | 5.500% | 9/1/18 (14) | 3,000 | 3,529 |
| New Jersey Economic Development Authority | | | | |
| Revenue (School Facilities Construction) | 5.000% | 12/15/18 | 5,000 | 5,742 |
| New Jersey Economic Development Authority | | | | |
| Revenue (School Facilities Construction) | 5.250% | 9/1/19 | 3,000 | 3,488 |
| New Jersey Economic Development Authority | | | | |
| Revenue (School Facilities Construction) | 5.000% | 12/15/19 | 2,100 | 2,406 |
| New Jersey Economic Development Authority | | | | |
| Revenue (School Facilities Construction) | 5.500% | 12/15/19 (2) | 1,550 | 1,831 |
| New Jersey Economic Development Authority | | | | |
| Revenue (School Facilities Construction) | 5.000% | 9/1/20 | 2,390 | 2,726 |
| New Jersey Economic Development Authority | | | | |
| Revenue (School Facilities Construction) | 5.250% | 12/15/20 (2) | 2,750 | 3,191 |
| New Jersey Economic Development Authority | | | | |
| Revenue (School Facilities Construction) | 5.500% | 9/1/21 | 2,500 | 2,926 |
| New Jersey Economic Development Authority | | | | |
| Revenue (School Facilities Construction) | 5.250% | 9/1/22 | 4,115 | 4,665 |
| New Jersey Economic Development Authority | | | | |
| Revenue (School Facilities Construction) | 5.000% | 9/1/23 | 880 | 969 |
| New Jersey Economic Development Authority | | | | |
| Revenue (School Facilities Construction) | 5.250% | 9/1/23 | 3,500 | 3,921 |
| New Jersey Economic Development Authority | | | | |
| Revenue (School Facilities Construction) | 5.750% | 9/1/23 | 3,000 | 3,465 |
| New Jersey Economic Development Authority | | | | |
| Revenue (School Facilities Construction) | 5.250% | 9/1/24 | 375 | 414 |
| New Jersey Economic Development Authority | | | | |
| Revenue (School Facilities Construction) | 5.500% | 9/1/24 (2) | 3,250 | 3,741 |
New Jersey Long-Term Tax-Exempt Fund
| | | | |
| | | | Face | Market |
| | | Maturity | Amount | Value |
| | Coupon | Date | ($000) | ($000) |
| New Jersey Economic Development Authority | | | | |
| Revenue (School Facilities Construction) | 5.250% | 9/1/25 | 3,460 | 3,780 |
| New Jersey Economic Development Authority | | | | |
| Revenue (School Facilities Construction) | 5.500% | 9/1/25 (4) | 1,650 | 1,902 |
| New Jersey Economic Development Authority | | | | |
| Revenue (School Facilities Construction) | 5.250% | 3/1/26 | 9,500 | 10,068 |
| New Jersey Economic Development Authority | | | | |
| Revenue (School Facilities Construction) | 5.250% | 9/1/26 | 3,000 | 3,256 |
| New Jersey Economic Development Authority | | | | |
| Revenue (School Facilities Construction) | 5.125% | 3/1/28 | 8,000 | 8,348 |
| New Jersey Economic Development Authority | | | | |
| Revenue (School Facilities Construction) | 5.500% | 9/1/29 (14) | 7,055 | 7,985 |
| New Jersey Economic Development Authority | | | | |
| Revenue (School Facilities Construction) | 5.500% | 12/15/29 | 11,520 | 12,433 |
| New Jersey Economic Development Authority | | | | |
| Revenue (School Facilities Construction) | 5.125% | 3/1/30 | 9,500 | 9,858 |
| New Jersey Economic Development Authority | | | | |
| Revenue (School Facilities Construction) | 5.125% | 3/1/30 (10) | 1,000 | 1,038 |
| New Jersey Economic Development Authority | | | | |
| Revenue (School Facilities Construction) | 5.000% | 9/1/30 | 4,065 | 4,240 |
| New Jersey Economic Development Authority | | | | |
| Revenue (School Facilities Construction) | 5.000% | 9/1/30 (14) | 3,480 | 3,605 |
| New Jersey Economic Development Authority | | | | |
| Revenue (School Facilities Construction) | 5.000% | 12/15/31 | 7,105 | 7,395 |
| New Jersey Economic Development Authority | | | | |
| Revenue (School Facilities Construction) | 5.000% | 12/15/32 | 3,780 | 3,915 |
| New Jersey Economic Development Authority | | | | |
| Revenue (School Facilities Construction) | 5.000% | 9/1/33 | 1,825 | 1,871 |
| New Jersey Economic Development Authority | | | | |
| Revenue (School Facilities Construction) | 5.000% | 9/1/34 | 8,000 | 8,238 |
| New Jersey Economic Development Authority | | | | |
| Revenue (School Facilities Construction) | 5.000% | 9/1/36 | 11,450 | 11,741 |
| New Jersey Economic Development Authority | | | | |
| Revenue (School Facilities Construction) | 5.000% | 9/1/37 | 8,635 | 8,838 |
| New Jersey Economic Development Authority | | | | |
| Revenue (School Facilities Construction) PUT | 5.000% | 9/1/14 (4) | 12,500 | 13,605 |
| New Jersey Economic Development Authority | | | | |
| Revenue (School Facilities Construction) PUT | 5.000% | 9/1/14 (4) | 8,000 | 8,707 |
| New Jersey Economic Development Authority | | | | |
| Revenue (School Facilities Construction) PUT | 5.000% | 9/1/14 (4) | 5,000 | 5,536 |
| New Jersey Economic Development Authority | | | | |
| Revenue (School Facilities Construction) PUT | 5.000% | 9/1/15 (4) | 26,625 | 29,477 |
| New Jersey Economic Development Authority | | | | |
| Revenue (St. Barnabas Project) | 0.000% | 7/1/12 (14) | 4,550 | 4,467 |
| New Jersey Economic Development Authority | | | | |
| Revenue (St. Barnabas Project) | 0.000% | 7/1/13 (14) | 4,500 | 4,250 |
| New Jersey Economic Development Authority | | | | |
| Revenue (St. Barnabas Project) | 0.000% | 7/1/14 (14) | 4,210 | 3,805 |
| New Jersey Economic Development Authority | | | | |
| Revenue (Trustees of the Lawrenceville | | | | |
| School Project) VRDO | 0.080% | 12/1/11 | 17,050 | 17,050 |
| New Jersey Economic Development Authority | | | | |
| Transportation Project Sublease Revenue | | | | |
| (New Jersey Transit Corp. Light Rail Transit | | | | |
| System Project) | 5.000% | 5/1/14 | 15,000 | 16,285 |
34
New Jersey Long-Term Tax-Exempt Fund
| | | | |
| | | | Face | Market |
| | | Maturity | Amount | Value |
| | Coupon | Date | ($000) | ($000) |
| New Jersey Economic Development Authority | | | | |
| Transportation Project Sublease Revenue | | | | |
| (New Jersey Transit Corp. Light Rail Transit | | | | |
| System Project) | 5.000% | 5/1/18 | 6,260 | 7,151 |
| New Jersey Economic Development Authority | | | | |
| Transportation Project Sublease Revenue | | | | |
| (New Jersey Transit Corp. Light Rail Transit | | | | |
| System Project) | 5.000% | 5/1/19 | 2,580 | 2,953 |
| New Jersey Educational Facilities Authority | | | | |
| Revenue (College of New Jersey) | 5.000% | 7/1/14 (4) | 3,180 | 3,446 |
| New Jersey Educational Facilities Authority | | | | |
| Revenue (College of New Jersey) | 5.000% | 7/1/16 (4) | 4,410 | 4,959 |
| New Jersey Educational Facilities Authority | | | | |
| Revenue (Drew University) | 5.250% | 7/1/20 (14) | 2,060 | 2,414 |
| New Jersey Educational Facilities Authority | | | | |
| Revenue (Drew University) | 5.250% | 7/1/21 (14) | 1,550 | 1,815 |
| New Jersey Educational Facilities Authority | | | | |
| Revenue (Fairleigh Dickinson University) | 5.500% | 7/1/23 | 2,750 | 2,803 |
| New Jersey Educational Facilities Authority | | | | |
| Revenue (Georgian Court University) | 5.000% | 7/1/33 | 1,000 | 969 |
| New Jersey Educational Facilities Authority | | | | |
| Revenue (Higher Education Trust Fund) | 5.000% | 9/1/19 (4) | 5,000 | 5,397 |
| New Jersey Educational Facilities Authority | | | | |
| Revenue (Higher Education Trust Fund) | 5.000% | 9/1/20 (4) | 5,015 | 5,245 |
| New Jersey Educational Facilities Authority | | | | |
| Revenue (Kean University) | 5.000% | 7/1/20 (14) | 2,585 | 2,854 |
| New Jersey Educational Facilities Authority | | | | |
| Revenue (Kean University) | 5.000% | 7/1/21 (14) | 3,025 | 3,306 |
| New Jersey Educational Facilities Authority | | | | |
| Revenue (Kean University) | 5.250% | 7/1/13 (Prere.) | 2,605 | 2,800 |
| New Jersey Educational Facilities Authority | | | | |
| Revenue (Kean University) | 5.250% | 7/1/13 (Prere.) | 2,775 | 2,983 |
| New Jersey Educational Facilities Authority | | | | |
| Revenue (Kean University) | 5.250% | 9/1/29 | 2,500 | 2,675 |
| New Jersey Educational Facilities Authority | | | | |
| Revenue (Kean University) | 5.500% | 9/1/36 | 5,000 | 5,358 |
| New Jersey Educational Facilities Authority | | | | |
| Revenue (Montclair State University) | 5.000% | 7/1/27 (2) | 5,000 | 5,195 |
| New Jersey Educational Facilities Authority | | | | |
| Revenue (Montclair State University) | 5.000% | 7/1/15 (Prere.) | 4,700 | 5,379 |
| New Jersey Educational Facilities Authority | | | | |
| Revenue (New Jersey Institute of Technology) | 5.000% | 7/1/20 | 2,725 | 3,153 |
| New Jersey Educational Facilities Authority | | | | |
| Revenue (New Jersey Institute of Technology) | 5.000% | 7/1/21 | 2,635 | 2,995 |
| New Jersey Educational Facilities Authority | | | | |
| Revenue (New Jersey Institute of Technology) | 5.000% | 7/1/31 | 1,000 | 1,041 |
| New Jersey Educational Facilities Authority | | | | |
| Revenue (Princeton University) | 5.000% | 7/1/20 | 6,020 | 7,299 |
| New Jersey Educational Facilities Authority | | | | |
| Revenue (Princeton University) | 5.000% | 7/1/27 | 5,000 | 5,801 |
| New Jersey Educational Facilities Authority | | | | |
| Revenue (Princeton University) | 5.000% | 7/1/29 | 2,535 | 2,896 |
| New Jersey Educational Facilities Authority | | | | |
| Revenue (Princeton University) | 5.000% | 7/1/30 | 4,090 | 4,636 |

New Jersey Long-Term Tax-Exempt Fund
| | | | |
| | | | Face | Market |
| | | Maturity | Amount | Value |
| | Coupon | Date | ($000) | ($000) |
| New Jersey Educational Facilities Authority | | | | |
| Revenue (Princeton University) | 5.000% | 7/1/34 | 2,000 | 2,218 |
| New Jersey Educational Facilities Authority | | | | |
| Revenue (Princeton University) | 4.500% | 7/1/35 | 9,900 | 10,219 |
| New Jersey Educational Facilities Authority | | | | |
| Revenue (Princeton University) | 5.000% | 7/1/35 | 2,000 | 2,213 |
| New Jersey Educational Facilities Authority | | | | |
| Revenue (Princeton University) | 4.500% | 7/1/37 | 5,000 | 5,131 |
| New Jersey Educational Facilities Authority | | | | |
| Revenue (Princeton University) | 5.000% | 7/1/39 | 3,000 | 3,307 |
| New Jersey Educational Facilities Authority | | | | |
| Revenue (Ramapo College) | 5.000% | 7/1/12 (Prere.) | 1,550 | 1,593 |
| New Jersey Educational Facilities Authority | | | | |
| Revenue (Ramapo College) | 5.000% | 7/1/12 (Prere.) | 1,700 | 1,747 |
| New Jersey Educational Facilities Authority | | | | |
| Revenue (Ramapo College) | 5.000% | 7/1/12 (Prere.) | 1,010 | 1,038 |
| New Jersey Educational Facilities Authority | | | | |
| Revenue (Richard Stockton College) | 5.375% | 7/1/38 | 8,395 | 8,839 |
| New Jersey Educational Facilities Authority | | | | |
| Revenue (Rowan University) | 5.125% | 7/1/13 (Prere.) | 2,800 | 3,004 |
| New Jersey Educational Facilities Authority | | | | |
| Revenue (Rowan University) | 5.000% | 7/1/24 (14) | 2,200 | 2,316 |
| New Jersey Educational Facilities Authority | | | | |
| Revenue (Stevens Institute of Technology) | 5.125% | 7/1/13 (Prere.) | 2,000 | 2,146 |
| New Jersey Educational Facilities Authority | | | | |
| Revenue (Stevens Institute of Technology) | 5.250% | 7/1/13 (Prere.) | 6,000 | 6,450 |
| New Jersey Educational Facilities Authority | | | | |
| Revenue (University Medical & Dentistry) | 7.500% | 12/1/32 | 7,250 | 8,461 |
| New Jersey Environmental Infrastructure | | | | |
| Trust Revenue | 5.000% | 9/1/28 | 4,410 | 4,922 |
| New Jersey Equipment Lease Purchase COP | 5.000% | 6/15/13 | 5,000 | 5,273 |
| New Jersey Equipment Lease Purchase COP | 5.000% | 6/15/16 | 4,000 | 4,367 |
| New Jersey Equipment Lease Purchase COP | 5.000% | 6/15/17 | 3,000 | 3,285 |
| New Jersey Equipment Lease Purchase COP | 5.000% | 6/15/18 | 9,000 | 9,867 |
| New Jersey Equipment Lease Purchase COP | 5.000% | 6/15/19 | 9,755 | 10,582 |
| New Jersey Equipment Lease Purchase COP | 5.000% | 6/15/20 | 1,500 | 1,604 |
| New Jersey Equipment Lease Purchase COP | 5.000% | 6/15/23 | 3,000 | 3,110 |
| New Jersey GO | 5.000% | 8/1/16 | 5,190 | 6,032 |
| New Jersey GO | 5.000% | 8/1/17 | 9,035 | 10,663 |
| New Jersey GO | 5.250% | 7/15/18 (2) | 4,000 | 4,833 |
| New Jersey GO | 5.500% | 7/15/18 (14) | 1,000 | 1,224 |
| New Jersey GO | 5.000% | 8/15/19 | 5,140 | 6,168 |
| New Jersey GO | 5.000% | 6/1/20 | 915 | 1,095 |
| New Jersey GO | 5.000% | 6/1/21 | 6,835 | 8,100 |
| New Jersey Health Care Facilities | | | | |
| Financing Authority Revenue | | | | |
| (AHS Hospital Corp.) | 5.000% | 7/1/13 | 7,330 | 7,727 |
| New Jersey Health Care Facilities | | | | |
| Financing Authority Revenue | | | | |
| (AHS Hospital Corp.) | 5.000% | 7/1/14 | 7,695 | 8,264 |
| New Jersey Health Care Facilities | | | | |
| Financing Authority Revenue | | | | |
| (AHS Hospital Corp.) | 5.000% | 7/1/15 | 5,000 | 5,446 |
36
New Jersey Long-Term Tax-Exempt Fund
| | | | |
| | | | Face | Market |
| | | Maturity | Amount | Value |
| | Coupon | Date | ($000) | ($000) |
| New Jersey Health Care Facilities | | | | |
| Financing Authority Revenue | | | | |
| (AHS Hospital Corp.) | 5.000% | 7/1/18 | 4,095 | 4,572 |
| New Jersey Health Care Facilities | | | | |
| Financing Authority Revenue | | | | |
| (AHS Hospital Corp.) | 6.000% | 7/1/41 | 1,500 | 1,637 |
| New Jersey Health Care Facilities | | | | |
| Financing Authority Revenue | | | | |
| (Atlantic City Medical Center) | 6.250% | 7/1/12 (Prere.) | 1,750 | 1,811 |
| New Jersey Health Care Facilities | | | | |
| Financing Authority Revenue | | | | |
| (Atlantic City Medical Center) | 6.250% | 7/1/17 | 2,200 | 2,280 |
| New Jersey Health Care Facilities | | | | |
| Financing Authority Revenue | | | | |
| (Atlantic City Medical Center) | 5.750% | 7/1/12 (Prere.) | 2,220 | 2,291 |
| New Jersey Health Care Facilities | | | | |
| Financing Authority Revenue | | | | |
| (Atlantic City Medical Center) | 5.750% | 7/1/25 | 2,780 | 2,808 |
| New Jersey Health Care Facilities | | | | |
| Financing Authority Revenue | | | | |
| (Atlanticare Regional Medical Center) | 5.000% | 7/1/23 | 2,675 | 2,815 |
| New Jersey Health Care Facilities | | | | |
| Financing Authority Revenue | | | | |
| (Atlanticare Regional Medical Center) | 5.000% | 7/1/26 | 2,780 | 2,845 |
| New Jersey Health Care Facilities | | | | |
| Financing Authority Revenue | | | | |
| (Atlanticare Regional Medical Center) | 5.000% | 7/1/37 | 10,000 | 10,038 |
| New Jersey Health Care Facilities | | | | |
| Financing Authority Revenue | | | | |
| (Capital Health Systems Obligated Group) | 5.750% | 7/1/13 (Prere.) | 7,000 | 7,533 |
| New Jersey Health Care Facilities | | | | |
| Financing Authority Revenue | | | | |
| (Children’s Specialized Hospital) | 5.500% | 7/1/30 | 3,055 | 3,009 |
| New Jersey Health Care Facilities | | | | |
| Financing Authority Revenue | | | | |
| (Children’s Specialized Hospital) | 5.500% | 7/1/36 | 6,800 | 6,534 |
| New Jersey Health Care Facilities | | | | |
| Financing Authority Revenue | | | | |
| (Hackensack University Medical Center) | 5.000% | 1/1/17 | 1,250 | 1,352 |
| New Jersey Health Care Facilities | | | | |
| Financing Authority Revenue | | | | |
| (Hackensack University Medical Center) | 5.000% | 1/1/19 | 2,000 | 2,156 |
| New Jersey Health Care Facilities | | | | |
| Financing Authority Revenue | | | | |
| (Hackensack University Medical Center) | 5.000% | 1/1/20 | 3,000 | 3,233 |
| New Jersey Health Care Facilities | | | | |
| Financing Authority Revenue | | | | |
| (Hackensack University Medical Center) | 5.125% | 1/1/21 | 15,000 | 15,945 |
| New Jersey Health Care Facilities | | | | |
| Financing Authority Revenue | | | | |
| (Hackensack University Medical Center) | 5.000% | 1/1/22 | 3,500 | 3,685 |
| New Jersey Health Care Facilities | | | | |
| Financing Authority Revenue | | | | |
| (Hackensack University Medical Center) | 5.000% | 1/1/28 | 3,500 | 3,462 |
37
New Jersey Long-Term Tax-Exempt Fund
| | | | |
| | | | Face | Market |
| | | Maturity | Amount | Value |
| | Coupon | Date | ($000) | ($000) |
| New Jersey Health Care Facilities | | | | |
| Financing Authority Revenue | | | | |
| (Hackensack University Medical Center) | 5.000% | 1/1/34 | 2,000 | 1,938 |
| New Jersey Health Care Facilities | | | | |
| Financing Authority Revenue | | | | |
| (Hospital Asset Transformation Program) | 5.000% | 10/1/13 | 3,785 | 4,050 |
| New Jersey Health Care Facilities | | | | |
| Financing Authority Revenue | | | | |
| (Hospital Asset Transformation Program) | 5.500% | 10/1/23 | 10,000 | 10,926 |
| New Jersey Health Care Facilities | | | | |
| Financing Authority Revenue | | | | |
| (Hospital Asset Transformation Program) | 5.750% | 10/1/31 | 1,500 | 1,599 |
| New Jersey Health Care Facilities | | | | |
| Financing Authority Revenue | | | | |
| (Hunterdon Medical Center) | 5.250% | 7/1/25 | 1,200 | 1,221 |
| New Jersey Health Care Facilities | | | | |
| Financing Authority Revenue | | | | |
| (Hunterdon Medical Center) | 5.125% | 7/1/35 | 3,450 | 3,378 |
| New Jersey Health Care Facilities | | | | |
| Financing Authority Revenue | | | | |
| (Meridian Health System Obligated Group) | 5.625% | 7/1/13 (4) | 7,255 | 7,280 |
| New Jersey Health Care Facilities | | | | |
| Financing Authority Revenue | | | | |
| (Meridian Health System Obligated Group) | 5.250% | 7/1/29 (4) | 8,355 | 8,359 |
| New Jersey Health Care Facilities | | | | |
| Financing Authority Revenue | | | | |
| (Meridian Health Systems) | 5.000% | 7/1/38 (12) | 4,380 | 4,421 |
| New Jersey Health Care Facilities | | | | |
| Financing Authority Revenue | | | | |
| (Meridian IV) VRDO | 0.070% | 12/7/11 (12) | 1,600 | 1,600 |
| 1 New Jersey Health Care Facilities | | | | |
| Financing Authority Revenue | | | | |
| (Meridian V) TOB VRDO | 0.290% | 12/7/11 (12) | 5,390 | 5,390 |
| New Jersey Health Care Facilities | | | | |
| Financing Authority Revenue | | | | |
| (Robert Wood Johnson University) | 5.000% | 7/1/31 | 5,000 | 5,127 |
| New Jersey Health Care Facilities | | | | |
| Financing Authority Revenue | | | | |
| (Robert Wood Johnson University) VRDO | 0.100% | 12/7/11 LOC | 6,500 | 6,500 |
| New Jersey Health Care Facilities | | | | |
| Financing Authority Revenue | | | | |
| (RWJ Health Care Corp.) VRDO | 0.090% | 12/7/11 LOC | 5,700 | 5,700 |
| New Jersey Health Care Facilities | | | | |
| Financing Authority Revenue | | | | |
| (South Jersey Hospital) | 5.000% | 7/1/36 | 10,000 | 9,874 |
| New Jersey Health Care Facilities | | | | |
| Financing Authority Revenue | | | | |
| (South Jersey Hospital) | 5.000% | 7/1/46 | 7,505 | 7,334 |
| New Jersey Health Care Facilities | | | | |
| Financing Authority Revenue | | | | |
| (St. Barnabas Health Care System) | 5.250% | 7/1/13 (14) | 2,695 | 2,701 |
| New Jersey Health Care Facilities | | | | |
| Financing Authority Revenue | | | | |
| (St. Barnabas Health Care System) | 5.000% | 7/1/16 | 1,500 | 1,580 |
38
New Jersey Long-Term Tax-Exempt Fund
| | | | |
| | | | Face | Market |
| | | Maturity | Amount | Value |
| | Coupon | Date | ($000) | ($000) |
| New Jersey Health Care Facilities | | | | |
| Financing Authority Revenue | | | | |
| (St. Barnabas Health Care System) | 5.250% | 7/1/16 (14) | 2,340 | 2,344 |
| New Jersey Health Care Facilities | | | | |
| Financing Authority Revenue | | | | |
| (St. Barnabas Health Care System) | 0.000% | 7/1/21 (ETM) | 1,260 | 980 |
| New Jersey Health Care Facilities | | | | |
| Financing Authority Revenue | | | | |
| (St. Barnabas Health Care System) | 5.000% | 7/1/24 | 2,000 | 1,992 |
| New Jersey Health Care Facilities | | | | |
| Financing Authority Revenue | | | | |
| (St. Barnabas Health Care System) | 5.000% | 7/1/29 | 1,000 | 966 |
| New Jersey Health Care Facilities | | | | |
| Financing Authority Revenue | | | | |
| (St. Barnabas Health Care System) | 5.625% | 7/1/32 | 2,000 | 2,009 |
| New Jersey Health Care Facilities | | | | |
| Financing Authority Revenue | | | | |
| (St. Barnabas Health Care System) | 5.625% | 7/1/37 | 2,500 | 2,481 |
| New Jersey Health Care Facilities | | | | |
| Financing Authority Revenue | | | | |
| (Virtua Health) | 6.000% | 7/1/29 (12) | 1,000 | 1,037 |
| New Jersey Health Care Facilities | | | | |
| Financing Authority Revenue | | | | |
| (Virtua Health) | 5.750% | 7/1/33 | 3,000 | 3,168 |
| New Jersey Health Care Facilities | | | | |
| Financing Authority Revenue | | | | |
| (Virtua Health) | 5.500% | 7/1/38 (12) | 3,000 | 3,126 |
| New Jersey Health Care Facilities | | | | |
| Financing Authority Revenue | | | | |
| (Virtua Health) VRDO | 0.090% | 12/1/11 LOC | 12,880 | 12,880 |
| New Jersey Health Care Facilities | | | | |
| Financing Authority Revenue | | | | |
| (Virtua Health) VRDO | 0.100% | 12/1/11 LOC | 11,235 | 11,235 |
| New Jersey Health Care Facilities | | | | |
| Financing Authority Revenue | | | | |
| (Virtua Health) VRDO | 0.090% | 12/7/11 LOC | 6,000 | 6,000 |
| New Jersey Health Care Facilities | | | | |
| Financing Authority Revenue | | | | |
| (Virtual Health) VRDO | 0.100% | 12/7/11 LOC | 15,000 | 15,000 |
| New Jersey Higher Education Assistance | | | | |
| Authority Student Loan Revenue | 4.750% | 12/1/21 | 5,000 | 5,342 |
| New Jersey Higher Education Assistance | | | | |
| Authority Student Loan Revenue | 5.000% | 12/1/25 | 1,500 | 1,553 |
| New Jersey Higher Education Assistance | | | | |
| Authority Student Loan Revenue | 5.000% | 12/1/26 | 1,500 | 1,548 |
| New Jersey Higher Education Assistance | | | | |
| Authority Student Loan Revenue | 5.000% | 6/1/27 | 6,280 | 6,446 |
| New Jersey Higher Education Assistance | | | | |
| Authority Student Loan Revenue | 4.500% | 12/1/29 | 3,000 | 2,979 |
| New Jersey Higher Education Assistance | | | | |
| Authority Student Loan Revenue | 4.750% | 12/1/29 | 6,000 | 6,048 |
| New Jersey Higher Education Assistance | | | | |
| Authority Student Loan Revenue | 5.625% | 6/1/30 | 5,000 | 5,299 |
| New Jersey Housing & Mortgage Finance | | | | |
| Agency Multi-Family Housing Revenue | 5.700% | 5/1/20 (4) | 1,905 | 1,908 |
39
New Jersey Long-Term Tax-Exempt Fund
| | | | |
| | | | Face | Market |
| | | Maturity | Amount | Value |
| | Coupon | Date | ($000) | ($000) |
| New Jersey Housing & Mortgage Finance | | | | |
| Agency Single Family Housing Revenue | 6.500% | 10/1/38 | 2,570 | 2,784 |
| New Jersey Sports & Exposition Authority | | | | |
| Revenue | 6.500% | 3/1/13 (ETM) | 605 | 631 |
| New Jersey Sports & Exposition Authority | | | | |
| Revenue | 6.500% | 3/1/13 (14) | 530 | 552 |
| New Jersey Sports & Exposition Authority | | | | |
| Revenue | 5.500% | 3/1/17 (ETM) | 250 | 304 |
| New Jersey Sports & Exposition Authority | | | | |
| Revenue | 5.500% | 3/1/17 (ETM) | 385 | 467 |
| New Jersey Sports & Exposition Authority | | | | |
| Revenue | 5.500% | 3/1/17 (14) | 5,120 | 5,915 |
| New Jersey Sports & Exposition Authority | | | | |
| Revenue (Convention Center Luxury Tax) | 5.500% | 3/1/21 (14) | 3,000 | 3,426 |
| New Jersey Sports & Exposition Authority | | | | |
| Revenue (Convention Center Luxury Tax) | 5.500% | 3/1/22 (14) | 1,120 | 1,275 |
| New Jersey Transportation Corp. COP | 5.500% | 9/15/12 (2) | 20,000 | 20,768 |
| New Jersey Transportation Corp. COP | 5.500% | 9/15/14 (2) | 1,600 | 1,756 |
| New Jersey Transportation Corp. COP | 5.500% | 9/15/15 (2) | 15,000 | 16,818 |
| New Jersey Transportation Trust Fund Authority | | | | |
| Transportation System Revenue | 5.250% | 6/15/15 (ETM) | 5,000 | 5,777 |
| New Jersey Transportation Trust Fund Authority | | | | |
| Transportation System Revenue | 5.250% | 12/15/15 (2) | 1,000 | 1,136 |
| New Jersey Transportation Trust Fund Authority | | | | |
| Transportation System Revenue | 5.500% | 12/15/15 (2) | 1,600 | 1,834 |
| New Jersey Transportation Trust Fund Authority | | | | |
| Transportation System Revenue | 5.000% | 12/15/17 | 2,910 | 3,325 |
| New Jersey Transportation Trust Fund Authority | | | | |
| Transportation System Revenue | 5.000% | 12/15/17 | 3,480 | 3,977 |
| New Jersey Transportation Trust Fund Authority | | | | |
| Transportation System Revenue | 5.000% | 12/15/17 | 2,500 | 2,857 |
| New Jersey Transportation Trust Fund Authority | | | | |
| Transportation System Revenue | 5.500% | 12/15/17 (4) | 1,775 | 2,098 |
| New Jersey Transportation Trust Fund Authority | | | | |
| Transportation System Revenue | 5.000% | 12/15/18 | 2,000 | 2,293 |
| New Jersey Transportation Trust Fund Authority | | | | |
| Transportation System Revenue | 5.500% | 12/15/18 (4) | 5,210 | 6,179 |
| New Jersey Transportation Trust Fund Authority | | | | |
| Transportation System Revenue | 5.250% | 6/15/15 (Prere.) | 8,795 | 10,161 |
| New Jersey Transportation Trust Fund Authority | | | | |
| Transportation System Revenue | 5.250% | 12/15/19 | 2,675 | 3,112 |
| New Jersey Transportation Trust Fund Authority | | | | |
| Transportation System Revenue | 5.250% | 12/15/19 | 2,500 | 2,909 |
| New Jersey Transportation Trust Fund Authority | | | | |
| Transportation System Revenue | 5.250% | 12/15/19 (4) | 8,000 | 9,332 |
| New Jersey Transportation Trust Fund Authority | | | | |
| Transportation System Revenue | 5.000% | 6/15/20 | 2,650 | 2,865 |
| New Jersey Transportation Trust Fund Authority | | | | |
| Transportation System Revenue | 5.500% | 6/15/13 (Prere.) | 1,000 | 1,078 |
| New Jersey Transportation Trust Fund Authority | | | | |
| Transportation System Revenue | 5.750% | 6/15/20 | 5,000 | 5,873 |
| New Jersey Transportation Trust Fund Authority | | | | |
| Transportation System Revenue | 5.250% | 12/15/20 | 6,500 | 7,526 |
| New Jersey Transportation Trust Fund Authority | | | | |
| Transportation System Revenue | 5.250% | 12/15/20 (4) | 5,000 | 5,845 |
40
New Jersey Long-Term Tax-Exempt Fund
| | | | |
| | | | Face | Market |
| | | Maturity | Amount | Value |
| | Coupon | Date | ($000) | ($000) |
| New Jersey Transportation Trust Fund Authority | | | | |
| Transportation System Revenue | 5.250% | 12/15/20 (4) | 5,800 | 6,780 |
| New Jersey Transportation Trust Fund Authority | | | | |
| Transportation System Revenue | 5.500% | 12/15/20 (3) | 7,000 | 8,241 |
| New Jersey Transportation Trust Fund Authority | | | | |
| Transportation System Revenue | 5.500% | 12/15/21 | 8,000 | 9,438 |
| New Jersey Transportation Trust Fund Authority | | | | |
| Transportation System Revenue | 5.250% | 12/15/22 | 2,500 | 2,896 |
| New Jersey Transportation Trust Fund Authority | | | | |
| Transportation System Revenue | 5.500% | 12/15/22 | 8,875 | 10,484 |
| New Jersey Transportation Trust Fund Authority | | | | |
| Transportation System Revenue | 5.750% | 6/15/23 (14) | 5,750 | 6,828 |
| New Jersey Transportation Trust Fund Authority | | | | |
| Transportation System Revenue | 0.000% | 12/15/23 | 8,900 | 4,930 |
| New Jersey Transportation Trust Fund Authority | | | | |
| Transportation System Revenue | 5.000% | 12/15/23 | 9,580 | 10,755 |
| New Jersey Transportation Trust Fund Authority | | | | |
| Transportation System Revenue | 5.250% | 12/15/23 (2) | 4,830 | 5,539 |
| New Jersey Transportation Trust Fund Authority | | | | |
| Transportation System Revenue | 5.750% | 6/15/24 (14) | 4,900 | 5,770 |
| New Jersey Transportation Trust Fund Authority | | | | |
| Transportation System Revenue | 5.000% | 12/15/24 | 3,000 | 3,326 |
| New Jersey Transportation Trust Fund Authority | | | | |
| Transportation System Revenue | 5.750% | 6/15/25 (14) | 7,000 | 8,175 |
| New Jersey Transportation Trust Fund Authority | | | | |
| Transportation System Revenue | 0.000% | 12/15/25 | 8,000 | 3,833 |
| New Jersey Transportation Trust Fund Authority | | | | |
| Transportation System Revenue | 0.000% | 12/15/25 | 10,800 | 5,175 |
| New Jersey Transportation Trust Fund Authority | | | | |
| Transportation System Revenue | 0.000% | 12/15/26 | 11,585 | 5,183 |
| New Jersey Transportation Trust Fund Authority | | | | |
| Transportation System Revenue | 5.000% | 6/15/27 | 5,000 | 5,356 |
| New Jersey Transportation Trust Fund Authority | | | | |
| Transportation System Revenue | 0.000% | 12/15/28 | 8,855 | 3,415 |
| New Jersey Transportation Trust Fund Authority | | | | |
| Transportation System Revenue | 0.000% | 12/15/28 | 18,000 | 6,942 |
| New Jersey Transportation Trust Fund Authority | | | | |
| Transportation System Revenue | 0.000% | 12/15/29 | 25,360 | 9,072 |
| New Jersey Transportation Trust Fund Authority | | | | |
| Transportation System Revenue | 5.250% | 6/15/30 | 1,825 | 1,949 |
| New Jersey Transportation Trust Fund Authority | | | | |
| Transportation System Revenue | 0.000% | 12/15/30 | 10,000 | 3,311 |
| New Jersey Transportation Trust Fund Authority | | | | |
| Transportation System Revenue | 5.250% | 6/15/31 | 5,395 | 5,728 |
| New Jersey Transportation Trust Fund Authority | | | | |
| Transportation System Revenue | 0.000% | 12/15/31 | 18,500 | 5,657 |
| New Jersey Transportation Trust Fund Authority | | | | |
| Transportation System Revenue | 0.000% | 12/15/32 | 10,000 | 2,842 |
| New Jersey Transportation Trust Fund Authority | | | | |
| Transportation System Revenue | 0.000% | 12/15/32 | 6,420 | 1,824 |
| New Jersey Transportation Trust Fund Authority | | | | |
| Transportation System Revenue | 5.000% | 12/15/32 (2) | 19,985 | 20,679 |
| New Jersey Transportation Trust Fund Authority | | | | |
| Transportation System Revenue | 0.000% | 12/15/33 | 3,000 | 796 |
41
New Jersey Long-Term Tax-Exempt Fund
| | | | |
| | | | Face | Market |
| | | Maturity | Amount | Value |
| | Coupon | Date | ($000) | ($000) |
| New Jersey Transportation Trust Fund Authority | | | | |
| Transportation System Revenue | 0.000% | 12/15/33 | 10,000 | 2,654 |
| New Jersey Transportation Trust Fund Authority | | | | |
| Transportation System Revenue | 0.000% | 12/15/34 | 8,210 | 2,038 |
| New Jersey Transportation Trust Fund Authority | | | | |
| Transportation System Revenue | 0.000% | 12/15/34 | 5,000 | 1,241 |
| New Jersey Transportation Trust Fund Authority | | | | |
| Transportation System Revenue | 6.000% | 6/15/35 | 4,000 | 4,571 |
| New Jersey Transportation Trust Fund Authority | | | | |
| Transportation System Revenue | 0.000% | 12/15/35 | 6,000 | 1,395 |
| New Jersey Transportation Trust Fund Authority | | | | |
| Transportation System Revenue | 0.000% | 12/15/36 | 11,675 | 2,549 |
| New Jersey Transportation Trust Fund Authority | | | | |
| Transportation System Revenue | 0.000% | 12/15/37 | 1,165 | 240 |
| New Jersey Transportation Trust Fund Authority | | | | |
| Transportation System Revenue | 0.000% | 12/15/38 | 6,500 | 1,253 |
| New Jersey Transportation Trust Fund Authority | | | | |
| Transportation System Revenue | 0.000% | 12/15/38 | 15,000 | 2,893 |
| New Jersey Transportation Trust Fund Authority | | | | |
| Transportation System Revenue | 5.500% | 12/15/38 (12) | 6,900 | 7,342 |
| New Jersey Transportation Trust Fund Authority | | | | |
| Transportation System Revenue | 6.000% | 12/15/18 (Prere.) | 1,740 | 2,246 |
| New Jersey Transportation Trust Fund Authority | | | | |
| Transportation System Revenue | 6.000% | 12/15/38 | 3,360 | 3,719 |
| New Jersey Transportation Trust Fund Authority | | | | |
| Transportation System Revenue | 0.000% | 12/15/39 | 15,150 | 2,742 |
| New Jersey Transportation Trust Fund Authority | | | | |
| Transportation System Revenue | 0.000% | 12/15/40 | 4,500 | 764 |
| New Jersey Transportation Trust Fund Authority | | | | |
| Transportation System Revenue | 5.500% | 6/15/41 | 10,000 | 10,753 |
| 1 New Jersey Transportation Trust Fund Authority | | | | |
| Transportation System Revenue TOB VRDO | 0.200% | 12/7/11 LOC | 6,690 | 6,690 |
| New Jersey Transportation Trust Fund Authority | | | | |
| Transportation System Revenue VRDO | 0.090% | 12/7/11 LOC | 1,700 | 1,700 |
| New Jersey Turnpike Authority Revenue | 6.000% | 1/1/13 (ETM) | 770 | 817 |
| New Jersey Turnpike Authority Revenue | 6.000% | 1/1/13 (14) | 230 | 242 |
| New Jersey Turnpike Authority Revenue | 6.500% | 1/1/13 (ETM) | 12,500 | 13,335 |
| New Jersey Turnpike Authority Revenue | 6.500% | 1/1/16 (ETM) | 1,560 | 1,900 |
| New Jersey Turnpike Authority Revenue | 6.500% | 1/1/16 (14) | 19,535 | 23,102 |
| New Jersey Turnpike Authority Revenue | 6.500% | 1/1/16 (ETM) | 22,095 | 24,415 |
| New Jersey Turnpike Authority Revenue | 5.000% | 1/1/20 | 5,000 | 5,727 |
| New Jersey Turnpike Authority Revenue | 5.000% | 1/1/21 | 5,000 | 5,644 |
| New Jersey Turnpike Authority Revenue | 5.000% | 1/1/22 | 3,325 | 3,699 |
| New Jersey Turnpike Authority Revenue | 5.250% | 1/1/26 (4) | 4,000 | 4,609 |
| New Jersey Turnpike Authority Revenue | 5.000% | 1/1/30 (4) | 16,000 | 16,639 |
| New Jersey Turnpike Authority Revenue | 5.000% | 1/1/35 | 6,400 | 6,672 |
| New Jersey Turnpike Authority Revenue | 5.000% | 1/1/36 | 11,000 | 11,398 |
| New Jersey Turnpike Authority Revenue | 5.250% | 1/1/40 | 21,285 | 22,309 |
| 1 New Jersey Turnpike Authority Revenue | | | | |
| TOB VRDO | 0.150% | 12/7/11 LOC | 1,825 | 1,825 |
| Newark NJ GO | 5.375% | 12/15/13 (14) | 2,000 | 2,093 |
| Ocean County NJ Utility Authority | | | | |
| Wastewater Revenue | 5.250% | 1/1/17 | 2,665 | 2,675 |
| Ocean County NJ Utility Authority | | | | |
| Wastewater Revenue | 5.250% | 1/1/18 | 2,220 | 2,228 |
42
New Jersey Long-Term Tax-Exempt Fund
| | | | |
| | | | Face | Market |
| | | Maturity | Amount | Value |
| | Coupon | Date | ($000) | ($000) |
| Ocean County NJ Utility Authority | | | | |
| Wastewater Revenue | 6.600% | 1/1/18 (ETM) | 2,220 | 2,620 |
| Passaic Valley NJ Sewage Commissioners | | | | |
| Sewer System Revenue | 5.750% | 12/1/19 | 1,680 | 1,968 |
| Passaic Valley NJ Sewage Commissioners | | | | |
| Sewer System Revenue | 5.750% | 12/1/20 | 1,450 | 1,698 |
| Passaic Valley NJ Sewage Commissioners | | | | |
| Sewer System Revenue | 5.750% | 12/1/21 | 3,500 | 4,101 |
| Port Authority of New York & | | | | |
| New Jersey Revenue | 5.375% | 3/1/28 | 1,280 | 1,492 |
| Port Authority of New York & | | | | |
| New Jersey Revenue | 4.500% | 7/15/28 | 4,000 | 4,189 |
| Port Authority of New York & | | | | |
| New Jersey Revenue | 5.000% | 3/1/29 | 4,500 | 4,842 |
| Port Authority of New York & | | | | |
| New Jersey Revenue | 5.000% | 7/15/31 | 5,140 | 5,579 |
| Port Authority of New York & | | | | |
| New Jersey Revenue | 5.000% | 7/15/31 | 3,395 | 3,671 |
| Port Authority of New York & | | | | |
| New Jersey Revenue | 5.000% | 7/15/32 | 3,500 | 3,758 |
| Port Authority of New York & | | | | |
| New Jersey Revenue | 5.000% | 10/15/32 | 6,625 | 7,078 |
| Port Authority of New York & | | | | |
| New Jersey Revenue | 4.750% | 11/15/32 | 4,000 | 4,149 |
| Port Authority of New York & | | | | |
| New Jersey Revenue | 4.750% | 7/15/33 | 8,000 | 8,271 |
| Port Authority of New York & | | | | |
| New Jersey Revenue | 5.000% | 10/15/33 | 1,250 | 1,331 |
| Port Authority of New York & | | | | |
| New Jersey Revenue | 5.000% | 7/15/35 | 6,500 | 6,941 |
| Port Authority of New York & | | | | |
| New Jersey Revenue | 5.000% | 9/15/36 | 3,400 | 3,600 |
| Port Authority of New York & | | | | |
| New Jersey Revenue | 5.000% | 5/1/39 | 6,600 | 6,938 |
| Port Authority of New York & | | | | |
| New Jersey Revenue | 5.000% | 7/15/39 | 12,000 | 12,697 |
| Port Authority of New York & | | | | |
| New Jersey Revenue | 5.000% | 10/15/39 | 4,000 | 4,215 |
| Port Authority of New York & | | | | |
| New Jersey Revenue | 4.250% | 7/15/40 | 2,250 | 2,129 |
| Port Authority of New York & | | | | |
| New Jersey Revenue | 5.000% | 1/15/41 | 8,065 | 8,543 |
| Port Authority of New York & | | | | |
| New Jersey Special Obligation Revenue | | | | |
| (John F. Kennedy International Air Terminal LLC) | 5.500% | 12/1/31 | 5,000 | 5,068 |
| Port Authority of New York & | | | | |
| New Jersey Special Obligation Revenue | | | | |
| (John F. Kennedy International Air Terminal LLC) | 6.000% | 12/1/36 | 3,000 | 3,130 |
| Port Authority of New York & | | | | |
| New Jersey Special Obligation Revenue | | | | |
| (John F. Kennedy International Air Terminal LLC) | 6.000% | 12/1/42 | 5,000 | 5,225 |
| Rutgers State University New Jersey Revenue | 5.000% | 5/1/29 | 1,110 | 1,219 |
| Rutgers State University New Jersey Revenue | | | | |
| VRDO | 0.090% | 12/1/11 | 3,000 | 3,000 |
| South Jersey Port Corp. New Jersey Revenue | 5.000% | 1/1/23 | 2,000 | 2,027 |
43
New Jersey Long-Term Tax-Exempt Fund
| | | | |
| | | | Face | Market |
| | | Maturity | Amount | Value |
| | Coupon | Date | ($000) | ($000) |
| South Jersey Port Corp. New Jersey Revenue | 5.100% | 1/1/33 | 1,500 | 1,509 |
| South Jersey Transportation Authority | | | | |
| New Jersey Transportation System Revenue | | | | |
| VRDO | 0.100% | 12/7/11 LOC | 7,300 | 7,300 |
| Tobacco Settlement Financing Corp. | | | | |
| New Jersey Revenue | 5.000% | 6/1/13 | 1,225 | 1,278 |
| Tobacco Settlement Financing Corp. | | | | |
| New Jersey Revenue | 4.500% | 6/1/23 | 12,665 | 11,445 |
| Tobacco Settlement Financing Corp. | | | | |
| New Jersey Revenue | 4.625% | 6/1/26 | 10,235 | 8,211 |
| Tobacco Settlement Financing Corp. | | | | |
| New Jersey Revenue | 5.000% | 6/1/29 | 9,765 | 7,446 |
| Tobacco Settlement Financing Corp. | | | | |
| New Jersey Revenue | 5.750% | 6/1/12 (Prere.) | 29,390 | 30,201 |
| Tobacco Settlement Financing Corp. | | | | |
| New Jersey Revenue | 4.750% | 6/1/34 | 8,500 | 5,804 |
| Tobacco Settlement Financing Corp. | | | | |
| New Jersey Revenue | 6.000% | 6/1/12 (Prere.) | 16,650 | 17,130 |
| Tobacco Settlement Financing Corp. | | | | |
| New Jersey Revenue | 5.000% | 6/1/41 | 11,455 | 7,920 |
| Tobacco Settlement Financing Corp. | | | | |
| New Jersey Revenue | 7.000% | 6/1/13 (Prere.) | 20,000 | 21,962 |
| University of Medicine & Dentistry | | | | |
| New Jersey COP | 5.250% | 6/15/18 (14) | 1,975 | 2,085 |
| University of Medicine & Dentistry | | | | |
| New Jersey COP | 5.250% | 6/15/20 (14) | 2,185 | 2,281 |
| University of Medicine & Dentistry | | | | |
| New Jersey COP | 5.250% | 6/15/22 (14) | 2,420 | 2,503 |
| University of Medicine & Dentistry | | | | |
| New Jersey Revenue | 6.500% | 12/1/12 (ETM) | 905 | 932 |
| University of Medicine & Dentistry | | | | |
| New Jersey Revenue | 5.375% | 12/1/15 (2) | 2,325 | 2,390 |
| University of Medicine & Dentistry | | | | |
| New Jersey Revenue | 5.375% | 12/1/16 (2) | 1,110 | 1,139 |
| University of Medicine & Dentistry | | | | |
| New Jersey Revenue | 5.500% | 12/1/19 (2) | 2,000 | 2,039 |
| University of Medicine & Dentistry | | | | |
| New Jersey Revenue | 5.500% | 12/1/20 (2) | 3,675 | 3,739 |
| University of Medicine & Dentistry | | | | |
| New Jersey Revenue | 5.500% | 12/1/21 (2) | 2,000 | 2,033 |
| | | | | 1,894,270 |
| Puerto Rico (1.6%) | | | | |
| Puerto Rico GO | 5.500% | 7/1/18 | 5,540 | 6,094 |
| 1 Puerto Rico GO TOB VRDO | 0.110% | 12/1/11 LOC | 8,700 | 8,700 |
| Puerto Rico Highway & Transportation | | | | |
| Authority Revenue | 5.500% | 7/1/14 (Prere.) | 3,500 | 3,924 |
| Puerto Rico Highway & Transportation | | | | |
| Authority Revenue | 5.500% | 7/1/14 (Prere.) | 4,125 | 4,625 |
| Puerto Rico Infrastructure Financing Authority | | | | |
| Special Tax Revenue | 0.000% | 7/1/33 (3) | 7,000 | 1,640 |
| Puerto Rico Public Finance Corp. Revenue | 6.000% | 8/1/26 (ETM) | 720 | 959 |
| Puerto Rico Public Finance Corp. Revenue | 5.500% | 2/1/12 (Prere.) | 3,250 | 3,279 |
| Puerto Rico Public Finance Corp. Revenue | 5.500% | 2/1/12 (Prere.) | 1,135 | 1,145 |
| | | | | 30,366 |
44
New Jersey Long-Term Tax-Exempt Fund
| | | | |
| | | | Face | Market |
| | | Maturity | Amount | Value |
| | Coupon | Date | ($000) | ($000) |
| Virgin Islands (0.2%) | | | | |
| VirginIslands Public Finance Authority Revenue | 5.250% | 10/1/18 | 3,390 | 3,553 |
| VirginIslands Public Finance Authority Revenue | 5.000% | 10/1/25 | 1,500 | 1,524 |
| | | | | 5,077 |
| Total Tax-Exempt Municipal Bonds (Cost $1,853,209) | | | | 1,929,713 |
| Other Assets and Liabilities (0.7%) | | | | |
| Other Assets | | | | 35,810 |
| Liabilities | | | | (22,542) |
| | | | | 13,268 |
| Net Assets (100%) | | | | 1,942,981 |
| |
| |
| At November 30, 2011, net assets consisted of: | | | | |
| | | | | Amount |
| | | | | ($000) |
| Paid-in Capital | | | | 1,903,300 |
| Undistributed Net Investment Income | | | | — |
| Accumulated Net Realized Losses | | | | (36,823) |
| Unrealized Appreciation (Depreciation) | | | | 76,504 |
| Net Assets | | | | 1,942,981 |
| |
| Investor Shares—Net Assets | | | | |
| Applicable to 25,108,590 outstanding $.001 par value shares of | | | |
| beneficial interest (unlimited authorization) | | | | 294,439 |
| Net Asset Value Per Share—Investor Shares | | | | $11.73 |
| |
| Admiral Shares—Net Assets | | | | |
| Applicable to 140,581,385 outstanding $.001 par value shares of | | | |
| beneficial interest (unlimited authorization) | | | | 1,648,542 |
| Net Asset Value Per Share—Admiral Shares | | | | $11.73 |
See Note A in Notes to Financial Statements.
1 Security exempt from registration under Rule 144A of the Securities Act of 1933. Such securities may be sold in transactions exempt from
registration, normally to qualified institutional buyers. At November 30, 2011, the aggregate value of these securities was $22,605,000,
representing 1.2% of net assets.
A key to abbreviations and other references follows the Statement of Net Assets.
See accompanying Notes, which are an integral part of the Financial Statements.
45
New Jersey Long-Term Tax-Exempt Fund
Key to Abbreviations
ARS—Auction Rate Security.
BAN—Bond Anticipation Note.
COP—Certificate of Participation.
CP—Commercial Paper.
FR—Floating Rate.
GAN—Grant Anticipation Note.
GO—General Obligation Bond.
PUT—Put Option Obligation.
RAN—Revenue Anticipation Note.
TAN—Tax Anticipation Note.
TOB—Tender Option Bond.
TRAN—Tax Revenue Anticipation Note.
VRDO—Variable Rate Demand Obligation.
VRDP—Variable Rate Demand Preferred.
(ETM)—Escrowed to Maturity.
(Prere.)—Prerefunded.
Scheduled principal and interest payments are guaranteed by:
(1) MBIA (Municipal Bond Investors Assurance).
(2) AMBAC (Ambac Assurance Corporation).
(3) FGIC (Financial Guaranty Insurance Company).
(4) AGM (Assured Guaranty Municipal Corporation).
(5) BIGI (Bond Investors Guaranty Insurance).
(6) Connie Lee Inc.
(7) FHA (Federal Housing Authority).
(8) CapMAC (Capital Markets Assurance Corporation).
(9) American Capital Access Financial Guaranty Corporation.
(10) XL Capital Assurance Inc.
(11) CIFG (CDC IXIS Financial Guaranty).
(12) Assured Guaranty Corporation.
(13) Berkshire Hathaway Assurance Corporation.
(14) National Public Finance Guarantee Corporation.
The insurance does not guarantee the market value of the municipal bonds.
LOC—Scheduled principal and interest payments are guaranteed by bank letter of credit.
46
New Jersey Long-Term Tax-Exempt Fund
Statement of Operations
| |
| | Year Ended |
| | November 30, 2011 |
| | ($000) |
| Investment Income | |
| Income | |
| Interest | 81,766 |
| Total Income | 81,766�� |
| Expenses | |
| The Vanguard Group—Note B | |
| Investment Advisory Services | 215 |
| Management and Administrative—Investor Shares | 429 |
| Management and Administrative—Admiral Shares | 1,352 |
| Marketing and Distribution—Investor Shares | 99 |
| Marketing and Distribution—Admiral Shares | 332 |
| Custodian Fees | 30 |
| Auditing Fees | 29 |
| Shareholders’ Reports—Investor Shares | 19 |
| Shareholders’ Reports—Admiral Shares | 4 |
| Trustees’ Fees and Expenses | 2 |
| Total Expenses | 2,511 |
| Net Investment Income | 79,255 |
| Realized Net Gain (Loss) | |
| Investment Securities Sold | (1,784) |
| Futures Contracts | (3,288) |
| Realized Net Gain (Loss) | (5,072) |
| Change in Unrealized Appreciation (Depreciation) | |
| Investment Securities | 23,797 |
| Futures Contracts | 5 |
| Change in Unrealized Appreciation (Depreciation) | 23,802 |
| Net Increase (Decrease) in Net Assets Resulting from Operations | 97,985 |
See accompanying Notes, which are an integral part of the Financial Statements.
47
New Jersey Long-Term Tax-Exempt Fund
Statement of Changes in Net Assets
| | |
| | Year Ended November 30, |
| | 2011 | 2010 |
| | ($000) | ($000) |
| Increase (Decrease) in Net Assets | | |
| Operations | | |
| Net Investment Income | 79,255 | 86,567 |
| Realized Net Gain (Loss) | (5,072) | 3,890 |
| Change in Unrealized Appreciation (Depreciation) | 23,802 | (14,720) |
| Net Increase (Decrease) in Net Assets Resulting from Operations | 97,985 | 75,737 |
| Distributions | | |
| Net Investment Income | | |
| Investor Shares | (12,167) | (19,150) |
| Admiral Shares | (67,088) | (67,417) |
| Realized Capital Gain | | |
| Investor Shares | — | — |
| Admiral Shares | — | — |
| Total Distributions | (79,255) | (86,567) |
| Capital Share Transactions | | |
| Investor Shares | (68,745) | (111,846) |
| Admiral Shares | (85,781) | 168,493 |
| Net Increase (Decrease) from Capital Share Transactions | (154,526) | 56,647 |
| Total Increase (Decrease) | (135,796) | 45,817 |
| Net Assets | | |
| Beginning of Period | 2,078,777 | 2,032,960 |
| End of Period | 1,942,981 | 2,078,777 |
See accompanying Notes, which are an integral part of the Financial Statements.
48
New Jersey Long-Term Tax-Exempt Fund
Financial Highlights
| | | | | |
| Investor Shares | | | | | |
| |
| For a Share Outstanding | Year Ended November 30, |
| Throughout Each Period | 2011 | 2010 | 2009 | 2008 | 2007 |
| Net Asset Value, Beginning of Period | $11.58 | $11.64 | $10.82 | $11.71 | $12.03 |
| Investment Operations | | | | | |
| Net Investment Income | .471 | .476 | .477 | .494 | .511 |
| Net Realized and Unrealized Gain (Loss) | | | | | |
| on Investments | .150 | (.060) | .820 | (.890) | (.276) |
| Total from Investment Operations | .621 | .416 | 1.297 | (.396) | .235 |
| Distributions | | | | | |
| Dividends from Net Investment Income | (.471) | (.476) | (.477) | (.494) | (.511) |
| Distributions from Realized Capital Gains | — | — | — | — | (.044) |
| Total Distributions | (.471) | (.476) | (.477) | (.494) | (.555) |
| Net Asset Value, End of Period | $11.73 | $11.58 | $11.64 | $10.82 | $11.71 |
| |
| Total Return1 | 5.54% | 3.59% | 12.19% | -3.49% | 2.04% |
| |
| Ratios/Supplemental Data | | | | | |
| Net Assets, End of Period (Millions) | $294 | $361 | $473 | $410 | $426 |
| Ratio of Total Expenses to | | | | | |
| Average Net Assets | 0.20% | 0.20% | 0.20% | 0.15% | 0.15% |
| Ratio of Net Investment Income to | | | | | |
| Average Net Assets | 4.11% | 4.06% | 4.22% | 4.32% | 4.35% |
| Portfolio Turnover Rate | 12% | 17% | 22% | 37% | 14% |
| 1 Total returns do not include account service fees that may have applied in the periods shown. Fund prospectuses provide information about |
| any applicable account service fees. |
See accompanying Notes, which are an integral part of the Financial Statements.
49
New Jersey Long-Term Tax-Exempt Fund
Financial Highlights
| | | | | |
| Admiral Shares | | | | | |
| |
| For a Share Outstanding | Year Ended November 30, |
| Throughout Each Period | 2011 | 2010 | 2009 | 2008 | 2007 |
| Net Asset Value, Beginning of Period | $11.58 | $11.64 | $10.82 | $11.71 | $12.03 |
| Investment Operations | | | | | |
| Net Investment Income | .480 | .485 | .487 | .502 | .519 |
| Net Realized and Unrealized Gain (Loss) | | | | | |
| on Investments | .150 | (.060) | .820 | (.890) | (.276) |
| Total from Investment Operations | .630 | .425 | 1.307 | (.388) | .243 |
| Distributions | | | | | |
| Dividends from Net Investment Income | (.480) | (.485) | (.487) | (.502) | (.519) |
| Distributions from Realized Capital Gains | — | — | — | — | (.044) |
| Total Distributions | (.480) | (.485) | (.487) | (.502) | (.563) |
| Net Asset Value, End of Period | $11.73 | $11.58 | $11.64 | $10.82 | $11.71 |
| |
| Total Return | 5.62% | 3.68% | 12.28% | -3.42% | 2.11% |
| |
| Ratios/Supplemental Data | | | | | |
| Net Assets, End of Period (Millions) | $1,649 | $1,718 | $1,560 | $1,375 | $1,402 |
| Ratio of Total Expenses to | | | | | |
| Average Net Assets | 0.12% | 0.12% | 0.12% | 0.08% | 0.08% |
| Ratio of Net Investment Income to | | | | | |
| Average Net Assets | 4.19% | 4.14% | 4.30% | 4.39% | 4.42% |
| Portfolio Turnover Rate | 12% | 17% | 22% | 37% | 14% |
See accompanying Notes, which are an integral part of the Financial Statements.
50
New Jersey Long-Term Tax-Exempt Fund
Notes to Financial Statements
Vanguard New Jersey Long-Term Tax-Exempt Fund is registered under the Investment Company Act of 1940 as an open-end investment company, or mutual fund. The fund invests in debt instruments of municipal issuers whose ability to meet their obligations may be affected by economic and political developments in the state. The fund offers two classes of shares: Investor Shares and Admiral Shares. Investor Shares are available to any investor who meets the fund’s minimum purchase requirements. Admiral Shares are designed for investors who meet certain administrative, service, and accountsize criteria.
A. The following significant accounting policies conform to generally accepted accounting principles for U.S. mutual funds. The fund consistently follows such policies in preparing its financial statements.
1. Security Valuation: Bonds, and temporary cash investments acquired over 60 days to maturity, are valued using the latest bid prices or using valuations based on a matrix system (which considers such factors as security prices, yields, maturities, and ratings), both as furnished by independent pricing services. Other temporary cash investments are valued at amortized cost, which approximates market value. Securities for which market quotations are not readily available, or whose values have been affected by events occurring before the fund’s pricing time but after the close of the securities’ primary markets, are valued by methods deemed by the board of trustees to represent fair value.
2. Futures Contracts: The fund uses futures contracts to invest in fixed income asset classes with greater efficiency and lower cost than is possible through direct investment, to add value when these instruments are attractively priced, or to adjust sensitivity to changes in interest rates. The primary risks associated with the use of futures contracts are imperfect correlation between changes in market values of bonds held by the fund and the prices of futures contracts, and the possibility of an illiquid market.
Futures contracts are valued based upon their quoted daily settlement prices. The aggregate principal amounts of the contracts are not recorded in the Statement of Net Assets. Fluctuations in the value of the contracts are recorded in the Statement of Net Assets as an asset (liability) and in the Statement of Operations as unrealized appreciation (depreciation) until the contracts are closed, when they are recorded as realized futures gains (losses).
The fund had no open futures contracts at November 30, 2011.
3. Federal Income Taxes: The fund intends to continue to qualify as a regulated investment company and distribute all of its income. Management has analyzed the fund’s tax positions taken for all open federal income tax years (November 30, 2008–2011), and has concluded that no provision for federal income tax is required in the fund’s financial statements.
4. Distributions: Distributions from net investment income are declared daily and paid on the first business day of the following month. Annual distributions from realized capital gains, if any, are recorded on the ex-dividend date.
5. Other: Interest income is accrued daily. Premiums and discounts on debt securities purchased are amortized and accreted, respectively, to interest income over the lives of the respective securities. Security transactions are accounted for on the date securities are bought or sold. Costs used to determine realized gains (losses) on the sale of investment securities are those of the specific securities sold.
51
New Jersey Long-Term Tax-Exempt Fund
Each class of shares has equal rights as to assets and earnings, except that each class separately bears certain class-specific expenses related to maintenance of shareholder accounts (included in Management and Administrative expenses) and shareholder reporting. Marketing and distribution expenses are allocated to each class of shares based on a method approved by the board of trustees. Income, other non-class-specific expenses, and gains and losses on investments are allocated to each class of shares based on its relative net assets.
B. The Vanguard Group furnishes at cost investment advisory, corporate management, administrative, marketing, and distribution services. The costs of such services are allocated to the fund under methods approved by the board of trustees. The fund has committed to provide up to 0.40% of its net assets in capital contributions to Vanguard. At November 30, 2011, the fund had contributed capital of $312,000 to Vanguard (included in Other Assets), representing 0.02% of the fund’s net assets and 0.12% of Vanguard’s capitalization. The fund’s trustees and officers are also directors and officers of Vanguard.
C. Various inputs may be used to determine the value of the fund’s investments. These inputs are summarized in three broad levels for financial statement purposes. The inputs or methodologies used to value securities are not necessarily an indication of the risk associated with investing in those securities.
Level 1—Quoted prices in active markets for identical securities.
Level 2—Other significant observable inputs (including quoted prices for similar securities, interest rates, prepayment speeds, credit risk, etc.).
Level 3—Significant unobservable inputs (including the fund’s own assumptions used to determine the fair value of investments).
At November 30, 2011, 100% of the market value of the fund’s investments were valued based on Level 2 inputs.
D. Capital gain distributions are determined on a tax basis and may differ from realized capital gains for financial reporting purposes. Differences may be permanent or temporary. Permanent differences are reclassified among capital accounts in the financial statements to reflect their tax character. Temporary differences arise when gains or losses are recognized in different periods for financial statement and tax purposes; these differences will reverse at some time in the future.
For tax purposes, at November 30, 2011, the fund had available capital loss carryforwards totaling $34,021,000 to offset future net capital gains of $18,584,000 through November 30, 2016, $10,333,000 through November 30, 2017, and $5,104,000 through November 30, 2019.
The fund had realized losses totaling $2,801,000 through November 30, 2011, which are deferred for tax purposes and reduce the amount of tax-basis unrealized appreciation on investment securities.
At November 30, 2011, the cost of investment securities for tax purposes was $1,856,011,000. Net unrealized appreciation of investment securities for tax purposes was $73,702,000, consisting of unrealized gains of $82,263,000 on securities that had risen in value since their purchase and $8,561,000 in unrealized losses on securities that had fallen in value since their purchase.
52
New Jersey Long-Term Tax-Exempt Fund
E. During the year ended November 30, 2011, the fund purchased $220,692,000 of investment securities and sold $409,719,000 of investment securities, other than temporary cash investments.
F. Capital share transactions for each class of shares were:
| | | | |
| | Year Ended November 30 |
| | 2011 | 2010 |
| | Amount | Shares | Amount | Shares |
| | ($000) | (000) | ($000) | (000) |
| Investor Shares | | | | |
| Issued | 59,686 | 5,215 | 111,899 | 9,534 |
| Issued in Lieu of Cash Distributions | 9,880 | 863 | 15,576 | 1,326 |
| Redeemed | (138,311) | (12,138) | (239,321) | (20,352) |
| Net Increase (Decrease)—Investor Shares | (68,745) | (6,060) | (111,846) | (9,492) |
| Admiral Shares | | | | |
| Issued | 190,834 | 16,678 | 367,783 | 31,315 |
| Issued in Lieu of Cash Distributions | 49,101 | 4,287 | 50,014 | 4,259 |
| Redeemed | (325,716) | (28,713) | (249,304) | (21,301) |
| Net Increase (Decrease)—Admiral Shares | (85,781) | (7,748) | 168,493 | 14,273 |
G. In preparing the financial statements as of November 30, 2011, management considered the impact of subsequent events for potential recognition or disclosure in these financial statements.
53
Report of Independent Registered
Public Accounting Firm
To the Trustees of Vanguard New Jersey Tax-Free Funds and the Shareholders of Vanguard New Jersey Tax-Exempt Money Market Fund and Vanguard New Jersey Long-Term Tax-Exempt Fund:
In our opinion, the accompanying statements of net assets, statement of assets and liabilities, and the related statements of operations and of changes in net assets and the financial highlights present fairly, in all material respects, the financial position of Vanguard New Jersey Tax-Exempt Money Market Fund and Vanguard New Jersey Long-Term Tax-Exempt Fund (constituting two separate portfolios of Vanguard New Jersey Tax-Free Funds, hereafter referred to as the “Funds”) at November 30, 2011, the results of each of their operations for the year then ended, the changes in each of their net assets for each of the two years in the period then ended and the financial highlights for each of the five years in the period then ended, in conformity with accounting principles generally accepted in the United States of America. These financial statements and financial highlights (hereafter referred to as “financial statements”) are the responsibility of the Funds’ management; our responsibility is to express an opinion on these financial statements based on our audits. We conducted our audits of these financial statements in accordance with the standards of the Public Company Accounting Oversight Board (United States). Those standards require that we plan and perform the audit to obtain reasonable assurance about whether the financial statements are free of material misstatement. An audit includes examining, on a test basis, evidence supporting the amounts and disclosures in the financial statements, assessing the accounting principles used and significant estimates made by management, and evaluating the overall financial statement presentation. We believe that our audits, which included confirmation of securities at November 30, 2011 by correspondence with the custodian, provide a reasonable basis for our opinion.
PricewaterhouseCoopers LLP
Philadelphia, Pennsylvania
January 13, 2012

Special 2011 tax information (unaudited) for Vanguard New Jersey Tax-Exempt Funds
This information for the fiscal year ended November 30, 2011, is included pursuant to provisions of
the Internal Revenue Code.
Each fund designates 100% of its income dividends as exempt-interest dividends.
54
About Your Fund’s Expenses
As a shareholder of the fund, you incur ongoing costs, which include costs for portfolio management, administrative services, and shareholder reports (like this one), among others. Operating expenses, which are deducted from a fund’s gross income, directly reduce the investment return of the fund.
A fund’s expenses are expressed as a percentage of its average net assets. This figure is known as the expense ratio. The following examples are intended to help you understand the ongoing costs (in dollars) of investing in your fund and to compare these costs with those of other mutual funds. The examples are based on an investment of $1,000 made at the beginning of the period shown and held for the entire period.
The accompanying table illustrates your fund’s costs in two ways:
• Based on actual fund return. This section helps you to estimate the actual expenses that you paid over the period. The ”Ending Account Value“ shown is derived from the fund‘s actual return, and the third column shows the dollar amount that would have been paid by an investor who started with $1,000 in the fund. You may use the information here, together with the amount you invested, to estimate the expenses that you paid over the period.
To do so, simply divide your account value by $1,000 (for example, an $8,600 account value divided by $1,000 = 8.6), then multiply the result by the number given for your fund under the heading ”Expenses Paid During Period.“
• Based on hypothetical 5% yearly return. This section is intended to help you compare your fund‘s costs with those of other mutual funds. It assumes that the fund had a yearly return of 5% before expenses, but that the expense ratio is unchanged. In this case—because the return used is not the fund’s actual return—the results do not apply to your investment. The example is useful in making comparisons because the Securities and Exchange Commission requires all mutual funds to calculate expenses based on a 5% return. You can assess your fund’s costs by comparing this hypothetical example with the hypothetical examples that appear in shareholder reports of other funds.
Note that the expenses shown in the table are meant to highlight and help you compare ongoing costs only and do not reflect transaction costs incurred by the fund for buying and selling securities. Further, the expenses do not include any purchase, redemption, or account service fees described in the fund prospectus. If such fees were applied to your account, your costs would be higher. Your fund does not carry a “sales load.”
The calculations assume no shares were bought or sold during the period. Your actual costs may have been higher or lower, depending on the amount of your investment and the timing of any purchases or redemptions.
You can find more information about the fund’s expenses, including annual expense ratios, in the Financial Statements section of this report. For additional information on operating expenses and other shareholder costs, please refer to your fund’s current prospectus.
55
| | | |
| Six Months Ended November 30, 2011 | | | |
| | Beginning | Ending | Expenses |
| | Account Value | Account Value | Paid During |
| | 5/31/2011 | 11/30/2011 | Period |
| Based on Actual Fund Return | | | |
| New Jersey Tax-Exempt Money Market Fund | $1,000.00 | $1,000.13 | $0.85 |
| New Jersey Long-Term Tax-Exempt Fund | | | |
| Investor Shares | $1,000.00 | $1,046.04 | $1.03 |
| Admiral Shares | 1,000.00 | 1,046.46 | 0.62 |
| Based on Hypothetical 5% Yearly Return | | | |
| New Jersey Tax-Exempt Money Market Fund | $1,000.00 | $1,024.22 | $0.86 |
| New Jersey Long-Term Tax-Exempt Fund | | | |
| Investor Shares | $1,000.00 | $1,024.07 | $1.01 |
| Admiral Shares | 1,000.00 | 1,024.47 | 0.61 |
The calculations are based on expenses incurred in the most recent six-month period. The funds’ annualized six-month expense ratios for that
period are: for the New Jersey Tax-Exempt Money Market Fund, 0.17%; and for the New Jersey Long-Term Tax-Exempt Fund, 0.20% for
Investor Shares and 0.12% for Admiral Shares. The dollar amounts shown as “Expenses Paid” are equal to the annualized expense ratio
multiplied by the average account value over the period, multiplied by the number of days in the most recent six-month period, then divided
by the number of days in the most recent 12-month period.
Glossary
7-Day SEC Yield and 30-Day SEC Yield. A money market fund’s 7-day SEC yield is calculated by annualizing its income distributions for the previous seven days, as required by the U.S. Securities and Exchange Commission. For other funds, 30-day SEC yield is derived using a formula specified by the commission. Under the formula, data related to the fund’s security holdings in the previous 30 days are used to calculate the fund’s hypothetical net income for that period, which is then annualized and divided by the fund’s estimated average net assets over the calculation period. For the purposes of this calculation, a security’s income is based on its current market yield to maturity (for bonds), its actual income (for asset-backed securities), or its projected dividend yield (for stocks). Because the SEC yield represents hypothetical annualized income, it will differ—at times significantly—from the fund’s actual experience. As a result, the fund’s income distributions may be higher or lower than implied by the SEC yield.
Average Coupon. The average interest rate paid on the fixed income securities held by a fund. It is expressed as a percentage of face value.
Average Duration. An estimate of how much the value of the bonds held by a fund will fluctuate in response to a change in interest rates. To see how the value could change, multiply the average duration by the change in rates. If interest rates rise by 1 percentage point, the value of the bonds in a fund with an average duration of five years would decline by about 5%. If rates decrease by a percentage point, the value would rise by 5%.
Average Effective Maturity. The average length of time until fixed income securities held by a fund reach maturity and are repaid, taking into consideration the possibility that the issuer may call the bond before its maturity date. The figure reflects the proportion of fund assets represented by each security; it also reflects any futures contracts held. In general, the longer the average effective maturity, the more a fund’s share price will fluctuate in response to changes in market interest rates.
Average Weighted Maturity. The average length of time until fixed income securities held by a fund reach maturity and are repaid. The figure reflects the proportion of fund assets represented by each security.
Beta. A measure of the magnitude of a fund’s past share-price fluctuations in relation to the ups and downs of a given market index. The index is assigned a beta of 1.00. Compared with a given index, a fund with a beta of 1.20 typically would have seen its share price rise or fall by 12% when the index rose or fell by 10%. For this report, beta is based on returns over the past 36 months for both the fund and the index. Note that a fund’s beta should be reviewed in conjunction with its R-squared (see definition). The lower the R-squared, the less correlation there is between the fund and the index, and the less reliable beta is as an indicator of volatility.
57
Credit Quality. For Vanguard money market funds, the Distribution by Credit Quality table includes tier ratings for consistency with SEC Rule 2a-7 under the Investment Company Act of 1940, which governs money market funds. A First Tier security is one that is eligible for money market funds and has been rated in the highest short-term rating category for debt obligations by the requisite nationally recognized statistical rating organizations. An unrated security is First Tier if it represents quality comparable to that of a rated security, as determined in accordance with SEC Rule 2a-7. A Second Tier security is one that is eligible for money market funds and is not a First Tier security. For Vanguard tax-exempt bond funds, credit-quality ratings are measured on a scale that generally ranges from AAA (highest) to D (lowest). “Not Rated” is used to classify securities for which a rating is not available. Credit-quality ratings are obtained from Moody’s and S&P, and the higher rating for each issue is used.
Expense Ratio. A fund’s total annual operating expenses expressed as a percentage of the fund’s average net assets. The expense ratio includes management and administrative expenses, but does not include the transaction costs of buying and selling portfolio securities.
Inception Date. The date on which the assets of a fund (or one of its share classes) are first invested in accordance with the fund’s investment objective. For funds with a subscription period, the inception date is the day after that period ends. Investment performance is measured from the inception date.
R-Squared. A measure of how much of a fund’s past returns can be explained by the returns from the market in general, as measured by a given index. If a fund’s total returns were precisely synchronized with an index’s returns, its R-squared would be 1.00. If the fund’s returns bore no relationship to the index’s returns, its R-squared would be 0. For this report, R-squared is based on returns over the past 36 months for both the fund and the index.
Short-Term Reserves. The percentage of a fund invested in highly liquid, short-term securities that can be readily converted to cash.
Yield to Maturity. The rate of return an investor would receive if the fixed income securities held by a fund were held to their maturity dates.
58
This page intentionally left blank.
The People Who Govern Your Fund
The trustees of your mutual fund are there to see that the fund is operated and managed in your best interests since, as a shareholder, you are a part owner of the fund. Your fund’s trustees also serve on the board of directors of The Vanguard Group, Inc., which is owned by the Vanguard funds and provides services to them on an at-cost basis.
A majority of Vanguard’s board members are independent, meaning that they have no affiliation with Vanguard or the funds they oversee, apart from the sizable personal investments they have made as private individuals. The independent board members have distinguished backgrounds in business, academia, and public service. Each of the trustees and executive officers oversees 180 Vanguard funds.
The following table provides information for each trustee and executive officer of the fund. More information about the trustees is in the Statement of Additional Information, which can be obtained, without charge, by contacting Vanguard at 800-662-7447, or online at vanguard.com.
| |
| Interested Trustee1 | and President (2006–2008) of Rohm and Haas Co. |
| | (chemicals); Director of Tyco International, Ltd. |
| F. William McNabb III | (diversified manufacturing and services) and Hewlett- |
| Born 1957. Trustee Since July 2009. Chairman of the | Packard Co. (electronic computer manufacturing); |
| Board. Principal Occupation(s) During the Past Five | Senior Advisor at New Mountain Capital; Trustee |
| Years: Chairman of the Board of The Vanguard Group, | of The Conference Board; Member of the Board of |
| Inc., and of each of the investment companies served | Managers of Delphi Automotive LLP (automotive |
| by The Vanguard Group, since January 2010; Director | components). |
| of The Vanguard Group since 2008; Chief Executive | |
| Officer and President of The Vanguard Group and of | Amy Gutmann |
| each of the investment companies served by The | Born 1949. Trustee Since June 2006. Principal |
| Vanguard Group since 2008; Director of Vanguard | Occupation(s) During the Past Five Years: President |
| Marketing Corporation; Managing Director of The | of the University of Pennsylvania; Christopher H. |
| Vanguard Group (1995–2008). | Browne Distinguished Professor of Political Science |
| | in the School of Arts and Sciences with secondary |
| | appointments at the Annenberg School for Commu- |
| Independent Trustees | nication and the Graduate School of Education |
| | of the University of Pennsylvania; Director of |
| Emerson U. Fullwood | Carnegie Corporation of New York, Schuylkill River |
| Born 1948. Trustee Since January 2008. Principal | Development Corporation, and Greater Philadelphia |
| Occupation(s) During the Past Five Years: Executive | Chamber of Commerce; Trustee of the National |
| Chief Staff and Marketing Officer for North America | Constitution Center; Chair of the Presidential |
| and Corporate Vice President (retired 2008) of Xerox | Commission for the Study of Bioethical Issues. |
| Corporation (document management products and | |
| services); Executive in Residence and 2010 | JoAnn Heffernan Heisen |
| Distinguished Minett Professor at the Rochester | Born 1950. Trustee Since July 1998. Principal |
| Institute of Technology; Director of SPX Corporation | Occupation(s) During the Past Five Years: Corporate |
| (multi-industry manufacturing), the United Way of | Vice President and Chief Global Diversity Officer |
| Rochester, Amerigroup Corporation (managed health | (retired 2008) and Member of the Executive |
| care), the University of Rochester Medical Center, | Committee (1997–2008) of Johnson & Johnson |
| Monroe Community College Foundation, and North | (pharmaceuticals/consumer products); Director of |
| Carolina A&T University. | Skytop Lodge Corporation (hotels), the University |
| | Medical Center at Princeton, the Robert Wood |
| Rajiv L. Gupta | Johnson Foundation, and the Center for Work Life |
| Born 1945. Trustee Since December 2001.2 | Policy; Member of the Advisory Board of the |
| Principal Occupation(s) During the Past Five Years: | Maxwell School of Citizenship and Public Affairs |
| Chairman and Chief Executive Officer (retired 2009) | at Syracuse University. |
| | |
| F. Joseph Loughrey | Thomas J. Higgins | |
| Born 1949. Trustee Since October 2009. Principal | Born 1957. Chief Financial Officer Since September |
| Occupation(s) During the Past Five Years: President | 2008. Principal Occupation(s) During the Past Five |
| and Chief Operating Officer (retired 2009) and Vice | Years: Principal of The Vanguard Group, Inc.; Chief |
| Chairman of the Board (2008–2009) of Cummins Inc. | Financial Officer of each of the investment companies |
| (industrial machinery); Director of SKF AB (industrial | served by The Vanguard Group since 2008; Treasurer |
| machinery), Hillenbrand, Inc. (specialized consumer | of each of the investment companies served by The |
| services), the Lumina Foundation for Education, and | Vanguard Group (1998–2008). |
| Oxfam America; Chairman of the Advisory Council | | |
| for the College of Arts and Letters and Member | Kathryn J. Hyatt | |
| of the Advisory Board to the Kellogg Institute for | Born 1955. Treasurer Since November 2008. Principal |
| International Studies at the University of Notre Dame. | Occupation(s) During the Past Five Years: Principal |
| | of The Vanguard Group, Inc.; Treasurer of each of |
| André F. Perold | the investment companies served by The Vanguard |
| Born 1952. Trustee Since December 2004. Principal | Group since 2008; Assistant Treasurer of each of the |
| Occupation(s) During the Past Five Years: George | investment companies served by The Vanguard Group |
| Gund Professor of Finance and Banking at the Harvard | (1988–2008). | |
| Business School (retired July 2011); Chief Investment | | |
| Officer and co-Managing Partner of HighVista | Heidi Stam | |
| Strategies LLC (private investment firm); Director of | Born 1956. Secretary Since July 2005. Principal |
| Rand Merchant Bank; Overseer of the Museum of | Occupation(s) During the Past Five Years: Managing |
| Fine Arts Boston. | Director of The Vanguard Group, Inc., since 2006; |
| | General Counsel of The Vanguard Group since 2005; |
| Alfred M. Rankin, Jr. | Secretary of The Vanguard Group and of each of the |
| Born 1941. Trustee Since January 1993. Principal | investment companies served by The Vanguard Group |
| Occupation(s) During the Past Five Years: Chairman, | since 2005; Director and Senior Vice President of |
| President, and Chief Executive Officer of NACCO | Vanguard Marketing Corporation since 2005; |
| Industries, Inc. (forklift trucks/housewares/lignite); | Principal of The Vanguard Group (1997–2006). |
| Director of Goodrich Corporation (industrial products/ | | |
| aircraft systems and services) and the National | | |
| Association of Manufacturers; Chairman of the | Vanguard Senior Management Team |
| Federal Reserve Bank of Cleveland; Vice Chairman | | |
| of University Hospitals of Cleveland; President of | R. Gregory Barton | Chris D. McIsaac |
| the Board of The Cleveland Museum of Art. | Mortimer J. Buckley | Michael S. Miller |
| | Kathleen C. Gubanich | James M. Norris |
| Peter F. Volanakis | Paul A. Heller | Glenn W. Reed |
| Born 1955. Trustee Since July 2009. Principal | Martha G. King | George U. Sauter |
| Occupation(s) During the Past Five Years: President | | |
| and Chief Operating Officer (retired 2010) of Corning | | |
| Incorporated (communications equipment); Director of | Chairman Emeritus and Senior Advisor |
| Corning Incorporated (2000–2010) and Dow Corning | | |
| (2001–2010); Overseer of the Amos Tuck School of | John J. Brennan | |
| Business Administration at Dartmouth College. | Chairman, 1996–2009 | |
| | Chief Executive Officer and President, 1996–2008 |
| |
| Executive Officers | | |
| | Founder | |
| Glenn Booraem | | |
| Born 1967. Controller Since July 2010. Principal | John C. Bogle | |
| Occupation(s) During the Past Five Years: Principal | Chairman and Chief Executive Officer, 1974–1996 |
| of The Vanguard Group, Inc.; Controller of each of | | |
| the investment companies served by The Vanguard | | |
| Group since 2010; Assistant Controller of each of | | |
| the investment companies served by The Vanguard | | |
| Group (2001–2010). | | |
1 Mr. McNabb is considered an “interested person,” as defined in the Investment Company Act of 1940, because he is an officer of the
Vanguard funds.
2 December 2002 for Vanguard Equity Income Fund, Vanguard Growth Equity Fund, the Vanguard Municipal Bond Funds, and the Vanguard
State Tax-Exempt Funds.

| |
| | P.O. Box 2600 |
| | Valley Forge, PA 19482-2600 |
| |
| |
| Connect with Vanguard® > vanguard.com | |
| |
| |
| Fund Information > 800-662-7447 | CFA® is a trademark owned by CFA Institute. |
| Direct Investor Account Services > 800-662-2739 | |
| Institutional Investor Services > 800-523-1036 | |
| Text Telephone for People | |
| With Hearing Impairment > 800-749-7273 | |
| |
| This material may be used in conjunction | |
| with the offering of shares of any Vanguard | |
| fund only if preceded or accompanied by | |
| the fund’s current prospectus. | |
| |
| All comparative mutual fund data are from Lipper Inc. or | |
| Morningstar, Inc., unless otherwise noted. | |
| |
| You can obtain a free copy of Vanguard’s proxy voting | |
| guidelines by visiting vanguard.com/proxyreporting or by | |
| calling Vanguard at 800-662-2739. The guidelines are | |
| also available from the SEC’s website, sec.gov. In | |
| addition, you may obtain a free report on how your fund | |
| voted the proxies for securities it owned during the 12 | |
| months ended June 30. To get the report, visit either | |
| vanguard.com/proxyreporting or sec.gov. | |
| |
| You can review and copy information about your fund at | |
| the SEC’s Public Reference Room in Washington, D.C. To | |
| find out more about this public service, call the SEC at | |
| 202-551-8090. Information about your fund is also | |
| available on the SEC’s website, and you can receive | |
| copies of this information, for a fee, by sending a | |
| request in either of two ways: via e-mail addressed to | |
| publicinfo@sec.gov or via regular mail addressed to the | |
| Public Reference Section, Securities and Exchange | |
| Commission, Washington, DC 20549-1520. | |
| | © 2012 The Vanguard Group, Inc. |
| | All rights reserved. |
| | Vanguard Marketing Corporation, Distributor. |
| |
| | Q140 012012 |
Item 2: Code of Ethics. The Registrant has adopted a code of ethics that applies to the Registrant’s principal executive officer, principal financial officer, principal accounting officer or controller or persons performing similar functions. The Code of Ethics was amended during the reporting period covered by this report to make certain technical, non-material changes.
Item 3: Audit Committee Financial Expert. The following members of the Audit Committee have been determined by the Registrant’s Board of Trustees to be Audit Committee Financial Experts serving on its Audit Committee, and to be independent: Charles D. Ellis, Rajiv L. Gupta, JoAnn Heffernan Heisen, André F. Perold, and Alfred M. Rankin, Jr.
Item 4: Principal Accountant Fees and Services.
(a) Audit Fees.
Audit Fees of the Registrant
Fiscal Year Ended November 30, 2011: $52,000
Fiscal Year Ended November 30, 2010: $48,000
Aggregate Audit Fees of Registered Investment Companies in the Vanguard Group.
Fiscal Year Ended November 30, 2011: $3,978,540
Fiscal Year Ended November 30, 2010: $3,607,060
(b) Audit-Related Fees.
Fiscal Year Ended November 30, 2011: $1,341,750
Fiscal Year Ended November 30, 2010: $791,350
Includes fees billed in connection with assurance and related services provided to the Registrant, The Vanguard Group, Inc., Vanguard Marketing Corporation, and other registered investment companies in the Vanguard Group.
(c) Tax Fees.
Fiscal Year Ended November 30, 2011: $373,830
Fiscal Year Ended November 30, 2010: $336,090
Includes fees billed in connection with tax compliance, planning and advice services provided to the Registrant, The Vanguard Group, Inc., Vanguard Marketing Corporation, and other registered investment companies in the Vanguard Group and related to income and excise taxes.
(d) All Other Fees.
Fiscal Year Ended November 30, 2011: $16,000
Fiscal Year Ended November 30, 2010: $16,000
Includes fees billed for services related to risk management and privacy matters. Services were provided to the Registrant, The Vanguard Group, Inc., Vanguard Marketing Corporation, and other registered investment companies in the Vanguard Group.
(e) (1) Pre-Approval Policies. The policy of the Registrant’s Audit Committee is to consider and, if appropriate, approve before the principal accountant is engaged for such services, all specific audit and non-audit services provided to: (1) the Registrant; (2) The Vanguard Group, Inc.; (3) other entities controlled by The Vanguard Group, Inc. that provide ongoing services to the Registrant; and (4) other registered investment companies in the Vanguard Group. In making a determination, the Audit Committee considers whether the services are consistent with maintaining the principal accountant’s independence.
In the event of a contingency situation in which the principal accountant is needed to provide services in between scheduled Audit Committee meetings, the Chairman of the Audit Committee would be called on to consider and, if appropriate, pre-approve audit or permitted non-audit services in an amount sufficient to complete services through the next Audit Committee meeting, and to determine if such services would be consistent with maintaining the accountant’s independence. At the next scheduled Audit Committee meeting, services and fees would be presented to the Audit Committee for formal consideration, and, if appropriate, approval by the entire Audit Committee. The Audit Committee would again consider whether such services and fees are consistent with maintaining the principal accountant’s independence.
The Registrant’s Audit Committee is informed at least annually of all audit and non-audit services provided by the principal accountant to the Vanguard complex, whether such services are provided to: (1) the Registrant; (2) The Vanguard Group, Inc.; (3) other entities controlled by The Vanguard Group, Inc. that provide ongoing services to the Registrant; or (4) other registered investment companies in the Vanguard Group.
(2) No percentage of the principal accountant’s fees or services were approved pursuant to the waiver provision of paragraph (c)(7)(i)(C) of Rule 2-01 of Regulation S-X.
(f) For the most recent fiscal year, over 50% of the hours worked under the principal accountant’s engagement were not performed by persons other than full-time, permanent employees of the principal accountant.
(g) Aggregate Non-Audit Fees.
Fiscal Year Ended November 30, 2011: $389,830
Fiscal Year Ended November 30, 2010: $352,090
Includes fees billed for non-audit services provided to the Registrant, The Vanguard Group, Inc., Vanguard Marketing Corporation, and other registered investment companies in the Vanguard Group.
(h) For the most recent fiscal year, the Audit Committee has determined that the provision of all non-audit services was consistent with maintaining the principal accountant’s independence.
Item 5: Audit Committee of Listed Registrants.
Not Applicable.
Item 6: Investments.
Not Applicable.
Item 7: Disclosure of Proxy Voting Policies and Procedures for Closed-End Management Investment Companies.
Not Applicable.
Item 8: Portfolio Managers of Closed-End Management Investment Companies.
Not Applicable.
Item 9: Purchase of Equity Securities by Closed-End Management Investment Company and Affiliated Purchasers.
Not Applicable.
Item 10: Submission of Matters to a Vote of Security Holders.
Not Applicable.
Item 11: Controls and Procedures.
(a) Disclosure Controls and Procedures. The Principal Executive and Financial Officers concluded that the Registrant's Disclosure Controls and Procedures are effective based on their evaluation of the Disclosure Controls and Procedures as of a date within 90 days of the filing date of this report.
(b) Internal Control Over Financial Reporting. There were no significant changes in Registrant’s Internal Control Over Financial Reporting or in other factors that could significantly affect this control subsequent to the date of the evaluation, including any corrective actions with regard to significant deficiencies and material weaknesses.
Item 12: Exhibits.
(a) Code of Ethics.
(b) Certifications.
Pursuant to the requirements of the Securities Exchange Act of 1934 and the Investment Company Act of 1940, the registrant has duly caused this report to be signed on its behalf by the undersigned, thereunto duly authorized.
| |
| | VANGUARD NEW JERSEY TAX-FREE FUNDS |
| |
| BY: | /s/ F. WILLIAM MCNABB III* |
| | F. WILLIAM MCNABB III |
| | CHIEF EXECUTIVE OFFICER |
| |
| Date: January 20, 2012 |
Pursuant to the requirements of the Securities Exchange Act of 1934 and the Investment Company Act of 1940, this report has been signed below by the following persons on behalf of the registrant and in the capacities and on the dates indicated.
| |
| | VANGUARD NEW JERSEY TAX-FREE FUNDS |
| |
| BY: | /s/ F. WILLIAM MCNABB III* |
| | F. WILLIAM MCNABB III |
| | CHIEF EXECUTIVE OFFICER |
| |
| Date: January 20, 2012 |
|
| | VANGUARD NEW JERSEY TAX-FREE FUNDS |
| |
| BY: | /s/ THOMAS J. HIGGINS* |
| | THOMAS J. HIGGINS |
| | CHIEF FINANCIAL OFFICER |
| |
| Date: January 20, 2012 |
* By: /s/ Heidi Stam
Heidi Stam, pursuant to a Power of Attorney filed on November 28, 2011 see file Number
33-23444, Incorporated by Reference.