UNITED STATES
SECURITIES AND EXCHANGE COMMISSION
Washington, D.C. 20549
FORM N-CSR
CERTIFIED SHAREHOLDER REPORT
OF
REGISTERED MANAGEMENT INVESTMENT COMPANIES
Investment Company Act file number: 811-05340
| ||
| Name of Registrant: Vanguard New Jersey Tax-Free Funds | ||
Address of Registrant: P.O. Box 2600 | ||
Valley Forge, PA 19482
| ||
Name and address of agent for service: Heidi Stam, Esquire | ||
| P.O. Box 876 | ||
Valley Forge, PA 19482
| ||
Registrant’s telephone number, including area code: (610) 669-1000
| ||
| Date of fiscal year end: November 30 | ||
Date of reporting period: December 1, 2013 – November 30, 2014
| ||
| Item 1: Reports to Shareholders | ||
Annual Report | November 30, 2014
Vanguard New Jersey Tax-Exempt Funds
Vanguard New Jersey Tax-Exempt Money Market Fund
Vanguard New Jersey Long-Term Tax-Exempt Fund
The mission continues
On May 1, 1975, Vanguard began operations, a fledgling company based on the simple but revolutionary idea that a mutual fund company should be managed solely in the interest of its investors.
Four decades later, that revolutionary spirit continues to animate the enterprise. Vanguard remains on a mission to give investors the best chance of investment success.
As we mark our 40th anniversary, we thank you for entrusting your assets to Vanguard and giving us the opportunity to help you reach your financial goals in the decades to come.
| Contents | |
| Your Fund’s Total Returns. | 1 |
| Chairman’s Letter. | 2 |
| Advisor’s Report. | 8 |
| New Jersey Tax-Exempt Money Market Fund. | 12 |
| New Jersey Long-Term Tax-Exempt Fund. | 28 |
| About Your Fund’s Expenses. | 59 |
| Glossary. | 61 |
Please note: The opinions expressed in this report are just that—informed opinions. They should not be considered promises or advice. Also, please keep in mind that the information and opinions cover the period through the date on the front of this report. Of course, the risks of investing in your fund are spelled out in the prospectus.
See the Glossary for definitions of investment terms used in this report.
About the cover: Since our founding, Vanguard has drawn inspiration from the enterprise and valor demonstrated by British naval hero Horatio Nelson and his command at the Battle of the Nile in 1798. The photograph displays a replica of a merchant ship from the same era as Nelson’s flagship, the HMS Vanguard.
Your Fund’s Total Returns
| Fiscal Year Ended November 30, 2014 | |||||
| SEC Yield | Taxable- Equivalent Yield | Income Returns | Capital Returns | Total Returns | |
| Vanguard New Jersey Tax-Exempt Money Market | |||||
| Fund | 0.01% | 0.02% | 0.01% | 0.00% | 0.01% |
| Other States Tax-Exempt Money Market Funds | |||||
| Average | 0.00 | ||||
| Other States Tax-Exempt Money Market Funds Average: Derived from data provided by Lipper, a Thomson Reuters Company. | |||||
| Vanguard New Jersey Long-Term Tax-Exempt Fund | |||||
| Investor Shares | 2.45% | 4.76% | 3.82% | 5.00% | 8.82% |
| Admiral™ Shares | 2.53 | 4.91 | 3.91 | 5.00 | 8.91 |
| Barclays NJ Municipal Bond Index | 7.49 | ||||
| New Jersey Municipal Debt Funds Average | 8.70 | ||||
| New Jersey Municipal Debt Funds Average: Derived from data provided by Lipper, a Thomson Reuters Company. | |||||
7-day SEC yield for the New Jersey Tax-Exempt Money Market Fund; 30-day SEC yield for the New Jersey Long-Term Tax-Exempt Fund.
The calculation of taxable-equivalent yield assumes a typical itemized tax return and is based on the maximum federal tax rate of 43.4% and the maximum income tax rate for the state. Local taxes were not considered. Please see the prospectus for a detailed explanation of the calculation.
Admiral Shares carry lower expenses and are available to investors who meet certain account-balance requirements.
| Your Fund’s Performance at a Glance November 30, 2013, Through November 30, 2014 | ||||
| Distributions Per Share | ||||
| Starting Share Price | Ending Share Price | Income Dividends | Capital Gains | |
| Vanguard New Jersey Tax-Exempt Money Market | ||||
| Fund | $1.00 | $1.00 | $0.000 | $0.000 |
| Vanguard New Jersey Long-Term Tax-Exempt Fund | ||||
| Investor Shares | $11.66 | $12.22 | $0.431 | $0.022 |
| Admiral Shares | 11.66 | 12.22 | 0.441 | 0.022 |
1

Chairman’s Letter
Dear Shareholder,
After a weak start, both taxable and tax-exempt bonds confounded expectations by rebounding robustly from their prior-year losses. For the 12 months ended November 30, 2014, the broad U.S. municipal bond market returned more than 8%, about 3 percentage points ahead of the broad U.S. taxable bond market.
In this favorable environment, Vanguard New Jersey Long-Term Tax-Exempt Fund returned 8.82% for Investor Shares and 8.91% for Admiral Shares, outperforming the broad muni market and its state-specific comparative standards. Price appreciation contributed more than half of the fund’s total return.
As I’ve cautioned in recent bond fund reports, we shouldn’t expect such exceptionally strong municipal bond performance to continue, especially given current low yields and expectations that the Federal Reserve will begin raising interest rates in 2015. It’s worth noting that about three-quarters of the fund’s return was earned in the first half of the fiscal year, when interest rates dropped the most.
As bond prices rose during the fiscal year, yields fell. (Bond prices and yields move in opposite directions.) The 30-day SEC yield for Investor Shares of the Long-Term Fund fell nearly a full percentage point, to 2.45% from 3.25%.
2
Vanguard New Jersey Tax-Exempt Money Market Fund returned 0.01%, just ahead of its peer average, as the Fed kept short-term interest rates at 0%–0.25%. The fund’s yield was unchanged at 0.01%.
Please note that although the funds are permitted to invest in securities whose income is subject to the alternative minimum tax (AMT), throughout the year the Long-Term Fund held no securities that would generate income distributions subject to the AMT. The Money Market Fund did hold such securities during the year and on November 30.
In case you haven’t heard about them, I want to let you know that in July the Securities and Exchange Commission (SEC) adopted a number of regulatory changes governing money market funds. With these changes, and the significant safeguards it adopted in 2010, the SEC has issued a strong response to those who believe institutional money market funds pose a risk to the financial system. The vast majority of investors in Vanguard money market funds will not be affected by the new rules. A brief overview can be found in the box on page 6.
Bond prices continued to climb almost without interruption
At the start of the fiscal year, analysts had anticipated higher interest rates and falling bond prices. Yields were already low in the United States and abroad, and the Fed was expected to begin tapering its monthly bond-buying program.
| Market Barometer | |||
| Average Annual Total Returns | |||
| Periods Ended November 30, 2014 | |||
| One Year | Three Years | Five Years | |
| Bonds | |||
| Barclays U.S. Aggregate Bond Index (Broad taxable | |||
| market) | 5.27% | 3.00% | 4.10% |
| Barclays Municipal Bond Index (Broad tax-exempt market) | 8.23 | 4.78 | 5.12 |
| Citigroup Three-Month U.S. Treasury Bill Index | 0.04 | 0.04 | 0.06 |
| Stocks | |||
| Russell 1000 Index (Large-caps) | 16.56% | 21.05% | 16.25% |
| Russell 2000 Index (Small-caps) | 3.99 | 18.36 | 16.69 |
| Russell 3000 Index (Broad U.S. market) | 15.53 | 20.84 | 16.28 |
| FTSE All-World ex US Index (International) | 1.05 | 10.29 | 5.94 |
| CPI | |||
| Consumer Price Index | 1.32% | 1.44% | 1.77% |
3
Instead of rising, however, U.S. bond yields declined even as the Fed began to scale back its bond purchases in January and ended the program in October. “Safe haven” demand for U.S. Treasury bonds, and for many municipal bonds, was strong amid heightened geopolitical risk in the Middle East, Ukraine, and elsewhere. (Municipal bonds that are backed by tax revenues are often viewed as being almost as safe as Treasury bonds.)
This demand helped the broad U.S. taxable bond market return 5.27% for the 12 months ended November 30. The yield of the 10-year Treasury note ended November at 2.25%, down from 2.74% a year earlier.
International bonds (as measured by the Barclays Global Aggregate Index ex USD) returned –2.53% for U.S. investors, as many foreign currencies weakened against the U.S. dollar during the fiscal year. (International bonds produced a positive return for U.S. investors after currency hedging, which helps mitigate the effects of movements in foreign exchange rates.)
Monetary policy, corporate earnings gave the U.S. stock market a boost
The broad U.S. stock market gained more than 15% for the fiscal year. Strong corporate earnings, along with generally accommodative central bank policies, helped offset investor concern about economic struggles in Europe and strife in the Middle East.
| Expense Ratios Your Fund Compared With Its Peer Group | |||
| Investor Shares | Admiral Shares | Peer Group Average | |
| New Jersey Tax-Exempt Money | |||
| Market Fund | 0.16% | — | 0.20% |
| New Jersey Long-Term Tax-Exempt | |||
| Fund | 0.20 | 0.12% | 0.97 |
The fund expense ratios shown are from the prospectus dated March 27, 2014, and represent estimated costs for the current fiscal year. For the fiscal year ended November 30, 2014, the funds’ expense ratios were: for the New Jersey Tax-Exempt Money Market Fund, 0.08%; and for the New Jersey Long-Term Tax-Exempt Fund, 0.20% for Investor Shares and 0.12% for Admiral Shares. The expense ratio for the New Jersey Tax-Exempt Money Market Fund reflects a temporary reduction in operating expenses (described in Note B of the Notes to Financial Statements). Before the reduction, the expense ratio was 0.16%. Peer-group expense ratios are derived from data provided by Lipper, a Thomson Reuters Company, and capture information through year-end 2013.
Peer groups: For the New Jersey Tax-Exempt Money Market Fund, Other States Tax-Exempt Money Market Funds; for the New Jersey Long-Term Tax-Exempt Fund, New Jersey Municipal Debt Funds.
Here, too, foreign currency weakness weighed on returns for U.S. investors: International stocks managed a return of only about 1% in dollar terms. Emerging markets fared better than the developed markets of Europe and the Pacific region.
Careful selection paid off amid state fiscal challenges
Many of the concerns and challenges that beset the broad municipal bond market during the 2013 fiscal year turned out to be less threatening than investors had feared: The tapering of the Fed’s bond-buying program, which began in January, wasn’t disruptive, and while Puerto Rico’s finances remained precarious, Detroit negotiated the terms of its bankruptcy settlement fairly swiftly.
The relatively light new tax-exempt supply, especially in the first half of the fiscal year, also supported bond prices, as did strong demand. Munis were popular not only with their traditional buyers (people in high tax brackets seeking tax-exempt income) but also with nontraditional buyers such as foreign investors, U.S. banks, insurance companies, and hedge funds.
Across much of the country, state and local finances improved, albeit at an uneven pace. In New Jersey, however, mounting revenue shortfalls led the budget gap to grow to more than $1 billion for the state fiscal year ended June 30, considerably higher than had been projected.
| Total Returns Ten Years Ended November 30, 2014 | |
| Average Annual Return | |
| New Jersey Tax-Exempt Money Market Fund | 1.19% |
| Spliced New Jersey Tax-Exempt Money Market Funds Average | 0.96 |
| For a benchmark description, see the Glossary. Spliced New Jersey Tax-Exempt Money Market Funds Average: Derived from data provided by Lipper, a Thomson Reuters Company. | |
| New Jersey Long-Term Tax-Exempt Fund Investor Shares | 4.49% |
| Barclays NJ Municipal Bond Index | 4.88 |
| New Jersey Municipal Debt Funds Average | 4.04 |
| New Jersey Municipal Debt Funds Average: Derived from data provided by Lipper, a Thomson Reuters Company. | |
The figures shown represent past performance, which is not a guarantee of future results. (Current performance may be lower or higher than the performance data cited. For performance data current to the most recent month-end, visit our website at vanguard.com/performance.) Note, too, that both investment returns and principal value can fluctuate widely, so an investor’s shares, when sold, could be worth more or less than their original cost.
5
Citing concerns about underfunded pension obligations and one-time measures to address deficits, three major credit-rating agencies lowered the state’s general obligation debt rating twice in 2014, each time by one notch.
In this challenging state environment, the Long-Term Fund was well-positioned by its advisor, Vanguard Fixed Income Group. As investors continued to search for yield, longer-maturity bonds—which typically sport higher yields—were among the best performers nationwide. This was also the case in New Jersey, where the fund benefited from the advisor’s selections among longer- maturity bonds. The advisor’s decision to de-emphasize state general obligation bonds in favor of bonds such as those issued to finance health care facilities also proved rewarding.
For more about the strategy and performance of the New Jersey funds during the fiscal year, please see the Advisor’s Report that follows this letter.
Strong credit analysis helped the funds navigate rough waters
At times during the 10 years ended November 30, media noise about the creditworthiness of municipal issuers and a few widely publicized municipal
| New rules on money market funds won’t affect most Vanguard investors |
| New rules governing money market funds garnered significant attention in 2014. But under |
| these rules, approved by the Securities and Exchange Commission (SEC), it will be business as |
| usual for the vast majority of Vanguard clients invested in such funds, including our tax-exempt |
| money market funds. A key point is that money market funds catering to individual investors |
| will be allowed to continue to seek to maintain a stable $1 share price, or net asset value (NAV). |
| The SEC has put in place a new framework that will enable a fund’s board of directors to |
| address a “run on the fund” by imposing redemption fees or even suspending redemptions. |
| The board will be able to take these measures when the fund’s liquidity—the percentage of |
| its assets invested in securities that may be readily traded in the market—falls below a certain |
| predefined level. (Government and Treasury money market funds will be permitted, but not |
| required, to implement these fees and restrictions.) |
| More extensive changes are in store for institutional money market funds, which proved more |
| susceptible to large-scale redemptions during the 2008–09 financial crisis. Most significantly, |
| these funds will have to shift from a fixed share price to a floating NAV. |
| Although some rules must be implemented sooner, the compliance date for the core reforms |
| is in autumn 2016, which gives investors time to find alternatives if they wish. We will no doubt |
| be reporting to you again as we work through the implications of these changes for our clients |
| and our lineup of funds. |
6
bankruptcies rattled the muni market. At Vanguard, however, our in-house analysis—always one of the pillars of our investment process—has helped us identify opportunities among muni bonds and sidestep potential problems. That evaluation is ongoing, even for the bonds already held in our portfolios.
The work of our credit analysts, along with our competitive advantage of having low costs, has been instrumental in enabling both New Jersey funds to outpace the average annual return of their peer groups over the last decade—an important measure of relative success for actively managed funds. The Long-Term Fund slightly trailed its benchmark index, after taking into account the expenses associated with running the funds.
Realistic expectations are key to reaching your long-term goals
Over the last several years, investors have grown accustomed to mostly strong returns from both stocks and bonds. This, of course, has been a welcome development for our clients as they strive to achieve their financial goals. But as any experienced investor knows, markets aren’t always so favorable.
Our recently published economic and market outlook research paper cautions that, over the next decade, returns for a balanced 60% equity/40% bond portfolio are likely to be moderately below long-run historical averages. (For more details, see
Vanguard’s Economic and Investment Outlook, available at vanguard.com/ research.)
I point out our modest projections not to be discouraging but to be helpful. Realistic expectations are the foundation of a sound plan to reach your long-term objective, whether it’s establishing a secure retirement, paying for a child’s education, or achieving some other goal.
If you expect too much from the markets, you might not save sufficiently. You might also take on excessive risk in your portfolio in the pursuit of unrealistically high returns.
We firmly believe that a better course is to follow Vanguard’s principles for investing success:
• Goals. Create clear, appropriate
investment goals.
• Balance. Develop a suitable asset
allocation using broadly diversified funds.
• Cost. Minimize cost.
• Discipline. Maintain perspective and
long-term discipline.
The beauty of these principles is that, unlike market returns, each one is within your control, and focusing on them can put you on the right path.
As always, thank you for investing with Vanguard.
Sincerely,

F. William McNabb III
Chairman and Chief Executive Officer
December 12, 2014
7
Advisor’s Report
For the fiscal year ended November 30, 2014, Vanguard New Jersey Tax-Exempt Money Market Fund returned 0.01%, compared with the 0.00% average return of peer funds. Vanguard New Jersey Long-Term Tax-Exempt Fund returned 8.82% for Investor Shares and 8.91% for Admiral Shares, outpacing the 7.49% return of its benchmark (the Barclays New Jersey Municipal Bond Index) and the 8.70% average return of its peer funds.
The investment environment
It was a remarkable year for municipal bonds as a whole. While the macroeconomic environment helped the broad U.S. taxable bond market produce solid returns, tax-exempt bonds did even better, boosted by light supply and a surge in demand.
The bond market was shaken in 2013 when the Federal Reserve signaled its intention to wind down its unprecedented bond-buying program. The Fed eventually succeeded in reassuring investors that the tapering would be gradual, that it would proceed only if the Fed saw sufficient underlying strength in the economy, and that interest rates were likely to remain low for a considerable period even after the program ended.
In 2014, the economy provided the signals the Fed was looking for, and the program ended in October. Gross domestic product increased at an annual rate of well above 2% during the 12 months through September (the latest data available) despite a sharp contraction in the first quarter of 2014 caused partly by the severe winter. The labor market
| Yields of Tax-Exempt Municipal Securities (AAA-Rated General-Obligation Issues) | ||
| November 30, | November 30, | |
| Maturity | 2013 | 2014 |
| 2 years | 0.33% | 0.14% |
| 5 years | 1.16 | 0.88 |
| 10 years | 2.65 | 1.98 |
| 30 years | 4.10 | 3.00 |
| Source: Vanguard. |
8
also improved, with the unemployment rate at 5.8% for November, and inflation remained well below the Fed’s target of 2%.
This benign environment for bonds—moderate economic growth, low inflation, and continuing easy monetary policy—helped revive demand. Heightened tensions in Eastern Europe and the Middle East also played a role, as more risk-averse investors turned to bonds as a safe harbor. During the period, the Treasury yield curve (the difference between short-term and long-term interest rates) flattened, as longer-maturity bonds strongly outperformed those with shorter maturities. Corporate bonds, with their higher-than-Treasury yields, also fared well.
Favorable supply-and-demand conditions helped municipal bonds outperform both Treasuries and corporates. Nationwide, total tax-exempt issuance from January through November was about 4% below the year-ago level. (In New Jersey, the 11-month volume of bonds issued was about 20% below the comparable period in 2013.) Many issuers remained focused on austerity despite the attractively low cost of borrowing, although supply picked up later in the fiscal year.
At the same time, demand for municipal securities rebounded. After municipal bonds fell out of favor with investors in 2013, their valuations reached very attractive levels compared with taxable bonds. As of November 30, 2013, the 2.65% tax-exempt yield of an AAA-rated general obligation tax-exempt bond (see the table on page 8) was almost the same as a comparable taxable Treasury bond’s yield. This enticed back individual investors looking for tax-free income along with many buyers that would not have been interested otherwise—including insurance companies, pension funds, and foreign investors. (It’s worth noting that, with strong demand bidding up municipal bonds’ prices, their yields at the end of November 2014 were less attractive than those of Treasuries.)
The Pew Charitable Trusts noted in a recent report that with the official end of the Great Recession now more than five years behind us, recovery by the states has been “slow and uneven.” New Jersey is one of the states lagging the national upswing, in part because of the damage caused by Hurricane Sandy in 2012. The state unemployment rate fell from 7.4% at the start of the funds’ fiscal year to 6.4% at the end of November, still among the highest of all states and above the national average.
Another gauge of the state’s economy is the Federal Reserve Bank of Philadelphia’s monthly report on State Coincident Indexes. New Jersey’s index climbed about 2% from November 2013 through October 2014, compared with more than 3% for the overall U.S. economy.
As we noted in our semiannual report, all three major credit-rating agencies downgraded the state’s general obligation bonds by one notch this spring, citing recurring revenue shortfalls and structurally unbalanced budgets coupled with spending
9
pressures including underfunded pension obligations. After another round of onestep downgrades in the fall, New Jersey’s general obligation bonds are now rated single-A, which is still investment-grade.
Management of the funds
Our positioning of the Long-Term Fund reflected our assessment of the evolving risk/reward tradeoffs among bonds issued by borrowers in New Jersey. Early in the period, we saw relative value in longer-maturity bonds and in A-rated bonds, where we felt we would be well-compensated for the risk inherent in such bonds. This proved to be the case as interest rates continued to fall and yield-hungry investors favored lower-rated bonds.
As the year moved on, we took steps to limit the impact of the deteriorating fiscal environment at the state level by reducing our exposure to state general obligation bonds. For example, we repositioned our holdings into more bonds issued in the education and health care sectors. Health care bonds performed especially well.
For the Money Market Fund, the low interest rate environment remained challenging but not unfamiliar as the Fed has kept its target for overnight rates at 0%–0.25% since late 2008. We continued to look for opportunities to support returns through risk management and security selection.
A word about Puerto Rico, whose triple-tax-free bonds are held in many state-specific and national tax-exempt bond funds: The Puerto Rican bonds in the Barclays Municipal Bond Index returned more than 7% for the fiscal year, but although the territory’s financial woes have receded from the headlines, they are ongoing. We continued to steer clear of any direct exposure because of the territory’s debt load, unbalanced budget, and uncertain outlook. As of November 30, the Long-Term Fund held one very small stake in a Puerto Rican bond that is not exposed to Puerto Rico credit risk because the bond is escrowed to maturity.
A look ahead
As we’ve noted, after a year of exceptionally strong performance, municipal bond valuations are at much fuller levels than a year ago. Over the next year, we expect their returns to be more or less in line with the income they produce because yields have already fallen so low, the overall economy continues to improve, and a potential interest rate rise is in the offing.
Our outlook is for the U.S. economy to grow at a moderate pace in 2015. The Fed is likely to begin raising the federal funds target rate in the second half of the year. Although market volatility will probably pick up as we approach that point, we believe that the Fed’s pace of tightening in monetary policy will be slow and that the target rate will eventually end at a level below its historical average. For municipal bonds, that’s likely to mean their interest rates will remain lower than the levels we’ve seen over the past 10 to 15 years.
10
As we enter the new fiscal year, the Long-Term Fund has an average stated maturity longer than that of its benchmark, but we favor bonds maturing in five to ten years. Because of the prospect of rising interest rates, we’ve positioned the fund’s duration to be modestly shorter than that of its benchmark. (Duration is a measure of the sensitivity of bond, and bond mutual fund, prices to changes in interest rates.)
As for Puerto Rico, we are likely to remain on the sidelines until we see sustained economic growth and budget discipline.
We expect to continue to hold above-average levels of liquidity, so that we can take advantage of any dislocations in pricing that may arise as the Fed begins to tighten monetary policy.
And as always, our experienced team of portfolio managers, traders, and credit analysts will seek opportunities to add to the funds’ performance by identifying bonds that we believe are mispriced by the market.
Christopher W. Alwine, CFA, Principal,
Head of Municipal Bond Funds
Pamela Wisehaupt Tynan, Principal,
Head of Municipal Money Market Funds
Mathew M. Kiselak, Principal,
Portfolio Manager
John M. Carbone, Principal,
Portfolio Manager
Vanguard Fixed Income Group
December 18, 2014
11
New Jersey Tax-Exempt Money Market Fund
Fund Profile
As of November 30, 2014
| Financial Attributes | |
| Ticker Symbol | VNJXX |
| Expense Ratio1 | 0.16% |
| 7-Day SEC Yield | 0.01% |
| Average Weighted | |
| Maturity | 50 days |
| Distribution by Credit Quality (% of portfolio) | |
| First Tier | 100.0% |
| A First Tier security is one that is eligible for money market funds and has been rated in the highest short-term rating category for debt obligations by nationally recognized statistical rating organizations. Credit-quality ratings are obtained from Moody's, Fitch, and S&P. For securities rated by all three agencies, where two of them are in agreement and assign the highest rating category, the highest rating applies. If a security is only rated by two agencies, and their ratings are in different categories, the lower of the ratings applies. An unrated security is First Tier if it represents quality comparable to that of a rated security, as determined in accordance with SEC Rule 2a-7. For more information about these ratings, see the Glossary entry for Credit Quality. | |
1 The expense ratio shown is from the prospectus dated March 27, 2014, and represents estimated costs for the current fiscal year. For the fiscal year ended November 30, 2014, the expense ratio was 0.08%, reflecting a temporary reduction in operating expenses (described in Note B of the Notes to Financial Statements). Before this reduction, the expense ratio was 0.16%.
12
New Jersey Tax-Exempt Money Market Fund
Performance Summary
Investment returns will fluctuate. All of the returns in this report represent past performance, which is not a guarantee of future results that may be achieved by the fund. (Current performance may be lower or higher than the performance data cited. For performance data current to the most recent month-end, visit our website at vanguard.com/performance.) The returns shown do not reflect taxes that a shareholder would pay on fund distributions. An investment in a money market fund is not insured or guaranteed by the Federal Deposit Insurance Corporation or any other government agency. Although the fund seeks to preserve the value of your investment at $1 per share, it is possible to lose money by investing in the fund. The fund’s 7-day SEC yield reflects its current earnings more closely than do the average annual returns.
Cumulative Performance: November 30, 2004, Through November 30, 2014
Initial Investment of $10,000
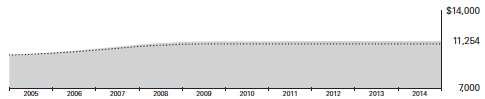
| Average Annual Total Returns Periods Ended November 30, 2014 | ||||
| One Year | Five Years | Ten Years | Final Value of a $10,000 Investment | |
| Market Fund | 0.01% | 0.05% | 1.19% | $11,254 |
| Spliced New Jersey Tax-Exempt | ||||
| •••••••• Money Market Funds Average | 0.00 | 0.00 | 0.96 | 11,002 |
| For a benchmark description, see the Glossary. Spliced New Jersey Tax-Exempt Money Market Funds Average: Derived from data provided by Lipper, a Thomson Reuters Company. | ||||
See Financial Highlights for dividend information.
13
New Jersey Tax-Exempt Money Market Fund
Fiscal-Year Total Returns (%): November 30, 2004, Through November 30, 2014
| Spliced NJ Tax-Exempt Money Mkt Funds Avg. Total Returns | ||
| Fiscal Year | Total Returns | |
| 2005 | 2.17% | 1.63% |
| 2006 | 3.25 | 2.74 |
| 2007 | 3.60 | 3.12 |
| 2008 | 2.27 | 1.90 |
| 2009 | 0.45 | 0.25 |
| 2010 | 0.11 | 0.01 |
| 2011 | 0.06 | 0.00 |
| 2012 | 0.04 | 0.01 |
| 2013 | 0.01 | 0.00 |
| 2014 | 0.01 | 0.00 |
| 7-day SEC yield (11/30/2014): 0.01% | ||
| For a benchmark description, see the Glossary. | ||
| Spliced New Jersey Tax-Exempt Money Market Funds Average: Derived from data provided by Lipper, a Thomson Reuters Company. | ||
Average Annual Total Returns: Periods Ended September 30, 2014
This table presents returns through the latest calendar quarter—rather than through the end of the fiscal period.
Securities and Exchange Commission rules require that we provide this information.
| Inception Date | One Year | Five Years | Ten Years | |
| New Jersey Tax-Exempt Money | ||||
| Market Fund | 2/3/1988 | 0.01% | 0.05% | 1.21% |
14
New Jersey Tax-Exempt Money Market Fund
Financial Statements
Statement of Net Assets
As of November 30, 2014
The fund reports a complete list of its holdings in various monthly and quarterly regulatory filings. The fund publishes its holdings on a monthly basis at vanguard.com and files them with the Securities and Exchange Commission on Form N-MFP. The fund’s Form N-MFP filings become public 60 days after the relevant month-end, and may be viewed at sec.gov or via a link on the “Portfolio Holdings” page on vanguard.com. For the second and fourth fiscal quarters, the lists appear in the fund’s semiannual and annual reports to shareholders. For the first and third fiscal quarters, the fund files the lists with the SEC on Form N-Q. Shareholders can look up the fund’s Forms N-Q on the SEC’s website at sec.gov. Forms N-Q may also be reviewed and copied at the SEC’s Public Reference Room (see the back cover of this report for further information).
| Coupon | Maturity Date | Face Amount ($000) | Market Value ($000) | |
| Tax-Exempt Municipal Bonds (100.5%) | ||||
| New Jersey (100.5%) | ||||
| Bergen County NJ Improvement Authority | ||||
| Pooled Loan Revenue | 3.000% | 2/15/15 | 1,830 | 1,841 |
| Bergen County NJ Improvement Authority | ||||
| School District Revenue | ||||
| (Elmwood Park Board of Education) | 1.000% | 8/1/15 | 1,400 | 1,408 |
| Bernards Township NJ School District GO | 1.000% | 1/1/15 | 2,305 | 2,307 |
| Burlington County NJ BAN | 0.750% | 5/19/15 | 50,000 | 50,143 |
| Burlington County NJ Bridge Commission | ||||
| Revenue | 5.250% | 12/15/14 (Prere.) | 3,290 | 3,297 |
| Burlington County NJ Bridge Commission | ||||
| Revenue BAN | 1.250% | 11/18/15 | 10,000 | 10,102 |
| Camden County NJ Improvement Authority | ||||
| Lease Revenue (Parkview Redevelopment | ||||
| Housing Project) VRDO | 0.040% | 12/5/14 LOC | 46,500 | 46,500 |
| Cherry Hill Township NJ BAN | 1.000% | 10/22/15 | 5,694 | 5,736 |
| Clifton NJ BAN | 1.000% | 10/14/15 | 5,272 | 5,305 |
| Delaware River & Bay Authority New Jersey | ||||
| Revenue VRDO | 0.040% | 12/5/14 LOC | 4,300 | 4,300 |
| Delaware River Port Authority Pennsylvania & | ||||
| New Jersey Revenue VRDO | 0.030% | 12/5/14 LOC | 44,000 | 44,000 |
| Delaware River Port Authority Pennsylvania & | ||||
| New Jersey Revenue VRDO | 0.040% | 12/5/14 LOC | 41,745 | 41,745 |
| Delaware River Port Authority Pennsylvania & | ||||
| New Jersey Revenue VRDO | 0.040% | 12/5/14 LOC | 11,000 | 11,000 |
| Delaware River Port Authority Pennsylvania & | ||||
| New Jersey Revenue VRDO | 0.050% | 12/5/14 LOC | 29,635 | 29,635 |
| Essex County NJ Improvement Authority Revenue | 1.500% | 10/1/15 | 3,615 | 3,653 |
| Essex County NJ Improvement Authority | ||||
| Revenue (Fern Senior Housing Project) VRDO | 0.040% | 12/5/14 LOC | 7,300 | 7,300 |
| Essex County NJ Improvement Authority Revenue | ||||
| (Jewish Community Center of MetroWest Inc. | ||||
| Project) VRDO | 0.040% | 12/5/14 LOC | 6,605 | 6,605 |
| Essex County NJ Improvement Authority Revenue | ||||
| (Pooled Government Loan) VRDO | 0.040% | 12/5/14 LOC | 3,025 | 3,025 |
15
| New Jersey Tax-Exempt Money Market Fund | ||||
| Face | Market | |||
| Maturity | Amount | Value | ||
| Coupon | Date | ($000) | ($000) | |
| Fair Lawn NJ BAN | 1.000% | 9/18/15 | 5,689 | 5,724 |
| Freehold Township NJ BAN | 1.000% | 12/16/14 | 11,855 | 11,859 |
| Garden State Preservation Trust New Jersey | ||||
| Revenue (Open Space & Farmland Preservation) | 5.800% | 11/1/15 (Prere.) | 6,000 | 6,309 |
| Garden State Preservation Trust New Jersey | ||||
| Revenue (Open Space & Farmland Preservation) | 5.800% | 11/1/15 (Prere.) | 5,115 | 5,376 |
| Gloucester County NJ Pollution Control Financing | ||||
| Authority Revenue (ExxonMobil Project) VRDO | 0.010% | 12/1/14 | 16,885 | 16,885 |
| Hopewell Township NJ BAN | 0.750% | 4/10/15 | 9,227 | 9,247 |
| Hudson County NJ BAN | 2.000% | 12/5/14 | 1,000 | 1,000 |
| Hudson County NJ Improvement Authority BAN | 1.000% | 12/10/14 | 7,500 | 7,501 |
| Hudson County NJ Improvement Authority BAN | 1.000% | 11/25/15 | 5,000 | 5,034 |
| 1 Madison Borough NJ Board of Education | ||||
| GO TOB VRDO | 0.040% | 12/5/14 LOC | 11,535 | 11,535 |
| Mahwah Township NJ BAN | 1.000% | 8/7/15 | 5,000 | 5,029 |
| Mahwah Township NJ BAN | 1.000% | 10/9/15 | 2,750 | 2,770 |
| Mercer County NJ BAN | 1.000% | 12/2/14 | 20,000 | 20,000 |
| Mercer County NJ BAN | 5.000% | 2/13/15 | 15,000 | 15,148 |
| Middlesex County NJ BAN | 0.750% | 6/5/15 | 24,200 | 24,276 |
| Monmouth County NJ GO | 2.000% | 3/1/15 | 3,340 | 3,356 |
| Monmouth County NJ GO | 2.000% | 3/1/15 | 440 | 442 |
| Monmouth County NJ GO | 2.000% | 3/1/15 | 290 | 291 |
| Monmouth County NJ Improvement Authority | ||||
| Revenue (Pooled Government Loan) | 2.000% | 12/4/14 | 11,000 | 11,002 |
| Morris County NJ GO | 0.500% | 2/1/15 | 1,000 | 1,001 |
| Morris County NJ GO | 3.000% | 2/1/15 | 5,000 | 5,024 |
| New Jersey Economic Development Authority | ||||
| (School Facilities Construction) | 5.000% | 3/1/15 (Prere.) | 1,000 | 1,012 |
| New Jersey Economic Development Authority | ||||
| Revenue (Applewood Estates Project) VRDO | 0.030% | 12/5/14 LOC | 9,000 | 9,000 |
| New Jersey Economic Development Authority | ||||
| Revenue (Bayonne/IMTT Project) VRDO | 0.040% | 12/1/14 LOC | 15,000 | 15,000 |
| New Jersey Economic Development Authority | ||||
| Revenue (Bayonne/IMTT Project) VRDO | 0.040% | 12/1/14 LOC | 10,000 | 10,000 |
| New Jersey Economic Development Authority | ||||
| Revenue (Columbia University Project) CP | 0.060% | 2/2/15 | 6,770 | 6,770 |
| New Jersey Economic Development Authority | ||||
| Revenue (Cooper Health System Project) VRDO | 0.040% | 12/5/14 LOC | 12,600 | 12,600 |
| New Jersey Economic Development Authority | ||||
| Revenue (Duke Farms Foundation Project) VRDO | 0.040% | 12/1/14 LOC | 28,800 | 28,800 |
| New Jersey Economic Development Authority | ||||
| Revenue (El Dorado Terminals Co. Project) VRDO | 0.040% | 12/1/14 LOC | 600 | 600 |
| New Jersey Economic Development Authority | ||||
| Revenue (Job Haines Home Project) VRDO | 0.050% | 12/5/14 LOC | 3,400 | 3,400 |
| New Jersey Economic Development Authority | ||||
| Revenue (Princeton Day School) VRDO | 0.030% | 12/5/14 LOC | 5,000 | 5,000 |
| New Jersey Economic Development Authority | ||||
| Revenue (Ranney School Project) VRDO | 0.030% | 12/5/14 LOC | 20,960 | 20,960 |
| New Jersey Economic Development Authority | ||||
| Revenue (School Facilities Construction) | 5.250% | 12/15/14 (ETM) | 1,000 | 1,002 |
| New Jersey Economic Development Authority | ||||
| Revenue (School Facilities Construction) | 5.000% | 3/1/15 (Prere.) | 1,000 | 1,012 |
| New Jersey Economic Development Authority | ||||
| Revenue (School Facilities Construction) | 5.000% | 3/1/15 (Prere.) | 1,000 | 1,012 |
| New Jersey Economic Development Authority | ||||
| Revenue (School Facilities Construction) | 5.000% | 3/1/15 (Prere.) | 1,000 | 1,012 |
16
| New Jersey Tax-Exempt Money Market Fund | ||||
| Face | Market | |||
| Maturity | Amount | Value | ||
| Coupon | Date | ($000) | ($000) | |
| New Jersey Economic Development Authority | ||||
| Revenue (School Facilities Construction) | 5.125% | 3/1/15 (Prere.) | 3,045 | 3,083 |
| New Jersey Economic Development Authority | ||||
| Revenue (School Facilities Construction) | 5.125% | 3/1/15 (Prere.) | 3,000 | 3,037 |
| New Jersey Economic Development Authority | ||||
| Revenue (School Facilities Construction) | 5.250% | 3/1/15 (Prere.) | 3,120 | 3,160 |
| New Jersey Economic Development Authority | ||||
| Revenue (School Facilities Construction) | 5.250% | 3/1/15 (Prere.) | 4,360 | 4,415 |
| New Jersey Economic Development Authority | ||||
| Revenue (School Facilities Construction) | 5.250% | 3/1/15 (Prere.) | 1,250 | 1,266 |
| New Jersey Economic Development Authority | ||||
| Revenue (School Facilities Construction) | 5.250% | 3/1/15 (Prere.) | 5,200 | 5,266 |
| New Jersey Economic Development Authority | ||||
| Revenue (School Facilities Construction) | 5.000% | 9/1/15 (ETM) | 2,760 | 2,860 |
| New Jersey Economic Development Authority | ||||
| Revenue (School Facilities Construction) | 5.125% | 9/1/15 (Prere.) | 1,000 | 1,037 |
| New Jersey Economic Development Authority | ||||
| Revenue (School Facilities Construction) | 5.250% | 9/1/15 (Prere.) | 4,070 | 4,225 |
| New Jersey Economic Development Authority | ||||
| Revenue (School Facilities Construction) | 5.250% | 9/1/15 (Prere.) | 1,195 | 1,241 |
| New Jersey Economic Development Authority | ||||
| Revenue (Trustees of the Lawrenceville | ||||
| School Project) VRDO | 0.050% | 12/1/14 | 6,500 | 6,500 |
| New Jersey Economic Development Authority | ||||
| Revenue Pollution Control Revenue | ||||
| (Exxon Project) VRDO | 0.010% | 12/1/14 | 2,000 | 2,000 |
| New Jersey Educational Facilities Authority | ||||
| Revenue (Institute for Advanced Studies) VRDO | 0.030% | 12/5/14 | 16,825 | 16,825 |
| 1 New Jersey Educational Facilities Authority | ||||
| Revenue (Institute for Advanced Studies) VRDO | 0.030% | 12/5/14 LOC | 17,400 | 17,400 |
| 1 New Jersey Educational Facilities Authority | ||||
| Revenue (Institute for Defense Analyses) VRDO | 0.040% | 12/5/14 LOC | 7,825 | 7,825 |
| 1 New Jersey Educational Facilities Authority | ||||
| Revenue (Princeton University) TOB VRDO | 0.040% | 12/5/14 | 2,665 | 2,665 |
| 1 New Jersey Educational Facilities Authority | ||||
| Revenue (Princeton University) TOB VRDO | 0.050% | 12/5/14 | 2,165 | 2,165 |
| New Jersey Educational Facilities Authority | ||||
| Revenue (Seton Hall University) VRDO | 0.040% | 12/5/14 LOC | 13,990 | 13,990 |
| 1 New Jersey Environmental Infrastructure Trust | ||||
| Revenue TOB VRDO | 0.040% | 12/5/14 | 4,015 | 4,015 |
| 1 New Jersey GO TOB VRDO | 0.050% | 12/1/14 LOC | 38,900 | 38,900 |
| 1 New Jersey GO TOB VRDO | 0.050% | 12/1/14 LOC | 5,000 | 5,000 |
| New Jersey Health Care Facilities Financing | ||||
| Authority Revenue (AHS Hospital Corp.) VRDO | 0.030% | 12/5/14 LOC | 6,500 | 6,500 |
| New Jersey Health Care Facilities Financing | ||||
| Authority Revenue (AHS Hospital Corp.) VRDO | 0.030% | 12/5/14 LOC | 8,085 | 8,085 |
| New Jersey Health Care Facilities Financing | ||||
| Authority Revenue (Hospital Capital Asset | ||||
| Pooled Program) VRDO | 0.040% | 12/5/14 LOC | 6,000 | 6,000 |
| New Jersey Health Care Facilities Financing | ||||
| Authority Revenue (Hospital Capital Asset | ||||
| Pooled Program) VRDO | 0.040% | 12/5/14 LOC | 9,300 | 9,300 |
| New Jersey Health Care Facilities Financing | ||||
| Authority Revenue (Hospital Capital Asset | ||||
| Pooled Program) VRDO | 0.040% | 12/5/14 LOC | 14,600 | 14,600 |
17
| New Jersey Tax-Exempt Money Market Fund | ||||
| Face | Market | |||
| Maturity | Amount | Value | ||
| Coupon | Date | ($000) | ($000) | |
| New Jersey Health Care Facilities Financing | ||||
| Authority Revenue (Hospital Capital Asset | ||||
| Pooled Program) VRDO | 0.040% | 12/5/14 LOC | 13,750 | 13,750 |
| New Jersey Health Care Facilities Financing | ||||
| Authority Revenue (Meridian Health System | ||||
| Obligated Group) VRDO | 0.030% | 12/5/14 LOC | 9,000 | 9,000 |
| New Jersey Health Care Facilities Financing | ||||
| Authority Revenue (MHAC I LLC) VRDO | 0.040% | 12/5/14 LOC | 6,400 | 6,400 |
| New Jersey Health Care Facilities Financing | ||||
| Authority Revenue (MHAC I LLC) VRDO | 0.040% | 12/5/14 LOC | 2,700 | 2,700 |
| New Jersey Health Care Facilities Financing | ||||
| Authority Revenue (Rahway Hospital) VRDO | 0.040% | 12/5/14 LOC | 3,765 | 3,765 |
| New Jersey Health Care Facilities Financing | ||||
| Authority Revenue (Robert Wood Johnson | ||||
| University) VRDO | 0.030% | 12/5/14 LOC | 7,500 | 7,500 |
| New Jersey Health Care Facilities Financing | ||||
| Authority Revenue (Robert Wood Johnson | ||||
| University) VRDO | 0.030% | 12/5/14 LOC | 1,100 | 1,100 |
| New Jersey Health Care Facilities Financing | ||||
| Authority Revenue (Robert Wood Johnson | ||||
| University) VRDO | 0.040% | 12/5/14 LOC | 6,800 | 6,800 |
| New Jersey Health Care Facilities Financing | ||||
| Authority Revenue (Robert Wood Johnson | ||||
| University) VRDO | 0.040% | 12/5/14 LOC | 3,100 | 3,100 |
| New Jersey Health Care Facilities Financing | ||||
| Authority Revenue (RWJ Health Care Corp.) | ||||
| VRDO | 0.040% | 12/5/14 LOC | 13,330 | 13,330 |
| New Jersey Health Care Facilities Financing | ||||
| Authority Revenue (Southern Ocean County | ||||
| Hospital) VRDO | 0.040% | 12/5/14 LOC | 5,890 | 5,890 |
| New Jersey Health Care Facilities Financing | ||||
| Authority Revenue (Underwood Memorial | ||||
| Hospital) VRDO | 0.040% | 12/5/14 LOC | 8,140 | 8,140 |
| New Jersey Health Care Facilities Financing | ||||
| Authority Revenue (Virtua Health) VRDO | 0.020% | 12/1/14 LOC | 3,100 | 3,100 |
| New Jersey Health Care Facilities Financing | ||||
| Authority Revenue (Virtua Health) VRDO | 0.030% | 12/5/14 LOC | 22,700 | 22,700 |
| New Jersey Health Care Facilities Financing | ||||
| Authority Revenue (Virtua Health) VRDO | 0.030% | 12/5/14 LOC | 14,000 | 14,000 |
| New Jersey Higher Education Assistance | ||||
| Authority Student Loan Revenue | 4.000% | 12/1/14 | 1,600 | 1,600 |
| New Jersey Higher Education Assistance | ||||
| Authority Student Loan Revenue | 5.000% | 6/1/15 | 3,750 | 3,837 |
| 1 New Jersey Higher Education Assistance | ||||
| Authority Student Loan Revenue TOB VRDO | 0.050% | 12/5/14 | 4,500 | 4,500 |
| 1 New Jersey Higher Education Assistance | ||||
| Authority Student Loan Revenue TOB VRDO | 0.080% | 12/5/14 LOC | 3,155 | 3,155 |
| 1 New Jersey Higher Education Assistance | ||||
| Authority Student Loan Revenue TOB VRDO | 0.080% | 12/5/14 LOC | 3,995 | 3,995 |
| 1 New Jersey Higher Education Assistance | ||||
| Authority Student Loan Revenue TOB VRDO | 0.190% | 12/5/14 | 26,985 | 26,985 |
| New Jersey Highway Authority Revenue | ||||
| (Garden State Parkway) | 5.500% | 1/1/15 (ETM) | 4,105 | 4,124 |
| New Jersey Housing & Mortgage Finance Agency | ||||
| Multi-Family Housing Revenue VRDO | 0.040% | 12/5/14 LOC | 6,815 | 6,815 |
18
| New Jersey Tax-Exempt Money Market Fund | ||||
| Face | Market | |||
| Maturity | Amount | Value | ||
| Coupon | Date | ($000) | ($000) | |
| New Jersey Housing & Mortgage Finance Agency | ||||
| Single Family Housing Revenue VRDO | 0.040% | 12/5/14 | 25,475 | 25,475 |
| New Jersey Housing & Mortgage Finance Agency | ||||
| Single Family Housing Revenue VRDO | 0.040% | 12/5/14 | 8,215 | 8,215 |
| New Jersey Housing & Mortgage Finance Agency | ||||
| Single Family Housing Revenue VRDO | 0.050% | 12/5/14 | 10,080 | 10,080 |
| New Jersey Housing & Mortgage Finance Agency | ||||
| Single Family Housing Revenue VRDO | 0.050% | 12/5/14 | 8,985 | 8,985 |
| 2 New Jersey Transportation Corp. COP | 5.000% | 9/15/15 (Prere.) | 6,880 | 7,143 |
| New Jersey Transportation Corp. COP | 5.000% | 9/15/15 (Prere.) | 5,290 | 5,492 |
| New Jersey Transportation Trust Fund Authority | ||||
| Transportation System Revenue | 5.250% | 12/15/14 | 3,100 | 3,106 |
| New Jersey Transportation Trust Fund Authority | ||||
| Transportation System Revenue | 5.750% | 12/15/14 (ETM) | 5,590 | 5,602 |
| New Jersey Transportation Trust Fund Authority | ||||
| Transportation System Revenue | 5.000% | 6/15/15 (Prere.) | 2,000 | 2,052 |
| New Jersey Transportation Trust Fund Authority | ||||
| Transportation System Revenue | 5.000% | 6/15/15 (Prere.) | 2,000 | 2,052 |
| New Jersey Transportation Trust Fund Authority | ||||
| Transportation System Revenue | 5.000% | 6/15/15 (Prere.) | 1,000 | 1,026 |
| New Jersey Transportation Trust Fund Authority | ||||
| Transportation System Revenue | 5.250% | 6/15/15 (ETM) | 1,950 | 2,004 |
| New Jersey Transportation Trust Fund Authority | ||||
| Transportation System Revenue | 5.250% | 6/15/15 (Prere.) | 2,050 | 2,106 |
| New Jersey Transportation Trust Fund Authority | ||||
| Transportation System Revenue | 5.250% | 6/15/15 (Prere.) | 1,165 | 1,197 |
| New Jersey Transportation Trust Fund Authority | ||||
| Transportation System Revenue | 5.250% | 6/15/15 (Prere.) | 1,050 | 1,079 |
| New Jersey Turnpike Authority Revenue VRDO | 0.040% | 12/5/14 LOC | 38,000 | 38,000 |
| North Bergen Township NJ BAN | 1.000% | 4/1/15 | 10,649 | 10,677 |
| 1 Nuveen New Jersey Dividend Advantage | ||||
| Municipal Fund VRDP VRDO | 0.120% | 12/5/14 LOC | 47,300 | 47,300 |
| 1 Nuveen New Jersey Dividend Advantage | ||||
| Municipal Fund VRDP VRDO | 0.120% | 12/5/14 LOC | 10,000 | 10,000 |
| 1 Nuveen New Jersey Dividend Advantage | ||||
| Municipal Fund VRDP VRDO | 0.150% | 12/5/14 LOC | 2,700 | 2,700 |
| 2 Ocean City NJ BAN | 1.000% | 12/3/15 | 4,160 | 4,189 |
| Paramus Borough NJ BAN | 1.000% | 2/20/15 | 10,105 | 10,120 |
| Port Authority of New York & New Jersey | ||||
| Revenue CP | 0.080% | 12/2/14 | 2,805 | 2,805 |
| Port Authority of New York & New Jersey | ||||
| Revenue CP | 0.080% | 12/9/14 | 18,785 | 18,785 |
| Port Authority of New York & New Jersey | ||||
| Revenue CP | 0.080% | 2/3/15 | 11,050 | 11,050 |
| Port Authority of New York & New Jersey | ||||
| Revenue CP | 0.090% | 2/11/15 | 12,735 | 12,735 |
| Port Authority of New York & New Jersey | ||||
| Revenue CP | 0.080% | 4/9/15 | 5,000 | 5,000 |
| 1 Port Authority of New York & New Jersey | ||||
| Revenue TOB VRDO | 0.050% | 12/5/14 | 9,900 | 9,900 |
| 1 Port Authority of New York & New Jersey | ||||
| Revenue TOB VRDO | 0.050% | 12/5/14 | 3,500 | 3,500 |
| 1 Port Authority of New York & New Jersey | ||||
| Revenue TOB VRDO | 0.060% | 12/5/14 | 15,190 | 15,190 |
| 1 Port Authority of New York & New Jersey | ||||
| Revenue TOB VRDO | 0.060% | 12/5/14 | 2,100 | 2,100 |
19
| New Jersey Tax-Exempt Money Market Fund | |||||
| Face | Market | ||||
| Maturity | Amount | Value | |||
| Coupon | Date | ($000) | ($000) | ||
| 1 | Port Authority of New York & New Jersey | ||||
| Revenue TOB VRDO | 0.090% | 12/5/14 | 1,000 | 1,000 | |
| 1 | Port Authority of New York & New Jersey | ||||
| Revenue TOB VRDO | 0.100% | 12/5/14 | 9,095 | 9,095 | |
| 1 | Port Authority of New York & New Jersey | ||||
| Revenue TOB VRDO | 0.100% | 12/5/14 | 2,700 | 2,700 | |
| Princeton University New Jersey CP | 0.050% | 12/1/14 | 24,000 | 24,000 | |
| Princeton University New Jersey CP | 0.060% | 2/2/15 | 25,000 | 25,000 | |
| 1 | Rutgers State University New Jersey Revenue | ||||
| TOB VRDO | 0.040% | 12/5/14 | 6,700 | 6,700 | |
| 1 | Rutgers State University New Jersey Revenue | ||||
| TOB VRDO | 0.080% | 12/5/14 | 11,780 | 11,780 | |
| Rutgers State University New Jersey Revenue | |||||
| VRDO | 0.040% | 12/1/14 | 52,495 | 52,495 | |
| Secaucus NJ BAN | 1.000% | 1/9/15 | 5,573 | 5,577 | |
| Secaucus NJ BAN | 1.000% | 6/12/15 | 4,819 | 4,837 | |
| South Jersey Transportation Authority New Jersey | |||||
| Transportation System Revenue VRDO | 0.040% | 12/5/14 LOC | 8,240 | 8,240 | |
| South Jersey Transportation Authority New Jersey | |||||
| Transportation System Revenue VRDO | 0.040% | 12/5/14 LOC | 3,700 | 3,700 | |
| Union County NJ BAN | 0.750% | 6/26/15 | 20,000 | 20,072 | |
| Union County NJ GO | 2.000% | 3/1/15 | 2,525 | 2,537 | |
| Union County NJ Pollution Control Financing | |||||
| Authority Revenue (Exxon Project) VRDO | 0.010% | 12/1/14 | 19,770 | 19,770 | |
| Union County NJ Pollution Control Financing | |||||
| Authority Revenue (Exxon Project) VRDO | 0.010% | 12/1/14 | 18,345 | 18,345 | |
| 1 | Union County NJ Utilities Authority Revenue | ||||
| TOB VRDO | 0.060% | 12/5/14 | 14,815 | 14,815 | |
| Wayne Township NJ BAN | 0.750% | 7/20/15 | 4,300 | 4,314 | |
| West Orange Township NJ BAN | 1.000% | 5/19/15 | 8,146 | 8,173 | |
| West Orange Township NJ BAN | 1.000% | 7/30/15 | 2,607 | 2,619 | |
| West Orange Township NJ BAN | 1.000% | 10/20/15 | 3,683 | 3,707 | |
| West Windsor Township NJ BAN | 1.000% | 11/20/15 | 4,811 | 4,848 | |
| Woodbridge Township NJ BAN | 1.000% | 8/21/15 | 5,000 | 5,029 | |
| Total Tax-Exempt Municipal Bonds (Cost $1,480,555) | 1,480,555 | ||||
| Other Assets and Liabilities (-0.5%) | |||||
| Other Assets | 8,289 | ||||
| Liabilities | (15,275) | ||||
| (6,986) | |||||
| Net Assets (100%) | |||||
| Applicable to 1,473,292,183 outstanding $.001 par value shares of | |||||
| beneficial interest (unlimited authorization) | 1,473,569 | ||||
| Net Asset Value Per Share | $1.00 | ||||
20
New Jersey Tax-Exempt Money Market Fund
| At November 30, 2014, net assets consisted of: | |
| Amount | |
| ($000) | |
| Paid-in Capital | 1,473,580 |
| Undistributed Net Investment Income | — |
| Accumulated Net Realized Losses | (11) |
| Net Assets | 1,473,569 |
See Note A in Notes to Financial Statements.
1 Security exempt from registration under Rule 144A of the Securities Act of 1933. Such securities may be sold in transactions exempt from registration, normally to qualified institutional buyers. At November 30, 2014, the aggregate value of these securities was $264,920,000, representing 18.0% of net assets.
2 Security purchased on a when-issued or delayed-delivery basis for which the fund has not taken delivery as of November 30, 2014.
A key to abbreviations and other references follows the Statement of Net Asset.
See accompanying Notes, which are an integral part of the Financial Statements.
21
New Jersey Tax-Exempt Money Market Fund
Key to Abbreviations
ARS—Auction Rate Security.
BAN—Bond Anticipation Note.
COP—Certificate of Participation.
CP—Commercial Paper.
FR—Floating Rate.
GAN—Grant Anticipation Note.
GO—General Obligation Bond.
PILOT—Payments in Lieu of Taxes.
PUT—Put Option Obligation.
RAN—Revenue Anticipation Note.
TAN—Tax Anticipation Note.
TOB—Tender Option Bond.
TRAN—Tax Revenue Anticipation Note.
VRDO—Variable Rate Demand Obligation.
VRDP—Variable Rate Demand Preferred.
(ETM)—Escrowed to Maturity.
(Prere.)—Prerefunded.
Scheduled principal and interest payments are guaranteed by:
(1) MBIA (Municipal Bond Investors Assurance).
(2) AMBAC (Ambac Assurance Corporation).
(3) FGIC (Financial Guaranty Insurance Company).
(4) AGM (Assured Guaranty Municipal Corporation).
(5) BIGI (Bond Investors Guaranty Insurance).
(6) Connie Lee Inc.
(7) FHA (Federal Housing Authority).
(8) CapMAC (Capital Markets Assurance Corporation).
(9) American Capital Access Financial Guaranty Corporation.
(10) XL Capital Assurance Inc.
(11) CIFG (CDC IXIS Financial Guaranty).
(12) AGC (Assured Guaranty Corporation).
(13) BHAC (Berkshire Hathaway Assurance Corporation).
(14) NPFG (National Public Finance Guarantee Corporation).
(15) BAM (Build America Mutual Assurance Company).
(16) MAC (Municipal Assurance Corporation).
(17) RAA (Radian Asset Assurance Inc.).
The insurance does not guarantee the market value of the municipal bonds.
LOC—Scheduled principal and interest payments are guaranteed by bank letter of credit.
22
New Jersey Tax-Exempt Money Market Fund
Statement of Operations
| Year Ended | |
| November 30, 2014 | |
| ($000) | |
| Investment Income | |
| Income | |
| Interest | 1,431 |
| Total Income | 1,431 |
| Expenses | |
| The Vanguard Group—Note B | |
| Investment Advisory Services | 309 |
| Management and Administrative | 1,735 |
| Marketing and Distribution | 391 |
| Custodian Fees | 24 |
| Auditing Fees | 27 |
| Shareholders’ Reports | 9 |
| Trustees’ Fees and Expenses | 1 |
| Total Expenses | 2,496 |
| Expense Reduction—Note B | (1,221) |
| Net Expenses | 1,275 |
| Net Investment Income | 156 |
| Realized Net Gain (Loss) on Investment Securities Sold | (14) |
| Net Increase (Decrease) in Net Assets Resulting from Operations | 142 |
See accompanying Notes, which are an integral part of the Financial Statements.
23
New Jersey Tax-Exempt Money Market Fund
Statement of Changes in Net Assets
| Year Ended November 30, | ||
| 2014 | 2013 | |
| ($000) | ($000) | |
| Increase (Decrease) in Net Assets | ||
| Operations | ||
| Net Investment Income | 156 | 238 |
| Realized Net Gain (Loss) | (14) | 21 |
| Net Increase (Decrease) in Net Assets Resulting from Operations | 142 | 259 |
| Distributions | ||
| Net Investment Income | (156) | (238) |
| Realized Capital Gain | — | — |
| Total Distributions | (156) | (238) |
| Capital Share Transactions (at $1.00 per share) | ||
| Issued | 923,321 | 1,111,779 |
| Issued in Lieu of Cash Distributions | 151 | 229 |
| Redeemed | (1,071,016) | (1,232,421) |
| Net Increase (Decrease) from Capital Share Transactions | (147,544) | (120,413) |
| Total Increase (Decrease) | (147,558) | (120,392) |
| Net Assets | ||
| Beginning of Period | 1,621,127 | 1,741,519 |
| End of Period | 1,473,569 | 1,621,127 |
See accompanying Notes, which are an integral part of the Financial Statements.
24
New Jersey Tax-Exempt Money Market Fund
Financial Highlights
| For a Share Outstanding | Year Ended November 30, | ||||
| Throughout Each Period | 2014 | 2013 | 2012 | 2011 | 2010 |
| Net Asset Value, Beginning of Period | $1.00 | $1.00 | $1.00 | $1.00 | $1.00 |
| Investment Operations | |||||
| Net Investment Income | .0001 | .0001 | .0004 | .001 | .001 |
| Net Realized and Unrealized Gain (Loss) | |||||
| on Investments | — | — | — | — | — |
| Total from Investment Operations | .0001 | .0001 | .0004 | .001 | .001 |
| Distributions | |||||
| Dividends from Net Investment Income | (.0001) | (.0001) | (.0004) | (.001) | (.001) |
| Distributions from Realized Capital Gains | — | — | — | — | — |
| Total Distributions | (.0001) | (.0001) | (.0004) | (.001) | (.001) |
| Net Asset Value, End of Period | $1.00 | $1.00 | $1.00 | $1.00 | $1.00 |
| Total Return1 | 0.01% | 0.01% | 0.04% | 0.06% | 0.11% |
| Ratios/Supplemental Data | |||||
| Net Assets, End of Period (Millions) | $1,474 | $1,621 | $1,742 | $1,949 | $2,206 |
| Ratio of Total Expenses to Average Net Assets | 0.08%2 | 0.12%2 | 0.16% | 0.17% | 0.17% |
| Ratio of Net Investment Income to | |||||
| Average Net Assets | 0.01% | 0.01% | 0.03% | 0.07% | 0.11% |
1 Total returns do not include account service fees that may have applied in the periods shown. Fund prospectuses provide information about any applicable account service fees.
2 The ratio of total expenses to average net assets before an expense reduction was 0.16% for 2014, and 0.16% for 2013. See Note B in Notes to Financial Statements.
See accompanying Notes, which are an integral part of the Financial Statements.
25
New Jersey Tax-Exempt Money Market Fund
Notes to Financial Statements
Vanguard New Jersey Tax-Exempt Money Market Fund is registered under the Investment Company Act of 1940 as an open-end investment company, or mutual fund. The fund invests in debt instruments of municipal issuers whose ability to meet their obligations may be affected by economic and political developments in the state.
A. The following significant accounting policies conform to generally accepted accounting principles for U.S. investment companies. The fund consistently follows such policies in preparing its financial statements.
1. Security Valuation: Securities are valued as of the close of trading on the New York Stock Exchange (generally 4 p.m., Eastern time) on the valuation date. Securities are valued at amortized cost, which approximates market value.
2. Federal Income Taxes: The fund intends to continue to qualify as a regulated investment company and distribute all of its income. Management has analyzed the fund’s tax positions taken for all open federal income tax years (November 30, 2011–2014), and has concluded that no provision for federal income tax is required in the fund’s financial statements.
3. Distributions: Distributions from net investment income are declared daily and paid on the first business day of the following month.
4. Credit Facility: The fund and certain other funds managed by The Vanguard Group participate in a $2.89 billion committed credit facility provided by a syndicate of lenders pursuant to a credit agreement that may be renewed annually; each fund is individually liable for its borrowings, if any, under the credit facility. Borrowings may be utilized for temporary and emergency purposes, and are subject to the fund’s regulatory and contractual borrowing restrictions. The participating funds are charged administrative fees and an annual commitment fee of 0.06% of the undrawn amount of the facility; these fees are allocated to the funds based on a method approved by the fund’s board of trustees and included in Management and Administrative expenses on the fund’s Statement of Operations. Any borrowings under this facility bear interest at a rate equal to the higher of the federal funds rate or LIBOR reference rate plus an agreed-upon spread.
The fund had no borrowings outstanding at November 30, 2014, or at any time during the period then ended.
5. Other: Interest income is accrued daily. Premiums and discounts on debt securities purchased are amortized and accreted, respectively, to interest income over the lives of the respective securities. Security transactions are accounted for on the date securities are bought or sold. Costs used to determine realized gains (losses) on the sale of investment securities are those of the specific securities sold.
B. The Vanguard Group furnishes at cost investment advisory, corporate management, administrative, marketing, and distribution services. The costs of such services are allocated to the fund based on methods approved by the board of trustees. The fund has committed to invest up to 0.40% of its net assets in Vanguard. At November 30, 2014, the fund had contributed capital of $144,000 to Vanguard (included in Other Assets), representing 0.01% of the fund’s net assets and 0.06% of Vanguard’s capitalization. The fund’s trustees and officers are also directors and officers of Vanguard. Vanguard and the board of trustees have agreed to temporarily limit certain net operating expenses in excess of the fund’s daily yield so as to maintain a zero or positive yield for the fund. Vanguard and the board of trustees may terminate the temporary expense limitation at any time. For the year ended November 30, 2014, Vanguard’s expenses were reduced by $1,221,000 (an effective annual rate of 0.08% of the fund’s average net assets).
26
New Jersey Tax-Exempt Money Market Fund
C. Various inputs may be used to determine the value of the fund’s investments. These inputs are summarized in three broad levels for financial statement purposes. The inputs or methodologies used to value securities are not necessarily an indication of the risk associated with investing in those securities.
Level 1—Quoted prices in active markets for identical securities.
Level 2—Other significant observable inputs (including quoted prices for similar securities, interest rates, prepayment speeds, credit risk, etc.).
Level 3—Significant unobservable inputs (including the fund’s own assumptions used to determine the fair value of investments).
At November 30, 2014, 100% of the market value of the fund’s investments was determined using amortized cost, in accordance with rules under the Investment Company Act of 1940. Amortized cost approximates the current fair value of a security, but since the value is not obtained from a quoted price in an active market, securities valued at amortized cost are considered to be valued using Level 2 inputs.
D. Management has determined that no material events or transactions occurred subsequent to November 30, 2014, that would require recognition or disclosure in these financial statements.
27
New Jersey Long-Term Tax-Exempt Fund
Fund Profile
As of November 30, 2014
| Share-Class Characteristics | ||
| Investor | Admiral | |
| Shares | Shares | |
| Ticker Symbol | VNJTX | VNJUX |
| Expense Ratio1 | 0.20% | 0.12% |
| 30-Day SEC Yield | 2.45% | 2.53% |
| Financial Attributes | |||
| Fund | Barclays NJ Muni Bond Index | Barclays Municipal Bond Index | |
| Number of Bonds | 454 | 1,299 | 46,044 |
| Yield to Maturity | |||
| (before expenses) | 2.5% | 2.7% | 2.1% |
| Average Coupon | 4.5% | 4.6% | 4.8% |
| Average Duration | 6.3 years | 7.5 years | 6.5 years |
| Average Stated | |||
| Maturity | 14.2 years | 12.7 years | 13.4 years |
| Short-Term | |||
| Reserves | 3.3% | — | — |
| Volatility Measures | ||
| Barclays NJ Muni Bond Index | Barclays Municipal Bond Index | |
| R-Squared | 0.99 | 0.99 |
| Beta | 1.03 | 1.14 |
| These measures show the degree and timing of the fund’s fluctuations compared with the indexes over 36 months. | ||
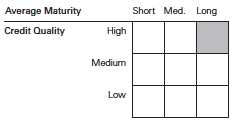
| Distribution by Stated Maturity | |
| (% of portfolio) | |
| Under 1 Year | 9.1% |
| 1 - 3 Years | 2.4 |
| 3 - 5 Years | 4.8 |
| 5 - 10 Years | 15.9 |
| 10 - 20 Years | 39.7 |
| 20 - 30 Years | 27.4 |
| Over 30 Years | 0.7 |
| Distribution by Credit Quality (% of portfolio) | |
| AAA | 6.2% |
| AA | 27.2 |
| A | 54.6 |
| BBB | 9.7 |
| BB | 1.0 |
| B | 0.2 |
| Not Rated | 1.1 |
| Credit-quality ratings are from Moody's and S&P. The higher rating for each issue is shown. "Not Rated" is used to classify securities for which a rating is not available. For more information about these ratings, see the Glossary entry for Credit Quality. | |
Investment Focus
1 The expense ratios shown are from the prospectus dated March 27, 2014, and represent estimated costs for the current fiscal year. For the fiscal year ended November 30, 2014, the expense ratios were 0.20% for Investor Shares and 0.12% for Admiral Shares.
28
New Jersey Long-Term Tax-Exempt Fund
Performance Summary
All of the returns in this report represent past performance, which is not a guarantee of future results that may be achieved by the fund. (Current performance may be lower or higher than the performance data cited. For performance data current to the most recent month-end, visit our website at vanguard.com/performance.) Note, too, that both investment returns and principal value can fluctuate widely, so an investor’s shares, when sold, could be worth more or less than their original cost. The returns shown do not reflect taxes that a shareholder would pay on fund distributions or on the sale of fund shares.
Cumulative Performance: November 30, 2004, Through November 30, 2014
Initial Investment of $10,000
| Average Annual Total Returns Periods Ended November 30, 2014 | |||||
| One Year | Five Years | Ten Years | Final Value of a $10,000 Investment | ||
| New Jersey Long-Term Tax-Exempt | |||||
| Fund Investor Shares | 8.82% | 4.91% | 4.49% | $15,519 | |
| •••••••• | Barclays NJ Municipal Bond Index | 7.49 | 5.07 | 4.88 | 16,108 |
| – – – – | New Jersey Municipal Debt Funds | ||||
| Average | 8.70 | 4.80 | 4.04 | 14,860 | |
| Barclays Municipal Bond Index | 8.23 | 5.12 | 4.81 | 15,999 | |
| New Jersey Municipal Debt Funds Average: Derived from data provided by Lipper, a Thomson Reuters Company. | |||||
| One Year | Five Years | Ten Years | Final Value of a $50,000 Investment | |
| New Jersey Long-Term Tax-Exempt Fund | ||||
| Admiral Shares | 8.91% | 4.99% | 4.57% | $78,189 |
| Barclays NJ Municipal Bond Index | 7.49 | 5.07 | 4.88 | 80,541 |
| Barclays Municipal Bond Index | 8.23 | 5.12 | 4.81 | 79,993 |
See Financial Highlights for dividend and capital gains information.
29
New Jersey Long-Term Tax-Exempt Fund
Fiscal-Year Total Returns (%): November 30, 2004, Through November 30, 2014
| Barclays NJ Muni Bond Index | ||||
| Investor Shares | ||||
| Fiscal Year | Income Returns | Capital Returns | Total Returns | Total Returns |
| 2005 | 4.42% | -1.13% | 3.29% | 4.55% |
| 2006 | 4.61 | 2.40 | 7.01 | 6.85 |
| 2007 | 4.34 | -2.30 | 2.04 | 2.15 |
| 2008 | 4.11 | -7.60 | -3.49 | -2.61 |
| 2009 | 4.61 | 7.58 | 12.19 | 13.15 |
| 2010 | 4.11 | -0.52 | 3.59 | 4.28 |
| 2011 | 4.24 | 1.30 | 5.54 | 5.85 |
| 2012 | 3.91 | 7.16 | 11.07 | 11.65 |
| 2013 | 3.41 | -7.24 | -3.83 | -3.31 |
| 2014 | 3.82 | 5.00 | 8.82 | 7.49 |
Average Annual Total Returns: Periods Ended September 30, 2014
This table presents returns through the latest calendar quarter—rather than through the end of the fiscal period.
Securities and Exchange Commission rules require that we provide this information.
| Ten Years | ||||||
| Inception Date | One Year | Five Years | Income | Capital | Total | |
| Investor Shares | 2/3/1988 | 8.77% | 4.50% | 4.17% | 0.23% | 4.40% |
| Admiral Shares | 5/14/2001 | 8.86 | 4.59 | 4.25 | 0.23 | 4.48 |
New Jersey Long-Term Tax-Exempt Fund
Financial Statements
Statement of Net Assets
As of November 30, 2014
The fund reports a complete list of its holdings in regulatory filings four times in each fiscal year, at the quarter-ends. For the second and fourth fiscal quarters, the lists appear in the fund’s semiannual and annual reports to shareholders. For the first and third fiscal quarters, the fund files the lists with the Securities and Exchange Commission on Form N-Q. Shareholders can look up the fund’s Forms N-Q on the SEC’s website at sec.gov. Forms N-Q may also be reviewed and copied at the SEC’s Public Reference Room (see the back cover of this report for further information).
| Face | Market | |||
| Maturity | Amount | Value | ||
| Coupon | Date | ($000) | ($000) | |
| Tax-Exempt Municipal Bonds (99.2%) | ||||
| New Jersey (98.1%) | ||||
| Atlantic City NJ GO | 4.000% | 11/1/16 | 2,700 | 2,722 |
| Atlantic City NJ GO | 4.000% | 11/1/17 | 3,965 | 3,977 |
| Atlantic City NJ GO | 4.000% | 11/1/18 | 450 | 445 |
| Atlantic City NJ GO | 5.000% | 11/1/22 | 3,000 | 2,992 |
| Atlantic County NJ Public Facilities COP | 6.000% | 3/1/15 (14) | 1,480 | 1,501 |
| Bayonne NJ GO | 5.750% | 7/1/35 | 7,500 | 8,260 |
| Bergen County NJ Improvement Authority | ||||
| Pooled Loan Revenue | 5.000% | 2/15/19 | 450 | 523 |
| Bergen County NJ Improvement Authority | ||||
| Pooled Loan Revenue | 5.000% | 2/15/20 | 455 | 539 |
| Bergen County NJ Improvement Authority | ||||
| Pooled Loan Revenue | 5.000% | 2/15/39 | 4,000 | 4,612 |
| Burlington County NJ Bridge Commission | ||||
| Revenue | 5.000% | 12/1/23 | 1,000 | 1,192 |
| Burlington County NJ Bridge Commission | ||||
| Revenue | 5.000% | 12/1/24 | 700 | 827 |
| Burlington County NJ Bridge Commission | ||||
| Revenue | 5.000% | 10/1/25 | 500 | 596 |
| Burlington County NJ Bridge Commission | ||||
| Revenue | 5.000% | 12/1/29 | 275 | 316 |
| Burlington County NJ Bridge Commission | ||||
| Revenue (Burlington County Solid Waste Project) | 5.000% | 10/1/26 | 2,100 | 2,482 |
| Burlington County NJ Bridge Commission | ||||
| Revenue (Burlington County Solid Waste Project) | 5.000% | 10/1/27 | 4,100 | 4,820 |
| Camden County NJ Improvement Authority | ||||
| Health Care Redevelopment Project Revenue | ||||
| (Cooper Health System Obligated Group) | 5.000% | 2/15/15 (Prere.) | 1,350 | 1,364 |
| Camden County NJ Improvement Authority | ||||
| Health Care Redevelopment Project Revenue | ||||
| (Cooper Health System Obligated Group) | 5.000% | 2/15/29 | 2,500 | 2,808 |
| Camden County NJ Improvement Authority | ||||
| Health Care Redevelopment Project Revenue | ||||
| (Cooper Health System Obligated Group) | 5.000% | 2/15/30 | 2,500 | 2,797 |
| Camden County NJ Improvement Authority | ||||
| Health Care Redevelopment Project Revenue | ||||
| (Cooper Health System Obligated Group) | 5.000% | 2/15/31 | 2,500 | 2,789 |
31
| New Jersey Long-Term Tax-Exempt Fund | ||||
| Face | Market | |||
| Maturity | Amount | Value | ||
| Coupon | Date | ($000) | ($000) | |
| Camden County NJ Improvement Authority | ||||
| Health Care Redevelopment Project Revenue | ||||
| (Cooper Health System Obligated Group) | 5.000% | 2/15/32 | 2,500 | 2,778 |
| Camden County NJ Improvement Authority | ||||
| Health Care Redevelopment Project Revenue | ||||
| (Cooper Health System Obligated Group) | 5.000% | 2/15/33 | 1,000 | 1,101 |
| Camden County NJ Improvement Authority | ||||
| Health Care Redevelopment Project Revenue | ||||
| (Cooper Health System Obligated Group) | 5.000% | 2/15/34 | 1,500 | 1,649 |
| Camden County NJ Improvement Authority | ||||
| Health Care Redevelopment Project Revenue | ||||
| (Cooper Health System Obligated Group) | 5.750% | 2/15/42 | 12,625 | 14,443 |
| Camden County NJ Improvement Authority | ||||
| Lease Revenue (Rowan University School of | ||||
| Osteopathic Medicine Project) | 5.000% | 12/1/32 | 4,000 | 4,454 |
| Camden County NJ Improvement Authority | ||||
| Revenue | 5.000% | 1/15/28 | 3,600 | 4,091 |
| Camden County NJ Improvement Authority | ||||
| Revenue | 5.000% | 1/15/29 | 3,225 | 3,638 |
| Delaware River & Bay Authority Delaware | ||||
| Revenue | 5.000% | 1/1/25 | 1,790 | 2,155 |
| Delaware River & Bay Authority Delaware | ||||
| Revenue | 5.000% | 1/1/26 | 2,000 | 2,388 |
| Delaware River & Bay Authority Delaware | ||||
| Revenue | 5.000% | 1/1/27 | 2,000 | 2,370 |
| Delaware River & Bay Authority Delaware | ||||
| Revenue | 5.000% | 1/1/28 | 2,250 | 2,633 |
| Delaware River & Bay Authority Delaware | ||||
| Revenue | 5.000% | 1/1/42 | 9,980 | 11,131 |
| Delaware River Joint Toll Bridge Commission | ||||
| Pennsylvania & New Jersey Revenue | 5.000% | 7/1/21 | 1,040 | 1,228 |
| Delaware River Joint Toll Bridge Commission | ||||
| Pennsylvania & New Jersey Revenue | 5.000% | 7/1/22 | 500 | 597 |
| Delaware River Joint Toll Bridge Commission | ||||
| Pennsylvania & New Jersey Revenue | 5.000% | 7/1/23 | 1,000 | 1,181 |
| Delaware River Joint Toll Bridge Commission | ||||
| Pennsylvania & New Jersey Revenue | 5.000% | 7/1/24 | 1,200 | 1,406 |
| Delaware River Joint Toll Bridge Commission | ||||
| Pennsylvania & New Jersey Revenue | 4.000% | 7/1/26 | 700 | 756 |
| Delaware River Joint Toll Bridge Commission | ||||
| Pennsylvania & New Jersey Revenue | 5.000% | 7/1/26 | 1,000 | 1,148 |
| Delaware River Port Authority Pennsylvania & | ||||
| New Jersey Revenue | 5.000% | 1/1/21 | 3,160 | 3,623 |
| Delaware River Port Authority Pennsylvania & | ||||
| New Jersey Revenue | 5.000% | 1/1/26 | 4,335 | 4,920 |
| Delaware River Port Authority Pennsylvania & | ||||
| New Jersey Revenue | 5.000% | 1/1/27 | 2,660 | 3,003 |
| Delaware River Port Authority Pennsylvania & | ||||
| New Jersey Revenue | 5.000% | 1/1/28 | 6,000 | 6,756 |
| Delaware River Port Authority Pennsylvania & | ||||
| New Jersey Revenue | 5.000% | 1/1/29 | 4,000 | 4,504 |
| Delaware River Port Authority Pennsylvania & | ||||
| New Jersey Revenue | 5.000% | 1/1/30 | 5,000 | 5,617 |
| Delaware River Port Authority Pennsylvania & | ||||
| New Jersey Revenue | 5.000% | 1/1/35 | 9,060 | 10,063 |
32
| New Jersey Long-Term Tax-Exempt Fund | ||||
| Face | Market | |||
| Maturity | Amount | Value | ||
| Coupon | Date | ($000) | ($000) | |
| Delaware River Port Authority Pennsylvania & | ||||
| New Jersey Revenue | 5.000% | 1/1/37 | 15,000 | 17,052 |
| Delaware River Port Authority Pennsylvania & | ||||
| New Jersey Revenue | 5.000% | 1/1/40 (4) | 1,000 | 1,107 |
| Delaware River Port Authority Pennsylvania & | ||||
| New Jersey Revenue | 5.000% | 1/1/40 | 2,500 | 2,819 |
| Essex County NJ Improvement Authority Revenue | ||||
| (Pooled Government Loan) VRDO | 0.040% | 12/5/14 LOC | 2,600 | 2,600 |
| Flemington Raritan NJ School District GO | 5.000% | 6/15/26 | 1,000 | 1,208 |
| Garden State Preservation Trust New Jersey | ||||
| Revenue (Open Space & Farmland Preservation) | 5.000% | 11/1/21 | 2,390 | 2,877 |
| Garden State Preservation Trust New Jersey | ||||
| Revenue (Open Space & Farmland Preservation) | 5.250% | 11/1/21 (4) | 6,000 | 7,332 |
| Garden State Preservation Trust New Jersey | ||||
| Revenue (Open Space & Farmland Preservation) | 0.000% | 11/1/22 (4) | 7,190 | 5,987 |
| Garden State Preservation Trust New Jersey | ||||
| Revenue (Open Space & Farmland Preservation) | 5.750% | 11/1/28 (4) | 16,240 | 20,562 |
| Gloucester Township NJ Municipal Utility | ||||
| Authority Revenue | 5.650% | 3/1/18 (2) | 1,390 | 1,490 |
| Hillsborough Township NJ School District GO | 5.375% | 10/1/19 (4) | 1,720 | 2,058 |
| Hopewell Township NJ GO | 5.000% | 10/1/25 | 1,035 | 1,278 |
| Hudson County NJ Improvement Authority | ||||
| Lease Revenue | 5.000% | 4/1/24 | 1,070 | 1,219 |
| Hudson County NJ Improvement Authority | ||||
| Lease Revenue | 5.000% | 4/1/25 | 500 | 563 |
| Hudson County NJ Improvement Authority | ||||
| Lease Revenue | 5.000% | 4/1/26 | 790 | 884 |
| Hudson County NJ Improvement Authority | ||||
| Solid Waste Systems Revenue | 5.750% | 1/1/35 | 2,000 | 2,319 |
| Hudson County NJ Improvement Authority | ||||
| Solid Waste Systems Revenue | 6.000% | 1/1/40 | 3,000 | 3,437 |
| Jersey City NJ GO | 5.000% | 3/1/19 | 1,550 | 1,765 |
| Jersey City NJ GO | 5.000% | 3/1/22 | 1,750 | 2,034 |
| Lenape NJ Regional High School District GO | 4.000% | 3/15/25 | 1,580 | 1,746 |
| Mercer County NJ Improvement Authority | ||||
| Revenue | 5.000% | 11/1/21 | 1,000 | 1,186 |
| Mercer County NJ Improvement Authority | ||||
| Revenue | 5.000% | 11/1/24 | 1,375 | 1,610 |
| Middlesex County NJ COP | 5.000% | 10/15/23 | 1,455 | 1,706 |
| Middlesex County NJ COP | 5.000% | 10/15/24 | 1,055 | 1,244 |
| Middlesex County NJ COP | 5.000% | 10/15/25 | 1,155 | 1,362 |
| Monmouth County NJ Improvement Authority | ||||
| Lease Revenue (Brookdale Community College) | 5.875% | 8/1/31 | 1,000 | 1,153 |
| Monmouth County NJ Improvement Authority | ||||
| Lease Revenue (Brookdale Community College) | 6.000% | 8/1/38 | 3,900 | 4,512 |
| Monmouth County NJ Improvement Authority | ||||
| Revenue (Pooled Government Loan) | 5.000% | 12/1/14 (ETM) | 20 | 20 |
| Monmouth County NJ Improvement Authority | ||||
| Revenue (Pooled Government Loan) | 5.000% | 12/1/16 (ETM) | 5 | 5 |
| Monmouth County NJ Improvement Authority | ||||
| Revenue (Pooled Government Loan) | 5.000% | 12/1/25 | 445 | 557 |
| Monroe Township NJ Board of Education GO | 5.000% | 8/1/26 | 1,500 | 1,741 |
| Morris County NJ Improvement Authority School | ||||
| District Revenue (Morris Hills Regional District | ||||
| Project) | 5.000% | 10/1/24 | 1,970 | 2,370 |
33
| New Jersey Long-Term Tax-Exempt Fund | ||||
| Face | Market | |||
| Maturity | Amount | Value | ||
| Coupon | Date | ($000) | ($000) | |
| Morris County NJ Improvement Authority School | ||||
| District Revenue (Morris Hills Regional District | ||||
| Project) | 5.000% | 10/1/25 | 1,000 | 1,196 |
| Morris County NJ Improvement Authority School | ||||
| District Revenue (Morris Hills Regional District | ||||
| Project) | 5.000% | 10/1/26 | 1,200 | 1,427 |
| Morris County NJ Improvement Authority School | ||||
| District Revenue (Morris Hills Regional District | ||||
| Project) | 5.000% | 10/1/27 | 1,090 | 1,291 |
| Morris County NJ Improvement Authority School | ||||
| District Revenue (Morris Hills Regional District | ||||
| Project) | 5.000% | 10/1/28 | 1,000 | 1,179 |
| Morris County NJ Improvement Authority School | ||||
| District Revenue (Morris Hills Regional District | ||||
| Project) | 5.000% | 10/1/29 | 1,235 | 1,449 |
| New Brunswick NJ Parking Authority Revenue | 5.000% | 9/1/18 | 1,250 | 1,414 |
| New Brunswick NJ Parking Authority Revenue | 5.000% | 9/1/19 | 865 | 993 |
| New Brunswick NJ Parking Authority Revenue | 5.000% | 9/1/20 | 1,605 | 1,860 |
| New Brunswick NJ Parking Authority Revenue | 5.000% | 9/1/21 | 1,000 | 1,164 |
| New Brunswick NJ Parking Authority Revenue | 5.000% | 9/1/22 | 1,880 | 2,197 |
| New Brunswick NJ Parking Authority Revenue | 5.000% | 9/1/24 | 1,035 | 1,184 |
| New Brunswick NJ Parking Authority Revenue | 5.000% | 9/1/25 | 615 | 696 |
| New Brunswick NJ Parking Authority Revenue | 5.000% | 9/1/28 | 465 | 520 |
| New Brunswick NJ Parking Authority Revenue | 5.000% | 9/1/30 | 570 | 634 |
| New Brunswick NJ Parking Authority Revenue | 5.000% | 9/1/31 | 600 | 664 |
| New Jersey Building Authority Revenue | 5.000% | 6/15/16 | 2,250 | 2,400 |
| New Jersey Casino Reinvestment Development | ||||
| Authority Revenue (Hotel Room Fee) | 5.250% | 1/1/16 (2) | 2,000 | 2,048 |
| New Jersey Casino Reinvestment Development | ||||
| Authority Revenue (Hotel Room Fee) | 5.250% | 1/1/20 (2) | 3,045 | 3,117 |
| New Jersey Casino Reinvestment Development | ||||
| Authority Revenue (Hotel Room Fee) | 5.250% | 1/1/21 (2) | 6,255 | 6,401 |
| New Jersey Casino Reinvestment Development | ||||
| Authority Revenue (Hotel Room Fee) | 5.250% | 1/1/22 (2) | 5,585 | 5,714 |
| New Jersey Casino Reinvestment Development | ||||
| Authority Revenue (Luxury Tax) | 5.000% | 11/1/28 (4) | 2,000 | 2,209 |
| New Jersey Casino Reinvestment Development | ||||
| Authority Revenue (Luxury Tax) | 5.000% | 11/1/29 (4) | 2,500 | 2,748 |
| New Jersey Casino Reinvestment Development | ||||
| Authority Revenue (Luxury Tax) | 5.000% | 11/1/30 (4) | 2,000 | 2,197 |
| New Jersey Casino Reinvestment Development | ||||
| Authority Revenue (Luxury Tax) | 5.000% | 11/1/31 (4) | 1,500 | 1,640 |
| New Jersey Casino Reinvestment Development | ||||
| Authority Revenue (Luxury Tax) | 5.000% | 11/1/32 (4) | 1,250 | 1,373 |
| New Jersey Casino Reinvestment Development | ||||
| Authority Revenue (Luxury Tax) | 5.250% | 11/1/39 | 4,000 | 4,341 |
| New Jersey Casino Reinvestment Development | ||||
| Authority Revenue (Luxury Tax) | 5.250% | 11/1/44 | 3,000 | 3,236 |
| New Jersey Casino Reinvestment Development | ||||
| Authority Revenue (Parking Fee) | 5.250% | 6/1/21 (14) | 3,000 | 3,058 |
| New Jersey Economic Development Authority | ||||
| (School Facilities Construction) | 5.000% | 6/15/31 | 4,000 | 4,391 |
| New Jersey Economic Development Authority | ||||
| Lease Revenue (Rutgers State University) | 5.000% | 6/15/38 | 4,000 | 4,538 |
34
| New Jersey Long-Term Tax-Exempt Fund | ||||
| Face | Market | |||
| Maturity | Amount | Value | ||
| Coupon | Date | ($000) | ($000) | |
| New Jersey Economic Development Authority | ||||
| Lease Revenue (Rutgers State University) | 5.000% | 6/15/46 | 4,475 | 5,029 |
| New Jersey Economic Development Authority | ||||
| Retirement Community Revenue (Seabrook | ||||
| Village Inc.) | 5.250% | 11/15/36 | 935 | 951 |
| New Jersey Economic Development Authority | ||||
| Revenue (Cigarette Tax) | 5.000% | 6/15/18 | 1,030 | 1,153 |
| New Jersey Economic Development Authority | ||||
| Revenue (Cigarette Tax) | 5.000% | 6/15/23 | 2,500 | 2,842 |
| New Jersey Economic Development Authority | ||||
| Revenue (Cigarette Tax) | 5.000% | 6/15/25 | 5,990 | 6,678 |
| New Jersey Economic Development Authority | ||||
| Revenue (Cigarette Tax) | 5.000% | 6/15/26 | 8,500 | 9,391 |
| New Jersey Economic Development Authority | ||||
| Revenue (Cigarette Tax) | 5.000% | 6/15/28 | 2,000 | 2,196 |
| New Jersey Economic Development Authority | ||||
| Revenue (Cigarette Tax) | 5.000% | 6/15/29 | 1,400 | 1,535 |
| New Jersey Economic Development Authority | ||||
| Revenue (Duke Farms Foundation Project) | 5.000% | 7/1/48 | 7,000 | 7,848 |
| New Jersey Economic Development Authority | ||||
| Revenue (El Dorado Terminals Co. Project) | ||||
| VRDO | 0.040% | 12/1/14 LOC | 5,700 | 5,700 |
| New Jersey Economic Development Authority | ||||
| Revenue (Lions Gate Project) | 5.000% | 1/1/34 | 1,000 | 1,028 |
| New Jersey Economic Development Authority | ||||
| Revenue (Lions Gate Project) | 5.125% | 1/1/39 | 2,000 | 2,050 |
| New Jersey Economic Development Authority | ||||
| Revenue (Lions Gate Project) | 5.250% | 1/1/44 | 4,850 | 5,004 |
| New Jersey Economic Development Authority | ||||
| Revenue (Motor Vehicle Surcharges) | 5.250% | 7/1/24 (14) | 6,000 | 7,218 |
| New Jersey Economic Development Authority | ||||
| Revenue (Motor Vehicle Surcharges) | 5.250% | 7/1/25 (14) | 14,000 | 16,904 |
| New Jersey Economic Development Authority | ||||
| Revenue (Motor Vehicle Surcharges) | 5.250% | 7/1/26 (14) | 2,500 | 3,030 |
| New Jersey Economic Development Authority | ||||
| Revenue (Motor Vehicle Surcharges) | 5.250% | 7/1/31 (14) | 17,675 | 18,004 |
| New Jersey Economic Development Authority | ||||
| Revenue (Provident Group-Montclair Properties | ||||
| LLC - Montclair State University Student | ||||
| Housing Project) | 5.000% | 6/1/18 | 1,390 | 1,517 |
| New Jersey Economic Development Authority | ||||
| Revenue (Provident Group-Montclair Properties | ||||
| LLC - Montclair State University Student | ||||
| Housing Project) | 5.375% | 6/1/25 | 1,340 | 1,466 |
| New Jersey Economic Development Authority | ||||
| Revenue (Provident Group-Montclair Properties | ||||
| LLC - Montclair State University Student | ||||
| Housing Project) | 5.750% | 6/1/31 | 1,160 | 1,279 |
| New Jersey Economic Development Authority | ||||
| Revenue (Provident Group-Montclair Properties | ||||
| LLC - Montclair State University Student | ||||
| Housing Project) | 5.875% | 6/1/42 | 8,280 | 9,146 |
| New Jersey Economic Development Authority | ||||
| Revenue (School Facilities Construction) | 5.125% | 3/1/15 (Prere.) | 9,500 | 9,622 |
35
| New Jersey Long-Term Tax-Exempt Fund | ||||
| Face | Market | |||
| Maturity | Amount | Value | ||
| Coupon | Date | ($000) | ($000) | |
| New Jersey Economic Development Authority | ||||
| Revenue (School Facilities Construction) | 5.125% | 3/1/15 (Prere.) | 1,000 | 1,013 |
| New Jersey Economic Development Authority | ||||
| Revenue (School Facilities Construction) | 5.125% | 3/1/15 (Prere.) | 8,000 | 8,103 |
| New Jersey Economic Development Authority | ||||
| Revenue (School Facilities Construction) | 5.250% | 3/1/15 (Prere.) | 9,500 | 9,625 |
| New Jersey Economic Development Authority | ||||
| Revenue (School Facilities Construction) | 5.000% | 9/1/15 (Prere.) | 3,480 | 3,608 |
| New Jersey Economic Development Authority | ||||
| Revenue (School Facilities Construction) | 5.000% | 9/1/17 | 1,025 | 1,131 |
| New Jersey Economic Development Authority | ||||
| Revenue (School Facilities Construction) | 5.000% | 12/15/17 | 3,040 | 3,378 |
| New Jersey Economic Development Authority | ||||
| Revenue (School Facilities Construction) | 5.000% | 9/1/18 | 2,500 | 2,807 |
| New Jersey Economic Development Authority | ||||
| Revenue (School Facilities Construction) | 5.500% | 9/1/18 (14) | 3,000 | 3,448 |
| New Jersey Economic Development Authority | ||||
| Revenue (School Facilities Construction) | 5.000% | 3/1/19 | 6,070 | 6,826 |
| New Jersey Economic Development Authority | ||||
| Revenue (School Facilities Construction) | 5.250% | 9/1/19 | 3,000 | 3,432 |
| New Jersey Economic Development Authority | ||||
| Revenue (School Facilities Construction) | 5.000% | 12/15/19 | 2,100 | 2,389 |
| New Jersey Economic Development Authority | ||||
| Revenue (School Facilities Construction) | 5.500% | 12/15/19 (2) | 3,550 | 4,123 |
| New Jersey Economic Development Authority | ||||
| Revenue (School Facilities Construction) | 5.500% | 9/1/21 | 2,500 | 2,927 |
| New Jersey Economic Development Authority | ||||
| Revenue (School Facilities Construction) | 5.250% | 9/1/22 | 4,115 | 4,696 |
| New Jersey Economic Development Authority | ||||
| Revenue (School Facilities Construction) | 5.250% | 9/1/23 | 3,500 | 3,986 |
| New Jersey Economic Development Authority | ||||
| Revenue (School Facilities Construction) | 5.750% | 9/1/23 | 3,000 | 3,502 |
| New Jersey Economic Development Authority | ||||
| Revenue (School Facilities Construction) | 5.000% | 3/1/24 | 11,650 | 13,172 |
| New Jersey Economic Development Authority | ||||
| Revenue (School Facilities Construction) | 5.250% | 9/1/24 | 375 | 426 |
| New Jersey Economic Development Authority | ||||
| Revenue (School Facilities Construction) | 5.000% | 6/15/25 (4) | 2,380 | 2,768 |
| New Jersey Economic Development Authority | ||||
| Revenue (School Facilities Construction) | 5.250% | 9/1/25 | 3,460 | 3,903 |
| New Jersey Economic Development Authority | ||||
| Revenue (School Facilities Construction) | 5.000% | 3/1/26 | 10,000 | 11,059 |
| New Jersey Economic Development Authority | ||||
| Revenue (School Facilities Construction) | 5.250% | 9/1/26 | 3,000 | 3,372 |
| New Jersey Economic Development Authority | ||||
| Revenue (School Facilities Construction) | 5.000% | 3/1/27 | 5,000 | 5,512 |
| New Jersey Economic Development Authority | ||||
| Revenue (School Facilities Construction) | 5.000% | 3/1/28 | 21,965 | 24,095 |
| New Jersey Economic Development Authority | ||||
| Revenue (School Facilities Construction) | 5.500% | 9/1/28 (14) | 2,165 | 2,667 |
| New Jersey Economic Development Authority | ||||
| Revenue (School Facilities Construction) | 5.000% | 3/1/29 | 7,000 | 7,647 |
| New Jersey Economic Development Authority | ||||
| Revenue (School Facilities Construction) | 5.500% | 9/1/29 (14) | 7,055 | 8,781 |
36
| New Jersey Long-Term Tax-Exempt Fund | ||||
| Face | Market | |||
| Maturity | Amount | Value | ||
| Coupon | Date | ($000) | ($000) | |
| New Jersey Economic Development Authority | ||||
| Revenue (School Facilities Construction) | 5.500% | 12/15/29 | 11,520 | 12,777 |
| New Jersey Economic Development Authority | ||||
| Revenue (School Facilities Construction) | 5.000% | 3/1/30 | 6,360 | 6,899 |
| New Jersey Economic Development Authority | ||||
| Revenue (School Facilities Construction) | 5.000% | 3/1/30 | 9,625 | 10,486 |
| New Jersey Economic Development Authority | ||||
| Revenue (School Facilities Construction) | 5.000% | 9/1/30 | 4,065 | 4,425 |
| New Jersey Economic Development Authority | ||||
| Revenue (School Facilities Construction) | 5.000% | 12/15/31 | 7,105 | 7,815 |
| New Jersey Economic Development Authority | ||||
| Revenue (School Facilities Construction) | 5.000% | 3/1/32 | 4,005 | 4,311 |
| New Jersey Economic Development Authority | ||||
| Revenue (School Facilities Construction) | 5.000% | 12/15/32 | 3,780 | 4,151 |
| New Jersey Economic Development Authority | ||||
| Revenue (School Facilities Construction) | 5.000% | 6/15/33 (4) | 5,000 | 5,557 |
| New Jersey Economic Development Authority | ||||
| Revenue (School Facilities Construction) | 5.000% | 6/15/34 | 3,800 | 4,172 |
| New Jersey Economic Development Authority | ||||
| Revenue (School Facilities Construction) | 5.000% | 9/1/34 | 8,000 | 8,649 |
| New Jersey Economic Development Authority | ||||
| Revenue (School Facilities Construction) | 5.000% | 3/1/35 | 12,095 | 13,003 |
| New Jersey Economic Development Authority | ||||
| Revenue (School Facilities Construction) | 5.000% | 3/1/38 | 5,000 | 5,372 |
| New Jersey Economic Development Authority | ||||
| Revenue (School Facilities Construction) | 5.000% | 6/15/40 | 7,515 | 8,150 |
| New Jersey Economic Development Authority | ||||
| Revenue (School Facilities Construction) PUT | 5.000% | 9/1/15 (Prere.) | 26,625 | 27,596 |
| New Jersey Economic Development Authority | ||||
| Revenue (School Facilities Construction) PUT | 5.000% | 9/1/15 (Prere.) | 5,000 | 5,182 |
| 1 New Jersey Economic Development Authority | ||||
| Revenue (School Facilities Construction) | ||||
| TOB VRDO | 0.150% | 12/5/14 LOC | 5,000 | 5,000 |
| 1 New Jersey Economic Development Authority | ||||
| Revenue (School Facilities Construction) | ||||
| TOB VRDO | 0.160% | 12/5/14 (12) | 1,235 | 1,235 |
| New Jersey Economic Development Authority | ||||
| Revenue (Trustees of the Lawrenceville | ||||
| School Project) VRDO | 0.050% | 12/1/14 | 8,500 | 8,500 |
| New Jersey Economic Development Authority | ||||
| Revenue (United Methodist Homes Obligated | ||||
| Group) | 4.000% | 7/1/24 | 2,000 | 2,052 |
| New Jersey Economic Development Authority | ||||
| Revenue (United Methodist Homes Obligated | ||||
| Group) | 5.000% | 7/1/29 | 2,000 | 2,188 |
| New Jersey Economic Development Authority | ||||
| Sublease Revenue (New Jersey Transit Corp. | ||||
| Light Rail Transit System Project) | 5.000% | 5/1/18 | 6,260 | 6,979 |
| New Jersey Economic Development Authority | ||||
| Sublease Revenue (New Jersey Transit Corp. | ||||
| Light Rail Transit System Project) | 5.000% | 5/1/19 | 2,580 | 2,909 |
| New Jersey Educational Facilities Authority | ||||
| Revenue (College of New Jersey) | 5.000% | 7/1/18 | 1,000 | 1,130 |
| New Jersey Educational Facilities Authority | ||||
| Revenue (College of New Jersey) | 5.000% | 7/1/19 | 1,105 | 1,268 |
37
| New Jersey Long-Term Tax-Exempt Fund | ||||
| Face | Market | |||
| Maturity | Amount | Value | ||
| Coupon | Date | ($000) | ($000) | |
| New Jersey Educational Facilities Authority | ||||
| Revenue (College of New Jersey) | 5.000% | 7/1/38 | 1,250 | 1,390 |
| New Jersey Educational Facilities Authority | ||||
| Revenue (College of New Jersey) | 5.000% | 7/1/43 | 2,500 | 2,766 |
| New Jersey Educational Facilities Authority | ||||
| Revenue (Drew University) | 5.250% | 7/1/20 (14) | 2,060 | 2,367 |
| New Jersey Educational Facilities Authority | ||||
| Revenue (Fairleigh Dickinson University) | 5.500% | 7/1/23 | 2,750 | 2,760 |
| New Jersey Educational Facilities Authority | ||||
| Revenue (Georgian Court University) | 5.000% | 7/1/33 | 1,000 | 1,067 |
| New Jersey Educational Facilities Authority | ||||
| Revenue (Higher Education Trust Fund) | 5.000% | 9/1/19 (4) | 5,000 | 5,174 |
| New Jersey Educational Facilities Authority | ||||
| Revenue (Higher Education Trust Fund) | 5.000% | 6/1/21 | 4,335 | 4,923 |
| New Jersey Educational Facilities Authority | ||||
| Revenue (Kean University) | 5.000% | 7/1/20 (14) | 2,585 | 2,810 |
| New Jersey Educational Facilities Authority | ||||
| Revenue (Kean University) | 5.000% | 7/1/21 (14) | 3,025 | 3,288 |
| New Jersey Educational Facilities Authority | ||||
| Revenue (Kean University) | 5.000% | 7/1/24 (14) | 3,000 | 3,277 |
| New Jersey Educational Facilities Authority | ||||
| Revenue (Kean University) | 5.250% | 9/1/29 | 2,980 | 3,235 |
| New Jersey Educational Facilities Authority | ||||
| Revenue (Kean University) | 5.500% | 9/1/36 | 12,500 | 14,256 |
| New Jersey Educational Facilities Authority | ||||
| Revenue (Montclair State University) | 5.000% | 7/1/15 (Prere.) | 4,700 | 4,835 |
| New Jersey Educational Facilities Authority | ||||
| Revenue (Montclair State University) | 5.000% | 7/1/27 (2) | 5,000 | 5,310 |
| New Jersey Educational Facilities Authority | ||||
| Revenue (Montclair State University) | 5.000% | 7/1/39 | 10,000 | 11,467 |
| New Jersey Educational Facilities Authority | ||||
| Revenue (Montclair State University) | 5.000% | 7/1/44 | 3,000 | 3,424 |
| New Jersey Educational Facilities Authority | ||||
| Revenue (New Jersey Institute of Technology) | 5.000% | 7/1/20 | 2,725 | 3,191 |
| New Jersey Educational Facilities Authority | ||||
| Revenue (New Jersey Institute of Technology) | 5.000% | 7/1/21 | 2,635 | 3,042 |
| New Jersey Educational Facilities Authority | ||||
| Revenue (New Jersey Institute of Technology) | 5.000% | 7/1/31 | 1,000 | 1,119 |
| New Jersey Educational Facilities Authority | ||||
| Revenue (Princeton University) | 5.000% | 7/1/20 | 6,020 | 7,005 |
| New Jersey Educational Facilities Authority | ||||
| Revenue (Princeton University) | 5.000% | 7/1/27 | 5,000 | 5,937 |
| New Jersey Educational Facilities Authority | ||||
| Revenue (Princeton University) | 5.000% | 7/1/30 | 4,090 | 4,872 |
| New Jersey Educational Facilities Authority | ||||
| Revenue (Princeton University) | 5.000% | 7/1/34 | 2,000 | 2,348 |
| New Jersey Educational Facilities Authority | ||||
| Revenue (Princeton University) | 4.500% | 7/1/35 | 7,400 | 8,068 |
| New Jersey Educational Facilities Authority | ||||
| Revenue (Princeton University) | 5.000% | 7/1/35 | 2,000 | 2,344 |
| New Jersey Educational Facilities Authority | ||||
| Revenue (Princeton University) | 5.000% | 7/1/39 | 3,000 | 3,418 |
| New Jersey Educational Facilities Authority | ||||
| Revenue (Ramapo College) | 5.000% | 7/1/29 | 1,430 | 1,593 |
38
| New Jersey Long-Term Tax-Exempt Fund | ||||
| Face | Market | |||
| Maturity | Amount | Value | ||
| Coupon | Date | ($000) | ($000) | |
| New Jersey Educational Facilities Authority | ||||
| Revenue (Ramapo College) | 5.000% | 7/1/30 | 1,500 | 1,668 |
| New Jersey Educational Facilities Authority | ||||
| Revenue (Ramapo College) | 5.000% | 7/1/31 | 1,575 | 1,748 |
| New Jersey Educational Facilities Authority | ||||
| Revenue (Ramapo College) | 5.000% | 7/1/37 | 2,065 | 2,274 |
| New Jersey Educational Facilities Authority | ||||
| Revenue (Ramapo College) | 5.000% | 7/1/42 | 2,390 | 2,620 |
| New Jersey Educational Facilities Authority | ||||
| Revenue (Richard Stockton College) | 5.500% | 7/1/23 | 1,265 | 1,436 |
| New Jersey Educational Facilities Authority | ||||
| Revenue (Richard Stockton College) | 5.375% | 7/1/38 | 8,395 | 9,344 |
| New Jersey Educational Facilities Authority | ||||
| Revenue (Rowan University) | 5.000% | 7/1/24 (14) | 2,200 | 2,351 |
| New Jersey Educational Facilities Authority | ||||
| Revenue (Seton Hall University) | 5.000% | 7/1/33 | 1,000 | 1,115 |
| New Jersey Educational Facilities Authority | ||||
| Revenue (Seton Hall University) | 5.000% | 7/1/38 | 1,200 | 1,334 |
| New Jersey Educational Facilities Authority | ||||
| Revenue (Seton Hall University) | 5.000% | 7/1/43 | 1,500 | 1,660 |
| New Jersey Educational Facilities Authority | ||||
| Revenue (University Medical & Dentistry) | 6.250% | 12/1/18 (ETM) | 420 | 506 |
| New Jersey Educational Facilities Authority | ||||
| Revenue (University Medical & Dentistry) | 7.125% | 6/1/19 (Prere.) | 65 | 82 |
| New Jersey Educational Facilities Authority | ||||
| Revenue (University Medical & Dentistry) | 7.500% | 6/1/19 (Prere.) | 7,250 | 9,257 |
| New Jersey Environmental Infrastructure | ||||
| Trust Revenue | 5.000% | 9/1/19 (Prere.) | 405 | 477 |
| New Jersey Environmental Infrastructure | ||||
| Trust Revenue | 5.000% | 9/1/19 (Prere.) | 135 | 159 |
| New Jersey Environmental Infrastructure | ||||
| Trust Revenue | 5.000% | 9/1/19 (Prere.) | 180 | 212 |
| New Jersey Environmental Infrastructure | ||||
| Trust Revenue | 5.000% | 9/1/28 | 3,690 | 4,209 |
| New Jersey Equipment Lease Purchase COP | 5.000% | 6/15/23 | 3,000 | 3,307 |
| New Jersey GO | 5.250% | 7/1/15 (4) | 4,500 | 4,635 |
| New Jersey GO | 5.000% | 8/15/19 | 5,000 | 5,789 |
| New Jersey GO | 5.000% | 6/1/20 | 915 | 1,054 |
| 1 New Jersey GO TOB VRDO | 0.050% | 12/1/14 LOC | 2,700 | 2,700 |
| New Jersey Health Care Facilities Financing | ||||
| Authority Department of Human Services | ||||
| Lease Revenue (Greystone Park Psychiatric | ||||
| Hospital Project) | 5.000% | 9/15/23 | 8,580 | 10,079 |
| New Jersey Health Care Facilities Financing | ||||
| Authority Department of Human Services | ||||
| Lease Revenue (Greystone Park Psychiatric | ||||
| Hospital Project) | 5.000% | 9/15/27 | 13,165 | 14,926 |
| New Jersey Health Care Facilities Financing | ||||
| Authority Department of Human Services Lease | ||||
| Revenue (Marlboro Psychiatric Hospital Project) | 5.000% | 9/15/33 | 5,085 | 5,601 |
| New Jersey Health Care Facilities Financing | ||||
| Authority Revenue (AHS Hospital Corp.) | 5.000% | 7/1/15 | 5,000 | 5,139 |
| New Jersey Health Care Facilities Financing | ||||
| Authority Revenue (AHS Hospital Corp.) | 5.000% | 7/1/18 | 4,095 | 4,614 |
39
| New Jersey Long-Term Tax-Exempt Fund | ||||
| Face | Market | |||
| Maturity | Amount | Value | ||
| Coupon | Date | ($000) | ($000) | |
| New Jersey Health Care Facilities Financing | ||||
| Authority Revenue (AHS Hospital Corp.) | 5.000% | 7/1/27 | 2,195 | 2,425 |
| New Jersey Health Care Facilities Financing | ||||
| Authority Revenue (AHS Hospital Corp.) | 5.500% | 7/1/31 | 95 | 111 |
| New Jersey Health Care Facilities Financing | ||||
| Authority Revenue (AHS Hospital Corp.) | 6.000% | 7/1/41 | 1,500 | 1,778 |
| New Jersey Health Care Facilities Financing | ||||
| Authority Revenue (Atlanticare Regional | ||||
| Medical Center) | 5.000% | 7/1/23 | 2,675 | 2,885 |
| New Jersey Health Care Facilities Financing | ||||
| Authority Revenue (Atlanticare Regional | ||||
| Medical Center) | 5.000% | 7/1/26 | 2,780 | 2,991 |
| New Jersey Health Care Facilities Financing | ||||
| Authority Revenue (Atlanticare Regional | ||||
| Medical Center) | 5.000% | 7/1/37 | 10,000 | 10,587 |
| New Jersey Health Care Facilities Financing | ||||
| Authority Revenue (Barnabas Health) | 4.000% | 7/1/18 | 300 | 321 |
| New Jersey Health Care Facilities Financing | ||||
| Authority Revenue (Barnabas Health) | 5.000% | 7/1/18 | 1,750 | 1,959 |
| New Jersey Health Care Facilities Financing | ||||
| Authority Revenue (Barnabas Health) | 5.000% | 7/1/19 | 2,000 | 2,275 |
| New Jersey Health Care Facilities Financing | ||||
| Authority Revenue (Barnabas Health) | 5.000% | 7/1/22 | 750 | 875 |
| New Jersey Health Care Facilities Financing | ||||
| Authority Revenue (Barnabas Health) | 5.000% | 7/1/23 | 2,600 | 3,002 |
| New Jersey Health Care Facilities Financing | ||||
| Authority Revenue (Barnabas Health) | 5.000% | 7/1/24 | 4,400 | 5,030 |
| New Jersey Health Care Facilities Financing | ||||
| Authority Revenue (Barnabas Health) | 5.000% | 7/1/25 | 6,680 | 7,586 |
| 2 New Jersey Health Care Facilities Financing | ||||
| Authority Revenue (Barnabas Health) | 5.000% | 7/1/44 | 5,000 | 5,457 |
| New Jersey Health Care Facilities Financing | ||||
| Authority Revenue (Children’s Specialized | ||||
| Hospital) | 5.000% | 7/1/18 | 1,000 | 1,021 |
| New Jersey Health Care Facilities Financing | ||||
| Authority Revenue (Children’s Specialized | ||||
| Hospital) | 5.000% | 7/1/24 | 1,600 | 1,629 |
| New Jersey Health Care Facilities Financing | ||||
| Authority Revenue (Children’s Specialized | ||||
| Hospital) | 5.500% | 7/1/30 | 4,055 | 4,140 |
| New Jersey Health Care Facilities Financing | ||||
| Authority Revenue (Children’s Specialized | ||||
| Hospital) | 5.500% | 7/1/36 | 6,800 | 6,907 |
| New Jersey Health Care Facilities Financing | ||||
| Authority Revenue (Hackensack University | ||||
| Medical Center) | 5.000% | 1/1/17 | 1,250 | 1,355 |
| New Jersey Health Care Facilities Financing | ||||
| Authority Revenue (Hackensack University | ||||
| Medical Center) | 5.000% | 1/1/19 | 2,170 | 2,429 |
| New Jersey Health Care Facilities Financing | ||||
| Authority Revenue (Hackensack University | ||||
| Medical Center) | 5.000% | 1/1/20 | 3,000 | 3,382 |
| New Jersey Health Care Facilities Financing | ||||
| Authority Revenue (Hackensack University | ||||
| Medical Center) | 5.125% | 1/1/21 | 15,000 | 16,178 |
40
| New Jersey Long-Term Tax-Exempt Fund | ||||
| Face | Market | |||
| Maturity | Amount | Value | ||
| Coupon | Date | ($000) | ($000) | |
| New Jersey Health Care Facilities Financing | ||||
| Authority Revenue (Hackensack University | ||||
| Medical Center) | 5.000% | 1/1/22 | 3,500 | 3,837 |
| New Jersey Health Care Facilities Financing | ||||
| Authority Revenue (Hackensack University | ||||
| Medical Center) | 5.000% | 1/1/28 | 3,500 | 3,746 |
| New Jersey Health Care Facilities Financing | ||||
| Authority Revenue (Hackensack University | ||||
| Medical Center) | 5.000% | 1/1/34 | 2,000 | 2,122 |
| New Jersey Health Care Facilities Financing | ||||
| Authority Revenue (Holy Name Medical Center) | 4.250% | 7/1/18 | 815 | 881 |
| New Jersey Health Care Facilities Financing | ||||
| Authority Revenue (Holy Name Medical Center) | 5.000% | 7/1/25 | 3,215 | 3,434 |
| New Jersey Health Care Facilities Financing | ||||
| Authority Revenue (Hospital Asset | ||||
| Transformation Program) | 5.500% | 10/1/23 | 10,000 | 11,499 |
| New Jersey Health Care Facilities Financing | ||||
| Authority Revenue (Hospital Asset | ||||
| Transformation Program) | 5.750% | 10/1/31 | 2,505 | 2,864 |
| New Jersey Health Care Facilities Financing | ||||
| Authority Revenue (Hunterdon Medical Center) | 5.250% | 7/1/25 | 1,200 | 1,277 |
| New Jersey Health Care Facilities Financing | ||||
| Authority Revenue (Kennedy Health Systems) | 5.000% | 7/1/31 | 2,250 | 2,489 |
| New Jersey Health Care Facilities Financing | ||||
| Authority Revenue (Kennedy Health Systems) | 5.000% | 7/1/37 | 4,960 | 5,370 |
| New Jersey Health Care Facilities Financing | ||||
| Authority Revenue (Kennedy Health Systems) | 5.000% | 7/1/42 | 1,750 | 1,884 |
| New Jersey Health Care Facilities Financing | ||||
| Authority Revenue (Meridian Health System | ||||
| Obligated Group) | 5.000% | 7/1/23 | 1,000 | 1,173 |
| New Jersey Health Care Facilities Financing | ||||
| Authority Revenue (Meridian Health System | ||||
| Obligated Group) | 5.000% | 7/1/23 | 1,500 | 1,732 |
| New Jersey Health Care Facilities Financing | ||||
| Authority Revenue (Meridian Health System | ||||
| Obligated Group) | 5.000% | 7/1/24 | 5,000 | 5,738 |
| New Jersey Health Care Facilities Financing | ||||
| Authority Revenue (Meridian Health System | ||||
| Obligated Group) | 5.000% | 7/1/25 | 1,250 | 1,445 |
| New Jersey Health Care Facilities Financing | ||||
| Authority Revenue (Meridian Health System | ||||
| Obligated Group) | 5.000% | 7/1/25 | 2,000 | 2,280 |
| New Jersey Health Care Facilities Financing | ||||
| Authority Revenue (Meridian Health System | ||||
| Obligated Group) | 5.000% | 7/1/26 | 2,225 | 2,521 |
| New Jersey Health Care Facilities Financing | ||||
| Authority Revenue (Meridian Health System | ||||
| Obligated Group) | 5.000% | 7/1/27 | 1,310 | 1,495 |
| New Jersey Health Care Facilities Financing | ||||
| Authority Revenue (Meridian Health System | ||||
| Obligated Group) | 5.000% | 7/1/27 | 3,635 | 4,096 |
| New Jersey Health Care Facilities Financing | ||||
| Authority Revenue (Meridian Health System | ||||
| Obligated Group) | 5.000% | 7/1/32 | 2,000 | 2,248 |
41
| New Jersey Long-Term Tax-Exempt Fund | ||||
| Face | Market | |||
| Maturity | Amount | Value | ||
| Coupon | Date | ($000) | ($000) | |
| New Jersey Health Care Facilities Financing | ||||
| Authority Revenue (Meridian Health System | ||||
| Obligated Group) | 5.000% | 7/1/38 (12) | 575 | 612 |
| New Jersey Health Care Facilities Financing | ||||
| Authority Revenue (Meridian Health System | ||||
| Obligated Group) | 5.000% | 7/1/38 (12) | 4,220 | 4,489 |
| 1 New Jersey Health Care Facilities Financing | ||||
| Authority Revenue (Meridian V) TOB VRDO | 0.190% | 12/5/14 (12) | 4,545 | 4,545 |
| New Jersey Health Care Facilities Financing | ||||
| Authority Revenue (MHAC I LLC) VRDO | 0.040% | 12/5/14 LOC | 2,840 | 2,840 |
| New Jersey Health Care Facilities Financing | ||||
| Authority Revenue (Palisades Medical Center | ||||
| Obligated Group) | 5.000% | 7/1/26 | 2,045 | 2,261 |
| New Jersey Health Care Facilities Financing | ||||
| Authority Revenue (Palisades Medical Center | ||||
| Obligated Group) | 5.250% | 7/1/31 | 2,000 | 2,219 |
| New Jersey Health Care Facilities Financing | ||||
| Authority Revenue (Palisades Medical Center | ||||
| Obligated Group) | 5.500% | 7/1/43 | 6,530 | 7,301 |
| New Jersey Health Care Facilities Financing | ||||
| Authority Revenue (Robert Wood Johnson | ||||
| University) | 5.000% | 7/1/31 | 5,500 | 5,983 |
| New Jersey Health Care Facilities Financing | ||||
| Authority Revenue (Robert Wood Johnson | ||||
| University) | 5.000% | 7/1/32 | 1,000 | 1,151 |
| New Jersey Health Care Facilities Financing | ||||
| Authority Revenue (Robert Wood Johnson | ||||
| University) | 5.000% | 7/1/33 | 1,200 | 1,374 |
| New Jersey Health Care Facilities Financing | ||||
| Authority Revenue (Robert Wood Johnson | ||||
| University) | 5.000% | 7/1/34 | 1,200 | 1,365 |
| New Jersey Health Care Facilities Financing | ||||
| Authority Revenue (Robert Wood Johnson | ||||
| University) | 5.250% | 7/1/35 | 7,000 | 8,019 |
| New Jersey Health Care Facilities Financing | ||||
| Authority Revenue (Robert Wood Johnson | ||||
| University) | 5.000% | 7/1/39 | 3,500 | 3,946 |
| New Jersey Health Care Facilities Financing | ||||
| Authority Revenue (Robert Wood Johnson | ||||
| University) | 5.000% | 7/1/43 | 4,000 | 4,499 |
| New Jersey Health Care Facilities Financing | ||||
| Authority Revenue (Robert Wood Johnson | ||||
| University) | 5.500% | 7/1/43 | 8,000 | 9,288 |
| New Jersey Health Care Facilities Financing | ||||
| Authority Revenue (Robert Wood Johnson | ||||
| University) VRDO | 0.040% | 12/5/14 LOC | 1,365 | 1,365 |
| New Jersey Health Care Facilities Financing | ||||
| Authority Revenue (St. Barnabas Health Care | ||||
| System) | 5.000% | 7/1/16 | 1,500 | 1,602 |
| New Jersey Health Care Facilities Financing | ||||
| Authority Revenue (St. Barnabas Health Care | ||||
| System) | 0.000% | 7/1/21 (ETM) | 1,260 | 1,122 |
| New Jersey Health Care Facilities Financing | ||||
| Authority Revenue (St. Barnabas Health Care | ||||
| System) | 5.000% | 7/1/24 | 2,000 | 2,260 |
42
| New Jersey Long-Term Tax-Exempt Fund | ||||
| Face | Market | |||
| Maturity | Amount | Value | ||
| Coupon | Date | ($000) | ($000) | |
| New Jersey Health Care Facilities Financing | ||||
| Authority Revenue (St. Barnabas Health Care | ||||
| System) | 5.000% | 7/1/29 | 1,000 | 1,048 |
| New Jersey Health Care Facilities Financing | ||||
| Authority Revenue (St. Barnabas Health Care | ||||
| System) | 5.625% | 7/1/32 | 2,000 | 2,293 |
| New Jersey Health Care Facilities Financing | ||||
| Authority Revenue (St. Barnabas Health Care | ||||
| System) | 5.625% | 7/1/37 | 5,260 | 5,959 |
| New Jersey Health Care Facilities Financing | ||||
| Authority Revenue (St. Joseph’s Healthcare | ||||
| System) | 6.625% | 7/1/38 | 3,885 | 4,343 |
| New Jersey Health Care Facilities Financing | ||||
| Authority Revenue (St. Luke’s Warren Hospital | ||||
| Obligated Group) | 4.500% | 8/15/43 | 5,800 | 5,968 |
| New Jersey Health Care Facilities Financing | ||||
| Authority Revenue (St. Peter’s University | ||||
| Hospital) | 5.000% | 7/1/15 | 3,520 | 3,586 |
| New Jersey Health Care Facilities Financing | ||||
| Authority Revenue (Trinitas Hospital Obligated | ||||
| Group) | 5.250% | 7/1/30 (9) | 2,170 | 2,313 |
| New Jersey Health Care Facilities Financing | ||||
| Authority Revenue (Virtua Health) | 5.000% | 7/1/23 | 2,390 | 2,841 |
| New Jersey Health Care Facilities Financing | ||||
| Authority Revenue (Virtua Health) | 5.000% | 7/1/24 | 3,120 | 3,713 |
| New Jersey Health Care Facilities Financing | ||||
| Authority Revenue (Virtua Health) | 5.000% | 7/1/25 | 3,470 | 4,107 |
| New Jersey Health Care Facilities Financing | ||||
| Authority Revenue (Virtua Health) | 5.000% | 7/1/26 | 7,600 | 8,897 |
| New Jersey Health Care Facilities Financing | ||||
| Authority Revenue (Virtua Health) | 5.000% | 7/1/27 | 4,000 | 4,660 |
| New Jersey Health Care Facilities Financing | ||||
| Authority Revenue (Virtua Health) | 5.000% | 7/1/28 | 3,000 | 3,479 |
| New Jersey Health Care Facilities Financing | ||||
| Authority Revenue (Virtua Health) | 5.000% | 7/1/29 | 2,410 | 2,787 |
| New Jersey Health Care Facilities Financing | ||||
| Authority Revenue (Virtua Health) | 5.750% | 7/1/33 | 3,010 | 3,407 |
| New Jersey Health Care Facilities Financing | ||||
| Authority Revenue (Virtua Health) | 5.500% | 7/1/38 (12) | 3,210 | 3,565 |
| New Jersey Health Care Facilities Financing | ||||
| Authority Revenue (Virtua Health) VRDO | 0.020% | 12/1/14 LOC | 1,100 | 1,100 |
| New Jersey Health Care Facilities Financing | ||||
| Authority Revenue (Virtua Health) VRDO | 0.050% | 12/1/14 LOC | 4,100 | 4,100 |
| New Jersey Higher Education Assistance | ||||
| Authority Student Loan Revenue | 4.750% | 12/1/21 | 4,145 | 4,442 |
| New Jersey Higher Education Assistance | ||||
| Authority Student Loan Revenue | 5.000% | 12/1/25 | 1,240 | 1,311 |
| New Jersey Higher Education Assistance | ||||
| Authority Student Loan Revenue | 5.000% | 12/1/26 | 1,245 | 1,314 |
| New Jersey Higher Education Assistance | ||||
| Authority Student Loan Revenue | 5.625% | 6/1/30 | 7,075 | 7,940 |
| New Jersey Housing & Mortgage Finance | ||||
| Agency Single Family Housing Revenue | 4.250% | 10/1/32 | 3,650 | 3,844 |
| New Jersey Housing & Mortgage Finance | ||||
| Agency Single Family Housing Revenue | 6.500% | 10/1/38 | 985 | 1,024 |
43
| New Jersey Long-Term Tax-Exempt Fund | ||||
| Face | Market | |||
| Maturity | Amount | Value | ||
| Coupon | Date | ($000) | ($000) | |
| New Jersey Institute of Technology Revenue | 5.000% | 7/1/32 | 1,500 | 1,709 |
| New Jersey Institute of Technology Revenue | 5.000% | 7/1/42 | 5,000 | 5,567 |
| New Jersey Sports & Exposition Authority | ||||
| Revenue | 5.500% | 3/1/17 (ETM) | 385 | 428 |
| New Jersey Sports & Exposition Authority | ||||
| Revenue | 5.500% | 3/1/17 (14) | 5,120 | 5,639 |
| New Jersey Sports & Exposition Authority | ||||
| Revenue | 5.500% | 3/1/17 (ETM) | 250 | 278 |
| New Jersey Sports & Exposition Authority | ||||
| Revenue (Convention Center Luxury Tax) | 5.500% | 3/1/21 (ETM) | 3,000 | 3,683 |
| New Jersey Sports & Exposition Authority | ||||
| Revenue (Convention Center Luxury Tax) | 5.500% | 3/1/22 (ETM) | 1,120 | 1,391 |
| New Jersey Transportation Corp. COP | 5.500% | 9/15/15 (ETM) | 15,000 | 15,638 |
| New Jersey Transportation Corp. GAN | 5.000% | 9/15/19 | 5,000 | 5,706 |
| New Jersey Transportation Trust Fund Authority | ||||
| Transportation Program Revenue | 5.000% | 6/15/38 | 4,000 | 4,285 |
| New Jersey Transportation Trust Fund Authority | ||||
| Transportation Program Revenue | 5.000% | 6/15/44 | 4,000 | 4,259 |
| 3 New Jersey Transportation Trust Fund Authority | ||||
| Transportation Program Revenue PUT | 1.240% | 12/15/21 | 7,000 | 7,004 |
| New Jersey Transportation Trust Fund Authority | ||||
| Transportation System Revenue | 5.250% | 6/15/15 (ETM) | 5,000 | 5,140 |
| New Jersey Transportation Trust Fund Authority | ||||
| Transportation System Revenue | 6.000% | 12/15/18 (Prere.) | 1,740 | 2,092 |
| New Jersey Transportation Trust Fund Authority | ||||
| Transportation System Revenue | 5.250% | 12/15/19 (4) | 4,450 | 5,139 |
| New Jersey Transportation Trust Fund Authority | ||||
| Transportation System Revenue | 5.750% | 6/15/20 | 5,000 | 5,816 |
| New Jersey Transportation Trust Fund Authority | ||||
| Transportation System Revenue | 5.250% | 12/15/22 | 2,500 | 2,920 |
| New Jersey Transportation Trust Fund Authority | ||||
| Transportation System Revenue | 0.000% | 12/15/23 | 3,900 | 2,812 |
| New Jersey Transportation Trust Fund Authority | ||||
| Transportation System Revenue | 5.000% | 6/15/24 | 2,500 | 2,805 |
| New Jersey Transportation Trust Fund Authority | ||||
| Transportation System Revenue | 5.750% | 6/15/24 (14) | 4,900 | 6,001 |
| New Jersey Transportation Trust Fund Authority | ||||
| Transportation System Revenue | 5.000% | 6/15/25 | 4,500 | 5,004 |
| New Jersey Transportation Trust Fund Authority | ||||
| Transportation System Revenue | 5.750% | 6/15/25 (14) | 7,000 | 8,615 |
| New Jersey Transportation Trust Fund Authority | ||||
| Transportation System Revenue | 0.000% | 12/15/26 | 10,915 | 6,586 |
| New Jersey Transportation Trust Fund Authority | ||||
| Transportation System Revenue | 5.000% | 6/15/27 | 5,000 | 5,517 |
| New Jersey Transportation Trust Fund Authority | ||||
| Transportation System Revenue | 5.000% | 6/15/27 | 11,245 | 12,550 |
| New Jersey Transportation Trust Fund Authority | ||||
| Transportation System Revenue | 5.125% | 6/15/28 | 5,245 | 5,790 |
| New Jersey Transportation Trust Fund Authority | ||||
| Transportation System Revenue | 0.000% | 12/15/28 | 8,855 | 4,818 |
| New Jersey Transportation Trust Fund Authority | ||||
| Transportation System Revenue | 0.000% | 12/15/28 | 15,000 | 8,162 |
| New Jersey Transportation Trust Fund Authority | ||||
| Transportation System Revenue | 5.000% | 6/15/29 | 2,785 | 3,076 |
44
| New Jersey Long-Term Tax-Exempt Fund | ||||
| Face | Market | |||
| Maturity | Amount | Value | ||
| Coupon | Date | ($000) | ($000) | |
| New Jersey Transportation Trust Fund Authority | ||||
| Transportation System Revenue | 0.000% | 12/15/29 (4) | 6,970 | 3,594 |
| New Jersey Transportation Trust Fund Authority | ||||
| Transportation System Revenue | 0.000% | 12/15/29 | 7,360 | 3,784 |
| New Jersey Transportation Trust Fund Authority | ||||
| Transportation System Revenue | 5.250% | 6/15/30 | 3,065 | 3,390 |
| New Jersey Transportation Trust Fund Authority | ||||
| Transportation System Revenue | 0.000% | 12/15/30 | 10,000 | 4,752 |
| New Jersey Transportation Trust Fund Authority | ||||
| Transportation System Revenue | 5.250% | 6/15/31 | 5,395 | 5,946 |
| New Jersey Transportation Trust Fund Authority | ||||
| Transportation System Revenue | 5.250% | 6/15/31 | 1,500 | 1,676 |
| New Jersey Transportation Trust Fund Authority | ||||
| Transportation System Revenue | 5.500% | 6/15/31 | 6,000 | 6,916 |
| New Jersey Transportation Trust Fund Authority | ||||
| Transportation System Revenue | 0.000% | 12/15/31 | 13,500 | 5,974 |
| New Jersey Transportation Trust Fund Authority | ||||
| Transportation System Revenue | 5.000% | 6/15/32 | 6,500 | 7,118 |
| New Jersey Transportation Trust Fund Authority | ||||
| Transportation System Revenue | 5.000% | 6/15/32 | 10,000 | 10,801 |
| New Jersey Transportation Trust Fund Authority | ||||
| Transportation System Revenue | 0.000% | 12/15/32 | 7,000 | 2,927 |
| New Jersey Transportation Trust Fund Authority | ||||
| Transportation System Revenue | 0.000% | 12/15/32 (4) | 8,000 | 3,429 |
| New Jersey Transportation Trust Fund Authority | ||||
| Transportation System Revenue | 5.000% | 12/15/32 (2) | 19,985 | 21,383 |
| New Jersey Transportation Trust Fund Authority | ||||
| Transportation System Revenue | 5.000% | 6/15/33 | 9,500 | 10,235 |
| New Jersey Transportation Trust Fund Authority | ||||
| Transportation System Revenue | 0.000% | 12/15/33 | 3,000 | 1,186 |
| New Jersey Transportation Trust Fund Authority | ||||
| Transportation System Revenue | 0.000% | 12/15/33 | 5,000 | 1,977 |
| New Jersey Transportation Trust Fund Authority | ||||
| Transportation System Revenue | 0.000% | 12/15/34 | 8,210 | 3,087 |
| New Jersey Transportation Trust Fund Authority | ||||
| Transportation System Revenue | 6.000% | 6/15/35 | 4,000 | 4,868 |
| New Jersey Transportation Trust Fund Authority | ||||
| Transportation System Revenue | 0.000% | 12/15/35 | 13,235 | 4,719 |
| New Jersey Transportation Trust Fund Authority | ||||
| Transportation System Revenue | 0.000% | 12/15/36 | 11,675 | 3,930 |
| New Jersey Transportation Trust Fund Authority | ||||
| Transportation System Revenue | 0.000% | 12/15/37 | 1,165 | 371 |
| New Jersey Transportation Trust Fund Authority | ||||
| Transportation System Revenue | 5.000% | 6/15/38 | 6,105 | 6,520 |
| New Jersey Transportation Trust Fund Authority | ||||
| Transportation System Revenue | 0.000% | 12/15/38 | 15,000 | 4,542 |
| New Jersey Transportation Trust Fund Authority | ||||
| Transportation System Revenue | 5.500% | 12/15/38 (12) | 6,900 | 7,876 |
| New Jersey Transportation Trust Fund Authority | ||||
| Transportation System Revenue | 6.000% | 12/15/38 | 3,360 | 3,903 |
| New Jersey Transportation Trust Fund Authority | ||||
| Transportation System Revenue | 5.500% | 6/15/39 | 5,400 | 6,111 |
| New Jersey Transportation Trust Fund Authority | ||||
| Transportation System Revenue | 5.500% | 6/15/41 | 10,000 | 11,211 |
45
| New Jersey Long-Term Tax-Exempt Fund | ||||
| Face | Market | |||
| Maturity | Amount | Value | ||
| Coupon | Date | ($000) | ($000) | |
| New Jersey Transportation Trust Fund Authority | ||||
| Transportation System Revenue | 5.000% | 6/15/42 | 16,535 | 17,440 |
| 1 New Jersey Transportation Trust Fund Authority | ||||
| Transportation System Revenue TOB VRDO | 0.140% | 12/5/14 LOC | 3,820 | 3,820 |
| 1 New Jersey Transportation Trust Fund Authority | ||||
| Transportation System Revenue TOB VRDO | 0.150% | 12/5/14 (4) | 5,660 | 5,660 |
| New Jersey Turnpike Authority Revenue | 5.000% | 1/1/15 (Prere.) | 16,000 | 16,071 |
| New Jersey Turnpike Authority Revenue | 6.500% | 1/1/16 (14)(ETM) | 6,720 | 7,174 |
| New Jersey Turnpike Authority Revenue | 6.500% | 1/1/16 (14) | 8,335 | 8,888 |
| New Jersey Turnpike Authority Revenue | 6.500% | 1/1/16 (ETM) | 1,560 | 1,665 |
| New Jersey Turnpike Authority Revenue | 6.500% | 1/1/16 (ETM) | 7,705 | 7,809 |
| New Jersey Turnpike Authority Revenue | 5.250% | 1/1/26 (4) | 4,000 | 4,937 |
| New Jersey Turnpike Authority Revenue | 5.000% | 1/1/33 | 8,500 | 9,530 |
| New Jersey Turnpike Authority Revenue | 0.000% | 1/1/35 (2) | 8,500 | 8,861 |
| New Jersey Turnpike Authority Revenue | 5.000% | 1/1/35 | 5,000 | 5,527 |
| New Jersey Turnpike Authority Revenue | 5.000% | 1/1/35 | 6,400 | 7,164 |
| New Jersey Turnpike Authority Revenue | 5.000% | 1/1/36 | 3,500 | 3,861 |
| New Jersey Turnpike Authority Revenue | 5.000% | 1/1/38 | 11,000 | 12,184 |
| New Jersey Turnpike Authority Revenue | 5.250% | 1/1/40 | 10,000 | 11,125 |
| New Jersey Turnpike Authority Revenue | 5.000% | 1/1/43 | 2,500 | 2,745 |
| Newark NJ Housing Authority Port Authority- | ||||
| Port Newark Marine Terminal Revenue | �� | |||
| (City of Newark Redevelopment Projects) | 5.000% | 1/1/16 (14) | 250 | 261 |
| Newark NJ Housing Authority Port Authority- | ||||
| Port Newark Marine Terminal Revenue | ||||
| (City of Newark Redevelopment Projects) | 4.375% | 1/1/37 (14) | 100 | 101 |
| Ocean County NJ GO | 5.000% | 6/1/24 | 1,440 | 1,724 |
| Ocean County NJ Utility Authority Wastewater | ||||
| Revenue | 6.600% | 1/1/18 (ETM) | 1,600 | 1,755 |
| Passaic County NJ Improvement Authority | ||||
| Lease Revenue (Preakness Healthcare Center | ||||
| Expansion Project) | 5.000% | 5/1/24 | 2,610 | 2,986 |
| Passaic County NJ Improvement Authority | ||||
| Lease Revenue (Preakness Healthcare Center | ||||
| Expansion Project) | 5.000% | 5/1/25 | 2,740 | 3,125 |
| Passaic County NJ Improvement Authority | ||||
| Lease Revenue (Preakness Healthcare Center | ||||
| Expansion Project) | 5.000% | 5/1/26 | 2,885 | 3,266 |
| Passaic Valley NJ Sewage Commissioners Sewer | ||||
| System Revenue | 5.750% | 12/1/19 | 1,680 | 1,980 |
| Passaic Valley NJ Sewage Commissioners Sewer | ||||
| System Revenue | 5.750% | 12/1/20 | 1,450 | 1,734 |
| Passaic Valley NJ Sewage Commissioners Sewer | ||||
| System Revenue | 5.750% | 12/1/21 | 3,500 | 4,226 |
| Passaic Valley NJ Water Commission Revenue | 5.000% | 12/15/32 (4) | 1,385 | 1,576 |
| Port Authority of New York & New Jersey | ||||
| Revenue | 5.000% | 12/1/25 | 3,000 | 3,562 |
| Port Authority of New York & New Jersey | ||||
| Revenue | 5.375% | 3/1/28 | 1,280 | 1,583 |
| Port Authority of New York & New Jersey | ||||
| Revenue | 4.500% | 7/15/28 | 4,000 | 4,386 |
| Port Authority of New York & New Jersey | ||||
| Revenue | 5.000% | 3/1/29 | 4,500 | 5,067 |
| Port Authority of New York & New Jersey | ||||
| Revenue | 5.000% | 7/15/31 | 3,395 | 3,907 |
46
| New Jersey Long-Term Tax-Exempt Fund | ||||
| Face | Market | |||
| Maturity | Amount | Value | ||
| Coupon | Date | ($000) | ($000) | |
| Port Authority of New York & New Jersey | ||||
| Revenue | 5.000% | 7/15/31 | 5,140 | 5,794 |
| Port Authority of New York & New Jersey | ||||
| Revenue | 5.000% | 9/1/31 | 1,800 | 2,124 |
| Port Authority of New York & New Jersey | ||||
| Revenue | 5.000% | 7/15/32 | 3,500 | 4,020 |
| Port Authority of New York & New Jersey | ||||
| Revenue | 5.000% | 10/15/32 | 6,625 | 7,590 |
| Port Authority of New York & New Jersey | ||||
| Revenue | 4.750% | 7/15/33 | 3,500 | 3,848 |
| Port Authority of New York & New Jersey | ||||
| Revenue | 5.000% | 9/1/33 | 5,500 | 6,455 |
| Port Authority of New York & New Jersey | ||||
| Revenue | 5.000% | 10/15/33 | 1,250 | 1,430 |
| Port Authority of New York & New Jersey | ||||
| Revenue | 5.000% | 9/1/34 | 1,930 | 2,254 |
| Port Authority of New York & New Jersey | ||||
| Revenue | 5.000% | 12/1/34 | 7,000 | 8,098 |
| Port Authority of New York & New Jersey | ||||
| Revenue | 5.000% | 7/15/35 | 6,500 | 7,410 |
| Port Authority of New York & New Jersey | ||||
| Revenue | 5.000% | 9/15/36 | 3,400 | 3,850 |
| Port Authority of New York & New Jersey | ||||
| Revenue | 5.000% | 7/15/39 | 13,250 | 14,941 |
| Port Authority of New York & New Jersey | ||||
| Revenue | 5.000% | 1/15/41 | 16,065 | 17,976 |
| Port Authority of New York & New Jersey | ||||
| Special Obligation Revenue (John F. Kennedy | ||||
| International Air Terminal LLC) | 5.500% | 12/1/31 | 5,000 | 5,736 |
| Port Authority of New York & New Jersey | ||||
| Special Obligation Revenue (John F. Kennedy | ||||
| International Air Terminal LLC) | 6.000% | 12/1/36 | 3,000 | 3,490 |
| Port Authority of New York & New Jersey | ||||
| Special Obligation Revenue (John F. Kennedy | ||||
| International Air Terminal LLC) | 6.000% | 12/1/42 | 5,000 | 5,786 |
| Rutgers State University New Jersey Revenue | 5.000% | 5/1/28 | 4,000 | 4,703 |
| Rutgers State University New Jersey Revenue | 5.000% | 5/1/30 | 5,000 | 5,816 |
| Rutgers State University New Jersey Revenue | 5.000% | 5/1/33 | 10,000 | 11,543 |
| Rutgers State University New Jersey Revenue | 5.000% | 5/1/36 | 3,000 | 3,417 |
| Rutgers State University New Jersey Revenue | 5.000% | 5/1/38 | 5,460 | 6,185 |
| Rutgers State University New Jersey Revenue | 5.000% | 5/1/43 | 12,590 | 14,153 |
| Rutgers State University New Jersey Revenue | ||||
| VRDO | 0.030% | 12/1/14 | 3,900 | 3,900 |
| Rutgers State University New Jersey Revenue | ||||
| VRDO | 0.040% | 12/1/14 | 12,000 | 12,000 |
| South Jersey Transportation Authority | ||||
| New Jersey Transportation System Revenue | 5.000% | 11/1/20 | 2,145 | 2,473 |
| South Jersey Transportation Authority | ||||
| New Jersey Transportation System Revenue | 5.000% | 11/1/21 | 3,000 | 3,460 |
| South Jersey Transportation Authority | ||||
| New Jersey Transportation System Revenue | 5.000% | 11/1/22 | 2,780 | 3,212 |
| South Jersey Transportation Authority | ||||
| New Jersey Transportation System Revenue | 5.000% | 11/1/25 | 4,000 | 4,443 |
| South Jersey Transportation Authority | ||||
| New Jersey Transportation System Revenue | 5.000% | 11/1/26 | 5,000 | 5,505 |
47
| New Jersey Long-Term Tax-Exempt Fund | ||||
| Face | Market | |||
| Maturity | Amount | Value | ||
| Coupon | Date | ($000) | ($000) | |
| South Jersey Transportation Authority | ||||
| New Jersey Transportation System Revenue | 5.000% | 11/1/27 | 2,960 | 3,239 |
| South Jersey Transportation Authority | ||||
| New Jersey Transportation System Revenue | 5.000% | 11/1/28 | 4,185 | 4,562 |
| South Jersey Transportation Authority | ||||
| New Jersey Transportation System Revenue | 5.000% | 11/1/29 | 2,000 | 2,171 |
| Tobacco Settlement Financing Corp. | ||||
| New Jersey Revenue | 5.000% | 6/1/18 | 6,225 | 6,811 |
| Tobacco Settlement Financing Corp. | ||||
| New Jersey Revenue | 4.500% | 6/1/23 | 15,000 | 14,949 |
| Tobacco Settlement Financing Corp. | ||||
| New Jersey Revenue | 4.625% | 6/1/26 | 5,030 | 4,618 |
| Tobacco Settlement Financing Corp. | ||||
| New Jersey Revenue | 0.000% | 6/1/41 | 25,000 | 6,000 |
| Union County NJ Improvement Authority Lease | ||||
| Revenue (Family Court Building Project) | 5.000% | 5/1/42 | 5,000 | 5,619 |
| Union County NJ Utilities Authority Revenue | 5.000% | 6/15/41 | 4,000 | 4,407 |
| West Deptford Township NJ GO | 5.000% | 7/1/22 (4) | 1,555 | 1,711 |
| West Deptford Township NJ GO | 5.000% | 7/1/23 (4) | 1,035 | 1,137 |
| 1,963,580 | ||||
| Virgin Islands (0.8%) | ||||
| Virgin Islands Public Finance Authority Revenue | 5.000% | 10/1/24 | 3,000 | 3,421 |
| Virgin Islands Public Finance Authority Revenue | 5.000% | 10/1/25 | 5,500 | 5,991 |
| Virgin Islands Public Finance Authority Revenue | 5.000% | 10/1/39 | 6,000 | 6,388 |
| 15,800 | ||||
| Guam (0.3%) | ||||
| Guam Government Waterworks Authority Water | ||||
| & Waste Water System Revenue | 5.500% | 7/1/43 | 3,000 | 3,430 |
| Guam Power Authority Revenue | 5.000% | 10/1/27 | 1,135 | 1,279 |
| Guam Power Authority Revenue | 5.000% | 10/1/29 | 1,355 | 1,514 |
| 6,223 | ||||
| Puerto Rico (0.0%) | ||||
| Puerto Rico Public Finance Corp. Revenue | 6.000% | 8/1/26 (ETM) | 720 | 924 |
| Total Tax-Exempt Municipal Bonds (Cost $1,880,350) | 1,986,527 | |||
| Other Assets and Liabilities (0.8%) | ||||
| Other Assets | 29,852 | |||
| Liabilities | (14,738) | |||
| 15,114 | ||||
| Net Assets (100%) | 2,001,641 | |||
48
New Jersey Long-Term Tax-Exempt Fund
| At November 30, 2014, net assets consisted of: | |
| Amount | |
| ($000) | |
| Paid-in Capital | 1,887,958 |
| Undistributed Net Investment Income | — |
| Accumulated Net Realized Gains | 7,506 |
| Unrealized Appreciation (Depreciation) | 106,177 |
| Net Assets | 2,001,641 |
| Investor Shares—Net Assets | |
| Applicable to 20,172,790 outstanding $.001 par value shares of | |
| beneficial interest (unlimited authorization) | 246,447 |
| Net Asset Value Per Share—Investor Shares | $12.22 |
| Admiral Shares—Net Assets | |
| Applicable to 143,670,281 outstanding $.001 par value shares of | |
| beneficial interest (unlimited authorization) | 1,755,194 |
| Net Asset Value Per Share—Admiral Shares | $12.22 |
See Note A in Notes to Financial Statements.
1 Security exempt from registration under Rule 144A of the Securities Act of 1933. Such securities may be sold in transactions exempt from registration, normally to qualified institutional buyers. At November 30, 2014, the aggregate value of these securities was $22,960,000, representing 1.1% of net assets.
2 Security purchased on a when-issued or delayed-delivery basis for which the fund has not taken delivery as of November 30, 2014.
3 Adjustable-rate security.
A key to abbreviations and other references follows the Statement of Net Assets.
See accompanying Notes, which are an integral part of the Financial Statements.
49
New Jersey Long-Term Tax-Exempt Fund
Key to Abbreviations
ARS—Auction Rate Security.
BAN—Bond Anticipation Note.
COP—Certificate of Participation.
CP—Commercial Paper.
FR—Floating Rate.
GAN—Grant Anticipation Note.
GO—General Obligation Bond.
PILOT—Payments in Lieu of Taxes.
PUT—Put Option Obligation.
RAN—Revenue Anticipation Note.
TAN—Tax Anticipation Note.
TOB—Tender Option Bond.
TRAN—Tax Revenue Anticipation Note.
VRDO—Variable Rate Demand Obligation.
VRDP—Variable Rate Demand Preferred.
(ETM)—Escrowed to Maturity.
(Prere.)—Prerefunded.
Scheduled principal and interest payments are guaranteed by:
(1) MBIA (Municipal Bond Investors Assurance).
(2) AMBAC (Ambac Assurance Corporation).
(3) FGIC (Financial Guaranty Insurance Company).
(4) AGM (Assured Guaranty Municipal Corporation).
(5) BIGI (Bond Investors Guaranty Insurance).
(6) Connie Lee Inc.
(7) FHA (Federal Housing Authority).
(8) CapMAC (Capital Markets Assurance Corporation).
(9) American Capital Access Financial Guaranty Corporation.
(10) XL Capital Assurance Inc.
(11) CIFG (CDC IXIS Financial Guaranty).
(12) AGC (Assured Guaranty Corporation).
(13) BHAC (Berkshire Hathaway Assurance Corporation).
(14) NPFG (National Public Finance Guarantee Corporation).
(15) BAM (Build America Mutual Assurance Company).
(16) MAC (Municipal Assurance Corporation).
(17) RAA (Radian Asset Assurance Inc.).
The insurance does not guarantee the market value of the municipal bonds.
LOC—Scheduled principal and interest payments are guaranteed by bank letter of credit.
50
New Jersey Long-Term Tax-Exempt Fund
Statement of Operations
| Year Ended | |
| November 30, 2014 | |
| ($000) | |
| Investment Income | |
| Income | |
| Interest | 73,667 |
| Total Income | 73,667 |
| Expenses | |
| The Vanguard Group—Note B | |
| Investment Advisory Services | 190 |
| Management and Administrative—Investor Shares | 398 |
| Management and Administrative—Admiral Shares | 1,562 |
| Marketing and Distribution—Investor Shares | 56 |
| Marketing and Distribution—Admiral Shares | 255 |
| Custodian Fees | 27 |
| Auditing Fees | 33 |
| Shareholders’ Reports—Investor Shares | 8 |
| Shareholders’ Reports—Admiral Shares | 4 |
| Trustees’ Fees and Expenses | 1 |
| Total Expenses | 2,534 |
| Net Investment Income | 71,133 |
| Realized Net Gain (Loss) | |
| Investment Securities Sold | 9,645 |
| Futures Contracts | (755) |
| Realized Net Gain (Loss) | 8,890 |
| Change in Unrealized Appreciation (Depreciation) of Investment Securities | 84,256 |
| Net Increase (Decrease) in Net Assets Resulting from Operations | 164,279 |
See accompanying Notes, which are an integral part of the Financial Statements.
51
New Jersey Long-Term Tax-Exempt Fund
Statement of Changes in Net Assets
| Year Ended November 30, | ||
| 2014 | 2013 | |
| ($000) | ($000) | |
| Increase (Decrease) in Net Assets | ||
| Operations | ||
| Net Investment Income | 71,133 | 74,438 |
| Realized Net Gain (Loss) | 8,890 | 25,284 |
| Change in Unrealized Appreciation (Depreciation) | 84,256 | (182,281) |
| Net Increase (Decrease) in Net Assets Resulting from Operations | 164,279 | (82,559) |
| Distributions | ||
| Net Investment Income | ||
| Investor Shares | (8,837) | (9,881) |
| Admiral Shares | (62,296) | (64,557) |
| Realized Capital Gain1 | ||
| Investor Shares | (452) | — |
| Admiral Shares | (3,042) | — |
| Total Distributions | (74,627) | (74,438) |
| Capital Share Transactions | ||
| Investor Shares | (11,024) | (35,306) |
| Admiral Shares | 28,734 | (90,637) |
| Net Increase (Decrease) from Capital Share Transactions | 17,710 | (125,943) |
| Total Increase (Decrease) | 107,362 | (282,940) |
| Net Assets | ||
| Beginning of Period | 1,894,279 | 2,177,219 |
| End of Period | 2,001,641 | 1,894,279 |
| 1 Includes fiscal 2014 and 2013 short-term gain distributions totaling $204,000 and $0, respectively. Short-term gain distributions are treated as ordinary income dividends for tax purposes. | ||
See accompanying Notes, which are an integral part of the Financial Statements.
52
New Jersey Long-Term Tax-Exempt Fund
Financial Highlights
| Investor Shares | |||||
| For a Share Outstanding | Year Ended November 30, | ||||
| Throughout Each Period | 2014 | 2013 | 2012 | 2011 | 2010 |
| Net Asset Value, Beginning of Period | $11.66 | $12.57 | $11.73 | $11.58 | $11.64 |
| Investment Operations | |||||
| Net Investment Income | .431 | .433 | .439 | .471 | .476 |
| Net Realized and Unrealized Gain (Loss) | |||||
| on Investments | . 582 | (.910) | .840 | .150 | (.060) |
| Total from Investment Operations | 1.013 | (.477) | 1.279 | .621 | .416 |
| Distributions | |||||
| Dividends from Net Investment Income | (. 431) | (. 433) | (. 439) | (. 471) | (.476) |
| Distributions from Realized Capital Gains | (.022) | — | — | — | — |
| Total Distributions | (. 453) | (. 433) | (. 439) | (. 471) | (.476) |
| Net Asset Value, End of Period | $12.22 | $11.66 | $12.57 | $11.73 | $11.58 |
| Total Return1 | 8.82% | -3.83% | 11.07% | 5.54% | 3.59% |
| Ratios/Supplemental Data | |||||
| Net Assets, End of Period (Millions) | $246 | $246 | $303 | $294 | $361 |
| Ratio of Total Expenses to Average Net Assets | 0.20% | 0.20% | 0.20% | 0.20% | 0.20% |
| Ratio of Net Investment Income to | |||||
| Average Net Assets | 3.58% | 3.60% | 3.62% | 4.11% | 4.06% |
| Portfolio Turnover Rate | 20% | 35% | 17% | 12% | 17% |
| 1 Total returns do not include account service fees that may have applied in the periods shown. Fund prospectuses provide information about any applicable account service fees. | |||||
See accompanying Notes, which are an integral part of the Financial Statements.
53
New Jersey Long-Term Tax-Exempt Fund
Financial Highlights
| Admiral Shares | |||||
| For a Share Outstanding | Year Ended November 30, | ||||
| Throughout Each Period | 2014 | 2013 | 2012 | 2011 | 2010 |
| Net Asset Value, Beginning of Period | $11.66 | $12.57 | $11.73 | $11.58 | $11.64 |
| Investment Operations | |||||
| Net Investment Income | .441 | .442 | .449 | .480 | .485 |
| Net Realized and Unrealized Gain (Loss) | |||||
| on Investments | . 582 | (.910) | .840 | .150 | (.060) |
| Total from Investment Operations | 1.023 | (.468) | 1.289 | .630 | .425 |
| Distributions | |||||
| Dividends from Net Investment Income | (. 441) | (. 442) | (. 449) | (. 480) | (.485) |
| Distributions from Realized Capital Gains | (.022) | — | — | — | — |
| Total Distributions | (. 463) | (. 442) | (. 449) | (. 480) | (.485) |
| Net Asset Value, End of Period | $12.22 | $11.66 | $12.57 | $11.73 | $11.58 |
| Total Return | 8.91% | -3.75% | 11.15% | 5.62% | 3.68% |
| Ratios/Supplemental Data | |||||
| Net Assets, End of Period (Millions) | $1,755 | $1,648 | $1,874 | $1,649 | $1,718 |
| Ratio of Total Expenses to Average Net Assets | 0.12% | 0.12% | 0.12% | 0.12% | 0.12% |
| Ratio of Net Investment Income to | |||||
| Average Net Assets | 3.66% | 3.68% | 3.70% | 4.19% | 4.14% |
| Portfolio Turnover Rate | 20% | 35% | 17% | 12% | 17% |
See accompanying Notes, which are an integral part of the Financial Statements.
54
New Jersey Long-Term Tax-Exempt Fund
Notes to Financial Statements
Vanguard New Jersey Long-Term Tax-Exempt Fund is registered under the Investment Company Act of 1940 as an open-end investment company, or mutual fund. The fund invests in debt instruments of municipal issuers whose ability to meet their obligations may be affected by economic and political developments in the state. The fund offers two classes of shares: Investor Shares and Admiral Shares. Investor Shares are available to any investor who meets the fund’s minimum purchase requirements. Admiral Shares are designed for investors who meet certain administrative, service, and account-size criteria.
A. The following significant accounting policies conform to generally accepted accounting principles for U.S. investment companies. The fund consistently follows such policies in preparing its financial statements.
1. Security Valuation: Securities are valued as of the close of trading on the New York Stock Exchange (generally 4 p.m., Eastern time) on the valuation date. Bonds, and temporary cash investments acquired over 60 days to maturity, are valued using the latest bid prices or using valuations based on a matrix system (which considers such factors as security prices, yields, maturities, and ratings), both as furnished by independent pricing services. Other temporary cash investments are valued at amortized cost, which approximates market value. Securities for which market quotations are not readily available, or whose values have been affected by events occurring before the fund’s pricing time but after the close of the securities’ primary markets, are valued by methods deemed by the board of trustees to represent fair value.
2. Futures Contracts: The fund uses futures contracts to invest in fixed income asset classes with greater efficiency and lower cost than is possible through direct investment, to add value when these instruments are attractively priced, or to adjust sensitivity to changes in interest rates. The primary risks associated with the use of futures contracts are imperfect correlation between changes in market values of bonds held by the fund and the prices of futures contracts, and the possibility of an illiquid market. Counterparty risk involving futures is mitigated because a regulated clearinghouse is the counterparty instead of the clearing broker. To further mitigate counterparty risk, the fund trades futures contracts on an exchange, monitors the financial strength of its clearing brokers and clearinghouse, and has entered into clearing agreements with its clearing brokers. The clearinghouse imposes initial margin requirements to secure the fund’s performance and requires daily settlement of variation margin representing changes in the market value of each contract.
Futures contracts are valued at their quoted daily settlement prices. The aggregate settlement values of the contracts are not recorded in the Statement of Net Assets. Fluctuations in the value of the contracts are recorded in the Statement of Net Assets as an asset (liability) and in the Statement of Operations as unrealized appreciation (depreciation) until the contracts are closed, when they are recorded as realized futures gains (losses).
During the year ended November 30, 2014, the fund’s average investments in long and short futures contracts each represented less than 1% of net assets, based on the average of aggregate settlement values at each quarter-end during the period. The fund had no open futures contracts at November 30, 2014.
3. Federal Income Taxes: The fund intends to continue to qualify as a regulated investment company and distribute all of its income. Management has analyzed the fund’s tax positions taken for all open federal income tax years (November 30, 2011–2014), and has concluded that no provision for federal income tax is required in the fund’s financial statements.
55
New Jersey Long-Term Tax-Exempt Fund
4. Distributions: Distributions from net investment income are declared daily and paid on the first business day of the following month. Annual distributions from realized capital gains, if any, are recorded on the ex-dividend date.
5. Credit Facility: The fund and certain other funds managed by The Vanguard Group participate in a $2.89 billion committed credit facility provided by a syndicate of lenders pursuant to a credit agreement that may be renewed annually; each fund is individually liable for its borrowings, if any, under the credit facility. Borrowings may be utilized for temporary and emergency purposes, and are subject to the fund’s regulatory and contractual borrowing restrictions. The participating funds are charged administrative fees and an annual commitment fee of 0.06% of the undrawn amount of the facility; these fees are allocated to the funds based on a method approved by the fund’s board of trustees and included in Management and Administrative expenses on the fund’s Statement of Operations. Any borrowings under this facility bear interest at a rate equal to the higher of the federal funds rate or LIBOR reference rate plus an agreed-upon spread.
The fund had no borrowings outstanding at November 30, 2014, or at any time during the period then ended.
6. Other: Interest income is accrued daily. Premiums and discounts on debt securities purchased are amortized and accreted, respectively, to interest income over the lives of the respective securities. Security transactions are accounted for on the date securities are bought or sold. Costs used to determine realized gains (losses) on the sale of investment securities are those of the specific securities sold.
Each class of shares has equal rights as to assets and earnings, except that each class separately bears certain class-specific expenses related to maintenance of shareholder accounts (included in Management and Administrative expenses) and shareholder reporting. Marketing and distribution expenses are allocated to each class of shares based on a method approved by the board of trustees. Income, other non-class-specific expenses, and gains and losses on investments are allocated to each class of shares based on its relative net assets.
B. The Vanguard Group furnishes at cost investment advisory, corporate management, administrative, marketing, and distribution services. The costs of such services are allocated to the fund based on methods approved by the board of trustees. The fund has committed to invest up to 0.40% of its net assets in Vanguard. At November 30, 2014, the fund had contributed capital of $195,000 to Vanguard (included in Other Assets), representing 0.01% of the fund’s net assets and 0.08% of Vanguard’s capitalization. The fund’s trustees and officers are also directors and officers of Vanguard.
C. Various inputs may be used to determine the value of the fund’s investments. These inputs are summarized in three broad levels for financial statement purposes. The inputs or methodologies used to value securities are not necessarily an indication of the risk associated with investing in those securities.
Level 1—Quoted prices in active markets for identical securities.
Level 2—Other significant observable inputs (including quoted prices for similar securities, interest rates, prepayment speeds, credit risk, etc.).
Level 3—Significant unobservable inputs (including the fund’s own assumptions used to determine the fair value of investments).
56
New Jersey Long-Term Tax-Exempt Fund
At November 30, 2014, 100% of the market value of the fund’s investments was determined based on Level 2 inputs.
D. Capital gain distributions are determined on a tax basis and may differ from realized capital gains for financial reporting purposes. Differences may be permanent or temporary. Permanent differences are reclassified among capital accounts in the financial statements to reflect their tax character. Temporary differences arise when gains or losses are recognized in different periods for financial statement and tax purposes. These differences will reverse at some time in the future.
The fund used a tax accounting practice to treat a portion of the price of capital shares redeemed during the year as distributions from realized capital gains. Accordingly, the fund has reclassified $659,000 from accumulated net realized gains to paid-in capital.
For tax purposes, at November 30, 2014, the fund had short-term and long-term capital gains of $2,329,000 and $6,292,000, respectively, available for distribution. Short-term gain distributions are treated as ordinary income dividends for tax purposes.
At November 30, 2014, the cost of investment securities for tax purposes was $1,881,465,000. Net unrealized appreciation of investment securities for tax purposes was $105,062,000, consisting of unrealized gains of $111,041,000 on securities that had risen in value since their purchase and $5,979,000 in unrealized losses on securities that had fallen in value since their purchase.
E. During the year ended November 30, 2014, the fund purchased $373,726,000 of investment securities and sold $364,670,000 of investment securities, other than temporary cash investments.
F. Capital share transactions for each class of shares were:
| Year Ended November 30, | |||||
| 2014 | 2013 | ||||
| Amount | Shares | Amount | Shares | ||
| ($000) | (000) | ($000) | (000) | ||
| Investor Shares | |||||
| Issued | 45,238 | 3,773 | 55,137 | 4,561 | |
| Issued in Lieu of Cash Distributions | 7,598 | 632 | 7,984 | 667 | |
| Redeemed | (63,860) | (5,325) | (98,427) | (8,224) | |
| Net Increase (Decrease)—Investor Shares | (11,024) | (920) | (35,306) | (2,996) | |
| Admiral Shares | |||||
| Issued | 175,302 | 14,601 | 204,753 | 16,986 | |
| Issued in Lieu of Cash Distributions | 48,121 | 4,004 | 47,117 | 3,938 | |
| Redeemed | (194,689) | (16,295) | (342,507) | (28,663) | |
| Net Increase (Decrease) —Admiral Shares | 28,734 | 2,310 | (90,637) | (7,739) | |
G. Management has determined that no material events or transactions occurred subsequent to November 30, 2014, that would require recognition or disclosure in these financial statements.
57
Report of Independent Registered
Public Accounting Firm
To the Board of Trustees of Vanguard New Jersey Tax-Free Funds and the Shareholders of Vanguard New Jersey Tax-Exempt Money Market Fund and Vanguard New Jersey Long-Term Tax-Exempt Fund:
In our opinion, the accompanying statements of net assets and the related statements of operations and of changes in net assets and the financial highlights present fairly, in all material respects, the financial position of Vanguard New Jersey Tax-Exempt Money Market Fund and Vanguard New Jersey Long-Term Tax-Exempt Fund (constituting Vanguard New Jersey Tax-Free Funds, hereafter referred to as the “Funds”) at November 30, 2014, the results of each of their operations for the year then ended, the changes in each of their net assets for each of the two years in the period then ended, and the financial highlights for each of the five years in the period then ended, in conformity with accounting principles generally accepted in the United States of America. These financial statements and financial highlights (hereafter referred to as “financial statements”) are the responsibility of the Funds’ management. Our responsibility is to express an opinion on these financial statements based on our audits. We conducted our audits of these financial statements in accordance with the standards of the Public Company Accounting Oversight Board (United States). Those standards require that we plan and perform the audit to obtain reasonable assurance about whether the financial statements are free of material misstatement. An audit includes examining, on a test basis, evidence supporting the amounts and disclosures in the financial statements, assessing the accounting principles used and significant estimates made by management, and evaluating the overall financial statement presentation. We believe that our audits, which included confirmation of securities at November 30, 2014 by correspondence with the custodian and the application of alternative auditing procedures where securities purchased had not been received, provide a reasonable basis for our opinion.
/s/PricewaterhouseCoopers LLP
Philadelphia, Pennsylvania
January 13, 2015
This information for the fiscal year ended November 30, 2014, is included pursuant to provisions of the Internal Revenue Code.
Each fund designates 100% of its income dividends as exempt-interest dividends.
The Long-Term Tax-Exempt Fund distributed $3,771,000 as capital gain dividends (from net long-term capital gains) to shareholders during the fiscal year.
For nonresident alien shareholders, 100% of short-term capital gain dividends distributed by the fund are qualified short-term capital gains.
58
About Your Fund’s Expenses
As a shareholder of the fund, you incur ongoing costs, which include costs for portfolio management, administrative services, and shareholder reports (like this one), among others. Operating expenses, which are deducted from a fund’s gross income, directly reduce the investment return of the fund.
A fund’s expenses are expressed as a percentage of its average net assets. This figure is known as the expense ratio. The following examples are intended to help you understand the ongoing costs (in dollars) of investing in your fund and to compare these costs with those of other mutual funds. The examples are based on an investment of $1,000 made at the beginning of the period shown and held for the entire period.
The accompanying table illustrates your fund’s costs in two ways:
• Based on actual fund return. This section helps you to estimate the actual expenses that you paid over the period. The ”Ending Account Value“ shown is derived from the fund‘s actual return, and the third column shows the dollar amount that would have been paid by an investor who started with $1,000 in the fund. You may use the information here, together with the amount you invested, to estimate the expenses that you paid over the period.
To do so, simply divide your account value by $1,000 (for example, an $8,600 account value divided by $1,000 = 8.6), then multiply the result by the number given for your fund under the heading ”Expenses Paid During Period.“
• Based on hypothetical 5% yearly return. This section is intended to help you compare your fund‘s costs with those of other mutual funds. It assumes that the fund had a yearly return of 5% before expenses, but that the expense ratio is unchanged. In this case—because the return used is not the fund’s actual return—the results do not apply to your investment. The example is useful in making comparisons because the Securities and Exchange Commission requires all mutual funds to calculate expenses based on a 5% return. You can assess your fund’s costs by comparing this hypothetical example with the hypothetical examples that appear in shareholder reports of other funds.
Note that the expenses shown in the table are meant to highlight and help you compare ongoing costs only and do not reflect transaction costs incurred by the fund for buying and selling securities. Further, the expenses do not include any purchase, redemption, or account service fees described in the fund prospectus. If such fees were applied to your account, your costs would be higher. Your fund does not carry a “sales load.”
The calculations assume no shares were bought or sold during the period. Your actual costs may have been higher or lower, depending on the amount of your investment and the timing of any purchases or redemptions.
You can find more information about the fund’s expenses, including annual expense ratios, in the Financial Statements section of this report. For additional information on operating expenses and other shareholder costs, please refer to your fund’s current prospectus.
59
| Six Months Ended November 30, 2014 | |||
| Beginning Account Value 5/31/2014 | Ending Account Value 11/30/2014 | Expenses Paid During Period | |
| Based on Actual Fund Return | |||
| New Jersey Tax-Exempt Money Market Fund | $1,000.00 | $1,000.05 | $0.35 |
| New Jersey Long-Term Tax-Exempt Fund | |||
| Investor Shares | $1,000.00 | $1,021.75 | $1.01 |
| Admiral Shares | 1,000.00 | 1,022.16 | 0.61 |
| Based on Hypothetical 5% Yearly Return | |||
| New Jersey Tax-Exempt Money Market Fund | $1,000.00 | $1,024.72 | $0.36 |
| New Jersey Long-Term Tax-Exempt Fund | |||
| Investor Shares | $1,000.00 | $1,024.07 | $1.01 |
| Admiral Shares | 1,000.00 | 1,024.47 | 0.61 |
The calculations are based on expenses incurred in the most recent six-month period. The funds’ annualized six-month expense ratios for that period are: for the New Jersey Tax-Exempt Money Market Fund, 0.07%; and for the New Jersey Long-Term Tax-Exempt Fund, 0.20% for Investor Shares and 0.12% for Admiral Shares. (The six-month expense ratio for the New Jersey Tax-Exempt Money Market Fund reflects a temporary reduction in operating expenses, described in Note B of the Notes to Financial Statements. Before the reduction, the fund’s annualized six-month expense ratio was 0.16%.) The dollar amounts shown as “Expenses Paid” are equal to the annualized expense ratio multiplied by the average account value over the period, multiplied by the number of days in the most recent six-month period, then divided by the number of days in the most recent 12-month period.
60
Glossary
7-Day SEC Yield and 30-Day SEC Yield. A money market fund’s 7-day SEC yield is calculated by annualizing its income distributions for the previous seven days, as required by the U.S. Securities and Exchange Commission. For other funds, 30-day SEC yield is derived using a formula specified by the commission. Under the formula, data related to the fund’s security holdings in the previous 30 days are used to calculate the fund’s hypothetical net income for that period, which is then annualized and divided by the fund’s estimated average net assets over the calculation period. For the purposes of this calculation, a security’s income is based on its current market yield to maturity (for bonds), its actual income (for asset-backed securities), or its projected dividend yield (for stocks). Because the SEC yield represents hypothetical annualized income, it will differ—at times significantly—from the fund’s actual experience. As a result, the fund’s income distributions may be higher or lower than implied by the SEC yield.
Average Coupon. The average interest rate paid on the fixed income securities held by a fund. It is expressed as a percentage of face value.
Average Duration. An estimate of how much the value of the bonds held by a fund will fluctuate in response to a change in interest rates. To see how the value could change, multiply the average duration by the change in rates. If interest rates rise by 1 percentage point, the value of the bonds in a fund with an average duration of five years would decline by about 5%. If rates decrease by a percentage point, the value would rise by 5%.
Average Stated Maturity. The average length of time until fixed income securities held by a fund reach maturity and are repaid using the maturity date of the security. The figure reflects the proportion of fund assets represented by each security; it also reflects any futures contracts held. In general, the longer the average stated maturity, the more a fund’s share price will fluctuate in response to changes in market interest rates.
Average Weighted Maturity. The average length of time until fixed income securities held by a fund reach maturity and are repaid. The figure reflects the proportion of fund assets represented by each security.
Beta. A measure of the magnitude of a fund’s past share-price fluctuations in relation to the ups and downs of a given market index. The index is assigned a beta of 1.00. Compared with a given index, a fund with a beta of 1.20 typically would have seen its share price rise or fall by 12% when the index rose or fell by 10%. For this report, beta is based on returns over the past 36 months for both the fund and the index. Note that a fund’s beta should be reviewed in conjunction with its R-squared (see definition). The lower the R-squared, the less correlation there is between the fund and the index, and the less reliable beta is as an indicator of volatility.
61
Credit Quality. For Vanguard money market funds, the Distribution by Credit Quality table includes tier ratings for consistency with SEC Rule 2a-7 under the Investment Company Act of 1940, which governs money market funds. A First Tier security is one that is eligible for money market funds and has been rated in the highest short-term rating category for debt obligations by the requisite nationally recognized statistical rating organizations. Credit-quality ratings are obtained from Moody’s, Fitch, and S&P. For securities rated by all three agencies, where two of them are in agreement and assign the highest rating category, the highest rating applies. If a security is only rated by two agencies, and their ratings are in different categories, the lower of the ratings applies. An unrated security is First Tier if it represents quality comparable to that of a rated security, as determined in accordance with SEC Rule 2a-7. A Second Tier security is one that is eligible for money market funds and is not a First Tier security. For Vanguard tax-exempt bond funds, credit-quality ratings are measured on a scale that generally ranges from AAA (highest) to D (lowest). “Not Rated” is used to classify securities for which a rating is not available. Credit quality ratings are obtained from Moody’s and S&P, and the higher rating for each issue is used.
Expense Ratio. A fund’s total annual operating expenses expressed as a percentage of the fund’s average net assets. The expense ratio includes management and administrative expenses, but does not include the transaction costs of buying and selling portfolio securities.
Inception Date. The date on which the assets of a fund (or one of its share classes) are first invested in accordance with the fund’s investment objective. For funds with a subscription period, the inception date is the day after that period ends. Investment performance is measured from the inception date.
R-Squared. A measure of how much of a fund’s past returns can be explained by the returns from the market in general, as measured by a given index. If a fund’s total returns were precisely synchronized with an index’s returns, its R-squared would be 1.00. If the fund’s returns bore no relationship to the index’s returns, its R-squared would be 0. For this report, R-squared is based on returns over the past 36 months for both the fund and the index.
Short-Term Reserves. The percentage of a fund invested in highly liquid, short-term securities that can be readily converted to cash.
Yield to Maturity. The rate of return an investor would receive if the fixed income securities held by a fund were held to their maturity dates.
Benchmark Information
Spliced New Jersey Tax-Exempt Money Market Funds Average: New Jersey Tax-Exempt Money Market Funds Average through August 31, 2013; Other States Tax-Exempt Money Market Funds Average thereafter.
62
This page intentionally left blank.
The People Who Govern Your Fund
The trustees of your mutual fund are there to see that the fund is operated and managed in your best interests since, as a shareholder, you are a part owner of the fund. Your fund’s trustees also serve on the board of directors of The Vanguard Group, Inc., which is owned by the Vanguard funds and provides services to them on an at-cost basis.
A majority of Vanguard’s board members are independent, meaning that they have no affiliation with Vanguard or the funds they oversee, apart from the sizable personal investments they have made as private individuals. The independent board members have distinguished backgrounds in business, academia, and public service. Each of the trustees and executive officers oversees 177 Vanguard funds.
The following table provides information for each trustee and executive officer of the fund. More information about the trustees is in the Statement of Additional Information, which can be obtained, without charge, by contacting Vanguard at 800-662-7447, or online at vanguard.com.
| InterestedTrustee1 | and Delphi Automotive LLP (automotive components); |
| Senior Advisor at New Mountain Capital. | |
| F. William McNabb III | |
| Born 1957. Trustee Since July 2009. Chairman of the | Amy Gutmann |
| Board. Principal Occupation(s) During the Past Five | Born 1949. Trustee Since June 2006. Principal |
| Years: Chairman of the Board of The Vanguard Group, | Occupation(s) During the Past Five Years: President of |
| Inc., and of each of the investment companies served | the University of Pennsylvania; Christopher H. Browne |
| by The Vanguard Group, since January 2010; Director | Distinguished Professor of Political Science, School of |
| of The Vanguard Group since 2008; Chief Executive | Arts and Sciences, and Professor of Communication, |
| Officer and President of The Vanguard Group, and of | Annenberg School for Communication, with secondary |
| each of the investment companies served by The | faculty appointments in the Department of Philosophy, |
| Vanguard Group, since 2008; Director of Vanguard | School of Arts and Sciences, and at the Graduate |
| Marketing Corporation; Managing Director of The | School of Education, University of Pennsylvania; |
| Vanguard Group (1995–2008). | Trustee of the National Constitution Center; Chair |
| of the Presidential Commission for the Study of | |
| IndependentTrustees | Bioethical Issues. |
| Emerson U. Fullwood | JoAnn Heffernan Heisen |
| Born 1948. Trustee Since January 2008. Principal | Born 1950. Trustee Since July 1998. Principal |
| Occupation(s) During the Past Five Years: Executive | Occupation(s) During the Past Five Years: Corporate |
| Chief Staff and Marketing Officer for North America | Vice President and Chief Global Diversity Officer |
| and Corporate Vice President (retired 2008) of Xerox | (retired 2008) and Member of the Executive |
| Corporation (document management products and | Committee (1997–2008) of Johnson & Johnson |
| services); Executive in Residence and 2009–2010 | (pharmaceuticals/medical devices/consumer |
| Distinguished Minett Professor at the Rochester | products); Director of Skytop Lodge Corporation |
| Institute of Technology; Director of SPX Corporation | (hotels), the University Medical Center at Princeton, |
| (multi-industry manufacturing), the United Way of | the Robert Wood Johnson Foundation, and the Center |
| Rochester, Amerigroup Corporation (managed health | for Talent Innovation; Member of the Advisory Board |
| care), the University of Rochester Medical Center, | of the Maxwell School of Citizenship and Public Affairs |
| Monroe Community College Foundation, and North | at Syracuse University. |
| Carolina A&T University. | |
| F. Joseph Loughrey | |
| Rajiv L. Gupta | Born 1949. Trustee Since October 2009. Principal |
| Born 1945. Trustee Since December 2001.2 | Occupation(s) During the Past Five Years: President |
| Principal Occupation(s) During the Past Five Years: | and Chief Operating Officer (retired 2009) of Cummins |
| Chairman and Chief Executive Officer (retired 2009) | Inc. (industrial machinery); Chairman of the Board |
| and President (2006–2008) of Rohm and Haas Co. | of Hillenbrand, Inc. (specialized consumer services), |
| (chemicals); Director of Tyco International, Ltd. | and of Oxfam America; Director of SKF AB (industrial |
| (diversified manufacturing and services), Hewlett- | machinery), Hyster-Yale Materials Handling, Inc. |
| Packard Co. (electronic computer manufacturing), | (forklift trucks), the Lumina Foundation for Education, |
| and the V Foundation for Cancer Research; Member | Executive Officers | |
| of the Advisory Council for the College of Arts and | ||
| Letters and of the Advisory Board to the Kellogg | Glenn Booraem | |
| Institute for International Studies, both at the | Born 1967. Controller Since July 2010. Principal | |
| University of Notre Dame. | Occupation(s) During the Past Five Years: Principal | |
| of The Vanguard Group, Inc.; Controller of each of | ||
| Mark Loughridge | the investment companies served by The Vanguard | |
| Born 1953. Trustee Since March 2012. Principal | Group; Assistant Controller of each of the investment | |
| Occupation(s) During the Past Five Years: Senior Vice | companies served by The Vanguard Group (2001–2010). | |
| President and Chief Financial Officer (retired 2013) | ||
| at IBM (information technology services); Fiduciary | Thomas J. Higgins | |
| Member of IBM’s Retirement Plan Committee (2004– | Born 1957. Chief Financial Officer Since September | |
| 2013); Member of the Council on Chicago Booth. | 2008. Principal Occupation(s) During the Past Five | |
| Years: Principal of The Vanguard Group, Inc.; Chief | ||
| Scott C. Malpass | Financial Officer of each of the investment companies | |
| Born 1962. Trustee Since March 2012. Principal | served by The Vanguard Group; Treasurer of each of | |
| Occupation(s) During the Past Five Years: Chief | the investment companies served by The Vanguard | |
| Investment Officer and Vice President at the University | Group (1998–2008). | |
| of Notre Dame; Assistant Professor of Finance at the | ||
| Mendoza College of Business at Notre Dame; Member | Kathryn J. Hyatt | |
| of the Notre Dame 403(b) Investment Committee; | Born 1955. Treasurer Since November 2008. Principal | |
| Board Member of TIFF Advisory Services, Inc. | Occupation(s) During the Past Five Years: Principal of | |
| (investment advisor); Member of the Investment | The Vanguard Group, Inc.; Treasurer of each of the | |
| Advisory Committees of the Financial Industry | investment companies served by The Vanguard | |
| Regulatory Authority (FINRA) and of Major League | Group; Assistant Treasurer of each of the investment | |
| Baseball. | companies served by The Vanguard Group (1988–2008). | |
| André F. Perold | Heidi Stam | |
| Born 1952. Trustee Since December 2004. Principal | Born 1956. Secretary Since July 2005. Principal | |
| Occupation(s) During the Past Five Years: George | Occupation(s) During the Past Five Years: Managing | |
| Gund Professor of Finance and Banking, Emeritus | Director of The Vanguard Group, Inc.; General Counsel | |
| at the Harvard Business School (retired 2011); | of The Vanguard Group; Secretary of The Vanguard | |
| Chief Investment Officer and Managing Partner of | Group and of each of the investment companies | |
| HighVista Strategies LLC (private investment firm); | served by The Vanguard Group; Director and Senior | |
| Director of Rand Merchant Bank; Overseer of the | Vice President of Vanguard Marketing Corporation. | |
| Museum of Fine Arts Boston. | ||
| Vanguard Senior ManagementTeam | ||
| Alfred M. Rankin, Jr. | ||
| Born 1941. Trustee Since January 1993. Principal | Mortimer J. Buckley | Chris D. McIsaac |
| Occupation(s) During the Past Five Years: Chairman, | Kathleen C. Gubanich | Michael S. Miller |
| President, and Chief Executive Officer of NACCO | Paul A. Heller | James M. Norris |
| Industries, Inc. (housewares/lignite), and of Hyster- | Martha G. King | Glenn W. Reed |
| Yale Materials Handling, Inc. (forklift trucks); Chairman | John T. Marcante | |
| of the Board of University Hospitals of Cleveland. | ||
| Chairman Emeritus and Senior Advisor | ||
| Peter F. Volanakis | ||
| Born 1955. Trustee Since July 2009. Principal | John J. Brennan | |
| Occupation(s) During the Past Five Years: President | Chairman, 1996–2009 | |
| and Chief Operating Officer (retired 2010) of Corning | Chief Executive Officer and President, 1996–2008 | |
| Incorporated (communications equipment); Trustee of | ||
| Colby-Sawyer College; Member of the Advisory Board | Founder | |
| of the Norris Cotton Cancer Center and of the Advisory | ||
| Board of the Parthenon Group (strategy consulting). | John C. Bogle | |
| Chairman and Chief Executive Officer, 1974–1996 | ||
1 Mr. McNabb is considered an “interested person,” as defined in the Investment Company Act of 1940, because he is an officer of the Vanguard funds.
2 December 2002 for Vanguard Equity Income Fund, the Vanguard Municipal Bond Funds, and the Vanguard State Tax-Exempt Funds.
 | |
| P.O. Box 2600 | |
| Valley Forge, PA 19482-2600 | |
| Connect with Vanguard® > vanguard.com | |
| Fund Information > 800-662-7447 | CFA® is a registered trademark owned by CFA Institute. |
| Direct Investor Account Services > 800-662-2739 | |
| Institutional Investor Services > 800-523-1036 | |
| Text Telephone for People | |
| Who Are Deaf or Hard of Hearing> 800-749-7273 | |
| This material may be used in conjunction | |
| with the offering of shares of any Vanguard | |
| fund only if preceded or accompanied by | |
| the fund’s current prospectus. | |
| All comparative mutual fund data are from Lipper, a | |
| Thomson Reuters Company, or Morningstar, Inc., unless | |
| otherwise noted. | |
| You can obtain a free copy of Vanguard’s proxy voting | |
| guidelines by visiting vanguard.com/proxyreporting or by | |
| calling Vanguard at 800-662-2739. The guidelines are | |
| also available from the SEC’s website, sec.gov. In | |
| addition, you may obtain a free report on how your fund | |
| voted the proxies for securities it owned during the 12 | |
| months ended June 30. To get the report, visit either | |
| vanguard.com/proxyreporting or sec.gov. | |
| You can review and copy information about your fund at | |
| the SEC’s Public Reference Room in Washington, D.C. To | |
| find out more about this public service, call the SEC at | |
| 202-551-8090. Information about your fund is also | |
| available on the SEC’s website, and you can receive | |
| copies of this information, for a fee, by sending a | |
| request in either of two ways: via e-mail addressed to | |
| publicinfo@sec.gov or via regular mail addressed to the | |
| Public Reference Section, Securities and Exchange | |
| Commission, Washington, DC 20549-1520. | |
| © 2015 The Vanguard Group, Inc. | |
| All rights reserved. | |
| Vanguard Marketing Corporation, Distributor. | |
| Q140 012015 | |
Item 2: Code of Ethics. The Registrant has adopted a code of ethics that applies to the Registrant’s principal executive officer, principal financial officer, principal accounting officer or controller or persons performing similar functions. The Code of Ethics was amended during the reporting period covered by this report to make certain technical, non-material changes.
Item 3: Audit Committee Financial Expert. The following members of the Audit Committee have been determined by the Registrant’s Board of Trustees to be Audit Committee Financial Experts serving on its Audit Committee, and to be independent: Rajiv L. Gupta, Amy Gutmann, JoAnn Heffernan Heisen, F. Joseph Loughrey, Mark Loughridge, Scott C. Malpass, and André F. Perold.
Item 4: Principal Accountant Fees and Services.
(a) Audit Fees.
Audit Fees of the Registrant
Fiscal Year Ended November 30, 2014: $60,000
Fiscal Year Ended November 30, 2013: $52,000
Aggregate Audit Fees of Registered Investment Companies in the Vanguard Group.
Fiscal Year Ended November 30, 2014: $6,605,127
Fiscal Year Ended November 30, 2013: $5,714,113
Includes fees billed in connection with audits of the Registrant, other registered investment companies in the Vanguard complex, The Vanguard Group, Inc. and Vanguard Marketing Corporation.
(b) Audit-Related Fees.
Fiscal Year Ended November 30, 2014: $2,176,479
Fiscal Year Ended November 30, 2013: $1,552,950
Includes fees billed in connection with assurance and related services provided to the Registrant, other registered investment companies in the Vanguard complex, The Vanguard Group, Inc., and Vanguard Marketing Corporation.
(c) Tax Fees.
Fiscal Year Ended November 30, 2014: $316,869
Fiscal Year Ended November 30, 2013: $110,000
Includes fees billed in connection with tax compliance, planning, and advice services provided to the Registrant, other registered investment companies in the Vanguard complex, The Vanguard Group, Inc., and Vanguard Marketing Corporation.
(d) All Other Fees.
Fiscal Year Ended November 30, 2014: $198,163
Fiscal Year Ended November 30, 2013: $132,000
Includes fees billed for services related to tax reported information provided to the Registrant, other registered investment companies in the Vanguard complex, The Vanguard Group, Inc., and Vanguard Marketing Corporation.
(e) (1) Pre-Approval Policies. The policy of the Registrant’s Audit Committee is to consider and, if appropriate, approve before the principal accountant is engaged for such services, all specific audit and non-audit services provided to: the Registrant, other registered investment companies in the Vanguard complex, The Vanguard Group, Inc., and entities controlled by The Vanguard Group, Inc. that provide ongoing services to the Registrant. In making a determination, the Audit Committee considers whether the services are consistent with maintaining the principal accountant’s independence.
In the event of a contingency situation in which the principal accountant is needed to provide services in between scheduled Audit Committee meetings, the Chairman of the Audit Committee would be called on to consider and, if appropriate, pre-approve audit or permitted non-audit services in an amount sufficient to complete services through the next Audit Committee meeting, and to determine if such services would be consistent with maintaining the accountant’s independence. At the next scheduled Audit Committee meeting, services and fees would be presented to the Audit Committee for formal consideration, and, if appropriate, approval by the entire Audit Committee. The Audit Committee would again consider whether such services and fees are consistent with maintaining the principal accountant’s independence.
The Registrant’s Audit Committee is informed at least annually of all audit and non-audit services provided by the principal accountant to the Vanguard complex, whether such services are provided to: the Registrant, other registered investment companies in the Vanguard complex, The Vanguard Group, Inc., or other entities controlled by The Vanguard Group, Inc. that provide ongoing services to the Registrant.
(2) No percentage of the principal accountant’s fees or services were approved pursuant to the waiver provision of paragraph (c)(7)(i)(C) of Rule 2-01 of Regulation S-X.
(f) For the most recent fiscal year, over 50% of the hours worked under the principal accountant’s engagement were not performed by persons other than full-time, permanent employees of the principal accountant.
(g) Aggregate Non-Audit Fees.
Fiscal Year Ended November 30, 2014: $515,032
Fiscal Year Ended November 30, 2013: $242,000
Includes fees billed for non-audit services provided to the Registrant, other registered investment companies in the Vanguard complex, The Vanguard Group, Inc., and Vanguard Marketing Corporation.
(h) For the most recent fiscal year, the Audit Committee has determined that the provision of all non-audit services was consistent with maintaining the principal accountant’s independence.
Item 5: Audit Committee of Listed Registrants.
Not Applicable.
Item 6: Investments.
Not Applicable.
Item 7: Disclosure of Proxy Voting Policies and Procedures for Closed-End Management Investment Companies.
Not Applicable.
Item 8: Portfolio Managers of Closed-End Management Investment Companies.
Not Applicable.
Item 9: Purchase of Equity Securities by Closed-End Management Investment Company and Affiliated Purchasers.
Not Applicable.
Item 10: Submission of Matters to a Vote of Security Holders.
Not Applicable.
Item 11: Controls and Procedures.
(a) Disclosure Controls and Procedures. The Principal Executive and Financial Officers concluded that the Registrant’s Disclosure Controls and Procedures are effective based on their evaluation of the Disclosure Controls and Procedures as of a date within 90 days of the filing date of this report.
(b) Internal Control Over Financial Reporting. There were no significant changes in Registrant’s Internal Control Over Financial Reporting or in other factors that could significantly affect this control subsequent to the date of the evaluation, including any corrective actions with regard to significant deficiencies and material weaknesses.
Item 12: Exhibits.
(a) Code of Ethics.
(b) Certifications.
Pursuant to the requirements of the Securities Exchange Act of 1934 and the Investment Company Act of 1940, the registrant has duly caused this report to be signed on its behalf by the undersigned, thereunto duly authorized.
VANGUARD NEW JERSEY TAX-FREE FUNDS
| |
| BY: | /s/ F. WILLIAM MCNABB III* |
| F. WILLIAM MCNABB III | |
| CHIEF EXECUTIVE OFFICER | |
| Date: January 21, 2015 | |
Pursuant to the requirements of the Securities Exchange Act of 1934 and the Investment Company Act of 1940, this report has been signed below by the following persons on behalf of the registrant and in the capacities and on the dates indicated.
VANGUARD NEW JERSEY TAX-FREE FUNDS
| |
| BY: | /s/ F. WILLIAM MCNABB III* |
| F. WILLIAM MCNABB III | |
| CHIEF EXECUTIVE OFFICER | |
Date: January 21, 2015
| |
VANGUARD NEW JERSEY TAX-FREE FUNDS
| |
| BY: | /s/ THOMAS J. HIGGINS* |
| THOMAS J. HIGGINS | |
| CHIEF FINANCIAL OFFICER | |
| Date: January 21, 2015 | |
* By: /s/ Heidi Stam
Heidi Stam, pursuant to a Power of Attorney filed on April 22, 2014 see file Number
2-17620, Incorporated by Reference.