Exhibit (d)
This description of KfW and the Federal Republic of Germany is dated May 10, 2012 and appears as Exhibit (d) to the Annual Report on Form 18-K of KfW for the fiscal year ended December 31, 2011.
TABLE OF CONTENTS
2
THIS DOCUMENT (OTHERWISE THAN AS PART OF A PROSPECTUS CONTAINED IN A REGISTRATION STATEMENT FILED UNDER THE U.S. SECURITIES ACT OF 1933) DOES NOT CONSTITUTE AN OFFER TO SELL OR THE SOLICITATION OF AN OFFER TO BUY ANY SECURITIES OF KFW. THE DELIVERY OF THIS DOCUMENT AT ANY TIME DOES NOT IMPLY THAT THE INFORMATION HEREIN IS CORRECT AS OF ANY TIME SUBSEQUENT TO ITS DATE.
PRESENTATION OF FINANCIAL AND OTHER INFORMATION
In this description, references to “€”, “euro” or “EUR” are to the single European currency of the member states of the European Union participating in the euro and references to “U.S. dollars”, “$” or “USD” are to United States dollars. See “Exchange Rate Information” below for information regarding the rates of conversion of the euro into United States dollars and “The Federal Republic of Germany-General-The European Union and European Integration” for a discussion of the introduction of the euro.
Unless explicitly stated otherwise, financial information relating to KfW Bankengruppe presented herein has been prepared in accordance with International Financial Reporting Standards as adopted by the European Union (“IFRS”).
Amounts in tables may not add up due to rounding differences.
On May 9, 2012, the euro foreign exchange reference rate as published by the European Central Bank was EUR 1.00 = U.S. dollar 1.2950 (EUR 0.7722 per U.S. dollar).
In this document, references to the “Federal Republic” and “Germany” are to the Federal Republic of Germany and references to the “Federal Government” are to the government of the Federal Republic of Germany. The terms “KfW Bankengruppe” and “group” refer to KfW and its consolidated subsidiaries.
EXCHANGE RATE INFORMATION
We file reports with the Securities and Exchange Commission giving financial and economic data expressed in euro.
The following table shows noon buying rates for euro, expressed as U.S. dollars per EUR 1.00, for the periods and dates indicated, as reported by the Federal Reserve Bank of New York. On January 1, 2009, the Federal Reserve Bank of New York discontinued daily publication of noon buying rates. As of this date, noon buying rates are as published on a weekly basis by the Federal Reserve Bank of New York.
| | | | | | | | | | | | | | | | |
Year ended December 31, | | Period End | | | Average (1) | | | High | | | Low | |
2007 | | | 1.4603 | | | | 1.3797 | | | | 1.4862 | | | | 1.2904 | |
2008 | | | 1.3919 | | | | 1.4695 | | | | 1.6010 | | | | 1.2446 | |
2009 | | | 1.4332 | | | | 1.3955 | | | | 1.5100 | | | | 1.2547 | |
2010 | | | 1.3269 | | | | 1.3216 | | | | 1.4536 | | | | 1.1959 | |
2011 | | | 1.2973 | | | | 1.4002 | | | | 1.4875 | | | | 1.2926 | |
| | | | |
| | | Period End | | | Average (1) | | | High | | | Low | |
Quarter ended March 31, 2012 | | | 1.3334 | | | | 1.3249 | | | | 1.3463 | | | | 1.2682 | |
| (1) | The average of the noon buying rates on the last business day of each month during the relevant period. |
3
The following table shows the high and low noon buying rates for euro, expressed as U.S. dollars per EUR 1.00, for each month from November 2011 through May 2012 (through May 4, 2012), as reported by the Federal Reserve Bank of New York.
| | | | | | | | |
| | | High | | | Low | |
2011 | | | | | | | | |
November | | | 1.3803 | | | | 1.3244 | |
December | | | 1.3487 | | | | 1.2926 | |
2012 | | | | | | | | |
January | | | 1.3192 | | | | 1.2686 | |
February | | | 1.3463 | | | | 1.3087 | |
March | | | 1.3336 | | | | 1.3025 | |
April | | | 1.3337 | | | | 1.3064 | |
May (through May 4, 2012) | | | 1.3226 | | | | 1.3091 | |
No representation is made that the euro or U.S. dollar amounts referred to herein or referred to in the documents which incorporate this information by reference could have been or could be converted into U.S. dollars or euro, as the case may be, at any particular rate.
There are, except in limited embargo circumstances, no legal restrictions in the Federal Republic of Germany on international capital movements and foreign exchange transactions. However, for statistical purposes only, every individual or corporation residing in the Federal Republic of Germany must report to the Deutsche Bundesbank, the German Central Bank, subject to a number of exceptions, any payment received from or made to an individual or a corporation resident outside of the Federal Republic of Germany if such payment exceeds EUR 12,500 (or the equivalent in a foreign currency).
4
RECENT DEVELOPMENTS
KFW
KfW’s Results for the Three Months Ended March 31, 2012
KfW is not required by law to prepare and publish interim financial statements in conformity with International Financial Reporting Standards as adopted by the EU (“IFRS”) applicable to interim financial reporting. Accordingly, KfW only prepares selected interim financial information rather than a full set of interim financial statements. The following information is based on this selected unaudited interim financial information prepared by KfW in accordance with IFRS applicable to interim financial reporting. This information is not necessarily indicative of the figures of KfW Bankengruppe for the full year ending December 31, 2012.
The group’s total assets decreased by 0.3%, or EUR 1.4 billion, from EUR 494.8 billion as of December 31, 2011 to EUR 493.4 billion as of March 31, 2012.
The group’s operating result before valuation amounted to EUR 576 million for the three months ended March 31, 2012, compared with EUR 509 million for the same period in 2011. The main driver for the group’s operating result before valuation during the three months ended March 31, 2012 was net interest income, reflecting favorable funding conditions for KfW. The group’s operating result before valuation is before (1) risk provisions for lending business, (2) net gains/losses from securities and investments, and (3) net gains/losses from hedge accounting and other financial instruments at fair value through profit or loss. These valuation effects consisted of the following:
| | • | Positive effects resulting from reversals of risk provisions (including reversals concerning special items due to risks related to former IKB risk protection measures) in an amount of EUR 99 million for the three months ended March 31, 2012, compared with corresponding positive effects in an amount of EUR 71 million for the same period in 2011; |
| | • | Positive effects in an amount of EUR 49 million as market values of securities and equity investments rose further in the three months ended March 31, 2012, compared with corresponding positive effects of EUR 23 million for the same period in 2011; and |
| | • | Charges in an amount of EUR 12 million for the three months ended March 31, 2012, due to fair value changes of derivatives used exclusively for hedging purposes in closed risk positions for the three months ended March 31, 2012, compared with corresponding positive effects in an amount of EUR 433 million for the same period in 2011. Economic hedging relationships are recognized through hedge accounting and by using the “fair value option.” However, as not all derivatives are subject to hedge accounting or the “fair value option,” changes in the fair value of some derivatives held as part of an economic hedging relationship are reflected in net income. Because the hedged risk associated with the underlying transactions has not yet been recognized in profit or loss under IFRS, the accounts do not reflect the risk-mitigating impact of such hedging relationships. |
The group’s consolidated result for the three months ended March 31, 2012, amounted to EUR 697 million compared with EUR 1,021 million for the same period in 2011.
5
Promotional Business Volume
The following table sets forth a breakdown of commitments by business area in the three months ended March 31, 2012 as compared with the same period in 2011.
PROMOTIONAL BUSINESS VOLUMEBY BUSINESS AREA
| | | | | | | | |
| | | Three months ended March 31, | |
| | | 2012 | | | 2011 | |
| | | (EUR in millions) | |
KfW Mittelstandsbank (1) | | | 5,178 | | | | 5,606 | |
KfW Privatkundenbank | | | 3,797 | | | | 4,542 | |
KfW Kommunalbank | | | 1,560 | | | | 9,027 | |
Export and project finance (KfW IPEX-Bank) | | | 3,108 | | | | 2,778 | |
Promotion of developing and transition countries | | | 833 | | | | 849 | |
of which KfW Entwicklungsbank | | | 589 | | | | 713 | |
of which DEG – Deutsche Investitions- und Entwicklungsgesellschaft mbH | | | 244 | | | | 136 | |
Capital markets | | | 273 | | | | 120 | |
| | | | | | | | |
Total promotional business volume (2) (3) | | | 14,735 | | | | 22,725 | |
| | | | | | | | |
| (1) | Commitment figures for the three months ended March 31, 2011 include EUR 57 million under the KfW Sonderprogramm that will not be disbursed due to cancellations and withdrawals which occurred after the contractual loan commitments but prior to or on March 31, 2011. |
| (2) | Total promotional business volume has been adjusted for commitments of EUR 14 million in the three months ended March 31, 2012 (same period in 2011: EUR 197 million) made by KfW IPEX-Bank relating to export and project finance and refinanced under certain of KfW Mittelstandsbank’s promotional programs. |
| (3) | Commitments represent the volume of funds committed for loans and other business transactions (with the exception of program-based global loans to Landesförderinstitute) in the relevant period, including amounts to be disbursed in future periods, and do not include amounts disbursed in the relevant period pursuant to commitments made in prior periods. In the case of program-based global loans to the Landesförderinstitute, commitments represent the actual volume of funds disbursed in the relevant period. |
KfW’s total promotional business volume decreased to EUR 14.7 billion for the three months ended March 31, 2012 from EUR 22.7 billion for the same period in 2011. This significant decrease was largely driven by a decrease in commitments of KfW Kommunalbank.
Commitments of KfW Mittelstandsbank decreased to EUR 5.2 billion for the three months ended March 31, 2012 from EUR 5.6 billion for the same period in 2011. This decrease mainly reflected the end of the commitment period of the KfW Sonderprogramm, which expired in accordance with its terms on June 30, 2011.
Commitments of KfW Privatkundenbank decreased to EUR 3.8 billion for the three months ended March 31, 2012 from EUR 4.5 billion for the same period in 2011. This decrease was due to reduced commitments under KfW’s Privatkundenbank’s housing investment programs.
KfW Kommunalbank’s commitments decreased to EUR 1.6 billion for the three months ended March 31, 2012 from EUR 9.0 billion for the same period in 2011. This development was primarily driven by a decrease in commitments for global funding facilities to Landesförderinstitute mainly attributable to a change in the recognition of commitments to Landesförderinstitute from yearly to quarterly commitment intervals, leading to a more consistent allocation of commitments for global funding facilities throughout the year.
Commitments in KfW’s export and project finance business during the three months ended March 31, 2012 amounted to EUR 3.1 billion compared to EUR 2.8 billion for the same period in 2011. The main drivers were increasing commitments in (1) the manufacturing industries, telecommunications, retail and health, (2) financial institutions, trade and commodity finance, and (3) the rail and aviation sectors.
Commitments in respect of KfW’s promotion of developing and transition countries, made by DEG and KfW Entwicklungsbank, remained stable at EUR 0.8 billion for the three months ended March 31, 2012 compared to EUR 0.8 billion for the same period in 2011.
6
Commitments under KfW’s capital markets business amounted to EUR 0.3 billion for the three months ended March 31, 2012 compared with EUR 0.1 billion for the same period in 2011. This increase was due to an increase in commitments under the program for the refinancing of export loans and global loans.
Sources of Funds
The volume of funding raised in the capital markets for the first four months ended April 30, 2012 totaled EUR 40.4 billion, of which 44.2% was raised in euro, 37.6% in U.S. dollar and the remainder in nine other currencies.
Capitalization and Indebtedness of KfW Bankengruppe as of March 31, 2012
| | | | |
| | | (EUR in millions) | |
Borrowings | | | | |
Short-term funds | | | 26,432 | |
Bonds and other fixed-income securities | | | 374,886 | |
Other borrowings | | | 37,810 | |
Subordinated liabilities (1) | | | 3,247 | |
| | | | |
Total borrowings | | | 442,373 | |
| |
Equity | | | | |
Paid-in subscribed capital (2) | | | 3,300 | |
Capital reserve (3) | | | 5,947 | |
Reserve from the ERP Special Fund | | | 1,071 | |
Retained earnings | | | 6,757 | |
Fund for general banking risks | | | 1,732 | |
Revaluation reserve | | | -5 | |
Total equity | | | 18,802 | |
| | | | |
Total capitalization | | | 461,175 | |
| | | | |
| (1) | Includes assets transferred from the ERP Special Fund in form of a subordinated loan of EUR 3,247 million. |
| (2) | KfW’s equity capital, 80% of which is held by the Federal Government and the remaining 20% by the Länder, amounted to EUR 3,750 million as of March 31, 2012, of which EUR 3,300 million has been paid in pro rata by the Federal Government and the Länder. |
| (3) | Includes equity capital in form of a promotional reserve (Förderrücklage) from the ERP Special Fund of EUR 4,650 million. |
The capitalization of KfW Bankengruppe as of March 31, 2012 is not necessarily indicative of its capitalization to be recorded as of December 31, 2012.
The increase of EUR 955 million in total equity, which totaled EUR 18,802 million as of March 31, 2012 compared to EUR 17,847 million as of December 31, 2011, reflected (1) an increase of EUR 257 million of revaluation reserves due to valuation profits recognized directly in equity relating to “available-for-sale financial assets,” and (2) KfW Bankengruppe’s consolidated result of EUR 697 million for the three months ended March 31, 2012.
KfW is not subject to the German Banking Act (Kreditwesengesetz) and the German Solvency Regulation (Solvabilitätsverordnung), which require banks to have adequate own funds (Eigenmittel) for the conduct of their business. However, KfW calculates capital ratios prescribed by these rules on a voluntary basis for internal purposes. KfW applies all material rules in calculating these ratios, with slight modifications for KfW’s promotional core business. According to the calculations based on the results for the three months ended March 31, 2012, KfW’s total capital ratio according to section 2(6) of the German Solvency Regulation amounted to 19.6% and its tier 1 ratio amounted to 17.0% as of March 31, 2012.
Other Recent Developments
Financial Support Measures for Greece
In mid-March 2012, the Euro Area Member States approved a second financial support program for Greece. Under this second program, the EFSF and the IMF have committed the undisbursed amounts of the first program plus an additional EUR 130 billion for the years 2012 to 2014. As a result, KfW’s loan facility to Greece on behalf of the Federal Republic has been reduced from EUR 22.3 billion to the amount disbursed as of April 11, 2012, which totaled EUR 15.2 billion.
7
THE FEDERAL REPUBLIC OF GERMANY
Overview of Key Economic Figures
The following economic information regarding the Federal Republic is derived from the public official documents cited below. Certain of the information is preliminary.
Gross Domestic Product (GDP)
GROSS DOMESTIC PRODUCT
(adjusted for price, seasonal and calendar effects)
| | | | |
Reference period | | Percentage change on previous quarter | | Percentage change on the same quarter
in previous year |
4th quarter 2010 | | 0.5 | | 3.7 |
1st quarter 2011 | | 1.3 | | 4.7 |
2nd quarter 2011 | | 0.3 | | 2.9 |
3rd quarter 2011 | | 0.6 | | 2.7 |
4th quarter 2011 | | -0.2 | | 2.0 |
At year-end 2011, the German economy suffered a slight setback as GDP in the fourth quarter of 2011 shrank compared to the third quarter of 2011.
Compared to the third quarter of 2011, the main factor which contributed positively to economic growth in the fourth quarter of 2011 was capital formation. In particular, capital formation in construction in the fourth quarter of 2011 increased by 1.9% compared to the third quarter of 2011. Capital formation in machinery and equipment in the fourth quarter of 2011 remained at the same level as in the third quarter of 2011. Private final consumption expenditure declined slightly by 0.2% in the fourth quarter of 2011 compared to the third quarter of 2011, while general government final consumption expenditure increased marginally by 0.1%. Overall, domestic uses had a slightly positive effect on GDP with a contribution to growth of 0.1 percentage points in the fourth quarter of 2011 compared to the third quarter of 2011. Foreign trade had a negative impact on German economic development in the fourth quarter of 2011 with exports of goods and services declining 0.8% compared to the third quarter of 2011. Because imports declined by 0.3% in the fourth quarter of 2011 compared to the third quarter of 2011 and thus declined less than exports, the balance of exports and imports had a negative impact of -0.3 percentage points to GDP growth in the period under review.
In a year-on-year comparison, GDP in the fourth quarter of 2011 increased compared to the fourth quarter of 2010.
Source: Statistisches Bundesamt, Ausführliche Ergebnisse zur Wirtschaftsleistung im 4. Quartal 2011, press release of February 24, 2012 (https://www.destatis.de/DE/PresseService/Presse/Pressemitteilungen/2012/02/PD12_063_811.html).
8
Inflation Rate
INFLATION RATE
(based on overall consumer price index)
| | | | |
Reference period | | Percentage change on
previous month | | Percentage change on the same month in
previous year |
March 2011 | | 0.5 | | 2.1 |
April 2011 | | 0.2 | | 2.4 |
May 2011 | | 0.0 | | 2.3 |
June 2011 | | 0.1 | | 2.3 |
July 2011 | | 0.4 | | 2.4 |
August 2011 | | 0.0 | | 2.4 |
September 2011 | | 0.1 | | 2.6 |
October 2011 | | 0.0 | | 2.5 |
November 2011 | | 0.0 | | 2.4 |
December 2011 | | 0.7 | | 2.1 |
January 2012 | | -0.4 | | 2.1 |
February 2012 | | 0.7 | | 2.3 |
March 2012 | | 0.3 | | 2.1 |
Consumer prices in Germany were 2.1% higher in March 2012 compared to March 2011, with the inflation rate having decreased slightly compared to the year-over-year inflation rate of 2.3% in February 2012.
The inflation rate in March 2012 was again driven by price increases in energy which increased by 6.7% compared to March 2011. The increase in prices for motor fuels had a particularly strong impact on the inflation rate. Prices of motor fuels were 7.7% higher in March 2012 compared to March 2011, reaching a new record high. While prices for household energy did not increase quite as strongly in March 2012, they still increased significantly by 6.0% compared to March 2011. Excluding energy prices, the inflation rate would have been 1.6% in March 2012 compared to March 2011. Prices for food increased by 3.1% in March 2012 compared to March 2011. Prices for goods overall increased above average by 3.2% in March 2012 compared to March 2011, while prices for services increased below average by 1.1% compared to a year earlier.
Compared to February 2012, the consumer price index in March 2012 increased by 0.3%, mainly due to a price increase of 4.0% for motor fuels.
Source: Statistisches Bundesamt, Verbraucherpreise März 2012: + 2,1 % gegenüber März 2011, press release of April 13, 2012 (https://www.destatis.de/DE/PresseService/Presse/Pressemitteilungen/2012/04/PD12_134_611.html).
9
Unemployment Rate
UNEMPLOYMENT RATE
(percent of unemployed persons in the total labor force according to the
International Labour Organization (ILO) definition) (1)
| | | | |
Reference period | | Original percentages | | Adjusted percentages (2) |
March 2011 | | 6.5 | | 6.2 |
April 2011 | | 5.9 | | 6.1 |
May 2011 | | 5.8 | | 6.0 |
June 2011 | | 6.0 | | 5.9 |
July 2011 | | 6.1 | | 5.9 |
August 2011 | | 6.0 | | 5.8 |
September 2011 | | 5.3 | | 5.8 |
October 2011 | | 5.2 | | 5.7 |
November 2011 | | 5.5 | | 5.6 |
December 2011 | | 5.5 | | 5.6 |
January 2012 | | 6.3 | | 5.6 |
February 2012 | | 5.9 | | 5.6 |
March 2012 | | 5.5 | | 5.6 |
| (1) | The time series on unemployment are based on the German Labour Force Survey (“LFS”) as from October 30, 2007 as the source of information for, among other things, the monthly ILO unemployment data. With the release of data for March 2011, the Statistical Office of the EU Communities and the Federal Statistical Office partly modified the previous, provisional method of calculating harmonized monthly unemployment figures, which had been in place since October 2007. The modified method continues to be based on the LFS and leads to marginal revisions of the unemployment series as published through February 2011. The changes concern some of the source data used for the denominator of the unemployment rate and the estimation method to adjust for seasonal variations. The employment data used in the denominator are now taken from the same source as the unemployment data, the LFS (in the past, employment figures were taken from the employment accounts as part of national accounting). This improves international harmonization as well as the internal consistency of the rate. Due to this change, the unemployment rate for Germany increased by about 0.2 percentage points. The general development was not affected, however. The use of auxiliary information derived from the German unemployment register for purposes of making seasonal adjustments has been discontinued. Because a number of methodological issues remain to be addressed before fully-fledged seasonal adjustments can be made to the LFS-based series, LFS-based trend estimations (trend cycle component) will temporarily be published in lieu of seasonally adjusted series. |
| (2) | Adjusted for seasonal and irregular effects (trend cycle component). |
The number of employed persons increased by approximately 572,000 persons, or 1.4%, in March 2012 compared to March 2011. Compared to February 2012, the number of employed persons in March 2012 increased by approximately 37,000, or 0.1%, after elimination of seasonal variations.
The number of unemployed persons in March 2012 decreased by approximately 418,000, or 15.4%, compared to March 2011. When adjusted for seasonal and irregular effects (trend cycle component), the number of unemployed persons in March 2012 increased by 16,000, or 0.4%, compared to February 2012.
Sources: Statistisches Bundesamt, März 2012: Arbeitsmarkt entwickelt sich weiter robust, press release of May 2, 2012 (https://www.destatis.de/DE/PresseService/Presse/Pressemitteilungen/2012/05/PD12_153_132.html); Statistisches Bundesamt, Genesis-Online Datenbank, Tabelle 13231-0001, Erwerbslose, Erwerbstätige, Erwerbspersonen, Erwerbslosenquote: Deutschland, Monate, Original- und bereinigte Daten (https://www-genesis.destatis.de/genesis/online/logon?sequenz=tabelleErgebnis&selectionname=13231-0001&startjahr=2010&endjahr=2012&leerzeilen=false).
Current Account and Foreign Trade
CURRENT ACCOUNT AND FOREIGN TRADE
| | | | |
| | | (balance in EUR billion)(1) |
| Item | | January to
March 2012 | | January to
March 2011 |
| | | | |
Foreign trade | | 45.5 | | 40.8 |
Services | | -0.5 | | 1.9 |
Factor income (net) | | 15.5 | | 13.2 |
Current transfers | | -15.1 | | -13.5 |
Supplementary trade items | | -4.5 | | -1.8 |
| | | | |
Current account | | 40.9 | | 40.5 |
| | | | |
| (1) | Figures may not add up due to rounding. |
Source: Statistiches Bundesamt, März 2012: Rekordwerte bei deutschen Aus-und Einfuhren, press release of May 9, 2012 (https://www.destatis.de/DE/PresseService/Presse/Pressemitteilungen/2012/05/PD12_159_51.html)
10
KFW
GENERAL
Overview
KfW is a public law institution (Anstalt des öffentlichen Rechts) serving domestic and international public policy objectives of the Federal Government (“Federal Government”) of the Federal Republic of Germany (“Federal Republic”). KfW promotes its financing activities under the umbrella brand name KfW Bankengruppe. It conducts its business in the following business areas:
| | • | | KfW Mittelstandsbank (KfW SME Bank) promotes small and medium-sized enterprises (“SMEs”), business founders, start-ups and self-employed professionals; |
| | • | | KfW Privatkundenbank (KfW Private Client Bank) provides housing-related loans and grants as well as financing for education to private individuals; |
| | • | | KfW Kommunalbank (KfW Municipal Bank) offers financing for infrastructure projects, primarily for municipalities, and grants global funding instruments to promotional institutes of the German federal states (“Landesförderinstitute”); |
| | • | | Export and project finance: KfW IPEX-Bank GmbH (“KfW IPEX-Bank”) offers customized financing for exports and project and corporate financing worldwide. KfW IPEX-Bank is a legally independent entity wholly owned by KfW; |
| | • | | Promotion of developing and transition countries: KfW Entwicklungsbank (KfW Development Bank) is responsible for KfW’s public sector development cooperation activities, and DEG - Deutsche Investitions- und Entwicklungsgesellschaft mbH (German Investment and Development Company, “DEG”) finances private-sector investments in developing countries. DEG is a legally independent entity wholly owned by KfW; and |
| | • | | Capital markets, which comprises KfW’s treasury, funding, securitization and other capital markets-related activities. |
As of December 31, 2011, KfW held total assets of EUR 494.8 billion, including loans and advances of EUR 365.1 billion. KfW’s promotional business volume amounted to EUR 70.4 billion in 2011.
KfW’s offices are located at Palmengartenstraße 5-9, 60325 Frankfurt am Main, Federal Republic of Germany. KfW’s telephone number is 011-49-69-74310. KfW also maintains branch offices in Berlin and Bonn, Germany, as well as a liaison office to the European Union in Brussels, Belgium.
Ownership
The Federal Republic holds 80% of KfW’s capital, and the German federal states (each, a “Land” and together, the “Länder”) hold the remaining 20%. The Law Concerning KfW (Gesetz über die Kreditanstalt für Wiederaufbau, or the “KfW Law”) does not provide for shareholders’ meetings; instead, the Board of Supervisory Directors assumes the responsibilities of a shareholders’ meeting. For more information on the Board of Supervisory Directors, see “Management and Employees—Board of Supervisory Directors.”
Shares in KfW’s capital may not be pledged or transferred to entities other than the Federal Republic or the Länder. Capital contributions have been, and are expected to continue to be, made to KfW in such proportions as to maintain the relative shares of capital held by the Federal Republic and the Länder.
11
Legal Status
KfW is organized under the KfW Law as a public law institution with unlimited duration. As a public law institution serving public policy objectives of the Federal Government, KfW itself is not subject to corporate taxes (although certain of its subsidiaries are) and as a promotional bank does not seek to maximize profits. KfW does, however, seek to maintain an overall level of profitability that allows it to strengthen its equity base in order to support its promotional activities and to grow the volume of its business. KfW is prohibited from distributing profits, which are instead allocated to statutory and special reserves. KfW is also prohibited from taking deposits, conducting current account business or dealing in securities for the account of others.
Relationship with the Federal Republic
Guarantee of the Federal Republic
The KfW Law expressly provides that the Federal Republic guarantees all existing and future obligations of KfW in respect of money borrowed, bonds and notes issued and derivative transactions entered into by KfW, as well as obligations of third parties that are expressly guaranteed by KfW (KfW Law, Article 1a). Under this statutory guarantee (the “Guarantee of the Federal Republic”), if KfW fails to make any payment of principal or interest or any other amount required to be paid with respect to securities issued by KfW, or if KfW fails to make any payment required to be made under KfW’s guarantee when that payment is due and payable, the Federal Republic will be liable at all times for that payment as and when it becomes due and payable. The Federal Republic’s obligation under the Guarantee of the Federal Republic ranks equally, without any preference, with all of its other present and future unsecured and unsubordinated indebtedness. Holders of securities issued by KfW or issued under KfW’s guarantee may enforce this obligation directly against the Federal Republic without first having to take legal action against KfW. The Guarantee of the Federal Republic is strictly a matter of statutory law and is not evidenced by any contract or instrument. It may be subject to defenses available to KfW with respect to the obligations covered.
Institutional Liability (Anstaltslast)
KfW is a public law institution (Anstalt des öffentlichen Rechts). Accordingly, under the German administrative law principle of Anstaltslast, the Federal Republic, as the constituting body of KfW, has an obligation to safeguard KfW’s economic basis. Under Anstaltslast, the Federal Republic must keep KfW in a position to pursue its operations and enable it, in the event of financial difficulties, through the allocation of funds or in some other appropriate manner, to meet its obligations when due. Anstaltslast is not a formal guarantee of KfW’s obligations by the Federal Republic, and creditors of KfW do not have a direct claim against the Federal Republic. Nevertheless, the effect of this legal principle is that KfW’s obligations, including the obligations to the holders of securities issued by it or issued under KfW’s guarantee, are fully backed by the credit of the Federal Republic. The obligation of the Federal Republic under Anstaltslast would constitute a charge on public funds that, as a legally established obligation, would be payable without the need for any appropriation or any other action by the German Parliament.
Understanding with the European Commission
In order to clarify that the Federal Republic’s responsibility for KfW’s obligations was and is compatible with European Union (“EU”) law prohibitions against state aid, the German Federal Ministry of Finance and the European Commissioner for Competition held discussions which were formalized in an understanding reached on March 1, 2002. In the understanding with the European Commission, it was agreed that, in respect of the promotional activities for which KfW is responsible, KfW will continue to benefit from Anstaltslast and the Guarantee of the Federal Republic. The understanding acknowledged that KfW’s role in providing financing for, in particular, small and medium-sized enterprises, risk capital, environmental protection, technology/innovation, infrastructure and housing, as well as its cooperation with developing countries, is promotional and thus compatible with EU rules.
In the area of export and project finance, the understanding with the European Commission required KfW to transfer to a legally independent subsidiary that portion of export finance and domestic and international project finance activities which the European Commission deemed to fall outside the scope of the promotional activities of KfW. The transfer of such activities was to be effected by December 31, 2007 and as from that date KfW has not been permitted to fund the subsidiary at other than market rates of interest or to extend to the subsidiary any benefits of Anstaltslast or the Guarantee of the Federal Republic.
12
KfW continues to be permitted, however, to engage directly in the following promotional export and project finance activities:
| | • | | implementation of international promotional programs, such as the interest-rate subsidized CIRR (Commercial Interest Reference Rate) and LASU (Large Aircraft Sector Understanding) schemes, which are recognized as promotional activities in accordance with the Organization for Economic Cooperation and Development (“OECD”) consensus; |
| | • | | participation in syndicated financing activities outside the EU, the European Economic Area and countries holding the status of official candidate for EU membership, subject to certain conditions, and sole financing activities in countries in which sufficient sources of financing do not exist; and |
| | • | | participation in projects in the interest of the EU that are co-financed by the European Investment Bank or similar European financing institutions. |
The European Commission transformed the understanding into a decision, which the Federal Republic formally accepted. A part of the Promotional Bank Restructuring Act (Förderbankenneustrukturierungsgesetz) implemented the understanding with the European Commission and amended the KfW Law and KfW’s by-laws accordingly.
On January 1, 2008, KfW IPEX-Bank GmbH, a limited liability corporation (Gesellschaft mit beschränkter Haftung) formed as a wholly owned subsidiary of KfW, commenced operations as a legally independent entity, thus satisfying the requirements set forth in the understanding with the European Commission. KfW IPEX-Bank conducts those export and project finance activities which the European Commission deemed to fall outside the scope of KfW’s promotional activities directly and on its own behalf. KfW provides funding for KfW IPEX Bank at market rates based on the ratings assigned to KfW IPEX-Bank by international rating agencies. The permitted promotional export and project finance activities are conducted by KfW IPEX-Bank in its own name on behalf of KfW on a trust basis. In accordance with the understanding with the European Commission, KfW IPEX-Bank obtained a banking license and is subject to the German Banking Act (Gesetz über das Kreditwesen — KWG) and the corporate tax regime. For more information on KfW IPEX-Bank, see “Business—Export and Project Finance (KfW IPEX-Bank).”
Supervision
Under the KfW Law, the Federal Ministry of Finance, in consultation with the Federal Ministry of Economics and Technology, supervises KfW and has the power to adopt all measures necessary to safeguard the compliance of KfW’s business operations with applicable laws, KfW’s by-laws and other regulations. Subject to the foregoing, the Federal Ministry of Finance does not have the right to influence business decisions made by KfW’s Executive Board or Board of Supervisory Directors. KfW’s overall activities are supervised by its Board of Supervisory Directors, which consists of seven Federal Ministers, seven appointees of each of the two houses of Parliament, the Bundesrat and the Bundestag, and representatives of various sectors and institutions of the German economy. For more information on the Executive Board and the Board of Supervisory Directors, see “Management and Employees.”
Effective January 1, 2011, KfW’s by-laws were amended, primarily with a view to bringing them broadly in line with the recommendations and proposals of the Public Corporate Governance Code of the Federation (the “Code”). The Code sets forth standards for the sound and responsible management of unlisted entities in which the Federal Republic of Germany holds a majority interest – in particular, with respect to the management and supervision of such entities by their governing bodies. Amendments to KfW’s by-laws in response to the Code’s standards involved, among other things, specifying the required qualifications of members of the Executive Board and the Board of Supervisory Directors, introducing references to the applicability of the business judgment rule to members of the Executive Board and the Board of Supervisory Directors, and providing for a regular review of the quality and efficiency of the Board of Supervisory Directors’ activities. Further, certain limits on decisions by the Executive Board, which need to be submitted to the Board of Supervisory Directors for approval, were raised.
Effective May 1, 2011, KfW’s by-laws were amended. The amendment was designed to enhance the efficiency of the decision-making processes of the Board of Supervisory Directors, primarily by delegating all approvals of loan commitments to its Credit Committee (Kreditausschuss).
13
KfW is generally exempt from the requirements of the German Banking Act (Gesetz über das Kreditwesen - KWG). Nevertheless, KfW applies certain rules of the German Banking Act on a voluntary basis. KfW plans to broaden its voluntary application of the German Banking Act to the extent appropriate. The plans may lead to further amendments of KfW’s by-laws. Any decision with respect to such amendments will be determined by KfW’s Board of Supervisory Directors and approved by the Federal Ministry of Finance. KfW is currently unable to predict whether, when or in what form such plans may be realized or such amendments will be implemented.
In addition to the annual audit of its financial statements, KfW, as a government-owned entity, is subject to an audit that meets the requirements of the Budgeting and Accounting Act (Haushaltsgrundsätzegesetz). The Budgeting and Accounting Act requires that this audit and the resulting reporting be designed so as to enable the Board of Supervisory Directors, the responsible Federal Ministries, and the Federal Court of Auditors (Bundesrechnungshof) to form their own opinions and to take action as and when required. One of the specific aspects to be covered by this audit and the related reporting is the proper conduct of KfW’s business by its management.
Under the terms of various agreements concluded between KfW and the government authorities sponsoring KfW’s programs, KfW is required to have an auditor report on the proper discharge of KfW’s duties and the efficiency and effectiveness of its administration.
Corporate Background
KfW was established in 1948 by the Administration of the Combined Economic Area, the immediate predecessor of the Federal Republic. Originally, KfW’s purpose was to distribute and lend funds of the European Recovery Program, which is also known as Marshall Plan (the “ERP”). Even today, several of KfW’s programs to promote the German and European economies are supported using funds for subsidizing interest rates from the so-called “ERP Special Fund.” KfW has expanded and internationalized its operations over the past decades. In 1994, following the reunification of the Federal Republic and the former German Democratic Republic (“GDR”), KfW assumed the operations of the former central bank of the GDR (Staatsbank), which was located in Berlin, Germany.
In September 2001, KfW acquired DEG from the Federal Republic. DEG is a limited liability company that acts as the German development finance institution for the promotion of private enterprises in developing countries and countries in transition. For more information on DEG, see “Business—Promotion of Developing and Transition Countries—DEG - Deutsche Investitions- und Entwicklungsgesellschaft mbH.”
In 2003, Deutsche Ausgleichsbank (“DtA”), which was based in Bonn, Germany, merged into KfW. DtA was formed in 1950 as a public law institution and promotional bank particularly active in the area of lending to SMEs and start-up businesses. The merger was accomplished through the Promotional Bank Restructuring Act and was designed to restructure and simplify promotional banking in the Federal Republic and harmonize it with the understanding reached with the European Commission.
14
BUSINESS
Introduction
KfW currently conducts its business in the following business areas:
| | • | | KfW Mittelstandsbank (KfW SME Bank), which focuses on SMEs and other commercial clients; |
| | • | | KfW Privatkundenbank (KfW Private Client Bank), which focuses on private clients; |
| | • | | KfW Kommunalbank (KfW Municipal Bank), which is responsible for public clients, such as municipalities and Landesförderinstitute; |
| | • | | Export and project finance (KfW IPEX-Bank); |
| | • | | Promotion of developing and transition countries (KfW Entwicklungsbank and DEG); and |
| | • | | Capital markets, which comprises KfW’s treasury, funding, securitization, and other capital markets-related activities. |
The following table sets forth the relative size of each of the business areas in terms of commitments for each of the years indicated.
PROMOTIONAL BUSINESS VOLUMEBY BUSINESS AREA
| | | | | | | | | | | | | | |
| | | Year ended December 31, |
| | | 2011 | | | | 2010 |
| | | (EUR in millions) |
KfW Mittelstandsbank (1) | | | | 22,407 | | | | | | | | 28,630 | | |
| | | | | | | |
KfW Privatkundenbank | | | | 16,722 | | | | | | | | 20,025 | | |
| | | | | | | |
KfW Kommunalbank (2) | | | | 11,798 | | | | | | | | 15,387 | | |
| | | | | | | |
Export and project finance (KfW IPEX-Bank) | | | | 13,409 | | | | | | | | 9,336 | | |
| | | | | | | |
Promotion of developing and transition countries | | | | 5,755 | | | | | | | | 5,679 | | |
of which KfW Entwicklungsbank | | | | 4,532 | | | | | | | | 4,452 | | |
of which DEG — Deutsche Investitions- und Entwicklungsgesellschaft mbH | | | | 1,223 | | | | | | | | 1,226 | | |
| | | | | | | |
Capital markets (2) | | | | 1,147 | | | | | | | | 2,525 | | |
| | | | | | | | | | | | | | |
| | | | | | | |
Total promotional business volume (3) | | | | 70,390 | | | | | | | | 81,351 | | |
| | | | | | | | | | | | | | |
| | | | | | | |
Special mandate by the Federal Government | | | | — | | | | | | | | 22,336 | | |
| | | | | | | | | | | | | | |
| | | | | | | |
Total commitments (4) | | | | 70,390 | | | | | | | | 103,687 | | |
| | | | | | | | | | | | | | |
| (1) | Commitments for 2011 include EUR 165 million under the KfW Sonderprogramm that will not be disbursed due to cancellations and withdrawals occurring after the contractual loan commitments but prior to or on December 31, 2011. In addition, commitments for 2011 include EUR 127 million in grants for advisory services compared with EUR 126 million for 2010. In the disclosure for 2010, the latter commitments were reported under a separate line item. Amounts for 2010 set forth in the table above have been adjusted to reflect this change and deviate from amounts which KfW disclosed previously. |
| (2) | In 2011, the responsibility for granting global loans in Europe was transferred from KfW Kommunalbank to the capital markets business area. Commitment figures for 2010 have been adjusted to reflect this change in reporting and deviate from the amounts disclosed previously. |
| (3) | Total promotional business volume has been adjusted for commitments of EUR 847 million in 2011 (2010: EUR 231 million) made by KfW IPEX-Bank relating to export and project finance and refinanced under certain of KfW Mittelstandsbank’s promotional programs. |
| (4) | Commitments represent the volume of funds committed for loans and other business transactions (with the exception of program-based global loans to Landesförderinstitute) in the relevant year, including amounts to be disbursed in future years, and do not include amounts disbursed in the relevant year pursuant to commitments made in prior years. In the case of program-based global loans to the Landesförderinstitute, commitments represent the actual volume of funds disbursed in the relevant year. |
The following table sets forth the total economic capital required of KfW Bankengruppe as well as the relative size of each of the operative business areas in terms of the percentage of economic capital required for each of the years indicated. The balance of economic capital required relates to group functions. The economic capital required has been calculated on a solvency level of 99.99%. For more information concerning economic capital required of KfW Bankengruppe, see “Financial Section—Risk Report—Risk Management Approach of KfW Bankengruppe—Economic Risk-Bearing Capacity” and note 37 to the financial statements.
15
ECONOMIC CAPITAL REQUIRED
| | | | | | | | |
| | | As of December 31, | |
| | | 2011 | | | 2010 | |
Total economic capital required (in EUR millions) | | | 12,558 | | | | 11,274 | |
of which KfW Mittelstandsbank | | | 17 % | | | | 21 % | |
of which KfW Privatkundenbank | | | 10 % | | | | 12 % | |
of which KfW Kommunalbank (1) | | | 1 % | | | | 2 % | |
of which export and project finance (KfW IPEX-Bank) | | | 20 % | | | | 21 % | |
of which promotion of developing and transition countries (KfW Entwicklungsbank and DEG) | | | 13 % | | | | 11 % | |
of which capital markets (1) | | | 14 % | | | | 17 % | |
| (1) | In 2011, the responsibility for granting global loans in Europe was transferred from KfW Kommunalbank to the capital markets business area. Figures for 2010 have been adjusted to reflect this change in reporting and deviate from the amounts disclosed previously. |
Domestic Promotional Business
General
To support the economic and policy objectives of the Federal Government, KfW offers a broad range of financing programs in Germany and, to a limited extent, elsewhere in Europe, as well as grants funded from the federal budget for domestic promotional purposes. KfW’s predominant domestic finance activities are conducted by the KfW Mittelstandsbank, KfW Privatkundenbank and KfW Kommunalbank business areas. Further promotional activities targeting the domestic market are reported under the capital markets business area.
Under the KfW Law, KfW must generally involve banks or other financing institutions when granting financings. Therefore, KfW involves commercial banks in the handling of its loans by extending loans to commercial banks, which, in turn, on-lend the funds to the ultimate borrowers. To a limited extent, however, KfW is allowed to grant financings directly to the ultimate borrower (e.g., for financings of municipalities in the KfW Kommunalbank business area).
By lending to commercial banks, KfW, in principle, insulates itself from credit exposure to the ultimate borrower and gains the benefit of the commercial banks’ knowledge of their customers as well as their administrative and servicing expertise. KfW monitors its exposures to, and the credit standing of, each banking institution to which it lends. In its KfW Mittelstandsbank, KfW Privatkundenbank and KfW Kommunalbank business areas, KfW currently lends to approximately 230 banks.
KfW’s German commercial banking on-lending customers include the nine German Landesbanken. The Landesbanken are German public law financial institutions that have traditionally focused on the banking business for and in the Land in which they operate. Originally, obligations of the Landesbanken benefited from government credit support (Gewährträgerhaftung). Under a settlement reached with the European Commission in July 2001 relating to state aid to the Landesbanken, however, borrowings by the Landesbanken incurred after the settlement date and maturing after December 31, 2015 and all borrowings incurred after July 19, 2005 no longer benefit from government credit support. KfW’s long-term receivables from on-lending operations involving Landesbanken amounted to EUR 70.9 billion as of December 31, 2011. Of this amount, EUR 14.5 billion, or 20.5 %, continues to benefit from government credit support. Since the settlement, KfW’s credit line management has increased its focus on the individual financial strength of each institution. In addition, most of the loans to the Landesbanken have been, and will continue to be, secured by collateral. Over time, the risk profile of the loans to the Landesbanken has been shifting from government risk to a profile more comparable to KfW’s other loans to the banking sector.
KfW offers two different models for processing KfW loans to commercial banks. KfW’s traditional and most important model for handling its lending business is based on individual loan applications by each borrower within the framework of specified loan, mezzanine capital or equity participation instruments. Under the other model, KfW extends global loans or global funding facilities to Landesförderinstitute, to selected commercial banks in Germany and Europe and, to a limited extent to leasing companies in Germany.
16
Individual Loans. KfW explicitly defines detailed formal requirements for each loan that it extends to a commercial bank as well as for each loan the commercial bank on-lends to the ultimate borrower under each of its lending programs. Borrowers do not apply directly to KfW, however, and may only apply for a KfW loan through a bank of their choice. The intermediate bank appraises the financial and business situation of the applicant, takes collateral for the loan and assumes liability for repayment to KfW. Loans made by commercial banks, as borrowers, are normally collateralized by real property or other assets, or are guaranteed by the Federal Republic or by one of the Länder. The processing of individual loans within KfW’s lending programs is characterized by two formally separate loan approvals - first by the intermediate bank and then by KfW - for each borrower. KfW’s loan approval, however, is in most cases depending solely on a review of the loan application, based on compliance with the formal requirements defined for the particular lending program.
KfW applies different pricing models for granting loans: a fixed-rate pricing model; and a risk-adjusted pricing model. Under the fixed-rate pricing model, the commercial banks to which KfW lends are permitted to on-lend the funds at fixed spreads over the applicable interest rate payable to KfW. This fixed-rate pricing model is applied to KfW Privatkundenbank’s lending programs and some of KfW Mittelstandsbank’s lending programs for start-up financing. Under the risk-adjusted pricing model, KfW establishes pricing categories based on a combination of the borrower’s creditworthiness and the collateral securing the loan. Under each lending program, KfW sets maximum interest rates for each pricing category. The on-lending banks assess the risk profile of the borrower and the collateral securing the loan to determine the applicable pricing category for each loan and the applicable maximum interest rate for the pricing category. KfW’s role in the pricing process is limited to verifying that banks derive the appropriate maximum interest rate from the ultimate borrower’s creditworthiness and the collateral provided.
In the traditional SME lending programs offered by KfW, the on-lending banks are liable to KfW and bear the risk of customer default as described above. In recent years, KfW Mittelstandsbank has constantly been reworking and renewing its SME financing programs to increase its support for SMEs. Under those lending programs, to which the risk-adjusted pricing model applies, KfW offers the option of a partial exemption from liability to on-lending banks. If the on-lending bank applies for an exemption from liability, KfW bears the risk not retained by the bank and the risk margin is shared pro rata between KfW and the bank. The risk-adjusted pricing model applies amongst others to KfW Mittelstandsbank’s largest and most important lending program, the KfW Unternehmerkredit, or Entrepreneurial Loan program. In addition, mezzanine capital and equity participations offered by KfW Mittelstandsbank and its special programs for investments by micro-enterprises are designed so that KfW assumes direct exposure to the credit risk of the ultimate borrower, which is covered or compensated in different ways: by means of risk premiums included in the interest rate charged to the ultimate borrower; or by means of guarantees from the Federal Government or the European Investment Fund.
Global Loans and Global Funding Facilities. Global loans and global funding facilities differ from KfW’s individual loans primarily in terms of simplified processing, the lack of a requirement for formal loan approval by KfW with respect to each individual ultimate borrower, and, in general, a higher degree of flexibility for the on-lending Landesförderinstitute, commercial banks and other institutions. KfW expects the receiving institutions or banks to on-lend these funds within a reasonable period of time. In contrast to KfW’s individual loans, these global loans offer greater loan structure flexibility. As a result, global loans and global funding facilities entail lower administrative costs for both KfW and the on-lending Landesförderinstitute, commercial banks or other institutions compared with KfW’s traditional lending programs. Accordingly, an on-lending bank’s or institution’s customers generally benefit from favorable interest rates as well as from streamlined processes.
KfW offers different kinds of global loans and global funding facilities: global loans to Landesförderinstitute, global funding facilities to Landesförderinstitute; and global loans to commercial banks or other institutions. Most of the Landesförderinstitute are independent public law institutions and benefit from explicit guarantees by the respective German federal state (Land). KfW extends global loans to 17 Landesförderinstitute, each of which is responsible for promotional issues within its Land or Länder, as the case may be. Landesförderinstitute use KfW’s global loans to finance specified investments relating to SMEs, housing projects and municipal infrastructure projects in their respective Land within the framework of cooperative loan programs of the Landesförderinstitut and KfW. The conditions of each cooperative loan program must comply with the conditions of the relevant KfW program. The funds to Landesförderinstitute are extended in the form of lump sums, which are then broken down and granted to the final borrower as individual loans. Moreover, KfW extends global funding facilities exclusively to Landesförderinstitute for their own promotional funding purposes, thus offering Landesförderinstitute broad flexibility with respect to the use of funds extended in their promotional business without a direct link to any of KfW’s lending programs.
17
Finally, KfW extends global loans to selected commercial banks in Germany and, to a limited extent, elsewhere in Europe in the form of a lump sum, which the banks break down and grant as individual loans to finance SMEs, housing projects and municipal infrastructure projects, and, increasingly, energy efficiency projects. Leasing companies in Germany are also entitled to apply for global loans, which they split into individual lease contracts in order to finance leasing projects with SMEs in Germany.
Strategic Focus
KfW places strong emphasis on managing the quality of its promotional activities. In this context, KfW systematically classifies all of its financing programs based on formal and content criteria, such as sustainability, subsidiarity and customer value. After the phase-out of several economic stimulus packages in 2010, KfW decided to focus its strategy on long-term qualitative growth. In order to reach this goal, KfW implemented measures to streamline and focus existing product lines according to this strategy. As a result, KfW broadened its supply of products and programs with high promotional effects and quality, while reducing products or programs of comparatively lower promotional quality. For example, KfW decided to further increase its commitments in respect of environmental and climate protection measures. In order to support the Federal Government’s strategy to reduce CO2 emissions, KfW intends to emphasize promotional measures in the field of renewable energy, energy efficiency and innovations in order to support the government’s strategy for the transition to a more sustainable energy set-up (Energiewende). In 2011, financings for environmental and climate protection accounted for nearly one-third of KfW’s total promotional business volume.
Participation in Government Stimulus Packages
In order to stabilize and strengthen the German economy, which had been negatively affected by the global economic and financial crisis, the Federal Government implemented packages of stimulus measures, which provide for the participation of KfW, in late 2008. These measures were amended in 2009. Against the backdrop of a lack of funding from financial institutions, KfW Mittelstandsbank initiated the KfW Sonderprogramm under the Federal Republic’s packages of measures to promote investments. This program was designed to safeguard businesses, primarily small- and medium-sized, but also larger enterprises, against a lack of funding from financial institutions and to provide project financing. The KfW Sonderprogramm offered financings primarily through KfW’s ordinary individual loan program, but also global loans to commercial banks and direct loans to large businesses and for project financing. In addition to the KfW Sonderprogramm, the measures under the Federal Government’s stimulus packages comprised financings of housing-related investments of individuals (KfW Privatkundenbank), financings of investments relating to innovation and energy efficiency by SMEs (KfW Mittelstandsbank), and financings of municipal infrastructure projects (KfW Kommunalbank).
At year-end 2010, the application period for various credit programs, which had been initiated in connection with the Federal Government’s economic stimulus measures (including, among others, the KfW Sonderprogramm) expired according to plan. However, new commitments relating to loan applications that were submitted prior to the December 31, 2010 deadline could be made until June 30, 2011.
KfW Mittelstandsbank (KfW SME Bank)
KfW Mittelstandsbank promotes SMEs, business founders, start-ups and self-employed professionals; it offers financings for various purposes to companies in different stages of development. According to the KfW-Mittelstandspanel 2011 survey of SMEs in Germany, there were nearly 3.8 million SMEs (including enterprises with an annual group turnover of up to EUR 500 million) in 2010. SMEs accounted for 55% of the gross investment by the German corporate sector, employed 70% of the workforce and trained 80% of the apprentices in 2010.
KfW Mittelstandsbank provides financings in the sectors of start-up financing and general investments, innovation and environmental protection, primarily by means of loans, including global loans to Landesförderinstitute as well as commercial banks (2011: EUR 20.7 billion, 2010: EUR 27.3 billion), mezzanine capital (2011: EUR 1.5 billion, 2010: EUR 1.1 billion) and equity participations (2011: EUR 0.2 billion, 2010: EUR 0.2 billion).
18
The following table shows KfW Mittelstandsbank’s commitments by sector for each of the years indicated.
KFW MITTELSTANDSBANK COMMITMENTS
| | | | | | | | | | | | | | |
| | | Year ended December 31, |
| | | 2011 | | | | 2010 |
| | | | | (EUR in millions) | | |
Start-up financing and general investment | | | | 9,365 | | | | | | | | 15,397 | | |
of which KfW Sonderprogramm (1) | | | | 691 | | | | | | | | 6,176 | | |
of which advisory services (2) | | | | 127 | | | | | | | | 126 | | |
Innovation | | | | 2,214 | | | | | | | | 2,119 | | |
Environmental investment | | | | 10,828 | | | | | | | | 11,113 | | |
| | | | | | | | | | | | | | |
Total commitments (3) | | | | 22,407 | | | | | | | | 28,630 | | |
| | | | | | | | | | | | | | |
of which global loans to Landesförderinstitute | | | | 4,131 | | | | | | | | 4,512 | | |
of which global loans to commercial banks | | | | 330 | | | | | | | | 1,600 | | |
| (1) | Commitments for 2011 include EUR 165 million under the KfW Sonderprogramm that will not be disbursed due to cancellations and withdrawals occurring after the contractual loan commitments but prior to or on December 31, 2011 (2010: EUR 1,514 million). The amount for 2010 includes the cancellation of one major commitment of EUR 1.15 billion. |
| (2) | In 2010, grants for advisory services were not reported under KfW Mittelstandsbank commitments, but under “Others.” Accordingly, total commitments for 2010 deviate from the amounts disclosed previously. |
| (3) | Commitments represent the volume of funds committed for loans and other business transactions (with the exception of program-based global loans to Landesförderinstitute) in the relevant year, including amounts to be disbursed in future years, and do not include amounts disbursed in the relevant year pursuant to commitments made in prior years. In the case of program-based global loans to the Landesförderinstitute, commitments represent the actual volume of funds disbursed in the relevant year. |
To support the German economy, KfW Mittelstandsbank committed financings in the amount of EUR 22.4 billion in 2011 (2010: EUR 28.6 billion). This decrease was principally attributable to reduced commitments under the KfW Sonderprogramm, which amounted to EUR 0.7 billion in 2011 (2010: EUR 6.2 billion). For more information, see “Participation in Government Stimulus Packages” above. Commitments in 2011 included EUR 4.1 billion extended as global loans to Landesförderinstitute (2010: EUR 4.5 billion), and EUR 0.3 billion extended as global loans to commercial banks (2010: EUR 1.6 billion).
KfW Mittelstandsbank primarily offers loan programs. In some cases, KfW Mittelstandsbank offers the on-lending banks a partial exemption from liability as described above. This is the case for KfW Unternehmerkredit, which is the most important SME loan program and offers financing for a broad range of investments, such as construction and purchases of machinery, in the start-up financing and general investment sector.
KfW Mittelstandsbank extends mezzanine capital in the form of unsecured subordinated loans, which contain equity-like elements combining characteristics of debt and equity capital. The on-lending bank is not liable to KfW Mittelstandsbank for the subordinated loan. In its mezzanine financing, KfW Mittelstandsbank seeks to tailor the terms and conditions of its lending to each borrower’s risk profile in order to provide a better correlation between yield and risk weighting. As a result, the interest rate of the subordinated loan takes into account the prevailing rates in the capital markets as well as the borrower’s credit standing. The borrower’s creditworthiness is first assessed by the on-lending bank. However, as KfW Mittelstandsbank fully assumes the risk of the subordinated loan, it reserves the right to review and, if necessary, to revise the bank’s assessment by applying KfW Mittelstandsbank’s own rating standards.
Finally, KfW Mittelstandsbank provides loans to equity investors. These investors, in turn, make equity investments in SMEs. In addition, KfW Mittelstandsbank provides equity for innovative SMEs by direct investment on a pari passu basis with private investors as well as equity for established SMEs from a designated equity fund, which was established together with private investors in 2010.
19
Start-up Financing and General Investment Programs
KfW Mittelstandsbank provides start-up financing and financial support for general investments for a wide range of purposes such as investments in property and buildings, in plant and machinery, equipment or in takeovers. In 2011, commitments in this sector amounted to EUR 9.4 billion (2010: EUR 15.4 billion). Commitments in form of KfW Unternehmerkredite amounted to EUR 6.3 billion in 2011 (2010: EUR 8.0 billion). The decrease in commitments for start-up financing and financial support for general investments in 2011 was mainly attributable to the economic recovery in Germany, reflecting a declining need for additional financing support through KfW.
Commitments under the KfW Sonderprogramm amounted to EUR 0.7 billion in 2011 (2010: EUR 6.2 billion). This decrease reflected the end of this program, which expired in accordance with its terms during the first half of 2011.
KfW Mittelstandsbank also offers advisory support to individuals and businesses to facilitate a better understanding of the German Federal Government’s various business-related promotional programs. KfW partially funds coaching and advisory services for individual entrepreneurs and for SMEs to support the early start-up phase of new businesses or to determine the necessary steps for a turnaround in case of temporary difficulties. Furthermore, KfW, in cooperation with the Federal Ministry of Economics and Technology, supports energy efficiency consultancy services for SMEs. In 2011, KfW extended EUR 127 million in grants for advisory services (2010: EUR 126 million).
Innovation Programs
KfW Mittelstandsbank provides financing for innovations by extending funds for research and development activities either by means of mezzanine capital or direct equity investments. In 2011, commitments amounted to EUR 2.2 billion (2010: EUR 2.1 billion).
Environmental Investment Programs
KfW Mittelstandsbank finances environmental protection projects, in particular, for measures aiming at increasing energy efficiency, reducing greenhouse gas emissions and promoting the use of sources of renewable energy. In 2011, commitments decreased slightly to EUR 10.8 billion (2010: EUR 11.1 billion).
KfW Privatkundenbank (KfW Private Client Bank)
KfW Privatkundenbank provides housing-related loans and grants as well as financing for education to private individuals. The following table shows KfW Privatkundenbank’s commitments by sector for each of the years indicated.
KFW PRIVATKUNDENBANK COMMITMENTS
| | | | | | | | | | | | | | |
| | | Year ended December 31, |
| | | 2011 | | | | 2010 |
| | | | | (EUR in millions) |
Housing investment programs | | | | 14,553 | | | | | | | | 17,973 | | |
Education programs | | | | 2,169 | | | | | | | | 2,052 | | |
| | | | | | | | | | | | | | |
Total commitments (1) | | | | 16,722 | | | | | | | | 20,025 | | |
| | | | | | | | | | | | | | |
of which global loans to Landesförderinstitute | | | | 662 | | | | | | | | 790 | | |
of which global loans to commercial banks | | | | — | | | | | | | | 500 | | |
| (1) | Commitments represent the volume of funds committed for loans and other business transactions (with the exception of program-based global loans to Landesförderinstitute) in the relevant year, including amounts to be disbursed in future years, and do not include amounts disbursed in the relevant year pursuant to commitments made in prior years. In the case of program-based global loans to the Landesförderinstitute, commitments represent the actual volume of funds disbursed in the relevant year. |
20
In 2011, KfW Privatkundenbank’s commitments amounted to EUR 16.7 billion (2010: EUR 20.0 billion). This decrease was in line with KfW’s expectations and was due to minor adjustments to KfW Privatkundenbank’s housing investment programs. The decrease also reflected the reduced federal budget available for energy-efficiency financing. Commitments in 2011 included EUR 0.7 billion extended as global loans to Landesförderinstitute (2010: EUR 0.8 billion). In 2011, no global loans to commercial banks were granted by KfW Privatkundenbank (2010: EUR 0.5 billion).
Housing Investment Programs
KfW Privatkundenbank’s housing investment programs provide funds for the promotion of home ownership, for energy-efficient construction and rehabilitation, and for the improvement of accessibility to existing homes. Some of these programs are subsidized through interest rate reductions paid for by federal funds. Commitments in 2011 amounted to EUR 14.6 billion (2010: EUR 18.0 billion), of which EUR 6.5 billion (2010: EUR 8.7 billion) were granted for energy efficient construction and rehabilitation measures and EUR 5.9 billion (2010: EUR 6.5 billion) for home ownership promotion programs. The decrease in these commitments was mainly attributable to the lower federal budget available for energy-efficiency financing. In 2011, KfW Privatkundenbank streamlined or closed existing lending programs to reduce overlaps between different programs. As part of KfW’s general focus on supporting measures for the transition to a more sustainable energy set-up (Energiewende), KfW Privatkundenbank will continue to focus its activities besides others on energy-efficient construction and rehabilitation.
Education Programs
KfW Privatkundenbank supports students and employees in advanced occupational training with direct loans. Some of these programs are subsidized through interest rate reductions paid for by federal funds. In 2011, commitments amounted to EUR 2.2 billion (2010: EUR 2.1 billion). This increase was due to an increase in commitments in most of the educational programs.
KfW Kommunalbank (KfW Municipal Bank)
KfW Kommunalbank provides financing for infrastructure projects to municipalities, municipal companies and non-profit organizations. KfW Kommunalbank is also responsible for granting global loans and global funding facilities to Landesförderinstitute. The following table shows commitments of KfW Kommunalbank for each of the years indicated.
KFW KOMMUNALBANK COMMITMENTS
| | | | | | | | | | | | | | |
| | | Year ended December 31, |
| | | 2011 | | | | 2010 |
| | | | | (EUR in millions) |
Municipal infrastructure programs | | | | 4,148 | | | | | | | | 6,137 | | |
of which global loans to Landesförderinstitute | | | | 559 | | | | | | | | 772 | | |
Global funding facilities to Landesförderinstitute | | | | 7,650 | | | | | | | | 9,150 | | |
Global loans to commercial banks in Germany | | | | — | | | | | | | | 100 | | |
Global loans to commercial banks in Europe (1) | | | | — | | | | | | | | — | | |
| | | | | | | | | | | | | | |
Total commitments (2) | | | | 11,798 | | | | | | | | 15,387 | | |
| | | | | | | | | | | | | | |
| (1) | In 2011, the responsibility for granting global loans to commercial banks in Europe was transferred to the Capital Markets business area. Commitments in 2011 amounted to EUR 10 million and are reported under Capital Markets commitments. Commitment figures for 2010 have been adjusted to reflect this change in reporting and deviate from the amounts disclosed previously. |
| (2) | Commitments represent the volume of funds committed for loans and other business transactions (with the exception of program-based global loans to Landesförderinstitute) in the relevant year, including amounts to be disbursed in future years, and do not include amounts disbursed in the relevant year pursuant to commitments made in prior years. In the case of program-based global loans to the Landesförderinstitute, commitments represent the actual volume of funds disbursed in the relevant year. |
In 2011, total commitments under KfW Kommunalbank’s programs decreased to EUR 11.8 billion (2010: EUR 15.4 billion). This significant decline was mainly due to a decrease in commitments in global funding facilities to Landesförderinstitute as well as for special loan facilities for municipal infrastructure projects covered by the Federal Governments stimulus packages, which expired on December 31, 2010 according to plan.
21
Municipal Infrastructure Programs
KfW Kommunalbank provides financing for investments in municipal and social infrastructure, predominantly as direct loans to municipalities (i.e., local and municipal authorities and municipal special-purpose associations). Infrastructure investments by private companies that are majority-owned by municipal authorities and social investments made by non-profit organizations are financed according to KfW’s ordinary on-lending scheme involving commercial banks. Some of these municipal infrastructure programs are subsidized by federal funds. Commitments for these programs decreased to EUR 4.1 billion in 2011 (2010: EUR 6.1 billion).
Global Funding Facilities to Landesförderinstitute
In 2011, KfW extended global funding facilities in the amount of EUR 7.7 billion to Landesförderinstitute (2010: EUR 9.2 billion). The decline was mainly due to a decrease in demand from the Landesförderinstitute.
Global Loans to Commercial Banks
In 2011, no global loans were extended to commercial banks in Germany (2010: EUR 0.1 billion).
Export and Project Finance (KfW IPEX-Bank)
Business
KfW IPEX-Bank focuses on supporting the internationalization and the competitiveness of internationally operating German and European companies, offering project, export and trade financing. It provides medium and long-term investment and export financings in the form of amortizing loans, guarantees or leasing financings as well as project, object and acquisition financings. It also offers derivative instruments to allow its clients to hedge interest and currency risk. KfW IPEX-Bank also offers instruments for short-term trade financing, such as participations in letters of credit.
As a strategic shareholding in the area of lease operations, KfW IPEX-Bank holds a 50% stake in Railpool Holding GmbH & Co. KG, an asset manager in rail transportation established in 2008.
KfW IPEX-Bank’s principal customers are German and European corporations (and their customers) with international operations and larger medium-sized companies in basic and manufacturing industries, as well as in the retail, health, telecommunications, power / renewables, water, shipping, aviation, rail, transport and social infrastructure sectors.
Traditionally, the bulk of loans extended by KfW IPEX-Bank has been used for export and project financings to buyers of German or European exports. In recent years, KfW IPEX-Bank has increasingly extended loans to finance direct investments by German enterprises and other corporate purposes linked to the internationalization of German companies. In addition, KfW IPEX-Bank co-finances large-scale infrastructure projects and means of transport (e.g., airplanes and vessels) in the German and European transport sector. KfW IPEX-Bank also provides, as part of its core business, financings for environment and climate protection projects. Finally, KfW IPEX-Bank’s loans are also used to secure sources of raw materials for the German industry.
KfW IPEX-Bank’s loans are generally extended directly to the ultimate borrower, and KfW IPEX-Bank grants a significant portion of these loans at its own risk. KfW IPEX-Bank regularly cooperates with other financial institutions by way of consortia and syndications. In some cases, KfW IPEX-Bank may arrange for commercial banks to assume the risk on portions of loans made by KfW IPEX-Bank through “risk-participations,” for which KfW IPEX-Bank pays a fee to the bank assuming the risk. KfW IPEX-Bank is eligible to act as on-lending bank under certain of KfW’s promotional programs. In 2011, KfW IPEX-Bank refinanced loan commitments for export and project finance under KfW’s promotional programs in the amount of EUR 847 million (2010: EUR 231 million).
From time to time, KfW IPEX-Bank also enters into framework loan agreements with foreign banks, which enable such banks to extend loans to their customers for the purpose of importing equipment from German or other European exporters. Because the amounts of individual loans are usually small, the related transaction costs are relatively high. The framework agreements help to reduce these transaction costs.
22
Loans extended by KfW IPEX-Bank are generally secured by collateral and often benefit from a payment guarantee or other security arrangement. Loans extended to finance direct investments may benefit from an investment guarantee against political risk by the Federal Republic if the host country risk is assessed to be substantial.
A portion of export finance loans extended by KfW IPEX-Bank is guaranteed by the Federal Republic through Euler Hermes Kreditversicherungs-AG, the official German export credit insurer (“HERMES”). HERMES insurance covers up to 95% of KfW IPEX-Bank’s risk, so that the risk of the portion covered is the equivalent of German government risk. HERMES also provides coverage for related deliveries from other, mainly European, countries provided that they do not exceed a certain portion of the total delivery for which an export finance loan was extended. Furthermore, KfW IPEX-Bank’s financings frequently benefit from a guarantee by a foreign export credit agency or a government instrumentality in the buyer’s country.
For borrowers in other European and OECD countries where the country risk is not considered high, KfW IPEX-Bank has been increasingly extending loans on the basis of ordinary banking collateral (e.g., mortgages on aircraft or ships) without seeking the benefit of HERMES or similar coverage. In addition, even when HERMES coverage is sought, KfW IPEX-Bank often extends loans on which the insured portion is less than 95%. As of December 31, 2011, KfW IPEX-Bank’s outstanding loans and guarantees outside Germany amounted to EUR 35 billion, of which EUR 7.6 billion, or 22%, were export finance loans (partly) guaranteed by HERMES.
Corporate Background
As of January 1, 2008, and in accordance with the understanding reached between the European Commission and the Federal Republic, KfW IPEX-Bank commenced operations as a legally independent entity wholly owned by KfW. For more information, see “General—Relationship with the Federal Republic—Understanding with the European Commission.” KfW IPEX-Bank conducts the portion of export and project finance activities which the European Commission deemed to fall outside the scope of KfW’s promotional activities directly and on its own behalf, while it conducts the promotional export and project finance activities in its own name on behalf of KfW on a trust basis. As of December 31, 2011, KfW IPEX-Bank’s total outstanding loans and guarantees (including promotional activities) amounted to EUR 48.7 billion (year-end 2010: EUR 47.3 billion). KfW IPEX-Bank is located in Frankfurt am Main, Germany, and maintains a branch office in London, United Kingdom. As of December 31, 2011, KfW IPEX-Bank employed 527 persons (excluding managing directors, but including temporary personnel).
KfW IPEX-Bank is approved as an IRB (internal rating based-advanced) bank under the Basel II rules by the relevant German supervisory authorities — the Bundesanstalt für Finanzdienstleistungsaufsicht (Federal Financial Supervisory Authority) and Deutsche Bundesbank (German Central Bank).
Commitments
In 2011, total commitments of export and project finance amounted to EUR 13.4 billion (including commitments under the CIRR scheme for ship financings, which is supported by the federal budget) (2010: EUR 9.3 billion). The following table shows commitments in KfW’s business area export and project finance in 2011 and 2010.
| | | | | | | | | | | | | | | | | | | | |
| | | Year ended December 31, |
| | | 2011 | | 2010 |
| | | (EUR in millions) | | (in % of total) | | (EUR in millions) | | (in % of total) |
Commercial business | | | | 7,039 | | | | | 52 | | | | | 5,396 | | | | | 58 | |
Promotional business (conducted on behalf of KfW) | | | | 6,370 | | | | | 48 | | | | | 3,940 | | | | | 42 | |
| | | | | | | | | | | | | | | | | | | | |
Total commitments (1) | | | | 13,409 | | | | | 100 | | | | | 9,336 | | | | | 100 | |
| | | | | | | | | | | | | | | | | | | | |
| (1) | Commitments represent the volume of funds committed for loans and other business transactions in the relevant year, including amounts to be disbursed in future years, and do not include amounts disbursed in the relevant year pursuant to commitments made in prior years. |
23
The following table shows KfW IPEX-Bank’s commitments by sectors in 2011 and 2010.
| | | | | | | | | | |
| | | Year ended December 31, |
| | | 2011 | | 2010 |
| | | (EUR in millions) |
Power, renewables and water | | | | 2,122 | | | | | 1,774 | |
Shipping | | | | 1,977 | | | | | 1,300 | |
Aviation and rail | | | | 1,964 | | | | | 1,031 | |
Basic industries | | | | 1,469 | | | | | 815 | |
Manufacturing industries, telecommunications, retail and health (1) | | | | 1,302 | | | | | 1,478 | |
Transport and social infrastructure | | | | 1,169 | | | | | 941 | |
Financial institutions, trade and commodity finance | | | | 983 | | | | | 741 | |
Leveraged finance, mezzanine and equity | | | | 462 | | | | | 197 | |
CIRR for ship finance | | | | 1,960 | | | | | 1,058 | |
| | | | | | | | | | |
Total commitments | | | | 13,409 | | | | | 9,336 | |
| | | | | | | | | | |
| (1) | In 2011, the telecommunications and media sector was merged into the manufacturing industries, retail and health sector. The previous year figure was adapted accordingly. |
Commitments by Sectors. In 2011, KfW IPEX-Bank was able to increase commitments in almost every business sector. The highest commitments were achieved in the power renewables and water sector with EUR 2.1 billion, followed by shipping as well as aviation and rail with EUR 2.0 billion each. This increase was largely due to favorable market conditions and, to a lesser extent, to the realization of projects which were postponed in 2010. Furthermore, KfW IPEX-Bank benefited from the general propensity of enterprises to invest and the relative restraints on the part of banks and other capital market participants to offer adequate financing in certain sectors.
Commitments by Geographic Area. In 2011, KfW IPEX-Bank’s commitments are reported for the following three regions: Germany; Europe (excluding Germany, but including Russia and Turkey); and the rest of the world. In 2011, KfW IPEX-Bank’s commitments for project and corporate financings (excluding CIRR for ship financing) within Germany increased to EUR 3.2 billion (2010: EUR 2.6 billion). In 2011, commitments in Europe (excluding Germany, but including Russia and Turkey) increased to EUR 4.0 billion (2010: EUR 3.0 billion). KfW IPEX-Bank’s commitments in the rest of the world increased to EUR 4.3 billion in 2011 (2010: EUR 2.7 billion). Transregional CIRR commitments for ship financing amounted to EUR 2.0 billion in 2011 (2010: EUR 1.1 billion).
Commitments by Products. The following table shows KfW IPEX-Bank’s commitments by product in 2011 and 2010.
| | | | | | | | | | |
| | | Year ended December 31, |
| | | 2011 | | 2010 |
| | | (EUR in millions) |
Direct loans | | | | 1,923 | | | | | 1,605 | |
Export finance | | | | 2,816 | | | | | 1,778 | |
Structured finance | | | | 1,320 | | | | | 833 | |
Project finance | | | | 1,356 | | | | | 907 | |
Guarantees | | | | 1,558 | | | | | 748 | |
Credit lines | | | | 911 | | | | | 802 | |
Lease finance | | | | 365 | | | | | 654 | |
Acquisition finance | | | | 411 | | | | | 196 | |
Other products | | | | 788 | | | | | 756 | |
CIRR for ship finance | | | | 1,960 | | | | | 1,058 | |
| | | | | | | | | | |
Total commitments | | | | 13,409 | | | | | 9,336 | |
| | | | | | | | | | |
24
Funding
The funds for KfW IPEX-Bank’s commitments are mainly provided by KfW through borrowings in the capital markets. KfW provides funding to KfW IPEX-Bank’s international project and export finance business at market rates based on the ratings assigned to KfW IPEX-Bank by international rating agencies. For those areas of export finance which the European Commission has deemed to fall within the scope of the promotional activities of KfW, funds from the ERP Special Fund may also be used for subsidizing interest rates. In 2011, EUR 106 million of loan disbursements were supported by the ERP Special Fund.
The terms of export and project finance loans funded in the capital markets are based on the cost of funds to KfW, plus a margin intended to cover the administrative cost of the loan, the credit risk and a return on the bank’s capital. Because the Federal Republic is a member of the OECD, loans financed with ERP Special Fund funds or under the CIRR scheme for the shipping industry must comply with OECD regulations, which provide for minimum interest rates and maximum credit periods. Margins on these loans are also generally intended to cover all the risks of such loans as well as administrative costs and a return on capital. In addition, KfW IPEX-Bank charges customary banking fees for reserving and providing financing and for handling. Foreign-currency denominated loans are hedged through matched funding or other mechanisms.
Promotion of Developing and Transition Countries
In its promotion of developing and transition countries business, KfW, on behalf of the Federal Republic, provides financial assistance to developing countries and countries in transition, either through KfW Entwicklungsbank (KfW Development Bank), which promotes mainly public-sector development cooperation activities, or through DEG, which promotes private-sector investments in developing countries.
The following table sets forth KfW’s commitments for its promotion of developing and transition countries business in 2011 and 2010.
PROMOTIONOF DEVELOPINGAND TRANSITION COUNTRIES COMMITMENTS
| | | | | | | | | | |
| | | Year ended December 31, |
| | | 2011 | | 2010 |
| | | (EUR in millions) |
KfW Entwicklungsbank | | | | 4,532 | | | | | 4,452 | |
DEG – Deutsche Investitions- und Entwicklungsgesellschaft mbH | | | | 1,223 | | | | | 1,226 | |
| | | | | | | | | | |
Total commitments | | | | 5,755 | | | | | 5,679 | |
| | | | | | | | | | |
KfW Entwicklungsbank (KfW Development Bank)
KfW acts as the Federal Republic’s international development bank, extending loans and disbursing grants mainly to foreign public-sector borrowers and recipients. In 2011, approximately 36% of these loans and grants was refinanced from federal budget funds provided to KfW. All of KfW’s international development activities are made according to instructions from the Federal Government. Mandates and all funds from the Federal Government involved in loan commitments and grants do, by their nature, not appear on KfW’s statement of financial position.
KfW extends financial cooperation loans in three ways:
| | • | | Traditional Financial Cooperation Loans (FZ-Standardkredite) that are extended for the account of the Federal Republic; |
| | • | | Financial Cooperation Development Loans (FZ-Entwicklungskredite), in which KfW offers its own funds as an additional source of financing. For these loans, federal budget funds at low interest rates or grant funds are combined with funds from KfW that are refinanced in the capital markets. Roughly 60% of the portion refinanced with KfW funds is guaranteed either by a special guarantee facility of the Federal Republic or by export credit agencies. Interest rates and related terms of Financial Cooperation Development Loans are significantly more favorable to the borrower than market terms and, therefore, meet the requirements for recognition as official development assistance; and |
25
| | • | | Financial Cooperation Promotional Loans (FZ-Förderkredite), which are funded solely through funds raised by KfW in the capital markets and do not include interest reduction elements from the federal budget. |
Generally, interested foreign governments submit applications for financial cooperation to the Federal Government, which then asks KfW to appraise the proposed projects. In the case of Financial Cooperation Promotional Loans, project sponsors may submit their proposals directly to KfW. KfW maintains a staff of economists, engineers and other specialists to assist in the appraisal and development of projects. KfW receives fees from the Federal Republic for loans and grants extended for the account of the Federal Government and Development Loans, calculated as a percentage of outstanding loans and grants, as far as they are financed out of the federal budget. Based on KfW’s appraisal and its recommendation, the Federal Republic decides whether or not to fund a particular project. Upon a favorable decision and upon determination of the terms and conditions of financing, KfW enters into a loan or grant agreement with the recipient country or, if applicable, the individual agency responsible for the project, in which case the obligations under that agreement would then usually be fully guaranteed by the respective recipient country.
Financial cooperation loans and grants are disbursed according to the progress of the relevant project, and KfW monitors the utilization of funds in order to verify compliance with the provisions of the loan or grant agreement.
The following table shows KfW Entwicklungsbank commitments in 2011 and 2010.
KFW ENTWICKLUNGSBANK COMMITMENTS
| | | | | | | | | | |
| | | Year ended December 31, |
| | | 2011 | | 2010 |
| | | (EUR in millions) |
Loan commitments | | | | 2,854 | | | | | 3,234 | |
of which federal funds | | | | 279 | | | | | 394 | |
of which KfW’s funds refinanced in the capital markets | | | | 2,575 | | | | | 2,840 | |
Grant commitments | | | | 1,336 | | | | | 1,036 | |
Mandates (1) | | | | 343 | | | | | 183 | |
| | | | | | | | | | |
Total commitments | | | | 4,532 | | | | | 4,452 | |
| | | | | | | | | | |
| (1) | Mandates are grants funded by governmental or supranational entities and distributed using KfW’s expertise and channels. |
Total commitments of KfW Entwicklungsbank increased by 2% to EUR 4,532 million in 2011 (2010: EUR 4,452 million). The relative share of loan commitments that were refinanced in the capital markets increased to 90% in 2011 (2010: 88%).
In 2011, Asia accounted for 31% of KfW Entwicklungsbank’s commitments; sub-Saharan Africa, for 19%; Europe/Caucasus, for 18%; Latin America, for 12%; Middle East/North Africa, for 9%; and transregional commitments accounted for 11%.
The following table shows KfW Entwicklungsbank’s commitments by sector in 2011.
| | | | | | | | | | |
| | | Year ended December 31, |
| | | 2011 |
| | | (EUR in millions) | | (in % of total) |
Financial sector | | | | 1,130 | | | | | 25 | |
Social infrastructure | | | | 1,392 | | | | | 31 | |
Economic infrastructure | | | | 1,044 | | | | | 23 | |
Production sector | | | | 180 | | | | | 4 | |
Others (1) | | | | 785 | | | | | 17 | |
| | | | | | | | | | |
Total commitments | | | | 4,532 | | | | | 100 | |
| | | | | | | | | | |
| (1) | Consists of commitments made for climate and nature protection projects and emergency assistance in crisis situations. |
26
DEG – Deutsche Investitions- und Entwicklungsgesellschaft mbH
DEG, a limited liability corporation, is a legally independent entity founded in 1962. DEG is located in Cologne, Germany. In 2001, KfW acquired DEG from the Federal Republic. Since that year, DEG has been fully consolidated in KfW’s consolidated financial statements. As of December 31, 2011, DEG maintained 13 representative offices in developing or transition countries. In 2011, DEG employed an average of 457 persons (2010: 436).
DEG’s activities extend to various countries in Africa, Asia, Latin America, and Central and Eastern Europe. DEG aims to establish and expand private enterprise structures in these countries as a contribution to sustainable growth and lasting improvement in the living conditions of the local population. To this end, DEG provides long-term capital for private enterprises investing in developing countries. In addition, DEG provides both finance and consultancy services in customized packages on a project by project basis.
DEG pursues four key economic aims in its private sector development policy:
| | • | | promoting direct investment, including through DEG’s own venture capital activity; |
| | • | | providing long-term debt finance to investment projects; |
| | • | | supporting pioneer investors in new countries and regions; and |
| | • | | strengthening local capital markets through financial sector development. |
DEG conducts its activities in cooperation with commercial banks rather than in competition with them. In its activities, DEG acts in accordance with commercial principles. Accordingly, it does not provide subsidized financing, but instead offers financing solely on commercial terms and conditions. DEG also seeks to mobilize other partners to provide additional capital for investment in its projects.
As an instrumentality serving public policy objectives of the Federal Government, DEG has been granted a favorable tax status under which only part of DEG’s activities are subject to corporate income tax. Like KfW, DEG does not distribute profits but instead re-channels them into new investments.
DEG’s obligations do not benefit from the Guarantee of the Federal Republic or from Anstaltslast, and while DEG’s indebtedness is reflected in KfW’s consolidated statement of financial position, its debt represents obligations of DEG and not of KfW. In June 2001, KfW and DEG entered into a refinancing agreement, pursuant to which KfW acts as sole issuer in the capital markets and provides DEG with mid- and long-term capital market funds according to DEG’s capital needs. In addition, internal agreements have been reached concerning the respective fields of business activities, the mutual use of offices abroad, joint public relations activities and joint information technology management.
The following table shows DEG’s commitments in 2011 and 2010.
DEG COMMITMENTS
| | | | | | | | | | |
| | | Year ended December 31, |
| | | 2011 | | 2010 |
| | | (EUR in millions) |
Loans | | | | 710 | | | | | 871 | |
Equity participations | | | | 274 | | | | | 170 | |
Mezzanine financing | | | | 235 | | | | | 174 | |
Guarantees | | | | 4 | | | | | 12 | |
| | | | | | | | | | |
Total commitments | | | | 1,223 | | | | | 1,226 | |
| | | | | | | | | | |
27
Capital Markets
KfW’s capital markets business area comprises KfW’s securitization programs, its ABS Portfolio, a program for the refinancing of export loans and the responsibility for granting certain global loans. All of these activities are part of KfW’s promotional activities. Furthermore, this business area includes the group’s treasury activities, including its funding activities and its financial asset management, as well as other capital markets-related activities currently consisting of privatization initiatives relating to Deutsche Telekom AG and Deutsche Post AG and the provision of financial stability measures to Greece on behalf of the Federal Government. The following table shows capital markets’ commitments and the amount of new funds raised in the capital markets for each of the years indicated.
CAPITAL MARKETS KEY FIGURES
| | | | | | | | | | |
| | | Year ended December 31, |
| | | 2011 | | 2010 |
| | | (EUR in millions) |
Capital markets commitments | | | | 1,147 | | | | | 2,525 | |
of which securitization program commitments | | | | — | | | | | — | |
of which ABS Portfolio | | | | 486 | | | | | 1,068 | |
of which program for the refinancing of export loans | | | | 651 | | | | | 1,057 | |
of which global loans (1) | | | | 10 | | | | | 400 | |
| | |
Special mandate by the Federal Government | | | | — | | | | | 22,336 | |
New funds raised in the capital markets | | | | 79,684 | | | | | 76,374 | |
| (1) | In 2011, the responsibility for granting global loans to commercial banks in Europe was transferred to the Capital Markets business area. In 2010, these commitments amounted to EUR 400 million and were reported under KfW Kommunalbank’s commitments. The commitment figures for 2010 have been adjusted to reflect this change in reporting and deviate from the amounts disclosed previously. |
Synthetic Securitization Programs
For a number of years, KfW has been running a synthetic securitization program known as PROMISE (Program for “Mittelstand” Loan Securitization) to promote the lending activities of banks to German SMEs. The program helps banks to transfer the credit risk on their SME portfolios to the capital markets. In addition, KfW established PROVIDE, a synthetic securitization program for residential mortgage loans. In 2011, no transactions were concluded under the securitization programs. At year-end 2011, KfW’s securitization commitments outstanding amounted to EUR 8.4 billion (year-end 2010: EUR 15.4 billion).
All securitization transactions to date have followed a standardized basic structure under which KfW acts as intermediary between originating banks and the capital markets. In principle, KfW transfers the entire credit risk assumed in connection with the transactions to third parties via credit linked certificates of indebtedness and financial guarantees. Between 2005 and 2007, KfW selectively retained parts of AAA-rated senior tranches in transactions under the securitization programs. As of December 31, 2011, one retained senior tranche was outstanding, amounting to EUR 0.046 billion (year-end 2010: two retained senior tranches amounting to EUR 0.6 billion).
There was no material change in 2011 with respect to the level of risk that KfW incurred as a result of changes in the ratings of transactions concluded under the securitization programs.
ABS Portfolio
In 2011, KfW invested EUR 0.5 billion (2010: EUR 1.1 billion) in senior tranches of securitized assets (e.g., SME loan-portfolios) in order to enable KfW’s promotional target groups to benefit from a sustainable and stable credit supply.
Program for the Refinancing of Export Loans
KfW offers commercial banks long-term refinancing of export loans covered by HERMES, the official German export credit insurer. These loans are guaranteed by the Federal Republic through HERMES, such that KfW’s exposure is fully covered by the Federal Republic. In 2011, KfW made commitments of EUR 651 million (2010: EUR 1,057 million) under this program.
28
Global Loans
KfW grants, to a limited extent, global loans to financial institutions in Europe. In 2011, the strategic focus for global loans in Europe was adjusted: KfW, in cooperation with the European Commission, now extends global loans mainly for energy efficiency projects in form of a lump sum to selected financial institutions in Europe. These institutions then break down the global loans and extend individual loans to SMEs and municipalities. In 2011, global loans to financial institutions in Europe amounted to EUR 0.01 billion (2010: EUR 0.4 billion).
Special Mandate by the Federal Government
Financial Support Measures for Greece. In 2010, the member states of the EU that form the euro area (the “Euro Area Member States”) together with the International Monetary Fund (“IMF”) decided on a loan facility to support the stability measures for Greece in an amount of up to EUR 110.0 billion, of which EUR 80.0 billion are to be contributed by the Euro Area Member States and EUR 30.0 billion by the IMF. Drawings under this loan facility may be made until May 2013.
KfW was mandated by the Federal Government to participate in this loan facility to Greece on behalf of the Federal Republic in an amount of up to EUR 22.3 billion. As of December 31, 2011, KfW has disbursed EUR 15.2 billion under this loan facility.
Funding
KfW Bankengruppe’s principal sources of funds are the international financial markets and public funds, with the majority of lending in its business areas being financed from funds raised by KfW in the international financial markets. KfW Bankengruppe’s consolidated balance sheet total at year-end 2011 was EUR 494.8 billion. EUR 445.2 billion, or 90% of this amount, was financed through borrowings (i.e., from financial market funds or public funds). In addition, at year-end 2011, KfW had EUR 16.7 billion in liabilities held in trust (i.e., for which the Federal Government provides the funding and assumes all risks), which do not appear on KfW’s consolidated statement of financial position. In line with the focus on mid-term and long-term loans within its loan portfolio resulting from its promotional business, approximately 73% of KfW Bankengruppe’s total borrowings outstanding at the end of 2011 had remaining maturities of one year or more.
Financial-Market Funds. KfW raises short-term and long-term funds in the international financial markets through the issuance of bonds and notes (including commercial paper) and by incurring loans against debt certificates (Schuldscheindarlehen). Long-term funding with initial maturities of more than one year (referred to as “capital-market funding” below) represents the most important source of funding. Short-term borrowings with initial maturities of less than one year in the form of commercial paper (referred to as “money-market funding” below) are primarily used for purposes of KfW’s liquidity management. The percentage of capital-market funding outstanding of total financial-market funds outstanding was 93% at the end of 2011.
KfW’s wholly owned finance subsidiary in the United States, KfW International Finance Inc., a Delaware corporation, which had been engaged in refinancing activities for KfW until 2008 and then ceased further operations, filed a certificate of dissolution under Delaware law in July 2010.
All amounts stated in connection with KfW’s capital- and money-market funding transactions or funding volume are, unless stated otherwise, based on net proceeds to KfW, which are calculated as principal amount less discount and underwriting commissions, if any.
Capital-Market Funding. KfW’s capital-market funding policy pursues dual objectives: to achieve the most favorable terms possible for funds raised in the capital markets; and to minimize, to the extent practicable, the effects of changes in interest rates and foreign exchange rates mainly through interest rate and currency risk hedging instruments and, to a more limited extent, by matching funding liabilities with loan assets. In order to achieve favorable terms for funds raised, KfW maintains an active presence in all major capital markets and utilizes a broad range of funding instruments in various currencies, covering a range of maturities.
29
KfW’s capital-market funding is based on three pillars: its “benchmark” bond programs (in euro and U.S. dollar); publicly-placed bonds outside the benchmark programs; and “private placements,” which is a term KfW uses in the commercial sense to refer to sales to a specific investor or a limited number of investors. In 2011, benchmark bonds accounted for a funding volume of EUR 42.5 billion, or 53% of KfW’s total capital-market funding. The two other funding sources accounted for EUR 32.5 billion, or 41%, and EUR 2.7 billion, or 3%, respectively, with the remaining 2% being funded by Schuldscheindarlehen. Total capital-market funding in 2011 amounted to EUR 79.7 billion (2010: EUR 76.4 billion).
KfW’s core currencies are the euro and the U.S. dollar, which together accounted for 79% of KfW’s total new capital-market funding in 2011. As compared to 2010, the volume of new funds raised in Australian dollar remained stable at 7%, again making the Australian dollar KfW’s third most significant funding currency. While the relative volume of pound sterling funding increased to 6% (2010: 4%), the volume of Japanese yen funding remained stable at 2% (2010: 2%). In 2011, KfW’s total new capital-market funding was raised in 11 different currencies and more than 350 separate capital market transactions.
KFW’S TOTAL NEW CAPITAL-MARKET FUNDING VOLUME 2011BY CURRENCIES
| | | | | | | | | | |
| | | EUR in billions | | In % of total |
Euro (EUR) | | | | 39.9 | | | | | 50 | |
U.S. dollar (USD) | | | | 23.3 | | | | | 29 | |
Australian dollar (AUD) | | | | 5.8 | | | | | 7 | |
Pound sterling (GBP) | | | | 4.8 | | | | | 6 | |
Japanese yen (JPY) | | | | 1.7 | | | | | 2 | |
Other currencies (e.g., SEK, NOK and TRY) | | | | 4.3 | | | | | 5 | |
| | | | | | | | | | |
Total | | | | 79.7 | | | | | 100 | |
| | | | | | | | | | |
KfW expects the volume of funding to be raised in the capital markets in 2012 to be approximately EUR 80 billion.
The most important source of capital-market funding for KfW Bankengruppe are bond and note issues. At year-end 2011, the amount of outstanding bonds and notes issued by KfW totaled EUR 368.0 billion, representing a EUR 36.3 billion increase from EUR 331.7 billion outstanding at year-end 2010. The amount of new bonds raised in the capital markets was EUR 77.8 billion in 2011 (2010: EUR 75.2 billion).
In 2011, KfW sold six bond issues in an aggregate principal amount of EUR 26 billion under its euro benchmark program and six note issues in an aggregate principal amount of USD 23 billion under its U.S. dollar program. In addition to the benchmark issues, three additional global bonds denominated in U.S. dollar were issued by KfW in 2011.
KFW’S BENCHMARK BOND ISSUESIN 2011
| | | | | | | | | | | | | | | |
| | | Principal amount
in billions | | Initial maturity (in years) | | Interest rate
in % per annum |
U.S. $-Benchmark I/2011 | | | | USD 5.0 | | | | | 3 | | | | | 1.375 | |
U.S. $-Benchmark II/2011 | | | | USD 4.0 | | | | | 5 | | | | | 2.625 | |
U.S. $-Benchmark III/2011 | | | | USD 4.0 | | | | | 3 | | | | | 1.500 | |
U.S. $-Benchmark IV/2011 | | | | USD 5.0 | | | | | 5 | | | | | 2.000 | |
U.S. $-Benchmark V/2011 | | | | USD 2.0 | | | | | 10 | | | | | 2.375 | |
U.S. $-Benchmark VI/2011 | | | | USD 3.0 | | | | | 5 | | | | | 1.250 | |
Euro-Benchmark I/2011 | | | | EUR 4.0 | | | | | 10 | | | | | 3.375 | |
Re-opening of Euro-Benchmark I/2011 | | | | EUR 2.0 | | | | | 10 | | | | | 3.375 | |
Euro-Benchmark II/2011 | | | | EUR 5.0 | | | | | 3 | | | | | 2.125 | |
Euro-Benchmark III/2011 | | | | EUR 5.0 | | | | | 5 | | | | | 3.125 | |
Euro-Benchmark IV/2011 | | | | EUR 5.0 | | | | | 7 | | | | | 3.125 | |
Euro-Benchmark V/2011 | | | | EUR 5.0 | | | | | 5 | | | | | 2.000 | |
30
Of outstanding borrowings, Schuldscheindarlehen continue to be KfW’s second most important capital-market funding instrument, with EUR 10.6 billion outstanding at year-end 2011. Of this amount, EUR 2.2 billion was included on KfW’s consolidated statement of financial position in liabilities to banks and EUR 8.3 billion in liabilities to customers. Schuldscheindarlehen are a special instrument of the German capital market, under which the lending entity (generally a bank, insurance company or public pension fund) receives a certificate evidencing its loan to the borrower and the terms of such loan. Maturities on Schuldscheindarlehen range from one to 30 years, thereby providing a high degree of flexibility to both the borrower and the lender. Transferable only by way of assignment, Schuldscheindarlehen have only limited liquidity in the interbank secondary market.
The following table sets forth summary information concerning KfW’s outstanding bonds and notes as well as Schuldscheindarlehen with an initial maturity of more than one year and issued in the capital markets.
31
INFORMATIONON ISSUESOF FUNDED DEBTOF KFW BANKENGRUPPE
(ASOF DECEMBER 31, 2011)
| | | | | | | | | | | | | | | | | | | | |
Currency | | Number of
transactions | | Interest
type | | Average
interest
rate in %
per annum
(1) (2) | | Year
of
issue | | Year of
maturity | | Average
time to
maturity
in years (2) | | Principal amount
outstanding
in currency | | | Principal amount
outstanding
in EUR (3) | |
AUD | | 28 | | FIXED | | 5.80 | | 2003-2011 | | 2012-2028 | | 4.7 | | | 24,617,080,000 | | | | 19,348,486,992 | |
AUD | | 11 | | FLOATING | | 4.02 | | 2008-2011 | | 2012-2016 | | 2.7 | | | 1,053,060,000 | | | | 827,682,150 | |
BGN | | 1 | | FLOATING | | 0.00 | | 2007 | | 2012 | | 0.9 | | | 10,000,000 | | | | 5,112,997 | |
BRL | | 1 | | FIXED | | 0.00 | | 2006 | | 2017 | | 5.7 | | | 300,000,000 | | | | 124,133,651 | |
BRL | | 12 | | FLOATING | | N/A | | 2006-2011 | | 2012-2020 | | 1.5 | | | 2,399,040,000 | | | | 992,671,977 | |
CAD | | 13 | | FIXED | | 4.03 | | 2004-2010 | | 2012-2037 | | 7.1 | | | 4,355,200,000 | | | | 3,295,648,884 | |
CAD | | 1 | | FLOATING | | 1.38 | | 2009 | | 2012 | | 1.0 | | | 350,000,000 | | | | 264,850,549 | |
CHF | | 13 | | FIXED | | 2.93 | | 2000-2010 | | 2012-2037 | | 6.9 | | | 4,955,000,000 | | | | 4,076,176,374 | |
CHF | | 1 | | FLOATING | | 0.05 | | 2010 | | 2012 | | 0.6 | | | 11,000,000 | | | | 9,049,029 | |
DEM | | 1 | | FIXED | | 0.00 | | 1993 | | 2023 | | 11.3 | | | 105,985,000 | | | | 54,189,270 | |
EGP | | 1 | | FLOATING | | N/A | | 2007 | | 2012 | | 0.9 | | | 400,000,000 | | | | 51,261,087 | |
EUR | | 226 | | FIXED | | 3.15 | | 1980-2011 | | 2012-2044 | | 4.9 | | | 145,183,703,048 | | | | 145,183,703,048 | |
EUR | | 207 | | FLOATING | | 2.11 | | 1997-2011 | | 2012-2057 | | 8.2 | | | 15,165,585,312 | | | | 15,165,585,312 | |
GBP | | 22 | | FIXED | | 4.69 | | 2000-2011 | | 2012-2037 | | 6.2 | | | 26,122,785,000 | | | | 31,273,536,454 | |
GBP | | 30 | | FLOATING | | 1.14 | | 1999-2010 | | 2012-2044 | | 3.2 | | | 2,270,090,333 | | | | 2,717,694,641 | |
HKD | | 4 | | FIXED | | 1.77 | | 2003-2009 | | 2012-2017 | | 3.2 | | | 763,000,000 | | | | 75,912,844 | |
HKD | | 1 | | FLOATING | | 0.35 | | 2009 | | 2012 | | 0.1 | | | 2,080,000,000 | | | | 206,944,583 | |
HUF | | 1 | | FIXED | | 6.50 | | 2006 | | 2012 | | 0.2 | | | 20,500,000,000 | | | | 65,166,253 | |
IDR | | 4 | | FLOATING | | N/A | | 2007-2009 | | 2012 | | 0.6 | | | 1,600,000,000,000 | | | | 134,566,863 | |
ISK | | 1 | | FIXED | | 7.75 | | 2007 | | 2017 | | 5.4 | | | 500,000,000 | | | | 1,724,138 | |
JPY | | 67 | | FIXED | | 2.27 | | 1995-2011 | | 2012-2038 | | 8.7 | | | 447,857,000,000 | | | | 4,469,630,738 | |
JPY | | 870 | | FLOATING | | 0.29 | | 1999-2011 | | 2012-2041 | | 15.0 | | | 1,472,999,000,000 | | | | 14,700,588,822 | |
MYR | | 2 | | FIXED | | 4.29 | | 2006-2007 | | 2013-2017 | | 3.2 | | | 805,000,000 | | | | 196,262,001 | |
NOK | | 32 | | FIXED | | 4.48 | | 2002-2011 | | 2012-2036 | | 4.0 | | | 57,785,000,000 | | | | 7,452,282,693 | |
NOK | | 2 | | FLOATING | | 3.01 | | 2011 | | 2015-2016 | | 3.9 | | | 4,250,000,000 | | | | 548,104,204 | |
NZD | | 10 | | FIXED | | 5.55 | | 2005-2010 | | 2012-2015 | | 1.7 | | | 2,628,200,000 | | | | 1,570,293,362 | |
NZD | | 1 | | FLOATING | | 3.20 | | 2009 | | 2012 | | 0.4 | | | 150,000,000 | | | | 89,621,796 | |
PEN | | 1 | | FLOATING | | N/A | | 2010 | | 2017 | | 5.2 | | | 75,000,000 | | | | 21,471,822 | |
PLN | | 1 | | FIXED | | 4.50 | | 2006 | | 2025 | | 13.1 | | | 62,309,097 | | | | 13,976,917 | |
RON | | 1 | | FIXED | | 6.00 | | 2007 | | 2014 | | 2.2 | | | 54,000,000 | | | | 12,490,459 | |
RUB | | 2 | | FIXED | | 6.18 | | 2007 | | 2012 | | 0.3 | | | 8,000,000,000 | | | | 191,547,947 | |
SEK | | 14 | | FIXED | | 3.83 | | 2006-2011 | | 2012-2031 | | 7.4 | | | 29,350,000,000 | | | | 3,293,312,388 | |
SEK | | 3 | | FLOATING | | 2.92 | | 2008-2010 | | 2015-2020 | | 5.9 | | | 3,100,000,000 | | | | 347,845,601 | |
SGD | | 2 | | FIXED | | 1.71 | | 2009-2010 | | 2012-2014 | | 0.9 | | | 975,000,000 | | | | 579,701,528 | |
TRY | | 16 | | FIXED | | 9.03 | | 2007-2011 | | 2012-2017 | | 2.0 | | | 3,201,030,000 | | | | 1,310,179,273 | |
USD | | 182 | | FIXED | | 2.77 | | 1993-2011 | | 2012-2047 | | 4.7 | | | 126,141,898,940 | | | | 97,489,681,536 | |
USD | | 48 | | FLOATING | | 0.61 | | 2004-2011 | | 2012-2035 | | 2.1 | | | 10,603,187,126 | | | | 8,194,750,078 | |
ZAR | | 4 | | FIXED | | 7.67 | | 2005-2008 | | 2012-2015 | | 2.0 | | | 4,000,000,000 | | | | 381,570,161 | |
| | | | | | | | | | | | | | | | | | | | |
Total | | 1,837 | | | | | | | | | | 5.4 | | | | | | | 364,737,408,423 | |
| | | | | | | | | | | | | | | | | | | | |
| (1) | Interest rate of floating rate note means the applicable interest rate as of December 31, 2011. Floating rate notes for which the interest rate is fixed in arrears are not included in the calculation of the weighted average of the interest rate (marked “N/A” in the table). |
| (2) | Averages have been calculated on a capital-weighted basis taking into account the principal amount outstanding in euro. |
| (3) | Conversion into euro at the spot rate using the European Central Bank reference rates on December 31, 2011. |
32
Money-Market Funding. Commercial paper is issued under two commercial paper-programs: the multicurrency commercial paper-program; and the U.S. dollar commercial paper-program. The multicurrency commercial paper-program represents the more important source of short term liquidity for KfW. As of December 31, 2011, KfW Bankengruppe’s commercial paper outstanding totaled EUR 30.8 billion (year-end 2010: EUR 26.3 billion).
Public Funds. The proportion of public funds in the group’s borrowings was 3% at the end of 2011. The most important source of public funds for KfW is the budget of the Federal Republic. Total long-term and short-term borrowings from funds provided by the federal budget (excluding loans on a trust basis) amounted to EUR 10.1 billion as of December 31, 2011, including EUR 7.7 billion in borrowings which were transferred from the ERP Special Fund due to its reorganization with effect as of July 1, 2007. The group’s long-term and short-term borrowings from the ERP Special Fund amounted to EUR 399 million as of December 31, 2011. Public funds are made available to the group for use in special categories of KfW’s domestic activities and certain export and project finance transactions with developing countries. Public funds are particularly important in the area of financial cooperation, where KfW Entwicklungsbank extends loans and disburses grants to foreign public sector borrowers and recipients in developing and transition countries. Public funds constituted approximately 36% of the sources of funding for KfW Entwicklungsbank’s commitments in 2011.
Asset Management
As of December 31, 2011, KfW Bankengruppe held financial assets in an amount of EUR 31.9 billion (year-end 2010: EUR 35.2 billion). See “Financial Section—Financial Review—Financial Performance of KfW Bankengruppe—Development of Net Assets” for more information concerning financial assets. EUR 19.6 billion, or 61%, of all financial assets were held in the form of negotiable securities for liquidity purposes. The remaining financial assets were securities held as surrogate for loans or as equity investments in the context of KfW’s promotional business (e.g., ABS Portfolio or DEG’s direct investments), as well as liquidation portfolios. Finally, equity participations held, directly or indirectly, by KfW made up only a very limited amount of the group’s financial assets. The following table presents the amounts of financial assets held at the end of 2011 for the group’s most important securities portfolios.
33
KFW BANKENGRUPPE’S MOST IMPORTANT ASSET MANAGEMENT PORTFOLIOS
| | | | | |
| | | EUR in billions as of
December 31, 2011 |
Liquidity portfolios | | | | 19.6 | |
Liquidation portfolios | | | | 2.0 | |
of which managed by external portfolio managers | | | | 1.2 | |
| | | | | |
Total | | | | 21.7 | |
| | | | | |
Liquidity Portfolio. KfW pursues a conservative liquidity management strategy. For this purpose, KfW holds financial assets in its liquidity portfolio, which is managed by KfW’s Treasury department. The bulk of securities held in this portfolio are denominated in euro, with the remainder denominated in U.S. dollar. For its liquidity portfolio, which KfW holds as liquidity reserve, KfW purchases medium-term securities issued by banks, primarily covered bonds (Pfandbriefe), as well as bonds of public sector issuers and supranational institutions or agencies. The bulk of euro-denominated bonds included in KfW’s liquidity portfolio is eligible as collateral with the European Central Bank and enables KfW to enter into repurchase agreements in refinancing operations within the European System of Central Banks via the Deutsche Bundesbank. At the end of 2011, KfW held securities in the aggregate amount of EUR 19.6 billion in its liquidity portfolio. For financial reporting purposes, securities denominated in U.S. dollar were converted into euro at the currency exchange rate as of December 31, 2011. In addition to these securities, as of December 31, 2011, KfW held money-market assets (overnight and term loans as well as reserve repurchase transactions) for liquidity management purposes in the amount of EUR 43.0 billion.
Liquidation Portfolios. Due to changes in its asset management strategy in 2009, KfW reduced the investment of a portion of its own funds in securities, or income portfolios, and has restructured these into liquidation portfolios. In 2011, a liquidity portfolio held by KfW IPEX-Bank GmbH was also restructured into a liquidation portfolio. The size of these portfolios has decreased continuously in 2011. The remaining amount invested in liquidation portfolios denominated in euro and U.S. dollars amounted to EUR 2.0 billion as of December 31, 2011, and is managed by external managers and, to a lesser extent, by KfW. The liquidation portfolios include, among others, securities formerly owned by IKB Deutsche Industriebank (“IKB”) of Germany, which were transferred to KfW in the course of the IKB rescue. As previously reported, IKB had been seriously affected by the crisis in the U.S. subprime mortgage market, such that KfW, which at the time held a stake in IKB, and several of the German banking associations together provided substantial support and risk protection to IKB in 2007 and 2008. Some of the support measures are still in place.
Privatization Initiatives
In furtherance of the privatization initiatives of the Federal Government, KfW acquired and sold shares of both Deutsche Telekom AG and Deutsche Post AG in various transactions since 1997. KfW sold those shares through, among other transactions, German and international public offerings, private placements, block trades, exchangeable bonds and other transactions. Pursuant to an arms-length agreement with the Federal Government, KfW is protected against the market risk of these transactions. The agreement provides that KfW will receive a percentage of any market value increase in the shares acquired and sold, plus a fee for its services.
In the case of Deutsche Telekom AG, the number of shares held by KfW remained unchanged in 2011. At year-end 2011, KfW held 735.7 million shares of Deutsche Telekom AG, which represented a stake of approximately 17% (year-end 2010: 17%). To KfW’s knowledge, the Federal Republic continued to hold a direct stake of approximately 15% in Deutsche Telekom AG at year-end 2011 (year-end 2010: 15%).
In the case of Deutsche Post AG, the number of shares held by KfW remained unchanged in 2011. At year-end 2011, KfW held 368.3 million ordinary registered shares of Deutsche Post AG, which represented a stake of approximately 30.5%. To KfW’s knowledge, the Federal Republic does not hold any shares in Deutsche Post AG.
KfW has issued two exchangeable bonds due in June 2013 and July 2014 in aggregate principal amounts of EUR 3,300 million and EUR 750 million, which are exchangeable into ordinary registered shares of Deutsche Telekom AG and Deutsche Post AG, respectively. Upon exchange in full of these bonds, KfW’s ownership interest in Deutsche Telekom AG and Deutsche Post AG would be reduced by approximately 238.9 million and 54.1 million shares, respectively.
34
Given the above-mentioned agreement with the Federal Government, KfW’s holdings in shares of Deutsche Post AG and Deutsche Telekom AG are not included in financial assets, but are presented on KfW’s consolidated statement of financial position as loans and advances to customers.
The Federal Government may sell further stakes in Deutsche Telekom AG to KfW in 2012. KfW expects its holdings in Deutsche Telekom AG and Deutsche Post AG shares to be reduced in the medium term.
Others
KfW’s strategic shareholdings as well as certain services provided by KfW for or on behalf of the Federal Government in connection with activities associated with Germany’s reunification are presented in this section. For purposes of KfW’s segment reporting (see note 37 to the financial statements), these activities are reported under the “Group centre” item.
Strategic Shareholdings
KfW holds its subsidiary DEG directly, and its subsidiary KfW IPEX-Bank through the holding company KfW IPEX-Beteiligungsholding GmbH.
Other strategic subsidiaries and equity participations of KfW are held by KfW Beteiligungsholding GmbH. At year-end 2011, the main assets of KfW Beteiligungsholding GmbH consisted of a 100% stake each in Finanzierungs- und Beratungsgesellschaft mbH, ASTRA-Grundstücksgesellschaft mbH and tbg Technologie-Beteiligungs-Gesellschaft mbH.
KfW Beteiligungsholding GmbH also holds a 13.0% stake in Dedalus GmbH & Co. KGaA (“Dedalus”), which, in turn, indirectly holds a 7.5% economic stake (the “EADS stake”) in European Aeronautic Defence Space Company EADS N.V (“EADS”), a European aerospace and defense company, which holds, among other participations, a majority interest in Airbus S.A.S., the European aircraft manufacturer. In 2007, KfW, together with 14 other investors, had agreed to acquire jointly from DaimlerChrysler group (now Daimler group) the EADS stake; the economic interest in the EADS stake is held through Dedalus. As a result, KfW is exposed to the economic risk equivalent to holding an equity stake of approximately 0.975% in EADS. The interests of KfW and the other investors in Dedalus and the EADS stake are subject to various resale restrictions. KfW and the other investors benefit from a special dividend distribution. Voting rights in the EADS stake remain with the Daimler group, and neither KfW nor any of the other investors are entitled — either directly or indirectly — to exercise any voting rights attached to the EADS stake. The investment of KfW Bankengruppe in EADS, which was recorded on KfW’s statement of financial position in an amount of EUR 144 million as of December 31, 2011, was made under a special mandate of the Federal Government in accordance with section 2 paragraph 4 of the KfW Law, which authorizes the Federal Government to direct KfW to take measures in connection with matters in which the Federal Republic has an interest (Zuweisungsgeschäft).
In November 2011, the German Federal Ministry of Economics and Technology announced that it had been informed of the Daimler group’s intention to sell a 7.5% stake in EADS. The Federal Government stated that it regards the ownership structure of EADS as a matter of strategic interest and stated that it intends to mandate KfW in accordance with section 2 paragraph 4 of the KfW Law to acquire temporarily the stake to be sold by the Daimler group. It is envisaged, however, that for the time being the Daimler group will continue to represent German interests in EADS. The terms of any such sale have yet to be negotiated. The Federal Government expects the transaction to close in 2012. If mandated, KfW expects to be protected by the Federal Republic against the risks arising out of any such transaction. In case of a sale of Daimler group’s stake in EADS, the investors in Dedalus, which otherwise are subject to various resale restrictions, would be allowed to sell their interests. On March 21, 2012, the Federal Government announced, that various investors have already indicated their intention to sell their interests. Accordingly, the Federal Government decided to increase the amount set aside for potential costs and risks related to an interest in EADS.
Other Services
KfW provides services for and on behalf of the Federal Government in connection with activities associated with Germany’s reunification. KfW administers certain claims transferred to the Federal Government under the 1990 Unification Treaty between the Federal Republic and the former GDR and performs other services in connection with the assets and obligations assumed from the former GDR. In 2011, KfW continued to make progress in resolving the remaining open cases, claims and accounts.
35
CAPITALIZATION
CAPITALIZATIONOF KFW BANKENGRUPPEASOF DECEMBER 31, 2011
| | | | | |
| | | (EUR in millions) |
Borrowings | | | | | |
Short-term funds | | | | 32,276 | |
Bonds and other fixed-income securities | | | | 368,042 | |
Other borrowings | | | | 41,644 | |
Subordinated liabilities (1) | | | | 3,247 | |
| | | | | |
Total borrowings | | | | 445,209 | |
| |
Equity | | | | | |
Paid-in subscribed capital (2) | | | | 3,300 | |
Capital reserve (3) | | | | 5,947 | |
Reserve from the ERP Special Fund | | | | 1,056 | |
Retained earnings | | | | 6,107 | |
Fund for general banking risks | | | | 1,700 | |
Revaluation reserve | | | | -262 | |
| | | | | |
Total equity | | | | 17,847 | |
| | | | | |
Total capitalization | | | | 463,056 | |
| | | | | |
| (1) | Includes assets transferred from the ERP Special Fund in form of a subordinated loan of EUR 3,247 million. |
| (2) | KfW’s equity capital, 80% of which is held by the Federal Government and the remaining 20% by the Länder, amounted to EUR 3,750 million in 2011, of which EUR 3,300 million has been paid in pro rata by the Federal Government and the Länder. |
| (3) | Includes equity capital in form of a promotional reserve (Förderrücklage) from the ERP Special Fund of EUR 4,650 million. |
36
MANAGEMENT AND EMPLOYEES
The bodies of KfW are the Executive Board (Vorstand) and the Board of Supervisory Directors (Verwaltungsrat).
Executive Board
The Executive Board is responsible for the day-to-day conduct of KfW’s business and the administration of its assets. Typically, members of the Executive Board are initially appointed for a maximum of three years by the Board of Supervisory Directors. After this first tenure each member may be repeatedly reappointed for, or his or her term of office may be repeatedly extended by, up to five years by the Board of Supervisory Directors. Each Member of the Executive Board is responsible for certain aspects of KfW’s activities but shares the responsibility for actions taken by the Executive Board.
The names of the current members of the Executive Board and the dates of their initial appointments to the Board are set forth below:
| | | | |
Name | | Date of Initial Appointment | |
Dr Ulrich Schröder (Chief Executive Officer) | | | September 1, 2008 | |
Dr Günther Bräunig | | | October 1, 2006 | |
Dr Norbert Kloppenburg | | | January 1, 2007 | |
Dr Edeltraud Leibrock | | | October 1, 2011 | |
Bernd Loewen | | | July 1, 2009 | |
Dr Axel Nawrath | | | April 1, 2009 | |
In 2011, the Board of Supervisory Directors appointed Ms. Dr Edeltraud Leibrock as additional member of the Executive Board of KfW. Dr Leibrock took office on October 1, 2011 and assumed the newly created position as Chief Operating Officer and Chief Information Officer of KfW. Before joining KfW, Dr Leibrock headed the Group IT division of Bayerische Landesbank (BayernLB) as Chief Information Officer and Executive Manager.
For information on the remuneration of the Executive Board, see note 78 to the financial statements.
Board of Supervisory Directors
The Board of Supervisory Directors generally has 37 members and consists of the Federal Minister of Finance; the Federal Minister of Economics and Technology; the Federal Minister of Foreign Affairs; the Federal Minister of Food, Agriculture and Consumer Protection; the Federal Minister of Transport, Building and Urban Affairs; the Federal Minister for Economic Cooperation and Development; the Federal Minister for the Environment, Nature Conservation and Nuclear Safety; seven members appointed by the Bundesrat; seven members appointed by the Bundestag; five representatives of commercial banks; two representatives of industry; one representative each of the local municipalities, agriculture, crafts, trade and the housing industry; and four representatives of the trade unions. The representatives of the commercial banks, industry, the local municipalities, agriculture, crafts, trade, the housing industry and the trade unions are appointed by the Federal Government after consultation with their constituencies.
The Federal Minister of Finance and the Federal Minister of Economics and Technology are appointed on a year-by-year rotating basis as Chairman and Deputy Chairman of the Board of Supervisory Directors, with the latter serving as Chairman for the year 2012. The term of office of all Federal Ministers on KfW’s Board of Supervisory Directors corresponds to their term of office as Federal Minister, while the other members of the Board of Supervisory Directors are personally appointed for a term of three years.
The Board of Supervisory Directors supervises the overall conduct of KfW’s business and the administration of its assets. It may give the Executive Board general or special directives. In particular, the Board of Supervisory Directors (via its Credit Committee) generally must approve, inter alia, short-term financings, loan commitments to a single borrower exceeding EUR 50 million for non-investment grade, or unrated borrowers, certain unsecured loans, and loan commitments exceeding EUR 100 million to investment grade borrowers. The Board of Supervisory Directors may reserve the right to approve other transactions or types of transactions. However, it is not authorized to represent KfW or to commit funds on KfW’s behalf.
37
The Board of Supervisory Directors has an Executive Committee (Präsidialausschuss), a Credit Committee (Kreditausschuss), and an Audit Committee (Prüfungsausschuss). The Executive Committee is responsible for the handling of legal and administrative matters as well as for business and corporate policy matters of general importance. It may take decisions on the Board of Supervisory Directors’ behalf in urgent matters (Eilentscheidung). The Credit Committee is responsible for approving certain credit (and related) matters as well as the issuance of debt securities, borrowings in foreign countries and swap transactions. The Audit Committee prepares matters relating to financial reporting and risk management but does not have any decision-making power. In particular, the Audit Committee deals with matters such as monitoring the accounting process, the effectiveness of the internal controls system, the internal audit system and the risk management system, the audit of the annual unconsolidated and consolidated financial statements, auditor independence matters and the determination of the main focus points of the audit. While the Chairman of the Board of Supervisory Directors simultaneously acts as Chairman of the Executive Committee and the Credit Committee, the Audit Committee is chaired by a representative of the banking sector. The Chairmen of the committees report regularly to the Board of Supervisory Directors. The Board of Supervisory Directors has the right to reclaim powers that have been delegated to the committees at any time.
38
The current members of the Board of Supervisory Directors are:
| | |
Name | | Position |
Ilse Aigner | | Federal Minister of Food, Agriculture and Consumer Protection |
Norbert Barthle | | Member of Parliament; appointed by the Bundestag |
Jan Bettink | | President of the Verband Deutscher Pfandbriefbanken; representative of the mortgage banks |
Anton F. Börner | | President of the Bundesverband Großhandel, Außenhandel, Dienstleistungen (BGA) e.V.; representative of the wholesale and foreign trade sector |
Volker Bouffier | | Minister President of the State of Hesse; appointed by the Bundesrat |
Frank Bsirske | | Chairman of ver.di – Vereinigte Dienstleistungsgewerkschaft; representative of the trade unions |
Helmut Dedy | | Permanent Representative of the Executive Director of the Deutscher Städtetag; representative of the local municipalities |
Prof Dr Hans Heinrich Driftmann | | President of the Deutscher Industrie- und Handelskammertag (DIHK) e.V.; representative of the industry |
Ingeborg Esser | | Member of the Board of GdW Bundesverband deutscher Wohnungs- und Immobilienunternehmen e.V.; representative of the housing sector |
Heinrich Haasis | | President of the Deutscher Sparkassen- und Giroverband; representative of the savings banks |
Hubertus Heil | | Member of Parliament; appointed by the Bundestag |
Gerhard Hofmann | | Member of the Board of Managing Directors of Bundesverband der Deutschen Volksbanken und Raiffeisenbanken e.V. (BVR); representative of the cooperative banks |
Frank Horch | | Senator for economics, transport and innovation in the city state of Hamburg; appointed by the Bundesrat |
Bartholomäus Kalb | | Member of Parliament; appointed by the Bundestag |
Dr Markus Kerber | | Executive Director of the Bundesverband der Deutschen Industrie e.V.; representative of the industry |
Dr h.c. Jürgen Koppelin | | Member of Parliament; appointed by the Bundestag |
Karoline Linnert | | Senator for finance in the city state of Bremen; appointed by the Bundesrat |
Dr Gesine Lötzsch | | Member of Parliament; appointed by the Bundestag |
Claus Matecki | | Member of the Federal Executive Committee of Deutscher Gewerkschaftsbund; representative of the trade unions |
Dr Michael Meister | | Member of Parliament; appointed by the Bundestag |
Franz-Josef Möllenberg | | Chairman of the Gewerkschaft Nahrung-Genuss-Gaststätten; representative of the trade unions |
Dirk Niebel | | Federal Minister for Economic Cooperation and Development |
Dr Peter Ramsauer | | Federal Minister of Transport, Building and Urban Development |
Dr Philipp Rösler | | Federal Minister of Economics and Technology; Chairman in 2012 |
Dr Norbert Röttgen | | Federal Minister for the Enviroment, Nature Conservation and Nuclear Safety |
Dr Wolfgang Schäuble | | Federal Minister of Finance; Deputy Chairman in 2012 |
Hanns-Eberhard Schleyer | | Former Secretary General of the Zentralverband des Deutschen Handwerks; representative of the crafts |
Dr Nils Schmid | | Minister of Finance of the State of Baden-Württemberg; appointed by the Bundesrat |
Andreas Schmitz | | President of the Bundesverband Deutscher Banken e.V.; Chairman of the Management Board of HSBC Trinkaus & Burkhardt AG; representative of the commercial banks |
Carsten Schneider | | Member of Parliament; appointed by the Bundestag |
Dr Markus Söder | | Minister of Finance of the Free State of Bavaria; appointed by the Bundesrat |
Michael Sommer | | Chairman of the Deutscher Gewerkschaftsbund; representative of the trade unions |
Gerd Sonnleitner | | President of the Deutscher Bauernverband e.V.; representative of the agricultural sector |
Marion Walsmann | | Minister of Finance of the Free State of Thuringia; appointed by the Bundesrat |
Dr Norbert Walter-Borjans | | Minister of Finance of the State of Northrhine-Westphalia; appointed by the Bundesrat |
Dr Guido Westerwelle | | Federal Minister of Foreign Affairs |
For information concerning the remuneration of the Board of Supervisory Directors, see note 78 to the financial statements.
39
Employees
In 2011, KfW Bankengruppe employed an average of 4,765 persons (excluding members of the Executive Board and trainees, but including temporary personnel) (2010: 4,531 persons). Approximately 30% of KfW’s staff is covered by collective bargaining agreements. KfW provides employee benefits such as pensions to its employees.
Of KfW Bankengruppe’s staff, approximately 21% is engaged in KfW’s domestic business activities, 23% in promotion of developing and transition countries, 11% in export and project finance, and the balance in KfW’s accounting, disbursements, collateral, funding and lending support departments and in general administrative and staff functions.
For more information concerning KfW Bankengruppe’s employees, see note 77 to the financial statements.
40
FINANCIAL SECTION
Financial Statements and Auditors
The consolidated financial statements of KfW included in this annual report have been prepared in accordance with International Financial Reporting Standards as adopted by the EU (“IFRS”) and the additional requirements of German commercial law pursuant to § 315a (1) of the German Commercial Code (Handelsgesetzbuch, or “HGB”) and supplementary provisions of the KfW Law and the by-laws of KfW. IFRS differs in certain significant respects from accounting principles generally accepted and financial reporting practices followed in the United States (“U.S. GAAP”), and, as a result, KfW’s consolidated financial statements included in this annual report may differ substantially from financial statements prepared in accordance with U.S. GAAP.
Pursuant to the KfW Law, the annual financial statements of KfW are examined by a Wirtschaftsprüfer (Certified Public Accountant) who is appointed by the Federal Minister of Finance in consultation with the Board of Supervisory Directors and the Federal Court of Auditors (Bundesrechnungshof). KfW’s external auditors for the fiscal year 2011 are KPMG AG Wirtschaftsprüfungsgesellschaft (“KPMG”), a member firm of KPMG International.
The annual audit is conducted in accordance with German Generally Accepted Auditing Standards (“German GAAS”).
The auditor’s report of KPMG for the year ended December 31, 2011, dated February 28, 2012, refers to a group management report (Konzernlagebericht). The examination of, and the auditor’s report upon, this group management report are required under German GAAS. This examination was not made in accordance with U.S. generally accepted auditing standards (“U.S. GAAS”) or U.S. attestation standards. Therefore, KPMG does not provide any opinion on such examination, on the group management report or on the financial statements included in this annual report in accordance with U.S. GAAS or U.S. attestation standards.
Financial Review
Overview of KfW Bankengruppe
KfW Bankengruppe consists of KfW and six consolidated subsidiaries. In addition to KfW, the group’s main operating subsidiaries are KfW IPEX-Bank, which provides project and export financing, and DEG, which is active in promoting the private sector in developing and industrializing countries.
In accordance with the requirements of the Standing Interpretation Committee’s interpretation no. 12 (SIC-12), two special funds responsible for the group’s strategic asset management were included in the consolidated financial statements. The total volume of special funds was further reduced in 2011 following the realignment of the investment strategy in 2009.
The development of the group’s operating result is largely dependent on the financial performance of KfW.
41
COMPOSITIONOF KFW BANKENGRUPPE – TOTAL ASSETS (BEFORE CONSOLIDATION)
| | | | | | | | | | |
| | | As of December 31, |
| | | 2011 | | 2010 |
| | | (EUR in millions) |
KfW | | | | 493,337 | | | | | 440,280 | |
Subsidiaries | | | | | | | | | | |
KfW IPEX-Bank GmbH, Frankfurt am Main, Germany | | | | 24,606 | | | | | 24,140 | |
DEG — Deutsche Investitions- und Entwicklungsgesellschaft mbH, Cologne, Germany | | | | 4,640 | | | | | 4,215 | |
KfW IPEX-Beteiligungsholding GmbH, Frankfurt am Main, Germany | | | | 1,871 | | | | | 1,871 | |
KfW Beteiligungsholding GmbH, Bonn, Germany | | | | 1,025 | | | | | 1,093 | |
tbg Technologie-Beteiligungs-Gesellschaft mbH, Bonn, Germany | | | | 274 | | | | | 330 | |
Finanzierungs- und Beratungsgesellschaft mbH, Berlin, Germany | | | | 26 | | | | | 27 | |
Special purpose entities required to be consolidated | | | | | | | | | | |
Special funds | | | | 1,283 | | | | | 2,237 | |
Investments accounted for using the equity method | | | | | | | | | | |
Railpool Holding GmbH & Co. KG, Munich, Germany (50%) | | | | 400 | | | | | 303 | |
Railpool GmbH, Munich, Germany (50%) | | | | 11 | | | | | 8 | |
Microfinance Enhancement Facility S.A., Luxembourg (9.4%) | | | | 151 | | | | | 100 | |
Green for Growth Fund, Southeast Europe S.A., Luxembourg (10.5%) | | | | 78 | | | | | 58 | |
AF Eigenkapitalfonds für deutschen Mittelstand GmbH & Co KG, Munich, Germany (47.7%) | | | | 10 | | | | | 4 | |
Financial Performance of KfW Bankengruppe
KfW Bankengruppe continued to benefit from a favorable environment in 2011. Earnings benefited in particular from KfW’s good refinancing conditions at continued low interest rates and a steep yield curve that has, however, flattened compared to 2010, in conjunction with a strong German economy. Consequently, interest income as a main source of earnings as well as risk provisions for lending business were both above long-term expectations, although considerably below the exceptional year 2010. With a consolidated profit of EUR 2.1 billion (2010: EUR 2.6 billion), business activities remained at an extraordinarily high level. Given the stricter regulatory capital requirements and the uncertainties surrounding future economic development, the resulting improved capital base supports KfW’s long-term promotional capacities, including by further strengthening the fund for general banking risks to which KfW allocates EUR 1.1 billion. In its current comprehensive income projections for 2012, KfW expects total earnings of approximately EUR 1.2 billion as earnings are expected to continue to return to a normal level.
The group’s financial performance in 2011 was largely characterized by the following developments:
| | A. | Strong demand for KfW products while focusing the long-term strategy of qualitative growth reflected in the product portfolio. In addition to financing SMEs, KfW’s priorities in 2011 were the financing of climate and environmental protection, which is an area of continued expansion, and ensuring the availability of long-term credit. |
| | B. | A high operating result due to the favorable refinancing conditions from which KfW continues to benefit. |
| | C. | KfW’s overall risk situation continued to improve particularly due to Germany’s robust economy. Risk provisions for the lending business were further reduced. The equity investment portfolio benefited from the strong German economy, making positive contributions to earnings. |
| | D. | The securities portfolio was burdened primarily by developments in the countries that were affected by the European sovereign debt crisis - in particular, Greece. The continued uncertainties related to the financial markets in this difficult environment resulted in substantial fluctuations of parameters relevant for valuation, which had a purely IFRS-related positive effect on earnings due to hedging. |
42
A. High Demand for KfW Products. The group approved a total promotional business volume of EUR 70.4 billion for 2011 (2010: EUR 81.4 billion). The significant decrease was due to the expiration of the promotional measures offered by KfW that had been significantly expanded in 2010 in connection with economic stimulus measures. After an exceptional year 2010, KfW, in 2011, returned to a moderate and long-term qualitative growth path above the promotional level of 2009, with commitments of EUR 63.9 billion. In 2011, the focus of commitments was again on the promotion of German SMEs, the environment, housing and education in Germany in the amount of EUR 50.9 billion, of which EUR 22.4 billion was granted to commercial enterprises alone. Strong momentum came from international business with a volume of EUR 19.2 billion (2010: EUR 15.0 billion). The growth resulted almost entirely from a considerable increase in commitments in export and project financing, whereas the commitments to support developing and transition countries remained largely unchanged. One of KfW’s main promotional priorities which continues to gain in importance is climate and environmental protection, for which EUR 22.8 billion, or almost a third of the total promotional volume, were employed in 2011.
For more information on commitments by each business area, see “Business—Introduction.”
B. High Operating Result. The operating result before valuation remained at a high level of EUR 1,869 million despite its expected decline when compared to the exceptional year 2010 (EUR 2,302 million).
The decrease was mainly due to a reduction in net interest income by EUR 353 million to EUR 2,399 million. Net interest income remained the main source of earnings for the group. KfW’s excellent funding opportunities, which were a result of its credit rating along with the current sustained low short-term interest rate environment - with a steep yield curve that has nevertheless become flatter than in 2010 - were responsible for continued above-average earnings. At EUR 557 million, the interest rate reductions as a component of KfW’s promotional business remained unchanged at the high level of 2010.
Net commission income also decreased slightly and administrative expenses increased moderately mainly due to the continuation of KfW’s modernization measures.
C. Continued Improvement in the Risk Situation. The group’s risk situation continued its positive development in 2011, building on the considerable improvement in 2010. This development mainly reflected the robust economic situation in Germany. Risk provisions were reduced by a total of EUR 185 million (2010: reduction of EUR 424 million) even as the group maintained a conservative risk approach.
Collective impairments for latent risks in the loan portfolio were further reversed by EUR 220 million (2010: reversal of EUR 405 million). These provisions had been made primarily for sectors and countries that were particularly hard hit by the recession. The moderate need to provision for immediate lending risks, which predominantly involve export and project finance as well as financing for SMEs, was largely offset by recoveries on loans that had already been written off.
The equity investment portfolio posted positive results in this favorable environment. After high earnings of EUR 163 million in 2010, earnings for 2011 stood at EUR 54 million.
D. Difficult Financial Market Environment. The financial markets are characterized by persisting high levels of uncertainty, particularly as a result of the problems in the European sovereign debt sector - in particular, Greece - that peaked in the course of 2011.
These conditions had a negative impact of EUR 255 million on the group’s securities portfolio (2010: positive effect of EUR 107 million). Of this amount, EUR 183 million alone was attributable to Greek government bonds with an aggregate principal amount of EUR 251 million which were written down to their market value of 27% on average. Moreover, negative performance of EUR 71 million were recorded directly in equity (2010: positive effect of EUR 22 million), while differences to market values decreased considerably for securities and investments not carried at fair value.
Following high charges of EUR 431 million in 2010, the valuation of derivatives resulted in positive earnings of EUR 167 million in 2011. As a non-trading book institution, KfW uses derivatives exclusively to hedge risks that arise in connection with refinancing. Accordingly, the resulting effects on earnings are not economically meaningful, as they will offset each other again in the future.
43
The following key financial data provide an overview of the developments in 2011 and are explained in more detail below:
KEY FINANCIAL FIGURESFOR KFW BANKENGRUPPE
| | | | | | | | | | |
| | | As of December 31, |
| | | 2011 | | 2010 |
| | | (EUR in billions, unless otherwise indicated) |
Statement of financial position | | | | | | | | | | |
Total assets | | | | 494.8 | | | | | 441.8 | |
Volume of lending | | | | 436.7 | | | | | 426.7 | |
Contingent liabilities | | | | 6.3 | | | | | 7.0 | |
Irrevocable loan commitments | | | | 55.7 | | | | | 65.3 | |
Assets held in trust | | | | 16.7 | | | | | 16.6 | |
Volume of business | | | | 573.6 | | | | | 530.6 | |
Equity | | | | 17.8 | | | | | 15.8 | |
Equity ratio (%) | | | | 3.6 | % | | | | 3.6 | % |
| |
| | | Year ended December 31, |
| | | 2011 | | 2010 |
| | | (EUR in millions,
unless otherwise indicated) |
Income statement | | | | | | | | | | |
Operating result before valuation | | | | 1,869 | | | | | 2,302 | |
Operating result after valuation | | | | 2,086 | | | | | 2,712 | |
Consolidated profit | | | | 2,068 | | | | | 2,631 | |
Cost/income ratio before interest rate reductions (%) (1) | | | | 23.8 | % | | | | 20.2 | % |
| |
| | | Year ended December 31, |
| | | 2011 | | 2010 |
| | | (EUR in millions) |
Economic key figures | | | | | | | | | | |
Consolidated profit before IFRS effects from hedging | | | | 1,900 | | | | | 3,061 | |
Change in revaluation reserves recognized directly in equity | | | | -5 | | | | | 33 | |
| (1) | Administrative expense in relation to adjusted income, which is calculated from the net interest and commission income plus interest rate reductions. |
The consolidated total assets of KfW Bankengruppe increased by EUR 53.1 billion to EUR 494.8 billion at year-end 2011. The increase was primarily attributable to an increase in liquid assets and to market value changes in derivatives used for hedging purposes. New lending business resulted in an increase in total loans by EUR 19.7 billion to EUR 365.1 billion. Of this amount, EUR 9.2 billion was attributable to further payments to Greece as part of the special mandate by the Federal Government in 2010. High unscheduled repayments in the domestic promotional loans business had a negative impact on total assets. As in previous years, growth in total assets was funded by issuing activities. At EUR 398.8 billion, the volume of own issues reported under certificated liabilities was EUR 40.8 billion higher than at year-end 2010.
44
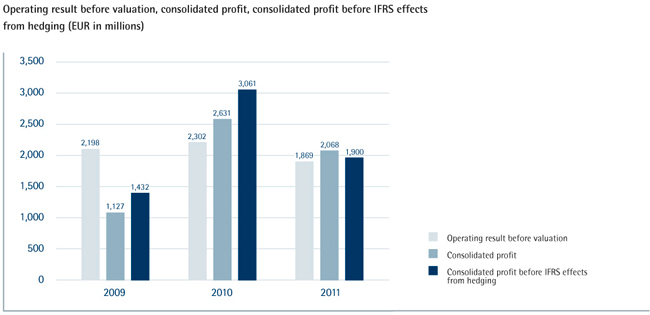
The operating result before valuation of EUR 1,869 million remained at a high level despite the expected decrease when compared to the exceptional year 2010.
This positive development was supported by the reversal of risk provisions for the lending business and by valuation gains in the equity investment portfolio, while the securities portfolio had a negative effect on earnings. The combination of sustained favorable refinancing opportunities and the further improved risk situation in the lending business contributed EUR 2,068 million to consolidated profit. This sustained high profit level was - as expected - lower than in 2010.
Consolidated comprehensive income in 2011 amounted to EUR 2,063 million (2010: EUR 2,663 million) and included the overall low impact of transactions recognized directly in group equity of EUR -5 million, mainly due to securities and equity investment valuations.
Consolidated profit comprises positive effects due to changes in the fair value of derivatives used exclusively for hedging purposes amounting to EUR 167 million (2010: charges of EUR 431 million), which inflate the actual earnings position. To aid transparency, KfW reported a consolidated profit adjusted for these effects of EUR 1,900 million (2010: EUR 3,061 million).
45
Development of Net Assets
The group’s core business remains lending to banks and customers. 73% of the group’s assets in 2011 was attributable to its lending business.
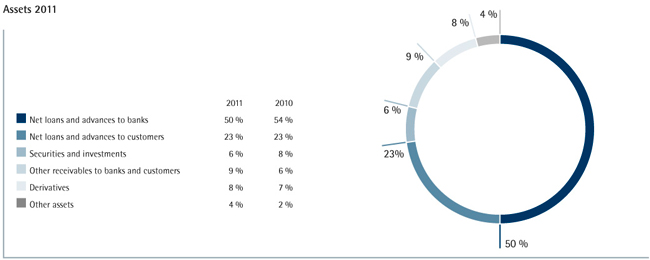
The volume of lending increased by EUR 10.0 billion, or 2%, to EUR 436.7 billion at year-end 2011.
VOLUMEOF LENDING
| | | | | | | | | | | | | | | |
| | | As of December 31, | | Change |
| | | 2011 | | 2010 | |
| | | (EUR in millions) |
Loans and advances | | | | 365,052 | | | | | 345,402 | | | | | 19,651 | |
Risk provisions for lending business | | | | -4,940 | | | | | -5,422 | | | | | 482 | |
| | | | | | | | | | | | | | | |
Net loans and advances | | | | 360,112 | | | | | 339,980 | | | | | 20,132 | |
Contingent liabilities from financial guarantees | | | | 4,448 | | | | | 4,950 | | | | | -502 | |
Irrevocable loan commitments | | | | 55,720 | | | | | 65,276 | | | | | -9,556 | |
Loans and advances held in trust | | | | 16,449 | | | | | 16,496 | | | | | -47 | |
| | | | | | | | | | | | | | | |
Total | | | | 436,729 | | | | | 426,701 | | | | | 10,028 | |
| | | | | | | | | | | | | | | |
Loans and advances increased by EUR 19.7 billion to EUR 365.1 billion at year-end 2011, mainly due to new lending business and further loan disbursements to Greece. Risk provisions for lending business decreased mainly as a result of defaults on liquidity lines related to the IKB rescue measures, which were already impaired in 2008, and to the reversal of risk provisions through profit or loss resulting from the improved risk situation. Net loans and advances totaled EUR 360.1 billion at year-end 2011, representing 82% of the volume of lending.
Contingent liabilities from financial guarantees stood at EUR 4.4 billion at year-end 2011, below the level at year-end 2010. Irrevocable loan commitments decreased by EUR 9.6 billion to EUR 55.7 billion at year-end 2011, largely due to further disbursements under the 2010 loan commitment made to Greece. Within assets held in trust, the volume of loans and advances held in trust, which primarily comprise loans to support developing countries that are financed by budget funds provided by the Federal Republic, remained at EUR 16.4 billion at the same level as in 2010.
At EUR 44.2 billion, other loans and advances to banks and customers increased in 2011 by EUR 18.1 billion from EUR 26.1 billion at year-end 2010. Other loans and advances primarily comprises short-term investments, which were made due to loan commitments that had already been refinanced as well as for overall liquidity maintenance.
46
The total amount of securities and investments was EUR 31.9 billion at year-end 2011, 10% below the level at year-end 2010.
SECURITIESAND INVESTMENTS
| | | | | | | | | | | | | | | |
| | | As of December 31, | | Change |
| | | 2011 | | 2010 | |
| | | (EUR in millions) |
Bonds and other fixed-income securities | | | | 30,016 | | | | | 33,599 | | | | | -3,583 | |
Shares and other non-fixed income securities | | | | 13 | | | | | 16 | | | | | -4 | |
Equity investments | | | | 1,831 | | | | | 1,591 | | | | | 240 | |
Shares in affiliated entities not included in the consolidated financial statements | | | | 2 | | | | | 2 | | | | | 0 | |
| | | | | | | | | | | | | | | |
Total | | | | 31,861 | | | | | 35,207 | | | | | -3,346 | |
| | | | | | | | | | | | | | | |
The securities portfolio was reduced by EUR 3.6 billion to EUR 30.0 billion at year-end 2011 as a result of the further implementation of the group’s investment strategy which had already been applied in previous years and which focuses on low-risk business and maintaining liquidity. Bonds and other fixed-income securities (excluding money market securities) decreased by EUR 3.5 billion to EUR 29.7 billion at year-end 2011 while the volume of money market securities remained at EUR 0.3 billion at year-end 2011, just below the previous year’s level. The volume of securities held in the special funds for strategic investment purposes was also further reduced. At year-end 2011, the portfolio totaled EUR 1.3 billion (year-end 2010: EUR 2.2 billion).
The fair values of derivatives with positive fair values, which are used primarily to hedge refinancing transactions, increased by EUR 11.6 billion to EUR 41.5 billion at year-end 2011 due to the development of market parameters, including exchange rates. Netting agreements reached with counterparties that also include derivatives with negative fair values and collateral agreements (largely cash collateral received) reduced the counterparty risk substantially. Value adjustments from macro hedging for underlying asset portfolios increased significantly by EUR 6.0 billion to EUR 13.5 billion at year-end 2011 due to market interest rate developments.
There were only minor changes to the other items on the statement of financial position.
47
Development of Financial Position
Funds raised in the form of certificated liabilities continued to play a key role, accounting for a share of 81% of total assets at year-end 2011, unchanged from year-end 2010.
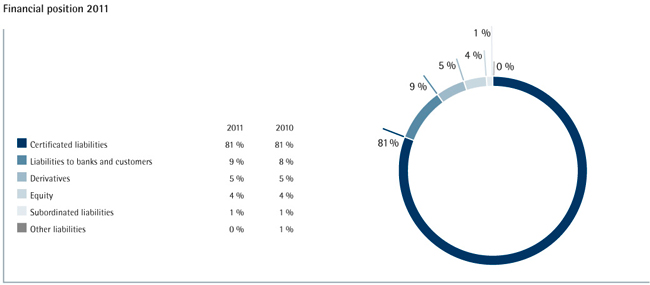
Borrowings increased by EUR 47.2 billion, or 12%, to EUR 445.2 billion at year-end 2011.
BORROWINGS
| | | | | | | | | | | | | | | |
| | | As of December 31, | | Change |
| | | 2011 | | 2010 | |
| | | (EUR in millions) |
Short-term funds | | | | 32,276 | | | | | 26,422 | | | | | 5,854 | |
Bonds and notes | | | | 368,042 | | | | | 331,712 | | | | | 36,330 | |
Other borrowings | | | | 41,644 | | | | | 36,588 | | | | | 5,056 | |
Subordinated liabilities | | | | 3,247 | | | | | 3,247 | | | | | 0 | |
| | | | | | | | | | | | | | | |
Total | | | | 445,209 | | | | | 397,969 | | | | | 47,240 | |
| | | | | | | | | | | | | | | |
The group’s principal sources of funding were medium- and long-term bonds and other fixed-income securities of KfW. Funds from these sources amounted to EUR 368.0 billion and accounted for 83% of borrowings at year-end 2011. The increase of EUR 36.3 billion is a result of both new business and changes in exchange rates over the course of 2011 (especially in the case of the U.S. dollar). Short-term issues of commercial paper increased by EUR 4.5 billion to EUR 30.8 billion at year-end 2011. Total short-term funds, including call and term money, amounted to EUR 32.3 billion at year-end 2011. Other borrowings by KfW, in addition to promissory notes to banks and customers (Schuldscheindarlehen), which declined by EUR 0.9 billion to EUR 10.6 billion at year-end 2011, consisted mainly of liabilities to the Federal Republic and cash collateral received to reduce counterparty risk from the derivatives business.
Subordinated liabilities continued to include a subordinated loan totaling EUR 3.25 billion granted by the ERP Special Fund as part of the restructuring of the ERP economic promotion program in 2007.
The carrying value of derivatives with negative fair values increased by EUR 3.5 billion, amounting to EUR 26.3 billion at year-end 2011.
There were only minor changes to the other liability items on the statement of financial position.
Equity increased by EUR 2.1 billion in 2011 compared with year-end 2010 due to the strong consolidated comprehensive income result. As a result, the equity ratio remained unchanged at 3.6% (year-end 2011) despite the growth in total assets.
48
EQUITY
| | | | | | | | | | | | | | | | | | | | | | |
| | | As of December 31, | | | | | | | | |
| | | 2011 | | | | 2010 | | | | Change |
| | | | | | | | | | | (EUR in millions) | | | | | | | | |
Paid-in subscribed capital | | | | 3,300 | | | | | | | | 3,300 | | | | | | | | 0 | | |
Capital reserve | | | | 5,947 | | | | | | | | 5,947 | | | | | | | | 0 | | |
of which promotional reserves from the ERP Special Fund | | | | 4,650 | | | | | | | | 4,650 | | | | | | | | 0 | | |
Reserve from the ERP Special Fund | | | | 1,056 | | | | | | | | 977 | | | | | | | | 79 | | |
Retained earnings | | | | 6,107 | | | | | | | | 5,218 | | | | | | | | 889 | | |
Fund for general banking risks | | | | 1,700 | | | | | | | | 600 | | | | | | | | 1,100 | | |
Revaluation reserves | | | | -262 | | | | | | | | -257 | | | | | | | | -5 | | |
| | | | | | | | | | | | | | | | | | | | | | |
Total | | | | 17,847 | | | | | | | | 15,784 | | | | | | | | 2,063 | | |
| | | | | | | | | | | | | | | | | | | | | | |
The profit was used to increase retained earnings and strengthen the fund for general banking risks in 2011. With the addition of EUR 1.1 billion to the fund for general banking risks, KfW’s strategy of maintaining separate risk provisions has been continued. There was a sustained improvement in the group’s capital base in 2011, which helps to secure KfW’s promotional capacities in the long-term and to prepare for the stricter capital requirements in accordance with Basel III.
Development of Earnings Position
The group’s operating result has been characterized by consistently high net interest income. Net interest income, together with the overall positive valuation result, led to the high consolidated profit in 2011, which was, however, as expected, below the record result of 2010.
EARNINGS POSITION
| | | | | | | | | | | | | | | | | | | | | | |
| | | For the year ended December 31, | | | | | | | | |
| | | 2011 | | | | 2010 | | | | Change |
| | | (EUR in millions) |
Net interest income | | | | 2,399 | | | | | | | | 2,752 | | | | | | | | -353 | | |
including interest rate reductions | | | | -557 | | | | | | | | -558 | | | | | | | | 0 | | |
Net commission income | | | | 226 | | | | | | | | 273 | | | | | | | | -47 | | |
Administrative expense | | | | 757 | | | | | | | | 722 | | | | | | | | 34 | | |
| | | | | | | | | | | | | | | | | | | | | | |
Operating result before valuation | | | | 1,869 | | | | | | | | 2,302 | | | | | | | | -434 | | |
Risk provisions for lending business | | | | 185 | | | | | | | | 424 | | | | | | | | -239 | | |
Net gains/losses from hedge accounting and other financial instruments at fair value through profit or loss | | | | 260 | | | | | | | | -13 | | | | | | | | 273 | | |
Net gains/losses from securities and investments and from investments accounted for using the equity method | | | | -227 | | | | | | | | -1 | | | | | | | | -226 | | |
| | | | | | | | | | | | | | | | | | | | | | |
Operating result after valuation | | | | 2,086 | | | | | | | | 2,712 | | | | | | | | -625 | | |
Net other operating income | | | | 11 | | | | | | | | -27 | | | | | | | | 39 | | |
| | | | | | | | | | | | | | | | | | | | | | |
Profit from operating activities | | | | 2,098 | | | | | | | | 2,685 | | | | | | | | -587 | | |
Taxes on income | | | | 30 | | | | | | | | 54 | | | | | | | | -24 | | |
| | | | | | | | | | | | | | | | | | | | | | |
Consolidated profit | | | | 2,068 | | | | | | | | 2,631 | | | | | | | | -563 | | |
| | | | | | | | | | | | | | | | | | | | | | |
Consolidated profit before IFRS effects from hedging | | | | 1,900 | | | | | | | | 3,061 | | | | | | | | -1,161 | | |
At EUR 1,869 million in 2011, the operating result before valuation was EUR 434 million lower than the EUR 2,302 million achieved in 2010.
49
Net interest income was the group’s most important source of income and, at EUR 2,399 million in 2011, decreased by EUR 353 million when compared to 2010. Net interest income continued to benefit from the favorable refinancing opportunities for KfW. These opportunities were primarily a result of KfW’s credit rating, in addition to the generally favorable interest rate environment, with continued low short-term rates, and a steep yield curve that has nevertheless flattened compared to 2010. The earnings power of the lending business has proven stable overall. At EUR 557 million in 2011, the interest rate reductions granted in the promotional lending business remained at the same elevated level as in 2010.
Net commission income decreased to EUR 226 million in 2011 (2010: EUR 273 million). In particular, the reduction of EUR 29 million in loan processing fees due to a decrease in new business volume (EUR 83 million) and a decrease in net income from the PROMISE and PROVIDE securitization platforms (EUR 16 million in 2011 compared to EUR 24 million in 2010) had a negative effect on net commission income. Nominal volume of outstanding securitization transactions decreased by EUR 7.0 billion to EUR 8.4 billion in 2011. Income generated by managing German Financial Cooperation in the Promotion for developing and transition countries business area, which was offset by corresponding administrative expenses, decreased slightly to EUR 104 million in 2011.
Administrative expense increased moderately by EUR 35 million to EUR 757 million in 2011 compared to EUR 722 million in 2010. Personnel expenses rose by EUR 13 million to EUR 461 million in 2011 as a result of salary increases due to collective bargaining agreements and performance-related step-ups, as well as an increase in the employee headcount by an annual average of +5%. Non-personnel expenses increased by EUR 21 million to EUR 296 million in 2011 largely due to investments for a complete overhaul of KfW’s IT architecture, which will be intensively pursued in the next few years. This IT project is expected to result in a significant increase in administrative expense.
The cost/income ratio before interest rate reductions rose to 23.8% in 2011 (2010: 20.2%) due to a decrease in operating income and a simultaneous rise in administrative expense.
The group’s positive net result from risk provisions for lending business reflected an overall improvement in the risk situation in 2011, which was attributable, in particular, to Germany’s robust economy. Portfolio impairments, on balance, thus were reversed in 2011. Taking into account recoveries of amounts previously written off, net income from risk provisions for lending business was EUR 185 million in 2011 (2010: EUR 424 million).
At EUR 114 million for 2011, impairment charges for immediate lending risks, including direct write-offs, were below the low level of EUR 203 million in 2010. These charges primarily related to export and project financing, particularly in the transport sector. The KfW Mittelstandsbank business area continued to record net risk provisions for lending business, particularly for start-up and innovation financing. In contrast, the Promotion of developing and transition countries business area recorded net reversals in connection with activities of DEG.
In light of sustained positive economic developments, a further substantial net reduction of EUR 220 million in risk provisions for not yet specifically identifiable risks in the loan portfolio was recorded in 2011 (2010: EUR 405 million). Risk provisions at year-end 2011 thus amounted to EUR 0.7 billion (year-end 2010: EUR 0.9 billion). Net income was mainly attributable to the reversal of risk provisions for the sectors and countries that were particularly hard-hit by the recession in the Export and project finance business area.
The provisions for losses on loans and advances cover all immediate and latent risks, reflecting consistent implementation of KfW Bankengruppe’s conservative risk policy.
One-off charges resulting from the valuation of all measures implemented in 2007 and 2008 to rescue IKB remained virtually unchanged in 2011 compared to 2010. After impairments, the remaining portfolio resulting from the various rescue measures was slightly reduced in 2011 to EUR 0.3 billion.
Net gains/losses from hedge accounting and other financial instruments at fair value through profit or loss were characterized by a variety of different developments in 2011. Charges from the securities portfolio as a result of uncertainties affecting the financial markets were offset by positive contributions to income from the equity investment portfolio as well as hedging relationships under IFRS. The net result from these components amounted to EUR 260 million in 2011.
50
Increasing uncertainty affecting the financial markets during the course of 2011 due to the European sovereign debt crisis resulted in charges from securities recorded at fair value through profit or loss, including fair value accounting for gains and losses on special funds for strategic asset management totaling EUR 77 million in 2011 (2010: net gains of EUR 80 million).
The equity investment portfolio measured at fair value through profit or loss generated income of EUR 102 million in 2011, an amount lower than that of 2010 (EUR 200 million). The income in 2011 was largely due to the positive performance of individual investments. This income contribution was attributable, among other factors, to the business activities of DEG’s venture capital financing in promoting developing and transition countries.
The positive earnings effects from hedging and borrowings recorded at fair value, including derivative financial instruments entered into for hedging purposes, amounted to EUR 167 million in 2011, following high charges totaling EUR 431 million in 2010. The marked-to-market derivatives are each components of economically hedged positions. However, situations in which the corresponding financial instrument of the relevant hedged position cannot be carried at fair value or in which different methods have to be used in the valuation inevitably result in temporary fluctuations in earnings that fully offset each other by maturity of the transaction. Due to considerable changes in the relevant market factors — especially market interest and currency exchange rates — these effects continue to be significant.
The significant decrease in net gains/losses from securities and investments and from investments accounted for using the equity method to a loss of EUR 227 million in 2011 (2010: net charges of EUR 1 million) was the result of negative fair value changes in the securities and equity investment portfolios.
Net gains/losses from securities not carried at fair value through profit or loss deteriorated to a net loss of EUR 178 million in 2011 (2010: net income of EUR 27 million). The charges resulted largely from the write-down of Greek government bonds to their market value.
The uncertainty affecting the financial markets resulted in an additional decrease in the value of securities and investments recognized in equity under revaluation reserves totaling EUR 71 million in 2011. These included write-ups due to the reclassifications that took place in 2008 (structured securities) and 2009 (securities held as a liquidity reserve).
The total volume of securities and investments not carried at fair value decreased to EUR 15.0 billion at year-end 2011 (year-end 2010: EUR 20.1 billion). Price losses were primarily observable in securities of countries that were particularly affected by the European sovereign debt crisis, with the major portion related to collateralized covered bonds (Pfandbriefe). Even though the difference between the carrying amount and the fair value has narrowed by EUR 295 million to EUR 600 million in 2011, this continues to be viewed as a short-term development. One reason for this development was the early redemption of Pfandbriefe at nominal value.
Taking into account net other operating income and taxes on income, a consolidated profit of EUR 2,068 million was recorded in 2011, which, as anticipated, was below the record consolidated profit of the year 2010 (EUR 2,631 million).
The consolidated profit before IFRS effects from hedging is a further key financial figure based on the consolidated profit in accordance with IFRS. Derivative financial instruments are entered into for hedging purposes. Generally, economic hedging relationships are recognized through hedge accounting by using the fair value option. However, as not all derivatives are subject to hedge accounting or the fair value option, changes in the fair value of some derivatives held as part of an economic hedging relationship are reflected in net income. Since the hedged risk associated with the underlying transactions has not yet been recognized in profit or loss under IFRS, the accounts do not reflect the risk-mitigating impact of such hedging relationships.
As a result, the following reconciliations were performed by eliminating temporary negative contributions to income in the amount of EUR 167 million for 2011, as follows:
| | • | | Valuation results from micro and macro hedge accounting; all of the group’s hedges are economically effective and do not give rise to any net gain or loss over the entire period to maturity. |
| | • | | Valuation results from the use of the fair value option to avoid an accounting mismatch in the case of borrowings, including related hedging derivatives. The economically effective hedges do not give rise to any net gain or loss over the entire period to maturity. |
51
| | • | | Valuation results from the fair value accounting of hedges with high economic effectiveness but not qualifying for hedge accounting; these hedges do not give rise to any net gain or loss over the entire period to maturity. |
| | • | | Results from foreign currency translation of currency positions, due to requirements for recognition and valuation of derivatives and hedges. |
The reconciled earnings position stood at a net gain of EUR 1,900 million in 2011 (2010: EUR 3,061 million).
Overall, KfW Bankengruppe achieved a strong result for 2011. This result was principally due to the positive overall business environment and very favorable refinancing opportunities, together with a further improved risk situation in the loan portfolio.
Supplementary Report (as of February 28, 2012)
No matters of particular importance have occurred since the end of 2011.
Risk Report
Current Developments
The global economy initially continued on the road to recovery in the first half of 2011. However, the economic environment distinctly worsened in the second half of 2011. Government rescue measures to limit the effects of the financial market crisis led to high budget deficits and rising debt ratios in industrialized nations. These developments, together with structural deficiencies in some EU member states, led to a loss of confidence among investors in the capital markets. As a result, refinancings through the capital markets became too costly for some countries. Portugal was the second country after Ireland to have to resort to the newly established European Financial Stabilization Facility (EFSF). Despite large-scale international support measures, Greece still needed a debt restructuring. The EU member states agreed on stronger economic integration and stricter budget discipline in order to solve the European sovereign debt crisis. Even so, support measures for further Euro Area member states cannot be ruled out for 2012.
The situation for banks, especially European banks, also worsened in 2011. In addition to the challenges of the European sovereign debt crisis, capital requirements, which were increased at short notice and are to be implemented by mid-2012, negatively impacted the economic situation for banks and also restricted business opportunities. The situation in the interbank market has recently deteriorated and exhibits parallels with the market environment after Lehman Brothers’ collapse in autumn 2008. The European Central Bank’s significant interventions to support liquidity could prevent serious upheavals in the banking sector. Overall, the European banking sector is expected to again face major challenges in 2012. The difficulties remain diverse — the European sovereign debt crisis, economic slowdown, increasing problems in Eastern Europe and the implementation of increased capital requirements. Despite the euro crisis — and in contrast to most other European countries — Germany’s economic recovery continued across all sectors in 2011. Many companies returned to their pre-crisis level, built reserves and emerged strengthened from the crisis. However, in international merchant shipping there are no signs for a recovery in the short term, as additional shipping capacity becoming available meant that excess supply increased again in 2011, pushing down freight and charter rates considerably. A continuation of the European sovereign debt crisis and the weakening global economy will have a dampening effect on the German economy in 2012, meaning that companies will probably invest less or delay investments.
The problems in the European sovereign debt sector caused continued high volatility in the currency markets in 2011. Although the euro recovered on average considerably compared to 2010, the exchange rate fell again against the U.S. dollar to a EUR/USD level of below 1.30 at year-end 2011. In addition, credit spreads experienced increased volatility as a consequence of the sovereign debt crisis.
KfW Bankengruppe was also affected by the developments described above due to its international promotional mandate. However, the overall effects on the group portfolio were manageable, and KfW was able to reduce risk provisions in the group over 2011. All recognizable risks are measured using conservative standards and are taken into account in the new business management through systematic establishment of risk guidelines. The regular calculations of risk-bearing capacity show that KfW Bankengruppe is able to bear the risks assumed in the context of its mandate — even based on conservative stress scenarios.
52
As in previous years, KfW continued to further develop, on a systematic basis, its processes and instruments in risk management and control in 2011, taking into account current bank regulatory requirements. With a few exceptions, KfW is exempt from the German Banking Act (Kreditwesengesetz — KWG) pursuant to Section 2 (1) no. 2 of the Act. However, KfW voluntarily applies the core components of the German Banking Act, particularly the minimum requirements for risk management and the German Solvency Regulation (Solvabilitätsverordnung — SolvV). In order to continue and develop the application of the German Banking Act in accordance with KfW’s business model and its particular situation as a public sector entity, KfW set up a separate project in 2011. Furthermore, the stress testing concept was further developed and supplemented by inverse stress tests and concentration stress tests covering all types of risk in order to implement the third amendment to the minimum requirements for risk management (MaRisk). A comprehensive risk inventory was designed and implemented, in which all risks faced by KfW Bankengruppe were reviewed for their materiality in a structured process. Another focus was the methodical development and group-wide standardization of the measurement and management of market price and liquidity risk.
The ongoing development of processes and instruments in risk management and control in 2012 will again be strongly affected by developments in the banking regulatory environment. The focus in this regard is on anticipated changes under Basel III, which will entail increased liquidity and capital requirements. In addition, improvements concerning the identification and management of reputational and earnings risks and risks from embedded derivatives are targeted. The risk model will be benchmarked and the development of counterparty risk measurement investigated.
Basic Principles and Objectives of Risk Management
KfW Bankengruppe has a statutory promotional mandate, which provides the foundations for its special position and its institutional structure. Sustainable promotion is the group’s overarching purpose. Measuring and controlling the risks assumed is the key to the efficient use of available resources to carry out this promotional mandate. As part of its risk management, the group seeks to incur risks only to the extent that they appear manageable in the context of the group’s current and anticipated earnings and the probable outcome of the risks. Group risk/return management takes into account the special characteristics of a promotional bank. Banking supervisory law requirements, such as the minimum requirements for risk management (MaRisk), constitute important secondary requirements for KfW’s risk management structures and procedures.
In order to establish risk management and control competence within its organization, KfW offers training courses that include a modular program on risk topics. This training program enables employees and management throughout KfW Bankengruppe to acquire basic knowledge or to deepen their specialized knowledge.
Organization of Risk Management and Monitoring
Risk Management Bodies and Functional Aspects of Risk Management. As part of its overall responsibility, KfW’s Executive Board determines the group’s risk principles and guidelines. KfW’s supervisory bodies – the Board of Supervisory Directors and the Federal Ministry of Finance and the Federal Ministry of Economics and Technology, which alternate in providing the Chairman and Deputy Chairman of the Board of Supervisory Directors – are informed at least once per quarter of the group’s risk profile. The Executive Committee of the Board of Supervisory Directors is responsible, in particular, for decisions concerning urgent matters (Eilentscheidungen). The Chairman of the Board of Supervisory Directors decides whether an issue is urgent. The Credit Committee is responsible, in particular for the authorization of loan applications, while the Audit Committee handles accounting and risk management issues, including auditing the consolidated and unconsolidated annual financial statements. Risk management within KfW Bankengruppe is exercised by closely intertwined decision-making bodies. The Executive Board is at the helm of the system; it makes the key decisions on risk policy. There are three risk committees below the level of the Executive Board which prepare decisions for the Executive Board and also make their own decisions within defined ranges of competency: Credit Risk Committee, Market Price Risk Committee and Operational Risk Committee. The increasing focus of the committees on group strategy and planning functions in 2011 led to the inclusion in these committees of representatives from KfW IPEX-Bank and DEG. Further working groups support the three risk committees. The middle and back office departments (Marktfolge) generally have the right of veto in the committees. If no unanimous decision can be reached on a particular matter, the matter may be escalated to Executive Board level.
53
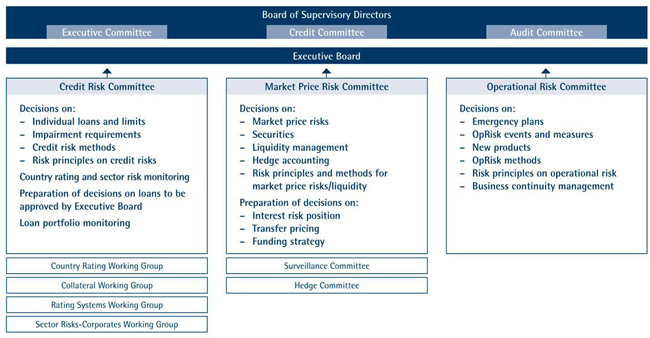
Credit Risk Committee. The Credit Risk Committee is chaired by KfW’s Chief Risk Officer and meets once a week. Its other members are the director of Risk Management and Controlling, all three members of the Executive Board with front-office responsibilities, and the Chief Risk Officer of KfW IPEX-Bank. The Credit Risk Committee is supported by the Country Rating, Collateral, Rating Systems and Sector Risks-Corporates Working Groups. The weekly meetings involve decisions on loans and limits. KfW IPEX-Bank and DEG’s large volume commitments have been presented in the Credit Risk Committee since 2011. Additional meetings, held on a quarterly basis, are attended by representatives of the business areas and DEG. Internal Auditing has observer status. Reports about the development of supervisory requirements (e.g., MaRisk/Basel III), their impact and the progress of implementation projects for KfW, KfW IPEX-Bank and DEG are discussed at this quarterly meetings. Major changes to existing risk principles and credit risk methods, and drafts of new principles and methods are adopted at these quarterly meetings. The committee also monitors the group’s loan portfolio.
Market Price Risk Committee. The Market Price Risk Committee is chaired by KfW’s Chief Risk Officer and meets once a month. Other members include the Executive Board member responsible for capital market activities, and the directors of Financial Markets, Asset Securitization, Risk Management and Controlling, and Accounting. Representatives of KfW IPEX-Bank and DEG participate in the meetings on a quarterly basis and, in addition, whenever needed. The Market Price Risk Committee makes decisions regarding entering into market price risks, the valuation of securities, changes in market price risk methods, liquidity management issues and risk principles on market price and liquidity risk management. It also prepares resolutions on interest risk positions, transfer pricing and the funding strategy for the Executive Board. The Market Price Risk Committee is supported by the Surveillance Committee, which deals with the valuation of securities, and the Hedge Committee, which deals primarily with the earnings effects of IFRS hedge accounting and the further development thereof.
Operational Risk Committee. The Operational Risk Committee comprises directors of various departments and meets once a quarter. It is chaired by the director of Risk Management and Controlling. The central staff departments and subsidiaries of KfW are also represented on this committee. This committee handles operational risk issues (i.e., operational risks and business continuity management). As part of the risk report, the Operational Risk Committee is informed on a monthly or quarterly basis about current operational risk losses and risk potentials as well as any measures taken as a result.
Reports about planned or implemented emergency and crisis team tests and significant disruptions to business are made to the Operational Risk Committee at quarterly meetings. Resolutions and recommendations by the Operational Risk Committee are presented to the Executive Board.
54
There are six working groups or committees below the level of the main risk committees, which report to the Credit Risk Committee or Market Price Risk Committee and prepare decisions. These working groups and committees are as follows:
Country Rating Working Group. The Country Rating Working Group is the central unit for assessing country risks. It consists of economists from the regional departments of KfW Entwicklungsbank and representatives of KfW IPEX-Bank, DEG and KfW’s Transaction and Collateral Management. It is chaired by Risk Management. The working group currently meets once a month due to the challenging economic and financial environment — in particular, in the euro area and North Africa/the Middle East. If necessary, country ratings can be adjusted between regular meetings. The role of the Country Rating Working Group is to identify, analyze and assess political and economic risks — and opportunities — in the global economy and particularly in the countries in which KfW Bankengruppe does or plans to do business. Proposals for risk ratings assigned to developing, transition and emerging countries are made by economists working in the relevant country section, while proposals for ratings assigned to industrial countries are submitted by Risk Management. Countries are ultimately assigned to risk categories on the basis of discussions conducted within the Country Rating Working Group. If no consensus is reached, Risk Management casts the deciding vote. Risk Management reports on the conclusions of meetings to the Credit Risk Committee.
Collateral Working Group. The Collateral Working Group is a central body serving KfW and its subsidiaries to help ensure that procedures are sufficiently understood and uniform throughout the group for all essential aspects of collateral acceptance and valuation, as well as for collateral management processes for lending and trading activities and structured products. It also makes recommendations for development and enhancement measures for approval/decision by the management and, when the matter falls within its defined range of competency, takes these decisions independently. The Collateral Working Group consists of representatives from various business areas and departments. Its central functions include the development, enhancement and review of collateral valuation procedures, the review and expansion of accepted and acceptable collateral and the related acceptance criteria, definition and review of minimum requirements of collateral management processes and collateral acceptance. In addition, the Collateral Working Group is in charge of establishing conditions for meeting guidelines under regulatory law regarding risk mitigation techniques.
Rating Systems Working Group. The Rating Systems Working Group is a central body serving KfW and its subsidiaries, which helps to ensure sufficient understanding of all essential aspects of credit risk measurement instruments. These include, in particular, rating systems, loan portfolio models, risk indicators and limit management systems. The working group’s tasks include evaluating and approving reports on validation and further development as well as deriving recommendations for measures to develop and enhance credit risk measurement instruments.
Sector Risks-Corporates Working Group. The Sector Risks-Corporates Working Group is a central body of experts serving KfW and its subsidiaries. It analyzes sector-based credit risks in the corporate segment. It provides relevant information based on these analyses to the relevant areas of the group and, if appropriate, makes proposals to minimize risk. Sector and product-related risk guidelines and recommendations for the business areas and subsidiaries are developed, updated and checked for consistency on an annual basis, with the objective of uniformly and transparently managing corporate risks in the group as a whole. This process was carried out for the first time in 2011.
Surveillance Committee. The Surveillance Committee is an integral component of the surveillance and impairment process for securities and structured credit products, and reports to the Market Price Risk Committee. One of the Surveillance Committee’s key functions is to evaluate market developments with regard to their implication for KfW’s securities portfolio. In this context, representatives of the responsible front-office departments and of Risk Management submit an assessment of the long-term value of selected securities. The Surveillance Committee also discusses any write-downs on individual securities which Risk Management has planned or made.
Members of the Surveillance Committee include representatives of the middle and back-office departments (Marktfolge; Risk Management and Controlling, Accounting, as well as Transaction and Collateral Management) and of the responsible front-office departments.
Hedge Committee. The economic management of market price risks at KfW is the responsibility of the Market Price Risk Committee. Measures relating to the management of these risks can lead to fluctuations in valuation/results in purely accounting terms, when instruments that must be recognized at fair value under IFRS are used. At KfW, this applies in particular to the use of derivatives. The purpose of the Hedge Committee is to analyze the treatment of instruments recognized at fair value under IFRS in line with the economic objective of the use of derivatives at KfW, and to further develop their use in compliance with IFRS.
55
The subsidiaries of KfW Bankengruppe and the organizational units exercise their own control functions within the group-wide risk management system. Group-wide projects and working groups ensure a coordinated approach, for example in the rollout of rating instruments to subsidiaries or the management and valuation of collateral.
Responsibility for developing and ensuring the quality of risk management and control lies outside the credit departments with Risk Management and Controlling and, for specific tasks, with Transaction and Collateral Management (e.g., operating collateral management processes in the lending business as well as collateral, limit and rating control and evaluation methodology for trading activities). There is a comprehensive risk manual for this purpose which is continually updated. The rules and regulations laid out in the risk manual are binding for the entire group and are accessible to all employees. Risk principles (i.e., normative rules for loan and risk management procedures) and portfolio guidelines (e.g., business restrictions, collateral requirements) make up the core of the risk manual. In addition, sector, product, risk and portfolio guidelines were significantly improved. The risk principles and portfolio guidelines serve as the framework for the operating activities of all business areas. The risk manual ensures that uniform procedures are applied throughout the group to identify, measure, control and monitor risks. In addition, group-wide regulations are supplemented in individual business areas by specific rules.
Risk Management
The primary task of the Risk Management department is to ensure that the group is able to bear the risks falling within its defined risk tolerance. To this end, it formulates and regularly reviews the group’s risk strategy, including the risk management of the major subsidiaries. The risk strategy builds on the basic business policy and establishes general risk principles and concrete risk policy measures in line with the business strategy. A variety of instruments to control credit, market price and operational risks are used to implement the risk strategy. Risk management instruments for individual counterparties and portfolios include, among others, the following: capital allocation, second vote for loan approvals, a limit management system, portfolio guidelines, specified risk guidelines for countries and sectors, and early warning systems. Concentration limits apply at various sub-portfolio levels (including borrower units, countries and sectors) to prevent major individual losses and to restrict risk concentration in the loan portfolio. If necessary, a selective risk transfer can also be made to the capital market (e.g., through credit derivatives), depending on the market situation.
At KfW, Group Risk Management has the right to exercise a second vote (i.e., a veto) in terms of credit risk assessment on a single exposure level. KfW IPEX-Bank and DEG each have their own second vote independent of the front office. The relevant business decision-making processes are structured with a view to risk. The need for a second vote is determined by the type, scope (material risk content and effect on the overall risk position) and complexity of a transaction. The rules for the second vote requirement will be adapted in 2012 in view of the application of the German Banking Act (Kreditwesengesetz). Major and high risk commitments will generally be presented to the Credit Risk Committee, and if necessary also to the Executive Board, the Credit Committee or the Board of Supervisory Directors.
Risk Management and Controlling – Restructuring
The Risk Management and Controlling – Restructuring department is responsible for non-performing loans and for providing intensive support for banks and corporates in the KfW portfolio. A separate Restructuring department is responsible for looking after retail business. KfW IPEX-Bank and DEG’s non-performing commitments and commitments requiring intensive support are managed by each subsidiary for themselves. If more than one group company is involved, Risk Management and Controlling – Restructuring will coordinate centrally.
Risk Management and Controlling – Restructuring becomes involved and assumes full responsibility and further functions as soon as there are initial signs of crisis. The objective is to achieve recovery of a loan through restructuring, reorganization and workout arrangements. If the business partner is deemed incapable or undeserving of restructuring, the priority becomes realizing as much value as possible from the asset and the related collateral. Internal interface regulations are in place with the relevant business areas to ensure clear allocation and control of competences: Risk Management and Controlling – Restructuring cooperate closely with the credit departments and legal department.
In the event of a crisis in the banking sector, the department needs to be able to act immediately both in-house and externally. The financial institution crisis plan has been further developed for this purpose. It primarily provides for the establishment of a working group headed by Risk Management, immediate loss analysis and implementation of the next necessary steps.
56
Risk Controlling
The Risk Controlling department is in charge of centrally measuring and reporting all risks and risk groups of KfW Bankengruppe and analyzing the group’s risk-bearing capacity. Uniform methods and models are implemented throughout the group at an operating level. Stress tests and scenario calculations are also used to assess the group’s risk-bearing capacity, quantifying on the one hand the increase of capital requirements and on the other hand the impact on the group’s available financial resources.
The department is involved in the quality management process for the risk indicators used in risk management and control, and also provides professional support in relation to the information systems used in reporting. In operational risk and business continuity management, the department is responsible for the group frameworks and guidelines and supports the business areas in implementing these standards.
Risk reporting is in line with regulatory requirements (MaRisk). The Executive Board is informed on a monthly basis about the group’s risk situation. A risk report is issued quarterly to the group’s supervisory bodies. The Executive Board and the group’s supervisory bodies are informed on an ad-hoc basis, if necessary.
Risk Methods and Instruments
The Risk Methods and Instruments department is responsible for providing suitable methods and instruments for group-wide risk analysis and management. The development of a long-term, sustainable and consistent method and instrument strategy for risk management and risk control is rounded off with regular validations, and developments and enhancements of models and methods. The focus is on models to measure, control and price credit and market price risks. In addition, the department is responsible for the coordination and project management of the implementation of the requirements placed on instruments and IT systems used in risk management and control.
Risk Controlling – Export & Project Finance and Supervisory Law
The Risk Controlling – Export & Project Finance and Supervisory Law department was established in 2011. It is a central point of contact throughout KfW Bankengruppe for all supervisory law issues within the department’s responsibility. As part of this activity, it monitors, provides the initial evaluation of, and reports regularly on, supervisory law developments. Implementation measures are initiated as and when required. The department also defines group-wide standards for the structure and formulation of framework conditions.
The department also is responsible for KfW IPEX-Bank’s risk reporting. It functions as a competence centre for KfW IPEX-Bank’s management with regard to planning and management information relating to credit risk assumed, potential for optimization from a portfolio management perspective and KfW IPEX-Bank’s risk-bearing capacity.
Internal Auditing
The Internal Auditing department supports the Executive Board. As an entity that works independently of group procedures, it generally audits and assesses all of KfW’s processes and activities to identify the risks involved and reports directly to the Executive Board.
With a view to risk management processes, Internal Auditing audited the decentralized risk management processes and central aspects of risk management, which are relevant bank-wide, in 2011. One focus was on risk assessment processes in lending and loan support in various business areas. In addition, Internal Auditing focused on and monitored the central procedures and methods of risk management and on their further development by participating (with observer status) in meetings of decision-making bodies in 2011.
KfW’s Internal Auditing is also the group auditing department for KfW Bankengruppe. It incorporates the internal auditing departments of the subsidiaries in group-wide audit reporting.
57
Risk Management Approach of KfW Bankengruppe
The following chart shows KfW Bankengruppe’s risk management process. Risk management within the group serves one central purpose: safeguarding the group’s risk-bearing capacity.
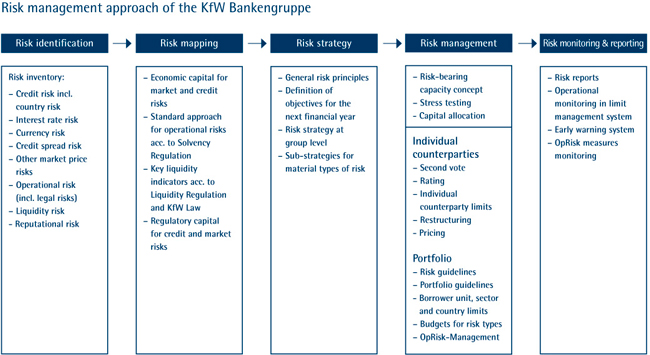
Internal Capital Adequacy Process
MaRisk requires banks to set up an internal capital adequacy process for safeguarding the risk-bearing capacity on an ongoing basis. KfW Bankengruppe’s internal capital adequacy process treats both economic and regulatory requirements regarding risk-bearing capacity as equally important objectives for the group. Accordingly, all risk monitoring and management measures must ensure that economic solvency targets and minimum requirements for tier 1 and total capital ratios are met. This approach aims at harmonizing economically reasonable capital management with compliance with regulatory minimum capital requirements. KfW takes a uniform approach to the resources available for risk coverage as the basis for the close integration of the two perspectives: the modified equity available pursuant to sections 10 and 10a of the German Banking Act (Kreditwesengesetz).
A further core feature of the capital adequacy process is the decision making input from a forward-looking perspective. This forward-looking component measures the absorption potential of KfW’s reserves – and thus its ability to act – in the event of certain economic scenarios, such as stress scenarios. As part of the operational and strategic management, a “traffic light” system has been established with thresholds that signal the required action in the event of critical developments.
KfW Bankengruppe’s risk-bearing capacity concept adopts a liquidation perspective in its basic form. However, the addition of a forward-looking perspective, which safeguards compliance with regulatory minimum capital requirements, expands the concept to include a “going-concern view” and results in the inclusion of elements of the two basic types of risk-bearing capacity concepts.
The targets for risk-bearing capacity are transposed via capital allocation in the form of economic capital budgets to individual business areas/departments. The allocated risk-covering potential is available to the business areas/departments for backing various types of risk concerning old and new business. Capital allocation is conducted annually as part of the group’s business area planning. In addition to requirements of the business areas/departments, this planning takes risk objectives and risk appetite into account (e.g., traffic light limits). At the same time, the Executive Board establishes a centrally held capital buffer for stress cases, with the purpose of anti-cyclical risk management. Compliance is checked quarterly and necessary actions are taken. In addition, the corresponding target figures for regulatory capital employed are determined at group level for the business areas/departments and monitored quarterly.
58
KfW’s capital adequacy process was further improved in 2011, particularly in terms of technical and organizational aspects. Further developments, which primarily result from the new supervisory requirements for risk-bearing capacity concepts, are expected to be implemented in 2012.
Regulatory Risk-Bearing Capacity
INDICATORS UNDER SUPERVISORY LAW
| | | | | | | | | | |
| | | As of December 31, |
| | | 2011 | | 2010 |
| | | (EUR in millions, unless otherwise indicated) |
Risk position | | | | 113,283 | | | | | 124,077 | |
Tier 1 capital | | | | 17,414 | | | | | 15,347 | |
Regulatory capital (available financial resources) | | | | 20,216 | | | | | 18,259 | |
Tier 1 ratio | | | | 15.4 | % | | | | 12.4 | % |
Total capital ratio | | | | 17.8 | % | | | | 14.7 | % |
The “risk position” indicator is the product of the total amounts of capital charges for counterparty risks, market risks and operational risks multiplied by 12.5.
KfW is not subject to the requirements of sections 10 and 10a of the German Banking Act (Kreditwesengesetz). However, KfW calculates the regulatory capital ratios on a voluntarily basis for internal purposes. KfW applies all material rules in calculating these ratios. In-house rating methods are used for large sections of the loan portfolio to calculate the capital requirements (advanced internal ratings-based approach).
Similar to the application of the requirements of the German Banking Act (Kreditwesengesetz), KfW is also exempt from the scope of the EU capital requirements directive (CRD). However, KfW will implement the amendments which come into force from 2013 on a voluntary basis, similarly to its previous approach. As part of internal reporting, the regulatory risk-bearing capacity is already calculated indicatively, taking account of the current status of the Basel III drafts. KfW, in general, already fulfills the minimum ratios which will apply from 2019. However, in view of the still open discussions and the pending finalization of key aspects, KfW has not published any specific figures yet.
KfW Bankengruppe’s regulatory capital ratios for 2011 improved significantly compared to 2010. As of December 31, 2011, the total capital ratio taking into account the consolidated comprehensive income was 17.8% (year-end 2010: 14.7%), and the core capital ratio was 15.4% (year-end 2010: 12.4%). This positive development was largely due to the increase in regulatory capital due to the consolidated comprehensive income in 2011. In addition, the selective reduction of risk positions and methodical further development of risk assessment contributed to the decline in capital requirements for credit risks. The low capital requirement for market price risks is due to the fact that KfW uses the rules for non-trading-book institutions. The regulatory capital requirements for market price risks result solely from the requirement to back open foreign exchange positions (Unterlegungspflicht).
The following chart provides an overview of KfW’s regulatory risk-bearing capacity as of December 31, 2011.
59
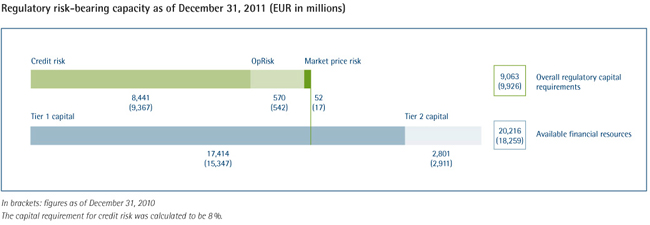
Economic Risk-Bearing Capacity
To assess its economic risk-bearing capacity, KfW compares its economic capital requirement for potential losses from material risks against its available financial resources. KfW uses an economic solvency target of 99.99% as the basis for this.
KfW makes an inventory of its risks at least once a year in order to determine its material risks. The risk inventory identifies and defines categories of risk relevant for KfW in a structured process, and then subjects these to an evaluation of materiality. The materiality of a risk category depends primarily on the potential risk for KfW’s net assets, earnings and liquidity. The key outcome of the risk inventory is the overall risk profile, which provides an overview of the group’s material and immaterial risk categories.
The most significant risk category at KfW is credit risk. It means the risk of losses if business partners fail to meet their payment obligations to KfW, in due time or in full (default) or their credit ratings worsen (migration). Credit risk thus comprises counterparty default and migration risk. Risk measurement is based primarily on the following three variables:
| | • | | the (expected) amount of receivables at the time of a potential default (exposure at default, or EAD); |
| | • | | the probability of a business partner’s default (probability of default, or PD); and |
| | • | | the (expected) loss rate upon default (loss given default, or LGD). |
The probability of default is estimated for each business partner with the aid of rating methods. The result of the rating measures is an estimate of the probability that a counterparty will be unable to fulfill its obligations within the next twelve months. The estimated loss given default takes account of the existence of collateral.
The product of the three aforementioned variables is the expected loss – the statistical average loss predicted to arise over a number of years. The expected loss is taken into account when determining risk-bearing capacity by deducting it from the available financial resources in accordance with the supervisory requirements of sections 104 et seq. of the German Solvency Regulation (Solvabilitätsverordnung – SolvV).
The economic capital requirement for credit risks is quantified by Risk Controlling with the aid of statistical models. For credit risks, the loss potential is computed using a loan portfolio model and using the risk measure “credit value-at-risk.” The difference between credit value-at-risk and expected loss is referred to as the economic capital requirement. Migration risks are taken into account in the forward-looking component of the calculation of the risk-bearing capacity, on the basis of scenarios.
The group takes a similar approach with regard to market price risks. In the case of such risks, the possible loss of present value in a worst case scenario (defined by the solvency level) is determined for each type of risk using statistical models. The economic capital requirement is equal to this loss of present value.
60
The capital requirement for operational risks is calculated using the regulatory standard approach according to the German Solvency Regulation (Solvabilitätsverordnung – SolvV).
The forecast period for all risk categories is one year. The capital requirement for credit and market price risks is aggregated conservatively (i.e., without taking diversification effects into account).
Using this method, the economic risk-bearing capacity as of December 31, 2011 satisfied a solvency level of 99.99%. The excess coverage of the available financial resources beyond the total capital requirement as of December 31, 2011 (EUR 7,658 million) improved compared to 2010 (EUR 6,985 million). The increase was partly due to the higher available financial resources, which are principally attributable to the consolidated comprehensive income in 2011. The rise in overall capital requirements in 2011 compared to 2010 was primarily due to market price risks. In contrast to the regulatory requirements of pillar I on non-trading-book institutions, pillar II’s economic analysis also takes account of interest-rate risk, credit-spread risk and other market price risks. In addition, in contrast to the pillar I approach, it uses an internal model for currency risk. The increase in capital requirement for market price risks compared to the previous year largely results from adjustments to the methods used. See “Market Price Risk” below.
The following chart provides an overview of KfW’s economic risk-bearing capacity as of December 31, 2011 and as of December 31, 2010.
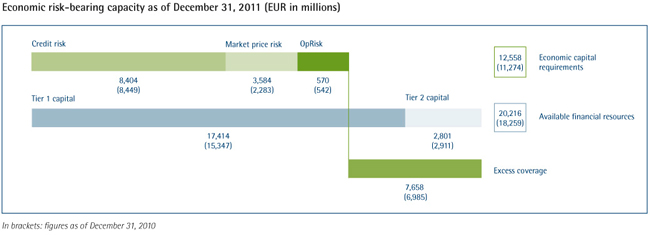
Hidden reserves (stille Reserven) and hidden burdens (stille Lasten) from the securities portfolio are treated separately: the balance of hidden reserves and hidden burdens existing as of the balance sheet date on the basis of IFRS is offset against the available economic capital buffer (excess coverage) in a memo item. Excess coverage after hidden reserves and hidden burdens (on the basis of IFRS) amounted to EUR 7,058 million as of December 31, 2011.
KfW addresses liquidity and other risks by monitoring appropriate key figures and by regularly testing the processes of its banking operations.
KfW’s risk measurement is based on state-of-the-art models used in banking practice. However, each model represents a simplification of a complex reality and builds on the assumption that risk parameters observed in the past can be considered representative of the future. Not all possible influential factors and their complex interactions can be identified and modeled for the risk development of a portfolio. This is one reason why KfW carries out stress tests both in the credit risk models and the market risk models. The group works continually to refine its risk models and processes. Thus, the parameters of the loan portfolio model were changed in 2011 and the aggregation of types of risk revised – prompted by the third MaRisk amendment. In 2012, the foreseeable changes under Basel III, meaning increased liquidity and capital requirements, will be one of the focuses for further development.
61
Stress and Scenario Calculations
When assessing risk-bearing capacity, KfW takes into account potential additional capital requirements for stress scenarios calculated in accordance with conservative standards. To ensure a stronger proactive focus in its risk-bearing capacity concept, KfW monitors, on a quarterly basis, a forecast scenario (baseline scenario), a downturn scenario (slight economic slowdown) and a stress scenario (deep recession), and their effects on economic and regulatory risk-bearing capacity. This forward-looking component documents KfW’s resilience and ability to act in the event of one of these scenarios materializing and, as such, provides direct management stimuli.
The forecast scenario provides a preview of risk-bearing capacity at year-end and includes the impact of the expected economic development on credit risks and interest rates. The current forecast for year-end 2012 shows a decrease in the excess coverage of the available financial resoures over the economic capital requirement compared to December 31, 2011. The main reason for the forecast decrease is the planned conversion to a more sophisticated model for measuring interest rate risks. The new model will increase the economic capital requirement for market price risks.
In the downturn and stress scenario, effects on earnings and changes in the capital requirement are simulated for a 12-month period assuming (different degrees of) negative economic development. In the stress scenario, the effects of a severe recession are depicted. In both scenarios KfW assumes an overall increase in credit risks (counterparty and migration risks). These scenarios anticipate a decline in euro and U.S. dollar interest rates. At the same time, it is assumed that increasing market uncertainties will lead to increased volatility in interest rates, currencies and credit spreads, as a result of which the economic capital requirement for the corresponding types of risk will rise. Potential losses from operational risks also reduce the available financial resources in the stress scenario.
On the basis of the analyses carried out, KfW would expect a reduction in excess coverage of EUR 7.7 billion to EUR 2.2 billion in the stress scenario. Accordingly, KfW would expect its risk-bearing capacity to be assured at a solvency level of 99.99%, even under unfavorable economic conditions.
Further stress tests are carried out in addition to the tests based on economic scenarios, to examine the resilience of KfW’s risk-bearing capacity. Current potential macroeconomic dangers form the basis for the changing scenario stress tests. The concentration and inverse stress test introduced in 2011 – in accordance with the new requirements of the third MaRisk amendment – show how concentration risks materializing in unfavorable constellations could bring KfW’s risk-bearing capacity to its limits.
Types of Risks
Counterparty Default Risk. KfW Bankengruppe assumes counterparty risks related to its promotional mandate. The main risks in the domestic promotional lending business are in the areas of start-up finance for small and medium-sized enterprises and equity investments, as KfW, particularly in these segments of domestic promotion, also bears end-borrower risks (for a large proportion of domestic promotion, the on-lending banks bear the end-borrower’s default risks as part of the principle of disbursement through the end-borrower’s own bank (Hausbankprinzip)). In addition, KfW assumes risks in the context of export and project finance as well as in the context of promotion for developing and transition countries.
62
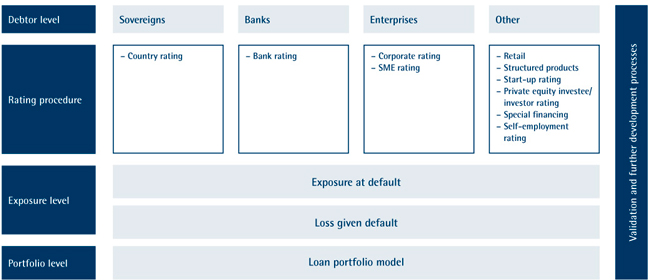
Counterparty default risk is defined as the risk of financial loss that can occur if the borrower or counterparty fails to meet contractual payment obligations. Counterparty default risk also includes country risk, comprising transfer, conversion and political risks.
Counterparty default risk is measured by estimating the PD, EAD and LGD.
In identifying the probability of default, the group uses internal rating procedures for banks, corporates, small- and medium-sized enterprises, private equity investors, private equity investees, the self-employed, start-up businesses, and countries. These procedures are based on scorecards and follow a uniform and consistent model architecture. Scorecards are a mathematical and statistical model and/or an expert-knowledge-based model. The individual risk factors considered relevant for credit rating are converted into a score depending on their value and weighted for aggregation. A simulation-based rating method is often used for specialized financing, and cash flow-based rating methods are applied for structured products. For securitization transactions, tranche ratings are determined by use a randomized approach on the basis of the default pattern of the asset pool and the waterfall structure of the transactions. The rating procedures aim at forecasting one-year default probability. As a rule, the middle- and back office-departments (Marktfolge) are responsible for preparing ratings for risk-bearing business – there are exceptions to this process in the on-lending business. Ratings are updated at least once per year with the exception of ratings for business partners with whom only retail business is conducted.
Mapping the default probability to a master scale which is uniform for the entire KfW Bankengruppe ensures comparability of ratings issued using different rating procedures and for various business areas. The master scale consists of 20 different classes that can be divided into four groups: investment grade; non-investment grade; watch list; and default. The range of default probabilities and the average default probability are defined for each master scale class.
Specific organization regulations, which mainly specify the responsibilities, competencies and control mechanisms associated with a particular rating, apply to each rating procedure. External ratings are mapped to the KfW master scale to ensure the comparability of internal ratings within KfW Bankengruppe with ratings of external rating agencies. Periodic validation and further development of the rating procedures ensure that KfW is able to rapidly respond to changes in overall conditions. Rating instruments and procedures largely meet the minimum requirements of the prevailing regulatory standards (MaRisk/Basel II).
EAD and valuation of collateral are heavily weighted when determining the severity of loss. Collateral has a risk-mitigating effect in calculating LGD. When valuing acceptable collateral the expected net revenue from realizing the collateral in case of loss is estimated over the entire loan term. This estimate takes into account haircuts based, in the case of personal guarantees, to take into account the probability of default and the magnitude of loss incurred by the collateral provider. For tangible collateral, the haircuts are chiefly attributable to fluctuations in market prices and depreciation. The determined value is an important element in estimating loss given default within KfW Bankengruppe. Depending on the availability of data, the various valuation procedures for individual types of collateral are based on internal and external historical data and expert estimates. The valuation parameters are reviewed on a regular basis, with a view to achieving reliable valuations of individual collateral. The uniform management, valuation and recognition of collateral across the group are regulated by a risk manual.
63
KfW Bankengruppe has a limit framework (i.e., limit management systems), risk guidelines for countries, sectors and products as well as various portfolio guidelines to limit risks from new business. These instruments form the basis for the second vote on lending transactions. They are designed to support an adequate quality and an appropriate risk structure of KfW’s portfolio. The portfolio guidelines, which take into account the special nature of KfW’s promotional business, distinguish between types of counterparties and product variants and define the general conditions under which business transactions may be conducted. In addition, risk guidelines for countries, sectors and products are defined in order to react to existing or potential negative developments by setting specific requirements for lending or by stopping new business at short notice. Ultimately, the limit framework serves to restrict risk concentrations in the loan portfolio (with respect to countries, sectors and individual counterparty risks) and, consequently, mitigate the impact of major individual losses.
Existing higher-risk exposures are divided into a watch list and a list of non-performing loans. The watch list serves to identify potential problem loans early and, if necessary, to allow preparations for the handling of these loans to be made. KfW regularly reviews and documents the economic situation, the particular borrower’s market environment and the collateral provided, and formulates proposals for remedial action – particularly for risk-limiting measures. In the case of non-performing loans and also to a great extent for watch-list commitments, the units in charge of restructuring are responsible for this process. This enables the involvement of specialists at an early stage to ensure professional management of problem loans. The assumption of responsibility for watch-list cases at KfW IPEX-Bank is decided on a case-by-case basis by Risk Management in consultation with KfW IPEX-Bank’s unit responsible for restructuring.
Risk Provisions for Lending Business. KfW Bankengruppe takes appropriate measures to address all identifiable default risks in its lending business by making risk provisions for loans. These risks also include political risks resulting from financing transactions outside Germany. For loans with an immediate risk of default (i.e., non-performing loans) KfW recognizes individual impairment charges or provisions for undisbursed portions. These events are identified on the basis of criteria that meet both Basel II and IFRS requirements. Criteria include the identification of considerable financial difficulties on the part of the debtor, payment arrears, concessions made to the debtor owing to its financial situation (e.g., in the context of restructuring measures), conspicuous measures undertaken by the debtor to increase its liquidity, and a substantial deterioration in the value of collateral received. These criteria are further specified in KfW’s risk manual. Individual impairment charges are determined by means of an impairment procedure. The calculation of individual impairment charges is also based on an individual assessment of the borrower’s ability to make payments in the future. The calculation takes into account the scope and value of the collateral as well as the political risk. A simplified impairment procedure is performed for small and standardized loans on the basis of homogeneous sub-portfolios.
Risk provisions for latent risks (i.e., portfolio impairment) are derived from the valuation of loan receivables in the context of annual rating procedures and collateral valuations. Portfolio impairment charges are recorded for both economic and political risks. The basis for this is the expected loss model described above, which is adjusted for IFRS purposes. Risk provisions for irrevocable loan commitments and financial guarantees are set up using the same method of calculation.
Further portfolio impairment charges taken for the sectors and countries particularly affected by the economic crisis were further reduced in 2011 as a result of the economic recovery.
Maximum Risk of Default. According to IFRS 7.36, the maximum exposure to credit risk for KfW Bankengruppe arising from financial instruments is the total loss of the respective risk positions. Contingent liabilities and irrevocable loan commitments are also taken into account. Carrying amounts have been reduced by the risk provisions made.
Payment arrears on the balance sheet date were reported only in loans and advances to banks and customers, and securities and investments. Individual impairment charges were also reported under contingent liabilities and irrevocable loan commitments.
64
MAXIMUM RISKOF DEFAULT
| | | | | | | | | | | | | | | | | | | | | | | | | | | | | | | | | | | | | | | | | | | | | | | | |
| | | Loans and advances
to banks | | | Loans and advances to
customers | | | Value adjustments
from macro fair
value hedge
accounting | | | Derivatives used
for hedge
accounting; other
derivatives | | | Securities and
investments;
investments
accounted for
using the equity
method | | | Contingent
liabilities;
irrevocable loan
commitments | |
| | | As of December 31, | | | As of December 31, | | | As of December 31, | | | As of December 31, | | | As of December 31, | | | As of December 31, | |
| | | 2011 | | | 2010 | | | 2011 | | | 2010 | | | 2011 | | | 2010 | | | 2011 | | | 2010 | | | 2011 | | | 2010 | | | 2011 | | | 2010 | |
| | | (EUR in millions) | |
Carrying amount as equivalent for maximum risk of default | | | 290,810 | | | | 263,222 | | | | 113,528 | | | | 102,878 | | | | 13,468 | | | | 7,478 | | | | 41,494 | | | | 29,891 | | | | 31,904 | | | | 35,236 | | | | 62,007 | | | | 72,257 | |
Risk provisions | | | 162 | | | | 200 | | | | 4,778 | | | | 5,221 | | | | 0 | | | | 0 | | | | 0 | | | | 0 | | | | 15 | | | | 20 | | | | 256 | | | | 484 | |
Carrying amount neither past due nor impaired | | | 290,308 | | | | 262,969 | | | | 110,392 | | | | 100,984 | | | | 13,468 | | | | 7,478 | | | | 41,494 | | | | 29,891 | | | | 31,625 | | | | 34,993 | | | | 62,003 | | | | 72,256 | |
Collateral | | | 191,053 | | | | 170,154 | | | | 27,690 | | | | 23,627 | | | | 0 | | | | 0 | | | | 11,520 | | | | 9,353 | | | | 1,677 | | | | 94 | | | | 1,659 | | | | 2,828 | |
FINANCIAL INSTRUMENTS PAST DUEANDNOT INDIVIDUALLY IMPAIRED
| | | | | | | | | | | | | | | | | | | | | | | | |
| | | Loans and advances to banks | | | Loans and advances to
customers | | | Securities and investments;
investments accounted for using
the equity method | |
| | | As of December 31, | | | As of December 31, | | | As of December 31, | |
| | | 2011 | | | 2010 | | | 2011 | | | 2010 | | | 2011 | | | 2010 | |
| | | (EUR in millions) | |
Carrying amount less than 90 days past due | | | 323 | | | | 86 | | | | 882 | | | | 268 | | | | 2 | | | | 1 | |
Carrying amount 90 days and more past due | | | 24 | | | | 16 | | | | 985 | | | | 215 | | | | 0 | | | | 0 | |
Collateral | | | 310 | | | | 56 | | | | 461 | | | | 257 | | | | 0 | | | | 0 | |
INDIVIDUALLY IMPAIRED FINANCIAL INSTRUMENTS
| | | | | | | | | | | | | | | | | | | | | | | | | | | | | | | | |
| | | Loans and advances to banks | | | Loans and advances to
customers | | | Securities and
investments;
investments accounted
for using the equity
method | | | Contingent liabilities;
irrevocable loan
commitments | |
| | | As of December 31, | | | As of December 31, | | | As of December 31, | | | As of December 31, | |
| | | 2011 | | | 2010 | | | 2011 | | | 2010 | | | 2011 | | | 2010 | | | 2011 | | | 2010 | |
| | | (EUR in millions) | |
Carrying amount | | | 154 | | | | 151 | | | | 1,268 | | | | 1,411 | | | | 277 | | | | 242 | | | | 4 | | | | 1 | |
Individual impairments, provisions | | | 66 | | | | 88 | | | | 4,232 | | | | 4,483 | | | | 0 | | | | 0 | | | | 210 | | | | 429 | |
Collateral | | | 35 | | | | 26 | | | | 540 | | | | 428 | | | | 6 | | | | 7 | | | | 0 | | | | 0 | |
At year-end 2011, EUR 1.7 billion of financial instruments net after deduction of risk provisions (year-end 2010: EUR 1.8 billion), was classified as individually impaired out of EUR 553 billion (year-end 2010: EUR 511 billion) in financial instruments outstanding. Potential losses are conservatively estimated, and individual impairments totaled EUR 4.5 billion at year-end 2011 (year-end 2010: EUR 5.0 billion). The individual impairments included provision for risks from the various IKB rescue measures in the amount of EUR 3.2 billion (year-end 2010: EUR 3.7 billion). The EUR 22.3 billion transaction mandated by the Federal Government as part of the support measures for Greece is completely hedged by a federal guarantee and thus is not shown in the portfolio of individually impaired financial instruments.
In addition to provisions for immediate risks of default, KfW Bankengruppe makes provisions for latent risks of default (economic and political risks). As of December 31, 2011, risk provisions for transactions not individually impaired totaled EUR 0.7 billion (year-end 2010: EUR 0.9 billion). The collateralization of loans in the group portfolio primarily relates to KfW’s on-lending business and promotional business guaranteed by the Federal Republic or individual federal states. The collateral is presented as recognized for purposes of internal management of economic risks. Participation effects are taken into account in order to avoid double reporting of collateralization. By far the largest portion of collateral is attributable to assigned end-borrower receivables from on-lending business. Tangible collateral (e.g., ships and airplanes) plays only a minor role compared to the total amount of collateral.
The high exposure relating to derivatives with positive fair values has to be put into the context of the netting agreements with counterparties. These netting agreements also include derivatives with negative fair values and considerably reduce the counterparty risk.
The group experienced an increase in loans and advances which were past due and not individually impaired in 2011. The loans and advances less than 90 days past due were largely in arrears of one day and have since been settled. The loans and advances to customers which were in arrears for 90 days or longer include defaulted loans from the KfW Sonderprogramm. No individual risk provisions were made due to the full federal guarantee for these transactions.
In 2011, KfW Bankengruppe did not take possession of any significant assets previously held as tangible collateral.
65
Portfolio Structure. The contribution of individual positions to the risk associated with KfW Bankengruppe’s loan portfolio is assessed based on an internal portfolio model. Concentrations of individual borrowers or groups of borrowers give rise to the risk of major losses that could jeopardize KfW’s existence. On the basis of the economic capital concept, the Risk Controlling department measures the risk concentrations by individual borrower, sector and country. Risk concentrations are primarily reflected in the economic capital requirement. This process ensures that not only high risk volumes but also unfavorable probabilities of default and undesirable risk correlations are taken into account. These results form a central basis for the management of the loan portfolio.
Regions. At year-end 2011, 67% of the group’s loan portfolio (which includes loans as well as securities and investments in performing business) in terms of economic capital requirements was attributable to the euro area (year-end 2010: 73%). In Germany, the alignment of the economic capital requirement for domestic government-guaranteed lending business, including the lending business with special credit institutions of the federal states, to the supervisory approach (zero weighting), resulted in a noticeable decrease in capital employed. Repayments of global loans and covered bonds (Pfandbriefe) in Portugal and fixed-term deposits in France and Austria led to lower capital employed in the euro area (excluding Germany).
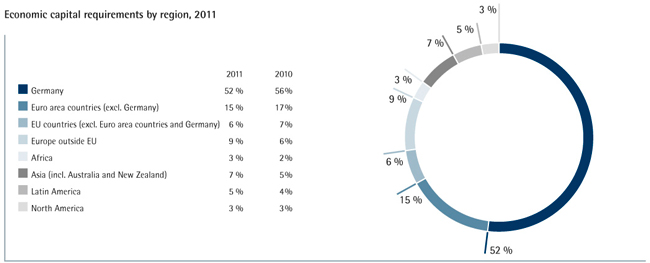
Sectors. The significant share of overall capital required for credit risks attributable to the financial sector is due to KfW Bankengruppe’s promotional mandate. The most significant portion of the group’s domestic promotional lending business consists of loans that are on-lent through banks. The decrease in capital employed in the financial sector is largely due to the above-mentioned zero weighting of the lending business with domestic government-guaranteed special credit institutions of the federal states. In the commodities sector, in particular new business in renewable energies led to an increase in capital employed.
66
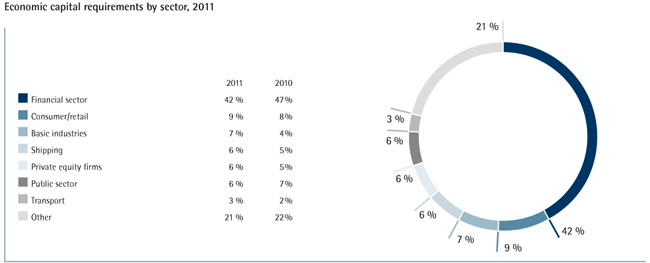
Credit Quality. Credit quality is a major factor influencing the economic capital requirement, such that it is appropriate in analyzing the credit quality structure to examine the distribution of net exposures by credit quality category. The zero weighting of the domestic government-guaranteed lending business will result in a stronger decrease in net exposure in the investment-grade area. This will cause an increase in the relative share of other credit quality categories with respect to the overall portfolio’s net exposure. However, the average probability of default of the group’s loan portfolio remained almost unchanged compared to 2010. The group’s loan portfolio thus continued to show a good credit quality structure in 2011.
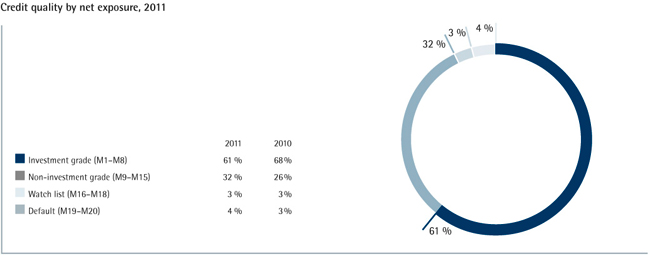
Structured Products in the Group Portfolio. The group’s portfolio of structured products, divided into asset-backed securities (ABS) and platform securitizations (i.e., PROMISE and PROVIDE), is presented separately.
Asset-Backed Securities. In addition to its own ABS holdings, the group’s ABS portfolio includes ABS investments in special funds. These investments were again reduced in 2011.
The ABS had a par value of around EUR 4.4 billion as of December 31, 2011. Accounting for the mark-to-market valuation of the securities reported at fair value and impairments, the portfolio had a total value (including pro-rata interest) of EUR 4.1 billion. The following tables show the composition of the ABS portfolio by asset class, rating and geographic distribution of the underlying assets in the securitization portfolios.
67
EXPOSURE BASEDONPAR VALUES
| | | | | | | | | | | | | | | | | | | | | | | | | | | | |
| | | As of December 31, 2011 | | | | |
| | | CLO | | | RMBS | | | CMBS | | | CDO | | | ABS & other | | | Total 2011 | | | Total 2010 | |
| | | (EUR in millions) | |
Investment grade | | | 1,573 | | | | 862 | | | | 323 | | | | 14 | | | | 849 | | | | 3,621 | | | | 4,123 | |
Non-investment grade | | | 276 | | | | 22 | | | | — | | | | 2 | | | | 1 | | | | 301 | | | | 322 | |
Watch list | | | 35 | | | | 65 | | | | 6 | | | | — | | | | — | | | | 107 | | | | 80 | |
Default | | | 202 | | | | 13 | | | | 47 | | | | 142 | | | | — | | | | 404 | | | | 471 | |
| | | | | | | | | | | | | | | | | | | | | | | | | | | | |
| | | 2,086 | | | | 962 | | | | 377 | | | | 158 | | | | 850 | | | | 4,433 | | | | 4,995 | |
| | | | | | | | | | | | | | | | | | | | | | | | | | | | |
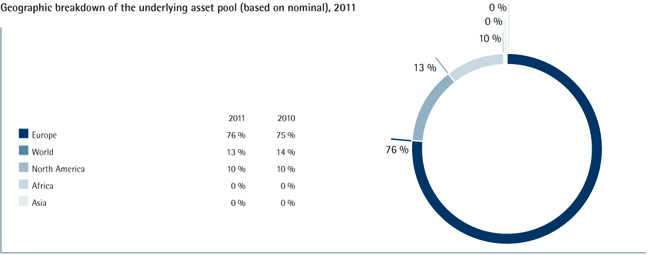
The portfolio volume in 2011 was lower than in 2010 due to repayments and sales of some holdings (decrease in par value of EUR 0.6 billion). A comparison of the portfolio’s rating structure shows a reduction in default holdings, which is attributable to repayments and improvements in credit quality. The asset pool’s geographical distribution has changed little compared to 2010; the regional focus of the ABS portfolio remains on Europe.
Overall, in 2011 European securitizations, including German securitizations, showed a solid performance. The cumulative default rates for European securitizations remain low.
The group has indirect exposure to additional risks associated with structured securities, via the risk protection measures for IKB. KfW assumed all of IKB’s rights and obligations under IKB’s liquidity lines to refinance the special purpose entities of the Rhineland Funding Capital Corporation conduit. Taking into account redemptions and loss realization, receivables in the amount of EUR 3.4 billion from the purchasing companies remained outstanding as of December 31, 2011. Impairment charges of EUR 3.1 billion have been taken on these receivables.
Platform Securitizations. Banks may transfer credit risks synthetically from SME loan portfolios to the capital markets using the PROMISE securitization platform. KfW complements its promotional offering with its PROVIDE securitization program, which seeks to securitize private housing loans. The securitization of housing loans and corporate loans each accounted for around half of the underlying asset volume in platform securitizations as of December 31, 2011. As of the same date, the volume securitized via the platforms totaled EUR 8.4 billion. Of this total, EUR 8.3 billion was securitized through portfolio credit default swaps or credit-linked notes. The group has retained risks from senior tranches with respect to the remaining approximately EUR 0.05 billion. The decline in the securitization volume of EUR 7.0 billion at year-end 2011 compared to year-end 2010 was primarily a result of the use of the originator banks’ call options. In addition, no new business was entered into in 2011.
Risk in the platform business is primarily determined by the quality of the securitized portfolios. There are currently no immediate loss expectations for KfW.
68
Commitments in European Crisis Countries
The following table shows the net carrying amounts of the liabilities to public-sector borrowers (including municipalities and local authorities) in the countries particularly affected by the euro sovereign debt crisis and to banks in these countries.
| | | | | | | | | | | | | | | | |
| | | Net carrying amount (including irrevocable loan commitments) | |
| | | December 31, 2011 | | | December 31, 2010 | |
| | | | | | of which collateralized | | | | | | of which collateralized | |
| | | (in EUR millions) | |
Country | | | | | | | | | | | | | | | | |
Greece | | | 22,398 | | | | 22,320 | | | | 22,657 | | | | 22,341 | |
of which public-sector borrowers | | | 22,380 | | | | 22,307 | | | | 22,611 | | | | 22,324 | |
of which financial institutions | | | 18 | | | | 13 | | | | 46 | | | | 17 | |
Spain | | | 3,211 | | | | 2,510 | | | | 3,644 | | | | 2,904 | |
of which public-sector borrowers | | | 399 | | | | — | | | | 121 | | | | — | |
of which financial institutions | | | 2,812 | | | | 2,510 | | | | 3,523 | | | | 2,904 | |
Italy | | | 1,746 | | | | 652 | | | | 3,110 | | | | 717 | |
of which public-sector borrowers | | | 387 | | | | — | | | | 464 | | | | — | |
of which financial institutions | | | 1,359 | | | | 652 | | | | 2,646 | | | | 717 | |
Ireland | | | 1,486 | | | | 1,211 | | | | 1,832 | | | | 1,156 | |
of which public-sector borrowers | | | 2 | | | | — | | | | 2 | | | | — | |
of which financial institutions | | | 1,484 | | | | 1,211 | | | | 1,830 | | | | 1,156 | |
Portugal | | | 560 | | | | 236 | | | | 2,689 | | | | 1,603 | |
of which public-sector borrowers | | | 115 | | | | — | | | | 118 | | | | — | |
of which financial institutions | | | 445 | | | | 236 | | | | 2,571 | | | | 1,603 | |
Total | | | 29,401 | | | | 26,928 | | | | 33,932 | | | | 28,722 | |
The net carrying amounts in the above table were determined depending on their IAS 39 measurement category, taking into account any impairments or fair value measurements, and also include pro-rata interest. With the derivatives, transactions with the same counterparty are offset against one another on the basis of contractual provisions for offsetting, regardless of provisions for offsetting for reporting purposes. Irrevocable loan commitments and other contingent liabilities are also included.
Of the commitments shown, as of December 31, 2011, a total of EUR 27,248 million (year-end 2010: EUR 31,652 million) was attributable to the “loans and receivables” measurement category, EUR 55 million (year-end 2010: EUR 55 million) to “held-to-maturity investments”, EUR 763 million (year-end 2010: EUR 985 million) to “available-for-sale financial assets” and EUR 1,335 million (year-end 2010: EUR 1,240 million) to “financial assets at fair value through profit or loss.”
The largest item was the commitment of EUR 22.3 billion for Greece mandated by the Federal Government in 2010 (which benefits from a federal guarantee). The other commitments to public-sector borrowers were largely bonds held in the liquidity portfolio. The commitments to financial institutions largely consisted of covered bonds (Pfandbriefe). The remainder of the portfolio consisted of primarily global loans, financial derivatives and bank bonds.
Apart from the federal guarantee for the transaction with Greece mandated by the Federal Government, the collateral primarily consisted of cash collateral of EUR 0.9 billion (at year-end 2010: EUR 0.9 billion) from the derivatives business. In addition, the EUR 3.4 billion (year-end 2010: EUR 5.2 billion) in covered bonds (Pfandbriefe) in the portfolio is also presented as a collateralized commitment.
Commitments are also subject to strict and regular monitoring in internal management. In new business management, business with or in these countries has higher collateral requirements. In some cases there is also a fundamental freeze on new business. During the course of 2011, the internal ratings for these countries and the banks in these countries were also downgraded, limiting, among other things, the scope for new business as a whole across all sectors. Because KfW’s risk management is based on its own internal ratings, the changes to external country and bank ratings by independent rating agencies have no direct influence on KfW’s risk assessments.
There was a selective reduction of risk positions in the group’s exposures in 2011. In particular, through repayments of global loans and covered bonds (Pfandbriefe), and reallocation of money market transactions, KfW substantially reduced its exposure to banks, especially in Italy, Portugal and Spain.
69
Market Price Risk
Market price risks result primarily from potential losses that may arise from changes in the following:
| | • | | the interest structure (interest rate risks); |
| | • | | exchange rates (currency risks); |
| | • | | issuer-related premiums on the interest rate of securities (credit spread risks); and |
| | • | | other market prices (e.g., share prices, commodity prices). |
KfW and its subsidiaries are non-trading book institutions as per the German Commercial Code; consequently, their market price risks are limited to the banking book. The largest concentration within market price risks is interest-rate risk, with an average of 75% of the economic capital requirement over the course of the year.
In 2011, the model for measuring interest rate and currency risks was substantially revised, with the objective of standardizing and methodically further developing it across KfW Bankengruppe.
| | • | | The method for calculating the economic capital requirement for interest-rate risks was revised in 2011. The Monte Carlo simulation on the basis of a Cox-Ingersoll-Ross interest structure model previously used, will be replaced by a parametric delta-normal model in future. The new method will be used from January 1, 2012. Therefore, the effects of the shift will only be shown in 2012. The additional economic capital that will be required as a result of these adjustments amounts to approximately EUR 800 million. |
| | • | | The economic (present value) approach was established in addition to the accounting approach as the primary management instrument for measuring the economic capital requirement for currency risks. The definition of the economic capital requirement was also revised (see “Currency Risks” below). |
| | • | | When determining the economic capital requirement, diversification effects between market and credit risks since June 30, 2011 were not taken into account; instead a conservative approach has been used since that date even in extreme market situations. |
The following chart provides an overview of the key developments in methods in 2011 and their implementation:
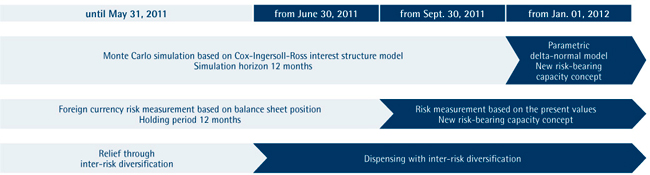
70
In total, market price risks within the group required a total of EUR 3,584 million in economic capital as of December 31, 2011. This position was composed of the following individual risks:
TOTAL ECONOMIC CAPITALFOR MARKET PRICE RISKS
| | | | | | | | | | |
| | | As of December 31, |
| | | 2011 | | 2010 |
| | | (EUR in millions) |
Interest rate risks | | | | 2,430 | | | | | 1,623 | |
Currency risks | | | | 480 | | | | | 114 | |
Credit spread risks | | | | 511 | | | | | 425 | |
Other market price risks | | | | 163 | | | | | 121 | |
| | | | | | | | | | |
Market price risk | | | | 3,584 | | | | | 2,283 | |
| | | | | | | | | | |
Interest Rate Risks. The main market price risk component in KfW Bankengruppe is interest rate risk. The group assumes limited interest rate risks in order to take advantage of long-term opportunities for returns. Additionally, interest rate risks arise from the special design of the domestic lending business with its prepayment options. KfW takes this into account in its risk management by including the estimated future volume of exercised prepayment options in its funding strategy.
To record interest rate risks in its banking book, KfW Bankengruppe uses standard software that integrates all data relevant for risk assessment. The current balances of interest rate maturities (e.g., euro, U.S. dollar and British pound) are determined with the aid of this standard software. On this basis, KfW Bankengruppe regularly performs value-at-risk calculations to assess its interest risk position.
Key optional components of business are accounted for in the group’s cash flow. The economic capital requirements, as well as credit risks, are identified for a period of one year. Periodic stress tests supplement this calculation to estimate possible losses under extreme market conditions. These have been adapted to current supervisory requirements (Statutory parallel upward (or downward) shift in the yield curve by 200 basis points. The less favorable result in each case is reported. Up to and including October 2011, the shift in basis points was +130 basis points (or -190 basis points)). In addition to the parallel shift in the yield curve prescribed by supervisory law, these tests included scenarios such as an inversion of the yield curve and an extension of the holding period.
The capital requirement for interest-rate risks rose as of December 31, 2011. The key drivers of the rise were a change in correlation assumptions and a slightly increased risk position, which included both internal and debt financing.
Currency Risks. Foreign currency loans are largely refinanced in the same currency or secured by appropriate foreign currency hedging instruments. Open currency positions on the statement of financial position resulting from accrued margins or impairment losses are generally closed as soon as possible.
DEG’s foreign currency equity investments and to a small extent KfW Entwicklungsbank’s promotional instruments are only funded in the same currency if this is possible and practical.
The method for measuring and managing currency risk was substantially revised in 2010 and 2011. The main change affected the shift in the management of risk from a German Commercial Code (Handelsgesetzbuch — HGB) accounting approach to an economic (present value) approach. This change now allows the group’s currency risk to be reflected consistently irrespective of accounting standards.
The new management concept for currency risks focuses more on operational circumstances. For currency risk, it is possible to close the risk positions at short notice both in market terms and in terms of operating processes if the operating loss of value in the calendar year exceeds a predefined stop loss buffer. The economic capital requirement will therefore be re-determined as the sum of this buffer and a “position risk” (possible loss during closure). The value-at-risk risk measure is used to determine the position risk; the holding period is based on the time needed to close the position (2 months). The aim of avoiding exchange rate effects on the income statement was maintained within the management concept.
The increase in the capital requirement for currency risks as of December 31, 2011 was largely due to this change of method.
71
Credit Spread Risks. For the group, risks arising from credit spread changes are estimated for positions in the “available-for-sale financial assets” and “financial assets at fair value through profit or loss” categories. The economic capital requirement is determined by means of a historical simulation on the basis of a time series comprising the previous year (250 trading days). The value-at-risk is initially ascertained from credit spread changes for a holding period of one day at a confidence level of 95%, and then scaled to a period of one year and a solvency level of 99.99%.
The increased economic capital required to back credit spread risks is largely due to the spread volatility caused by the euro debt crisis.
Other Market Price Risks. Other market price risks include risks from certain investments and commodity price risks from CO2 certificates. The risks from CO2 certificates arise as a result of the group’s decision to act as an intermediary between the buyers and sellers of CO2 certificates. As a result, KfW also keeps certificates on its own books.
Other market price risks are measured for each risk type using an independent variance/covariance approach. The required parameters (price volatility and the expected value of changes in prices) are calculated using historical data. The historical data used for estimating the model parameters for CO2 certificates are daily prices since June 2005, and for share price risks, monthly prices since the beginning of 2005.
The economic capital requirement for other market price risks rose primarily due to the higher value of KfW’s investments.
Liquidity Risk
Liquidity risk is the risk of a lack of liquidity. KfW differentiates between institutional liquidity risk (i.e., the risk of not being able to meet payment obligations) and market liquidity risk (i.e., the risk that the required funds are only available at costs higher than the risk-commensurate interest rate).
The primary objective of liquidity management is to ensure that KfW Bankengruppe is at all times capable of meeting its payment obligations. Although KfW’s subsidiaries are principally responsible for ensuring and managing their own liquidity and complying with the existing regulatory requirements, KfW is available as a contractual partner for all of its subsidiaries’ commercial transactions, particularly for their funding. For this reason the liquidity requirements of the subsidiaries are included both in KfW’s funding schedule and in the liquidity maintenance strategy.
Liquidity risk is measured on the basis of the liquidity risk indicator under regulatory law, the utilization threshold in accordance with the KfW Law and economic scenario analyses.
72
A significant component for the assessment of liquidity risk is the contractual payment obligations (principal and interest) of KfW Bankengruppe arising from financial instruments. The following table presents the group’s contractual payment obligations:
CONTRACTUAL PAYMENT OBLIGATIONS ARISING FROM FINANCIAL INSTRUMENTSBY MATURITY RANGE
| | | | | | | | | | | | | | | | | | | | | | | | | | | | | | |
| | | December 31, 2011 (1) |
| | | Up to 1 month | | More than 1
month, up to 3
months | | More than 3
months, up to 1
year | | More than 1 year,
up to 5 years | | 5 years and
more | | Total |
| | | (EUR in millions) |
Liabilities to banks and customers | | | | 20,880 | | | | | 4,634 | | | | | 6,906 | | | | | 11,852 | | | | | 15,296 | | | | | 59,568 | |
Certificated liabilities | | | | 25,411 | | | | | 21,708 | | | | | 50,035 | | | | | 203,733 | | | | | 147,594 | | | | | 448,482 | |
Net liabilities under derivative financial instruments | | | | -983 | | | | | -611 | | | | | -1,698 | | | | | -9,673 | | | | | -21,818 | | | | | -34,785 | |
of which liabilities under derivative financial instruments | | | | 16,391 | | | | | 18,853 | | | | | 36,274 | | | | | 147,495 | | | | | 91,276 | | | | | 310,288 | |
Subordinated liabilities | | | | 0 | | | | | 0 | | | | | 146 | | | | | 314 | | | | | 3,303 | | | | | 3,763 | |
| | | | | | | | | | | | | | | | | | | | | | | | | | | | | | |
Liabilities under on-balance sheet financial instruments | | | | 45,308 | | | | | 25,731 | | | | | 55,389 | | | | | 206,226 | | | | | 144,374 | | | | | 477,028 | |
| | | | | | |
Contingent liabilities | | | | 6,287 | | | | | 0 | | | | | 0 | | | | | 0 | | | | | 0 | | | | | 6,287 | |
Irrevocable loan commitments | | | | 55,720 | | | | | 0 | | | | | 0 | | | | | 0 | | | | | 0 | | | | | 55,720 | |
Liabilities under off-balance sheet financial instruments | | | | 62,008 | | | | | 0 | | | | | 0 | | | | | 0 | | | | | 0 | | | | | 62,008 | |
| | | | | | | | | | | | | | | | | | | | | | | | | | | | | | |
Liabilities under financial instruments | | | | 107,315 | | | | | 25,731 | | | | | 55,389 | | | | | 206,226 | | | | | 144,374 | | | | | 539,036 | |
| | | | | | | | | | | | | | | | | | | | | | | | | | | | | | |
| |
| | | December 31, 2010 (1) |
| | | Up to 1 month | | More than 1 month,
up to 3 months | | More than 3 months,
up to 1 year | | More than 1 year, up
to 5 years | | 5 years and
more | | Total |
| | | (EUR in millions) |
Liabilities to banks and customers | | | | 13,355 | | | | | 2,848 | | | | | 1,831 | | | | | 13,366 | | | | | 18,979 | | | | | 50,380 | |
Certificated liabilities | | | | 9,855 | | | | | 15,183 | | | | | 34,179 | | | | | 199,748 | | | | | 143,622 | | | | | 402,587 | |
Net liabilities under derivative financial instruments | | | | -674 | | | | | -327 | | | | | -3,201 | | | | | -6,453 | | | | | -14,208 | | | | | -24,862 | |
of which liabilities under derivative financial instruments (2) | | | | 13,612 | | | | | 29,820 | | | | | 26,783 | | | | | 151,925 | | | | | 103,174 | | | | | 325,315 | |
Subordinated liabilities | | | | 0 | | | | | 0 | | | | | 146 | | | | | 404 | | | | | 3,359 | | | | | 3,909 | |
| | | | | | | | | | | | | | | | | | | | | | | | | | | | | | |
Liabilities under on-balance sheet financial instruments | | | | 22,536 | | | | | 17,705 | | | | | 32,956 | | | | | 207,065 | | | | | 151,752 | | | | | 432,014 | |
| | | | | | |
Contingent liabilities | | | | 6,982 | | | | | 0 | | | | | 0 | | | | | 0 | | | | | 0 | | | | | 6,982 | |
Irrevocable loan commitments | | | | 65,276 | | | | | 0 | | | | | 0 | | | | | 0 | | | | | 0 | | | | | 65,276 | |
Liabilities under off-balance sheet financial instruments | | | | 72,257 | | | | | 0 | | | | | 0 | | | | | 0 | | | | | 0 | | | | | 72,257 | |
| | | | | | | | | | | | | | | | | | | | | | | | | | | | | | |
Liabilities under financial instruments | | | | 94,793 | | | | | 17,705 | | | | | 32,956 | | | | | 207,065 | | | | | 151,752 | | | | | 504,271 | |
| | | | | | | | | | | | | | | | | | | | | | | | | | | | | | |
| (1) | The net liabilities under derivative financial instruments comprise payment obligations which are offset against the corresponding payment claims from derivative contracts; the gross liabilities are reported as liabilities under derivative financial instruments. Irrevocable loan commitments and contingent liabilities are generally allocated to the first maturity range. |
| (2) | Adjustment of corresponding figures for the previous year due to refinement of the method. Non-cash liabilities from nominal values of interest-related derivatives are no longer taken into account. |
73
Liquidity risk management is based on scenario calculations. This approach first analyzes the expected inflow and total outflow of funds for the next twelve months based on business already concluded. This basis cash flow is then supplemented by uncertain payments (e.g., borrowings from the capital market, expected loan defaults or planned new business). The result provides an overview of the liquidity required by KfW in the next twelve months. The required liquidity is calculated for a total of four scenarios. Stress is placed on market-wide and institution-specific risk factors and an evaluation of the impact on KfW Bankengruppe’s liquidity is made.
The available liquidity potential is calculated on a parallel basis. It largely consists of KfW’s ECB collateral account, repo assets, liquidity portfolios and the volume of commercial paper that is regularly placeable on the market. Available liquidity is subjected to stress analysis in the same way as the other cash flow components in the market-wide stress case, institution-specific worst case scenario and worst case scenario tests.
The ratio of cumulative required liquidity to the cumulative available liquidity potential is calculated for each scenario. This figure may not exceed the value of 1 in any scenario for any period. The prescribed horizon in the normal case scenario is 12 months, in the market-wide stress case six months, and in the two worst case scenarios, three months.
The key figures are calculated and reported to the Market Price Risk Committee on a monthly basis. The following table shows the key risk indicators for the scenarios as of December 31, 2011:
LIQUIDITY RISK INDICATORSASOF DECEMBER 31, 2011
| | | | |
Normal case | | | 0.29 | |
Market-Wide stress case | | | 0.47 | |
Institution-Specific worst case | | | 0.41 | |
Worst case | | | 0.51 | |
Because the indicators for all four scenarios including the extremely conservative “worst case” are significantly below 1, KfW believes it has a comfortable liquidity position as of December 31, 2011.
Operational Risks and Business Continuity Management (Operating Risks) and Other Risks
KfW Bankengruppe uses operational risks (“OpRisk”) as the umbrella term for operational risks and risks arising from business interruption (business continuity management).
The organizational structure provides for a two-tier system comprising both decentralized management units and central control units liaising with the Operational Risk Committee. Operating risks are managed in a decentralized manner within the business areas and subsidiaries, by the respective directors and/or managing directors and the coordinator of the operational risks and business continuity management function. An operating risk management team performs central control of operating risks in the area of risk management and control. It develops the methods and instruments for identifying and assessing operating risks and monitors their uniform application.
The objective of management and control of operational risks and business continuity management is to identify and prevent potential losses for KfW ahead of time, in other words to make emergencies and crises manageable and secure the bank’s structural ability to remain in operation despite the loss of key resources.
In compliance with section 269 of the German Solvency Regulation (Solvabilitätsverordnung – SolvV), KfW defines operational risk as the risk of loss resulting from inadequate or failed internal processes, people and systems or from external events. This definition includes legal risks. It does not include reputational or strategic risks.
Losses which have occurred are recorded in an OpRisk events database.
74
Operational risks are also systematically recorded in the risk assessments which are carried out in all departments and across selected process chains. Operational risks are measured within the risk assessments on the basis of data-supported expert estimates which are backed by a distribution assumption for loss frequency and amount. An increased risk potential detected in a risk assessment is reported to the respective senior vice president and first vice president. Throughout the year, the respective business areas have to check the implementation of risk indicators for the purpose of monitoring whether the risk potentials which were established in the risk assessment are above a fixed threshold value. Each quarter, a detailed report is made of the loss events recorded and any measures introduced in the relevant departments as a result. The Executive Board, the Board of Supervisory Directors and the Operational Risk Committee are briefed monthly or quarterly as part of the risk report. If certain fixed level of loss are exceeded, ad hoc reports are made.
Capital charges for operational risks are calculated in accordance with the standardized approach pursuant to section 272 of the German Solvency Regulation (Solvabilitätsverordnung — SolvV). As of December 31, 2011, the operational risks at KfW were backed by EUR 570 million (year-end 2010: EUR 542 million). As part of the economic management, the regulatory capital required according to the standardized approach is charged to the relevant business areas. The required regulatory capital is then compared to the loss which has actually occurred.
Business continuity management is implemented if an unavoidable business interruption occurs due to internal or external events. This is an integrated management process which covers all the aspects of the four key outage and loss scenarios: site outage (building or infrastructure), IT system outages (including facilities), staff outage and service provider outage. Business continuity management focuses on preventative components (emergency provisions) and reactive components (emergency and crisis management) in equal measures.
For the purpose of business continuity management, business processes are analyzed and categorized according to their criticality, and the supporting resources for each case are examined. Identifying critical business processes and their dependency on supporting resources forms the basis for effective business continuity management. Individual measures are developed for these business processes and their supporting resources, which ensure their availability and the reduction of business risks. These measures include emergency workspaces, emergency plans, communication tools and alerts/alarms.
KfW’s crisis team takes responsibility for crisis management as a whole when unplanned events occur and practices emergency and crisis organization teamwork in regular crisis team tests.
To the extent that reputational risks are based on operational risks, they are taken into account in KfW Bankengruppe’s risk management process for operational risks, in the risk assessment, in gathering event data and in outsourcing risk analysis.
The group addresses legal risks by involving its in-house legal department early in the process and by cooperating closely with external legal advisers in Germany and abroad.
Equity Investment Risks
In managing equity investment risks, KfW Bankengruppe differentiates between risks from operating investments and strategic equity investments.
Operating Investments. Operating investments are used to carry out KfW’s promotional mandate or to fulfill its subsidiaries’ business objectives. The group-wide basic rules for operating investments are specified in a business model. Specific rules tailored to certain segments of equity investments are set out in sub-portfolio guidelines.
Risk measurement is performed at the level of individual commitments for operating investments in the same way as for credit risks. With regard to reporting, the equity investment portfolio risks are additionally presented in a separate report.
Strategic Equity Investments. A specialized unit is responsible for the management of strategic equity investments based on an equity investment manual which describes legal bases, strategies, principles, procedures and responsibilities of equity investment management. Acquisitions and disposals of and changes to strategic equity investments are subject to defined due diligence processes as well as authorization by the Executive Board and the Board of Supervisory Directors. In addition, equity investments resulting in a stake of more than 25% require authorization by the Federal Ministry of Finance in accordance with the Federal Budget Code (Bundeshaushaltsordnung — BHO). Individual equity investment strategies and specific risks are constantly monitored and are
75
presented to the Executive Board as part of an annual equity investment report and additionally, if necessary, in ad hoc reports. In addition, members of the Executive Board generally represent KfW in the supervisory bodies of companies in which it has a significant holding.
Due to the high risk relevance for the group and for reasons of uniform group management, KfW IPEX-Bank and DEG’s risks are managed as part of the group’s risk management. For example, the subsidiaries’ business activities are included in the group-wide limits under the look-through principle; economic capital budgets are assigned to their business areas and representatives of the subsidiaries are included in the group risk committees. Risk monitoring for these two subsidiaries is also performed at a stand-alone level. This monitoring includes regular reporting to the Executive Board as part of the group risk report.
Management of Compliance Risks
Compliance with regulatory requirements and self-imposed codes of conduct is part of the corporate culture of KfW. The compliance organization of KfW includes, in particular, systems for data protection as well as for the prevention of insider trading, money laundering, terrorism financing and other criminal activities. Binding rules and procedures influence the day-to-day implementation of values and the corporate culture; these are continually updated to reflect the latest statutory and regulatory requirements as well as market requirements. Compliance carries out independent control procedures for the purpose of compliance with and continual improvement of these rules and procedures. Regular training sessions on compliance are held for KfW employees. E-learning programs are available in addition to the classroom seminars.
Internal Control System. The principal objective of KfW Bankengruppe’s internal control system is to use suitable principles, measures and procedures to ensure the effectiveness and profitability of business activities, compliance with the applicable legal provisions and protection of assets.
KfW’s internal control system is based on the relevant legal requirements (under bank regulation; see section 25a (1) no. 1 KWG, MaRisk AT 4.3, and sections 289 (5), 315 (2) no. 5, 324, and 264d HGB), in particular those set forth in the German Accounting Law Reform Act (Bilanzrechtsmodernisierungsgesetz - BilMoG), German Banking Act (Kreditwesengesetz - KWG), MaRisk, and the market standard COSO model (Committee of Sponsoring Organizations of the Treadway Commission).
Like the COSO model, KfW’s internal control system consists of the five interrelated components of control environment, risk assessment, control activities, information/communication and monitoring. These extend to all KfW Bankengruppe business units, functions and processes. The control environment is the environment within which KfW introduces and applies rules. Risk assessment includes the identification, analysis and evaluation of risks which result from implementing the corporate strategy. Control activities are aimed at achieving corporate objectives effectively and at preventing or detecting risks. Adequate information and communication procedures in KfW Bankengruppe enable all stakeholders to be provided with the information they need in the necessary detail. Appropriate monitoring mechanisms determine the functionality and effectiveness of KfW’s internal control system.
A written framework forms the basis of KfW’s internal control system. It lays out the conditions for proper business organization at KfW Bankengruppe and formulates binding rules and requirements for process documentation and controls and for an organizational manual.
Organizational measures and controls in the workflows ensure monitoring is integrated into processes. Monitoring measures that are integrated into processes serve to avoid, reduce, detect and/or correct processing errors or financial loss.
The system is supplemented by Compliance, which, on the basis of statutory and supervisory requirements, defines and monitors compliance with measures related to personal data protection, money-laundering prevention, fraud prevention and securities trading and relating to compliance with financial sanctions and protection against the financing of terrorism.
The effectiveness and adequacy of KfW’s internal control system is also assessed by Internal Auditing on the basis of audits carried out independently of group procedures.
The details of the implementation of the internal control system at KfW and its legally independent subsidiaries DEG and KfW IPEX-Bank are determined by their respective risk strategies and business areas and the prevailing circumstances.
76
The Executive Board holds overall responsibility for the internal control system at KfW. At DEG and KfW IPEX-Bank, KfW’s legally independent subsidiaries, overall responsibility is held by the management. The design and implementation at the different corporate levels is the responsibility of the relevant managers according to the organizational structure. KfW Bankengruppe’s supervisory bodies are provided with a report on an annual basis.
To ensure the effectiveness of KfW’s internal control system, KfW regularly examines and continually develops the standards and conventions set and assures that KfW’s business areas are aware of them at all times.
KfW Bankengruppe has an accounting-related internal control system in order to fulfill statutory requirements in connection with the accounting process. The accounting-related internal control system is part of the group-wide internal control system.
Accounting-related Internal Control System. KfW has implemented an accounting-related internal control system to minimize the risk of error in single-entity and consolidated financial statements and ensure the correctness and reliability of internal and external accounting. KfW’s accounting-related internal control system has five key elements:
The control environment defines the framework for the adoption and application of regulations. The accounting-related internal control system covers all systems and processes from recording business transactions to further processing and booking, and defines the relevant key controls for the responsible organizational units.
Risk assessment includes the identification, analysis and evaluation of risks. In the accounting-related internal control system, all processes between the accounting department and the relevant departments are subjected to a risk evaluation (with profitability aspects taken into account) with a view to their influence on the completeness, accuracy, recognition and measurement in the financial statements. The preparation and structuring of control items in the front-office, the settlement department and accounting department is made based on strictly defined subject areas, which comprise the complete chain of accounting-related steps from the recording of transactions to external reporting. Workshops are held on a regular basis for accounting staff and staff from KfW’s business areas to rectify discrepancies and agree on procedural adjustments based on practical experience.
Control activities are aimed at achieving corporate objectives effectively and at preventing or detecting risks. All defined control functions are clearly assigned and are exercised by the managers of the respective departments. Each control is documented for auditing purposes and monitored centrally. The accounting department is responsible for the coordination and central monitoring of these processes.
The IT systems used at KfW are protected against unauthorized access and are integrated in the internal control system. Data in the feeding systems (sub-ledgers) and the general ledger are matched on a monthly basis to ensure the completeness and accuracy of the data for further processing in the financial statements. External data sources (e.g., Bloomberg, Reuters) are used to value financial instruments, and are continuously monitored. Model-based valuations are in line with the market standard.
| (4) | Information and Communication |
Information and communication ensures that all parties involved receive the necessary information in order to meet their control-related responsibilities.
The applicable principles, the organizational structure and workflow and the central processes relevant for accounting and risk management are recorded in process descriptions, working instructions and generally accessible manuals. The relevant accounting requirements are documented in full detail in a group accounting policy (IFRS) and an accounting manual (HGB). These are updated on a regular basis according to amendments by the standard setters or legislation and provided to the relevant group units. In addition, the members of group staff involved with accounting receive regular and comprehensive training.
77
The entire control process is automated within the internal control system, from carrying out the control, through issuing confirmations, to ongoing monitoring. During the preparation of the annual financial statements, reports are submitted to the decision makers in a prompt and decision-oriented manner.
The Executive Board and Audit Committee (Prüfungsausschuss) are regularly updated on the effectiveness of the accounting-related internal control system and compliance with legal requirements.
The monitoring of the internal control system ensures its functionality and effectiveness. The accounting-related internal control system is subject to an ongoing monitoring and escalation process. Updates and expansions are incorporated on an ongoing basis. The established processes provide enough scope to accommodate both accounting changes and new (technical) procedures, thereby ensuring a consistent high quality level for the annual financial statements.
78
Consolidated Financial Statements of KfW Bankengruppe
Consolidated Statement of Comprehensive Income
CONSOLIDATED INCOME STATEMENT
| | | | | | | | | | | | | | | | | | | | |
| | | Note(s) | | 2011 | | 2010 | | Change |
| | | | | (EUR in millions) |
Interest income | | | | (26) | | | | | 15,791 | | | | | 14,454 | | | | | 1,337 | |
Interest expense | | | | (26) | | | | | 13,392 | | | | | 11,702 | | | | | 1,690 | |
| | | | | | | | | | | | | | | | | | | | |
Net interest income | | | | | | | | | 2,399 | | | | | 2,752 | | | | | -353 | |
Risk provisions for lending business | | | | (13), (27) | | | | | 185 | | | | | 424 | | | | | -239 | |
| | | | | | | | | | | | | | | | | | | | |
Net interest income after risk provisions | | | | | | | | | 2,584 | | | | | 3,176 | | | | | -592 | |
Commission income | | | | (28) | | | | | 312 | | | | | 375 | | | | | -64 | |
Commission expense | | | | (28) | | | | | 85 | | | | | 102 | | | | | -17 | |
| | | | | | | | | | | | | | | | | | | | |
Net commission income | | | | | | | | | 226 | | | | | 273 | | | | | -47 | |
Net gains/losses from hedge accounting | | | | (8), (29) | | | | | 329 | | | | | -219 | | | | | 548 | |
Net gains/losses from other financial instruments at fair value through profit or loss | | | | (8), (10), (30) | | | | | -69 | | | | | 206 | | | | | -275 | |
Net gains/losses from securities and investments | | | | (14), (31) | | | | | -222 | | | | | 1 | | | | | -223 | |
Net gains/losses from investments accounted for using the equity method | | | | (4), (32) | | | | | -5 | | | | | -3 | | | | | -2 | |
Administrative expense | | | | (33) | | | | | 757 | | | | | 722 | | | | | 34 | |
Net other operating income | | | | (34) | | | | | 11 | | | | | -27 | | | | | 39 | |
| | | | | | | | | | | | | | | | | | | | |
Profit from operating activities | | | | | | | | | 2,098 | | | | | 2,685 | | | | | -587 | |
Taxes on income | | | | (18), (35) | | | | | 30 | | | | | 54 | | | | | -24 | |
| | | | | | | | | | | | | | | | | | | | |
Consolidated profit | | | | | | | | | 2,068 | | | | | 2,631 | | | | | -563 | |
| | | | | | | | | | | | | | | | | | | | |
CONSOLIDATED STATEMENTOF COMPREHENSIVE INCOME | |
| | | Notes | | 2011 | | 2010 | | Change |
| | | | | (EUR in millions) |
Consolidated profit | | | | | | | | | 2,068 | | | | | 2,631 | | | | | -563 | |
Other comprehensive income from financial instruments | | | | (14), (36) | | | | | -11 | | | | | 30 | | | | | -41 | |
Other comprehensive income from deferred taxes on financial instruments | | | | (18), (36) | | | | | 6 | | | | | 8 | | | | | -2 | |
Other comprehensive income from investments accounted for using the equity method | | | | (4), (36) | | | | | 0 | | | | | -6 | | | | | 6 | |
Other comprehensive income, total | | | | | | | | | -5 | | | | | 33 | | | | | -38 | |
| | | | | | | | | | | | | | | | | | | | |
Consolidated comprehensive income | | | | | | | | | 2,063 | | | | | 2,663 | | | | | -601 | |
| | | | | | | | | | | | | | | | | | | | |
Other comprehensive income comprises income and expenses recorded under “revaluation reserves.”
79
PRESENTATIONOF RECLASSIFICATION AMOUNTS INCLUDEDINTHE INCOME STATEMENT
| | | | | | | | | | | | | | | |
| | | 2011 | | 2010 | | Change |
| | | (EUR in millions) |
Reclassification amounts relating to financial instruments | | | | 83 | | | | | 57 | | | | | 27 | |
Reclassification amounts relating to deferred taxes on financial instruments | | | | 3 | | | | | 0 | | | | | 3 | |
| | | | | | | | | | | | | | | |
Total | | | | 86 | | | | | 56 | | | | | 30 | |
| | | | | | | | | | | | | | | |
The reclassification amounts are the result of income and expenses which were accounted for through profit or loss during the reporting period and which were previously recognised directly in equity in the “revaluation reserves”. They also include amortisation of “revaluation reserves” from the reclassification of “securities and investments” from the “available-for-sale financial assets” valuation category to the “loans and advances” category. Income recognised in the income statement is reported with a negative sign preceding the amount and expenses with a positive sign.
80
Consolidated Statement of Financial Position
CONSOLIDATED STATEMENTOF FINANCIAL POSITION
| | | | | | | | | | | | | | | | | | | | |
| | | Note(s) | | 31 December
2011 | | 31 December
2010 | | Change |
| | | | | (EUR in millions) |
ASSETS | | | | | | | | | | | | | | | | | | | | |
Cash reserves | | | | (39) | | | | | 997 | | | | | 604 | | | | | 393 | |
Loans and advances to banks | | | | (10), (12), (40) | | | | | 290,971 | | | | | 263,422 | | | | | 27,550 | |
Loans and advances to customers | | | | (10), (12), (41) | | | | | 118,306 | | | �� | | 108,099 | | | | | 10,207 | |
Risk provisions for lending business | | | | (13), (42) | | | | | -4,940 | | | | | -5,422 | | | | | 482 | |
Value adjustments from macro fair value hedge accounting | | | | (8), (43) | | | | | 13,468 | | | | | 7,478 | | | | | 5,990 | |
Derivatives used for hedge accounting | | | | (8), (44) | | | | | 30,403 | | | | | 23,323 | | | | | 7,080 | |
Other derivatives | | | | (8), (9), (10), (45) | | | | | 11,091 | | | | | 6,568 | | | | | 4,523 | |
Securities and investments | | | | (14), (15), (46) | | | | | 31,861 | | | | | 35,207 | | | | | -3,346 | |
Investments accounted for using the equity method | | | | (4), (47) | | | | | 43 | | | | | 29 | | | | | 14 | |
Property, plant and equipment | | | | (16), (48) | | | | | 917 | | | | | 912 | | | | | 5 | |
Intangible assets | | | | (17), (49) | | | | | 46 | | | | | 44 | | | | | 3 | |
Income tax assets | | | | (18), (50) | | | | | 359 | | | | | 198 | | | | | 161 | |
Other assets | | | | (51) | | | | | 1,295 | | | | | 1,296 | | | | | -1 | |
| | | | | | | | | | | | | | | | | | | | |
Total | | | | | | | | | 494,818 | | | | | 441,757 | | | | | 53,061 | |
| | | | | | | | | | | | | | | | | | | | |
| | | | |
LIABILITIES AND EQUITY | | | | | | | | | | | | | | | | | | | | |
Liabilities to banks | | | | (10), (19), (52) | | | | | 23,031 | | | | | 15,461 | | | | | 7,570 | |
Liabilities to customers | | | | (10), (19), (53) | | | | | 20,856 | | | | | 22,011 | | | | | -1,154 | |
Certificated liabilities | | | | (19), (54) | | | | | 398,829 | | | | | 357,984 | | | | | 40,845 | |
Value adjustments from macro fair value hedge accounting | | | | (8), (55) | | | | | 313 | | | | | 141 | | | | | 172 | |
Derivatives used for hedge accounting | | | | (8), (56) | | | | | 20,927 | | | | | 18,191 | | | | | 2,736 | |
Other derivatives | | | | (8), (9), (10), (57) | | | | | 5,365 | | | | | 4,623 | | | | | 742 | |
Provisions | | | | (13), (20), (58) | | | | | 2,214 | | | | | 2,290 | | | | | -77 | |
Income tax liabilities | | | | (18), (59) | | | | | 187 | | | | | 118 | | | | | 68 | |
Other liabilities | | | | (21), (60) | | | | | 2,003 | | | | | 1,906 | | | | | 97 | |
Subordinated liabilities | | | | (21), (61) | | | | | 3,247 | | | | | 3,247 | | | | | 0 | |
Equity | | | | (22), (62) | | | | | 17,847 | | | | | 15,784 | | | | | 2,063 | |
Paid-in subscribed capital | | | | | | | | | 3,300 | | | | | 3,300 | | | | | 0 | |
Capital reserve | | | | | | | | | 5,947 | | | | | 5,947 | | | | | 0 | |
Reserve from the ERP Special Fund | | | | | | | | | 1,056 | | | | | 977 | | | | | 79 | |
Retained earnings | | | | | | | | | 6,107 | | | | | 5,218 | | | | | 889 | |
Fund for general banking risks | | | | | | | | | 1,700 | | | | | 600 | | | | | 1,100 | |
Revaluation reserves | | | | (4), (14) | | | | | -262 | | | | | -257 | | | | | -5 | |
| | | | | | | | | | | | | | | | | | | | |
Total | | | | | | | | | 494,818 | | | | | 441,757 | | | | | 53,061 | |
| | | | | | | | | | | | | | | | | | | | |
81
Consolidated Statement of Changes in Equity
STATEMENTOF CHANGESIN EQUITYINTHE 2011 FINANCIAL YEAR
| | | | | | | | | | | | | | | | | | | | |
(EUR in millions) | | As at 1
January
2011 | | Owner-related
changes
in equity | | Appropriation of
comprehensive income
2011 | | As at 31
December
2011 |
Subscribed capital | | | | 3,750 | | | | | 0 | | | | | 0 | | | | | 3,750 | |
less uncalled outstanding contributions | | | | -450 | | | | | 0 | | | | | 0 | | | | | -450 | |
Capital reserve | | | | 5,947 | | | | | 0 | | | | | 0 | | | | | 5,947 | |
Promotional reserves from the ERP Special Fund | | | | 4,650 | | | | | 0 | | | | | 0 | | | | | 4,650 | |
Reserve from the ERP Special Fund | | | | 977 | | | | | 0 | | | | | 79 | | | | | 1,056 | |
Retained earnings | | | | 5,218 | | | | | 0 | | | | | 889 | | | | | 6,107 | |
Statutory reserve under § 10 (2) KfW Law | | | | 1,838 | | | | | 0 | | | | | 37 | | | | | 1,875 | |
Special reserve under § 10 (3) KfW Law | | | | 2,178 | | | | | 0 | | | | | 510 | | | | | 2,689 | |
Special reserve less the special loss account from provisioning pursuant to Section 17 (4) of the D-Mark Balance Sheet Law | | | | 21 | | | | | 0 | | | | | 0 | | | | | 21 | |
Other retained earnings | | | | 1,181 | | | | | 0 | | | | | 341 | | | | | 1,522 | |
Fund for general banking risks | | | | 600 | | | | | 0 | | | | | 1,100 | | | | | 1,700 | |
Revaluation reserves | | | | -257 | | | | | 0 | | | | | -5 | | | | | -262 | |
| | | | | | | | | | | | | | | | | | | | |
Equity | | | | 15,784 | | | | | 0 | | | | | 2,063 | | | | | 17,847 | |
| | | | | | | | | | | | | | | | | | | | |
KfW’s reserves from the ERP Special Fund are increased on the basis of contractual agreements. KfW’s net income amounting to EUR 548 million was used to increase the statutory reserve under section 10 (2) of the KfW Law by EUR 37 million and the special reserve under section 10 (3) of the KfW Law by EUR 510 million. Moreover, the fund for general banking risks was increased by EUR 1,100 million.
The difference from the comprehensive income is allocated to “other retained earnings” or - if recognised directly in equity - to “revaluation reserves”.
82
STATEMENTOF CHANGESIN REVALUATION RESERVESINTHE 2011 FINANCIAL YEAR
| | | | | | | | | | | | | | | | | | | | | | | | | | | | | | |
(EUR in millions) | | Bonds and other fixed-
income securities | | Shares and
other non-fixed
income
securities | | Equity
investments | | Effects
of
deferred
taxes | | Investments
accounted for
using the
equity method | | Total |
As at 1 January 2011 | | | | -249 | | | | | 1 | | | | | 8 | | | | | -4 | | | | | -13 | | | | | -257 | |
A. Changes recognised in the income statement | | | | | | | | | | | | | | | | | | | | | | | | | | | | | | |
Decrease due to disposals | | | | 0 | | | | | 0 | | | | | 0 | | | | | 0 | | | | | 0 | | | | | 0 | |
Increase due to disposals | | | | 0 | | | | | 0 | | | | | 0 | | | | | 0 | | | | | 0 | | | | | 0 | |
Decrease due to impairments | | | | -3 | | | | | 0 | | | | | 0 | | | | | 3 | | | | | 0 | | | | | 0 | |
Amortisation after reclassification | | | | 86 | | | | | 0 | | | | | 0 | | | | | 0 | | | | | 0 | | | | | 86 | |
| | | | | | | | | | | | | | | | | | | | | | | | | | | | | | |
Total changes recognised in the income statement | | | | 83 | | | | | 0 | | | | | 0 | | | | | 3 | | | | | 0 | | | | | 86 | |
B. Changes recognized directly in equity | | | | | | | | | | | | | | | | | | | | | | | | | | | | | | |
| Changes in revaluation reserves due to impairment reversal only for equity instruments | | | | 0 | | | | | 0 | | | | | 55 | | | | | 0 | | | | | 0 | | | | | 55 | |
| Changes in revaluation reserves due to fair value changes | | | | -154 | | | | | 1 | | | | | 5 | | | | | 3 | | | | | 0 | | | | | -146 | |
| | | | | | | | | | | | | | | | | | | | | | | | | | | | | | |
Total changes recognized directly in equity | | | | -154 | | | | | 1 | | | | | 60 | | | | | 3 | | | | | 0 | | | | | -91 | |
Effects of exchange rate changes | | | | 0 | | | | | 0 | | | | | 0 | | | | | 0 | | | | | 0 | | | | | 0 | |
| | | | | | | | | | | | | | | | | | | | | | | | | | | | | | |
As at 31 December 2011 | | | | -320 | | | | | 1 | | | | | 69 | | | | | 2 | | | | | -14 | | | | | -262 | |
| | | | | | | | | | | | | | | | | | | | | | | | | | | | | | |
83
STATEMENTOF CHANGESIN EQUITYINTHE 2010 FINANCIAL YEAR
| | | | | | | | | | | | | | | | | | | | |
(EUR in millions) | | As at 1
January
2010 | | Owner-related
changes in equity | | Appropriation of
comprehensive
income 2010 | | As at 31
December
2010 |
Subscribed capital | | | | 3,750 | | | | | 0 | | | | | 0 | | | | | 3,750 | |
less uncalled outstanding contributions | | | | -450 | | | | | 0 | | | | | 0 | | | | | -450 | |
Capital reserve | | | | 5,947 | | | | | 0 | | | | | 0 | | | | | 5,947 | |
Promotional reserves from the ERP Special Fund | | | | 4,650 | | | | | 0 | | | | | 0 | | | | | 4,650 | |
Reserve from the ERP Special Fund | | | | 893 | | | | | 0 | | | | | 84 | | | | | 977 | |
Retained earnings | | | | 4,725 | | | | | 0 | | | | | 493 | | | | | 5,218 | |
Statutory reserve under § 10 (2) KfW Law | | | | 1,574 | | | | | 0 | | | | | 264 | | | | | 1,838 | |
Special reserve under § 10 (3) KfW Law | | | | 1,928 | | | | | 0 | | | | | 250 | | | | | 2,178 | |
Special reserve less the special loss account from provisioning pursuant to section 17 (4) of the D-Mark Balance Sheet Law | | | | 21 | | | | | 0 | | | | | 0 | | | | | 21 | |
Other retained earnings | | | | 1,202 | | | | | 0 | | | | | -21 | | | | | 1,181 | |
Fund for general banking risks | | | | 46 | | | | | 0 | | | | | 554 | | | | | 600 | |
Revaluation reserves | | | | -290 | | | | | 0 | | | | | 33 | | | | | -257 | |
Balance sheet loss | | | | -1,499 | | | | | 0 | | | | | 1,499 | | | | | 0 | |
| | | | | | | | | | | | | | | | | | | | |
Equity | | | | 13,121 | | | | | 0 | | | | | 2,663 | | | | | 15,784 | |
| | | | | | | | | | | | | | | | | | | | |
84
STATEMENTOF CHANGESIN REVALUATION RESERVESINTHE 2010 FINANCIAL YEAR
| | | | | | | | | | | | | | | | | | | | | | | | | | | | | | |
(EUR in millions) | | Bonds and other
fixed-income
securities | | Shares and
other non-fixed
income
securities | | Equity
investments | | Effects of
deferred
taxes | | Investments
accounted for
using the equity
method | | Total |
As at 1 January 2010 | | | | -291 | | | | | 21 | | | | | 0 | | | | | -13 | | | | | -7 | | | | | -290 | |
A. Changes recognised in the income statement | | | | | | | | | | | | | | | | | | | | | | | | | | | | | | |
Decrease due to disposals | | | | 0 | | | | | -60 | | | | | 0 | | | | | 0 | | | | | 0 | | | | | -60 | |
Increase due to disposals | | | | 4 | | | | | 0 | | | | | 0 | | | | | 0 | | | | | 0 | | | | | 4 | |
Decrease due to impairments | | | | 0 | | | | | 0 | | | | | 0 | | | | | 0 | | | | | 0 | | | | | 0 | |
Amortisation after reclassification | | | | 113 | | | | | 0 | | | | | 0 | | | | | 0 | | | | | 0 | | | | | 113 | |
| | | | | | | | | | | | | | | | | | | | | | | | | | | | | | |
Total changes recognised in the income statement | | | | 117 | | | | | -60 | | | | | 0 | | | | | 0 | | | | | 0 | | | | | 56 | |
B. Changes recognised directly in equity | | | | | | | | | | | | | | | | | | | | | | | | | | | | | | |
Changes in revaluation reserves due to impairment reversal only for equity instruments | | | | 0 | | | | | 0 | | | | | 8 | | | | | 0 | | | | | 0 | | | | | 8 | |
Changes in revaluation reserves due to fair value changes | | | | -73 | | | | | 38 | | | | | 0 | | | | | 9 | | | | | -6 | | | | | -32 | |
| | | | | | | | | | | | | | | | | | | | | | | | | | | | | | |
Total changes recognised directly in equity | | | | -73 | | | | | 38 | | | | | 8 | | | | | 9 | | | | | -6 | | | | | -24 | |
Effects of exchange rate changes | | | | -2 | | | | | 2 | | | | | 0 | | | | | 0 | | | | | 0 | | | | | 0 | |
| | | | | | | | | | | | | | | | | | | | | | | | | | | | | | |
As at 31 December 2010 | | | | -249 | | | | | 1 | | | | | 8 | | | | | -4 | | | | | -13 | | | | | -257 | |
| | | | | | | | | | | | | | | | | | | | | | | | | | | | | | |
85
Consolidated Statement of Cash Flow
CONSOLIDATED STATEMENTOF CASH FLOW
| | | | | | | | |
| (EUR in millions) | | 2011 | | | 2010 | |
Consolidated profit | | | 2,068 | | | | 2,631 | |
| | |
| Non-cash items included in consolidated profit/loss and reconciliation to cash flow from operating activities: | | | | | | | | |
Depreciation, amortisation, impairment and reversal of impairment losses (receivables, property, plant and equipment, securities and investments) and changes in risk provisions for lending business | | | 142 | | | | -134 | |
Changes in other provisions | | | 247 | | | | 174 | |
Profit/loss from the disposal of securities and investments and property, plant and equipment | | | -1 | | | | 1 | |
Other adjustments | | | -2,650 | | | | -2,532 | |
| | | | | | | | |
Subtotal | | | -195 | | | | 139 | |
| | |
Changes in assets and liabilities from operating activities after adjustment for non-cash items: | | | | | | | | |
Loans and advances to banks | | | -27,549 | | | | -21,862 | |
Loans and advances to customers | | | -10,901 | | | | -10,211 | |
Securities and investments (securities) | | | 3,464 | | | | 1,732 | |
Other assets relating to operating activities | | | -17,246 | | | | -10,646 | |
Liabilities to banks | | | 7,570 | | | | 7,365 | |
Liabilities to customers | | | -1,154 | | | | -1,724 | |
Certificated liabilities | | | 40,845 | | | | 36,556 | |
Other liabilities relating to operating activities | | | 3,649 | | | | -3,546 | |
Interest and dividends received | | | 15,791 | | | | 14,454 | |
Interest paid | | | -13,392 | | | | -11,702 | |
Income tax paid | | | -106 | | | | -33 | |
| | | | | | | | |
Cash flow from operating activities | | | 776 | | | | 523 | |
Cash proceeds from the disposal of: | | | | | | | | |
Property, plant and equipment | | | 8 | | | | 10 | |
Cash payments for investment in: | | | | | | | | |
Securities and investments (equity investments) | | | -328 | | | | -173 | |
Property, plant and equipment | | | -63 | | | | -93 | |
| | | | | | | | |
Cash flow from investing activities | | | -383 | | | | -256 | |
Cash proceeds from/(cash payments for) capital increases/(decreases) | | | 0 | | | | 0 | |
Cash flow from financing activities | | | 0 | | | | 0 | |
| | |
Cash and cash equivalents as at the end of the previous period | | | 604 | | | | 337 | |
Cash flow from operating activities | | | 776 | | | | 523 | |
Cash flow from investing activities | | | -383 | | | | -256 | |
Cash flow from financing activities | | | 0 | | | | 0 | |
| | | | | | | | |
Cash and cash equivalents as at the end of the period | | | 997 | | | | 604 | |
| | | | | | | | |
The IAS 7 item “cash and cash equivalents” reported in the statement of cash flow is identical to the balance sheet item “cash reserves” and thus comprises cash on hand and balances with central banks.
The statement of cash flow shows the changes in cash and cash equivalents in the financial year through the cash flows from operating activities, investing activities and financing activities.
The item “other adjustments” largely comprises the adjustment for net interest income in the amount of EUR -2,399 million (2010: EUR -2,752 million) as well as for valuation results amounting to EUR -347 million (2010: EUR -120 million) and effects of exchange rate changes amounting to EUR 83 million (2010: EUR 265 million).
For more information on the KfW Bankengruppe’s liquidity risk management, see “Financial Section — Risk Report — Liquidity Risk.”
86
Notes to the Consolidated Financial Statements
Accounting Policies
KfW is the promotional bank of the Federal Republic of Germany and was founded in 1948 as a public law institution based in Frankfurt am Main.
The Executive Board of KfW is responsible for the presentation of the consolidated financial statements and the group management report. After the consolidated financial statements and the group management report have been approved by the Audit Committee, they are submitted to the KfW Board of Supervisory Directors for final approval. No incidents of particular importance have occurred since 31 December 2011, the end of the financial year (as at 28 February 2012).
As at 31 December 2011, KfW Bankengruppe includes six subsidiaries and two special funds (securities funds - Wertpapiersondervermögen) that are fully consolidated. Two jointly controlled entities and three associated companies are accounted for using the equity method.
The consolidated financial statements as at 31 December 2011 have been prepared, pursuant to section 315a (1) of the German Commercial Code (Handelsgesetzbuch-HGB), in accordance with the International Financial Reporting Standards (IFRS), as adopted by the European Union (EU), and with the interpretations set out by the International Financial Reporting Interpretations Committee (IFRIC), as mandatory consolidated accounts in accordance with article 4 of Regulation (EC) No. 1606/2002 (IAS Regulation) of the European Parliament and of the Council of 19 July 2002, as well as further regulations on the adoption of certain international accounting standards. The standards and interpretations that apply are those that had been published and endorsed by the European Union by 31 December 2011.
The supplementary provisions of the German Commercial Code that also apply to IFRS consolidated financial statements have been taken into account. The group management report prepared in accordance with section 315 of the German Commercial Code includes the risk report with the risk-oriented information on financial instruments as set out in IFRS 7, including a report on the exposures to the countries particularly affected by the European sovereign debt crisis, material events after the balance sheet date according to IAS 10 as well as information on capital and capital management as set out in IAS 1.134.
The consolidated financial statements were prepared in accordance with accounting policies that are uniform within KfW and are based on the going concern principle. The companies accounted for prepared their annual financial statements as at 31 December 2011, except where financial statements as at 30 September 2011 were used for companies accounted for using the equity method.
The accounting policies were used consistently in the consolidated financial statements.
The reporting currency and the functional currency of all consolidated entities is the euro. Unless otherwise specified, all amounts are stated in millions of euros (EUR in millions).
As a general rule, at the reporting date assets are carried at (amortised) cost, with the exception of the following financial instruments:
| | • | | derivative financial instruments carried at fair value through profit or loss; |
| | • | | designated financial instruments carried at fair value through profit or loss; and |
| | • | | available-for-sale financial assets carried at fair value recognised directly in equity. |
| (2) | Judgements and estimates |
The consolidated financial statements include values which are determined in an optimal manner in accordance with the applicable standard and on the basis of judgements and/or estimates and assumptions. The amounts actually realised in the future can deviate from these estimates. Estimates and assumptions are required, in particular, for calculating risk provisions, recognising and measuring provisions (primarily for pension liabilities and legal risks), performing the fair value accounting for financial instruments based on valuation models, assessing and measuring impairment of assets, and assessing the realizability of deferred tax assets. The
87
estimates and assumptions underlying these estimates are reviewed on an ongoing basis and are based, among other things, on historical experience or expected future events that appear likely given the particular circumstances. Insofar as estimates and their underlying assumptions were required, the assumptions made are explained in the notes to the relevant items.
KfW does not expect any deviations from its assumptions or any uncertainties with respect to estimates that could result in a substantial adjustment to the related assets and liabilities within the next financial year. Given the strong dependency on the development of the economic situation and financial markets, however, deviations or uncertainties cannot be fully excluded. These risks are nevertheless low because valuation models for measuring the fair value of financial instruments - especially those involving the use of inputs not based on observable market data - are only employed for part of the portfolio.
Further material judgements in the exercise of accounting policies concern the voluntary early adoption of new or amended IFRS/IFRIC standards, the use of the fair value option for the categorisation of financial assets and liabilities, the use of possibilities to reclassify financial assets according to IAS 39, the determination of fair values for certain financial instruments including the assessment as to whether an active market exists as well as the reporting of economic hedging relationships.
| (3) | Assessment of the impact of new or amended IFRS/IFRIC standards applied for the first time or to be applied in the future |
The new rules of the amended standards IAS 32 “Financial Instruments: Presentation” (October 2009), the “improvements to IFRS 2008 — 2010” (May 2010), the amended IFRIC 14 “Prepayments of a Minimum Funding Requirement” as well as IFRIC 19 “Extinguishing Financial Liabilities with Equity Instruments”, to be applied for the first time in the 2011 financial year, do not have any material impact on the net assets, financial position and results of operations.
The new rules of the amended standard IAS 24 “Related Party Disclosures” (November 2009), which are mandatory to apply with effect from financial year 2011, were voluntarily already applied in 2010.
The amendments of IFRS 7 “Financial Instruments: Disclosures” (November 2011), which the EU has already adopted and the application of which is mandatory with effect from financial year 2012, were not voluntarily applied early. These amendments are not expected to have any material impact on the group’s net assets, financial position and results of operations.
All significant subsidiaries, jointly controlled entities and associated companies have been included in the consolidated financial statements.
Affiliated entities are consolidated in accordance with IAS 27 if KfW can exercise control over the relevant company directly or indirectly. They are consolidated for the first time as soon as they can be controlled. Affiliated entities are deconsolidated when control can no longer be exercised.
Associated companies and jointly controlled entities are included in accordance with IAS 28/IAS 31 insofar as significant influence or joint control exists.
Special purpose entities (SPEs) are companies formed to accomplish a narrow, well-defined objective. In accordance with IAS 27/SIC-12, a special purpose entity is consolidated when the substance of the relationship between the reporting enterprise and the SPE indicates that the SPE is controlled by that enterprise. This presentation is indicated if:
| | a. | the SPE conducts its activities to meet the enterprise’s needs and the enterprise derives benefit from the SPE’s activities, or |
| | b. | the enterprise has the decision-making power to obtain the majority of the benefits of the SPE’s activities, or |
| | c. | the enterprise has rights to obtain the majority of the benefits of the SPE’s activities or |
88
| | d. | the enterprise holds the majority of the risks and rewards. |
The “Rhineland Funding Capital Corporation, New York/USA” conduit, to which KfW granted liquidity lines for the refinancing of the special purpose entities, is not consolidated by KfW Bankengruppe, as KfW does not exercise control in the meaning of the Standing Interpretation Committee’s interpretation no. 12 (SIC-12) over the special purpose entities (SPEs). KfW did not obtain any power of disposal over the SPEs or over their assets by providing the liquidity lines. KfW serves solely as provider of debt capital for the Conduit and did not possess any decision-making powers over the assets of the SPEs or over the SPEs themselves.
The structure of the consolidated group is set out in Note 81 “Disclosures on shareholdings”.
| (5) | Basis of consolidation |
Consolidation involves revaluing the total assets and liabilities of the subsidiaries at the acquisition date, irrespective of the percentage of equity instruments acquired, and incorporating them into the consolidated statement of financial position. Revealed hidden reserves and hidden burdens are treated in accordance with the applicable standards. If the revaluation procedure results in an excess of acquisition cost, this amount is capitalised as goodwill. At present, no goodwill is recognised.
Any intragroup assets and liabilities as well as expenses and revenues from transactions between companies included in the consolidated financial statements are eliminated in the process of the intragroup consolidation of debt, expenses and earnings. Intragroup profits between consolidated companies are also eliminated.
Associated and jointly controlled entities are accounted for using the equity method. These are presented separately in the consolidated statement of financial position. Changes in value are shown depending on their underlying cause as a separate item in the income statement or in the revaluation reserves.
There are no minority interests.
| (6) | Financial instruments: recognition and measurement |
A financial instrument is any contract that gives rise to a financial asset of one entity and a financial liability or equity instrument of another entity. The following explanations provide an overview of how the requirements of IAS 39 are implemented.
Initial recognition is as at the settlement date for non-derivative financial instruments and as at the trade date for derivatives.
Upon initial recognition, financial instruments must be assigned to one of the following categories. The subsequent valuation depends on this categorisation:
| | b. | Held-to-maturity investments; |
| | c. | Financial assets and liabilities at fair value through profit or loss: |
| | a. | Financial assets and liabilities designated at fair value through profit or loss, fair value option |
| | b. | Financial assets and liabilities held for trading; |
| | d. | Available-for-sale financial assets; or |
“Loans and receivables” include non-derivative financial assets with fixed or determinable payments that are not quoted in an active market. These are measured at amortised cost using the effective interest method. For KfW Bankengruppe, this primarily relates to the lending business reported under “loans and advances to banks” and “loans and advances to customers”. In its lending business KfW Bankengruppe uses the Basel definition for its selection of default criteria and applies a uniform definition of default group-wide. Default criteria are, in particular, payments overdue for more than 90 days (taking a marginality limit into account) and anticipated non-fulfilment of payment obligations in the face of indicators such as filing for bankruptcy, material adverse
89
change, distressed loan indication, cases of conversion and transfer, debt to equity swaps, deferment/restructuring and disposal of loans or advances at significant loss.
“Held-to-maturity investments” are non-derivative financial assets with fixed or determinable payments and fixed maturity that an entity has the intention and ability to hold to maturity. This valuation category is used for acquisitions in the group’s securities portfolio on a case-by-case basis. These are carried under “securities and investments” and, any impairments and reversals of impairment losses are to be recognised in net gains/losses from “securities and investments”. Premiums and discounts amortised according to the effective interest method are accounted for through profit or loss under “interest income”.
For financial assets and liabilities, the fair value option can be used irrevocably if:
| | • | | the categorisation can resolve or substantially reduce an accounting mismatch resulting from the valuation of financial assets or financial liabilities or the recognition of a loss or a gain as a result of differing accounting policies; |
| | • | | a group of financial assets and/or financial liabilities is managed in accordance with the documented risk management or investment strategy and its performance is assessed on the basis of the fair value and the information is passed on to key personnel; or |
| | • | | a contract contains one or several embedded derivatives which significantly modify the cash flows required by the contract or an analysis is required to determine that the embedded derivative(s) may not be separated. |
“Designated financial assets and liabilities” are measured at fair value through profit or loss. KfW Bankengruppe uses the fair value option for hedging relationships, structured products, securitisation transactions, equity finance business, and for financial instruments of special funds that are managed on a fair-value basis and are included in the internal reporting. These financial instruments are reported under “securities and investments”, lLiabilities to banks and customers” and certificated liabilities”. Changes to the fair value are stated under “net gains/losses from other financial instruments at fair value through profit or loss”, while interest income/expense is reported under “net interest income”.
Financial instruments that belong to the “financial assets and liabilities held for trading” category are measured at fair value through profit or loss. This category includes both derivative and non-derivative financial instruments purchased with the intention of generating a short-term profit. KfW Bankengruppe does not enter into any transactions with the intention of generating a short-term profit. Derivative transactions concluded exclusively for hedging purposes are allocated to this category if hedge accounting according to IAS 39 is not or cannot be applied. They are reported under “other derivatives”. Changes to the fair value are reported under “net gains/losses from other financial instruments at fair value through profit or loss”. Derivatives used for hedge accounting are carried under the item of the same name. Changes to the fair value are reported under “net gains/losses from hedge accounting”. Interest income/expense from derivatives is reported under “net interest income”.
All other financial assets fall under the “available-for-sale financial assets” category. The difference between the fair value and the (amortised) cost is recognised directly in a separate equity item until the asset is sold or an impairment loss has to be recognised in profit or loss. This presentation is the case for debt instruments if there is objective evidence (“trigger”) of impairment with an impact on the expected future cash flows. Specific trigger events are defined depending on the type of financial instrument. Events such as payments overdue for 30 days or more, a deterioration in the internal rating to the non- performing loans category, and a decline in the market price can be considered objective evidence of a possible impairment. Furthermore, an impairment has to be recognised in profit or loss in the case of a significant or prolonged decline below the acquisition cost of equity instruments. The impairment of a debt instrument assigned to this category is reversed through profit or loss if there is no longer any objective evidence for an impairment. Impairments of equity instruments assigned to this category may only be reversed directly in equity. Equity instruments that cannot be reliably measured at fair value are accounted for at cost. Impairments are recognised in profit or loss, while reversals of impairment losses are not considered. Within KfW Bankengruppe, the “available-for-sale financial assets” are reported under “securities and investments”. Gains and losses from disposals, impairments to be recognised in profit or loss and the reversal of impairments from debt instruments are reported under “net gains/losses from securities and investments”. Premiums and discounts are amortised through profit or loss using the effective interest method and recognised under “interest income”.
90
All non-derivative financial liabilities for which the fair value option is not applied are categorised as “other liabilities”. These are measured at amortised cost using the effective interest method. For KfW Bankengruppe, this category covers borrowings that are reported under “liabilities to banks and customers”, “certificated liabilities” and “subordinated liabilities”.
Financial assets are derecognised as at the settlement date, with the exception of derivatives. Derecognition is performed when the contractual rights relating to the asset have expired, the power of disposal/control has been transferred, or the substantial risks and rewards have been transferred to a third party unrelated to KfW Bankengruppe.
Financial liabilities are derecognised if the obligations set out in the agreement have been fulfilled or cancelled or have expired.
For operations assigned to KfW by the Federal Government in accordance with section 2 (4) of the KfW Law, and for which KfW may or may not assume the risk, the group’s general recognition procedures for the relevant financial instruments will be applied. Measurement is based on the relevant individual contractual regulations concerning risk allocation.
The amendment to IAS 39 in the version dated 13 October 2008 expanded the possibilities to reclassify financial assets. Accordingly, until 31 October 2008, it was possible to reclassify assets carried as “available-for-sale financial assets” as “loans and receivables” with retroactive effect as at 1 July 2008 and afterwards prospectively as at the date of the resolution if there was the intention and ability to hold the respective financial instruments for the foreseeable future or until maturity and if the general categorisation criteria for “loans and receivables” were fulfilled at the date of reclassification.
On 31 October 2008, KfW Bankengruppe decided to use this approach with retroactive effect as of 1 July 2008 for its asset-backed securities for which, as part of the general crisis of confidence in the financial markets, there was no longer an active market when the decision was passed (i.e., no current, regularly occurring market transactions on an arm’s length basis could be observed) and which were to be held through to maturity.
In addition, some of the securities that serve to maintain group liquidity — through their use in repo transactions or open market transactions of the European Central Bank — were reclassified with prospective effect taking advantage of the resolution dated 17 February 2009. An active market for these securities that were to be held for the foreseeable future no longer existed at the date of the resolution, as a result of the general crisis of confidence in the financial markets.
The fair value on the date of reclassification is the new acquisition cost of the reclassified financial assets. Amortisation is accounted for through profit or loss under Interest income according to the effective interest method. The difference between the fair value and (amortised) cost which had been recognised directly in equity until the reclassification continues to be carried under equity as a separate item. Amortisation using the effective interest method is accounted for through profit or loss under “interest income”.
Classification for the Notes was performed in agreement with the group’s business model focussed primarily on the lending business — valued at (amortised) cost — on the basis of products or the balance sheet items which encompass them.
| (7) | Financial instruments: valuation techniques |
At KfW Bankengruppe, initial recognition of financial instruments is at fair value, taking into account transaction costs.
Subsequent valuation at amortised cost is based, within the group, on the fair value upon initial recognition, taking into account any principal repayments and any impairments. The amortisation of premiums and discounts, transaction costs and fees is performed in accordance with the effective interest method on the basis of the contractual cash flows. In its promotional business, only discounts are amortised; this is carried out until the end of the first fixed interest rate period (generally five or ten years).
91
At KfW Bankengruppe, subsequent valuation at fair value is based on the following hierarchy:
1. Active market
The best objective evidence of fair value is provided by published price quotations in an active market. A financial instrument is regarded as quoted in an active market if quoted prices are readily and regularly available and those prices represent current — i.e., traded on the date of conclusion or shortly before — and regularly occurring market transactions on an arm’s length basis. In addition to traded nominal volumes, the contract sizes and the number of contracts, this assessment takes into account in particular the bid-ask spreads observed, which in the event of a significant expansion point towards an inactive market.
2. No active market — valuation techniques
If the financial instrument is not quoted in an active market, valuation techniques are used. The valuation techniques used include, in particular, the discounted cash flow (DCF) method and option pricing models, as well as a comparison with the fair value of a financial instrument with almost identical characteristics (e.g., multiplier-based models). The valuation techniques take account of all of the parameters that the market participants would include in the pricing process, e.g., market rates, risk-free interest rates, credit spreads or swap curves. As these data can generally be observed on the market and are also usually the only relevant parameters in measuring financial instruments to be valued using valuation techniques, the disclosures on valuation methods used for financial instruments carried at fair value normally state “Valuation method based on observable market data (model)”. If, however, relevant data are used in valuation that are not observable on the market, the instrument is allocated to the “Valuation method based in part on unobservable market data” category.
If differences between the transaction price and model value arise from the use of a valuation technique that makes significant use of unobservable inputs, the differential amounts are amortised through profit or loss over the life of the financial instruments. This treatment only applied to a small part of the derivative portfolio.
3. No active market — equity instruments
If in exceptional cases it is not possible to reliably determine the fair value of equity instruments that are not quoted in an active market using valuation models, they are measured at cost. The fair value cannot be calculated reliably if the range of reasonable fair value estimates for this instrument is significant and the probabilities of the various estimates cannot be reasonably assessed.
For its securities, the group examines whether a financial instrument is quoted on an active market on the basis of homogeneous portfolios, or — provided that the securities are managed in the special securities funds included — per class of security. In examining the criteria of an active market, particular account also need be taken of whether the market transactions and pricing are characterised by very high illiquidity discounts, as the criteria for regularly occurring market transactions on an arm’s length basis can thus no longer be regarded as fulfilled.
As a result, in these cases, according to the valuation hierarchy of IAS 39, valuation methods to determine the fair value are used, which take into account the parameters which can be observed on the market. The valuation methods used thus include, in particular, changes in creditworthiness and risk-free interest rates, however they also take into account the general and the financial instrument-specific tightening of the market due to lower liquidity.
With the exception of specific securities in the special securities funds included, this treatment was not the case for the group’s securities as at 31 December 2011. Thus, the prices of liquid markets could generally continue to be used to determine the fair value.
92
Fair values are determined on the basis of the valuation category for recognition on the balance sheet and for information on financial instruments in the Notes. Fair values from active markets are applied, in particular, for bonds and other fixed-income securities — unless there are inactive markets and thus valuation techniques are used — as well as shares and other non-fixed income securities. However, valuation techniques for non-derivative financial instruments are applied in particular to the products reported under “lLoans and advances to banks and customers”, “liabilities to banks and customers”, and “certificated liabilities”. Furthermore, in the case of OTC derivatives, valuation techniques are used that pay special attention to the counterparty-specific default risks, taking into account available collateral. Equity investments and shares which cannot be reliably measured at fair value are measured at cost.
The fair value for loans to banks and customers is calculated using the discounted cash flow (DCF) method based on the discounting of the risk-adjusted cash flows with the swap curve. The expected loss calculated for the respective reporting date is used to correct the contractual cash flows. The fair value at initial recognition is equivalent to the cost upon acquisition. The customer fee includes operating expenses, the margin, the equity and debt risk premium, and any subsidies. The customer fee remains unchanged for subsequent valuation (constant spread).
The fair value of financial instruments due on demand, such as cash reserves or receivables and liabilities due on demand, is the carrying amount.
In cases in which no prices from liquid markets are available, recognised valuation models and methods are applied. The DCF method is used for securities, swaps, and currency and money market transactions with no embedded options and no complex coupons. Independent options, as well as derivatives with embedded options, triggers, guaranteed interest rates and/or complex coupon agreements, are measured using recognised models (e.g., Hull & White) unless they are listed on a stock exchange. The same applies for credit default swaps.
The aforementioned models are calibrated, if possible, on the basis of observable market data for instruments that are similar in terms of the type of transaction, maturity, and credit quality.
Derivatives are used within KfW Bankengruppe for the hedging of interest rate and currency risks. The risk mitigating effect of economic hedging relationships is reflected in the financial statements through hedge accounting and by using the fair value option. Economic hedging relationships also impact the accounts in the form of embedded derivatives requiring separation which are accounted for through profit or loss. However, as not all derivatives are subject to hedge accounting or the fair value option, the risk-mitigating impact of some derivatives used in economic hedging relationships is not reflected in the accounts because the hedged risk associated with the underlying transactions is not recognised in profit or loss under IFRS.
Hedge accounting, i. e., the accounting for hedging instruments (derivatives) and hedged transactions in accordance with special rules, is subject to strict requirements.
Within KfW Bankengruppe, hedge accounting is used solely in the form of fair value hedges to recognise hedging relationships between derivatives and the respective assets/liabilities. Hedging relationships are reported at the individual transaction level in the form of micro fair value hedge accounting or at portfolio level in the form of macro fair value hedge accounting. The effectiveness of the hedging relationships is verified using the dollar offset method and a regression analysis.
In micro fair value hedge accounting, interest rate and currency risks from bonds allocated to securities and investments (“loans and receivables” and “available-for-sale financial assets” categories) and borrowings (“other liabilities” category) are hedged. The fair values attributable to the hedged risks are reported as an adjustment of the carrying amount of the hedged items with the corresponding gain or loss reported under “net gains/losses from hedge accounting”. The hedging instruments are recognised at fair value under “derivatives used for hedge accounting”. Changes in the value of these instruments are also reported under “net gains/losses from hedge accounting”, leading to a substantial compensation of the earnings effects resulting from the valuation of the hedged items. The fair value of the hedged risks from hedging relationships which no longer fulfil the strict hedge accounting requirements is amortised over the residual term of the original hedging relationship under “net gains/losses from hedge accounting”.
93
In macro fair value hedge accounting, interest rate risks from loan receivables (“loans and receivables” category) and borrowings (“other liabilities” category) are hedged. The fair values attributable to the hedged risks in the hedged portfolios in the “loans and receivables” category are reported under “value adjustments from macro fair value hedge accounting” on the assets side. The fair values attributable to the hedged risks in the hedged portfolios in the “other liabilities” category are reported under “value adjustments from macro fair value hedge accounting” on the liabilities side. Changes in the fair values of the hedged risks from the hedged portfolios are reported under “net gains/losses from hedge accounting”. The hedging instruments are reported at fair value under “derivatives used for hedge accounting”. Changes in the value of these instruments are also reported under nNet gains/losses from hedge accounting”, with the consequence that they almost fully offset the earnings effects from the valuation of the hedged portfolios. The portfolio of underlying transactions is determined each month in the context of a dynamic hedge designation and reversal process. The resultant value adjustment items are amortised over the residual term of the maturity period in “net gains/losses from hedge accounting”. Disposals from the hedged portfolios result in a partial reversal of the related value adjustments in “net gains/losses from hedge accounting”. For disposals from the hedged portfolios and substitution with new transactions during the hedging period, the related value adjustments from the hedged portfolios are further amortised in the “net interest income” item.
If the strict hedge accounting requirements for the designation of hedging relationships between derivatives and financial assets/liabilities are not fulfilled within KfW Bankengruppe, the fair value option is used for the non-derivative financial instruments in certain circumstances, in particular for structured products. Based on the product, in the case of some structured financial liabilities the embedded derivatives requiring separation are accounted for independently instead of using the fair value option.
Further derivative financial instruments are also used to hedge risks, but their resultant hedge effect is not reflected in the accounts.
The fair values of all derivatives not subject to hedge accounting are reported under “other derivatives”. Changes in the fair values are recognised in the income statement under “net gains/losses from other financial instruments at fair value through profit or loss.”
| (9) | Treatment of embedded derivatives |
Derivative financial instruments can be part of a hybrid (combined) financial instrument as embedded derivatives. Under certain conditions, they are reported separately from the host contract, similar to stand-alone derivatives. They must be reported separately if the economic characteristics and risks of the embedded derivative are not closely related to the economic characteristics and risks of the host contract. The host contract will be accounted for depending on its categorisation.
KfW Bankengruppe enters into contracts with embedded derivatives requiring separation particularly with respect to borrowings. As it makes use of the fair value option, KfW reports these hybrid (combined) financial instruments at fair value. In the case of certain products, the embedded derivatives requiring separation are spun-off and accounted for separately. Changes in fair value are recorded in “net gains/losses from other financial instruments at fair value through profit or loss” under the item “derivatives not qualifying for hedge accounting”, where they have a compensatory effect on the valuation of the hedging derivatives.
Supplementary agreements made in KfW Bankengruppe’s equity finance business are treated as separate embedded derivatives which are measured at fair value through profit or loss and reported under “other derivatives”. The loan receivables are reported under “loans and advances to customers”. Changes in fair value are recorded in “net gains/losses from other financial instruments at fair value through profit or loss” under “derivatives not qualifying for hedge accounting”.
Unscheduled termination rights that are granted regularly in promotional loan transactions are not recorded as embedded derivatives requiring separation since the economic characteristics and risks associated with the termination rights are closely related to the economic characteristics and risks of the loans and a premature repayment is made at approximately amortised cost.
94
As part of active portfolio management, single name credit default swaps (CDSs) are used to hedge the risks of individual counterparties. These are recognised at fair value under “other derivatives”. The changes in value are reported in the income statement under “net gains/losses from other financial instruments at fair value through profit or loss”. The current risk premiums are reported under “commission expense”.
As part of its promotional loan business, KfW Bankengruppe gives commercial banks the opportunity to place their credit risks in the capital markets through synthetic securitisation under the two standardised platforms PROMISE (programme for the securitisation of SME loans) and PROVIDE (programme for the securitisation of housing loans). In a first step, KfW Bankengruppe assumes the default risks of the reference portfolio via portfolio CDSs, while the risks are simultaneously passed on to third parties via portfolio CDSs/credit-linked notes. These transactions are reported using the fair value option. The fair values are reported as receivables or liabilities. Changes to the fair values are recognised under “net gains/losses from other financial instruments at fair value through profit or loss”. The current risk premiums are reported under “net commission income”.
In the case of transactions for which, in line with individual contractual terms, the fair value option is not used in order to avoid an accounting mismatch, portfolio CDSs are recognised in the statement of financial position as financial guarantees issued or received in accordance with the generally applicable procedure for these financial instruments. Credit-linked notes with embedded financial guarantees not requiring separation are classified as “other liabilities” and recognised in accordance with the principles for reporting borrowings.
| (11) | Foreign currency translation |
The functional currency of KfW and its consolidated subsidiaries and special funds is the euro.
Monetary assets and liabilities denominated in foreign currency are converted at the spot rate. Translation is made as at the balance sheet date using the European Central Bank reference rates. Income and expenses are translated strictly at the average monthly rate.
The results from foreign currency translation are recognised in profit or loss under “net gains/losses from other financial instruments at fair value through profit or loss”.
| (12) | Loans and advances to banks and customers |
KfW Bankengruppe’s lending business carried at amortised cost is reported under “loans and advances to banks and customers”. This item consists primarily of the promotional loan business, in which loans are typically granted to the final borrowers through accredited commercial banks. These assets are reported under “loans and advances to banks” insofar as the commercial banks underwrite part of the liability. Promotional on-lending without underwriting of liability by commercial banks is reported under lLoans and advances to customers”.
Current interest and similar income are recorded under “interest income”. Premiums, discounts, processing fees and charges are amortised in “interest income” using the effective interest method. Processing fees that do not need to be amortised using the effective interest method are recognised under “commission income”.
Loans and advances to banks and customers also include loans with a subsidy element (interest rate reductions) granted by KfW as part of the economic promotion by ERP. The promotional subsidies granted annually to KfW through the ERP Special Fund based on the ERP-Wirtschaftsplangesetz for the purpose of executing ERP promotion of economic development are reported as deferred income under “other liabilities” and are amortised in profit or loss under “interest income” as the underlying expenses for promoting the economic development are incurred.
The fully drawn liquidity lines provided to refinance the special purpose entities of the Rhineland Funding Capital Corporation, New York/USA conduit, are reported under “loans and advances to customers”. The valuation of receivables resulting from the assumption of the liquidity lines is based on an analysis of the underlying assets. The assets are differentiated by asset category, rating and, in some cases, year of issue. Quotations by arrangers and/or independent estimates used in this context are verified by specialists. Using this as a basis, KfW recorded individual impairments for the receivables or adjusted the allowance account in subsequent valuations recognising the change in profit or loss.
95
Individual special purpose entities of the Rhineland Funding Capital Corporation, New York/USA conduit have filed action for damages from the purchase of structured securities, which, if successful, also have to be taken into account in the context of the subsequent valuation.
| (13) | Risk provisions for lending business |
The overall risk provisions for lending business include the provisions for losses on loans and advances from money market investments, including reverse repos, as a separate asset item, as well as the provisions for contingent liabilities and irrevocable loan commitments reported under “provisions”.
The risks resulting from on balance sheet lending business are accounted for by individual and portfolio impairments recognised in profit or loss.
Individual impairments are recorded for counterparty risks identified in an impairment test of individual loans. The amount of the impairment loss corresponds to the difference between the carrying amount of the loan and the discounted expected future cash flows from interest and redemption payments and from collateral-based cash flows. The recognition of interest income in accordance with the original contractual terms is terminated as at the date on which the first individual impairment is set up. In the subsequent valuation, the effect of compounding the present value of anticipated cash flows using the original effective interest rate is determined and carried as interest income (unwinding). The risk provisions are reduced by this amount. Any reversals of individual impairment losses are accounted for through profit or loss.
Smaller and standardised loans are grouped into homogenous subportfolios for portfolio impairment on the basis of the default risks identified. Any reversals of portfolio impairment losses are accounted for through profit or loss.
For performing loans not subject to individual impairment, the risk of impairment losses that have already occurred but have not yet been individually identified is addressed by portfolio impairment. Economic risk and transfer risk are taken into account for the calculation. The key parameters are the outstanding loan volume (based on the carrying amount) as at 31 December 2011, the expected loss given default and one-year probabilities of default (given a loss identification period [LIP] factor of 1). The probabilities of default are provided by credit risk control, as is the loss given default, whereby the latter is adjusted for imputed cost. The underlying assumptions of expected losses are backtested on a regular basis against the actual loss experience.
In addition, portfolio impairments are recorded for impairment losses from the loan portfolio that have already occurred but have not yet been individually identified, and which occur particularly in periods of strong economic downturn. Identification is based on empirical values from comparable past economic scenarios, for example at sector or regional level.
Any reversal of impairment losses that have not yet been individually identified (e.g., due to economic recovery after a downturn) are accounted for through profit or loss.
For contingent liabilities and irrevocable loan commitments the individual risks detected are addressed in the form of provisions, with a corresponding effect on the income statement. For irrevocable loan commitments, impairments not yet identified individually are addressed by forming provisions, which are determined based on portfolio models.
If the loans are deemed partially or fully uncollectible they are written-down or written-off against the allowance account. Uncollectible loans, for which no individual impairments have been recorded, are written off directly. Recoveries on loans already written off are recognised as income from risk provisions.
| (14) | Securities and investments |
“Securities and investments” principally include securities portfolios. These portfolios mainly serve to support KfW’s liquidity status or are used to optimise and stabilise the ability of the group to fulfil its promotional mandate in the long term.
96
The “securities and investments” item on the statement of financial position comprises bonds and other fixed-income securities, shares and other non-fixed income securities, equity investments, and shares in affiliated entities not included in the consolidated financial statements which are held by KfW, its subsidiaries and consolidated special funds.
To ensure uniform accounting treatment for equity investments with and without significant influence, individual group business divisions that provide equity financing as part of their promotional mandate are categorised as venture capital organisations for accounting purposes provided they meet the respective requirements. These equity investments, like all other equity investments, are reported under “securities and investments”.
Securities and investments are initially recognised at fair value and subsequently measured depending on their classification either as “financial assets at fair value through profit or loss” or “available-for-sale financial assets”. Financial instruments with fixed or determinable payments which are not quoted in an active market are categorised as “loans and receivables”. Classification as “held-to-maturity investments” occurs on a case-by-case basis provided that the relevant criteria were fulfilled at the time of acquisition.
When non-listed equity investments are measured at fair value, appropriate allowances are made for illiquidity. For example, when discounted cash flow (DCF) models are used, a discount rate adjusted for a fungibility factor is applied. In cases where the fair value of non-listed equity investments cannot be reliably measured, such assets are carried at cost allowing for impairment losses.
Any changes in the value of “financial assets at fair value through profit or loss” are reported under “net gains/losses from other financial instruments at fair value through profit or loss”. Realised gains and losses and impairments relating to the “available-for-sale financial assets”, “loans and receivables” and “held-to-maturity investments” categories are recognised under “net gains/losses from securities and investments”; amounts reported for “loans and receivables” and “held-to-maturity investments” include allowances for impairment losses that have already occurred but have not yet been individually identified, based on the expected loss for one year. Unrealised gains from “available-for-sale financial assets” are recognised directly in equity as revaluation reserves. Current interest payments and dividends are reported under Interest income.
| (15) | Repurchase agreements |
KfW Bankengruppe enters into repurchase agreements (repos) as standardised repos or reverse repos. These are combinations of simultaneous spot and forward transactions on securities with the same counterparty. The terms and modalities of collateralisation and for the use of collateral follow common market practice. Credit claims are also an eligible type of collateral for open-market transactions.
The securities sold under repo transactions (spot sale) continue to be recognised and measured as securities. The repayment obligation is carried as a liability to banks or customers in the amount of the cash inflow. Interest is recorded under Interest expense in accordance with the respective conditions of the repurchase agreements.
A repayment claim is recognised and measured as a loan or advance to banks or customers in the amount of the cash outflow generated by reverse repos. The securities received (spot purchase) are not recognised or measured. Interest is recorded in Interest income in accordance with the respective conditions of the reverse repurchase agreements.
| (16) | Property, plant and equipment |
The land and buildings and the plant and equipment reported by KfW Bankengruppe are carried at cost less depreciation on a straight-line basis and impairment, both recognised under “administrative expense”. An impairment is recognised if the carrying amount of the asset exceeds the recoverable amount, which is the higher of the fair value less the disposal cost or the value in use. The useful life is determined based on expected wear and tear. KfW Bankengruppe assumes an estimated useful life of 40 to 50 years for premises, four years for workstation computer equipment and five years for other property, plant and equipment. Gains and losses from the sale of property, plant and equipment are reported under “net other operating income”.
KfW Bankengruppe’s land and buildings are almost entirely owner-occupied. There is only a small volume of rental activity to third parties.
97
Payments in advance and assets under construction are reported under “other property, plant and equipment” and are not subject to depreciation.
Under “intangible assets”, KfW Bankengruppe reports purchased and internally generated software at cost, less scheduled straight-line amortisation and impairments, both recognised under “administrative expense”. The useful life is determined based on expected wear and tear. KfW Bankengruppe assumes a useful life of five years.
Assets are impaired when the carrying amount of an asset exceeds the recoverable amount. An impairment is recorded when no future economic benefits can be identified.
In-house software under development is reported under “other intangible assets” and is not subject to amortisation.
KfW is a non-taxable entity. Taxes on income for non-exempt subsidiaries and their taxed permanent establishments are determined using tax laws in the country of residence. Current taxes on income as well as expenses and income from the change in deferred taxes are recognised in profit or loss as “taxes on income” or directly in equity under “revaluation reserves” depending on the underlying transaction. Current and deferred tax assets and liabilities are reported as separate items. Deferred income tax assets and liabilities are offset insofar as the requirements are met.
Current taxes on income are calculated using currently applicable tax rates.
Deferred tax assets and liabilities arise as a result of differences between carrying values according to IFRS of an asset or a liability and the respective tax bases if these are likely to result in taxable or tax deductible amounts in the future (temporary differences). Deferred tax assets relating to loss carryforwards not yet used are recognised only if there is a sufficient degree of certainty that the respective taxable entity will earn sufficient taxable income in subsequent periods to use the loss carryforward.
| (19) | Liabilities to banks and customers and certificated liabilities |
“Liabilities to banks and customers” primarily include non-current borrowings carried at amortised cost and KfW Bankengruppe’s money-market transactions. “Certificated liabilities” contain bonds, notes and money-market instruments issued. Own issues repurchased for market-making purposes are deducted from the liabilities as at the repurchase date.
The fair value option is used for structured liabilities. There are no changes in the fair value due to changes in credit risk as KfW is classified in the highest rating classes with stable outlook by the leading international rating agencies. The valuation effects from market-related changes in purchase prices (including liquidity spreads) generated by the development of demand for the different KfW refinancing instruments are recognised under Net gains/losses from other financial instruments at fair value through profit or loss. In the case of certain products, the embedded derivatives requiring separation are accounted for separately. Presentation of the different types of borrowed funds is not based on their categorisation or their designation as hedged items. Valuation of the items is based on their respective categorisation.
Current interest is recorded in “interest expense”; premiums and discounts are amortised using the effective interest method over the expected life in “interest expense”. Changes in the value of liabilities designated at fair value are recorded in profit or loss under “net gains/losses from other financial instruments at fair value through profit or loss”. Results from the repurchase of own issues categorised as “other liabilities” are recognised as at the repurchase date under “net other operating income”.
98
“Provisions” include provisions for pensions and similar commitments, credit risks as well as other obligations of uncertain amount and timing involving a probable outflow of funds.
The employees of KfW Bankengruppe participate in a company pension plan that pays retirement, long-term disability and survivor benefits. KfW Bankengruppe’s pension plans are exclusively defined-benefit plans. The benefits depend on the length of service and salary. Apart from employer-financed pension plans there are also plans in place involving contributions by employees.
The pension commitments are calculated by an independent qualified expert in accordance with the projected unit credit method on the basis of group-wide uniform parameters such as age, length of service and salary. The commitments are recognised at present value of the defined-benefit obligations as at the reporting date, taking into consideration actuarial gains and losses to be amortised. The discount factor is based on current market conditions for corporate bonds with a maturity matching that of the obligations. Additional demographic factors (including the Heubeck actuarial tables for 2005 G) and actuarial assumptions (rate of salary increases, rate of pension increases, rate of staff turnover, etc.) are accounted for. No plan assets were defined for the pension obligations of KfW Bankengruppe, so the related special regulations do not apply.
KfW Bankengruppe recognises net cumulative actuarial gains and losses that exceed 10% of the present value of the defined-benefit obligations (corridor approach). Amounts in excess of the 10% level are amortised in “profit or loss” on a straight-line basis over the expected average remaining working life under “administrative expense” and recognised under “provisions for pensions and similar commitments”.
All pension obligations are financed from the recognised pension provisions. There are no fund-financed pension obligations. Allocations to pension provisions distinguish between current service cost, interest expense and other allocations (including past service cost). The interest expense for pension obligations is reported under Other interest expense and other allocations are included in the item “administrative expense”.
Pension-like obligations include commitments for deferred compensation, early retirement and partial retirement. Actuarial reports are prepared and a provision is set up accordingly for these types of commitments as well. There are no actuarial gains and losses, so that the recognised provision matches the present value of the obligations.
Other provisions are set up, including those for obligations to employees and for audit and consultancy services at the estimated expenditure. Long-term provisions are discounted where the effect is material. Added to this are obligations arising from the assumption of the tasks of the State Insurance Company of the German Democratic Republic in liquidation (Staatliche Versicherung der Deutschen Demokratischen Republik in Abwicklung — SinA (institution under public law)), which are offset by receivables in the same amount from the Federal Agency for Special Tasks arising from Unification (Bundesanstalt für vereinigungsbedingte Sonderaufgaben — BvS) reported under “other assets”.
| (21) | Subordinated liabilities |
Subordinated liabilities relate to the ERP Special Fund.
Subordinated liabilities are classified as “other liabilities” and carried at amortised cost.
Deferred interest as well as value adjustments from micro fair value hedge accounting are recognised under “other liabilities”.
Current interest expenses are recorded under “interest expense”.
99
The equity structure is determined by the KfW Law and IFRS.
Pursuant to section 10 (2) and (3) of the KfW Law, KfW’s net income for the period determined in accordance with the German Commercial Code is transferred to reserves and is included in equity under IFRS. In accordance with IFRS, KfW Bankengruppe must report the contractually agreed “strengthening” of the reserve from the ERP Special Fund under equity as appropriation of consolidated profit/loss.
KfW Bankengruppe maintains a fund for general banking risks. Additions to or reductions of the fund are shown under IFRS as appropriation of consolidated profit/loss.
Under IFRS any remaining consolidated net income is allocated to “other retained earnings” in the same period.
The “revaluation reserves” include the valuation results from the “available-for-sale financial assets” category and also deferred taxes recognised directly in equity, depending on the underlying transaction.
| (23) | Contingent liabilities and irrevocable loan commitments |
KfW Bankengruppe’s contingent liabilities result mainly from guarantees (financial guarantee contracts). All contingent liabilities are listed in the Notes at their nominal amounts less provisions.
As part of the sale of its stake in IKB in the 2008, KfW agreed to indemnify IKB for certain legal risks in a certain amount. As at the end of 2011, proceedings against IKB which are relevant in this context were pending.
Irrevocable loan commitments are firm commitments by KfW Bankengruppe to grant a loan under contractually agreed terms. These are listed in the Notes at their nominal amounts less provisions.
Assets and liabilities held by KfW Bankengruppe in its own name but for third-party accounts are not recognised. This applies in particular to loans granted under German Financial Cooperation to support developing countries; the federal budget both grants the funds and underwrites these loans. The remuneration associated with these transactions is recognised under “commission income”.
Leases are classified as operating leases or as finance leases depending on the risks and rewards relating to ownership of an asset. This classification determines their accounting treatment.
KfW Bankengruppe enters into both types of leases as a lessee. Real estate leases are classified as “operating leases”; the corresponding rental payments are included under “administrative expense”.
Finance leases are entered into only to a limited extent. The leased assets are capitalised and depreciated over the useful life or lease term, whichever is shorter, in administrative expense”. Liabilities arising from future leasing payments are reported under “other liabilities”.
The small number of contracts in which KfW Bankengruppe acts as the lessor are classified as operating leases. The corresponding rental income is reported under “other operating income”.
100
Notes to the Statement of Comprehensive Income
(26) Net interest income
ANALYSISOF NET INTEREST INCOMEBY CLASS
| | | | | | | | | | | | | | | |
| | | 2011 | | 2010 | | Change |
| | | (EUR in millions) |
Interest and similar income from loans and advances to banks and customers | | | | 11,701 | | | | | 11,152 | | | | | 549 | |
Similar income from financial guarantees | | | | 39 | | | | | 41 | | | | | -2 | |
Interest income from securities and investments | | | | 972 | | | | | 1,057 | | | | | -85 | |
Interest income from derivatives | | | | 3,069 | | | | | 2,187 | | | | | 882 | |
Other interest income | | | | 10 | | | | | 16 | | | | | -7 | |
| | | | | | | | | | | | | | | |
Interest income | | | | 15,791 | | | | | 14,454 | | | | | 1,337 | |
Interest and similar expense for liabilities to banks and customers | | | | 788 | | | | | 767 | | | | | 21 | |
Interest expense for certificated liabilities | | | | 11,085 | | | | | 11,358 | | | | | -273 | |
Interest expense for subordinated liabilities | | | | 146 | | | | | 146 | | | | | 0 | |
Interest expense for derivatives | | | | 1,199 | | | | | -746 | | | | | 1,945 | |
Other interest expense | | | | 174 | | | | | 177 | | | | | -3 | |
| | | | | | | | | | | | | | | |
Interest expense | | | | 13,392 | | | | | 11,702 | | | | | 1,690 | |
| | | | | | | | | | | | | | | |
Total | | | | 2,399 | | | | | 2,752 | | | | | -353 | |
| | | | | | | | | | | | | | | |
Income from unwinding in the amount of EUR 27 million (2010: EUR 41 million) is reported under “interest and similar income from loans and advances to banks and customers”.
“Interest income from derivatives” includes the net interest income from derivatives irrespective of whether they are designated for hedge accounting. Interest income and expenses from derivatives which are directly related to individual financial instruments either on the assets or liabilities side and are not included in macro fair value hedge accounting are reported in interest income from derivatives (for financial instruments on the assets side) or in interest expenses from derivatives (for financial instruments on the liabilities side), depending on the hedged item. Taking account of interest income or expenses from the related hedged items, presentation is thus based on the economic nature of the hedged financial assets (variable-rate financial assets) or hedged financial liabilities (variable-rate financial liabilities).
101
ANALYSISOF INTEREST INCOMEFROM SECURITIESAND INVESTMENTS
| | | | | | | | | | | | | | | |
| | | 2011 | | 2010 | | Change |
| | | (EUR in millions) |
Interest income from bonds and other fixed-income securities | | | | 936 | | | | | 989 | | | | | -53 | |
Income from shares and other non-fixed income securities | | | | 0 | | | | | 1 | | | | | 0 | |
Income from equity investments | | | | 35 | | | | | 67 | | | | | -32 | |
| | | | | | | | | | | | | | | |
Total | | | | 972 | | | | | 1,057 | | | | | -85 | |
| | | | | | | | | | | | | | | |
(27) Risk provisions for lending business
ANALYSISOF RISK PROVISIONSBY TRANSACTION
| | | | | | | | | | | | | | | |
| | | 2011 | | 2010 | | Change |
| | | (EUR in millions) |
Impairment charges | | | | 567 | | | | | 680 | | | | | -113 | |
Direct write-offs | | | | 66 | | | | | 109 | | | | | -43 | |
| | | | | | | | | | | | | | | |
Expense for risk provisions | | | | 632 | | | | | 789 | | | | | -156 | |
| | | |
Income from the reversal of impairment losses | | | | 739 | | | | | 990 | | | | | -251 | |
Income from recoveries of amounts previously written off | | | | 78 | | | | | 223 | | | | | -144 | |
| | | | | | | | | | | | | | | |
Income from risk provisions | | | | 817 | | | | | 1,213 | | | | | -396 | |
| | | | | | | | | | | | | | | |
Total | | | | 185 | | | | | 424 | | | | | -239 | |
| | | | | | | | | | | | | | | |
(28) Net commission income
ANALYSISOF NET COMMISSION INCOMEBY CLASS
| | | | | | | | | | | | | | | |
| | | 2011 | | 2010 | | Change |
| | | (EUR in millions) |
Commission income from lending business | | | | 177 | | | | | 234 | | | | | -57 | |
Commission income from credit derivatives | | | | 0 | | | | | 2 | | | | | -2 | |
Other commission income | | | | 134 | | | | | 139 | | | | | -5 | |
Income from trust activities | | | | 1 | | | | | 1 | | | | | 0 | |
| | | | | | | | | | | | | | | |
Commission income | | | | 312 | | | | | 375 | | | | | -64 | |
| | | |
Commission expense for lending business | | | | 73 | | | | | 93 | | | | | -20 | |
Commission expense for credit derivatives | | | | 3 | | | | | 1 | | | | | 2 | |
Other commission expense | | | | 9 | | | | | 8 | | | | | 1 | |
| | | | | | | | | | | | | | | |
Commission expense | | | | 85 | | | | | 102 | | | | | -17 | |
| | | | | | | | | | | | | | | |
Total | | | | 226 | | | | | 273 | | | | | -47 | |
| | | | | | | | | | | | | | | |
“Commission income from lending business” also includes current premiums and fees from the PROMISE and PROVIDE securitisation platforms.
“Other commission income” includes fees for handling German Financial Cooperation with developing countries in the amount of EUR 104 million (2010: EUR 107 million).
102
(29) Net gains/losses from hedge accounting
ANALYSISOF NET GAINS/LOSSESFROM HEDGE ACCOUNTINGBY TYPEOF HEDGING RELATIONSHIP
| | | | | | | | | | | | | | | |
| | | 2011 | | 2010 | | Change |
| | | (EUR in millions) |
Micro fair value hedge accounting | | | | -171 | | | | | 48 | | | | | -219 | |
Macro fair value hedge accounting | | | | 501 | | | | | -267 | | | | | 768 | |
| | | | | | | | | | | | | | | |
Total | | | | 329 | | | | | -219 | | | | | 548 | |
| | | | | | | | | | | | | | | |
Net gains/losses from “macro fair value hedge accounting” comprise the valuation of hedging instruments in the amount of EUR -6,038 million (2010: EUR -1,763 million) and the valuation of hedged risks from the hedged portfolios. It also includes the amortisation of the value adjustments from the dynamic hedge designation and reversal process and the pro-rata reversal of value adjustments in the event of disposals from the underlying portfolios as well as the residual term effect of the hedging derivatives.
ANALYSISOF NET RESULTSFROM MICRO FAIR VALUE HEDGE ACCOUNTINGBY HEDGED ITEM
| | | | | | | | | | | | | | | |
| | | 2011 | | 2010 | | Change |
| | | (EUR in millions) |
Hedging of securities and investments | | | | -7 | | | | | 0 | | | | | -7 | |
Hedging of liabilities to banks and customers | | | | 0 | | | | | 0 | | | | | 0 | |
Hedging of certificated liabilities | | | | -147 | | | | | 41 | | | | | -188 | |
Hedging of subordinated liabilities | | | | 3 | | | | | 0 | | | | | 3 | |
| | | | | | | | | | | | | | | |
Subtotal: Effectiveness of hedges | | | | -152 | | | | | 41 | | | | | -193 | |
Amortisation of value adjustments | | | | -19 | | | | | 7 | | | | | -27 | |
| | | | | | | | | | | | | | | |
Total | | | | -171 | | | | | 48 | | | | | -219 | |
| | | | | | | | | | | | | | | |
GROSS ANALYSISOF VALUATION RESULTSFROM MICRO FAIR VALUE HEDGE ACCOUNTING: COMPARISONOF
HEDGED ITEMSAND HEDGING INSTRUMENTSINTHE 2011 FINANCIAL YEAR
| | | | | | | | | | | | | | | |
| | | Hedged items | | Hedging instruments | | Impact on valuation
result |
| | | (EUR in millions) |
Hedging of securities and investments | | | | 250 | | | | | -257 | | | | | -7 | |
Hedging of liabilities to banks and customers | | | | -239 | | | | | 239 | | | | | 0 | |
Hedging of certificated liabilities | | | | -5,546 | | | | | 5,398 | | | | | -147 | |
Hedging of subordinated liabilities | | | | -28 | | | | | 31 | | | | | 3 | |
| | | | | | | | | | | | | | | |
Total | | | | -5,564 | | | | | 5,412 | | | | | -152 | |
| | | | | | | | | | | | | | | |
103
GROSS ANALYSISOF VALUATION RESULTSFROM MICRO FAIR VALUE HEDGE ACCOUNTING: COMPARISONOF
HEDGED ITEMSAND HEDGING INSTRUMENTSINTHE 2010 FINANCIAL YEAR
| | | | | | | | | | | | | | | |
| | | Hedged items | | Hedging instruments | | Impact on valuation
result |
| | | (EUR in millions) |
Hedging of securities and investments | | | | 121 | | | | | -121 | | | | | 0 | |
Hedging of liabilities to banks and customers | | | | -25 | | | | | 25 | | | | | 0 | |
Hedging of certificated liabilities | | | | -961 | | | | | 1,001 | | | | | 41 | |
Hedging of subordinated liabilities | | | | -26 | | | | | 26 | | | | | 0 | |
| | | | | | | | | | | | | | | |
Total | | | | -891 | | | | | 932 | | | | | 41 | |
| | | | | | | | | | | | | | | |
(30) Net gains/losses from other financial instruments at fair value through profit or loss
ANALYSISOF NET GAINS/LOSSESFROM OTHER FINANCIAL INSTRUMENTSAT FAIR VALUETHROUGH PROFITOR
LOSSBY CLASS
| | | | | | | | | | | | | | | |
| | | 2011 | | 2010 | | Change |
| | | (EUR in millions) |
Securities and investments | | | | 33 | | | | | 312 | | | | | -279 | |
| | | | | | | | | | | | | | | |
Assets | | | | 33 | | | | | 312 | | | | | -279 | |
| | | |
Liabilities to banks and customers | | | | -94 | | | | | -52 | | | | | -42 | |
Certificated liabilities | | | | -1,806 | | | | | -269 | | | | | -1,538 | |
| | | | | | | | | | | | | | | |
Liabilities | | | | -1,901 | | | | | -321 | | | | | -1,580 | |
| | | |
Financial derivatives not qualifying for hedge accounting | | | | 1,675 | | | | | 100 | | | | | 1,575 | |
Credit derivatives | | | | -15 | | | | | 27 | | | | | -42 | |
| | | | | | | | | | | | | | | |
Derivative financial instruments | | | | 1,660 | | | | | 127 | | | | | 1,533 | |
| | | |
Foreign currency translation | | | | 139 | | | | | 88 | | | | | 51 | |
| | | | | | | | | | | | | | | |
Total | | | | -69 | | | | | 206 | | | | | -275 | |
| | | | | | | | | | | | | | | |
The net gains/losses from “liabilities to banks and customers” include the result of the credit-linked notes issued under the PROMISE and PROVIDE securitisation platforms. The net gains/losses from “credit derivatives” include the result from the portfolio CDSs concluded under this item.
The net gains/losses from derivatives not qualifying for hedge accounting are attributable mainly to derivatives in economic hedges which are recognised by using the fair value option for classifying the hedged items. The hedged items include, in particular, borrowings in the form of “certificated liabilities” and “liabilities to banks and customers” as well as “securities and investments”.
Net gains/losses from financial derivatives that do not qualify for hedge accounting include changes in the value of embedded derivatives from equity finance business which have to be separated. In addition, this item is used to carry results from embedded derivatives that are accounted for separately and which are connected to financial liabilities; the net gains/losses from the valuation of the associated hedging derivatives are thus compensated for.
104
ANALYSISOF NET GAINS/LOSSESFROM SECURITIESAND INVESTMENTSAT FAIR VALUETHROUGH PROFITOR
LOSSBY PRODUCT TYPE
| | | | | | | | | | | | | | | |
| | | 2011 | | 2010 | | Change |
| | | (EUR in millions) |
Bonds and other fixed-income securities | | | | -29 | | | | | 160 | | | | | -189 | |
Shares and other non-fixed income securities | | | | 0 | | | | | 1 | | | | | -1 | |
Equity investments | | | | 62 | | | | | 151 | | | | | -89 | |
| | | | | | | | | | | | | | | |
Total | | | | 33 | | | | | 312 | | | | | -279 | |
| | | | | | | | | | | | | | | |
ANALYSISOF NET GAINS/LOSSESFROM CREDITDERIVATIVESAND CREDIT-LINKED NOTESFROMTHE
SECURITISATION PLATFORMS PROMISEAND PROVIDEATFAIR VALUETHROUGH PROFITOR LOSS
| | | | | | | | | | | | | | | |
| | | 2011 | | 2010 | | Change |
| | | (EUR in millions) |
Single Name CDSs | | | | 27 | | | | | 1 | | | | | 26 | |
PROMISE / PROVIDE | | | | 15 | | | | | 13 | | | | | 3 | |
CDSs | | | | -42 | | | | | 26 | | | | | -69 | |
Issued credit-linked notes | | | | 58 | | | | | -13 | | | | | 71 | |
| | | | | | | | | | | | | | | |
Total | | | | 43 | | | | | 14 | | | | | 29 | |
| | | | | | | | | | | | | | | |
GROSS ANALYSISOF RESULTSFROM ECONOMICALLY HEDGED BORROWING: COMPARISONOF HEDGED ITEMS
AND HEDGING INSTRUMENTS
| | | | | | | | | | | | | | | |
| | | 2011 | | 2010 | | Change |
| | | (EUR in millions) |
Borrowings | | | | -1,958 | | | | | -307 | | | | | -1,651 | |
Hedging instruments | | | | 1,974 | | | | | 694 | | | | | 1,280 | |
| | | | | | | | | | | | | | | |
Total (Effectiveness of economic hedges) | | | | 15 | | | | | 387 | | | | | -371 | |
| | | | | | | | | | | | | | | |
(31) Net gains/losses from securities and investments
ANALYSISOF NETGAINS/LOSSESFROM SECURITIESAND INVESTMENTSBY CLASS
| | | | | | | | | | | | | | | |
| | | 2011 | | 2010 | | Change |
| | | (EUR in millions) |
Bonds and other fixed-income securities | | | | -164 | | | | | -17 | | | | | -147 | |
Shares and other non-fixed income securities | | | | 1 | | | | | 58 | | | | | -57 | |
Equity investments | | | | -59 | | | | | -39 | | | | | -20 | |
| | | | | | | | | | | | | | | |
Total | | | | -222 | | | | | 1 | | | | | -223 | |
| | | | | | | | | | | | | | | |
The net gains/losses from financial instruments include gains and losses realised from the sale and impairment of securities and investments classified as “available-for-sale financial assets”, “loans and receivables” or “held-to-maturity investments”.
In 2011, “equity instruments” at a carrying amount of EUR 46 million (2010: EUR 37 million) for which the fair value could not be reliably determined, were disposed of. This generated a realised net loss of EUR -3 million (2010: EUR -12 million), which is contained in the net gains/losses from “shares and other non-fixed income securities” and the net gains/losses from “equity investments”.
105
DISCLOSURESON IMPAIRMENTOF SECURITIESAND INVESTMENTS
| | | | | | | | | | | | | | | |
| | | 2011 | | 2010 | | Change |
| | | (EUR in millions) |
Securities and investments | | | | 308 | | | | | 84 | | | | | 223 | |
Bonds and other fixed-income securities | | | | 241 | | | | | 43 | | | | | 197 | |
Shares and other non-fixed income securities | | | | 2 | | | | | 2 | | | | | 0 | |
Equity investments | | | | 64 | | | | | 39 | | | | | 25 | |
DISCLOSURESONTHE REVERSALOF IMPAIRMENT LOSSESFROM SECURITIESAND INVESTMENTS
| | | | | | | | | | | | | | | |
| | | 2011 | | 2010 | | Change |
| | | EUR in millions |
Securities and investments | | | | 78 | | | | | 23 | | | | | 55 | |
Bonds and other fixed-income securities | | | | 78 | | | | | 23 | | | | | 55 | |
(32) Net gains/losses from investments accounted for using the equity method
| | | | | | | | | | | | | | | |
| | | 2011 | | 2010 | | Change |
| | | (EUR in millions) |
Net gains/losses from investments accounted for using the equity method | | | | -5 | | | | | -3 | | | | | -3 | |
(33) Administrative expense
ANALYSISOF ADMINISTRATIVE EXPENSE
| | | | | | | | | | | | | | | |
| | | 2011 | | 2010 | | Change |
| | | (EUR in millions) |
Wages and salaries | | | | 378 | | | | | 360 | | | | | 18 | |
Social security contributions | | | | 49 | | | | | 49 | | | | | 0 | |
Expense for pension provision and other employee benefits | | | | 34 | | | | | 39 | | | | | -5 | |
| | | | | | | | | | | | | | | |
Personnel expense | | | | 461 | | | | | 448 | | | | | 13 | |
| | | |
Other administrative expense | | | | 249 | | | | | 227 | | | | | 22 | |
Depreciation, amortisation and impairment of property, plant and equipment and intangible assets | | | | 47 | | | | | 47 | | | | | -1 | |
| | | | | | | | | | | | | | | |
Non-personnel expense | | | | 296 | | | | | 274 | | | | | 21 | |
| | | | | | | | | | | | | | | |
Total | | | | 757 | | | | | 722 | | | | | 34 | |
| | | | | | | | | | | | | | | |
“Non-personnel expense” includes EUR 5 million for depreciation, amortisation and impairment relating to finance leases (2010: EUR 5 million).
“Other administrative expense” includes rental expense arising from operating leases in the amount of EUR 5 million (2010: EUR 7 million).
106
(34) Net other operating income
ANALYSISOF NET OTHER OPERATING INCOME
| | | | | | | | | | | | | | | |
| | | 2011 | | 2010 | | Change |
| | | (EUR in millions) |
Other operating income | | | | 43 | | | | | 68 | | | | | -24 | |
Other operating expense | | | | 32 | | | | | 95 | | | | | -63 | |
| | | | | | | | | | | | | | | |
Total | | | | 11 | | | | | -27 | | | | | 39 | |
| | | | | | | | | | | | | | | |
“Other operating income” contains income from repurchasing own issues, rental income of EUR 2 million, unchanged from the previous year, and income from the reversal of other provisions.
“Other operating expense” includes contributions payable to the restructuring fund for banks in the amount of EUR 5 million. KfW is not obligated to contribute to the fund in accordance with section 2 of the Restructuring Fund Act (Restrukturierungsfondsgesetz – RStrukFG).
(35) Taxes on income
ANALYSISOF TAXESON INCOMEBY COMPONENT
| | | | | | | | | | | | | | | |
| | | 2011 | | 2010 | | Change |
| | | (EUR in millions) |
Current taxes on income | | | | 84 | | | | | 42 | | | | | 43 | |
Deferred taxes | | | | -54 | | | | | 12 | | | | | -66 | |
| | | | | | | | | | | | | | | |
Total | | | | 30 | | | | | 54 | | | | | -24 | |
| | | | | | | | | | | | | | | |
In 2011, deferred tax assets resulted in earnings of EUR 54 million (2010: EUR 12 million expenses). These were a result of the change in recognition of temporary differences.
The following reconciliation presents the relationship between the calculated income tax expense for the financial year and reported taxes on income.
107
TAX RECONCILIATION
| | | | | | | | | | | | | | | |
| | | 2011 | | 2010 | | Change |
| | | (EUR in millions) |
Profit/loss from operating activities (before taxes) | | | | 2,098 | | | | | 2,685 | | | | | -587 | |
Group income tax rate | | | | 0 | % | | | | 0 | % | | | | 0 | % |
| | | | | | | | | | | | | | | |
Calculated income tax expense | | | | 0 | | | | | 0 | | | | | 0 | |
Effects of tax rate differentials within the Group | | | | 112 | | | | | 134 | | | | | -22 | |
Effect of tax rate changes | | | | 0 | | | | | 0 | | | | | 0 | |
Effects of previous year taxes recorded in the reporting year | | | | -16 | | | | | -14 | | | | | -2 | |
Effects of non-deductible taxes on income | | | | 6 | | | | | 2 | | | | | 4 | |
Effects of non-deductible business expenses | | | | 8 | | | | | 2 | | | | | 6 | |
Effects of tax-free income | | | | -1 | | | | | -6 | | | | | 5 | |
Trade tax add-ons | | | | 4 | | | | | 3 | | | | | 1 | |
Permanent accounting differences | | | | 29 | | | | | -4 | | | | | 33 | |
Effects of changes in recognised deferred tax assets | | | | -109 | | | | | -63 | | | | | -46 | |
Other effects | | | | -3 | | | | | 0 | | | | | -3 | |
| | | | | | | | | | | | | | | |
Reported taxes on income | | | | 30 | | | | | 54 | | | | | -24 | |
| | | | | | | | | | | | | | | |
KfW Bankengruppe’s applicable income tax rate of zero per cent, on which the reconciliation is based, takes into account the tax status of KfW as a non-taxable public-law institution and the major effect of this status on profit/loss from operating activities.
The effects of tax rate differentials result from individual group companies being taxable and the related different tax rates. The tax rates continue to range from 0% to 32%.
108
(36) Notes to other comprehensive income
ANALYSISOF OTHER COMPREHENSIVE INCOMEBY CLASS
| | | | | | | | | | | | | | | |
| | | 2011 | | 2010 | | Change |
| | | (EUR in millions) |
Financial instruments | | | | -11 | | | | | 30 | | | | | -41 | |
Bonds and other fixed-income securities | | | | -71 | | | | | 42 | | | | | -114 | |
Shares and other non-fixed income securities | | | | 1 | | | | | -20 | | | | | 21 | |
Equity investments | | | | 60 | | | | | 8 | | | | | 52 | |
Deferred taxes on financial instruments | | | | 6 | | | | | 8 | | | | | -2 | |
Investments accounted for using the equity method | | | | 0 | | | | | -6 | | | | | 6 | |
| | | | | | | | | | | | | | | |
Total | | | | -5 | | | | | 33 | | | | | -38 | |
| | | | | | | | | | | | | | | |
“Other comprehensive income” comprises income and expenses recognised directly in equity under “revaluation reserves”.
ANALYSISOF RECLASSIFICATION AMOUNTS INCLUDEDINTHE INCOME STATEMENTBY CLASS
| | | | | | | | | | | | |
| | | 2011 | | | 2010 | | | Change | |
| | | (EUR in millions) | |
Reclassification amounts relating to financial instruments | | | 83 | | | | 57 | | | | 27 | |
Bonds and other fixed-income securities | | | 83 | | | | 117 | | | | -33 | |
Shares and other non-fixed income securities | | | 0 | | | | -60 | | | | 60 | |
Reclassification amounts relating to deferred taxes on financial instruments | | | 3 | | | | 0 | | | | 3 | |
| | | | | | | | | | | | |
Total | | | 86 | | | | 56 | | | | 30 | |
| | | | | | | | | | | | |
The reclassification amounts are the result of income and expenses which were accounted for through profit or loss during the reporting period and which were previously recognised directly in equity in the “revaluation reserves”. They also include amortisation of revaluation reserves from the reclassification of securities and investments from the “available-for-sale financial assets” valuation category to the “loans and advances” category. Income recognised in the income statement is reported with a negative sign preceding the amount and expenses with a positive sign.
109
Segment Reporting
(37) Segment reporting by business area
In accordance with the provisions of IFRS 8, segment reporting follows the internal management reporting system, which is used by the group’s main decision makers to assess each segment’s performance and to allocate resources to segments.
In accordance with the business area structure for KfW Bankengruppe, the segments and their products and services are broken down as follows:
| | | | |
| KfW Mittelstandsbank | | - | | Financing of corporate investments and industrial pollution control |
| | - | | Equity financing |
| | - | | Advisory services |
| | |
| KfW Privatkundenbank | | - | | Financing for housing construction and modernisation |
| | - | | Education finance |
| | |
| KfW Kommunalbank | | - | | Infrastructure and social finance |
| | - | | General funding of the special credit institutions of the federal states |
| | - | | Transactions on behalf of the Federal Government |
| | |
| Export and project finance | | - | | Financing for German and European export activities |
| | - | | Financing for projects and investments in German and European interests |
| | |
| Promotion for developing and transition countries | | - | | Promotion for developing and transition countries on behalf of the Federal Government (budget funds) with complementary market funds raised by KfW |
| | - | | Financing provided by DEG – Deutsche Investitions- und Entwicklungsgesellschaft mbH (private enterprise financing) |
| | |
| Capital markets | | - | | Securities and money market investments |
| | - | | Asset securitisation and capital market-related products |
| | - | | Global loans Europe |
| | - | | Holding arrangements for the Federal Republic of Germany |
| | - | | Refinancing |
| | |
| Group centre | | - | | Central interest rate and currency management |
| | - | | Strategic equity investments |
The business area structure was adjusted in two places from the structure of previous reports, in line with the realigned organisational structure and product responsibility, with effect from 1 January 2011:
| | - | The “advisory services” product group, previously part of the group centre, has been reallocated to the KfW Mittelstandsbank business area responsible for this product. |
| | - | The “global loans Europe” product group, previously under the responsibility of KfW Kommunalbank, has been reallocated to the Capital markets business area responsible for this product. |
The new business area structure was used as the basis for conforming comparative figures for 2010.
110
The business areas are measured on the basis of their contribution to consolidated profit. The individual line items are based on the following methods:
| | - | “Net interest income” (before interest rate reductions) comprises interest margins from asset operations calculated on the basis of the market interest rate method1. The item also includes the imputed return on equity with an analysis based on economic capital usage. Group centre also includes the treasury result, which largely comprises the income/loss from interest rate management. The treasury result reflecting the profit contribution from KfW refinancing2 is allocated to the Capital markets business area. |
| | - | The interest rate reductions included in “net interest income” in the income statement are reported separately in line with the internal management report due to their special relevance as a management variable. “Interest rate reductions” are components of promotional business of the KfW Mittelstandsbank, KfW Privatkundenbank and KfW Kommunalbank business areas. Promotional loans with a KfW interest receivable which is below the KfW refinancing rate are deemed reduced-interest loans. |
| | - | The allocation of “administrative expense” is based on the results from activity-based accounting by cost centres3. “Administrative expense” includes depreciation on property, plant and equipment. |
| | - | Risk provisions for lending business, net impairment charges, direct write-offs and recoveries on loans written off are distributed among the business areas according to the attributable risk provision amounts. |
| | - | The valuation result comprises the net gains/losses from hedge accounting, the net gains/losses from other financial instruments at fair value, the net gains/losses from securities and investments, the net gains/losses from investments accounted for using the equity method and net other operating income. |
| | - | When taxes on income are allocated to the business areas (excluding the group centre), only the current taxes on income are taken in account. Deferred taxes are allocated to the group centre. |
| | - | The reported economic capital requirement to cover potential credit, market price and operating risks is quantified for a solvency level of 99.99%4. |
| | - | Segment assets are not reported as, as per the internal management reporting system, they are used neither to assess each segment’s performance nor to allocate resources to segments. |
| | - | The presentation of segment income and expenses is based on consolidated figures. Administrative and commission expense as well as commission income and other operating income resulting from service relationships within the group is adjusted in segment reporting. Negligible consolidation effects remaining are reported in the Reconciliation/consolidation column. |
| (1) | Refinancing at matching maturities using KfW’s internal refinancing curve is assumed for the calculation of interest margins in this method. |
| (2) | The difference between the realised refinancing rates and the maturity-matched refinancing rates calculated in-house. |
| (3) | The costs incurred in the organisational units are allocated to the products by means of core services. |
| (4) | The statistical models and methods used are explained in the risk report section of the group management report. |
111
SEGMENT REPORTINGBY BUSINESS AREAFOR FINANCIAL YEAR 2011
| | | | | | | | | | | | | | | | | | | | | | | | | | | | | | | | | | | | |
| (EUR in millions) | | KfW
Mittel-
standsbank (1) | | | KfW
Privatkundenbank | | | KfW
Kommunalbank | | | Export
and
project
finance (1) | | | Promotion
for
developing
and
transition
countries (1) | | | Capital
markets | | | Group
centre | | | Reconciliation
/consolidation | | | KfW
Group | |
Volume of new commitments | | | 22,407 | | | | 16,722 | | | | 11,798 | | | | 13,409 | | | | 5,755 | | | | 1,147 | | | | — | | | | -847 | | | | 70,390 | |
| | | | | | | | | | | | | | | | | | | | | | | | | | | | | | | | | | | | |
Net interest income before interest rate reductions | | | 290 | | | | 194 | | | | 44 | | | | 706 | | | | 260 | | | | 562 | | | | 901 | | | | 0 | | | | 2,956 | |
Net commission income | | | 16 | | | | 14 | | | | 6 | | | | 48 | | | | 127 | | | | 13 | | | | 2 | | | | 0 | | | | 226 | |
Administrative expense | | | 137 | | | | 120 | | | | 29 | | | | 151 | | | | 238 | | | | 61 | | | | 22 | | | | 0 | | | | 757 | |
| | | | | | | | | | | | | | | | | | | | | | | | | | | | | | | | | | | | |
Operating result before valuation (before interest rate reductions) | | | 168 | | | | 89 | | | | 22 | | | | 603 | | | | 150 | | | | 514 | | | | 881 | | | | 0 | | | | 2,426 | |
| | | | | | | | | | | | | | | | | | | | | | | | | | | | | | | | | | | | |
Risk provisions for lending business | | | -13 | | | | -9 | | | | 6 | | | | 76 | | | | 58 | | | | 24 | | | | 43 | | | | — | | | | 185 | |
Valuation result | | | 17 | | | | 0 | | | | 0 | | | | -7 | | | | 63 | | | | -250 | | | | 221 | | | | 0 | | | | 44 | |
| | | | | | | | | | | | | | | | | | | | | | | | | | | | | | | | | | | | |
Profit/loss from operating activities (before interest rate reductions) | | | 172 | | | | 79 | | | | 28 | | | | 672 | | | | 271 | | | | 289 | | | | 1,144 | | | | 0 | | | | 2,655 | |
| | | | | | | | | | | | | | | | | | | | | | | | | | | | | | | | | | | | |
Interest rate reductions | | | -310 | | | | -195 | | | | -53 | | | | — | | | | — | | | | — | | | | — | | | | — | | | | -557 | |
Taxes on income | | | — | | | | — | | | | — | | | | 49 | | | | 29 | | | | 0 | | | | -47 | | | | — | | | | 30 | |
Consolidated profit | | | -137 | | | | -116 | | | | -25 | | | | 623 | | | | 242 | | | | 289 | | | | 1,191 | | | | 0 | | | | 2,068 | |
| | | | | | | | | | | | | | | | | | | | | | | | | | | | | | | | | | | | |
| | | | | | | | | |
Economic capital requirement | | | 2,184 | | | | 1,263 | | | | 183 | | | | 2,531 | | | | 1,601 | | | | 1,747 | | | | 3,048 | | | | — | | | | 12,558 | |
| (1) | The valuation result of the business areas contains the following net gains/losses from investments accounted for using the equity method: KfW Mittelstandsbank EUR -2.5 million, Export and project finance EUR -2.0 million and Promotion for developing and transition countries EUR -0.6 million. |
112
SEGMENT REPORTINGBY BUSINESS AREAFOR FINANCIAL YEAR 2010
| | | | | | | | | | | | | | | | | | | | | | | | | | | | | | | | | | | | | | | | | | | | | |
| (EUR in millions) | | KfW
Mittel-
standsbank (1) | | KfW
Privatkundenbank | | KfW
Kommunalbank | | Export
and
project
finance (1) | | Promotion
for
developing
and
transition
countries (1) | | Capital
markets (2) | | Group
centre | | Reconciliation
/consolidation | | KfW
Group |
Volume of new commitments | | | | 28,630 | | | | | 20,025 | | | | | 15,387 | | | | | 9,336 | | | | | 5,679 | | | | | 2,525 | | | | | — | | | | | -231 | | | | | 81,351 | |
| | | | | | | | | | | | | | | | | | | | | | | | | | | | | | | | | | | | | | | | | | | | | |
Net interest income before interest rate reductions | | | | 332 | | | | | 174 | | | | | 22 | | | | | 746 | | | | | 239 | | | | | 633 | | | | | 1,163 | | | | | 0 | | | | | 3,309 | |
Net commission income | | | | 19 | | | | | 28 | | | | | 6 | | | | | 63 | | | | | 132 | | | | | 25 | | | | | 1 | | | | | 0 | | | | | 273 | |
Administrative expense | | | | 139 | | | | | 116 | | | | | 25 | | | | | 136 | | | | | 219 | | | | | 62 | | | | | 25 | | | | | 0 | | | | | 722 | |
| | | | | | | �� | | | | | | | | | | | | | | | | | | | | | | | | | | | | | | | | | | | | | | |
Operating result before valuation (before interest rate reductions) | | | | 213 | | | | | 87 | | | | | 2 | | | | | 673 | | | | | 152 | | | | | 595 | | | | | 1,138 | | | | | 0 | | | | | 2,860 | |
| | | | | | | | | | | | | | | | | | | | | | | | | | | | | | | | | | | | | | | | | | | | | |
Risk provisions for lending business | | | | -28 | | | | | -17 | | | | | 2 | | | | | 191 | | | | | 139 | | | | | 259 | | | | | -121 | | | | | 0 | | | | | 424 | |
Valuation result | | | | 15 | | | | | 0 | | | | | 1 | | | | | 60 | | | | | 208 | | | | | -32 | | | | | -294 | | | | | 0 | | | | | -42 | |
| | | | | | | | | | | | | | | | | | | | | | | | | | | | | | | | | | | | | | | | | | | | | |
Profit/loss from operating activities (before interest rate reductions) | | | | 200 | | | | | 70 | | | | | 6 | | | | | 923 | | | | | 498 | | | | | 822 | | | | | 723 | | | | | 0 | | | | | 3,242 | |
| | | | | | | | | | | | | | | | | | | | | | | | | | | | | | | | | | | | | | | | | | | | | |
Interest rate reductions | | | | -286 | | | | | -211 | | | | | -61 | | | | | — | | | | | — | | | | | — | | | | | — | | | | | — | | | | | -558 | |
Taxes on income | | | | — | | | | | — | | | | | 0 | | | | | 34 | | | | | 4 | | | | | 0 | | | | | 16 | | | | | — | | | | | 54 | |
Consolidated profit | | | | -86 | | | | | -141 | | | | | -55 | | | | | 889 | | | | | 494 | | | | | 822 | | | | | 707 | | | | | 0 | | | | | 2,631 | |
| | | | | | | | | | | | | | | | | | | | | | | | | | | | | | | | | | | | | | | | | | | | | |
| | | | | | | | | |
Economic capital requirement | | | | 2,356 | | | | | 1,378 | | | | | 206 | | | | | 2,325 | | | | | 1,190 | | | | | 1,893 | | | | | 1,924 | | | | | — | | | | | 11,274 | |
| (1) | The valuation result of the business areas contains the following net gains/losses from investments accounted for using the equity method: KfW Mittelstandsbank EUR -0.5 million, Export and project finance EUR -3.1 million and Promotion for developing and transition countries EUR 1.0 million. |
| (2) | The amount reported in the volume of new commitments line comprises new commitments in the core business of the Capital Markets segment. In addition, a volume of EUR 22,336 was committed as part of a loan granted to Greece, resulting in a total commitment volume for financial year 2010 of EUR 103.7 billion. |
The reconciliation/consolidation column includes all adjustments that were necessary to reconcile segment information with the aggregated information for the KfW Group. The consolidation effects reported for “Volume of new commitments” relate to commitments for programme loans made by KfW Mittelstandsbank for which KfW IPEX-Bank acts as on-lending bank. The other amounts in this column result from minimal consolidation effects.
(38) Segment reporting by region
Net interest and commission income are allocated on the basis of the geographical locations of clients. The imputed return on equity included in net interest income, the treasury result and the interest rate management result are allocated to Germany. KfW receives commission income from the Federal Government for supporting developing and transition countries using budget funds of the Federal Government. This is allocated according to the region of the country receiving the investment. Commission expense paid to special purpose entities resulting from the asset securitisation platform is distributed according to the geographical location of the originator bank.
Property, plant and equipment and intangible assets are not reported according to region because these assets relate to Germany except for immaterial amounts.
113
SEGMENT REPORTINGBY REGIONFOR FINANCIAL YEAR 2011
| | | | | | | | | | | | | | | | | | | | | | | | | |
| (EUR in millions) | | Germany | | Europe
(excl.
Germany) | | Rest of
the world | | Reconciliation
/ consolidation | | KfW
Group |
Net interest income | | | | 1,580 | | | | | 433 | | | | | 386 | | | | | 0 | | | | | 2,399 | |
Net commission income | | | | 75 | | | | | 34 | | | | | 118 | | | | | 0 | | | | | 226 | |
| | | | | | | | | | | | | | | | | | | | | | | | | |
Segment income | | | | 1,654 | | | | | 467 | | | | | 504 | | | | | 0 | | | | | 2,625 | |
| | | | | | | | | | | | | | | | | | | | | | | | | |
SEGMENT REPORTINGBY REGIONFOR FINANCIAL YEAR 2010
| | | | | | | | | | | | | | | | | | | | | | | | | |
| (EUR in millions) | | Germany | | Europe
(excl.
Germany) | | Rest of
the world | | Reconciliation/
consolidation | | KfW
Group |
Net interest income | | | | 1,873 | | | | | 422 | | | | | 456 | | | | | 0 | | | | | 2,752 | |
Net commission income | | | | 107 | | | | | 38 | | | | | 128 | | | | | 0 | | | | | 273 | |
| | | | | | | | | | | | | | | | | | | | | | | | | |
Segment income | | | | 1,979 | | | | | 461 | | | | | 584 | | | | | 0 | | | | | 3,025 | |
| | | | | | | | | | | | | | | | | | | | | | | | | |
The reconciliation/consolidation column includes all adjustments that were necessary to reconcile segment information with the aggregated information for KfW Bankengruppe. The amounts in this column result solely from minimal consolidation effects.
114
Notes to the Statement of Financial Position
(39) Cash reserves
ANALYSISOF CASH RESERVESBY CLASS
| | | | | | | | | | | | | | | |
| | | 31 Dec. 2011 | | 31 Dec. 2010 | | Change |
| | | (EUR in millions) |
Balances with central banks | | | | 997 | | | | | 604 | | | | | 393 | |
(40) Loans and advances to banks
ANALYSISOF LOANSAND ADVANCESTO BANKSBY CLASS
| | | | | | | | | | | | | | | |
| | | 31 Dec. 2011 | | 31 Dec. 2010 | | Change |
| | | (EUR in millions) |
Money-market transactions | | | | 13,252 | | | | | 6,423 | | | | | 6,829 | |
Loans and advances | | | | 247,584 | | | | | 237,897 | | | | | 9,687 | |
Other receivables | | | | 30,136 | | | | | 19,101 | | | | | 11,034 | |
| | | | | | | | | | | | | | | |
Total | | | | 290,971 | | | | | 263,422 | | | | | 27,550 | |
| | | | | | | | | | | | | | | |
The receivables from reverse repos and the PROMISE and PROVIDE securitisation platforms are included in “other receivables”.
ANALYSISOF LOANSAND ADVANCESTO BANKSBY LIABILITY TYPE
| | | | | | | | | | | | | | | |
| | | 31 Dec. 2011 | | 31 Dec. 2010 | | Change |
| | | (EUR in millions) |
Direct loans to banks | | | | 88,646 | | | | | 87,721 | | | | | 926 | |
On-lent customer loans with full underwriting risk borne by the on-lending bank | | | | 152,562 | | | | | 143,024 | | | | | 9,538 | |
On-lent customer loans with partial underwriting risk borne by the on-lending bank | | | | 5,966 | | | | | 6,758 | | | | | -792 | |
Direct and on-lent subordinated loans | | | | 410 | | | | | 394 | | | | | 16 | |
| | | | | | | | | | | | | | | |
Total | | | | 247,584 | | | | | 237,897 | | | | | 9,687 | |
| | | | | | | | | | | | | | | |
“Direct loans to banks” includes in particular global loans granted as part of financing for domestic housing construction and SMEs.
(41) Loans and advances to customers
ANALYSISOF LOANSAND ADVANCESTO CUSTOMERSBY CLASS
| | | | | | | | | | | | | | | |
| | | 31 Dec. 2011 | | 31 Dec. 2010 | | Change |
| | | (EUR in millions) |
Loans and advances | | | | 117,468 | | | | | 107,505 | | | | | 9,964 | |
Other receivables | | | | 838 | | | | | 595 | | | | | 243 | |
| | | | | | | | | | | | | | | |
Total | | | | 118,306 | | | | | 108,099 | | | | | 10,207 | |
| | | | | | | | | | | | | | | |
The receivables from reverse repos and the PROMISE and PROVIDE securitisation platforms are included in “other receivables”.
115
ANALYSISOF LOANSAND ADVANCESTO CUSTOMERSBY LIABILITY TYPE
| | | | | | | | | | | | | | | |
| | | 31 Dec. 2011 | | 31 Dec. 2010 | | Change |
| | | (EUR in millions) |
Direct loans to customers | | | | 111,184 | | | | | 100,579 | | | | | 10,605 | |
On-lent customer loans without underwriting risk borne by the on-lending bank | | | | 441 | | | | | 629 | | | | | -188 | |
Direct and on-lent subordinated loans | | | | 5,843 | | | | | 6,297 | | | | | -453 | |
| | | | | | | | | | | | | | | |
Total | | | | 117,468 | | | | | 107,505 | | | | | 9,964 | |
| | | | | | | | | | | | | | | |
“Direct loans to customers” include in particular loans granted under export and project financing, municipal financing and education financing. The item also includes loans connected with certain transactions commissioned by the Federal Government in accordance with the KfW Law.
116
(42) Risk provisions for lending business
ANALYSISOF RISK PROVISIONSFOR LENDING BUSINESSBY CLASS
| | | | | | | | | | | | | | | |
| | | 31 Dec. 2011 | | 31 Dec. 2010 | | Change |
| | | (EUR in millions) |
Loans and advances to banks | | | | 162 | | | | | 200 | | | | | -38 | |
Loans and advances to customers | | | | 4,778 | | | | | 5,221 | | | | | -443 | |
| | | | | | | | | | | | | | | |
Provisions for losses on loans and advances | | | | 4,940 | | | | | 5,422 | | | | | -482 | |
Provisions for contingent liabilities and irrevocable loan commitments | | | | 256 | | | | | 484 | | | | | -228 | |
| | | | | | | | | | | | | | | |
Total | | | | 5,196 | | | | | 5,906 | | | | | -710 | |
| | | | | | | | | | | | | | | |
“Provisions for losses on loans and advances” also includes money market investments and reverse repos.
DEVELOPMENTOF RISK PROVISIONSFOR LENDING BUSINESSINTHE 2011 FINANCIAL YEARBY RISK ASSESSMENT
TYPE
| | | | | | | | | | | | | | | | | | | | | | | | | | | | | | |
| | | Individually
assessed
risks | | Risks
assessed on
a portfolio
basis | | Provisions
for losses
on loans
and
advances | | Provisions
(individual
risks) | | Provisions
(portfolio risks) | | Total |
| | | | | | | (EUR in millions) | | | | |
As at 1 Jan. 2011 | | | | 4,571 | | | | | 851 | | | | | 5,422 | | | | | 429 | | | | | 56 | | | | | 5,906 | |
Additions | | | | 551 | | | | | 29 | | | | | 581 | | | | | 47 | | | | | 5 | | | | | 632 | |
Write-offs | | | | -598 | | | | | 0 | | | | | -598 | | | | | -97 | | | | | 0 | | | | | -695 | |
Reversals | | | | -315 | | | | | -240 | | | | | -556 | | | | | -169 | | | | | -14 | | | | | -739 | |
Unwinding | | | | -27 | | | | | 0 | | | | | -27 | | | | | 0 | | | | | 0 | | | | | -27 | |
Exchange rate changes | | | | 116 | | | | | 3 | | | | | 119 | | | | | 0 | | | | | 0 | | | | | 119 | |
Transfers | | | | 0 | | | | | 0 | | | | | 0 | | | | | 0 | | | | | 0 | | | | | 0 | |
| | | | | | | | | | | | | | | | | | | | | | | | | | | | | | |
As at 31 Dec. 2011 | | | | 4,297 | | | | | 642 | | | | | 4,940 | | | | | 210 | | | | | 46 | | | | | 5,196 | |
| | | | | | | | | | | | | | | | | | | | | | | | | | | | | | |
Risks assessed on a portfolio basis comprise both credit rating risks and country risks.
In 2011, EUR 154 million (2010: EUR 129 million) in interest income was not collected for impaired loans.
117
DEVELOPMENTOF RISK PROVISIONSFOR LENDING BUSINESSINTHE 2010 FINANCIAL YEARBY RISK ASSESSMENT TYPE
| | | | | | | | | | | | | | | | | | | | | | | | | | | | | | |
| | | Individually
assessed risks | | Risks
assessed on
portfolio
basis | | Provisions
for losses
on loans
and
advances | | Provisions
(individual
risks) | | Provisions
(portfolio
risks) | | Total |
| | | (EUR in millions) |
As at 1 Jan. 2010 | | | | 5,702 | | | | | 1,201 | | | | | 6,904 | | | | | 278 | | | | | 76 | | | | | 7,258 | |
Additions | | | | 519 | | | | | 13 | | | | | 532 | | | | | 250 | | | | | 7 | | | | | 789 | |
Write-offs | | | | -1,487 | | | | | 0 | | | | | -1,487 | | | | | -1 | | | | | 0 | | | | | -1,488 | |
Reversals | | | | -452 | | | | | -396 | | | | | -847 | | | | | -114 | | | | | -29 | | | | | -990 | |
Unwinding | | | | -41 | | | | | 0 | | | | | -41 | | | | | 0 | | | | | 0 | | | | | -41 | |
Exchange rate changes | | | | 334 | | | | | 27 | | | | | 362 | | | | | 14 | | | | | 2 | | | | | 378 | |
Transfers | | | | -5 | | | | | 5 | | | | | 0 | | | | | 0 | | | | | 0 | | | | | 0 | |
| | | | | | | | | | | | | | | | | | | | | | | | | | | | | | |
As at 31 Dec. 2010 | | | | 4,571 | | | | | 851 | | | | | 5,422 | | | | | 429 | | | | | 56 | | | | | 5,906 | |
| | | | | | | | | | | | | | | | | | | | | | | | | | | | | | |
(43) Value adjustments from macro fair value hedge accounting
| | | | | | |
| | | 31 Dec. 2011 | | 31 Dec. 2010 | | Change |
| | | (EUR in millions) |
Value adjustments to assets designated for macro fair value hedge accounting | | 13,468 | | 7,478 | | 5,990 |
The fair values attributable to the hedged risks in the hedged portfolios under the category “loans and receivables” are included in this item.
(44) Derivatives subject to hedge accounting
ANALYSISOF DERIVATIVESWITH POSITIVE FAIR VALUES RESIGNATEDFOR HEDGE ACCOUNTINGBY TYPEOF
HEDGING RELATIONSHIP
| | | | | | | | | | | | | | | |
| | | 31 Dec. 2011 | | 31 Dec. 2010 | | Change |
| | | (EUR in millions) |
Micro fair value hedge accounting | | | | 29,560 | | | | | 22,282 | | | | | 7,279 | |
Macro fair value hedge accounting | | | | 842 | | | | | 1,041 | | | | | -199 | |
| | | | | | | | | | | | | | | |
Total | | | | 30,403 | | | | | 23,323 | | | | | 7,080 | |
| | | | | | | | | | | | | | | |
ANALYSISOF DERIVATIVESWITH POSITIVE FAIR VALUES DESIGNATEDFOR HEDGE ACCOUNTINGBY CLASS
| | | | | | | | | | | | | | | |
| | | 31 Dec. 2011 | | 31 Dec. 2010 | | Change |
| | | (EUR in millions) |
Interest-related derivatives | | | | 17,397 | | | | | 12,296 | | | | | 5,101 | |
Currency-related derivatives | | | | 13,006 | | | | | 11,026 | | | | | 1,979 | |
| | | | | | | | | | | | | | | |
Total | | | | 30,403 | | | | | 23,323 | | | | | 7,080 | |
| | | | | | | | | | | | | | | |
Only “interest-related derivatives” are designated for macro fair value hedge accounting.
Cross-currency swaps are presented under “currency-related derivatives”.
118
(45) Other derivatives
ANALYSISOF OTHER DERIVATIVESWITH POSITIVE FAIR VALUESBY CLASS
| | | | | | | | | | | | | | | |
| | | 31 Dec. 2011 | | 31 Dec. 2010 | | Change |
| | | (EUR in millions) |
Interest-related derivatives | | | | 5,572 | | | | | 3,246 | | | | | 2,326 | |
Currency-related derivatives | | | | 5,398 | | | | | 3,276 | | | | | 2,122 | |
Credit derivatives | | | | 1 | | | | | 2 | | | | | -1 | |
Other derivatives | | | | 120 | | | | | 44 | | | | | 76 | |
| | | | | | | | | | | | | | | |
Total | | | | 11,091 | | | | | 6,568 | | | | | 4,523 | |
| | | | | | | | | | | | | | | |
Cross-currency swaps are presented under Currency-related derivatives.
(46) Securities and investments
ANALYSISOF SECURITIESAND INVESTMENTSBY CLASS
| | | | | | | | | | | | | | | |
| | | 31 Dec. 2011 | | 31 Dec. 2010 | | Change |
| | | (EUR in millions) |
Bonds and other fixed-income securities | | | | 30,016 | | | | | 33,599 | | | | | -3,583 | |
Shares and other non-fixed income securities | | | | 13 | | | | | 16 | | | | | -4 | |
Equity investments | | | | 1,831 | | | | | 1,591 | | | | | 240 | |
Shares in affiliated entities not included in the consolidated financial statements | | | | 2 | | | | | 2 | | | | | 0 | |
| | | | | | | | | | | | | | | |
Total | | | | 31,861 | | | | | 35,207 | | | | | -3,346 | |
| | | | | | | | | | | | | | | |
“Bonds and other fixed-income securities” are recognised less impairments for the risk of decreases in value that have already occurred but have not yet been individually identified.
(47) Investments accounted for using the equity method
| | | | | | | | | | | | | | | |
| | | 31 Dec. 2011 | | 31 Dec. 2010 | | Change |
| | | (EUR in millions) |
Investments accounted for using the equity method | | | | 43 | | | | | 29 | | | | | 14 | |
Note 81 “Disclosures on shareholdings” contains a list of “investments accounted for using the equity method”.
119
(48) Property, plant and equipment
ANALYSISOF PROPERTY, PLANTAND EQUIPMENTBY CLASS
| | | | | | | | | | | | | | | |
| | | 31 Dec. 2011 | | 31 Dec. 2010 | | Change |
| | | (EUR in millions) |
Land and buildings | | | | 868 | | | | | 780 | | | | | 87 | |
Plant and equipment | | | | 48 | | | | | 45 | | | | | 3 | |
Other property, plant and equipment | | | | 0 | | | | | 85 | | | | | -85 | |
| | | | | | | | | | | | | | | |
Property, plant and equipment for own use | | | | 916 | | | | | 911 | | | | | 5 | |
Investment property | | | | 1 | | | | | 1 | | | | | 0 | |
| | | | | | | | | | | | | | | |
Total | | | | 917 | | | | | 912 | | | | | 5 | |
| | | | | | | | | | | | | | | |
“Plant and equipment” includes leased assets from finance leases that are required to be capitalised.
Payments in advance and assets under construction are presented under “other property, plant and equipment”.
DEVELOPMENTIN PROPERTY, PLANTAND EQUIPMENTINTHE 2011 FINANCIAL YEAR
| | | | | | | | | | | | | | | |
| | | Purchase/production
cost | | Accumulated
depreciation,
impairment and
reversal of
impairment losses | | Net carrying amount |
| | | (EUR in millions) |
Carrying amount as at 1 Jan. 2011 | | | | 1,150 | | | | | -238 | | | | | 912 | |
Additions/reversals of impairment losses | | | | 46 | | | | | 0 | | | | | 46 | |
Disposals | | | | -22 | | | | | 15 | | | | | -8 | |
Depreciation | | | | — | | | | | -33 | | | | | -33 | |
Impairment losses | | | | — | | | | | 0 | | | | | 0 | |
| | | | | | | | | | | | | | | |
Carrying amount as at 31 Dec. 2011 | | | | 1,174 | | | | | -257 | | | | | 917 | |
| | | | | | | | | | | | | | | |
DEVELOPMENTIN PROPERTY, PLANTAND EQUIPMENTINTHE 2010 FINANCIAL YEAR
| | | | | | | | | | | | | | | |
| | | Purchase/production
cost | | Accumulated
depreciation,
impairment and
reversal of
impairment losses | | Net carrying amount |
| | | (EUR in millions) |
Carrying amount as at 1 Jan. 2010 | | | | 1,086 | | | | | -210 | | | | | 876 | |
Additions/reversals of impairment losses | | | | 76 | | | | | 0 | | | | | 76 | |
Disposals | | | | -12 | | | | | 3 | | | | | -9 | |
Depreciation | | | | — | | | | | -30 | | | | | -30 | |
Impairment losses | | | | — | | | | | 0 | | | | | 0 | |
| | | | | | | | | | | | | | | |
Carrying amount as at 31 Dec. 2010 | | | | 1,150 | | | | | -238 | | | | | 912 | |
| | | | | | | | | | | | | | | |
120
(49) Intangible assets
ANALYSISOF INTANGIBLE ASSETSBY CLASS
| | | | | | | | | | | | | | | |
| | | 31 Dec. 2011 | | 31 Dec. 2010 | | Change |
| | | (EUR in millions) |
Software | | | | 31 | | | | | 29 | | | | | 1 | |
Acquired software | | | | 13 | | | | | 13 | | | | | 0 | |
Internally generated software | | | | 18 | | | | | 16 | | | | | 1 | |
Other intangible assets | | | | 16 | | | | | 14 | | | | | 1 | |
| | | | | | | | | | | | | | | |
Total | | | | 46 | | | | | 44 | | | | | 3 | |
| | | | | | | | | | | | | | | |
“Other intangible assets” include, in particular, software under development.
DEVELOPMENTIN INTANGIBLE ASSETSINTHE 2011 FINANCIAL YEAR
| | | | | | | | | | | | | | | |
| | | Purchase/production
cost | | Accumulated
amortisation,
impairment and
reversal of impairment
losses | | Net carrying amount |
| | | (EUR in millions) |
Carrying amount as at 1 Jan. 2011 | | | | 114 | | | | | -71 | | | | | 44 | |
Additions/reversals of impairment losses | | | | 16 | | | | | 0 | | | | | 16 | |
Disposals | | | | -10 | | | | | 10 | | | | | 0 | |
Amortisation | | | | — | | | | | -13 | | | | | -13 | |
Impairment losses | | | | — | | | | | -1 | | | | | -1 | |
| | | | | | | | | | | | | | | |
Carrying amount as at 31 Dec. 2011 | | | | 121 | | | | | -74 | | | | | 46 | |
| | | | | | | | | | | | | | | |
DEVELOPMENTIN INTANGIBLE ASSETSINTHE 2010 FINANCIAL YEAR
| | | | | | | | | | | | | | | |
| | | Purchase/production
cost | | Accumulated
amortisation,
impairment and
reversal of impairment
losses | | Net carrying amount |
| | | (EUR in millions) |
Carrying amount as at 1 Jan. 2010 | | | | 103 | | | | | -59 | | | | | 44 | |
Additions/reversals of impairment losses | | | | 17 | | | | | 0 | | | | | 17 | |
Disposals | | | | -5 | | | | | 5 | | | | | 0 | |
Amortisation | | | | — | | | | | -17 | | | | | -17 | |
Impairment losses | | | | — | | | | | 0 | | | | | 0 | |
| | | | | | | | | | | | | | | |
Carrying amount as at 31 Dec. 2010 | | | | 114 | | | | | -71 | | | | | 44 | |
| | | | | | | | | | | | | | | |
121
(50) Income tax assets
| | | | | | | | | | | | | | | |
| | | 31 Dec. 2011 | | 31 Dec. 2010 | | Change |
| | | (EUR in millions) |
Current income tax assets | | | | 47 | | | | | 25 | | | | | 22 | |
Deferred income tax assets | | | | 312 | | | | | 173 | | | | | 139 | |
| | | | | | | | | | | | | | | |
Total | | | | 359 | | | | | 198 | | | | | 161 | |
| | | | | | | | | | | | | | | |
The “current income tax assets” derive from deductible taxes (investment income tax/solidarity surcharge) and tax receivables from advance tax payments during the reporting year.
“Deferred income tax assets” mostly result from valuation differences relating to the balance sheet items listed below.
ANALYSISOF DEFERRED TAX ASSETSBY BALANCE SHEET ITEM
| | | | | | | | | | | | | | | |
| | | 31 Dec. 2011 | | 31 Dec. 2010 | | Change |
| | | (EUR in millions) |
Loans and advances to banks and customers (incl. risk provisions) | | | | 82 | | | | | 56 | | | | | 26 | |
Securities and investments | | | | 12 | | | | | 5 | | | | | 7 | |
Intangible assets | | | | 23 | | | | | 23 | | | | | 0 | |
Other derivatives (liabilities) | | | | 141 | | | | | 45 | | | | | 96 | |
Provisions | | | | 36 | | | | | 15 | | | | | 21 | |
Other balance sheet items | | | | 17 | | | | | 28 | | | | | -11 | |
Tax loss carryforwards | | | | 1 | | | | | 1 | | | | | 0 | |
| | | | | | | | | | | | | | | |
Subtotal | | | | 312 | | | | | 173 | | | | | 139 | |
Offset against deferred tax liabilities | | | | 0 | | | | | 0 | | | | | 0 | |
| | | | | | | | | | | | | | | |
Total | | | | 312 | | | | | 173 | | | | | 139 | |
| | | | | | | | | | | | | | | |
The use of existing tax loss carryforwards for the taxable group companies is not sufficiently probable, with the result that it was only possible to carry deferred tax assets to a limited extent.
(51) Other assets
ANALYSISOF OTHER ASSETSBY CLASS
| | | | | | | | | | | | | | | |
| | | 31 Dec. 2011 | | 31 Dec. 2010 | | Change |
| | | (EUR in millions) |
Other assets and receivables | | | | 950 | | | | | 827 | | | | | 123 | |
Prepaid expenses and deferred charges | | | | 344 | | | | | 468 | | | | | -124 | |
| | | | | | | | | | | | | | | |
Total | | | | 1,295 | | | | | 1,296 | | | | | -1 | |
| | | | | | | | | | | | | | | |
122
(52) Liabilities to banks
ANALYSISOF LIABILITIESTO BANKSBY CLASS
| | | | | | | | | | | | | | | |
| | | 31 Dec. 2011 | | 31 Dec. 2010 | | Change |
| | | (EUR in millions) |
Promissory note loans | | | | 2,206 | | | | | 1,665 | | | | | 541 | |
Other financial liabilities | | | | 20,825 | | | | | 13,796 | | | | | 7,029 | |
| | | | | | | | | | | | | | | |
Total | | | | 23,031 | | | | | 15,461 | | | | | 7,570 | |
| | | | | | | | | | | | | | | |
Liabilities from repos, cash collateral received and the PROMISE and PROVIDE securitisation platforms are included in “other liabilities”.
(53) Liabilities to customers
ANALYSISOF LIABILITIESTO CUSTOMERSBY CLASS
| | | | | | | | | | | | | | | |
| | | 31 Dec. 2011 | | 31 Dec. 2010 | | Change |
| | | (EUR in millions) |
Money-market transactions | | | | 1,489 | | | | | 150 | | | | | 1,339 | |
Promissory note loans | | | | 8,348 | | | | | 9,783 | | | | | -1,435 | |
Other liabilities | | | | 11,020 | | | | | 12,078 | | | | | -1,059 | |
| | | | | | | | | | | | | | | |
Total | | | | 20,856 | | | | | 22,011 | | | | | -1,154 | |
| | | | | | | | | | | | | | | |
Liabilities from repos, cash collateral received and the PROMISE and PROVIDE securitisation platforms are included in “other liabilities”. Credit-linked notes issued under these platforms are included under “promissory note loans”.
(54) Certificated liabilities
ANALYSISOF CERTIFICATED LIABILITIESBY CLASS
| | | | | | | | | | | | | | | |
| | | 31 Dec. 2011 | | 31 Dec. 2010 | | Change |
| | | (EUR in millions) |
Money-market issues | | | | 30,788 | | | | | 26,272 | | | | | 4,515 | |
Bonds and notes | | | | 368,042 | | | | | 331,712 | | | | | 36,330 | |
| | | | | | | | | | | | | | | |
Total | | | | 398,829 | | | | | 357,984 | | | | | 40,845 | |
| | | | | | | | | | | | | | | |
(55) Value adjustments from macro fair value hedge accounting
| | | | | | | | | | | | | | | |
| | | 31 Dec. 2011 | | 31 Dec. 2010 | | Change |
| | | (EUR in millions) |
Value adjustments to liabilities under macro fair value hedge accounting | | | | 313 | | | | | 141 | | | | | 172 | |
The fair values attributable to hedged risks in the hedged portfolios in the “other liabilities” category are included in this item.
123
(56) Derivatives subject to hedge accounting
ANALYSISOF DERIVATIVESWITH NEGATIVE FAIR VALUES DESIGNATEDFOR HEDGE ACCOUNTINGBY TYPEOF
HEDGING RELATIONSHIP
| | | | | | | | | | | | | | | |
| | | 31 Dec. 2011 | | 31 Dec. 2010 | | Change |
| | | (EUR in millions) |
Micro fair value hedge accounting | | | | 3,943 | | | | | 6,017 | | | | | -2,073 | |
Macro fair value hedge accounting | | | | 16,984 | | | | | 12,174 | | | | | 4,809 | |
| | | | | | | | | | | | | | | |
Total | | | | 20,927 | | | | | 18,191 | | | | | 2,736 | |
| | | | | | | | | | | | | | | |
ANALYSISOF DERIVATIVESWITH NEGATIVE FAIR VALUES DESIGNATEDFOR HEDGE ACCOUNTINGBY CLASS
| | | | | | | | | | | | | | | |
| | | 31 Dec. 2011 | | 31 Dec. 2010 | | Change |
| | | (EUR in millions) |
Interest-related derivatives | | | | 19,166 | | | | | 14,063 | | | | | 5,103 | |
Currency-related derivatives | | | | 1,761 | | | | | 4,128 | | | | | -2,367 | |
| | | | | | | | | | | | | | | |
Total | | | | 20,927 | | | | | 18,191 | | | | | 2,736 | |
| | | | | | | | | | | | | | | |
Only “interest-related derivatives” are designated for macro fair value hedge accounting. Cross-currency swaps are presented under “currency-related derivatives”.
(57) Other derivatives
ANALYSISOF OTHER DERIVATIVESWITH NEGATIVE FAIR VALUESBY CLASS
| | | | | | | | | | | | | | | |
| | | 31 Dec. 2011 | | 31 Dec. 2010 | | Change |
| | | (EUR in millions) |
Interest-related derivatives | | | | 2,146 | | | | | 1,270 | | | | | 876 | |
Currency-related derivatives | | | | 3,158 | | | | | 3,351 | | | | | -193 | |
Other derivatives | | | | 62 | | | | | 2 | | | | | 59 | |
| | | | | | | | | | | | | | | |
Total | | | | 5,365 | | | | | 4,623 | | | | | 742 | |
| | | | | | | | | | | | | | | |
Cross-currency swaps are presented under “currency-related derivatives”.
(58) Provisions
ANALYSISOF PROVISIONSBY CLASS
| | | | | | | | | | | | | | | |
| | | 31 Dec. 2011 | | 31 Dec. 2010 | | Change |
| | | (EUR in millions) |
Provisions for pensions and similar commitments | | | | 1,083 | | | | | 1,042 | | | | | 41 | |
Provisions for credit risks | | | | 256 | | | | | 484 | | | | | -228 | |
Other provisions | | | | 874 | | | | | 764 | | | | | 111 | |
| | | | | | | | | | | | | | | |
Total | | | | 2,214 | | | | | 2,290 | | | | | -77 | |
| | | | | | | | | | | | | | | |
124
DEVELOPMENTIN PROVISIONSFOR PENSIONSAND SIMILAR COMMITMENTSINTHE 2011 FINANCIAL YEAR
| | | | | | | | | | | | | | | | | | | | |
| | | Pension obligations | | Early
retirement | | Partial
retirement | | Total |
| | | (EUR in millions) |
As at 1 Jan. 2011 | | | | 1,020 | | | | | 13 | | | | | 9 | | | | | 1,042 | |
Pension benefits paid | | | | -36 | | | | | -2 | | | | | -2 | | | | | -40 | |
Additions | | | | 75 | | | | | 4 | | | | | 3 | | | | | 81 | |
Service cost | | | | 27 | | | | | 4 | | | | | 3 | | | | | 33 | |
Interest cost | | | | 44 | | | | | 0 | | | | | 0 | | | | | 44 | |
Contributions by plan participants | | | | 4 | | | | | 0 | | | | | 0 | | | | | 4 | |
Reversals | | | | 0 | | | | | 0 | | | | | 0 | | | | | 0 | |
| | | | | | | | | | | | | | | | | | | | |
As at 31 Dec. 2011 | | | | 1,059 | | | | | 14 | | | | | 10 | | | | | 1,083 | |
| | | | | | | | | | | | | | | | | | | | |
The calculation of the pension entitlements which were vested as at the valuation reference date results in actuarial gains to be amortised of EUR 44 million (2010: EUR 42 million).
| | | | | | | | | | | | | | | | | | | | | | | | | |
| | | 31 Dec. 2011 | | 31 Dec. 2010 | | 31 Dec. 2009 | | 31 Dec. 2008 | | 31 Dec. 2007 |
| | | (EUR in millions) |
Projected benefit obligation under the pension commitments | | | | 976 | | | | | 980 | | | | | 884 | | | | | 771 | | | | | 769 | |
DEVELOPMENTIN PROVISIONSFOR PENSIONSAND SIMILAR COMMITMENTSINTHE 2010 FINANCIAL YEAR
| | | | | | | | | | | | | | | | | | | | |
| | | Pension obligations | | Early
retirement | | Partial
retirement | | Total |
| | | (EUR in millions) |
As at 1 Jan. 2010 | | | | 984 | | | | | 3 | | | | | 6 | | | | | 993 | |
Pension benefits paid | | | | -34 | | | | | -1 | | | | | -1 | | | | | -36 | |
Additions | | | | 70 | | | | | 11 | | | | | 4 | | | | | 85 | |
Service cost | | | | 23 | | | | | 11 | | | | | 3 | | | | | 38 | |
Interest cost | | | | 44 | | | | | 0 | | | | | 0 | | | | | 44 | |
Contributions by plan participants | | | | 4 | | | | | 0 | | | | | 0 | | | | | 4 | |
Reversals | | | | 0 | | | | | 0 | | | | | 0 | | | | | 0 | |
| | | | | | | | | | | | | | | | | | | | |
As at 31 Dec. 2010 | | | | 1,020 | | | | | 13 | | | | | 9 | | | | | 1,042 | |
| | | | | | | | | | | | | | | | | | | | |
125
The provisions for pensions and similar commitments are calculated on the basis of the 2005 G Heubeck actuarial tables and based on the following actuarial assumptions:
ACTUARIAL ASSUMPTIONSIN %P.A.
| | | | | | | | | | |
| | | 31 Dec. 2011 | | 31 Dec. 2010 |
Technical discount rate | | | | 4.60 | | | | | 4.40 | |
Rate of salary increases | | | | 3.00 | | | | | 3.00 | |
Rate of pension increases | | | | 2.30 | | | | | 2.30 | |
Rate of staff turnover | | | | 1.50 | | | | | 0.80 | |
Development in risk provisions for lending business
For the development in risk provisions for lending business see note 42 “risk provisions for lending business”.
DEVELOPMENTIN OTHER PROVISIONSINTHE 2011 FINANCIAL YEAR
| | | | | | | | | | | | | | | |
| | | Obligations to
employees | | Other provisions | | Total |
| | | (EUR in millions) |
As at 1 Jan. 2011 | | | | 22 | | | | | 742 | | | | | 764 | |
Additions | | | | 8 | | | | | 165 | | | | | 174 | |
Interest cost | | | | 0 | | | | | 1 | | | | | 1 | |
Other additions | | | | 8 | | | | | 164 | | | | | 172 | |
Used amounts | | | | -9 | | | | | -46 | | | | | -55 | |
Reversals | | | | -1 | | | | | -8 | | | | | -9 | |
| | | | | | | | | | | | | | | |
As at 31 Dec. 2011 | | | | 21 | | | | | 854 | | | | | 874 | |
| | | | | | | | | | | | | | | |
The obligations to employees show other long-term employee benefits including provisions for service anniversaries. Corresponding actuarial reports have been prepared for these obligations. Other provisions comprises obligations arising from the assumption of the tasks of the State Insurance Company of the GDR in liquidation (Staatliche Versicherung der Deutschen Demokratischen Republik in Abwicklung — SinA (institution under public law)), which are offset by receivables in the same amount from the Federal Agency for Special Tasks arising from Unification (Bundesanstalt für vereinigungsbedingte Sonderaufgaben - BvS) reported under “other assets”.
126
DEVELOPMENTIN OTHER PROVISIONSINTHE 2010 FINANCIAL YEAR
| | | | | | | | | | | | | | | |
| | | Obligations to
employees | | Other provisions | | Total |
| | | | | (EUR in millions) | | |
As at 1 Jan. 2010 | | | | 28 | | | | | 689 | | | | | 717 | |
Additions | | | | 2 | | | | | 98 | | | | | 100 | |
Interest cost | | | | 0 | | | | | 0 | | | | | 0 | |
Other additions | | | | 2 | | | | | 98 | | | | | 100 | |
Used amounts | | | | -5 | | | | | -37 | | | | | -42 | |
Reversals | | | | -4 | | | | | -7 | | | | | -11 | |
| | | | | | | | | | | | | | | |
As at 31 Dec. 2010 | | | | 22 | | | | | 742 | | | | | 764 | |
| | | | | | | | | | | | | | | |
(59) Income tax liabilities
| | | | | | | | | | | | | | | |
| | | 31 Dec. 2011 | | 31 Dec. 2010 | | Change |
| | | | | (EUR in millions) | | |
Current income tax liabilities | | | | 27 | | | | | 38 | | | | | -11 | |
Deferred income tax liabilities | | | | 160 | | | | | 80 | | | | | 79 | |
| | | | | | | | | | | | | | | |
Total | | | | 187 | | | | | 118 | | | | | 68 | |
| | | | | | | | | | | | | | | |
The “current income tax liabilities” in the reporting year are the result of tax provisions at the level of taxable companies included in the group.
DEVELOPMENTIN TAX PROVISIONS
| | | | | | | | | | |
| | | 2011 | | 2010 |
| | | (EUR in millions) |
As at 1 Jan. | | | | 38 | | | | | 9 | |
Additions | | | | 16 | | | | | 36 | |
Used amounts | | | | -27 | | | | | -4 | |
Reversals | | | | 0 | | | | | -2 | |
| | | | | | | | | | |
As at 31 Dec. | | | | 27 | | | | | 38 | |
| | | | | | | | | | |
127
“Deferred income tax liabilities” mostly result from valuation differences relating to the balance sheet items listed below.
ANALYSISOF DEFERRED TAX LIABILITIESBY BALANCE SHEET ITEM
| | | | | | | | | | | | | | | |
| | | 31 Dec. 2011 | | 31 Dec. 2010 | | Change |
| | | (EUR in millions) |
Other derivatives (assets) | | | | 133 | | | | | 45 | | | | | 88 | |
Securities and investments | | | | 1 | | | | | 7 | | | | | -6 | |
Other balance sheet items | | | | 26 | | | | | 28 | | | | | -2 | |
| | | | | | | | | | | | | | | |
Subtotal | | | | 160 | | | | | 80 | | | | | 80 | |
Offset against deferred tax assets | | | | 0 | | | | | 0 | | | | | 0 | |
| | | | | | | | | | | | | | | |
Total | | | | 160 | | | | | 80 | | | | | 80 | |
| | | | | | | | | | | | | | | |
(60) Other liabilities
ANALYSISOF OTHER LIABILITIESBY CLASS
| | | | | | | | | | | | | | | |
| | | 31 Dec. 2011 | | 31 Dec. 2010 | | Change |
| | | (EUR in millions) |
Other financial liabilities | | | | 1,484 | | | | | 1,486 | | | | | -2 | |
Deferred income | | | | 519 | | | | | 420 | | | | | 99 | |
| | | | | | | | | | | | | | | |
Total | | | | 2,003 | | | | | 1,906 | | | | | 97 | |
| | | | | | | | | | | | | | | |
The promotional subsidies granted to KfW through the ERP Special Fund based on the German Law to define the economic plan of the ERP Special Fund (ERP-Wirtschaftsplangesetz) in the amount of EUR 106 million (2010: EUR 104 million) were reported as “deferred income”.
(61) Subordinated liabilities
ANALYSISOF SUBORDINATED LIABILITIESBY CLASS
| | | | | | | | | | | | | | | |
| | | 31 Dec. 2011 | | 31 Dec. 2010 | | Change |
| | | (EUR in millions) |
Subordinated liabilities | | | | 3,247 | | | | | 3,247 | | | | | 0 | |
As part of the new legislation governing ERP economic promotion as at 1 July 2007, the ERP Special Fund provided a subordinated loan to KfW in the amount of EUR 3,247 million. The loan consists of three tranches with different fixed-interest periods. The period during which capital is tied up in all tranches ends as at 31 December 2017. Interest is charged on the tranches at an initial rate of 4.5% p.a.
128
(62) Equity
ANALYSISOF EQUITY
| | | | | | | | | | | | | | | |
| | | 31 Dec. 2011 | | 31 Dec. 2010 | | Change |
| | | (EUR in millions) |
Subscribed capital | | | | 3,750 | | | | | 3,750 | | | | | 0 | |
less uncalled outstanding contributions | | | | -450 | | | | | -450 | | | | | 0 | |
| | | | | | | | | | | | | | | |
Paid-in subscribed capital | | | | 3,300 | | | | | 3,300 | | | | | 0 | |
Capital reserve | | | | 5,947 | | | | | 5,947 | | | | | 0 | |
of which promotional reserves from the ERP Special Fund | | | | 4,650 | | | | | 4,650 | | | | | 0 | |
Reserve from the ERP Special Fund | | | | 1,056 | | | | | 977 | | | | | 79 | |
Retained earnings | | | | 6,107 | | | | | 5,218 | | | | | 889 | |
Statutory reserve under Section 10 (2) KfW Law | | | | 1,875 | | | | | 1,838 | | | | | 37 | |
Special reserve under Section 10 (3) KfW Law | | | | 2,689 | | | | | 2,178 | | | | | 510 | |
Special reserve less the special loss account from provisioning pursuant to Section 17 (4) of the D-Mark Balance Sheet Law | | | | 21 | | | | | 21 | | | | | 0 | |
Other retained earnings | | | | 1,522 | | | | | 1,181 | | | | | 341 | |
Fund for general banking risks | | | | 1,700 | | | | | 600 | | | | | 1,100 | |
Revaluation reserves | | | | -262 | | | | | -257 | | | | | -5 | |
| | | | | | | | | | | | | | | |
Total | | | | 17,847 | | | | | 15,784 | | | | | 2,063 | |
| | | | | | | | | | | | | | | |
Equity forms the basis for the economic resources available which are matched against the capital requirements derived from internal steering.
For information concerning equity in relation to risk-bearing capacity see “Financial Section—Risk Report—Internal Capital Adequacy Process”.
Notes on financial instruments
(63) Gains and losses from financial instruments by valuation category
The following tables show an analysis of the results from financial instruments included in the various income statement items organised by valuation category. In addition to interest and similar income and expenses reported in “net interest” and commission income and loan processing fees included in “net commission income”, contributions to income included in particular the risk provisions for lending business. Depending on measurement and designation for hedge accounting, the effects of fair value measurement, impairment losses and reversals of impairment losses and gains and losses from disposals are also included. The result from foreign currency translation is not included.
129
GAINSAND LOSSESFROM FINANCIAL INSTRUMENTSBY VALUATION CATEGORYINTHE 2011 FINANCIAL YEAR
| | | | | | | | | | | | | | | | | | | | | | | | | | | | | | | | | | | | | | | | |
| | | Net interest
income | | Risk
provisions
for lending
business | | Net
commission
income | | Net
gains/losses
from hedge
accounting | | Net
gains/losses
from other
financial
instruments at
fair value
through profit
or loss | | Net
gains/losses
from securities
and
investments | | Net other
operating
income | | Total |
| | | (EUR in millions) |
Loans and receivables | | | | 12,238 | | | | | 185 | | | | | 101 | | | | | 5,938 | | | | | — | | | | | -174 | | | | | — | | | | | 18,288 | |
Held-to-maturity investments | | | | 20 | | | | | — | | | | | — | | | | | — | | | | | — | | | | | 0 | | | | | — | | | | | 20 | |
Other liabilities | | | | -11,154 | | | | | — | | | | | 0 | | | | | -5,984 | | | | | — | | | | | — | | | | | 1 | | | | | -17,137 | |
Available-for-sale financial assets | | | | 336 | | | | | — | | | | | 0 | | | | | 277 | | | | | — | | | | | -49 | | | | | — | | | | | 565 | |
Financial assets at fair value through profit or loss | | | | 128 | | | | | — | | | | | 76 | | | | | — | | | | | 33 | | | | | — | | | | | — | | | | | 237 | |
Financial liabilities at fair value through profit or loss | | | | -990 | | | | | — | | | | | -73 | | | | | — | | | | | -1,943 | | | | | — | | | | | — | | | | | -3,006 | |
Derivatives subject to hedge accounting | | | | 1,534 | | | | | — | | | | | — | | | | | 99 | | | | | — | | | | | — | | | | | — | | | | | 1,633 | |
Other derivatives | | | | 336 | | | | | — | | | | | -3 | | | | | — | | | | | 1,702 | | | | | — | | | | | — | | | | | 2,035 | |
| | | | | | | | | | | | | | | | | | | | | | | | | | | | | | | | | | | | | | | | |
Total | | | | 2,448 | | | | | 185 | | | | | 101 | | | | | 329 | | | | | -208 | | | | | -222 | | | | | 1 | | | | | 2,634 | |
| | | | | | | | | | | | | | | | | | | | | | | | | | | | | | | | | | | | | | | | |
130
GAINSAND LOSSESFROM FINANCIAL INSTRUMENTSBY VALUATION CATEGORYINTHE 2010 FINANCIAL YEAR
| | | | | | | | | | | | | | | | | | | | | | | | | | | | | | | | | | | | | | | | |
| | | Net interest
income | | Risk
provisions for
lending
business | | Net
commission
income | | Net
gains/losses
from hedge
accounting | | Net
gains/losses
from other
financial
instruments at
fair value
through profit
or loss | | Net
gains/losses
from
securities and
investments | | Net other
operating
income | | Total |
| | | (EUR in millions) |
Loans and receivables | | | | 11,774 | | | | | 424 | | | | | 131 | | | | | 794 | | | | | — | | | | | -22 | | | | | — | | | | | 13,101 | |
Held-to-maturity investments | | | | 16 | | | | | — | | | | | — | | | | | — | | | | | — | | | | | 0 | | | | | — | | | | | 16 | |
Other liabilities | | | | -11,289 | | | | | — | | | | | -12 | | | | | -1,099 | | | | | — | | | | | — | | | | | 14 | | | | | -12,387 | |
Available-for-sale financial assets | | | | 286 | | | | | — | | | | | 0 | | | | | 40 | | | | | — | | | | | 23 | | | | | — | | | | | 349 | |
Financial assets at fair value through profit or loss | | | | 188 | | | | | — | | | | | 101 | | | | | — | | | | | 338 | | | | | — | | | | | — | | | | | 627 | |
Financial liabilities at fair value through profit or loss | | | | -1,114 | | | | | — | | | | | -81 | | | | | — | | | | | -321 | | | | | — | | | | | — | | | | | -1,516 | |
Derivatives subject to hedge accounting | | | | 2,021 | | | | | — | | | | | — | | | | | 47 | | | | | — | | | | | — | | | | | — | | | | | 2,068 | |
Other derivatives | | | | 912 | | | | | — | | | | | 2 | | | | | — | | | | | 101 | | | | | — | | | | | — | | | | | 1,015 | |
| | | | | | | | | | | | | | | | | | | | | | | | | | | | | | | | | | | | | | | | |
Total | | | | 2,794 | | | | | 424 | | | | | 141 | | | | | -219 | | | | | 118 | | | | | 1 | | | | | 14 | | | | | 3,273 | |
| | | | | | | | | | | | | | | | | | | | | | | | | | | | | | | | | | | | | | | | |
131
(64) Balance sheet for financial instruments by valuation category
The following tables show the assets and liabilities from financial instruments included in the different balance sheet items organised by valuation category.
FINANCIAL ASSETSBY VALUATION CATEGORYASAT 31 DECEMBER 2011
| | | | | | | | | | | | | | | | | | | | | | | | | | | | | | | | | | | | | | | | | | | | | |
| | | Loans and
advances to
banks | | Loans and
advances to
customers | | Risk
provisions for
lending
business | | Value
adjustments
from macro
fair value
hedge
accounting | | Derivatives
subject to
hedge
accounting | | Other
derivatives | | Securities and
investments | | Assets (financial
instruments) |
| | | (EUR in millions) | | (in %) |
Loans and receivables | | | | 290,595 | | | | | 118,293 | | | | | -4,940 | | | | | 13,468 | | | | | — | | | | | — | | | | | 13,920 | | | | | 431,336 | | | | | 87.8 | % |
Held-to-maturity investments | | | | — | | | | | — | | | | | — | | | | | — | | | | | — | | | | | — | | | | | 1,084 | | | | | 1,084 | | | | | 0.2 | % |
Available-for-sale financial assets | | | | 0 | | | | | 0 | | | | | — | | | | | — | | | | | — | | | | | — | | | | | 13,681 | | | | | 13,681 | | | | | 2.8 | % |
Financial assets at fair value through profit or loss | | | | 376 | | | | | 13 | | | | | — | | | | | — | | | | | — | | | | | — | | | | | 3,176 | | | | | 3,565 | | | | | 0.7 | % |
Derivatives subject to hedge accounting | | | | — | | | | | — | | | | | — | | | | | — | | | | | 30,403 | | | | | — | | | | | — | | | | | 30,403 | | | | | 6.2 | % |
Other derivatives | | | | — | | | | | — | | | | | — | | | | | — | | | | | — | | | | | 11,091 | | | | | — | | | | | 11,091 | | | | | 2.3 | % |
| | | | | | | | | | | | | | | | | | | | | | | | | | | | | | | | | | | | | | | | | | | | | |
Total | | | | 290,971 | | | | | 118,306 | | | | | -4,940 | | | | | 13,468 | | | | | 30,403 | | | | | 11,091 | | | | | 31,861 | | | | | 491,161 | | | | | 100.0 | % |
| | | | | | | | | | | | | | | | | | | | | | | | | | | | | | | | | | | | | | | | | | | | | |
132
FINANCIAL LIABILITIESBY VALUATION CATEGORYASAT 31 DECEMBER 2011
| | | | | | | | | | | | | | | | | | | | | | | | | | | | | | | | | | | | | | | | | | | | | | | | | | |
| | | Liabilities to
banks | | Liabilities to
customers | | Certificated
liabilities | | Value
adjustments
from macro
fair value
hedge
accounting | | Derivatives
subject to
hedge
accounting | | Other
derivatives | | Other
liabilities | | Subordinated
liabilities | | Liabilities (financial
instruments) |
| | | (EUR in millions) | | (in %) |
Other financial liabilities | | | | 21,964 | | | | | 17,462 | | | | | 372,606 | | | | | 313 | | | | | — | | | | | — | | | | | 317 | | | | | 3,247 | | | | | 415,908 | | | | | 88.0 | % |
Financial liabilities at fair value through profit or loss | | | | 1,067 | | | | | 3,394 | | | | | 26,223 | | | | | — | | | | | — | | | | | — | | | | | — | | | | | 0 | | | | | 30,684 | | | | | 6.5 | % |
Derivatives subject to hedge accounting | | | | — | | | | | — | | | | | — | | | | | — | | | | | 20,927 | | | | | — | | | | | — | | | | | — | | | | | 20,927 | | | | | 4.4 | % |
Other derivatives | | | | — | | | | | — | | | | | — | | | | | — | | | | | — | | | | | 5,365 | | | | | — | | | | | — | | | | | 5,365 | | | | | 1.1 | % |
| | | | | | | | | | | | | | | | | | | | | | | | | | | | | | | | | | | | | | | | | | | | | | | | | | |
Total | | | | 23,031 | | | | | 20,856 | | | | | 398,829 | | | | | 313 | | | | | 20,927 | | | | | 5,365 | | | | | 317 | | | | | 3,247 | | | | | 472,884 | | | | | 100.0 | % |
| | | | | | | | | | | | | | | | | | | | | | | | | | | | | | | | | | | | | | | | | | | | | | | | | | |
133
FINANCIAL ASSETSBY VALUATION CATEGORYASAT 31 DECEMBER 2010
| | | | | | | | | | | | | | | | | | | | | | | | | | | | | | | | | | | | | | | | | | | | | |
| | | Loans and
advances to
banks | | Loans and
advances to
customers | | Risk
provisions for
lending
business | | Value
adjustments
from macro
fair value
hedge
accounting | | Derivatives
subject to
hedge
accounting | | Other
derivatives | | Securities and
investments | | Assets (financial
instruments) |
| | | (EUR in millions) | | (in %) |
Loans and receivables | | | | 263,020 | | | | | 108,076 | | | | | -5,422 | | | | | 7,478 | | | | | — | | | | | — | | | | | 19,023 | | | | | 392,175 | | | | | 89.4 | % |
Held-to-maturity investments | | | | — | | | | | — | | | | | — | | | | | — | | | | | — | | | | | — | | | | | 1,089 | | | | | 1,089 | | | | | 0.2 | % |
Available-for-sale financial assets | | | | 0 | | | | | 0 | | | | | — | | | | | — | | | | | — | | | | | — | | | | | 10,766 | | | | | 10,766 | | | | | 2.5 | % |
Financial assets at fair value through profit or loss | | | | 402 | | | | | 23 | | | | | — | | | | | — | | | | | — | | | | | — | | | | | 4,329 | | | | | 4,754 | | | | | 1.1 | % |
Derivatives subject to hedge accounting | | | | — | | | | | — | | | | | — | | | | | — | | | | | 23,323 | | | | | — | | | | | — | | | | | 23,323 | | | | | 5.3 | % |
Other derivatives | | | | — | | | | | — | | | | | — | | | | | — | | | | | — | | | | | 6,568 | | | | | — | | | | | 6,568 | | | | | 1.5 | % |
| | | | | | | | | | | | | | | | | | | | | | | | | | | | | | | | | | | | | | | | | | | | | |
Total | | | | 263,422 | | | | | 108,099 | | | | | -5,422 | | | | | 7,478 | | | | | 23,323 | | | | | 6,568 | | | | | 35,207 | | | | | 438,675 | | | | | 100.0 | % |
| | | | | | | | | | | | | | | | | | | | | | | | | | | | | | | | | | | | | | | | | | | | | |
134
FINANCIAL LIABILITIESBY VALUATION CATEGORYASAT 31 DECEMBER 2010
| | | | | | | | | | | | | | | | | | | | | | | | | | | | | | | | | | | | | | | | | | | | | | | | | | |
| | | Liabilities to
banks | | Liabilities to
customers | | Certificated
liabilities | | Value
adjustments
from macro
fair value
hedge
accounting | | Derivatives
subject to
hedge
accounting | | Other
derivatives | | Other
liabilities | | Subordinated
liabilities | | Liabilities (financial
instruments) |
| | | (EUR in millions) | | (in %) |
Other financial liabilities | | | | 14,522 | | | | | 16,926 | | | | | 333,128 | | | | | 141 | | | | | — | | | | | — | | | | | 289 | | | | | 3,247 | | | | | 368,252 | | | | | 87.3 | % |
Financial liabilities at fair value through profit or loss | | | | 939 | | | | | 5,085 | | | | | 24,856 | | | | | — | | | | | — | | | | | — | | | | | — | | | | | 0 | | | | | 30,880 | | | | | 7.3 | % |
Derivatives subject to hedge accounting | | | | — | | | | | — | | | | | — | | | | | — | | | | | 18,191 | | | | | — | | | | | — | | | | | — | | | | | 18,191 | | | | | 4.3 | % |
Other derivatives | | | | — | | | | | — | | | | | — | | | | | — | | | | | — | | | | | 4,623 | | | | | — | | | | | — | | | | | 4,623 | | | | | 1.1 | % |
| | | | | | | | | | | | | | | | | | | | | | | | | | | | | | | | | | | | | | | | | | | | | | | | | | |
Total | | | | 15,461 | | | | | 22,011 | | | | | 357,984 | | | | | 141 | | | | | 18,191 | | | | | 4,623 | | | | | 289 | | | | | 3,247 | | | | | 421,947 | | | | | 100.0 | % |
| | | | | | | | | | | | | | | | | | | | | | | | | | | | | | | | | | | | | | | | | | | | | | | | | | |
135
(65) Disclosures on the reclassification of financial assets
In the 2008 financial year and with retroactive effect from 1 July 2008, KfW Bankengruppe reclassified bonds and other fixed-income securities reported under “securities and investments” (variable-interest asset-backed securities) with a volume of EUR 2,750 million (fair value as at the date of reclassification) from the “available-for-sale financial assets” valuation category to the “loans and receivables” category.
The following table shows the carrying amounts of the reclassified financial assets and their fair values.
| | | | | | | | | | |
| | | 31 Dec. 2011 | | 31 Dec. 2010 |
| | | (EUR in millions) |
Carrying amount (balance sheet) | | | | 1,063 | | | | | 1,369 | |
Fair value | | | | 989 | | | | | 1,313 | |
For the reclassified financial assets a change of EUR -8 million (2010: EUR 41 million) in fair value would have been recorded directly in equity under “revaluation reserves”, and net gains/losses from “securities and investments” of EUR 5 million (2010: EUR 5 million) would have been recorded as well.
Net gains/losses from “securities and investments” include reversals of impairment losses and impairments on reclassified financial assets totalling EUR 5 million (2010: EUR 4 million); as in 2010, no realised gains and losses were recorded. Interest income from the reclassified securities is still received unchanged.
In the 2009 financial year, in accordance with a resolution with prospective effect dated 17 February 2009, bonds and other fixed-income securities reported under “securities and investments” (which serve to maintain liquidity through the use of repo transactions (repos) or open market transactions of the European Central Bank) with a volume of EUR 18,170 million (fair value as at the date of reclassification) were reclassified from the “available-for-sale financial assets” valuation category to the “loans and receivables” category.
The following table shows the carrying amounts of the reclassified financial assets and their fair values.
| | | | | | | | | | |
| | | 31 Dec. 2011 | | 31 Dec. 2010 |
| | | (EUR in millions) |
Carrying amount (balance sheet) | | | | 9,385 | | | | | 14,437 | |
Fair value | | | | 9,004 | | | | | 13,838 | |
For the reclassified financial assets a change of EUR 111 million (2010: EUR -547 million) in fair value would have been recorded directly in equity under Revaluation reserves, and net gains/losses from securities and investments of EUR -168 million (2010: EUR -4 million).
Net gains/losses from “securities and investments” include reversals of impairment losses and impairments taken on reclassified financial assets totalling EUR -165 million (2010: EUR -11 million); realised gains and losses of EUR 0 million were recorded on a net basis (2010: EUR -4 million). Interest income from the reclassified securities is still received unchanged.
(66) Disclosures on the valuation methods used for financial instruments carried at fair value
The following tables show the financial instruments carried at fair value according to the valuation methods used.
Financial instruments allocated to the “quoted market prices” class are primarily bonds and other fixed-income securities reported under “securities and investments”, for which prices from an active market are available.
136
Fair value measurement of OTC derivatives as well as borrowings accounted for under the fair value option is largely performed using valuation models with inputs that are observable on the market and are also usually the only relevant inputs, resulting in allocation to the “Valuation method based on observable market data (model)” class.
The “Valuation method based in part on unobservable market data” class largely comprises low-risk tranches of portfolio CDSs (with KfW as both protection seller and protection buyer) accounted for using the fair value option and reported under “loans and advances” or “liabilities” as well as “securities and investments from equity finance business recorded at fair value through profit or loss”, which are not listed or for which prices cannot be derived from similar financial instruments listed on an exchange.
Equity instruments included in “available-for-sale — securities and investments”, for which the fair value could not be reliably determined, are also allocated to this class.
FINANCIAL ASSETS CARRIEDAT FAIR VALUEASAT 31 DECEMBER 2011
| | | | | | | | | | | | | | | | | | | | |
| | | Quoted market
price | | Valuation method
based on
observable
market data
(model) | | Valuation method
based in part on
unobservable
market data | | Total |
| | | (EUR in millions) |
Loans and advances to banks – recorded at fair value through profit or loss | | | | 14 | | | | | 302 | | | | | 59 | | | | | 376 | |
Loans and advances to customers – recorded at fair value through profit or loss | | | | 0 | | | | | 9 | | | | | 4 | | | | | 13 | |
Derivatives subject to hedge accounting | | | | 0 | | | | | 30,403 | | | | | 0 | | | | | 30,403 | |
Other derivatives | | | | 62 | | | | | 10,674 | | | | | 356 | | | | | 11,091 | |
Securities and investments – available for sale | | | | 12,831 | | | | | 5 | | | | | 845 | | | | | 13,681 | |
Securities and investments – recorded at fair value through profit or loss | | | | 1,585 | | | | | 1,397 | | | | | 195 | | | | | 3,176 | |
| | | | | | | | | | | | | | | | | | | | |
Total | | | | 14,492 | | | | | 42,790 | | | | | 1,459 | | | | | 58,740 | |
| | | | | | | | | | | | | | | | | | | | |
137
FINANCIAL LIABILITIES CARRIEDAT FAIR VALUEASAT 31 DECEMBER 2011
| | | | | | | | | | | | | | | | | | | | |
| | | Quoted market
price | | Valuation method
based on
observable
market data
(model) | | Valuation method
based in part on
unobservable
market data | | Total |
| | | (EUR in millions) |
Liabilities to banks – recorded at fair value through profit or loss | | | | 0 | | | | | 1,002 | | | | | 65 | | | | | 1,067 | |
Liabilities to customers – recorded at fair value through profit or loss | | | | 0 | | | | | 3,394 | | | | | 0 | | | | | 3,394 | |
Certificated liabilities – recorded at fair value through profit or loss | | | | 48 | | | | | 26,175 | | | | | 0 | | | | | 26,223 | |
Derivatives subject to hedge accounting | | | | 0 | | | | | 20,924 | | | | | 4 | | | | | 20,927 | |
Other derivatives | | | | 63 | | | | | 5,299 | | | | | 3 | | | | | 5,365 | |
| | | | | | | | | | | | | | | | | | | | |
Total | | | | 111 | | | | | 56,793 | | | | | 72 | | | | | 56,976 | |
| | | | | | | | | | | | | | | | | | | | |
138
FINANCIAL ASSETS CARRIEDATFAIR VALUEASAT 31 DECEMBER 2010
| | | | | | | | | | | | | | | | | | | | |
| | | Quoted market
price | | Valuation method
based on
observable
market data
(model) | | Valuation method
based in part on
unobservable
market data | | Total |
| | | (EUR in millions) |
Loans and advances to banks – recorded at fair value through profit or loss | | | | 42 | | | | | 308 | | | | | 52 | | | | | 402 | |
Loans and advances to customers – recorded at fair value through profit or loss | | | | 0 | | | | | 13 | | | | | 10 | | | | | 23 | |
Derivatives subject to hedge accounting | | | | 0 | | | | | 23,323 | | | | | 0 | | | | | 23,323 | |
Other derivatives | | | | 7 | | | | | 6,498 | | | | | 63 | | | | | 6,568 | |
Securities and investments – available for sale | | | | 10,013 | | | | | 0 | | | | | 753 | | | | | 10,766 | |
Securities and investments – recorded at fair value through profit or loss | | | | 2,398 | | | | | 1,511 | | | | | 420 | | | | | 4,329 | |
| | | | | | | | | | | | | | | | | | | | |
Total | | | | 12,461 | | | | | 31,653 | | | | | 1,298 | | | | | 45,411 | |
| | | | | | | | | | | | | | | | | | | | |
139
FINANCIAL LIABILITIES CARRIEDAT FAIR VALUEASAT 31 DECEMBER 2010
| | | | | | | | | | | | | | | | | | | | |
| | | Quoted market
price | | Valuation method
based on
observable
market data
(model) | | Valuation method
based in part on
unobservable
market data | | Total |
| | | (EUR in millions) |
Liabilities to banks – recorded at fair value through profit or loss | | | | 0 | | | | | 874 | | | | | 65 | | | | | 939 | |
Liabilities to customers – recorded at fair value through profit or loss | | | | 0 | | | | | 5,083 | | | | | 2 | | | | | 5,085 | |
Certificated liabilities – recorded at fair value through profit or loss | | | | 137 | | | | | 24,719 | | | | | 0 | | | | | 24,856 | |
Derivatives subject to hedge accounting | | | | 0 | | | | | 18,188 | | | | | 3 | | | | | 18,191 | |
Other derivatives | | | | 2 | | | | | 4,601 | | | | | 20 | | | | | 4,623 | |
| | | | | | | | | | | | | | | | | | | | |
Total | | | | 140 | | | | | 53,465 | | | | | 90 | | | | | 53,694 | |
| | | | | | | | | | | | | | | | | | | | |
140
DEVELOPMENTOF FINANCIAL ASSETS CARRIEDAT FAIR VALUEINTHE 2011 FINANCIAL YEAR, USING VALUATION METHODS BASEDIN PARTON UNOBSERVABLE MARKET DATA
| | | | | | | | | | | | | | | | | | | | | | | | | | | | | | | | | | | |
| | | Loans and
advances to
banks -
recorded at fair
value through
profit or loss | | Loans and
advances to
customers -
recorded at fair
value through
profit or loss | | Derivatives
subject to
hedge
accounting | | Other
derivatives | | Securities and
investments -
available for
sale | | Securities and
investments -
recorded at fair
value through
profit or loss | | Total |
| | | (EUR in millions) |
As at 1 Jan. 2011 | | | | 52 | | | | | 10 | | | | | 0 | | | | | 63 | | | | | 754 | | | | | 420 | | | | | 1,299 | |
A. Changes recognised in the income statement | | | | | | | | | | | | | | | | | | | | | | | | | | | | | | | | | | | |
Net interest and commission income | | | | 0 | | | | | 0 | | | | | 0 | | | | | 2 | | | | | 0 | | | | | 0 | | | | | 2 | |
Contracts still valid at year-end | | | | 0 | | | | | 0 | | | | | 0 | | | | | 2 | | | | | 0 | | | | | 0 | | | | | 2 | |
Net gains/losses from hedge accounting | | | | 0 | | | | | 0 | | | | | 0 | | | | | 0 | | | | | 0 | | | | | 0 | | | | | 0 | |
Contracts still valid at year-end | | | | 0 | | | | | 0 | | | | | 0 | | | | | 0 | | | | | 0 | | | | | 0 | | | | | 0 | |
Net gains/losses from other financial instruments at fair value through profit or loss | | | | 94 | | | | | -6 | | | | | 0 | | | | | 310 | | | | | 0 | | | | | 11 | | | | | 409 | |
Contracts still valid at year-end | | | | 100 | | | | | -6 | | | | | 0 | | | | | 310 | | | | | 0 | | | | | 10 | | | | | 414 | |
Net gains/losses from securities and investments | | | | 0 | | | | | 0 | | | | | 0 | | | | | 0 | | | | | -56 | | | | | 0 | | | | | -56 | |
Contracts still valid at year-end | | | | 0 | | | | | 0 | | | | | 0 | | | | | 0 | | | | | -41 | | | | | 0 | | | | | -41 | |
Change in revaluation reserves | | | | 0 | | | | | 0 | | | | | 0 | | | | | 0 | | | | | 55 | | | | | 0 | | | | | 55 | |
Contracts still valid at year-end | | | | 0 | | | | | 0 | | | | | 0 | | | | | 0 | | | | | 55 | | | | | 0 | | | | | 55 | |
| | | | | | | | | | | | | | | | | | | | | | | | | | | | | | | | | | | |
Total changes recognised in the income statement | | | | 94 | | | | | -6 | | | | | 0 | | | | | 312 | | | | | -1 | | | | | 11 | | | | | 411 | |
B. Changes recognised directly in equity | | | | | | | | | | | | | | | | | | | | | | | | | | | | | | | | | | | |
Change of valuation method used | | | | -87 | | | | | 0 | | | | | 0 | | | | | 0 | | | | | -9 | | | | | -226 | | | | | -321 | |
Additions | | | | 0 | | | | | 0 | | | | | 0 | | | | | 2 | | | | | 155 | | | | | 2 | | | | | 159 | |
Disposals | | | | 0 | | | | | 0 | | | | | 0 | | | | | -6 | | | | | -56 | | | | | -12 | | | | | -74 | |
| | | | | | | | | | | | | | | | | | | | | | | | | | | | | | | | | | | |
Total changes recognised directly in equity | | | | -87 | | | | | 0 | | | | | 0 | | | | | -4 | | | | | 90 | | | | | -236 | | | | | -237 | |
Exchange rate changes | | | | 0 | | | | | 0 | | | | | 0 | | | | | 7 | | | | | 2 | | | | | 0 | | | | | 8 | |
Other changes | | | | 0 | | | | | 0 | | | | | 0 | | | | | -22 | | | | | 0 | | | | | 0 | | | | | -22 | |
| | | | | | | | | | | | | | | | | | | | | | | | | | | | | | | | | | | |
As at 31 Dec. 2011 | | | | 59 | | | | | 4 | | | | | 0 | | | | | 356 | | | | | 845 | | | | | 195 | | | | | 1,459 | |
| | | | | | | | | | | | | | | | | | | | | | | | | | | | | | | | | | | |
141
DEVELOPMENTOF FINANCIAL LIABILITIES CARRIEDAT FAIR VALUEINTHE 2011 FINANCIAL YEAR, USING VALUATION METHODS BASEDIN PARTON UNOBSERVABLE MARKET DATA
| | | | | | | | | | | | | | | | | | | | | | | | | | | | | | | | | | | |
| | | Liabilities to banks
- recorded at fair
value through
profit or loss | | Liabilities to
customers -
recorded at fair
value through
profit or loss | | Certificated
liabilities -
recorded at fair
value through
profit or loss | | Derivatives
subject to
hedge
accounting | | Other
derivatives | | Subordinated
liabilities -
recorded at fair
value through
profit or loss | | Total |
| | | EUR in millions |
As at 1 Jan. 2011 | | | | 65 | | | | | 2 | | | | | 0 | | | | | 3 | | | | | 20 | | | | | 0 | | | | | 90 | |
A. Changes recognised in the income statement | | | | | | | | | | | | | | | | | | | | | | | | | | | | | | | | | | | |
Net interest and commission income | | | | 0 | | | | | 0 | | | | | 0 | | | | | 0 | | | | | 0 | | | | | 0 | | | | | 0 | |
Contracts still valid at year-end | | | | 0 | | | | | 0 | | | | | 0 | | | | | 0 | | | | | 0 | | | | | 0 | | | | | 0 | |
Net gains/losses from hedge accounting | | | | 0 | | | | | 0 | | | | | 0 | | | | | 0 | | | | | 0 | | | | | 0 | | | | | 0 | |
Contracts still valid at year-end | | | | 0 | | | | | 0 | | | | | 0 | | | | | 0 | | | | | 0 | | | | | 0 | | | | | 0 | |
Net gains/losses from other financial instruments at fair value through profit or loss | | | | 86 | | | | | -1 | | | | | 0 | | | | | 0 | | | | | 3 | | | | | 0 | | | | | 89 | |
Contracts still valid at year-end | | | | 92 | | | | | -1 | | | | | 0 | | | | | 0 | | | | | 3 | | | | | 0 | | | | | 95 | |
| | | | | | | | | | | | | | | | | | | | | | | | | | | | | | | | | | | |
Total changes recognised in the income statement | | | | 86 | | | | | -1 | | | | | 0 | | | | | 0 | | | | | 4 | | | | | 0 | | | | | 89 | |
B. Changes recognised directly in equity | | | | | | | | | | | | | | | | | | | | | | | | | | | | | | | | | | | |
Change of valuation method used | | | | -87 | | | | | 0 | | | | | 0 | | | | | 0 | | | | | 0 | | | | | 0 | | | | | -87 | |
Additions | | | | 0 | | | | | 0 | | | | | 0 | | | | | 0 | | | | | 0 | | | | | 0 | | | | | 0 | |
Disposals | | | | 0 | | | | | 0 | | | | | 0 | | | | | 0 | | | | | -2 | | | | | 0 | | | | | -2 | |
| | | | | | | | | | | | | | | | | | | | | | | | | | | | | | | | | | | |
Total changes recognised directly in equity | | | | -87 | | | | | 0 | | | | | 0 | | | | | 0 | | | | | -2 | | | | | 0 | | | | | -89 | |
Exchange rate changes | | | | 0 | | | | | 0 | | | | | 0 | | | | | 0 | | | | | 0 | | | | | 0 | | | | | 0 | |
Other changes | | | | 0 | | | | | 0 | | | | | 0 | | | | | 0 | | | | | -19 | | | | | 0 | | | | | -19 | |
| | | | | | | | | | | | | | | | | | | | | | | | | | | | | | | | | | | |
As at 31 Dec. 2011 | | | | 65 | | | | | 0 | | | | | 0 | | | | | 4 | | | | | 3 | | | | | 0 | | | | | 72 | |
| | | | | | | | | | | | | | | | | | | | | | | | | | | | | | | | | | | |
142
DEVELOPMENTOF FINANCIAL ASSETS CARRIEDAT FAIR VALUEINTHE 2010 FINANCIAL YEAR, USING VALUATION METHODS BASEDIN PARTON UNOBSERVABLE MARKET DATA
| | | | | | | | | | | | | | | | | | | | | | | | | | | | | | | | | | | |
| | | Loans and
advances to
banks -
recorded at fair
value through
profit or loss | | Loans and
advances to
customers -
recorded at fair
value through
profit or loss | | Derivatives
subject to
hedge
accounting | | Other
derivatives | | Securities and
investments -
available for
sale | | Securities and
investments -
recorded at fair
value through
profit or loss | | Total |
| | | (EUR in millions) |
As at 1 Jan. 2010 | | | | 324 | | | | | 3 | | | | | 0 | | | | | 26 | | | | | 645 | | | | | 314 | | | | | 1,313 | |
A. Changes recognised in the income statement | | | | | | | | | | | | | | | | | | | | | | | | | | | | | | | | | | | |
Net interest and commission income | | | | 1 | | | | | 0 | | | | | 0 | | | | | 1 | | | | | 0 | | | | | 0 | | | | | 2 | |
Contracts still valid at year-end | | | | 0 | | | | | 0 | | | | | 0 | | | | | 1 | | | | | 0 | | | | | 0 | | | | | 1 | |
Net gains/losses from hedge accounting | | | | 0 | | | | | 0 | | | | | 0 | | | | | 0 | | | | | 0 | | | | | 0 | | | | | 0 | |
Contracts still valid at year-end | | | | 0 | | | | | 0 | | | | | 0 | | | | | 0 | | | | | 0 | | | | | 0 | | | | | 0 | |
Net gains/losses from other financial instruments at fair value through profit or loss | | | | -5 | | | | | 7 | | | | | 0 | | | | | 45 | | | | | 0 | | | | | -38 | | | | | 8 | |
Contracts still valid at year-end | | | | -5 | | | | | 7 | | | | | 0 | | | | | 45 | | | | | 0 | | | | | -45 | | | | | 2 | |
Net gains/losses from securities and investments | | | | 0 | | | | | 0 | | | | | 0 | | | | | 0 | | | | | -36 | | | | | 0 | | | | | -36 | |
Contracts still valid at year-end | | | | 0 | | | | | 0 | | | | | 0 | | | | | 0 | | | | | -18 | | | | | 0 | | | | | -18 | |
Change in revaluation reserves | | | | 0 | | | | | 0 | | | | | 0 | | | | | 0 | | | | | 8 | | | | | 0 | | | | | 8 | |
Contracts still valid at year-end | | | | 0 | | | | | 0 | | | | | 0 | | | | | 0 | | | | | 8 | | | | | 0 | | | | | 8 | |
| | | | | | | | | | | | | | | | | | | | | | | | | | | | | | | | | | | |
Total changes recognised in the income statement | | | | -4 | | | | | 7 | | | | | 0 | | | | | 46 | | | | | -27 | | | | | -38 | | | | | -17 | |
B. Changes recognised directly in equity | | | | | | | | | | | | | | | | | | | | | | | | | | | | | | | | | | | |
Change of valuation method used | | | | -268 | | | | | 0 | | | | | 0 | | | | | 0 | | | | | 32 | | | | | 120 | | | | | -116 | |
Additions | | | | 0 | | | | | 0 | | | | | 0 | | | | | 0 | | | | | 124 | | | | | 34 | | | | | 158 | |
Disposals | | | | 0 | | | | | 0 | | | | | 0 | | | | | -8 | | | | | -29 | | | | | -49 | | | | | -86 | |
| | | | | | | | | | | | | | | | | | | | | | | | | | | | | | | | | | | |
Total changes recognised directly in equity | | | | -268 | | | | | 0 | | | | | 0 | | | | | -8 | | | | | 127 | | | | | 105 | | | | | -44 | |
Exchange rate changes | | | | 0 | | | | | 0 | | | | | 0 | | | | | -1 | | | | | 8 | | | | | 29 | | | | | 36 | |
Other changes | | | | 0 | | | | | 0 | | | | | 0 | | | | | 0 | | | | | 0 | | | | | 10 | | | | | 10 | |
| | | | | | | | | | | | | | | | | | | | | | | | | | | | | | | | | | | |
As at 31 Dec. 2010 | | | | 52 | | | | | 10 | | | | | 0 | | | | | 63 | | | | | 753 | | | | | 420 | | | | | 1,298 | |
| | | | | | | | | | | | | | | | | | | | | | | | | | | | | | | | | | | |
143
DEVELOPMENTOF FINANCIAL LIABILITIES CARRIEDAT FAIRVALUEINTHE 2010 FINANCIAL YEAR, USING VALUATION METHODS BASEDIN PARTON UNOBSERVABLE MARKET DATA
| | | | | | | | | | | | | | | | | | | | | | | | | | | | | | | | | | | |
| | | Liabilities to banks
- recorded at fair
value through
profit or loss | | Liabilities to
customers -
recorded at fair
value through
profit or loss | | Certificated
liabilities -
recorded at fair
value through
profit or loss | | Derivatives
subject to
hedge
accounting | | Other
derivatives | | Subordinated
liabilities -
recorded at fair
value through
profit or loss | | Total |
| | | (EUR in millions) |
As at 1 Jan. 2010 | | | | 357 | | | | | 2 | | | | | 0 | | | | | 114 | | | | | 0 | | | | | 0 | | | | | 473 | |
A. Changes recognised in the income statement | | | | | | | | | | | | | | | | | | | | | | | | | | | | | | | | | | | |
Net interest and commission income | | | | -1 | | | | | 0 | | | | | 0 | | | | | 3 | | | | | 0 | | | | | 0 | | | | | 2 | |
Contracts still valid at year-end | | | | 0 | | | | | 0 | | | | | 0 | | | | | 0 | | | | | 0 | | | | | 0 | | | | | -1 | |
Net gains/losses from hedge accounting | | | | 0 | | | | | 0 | | | | | 0 | | | | | 3 | | | | | 0 | | | | | 0 | | | | | 3 | |
Contracts still valid at year-end | | | | 0 | | | | | 0 | | | | | 0 | | | | | 0 | | | | | 0 | | | | | 0 | | | | | 0 | |
Net gains/losses from other financial instruments at fair value through profit or loss | | | | 6 | | | | | 0 | | | | | 0 | | | | | 0 | | | | | 19 | | | | | 0 | | | | | 24 | |
Contracts still valid at year-end | | | | 6 | | | | | 0 | | | | | 0 | | | | | 0 | | | | | 20 | | | | | 0 | | | | | 25 | |
| | | | | | | | | | | | | | | | | | | | | | | | | | | | | | | | | | | |
Total changes recognised in the income statement | | | | 5 | | | | | 0 | | | | | 0 | | | | | 5 | | | | | 19 | | | | | 0 | | | | | 29 | |
B. Changes recognised directly in equity | | | | | | | | | | | | | | | | | | | | | | | | | | | | | | | | | | | |
Change of valuation method used | | | | -297 | | | | | 0 | | | | | 0 | | | | | 0 | | | | | 0 | | | | | 0 | | | | | -297 | |
Additions | | | | 0 | | | | | 0 | | | | | 0 | | | | | 0 | | | | | -1 | | | | | 0 | | | | | -1 | |
Disposals | | | | 0 | | | | | 0 | | | | | 0 | | | | | -116 | | | | | 1 | | | | | 0 | | | | | -115 | |
| | | | | | | | | | | | | | | | | | | | | | | | | | | | | | | | | | | |
Total changes recognised directly in equity | | | | -297 | | | | | 0 | | | | | 0 | | | | | -116 | | | | | 0 | | | | | 0 | | | | | -412 | |
Exchange rate changes | | | | 0 | | | | | 0 | | | | | 0 | | | | | 0 | | | | | 1 | | | | | 0 | | | | | 1 | |
Other changes | | | | 0 | | | | | 0 | | | | | 0 | | | | | 0 | | | | | 0 | | | | | 0 | | | | | 0 | |
| | | | | | | | | | | | | | | | | | | | | | | | | | | | | | | | | | | |
As at 31 Dec. 2010 | | | | 65 | | | | | 2 | | | | | 0 | | | | | 3 | | | | | 20 | | | | | 0 | | | | | 90 | |
| | | | | | | | | | | | | | | | | | | | | | | | | | | | | | | | | | | |
144
In accordance with the valuation method defined for KfW Bankengruppe, the fair value reported in the statement of financial position is the best evidence of the fair value for those financial instruments allocated to the “Valuation method based in part on unobservable market data” class.
The following tables show how an alternative determination of relevant unobservable market data (liquidity discounts above all), i.e., values in best and worst case scenarios, would impact fair values for significant products allocated to this class, such as the portfolio CDSs (with KfW as protection seller and protection buyer) accounted for using the fair value option and the securities and investments from equity finance business recorded at fair value through profit or loss.
SENSITIVITY ANALYSISFORTHE FINANCIAL ASSETS CARRIEDAT FAIR VALUE, USING VALUATION METHODS
BASEDIN PARTON UNOBSERVABLE MARKETDATAASAT 31 DECEMBER 2011
| | | | | | | | | | | | | | | |
| | | Best case
scenario | | Reported value | | Worst case
scenario |
| | | (EUR in millions) |
Loans and advances to banks – recorded at fair value through profit or loss | | | | 62 | | | | | 59 | | | | | 58 | |
Loans and advances to customers – recorded at fair value through profit or loss | | | | 4 | | | | | 4 | | | | | 4 | |
Securities and investments – recorded at fair value through profit or loss | | | | 212 | | | | | 195 | | | | | 164 | |
| | | | | | | | | | | | | | | |
Total | | | | 279 | | | | | 258 | | | | | 226 | |
| | | | | | | | | | | | | | | |
SENSITIVITY ANALYSISFORTHE FINANCIAL LIABILITIES CARRIEDAT FAIR VALUE, USING VALUATION METHODS
BASEDIN PARTON UNOBSERVABLE MARKET DATAASAT 31 DECEMBER 2011
| | | | | | | | | | | | | | | |
| | | Best case
scenario | | Reported value | | Worst case
scenario |
| | | (EUR in millions) |
Liabilities to banks – recorded at fair value through profit or loss | | | | 64 | | | | | 65 | | | | | 68 | |
Liabilities to customers – recorded at fair value through profit or loss | | | | 0 | | | | | 0 | | | | | 0 | |
| | | | | | | | | | | | | | | |
Total | | | | 64 | | | | | 65 | | | | | 69 | |
| | | | | | | | | | | | | | | |
145
SENSITIVITY ANALYSISFORTHE FINANCIAL ASSETS CARRIEDAT FAIR VALUE, USING VALUATION METHODS
BASEDIN PARTON UNOBSERVABLE MARKET DATAASAT 31 DECEMBER 2010
| | | | | | | | | | | | | | | |
| | | Best case
scenario | | Reported value | | Worst case
scenario |
| | | (EUR in millions) |
Loans and advances to banks – recorded at fair value through profit or loss | | | | 57 | | | | | 52 | | | | | 51 | |
Loans and advances to customers – recorded at fair value through profit or loss | | | | 11 | | | | | 10 | | | | | 9 | |
Securities and investments – recorded at fair value through profit or loss | | | | 492 | | | | | 420 | | | | | 348 | |
| | | | | | | | | | | | | | | |
Total | | | | 560 | | | | | 482 | | | | | 408 | |
| | | | | | | | | | | | | | | |
SENSITIVITY ANALYSISFORTHE FINANCIAL LIABILITIES CARRIEDAT FAIR VALUE, USING VALUATION METHODS
BASEDIN PARTON UNOBSERVABLE MARKET DATAASAT 31 DECEMBER 2010
| | | | | | | | | | | | | | | |
| | | Best case
scenario | | Reported value | | Worst case
scenario |
| | | (EUR in millions) |
Liabilities to banks – recorded at fair value through profit or loss | | | | 63 | | | | | 65 | | | | | 72 | |
Liabilities to customers – recorded at fair value through profit or loss | | | | 2 | | | | | 2 | | | | | 2 | |
| | | | | | | | | | | | | | | |
Total | | | | 65 | | | | | 67 | | | | | 73 | |
| | | | | | | | | | | | | | | |
(67) Fair values of financial instruments
In the following tables, the fair values of financial instruments are compared to their carrying amounts. Existing provisions for losses on loans and advances are deducted from the carrying amounts of loans and advances to banks and customers. The carrying amount of the subordinated liabilities comprises pro-rata interest and value adjustments from micro fair value hedge accounting reported in the item “other liabilities”.
146
FAIR VALUESOF FINANCIAL INSTRUMENTSASAT 31 DECEMBER 2011
| | | | | | | | | | | | | | | |
| | | Fair value | | Carrying amount
(statement of
financial
position) | | Difference |
| | | (EUR in millions) |
Loans and advances to banks | | | | 303,065 | | | | | 290,810 | | | | | 12,255 | |
Loans and advances to customers | | | | 117,379 | | | | | 113,528 | | | | | 3,851 | |
Value adjustments from macro fair value hedge accounting | | | | — | | | | | 13,468 | | | | | -13,468 | |
Derivatives subject to hedge accounting | | | | 30,403 | | | | | 30,403 | | | | | 0 | |
Other derivatives | | | | 11,091 | | | | | 11,091 | | | | | 0 | |
Securities and investments | | | | 31,262 | | | | | 31,861 | | | | | -600 | |
| | | | | | | | | | | | | | | |
Assets | | | | 493,200 | | | | | 491,161 | | | | | 2,039 | |
| | | | | | | | | | | | | | | |
| | | |
Liabilities to banks | | | | 23,258 | | | | | 23,031 | | | | | 228 | |
Liabilities to customers | | | | 22,245 | | | | | 20,856 | | | | | 1,389 | |
Certificated liabilities | | | | 401,860 | | | | | 398,829 | | | | | 3,031 | |
Value adjustments from macro fair value hedge accounting | | | | — | | | | | 313 | | | | | -313 | |
Derivatives subject to hedge accounting | | | | 20,927 | | | | | 20,927 | | | | | 0 | |
Other derivatives | | | | 5,365 | | | | | 5,365 | | | | | 0 | |
Subordinated liabilities | | | | 3,569 | | | | | 3,563 | | | | | 5 | |
| | | | | | | | | | | | | | | |
Liabilities | | | | 477,224 | | | | | 472,884 | | | | | 4,340 | |
| | | | | | | | | | | | | | | |
Interest-related changes in value are also included in calculating the fair value of the financial instruments. Accordingly, when the comparison is made with the carrying amount, it is necessary to take account of the (interest-related) changes in value resulting from the recognition of loans and advances and borrowings in macro fair value hedge accounting.
Equity instruments included in “securities and investments”, for which the fair value could not be reliably determined, are carried at cost allowing for impairment losses in the amount of EUR 699 million (2010: EUR 627 million); disposal in the subsequent year is possible on a case-by-case basis.
147
FAIR VALUESOF FINANCIAL INSTRUMENTSASAT 31 DECEMBER 2010
| | | | | | | | | | | | | | | |
| | | Fair value | | Carrying amount
(statement of
financial position) | | Difference |
| | | | | (EUR in millions) | | |
Loans and advances to banks | | | | 270,522 | | | | | 263,222 | | | | | 7,300 | |
Loans and advances to customers | | | | 105,496 | | | | | 102,878 | | | | | 2,618 | |
Value adjustments from macro fair value hedge accounting | | | | — | | | | | 7,478 | | | | | -7,478 | |
Derivatives subject to hedge accounting | | | | 23,323 | | | | | 23,323 | | | | | 0 | |
Other derivatives | | | | 6,568 | | | | | 6,568 | | | | | 0 | |
Securities and investments | | | | 34,312 | | | | | 35,207 | | | | | -895 | |
| | | | | | | | | | | | | | | |
Assets | | | | 440,221 | | | | | 438,675 | | | | | 1,546 | |
| | | | | | | | | | | | | | | |
| | | |
Liabilities to banks | | | | 15,508 | | | | | 15,461 | | | | | 47 | |
Liabilities to customers | | | | 23,076 | | | | | 22,011 | | | | | 1,066 | |
Certificated liabilities | | | | 360,085 | | | | | 357,984 | | | | | 2,100 | |
Value adjustments from macro fair value hedge accounting | | | | — | | | | | 141 | | | | | -141 | |
Derivatives subject to hedge accounting | | | | 18,191 | | | | | 18,191 | | | | | 0 | |
Other derivatives | | | | 4,623 | | | | | 4,623 | | | | | 0 | |
Subordinated liabilities | | | | 3,530 | | | | | 3,536 | | | | | -6 | |
| | | | | | | | | | | | | | | |
Liabilities | | | | 425,013 | | | | | 421,947 | | | | | 3,067 | |
| | | | | | | | | | | | | | | |
(68) Additional disclosures on liabilities to banks
DISCLOSURESON LIABILITIESTO BANKS DESIGNATEDAT FAIR VALUETHROUGH PROFITOR LOSS (FAIR VALUE OPTION)
| | | | | | | | | | | | | | | |
| | | 31 Dec. 2011 | | 31 Dec. 2010 | | Change |
| | | (EUR in millions) |
Carrying amount | | | | 318 | | | | | 229 | | | | | 89 | |
Repayment at maturity | | | | 859 | | | | | 740 | | | | | 119 | |
| | | | | | | | | | | | | | | |
Difference | | | | 542 | | | | | 511 | | | | | 31 | |
| | | | | | | | | | | | | | | |
Of the difference between the repayment amount at maturity and the carrying amount, EUR 451 million (2010: EUR 392 million) was attributable to borrowings for which the repayment amount builds up as a result of the capitalisation over time of interest due.
148
(69) Additional disclosures on liabilities to customers
DISCLOSURESON LIABILITIESTO CUSTOMERS DESIGNATEDAT FAIR VALUETHROUGH PROFITOR LOSS (FAIR VALUE OPTION)
| | | | | | | | | | | | | | | |
| | | 31 Dec. 2011 | | 31 Dec. 2010 | | Change |
| | | (EUR in millions) |
Carrying amount | | | | 3,391 | | | | | 5,064 | | | | | -1,673 | |
Repayment at maturity | | | | 6,408 | | | | | 8,809 | | | | | -2,401 | |
| | | | | | | | | | | | | | | |
Difference | | | | 3,018 | | | | | 3,745 | | | | | -728 | |
| | | | | | | | | | | | | | | |
Of the difference between the repayment amount at maturity and the carrying amount, EUR 2,646 million (2010: EUR 3,422 million) was attributable to borrowings for which the repayment amount builds up as a result of the capitalisation over time of interest due.
(70) Additional disclosures on certificated liabilities
DISCLOSURESON CERTIFICATED LIABILITIES DESIGNATEDAT FAIR VALUETHROUGH PROFITOR LOSS (FAIR VALUE OPTION)
| | | | | | | | | | | | | | | |
| | | 31 Dec. 2011 | | 31 Dec. 2010 | | Change |
| | | (EUR in millions) |
Carrying amount | | | | 26,223 | | | | | 24,856 | | | | | 1,367 | |
Repayment at maturity | | | | 34,391 | | | | | 38,232 | | | | | -3,842 | |
| | | | | | | | | | | | | | | |
Difference | | | | 8,168 | | | | | 13,376 | | | | | -5,209 | |
| | | | | | | | | | | | | | | |
Of the difference between the repayment amount at maturity and the carrying amount, EUR 8,252 million (2010: EUR 9,536 million) was attributable to borrowings for which the repayment amount builds up as a result of the capitalisation over time of interest due.
(71) Additional disclosures on derivatives
ANALYSISOF DERIVATIVESBY COUNTERPARTY
| | | | | | | | | | | | | | | | | | | | | | | | | | | | | | |
| | | Par value | | Fair value 31 Dec. 2011 | | Fair value 31 Dec. 2010 |
| | | 31 Dec. 2011 | | 31 Dec. 2010 | | positive | | negative | | positive | | negative |
| | | (EUR in millions) |
OECD banks | | | | 671,107 | | | | | 641,633 | | | | | 38,865 | | | | | 23,647 | | | | | 28,113 | | | | | 21,142 | |
Non-OECD banks | | | | 64 | | | | | 37 | | | | | 1 | | | | | 6 | | | | | 0 | | | | | 4 | |
Other counterparties | | | | 34,753 | | | | | 35,675 | | | | | 2,149 | | | | | 2,427 | | | | | 1,613 | | | | | 1,653 | |
Public sector | | | | 6,999 | | | | | 1,888 | | | | | 152 | | | | | 183 | | | | | 62 | | | | | 0 | |
| | | | | | | | | | | | | | | | | | | | | | | | | | | | | | |
Total | | | | 712,925 | | | | | 679,233 | | | | | 41,167 | | | | | 26,263 | | | | | 29,788 | | | | | 22,799 | |
| | | | | | | | | | | | | | | | | | | | | | | | | | | | | | |
149
The analysis includes stand-alone financial and credit derivatives which are presented in the items “derivatives subject to hedge accounting” and “other derivatives”.
The volume of differences between the transaction price and model value arising from the use of a valuation technique that makes significant use of unobservable market data which have yet to be amortised over the life of the financial instrument amounts to EUR 48 million (2010: EUR 20 million). The net gains/losses from derivatives not qualifying for hedge accounting includes amortisation effects in the amount of EUR 2 million (2010: EUR 1 million).
The economic hedge effect of financial derivatives with a nominal volume of EUR 640.6 billion (2010: EUR 598.0 billion) is presented in accordance with IAS 39; the risk-mitigating impact of the remaining financial derivatives is not reflected in the accounts.
As in 2010, KfW Bankengruppe did not pledge any collateral (in the form of securities) under derivative transactions, in 2011, which can be resold or repledged at any time, without the party furnishing collateral having defaulted.
However, liquid collateral totalling EUR 1 million was provided, which was reported under “loans and advances to banks and customers”.
As in 2010 KfW Bankengruppe did not receive any collateral (in the form of securities) under derivative transactions, in 2011 which could be resold or repledged at any time, even if the party furnishing collateral has not defaulted. However, provision of liquid collateral totalling EUR 17,162 million (2010: EUR 10,973 million) was accepted, which was reported under “liabilities to banks and customers”.
(72) Additional disclosures on the PROMISE/PROVIDE securitisation platforms
As in 2010 KfW Bankengruppe did not receive any collateral (in the form of securities) in transactions under the PROMISE and PROVIDE securitisation platforms in 2011, which could be resold or repledged at any time, without the party furnishing collateral having defaulted. However, provision of liquid collateral totalling EUR 295 million (2010: EUR 106 million) was accepted, which was reported under “liabilities to banks and customers”.
(73) Disclosures on repurchase agreements
DISCLOSURESON REPO TRANSACTIONS
| | | | | | | | | | | | | | | |
| | | 31 Dec. 2011 | | 31 Dec. 2010 | | Change |
| | | (EUR in millions) |
Carrying amount of securities sold under repo transactions that continue to be recognised in securities and investments | | | | 1,535 | | | | | 804 | | | | | 731 | |
Liabilities to banks (countervalue) | | | | 1,553 | | | | | 796 | | | | | 757 | |
In 2010, KfW Bankengruppe pledged collateral (in the form of securities) under repo transactions which can be resold or repledged at any time, without the party furnishing collateral having defaulted. The carrying amount of this collateral totalled EUR 1 million and no collateral was pledged in 2011.
KfW Bankengruppe received collateral (in the form of securities) under repo transactions, which can be resold or repledged at any time, without the party furnishing collateral having defaulted. The fair value of this collateral totalled EUR 2 million. The collateral has been neither resold nor pledged. No such collateral was accepted in 2010.
As in 2010, no liquid collateral was provided in 2011.
150
DISCLOSURESON REVERSE REPO TRANSACTIONS
| | | | | | | | | | | | | | | |
| | | 31 Dec. 2011 | | 31 Dec. 2010 | | Change |
| | | (EUR in millions) |
Loans and advances to banks (countervalue) | | | | 29,730 | | | | | 18,664 | | | | | 11,066 | |
Securities purchased under reverse repos are not recognised.
KfW Bankengruppe pledged collateral (in the form of securities) under reverse repo transactions which can be resold or repledged at any time, without the party furnishing collateral having defaulted. The carrying amount of this collateral totalled EUR 16 million. No such collateral was pledged in 2010.
KfW Bankengruppe received collateral under reverse repo transactions, which can be resold or repledged at any time, without the party furnishing collateral having defaulted. The fair value of this collateral totalled EUR 1 million. The collateral has been neither resold nor repledged. No such collateral was accepted in 2010.
As in 2010, no liquid collateral was provided.
151
Other Notes
(74) Contingent liabilities and irrevocable loan commitments
ANALYSISOF CONTINGENT LIABILITIESBY CLASS
| | | | | | | | | | | | | | | |
| | | 31 Dec. 2011 | | 31 Dec. 2010 | | Change |
| | | (EUR in millions) |
Contingent liabilities from financial guarantees | | | | 4,448 | | | | | 4,950 | | | | | -502 | |
Contingent liabilities from PROMISE/PROVIDE securitisation platforms | | | | 762 | | | | | 1,142 | | | | | -380 | |
Performance guarantees | | | | 51 | | | | | 53 | | | | | -2 | |
Other contingent liabilities | | | | 1,027 | | | | | 837 | | | | | 190 | |
| | | | | | | | | | | | | | | |
Total | | | | 6,287 | | | | | 6,982 | | | | | -694 | |
| | | | | | | | | | | | | | | |
“Other contingent liabilities” include payment obligations attributable to investments which are not fully paid up and do not have to be consolidated. Information has not been provided on further contingent liabilities in accordance with IAS 37.92.
VOLUMEOF IRREVOCABLE LOAN COMMITMENTS
| | | | | | | | | | | | | | | |
| | | 31 Dec. 2011 | | 31 Dec. 2010 | | Change |
| | | (EUR in millions) |
Irrevocable loan commitments | | | | 55,720 | | | | | 65,276 | | | | | -9,556 | |
“The irrevocable loan commitments” are mainly attributable to domestic promotional lending business as well as the portion of the loan to Greece that has not yet been paid out.
(75) Trust activities and administered loans
ANALYSISOF TRUST ACTIVITIESBY CLASS (TRANSACTIONSINTHE BANK’S OWN NAMEBUTFOR THIRD PARTY ACCOUNTS)
| | | | | | | | | | | | | | | |
| | | 31 Dec. 2011 | | 31 Dec. 2010 | | Change |
| | | (EUR in millions) |
Loans and advances to banks | | | | 2,023 | | | | | 2,008 | | | | | 14 | |
Loans and advances to customers | | | | 14,427 | | | | | 14,488 | | | | | -61 | |
Securities and investments | | | | 276 | | | | | 109 | | | | | 167 | |
| | | | | | | | | | | | | | | |
Assets held in trust | | | | 16,725 | | | | | 16,605 | | | | | 120 | |
| | | | | | | | | | | | | | | |
Liabilities to banks | | | | 8 | | | | | 10 | | | | | -2 | |
Liabilities to customers | | | | 16,717 | | | | | 16,596 | | | | | 122 | |
| | | | | | | | | | | | | | | |
Liabilities held in trust | | | | 16,725 | | | | | 16,605 | | | | | 120 | |
| | | | | | | | | | | | | | | |
EUR 14,659 million (2010: EUR 14,800 million) of the assets held in trust was attributable to the business area Promotion for developing and transition countries.
152
VOLUMEOF ADMINISTERED LOANS GRANTED (LOANSINTHE NAMEANDFORTHE ACCOUNTOF THIRD PARTIES)
| | | | | | | | | | | | | | | |
| | | 31 Dec. 2011 | | 31 Dec. 2010 | | Change |
| | | (EUR in millions) |
Administered loans | | | | 7,525 | | | | | 6,793 | | | | | 732 | |
(76) Leasing transactions as lessee
DISCLOSURESON LESSEE AGREEMENTSASAT 31 DECEMBER 2011
| | | | | | | | | | | | | | | | | | | | |
| | | Due within one
year | | Due in between
one and five years | | Due in more than
five years | | Total |
| | | (EUR in millions) |
Finance leases | | | | | | | | | | | | | | | | | | | | |
Future minimum leasing payments | | | | 0 | | | | | 0 | | | | | 0 | | | | | 0 | |
Unearned finance income | | | | 0 | | | | | 0 | | | | | 0 | | | | | 0 | |
Present value of future minimum leasing payments | | | | 0 | | | | | 0 | | | | | 0 | | | | | 0 | |
Operating leases | | | | | | | | | | | | | | | | | | | | |
Future minimum leasing payments | | | | 5 | | | | | 13 | | | | | 1 | | | | | 19 | |
DISCLOSURESON LESSEE AGREEMENTSASAT 31 DECEMBER 2010
| | | | | | | | | | | | | | | | | | | | |
| | | Due within one
year | | Due in between
one and five years | | Due in more than
five years | | Total |
| | | (EUR in millions) |
Finance leases | | | | | | | | | | | | | | | | | | | | |
Future minimum leasing payments | | | | 4 | | | | | 6 | | | | | 0 | | | | | 10 | |
Unearned finance income | | | | 0 | | | | | 1 | | | | | 0 | | | | | 1 | |
Present value of future minimum leasing payments | | | | 4 | | | | | 5 | | | | | 0 | | | | | 9 | |
Operating leases | | | | | | | | | | | | | | | | | | | | |
Future minimum leasing payments | | | | 6 | | | | | 14 | | | | | 0 | | | | | 20 | |
153
(77) Average number of employees during the financial year
| | | | | | | | | | | | | | | |
| | | 2011 | | 2010 | | Change |
Employees (female) | | | | 2,359 | | | | | 2,227 | | | | | 132 | |
Employees (male) | | | | 2,406 | | | | | 2,304 | | | | | 102 | |
| | | | | | | | | | | | | | | |
Total | | | | 4,765 | | | | | 4,531 | | | | | 234 | |
Staff not covered by collective agreements | | | | 3,320 | | | | | 3,193 | | | | | 127 | |
Staff covered by collective agreements | | | | 1,445 | | | | | 1,338 | | | | | 107 | |
The average number of employees including temporary staff excluding members of the Executive Board and trainees, was calculated based on the levels at the end of each quarter.
(78) Compensation report
OVERVIEWOF TOTAL COMPENSATIONTO MEMBERSOFTHE EXECUTIVE BOARDAND BOARDOF SUPERVISORY DIRECTORS
| | | | | | | | | | | | | | | |
| | | 2011 | | 2010 | | Change |
| | | (EUR in thousands) |
Members of the Executive Board | | | | 3,365 | | | | | 3,346 | | | | | 19 | |
Former members of the Executive Board and their surviving dependents | | | | 3,827 | | | | | 4,026 | | | | | -199 | |
Members of the Board of Supervisory Directors | | | | 175 | | | | | 176 | | | | | -1 | |
| | | | | | | | | | | | | | | |
Total | | | | 7,367 | | | | | 7,548 | | | | | -181 | |
| | | | | | | | | | | | | | | |
Compensation to the Executive Board
The objective of the compensation system for the KfW Executive Board is to compensate members of the Executive Board for their duties and responsibilities. Executive Board contracts are drawn up based on the 1992 version of the policy for hiring executive board members at credit institutions of the Federal Government (Grundsätze für die Anstellung der Vorstandsmitglieder bei den Kreditinstituten des Bundes). The Federal Public Corporate Governance Code (Public Corporate Governance Kodex des Bundes — PCGK) in the version dated 30 June 2009 was taken into account when drafting these contracts. The individual contracts contain adjustments.
Compensation components
Executive Board members who were appointed to the Executive Board prior to June 2009 currently receive annual salaries paid in twelve equal payments. They also receive a fixed end-of-year bonus paid annually upon approval of the annual financial statements by the Board of Supervisory Directors. Executive Board members who have been appointed or reappointed since June 2009 receive the fixed end-of-year bonus paid out as part of their monthly salaries.
Compensation of the Chief Executive Officer is an exception. Based on an annual agreement on objectives, he receives a variable end-of-year bonus of at least EUR 160,000 in addition to his fixed annual salary. This minimum bonus payment does not apply if KfW net income for a financial year is insufficient to ensure allocation to the statutory reserves. A maximum bonus payment has not been defined. The agreement on objectives for 2011 comprises promotional, quantitative and other objectives.
Responsibilities
The Executive Committee (Präsidialausschuss) discusses the Executive Board compensation system including contract components in detail and regularly reviews it. The Board of Supervisory Directors resolves upon the basic structure of the Executive Board compensation system as proposed by the Executive Committee.
154
The following table shows total compensation, broken down into fixed and, where applicable, variable components and other forms of compensation, as well as allocations to pension provisions for the individual board members.
Annual compensation to the Executive Board and allocations to pension provisions in 2011 and 2010, EUR in thousands
| | | | | | | | | | | | | | | | | | | | | | | | | | | | | | |
| | | | | Salary | | Variable
compensation | | Other
compensation1 | | Total | | Allocation to
pension
provisions |
Dr Ulrich Schröder (Chief Executive Officer) | | | | 2011 | | | | | 673.1 | | | | | 240.0 | | | | | 117.9 | | | | | 1,031.0 | | | | | 297.8 | |
| | | | 2010 | | | | | 660.0 | | | | | 160.0 | | | | | 177.2 | | | | | 997.2 | | | | | 516.4 | |
Dr Günther Bräunig | | | | 2011 | | | | | 515.8 | | | | | 0.0 | | | | | 27.2 | | | | | 543.0 | | | | | 216.2 | |
| | | | 2010 | | | | | 466.6 | | | | | 0.0 | | | | | 26.0 | | | | | 492.6 | | | | | 269.2 | |
Dr Norbert Kloppenburg | | | | 2011 | | | | | 474.0 | | | | | 0.0 | | | | | 69.7 | | | | | 543.7 | | | | | 217.0 | |
| | | | 2010 | | | | | 466.6 | | | | | 0.0 | | | | | 52.0 | | | | | 518.7 | | | | | 270.2 | |
Dr Edeltraud Leibrock (from 1 October 2011) | | | | 2011 | | | | | 124.5 | | | | | 0.0 | | | | | 11.4 | | | | | 135.9 | | | | | 64.5 | |
| | | | 2010 | | | | | — | | | | | — | | | | | — | | | | | — | | | | | — | |
Bernd Loewen | | | | 2011 | | | | | 487.7 | | | | | 0.0 | | | | | 45.4 | | | | | 533.1 | | | | | 126.3 | |
| | | | 2010 | | | | | 480.0 | | | | | 0.0 | | | | | 283.6 | | | | | 763.6 | | | | | 181.4 | |
Dr Axel Nawrath | | | | 2011 | | | | | 473.5 | | | | | 0.0 | | | | | 104.7 | | | | | 578.2 | | | | | 292.7 | |
| | | | 2010 | | | | | 466.0 | | | | | 0.0 | | | | | 107.6 | | | | | 573.6 | | | | | 412.9 | |
| | | | | | | | | | | | | | | | | | | | | | | | | | | | | | |
Total | | | | 2011 | | | | | 2,748.6 | | | | | 240.0 | | | | | 376.3 | | | | | 3,364.9 | | | | | 1,214.5 | |
| | | | | | | | | | | | | | | | | | | | | | | | | | | | | | |
Total | | | | 2010 | | | | | 2,539.2 | | | | | 160.0 | | | | | 646.5 | 2 | | | | 3,345.8 | | | | | 1,650.1 | |
| | | | | | | | | | | | | | | | | | | | | | | | | | | | | | |
| (1) | Changes in Other compensation from 2010 to 2011 are partly due to the fact that this item contains cost for security measures at Executive Board members’ residences in 2010, which are reported in the annual financial statements as non-personnel expense and no longer included in Other compensation in 2011. |
| (2) | Other compensation in 2010 without costs for security expenses amounted to EUR 334,200. |
Contractually agreed fringe benefits
Other compensation largely comprises contractually agreed fringe benefits. Executive Board members are entitled to a company car with driver services for business and personal use. Executive Board members reimburse KfW for using a company car with a driver for private purposes in accordance with applicable tax regulations. They are reimbursed for the costs of maintaining a secondary residence for business reasons under tax regulations.
Executive Board members are insured under a group accident insurance policy. Supplements are paid on health and long-term care insurance premiums. Executive Board members are covered by a directors and officers liability insurance policy, which insures them against the risks of financial loss associated with their actions in their capacity as Executive Board members and by a supplemental legal expenses insurance policy. At present, there is no deductible. KfW Executive Board members acting in their management capacity are also protected by a special legal expenses group policy for employees covering criminal action brought against Board members.
Other compensation also includes compensation for exercising group mandates. As of 1 July 2011, no compensation was paid to members of the Executive Board for assuming executive body functions at Group companies.
As all other executives, Executive Board members may also opt to participate in the deferred compensation program — a supplemental company pension scheme financed via tax-free salary conversion.
As contractually agreed fringe benefits and based on a personal security scheme, costs for security measures at Executive Board members’ residences are covered to an appropriate extent. These security benefits have been reported as non-personnel expenses in the 2011 annual financial statements.
The contractually agreed fringe benefits are granted tax-free to Executive Board members; if this is not possible or has not been contractually agreed, any taxes incurred on such benefits are borne in full by the Executive Board members.
155
As at the end of the year, there was one loan to a member of the Executive Board with an outstanding amount of EUR 75.1 thousand (2010: EUR 81.4 thousand). The interest rate is between 3% p.a. and 4% p.a. The residual term of the loan was 9.9 years as at year-end 2011. No new loans were granted to Executive Board members in the 2011 financial year nor will any more be granted in future.
No Executive Board member was granted or promised any benefits by a third party during the past financial year with a view to his position as a member of the KfW Executive Board.
Pension benefits and other benefits in the case of early retirement
In accordance with section 1 (1) of the By-Laws of KfW, the appointment of an Executive Board member should not extend, as a rule, beyond the completion of the legal age of retirement. After reaching 65 years of age or the legal age of retirement and expiration of their Executive Board contract, Executive Board members are entitled to claim pension payments; they may also elect to retire early after reaching 63 years of age.
Pension commitments for Executive Board members as well as their surviving dependents are based on the 1992 version of the Federal Government’s policy for hiring executive board members at credit institutions. The Federal Public Corporate Governance Code in the version dated 30 June 2009 was taken into account when drawing up the Executive Board contracts.
In the case of Executive Board members who have been appointed or reappointed to the Executive Board since 2010, a severance pay cap was included in the Executive Board contracts in accordance with the recommendations of the Federal Public Corporate Governance Code. In other words, payments to an Executive Board member due to early termination of the Executive Board function without good cause in accordance with Section 626 German Civil Code (Bürgerliches Gesetzbuch — BGB) should not exceed the equivalent of two years’ salary or compensation including fringe benefits for the remainder of the contract, depending on which of the amounts is lower.
Executive Board contracts which were concluded before 2010 generally provided for early retirement benefits after two terms on the Board, regardless of age and even in the case that KfW did not extend the Executive Board contract. This no longer applies to the Executive Board contract concluded in 2011. For Executive Board members reappointed to the Executive Board since 2010, any early retirement benefit entitlements were grandfathered by converting them into claims with a time limit. Moreover, Executive Board members are entitled to pension benefits if their employment relationship terminates due to permanent disability.
The full benefit entitlement totals 70% of the pensionable salary. The pensionable salary is 70% of the last salary. The benefit entitlement — with the exception of the Chief Executive Officer — normally amounts to 70% for a first-time appointment and increases over ten years by 3 percent for every year of service completed.
The Executive Board contracts contain additional individual provisions, in particular concerning vesting of pension benefits.
In 2011, KfW concluded a settlement agreement with a former Executive Board member upon judicial clarification and to avoid expensive legal proceedings. Pursuant to this agreement, this former Executive Board member receives no severance and waives parts of his contractual salary and pension benefits in settlement of damages but without admitting that he caused the damage to KfW.
156
Pension payments to former Executive Board members or their surviving dependents were as follows in 2011 and 2010:
PENSION PAYMENTSTO FORMER EXECUTIVE BOARD MEMBERSAND THEIR SURVIVING DEPENDENTS
| | | | | | | | | | | | | | | | | | | | |
| | | Number 2011 | | EUR in thousands
2011 | | Number 2010 | | EUR in thousands
2010 |
Former members of the Executive Board | | | | 20 | | | | | 3,227 | | | | | 20 | | | | | 3,318 | |
Surviving dependents | | | | 10 | | | | | 600 | | | | | 10 | | | | | 708 | |
| | | | | | | | | | | | | | | | | | | | |
Total | | | | 30 | | | | | 3,827 | | | | | 30 | | | | | 4,026 | |
| | | | | | | | | | | | | | | | | | | | |
Provisions in the amount of EUR 48,413 thousand had been set up at the end of the financial year for pension obligations to former members of the Executive Board and their surviving dependents (2010: EUR 48,515 thousand).
No loans were granted to former Executive Board members and their surviving dependents in the 2011 financial year.
Compensation to members of the Board of Supervisory Directors
The amount of compensation to members of the Board of Supervisory Directors is determined by the Supervisory Authority in accordance with section 5 (8) of the By-Laws of KfW. Prior to the amendment to the By-Laws effective 1 January 2011, the term “Aufwandsentschädigung” was used. With the last revision in May 2010, compensation to members of the Federal Government who are members of the Board of Supervisory Directors pursuant to section 7 (1) No. 2 of the KfW Law was set at EUR 0.00. Moreover, compensation for the Chairman of the Board of KfW Supervisory Directors and his deputies was also set at EUR 0.00.
For 2011, compensation for other members of the Board of Supervisory Directors pursuant to section 7 (1) no. 3 — 6 of the KfW Law amounted to EUR 5.1 thousand p.a.; compensation for membership on the Executive, Credit or Audit Committees, was a standard amount of EUR 0.6 thousand p.a. for each member. Committee chairs received no special compensation.
Members who join during the year receive their compensation on a pro-rata basis.
A daily allowance (EUR 0.2 thousand per meeting day) is paid and travel expenses and applicable VAT are reimbursed upon request.
157
The following tables provide details on the compensation paid to the Board of Supervisory Directors in the 2011 and 2010 financial years: stated amounts are net amounts in EUR thousands. Travel expenses are reimbursed upon submission of receipts and are not taken into account in the table.
Compensation to members of the Board of Supervisory Directors for financial year 2011
| | | | | | | | | | | | | | | | | | | | | | | | | | | | | |
No. | | Name | | | | Dates of
membership | | Board of
Supervisory
Directors
membership1) | | Committee
membership 1) | | Daily
allowance | | Total |
| | | | | | | 2011 | | EUR in
thousands | | EUR in
thousands | | EUR in
thousands | | EUR in
thousands |
1. | | Dr Wolfgang Schäuble | | | | 1 Jan. – 31 Dec. | | | | 0.0 | | | | | 0.0 | | | | | 0.0 | | | | | 0.0 | |
2. | | Rainer Brüderle | | | | 1 Jan. – 12 May | | | | 0.0 | | | | | 0.0 | | | | | 0.0 | | | | | 0.0 | |
3. | | Dr Philipp Rösler | | | | 12 May – 31 Dec. | | | | 0.0 | | | | | 0.0 | | | | | 0.0 | | | | | 0.0 | |
4. | | Ilse Aigner | | | | 1 Jan. – 31 Dec. | | | | 0.0 | | | | | 0.0 | | | | | 0.0 | | | | | 0.0 | |
5. | | Norbert Barthle | | | | 1 Jan. – 31 Dec. | | | | 5.1 | | | | | 1.0 | | | | | 0.4 | | | | | 6.5 | |
6. | | Jan Bettink | | | | 1 Jan. – 31 Dec. | | | | 5.1 | | | | | 1.2 | | | | | 0.0 | | | | | 6.3 | |
7. | | Anton F. Börner | | | | 1 Jan. – 31 Dec. | | | | 5.1 | | | | | 0.6 | | | | | 0.0 | | | | | 5.7 | |
8. | | Volker Bouffier2) | | | | 1 Jan. – 31 Dec. | | | | 5.1 | | | | | 0.5 | | | | | 0.0 | | | | | 5.6 | |
9. | | Frank Bsirske | | | | 1 Jan. – 31 Dec. | | | | 5.1 | | | | | 0.0 | | | | | 0.0 | | | | | 5.1 | |
10. | | Prof Dr Hans Heinrich Driftmann | | | | 1 Jan. – 31 Dec. | | | | 5.1 | | | | | 0.0 | | | | | 0.2 | | | | | 5.3 | |
11. | | Ingeborg Esser | | | | 1 Jan. – 31 Dec. | | | | 5.1 | | | | | 0.6 | | | | | 0.2 | | | | | 5.9 | |
12. | | Georg Fahrenschon2) | | | | 1 Jan. – 3 Nov. | | | | 4.7 | | | | | 0.4 | | | | | 0.0 | | | | | 5.1 | |
13. | | Heinrich Haasis | | | | 1 Jan. – 31 Dec. | | | | 5.1 | | | | | 1.8 | | | | | 0.8 | | | | | 7.7 | |
14. | | Hubertus Heil | | | | 1 Jan. – 31 Dec. | | | | 5.1 | | | | | 1.0 | | | | | 0.6 | | | | | 6.7 | |
15. | | Gerhard Hofmann | | | | 1 Jan. – 31 Dec. | | | | 5.1 | | | | | 1.2 | | | | | 0.6 | | | | | 6.9 | |
16. | | Frank Horch2) | | | | 17 June – 31 Dec. | | | | 3.0 | | | | | 0.3 | | | | | 0.0 | | | | | 3.3 | |
17. | | Bartholomäus Kalb | | | | 1 Jan. – 31 Dec. | | | | 5.1 | | | | | 0.7 | | | | | 0.8 | | | | | 6.6 | |
18. | | Dr h.c. Jürgen Koppelin | | | | 1 Jan. – 31 Dec. | | | | 5.1 | | | | | 0.6 | | | | | 0.8 | | | | | 6.5 | |
19. | | Monika Kuban | | | | 1 Jan. – 31 Dec. | | | | 5.1 | | | | | 0.0 | | | | | 0.4 | | | | | 5.5 | |
20. | | Karoline Linnert2) | | | | 1 Jan. – 31 Dec. | | | | 5.1 | | | | | 0.6 | | | | | 0.6 | | | | | 6.3 | |
21. | | Dr Gesine Lötzsch | | | | 1 Jan. – 31 Dec. | | | | 5.1 | | | | | 0.6 | | | | | 0.6 | | | | | 6.3 | |
22. | | Stefan Mappus2) | | | | 1 Jan. – 31 Aug. | | | | 3.4 | | | | | 0.3 | | | | | 0.0 | | | | | 3.7 | |
23. | | Claus Matecki | | | | 1 Jan. – 31 Dec. | | | | 5.1 | | | | | 0.0 | | | | | 0.4 | | | | | 5.5 | |
24. | | Dr Michael Meister | | | | 1 Jan. – 31 Dec. | | | | 5.1 | | | | | 0.6 | | | | | 0.6 | | | | | 6.3 | |
25. | | Franz-Josef Möllenberg | | | | 1 Jan. – 31 Dec. | | | | 5.1 | | | | | 1.2 | | | | | 0.8 | | | | | 7.1 | |
26. | | Dirk Niebel | | | | 1 Jan. – 31 Dec. | | | | 0.0 | | | | | 0.0 | | | | | 0.0 | | | | | 0.0 | |
27. | | Dr Peter Ramsauer | | | | 1 Jan. – 31 Dec. | | | | 0.0 | | | | | 0.0 | | | | | 0.0 | | | | | 0.0 | |
28. | | Dr Norbert Röttgen | | | | 1 Jan. – 31 Dec. | | | | 0.0 | | | | | 0.0 | | | | | 0.0 | | | | | 0.0 | |
29. | | Hanns-Eberhard Schleyer | | | | 1 Jan. – 31 Dec. | | | | 5.1 | | | | | 1.2 | | | | | 0.8 | | | | | 7.1 | |
30. | | Dr Nils Schmid2) | | | | 4 Nov. – 31 Dec. | | | | 0.8 | | | | | 0.1 | | | | | 0.2 | | | | | 1.1 | |
31. | | Andreas Schmitz | | | | 1 Jan. – 31 Dec. | | | | 5.1 | | | | | 1.8 | | | | | 0.2 | | | | | 7.1 | |
32. | | Dr Werner Schnappauf | | | | 1 Jan. – 31 Dec. | | | | 5.1 | | | | | 0.6 | | | | | 0.4 | | | | | 6.1 | |
33. | | Carsten Schneider | | | | 1 Jan. – 31 Dec. | | | | 5.1 | | | | | 0.9 | | | | | 0.8 | | | | | 6.8 | |
34. | | Dr Markus Söder2) | | | | 16 Dec. – 31 Dec. | | | | 0.4 | | | | | 0.0 | | | | | 0.0 | | | | | 0.4 | |
35. | | Michael Sommer | | | | 1 Jan. – 31 Dec. | | | | 5.1 | | | | | 0.6 | | | | | 0.0 | | | | | 5.7 | |
36. | | Gerd Sonnleitner | | | | 1 Jan. – 31 Dec. | | | | 5.1 | | | | | 0.6 | | | | | 0.4 | | | | | 6.1 | |
158
| | | | | | | | | | | | | | | | | | | | | | | | | | | | | |
37. | | Marion Walsmann2) | | | | 1 Jan. – 31 Dec. | | | | 5.1 | | | | | 0.0 | | | | | 0.0 | | | | | 5.1 | |
38. | | Dr Norbert Walter-Borjans2) | | | | 1 Jan. – 31 Dec. | | | | 5.1 | | | | | 0.5 | | | | | 0.2 | | | | | 5.8 | |
39. | | Dr Guido Westerwelle | | | | 1 Jan. – 31 Dec. | | | | 0.0 | | | | | 0.0 | | | | | 0.0 | | | | | 0.0 | |
| | | | | | | | | | | | | | | | | | | | | | | | | | | |
Total | | | | | | | | 144.9 | | | | | 19.5 | | | | | 10.8 | | | | | 175.2 | |
| | | | | | | | | | | | | | | | | | | | | | | | | | | |
| (1) | The amounts were not yet paid out as of the reporting date 31 December 2011 |
| (2) | Amount determined by state law |
159
Compensation to members of the Board of Supervisory Directors for financial year 2010
| | | | | | | | | | | | | | | | | | | | | | | | | | | | | |
No. | | Name | | | | Dates of
membership in
2010 | | Board of
Supervisory
Directors
membership | | Committee
membership | | Daily
allowance 1) | | Total |
1. | | Rainer Brüderle | | | | 1 Jan. – 31 Dec. | | | | 0.0 | | | | | 0.0 | | | | | 0.0 | | | | | 0.0 | |
2. | | Dr Wolfgang Schäuble | | | | 1 Jan. – 31 Dec. | | | | 0.0 | | | | | 0.0 | | | | | 0.0 | | | | | 0.0 | |
3. | | Ilse Aigner | | | | 1 Jan. – 31 Dec. | | | | 0.0 | | | | | 0.0 | | | | | 0.0 | | | | | 0.0 | |
4. | | Anton F. Börner3) | | | | 1 Jan. – 31 Dec. | | | | 5.1 | | | | | 0.6 | | | | | 0.2 | | | | | 5.9 | |
5. | | Christian Brand3) | | | | 1 Jan. – 31 Dec. | | | | 5.1 | | | | | 1.2 | | | | | 0.0 | | | | | 6.3 | |
6. | | Frank Bsirske3) | | | | 1 Jan. – 31 Dec. | | | | 5.1 | | | | | 0.0 | | | | | 0.0 | | | | | 5.1 | |
7. | | Prof Dr Hans Heinrich Driftmann3) | | | | 1 Jan. – 31 Dec. | | | | 5.1 | | | | | 0.0 | | | | | 0.0 | | | | | 5.1 | |
8. | | Prof Dr Kurt Faltlhauser2) 3) | | | | 1 Jan. – 31 Dec. | | | | 5.1 | | | | | 0.6 | | | | | 0.8 | | | | | 6.5 | |
9. | | Axel Gedaschko2) 3) | | | | 1 Jan. – 31 Oct. | | | | 4.2 | | | | | 0.4 | | | | | 0.0 | | | | | 4.7 | |
10. | | Heinrich Haasis3) | | | | 1 Jan. – 31 Dec. | | | | 5.1 | | | | | 1.8 | | | | | 0.6 | | | | | 7.6 | |
11. | | Hubertus Heil3) | | | | 1 Jan. – 31 Dec. | | | | 5.1 | | | | | 0.5 | | | | | 0.2 | | | | | 5.8 | |
12. | | Gerhard P. Hofmann3) | | | | 1 Jan. – 31 Dec. | | | | 5.1 | | | | | 1.2 | | | | | 0.8 | | | | | 7.1 | |
13. | | Bartholomäus Kalb3) | | | | 1 Jan. – 31 Dec. | | | | 5.1 | | | | | 1.2 | | | | | 0.4 | | | | | 6.7 | |
14. | | Roland Koch2) 3) | | | | 1 Jan. – 31 Dec. | | | | 5.1 | | | | | 0.6 | | | | | 0.0 | | | | | 5.7 | |
15. | | Dr h.c. Jürgen Koppelin3) | | | | 1 Jan. – 31 Dec. | | | | 5.1 | | | | | 0.6 | | | | | 0.8 | | | | | 6.5 | |
16. | | Monika Kuban3) | | | | 1 Jan. – 31 Dec. | | | | 5.1 | | | | | 0.0 | | | | | 0.2 | | | | | 5.3 | |
17. | | Karoline Linnert2) 3) | | | | 1 Jan. – 31 Dec. | | | | 5.1 | | | | | 0.5 | | | | | 0.4 | | | | | 6.1 | |
18. | | Dr Helmut Linssen2) 3) | | | | 1 Jan. – 24 Aug. | | | | 3.4 | | | | | 0.7 | | | | | 0.0 | | | | | 4.1 | |
19. | | Dr Gesine Lötzsch3) | | | | 1 Jan. – 31 Dec. | | | | 5.1 | | | | | 0.5 | | | | | 0.8 | | | | | 6.4 | |
20. | | Claus Matecki3) | | | | 1 Jan. – 31 Dec. | | | | 5.1 | | | | | 0.0 | | | | | 0.2 | | | | | 5.3 | |
21. | | Dr Michael Meister3) | | | | 1 Jan. – 31 Dec. | | | | 5.1 | | | | | 0.6 | | | | | 0.6 | | | | | 6.3 | |
22. | | Franz-Josef Möllenberg3) | | | | 1 Jan. – 31 Dec. | | | | 5.1 | | | | | 1.2 | | | | | 0.6 | | | | | 6.9 | |
23. | | Hartmut Möllring2) 3) | | | | 1 Jan. – 31 Dec. | | | | 5.1 | | | | | 0.0 | | | | | 0.6 | | | | | 5.7 | |
24. | | Dirk Niebel | | | | 1 Jan. – 31 Dec. | | | | 0.0 | | | | | 0.0 | | | | | 0.0 | | | | | 0.0 | |
25. | | Dr Peter Ramsauer | | | | 1 Jan. – 31 Dec. | | | | 0.0 | | | | | 0.0 | | | | | 0.0 | | | | | 0.0 | |
26. | | Dr Norbert Röttgen | | | | 1 Jan. – 31 Dec. | | | | 0.0 | | | | | 0.0 | | | | | 0.0 | | | | | 0.0 | |
27. | | Alexander Rychter3) | | | | 1 Jan. – 31 Dec. | | | | 5.1 | | | | | 0.6 | | | | | 0.6 | | | | | 6.3 | |
160
| | | | | | | | | | | | | | | | | | | | | | | | | | | | | |
28. | | Christine Scheel3) | | | | 1 Jan. –31 Dec. | | | | 5.1 | | | | | 0.6 | | | | | 0.6 | | | | | 6.3 | |
29. | | Hanns-Eberhard Schleyer3) | | | | 1 Jan. –31 Dec. | | | | 5.1 | | | | | 1.2 | | | | | 0.6 | | | | | 6.9 | |
30. | | Andreas Schmitz3) | | | | 1 Jan. – 31 Dec. | | | | 5.1 | | | | | 1.8 | | | | | 0.2 | | | | | 7.2 | |
31. | | Dr Werner Schnappauf3) | | | | 1 Jan. – 31 Dec. | | | | 5.1 | | | | | 0.6 | | | | | 0.0 | | | | | 5.7 | |
32. | | Carsten Schneider3) | | | | 1 Jan. – 31 Dec. | | | | 5.1 | | | | | 0.5 | | | | | 0.8 | | | | | 6.4 | |
33. | | Michael Sommer3) | | | | 1 Jan. – 31 Dec. | | | | 5.1 | | | | | 0.6 | | | | | 0.0 | | | | | 5.7 | |
34. | | Gerd Sonnleitner3) | | | | 1 Jan. – 31 Dec. | | | | 5.1 | | | | | 0.6 | | | | | 0.0 | | | | | 5.7 | |
35. | | Marion Walsmann2) 3) | | | | 1 Jan. – 31 Dec. | | | | 5.1 | | | | | 0.0 | | | | | 0.0 | | | | | 5.1 | |
36. | | Dr Norbert Walter-Borjans2) 3) | | | | 15 Oct. – 31 Dec. | | | | 1.3 | | | | | 0.0 | | | | | 0.0 | | | | | 1.3 | |
37. | | Dr Guido Westerwelle | | | | 1 Jan. – 31 Dec. | | | | 0.0 | | | | | 0.0 | | | | | 0.0 | | | | | 0,0 | |
| | | | | | | | | | | | | | | | | | | | | | | | | | | |
Total | | | | | | | | 147.0 | 4) | | | | 19.1 | 4) | | | | 10.0 | | | | | 176.1 | 4) |
| | | | | | | | | | | | | | | | | | | | | | | | | | | |
| (1) | Reported for the first time in 2010 under Compensation paid to the Board of Supervisory Directors |
| (2) | Amount determined by state law |
| (3) | Amount not yet called as of the reporting date 31 December 2010 |
| (4) | Including amounts not yet called |
There are no pension obligations for members of the Board of Supervisory Directors.
In the reporting year, members of the Board of Supervisory Directors received no compensation for personal services provided.
No direct loans were granted to members of the Board of Supervisory Directors in 2011.
Members of the Board of Supervisory Directors are covered by a directors and officers liability insurance policy, which insures them against the risks of financial loss associated with their actions in their capacity as Supervisory Directors and by a supplemental legal expenses insurance policy. These two policies are group insurance policies. The D&O policy protects against financial loss, which could arise from performance of duties as KfW Supervisory Directors. There is no deductible. KfW Supervisory Directors acting in that capacity are also protected by a special legal expenses group policy for employees covering criminal action brought against Supervisory Directors and by a group accident insurance policy.
(79) Related party disclosures
KfW Bankengruppe’s related parties, in accordance with IAS 24, include as legal entities the consolidated subsidiaries, the non-consolidated affiliated entities, jointly controlled entities, associated entities and the shareholdings for the Federal Government.
Natural persons considered related parties in accordance with IAS 24 include the members of the Executive Board and the Directors of KfW, the managing directors of all subsidiaries included in the financial statements and the members of the supervisory boards of certain consolidated subsidiaries.
KfW is a public law institution in which the Federal Republic of Germany (Federal Republic) holds an 80% and the Federal States a 20% stake. Any transactions with the Federal Republic and the Federal States in 2011 are covered by the rules and regulations set forth in the KfW Law. This also includes operations in which the Federal Republic of Germany has a state interest and which the Federal Government has assigned to KfW (mandated transactions in accordance with section 2 (4) of the KfW Law).
161
The business relationships between KfW and its affiliates and other natural persons considered related parties are primarily determined by the rules set out in the KfW Law, the KfW By-Laws and by applying the principles of the Federal Public Corporate Governance Code (Public Corporate Governance Kodex des Bundes). The conditions and prices are in line with standard market conditions and are concluded in accordance with KfW’s general conditions for its loan programmes open to the general public.
(80) Auditor’s fees
| | | | | | | | | | | | | | | |
| | | 2011 | | 2010 | | Change |
| | | (EUR in thousands) |
Audit | | | | 1,695 | | | | | 1,635 | | | | | 60 | |
Other audit-related services | | | | 516 | | | | | 237 | | | | | 278 | |
Tax advisory services | | | | 100 | | | | | 156 | | | | | -56 | |
Other services | | | | 727 | | | | | 677 | | | | | 50 | |
| | | | | | | | | | | | | | | |
Total | | | | 3,038 | | | | | 2,706 | | | | | 332 | |
| | | | | | | | | | | | | | | |
(81) Disclosures on shareholdings
SUBSIDIARIES INCLUDEDINTHE CONSOLIDATED FINANCIAL STATEMENTS
| | | | | | | | | | |
Name/registered office | | Capital share | | Equity (IFRS)
as at 31 Dec. 2011 |
| | | % | | (EUR in millions) |
KfW IPEX-Bank GmbH, Frankfurt am Main, Germany (www.kfw-ipex-bank.de) | | | | 100.0 | | | | | 2,797 | |
KfW IPEX-Beteiligungsholding GmbH, Frankfurt am Main, Germany | | | | 100.0 | | | | | 1,858 | |
DEG — Deutsche Investitions- und Entwicklungsgesellschaft mbH, Cologne, Germany (www.deginvest.de) | | | | 100.0 | | | | | 2,053 | |
tbg Technologie-Beteiligungs-Gesellschaft mbH, Bonn, Germany | | | | 100.0 | | | | | 253 | |
KfW Beteiligungsholding GmbH, Bonn, Germany | | | | 100.0 | | | | | 344 | |
Finanzierungs- und Beratungsgesellschaft mbH, Berlin, Germany | | | | 100.0 | | | | | 18 | |
162
INVESTMENTS INCLUDEDINTHE CONSOLIDATED FINANCIAL STATEMENTS USINGTHE EQUITY METHOD
| | | | | | | | | | |
Name/registered office | | Capital share | | Equity
as at 31 Dec. 2011 |
| | | % | | (EUR in millions) |
Railpool Holding GmbH & Co. KG, Munich, Germany | | | | 50.0 | | | | | 1 | |
Railpool GmbH, Munich, Germany | | | | 50.0 | | | | | 2 | |
Microfinance Enhancement Facility S.A., Luxembourg | | | | 9.4 | | | | | 147 | |
Green for Growth Fund, Southeast Europe S.A., Luxembourg | | | | 10.5 | | | | | 77 | |
AF Eigenkapitalfonds für deutschen Mittelstand GmbH & Co KG, Munich, Germany | | | | 47.7 | | | | | 9 | |
The leasing company Railpool GmbH was formed in 2008 as an asset manager for rail vehicles, and has been included in the consolidated financial statements as a jointly controlled entity accounted for using the equity method (with the equity share increased by the pro-rata net income share) since 2009. KfW IPEX-Bank holds a 50% share in Railpool GmbH and actively supports building up this company. Railpool Holding GmbH & Co. KG was already accounted for using the equity method in the consolidated financial statements in 2008. Railpool Holding GmbH & Co. KG covers all of the key elements in providing leasing for locomotives and other railway vehicles via various operating companies. Details of the areas of operation as well as a summary of financial information can be found on the respective companies’ websites (http://www.railpool.eu).
Microfinance Enhancement Facility S.A. (MEF), an associated entity, has also been accounted for using the equity method since 2009. The business area Promotion for developing and transition countries is responsible for MEF, a KfW investment in a refinancing facility for microfinance institutions.
Green for Growth Fund, Southeast Europe S.A. (GGF) as well as “AF Eigenkapitalfonds für deutschen Mittelstand GmbH & Co. KG” have been included in the consolidated financial statements as associates accounted for using the equity method since 2010. GGF is a fund to promote SME and private household investment in energy efficiency and renewable energy in the Western Balkans and in Turkey (business area: Promotion for developing and transition countries) The “Eigenkapitalfonds für deutschen Mittelstand” initiated by KW Bankengruppe and Commerzbank serves to provide equity for the sustainable development of larger SMEs (business area: KfW Mittelstandsbank).
SPECIAL FUNDS INCLUDEDINTHE CONSOLIDATED FINANCIAL STATEMENTS
| | | | | | | | | | |
Name | | Capital share | | Fund volume (IFRS)
as at 31 Dec. 2011 |
| | | % | | (EUR in millions) |
Frankfurt I | | | | 100.0 | | | | | 634 | |
Atlantik | | | | 100.0 | | | | | 566 | |
The investments held in the special security funds are part of KfW Bankengruppe’s strategic asset management.
163
Affiliated entities not included in the consolidated financial statements
Five affiliated entities, four jointly controlled entities, thirteen associated entities, and eight special purpose vehicles of minor significance to the presentation of the net assets, financial position and results of operations of KfW Bankengruppe have not been consolidated; instead they are shown in the statement of financial position under Securities and investments or Loans and advances. These companies account for approximately 0.1% of KfW Bankengruppe’s balance sheet total.
164
LISTOF KFW GROUP SHAREHOLDINGSASAT 31 DECEMBER 2011
| | | | | | | | | | | | | | | | | | | | | | | | | | | | | |
| No. | | Name | | Place | | Capital share in % | | CC 1) | | Exchange
rate EUR 1.00 =_CU 2) as at 31
Dec. 2011 | | Equity in
TCU 3) | | Net income in
TCU 3) |
KfW shareholdings | | | | | | | | | | | | | | | | | | | | | | | | | | | |
A. Fully consolidated affiliated entities included in the consolidated financial statements | |
1 | | DEG - Deutsche Investitions- und Entwicklungsgesellschaft mbH | | Cologne, Germany | | | | 100.0 | | | | | EUR | | | | | 1 | | | | | 1,700,287 | | | | | 217,900 | |
2 | | KfW Beteiligungsholding GmbH | | Bonn, Germany | | | | 100.0 | | | | | EUR | | | | | 1 | | | | | 343,445 | | | | | 67,473 | |
3 | | KfW IPEX-Beteiligungsholding GmbH | | Frankfurt am Main, Germany | | | | 100.0 | | | | | EUR | | | | | 1 | | | | | 1,626,490 | | | | | 527 | |
| | | | |
B. Affiliated entities not included in the consolidated financial statements | | | | | | | | | | | | | | | | | | | | | |
4 | | Astra Grundstücksgesellschaft mbH & Co. Bauträger KG | | Frankfurt am Main, Germany | | | | 100.0 | | | | | EUR | | | | | 1 | | | | | 1,500 | | | | | 0 | |
5 | | KfW International Finance Inc. i. L. | | Delaware, USA | | | | 100.0 | | | | | USD | | | | | 1.2939 | | | | | 0 | | | | | 0 | |
| | | | |
C. Jointly controlled entities not included in the consolidated financial statements | | | | | | | | | | | | | | | | | | | | | |
6 | | Berliner Energieagentur GmbH | | Berlin, Germany | | | | 25.0 | | | | | EUR | | | | | 1 | | | | | 3,647 | | | | | 304 | |
7 | | Deutsche Energie-Agentur GmbH (dena) | | Berlin, Germany | | | | 26.0 | | | | | EUR | | | | | 1 | | | | | 5,223 | | | | | 351 | |
|
D. Other shareholdings (only capital shares totalling at least 20%) | |
8 | | AF Eigenkapitalfonds für deutschen Mittelstand GmbH & Co. KG | | Munich, Germany | | | | 47.7 | | | | | EUR | | | | | 1 | | | | | 2,695 | | | | | -285 | |
9 | | Deutsche Post AG | | Bonn, Germany | | | | 30.5 | | | | | EUR | | | | | 1 | | | | | 10,696,000 | | | | | 2,630,000 | |
10 | | eCapital Technologies Fonds II GmbH & Co. KG | | Münster, Germany | | | | 24.8 | | | | | EUR | | | | | 1 | | | | | 23,541 | | | | | 116 | |
11 | | Mittelstandsfonds Hamburg MHH GMBH & CO. KG | | Hamburg, Germany | | | | 24.9 | | | | | EUR | | | | | 1 | | | | | 10,219 | | | | | -643 | |
12 | | Post 2012 Carbon Credit Fund CV | | Amsterdam, Netherlands | | | | 20.0 | | | | | EUR | | | | | 1 | | | | | 21 | | | | | -192 | |
13 | | Galaxy S.à.r.l. | | Luxembourg, Luxembourg | | | | 20.0 | | | | | EUR | | | | | 1 | | | | | 125,569 | | | | | 38,961 | |
| | | | | |
Shareholdings of KfW IPEX-Bank GmbH | | | | | | | | | | | | | | | | | | | | | | | | | |
|
A. Affiliated entities not included in the consolidated financial statements | |
1 | | Sperber Rail Holdings Inc. | | Wilmington, USA | | | | 100.0 | | | | | USD | | | | | 1.2939 | | | | | 373 | | | | | -330 | |
|
B. Jointly controlled entities included in the consolidated financial statements | |
2. | | Railpool GmbH | | Munich, Germany | | | | 50.0 | | | | | EUR | | | | | 1 | | | | | 1,993 | | | | | 845 | |
3 | | Railpool Holding GmbH & Co. KG | | Munich, Germany | | | | 50.0 | | | | | EUR | | | | | 1 | | | | | 1,195 | | | | | -5,038 | |
| | | | |
C. Jointly controlled entities not included in the consolidated financial statements | | | | | | | | | | | | | | | | | | | | | |
4 | | Movesta Development Capital Beteiligungsgesellschaft mbH | | Düsseldorf, Germany | | | | 50.0 | | | | | EUR | | | | | 1 | | | | | 2,429 | | | | | -196 | |
5 | | Canas Leasing Ltd. | | Dublin, Ireland | | | | 50.0 | | | | | USD | | | | | 1.2939 | | | | | 0 | | | | | 0 | |
165
| | | | | | | | | | | | | | | | | | | | | | | | | | | | | |
| No. | | Name | | Place | | Capital share in % | | CC 1) | | Exchange
rate EUR 1.00 =_CU 2) as at 31 Dec. 2011 | | Equity in
TCU 3) | | Net income in
TCU 3) |
|
D. Other shareholdings | |
(only capital shares totalling at least 20%) | | | | | | | | | | | | | | | | | | | | | |
6 | | Freighter Leasing S.A. | | Luxembourg, Luxembourg | | | | 22.2 | | | | | USD | | | | | 1.2939 | | | | | 13,969 | | | | | 10,123 | |
7 | | 8F Leasing S.A. 4) | | Luxembourg, Luxembourg | | | | 22.2 | | | | | USD | | | | | 1.2939 | | | | | n.a. | | | | | n.a. | |
| | | | | |
Shareholdings of tbg Technologie-Beteiligungs-Gesellschaft mbH | | | | | | | | | | | | | | | | | | | | | | | | | |
| | | | | |
A. Affiliated entities not included in the consolidated financial statements | | | | | | | | | | | | | | | | | | | | | | | | | |
1 | | Strategic European Technologies N.V. | | s-Hertogenbosch, Netherlands | | | | 52.0 | | | | | EUR | | | | | 1 | | | | | 29,413 | | | | | 2,443 | |
| | | | | |
B. Other shareholdings | | | | | | | | | | | | | | | | | | | | | | | | | |
(only capital shares totalling at least 20%) | | | | | | | | | | | | | | | | | | | | | | | | | |
2 | | Argantis GmbH | | Cologne, Germany | | | | 22.1 | | | | | EUR | | | | | 1 | | | | | 46,700 | | | | | -70 | |
3 | | AURELIA Technologie-Fonds I GmbH &Co. Beteiligungen KG | | Frankfurt am Main, Germany | | | | 24.6 | | | | | EUR | | | | | 1 | | | | | 5,728 | | | | | -1,231 | |
4 | | BioM VC GmbH & Co. Fonds KG | | Munich, Germany | | | | 22.3 | | | | | EUR | | | | | 1 | | | | | 2,148 | | | | | -10 | |
5 | | Business-Angel-Beteiligungsgesellschaft mbH & Co. KG | | Hannover, Germany | | | | 23.8 | | | | | EUR | | | | | 1 | | | | | 196 | | | | | 115 | |
6 | | Chromatec GmbH | | Greifswald, Germany | | | | 24.8 | | | | | EUR | | | | | 1 | | | | | 0 | | | | | -22 | |
7 | | cv cryptovision GmbH | | Gelsenkirchen, Germany | | | | 24.8 | | | | | EUR | | | | | 1 | | | | | 595 | | | | | 29 | |
8 | | eCapital New Technologies Fonds AG & Co.Unternehmensbeteiligungsgesellschaft KG | | Münster, Germany | | | | 24.8 | | | | | EUR | | | | | 1 | | | | | 2,730 | | | | | 629 | |
9 | | FAMA Fassaden GmbH | | Zottelstedt-Apolda, Germany | | | | 24.7 | | | | | EUR | | | | | 1 | | | | | 133 | | | | | 30 | |
10 | | FIB Fonds für Innovation und Beschäftigung Rheinland Pfalz UBG mbH | | Mainz, Germany | | | | 24.0 | | | | | EUR | | | | | 1 | | | | | 2,053 | | | | | -790 | |
11 | | IMH Venture Capital Berlin GmbH | | Berlin, Germany | | | | 26.8 | | | | | EUR | | | | | 1 | | | | | 69 | | | | | 770 | |
12 | | infoRoad GmbH | | Heroldsberg, Germany | | | | 22.5 | | | | | EUR | | | | | 1 | | | | | 0 | | | | | -21 | |
13 | | i42 Informationsmanagement GmbH | | Mannheim, Germany | | | | 20.9 | | | | | EUR | | | | | 1 | | | | | 75 | | | | | -97 | |
14 | | KTB Technologie Beteiligungsgesellschaft mbH & Co. KG | | Leverkusen, Germany | | | | 25.0 | | | | | EUR | | | | | 1 | | | | | 4,160 | | | | | 1,212 | |
15 | | Medizin Forum AG | | Bad Nauheim, Germany | | | | 24.9 | | | | | EUR | | | | | 1 | | | | | 44 | | | | | -28 | |
16 | | MicroVenture GmbH & Co. KGaA Beteiligungsgesellschaft | | Düsseldorf, Germany | | | | 23.3 | | | | | EUR | | | | | 1 | | | | | 4,500 | | | | | 4,050 | |
166
| | | | | | | | | | | | | | | | | | | | | | | | | | | | | |
| No. | | Name | | Place | | Capital share in % | | CC 1) | | Exchange
rate EUR 1.00 =_CU 2) as at 31
Dec. 2011 | | Equity in
TCU 3) | | Net income in TCU 3) |
17 | | Premium Bodywear AG | | Chemnitz, Germany | | | | 24.0 | | | | | EUR | | | | | 1 | | | | | 442 | | | | | 48 | |
18 | | Prudsys AG | | Chemnitz, Germany | | | | 24.9 | | | | | EUR | | | | | 1 | | | | | 936 | | | | | -883 | |
19 | | Saarländische Wagnisfinanzierungsgesellschaft mbH | | Saarbrücken, Germany | | | | 20.4 | | | | | EUR | | | | | 1 | | | | | 6,551 | | | | | 167 | |
20 | | Sachsen LB V.C. GmbH & Co. KG | | Leipzig, Germany | | | | 24.8 | | | | | EUR | | | | | 1 | | | | | 4,755 | | | | | 100 | |
21 | | Sepiatec GmbH | | Berlin, Germany | | | | 21.9 | | | | | EUR | | | | | 1 | | | | | 0 | | | | | 34 | |
22 | | SHS Gesellschaft für Beteiligungen mbH & Co. Mittelstand KG | | Tübingen, Germany | | | | 24.8 | | | | | EUR | | | | | 1 | | | | | 5,090 | | | | | -111 | |
23 | | S-ReFIT AG | | Regensburg, Germany | | | | 21.5 | | | | | EUR | | | | | 1 | | | | | 26,814 | | | | | 1,487 | |
24 | | Technologie Beteiligungsfonds Bayern GmbH & Co. KG | | Munich, Germany | | | | 25.0 | | | | | EUR | | | | | 1 | | | | | 3,736 | | | | | 203 | |
25 | | Technologie Beteiligungsfonds Bayern Verwaltungs GmbH | | Landshut, Germany | | | | 25.0 | | | | | EUR | | | | | 1 | | | | | 35 | | | | | 1 | |
26 | | Tübinger Seed Fonds KG | | Tübingen, Germany | | | | 21.9 | | | | | EUR | | | | | 1 | | | | | 636 | | | | | -2 | |
27 | | TVM Medical Ventures GmbH & Co. KG | | Munich, Germany | | | | 23.3 | | | | | EUR | | | | | 1 | | | | | 6,390 | | | | | -425 | |
28 | | Venture Capital Thüringen GmbH & Co. KG | | Erfurt, Germany | | | | 24.9 | | | | | EUR | | | | | 1 | | | | | 9,019 | | | | | 1,100 | |
29 | | Wikon Kommunikationstechnik GmbH | | Kaiserslautern, Germany | | | | 20.0 | | | | | EUR | | | | | 1 | | | | | 0 | | | | | 1,079 | |
| | | | |
Shareholdings of KfW IPEX Beteiligungsholding GmbH | | | | | | | | | | | | | | | | | | | | | |
| | | | |
A. Fully consolidated affiliated entities included in the consolidated financial statements | | | | | | | | | | | | | | | | | | | | | |
1 | | KfW IPEX Bank GmbH | | Frankfurt am Main, Germany | | | | 100.0 | | | | | EUR | | | | | 1 | | | | | 2,589,550 | | | | | 30,148 | |
| | | | | |
Shareholdings of KfW Beteiligungsholding GmbH | | | | | | | | | | | | | | | | | | | | | | | | | |
| | | |
A. Fully consolidated affiliated entities included in the consolidated financial statements | | | | | | | | | | | | | | | | |
1 | | Finanzierungs- und Beratungsgesellschaft mbH | | Berlin, Germany | | | | 100.0 | | | | | EUR | | | | | 1 | | | | | 13,451 | | | | | 161 | |
2 | | tbg Technologie-Beteiligungsgesellschaft mbH | | Bonn, Germany | | | | 100.0 | | | | | EUR | | | | | 1 | | | | | 273,600 | | | | | 0 | |
| | | | | |
B. Affiliated entities not included in the consolidated financial statements | | | | | | | | | | | | | | | | | | | | | | | | | |
3 | | ASTRA Grundstücksgesellschaft mbH | | Frankfurt, Germany | | | | 100.0 | | | | | EUR | | | | | 1 | | | | | 59 | | | | | 0 | |
|
Shareholdings of DEG – Deutsche Investitions- und Entwicklungsgesellschaft mbH | |
| | | | | |
A. Other shareholdings (only capital shares totalling at least 20%) | | | | | | | | | | | | | | | | | | | | | | | | | |
1 | | PCC-DEG Renewables GmbH | | Duisburg, Germany | | | | 40.0 | | | | | EUR | | | | | 1 | | | | | 12,149 | | | | | -432 | |
2 | | Banque Nationale de Dévelopement Agricole | | Bamako, Mali | | | | 21.4 | | | | | XOF | | | | | 655.957 | | | | | 15,740,862 | | | | | 3,550,781 | |
3 | | Corporate Leasing Company Egypt | | Cairo, Egypt | | | | 22.2 | | | | | EGP | | | | | 7.81043 | | | | | 148,774 | | | | | 40,168 | |
167
| | | | | | | | | | | | | | | | | | | | | | | | | | | | | |
| No. | | Name | | Place | | Capital share in % | | CC 1) | | Exchange
rate EUR 1.00 =_CU 2) as at 31
Dec. 2011 | | Equity in
TCU 3) | | Net income in TCU 3) |
4 | | Tourism Promotion Services Ltd. | | Kigali, Rwanda | | | | 26.7 | | | | | RWF | | | | | 779.005 | | | | | 9,991,117 | | | | | 120,488 | |
5 | | Banyan Tree Growth Capital | | Port Louis, Mauritius | | | | 27.0 | | | | | USD | | | | | 1.2939 | | | | | 42,729 | | | | | -3,098 | |
6 | | NAMF II (Mauritius) Limited 4) | | Ebene, Mauritius | | | | 29.1 | | | | | USD | | | | | 1.2939 | | | | | n.a. | | | | | n.a. | |
7 | | The SEAF Central and Eastern Europe Growth Fund | | Washington, D.C., USA | | | | 25.0 | | | | | USD | | | | | 1.2939 | | | | | 12,473 | | | | | -246 | |
8 | | SAE Towers, LP | | Washington, D.C., USA | | | | 26.9 | | | | | USD | | | | | 1.2939 | | | | | 18,086 | | | | | -4,010 | |
9 | | Kendall Court Mezzanine (Asia) Bristol Merit Fund L.P. | | Cayman Islands | | | | 24.4 | | | | | USD | | | | | 1.2939 | | | | | 24,617 | | | | | -1,134 | |
10 | | Tolstoi Investimentos S.A. | | Sao Paulo, Brazil | | | | 31.1 | | | | | BRL | | | | | 2.41625 | | | | | 83,420 | | | | | 17,205 | |
11 | | Acon Latin American Opportunities Fund-A, L.P. | | Washington, D.C., USA | | | | 40.0 | | | | | USD | | | | | 1.2939 | | | | | 23,970 | | | | | -1,593 | |
12 | | EMX Capital Partners LP 4) | | Mexico City, Mexico | | | | 37.2 | | | | | USD | | | | | 1.2939 | | | | | n.a. | | | | | n.a. | |
13 | | Mongolia Opportunities Fund I LP 4) | | Grand Cayman, Cayman Islands | | | | 20.0 | | | | | USD | | | | | 1.2939 | | | | | n.a. | | | | | n.a. | |
14 | | Worldwide Group Inc. 4) | | Charlestown, Saint Christopher-Nevis-Anguilla | | | | 32.3 | | | | | USD | | | | | 1.2939 | | | | | n.a. | | | | | n.a. | |
15 | | Russia Partners Technology Fund LP 4) | | New York, USA | | | | 27.7 | | | | | USD | | | | | 1.2939 | | | | | n.a. | | | | | n.a. | |
16 | | H&Q Philippine Holdings, Inc. | | Manila, Philippines | | | | 50.0 | | | | | PHP | | | | | 56.7730 | | | | | 42,042 | | | | | 5,025 | |
17 | | Benetex Industries Ltd. | | Dhaka, Bangladesh | | | | 28.3 | | | | | BDT | | | | | 105.9781 | | | | | 180,542 | | | | | -97,672 | |
18 | | Langfang Hess Building Materials Machinery, Co. Ltd. | | Langfang, China | | | | 40.0 | | | | | CNY | | | | | 8.1588 | | | | | 42,040 | | | | | 4,921 | |
19 | | Jade Cargo International Co. Ltd. | | Shenzhen, China | | | | 24.0 | | | | | CNY | | | | | 8.1588 | | | | | -522,061 | | | | | 149,383 | |
20 | | The New Baghlan Sugar Company Ltd. | | Baghlan-e Sonhati, Afghanistan | | | | 30.3 | | | | | AFN | | | | | 63.7584 | | | | | 400,208 | | | | | -16,735 | |
21 | | HaPe International Ningbo Ltd. | | Ningbo, China | | | | 37.5 | | | | | CNY | | | | | 8.1588 | | | | | 88,476 | | | | | 12,762 | |
22 | | Wanfeng MotorcycleWheel Co. Ltd. | | Xinchang, China | | | | 25.0 | | | | | CNY | | | | | 8.1588 | | | | | 654,980 | | | | | 176,404 | |
23 | | Ace Power Pvt. Ltd. | | Colombo, Sri Lanka | | | | 26.0 | | | | | LKR | | | | | 147.5120 | | | | | 3,937,420 | | | | | 1,078,853 | |
24 | | OJSC Tourism Promotion Services | | Dushanbe, Tajikistan | | | | 21.0 | | | | | TJS | | | | | 6.1570 | | | | | -251 | | | | | -192 | |
25 | | Asia Insurance 1950 Company Ltd. | | Bangkok, Thailand | | | | 24.6 | | | | | THB | | | | | 40.9640 | | | | | 179,306 | | | | | -19,846 | |
26 | | WPD Energy Vietnam Company Ltd. | | Hanoi, Vietnam | | | | 30.0 | | | | | VND | | | | | 27.2405 | | | | | -156,687 | | | | | -784,592 | |
168
| | | | | | | | | | | | | | | | | | | | | | | | | | | | | |
| No. | | Name | | Place | | Capital share in % | | CC 1) | | Exchange
rate EUR 1.00 =_CU 2) as at 31
Dec. 2011 | | Equity in TCU 3) | | Net income in TCU 3) |
27 | | PT Avrist Assurance | | Jakarta, Indonesia | | | | 23.0 | | | | | IDR | | | | | 11.7433 | | | | | 1,421,471,000 | | | | | 193,806,000 | |
28 | | Windprojektentwicklung Thailand 4) | | Bangkok, Thailand | | | | 33.3 | | | | | THB | | | | | 40.9640 | | | | | n.a. | | | | | n.a. | |
29 | | TOO Knauf Gips Kaptschagaij GmbH | | Kapshagaij, Kazakhstan | | | | 40.0 | | | | | KZT | | | | | 192.34 | | | | | 7,647,745 | | | | | 1,583,615 | |
30 | | PII TOW Ukrspon LLC | | Kiev, Ukraine | | | | 20.2 | | | | | EUR | | | | | 1 | | | | | 1,475 | | | | | 371 | |
31 | | Tirana Airport Partners SHPK | | Rinas, Albania | | | | 31.7 | | | | | EUR | | | | | 1 | | | | | 30,614 | | | | | 8,501 | |
32 | | Center-Invest Bank | | Rostov-on-Don, Russ. Federation | | | | 22.5 | | | | | RUB | | | | | 41.765 | | | | | 5,774,088 | | | | | 219,814 | |
33 | | TOO Isi Gips Inder | | Inderborskij, Kazakhstan | | | | 40.0 | | | | | KZT | | | | | 192.34 | | | | | 1,494,684 | | | | | 102,033 | |
34 | | Emerging Europe Leasing and Finance (EELF) B.V. | | Amsterdam, Netherlands | | | | 25.0 | | | | | EUR | | | | | 1 | | | | | 18,883 | | | | | 727 | |
35 | | OOO Gematek | | Saint Petersburg, Russ. Federation | | | | 28.0 | | | | | RUB | | | | | 41.765 | | | | | 290,605 | | | | | 83,886 | |
| (2) | CU -Currency units in local currency |
| (3) | Financial statements prepared in accordance with local financial reporting framework |
| (4) | The company is in the start-up phase. No financial statements have been prepared yet. |
169
Reprint of the Auditor’s Report
Based on the final results of our audit we issued the following unqualified auditor’s report dated February 28, 2012
“Auditor’s report
We have audited the consolidated financial statements prepared by KfW, Frankfurt am Main, comprising the statement of comprehensive income, statement of financial position, statement of changes in equity, statement of cash flows and the notes to the consolidated financial statements, together with the group management report for the business year from 1 January to 31 December 2011. The preparation of the consolidated financial statements and the group management report in accordance with IFRSs, as adopted by the EU, and the additional requirements of German commercial law pursuant to § (Article) 315a Abs. (paragraph) 1 HGB [Handelsgesetzbuch “German Commercial Code”] and supplementary provisions of the Law concerning KfW (KfW Law) are the responsibility of KfW’s Executive Board. Our responsibility is to express an opinion on the consolidated financial statements and on the group management report based on our audit.
We conducted our audit of the consolidated financial statements in accordance with § 317 HGB [Handelsgesetzbuch “German Commercial Code”] and German generally accepted standards for the audit of financial statements promulgated by the Institut der Wirtschaftsprüfer [Institute of Public Auditors in Germany] (IDW). Those standards require that we plan and perform the audit such that misstatements materially affecting the presentation of the net assets, financial position and results of operations in the consolidated financial statements in accordance with the applicable financial reporting framework and in the group management report are detected with reasonable assurance. Knowledge of the business activities and the economic and legal environment of the Group and expectations as to possible misstatements are taken into account in the determination of audit procedures. The effectiveness of the accounting-related internal control system and the evidence supporting the disclosures in the consolidated financial statements and the group management report are examined primarily on a test basis within the framework of the audit. The audit includes assessing the annual financial statements of those entities included in consolidation, the determination of entities to be included in consolidation, the accounting and consolidation principles used and significant estimates made by the Executive Board, as well as evaluating the overall presentation of the consolidated financial statements and the group management report. We believe that our audit provides a reasonable basis for our opinion.
Our audit has not led to any reservations.
In our opinion, based on the findings of our audit, the consolidated financial statements comply with IFRSs, as adopted by the EU and the additional requirements of German commercial law pursuant to § 315a Abs. 1 HGB and supplementary provisions of the KfW Law and give a true and fair view of the net assets, financial position and results of operations of the group in accordance with these requirements. The group management report is consistent with the consolidated financial statements and as a whole provides a suitable view of the Group’s position and suitably presents the opportunities and risks of future development.”
Frankfurt am Main, 28 February 2012
KPMG AG
Wirtschaftsprüfungsgesellschaft
| | | | |
| | Mock | | Schweitzer |
| | Wirtschaftsprüfer | | Wirtschaftsprüfer |
| | (German Public Auditor) | | (German Public Auditor) |
170
THE FEDERAL REPUBLIC OF GERMANY
GENERAL
Area, Location and Population
The Federal Republic is situated in central Europe and comprises an area of about 357,000 square kilometers (about 138,000 square miles). Its total population was in the range of 81.8 million in 2010. Approximately 16% of the total population is concentrated in metropolitan areas with more than 500,000 inhabitants; the largest of these areas are (in descending order) Berlin, Hamburg, Munich, Cologne and Frankfurt am Main.
Source: Statistisches Bundesamt, Statistisches Jahrbuch 2011, Tables 2.1.1, 2.4, 2.5, and 2.6.
Government
The Federal Republic is a federated republic whose constitution is codified in the Grundgesetz of 1949. The capital of the Federal Republic is Berlin. The Federal Republic consists of 16 federal states (Länder). The Länder have legislative sovereignty over matters not expressly reserved to the legislative, executive and judicial bodies of the Federal Republic.
The Grundgesetz provides for a Federal President (Bundespräsident), two Houses of Parliament (the Bundestag and the Bundesrat, which consists of representatives of the 16 Länder governments), a Chancellor (Bundeskanzler) and a Federal Constitutional Court (Bundesverfassungsgericht). The Chancellor heads the Federal Government (Bundesregierung), consisting of the Chancellor and the Federal Ministers. The Bundespräsident acts as head of state.
General elections for the Bundestag are generally held every four years on the basis of an electoral system of proportional representation. The last general election was held on September 27, 2009.
A political party is not entitled to party representation in the Bundestag unless it receives at least 5% of the votes cast or three direct mandates in a general election. The Chancellor is elected by and is responsible to the Bundestag.
Political Parties
The political parties currently represented in the Bundestag are the Christian Democratic Union (CDU) and its Bavarian sister party, the Christian Social Union (CSU), the Social Democratic Party (SPD), the Free Democratic Party (FDP), the Left-Wing Party (Die Linke., founded in 2007 by the merger of the Left-Wing Party of Democratic Socialism (Linkspartei.PDS) and the party Labor and Social Justice - The Election Alternative (WASG)), and the Greens (Bündnis 90/Die Grünen).
Since 1949, the Federal Republic has been governed by eight Chancellors over 17 electoral periods. The most recent general election, held in September 2009, resulted in a coalition between the Christian Democrats (CDU/CSU) and the Free Democratic Party (FDP), led by Chancellor Ms. Dr Angela Merkel (CDU). Ms. Dr Merkel has been serving as Chancellor since 2005.
Sources: The Federal Returning Officer, Official final result of the 2009 Bundestag election, press release of October 14, 2009
(http://www.bundeswahlleiter.de/en/bundestagswahlen/BTW_BUND_09/presse/75_EndgueltigesErgebnis.html); Growth. Education. Unity. Coalition Agreement between CDU, CSU and FDP (http://www.cdu.de/doc/pdfc/091215-koalitionsvertrag-2009-2013-englisch.pdf).
G-1
The following table shows the results of the five most recent general elections for the Bundestag.
ELECTION RESULTSTOTHE GERMAN BUNDESTAG
| | | | | | | | | | | | | | | | | | | | | | | | | | | | | | | | | | | | | | | | | | | | | | | | | | |
| | | 2009 Elections | | 2005 Elections | | 2002 Elections | | 1998 Elections | | 1994 Elections |
| | | % of
Votes | | Seats | | % of
Votes | | Seats | | % of
Votes | | Seats | | % of
Votes | | Seats | | % of
Votes | | Seats |
| | | | | | | | | | |
CDU/CSU | | | | 33.8 | | | | | 239 | | | | | 35.2 | | | | | 226 | | | | | 38.5 | | | | | 248 | | | | | 35.1 | | | | | 245 | | | | | 41.4 | | | | | 294 | |
SPD | | | | 23.0 | | | | | 146 | | | | | 34.2 | | | | | 222 | | | | | 38.5 | | | | | 251 | | | | | 40.9 | | | | | 298 | | | | | 36.4 | | | | | 252 | |
FDP | | | | 14.6 | | | | | 93 | | | | | 9.8 | | | | | 61 | | | | | 7.4 | | | | | 47 | | | | | 6.2 | | | | | 43 | | | | | 6.9 | | | | | 47 | |
Die Linke. (1) | | | | 11.9 | | | | | 76 | | | | | 8.7 | | | | | 54 | | | | | 4.0 | | | | | 2 | | | | | 5.1 | | | | | 36 | | | | | 4.4 | | | | | 30 | |
Bündnis 90/Die Grünen | | | | 10.7 | | | | | 68 | | | | | 8.1 | | | | | 51 | | | | | 8.6 | | | | | 55 | | | | | 6.7 | | | | | 47 | | | | | 7.3 | | | | | 49 | |
Others | | | | 6.0 | | | | | — | | | | | 3.9 | | | | | — | | | | | 3.0 | | | | | — | | | | | 5.9 | | | | | — | | | | | 3.6 | | | | | — | |
| | | | | | | | | | | | | | | | | | | | | | | | | | | | | | | | | | | | | | | | | | | | | | | | | | |
Total | | | | | | | | | 622 | | | | | | | | | | 614 | | | | | | | | | | 603 | | | | | | | | | | 669 | | | | | | | | | | 672 | |
| | | | | | | | | | | | | | | | | | | | | | | | | | | | | | | | | | | | | | | | | | | | | | | | | | |
| (1) | Results for the Party of Democratic Socialism (PDS) for all elections prior to 2005. |
Sources: Statistisches Bundesamt, Statistisches Jahrbuch 2011, Tables 4.3 and 4.6; Statistisches Bundesamt, Statistisches Jahrbuch 2009, Tables 4.3 and 4.6.
International Organizations
In addition to the European Union (“EU”), the Federal Republic is a member of various major multilateral institutions, including the United Nations, the International Monetary Fund (“IMF”), the International Bank for Reconstruction and Development and the International Development Association (“World Bank”), the Council of Europe, the Organization for Economic Cooperation and Development (“OECD”), the West European Union (“WEU”), and the North Atlantic Treaty Organization (“NATO”). In addition, the Federal Republic is a signatory to the General Agreement on Tariffs and Trade (“GATT”) and a member of the World Trade Organization (“WTO”). It is also a shareholder of, among others, the European Investment Bank, the European Bank for Reconstruction and Development, and the European Atomic Energy Community.
The European Union and European Integration
The Federal Republic was a founding member of the European Coal and Steel Community (“ECSC”) in 1951, which later developed into the European Union. Today, the Federal Republic is one of 27 member states of the EU (the “Member States”). On January 1, 2007, Bulgaria and Romania became part of the EU, joining the EU’s previous members Austria, Belgium, Cyprus, the Czech Republic, Denmark, Estonia, Finland, France, Germany, Greece, Hungary, Ireland, Italy, Latvia, Lithuania, Luxembourg, Malta, the Netherlands, Poland, Portugal, the Slovak Republic, Slovenia, Spain, Sweden, and the United Kingdom. According to provisional data, the aggregate population of the Member States was approximately 502 million as of January 1, 2011. The EU is still in the process of enlargement. Croatia has been granted accession country status after a successful Croatian referendum on January 22, 2012 and, pending ratification by the Member States’ parliaments will become the twenty-eighth Member State on July 1, 2013. Formal membership negotiations have been opened with Turkey and Iceland. Former Yugoslav Republic of Macedonia, Serbia, and Montenegro have been granted candidate status. Albania, Bosnia and Herzegovina, and Kosovo are potential candidates.
Sources: Europa.eu, The history of the European Union (http://europa.eu/about-eu/eu-history/index_en.htm); Europa.eu, 2000-2009: The history of the European Union, Further expansion (http://europa.eu/about-eu/eu-history/2000-2009/index_en.htm); Statistical Office of the European Communities, Total population (http://epp.eurostat.ec.europa.eu/tgm/table.do?tab=table&language=en&pcode=tps00001&tableSelection=1&footnotes=yes&labeling=labels&plugin=1); Europa.eu, Joint statement of European Commission President Barroso and European Council President Van Rompuy on the outcome of the EU accession referendum in Croatia, press release dated January 22, 2012 (http://europa.eu/rapid/pressReleasesAction.do?reference=MEMO/12/29&format=HTML&aged=0&language=EN&guiLanguage=en); Europa.eu, Enlargement, The policy, Countries on the road to EU membership (http://ec.europa.eu/enlargement/the-policy/countries-on-the-road-to-membership/index_en.htm).
G-2
Economic Integration
From its inception, the EU has had the fundamental objective, like its predecessors, of economic integration of its Member States. Culminating a long process, a single market that provides for the free movement of goods and services, persons and capital among the Member States was established as of January 1, 1993. The integration of the Member States’ economies and the completion of a single market are also promoted by a European competition policy, which aims at creating a level playing field for Member States’ companies, and promoting economic efficiency, and a European consumer policy. In addition, various liberalization and harmonization measures are being implemented, for example in the telecommunication and energy sectors. In the financial sector, the single market has been fostered by providing for the free movement of capital and the freedom to perform banking services throughout the EU under the “single passport,” which enables financial institutions to provide financial services throughout the EU based on a single license obtained in one Member State. Another important policy area for the EU has been agriculture. Subsidies to this sector make up more than 40% of the EU’s budget. The EU also promotes economic integration with regional aid, which is designed to focus development efforts on certain disadvantaged regions and sections of population of the EU.
The financial framework for the enlarged EU for the period from 2007 until 2013 was formally adopted on May 17, 2006, with an Interinstitutional Agreement (“IIA”) signed by the European Parliament (the “Parliament”), the Council of the European Union (the “Council”) and the European Commission. Among other things, the IIA defines maximum amounts for commitment appropriations, which cover commitments made to spend funds over one or more years in certain expenditure categories. Additionally, the IIA defines an annual maximum amount for payment appropriations, which cover payments made to honor the legal commitments entered into during the current financial year and/or earlier financial years. The 2012 EU budget, which was adopted by the Parliament on December 1, 2011, amounts to EUR 147.2 billion in commitment appropriations and EUR 129.1 billion in payment appropriations. The amount of commitment appropriations corresponds to 1.12% of the EU gross national income, while the amount of payment appropriations corresponds to 0.98% of the EU gross national income.
Sources: Europa.eu, What does the EU do? (http://europa.eu/abc/12lessons/lesson_5/index_en.htm); Europe.eu, The single market (http://europa.eu/abc/12lessons/lesson_6/index_en.htm); European Commission, Banking (http://ec.europa.eu/internal_market/bank/index_en.htm); European Commission, Financial Programming and Budget, Budget in figures, Financial framework 2007-2013 (http://ec.europa.eu/budget/figures/fin_fwk0713/fwk0713_en.cfm#cf07_13); Official Journal of the European Union, Interinstitutional Agreement between the European Parliament, the Council and the Commission on budgetary discipline and sound financial management (2006/C 139/01) (http://eur-lex.europa.eu/LexUriServ/LexUriServ.do?uri=OJ:C:2006:139:0001:0017:EN:PDF); European Commission, Financial Programming and Budget, Budget in figures, 2012 (http://ec.europa.eu/budget/figures/2012/2012_en.cfm).
G-3
Monetary Integration
The Federal Republic is a signatory to and has ratified the Treaty on European Union of February 1992 (also known as the “Maastricht Treaty”). The Maastricht Treaty was the basis for the establishment of the European Economic and Monetary Union (“EMU”). The EMU led, in turn, to the adoption of irrevocable conversion rates between the euro and the national currencies of the initial participating Member States on December 31, 1998 and the introduction of the euro as the single European currency in the “euro area” on January 1, 1999. On January 1, 2002, banknotes and coins denominated in euro were introduced as legal tender to replace the national currencies in the 12 Member States forming the euro area at that time (Austria, Belgium, Finland, France, Germany, Greece, Ireland, Italy, Luxembourg, the Netherlands, Portugal and Spain). Slovenia, Malta, Cyprus, and Slovakia subsequently joined as Member States. In January 2011, Estonia joined as the seventeenth Member State.
The European Central Bank (“ECB”) was established on June 1, 1998, as part of the European System of Central Banks (“ESCB”). According to the Maastricht Treaty, the primary objective of the ESCB is to maintain price stability. Without prejudice to the objective of price stability, the ESCB supports the general economic policies of the EU. See “Monetary and Financial System” for more information on the ECB and ESCB. The Eurosystem, consisting of the ECB and the national central banks of those Member States whose currency is the euro (the “Euro Area Member States”), assumed sole responsibility for the monetary policy in the euro area on January 1, 1999.
Sources: The European Union, Treaty on European Union (http://eur-lex.europa.eu/en/treaties/dat/11992M/htm/11992M.html); The European Central Bank, Economic and Monetary Union (EMU) (http://www.ecb.int/ecb/history/emu/html/index.en.html); The European Central Bank, The first ten years (http://www.ecb.int/ecb/10ann/html/index.en.html)
EU Economic Governance
In light of the challenges posed by the ongoing economic and financial crisis in certain Euro Area Member States, the Member States have taken a series of measures to strengthen economic and budgetary coordination for the EU as a whole and for the euro area in particular. The process is still ongoing. The enhanced and strengthened EU economic governance framework consists of the following main components.
Stability and Growth Pact. To ensure continuous budgetary discipline in the EMU, the Member States established the Stability and Growth Pact (the “SGP”) in 1996. A package of six new legislative acts (the so-called “six-pack”) entered into force on December 13, 2011. Parts of the six-pack reinforce both the preventive and the corrective arm of the SGP. The preventive arm of the SGP guides Member States towards a country-specific, medium-term budgetary objective, which seeks to ensure the sustainability of public finances. To assess progress towards the medium-term budgetary objective, in addition to the structural budget balance (defined as the cyclically adjusted balance net of one-off and temporary measures), the new rules provide for a new “expenditure benchmark.” This expenditure benchmark places a cap on the annual growth of public expenditure according to a medium-term rate of GDP growth. For Member States that have not yet reached their medium-term budgetary objective, the rate of growth of expenditure should be below this reference rate in order to ensure adequate progress. Under the amended SGP, a significant deviation from the medium-term budgetary objective, or from an appropriate adjustment path towards it, can lead to a financial sanction for Euro Area Member States (an interest-bearing deposit of 0.2% of GDP). A sanction is proposed by the European Commission and adopted by reverse qualified majority voting in the Economic and Finance Affairs Council (the “Ecofin Council”), a mechanism which implies that a recommendation or a proposal of the Commission is considered adopted in the Ecofin Council unless a qualified majority of Member States votes against it, thus ensuring more automatic enforcement.
The corrective arm of the SGP consists of the excessive deficit procedure (“EDP”). The EDP is a mechanism established in the EU treaties requiring Member States to keep their general government deficits equal or below 3% of GDP and general government gross debt equal or below (or on a sufficiently downward trend towards) 60% of GDP. Previously, the implementation of the EDP by EU regulations only provided for an EDP to be triggered on the basis of a deficit in excess of 3% of GDP. The new six-pack gives effect to the debt criterion, so that an EDP may also be launched on the basis of a debt ratio in excess of 60% of GDP. A Member State may become subject to an EDP even if its deficit is equal or below 3% of GDP if the gap between its debt level and the 60% reference is not reduced by 1/20th annually. The EDP provides that the Ecofin Council decides with a qualified majority whether an excessive deficit has been incurred after taking into account all relevant factors that have been agreed upon by Member States as well as the impact of the economic cycle. If it concludes that there is an excessive deficit, the Ecofin Council, based on recommendations by the European Commission, suggests corrective measures aimed at a deficit reduction and then reviews the corrective measures taken by the Member State. Under the amended SGP, financial sanctions for Euro Area Member States are imposed at an earlier stage of the EDP. A non-interest bearing deposit of 0.2% of GDP may be requested from a Euro Area Member State which is placed in an EDP on
G-4
the basis of its deficit or its debt. Failure of a Euro Area Member State to comply with recommendations for corrective action will result in a fine of 0.2% of GDP. As in the preventive arm of the SGP, these new sanctions will be proposed by the European Commission and adopted by reverse qualified majority voting in the Ecofin Council. Finally, if the Euro Area Member State further fails to take effective action, the sanctions already provided for in the EU treaties can be imposed (as a rule, a fine of up to 0.5% of GDP).
For information on the pending EDP with respect to the Federal Republic, see “Public Finance—Germany’s General Government Deficit/Surplus, the General Government Gross Debt and the Excessive Deficit Procedure.”
Sources: European Council, Dublin European Council 13 and 14 December 1996 Presidency Conclusions
(http://europa.eu/rapid/pressReleasesAction.do?reference=DOC/96/8&format=HTML&ag ed=1&language=EN&guiLanguage=en); Consolidated versions of the Treaty on European Union and the Treaty on the Functioning of the European Union (http://eur-lex.europa.eu/JOHtml.do?uri=OJ:C:2010:083:SOM:EN:HTML); European Commission, Economic and Financial Affairs, Economic Governance (http://ec.europa.eu/economy_finance/economic_governance/index_en.htm); European Commission, Economic and Financial Affairs, Economic Governance, Stability and Growth Pact (http://ec.europa.eu/economy_finance/economic_governance/sgp/index_en.htm); Six-pack? Two-pack? Fiscal compact? A short guide to the new EU fiscal governance (http://ec.europa.eu/economy_finance/articles/governance/2012-03-14_six_pack_en.htm); EU Economic governance “Six-Packs” enters into force, press release of December 12, 2011 (http://europa.eu/rapid/pressReleasesAction.do?reference=MEMO/11/898).
Macroeconomic Imbalance Procedure. The economic and financial crisis in the euro area demonstrated a need for strengthened surveillance of the economic policies of the Member States beyond the fiscal field. Accordingly, in 2011 the macroeconomic imbalance procedure (“MIP”) was established as part of the six-pack legislation described above. The aim of the MIP is to identify potential risks early on, prevent the emergence of harmful imbalances and correct the existing excessive imbalances. The preventive arm of the process relies on an early warning system that uses a scoreboard of indicators and in-depth country studies. It allows the European Commission and the Council to adopt recommendations to the Member State affected at an early stage. In cases when excessive macroeconomic imbalances have already arisen, there is a corrective arm according to which an excessive imbalance procedure (“EIP”) may be initiated against a Member State by a Council decision with qualified majority. In this case, the Member State concerned will have to submit a corrective action plan which will be monitored by the European Commission on the basis of regular progress reports submitted by such Member State. In addition, a new enforcement regime has been introduced for Euro Area Member States, which, as an ultima ratio, imposes financial sanctions if the Euro Area Member State repeatedly does not comply with its obligations. The Council is to rely on reverse qualified majority voting to take the decisions leading up to sanctions. The financial sanctions may eventually result in a fine up to 0.1% of GDP.
Sources: European Commission, Economic and Financial Affairs, Economic Governance, Macroeconomic Imbalance Procedure (http://ec.europa.eu/economy_finance/economic_governance/macroeconomic_imbalance_procedure/index_en.htm); EU Economic governance “Six-Pack” enters into force, press release of December 12, 2011 (http://europa.eu/rapid/pressReleasesAction.do?reference=MEMO/11/898).
Treaty on Stability, Coordination and Governance in the EMU. On March 2, 2012, the Heads of State or Government of all Member States, with the exception of the United Kingdom and the Czech Republic, signed the Treaty on Stability, Coordination and Governance in the EMU. This treaty will enter into force once twelve Euro Area Member States have ratified it. Its provisions will be binding for Euro Area Member States, while the other Member States will only be bound if they adopt the euro, unless they declare their intention to be bound by certain provisions of the treaty at an earlier date. The core set of rules aims at further strengthening fiscal discipline within the euro area and is also known as the “fiscal compact.” The Treaty on Stability, Coordination and Governance in the EMU is not EU law but an entirely new intergovernmental agreement. Therefore, the fiscal compact will not replace the SGP but be applicable in parallel once it enters into force. The fiscal compact requires contracting parties to ensure convergence towards the country-specific MTO, as defined in the SGP, with an upper limit of a structural deficit of 0.5% of GDP. In the event of a deviation from this rule, an automatic correction mechanism is to be triggered, with escape clauses for exceptional circumstances. These budget rules are to be transposed into national law through provisions of “binding force and permanent character, preferably constitutional” one year after the entry into force of the treaty. If a Member State does not comply with this obligation, the matter will automatically be brought before the EU Court of Justice. The court’s judgment would be binding, and, in the case of non-compliance with the judgment, could be followed up with a penalty of up to 0.1% of GDP, payable to the European Stability Mechanism (“ESM”) in the case of Euro Area Member States. Moreover, the contracting parties agreed that financial assistance will only be granted under the ESM, if the relevant Member State has ratified the Treaty on Stability, Coordination and Governance in the EMU by March 1, 2013 and transposed the provisions relating to the balanced budget rule into national law within the time frame set in the fiscal compact. For more information, see “—Response to the European Sovereign Debt Crisis—Treaty on the European Stability Mechanism.” Finally, the fiscal compact includes a commitment by Euro Area Member States to adopt the European Commission’s recommendations in the framework of an EDP unless opposed by a qualified majority. In fact, this commitment extends the use of reverse qualified majority voting to all stages of an EDP, even if this is not provided for in the EU treaties and regulations.
G-5
Sources: Six-pack? Two-pack? Fiscal compact? A short guide to the new EU fiscal governance
(http://ec.europa.eu/economy_finance/articles/governance/2012-03-14_six_pack_en.htm); Fiscal compact signed: Strengthened fiscal discipline and convergence in the euro area, press release of March 2, 2012 (http://www.consilium.europa.eu/uedocs/cms_data/docs/pressdata/en/ec/128454.pdf); Bundesregierung, Ein Vertrag für mehr Stabilität in der Wirtschafts- und Währungsunion, press release of March 7, 2012 (http://www.bundesregierung.de/Content/DE/Artikel/2012/03/2012-03-07-kabinett-fiskalvertrag.html).
Response to the European Sovereign Debt Crisis
Temporary Financial Backstop Mechanism. In May 2010, the Council of the European Union and the Member States decided to set up a temporary stability mechanism to preserve the stability of the euro area by providing temporary financial assistance to Euro Area Member States if needed. One part of the mechanism consists of a new community instrument (the European Financial Stabilisation Mechanism, or “EFSM”) of up to EUR 60 billion. In addition, the Euro Area Member States established the European Financial Stability Facility (“EFSF”). This special purpose vehicle has a lending capacity of EUR 440 billion backed by guarantees extended by the Euro Area Member States for the purpose of on-lending to Euro Area Member States in financial difficulties, subject to conditions which are to be negotiated with the European Commission together with the ECB and the IMF and to be approved by the euro area finance ministers. The IMF participates in financing arrangements with up to EUR 250 billion. The EFSF has been operational since August 2010 and commenced refinancing activities at the beginning of 2011 through EFSF SA, a Luxembourg-registered company owned by the Euro Area Member States.
In mid-2011, the Heads of State or Government agreed to increase the EFSF’s guarantee commitments from EUR 440 billion to EUR 780 billion in order to safeguard the intended effective lending capacity of EUR 440 billion and to increase its scope of activity, by announcing additional measures designed to alleviate the Greek debt crisis and the stability of the euro area as a whole. In order to fulfill its mission, the EFSF has since then not only been authorized to provide loans to Euro Area Member States in financial difficulties, but also to intervene in the primary and secondary debt markets, to provide credit lines to non-program countries within the framework of an EFSF precautionary program and to finance recapitalizations of financial institutions through loans to governments including in non-program countries. These amendments to the EFSF Framework entered into force in October 2011.
In November 2011, the economics and finance ministers of the euro area agreed on two models to optimize available resources of the EFSF and adopted corresponding guidelines. Under the first option, the EFSF would provide partial risk protection to newly issued bonds of a Euro Area Member State. It would provide for a fixed credit protection of 20-30% of the principal amount of the sovereign bond. The partial risk protection is to be used primarily under one of the EFSF’s precautionary programs and is designed to increase demand for new issues of Euro Area Member States and lowering funding costs. In early 2012, the European Sovereign Bond Protection Facility was established, implying that the risk protection model has since been operational. The second option aims at the creation of one or more co-investment funds which would allow a combination of public and private funding. A co-investment fund would provide funding for interventions in the primary and secondary debt markets and could, inter alia, be used by Euro Area Member States for bank recapitalizations. A first loss tranche of the fund would be financed by the EFSF. As of May 10, 2012, no co-investment fund has been established.
The Federal Republic has committed guarantees of approximately EUR 211 billion to the EFSF in accordance with its share in the paid-up capital of ECB. Accordingly, the Federal Republic contributes approximately 29% of the guarantees provided by Euro Area Member States, excluding the Euro Area Member States which are receiving financial support (Ireland, Portugal and Greece). As of the end of April 2012, the EFSF had outstanding bonds and bills of approximately EUR 77 billion. The EFSF has been created as a temporary institution (i.e., after June 2013, the EFSF would not enter into any new programs but will continue the management and repayment of any outstanding debt and will cease operations once all outstanding debt has been repaid).
Sources: EFSF FAQ Update as of March 28, 2012 (http://www.efsf.europa.eu/attachments/faq_en.pdf); European Commission, Economic and Financial Affairs, Economic Governance (http://ec.europa.eu/economy_finance/economic_governance/index_en.htm). EFSF, Investor Relations, Transactions (http://www.efsf.europa.eu/investor_relations/issues/index.htm).
Treaty on the European Stability Mechanism. On February 2, 2012, the Euro Area Member States signed the revised treaty on the ESM. Prior to its entry into force, which is targeted for July 2012 (a year earlier than originally planned), the ESM treaty must be ratified by Euro Area Member States that represent in the aggregate 90% of the total subscriptions in the ESM.
The ESM has been designed as a permanent crisis mechanism that will assume the tasks currently fulfilled by the EFSF and the EFSM and will be established as an intergovernmental organization under public international law. The ESM will have an effective lending capacity of EUR 500 billion backed by total subscribed capital of EUR 700 billion. Of this amount, EUR 80 billion will be in the form of paid-in capital provided by the Euro Area Member States and EUR 620 billion in the form of callable capital committed by Euro Area Member States. The contribution of each Euro Area Member State will be based on the paid-in capital for the ECB. On
G-6
this basis, the Federal Republic’s contribution will amount to approximately 27%. The Federal Republic will contribute paid-in capital in an amount of approximately EUR 22 billion to the ESM. The payment of paid-in shares should be made in five equal installments of 20% of the total amount starting fifteen days after the date of entry into force of the treaty. Two installments are scheduled to be paid in 2012, two more in 2013 and the final tranche in the first half of 2014. This payment schedule implies a payment obligation of approximately EUR 8.7 billion for the Federal Republic in 2012.
The ESM’s purpose will be to provide financial assistance to Euro Area Member States experiencing or threatened by severe financing problems, if such assistance is deemed essential to safeguard financial stability in the euro area as a whole. The ESM will be able to use the range of instruments that has been put in place for the EFSF. In addition to loans to beneficiary Euro Area Member States, it will provide precautionary financial assistance and loans to Euro Area Member States for the recapitalization of financial institutions. It will also be authorized to purchase bonds of beneficiary Euro Area Member States in the primary and secondary markets. Financial support will be provided subject to strict economic policy conditionality. Furthermore, parallel to the Treaty on Stability, Coordination and Governance in the EMU, the contracting parties stated in the ESM treaty that as of March 1, 2013, only Euro Area Member States that have ratified the fiscal compact and have implemented the balanced budget rule as specified in the fiscal compact within the agreed time line (one year after entry into force) will be eligible for financial support from the ESM. Financial assistance from the ESM will be activated upon a Euro Area Member State’s request and active participation of the IMF will be sought. The ESM’s rules will provide for case-by-case participation of private sector creditors, consistent with IMF policies. In order to facilitate this process, standardized and identical collective action clauses will be included in the terms and conditions of all new euro area government bonds with a maturity of more than one year, as of January 1, 2013. ESM loans will enjoy preferred creditor status in a similar fashion to those extended by the IMF, while accepting preferred creditor status of the IMF over the ESM, except in the case of countries which were beneficiaries under a European financial assistance program at the signing of the ESM treaty.
In principle, decisions under the ESM will be taken by mutual agreement. However, the ESM treaty provides for an emergency voting rule. In the event that the European Commission and the ECB conclude that an urgent decision related to financial assistance is needed because the financial and economic sustainability of the euro area is threatened, the mutual agreement rule is replaced by a qualified majority of 85%.
Due to the advanced start, the ESM will operate alongside the EFSF for twelve months. These mechanisms will have a joint lending capacity of EUR 700 billion, and until mid-2013 the EFSF may engage in new programs in order to ensure a full fresh lending capacity of EUR 500 billion.
Sources: European Council, Factsheet on the Treaty establishing the European Stability Mechanism, dated February 2, 2012 (http://www.consilium.europa.eu/uedocs/cms_data/docs/pressdata/en/ecofin/127788.pdf); European Council, Treaty establishing the European Stability Mechanism, dated February 2, 2012 (http://www.european-council.europa.eu/media/582311/05-tesm2.en12.pdf); EFSF FAQ Update as of March 28, 2012 (http://www.efsf.europa.eu/attachments/faq_en.pdf); European Council, Statement by the Euro Area Heads of State or Government, dated March 2, 2012 (http://www.consilium.europa.eu/uedocs/cms_data/docs/pressdata/en/ec/128521.pdf); Bundesministerium der Finanzen, Kabinett beschließt Ratifizierung und Finanzierung des Europäischen Stabilitätsmechanismus (ESM), press release dated March 14, 2012 (http://www.bundesfinanzministerium.de/nn_54/DE/Presse/Pressemitteilungen/Finanzpolitik/2012/03/14-03-2012-PM08a.html?__nnn=true); European Council, Statement of the Eurogroup, dated March 30, 2012 (http://www.consilium.europa.eu/uedocs/cms_Data/docs/pressdata/en/ecofin/129381.pdf).
Financial Assistance to Euro Area Member States. After Greece had experienced serious difficulties in accessing the financial markets to obtain new borrowings to cover its substantial financing needs in the first months of 2010, the Euro Area Member States concluded that the stability of the euro area as a whole was threatened and agreed to help Greece meet its financing needs. In May 2010, the Euro Area Member States agreed to provide Greece with stability support in the form of pooled bilateral loans of up to EUR 80 billion, parallel to a loan facility provided by the IMF of up to EUR 30 billion. The amounts under the so-called Greek Loan Facility were planned to be disbursed over the period May 2010 through June 2013. The Federal Republic committed to contribute up to approximately EUR 22.3 billion, which was to be extended by KfW on behalf of the Federal Republic. As of December 2011, a total amount of EUR 73 billion has been disbursed, of which approximately EUR 53 billion was provided by Euro Area Member States and EUR 20 billion by the IMF. At year-end 2011, KfW had disbursed EUR 15.2 billion under this loan facility. Due to the set up of the second financial support program for Greece described below, no further disbursements are expected to be made by KfW. See also “KfW—Business—Capital Markets—Special Mandate by the Federal Government-Support Measures for Greece.”
In mid-2011, the need for a second financial support program became clear. In July 2011, the Heads of State or Government of the euro area and EU institutions agreed to support a new program for Greece and, together with the IMF and the voluntary contribution of the private sector, fully cover the financing gap. A sufficient majority of private sector creditors accepted the voluntary exchange of Greek debt in early March 2012. Of a total of EUR 205.6 billion in bonds eligible for the exchange offer, approximately EUR 197
G-7
billion, or 95.7%, had been exchanged. Accordingly, in mid-March 2012, Euro Area Member States formally approved a second adjustment program for Greece. Under the second program, the EFSF and the IMF have committed the undisbursed amounts of the first program plus an additional EUR 130 billion for the years 2012 to 2014. The EFSF has committed an overall amount of EUR 144.6 billion (including the already committed or disbursed amounts for the involvement of private sector creditors and bank recapitalization) for the years 2012 to 2014, while the IMF has committed to contribute EUR 28 billion over the course of a four-year period.
Sources: European Commission, Economic and Financial Affairs, The EU as a borrower, Greek Loan Facility (http://ec.europa.eu/economy_finance/eu_borrower/greek_loan_facility/index_en.htm); Council of the European Union, Statement by the heads of state or government of the euro area and EU institutions, dated July 21, 2011 (http://www.consilium.europa.eu/uedocs/cms_data/docs/pressdata/en/ec/123978.pdf); Bundesfinanzministerium, Griechenland: erfolgreicher Schuldenschnitt, press release of March 9, 2012
(http://www.bundesregierung.de/Content/DE/Artikel/2012/03/2012-03-09-griechenland-schuldenschnitt.html); Statement by Commission Vice-President Olli Rehn on private sector participation in the second Greek programme, dated March 9, 2012 (http://europa.eu/rapid/pressReleasesAction.do?reference=MEMO/12/174); Summary for non-specialists, Occasional Papers No. 94/March 2012, The Second Economic Adjustment Programme for Greece, March 2012.(http://ec.europa.eu/economy_finance/publications/occasional_paper/2012/pdf/ocp94_summary_en.pdf); Statement by the President of the Eurogroup, Jean-Claude Juncker, press release of March 14, 2012 (http://www.consilium.europa.eu/uedocs/cms_Data/docs/pressdata/en/ecofin/128941.pdf).
The first Euro Area Member State to receive support by the EFSM and EFSF was Ireland. The financial assistance, which was agreed upon in December 2010 and is being provided subject to compliance with the economic adjustment program, consists of financial support of EUR 85 billion, including EUR 22.5 billion to be financed through the EFSM, EUR 17.7 billion through the EFSF, EUR 22.5 billion through the IMF, and EUR 4.8 billion through bilateral loans from the United Kingdom, Denmark and Sweden. The remaining EUR 17.5 billion is being financed by the Irish Treasury cash buffer and investments of the Irish National Pension Reserve Fund. In March 2012, the European Commission announced the completion of the fifth review of the financial assistance program for Ireland. It concluded that program implementation by Ireland remains strong and on track, while some challenges remain. In this context, the disbursement of the next tranche was authorized in March 2012, bringing total EU/IMF funding to Ireland to EUR 47.9 billion since the launch of the program. The financial assistance program is expected to cover financing needs until the second half of 2013, although Ireland intends to re-enter the financial market earlier.
In early April 2011, the Portuguese Republic officially applied for support under the financial support mechanisms. Euro area, EU and IMF financial support is provided for the 2011 to mid-2014 period on the basis of an agreement on an economic adjustment program which was negotiated between the Portuguese authorities and officials from the European Commission, the IMF and the ECB in May 2011. The total financial support to be provided amounts to EUR 78 billion, of which the EU has pledged EUR 52 billion and the IMF’s contribution consists of a three-year loan in an amount equivalent to approximately EUR 26 billion. In February 2012, the European Commission, the ECB and the IMF announced the results of the third review mission. They concluded that Portugal is making good progress towards adjusting its economic imbalances and, provided the authorities continue with strict program implementation, the Euro Area Member States have declared they stand ready to support Portugal until market access is regained. The disbursement of the next tranche, which is expected to be completed by May 2012, will raise total EU/IMF funding to Portugal to around EUR 53 billion. The financial assistance program is expected to cover financing needs through the second half of 2014, with partial capital markets financing planned from the second half of 2013.
Sources: Council agrees on joint EU-IMF financial assistance package for Ireland, December 7, 2010 (http://ec.europa.eu/economy_finance/articles/eu_economic_situation/2010-12-01-financial-assistance-ireland_en.htm); European Commission, Economic and Financial Affairs, The EU as a borrower, Ireland (http://ec.europa.eu/economy_finance/eu_borrower/ireland/index_en.htm); European Commission, Ireland: European Commission gives green light for €5.8 billion payment following successful completion of fifth review of financial assistance programme, press release dated March 1, 2012 (http://europa.eu/rapid/pressReleasesAction.do?reference=MEMO/12/149); European Commission, Economic Adjustment Programme for Ireland – Winter 2011 Review, Occasional Paper 93, March 2012 (http://ec.europa.eu/economy_finance/publications/occasional_paper/2012/pdf/ocp93_en.pdf); European Commission, Economic and Financial Affairs, The EU as a borrower, Portugal (http://ec.europa.eu/economy_finance/eu_borrower/portugal/index_en.htm); Statement by the EC, ECB, and IMF on the Third Review Mission to Portugal, press release dated February 28, 2012 (http://europa.eu/rapid/pressReleasesAction.do?reference=MEMO/12/142); European Commission, The Economic Adjustment Programme for Portugal, Third Review Winter 2011/ 2012 (http://ec.europa.eu/economy_finance/publications/occasional_paper/2012/pdf/ocp95_en.pdf, page 6).
Political Integration
The EU’s three main institutions are the Council (representing the governments of the Member States), the Parliament (elected by and representing the citizens of the Member States) and the European Commission (the executive body of the EU). In order to ensure that the decision-making process within the EU’s institutions continues to work effectively, the European Convention was formed in 2001. Its goal was to draft a European constitution that would set out the powers and responsibilities of the institutions and the decision-making process, thus enabling the EU to cope with its main challenges in the mid-term future, the enlargement of the EU and the increased involvement of EU citizens, by introducing more direct democratic processes and transparency into the governance of
G-8
the EU. The European constitution was signed by the Heads of State or Government and the foreign ministers in October 2004; it was required to be ratified by all Member States as a precondition to its entry into force. After the failure of referendums on ratification held in France and the Netherlands, the European Council in June 2005 decided to enter a period of reflection on the process of reforming the EU institutions. In June 2007, the European Council decided to convene an Intergovernmental Conference to draft a new EU treaty. The treaty, which was signed by the Heads of State or Government and the foreign ministers in Lisbon on December 13, 2007 (the “Treaty of Lisbon”), largely reflects the institutional reforms embodied in the constitution, while modifying or leaving out certain controversial topics. It entered into force on December 1, 2009.
Sources: Europa.eu, How does the EU work?, Europe in 12 lessons: Lesson 4 (http://europa.eu/abc/12lessons/lesson_4/index_en.htm); Europa.eu, Institutional Reform of the European Union: Main dates (http://europa.eu/documentation/legislation/institutional_reform/chronology/index_en.htm); Official Journal of the European Union, 2004/C 310/01 (http://eur-lex.europa.eu/JOHtml.do?uri=OJ:C:2004:310:SOM:EN:HTML); European Council, Declaration by the Heads of State or Government of the Member States of the European Union, June 18, 2005
(http://europa.eu/rapid/pressReleasesAction.do?reference=DOC/05/3&format=HTML&aged=0&language=EN&guiLanguage=en); European Council, The Brussels European Council—June 21 and 22, 2007 (http://europa.eu/legislation_summaries/other/constitution_european_council_2007_en.htm); Europa.eu, Treaty of Lisbon: The treaty at a glance (http://europa.eu/lisbon_treaty/glance/index_en.htm); Europa.eu, Treaty of Lisbon: News (http://europa.eu/lisbon_treaty/index_en.htm).
Statistical Disclosure Standards of the International Monetary Fund
The Federal Republic currently meets the Special Data Dissemination Standard (“SDDS”) of the IMF relating to coverage, periodicity and timeliness of economic data. Although subscription by member countries to the SDDS is voluntary, it carries a commitment requiring members to observe the standard and to provide certain information to the IMF about their practices in disseminating economic and financial data.
G-9
THE ECONOMY
Overview
Since 1945, the Federal Republic’s economic system has developed into a social market economy, combining the free initiative of the individual with progressive social principles. The Grundgesetz guarantees freedom of private enterprise and private property, provided that these basic rights are not exercised against the public good. The state mainly has a regulatory function in the market economy, setting the general framework of conditions within which market processes take place. State intervention in price setting is limited to a very small number of industries.
Key Economic Figures
The German economy is one of the world’s largest economies. In 2011, the GDP of Germany expressed at current prices was EUR 2,570.8 billion, compared to EUR 2,476.8 billion in 2010, which represents an increase of 3.8%. GDP adjusted for price effects rose by 3.0% compared to 2010 and exceeded the 1991 level by 30.2%. 1991 represents the first full year after German reunification on October 3, 1990. The growth in GDP since 1991 has been largely driven by productivity gains, as price-adjusted GDP per employee has risen by 22.7% since 1991. In calculating price-adjusted GDP, the Federal Statistical Office uses a chain index based on the previous year’s prices. In 2011, GDP per capita at current prices was EUR 31,437, while GDP per employee at current prices was EUR 62,550.
Source: Statistisches Bundesamt, Fachserie 18, Reihe 1.4 - 2011 (März 2012), Tables 2.1.1 and 2.1.4.
As in many advanced economies, the services sector of the Federal Republic has become the largest contributor to GDP (in terms of gross value added). In 2011, services accounted for 69.0% of gross value added, measured at current prices compared to 62.5% in 1991. The two most important subsectors were “trade, transport, accommodation and food services”, accounting for 15.2% in 2011, compared to 16.3% in 1991, and “public services, education, health”, accounting for 17.9% of gross value added in 2011, compared to 15.9% in 1991. The production sector (excluding construction) generated 25.6% of gross value added compared to 30.2% in 1991. Construction contributed 4.4% to gross value added in 2011, compared to 6.1% in 1991, and agriculture, forestry and fishing accounted for 1.0% of gross value added in 2011, compared to 1.2% in 1991.
Source: Statistisches Bundesamt, Fachserie 18, Reihe 1.4 - 2011 (März 2012), Table 2.2.1.
In 2011, private final consumption expenditure totaled 57.4% of GDP in current prices, gross capital formation amounted to 18.0%, and government final consumption expenditure equaled 19.6%. Exports and imports of goods and services accounted for 50.1% and 45.0% of GDP at current prices, respectively. The trade balance (according to national accounts) thus showed a surplus equal to 5.1% of GDP in 2011.
Source: Statistisches Bundesamt, Fachserie 18, Reihe 1.4 - 2011 (März 2012), Table 2.3.1.
In 2011, price-adjusted GDP rose by 3.0% compared to 2010. The GDP adjusted for price and calendar effects increased by 3.1% compared to 2010. Net exports contributed 0.8 percentage points to economic growth in 2011. This was due to an increase in exports by 8.2%, compared to an increase of 13.7% in 2010 and a 13.6% decline in 2009, while imports rose by 7.4% on a price-adjusted basis, compared to an increase of 11.7% in 2010 and a 9.2% decline in 2009. Exports measured at current prices reached EUR 1,289.16 billion and imports stood at EUR 1,157.74 billion. Gross fixed capital formation in machinery and equipment also increased in 2011 by 7.6% compared to a 10.5% increase in 2010 and a 22.8% decline in 2009, in price-adjusted terms, and gross fixed capital formation in construction rose by 5.8%. Final consumption expenditure of general government rose by 1.4% in 2011 upon price adjustment, and final consumption expenditure of households rose by 1.5% on a price-adjusted basis compared to 2010.
Source: Statistisches Bundesamt, Fachserie 18, Reihe 1.4 - 2011 (März 2012), Tables 2.3.1, 2.3.2 and 2.3.10.
The rate of registered unemployment (as computed under the “national definition” of the Federal Employment Agency) declined from 7.7% in 2010 to 7.1% in 2011. Based on the internationally comparable method of calculation promulgated by the International Labour Organization (“ILO”), which is referred to as the “ILO definition,” the unemployment rate decreased from 6.8% in 2010 to 5.8% in 2011. For an explanation of the differences between the national definition and the ILO definition, see “—Employment and Labor.” Inflation as measured by the percentage increase in the national consumer price index (“CPI”) accelerated from 1.1% in 2010 to 2.3% in 2011. This was mainly due to the increase in prices for energy by 10.0%, in particular fuels, which increased 13.9%. Without energy prices, the index rose by only 1.3%. General government gross debt stood at EUR 2,088.5 billion at year-end 2011, compared to EUR 2,056.7 billion at year-end 2010.
G-10
Sources: Bundesagentur für Arbeit, Monatsbericht März 2012, Table 5.1; Statistisches Bundesamt, Fachserie 18, Reihe 1.4 – 2011 (März 2012), Table 2.1.12; Statistisches Bundesamt, Fachserie 17, Reihe 7 - Februar 2012, Table 1.1 and 1.2; Deutsche Bundesbank, Monatsbericht April 2012, Table IX.1.
Due to deteriorating global economic conditions in the second half of 2011 and in the first months of 2012, the German economy is experiencing a slowdown as well. However, domestic demand and employment are expected to strengthen further, and the slowdown is perceived to be of a temporary nature. In particular, private final consumption expenditure is expected to support growth. In its forecast published in April 2012, the Federal Government projected that GDP in Germany will grow by 0.7% in 2012, with private consumption growing by 1.0% (all growth rates are in price-adjusted terms). Exports and imports are expected to increase by 3.0% and 4.0%, respectively, compared to 2011. Capital formation is also expected to support domestic demand. Gross fixed capital formation is projected to grow by 1.9% in 2012, supported by a projected increase in machinery and equipment by 2.6%, while the sub-category construction is predicted to increase by only 1.0%. In 2012, government final consumption expenditure is forecast to increase by 1.1%. The Federal Government expects that employment will equal approximately 41.5 million persons on average in 2012 compared to 41.1 million persons in 2011. The registered unemployment rate (Arbeitslosenquote) is expected to decrease further to 6.7% on average in 2012 (2011: 7.1%), which would constitute the lowest unemployment rate since German reunification.
Source: Bundesministerium für Wirtschaft und Technologie, Rösler zur Frühjahrsprojektion: “Die deutsche Wirtschaft kommt wieder in Schwung,” press release of April 25, 2012 (http://www.bmwi.de/BMWi/Navigation/Presse/pressemitteilungen,did=486758.html).
The following table shows selected key economic figures for the Federal Republic for 2007 to 2011.
KEY ECONOMIC FIGURES
| | | | | | | | | | | | | | | | | | | | | | | | | |
| | | 2011 | | 2010 | | 2009 | | 2008 | | 2007 |
| | | (EUR in billions, unless otherwise indicated) |
GDP - at current prices | | | | 2,570.8 | | | | | 2,476.8 | | | | | 2,374.5 | | | | | 2,473.8 | | | | | 2,428.5 | |
(change from previous year in %) | | | | 3.8 | | | | | 4.3 | | | | | -4.0 | | | | | 1.9 | | | | | 5.0 | |
GDP - price-adjusted, chain-linked index (2005=100),
not adjusted for calendar effects | | | | 109.7 | | | | | 106.5 | | | | | 102.7 | | | | | 108.3 | | | | | 107.1 | |
(change from previous year in %) | | | | 3.0 | | | | | 3.7 | | | | | -5.1 | | | | | 1.1 | | | | | 3.3 | |
GDP - price-adjusted, chain-linked index (2005=100),
adjusted for calendar effects | | | | 109.5 | | | | | 106.3 | | | | | 102.6 | | | | | 108.1 | | | | | 107.3 | |
(change from previous year in %) | | | | 3.1 | | | | | 3.6 | | | | | -5.1 | | | | | 0.8 | | | | | 3.4 | |
Unemployment rate (ILO definition) (in %) (1) | | | | 5.8 | | | | | 6.8 | | | | | 7.4 | | | | | 7.2 | | | | | 8.3 | |
Rate of inflation (year-to-year change in consumer
price index (CPI) in %) | | | | 2.3 | | | | | 1.1 | | | | | 0.4 | | | | | 2.6 | | | | | 2.3 | |
Balance of payments - current account | | | | 147.7 | | | | | 150.7 | | | | | 140.6 | | | | | 153.6 | | | | | 180.9 | |
General government gross debt (2) | | | | 2,088.5 | | | | | 2,056.7 | | | | | 1,766.9 | | | | | 1,649.3 | | | | | 1,582.4 | |
| (1) | Unemployed persons, available and seeking work. |
| (2) | Definition according to Maastricht Treaty. |
Sources: Statistisches Bundesamt, Fachserie 18, Reihe 1.2 - 4. Vierteljahr 2011 (February 2012), Tables 1.1 and 1.10; Statistisches Bundesamt, Verbraucherpreise, Verbraucherpreisindex für Deutschland, Veränderungsraten zum Vorjahr in % (https://www.destatis.de/DE/ZahlenFakten/Indikatoren/Konjunkturindikatoren/Basisdaten/VerbraucherpreiseKategorien.html?cms_gtp=145114_list%253D2%2526145110_slot%253D2&https=1); Deutsche Bundesbank, Monatsbericht April 2012, Tables IX.1 and XI.2.
G-11
Economic Policy
General
The Federal Government’s foremost economic policy objectives are to further strengthen the forces for economic growth and employment. In addition, the Federal Government seeks to modernize the German economy and German society on every level in order to face successfully the challenges resulting from European integration, globalization and the emergence of a knowledge-based economy. The Federal Government believes that achieving these objectives is also necessary to further improve the Federal Republic’s position as a business location that is able to compete globally for capital, ideas and innovation. The structural reforms contribute to strengthening the potential for growth and enhancing domestic sources of demand while preserving high international competitiveness.
In 2010 and 2011, Germany experienced strong economic growth. While this development was partly attributable to the rebound of the world economy, fiscal policy measures, including the Government’s “stimulus packages,” also played an important role in shielding the real economy from the effects of the global financial and economic crisis. German companies were able to build on their earlier export success and get back on track quickly. Since then, the initial economic stimulus from exports spread to the domestic economy, which has increasingly become the driving force behind Germany’s economic expansion. Accordingly, demand has become increasingly broad-based, strengthening the resilience of Germany’s economy with regard to external risks. The economic rebound has also led to an increase in employment. During the crisis, there were no major job losses despite the drastic decline in industrial output and overall economic activity in 2009. This was a positive exception compared to most other advanced economies. In recent years, employees and employers have agreed moderate wage agreements and thereby made a significant contribution toward improving the competitiveness of German companies. Furthermore, in recent years, Germany has reformed its systems of basic allowances for job-seekers and promoting employment. More efficient job placement services, as well as lower barriers to, and flexible patterns of, employment, have contributed to the overall functioning of the labor market. Collective bargaining agreements have become more flexible. For more information on recent economic developments, see “—Key Economic Figures.”
Sources: Bundesministerium für Wirtschaft und Technologie, 2012 Annual Economic Report (http://www.bmwi.de/English/Navigation/Service/publications,did=479718.html); Growth. Education. Unity. Coalition Agreement between CDU, CSU and FDP (http://www.cdu.de/doc/pdfc/091215-koalitionsvertrag-2009-2013-englisch.pdf).
Current Policy Initiatives
Following the economic and financial crisis-related government interventions of 2009 and 2010, the objectives of economic policy shifted during 2011 to restoring the balance between government and markets in order to strengthen domestic growth drivers in the long term and thereby secure future prosperity. To this end, government measures to overcome the crisis have been or will be successively phased out. Because the supply of credit to businesses steadily improved during the economic rebound, it was possible to phase out the credit and guarantee programs at the end of 2010 as planned. Short-time work arrangements proved to have a stabilizing effect on overall employment during the crisis. While the special arrangements for short-time work were initially scheduled to expire at the end of 2010, the Federal Government extended certain favorable regulations with respect to short-time work until March 2012. The bulk of additional investment spending by the Federal Government during the crisis was channeled into a special fund called the Investment and Redemption Fund (Investitions- und Tilgungsfonds). This fund only financed measures through the end of 2011, and has entered the redemption phase in 2012.
The Federal Government has also started the consolidation of public finances, in order to adhere both to the requirements stipulated by the constitutional balanced budget rule (the so-called “debt brake” (Schuldenbremse)), as well as to the European frameworks such as the SGP and the new fiscal compact. For further details on the budget surveillance procedures, see “General—The European Union and European Integration—EU Economic Governance.” This process will involve limiting government spending, reducing subsidies, enhancing incentives, and placing a continued priority on funding for education and research. The financial budget targets until 2016 adopted by the Federal Government reflect this shift in fiscal policy. They seek to achieve structural consolidation that strengthens the growth potential and enhances confidence in the stability of the euro. In 2011, the general government deficit was already reduced to 1.0% of GDP, well below the Maastricht-threshold of 3% (for further information on the Federal Republic’s fiscal situation and prospects, see “Public Finance—Germany’s General Government Deficit/Surplus, the General Government Gross Debt and the Excessive Deficit Procedure”).
Properly functioning financial markets support long-term growth potential. As financial markets have continued to stabilize, the key task is to overcome structural deficiencies (e.g., moral hazard problems) that the crisis exposed in the German and international financial systems. The objective of the Federal Government’s reform agenda is to bolster the resilience of financial institutions and the overall financial system with a number of different measures at both the national and EU level. The Federal Government intends to
G-12
conclude the ongoing negotiations with respect to the implementation of Basel III at the EU level in a timely manner. Among other things, the Federal Government wants to ensure that the financing of companies, projects and investments is not hampered by its implementation. As a consequence of the developments in the euro area, the Federal Government has reopened the Special Financial Market Stabilization Fund SoFFin (Sonderfonds Finanzmarktstabilisierung) for new applications until the end of 2012.
Demographic changes are expected to have a significant impact on the future German growth potential. Consequently, the Federal Government’s policies are geared toward increasing the labor force participation of women and older people in particular, as well as low-skilled workers and individuals with an immigrant background. To further reduce structural unemployment in Germany, the Federal Government is observing the existing incentive structures and, if necessary, intends to modify them in order to further improve the functioning of the labor market.
Well-trained, highly skilled workers are an important factor for the competitiveness of the German economy. For this reason, the Federal Government adopted the Plan to Secure Specialized Staff (Konzept Fachkräftesicherung) in June 2011. It is committed to improving the quality and breadth of education and training, and to enabling people at every stage of life to participate comprehensively in education and training programs. In order to successfully counteract the impending shortage of skilled workers, the Federal Government primarily intends to harness the untapped potential of its domestic workforce, while also considering measures to attract qualified foreign specialists to Germany. To this end, the Federal Government has passed a bill to reduce the salary threshold, from which onwards foreign specialists enjoy an easier immigration procedure, to an annual salary of EUR 48,000, as compared to EUR 66,000 under the former regulation. For foreign experts in the field of mathematics, informatics, natural sciences, technology, and for foreign physicians the threshold will be reduced even further to EUR 33,000 per year.
In addition, the Federal Government has earmarked another EUR 12 billion for investments in education and research in the current legislative period (i.e., until September 2013) with the objective of enhancing productivity in the medium and long term. In this context, funding to promote key technologies will place a higher priority on finding solutions to urgent social challenges (e.g. climate/energy, health/nutrition, mobility, safety/security and communication). As an efficient transport infrastructure supports economic growth, the Federal Government seeks to maintain and enhance the quality of Germany’s railways, roads and waterways. It has earmarked about EUR 10 billion per year until 2016 for infrastructure investments.
To boost competition, the Federal Government revised the Act against Restraints of Competition (8. Novelle des Gesetzes gegen Wettbewerbsbeschränkungen) to further improve conditions of competition, particularly in the areas of merger control, the abuse of dominant positions, provisions on fines, and procedures governing violations of anti-trust rules. Additional revisions are planned in the area of transport regulation.
In 2010, the Federal Government adopted new guidelines for energy policy through the year 2050. Following the nuclear disaster which affected the Japanese nuclear power plant in Fukushima in March 2011, the Federal Government decided to accelerate the transition to a more sustainable energy set-up (Energiewende). Among other things, this energy concept provides for the shutdown of all nuclear power stations in Germany by 2022 and unites other key energy policy objectives (i.e., energy security, climate protection, economic growth and greater competitiveness) within a single strategy. It sets the long-term target of achieving an 80% reduction in greenhouse gas emissions by 2050, compared to 1990 levels. To this end, it is intended to increase the production and use of renewable energy sources, making them the primary source of German energy supply. In particular, by 2050, renewable energy is intended to meet 60% of German energy demand and make up for 80% of German electricity generation. Achievement of these energy and climate policy targets will require substantial investments. The development of new technologies, the further expansion of power grids, and the integration of these grids into a European electricity grid as well as striving for the conclusion of a new international climate protection agreement are all integral parts of the energy concept.
Germany’s external economic policy aims to increase the openness of international markets for goods and services, reduce trade barriers, and improve the conditions for cross-border investment. Among other things, this policy includes strengthening international competition through the elimination of unfair trade practices and subsidies as well as improving the protection and enforcement of intellectual property rights. For this reason, the Federal Government remains committed to reaching a comprehensive and balanced agreement in the WTO negotiations under the Doha Round. This agreement should also reflect the interests of developing countries. WTO-compatible regional and bilateral free trade agreements between the EU and its trading partners constitute an important complement to multilateral agreements within the framework of the WTO.
For information on government measures to stabilize Germany’s financial system, see “Monetary and Financial System—Policy Response to the Global Economic and Financial Crisis—Policy Responses by the Federal Republic.” For information on government budgets, see “Public Finance.” For information on the response to the European Sovereign Debt Crisis and the reform of the Stability and Growth Pact, see “General—The European Union and European Integration —Response to the European Sovereign Debt Crisis” and “General—The European Union and European Integration—EU Economic Governance.”
Sources: Bundesministerium für Wirtschaft und Technologie, 2012 Annual Economic Report (http://www.bmwi.de/English/Navigation/Service/publications,did=479718.html); Bundesministerium für Wirtschaft und Technologie, Jahreswirtschaftsbericht 2011; Bundesministerium für Wirtschaft und Technologie, Jahreswirtschaftsbericht 2010.
G-13
Gross Domestic Product
The following tables show the structure of the Federal Republic’s GDP at current prices by use and origin for each of the years indicated along with changes over the respective preceding period.
STRUCTUREOF GDP — USE
| | | | | | | | | | | | | | | | | | | | | | | | | | | | | | | | | | | | | | | | | | | | | | | | | | |
| | | 2011 | | 2010 | | 2009 | | 2008 | | 2007 | | | | 2011 | | 2010 | | 2009 | | 2008 |
| | | (EUR in billions) | | | | (change in %) |
Domestic uses | | | | 2,439.4 | | | | | 2,341.4 | | | | | 2,256.0 | | | | | 2,319.6 | | | | | 2,258.5 | | | | | | | 4.2 | | | | | 3.8 | | | | | -2.7 | | | | | 2.7 | |
Final private consumption | | | | 1,474.4 | | | | | 1,423.0 | | | | | 1,387.4 | | | | | 1,387.7 | | | | | 1,356.7 | | | | | | | 3.6 | | | | | 2.6 | | | | | -0.0 | | | | | 2.3 | |
Final government consumption | | | | 502.9 | | | | | 488.8 | | | | | 475.8 | | | | | 452.6 | | | | | 434.0 | | | | | | | 2.9 | | | | | 2.7 | | | | | 5.1 | | | | | 4.3 | |
Gross fixed capital formation | | | | 467.7 | | | | | 433.6 | | | | | 409.3 | | | | | 460.7 | | | | | 447.9 | | | | | | | 7.9 | | | | | 5.9 | | | | | -11.2 | | | | | 2.9 | |
Machinery and equipment | | | | 183.5 | | | | | 170.8 | | | | | 155.1 | | | | | 201.4 | | | | | 195.5 | | | | | | | 7.4 | | | | | 10.1 | | | | | -23.0 | | | | | 3.0 | |
Construction | | | | 255.5 | | | | | 235.0 | | | | | 227.1 | | | | | 231.5 | | | | | 225.6 | | | | | | | 8.7 | | | | | 3.5 | | | | | -1.9 | | | | | 2.6 | |
Other products | | | | 28.6 | | | | | 27.8 | | | | | 27.0 | | | | | 27.9 | | | | | 26.7 | | | | | | | 3.1 | | | | | 2.7 | | | | | -2.9 | | | | | 4.3 | |
Changes in inventories (1) | | | | -5.7 | | | | | -4.0 | | | | | -16.5 | | | | | 18.6 | | | | | 19.9 | | | | | | | — | | | | | — | | | | | — | | | | | — | |
Net exports (1) | | | | 131.4 | | | | | 135.5 | | | | | 118.5 | | | | | 154.2 | | | | | 170.0 | | | | | | | — | | | | | — | | | | | — | | | | | — | |
Exports | | | | 1,289.2 | | | | | 1,159.8 | | | | | 995.9 | | | | | 1,189.2 | | | | | 1,145.4 | | | | | | | 11.2 | | | | | 16.5 | | | | | -16.2 | | | | | 3.8 | |
Imports | | | | 1,157.7 | | | | | 1,024.4 | | | | | 877.4 | | | | | 1,035.0 | | | | | 975.4 | | | | | | | 13.0 | | | | | 16.7 | | | | | -15.2 | | | | | 6.1 | |
| | | | | | | | | | | | | | | | | | | | | | | | | | | | | | | | | | | | | | | | | | | | | | |
Gross domestic product | | | | 2,570.8 | | | | | 2,476.8 | | | | | 2,374.5 | | | | | 2,473.8 | | | | | 2,428.5 | | | | | | | 3.8 | | | | | 4.3 | | | | | -4.0 | | | | | 1.9 | |
| | | | | | | | | | | | | | | | | | | | | | | | | | | | | | | | | | | | | | | | | | | | | | |
| (1) | Percentage changes are not presented due to the potentially changing signs of these net positions. |
Source: Statistisches Bundesamt, Fachserie 18, Reihe 1.2 – 4. Vierteljahr 2011 (February 2012), Tables 3.1 and 3.9.
STRUCTUREOF GDP — ORIGIN
| | | | | | | | | | | | | | | | | | | | | | | | | | | | | | | | | | | | | | | | | | | | | | | | | | |
| | | 2011 | | 2010 | | 2009 | | 2008 | | 2007 | | | | 2011 | | 2010 | | 2009 | | 2008 |
| | | (EUR in billions) | | | | (change in %) |
Gross value added of all economic sectors | | | | 2,295.9 | | | | | 2,216.8 | | | | | 2,117.2 | | | | | 2,217.0 | | | | | 2,177.0 | | | | | | | 3.6 | | | | | 4.7 | | | | | -4.5 | | | | | 1.8 | |
Agriculture, forestry and fishing | | | | 21.9 | | | | | 18.7 | | | | | 16.2 | | | | | 20.9 | | | | | 19.0 | | | | | | | 17.1 | | | | | 15.0 | | | | | -22.2 | | | | | 10.1 | |
Production sector (excluding construction) | | | | 588.2 | | | | | 548.1 | | | | | 496.1 | | | | | 574.9 | | | | | 575.2 | | | | | | | 7.3 | | | | | 10.5 | | | | | -13.7 | | | | | -0.1 | |
Construction | | | | 100.9 | | | | | 96.3 | | | | | 94.8 | | | | | 93.2 | | | | | 88.7 | | | | | | | 4.8 | | | | | 1.5 | | | | | 1.7 | | | | | 5.1 | |
Trade, transport, accommodation and food services | | | | 349.8 | | | | | 335.9 | | | | | 322.0 | | | | | 354.3 | | | | | 349.9 | | | | | | | 4.1 | | | | | 4.3 | | | | | -9.1 | | | | | 1.3 | |
Information and communication | | | | 88.8 | | | | | 89.1 | | | | | 91.4 | | | | | 86.9 | | | | | 86.9 | | | | | | | -0.2 | | | | | -2.6 | | | | | 5.2 | | | | | 0.1 | |
Financial and insurance services | | | | 118.3 | | | | | 117.9 | | | | | 105.5 | | | | | 83.6 | | | | | 90.5 | | | | | | | 0.4 | | | | | 11.8 | | | | | 26.2 | | | | | -7.6 | |
Real estate activities | | | | 266.3 | | | | | 264.1 | | | | | 263.2 | | | | | 266.3 | | | | | 254.7 | | | | | | | 0.9 | | | | | 0.3 | | | | | -1.2 | | | | | 4.6 | |
Business services | | | | 246.2 | | | | | 238.6 | | | | | 231.4 | | | | | 258.4 | | | | | 249.3 | | | | | | | 3.2 | | | | | 3.1 | | | | | -10.4 | | | | | 3.7 | |
Public services, education, health | | | | 412.1 | | | | | 405.0 | | | | | 394.7 | | | | | 378.8 | | | | | 366.4 | | | | | | | 1.8 | | | | | 2.6 | | | | | 4.2 | | | | | 3.4 | |
Other services | | | | 103.4 | | | | | 103.4 | | | | | 102.0 | | | | | 99.8 | | | | | 96.6 | | | | | | | -0.1 | | | | | 1.4 | | | | | 2.2 | | | | | 3.4 | |
Taxes on products offset against subsidies on products | | | | 275.0 | | | | | 260.0 | | | | | 257.3 | | | | | 256.8 | | | | | 251.5 | | | | | | | 5.8 | | | | | 1.0 | | | | | 0.2 | | | | | 2.1 | |
| | | | | | | | | | | | | | | | | | | | | | | | | | | | | | | | | | | | | | | | | | | | | | |
Gross domestic product | | | | 2,570.8 | | | | | 2,476.8 | | | | | 2,374.5 | | | | | 2,473.8 | | | | | 2,428.5 | | | | | | | 3.8 | | | | | 4.3 | | | | | -4.0 | | | | | 1.9 | |
| | | | | | | | | | | | | | | | | | | | | | | | | | | | | | | | | | | | | | | | | | | | | | |
Source: Statistisches Bundesamt, Fachserie 18, Reihe 1.2 – 4. Vierteljahr 2011 (February 2012), Tables 1.13 and 2.1.
G-14
Sectors of the Economy
Production Sector
The production sector of the Federal Republic grew rapidly after 1945. The main cause for this development was the transition from a state-controlled economy to a social market economy, in which state intervention is limited to furthering social welfare and creating favorable economic conditions. Following German reunification in 1990, industry in the eastern Länder (i.e., the former German Democratic Republic), has undergone a restructuring process. Today, the German production sector is characterized by a balanced mix of small, medium and large enterprises and is almost entirely privately owned. It is geographically concentrated in the western Länder of Northrhine-Westphalia, Bavaria and Baden-Württemberg. The main segments of the production sector relate to the manufacturing of motor vehicles, machinery and equipment, electrical and optical equipment, basic metals and fabricated metal products, as well as chemicals and chemical products. In 2011, the production sector’s aggregate contribution to gross value added at current prices was 25.6% (excluding construction) and 30.0% (including construction), respectively. Its price-adjusted gross value added (excluding construction) increased by 5.9% year-on-year in 2011 after rising by 9.8% in 2010 and declining by 17.9% in 2009.
Sources: Volkswirtschaftliche Gesamtrechnungen der Länder, Reihe 1, Länderergebnisse Band 1 (February 2011), Table 2.3; Statistisches Bundesamt, Fachserie 18, Reihe 1.4 - 2011 (March 2012), Tables 2.2.1, 2.2.2 and 3.2.1.
The following table shows the output of the production sector in index form using 2005 as the base year for each of the years indicated.
OUTPUTINTHE PRODUCTION SECTOR (1)
(2005 = 100)
| | | | | | | | | | | | | | | | | | | | | | | | | |
| | | 2011 (2) | | 2010 | | 2009 | | 2008 | | 2007 |
| | | | | |
Production sector, total | | | | 112.1 | | | | | 103.9 | | | | | 94.3 | | | | | 111.5 | | | | | 111.6 | |
Industry (3) | | | | 114.0 | | | | | 104.6 | | | | | 93.7 | | | | | 113.4 | | | | | 113.1 | |
of which: | | | | | | | | | | | | | | | | | | | | | | | | | |
Intermediate goods (4) | | | | 116.2 | | | | | 107.1 | | | | | 93.3 | | | | | 114.2 | | | | | 114.5 | |
Capital goods (5) | | | | 116.6 | | | | | 103.7 | | | | | 92.0 | | | | | 116.8 | | | | | 114.9 | |
Durable goods (6) | | | | 100.2 | | | | | 95.7 | | | | | 87.6 | | | | | 104.0 | | | | | 108.4 | |
Nondurable goods (7) | | | | 104.4 | | | | | 102.4 | | | | | 100.6 | | | | | 104.4 | | | | | 105.8 | |
Energy (8) | | | | 86.7 | | | | | 93.6 | | | | | 90.6 | | | | | 95.6 | | | | | 98.2 | |
Construction (9) | | | | 123.0 | | | | | 108.5 | | | | | 108.2 | | | | | 108.3 | | | | | 108.8 | |
| (1) | Adjusted for working-day variations. |
| (3) | Manufacturing sector, unless assigned to the main grouping energy, plus mining and quarrying. |
| (4) | Including mining and quarrying except energy-producing goods. |
| (5) | Including manufacture of motor vehicles and components. |
| (6) | Consumption goods that have a long-term use, such as furniture. |
| (7) | Consumption goods that have a short-term use, such as food. Including printing and service activities related to printing. |
| (8) | Electricity, gas, steam and hot water supply, mining and quarrying of energy-producing materials, and especially manufacture of refined petroleum products. |
| (9) | Comprises the economic classifications “Site preparation” and “Building of complete constructions or parts thereof; civil engineering.” |
Source: Deutsche Bundesbank, Monatsbericht März 2012, Table X.2.
Services Sector
As in most other industrialized countries, the services sector, which comprises “trade, transport, accommodation and food services”, “information and communication”, “financial and insurance services”, “real estate activities,” “business services”, “public services, education, health” as well as “other services”, has expanded rapidly in recent years and is currently the largest contributor to gross value added. In 2011, the services sector’s aggregate contribution to gross value added at current prices decreased slightly to 69.0% (after 70.1% in 2010 and only 62.0% in 1991). Within the services sector, “public services, education, health” represented the largest subsector in terms of contribution to total gross value added at current prices, contributing 17.9% in 2011 (after 18.3% in 2010).
Source: Statistisches Bundesamt, Fachserie 18, Reihe 1.4 - 2011 (March 2012), Table 2.2.1.
G-15
Employment and Labor
In 2011, the average unemployment rate according to the national definition was 7.1%, compared to 7.7% in 2010. Under the ILO definition, the average unemployment rate was 5.8% in 2011 compared to 6.8% in 2010. Under both definitions, the average unemployment rate in 2011 decreased significantly to the lowest level of unemployment since 1991.
The strong labor market in 2010 and 2011 was attributable to the strong growth performance of the German economy, but also to favorable rules regarding the use of short-time work that the Federal Government adopted as a part of its stimulus packages in 2009. In 2009, among other favorable special regulations, the maximum period of short-time work was temporarily extended from six to 24 months. As of January 1, 2012, the period of entitlement to short-time allowances has been reduced to a maximum of six months. Favorable regulations regarding the reimbursement of employers’ social security contributions remained in effect until the end of March 2012.
The number of persons resident in Germany who were either employed or self-employed in 2011 was approximately 41.0 million, an increase of 1.3% compared to 2010.
Sources: Bundesagentur für Arbeit, Der Arbeits- und Ausbildungsmarkt in Deutschland: Dezember und das Jahr 2011, Table 10.1 (http://statistik.arbeitsagentur.de/Statischer-Content/Arbeitsmarktberichte/Monatsbericht-Arbeits-Ausbildungsmarkt-Deutschland/Monatsberichte/Generische-Publikationen/Monatsbericht-201112.pdf); Statistisches Bundesamt, Fachserie 18, Reihe 1.4—2011 (March 2012), Table 2.1.12; Bundesministerium für Wirtschaft und Technologie, 2012 Annual Economic Report (http://www.bmwi.de/English/Navigation/Service/publications,did=479718.html); Bundesagentur für Arbeit, short-time allowance due to the economic situation (http://www.arbeitsagentur.de/nn_439356/EN/Navigation/zentral/Leistungen/Kurzarbeitergeld/Kurzarbeitergeld-Nav.html).
The following table presents data with respect to employment and unemployment for each of the years indicated. Persons who are participating in programs such as vocational training, job creation plans or early retirement, which are designed to reduce unemployment are not included in the unemployment rates shown below, as they are not treated as unemployed.
EMPLOYMENTAND UNEMPLOYMENT
| | | | | | | | | | | | | | | | | | | | | | | | | |
| | | 2011 | | 2010 | | 2009 | | 2008 | | 2007 |
Employed (in thousands)–ILO definition | | | | 41,037 | | | | | 40,506 | | | | | 40,311 | | | | | 40,290 | | | | | 39,791 | |
Unemployed (in thousands)–ILO definition (1) | | | | 2,505 | | | | | 2,946 | | | | | 3,228 | | | | | 3,136 | | | | | 3,601 | |
Unemployment rate (in %)–ILO definition | | | | 5.8 | | | | | 6.8 | | | | | 7.4 | | | | | 7.2 | | | | | 8.3 | |
Unemployed (in thousands)–national definition (2) | | | | 2,976 | | | | | 3,238 | | | | | 3,415 | | | | | 3,258 | | | | | 3,760 | |
Unemployment rate (in %)–national definition (3) | | | | 7.1 | | | | | 7.7 | | | | | 8.1 | | | | | 7.8 | | | | | 9.0 | |
| (1) | Unemployed persons, available and seeking work. |
| (2) | Registered unemployed persons, available and seeking work (but including persons working up to 15 hours per week). |
| (3) | As a percentage of the total work force (excluding armed forces). |
Sources: Bundesagentur für Arbeit, Der Arbeits- und Ausbildungsmarkt in Deutschland: Dezember und das Jahr 2011, Table 10.1; Statistisches Bundesamt, Fachserie 18, Reihe 1.2 – 4. Vierteljahr 2011 (February 2012), Table 1.10.
Beginning in 1989, the increase in the number of immigrants of German descent from Eastern Europe and the German reunification in 1990 resulted in an accelerated growth of the workforce and contributed, in part, to a subsequent increase in the number of registered unemployed persons. As a result of the fundamental restructuring of the eastern German economy following reunification, a significant number of employees in the eastern Länder lost their jobs. In 2011, under the national definition, the unemployment rate in the eastern Länder was 11.3% (2010: 12.0%), compared to an unemployment rate of 6.0% (2010: 6.6%) in the western Länder.
Source: Bundesagentur für Arbeit, Der Arbeits- und Ausbildungsmarkt in Deutschland: Dezember und das Jahr 2011, Tables 10.2 and 10.3 (http://statistik.arbeitsagentur.de/Statischer-Content/Arbeitsmarktberichte/Monatsbericht-Arbeits-Ausbildungsmarkt-Deutschland/Monatsberichte/Generische-Publikationen/Monatsbericht-201112.pdf).
G-16
In 2011, gross wages and salaries per employee in Germany increased by 3.3%. Unit labor costs, which had declined by 1.5% in 2010, posted an increase of 1.2% in 2011.
Source: Statistisches Bundesamt, Fachserie 18, Reihe 1.4. -2011(March 2012), Tables 2.17 and 2.20.
The following table shows changes in the annual wage level per employee and unit labor costs per hour worked for each of the years indicated.
WAGE TRENDSAND LABOR COSTS
| | | | | | | | | | | | | | | | | | | | | | | | | |
| | | 2011 | | 2010 | | 2009 | | 2008 | | 2007 |
Gross wages and salaries per employee in EUR | | | | 29,359 | | | | | 28,421 | | | | | 27,830 | | | | | 27,928 | | | | | 27,306 | |
Change from previous year in % | | | | 3.3 | | | | | 2.1 | | | | | -0.4 | | | | | 2.3 | | | | | 1.4 | |
Unit labor costs per hour worked | | | | | | | | | | | | | | | | | | | | | | | | | |
Index (2005=100) | | | | 104.6 | | | | | 103.3 | | | | | 104.8 | | | | | 98.9 | | | | | 96.7 | |
Change from previous year in % | | | | 1.2 | | | | | -1.5 | | | | | 6.0 | | | | | 2.3 | | | | | -1.0 | |
Source: Statistisches Bundesamt, Fachserie 18, Reihe 1.2 – 4. Vierteljahr 2011 (February 2012), Tables 2.17 and 2.20.
Approximately one-fifth of the German work force consists of members of unions. The German Trade Union Federation (Deutscher Gewerkschaftsbund) serves as an umbrella organization for eight such unions. Each member union typically covers employees of an entire industry, regardless of the precise type of work done by those employees (the “one union, one industry” principle). As a result, employers usually deal with only one negotiating partner on the labor side in each specific industry.
The unions and employers of each specific industry enter into collective labor agreements (Tarifverträge) without government intervention. As a practical matter, the collective labor agreements usually apply to all employees of a given industry, regardless of whether or not a particular employee is a member of a union, so long as the employer is a member of the relevant association of employers, which is often the case. Despite their binding character, collective labor agreements usually contain opt-out clauses (Öffnungsklauseln) allowing for company-specific adjustments to be negotiated between the employer and the works council at the specific company. Moreover, there is a range of additional possibilities to deviate from these agreements. Many employers in the eastern Länder are no longer members of employers’ associations, in which case wages are individually negotiated, which often results in wage levels that are lower than those provided for by the Tarifverträge. In recent years, the number of employees in companies that are subject to labor agreements has declined.
Under the Law on Posting Workers (Arbeitnehmer-Entsendegesetz) it is possible to use minimum wage rules at the industry level, but there is no national statutory minimum wage.
Sources: Bundesarbeitsgericht, Pressemitteilungen 9/2010 and 46/2010 (http://juris.bundesarbeitsgericht.de/cgi-bin/rechtsprechung/document.py?Gericht=bag&Art=pm&Datum=2010-1&nr=14041&pos=1&anz=10 and http://juris.bundesarbeitsgericht.de/cgi-bin/rechtsprechung/document.py?Gericht=bag&Art=pm&sid=9bd142e7371d44048521f1d32cee1d31&nr=14436&linked=bes); Sachverständigenrat zur Begutachtung der gesamtwirtschaftlichen Entwicklung, Jahresgutachten 2010/2011, Rz. 499-507 (http://www.sachverstaendigenrat-wirtschaft.de/fileadmin/dateiablage/download/gutachten/ga10_ges.pdf); Bundesministerium für Wirtschaft und Technologie, Jahreswirtschaftsbericht 2011, Rz. 115; Bundesministerium für Arbeit und Soziales, Mindestlohn-Gesetze (http://www.bmas.de/DE/Themen/Arbeitsrecht/Mindestlohngesetze/mindestlohngesetze.html).
G-17
Social Security Legislation and Social Policy
The comprehensive system of social security legislation and services in effect in the Federal Republic includes health insurance, long-term care insurance, retirement and disability pensions, unemployment benefits, child welfare programs, care for physically and mentally handicapped persons, allowances to orphans and to single persons with dependents, and the provision of general public assistance to needy persons. The majority of the German population is covered by mandatory statutory retirement pensions and health insurance. Most of the hospitals and institutions caring for children and handicapped persons are operated by municipalities, churches and charitable institutions.
These social security programs are mainly funded through social security contributions from employers and employees, and a smaller part is funded through direct contributions by the Federal Republic, the Länder, municipalities and other public institutions. The most important part of the social security system – retirement pensions, health insurance and unemployment insurance – is funded primarily through equal contributions by employers and employees.
The Federal Republic’s statutory retirement insurance system operates on a pay-as-you-go basis, with the contributions from current employers and employees funding payments to current retired persons. Certain persons, including members of certain professions, and civil servants, may either apply for exemption or are automatically exempted from mandatory participation in the statutory retirement pension insurance system. They may instead contribute to private pension schemes or, in the case of civil servants, benefit from special pension schemes for civil servants. The Retirement Funds Act (Altersvermögensgesetz) aims to ensure the long-term
G-18
viability of the statutory retirement pension insurance system by encouraging insurees to also sign up for designated privately funded or funded corporate pension schemes, for which certain bonus payments and tax incentives are provided, with a view to offsetting the expected decline of payments from the statutory retirement pension insurance.
Statutory health insurance coverage must be made available to all persons fulfilling the applicable eligibility criteria. Within the statutory health insurance system, insurees may choose among a large number of statutory health insurance providers that have developed historically. Persons whose gross income exceeds certain thresholds as well as civil servants, self-employed persons and members of certain professions may opt out of the statutory system and choose private health insurance coverage. Contributions to the statutory health insurance system are based solely on the insuree’s income situation and are independent of the insuree’s gender, age and medical risk. By contrast, to date, contributions towards private health insurance coverage are mainly calculated based on the insuree’s gender, age, medical risk and the desired level of coverage.
In 2011, social security revenue, as shown in the national accounts, amounted to EUR 525.9 billion, and expenditure was EUR 510.8 billion. The social security budget thus incurred a surplus of EUR 15.1 billion in 2011, after a surplus of EUR 2.3 billion in 2010.
Source: Statistisches Bundesamt, Fachserie 18, Reihe 1.4 - 2011 (March 2012), Table 3.4.3.7.
In light of a changing population structure, the Federal Government has already implemented structural reforms of the statutory pension system in order to safeguard the sustainability of the social security system in the long term. Among the important reforms of the previous government were reforms of the health insurance, making health insurance compulsory and introducing a “health fund” (Gesundheitsfonds) that collects health care contributions based on uniform rates and distributes them – adjusted for differences in the risk structures of the insuree pool – in equal amounts per capita among statutory health insurance providers, as well as reforms of the statutory pension insurance, which gradually raise the regular retirement age by two years to the age of 67 between 2012 and 2029.
Sources: Bundesministerium für Wirtschaft und Technologie, 2012 Annual Economic Report (http://www.bmwi.de/English/Navigation/Service/publications,did=479718.html); Growth. Education. Unity. Coalition Agreement between CDU, CSU and FDP, page 121 (http://www.cdu.de/doc/pdfc/091215-koalitionsvertrag-2009-2013-englisch.pdf); Bundesministerium der Gesundheit, Gesundheitsfonds (http://www.bmg.bund.de/Krankenversicherung/finanzierung/gesundheitsfonds.html); Bundesministerium für Arbeit und Soziales, Altersrenten (http://www.bmas.de/DE/Themen/Rente/Gesetzliche-Rentenversicherung/Leistungen/Altersrenten/altersrenten.html); Bundesministerium für Arbeit und Soziales, Fragen und Antworten zur Rente mit 67 (http://www.bmas.de/EN/Our-Topics/Pensions/pensions-from-age-67.html).
International Economic Relations
International economic relations are of major importance to the German economy. In 2011, exports and imports of goods and services amounted to 50.1% and 45.0% of GDP at current prices, respectively. The Federal Republic pursues a liberal foreign trade policy aimed at dismantling tariffs and other barriers to trade.
Source: Statistisches Bundesamt, Fachserie 18, Reihe 1.4 - 2011 (March 2012), Table 2.3.1.
Because the Federal Republic’s economy depends on exports, it is particularly vulnerable to trade barriers, such as protective tariffs. The Federal Government thus supports efforts to reduce trade barriers, such as the current negotiations within the framework of the WTO under the Doha Development Agenda.
Source: Bundesministerium für Wirtschaft und Technologie, Handelspolitik EU / WTO (http://www.bmwi.de/BMWi/Navigation/Aussenwirtschaft/handelspolitik-eu-wto.html).
Balance of Payments
The Federal Republic typically achieves a surplus in the trading of goods. Traditionally, this surplus has been partially offset by deficits in other fields, such as in services, as well as by remittances by foreign employees to their home countries, the Federal Republic’s net payments to the EU and various other payments. In 2011, the current account surplus totaled EUR 147.7 billion, compared to EUR 150.7 billion in 2010.
Source: Deutsche Bundesbank, Monatsbericht März 2012, Table XI.2.
According to data prepared by the Deutsche Bundesbank, applying the annual averages of a broad monthly indicator of Germany’s price competitiveness compared to 56 trading partners based on consumer price indices, Germany’s price competitiveness has been relatively stable since 1999, fluctuating within a range of 7.6% of the average indicator value in the period from 1999 to 2011. In
G-19
2011, price competitiveness improved slightly by 0.5%, mainly due to the depreciations of the euro relative to the U.S. dollar. However, the influence of variations in the euro/U.S. dollar exchange rate is not overly pronounced as other Euro Area Member States account for a major part of German exports (39.7% in 2011).
Since the introduction of the euro, the exchange rate against the U.S. dollar has shown high volatility. After appreciating by approximately 85% against the U.S. dollar between June 2001 and July 2008, the euro depreciated considerably relative to the U.S. dollar by approximately 23% between July 2008 and June 2010, breaking a long-term trend of appreciation. In 2011, the euro appreciated by 5% from its 2010 average. In February 2012, however, the euro had depreciated again by 5% from its 2011 average.
Sources: Deutsche Bundesbank, Monatsbericht März 2002, Table X.11; Deutsche Bundesbank, Monatsbericht März 2009, Table XI.11; Deutsche Bundesbank, Monatsbericht März 2011, Table XI. 11; Deutsche Bundesbank, Monatsbericht März 2012, Tables XI.3, XI.11 and XI.13; Deutsche Bundesbank, Statistics, Exchange rates, gold prices, Time series BBEE2.M.DE.AAA.XY16.R.AACPE.M00: Indicator of the German economy’s price competitiveness against 56 trading partners, based on consumer price indices (http://www.bundesbank.de/statistik/statistik_zeitreihen.en.php?lang=en&open=dev isen&func=row&tr=BBEE2.M.DE.AAA.XY16.R.AACPE.M00).
The following table shows the Federal Republic’s balance of payments for each of the years indicated.
BALANCEOF PAYMENTS (BALANCES) (1)
| | | | | | | | | | | | | | | | | | | | | | | | | |
| | | 2011 | | 2010 | | 2009 | | 2008 | | 2007 �� |
| | | (EUR in millions) |
Current account (2) | | | | | | | | | | | | | | | | | | | | | | | | | |
Foreign trade (3) | | | | 158,087 | | | | | 154,863 | | | | | 138,697 | | | | | 178,297 | | | | | 195,348 | |
Supplementary trade items | | | | -18,852 | | | | | -11,613 | | | | | -15,052 | | | | | -13,628 | | | | | -9,816 | |
Services (4) | | | | -6,494 | | | | | -4,258 | | | | | -8,049 | | | | | -10,258 | | | | | -14,852 | |
Factor income | | | | 48,415 | | | | | 49,864 | | | | | 58,120 | | | | | 32,379 | | | | | 42,918 | |
Current transfers | | | | -33,501 | | | | | -38,187 | | | | | -33,158 | | | | | -33,157 | | | | | -32,685 | |
| | | | | | | | | | | | | | | | | | | | | | | | | |
Total current account | | | | 147,656 | | | | | 150,668 | | | | | 140,558 | | | | | 153,633 | | | | | 180,914 | |
Capital transfers and purchases/sales of intangible non-produced assets | | | | 641 | | | | | -586 | | | | | 29 | | | | | -210 | | | | | 104 | |
Capital account | | | | | | | | | | | | | | | | | | | | | | | | | |
Total net German investment abroad (increase/capital exports—negative figure) | | | | -230,661 | | | | | -408,695 | | | | | -21,427 | | | | | -203,251 | | | | | -693,802 | |
Total net foreign investment in Germany (increase/capital imports—positive figure) | | | | 68,725 | | | | | 261,256 | | | | | -134,013 | | | | | 29,341 | | | | | 483,652 | |
| | | | | | | | | | | | | | | | | | | | | | | | | |
Total net capital export (5) | | | | -161,937 | | | | | -147,439 | | | | | -155,440 | | | | | -173,910 | | | | | -210,151 | |
Balance of unclassifiable transactions | | | | 13,640 | | | | | -2,643 | | | | | 14,853 | | | | | 20,487 | | | | | 29,133 | |
| (1) | Figures are subject to considerable uncertainty owing to changes in the method of data collection in foreign trade. |
| (2) | Foreign trade and services are recorded on the basis of exports (f.o.b.)/imports (c.i.f.) (i.e., including the freight and insurance costs of imports). |
| (3) | Special trade according to the official foreign trade statistics. Special trade consists principally of goods that are imported into the Federal Republic for use, consumption, adaptation or processing, as well as goods that are produced, manufactured, adapted or processed in the Federal Republic and are exported. (Source: Statistisches Bundesamt, Statistisches Jahrbuch 2011, page 464). |
| (4) | Excluding the freight and insurance costs included in the c.i.f. import value. |
| (5) | Including change of currency reserves. |
Source: Deutsche Bundesbank, Statistisches Beiheft 3 zum Monatsbericht März 2012, Zahlungsbilanzstatistik, Tables I.1 and I.9.a.
G-20
Balance of Trade
The following tables show information relating to foreign trade of the Federal Republic for each of the years indicated.
FOREIGN TRADE OF GOODS
| | | | | | | | | | | | | | | | | | | | | | | | | |
| | | 2011 | | 2010 | | 2009 | | 2008 | | 2007 |
| | | (EUR in millions) |
| | | | | |
Exports of goods (f.o.b.) | | | | 1,060,037 | | | | | 951,959 | | | | | 803,312 | | | | | 984,140 | | | | | 965,236 | |
Imports of goods (c.i.f.) | | | | 901,950 | | | | | 797,097 | | | | | 664,615 | | | | | 805,842 | | | | | 769,887 | |
| | | | | | | | | | | | | | | | | | | | | | | | | |
Trade surplus | | | | 158,087 | | | | | 154,863 | | | | | 138,697 | | | | | 178,297 | | | | | 195,348 | |
| | | | | | | | | | | | | | | | | | | | | | | | | |
Source: Deutsche Bundesbank, Statistisches Beiheft 3 zum Monatsbericht März 2012, Zahlungsbilanzstatistik, Table I.1.
The Federal Republic’s principal export goods are machinery of all kinds, motor vehicles and chemical products.
The principal import goods are computer, electronic and optical products, motor vehicles, crude petroleum and natural gas. The Federal Republic has relatively few resources of industrial raw materials. As a result, it largely depends on imports to satisfy its demand for raw materials. This dependence on foreign supplies is particularly significant in the case of metals such as copper, bauxite, manganese, titanium, rock phosphate, tungsten and tin. The Federal Republic currently imports nearly two-thirds of its energy requirements, including virtually all of its oil and a significant portion of its natural gas requirements as well as all enriched uranium needed for nuclear energy.
COMPOSITIONOF EXPORTEDAND IMPORTED GOODS
| | | | | | | | | | |
| | | 2011 (1) |
| | | Imports | | Exports |
| | | (Percent of total) |
Products of agriculture and hunting | | | | 2.9 | | | | | 0.8 | |
Products of forestry | | | | 0.1 | | | | | 0.0 | |
Fish and products of fishing | | | | 0.1 | | | | | 0.0 | |
Coal and lignite | | | | 0.5 | | | | | 0.0 | |
Crude petroleum and natural gas | | | | 9.1 | | | | | 0.6 | |
Metal ores | | | | 1.0 | | | | | 0.0 | |
Other mining and quarrying products | | | | 0.2 | | | | | 0.1 | |
Food products | | | | 4.2 | | | | | 4.0 | |
Beverages | | | | 0.6 | | | | | 0.4 | |
Tobacco products | | | | 0.1 | | | | | 0.3 | |
Textiles | | | | 1.1 | | | | | 1.0 | |
Wearing apparel | | | | 3.0 | | | | | 1.3 | |
Leather and related products | | | | 1.0 | | | | | 0.5 | |
Wood and of products of wood and cork, except furniture; articles of straw and plaiting materials | | | | 0.6 | | | | | 0.6 | |
Paper and paper products | | | | 1.6 | | | | | 1.8 | |
Coke and refined petroleum products | | | | 3.3 | | | | | 1.3 | |
Chemicals and chemical products | | | | 7.9 | | | | | 9.5 | |
Basic pharmaceutical products and pharmaceutical preparations | | | | 4.3 | | | | | 4.8 | |
Rubber and plastic products | | | | 2.8 | | | | | 3.5 | |
Other non-metallic mineral products | | | | 1.0 | | | | | 1.2 | |
Basic metals | | | | 6.8 | | | | | 5.7 | |
Fabricated metal products, except machinery and equipment | | | | 2.5 | | | | | 3.4 | |
Computer, electronic and optical products | | | | 9.9 | | | | | 8.0 | |
Electrical equipment | | | | 4.7 | | | | | 6.2 | |
Machinery and equipment not elsewhere classified. | | | | 7.8 | | | | | 15.2 | |
Motor vehicles, trailers and semi-trailers | | | | 9.0 | | | | | 17.4 | |
Other transport equipment | | | | 4.0 | | | | | 3.9 | |
Furniture | | | | 1.0 | | | | | 0.8 | |
Energy | | | | 0.3 | | | | | 0.3 | |
Other goods | | | | 8.7 | | | | | 7.2 | |
| | | | | | | | | | |
Total | | | | 100.0 | | | | | 100.0 | |
| | | | | | | | | | |
Source: Statistisches Bundesamt, Fachserie 7, Reihe 1 – December 2011 (March 2011), Tables 5.1 and 5.2; calculation of percentages by KfW based on import and export values in EUR thousands, respectively.
G-21
FOREIGN TRADE (SPECIAL TRADE)BY GROUPSOF COUNTRIESAND COUNTRIES (1)
| | | | | | | | | | | | | | | |
| | | 2011 | | 2010 | | 2009 |
| | | (EUR in millions) |
| | | |
Exports to: | | | | | | | | | | | | | | | |
Total | | | | 1,060,037 | | | | | 951,959 | | | | | 803,312 | |
of which: | | | | | | | | | | | | | | | |
France | | | | 101,555 | | | | | 89,582 | | | | | 81,304 | |
United States | | | | 73,694 | | | | | 65,574 | | | | | 54,356 | |
The Netherlands | | | | 69,312 | | | | | 62,978 | | | | | 53,195 | |
United Kingdom | | | | 65,334 | | | | | 58,666 | | | | | 53,240 | |
China (2) | | | | 64,762 | | | | | 53,791 | | | | | 37,273 | |
Italy | | | | 62,122 | | | | | 58,589 | | | | | 50,620 | |
Austria | | | | 57,868 | | | | | 52,156 | | | | | 46,093 | |
Belgium/Luxembourg | | | | 53,260 | | | | | 50,545 | | | | | 46,262 | |
Switzerland | | | | 47,708 | | | | | 41,659 | | | | | 35,510 | |
Southeast Asia (3) | | | | 41,532 | | | | | 38,183 | | | | | 28,606 | |
Spain | | | | 34,868 | | | | | 34,222 | | | | | 31,281 | |
Japan | | | | 15,118 | | | | | 13,149 | | | | | 10,875 | |
| | | |
Imports from: | | | | | | | | | | | | | | | |
Total | | | | 901,950 | | | | | 797,097 | | | | | 664,615 | |
of which: | | | | | | | | | | | | | | | |
The Netherlands | | | | 82,163 | | | | | 67,205 | | | | | 55,583 | |
China (2) | | | | 79,168 | | | | | 77,270 | | | | | 56,706 | |
France | | | | 66,464 | | | | | 60,673 | | | | | 53,338 | |
Italy | | | | 48,316 | | | | | 41,977 | | | | | 37,197 | |
United States | | | | 48,289 | | | | | 45,241 | | | | | 39,283 | |
United Kingdom | | | | 44,898 | | | | | 37,923 | | | | | 32,452 | |
Belgium/Luxembourg | | | | 41,282 | | | | | 36,026 | | | | | 30,694 | |
Southeast Asia (3) | | | | 38,994 | | | | | 39,562 | | | | | 28,338 | |
Austria | | | | 37,700 | | | | | 33,013 | | | | | 27,565 | |
Switzerland | | | | 36,863 | | | | | 32,507 | | | | | 28,096 | |
Japan | | | | 23,545 | | | | | 22,475 | | | | | 18,946 | |
Spain | | | | 22,521 | | | | | 21,955 | | | | | 18,959 | |
| (1) | Exports (f.o.b.) by country of destination, imports (c.i.f.) by country of origin. Special trade consists mainly of goods that are imported into the Federal Republic for use, consumption, adaptation or processing, as well as goods that are produced, manufactured, adapted or processed in the Federal Republic and subsequently exported. (Source: Statistisches Bundesamt, Statistisches Jahrbuch 2011, page 464). |
| (3) | Includes Brunei Darussalam, Hong Kong, Indonesia, Malaysia, Philippines, Singapore, South Korea, Taiwan and Thailand. |
Source: Deutsche Bundesbank, Monatsbericht März 2012, Table XI.3.
G-22
MONETARY AND FINANCIAL SYSTEM
The European System of Central Banks and the Eurosystem
The ESCB comprises the ECB and the national central banks of the Member States of the EU, while the Eurosystem consists of the ECB and the national central banks of the Euro Area Member States.
The Eurosystem is responsible for the single monetary policy for the euro area. Its decision-making bodies are the Governing Council and the Executive Board of the ECB. The national central banks of the Member States that are not part of the Eurosystem are represented in the General Council of the ECB, but have no voting right in the decision-making process, particularly with respect to monetary policy. The ESCB’s primary objective is to maintain price stability. Without prejudice to the objective of price stability the ESCB supports the general economic policies of the EU.
The Deutsche Bundesbank - Germany’s national central bank within the ESCB - has the responsibility of implementing the single monetary policy in Germany and continues to perform various other tasks, including acting as the Federal Government’s fiscal agent and playing an important role in banking and financial market supervision, as further described below under the caption “—Financial System.”
Sources: European Central Bank, Annual Report 2004, pages 162-168 (http://www.ecb.eu/pub/pdf/annrep/ar2004en.pdf); Deutsche Bundesbank, Tasks and organisation (http://www.bundesbank.de/aufgaben/aufgaben.en.php).
Monetary Policy Instruments of the ESCB
To achieve its operational goals, the ESCB conducts open market operations, offers standing facilities and requires credit institutions to maintain minimum reserves in accounts with the ESCB. Open market operations play an important role in the ESCB’s monetary policy for the purposes of steering interest rates and managing the liquidity situation in the market. Available open market operations are reverse transactions, outright transactions, the issuance of debt certificates or foreign exchange swaps, and the collection of fixed-term deposits. Standing facilities are designed to provide or absorb overnight liquidity and the imposition of minimum reserve requirements allows the ESCB to stabilize money market interest rates, create (or enlarge) a structural liquidity shortage and possibly contribute to the control of monetary expansion. The ESCB has employed a variety of policy instruments in response to the global economic and financial crisis and the European sovereign debt crisis. For further information, see “—Policy Response to the Global Economic and Financial Crisis—Policy Responses at the EU Level.”
Source: European Central Bank, Implementation of Monetary Policy in the Euro Area, September 2006, pages 7-9 (http://www.ecb.int/pub/pdf/other/gendoc2006en.pdf).
Monetary Policy Strategy and Prices
The ECB’s primary goal is to maintain medium-term price stability, which is defined as a year-on-year increase in the harmonized index of consumer prices for the euro area of less than 2%. However, the ECB has clarified that, within this definition, it aims at an inflation rate close to 2%. This goal indicates the commitment to provide an adequate margin to avoid the risk of deflation. The stability-oriented monetary policy strategy of the Eurosystem used by the ECB to achieve this goal is based on two pillars: (1) analysis and assessment of short- to medium-term risks to price stability (economic analysis); and (2) assessment of medium- to long-term monetary developments (monetary analysis).
Sources: European Central Bank, Monthly Bulletin, January 1999, pages 45-50 (http://www.ecb.eu/pub/pdf/mobu/mb199901en.pdf); European Central Bank, The Monetary Policy of the ECB, 2004, page 50ff. (http://www.ecb.int/pub/pdf/other/monetarypolicy2004en.pdf).
The following table shows price trends in Germany for the periods indicated.
G-23
PRICE TRENDS
| | | | | | | | | | | | | | | | | | | | | | | | | |
| | | 2011 | | 2010 | | 2009 | | 2008 | | 2007 |
| | | (change from previous year in %) |
| | | | | |
Harmonized index of consumer prices (HICP) | | | | 2.5 | | | | | 1.1 | | | | | 0.2 | | | | | 2.8 | | | | | 2.3 | |
Consumer price index (CPI) | | | | 2.3 | | | | | 1.1 | | | | | 0.4 | | | | | 2.6 | | | | | 2.3 | |
Index of producer prices of industrial products sold on the domestic market (1) | | | | 5.7 | | | | | 1.6 | | | | | -4.2 | | | | | 5.5 | | | | | 1.3 | |
| (1) | Excluding value-added tax. |
Sources: Statistisches Bundesamt, Verbraucherpreise, Harmonisierter Verbraucherpreisindex, Veränderungsraten zum Vorjahr in % (https://www.destatis.de/DE/ZahlenFakten/Indikatoren/Konjunkturindikatoren/Basisdaten/HarmonisierterVerbraucherpreisindex.html?cms_gtp=146602_list%253D2%2526146598_slot%253D2&https=1); Statistisches Bundesamt, Verbraucherpreise, Verbraucherpreisindex für Deutschland, Veränderungsraten zum Vorjahr in % (https://www.destatis.de/DE/ZahlenFakten/Indikatoren/Konjunkturindikatoren/Basisdaten/VerbraucherpreiseKategorien.html?cms_gtp=145114_list%253D2%2526145110_slot%253D2&https=1); Deutsche Bundesbank, Monatsbericht Februar 2012, Table X.7.
Official Foreign Exchange Reserves
The following table shows the breakdown of the Federal Republic’s official foreign exchange reserves as of the end of the years indicated.
OFFICIAL FOREIGN EXCHANGE RESERVESOFTHE FEDERAL REPUBLIC (1)
| | | | | | | | | | | | | | | | | | | | | | | | | |
| | | As of December 31 |
| | | 2011 | | 2010 | | 2009 | | 2008 | | 2007 |
| | | (EUR in millions) |
Gold | | | | 132,874 | | | | | 115,403 | | | | | 83,939 | | | | | 68,194 | | | | | 62,433 | |
Foreign currency balances | | | | 29,433 | | | | | 27,957 | | | | | 25,634 | | | | | 27,705 | | | | | 27,694 | |
Reserve position in the IMF and special drawing rights | | | | 22,296 | | | | | 18,740 | | | | | 15,969 | | | | | 3,285 | | | | | 2,418 | |
| | | | | | | | | | | | | | | | | | | | | | | | | |
Total | | | | 184,603 | | | | | 162,100 | | | | | 125,541 | | | | | 99,185 | | | | | 92,545 | |
| | | | | | | | | | | | | | | | | | | | | | | | | |
| (1) | External position of the Deutsche Bundesbank in the EMU. Assets and liabilities vis-à-vis all EMU member countries and non-EMU member countries. |
Source: Deutsche Bundesbank, Monatsbericht Februar 2012, Table XI.9.
The Federal Republic’s foreign reserve assets are managed by the Deutsche Bundesbank. The Euro Area Member States have transferred foreign reserve assets in an aggregate amount equivalent to approximately EUR 40.3 billion to the ECB, consisting of foreign currency reserves and gold. The ECB manages the foreign reserve assets transferred to it. The foreign reserve assets not transferred to the ECB continue to be held and managed by the national central banks of the Euro Area Member States. In order to ensure consistency within the single monetary and foreign exchange policies of the EMU, the ECB monitors and coordinates market transactions conducted with those assets.
Sources: European Central Bank, Annual Report 1998, page 74 (http://www.ecb.int/pub/pdf/annrep/ar1998en.pdf); European Central Bank, Annual Report 2011, p.173 (http://www.ecb.eu/pub/pdf/annrep/ar2011en.pdf).
External Positions of Banks
The following table shows the external assets and liabilities of the Deutsche Bundesbank and the banks (monetary financial institutions) of the Federal Republic as of the end of each of the years indicated.
G-24
EXTERNAL FINANCIAL ASSETSAND LIABILITIESBY SECTOR
| | | | | | | | | | | | | | | | | | | | | | | | | |
| | | 2011 | | 2010 | | 2009 | | 2008 | | 2007 |
| | | (EUR in billions) |
Deutsche Bundesbank | | | | | | | | | | | | | | | | | | | | | | | | | |
Assets | | | | 714.7 | | | | | 524.7 | | | | | 323.3 | | | | | 230.8 | | | | | 179.5 | |
Liabilities | | | | 46.6 | | | | | 14.6 | | | | | 9.1 | | | | | 30.2 | | | | | 16.0 | |
| | | | | | | | | | | | | | | | | | | | | | | | | |
Net position | | | | 668.1 | | | | | 510.1 | | | | | 314.2 | | | | | 200.6 | | | | | 163.5 | |
of which: within Eurosystem (1) | | | | 475.9 | | | | | 337.9 | | | | | 189.9 | | | | | 128.7 | | | | | 84.1 | |
Banks | | | | | | | | | | | | | | | | | | | | | | | | | |
Loans to foreign banks | | | | 1,117.6 | | | | | 1,154.1 | | | | | 1,277.4 | | | | | 1,446.6 | | | | | 1,433.5 | |
Loans to foreign non-banks | | | | 744.4 | | | | | 773.8 | | | | | 815.7 | | | | | 908.4 | | | | | 908.3 | |
Loans from foreign banks | | | | 655.7 | | | | | 741.7 | | | | | 652.6 | | | | | 703.3 | | | | | 738.9 | |
Loans from foreign non-banks | | | | 224.4 | | | | | 226.5 | | | | | 216.3 | | | | | 286.1 | | | | | 303.1 | |
| (1) | Consists mainly of claims from the interbank payment system for the real-time processing of cross-border transfers throughout the EMU (TARGET2). |
Source: Deutsche Bundesbank, Monatsbericht Februar 2012, Tables IV.4 and XI.9.
Foreign Exchange Rates and Controls
The euro is a freely convertible currency. Since its introduction in 1999, the euro has become the second most widely used currency internationally. Currency transactions do not require licenses or other permissions. Capital market transactions are not subject to any license or similar requirements. Gold may be imported and exported freely, subject only to the levy of VAT on some transactions.
The following table shows the annual average exchange rates for selected currencies in relation to the euro for the years indicated.
ANNUAL AVERAGE EXCHANGE RATESOFTHE EURO (1)
| | | | | | | | | | | | | | | | | | | | | | | | | |
| | | 2011 | | 2010 | | 2009 | | 2008 | | 2007 |
U.S. dollars per euro | | | | 1.3920 | | | | | 1.3257 | | | | | 1.3948 | | | | | 1.4708 | | | | | 1.3705 | |
Pound sterling per euro | | | | 0.86788 | | | | | 0.85784 | | | | | 0.89094 | | | | | 0.79628 | | | | | 0.68434 | |
Japanese yen per euro | | | | 110.96 | | | | | 116.24 | | | | | 130.34 | | | | | 152.45 | | | | | 161.25 | |
Swiss franc per euro | | | | 1.2326 | | | | | 1.3803 | | | | | 1.5100 | | | | | 1.5874 | | | | | 1.6427 | |
Chinese yuan per euro | | | | 8.9960 | | | | | 8.9812 | | | | | 9.5277 | | | | | 10.2236 | | | | | 10.4178 | |
| (1) | Calculated from daily values. |
Source: Deutsche Bundesbank, Monthly Report February 2012, Table XI.11.
Financial System
As of January 31, 2012, 1,899 monetary financial institutions in Germany reported an aggregate balance sheet total of EUR 8,589.2 billion to the Deutsche Bundesbank. According to the Deutsche Bundesbank’s classification, these institutions included 282 commercial banks (with an aggregate balance sheet total of EUR 3,293.6 billion), 426 savings banks (with an aggregate balance sheet total of EUR 1,088.0 billion) and their ten regional institutions (including nine Landesbanken and Deka-Bank Deutsche Girozentrale, the central asset managing institution of the German savings banks and Landesbanken, with an aggregate balance sheet total of EUR 1,434.1 billion), 17 special-purpose credit institutions (including KfW, KfW IPEX-Bank and promotional banks of the federal states (Landesförderinstitute) with an aggregate balance sheet total of EUR 965.5 billion), 1,121 credit cooperatives (with an aggregate balance sheet total of EUR 725.1 billion) and their two central institutions (with an aggregate balance sheet total of EUR 292.2 billion), 18 mortgage banks (with an aggregate balance sheet total of EUR 592.6 billion) and 23 building and loan associations (with an aggregate balance sheet total of EUR 198.2 billion). Also included in this classification are the 150 subsidiaries and branches of foreign banks located in the Federal Republic, with an aggregate balance sheet total of EUR 1,036.1 billion.
Sources: Deutsche Bundesbank, Monatsbericht März 2012, Table IV.2; Deutsche Bundesbank, Statistik der Banken und sonstigen Finanzinstitute, Richtlinien und Kundensystematik, Januar 2012, Statistische Sonderveröffentlichung 1, 638 – 652 (http://www.bundesbank.de/download/statistik/stat_sonder/statso1_14verzeich.pdf).
G-25
The German Banking Act (Kreditwesengesetz) regulates all banks except for the Deutsche Bundesbank and KfW (although it may regulate subsidiaries of KfW). German commercial banking institutions operate as “universal” banks and are not restricted by law or otherwise from offering a complete range of diverse financial services.
The Financial Supervisory Authority (Bundesanstalt für Finanzdienstleistungsaufsicht, or “BaFin”) is responsible for the integrated supervision of financial services. Its primary objective is to guarantee the proper functioning, stability and integrity of the German financial system. The BaFin operates exclusively in the public interest. It seeks to ensure the ability of banks, financial services institutions and insurance companies to meet their payment obligations (solvency supervision), and it also enforces standards of professional conduct aimed at preserving investors’ trust in the financial markets (market supervision). In addition, the BaFin has an investor protection role in that it seeks to prevent unauthorized financial business from being carried out. The Deutsche Bundesbank is closely involved in the ongoing supervision of the banking sector by the BaFin and has been assigned most of the ongoing operational tasks in banking supervision. The BaFin is supervised by the Federal Ministry of Finance.
Sources: Bundesministerium der Justiz, Gesetz über das Kreditwesen (http://www.gesetze-im-internet.de/kredwg/index.html); Bundesanstalt für Finanzdienstleistungsaufsicht, BaFin, Functions & history (http://www.bafin.de/EN/BaFin/FunctionsHistory/functionshistory_node.html); Deutsche Bundesbank and Bundesanstalt für Finanzdienstleistungsaufsicht, Joint press release of November 4, 2002 (http://www.bundesbank.de/download/presse/pressenotizen/2002/20021104bbk1_en.pdf); Bundesanstalt für Finanzdienstleistungsaufsicht, Aufsichtsrichtlinie—Richtlinie zur Durchführung und Qualitätssicherung der laufenden Überwachung der Kredit- und Finanzdienstleistungsinstitute durch die Deutsche Bundesbank (AufsichtsRL), February 21, 2008 (http://www.bafin.de/SharedDocs/Aufsichtsrecht/DE/Richtlinie/rl_080221_aufsichtsrichtlinie.html).
The new European system of financial supervisors became operational on January 1, 2011. It consists of a European Systemic Risk Board (the “ESRB”), which provides macro-prudential oversight of the financial system. The ESRB’s role is to monitor and assess potential risks to the stability of the financial system. If necessary, it will issue risk warnings and recommendations for remedial action and will monitor their implementation. The ESRB is chaired by the President of the ECB for an initial term of five years.
In addition three new supervisory authorities at the micro-financial level have been established:
| | • | | the European Banking Authority, or “EBA”; |
| | • | | the European Insurance and Occupational Pensions Authority, or “EIOPA”; and |
| | • | | the European Securities and Markets Authority, or “ESMA.” |
The three European Supervisory Authorities (the “ESAs”) replace the previous three committees of supervisors at the EU level (the Committee of European Securities Regulators, the Committee of European Banking Supervisors and the Committee of European Insurance and Occupational Pensions). The ESAs work in tandem with the supervisory authorities of the Member States. National authorities remain responsible for the day-to-day supervision of individual firms, whereas the ESAs will be responsible for ensuring that a single set of harmonized rules and consistent supervisory practices are applied by supervisory authorities of the Member States. The ESAs have, for example, the power to settle disputes among national financial supervisors by imposing legally binding mediation and to impose temporary bans on risky financial products or activities.
Source: European Commission, Financial Supervision (http://ec.europa.eu/internal_market/finances/committees/index_en.htm).
In response to the global economic and financial crisis, regulatory authorities and central banks launched a comprehensive regulatory reform program. Consultative proposals for a new liquidity and capital framework were published in December 2009 by the Basel Committee on Banking Supervision. In July 2010, the Group of Governors and Heads of Supervision, the oversight body of the Basel Committee on Banking Supervision, reached a broad agreement on the overall design of a capital and liquidity reform package. Further agreement on specific higher minimum capital standards and new liquidity standards was reached by the Group of Governors and Heads of Supervision in September 2010. In December 2010, the Basel Committee on Banking Supervision launched a package of new standards on bank capital adequacy and liquidity to enhance the banking regulatory framework. The capital and liquidity reform package, typically referred to as Basel III, will be phased in between 2013 and 2019. As of the beginning of May 2012, translation of these rules into European and national law is still ongoing.
Sources: Bank for International Settlements, Consultative proposals to strengthen the resilience of the banking sector announced by the Basel Committee, press release of December 17, 2009 (http://www.bis.org/press/p091217.htm); Bank for International Settlements, The Group of Governors and Heads of Supervision reach broad agreement on Basel Committee capital and liquidity reform package, press release of July 26, 2010 (http://www.bis.org/press/p100726.htm); Bank for International Settlements, Basel Committee on Banking Supervision, Group of Governors and Heads of Supervision announces higher global minimum capital standards, press release of September 12, 2010 (http://www.bis.org/press/p100912.pdf).
G-26
Securities Market
The Federal Republic’s securities market is among Europe’s largest. Trading in listed securities is not legally or otherwise confined to the stock exchanges. It is estimated, however, that most transactions in equity securities are executed through stock exchanges. By contrast, debt securities, although typically listed, are predominantly traded over-the-counter.
Highly developed secondary markets, combined with the distribution capabilities of an extensive network of financial institutions, provide the basis for the Federal Republic’s position in the world’s capital markets. Equity and debt issues are generally underwritten and distributed through banking syndicates, which typically include commercial banks as well as certain regional and specialized institutions. The official securities markets of Berlin, Dusseldorf, Frankfurt am Main, Hamburg, Hanover, Munich and Stuttgart, the futures and options exchange Eurex Deutschland and the European Energy Exchange are recognized as regulated markets of the EU according to Article 47 of Directive 2004/39/EC on Markets in Financial Instruments and comply with globally accepted regulatory standards.
Based on total turnover on German securities exchanges, the Frankfurt Stock Exchange, operated by Deutsche Börse AG, is by far the most important stock exchange in the Federal Republic.
Policy Responses to the Global Economic and Financial Crisis
Policy Responses by the Federal Republic
Two liquidation sub-agencies (Abwicklungsanstalten) for troubled German banks were established within the framework set out by the German Further Stabilization of the Financial Market Act (Finanzmarkstabilisierungsergänzungsgesetz), which was introduced in April 2009. The first liquidation sub-agency, Erste Abwicklungsanstalt, was established in December 2009 to liquidate a portfolio of EUR 77.5 billion assumed from WestLB. As of December 31, 2011, its portfolio had been reduced to EUR 51.0 billion. The second liquidation sub-agency, FMS Wertmanagement, assumed a portfolio of EUR 175.7 billion from Hypo Real Estate Group in October 2010 to support restructuring efforts. As of June 30, 2011, its portfolio was reduced to EUR 160.5 billion.
Sources: Erste Abwicklungsanstalt, Geschäftsbericht 2009/2010 (https://www.aa1.de/fileadmin/aa1-website/content/downloads/Geschaeftsbericht_2009-2010.pdf); Erste Abwicklungsanstalt, Geschäftsbericht 2011, page 59 (https://www.aa1.de/fileadmin/aa1-website/content/downloads/EAA_Geschaeftsbericht_2011.pdf); FMS Wertmanagement, FMS Wertmanagement verzeichnet Fortschritte beim Abbau des Portfolios, press release dated October 18, 2011 (http://www.fms-wm.de/Deutsch/presse/presseerklaerungen-/fms-wertmanagement-verzeichnet-fortschritte-beim-abbau-des-portfolios/fms-wertmanagement-verzeichnet-fortschritte-beim-abbau-des-portfolios.html); FMS Wertmanagement, FMS Wertmanagement expands Executive Board, press release dated February 27, 2012
(http://www.fms-wm.de/English/press/press-releases/fms-wertmanagement-expands-executive-board/fms-wertmanagement-expands-executive-board.html).
The Restructuring Act, enacted in December 2010, has established new regulations for the restructuring and liquidation of banks. It provides for the establishment of a restructuring fund (Restrukturierungsfonds) to finance the measures that will be undertaken in restructuring proceedings that come within its ambit. The fund is financed by contributions of credit institutions (Bankenabgabe), thus ensuring that the financial sector participates in the costs of any future financial crisis. Promotional or development banks (such as KfW) are not required to contribute to the fund. The restructuring fund is managed by the Federal Institute for Market Stabilization (Bundesanstalt für Finanzmarktstabilisierung), which is also responsible for collecting the contributions of the credit institutions to the fund and for implementing the measures in restructuring proceedings under the Restructuring Act. Details of the implementation of the Bankenabgabe have been formalized in a restructuring fund regulation (Restrukturierungsfondsverordnung). The first payments were made in 2011.
Sources: Bundesministerium der Finanzen, Systemische Risiken im Finanzsektor wirksam begrenzen - Bundesregierung beschließt Restrukturierungsgesetz, press release of August 25, 2010 (http://www.bundesfinanzministerium.de/nn_53848/DE/Presse/Pressemitteilungen/Finanzpolitik/2010/08/20100825__PM32.html?__nnn=true); Bundesministerium der Finanzen, Wirtschaft und Verwaltung, Was macht die Bundesanstalt für Finanzmarktstabilisierung? Neue Aufgaben der FMSA zur Stabilisierung des Finanzsektors, September 20, 2010 (http://www.bundesfinanzministerium.de/nn_54/DE/Wirtschaft__und__Verwaltung/Geld__und__Kredit/20100917-FMSA.html?__nnn=true); Bundestagsdrucksache 17/3407 (http://dip21.bundestag.de/dip21/btd/17/034/1703407.pdf); Bundesministerium der Finanzen, Bundeskabinett beschließt Restrukturierungsfonds-Verordnung, press release dated July 20, 2011 (http://www.bundesfinanzministerium.de/nn_1928/DE/Wirtschaft__und__Verwaltung/Geld__und__Kredit/Kapitalmarktpolitik/20110720-Restrukturierungsfonds-Verordnung.html?__nnn=true).
In March 2012, the second Financial Market Stabilization Act entered into force. Under this act, the Special Financial Market Stabilization Fund (“SoFFin”) has been reactivated for a period ending on December 31, 2012. According to this act, SoFFin is ready to extend guarantees up to a total amount of EUR 400 billion for a period of five years to stabilize German banks, if required. In
G-27
addition, SoFFin is authorized to incur loans in a total amount of up to EUR 80 billion. This act also extends the previous model, which provided for the granting of guarantees with respect to structured securities that have been transferred to special purpose entities, to securities more generally. With respect to the German Banking Act (Kreditwesengesetz), this act authorizes the BaFin until the end of 2012 to require financial institutions to comply with more stringent capital requirements than are currently applicable. As of May 1, 2012, the outstanding stabilization measures provided by the SoFFin amounted to EUR 31.0 billion.
Sources: Bundesregierung, Für Vertrauen auf dem Finanzmarkt, press release of January 26, 2012
(http://www.bundesregierung.de/Content/DE/Artikel/2011/12/2011-12-14-finanzmarktstabilisierung.html); Die Beschlüsse des Bundestages am 26. und 27. Januar, publication of January 27, 2012 (http://www.bundestag.de/dokumente/textarchiv/2012/37536609_kw04_angenommen_abgelehnt/index.html); FMSA Bundesanstalt für Finanzmarktstabilisierung (http://www.fmsa.de/de/fmsa/soffin/instrumente/massnahmen-aktuell/; accessed on May 3, 2012).
Policy Responses at the EU Level
In mid-December 2010, the ECB decided to increase its subscribed capital by EUR 5 billion, from EUR 5.76 billion to EUR 10.76 billion, with effect from December 29, 2010. The national central banks of the euro area must pay their additional capital contributions in three equal annual installments, starting in December 2010. The overall additional capital contribution of Deutsche Bundesbank will amount to EUR 946.9 million. The share of Deutsche Bundesbank in ECB’s subscribed capital will remain unchanged. The capital increase was deemed appropriate in view of increased volatility in foreign exchange rates, interest rates and gold prices as well as credit risk.
Source: European Central Bank, ECB increases its capital, press release of December 16, 2010 (http://www.ecb.int/press/pr/date/2010/html/pr101216_2.en.html).
The Heads of State or Government of the Euro Area Member States, in light of continued tensions in the financial markets, in October 2011, agreed on a set of measures to restore confidence in the financial markets, among others, a comprehensive set of measures to raise confidence in the banking sector. The measures include facilitating access to term-funding through a coordinated approach at EU level involving state guarantees, and increasing the capital position of banks to 9% of Core Tier 1 capital by the end of June 2012. National supervisors must ensure that banks’ recapitalization plans do not lead to excessive deleveraging, in order to safeguard the flow of credit to the real economy, which is essential for growth prospects.
Sources: European Council, Euro Summit Statement, dated October 26, 2011 (http://www.consilium.europa.eu/uedocs/cms_Data/docs/pressdata/en/ec/125644.pdf); European Council, Main results of Euro Summit, dated October 26, 2011 (http://www.consilium.europa.eu/uedocs/cms_Data/docs/pressdata/en/ec/125645.pdf); European Council, Remarks by President Van Rompuy following the meeting of the Euro Summit (http://www.consilium.europa.eu/uedocs/cms_Data/docs/pressdata/en/ec/125646.pdf); Bundesregierung, Euro-Gipfel, für Schuldenschnitt und stärkeren Rettungsschirm, press release dated October 27, 2011
(http://www.bundesregierung.de/Webs/Breg/DE/Themen/Euro/GriechenlandHilfe/eu_rat_2/_node.html); Bundesregierung, Stabiler Euro geht vor, press release of November 3, 2011 (http://www.bundesregierung.de/nn_1264/Content/DE/Artikel/2011/11/2011-11-03-merkel-sakozy-griechenland.html).
In December 2011, EBA published the final results of its bank recapitalization exercise which was part of co-ordinated measures to restore confidence in the banking sector. The formal recommendation adopted by the EBA’s board of supervisors states that national supervisory authorities should require the banks included in the sample to strengthen their capital positions by building up an exceptional and temporary capital buffer against sovereign debt exposures to reflect market prices as at the end of September 2011. In addition, banks are required to establish an exceptional and temporary buffer such that the Core Tier 1 capital ratio reaches a level of 9% by the end of June 2012. Based on figures as of the end of September 2011, the 13 German banks covered by the exercise have an aggregate capital shortfall of EUR 13.1 billion.
Source: European Banking Authority,The EBA publishes Recommendation and final results of bank recapitalisation plan as part of co-ordinated measures to restore confidence in the banking sector, press release dated December 8, 2011 (http://stress-test.eba.europa.eu/capitalexercise/Press%20release%20FINALv2.pdf).
In order to address renewed tensions in some financial markets in the euro area, the ECB, in early August 2011, announced enhancements to its liquidity-providing operations for the banking sector and its return to active interventions in the euro area public and private debt securities markets through its Securities Markets Programme. This program was first introduced in early May 2010 with a view to ensuring depth and liquidity in certain dysfunctional market segments.
Sources: European Central Bank, Decisions taken by the Governing Council of the ECB (in addition to decisions setting interest rates), press release of August 4, 2011 (http://www.ecb.int/press/govcdec/otherdec/2011/html/gc110805.en.html); European Central Bank, Statement by the President of the ECB, press release of August 7, 2011 (http://www.ecb.int/press/pr/date/2011/html/pr110807.en.html); European Central Bank, ECB decides on measures to address severe tensions in financial markets, press release of May 10, 2010 (http://www.ecb.int/press/pr/date/2010/html/pr100510.en.html).
In mid-September 2011, the ECB, in coordination with the U.S. Federal Reserve Bank, the Bank of England, the Bank of Japan and the Swiss National Bank, agreed to conduct three U.S. dollar liquidity-providing operations with a maturity of approximately
G-28
three months covering the end of the year. These operations were conducted in addition to ongoing weekly seven-day U.S. dollar liquidity operations which were announced in May 2010. In November 2011, the Bank of Canada, the Bank of England, the Bank of Japan, the ECB, the U.S. Federal Reserve and the Swiss National Bank announced coordinated actions to enhance their capacity to provide liquidity support to the global financial system. These central banks agreed to lower the pricing on existing temporary U.S. dollar liquidity swap arrangements, which have been extended until February 1, 2013, with effect from December 5, 2011. As a contingency measure, the central banks have also agreed to establish temporary bilateral liquidity swap arrangements so that liquidity can be provided in each jurisdiction in any of their currencies, if required by market conditions. These swap lines are authorized through February 1, 2013.
Sources: European Central Bank, ECB announces additional US dollar liquidity-providing operations over year-end, press release of September 15, 2011 (http://www.ecb.int/press/pr/date/2011/html/pr110915.en.html); European Central Bank, ECB announces details of refinancing operations from October 2011 to 10 July 2012, press release of October 6, 2011 (http://www.ecb.int/press/pr/date/2011/html/pr111006_4.en.html); European Central Bank, Coordinated central bank action to address pressures in global money markets, press release of November 30, 2011 (http://www.ecb.int/press/pr/date/2011/html/pr111130.en.html).
Furthermore, in early October 2011, the ECB announced decisions (1) to launch a new covered bond purchase program in an anticipated amount of EUR 40 billion, with purchases beginning in November 2011 and expected to be completed by the end of October 2012, and (2) to conduct two longer-term refinancing operations with maturities of approximately 12 and 13 months in October and December 2011, respectively. On December 8, 2011, the ECB decided on additional enhanced credit support measures to improve bank lending and liquidity in the euro area money market, including the following:
| | • | | conducting two longer-term refinancing operations (“LTRO”) with a maturity of 36 months and the option of early repayment after one year; and |
| | • | | increasing collateral availability by (1) reducing the rating threshold for certain asset-backed securities and (2) allowing national central banks, as a temporary solution, to accept as collateral additional performing credit claims (i.e., bank loans) that satisfy specific eligibility criteria. |
Sources: European Central Bank, ECB announces new covered bond purchase program, press release of October 6, 2011 (http://www.ecb.int/press/pr/date/2011/html/pr111006_3.en.html); European Central Bank, ECB announces measures to support bank lending and money market activity, press release of December 8, 2011 (http://www.ecb.int/press/pr/date/2011/html/pr111208_1.en.html).
In the first LTRO, on December 22, 2011, EUR 489.2 billion was settled; and in the second LTRO, EUR 529.5 billion was settled on March 1, 2012.
Sources: ECB, Consolidated Financial Statement of the Eurosystem as at December 23, 2011, press release dated December 28, 2011 (http://www.ecb.eu/press/pr/wfs/2011/html/fs111228.en.html); ECB, Consolidated Financial Statement of the Eurosystem as at March 2, 2012, press release dated March 6, 2012 (http://www.ecb.eu/press/pr/wfs/2012/html/fs120306.en.html).
G-29
PUBLIC FINANCE
Receipts and Expenditures
The Federal Government, each of the Länder governments and each of the municipalities (Gemeinden) have separate budgets. The federal budget is the largest single public budget.
The fiscal year of the Federal Republic is the calendar year. The annual federal budget is passed by an act of parliament. On the basis of a proposal prepared by the Ministry of Finance, the Federal Government introduces the federal budget bill to the parliament, generally in the summer of each year. The proposal has to pass through three Bundestag sessions, the budget committee of the Bundestag, and the Bundesrat, which deliberates the proposal twice. The final vote on the proposal is taken by the Bundestag in its third session.
In addition to the federal, Länder and municipal budgets, there are separate budgets for the social security funds and various special funds (Sondervermögen) of the federal administration and the Länder as well as other off-budgetary entities at all levels of government that are created for specific public purposes. General government, as defined in the national accounts, comprises all these different levels of government activity.
In 2011, total consolidated general government revenue as presented in the national accounts amounted to EUR 1,148.2 billion, with tax revenue of EUR 587.8 billion and social contributions of EUR 435.3 billion.
Source: Statistisches Bundesamt, Fachserie 18, Reihe 1.4 - 2011 (March 2012), Table 3.4.3.2.
In 2011, the value added tax and the taxes on income and wealth as presented in the national accounts amounted to EUR 188.2 billion and EUR 295.7 billion, respectively. In addition to these taxes, the Federal Government, the Länder governments and the municipal authorities each levied special taxes - for example, on tobacco and beer. The joint taxes are distributed among the Federal Government, the Länder governments and municipal authorities, according to a predetermined formula.
Source: Statistisches Bundesamt, Fachserie 18, Reihe 1.4 - 2011 (March 2012), Table 3.4.3.16.
Consolidated general government expenditure in 2011, as presented in the national accounts, amounted to a total of EUR 1,173.5 billion. The most significant consolidated general government expenditures were monetary social benefits (EUR 423.5 billion), social benefits in kind (EUR 207.4 billion) and employee compensation (EUR 199.8 billion). Other significant consolidated general government expenditure included intermediate consumption (EUR 127.7 billion), interest on public debt (EUR 67.7 billion), and gross capital formation (EUR 42.3 billion).
Source: Statistisches Bundesamt, Fachserie 18, Reihe 1.4 - 2011 (March 2012), Table 3.4.3.2.
GENERAL GOVERNMENT ACCOUNTS (1)
| | | | | | | | | | | | | | | | | | | | | | | | | |
| | | 2011 | | 2010 | | 2009 | | 2008 | | 2007 |
| | | (EUR in billions) |
Federal Government, Länder governments and municipalities | | | | | | | | | | | | | | | | | | | | | | | | | |
Revenue | | | | 740.7 | | | | | 689.8 | | | | | 683.5 | | | | | 705.5 | | | | | 684.3 | |
of which: Taxes (2) | | | | 587.8 | | | | | 548.9 | | | | | 546.3 | | | | | 572.6 | | | | | 558.4 | |
Expenditure | | | | 781.2 | | | | | 798.1 | | | | | 744.4 | | | | | 714.1 | | | | | 689.6 | |
| | | | | | | | | | | | | | | | | | | | | | | | | |
Balance | | | | -40.4 | | | | | -108.3 | | | | | -60.9 | | | | | -8.6 | | | | | -5.3 | |
Social security funds | | | | | | | | | | | | | | | | | | | | | | | | | |
Revenue | | | | 525.9 | | | | | 515.2 | | | | | 491.4 | | | | | 485.7 | | | | | 476.3 | |
Expenditure | | | | 510.8 | | | | | 512.9 | | | | | 506.6 | | | | | 478.5 | | | | | 465.5 | |
| | | | | | | | | | | | | | | | | | | | | | | | | |
Balance | | | | 15.1 | | | | | 2.3 | | | | | -15.2 | | | | | 7.2 | | | | | 10.8 | |
General Government | | | | | | | | | | | | | | | | | | | | | | | | | |
Revenue | | | | 1,148.2 | | | | | 1,079.8 | | | | | 1,066.0 | | | | | 1,088.2 | | | | | 1,062.3 | |
Expenditure | | | | 1,173.5 | | | | | 1,185.8 | | | | | 1,142.1 | | | | | 1,089.6 | | | | | 1,056.8 | |
| | | | | | | | | | | | | | | | | | | | | | | | | |
Balance | | | | -25.3 | | | | | -106.0 | | | | | -76.1 | | | | | -1.4 | | | | | 5.5 | |
| | | | | | | | | | | | | | | | | | | | | | | | | |
| (1) | Definition according to the national accounts. |
| (2) | Excluding capital taxes and taxes of domestic sectors to EU. |
Source: Statistisches Bundesamt, Fachserie 18, Reihe 1.4 – 2011 (March 2012), Tables 3.4.3.2, 3.4.3.3 and 3.4.3.7.
G-30
FEDERAL GOVERNMENT ACCOUNTS (1)
| | | | | | | | | | | | | | | | | | | | | | | | | |
| | | 2011 | | 2010 | | 2009 | | 2008 | | 2007 |
| | | (EUR in billions) |
Revenue | | | | 348.2 | | | | | 320.9 | | | | | 316.5 | | | | | 319.0 | | | | | 308.0 | |
of which: Taxes (2) | | | | 304.6 | | | | | 284.4 | | | | | 280.9 | | | | | 285.8 | | | | | 279.0 | |
Expenditure | | | | 374.6 | | | | | 400.9 | | | | | 354.6 | | | | | 334.2 | | | | | 326.9 | |
| | | | | | | | | | | | | | | | | | | | | | | | | |
Balance | | | | -26.3 | | | | | -80.0 | | | | | -38.1 | | | | | -15.2 | | | | | -18.8 | |
| | | | | | | | | | | | | | | | | | | | | | | | | |
| (1) | Definition according to the national accounts. |
| (2) | Excluding taxes of domestic sectors to EU. |
Source: Statistisches Bundesamt, Fachserie 18, Reihe 1.4 – 2011 (March 2012), Table 3.4.3.4.
GENERAL GOVERNMENT EXPENDITURE: BREAKDOWNBY FUNCTIONS (1)
| | | | | | | | | | | | | | | | | | | | | | | | | |
| | | 2011 | | 2010 | | 2009 | | 2008 | | 2007 |
| | | (EUR in billions) |
General public services | | | | 162.0 | | | | | 151.4 | | | | | 147.4 | | | | | 147.3 | | | | | 140.9 | |
Defense | | | | 27.1 | | | | | 26.2 | | | | | 25.9 | | | | | 24.6 | | | | | 23.6 | |
Public order and safety | | | | 40.8 | | | | | 39.6 | | | | | 38.4 | | | | | 37.5 | | | | | 36.6 | |
Economic affairs | | | | 89.6 | | | | | 118.5 | | | | | 92.7 | | | | | 88.2 | | | | | 78.7 | |
Environmental protection | | | | 17.1 | | | | | 16.8 | | | | | 19.1 | | | | | 13.8 | | | | | 13.3 | |
Housing and community amenities | | | | 15.3 | | | | | 16.4 | | | | | 17.5 | | | | | 18.7 | | | | | 20.3 | |
Health | | | | 181.4 | | | | | 178.3 | | | | | 174.4 | | | | | 164.8 | | | | | 158.5 | |
Recreation, culture and religion | | | | 22.1 | | | | | 20.8 | | | | | 20.1 | | | | | 19.5 | | | | | 19.0 | |
Education | | | | 110.4 | | | | | 106.3 | | | | | 102.7 | | | | | 98.3 | | | | | 95.6 | |
Social protection | | | | 507.6 | | | | | 511.4 | | | | | 503.9 | | | | | 476.9 | | | | | 470.2 | |
| | | | | | | | | | | | | | | | | | | | | | | | | |
Total expenditure | | | | 1,173.5 | | | | | 1,185.8 | | | | | 1,142.1 | | | | | 1,089.6 | | | | | 1,056.8 | |
| | | | | | | | | | | | | | | | | | | | | | | | | |
| (1) | Definition according to the national accounts. |
Source: Statistisches Bundesamt, Fachserie 18, Reihe 1.4 – 2011 (March 2012), Table 3.4.3.11.
Germany’s General Government Deficit/Surplus, the General Government Gross Debt and the Excessive Deficit Procedure
For purposes of the Member States’ reports to the European Commission under the EDP, the general government or “Maastricht” deficit/surplus refers to the difference between consolidated public sector revenue and consolidated public sector expenditure and is the balancing item “net borrowing/net lending” of general government as defined in the European System of National Accounts 1995, but including streams of interest payments resulting from swap arrangements and forward-rate agreements. In 2011, Germany’s general government deficit amounted to EUR 25.3 billion, or 1.0% of nominal GDP. The German general government gross debt-to-GDP ratio decreased from 83.0% in 2010 to 81.2% in 2011, which is above the EU’s 60% reference value.
Sources: Statistisches Bundesamt, Staatliche Defizitquote im Jahr 2011 bei 1,0 %, press release of February 24, 2012 (https://www.destatis.de/DE/PresseService/Presse/Pressemitteilungen/2012/02/PD12_064_813pdf.pdf?__blob=publicationFile); The European Union, Treaty on European Union (http://eurlex.europa.eu/en/treaties/dat/11992M/htm/11992M.html); Deutsche Bundesbank, Deutscher Maastricht-Schuldenstand 2011: 2,09 Billionen € bzw. 81,2% des BIP, press release of April 17, 2102 (http://www.bundesbank.de/download/presse/pressenotizen/2012/20120417.maastricht_schuldenstand.php).
The following table shows historical information on the Federal Republic’s general government deficit/surplus and debt as a percentage of GDP.
G-31
THE FEDERAL REPUBLIC’S FISCAL MAASTRICHT CRITERIA
| | | | | | | | | | | | | | | | | | | | | | | | | |
| | | 2011 (1) | | 2010 | | 2009 | | 2008 | | 2007 |
| | | (% of GDP) |
General government deficit (-) / surplus (+) (2) | | | | -1.0 | | | | | -4.3 | | | | | -3.2 | | | | | -0.1 | | | | | 0.2 | |
General government gross debt | | | | 81.2 | | | | | 83.0 | | | | | 74.4 | | | | | 66.7 | | | | | 65.2 | |
| (1) | Provisional figures, partly estimated. |
| (2) | Definition according to the reporting under the EDP: For purposes of the Member States’ reports to the European Commission under the EDP, “general government deficit/surplus” is the balancing item “net borrowing/net lending” of general government as defined in the national accounts, but including streams of interest payments resulting from swap arrangements and forward-rate agreements. |
Sources: Deutsche Bundesbank, Monatsbericht März 2012, Table IX.1; Deutsche Bundesbank, Deutscher Maastricht-Schuldenstand 2011: 2,09 Billionen € bzw. 81,2% des BIP, press release of April 17, 2102 (http://www.bundesbank.de/download/presse/pressenotizen/2012/20120417.maastricht_schuldenstand.php).
On December 2, 2009, based on, among other factors, a deficit in excess of 3% of GDP for Germany forecast for 2009 and a further deterioration forecast for 2010, the Ecofin Council initiated an EDP against Germany and called on Germany to reduce its deficit to below the reference value of 3% of GDP by 2013. As of April 2012, in addition to Germany, 22 other Member States are facing an EDP. With a deficit of 1.0% of GDP in 2011, Germany has reached the goal of bringing the deficit below 3% two years earlier than initially recommended by the Ecofin Council. The April 2012 update of the German stability program forecasts a general government deficit of 1% of GDP in 2012 and of 1/2% of GDP in 2013. The medium-term objective of a structural deficit not exceeding 0.5% of GDP is expected to be met commencing with 2012.
According to the April 2012 update of the German stability program, Germany’s general government gross debt-to-GDP ratio is projected to decrease to around 73% by 2016. The debt ratio, however, is expected to continue to be in excess of the EU’s reference value of 60% of nominal GDP until 2016, the end of the current forecast horizon. The most important reason for this decrease is expected to be the liquidation of parts of the liquidation sub-agencies’ portfolios, which is expected to continue over the coming years. The debt ratio is anticipated to decline in line with the amount by which these agencies’ liabilities are reduced. In addition to the liquidation effect, the consolidation efforts in the federal, Länder and municipal authorities’ budgets are expected to contribute to the decline in the debt ratio. Together, these effects are expected to lead to a decreasing debt ratio from 2012 onwards. In 2012, however, financial assistance provided as part of the support measures in order to combat the European sovereign debt crisis is expected to overcompensate the reducing effects and lead to an increase of the German debt ratio to 82%.
The Federal Republic participates in the stabilization measures for certain Euro Area Member States, bilaterally in the case of the first support package to Greece and through its participation in the EFSF for the second support package to Greece as well as for Ireland and Portugal. In all cases, the deficit ratio is not affected (apart from immaterial interest revenue effects). With respect to the measures extended by the EFSF and according to a Eurostat decision of January 2011, the Federal Republic – like any other Euro Area Member State participating in an EFSF support operation – must record its contribution in the general government gross debt ratio in proportion to the share of the guarantee it has provided. Similarly, the German loan to Greece extended by KfW affects the German debt ratio.
Sources: Council of the European Union, press release of December 2nd, 2009 (http://register.consilium.europa.eu/pdf/en/09/st16/st16838.en09.pdf); European Commission, Economic and Financial Affairs, EU Economic governance, Stability and Growth Pact, Excessive Deficit procedure (http://ec.europa.eu/economy_finance/economic_governance/sgp/deficit/index_en.htm);
Eurostat, The statistical recording of operations undertaken by the European Financial Stability Facility, press release of January 27, 2011 (http://epp.eurostat.ec.europa.eu/cache/ITY_PUBLIC/2-27012011-AP/EN/2-27012011-AP-EN.PDF); Bundesministerium der Finanzen, German Stability Programme 2012 Update (http://www.bundesfinanzministerium.de/nn_4540/DE/Wirtschaft__und__Verwaltung/Finanz__und__Wirtschaftspolitik/Finanzpolitik/Deutsches__Stabilitaetsprogramm/1204181a1002,templateId=raw,property=publicationFile.pdf).
G-32
GENERAL GOVERNMENT BUDGETARY PROSPECTS (1)
| | | | | | | | | | | | | | | | | | | | | | | | | | | | | | |
| | | 2016 | | 2015 | | 2014 | | 2013 | | 2012 | | 2011 |
| | | (% of GDP) |
Revenue | | | | 44 1/2 | | | | | 44 1/2 | | | | | 44 1/2 | | | | | 44 1/2 | | | | | 45 | | | | | 44.7 | |
Total taxes | | | | 23 1/2 | | | | | 23 1/2 | | | | | 23 1/2 | | | | | 23 1/2 | | | | | 23 1/2 | | | | | 22.9 | |
Social contributions | | | | 16 1/2 | | | | | 16 1/2 | | | | | 16 1/2 | | | | | 16 1/2 | | | | | 17 | | | | | 16.9 | |
Property income | | | | 1 | | | | | 1 | | | | | 1 | | | | | 1 | | | | | 1 | | | | | 1.0 | |
Other | | | | 3 1/2 | | | | | 3 1/2 | | | | | 3 1/2 | | | | | 3 1/2 | | | | | 3 1/2 | | | | | 3.8 | |
Expenditure | | | | 44 1/2 | | | | | 44 1/2 | | | | | 44 1/2 | | | | | 45 1/2 | | | | | 46 | | | | | 45.7 | |
Compensation of employees and intermediate consumption | | | | 12 | | | | | 12 | | | | | 12 1/2 | | | | | 12 1/2 | | | | | 12 1/2 | | | | | 12.7 | |
Social payments | | | | 24 1/2 | | | | | 24 1/2 | | | | | 24 1/2 | | | | | 24 1/2 | | | | | 24 1/2 | | | | | 24.5 | |
Interest expenditure | | | | 2 1/2 | | | | | 2 1/2 | | | | | 2 1/2 | | | | | 2 1/2 | | | | | 2 1/2 | | | | | 2.6 | |
Subsidies | | | | 1 | | | | | 1 | | | | | 1 | | | | | 1 | | | | | 1 | | | | | 1.0 | |
Gross fixed capital formation | | | | 1 1/2 | | | | | 1 1/2 | | | | | 1 1/2 | | | | | 1 1/2 | | | | | 1 1/2 | | | | | 1.6 | |
Other | | | | 3 | | | | | 3 | | | | | 3 | | | | | 3 | | | | | 3 | | | | | 3.1 | |
| | | | | | | | | | | | | | | | | | | | | | | | | | | | | | |
General government deficit (-) / surplus (+) | | | | 0 | | | | | 0 | | | | | -0 | | | | | - 1/2 | | | | | -1 | | | | | -1.0 | |
Federal government | | | | -0 | | | | | -0 | | | | | - 1/2 | | | | | - 1/2 | | | | | -1 | | | | | -1.0 | |
Länder governments | | | | -0 | | | | | -0 | | | | | - 1/2 | | | | | - 1/2 | | | | | - 1/2 | | | | | -0.6 | |
Municipalities | | | | 1/2 | | | | | 1/2 | | | | | 1/2 | | | | | 1/2 | | | | | 0 | | | | | 0.0 | |
Social security funds | | | | 0 | | | | | 0 | | | | | 0 | | | | | 0 | | | | | 1/2 | | | | | 0.6 | |
| | | | | | |
General government gross debt | | | | 73 | | | | | 76 | | | | | 78 | | | | | 80 | | | | | 82 | | | | | 81.2 | |
| (1) | Definition according to the reporting under the EDP: for purposes of the Member States’ reports to the European Commission under the EDP, “general government deficit/surplus” is the balancing item “net borrowing/net lending” of general government as defined in the national accounts, but including streams of interest payments resulting from swap arrangements and forward-rate agreements. Accordingly, interest included in the figures set forth in the table above reflects these streams. |
Source: Bundesministerium der Finanzen, German Stability Programme 2012 Update, Tables 12 and 15.
Tax Structure
Income Tax
Significant sources of revenue for the Federal Government are the various types of income taxes. Income taxation for employees and self-employed persons is based on a progressive tax scale ranging from 14% to 45% subject to the amount of taxable income. Employees pay taxes on their income from employment in the form of wage taxes. Self-employed persons typically pay estimated taxes during the year before filing their annual income tax return. Income generated by partnerships is not subject to tax at the partnership level, but at the level of the partners. The partners pay tax on this income according to their individual income tax brackets.
Income generated by corporations is subject to corporate income tax (Körperschaftsteuer) at a flat rate of 15%.
Capital income received by domestic taxpayers (all types of income from capital as well as private shareholders’ net gains from sales of shares in corporations) is subject to a final uniform tax rate of 25% (Abgeltungssteuer), taking into consideration an allowance (Sparerfreibetrag) of EUR 801 (EUR 1,602 for married couples).
In addition to the various types of income tax, a solidarity surcharge of 5.5% is imposed on the applicable income tax liability.
Sources: Bundesministerium der Justiz, Einkommensteuergesetz (http://bundesrecht.juris.de/estg/index.html); Bundesministerium der Justiz, Section 4, Solidaritätszuschlaggesetz (http://bundesrecht.juris.de/solzg_1995/__4.html); Bundesministerium der Justiz, Körperschaftsteuergesetz (http://bundesrecht.juris.de/kstg_1977/index.html).
Value-Added Tax and Consumption Taxes
Value-added tax (“VAT”) serves as a significant source of revenue. VAT is a general consumption tax that is imposed on the value of most goods and services. The standard rate applicable to most goods and services is 19%. Certain items that are classified as basic necessities, such as food (except beverages and all turnovers in restaurants) and books, are subject to a reduced rate of 7%.
G-33
In addition to the VAT, there are specific consumption taxes. The most significant specific consumption taxes relate to energy and tobacco.
Sources: Bundesministerium der Justiz, Umsatzsteuergesetz (http://bundesrecht.juris.de/ustg_1980/index.html); Bundesministerium der Justiz, Umsatzsteuergesetz, Section 12 (http://bundesrecht.juris.de/ustg_1980/__12.html); Bundesministerium der Justiz, Energiesteuergesetz (http://bundesrecht.juris.de/energiestg/); Bundesministerium der Finanzen, Glossar, Tabaksteuer (http://www.bundesfinanzministerium.de/nn_39850/DE/BMF__Startseite/Service/Glossar/T/001__Tabaksteuer.html).
Environmental Tax
The environmental tax regime aims to encourage energy conservation and to lower employers’ and employees’ contributions to the public pension system at the same time, thereby allocating the burden of taxes and contributions more equally among labor, capital and natural resources. Key points of the environmental tax regime are an electricity tax imposed on the consumption of electricity and an energy tax on mineral oil and coal. The electricity tax rate is EUR 20.50 per megawatt-hour. The rates of the energy tax are assessed in accordance with certain environmental criteria.
Sources: Bundesministerium der Justiz, Stromsteuergesetz (http://bundesrecht.juris.de/stromstg/index.html); Bundesministerium der Justiz, Stromsteuergesetz, Section 3 (http://bundesrecht.juris.de/stromstg/__3.html); Bundesministerium der Finanzen, Ökosteuer / Ökologische Steuerreform, Glossary (http://www.bundesfinanzministerium.de/nn_39840/DE/BMF__Startseite/Service/Glossar/O/001__Oekosteuer-Oekologische_20Steuerreform.html).
Trade Tax
Trade tax (Gewerbesteuer) is levied at the municipal level and is imposed on businesses and their objective earning power. The trade tax rate varies and depends on the municipality that levies the tax. Basis of assessment are the profits of a business enterprise as determined under income tax law or corporation tax law, increased or decreased by certain adjustments. The result is multiplied by the basic federal rate (Gewerbesteuermesszahl) to achieve the base amount for the trade tax (Steuermessbetrag), which is then multiplied by the municipal multiplier (Hebesatz). Beyond a required minimum level of 200%, municipalities have discretion to fix the municipal tax collection rate.
Source: Bundesministerium der Justiz, Gewerbesteuergesetz (http://bundesrecht.juris.de/gewstg/index.html).
Recent and Pending Tax Reform Measures
Because of the progressive structure of the income tax system, the Federal Republic benefits from extra tax revenue generated by the effect of “fiscal drag” (kalte Progression). The Federal Government seeks to correct the income tax rate to offset this tax burden. In December 2011, the Federal Government adopted a draft act to reduce additional tax burdens deriving from fiscal drag which is scheduled to be implemented in two stages, effective from January 1, 2013 and January 1, 2014 respectively. The objective is to prevent a higher average tax rate being imposed on taxpayers who receive a pay increase that simply keeps pace with inflation. This ensures that the government does not benefit from pay increases that do not improve the economic position of the taxpayer. The Federal Government stated that it plans to assess the effects of fiscal drag in the tax schedule every two years.
Source: Bundesministerium für Wirtschaft und Technologie, 2012 Annual Economic Report: Boosting confidence – generating opportunities – continuing to grow with Europe, pp. 35-36 (http://www.bmwi.de/English/Navigation/Service/publications,did=479718.html).
The following table provides an overview of the annual tax revenues of the general government divided by categories for each of the years indicated as presented in the national accounts.
G-34
TAXES (1)
| | | | | | | | | | | | | | | | | | | | | | | | | |
| | | 2011 | | 2010 | | 2009 | | 2008 | | 2007 |
| | | (EUR in billions) |
Current taxes | | | | 587.8 | | | | | 548.9 | | | | | 546.3 | | | | | 572.6 | | | | | 558.4 | |
Taxes on production and imports | | | | 292.1 | | | | | 275.4 | | | | | 272.3 | | | | | 269.8 | | | | | 265.5 | |
of which: Value-added tax | | | | 188.2 | | | | | 178.6 | | | | | 176.0 | | | | | 172.5 | | | | | 166.5 | |
Current taxes on income and wealth | | | | 295.7 | | | | | 273.5 | | | | | 274.0 | | | | | 302.7 | | | | | 292.9 | |
of which: Wage tax | | | | 174.1 | | | | | 162.4 | | | | | 168.1 | | | | | 173.0 | | | | | 162.3 | |
Assessed income tax | | | | 31.7 | | | | | 31.6 | | | | | 33.3 | | | | | 32.6 | | | | | 30.6 | |
Non-assessed taxes on earnings | | | | 25.1 | | | | | 22.5 | | | | | 24.3 | | | | | 30.9 | | | | | 27.3 | |
Corporate tax | | | | 17.2 | | | | | 13.7 | | | | | 8.8 | | | | | 17.8 | | | | | 25.0 | |
Capital taxes | | | | 4.3 | | | | | 4.4 | | | | | 4.5 | | | | | 4.8 | | | | | 4.2 | |
| | | | | | | | | | | | | | | | | | | | | | | | | |
Tax revenue of general government | | | | 592.1 | | | | | 553.3 | | | | | 550.9 | | | | | 577.3 | | | | | 562.6 | |
Taxes of domestic sectors to EU | | | | 6.3 | | | | | 5.7 | | | | | 5.7 | | | | | 8.1 | | | | | 7.8 | |
| | | | | | | | | | | | | | | | | | | | | | | | | |
Taxes | | | | 598.4 | | | | | 559.0 | | | | | 556.5 | | | | | 585.5 | | | | | 570.4 | |
| | | | | | | | | | | | | | | | | | | | | | | | | |
| (1) | Definition according to the national accounts. |
Source: Statistisches Bundesamt, Fachserie 18, Reihe 1.4 – 2011 (March 2012), Table 3.4.3.16.
Government Participations
The Federal Republic held direct participations in 84 public and private enterprises, and various special funds held participations in 21 (20 without double counting) enterprises. The aggregate nominal capital of the enterprises in which the Federal Republic and special funds held direct participations amounted to EUR 23.9 billion (EUR 18.0 billion for the participations held directly by the Federal Republic plus EUR 5.9 billion for the participations held by special funds) as of December 31, 2010 compared to EUR 25 billion as of December 31, 2009.
Sources: Bundesministerium der Finanzen, Die Beteiligungen des Bundes - Beteiligungsbericht 2011, Chapters A and J paragraphs I and II; Bundesministerium der Finanzen, Beteiligungsbericht 2010, Chapters A and K paragraphs I and II.
The following table shows information on the Federal Republic’s significant direct participations (including those held through special funds) as of December 31, 2010.
PARTICIPATIONSOFTHE FEDERAL REPUBLIC
| | | | | | | | | | |
Enterprises | | Nominal capital of enterprise | | Participation of the Federal
Republic |
| | | (EUR in millions) | | (%) |
Significant majority participations: | | | | | | | | | | |
Deutsche Bahn AG | | | | 2,150 | | | | | 100.0 | |
KfW | | | | 3,750 | | | | | 80.0 | |
Hypo Real Estate Holding AG (1) | | | | 2,673 | | | | | 100.0 | |
| | |
Significant minority participations exceeding 25%: | | | | | | | | | | |
Flughafen München GmbH | | | | 307 | | | | | 26.0 | |
Commerzbank AG (1) | | | | 3,072 | | | | | 25.0 | + 1 share |
| (1) | Participations held by a special fund. |
Source: Bundesministerium der Finanzen, Die Beteiligungen des Bundes - Beteiligungsbericht 2011, Chapters B, E and J paragraph II.
G-35
Direct Debt of the Federal Government
As of December 31, 2011, the Federal Government’s direct debt totaled EUR 1,075.7 billion compared to EUR 1,065.3 billion as of December 31, 2010.
Sources: Bundesministerium der Finanzen, Übersicht über den Stand der Schuld der Bundesrepublik Deutschland zum 31. Dezember 2011, Bundesanzeiger Nr. 38 of March 7, 2012, page 975-976.
The Federal Government raises funds primarily through the issuance of bonds and notes. Euro-denominated bonds and notes issued by the Federal Republic are evidenced by book entry and no certificates are issued.
In addition to its own direct debt obligations, the Federal Government had outstanding guarantees in an aggregate amount of EUR 302.4 billion as of December 31, 2010. Of this amount, EUR 107.5 billion was outstanding in the form of export credit insurance, which is handled by Euler Hermes Kreditversichtungs-AG on behalf of and for the account of the Federal Government. Furthermore, EUR 22.4 billion was outstanding in the form of a guarantee for a loan to Greece according to the German Financial Stability Act.
Source: Bundesministerium der Finanzen, Finanzbericht 2012, Overview 4, page 348.
For more detailed information regarding the Federal Government’s debt and guarantees, see “Tables and Supplementary Information.”
For information on the Federal Government’s liability as of December 31, 2011 for capital subscriptions to various international financial organizations, see the table entitled “Tables and Supplementary Information—III. Liabilities to International Financial Organizations.”
G-36
TABLES AND SUPPLEMENTARY INFORMATION
I. DIRECT DEBT OF THE FEDERAL GOVERNMENT
SUMMARY
| | | | |
| | | Principal amount
outstanding as of
December 31, 2011 | |
| | | (EUR in millions) | |
Federal Bonds (Bundesanleihen) | | | 650,736 | |
Inflation-linked Securities (Inflationsindexierte Bundeswertpapiere) | | | 46,000 | |
Five-year Federal Notes (Bundesobligationen) | | | 203,000 | |
Federal Treasury Notes (Bundesschatzanweisungen) | | | 136,000 | |
Federal Savings Notes (Bundesschatzbriefe) | | | 8,208 | |
Treasury Discount Paper (Unverzinsliche Schatzanweisungen) | | | 57,830 | |
Federal Treasury Financing Paper (Finanzierungsschätze) | | | 467 | |
German Government Day-Bonds (Tagesanleihe des Bundes) | | | 2,154 | |
Further short-term debt (£ 1 year) | | | 1,115 | |
Borrowers’ note loans (Schuldscheindarlehen) | | | 12,061 | |
Of which: | | | | |
From residents | | | 11,844 | |
From non-residents | | | 217 | |
Old debt (1) | | | 4,417 | |
Of which: | | | | |
Equalization claims | | | 4,137 | |
Other | | | 40 | |
Repurchased debt | | | 46,364 | |
| | | | |
Total | | | 1,075,664 | |
| | | | |
| (1) | Mainly equalization and covering claims of the Deutsche Bundesbank, other banks and insurance companies in connection with the currency reform of 1948. |
Source: Bundesministerium der Finanzen, Übersicht über den Stand der Schuld der Bundesrepublik Deutschland zum 31. Dezember 2011, Bundesanzeiger Nr. 38 of March 7, 2012, pages 975-976.
G-37
DEBT TABLES
1. Federal Bonds (1)
| | | | | | | | | | | | | | | | | | | | |
Title | | Interest
rate | | Year of
issue | | Maturity | | Principal amount
outstanding as of
December 31, 2011 |
| | | (% per
annum) | | | | | | (EUR in millions) |
6% Bonds of the Federal Republic of 1986 (II) | | | | 6 | | | | | 1986 | | | | | 2016 | | | | | 3,750 | |
5.625% Bonds of the Federal Republic of 1986 | | | | 5.625 | | | | | 1986 | | | | | 2016 | | | | | 750 | |
6.25% Bonds of the Federal Republic of 1994 | | | | 6.25 | | | | | 1994 | | | | | 2024 | | | | | 10,250 | |
6.5% Bonds of the Federal Republic of 1997 | | | | 6.5 | | | | | 1997 | | | | | 2027 | | | | | 11,250 | |
5.625% Bonds of the Federal Republic of 1998 | | | | 5.625 | | | | | 1998 | | | | | 2028 | | | | | 14,500 | |
4.75% Bonds of the Federal Republic of 1998 (II) | | | | 4.75 | | | | | 1998 | | | | | 2028 | | | | | 11,250 | |
6.25% Bonds of the Federal Republic of 2000 | | | | 6.25 | | | | | 2000 | | | | | 2030 | | | | | 9,250 | |
5.5% Bonds of the Federal Republic of 2000 | | | | 5.5 | | | | | 2000 | | | | | 2031 | | | | | 17,000 | |
5% Bonds of the Federal Republic of 2002 (I) | | | | 5 | | | | | 2002 | | | | | 2012 | | | | | 25,000 | |
5% Bonds of the Federal Republic of 2002 (II) | | | | 5 | | | | | 2002 | | | | | 2012 | | | | | 27,000 | |
4.5% Bonds of the Federal Republic of 2003 | | | | 4.5 | | | | | 2003 | | | | | 2013 | | | | | 24,000 | |
3.75% Bonds of the Federal Republic of 2003 | | | | 3.75 | | | | | 2003 | | | | | 2013 | | | | | 22,000 | |
4.25% Bonds of the Federal Republic of 2003 | | | | 4.25 | | | | | 2003 | | | | | 2014 | | | | | 24,000 | |
4.75% Bonds of the Federal Republic of 2003 | | | | 4.75 | | | | | 2003 | | | | | 2034 | | | | | 20,000 | |
4.25% Bonds of the Federal Republic of 2004 | | | | 4.25 | | | | | 2004 | | | | | 2014 | | | | | 25,000 | |
3.75% Bonds of the Federal Republic of 2004 | | | | 3.75 | | | | | 2004 | | | | | 2015 | | | | | 23,000 | |
4% Bonds of the Federal Republic of 2005 | | | | 4 | | | | | 2005 | | | | | 2037 | | | | | 23,000 | |
3.25% Bonds of the Federal Republic of 2005 | | | | 3.25 | | | | | 2005 | | | | | 2015 | | | | | 21,000 | |
3.5% Bonds of the Federal Republic of 2005 | | | | 3.5 | | | | | 2005 | | | | | 2016 | | | | | 23,000 | |
4% Bonds of the Federal Republic of 2006 | | | | 4 | | | | | 2006 | | | | | 2016 | | | | | 23,000 | |
3.75% Bonds of the Federal Republic of 2006 | | | | 3.75 | | | | | 2006 | | | | | 2017 | | | | | 20,000 | |
4.25% Bonds of the Federal Republic of 2007 (I) | | | | 4.25 | | | | | 2007 | | | | | 2039 | | | | | 14,000 | |
4.25% Bonds of the Federal Republic of 2007 (II) | | | | 4.25 | | | | | 2007 | | | | | 2017 | | | | | 19,000 | |
4% Bonds of the Federal Republic of 2007 | | | | 4 | | | | | 2007 | | | | | 2018 | | | | | 20,000 | |
4.25% Bonds of the Federal Republic of 2008 | | | | 4.25 | | | | | 2008 | | | | | 2018 | | | | | 21,000 | |
3.75% Bonds of the Federal Republic of 2008 | | | | 3.75 | | | | | 2008 | | | | | 2019 | | | | | 24,000 | |
4.75% Bonds of the Federal Republic of 2008 | | | | 4.75 | | | | | 2008 | | | | | 2040 | | | | | 16,000 | |
3.5% Bonds of the Federal Republic of 2009 | | | | 3.5 | | | | | 2009 | | | | | 2019 | | | | | 24,000 | |
3.25% Bonds of the Federal Republic of 2009 | | | | 3.25 | | | | | 2009 | | | | | 2020 | | | | | 22,000 | |
1.5% USD-Bonds of the Federal Republic of 2009 (2) | | | | 1.5 | | | | | 2009 | | | | | 2012 | | | | | 2,736 | |
3.25% Bonds of the Federal Republic of 2010 | | | | 3.25 | | | | | 2010 | | | | | 2042 | | | | | 12,000 | |
3% Bonds of the Federal Republic of 2010 | | | | 3 | | | | | 2010 | | | | | 2020 | | | | | 22,000 | |
2.25% Bonds of the Federal Republic of 2010 | | | | 2.25 | | | | | 2010 | | | | | 2020 | | | | | 16,000 | |
2.5% Bonds of the Federal Republic of 2010 | | | | 2.5 | | | | | 2010 | | | | | 2021 | | | | | 19,000 | |
3.25% Bonds of the Federal Republic of 2011 | | | | 3.25 | | | | | 2011 | | | | | 2021 | | | | | 19,000 | |
2.25% Bonds of the Federal Republic of 2011 | | | | 2.25 | | | | | 2011 | | | | | 2021 | | | | | 16,000 | |
2% Bonds of the Federal Republic of 2011 | | | | 2 | | | | | 2011 | | | | | 2022 | | | | | 6,000 | |
| | | | | | | | | | | | | | | | | | | | |
Total Federal Bonds | | | | | | | | | | | | | | | | | | | 650,736 | |
| | | | | | | | | | | | | | | | | | | | |
| (1) | Federal Bonds (Bundesanleihen) are evidenced by book entry, and no certificates are issued. Maturities are 10 to 30 years. No redemption prior to maturity; including principal strips. |
| (2) | The principal amount of the USD-Bonds was converted to euro at the exchange rate of the issue day. |
G-38
2. Inflation-linked Securities (1)
| | | | | | | | | | | | | | | | | | | | |
Title | | Interest
rate | | Year of
issue | | Maturity | | Principal amount
outstanding as of
December 31, 2011 |
| | | (% per
annum) | | | | | | (EUR in millions) |
1.5% Inflation-linked Bonds of the Federal Republic of 2006 | | | | 1.5 | | | | | 2006 | | | | | 2016 | | | | | 15,000 | |
2.25% Inflation-linked Notes of the Federal Republic of 2007 | | | | 2.25 | | | | | 2007 | | | | | 2013 | | | | | 11,000 | |
1.75% Inflation-linked Bonds of the Federal Republic of 2009 | | | | 1.75 | | | | | 2009 | | | | | 2020 | | | | | 15,000 | |
0.75% Inflation-linked Notes of the Federal Republic of 2011 | | | | 0.75 | | | | | 2011 | | | | | 2018 | | | | | 5,000 | |
| | | | | | | | | | | | | | | | | | | | |
Total Inflation-linked Securities | | | | | | | | | | | | | | | | | | | 46,000 | |
| | | | | | | | | | | | | | | | | | | | |
| (1) | Inflation-linked Securities (Inflationsindexierte Bundeswertpapiere) are evidenced by book entry, and no certificates are issued. Maturities are five to ten years. No redemption prior to maturity. |
3. Five-Year Federal Notes (1)
| | | | | | | | | | | | | | | | | | | | |
Title | | Interest
rate | | Year of
issue | | Maturity | | Principal amount
outstanding as of
December 31, 2011 |
| | | (% per annum) | | | | | | (EUR in millions) |
4.0% Bonds of 2007-Series 150 | | | | 4.0 | | | | | 2007 | | | | | 2012 | | | | | 16,000 | |
4.25% Bonds of 2007-Series 151 | | | | 4.25 | | | | | 2007 | | | | | 2012 | | | | | 16,000 | |
3.5% Bonds of 2008-Series 152 | | | | 3.5 | | | | | 2008 | | | | | 2013 | | | | | 17,000 | |
4.0% Bonds of 2008-Series 153 | | | | 4.0 | | | | | 2008 | | | | | 2013 | | | | | 16,000 | |
2.25% Bonds of 2009-Series 154 | | | | 2.25 | | | | | 2009 | | | | | 2014 | | | | | 19,000 | |
2.5% Bonds of 2009-Series 155 | | | | 2.5 | | | | | 2009 | | | | | 2014 | | | | | 17,000 | |
2.5% Bonds of 2010-Series 156 | | | | 2.5 | | | | | 2010 | | | | | 2015 | | | | | 17,000 | |
2.25% Bonds of 2010-Series 157 | | | | 2.25 | | | | | 2010 | | | | | 2015 | | | | | 19,000 | |
1.75% Bonds of 2010-Series 158 | | | | 1.75 | | | | | 2010 | | | | | 2015 | | | | | 16,000 | |
2.0% Bonds of 2011-Series 159 | | | | 2.0 | | | | | 2011 | | | | | 2016 | | | | | 16,000 | |
2.75% Bonds of 2011-Series 160 | | | | 2.75 | | | | | 2011 | | | | | 2016 | | | | | 18,000 | |
1.25% Bonds of 2011-Series 161 | | | | 1.25 | | | | | 2011 | | | | | 2016 | | | | | 16,000 | |
| | | | | | | | | | | | | | | | | | | | |
Total Five-Year Federal Notes | | | | | | | | | | | | | | | | | | | 203,000 | |
| | | | | | | | | | | | | | | | | | | | |
| (1) | Five-Year Federal Notes (Bundesobligationen) are evidenced by book entry, and no certificates are issued. Maturities are approximately five years. No redemption prior to maturity. |
4. Federal Treasury Notes (1)
| | | | | | | | | | | | | | | | | | | | |
Title | | Interest
Rate | | Year of
Issue | | Maturity | | Principal Amount
Outstanding as of
December 31, 2011 |
| | | (% per
annum) | | | | | | (EUR in millions) |
1.0% Notes of 2010 | | | | 1.0 | | | | | 2010 | | | | | 2012 | | | | | 19,000 | |
0.5% Notes of 2010 | | | | 0.5 | | | | | 2010 | | | | | 2012 | | | | | 19,000 | |
0.75% Notes of 2010 | | | | 0.75 | | | | | 2010 | | | | | 2012 | | | | | 18,000 | |
1.0% Notes of 2010 | | | | 1.0 | | | | | 2010 | | | | | 2012 | | | | | 17,000 | |
1.5% Notes of 2011 | | | | 1.5 | | | | | 2011 | | | | | 2013 | | | | | 18,000 | |
1.75% Notes of 2011 | | | | 1.75 | | | | | 2011 | | | | | 2013 | | | | | 17,000 | |
0.75% Notes of 2011 | | | | 0.75 | | | | | 2011 | | | | | 2013 | | | | | 17,000 | |
0.25% Notes of 2011 | | | | 0.25 | | | | | 2011 | | | | | 2013 | | | | | 11,000 | |
| | | | | | | | | | | | | | | | | | | | |
Total Federal Treasury Notes | | | | | | | | | | | | | | | | | | | 136,000 | |
| | | | | | | | | | | | | | | | | | | | |
| (1) | Federal Treasury Notes (Bundesschatzanweisungen) are evidenced by book-entry, and no certificates are issued. Maturities are two years. No redemption prior to maturity. |
G-39
5. Federal Savings Notes (1)
| | | | | | | | | | | | | | | | | | | | |
| | | Interest Rate | | Year of Issue | | Maturity | | Principal amount
outstanding as of
December 31, 2011 |
| | | (% per annum) | | | | | | (EUR in millions) |
Federal Savings Notes | | | | 0.25% to 4.75% | | | | | 2005 to 2011 | | | | | 2012 to 2018 | | | | | 8,208 | |
6. Treasury Discount Paper (2)
| | | | | | | | | | | | | | | | | | | | |
| | | Interest Rate(3) | | Year of Issue | | Maturity | | Principal amount
outstanding as of
December 31, 2011 |
| | | (% per annum) | | | | | | (EUR in millions) |
Treasury Discount Paper | | | | 0.0005% to 1.39% | | | | | 2011 | | | | | 2012 | | | | | 57,830 | |
7. Federal Treasury Financing Paper (4)
| | | | | | | | | | | | | | | | | | | | |
| | | Interest Rate(3) | | Year of Issue | | Maturity | | Principal amount
outstanding as of
December 31, 2011 |
| | | (% per annum) | | | | | | (EUR in millions) |
Federal Treasury Financing Paper | | | | 0.05% to 1.53% | | | | | 2010 to 2011 | | | | | 2012 to 2013 | | | | | 467 | |
8. German Government Day-Bonds
| | | | | | | | | | | | | | | | | | | | |
| | | Interest Rate | | Year of Issue | | Maturity | | Principal amount
outstanding as of
December 31, 2011 |
| | | (% per annum) | | | | | | (EUR in millions) |
German Government Day-Bonds | | |
| variable,
tied to EONIA |
| | |
| 2008/
continuous tap |
| | | | unlimited | | | | | 2,154 | |
9. Borrowers’ note loans (5)
| | | | | | | | | | | | | | | | | | | | |
| | | Interest Rate | | Year of Issue | | Maturity | | Principal amount
outstanding as of
December 31, 2011 |
| | | (% per annum) | | | | | | (EUR in millions) |
Borrowers’ note loans (Schuldscheindarlehen) | | | | 1.89% to 7.75% | | | | | 1954 to 2011 | | | | | 2012 to 2037 | | | | | 12,061 | |
G-40
10. Further short-term debt (£ 1 year)
| | | | | | | | | | | | | | | | | | | | |
| | | Interest Rate | | Year of Issue | | Maturity | | Principal amount
outstanding as of
December 31, 2011 |
| | | (% per annum) | | | | | | (EUR in millions) |
Further short-term debt (£ 1 year) | | | | money market rates | | | | | 2011 | | | | | 2012 | | | | | 1,115 | |
| (1) | Federal Savings Notes (Bundesschatzbriefe) are evidenced by book entry and no certificates are issued. Maturities are six or seven years. The terms of the Federal Savings Notes provide for interest rates that increase during the term of the bonds. In addition, the seven-year Federal Savings Notes provide for payment of compounded interest at maturity or upon redemption prior to maturity. No redemption is permitted prior to maturity. |
| (2) | Treasury Discount Papers (Unverzinsliche Schatzanweisungen) are issued at a discount and repaid at par value on the maturity date. No interest payments are made during the term of the paper. The papers are auctioned and intended for institutional investors. Maturities range from six months to twelve months. No redemption is permitted prior to maturity. |
| (3) | Reflects annual interest rate paid to the holder by way of the initial issue discount. No redemption is permitted prior to maturity. |
| (4) | Federal Treasury Financing Papers (Finanzierungsschätze) are issued at a discount and repaid at par value on the maturity date. No interest payments are made during the term of the paper. Federal Treasury Financing Papers are intended to be sold to retail customers. Maturities range from one year to two years. No redemption is permitted prior to maturity. |
| (5) | Borrowers’ note loans (Schuldscheindarlehen) are an instrument of the German capital market where the lending entity, generally an institutional investor, receives a certificate evidencing its loan to the borrower and the term of such loans. The certificate generally authorizes at least three assignments. No redemption is permitted prior to maturity. |
11. Other Liabilities
| | | | | | | | | | | | | | | | | | | | |
Title | | Interest Rate | | Year of
incurrence | | Maturity | | Principal amount
outstanding as of
December 31, 2011 |
| | | (% per annum) | | | | | | (EUR in millions) |
Old debt (1) | | | | 0% to 3% | | | | | Various | | | | | Various | | | | | 4,417 | |
Other debt (2) | | | | Various | | | | | Various | | | | | Various | | | | | 40 | |
| (1) | Includes mainly equalization and covering claims of the Deutsche Bundesbank, other banks and insurance companies in connection with the currency reform of 1948. |
| (2) | Includes liabilities of the Federal Government to repay amounts received from the Investitionshilfeabgabe, a special duty levied on income, the proceeds of which were to be used to promote investments. |
Source: Bundesministerium der Finanzen, Übersicht über den Stand der Schuld der Bundesrepublik Deutschland zum 31. Dezember 2011, Bundesanzeiger Nr. 38 of March 7, 2012, pages 975-976.
G-41
II. GUARANTEES BY THE FEDERAL GOVERNMENT (1)
| | | | | | | | | | |
| | | Principal amount outstanding
as of December 31, |
Purpose of Guarantees | | 2009 | | 2010 |
| | | (EUR in millions) |
Export finance loans (including rescheduled loans)(2) | | | | 107,840 | | | | | 107,497 | |
Untied loans; direct foreign investments by German companies; Loans of the European Investment Bank to non-EU borrowers | | | | 29,691 | | | | | 34,267 | |
Loans in connection with EU agricultural policy measures | | | | 7,500 | | | | | 0 | |
Loans to domestic corporations and for projects in areas of Agriculture, fishing and housing construction | | | | 129,220 | | | | | 98,026 | |
Contributions to international financing institutions | | | | 50,638 | | | | | 53,333 | |
Co-financing of bilateral projects of German financial co-operation | | | | 1,294 | | | | | 2,254 | |
Successor agencies to Treuhandanstalt | | | | 1,009 | | | | | 1,009 | |
Interest compensation guarantees | | | | 4,000 | | | | | 6,000 | |
| | | | | | | | | | |
Total guarantees pursuant to the 2010 German Budget Act | | | | 331,192 | | | | | 302,385 | |
| | | | | | | | | | |
Guarantee for a loan to Greece according to the German Financial Stability Act | | | | — | | | | | 22,400 | |
| | | | | | | | | | |
Total guarantees | | | | 331,192 | | | | | 324,785 | |
| | | | | | | | | | |
| (1) | Does not include guarantees under the KfW Law with respect to money borrowed, bonds issued and derivative transactions entered into by KfW. For information relating to KfW’s borrowings, see “KfW—Business—Capital Markets—Funding.” |
| (2) | Includes export finance loans extended by KfW IPEX-Bank guaranteed by the Federal Republic through Euler Hermes Kreditversicherungs-AG (“HERMES”), the official German export credit insurer. For information relating to loans extended by KfW IPEX-Bank benefiting from HERMES coverage, see “KfW—Business—Export and Project Finance (KfW IPEX-Bank)—Business.” |
Sources: Bundesministerium der Finanzen, Finanzbericht 2011, Overview 4, page 337; Finanzbericht 2012, Overview 4, page 349.
G-42
III. LIABILITIES TO INTERNATIONAL FINANCIAL ORGANIZATIONS
The Federal Republic is obligated to contribute to the capital subscriptions and, in some cases, to the additional financing requirements of certain international organizations in which it participates. Such contributions are in many cases stated initially in 1944 U.S. dollars. One 1944 U.S. dollar is equivalent to one Special Drawing Right (“SDR”), a unit of value established by an amendment in July 1969 to the Articles of Agreement of the IMF. From July 1, 1974 to December 31, 1980, the exchange rate between world currencies and the SDR was determined on the basis of a basket of 16 currencies, including the U.S. dollar, which accounted for approximately one-third of the value of the basket. From 1981 to 2000, the exchange rate between world currencies and the SDR was determined on the basis of a basket of five currencies, including the U.S. dollar. The currencies that determine the value of the SDR, the proportion of each of these currencies in the basket, and the financial instruments used in determining the interest rate on the SDR, are reviewed every five years. The adoption of the euro as the common currency for the initial 11 Member States of the European Union called for a change in the composition of the SDR basket. With effect from January 1, 2001, the SDR basket consists of four currencies: U.S. dollar, euro, Japanese yen and pound sterling. The currency weight of the U.S. dollar in the SDR basket initially was 45%, changing on a daily basis as a result of exchange rate fluctuations. On December 30, 2011, SDR 1 equaled EUR 1.18654.
SUBSCRIPTIONSOR COMMITMENTSBYTHE FEDERAL REPUBLIC
TO INTERNATIONAL FINANCIAL ORGANIZATIONS
ASOF DECEMBER 31, 2011
| | | | | | | | | | |
Name of organization | | Subscription or
commitment by the
Federal Republic (1) | | Amount paid in |
| | | (U.S. $ in millions) |
IMF (2) | | | | 22,362.0 | | | | | 22,362.0 | |
International Bank for Reconstruction and Development (IBRD) (3)(4) | | | | 8,733.9 | | | | | 542.9 | |
International Development Association (IDA) (3)(4) | | | | 22,225.7 | | | | | 22,225.7 | |
International Finance Corporation (IFC) (3)(4) | | | | 128.9 | | | | | 128.9 | |
European Investment Bank (EIB) (5) | | | | 48,622.2 | | | | | 2,431.1 | |
African Development Bank (AfDB) (3) | | | | 4,140.5 | | | | | 303.6 | |
African Development Fund (AfDF) (3) | | | | 3,517.5 | | | | | 3,108.1 | |
Asian Development Bank (AsDB) (3) | | | | 7,050.0 | | | | | 352.6 | |
Asian Development Fund (AsDF) (3) | | | | 1,921.0 | | | | | 1,878.3 | |
Inter-American Development Bank (IDB) (3) | | | | 1,913.7 | | | | | 82.3 | |
Inter-American Investment Corporation (IIC) (3) | | | | 13.3 | | | | | 13.3 | |
Fund for Special Operations (FSO) (3) | | | | 241.3 | | | | | 241.3 | |
International Fund for Agricultural Development (IFAD) (3) | | | | 359.7 | | | | | 375.2 | |
Caribbean Development Bank (CDB) (3) | | | | 106.6 | | | | | 23.5 | |
Special Development Fund of the Caribbean Development Bank (SDF) (3) | | | | 82.0 | | | | | 78.8 | |
European Bank for Reconstruction and Development (EBRD) (3)(5) | | | | 2,618.9 | | | | | 689.6 | |
Council of Europe Development Bank (CEB) (3)(5) | | | | 1,184.9 | | | | | 131.5 | |
| (1) | Subscriptions are in part committed in U.S. $, SDR or EUR. SDR or EUR commitments are converted to U.S. $ at year-end exchange rates, except that certain SDR commitments are converted at the fixed conversion rate of SDR 1 = U.S. $1.53527. |
| (2) | Source: computation provided by the Ministry of Finance based on data provided by the IMF. |
| (3) | Source: computation provided by the Ministry of Finance and the Ministry for Economic Cooperation and Development. AsDB: On April 29, 2009 the Board of Governors adopted Resolution No. 336 increasing authorized capital stock from U.S. $60.8 billion to U.S. $166.2 billion (each member may subscribe for additional shares pursuant to the Resolution at any time until December 31, 2010). SDF and IFAD: The amounts as of December 31, 2009. |
| (4) | Source: IBRD and IDA: Worldbank Annual Report 2011 (June 30, 2011); IFC: Consolidated Financial Statements 2011 (June 30, 2011). The amount does not differentiate between amount subscribed and paid-in. |
| (5) | Source: computation provided by the Ministry of Finance based on euro exchange rate of the European Central Bank at year-end 2011 of EUR 1 per U.S. $1.29390. |
G-43