Exhibit (e)

Group management report
Basic information on KfW Group
Overview
KfW Group consists of KfW and four consolidated subsidiaries. As the promotional bank of the Federal Republic of Germany – which owns 80% of KfW while the German Federal States own 20% – KfW is one of the world’s leading promotional banks. The institutional framework for the promotional mandate including the Federal Republic of Germany’s liability for KfW’s obligations is defined in the Law Concerning KfW (KfW Law).
KfW supports sustainable improvement of economic, social and environmental conditions around the world, with an emphasis on promotion of the German economy. In its promotional activities, KfW focuses on societal megatrends. A variety of different financing products and services address in particular the areas small and medium-sized enterprises (SMEs), start-ups, innovation, environmental protection, the housing sector, infrastructure, education, export and project finance, and development cooperation. The domestic promotional lending business with
enterprises and private individuals is characterised by the proven and successful strategy of on-lending, in which KfW extends loans to commercial banks, which, in turn, lend the funds to the ultimate borrowers at favourable rates. This strategy eliminates any need for KfW to have its own network of branch offices. Business activities are funded almost fully through the international capital markets; KfW is one of the most active and largest bond issuers worldwide. In addition to KfW, the group’s main operating subsidiaries are (i) KfW IPEX-Bank, which provides export and project finance, and (ii) DEG, which is active in promoting the private sector in developing countries and emerging economies.
In accordance with the business sector structure for KfW Group, the sectors and their main products and services can be presented as follows:
| | | | |
| Mittelstandsbank (SME Bank) | | | | – Financing of industrial pollution control and corporate investments |
| | | | – Equity financing |
| | | | |
Kommunal– und Privatkundenbank/Kreditinstitute (Municipal and Private Client Bank/Credit Institutions) | | | | – Financing for housing construction and modernisation |
| | | | – Education finance |
| | | | – Infrastructure and social finance |
| | | | – Global funding of the promotional institutions of the federal states |
| | | | (Landesförderinstitute) |
| | | | – Individual financing of banks |
| | | | – Transactions on behalf of the Federal Government |
| | | | |
| Export and project finance | | | | – Financing for German and European export activities |
| | | | – Financing for projects and investments in line with German and European interests |
| | | | |
| Promotion of developing countries and emerging economies | | | | – Promotion of developing countries and emerging economies on behalf of the |
| | | | Federal Government (budget funds) with complementary market funds raised by KfW |
| | | | – Financing provided by DEG – Deutsche Investitions- und |
| | | | Entwicklungsgesellschaft mbH (private enterprise financing) |
| | | | |
| | | | – Securities and money market investments |
| Financial markets | | | | – Holding arrangements of the Federal Republic of Germany |
| | | | – Transactions mandated by the Federal Government, loan granted to Greece |
| | | | – Funding |
| | | | |
| Head office | | | | – Central interest rate and currency management |
| | | | – Strategic equity investments |
3
KfW Financial Information 2017 Group management report
Composition of the KfW Group Total assets (IFRS, before consolidation)1)
| | | | | | | | | | | | | | | | | | |
| | | | | | | 31 Dec. 2017 | | | | | | | | | | 31 Dec. 2016 | | |
| | | | | | | EUR in millions | | | | | | | | | | EUR in millions | | |
| | | | | | | |
| KfW, Frankfurt am Main, Germany | | | | | | 470,645 | | | | | | | | | | 505,597 | | |
| Subsidiaries | | | | | | | | | | | | | | | | | | |
| KfW IPEX-Bank GmbH, Frankfurt am Main (KfW IPEX-Bank), Germany | | | | | | 26,362 | | | | | | | | | | 30,561 | | |
| DEG – Deutsche Investitions- und Entwicklungsgesellschaft mbH, Cologne (DEG), Germany | | | | | | 5,707 | | | | | | | | | | 6,260 | | |
| KfW Beteiligungsholding GmbH, Bonn, Germany | | | | | | 2,951 | | | | | | | | | | 2,552 | | |
| Interkonnektor GmbH, Frankfurt am Main, Germany | | | | | | 182 | | | | | | | | | | 95 | | |
| Investments accounted for using the equity method | | | | | | | | | | | | | | | | | | |
| Microfinance Enhancement Facility S.A., Luxembourg (19.8%), Luxembourg | | | | | | 552 | | | | | | | | | | 617 | | |
| DC Nordseekabel GmbH & Co. KG, Bayreuth (50.0%), Germany | | | | | | 542 | | | | | | | | | | 277 | | |
| Green for Growth Fund, Southeast Europe S.A., Luxembourg (15.7%), Luxembourg | | | | | | 414 | | | | | | | | | | 373 | | |
| AF Eigenkapitalfonds für deutschen Mittelstand GmbH & Co KG, Munich (47.5%), Germany | | | | | | 174 | | | | | | | | | | 193 | | |
coparion GmbH & Co. KG, Cologne (20.0%), Germany | | | | | | 14 | | | | | | | | | | 6 | | |
| 1) | tbg Technologie-Beteiligungs-Gesellschaft mbH was deconsolidated effective 31 December 2017. |
The development of the group’s operating result is largely dependent on KfW.
Strategic objectives
KfW Group has a set of strategic objectives in place that define KfW’s targeted medium-term positioning. This framework encompasses selected top-level objectives at the overall bank level and serves as a central, binding reference for the strategic orientation of all business sectors, with a five-year horizon.
The primary objective of all of KfW’s market areas is promotion – the heart of KfW’s business activities – abiding by the fundamental principles of subsidiarity and sustainability. KfW addresses the primary objective of promotion largely by focusing its promotional activities on the socially and economically important megatrends of “climate change and the environment”, “globalisation”, “digitalisation and innovation”, and “social change”.
In relation to the “climate change and the environment” mega-trend, KfW finances measures to support renewable energies, improve energy efficiency, safeguard biodiversity and prevent and/or reduce environmental pollution. To address the particular importance of this megatrend, KfW has set an environmental commitment ratio of around 35% of total promotional business
volume. In the context of the “globalisation” megatrend, KfW contributes to strengthening the international competitiveness of German companies by granting loans for projects to secure Germany’s supply of raw materials and in areas such as infrastructure and transport. The “digitalisation and innovation” megatrend reflects the importance of the increasing digitalisation that is critical to the German economy’s success. Establishing the megatrend sets the standard for advancing and expanding targeted promotion in this area through suitable product approaches. Measures such as the planned expansion of domestic equity financing are a direct response to this megatrend. KfW’s objective with respect to the “social change” megatrend is focused on the issues of demographic change in the stricter sense (e.g. age-appropriate infrastructure, follow-on financing) and vocational and further training. KfW’s domestic commitment to meeting the challenges presented by the influx of refugees is also reflected in this megatrend. KfW also focuses on “non-trend-based promotional issues” that play an important role for KfW but that are not related to any of the four megatrends, such as combating poverty in developing countries.
4
KfW Financial Information 2017 Group management report
In addition to focusing on the issues described above, the primary objective in the bank’s strategic framework also extends to covering KfW’s most important customer groups and regions as well as to ensuring promotional quality. For KfW, this means a commitment to maintain the high level of quality of its promotional products that it has achieved in recent years and sufficient coverage of KfW’s key regions and customer groups. Given the special importance of SMEs, KfW aims to have around 45% of its domestic promotional business volume utilised for this target group.
The stated priorities set for the primary objective are complemented by a set of secondary objectives or strict ancillary conditions that reflect profitability and efficiency, risk-bearing capacity, as well as liquidity and regulatory aspects. KfW acts in accordance with the principle of subsidiarity and plans nominal growth of 2% to 3% p.a. as measured by the group’s total new commitment volume. Moreover, KfW’s success depends upon a high level of customer and employee satisfaction as well as continuing to pursue the path of professionalism in the modernisation process upon which it has embarked.
Internal management system
KfW has a closely interlinked strategy and planning process. Conceived as a group-wide strategy process, group business sector planning is KfW Group’s central planning and management tool. Group business sector planning consists of two consecutive sub-processes performed every year: strategic planning and operational planning. The overall strategy and planning process includes close communication between the employees responsible for planning in all areas including the Risk Controlling department.
The group-wide strategic objectives set by the Executive Board form the basis for the strategic planning. In particular, the system of objectives serves KfW Group as a clear roadmap, indicating the direction in which KfW would like to develop over the next five years. The system defines KfW Group’s medium-term targeted positioning and sets top-level objectives at overall bank level. The strategic objectives are reviewed annually for topicality, completeness and aspiration level and adjusted where necessary – for example, due to changed parameters or newly determined focal areas. Efforts are made, however, to maintain a high degree of consistency to ensure that there are no fundamental changes made to strategic impetus in the course of the annual review. Strategic medium-term courses of action are developed by the business sectors in a base case within this strategic framework. Assumptions regarding to the future development of determining factors are made on the basis of assessments of risks and opportunities. This analysis takes into account both external factors (including market development, regulatory requirements, the competitive situation and customer behaviour) and internal factors and resources (including human, technical and organisational resources, promotional expense, primary cost planning and tied-up capital) as well as targeted earnings levels. It involves regular evaluation of the key business and revenue drivers for the business sectors and the group. The central departments (e.g. information technology, human resources and central services) play important roles in achieving the strategic objectives. By involving these departments, their own strategies are aligned with the strategic objectives. The first regular capital budgeting in the base and stress case will be undertaken on a multi-year horizon on the basis of the strategic business sector planning. This enables early identification of any capital bottlenecks arising from strategic assessment or changed parameters and counteraction to be taken by
resolution of relevant measures. Cost planning and full-time equivalent (staff) planning are conducted in parallel to strategic planning for all business sectors for the entire planning period. The underlying assumptions are reviewed annually via a rolling planning process. The Executive Board defines business sector objectives for all sectors in the form of guidelines (with regard to operations, risk and budget) for the entire planning period on the basis of the group-wide strategic assessment.
Strategic group-level planning was expanded this year to include business strategy scenario analysis. Scenario analysis is a “what if” analysis of a specific but plausible scenario, looking at the interaction of external influencing factors. The results of this analysis are then translated into management-relevant parameters in the new business, earnings and risk/capital dimensions. Such scenarios assist the process of identifying potential risks and opportunities for promotional targets and KfW’s profitability and risk-bearing capacity, thus facilitating the inclusion of these factors in the further planning process.
In operations planning, the business sectors plan their new business, risks and earnings, and all departments of the bank plan their budgets based on the guidelines issued by the Executive Board, taking into account any changes in external or internal factors. These plans are checked for consistency with the group’s and business sectors’ strategic planning. The forecast interest rate development is a key factor in KfW’s earnings position. Thus, a high and a low interest rate scenario are also examined in addition to the anticipated base case. The plans are also assessed for future risk-bearing capacity in a second round of regular capital budgeting over a multi-year horizon. The Executive Board either approves the resultant operating budget or has plans fine-tuned in a revision round. The external assumptions underlying the plans are also checked at this stage. The operational planning process ends when the Executive Board has adopted a final budget for the entire planning period, including the future capital requirement.
The key conclusions from the planning process are incorporated into the business and risk strategies. The management has overall responsibility for formulating and adopting both strategies. The business strategy comprises the group’s strategic objectives for its main business activities as well as important internal and external factors, which are included in the strategy
5
KfW Financial Information 2017 Group management report
process. It also contains the business sectors’ contribution to the strategic objectives and the measures for achieving each objective. Moreover, the business strategy combines the operating budget at the group and business sector levels. The Executive Board sets KfW Group’s risk policies in its risk strategy, which is consistent with the business strategy. KfW Group has defined strategic risk objectives for factors including risk-bearing capacity and liquidity. The main risk management approaches and risk tolerance are also incorporated into the risk strategy as a basis for operational risk management. Any changes to the business strategy are subject to consultation with the Risk Controlling department in order to ensure consistency between the business and risk strategy.
The Executive Board draws up the operating budget for the entire planning period, including any future capital requirement as well as the business and risk strategy. The budget is then presented to the supervisory body (Board of Supervisory Directors) for approval, along with the business and risk strategy for discussion. After the Board of Supervisory Directors decided on the business and risk strategy, it is appropriately communicated to the staff.
When the group business sector planning is approved, this establishes the group’s qualitative and quantitative objectives. The Executive Board reviews achievement of these objectives as part of controlling on both a regular and an ad hoc basis during the current financial year. The assumptions concerning external and internal factors made when determining the business strategy are also subject to regular checks. The development of relevant control variables, their attainment, and the cause of any failure in this respect are analysed as part of strategic controlling. Strategic assumptions are reviewed and a systematic planned vs actual comparison of early objectives and forecasts is performed at the beginning of every year. Experience gained from this comparison is incorporated into the next planning process.
This is accompanied by an annual structured peer group comparison of key indicators, which yields important contributions to systematic assessment and indicates any need for action. The integrated forecasting process serves at mid-year as a comprehensive basis for interim quantitative management input on group variables of strategic importance (new business, risks and earnings, taking funding opportunities into account), while functioning as a well-founded guide to achieving planned objectives. Promised benefits (e.g. project efficiencies) are pooled and monitored as part of strategic controlling to enable appropriate consideration in business sector planning. Ad hoc issues of strategic relevance are also addressed in consultation with the group’s departments. Recommendations for action concerning potential strategy adjustments or optimising the use of resources are made to the Executive Board by means of the strategic performance report. The results of the analysis are included in further strategy discussions and strategic planning processes. The achievement of objectives is regularly monitored by the Board of Supervisory Directors based on reports submitted under KfW Bylaws. The commentary in these reports outlines analyses of causes and any potential plans for action. Comprehensive and detailed reports are prepared on a monthly or quarterly basis as part of operational controlling. These comprehensive detailed analyses at group, business sector and/or product group level comprise earnings, cost and full-time equivalent (staff) developments and are reported to specific departments. Additionally, complete analyses of significant relevance to overall group performance are also presented directly to the Executive Board. The risk controlling function has been implemented alongside strategic and operational controlling. Early warning systems have been established and mitigation measures defined for all material risk types in line with the risk management requirements set out in the risk strategy. All controlling and monitoring approaches are integrated into regular and comprehensive risk reporting.
Alternative key financial figures used
The KfW Group Management Report contains key financial figures that are not determined in accordance with IFRS. KfW uses key financial figures in its strategic objectives that reflect the status of promotion as the core business activity. It also uses key figures that exclude any temporary effects on results determined and reported in the consolidated financial statements in accordance with IFRS, which are not considered representative by KfW.
KfW has defined the following alternative key financial figures:
Promotional business volume
Promotional business volume refers to the commitments of each business sector during the reporting period. In addition to the lending commitments shown in the statement of financial position, promotional business volume comprises loans from Federal Government funds for promotion of developing countries and emerging economies – which are accounted for as trust activities – financial guarantees, equity financing and securities
purchases in certain asset classes (green bonds, SME loan securitisation). Promotional business volume also includes grants committed as part of development aid and in domestic promotional programmes. Allocation to promotional business volume for the current financial year is generally based on the commitment date of each loan, financial guarantee and grant, and the transaction date of the equity finance and securities transactions. Allocation of global loans to the promotional institutions of the federal states (Landesförderinstitute – “LFI”) and BAföG government loans is, however, based on individual drawdown volume and date, instead of the total volume of the contract at the time of commitment. Financing amounts denominated in foreign currency are translated into euros in the lending business at the exchange rate on the commitment date, and in the securities and equity finance business generally at the rate on the transaction date.
See the “Development of KfW Group” economic report or segment reports for a breakdown of promotional business volume by individual segment.
6
KfW Financial Information 2017 Group management report
Promotional expense
The term “promotional activity” is to be replaced in internal and external communication from 2018 onwards by the term “promotional expense” with the definition remaining fundamentally unchanged. Promotional expense is understood to mean certain expenses of the two business sectors Mittelstandsbank (SME Bank) and Kommunal- und Privatkundenbank/Kreditinstitute (Municipal and Private Client Bank/Credit Institutions) with a positive impact on the achievement of KfW’s promotional objectives.
The key component of KfW’s promotional expense comprises interest rate reductions accounted for at present value. KfW grants these reductions for certain domestic promotional loans for new business during the first fixed interest rate period in addition to passing on KfW’s favourable funding conditions. The difference between the fair value of these promotional loans and the transaction value during the first fixed interest rate period, due to the interest rate being below the market rate, is recognised in profit or loss as an interest expense and accounted for as an adjustment to the carrying amount under the items Loans and advances to banks or Loans and advances to customers. In addition, the amount by which interest rate reductions are compounded over the fixed interest rate period is recognised in Net interest income through profit or loss (see the relevant Notes on KfW’s promotional lending business, loans and advances to banks or customers, and provisions).
As of financial year 2017, promotional components in Commission expense exclusively comprise upfront fees paid to sales partners for processing microloans. Promotional expenses from KfW’s one-time financing share in the advisory programme newly launched by the Federal Office of Economics and Export Control (Bundesamt für Wirtschaft und Ausfuhrkontrolle – “BAFA”) to promote entrepreneurial knowledge and skills were also included in the comparative figures for the previous year. Promotional expense also contains disposable and product- related marketing and sales expenses (Administrative expense).
Cost-income ratio (before promotional expense)
The cost-income ratio (before promotional expense) comprises Administrative expense (excluding promotional expense) in relation to Net interest income and Net commission income before promotional expense.
The cost-income ratio shows costs in relation to income and is thus a measure of efficiency. By incorporating the CIR as a long-term measure of efficiency into its strategic objectives, KfW aims to strengthen its leading position in Germany’s promotional banking landscape. The reason for this way of calculating the cost-income ratio is that promotional expense is a promotional bank-specific expense (and, as an interest rate reduction accounted for at present value, gives a multi-period view). To enable comparison of the CIR with other (non-promotional) institutions and to determine a correct standardised amount, it is necessary to eliminate promotional expense from the numerator (Administrative expense) and denominator (Net interest income and Net commission income). Promotional expense is managed separately and independently via own budgets.
Consolidated profit before IFRS effects
Consolidated profit before IFRS effects from hedging is another key financial figure based on Consolidated profit in accordance with IFRS. Derivative financial instruments are entered into for hedging purposes. Under IFRS, the requirements for the recognition and valuation of derivatives and hedges nevertheless give rise to temporary net gains or losses. In KfW’s opinion, such net gains or losses do not sufficiently reflect economically effective hedges in financial terms.
As a result, the following reconciliations were performed by eliminating temporary contributions to income as follows:
| – | Valuation results from micro and macro hedge accounting. All hedging relationships are economically effective and do not give rise to any net gain or loss over the entire life of the hedge. |
| – | Net gains or losses from the use of the fair value option to avoid an accounting mismatch in the case of funding including related hedging derivatives. Accumulated over the entire life of the hedge, the economically effective hedges do not give rise to any net gain or loss. |
| – | Net gains or losses from the fair value accounting of hedges with high economic effectiveness but not qualifying for hedge accounting. These hedges do not give rise to any net gain or loss over the entire period to maturity. |
| – | Net gains or losses from foreign currency translation of foreign currency positions, in accordance with recognition and valuation requirements for derivatives and hedging relationships. |
7
KfW Financial Information 2017 Group management report
Economic report
General economic environment
The global economy accelerated considerably in 2017, ending the downward growth trend that had persisted since 2011. The industrialised nations, developing countries and emerging economies all contributed to this. Preliminary figures show that more than half of all countries worldwide increased their growth rate year-on-year. After a weak start, the US economy performed very robustly, and the Japanese economy also grew more strongly than had been expected at the start of the year. The Chinese economy put in a strong performance, benefiting from policies implemented in the previous year. Inflationary pressure was only modest. Along with favourable financing conditions worldwide, this helped to underpin global growth. Over the course of the year, there was an easing of the uncertainty surrounding the political stability of the European Union, the direct consequences of the Brexit decision and the political stance of the new US administration especially on trade-related issues. As a result, world trade grew more strongly than in recent years, supported by a continuing recovery of investment activity in industrialised countries and emerging economies.
Economic performance in the member states of the European Economic and Monetary Union (EMU) surprisingly improved with the strongest growth since 2007. Overall, economic output in EMU member states rose by 2.5% year-on-year in 2017. The growth rate was thus also higher than KfW expected a year ago. Growth now has a broad foundation, both in terms of regions and the sources of demand. Consumer spending reaffirmed its role as a dependable pillar of growth, driven by the continuing improvement on labour markets and the associated rise in incomes. An additional boost was provided especially by the upturn in global trade, from which the European economy was also able to benefit despite the appreciation of the euro over the course of the year. With political risks subsiding as the year progressed and supported by a tailwind from foreign trade, corporate sentiment significantly improved, causing companies to overcome their reluctance to invest and make greater use of the favourable financing conditions.
Germany grew strongly by 2.2% in 2017 according to preliminary estimates by the German Federal Statistical Office, thus outpacing the growth recorded in 2016 (1.9%). A year ago, KfW predicted that economic growth would slow to 1.3% in 2017. Like almost all forecasters, it thus underestimated the actual development of gross domestic product. The 2017 publicly available economic growth forecasts at the end of 2016 ranged from 0.9% to 1.7%. The main reason for what later proved to be overly cautious growth expectations for 2017 was the view taken on the prevailing political uncertainty. Given Germany’s export focus, KfW expected that the uncertain consequences of
the Brexit vote and the risk of a less open system of world trade following US policy would permit only a moderate increase in corporate investment. This despite generally favourable conditions for investment, such as the already very high utilisation of industrial capacity. In fact, however, the impact of these risks on corporate investment was far less than feared. Private sector investments in equipment actually accelerated in 2017. Residential construction and consumer spending remained on their clear upward trajectory and made a substantial contribution to the year’s strong growth. With growth in both exports and imports increasing, net exports provided only a slight stimulus to economic growth.
The financial markets presented a favourable picture overall in 2017 and were spared from turbulence. The strong stock market performance on both sides of the Atlantic was notable. There was little price fluctuation and volatility indices were at historically low levels. Optimism among equity investors was fed by surprisingly strong global economic growth combined with a continuation of a highly expansionary monetary policy by the major central banks. This policy kept interest rates especially in Europe and Japan at extremely low levels. International investors also showed growing interest in euro zone investments again in 2017. One significant trigger for this was the victory by the pro-European candidate Emmanuel Macron in the French presidential elections. Investor sentiment was boosted once again at the end of the year by the passing of the US tax reform bill. The crude oil price also rose substantially in 2017, which is likely to have fuelled higher growth in oil-exporting countries and thus bolstered the world economy as a whole.
In 2017, the European Central Bank began a gradual withdrawal from its unconventional monetary policy by reducing the volume of its monthly bond purchases from EUR 80 to EUR 60 billion from April onwards. Amid steadier inflation and strong growth, it decided in the autumn to halve its bond purchases from January 2018 onwards and to maintain this level until at least September 2018. At the same time, it repeatedly indicated in 2017 that it will not raise interest rates until well after the bond purchasing programme has ended. Against this backdrop, money market rates in the euro zone remained at historically low levels (and in negative territory), while the capital market experienced slight rate increases. Yields on ten-year German government bonds in 2017 were up by an average of approximately 24 basis points year-on-year and stood at 0.43% at year-end. Averaged over the year, the yield curve steepened considerably, which noticeably benefited bank stocks. From early 2017, the ECB began for the first time to buy bonds with yields below the ECB deposit rate of –0.40%, which partly
8
KfW Financial Information 2017 Group management report
explains the steeper yield curve. Initially, the ECB’s move put further downward pressure on yields for short-term bonds that were already close to the deposit rate.
With the US Federal Reserve continuing its rate-hike cycle, money market rates in the US continued to increase throughout 2017. The Federal Reserve raised rates three times in 2017 to a range of 1.25% to 1.50% for its benchmark rate by the end of the year. It also began to gradually reduce its balance sheet. Beginning in the autumn, maturing bonds from the Fed’s portfolio were no longer replaced by new purchases. On the US sovereign bond market, yields increased mainly for short-term bonds. Market participants believed that, although the Fed would conduct several rate hikes in the near term, it would struggle to raise key rates beyond the region of 2% in the medium term given the advanced stage of the business cycle. This resulted in
a noticeable flattening of the yield curve. In early 2017, the yield spread between ten-year and two-year US government bonds was above 120 basis points. This narrowed to just over 50 basis points by the end of the year. The yield on ten-year bonds rose by just under ten basis points to around 2.40% over this period.
The EUR/USD exchange rate rose noticeably in 2017 – from around USD 1.05 per EUR at the start of the year to EUR 1.20 at year-end. The strength of the euro against the US dollar was not explained by a smaller interest rate differential, but by the rediscovery of the euro zone by international investors following the positive outcome of the French presidential elections. From this point in time, the EUR/USD rate rose significantly before consolidating in the autumn. The average for the year of 1.13 in 2017 was slightly up on the previous year’s rate of 1.11.
Development of KfW Group
2017 was an encouraging financial year for KfW. The plans and strategic objectives for the positioning targeted in the medium term were achieved overall. With a promotional business volume of EUR 76.5 billion (2016: EUR 81.0 billion), it was also a very positive and successful year in promotional terms. KfW made a key contribution to addressing current economic and social challenges with its promotional products. Promotional activities focused on the socially and economically significant megatrends of “climate change and the environment”, “globalisa-tion”, “digitalisation and innovation”, and “social change”.
The earnings position remained very satisfactory in financial year 2017. As expected, consolidated profit fell short of the high prior-year figure, which had been boosted by non-recurring effects. However, it was still well above the long-term earnings potential. The operating result before valuation (before promotional expense) was down compared to the previous year at EUR 1.7 billion (2016: EUR 1.9 billion). The cost-income ratio (before promotional expense) increased to 42.6% (2016: 38.4%) due to decreasing interest income and increasing administrative costs, which were attributable in particular to the modernisation of KfW Group and measures addressing regulatory requirements, such as KfW’s mandatory application, by analogy, of the German Banking Act (Gesetz über das Kreditwesen – “KWG”). The valuation result made a positive and larger-than-expected contribution to consolidated profit. In net terms, however, it was down year-on-year. This was partially due to the increased though still substantially lower-than-planned net charges from
risk provisions for lending business and in part to negative exchange rate-induced effects in the equity investment portfolio. The strong consolidated profit of EUR 1.4 billion was down year-on-year (2016: EUR 2.0 billion) but exceeded projections. Consolidated profit adjusted for IFRS effects from hedging was EUR 1.2 billion (2016: EUR 1.8 billion). This result shows that KfW is stabilising its capital base, thereby safeguarding its promotional capacity in the long term and ensuring it can meet regulatory requirements. In its current consolidated income projections for 2018, KfW expects a consolidated profit before IFRS effects of around EUR 0.9 billion, which is at the lower end of the range of strategic projections.
Consolidated total assets fell by EUR 34.7 billion to EUR 472.3 billion in 2017. This decline was attributable to a reduction of EUR 24.9 billion in the carrying amount of derivatives designated for hedging purposes and a decrease of EUR 11.3 billion in liquidity held (EUR 33.8 billion). KfW’s promotional business is primarily funded through the international capital markets. The volume of own issues reported under certificated liabilities amounted to EUR 406.3 billion (year-end 2016: EUR 422.6 billion). The EUR 1.7 billion increase in equity to EUR 28.7 billion was especially due to consolidated comprehensive income.
Business performance in 2017 was largely characterised by the following developments:
9
KfW Financial Information 2017 Group management report
A. Continued high demand for KfW products
With a promotional business volume of EUR 76.5 billion in 2017 (2016: EUR 81.0 billion), the group slightly exceeded its projected new business volume of EUR 75.5 billion. This development was primarily due to the high demand for the promotion of climate and environmental projects, which, at 43% (2016: 44%) of total promotional volume, makes KfW one of the world’s largest finance providers in the area of climate and environmental protection.
KfW’s domestic promotional business looks back on a highly successful financial year 2017 with a promotional business volume of EUR 51.8 billion (2016: EUR 55.1 billion). This mainly reflects the high demand for investment loans for business energy efficiency, digitalisation and innovation, as well as the continued high
demand for housing construction loans. At 44% in 2017 (2016: 41%), the SME share improved slightly year-on-year. The promotional volume in the international business remained stable at EUR 23.6 billion (2016: EUR 24.9 billion). A new commitment volume of EUR 13.8 billion (2016: EUR 16.1 billion) was generated in a very competitive business environment in 2017. The business sector Promotion of developing countries and emerging economies recorded a slight increase of the promotional business volume to EUR 9.8 billion (2016: EUR 8.9 billion); a major part of new commitments were for climate and environmental protection projects.
KfW raised EUR 78.2 billion in the international capital markets to fund its business activities (2016: EUR 72.8 billion).
Promotional business volume of KfW Group
| | | | | | | | | | | | | | | | | | |
| | | | | | | 2017 | | | | | | | | | | 2016 | | |
| | | | | | | EUR in billions | | | | | | | | | | EUR in billions | | |
| | | | | | | |
| Domestic business | | | | | | 51.8 | | | | | | | | | | 55.1 | | |
| Mittelstandsbank (SME Bank) | | | | | | 21.9 | | | | | | | | | | 21.4 | | |
| Kommunal– und Privatkundenbank/Kreditinstitute (Municipal and Private Client Bank/Credit Institutions) | | | | | | 29.9 | | | | | | | | | | 33.7 | | |
| Financial markets | | | | | | 1.5 | | | | | | | | | | 1.3 | | |
| International business | | | | | | 23.5 | | | | | | | | | | 24.9 | | |
| Export and project finance | | | | | | 13.8 | | | | | | | | | | 16.1 | | |
| Promotion of developing countries and emerging economies | | | | | | 9.8 | | | | | | | | | | 8.9 | | |
| | |
Volume of new commitments1) | | | | | | 76.5 | | | | | | | | | | 81.0 | | |
1) Adjusted for export and project financing refinanced through KfW programme loans
B. Operating result slightly below expectations
At EUR 1,661 million (2016: EUR 1,898 million), the operating result before valuation (before promotional expense) was below the prior-year level. Net interest income (before promotional expense) based on continued favourable funding conditions for KfW remained the main source of income. It declined slightly to EUR 2,579 million (2016: EUR 2,802 million).
Net commission income (before promotional expense) stood at EUR 316 million, which was higher than the previous year’s level (2016: EUR 280 million).
At EUR 1,234 million (2016: EUR 1,185 million), Administrative expense (before promotional expense) increased slightly and were in line with the targets overall. The decisive factor for this slight increase were extensive investments in modernising KfW Group.
C. Positive valuation result continues to benefit from low risk provisions
Charges arising from risk provisions for lending business totalled EUR 209 million in 2017. This was still significantly below the projected standard risk costs but above the prior-year figure (2016: EUR 150 million).
The purely IFRS-induced effects from the valuation of derivatives designated for hedging purposes remained relatively stable compared to the previous year at EUR 235 million (2016: 233 million). The EUR 19 million reduction in earnings caused by the equity investment portfolio (2016: contribution of EUR 98 million to earnings) largely resulted from the Promotion of developing countries and emerging economies business sector. In the DEG portfolio, negative exchange rate-induced effects more than offset the positive performance, producing a net result of EUR –61 million.
In the securities portfolio, the result was almost unchanged at EUR 8 million (2016: EUR 9 million).
10
KfW Financial Information 2017 Group management report
D. Limited scope for reductions in the low interest rate environment
KfW’s domestic promotional expense, which has a negative impact on KfW Group’s earnings position, decreased slightly to EUR 213 million in 2017 (2016: EUR 230 million) and was considerably lower than expected. This was a result of declining interest rate reductions of EUR 186 million (2016: EUR 193 million),
particularly due to the lower demand for promotional loans subsidised with KfW funds and the decreased scope for reductions in the low interest rate environment.
The following key figures provide an overview of the developments in 2017 and are explained in more detail below:
Key financial figures of KfW Group
| | | | | | | | | | | | | | | | | | |
| | | | | | | |
| | | | | | | 2017 | | | | | | | | | | 2016 | | |
| Key figures of the income statement | | | | | | EUR in millions | | | | | | | | | | EUR in millions | | |
| | | | | | | |
| Operating result before valuation (before promotional expense) | | | | | | 1,661 | | | | | | | | | | 1,898 | | |
| Operating result after valuation (before promotional expense) | | | | | | 1,669 | | | | | | | | | | 2,108 | | |
| Promotional expense | | | | | | 213 | | | | | | | | | | 230 | | |
| Consolidated profit | | | | | | 1,427 | | | | | | | | | | 2,002 | | |
| Cost-income ratio before promotional expense1) | | | | | | 42.6% | | | | | | | | | | 38.4% | | |
| | | | | | | |
| | | | | | | 2017 | | | | | | | | | | 2016 | | |
| Key economic figures | | | | | | EUR in millions | | | | | | | | | | EUR in millions | | |
| | | | | | | |
| Consolidated profit before IFRS effects | | | | | | 1,192 | | | | | | | | | | 1,769 | | |
| | | | | | | |
| | | | | | | 31 Dec. 2017 | | | | | | | | | | 31 Dec. 2016 | | |
| Key figures of the statement of financial position | | | | | | EUR in billions | | | | | | | | | | EUR in billions | | |
| | | | | | | |
| Total assets | | | | | | 472.3 | | | | | | | | | | 507.0 | | |
| Volume of lending | | | | | | 471.7 | | | | | | | | | | 472.4 | | |
| Volume of business | | | | | | 572.2 | | | | | | | | | | 609.2 | | |
| Equity | | | | | | 28.7 | | | | | | | | | | 27.1 | | |
Equity ratio | | | | | | 6.1% | | | | | | | | | | 5.3% | | |
| 1) | Administrative expense (before promotional expense) in relation to adjusted income. Adjusted income is calculated from net interest income and net commission income (in each case before promotional expense). |
11
KfW Financial Information 2017 Group management report
Development of earnings position
The earnings position remained encouraging in 2017 and was characterised by a slight year-on-year decline in the operating result combined with a positive valuation result. At EUR 1.4 billion,
the resulting consolidated profit was down on the previous year as expected, but still exceeded the target.
Reconciliation of earnings position before/after promotional expense for financial year 2017
| | | | | | | | | | | | | | | | | | | | | | | | | | | | | | | | | | | | | | | | |
| | | | | | | | | | | | | | | | | Promotional | | | | | | | | | | | | | | | | | |
| | | | | | | | | | | | | | | | | expense | | | | | | | | | | | | | | | | | |
| | | | | | | | | EUR in millions | | | | | | | | EUR in millions | | | | | | | | EUR in millions | | | | | | | | | |
| | | | | | | | | | | | | |
| Net interest income (before promotional expense) | | | | | | | | | | 2,579 | | | | | | | | | | –186 | | | | | | | | | | 2,393 | | | | | | | | Net interest income | | |
Net commission income (before promotional expense) | | | | | | | | | | 316 | | | | | | | | | | –14 | | | | | | | | | | 303 | | | | | | | | Net commission income | | |
Administrative expense (before promotional expense) | | | | | | | | | | 1,234 | | | | | | | | | | 14 | | | | | | | | | | 1,247 | | | | | | | | Administrative expense | | |
Operating result before valuation (before promotional expense) | | | | | | | | | | 1,661 | | | | | | | | | | –213 | | | | | | | | | | 1,448 | | | | | | | | Operating result before valuation | | |
Risk provisions for lending business | | | | | | | | | | –209 | | | | | | | | | | | | | | | | | | | | –209 | | | | | | | | Risk provisions for lending business | | |
Net gains/losses from hedge accounting | | | | | | | | | | 591 | | | | | | | | | | | | | | | | | | | | 591 | | | | | | | | Net gains/losses from hedge accounting | | |
Other financial instruments at fair value through profit or loss | | | | | | | | | | –397 | | | | | | | | | | | | | | | | | | | | –397 | | | | | | | | Net gains/losses from other financial instruments at fair value through profit or loss | | |
Net gains/losses from securities and investments | | | | | | | | | | 0 | | | | | | | | | | | | | | | | | | | | 0 | | | | | | | | Net gains/losses from securities and investments | | |
Net gains/losses from investments accounted for using the equity method | | | | | | | | | | 22 | | | | | | | | | | | | | | | | | | | | 22 | | | | | | | | Net gains/losses from investments accounted for using the equity method | | |
Operating result after valuation (before promotional expense) | | | | | | | | | | 1,669 | | | | | | | | | | –213 | | | | | | | | | | 1,456 | | | | | | | | Operating result after valuation | | |
Net other operating income | | | | | | | | | | –2 | | | | | | | | | | | | | | | | | | | | –2 | | | | | | | | Net other operating income | | |
Profit/loss from operating activities (before promotional expense) | | | | | | | | | | 1,667 | | | | | | | | | | –213 | | | | | | | | | | 1,453 | | | | | | | | Profit/loss from operating activities | | |
Promotional expense | | | | | | | | | | 213 | | | | | | | | | | –213 | | | | | | | | | | 0 | | | | | | | | – | | |
Taxes on income | | | | | | | | | | 26 | | | | | | | | | | | | | | | | | | | | 26 | | | | | | | | Taxes on income | | |
Consolidated profit | | | | | | | | | | 1,427 | | | | | | | | | | | | | | | | | | | | 1,427 | | | | | | | | Consolidated profit | | |
Temporary net gains/losses from hedge accounting | | | | | | | | | | –235 | | | | | | | | | | | | | | | | | | | | –235 | | | | | | | | Temporary net gains/losses from hedge accounting | | |
Consolidated profit before IFRS effects | | | | | | | | | | 1,192 | | | | | | | | | | | | | | | | | | | | 1,192 | | | | | | | | Consolidated profit before IFRS effects | | |
12
KfW Financial Information 2017 Group management report
Reconciliation of earnings position before/after promotional expense for financial year 2016
| | | | | | | | | | | | | | | | | | | | | | | | | | | | | | | | | | | | | | | | |
| | | | | | | | | | | | | | | | | Promotional | | | | | | | | | | | | | | | | | |
| | | | | | | | | | | | | | | | | expense | | | | | | | | | | | | | | | | | |
| | | | | | | | | EUR in millions | | | | | | | | EUR in millions | | | | | | | | EUR in millions | | | | | | | | | |
| | | | | | | | | | | | | |
| Net interest income (before promotional expense) | | | | | | | | | | 2,802 | | | | | | | | | | –193 | | | | | | | | | | 2,610 | | | | | | | | Net interest income | | |
Net commission income (before promotional expense) | | | | | | | | | | 280 | | | | | | | | | | –23 | | | | | | | | | | 257 | | | | | | | | Net commission income | | |
Administrative expense (before promotional expense) | | | | | | | | | | 1,185 | | | | | | | | | | 14 | | | | | | | | | | 1,199 | | | | | | | | Administrative expense | | |
Operating result before valuation (before promotional expense) | | | | | | | | | | 1,898 | | | | | | | | | | –230 | | | | | | | | | | 1,668 | | | | | | | | Operating result before valuation | | |
Risk provisions for lending business | | | | | | | | | | –150 | | | | | | | | | | | | | | | | | | | | –150 | | | | | | | | Risk provisions for lending business | | |
Net gains/losses from hedge accounting | | | | | | | | | | 294 | | | | | | | | | | | | | | | | | | | | 294 | | | | | | | | Net gains/losses from hedge accounting | | |
Other financial instruments at fair value through profit or loss | | | | | | | | | | 55 | | | | | | | | | | | | | | | | | | | | 55 | | | | | | | | Net gains/losses from other financial instruments at fair value through profit or loss | | |
Net gains/losses from securities and investments | | | | | | | | | | –10 | | | | | | | | | | | | | | | | | | | | –10 | | | | | | | | Net gains/losses from securities and investments | | |
Net gains/losses from investments accounted for using the equity method | | | | | | | | | | 21 | | | | | | | | | | | | | | | | | | | | 21 | | | | | | | | Net gains/losses from investments accounted for using the equity method | | |
Operating result after valuation (before promotional expense) | | | | | | | | | | 2,108 | | | | | | | | | | –230 | | | | | | | | | | 1,878 | | | | | | | | Operating result after valuation | | |
Net other operating income | | | | | | | | | | 102 | | | | | | | | | | | | | | | | | | | | 102 | | | | | | | | Net other operating income | | |
Profit/loss from operating activities (before promotional expense) | | | | | | | | | | 2,210 | | | | | | | | | | –230 | | | | | | | | | | 1,980 | | | | | | | | Profit/loss from operating activities | | |
Promotional expense | | | | | | | | | | 230 | | | | | | | | | | –230 | | | | | | | | | | 0 | | | | | | | | – | | |
Taxes on income | | | | | | | | | | –21 | | | | | | | | | | | | | | | | | | | | –21 | | | | | | | | Taxes on income | | |
Consolidated profit | | | | | | | | | | 2,002 | | | | | | | | | | | | | | | | | | | | 2,002 | | | | | | | | Consolidated profit | | |
Temporary net gains/losses from hedge accounting | | | | | | | | | | –233 | | | | | | | | | | | | | | | | | | | | –233 | | | | | | | | Temporary net gains/losses from hedge accounting | | |
Consolidated profit before IFRS effects | | | | | | | | | | 1,769 | | | | | | | | | | | | | | | | | | | | 1,769 | | | | | | | | Consolidated profit before IFRS effects | | |
At EUR 1,661 million (2016: EUR 1,898 million), the Operating result before valuation (before promotional expense) was slightly below both the prior-year figure and the target.
At EUR 2,579 million, Net interest income (before promotional expense) declined slightly compared to 2016 (EUR 2,802 million). This was partly because the grant received in previous years for ERP economic promotion (2016: EUR 98 million) was no longer awarded in 2017. In addition, lower income from early repayment penalties of EUR 123 million (2016: EUR 154 million) and changes to the contractual terms of the Energy-efficient Construction and Refurbishment promotional programmes as of 1 July 2017, which meant that the remuneration of EUR 34 million was recognised in Net commission income, led to a decline in interest income. Unrelated to these developments, interest margins in the lending business remained stable. Due to its top-notch credit rating, KfW’s funding conditions on the capital and money markets also remained very good and made a substantial contribution to net interest income. Overall, Net interest income remained the main source of income.
Net commission income (before promotional expense) was EUR 316 million, which is considerably higher than the 2016 figure of EUR 280 million. The increase was mainly due to remuneration received for the Energy-efficient Construction
and Refurbishment programmes of EUR 74 million (2016: EUR 35 million) and a rise in loan processing fees to EUR 120 million (2016: EUR 98 million). KfW also generated commission income totalling EUR 180 million (2016: EUR 175 million) from the administration of German Financial Cooperation in the business sector Promotion of developing countries and emerging economies, which was offset by related Administrative expense.
The increase in Administrative expense (before promotional expense) to EUR 1,234 million (2016: EUR 1,185 million) was in line with expectations overall. The main factors driving this increase remain the measures connected with the mandatory application of the KWG and the extensive investments in modernising the group. Personnel expense increased by EUR 34 million to EUR 668 million (2016: EUR 634 million). In addition to the higher number of employees, this was also due to negotiated pay increases. Non-personnel expense (before promotional expense) amounted to EUR 566 million (2016: EUR 550 million). The increase of EUR 15 million was due in particular to the use of consultancy and support services. These services related to, in particular, the necessary fulfilment of regulatory requirements and the comprehensive modernisation of KfW’s information technology architecture, which will continue to be pursued intensively over the coming years. This extensive project
13
KfW Financial Information 2017 Group management report
portfolio is also expected to entail a rise in Administrative expense in the future.
The Cost-income ratio before promotional expense increased to 42.6% (2016: 38.4%). This was primarily due to the decline in operating income as well as increased expenditure associated with KfW’s mandatory application, by analogy, of the KWG, and the further modernisation of KfW.
KfW Group’s Risk provisions for lending business resulted in charges of EUR 209 million (2016: EUR 150 million). Though these were up year-on-year, they were still significantly below the projected standard risk costs. The expenses resulting from risk provisions for lending business largely related to the business sector Export and project finance as well as education financing in the business sector Kommunal- und Privatkunden- bank/Kreditinstitute (Municipal and Private Client Bank/Credit Institutions).
At EUR 316 million, net additions to the provision for imminent credit risks including direct write-offs declined year-on-year (2016: EUR 381 million) and primarily related to the business sector Export and project finance with additions of EUR 147 million (2016: EUR 192 million). Thereof, EUR 61 million was attributable to the Maritime Industries segment. In the previous year, this segment recorded net additions of EUR 195 million in the course of portfolio adjustments. The domestic promotional business experienced an increase in net additions to EUR 128 million (2016: EUR 81 million), attributable in equal parts to the Mittelstandsbank (SME Bank) and Kommunalund Privatkundenbank/Kreditinstitute (Municipal and Private Client Bank/Credit Institutions) business sectors.
At EUR 107 million, income from recoveries of loans previously written off almost halved year-on-year (2016: EUR 216 million). Thereof, EUR 40 million was attributable to the business sector Mittelstandsbank (SME Bank) (2016: EUR 36 million) and EUR 43 million to the business sector Export and project finance (2016: EUR 61 million). The risk provisions declined from EUR 1.1 billion in 2016 to EUR 1.0 billion in 2017. Of this total, EUR 0.4 billion was attributable to the Export and project finance business sector and EUR 0.3 billion to the Promotion of developing countries and emerging economies business sector.
In 2017, risk provisions for loan portfolio risks which were not yet allocable remained almost unchanged at EUR 0.6 billion.
Risk provisions for lending business cover all imminent and latent risks, reflecting the consistent implementation of KfW Group’s conservative risk policy.
Net gains/losses from hedge accounting and other financial instruments at fair value through profit or loss stood at EUR 194 million (2016: EUR 349 million) and in 2017 were primarily driven by negative effects from the equity investment portfolio and high positive purely IFRS-related effects from the valuation of derivatives used for hedging purposes.
The equity investment portfolio measured at fair value through profit or loss was influenced by the positive performance of
investments as well as by offsetting exchange rate-induced reductions in value, particularly due to the depreciation of the US dollar. Overall, the valuation resulted in an expenditure of EUR 32 million (2016: income of EUR 99 million). This development was primarily attributable to the business activities of DEG in promoting developing countries and emerging economies.
The result from foreign currency translation had a slight positive effect with income of EUR 4 million (2016: EUR 11 million) resulting from exchange rate changes, particularly in the US dollar, combined with the corresponding foreign currency items in the consolidated statement of financial position.
Hedge accounting and borrowings recognised at fair value, including derivatives designated for hedging purposes resulted in net gains of EUR 235 million (2016: EUR 233 million). The mark-to-market derivatives are part of economically hedged positions. However, situations where the other part of the hedging relationship cannot be carried at fair value or has to be measured with a different method inevitably result in temporary fluctuations in the net gain or loss that fully reverse over the term of the transaction.
There were Net gains from securities and investments accounted for using the equity method of EUR 22 million (2016: EUR 11 million).
Securities not carried at fair value through profit or loss had a positive earnings contribution of EUR 9 million (2016: EUR 12 million).
The general development of financial markets led to an increase in the value of securities not recognised through profit or loss of EUR 44 million (2016: increase in value of EUR 59 million), which were recognised in equity under Revaluation reserves. This was primarily due to the contributions of European covered bonds. Moreover, the net positive difference between the carrying amount and the fair value for those securities not carried at fair value rose by EUR 12 million to EUR 67 million as of 31 December 2017 (2016: increase of EUR 36 million). This was attributable to, among other things, the reversal of impairment losses on securities from securities-based lending. By contrast, equity investments not carried at fair value through profit or loss resulted in charges amounting to EUR 9 million (2016: EUR 22 million).
The group generated a positive result of EUR 22 million (2016: EUR 21 million) from investments accounted for using the equity method. The performance of DC Nordseekabel GmbH & Co. KG in the business sector Export and project finance constituted a particularly strong contribution to earnings.
Net other operating income was EUR –2 million in 2017. This was a significant decrease compared to last year’s figure (2016: EUR 102 million). However, the prior-year figure was influenced by income of EUR 100 million from a waiver of the repayment of a part of the subordinated loan granted by the ERP Special Fund. Contractual changes meant that this income was not
14
KfW Financial Information 2017 Group management report
repeated in the reporting year. In this context, the remaining subordinated loan of EUR 200 million was repaid to the ERP Special Fund.
KfW’s domestic promotional expense, which has a negative impact on KfW Group’s earnings position, was slightly below the prior-year level (2016: EUR 230 million) and substantially below projections at EUR 213 million in 2017.
The key component of KfW’s promotional expense comprises interest rate reductions. KfW grants these for certain domestic promotional loans during the first fixed interest rate period in addition to passing on KfW’s favourable funding conditions, thus affecting its earnings position. The volume of interest rate reductions provided fell slightly to EUR 186 million in 2017 (2016: EUR 193 million). This was partly due to a demand-induced decline in the volume of interest rate-reduced promotional loans. The persistently low interest rates also reduced the potential to stimulate the promotional business with additional reductions.
Moreover, promotional expenses, as reported in Net commission income and Administrative expense, were incurred in the amount of EUR 27 million (2016: EUR 37 million). This activity aimed, among other things, at better and more targeted sales for KfW’s promotional products.
Taking into account taxes on income (EUR 26 million), a Consolidated profit of EUR 1,427 million was recorded, which was below that of the previous year (EUR 2,002 million) but far exceeded expectations.
Consolidated profit before IFRS effects from hedging is another key financial figure based on consolidated profit in accordance with IFRS to reflect the fact that derivative financial instruments are entered into for hedging purposes. Under IFRS, the requirements for the recognition and valuation of derivatives and hedges nevertheless give rise to temporary net gains or losses. In KfW’s opinion, such net gains or losses do not sufficiently reflect economically effective hedges in financial terms.
As a result, the following reconciliations were performed by eliminating temporary contributions to net gains in the amount of EUR –235 million (2016: EUR –233 million) as follows:
| – | Valuation results from micro and macro hedge accounting. All hedging relationships are economically effective and do not give rise to any net gain or loss over the entire life of the hedge. |
| – | Net gains or losses from the use of the fair value option to avoid an accounting mismatch in the case of funding including related hedging derivatives. Accumulated over the entire life of the hedge, the economically effective hedges do not give rise to any net gain or loss. |
| – | Net gains or losses from the fair value accounting of hedges with high economic effectiveness but not qualifying for hedge accounting. These hedges do not give rise to any net gain or loss over the entire period to maturity. |
| – | Net gains or losses from foreign currency translation of foreign currency positions, in accordance with recognition and valuation requirements for derivatives and hedging relationships. |
The reconciled earnings position amounted to a profit of EUR 1,192 million (2016: EUR 1,769 million). KfW Group achieved a good result in financial year 2017 that continued to exceed its sustainable earnings potential.
Development of net assets
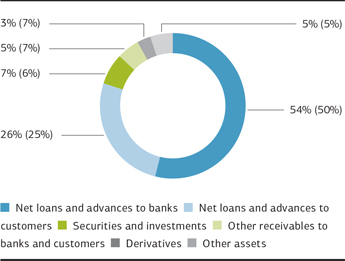
Lending to banks and customers has remained KfW Group’s core business. As of 31 December 2017, a total of 80% of KfW Group’s assets was attributable to its lending business.
Assets
31 Dec. 2017 (31 Dec. 2016)
15
KfW Financial Information 2017 Group management report
At EUR 471.7 billion, the volume of lending remained at the previous year’s level.
Volume of lending
| | | | | | | | | | | | | | | | | | | | |
| | | | | | | | | | |
| | | | | | | 31 Dec. 2017 | | | | | | 31 Dec. 2016 | | | | | | Change | | |
| | | | | | | EUR in millions | | | | | | EUR in millions | | | | | | EUR in millions | | |
| | | | | | | | | | |
| Loans and advances | | | | | | 378,436 | | | | | | 377,871 | | | | | | 564 | | |
| Risk provisions for lending business | | | | | | –1,457 | | | | | | –1,610 | | | | | | 153 | | |
| Net loans and advances | | | | | | 376,979 | | | | | | 376,262 | | | | | | 717 | | |
| Contingent liabilities from financial guarantees | | | | | | 2,229 | | | | | | 2,647 | | | | | | –418 | | |
| Irrevocable loan commitments | | | | | | 80,032 | | | | | | 80,410 | | | | | | –378 | | |
| Loans and advances held in trust | | | | | | 12,433 | | | | | | 13,073 | | | | | | –641 | | |
Total | | | | | | 471,673 | | | | | | 472,392 | | | | | | –720 | | |
Loans and advances increased slightly in 2017 due to various effects. Disbursements in new lending business more than offset unscheduled loan repayments of EUR 13.4 billion (2016: EUR 12.8 billion) and exchange rate effects resulting particularly from the weaker US dollar. At EUR 377.0 billion, Net loans and advances represented 80% of lending volume (year-end 2016: 80%).
Contingent liabilities from financial guarantees declined from EUR 2.6 billion in 2016 to EUR 2.2 billion in 2017. Irrevocable loan commitments at EUR 80.0 billion were at the same level as in the previous year. Within assets held in trust, the volume of
loans and advances held in trust, which primarily comprised loans to promote developing countries financed by budget funds provided by the Federal Republic of Germany, decreased slightly by EUR 0.6 billion to EUR 12.4 billion.
At EUR 23.8 billion, Other loans and advances to banks and customers were considerably below the previous year’s amount of EUR 34.8 billion. This item in particular includes short-term secured and unsecured investments held for general liquidity management purposes and in connection with collateral management in the derivatives business. The decline mainly affected short-term, collateralised investments.
The total amount of securities and investments at EUR 33.6 billion was at the previous year’s level.
Securities and investments
| | | | | | | | | | | | | | | | | | | | |
| | | | | | | | | | |
| | | | | | | 31 Dec. 2017 | | | | | | 31 Dec. 2016 | | | | | | Change | | |
| | | | | | | EUR in millions | | | | | | EUR in millions | | | | | | EUR in millions | | |
| | | | | | | | | | |
| Bonds and other fixed-income securities | | | | | | 30,900 | | | | | | 30,118 | | | | | | 782 | | |
| Shares and other non-fixed income securities | | | | | | 0 | | | | | | 1 | | | | | | –1 | | |
| Equity investments | | | | | | 2,672 | | | | | | 2,595 | | | | | | 77 | | |
| Shares in non-consolidated subsidiaries | | | | | | 43 | | | | | | 0 | | | | | | 43 | | |
Total | | | | | | 33,615 | | | | | | 32,715 | | | | | | 900 | | |
16
KfW Financial Information 2017 Group management report
The securities portfolio, which slightly increased year-on-year, accounted for significant items in securities and investments. The increase in the portfolio was almost completely due to the increase of EUR 0.7 billion to EUR 29.6 billion in bonds and other fixed-income securities, while the volume of money market securities rose slightly by EUR 0.1 billion to EUR 1.3 billion. In addition, equity investments increased by EUR 0.1 billion to EUR 2.7 billion.
The fair values of derivatives with positive fair values, which were primarily used to hedge refinancing transactions, decreased by EUR 20.6 billion, from EUR 34.8 billion to EUR 14.2 billion, mainly due to changes in market parameters. In addition to these changes, the decline was also attributable
to the introduction of the settlement of derivative transactions via EUREX central clearing by KfW in 2017, which resulted in the recognition of a net amount in the balance sheet for the affected derivatives transactions with a positive and negative fair value. For transactions not included in central clearing, the netting agreements and collateralisation agreements concluded with the counterparties (largely cash collateral received) reduced counterparty risk substantially. Value adjustments from macro hedging related to the underlying asset portfolios decreased significantly by EUR 4.3 billion, from EUR 13.9 billion to EUR 9.6 billion.
There were only minor changes in the other asset line items in the statement of financial position.
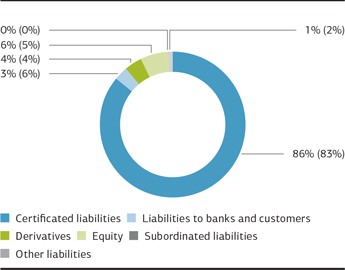
Development of financial position
KfW Group’s funding strategy in the international capital markets is based on three pillars: “benchmark bonds in euros and US dollars”, “other public bonds” and “private placements”. Funds raised in the form of certificated liabilities continued to play a key role, with a share of 86% of total assets, representing an increase over the previous year (83%).
Financial position
31 Dec. 2017 (31 Dec. 2016)
Borrowings decreased by EUR 32.1 billion, to EUR 422.2 billion.
Borrowings
| | | | | | | | | | | | | | | | | | | | |
| | | | | | | | | | |
| | | | | | | 31 Dec. 2017 | | | | | | 31 Dec. 2016 | | | | | | Change | | |
| | | | | | | EUR in millions | | | | | | EUR in millions | | | | | | EUR in millions | | |
| | | | | | | | | | |
| Short-term funds | | | | | | 40,497 | | | | | | 49,736 | | | | | | –9,239 | | |
Bonds and notes | | | | | | 366,105 | | | | | | 375,483 | | | | | | –9,379 | | |
Other funding | | | | | | 15,563 | | | | | | 28,806 | | | | | | –13,243 | | |
Subordinated liabilities | | | | | | 0 | | | | | | 200 | | | | | | –200 | | |
Total | | | | | | 422,164 | | | | | | 454,225 | | | | | | –32,061 | | |
17
KfW Financial Information 2017 Group management report
KfW Group’s principal sources of funding were medium and long-term bonds and notes issued by KfW. At year-end 2017, such funds amounted to EUR 366.1 billion (2016: EUR 375.5 billion) and accounted for 87% of borrowings. Short-term issues of commercial paper decreased by EUR 6.9 billion to EUR 40.2 billion. Total short-term funds, including demand deposits and term deposits, amounted to EUR 40.5 billion. Other funding for KfW, in addition to promissory notes from banks and customers (Schuldscheindarlehen), which decreased by EUR 0.4 billion to EUR 7.1 billion year-on-year, consisted mainly of liabilities to the Federal Republic of Germany and cash collateral received primarily to reduce counterparty risk from the derivatives business of EUR 4.2 billion (year-end 2016: EUR 17.8 billion).
The carrying amounts of derivatives with negative fair values, which were primarily used to hedge loans, decreased by EUR 4.1 billion from EUR 21.5 billion, primarily due to changes in market parameters, and amounted to EUR 17.4 billion at year-end 2017.
The subordinated loan granted by the ERP Special Fund as part of the restructuring of the 2007 ERP economic promotion programme was fully repaid in 2017. As of 31 December 2016, the subordinated loan was still recognised under subordinated liabilities with a balance of EUR 0.2 billion.
There were only minor changes in the other liability line items in the statement of financial position.
At EUR 28.7 billion, equity was above the level of 31 December 2016 of EUR 27.1 billion. This increase was largely due to the consolidated profit (EUR 1.4 billion) and the measurement of equity investments at fair value, recognised directly in equity
(EUR 0.2 billion). The increase in equity combined with a reduction in total assets led to an improvement in the equity ratio from 5.3% at the end of 2016 to 6.1% as of 31 December 2017.
Equity
| | | | | | | | | | | | | | | | | | | | |
| | | | | | | | | | |
| | | | | | | 31 Dec. 2017 | | | | | | 31 Dec. 2016 | | | | | | Change | | |
| | | | | | | EUR in millions | | | | | | EUR in millions | | | | | | EUR in millions | | |
| | | | | | | | | | |
| Paid-in subscribed capital | | | | | | 3,300 | | | | | | 3,300 | | | | | | 0 | | |
Capital reserve | | | | | | 8,447 | | | | | | 8,447 | | | | | | 0 | | |
of which promotional reserves from the ERP Special Fund | | | | | | 7,150 | | | | | | 7,150 | | | | | | 0 | | |
Reserve from the ERP Special Fund | | | | | | 1,191 | | | | | | 1,191 | | | | | | 0 | | |
Retained earnings | | | | | | 15,500 | | | | | | 14,092 | | | | | | 1,407 | | |
Fund for general banking risks | | | | | | 600 | | | | | | 600 | | | | | | 0 | | |
Revaluation reserves | | | | | | –295 | | | | | | –576 | | | | | | 281 | | |
Total | | | | | | 28,742 | | | | | | 27,055 | | | | | | 1,688 | | |
The consolidated profit was allocated to Retained earnings.
18
KfW Financial Information 2017 Group management report
Risk report
Overview of key indicators
Risks are reported in accordance with KfW Group’s internal risk management. The key risk indicators are presented below:
Regulatory capital ratios remain at a good level
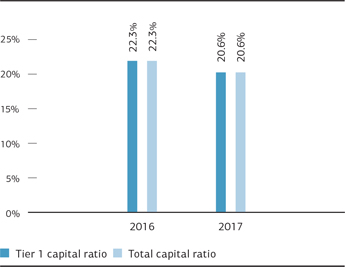
KfW obtained regulatory approval from BaFin to measure material portfolio segments using the advanced internal ratings-based (IRB) approach, with effect from 30 June 2017. The decline in the capital ratio is primarily due to transition effects resulting from the previous use by analogy of the IRB approach for internal purposes.
Credit risk: Good credit quality structure maintained
2017 (2016) Net exposure breakdown
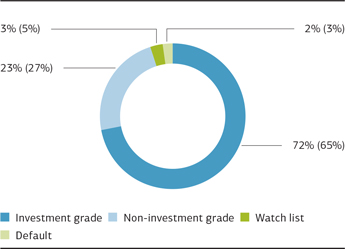
In 2017, the share of investment grade net exposure comprised 72% of the total net exposure. Risk provisions (specific and portfolio valuation allowances, loan loss provisions) declined slightly to EUR 1.5 billion (31 Dec. 2016: EUR 1.7 billion).
Economic risk-bearing capacity: Clearly secured
EUR in billions
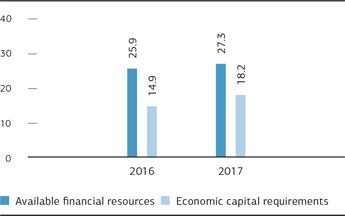
The excess coverage was reduced due to a higher total capital requirement. Overall, risk-bearing capacity is clearly secured at a solvency level of 99.99%.
Market price risks: Slight decrease in capital requirement
2017 (2016), ECAP EUR in billions
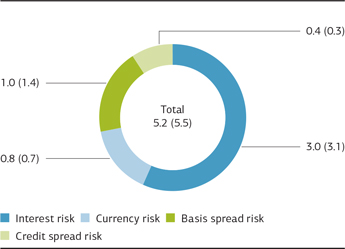
The capital requirement for market price risks declined slightly year on year. This was primarily due to a reduced ECAP requirement for basis spread risk, which was offset by the increased capital requirement for currency and credit spread risk.
19
KfW Financial Information 2017 Group management report
Liquidity risk: Situation remains comfortable
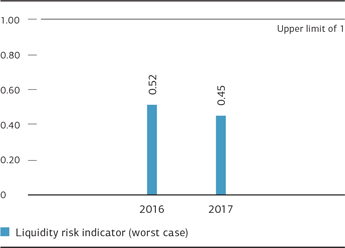
The liquidity risk indicators remained considerably below the internal limit throughout 2017.
Operational risk: Significant increase in capital requirement
EUR in millions
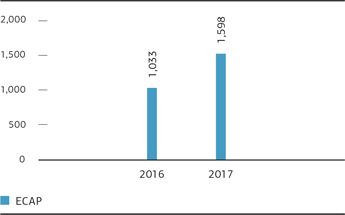
Individual losses and updated risk scenarios led to a higher economic capital requirement in 2017.
Current developments
The global economy recorded real growth of over three percent for the fifth consecutive year in 2017, and momentum actually increased year on year. This relatively healthy development was a result of the broadly stable economic trend overall in many industrialised countries and emerging economies. While industrialised nations such as the USA, Canada, the Euro area and Japan posted significant increases in growth, the UK suffered a slowdown in growth – as was expected following the Brexit vote – although the country is still far from the recession forecast by many economists. Moreover, the current situation is not solely a result of the Brexit vote or the uncertainties caused thereby, but is also due to familiar problems such as the traditional twin deficit (concurrent budget and current account deficit) and the comparatively weak international competitiveness in the industrial sector. The key factor for the economic future of the UK, aside from the new relationship between the country and the EU, will be the necessary reorientation of the British economy. As for the large emerging economies, China and India more or less maintained their high level of growth of the previous year and Brazil and Russia came out of their recessions, while South Africa remained close to economic stagnation. Positive sentiment among consumers and businesses generated and buoyed by impetus from economic policy along with increased industrial production and a recovery in trade served to secure growth on a broad base in many countries. Growth expectations in the base scenario remain positive for 2018, as current sentiment indicators and new orders suggest that economic
performance in many industrialised countries and emerging economies will remain stable and broadbased.
However, the improved growth momentum in 2017 should not disguise the fact that economic performance was restrained compared to previous upswing periods. Despite the evident improvements, the after-effects of the financial crisis are still noticeable in 2017 in the areas of productivity, investment, wage development and trade. The higher economic momentum in the industrialised nations was largely supported by the continuing expansionary monetary policy and increasingly also by an easing of fiscal policy. The downside to this economic policy is the steady rise in risks to be seen in the financial markets, because the long period of low interest rates has both increased risk tolerance and caused asset prices to climb, particularly in the residential property markets. Growth development, and thus the recovery process in the emerging economies and developing countries as well, where growth is still weaker than in the past, is being inhibited by reduced or delayed reform efforts and increasing financial risks as result of a rising debt load (primarily in China).
KfW Group observes and assesses these trends on a continuous basis. The downward adjustments to the country risk assessment in 2017 again mainly concerned countries that are highly vulnerable to external shocks (exporters of commodities, above all) and those with significantly increased political risks.
20
KfW Financial Information 2017 Group management report
The development of the European banking sector remained un-stable in 2017, but showed positive signs overall, due to, among other reasons, further capital increases by systemically important banks. The large number of non-performing loans (NPLs) and the resulting restrictions to business activity were a key issue last year. Ideas about forming a European “bad bank” or much more conservative risk provisions for NPLs from 2018 have not yet taken hold. More progress was made in sales of these to private investors in the second half of the year, particularly in Italy, where the majority of NPLs is concentrated, although most were sold well under book value. Despite this, the situation for Italian banks remained difficult. Several large banks had to be bailed out because of the oppressive problem loans. The government intervened directly to prevent losses for senior unsecured creditors, despite the Banking Recovery and Resolution Directive (BRRD). The fear of an excessive shock to the financial markets relating to senior unsecured losses remained significant as a considerable proportion of bank loan holders in Italy are private clients, among other reasons.
The weaknesses of the German banking sector, high administrative costs and low returns, force the banks to continue working on their business models. Problems affecting regional state banks (Landesbanken), some of which were still suffering greatly due to shipping loans and some of which were under privatisation pressure, could not be adequately solved. Moreover, the Bundesbank warned of the high interest-change risk in the savings and cooperative bank sector, which is particularly heavily dependent on net interest income. Uncertainties regarding future business opportunities in Europe for banks with registered offices in the UK prompted primarily Japanese banks to relocate their European headquarters to Frankfurt or Amsterdam. A feared deterioration of credit quality in the Turkish banking sector due to considerable depreciation of the Turkish lira combined with a high share of refinancing in foreign currencies has not yet materialised; credit growth and consequently the economy too were further sustained for the time being through the KGF – Credit Guarantee Fund. Different countries showed excessive valuation levels in the real estate markets (Sweden, Norway, Australia and Canada, above all) and high levels of consumer and automobile loans (US and UK above all), some of which were reminiscent of pre-crisis levels and could put pressure on the banking sector in the future. However, the banks in those countries currently appear robust and adequately prepared. Changes in the banking markets are under constant observation and assessment to enable undertaking risk-mitigating measures early on.
In light of stable domestic demand, positive overall performance continues to be expected for the German and European business sector in 2018. Given the high capacity utilisation, investment
activity could moreover increase in Germany as well as in Europe, which would provide further positive economic impetus. Expectations for the US market are also favourable. The group continues to expect difficult performance only in the offshore oil sector. On the assumption that there will be no escalations in any of the different hotspots around the world, the group expects stable overall development in portfolio credit quality. The sub-portfolios concerned will be closely monitored on a continuous basis.
The group’s portfolio recorded stable performance overall. All recognisable risks are measured using conservative standards and are taken into account in KfW Group’s new business management through the systematic implementation of risk guidelines. The regularly performed calculations of risk-bearing capacity show that KfW Group can bear the risks assumed in the context of its mandate – even based on conservative stress scenarios. In financial year 2017, as in previous years, KfW Group systematically refined the processes and instruments in its risk management and controlling, taking into account current banking regulations. This particularly affected the further development of the measurement process for credit spread and settlement risks, the separation of continued development and validation of credit risk models at departmental level as well as revision of OpRisk management in terms of reporting and governance processes. After finalisation of the fifth amendment to the German Minimum Requirements for Risk Management (Mindestanforderungen an das Risikomanagement – “MaRisk”), KfW commenced the related implementation measures.
As a result of an amendment to the KfW Law in 2013 and the issuance of the “Regulation concerning key banking supervision standards under the German Banking Act to be declared applicable by analogy to KfW and supervision of compliance to these standards to be assigned to the German Federal Financial Supervisory Authority” (the “KfW Regulation”), the German legislature enacted an expanded application of the KWG to KfW. KfW has since been obliged to apply key bank regulatory standards (KWG and Capital Requirements Regulation, “CRR”) by analogy. The German Federal Financial Supervisory Authority and the German Central Bank (Bundesbank) are responsible for supervising compliance with the relevant applicable bank regulatory standards. Since autumn 2015 KfW has been undergoing the approval process for application of the advanced IRB approach (“IRBA”). The initial IRBA (partial) approval was granted with effect as of 30 June 2017. Having obtained regulatory approval for the advanced IRBA, KfW applied the advanced IRB approach to capital market communication, internal management and reporting. The IRBA approval process is currently scheduled to be fully completed as of 30 June 2022 at the latest.
21
KfW Financial Information 2017 Group management report
Basic principles and objectives of risk management
KfW Group has a statutory promotional mandate, which provides the basis for its special position and institutional structure. Sustainable promotion is KfW Group’s overarching purpose. In order to utilise available resources to best carry out KfW Group’s promotional mandate, it is vital to measure and control incurred risks. As part of its risk management, KfW Group takes risks only to the extent that they appear manageable in the context of its current and anticipated earnings position and the development of the risks. KfW Group’s risk/return management takes into account the special characteristics of a promotional bank, with adherence to supervisory requirements constituting a fundamental prerequisite to the group’s business activities.
KfW Group’s risk culture forms the basis for efficient risk management; this culture is largely characterised by the promotional bank business model with no primary intention of generating profit and no trading book. In addition to the code of conduct, the risk culture is also marked by open communication, clear responsibilities and an appropriate incentive structure. In order to solidify risk management and controlling know-how within its organisation, KfW Group offers its employees training that includes a modular programme on risk topics. The training programme enables management and non-management staff throughout KfW Group to acquire basic knowledge or to deepen their specialised knowledge.
Organisation of risk management and monitoring
Risk management bodies and responsibilities
As part of its overall responsibility, KfW’s Executive Board determines the group’s risk policies. The Board of Supervisory Directors is informed at least quarterly of KfW Group’s risk situation. The Presidial and Nomination Committee is responsible for dealing with legal and administrative matters as well as fundamental business and corporate policy issues. Moreover, in certain urgent cases, the committee has the authority to adopt resolutions in lieu of the Board of Supervisory Directors. The Chair of the Board of Supervisory Directors decides whether an issue is urgent. The Risk and Credit Committee is primarily responsible for advising the Board of Supervisory Directors on the group’s current and future overall risk tolerance and strategy and supports it in monitoring implementation of the latter. It decides on loan approvals (including loans to members of management), operational level equity investments, funding and swap transactions, for which committee authorisation is required by the KfW Bylaws. The Audit Committee monitors, above all, the accounting process and the effectiveness of the risk management system and internal monitoring procedures and offers recommendations to the Board of Supervisory Directors concerning its approval of the consolidated financial statements. The Remuneration Committee monitors whether the structure of the remuneration system for the Executive Board and employees is appropriate.
In accordance with applicable bank regulatory provisions, the Remuneration Committee is also responsible for monitoring whether the structure of the remuneration systems for the heads of the Risk Controlling and Compliance functions and for any employees who have a significant impact on the group’s overall risk profile is appropriate.
Risk management within KfW Group is exercised by closely interlinked decision-making bodies. At the top of the system is the Executive Board, which takes the key decisions on risk policy and receives relevant information for this purpose. There are three risk committees below the level of the Executive Board (Credit Risk Committee, Market Price Risk Committee and Operational Risk Committee) which prepare decisions for the Executive Board and also take their own decisions within their remits. The committees also perform KfW Group management functions; thus, representatives from the subsidiaries KfW IPEX-Bank and DEG are also included. Additional working groups do the preliminary work for these committees. Committee resolutions are adopted by simple majority with middle and back office departments (Marktfolge) or Risk Controlling being generally entitled to veto. An issue may be escalated to the Executive Board level in the Credit Risk Committee and the Operational Risk Committee.
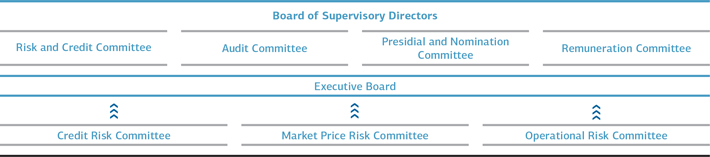
22
KfW Financial Information 2017 Group management report
Credit Risk Committee
The Credit Risk Committee is chaired by the Chief Risk Officer and meets once a week. The committee’s other voting members are the Director of Credit Risk Management, members of the Ex- ecutive Board with front-office responsibilities and KfW IPEX-Bank’s Chief Risk Officer (“CRO”). The Credit Risk Committee is supported by various working groups. The Country Rating Working Group serves as the central unit for assessing country risk. The Collateral Working Group is responsible for handling fundamental aspects of collateral acceptance and valuation, particularly in terms of the methods used and their validation as well as the collateral management processes. The Rating Systems Working Group is responsible for credit risk measurement instruments and rating procedures. The Corporate Sector Risk Working Group analyses sector and product-related credit risks in the corporate segment. The weekly Credit Risk Committee meetings involve decisions on loans and credit lines and discussions on current loan portfolio developments. KfW IPEX-Bank’s and DEG’s commitments are also presented to the Credit Risk Committee. An additional meeting, held on a quarterly basis, also includes the Director of Risk Controlling and those of the business sectors as well as the DEG CRO. Internal Auditing, Compliance and Legal staff are granted guest status. Reports about the development of regulatory requirements, their impact and the progress of implementation projects in KfW Group are given at this quarterly meeting. The committee also approves major changes to existing risk principles and credit risk methods as well as new principles and methods and procedural rules for the working groups performing the groundwork. The committee also monitors KfW Group’s loan portfolio, including country and sector risks.
Market Price Risk Committee
The Market Price Risk Committee is chaired by the Chief Risk Officer and meets once a month. The committee’s other members include the Executive Board members responsible for capital markets business and finance as well as the directors of Financial Markets, Risk Controlling, Accounting, Transaction Management, Group Development and Economics. Internal Auditing and Compliance have guest status. The Chief Risk Officers of KfW IPEX-Bank and DEG attend the meetings on a quarterly basis and as necessary. The Market Price Risk Committee discusses KfW Group’s market price risk position and assesses the market price risk strategy on a monthly basis. The committee also monitors KfW Group’s liquidity risk position and decides on all questions relating to the principles and methods for the management of market price and liquidity risks, and funding as well as transfer pricing and the valuation model for commercial transactions. The committee prepares the final decision of the Executive Board regarding the interest risk strategy. Furthermore, the Market Price Risk Committee is supported by the Hedge Committee,
which deals primarily with the earnings effects of IFRS hedge accounting and the further development thereof, and the Market Price Risk Working Group. In addition to accepting validation reports and changes to models, this working group also works and decides – or prepares decisions by the Market Price Risk Committee – on other methodological issues relating to market price and liquidity risks as well as measurement issues.
Operational Risk Committee
The Operational Risk Committee meets once a quarter and provides support to the Executive Board in cross-functional management and the necessary decisions and acknowledgements in respect of operational and reputational risk, and group security including business continuity management. The Operational Risk Committee is comprised of the Chief Risk Officer, who is responsible for chairing the meetings, a further Executive Board member (deputy chair of meetings) and all KfW directors, who can be represented in exceptional cases by the heads of the departments appointed. KfW IPEX-Bank and DEG are also represented in the committee. Internal Auditing participates in the meetings but is not entitled to vote. The committee’s task is to resolve on risk principles anchored in guidelines and on methods and instruments that are applied by the first line of defence in the risk management cycle. It also takes decisions on group-wide management measures. Moreover, the committee discusses the risk status on the basis of the findings obtained through different methods and instruments and evaluates any group-wide need for action, with the aim of adequate risk management. In the area of business continuity management the committee establishes crisis-prevention and emergency-planning measures using the results of the annual business impact analysis. Monitoring is based on reports about planned or implemented emergency and crisis team tests and significant disruptions to business. All resolutions and recommendations by the Operational Risk Committee are presented to the Executive Board. The Operational Risk Committee may form sub-committees for certain focal areas to facilitate its work. It formed the Group Security Board for matters relating to group security and business continuity management and the OpRisk Working Group for exchange with the decentralised department coordinators for operational risk and business continuity management.
Additionally, the subsidiaries and organisational entities of KfW Group exercise their own control functions within the group-wide risk management system. In these entities, group-wide projects and working groups ensure a coordinated approach, for example, in the rollout of rating instruments to subsidiaries or in the management and valuation of collateral. The responsibility for developing and structuring risk management and risk control activities is located outside the market areas and lies in particular with the Risk Controlling department.
23
KfW Financial Information 2017 Group management report
Risk management approach of KfW Group
OVERVIEW
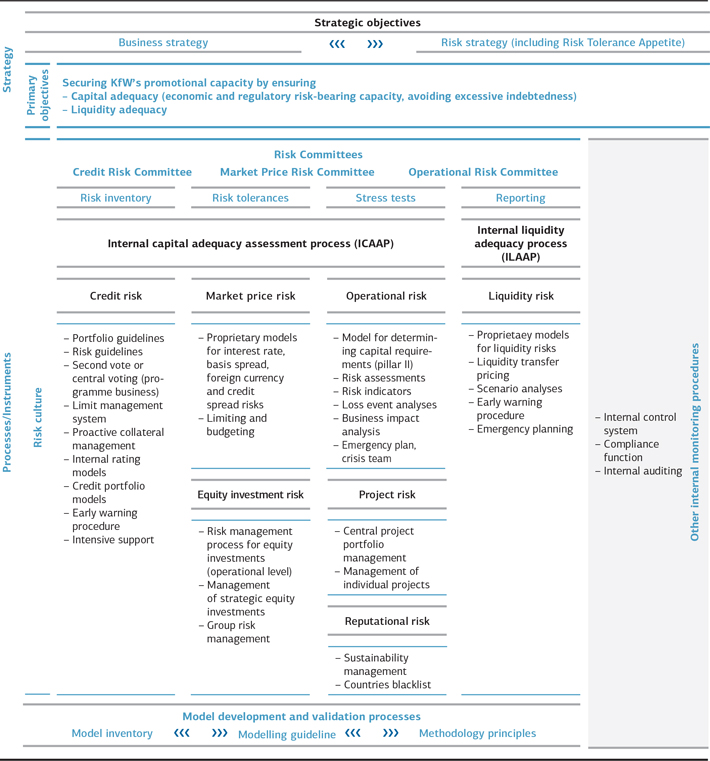
liquidity. The key outcome of the risk inventory is an overall risk profile, which provides an overview of KfW Group’s material and immaterial risk types. The 2017 inventory identified that KfW Group faces the following material risks: credit, market price, liquidity, operational, equity investment, project and reputational risks. Risk concentrations within a risk type or across various risk types are taken into account in the risk inventory.
Risk reporting is in line with regulatory requirements (MaRisk). The Executive Board is informed about KfW Group’s risk situation on a monthly basis. A risk report is issued quarterly to KfW Group’s supervisory bodies. The respective bodies are informed on an ad hoc basis as required. The risk indicators and information systems used by the Risk Management and Controlling department are reviewed on an ongoing basis.
The methods and instruments for KfW group-wide risk measurement and controls are regularly validated and adjusted through further development, if necessary. The focus is particularly on models to measure, control and price credit, market price, liquidity and operational risks. Validation and further development activities take account of regulatory requirements.
The risk management approach is set out in KfW Group’s risk manual. The risk manual stipulates the framework for the application of uniform procedures and rules and regulations to identify, measure, control and monitor risk. The rules and regulations laid out in the risk manual are binding for the entire KfW Group, accessible to all employees and continually updated. KfW group-wide regulations are supplemented by rules specific to each business sector. See the following sections for details on other elements of KfW Group’s risk management approach.
INTERNAL CAPITAL ADEQUACY ASSESSMENT PROCESS
KfW Group’s internal capital adequacy assessment process is characterised by the fact that compliance with regulatory and economic requirements regarding risk-bearing capacity are equally important overarching objectives for KfW Group. Accordingly, all risk monitoring and management measures must ensure compliance with both an economic solvency target and minimum requirements for the regulatory capital ratios. This approach combines economically practicable capital management with the obligation to comply with regulatory capital requirements. KfW Group takes a uniform definition of capital as the basis for the close integration of these two perspectives: regulatory capital in line with Articles 25-91 of Regulation (EU) No. 575/2013 (CRR) is used as available risk coverage resources for both views.
A further core feature of the capital adequacy assessment process is the proactive focus resulting from an additional forward-looking component. This focus evaluates the absorption potential of KfW Group’s reserves – and thus also its ability to act – in the event of certain economic and stress scenarios. A traffic light system, established in this context with thresholds for regulatory and economic risk-bearing capacity, signals the required action in the event of critical developments as part of operational and strategic management.
KfW Group’s risk-bearing capacity concept serves first and foremost to protect senior debt capital providers from losses and therefore adopts a liquidation approach in its basic form. However, the addition of a forward-looking component, which also guarantees compliance with regulatory capital requirements, expands the concept to include a going-concern view. KfW Group’s risk-bearing concept thus includes elements of both basic types of risk-bearing capacity approaches.
Budgets based on risk-weighted assets (RWA) at the level of each business sector/department are taken into account to
ensure risk-bearing capacity. The allocated budgets are available to the business sectors/departments for backing old and new business for the various types of risk. Capital allocation is conducted as part of KfW Group’s annual business sector planning. In addition to the requirements induced by business sector planning, this process also takes into account the risk objectives and the bank’s risk tolerance. Budget compliance is checked on a monthly basis and action is taken, if necessary. Moreover, economic capital budgets are set for different types of risk as their central control and limit variable, and monitored monthly.
To avoid excessive debt, the leverage ratio is integrated into the capital adequacy assessment process as a further control variable. The leverage ratio is taken into account in additional forward-looking projections, and compliance with defined traffic light limits checked on a quarterly basis.
In addition to KfW Group’s risk-bearing capacity concept, the capital planning process monitors the medium-term development of capital adequacy. Reliance on scenario-based extrapolations of regulatory and economic risk-bearing capacity as well as the leverage ratio over a multi-year observation horizon enables the capital planning process to identify potential capital bottlenecks early on in order to derive recommendations for action that strengthen capital or reduce risk, as necessary. The process takes into account changes in strategic objectives, business activity and the economic environment. In addition to a base case, regulatory and economic risk-bearing capacity and the leverage ratio are also taken into account in a stress case. Capital planning is performed as part of the overall KfW group-wide planning and strategy process.
The risk-bearing capacity concept is subject to annual review of its limits and restrictions. The results are taken into account accordingly in the assessment of risk-bearing capacity.
25
KfW Financial Information 2017 Group management report
Regulatory risk-bearing capacity
Key regulatory figures (pursuant to advanced IRBA)
| | | | | | | | | | | | | | | | | | |
| | | | | | | 31 Dec. 2017 | | | | | | | | | | 31 Dec. 20161) | | |
| | | | | | | EUR in millions | | | | | | | | | | EUR in millions | | |
| | | | | | | |
Total risk exposure in accordance with Art. 92 CRR | | | | | | 133,072 | | | | | | | | | | 116,108 | | |
– Credit risk | | | | | | 126,180 | | | | | | | | | | 108,723 | | |
– Market price risk | | | | | | 1,233 | | | | | | | | | | 1,298 | | |
– Operational risk | | | | | | 5,660 | | | | | | | | | | 6,087 | | |
Regulatory capital (available risk coverage resources) | | | | | | 27,347 | | | | | | | | | | 25,890 | | |
– Tier 1 capital | | | | | | 27,347 | | | | | | | | | | 25,890 | | |
– Tier 2 capital | | | | | | 0 | | | | | | | | | | 0 | | |
Tier 1 capital ratio | | | | | | 20.6% | | | | | | | | | | 22.3% | | |
Total capital ratio | | | | | | 20.6% | | | | | | | | | | 22.3% | | |
| 1) | Analogous application of advanced IRBA for internal purposes |
At the end of the second quarter 2017 KfW, as expected, received an initial partial approval to calculate the regulatory capital ratios in accordance with the advanced IRBA. The aim is to obtain additional approval for other portfolio segments by 2022. Meanwhile, portfolio segments not yet approved are valued by applying the generally more capital-intensive credit risk standardised approach (“CRSA”). These portfolio segments were previously valued in accordance with the advanced IRBA under voluntary, analogous application of the advanced IRBA based on the main legal requirements. The decline in capital ratios over
the course of the year was largely due to the transition from the previous analogous IRBA application to the regulator-approved IRBA application from mid-year on. Adjustments made to the methods of collateral valuation for final-borrower assignments in the domestic promotional business were necessary as part of the IRBA approval process, which resulted not only in increasing RWA but also a higher economic capital requirement (see also the following section). At 20.6%, the total capital ratio at year-end 2017 far exceeded the overall capital requirement:
Minimum capital requirements1)
| | | | | | | | | | |
| | | | | | | 31 Dec. 2017 | | | | |
Total SREP Capital Requirements (TSCR) | | | | | | 13.0% | | | | |
Capital conservation buffer | | | | | | 1.250% | | | | |
Countercyclical capital buffer | | | | | | 0.054% | | | | |
Overall Capital Requirement (OCR) | | | | | | 14.3% | | | | |
| 1) | As of 31 December 2016, KfW reported its capital ratio according to the CRSA; therefore, no year-on-year comparison is made. |
Economic risk-bearing capacity
To assess its economic risk-bearing capacity, KfW Group compares its economic capital requirement for potential losses from material quantifiable risks to its available risk coverage resources. KfW Group bases its calculation of the economic capital requirement on a solvency target of 99.99% and a time frame of one year. The aggregation of the economic capital requirement across various types of risks is made through addition without taking account of diversification effects.
The most significant risk type for KfW Group is credit risk. Credit risk is the risk of losses if business partners fail to meet their payment obligations to KfW Group at all, in due time or in full (“default”) or if their credit ratings deteriorate (“migration”).
Credit risk includes settlement risk involved in settling derivative transactions. The economic capital requirement for credit risk is quantified by the Risk Controlling department, largely with the help of statistical models. For counterparty risk, the loss potential is computed using a loan portfolio model and the risk measure of “credit value-at-risk”. The difference between credit value-at-risk and expected loss is referred to as the economic capital requirement. Migration risk is taken into account in the forward-looking component of the calculation of risk-bearing capacity on the basis of scenarios. For settlement risks, a buffer determined on the basis of different quantification approaches, which is validated annually, is applied in calculating economic risk-bearing capacity.
26
KfW Financial Information 2017 Group management report
The economic capital requirement for equity investments at operational level is measured in the same way as for counter-party and migration risks.
The economic capital requirement for market price risk is calculated on the basis of the value-at-risk concept. Pillar II’s economic analysis takes account of interest risk in the banking book, foreign currency risk, credit spread risk for securities, and basis spread risk. The possible loss of present value or price is determined for each type of market price risk using a value-at-risk based on statistical models. Moreover, a stop loss buffer is maintained for interest and foreign currency risks. Ultimately, the economic capital requirement is defined as the sum of value-at-risk and an additional stop loss buffer.
The capital requirement for operational risk is calculated using an internal statistical model, which was designed based on regulatory requirements for advanced measurement approaches. It takes a risk-sensitive approach to internal and external event data and risk scenarios. The capital requirement is calculated using diversification effects at the business sector level. Moreover, the measurement of the quality of operational risk management within the group generates premiums and discounts that are then applied to the capital requirement.
Project risks are also taken into account in the risk-bearing capacity concept. Both quantified individual risks from major projects and general assumptions about potential losses in the project portfolio are included in risk measurement.
KfW Group also includes hidden burdens (stille Lasten) for securities held as fixed assets, which are held directly as an economic capital requirement without including offsetting hidden reserves (stille Reserven).
Using this method, the economic risk-bearing capacity as of 31 December 2017 satisfied a solvency level of 99.99%. The excess coverage of the available risk coverage resources beyond the total capital requirement as of 31 December 2017 of EUR 9,119 million decreased compared to 31 December 2016 (EUR 10,971 million). The decrease is largely due to the higher capital requirement for credit risk due to the aforementioned adjustments made to methods of collateral valuation for final-
borrower assignments. The capital requirement for operational risks rose as well due to individual losses and updated risk scenarios. The capital requirement for market price risks declined mainly due to lower basis spread risks, while that for project risks rose slightly. Hidden burdens, on the other hand, declined. Intercompany profits of the first three quarters of 2017, in particular, raised available risk coverage resources, thus partially offsetting the risk-bearing capacity burden resulting from the higher capital requirement. The fourth quarter result will be taken into account on 31 March 2018 after the issuance of the auditor’s opinion.
The group manages liquidity risks using appropriate internal key risk figures, maximum liquidity gap limits (outflows on a monthly and yearly basis) and minimum levels of available liquidity (liquidity potential) as well as the utilisation threshold in accordance with Article 4 of the KfW Law. Internal calculations relating to the liquidity situation are based on comparing liquidity need and liquidity potential as a ratio in stress scenarios of differing severity. No capital backing is provided as part of calculating risk-bearing capacity.
Reputational risks are evaluated and managed on a qualitative basis. Capital backing as part of calculating risk-bearing capacity is not currently provided, as the materiality of risk is primarily due to the fact that KfW is a government-owned institution with a high moral responsibility and as such subject to corresponding expectations of the public at large and other stakeholders. Materiality is thus based less on observed or potential decreases in KfW Group’s net assets, earnings or liquidity. Moreover, reputational risks are to some extent implicitly included in other quantified types of risk.
KfW Group’s risk measurement is based on state-of-the-art models used in banking practice. However, each model represents a simplification of a complex reality and builds on the assumption that risk parameters observed in the past can be considered representative of the future. Not all possible inputs and their complex interactions can be identified and modelled for the risk development of a portfolio. This is one reason why KfW Group carries out stress tests with both the credit risk models and the market price risk models. KfW Group also continually works to refine its risk models and processes.
27
KfW Financial Information 2017 Group management report
Economic risk-bearing capacity as of 31 December 2017
EUR in millions
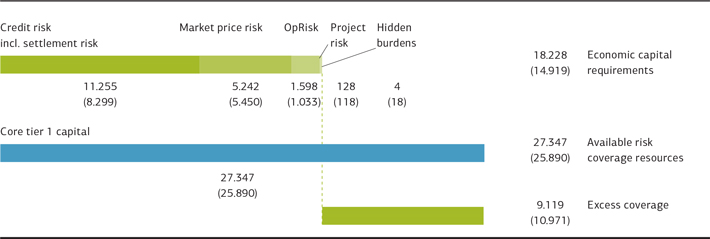
In brackets: figures as of 31 December 2016
Stress and scenario calculations
To ensure a stronger early indicator function and proactive focus in its risk-bearing capacity concept, KfW Group monitors, on a quarterly basis, a forecast scenario (baseline scenario), a downturn scenario (slight economic slowdown) and a stress scenario (deep recession) as well as their respective effects on economic and regulatory risk-bearing capacity. This forward-looking perspective illustrates KfW Group’s resilience and ability to act in the event of these scenarios and, accordingly, delivers direct input to management. A forecast and stress scenario are also calculated for the leverage ratio.
The forecast scenario provides a preview of risk-bearing capacity at the relevant year-end and includes the projected business performance, expected consolidated comprehensive income, and other effects influencing risk-bearing capacity, such as foreseeable changes in the capital structure and methodological developments. The current forecast for 31 December 2018 shows reduced excess coverage of available risk coverage resources over the economic capital requirement compared to 31 December 2017. At the same time, the forecast shows a slight drop in the total capital ratio compared to 31 December 2017. It should be noted in this respect that the overall capital requirements for the turn of the year 2017/2018 and 2018/2019 will increase in each case as a result of phasing in the buffer requirements and that these may change under the banking supervisory authorities’ Supervisory Review and Evaluation Process (SREP). According to current planning, the forecast complies with overall capital requirements at all times.
In the downturn and stress scenarios, effects on earnings and changes in capital requirements are simulated for a twelve-month
period assuming negative economic development scenarios of varying severity. The effects of a severe global recession emanating from the euro area are depicted in the stress scenario. In both scenarios, KfW Group currently assumes an overall increase in credit risk (counterparty and migration risks) and equity investment risk. In these scenarios, the EUR and USD interest rates as well as the EUR-USD exchange rate are forecast to develop in line with the economic situation. At the same time, it is assumed that increasing market uncertainties will lead to increased volatility in interest rates, credit spreads and basis spreads, as a result of which the economic capital requirement for the corresponding types of risk will rise. Losses from securities prices as well as from operational and project risk further reduce available risk coverage resources in the stress scenario.
Overall, risk-bearing capacity at a solvency level of 99.99% and the leverage ratio are at an adequate level.
Further stress tests are regularly carried out in addition to the economic scenarios to examine the resilience of KfW Group’s economic and regulatory risk-bearing capacity. In addition to the standard stress tests, current potential macroeconomic dangers form the basis for varying scenario stress tests. In 2017, the scenarios focused on US protectionism, the Qatar crisis, the potential resolution of a major German bank and China’s high debt level. The concentration and inverse stress tests show how concentration risks and other potential dangers materialising in unfavourable combinations could jeopardise KfW Group’s business model. In 2017, they again simulated the potential impact of the planned regulatory changes associated with the finalisation of Basel III on the group’s capital ratios.
28
KfW Financial Information 2017 Group management report
Types of risk
COUNTERPARTY DEFAULT RISK
KfW Group faces counterparty risks1) in the context of its promotional mandate. In the domestic promotional lending business, the majority of final borrower default risks are borne by the on-lending institutions. Due to the business model, this results in a large proportion of bank risks in the portfolio. Other main risks result from promotional activities
in the area of start-up finance for SMEs and equity investments. Particularly in these segments of domestic promotion, KfW Group bears the risk stemming from final borrowers. In addition, KfW Group faces risks in the business sectors Export and project finance as well as Promotion of developing countries and emerging economies.
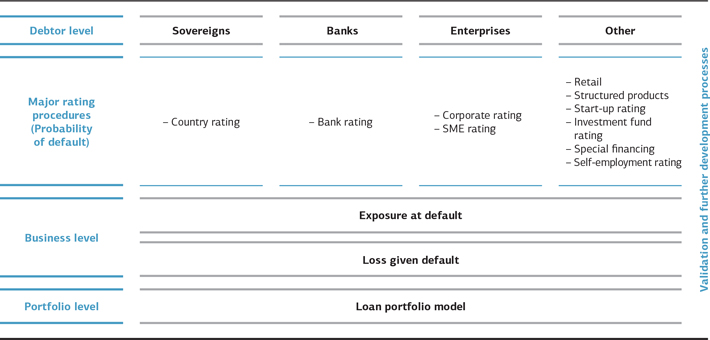
Counterparty default risk is measured by estimating the probability of default (“PD”), the exposure at default (“EAD”) and the loss given default (“LGD”). The product of the three aforementioned variables is the loss that can be expected, statistically, on average over many years. The expected loss is taken into account when determining risk-bearing capacity by deducting it from the available financial resources in accordance with the supervisory requirements of Article 158 of the CRR.
KfW Group uses internal rating procedures for the measurement of the probability of default for banks, countries, corporations, small and medium-sized enterprises, start-ups, the self-employed, investment funds and private equity investors. These procedures are based on scorecards2) and follow a consistent uniform model. Simulation and cash flow-based rating procedures are used for significant parts of special financing and structured products, some of which were licensed by an external provider. For structured products, tranche ratings are determined on the basis of the default pattern of the asset pool and the waterfall structure of the transactions. The rating procedures aim to predict the probability of default on a one-year basis. As a rule, the middle and back office departments
are responsible for preparing ratings for risk-bearing business. Ratings are updated regularly, at least once per year.
The probability of default is mapped on a uniform master scale for the entire KfW Group, allowing comparison of ratings from different rating procedures and business sectors. The master scale consists of 20 distinct classes which are divided into four groups: investment grade, non-investment grade, watch list and default. The range of default probabilities and the average default probability are defined for each class of the master scale. There are operating procedures specifying the responsibilities, competencies and control mechanisms associated with each rating procedure. External ratings are mapped to KfW Group’s master scale to ensure the comparability of internal ratings with ratings of external rating agencies. Periodic validation and continued development of the internal rating procedures ensure a rapid response to changes in overall conditions.
Exposure at default and valuation of collateral have significant influence on the severity of loss. Collateral has a risk-mitigating effect in calculating loss given default. In valuing acceptable collateral, the expected net revenue from collateral reali-
| 1) | Counterparty default risk is defined as the risk of financial loss that can occur if the borrower or counterparty fails to meet contractual payment obligations. Counterparty default risk also includes country risk, comprising transfer, conversion and political risks. |
| 2) | A scorecard is a mathematical and statistical model and/or an expert knowledge-based model. The individual risk factors considered relevant for credit rating are converted into a score depending on their value and weighted for aggregation. |
29
KfW Financial Information 2017 Group management report
sation in the case of loss, including haircuts, is determined. Haircuts to cover the credit risk of final borrowers are a major factor in the valuation of assignments made by financing partners in the on-lending business. For tangible collateral, haircuts are applied in particular for market price volatility, the costs of realisation and devaluation resulting from depreciation. Depending on the availability of data, the various valuation procedures for individual types of collateral are based on internal and external historical data and on expert estimates. A risk principle for loan collateral regulates uniform management, valuation and recognition of collateral across KfW Group. In addition to net revenue from collateral realisation, the recovery rate for uncollateralised exposure amounts is also an important component in determining loss given default (LGD). The collateral valuation procedure and the procedure for estimating EAD and LGD are also subject to regulation validation and further developed as needed.
KfW Group has limit management systems, risk guidelines and various portfolio guidelines to limit risks from new business. This set of risk management instruments forms the basis for the second vote on lending transactions, serves as an orientation guide for loan approvals and has the function of ensuring the appropriate quality and risk structure of KfW Group’s portfolio. The special nature of KfW Group’s promotional business is taken into account in the process. At KfW, Group Risk Management has the second vote on a single exposure level. KfW IPEX-Bank and DEG each have their own second vote independent of the front office. The relevant business decision-making processes are structured with a view to risk. Lending transactions currently require a second vote depending on the type, scope (material risk content and effect on the overall risk position) and complexity of the transaction. The qualification levels for approval of new business depend on rating, collateralisation or net exposure and total commitments to the group of connected borrowers and product type. Approval is also required by the Board of Supervisory Directors’ Risk and Credit Committee for pre-defined, individual transaction volumes (according to rating and product type).
The portfolio guidelines distinguish between different types of counterparties and product variants and define the conditions under which business transactions may generally be conducted. In addition, risk guidelines for countries, sectors and products are defined in order to react to existing or potential negative developments with specific requirements for lending. The limit management systems ultimately track both risk concentrations (concentration limits) and credit rating-dependent individual counterparty risk (counterparty limits). Concentration limits serve to restrict risk concentrations in the loan portfolio and thus to prevent major individual losses. Counterparty limits serve to fine-tune the counterparty-specific management of credit default risk.
Existing higher-risk exposures are divided into a watch list and a list for non-performing loans. The watch list serves to identify potential problem loans early and, if necessary, to make preparations for handling these loans. It regularly reviews and documents the economic situation, the particular borrower’s market environment and the collateral provided, and formulates proposals for remedial action – particularly proposals for risk-limiting measures. Non-performing loans and to a great extent watch-list loan exposures3) are handed over to restructuring units. This transfer of responsibility enables the involvement of specialists from an early stage to ensure professional management of problematic loans. The objective of this system is to achieve recovery of a loan through restructuring, reorganisation and workout arrangements. If the business partner is deemed incapable or unworthy of restructuring, the priority becomes optimum realisation of the asset and the related collateral. The Restructuring division is responsible for non-performing loans and for providing intensive support to banks and higher volume loans with a risk amount greater than EUR 1 million in the KfW portfolio. The portfolio credit management department is responsible for supporting retail business. KfW IPEX-Bank and DEG’s non-performing loans and commitments requiring intensive support are managed directly by each subsidiary. Internal interface regulations are in place in the relevant business sectors to ensure clear control of responsibilities and allocation. Restructuring also cooperates closely with the market areas and the central Legal Affairs department.
In the event of a crisis in the banking sector, the Risk Management department has to be able to act immediately both in-house and externally. A financial institution crisis plan is also in place for this purpose. It primarily provides for the establishment of a working group under the direction of the Credit Risk Management department, immediate loss analysis and implementation of the necessary next steps.
Risk provisions for lending business
KfW Group takes appropriate measures to address all identifiable default risks in its lending business by making risk provisions for loans. These risks include the political risk resulting from financing transactions outside Germany. For loans with an imminent risk of default (i. e. non-performing loans), KfW Group recognises individual impairment charges or provisions for undisbursed portions. These events are identified on the basis of criteria that meet both CRR and IFRS requirements. Criteria include the identification of considerable financial difficulties on the part of the debtor, payment arrears, concessions made to the debtor owing to its financial situation (for example, in the context of restructuring measures), conspicuous measures undertaken by the debtor to increase its liquidity, and a substantial deterioration in the value of collateral received. Individual impairment charges are determined by means of an impairment procedure. The calculation of individual impairment charges in the non-retail business incorporates
| 3) | The assumption of responsibility for watch-list cases at KfW IPEX-Bank is decided on a case-by-case basis by Risk Management in consultation with the unit responsible for restructuring. |
30
KfW Financial Information 2017 Group management report
an individual assessment of the borrower’s ability to make payments in the future. The calculation takes into account the scope and value of the collateral as well as the political risk. A simplified impairment procedure is performed for small and standardised loans (retail business) on the basis of homogeneous sub-portfolios.
Risk provisions for latent risks (i. e. portfolio impairment) are derived from the valuation of loan receivables in the context of annual rating procedures and collateral valuations. Portfolio impairment charges are recorded for both economic and political risks based on the expected loss model described above, which is adjusted for IFRS purposes. Risk provisions for irrevocable loan commitments and financial guarantees are set up using the same method of calculation.
Maximum risk of default
According to IFRS 7.36, the maximum exposure to credit risk for KfW Group arising from financial instruments is the total loss of the respective risk positions. Contingent liabilities and irrevocable loan commitments are also taken into account. Carrying amounts are reduced by the risk provisions made.
Payment arrears on the balance sheet date were reported only in Loans and advances to banks and customers, and Securities and investments. Individual impairment charges were also reported under Contingent liabilities and Irrevocable loan commitments.
Maximum risk of default
EUR in millions
| | | | | | | | | | | | | | | | | | | | | | | | | | | | | | | | | | | | | | | | | | | | | | | | | | | | | | | | | | | | | | | | |
| | | | | | | | | | Loans and advances to banks | | | | | | | | | | Loans and advances to customers | | | | | | | | | | Value adjustments from macro fair value hedge accounting | | | | |
| | | | | | | | | | | | | | | | | | | | | | | | | | | | | | | | | | | | | | | | | | | | | | | | | | | | | | | | | | | | | | | | |
| | | | | | | | | | 31 Dec. 2017 | | | | | | | | | | 31 Dec. 2016 | | | | | | | | | | 31 Dec. 2017 | | | | | | | | | | 31 Dec. 2016 | | | | | | | | | | 31 Dec. 2017 | | | | | | | | | | 31 Dec. 2016 | | | | |
Carrying amount as equivalent for maximum risk of default | | | | | | | | | | 274,119 | | | | | | | | | | 275,752 | | | | | | | | | | 126,671 | | | | | | | | | | 135,265 | | | | | | | | | | 9,648 | | | | | | | | | | 13,917 | | | | |
Risk provisions for lending business | | | | | | | | | | 177 | | | | | | | | | | 171 | | | | | | | | | | 1,280 | | | | | | | | | | 1,439 | | | | | | | | | | 0 | | | | | | | | | | 0 | | | | |
Carrying amount neither past due nor impaired | | | | | | | | | | 273,674 | | | | | | | | | | 275,482 | | | | | | | | | | 123,669 | | | | | | | | | | 132,900 | | | | | | | | | | 9,648 | | | | | | | | | | 13,917 | | | | |
Collateral provided | | | | | | | | | | 151,487 | | | | | | | | | | 167,033 | | | | | | | | | | 51,108 | | | | | | | | | | 53,409 | | | | | | | | | | 0 | | | | | | | | | | 0 | | | | |
|
| | |
| | | | | | | | | | Derivatives designated for hedge accounting; other derivatives | | | | | | | | | | Securities and investments; investments accounted for
using the equity method | | | | | | | | | | Contingent liabilities; irrevocable loan commitments | | | | |
| | | | | | | | | | | | | | | | | | | | | | | | | | | | | | | | | | | | | | | | | | | | | | | | | | | | | | | | | | | | | | | | |
| | | | | | | | | | 31 Dec. 2017 | | | | | | | | | | 31 Dec. 2016 | | | | | | | | | | 31 Dec. 2017 | | | | | | | | | | 31 Dec. 2016 | | | | | | | | | | 31 Dec. 2017 | | | | | | | | | | 31 Dec. 2016 | | | | |
Carrying amount as equivalent for maximum risk of default | | | | | | | | | | 14,219 | | | | | | | | | | 34,808 | | | | | | | | | | 34,029 | | | | | | | | | | 33,061 | | | | | | | | | | 83,733 | | | | | | | | | | 85,489 | | | | |
Risk provisions for lending business | | | | | | | | | | 0 | | | | | | | | | | 0 | | | | | | | | | | 2 | | | | | | | | | | 4 | | | | | | | | | | 61 | | | | | | | | | | 44 | | | | |
Carrying amount neither past due nor impaired | | | | | | | | | | 14,219 | | | | | | | | | | 34,808 | | | | | | | | | | 33,879 | | | | | | | | | | 32,883 | | | | | | | | | | 83,718 | | | | | | | | | | 85,438 | | | | |
Collateral provided | | | | | | | | | | 3,797 | | | | | | | | | | 17,355 | | | | | | | | | | 182 | | | | | | | | | | 294 | | | | | | | | | | 0 | | | | | | | | | | 0 | | | | |
|
Financial instruments past due and not individually impaired EUR in millions | |
| | | | | | | | | | Loans and advances to banks | | | | | | | | | | Loans and advances
to customers | | | | | | | | | | Securities and investments; investments accounted for using the equity method | | | | |
| | | | | | | | | | | | | | | | | | | | | | | | | | | | | | | | | | | | | | | | | | | | | | | | | | | | | | | | | | | | | | | | |
| | | | | | | | | | 31 Dec. 2017 | | | | | | | | | | 31 Dec. 2016 | | | | | | | | | | 31 Dec. 2017 | | | | | | | | | | 31 Dec. 2016 | | | | | | | | | | 31 Dec. 2017 | | | | | | | | | | 31 Dec. 2016 | | | | |
Carrying amount less than 90 days past due | | | | | | | | | | 341 | | | | | | | | | | 207 | | | | | | | | | | 1,854 | | | | | | | | | | 1,143 | | | | | | | | | | 0 | | | | | | | | | | 0 | | | | |
Carrying amount 90 days and more past due | | | | | | | | | | 52 | | | | | | | | | | 19 | | | | | | | | | | 284 | | | | | | | | | | 269 | | | | | | | | | | 1 | | | | | | | | | | 1 | | | | |
Total | | | | | | | | | | 394 | | | | | | | | | | 225 | | | | | | | | | | 2,138 | | | | | | | | | | 1,412 | | | | | | | | | | 1 | | | | | | | | | | 1 | | | | |
Collateral provided | | | | | | | | | | 245 | | | | | | | | | | 149 | | | | | | | | | | 452 | | | | | | | | | | 716 | | | | | | | | | | 0 | | | | | | | | | | 0 | | | | |
31
KfW Financial Information 2017 Group management report
Individually impaired financial instruments
EUR in millions
| | | | | | | | | | | | | | | | | | | | | | | | | | | | | | | | | | | | | | | | | | | | | | | | | | | | | | | | | | | | | | | | | | | | | | | | | | | | | | | | |
| | | | | Loans and advances to
banks | | | | | | Loans and advances to customers | | | | | | | | Securities and invest- ments; investments
accounted for using the equity method | | | | | | | | Contingent liabilities;
irrevocable loan commitments | | |
| | | | | | | | 31 Dec. 2017 | | | | | | | | 31 Dec. 2016 | | | | | | | | | 31 Dec. 2017 | | | | | | | | 31 Dec. 2016 | | | | | | | | 31 Dec. 2017 | | | | | | | | 31 Dec. 2016 | | | | | | | | 31 Dec. 2017 | | | | | | | | 31 Dec. 2016 | | |
Carrying amount | | | | | | | | 52 | | | | | | | | | | 45 | | | | | | | | | | 864 | | | | | | | | | | 952 | | | | | | | | | | 150 | | | | | | | | | | 177 | | | | | | | | | | 14 | | | | | | | | | | 51 | | |
Individual impairments, provisions | | | | | | | | 26 | | | | | | | | | | 40 | | | | | | | | | | 930 | | | | | | | | | | 1,024 | | | | | | | | | | 0 | | | | | | | | | | 0 | | | | | | | | | | 8 | | | | | | | | | | 9 | | |
Collateral provided | | | | | | | | 1 | | | | | | | | | | 1 | | | | | | | | | | 446 | | | | | | | | | | 438 | | | | | | | | | | 0 | | | | | | | | | | 2 | | | | | | | | | | 0 | | | | | | | | | | 0 | | |
As of 31 December 2017, EUR 1.1 billion (net after deduction of risk provisions, year-end 2016: EUR 1.2 billion) was classified as individually impaired out of EUR 542 billion (year-end 2016: EUR 578 billion) in financial instruments outstanding. Potential losses are conservatively estimated, and individual impairment losses of EUR 1.0 billion (year-end 2016: EUR 1.1 billion) were recognised.4)
In addition to provisions for immediate risks of default, KfW Group made provisions for latent risks of default (economic and political risks). As of 31 December 2017, risk provisions for transactions not individually impaired totalled EUR 0.6 billion (year-end 2016: EUR 0.6 billion). The collateralisation of loans in KfW Group’s portfolio primarily relates to the on-lending business and the promotional business guaranteed by the Federal Republic or individual federal states (Länder).5) By far the largest portion of collateral is attributable to assigned final-borrower receivables from the on-lending business. Tangible collateral, e.g. ships and aeroplanes, plays only a minor role in relation to the total amount of collateral.
The decline in derivatives exposure is primarily due to exchange rate effects (USD depreciation). The derivatives exposure with positive fair values has to be seen in the context of the netting agreements with counterparties. These netting agreements also include derivatives with negative fair values and considerably reduce the counterparty risk.
There was an increase in loans and advances which were less than 90 days past due and not individually impaired in the year under review. These were largely arrears of one day. Most of these loans and advances were settled the following working day.
KfW Group did not take possession of any significant assets previously held as tangible collateral in 2017. Deferred payments in the performing portfolio in 2017 were primarily in the Export and project finance business sector. This deferred payment volume is not significant based on total lending volume.
Portfolio structure
The contribution of individual positions to the risk associated with KfW Group’s loan portfolio6) is assessed based on an internal portfolio model. Concentrations of individual borrowers or groups of borrowers give rise to a risk of major losses that could jeopardise KfW Group’s existence. On the basis of the economic capital concept, Risk Controlling department measures risk concentrations by individual borrower, sector and country. Risk concentrations are primarily reflected in the economic capital requirement, ensuring that high risk volumes and unfavourable probabilities of default are taken into account, along with undesirable risk correlations. The results form the main basis for managing the loan portfolio.
| 4) | The transaction of approximately EUR 15 billion mandated by the Federal Government as part of the support measures for Greece is completely hedged by a federal guarantee and is therefore not presented in the portfolio of individually impaired financial instruments. |
| 5) | The collateral is presented as recognised for purposes of internal management of economic risks. Participation effects are taken into account in order to avoid reporting double collateralisation. |
| 6) | The loan portfolio includes loans as well as securities and investments in performing business. The non-performing portfolio is only included in the presentation of credit quality. |
32
KfW Financial Information 2017 Group management report
Regions
As of 31 December 2017, 87% of KfW Group’s loan portfolio in terms of economic capital requirements was attributable to the euro area (year-end 2016: 67%). The key drivers for this development were adjustments made to methods of collateral valuation for final borrower assignments. This resulted in a significant increase in economic capital requirements, especially in Germany and primarily in the on-lending business (mainly in housing and environmental programmes). Outside of Germany, these adjustments resulted in lower economic capital requirements due to portfolio effects and a decrease in business, particularly in the Export and project finance business sector.
Economic capital requirements by region
31 Dec. 2017 (31 Dec. 2016)
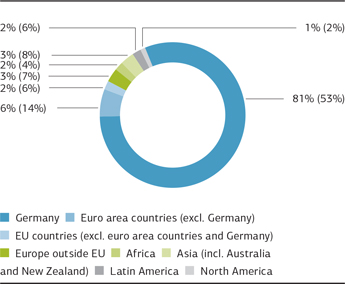
Sectors
The significant share of overall capital required for credit risks attributable to the financial sector is due to KfW Group’s promotional mandate. By far the greatest portion of KfW Group’s domestic promotional business consists of loans on-lent through commercial banks. The financial sector’s economic capital requirement increased overall, primarily due to the adjustments to methods described above. This particularly affected banks with large volumes of on-lending business. For all other sector clusters, the adjustments to methods led to a reduction of the capital requirement.
Economic capital requirements by sector
31 Dec. 2017 (31 Dec. 2016)
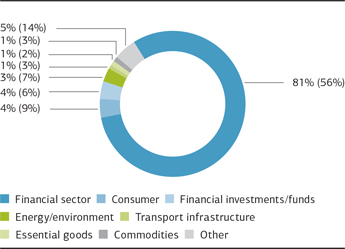
Credit quality
As credit quality is a major factor influencing economic capital requirements, it is appropriate to examine the distribution of net exposure7) by credit quality category when analysing the credit quality structure. Overall, net exposure at nearly stable volumes rose due to the aforementioned adjustments to collateral valuation methods, in particular in the on-lending business (mainly in housing and environmental programmes). This resulted in an increase in good rating classes or a higher investment grade exposure. The proportion of watch list and non-performing loan exposures decreased both in absolute as well as relative terms. KfW Group’s loan portfolio continued to possess a good credit quality structure.
Credit quality by net exposure
31 Dec. 2017 (31 Dec. 2016)

| 7) | Net exposure is the economic loss that potentially occurs in the event of an economic or political default event. |
33
KfW Financial Information 2017 Group management report
Structured products in KfW Group’s portfolio
Asset-backed securities (ABS)
ABSs had a par value of around EUR 4.8 billion as of 31 December 2017. Accounting for the mark-to-market valuation of the securities reported at fair value and impairments, the portfolio also had a book value (including pro rata interest) of around EUR 4.8 billion. The following tables show the composition of the ABS portfolio by asset class, rating and geographic distribution of the underlying assets in the securitisation portfolios.
Geographic breakdown of the underlying asset pool
(based on par value)
31 Dec. 2017 (31 Dec. 2016)
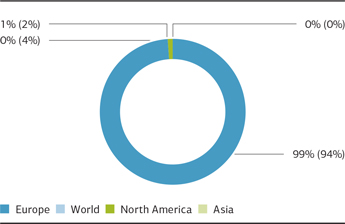
Exposure based on par values
| | | | | | | | | | | | | | | | | | | | | | | | | | | | | | | | | | | | | | | | | | | | | | | | | | | | | | | | | | | | | | |
| | | | | | | | | CLO | | | | | | | | RMBS | | | | | | | | CMBS | | | | | | | | ABS & | | | | | | | | Total | | | | | | | | Total | | |
| | | | | | | | | | | | | | | | | | | | | | | | | | | | | | | | | other | | | | | | | | 31 Dec. | | | | | | | | 31 Dec. | | |
| | | | | | | | | | | | | | | | | | | | | | | | | | | | | | | | | | | | | | | | 2017 | | | | | | | | 2016 | | |
| | | | | | | | | EUR | | | | | | | | EUR | | | | | | | | EUR | | | | | | | | EUR | | | | | | | | EUR | | | | | | | | EUR | | |
| | | | | | | | in millions | | | | | | | | in millions | | | | | | | | in millions | | | | | | | | in millions | | | | | | | | in millions | | | | | | | | in millions | | |
Investment Grade | | | | | | | | | | 0 | | | | | | | | | | 975 | | | | | | | | | | 5 | | | | | | | | | | 3,792 | | | | | | | | | | 4,773 | | | | | | | | | | 4,792 | | |
Non-Investment Grade | | | | | | | | | | 0 | | | | | | | | | | 7 | | | | | | | | | | 1 | | | | | | | | | | 42 | | | | | | | | | | 50 | | | | | | | | | | 56 | | |
Watch List | | | | | | | | | | 0 | | | | | | | | | | 0 | | | | | | | | | | 0 | | | | | | | | | | 0 | | | | | | | | | | 0 | | | | | | | | | | 0 | | |
Default | | | | | | | | | | 21 | | | | | | | | | | 0 | | | | | | | | | | 0 | | | | | | | | | | 0 | | | | | | | | | | 21 | | | | | | | | | | 58 | | |
| | | | | | | | | | | 21 | | | | | | | | | | 982 | | | | | | | | | | 6 | | | | | | | | | | 3,834 | | | | | | | | | | 4,844 | | | | | | | | | | 4,906 | | |
The portfolio volume as of 31 December 2017 decreased slightly year on year (nominal value EUR –0.1 billion). The decrease affected investment and non-investment grade as well as default holdings. The regional focus on Europe remains unchanged in the geographic breakdown of the underlying asset
pool compared with 31 December 2016, with the largest share attributable to Germany. Overall, European securitisations, including German securitisations, performed well. The cumulative default rates for European securitisations remained low.
MARKET PRICE RISK
KfW Group measures and manages market price risk on a present-value basis. The key drivers of market price risk in this context are:
| – | the interest rate structure (interest risk) particularly for the EUR and USD currency areas, |
| – | exchange rates (currency risk), |
| – | basis spreads (basis spread risk) and |
| – | issuer-related spreads for securities (credit spread risk). |
In total, market price risk within the group required a total of EUR 5.2 billion in economic capital as of 31 December 2017. This is EUR 208 million less than compared to the previous year. KfW Group market price risk is broken down as follows:
34
KfW Financial Information 2017 Group management report
Total economic capital requirements for market price risk
| | | | | | | | | | | | | | | | | | | | |
| | | | | | | | | 31 Dec. 2017 | | | | | | | | | | 31 Dec. 2016 | | |
| | | | | | | | | EUR in millions | | | | | | | | | | EUR in millions | | |
| | | | | | | |
| Interest risk | | | | | | | | 2,975 | | | | | | | | | | 3,066 | | |
Currency risk | | | | | | | | 833 | | | | | | | | | | 744 | | |
Basis spread risk | | | | | | | | 969 | | | | | | | | | | 1,350 | | |
Credit spread risk | | | | | | | | 464 | | | | | | | | | | 290 | | |
Market price risk | | | | | | | | 5,242 | | | | | | | | | | 5,450 | | |
Interest risk
KfW Group assumes limited interest rate risk in EUR and USD only, in order to take advantage of long-term opportunities for returns. All relevant data from the preparation of fixed interest statements are considered in the determination of interest risk in the banking book. On the basis of this data, KfW Group regularly performs value-at-risk calculations using a variance/covariance approach to assess its interest risk position. The management concept for interest risk is part of a long-term management philosophy. A substantial stop loss buffer is maintained in order to mitigate short-term fluctuations in present value caused by interest rates. In addition to this buffer, value at risk is computed at a solvency level of 99.99% and for a period of two months in order to calculate risk-bearing capacity. The choice of this period is based on a conservative estimate of the maximum timeframe to close the entire interest risk position. Continuous monitoring of the risk position and the available management options ensures that the allocated capital is also sufficient to cover the risk for a one-year period in accordance with the uniformly applied solvency level of 99.99%. Periodic stress tests supplement this calculation to examine possible losses under extreme market conditions. Apart from this shift required by regulatory law, the tests include scenarios such as tilts of the yield curve and an extension of the holding period. The capital requirement for interest risk decreased only slightly by EUR 90 million as of 31 December 2017; the USD exposure was slightly reduced.
Currency risk
Foreign currency loans are largely funded in the same currency or secured by appropriate foreign currency hedging instruments. DEG’s foreign currency equity investments and to a small extent KfW Development Bank’s promotional instruments are only funded in the same currency when possible and practical. Foreign currency earnings generated from the lending business throughout the year are sold promptly. As with interest risk, the economic capital requirement for liquid currency positions is calculated analogously to interest risk using a variance/covariance approach as the sum of a stop loss buffer and a two-month value-at-risk at a solvency level of 99.99%. A twelve-month value-
at-risk is used for all currencies with limited trading and hedging opportunities. The Market Price Risk Committee classifies each currency as liquid or illiquid at least once a year. The currency portfolio predominantly comprises liquid positions. Stress tests are regularly conducted in order to estimate possible losses in the event of extreme market conditions. USD depreciation in the reporting year (EUR/USD as of 31 December 2017: 1.1993 and as of 31 December 2016: 1.0541) resulted in negative effects on net present value, which were offset by forward sales of margins. Moreover, the stop-loss buffer totalling EUR 230 million was increased to EUR 550 million. This resulted in an increase in the capital requirement for currency risks of EUR 89 million as of 31 December 2017 which was compensated by the aforementioned reduction in the USD interest risk position in 2017.
Basis spread risk
Basis spread risk largely comprises tenor and foreign exchange basis spread risk. The economic capital requirement for this risk is calculated with a variance/covariance approach at a solvency level of 99.99% and with a holding period of twelve months. The capital requirement for basis spread risk as of 31 December 2017 stood at EUR 969 million, representing a year-on-year decrease of EUR 380 million. The decline resulted in particular from a reduced liquidity maturity transformation and a cross-currency spread position in USD, in addition to risk-mitigating market data effects.
Credit spread risk
Risk measurement is carried out for the securities portfolio. The economic capital requirement is calculated using the historical simulation method on the basis of a credit spread time series comprising the previous three years (750 trading days). Value at risk is initially ascertained from credit spread changes for a holding period of one day at a confidence level of 95%, and then scaled to a period of one year and a solvency level of 99.99%. The economic capital requirement for credit spread risk as of 31 December 2017 was EUR 464 million. Credit spread risk rose by EUR 174 million year on year. The rise resulted primarily from the use of sector curves rather than security-specific spreads as were used thus far.
35
KfW Financial Information 2017 Group management report
LIQUIDITY RISK
Liquidity risk is the risk of not being able to make payments in a timely manner when due. A distinction is made between
| – | institutional liquidity risk (the risk of not being able to meet payment obligations), |
| – | refinancing risk (the risk of lower income due to more expensive funding (liabilities) that cannot be passed on to borrowers) and |
| – | market liquidity risk (the risk of being unable to unwind specific exposures without significantly lowering market prices because of inadequate market depth or market disruptions). |
The primary objective of liquidity management is to ensure that KfW Group is capable of meeting its payment obligations at all times. KfW is available as a contractual partner for all commer-
cial transactions of its subsidiaries, particularly for their funding. For this reason the liquidity requirements of the subsidiaries are included both in KfW Group’s funding plans and in the liquidity maintenance strategy.
Liquidity risk is measured on the basis of economic scenario analyses and the utilisation threshold under the KfW Law. In addition, liquidity gaps are limited based on business already concluded and available liquidity potential.
A significant component for liquidity risk assessment comprises the contractual payment obligations (principal and interest) of KfW Group arising from financial instruments, which are shown in the table below by maturity range:
Contractual payment obligations arising from financial instruments by maturity range
as of 31 December 20171)
| | | | | | | | | | | | | | | | | | | | | | | | | | | | |
| | | | | | | Up to 1 month | | | | More than 1 and up to 3 months | | | | More than 3 months and up to 1 year | | | | More than 1 and up to 5 years | | | | More than 5 years | | | | Total | | |
| | | | | | | EUR in millions | | | | EUR in millions | | | | EUR in millions | | | | EUR in millions | | | | EUR in millions | | | | EUR in millions | | |
| | | | | | | | | | | | | | |
Liabilities to banks and customers | | | | | | 4,394 | | | | 1,795 | | | | 565 | | | | 3,144 | | | | 8,596 | | | | 18,494 | | |
Certificated liabilities | | | | | | 25,916 | | | | 18,311 | | | | 69,123 | | | | 209,530 | | | | 103,246 | | | | 426,126 | | |
Net liabilities arising from derivative financial instruments | | | | | | –190 | | | | –251 | | | | –356 | | | | 297 | | | | –6,842 | | | | –7,341 | | |
thereof Liabilities arising from derivative financial instruments | | | | | | 16,465 | | | | 15,086 | | | | 44,213 | | | | 129,157 | | | | 43,442 | | | | 248,363 | | |
Subordinated liabilities | | | | | | 0 | | | | 0 | | | | 0 | | | | 0 | | | | 0 | | | | 0 | | |
Liabilities arising from on-balance sheet financial instruments | | | | | | 30,120 | | | | 19,856 | | | | 69,332 | | | | 212,972 | | | | 105,000 | | | | 437,279 | | |
Contingent liabilities | | | | | | 3,651 | | | | 0 | | | | 0 | | | | 0 | | | | 0 | | | | 3,651 | | |
Irrevocable loan commitments | | | | | | 80,082 | | | | 0 | | | | 0 | | | | 0 | | | | 0 | | | | 80,082 | | |
Liabilities arising from off-balance sheet financial instruments | | | | | | 83,733 | | | | 0 | | | | 0 | | | | 0 | | | | 0 | | | | 83,733 | | |
Liabilities arising from financial instruments | | | | | | 113,852 | | | | 19,856 | | | | 69,332 | | | | 212,972 | | | | 105,000 | | | | 521,012 | | |
| 1) | Net liabilities arising from derivative financial instruments comprise payment obligations which are offset against the corresponding payment claims from derivative contracts; the gross liabilities are reported as liabilities arising from derivative financial instruments. Irrevocable loan commitments and contingent liabilities are generally allocated to the first maturity range. |
36
KfW Financial Information 2017 Group management report
Contractual payment obligations arising from financial instruments by maturity range
as of 31 December 20161)
| | | | | | | | | | | | | | | | | | | | | | | | | | | | |
| | | | | | | Up to 1 month | | | | More than 1 and up to 3 months | | | | More than 3 months and up to 1 year | | | | More than 1 and up to 5 years | | | | More than 5 years | | | | Total | | |
| | | | | | | EUR in millions | | | | EUR in millions | | | | EUR in millions | | | | EUR in millions | | | | EUR in millions | | | | EUR in millions | | |
| | | | | | | | | | | | | | |
Liabilities to banks and customers | | | | | | 18,481 | | | | 2,944 | | | | 603 | | | | 3,221 | | | | 8,828 | | | | 34,076 | | |
Certificated liabilities | | | | | | 30,398 | | | | 36,185 | | | | 50,879 | | | | 235,095 | | | | 91,766 | | | | 444,323 | | |
Net liabilities arising from derivative financial instruments | | | | | | –1,276 | | | | –2,503 | | | | –3,012 | | | | –13,632 | | | | –10,633 | | | | –31,057 | | |
thereof Liabilities arising from derivative financial instruments | | | | | | 14,921 | | | | 19,589 | | | | 28,398 | | | | 137,634 | | | | 50,427 | | | | 250,969 | | |
Subordinated liabilities | | | | | | 0 | | | | 0 | | | | 4 | | | | 23 | | | | 235 | | | | 262 | | |
Liabilities arising from on-balance sheet financial instruments | | | | | | 47,603 | | | | 36,626 | | | | 48,473 | | | | 224,707 | | | | 90,195 | | | | 447,604 | | |
Contingent liabilities | | | | | | 3,955 | | | | 0 | | | | 0 | | | | 0 | | | | 0 | | | | 3,955 | | |
Irrevocable loan commitments | | | | | | 81,534 | | | | 0 | | | | 0 | | | | 0 | | | | 0 | | | | 81,534 | | |
Liabilities arising from off-balance sheet financial instruments | | | | | | 85,489 | | | | 0 | | | | 0 | | | | 0 | | | | 0 | | | | 85,489 | | |
Liabilities arising from financial instruments | | | | | | 133,092 | | | | 36,626 | | | | 48,473 | | | | 224,707 | | | | 90,195 | | | | 533,093 | | |
| 1) | Net liabilities arising from derivative financial instruments comprise payment obligations which are offset against the corresponding payment claims from derivative contracts; the gross liabilities are reported as liabilities arising from derivative financial instruments. Irrevocable loan commitments and contingent liabilities are generally allocated to the first maturity range. |
Internal measurement of liquidity risk is based on scenario calculations. This approach first analyses the expected inflow and total outflow of payments for the next twelve months based on business already concluded. This basis cash flow is then supplemented by planned and estimated payments (e.g. borrowings from the capital market, expected liquidity-related loan defaults or planned new business). The result provides an overview of the liquidity required by KfW Group over the next twelve months. The liquidity required is calculated for different scenarios. In this respect, market-wide and institution-specific risk factors are stressed and an evaluation is made of the impact on KfW Group’s liquidity.
Parallel to the above approach, KfW Group also determines the available liquidity potential, which largely consists of KfW’s collateral account with the Bundesbank, repurchase agreement assets, the liquidity portfolio and the volume of commercial paper that is regularly placeable on the market. The available liquidity potential is subjected to stress analysis in the same way as the other cash flow components. The ratio of cumulative required liquidity to the cumulative available liquidity potential is calculated for each scenario. This figure may not exceed the value of 1 in any scenario for any period. The prescribed horizon in the normal case scenario is twelve months, in the stress case six months, and in the two worst case scenarios, three months. The scenario assumptions are validated on an annual basis.
The key figures are calculated and reported to the Market Price Risk Committee on a monthly basis. The following table shows the key risk indicators for the scenarios as of 31 December 2017:
KfW liquidity risk indicators as of 31 December 2017
| | | | | | |
| | | | | | Indicator | |
| | |
| Normal case | | | | | 0.13 | |
| Stress case | | | | | 0.23 | |
| Worst case (institution-specific) | | | | | 0.16 | |
Worst case | | | | | 0.45 | |
The internal liquidity risk indicators remained below the maximum limit of 1 throughout 2017.
Current funding environment
Developments on the international capital markets in 2017 were characterised by major political events in France and Germany as well as the persistence of loose central bank policy in the euro area and interest rate hikes in the US. While the ECB’s monetary policy continued its expansionary course in 2017 regardless of strong economic growth and subdued inflation expectations, the US Federal Reserve undertook three rate hikes over the course of the year and stayed its course of a more contractionary monetary policy. Despite high volatility at the beginning of 2017, the euro market saw a considerable increase in investor demand as the year progressed. In addition to the Eurosystem public sector purchase programme (“PSPP”), the growing positive perception of Europe underpinned by positive economic data at the end of the year was also a determining factor.
KfW Group’s established funding strategy is characterised by high-volume bonds well placed to a global investor base. KfW successfully completed its funding activities thanks to its flexible attitude to currencies, instruments and structures. It raised a total volume
37
KfW Financial Information 2017 Group management report
of EUR 78.2 billion on the international capital markets (2016: EUR 72.8 billion) in 10 different currencies and 145 individual transactions in financial year 2017. Around 88% of its long-term funding was undertaken in the two main funding currencies: euro and US dollar. The share of bonds denominated in euros rose to a multi-year high of 53% in 2017 (2016: 36%); those denominated in US dollars amounted to 34% (2016: 47%).
The development of KfW’s funding activities in the money market segment was equally positive in 2017. The programme volume of the Euro Commercial Paper (“ECP”) programme designed for global
investors amounted to EUR 60 billion. As planned, the volume issued in the Euro Commercial Paper programme was lower in 2017 than in the previous year. The outstanding volume here amounted to EUR 34.7 billion at the end of 2017 (year-end 2016: EUR 37.8 billion). The issue volume in the US Commercial Paper (“USCP”) programme was also lower year on year in 2017. The USCP, with a programme volume of USD 10 billion, is specially designed for the US market. KfW Group uses this programme to cover a large portion of its need for short-term funds in US dollars. The outstanding volume amounted to USD 8.1 billion at the end of 2017 (year-end 2016: USD 8.7 billion).
OPERATIONAL RISK AND BUSINESS CONTINUITY
MANAGEMENT (OPERATING RISK)
KfW Group’s organisational structure provides for a two-tier system comprising decentralised and centralised units liaising with the Operational Risk Committee. Management of focal areas is decentralised within the business sectors and the subsidiaries, and is performed by the respective directors or managing directors, who are supported by the respective sector coordinators of Operational Risk and Business Continuity Management. Monitoring and communication of focal areas is performed by Risk Controlling (central OpRisk Controlling) and Compliance (central Business Continuity Management). These groups develop the relevant methods and instruments for identifying and assessing risks and monitor their group-wide uniform application.
The aim of management and control of operational risk and business continuity management is the proactive identification and prevention of potential losses for KfW Group, i.e. to make emergencies and crises manageable and to secure KfW Group’s structural ability to remain in operation even in the event of loss of key resources.
In accordance with Article 4 (1) No. 52 of the CRR, KfW Group defines operational risk as the risk of loss resulting from inadequate or failed internal processes, people and systems or from external events. The following types of risk/sub-types of operational risk are also defined and generally monitored by specialised second line of defence units: compliance risk, information security risk, physical security risk, legal risk, conduct risk, service provider risk (including outsourcing risk), personnel risk, operational risk from adjustment processes, model risk and information technology risk unrelated to information security.
Losses are recorded in KfW Group in an OpRisk events database. After each quarter, a detailed report is made in the relevant departments of the loss events recorded and any measures introduced as a result. The Executive Board, the Board of Supervisory Directors and the Operational Risk Committee are briefed monthly or quarterly as part of internal risk reporting. Ad hoc reports are also made if a loss exceeds a certain level.
In addition, operational risk is systematically recorded in risk assessments that are carried out group-wide. Such assessments also examine new activities in the New Products Pro-
cess (“NPP”) as well as changes in operational processes for potential operational risks. Within the risk assessments, operational risk is measured on the basis of internal data or expert estimates which are backed by a distribution assumption for loss frequency and amount. The potential losses revealed in the risk assessments carried out are reported to the directors and heads of department and the Executive Board once the data have been collected. As part of the risk assessment, the business areas check the implementation of additional risk-mitigating measures (e.g. checks as part of the internal control system, or “ICS”).
Where adequate monitoring of operational risks using metrics is possible, risk indicators are used. Compliance with centrally prescribed risk-sensitive methodology requirements (e. g. training course participation, deadlines, escalation procedures) is monitored using business area-specific OpRisk information dashboards that ensure escalation across all levels up to the Executive Board in the event of non-compliance.
In total, operational risk within the group required a total of EUR 1,598 million in economic capital as of 31 December 2017. This amount is EUR 565 million higher than as of 31 December 2016 as a result of several individual losses in particular due to creation of provisions and updated risk scenarios.
Business continuity management is implemented if a business interruption occurs due to internal or external events. This is an integrated management process which covers all the aspects of the four key outage and loss scenarios: site outages (building or infrastructure), IT system outages, staff outages and service provider outages. Business continuity management incorporates preventative components (emergency preparedness) and reactive components (emergency and crisis management) in equal measure.
For the purpose of business continuity management, business processes are analysed and categorised based on how critical they are, and the supporting resources for each case examined accordingly. Identifying critical business processes and their dependency on supporting resources forms the basis for effective business continuity management. Individual measures are developed for these business processes and their
38
KfW Financial Information 2017 Group management report
supporting resources, ensuring that the required availability is guaranteed and business risks are reduced. These include emergency workstations, emergency plans, communication tools and alerts/alarms. KfW Group’s crisis team takes respon-
sibility for overall crisis management if necessary. It practises emergency and crisis organisation teamwork in regular crisis team tests.
OTHER RISKS
Equity investment risks
In managing equity investment risks, KfW Group differentiates between risks from equity investments at operational level and strategic equity investments.
Equity investments (operational level)
Undertaking equity investments at operational level is part of the group’s promotional mandate. Accordingly, there are equity investments in connection with domestic and European investment financing and in the Promotion of developing countries and emerging economies and Export and project finance business areas. KfW group-wide basic rules for equity investments at operational level are set out in guidelines. Specific rules tailored to certain segments of equity investments are also set out in portfolio guidelines, working instructions or risk guidelines. Risk measurement is performed at an individual loan commitment level for operational level equity investments in the same way as for credit risk. In addition, equity investment portfolio risk is reported separately.
Strategic equity investments
Strategic equity investments support KfW’s mandate of providing an efficient and sustainable promotional offering. In addition to reinforcing and expanding core competencies, the focus of this investment type is on complementing KfW’s business sectors. Strategic equity investments normally have a long-term holding period. In addition, KfW also makes equity investments in accordance with Article 2 (4) of the KfW Law (mandated transactions). The Federal Government mandates these equity investments to KfW because the Federal Republic of Germany has a state interest in them.
A dedicated organisational unit is responsible for strategic equity investments based on an equity investment manual that describes legal bases, strategies, principles, procedures and responsibilities of equity investment management. Acquisitions and disposals of and changes to strategic equity investments are subject to defined due diligence processes as well as authorisation by the Executive Board and Board of Supervisory Directors in accordance with the KfW Bylaws. Moreover, the acquisition of an equity investment in excess of 25%, the increase of such an equity investment or their partial or full disposal requires authorisation by the Federal Ministry of Finance in accordance with Section 65 (3) of the Federal Budget Code (Bundeshaushaltsordnung – “BHO”). Strategic equity investments and their individual risks are constantly monitored and are presented to the Executive Board as part of an annual equity investment report – as well as in ad hoc reports. The individually defined strategies for the equity investments are updated annually. Moreover, the group is normally represented in the supervisory bodies of its strategic equity investments.
Due to the high risk relevance for KfW Group and for reasons of uniform group management, KfW IPEX-Bank and DEG’s risks are managed as part of KfW Group’s risk management. For example, the subsidiaries’ business activities are included under the look-through principle in KfW group-wide limits and in KfW Group’s capital budget, while representatives of the subsidiaries are included in KfW Group’s risk committees. KfW also monitors the risk situation of DEG and KfW IPEX-Bank on a stand-alone basis and regularly reports to the Executive Board as part of the monthly internal KfW Group risk report.
Reputational risk
Reputational risk is the risk that the perception of the group from the point of view of the relevant internal and external interest groups will deteriorate for the long term with a negative impact on KfW Group. This negative impact could lead to a decrease in KfW Group’s net assets, earnings or liquidity (e.g. decline in new business) or may be of a non-monetary nature (e.g. difficulty in recruiting new staff). Reputational risk may arise as a consequence of other types of risk, or independently.
In the risk management process, reputational risk is managed in a decentralised manner. The framework for this purpose includes sustainability management with group-wide environmental and social principles relevant to credit approvals, or basing the management of KfW Group’s own securities portfolio on sustainability criteria. Furthermore, examinations of new activities in the NPP as well as of outsourced activities in outsourcing management are regularly conducted to detect potential reputational risks.
Moreover, as part of risk identification, the central reputational risk control function coordinates qualitative reputational risk assessment and creates a risk profile outlining the group’s greatest reputational risks. In addition, reputational risk events that have occurred are reported on an ongoing basis.
Project risk
Original project risk comprises, in particular, planning assumptions that turn out to be inaccurate. Project risk has implications for the achievement of project objectives with regard to cost, time and quality (e.g. new technical requirements, and time constraints arising from parallel projects). KfW Group’s project risk arises particularly in connection with various major long-term projects. Managing project risk is part of project management and takes place in both the project planning and execution stages.
39
KfW Financial Information 2017 Group management report
The Central Project Management Office supports major projects in fulfilling their objectives and achieving their targets. As the central authority for project portfolio management, it provides the methodological framework for KfW Group’s major project implementation and creates transparency at the level of the entire project portfolio. This enables the Project Board and Executive Board
to take targeted decisions. Setting requirements in respect of methods through the Central Project Management Office enables a consistently high quality of implementation. Compliance with this framework and these requirements by major projects is also monitored and supported.
Internal monitoring procedures
Internal control system (ICS)
The aim of KfW Group’s ICS is to use suitable principles, measures and procedures to ensure the effectiveness and profitability of business activities, compliance with the legal requirements applicable to KfW Group, the accuracy and reliability of external and internal accounting, and the protection of assets.
There are group-wide ICS rules as well as binding group-wide minimum requirements of the ICS. KfW Group’s ICS is based on the relevant legal (bank regulatory) requirements8), in particular those set forth in the KWG and MaRisk, and the market standard COSO model.9)
The KfW Executive Board holds overall responsibility for the group’s internal control system. At DEG and KfW IPEX-Bank, overall responsibility is held by the management. The design and implementation at the different corporate levels is the responsibility of the relevant managers according to the organisational structure.
In accordance with the COSO model, the ICS consists of the five following interrelated components: control environment, risk assessment, control activities, information/communication and monitoring/auditing. These components extend to all KfW Group’s organisational entities, functions and processes. The control environment is the environment within which KfW Group introduces and applies rules. Risk assessment includes the identification, analysis and evaluation of risks that result from implementing corporate strategy. Control activities are aimed at achieving corporate objectives effectively and detecting or minimising risks. Adequate information and communication procedures in KfW Group enable all stakeholders to be provided with the information they need in the necessary detail.
Appropriate monitoring and audit mechanisms determine the functionality and effectiveness of the ICS.
Procedural rules form the basis of the ICS. These constitute the framework for a proper business organisation within KfW Group, in the form of a binding policy.
Workflow organisational measures and controls ensure that monitoring is integrated into processes. Monitoring measures integrated into processes serve to avoid, reduce, detect and/or correct processing errors or financial loss. The effects of any planned changes to operational processes and structures on the procedure and intensity of monitoring are analysed in advance. KfW Group has implemented accounting-related controls to minimise the risk of error in stand-alone and consolidated financial statements and ensure the correctness and reliability of internal and external financial reporting. The accounting-related controls are part of the ICS.
The system is supplemented by the Compliance department, which defines and monitors compliance with relevant measures on the basis of relevant rules and norms. The Compliance function performs regular process-based and accompanying monitoring of the relevant areas of the internal control system. The results of additional second line of defence units (OpRisk in particular) are included in monitoring and the further development of the internal control system.
In ICS testing, Internal Auditing examines the proper implementation of controls relevant to ICS.
To ensure the adequacy and effectiveness of the ICS, KfW regularly scrutinises and continually refines its standards and conventions.
| 8) | See section 25 a (1) no.1 KWG, MaRisk AT 4.3, and sections 289 (5), 315 (2) no.5, 324, and 264 d HGB. |
| 9) | COSO = Committee of Sponsoring Organizations of the Treadway Commission. |
40
KfW Financial Information 2017 Group management report
A report is rendered annually to KfW Group’s supervisory bodies. The adequacy and effectiveness of the ICS is also assessed by Internal Auditing on the basis of risk-based audits carried out independently of group procedures.
Compliance
The success of KfW Group is largely based on the confidence its shareholders, customers, business partners, employees and the general public place in its efficiency and above all in its integrity. This confidence rests to a large extent on the implementation of and compliance with relevant statutory, supervisory and internal regulations and other relevant laws and rules. The Executive Board bears the overall responsibility for compliance within the Group. The Executive Board delegates the associated tasks to the Compliance department.
The Compliance organisation is structured in accordance with the Three Lines of Defence model and as the second line of defence, it is aligned with the requirements for a MaRisk compliance function. In this connection, group compliance has, for a number of years, included measures to comply with data protection regulations as well as measures for the prevention of insider trading, money laundering, terrorism financing and other criminal activities, and for monitoring legal requirements and the associated implementation measures. This also includes protection of information, buildings, individuals and the IT infrastructure as well as ensuring business continuity management. There are therefore binding rules and procedures that influence the day-today implementation of values and the corporate culture, which are continually updated to reflect current law as well as market requirements.
Regular training sessions on compliance and anti-money laundering are held for KfW Group employees. In addition to these classroom seminars, e-learning programmes on data protection, information security, securities compliance, and prevention of money laundering and fraud are available.
Internal Auditing
Internal Auditing is an instrument of the Executive Board. As an entity that works independently of KfW Group procedures, it audits and assesses all of KfW Group’s processes and activities to identify the risks involved and reports directly to the Executive Board.
With a view to risk management processes, Internal Auditing in 2017 audited the decentralised risk management processes and central aspects of risk management and risk control which were relevant group-wide. Focal points included analyses of market and credit risk and reporting in support of major projects, as well as review of rating systems and operations to meet the provisions of Article 191 of the Capital Requirements Regulation (“CRR”).
As in previous years, Internal Auditing also monitored the continued development of risk measurement procedures in 2017 by participating (with guest status) in meetings of decision-making bodies.
Internal Auditing also functions as KfW Group’s internal auditing department. It is involved in subsidiaries’ audit planning and incorporates the audit results of the subsidiaries’ internal auditing departments in group-wide internal audit reporting.
41
KfW Financial Information 2017 Group management report
Forecast and opportunity report
General economic environment and development trends
KfW expects real global growth of 3.8% for 2018, which means somewhat stronger momentum again year on year. This is based on a broad forecast as industrialised countries are expected to maintain their growth momentum (2018: 2.2%), while growth in developing countries and emerging economies is expected to be even higher than in 2017 (2018: 5.0%). The US economy is on a sound growth path. In the UK, in contrast, the negative consequences of the Brexit referendum and the unsatisfactory course of exit negotiations are likely to become more evident. The forecast for developing countries and emerging markets is mixed. Following the recessions in Brazil, Russia and major sub-Saharan African countries, continued recovery will have a positive impact on those regions. Higher growth is expected for commodity exporters; however, some of them will still be required to make considerable macroeconomic adjustments to the comparatively low commodity prices. While India is likely to benefit from its structural reforms, China will further adapt its growth model, which will result in a moderate slowdown.
The economic upswing in the Economic and Monetary Union (EMU) gained momentum in 2017 and the strong recovery appears set to continue in 2018. Accordingly, KfW forecasts real GDP growth of 2.4%, with such growth meanwhile having a broad regional base. In particular, the greater momentum has now also reached Italy and France. The most important pillar of economic recovery in the EMU remains its sound domestic economic performance. Private consumption is boosted by labour market improvements and the associated rise in wages. In addition, accelerated growth worldwide provides tailwind to the export sector, compensating for the negative consequences of the strong euro. KfW expects the fiscal policy to provide a slightly expansionary impetus. Progress has also been made in cleaning up bank balance sheets – in Italy in particular. Financing conditions are thus likely to remain advantageous for the time being and, together with high capacity utilisation, prompt companies to make greater efforts to modernise their capital stock.
The German economy was in excellent shape at the beginning of 2018. The boost to export as a result of the steady recovery in Europe and around the world, along with stable domestic demand, ensures higher capacity utilisation. This has had a positive impact on businesses, which are likely to increase their investments. Consumption appears to remain in a clear upswing at the same time due to the steady increase in employment and rising wages. Prospects for housing construction still also appear favourable in the long term given an excess of 600,000 building permits over residential homes completed. Overall, KfW expects solid real growth of around 2.5% in 2018.
The financial market environment remains characterised by extremely expansionary monetary policy in 2018, although the two largest central banks will be gradually scaling back their stimulus programmes. The European Central Bank will cut its bonds purchases in half, to EUR 30 billion per month from January 2018, and has announced that it will continue to do so until September 2018. It currently appears that the purchases will also continue after September 2018, although likely at a further reduced level. The first key interest rate hikes are not expected until the beginning of 2019 as the ECB has repeatedly communicated that it will not take such measures until well after the bond purchasing programme has ended. KfW consequently expects moderate yield increases on the euro area capital market in 2018 and slightly higher interest rates on longer maturities on the money markets from the second half of the year. The US Federal Reserve is expected to continue tightening its monetary reins in 2018, with a slight hike of key interest rates as last year. Given the advanced stage of the economic cycle, KfW assumes that the Federal Reserve will hardly restrict its monetary policy any further from mid-2019 and further expects somewhat higher rate increases for short term maturities than for longer term ones.
Risk outlook – Risk situation and risk-bearing capacity
Global economic growth in 2017 recorded the highest rate in seven years. The upturn was triggered and driven, in particular, by monetary policies and recently also by fiscal stimulus and is broad-based in terms of indicators, economic sectors and number of countries. Short-term economic prospects thus remain fundamentally positive although the current momentum does not appear to be sufficient to achieve and secure sustainable growth and higher potential growth.
Moreover, there remain considerable downside risks, in particular relating to medium and long-term development. Such risks result, among others, from developments relating to (i) the continued uncertainty about the US’s economic and foreign policy, (ii) a lack of clarity as to the impact of Britain’s exit from the EU on Europe’s economic environment, (iii) the prevailing structural impediments in many countries, (iv) a quicker and more stringent tightening of global financial conditions than previously anticipated if US economic policy has an inflationary impact,
42
KfW Financial Information 2017 Group management report
and (v) a persistent low inflation in industrialised countries, which leaves central banks with very little leeway to lower real interest rates in the event of a downturn in order to reinstate full employment. The current situation has further been driven by considerably heightened geopolitical risks on an international scale for some time now – from different crisis countries and regions, such as North Korea, the Persian Gulf (Iran, Qatar crisis, Saudi Arabia) and Syria. In addition, there is an increasing risk that recent signs of a broader approach to tighten monetary policy will result in a new financial crisis, particularly due to the prevalent phenomenon of high and increasing private debt levels, which has significantly increased private sector vulnerability to external shocks in many countries.
In light of the above, continued acceleration of economic growth in 2018 represents an optimistic scenario but not one that will occur automatically, as these medium-term risks could materialise as early as 2018. In addition, the Italian general election in 2018 also represents a short-term risk. If anti-European political parties are able to obtain a significantly higher share of votes than currently expected, this could trigger turbulence on euro-area government bond markets with possibly far-reaching consequences for other financial markets and the real economy. In the short term, however, there is also a chance that the positive business and consumer sentiment, supported by the continued favourable financing conditions, translates into stronger than expected economic momentum.
The low interest rate environment in Europe will persist in 2018 and, in combination with high regulatory costs and greater investment in digitalisation, continue to burden European banks’ profitability, which is already at a low level. As a consequence thereof, pressure on banks to further lower costs (by reducing staff and branches) and to continue consolidation will remain high. In view of this, assessing the sustainability of bank business models and revenue drivers will be a focal point in European banking supervision in 2018.
The favourable forecast of economic growth in Germany and Europe as a whole is expected to bolster the recent increase in lending to companies and private households in 2018. This has resulted in early signs of overheating in various real estate markets. Evidence of this can already be seen on the markets in Norway and Sweden above all (but also on non-European markets, such as in Canada, Australia and New Zealand), to which particular attention should be paid.
The European Banking Authority focused, among other things, on the improvement of asset quality (above all in Italy, Portugal and Ireland) in 2017. Due to the introduction of IFRS 9, the ECB’s new guidance to banks with respect to non-performing loans (NPLs) and the forthcoming EBA stress test, KfW expects a continuing reduction of NPLs in Europe in 2018, a trend that is also underpinned by the favourable economic environment. The Ecofin Council agreed to an action plan to reduce NPLs as well. Banks have been demanding the implementation of a secondary market for NPLs, as it is currently expected to be implemented by the end of 2018, for years. Further effects to be expected as a result of IFRS 9 are heightened earnings volatility and a capital adequacy burden that is nevertheless manageable.
The above mentioned geopolitical risks also have the potential to create turbulence on the financial markets. The European Banking Authority will continue to focus increasingly on banks’ Brexit plans due to continued uncertainty as the Brexit negotiations proceed. This should ensure that the banking system is well prepared for the looming “hard” Brexit.
In the US, the expected gradual normalisation of monetary policy is likely to have a positive impact on banks’ interest margins. The tax reform adopted at the end of 2017 will result in future tax relief for banks after a one-off high burden on earnings. A possible repeal of certain regulatory requirements could give US banks further competitive advantages.
The US Federal Reserve balance sheet reduction initiated recently and anticipated further interest rate hikes could gradually cause a shortage of USD liquidity and thus divert capital flows to the US. In particular, emerging economies and their banks, which grant loans and raise funding in USD, could be among those negatively affected.
In light of stable domestic demand, positive overall performance continues to be expected for the German and European corporate sector in 2018. Given the high capacity utilisation, investment activity could moreover increase in Germany as well as in Europe, which would provide further positive economic impetus. Expectations for the US market are also favourable.
The positive sentiment in the German private equity market has continued. Both fundraising and the exit climate are highly favourable throughout all stages. The private equity scene continues to benefit from the ongoing low interest rate environment and the associated sustained investor interest in alternative investments. This is also increasingly reflected in comparatively high transaction volumes and company valuations, which, however, implies risks in the event of a potential downturn. The market outlook for 2018 remains optimistic, assuming a stable politico-economic environment.
The performance of European securitisations is expected to remain at a good, stable level in 2018 due to solidly hedged structures, despite various politico-economic uncertainties. Anticipated developments in the KfW Group segments that are relevant to risk are not expected to have any material adverse effects on the risk situation in general, provided that the risks mentioned above do not materialise.
Overall, stable development is anticipated for KfW Group’s (core) tier 1 and total capital ratios as well as for its economic risk-bearing capacity (99.99% solvency level) in financial year 2018, based on forecasts prepared in the group’s internal capital adequacy process.
The liquidity situation was stable in 2017. The funding volume was in line with projections. The need for funding in 2018 has increased year on year, due to slightly higher cash inflows from repayments and higher outflows of funds compared to 2017. Unscheduled repayments can be expected to remain at a high level. No significant changes in liquidity risk are anticipated, due to the continued stable funding situation.
43
KfW Financial Information 2017 Group management report
New business projections
Overview
KfW Group plans a promotional business volume of EUR 77.5 billion for 2018, thus expecting a growing promotional business over plan year 2017 in accordance with the bank’s strategic objectives. The establishment of a subsidiary for equity finance in domestic promotion as well as the utilisation of additional public funds in development cooperation are important new developments.
In order to implement KfW Group’s strategic objectives, the planning for the group’s business sectors reflects measures with a strategic focus on promotional quality and an orientation of business activities towards the key megatrends “climate change and the environment”, “globalisation”, “social change” and “digitalisation and innovation”. Establishing the new “digitalisation and innovation” megatrend sets the standard for advancing and expanding targeted promotion in this area through suitable product approaches. The aggregate portion of promotional business volume dedicated to climate and environmental protection financing of 38% is at a high stable level. The portion of planned new commitments made by Mittelstandsbank (SME Bank) in domestic promotional business will temporarily decrease somewhat and probably amount to 41%.
Domestic business
Domestically, KfW supports the German economy with the promotional programmes of the business sectors Mittelstandsbank (SME Bank) and Kommunal- und Privatkundenbank/Kreditinstitute (Municipal and Private Client Bank/Credit Institutions) through the promotion of investments by private individuals, companies, cities and municipalities as well as non-profit and social organisations.
Equity financing in the domestic promotional lending business is to be undertaken by an independent wholly-owned subsidiary in the future. The details of the specific structure and preparations for the commencement of operation are currently being developed in a project. Planning calls for a total of EUR 2 billion in venture capital to be made available over the next ten years through participation in venture capital funds for start-ups and fast-growing, innovative tech companies, in order to strengthen Germany as a centre of technology. The incorporation of a subsidiary enables a focus on equity investments, while strengthening the professionalisation and marketability of equity financing within KfW Group. The subsidiary is to be incorporated at the beginning of 2018 and commence operations mid-year.
Once the subsidiary has been formed, it will function as an independent business sector in KfW Group’s domestic promotional business. An equity finance commitment volume of EUR 125 million is planned for 2018.
Mittelstandsbank (SME Bank) continues to regard itself as a reliable and goal-oriented partner of German SMEs and ministries, as well as its financing partners. With the combination of
high-volume on-lending business and individual financing, its promotional offerings are tailored to the SME sector. Mittelstands-bank’s long-term financings at favourable rates for investment and start-up projects, as well as for corporate succession, contribute indirectly to maintaining the competitiveness and future viability of the German economy and creating and safeguarding jobs.
The following market developments are important external factors for Mittelstandsbank:
| 1. | Liquidity and funding terms for banks remain favourable in 2018, in particular due to the fact that the ECB is expected to depart from its ultra-expansionary monetary policy by cautiously tapering bond purchases from 2018 onwards. |
| 2. | Digitalisation is changing SMEs’ economic parameters for the long term (Industry 4.0). As a consequence, innovative ability and speed will remain key to the success of German companies and the German economy, and the main focal point of the Federal Government’s promotional policy, including its “Digital Strategy 2025” and “High-tech Strategy”. |
| 3. | Supporting the energy transition remains highly relevant as one of the German government’s chief economic and environmental policy projects. The promotional areas renewable energy and energy efficiency, which are important in meeting the objectives of the Paris Agreement on climate change, are heavily dependent on the current national and European regulatory environment and thus also on the new federal government’s energy policy course from 2018 onwards. |
Mittelstandsbank plans a total commitment volume of EUR 19 billion for 2018, which is somewhat below the 2017 plan level.
The focus will remain on digitalisation of all dimensions of the promotional business (products, marketing and processes). By launching the new ERP innovation and digitalisation programme, alignment of innovation promotion to the future trend of digitalisation was already undertaken in 2017. For 2018, Mittel-standsbank plans to advance and expand promotion in this area through suitable product approaches. Systematic digitalisation of the promotional business also requires upgrading KfW’s relevant IT systems. To this end, the “On-lending Online 2.0” distribution platform for Mittelstandsbank’s first products as well as for a number of pilot sales partners paved the way in mid-2016 for the online application and approval of commercial promotional products. Additional sales partners are being gradually included and all on-lent commercial products integrated in 2018. With over 40% of its commitment volume, Mittelstandsbank remains an important financing partner in environmental and climate protection, particularly as part of the energy transition. Further development of the product offering as part of the Renewable Energy programme enables the bank to support the important integration of renewable energy into the overall energy system and offset the volume decreases expected as a result of the Renewable Energy Sources Act 2017 (Erneuerbare-Energien-Gesetz – “EEG 2017”).
44
KfW Financial Information 2017 Group management report
Kommunal- und Privatkundenbank/Kreditinstitute (Municipal and Private Client Bank/Credit Institutions) continues to focus its promotional activities on the two megatrends “climate change and the environment” and “social change”. Support of the progress in digitalisation is also provided in this context through products and processes. The aim is to maintain high proportions of promotion within these megatrends along with high quality of promotional products.
In addition to its focus on private clients, the long-term objective of the business sector is to continue to be a reliable partner to municipalities and municipal service companies as well as to the promotional institutions of the federal states (Landesförder- institute). Moreover, support for leasing investment finance addresses the major importance of the SME client group.
Four major factors are expected to contribute to ongoing high demand in KfW’s private client business in the medium term:
| 1. | The persistent low interest rate environment and rising incomes promote investments in residential property. |
| 2. | Climate change and Germany’s energy transition bolster demand in the housing-related programmes for Energy- efficient Construction and Refurbishment. |
| 3. | Demographic change requires increasing investments in the needs-based development of housing. |
| 4. | The necessary increase in intensity of education and the needs-based training of skilled workers result in continued funding needs in educational programmes for primary and secondary school pupils, university students and those in professional training. |
In particular, the Energy-efficient Construction and Refurbishment programmes, successfully established on the market for ten years, positions KfW as a key promoter of environmental protection for private and public costumers and standard-setter for energy efficiency in residential and public buildings. The business sector pursues the strategic aim of “social change” within the framework of promotional activities through programmes to improve accessibility in existing properties, as well as through reliable and customer-focused financing offerings for housing. Moreover, the achievement of this strategic aim is underpinned by the continuation of the student loan programme and accompanying educational offerings for academic and professional qualifications. The two basic programmes “IKK – Investment Loans for Municipalities” and “IKU – Investment Loans for Municipal Companies and Social Organisations” serve to position KfW as a reliable partner to municipalities and municipal service companies. As a financing partner to the promotional institutions of the federal states, the business sector aims to ensure a business volume of programme-based global loans at the current high level. The aim in “general funding”, too, is to maintain the business volume at a high level. Due to the major importance of KfW’s SME customer group, the business sector’s traditional domestic promotional offering is complemented by global loans for lease financing and global loans to European commercial and promotional banks for SME and energy efficiency financing.
After successfully automating the online application process for housing-related promotional programmes, the business sector continues to drive the systematic expansion of the digitalisation strategy. KfW’s newly launched grant portal was also gradually further expanded in this context.
Kommunal- und Privatkundenbank/Kreditinstitute (Municipal and Private Client Bank/Credit Institutions) plans to increase new business volume to EUR 30.8 billion for 2018, a moderate increase over the 2017 plan level.
Financial markets
The business sector Financial markets invests in securitisation transactions in order to support improvement in the credit supply via capital market instruments. In this way, KfW contributes to the diversification and stabilisation of financing opportunities for SMEs in Germany and Europe.
SME-related securities investments of around EUR 1 billion are planned for 2018. The EIF-NPB Securitisation Initiative (“ENSI”) of European promotional institutions, which was initiated by KfW and the European Investment Fund (“EIF”), continues its cooperation to strengthen capital market-based SME financing. KfW continues its purchase of green bonds to finance environmental and climate protection projects and further develop the green bond market. In 2017, the green bond portfolio target volume was raised by EUR 1 billion to EUR 2 billion, with an investment horizon of three to five years. The promotional mandate issued by the Federal Ministry for the Environment, Nature Conservation, Building and Nuclear Safety in 2015 was expanded accordingly. Green bond investments totalling EUR 300 million are planned for 2018.
For financial year 2018, the Financial markets business sector thus expects new business volume totalling EUR 1.3 billion.
International business
As a specialist financier and responsible partner, the Export and project finance business sector continues to pursue its objective of strengthening the German and European economies. Economic performance in the markets relevant to the business sector is stable in Germany and overall satisfactory in the OECD countries. There are indeed regions with growth potential in the relevant developing countries and emerging economies, such as the Andean states. Key markets such as Brazil, Russia and, in particular, Turkey continue to face challenges. Geopolitical risks, in North Korea and Iran, for example, are also relevant for the business sector. Overall, there is sufficient potential for German and European exporters and enterprises that invest in their competitiveness. Financing approaches can be developed for this purpose by the business sector.
The Export and project finance business sector (i.e., the promotional business on KfW’s balance sheet and the market business of KfW’s subsidiary KfW IPEX-Bank) aims to sustainably support the German and European economies with project and export financing to maintain and increase competitiveness and internationalisation. Further sustainable development of structuring
45
KfW Financial Information 2017 Group management report
competence is key to the business sector’s positioning as a leading special finance provider. This specifically includes the offering of products that conserve equity, such as private risk insurance (PRI), and the assumption of selected roles in capital market transactions, including project bonds and structured corporate bonds, as well as the placement of large self-structured financings. A high priority is placed on continued improvement of risk diversification to stabilise earnings in an RWA-efficient manner in the long term. The main points are a stronger focus on marketing business that does not affect risk-weighted assets, and the increased use of hedging instruments and transfer of risk to the market (PRI and syndication) as well as more active portfolio management and the associated increase in RWA optimisation of the loan portfolio. Overall, this should result in less volatile and more limited risk costs.
Normalisation of new business development already registered in 2016 continues its course in the Export and project finance business sector, resulting in an expected new business volume for financial year 2018 of EUR 16.3 billion, a 3% increase over the 2017 projection.
The Promotion of developing countries and emerging economies business sector encompasses the business activities of KfW Development Bank and DEG.
KfW Development Bank expects dynamic business growth to continue in the next few years:
In global development financing, collaboration with low-wage and fragile countries as well as emerging economies continues to be of major importance. In view of the high importance of refugee aid in Europe and combating the root causes of flight from native countries, combined with increased Federal Government responsibility in global environmental and climate protection, corresponding public funding (official development assistance – ODA) will be heavily increased. The Federal Ministry for Economic Cooperation and Development (“BMZ”) focuses, among other things, on stabilising crisis countries and particularly Africa as a region. Against the background of the refugee influx, the European Commission announced an External Investment Plan (EIP) to combat the root causes of migration. The European Commission will set up regional platforms for financing which will include proven instruments but also an offer to assume risk for certain financings. In addition, assumption of the global indicator set to gauge the implementation success of the 2030 agenda raises the overall importance of the quality of promotion, monitoring and transparent presentation of effects. KfW Development Bank aims to quickly implement additional budget funds and increase new commitments accordingly as a means of supporting the Federal Government in expanding and globally positioning German Financial Cooperation. To this end, KfW will further expand its international climate financing in climate adaptation, demand-based energy efficiency and the addition of renewable energy to energy systems, among other areas. KfW Development Bank is thus responsible for a considerable share of Germany’s contribution to achieving the objectives of the Paris Agreement on climate change. Support must
be extended to the Federal Government in view of the refugee influx to aid it in its civil contribution to global security and stability.
KfW Development Bank aims to continue and expand its cooperation with strategic partners in a targeted manner. KfW Development Bank has made important proposals under the EIP, including a proposal to develop a European collateral instrument. In the process, it has worked in close cooperation with bilateral European promotional institutions. In particular, a more intensive cooperation with the French development bank AFD is to be achieved in the political context of a stronger Franco-German axis.
KfW Development Bank will continue to expand its promotion from the current high level and expects new business volume of EUR 8.4 billion for 2018.
The economic environment for DEG’s commitment in developing countries and emerging economies has improved overall, despite increasingly diverging outlooks for key DEG markets. At the same time, challenges, such as the lack of a reliable environment for private investors in less developed markets, persist. Private sector promotion as an indispensable factor in global partnership to achieve the sustainable development goals (SDGs) plays an important role in all markets. DEG’s strategy is aimed at a sustainable business that is profitable and effective for development, as well as promoting the German economy in developing countries and emerging economies. Sustainable earnings ensure its risk-bearing capacity and organic growth. Profits are retained, thereby supporting DEG’s capital base and enabling new investments. The activities of private companies are very important for the implementation of the SDGs. Private companies create jobs, generate local income and innovatively develop markets and sectors with their investments and activities. DEG has expanded its current financing and promotional offerings for German companies and teamed up with four local partner banks so far to establish ’German desks’ in support of the German economy in developing countries and emerging economies. The aim is to improve access to local financing for German clients and their business partners and enhance mobilisation of German private funds. Regionally, DEG plans include strengthening its commitment in Africa, where it makes important contributions to the Federal Government’s Africa initiatives via its role of providing signals to drive private sector commitment. DEG focuses on continuous development of its “Financing+” approach, which enables it as a value-added service provider to offer clients demand-based individual financing and advisory and other services, such as mobilisation of additional funds. As part of its targeted moderate growth, DEG plans new business volume of EUR 1.7 billion for 2018.
Privatisation transactions with the
German Federal Government
In connection with the Federal Government’s privatisation transactions, KfW is generally prepared to conduct further privatisation transactions in 2018, taking into account market conditions and the strategic requirements of the Federal Government.
46
KfW Financial Information 2017 Group management report
Funding projections
As one of the world’s largest non-governmental issuers, KfW issues bonds worldwide and enjoys excellent credit quality thanks to the explicit, direct guarantee from the Federal Republic of Germany. KfW has achieved a stable position in the capital markets with a well-diversified long term-oriented funding strategy. It enjoys an excellent reputation among international market participants and is able to react in a flexible way to rapidly changing market conditions. KfW seeks to maintain this position with great care and responsibility in order to secure the funding of KfW’s promotional business. KfW expects to raise
approximately EUR 70 to EUR 75 billion in long-term funds to finance its promotional mandate in 2018.
The three pillars of KfW’s funding strategy remain: highly liquid benchmark bonds in euros and US dollars, public bonds and private placements. The product offering in the bond issue business will continue to be focused on investors’ needs. The sustainability strategy in the capital markets will be consistently pursued in the future through the issue of green bonds in different currencies and structures.
Earnings projections
In the current group earnings projections for 2018, KfW expects Consolidated profit (before IFRS effects) of approximately EUR 0.9 billion based on anticipated macroeconomic conditions. The expected result is thus just below the strategic objective level of EUR 1 billion. Contributions from Net interest income and Net commission income (in each case before promotional expense) are at a high level similar to that of previous years; however, the ongoing low interest environment may limit the potential for additional earnings contributions from interest rate and liquidity maturity transformation and consequently become an increasing burden on Total net interest income in subsequent years.
The planned Administrative expense for 2018 exceeds the amount planned for 2017 by 5.6%. The increase is primarily attributable to regulatory requirements combined with implementation of new market trends (equity finance and expansion of Financial Cooperation). As a consequence thereof, the expected cost-income ratio (CIR) before promotional expense has been raised to 44.9%.
The projected standard risk costs, which as a long-standing historical average are considerably higher for 2018 than the actual risk provisions for the lending business in 2017 will have a negative effect on earnings. Given the macroeconomic scenario on which the projections are based, the actual risk provisions for the lending business are not likely to reach the standard risk costs level for 2018 either. The achievement of the strategic consolidated profit objective therefore appears to be possible. Market conditions permitting, KfW also expects promotional expense in 2018 to be close to the previous budget.
KfW’s business model is oriented towards the medium to long term; income from the lending business (interest rate margins and net commission income) in particular is very stable. Opportunities and risks for consolidated profit may arise above all for the treasury result from deviating market conditions in conjunction with KfW’s positioning. In addition, opportunities and risks may arise for the valuations as a result of risk provisions that may vary from those planned as well as from temporary effects on results arising from the valuation of economically effective hedges (IFRS-related effects on results). The latter have no economic basis and therefore are not explicitly included in KfW’s planning.
HR strategy/development of workforce
Adequate staffing is a key requirement for implementing KfW’s business strategy.
In its continuous planning, the Executive Board adopts binding FTE ceilings each year for the KfW parent company (excl. KFW IPEX-Bank and DEG) for the entire budget period. These ceilings take into account all internal staff in order to ensure business operations in normal and crisis times and to be able to react flexibly to any changed situations and/or responsibilities.
To improve personnel cost management, numerous measures, such as improved management at group-level and establishment of a cost type manager for personnel costs, will be implemented over the next few years with the aim of raising cost
awareness. The applicability of the Remuneration Regulation for Institutions (Institutsvergütungsverordnung – “IVV”) as of 1 January 2018, which covers all of KfW’s employees, and current cost objectives result in far-reaching changes. The project that has been developed to address such changes is aimed at the mandatory implementation of supervisory requirements on the compensation and performance management system. KfW is also implementing more stringent requirements on temporary employment and false self-employment.
In HR development, comprehensive talent and skills management is aimed at enabling professional and personal skills training suited to the needs of all employees and managers, and estab-
47
KfW Financial Information 2017 Group management report
lishing skills as a strategic factor, particularly in view of the modernisation, professionalisation and efficiency-enhancement projects underway at KfW. In addition, KfW continues to adapt its existing working models to the new requirements for mobile and flexible working in light of digitalisation, statutory requirements (e.g. the Caregiver Leave Act (Gesetz über die Pflegezeit) and the Part-Time and Limited-Term Employment Act (Gesetz über Teilzeitarbeit und befristete Arbeitsverträge), as well as the increased importance of reconciling work and private life, on an ongoing basis. In this manner, it creates a modern attractive working environment that is competitive on the market and that reinforces staff employability in the long term.
Further development of the occupational health management initiative is an additional important component in supporting employees’ health in the future, thus creating a healthy foundation for KfW. Diversity management will become a new focal point over the next few years in order to systematically include diversity at KfW as a strategic competitive advantage. Firstly, existing measures in sub-areas (e.g., gender balance, inclusion of people with severe disabilities, and knowledge transfer between younger and older employees) will be enhanced, and integrated into a holistic multi-dimensional approach, and secondly, greater attention will be paid to diversity management in the future development of personnel measures and structures.
Digitalisation as an opportunity
The digitalisation of the economy drives productivity, innovation and new business models. The success of this change process requires investments in digital infrastructure, adequate data security and data protection plans and the relevant skills for employees.
One the one hand, KfW supports the digital transformation of the economy via its promotional activities, for example, with suitable products in domestic promotion, projects to promote digitalisation in Germany and abroad and development of digital platforms with suitable partners. On the other hand, KfW sees the technological applications driving digitalisation as a chance to improve its own promotional offeing. It thus takes a targeted approach to advancing the digital transformation at KfW with the aim of securing and further developing its promotional
offering and increasing efficiency. To this end, the bank invests in digital solutions for streamlined, digital processing of promotional programmes (the digital on-lending system “BDO 2.0” and the KfW grant portal) and tests new technologies to optimise processes and workflows in the promotional business (e.g., piloting blockchains in development cooperation and bond trading).
The digital transformation at KfW also includes supporting the cultural change and employee training. The focus is on the long-term changes in working relationships, management and communication as a result of digitalisation. A digital academy serving as a central hub for exchanging knowledge and experience on digitalisation was created for this express purpose. Its expansion is a key factor in actively supporting employees in the change process accelerated by digitalisation.
48
KfW Financial Information 2017 Group management report

Consolidated
financial
statements
Consolidated statement of comprehensive income
Income statement
| | | | | | | | | | | | | | | | | | | | | | | | | | | | | | | | | | | | | | | | | | |
| | | | | | | | | | | | | |
| | | | | | | | Notes | | | | | | | | 2017 | | | | | | | | 2016 | | | | | | | | Change | | |
| | | | | | | | | | | | | | | | EUR in millions | | | | | | | | EUR in millions | | | | | | | | EUR in millions | | |
| | | | | | | | | | | | | |
Interest income | | | | | | | | | | (27) | | | | | | | | | | 7,296 | | | | | | | | | | 8,420 | | | | | | | | | | –1,124 | | |
Interest expense | | | | | | | | | | (27) | | | | | | | | | | 4,903 | | | | | | | | | | 5,810 | | | | | | | | | | –907 | | |
Net interest income | | | | | | | | | | | | | | | | | | | | 2,393 | | | | | | | | | | 2,610 | | | | | | | | | | –217 | | |
Risk provisions for lending business | | | | | | | | | | (14), (28) | | | | | | | | | | –209 | | | | | | | | | | –150 | | | | | | | | | | –58 | | |
Net interest income after risk provisions | | | | | | | | | | | | | | | | | | | | 2,184 | | | | | | | | | | 2,460 | | | | | | | | | | –275 | | |
Commission income | | | | | | | | | | (29) | | | | | | | | | | 331 | | | | | | | | | | 336 | | | | | | | | | | –5 | | |
Commission expense | | | | | | | | | | (29) | | | | | | | | | | 29 | | | | | | | | | | 79 | | | | | | | | | | –51 | | |
Net commission income | | | | | | | | | | | | | | | | | | | | 303 | | | | | | | | | | 257 | | | | | | | | | | 46 | | |
Net gains/losses from hedge accounting | | | | | | | | | | (9), (10) | | | | | | | | | | 591 | | | | | | | | | | 294 | | | | | | | | | | 297 | | |
Net gains/losses from other financial instruments at fair value through profit or loss | | | | | | | | | | (10), (11), (31) | | | | | | | | | | –397 | | | | | | | | | | 55 | | | | | | | | | | –452 | | |
Net gains/losses from securities and investments | | | | | | | | | | (15), (32) | | | | | | | | | | 0 | | | | | | | | | | –10 | | | | | | | | | | 10 | | |
Net gains/losses from investments accounted for using the equity method | | | | | | | | | | (5), (33) | | | | | | | | | | 22 | | | | | | | | | | 21 | | | | | | | | | | 1 | | |
Administrative expense | | | | | | | | | | (34) | | | | | | | | | | 1,247 | | | | | | | | | | 1,199 | | | | | | | | | | 49 | | |
Net other operating income or loss | | | | | | | | | | (35) | | | | | | | | | | –2 | | | | | | | | | | 102 | | | | | | | | | | –105 | | |
Profit/loss from operating activities | | | | | | | | | | | | | | | | | | | | 1,453 | | | | | | | | | | 1,980 | | | | | | | | | | –527 | | |
Taxes on income | | | | | | | | | | (19), (36) | | | | | | | | | | 26 | | | | | | | | | | –21 | | | | | | | | | | 47 | | |
Consolidated profit | | | | | | | | | | | | | | | | | | | | 1,427 | | | | | | | | | | 2,002 | | | | | | | | | | –574 | | |
Consolidated statement of comprehensive income | | | | | | | | | | | | | | | | | | | | | | | | | | | | | | | | | | | | | | | | | | |
| | | | | | | | | | | | | | |
| | | | | | | | Notes | | | | | | | | 2017 | | | | | | | | 2016 | | | | | | | | Change | | |
| | | | | | | | | | | | | | | | EUR in millions | | | | | | | | EUR in millions | | | | | | | | EUR in millions | | |
| | | | | | | | | | | | | |
Consolidated profit | | | | | | | | | | | | | | | | | | | | 1,427 | | | | | | | | | | 2,002 | | | | | | | | | | –575 | | |
| | | | | | | | | | | | | |
Amounts reclassifiable to the income statement | | | | | | | | | | | | | | | | | | | | 202 | | | | | | | | | | 60 | | | | | | | | | | 142 | | |
Financial instruments | | | | | | | | | | (15), (37) | | | | | | | | | | 208 | | | | | | | | | | 59 | | | | | | | | | | 149 | | |
Deferred taxes on financial instruments | | | | | | | | | | (19), (37) | | | | | | | | | | –6 | | | | | | | | | | 0 | | | | | | | | | | –6 | | |
Investments accounted for using the equity method | | | | | | | | | | (5), (37) | | | | | | | | | | 0 | | | | | | | | | | 0 | | | | | | | | | | 0 | | |
| | | | | | | | | | | | | |
Amounts not reclassified to the income statement | | | | | | | | | | | | | | | | | | | | 79 | | | | | | | | | | –207 | | | | | | | | | | 286 | | |
Defined benefit pension obligations | | | | | | | | | | (21) | | | | | | | | | | 82 | | | | | | | | | | –221 | | | | | | | | | | 303 | | |
Deferred taxes on defined benefit pension obligations | | | | | | | | | | (19) | | | | | | | | | | –3 | | | | | | | | | | 15 | | | | | | | | | | –18 | | |
Other comprehensive income, total | | | | | | | | | | | | | | | | | | | | 281 | | | | | | | | | | –147 | | | | | | | | | | 428 | | |
Consolidated comprehensive income | | | | | | | | | | | | | | | | | | | | 1,708 | | | | | | | | | | 1,855 | | | | | | | | | | –147 | | |
52
KfW Financial Information 2017 Consolidated financial statements
Other comprehensive income comprises amounts recognised directly in equity under Revaluation reserves. These amounts include income and expenses from financial instruments classified as available-for-sale financial assets, changes in actuarial gains and losses for defined benefit obligations, and changes in deferred taxes reported depending on the underlying transaction.
Presentation of reclassification amounts included in the income statement
| | | | | | | | | | | | | | | | | | | | |
| | | | | | | | | | |
| | | | | | | 2017 | | | | | | 2016 | | | | | | Change | | |
| | | | | | | EUR in millions | | | | | | EUR in millions | | | | | | EUR in millions | | |
| | | | | | | | | | |
| Amounts relating to the reclassification of financial instruments | | | | | | 6 | | | | | | 8 | | | | | | –2 | | |
Amounts relating to the reclassification of deferred taxes on financial instruments | | | | | | 0 | | | | | | 0 | | | | | | 0 | | |
Amounts relating to the reclassification of investments accounted for using the equity method | | | | | | 0 | | | | | | 0 | | | | | | 0 | | |
Total | | | | | | 6 | | | | | | 8 | | | | | | –2 | | |
The reclassification amounts detailed in the table above represent income and expenses which were accounted for through profit or loss during the reporting period and which were previously recognised directly in equity in the Revaluation reserves. They also include amortisation of Revaluation reserves related to the reclassification of Securities and investments from the measurement category available-for-sale financial assets to the loans and receivables measurement category. Income recognised in the income statement is reported with a negative sign preceding the amount, and expenses are presented with a positive sign.
53
KfW Financial Information 2017 Consolidated financial statements
Consolidated statement of
financial position
Assets
| | | | | | | | | | | | | | | | | | | | | | | | | | |
| | | | | | | Notes | | | | | | 31 Dec. 2017 | | | | | | 31 Dec. 2016 | | | | | | Change | | |
| | | | | | | | | | | | | EUR in millions | | | | | | EUR in millions | | | | | | EUR in millions | | |
Cash reserves | | | | | | (40) | | | | | | 11,087 | | | | | | 11,573 | | | | | | –485 | | |
Loans and advances to banks | | | | | | (8), (13), (14), (41) | | | | | | 274,296 | | | | | | 275,922 | | | | | | –1,626 | | |
Loans and advances to customers | | | | | | (8), (13), (14), (42) | | | | | | 127,951 | | | | | | 136,704 | | | | | | –8,753 | | |
Risk provisions for lending business | | | | | | (14), (43) | | | | | | –1,457 | | | | | | –1,610 | | | | | | 153 | | |
Value adjustments from macro fair value hedge accounting | | | | | | (9), (44) | | | | | | 9,648 | | | | | | 13,917 | | | | | | –4,269 | | |
Derivatives designated for hedge accounting | | | | | | (9), (45) | | | | | | 9,074 | | | | | | 27,464 | | | | | | –18,390 | | |
Other derivatives | | | | | | (9), (10), (11), (46) | | | | | | 5,145 | | | | | | 7,344 | | | | | | –2,199 | | |
Securities and investments | | | | | | (15), (16), (47) | | | | | | 33,615 | | | | | | 32,715 | | | | | | 900 | | |
Investments accounted for using the equity method | | | | | | (5), (48) | | | | | | 415 | | | | | | 346 | | | | | | 68 | | |
Property, plant and equipment | | | | | | (17), (49) | | | | | | 950 | | | | | | 931 | | | | | | 19 | | |
Intangible assets | | | | | | (18), (50) | | | | | | 252 | | | | | | 235 | | | | | | 17 | | |
Income tax assets | | | | | | (19), (51) | | | | | | 498 | | | | | | 540 | | | | | | –42 | | |
Other assets | | | | | | (52) | | | | | | 872 | | | | | | 932 | | | | | | –60 | | |
Total | | | | | | | | | | | | 472,347 | | | | | | 507,013 | | | | | | –34,666 | | |
| | | | | | | | | | | | | |
Liabilities and equity | | | | | | | | | | | | | | | | | | | | | | | | | | |
| | | | | | | | | | | | | | | | | | | | | | | | | | |
| | | | | | | Notes | | | | | | 31 Dec. 2017 | | | | | | 31 Dec. 2016 | | | | | | Change | | |
| | | | | | | | | | | | | EUR in millions | | | | | | EUR in millions | | | | | | EUR in millions | | |
Liabilities to banks | | | | | | (11), (20), (53) | | | | | | 6,002 | | | | | | 19,837 | | | | | | –13,835 | | |
Liabilities to customers | | | | | | (11), (20), (54) | | | | | | 9,889 | | | | | | 11,634 | | | | | | –1,745 | | |
Certificated liabilities | | | | | | (20), (55) | | | | | | 406,290 | | | | | | 422,574 | | | | | | –16,285 | | |
Value adjustments from macro fair value hedge accounting | | | | | | (9), (56) | | | | | | 119 | | | | | | 127 | | | | | | –8 | | |
Derivatives designated for hedge accounting | | | | | | (9), (57) | | | | | | 14,488 | | | | | | 18,451 | | | | | | –3,963 | | |
Other derivatives | | | | | | (9), (10), (11), (58) | | | | | | 2,902 | | | | | | 3,007 | | | | | | –105 | | |
Provisions | | | | | | (8), (14), (21), (59) | | | | | | 2,877 | | | | | | 2,865 | | | | | | 12 | | |
Income tax liabilities | | | | | | (19), (60) | | | | | | 272 | | | | | | 324 | | | | | | –52 | | |
Other liabilities | | | | | | (22), (61) | | | | | | 765 | | | | | | 938 | | | | | | –173 | | |
Subordinated liabilities | | | | | | (22), (62) | | | | | | 0 | | | | | | 200 | | | | | | –200 | | |
Equity | | | | | | (23), (63) | | | | | | 28,742 | | | | | | 27,055 | | | | | | 1,688 | | |
Paid-in subscribed capital | | | | | | | | | | | | 3,300 | | | | | | 3,300 | | | | | | 0 | | |
Capital reserve | | | | | | | | | | | | 8,447 | | | | | | 8,447 | | | | | | 0 | | |
Reserve from the ERP Special Fund | | | | | | | | | | | | 1,191 | | | | | | 1,191 | | | | | | 0 | | |
Retained earnings | | | | | | | | | | | | 15,500 | | | | | | 14,092 | | | | | | 1,407 | | |
Fund for general banking risks | | | | | | | | | | | | 600 | | | | | | 600 | | | | | | 0 | | |
Revaluation reserves | | | | | | (5), (15), (21), (59) | | | | | | –295 | | | | | | –576 | | | | | | 281 | | |
Total | | | | | | | | | | | | 472,347 | | | | | | 507,013 | | | | | | –34,666 | | |
54
KfW Financial Information 2017 Consolidated financial statements
Consolidated statement of
changes in equity
Consolidated statement of changes in equity in the financial year 2017
| | | | | | | | | | | | | | | | | | | | | | | | | | | | | | | | | | | | | | |
| | | | | | |
| As of
1 Jan. 2017 |
| | | | | | | | Changes in consolidated group | | | | | | Owner-related changes in equity | | | | | | Appropriation of consolidated comprehensive income
2017 | | | | | | Total as of 31 Dec. 2017 | | | | |
| | | | | | | | EUR in millions | | | | | | | | | EUR in millions | | | | | | EUR in millions | | | | | | EUR in millions | | | | | | EUR in millions | | | | |
Subscribed capital | | | | | | | 3,750 | | | | | | | | | 0 | | | | | | 0 | | | | | | 0 | | | | | | 3,750 | | | | |
less uncalled outstanding contributions | | | | | | | –450 | | | | | | | | | 0 | | | | | | 0 | | | | | | 0 | | | | | | –450 | | | | |
Capital reserve | | | | | | | 8,447 | | | | | | | | | 0 | | | | | | 0 | | | | | | 0 | | | | | | 8,447 | | | | |
of which promotional reserves from the ERP Special Fund | | | | | | | 7,150 | | | | | | | | | 0 | | | | | | 0 | | | | | | 0 | | | | | | 7,150 | | | | |
Reserve from the ERP Special Fund | | | | | | | 1,191 | | | | | | | | | 0 | | | | | | 0 | | | | | | 0 | | | | | | 1,191 | | | | |
Retained earnings | | | | | | | 14,092 | | | | | | | | | –20 | | | | | | 0 | | | | | | 1,427 | | | | | | 15,500 | | | | |
Statutory reserve under
Article 10 (2) KfW Law | | | | | | | 1,875 | | | | | | | | | 0 | | | | | | 0 | | | | | | 0 | | | | | | 1,875 | | | | |
Special reserve under
Article 10 (3) KfW Law | | | | | | | 8,312 | | | | | | | | | 0 | | | | | | 0 | | | | | | 895 | | | | | | 9,207 | | | | |
Special reserve less the special loss
account from provisioning pursuant to
Section 17 (4) of the D-Mark Balance
Sheet Law | | | | | | | 21 | | | | | | | | | 0 | | | | | | 0 | | | | | | 0 | | | | | | 21 | | | | |
Other retained earnings | | | | | | | 3,885 | | | | | | | | | –20 | | | | | | 0 | | | | | | 532 | | | | | | 4,396 | | | | |
Fund for general banking risks | | | | | | | 600 | | | | | | | | | 0 | | | | | | 0 | | | | | | 0 | | | | | | 600 | | | | |
Revaluation reserves | | | | | | | –576 | | | | | | | | | 0 | | | | | | 0 | | | | | | 281 | | | | | | –295 | | | | |
Valuation results from financial instruments (after tax) | | | | | | | 75 | | | | | | | | | 0 | | | | | | 0 | | | | | | 202 | | | | | | 277 | | | | |
Investments accounted for using the equity method | | | | | | | 0 | | | | | | | | | 0 | | | | | | 0 | | | | | | 0 | | | | | | 0 | | | | |
Actuarial gains and losses from defined-benefit plan pension obligations (after tax) | | | | | | | –650 | | | | | | | | | 0 | | | | | | 0 | | | | | | 79 | | | | | | –572 | | | | |
Equity | | | | | | | 27,055 | | | | | | | | | –20 | | | | | | 0 | | | | | | 1,708 | | | | | | 28,742 | | | | |
KfW’s net income amounting to EUR 895 million was used to increase the special reserve under Article 10 (3) of the KfW Law.
The difference to the consolidated comprehensive income is allocated to Other retained earnings or – if recognised directly in equity – to Revaluation reserves.
55
KfW Financial Information 2017 Consolidated financial statements
Change in the revaluation reserves from financial instruments including the related deferred taxes and in the investments accounted for using the equity method in the financial year 2017
| | | | | | | | | | | | | | | | | | | | | | | | | | | | | | | | | | | | | | | | |
| | | | | | | Bonds and other fixed- income securities | | | | | | Shares and other non- fixed income securities | | | | | | Equity investments | | | | | | Effects of deferred taxes | | | | | | Investments accounted for using the equity method | | | | | | Total | | | | |
| | | | | | | EUR in millions | | | | | | EUR in millions | | | | | | EUR in millions | | | | | | EUR in millions | | | | | | EUR in millions | | | | | | EUR in millions | | | | |
As of 1 Jan. 2017 | | | | | | 75 | | | | | | 0 | | | | | | 0 | | | | | | 0 | | | | | | 0 | | | | | | 75 | | | | |
A. Changes recognised in the income statement | | | | | | | | | | | | | | | | | | | | | | | | | | | | | | | | | | | | | | | | |
Decrease due to disposals | | | | | | 0 | | | | | | 0 | | | | | | 0 | | | | | | 0 | | | | | | 0 | | | | | | 0 | | | | |
Increase due to disposals | | | | | | 0 | | | | | | 0 | | | | | | 0 | | | | | | 0 | | | | | | 0 | | | | | | 0 | | | | |
Decrease due to impairments | | | | | | 0 | | | | | | 0 | | | | | | 0 | | | | | | 0 | | | | | | 0 | | | | | | 0 | | | | |
Amortisation after reclassification | | | | | | 6 | | | | | | 0 | | | | | | 0 | | | | | | 0 | | | | | | 0 | | | | | | 6 | | | | |
Changes in consolidated group | | | | | | 0 | | | | | | 0 | | | | | | 0 | | | | | | 0 | | | | | | 0 | | | | | | 0 | | | | |
Total changes recognised in the income statement | | | | | | 6 | | | | | | 0 | | | | | | 0 | | | | | | 0 | | | | | | 0 | | | | | | 6 | | | | |
B. Changes recognised directly in equity | | | | | | | | | | | | | | | | | | | | | | | | | | | | | | | | | | | | | | | | |
Changes in revaluation reserves due to impairment reversal only for equity instruments | | | | | | 0 | | | | | | 0 | | | | | | 0 | | | | | | 0 | | | | | | 0 | | | | | | 0 | | | | |
Changes in revaluation reserves due to fair value changes | | | | | | 38 | | | | | | 0 | | | | | | 165 | | | | | | –6 | | | | | | 0 | | | | | | 196 | | | | |
Total changes recognised directly in equity | | | | | | 38 | | | | | | 0 | | | | | | 165 | | | | | | –6 | | | | | | 0 | | | | | | 196 | | | | |
Exchange rate changes | | | | | | 0 | | | | | | 0 | | | | | | 0 | | | | | | 0 | | | | | | 0 | | | | | | 0 | | | | |
As of 31 Dec. 2017 | | | | | | 118 | | | | | | 0 | | | | | | 165 | | | | | | –6 | | | | | | 0 | | | | | | 277 | | | | |
Change in the revaluation reserves from actuarial gains and losses for defined-benefit plan pension commitments including the related deferred taxes in the financial year 2017
| | | | | | | | | | | | | | | | | | | | | | | | | | | | |
| | | | | | | | | | | | |
| | | | | | | Actuarial gains and losses for defined-benefit plan pension commitments | | | | | | | | Effects of deferred taxes | | | | | | | | | | Total | | | | |
| | | | | | | EUR in millions | | | | | | | | EUR in millions | | | | | | | | | | EUR in millions | | | | |
As of 1 Jan. 2017 | | | | | | –685 | | | | | | | | 35 | | | | | | | | | | –650 | | | | |
Changes recognised directly in equity | | | | | | | | | | | | | | | | | | | | | | | | | | | | |
Changes in revaluation reserves due to changes in actuarial gain or loss valuation parameters | | | | | | 82 | | | | | | | | –3 | | | | | | | | | | 79 | | | | |
As of 31 Dec. 2017 | | | | | | –603 | | | | | | | | 32 | | | | | | | | | | –572 | | | | |
56
KfW Financial Information 2017 Consolidated financial statements
Consolidated statement of changes in equity in the financial year 2016
| | | | | | | | | | | | | | | | | | | | | | | | | | | | | | | | |
| | | | | | | | | | | |
| | | | | As of
1 Jan. 2016 | | | | | Changes in
consolidated
group | | | | | Owner-related
changes in
equity | | | | | Appropriation
of consolidated
comprehensive income 2016 | | | | | Total as of
31 Dec. 2016 | | |
| | | | | EUR in millions | | | | | EUR in millions | | | | | EUR in millions | | | | | EUR in millions | | | | | EUR in millions | | |
| | | | | | | | | | | |
Subscribed capital | | | | | | 3,750 | | | | | | 0 | | | | | | 0 | | | | | | 0 | | | | | | 3,750 | | |
less uncalled outstanding contributions | | | | | | –450 | | | | | | 0 | | | | | | 0 | | | | | | 0 | | | | | | –450 | | |
Capital reserve | | | | | | 8,447 | | | | | | 0 | | | | | | 0 | | | | | | 0 | | | | | | 8,447 | | |
of which promotional reserves from the ERP Special Fund | | | | | | 7,150 | | | | | | 0 | | | | | | 0 | | | | | | 0 | | | | | | 7,150 | | |
Reserve from the ERP Special Fund | | | | | | 1,191 | | | | | | 0 | | | | | | 0 | | | | | | 0 | | | | | | 1,191 | | |
Retained earnings | | | | | | 12,091 | | | | | | 0 | | | | | | 0 | | | | | | 2,002 | | | | | | 14,092 | | |
Statutory reserve under Article 10 (2) KfW Law | | | | | | 1,875 | | | | | | 0 | | | | | | 0 | | | | | | 0 | | | | | | 1,875 | | |
Special reserve under Article 10 (3) KfW Law | | | | | | 7,022 | | | | | | 0 | | | | | | 0 | | | | | | 1,290 | | | | | | 8,312 | | |
Special reserve less the special loss account from provisioning pursuant to Section 17 (4) of the D-Mark Balance Sheet Law | | | | | | 21 | | | | | | 0 | | | | | | 0 | | | | | | 0 | | | | | | 21 | | |
Other retained earnings | | | | | | 3,173 | | | | | | 0 | | | | | | 0 | | | | | | 712 | | | | | | 3,885 | | |
Fund for general banking risks | | | | | | 600 | | | | | | 0 | | | | | | 0 | | | | | | 0 | | | | | | 600 | | |
Revaluation reserves | | | | | | –429 | | | | | | 0 | | | | | | 0 | | | | | | –147 | | | | | | –576 | | |
Valuation results from financial instruments (after tax) | | | | | | 15 | | | | | | 0 | | | | | | 0 | | | | | | 60 | | | | | | 75 | | |
Investments accounted for using the equity method | | | | | | 0 | | | | | | 0 | | | | | | 0 | | | | | | 0 | | | | | | 0 | | |
Actuarial gains and losses from defined-benefit plan pension obligations (after tax) | | | | | | –443 | | | | | | 0 | | | | | | 0 | | | | | | –207 | | | | | | –650 | | |
Equity | | | | | | 25,200 | | | | | | 0 | | | | | | 0 | | | | | | 1,855 | | | | | | 27,055 | | |
57
KfW Financial Information 2017 Consolidated financial statements
Change in the revaluation reserves from financial instruments including the related deferred taxes and in the investments accounted for using the equity method in the financial year 2016
| | | | | | | | | | | | | | | | | | | | | | | | | | | | | | | | | | | | | | | | |
| | | | | | | | | | | | | | |
| | | | | | Bonds and
other fixed-
income
securities | | | | | Shares and
other non-
fixed income
securities | | | | | Equity
investments | | | | | Effects of
deferred
taxes | | | | | Investments
accounted
for using the equity
method | | | | | Total | | | | |
| | | | | | EUR in
millions | | | | | EUR in
millions | | | | | EUR in
millions | | | | | EUR in
millions | | | | | EUR in
millions | | | | | EUR in
millions | | | | |
| | | | | | | | | | | | | | |
As of 1 Jan. 2016 | | | | | | 15 | | | | | | 0 | | | | | | 0 | | | | | | 0 | | | | | | 0 | | | | | | 15 | | | | |
A. Changes recognised in the income statement | | | | | | | | | | | | | | | | | | | | | | | | | | | | | | | | | | | | | | | | |
Decrease due to disposals | | | | | | –3 | | | | | | 0 | | | | | | 0 | | | | | | 0 | | | | | | 0 | | | | | | –3 | | | | |
Increase due to disposals | | | | | | 0 | | | | | | 0 | | | | | | 0 | | | | | | 0 | | | | | | 0 | | | | | | 0 | | | | |
Decrease due to impairments | | | | | | 0 | | | | | | 0 | | | | | | 0 | | | | | | 0 | | | | | | 0 | | | | | | 0 | | | | |
Amortisation after reclassification | | | | | | 11 | | | | | | 0 | | | | | | 0 | | | | | | 0 | | | | | | 0 | | | | | | 11 | | | | |
Changes in consolidated group | | | | | | 0 | | | | | | 0 | | | | | | 0 | | | | | | 0 | | | | | | 0 | | | | | | 0 | | | | |
Total changes recognised in the income statement | | | | | | 8 | | | | | | 0 | | | | | | 0 | | | | | | 0 | | | | | | 0 | | | | | | 8 | | | | |
B. Changes recognised directly in equity | | | | | | | | | | | | | | | | | | | | | | | | | | | | | | | | | | | | | | | | |
Changes in revaluation reserves due to impairment reversal only for equity instruments | | | | | | 0 | | | | | | 0 | | | | | | 0 | | | | | | 0 | | | | | | 0 | | | | | | 0 | | | | |
Changes in revaluation reserves due to fair value changes | | | | | | 52 | | | | | | 0 | | | | | | 0 | | | | | | 0 | | | | | | 0 | | | | | | 52 | | | | |
Total changes recognised directly in equity | | | | | | 52 | | | | | | 0 | | | | | | 0 | | | | | | 0 | | | | | | 0 | | | | | | 52 | | | | |
Exchange rate changes | | | | | | 0 | | | | | | 0 | | | | | | 0 | | | | | | 0 | | | | | | 0 | | | | | | 0 | | | | |
As of 31 Dec. 2016 | | | | | | 75 | | | | | | 0 | | | | | | 0 | | | | | | 0 | | | | | | 0 | | | | | | 75 | | | | |
Change in the revaluation reserves from actuarial gains and losses for defined-benefit plan pension commitments including the related deferred taxes in the financial year 2016
| | | | | | | | | | | | | | | | | | | | |
| | | | | | Actuarial gains and
losses for
defined-benefit
plan pension
commitments | | | | | | Effects of deferred taxes | | | | | | Total | | |
| | | | | | EUR in millions | | | | | | EUR in millions | | | | | | EUR in millions | | |
| | | | | | | | | | |
As of 1 Jan. 2016 | | | | | | –463 | | | | | | 20 | | | | | | –443 | | |
Changes recognised directly in equity | | | | | | | | | | | | | | | | | | | | |
Changes in revaluation reserves due to changes in actuarial gain or loss valuation parameters | | | | | | –221 | | | | | | 15 | | | | | | –207 | | |
As of 31 Dec. 2016 | | | | | | –685 | | | | | | 35 | | | | | | –650 | | |
58
KfW Financial Information 2017 Consolidated financial statements
Consolidated statement of
cash flows
| | | | | | | | | | | | | | |
| | | | | | | | | | | | | | | |
| | | | | | | |
| | | | | | 2017 | | | | | | 2016 | | |
| | | | | | EUR in millions | | | | | | EUR in millions | | |
| | | | | | | |
Consolidated profit | | | | | | 1,427 | | | | | | 2,002 | | |
Non-cash items included in consolidated profit and reconciliation to cash flow from operating activities: | | | | | | | | | | | | | | |
Depreciation, amortisation, impairment and reversal of impairment losses (receivables, property, plant and equipment, securities and investments) and changes in risk provisions for lending business | | | | | | 401 | | | | | | 451 | | |
Changes in other provisions | | | | | | 190 | | | | | | 172 | | |
Other non-cash expenses and income: | | | | | | | | | | | | | | |
Profit/loss from the disposal of securities and investments and property, plant and equipment | | | | | | –16 | | | | | | 5 | | |
Other adjustments | | | | | | –2,920 | | | | | | –3,089 | | |
Subtotal | | | | | | –919 | | | | | | –460 | | |
Changes in assets and liabilities from operating activities after adjustment for non-cash items: | | | | | | | | | | | | | | |
Loans and advances to banks | | | | | | 1,798 | | | | | | 1,359 | | |
Loans and advances to customers | | | | | | 8,433 | | | | | | –2,475 | | |
Securities | | | | | | –704 | | | | | | –967 | | |
Other assets relating to operating activities | | | | | | 25,438 | | | | | | 9,751 | | |
Liabilities to banks | | | | | | –13,835 | | | | | | –4,166 | | |
Liabilities to customers | | | | | | –1,745 | | | | | | 2,010 | | |
Certificated liabilities | | | | | | –16,285 | | | | | | 7,374 | | |
Other liabilities relating to operating activities | | | | | | –4,362 | | | | | | –3,349 | | |
Interest and dividends received | | | | | | 6,902 | | | | | | 7,960 | | |
Interest paid | | | | | | –4,717 | | | | | | –5,618 | | |
Income tax paid | | | | | | –56 | | | | | | –34 | | |
Cash flow from operating activities | | | | | | –50 | | | | | | 11,384 | | |
Property, plant and equipment: | | | | | | | | | | | | | | |
Cash proceeds from disposals | | | | | | 2 | | | | | | 1 | | |
Cash payments for acquisitions | | | | | | –131 | | | | | | –149 | | |
Securities and investments (equity investments): | | | | | | | | | | | | | | |
Cash proceeds from disposals/Cash payments for acquisitions | | | | | | –86 | | | | | | –123 | | |
Cash flow from investing activities | | | | | | –215 | | | | | | –271 | | |
Cash proceeds from/(cash payments for) capital increases/(decreases) | | | | | | 0 | | | | | | 0 | | |
Changes from other financing activities | | | | | | –200 | | | | | | 0 | | |
Cash flow from financing activities | | | | | | –200 | | | | | | 0 | | |
| | | | | | | |
Cash and cash equivalents as of the end of the previous period | | | | | | 11,573 | | | | | | 460 | | |
Cash flow from operating activities | | | | | | –50 | | | | | | 11,384 | | |
Cash flow from investing activities | | | | | | –215 | | | | | | –271 | | |
Cash flow from financing activities | | | | | | –200 | | | | | | 0 | | |
Cash and cash equivalents as of the end of the period | | | | | | 11,108 | | | | | | 11,573 | | |
59
KfW Financial Information 2017 Consolidated financial statements
The balance of Cash and cash equivalents reported in the statement of cash flows in accordance with IAS 7 is identical to the balance sheet item Cash reserves and thus comprises cash on hand and balances with central banks.
The Statement of cash flows shows the changes in Cash and cash equivalents in the financial year classified as the Cash flows from operating activities, investing activities and financing activities. Other adjustments largely comprise the adjustments for net interest income in the amount of EUR –2,393 million (2016: EUR –2,610 million) as well as for valuation results amounting to EUR –525 million (2016: EUR –352 million) and effects of foreign exchange rate changes amounting to EUR –94 million (2016: EUR +27 million).
For more information on KfW Group’s liquidity risk management, see “Risk report – Liquidity risk”.
The cash adjustment amounting to EUR 200 million reported in Cash flow from financing activities solely concerns the early repayment of the subordinated loan (Note 62).
60
KfW Financial Information 2017 Consolidated financial statements
Notes
61
KfW Financial Information 2017 Consolidated financial statements
Accounting policies
(1) Basis of presentation
KfW is the promotional bank of the Federal Republic of Germany and was founded in 1948 as a public law institution based in Frankfurt am Main.
The Executive Board of KfW is responsible for the preparation of the consolidated financial statements and the group management report. After the recommendation of the Audit Committee, the consolidated financial statements and the group management report are submitted to KfW’s Board of Supervisory Directors for approval. As of 27 February 20181), no significant events have occurred since the reporting date (31 December 2017).
As of 31 December 2017, KfW Group comprises KfW and four subsidiaries that are fully consolidated. Due to deconsolidation of tbg Technologie-Beteiligungs-Gesellschaft mbH effective 31 December 2017, the number of subsidiaries has declined by one compared to the previous year. Similar to the previous year, one joint venture and four associated companies are accounted for using the equity method.
Pursuant to Section 315e (1) of the German Commercial Code (Handelsgesetzbuch – “HGB” ), the consolidated financial statements as of 31 December 2017 have been prepared in accordance with the International Financial Reporting Standards (IFRS), as adopted by the European Union (EU), and with the interpretations set out by the IFRS Interpretations Committee (IFRS IC), as mandatory consolidated accounts in accordance with Article 4 of Regulation (EC) No. 1606/2002 (IAS Regulation) of the European Parliament and of the Council of 19 July 2002, as well as further regulations on the adoption of certain international accounting standards. The standards and interpretations that apply are those that have been published and endorsed by the European Union as of the reporting date.
The supplementary provisions of the German Commercial Code that also apply to IFRS consolidated financial statements have been taken into account. The group management report prepared in accordance with Section 315 of the German Commercial Code includes the risk report with risk-oriented information on financial instruments as set out in IFRS 7, as well as information on capital and capital management as set out in IAS 1.134.
The consolidated financial statements were prepared in accordance with accounting policies that are consistent across KfW Group and are prepared on a going concern basis. The companies included in the consolidated financial statements have prepared their annual financial statements as of 31 December 2017, except for some associated companies accounted for using the equity method, where financial statements as of 30 September 2017 were used. Material events for the latter companies as of the reporting date were also taken into account.
The accounting policies in the consolidated financial statements were applied consistently.
The reporting currency and functional currency is the euro. Unless otherwise specified, all amounts are stated in millions of euros (EUR in millions).
| 1) | Date of Executive Board approval of publication |
62
KfW Financial Information 2017 Consolidated financial statements
As a general rule, assets and liabilities are measured at the reporting date at (amortised) cost, with the exception of the following financial instruments:
| | – | designated financial instruments measured at fair value through profit or loss |
| | – | financial instruments classified as held for trading and measured at fair value through profit or loss |
| | – | available-for-sale financial assets measured at fair value, with fair value changes recognised directly in equity. |
(2) Judgements and accounting estimates
The consolidated financial statements include amounts based on management’s judgements and/or estimates and assumptions which are determined to the best of our ability and in accordance with the applicable accounting standard. Actual results realised in a future period may differ from these estimates. Material judgements, estimates and assumptions are required, in particular, for calculating risk provisions (including risk provisions for contingent liabilities and irrevocable loan commitments), recognising and measuring provisions (primarily for pension liabilities and legal risks), measuring the fair value of financial instruments based on valuation models (including determining the existence of an active market), assessing and measuring impairment of assets, and assessing the utilisation of deferred tax assets. The estimates and the assumptions underlying these estimates are reviewed on an ongoing basis and are based, among other things, on historical experience or expected future events that appear likely given the particular circumstances. Where judgements as well as estimates and their underlying assumptions were required, the assumptions made are explained in the relevant notes.
KfW does not expect any deviations from its assumptions and does not foresee any uncertainties in its estimates that could result in a material adjustment to the related assets and liabilities within the next financial year. Given the strong dependency on the development of the economy and financial markets, however, such deviations and uncertainties cannot be fully ruled out. These risks are nevertheless low because valuation models – especially those involving the use of inputs not based on observable market data – are employed to measure only small parts of the securities and investments portfolio and borrowings measured at fair value, on the one hand, and only a small portion of financial derivatives used to economically hedge risk, on the other hand.
Further material decisions in the application of accounting policies concern the voluntary early application of new or amended IFRS standards/IFRIC interpretations, the determination of the consolidated group, the use of the fair value option for the classification of financial assets and liabilities, the use of possibilities to reclassify options for financial assets in accordance with IAS 39, the reporting of economic hedging relationships and the creation of classes as part of disclosing information on financial instruments.
63
KfW Financial Information 2017 Consolidated financial statements
(3) Assessment of the impact of new or amended IFRS/IFRIC interpretations applied for the first time or to be applied in the future
A. Impact of new or amended IFRS/IFRIC interpretations adopted for the first time in financial year 2017
The amendments to IAS 12 “Income Taxes” (January 2016, Recognition of Deferred Tax Assets for Unrealised Losses), applied for the first time, did not have any impact on the group’s net assets, financial position and results of operations.
The amendments to IAS 7 “Statement of Cash Flows” (January 2016, Disclosure Initiative – Amendments to IAS 7), applied for the first time, did not have any impact on the group’s net assets, financial position and results of operations.
B. Impact of new or amended IFRS/IFRIC interpretations to be adopted in the future that were endorsed by the EU into European law before the reporting date
In July 2014, the IASB published IFRS 9 “Financial Instruments”, which will replace IAS 39 “Financial Instruments: Recognition and Measurement”. The standard – transposed into European law in November 2016 – is effective for financial years beginning on or after 1 January 2018. IFRS 9 contains new rules for classification and measurement of financial instruments and for impairment and hedge accounting.
The balance sheet will be affected by revised rules regarding the classification and measurement of financial assets. We expect an increase in equity of around EUR 30 million to EUR 40 million as a result of loans and advances being measured at fair value through profit or loss, rather than as previously at amortised cost. In addition, retrospective reclassification of securities from “available-for-sale financial assets” to “financial assets carried at amortised cost” will reduce equity by an amount ranging from approximately EUR 110 million to EUR 150 million.
There will also be effects from changes in impairment requirements. Moving from the incurred loss model to an expected loss model where risk provisions will be measured on the basis of the change in credit risk since the initial recognition of the financial instrument is expected to result in higher risk provisions. The negative impact on equity is likely to range from approximately EUR 140 million to EUR 180 million.
Implementation of the rules under IFRS 9 will likely reduce group equity by a total amount ranging from approximately EUR 200 million to EUR 270 million (taking into account deferred taxes; quantitative information is estimated; there are no audited IFRS 9 figures available). Application of the IFRS 9 requirements has been designed, implemented in the IT infrastructure and tested in recent years as part of a major project. Comprehensive courses and training seminars were also held to anchor specialist and IT knowledge across functions.
IFRS 9 monthly financial statements have already been prepared in parallel operations since August 2017, serving as a basis for assessing technical and process operability. The development of the accounting approach has largely been concluded, comprising in particular the derivation of measurement categories for financial instruments and the method for determining expected loss-based risk provisions. In this process, individual portfolio business models were identified and confirmed by the Executive Board and contracts analysed for ancillary agreements.
64
KfW Financial Information 2017 Consolidated financial statements
The rules on classification of IFRS 9 will result in a changed classification of financial assets. The classification and related subsequent measurement will be based on the business model and the characteristics of the contractual cash flows. The KfW business model is focused on sustainability and a long-term approach. Sales to realise gains through non-sustainable fluctuations in market value are of minor significance in this context, for which reason the core business is allocated to the “hold” business model and measured at amortised cost. One exception to this is KfW IPEX-Bank’s syndication business, which is to be measured at fair value through profit or loss due to its business model.
The rules for financial liabilities, in contrast, will remain largely unchanged. When using the fair value option, however, the changes in fair value that result from changes in own credit risk will need to be recognised directly in equity in the revaluation reserve in future. There was an option for early application of this rule, which KfW did not exercise.
According to IFRS 9, changes in the contractual cash flows resulting from insignificant contractual modifications which do not lead to derecognition must be recognised in the income statement at present value. In the practice of credit restructuring, contractual modifications are normally undertaken in such a way that no significant present value loss is incurred.
Changes due to new requirements for the impairment of financial assets are another major measurement issue. Moving from the incurred loss model to the expected loss model effects comprehensive changes in impairment requirements. In determining expected losses, the change in credit risk will be tracked from initial recognition of a financial instrument. If there has been a significant deterioration of the credit risk on a financial asset (stage 2) or objective evidence of impairment is identified (stage 3), expected credit losses are to be recognised over the full remaining life of the asset. Otherwise only the expected losses over the life of the instrument associated with the possibility of a default in the next twelve months are to be recognised (stage 1).
A corresponding method for allocating stages was developed and implemented for this in the group. Information already used in Risk Controlling such as ratings and days past due as well as information on financial concessions (forbearance) was used. In addition, the existing methods for determining the expected losses were modified to meet IFRS 9 requirements. This included in particular the introduction of a point-in-time view of expected losses that also takes forward-looking (macroeconomic) information adequately into account.
The option to determine the lifetime expected credit losses of all existing financial instruments (provided they are not low credit risk) at the date of initial application and at each subsequent reporting date was not utilised.
With regard to hedge accounting, no material implications are expected for the consolidated financial statements, as the option to continue applying the requirements under IAS 39 until the accounting rules on representing dynamic risk management enter into effect is being utilised.
The group will also utilise the option to not use comparative figures in the 2018 consolidated financial statements, in transitioning to IFRS 9.
65
KfW Financial Information 2017 Consolidated financial statements
In May 2014, the IASB published IFRS 15 “Revenue from Contracts with Customers”, replacing standards IAS 11 “Construction Contracts”, IAS 18 “Revenue”, IFRIC 13 “Customer Loyalty Programmes”, IFRIC 15 “Agreements for the Construction of Real Estate”, IFRIC 18 “Transfers of Assets from Customers” and SIC 31 “Revenue – Barter Transactions Involving Advertising Services”. Retrospective application of the standard is mandatory for financial years beginning on or after 1 January 2018.
IFRS 15 defines the nature, amount and timing of revenue arising from contracts with customers. Such revenue includes fees which are not an integral part of the effective interest rate and which are to be reported under Commission income. In this context, a five-step principle-based model is to be applied to relevant customer contracts. Moreover, the Notes are to include comprehensive detailed quantitative and qualitative information. IFRS 15 does not apply to fees and charges which are an integral part of the effective interest rate as they fall under the scope of IFRS 9. The IAS 18 requirements on consideration for financial services largely correspond to those contained in IFRS 9.
The application of IFRS 15 for KfW largely concerns mandate contractual arrangements with the Federal Government as contracting authority for administrative activities. As performance obligations are mostly satisfied over time, revenue from customer contracts is currently already recognised according to the measure of progress and is thus normally period-based. Point-in-time-based consideration paid in the form of one-off payments is of minor importance.
Applying IFRS 15 therefore will not result in any major changes for KfW compared to IAS 18 and consequently will not have any material impact on the group’s net assets, financial position and results of operations. There will be no major need for adjustment to retained earnings as of 1 January 2018 with respect to the partially retrospective adjustment undertaken by KfW in accordance with IFRS 15.C3(b).
In January 2016, the IASB published the new IFRS 16 “Leases” standard, replacing IAS 17 “Leases”, IFRIC 4 “Determining Whether an Arrangement Contains a Lease”, SIC 15 “Operating Leases – Incentives” and SIC 27 “Evaluating the Substance of Transactions in the Legal Form of a Lease”. The standard is to be applied for financial years beginning on or after 1 January 2019. Implementation of the new accounting model means that in future, for all leases, lessees must recognise each right of use as an asset and the associated lease obligation as a liability on the balance sheet. Application is optional for leases with a term of less than 12 months or if the underlying asset is of low value.
The effects on net assets, financial position and results of operations (particularly for KfW and KfW IPEX-Bank) will result primarily from buildings rented by KfW Group. The respective rights of use must be accordingly recognised on the balance sheet in future. These items currently relate to an operating lease in accordance with IAS 17; the related leasing expenses are recognised in the income statement.
An early application of IFRS 16 together with the introduction of IFRS 15 “Revenue from Contracts with Customers” as of 1 January 2018 is not planned.
(4) Group of consolidated companies
All significant subsidiaries, joint ventures and associated companies are included in the consolidated financial statements.
Subsidiaries are all business units (including structured entities) over which the group exercises control. Control exists when a group is exposed or entitled to variable cash flows through its relationship and has the opportunity to use its power of disposal to influence the amount of such cash flows. Subsidiaries are included in the consolidated financial statements (full consolidation) from the point at which control is transferred to the group. They are deconsolidated when control is lost.
66
KfW Financial Information 2017 Consolidated financial statements
Joint ventures and associated companies are included in the consolidated financial statements in accordance with IFRS 11/IAS 28 if a joint agreement is in place or the group has significant influence.
The composition of the consolidated group is presented in the Notes under “List of KfW Group shareholdings”.
(5) Basis of consolidation
Consolidation involves revaluing the total assets and liabilities of the subsidiaries at the acquisition date, irrespective of the equity interest held, and incorporating them into the consolidated statement of financial position. The resulting adjustments from hidden reserves and hidden burdens are treated in accordance with the applicable standards. If the revaluation adjustments result in an excess compared to acquisition cost, this excess amount is capitalised as goodwill. No goodwill is currently recognised.
Any intercompany assets and liabilities as well as expenses and revenues from transactions between group companies are eliminated. Intercompany profits between consolidated companies are also eliminated.
Investments in associates are accounted for using the equity method. The group’s share of the profits or losses of associates is recognised as a separate line item in the income statement.
There are no minority interests within KfW Group.
(6) Financial instruments: recognition and measurement
A financial instrument is any contract that gives rise to a financial asset of one entity and a financial liability or equity instrument of another entity. The following explanations provide an overview of how the requirements of IAS 39 are implemented.
Initial recognition is as of the settlement date for non-derivative financial instruments and as of the trade date for derivatives.
Upon initial recognition, financial instruments must be classified into one of the following categories. Their subsequent measurement depends on the following classification:
| | B. | Held-to-maturity investments |
| | C. | Financial assets and liabilities at fair value through profit or loss |
| | a. | Financial assets and liabilities designated at fair value through profit or loss (fair value option) |
| | b. | Financial assets and liabilities classified as held for trading |
| | D. | Available-for-sale financial assets |
The loans and receivables category includes non-derivative financial assets with fixed or determinable payments that are not quoted in an active market. These are measured at amortised cost using the effective interest method. For KfW Group, this primarily relates to the lending business presented under Loans and advances to banks and Loans and advances to customers. An assessment will be performed as of every balance sheet date as to whether there is objective evidence of impairment (default criteria). For its lending business, KfW Group uses the Basel definition for its default criteria and applies a consistent definition across the group. Default criteria are payments more than 90 days past due (taking a marginality limit into account), anticipated non-fulfilment of payment obligations or disposal of loans or advances at significant loss due to deterioration in the borrower’s credit rating.
67
KfW Financial Information 2017 Consolidated financial statements
Held-to-maturity investments are non-derivative financial instruments with fixed or determinable payments and fixed maturity that the group has the intention and ability to hold to maturity. This category is used on a case-by-case basis for financial instruments which are part of the group’s securities portfolio at inception. These instruments are presented as Securities and investments; any impairment losses and their reversals are recognised in Net gains/losses from securities and investments. Premiums and discounts are amortised according to the effective interest method. The amortisation for the period is recognised as Net interest income.
For financial assets and liabilities, the fair value option can be irrevocably exercised upon initial recognition, if
| | – | the classification can resolve or substantially reduce an accounting mismatch resulting from the measurement of financial assets or financial liabilities or the recognition of a loss or a gain as a result of different accounting policies; or |
| | – | a group of financial assets and/or financial liabilities is managed in accordance with a documented risk management or investment strategy and its performance is assessed on the basis of fair value and the information is reported to key management personnel; or |
| | – | a contract contains one or more embedded derivatives which significantly modify the cash flows associated with the contract or an analysis is required to determine that the embedded derivative(s) may not be separated. |
Designated financial assets and liabilities are measured at fair value through profit or loss. KfW Group uses the fair value option for economic hedging relationships, structured products, securitisation transactions, and equity finance business. These financial instruments in particular are recognised in Securities and investments, Liabilities to banks and customers and Certificated liabilities. Fair value changes are presented in Net gains/losses from other financial instruments at fair value through profit or loss, while interest income/expense is presented in Net interest income.
Financial instruments belonging to the financial assets and liabilities classified as held for trading category are measured at fair value through profit or loss. This category includes derivatives as well as non-derivative financial instruments purchased with the intention of generating a short-term profit or selling them. KfW Group does not enter into any transactions with the intention of generating a short-term profit. Instruments may be held in the group for short-term sale in anticipation of a loan syndication in export and project financing business. These are recognised under Loans and advances to banks and customers. Interest income is presented in Net interest income while changes in fair value are presented in Net gains/losses from other financial instruments at fair value through profit or loss. Derivative transactions entered into exclusively for hedging purposes are classified as held-for-trading if they do not fulfil the hedge accounting requirements in accordance with IAS 39. They are presented as Other derivatives. Fair value changes are recognised in Net gains/losses from other financial instruments at fair value through profit or loss. derivatives designated for hedge accounting are presented in the statement of financial position in the line item of the same name. Fair value changes are recognised in Net gains/losses from hedge accounting. Interest income/expense from derivatives is reported in Net interest income.
All other financial assets fall under the available-for-sale financial assets category. The difference between the fair value and the (amortised) cost is recognised directly in a separate component of equity until the asset is sold or an impairment loss has to be recognised in profit or loss. A debt instrument is impaired if there is objective evidence (trigger) of impairment with an impact on the expected future cash flows. Specific trigger events are defined according to the type of financial instrument. Events such as payments overdue for 30 days or more, deterioration in the internal rating to the non-performing loans category, or a considerable decline in the market price can
68
KfW Financial Information 2017 Consolidated financial statements
be considered as objective evidence of impairment. Furthermore, for equity instruments, an impairment loss has to be recognised in profit or loss in the case of a significant or prolonged decline of the fair value below the acquisition cost of equity instruments. A permanent impairment is assumed if the fair value of an exchange-listed equity instrument remains constantly below the historical cost for a period of nine months. A significant impairment is assumed for such financial instruments if the fair value is at least 20% below the historical cost as of the reporting date. The impairment loss of a debt security is reversed through profit or loss if there is no longer any objective evidence of impairment. Impairment losses of equity instruments may only be reversed directly in Other comprehensive income. Impairments are recognised in profit or loss, while reversals of impairment losses are not accounted for in this case. Within KfW Group, the available-for-sale financial assets are reported in Securities and investments. Gains and losses from disposals, impairment losses and the reversal of impairments from debt instruments are reported in Net gains/losses from securities and investments. Premiums and discounts are amortised through profit or loss using the effective interest method. The amortisation is recognised under Interest income.
All non-derivative financial liabilities for which the fair value option has not been exercised are classified as other liabilities. These are measured at amortised cost using the effective interest method. For the group, this category covers funding reported in Liabilities to banks and customers, Certificated liabilities and Subordinated liabilities.
Derivatives are derecognised as of the trade date; all other financial assets as of the settlement date. Financial assets are derecognised when the contractual rights from the assets have expired, the power of disposal or control has been transferred, or a substantial portion of the risks and rewards has been transferred to a third party unrelated to KfW Group.
Financial liabilities are derecognised if the obligations specified in the contract have been discharged or cancelled, or have expired.
For transactions mandated by the German Federal Government in accordance with Article 2 (4) of the KfW Law, the group’s general recognition procedures for the relevant financial instruments will be applied. Measurement is based on the relevant individual contractual terms and conditions concerning risk allocation.
The amendment to IAS 39 dated 13 October 2008 expanded the reclassification options for financial assets. Accordingly, until 31 October 2008, it was possible to reclassify assets classified as available-for-sale financial assets as loans and receivables with retroactive effect to 1 July 2008, and thereafter prospectively from the date of the reclassification, if there was the intention and ability to hold the financial instruments for the foreseeable future or until maturity and if the general classification criteria for loans and receivables were met at the date of reclassification.
On 31 October 2008, KfW Group resolved to make use of its option to reclassify its asset-backed securities retrospectively as of 1 July 2008. Due to the general crisis of confidence in the financial markets, there was no longer an active market for these securities at the date of the resolution (i.e. no current, regularly occurring market transactions on an arm’s length basis could be observed) and they were to be held through to maturity.
In addition, by resolution dated 17 February 2009, some of the securities that were held to meet the group’s liquidity needs – through their use in repurchase transactions or open market transactions with the European Central Bank – were reclassified with prospective effect. As a result of the general crisis of confidence in the financial markets, an active market for these securities that were to be held for the foreseeable future no longer existed at the date of the resolution.
69
KfW Financial Information 2017 Consolidated financial statements
The fair value at the date of reclassification is the new cost of the reclassified financial assets. Amortisation is accounted for through profit or loss under Interest income using the effective interest method. The difference between the fair value and amortised cost, which had been recognised directly in equity until the reclassification date, remains in Other comprehensive income as a separate line item. Amortisation is accounted for through profit or loss under Interest income using the effective interest method.
Classes for financial instruments have been largely defined in agreement with the group’s business model, which is focused on the lending business – carried at (amortised) cost – and are based on products (e.g. Loans and advances to banks broken down into money-market transactions and loans and advances) or on the line items of the statement of financial position comprising these products. The balance sheet items thus generally reflect a view based on the material risks encompassed by each against the backdrop of interest rate and currency risk management at the overall bank level (interaction between non-derivative financial instruments and derivative hedging transactions). Information about the type and extent of risks associated with financial instruments is also provided in the risk report section of the group management report.
(7) Financial instruments: valuation techniques
KfW Group initially recognises financial instruments at fair value.
Financial instruments subsequently measured at amortised cost are measured, within KfW Group, based on the fair value at initial recognition, taking into account any principal repayments and any impairment. The amortisation of premiums and discounts, transaction costs and fees is performed in accordance with the effective interest method on the basis of the contractual cash flows. Discounts are amortised in the promotional lending business until the end of the first fixed interest rate period (generally five or ten years).
The subsequent measurement at fair value, which, depending on the measurement category, is regularly determined either for recognition in the statement of financial position or for the disclosure of financial instruments in the Notes, is based on the following hierarchy at KfW Group:
A. Active market (allocation to the “Quoted market price” level)
The best objective evidence of fair value is provided by published price quotations in an active market. A financial instrument is regarded as quoted in an active market if quoted prices are readily and regularly available and those prices represent current – i.e. traded on the reporting date or shortly before – and regularly occurring market transactions on an arm’s length basis. Together with the traded nominal volumes, the contract sizes and the number of contracts, this assessment takes into account in particular the bid-ask spreads observed which in the event of a significant increase indicate the absence of an active market.
B. No active market – valuation techniques (allocation to “Valuation methods based on observable market data [model]” or “Valuation methods based in part on data not observable in a market”)
If the financial instrument is not quoted in an active market, valuation techniques are used. The valuation techniques applied include, in particular, the discounted cash flow (DCF) method and option pricing models, as well as a comparison to the fair value of a financial instrument with almost identical characteristics (e.g. multiple-based models). The valuation techniques take account of all input parameters that the market participants would include in the pricing of that financial instrument, e.g. market interest rates, risk-free interest rates, credit spreads or swap curves. As these input parameters can generally be observed in the market and are usually the only significant parameters for measuring financial instruments using valuation techniques, the level
70
KfW Financial Information 2017 Consolidated financial statements
for the financial instruments measured at fair value using valuation methods is usually “Valuation methods based on observable market data (model)”. This allocation also generally applies for prices quoted on inactive markets published by price service agencies.
If significant input parameters that are not observable on the market, such as expected risk-free customer margins or capital costs, are used in valuation techniques, the financial instrument is allocated to the “Valuation methods based in part on data not observable in a market” level.
If, at the date of initial recognition, differences arise between the market-based transaction price and the model price resulting from a valuation technique that makes significant use of unobservable parameters, an analysis is performed to determine whether there are economic reasons for these initial differences (e.g. conclusion of a transaction on a market that is not the main market for this transaction.) These economic reasons only apply to a small part of the derivative portfolio of KfW Group, which comprises a hedging instrument for customers with respect to the export and project financing business. In relation to this, OTC (over the counter) derivatives in line with the market are not concluded on the main market (OTC interbank market) relevant to valuation. The initial differences determined upon conclusion of these derivatives are amortised through profit or loss over the life of the financial instruments, as the valuation parameters unobservable on the market are relevant to the valuation procedure. The reliability of this valuation technique is ensured via regular model validations.
This (valuation) hierarchy is applied in the group as follows:
Fair values are derived from active markets, in particular, for bonds and other fixed-income securities – unless there are inactive markets, and valuation techniques or prices quoted on inactive markets published by price service agencies are therefore used – as well as own issues reported on the liabilities side. However, fair values are derived from valuation techniques for non-derivative financial instruments recognised in Loans and advances to banks and customers, Liabilities to banks and customers, and Certificated liabilities. Valuation techniques are also used for OTC derivatives.
The steps detailed below are undertaken for certain product groups:
For securities in the Securities and investments line item, the group examines whether a financial instrument is quoted on an active market on the basis of homogeneous portfolios. Market activity is assessed based on the following criteria:
| | – | There is more than one market maker. |
| | – | Prices are set on a regular basis. |
| | – | Prices deviate only slightly between market makers. |
| | – | The bid-ask spread is narrow. |
Prices on active markets are used to determine the fair value of the group’s asset securities as of the reporting date. In addition, for parts of the portfolio, prices from price service agencies are used that do not qualify as prices quoted on active markets. Should these not be available in individual cases, valuation techniques are used to determine fair value taking into account observable market parameters. The input parameters include, in particular, changes in creditworthiness and risk-free interest rates, but they also take into account general and financial instrument-specific tightening of the market due to lower liquidity.
In the case of OTC derivatives, valuation techniques are used that pay special attention to counterparty-specific default risks, taking into account available collateral. Default risks are not calculated separately for each transaction but for the portfolio of transactions on which a framework agreement is based. The resulting credit risk
71
KfW Financial Information 2017 Consolidated financial statements
adjustment amounts are very low as KfW generally pledges collateral for positive market values in accordance with the collateral agreements concluded. In accordance with market practices, risk-free overnight interest rates were used for the valuation of a major part of the derivatives portfolio with collateralisation agreements.
Equity investments and shares which cannot be reliably measured at fair value are measured at cost.
The fair value for Loans to banks and customers is calculated using the discounted cash flow (DCF) method based on the discounting of the risk-adjusted cash flows. The expected loss calculated for the respective reporting date is used to correct the contractual cash flows.
The Federal Republic of Germany’s liability for specific KfW liabilities in accordance with Article 1a of the KfW Law has an advantageous effect on KfW’s ability to fund itself. In determining the fair value of KfW’s liabilities, the effect of this explicit direct state guarantee is also taken into account. The state guarantee does not represent an independent unit of account.
The fair value of financial instruments due on demand, such as Cash reserves or receivables and liabilities due on demand, is their carrying amount.
When no prices from liquid markets are available and prices on inactive markets cannot be provided by price service agencies, recognised valuation models and methods are used. The DCF method is used for securities, swaps, and currency and money market transactions with no embedded options and no complex coupons. Stand-alone options, as well as derivatives with embedded options, triggers, guaranteed interest rates and/or complex coupon agreements, are measured using recognised models (e.g. Hull & White) unless they are listed on a stock exchange.
The aforementioned models are calibrated, if possible, on the basis of observable market data for instruments that are similar in terms of the type of transaction, maturity, and credit quality.
(8) Promotional lending business at KfW
The general promotional loans market, which distinguishes itself from the market for general lending business, is relevant for KfW’s promotional lending business conducted as part of its legal promotional mandate. This market is characterised by the fact that promotional banks, as part of their legal mandate, pass on all advantages of funding projects eligible for promotion to the ultimate borrowers. In setting the terms and conditions of the corresponding promotional loans, KfW uses its current term-differentiated refinancing rates.
At initial recognition of such loans, the fair value is thus equivalent to the transaction value.
KfW also grants promotional loans which include additional subsidies granted during the first fixed interest rate period, in the form of interest rate reductions impacting KfW’s earnings position. The fair value of these promotional loans – measured using the parameters of the general promotional loan market – is thus not equivalent to the transaction value at initial recognition as in this case the interest rate is below the market rate.
The difference that normally results from such loan commitments – present value of the nominal scheduled interest rate reductions during the first fixed interest rate period – is recognised in profit or loss as an interest expense and accounted for as an adjustment to the carrying amount in loans and advances under the items Loans and advances to banks or Loans and advances to customers. The adjustment to the
72
KfW Financial Information 2017 Consolidated financial statements
carrying amount is amortised in Net interest income using the effective interest rate method. In the event of unscheduled repayment in full, this will be recognised in profit or loss under Interest income.
Differences that relate to irrevocable loan commitments are reported in Provisions. Changes to the portfolio are offset via the adjustments to the carrying amounts of already disbursed promotional loans recognised on the assets side.
(9) Financial derivatives and hedging relationships
KfW Group enters into financial derivatives to economically hedge interest rate fluctuation and currency risks, particularly those related to funding, lending and securities activities.
Economic hedging relationships are designated as hedge accounting relationships or designated as fair value through profit or loss by using the fair value option when the IFRS requirements are met. Economic hedging relationships can also be recognised in the financial statements through bifurcation of separable embedded derivatives that are accounted for through profit or loss. In these cases, if the hedges are economically effective, the impact on the financial statements, with respect to the hedged risks, from the instruments used for hedging purposes and the hedged transactions will substantially offset each other, so that the group’s income statement substantially reflects the risk-mitigating impact of these hedging relationships.
However, not all economic hedging relationships qualify for hedge accounting or the fair value option. In these cases, the risk-mitigating impact of the derivatives used for hedging purposes is not reflected in the accounts because the hedged risk associated with the underlying transactions is not recognised in profit or loss under IFRS. The applicable recognition requirements may therefore lead to one-sided valuation results from the derivatives used for hedging purposes in the group’s income statement – as well as volatility in profit or loss – despite an economically effective hedging relationship.
Hedge accounting in the group is used solely in the form of fair value hedges to recognise hedging relationships. The hedging relationship is designated, firstly, at individual transaction and group level in the form of micro fair value hedge accounting, and, secondly, at portfolio level in the form of macro fair value hedge accounting. Micro fair value hedging relationships at group level are created exclusively to hedge the foreign currency exposure. If risk-free overnight interest rates are used in the valuation of the derivatives, this market practice is also subject to micro fair value hedge accounting for the measurement of the hedged risk related to the hedged item. The hedged risk in macro fair value hedge accounting relates to the variable interest rates of the derivative portfolio. The effectiveness of the hedging relationships is assessed using the dollar offset method and a regression analysis.
In micro fair value hedge accounting, the hedged risks are interest rate and currency risks from bonds allocated to Securities and investments (loans and receivables and available-for-sale financial assets categories) and, in particular, funding (other liabilities category). In micro fair value hedging relationships at individual transaction level, the fair values attributable to the hedged risks are reported as an adjustment of the carrying amount of the hedged items with the corresponding gain or loss recognised in Net gains/losses from hedge accounting. The hedging instruments used for this purpose are recognised at fair value in Derivatives used for hedge accounting. Changes in the value of the hedging instruments are also recognised in Net gains/losses from hedge accounting, largely compensating the profit or loss effects of the hedged items. The currency-related changes in value of the hedged items and hedging instruments in micro fair value hedging relationships at group level are presented in Net gains/ losses from other financial instruments at fair value through profit or loss.
73
KfW Financial Information 2017 Consolidated financial statements
Interest rate fluctuation risks, primarily from loans (loans and receivables category), are hedged in macro fair value hedge accounting. The fair values attributable to the hedged risks in the hedged portfolios in the loans and receivables category are accounted for in Value adjustments from macro fair value hedge accounting on the assets side. Fair value changes attributable to the hedged risks from the hedged portfolios are shown in Net gains/losses from hedge accounting.
The hedging instruments are reported at fair value in Derivatives used for hedge accounting. Changes in the value of these instruments are also recognised in Net gains/losses from hedge accounting, with the effect that they almost fully offset the earnings effects from the valuation of the hedged portfolios.
The portfolio of hedged items is updated monthly in the context of a dynamic hedge de-designation and designation process. The resulting fair value adjustments are amortised over the residual term of the maturity period in Net gains/losses from hedge accounting. Disposals from the hedged portfolios result in a proportional amortisation of the related fair value adjustments in Net gains/losses from hedge accounting. When cash flows from hedging instruments are derecognised while the economic hedge based on non-derivative financial instruments remains, the related fair value adjustments from the hedged portfolios are amortised in Net interest income.
If the strict hedge accounting requirements for the designation of hedging relationships between derivatives and financial assets/liabilities are not fulfilled within KfW Group, the fair value option is used in certain circumstances. The fair values of the corresponding hedging instruments are presented in Other derivatives and fair value changes are recognised in Net gains/losses from other financial instruments at fair value through profit or loss. These are largely offset by valuation effects from the hedged transactions.
Further derivative financial instruments are used to hedge risks, but their economic effects cannot be reflected in the accounts. The fair values of these hedging instruments are also recognised in the Other derivatives item, with changes in fair value being recognised in Net gains/losses from other financial instruments at fair value through profit or loss.
KfW Group neither uses derivatives for trading purposes nor does it enter into derivatives acting as a broker or intermediary on behalf of third parties.
(10) Treatment of embedded derivatives
Derivative financial instruments can be part of a hybrid (combined) financial instrument as embedded derivatives. Under certain conditions, they are accounted for separately from the host contract, similar to stand-alone derivatives. They must be bifurcated if the economic characteristics and risks of the embedded derivative are not closely related to the economic characteristics and risks of the host contract. The host contract will be accounted for according to its classification at inception.
KfW Group enters into contracts with separable embedded derivatives particularly with respect to its own funding. In making use of the fair value option, KfW accounts for these hybrid (combined) financial instruments at fair value. In the case of certain products, however, the embedded derivatives must be bifurcated. Changes in fair value are then recognised in Net gains/losses from other financial instruments at fair value through profit or loss in the sub-line item Financial derivatives not qualifying for hedge accounting, where they have a compensatory effect on the valuation of the economic hedging derivatives.
Ancillary agreements made within KfW Group’s equity finance business are accounted for as separable embedded derivatives which are measured at fair value through profit or loss and recognised in Other derivatives. Changes in fair value are recorded in Net gains/losses from other financial instruments at fair value through profit or
74
KfW Financial Information 2017 Consolidated financial statements
loss in the sub-line item Financial derivatives not qualifying for hedge accounting. Loan receivables are recognised in Loans and advances to customers.
Prepayment rights that are granted regularly in the promotional lending business are not separable embedded derivatives since the economic characteristics and risks associated with the prepayment rights are closely related to the economic characteristics and risks of the loan and the early prepayment amount approximately equals the amortised cost of the loan.
(11) Credit derivatives
As part of its promotional lending business, KfW Group offers commercial banks the opportunity to place their credit risks in the capital market as part of a synthetic securitisation via the two standardised platforms PROMISE (programme for the securitisation of SME loans) and PROVIDE (programme for the securitisation of housing loans). In the first stage, KfW Group assumes the default risks of the reference portfolio via portfolio credit default swaps (CDSs), while the risks are simultaneously passed on to third parties via portfolio CDSs/credit-linked notes. Some of these transactions are recognised using the fair value option. The fair values are reported as receivables or liabilities. Fair value changes are recognised under Net gains/losses from other financial instruments at fair value through profit or loss. The ongoing risk premiums are recognised in Net commission income. In the case of transactions for which, in line with individual contractual conditions, the fair value option has not been used to avoid an accounting mismatch, portfolio CDSs are recognised in the statement of financial position as financial guarantees issued or received in accordance with the generally applicable accounting policies for these financial instruments. Credit-linked notes with non-separable embedded financial guarantees are accounted for as other liabilities.
(12) Foreign currency translation
The functional currency of KfW and its consolidated subsidiaries is the euro. Monetary assets and liabilities denominated in a foreign currency are converted at the spot rate as of the reporting date.
Non-monetary assets and liabilities denominated in a foreign currency are normally converted at historical rates if they are measured at (amortised) cost.
Translation is made using the European Central Bank reference rates. Income and expenses are translated generally at the average monthly rate.
The results from the translation of foreign currency transactions are recognised in profit or loss under Net gains/losses from other financial instruments at fair value through profit or loss.
(13) Loans and advances to banks and customers
KfW Group’s lending business carried at amortised cost is recognised in Loans and advances to banks and customers, along with the pending syndication business in the business sector Export and project finance, which is measured at fair value. These line items primarily consist of the promotional lending business, in which loans are typically granted to the final borrowers through accredited commercial banks and insurance companies. These assets are presented in Loans and advances to banks when the commercial banks underwrite part of the liability. Promotional loans that the commercial banks on-lend without underwriting of liability are recognised in Loans and advances to customers.
Current interest and similar income are generally recorded under Interest income. If, due to the low interest environment, negative interest rates arise from a financial asset, these are recorded in Interest expense. Premiums, discounts, processing fees and charges are amortised in Interest income using the effective interest method. Processing fees that are not part of the effective interest method are recognised under Commission income.
75
KfW Financial Information 2017 Consolidated financial statements
Loans and advances to banks and customers also include loans with a subsidy (interest rate reductions) granted by KfW under the ERP economic promotion programme. The promotional grants awarded annually to KfW through the ERP Special Fund based on the ERP Economic Planning Act (ERP-Wirtschaftsplangesetz) for the purpose of executing the ERP economic promotion programme are recognised as deferred income in Other liabilities and are amortised in profit or loss under Interest income as the underlying funding expenses occur.
(14) Risk provisions for lending business
The overall risk provisions for lending business include the provisions for losses on loans and advances and money market investments, including reverse repurchase agreements (reverse repos), as a separate line item on the assets side of the statement of financial position, as well as the provisions for contingent liabilities and irrevocable loan commitments accounted for on the liabilities side as Provisions.
The risks resulting from on balance sheet lending business are accounted for by individual and portfolio impairments recognised in profit or loss.
Individual impairment is recognised for incurred losses and is computed on the basis of individual loans. The amount of the impairment loss equals the difference between the carrying amount of the loan and the present value of discounted expected future cash flows from interest, redemption payments and collateral cash flows. The recognition of interest income in accordance with the original contractual terms ends with the date of the first individual impairment. In the subsequent measurement, the effect of compounding the present value of anticipated cash flows using the effective interest rate at inception is determined and recognised as interest income (unwinding). The risk provisions are reduced by this amount. Any reversals of individual impairment losses are accounted for through profit or loss.
Smaller and standardised loans are grouped into homogeneous sub-portfolios and collectively assessed for impairment on the basis of the default risks identified. Any reversals of collective impairment losses are recognised in profit or loss.
For performing loans not subject to individual impairment, the risk of impairment losses that have already occurred but have not yet been individually identified is addressed by portfolio impairment. Economic risk and transfer risk are taken into account in the calculation. The key parameters are the outstanding lending volume (based on the carrying amount) as of the reporting date, the expected loss given default and one-year probabilities of default (given an LIP [loss identification period] factor of 1). The probabilities of default and the loss given default are provided by credit risk controlling whereby the latter is adjusted for imputed cost. The underlying assumptions of expected losses are backtested on a regular basis against the actual loss experience.
For contingent liabilities and irrevocable loan commitments, impairment is assessed on an individual basis and accounted for as a provision in the statement of financial position with a corresponding effect on the income statement. For irrevocable loan commitments, impairments not yet identified individually are assessed on a portfolio basis and recognised as provisions.
If the loans are deemed partially or fully uncollectible, they are written down or written off against the impairment allowance account. Uncollectible loans for which no individual impairments were recorded are written off directly. Recoveries on loans already written off are recognised as income in Risk provisions for lending business.
76
KfW Financial Information 2017 Consolidated financial statements
(15) Securities and investments
Securities and investments mainly comprises bonds and other fixed-income securities held in securities portfolios that belong to KfW and its subsidiaries, along with equity investments.
The securities portfolios mainly serve to support KfW’s liquidity position and to stabilise and sustainably ensure the group’s promotional capacity in the long term.
To achieve the same accounting treatment for equity investments with and without significant influence, individual group business areas that provide equity finance as part of their promotional mandate are considered as venture capital organisations for accounting purposes provided they meet the respective requirements. These equity investments, like other equity investments, are recognised in Securities and investments.
Securities and investments are recognised at fair value and subsequently measured depending on the measurement category to which they are assigned.
When non-listed equity investments are measured at fair value, appropriate allowances are made for illiquidity. For example, when applying the discounted cash flow (DCF) models the discount rate is adjusted for a fungibility factor.
Any fair value changes of financial assets at fair value through profit or loss are recognised in Net gains/losses from other financial instruments at fair value through profit or loss. Realised gains or losses and impairment losses relating to the available-for-sale financial assets, loans and receivables and held-to-maturity investments categories are recognised under Net gains/losses from securities and investments; amounts reported for loans and receivables and held-to-maturity investments include allowances for impairment losses that have already occurred but have not yet been individually identified, based on the expected loss for one year. Unrealised gains from available-for-sale financial assets are recognised directly in equity as Revaluation reserves. Current interest payments and dividends are recognised in Interest income.
(16) Repurchase agreements
KfW Group enters into repurchase agreements as standardised repos or reverse repos. These are combinations of simultaneous spot and forward transactions on securities with the same counterparty. The terms and modalities of collateral and its use follow common market practice. Credit claims are also an eligible type of collateral for open-market transactions.
The securities sold under repo transactions (spot sales) continue to be recognised and measured as securities. The repayment obligation towards the counterparty is carried as a liability to banks or customers for the amount of cash consideration received. Interest is recorded in Interest expense in accordance with the respective term of the repurchase agreements.
A repayment claim is recognised and measured as a loan or advance to banks or customers for the amount of cash outflow generated by reverse repos. The securities received (spot purchases) are not recognised or measured. Interest is recorded in Interest income in accordance with the respective term of the reverse repurchase agreements.
77
KfW Financial Information 2017 Consolidated financial statements
(17) Property, plant and equipment
The land and buildings and the plant and equipment reported by KfW Group are carried at cost less depreciation on a straight-line basis and any impairment, both recognised in Administrative expense. In accordance with the requirements in IAS 36, an impairment is recognised if there are indications of impairment and the carrying amount of the asset exceeds the recoverable amount, which is the higher of the fair value less the cost to sell or the value in use. The useful life is determined based on expected wear and tear. KfW Group assumes an estimated useful life of 40 to 50 years for buildings, 4 years for workstation computer equipment and 5 to 15 years for other property, plant and equipment. Gains and losses from the sale of property, plant and equipment are recognised in Net other operating income.
Payments in advance and assets under construction are recognised in Other property, plant and equipment and are not subject to depreciation.
(18) Intangible assets
Under Intangible assets, KfW Group reports purchased and internally generated software at cost, less straight-line amortisation and impairments, both recognised in Administrative expense. KfW Group assumes a useful life of five years, based on the expected economic life of the assets.
Assets are impaired when the carrying amount of an asset exceeds the recoverable amount. An impairment is recorded when no future economic benefits can be identified.
Internally generated software under development is reported under Other intangible assets and is not subject to amortisation.
(19) Taxes on income
KfW is a non-taxable entity. Taxes on income for non-exempt subsidiaries and their permanent establishments are determined according to the tax laws in the country of domicile. Current taxes on income as well as deferred tax expenses and income are recognised in profit or loss as Taxes on income or directly in equity under Revaluation reserves depending on the underlying transaction. Current and deferred tax assets and liabilities are reported as a separate line item in the statement of financial position. Deferred Income tax assets and liabilities are offset only when the requirements are met.
Current taxes on income are calculated using currently applicable tax rates.
Deferred tax assets and liabilities arise as a result of differences between carrying values of an asset or a liability and the respective tax bases if the differences are likely to result in taxable or tax deductible amounts in the future (temporary differences). Deferred tax assets relating to loss carryforwards not yet used are recognised only if there is a sufficient degree of certainty that the taxable entity will earn sufficient taxable income in subsequent periods to use the loss carryforward.
(20) Liabilities to banks and customers and Certificated liabilities
Liabilities to banks and customers primarily include non-current funding carried at amortised cost and KfW Group’s money-market transactions. Certificated liabilities contain issued bonds, notes and money-market instruments. Own issues repurchased in the open market are deducted from the liabilities as of the repurchase date.
The fair value option is exercised for structured liabilities, or, in the case of certain products, separable embedded derivatives are bifurcated and accounted for as stand-alone derivatives.
78
KfW Financial Information 2017 Consolidated financial statements
Presentation of the different types of funding is not based on their classification or their designation as hedged items. Measurement of liabilities is based on their respective classification.
Current interest is generally recorded in Interest expense. If, due to the low interest environment, negative interest rates arise from a financial liability, these are recorded in Interest income. Premiums and discounts are amortised using the effective interest method over the expected life in Interest expense. Fair value changes of liabilities designated at fair value are recognised in profit or loss under Net gains/losses from other financial instruments at fair value through profit or loss, where they have an offsetting effect with the fair value changes from economic hedging derivatives. Results from the repurchase of own issues categorised as other liabilities are recognised at the repurchase date in Net other operating income.
(21) Provisions
Provisions include provisions for pensions and similar commitments, credit risks, interest rate reductions in irrevocable loan commitments granted by KfW in the promotional lending business and negatively impacting its earnings position, as well as other obligations of uncertain amount and timing involving a probable outflow of funds.
The employees of KfW Group participate in a company pension plan that pays retirement, long-term disability and survivor benefits. KfW Group has various pension plans, consisting exclusively of defined-benefit schemes. The benefits largely depend on the length of company service and salary. The pension plan that was applied for new hires until 1985 offered a full pension (Gesamtversorgung), in which a certain portion of the income paid before the benefits were due was allocated as a benefit after deducting the state pension. Apart from employer-financed pension plans there are also plans in place involving contributions by employees.
KfW Group pension plans are subject to the following risks in particular: longevity, interest rate fluctuation, pension adjustment risk as well as the risk of future changes to the assessment bases.
Longevity risk is the risk that higher expenses will be incurred for the company pension plan if the pensioners live longer than projected. In general, this risk is balanced out across all pensioners and would only have an impact if life expectancy were to rise faster in the future than anticipated.
Due to the long term of the company pension plan, provisions for pension obligations are subject to general interest rate fluctuation risks.
Pension adjustment risk largely relates to the pension plan offering a full pension (Gesamtversorgung). In this scheme, benefits are recalculated as soon as there is a change in the base income eligible for pension or the state pension to be offset. Another pension plan must be examined regularly in terms of forecast and actual pension adjustments and amended accordingly.
The amount of the benefits promised under the existing pension plans at KfW Group depends, among other things, on development of the income eligible for benefits and the social security contribution ceiling (Beitragsbemessungsgrenze). There is a risk that the basis of assessment will develop differently than was assumed.
Pension obligations are calculated by an independent qualified actuary in accordance with the projected unit credit method on the basis of group-wide uniform parameters such as age, length of company service and salary. The pension provision is recognised at the present value of the defined-benefit obligations as of the reporting date. The discount factor is based on current market conditions for a portfolio of high
79
KfW Financial Information 2017 Consolidated financial statements
quality corporate bonds/bonds from supranational issuers with a maturity matching that of the obligations. The definition of the portfolio takes into account actual market conditions. Additional demographic factors (including the 2005 G Heubeck actuarial tables) and actuarial assumptions (rate of salary and pension increases, rate of staff turnover, etc.) are taken into account.
No plan assets were defined for the pension obligations of KfW Group, so the related special accounting rules do not apply. Provisions for pensions and similar obligations are financed in-house with sufficient assets with corresponding maturities.
Actuarial gains and losses are immediately recognised at the time they occur. They occur as a result of remeasurement of pension obligations as of the reporting date compared to the figures forecast at the beginning of the year.
Additions to pension provisions distinguish between service cost and interest expense. Service cost is reported under Administrative expense; interest expense is reported under Other interest expense. The pension provision changes recognised directly in equity comprise the actuarial gains and losses reported in Revaluation reserves; these are reported in Other comprehensive income.
Pension-like obligations include commitments for deferred compensation, early retirement and partial retirement. Actuarial reports are prepared and a provision is recognised accordingly for these types of commitments as well. No actuarial gains or losses are incurred.
Other provisions, including those for obligations to employees and for audit and consultancy services, are recognised at the estimated expenditure. Long-term provisions are discounted where the effect is material. Added to this are obligations arising from the assumption of the tasks of the State Insurance Company of the German Democratic Republic in liquidation (Staatliche Versicherung der Deutschen Demokratischen Republik in Abwicklung – “SinA” institution under public law), which are offset by receivables in the same amount from the Federal Agency for Special Tasks Arising from Unification (Bundesanstalt für vereinigungsbedingte Sonderaufgaben – “BvS”) reported under Other assets.
(22) Subordinated liabilities
Subordinated liabilities include liabilities to the ERP Special Fund.
Subordinated liabilities are classified as other liabilities and carried at amortised cost.
Deferred interest as well as value adjustments from micro fair value hedge accounting are recognised in Other liabilities. Current interest expenses are recorded in Interest expense.
80
KfW Financial Information 2017 Consolidated financial statements
(23) Equity
The equity structure is, in particular, determined by the KfW Law and the requirements of IFRS.
Pursuant to Article 10 (2) and (3) of the KfW Law, KfW’s net income for the period determined in accordance with the German Commercial Code is transferred to reserves and is included in group equity under IFRS.
KfW Group has created a fund for general banking risks. Additions to or reductions of the fund are shown under IFRS as appropriation of consolidated profit/loss.
Under IFRS, any remaining consolidated net income is allocated to Other retained earnings in the same period.
Under IFRS, revaluation reserves comprise transactions to be recognised directly in equity. These include valuation results from financial instruments of the category available-for-sale financial assets, and actuarial gains or losses in the case of defined-benefit plan pension commitments. They also may include deferred taxes, depending on the underlying transaction.
(24) Contingent liabilities and irrevocable loan commitments
KfW Group’s contingent liabilities result mainly from guarantees (financial guarantee contracts). All contingent liabilities are disclosed in the Notes at their nominal amounts less any related provision.
As part of the sale of its stake in Deutsche Industriebank (“IKB”)^ in 2008, KfW agreed to indemnify IKB for certain legal risks to a certain amount. As of the end of the reporting period, no proceedings are pending against IKB which are relevant in this context.
Irrevocable loan commitments are firm commitments by KfW Group to grant a loan under contractually agreed terms. This also includes commitments for loans that are intended for placement in syndicate transactions. Irrevocable loan commitments are disclosed in the Notes at their nominal amounts less any related provision.
(25) Trust activities
Assets and liabilities held by KfW Group in its own name but for the account of third parties are not recognised. This applies in particular to loans granted under German Financial Cooperation to support developing countries. The related funds are granted and underwritten by the German federal budget. The fees earned associated with these transactions are recognised under Commission income.
81
KfW Financial Information 2017 Consolidated financial statements
(26) Leasing transactions
Leases are classified as operating leases or as finance leases depending on the risks and rewards relating to ownership of an asset. This classification determines their accounting treatment.
Contracts where the group is a lessee (including real estate leases) are largely classified as operating leases; the corresponding rental payments are included in Administrative expense.
The small number of contracts in which KfW Group acts as a lessor are classified as operating leases. The corresponding rental income is recognised in Other operating income.
82
KfW Financial Information 2017 Consolidated financial statements
Notes to the statement
of comprehensive income
(27) Net interest income
Analysis of Net interest income by class
| | | | | | | | | | | | | | | | | | | | |
| | | | | | 2017 | | | | | | 2016 | | | | | | Change | | |
| | | | | | EUR in millions | | | | | | EUR in millions | | | | | | EUR in millions | | |
| | | | | | | | | | |
Interest and similar income from loans and advances to banks and customers | | | | | | 7,138 | | | | | | 7,849 | | | | | | –712 | | |
Similar income from financial guarantees | | | | | | 21 | | | | | | 25 | | | | | | –5 | | |
Interest income from securities and investments | | | | | | 271 | | | | | | 378 | | | | | | –107 | | |
Interest income from derivatives | | | | | | –527 | | | | | | –292 | | | | | | –235 | | |
Other interest income | | | | | | 394 | | | | | | 460 | | | | | | –66 | | |
Interest income | | | | | | 7,296 | | | | | | 8,420 | | | | | | –1,124 | | |
Interest and similar expense for liabilities to banks and customers | | | | | | 378 | | | | | | 383 | | | | | | –5 | | |
Interest expense for certificated liabilities | | | | | | 6,939 | | | | | | 7,587 | | | | | | –648 | | |
Interest expense for subordinated liabilities | | | | | | 2 | | | | | | 3 | | | | | | –1 | | |
Interest expense for derivatives | | | | | | –2,720 | | | | | | –2,442 | | | | | | –278 | | |
Other interest expense | | | | | | 304 | | | | | | 279 | | | | | | 24 | | |
Interest expense | | | | | | 4,903 | | | | | | 5,810 | | | | | | –907 | | |
Total | | | | | | 2,393 | | | | | | 2,610 | | | | | | –217 | | |
Expenses for granting promotional loans below market rates – due to additional promotional funds in the form of interest rate reductions impacting KfW’s earnings position – amount to EUR 186 million (2016: EUR 193 million) and are reported in Other interest expense. In addition to the charges resulting from the present value of the nominal scheduled interest rate reductions in new lending business, the Other interest expense also comprises the expenses arising from amortisation at a constant effective interest rate. Interest and similar income from loans and advances to banks and customers also comprises income of EUR 360 million (2016: EUR 421 million) from accrual-based amortisation in the amount of the pro-rata nominal planned interest rate reductions for these promotional loans.
Income from unwinding in the amount of EUR 24 million (2016: EUR 32 million) is reported under Interest and similar income from loans and advances to banks and customers.
The Interest and similar income from loans and advances to banks and customers comprises EUR 68 million (2016: EUR 51 million) in certificated liabilities and liabilities-side money-market transactions. The Interest and similar expenses for liabilities to banks and customers comprises EUR 179 million (2016: EUR 112 million) from assets-side money-market transactions, balances with central banks and holding arrangements of the Federal Republic of Germany. This is due to the negative interest contributions as a result of the low interest environment.
83
KfW Financial Information 2017 Consolidated financial statements
Interest income from derivatives includes the net interest income and expenses from all derivatives irrespective of whether they are designated for hedge accounting. Interest income and expenses from derivatives which are directly related to individual financial assets or financial liabilities and which are not included in macro fair value hedge accounting are recognised depending on the related hedged transaction in Interest income from derivatives (for related financial assets) or in Interest expenses from derivatives (for related financial liabilities). Taking account of interest income or expenses from the related hedged transactions, presentation is thus based on the economic nature of the hedged financial assets (floating rate financial assets) or hedged financial liabilities (floating rate financial liabilities).
Analysis of interest income from securities and investments
| | | | | | | | | | | | | | | | | | | | | | | | | | |
| | | | | | | | | |
| | | | | | | | 2017 | | | | | | | 2016 | | | | | Change | | |
| | | | | | | | EUR in millions | | | | | | | EUR in millions | | | | | EUR in millions | | |
| | | | | | | | | |
Interest income from bonds and other fixed-income securities | | | | | | | | | | 223 | | | | | | | | 318 | | | | | | –95 | | |
Income from equity investments | | | | | | | | | | 48 | | | | | | | | 51 | | | | | | –4 | | |
Income from shares in subsidiaries not included in the consolidated financial statements | | | | | | | | | | 0 | | | | | | | | 9 | | | | | | –9 | | |
Total | | | | | | | | | | 271 | | | | | | | | 378 | | | | | | –107 | | |
(28) Risk provisions for lending business Analysis of Risk provisions by transaction |
| | | | | | | | | |
| | | | | | | | 2017 | | | | | | | 2016 | | | | | Change | | |
| | | | | | | | EUR in millions | | | | | | | EUR in millions | | | | | EUR in millions | | |
| | | | | | | | | |
Expense for allocations to risk provisions | | | | | | | | | | 529 | | | | | | | | 667 | | | | | | –138 | | |
Direct write-offs | | | | | | | | | | 52 | | | | | | | | 78 | | | | | | –25 | | |
Expense for risk provisions | | | | | | | | | | 581 | | | | | | | | 744 | | | | | | –163 | | |
Income from the release of risk provisions | | | | | | | | | | 266 | | | | | | | | 378 | | | | | | –112 | | |
Income from recoveries of amounts previously written off | | | | | | | | | | 107 | | | | | | | | 216 | | | | | | –109 | | |
Income from risk provisions | | | | | | | | | | 373 | | | | | | | | 594 | | | | | | –221 | | |
Total | | | | | | | | | | –209 | | | | | | | | –150 | | | | | | –58 | | |
84
KfW Financial Information 2017 Consolidated financial statements
(29) Net commission income
Analysis of Net commission income by class
| | | | | | | | | | | | | | | | | | | | |
| | | | | | | | | | |
| | | | | | 2017 | | | | | | 2016 | | | | | | Change | | |
| | | | | | EUR in millions | | | | | | EUR in millions | | | | | | EUR in millions | | |
| | | | | | | | | | |
Commission income from lending business | | | | | | 124 | | | | | | 133 | | | | | | –9 | | |
Other commission income | | | | | | 207 | | | | | | 203 | | | | | | 5 | | |
Income from trust activities | | | | | | 0 | | | | | | 1 | | | | | | 0 | | |
Commission income | | | | | | 331 | | | | | | 336 | | | | | | –5 | | |
Commission expense for lending business | | | | | | 17 | | | | | | 50 | | | | | | –33 | | |
Commission expense for credit derivatives | | | | | | 0 | | | | | | 1 | | | | | | 0 | | |
Other commission expense | | | | | | 11 | | | | | | 29 | | | | | | –18 | | |
Commission expense | | | | | | 29 | | | | | | 79 | | | | | | –51 | | |
Total | | | | | | 303 | | | | | | 257 | | | | | | 46 | | |
Commission income from lending business also includes current premiums and fees from the synthetic securitisation platforms PROMISE and PROVIDE.
Other commission income includes fees for the administration of German Financial Cooperation in the business sector Promotion of developing countries and emerging economies in the amount of EUR 180 million (2016: EUR 175 million).
(30) Net gains/losses from hedge accounting
Analysis of Net gains/losses from hedge accounting by type of hedging relationship
| | | | | | | | | | | | | | | | | | | | |
| | | | | | 2017 | | | | | | 2016 | | | | | | Change | | |
| | | | | | EUR in millions | | | | | | EUR in millions | | | | | | EUR in millions | | |
| | | | | | | | | | |
Micro fair value hedge accounting | | | | | | 93 | | | | | | 45 | | | | | | 48 | | |
Macro fair value hedge accounting | | | | | | 498 | | | | | | 249 | | | | | | 249 | | |
Total | | | | | | 591 | | | | | | 294 | | | | | | 297 | | |
Net gains/losses from macro fair value hedge accounting comprise the valuation of hedging instruments in the amount of EUR 2,182 million (2016: EUR –2,904 million) and the valuation of hedged risks from the hedged portfolios. It also includes the amortisation of the value adjustments from the dynamic hedge designation and de-designation and the pro rata reversal of value adjustments in the event of derecognition of financial instruments from the underlying portfolios as well as the pull-to-par effect of the hedging derivatives.
85
KfW Financial Information 2017 Consolidated financial statements
Analysis of Net gains/losses from micro fair value hedge accounting by hedged item
| | | | | | | | | | | | | | | | | | | | |
| | | | | | 2017 | | | | | | 2016 | | | | | | Change | | |
| | | | | | EUR in millions | | | | | | EUR in millions | | | | | | EUR in millions | | |
| | | | | | | | | | |
Hedging of securities and investments | | | | | | 0 | | | | | | 1 | | | | | | 0 | | |
Hedging of liabilities to banks and customers | | | | | | –1 | | | | | | –1 | | | | | | 0 | | |
Hedging of certificated liabilities | | | | | | 91 | | | | | | 44 | | | | | | 48 | | |
Subtotal: Effectiveness of hedges | | | | | | 92 | | | | | | 44 | | | | | | 48 | | |
Amortisation of value adjustments | | | | | | 1 | | | | | | 1 | | | | | | 0 | | |
Total | | | | | | 93 | | | | | | 45 | | | | | | 48 | | |
Gross analysis of valuation gains/losses from micro fair value hedge accounting:
Comparison of hedged items and hedging instruments in the financial year 2017
| | | | | | | | | | | | | | | | | | | | |
| | | | | | | Hedged items | | | | | | Hedging | | | | | | Effectiveness | | |
| | | | | | | | | | | | instruments | | | | | | of hedges | | |
| | | | | | EUR in millions | | | | | | EUR in millions | | | | | | EUR in millions | | |
| | | | | | | | | | |
Hedging of securities and investments | | | | | | –198 | | | | | | 198 | | | | | | 0 | | |
Hedging of liabilities to banks and customers | | | | | | 111 | | | | | | –112 | | | | | | –1 | | |
Hedging of certificated liabilities | | | | | | 2,109 | | | | | | –2,018 | | | | | | 91 | | |
Hedging of subordinated liabilities | | | | | | 3 | | | | | | –2 | | | | | | 1 | | |
Total | | | | | | 2,025 | | | | | | –1,933 | | | | | | 92 | | |
Gross analysis of valuation gains/losses from micro fair value hedge accounting:
Comparison of hedged items and hedging instruments in the financial year 2016
| | | | | | | | | | | | | | | | | | | | |
| | | | | | | Hedged items | | | | | | Hedging | | | | | | Effectiveness | | |
| | | | | | | | | | | | instruments | | | | | | of hedges | | |
| | | | | | EUR in millions | | | | | | EUR in millions | | | | | | EUR in millions | | |
| | | | | | | | | | |
Hedging of securities and investments | | | | | | –120 | | | | | | 120 | | | | | | 1 | | |
Hedging of liabilities to banks and customers | | | | | | –13 | | | | | | 12 | | | | | | –1 | | |
Hedging of certificated liabilities | | | | | | 2,286 | | | | | | –2,243 | | | | | | 44 | | |
Hedging of subordinated liabilities | | | | | | 5 | | | | | | –4 | | | | | | 0 | | |
Total | | | | | | 2,158 | | | | | | –2,115 | | | | | | 44 | | |
86
KfW Financial Information 2017 Consolidated financial statements
(31) Net gains/losses from other financial instruments measured at fair value
Analysis of Net gains/losses from other financial instruments measured at fair value by class
| | | | | | | | | | | | | | | | | | | | |
| | | | | | 2017 | | | | | | 2016 | | | | | | Change | | |
| | | | | | EUR in millions | | | | | | EUR in millions | | | | | | EUR in millions | | |
| | | | | | | | | | |
Net gains/losses from securities and investments | | | | | | –54 | | | | | | 74 | | | | | | –128 | | |
Assets | | | | | | –54 | | | | | | 74 | | | | | | –128 | | |
Liabilities to banks and customers | | | | | | 74 | | | | | | –15 | | | | | | 89 | | |
Certificated liabilities | | | | | | 74 | | | | | | 122 | | | | | | –48 | | |
Liabilities | | | | | | 148 | | | | | | 107 | | | | | | 40 | | |
Financial derivatives not qualifying for hedge accounting | | | | | | –459 | | | | | | –128 | | | | | | –331 | | |
Credit derivatives | | | | | | –11 | | | | | | 2 | | | | | | –13 | | |
Derivative financial instruments | | | | | | –470 | | | | | | –126 | | | | | | –344 | | |
Foreign currency translation | | | | | | –20 | | | | | | 0 | | | | | | –20 | | |
Total | | | | | | –397 | | | | | | 55 | | | | | | –452 | | |
Net gains/losses from Liabilities to banks and customers include the result of the credit-linked notes issued using the PROMISE and PROVIDE synthetic securitisation platforms. The net gains/losses from Credit derivatives include the result from the portfolio CDSs concluded via these platforms.
Net gains/losses from financial derivatives not qualifying for hedge accounting are attributable to derivatives in economic hedges. Economic hedges are mainly recognised by exercising the fair value option for the hedged items. The hedged items include, in particular, borrowings in the form of Certificated liabilities and Liabilities to banks and customers as well as securities and investments.
In addition, the net gains/losses from financial derivatives that do not qualify for hedge accounting include fair value changes of embedded derivatives from the lending and equity finance business which are separable. Furthermore, this line item includes gains/losses from embedded derivatives from financial liabilities that are bifurcated; the net gains/losses from the valuation of the associated hedging derivatives are thus compensated for.
Analysis of Net gains/losses from securities and investments measured at fair value by product type
| | | | | | | | | | | | | | | | | | | | |
| | | | | | 2017 | | | | | | 2016 | | | | | | Change | | |
| | | | | | EUR in millions | | | | | | EUR in millions | | | | | | EUR in millions | | |
| | | | | | | | | | |
| Bonds and other fixed-income securities | | | | | | –3 | | | | | | –4 | | | | | | 1 | | |
Equity investments | | | | | | –52 | | | | | | 78 | | | | | | –129 | | |
Total | | | | | | –54 | | | | | | 74 | | | | | | –128 | | |
87
KfW Financial Information 2017 Consolidated financial statements
Analysis of net gains/losses from credit derivatives and credit-linked notes from the PROMISE and PROVIDE synthetic securisation platforms measured at fair value
| | | | | | | | | | | | | | | | | | | | |
| | | | | | 2017 | | | | | | 2016 | | | | | | Change | | |
| | | | | | EUR in millions | | | | | | EUR in millions | | | | | | EUR in millions | | |
| | | | | | | | | | |
CDSs | | | | | | –11 | | | | | | 2 | | | | | | –13 | | |
Issued credit-linked notes | | | | | | 11 | | | | | | –2 | | | | | | 13 | | |
Total | | | | | | 0 | | | | | | 0 | | | | | | 0 | | |
Gross analysis of results from economically hedged borrowings: Comparison of hedged items and
hedging instruments
| | | | | | | | | | | | | | | | | | | | |
| | | | | | 2017 | | | | | | 2016 | | | | | | Change | | |
| | | | | | EUR in millions | | | | | | EUR in millions | | | | | | EUR in millions | | |
| | | | | | | | | | |
Borrowings | | | | | | 137 | | | | | | 110 | | | | | | 27 | | |
Hedging instruments | | | | | | –349 | | | | | | 74 | | | | | | –423 | | |
Total (Net effect of economic hedges) | | | | | | –212 | | | | | | 183 | | | | | | –395 | | |
(32) Net gains/losses from securities and investments
Analysis of Net gains/losses from securities and investments by class
| | | | | | | | | | | | | | | | | | | | |
| | | | | | 2017 | | | | | | 2016 | | | | | | Change | | |
| | | | | | EUR in millions | | | | | | EUR in millions | | | | | | EUR in millions | | |
| | | | | | | | | | |
Bonds and other fixed-income securities | | | | | | 25 | | | | | | 23 | | | | | | 2 | | |
Shares and other non-fixed income securities | | | | | | 0 | | | | | | 0 | | | | | | 0 | | |
Equity investments | | | | | | –25 | | | | | | –25 | | | | | | 0 | | |
Shares in subsidiaries not included in the consolidated financial statements | | | | | | 0 | | | | | | –8 | | | | | | 8 | | |
Total | | | | | | 0 | | | | | | –10 | | | | | | 10 | | |
The net gains/losses from securities and investments include gains and losses realised from the sale and impairment of Securities and investments classified as available- for-sale financial assets, loans and receivables or held-to-maturity investments.
In the reporting year, equity instruments at a carrying amount of EUR 79 million (2016: EUR 106 million), for which the fair value could not be reliably determined, were disposed of. This generated a realised net gain of EUR 12 million (2016: EUR –8 million), which is contained in the net gains/losses from equity investments.
88
KfW Financial Information 2017 Consolidated financial statements
Disclosures on impairment of securities and investments
| | | | | | | | | | | | | | | | | | | | |
| | | | | | 2017 | | | | | | 2016 | | | | | | Change | | |
| | | | | | EUR in millions | | | | | | EUR in millions | | | | | | EUR in millions | | |
| | | | | | | | | | |
Securities and investments | | | | | | 43 | | | | | | 32 | | | | | | 11 | | |
Bonds and other fixed-income securities | | | | | | 1 | | | | | | 3 | | | | | | –2 | | |
Equity investments | | | | | | 42 | | | | | | 20 | | | | | | 21 | | |
Shares in subsidiaries not included in the consolidated financial statements | | | | | | 0 | | | | | | 9 | | | | | | –9 | | |
Disclosures on the reversal of impairment losses from securities and investments
| | | | | | | | | | | | | | | | | | | | |
| | | | | | 2017 | | | | | | 2016 | | | | | | Change | | |
| | | | | | EUR in millions | | | | | | EUR in millions | | | | | | EUR in millions | | |
| | | | | | | | | | |
Securities and investments | | | | | | 25 | | | | | | 23 | | | | | | 2 | | |
Bonds and other fixed-income securities | | | | | | 25 | | | | | | 23 | | | | | | 2 | | |
(33) Net gains/losses from investments accounted for using the equity method
| | | | | | | | | | | | | | | | | | | | |
| | | | | | 2017 | | | | | | 2016 | | | | | | Change | | |
| | | | | | EUR in millions | | | | | | EUR in millions | | | | | | EUR in millions | | |
Net gains/losses from investments accounted for using the equity method | | | | | | 22 | | | | | | 21 | | | | | | 1 | | |
89
KfW Financial Information 2017 Consolidated financial statements
(34) Administrative expense
Analysis of Administrative expense
| | | | | | | | | | | | | | | | | | | | |
| | | | | | 2017 | | | | | | 2016 | | | | | | Change | | |
| | | | | | EUR in millions | | | | | | EUR in millions | | | | | | EUR in millions | | |
| | | | | | | | | | |
Wages and salaries | | | | | | 517 | | | | | | 506 | | | | | | 11 | | |
Social security contributions | | | | | | 73 | | | | | | 68 | | | | | | 5 | | |
Expense for pension provision and other employee benefits | | | | | | 78 | | | | | | 61 | | | | | | 18 | | |
Personnel expense | | | | | | 668 | | | | | | 634 | | | | | | 34 | | |
Other administrative expense | | | | | | 487 | | | | | | 456 | | | | | | 31 | | |
Depreciation, amortisation and impairment of property, plant and equipment and intangible assets | | | | | | 92 | | | | | | 108 | | | | | | –16 | | |
Non-personnel expense | | | | | | 579 | | | | | | 565 | | | | | | 15 | | |
Total | | | | | | 1,247 | | | | | | 1,199 | | | | | | 49 | | |
Other administrative expenses include rental expenses arising from Operating leases in the amount of EUR 14 million (2016: EUR 13 million).
(35) Net other operating income or loss
Analysis of Net other operating income or loss
| | | | | | | | | | | | | | | | | | | | |
| | | | | | 2017 | | | | | | 2016 | | | | | | Change | | |
| | | | | | EUR in millions | | | | | | EUR in millions | | | | | | EUR in millions | | |
| | | | | | | | | | |
Other operating income | | | | | | 36 | | | | | | 135 | | | | | | –99 | | |
Other operating expense | | | | | | 39 | | | | | | 33 | | | | | | 6 | | |
Total | | | | | | –2 | | | | | | 102 | | | | | | –105 | | |
Other operating income includes income from the reversal of other provisions and accruals in the amount of EUR 17 million (2016: EUR 18 million) and income from repurchasing own issues in the amount of EUR 5 million (2016: EUR 1 million). Income from the waiver of repayment of a part of the ERP subordinated loan in the amount of EUR 100 million was collected in 2016.
Other operating expense includes contributions payable by KfW IPEX-Bank GmbH to the restructuring fund for banks in the amount of EUR 13 million (2016: EUR 11 million). KfW is not obligated to contribute to the fund in accordance with Section 2 of the Restructuring Fund Act (Restrukturierungsfondsgesetz – “RStrukFG”).
90
KfW Financial Information 2017 Consolidated financial statements
(36) Taxes on income
Analysis of Taxes on income by component
| | | | | | | | | | | | | | | | | | | | |
| | | | | | 2017 | | | | | | 2016 | | | | | | Change | | |
| | | | | | EUR in millions | | | | | | EUR in millions | | | | | | EUR in millions | | |
| | | | | | | | | | |
Current taxes on income | | | | | | 36 | | | | | | 36 | | | | | | 0 | | |
Deferred taxes | | | | | | –10 | | | | | | –58 | | | | | | 47 | | |
Total | | | | | | 26 | | | | | | –21 | | | | | | 47 | | |
Deferred tax assets resulted in tax income of EUR 10 million (2016: EUR 58 million in tax income). This resulted from the changed recognition of temporary differences and the recognition of tax loss carryforwards.
The reconciliation presents the relationship between the calculated income tax expense for the financial year and reported taxes on income.
Tax reconciliation
| | | | | | | | | | | | | | | | | | | | |
| | | | | | 2017 | | | | | | 2016 | | | | | | Change | | |
| | | | | | EUR in millions | | | | | | EUR in millions | | | | | | EUR in millions | | |
| | | | | | | | | | |
Profit/loss from operating activities (before taxes) | | | | | | 1,453 | | | | | | 1,980 | | | | | | –527 | | |
Group income tax rate | | | | | | 0% | | | | | | 0% | | | | | | 0% | | |
Calculated income tax expense | | | | | | 0 | | | | | | 0 | | | | | | 0 | | |
Effects of tax rate differentials within the group | | | | | | 32 | | | | | | 9 | | | | | | 23 | | |
Effect of tax rate changes | | | | | | 0 | | | | | | 0 | | | | | | 0 | | |
Effects of previous year taxes recorded in the reporting year | | | | | | 2 | | | | | | 2 | | | | | | 0 | | |
Effects of non-deductible taxes on income | | | | | | 7 | | | | | | 7 | | | | | | 0 | | |
Effects of non-deductible business expenses | | | | | | 14 | | | | | | 12 | | | | | | 2 | | |
Effects of tax-free income | | | | | | 1 | | | | | | 16 | | | | | | –15 | | |
Trade tax add-ons/reductions | | | | | | 1 | | | | | | 1 | | | | | | 0 | | |
Permanent accounting differences | | | | | | –2 | | | | | | 0 | | | | | | –2 | | |
Effects of changes in recognised deferred tax assets | | | | | | –29 | | | | | | –68 | | | | | | 39 | | |
Reported taxes on income | | | | | | 26 | | | | | | –21 | | | | | | 47 | | |
KfW’s applicable income tax rate of 0%, on which the reconciliation is based, takes into account the tax status of KfW as a non-taxable public-law institution and the major effect of this status on profit/loss from operating activities.
The effects of tax rate differentials result from individual group companies being taxable and the related different tax rates. The tax rates continue to range from 0% to 32%.
91
KfW Financial Information 2017 Consolidated financial statements
(37) Other comprehensive income
Analysis of Other comprehensive income by class
| | | | | | | | | | | | | | | | | | | | |
| | | | | | 2017 | | | | | | 2016 | | | | | | Change | | |
| | | | | | EUR in millions | | | | | | EUR in millions | | | | | | EUR in millions | | |
| | | | | | | | | | |
Amounts reclassifiable to the income statement | | | | | | 202 | | | | | | 60 | | | | | | 142 | | |
Financial instruments | | | | | | 208 | | | | | | 59 | | | | | | 149 | | |
Bonds and other fixed-income securities | | | | | | 44 | | | | | | 59 | | | | | | –16 | | |
Shares and other non-fixed income securities | | | | | | 0 | | | | | | 0 | | | | | | 0 | | |
Equity investments | | | | | | 165 | | | | | | 0 | | | | | | 165 | | |
Deferred taxes on financial instruments | | | | | | –6 | | | | | | 0 | | | | | | –7 | | |
Investments accounted for using the equity method | | | | | | 0 | | | | | | 0 | | | | | | 0 | | |
Amounts not reclassified to the income statement | | | | | | 79 | | | | | | –207 | | | | | | 285 | | |
Defined benefit pension obligations | | | | | | 82 | | | | | | –221 | | | | | | 303 | | |
Deferred taxes on defined benefit pension obligations | | | | | | –3 | | | | | | 15 | | | | | | –18 | | |
Total | | | | | | 281 | | | | | | –147 | | | | | | 428 | | |
Other comprehensive income comprises amounts recognised directly in equity under Revaluation reserves. These amounts include income and expenses from financial instruments classified as available-for-sale financial assets, changes in actuarial gains and losses for defined benefit obligations, and changes in deferred taxes reported depending on the underlying transaction.
Analysis of reclassification amounts included in the income statement by class
| | | | | | | | | | | | | | | | | | | | |
| | | | | | 2017 | | | | | | 2016 | | | | | | Change | | |
| | | | | | EUR in millions | | | | | | EUR in millions | | | | | | EUR in millions | | |
| | | | | | | | | | |
Amounts relating to the reclassification of financial instruments | | | | | | 6 | | | | | | 8 | | | | | | –2 | | |
Bonds and other fixed-income securities | | | | | | 6 | | | | | | 8 | | | | | | –2 | | |
Shares and other non-fixed income securities | | | | | | 0 | | | | | | 0 | | | | | | 0 | | |
Equity investments | | | | | | 0 | | | | | | 0 | | | | | | 0 | | |
Subordinated assets | | | | | | 0 | | | | | | 0 | | | | | | 0 | | |
Amounts relating to the reclassification of deferred taxes on financial instruments | | | | | | 0 | | | | | | 0 | | | | | | 0 | | |
Amounts relating to the reclassification of investments accounted for using the equity method | | | | | | 0 | | | | | | 0 | | | | | | 0 | | |
Total | | | | | | 6 | | | | | | 8 | | | | | | –2 | | |
The reclassification amounts detailed in the table above represent income and expenses which were accounted for through profit or loss during the reporting period and which were previously recognised directly in equity in the Revaluation reserves. They also include amortisation of Revaluation reserves related to the reclassification of Securities and investments from the measurement category available-for-sale financial assets to the loans and receivables measurement category. Income recognised in the income statement is reported with a negative sign preceding the amount and expenses are presented with a positive sign.
92
KfW Financial Information 2017 Consolidated financial statements
Segment reporting
(38) Segment reporting by business sector
In accordance with the provisions of IFRS 8, segment reporting follows the internal management reporting system, which is used by the group’s main decision-makers to assess each segment’s performance and to allocate resources to segments.
In accordance with the business sector structure for KfW Group, the segments and their products and services can be presented as follows:
| | | | |
| | |
| Mittelstandsbank (SME Bank) | | | | – Financing of corporate investments and industrial pollution control investments – Equity financing |
| | | | |
| | |
Kommunal- und Privatkundenbank/Kreditinstitute (Municipal and Private Client Bank/Credit Institutions) | | | | – Financing for housing construction and modernisation – Education financing – Infrastructure and social finance – Global funding of promotional institutions of the German Federal States (Landesförderinstitute) – Individual financing of banks – Transactions on behalf of the Federal Government |
| | | | |
| | |
| Export and project finance | | | | – Financing for German and European export activities – Financing for projects and investments in line with German and European interests |
| | | | |
| Promotion of developing countries and emerging economies | | | | – Promotion of developing countries and emerging economies on behalf of the Federal Government (budget funds) with complementary market funds raised by KfW – Financing provided by DEG – Deutsche Investitions- und Entwicklungsgesellschaft mbH (private enterprise financing) |
| | | | |
| Financial markets | | | | – Securities and money market investments – Holding arrangements for the Federal Republic of Germany – Transactions mandated by the Federal Government, loan granted to Greece – Funding |
| | | | |
| Head office | | | | – Central interest rate and currency management – Strategic equity investments |
The business sectors are measured on the basis of their contribution to consolidated profit. The individual line items are based on the following methods:
| | – | Net interest income (before promotional expense) comprises interest margins from lending business calculated on the basis of the market interest rate method.1) The item also includes the imputed return on equity with an analysis based on economic capital usage. Head office also includes the treasury result, which largely comprises the income/loss from interest rate and spread management. The profit contribution from KfW funding2) is allocated to the Financial markets business sector. |
| | – | The promotional expense included in interest, commission and administrative expenses in the income statement is reported separately pursuant to the internal management report due to the special relevance of promotional expense as a management variable. |
1) Funding at matching maturities using KfW’s internal refinancing curve is assumed for the calculation of interest margins under this method.
2) The difference between the realised refinancing rates and the maturity-matched refinancing rates calculated in-house.
93
KfW Financial Information 2017 Consolidated financial statements
Promotional expense is understood to mean certain expenses of the two business sectors Mittelstandsbank (SME Bank) and Kommunal- und Privatkundenbank/Kredit-institute (Municipal and Private Client Bank/Credit Institutions) with a positive impact on the achievement of KfW’s promotional objectives. Promotional expense primarily consists of additions of the interest rate reductions3) accounted for at present value from new commitments and also comprises the compounding effect. Additional support components are the expense for consultancy grants (until 31 December 2016) and sales partner incentives through upfront fees (included in Commission expense) as well as for available and product-related marketing and sales measures (included in Administrative expense).
| | – | The allocation of Administrative expense (before promotional expense) is based on the results from activity-based accounting by cost centres.4) Administrative expense (before promotional expense) includes depreciation on property, plant and equipment and amortisation of intangible assets. |
| | – | In the Risk provisions for lending business item, net impairment charges, direct write-offs and recoveries on loans written off are distributed among the segments according to the underlying loan. |
| | – | The Valuation result comprises the net gains/losses from hedge accounting, the Net gains/losses from other financial instruments at fair value, the Net gains/losses from securities and investments, the Net gains/losses from investments accounted for using the equity method and net other operating income. |
| | – | When Taxes on income are allocated to the business sectors (excluding the Head office), only the current taxes on income are taken in account. Deferred taxes are allocated to the Head office. |
| | – | The reported Economic capital requirement covers all types of risk under the definition of economic capital requirements in the risk report section of the group management report. |
| | – | Segment assets are not reported as, in accordance with the internal management reporting system, they are used neither to assess each segment’s performance nor to allocate resources to segments. |
| | – | The presentation of segment income and expenses is based on consolidated figures. Administrative and commission expense as well as commission income and other operating income resulting from service relationships within KfW Group are adjusted in segment reporting. Any remaining negligible consolidation effects are reported in the reconciliation/consolidation column. |
| 3) | See note regarding “KfW’s promotional lending business” for details of KfW’s interest rate reductions in the promotional lending business. The present value of the nominal scheduled interest rate reductions, which is recognised as interest expense in profit or loss, is allocated to the Mittelstandsbank (SME Bank) and Kommunal- und Privatkundenbank/Kreditinstitute (Municipal and Private Client Bank/Credit Institutions) business sectors. The compounding effect on the present values contained in interest expense is allocated to the Head office for simplicity’s sake. |
| 4) | The costs incurred in the organisational units are largely allocated to the products by means of core services. |
94
KfW Financial Information 2017 Consolidated financial statements
Segment reporting by business sector for the financial year 2017
| | | | | | | | | | | | | | | | | | | | | | | | | | | | | | | | | | | | | | |
| | | | | | | | | | | | | | | | | | |
| | | | | | | Mittel- stands- bank (SME Bank)1) | | | | Kommunal- und Privat- kunden- bank/ Kredit- institute (Municipal and Private Client Bank/Credit Institutions) | | | | Export and project finance1) | | | | Promotion of devel- oping coun- tries and emerging economies1) | | | | Financial markets | | | | Head office | | | | Reconcili- ation/con- solidation | | | | | | KfW Group | | |
| | | | | | | EUR in millions | | | | EUR in millions | | | | EUR in millions | | | | EUR in millions | | | | EUR in millions | | | | EUR in millions | | | | EUR in millions | | | | | | EUR in millions | | |
| | | | | | | | | | | | | | | | | | |
| Volume of new commitments | | | | | | 21,899 | | | | 29,913 | | | | 13,751 | | | | 9,749 | | | | 1,541 | | | | 0 | | | | –372 | | | | | | 76,481 | | |
Net interest income (before promotional expense) | | | | | | 205 | | | | 366 | | | | 798 | | | | 381 | | | | 235 | | | | 596 | | | | –3 | | | | | | 2,579 | | |
Net commission income (before promotional expense) | | | | | | 6 | | | | 91 | | | | 21 | | | | 198 | | | | 0 | | | | 0 | | | | 0 | | | | | | 316 | | |
Administrative expense (before promotional expense) | | | | | | 185 | | | | 275 | | | | 238 | | | | 389 | | | | 88 | | | | 58 | | | | 0 | | | | | | 1,234 | | |
Operating result before valuation (before promotional expense) | | | | | | 25 | | | | 183 | | | | 581 | | | | 189 | | | | 147 | | | | 539 | | | | –3 | | | | | | 1,661 | | |
Risk provisions for lending business | | | | | | 1 | | | | –80 | | | | –89 | | | | –42 | | | | 2 | | | | 0 | | | | 0 | | | | | | –209 | | |
Valuation result | | | | | | 31 | | | | 0 | | | | –2 | | | | –31 | | | | 4 | | | | 209 | | | | 3 | | | | | | 214 | | |
Profit/loss from operating activities (before promotional expense) | | | | | | 57 | | | | 103 | | | | 489 | | | | 117 | | | | 152 | | | | 748 | | | | 0 | | | | | | 1,667 | | |
Promotional expense | | | | | | 176 | | | | 17 | | | | 0 | | | | 0 | | | | 0 | | | | 20 | | | | 0 | | | | | | 213 | | |
Taxes on income | | | | | | 1 | | | | 0 | | | | 21 | | | | 10 | | | | 0 | | | | –5 | | | | 0 | | | | | | 26 | | |
Consolidated profit | | | | | | –120 | | | | 86 | | | | 469 | | | | 107 | | | | 152 | | | | 733 | | | | 0 | | | | | | 1,427 | | |
Economic capital requirement | | | | | | 3,593 | | | | 5,289 | | | | 1,307 | | | | 1,947 | | | | 1,137 | | | | 4,956 | | | | 0 | | | | | | 18,228 | | |
| 1) | The valuation result of the business sectors contains the following net gains/losses from investments accounted for using the equity method: Mittelstandsbank (SME Bank) EUR –2.8 million, Export and project finance EUR 17.4 million and Promotion of developing countries and emerging economies EUR 7.2 million. |
95
KfW Financial Information 2017 Consolidated financial statements
Segment reporting by business sector for the financial year 2016
| | | | | | | | | | | | | | | | | | | | | | | | | | | | | | | | | | | | |
| | | | | | | | | | | | | | | | | | |
| | | | | Mittel- stands- bank (SME Bank)1) | | | | Kommunal- und Privat- kunden- bank/ Kredit- institute (Municipal and Private Client Bank/Credit Institutions) | | | | Export and project finance1) | | | | Promotion of devel- oping coun- tries and emerging economies1) | | | | Financial markets | | | | Head office | | | | Reconcili- ation/con- solidation | | | | | | KfW Group | | |
| | | | | EUR in millions | | | | EUR in millions | | | | EUR in millions | | | | EUR in millions | | | | EUR in millions | | | | EUR in millions | | | | EUR in millions | | | | | | EUR in millions | | |
| | | | | | | | | | | | | | | | | | |
| Volume of new commitments | | | | 21,388 | | | | 33,698 | | | | 16,072 | | | | 8,844 | | | | 1,274 | | | | 0 | | | | –273 | | | | | | 81,002 | | |
Net interest income (before promotional expense) | | | | 205 | | | | 380 | | | | 853 | | | | 400 | | | | 224 | | | | 742 | | | | 0 | | | | | | 2,802 | | |
Net commission income (before promotional expense) | | | | 12 | | | | 54 | | | | 26 | | | | 195 | | | | –7 | | | | 0 | | | | 0 | | | | | | 280 | | |
Administrative expense (before promotional expense) | | | | 177 | | | | 263 | | | | 233 | | | | 364 | | | | 92 | | | | 54 | | | | 0 | | | | | | 1,185 | | |
Operating result before valuation (before promotional expense) | | | | 39 | | | | 171 | | | | 645 | | | | 230 | | | | 124 | | | | 688 | | | | 0 | | | | | | 1,898 | | |
Risk provisions for lending business | | | | 21 | | | | –37 | | | | –134 | | | | –93 | | | | 0 | | | | 93 | | | | 0 | | | | | | –150 | | |
Valuation result | | | | 12 | | | | –8 | | | | –13 | | | | 78 | | | | 13 | | | | 380 | | | | 1 | | | | | | 463 | | |
Profit/loss from operating activities (before promotional expense) | | | | 72 | | | | 126 | | | | 499 | | | | 215 | | | | 138 | | | | 1,160 | | | | 1 | | | | | | 2,210 | | |
Promotional activity | | | | 170 | | | | 32 | | | | 0 | | | | 0 | | | | 0 | | | | 28 | | | | 0 | | | | | | 230 | | |
Taxes on income | | | | 0 | | | | 0 | | | | 14 | | | | 15 | | | | 0 | | | | –51 | | | | 0 | | | | | | –21 | | |
Consolidated profit | | | | –98 | | | | 94 | | | | 484 | | | | 200 | | | | 138 | | | | 1,183 | | | | 1 | | | | | | 2,002 | | |
Economic capital requirement | | | | 1,938 | | | | 2,109 | | | | 1,893 | | | | 2,440 | | | | 1,181 | | | | 5,357 | | | | 0 | | | | | | 14,919 | | |
| 1) | The valuation result of the business sectors includes the following net gains/losses from investments accounted for using the equity method: Mittelstandsbank (SME Bank) EUR 8.3 million, Export and project finance EUR 8.3 million and Promotion of developing countries and emerging economies EUR 4.3 million. |
The reconciliation/consolidation column includes all adjustments that were necessary to reconcile segment information with the aggregated information for KfW Group. The consolidation effects reported for “Volume of new commitments” relate to commitments for programme loans made by Mittelstandsbank (SME Bank) and Kommunal- und Privatkundenbank/Kreditinstitute (Municipal and Private Client Bank/Credit Institutions) for which KfW IPEX-Bank acts as on-lending bank. The other amounts in this column result from minimal consolidation effects.
96
KfW Financial Information 2017 Consolidated financial statements
(39) Segment reporting by region
Net interest and commission income are allocated on the basis of the customers’ geographical location. The imputed return on equity included in net interest income, the profit contribution from KfW funding and the treasury result are allocated to Germany. KfW receives commission income from the Federal Government for supporting developing countries and emerging economies using budget funds of the Federal Government. This is allocated according to the region of the country receiving the investment. The commission expense paid to special purpose entities resulting from the asset securitisation platforms is distributed according to the geographical location of the originator bank.
Property, plant and equipment and intangible assets are not reported according to region because, apart from immaterial amounts, these assets relate to Germany.
Segment reporting by region for the financial year 2017
| | | | | | | | | | | | | | | | | | | | | | | | | | | | | | | | | | |
| | | | | Germany | | | | | | Europe (excl. Germany) | | | | | | Rest of the world | | | | | | Reconciliation/ consolidation | | | | | | | | KfW Group | | | | |
| | | | | EUR in millions | | | | | | EUR in millions | | | | | | EUR in millions | | | | | | EUR in millions | | | | | | | | EUR in millions | | | |
Net interest income | | | | 1,330 | | | | | | 420 | | | | | | 646 | | | | | | –3 | | | | | | | | 2,393 | | | | |
Net commission income | | | | 87 | | | | | | 30 | | | | | | 185 | | | | | | 0 | | | | | | | | 303 | | | | |
Segment income | | | | 1,417 | | | | | | 450 | | | | | | 831 | | | | | | –3 | | | | | | | | 2,695 | | | | |
Segment reporting by region for the financial year 2016 | | | | |
| | |
| | | | | Germany | | | | | | Europe (excl. Germany) | | | | | | Rest of the world | | | | | | Reconciliation/ consolidation | | | | | | | | KfW Group | | | | |
| | | | | EUR in millions | | | | | | EUR in millions | | | | | | EUR in millions | | | | | | EUR in millions | | | | | | | | EUR in millions | | | |
Net interest income | | | | 1,517 | | | | | | 458 | | | | | | 636 | | | | | | 0 | | | | | | | | 2,610 | | | | |
Net commission income | | | | 51 | | | | | | 24 | | | | | | 183 | | | | | | 0 | | | | | | | | 257 | | | | |
Segment income | | | | 1,567 | | | | | | 481 | | | | | | 818 | | | | | | 0 | | | | | | | | 2,867 | | | | |
The reconciliation/consolidation column includes all adjustments that were necessary to reconcile segment information with the aggregated information for KfW Group. The amounts in this column result solely from minimal consolidation effects.
97
KfW Financial Information 2017 Consolidated financial statements
Notes to the statement
of financial position
(40) Cash reserves
Analysis of Cash reserves by class
| | | | | | | | | | | | | | | | | | | | |
| | | | | | | 31 Dec. 2017 | | | | | | 31 Dec. 2016 | | | | | | Change | | |
| | | | | | | EUR in millions | | | | | | EUR in millions | | | | | | EUR in millions | | |
| Cash | | | | | | 0 | | | | | | 0 | | | | | | 0 | | |
Balances with central banks | | | | | | 11,087 | | | | | | 11,572 | | | | | | –485 | | |
Total | | | | | | 11,087 | | | | | | 11,573 | | | | | | –485 | | |
(41) Loans and advances to banks
Analysis of Loans and advances to banks by class
| | | | | | | | | | | | | | | | | | | | |
| | | | | | | 31 Dec. 2017 | | | | | | 31 Dec. 2016 | | | | | | Change | | |
| | | | | | | EUR in millions | | | | | | EUR in millions | | | | | | EUR in millions | | |
| | | | | | | | | | |
Money-market transactions | | | | | | 10,390 | | | | | | 11,771 | | | | | | –1,381 | | |
Loans and advances | | | | | | 256,280 | | | | | | 251,833 | | | | | | 4,447 | | |
Other receivables | | | | | | 7,626 | | | | | | 12,318 | | | | | | –4,692 | | |
Total | | | | | | 274,296 | | | | | | 275,922 | | | | | | –1,626 | | |
An adjustment to the carrying amount totalling EUR 1,185 million (31 Dec. 2016: EUR 1,357 million) is reported under Loans and advances due to the interest rate being below the market rate for promotional loans paid out with additional promotional funds in the form of interest rate reductions with an impact on KfW’s earnings position.
The receivables from reverse repurchase agreements (reverse “repos”), cash collateral pledged and the PROMISE and PROVIDE synthetic securitisation platforms are included in Other receivables.
Analysis of Loans and advances to banks by underwriting liability type
| | | | | | | | | | | | | | | | | | | | | | | | | | | | |
| | | | | | | 31 Dec. 2017 | | | | | | | | | | 31 Dec. 2016 | | | | | | | | | | Change | | |
| | | | | | | EUR in millions | | | | | | | | | | EUR in millions | | | | | | | | | | EUR in millions | | |
Direct loans to banks | | | | | | 72,111 | | | | | | | | | | 79,099 | | | | | | | | | | –6,988 | | |
On-lent customer loans with full underwriting borne by the on-lending commercial bank | | | | | | 182,449 | | | | | | | | | | 171,293 | | | | | | | | | | 11,157 | | |
On-lent customer loans with partial underwriting borne by the on-lending commercial bank | | | | | | 2,191 | | | | | | | | | | 2,340 | | | | | | | | | | –149 | | |
Direct and on-lent subordinated loans | | | | | | 714 | | | | | | | | | | 459 | | | | | | | | | | 255 | | |
Adjustment to the carrying amount due to the interest rate being below the market rate for promotional loans paid out with additional promotional funds in the form of interest rate reductions with an impact on KfW’s earning position | | | | | | –1,185 | | | | | | | | | | –1,357 | | | | | | | | | | 172 | | |
Total | | | | | | 256,280 | | | | | | | | | | 251,833 | | | | | | | | | | 4,447 | | |
Direct loans to banks include in particular global loans granted as part of financing for domestic housing construction and SMEs.
98
KfW Financial Information 2017 Consolidated financial statements
(42) Loans and advances to customers
Analysis of Loans and advances to customers by class
| | | | | | | | | | | | | | | | | | | | |
| | | | | | | 31 Dec. 2017 | | | | | | 31 Dec. 2016 | | | | | | Change | | |
| | | | | | | EUR in millions | | | | | | EUR in millions | | | | | | EUR in millions | | |
Money-market transactions | | | | | | 5,156 | | | | | | 9,592 | | | | | | –4,435 | | |
Loans and advances | | | | | | 122,156 | | | | | | 126,038 | | | | | | –3,882 | | |
Other receivables | | | | | | 639 | | | | | | 1,074 | | | | | | –436 | | |
Total | | | | | | 127,951 | | | | | | 136,704 | | | | | | –8,753 | | |
An adjustment to the carrying amount totalling EUR 111 million (31 Dec. 2016: EUR 142 million) is reported under Loans and advances due to the interest rate being below the market rate for promotional loans paid out with additional promotional funds in the form of interest rate reductions with an impact on KfW’s earnings position.
Analysis of Loans and advances to customers by underwriting liability type
| | | | | | | | | | | | | | | | | | | | |
| | | | | | | 31 Dec. 2017 | | | | | | 31 Dec. 2016 | | | | | | Change | | |
| | | | | | | EUR in millions | | | | | | EUR in millions | | | | | | EUR in millions | | |
Direct loans to customers | | | | | | 119,427 | | | | | | 122,564 | | | | | | –3,136 | | |
On-lent customer loans without underwriting borne by the on-lending commercial bank | | | | | | 234 | | | | | | 350 | | | | | | –117 | | |
Customer loans on-lent through insurance companies with full underwriting borne by the on-lending insurance company | | | | | | 621 | | | | | | 469 | | | | | | 152 | | |
Direct subordinated loans and subordinated loans on-lent through commercial banks and insurance companies | | | | | | 1,985 | | | | | | 2,797 | | | | | | –812 | | |
Adjustment to the carrying amount due to the interest rate being below the market rate for promotional loans paid out with additional promotional funds in the form of interest rate reductions with an impact on KfW’s earnings position | | | | | | –111 | | | | | | –142 | | | | | | 31 | | |
Total | | | | | | 122,156 | | | | | | 126,038 | | | | | | –3,882 | | |
Direct loans to customers include in particular loans granted under export and project financing, municipal financing and education financing. The item also includes loans connected with certain transactions mandated by the Federal Government in accordance with the KfW Law.
99
KfW Financial Information 2017 Consolidated financial statements
(43) Risk provisions for lending business
Analysis of Risk provisions for lending business by class
| | | | | | | | | | | | | | | | | | | | |
| | | | | | | 31 Dec. 2017 | | | | | | 31 Dec. 2016 | | | | | | Change | | |
| | | | | | | EUR in millions | | | | | | EUR in millions | | | | | | EUR in millions | | |
Loans and advances to banks | | | | | | 177 | | | | | | 171 | | | | | | 6 | | |
Loans and advances to customers | | | | | | 1,280 | | | | | | 1,439 | | | | | | –159 | | |
Provisions for losses on loans and advances | | | | | | 1,457 | | | | | | 1,610 | | | | | | –153 | | |
Provisions for contingent liabilities and irrevocable loan commitments | | | | | | 61 | | | | | | 44 | | | | | | 17 | | |
Total | | | | | | 1,517 | | | | | | 1,654 | | | | | | –136 | | |
Provisions for losses on loans and advances also include money market investments and reverse repos.
Development of Risk provisions for lending business in the financial year 2017 by risk assessment type
| | | | | | | | | | | | | | | | | | | | | | | | | | | | | | | | | | | | | | | | | | | | | | |
| | | | | | | Individually | | | | | | | | Risks assessed | | | | | | | Provisions for | | | | | | | Provisions | | | | | | | | Provisions | | | | | | | Total | | |
| | | | | | | assessed risks | | | | | | | | on a portfolio | | | | | | | losses on loans | | | | | | | (individual | | | | | | | | (portfolio | | | | | | | | | |
| | | | | | | | | | | | | | | basis | | | | | | | and advances | | | | | | | risks) | | | | | | | | risks) | | | | | | | | | |
| | | | | | | EUR in millions | | | | | | | | EUR in millions | | | | | | | EUR in millions | | | | | | | EUR in millions | | | | | | | | EUR in millions | | | | | | | EUR in millions | | |
As of 1 Jan. 2017 | | | | | | | 1,064 | | | | | | | | 546 | | | | | | | 1,610 | | | | | | | 9 | | | | | | | | 35 | | | | | | | 1,654 | | |
Additions | | | | | | | 497 | | | | | | | | 68 | | | | | | | 565 | | | | | | | 2 | | | | | | | | 14 | | | | | | | 581 | | |
Utilisation | | | | | | | –328 | | | | | | | | 0 | | | | | | | –328 | | | | | | | 0 | | | | | | | | 0 | | | | | | | –328 | | |
Reversals | | | | | | | –180 | | | | | | | | –82 | | | | | | | –261 | | | | | | | –3 | | | | | | | | –1 | | | | | | | –266 | | |
Unwinding | | | | | | | –24 | | | | | | | | 0 | | | | | | | –24 | | | | | | | 0 | | | | | | | | 0 | | | | | | | –24 | | |
Exchange rate changes | | | | | | | –67 | | | | | | | | –25 | | | | | | | –92 | | | | | | | 0 | | | | | | | | –1 | | | | | | | –94 | | |
Changes
in consolidated group | | | | | | | –6 | | | | | | | | –6 | | | | | | | –12 | | | | | | | 0 | | | | | | | | 6 | | | | | | | –6 | | |
As of 31 Dec. 2017 | | | | | | | 956 | | | | | | | | 500 | | | | | | | 1,456 | | | | | | | 8 | | | | | | | | 53 | | | | | | | 1,517 | | |
Risks assessed on a portfolio basis comprise both credit rating risks and country risks.
As of 31 Dec. 2017, EUR 54 million (31 Dec. 2016: EUR 60 million) in interest income had not been collected for impaired loans.
100
KfW Financial Information 2017 Consolidated financial statements
Development of Risk provisions for lending business in the financial year 2016 by risk assessment type
| | | | | | | | | | | | | | | | | | | | | | | | | | | | | | | | | | | | | | | | | | | | | | |
| | | | | | | Individually | | | | | | | | Risks assessed | | | | | | | Provisions for | | | | | | | Provisions | | | | | | | | Provisions | | | | | | | Total | | |
| | | | | | | assessed risks | | | | | | | | on a portfolio | | | | | | | losses on loans | | | | | | | (individual | | | | | | | | (portfolio | | | | | | | | | |
| | | | | | | | | | | | | | | basis | | | | | | | and advances | | | | | | | risks) | | | | | | | | risks) | | | | | | | | | |
| | | | | | | EUR in millions | | | | | | | | EUR in millions | | | | | | | EUR in millions | | | | | | | EUR in millions | | | | | | | | EUR in millions | | | | | | | EUR in millions | | |
As of 1 Jan. 2016 | | | | | | | 1,197 | | | | | | | | 546 | | | | | | | 1,743 | | | | | | | 19 | | | | | | | | 42 | | | | | | | 1,804 | | |
Additions | | | | | | | 692 | | | | | | | | 48 | | | | | | | 740 | | | | | | | 3 | | | | | | | | 1 | | | | | | | 744 | | |
Utilisation | | | | | | | –512 | | | | | | | | 0 | | | | | | | –512 | | | | | | | 0 | | | | | | | | 0 | | | | | | | –512 | | |
Reversals | | | | | | | –301 | | | | | | | | –54 | | | | | | | –356 | | | | | | | –13 | | | | | | | | –9 | | | | | | | –378 | | |
Unwinding | | | | | | | –32 | | | | | | | | 0 | | | | | | | –32 | | | | | | | 0 | | | | | | | | 0 | | | | | | | –32 | | |
Exchange rate changes | | | | | | | 21 | | | | | | | | 7 | | | | | | | 27 | | | | | | | 0 | | | | | | | | 0 | | | | | | | 28 | | |
Changes
in consolidated group | | | | | | | 0 | | | | | | | | 0 | | | | | | | 0 | | | | | | | 0 | | | | | | | | 0 | | | | | | | 0 | | |
As of 31 Dec. 2016 | | | | | | | 1,064 | | | | | | | | 546 | | | | | | | 1,610 | | | | | | | 9 | | | | | | | | 35 | | | | | | | 1,654 | | |
(44) Value adjustments from macro fair value hedge accounting
| | | | | | | | | | | | | | | | | | | | |
| | | | | | | 31 Dec. 2017 | | | | | | 31 Dec. 2016 | | | | | | Change | | |
| | | | | | | EUR in millions | | | | | | EUR in millions | | | | | | EUR in millions | | |
Value adjustments to assets under macro fair value hedge accounting | | | | | | 9,648 | | | | | | 13,917 | | | | | | –4,269 | | |
The fair values attributable to hedged risks in the hedged portfolios in the loans and receivables category are included in this item.
(45) Derivatives designated for hedge accounting
Analysis of derivatives with positive fair values designated for hedge accounting by type
of hedging relationship
| | | | | | | | | | | | | | | | | | | | |
| | | | | | | 31 Dec. 2017 | | | | | | 31 Dec. 2016 | | | | | | Change | | |
| | | | | | | EUR in millions | | | | | | EUR in millions | | | | | | EUR in millions | | |
Micro fair value hedge accounting | | | | | | 8,820 | | | | | | 26,471 | | | | | | –17,651 | | |
Macro fair value hedge accounting | | | | | | 254 | | | | | | 993 | | | | | | –739 | | |
Total | | | | | | 9,074 | | | | | | 27,464 | | | | | | –18,390 | | |
101
KfW Financial Information 2017 Consolidated financial statements
Analysis of derivatives with positive fair values designated for hedge accounting by class
| | | | | | | | | | | | | | | | | | | | |
| | | | | | | | | | |
| | | | | | | 31 Dec. 2017 | | | | | | 31 Dec. 2016 | | | | | | Change | | |
| | | | | | | EUR in millions | | | | | | EUR in millions | | | | | | EUR in millions | | |
Interest-related derivatives | | | | | | 3,688 | | | | | | 8,181 | | | | | | –4,492 | | |
Currency-related derivatives | | | | | | 5,386 | | | | | | 19,283 | | | | | | –13,897 | | |
Total | | | | | | 9,074 | | | | | | 27,464 | | | | | | –18,390 | | |
Only Interest-related derivatives are designated for macro fair value hedge accounting. Cross-currency swaps are presented under Currency-related derivatives.
(46) Other derivatives
Analysis of Other derivatives with positive fair values by class
| | | | | | | | | | | | | | | | | | | | |
| | | | | | | 31 Dec. 2017 | | | | | | 31 Dec. 2016 | | | | | | Change | | |
| | | | | | | EUR in millions | | | | | | EUR in millions | | | | | | EUR in millions | | |
| | | | | | | | | | |
| Interest-related derivatives | | | | | | 4,461 | | | | | | 5,515 | | | | | | –1,054 | | |
Currency-related derivatives | | | | | | 639 | | | | | | 1,776 | | | | | | –1,137 | | |
Credit derivatives | | | | | | 0 | | | | | | 1 | | | | | | –1 | | |
Miscellaneous | | | | | | 45 | | | | | | 53 | | | | | | –8 | | |
Total | | | | | | 5,145 | | | | | | 7,344 | | | | | | –2,199 | | |
Cross-currency swaps are presented under Currency-related derivatives.
Under Other derivatives are derivatives with positive fair values of EUR 92 million (31 Dec. 2016: EUR 123 million) attributable to embedded derivatives that are bifurcated.
(47) Securities and investments
Analysis of Securities and investments by class
| | | | | | | | | | | | | | | | | | | | |
| | | | | | | 31 Dec. 2017 | | | | | | 31 Dec. 2016 | | | | | | Change | | |
| | | | | | | EUR in millions | | | | | | EUR in millions | | | | | | EUR in millions | | |
| | | | | | | | | | |
| Bonds and other fixed-income securities | | | | | | 30,900 | | | | | | 30,118 | | | | | | 782 | | |
Shares and other non-fixed income securities | | | | | | 0 | | | | | | 1 | | | | | | –1 | | |
Equity investments | | | | | | 2,672 | | | | | | 2,595 | | | | | | 77 | | |
| Shares in non-consolidated subsidiaries | | | | | | 43 | | | | | | 0 | | | | | | 43 | | |
Total | | | | | | 33,615 | | | | | | 32,715 | | | | | | 900 | | |
Bonds and other fixed-income securities are recorded net of provisions for the risk of impairment losses that have already occurred but have not yet been individually identified.
102
KfW Financial Information 2017 Consolidated financial statements
(48) Investments accounted for using the equity method
| | | | | | | | | | | | | | | | | | | | |
| | | | | | | 31 Dec. 2017 | | | | | | 31 Dec. 2016 | | | | | | Change | | |
| | | | | | | EUR in millions | | | | | | EUR in millions | | | | | | EUR in millions | | |
Investments accounted for using the equity method | | | | | | 415 | | | | | | 346 | | | | | | 68 | | |
The note regarding “Disclosures on shareholdings” contains a list of Investments accounted for using the equity method.
(49) Property, plant and equipment
Analysis of Property, plant and equipment by class
| | | | | | | | | | | | | | | | | | | | |
| | | | | | | 31 Dec. 2017 | | | | | | 31 Dec. 2016 | | | | | | Change | | |
| | | | | | | EUR in millions | | | | | | EUR in millions | | | | | | EUR in millions | | |
| | | | | | | | | | |
| Land and buildings | | | | | | 856 | | | | | | 828 | | | | | | 28 | | |
Plant and equipment | | | | | | 78 | | | | | | 68 | | | | | | 10 | | |
Other property, plant and equipment | | | | | | 17 | | | | | | 35 | | | | | | –18 | | |
Total | | | | | | 950 | | | | | | 931 | | | | | | 19 | | |
Payments in advance and assets under construction are presented in Other property, plant and equipment.
Development in Property, plant and equipment in the financial year 2017
| | | | | | | | | | | | | | | | | | | | |
| | | | | | Acquisition/ | | | | | | Accumulated | | | | | | Net carrying | | |
| | | | | | production cost | | | | | | depreciation, | | | | | | amount | | |
| | | | | | | | | | | | impairment and | | | | | | | | |
| | | | | | | | | | | | reversal of im- | | | | | | | | |
| | | | | | | | | | | | | pairment losses | | | | | | | | |
| | | | | | | EUR in millions | | | | | | EUR in millions | | | | | | EUR in millions | | |
| | | | | | | | | | |
| Carrying amount as of 1 Jan. 2017 | | | | | | 1,278 | | | | | | –347 | | | | | | 931 | | |
Additions/reversals of impairment losses | | | | | | 66 | | | | | | 0 | | | | | | 66 | | |
Disposals | | | | | | –6 | | | | | | 5 | | | | | | –1 | | |
Depreciation | | | | | | 0 | | | | | | –46 | | | | | | –46 | | |
Impairment losses | | | | | | 0 | | | | | | 0 | | | | | | 0 | | |
Carrying amount as of 31 Dec. 2017 | | | | | | 1,339 | | | | | | –388 | | | | | | 951 | | |
103
KfW Financial Information 2017 Consolidated financial statements
Development in Property, plant and equipment in the financial year 2016
| | | | | | | | | | | | | | | | | | | | |
| | | | | | Acquisition/ | | | | | | Accumulated | | | | | | Net carrying | | |
| | | | | | production cost | | | | | | depreciation, | | | | | | amount | | |
| | | | | | | | | | | | impairment and | | | | | | | | |
| | | | | | | | | | | | reversal of im- | | | | | | | | |
| | | | | | | | | | | | | pairment losses | | | | | | | | |
| | | | | | | EUR in millions | | | | | | EUR in millions | | | | | | EUR in millions | | |
| | | | | | | | | | |
| Carrying amount as of 1 Jan. 2016 | | | | | | 1,232 | | | | | | –312 | | | | | | 919 | | |
Additions/reversals of impairment losses | | | | | | 64 | | | | | | 0 | | | | | | 64 | | |
Disposals | | | | | | –17 | | | | | | 17 | | | | | | –1 | | |
Depreciation | | | | | | 0 | | | | | | –42 | | | | | | –42 | | |
Impairment losses | | | | | | 0 | | | | | | –9 | | | | | | –9 | | |
Carrying amount as of 31 Dec. 2016 | | | | | | 1.278 | | | | | | –347 | | | | | | 931 | | |
(50) Intangible assets
Analysis of Intangible assets by class
| | | | | | | | | | | | | | | | | | | | |
| | | | | | | 31 Dec. 2017 | | | | | | 31 Dec. 2016 | | | | | | Change | | |
| | | | | | | EUR in millions | | | | | | EUR in millions | | | | | | EUR in millions | | |
| | | | | | | | | | |
| Software | | | | | | 206 | | | | | | 158 | | | | | | 49 | | |
Purchased software | | | | | | 138 | | | | | | 125 | | | | | | 13 | | |
Internally generated software | | | | | | 68 | | | | | | 33 | | | | | | 36 | | |
Other intangible assets | | | | | | 46 | | | | | | 77 | | | | | | –32 | | |
Total | | | | | | 252 | | | | | | 235 | | | | | | 17 | | |
Other intangible assets include, in particular, software under development.
Development in Intangible assets in the financial year 2017
| | | | | | | | | | | | | | | | | | | | |
| | | | | | Acquisition/ | | | | | | Accumulated | | | | | | Net carrying | | |
| | | | | | production cost | | | | | | amortisation, | | | | | | amount | | |
| | | | | | | | | | | | impairment and | | | | | | | | |
| | | | | | | | | | | | reversal of im- | | | | | | | | |
| | | | | | | | | | | | | pairment losses | | | | | | | | |
| | | | | | | EUR in millions | | | | | | EUR in millions | | | | | | EUR in millions | | |
| | | | | | | | | | |
| Carrying amount as of 1 Jan. 2017 | | | | | | 338 | | | | | | –103 | | | | | | 235 | | |
Changes in consolidated group | | | | | | 0 | | | | | | 0 | | | | | | 0 | | |
Additions/reversals of impairment losses | | | | | | 64 | | | | | | 0 | | | | | | 64 | | |
Disposals | | | | | | –5 | | | | | | 4 | | | | | | –2 | | |
Amortisation | | | | | | 0 | | | | | | –39 | | | | | | –39 | | |
Impairment losses | | | | | | 0 | | | | | | –7 | | | | | | –7 | | |
Carrying amount as of 31 Dec. 2017 | | | | | | 397 | | | | | | –145 | | | | | | 252 | | |
104
KfW Financial Information 2017 Consolidated financial statements
Development in Intangible assets in the financial year 2016
| | | | | | | | | | | | | | | | | | | | |
| | | | | | Acquisition/ | | | | | | Accumulated | | | | | | Net carrying | | |
| | | | | | production cost | | | | | | amortisation, | | | | | | amount | | |
| | | | | | | | | | | | impairment and | | | | | | | | |
| | | | | | | | | | | | reversal of im- | | | | | | | | |
| | | | | | | | | | | | | pairment losses | | | | | | | | |
| | | | | | | EUR in millions | | | | | | EUR in millions | | | | | | EUR in millions | | |
| | | | | | | | | | |
| Carrying amount as of 1 Jan. 2016 | | | | | | 324 | | | | | | –117 | | | | | | 206 | | |
Changes in consolidated group | | | | | | 0 | | | | | | 0 | | | | | | 0 | | |
Additions/reversals of impairment losses | | | | | | 85 | | | | | | 0 | | | | | | 85 | | |
Disposals | | | | | | –71 | | | | | | 71 | | | | | | 0 | | |
Amortisation | | | | | | 0 | | | | | | –29 | | | | | | –29 | | |
Impairment losses | | | | | | 0 | | | | | | –28 | | | | | | –28 | | |
Carrying amount as of 31 Dec. 2016 | | | | | | 338 | | | | | | –103 | | | | | | 235 | | |
(51) Income tax assets
Analysis of Income tax assets by type
| | | | | | | | | | | | | | | | | | | | |
| | | | | | | 31 Dec. 2017 | | | | | | 31 Dec. 2016 | | | | | | Change | | |
| | | | | | | EUR in millions | | | | | | EUR in millions | | | | | | EUR in millions | | |
| | | | | | | | | | |
| Current income tax assets | | | | | | 29 | | | | | | 10 | | | | | | 19 | | |
Deferred income tax assets | | | | | | 469 | | | | | | 529 | | | | | | –61 | | |
Total | | | | | | 498 | | | | | | 540 | | | | | | –42 | | |
Current income tax assets result from creditable taxes (investment income tax/solidarity surcharge) and tax receivables from advance tax payments during the reporting year.
Deferred income tax assets mostly result from valuation differences relating to the balance sheet items listed below.
105
KfW Financial Information 2017 Consolidated financial statements
Analysis of deferred tax assets by balance sheet item
| | | | | | | | | | | | | | | | | | | | | | | | | | | | |
| | | | | | | 31 Dec. 2017 | | | | | | | | | | 31 Dec. 2016 | | | | | | | | | | Change | | |
| | | | | | | EUR in millions | | | | | | | | | | EUR in millions | | | | | | | | | | EUR in millions | | |
| | | | | | | | | | |
| Loans and advances to banks and customers (incl. risk provisions) | | | | | | 59 | | | | | | | | | | 69 | | | | | | | | | | –10 | | |
Securities and investments | | | | | | 21 | | | | | | | | | | 19 | | | | | | | | | | 2 | | |
Intangible assets | | | | | | 15 | | | | | | | | | | 15 | | | | | | | | | | 0 | | |
Other derivatives (liabilities) | | | | | | 255 | | | | | | | | | | 312 | | | | | | | | | | –57 | | |
Provisions | | | | | | 58 | | | | | | | | | | 58 | | | | | | | | | | 0 | | |
Other balance sheet items | | | | | | 0 | | | | | | | | | | 1 | | | | | | | | | | –1 | | |
Tax loss carryforwards | | | | | | 61 | | | | | | | | | | 55 | | | | | | | | | | 6 | | |
Subtotal | | | | | | 469 | | | | | | | | | | 529 | | | | | | | | | | –61 | | |
Offset against deferred tax liabilities | | | | | | 0 | | | | | | | | | | 0 | | | | | | | | | | 0 | | |
Total | | | | | | 469 | | | | | | | | | | 529 | | | | | | | | | | –61 | | |
(52) Other assets
Analysis of Other assets by class
| | | | | | | | | | | | | | | | | | | | | | | | | | | | |
| | | | | | | 31 Dec. 2017 | | | | | | | | | | 31 Dec. 2016 | | | | | | | | | | Change | | |
| | | | | | | EUR in millions | | | | | | | | | | EUR in millions | | | | | | | | | | EUR in millions | | |
| | | | | | | | | | |
| Other assets and receivables | | | | | | 835 | | | | | | | | | | 887 | | | | | | | | | | –52 | | |
Prepaid and deferred charges | | | | | | 37 | | | | | | | | | | 45 | | | | | | | | | | –8 | | |
Total | | | | | | 872 | | | | | | | | | | 932 | | | | | | | | | | –60 | | |
(53) Liabilities to banks
Analysis of Liabilities to banks by class
| | | | | | | | | | | | | | | | | | | | | | | | | | | | |
| | | | | | | 31 Dec. 2017 | | | | | | | | | | 31 Dec. 2016 | | | | | | | | | | Change | | |
| | | | | | | EUR in millions | | | | | | | | | | EUR in millions | | | | | | | | | | EUR in millions | | |
| | | | | | | | | | |
| Money-market transactions | | | | | | 19 | | | | | | | | | | 7 | | | | | | | | | | 11 | | |
Promissory note loans | | | | | | 1,864 | | | | | | | | | | 2,157 | | | | | | | | | | –294 | | |
Other financial liabilities | | | | | | 4,120 | | | | | | | | | | 17,672 | | | | | | | | | | –13,553 | | |
Total | | | | | | 6,002 | | | | | | | | | | 19,837 | | | | | | | | | | –13,835 | | |
Liabilities from cash collateral received and the PROMISE and PROVIDE synthetic securitisation platforms are included in Other financial liabilities.
106
KfW Financial Information 2017 Consolidated financial statements
(54) Liabilities to customers
Analysis of Liabilities to customers by class
| | | | | | | | | | | | | | | | | | | | | | | | | | | | |
| | | | | | | 31 Dec. 2017 | | | | | | | | | | 31 Dec. 2016 | | | | | | | | | | Change | | |
| | | | | | | EUR in millions | | | | | | | | | | EUR in millions | | | | | | | | | | EUR in millions | | |
| | | | | | | | | | |
| Money-market transactions | | | | | | 293 | | | | | | | | | | 2,638 | | | | | | | | | | –2,345 | | |
Promissory note loans | | | | | | 5,188 | | | | | | | | | | 5,266 | | | | | | | | | | –78 | | |
Other financial liabilities | | | | | | 4,409 | | | | | | | | | | 3,730 | | | | | | | | | | 678 | | |
Total | | | | | | 9,889 | | | | | | | | | | 11,634 | | | | | | | | | | –1,745 | | |
Liabilities from cash collateral received are included in Other financial liabilities. Credit-linked notes issued via the PROMISE and PROVIDE synthetic securitisation platforms are included under Promissory note loans.
(55) Certificated liabilities
Analysis of Certificated liabilities by class
| | | | | | | | | | | | | | | | | | | | | | | | | | | | |
| | | | | | | 31 Dec. 2017 | | | | | | | | | | 31 Dec. 2016 | | | | | | | | | | Change | | |
| | | | | | | EUR in millions | | | | | | | | | | EUR in millions | | | | | | | | | | EUR in millions | | |
| | | | | | | | | | |
| Money-market issues | | | | | | 40,185 | | | | | | | | | | 47,091 | | | | | | | | | | –6,906 | | |
Bonds and notes | | | | | | 366,105 | | | | | | | | | | 375,483 | | | | | | | | | | –9,379 | | |
Total | | | | | | 406,290 | | | | | | | | | | 422,574 | | | | | | | | | | –16,285 | | |
(56) Value adjustments from macro fair value hedge accounting
| | | | | | | | | | | | | | | | | | | | | | | | | | | | |
| | | | | | | 31 Dec. 2017 | | | | | | | | | | 31 Dec. 2016 | | | | | | | | | | Change | | |
| | | | | | | EUR in millions | | | | | | | | | | EUR in millions | | | | | | | | | | EUR in millions | | |
Value adjustments to liabilities under macro fair value hedge accounting | | | | | | 119 | | | | | | | | | | 127 | | | | | | | | | | –8 | | |
The fair values attributable to hedged risks in the hedged portfolios in the other liabilities category are included in this item.
107
KfW Financial Information 2017 Consolidated financial statements
(57) Derivatives designated for hedge accounting
Analysis of derivatives with negative fair values designated for hedge accounting by type
of hedging relationship
| | | | | | | | | | | | | | | | | | | | | | | | | | | | |
| | | | | | | 31 Dec. 2017 | | | | | | | | | | 31 Dec. 2016 | | | | | | | | | | Change | | |
| | | | | | | EUR in millions | | | | | | | | | | EUR in millions | | | | | | | | | | EUR in millions | | |
| | | | | | | | | | |
| Micro fair value hedge accounting | | | | | | 9,233 | | | | | | | | | | 4,153 | | | | | | | | | | 5,079 | | |
Macro fair value hedge accounting | | | | | | 5,255 | | | | | | | | | | 14,297 | | | | | | | | | | –9,042 | | |
Total | | | | | | 14,488 | | | | | | | | | | 18,451 | | | | | | | | | | –3,963 | | |
Analysis of derivatives with negative fair values designated for hedge accounting by class
| | | | | | | | | | | | | | | | | | | | | | | | | | | | |
| | | | | | | 31 Dec. 2017 | | | | | | | | | | 31 Dec. 2016 | | | | | | | | | | Change | | |
| | | | | | | EUR in millions | | | | | | | | | | EUR in millions | | | | | | | | | | EUR in millions | | |
| | | | | | | | | | |
| Interest-related derivatives | | | | | | 6,293 | | | | | | | | | | 16,069 | | | | | | | | | | –9,777 | | |
Currency-related derivatives | | | | | | 8,195 | | | | | | | | | | 2,381 | | | | | | | | | | 5,814 | | |
Total | | | | | | 14,488 | | | | | | | | | | 18,451 | | | | | | | | | | –3,963 | | |
Only Interest-related derivatives are designated for macro fair value hedge accounting. Cross-currency swaps are presented under Currency-related derivatives.
(58) Other derivatives
Analysis of Other derivatives with negative fair values by class
| | | | | | | | | | | | | | | | | | | | | | | | | | | | |
| | | | | | | 31 Dec. 2017 | | | | | | | | | | 31 Dec. 2016 | | | | | | | | | | Change | | |
| | | | | | | EUR in millions | | | | | | | | | | EUR in millions | | | | | | | | | | EUR in millions | | |
| | | | | | | | | | |
| Interest-related derivatives | | | | | | 974 | | | | | | | | | | 1,211 | | | | | | | | | | –236 | | |
Currency-related derivatives | | | | | | 1,927 | | | | | | | | | | 1,796 | | | | | | | | | | 131 | | |
Total | | | | | | 2,902 | | | | | | | | | | 3,007 | | | | | | | | | | –105 | | |
Cross-currency swaps are presented under Currency-related derivatives.
Under Other derivatives are derivatives with negative fair values of EUR 18 million (31 Dec. 2016: EUR 20 million) attributable to embedded derivatives that are bifurcated.
108
KfW Financial Information 2017 Consolidated financial statements
(59) Provisions
Analysis of Provisions by class
| | | | | | | | | | | | | | | | | | | | | | | | | | | | |
| | | | | | | | | 31 Dec. 2017 | | | | | | 31 Dec. 2016 | | | | | | | | | | Change | | | | |
| | | | | | | | | EUR in millions | | | | | | EUR in millions | | | | | | | | | | EUR in millions | | | | |
| | | | | | | | | | |
| Provisions for pensions and similar commitments | | | | | | | | 2,024 | | | | | | 2,050 | | | | | | | | | | –27 | | | | |
Provisions for credit risks | | | | | | | | 61 | | | | | | 44 | | | | | | | | | | 17 | | | | |
Other provisions | | | | | | | | 793 | | | | | | 771 | | | | | | | | | | 22 | | | | |
Total | | | | | | | | 2,877 | | | | | | 2,865 | | | | | | | | | | 12 | | | | |
Development in Provisions for pensions and similar commitments in the financial year 2017
| | | | | | | | | | | | | | | | | | | | | | | | | | | | | | | | |
| | | | | | | | | | | Defined benefit obligations | | | | | | Early retirement | | | | | | Partial retirement | | | | | | Total | | | | |
| | | | | | | | | | | EUR in millions | | | | | | EUR in millions | | | | | | EUR in millions | | | | | | EUR in millions | | | | |
| | | | | | | | | | | | | |
| As of 1 Jan. 2017 | | | | | | | | | | 2,002 | | | | | | 34 | | | | | | 14 | | | | | | 2,050 | | | | |
Additions | | | | | | | | | | 102 | | | | | | 4 | | | | | | 5 | | | | | | 110 | | | | |
Current service cost | | | | | | | | | | 68 | | | | | | 4 | | | | | | 5 | | | | | | 77 | | | | |
Past service cost | | | | | | | | | | 0 | | | | | | 0 | | | | | | 0 | | | | | | 0 | | | | |
Interest cost | | | | | | | | | | 33 | | | | | | 0 | | | | | | 0 | | | | | | 33 | | | | |
Other additions | | | | | | | | | | 0 | | | | | | 0 | | | | | | 0 | | | | | | 0 | | | | |
Actuarial gains and losses | | | | | | | | | | –82 | | | | | | 0 | | | | | | 0 | | | | | | –82 | | | | |
Changes in demographic assumptions | | | | | | | | | | –2 | | | | | | 0 | | | | | | 0 | | | | | | –2 | | | | |
Changes in financial assumptions | | | | | | | | | | –100 | | | | | | 0 | | | | | | 0 | | | | | | –100 | | | | |
Changes in experience adjustments | | | | | | | | | | 20 | | | | | | 0 | | | | | | 0 | | | | | | 20 | | | | |
Utilisation | | | | | | | | | | –46 | | | | | | –9 | | | | | | –5 | | | | | | –60 | | | | |
Reversals | | | | | | | | | | 0 | | | | | | 0 | | | | | | 0 | | | | | | 0 | | | | |
Transfers | | | | | | | | | | 0 | | | | | | 0 | | | | | | 0 | | | | | | 0 | | | | |
Contributions by members (recognised in equity) | | | | | | | | | | 5 | | | | | | 0 | | | | | | 0 | | | | | | 5 | | | | |
Changes in consolidated group | | | | | | | | | | 0 | | | | | | 0 | | | | | | 0 | | | | | | 0 | | | | |
As of 31 Dec. 2017 | | | | | | | | | | 1,981 | | | | | | 29 | | | | | | 14 | | | | | | 2,024 | | | | |
The average residual term of the defined benefit pension obligations is 19.3 years as of 31 Dec. 2017 (31 Dec. 2016: 20.0 years).
109
KfW Financial Information 2017 Consolidated financial statements
Development in Provisions for pensions and similar commitments in the financial year 2016
| | | | | | | | | | | | | | | | | | | | | | | | | | | | | | | | | | | | | | | | | | | | |
| | | | | | | | | | | Defined benefit obligations | | | | | | | | | | Early retirement | | | | | | | | | | Partial retirement | | | | | | | | | | Total | | | | |
| | | | | | | | | | | EUR in millions | | | | | | | | | | EUR in millions | | | | | | | | | | EUR in millions | | | | | | | | | | EUR in millions | | | | |
| | | | | | | | | | | | | |
| As of 1 Jan. 2016 | | | | | | | | | | 1,726 | | | | | | | | | | 41 | | | | | | | | | | 13 | | | | | | | | | | 1,780 | | | | |
Additions | | | | | | | | | | 95 | | | | | | | | | | 0 | | | | | | | | | | 5 | | | | | | | | | | 100 | | | | |
Current service cost | | | | | | | | | | 55 | | | | | | | | | | 0 | | | | | | | | | | 5 | | | | | | | | | | 60 | | | | |
Past service cost | | | | | | | | | | 0 | | | | | | | | | | 0 | | | | | | | | | | 0 | | | | | | | | | | 0 | | | | |
Interest cost | | | | | | | | | | 40 | | | | | | | | | | 0 | | | | | | | | | | 0 | | | | | | | | | | 40 | | | | |
Other additions | | | | | | | | | | 0 | | | | | | | | | | 0 | | | | | | | | | | 0 | | | | | | | | | | 0 | | | | |
Actuarial gains and losses | | | | | | | | | | 221 | | | | | | | | | | 0 | | | | | | | | | | 0 | | | | | | | | | | 221 | | | | |
Changes in demographic assumptions | | | | | | | | | | 0 | | | | | | | | | | 0 | | | | | | | | | | 0 | | | | | | | | | | 0 | | | | |
Changes in financial assumptions | | | | | | | | | | 236 | | | | | | | | | | 0 | | | | | | | | | | 0 | | | | | | | | | | 236 | | | | |
Changes in experience adjustments | | | | | | | | | | –14 | | | | | | | | | | 0 | | | | | | | | | | 0 | | | | | | | | | | –14 | | | | |
Utilisation | | | | | | | | | | –45 | | | | | | | | | | –7 | | | | | | | | | | –4 | | | | | | | | | | –57 | | | | |
Reversals | | | | | | | | | | 0 | | | | | | | | | | 0 | | | | | | | | | | 0 | | | | | | | | | | 0 | | | | |
Transfers | | | | | | | | | | 0 | | | | | | | | | | 0 | | | | | | | | | | 0 | | | | | | | | | | 0 | | | | |
Contributions by members (recognised in equity) | | | | | | | | | | 6 | | | | | | | | | | 0 | | | | | | | | | | 0 | | | | | | | | | | 6 | | | | |
Changes in consolidated group | | | | | | | | | | 0 | | | | | | | | | | 0 | | | | | | | | | | 0 | | | | | | | | | | 0 | | | | |
As of 31 Dec. 2016 | | | | | | | | | | 2,002 | | | | | | | | | | 34 | | | | | | | | | | 14 | | | | | | | | | | 2,050 | | | | |
Provisions for pensions and similar commitments are calculated on the basis of the 2005 G Heubeck actuarial tables and the following other actuarial assumptions:
Actuarial assumptions in % p. a.
| | | | | | | | | | | | | | | | |
| | | | | | | |
| | | | | | | 31 Dec. 2017 | | | | | | 31 Dec. 2016 | | |
| | | | | | | |
Technical discount rate | | | | | | | | 1.88 | | | | | | 1.63 | | |
Rate of salary increases | | | | | | | | 2.20 | | | | | | 2.20 | | |
Rate of pension increases | | | | | | | | 2.50 | | | | | | 2.50 | | |
Rate of staff turnover | | | | | | | | 1.50 | | | | | | 1.50 | | |
110
KfW Financial Information 2017 Consolidated financial statements
Sensitivity of defined benefit pension obligations as of 31 December 2017
| | | | | | | | | | | | | | | | | | | | | | | | | | |
| | | | | | | Difference | | | | | | Change in | | | | | | Difference | | | | | | Change in | | |
| | | | | | | | | | | | | defined benefit | | | | | | | | | | | | defined benefit | | |
| | | | | | | | | | | | obligations | | | | | | | | | | | | obligations | | |
| | | | | | | | | | | | EUR in millions | | | | | | | | | | | | EUR in millions | | |
| | | | | | | | | | | | | |
Life expectancy | | | | | | +1 year | | | | | | 83 | | | | | | –1 year | | | | | | –84 | | |
Technical discount rate | | | | | | +0.25% | | | | | | –93 | | | | | | –0.25% | | | | | | 100 | | |
Rate of salary increases | | | | | | +0.50% | | | | | | 17 | | | | | | –0.50% | | | | | | –16 | | |
Rate of pension increases | | | | | | +0.50% | | | | | | 129 | | | | | | –0.50% | | | | | | –117 | | |
Rate of staff turnover | | | | | | +1.00% | | | | | | –4 | | | | | | –1.00% | | | | | | 5 | | |
Sensitivity of defined benefit pension obligations as of 31 December 2016
| | | | | | | | | | | | | | | | | | | | | | | | | | |
| �� | | | | | | Difference | | | | | | Change in | | | | | | Difference | | | | | | Change in | | |
| | | | | | | | | | | | | defined benefit | | | | | | | | | | | | defined benefit | | |
| | | | | | | | | | | | obligations | | | | | | | | | | | | obligations | | |
| | | | | | | | | | | | EUR in millions | | | | | | | | | | | | EUR in millions | | |
| | | | | | | | | | | | | |
Life expectancy | | | | | | +1 year | | | | | | 75 | | | | | | –1 year | | | | | | –74 | | |
Technical discount rate | | | | | | +0.25% | | | | | | –83 | | | | | | –0.25% | | | | | | 90 | | |
Rate of salary increases | | | | | | +0.50% | | | | | | 18 | | | | | | –0.50% | | | | | | –17 | | |
Rate of pension increases | | | | | | +0.50% | | | | | | 82 | | | | | | –0.50% | | | | | | –75 | | |
Rate of staff turnover | | | | | | +1.00% | | | | | | –17 | | | | | | –1.00% | | | | | | 21 | | |
111
KfW Financial Information 2017 Consolidated financial statements
Development in Risk provisions for lending business
For the development in Risk provisions for lending business see the note regarding “Risk provisions for lending business”.
Development in Other provisions in the financial year 2017
| | | | | | | | | | | | | | | | | | | | | | | | | | | | |
| | | | | | | Obligations to | | | | | | | | Other | | | | | | | | Total | | |
| | | | | | employees | | | | | | | | provisions | | | | | | | | | | |
| | | | | | EUR in millions | | | | | | | | EUR in millions | | | | | | | | EUR in millions | | |
| | | | | | | | | | |
As of 1 Jan. 2017 | | | | | | 33 | | | | | | | | | | 739 | | | | | | | | | | 771 | | |
Additions | | | | | | 5 | | | | | | | | | | 80 | | | | | | | | | | 86 | | |
Interest cost | | | | | | 0 | | | | | | | | | | 3 | | | | | | | | | | 3 | | |
Other additions | | | | | | 5 | | | | | | | | | | 77 | | | | | | | | | | 83 | | |
Utilisation | | | | | | –4 | | | | | | | | | | –48 | | | | | | | | | | –53 | | |
Reversals | | | | | | –1 | | | | | | | | | | –11 | | | | | | | | | | –11 | | |
Transfers | | | | | | 0 | | | | | | | | | | 0 | | | | | | | | | | 0 | | |
Exchange rate changes | | | | | | 0 | | | | | | | | | | 0 | | | | | | | | | | 0 | | |
Changes in consolidated group | | | | | | 0 | | | | | | | | | | 0 | | | | | | | | | | 0 | | |
As of 31 Dec. 2017 | | | | | | 33 | | | | | | | | | | 760 | | | | | | | | | | 793 | | |
Obligations to employees show other long-term employee benefits including provisions for service anniversaries. Corresponding actuarial reports have been prepared for these obligations.
An Other provision item in the amount of EUR 40 million (31 Dec. 2016: EUR 44 million) is reported due to the interest rate being below the market rate for irrevocable promotional loan commitments with additional promotional funds in the form of interest rate reductions with an impact on KfW’s earnings position. Changes to existing provisions are presented as net additions or, in the case of a decline, as a transfer via the adjustments to the carrying amounts of already disbursed promotional loans recognised on the assets side under Loans and advances to banks or customers.
Other provisions also comprise obligations arising from the assumption of the operations of the State Insurance Company of the GDR in liquidation (Staatliche Versicherung der Deutschen Demokratischen Republik in Abwicklung – “SINA”, an institution under public law), which are offset by receivables in the same amount from the Federal Agency for Special Tasks Arising from Unification (Bundesanstalt für vereinigungsbedingte Sonderaufgaben – “BvS”) recognised in Other assets.
112
KfW Financial Information 2017 Consolidated financial statements
Development in Other provisions in the financial year 2016
| | | | | | | | | | | | | | | | | | | | |
| | | | | | | Obligations to | | | | | | Other | | | | | | Total | | |
| | | | | | employees | | | | | | provisions | | | | | | | | |
| | | | | | EUR in millions | | | | | | EUR in millions | | | | | | EUR in millions | | |
| | | | | | | | | | |
As of 1 Jan. 2016 | | | | | | 28 | | | | | | 728 | | | | | | 756 | | |
Additions | | | | | | 7 | | | | | | 63 | | | | | | 69 | | |
Interest cost | | | | | | 0 | | | | | | 10 | | | | | | 10 | | |
Other additions | | | | | | 7 | | | | | | 52 | | | | | | 59 | | |
Utilisation | | | | | | –2 | | | | | | –48 | | | | | | –51 | | |
Reversals | | | | | | 0 | | | | | | –3 | | | | | | –4 | | |
Transfers | | | | | | 0 | | | | | | 0 | | | | | | 0 | | |
Exchange rate changes | | | | | | 0 | | | | | | 0 | | | | | | 0 | | |
Changes in consolidated group | | | | | | 0 | | | | | | 0 | | | | | | 0 | | |
As of 31 Dec. 2016 | | | | | | 33 | | | | | | 739 | | | | | | 771 | | |
(60) Income tax liabilities
| | | | | | | | | | | | | | | | | | | | |
| | | | | | 31 Dec. 2017 | | | | | | 31 Dec. 2016 | | | | | | Change | | |
| | | | | | EUR in millions | | | | | | EUR in millions | | | | | | EUR in millions | | |
| | | | | | | | | | |
Current income tax liabilities | | | | | | 16 | | | | | | 11 | | | | | | 5 | | |
Deferred income tax liabilities | | | | | | 257 | | | | | | 314 | | | | | | –57 | | |
Total | | | | | | 272 | | | | | | 324 | | | | | | –52 | | |
Current income tax liabilities as of 31 Dec. 2017 primarily include tax provisions at the level of taxable companies included in KfW Group.
Development in tax provisions
| | | | | | | | | | | | | | | | | | | | | | | | |
| | | | | | | | 2017 | | | | | | | | 2016 | | | |
| | | | | | | | EUR in millions | | | | | | | | EUR in millions | | | |
| | | | | | | |
As of 1 Jan. | | | | | | | | | | 11 | | | | | | | | | | 29 | | | | |
Additions | | | | | | | | | | 25 | | | | | | | | | | 15 | | | | |
Utilisation | | | | | | | | | | –20 | | | | | | | | | | –34 | | | | |
Reversals | | | | | | | | | | 0 | | | | | | | | | | 0 | | | | |
As of 31 Dec. | | | | | | | | | | 16 | | | | | | | | | | 11 | | | | |
Deferred income tax liabilities mostly resulted from valuation differences relating to the balance sheet items listed below.
113
KfW Financial Information 2017 Consolidated financial statements
Analysis of deferred tax liabilities by balance sheet item
| | | | | | | | | | | | | | | | | | | | | | | | | | | | |
| | | | | | | | 31 Dec. 2017 | | | | | | | | 31 Dec. 2016 | | | | | Change | | |
| | | | | | | | EUR in millions | | | | | | | | EUR in millions | | | | | EUR in millions | | |
| | | | | | | | | |
Other derivatives (assets) | | | | | | | | | | 254 | | | | | | | | | | 308 | | | | | | –54 | | |
Securities and investments | | | | | | | | | | 0 | | | | | | | | | | 0 | | | | | | 0 | | |
Other balance sheet items | | | | | | | | | | 3 | | | | | | | | | | 5 | | | | | | –2 | | |
Subtotal | | | | | | | | | | 257 | | | | | | | | | | 314 | | | | | | –57 | | |
Offset against deferred tax assets | | | | | | | | | | 0 | | | | | | | | | | 0 | | | | | | 0 | | |
Total | | | | | | | | | | 257 | | | | | | | | | | 314 | | | | | | –57 | | |
(61) Other liabilities
Analysis of Other liabilities by class
| | | | | | | | | | | | | | | | | | | | | | | | | | | | |
| | | | | | | | 31 Dec. 2017 | | | | | | | | 31 Dec. 2016 | | | | | Change | | |
| | | | | | | | EUR in millions | | | | | | | | EUR in millions | | | | | EUR in millions | | |
| | | | | | | | | |
Other financial liabilities | | | | | | | | | | 608 | | | | | | | | | | 723 | | | | | | –115 | | |
Deferred income | | | | | | | | | | 157 | | | | | | | | | | 215 | | | | | | –58 | | |
Total | | | | | | | | | | 765 | | | | | | | | | | 938 | | | | | | –173 | | |
(62) Subordinated liabilities
Analysis of Subordinated liabilities by class
| | | | | | | | | | | | | | | | | | | | | | | | | | | | |
| | | | | | | | 31 Dec. 2017 | | | | | | | | 31 Dec. 2016 | | | | | Change | | |
| | | | | | | | EUR in millions | | | | | | | | EUR in millions | | | | | EUR in millions | | |
Subordinated liabilities | | | | | | | | | | 0 | | | | | | | | | | 200 | | | | | | –200 | | |
As part of the new legislation governing ERP economic promotion as of 1 July 2007, the ERP Special Fund had provided a subordinated loan to KfW in the original amount of EUR 3,247 million. KfW repaid the subordinated loan, which was still reported in the amount of EUR 200 million as of 31 Dec. 2016, to the ERP Special Fund early on 29 September 2017. The loan consisted of three tranches with different fixed-interest periods. Interest was charged on the tranches at an average rate of 1.82% in financial year 2017 (previous year: 1.82%).
114
KfW Financial Information 2017 Consolidated financial statements
(63) Equity
Analysis of Equity
| | | | | | | | | | | | | | | | | | | | | | | | | | | | | | |
| | | | | | | | | | 31 Dec. 2017 | | | | | | | | | | 31 Dec. 2016 | | | | | | Change | | | | |
| | | | | | | | | | | EUR in millions | | | | | | | | | | EUR in millions | | | | | | EUR in millions | | | | |
| | | | | | | | | |
Subscribed capital | | | | | | | | | | 3,750 | | | | | | | | | | 3,750 | | | | | | 0 | | | | |
less uncalled outstanding contributions | | | | | | | | | | –450 | | | | | | | | | | –450 | | | | | | 0 | | | | |
Paid-in subscribed capital | | | | | | | | | | 3,300 | | | | | | | | | | 3,300 | | | | | | 0 | | | | |
Capital reserve | | | | | | | | | | 8,447 | | | | | | | | | | 8,447 | | | | | | 0 | | | | |
of which promotional reserve from the ERP Special Fund | | | | | | | | | | 7,150 | | | | | | | | | | 7,150 | | | | | | 0 | | | | |
Reserve from the ERP Special Fund | | | | | | | | | | 1,191 | | | | | | | | | | 1,191 | | | | | | 0 | | | | |
Retained earnings | | | | | | | | | | 15,500 | | | | | | | | | | 14,092 | | | | | | 1,407 | | | | |
Statutory reserve under Article 10 (2) KfW Law | | | | | | | | | | 1,875 | | | | | | | | | | 1,875 | | | | | | 0 | | | | |
Special reserve under Article 10 (3) KfW Law | | | | | | | | | | 9,207 | | | | | | | | | | 8,312 | | | | | | 895 | | | | |
Special reserve less the special loss account from provisioning pursuant to Section 17 (4) of the D-Mark Balance Sheet Law | | | | | | | | | | 21 | | | | | | | | | | 21 | | | | | | 0 | | | | |
Other retained earnings | | | | | | | | | | 4,396 | | | | | | | | | | 3,884 | | | | | | 512 | | | | |
Fund for general banking risks | | | | | | | | | | 600 | | | | | | | | | | 600 | | | | | | 0 | | | | |
Revaluation reserves | | | | | | | | | | –295 | | | | | | | | | | –576 | | | | | | 281 | | | | |
Valuation gains/losses from available-for-sale financial assets (after tax) | | | | | | | | | | 277 | | | | | | | | | | 75 | | | | | | 202 | | | | |
Actuarial gains and losses from defined benefit pension obligations (after tax) | | | | | | | | | | –572 | | | | | | | | | | –650 | | | | | | 79 | | | | |
Total | | | | | | | | | | 28,742 | | | | | | | | | | 27,055 | | | | | | 1,688 | | | | |
Equity forms the basis for the capital available for covering risks, which are matched against the capital requirements derived from internal management.
For information concerning equity in relation to risk-bearing capacity see the risk report in the group management report.
115
KfW Financial Information 2017 Consolidated financial statements
Notes to financial instruments
(64) Gains and losses from financial instruments by measurement category
The following tables show an analysis of the results from financial instruments included in the various income statement items presented by measurement category. In addition to interest and similar income and expense reported in Net interest and commission income and loan processing fees included in Net commission income, contributions to Comprehensive income include in particular the Risk provisions for lending business. Depending on measurement and designation for hedge accounting, the effects of fair value measurement, impairment losses, reversals of impairment losses and gains and losses from disposals are also included. The result from foreign currency translation is not included.
Gains and losses from financial instruments by measurement category in the financial year 2017
| | | | | | | | | | | | | | | | | | | | | | | | | | | | | | | | | | | | | | | | | | | | | | | | | | | | | | |
| | | | | | | | | | | | | | | | | | |
| | | | | Net interest income | | | | | | Risk pro- visions for lending business | | | | | | Net com- mission income | | | | | | Net gains/ losses from hedge account- ing | | | | | | Net gains/ losses from other financial instru- ments at fair value through profit or loss | | | | | | Net gains/ losses from securities and invest- ments | | | | | | Net other operating income | | | | | | | | | | Total | | | | |
| | | | | EUR in millions | | | | | | EUR in millions | | | | | | EUR in millions | | | | | | EUR in millions | | | | | | EUR in millions | | | | | | EUR in millions | | | | | | EUR in millions | | | | | | | | | | EUR in millions | | | | |
| | | | | | | | | | | | | | | | | | |
Loans and receivables | | | | 6,419 | | | | | | –209 | | | | | | 106 | | | | | | –3,412 | | | | | | 0 | | | | | | 4 | | | | | | 0 | | | | | | | | | | 2,910 | | | | |
Held-to-maturity investments | | | | –3 | | | | | | 0 | | | | | | 0 | | | | | | 0 | | | | | | 0 | | | | | | 0 | | | | | | 0 | | | | | | | | | | –3 | | | | |
Other liabilities | | | | –6,727 | | | | | | 0 | | | | | | 0 | | | | | | 2,241 | | | | | | 0 | | | | | | 0 | | | | | | 5 | | | | | | | | | | –4,481 | | | | |
Available-for-sale financial assets | | | | 185 | | | | | | 0 | | | | | | 0 | | | | | | –169 | | | | | | 0 | | | | | | –4 | | | | | | 0 | | | | | | | | | | 11 | | | | |
Financial assets at fair value through profit or loss | | | | 39 | | | | | | 0 | | | | | | 3 | | | | | | 0 | | | | | | –54 | | | | | | 0 | | | | | | 0 | | | | | | | | | | –12 | | | | |
Financial liabilities at fair value through profit or loss | | | | –587 | | | | | | 0 | | | | | | –3 | | | | | | 0 | | | | | | 137 | | | | | | 0 | | | | | | 0 | | | | | | | | | | –453 | | | | |
Financial instruments classified as held for trading | | | | 1,811 | | | | | | 0 | | | | | | 0 | | | | | | 0 | | | | | | –459 | | | | | | 0 | | | | | | 0 | | | | | | | | | | 1,352 | | | | |
Derivatives designated for hedge accounting | | | | 1,290 | | | | | | 0 | | | | | | 0 | | | | | | 1,931 | | | | | | 0 | | | | | | 0 | | | | | | 0 | | | | | | | | | | 3,222 | | | | |
Total | | | | 2,427 | | | | | | –209 | | | | | | 106 | | | | | | 591 | | | | | | –377 | | | | | | 0 | | | | | | 5 | | | | | | | | | | 2,545 | | | | |
116
KfW Financial Information 2017 Consolidated financial statements
Gains and losses from financial instruments by measurement category in the financial year 2016
| | | | | | | | | | | | | | | | | | | | | | | | | | | | | | | | | | | | | | | | | | | | | | | | | | | | | | | | | | |
| | | | | | | | | | | | | | | | | | | | |
| | | | | | | Net interest income | | | | | | Risk pro- visions for lending business | | | | | | Net com- mission income | | | | | | Net gains/ losses from hedge account- ing | | | | | | Net gains/ losses from other financial instru- ments at fair value through profit or loss | | | | | | Net gains/ losses from securities and invest- ments | | | | | | Net other operating income | | | | | | | | | | Total | | | | | | |
| | | | | | | EUR in millions | | | | | | EUR in millions | | | | | | EUR in millions | | | | | | EUR in millions | | | | | | EUR in millions | | | | | | EUR in millions | | | | | | EUR in millions | | | | | | | | | | EUR in millions | | | | | | |
| | | | | | | | | | | | | | | | | | | | |
| Loans and receivables | | | | | | 7,386 | | | | | | –150 | | | | | | 125 | | | | | | 28 | | | | | | 0 | | | | | | 2 | | | | | | 0 | | | | | | | | | | 7,391 | | | | | | |
Held-to-maturity investments | | | | | | –2 | | | | | | 0 | | | | | | 0 | | | | | | 0 | | | | | | 0 | | | | | | 0 | | | | | | 0 | | | | | | | | | | –2 | | | | | | |
Other financial liabilities | | | | | | –7,112 | | | | | | 0 | | | | | | –27 | | | | | | 2,287 | | | | | | 0 | | | | | | 0 | | | | | | 101 | | | | | | | | | | –4,751 | | | | | | |
Available-for-sale financial assets | | | | | | 253 | | | | | | 0 | | | | | | 0 | | | | | | –79 | | | | | | 0 | | | | | | –12 | | | | | | 0 | | | | | | | | | | 163 | | | | | | |
Financial assets at fair value through profit or loss | | | | | | 44 | | | | | | 0 | | | | | | 8 | | | | | | 0 | | | | | | 76 | | | | | | 0 | | | | | | 0 | | | | | | | | | | 128 | | | | | | |
Financial liabilities at fair value through profit or loss | | | | | | –644 | | | | | | 0 | | | | | | –8 | | | | | | 0 | | | | | | 107 | | | | | | 0 | | | | | | 0 | | | | | | | | | | –545 | | | | | | |
Financial instruments classified as held for trading | | | | | | 1,567 | | | | | | 0 | | | | | | –1 | | | | | | 0 | | | | | | –128 | | | | | | 0 | | | | | | 0 | | | | | | | | | | 1,439 | | | | | | |
Derivatives designated for hedge accounting | | | | | | 1,158 | | | | | | 0 | | | | | | 0 | | | | | | –1,943 | | | | | | 0 | | | | | | 0 | | | | | | 0 | | | | | | | | | | –785 | | | | | | |
Total | | | | | | 2,650 | | | | | | –150 | | | | | | 97 | | | | | | 294 | | | | | | 55 | | | | | | –10 | | | | | | 101 | | | | | | | | | | 3,038 | | | | | | |
117
KfW Financial Information 2017 Consolidated financial statements
(65) Balance sheet for financial instruments by measurement category
The following tables show the assets and liabilities from financial instruments included in the different balance sheet items presented by measurement category.
Financial assets by measurement category as of 31 December 2017
| | | | | | | | | | | | | | | | | | | | | | | | | | | | | | | | | | | | | | | | | | | | | | | | | | | | |
| | | | | | | | | | | | | | | | | | | | | | | | |
| | | | | | Loans and advances to banks | | | | | | Loans and advances to cus- tomers | | | | | | Risk pro- visions for lend- ing busi- ness | | | | | | Value adjust- ments from macro fair value hedge account- ing | | | | | | Deriva- tives desig- nated for hedge account- ing | | | | | | Other deriva- tives | | | | | | Secu- rities and invest- ments | | | | Assets (financial instruments) | | |
| | | | | | | | | | | | | | | | | | | | | | | | | | | | | | | | | | | | | | | | | | | | | | | | | | | | |
| | | | | | | EUR in millions | | | | | | EUR in millions | | | | | | EUR in millions | | | | | | EUR in millions | | | | | | EUR in millions | | | | | | EUR in millions | | | | | | EUR in millions | | | | EUR in millions | | | | in % | | |
Loans and receivables | | | | | | 274,291 | | | | | | 127,951 | | | | | | –1,457 | | | | | | 9,648 | | | | | | 0 | | | | | | 0 | | | | | | 6,242 | | | | 416,675 | | | | 90.9 | | |
Held-to-maturity investments | | | | | | 0 | | | | | | 0 | | | | | | 0 | | | | | | 0 | | | | | | 0 | | | | | | 0 | | | | | | 2,587 | | | | 2,587 | | | | 0.6 | | |
Available-for-sale financial assets | | | | | | 0 | | | | | | 0 | | | | | | 0 | | | | | | 0 | | | | | | 0 | | | | | | 0 | | | | | | 22,909 | | | | 22,909 | | | | 5.0 | | |
Financial assets at fair value through profit or loss | | | | | | 5 | | | | | | 0 | | | | | | 0 | | | | | | 0 | | | | | | 0 | | | | | | 0 | | | | | | 1,876 | | | | 1,882 | | | | 0.4 | | |
Financial assets classified as held for trading | | | | | | 0 | | | | | | 0 | | | | | | 0 | | | | | | 0 | | | | | | 0 | | | | | | 5,145 | | | | | | 0 | | | | 5,145 | | | | 1.1 | | |
Derivatives designated for hedge accounting | | | | | | 0 | | | | | | 0 | | | | | | 0 | | | | | | 0 | | | | | | 9,074 | | | | | | 0 | | | | | | 0 | | | | 9,074 | | | | 2.0 | | |
Total | | | | | | 274,296 | | | | | | 127,951 | | | | | | –1,457 | | | | | | 9,648 | | | | | | 9,074 | | | | | | 5,145 | | | | | | 33,615 | | | | 458,273 | | | | 100.0 | | |
118
KfW Financial Information 2017 Consolidated financial statements
Financial liabilities by measurement category as of 31 December 2017
| | | | | | | | | | | | | | | | | | | | | | | | | | | | | | | | | | | | | | | | | | |
| | | | Liabili- ties to banks | | | | Liabili- ties to cus- tomers | | | | Certifi- cated liabilities | | | | Value adjust- ments from macro fair value hedge account- ing | | | | Deriva- tives desig- nated for hedge account- ing | | | | Other deriva- tives | | | | Other liabilities | | | | Sub- ordinated liabilities | | | | Liabilities (finan- cial instruments) |
| | | | | | | | | | | | | | | | | | | | | | | | | | | | | | | | | | | | | | | | | | |
| | | | | EUR in millions | | | | EUR in millions | | | | EUR in millions | | | | EUR in millions | | | | EUR in millions | | | | EUR in millions | | | | EUR in millions | | | | EUR in millions | | | | EUR in millions | | | | in % | | |
| | | | | | | | | | | | | | | | | | | | | |
| Other financial liabilities | | | | 5,748 | | | | 8,055 | | | | 394,599 | | | | 119 | | | | 0 | | | | 0 | | | | 0 | | | | 0 | | | | 408,521 | | | | 92.9 | | |
Financial liabilities at fair value through profit or loss | | | | 255 | | | | 1,835 | | | | 11,691 | | | | 0 | | | | 0 | | | | 0 | | | | 0 | | | | 0 | | | | 13,780 | | | | 3.1 | | |
Financial liabilities classified as held for trading | | | | 0 | | | | 0 | | | | 0 | | | | 0 | | | | 0 | | | | 2,902 | | | | 0 | | | | 0 | | | | 2,902 | | | | 0.7 | | |
Derivatives designated for hedge accounting | | | | 0 | | | | 0 | | | | 0 | | | | 0 | | | | 14,488 | | | | 0 | | | | 0 | | | | 0 | | | | 14,488 | | | | 3.3 | | |
Total | | | | 6,002 | | | | 9,889 | | | | 406,290 | | | | 119 | | | | 14,488 | | | | 2,902 | | | | 0 | | | | 0 | | | | 439,690 | | | | 100.0 | | |
119
KfW Financial Information 2017 Consolidated financial statements
Financial assets by measurement category as of 31 December 2016
| | | | | | | | | | | | | | | | | | | | | | | | | | | | | | | | | | | | | | | | | | | | | | | | | | | | | | | | | | | | | | | | | | | | |
| | | | | | | | Loans and advances to banks | | | | | | Loans and advances to cus- tomers | | | | | | Risk pro- visions for lend- ing busi- ness | | | | | | Value adjust- ments from macro fair value hedge account- ing | | | | | | Deriva- tives desig- nated for hedge account- ing | | | | | | Other deriva- tives | | | | | | Secur- ities and invest- ments | | | | | | | | Assets (financial instruments) | | |
| | | | | | | | EUR in millions | | | | | | EUR in millions | | | | | | EUR in millions | | | | | | EUR in millions | | | | | | EUR in millions | | | | | | EUR in millions | | | | | | EUR in millions | | | | | | | | EUR in millions | | | | in % | | |
| | | | | | | | | | | | | | | | | | | | |
Loans and receivables | | | | | | | 275,916 | | | | | | 136,704 | | | | | | –1,610 | | | | | | 13,917 | | | | | | 0 | | | | | | 0 | | | | | | 6,435 | | | | | | | | 431,362 | | | | 87.6 | | |
Held-to-maturity investments | | | | | | | 0 | | | | | | 0 | | | | | | 0 | | | | | | 0 | | | | | | 0 | | | | | | 0 | | | | | | 3,029 | | | | | | | | 3,029 | | | | 0.6 | | |
Available-for-sale financial assets | | | | | | | 0 | | | | | | 0 | | | | | | 0 | | | | | | 0 | | | | | | 0 | | | | | | 0 | | | | | | 21,267 | | | | | | | | 21,267 | | | | 4.3 | | |
Financial assets at fair value through profit or loss | | | | | | | 6 | | | | | | 0 | | | | | | 0 | | | | | | 0 | | | | | | 0 | | | | | | 0 | | | | | | 1,983 | | | | | | | | 1,990 | | | | 0.4 | | |
Financial assets classified as held for trading | | | | | | | 0 | | | | | | 0 | | | | | | 0 | | | | | | 0 | | | | | | 0 | | | | | | 7,344 | | | | | | 0 | | | | | | | | 7,344 | | | | 1.5 | | |
Derivatives designated for hedge accounting | | | | | | | 0 | | | | | | 0 | | | | | | 0 | | | | | | 0 | | | | | | 27,464 | | | | | | 0 | | | | | | 0 | | | | | | | | 27,464 | | | | 5.6 | | |
Total | | | | | | | | | | | | | | | | | | 275,922 | | | | | | 136,704 | | | | | | –1,610 | | | | | | 13,917 | | | | | | 27,464 | | | | | | 7,344 | | | | | | 32,715 | | | | | | | | 492,456 | | | | 100.0 | | |
120
KfW Financial Information 2017 Consolidated financial statements
Financial liabilities by measurement category as of 31 December 2016
| | | | | | | | | | | | | | | | | | | | | | | | | | | | | | | | | | | | | | | | | | | | | | | | | | | | | | | | | | | | | | | | | | | | |
| | | | | | | | | | | | Liabili- ties to banks | | | | | | | Liabili- ties to cus- tomers | | | | | | Certi- ficated liabilities | | | | | | Value adjust- ments from macro fair value hedge account- ing | | | | | | Deriva- tives desig nated for hedge account- ing | | | | | | Other deriva- tives | | | | | | Other liabilities | | | | | | Sub- ordinated liabilities | | | | | | | | Liabilities (finan- cial instruments) | | |
| | | | | | | | | | |
| EUR in
millions |
| | | | | | EUR in millions | | | | | | EUR in millions | | | | | | EUR in millions | | | | | | EUR in millions | | | | | | EUR in millions | | | | | | EUR in millions | | | | | | EUR in millions | | | | | | | | EUR in millions | | | | in % | | |
| | | | | | | | | | | | | | | | | | | | | | | |
Other financial liabilities | | | | | | | | | | | 19,541 | | | | | | | 9,807 | | | | | | 408,173 | | | | | | 127 | | | | | | 0 | | | | | | 0 | | | | | | 4 | | | | | | 200 | | | | | | | | 437,852 | | | | 92.0 | | |
Financial liabilities at fair value through profit or loss | | | | | | | | | | | 297 | | | | | | | 1,828 | | | | | | 14,401 | | | | | | 0 | | | | | | 0 | | | | | | 0 | | | | | | 0 | | | | | | 0 | | | | | | | | 16,525 | | | | 3.5 | | |
Financial liabilities classified as held for trading | | | | | | | | | | | 0 | | | | | | | 0 | | | | | | 0 | | | | | | 0 | | | | | | 0 | | | | | | 3,007 | | | | | | 0 | | | | | | 0 | | | | | | | | 3,007 | | | | 0.6 | | |
Derivatives designated for hedge accounting | | | | | | | | | | | 0 | | | | | | | 0 | | | | | | 0 | | | | | | 0 | | | | | | 18,451 | | | | | | 0 | | | | | | 0 | | | | | | 0 | | | | | | | | 18,451 | | | | 3.9 | | |
Total | | | | | | | | | | | 19,837 | | | | | | | 11,634 | | | | | | 422,574 | | | | | | 127 | | | | | | 18,451 | | | | | | 3,007 | | | | | | 4 | | | | | | 200 | | | | | | | | 475,834 | | | | 100.0 | | |
121
KfW Financial Information 2017 Consolidated financial statements
(66) Disclosures on the reclassification of financial assets
In 2008 and with retrospective effect from 1 July 2008, KfW Group reclassified bonds and other fixed-income securities recognised in Securities and investments (floating interest asset-backed securities) with a volume of EUR 2,750 million (fair value as of the date of reclassification) from the available-for-sale financial assets measurement category to the loans and receivables measurement category.
The following table shows the carrying amounts of the reclassified financial assets and their fair values:
| | | | | | | | | | | | | | | | | | | | | | |
| | | | | | | 31 Dec. 2017 | | | | | | | | | | | | | | 31 Dec. 2016 | | |
| | | | | | | EUR in millions | | | | | | | | | | | | | | EUR in millions | | |
| | | | | | | | |
Carrying amount (statement of financial position) | | | | | | 144 | | | | | | | | | | | | | | 204 | | |
Fair value | | | | | | 147 | | | | | | | | | | | | | | 205 | | |
For the reclassified financial assets, a change of EUR –9 million (2016: EUR 2 million) in fair value would have been recorded directly in equity under Revaluation reserves and – as in the previous year – no Net gains/losses from securities and investments would have been recorded.
As in financial year 2016, Net gains/losses from securities and investments do not include any reversals of impairment losses or impairments on reclassified financial assets; as in the previous year, no realised gains and losses were recorded. Interest income from the reclassified securities is still recognised in the same manner.
In 2009, in accordance with a prospective resolution taking effect on 17 February 2009, bonds and other fixed-income securities recognised in Securities and investments (which serve to maintain liquidity through the use of repo transactions or open market transactions of the European Central Bank) with a volume of EUR 18,170 million (fair value as of the date of reclassification) were reclassified from the available-for-sale financial assets measurement category to the loans and receivables measurement category.
The following table shows the carrying amounts of the reclassified financial assets and their fair values:
| | | | | | | | | | | | | | | | | | | | | | |
| | | | | | | 31 Dec. 2017 | | | | | | | | | | | | | | 31 Dec. 2016 | | |
| | | | | | | EUR in millions | | | | | | | | | | | | | | EUR in millions | | |
| | | | | | | | |
Carrying amount (statement of financial position) | | | | | | 375 | | | | | | | | | | | | | | 870 | | |
Fair value | | | | | | 377 | | | | | | | | | | | | | | 874 | | |
122
KfW Financial Information 2017 Consolidated financial statements
For the reclassified financial assets, a change of EUR –21 million (2016: EUR –36 million) in fair value would have been recorded directly in equity under Revaluation reserves and – as in the previous year – no Net gains/losses from securities and investments would have been recorded.
Once again, Net gains/losses from securities and investments include reversals of impairment losses and impairments on reclassified financial assets totalling EUR 1 million; as in the financial year 2016, no realised gains and losses were recorded. Interest income from the reclassified securities is still recognised in the same manner.
(67) Fair values of financial instruments
In the following tables, the fair values of financial instruments are compared with their carrying amounts. The fair value of the additional balances with central banks recognised in Cash reserves is their carrying amount. Existing Risk provisions for lending business are deducted from the carrying amounts of Loans and advances to banks and customers. The (prior-year) carrying amount of the Subordinated liabilities comprises pro rata interest and value adjustments from micro fair value hedge accounting reported in the Other liabilities line item.
Fair values of financial instruments as of 31 December 2017
| | | | | | | | | | | | | | | | | | | | | | | | | | | | |
| | | | | | | Fair value | | | | | | | | | | Carrying amount (state- ment of finan- cial position) | | | | | | | | | | Diiference | | |
| | | | | | | EUR in millions | | | | | | | | | | EUR in millions | | | | | | | | | | EUR in millions | | |
Loans and advances to banks | | | | | | 284,750 | | | | | | | | | | 274,119 | | | | | | | | | | 10,631 | | |
Loans and advances to customers | | | | | | 128,759 | | | | | | | | | | 126,671 | | | | | | | | | | 2,088 | | |
Value adjustments from macro fair value hedge accounting | | | | | | 0 | | | | | | | | | | 9,648 | | | | | | | | | | –9,648 | | |
Derivatives designated for hedge accounting | | | | | | 9,074 | | | | | | | | | | 9,074 | | | | | | | | | | 0 | | |
Other derivatives | | | | | | 5,145 | | | | | | | | | | 5,145 | | | | | | | | | | 0 | | |
Securities and investments | | | | | | 33,682 | | | | | | | | | | 33,615 | | | | | | | | | | 67 | | |
Assets | | | | | | 461,411 | | | | | | | | | | 458,273 | | | | | | | | | | 3,138 | | |
Liabilities to banks | | | | | | 6,122 | | | | | | | | | | 6,002 | | | | | | | | | | 120 | | |
Liabilities to customers | | | | | | 10,058 | | | | | | | | | | 9,889 | | | | | | | | | | 169 | | |
Certificated liabilities | | | | | | 409,187 | | | | | | | | | | 406,290 | | | | | | | | | | 2,897 | | |
Value adjustments from macro fair value hedge accounting | | | | | | 0 | | | | | | | | | | 119 | | | | | | | | | | –119 | | |
Derivatives designated for hedge accounting | | | | | | 14,488 | | | | | | | | | | 14,488 | | | | | | | | | | 0 | | |
Other derivatives | | | | | | 2,902 | | | | | | | | | | 2,902 | | | | | | | | | | 0 | | |
Subordinated liabilities | | | | | | 0 | | | | | | | | | | 0 | | | | | | | | | | 0 | | |
Liabilities | | | | | | 442,757 | | | | | | | | | | 439,690 | �� | | | | | | | | | 3,067 | | |
123
KfW Financial Information 2017 Consolidated financial statements
Interest-related changes in value are also included in measuring the fair value of the financial instruments. Accordingly, when the comparison is made with the carrying amount, it is necessary to take into account the changes in value (interest-related) resulting from the recognition of Loans and advances and borrowings in macro fair value hedge accounting.
All equity instruments are measured at fair value as of the balance sheet date. As of 31 Dec. 2016, equity instruments in the amount of EUR 825 million were measured at cost less impairment losses as their fair value could not be reliably determined.
Fair values of financial instruments as of 31 December 2016
| | | | | | | | | | | | | | | | | | | | | | | | | | | | |
| | | | | | | Fair value | | | | | | | | | | Carrying amount (state- ment of finan- cial position) | | | | | | | | | | Difference | | |
| | | | | | | EUR in millions | | | | | | | | | | EUR in millions | | | | | | | | | | EUR in millions | | |
Loans and advances to banks | | | | | | 290,070 | | | | | | | | | | 275,752 | | | | | | | | | | 14,318 | | |
Loans and advances to customers | | | | | | 138,198 | | | | | | | | | | 135,265 | | | | | | | | | | 2,933 | | |
Value adjustments from macro fair value hedge accounting | | | | | | 0 | | | | | | | | | | 13,917 | | | | | | | | | | –13,917 | | |
Derivatives designated for hedge accounting | | | | | | 27,464 | | | | | | | | | | 27,464 | | | | | | | | | | 0 | | |
Other derivatives | | | | | | 7,344 | | | | | | | | | | 7,344 | | | | | | | | | | 0 | | |
Securities and investments | | | | | | 32,770 | | | | | | | | | | 32,715 | | | | | | | | | | 56 | | |
Assets | | | | | | 495,846 | | | | | | | | | | 492,456 | | | | | | | | | | 3,390 | | |
Liabilities to banks | | | | | | 19,998 | | | | | | | | | | 19,837 | | | | | | | | | | 161 | | |
Liabilities to customers | | | | | | 11,839 | | | | | | | | | | 11,634 | | | | | | | | | | 205 | | |
Certificated liabilities | | | | | | 426,854 | | | | | | | | | | 422,574 | | | | | | | | | | 4,280 | | |
Value adjustments from macro fair value hedge accounting | | | | | | 0 | | | | | | | | | | 127 | | | | | | | | | | –127 | | |
Derivatives designated for hedge accounting | | | | | | 18,451 | | | | | | | | | | 18,451 | | | | | | | | | | 0 | | |
Other derivatives | | | | | | 3,007 | | | | | | | | | | 3,007 | | | | | | | | | | 0 | | |
Subordinated liabilities | | | | | | 208 | | | | | | | | | | 204 | | | | | | | | | | 4 | | |
Liabilities | | | | | | 480,356 | | | | | | | | | | 475,834 | | | | | | | | | | 4,522 | | |
(68) Disclosures on methods used to measure financial instruments at fair value
The following tables show the financial instruments measured at fair value or for which the fair value is indicated in the Notes according to the valuation methods used.
Financial instruments measured at fair value are allocated to the following valuation methods:
Financial instruments allocated to the “Quoted market price” level are primarily bonds and other fixed-income securities recognised in Securities and investments, as well as the majority of borrowings accounted for under the fair value option, for which prices from an active market are available.
124
KfW Financial Information 2017 Consolidated financial statements
Fair value measurement of OTC derivatives as well as borrowings accounted for under the fair value option for which no prices from an active market are available is largely performed using valuation models with inputs that are observable in the market and are also usually the only relevant inputs, resulting in allocation to the “Valuation method based on observable market data (model)” level.
The “Valuation method based in part on data not observable in a market” level largely comprises derivatives recognised in Other derivatives with positive or negative fair values, which comprise a hedging instrument for customers with respect to export and project financing business, as well as available-for-sale Securities and investments from equity finance business recorded at fair value through profit or loss, which are not listed or for which prices cannot be derived from similar financial instruments listed on an exchange. This level also comprises, to a small extent, borrowings accounted for under the fair value option, whose fair value is based in part on data not observable in a market.
Financial instruments carried at amortised cost, for which the fair value is indicated in the Notes, are allocated to the valuation methods used as follows:
The lending business presented under Loans and advances to banks and Loans and advances to customers is predominantly allocated to “Valuation method based in part on data not observable in a market”. The measurement of fair value using the discounted cash flow method is based to a significant extent on data not observable in a market (expected loss, etc.).
The majority of the bonds and notes reported under Certificated liabilities are allocated to the “Quoted market price” level or – if there is no active market – the “Valuation method based on observable market data (model)” level. These include in particular KfW’s large volume and highly liquid benchmark bonds denominated in euros and US dollars as well as other public bonds.
In subsequent measurement at fair value in line with the applicable hierarchy, changes of valuation method used are deemed to have been made as of the end of the financial year because no specific event (and therefore no specific date) can generally be identified that caused the change of valuation method used.
125
KfW Financial Information 2017 Consolidated financial statements
Financial assets measured at fair value or for which the fair value is indicated in the Notes,
as of 31 December 2017
| | | | | | | | | | | | | | | | | | | | | | | | | | | | | | | | | | | | | | |
| | | | | | | Quoted market price | | | | | | | | | | Valuation method based on observable market data (model) | | | | | | | | | | Valuation method based in part on data not observable in a market | | | | | | | | | | Total | | |
| | | | | | | EUR in millions | | | | | | | | | | EUR in millions | | | | | | | | | | EUR in millions | | | | | | | | | | EUR in millions | | |
Financial assets measured at fair value | | | | | | | | | | | | | | | | | | | | | | | | | | | | | | | | | | | | | | |
Loans and advances to banks – recorded at fair value through profit or loss | | | | | | 0 | | | | | | | | | | 5 | | | | | | | | | | 0 | | | | | | | | | | 5 | | |
Loans and advances to customers – classified as held for trading | | | | | | 0 | | | | | | | | | | 0 | | | | | | | | | | 0 | | | | | | | | | | 0 | | |
Derivatives designated for hedge accounting | | | | | | 0 | | | | | | | | | | 9,074 | | | | | | | | | | 0 | | | | | | | | | | 9,074 | | |
Other derivatives | | | | | | 0 | | | | | | | | | | 4,472 | | | | | | | | | | 673 | | | | | | | | | | 5,145 | | |
Securities and investments – available for sale | | | | | | 21,869 | | | | | | | | | | 689 | | | | | | | | | | 351 | | | | | | | | | | 22,909 | | |
Securities and investments – recorded at fair value through profit or loss | | | | | | 92 | | | | | | | | | | 1,447 | | | | | | | | | | 338 | | | | | | | | | | 1,876 | | |
Subtotal of financial assets measured at fair value | | | | | | 21,960 | | | | | | | | | | 15,688 | | | | | | | | | | 1,362 | | | | | | | | | | 39,010 | | |
Fair values of financial assets carried at amortised cost | | | | | | | | | | | | | | | | | | | | | | | | | | | | | | | | | | | | | | |
Loans and advances to banks – loans and receivables | | | | | | 0 | | | | | | | | | | 17,629 | | | | | | | | | | 267,116 | | | | | | | | | | 284,745 | | |
Loans and advances to customers – loans and receivables | | | | | | 0 | | | | | | | | | | 5,156 | | | | | | | | | | 123,602 | | | | | | | | | | 128,759 | | |
Securities and investments – loans and receivables | | | | | | 651 | | | | | | | | | | 5,636 | | | | | | | | | | 7 | | | | | | | | | | 6,293 | | |
Securities and investments – held-to-maturity investments | | | | | | 2,069 | | | | | | | | | | 535 | | | | | | | | | | 0 | | | | | | | | | | 2,603 | | |
Subtotal of fair values of financial assets carried at amortised cost | | | | | | 2,719 | | | | | | | | | | 28,956 | | | | | | | | | | 390,725 | | | | | | | | | | 422,401 | | |
Total | | | | | | 24,680 | | | | | | | | | | 44,644 | | | | | | | | | | 392,087 | | | | | | | | | | 461,411 | | |
126
KfW Financial Information 2017 Consolidated financial statements
Financial liabilities measured at fair value or for which the fair value is indicated in the Notes,
as of 31 December 2017
| | | | | | | | | | | | | | | | | | | | | | | | | | |
| | | | | | | | | | | | | |
| | | | | | Quoted market price | | | | | | Valuation method based on observable market data (model) | | | | | | Valuation method based in part on data
not observable in a market | | | | | | Total | | |
| | | | | | EUR in millions | | | | | | EUR in millions | | | | | | EUR in millions | | | | | | EUR in millions | | |
Financial liabilities measured at fair value | | | | | | | | | | | | | | | | | | | | | | | | | | |
Liabilities to banks – recorded at fair value through profit or loss | | | | | | 0 | | | | | | 255 | | | | | | 0 | | | | | | 255 | | |
Liabilities to customers – recorded at fair value through profit or loss | | | | | | 0 | | | | | | 1,820 | | | | | | 15 | | | | | | 1,835 | | |
Certificated liabilities – recorded at fair value through profit or loss | | | | | | 8,139 | | | | | | 3,392 | | | | | | 160 | | | | | | 11,691 | | |
Derivatives designated for hedge accounting | | | | | | 0 | | | | | | 14,488 | | | | | | 0 | | | | | | 14,488 | | |
Other derivatives | | | | | | 0 | | | | | | 2,816 | | | | | | 86 | | | | | | 2,902 | | |
Subtotal of financial liabilities measured at fair value | | | | | | 8,139 | | | | | | 22,770 | | | | | | 261 | | | | | | 31,170 | | |
Fair values of financial liabilities carried at amortised cost | | | | | | | | | | | | | | | | | | | | | | | | | | |
Liabilities to banks – other liabilities | | | | | | 0 | | | | | | 5,867 | | | | | | 0 | | | | | | 5,867 | | |
Liabilities to customers – other liabilities | | | | | | 0 | | | | | | 8,206 | | | | | | 18 | | | | | | 8,224 | | |
Certificated liabilities – other liabilities | | | | | | 346,519 | | | | | | 50,978 | | | | | | 0 | | | | | | 397,496 | | |
Subordinated liabilities – other liabilities | | | | | | 0 | | | | | | 0 | | | | | | 0 | | | | | | 0 | | |
Subtotal of fair values of financial liabilities carried at amortised cost | | | | | | 346,519 | | | | | | 65,051 | | | | | | 18 | | | | | | 411,588 | | |
Total | | | | | | 354,658 | | | | | | 87,821 | | | | | | 278 | | | | | | 442,757 | | |
127
KfW Financial Information 2017 Consolidated financial statements
Financial assets measured at fair value or for which the fair value is indicated in the Notes,
as of 31 December 2016
| | | | | | | | | | | | | | | | | | | | | | | | |
| | | | Quoted market price | | | | | Valuation method based on observable market data (model) | | | | | Valuation method based in part data not observed in a market | | | | | Total | | |
| | | | EUR in millions | | | | | EUR in millions | | | | | EUR in millions | | | | | EUR in millions | | |
Financial assets measured at fair value | | | | | | | | | | | | | | | | | | | | | | | | |
Loans and advances to banks – recorded at fair value through profit or loss | | | | 0 | | | | | | 6 | | | | | | 0 | | | | | | 6 | | |
Loans and advances to customers – classified as held for trading | | | | 0 | | | | | | 0 | | | | | | 0 | | | | | | 0 | | |
Derivatives designated for hedge accounting | | | | 0 | | | | | | 27,464 | | | | | | 0 | | | | | | 27,464 | | |
Other derivatives | | | | 0 | | | | | | 6,480 | | | | | | 864 | | | | | | 7,344 | | |
Securities and investments – available for sale | | | | 19,995 | | | | | | 446 | | | | | | 825 | | | | | | 21,267 | | |
Securities and investments – recorded at fair value through profit or loss | | | | 201 | | | | | | 1,350 | | | | | | 432 | | | | | | 1,983 | | |
Subtotal of financial assets measured at fair value | | | | 20,196 | | | | | | 35,746 | | | | | | 2,123 | | | | | | 58,064 | | |
Fair values of financial assets carried at amortised cost | | | | | | | | | | | | | | | | | | | | | | | | |
Loans and advances to banks – loans and receivables | | | | 0 | | | | | | 23,662 | | | | | | 266,402 | | | | | | 290,064 | | |
Loans and advances to customers – loans and receivables | | | | 0 | | | | | | 9,891 | | | | | | 128,307 | | | | | | 138,198 | | |
Securities and investments – loans and receivables | | | | 980 | | | | | | 5,406 | | | | | | 92 | | | | | | 6,477 | | |
Securities and investments – held-to-maturity investments | | | | 2,304 | | | | | | 739 | | | | | | 0 | | | | | | 3,043 | | |
Subtotal of fair values of financial assets carried at amortised cost | | | | 3,284 | | | | | | 39,697 | | | | | | 394,801 | | | | | | 437,782 | | |
Total | | | | 23,480 | | | | | | 75,443 | | | | | | 396,923 | | | | | | 495,846 | | |
128
KfW Financial Information 2017 Consolidated financial statements
Financial liabilities measured at fair value or for which the fair value is indicated in the Notes,
as of 31 December 2016
| | | | | | | | | | | | | | | | | | | | | | | | | | |
| | | | | Quoted market price | | | | | Valuation
method based
on observable
market data
(model) | | | | | Valuation
method based
in part on data not observable
in a market | | | | | Total | | |
| | | | | EUR in millions | | | | | EUR in millions | | | | | EUR in millions | | | | | EUR in millions | | |
Financial liabilities measured at fair value | | | | | | | | | | | | | | | | | | | | | | | | | | |
Liabilities to banks – recorded at fair value through profit or loss | | | | | | 0 | | | | | | 296 | | | | | | 0 | | | | | | 297 | | |
Liabilities to customers – recorded at fair value through profit or loss | | | | | | 0 | | | | | | 1,796 | | | | | | 32 | | | | | | 1,828 | | |
Certificated liabilities – recorded at fair value through profit or loss | | | | | | 9,994 | | | | | | 4,292 | | | | | | 114 | | | | | | 14,401 | | |
Derivatives designated for hedge accounting | | | | | | 0 | | | | | | 18,448 | | | | | | 3 | | | | | | 18,451 | | |
Other derivatives | | | | | | 0 | | | | | | 2,917 | | | | | | 90 | | | | | | 3,007 | | |
Subtotal of financial liabilities measured at fair value | | | | | | 9,994 | | | | | | 27,748 | | | | | | 240 | | | | | | 37,982 | | |
Fair values of financial liabilities carried at amortised cost | | | | | | | | | | | | | | | | | | | | | | | | | | |
Liabilities to banks – other liabilities | | | | | | 0 | | | | | | 19,017 | | | | | | 684 | | | | | | 19,701 | | |
Liabilities to customers – other liabilities | | | | | | 0 | | | | | | 7,124 | | | | | | 2,888 | | | | | | 10,011 | | |
Certificated liabilities – other liabilities | | | | | | 349,869 | | | | | | 62,580 | | | | | | 5 | | | | | | 412,453 | | |
Subordinated liabilities – other liabilities | | | | | | 0 | | | | | | 208 | | | | | | 0 | | | | | | 208 | | |
Subtotal of fair values of financial liabilities carried at amortised cost | | | | | | 349,869 | | | | | | 88,928 | | | | | | 3,576 | | | | | | 442,374 | | |
Total | | | | | | 359,863 | | | | | | 116,677 | | | | | | 3,816 | | | | | | 480,356 | | |
129
KfW Financial Information 2017 Consolidated financial statements
Change of valuation method used for financial assets measured at fair value with a transfer between the “Quoted market price” and “Valuation method based on observable market data (model)” levels in the financial year 2017
| | | | | | | | | | | | | | |
| | | | | | | Transfers from “Quoted market price” to “Valuation method based on observable market data (model)” | | | | | | Transfers from “Valuation method based on observable market data (model)” to “Quoted market price” | | |
| | | | | | | EUR in millions | | | | | | EUR in millions | | |
Securities and investments – available for sale | | | | | | 0 | | | | | | 222 | | |
Securities and investments – recorded at fair value through profit or loss | | | | | | 20 | | | | | | 0 | | |
The transfers within Securities and investments are a result of changes in market activity as of the reporting date.
Change of valuation method used for financial liabilities measured at fair value with a transfer between the “Quoted market price” and “Valuation method based on observable market data (model)” levels in the financial year 2017
| | | | | | | | | | | | | | |
| | | | | | | Transfers from “Quoted market price” to “Valuation method based on observable market data (model)” | | | | | | Transfers from “Valuation method based on observable market data (model)” to “Quoted market price” | | |
| | | | | | | EUR in millions | | | | | | EUR in millions | | |
Certificated liabilities – recorded at fair value through profit or loss | | | | | | 0 | | | | | | 346 | | |
130
KfW Financial Information 2017 Consolidated financial statements
Change of valuation method used for financial assets measured at fair value with a transfer between the “Quoted market price” and “Valuation method based on observable market data (model)” levels in the financial year 2016
| | | | | | | | | | | | | | |
| | | | | | | Transfers from “Quoted market price” to “Valuation method based on observable market data (model)” | | | | | | Transfers from “Valuation method based on observable market data (model)” to “Quoted market price” | | |
| | | | | | | EUR in millions | | | | | | EUR in millions | | |
Securities and investments – available for sale | | | | | | 70 | | | | | | 1,002 | | |
Securities and investments – recorded at fair value through profit or loss | | | | | | 62 | | | | | | 133 | | |
Change of valuation method used for financial liabilities measured at fair value with a transfer between the “Quoted market price” and “Valuation method based on observable market data (model)” levels in the financial year 2016
| | | | | | | | | | | | | | |
| | | | | | | Transfers from “Quoted market price” to “Valuation method based on observable market data (model)” | | | | | | Transfers from “Valuation method based on observable market data (model)” to “Quoted market price” | | |
| | | | | | | EUR in millions | | | | | | EUR in millions | | |
Certificated liabilities – recorded at fair value through profit or loss | | | | | | 0 | | | | | | 9,913 | | |
131
KfW Financial Information 2017 Consolidated financial statements
Development of financial assets measured at fair value in the financial year 2017, using valuation methods based in part
| | | | | | | | | | | | | | | | | | | | | | | | | | | | | | | | | | |
| | | | | | | | | | | | | |
| | | | | | | Loans and advances to banks – recorded at fair value through profit or loss | | | | | | | Loans and advances to banks – classified as held for trading | | | | | | | Loans and advances to customers – recorded at fair value through profit or loss | | | | | | | Loans and advances to customers – classified as held for trading | | |
| | | | | | | EUR in millions | | | | | | | EUR in millions | | | | | | | EUR in millions | | | | | | | EUR in millions | | |
| | | | | | | | | | | | | |
As of 1 Jan. 2017 | | | | | | | | 0 | | | | | | | | 0 | | | | | | | | 0 | | | | | | | | 0 | | |
A. Changes recognised in the income statement | | | | | | | | | | | | | | | | | | | | | | | | | | | | | | | | | | |
Net interest and commission income | | | | | | | | 0 | | | | | | | | 0 | | | | | | | | 0 | | | | | | | | 0 | | |
Contracts still valid at year-end | | | | | | | | 0 | | | | | | | | 0 | | | | | | | | 0 | | | | | | | | 0 | | |
Net gains/losses from hedge accounting | | | | | | | | 0 | | | | | | | | 0 | | | | | | | | 0 | | | | | | | | 0 | | |
Contracts still valid at year-end | | | | | | | | 0 | | | | | | | | 0 | | | | | | | | 0 | | | | | | | | 0 | | |
| | | | | | | | | | | | | |
Net gains/losses from other financial instruments measured at fair value | | | | | | | | 0 | | | | | | | | 0 | | | | | | | | 0 | | | | | | | | 0 | | |
Contracts still valid at year-end | | | | | | | | 0 | | | | | | | | 0 | | | | | | | | 0 | | | | | | | | 0 | | |
Net gains/losses from securities and investments | | | | | | | | 0 | | | | | | | | 0 | | | | | | | | 0 | | | | | | | | 0 | | |
Contracts still valid at year-end | | | | | | | | 0 | | | | | | | | 0 | | | | | | | | 0 | | | | | | | | 0 | | |
Change in revaluation reserves | | | | | | | | 0 | | | | | | | | 0 | | | | | | | | 0 | | | | | | | | 0 | | |
Contracts still valid at year-end | | | | | | | | 0 | | | | | | | | 0 | | | | | | | | 0 | | | | | | | | 0 | | |
Total changes recognised in the income statement | | | | | | | | 0 | | | | | | | | 0 | | | | | | | | 0 | | | | | | | | 0 | | |
B. Changes recognised directly in equity | | | | | | | | | | | | | | | | | | | | | | | | | | | | | | | | | | |
Change of valuation method used | | | | | | | | 0 | | | | | | | | 0 | | | | | | | | 0 | | | | | | | | 0 | | |
Transfers from “Quoted market price” and “Valuation method based on observable market data (model)” | | | | | | | | 0 | | | | | | | | 0 | | | | | | | | 0 | | | | | | | | 0 | | |
Transfers to “Quoted market price” and “Valuation method based on observable market data (model)” | | | | | | | | 0 | | | | | | | | 0 | | | | | | | | 0 | | | | | | | | 0 | | |
Additions | | | | | | | | 0 | | | | | | | | 0 | | | | | | | | 0 | | | | | | | | 0 | | |
Disposals | | | | | | | | 0 | | | | | | | | 0 | | | | | | | | 0 | | | | | | | | 0 | | |
Total changes recognised directly in equity | | | | | | | | 0 | | | | | | | | 0 | | | | | | | | 0 | | | | | | | | 0 | | |
Changes in consolidated group | | | | | | | | 0 | | | | | | | | 0 | | | | | | | | 0 | | | | | | | | 0 | | |
Exchange rate changes | | | | | | | | 0 | | | | | | | | 0 | | | | | | | | 0 | | | | | | | | 0 | | |
Other changes | | | | | | | | 0 | | | | | | | | 0 | | | | | | | | 0 | | | | | | | | 0 | | |
As of 31 Dec. 2017 | | | | | | | | 0 | | | | | | | | 0 | | | | | | | | 0 | | | | | | | | 0 | | |
132
KfW Financial Information 2017 Consolidated financial statements
on data not observable in a market
| | | | | | | | | | | | | | | | | | | | | | | | | | | | |
| | | | | | | | | | |
| | | Derivatives designated for hedge accounting | | | | | Other derivatives | | | | | Securities and investments – available for sale | | | | | Securities and investments – recorded
at fair value through profit or loss | | | | | Total | | |
| | | EUR in millions | | | | | EUR in millions | | | | | EUR in millions | | | | | EUR in millions | | | | | EUR in millions | | |
| | | | | | | | | | |
| | 0 | | | | | | 864 | | | | | | 825 | | | | | | 432 | | | | | | 2,123 | | |
| | | | | | | | | | | | | | | | | | | | | | | | | | | | |
| | 0 | | | | | | –2 | | | | | | 0 | | | | | | 0 | | | | | | –2 | | |
| | 0 | | | | | | –1 | | | | | | 0 | | | | | | 0 | | | | | | –1 | | |
| | 0 | | | | | | 0 | | | | | | 0 | | | | | | 0 | | | | | | 0 | | |
| | 0 | | | | | | 0 | | | | | | 0 | | | | | | 0 | | | | | | 0 | | |
| | | | | | | | | | |
| | 0 | | | | | | –129 | | | | | | 0 | | | | | | 2 | | | | | | –127 | | |
| | 0 | | | | | | –126 | | | | | | 0 | | | | | | 3 | | | | | | –123 | | |
| | | | | | | | | | |
| | 0 | | | | | | 0 | | | | | | –6 | | | | | | 0 | | | | | | –6 | | |
| | 0 | | | | | | 0 | | | | | | –13 | | | | | | 0 | | | | | | –13 | | |
| | 0 | | | | | | 0 | | | | | | 165 | | | | | | 0 | | | | | | 165 | | |
| | 0 | | | | | | 0 | | | | | | 165 | | | | | | 0 | | | | | | 165 | | |
| | | | | | | | | | |
| | 0 | | | | | | –131 | | | | | | 158 | | | | | | 2 | | | | | | 29 | | |
| | | | | | | | | | | | | | | | | | | | | | | | | | | | |
| | 0 | | | | | | 0 | | | | | | –596 | | | | | | –71 | | | | | | –667 | | |
| | | | | | | | | | |
| | 0 | | | | | | 1 | | | | | | 0 | | | | | | 0 | | | | | | 1 | | |
| | | | | | | | | | |
| | 0 | | | | | | 0 | | | | | | –596 | | | | | | –71 | | | | | | –668 | | |
| | 0 | | | | | | 1 | | | | | | 151 | | | | | | 4 | | | | | | 156 | | |
| | 0 | | | | | | –51 | | | | | | –101 | | | | | | –1 | | | | | | –153 | | |
| | | | | | | | | | |
| | 0 | | | | | | –50 | | | | | | –546 | | | | | | –68 | | | | | | –665 | | |
| | 0 | | | | | | 0 | | | | | | –28 | | | | | | –29 | | | | | | –56 | | |
| | 0 | | | | | | –8 | | | | | | –59 | | | | | | 0 | | | | | | –67 | | |
| | 0 | | | | | | –1 | | | | | | 0 | | | | | | 0 | | | | | | –1 | | |
| | | 0 | | | | | | 673 | | | | | | 350 | | | | | | 338 | | | | | | 1,362 | | |
133
KfW Financial Information 2017 Consolidated financial statements
Development of financial liabilities measured at fair value in the financial year 2017, using valuation methods based in
| | | | | | | | | | | | | | |
| | | | | | | |
| | | | | | Liabilities to banks –
recorded at fair value
through profit or loss | | | | | | Liabilities to customers –
recorded at fair value
through profit or loss | | |
| | | | | | EUR in millions | | | | | | EUR in millions | | |
| | | | | | | |
As of 1 Jan. 2017 | | | | | | 0 | | | | | | 32 | | |
A. Changes recognised in the income statement | | | | | | | | | | | | | | |
Net interest and commission income | | | | | | 0 | | | | | | 0 | | |
Contracts still valid at year-end | | | | | | 0 | | | | | | 0 | | |
Net gains/losses from hedge accounting | | | | | | 0 | | | | | | 0 | | |
Contracts still valid at year-end | | | | | | 0 | | | | | | 0 | | |
Net gains/losses from other financial instruments measured at fair value | | | | | | 0 | | | | | | 0 | | |
Contracts still valid at year-end | | | | | | 0 | | | | | | 0 | | |
Total changes recognised in the income statement | | | | | | 0 | | | | | | 0 | | |
B. Changes recognised directly in equity | | | | | | | | | | | | | | |
Change of valuation method used | | | | | | 0 | | | | | | 0 | | |
Transfers from “Quoted market price” and “Valuation method based on observable market data (model)” | | | | | | 0 | | | | | | 0 | | |
Transfers to “Quoted market price” and “Valuation method based on observable market data (model)” | | | | | | 0 | | | | | | 0 | | |
Additions | | | | | | 0 | | | | | | 0 | | |
Disposals | | | | | | 0 | | | | | | –17 | | |
Total changes recognised directly in equity | | | | | | 0 | | | | | | –17 | | |
Changes in consolidated group | | | | | | 0 | | | | | | 0 | | |
Exchange rate changes | | | | | | 0 | | | | | | 0 | | |
Other changes | | | | | | 0 | | | | | | 0 | | |
As of 31 Dec. 2017 | | | | | | 0 | | | | | | 15 | | |
134
KfW Financial Information 2017 Consolidated financial statements
part on data not observable in a market
| | | | | | | | | | | | | | | | | | |
| | | | | | | | |
| | | Certificated liabilities – recorded at fair value through profit or loss | | | | Derivatives designated for hedge accounting | | | | Other derivatives | | | | Total | | | |
| | | EUR in millions | | | | EUR in millions | | | | EUR in millions | | | | EUR in millions | | | |
| | | | | | | | |
| | 114 | | | | 3 | | | | 90 | | | | 240 | | | | |
| | | | | | | | | | | | | | | | | | |
| | 0 | | | | 0 | | | | 0 | | | | 0 | | | | |
| | 0 | | | | 0 | | | | 0 | | | | 0 | | | | |
| | 0 | | | | 0 | | | | 0 | | | | 0 | | | | |
| | 0 | | | | 0 | | | | 0 | | | | 0 | | | | |
| | 4 | | | | 0 | | | | 5 | | | | 9 | | | | |
| | 4 | | | | 0 | | | | 5 | | | | 9 | | | | |
| | 4 | | | | 0 | | | | 5 | | | | 9 | | | | |
| | | | | | | | | | | | | | | | | | |
| | 49 | | | | 0 | | | | 0 | | | | 49 | | | | |
| | 70 | | | | 0 | | | | 1 | | | | 71 | | | | |
| | –22 | | | | 0 | | | | –1 | | | | –23 | | | | |
| | | | | | | | |
| | 0 | | | | 0 | | | | 0 | | | | 0 | | | | |
| | | | | | | | |
| | 0 | | | | –2 | | | | –12 | | | | –31 | | | | |
| | 49 | | | | –2 | | | | –12 | | | | 17 | | | | |
| | 0 | | | | 0 | | | | 0 | | | | 0 | | | | |
| | –7 | | | | –1 | | | | 4 | | | | –4 | | | | |
| | 0 | | | | 0 | | | | –1 | | | | –1 | | | | |
| | | 160 | | | | 0 | | | | 86 | | | | 261 | | | | |
135
KfW Financial Information 2017 Consolidated financial statements
Development of financial assets measured at fair value in the financial year 2016, using valuation methods based in part
| | | | | | | | | | | | | | | | | | | | | | | | | | |
| | | | | | | Loans and advances | | | | | | Loans and advances | | | | | | Loans and advances | | | | | | Loans and advances | | |
| | | | | | | to banks – recorded at | | | | | | to banks – classified | | | | | | to customers – | | | | | | to customers – | | |
| | | | | | | fair value through | | | | | | as held for trading | | | | | | recorded at fair value | | | | | | classified as held | | |
| | | | | | | profit or loss | | | | | | | | | | | | through profit or loss | | | | | | for trading | | |
| | | | | | | EUR in millions | | | | | | EUR in millions | | | | | | EUR in millions | | | | | | EUR in millions | | |
As of 1 Jan. 2016 | | | | | | 4 | | | | | | 0 | | | | | | 0 | | | | | | 29 | | |
A. Changes recognised in the income statement | | | | | | | | | | | | | | | | | | | | | | | | | | |
Net interest and commission income | | | | | | –2 | | | | | | 0 | | | | | | 0 | | | | | | 0 | | |
Contracts still valid at year-end | | | | | | –2 | | | | | | 0 | | | | | | 0 | | | | | | 0 | | |
Net gains/losses from hedge accounting | | | | | | 0 | | | | | | 0 | | | | | | 0 | | | | | | 0 | | |
Contracts still valid at year-end | | | | | | 0 | | | | | | 0 | | | | | | 0 | | | | | | 0 | | |
Net gains/losses from other financial instruments measured at fair value | | | | | | –2 | | | | | | 0 | | | | | | 0 | | | | | | 0 | | |
Contracts still valid at year-end | | | | | | –2 | | | | | | 0 | | | | | | 0 | | | | | | 0 | | |
Net gains/losses from securities and investments | | | | | | 0 | | | | | | 0 | | | | | | 0 | | | | | | 0 | | |
Contracts still valid at year-end | | | | | | 0 | | | | | | 0 | | | | | | 0 | | | | | | 0 | | |
Change in revaluation reserves | | | | | | 0 | | | | | | 0 | | | | | | 0 | | | | | | 0 | | |
Contracts still valid at year-end | | | | | | 0 | | | | | | 0 | | | | | | 0 | | | | | | 0 | | |
Total changes recognised in the income statement | | | | | | –4 | | | | | | 0 | | | | | | 0 | | | | | | 0 | | |
B. Changes recognised directly in equity | | | | | | | | | | | | | | | | | | | | | | | | | | |
Change of valuation method used | | | | | | 0 | | | | | | 0 | | | | | | 0 | | | | | | 0 | | |
Transfers from “Quoted market price” and “Valuation method based on observable market data (model)” | | | | | | 0 | | | | | | 0 | | | | | | 0 | | | | | | 0 | | |
Transfers to “Quoted market price” and “Valuation method based on observable market data (model)” | | | | | | 0 | | | | | | 0 | | | | | | 0 | | | | | | 0 | | |
Additions | | | | | | 0 | | | | | | 0 | | | | | | 0 | | | | | | 0 | | |
Disposals | | | | | | 0 | | | | | | 0 | | | | | | 0 | | | | | | –28 | | |
Total changes recognised directly in equity | | | | | | 0 | | | | | | 0 | | | | | | 0 | | | | | | –28 | | |
Changes in consolidated group | | | | | | 0 | | | | | | 0 | | | | | | 0 | | | | | | 0 | | |
Exchange rate changes | | | | | | 0 | | | | | | 0 | | | | | | 0 | | | | | | 0 | | |
Other changes | | | | | | 0 | | | | | | 0 | | | | | | 0 | | | | | | 0 | | |
As of 31 Dec. 2016 | | | | | | 0 | | | | | | 0 | | | | | | 0 | | | | | | 0 | | |
136
KfW Financial Information 2017 Consolidated financial statements
on data not observable in a market
| | | | | | | | | | | | | | | | | | | | | | | | | | | | | | |
| | | | | | | | | | | | | | | | | | | | | | | | | | | | |
| | | | | | | | | | | | | | | | | | | | | | | | | | | | |
| | | Derivatives designated | | | | Other derivatives | | | | Securities and | | | | Securities and | | | | | | | Total | | | | | | |
| | | for hedge accounting | | | | | | | | investments – | | | | investments – recorded | | | | | | | | | | | | | |
| | | | | | | | | | | available for sale | | | | at fair value through | | | | | | | | | | | | | |
| | | | | | | | | | | | | | | profit or loss | | | | | | | | | | | | | |
| | EUR in millions | | | | EUR in millions | | | | EUR in millions | | | | EUR in millions | | | | | | | | EUR in millions | | | | | | | | |
| | 0 | | | | 782 | | | | 796 | | | | 475 | | | | | | | | 2,086 | | | | | | | | |
| | | | | | | | | | | | | | | | | | | | | | | | | | | | | | |
| | 0 | | | | –4 | | | | 0 | | | | 0 | | | | | | | | –6 | | | | | | | | |
| | 0 | | | | –3 | | | | 0 | | | | 0 | | | | | | | | –5 | | | | | | | | |
| | 0 | | | | 0 | | | | 0 | | | | 0 | | | | | | | | 0 | | | | | | | | |
| | 0 | | | | 0 | | | | 0 | | | | 0 | | | | | | | | 0 | | | | | | | | |
| | 0 | | | | 122 | | | | 0 | | | | –20 | | | | | | | | 100 | | | | | | | | |
| | 0 | | | | 134 | | | | 0 | | | | –20 | | | | | | | | 112 | | | | | | | | |
| | 0 | | | | 0 | | | | –20 | | | | 0 | | | | | | | | –20 | | | | | | | | |
| | 0 | | | | 0 | | | | –140 | | | | 0 | | | | | | | | –140 | | | | | | | | |
| | 0 | | | | 0 | | | | 0 | | | | 0 | | | | | | | | 0 | | | | | | | | |
| | 0 | | | | 0 | | | | 0 | | | | 0 | | | | | | | | 0 | | | | | | | | |
| | 0 | | | | 118 | | | | –20 | | | | –20 | | | | | | | | 75 | | | | | | | | |
| | | | | | | | | | | | | | | | | | | | | | | | | | | | | | |
| | 0 | | | | 3 | | | | 0 | | | | –72 | | | | | | | | –68 | | | | | | | | |
| | 0 | | | | 3 | | | | 0 | | | | 28 | | | | | | | | 31 | | | | | | | | |
| | 0 | | | | 0 | | | | 0 | | | | –100 | | | | | | | | –100 | | | | | | | | |
| | 0 | | | | 0 | | | | 157 | | | | 33 | | | | | | | | 190 | | | | | | | | |
| | 0 | | | | –30 | | | | –109 | | | | –1 | | | | | | | | –169 | | | | | | | | |
| | 0 | | | | –27 | | | | 47 | | | | –40 | | | | | | | | –48 | | | | | | | | |
| | 0 | | | | 0 | | | | –9 | | | | 0 | | | | | | | | –9 | | | | | | | | |
| | 0 | | | | –35 | | | | 15 | | | | 18 | | | | | | | | –2 | | | | | | | | |
| | 0 | | | | 26 | | | | –5 | | | | 0 | | | | | | | | 21 | | | | | | | | |
| | | 0 | | | | 864 | | | | 825 | | | | 432 | | | | | | | | 2,123 | | | | | | | | |
137
KfW Financial Information 2017 Consolidated financial statements
Development of financial liabilities measured at fair value in the financial year 2016, using valuation methods based in
| | | | | | | | | | | | | | | | | | |
| | | | | | | |
| | | | | | | Liabilities to banks – | | | | | | | | Liabilities to customers – | | |
| | | | | | | �� recorded at fair value | | | | | | | | recorded at fair value | | |
| | | | | | through profit or loss | | | | | | | | through profit or loss | | |
| | | | | | EUR in millions | | | | | | | | EUR in millions | | |
| | | | | | | |
As of 1 Jan. 2016 | | | | | | 4 | | | | | | | | | | 58 | | |
A. Changes recognised in the income statement | | | | | | | | | | | | | | | | | | |
Net interest and commission income | | | | | | –4 | | | | | | | | | | 0 | | |
Contracts still valid at year-end | | | | | | –4 | | | | | | | | | | 0 | | |
Net gains/losses from hedge accounting | | | | | | 0 | | | | | | | | | | 0 | | |
Contracts still valid at year-end | | | | | | 0 | | | | | | | | | | 0 | | |
Net gains/losses from other financial instruments measured at fair value | | | | | | 1 | | | | | | | | | | –2 | | |
Contracts still valid at year-end | | | | | | 1 | | | | | | | | | | –2 | | |
Total changes recognised in the income statement | | | | | | –4 | | | | | | | | | | –2 | | |
B. Changes recognised directly in equity | | | | | | | | | | | | | | | | | | |
Change of valuation method used | | | | | | 0 | | | | | | | | | | 0 | | |
Transfers from “Quoted market price” and “Valuation method based on observable market data (model)” | | | | | | 0 | | | | | | | | | | 0 | | |
Transfers to “Quoted market price” and “Valuation method based on observable market data (model)” | | | | | | 0 | | | | | | | | | | 0 | | |
Additions | | | | | | 0 | | | | | | | | | | 0 | | |
Disposals | | | | | | 0 | | | | | | | | | | –25 | | |
Total changes recognised directly in equity | | | | | | 0 | | | | | | | | | | –25 | | |
Changes in consolidated group | | | | | | 0 | | | | | | | | | | 0 | | |
Exchange rate changes | | | | | | 0 | | | | | | | | | | 0 | | |
Other changes | | | | | | 0 | | | | | | | | | | 0 | | |
As of 31 Dec. 2016 | | | | | | 0 | | | | | | | | | | 32 | | |
138
KfW Financial Information 2017 Consolidated financial statements
part on data not observable in a market
| | | | | | | | | | | | | | | | | | | | | | | | |
| | | | | | | | |
| | | Certificated liabilities –
recorded at fair value through profit or loss | | | | | Derivatives designated for
hedge accounting | | | | | Other derivatives | | | | | Total | | | |
| | | EUR in millions | | | | | EUR in millions | | | | | EUR in millions | | | | | EUR in millions | | | |
| | | | | | | | |
| | 5 | | | | | | 2 | | | | | | 15 | | | | | | 84 | | | | |
| | | | | | | | | | | | | | | | | | | | | | | | |
| | 0 | | | | | | 0 | | | | | | 0 | | | | | | –4 | | | | |
| | 0 | | | | | | 0 | | | | | | 0 | | | | | | –4 | | | | |
| | 0 | | | | | | 0 | | | | | | 0 | | | | | | 0 | | | | |
| | 0 | | | | | | 0 | | | | | | 0 | | | | | | 0 | | | | |
| | 0 | | | | | | 0 | | | | | | 22 | | | | | | 20 | | | | |
| | 0 | | | | | | 0 | | | | | | 22 | | | | | | 20 | | | | |
| | 0 | | | | | | 0 | | | | | | 22 | | | | | | 17 | | | | |
| | | | | | | | | | | | | | | | | | | | | | | | |
| | 109 | | | | | | 0 | | | | | | 23 | | | | | | 132 | | | | |
| | | | | | | | |
| | 109 | | | | | | 0 | | | | | | 24 | | | | | | 133 | | | | |
| | | | | | | | |
| | 0 | | | | | | 0 | | | | | | –1 | | | | | | –1 | | | | |
| | 0 | | | | | | 0 | | | | | | 0 | | | | | | 0 | | | | |
| | 0 | | | | | | 0 | | | | | | –8 | | | | | | –32 | | | | |
| | 109 | | | | | | 0 | | | | | | 16 | | | | | | 100 | | | | |
| | 0 | | | | | | 0 | | | | | | 0 | | | | | | 0 | | | | |
| | 1 | | | | | | 1 | | | | | | 12 | | | | | | 13 | | | | |
| | 0 | | | | | | 0 | | | | | | 26 | | | | | | 26 | | | | |
| | | 114 | | | | | | 3 | | | | | | 90 | | | | | | 240 | | | | |
139
KfW Financial Information 2017 Consolidated financial statements
In accordance with the valuation methods defined for KfW Group, the fair value reported in the statement of financial position is the best evidence of the fair value for those financial instruments allocated to the “Valuation method based in part on data not observable in a market” level.
The following tables show how an alternative determination of relevant unobservable valuation parameters, i.e. values in best and worst case scenarios, would have an impact on fair values for significant products allocated to this level.
| | | | | | | | | | | | | | |
| | | | | | | |
| Major products | | | | Valuation method used | | | | Relevant data not observable in a market | | | | Range | | |
Derivatives with positive or negative fair values, which are used as a hedging instrument for customers with respect to export and project finance | | | | Discounted cash flow method | | | | Expected risk-free customer margin | | | | 8% to 14% | | |
Securities and investments from equity finance accounted for at fair value through profit or loss | | | | Discounted cash flow method | | | | Cost of capital | | | | 0.5% to 1.5% (real fluctuation) | | |
| | | | | | | |
| | | | | | | | Long-term result | | | | 5% | | |
| | | | | | | | | | | | | (relative fluctuation) | | |
Sensitivity analysis for the financial assets measured at fair value, using valuation methods based in part on data not observable in a market, as of 31 December 2017
| | | | | | | | | | | | | | | | | | | | | | | | |
| | | | | | | Best case scenario | | | | | | | | Reported value | | | | | | | | Worst case scenario | | |
| | | | | | | EUR in millions | | | | | | | | EUR in millions | | | | | | | | EUR in millions | | |
| | | | | | | | | | |
| Other derivatives – with positive fair values | | | | | | 682 | | | | | | | | 673 | | | | | | | | 664 | | |
Securities and investments – recorded at fair value through profit or loss | | | | | | 399 | | | | | | | | 338 | | | | | | | | 290 | | |
Total | | | | | | 1,082 | | | | | | | | 1,011 | | | | | | | | 954 | | |
Sensitivity analysis for the financial liabilities measured at fair value, using valuation methods based in part on data not observable in a market, as of 31 December 2017
| | | | | | | | | | | | | | | | | | | | | | | | |
| | | | | | | Best case scenario | | | | | | | | Reported value | | | | | | | | Worst case scenario | | |
| | | | | | | EUR in millions | | | | | | | | EUR in millions | | | | | | | | EUR in millions | | |
| | | | | | | | | | |
| Certificated liabilities – recorded at fair value through profit or loss | | | | | | 158 | | | | | | | | 160 | | | | | | | | 162 | | |
Other derivatives – with negative fair values | | | | | | 85 | | | | | | | | 86 | | | | | | | | 87 | | |
Total | | | | | | 242 | | | | | | | | 246 | | | | | | | | 248 | | |
140
KfW Financial Information 2017 Consolidated financial statements
Sensitivity analysis for the financial assets measured at fair value, using valuation methods based in part on data not observable in a market, as of 31 December 2016
| | | | | | | | | | | | | | | | | | | | |
| | | | | Best case
scenario | | | | | Reported value | | | | | Worst case
scenario | | |
| | | | | EUR in millions | | | | | EUR in millions | | | | | EUR in millions | | |
| | | | | | | |
Other derivatives – with positive fair values | | | | | | 875 | | | | | | 864 | | | | | | 854 | | |
Securities and investments – recorded at fair value through profit or loss | | | | | | 512 | | | | | | 432 | | | | | | 373 | | |
Total | | | | | | 1,387 | | | | | | 1,297 | | | | | | 1,226 | | |
Sensitivity analysis for the financial liabilities measured at fair value, using valuation methods based in part on data not observable in a market, as of 31 December 2016
| | | | | | | | | | | | | | | | | | | | |
| | | | | | Best case
scenario | | | | | Reported value | | | | | Worst case
scenario | | |
| | | | | | EUR in millions | | | | | EUR in millions | | | | | EUR in millions | | |
| | | | | | | | |
Certificated liabilities – recorded at fair value through profit or loss | | | | | | 113 | | | | | | 114 | | | | | | 115 | | |
Other derivatives – with negative fair values | | | | | | 89 | | | | | | 90 | | | | | | 91 | | |
Total | | | | | | 202 | | | | | | 204 | | | | | | 207 | | |
(69) Additional disclosures on Liabilities to banks
Disclosures on Liabilities to banks designated at fair value through profit or loss
(fair value option)
| | | | | | | | | | | | | | | | | | | | | | | | |
| | | | | | 31 Dec. 2017 | | | | | | | | 31 Dec. 2016 | | | | | Change | | |
| | | | | | EUR in millions | | | | | | | | EUR in millions | | | | | EUR in millions | | |
| | | | | | | | | |
Carrying amount | | | | | | 237 | | | | | | | | | | 276 | | | | | | –39 | | |
Repayment at maturity | | | | | | 245 | | | | | | | | | | 303 | | | | | | –58 | | |
Difference | | | | | | 8 | | | | | | | | | | 27 | | | | | | –19 | | |
Of the difference between the repayment amount at maturity and the carrying amount, there is no amount attributable to borrowings for which the repayment amount builds up as a result of the capitalisation over time of interest due (31 Dec. 2016: EUR 21 million).
141
KfW Financial Information 2017 Consolidated financial statements
(70) Additional disclosures on Liabilities to customers
Disclosures on Liabilities to customers designated at fair value through profit or loss
(fair value option)
| | | | | | | | | | | | | | | | | | | | | | | | |
| | | | | | 31 Dec. 2017 | | | | | | | | 31 Dec. 2016 | | | | | Change | | |
| | | | | | EUR in millions | | | | | | | | EUR in millions | | | | | EUR in millions | | |
| | | | | | | | | |
Carrying amount | | | | | | 1,835 | | | | | | | | | | 1,828 | | | | | | 7 | | |
| Repayment at maturity | | | | | | 3,159 | | | | | | | | | | 3,113 | | | | | | 47 | | |
Difference | | | | | | 1,325 | | | | | | | | | | 1,285 | | | | | | 40 | | |
Of the difference between the repayment amount at maturity and the carrying amount, EUR 1,312 million (31 Dec. 2016: EUR 1,244 million) is attributable to borrowings for which the repayment amount builds up as a result of the capitalisation over time of interest due.
(71) Additional disclosures on Certificated liabilities
Disclosures on certificated liabilities designated at fair value through profit or loss
(fair value option)
| | | | | | | | | | | | | | | | | | | | | | | | |
| | | | | | 31 Dec. 2017 | | | | | | | | 31 Dec. 2016 | | | | | Change | | |
| | | | | | EUR in millions | | | | | | | | EUR in millions | | | | | EUR in millions | | |
| | | | | | | | | |
Carrying amount | | | | | | 11,691 | | | | | | | | | | 14,401 | | | | | | –2,710 | | |
Repayment at maturity | | | | | | 13,887 | | | | | | | | | | 17,101 | | | | | | –3,213 | | |
Difference | | | | | | 2,197 | | | | | | | | | | 2,700 | | | | | | –503 | | |
Of the difference between the repayment amount at maturity and the carrying amount, EUR 3,727 million (31 Dec. 2016: EUR 4,578 million) is attributable to borrowings for which the repayment amount builds up as a result of the capitalisation over time of interest due.
142
KfW Financial Information 2017 Consolidated financial statements
| | (72) | Additional disclosures on financial liabilities designated at fair value through profit or loss |
(fair value option)
The valuation effects resulting from changes in fair value due to changes in KfW’s funding conditions included in Net gains/losses from other financial instruments measured at fair value amount to EUR –103 million (2016: EUR 264 million). The cumulative effect amounts to EUR –178 million (31 Dec. 2016: EUR –74 million).
These valuation effects included in particular the market-related changes in KfW’s funding conditions generated by the development of demand for various KfW funding instruments.
(73) Additional disclosures on derivatives
Analysis of derivatives by class
| | | | | | | | | | | | | | | | | | | | | | | | | | | | | | | | |
| | | | | Par value | | | | Fair value | | | | | | Fair value |
| | | | | | 31 Dec. 2017 | | | | | | 31 Dec. 2016 |
| | | | | | | | | | | | | | | | | | | | | | | | | | | | | | | |
| | | | | 31 Dec. | | | | 31 Dec. | | | | positive | | | | | negative | | | | | | positive | | | | | negative | | |
| | | | 2017 | | | | 2016 | | | | | | | | | | | | | | | | | | | | | | |
| | | | EUR in
millions | | | | EUR in
millions | | | | EUR in
millions | | | | | EUR in
millions | | | | | | EUR in
millions | | | | | EUR in
millions | | |
| | | | | | | | | | | | | | |
Interest-related derivatives | | | | 423,508 | | | | 412,338 | | | | 8,149 | | | | | | 7,263 | | | | | | 13,692 | | | | | | 17,277 | | |
Currency-related derivatives | | | | 201,670 | | | | 224,014 | | | | 5,978 | | | | | | 10,108 | | | | | | 20,993 | | | | | | 4,161 | | |
Credit derivatives | | | | 9 | | | | 10 | | | | 0 | | | | | | 0 | | | | | | 1 | | | | | | 0 | | |
Total | | | | 625,187 | | | | 636,363 | | | | 14,127 | | | | | | 17,371 | | | | | | 34,685 | | | | | | 21,438 | | |
Cross-currency swaps are presented under Currency-related derivatives.
Analysis of derivatives by counterparty
| | | | | | | | | | | | | | | | | | | | | | | | | | | | | | | | | | | | | | |
| | | | | | |
| | | | | Par value | | | Fair value | | | | | Fair value | | |
| | | | | | | 31 Dec. 2017 | | | | | 31 Dec. 2016 | | |
| | | | | | | | | | | | | | | | | | | | | | | | | | | | | | | | | | |
| | | | | 31 Dec. | | | | | 31 Dec. | | | | | positive | | | | | negative | | | | | | | positive | | | | | negative | | |
| | | | 2017 | | | | | 2016 | | | | | | | | | | | | | | | | | | | | | | | | |
| | | | EUR in millions | | | | | EUR in millions | | | | | EUR in millions | | | | | EUR in millions | | | | | | | EUR in millions | | | | | EUR in millions | | |
| | | | | | | | | | | | | | |
OECD banks | | | | 612,782 | | | | | | 624,675 | | | | | | 13,474 | | | | | | 17,050 | | | | | | | | 33,819 | | | | | | 21,098 | | |
Non-OECD banks | | | | 741 | | | | | | 824 | | | | | | 0 | | | | | | 48 | | | | | | | | 21 | | | | | | 2 | | |
Other counterparties | | | | 8,798 | | | | | | 8,152 | | | | | | 597 | | | | | | 64 | | | | | | | | 782 | | | | | | 62 | | |
Public sector | | | | 2,865 | | | | | | 2,712 | | | | | | 55 | | | | | | 210 | | | | | | | | 64 | | | | | | 275 | | |
Total | | | | 625,187 | | | | | | 636,363 | | | | | | 14,127 | | | | | | 17,371 | | | | | | | | 34,685 | | | | | | 21,438 | | |
143
KfW Financial Information 2017 Consolidated financial statements
The analysis includes stand-alone financial and credit derivatives which are presented in the items Derivatives designated for hedge accounting and Other derivatives.
The volume of initial differences between the transaction price and the model value as of the recognition date arising from the use of a valuation technique that makes significant use of data not observable in a market which have yet to be amortised over the life of the financial instrument amounts to EUR 91 million (31 Dec. 2016: EUR 93 million). The net gains/losses from derivatives not qualifying for hedge accounting include amortisation effects in the amount of EUR 10 million (2016: EUR 9 million).
The economic hedge effect of financial derivatives with an aggregate principal amount of EUR 567.8 billion (31 Dec. 2016: EUR 578.8 billion) is presented in accordance with IAS 39; the risk-mitigating impact of the remaining financial derivatives is not reflected in the accounts.
KfW Group did not pledge any collateral (in the form of securities) under derivative transactions that can be resold or repledged at any time without payments being past due, unchanged from 31 Dec. 2016.
However, liquid collateral totalling EUR 6,227 million (31 Dec. 2016: EUR 2,409 million) was provided, which is recognised in Loans and advances to banks and customers.
Unchanged from 31 Dec. 2016, KfW Group did not receive any collateral (in the form of securities) under derivative transactions, which can be resold or repledged at any time without payments by the protection seller being past due.
However, provision of liquid collateral totalling EUR 3,358 million (31 Dec. 2016: EUR 16,976 million) was accepted, which was reported under Liabilities to banks and customers.
(74) Additional disclosures on the PROMISE/PROVIDE synthetic securitisation platforms
KfW Group did not receive any collateral (in the form of securities) under platform transactions that can be resold or repledged at any time without payments being past due by the protection seller, unchanged from 31 Dec. 2016.
Nor was any provision of liquid collateral accepted, unchanged from 31 Dec. 2016.
144
KfW Financial Information 2017 Consolidated financial statements
(75) Disclosures on repurchase agreements
Disclosures on repo transactions
| | | | | | | | | | | | | | | | | | | | |
| | | | | | | 31 Dec. 2017 | | | | | | 31 Dec. 2016 | | | | | | Change | | |
| | | | | | | EUR in millions | | | | | | EUR in millions | | | | | | EUR in millions | | |
| | | | | | | | | | |
| Carrying amount of securities sold under repo transactions that continue to be recognised in Securities and investments | | | | | | 11 | | | | | | 0 | | | | | | 11 | | |
Liabilities to banks (countervalue) | | | | | | 11 | | | | | | 0 | | | | | | 11 | | |
The fair value of securities sold under repo transactions that continue to be recognised in Securities and investments totals EUR 11 million (31 Dec. 2016: EUR 0 million). The fair value of the corresponding repayment obligations is EUR 11 million (31 Dec. 2016: EUR 0 million).
KfW Group did not pledge any collateral (in the form of securities) under repo transactions that can be resold or repledged at any time without payments being past due, unchanged from 31 Dec. 2016.
KfW Group did not receive any collateral (in the form of securities) under repo transactions that can be resold or repledged at any time without payments by the protection seller being past due, unchanged from 31 Dec. 2016.
The group neither pledged nor accepted any liquid collateral, unchanged from 31 Dec. 2016.
Disclosures on reverse repo transactions
| | | | | | | | | | | | | | | | | | | | |
| | | | | | | 31 Dec. 2017 | | | | | | 31 Dec. 2016 | | | | | | Change | | |
| | | | | | | EUR in millions | | | | | | EUR in millions | | | | | | EUR in millions | | |
| | | | | | | | | | |
| Loans and advances to banks (countervalue) | | | | | | 972 | | | | | | 9,522 | | | | | | –8,551 | | |
Loans and advances to customers (countervalue) | | | | | | 0 | | | | | | 300 | | | | | | –300 | | |
Total | | | | | | 972 | | | | | | 9,822 | | | | | | –8,851 | | |
Securities purchased under reverse repos are not recognised.
KfW Group did not pledge any collateral (in the form of securities) under reverse repo transactions that can be resold or repledged at any time without payments being past due, unchanged from 31 Dec. 2016.
KfW Group did not receive any collateral (in the form of securities) under reverse repo transactions that can be resold or repledged at any time without payments by the protection seller being past due, unchanged from 31 Dec. 2016.
The group neither pledged nor accepted any liquid collateral, unchanged from 31 Dec. 2016.
145
KfW Financial Information 2017 Consolidated financial statements
(76) Disclosure on offsetting financial instruments
Offsetting agreements within framework agreements between KfW and its business partners
KfW introduced the settlement of derivative transactions via EUREX central clearing for the first time in 2017. This form of settling derivative transactions, which is new for KfW, results in the recognition of a net amount in the balance sheet for the transactions affected, as the involvement of EUREX as the central counterparty (CCP) meets all of the requirements for offsetting as set forth in the relevant IFRS standard (IAS 32.42). Accordingly, positive and negative fair values of derivatives for which EUREX acts as the central counterparty are offset against the corresponding collateral and reported in a net item in the balance sheet.
For securities repo transactions (reverse repos and repos) for which EUREX acts as the central counterparty, offsetting is also performed for receivables and liabilities.
In addition, framework agreements featuring netting agreements are in place between KfW and its business partners for OTC derivatives and securities repo transactions.
One form of netting is close-out netting, which provides for the extinction of all rights and obligations relating to individual transactions under the framework agreement upon termination of said framework agreement by the contractual partner, or upon the latter’s insolvency, with the rights and obligations replaced by a single compensation claim (or obligation) in the amount of the net replacement costs of the terminated individual transactions. This does not represent a present legal claim for offsetting.
Close-out netting is not to be confused with the offsetting of payments in normal business. The same framework agreement provides for the latter case, that payments due on the same day and in the same currency may be offset and a net payment made instead of each individual payment (payment netting). This represents a present legal claim for offsetting.
KfW’s framework agreements relating to bilateral OTC derivatives (not in central clearing) all include close-out netting agreements with the business partners. Payment netting is limited in the agreement to the relevant individual transaction, so that multiple transaction payment netting does not occur. The requirements for offsetting financial assets and financial liabilities therefore are not applicable to this type of KfW’s OTC derivatives.
KfW’s framework agreements for repo transactions include close-out netting agreements and in some cases also payment netting agreements with the business partners. However, as KfW does not generally perform multiple transaction payment netting with repo transactions either, the requirements for offsetting of financial assets and financial liabilities are not met for KfW’s repo transactions.
146
KfW Financial Information 2017 Consolidated financial statements
In accordance with the collateral agreements concluded for OTC derivatives and repo transactions, the values of the available collateral are used in determining the single compensation claim (or obligation) in close-out netting. Both cash and securities are permitted forms of collateral under the existing collateral agreements between KfW and its business partners. The collateral agreements provide for a transfer of title in the case of securities as collateral. Consequently, the transferred securities are not subject to any selling or pledging restrictions.
Disclosures on financial assets with netting agreements as of 31 December 2017
| | | | | | | | | | | | | | | | | | | | | | | | | | | | | | | | | | | | | | | | | | | | | | | | | | | | | | | | | | | | | | | | |
| | | | | | | | | | Carrying amount of financial assets before offsetting (gross amount) | | | | | | | | | | Netted figure as carrying amount of financial liabilities (gross amount) | | | | | | | | | | Reported financial assets (net amount) | | | | | | | | | | Carrying amount of non-offset- table financial liabilities | | | | | | | | | | Fair value of collateral received | | | | | | | | | | Total net amount | | | | |
| | | | | | | | | | EUR in millions | | | | | | | | | | EUR in millions | | | | | | | | | | EUR in millions | | | | | | | | | | EUR in millions | | | | | | | | | | EUR in millions | | | | | | | | | | EUR in millions | | | | |
| | | | | | | | | | | | | | | | | | | |
| OTC derivatives | | | | | | | | | | 16,134 | | | | | | | | | | 2,632 | | | | | | | | | | 13,502 | | | | | | | | | | 10,114 | | | | | | | | | | 3,174 | | | | | | | | | | 214 | | | | |
Reverse repos | | | | | | | | | | 972 | | | | | | | | | | 0 | | | | | | | | | | 972 | | | | | | | | | | 11 | | | | | | | | | | 961 | | | | | | | | | | 0 | | | | |
Total | | | | | | | | | | 17,106 | | | | | | | | | | 2,632 | | | | | | | | | | 14,474 | | | | | | | | | | 10,125 | | | | | | | | | | 4,135 | | | | | | | | | | 214 | | | | |
Disclosures on financial liabilities with netting agreements as of 31 December 2017 | | | | |
| | | | | | | | | | | | | | | | | | | | | | | | | | | | | | | | | | | | | | | | | | | | | | | | | | | | | | | | | | | | | | | | |
| | | | | | | | | | Carrying amount of financial lia- bilities before offsetting (gross amount) | | | | | | | | | | Netted figure as carrying amount of financial assets (gross amount) | | | | | | | | | | Reported financial liabilities (net amount) | | | | | | | | | | Carrying amount of non-offset- table financial assets | | | | | | | | | | Fair value of collateral pledged | | | | | | | | | | Total net amount | | | | |
| | | | | | | | | | EUR in millions | | | | | | | | | | EUR in millions | | | | | | | | | | EUR in millions | | | | | | | | | | EUR in millions | | | | | | | | | | EUR in millions | | | | | | | | | | EUR in millions | | | | |
| | | | | | | | | | | | | | | | | | | |
| OTC derivatives | | | | | | | | | | 22,961 | | | | | | | | | | 5,866 | | | | | | | | | | 17,095 | | | | | | | | | | 10,114 | | | | | | | | | | 6,211 | | | | | | | | | | 770 | | | | |
Repos | | | | | | | | | | 11 | | | | | | | | | | 0 | | | | | | | | | | 11 | | | | | | | | | | 11 | | | | | | | | | | 0 | | | | | | | | | | 0 | | | | |
Total | | | | | | | | | | 22,972 | | | | | | | | | | 5,866 | | | | | | | | | | 17,106 | | | | | | | | | | 10,125 | | | | | | | | | | 6,211 | | | | | | | | | | 770 | | | | |
In addition to the net amount, the items Derivatives designated for hedge accounting and Other derivatives also include bifurcated embedded derivatives not subject to netting agreements.
Receivables from reverse repo transactions are reported under Loans and advances to banks and customers.
147
KfW Financial Information 2017 Consolidated financial statements
Disclosures on financial assets with netting agreements as of 31 December 2016
| | | | | | | | | | | | | | | | | | | | | | | | | | | | | | | | | | | | | | | | | | | | | | | | | | | | | | | | | | | | | | | | | | | | |
| | | | | | | | | | | | | | Carrying amount of financial assets before offsetting (gross amount) | | | | | | | | | | Netted figure as carrying amount of financial liabilities (gross amount) | | | | | | | | | | Reported financial assets (net amount) | | | | | | | | | | Carrying amount of non-offset- table financial liabilities | | | | | | | | | | Fair value of collateral received | | | | | | | | | | Total net amount | | | | |
| | | | | | | | | | | | | | EUR in millions | | | | | | | | | | EUR in millions | | | | | | | | | | EUR in millions | | | | | | | | | | EUR in millions | | | | | | | | | | EUR in millions | | | | | | | | | | EUR in millions | | | | |
| | | | | | | | | | | | | | | | | | | | |
| OTC derivatives | | | | | | | | | | | | | | 33,876 | | | | | | | | | | 0 | | | | | | | | | | 33,876 | | | | | | | | | | 18,176 | | | | | | | | | | 15,488 | | | | | | | | | | 212 | | | | |
Reverse repos | | | | | | | | | | | | | | 9,822 | | | | | | | | | | 0 | | | | | | | | | | 9,822 | | | | | | | | | | 0 | | | | | | | | | | 9,822 | | | | | | | | | | 0 | | | | |
Total | | | | | | | | | | | | | | 43,699 | | | | | | | | | | 0 | | | | | | | | | | 43,699 | | | | | | | | | | 18,176 | | | | | | | | | | 25,311 | | | | | | | | | | 212 | | | | |
| | | | | | | | | | | | | | | | | | | | | | | | | | | | | | | | | | | | | | | | | | |
Disclosures on financial liabilities with netting agreements as of 31 December 2016 | | | | | | |
| | | | | | | | | | | | | | | | | | | | | | | | | | | | | | | | | | | | | | | | | | | | | | | | | | | | | | | | | | | | | | | | |
| | | | | | | | | | Carrying amount of financial lia- bilities before offsetting (gross amount) | | | | | | | | | | Netted figure as carrying amount of financial assets (gross amount) | | | | | | | | | | Reported financial liabilities (net amount) | | | | | | | | | | Carrying amount of non-offset- table financial assets | | | | | | | | | | Fair value of collateral pledged | | | | | | | | | | Total net amount | | | | |
| | | | | | | | | | EUR in millions | | | | | | | | | | EUR in millions | | | | | | | | | | EUR in millions | | | | | | | | | | EUR in millions | | | | | | | | | | EUR in millions | | | | | | | | | | EUR in millions | | | | |
| | | | | | | | | | | | | | | | | | | |
| OTC derivatives | | | | | | | | | | 21,097 | | | | | | | | | | 0 | | | | | | | | | | 21,097 | | | | | | | | | | 18,176 | | | | | | | | | | 2,400 | | | | | | | | | | 521 | | | | |
Repos | | | | | | | | | | 0 | | | | | | | | | | 0 | | | | | | | | | | 0 | | | | | | | | | | 0 | | | | | | | | | | 0 | | | | | | | | | | 0 | | | | |
Total | | | | | | | | | | 21,097 | | | | | | | | | | 0 | | | | | | | | | | 21,097 | | | | | | | | | | 18,176 | | | | | | | | | | 2,400 | | | | | | | | | | 521 | | | | |
148
KfW Financial Information 2017 Consolidated financial statements
Other Notes
(77) Contingent liabilities and irrevocable loan commitments
Analysis of contingent liabilities by class
| | | | | | | | | | | | | | | | | | | | | | |
| | | | | | | 31 Dec. 2017 | | | | | | | | 31 Dec. 2016 | | | | | | Change | | |
| | | | | | | EUR in millions | | | | | | | | EUR in millions | | | | | | EUR in millions | | |
| | | | | | | | | |
| Contingent liabilities from financial guarantees | | | | | | 2,229 | | | | | | | | 2,647 | | | | | | –418 | | |
Contingent liabilities from PROMISE/PROVIDE securitisation platforms | | | | | | 0 | | | | | | | | 0 | | | | | | 0 | | |
Performance guarantees | | | | | | 2 | | | | | | | | 2 | | | | | | –1 | | |
Other contingent liabilities | | | | | | 1,420 | | | | | | | | 1,305 | | | | | | 115 | | |
Total | | | | | | 3,651 | | | | | | | | 3,955 | | | | | | –304 | | |
Other contingent liabilities include payment obligations attributable to equity investments which are not fully paid up and do not have to be consolidated. According to IAS 37.92, there is no need for further disclosure of additional contingent liabilities.
Volume of irrevocable loan commitments
| | | | | | | | | | | | | | | | | | | | | | | | |
| | | | | | | 31 Dec. 2017 | | | | | | | | | 31 Dec. 2016 | | | | | Change | | |
| | | | | | | EUR in millions | | | | | | | | | | EUR in millions | | | | | | EUR in millions | | |
Irrevocable loan commitments | | | | | | 80,082 | | | | | | | | | | 81,534 | | | | | | –1,452 | | |
The Irrevocable loan commitments are mainly attributable to the domestic promotional lending business.
(78) Trust activities and administered loans
Analysis of trust activities by class (transactions in KfW’s own name but for the account of third parties)
| | | | | | | | | | | | | | | | | | | | | | | | |
| | | | | | | 31 Dec. 2017 | | | | | | | | | | 31 Dec. 2016 | | | | | | Change | | |
| | | | | | | EUR in millions | | | | | | | | | | EUR in millions | | | | | | EUR in millions | | |
| | | | | | | | | |
| Loans and advances to banks | | | | | | 931 | | | | | | | | | | 951 | | | | | | –20 | | |
Loans and advances to customers | | | | | | 11,502 | | | | | | | | | | 12,123 | | | | | | –621 | | |
Securities and investments | | | | | | 3,737 | | | | | | | | | | 3,600 | | | | | | 137 | | |
Assets held in trust | | | | | | 16,170 | | | | | | | | | | 16,674 | | | | | | –503 | | |
Liabilities to banks | | | | | | 0 | | | | | | | | | | 0 | | | | | | 0 | | |
Liabilities to customers | | | | | | 16,170 | | | | | | | | | | 16,673 | | | | | | –503 | | |
Liabilities held in trust | | | | | | 16,170 | | | | | | | | | | 16,674 | | | | | | –503 | | |
EUR 11,597 million (31 Dec. 2016: EUR 12,114 million) of the assets held in trust are attributable to the business sector Promotion of developing countries and emerging economies.
149
KfW Financial Information 2017 Consolidated financial statements
Volume of administered loans granted (loans in the name and for the account of third parties)
| | | | | | | | | | | | | | | | | | | | |
| | | | | | | 31 Dec. 2017 | | | | | | 31 Dec. 2016 | | | | | | Change | | |
| | | | | | | EUR in millions | | | | | | EUR in millions | | | | | | EUR in millions | | |
Administered loans | | | | | | 15,524 | | | | | | 14,694 | | | | | | 829 | | |
(79) Leasing transactions as lessee
Disclosures on lessee agreements as of 31 December 2017
| | | | | | | | | | | | | | | | | | | | | | | | | | |
| | | | | | | Due within one year | | | | | | Due in between one and five years | | | | | | Due in more than five years | | | | | | Total | | |
| | | | | | | EUR in millions | | | | | | EUR in millions | | | | | | EUR in millions | | | | | | EUR in millions | | |
| | | | | | | | | | | | | |
| Operating leases | | | | | | | | | | | | | | | | | | | | | | | | | | |
Future minimum leasing payments | | | | | | 13 | | | | | | 52 | | | | | | 41 | | | | | | 106 | | |
Disclosures on lessee agreements as of 31 December 2016 |
| | | | | | | | | | | | | | | | | | | | | | | | | | |
| | | | | | | Due within one year | | | | | | Due in between one and five years | | | | | | Due in more than five years | | | | | | Total | | |
| | | | | | | EUR in millions | | | | | | EUR in millions | | | | | | EUR in millions | | | | | | EUR in millions | | |
| | | | | | | | | | | | | |
| Operating leases | | | | | | | | | | | | | | | | | | | | | | | | | | |
Future minimum leasing payments | | | | | | 13 | | | | | | 38 | | | | | | 24 | | | | | | 75 | | |
(80) Average number of employees during the financial year
| | | | | | | | | | | | | | | | | | | | | | | | | | | | |
| | | | | | | 2017 | | | | | | | | | | 2016 | | | | | | | | | | Change | | |
| | | | | | | | | | |
| Employees (female) | | | | | | 2,961 | | | | | | | | | | 2,892 | | | | | | | | | | 69 | | |
Employees (male) | | | | | | 3,152 | | | | | | | | | | 3,053 | | | | | | | | | | 99 | | |
Total | | | | | | 6,113 | | | | | | | | | | 5,944 | | | | | | | | | | 169 | | |
Staff not covered by collective agreements | | | | | | 4,281 | | | | | | | | | | 4,170 | | | | | | | | | | 111 | | |
Staff covered by collective agreements | | | | | | 1,832 | | | | | | | | | | 1,774 | | | | | | | | | | 58 | | |
The average number of employees includes temporary staff but excludes members of the Executive Board and trainees and was calculated based on the levels at the end of each quarter.
150
KfW Financial Information 2017 Consolidated financial statements
(81) Remuneration report
The remuneration report describes the basic structure of the remuneration plan for members of the Executive Board and Board of Supervisory Directors; it also discloses their remuneration on an individual basis.
Overview of total remuneration of members of the Executive Board and Board of Supervisory Directors
| | | | | | | | | | | | | | | | | | | | |
| | | | | | | 2017 | | | | | | 2016 | | | | | | Change | | |
| | | | | | | EUR in thousands | | | | | | EUR in thousands | | | | | | EUR in thousands | | |
| | | | | | | | | | |
| Members of the Executive Board | | | | | | 4,034.1 | | | | | | 4,033.0 | | | | | | 1,1 | | |
Former members of the Executive Board and their surviving dependants | | | | | | 4,236.2 | | | | | | 4,225.9 | | | | | | 10,3 | | |
Members of the Board of Supervisory Directors | | | | | | 191.8 | | | | | | 193.0 | | | | | | –1,2 | | |
Total | | | | | | 8,462.1 | | | | | | 8,451.9 | | | | | | 10,2 | | |
Remuneration of the Executive Board
The remuneration system for KfW’s Executive Board is aimed at appropriately compensating members of the Executive Board for their duties and responsibilities. Executive Board contracts are drawn up based on the 1992 version of the policy for hiring executive board members at credit institutions of the Federal Government (Grundsätze für die Anstellung der Vorstandsmitglieder bei den Kreditinstituten des Bundes). The Federal Public Corporate Governance Code (Public Corporate Governance Kodex des Bundes – “PCGK”) is taken into account when drawing up contracts. Each contract is individualised accordingly on this basis.
Components of remuneration
The Executive Board members receive fixed monetary remuneration paid in equal monthly instalments. The remuneration of the Chief Executive Officer serving in 2017 is an exception; based on an agreed set of annual targets, he receives a variable end-of-year bonus in addition to his fixed salary. The minimum bonus payment for financial year 2017 was set at EUR 181,947. This minimum bonus payment does not apply if KfW’s net income for a financial year is insufficient to ensure allocation to the statutory reserves. The annual agreement on objectives for financial year 2017 comprises promotional, economic and regulatory objectives with a weighting of 50% quantitative to 50% qualitative objectives. A cap on the end-of-year bonus has been agreed.
The following table shows total remuneration, broken down into fixed and, where applicable, variable components and other forms of remuneration, as well as additions to pension provisions for the individual members of the Executive Board.
151
KfW Financial Information 2017 Consolidated financial statements
Annual remuneration of the Executive Board and additions to pension provisions in financial years 2017 and 20161)
| | | | | | | | | | | | | | | | | | | | | | | | | | | | | | | | | | | | | | | | | | | | | | | | | | |
| | | | | | Salary | | | | Variable remuneration | | | | Other remuneration | | | | | | Total | | | | | | Additions to pension provisions2) | | | | |
| | | | | | 2017 | | | | 2016 | | | | 2017 | | | | 2016 | | | | 2017 | | | | 2016 | | | | | | 2017 | | | | 2016 | | | | | | 2017 | | | | 2016 | | | | |
| | | | | EUR in thou- sands | | | | EUR in thou- sands | | | | EUR in
thou-
sands | | | | EUR in thou- sands | | | | EUR in thou- sands | | | | EUR in thou- sands | | | | | | EUR in thou- sands | | | | EUR in thou- sands | | | | | | EUR in thou- sands | | | | EUR in thou- sands | | | |
Dr Ulrich Schröder | | | | | | | | | | | | | | | | | | | | | | | | | | | | | | | | | | | | | | | | | | | | | | | | | | |
(Chief Executive Officer) | | | | | | 750.5 | | | | 742.2 | | | | 218.0 | | | | 275.0 | | | | 87.2 | | | | 88.5 | | | | | | 1,055.7 | | | | 1,105.7 | | | | | | –468.93) | | | | 1,549.7 | | | | |
Dr Günther Bräunig | | | | | | 607.0 | | | | 563.6 | | | | 0.0 | | | | 0.0 | | | | 29.8 | | | | 33.3 | | | | | | 636.8 | | | | 596.9 | | | | | | 134.4 | | | | 1,093.0 | | | | |
Dr Ingrid Hengster | | | | | | 528.5 | | | | 522.6 | | | | 0.0 | | | | 0.0 | | | | 34.8 | | | | 34.8 | | | | | | 563.3 | | | | 557.4 | | | | | | 363.2 | | | | 618.8 | | | | |
Dr Norbert Kloppenburg4) | | | | | | 464.5 | | | | 551.2 | | | | 0.0 | | | | 0.0 | | | | 37.7 | | | | 44.7 | | | | | | 502.2 | | | | 595.9 | | | | | | 325.4 | | | | 1,069.4 | | | | |
Bernd Loewen | | | | | | 590.0 | | | | 583.5 | | | | 0.0 | | | | 0.0 | | | | 38.6 | | | | 37.4 | | | | | | 628.6 | | | | 620.9 | | | | | | 292.9 | | | | 787.8 | | | | |
Prof. Dr Joachim Nagel5) | | | | | | 86.7 | | | | 0.0 | | | | 0.0 | | | | 0.0 | | | | 7.2 | | | | 0.0 | | | | | | 93.9 | | | | 0.0 | | | | | | 456.1 | | | | 0.0 | | | | |
Dr Stefan Peiß | | | | | | 527.8 | | | | 521.9 | | | | 0.0 | | | | 0.0 | | | | 25.8 | | | | 34.3 | | | | | | 553.6 | | | | 556.2 | | | | | | 416.2 | | | | 595.0 | | | | |
Total | | | | | 3,555.0 | | | | 3,485.0 | | | | 218.0 | | | | 275.0 | | | | 261.1 | | | | 273.0 | | | | | | 4,034.1 | | | | 4,033.0 | | | | | | 1,519.3 | | | | 5,713.7 | | | |
| 1) | Amounts in the table are subject to rounding differences. |
| 2) | The discount rate for pension obligations increased in 2017 due to the rise in long-term capital market rates from 1.63% (31 Dec. 2016) to 1.88% (31 Dec. 2017), which accounted for a decrease in additions to pension provisions over the previous year. |
| 3) | The reversal of provisions in this amount was due to the rise in long-term capital market rates as well as the fact that Dr Schröder did not draw a pension in 2017 despite having reached retirement age in March 2017. The provisions relating to the undrawn portion of the pension were released. |
| 4) | Dr Kloppenburg resigned his membership on the KfW Executive Board during the year, with effect from 31 October 2017. |
| 5) | Prof. Dr Nagel was appointed as a member of the KfW Executive Board during the year, with effect from 1 November 2017. |
Responsibilities
The Presidial and Nomination Committee has discussed the Executive Board remuneration system including contract components since the committee structure was modified in accordance with the applicable Section 25d of the German Banking Act (Kreditwesengesetz – “KWG”) and adopts and regularly reviews it. The Presidial and Nomination Committee is advised on these matters by the Remuneration Committee, which in turn considers the results of certain analyses of the Risk and Credit Committee regarding the incentive effects of the remuneration systems. Likewise after consulting with the Remuneration Committee on the matter, the Board of Supervisory Directors decides upon the basic structure of the Executive Board’s remuneration system.
The Presidial and Nomination Committee discussed remuneration issues on numerous occasions during the reporting year, most recently on 13 December 2017.
Fringe benefits
Other remuneration largely comprises fringe benefits. Executive Board members are entitled to a company car with driver services for business and personal use. Executive Board members reimburse KfW for using a company car with a driver for private purposes in accordance with applicable tax regulations. They are reimbursed under tax regulations for the cost of maintaining a second home for business reasons.
152
KfW Financial Information 2017 Consolidated financial statements
Executive Board members are insured under a group accident insurance policy. Allowances are provided for health and long-term care insurance. Executive Board members are covered by a directors and officers liability insurance policy, which insures them against the risks of financial loss associated with their actions in their capacity as Executive Board members and by a supplemental legal expenses insurance policy. KfW Executive Board members acting in their management capacity are also protected by a special legal expenses group policy for employees covering criminal activities.
No remuneration is paid to members of the Executive Board for assuming executive body functions at group companies.
As with all other executives, Executive Board members may also opt to participate in the deferred remuneration programme – a supplemental company pension scheme financed via tax-free salary conversion. Moreover, they are entitled to anniversary bonuses in accordance with KfW’s general company policy.
In addition, the fringe benefits contain the cost of security systems at Executive Board members’ homes; these benefits are not recognised as other remuneration but as Non-personnel expenses.
The fringe benefits are subject to taxation as benefits in money’s worth for Executive Board members if they cannot be granted on a tax-free basis or if this is contractually agreed.
There were no loans to any members of the Executive Board in 2017.
No Executive Board member was granted or promised any benefits by a third party during the past financial year with a view to his position as a member of the KfW Executive Board.
Pension benefits and other benefits in the case of early retirement
In accordance with Article 1 (3) of the KfW Bylaws, the appointment of an Executive Board member should not generally extend beyond reaching the legal age of retirement. This provision was waived for the Chief Executive Officer; he would have been above the statutory retirement age at the end of his period of office, which was renewed until 31 December 2020, if he had not stepped down from his office early, effective 31 December 2017. Upon reaching the age of 65 or statutory retirement age and the expiry of their Executive Board contract, Executive Board members are entitled to claim pension payments; they are also entitled to pension benefits if their employment relationship terminates due to permanent disability. Two members of the Executive Board who were first appointed to the Board in 2006 and 2007 respectively and subsequently reappointed also have the option of retiring at their own request at the age of 63. Dr Norbert Kloppenburg shall receive a contractually granted and grandfathered temporary allowance from 1 November 2017.
Pension commitments for Executive Board members as well as their surviving dependants are based on the 1992 version of the Federal Government’s policy for hiring executive board members at credit institutions. The PCGK is taken into account when drawing up the Executive Board contracts.
153
KfW Financial Information 2017 Consolidated financial statements
Executive Board member contracts include a severance pay cap in accordance with the recommendations of the PCGK. In other words, payments to these Executive Board members due to early termination of the Executive Board function without good cause in accordance with Section 626 of the German Civil Code (Bürgerliches Gesetzbuch – “BGB”) should not exceed the equivalent of two years’ salary or remuneration including fringe benefits for the remainder of the contract, whichever is lower.
The full benefit entitlement totalled 49% of the final salary in the reporting year with different contractual arrangements. With the exception of the CEO serving in 2017, the retirement benefit entitlement amounted to 70% of the full entitlement for first-time appointment, with an increase per completed year of service of 0.98 to 3.0 percentage points depending on the contract (from an initial 34.3% to a maximum of 49% of the final salary).
The Executive Board contracts contain additional individual provisions, in particular concerning vesting of pension benefits. The newer contracts also include provisions on retrospective pension contributions where pension benefits are not yet vested and the member in question has not been reappointed.
Pension payments to former Executive Board members or their surviving dependants were as follows in 2017 and 2016:
| | | | | | | | | | | | | | | | | | | | | | | | | | | | | | | | | | | | | | | | | | | | | | | | | | |
Pension payments to former Executive Board members or their surviving dependants | |
| |
| | | | | | | | Headcount
2017 | | | | | | | | | EUR in
thousands
2017 | | | | | | | | | Headcount
2016 | | | | | | | | | EUR in
thousands
2016 | | | |
| | | | | | | | | | | | | |
Former members of the | | | | | | | | | | | | | | | | | | | | | | | | | | | | | | | | | | | | | | | | | | | | | | | | | | |
Executive Board | | | | | | | | | | | 20 | | | | | | | | | | | | 3,510.4 | | | | | | | | | | | | 19 | | | | | | | | | | | 3,421.2 | | | | |
Surviving dependants | | | | | | | | | | | 8 | | | | | | | | | | | | 725,8 | | | | | | | | | | | | 9 | | | | | | | | | | | 804,7 | | | | |
Total | | | | | | | | | | | 28 | | | | | | | | | | | | 4,236.2 | | | | | | | | | | | | 28 | | | | | | | | | | | 4,225.9 | | | | |
Provisions in the amount of EUR 65,932.3 thousand were set up at the end of the financial year 2017 for pension obligations to former members of the Executive Board and their surviving dependents (2016: EUR 66,182.9 thousand).
No loans were granted to former Executive Board members or their surviving dependants in financial year 2017.
154
KfW Financial Information 2017 Consolidated financial statements
Remuneration of members of the Board of Supervisory Directors
The amount of remuneration to members of the Board of Supervisory Directors is determined by the supervisory authority in accordance with Article 7 (10) of the KfW Bylaws. With the last revision in May 2010, remuneration to members of the Federal Government who are members of the Board of Supervisory Directors pursuant to Article 7 (1) No. 1 and No. 2 of the KfW Law was set at EUR 0.
In the reporting year, remuneration for other members of the Board of Supervisory Directors pursuant to Article 7 (1) Nos. 3-7 of the KfW Law amounted to EUR 5,100 p.a.; remuneration for membership of a Board of Supervisory Directors committee was a standard amount of EUR 600 p.a. for each member. Committee chairs received no special remuneration.
Members who join during the year receive their remuneration on a pro rata basis.
A daily allowance (EUR 200 per meeting day) is paid and travel expenses and applicable VAT are reimbursed upon request.
The following table provides details on the remuneration paid to the Board of Supervisory Directors in financial year 2017; stated amounts are net amounts in thousands of euros. Travel expenses are reimbursed upon submission of receipts and are not taken into account in the table.
155
KfW Financial Information 2017 Consolidated financial statements
Remuneration of members of the Board of Supervisory Directors for the financial year 2017
| | | | | | | | | | | | | | | | | | | | | | | | | | | | | | | | | | | | | | |
No. | | | | Name | | | | Dates of membership | | | | | Board of Supervisory
Directors
membership1) | | | | | Committee membership1) | | | | | Daily allowance | | | | | Total | | | | |
| | | | | | | | 2017 | | | | | EUR in
thousands | | | | | EUR in
thousands | | | | | EUR in
thousands | | | | | EUR in
thousands | | | | |
1. | | | | Dr Wolfgang Schäuble | | | | | 1 Jan. – 24 Oct. | | | | | | 0.0 | | | | | | 0.0 | | | | | | 0.0 | | | | | | 0.0 | | | | | |
2. | | | | Peter Altmaier | | | | | 24 Oct. – 31 Dec. | | | | | | 0.0 | | | | | | 0.0 | | | | | | 0.0 | | | | | | 0.0 | | | | | |
3. | | | | Sigmar Gabriel | | | | | 1 Jan. – 27 Jan. | | | | | | 0.0 | | | | | | 0.0 | | | | | | 0.0 | | | | | | 0.0 | | | | | |
4. | | | | Brigitte Zypries | | | | | 27 Jan. – 31 Dec. | | | | | | 0.0 | | | | | | 0.0 | | | | | | 0.0 | | | | | | 0.0 | | | | | |
5. | | | | Kerstin Andreae | | | | | 1 Jan. – 31 Dec. | | | | | | 5.1 | | | | | | 0.6 | | | | | | 0.6 | | | | | | 6.3 | | | | | |
6. | | | | Dr Holger Bingmann | | | | | 13 Dec. – 31 Dec. | | | | | | 0.4 | | | | | | 0.0 | | | | | | 0.0 | | | | | | 0.4 | | | | | |
7. | | | | Anton F. Börner | | | | | 1 Jan. – 26 Sept. | | | | | | 3.8 | | | | | | 0.5 | | | | | | 0.0 | | | | | | 4.3 | | | | | |
8. | | | | Volker Bouffier2) | | | | | 1 Jan. – 31 Dec. | | | | | | 5.1 | | | | | | 1.2 | | | | | | 0.0 | | | | | | 6.3 | | | | | |
9. | | | | Dr Uwe Brandl | | | | | 1 Jan. – 31 Dec. | | | | | | 5.1 | | | | | | 0.0 | | | | | | 0.0 | | | | | | 5.1 | | | | | |
10. | | | | Hans-Dieter Brenner | | | | | 1 Jan. – 31 Dec. | | | | | | 5.1 | | | | | | 0.6 | | | | | | 1.4 | | | | | | 7.1 | | | | | |
11. | | | | Frank Bsirske | | | | | 1 Jan. – 31 Dec. | | | | | | 5.1 | | | | | | 0.0 | | | | | | 0.0 | | | | | | 5.1 | | | | | |
12. | | | | Alexander Dobrindt | | | | | 1 Jan. – 24 Oct. | | | | | | 0.0 | | | | | | 0.0 | | | | | | 0.0 | | | | | | 0.0 | | | | | |
13. | | | | Georg Fahrenschon | | | | | 1 Jan. – 31 Dec. | | | | | | 5.1 | | | | | | 2.5 | | | | | | 0.4 | | | | | | 8.0 | | | | | |
14. | | | | Robert Feiger | | | | | 1 Jan. – 31 Dec. | | | | | | 5.1 | | | | | | 0.6 | | | | | | 0.4 | | | | | | 6.1 | | | | | |
15. | | | | Klaus-Peter Flosbach | | | | | 1 Jan. – 31 Dec. | | | | | | 5.1 | | | | | | 0.6 | | | | | | 1.2 | | | | | | 6.9 | | | | | |
16. | | | | Sigmar Gabriel | | | | | 27 Jan. – 31 Dec. | | | | | | 0.0 | | | | | | 0.0 | | | | | | 0.0 | | | | | | 0.0 | | | | | |
17. | | | | Christian Görke2) | | | | | 1 Jan. – 31 Dec. | | | | | | 5.1 | | | | | | 0.0 | | | | | | 0.0 | | | | | | 5.1 | | | | | |
18. | | | | Dr Louis Hagen | | | | | 1 Jan. – 31 Dec. | | | | | | 5.1 | | | | | | 1.2 | | | | | | 1.4 | | | | | | 7.7 | | | | | |
19. | | | | Hubertus Heil | | | | | 1 Jan. – 31 Dec. | | | | | | 5.1 | | | | | | 1.8 | | | | | | 0.0 | | | | | | 6.9 | | | | | |
20. | | | | Monika Heinold2) | | | | | 1 Jan. – 31 Dec. | | | | | | 5.1 | | | | | | 0.6 | | | | | | 0.0 | | | | | | 5.7 | | | | | |
21. | | | | Dr Barbara Hendricks | | | | | 1 Jan. – 31 Dec. | | | | | | 0.0 | | | | | | 0.0 | | | | | | 0.0 | | | | | | 0.0 | | | | | |
22. | | | | Reiner Hoffmann | | | | | 1 Jan. – 31 Dec. | | | | | | 5.1 | | | | | | 1.2 | | | | | | 0.0 | | | | | | 6.3 | | | | | |
23. | | | | Gerhard Hofmann | | | | | 1 Jan. – 31 Dec. | | | | | | 5.1 | | | | | | 1.2 | | | | | | 0.6 | | | | | | 6.9 | | | | | |
24. | | | | Andreas Ibel | | | | | 1 Jan. – 31 Dec. | | | | | | 5.1 | | | | | | 0.0 | | | | | | 0.6 | | | | | | 5.7 | | | | | |
25. | | | | Bartholomäus Kalb | | | | | 1 Jan. – 31 Dec. | | | | | | 5.1 | | | | | | 0.6 | | | | | | 1.4 | | | | | | 7.1 | | | | | |
26. | | | | Dr Markus Kerber | | | | | 1 Jan. – 31 Mar. | | | | | | 1.3 | | | | | | 0.3 | | | | | | 0.0 | | | | | | 1.6 | | | | | |
27. | | | | Stefan Körzell | | | | | 1 Jan. – 31 Dec. | | | | | | 5.1 | | | | | | 1.2 | | | | | | 0.2 | | | | | | 6.5 | | | | | |
28. | | | | Dr Joachim Lang | | | | | 1 Apr. – 31 Dec. | | | | | | 3.8 | | | | | | 0.9 | | | | | | 0.0 | | | | | | 4.7 | | | | | |
29. | | | | Lutz Lienenkämper | | | | | 22 Sep. – 31 Dec. | | | | | | 1.7 | | | | | | 0.0 | | | | | | 0.0 | | | | | | 1.7 | | | | | |
30. | | | | Dr Gesine Lötzsch | | | | | 1 Jan. – 31 Dec. | | | | | | 5.1 | | | | | | 1.2 | | | | | | 0.6 | | | | | | 6.9 | | | | | |
31. | | | | Dr Gerd Müller | | | | | 1 Jan. – 31 Dec. | | | | | | 0.0 | | | | | | 0.0 | | | | | | 0.0 | | | | | | 0.0 | | | | | |
32. | | | | Eckhardt Rehberg | | | | | 1 Jan. – 31 Dec. | | | | | | 5.1 | | | | | | 1.2 | | | | | | 0.0 | | | | | | 6.3 | | | | | |
33. | | | | Joachim Rukwied | | | | | 1 Jan. – 31 Dec. | | | | | | 5.1 | | | | | | 0.6 | | | | | | 0.6 | | | | | | 6.3 | | | | | |
34. | | | | Christian Schmidt | | | | | 1 Jan. – 31 Dec. | | | | | | 0.0 | | | | | | 0.0 | | | | | | 0.0 | | | | | | 0.0 | | | | | |
35. | | | | Christian Schmidt (BMVI) | | | | | 24 Oct. – 31 Dec. | | | | | | 0.0 | | | | | | 0.0 | | | | | | 0.0 | | | | | | 0.0 | | | | | |
36. | | | | Andreas Schmitz | | | | | 1 Jan. – 31 Dec. | | | | | | 5.1 | | | | | | 2.5 | | | | | | 1.8 | | | | | | 9.4 | | | | | |
37. | | | | Carsten Schneider | | | | | 1 Jan. – 31 Dec. | | | | | | 5.1 | | | | | | 1.2 | | | | | | 1.0 | | | | | | 7.3 | | | | | |
38. | | | | Peter-Jürgen Schneider2) | | | | | 1 Jan. – 20 Nov. | | | | | | 4.7 | | | | | | 1.1 | | | | | | 0.4 | | | | | | 6.2 | | | | | |
39. | | | | Holger Schwannecke | | | | | 1 Jan. – 31 Dec. | | | | | | 5.1 | | | | | | 1.8 | | | | | | 0.0 | | | | | | 6.9 | | | | | |
40. | | | | Edith Sitzmann2) | | | | | 1 Jan. – 31 Dec. | | | | | | 5.1 | | | | | | 0.1 | | | | | | 0.0 | | | | | | 5.2 | | | | | |
41. | | | | Dr Frank-Walter Steinmeier | | | | | 1 Jan. – 27 Jan. | | | | | | 0.0 | | | | | | 0.0 | | | | | | 0.0 | | | | | | 0.0 | | | | | |
42. | | | | Prof. Dr Georg Unland2) | | | | | 1 Jan. – 28 Dec. | | | | | | 5.1 | | | | | | 0.6 | | | | | | 1.0 | | | | | | 6.7 | | | | | |
43. | | | | Dr Norbert Walter-Borjans2) | | | | | 1 Jan. – 8 July | | | | | | 3.0 | | | | | | 0.4 | | | | | | 0.0 | | | | | | 3.4 | | | | | |
44. | | | | Dr Martin Wansleben | | | | | 1 Jan. – 31 Dec. | | | | | | 5.1 | | | | | | 0.6 | | | | | | 0.0 | | | | | | 5.7 | | | | | |
Total | | | | | | | | | | | | | | | 151.3 | | | | | | 26.9 | | | | | | 13.6 | | | | | | 191.8 | | | | | |
| 1) | The amounts had not yet been paid out as of the reporting date 31 December 2017. |
| 2) | Amount governed by state law. |
156
KfW Financial Information 2017 Consolidated financial statements
Remuneration of members of the Board of Supervisory Directors for the financial year 2016
| | | | | | | | | | | | | | | | | | | | | | | | | | | | | | | | | | | | |
No. | | | | Name | | | | Dates of
membership | | | | | Board of
Supervisory
Directors
membership1) | | | | | Committee
membership1) | | | | | Daily allowance | | | | | Total | | | |
| | | | | | | | 2016 | | | | | EUR in
thousands | | | | | EUR in
thousands | | | | | EUR in
thousands | | | | | EUR in
thousands | | | |
1. | | | | Sigmar Gabriel | | | | | 1 Jan. – 31 Dec. | | | | | | 0.0 | | | | | | 0.0 | | | | | | 0.0 | | | | | | 0.0 | | | |
2. | | | | Dr Wolfgang Schäuble | | | | | 1 Jan. – 31 Dec. | | | | | | 0.0 | | | | | | 0.0 | | | | | | 0.0 | | | | | | 0.0 | | | |
3. | | | | Kerstin Andreae | | | | | 1 Jan. – 31 Dec. | | | | | | 5.1 | | | | | | 0.6 | | | | | | 0.8 | | | | | | 6.5 | | | |
4. | | | | Jan Bettink | | | | | 1 Jan. – 31 Dec. | | | | | | 5.1 | | | | | | 1.2 | | | | | | 0.0 | | | | | | 6.3 | | | |
5. | | | | Anton F. Börner | | | | | 1 Jan. – 31 Dec. | | | | | | 5.1 | | | | | | 0.6 | | | | | | 0.0 | | | | | | 5.7 | | | |
6. | | | | Dr Uwe Brandl | | | | | 1 Jan. – 31 Dec. | | | | | | 5.1 | | | | | | 0.0 | | | | | | 0.2 | | | | | | 5.3 | | | |
7. | | | | Hans-Dieter Brenner | | | | | 1 Jan. – 31 Dec. | | | | | | 5.1 | | | | | | 0.6 | | | | | | 1.4 | | | | | | 7.1 | | | |
8. | | | | Frank Bsirske | | | | | 1 Jan. – 31 Dec. | | | | | | 5.1 | | | | | | 0.0 | | | | | | 0.0 | | | | | | 5.1 | | | |
9. | | | | Alexander Dobrindt | | | | | 1 Jan. – 31 Dec. | | | | | | 0.0 | | | | | | 0.0 | | | | | | 0.0 | | | | | | 0.0 | | | |
10. | | | | Georg Fahrenschon | | | | | 1 Jan. – 31 Dec. | | | | | | 5.1 | | | | | | 2.5 | | | | | | 0.0 | | | | | | 7.6 | | | |
11. | | | | Robert Feiger | | | | | 1 Jan. – 31 Dec. | | | | | | 5.1 | | | | | | 0.6 | | | | | | 0.8 | | | | | | 6.5 | | | |
12. | | | | Klaus-Peter Flosbach | | | | | 1 Jan. – 31 Dec. | | | | | | 5.1 | | | | | | 0.6 | | | | | | 0.6 | | | | | | 6.3 | | | |
13. | | | | Christian Görke2) | | | | | 1 Jan. – 31 Dec. | | | | | | 5.1 | | | | | | 0.0 | | | | | | 0.0 | | | | | | 5.1 | | | |
14. | | | | Hubertus Heil | | | | | 1 Jan. – 31 Dec. | | | | | | 5.1 | | | | | | 1.8 | | | | | | 0.6 | | | | | | 7.5 | | | |
15. | | | | Monika Heinold2) | | | | | 1 Jan. – 31 Dec. | | | | | | 5.1 | | | | | | 0.6 | | | | | | 0.0 | | | | | | 5.7 | | | |
16. | | | | Dr Barbara Hendricks | | | | | 1 Jan. – 31 Dec. | | | | | | 0.0 | | | | | | 0.0 | | | | | | 0.0 | | | | | | 0.0 | | | |
17. | | | | Reiner Hoffmann | | | | | 1 Jan. – 31 Dec. | | | | | | 5.1 | | | | | | 1.2 | | | | | | 0.2 | | | | | | 6.5 | | | |
18. | | | | Gerhard Hofmann | | | | | 1 Jan. – 31 Dec. | | | | | | 5.1 | | | | | | 1.2 | | | | | | 0.4 | | | | | | 6.7 | | | |
19. | | | | Bartholomäus Kalb | | | | | 1 Jan. – 31 Dec. | | | | | | 5.1 | | | | | | 0.6 | | | | | | 1.4 | | | | | | 7.1 | | | |
20. | | | | Dr Markus Kerber | | | | | 1 Jan. – 31 Dec. | | | | | | 5.1 | | | | | | 1.2 | | | | | | 0.0 | | | | | | 6.3 | | | |
21. | | | | Stefan Körzell | | | | | 1 Jan. – 31 Dec. | | | | | | 5.1 | | | | | | 1.2 | | | | | | 0.6 | | | | | | 6.9 | | | |
22. | | | | Dr Gesine Lötzsch | | | | | 1 Jan. – 31 Dec. | | | | | | 5.1 | | | | | | 1.2 | | | | | | 0.6 | | | | | | 6.9 | | | |
23. | | | | Dr Gerd Müller | | | | | 1 Jan. – 31 Dec. | | | | | | 0.0 | | | | | | 0.0 | | | | | | 0.0 | | | | | | 0.0 | | | |
24. | | | | Eckhardt Rehberg | | | | | 1 Jan. – 31 Dec. | | | | | | 5.1 | | | | | | 1.2 | | | | | | 0.4 | | | | | | 6.7 | | | |
25. | | | | Joachim Rukwied | | | | | 1 Jan. – 31 Dec. | | | | | | 5.1 | | | | | | 0.6 | | | | | | 0.2 | | | | | | 5.9 | | | |
26. | | | | Dr Nils Schmid2) | | | | | 1 Jan. – 31 Dec. | | | | | | 5.1 | | | | | | 0.6 | | | | | | 0.6 | | | | | | 6.3 | | | |
27. | | | | Christian Schmidt | | | | | 1 Jan. – 31 Dec. | | | | | | 0.0 | | | | | | 0.0 | | | | | | 0.0 | | | | | | 0.0 | | | |
28. | | | | Andreas Schmitz | | | | | 1 Jan. – 31 Dec. | | | | | | 5.1 | | | | | | 2.5 | | | | | | 1.6 | | | | | | 9.2 | | | |
29. | | | | Carsten Schneider | | | | | 1 Jan. – 31 Dec. | | | | | | 5.1 | | | | | | 1.2 | | | | | | 0.8 | | | | | | 7.1 | | | |
30. | | | | Peter-Jürgen Schneider2) | | | | | 1 Jan. – 31 Dec. | | | | | | 5.1 | | | | | | 1.2 | | | | | | 0.2 | | | | | | 6.5 | | | |
31. | | | | Holger Schwannecke | | | | | 1 Jan. – 31 Dec. | | | | | | 5.1 | | | | | | 1.8 | | | | | | 0.0 | | | | | | 6.9 | | | |
32. | | | | Dr Markus Söder2) | | | | | 1 Jan. – 31 Dec. | | | | | | 5.1 | | | | | | 1.2 | | | | | | 0.0 | | | | | | 6.3 | | | |
33. | | | | Dr Frank-Walter Steinmeier | | | | | 1 Jan. – 31 Dec. | | | | | | 0.0 | | | | | | 0.0 | | | | | | 0.0 | | | | | | 0.0 | | | |
34. | | | | Prof. Dr Georg Unland2) | | | | | 1 Jan. – 31 Dec. | | | | | | 5.1 | | | | | | 0.6 | | | | | | 0.0 | | | | | | 5.7 | | | |
35. | | | | Dr Norbert Walter-Borjans2) | | | | | 1 Jan. – 31 Dec. | | | | | | 5.1 | | | | | | 0.6 | | | | | | 0.0 | | | | | | 5.7 | | | |
36. | | | | Dr Martin Wansleben | | | | | 1 Jan. – 31 Dec. | | | | | | 5.1 | | | | | | 0.6 | | | | | | 0.2 | | | | | | 5.9 | | | |
37. | | | | Dr Kai H. Warnecke | | | | | 1 Jan. – 31 Dec. | | | | | | 5.1 | | | | | | 0.0 | | | | | | 0.6 | | | | | | 5.7 | | | |
Total | | | | | | | | | | | | | | | 153.0 | | | | | | 27.8 | | | | | | 12.2 | | | | | | 193.0 | | | |
| 1) | The amounts had not yet been paid out as of the reporting date 31 December 2016. |
| 2) | Amount governed by state law. |
157
KfW Financial Information 2017 Consolidated financial statements
There are no pension obligations for members of the Board of Supervisory Directors.
Members of the Board of Supervisory Directors received no remuneration in the reporting year for personal services provided.
No direct loans were granted by KfW to members of the Board of Supervisory Directors in the reporting year.
Members of the Board of Supervisory Directors are also covered by a directors and officers liability insurance policy, which insures them against the risks of financial loss associated with their actions in their capacity as Supervisory Directors and by a supplemental legal expenses insurance policy. Currently there are no deductibles agreed. KfW’s Supervisory Directors acting in their capacity as such are also protected by a special legal expenses group policy for employees covering criminal activity and by a group accident insurance policy.
(82) Related party disclosures
In accordance with IAS 24, KfW Group’s related entities include the consolidated subsidiaries, the non-consolidated subsidiaries, joint ventures, associates and the interests held by the Federal Government.
Natural persons considered related parties in accordance with IAS 24 include the members of the Executive Board and of the Board of Supervisory Directors, the Directors of KfW, the managing directors of all subsidiaries included in the consolidated financial statements, the members of the supervisory boards of certain consolidated subsidiaries and their close family members.
KfW is a public-law institution in which the Federal Republic of Germany (Federal Government) holds an 80% stake and the Federal States hold a 20% stake. Any transactions with the Federal Government and the Federal States in the financial year 2017 are covered by the rules and regulations set forth in the KfW Law. This also includes operations in which the Federal Republic of Germany has a state interest and for which the Federal Government has mandated KfW (mandated transactions in accordance with Article 2 (4) of the KfW Law). In addition to mandated transactions, the Federal Government also has agency agreements with KfW, which primarily govern the individual promotional programmes.
The business relationships between KfW and natural persons considered related parties are primarily determined by the KfW Bylaws and by applying the principles of the Federal Public Corporate Governance Code. The conditions and prices reflect market conditions or are concluded in accordance with KfW’s general conditions for its loan programmes open to the general public.
158
KfW Financial Information 2017 Consolidated financial statements
(83) Auditor’s fees
| | | | | | | | | | | | | | | | | | | | | | | | | | | | | | |
| | | | | | | | | 2017 | | | | | | | | | | 2016 | | | | | | | | | | Change | | |
| | | | | | | | | EUR in thousands | | | | | | | | | | EUR in thousands | | | | | | | | | | EUR in thousands | | |
| | | | | | | | | | |
| Audit | | | | | | | | 4,418 | | | | | | | | | | 3,945 | | | | | | | | | | 473 | | |
Other attestation services | | | | | | | | 285 | | | | | | | | | | 470 | | | | | | | | | | –184 | | |
Tax advisory services | | | | | | | | 0 | | | | | | | | | | 13 | | | | | | | | | | –13 | | |
Other Services | | | | | | | | 3 | | | | | | | | | | 0 | | | | | | | | | | 3 | | |
Total | | | | | | | | 4,706 | | | | | | | | | | 4,427 | | | | | | | | | | 279 | | |
(84) Disclosures on unconsolidated structured entities
KfW Group’s unconsolidated structured entities within the meaning of IFRS 12 relate to the following business sectors:
Structured entities in the business sector Financial markets
KfW makes investments in ABS and ABCP transactions to promote the financing of SMEs, of climate and environmental protection projects and as part of liquidity management. The business sector Financial markets also manages an existing portfolio to which no further acquisitions are added. This portfolio currently consists of securities issued since 2001. KfW’s investments average less than 10% of a transaction’s volume. In cases of investments for promotional purposes, the proportion of KfW’s investment may be higher, but generally no more than 50% of the transaction volume.
As of 31 December 2017, the carrying amount of the positions held totalled EUR 4.7 billion (31 December 2016: EUR 4.9 billion).
Structured entities in the business sector Export and project finance
Tailored leasing/financing concepts are structured via property leasing companies, primarily in the “Aviation and Rail” and “Maritime Industries” sector departments. A separate entity is basically created for each transaction, with KfW Group participating as the lender. In the case of some of these business partners, the sponsoring banks act as managers of trust companies, but in the majority of cases, these business partners are set up as separate legal entities. KfW Group provides loans to these companies, generally together with other credit institutions. KfW also has credit relationships with some structured entities as market participants in the commodities financing business, where KfW Group supports these customers with export pre-financing structures.
159
KfW Financial Information 2017 Consolidated financial statements
As of 31 December 2017, the carrying amount of the positions held totalled EUR 3.5 billion (31 December 2016: EUR 4.3 billion).
Structured entities in the business sector Promotion of developing countries and emerging economies
As a finance and advisory institution, DEG provides support within its development mandate in line with its business activity guidelines. DEG’s mandate is to promote the development of the private sector of a) developing countries, b) central and eastern European countries and New Independent States (NIS), and c) other countries approved by its shareholder KfW in agreement with the Federal Government. In certain isolated cases this is undertaken via investments in structured entities in the form of equity investments and loans. In accordance with the applied risk principles, the risk of loss is limited to the volume invested or committed.
As of 31 December 2017, the carrying amount of the positions held totalled EUR 0.2 billion (31 December 2016: EUR 0.2 billion).
The following table shows the carrying amounts of assets relating to unconsolidated structured entities and the maximum possible loss that could result from these exposures.
160
KfW Financial Information 2017 Consolidated financial statements
Maximum risk of loss as of 31 December 2017
| | | | | | | | | | | | | | | | | | | | | | | | | | | | |
| | | | | | | Loans and advances to customers | | | | | | Securities and investments | | | | | | Other assets | | | | | | | | Contingent liabilities; irrevocable loan commitments | | |
| | | | | | | EUR in millions | | | | | | EUR in millions | | | | | | EUR in millions | | | | | | | | EUR in millions | | |
| | | | | | | | | | | | | | |
| Carrying amount | | | | | | 3,133 | | | | | | 4,766 | | | | | | 15 | | | | | | | | 479 | | |
Risk and other provisions | | | | | | 19 | | | | | | 0 | | | | | | 0 | | | | | | | | 1 | | |
Max. risk of loss | | | | | | 3,114 | | | | | | 4,766 | | | | | | 15 | | | | | | | | 478 | | |
Maximum risk of loss as of 31 December 2016
| | | | | | | | | | | | | | | | | | | | | | | | | | | | |
| | | | | | | Loans and advances to customers | | | | | | Securities and investments | | | | | | Other assets | | | | | | | | Contingent liabilities; irrevocable loan commitments | | |
| | | | | | | EUR in millions | | | | | | EUR in millions | | | | | | EUR in millions | | | | | | | | EUR in millions | | |
| | | | | | | | | | | | | | |
| Carrying amount | | | | | | 3,669 | | | | | | 4,983 | | | | | | 18 | | | | | | | | 857 | | |
| Risk and other provisions | | | | | | 25 | | | | | | 0 | | | | | | 0 | | | | | | | | 1 | | |
Max. risk of loss | | | | | | 3,644 | | | | | | 4,983 | | | | | | 18 | | | | | | | | 856 | | |
The maximum risk of loss is equal to the nominal amount for credit lines, (financial) guarantees and other liquidity facilities less the provisions for credit risks recognised in the statement of financial position. The maximum risk of loss relating to KfW Group’s investments is their carrying amount (net). The maximum risk of loss does not include effects from KfW Group’s hedging instruments used to reduce the maximum risk of loss.
No support is provided to structured entities in KfW Group beyond the respective financing.
In exceptional cases, KfW Group acts as the sponsor for structured entities in which it holds shares purely on a trust basis on behalf of the Federal Government. The risk of these structured entities lies exclusively with the Federal Government. In such cases, KfW Group is considered as the sponsor of the structured entities because the entities were initiated and/or structured by KfW Group on behalf of the Federal Government.
161
KfW Financial Information 2017 Consolidated financial statements
(85) Disclosures on shareholdings
Subsidiaries included in the consolidated financial statements
| | | | | | | | | | | | | | | | |
| Name/registered office | | | | | | Capital share | | | | | | Equity (IFRS) | | | | |
| | | | | | | | | | | | | as of 31 Dec. 2017 | | | | |
| | | | | | | % | | | | | | EUR in millions | | | | |
KfW IPEX-Bank GmbH, Frankfurt am Main | | | | | | 100.0 | | | | | | 4,297 | | | | |
DEG – Deutsche Investitions- und Entwicklungsgesellschaft mbH, Köln | | | | | | 100.0 | | | | | | 2,831 | | | | |
KfW Beteiligungsholding GmbH, Bonn | | | | | | 100.0 | | | | | | 2,937 | | | | |
Interkonnektor GmbH, Frankfurt am Main | | | | | | 100.0 | | | | | | 47 | | | | |
tbg Technologie-Beteiligungs-Gesellschaft mbH was deconsolidated effective 31 December 2017.
Associates included in the consolidated financial statements using the equity method
| | | | | | | | | | | | | | | | | | | | |
| Name/registered office | | | | | | Capital share | | | | | | Equity | | | | | | |
| | | | | | | | | | | | | as of 30 Sept. 2017 | | | | | | | | |
| | | | | | | % | | | | | | EUR in millions | | | | | | |
Microfinance Enhancement Facility S. A., Luxembourg | | | | | | 19.8 | | | | | | 441 | | | | | | | | |
Green for Growth Fund, Southeast Europe S. A., Luxembourg | | | | | | 15.7 | | | | | | 336 | | | | | | | | |
AF Eigenkapitalfonds für deutschen Mittelstand GmbH & Co. KG, Munich | | | | | | 47.5 | | | | | | 171 | | | | | | | | |
coparion GmbH & Co. KG, Cologne | | | | | | 20.0 | | | | | | 14 | | | | | | | | |
Name/registered office | | | | | | Capital share | | | | | | Equity | | | | | | |
| | | | | | | | | | | | | as of 30 Dec. 2017 | | | | | | | | |
| | | | | | | % | | | | | | EUR in millions | | | | | | |
DC Nordseekabel GmbH und Co. KG, Bayreuth | | | | | | 50.0 | | | | | | 366 | | | | | | | | |
162
KfW Financial Information 2017 Consolidated financial statements
Microfinance Enhancement Facility S.A. (MEF) has been accounted for using the equity method since 2009. MEF, a KfW investment in a refinancing facility for microfinance institutions, is part of the business sector Promotion of developing countries and emerging economies. Details of the business sectors as well as a summary of financial information can be found on the company’s website (http://www.mef-fund.com/).
Green for Growth Fund, Southeast Europe S.A. (GGF) has been included in the consolidated financial statements using the equity method since 2010. GGF is a fund to promote SME and private household investment in energy efficiency and renewable energy in the Western Balkans and in Turkey (KfW’s investment in GGF is also part of the business sector Promotion of developing countries and emerging economies). Details of GGF’s business sectors as well as a summary of financial information can be found on the company’s website (http://www.ggf.lu).
The business sector Mittelstandsbank (SME Bank) initiated the Eigenkapitalfonds für deutschen Mittelstand (German SME Equity Fund) together with Commerzbank in July 2010, each providing funds of almost EUR 100 million. It is accounted for using the equity method. The fund focuses on small and medium-sized (family) companies with a maximum annual revenue of EUR 500 million. The fund acquires minority interests and provides the company with real equity particularly for the purpose of financing growth.
163
KfW Financial Information 2017 Consolidated financial statements
DC Nordseekabel GmbH und Co. KG (DC Nordseekabel) was accounted for using the equity method, as a joint venture of Interkonnektor GmbH (Nordseekabel-Projekt NordLink in the business sector Export and project finance), for the first time in the financial year 2015. The NordLink project is one of the major projects in the European energy sector and comprises an investment volume of around EUR 1.5 to 2 billion. As it will primarily serve as a conduit for renewably sourced energy, the underwater cable will play an important role in the success of Germany’s energy transition. Norwegian state-owned power grid operator Statnett, KfW and the transmission systems operator TenneT, which is responsible for the German territory of the North Sea, concluded a cooperation agreement in February 2015 to construct an underwater cable between Germany and Norway. The NordLink project will be realised by a syndicate, in which Statnett and DC Nordseekabel each hold a 50% stake. KfW – via its subsidiary Interkonnektor GmbH – and TenneT each hold a 50% stake in DC Nordseekabel, which is responsible for construction and obtaining permits in Germany.
coparion GmbH & Co. KG (coparion; business sector Mittelstandsbank (SME Bank)) as an associated company was accounted for using the equity method for the first time in financial year 2016.
This co-investment fund of KfW and the German Federal Ministry for Economic Affairs and Energy (BMWi) participates in young technology companies by offering venture capital, together with private lead investors.
Entities not included in the consolidated financial statements
Four subsidiaries, five joint ventures, twelve associated companies, and eight special purpose vehicles (including structured entities) of minor significance to the presentation of the net assets, financial position and results of operations of KfW Group have not been consolidated; instead, they are shown in the statement of financial position under Securities and investments or Loans and advances. These companies account for approximately 0.1% of KfW Group’s total assets.
164
KfW Financial Information 2017 Consolidated financial statements
List of KfW Group shareholdings as of 31 December 2017
| | | | | | | | | | | | | | | | | | | | | | | | | | | | | | | | | | | | | | | | | | | | | | | | | | | | | | |
| No. | | | | | Name | | | | | | | Place | | | | | | | Capital | | | | | | | CC1) | | | | | | | Exchange rate | | | | | | | Equity in | | | | | | | Net income in |
| | | | | | | | | | | | | | | | | | | | share | | | | | | | | | | | | | | EUR 1.00 | | | | | | | TCU2), 3) | | | | | | | TCU2), 3) |
| | | | | | | | | | | | | | | | | | | | in % | | | | | | | | | | | | | | = CU as of | | | | | | | | | | | | | | |
| | | | | | | | | | | | | | | | | | | | | | | | | | | | | | | | | 31 Dec. 20172) | | | | | | | | | | | | | | |
| | | | | | | |
| KfW shareholdings | | | | | | | | | | | | | | | | | | | |
A. Fully consolidated subsidiaries included in the consolidated financial statements |
1 | | | | | | DEG – Deutsche Investitions- und | | | | | | | | | | | | | | | | | | | | | | | | | | | | | | | | | | | | | | | | | | | | | | | | |
| | | | | | Entwicklungsgesellschaft mbH | | | | | | | | Cologne | | | | | | | | 100.0 | | | | | | | | EUR | | | | | | | | 1.0000 | | | | | | | | 2,462,893 | | | | | | | | 94,947 |
2 | | | | | | Interkonnektor GmbH | | | | | | | | Frankfurt | | | | | | | | | | | | | | | | | | | | | | | | | | | | | | | | | | | | | | | | |
| | | | | | | | | | | | | | am Main | | | | | | | | 100.0 | | | | | | | | EUR | | | | | | | | 1.0000 | | | | | | | | 47,203 | | | | | | | | –2,743 |
3 | | | | | | KfW Beteiligungsholding GmbH | | | | | | | | Bonn | | | | | | | | 100.0 | | | | | | | | EUR | | | | | | | | 1.0000 | | | | | | | | 2,088,878 | | | | | | | | 95,986 |
B. Subsidiaries not included in the consolidated financial statements |
4 | | | | | | Finanzierungs- und | | | | | | | | | | | | | | | | | | | | | | | | | | | | | | | | | | | | | | | | | | | | | | | | |
| | | | | | Beratungsgesellschaft mbH | | | | | | | | Berlin | | | | | | | | 100.0 | | | | | | | | EUR | | | | | | | | 1.0000 | | | | | | | | 5,094 | | | | | | | | –60 |
5 | | | | | | tbg Technologie- | | | | | | | | | | | | | | | | | | | | | | | | | | | | | | | | | | | | | | | | | | | | | | | | |
| | | | | | Beteiligungsgesellschaft mbH | | | | | | | | Bonn | | | | | | | | 100.0 | | | | | | | | EUR | | | | | | | | 1.0000 | | | | | | | | 57,938 | | | | | | | | 5,381 |
C. Joint ventures not included in the consolidated financial statements |
6 | | | | | | Deutsche Energie-Agentur GmbH | | | | | | | | | | | | | | | | | | | | | | | | | | | | | | | | | | | | | | | | | | | | | | | | |
| | | | | | (dena) | | | | | | | | Berlin | | | | | | | | 26.0 | | | | | | | | EUR | | | | | | | | 1.0000 | | | | | | | | 5,605 | | | | | | | | 1,079 |
D. Other shareholdings (only capital shares totalling at least 20%) |
7 | | | | | | AF Eigenkapitalfonds für deutschen | | | | | | | | | | | | | | | | | | | | | | | | | | | | | | | | | | | | | | | | | | | | | | | | |
| | | | | | Mittelstand GmbH & Co. KG | | | | | | | | Munich | | | | | | | | 47.5 | | | | | | | | EUR | | | | | | | | 1.0000 | | | | | | | | 154,376 | | | | | | | | 4,047 |
8 | | | | | | Berliner Energieagentur GmbH | | | | | | | | Berlin | | | | | | | | 25.0 | | | | | | | | EUR | | | | | | | | 1.0000 | | | | | | | | 5,757 | | | | | | | | 636 |
9 | | | | | | eCapital Technologies Fonds II | | | | | | | | | | | | | | | | | | | | | | | | | | | | | | | | | | | | | | | | | | | | | | | | |
| | | | | | GmbH & Co. KG | | | | | | | | Münster | | | | | | | | 24.8 | | | | | | | | EUR | | | | | | | | 1.0000 | | | | | | | | 18,487 | | | | | | | | 2,342 |
10 | | | | | | Galaxy S. à. r. l. | | | | | | | | Luxembourg, | | | | | | | | | | | | | | | | | | | | | | | | | | | | | | | | | | | | | | | | |
| | | | | | | | | | | | | | Luxembourg | | | | | | | | 20.0 | | | | | | | | EUR | | | | | | | | 1.0000 | | | | | | | | 15,442 | | | | | | | | 8,215 |
|
| | | | | |
| Shareholdings of KfW IPEX-Bank GmbH | | | | | | | | | | | | | | |
A. Subsidiaries not included in the consolidated financial statements |
1 | | | | | | Bussard Air Leasing Ltd. | | | | | | | | Dublin, Ireland | | | | | | | | 100.0 | | | | | | | | USD | | | | | | | | 1.1993 | | | | | | | | –2,152 | | | | | | | | 165 |
2 | | | | | | Sperber Rail Holdings Inc. | | | | | | | | Wilmington, USA | | | | | | | | 100.0 | | | | | | | | USD | | | | | | | | 1.1993 | | | | | | | | 4,787 | | | | | | | | 916 |
B. Joint ventures not included in the consolidated financial statements |
3 | | | | | | Canas Leasing Ltd. | | | | | | | | Dublin, Ireland | | | | | | | | 50.0 | | | | | | | | USD | | | | | | | | 1.1993 | | | | | | | | 0 | | | | | | | | 0 |
C. Other shareholdings (only capital shares totalling at least 20%) |
4 | | | | | | 8F Leasing S. A. | | | | | | | | Findel, | | | | | | | | | | | | | | | | | | | | | | | | | | | | | | | | | | | | | | | | |
| | | | | | | | | | | | | | Luxembourg | | | | | | | | 22.2 | | | | | | | | USD | | | | | | | | 1.1993 | | | | | | | | 11,650 | | | | | | | | 273 |
| | | | | | | |
| Shareholdings of KfW Beteiligungsholding GmbH | | | | | | | | | | | | | | | | | | | |
A. Fully consolidated subsidiaries included in the consolidated financial statements |
1 | | | | | | KfW IPEX-Bank GmbH | | | | | | | | Frankfurt | | | | | | | | | | | | | | | | | | | | | | | | | | | | | | | | | | | | | | | | |
| | | | | | | | | | | | | | | am Main | | | | | | | | 100.0 | | | | | | | | EUR | | | | | | | | 1.0000 | | | | | | | | 3,854,653 | | | | | | | | 0 |
165
KfW Financial Information 2017 Consolidated financial statements
List of KfW Group shareholdings as of 31 December 2017
| | | | | | | | | | | | | | | | | | | | | | | | | | | | | | | | | | | | | | | | | | | | |
| No. | | | | | Name | | | | | | Place | | | | | | Capital | | | | | | CC1)
| | | | | | Exchange rate | | | | | | Equity in | | | | | | Net income in | | |
| | | | | | | | | | | | | | | | | | share | | | | | | | | | | | | EUR 1.00 | | | | | | TCU2), 3) | | | | | | TCU2), 3) | | |
| | | | | | | | | | | | | | | | | | in % | | | | | | | | | | | | = CU as of | | | | | | | | | | | | | | |
| | | | | | | | | | | | | | | | | | | | | | | | | | | | | | 31 Dec. 20172) | | | | | | | | | | | | | | |
| | | | | | | | | | |
| Shareholdings of DEG – Deutsche Investitions- und Entwicklungsgesellschaft mbH | | | | | | | | | | | | | | | | | | | | |
A. Joint ventures not included in the consolidated financial statements | | | | |
1 | | | | | | PCC-DEG Renewables GmbH | | | | | | Duisburg | | | | | | 40.0 | | | | | | EUR | | | | | | 1.0000 | | | | | | 18,527 | | | | | | 555 | | |
B. Other shareholdings (only capital shares totalling at least 20%) | | | | |
2 | | | | | | Aavishkaar Frontier Fund | | | | | | Ebene, Mauritius | | | | | | 20.8 | | | | | | USD | | | | | | 1.1993 | | | | | | 5,578 | | | | | | –1,261 | | |
3 | | | | | | Ace Power Embilipitiya Pvt Ltd. | | | | | | Colombo, Sri Lanka | | | | | | 26.0 | | | | | | LKR | | | | | | 184.0235 | | | | | | 3,093,310 | | | | | | 1,113,511 | | |
4 | | | | | | ACON Latin America Opportunities | | | | | | | | | | | | | | | | | | | | | | | | | | | | | | | | | | | | | | |
| | | | | | Fund IV-A, L.P. | | | | | | Toronto, Canada | | | | | | 39.9 | | | | | | USD | | | | | | 1.1993 | | | | | | 45,525 | | | | | | 8,754 | | |
5 | | | | | | Acon Latin America Opportunities | | | | | | Toronto, Canada | | | | | | 40.0 | | | | | | USD | | | | | | 1.1993 | | | | | | 49,258 | | | | | | –4,625 | | |
6 | | | | | | ACON Retail MXD, L.P. | | | | | | Toronto, Canada | | | | | | 100.0 | | | | | | USD | | | | | | 1.1993 | | | | | | 14,066 | | | | | | –8,489 | | |
7 | | | | | | Adobe Mezzanine Fund II Limited | | | | | | Mexico D.F., | | | | | | | | | | | | | | | | | | | | | | | | | | | | | | | | |
| | | | | | Partnership | | | | | | Mexico | | | | | | 23.7 | | | | | | MXN | | | | | | 23.6215 | | | | | | 04) | | | | | | 04) | | |
8 | | | | | | Adobe Social Mezzanine Fund I, L.P. | | | | | | Montreal, Canada | | | | | | 24.8 | | | | | | USD | | | | | | 1.1993 | | | | | | 9,857 | | | | | | –1,153 | | |
9 | | | | | | ADP Enterprises W.L.L. | | | | | | Manama, Bahrain | | | | | | 23.3 | | | | | | BHD | | | | | | 0.4521 | | | | | | 216,832 | | | | | | 65,930 | | |
10 | | | | | | Advent Latin American Private | | | | | | Wilmington, | | | | | | | | | | | | | | | | | | | | | | | | | | | | | | | | |
| | | | | | Equity Fund III-B L.P. | | | | | | USA | | | | | | 100.0 | | | | | | USD | | | | | | 1.1993 | | | | | | 1,264 | | | | | | –155 | | |
11 | | | | | | AEP China Hydro, Ltd. | | | | | | Ebene, Mauritius | | | | | | 30.2 | | | | | | USD | | | | | | 1.1993 | | | | | | 60,394 | | | | | | 12,832 | | |
12 | | | | | | Apis Growth 2 Ltd. | | | | | | Ebene, Mauritius | | | | | | 25.6 | | | | | | USD | | | | | | 1.1993 | | | | | | 35,871 | | | | | | 5,414 | | |
13 | | | | | | Aqua Agro Fundo de Investimento | | | | | | São Paulo, | | | | | | | | | | | | | | | | | | | | | | | | | | | | | | | | |
| | | | | | em Participações | | | | | | Brazil | | | | | | 29.9 | | | | | | BRL | | | | | | 3.9711 | | | | | | 101,903 | | | | | | –214 | | |
14 | | | | | | Asia Insurance 1950 | | | | | | Bangkok, | | | | | | | | | | | | | | | | | | | | | | | | | | | | | | | | |
| | | | | | Public Company Ltd. | | | | | | Thailand | | | | | | 24.6 | | | | | | THB | | | | | | 39.1005 | | | | | | 492,118 | | | | | | 53,458 | | |
15 | | | | | | Banyan Tree Growth Capital, L.L.C. | | | | | | Port Louis, | | | | | | | | | | | | | | | | | | | | | | | | | | | | | | | | |
| | | | | | | | | | | | Mauritius | | | | | | 27.0 | | | | | | USD | | | | | | 1.1993 | | | | | | 65,595 | | | | | | 4,779 | | |
16 | | | | | | Benetex Industries Ltd. | | | | | | Dhaka, | | | | | | | | | | | | | | | | | | | | | | | | | | | | | | | | |
| | | | | | | | | | | | Bangladesh | | | | | | 28.3 | | | | | | BDT | | | | | | 99.2228 | | | | | | 05) | | | | | | 05) | | |
17 | | | | | | Berkeley Energy Wind Mauritius Ltd. | | | | | | Ebene, Mauritius | | | | | | 25.8 | | | | | | EUR | | | | | | 1.0000 | | | | | | 100,619 | | | | | | 3,576 | | |
18 | | | | | | Bozano Investimentos | | | | | | | | | | | | | | | | | | | | | | | | | | | | | | | | | | | | | | |
| | | | | | Growth Capital Fund I-B L.P. | | | | | | Brazil | | | | | | 31.3 | | | | | | BRL | | | | | | 3.9711 | | | | | | 04) | | | | | | 04) | | |
19 | | | | | | CGFT Capital Pooling GmbH & Co. KG | | | | | | Berlin, Germany | | | | | | 40.0 | | | | | | EUR | | | | | | 1.0000 | | | | | | –69 | | | | | | –31 | | |
20 | | | | | | CoreCo Central America Fund I L.P. | | | | | | Wilmington, USA | | | | | | 22.0 | | | | | | USD | | | | | | 1.1993 | | | | | | 10,260 | | | | | | –64 | | |
21 | | | | | | Darby Latin American Private Debt | | | | | | | | | | | | | | | | | | | | | | | | | | | | | | | | | | | | | | |
| | | | | | Fund IIIA L.P. | | | | | | Toronto, Canada | | | | | | 75.0 | | | | | | USD | | | | | | 1.1993 | | | | | | 04) | | | | | | 04) | | |
22 | | | | | | Deep Catch Namibia Holdings | | | | | | Windhoek, | | | | | | | | | | | | | | | | | | | | | | | | | | | | | | | | |
| | | | | | (Proprietary) Ltd. | | | | | | Namibia | | | | | | 30.0 | | | | | | NAD | | | | | | 14.8358 | | | | | | 111,300 | | | | | | 346 | | |
23 | | | | | | Emerald Sri Lanka Fund I Ltd. | | | | | | Port Louis, | | | | | | | | | | | | | | | | | | | | | | | | | | | | | | | | |
| | | | | | | | | | | | Mauritius | | | | | | 23.5 | | | | | | USD | | | | | | 1.1993 | | | | | | 5,116 | | | | | | –1,049 | | |
24 | | | | | | Emerging Europe Leasing | | | | | | Amsterdam, | | | | | | | | | | | | | | | | | | | | | | | | | | | | | | | | |
| | | | | | | and Finance (EELF) B.V. | | | | | | Netherlands | | | | | | 25.0 | | | | | | EUR | | | | | | 1.0000 | | | | | | 4,021 | | | | | | 580 | | |
166
KfW Financial Information 2017 Consolidated financial statements
List of KfW Group shareholdings as of 31 December 2017
| | | | | | | | | | | | | | | | | | | | | | | | | | | | | | | | | | | | | | | | | | | | | | | | | | | | | | | | |
| No. | | | | | Name | | | | | | Place | | | | | | | Capital | | | | | | | CC1) | | | | | | | Exchange rate | | | | | | | Equity in | | | | | | | Net income in | | | |
| | | | | | | | | | | | | | | | | | | share | | | | | | | | | | | | | | EUR 1.00 | | | | | | | TCU2), 3) | | | | | | | TCU2), 3) | | | |
| | | | | | | | | | | | | | | | | | | in % | | | | | | | | | | | | | | = CU as of | | | | | | | | | | | | | | | | | |
| | | | | | | | | | | | | | | | | | | | | | | | | | | | | | | | 31 Dec. 20172) | | | | | | | | | | | | | | | | | |
| | | | | | | | | |
| Shareholdings of DEG – Deutsche Investitions- und Entwicklungsgesellschaft mbH | | | | | | | | | | | | | | | | | | | | | | | | | |
B. Other shareholdings (only capital shares totalling at least 20%) | |
| | | | |
25 | | | | | | EMF NEIF I (A) L.P. | | | | | | Southampton, UK | | | | | | | | 28.1 | | | | | | | | USD | | | | | | | | 1.1993 | | | | | | | | 35,716 | | | | | | | | 10,342 | | | | |
26 | | | | | | EMX Capital Partners L.P. | | | | | | Mexico D.F., | | | | | | | | | | | | | | | | | | | | | | | | | | | | | | | | | | | | | | | | | | | | |
| | | | | | | | | | | | Mexico | | | | | | | | 20.1 | | | | | | | | USD | | | | | | | | 1.1993 | | | | | | | | 49,349 | | | | | | | | 1,347 | | | | |
27 | | | | | | Equis DFI Feeder, L.P. | | | | | | George Town, | | | | | | | | | | | | | | | | | | | | | | | | | | | | | | | | | | | | | | | | | | | | |
| | | | | | | | | | | | Cayman Islands | | | | | | | | 37.0 | | | | | | | | USD | | | | | | | | 1.1993 | | | | | | | | 8,899 | | | | | | | | 125 | | | | |
28 | | | | | | Frontier Bangladesh II L.P. | | | | | | Grand Cayman, | | | | | | | | | | | | | | | | | | | | | | | | | | | | | | | | | | | | | | | | | | | | |
| | | | | | | | | | | | Cayman Islands | | | | | | | | 20.0 | | | | | | | | USD | | | | | | | | 1.1993 | | | | | | | | 439 | | | | | | | | –2,830 | | | | |
29 | | | | | | Fundo Mútuo de Investimentos em Empresas Emergentes Stratus Fleet | | | | | | São Paulo, Brazil | | | | | | | | 39.7 | | | | | | | | BRL | | | | | | | | 3.9711 | | | | | | | | 35,087 | | | | | | | | 9,206 | | | | |
30 | | | | | | Global Credit Rating Company Ltd. | | | | | | Road Town, | | | | | | | | | | | | | | | | | | | | | | | | | | | | | | | | | | | | | | | | | | | | |
| | | | | | | | | | | | British Virgin Islands | | | | | | | | 27.0 | | | | | | | | USD | | | | | | | | 1.1993 | | | | | | | | 1,347 | | | | | | | | 4,338 | | | | |
31 | | | | | | Grassland Finance Ltd. | | | | | | Hong Kong, | | | | | | | | | | | | | | | | | | | | | | | | | | | | | | | | | | | | | | | | | | | | |
| | | | | | | | | | | | Hong Kong | | | | | | | | 24.9 | | | | | | | | HKD | | | | | | | | 9.3700 | | | | | | | | 424,285 | | | | | | | | –24,709 | | | | |
32 | | | | | | Kendall Court Mezzanine (Asia) | | | | | | George Town, | | | | | | | | | | | | | | | | | | | | | | | | | | | | | | | | | | | | | | | | | | | | |
| | | | | | Bristol Merit Fund, L.P. | | | | | | Cayman Islands | | | | | | | | 24.4 | | | | | | | | USD | | | | | | | | 1.1993 | | | | | | | | 14,683 | | | | | | | | –14 | | | | |
33 | | | | | | Kibele B.V. | | | | | | Amsterdam, | | | | | | | | | | | | | | | | | | | | | | | | | | | | | | | | | | | | | | | | | | | | |
| | | | | | | | | | | | Netherlands | | | | | | | | 22.3 | | | | | | | | USD | | | | | | | | 1.1993 | | | | | | | | 4,517 | | | | | | | | –4.202 | | | | |
34 | | | | | | Knauf Gips Buchara OOO | | | | | | Bukhara, | | | | | | | | | | | | | | | | | | | | | | | | | | | | | | | | | | | | | | | | | | | | |
| | | | | | | | | | | | Uzbekistan | | | | | | | | 25.0 | | | | | | | | UZS | | | | | | | | 9,691.4300 | | | | | | | | 152,633,390 | | | | | | | | 23,025,1854) | | | | |
35 | | | | | | KNAUF Gypsum Philippines Inc. | | | | | | Makati City, | | | | | | | | | | | | | | | | | | | | | | | | | | | | | | | | | | | | | | | | | | | | |
| | | | | | | | | | | | Philippines | | | | | | | | 25.1 | | | | | | | | PHP | | | | | | | | 59.7950 | | | | | | | | 205,180 | | | | | | | | –34,570 | | | | |
36 | | | | | | Leiden PE II, L.P. | | | | | | Toronto, Canada | | | | | | | | 27.0 | | | | | | | | USD | | | | | | | | 1.1993 | | | | | | | | 8,290 | | | | | | | | –1,460 | | | | |
37 | | | | | | Lereko Metier REIPPP Fund Trust | | | | | | Sandhurst, | | | | | | | | | | | | | | | | | | | | | | | | | | | | | | | | | | | | | | | | | | | | |
| | | | | | | | | | | | South Africa | | | | | | | | 32.3 | | | | | | | | ZAR | | | | | | | | 14.8054 | | | | | | | | 94,097 | | | | | | | | 17,186 | | | | |
38 | | | | | | Lereko Metier Solafrica Fund I Trust | | | | | | Johannesburg, | | | | | | | | | | | | | | | | | | | | | | | | | | | | | | | | | | | | | | | | | | | | |
| | | | | | | | | | | | South Africa | | | | | | | | 47.5 | | | | | | | | ZAR | | | | | | | | 14.8054 | | | | | | | | 191,069 | | | | | | | | 51,449 | | | | |
39 | | | | | | Lovcen Banka AD | | | | | | Podgorica, | | | | | | | | | | | | | | | | | | | | | | | | | | | | | | | | | | | | | | | | | | | | |
| | | | | | | | | | | | Montenegro | | | | | | | | 28.1 | | | | | | | | EUR | | | | | | | | 1.0000 | | | | | | | | 8,548 | | | | | | | | 1994) | | | | |
40 | | | | | | MC II Pasta Ltd. | | | | | | Qormi, Malta | | | | | | | | 36.1 | | | | | | | | EUR | | | | | | | | 1.0000 | | | | | | | | 15,985 | | | | | | | | –623 | | | | |
41 | | | | | | Medisia Investment | | | | | | Singapore, | | | | | | | | | | | | | | | | | | | | | | | | | | | | | | | | | | | | | | | | | | | | |
| | | | | | Holdings Pte Ltd. | | | | | | Singapore | | | | | | | | 32.7 | | | | | | | | USD | | | | | | | | 1.1993 | | | | | | | | 59,583 | | | | | | | | 19,333 | | | | |
42 | | | | | | Metier Retailability | | | | | | Sandhurst, | | | | | | | | | | | | | | | | | | | | | | | | | | | | | | | | | | | | | | | | | | | | |
| | | | | | en commandite Partnership | | | | | | South Africa | | | | | | | | 23.8 | | | | | | | | ZAR | | | | | | | | 14.8054 | | | | | | | | 564.057 | | | | | | | | –10,174 | | | | |
43 | | | | | | Navegar II (Netherlands) B.V. | | | | | | Amsterdam, | | | | | | | | | | | | | | | | | | | | | | | | | | | | | | | | | | | | | | | | | | | | |
| | | | | | | | | | | | Netherlands | | | | | | | | 29.2 | | | | | | | | USD | | | | | | | | 1.1993 | | | | | | | | 44.675 | | | | | | | | –2,794 | | | | |
44 | | | | | | OAO Bucharagips | | | | | | Bukhara, | | | | | | | | | | | | | | | | | | | | | | | | | | | | | | | | | | | | | | | | | | | | |
| | | | | | | | | | | | Uzbekistan | | | | | | | | 24.9 | | | | | | | | UZS | | | | | | | | 9,691.4300 | | | | | | | | 19,592,898 | | | | | | | | 7,852,917 | | | | |
45 | | | | | | Orilus Investment Holdings Pte. Ltd. | | | | | | Singapore, | | | | | | | | | | | | | | | | | | | | | | | | | | | | | | | | | | | | | | | | | | | | |
| | | | | | | | | | | | Singapore | | | | | | | | 33.0 | | | | | | | | USD | | | | | | | | 1.1993 | | | | | | | | 67,684 | | | | | | | | –223 | | | | |
46 | | | | | | Phi Capital Trust | | | | | | Chennai, India | | | | | | | | 22.5 | | | | | | | | INR | | | | | | | | 76.6055 | | | | | | | | 0 | | | | | | | | 237,050 | | | | |
47 | | | | | | Russia Partners Technology Fund, L.P. | | | | | | Grand Cayman, | | | | | | | | | | | | | | | | | | | | | | | | | | | | | | | | | | | | | | | | | | | | |
| | | | | | | | | | | | Cayman Islands | | | | | | | | 21.6 | | | | | | | | USD | | | | | | | | 1.1993 | | | | | | | | 126,367 | | | | | | | | –1,406 | | | | |
48 | | | | | | Stratus Capital Partners B L.P. | | | | | | Edinburgh, UK | | | | | | | | 73.3 | | | | | | | | USD | | | | | | | | 1.1993 | | | | | | | | 9,098 | | | | | | | | 3,968 | | | | |
| | | | | | | | | | | | | | | | | | | | | | | | | | | | | | | | | | | | | | | | | | | | | | | | | | | | | | | | | |
167
KfW Financial Information 2017 Consolidated financial statements
List of KfW Group shareholdings as of 31 December 2017
| | | | | | | | | | | | | | | | | | | | | | | | | | | | | | | | | | | | | | | | | | | | | | | | | | | | | | | | |
No. | | | | | | Name | | | | | | | | Place | | | | | | | | Capital | | | | | | | | CC1) | | | | | | | | Exchange rate | | | | | | | | Equity in | | | | | | | | Net income in TCU2), 3) | | |
| | | | | | | | | | | | | | | | | | | | | | share | | | | | | | | | | | | | | | | EUR 1.00 | | | | | | | | TCU2), 3) | | | | | | | | | |
| | | | | | | | | | | | | | | | | | | | | | in % | | | | | | | | | | | | | | | | = CU as of | | | | | | | | | | | | | | | | | |
| | | | | | | | | | | | | | | | | | | | | | | | | | | | | | | | | 31 Dec. 20172) | | | | | | | | | | | | | | | | |
|
| Shareholdings of DEG – Deutsche Investitions- und Entwicklungsgesellschaft mbH |
B. Other shareholdings (only capital shares totalling at least 20%) |
49 | | | | | | Takura II Feeder Fund Partnership | | | | | | | | Cape Town, | | | | | | | | | | | | | | | | | | | | | | | | | | | | | | | | | | | | | | | | | | |
| | | | | | | | | | | | | | South Africa | | | | | | | | 24.8 | | | | | | | | USD | | | | | | | | 1.1993 | | | | | | | | 28,508 | | | | | | | | 6,086 | | |
50 | | | | | | The SEAF Central and Eastern Europe Growth Fund (SEAFGF) LLC | | | | | | | | Washington, D.C., USA | | | | | | | | 23.9 | | | | | | | | USD | | | | | | | | 1.1993 | | | | | | | | 3,425 | | | | | | | | –1,416 | | |
51 | | | | | | Tolstoi Investimentos S.A. | | | | | | | | São Paulo, | | | | | | | | | | | | | | | | | | | | | | | | | | | | | | | | | | | | | | | | | | |
| | | | | | | | | | | | | | Brazil | | | | | | | | 31.1 | | | | | | | | BRL | | | | | | | | 3.9711 | | | | | | | | 05) | | | | | | | | 05) | | |
52 | | | | | | TOO Isi Gips Inder | | | | | | | | Rajon Inderski, | | | | | | | | | | | | | | | | | | | | | | | | | | | | | | | | | | | | | | | | | | |
| | | | | | | | | | | | | | Kazakhstan | | | | | | | | 40.0 | | | | | | | | KZT | | | | | | | | 398.7500 | | | | | | | | 1,115,640 | | | | | | | | 123,632 | | |
53 | | | | | | TOO Knauf Gips Kaptschagaj | | | | | | | | Kapchagay, | | | | | | | | | | | | | | | | | | | | | | | | | | | | | | | | | | | | | | | | | | |
| | | | | | | | | | | | | | Kazakhstan | | | | | | | | 40.0 | | | | | | | | EUR | | | | | | | | 1.0000 | | | | | | | | 22,119 | | | | | | | | 6,183 | | |
54 | | | | | | Unibank Commercial Bank OJSC | | | | | | | | Baku, | | | | | | | | | | | | | | | | | | | | | | | | | | | | | | | | | | | | | | | | | | |
| | | | | | | | | | | | | | Azerbaijan | | | | | | | | 24.4 | | | | | | | | AZN | | | | | | | | 2.0499 | | | | | | | | –87,287 | | | | | | | | –117,132 | | |
55 | | | | | | Whitlam Holding Pte. Ltd. | | | | | | | | Singapore, | | | | | | | | | | | | | | | | | | | | | | | | | | | | | | | | | | | | | | | | | | |
| | | | | | | | | | | | | | Singapore | | | | | | | | 38.7 | | | | | | | | USD | | | | | | | | 1.1993 | | | | | | | | 28,938 | | | | | | | | 1,410 | | |
56 | | | | | | Worldwide Group, Inc | | | | | | | | Charlestown, | | | | | | | | | | | | | | | | | | | | | | | | | | | | | | | | | | | | | | | | | | |
| | | | | | | | | | | | | | | Saint Kitts and Nevis | | | | | | | | 32.3 | | | | | | | | USD | | | | | | | | 1.1993 | | | | | | | | 22,740 | | | | | | | | 758 | | |
| |
| Shareholdings of Interkonnektor GmbH | | |
A. Joint ventures included in the consolidated financial statements | | | | |
1 | | | | | | DC Nordseekabel GmbH & | | | | | | | | | | | | | | | | | | | | | | | | | | | | | | | | | | | | | | | | | | | | | | | | | | |
| | | | | | | Co. KG | | | | | | | | Bayreuth | | | | | | | | 50.0 | | | | | | | | EUR | | | | | | | | 1.0000 | | | | | | | | 365,792 | | | | | | | | 33,613 | | |
B. Joint ventures not included in the consolidated financial statements | | | | |
2 | | | | | | DC Nordseekabel | | | | | | | | | | | | | | | | | | | | | | | | | | | | | | | | | | | | | | | | | | | | | | | | | | |
| | | | | | Beteiligungs GmbH | | | | | | | | Bayreuth | | | | | | | | 50.0 | | | | | | | | EUR | | | | | | | | 1.0000 | | | | | | | | 50 | | | | | | | | 0 | | |
3 | | | | | | DC Nordseekabel | | | | | | | | | | | | | | | | | | | | | | | | | | | | | | | | | | | | | | | | | | | | | | | | | | |
| | | | | | | Management GmbH | | | | | | | | Bayreuth | | | | | | | | 50.0 | | | | | | | | EUR | | | | | | | | 1.0000 | | | | | | | | 100 | | | | | | | | 0 | | |
| 2) | CU = currency units in local currency; TCU = thousand currency units in local currency |
| 3) | Financial statements prepared in accordance with local accounting standards. |
| 4) | The company is in the start-up phase; no annual financial statements have been prepared yet. |
| 5) | No current annual financial statements are available. |
The data is based on the most recent annual financial statements available from the associated company (where available).
168
KfW Financial Information 2017 Consolidated financial statements

Attestation
Independent auditor’s report
To KfW
Report on the audit of the consolidated financial statements and of the group management report
Opinions
We have audited the consolidated financial statements of KfW, Frankfurt am Main, and its subsidiaries (the Group), which comprise the consolidated statement of financial position as at 31 December, 2017, the consolidated statement of comprehensive income, consolidated statement of changes in equity and consolidated statement of cash flows for the fiscal year from 1 January, 2017 to 31 December, 2017, and notes to the financial statements, including a summary of significant accounting policies. In addition, we have audited the group management report of KfW for the fiscal year from 1 January, 2017 to 31 December, 2017.
In our opinion, on the basis of the knowledge obtained in the audit,
| | – | | the accompanying consolidated financial statements comply, in all material respects, with the IFRSs as adopted by the EU, and the additional requirements of German commercial law pursuant to Sec. 315e HGB and, in compliance with these requirements, give a true and fair view of the assets, liabilities and financial position of the Group as at December 31, 2017 and of its financial performance for the fiscal year from 1 January, 2017 to 31 December, 2017, and |
| | – | | the accompanying group management report as a whole provides an appropriate view of the Group’s position. In all material respects, this group management report is consistent with the consolidated financial statements, complies with German legal requirements and appropriately presents the opportunities and risks of future development. |
Pursuant to Sec. 322 (3) Sentence 1 HGB, we declare that our audit has not led to any reservations relating to the legal compliance of the consolidated financial statements and of the group management report.
Basis for the opinions
We conducted our audit of the consolidated financial statements and of the group management report in accordance with Sec. 317 HGB and in compliance with German Generally Accepted Standards for Financial Statement Audits promulgated by the Institut der Wirtschaftsprüfer [Institute of Public Auditors in Germany] (IDW). Our responsibilities under those requirements and principles are further described in the “Auditor’s responsibilities for the audit of the consolidated financial statements and of the group management report” section of our auditor’s report. We are independent of the Group entities in accordance with the requirements of German commercial and professional law, and we have fulfilled our other German professional responsibilities in accordance with these requirements. We believe that the audit evidence we have obtained is sufficient and appropriate to provide a basis for our opinions on the consolidated financial statements and on the group management report.
| | 1) | Translation of the independent auditors’ report issued in German language on the consolidated financial statements prepared in German language by the Executive Board of KfW, Frankfurt am Main. The German language statements are decisive. |
Other information
According to Art. 8 KfW Bylaws the Board of Supervisory Directors is responsible for the preparation of the annual Report of the Board of Supervisory Directors. According to Art. 19 KfW Bylaws the Executive Board and the Board of Supervisory Directors are required to annually declare that they recognise the Public Corporate Governance Code und to publish the declaration of compliance as part of the Corporate Governance Report. In all other respects, the Executive Board is responsible for the other information. The other information comprises the Corporate Governance Report, the Declaration of compliance, the Information on the “Summarised non-financial statement of KfW as the parent company and of KfW Group” as well as the sections “Key figures of KfW Group“ and “Overview of KfW“ of the Financial Report 2017, which we obtained prior to the date of this auditor’s report, and the Letter of the Executive Board, the Report of the Board of Supervisory Directors as well as the sections “Members and tasks of the Board of Supervisory Directors”, “Thinking ahead“ and “Making an impact“ of the Financial Report 2017, which are expected to be made available to us after that date.
Our opinions on the consolidated financial statements and on the group management report do not cover the other information, and consequently we do not express an opinion or any other form of assurance conclusion thereon.
In connection with our audit, our responsibility is to read the other information and, in so doing, to consider whether the other information
| | – | | is materially inconsistent with the consolidated financial statements, with the group management report or our knowledge obtained in the audit, or |
| | – | | otherwise appears to be materially misstated. |
Responsibilities of the Executive Board and the Board of Supervisory Directors for the consolidated financial statements and the group management report
The Executive Board is responsible for the preparation of the consolidated financial statements that comply, in all material respects, with IFRSs as adopted by the EU and the additional requirements of German commercial law pursuant to Sec 315e (1) HGB and that the consolidated financial statements, in compliance with these requirements, give a true and fair view of the assets, liabilities, financial position and financial performance of the Group. In addition, the Executive Board is responsible for such internal control as they have determined necessary to enable the preparation of consolidated financial statements that are free from material misstatement, whether due to fraud or error.
In preparing the consolidated financial statements, the Executive Board is responsible for assessing the Group’s ability to continue as a going concern. They also have the responsibility for disclosing, as applicable, matters related to going concern. In addition, they are responsible for financial reporting based on the going concern basis of accounting, unless there is an intention to liquidate the Group or to cease operations, or there is no realistic alternative but to do so.
Furthermore, the Executive Board is responsible for the preparation of the group management report that, as a whole, provides an appropriate view of the Group’s position and is, in all material respects, consistent with the consolidated financial statements, complies with German legal requirements and appropriately presents the opportunities and risks of future development. In addition, the Executive Board is responsible for such arrangements and measures (systems) as they have considered necessary to enable the preparation of a group management report that is in accordance with the applicable German legal requirements, and to be able to provide sufficient appropriate evidence for the assertions in the group management report.
The Board of Supervisory Directors is responsible for overseeing the Group’s financial reporting process for the preparation of the consolidated financial statements and of the group management report.
Auditor’s responsibilities for the audit of the consolidated financial statements and of the group management report
Our objectives are to obtain reasonable assurance about whether the consolidated financial statements as a whole are free from material misstatement, whether due to fraud or error, and whether the group management report as a whole provides an appropriate view of the Group’s position and, in all material respects, is consistent with the consolidated financial statements and the knowledge obtained in the audit, complies with the German legal requirements and appropriately presents the opportunities and risks of future development, as well as to issue an auditor’s report that includes our opinions on the consolidated financial statements and on the group management report.
Reasonable assurance is a high level of assurance, but is not a guarantee that an audit conducted in accordance with Sec. 317 HGB and in compliance with German Generally Accepted Standards for Financial Statement Audits promulgated by the Institut der Wirtschaftsprüfer (IDW) will always detect a material misstatement. Misstatements can arise from fraud or error and are considered material if, individually or in the aggregate, they could reasonably be expected to influence the economic decisions of users taken on the basis of these consolidated financial statements and this group management report.
We exercise professional judgment and maintain professional skepticism throughout the audit. We also:
| | – | | Identify and assess the risks of material misstatement of the consolidated financial statements and of the group management report, whether due to fraud or error, design and perform audit procedures responsive to those risks, and obtain audit evidence that is sufficient and appropriate to provide a basis for our opinions. The risk of not detecting a material misstatement resulting from fraud is higher than for one resulting from error, as fraud may involve collusion, forgery, intentional omissions, misrepresentations, or the override of internal control. |
| | – | | Obtain an understanding of internal control relevant to the audit of the consolidated financial statements and of arrangements and measures (systems) relevant to the audit of the group management report in order to design audit procedures that are appropriate in the circumstances, but not for the purpose of expressing an opinion on the effectiveness of these systems. |
| | – | | Evaluate the appropriateness of accounting policies used by the Executive Board and the reasonableness of estimates made by the Executive Board and related disclosures. |
| | – | | Conclude on the appropriateness of the Executive Board’s use of the going concern basis of accounting and, based on the audit evidence obtained, whether a material uncertainty exists related to events or conditions that may cast significant doubt on the Group’s ability to continue as a going concern. If we conclude that a material uncertainty exists, we are required to draw attention in the auditor’s report to the related disclosures in the consolidated financial statements and in the group management report or, if such disclosures are inadequate, to modify our respective opinions. Our conclusions are based on the audit evidence obtained up to the date of our auditor’s report. However, future events or conditions may cause the Group to cease to be able to continue as a going concern. |
| | – | | Evaluate the overall presentation, structure and content of the consolidated financial statements, including the disclosures, and whether the consolidated financial statements present the underlying transactions and events in a manner that the consolidated financial statements give a true and fair view of the assets, liabilities, financial position and financial performance of the Group in compliance with IFRSs as adopted by the EU and the additional requirements of German commercial law pursuant to Sec. 315e (1) HGB. |
| | – | | Obtain sufficient appropriate audit evidence regarding the financial information of the entities or business activities within the Group to express opinions on the consolidated financial statements and on the group management report. We are responsible for the direction, supervision and performance of the group audit. We remain solely responsible for our opinions. |
| | – | | Evaluate the consistency of the group management report with the consolidated financial statements, its conformity with [German] law, and the view of the Group’s position it provides. |
| | – | | Perform audit procedures on the prospective information presented by the executive directors in the group management report. On the basis of sufficient appropriate audit evidence we evaluate, in particular, the significant assumptions used by the executive directors as a basis for the prospective information, and evaluate the proper derivation of the prospective information from these assumptions. We do not express a separate opinion on the prospective information and on the assumptions used as a basis. There is a substantial unavoidable risk that future events will differ materially from the prospective information. |
We communicate with those charged with governance regarding, among other matters, the planned scope and timing of the audit and significant audit findings, including any significant deficiencies in internal control that we identify during our audit.
Eschborn, 27 February 2018
Ernst & Young GmbH
Wirtschaftsprüfungsgesellschaft
| | | | |
Wagner | | Dombek | | |
Wirtschaftsprüfer | | Wirtschaftsprüferin | | |
(German Public Auditor) | | (German Public Auditor) | | |