Exhibit (e)

Combined
Management
Report
KfW Financial Report 2022 Combined Management Report | 2
Basic information on KfW Group
The KfW management report is combined with KfW’s group management report in accordance with Section 315 (5) in conjunction with Section 298 (2) of the German Commercial Code (Handelsgesetzbuch – “HGB”). The combined management report is included in the KfW Group financial report and is submitted to the operator of the electronic Federal Gazette (Bundesanzeiger) and disclosed in the Bundesanzeiger.
The KfW annual financial statements prepared in accordance with the German Commercial Code and the KfW Group financial report are also available online at www.kfw.de.
Information on KfW as the parent company can be found under a separate section, “Notes to the KfW annual financial statements prepared in accordance with the German Commercial Code”.
The KfW consolidated financial statements were prepared in accordance with the provisions of Section 315e HGB in conjunction with the International Financial Reporting Standards (IFRS) as applicable within the European Union. With the exception of the HGB information in the section “Notes to the KfW annual financial statements prepared in accordance with the German Commercial Code”, all financial figures in this combined management report, including the comparative figures for the previous year, are reported in accordance with IFRS.
Overview
KfW Group consists of KfW and six consolidated subsidiaries. KfW is a promotional bank of the Federal Republic of Germany – which owns 80% of KfW while the German federal states own 20%. The institutional framework for the promotional mandate, including the Federal Republic of Germany’s liability for KfW’s obligations, is defined in the Law Concerning KfW (KfW Law).
KfW promotes sustainable improvement of economic, environmental and social conditions around the world, with an emphasis on the German economy. The focus of KfW’s promotional activities is on the promotional areas anchored in KfW’s strategic objectives. A variety of financing products and services address, in particular, the areas of climate change and environment, digitalisation and innovation, globalisation, social change and financing of small and medium-sized German enterprises (SMEs). The domestic promotional lending business with enterprises and private individuals is characterised by the on-lending strategy, pursuant to which KfW extends loans to commercial banks, which, in turn, lend the funds to the ultimate borrowers. KfW thus does not have its own network of branch offices. It funds its business activities via the national and international money and capital markets. The group’s main operating subsidiaries are (i) KfW IPEX-Bank, which provides export and project finance, and (ii) DEG, which is active in promoting the private sector in developing countries and emerging economies. KfW Capital invests in German and European venture capital and venture debt funds in order to strengthen venture and early growth financing in Germany.
In accordance with the business sector structure for KfW Group, the sectors and their main products and services can be presented as follows:
3 | KfW Financial Report 2022 Combined Management Report | Basic information on KfW Group
| | |
| | |
Mittelstandsbank & Private Kunden (SME Bank & Private Clients) | | – Start-up financing |
| | – Financing of general corporate investments and investments |
| | in innovation, energy and environmental protection |
| | – Education financing |
| | – Financing for housing construction, conversion and refurbishment |
| |
Individualfinanzierung & Öffentliche Kunden (Customised Finance & Public Clients) | | – Financing of municipal and social infrastructure – Customised corporate financing with equity and debt capital – Customised financing of banks and promotional institutions of the federal states – Mandated transactions for energy suppliers |
|
|
| | |
| |
KfW Capital | | – Investments in German and European venture capital and venture debt funds |
| |
Export and project finance | | – Financing of German and European export activities – Financing of projects and investments which are of special interest for Germany and Europe |
| | |
| |
| KfW Development Bank | | – Promotion of developing countries and emerging economies on behalf of the Federal Government with budget funds and complementary market funds raised by KfW |
| | |
| |
| DEG | | – Financing provided by DEG – Deutsche Investitions- und Entwicklungs- gesellschaft mbH in developing countries and emerging economies (private enterprise financing) |
| | |
| |
| Financial markets | | – Securities and money market investments |
| | – Holding arrangements for the Federal Republic of Germany |
| | – Transactions mandated by the Federal Government, loan granted to Greece |
| | – Funding |
| |
| Head office | | – Central interest rate and currency management |
| | – Strategic equity investments |
Composition of the KfW Group Total assets (IFRS, before consolidation)
| | | | | | | | | | | | | | |
| | | | | | | Total assets as of 31 Dec. 2022 | | | | | | Total assets as of 31 Dec. 2021 | | |
| | | | | | | EUR in millions | | | | | | EUR in millions | | |
| | | | | | |
| KfW, Frankfurt am Main, Germany | | | | | | 550,505 | | | | | | 546,648 | | |
| Subsidiaries | | | | | | | | | | | | | | |
| KfW IPEX-Bank GmbH, Frankfurt am Main (KfW IPEX-Bank), Germany | | | | | | 27,643 | | | | | | 28,860 | | |
| DEG – Deutsche Investitions- und Entwicklungsgesellschaft mbH, Cologne (DEG), Germany | | | | | | 7,817 | | | | | | 7,310 | | |
| KfW Beteiligungsholding GmbH, Bonn, Germany | | | | | | 3,212 | | | | | | 3,129 | | |
| KfW Capital GmbH & Co. KG, Frankfurt am Main, Germany | | | | | | 908 | | | | | | 754 | | |
| Interkonnektor GmbH, Frankfurt am Main, Germany | | | | | | 316 | | | | | | 357 | | |
| IPEX Asia Ltd., Singapore | | | | | | 13 | | | | | | – | | |
| | | | | | |
| Investments accounted for using the equity method | | | | | | Total assets as of 30 Sep. 2022 | | | | | | Total assets as of 30 Sep. 2021 | | |
| Microfinance Enhancement Facility S.A., Luxembourg (16.5%), Luxembourg | | | | | | 695 | | | | | | 641 | | |
| Green for Growth Fund, Southeast Europe S.A., Luxembourg (10.2%), Luxembourg | | | | | | 732 | | | | | | 689 | | |
| coparion GmbH & Co. KG, Cologne (16.4%), Germany | | | | | | 359 | | | | | | 294 | | |
| | | | | | |
| | | | | | | 31 Dec. 2022 | | | | | | 31 Dec. 2021 | | |
DC Nordseekabel GmbH & Co. KG, Bayreuth (50.0%), Germany | | | | | | 854 | | | | | | 895 | | |
KfW Financial Report 2022 Combined Management Report | Basic information on KfW Group | 4
Strategic objectives 2027
KfWplus is the group’s strategic transformation agenda, which will serve as the basis for realising KfW’s goal of becoming THE digital transformation and promotional bank. The strategic objectives are consistent with KfWplus and implement the control components, which are intended to enable comprehensive control and the achievement of targets. To this end, the strategic objectives define KfW’s targeted medium-term positioning. This strategic framework encompasses top-level objectives at group level and serves as a central and binding reference for the strategic orientation of all business sectors, with a five-year horizon. The strategic objectives for 2027 were adopted in 2022.
KfW’s primary objective, or purpose, is sustainable promotion, which means KfW aims to transform the economy and society to improve economic, environmental and social living conditions around the world. This primary objective is supported by the two promotional principles of subsidiarity and sustainability.
Subsidiarity means that KfW focuses on compensating market weaknesses. Putting this principle into practice, KfW Group strives to maintain high-quality promotional activities and to mobilise private capital, to ensure that the goal of transforming the economy and society is successfully achieved.
With regard to the principle of sustainability, KfW aims to achieve a ranking among the top five national and international promotional banks in the relevant sustainability ratings (Sustainalytics, ISS ESG and MSCI ESG Ratings). In addition, the contributions of KfW’s financing activities to the UN’s Sustainable Development Goals (“SDGs”) and to 1.5 °C compatibility are monitored as part of fulfilling the climate goals.
Within the framework of these promotional principles, KfW finances projects under the motto “promoting transformation – boosting resilience” in support of the dual transformation – the key challenge of this decade. This means further expanding the relevant promotional areas of climate change and the environment (environmental share of financing >38%), and digitalisation and innovation. Promotional activities linked to globalisation and social change, moreover, continue to be ongoing tasks for KfW. In domestic promotion, KfW still aims at achieving an SME ratio of >40% in financing small and medium-sized German enterprises.
The primary objective, or purpose, is complemented by secondary objectives in the areas of digitalisation and agility, operating model and governance, and customer and employee centricity, which help to maintain and support a top-performing KfW. The secondary objectives comprise the same focus areas as in the prior year, with more emphasis on internal digitalisation.
Internal management system
KfW Group has an integrated strategy and planning process. Conceived as a group-wide strategy process, group business sector planning is KfW Group’s central planning and management tool. Group business sector planning consists of three consecutive sub-processes performed every year: defining objectives, implementation and quality assurance and finalisation. The overall strategy and planning process includes the collaboration of staff responsible for planning in all areas.
Objectives: The KfWplus transformation agenda and the strategic objectives derived from it, both of which are set by the Executive Board, form the basis for strategic planning. These strategic objectives serve as a roadmap for KfW Group, laying out the direction in which KfW would like to develop over the next five years. They define KfW Group’s medium-term targeted positioning and set top-level objectives for the entire bank. The strategic objectives are reviewed annually for relevance, completeness and aspiration level and are adjusted where necessary – for example, due to changed parameters or newly determined focus areas. Efforts are made, however, to maintain a high degree of consistency to ensure that there are no fundamental changes made to the strategic road map in the course of the annual review. Within this strategic framework and the strategic focus areas set by the Executive Board, major medium-term strategic initiatives are developed on a base case scenario by the business sectors and subsidiaries, taking into account their statutory requirements. Promised benefits (such as project efficiencies and cost reduction measures) are also considered in business sector planning. Assumptions regarding the future development of both external factors (including market development, regulatory requirements, the competitive situation and customer behaviour) and internal factors and resources (including human, technical and organisational resources, promotional expense, primary cost planning and tied-up capital) as well as targeted earnings levels, are made based on a risk and opportunity assessment. This analysis involves an evaluation of the key business and revenue drivers for each group business sector, as well as for the group as a whole. The business sectors are also called upon to address the environmental, social and governance risks (“ESG” risks) resulting from their business activity and new (strategic) initiatives. As risk drivers, these can have
5 | KfW Financial Report 2022 Combined Management Report | Basic information on KfW Group
a considerable impact on the likelihood of occurrence or the extent of typical banking risk types. Although ESG risks primarily affect the lending and equity finance business of KfW Group, they can also potentially give rise to consequential risks, such as reputational risk. The central departments (e.g. information technology, human resources and central services) play important roles in achieving the strategic objectives. By involving these departments, their own strategies are aligned with the strategic objectives. The first regular capital budget in the base case is prepared on a multi-year horizon on this basis. In this way, any capital bottlenecks resulting from strategic considerations or changed parameters can be identified and mitigated by resolving and implementing appropriate measures. The Executive Board defines top-down objectives for each department and business sector (with regard to promotion, risk and finances) for the entire planning period based on the assessment and prioritisation of all strategic initiatives from a group perspective. Strategic group-level planning is complemented by business strategy scenario analyses. A scenario analysis is a “what if” analysis of a specific, plausible scenario, looking at the interaction of exogenous influencing factors and translating the results of the analysis into management-relevant parameters in new business, earnings and risk / capital. Such scenarios assist in the process of identifying potential risks and opportunities for promotional targets and KfW Group’s profitability and risk-bearing capacity, and enable these factors to be considered in the further planning process if necessary.
Implementation and quality assurance: The business sectors plan their new business, risks and earnings, and each department its budgets, and staffing in the form of full time equivalents (“FTEs”), based on the top-down objectives defined by the Executive Board, taking into account any changes in external or internal factors and in close collaboration with Accounting. These plans are checked for consistency with the objectives of the group and the business sectors/departments. The interest rate forecast plays a key role in shaping KfW Group’s earnings position. Hence, both a high and a low interest rate scenario are also examined in addition to the anticipated base case. The plans are also assessed for future risk-bearing capacity in a second round of regular capital budgeting in a base and stress case over a multi-year horizon.
Finalisation: The Executive Board approves the resulting budget or has plans fine-tuned in a revision round if necessary. The key conclusions from the planning process are incorporated into the business and risk strategies. The management has overall responsibility for formulating and adopting both strategies. The business strategy comprises the group’s strategic objectives for its main business activities as well as important internal and external factors, which are included in the strategy process. It also contains the business sectors’ contribution to the strategic objectives and the measures for achieving each objective. Moreover, the business strategy combines the budget at the group and business sector levels. The Executive Board sets out KfW Group’s risk policies in its risk strategy, which is consistent with the business strategy. KfW Group has defined strategic risk objectives for factors including risk-bearing capacity and liquidity. The main risk management approaches and risk tolerance levels are also incorporated into the risk strategy as a basis for operational risk management. There is regular consultation with the Risk Controlling department to ensure consistency between the business and risk strategies. The group business sector planning process ends when the Executive Board has adopted a final budget for the entire planning period, including the future capital requirement and the business and risk strategies. The budget is then presented to the supervisory body (Board of Supervisory Directors) for approval, along with the business and risk strategy for discussion. After the Board of Supervisory Directors has decided on the business and risk strategy, it is appropriately communicated to the staff.
The adoption of the business sector planning serves as a foundation for the group’s qualitative and quantitative objectives. The Executive Board reviews target achievement both on a regular and on an ad hoc basis during each financial year. The assumptions concerning external and internal factors made when determining the business strategy are also subject to regular checks. The development of relevant control variables, their attainment and the reasons for any shortfalls are analysed as part of strategic management. Strategic assumptions are reviewed and a systematic variance analysis of early objectives and forecasts is performed at the beginning of every year. Ad hoc issues of strategic relevance are also addressed in consultation with the group’s departments, and recommendations for action concerning potential strategy adjustments or optimisation of the use of resources are made to the Executive Board by means of the strategic performance report. The results of the analysis are included in further strategy discussions and strategic planning processes. At mid-year, the integrated forecasting process serves as a comprehensive basis for interim management input on quantitative group variables of strategic importance in line with the strategic objectives (new business, risk and earnings in respect of funding opportunities), while providing a well-founded guide to achieving planned objectives. The achievement of objectives is regularly monitored by the Board of Supervisory Directors based on reports submitted under the KfW Bylaws. The commentary in these reports outlines analyses of causes and any potential plans for action. Detailed reports are prepared on a monthly or quarterly basis as part of
KfW Financial Report 2022 Combined Management Report | Basic information on KfW Group | 6
financial controlling. These comprehensive detailed analyses at group and business sector level comprise earnings and cost developments and are reported to specific departments. Additionally, analyses of significant relevance to overall group performance are also presented directly to the Executive Board. The risk controlling function is implemented alongside strategic and financial controlling (see the risk report chapter). Early warning systems have been established and mitigation measures defined for all material risk types in line with the risk management requirements set out in the risk strategy. All controlling and monitoring approaches are integrated into regular risk reporting to the Executive Board. The Board of Supervisory Directors receives a risk report quarterly.
Alternative key financial figures used
The combined management report contains financial figures that are not defined in either the HGB or IFRS accounting standards. In its strategic objectives, KfW uses key indicators prescribed by accounting standards and supervisory regulations as well as key figures that are geared towards promotion as the core business activity. It also uses key figures, in which the temporary effects on results determined and reported in the consolidated financial statements in accordance with IFRS, and which KfW does not consider representative, are adjusted.
KfW has defined the following alternative key financial figures:
Promotional business volume
Promotional business volume refers to the commitments of each business sector during the reporting period. In addition to the lending commitments shown in the statement of financial position, promotional business volume comprises loans from Federal Government funds for promotion of developing countries and emerging economies – which are accounted for as trust activities – financial guarantees, equity financing and securities purchases (in the green bonds asset class). Promotional business volume also includes grants committed as part of development aid and in domestic promotional programmes. Allocation to the promotional business volume for the current financial year is generally based on the commitment date of each loan, financial guarantee and grant, and the transaction date of the equity finance and securities transactions. On the other hand, allocation of general funding and global loans to the promotional institutions of the federal states (Landesförderinstitute – “LFI”) and BAföG government loans is based on the individual drawdown volume and date, instead of the total volume of the contract at the time of commitment. In the lending business, financing amounts denominated in foreign currency are converted into euros at the exchange rate on the commitment date, whereas in the securities and equity finance business, the conversion generally occurs at the rate on the transaction date.
See the “Development of KfW Group” economic report or segment reports for a breakdown of promotional business volume by individual segment.
Promotional expense
Promotional expense is understood to mean certain expenses from the two business sectors Mittelstandsbank & Privatkunden (SME Bank & Private Clients) and Individualfinanzierung & Öffentliche Kunden (Customised Finance & Public Clients) incurred to achieve KfW’s promotional objectives.
Interest rate reductions accounted for at present value are the key component of KfW’s promotional expenses. KfW grants these reductions for certain domestic promotional loans for new business during the first fixed interest rate period in addition to passing on KfW’s favourable funding conditions (obtained on the strength of its triple-A rating). The difference between the fair value of these promotional loans and the transaction value during the first fixed interest rate period, due to the interest rate being below the market rate, is recognised in profit or loss as an interest expense and accounted for as an adjustment to the carrying amount under the item Financial assets at amortised cost. In addition, the accumulated interest rate reductions over the fixed interest rate period are recognised through profit or loss in Net interest income (see the relevant notes on KfW’s promotional lending business, financial assets at amortised cost, and provisions).
An additional promotional component (in commission expense) comprises the expense paid in the form of upfront fees to sales partners for processing microloans. Promotional expense also contains disposable and product-related marketing and sales expenses (administrative expense), expenses for innovative digital promotional approaches (commission and administrative expense), and promotional grants awarded as a supplement to the lending business (other operating expense).
7 | KfW Financial Report 2022 Combined Management Report | Basic information on KfW Group
Cost/income ratio (before promotional expense)
The cost/income ratio (before promotional expense) comprises administrative expense (excluding promotional expense) in relation to net interest and commission income before promotional expense.
The cost/income ratio (“CIR”) shows costs in relation to income and is thus a measure of efficiency. To enable a comparison of the CIR with other (non-promotional) institutions, an adjustment for the components of KfW’s promotional business results is made to the numerator (administrative expense) and denominator (net interest and commission income).
Consolidated profit before IFRS effects
Consolidated profit before IFRS effects from hedging is another key financial figure based on Consolidated profit in accordance with IFRS. Derivative financial instruments are entered into for hedging purposes. Under IFRS, the requirements for the recognition and valuation of derivatives and hedges give rise to temporary net gains or losses that are offset over the entire term. In KfW’s opinion, such temporary effects on results are not representative as they are caused solely by economically effective hedging relationships.
Consequently, the following reconciliations are performed by eliminating temporary contributions to profit and loss as follows:
| – | Valuation results from micro and macro hedge accounting. |
| – | Net gains or losses from the use of the fair value option to avoid an accounting mismatch in the case of funding including related hedging derivatives. |
| – | Net gains or losses from the fair value accounting of hedges with high economic effectiveness but not qualifying for hedge accounting. |
| – | Net gains or losses from foreign currency translation of foreign currency positions, in accordance with recognition and valuation requirements for derivatives and hedging relationships. |
| – | Net gains or losses from changes to deferred taxes on credit rating-related effects of other derivatives from subsidiaries. |
KfW Financial Report 2022 Combined Management Report | Basic information on KfW Group | 8
Economic report
General economic environment
Global real domestic product (“GDP”) increased by 3.4% year on year in 2022 according to estimates by the International Monetary Fund (“IMF”). Global real GDP thus grew at a positive rate in 2022, albeit more slowly than in 2021. This trend is apparent for industrialised nations as well as for developing countries and emerging economies. According to the IMF, this broad-based downturn in the global economy is due to the impact of the war in Ukraine, including its effects on international food and energy prices as well as uncertainty about the energy supply in Europe, the ongoing consequences of COVID-19 outbreaks, particularly in China, and higher-than-expected inflation around the world along with the related monetary policy response of central banks and tightening of financing conditions. Before the Russian attack on Ukraine at the end of February 2022, the Organisation for Economic Co-operation and Development (“OECD”) expected the economic situation to normalise following the above-average growth in 2021 in the wake of the recovery from the coronavirus pandemic.
Gross domestic product at constant prices
| | | | | | | | | | | | |
| | | | |
| | | | | | 2022 estimate | | | 2021 | |
| 2012 – 2021
average |
|
| Year-on-year change in % | | | | | | | | | | | | |
| Global economy1) | | | | | 3.4 | | | 6.0 | | | 3.0 | |
| Industrialised countries1) | | | | | 2.7 | | | 5.2 | | | 1.6 | |
Developing countries and emerging economies1) | | | | | 3.9 | | | 6.6 | | | 4.1 | |
| 1) | The IMF aggregates the annual growth rates of GDP at constant prices of each country on the basis of the shares of country-specific GDP at purchasing power parities in the corresponding global aggregate to the growth rate of global real GDP, for industrialised countries as well as developing countries and emerging economies. The average is calculated as the geometric mean of annual growth rates. |
The euro area economy grew at an above-average rate last year. Measured in terms of price-adjusted GDP, economic output rose by 3.5% year on year in 2022, after 2021 recorded the most significant increase in price-adjusted GDP since 1999 (5.3%) (see table on gross domestic product at constant prices, year-on-year change). The European Commission attributed growth in the first three quarters of 2022 to the easing of pandemic-induced restrictions. Demand by private households for contact-intensive services, such as those from the hospitality sector, increased. Towards the end of the year, however, the strain on euro area economic activity associated with the Ukraine war became more significant. High inflation eroded the purchasing power of household incomes, while energy costs reduced corporate profits. At the same time, external demand also cooled. Together with high uncertainty, this environment dampened consumer and investment demand. Nevertheless, the euro area’s price-adjusted GDP in 2022 was back above the pre-pandemic level.
Gross domestic product at constant prices, year-on-year change
| | | | | | | | | | | | | | | | | | |
| | | | 2022 | | | 2021 | | | 2012–2021
average | | | 1999–2021
maximum | |
| | | | in % | | | in % | | | in % | | | in % | |
Euro area | | | | | 3.5 | | | | 5.3 | | | | 0.9 | | | | 5.31) | |
Germany | | | | | 1.8 | | | | 2.6 | | | | 1.0 | | | | 4.22) | |
1) 2021 2) 2010
9 | KfW Financial Report 2022 Combined Management Report | Economic report
Against the backdrop of the Ukraine war, rising prices, in particular for energy and food , rising interest rates, persistent global supply chain issues, the scaling back of most public health and social measures to contain the coronavirus pandemic, price-adjusted GDP in Germany grew by 1.8% in 2022 compared the previous year after shrinking by 2.6% in 2021 and having grown by 1.0% per year on average during the preceding ten years (from 2012 up to and including 2021) (see table on gross domestic product at constant prices, year-on-year change). Price-adjusted private consumption expenditure (+4.6%), price-adjusted government final consumption expenditure (+1.1%), price-adjusted gross capital formation in other products (+2.1%) and price-adjusted gross fixed capital formation in machinery and equipment (+2.5%) provided positive momentum for the rate of change in price-adjusted GDP in 2022 , whereas price-adjusted gross fixed capital formation in construction fell (–1.6%). Overall, price-adjusted domestic use rose by 3.4% in 2022. Net exports detracted 1.3 percentage points from the rate of change of price-adjusted GDP in 2022, with the increase in price-adjusted exports (+3.2%) falling short that of price-adjusted imports (+6.7%). From a production perspective, price-adjusted gross value added was a positive driver for the rate of change of price-adjusted GDP in 2022 in most economic sectors, with the exception of agriculture, forestry and fishing (–4.5%) and construction (–2.3%), while manufacturing (excluding construction) stagnated (+/–0.0%). The number of people in employment located in Germany increased by 1.3% year on year in 2022 to 45.6 million.
Developments in the financial markets were dominated by high inflation rates in 2022. The Russian invasion of Ukraine sustained the momentum of already high inflation rates for energy, food and some intermediate products. The persistent inflationary macroeconomic environment in 2022 led central banks to reconsider their stance. The US Federal Reserve is well ahead, having raised the federal funds target rate range since March 2022 to 4.25%–4.5% as of the end of the year. It is gradually trimming its balance sheet of assets built up during the pandemic as part of quantitative tightening. The European Central Bank (“ECB”) discontinued its asset purchase programmes in March 2022 (pandemic emergency purchase programme, “PEPP”) and at the end of June 2022 (asset purchase programme, “APP”). The principal payments of the released assets will continue to be reinvested until the end of February 2023 in the case of the APP, and will continue to be reinvested until the end of 2024 in the case of the PEPP. The ECB plans to reduce its balance sheet volume by EUR 15 billion per month from March 2023 until end of June 2023. The ECB began its interest rate hikes at the end of July 2022. Beginning from –0.5%, it raised the deposit rate in 50 and 75 basis-point increments to 2.0% by the end of the year.
In order to reconcile the very favourable refinancing conditions for banks created during the pandemic with the changed monetary policy environment, early repayment dates were offered for targeted longer-term refinancing operations (“TLTRO III”), which will still be running until June 2023. The ECB has also raised the TLTRO rate to the average deposit rate between 22 November 2022 and either the end date or the early repayment date. The still elevated inflation rates are likely to decline over the course of 2023. According to the ECB’s own forecast, the ‘two percent target’ will not be reached again until 2025.
These developments have resulted in swap rates in the euro area and the USA rising noticeably year on year in 2022. Money market rates in both currency areas were also significantly above their prior-year averages. For instance, the 3-month EURIBOR averaged 0.35% in 2022 (2021: –0.55%); the 5-year EUR swap rate averaged 1.73% (2021: –0.26%); and the yield of the 10-year German government bond stood at 1.20% (2021: –0.31%). In the USA, the 3-month LIBOR was 2.4% on average for the year in 2022, compared with 0.16% in the previous year. The 5-year USD swap rate averaged 3.00% in 2022 (2021: 0.85%), and the yield on 10-year US Treasuries stood at 2.95% (2021: 1.44%). The yield curves, as measured by the difference between the yields of 10- and 2-year government bonds, developed differently for the EUR and the USD. On average in 2022, the curve slope of German government bonds was 43 bp (2021: 39 bp), while the US government bonds slope was –4 bp (2021: 117 bp).
KfW Financial Report 2022 Combined Management Report | Economic report | 10
There were also significant price corrections in global equity markets at times, particularly in the United States and the euro area. Major leading indices were down on the previous year. At 13,925 points, Germany’s leading DAX index registered 2,095 points (–13%) lower than at the beginning of 2022. The key US index S&P 500 stood at 3,839 points, 957 points (–20%) lower than at the beginning of 2022.
Development of KfW Group
KfW had an exceptional promotional year in 2022. Multiple crises, such as the war in Europe and the subsequent energy price crisis, had a significant impact on the group’s net assets, financial and earnings position in 2022. At the same time, KfW achieved its historically strongest promotional year in 2022 with a promotional volume of EUR 166.9 billion (2021: EUR 107.0 billion).
With a consolidated profit of EUR 1.4 billion for 2022, the bank’s earnings position was robust and, despite the crisis environment, came in well above expectations (EUR 0.9 billion) following the previous year’s earning position, which had been boosted by pent-up demand after the pandemic (EUR 2.2 billion). The operating result before valuation (before promotional expense) was, as expected, down on the previous year at EUR 1.5 billion (EUR 1.7 billion). This development was also reflected in the cost/income ratio (before promotional expense), which rose to 49.6% (2021: 45.9%) due to higher administrative expense and the overall slight decline in income from interest and commissions. The valuation result contributed slightly to consolidated profit with EUR 0.1 billion (2021: +EUR 0.8 billion). The IFRS effects from hedging relationships amounted to EUR 182 million (2021: EUR –139 million), resulting in a consolidated profit before IFRS effects of EUR 1,183 million (2021: EUR 2,354 million) from the reconciliation.
Consolidated total assets rose by EUR 3.9 billion to EUR 554.6 billion in financial year 2022. This development was largely attributable to the increase in Net loans and advances of EUR 24.9 billion to EUR 463.6 billion, of which EUR 22.4 billion came from transactions mandated on behalf of the Federal Government in order to secure Germany’s energy supply. The increased liquidity holdings of EUR 13.8 billion also contributed to total asset growth. The value adjustments from macro hedge accounting trended in the opposite direction, posting a market-price-induced decline of EUR 30.5 billion. The volume of own issues reported under Certificated liabilities amounted to EUR 424.9 billion (31 Dec. 2021: EUR 447.6 billion). In addition to consolidated comprehensive income, the increase in equity of EUR 2.4 billion to EUR 36.6 billion was due to an improvement of EUR 0.9 billion in the revaluation reserve as a result of the increase in the discount rate for pension provisions.
Business performance in 2022 was largely characterised by the following developments:
A. Demand for KfW products at a historic high
With a promotional business volume of EUR 166.9 billion in 2022 (2021: EUR 107.0 billion), KfW recorded the strongest promotional year in its history. The main reason for the 56% year-on-year rise in promotional business volume is the large volume of Federal Government-mandated transactions, primarily in connection with securing Germany’s energy supply. In this context, KfW, in particular, provided financing for replacement purchases of gas, to meet short-term ‘margining’ liquidity requirements (obligatory collateral pledged when trading in energy) and to procure gas to maintain certain gas storage facility filling levels, which are legally required in Germany, as well as to implement the short-term emergency aid for gas and heat for advance payments in December. The Federal Government mandated these transactions in accordance with Article 2 (4) of the Law Concerning KfW (KfW-Gesetz – “KfW Law”) with a full federal guarantee, meaning that KfW is released from all risks and charges associated with implementing the measures. For the trust-based transactions and the emergency aid for gas and heat, KfW agreed remuneration with the Federal Government on a time and material basis. On the loan financings, KfW is entitled to upfront loan fees and percentages of commitment fees.
Total commitment volume from transactions mandated to secure the gas supply amounted to EUR 54.2 billion. Of this amount, a total of EUR 34.2 billion had been disbursed by the end of the year. Taking partial repayments or redemptions by the Federal Government into account, reported receivables amounted to EUR 22.4 billion as of 31 December 2022.
KfW’s domestic promotional business had a very strong financial year with a promotional business volume of EUR 136.1 billion (2021: EUR 82.9 billion). In addition to the measures to secure Germany’s energy supply, the high demand for the Federal Funding for Efficient Buildings programme of EUR 37.4 billion accounted for a large share of domestic promotional business volume. The subsidiary KfW Capital reached commitments totalling EUR 1.3 billion in 2022 (2021: EUR 0.5 billion).
11 | KfW Financial Report 2022 Combined Management Report | Economic report
International business commitments increased by 29% to a promotional business volume of EUR 30.7 billion in financial year 2022 (2021: EUR 23.8 billion). The business sector Export and project finance recorded a significant recovery in business volume with new commitments of EUR 18.1 billion (2021: EUR 13.6 billion). Commitments in the business sector KfW Development Bank increased by 27% to EUR 10.9 billion (2021: EUR 8.6 billion), while DEG commitments of EUR 1.6 billion also showed a positive development in new business (2021: EUR 1.5 billion).
In 2022, KfW raised a record volume of EUR 89.4 billion in the capital markets to fund its business activities (2021: EUR 82.6 billion). Since November 2022, KfW has been able to draw on funds from the Economic Stabilisation Fund (“WSF”) to finance the mandated transactions to secure Germany’s energy supply. By year-end, EUR 22.4 billion (nominal) of WSF funds had been drawn down for bridge loans provided under the mandated transactions and a further EUR 12.0 billion had been used for coronavirus aid measures (2021: EUR 3.0 billion). In 2022, KfW did not provide funding via participation in the Eurosystem TLTRO III (2021: EUR 1.4 billion).
Promotional business volume of KfW Group
| | | | | | | | | | | | | | | | | | |
| | | | | | | |
| | | | | | | 2022 | | | | | | | | | | 2021 | | |
| | | | | | | EUR in billions | | | | | | | | | | EUR in billions | | |
| | | | | | | |
| Domestic business | | | | | | 136.1 | | | | | | | | | | 82.9 | | |
| Mittelstandsbank & Private Kunden (SME Bank & Private Clients) | | | | | | 64.8 | | | | | | | | | | 73.0 | | |
| Individualfinanzierung & Öffentliche Kunden (Customised Finance & Public Clients) | | | | | | 70.0 | | | | | | | | | | 9.5 | | |
| KfW Capital | | | | | | 1.3 | | | | | | | | | | 0.5 | | |
| Financial markets | | | | | | 0.4 | | | | | | | | | | 0.5 | | |
| International business | | | | | | 30.7 | | | | | | | | | | 23.8 | | |
| Export and project finance | | | | | | 18.1 | | | | | | | | | | 13.6 | | |
| KfW Development Bank | | | | | | 10.9 | | | | | | | | | | 8.6 | | |
| DEG | | | | | | 1.6 | | | | | | | | | | 1.5 | | |
| | |
Volume of new commitments1) | | | | | | 166.9 | | | | | | | | | | 107.0 | | |
| 1) | Adjusted for export and project financing refinanced through KfW programme loans |
B. Operating result exceeds expectations
At EUR 1,536 million (2021: EUR 1,712 million), the Operating result before valuation (before promotional expense) was 10% below the prior-year level and exceeded the target by 5%. The outperformance was primarily due to Net commission income (before promotional expense) of EUR 629 million (2021: EUR 634 million), which was 11% above target. At EUR 1,509 million, Administrative expense (before promotional expense) was still slightly below plan, despite exceeding the previous year’s figure by EUR 57 million. At EUR 2,416 million, Net interest income (before promotional expense) almost reached the target level, although it recorded a 5% year-on-year decline (EUR 2,531 million) due to the decreasing structure contribution given the current interest rate development. Nevertheless, net interest income still constituted the main source of KfW’s income.
C. Moderate need for risk provisioning despite crisis environment
Despite the challenging environment, risk provisions for lending business resulted in moderate net charges of EUR 122 million in 2022 (2021: net income of EUR 196 million). The risk provision result is therefore significantly better than the projected standard risk costs (EUR –473 million). The provisions were largely created by net additions to provisions for latent credit risks (stages 1 and 2) in an amount of EUR 202 million (2021: net income of EUR 142 million). The additions resulted, in particular, from risks relating to the war in Ukraine. The macroeconomic environment, which deteriorated as a result of the war and the ensuing crises, had a negative impact. In contrast, net reversals from stage 3 credit commitments of EUR 16 million (2021: net additions of EUR 8 million) and income from recoveries of loans previously written off of EUR 62 million had a positive impact on risk provisioning.
D. Mixed developments shape the equity investment result
The group generated a result of EUR 89 million from the valuation of the entire equity investment portfolio in financial year 2022, which was significantly below the previous year (EUR 766 million), which had benefited from reversals of COVID-related impairments. Strains resulting from the Russia-Ukraine war impacted the business sectors KfW Development Bank and DEG in particular; this was offset by value increases in the equity investment portfolios
KfW Financial Report 2022 Combined Management Report | Economic report | 12
of the business sectors Export and project finance, KfW Capital and Individualfinanzierung & Öffentliche Kunden (Customised Finance & Public Clients).
E. Increasing promotional expense following the interest rate turnaround
KfW’s domestic promotional expense, which has a negative impact on its earnings position, increased year on year by EUR 117 million to EUR 305 million in 2022, but was still below target (EUR 365 million). The reasons for the increase were negative funding rates for financing partners in the on-lending promotional business introduced as of 1 July 2021 and the interest rate turnaround noted in particular in the second half of 2022. This enabled KfW to regain scope for interest rate reductions, which had been very limited in the persistent low interest environment.
The following key figures provide an overview of the development of key financial figures in financial year 2022:
Key financial figures of KfW Group
| | | | | | | | | | | | | | | | | | |
| | | | | | | 2022 | | | | | | | | | | 2021 | | |
| Key figures of the income statement | | | | | | EUR in millions | | | | | | | | | | EUR in millions | | |
| | | | | | | |
| Operating result before valuation (before promotional expense) | | | | | | 1,536 | | | | | | | | | | 1,712 | | |
| Operating result after valuation (before promotional expense) | | | | | | 1,668 | | | | | | | | | | 2,575 | | |
| Promotional expense | | | | | | 305 | | | | | | | | | | 188 | | |
| Consolidated profit | | | | | | 1,365 | | | | | | | | | | 2,215 | | |
| Cost-income ratio (before promotional expense)1) | | | | | | 49.6% | | | | | | | | | | 45.9% | | |
| | | | | | | |
| | | | | | | 2022 | | | | | | | | | | 2021 | | |
| Key economic figures | | | | | | EUR in millions | | | | | | | | | | EUR in millions | | |
| | | | | | | |
| Consolidated profit before IFRS effects | | | | | | 1,183 | | | | | | | | | | 2,354 | | |
| | | | | | | |
| | | | | | | 31 Dec. 2022 | | | | | | | | | | 31 Dec. 2021 | | |
| Key figures of the statement of financial position | | | | | | EUR in billions | | | | | | | | | | EUR in billions | | |
| | | | | | | |
| Total assets | | | | | | 554.6 | | | | | | | | | | 550.72) | | |
| Volume of lending | | | | | | 607.0 | | | | | | | | | | 564.2 | | |
| Volume of business | | | | | | 709.6 | | | | | | | | | | 686.62) | | |
| Equity | | | | | | 36.6 | | | | | | | | | | 34.2 | | |
Equity ratio | | | | | | 6.6% | | | | | | | | | | 6.2% | | |
| 1) | Administrative expense (before promotional expense) in relation to adjusted income. Adjusted income is calculated from net interest income and net commission income (in each case before promotional expense). |
| 2) | Adjustments to corresponding prior-year figures due to methodical change in calculating deferred taxes on derivatives, implemented in 2022. |
Comparison with the previous year’s forecast
| | | | | | | | | | | | | | |
| | | | | | | 2021 forecast for 2022 | | | | | | 2022 actual | | |
| New business | | | | | | | | | | | | | | |
| Promotional business volume | | | | | | EUR 87.1 billion | | | | | | EUR 166.9 billion | | |
| Funding | | | | | | EUR 80–85 billion | | | | | | EUR 89.4 billion | | |
| Result | | | | | | | | | | | | | | |
| Consolidated profit | | | | | | EUR 0.9 billion | | | | | | EUR 1.4 billion | | |
| Net interest income (before promotional expense) | | | | | | EUR 2.4–2.5 billion | | | | | | EUR 2.4 billion | | |
| Net commission income (before promotional expense) | | | | | | EUR 0.6 billion | | | | | | EUR 0.6 billion | | |
| Administrative expense (before promotional expense) | | | | | | EUR 1.5 billion | | | | | | EUR 1.5 billion | | |
| CIR (before promotional expense) | | | | | | 51% | | | | | | 50% | | |
| Risk provisions for lending business | | | | | | EUR –0.5 billion | | | | | | EUR –0.1 billion | | |
| Valuation result | | | | | | EUR +0.2 billion | | | | | | EUR +0.3 billion | | |
| Promotional expense | | | | | | EUR 0.4 billion | | | | | | EUR 0.3 billion | | |
13 | KfW Financial Report 2022 Combined Management Report | Economic report
The main differences between the forecasts from the Financial Report 2021 and the actual business development in 2022 are presented in the Economic report.
Development of earnings position
The earnings position in 2022 was characterised by a year-on-year decrease in the operating result combined with a reduced but still positive valuation result. This resulted in a consolidated profit of EUR 1.4 billion, which was below the prior-year figure (EUR 2.2 billion), but above the target (EUR 0.9 billion).
Reconciliation of internal earnings position (before promotional expense) with external earnings position (after promotional expense) for financial year 2022
| | | | | | | | | | | | | | | | | | | | | | | | | | | | | | | | | | |
| | | | | | | | | | | | Reconciliation | | | | | | | | | | | | | | | |
| | | | | | EUR in millions | | | | | | EUR in millions | | | | | | EUR in millions | | | | | | | | | |
| | | | | | | | | |
Net interest income (before promotional expense) | | | | | | | 2,416 | | | | | | | | –267 | | | | | | | | 2,148 | | | | | | | Net interest income | | | | |
| | | | | | | | | |
Net commission income (before promotional expense) | | | | | | | 629 | | | | | | | | –12 | | | | | | | | 617 | | | | | | | Net commission income | | | | |
| | | | | | | | | |
Administrative expense (before promotional expense) | | | | | | | 1,509 | | | | | | | | 16 | | | | | | | | 1,525 | | | | | | | Administrative expense | | | | |
| | | | | | | | | |
Operating result before valuation (before promotional expense) | | | | | | | 1,536 | | | | | | | | –295 | | | | | | | | 1,241 | | | | | | | Operating result before valuation | | | | |
| | | | | | | | | |
| Risk provisions for lending business | | | | | | | –122 | | | | | | | | –2 | | | | | | | | –124 | | | | | | | Net gains/losses from risk provisions | | | | |
| | | | | | | | | |
| Net gains/losses from hedge accounting | | | | | | | 150 | | | | | | | | 0 | | | | | | | | 150 | | | | | | | Net gains/losses from hedge accounting | | | | |
| | | | | | | | | |
| Other financial instruments at fair value through profit or loss | | | | | | | 64 | | | | | | | | 0 | | | | | | | | 64 | | | | | | | Net gains/losses from other financial instruments at fair value through profit or loss | | | | |
| | | | | | | | | |
| Securities and investments | | | | | | | –3 | | | | | | | | 2 | | | | | | | | –1 | | | | | | | Net gains/losses from disposal of financial assets at amortised cost | | | | |
| | | | | | | | | |
| Net gains/losses from investments accounted for using the equity method | | | | | | | 43 | | | | | | | | 0 | | | | | | | | 43 | | | | | | | Net gains/losses from investments accounted for using the equity method | | | | |
| | | | | | | | | |
Operating result after valuation (before promotional expense) | | | | | | | 1,668 | | | | | | | | –295 | | | | | | | | 1,373 | | | | | | | Operating result after valuation | | | | |
| | | | | | | | | |
Net other operating income (before promotional expense) | | | | | | | 1 | | | | | | | | –10 | | | | | | | | –8 | | | | | | | Net other operating income or loss | | | | |
| | | | | | | | | |
Profit/loss from operating activities (before promotional expense) | | | | | | | 1,669 | | | | | | | | –305 | | | | | | | | 1,365 | | | | | | | Profit/loss from operating activities | | | | |
| Promotional expense | | | | | | | 305 | | | | | | | | –305 | | | | | | | | 0 | | | | | | | - | | | | |
| Taxes on income | | | | | | | –1 | | | | | | | | 0 | | | | | | | | –1 | | | | | | | Taxes on income | | | | |
| | | | | | | | | |
| Consolidated profit | | | | | | | 1,365 | | | | | | | | 0 | | | | | | | | 1,365 | | | | | | | Consolidated profit | | | | |
| | | | | | | | | |
| Temporary net gains/losses from hedge accounting | | | | | | | 182 | | | | | | | | | | | | | | | | 182 | | | | | | | Temporary net gains/losses from hedge accounting | | | | |
Consolidated profit before IFRS effects | | | | | | | 1,183 | | | | | | | | 0 | | | | | | | | 1,183 | | | | | | | Consolidated profit before IFRS effects | | | | |
KfW Financial Report 2022 Combined Management Report | Economic report | 14
Reconciliation of internal earnings position (before promotional expense) with external earnings position (after promotional expense) for financial year 2021
| | | | | | | | | | | | | | | | | | | | | | | | | | | | | | | | | | |
| | | | | | | | | | | | Reconciliation | | | | | | | | | | | | | | | |
| | | | | | EUR in millions | | | | | | EUR in millions | | | | | | EUR in millions | | | | | | | | | |
| | | | | | | | | |
Net interest income (before promotional expense) | | | | | | | 2,531 | | | | | | | | –144 | | | | | | | | 2,386 | | | | | | | Net interest income | | | | |
| | | | | | | | | |
Net commission income (before promotional expense) | | | | | | | 634 | | | | | | | | –12 | | | | | | | | 623 | | | | | | | Net commission income | | | | |
| | | | | | | | | |
Administrative expense (before promotional expense) | | | | | | | 1,452 | | | | | | | | 14 | | | | | | | | 1,466 | | | | | | | Administrative expense | | | | |
| | | | | | | | | |
Operating result before valuation (before promotional expense) | | | | | | | 1,712 | | | | | | | | –170 | | | | | | | | 1,542 | | | | | | | Operating result before valuation | | | | |
| | | | | | | | | |
| Risk provisions for lending business | | | | | | | 196 | | | | | | | | 0 | | | | | | | | 196 | | | | | | | Net gains/losses from risk provisions | | | | |
| | | | | | | | | |
| Net gains/losses from hedge accounting | | | | | | | –110 | | | | | | | | 0 | | | | | | | | –110 | | | | | | | Net gains/losses from hedge accounting | | | | |
| | | | | | | | | |
| Other financial instruments at fair value through profit or loss | | | | | | | 767 | | | | | | | | 0 | | | | | | | | 767 | | | | | | | Net gains/losses from other financial instruments at fair value through profit or loss | | | | |
| | | | | | | | | |
| Securities and investments | | | | | | | –4 | | | | | | | | –0 | | | | | | | | –4 | | | | | | | Net gains/losses from disposal of financial assets at amortised cost | | | | |
| | | | | | | | | |
| Net gains/losses from investments accounted for using the equity method | | | | | | | 14 | | | | | | | | 0 | | | | | | | | 14 | | | | | | | Net gains/losses from investments accounted for using the equity method | | | | |
| | | | | | | | | |
Operating result after valuation (before promotional expense) | | | | | | | 2,575 | | | | | | | | –170 | | | | | | | | 2,405 | | | | | | | Operating result after valuation | | | | |
| | | | | | | | | |
Net other operating income (before promotional expense) | | | | | | | –34 | | | | | | | | –18 | | | | | | | | –53 | | | | | | | Net other operating income or loss | | | | |
| | | | | | | | | |
Profit/loss from operating activities (before promotional expense) | | | | | | | 2,541 | | | | | | | | –188 | | | | | | | | 2,353 | | | | | | | Profit/loss from operating activities | | | | |
| Promotional expense | | | | | | | 188 | | | | | | | | –188 | | | | | | | | 0 | | | | | | | - | | | | |
| Taxes on income | | | | | | | 137 | | | | | | | | 0 | | | | | | | | 137 | | | | | | | Taxes on income | | | | |
| | | | | | | | | |
| Consolidated profit | | | | | | | 2,215 | | | | | | | | 0 | | | | | | | | 2,215 | | | | | | | Consolidated profit | | | | |
| | | | | | | | | |
| Temporary net gains/losses from hedge accounting | | | | | | | –139 | | | | | | | | | | | | | | | | –139 | | | | | | | Temporary net gains/losses from hedge accounting | | | | |
Consolidated profit before IFRS effects | | | | | | | 2,354 | | | | | | | | 0 | | | | | | | | 2,354 | | | | | | | Consolidated profit before IFRS effects | | | | |
At EUR 1,536 million (2021: EUR 1,712 million), the Operating result before valuation (before promotional expense) was below the prior-year level but above the target (EUR 1,464 million).
At EUR 2,416 million, Net interest income (before promotional expense) decreased compared to the 2021 figure (EUR 2,531 million). The main factor behind the decline was the lower structure contribution due to market conditions, which was significantly below target. The opposite was true for interest margin income and commitment fees, which exceeded both the previous year and the target. In this context, net interest income benefited, among other things, from fees collected by KfW as part of the transactions mandated to secure the energy supply. Moreover, KfW’s funding conditions on the capital and money markets remained very good and made a positive contribution to Net interest income due to the bank’s top-notch credit rating.
Net commission income (before promotional expense) amounted to EUR 629 million, which was nearly on par with the 2021 figure (EUR 634 million) and exceeded expectations (EUR 565 million). This figure was mainly due to the cost-based remuneration of EUR 363 million (2021: EUR 362 million) for the implementation of the promotional programmes for the Federal Government, which was primarily in energy efficiency and renewables, including charging infrastructure. Remuneration for administration of German Financial Cooperation (“FC”) increased slightly to EUR 231 million (2021: EUR 229 million). The remuneration from the Federal Government was offset by related administrative expenses. In addition to the time and material fees, syndication fees and restructuring fees in the business sector Export and project finance contributed to the outperformance.
15 | KfW Financial Report 2022 Combined Management Report | Economic report
Administrative expense (before promotional expense) grew from EUR 1,452 million to EUR 1,509 million, but was lower than expected (EUR 1,546 million). Personnel expense amounted to EUR 887 million, which is higher than the previous year’s figure of EUR 842 million. This increase was due in part to a full-time equivalent (“FTE”) increase that was lower than expected. In addition, collective wage increases and special payments to employees to compensate for inflation had a cost-increasing effect. Non-personnel expense (before promotional expense) rose slightly from EUR 610 million to EUR 622 million.
The cost-income ratio before promotional expense increased to 49.6% (2021: 45.9%), mainly due to the increase in administrative expense and the overall decline in operating income. Adjusted for income and expenses from products for which cost-based remuneration has been agreed with the Federal Government, the cost-income ratio for 2022 amounted to 37.1% (2021: 33.3%).
Despite the more challenging environment, the risk provision result saw moderate charges of EUR 122 million in 2022, which were significantly below the projected standard risk costs (EUR –473 million). There was a considerable deterioration compared to the previous year’s net income of EUR 196 million, which had benefited from pent-up demand following the global coronavirus crisis. The net additions were due in particular to the economic impact of the Russia-Ukraine war and the resulting crises. These additions were offset by relief from the validation and continued development of provisioning and its methods. Net additions mainly affected the business sectors DEG and Mittelstandsbank & Private Kunden (SME Bank & Private Clients).
The gloomy macroeconomic environment led to a need for risk provisions for performing loans of EUR 202 million (2021: net income of EUR 142 million). The impact of the Russia-Ukraine war and the energy crisis are reflected in the adjusted probabilities of default, more conservative treatment of loss ratios and inclusion of a second conservative macroeconomic scenario.
Net reversals of EUR 16 million (2021: net additions of EUR 8 million) were recorded in risk provisions for non-performing loans (stage 3) including direct write-offs in 2022. Net additions arose mainly from the business sector DEG, in an amount of EUR 55 million (2021: EUR 53 million), of which almost 50% were attributable to exposures directly related to Ukraine, and in the business sector Mittelstandsbank & Private Kunden (SME Bank & Private Clients) in an amount of EUR 44 million (2021: EUR 47 million), of which EUR 54 million was attributable to education financing (2021: EUR 37 million). These additions were offset by net reversals in the business sector Export and project finance of EUR 107 million (2021: EUR 74 million), which largely resulted from the reversal of risk provisions due to validation results.
At EUR 62 million, income from recoveries of loans previously written off was below that of the previous year (EUR 83 million). Of this amount, EUR 38 million was attributable to the business sector Mittelstandsbank & Private Kunden (SME Bank & Private Clients) and EUR 19 million to the business sector DEG.
Risk provisions for lending business increased to EUR 2.2 billion in financial year 2022 (2021: EUR 2.0 billion), of which EUR 1.4 billion was related to provisions for imminent risks in stage 3 (2021: EUR 1.4 billion). Provisions for individual risks in stage 2 that cannot be allocated increased from EUR 0.4 billion to EUR 0.5 billion, and in stage 1 from EUR 0.3 billion to EUR 0.4 billion.
The net gains/losses from hedge accounting and other financial instruments at fair value through profit or loss amounted to EUR 214 million (2021: EUR 657 million) and, in financial year 2022, were driven by positive valuation effects from the equity investment portfolio, and by purely IFRS-related effects from the measurement of derivatives used for hedging purposes.
The equity investment portfolios measured at fair value through profit or loss generated total income of EUR 46 million in financial year 2022, after the previous year’s result of EUR 752 million which was due to reversals of impairment losses as a result of the absence of pandemic-related charges. The development in 2022 was characterised by the impact of the war in Ukraine, which mainly affected the equity investment portfolios of the business sectors KfW Development Bank and DEG, with a result of EUR –61 million (2021: EUR 448 million) and EUR 17 million (2021: EUR 424 million), respectively. DEG’s negative securities result of EUR –73 million was more than compensated for by positive exchange rate-induced increases in value – in particular, from the appreciation of the US dollar. There was positive performance in the equity investment portfolios of the business sectors Individualfinanzierung & Öffentliche Kunden (Customised Finance & Public Clients) (EUR 31 million; 2021: EUR 54 million), KfW Capital (EUR 26 million; 2021: EUR 194 million) and Export and project finance (EUR 11 million; 2021: EUR 51 million).
KfW Financial Report 2022 Combined Management Report | Economic report | 16
Hedge accounting and borrowings recognised at fair value, including derivatives used for hedging purposes, resulted in net expenses of EUR 202 million (2021: EUR 139 million). The mark-to-market derivatives are part of economically hedged positions. However, if the other part of the hedging relationship cannot be carried at fair value or different valuation methods and parameters have to be applied, this inevitably results in temporary fluctuations in income that are fully offset over the term of the transactions.
The measurement of securities at fair value through profit or loss yielded a balanced result as in the previous year of EUR 0 million.
In the case of securities not carried at fair value, developments in the financial markets resulted in a net difference of EUR –57 million between the carrying amount and the fair value (2021: EUR 98 million). This development is partly attributable to decreases in the value of the covered bonds. However, there were no defaults or significant deteriorations in credit quality.
There were net gains of EUR 41 million (2021: EUR 10 million) from securities and investments as well as from investments accounted for using the equity method. Investments accounted for using the equity method contributed EUR 43 million to the result. This was primarily due to value increases in the business sector Export and project finance.
Net other operating income (before promotional expense) was EUR 1 million, which was up on the previous year’s figure (2021: EUR –34 million).
At EUR 305 million in 2022, KfW’s domestic promotional expense, which has a negative impact on KfW Group’s earnings position, was above the prior-year level (EUR 188 million) but below projections (EUR 365 million), due to the low interest environment.
Interest rate reductions are the key component of KfW’s promotional expense. KfW grants these for certain domestic promotional loans during the first fixed-interest-rate period, which has a negative effect on its earnings position, in addition to passing on its funding conditions which are influenced by its triple-A rating. The volume of interest rate reductions was EUR 267 million in financial year 2022, which was above the prior-year figure (EUR 144 million) but below the projected figure (EUR 330 million). The increase in interest rate reductions was the result not only of passing on negative funding rates to KfW financing partners from the third quarter 2021 onwards, but also primarily of the significant increase in interest rates, in particular in the second half of 2022, which led to an additional increase in demand for promotional loans at reduced rates. In addition to its lending business, KfW provided promotional grants, in particular for the Climate action campaign and the ERP Digitalisation and Innovation programmes, totalling EUR 10 million in financial year 2022 (2021: EUR 18 million), which were recognised as promotional expense in Net other operating income. Moreover, promotional expenses reported in net commission income and administrative expense amounted to EUR 28 million (2021: EUR 26 million). This spending was aimed at, among other things, the sale of KfW’s promotional products.
KfW reported a tax result of EUR 1 million for financial year 2022 (2021: EUR –137 million), with the current taxes on income of EUR 46 million (2021: EUR 49 million) offset by deferred tax income of EUR 47 million (2021: expense of EUR 88 million).
Overall, KfW generated a consolidated profit of EUR 1,365 million, which is significantly lower than in 2021 (EUR 2,215 million) but above expectations of around EUR 900 million.
Consolidated profit before IFRS effects from hedging is another key financial figure based on Consolidated profit in accordance with IFRS to reflect the fact that KfW uses derivative financial instruments solely for hedging purposes. Under IFRS, the requirements for the recognition and valuation of derivatives and hedges give rise to temporary net gains or losses that are offset over the entire term. Against this backdrop, IFRS effects from hedging relationships amounting to EUR 182 million (2021: EUR –139 million) were eliminated.
The reconciled earnings position amounted to a profit of EUR 1,183 million (2021: EUR 2,354 million). The significant decline in consolidated profit is largely due to the charges from risk provisions and the declining valuation result of the equity investment portfolio, after the previous year’s profit had benefited exceptionally from recovery after COVID-related pressures. Nevertheless, the result still exceeds the sustainable earnings potential of EUR 1.0 billion.
17 | KfW Financial Report 2022 Combined Management Report | Economic report
Development of net assets
Lending to banks and customers accounted for 84% of the group’s assets as of 31 December 2022 (2021: 80%).
Assets as of 31 December 2022 (31 Dec. 2021)
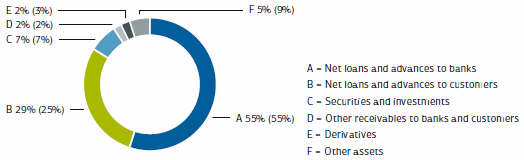
The volume of lending increased significantly compared to the previous year, amounting to EUR 607.0 billion (2021: EUR 564.2 billion).
Volume of lending
| | | | | | | | | | | | | | | | | | | | | | | | |
| | | | | | | |
| | | | | | | | | 31 Dec. 2022 | | | | | | | 31 Dec. 2021 | | | | |
| | | | | | | |
| | | | | | | | | EUR in millions | | | | | | | EUR in millions | | | | |
| | | | | | | |
Loans and advances | | | | | | | | | | | 465,655 | | | | | | | | 440,623 | | | | | |
| | | | | | | |
Risk provisions for lending business | | | | | | | | | | | –2,102 | | | | | | | | –1,943 | | | | | |
| | | | | | | |
Net loans and advances | | | | | | | | | | | 463,554 | | | | | | | | 438,680 | | | | | |
| | | | | | | |
Contingent liabilities from financial guarantees | | | | | | | | | | | 3,543 | | | | | | | | 3,168 | | | | | |
| | | | | | | |
Irrevocable loan commitments | | | | | | | | | | | 129,183 | | | | | | | | 111,376 | | | | | |
| | | | | | | |
Loans and advances held in trust | | | | | | | | | | | 10,681 | | | | | | | | 10,999 | | | | | |
| | | | | | | |
Total | | | | | | | | | | | 606,961 | | | | | | | | 564,223 | | | | | |
Loans and advances increased by EUR 25.0 billion in 2022, which was primarily the result of liquidity support for energy suppliers (around EUR 22 billion) and the Federal Funding for Efficient Buildings programme (BEG) (EUR 10.4 billion). The coronavirus special programme 2020, particularly the KfW Entrepreneur Loan and KfW Entrepreneur Loan – SMEs, in contrast, posted a decrease of EUR 5.9 billion. Overall, disbursements in new lending business more than compensated for unscheduled repayments (EUR 14.5 billion; 2021: EUR 14.2 billion) and scheduled repayments. At EUR 463.6 billion, Net loans and advances accounted for 76% of lending volume.
Contingent liabilities from financial guarantees amounted to EUR 3.5 billion, an increase of EUR 0.4 billion on the prior-year figure (2021: EUR 3.2 billion). Irrevocable loan commitments rose by EUR 17.8 billion to EUR 129.2 billion largely as a result of irrevocable commitments to liquidity support of EUR 20.0 billion for energy suppliers. Within assets held in trust, the volume of Loans and advances held in trust, which primarily comprise loans to promote developing countries and emerging economies financed by budget funds provided by the Federal Republic of Germany, decreased by EUR 0.3 billion to EUR 10.7 billion.
Other loans and advances to banks and customers posted an increase from 8.4 billion to EUR 12.7 billion. The increase of EUR 4.3 billion was attributable to receivables from cash collateral in connection with collateral management in the derivatives business.
KfW Financial Report 2022 Combined Management Report | Economic report | 18
The total amount of securities and investments, at EUR 38.1 billion, was 4% below the previous year’s level.
Securities and investments
| | | | | | | | | | | | | | | | | | | | | | | | |
| | | | | | | |
| | | | | | | | | 31 Dec. 2022 | | | | | | | 31 Dec. 2021 | | | | |
| | | | | | | |
| | | | | | | | | EUR in millions | | | | | | | EUR in millions | | | | |
| | | | | | | |
Bonds and other fixed-income securities | | | | | | | | | | | 33,721 | | | | | | | | 35,774 | | | | | |
| | | | | | | |
Shares and other non-fixed income securities | | | | | | | | | | | 0 | | | | | | | | 0 | | | | | |
| | | | | | | |
Equity investments | | | | | | | | | | | 4,342 | | | | | | | | 4,015 | | | | | |
| | | | | | | |
Shares in non-consolidated subsidiaries | | | | | | | | | | | 80 | | | | | | | | 68 | | | | | |
| | | | | | | |
Total | | | | | | | | | | | 38,143 | | | | | | | | 39,856 | | | | | |
The securities portfolio decreased by EUR 2.1 billion to EUR 33.7 billion in financial year 2022 (31 Dec. 2021: EUR 35.8 billion). The portfolio of Equity investments and Shares in non-consolidated subsidiaries increased by EUR 0.3 billion to EUR 4.4 billion in 2022. This was due in part to portfolio growth in DEG and KfW Capital.
Value adjustments from macro hedge accounting declined by EUR 30.5 billion, based on fair value, from EUR 4.6 billion to EUR –25.9 billion. Derivatives with positive fair values, which are primarily used to hedge refinancing transactions, declined from EUR 13.9 billion in 2021 to EUR 11.5 billion. This was primarily due to value adjustments of stand-alone derivatives decreasing from EUR 5.4 billion to EUR 2.5 billion.
KfW increased its balances with central banks by EUR 9.4 billion to EUR 51.8 billion. The liquidity held continues to ensure the expected servicing of measures related to securing the energy supply and, in addition, enables reaction to market events at short notice. There were only minor changes in the other asset line items in the statement of financial position.
Development of financial position
KfW Group’s funding strategy in the national and international capital markets is based on the four product categories: “benchmark programmes in euros and US dollars”, “Green Bonds – Made by KfW”, “other public bonds” and “private placements”. In addition, funds totalling EUR 34.4 billion (nominal) were raised via the Economic Stabilisation Fund (“WSF”) in 2022 to fund support measures for energy suppliers due to the Ukraine war (EUR 22.4 billion) and the coronavirus special programmes (EUR 12.0 billion). KfW fully repaid its funding via participation in the targeted longer-term funding of the Eurosystem via TLTRO III in 2022. Overall, the share of total assets accounted for by funding in the form of certificated liabilities therefore declined to 77% (previous year: 81%).
Financial position as of 31 December 2022 (31 Dec. 2021)
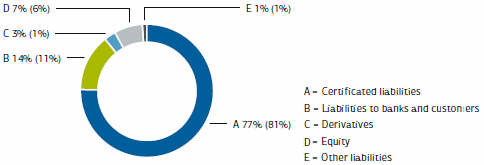
Borrowings decreased by EUR 5.8 billion to EUR 500.3 billion.
19 | KfW Financial Report 2022 Combined Management Report | Economic report
Borrowings
| | | | | | | | | | | | | | | | | | | | | | | | |
| | | | | | | |
| | | | | | | | | 31 Dec. 2022 | | | | | | | 31 Dec. 2021 | | | | |
| | | | | | | |
| | | | | | | | | EUR in millions | | | | | | | EUR in millions | | | | |
| | | | | | | |
Short-term funds | | | | | | | | | | | 43,810 | | | | | | | | 51,588 | | | | | |
| | | | | | | |
Bonds and notes | | | | | | | | | | | 385,810 | | | | | | | | 397,617 | | | | | |
| | | | | | | |
Other funding | | | | | | | | | | | 70,678 | | | | | | | | 56,854 | | | | | |
| | | | | | | |
Total | | | | | | | | | | | 500,298 | | | | | | | | 506,059 | | | | | |
Funds raised in the form of certificated liabilities declined by EUR 22.7 billion to EUR 424.9 billion. Of this decrease, EUR 11.8 billion was a result of a lower volume of medium and long-term bonds and notes, which remain the group’s principal source of funding. At year-end 2022, such funds amounted to EUR 385.8 billion (31 Dec. 2021: EUR 397.6 billion) and accounted for 77% of borrowings. Short-term issues of commercial paper declined by EUR 10.9 billion to EUR 39.1 billion. Total short-term funds, including demand deposits and term deposits, amounted to EUR 43.8 billion, compared with EUR 51.6 billion the previous year. Additional funds were raised in connection with the provision of liquidity support for energy suppliers. This largely resulted in an increase in Other funding of EUR 13.8 billion to EUR 70.7 billion (31 Dec. 2021: EUR 56.9 billion). In addition to the increase of EUR 12.7 billion in promissory note loans (Schuldscheindarlehen) from banks and customers to EUR 53.5 billion (mainly funding via the WSF); this also includes higher liabilities to the Federal Republic of Germany for future disbursements in short-term emergency aid for gas and heat (EUR 4.4 billion). In contrast, cash collateral received, which primarily serves to reduce counterparty risk from the derivatives business, declined from EUR 9.0 billion in the previous year to EUR 5.4 billion.
The carrying amounts of derivatives with negative fair values, which were primarily used to hedge own issues, increased by EUR 8.1 billion from EUR 6.4 billion as of 31 December 2021, primarily due to changes in market parameters, and amounted to EUR 14.5 billion at year-end 2022. One significant factor was the dramatic hike in key interest rates by the European Central Bank in 2022.
There were only minor changes in the other liability line items of the statement of financial position.
At EUR 36.6 billion, equity was EUR 2.4 billion above the level of 31 December 2021 of EUR 34.2 billion. The increase resulted in particular from consolidated profit (EUR 1.4 billion). The significant increase in the discount rate for pension obligations from 1.32% to 3.89% provided a reduction of EUR 0.9 billion in the revaluation reserves. The equity ratio increased year on year from 6.2% to 6.6% as of 31 December 2022, primarily due to the increase in equity.
Equity
| | | | | | | | | | | | | | | | | | | | | | | | |
| | | | | | | |
| | | | | | | | | 31 Dec. 2022 | | | | | | | 31 Dec. 2021 | | | | |
| | | | | | | |
| | | | | | | | | EUR in millions | | | | | | | EUR in millions | | | | |
| | | | | | | |
Paid-in subscribed capital | | | | | | | | | | | 3,300 | | | | | | | | 3,300 | | | | | |
| | | | | | | |
Capital reserve | | | | | | | | | | | 8,447 | | | | | | | | 8,447 | | | | | |
| | | | | | | |
Reserve from the ERP Special Fund | | | | | | | | | | | 1,191 | | | | | | | | 1,191 | | | | | |
| | | | | | | |
Retained earnings | | | | | | | | | | | 23,391 | | | | | | | | 22,026 | | | | | |
| | | | | | | |
Fund for general banking risks | | | | | | | | | | | 200 | | | | | | | | 200 | | | | | |
| | | | | | | |
Revaluation reserves | | | | | | | | | | | 50 | | | | | | | | –957 | | | | | |
| | | | | | | |
Total | | | | | | | | | | | 36,579 | | | | | | | | 34,207 | | | | | |
The consolidated profit was allocated to retained earnings.
KfW Financial Report 2022 Combined Management Report | Economic report | 20
Risk report
Overview of key indicators
Risks are reported at group level in accordance with KfW Group’s internal risk management. The key risk indicators are presented below:
Regulatory capital ratios:
| | |
 | | The increase in the capital ratio is primarily due to the increase in own funds, which rose by around EUR 2.8 billion year on year and thus more than offset the increase in total risk exposure, which was largely due to methodology. |
| | A = Tier 1 capital ratio B = Total capital ratio |
Credit risk:
2022 (2021), Net exposure breakdown
| | |
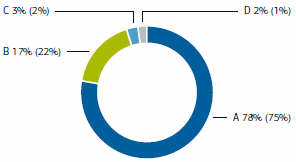 | | The share of investment grade net exposure increased slightly year on year to 78% of total net exposure. The change is primarily due to rating improvements in the banking portfolio. The distribution of exposures is quite stable overall. |
| | A = Investment grade B = Non-investment grade C = Watch list D = Default |
21 | KfW Financial Report 2022 Combined Management Report | Risk report
Economic risk-bearing capacity:
(EUR in billions)
| | |
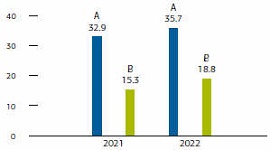 | | The year 2022 was characterised by high volatilities in the markets. This led to a higher economic capital requirement for market price risks. The increase in available financial resources, in particular due to the positive annual result, largely compensated for the increase in the economic capital requirement. Economic risk-bearing capacity, which was transitioned to a present-value calculation in 2022, was maintained at a confidence level of 99.9% in the reporting year. A = Available financial resources B = Total economic capital requirement |
Market price risk:
2022 (2021), ECAP (EUR in billions)
| | |
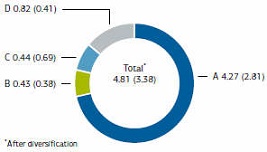 | | Greater volatility in the market due to the Russia-Ukraine war caused a higher capital requirement for market price risk compared to the previous year, primarily due to the increased interest risk. The highly volatile markets also caused an increase in interest rate volatility risk and credit spread risk. Currency risk decreased due to a lower USD present value. A = Interest risk B = Interest volatility risk C = Currency risk D = Credit spread risk |
Liquidity risk:
| | |
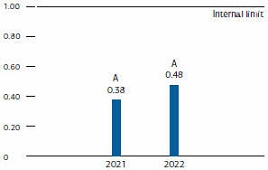 | | The liquidity risk indicator remained considerably below the internal limit throughout the year. The increase in the liquidity risk indicator largely resulted from new lines of credit granted within the scope of mandated transactions. A = Liquidity risk indicator (worst case) |
KfW Financial Report 2022 Combined Management Report | Risk report | 22
Operational risk:
ECAP (EUR in millions)
| | |
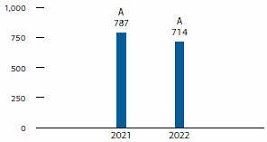 | | The updating of risk scenarios led to a reduction in economic capital requirements at the end of 2022. A = ECAP |
In financial year 2022, as in previous years, KfW Group refined the processes and instruments of its risk management and controlling taking into account current banking supervisory requirements. Economic risk-bearing capacity was changed to a present-value calculation. The measurement of available financial resources and of economic capital for credit risk was developed accordingly. A new digital stress test reporting system was also introduced.
Other focus areas included the expansion of the reporting systems in Risk Controlling and further development of the management of environmental, social and governance risks (“ESG” risks) as part of a group-wide project. KfW has been implementing its sustainable finance concept as part of this project (“tranSForm”) since the end of 2020. KfW is enhancing its ESG risk management on this basis in order to identify and assess ESG risks even earlier in future and to take mounting regulatory requirements into account. The ESG risk project is based on developing and implementing an ESG risk database (“ESG risk profile”) to store an assessment of ESG risks for risk-relevant business partners as an ESG risk profile in the future. Other central issues include further development of ESG stress testing methods and reporting, and improved consideration of ESG risks in the relevant overall bank and risk management processes.
Basic principles and objectives of risk management
KfW Group has a statutory promotional mandate. Sustainable promotion is KfW Group’s overarching purpose. The aim of risk management is for the group to take risks only to the extent that they appear manageable in the context of its current and anticipated earnings position and capital resources. KfW Group’s risk/return management takes into account the business model of a promotional bank without the primary intention of generating a profit and without a trading book, with appropriate implementation of supervisory requirements constituting a fundamental prerequisite for the group’s business activities.
The promotional bank business model determines the group’s risk culture with its four regulatory-based elements: leadership culture, responsibilities, communication and incentives. Incentive structures for employees and their responsibilities are designed accordingly. Senior management specifies the desired code of conduct and sets an example in practising it, with the desired dialogue established by means of communication with and through the relevant bodies.
Current developments
The global economic situation in 2022 was dominated by the Russia-Ukraine war. Its consequences thwarted the economic recovery that began in 2021 after the pandemic-induced crisis. The global economy has been slowed more broadly and more significantly than expected. The return of historically high inflation, in particular, poses a great
23 | KfW Financial Report 2022 Combined Management Report | Risk report
challenge in this environment. Central banks are aiming to contain inflation but risk further slowing the economy in the process. Governments, in turn, are confronted with the public’s demands to curb costs. At the same time, the fiscal leeway of many countries has already shrunk considerably after two years of pandemic. There is pressure from interest rates, which are expected to continue to rise, and the US dollar, which was boosted by the Federal Reserve’s systematic interest rate policy, on heavily indebted developing countries and emerging economies, in particular, but also on highly indebted industrialised countries. The countries most at risk are the ones that are particularly vulnerable to external shocks due to prolonged current account deficits. These negative developments are primarily reflected in increased rating downgrades in KfW’s country risk management in the second half of 2022. These rating downgrades result in the respective country limits potentially being reduced. The deterioration in credit quality also affects the bank ratings of counterparties in the respective countries.
Immediately after the outbreak of the Russia-Ukraine war, KfW’s risk management identified business partner banks with significant exposure to the affected countries. Processes were temporarily adapted, and monitoring stepped up as a precautionary measure. The regular ratings for the bank portfolio in 2022 were significantly influenced by country rating changes, which are included as parameters in the bank rating. Global banking markets were challenged by rapidly and significantly rising interest rates in 2022. Banks had to rebalance their pricing policy at the end of the low-interest period. Although interest margins would increase, lending also had to remain intact. The latter proved particularly difficult for the real estate sector. Rising interest rates on loans were compounded by higher prices for building materials and scarce construction capacities in that sector, causing a significant decline in demand for home ownership in many countries. The developments outlined above became intertwined with the coronavirus crisis. The moratoria and other COVID-related support measures granted in most countries ended. The effects on banks expected at the outset of the pandemic (higher rates of NPLs and declining earnings) have failed to materialise thus far because, in many cases, they have been mitigated by means of regulation and government spending. The overall situation is currently very challenging. While the COVID, Ukraine and energy crises demand greater spending and the debt burden is accumulating, rising key interest rates are rendering financing increasingly costly. Declining securities prices have in turn impacted bank balance sheets in different countries and also accounting standards. The forecast for 2023 is therefore subject to considerable uncertainties.
The consequences of the Russia-Ukraine war and the related sanctions are exacerbating the supply chain, energy and price problems that were already present at the beginning of 2022 and weighing on the corporate sector. KfW responded to the outbreak of the Russia-Ukraine war by creating a crisis team together with its subsidiaries to coordinate the complex issues and took extensive action in the corporate segment in risk/portfolio and credit management. In addition to the monitoring, reporting and strict management of credit risks related to the Russia-Ukraine war, these measures include, in particular, the further reduction of the direct exposure to Russia by prohibiting new business, making portfolio sales and assigning default status on corporate loans for customers with registered offices in Russia and Ukraine (direct exposure to Belarus is negligible). Direct and indirect risk exposures (i.e. borrowers with first-round exposure – such as through important supply relationships) to corporates associated with Russia, Belarus and Ukraine are largely hedged, account for only a small part of the credit risks in the entire corporate segment and are also declining. For example, Russian business has been heavily restricted since 2014 and direct Russian exposure in the corporate segment has been considerably limited in this regard. In contrast, extensive mandated transactions were concluded on behalf of the Federal Government in connection with the war in Ukraine in order to support energy suppliers. Negative macroeconomic effects of the war in Ukraine (gas supply shortage, energy price pressure, monetary policy tightening to combat persistent inflation, increasing supply chain issues), and the pressure on the corporate sector already felt before the war due to the pandemic, have resulted in great uncertainty about the extent to which the corporate segment will be affected in the future. However, the corporate loan portfolio has been largely stable thus far despite the difficult economic environment.
KfW Financial Report 2022 Combined Management Report | Risk report | 24
Organisation of risk management and monitoring
Risk management bodies and responsibilities
As part of its overall responsibility, KfW’s Executive Board determines the group’s risk policies. The Board of Supervisory Directors is informed at least quarterly of KfW Group’s risk situation. The Risk and Credit Committee set up by the Board of Supervisory Directors is primarily responsible for advising the Board of Supervisory Directors about the group’s current and future overall risk tolerance and strategy and supports it in monitoring the implementation of the latter. The Committee decides on loan approvals (including loans to members of management), operational level equity investments, funding and swap transactions, where committee authorisation is required by the KfW Bylaws. The Audit Committee monitors, above all, the accounting process and the effectiveness of the risk management system and internal control and offers recommendations to the Board of Supervisory Directors concerning its approval of KfW’s annual and consolidated financial statements.
Group risk management is carried out by various interconnected decision-making bodies. At the top of the system is the Executive Board, which takes the key decisions on risk policy. There are three risk committees below Executive Board level (Credit Risk Committee, Market Price Risk Committee and Operational Risk Committee) that prepare decisions for the Executive Board and also take their own decisions within their remits. The committees also perform KfW Group management functions; thus, representatives from KfW subsidiaries are also included. Internal Auditing also has the right to attend committee meetings as a guest. Working groups such as the Rating Systems Working Group, Collateral Working Group, Country Rating Working Group, Corporate Sector Risk Working Group, Market Price Risk Working Group, Hedge Committee and OpRisk Working Group support the committees. Committee resolutions are adopted by simple majority with middle and back-office departments (Marktfolge) or Risk Controlling entitled to veto decisions. Escalation to Executive Board level is possible in all committees.
| | | | | | | | | | | | |
| | | | | Board of Supervisory Directors | | | | |
| | | | | | | |
Risk and Credit Committee | | | | Audit Committee | | | | Presidial and Nomination Committee | | | | Remuneration Committee |

Executive Board
| | | | | | | | |
| | | | | | | |
|
| | | | | |
| Credit Risk Committee | | | | Market Price Risk Committee | | | | Operational Risk Committee |
Credit Risk Committee
The Credit Risk Committee is chaired by the Chief Risk Officer and meets once a week. Additional voting members of the committee are the Director of Credit Risk Management, members of the Executive Board with front-office responsibilities and KfW IPEX-Bank’s Chief Risk Officer (“CRO”). The CRO of DEG has guest status. The weekly meetings of the Credit Risk Committee involve, in particular, making important lending decisions in line with the credit approval policy, with KfW subsidiary exposures also being presented. In addition, current developments in the loan portfolio, including country and sector risks, are discussed on an ad hoc basis; DEG’s CRO is also entitled to vote in these discussions and the managing director of KfW Capital responsible for risk issues has guest status. Once a month, the (General) Credit Risk Committee acknowledges the submissions addressed in the working groups, discusses overarching credit risk issues and makes decisions on significant adjustments in accordance with the competency matrix. In particular, these include reports and draft resolutions on the risk situation and risk management as well as on credit risk methods and principles. Reports are also made on the development of regulatory requirements, their impact and the progress of implementation projects in KfW Group. To this end, membership of the Credit Risk Committee has been expanded to include the Director of Risk Controlling, the DEG CRO and the managing director of KfW Capital responsible for risk issues. The Credit Risk
25 | KfW Financial Report 2022 Combined Management Report | Risk report
Committee is supported by various working groups. The Country Rating Working Group serves as the central unit for assessing country risk. The Collateral Working Group supports the committee in connection with methodological and procedural issues and decisions relating to collateral acceptance and valuation, in particular the (further) development of methods used, approval of validation results and adjustments to the collateral management processes. The Rating Systems Working Group is responsible for credit risk measurement instruments and rating procedures.
The Corporate Sector Risk Working Group is a group-wide expert panel which analyses sector and product-related credit risks in the corporate segment. The decisions made, reports submitted and other key topics addressed in the working groups are communicated to the Credit Risk Committee via the working group minutes.
Market Price Risk Committee
The Market Price Risk Committee meets monthly or on an ad hoc basis as required and is chaired by the Chief Risk Officer. In addition to the Chief Risk Officer, the members of the Executive Board responsible for capital markets business and finance are also represented. The members of the committee also include the directors of Risk Controlling, Financial Markets, Accounting, Transaction Management and the CROs of KfW IPEX-Bank and DEG. The Market Price Risk Committee discusses KfW Group’s market price and liquidity risk position and assesses the market price risk strategy on a monthly basis. The committee also decides on questions relating to the principles and methods applied for the management of market price and liquidity risks, on funding, transfer pricing and on valuation for commercial transactions. The Market Price Risk Committee is supported by the Hedge Committee and the Market Price Risk Working Group. The Hedge Committee deals primarily with the earnings effects of IFRS hedge accounting and the further development thereof. The Market Price Risk Working Group deals with methodology issues relating to market price and liquidity risks as well as measurement issues. These include matters relating to model development, validation and financial reporting measurement, in particular, acknowledging validation reports and making decisions on recommendations resulting from validation. A decision on the matters addressed is either made directly by the Market Price Risk Working Group or prepared for referral to the Market Price Risk Committee.
Operational Risk Committee
The Operational Risk Committee meets once every quarter and provides support to the Executive Board in cross-functional management and the necessary decisions and acknowledgements in respect of operational and reputational risk, and group security including business continuity management (“BCM”). The Chief Risk Officer is responsible for chairing the Operational Risk Committee meetings. In principle, all areas of the bank are represented in the committee – in selected cases based on a representation concept. Moreover, the managing director level of KfW IPEX-Bank, DEG and KfW Capital is represented on the committee. The committee makes decisions on group-wide management measures. Furthermore, the committee discusses the risk status on the basis of the findings obtained through different methods and instruments and evaluates any group-wide need for action, with the aim of adequate risk management. The results of the validation of the OpRisk model are acknowledged. In the area of BCM, the committee establishes crisis-prevention and emergency-planning measures using the results of the annual business impact analysis. Monitoring is based on reports about planned or implemented emergency and crisis team tests and significant disruptions to business. The committee meeting documents, together with the minutes and the resolutions and recommendations contained therein, are submitted to the Executive Board. The committee formed the Group Security Board (“GSB”) to take up matters related to group security and business continuity management (“BCM”) and the OpRisk Working Group as a working group for exchange with the decentralised department coordinators for operational risk and business continuity management (“BOB”).
Additionally, the subsidiaries and organisational entities of KfW Group exercise their own control functions within the group-wide risk management system. Group-wide regulations, projects and working groups are in place to implement a uniform approach, such as in the rollout of rating instruments to subsidiaries or in the management and valuation of collateral. The responsibility for developing and structuring risk management and risk control activities is located outside the front-office departments and lies in particular with the Risk Controlling and Credit Risk Management areas.
KfW Financial Report 2022 Combined Management Report | Risk report | 26
Risk management approach of KfW Group (overview)
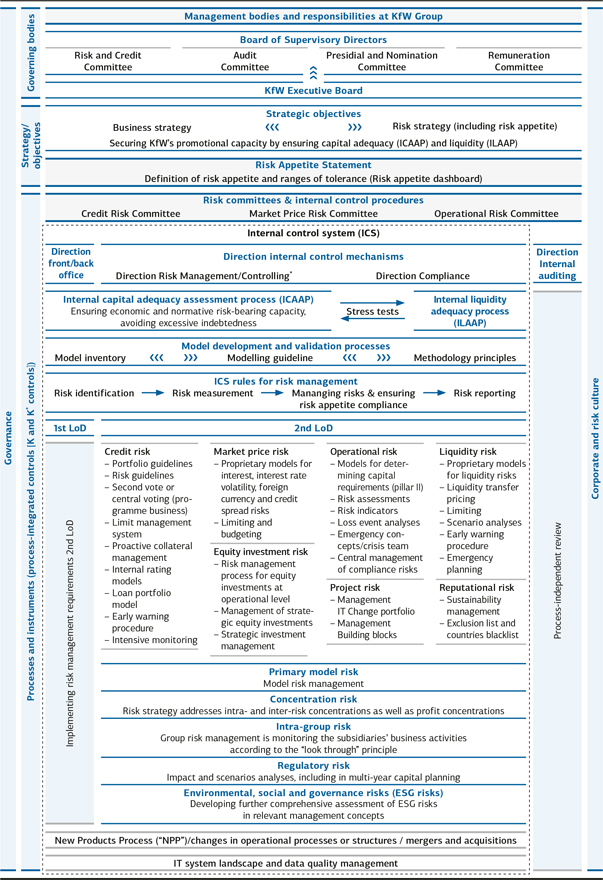
* In addition to Risk Controlling, Credit Risk Management and Transaction Management in some cases also exercise control functions due to organisational reasons.
27 | KfW Financial Report 2022 Combined Management Report | Risk report
To ensure capital and liquidity adequacy in line with the defined risk appetite, Risk Controlling supports the Executive Board in developing and implementing the group’s risk strategy together with the relevant subsidiaries, KfW IPEX-Bank, DEG and KfW Capital.
The risk strategy translates the group’s long-term and strategic risk objectives into operational risk management requirements. This involves defining risk management objectives for core business activities and measures for achieving targets, as well as determining KfW Group’s appetite for material risks.
In order to determine its material risks, KfW Group conducts a risk inventory at least once a year. The risk inventory identifies and defines types of risks relevant to the group and then subjects them to a materiality evaluation. The materiality of a risk type depends on the potential danger for KfW Group’s net assets, earnings and liquidity. The materiality evaluation looks at both the quantified net risk (taking existing risk mitigation instruments into account) and the gross risk. The key outcome of the risk inventory is an overall risk profile, which provides an overview of KfW Group’s material and immaterial risk types. The 2022 inventory identified that KfW Group faces the following material risks: credit, market price, liquidity, operational, equity investment, regulatory, project, reputational and intra-group and primary model risks. Risk concentrations associated with material risks either within a risk type or across various risk types are taken into account in the risk inventory. In addition, the risk inventory process involves looking at the impact of ESG (environmental, social and governance) risks on the overall risk profile.
The Executive Board is informed about KfW Group’s risk situation on a monthly basis. A risk report is issued quarterly to KfW Group’s supervisory bodies. The respective bodies are informed on an ad hoc basis as required.
The models used for group-wide risk measurement and management, as well as for financial reporting measurement, are regularly validated and refined where necessary. These primarily include the models for measuring and managing credit, equity investment, market price, liquidity and operational risks, as well as the models for financial reporting measurement. The model for measuring risks for the “project risk” risk type, which is classed as material, is also subject to regular review.
The risk management approach is set out in the group’s procedural rules. The procedural rules stipulate the framework for the application of uniform policies and procedures to identify, measure, control and monitor risk. The rules and regulations laid out in the procedural rules are binding for the entire group and are accessible to employees through their publication on the intranet. KfW group-wide regulations are supplemented by rules specific to each business sector. See the following sections for details on other elements of KfW Group’s risk management approach.
INTERNAL CAPITAL ADEQUACY ASSESSMENT PROCESS
The group’s internal capital adequacy assessment process (“ICAAP”) is aimed at safeguarding its risk-bearing capacity at any time and thus also the long-term continuation of corporate activities on the basis of substance and profitability. This is accomplished based on two perspectives:
The normative perspective of ICAAP in particular ensures continuous compliance with the regulatory capital requirements of Pillar I in accordance with the Capital Requirements Regulation (“CRR”) and the German Banking Act (Kreditwesen-gesetz – “KWG”) both on an ongoing basis, and in a longer-term view (normative capital planning). In addition to a base scenario, the total capital ratio is also considered in adverse scenarios (downturn and stress scenarios). This is intended to enable early identification of any capital bottlenecks. This also takes into account potential effects resulting from risks that do not have to be explicitly backed by capital under Pillar I. Achievement of the strategic risk-bearing capacity objectives is also monitored in KfW’s planning and management process. The development of the large exposure limit and the leverage ratio are monitored as further structural capital requirements.
The economic perspective of the ICAAP serves to safeguard the economic assets of the institution in order to protect creditors from economic loss. This is achieved by comparing the available financial resources as of a key date with the risk assumed as of the same date (economic capital requirement or ECAP for all material risks to capital). Both available financial resources and risk figures are calculated at present value and static, i.e. they do not take into account new business or expected results from transactions not yet executed. The amount of economic capital required is largely determined by the confidence level for risk measurement. The multi-year capital planning process does not include a regular forecast of economic risk-bearing capacity, although an indicative forecast of economic risk-bearing capacity may be produced if necessary, if future developments which may have a material impact on risk-bearing capacity are identified via a list of questions.
KfW Financial Report 2022 Combined Management Report | Risk report | 28
The ICAAP is subject to an annual review of its adequacy. The results of this review are taken into account in the assessment of risk-bearing capacity.
Both ICAAP perspectives include regularly performed stress tests in the form of simulations of adverse economic conditions (downturn and stress scenarios). A traffic light system established in this context with thresholds for the key indicators relating to normative and economic risk-bearing capacity indicates a need for action as part of operational and strategic management in the event of critical developments.
Budgets based on total risk exposure in accordance with Art. 92 CRR at the level of each business sector/area are taken into account to ensure risk-bearing capacity. The allocated budgets are available to the business sectors/areas for backing existing and new business for the various types of risk. Capital allocation is conducted as part of KfW Group’s annual business sector planning process. In addition to the requirements induced by business sector and area planning, this process also takes into account the risk objectives and the bank’s risk appetite. Budget compliance is checked on a monthly basis and action is taken if necessary. Moreover, economic capital budgets are set for material risk types as their central control and limit variable, and are monitored monthly.
Normative risk-bearing capacity
Key regulatory figures
| | | | | | | | | | | | | | |
| | | | | 31 Dec. 2022 | | | | | | | | 31 Dec. 2021 | | |
| | | | | EUR in millions | | | | | | | | EUR in millions | | |
| | | | | | |
| Total risk exposure in accordance with Art. 92 CRR | | | | 139,643 | | | | | | | | 135,135 | | |
– Credit risk | | | | 131,642 | | | | | | | | 127,261 | | |
– Market price risk | | | | 2,369 | | | | | | | | 2,488 | | |
– Operational risk | | | | 5,632 | | | | | | | | 5,386 | | |
| Regulatory capital | | | | 35,126 | | | | | | | | 32,335 | | |
– (Common equity) tier 1 capital | | | | 34,891 | | | | | | | | 32,279 | | |
– Additional tier 1 capital | | | | 0 | | | | | | | | 0 | | |
– Tier 2 capital | | | | 235 | | | | | | | | 57 | | |
| CET1 ratio | | | | 25.0% | | | | | | | | 23.9% | | |
| Tier 1 capital ratio | | | | 25.0% | | | | | | | | 23.9% | | |
| Total capital ratio | | | | 25.2% | | | | | | | | 23.9% | | |
KfW calculates the total risk exposure for significant parts based on an advanced IRBA. The increase in the capital ratio is primarily due to the increase in own funds, which rose by around EUR 2.8 billion year on year and thus more than offset the increase in total risk exposure, which was largely driven by methodology. At 25.2%, the total capital ratio at year-end 2022 remained above the overall capital requirement. KfW Group’s exposure to the macroprudential measures announced on 12 January 2022 to mitigate systemic risks in the residential property market continues to be assessed as low, as KfW’s portfolio does not contain any material exposure secured by residential property. According to the current impact analysis, the increase in the countercyclical capital buffer in Germany by 0.75 percentage points will increase the capital requirements by 0.21 percentage points, which will be included in capital planning from
1 February 2023.
Minimum requirements for total capital ratios
| | | | | | | | | | | | | | |
| | | | | 31 Dec. 2022 | | | | | | | | 31 Dec. 2021 | | |
| | | | | | |
| Total SREP capital requirements (TSCR) | | | | 12.25% | | | | | | | | 12.50% | | |
Capital conservation buffer | | | | 2.50% | | | | | | | | 2.50% | | |
Countercyclical capital buffer | | | | 0.17% | | | | | | | | 0.08% | | |
Other systemic buffer | | | | 1.00% | | | | | | | | 1.00% | | |
| Overall capital requirement (OCR) | | | | 15.92% | | | | | | | | 16.08% | | |
29 | KfW Financial Report 2022 Combined Management Report | Risk report
Economic risk-bearing capacity
To assess its economic risk-bearing capacity, KfW Group compares its economic capital requirement for potential losses from material quantifiable risks to capital with its available financial resources calculated at present value. The basis of available financial resources is KfW Group’s equity adjusted for present value differences from the present-value calculation of market price risk, previously unrecognised accrued profits, the risk provisions for non-value-adjusted business and some capital deduction items to ensure a prudent economic valuation. KfW Group bases its calculation of the economic capital requirement on a one-year time frame.
Credit risk is the risk of a negative impact on net assets, earnings position and liquidity if business partners fail to meet their payment obligations to KfW Group at all, in due time or in full (default) or if their credit ratings deteriorate (migration). Credit risk includes settlement risk in connection with derivative transactions and counterparty risk including credit valuation adjustment risk (“CVA” risk) in relation to derivative exposures. CVA risk is reported as part of the combined “counterparty risk (including CVA risk)” sub-risk type. The economic capital requirement for credit risk is quantified by the Risk Controlling department, largely with the help of statistical models. For counterparty risk including migration risks, the loss potential is computed using a loan portfolio model and the risk measure “credit value-at-risk”. In this context, possible migrations until the end of the respective loan term are included at present value in the present value-based approach adjusted in November 2022. The economic capital requirement for CVA risk is based on the CVA charge of Pillar I, which is adjusted for economically relevant aspects (including consideration of other risk-relevant items and the use of internal ratings). For settlement risks, a buffer determined on the basis of different quantification approaches, which is reviewed annually, is applied in calculating economic risk-bearing capacity.
Since January 2021, the economic capital requirement for equity investments at operational level has been measured using a new approach in order to take account of possible fluctuations in the value of the positions and thereby also to meet the corresponding requirements set out in the Bundesbank guideline on procedural integration into the overall performance and risk management processes (“ICAAP”).
The economic capital requirement for market price risk is calculated on the basis of the value-at-risk concept. Pillar II’s economic analysis takes account of interest risk (consisting of the jointly analysed sub-risk types: interest risk, as well as tenor and cross-currency basis spread risks) of the banking book, foreign currency risk, credit spread risk for securities and interest rate volatility risk. The possible loss of present value or price is determined for each type of market price risk using a value-at-risk based on historical simulation. Ultimately, the economic capital requirement is determined by total value-at-risk (“VaR”), which takes into account diversification effects between the various sub-types of market price risk.
The economic capital requirement for operational risk is calculated using an internal statistical model, which was derived from regulatory requirements for advanced measurement approaches. It takes a risk-sensitive approach to internal and external event data and risk scenarios. The capital requirement is calculated at group level, taking into account diversification effects, and then allocated to the business sectors. Moreover, the measurement of the quality of operational risk management within the group can generate premiums that are then applied to the capital requirement.
Project risks are also taken into account in the risk-bearing capacity concept. Both quantified individual risks from projects and building blocks (agile implementation units used to bundle activities to further develop IT) and general assumptions about potential losses in the project portfolio are included in risk measurement.
In addition, as a central result of the annual ICAAP, a model risk buffer is applied to cover model weaknesses and foreseeable methodological changes in economic risk-bearing capacity, adjusted during the year as necessary.
Using this method, the economic risk-bearing capacity as of 31 December 2022 satisfied a confidence level of 99.90%. The excess coverage of the available financial resources beyond the total capital requirement as of 31 December 2022 (EUR 16,887 million) decreased compared to the previous year’s figure (EUR 17,579 million). This is largely due to the increase in the total capital requirement, which resulted in particular from higher market price risks in 2022 due to greater market volatility and the associated higher interest risk. The capital requirement for equity investment, credit and project risks also increased. The higher capital requirement for equity investment risk is due to both method adjustments and business expansion. The capital requirement for credit risk rose in particular due to the transition to the present value approach, with a corresponding reduction in counterparty risk (including CVA risk). The capital
KfW Financial Report 2022 Combined Management Report | Risk report | 30
requirement for project risk increased primarily due to technical aspects of the transition to the new “building blocks” project management structure. By contrast, the capital requirement for operational risk decreased, due in particular to updates to the risk scenarios included in the model. The model risk buffer was increased during the year mainly due to a model weakness regarding the delayed reaction of the market price risk model to sudden crisis scenarios. Available financial resources, which also increased primarily due to the change to the present value approach as well as the positive annual result, only partially compensated for the increase in the total capital requirement.
Economic risk-bearing capacity as of 31 December 2022
EUR in millions
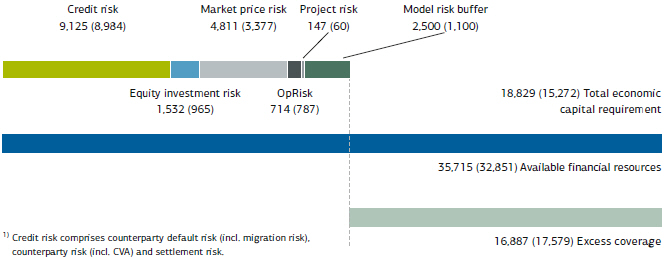
In brackets: figures as of 31 December 2021
The group manages liquidity risks in the narrower sense (synonymous with insolvency risk) primarily on the basis of internal risk indicators. Moreover, maximum liquidity gap limits (outflows on a monthly and yearly basis), available liquidity (liquidity potential) and the difference between the average residual maturity of inflows and outflows (maturity gap) are monitored. On the basis of the KfW Law, KfW’s liquidity risks are additionally limited by the utilisation threshold in accordance with Article 4 of the KfW Law. The utilisation threshold compares current and non-current liabilities and must not exceed 10%. Internal indicators relating to the liquidity situation are based on comparing liquidity requirements and liquidity potential as a ratio in stress scenarios of differing severity. No capital is currently allocated as part of calculating risk-bearing capacity.
Reputational risks are evaluated and managed on a qualitative basis. No capital backing is currently provided as part of calculating risk-bearing capacity. The materiality of reputational risk is derived from KfW Group’s Federal Government mandate. It reflects stakeholders’ expectations as well as the bank’s self-image of adhering to all relevant ethical, governance, environmental and compliance standards. This also applies irrespective of previously unobserved or potential adverse effects on net assets, earnings position or liquidity due to reputational events.
Each risk identification model represents a simplification of a complex reality and builds on the assumption that risk parameters observed in the past can be considered representative of the future. Not all possible inputs and their complex interactions can be identified and modelled for the risk development of a portfolio. This is addressed by including safety margins in the design of the model, and a supplementary model risk buffer in the calculation of economic risk-bearing capacity. This is one reason why KfW Group carries out stress tests with both the credit risk models and the market price risk models. The group continues to develop its risk models and processes in line with current banking regulations.
31 | KfW Financial Report 2022 Combined Management Report | Risk report
Stress and scenario calculations
To ensure the early indicator function and proactive focus in the ICAAP, KfW Group monitors, on a quarterly basis, different scenarios (a baseline or expected scenario, a downturn scenario (slightly deteriorated economic conditions compared to expectations) and a stress scenario (deep recession)) as well as their respective effects on risk-bearing capacity. These analyses demonstrate the group’s resilience and ability to act in the event of the occurrence of one of these scenarios. The baseline and stress scenarios also take the leverage ratio into account.
The baseline scenario includes projected business performance, expected consolidated comprehensive income, and other effects influencing normative risk-bearing capacity, such as foreseeable changes in the capital structure and methodological developments. It also takes into account the negative effects on the earnings position and risk situation resulting from the expected economic development.
The downturn and stress scenarios simulate adverse effects of varying severity on earnings and changes in capital requirements during the forecast period (in the economic perspective directly related to risk-bearing capacity as of the balance sheet date) extending beyond the negative effects expected in the baseline scenario. The stress scenario assumes a prolonged and severe global recession. In both scenarios, the group assumes an extended increase in credit and equity investment risks and losses. In these scenarios, the EUR and USD interest rates as well as the EUR-USD exchange rate are forecast to develop in line with the economic situation. At the same time, it is assumed that increasing market uncertainties will lead to increased volatility in interest rates, currencies and credit spreads, as a result of which the economic capital requirement for the corresponding types of risk will rise. Losses from operational and project risk further reduce available capital in the stress scenario.
The group met the economic risk-bearing capacity requirements, including the confidence level of 99.90% in the scenarios analysed, as of all quarterly calculation dates in 2022. The regulatory capital ratios and the leverage ratio exceeded the threshold values defined for risk appetite at all times.
Stress testing activities in 2022 focused on simulating the impact of the Russian attack on Ukraine, including the economic consequences from energy and raw material shortages. Moreover, the potential consequences of the looming conflict between China and the USA with bloc formation at global level were also considered. A scenario was also prepared on consequences for selected sectors and companies in the case of attacks on critical infrastructure in Europe. In addition to the scenarios motivated by current macroeconomic risk potentials, further stress tests are regularly carried out to examine the resilience of KfW Group’s economic and normative risk-bearing capacity, as well as its liquidity resources. Sensitivity analyses and standard stress tests as well as concentration and inverse stress tests are also carried out to demonstrate how concentration risks and other potential dangers could jeopardise KfW Group’s risk-bearing capacity and business model. Work on expanding the stress testing methods for ESG risks, also continued in 2022, with a current focus on acute physical climate risks.
The scenario calculations and stress tests performed do not indicate any need for action with regard to KfW Group’s risk-bearing capacity or liquidity resources. A digital stress test quarterly reporting system was introduced in the first half of 2022 in order to present the assumptions and results of the various stress tests and scenario calculations to the KfW Group decision-makers in a target group-appropriate manner.
KfW’s stress testing programme is subject to an annual adequacy assessment, the aim being to further enhance the stress tests and scenario calculations as a component of overall bank management in order to meet internal and regulatory requirements.
KfW Financial Report 2022 Combined Management Report | Risk report | 32
Types of risk
CREDIT RISK
KfW Group is subject to credit risk in the context of its promotional mandate. Credit risk includes, in particular, counterparty default risk (including migration risk), as well as counterparty risk (including credit valuation adjustment (CVA) risk) and settlement risk.
The majority of final borrower default risks are borne by the on-lending institutions in the domestic promotional lending business. Due to the business model, this results in a large proportion of bank risks in the portfolio. Other main risks result from promotional activities in the area of start-up finance for SMEs and equity investments. Particularly in these segments of domestic promotion, KfW Group bears the risk stemming from final borrowers. In addition, KfW Group faces risks in the business sectors Export and project finance as well as Promotion of developing countries and emerging economies.
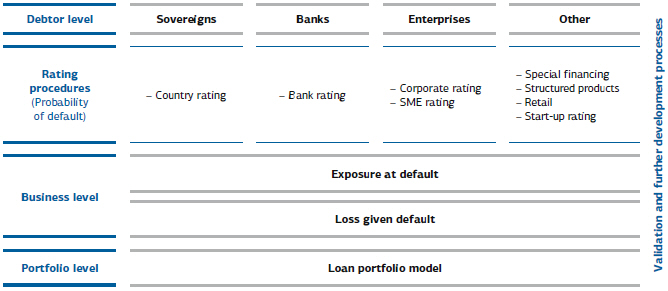
Counterparty default risk1) is measured by estimating the probability of default (“PD”), the exposure at default (“EAD”) and the loss given default (“LGD”). The product of the three aforementioned variables is the loss that can be expected, statistically, on average over many years.
KfW Group uses internal rating procedures to determine the probability of default for banks, countries, corporates, small and medium-sized enterprises (SMEs) and start-ups. These procedures are based on scorecards2) and generally follow a uniform model architecture consisting of a machine rating, a checklist, a group logic and a manual override. Simulation and cash flow-based rating procedures are used for significant parts of special financing and structured products, some of which were licensed from an external provider. For structured products, tranche ratings are determined on the basis of the default pattern of the asset pool and the waterfall structure of the transactions. The existing small-ticket retail positions (e.g. in the area of education financing) are valued using an automated procedure specially set up for this purpose. The rating procedures aim to predict the probability of default on a one-year basis. As a rule, the middle and back-office departments are responsible for preparing ratings for risk-bearing business. Ratings for these exposures are updated regularly, at least once per year. There are exceptions for loans below a threshold of EUR 10 million from the special programmes for coronavirus aid. There were several further developments in PD rating procedures in the reporting year. The largest advanced procedure for banks is scheduled to go live in January 2023.
| 1) | Also includes counterparty risk |
| 2) | A scorecard is a mathematical and statistical model and/or an expert knowledge-based model. The individual risk factors considered relevant for credit rating are converted into a score depending on their prevalence or value and weighted for aggregation. |
33 | KfW Financial Report 2022 Combined Management Report | Risk report
Mapping the probability of default on a uniform master scale for the entire KfW Group enables a comparison of ratings from different rating procedures and business sectors. The master scale generally consists of 20 distinct classes which are divided into four groups: investment grade, non-investment grade, watch list and default. The range of default probabilities and the average default probability are defined for each class of the master scale. There are operating procedures specifying the responsibilities, competencies and control mechanisms associated with each rating procedure. External ratings are mapped to KfW Group’s master scale to ensure the comparability of internal ratings with ratings of external rating agencies. The rating procedures are validated and further developed at regular intervals.
Exposure at default (“EAD”) and valuation of collateral influence the severity of loss. Collateral has a risk-mitigating effect in calculating loss given default (“LGD”). In valuing acceptable collateral, the expected net revenue from collateral realisation in the case of loss is determined. Haircuts to cover the credit risk of final borrowers are a major factor in the valuation of assignments made by financing partners in the on-lending business. For tangible collateral, further haircuts are applied for expected changes in value, as well as devaluation resulting from depreciation. Depending on the availability of data, the various valuation procedures for individual types of collateral are based on internal and external historical data and on expert estimates. In the case of personal collateral, the collateralised portion is treated as a direct transaction with the collateral provider, i.e. the probability of default and the extent of the collateral provider’s uncollateralised loss are applied. A risk principle for loan collateral regulates uniform management, valuation and recognition of collateral across KfW Group. In addition to net revenue from collateral realisation, the recovery rate for uncollateralised exposure amounts is also an important component in determining LGD. The collateral valuation procedure and the procedure for estimating the EAD and LGD are also subject to validation and further developed as needed, with new regulatory requirements also addressed.
Settlement risks and counterparty risks (including CVA)3) arise for KfW in connection with derivative transactions when hedging interest and currency risks. Settlement risks arise if, after the bank’s own transaction has been concluded, the derivative partner’s counterpayment is not made. Derivative transactions also involve the risk of changes in value (counterparty risks including credit valuation adjustment (CVA)), which can be caused by a change in the credit quality of the counterparty (credit risk including default risk), a change in the absolute price of the derivative (market price risk) or a combination of the two.
KfW Group has limit management systems, risk guidelines and various portfolio guidelines to limit risks from new business. This set of risk management instruments forms the basis for the second vote on lending transactions, serves as an orientation guide for loan approvals and has the function of ensuring the appropriate quality and risk structure of KfW Group’s portfolio while taking into account the special nature of KfW Group’s promotional business. At KfW, Group Risk Management has the second vote on a single exposure level. KfW IPEX-Bank and DEG each have their own second vote independent of the front office. The relevant business decision-making processes are structured with a view to risk. Lending transactions require a second vote depending on the type, scope of the risk content and complexity of the transaction. The qualification levels for approval of new business depend on rating, collateralisation or net exposure and total commitments to the group of connected customers. Approval of the responsible supervisory body is also required for individual transactions of pre-defined volumes.
The portfolio guidelines distinguish between different types of counterparties and product variants and define the conditions under which business transactions may be conducted. In addition, risk guidelines for countries, sectors and products are defined in order to react to existing or potential negative developments with specific requirements for lending. The limit management systems ultimately track both risk concentrations (concentration limits) and credit rating-dependent individual counterparty risk (counterparty limits). Concentration limits serve to restrict risk concentrations in the loan portfolio and thus to prevent major individual losses. Counterparty limits serve to fine-tune the counterparty-specific management of credit default risk.
| 3) | See section on “Economic risk-bearing capacity” for measurement of the economic capital requirement for credit risks. |
KfW Financial Report 2022 Combined Management Report | Risk report | 34
Existing higher-risk exposures are divided into a watch list and a list for non-performing loans. The watch list serves to identify potential problem loans early. This involves regularly reviewing and documenting the economic situation, the particular borrower’s market environment and the collateral provided, and formulating and deciding proposals for remedial action as needed – particularly proposals for risk-limiting measures. Process responsibility for non-performing loans, and also to a large extent for watch-list exposures4), lies with restructuring units, ensuring involvement of specialists, intensive support and professional management of problematic loans. The objective of this system is to achieve recovery of a loan through restructuring, reorganisation and workout arrangements. If the business partner is deemed incapable or unworthy of restructuring, the priority becomes optimum realisation of the asset and the related collateral. The Restructuring division is responsible for non-performing loans and for providing intensive support to banks and higher volume loans with a risk amount greater than EUR 1 million in the KfW portfolio. The portfolio credit management department is responsible for supporting retail business. Rules with differing details apply for the special programmes for coronavirus aid, which are fully backed by a federal guarantee. KfW IPEX-Bank’s non-performing loans and exposures under intensive support, including KfW and DEG’s trust activities, are managed directly by each subsidiary. Internal interface regulations are in place in the relevant business sectors to ensure control of responsibilities and allocation. Restructuring also cooperates with the front-office departments and the central Legal Affairs department.
In the event of a crisis in the banking sector, the bank has to be able to act without delay both in-house and externally. A crisis plan for banks is in place for this purpose. It primarily provides for the establishment of a dedicated working group under the direction of the Credit Risk Management department and immediate loss analysis so that the necessary next steps can be implemented quickly.
Information on default risk and default risk concentrations (gross carrying amounts)
as of 31 December 2022 – amortised cost
| | | | | | | | | | | | | | | | | | | | | | | | | | | | |
| | | | | Loans and advances
to banks | | | Loans and advances
to customers1) | |
| | | | | Stage 1 | | | Stage 2 | | | Stage 3 | | | Stage 1 | | | Stage 2 | | | Stage 3 | |
| | | | | EUR in
millions | | | EUR in
millions | | | EUR in
millions | | | EUR in
millions | | | EUR in
millions | | | EUR in
millions | |
| | | | | | | |
Investment grade | | | Rating 1–4 | | | | 156,552 | | | | 0 | | | | 0 | | | | 48,233 | | | | 36 | | | | 0 | |
| | | Rating 5–8 | | | | 121,873 | | | | 0 | | | | 0 | | | | 32,556 | | | | 0 | | | | 0 | |
Non-investment grade | | | Rating 9–15 | | | | 20,978 | | | | 657 | | | | 0 | | | | 53,634 | | | | 4,204 | | | | 0 | |
Watch list | | | Rating 16–18 | | | | 10,911 | | | | 2,179 | | | | 0 | | | | 5,888 | | | | 4,587 | | | | 0 | |
Default | | | Rating 19–20 | | | | 0 | | | | 0 | | | | 1,018 | | | | 0 | | | | 0 | | | | 5,339 | |
Total | | | | | | | 310,314 | | | | 2,836 | | | | 1,018 | | | | 140,311 | | | | 8,827 | | | | 5,339 | |
| | | |
| | | | | | | | | | |
| | | |
| | | | | Securities and investments | | | Off-balance sheet transactions | |
| | | | | Stage 1 | | | Stage 2 | | | Stage 3 | | | Stage 1 | | | Stage 2 | | | Stage 3 | |
| | | | | EUR in
millions | | | EUR in
millions | | | EUR in
millions | | | EUR in
millions | | | EUR in
millions | | | EUR in
millions | |
| | | | | | | |
Investment grade | | | Rating 1–4 | | | | 21,246 | | | | 0 | | | | 0 | | | | 55,154 | | | | 14 | | | | 0 | |
| | | Rating 5–8 | | | | 12,394 | | | | 8 | | | | 0 | | | | 39,562 | | | | 0 | | | | 0 | |
Non-investment grade | | | Rating 9–15 | | | | 62 | | | | 0 | | | | 0 | | | | 33,412 | | | | 1,196 | | | | 0 | |
Watch list | | | Rating 16–18 | | | | 24 | | | | 0 | | | | 0 | | | | 1,566 | | | | 1,568 | | | | 0 | |
Default | | | Rating 19–20 | | | | 0 | | | | 0 | | | | 0 | | | | 0 | | | | 0 | | | | 532 | |
Total | | | | | | | 33,725 | | | | 8 | | | | 0 | | | | 129,693 | | | | 2,777 | | | | 532 | |
| 1) | Loans and advances to customers also include the retail business, for which the stage is not derived based on the current rating but on the basis of negative criteria and 30 days past due status. Risk concentrations arise in the event of negative criteria or 30 days past due status. If one of these criteria is met, the customer is placed on the watch list. In contrast, the stage 1 share of the retail segment without significant deterioration in credit risk is largely allocated to “non-investment grade”. |
| 4) | The assumption of responsibility for watch-list cases at KfW IPEX-Bank is decided on a case-by-case basis by Risk Management in consultation with the unit responsible for restructuring. |
35 | KfW Financial Report 2022 Combined Management Report | Risk report
Information on default risk and default risk concentrations (gross carrying amounts)
as of 31 December 2021 – amortised cost
| | | | | | | | | | | | | | | | | | | | | | | | | | | | |
| | | | | Loans and advances
to banks | | | Loans and advances
to customers1) | |
| | | | | Stage 1 | | | Stage 2 | | | Stage 3 | | | Stage 1 | | | Stage 2 | | | Stage 3 | |
| | | | | EUR in
millions | | | EUR in
millions | | | EUR in
millions | | | EUR in
millions | | | EUR in
millions | | | EUR in
millions | |
| | | | | | | |
Investment grade | | | Rating 1–4 | | | | 111,392 | | | | 0 | | | | 0 | | | | 33,960 | | | | 0 | | | | 0 | |
| | | Rating 5–8 | | | | 144,040 | | | | 0 | | | | 0 | | | | 24,370 | | | | 0 | | | | 0 | |
Non-investment grade | | | Rating 9–15 | | | | 34,326 | | | | 243 | | | | 0 | | | | 34,503 | | | | 4,675 | | | | 0 | |
Watch list | | | Rating 16–18 | | | | 16,204 | | | | 1,636 | | | | 0 | | | | 8,765 | | | | 20,098 | | | | 0 | |
Default | | | Rating 19–20 | | | | 0 | | | | 0 | | | | 648 | | | | 0 | | | | 0 | | | | 4,531 | |
Total | | | | | | | 305,962 | | | | 1,880 | | | | 648 | | | | 101,598 | | | | 24,773 | | | | 4,531 | |
| | | |
| | | | | | | | | | |
| | | |
| | | | | Securities and investments | | | Off-balance sheet transactions | |
| | | | | Stage 1 | | | Stage 2 | | | Stage 3 | | | Stage 1 | | | Stage 2 | | | Stage 3 | |
| | | | | EUR in
millions | | | EUR in
millions | | | EUR in
millions | | | EUR in
millions | | | EUR in
millions | | | EUR in
millions | |
| | | | | | | |
Investment grade | | | Rating 1–4 | | | | 21,681 | | | | 0 | | | | 0 | | | | 41,582 | | | | 0 | | | | 0 | |
| | | Rating 5–8 | | | | 13,736 | | | | 0 | | | | 0 | | | | 41,555 | | | | 0 | | | | 0 | |
Non-investment grade | | | Rating 9–15 | | | | 346 | | | | 0 | | | | 0 | | | | 22,579 | | | | 1,440 | | | | 0 | |
Watch list | | | Rating 16–18 | | | | 22 | | | | 0 | | | | 0 | | | | 3,468 | | | | 3,285 | | | | 0 | |
Default | | | Rating 19–20 | | | | 0 | | | | 0 | | | | 0 | | | | 0 | | | | 0 | | | | 312 | |
Total | | | | | | | 35,784 | | | | 0 | | | | 0 | | | | 109,184 | | | | 4,725 | | | | 312 | |
| 1) | Loans and advances to customers also include the retail business, for which the stage is not derived based on the current rating but on the basis of negative criteria and 30 days past due status. Risk concentrations arise in the event of negative criteria or 30 days past due status. If one of these criteria is met, the customer is placed on the watch list. In contrast, the stage 1 share of the retail segment without significant deterioration in credit risk is largely allocated to “non-investment grade”. |
Credit risks and related credit protection of financial instruments
measured at amortised cost as of 31 December 2022
| | | | | | | | |
| | Maximum risk
of default1) | | Maximum risk
of default
stage 3 | | Risk mitigation
from collateral
stage 3 |
| | | | | | tangible | | personal |
| | EUR in millions | | EUR in millions | | EUR in millions | | EUR in millions |
| | | | |
| Loans and advances to banks | | 313,919 | | 890 | | 11 | | 602 |
Loans and advances to customers | | 152,624 | | 4,128 | | 93 | | 2,971 |
Securities and investments | | 33,721 | | 0 | | 0 | | 0 |
| Off-balance sheet transactions | | 132,887 | | 484 | | 0 | | 28 |
Total | | 633,151 | | 5,502 | | 104 | | 3,601 |
| 1) | Net carrying amount, excluding collateral and other credit enhancements |
KfW Financial Report 2022 Combined Management Report | Risk report | 36
Credit risks and related credit protection of financial instruments
measured at amortised cost as of 31 December 2021
| | | | | | | | |
| | | Maximum risk of default1) | | Maximum risk of default | | Risk mitigation from collateral |
| | | | stage 3 | | stage 3 |
| | | | | | tangible | | personal |
| | EUR in millions | | EUR in millions | | EUR in millions | | EUR in millions |
| | | | |
| Loans and advances to banks | | 308,251 | | 546 | | 13 | | 354 |
Loans and advances to customers | | 129,197 | | 3,293 | | 118 | | 2,132 |
Securities and investments | | 35,774 | | 0 | | 0 | | 1 |
| Off-balance sheet transactions | | 114,126 | | 297 | | 0 | | 3 |
| | | | |
Total | | 587,348 | | 4,136 | | 132 | | 2,491 |
| 1) | Net carrying amount, excluding collateral and other credit enhancements |
A large part of the personal collateral of the financial instruments classified as stage 3 comprises federal guarantees and credit insurance. Tangible collateral for financial instruments classified as stage 3 primarily consists of aircraft and ship mortgages.
As a rule, the collateral for financial instruments measured at fair value relates almost entirely to the collateral for financial derivatives.
KfW Group did not take possession of any assets previously held as tangible collateral in 2022.
Portfolio structure
The interaction of the risks associated with the individual exposures in KfW Group’s loan portfolio5) is assessed based on an internal portfolio model. Concentrations of individual borrowers or groups of borrowers give rise to a risk of major losses that could jeopardise KfW Group’s existence. On the basis of the economic capital concept, the Risk Controlling department measures risk concentrations by individual borrower, sector and country. Risk concentrations are primarily reflected in the economic capital requirement. The results of these measurements form the main basis for managing the loan portfolio.
Economic capital requirement by region
31 December 2022 (31 Dec. 2021)
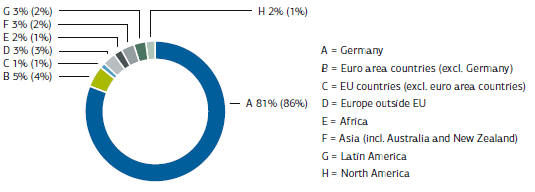
Regions
As of 31 December 2022, 86% of KfW Group’s loan portfolio in terms of economic capital requirements was attributable to the euro area (31 Dec. 2021: 90%). The main driver behind the decline is the move to a new present-value method for calculating risk indicators. For the banking portfolio in particular, this results in a sharp reduction in the economic capital requirement. This is offset by an increase in the economic capital requirement for other counterparties in the portfolio.
| 5) | The loan portfolio includes loans as well as securities and investments in performing business. The non-performing portfolio is only included in the presentation of credit quality. |
37 | KfW Financial Report 2022 Combined Management Report | Risk report
Economic capital requirement by sector
31 December 2022 (31 Dec. 2021)
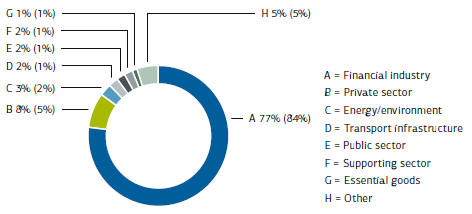
Sectors
The significant share of overall capital required for credit risks attributable to the financial sector is due to KfW Group’s promotional mandate. By far the greatest portion of KfW Group’s domestic promotional business consists of loans on-lent through commercial banks. The model adjustment stated in the previous paragraph also relates to sectors. Overall, the financial sector’s share of the economic capital requirement declined to 77% (31 Dec. 2021: 84%). This development was primarily due to the above-mentioned decrease in the economic capital requirement in the banking portfolio, which is included in the financial sector.
Credit quality by net exposure
31 December 2022 (31 Dec. 2021)
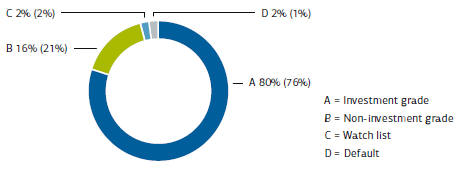
Credit quality
As credit quality is a major factor influencing economic capital requirements, analysing the credit quality structure involves examining the distribution of net exposure6) by credit quality category. The increase in the investment grade share of net exposure and the reduction in the non-investment grade share, largely result from rating upgrades in the banking portfolio in 2022. The share of watch list positions of 2.1% (previous year: 1.8%) and the share of default positions of 1.9% (previous year: 1.4%) both rose slightly.
Securities-based securitisations in KfW Group’s portfolio
Securitisations had a par value of around EUR 6.0 billion as of 31 December 2022. Accounting for the mark-to-market valuation of the securities reported at fair value and impairments, the portfolio had a book value (including pro rata interest) of around EUR 6.1 billion. The following tables present the composition of the securitisation portfolio by asset class, rating grade and geographical distribution.
| 6) | Net exposure is the economic loss that potentially occurs in the event of an economic or political default event. |
KfW Financial Report 2022 Combined Management Report | Risk report | 38
Geographical breakdown of the underlying asset pool (based on par value)
| | | | | | | | | | | | | | | | | | | | | | |
| | | | | | | | | | 31 Dec. 2022 | | | | | | | | | | | 31 Dec. 2021 | | |
| | | | | | | | | | % | | | | | | | | | | | % | | |
| | | | | | | | |
| Europe | | | | | | | | | 99.9 | | | | | | | | | | | 99.9 | | |
| World | | | | | | | | | 0.0 | | | | | | | | | | | 0.0 | | |
| North America | | | | | | | | | 0.1 | | | | | | | | | | | 0.1 | | |
| Africa | | | | | | | | | 0.0 | | | | | | | | | | | 0.0 | | |
| | | | | | | | |
Asia | | | | | | | | | 0.0 | | | | | | | | | | | 0.0 | | |
Exposure based on par values
| | | | | | | | | | | | | | | | | | | | | | | | | | | | | | | | | | | | | | |
| | | | | | | ABCP | | | | | | Auto-ABS1) | | | | | | RMBS | | | | | | Other | | | | | | Total as of | | | | | | Total as of | | |
| | | | | | | | | | | | | | | | | | | | | | | | | securitisa- | | | | | | 31 Dec. 2022 | | | | | | 31 Dec. 2021 | | |
| | | | | | | | | | | | | | | | | | | | | | | | | tions | | | | | | | | | | | | | | |
| | | | | | | EUR in | | | | | | EUR in | | | | | | EUR in | | | | | | EUR in | | | | | | EUR in | | | | | | EUR in | | |
| | | | | | | millions | | | | | | millions | | | | | | millions | | | | | | millions | | | | | | millions | | | | | | millions | | |
| | | | | | | | | | | | | | | | | | | |
| Investment grade | | | | | | 3,385 | | | | | | 1,512 | | | | | | 744 | | | | | | 399 | | | | | | 6,040 | | | | | | 6,090 | | |
| | | | | | | | | | | | | | | | | | | |
| Non-investment grade | | | | | | 0 | | | | | | 0 | | | | | | 0 | | | | | | 0 | | | | | | 0 | | | | | | 0 | | |
| | | | | | | | | | | | | | | | | | | |
| Watch list | | | | | | 0 | | | | | | 0 | | | | | | 0 | | | | | | 0 | | | | | | 0 | | | | | | 0 | | |
| | | | | | | | | | | | | | | | | | | |
| Default | | | | | | 0 | | | | | | 0 | | | | | | 0 | | | | | | 7 | | | | | | 7 | | | | | | 7 | | |
| | | | | | | | | | | | | | | | | | | |
| | | | | | | 3,385 | | | | | | 1,512 | | | | | | 744 | | | | | | 406 | | | | | | 6,047 | | | | | | 6,097 | | |
| 1) | Auto ABS are based on receivables from automotive financing agreements. |
The portfolio volume decreased slightly compared to the volume of 31 December 2021 (nominal value around EUR –0.1 billion). The decline largely relates to the investment grade portfolio. In terms of the geographical breakdown of the underlying asset pool, the entire portfolio remains almost fully attributable to Europe, with Germany accounting for the lion’s share.
EQUITY INVESTMENT RISKS
In managing equity investment risks, KfW Group differentiates between risks from equity investments at an operational level and strategic equity investments:
Equity investments (operational level)
Undertaking equity investments at an operational level is part of the group’s promotional mandate. Accordingly, equity investments are made in connection with domestic and European investment financing and in the business sectors KfW Development Bank, DEG and Export and project finance, and fund investments of KfW Capital. KfW’s group-wide basic rules for equity investments at an operational level are set out in guidelines. Specific rules tailored to certain segments of equity investments are also set out in portfolio guidelines, working instructions or risk guidelines. Risks are measured at the individual loan commitment level for operational equity investments using recently further developed models specified for this purpose. Equity investment portfolio risks are monitored quarterly in the KfW Group risk report and reported annually in a separate report.
Strategic equity investments
Strategic equity investments support KfW’s mandate of providing an efficient and sustainable promotional offering. In addition to reinforcing and expanding core competencies, the focus of this investment type is on complementing KfW’s business sectors. Strategic equity investments normally have a long-term holding period. KfW also makes strategic equity investments in accordance with Article 2 (4) of the KfW Law (mandated transactions). The Federal Government mandates such equity investments to KfW because the Federal Republic of Germany has a state interest in them.
39 | KfW Financial Report 2022 Combined Management Report | Risk report
Dedicated organisational units are responsible for strategic equity investments based on an equity investment manual that describes legal bases, strategies, principles, procedures and responsibilities of equity investment management. Acquisitions and disposals of and changes to strategic equity investments are subject to defined processes as well as authorisation by the Executive Board and, in the cases covered under the KfW Bylaws, authorisation by the Board of Supervisory Directors. Moreover, acquiring a strategic equity investment in excess of 25%, creating or increasing such an equity investment or fully disposing of it requires authorisation by the Federal Ministry of Finance in accordance with Section 65 (3) of the Federal Budget Code (Bundeshaushaltsordnung – “BHO”). Strategic equity investments and their individual risks are monitored and presented to the Executive Board as part of an annual equity investment report, as well as in ad hoc reports if necessary. The individually defined strategies for the equity investments are updated annually. Moreover, the group is normally represented in the supervisory bodies of its strategic equity investments.
As of 31 December 2022, the group’s equity investment portfolio consists of fund investments of KfW Capital with an economic capital requirement of EUR 558 million, equity investments of DEG including promotional business with an economic capital requirement of EUR 297 million, and other promotional business (economic capital requirement: EUR 677 million).
MARKET PRICE RISK
KfW Group measures and manages market price risk on a present-value basis. The key drivers of market price risk in this context are:
| – | interest risk (consisting of the jointly analysed sub-risk types of interest risk, tenor basis risk and cross-currency basis spread risk), |
| – | interest rate volatility risk, |
| – | foreign currency risk and |
| – | issuer-related spreads for securities (credit spread risk). |
Market price risk within the group required a total of EUR 4.81 billion in economic capital as of 31 December 2022. This is EUR 1.43 billion more than as of 31 December 2021. The change is mainly due to the increased interest risk (highly volatile markets). The highly volatile markets also caused an increase in interest rate volatility risk and credit spread risk. Currency risk decreased due to a lower USD present value.
Economic capital requirement for market price risk
| | | | | | | | | | | | | | | | | | | | |
| | | | | | | | | 31 Dec. 2022 | | | | | | | | | | 31 Dec. 2021 | | |
| | | | | | | | | EUR in millions | | | | | | | | | | EUR in millions | | |
| | | | | | | |
| Interest risk1) | | | | | | | | 4,268 | | | | | | | | | | 2,813 | | |
| | | | | | | |
Interest risk | | | | | | | | 4,026 | | | | | | | | | | 2,734 | | |
| | | | | | | |
Tenor basis spread risk | | | | | | | | 404 | | | | | | | | | | 282 | | |
| | | | | | | |
Cross-currency basis spread risk | | | | | | | | 489 | | | | | | | | | | 631 | | |
| | | | | | | |
| Interest rate volatility risk | | | | | | | | 426 | | | | | | | | | | 384 | | |
| | | | | | | |
| Foreign currency risk | | | | | | | | 439 | | | | | | | | | | 693 | | |
| | | | | | | |
| Credit spread risk | | | | | | | | 816 | | | | | | | | | | 411 | | |
| | | | | | | |
| Diversification | | | | | | | | –1,138 | | | | | | | | | | –925 | | |
| | | | | | | |
Market price risk | | | | | | | | 4,811 | | | | | | | | | | 3,377 | | |
| 1) | Due to diversification effects in the interest risk, the sub-risks do not add up to the total interest risk. |
KfW Financial Report 2022 Combined Management Report | Risk report | 40
Value-at-risk approach
The economic capital requirement is calculated using a value-at-risk (“VaR”) calculation across the various types of market price risk using a uniform method. Historical simulation is used as the VaR model. Historical simulation is based on market data time series comprising the previous three years (751 trading days). The uniform holding period is twelve months, with time scaling based on a one-day holding period. In addition, scaling to the target quantile (99.9%) is carried out on the basis of a 97.5% quantile determined using historical simulation.
VaR indicators are determined for each of the following sub-types of market price risk: interest risk, tenor and cross-currency basis spread risks, foreign currency risk, interest rate volatility risk and credit spread risk. The total VaR is also calculated, taking account of diversification effects between the aforementioned risk sub-types. The total VaR, interest risk, interest rate volatility risk, credit spread risk and foreign currency risk are limited.
Interest risk
Yield curves defined as risk factors serve as the basis for historical simulation to quantify interest risks. These implicitly include interest risk as well as tenor and cross-currency basis spread risks. In contrast, interest rate volatility and credit spread risks are explicitly not included in interest risk, but are modelled separately and reported using separate key VaR indicators. The capital requirement for interest risk increased by EUR 1,455 million to EUR 4,268 million as of 31 December 2022.
Interest rate volatility risk
The interest rate volatility risk is based on changes in the market values of modelled interest rate options (e.g. termination rights or floors in the variable-rate lending business). The economic capital requirement for these risks is calculated in the same way as for other sub-types of risk, using historical simulation (see Value at Risk section). Interest rate volatility risk arises primarily as a side effect of the original lending business and is limited by means of an ECAP sub-limit. The capital requirement for interest rate volatility risk was EUR 426 million as of 31 December 2022.
Foreign currency risk
The economic capital requirement for foreign currency positions is calculated in the same way as for interest risk, using historical simulation. The capital requirement for foreign currency risk remained unchanged at EUR 439 million as of 31 December 2022.
Credit spread risks for securities
Risk measurement is carried out for the securities portfolio. The economic capital requirement for this risk type is calculated in the same way as for other risk types, using historical simulation. The economic capital requirement for credit spread risk as of 31 December 2022 was EUR 816 million. Credit spread risk increased by EUR 405 million year on year.
Stress testing
In addition to the calculation of the ECAP requirement based on the VaR model of historical simulation, the effects of extreme market situations (scenarios) on the present value and VaR target variables are determined by means of stress tests.
LIQUIDITY RISK
Liquidity risk in the narrower sense (synonymous with insolvency risk) is the risk of a lack of liquidity on the part of an institution or market. The liquidity gap creates the risk that payment obligations cannot be met, cannot be met on time or cannot be met in full.
The primary objective of liquidity management is to ensure that KfW Group is capable of meeting its payment obligations at all times. KfW is available as a contractual partner for all commercial transactions of its subsidiaries, particularly for their funding. For this reason, the liquidity requirements of the subsidiaries are included both in KfW Group’s funding plans and in the liquidity maintenance strategy.
41 | KfW Financial Report 2022 Combined Management Report | Risk report
Liquidity risk is measured on the basis of economic scenario analyses and the utilisation threshold under Article 4 of the KfW Law. In addition, liquidity gaps are limited based on business already concluded, available liquidity potential and the maturity gap between inflows and outflows.
INTERNAL LIQUIDITY ADEQUACY ASSESSMENT PROCESS (“ILAAP”)
The internal liquidity adequacy assessment process (“ILAAP”) principle describes the management and monitoring of KfW Group’s liquidity risk position. The procedure established by the institution serves to identify, measure, manage and monitor liquidity. The aim of the ILAAP is to ensure liquidity and avoid liquidity bottlenecks. It also assesses internal governance and institution-wide controls.
Insolvency risks are mainly limited through economic liquidity risk ratios and limits for liquidity potential and liquidity gaps. The aim of the liquidity risk strategy is to preserve the ability to meet payment obligations at all times and when due, even in stress scenarios.
Internal measurement of liquidity risk is based on scenario calculations. This approach first analyses the expected inflow and total outflow of payments for the next twelve months based on business already concluded. This baseline cash flow is then supplemented by planned and estimated payments (e.g. borrowings from the capital market, expected liquidity-related loan defaults or planned new business). The result provides an overview of the liquidity required by KfW Group over the next twelve months. The liquidity required is calculated for different scenarios. In this respect, market-wide and institution-specific risk factors are stressed and an evaluation is made of the impact on KfW Group’s liquidity.
Parallel to the above approach, KfW Group also determines the available liquidity potential, which largely consists of KfW’s account with the Bundesbank, repurchase agreement assets, the liquidity portfolio and the volume of commercial paper that is regularly placeable on the market. The available liquidity potential is subjected to stress analysis in the same way as the other cash flow components. The ratio of cumulative required liquidity to the cumulative available liquidity potential is calculated for each scenario. This figure may not exceed the value of 1 in any scenario for any period. The prescribed horizon in the normal case scenario is twelve months, in the stress case six months, and in the two worst case scenarios, three months. The scenario assumptions are validated on an annual basis.
The indicators are calculated and reported to the Market Price Risk Committee on a monthly basis. The following table presents the risk indicators for the scenarios as of 31 December 2022:
KfW liquidity risk indicators
| | | | | | | | | | | | | | | | | | |
| | | | | | | 31 Dec. 2022 | | | | | | | | | | 31 Dec. 2021 | | |
| | | | | | | Indicator | | | | | | | | | | Indicator | | |
| | | | | | | |
| Normal case | | | | | | 0.23 | | | | | | | | | | 0.20 | | |
| | | | | | | |
| Stress case | | | | | | 0.28 | | | | | | | | | | 0.28 | | |
| | | | | | | |
| Worst case (institution-specific) | | | | | | 0.32 | | | | | | | | | | 0.18 | | |
| | | | | | | |
Worst case | | | | | | 0.48 | | | | | | | | | | 0.38 | | |
The internal liquidity risk indicators remained below the internal limit of 1 throughout the year.
As a result of the Russia-Ukraine war, KfW has provided a considerable volume of loans and lines of credit to support the energy sector on behalf of the Federal Government. At EUR 54.2 billion the volume considerably exceeded that of normal disbursement for new lending business. Refinancing facilities from the Economic Stabilisation Fund (“WSF”) among other sources, were available to ensure solvency at all times. Disbursements under the Federal Government’s coronavirus special programme only had a very minor impact on liquidity held.
KfW Financial Report 2022 Combined Management Report | Risk report | 42
Current funding environment
KfW Group raised a total volume (net proceeds) of EUR 89.4 billion on the international capital markets in financial year 2022 (2021: EUR 82.6 billion).
There were 206 individual transactions, and bonds were issued in 13 different currencies. Around 84% of its long-term funding was in the two main funding currencies: the euro and the US dollar. The share of bonds denominated in euros was 65% in 2022 (2021: 55%), those denominated in US dollars amounted to 19% (2021: 26%). In addition, a total of EUR 31.6 billion in funds was raised through the WSF in 2022, of which EUR 19.8 billion were used to fund support measures for energy suppliers as a result of the Russia-Ukraine war and EUR 11.8 billion to fund the coronavirus special programmes. The outstanding volume of funding raised via the WSF totalled EUR 50.8 billion as of 31 December 2022, of which EUR 19.8 billion was for support measures for energy suppliers and EUR 31.0 billion for funding the coronavirus special programmes.
The programme volume of the Multi-Currency Commercial Paper programme, also known as the Euro Commercial Paper (“ECP”) programme, designed for global investors amounted to EUR 90 billion. While at EUR 116.5 billion, the nominal volume issued under this programme was higher in 2022 than in the previous year (EUR 82.6 billion), the average maturity of the issues was lower, at 131 days (previous year: 160 days). The volume outstanding as of the reporting date 31 December 2022 was EUR 31.6 billion. The programme volume of the U.S. Commercial Paper (“USCP”) programme came to USD 30 billion in 2022. KfW Group uses this programme, which is designed specifically for the US market, to cover a large portion of its need for short-term funds in US dollars. The nominal volume issued under the USCP programme was higher again than in the previous year (USD 62.3 billion) at USD 64.2 billion. The average maturity of the issues declined again, to 56 days (prior year: 66 days). The outstanding volume amounted to USD 6.8 billion as of 31 December 2022. In addition, KfW initially still held funds of around EUR 1.4 billion at the beginning of 2022 from the ECB’s targeted longer-term refinancing operation (“TLTRO”) concluded in March 2021. These funds were repaid to the ECB in March 2022.
OPERATIONAL RISK AND BUSINESS CONTINUITY MANAGEMENT
In accordance with Article 4 (1) no. 52 of the CRR, KfW Group defines operational risk as the negative impact on net assets, earnings position or liquidity that can result from inadequate or failed internal processes, people and systems or from external events. Operational risks are monitored by a central Risk Controlling unit and the methodology behind the models and procedures used for measurement and monitoring is adjusted on a regular basis. Moreover, the following operational risk sub-types are defined as material and are usually also monitored by specialised second line of defence functions: compliance risk, information security risk, business interruption risk and legal risk7).
Compliance risk refers to the risk of legal or regulatory sanctions or negative effects on net assets, earnings position and liquidity arising from non-compliance with external/internal requirements, voluntary commitments or legal regulations.
Information security risk refers to the risk of negative effects on net assets, earnings position and liquidity arising from the inadequacy or failure of people, systems, processes or from external events that could adversely impact the confidentiality, integrity, authenticity and availability of data/information. This also includes threats posed by cyber risks.
Business interruption risk refers to the risk of negative effects on net assets, earnings position and liquidity arising from the disruption or interruption of critical business processes.
Legal risk refers to the risk of negative effects on net assets, earnings position and liquidity arising from the infringement of or non-compliance with formal or substantive laws insofar as this leads to legal disputes or action to avoid legal disputes. Infringement or non-compliance may be due in particular to legal adjustments/changes with retroactive effect, misinterpretation or misapplication of formal or substantive laws or incorrect drafting of agreements.
| 7) | Other risk sub-types: service provider risk (including outsourcing risk), secondary model risk, personnel risk, personal and physical security risk, conduct risk and operational risk from adjustment processes. |
43 | KfW Financial Report 2022 Combined Management Report | Risk report
Management of risks is decentralised and performed within the business sectors and subsidiaries by the respective directors or managing directors, who are supported by the respective sector coordinators for Operational Risk and Business Continuity Management. Monitoring and communication of risks is performed on a cross-functional basis by Risk Controlling (central OpRisk Controlling) and Transaction Management (central Business Continuity Management). These staff develop the relevant methods and instruments for identifying and assessing risks and monitor their group-wide uniform application. The model for calculating the economic risk resulting from operational risks is also validated in the Risk Controlling department.
The aim of management and control of operational risk and business continuity management is the proactive identification and averting of potential losses for KfW Group, i.e. to make emergencies and crises manageable and to secure KfW Group’s structural ability to remain in operation even in the event of loss of key resources.
Losses in KfW Group are recorded in an OpRisk events database and updated in the event of changes/developments. After each quarter, recorded loss events and any measures introduced as a result are reported to the relevant departments. The Executive Board, the Board of Supervisory Directors and the Operational Risk Committee are briefed monthly or quarterly as part of internal risk reporting. Ad hoc reports are also made if a loss exceeds a certain level.
In addition, potential operational risks are identified based on risk scenarios that are carried out group-wide. Operational risks are measured on the basis of expert assessments in combination with internal and external loss events as well as internal data (transactions, ratings, etc.), which are backed by a distribution assumption for loss frequency and loss amount. The results of the annual risk assessment and the calculated risk scenarios are reported to the Operational Risk Committee and the Executive Board. As part of the risk assessment, the business areas check the implementation of additional risk-mitigating measures (e.g. checks as part of the internal control system, or “ICS”).
Where adequate monitoring of operational risks using metrics is possible, risk indicators are used. Compliance with centrally prescribed risk-mitigating requirements (e.g. training course participation, deadlines, escalation procedures) is monitored by the overarching Controlling function using business area-specific OpRisk information dashboards to ensure escalation across all levels up to the Executive Board in the event of non-compliance.
Losses caused by Russia’s war on Ukraine that relate to operational risks are recorded as a collective event bank-wide; in addition, potential effects are evaluated as part of the risk scenarios to also ensure their inclusion in the calculation of the economic capital requirement for OpRisk.
The 2022 risk assessment was carried out from June to November 2022. Updating and recalculation of the scenarios led to a year-on-year reduction in the ECAP for operational risks (of approx. EUR 67 million) as of the reporting date.
Business continuity management is implemented if a business interruption occurs due to internal or external events. This is an integrated management process which covers the four key outage and loss scenarios: site outages (building or infrastructure), IT system outages, staff outages and service provider outages. Business continuity management incorporates preventative components (emergency preparedness) and reactive components (emergency and crisis management).
For the purpose of business continuity management, business processes are analysed and categorised based on how critical they are, and the supporting resources for each case examined accordingly. Identifying critical business processes and their dependency on supporting resources forms the basis for effective business continuity management. Individual measures are developed for these business processes and their supporting resources in order to be able to guarantee the required availability and reduce business risks. These include emergency workstations, emergency plans, communication tools and alerts/alarms. KfW Group’s crisis team takes responsibility for overall crisis management if necessary. It practises emergency and crisis organisation teamwork in regular crisis team tests.
KfW Financial Report 2022 Combined Management Report | Risk report | 44
In light of the possible tightening of the gas and electricity supply, analyses of the impact on KfW were performed during the year. KfW can respond to temporary and locally limited power outages with established emergency processes to maintain emergency business operations for as long as possible. KfW’s crisis management would step in in the event of more serious scenarios, such as a nationwide blackout.
Pandemic-related measures at KfW were lifted or eased with the discontinuation of various government coronavirus pandemic regulations. The established Covid task force was kept in place in a modified form and continuously assesses the current situation. The objective remains to prevent a loss of staff that would have an adverse impact on KfW’s business activities; measures have been defined and communicated for this purpose.
Intra-group risk
Due to the risk relevance for the group and the objective of consistent group management, the risks of KfW IPEX-Bank, DEG and KfW Capital are fully taken into account as part of group risk management. For example, the business activities of these subsidiaries are applied to the group-wide limits on a look-through basis and included in the capital allocation and risk-bearing capacity calculation of the group. In addition, representatives of the subsidiaries are members of the group’s risk committees. KfW also monitors the risk situation of its subsidiaries on a stand-alone basis. The management of each subsidiary reports regularly to the responsible members of the Executive Board on risk, as well as finance and strategy. KfW’s Executive Board is also informed of the intra-group risk situation in a quarterly report.
Reputational risk
Reputational risk is the risk that the perception of the group from the point of view of the relevant internal and external stakeholders will deteriorate for the long term with a negative impact on KfW Group. This negative impact could lead to a decrease in KfW Group’s net assets, earnings or liquidity (e.g. decline in new business) or may be of a non-monetary nature (e.g. difficulty in recruiting new staff). Reputational risk may arise as a consequence of other types of risk, or independently.
In the risk management process, reputational risk is primarily managed in a decentralised manner. The framework for this purpose includes sustainability management with group-wide sustainability mission statement, which uses a multidimensional approach to address central areas of action in the banking business and operations and as an employer. Furthermore, examinations of new activities in the NPP as well as of outsourced activities in outsourcing management are regularly conducted to detect potential reputational risks.
Moreover, as part of risk identification, the central reputational risk control function coordinates qualitative reputational risk assessment and creates a risk profile outlining the group’s greatest reputational risks relating to the bank’s most important stakeholders. In addition, reputational risk events that have occurred are reported on an ongoing basis.
Departing from a high reputational level achieved over the course of the COVID-19 crisis due to KfW’s support measures to mitigate macroeconomic consequences, two emerging trends that could exacerbate risk were identified in 2022.
| – | KfW is stepping up its involvement in the fossil fuel sector on behalf of the Federal Government. This may result in sustainability rating downgrades and may be perceived as contradicting KfW’s sustainability objectives. KfW’s communication measures focus on explaining the background of the Federal Government-mandated transactions and KfW’s role, as well as the impact of these commitments on the Paris Agreement sector guidelines, carbon accounting and SDG mapping, among other things. |
| – | Due to the ongoing Russia-Ukraine war, a dynamic sanctions environment continues to prevail, which continues to entail elevated reputational risks. Established compliance processes have been a contributing factor in the non-occurrence of any events so far. |
45 | KfW Financial Report 2022 Combined Management Report | Risk report
Project risk
Original project risk comprises, in particular, planning assumptions that turn out to be inaccurate. Project risk has implications for the achievement of project/building block objectives with regard to cost, time and scope (e.g. new technical requirements, and time constraints arising from parallel projects/change activities in building blocks). Managing project risk is part of building block management both during building block planning and during the execution of change activities in building blocks.
The internal “Planning, Control and Project Management” department supports the building blocks in fulfilling their objectives and achieving their targets. As the central authority for overall portfolio management, it provides the methodological framework for implementation of change activities in building blocks within the group and is responsible for the evaluation and presentation of the risk situation of the overall portfolio. Compliance with this framework and these requirements by the aforementioned building blocks is also monitored and supported.
Regulatory risk
Regulatory risks for KfW Group arise primarily from an increase in requirements regarding minimum capital ratios and from possible negative effects on the group’s business model due to future changes in the regulatory environment. These include the costs resulting from the implementation and ongoing fulfilment of the additional requirements as well as the associated capital tie-up.
As part of the capital adequacy process, regulatory risk is addressed through conservative traffic light limits as a management and early warning instrument with regard to regulatory capital requirements. In addition, the capital adequacy of KfW Group is reviewed with the owners as part of its coordinated capital planning. In this context, in particular, potential negative effects arising from the finalisation of the capital adequacy requirements under Basel III are analysed and assessed.
Moreover, KfW actively keeps track of changes in its legal environment, which makes it possible to identify new regulatory requirements and to determine any necessary action.
Concentration risk
Concentration risk refers to the risk of negative effects on net assets, earnings position and liquidity arising from particularly large individual risk exposures or increased correlations of risk exposures. A distinction must be made between intra-risk concentrations (affecting one type of risk) and inter-risk concentrations (affecting different types of risk). In line with the “on-lending principle” enshrined in the KfW Law, KfW’s risk profile is essentially characterised by a tendency towards high exposures to individual bank counterparties and the financial sector as a whole. The resulting concentration risks are limited based on defined risk appetite and are subject to stress tests. Additionally, KfW’s business model as a promotional bank inevitably involves concentrations of earnings which are addressed by monitoring the risk appetite for performance and earnings.
Primary model risk
Primary model risk was identified in the 2022 risk inventory as a new significant overarching risk, as direct implications on net assets, earnings position and liquidity can arise from weaknesses or errors at both the model and model interaction level. At KfW, models are an essential component in risk, capital and business management. Using models means there are model risks, which can affect other types of risk such as credit or market price risk. A distinction is made between model risks arising from weaknesses and deficiencies in existing models (primary model risks) and model risks resulting from inappropriate use of these models (secondary model risks, as a sub-type of operational risk). Identifying and managing model risks is aimed at promoting an appropriate risk culture for dealing with models, adequate control of model risks, and timely and risk-oriented elimination or compensation of (systematic) model
KfW Financial Report 2022 Combined Management Report | Risk report | 46
weaknesses that have been identified, such as through independent validation. Primary model risk is compensated by capital buffers in the economic risk-bearing capacity and individual adjustments at the model level, such as valuation reserves and manual adjustments, or by taking margin of conservatism (MoC) premiums into account in model parameterisation. The annual model risk report gives the KfW Executive Board an overview of the models in focus, as well as a general assessment of model risks at KfW. The ongoing management of model risks is carried out via active performance of the individual model roles and through discussions and decisions in the risk committee meetings that regularly take place.
Additional internal control procedures
Process-integrated internal control system (ICS)
The aim of KfW Group’s ICS is to use suitable principles, measures and procedures to ensure the effectiveness and profitability of business activities, compliance with the legal requirements applicable to KfW Group, the accuracy and reliability of external and internal accounting, and the protection of assets.
There are group-wide ICS rules as well as binding group-wide minimum requirements of the ICS. KfW Group’s ICS is based on the relevant legal (bank regulatory) requirements8), in particular those set forth in the KWG and MaRisk, and the market standard COSO model9).
The KfW Executive Board holds overall responsibility for the group’s internal control system. At KfW IPEX-Bank, KfW Capital and DEG, the respective company management holds overall responsibility. Design and implementation at the different corporate levels are the responsibility of the relevant managers according to the organisational structure.
In accordance with the COSO model, the ICS consists of the five following interrelated components: control environment, risk assessment, control activities, information/communication and monitoring/auditing. These components extend to all KfW Group’s organisational entities, functions and processes.
The control environment is the environment within which KfW Group introduces and applies rules. Risk assessment includes the identification, analysis and evaluation of risks that result from implementing corporate strategy. Control activities are aimed at achieving corporate objectives effectively and detecting or minimising risks. A KfW Group information and communication policy is aimed at comprehensively providing all stakeholders with the information they need in the required detail to make decisions. Appropriate monitoring and audit mechanisms are in place to determine the functionality and effectiveness of the ICS.
Procedural rules form the basis of the ICS. These constitute the framework for a proper business organisation within KfW Group, in the form of a binding policy.
Workflow organisational measures and controls are intended to ensure that monitoring is integrated into processes. Monitoring measures integrated into processes serve to avoid, reduce, detect and/or correct processing errors or financial loss. The effects of any planned changes to operational processes and structures on the procedure and intensity of monitoring are analysed in advance.
KfW Group has implemented accounting-related controls to minimise the risk of error in stand-alone and consolidated financial statements and ensure the correctness and reliability of internal and external financial reporting. The accounting-related controls are part of the ICS.
The system is supplemented by the Compliance department, which defines and monitors compliance with relevant measures, on the basis of relevant rules and norms. The Compliance function performs regular process-based and
| 8) | See Section 25a (1) no. 1 KWG, MaRisk AT 4.3, and Sections 289 (5), 315 (2) no. 5, 324, and 264d HGB. |
| 9) | COSO = Committee of Sponsoring Organizations of the Treadway Commission |
47 | KfW Financial Report 2022 Combined Management Report | Risk report
accompanying monitoring of the relevant areas of the internal control system. The results of additional second line of defence units (OpRisk in particular) are included in monitoring and the further development of the internal control system.
To ensure the adequacy and effectiveness of the ICS, KfW regularly scrutinises and continually refines its standards and conventions.
A report is rendered annually to KfW Group’s supervisory bodies. The adequacy and effectiveness of the ICS is also assessed by Internal Auditing on the basis of risk-based audits carried out independently of group procedures.
Compliance
The Executive Board bears the overall responsibility for compliance within the Group. The Executive Board delegates the associated tasks to the Compliance department. The officers appointed by the Executive Board for the relevant areas of responsibility are located in the Compliance department. They include, in particular, the (group) money laundering officer, the fraud officer (central unit in accordance with Section 25h KWG) and the company data protection officer.
The Compliance organisation is structured in accordance with the Three Lines of Defence (“LoD”) model and as the second line of defence, it is aligned with the requirements for a MaRisk compliance function. In this context, group compliance has particularly included measures to adhere to data protection regulations and tax compliance as well as measures to prevent insider trading (securities compliance), general conflicts of interest, money laundering, terrorist financing (“TF”) and other criminal activities as well as to comply with sanctions and embargo regulations and for monitoring legal requirements and the associated implementation measures. There are therefore binding rules and procedures that influence the day-to-day implementation of values and the corporate culture, which are updated regularly and on an ad hoc basis to reflect current law as well as market requirements. The aim is to manage and assess compliance risks as part of non-financial risks (“NFRs”) by means, among other things, of key indicators (e.g. for financial sanctions) in line with the central requirements for operational risk management. Since the entry into force of the material requirements of the Supply Chain Act (Lieferkettensorgfaltspflichtengesetz – “LkSG”) on 1 January 2023, the compliance organisation also acts as a central point for recording, monitoring and controlling compliance with the related requirements.
Within the scope of its duties as second line of defence, Compliance is responsible for and authorised to implement statutory or regulatory requirements and Executive Board decisions, to analyse individual cases/irregularities, to coordinate necessary measures and, where applicable, to initiate ad hoc measures to limit damage. In relation to all other areas of the group, the Compliance department performs its tasks autonomously and independently and is not subject to any instructions, in particular with regard to analysis (including evaluation of results), monitoring activities, defining and implementing rules and measures, and reporting. In order to perform its duties, Compliance has a complete and unrestricted right to information, inspection and access to all premises, documents, records, audio recordings and systems.
More intense monitoring of sanctions requirements resulting from the Russia-Ukraine war is being implemented, among other things, by means of a specially established task force headed by Compliance. In addition, to the extent necessary, internal audit and monitoring processes of the compliance organisation have been adapted to the changed risk situation. Compliance monitors legal and regulatory requirements on an ongoing basis and adapts to the changed risk situation in coordination with the affected functions of the first line of defence, as necessary.
The implementation of KfW’s business activities relating to the COVID-19 pandemic in the context of the coronavirus special programmes generated an increase in the number of suspected cases in relevant compliance areas (money laundering/TF and criminal activities). Nevertheless, a sustained increase in the overall risk level is not discernible – even when taking into account the application and commitment volumes in the coronavirus special programme.
KfW Financial Report 2022 Combined Management Report | Risk report | 48
Internal Auditing
Internal Auditing is an instrument of the Executive Board. As an entity that works independently of KfW Group procedures, it audits and assesses all of KfW Group’s processes and activities to identify the risks involved and reports directly to the Executive Board.
With a view to risk management processes, Internal Auditing performed an audit in the reporting year of the decentralised risk management processes and central aspects of risk management and risk control which were relevant group-wide. With regard to risk management, the focus areas of the audit included the application, operation and further development of the models used in risk management across all risk types, as well as KfW’s combined risk assessment within the ICAAP. Additionally, risk-type-specific audits were performed on the management of operational risk, market price risk and liquidity risk. Audits of key second line functions were also part of the 2022 audit plan. The risk management projects that Internal Auditing assessed as material were supported by Internal Auditing, maintaining the latter’s impartiality and avoiding any conflicts of interest.
Moreover, Internal Auditing continued to monitor the ongoing development of risk measurement procedures in 2022 by attending meetings of decision-making bodies (as a guest).
Internal Auditing also functions as KfW Group’s internal auditing department. It is involved in subsidiaries’ audit planning and, in addition to the audit results obtained independently in group-wide audits, it also incorporates the audit results of the subsidiaries’ internal auditing departments in its group-wide internal audit reporting.
49 | KfW Financial Report 2022 Combined Management Report | Risk report
Forecast and opportunity report
General economic environment and development trends
KfW expects global real gross domestic product (“GDP”) to grow by 2.4% year on year in 2023, after increasing by 3.4% in 2022, according to International Monetary Fund (“IMF”) estimates. The expected growth rate of global real GDP in 2023 is below both that of the previous year and the average for 2012–2021. The below-average growth by historical comparison is forecast for both industrialised nations and developing countries and emerging economies (see table on gross domestic product at constant prices). KfW agrees with the IMF’s assessment that the outlook for 2023 is determined largely by the Russian war on Ukraine, which has contributed to globally rising food and energy prices and generated an energy crisis in Europe. IMF also expects the 2023 rate of inflation in most economies worldwide to be above the 2012 to 2021 average and that the effects of the high inflation and monetary tightening will become apparent. Another factor is the impact of the COVID-19 pandemic and its after-effects.
Gross domestic product at constant prices
| | | | | | | | | | | | | | | | | | | | | | |
| | | | | | | 2022 estimate | | | | | | | | 2023 forecast | | | | | | 2012–2021 average | | |
| Year-on-year change | | | | | | in % | | | | | | | | in % | | | | | | in % | | |
| | | | | | | | | |
| Global economy* | | | | | | 3.4 | | | | | | | | 2.4 | | | | | | 3.0 | | |
| | | | | | | | | |
| Industrialised countries* | | | | | | 2.7 | | | | | | | | 0.8 | | | | | | 1.6 | | |
| | | | | | | | | |
Developing countries and emerging economies* | | | | | | 3.9 | | | | | | | | 3.6 | | | | | | 4.1 | | |
| * | Aggregation of annual GDP growth rates at each country’s constant prices based on the shares of each country’s GDP valued at purchasing power parity (“PPP”) in the corresponding aggregate. Grouped into industrialised countries and emerging economies based on IMF classification. Average calculated as the geometric mean of annual growth rates. |
According to the IMF, there is unusually high uncertainty about global growth, with the risk of further deterioration of the situation clearly predominant. The ongoing Russia-Ukraine war could continue to drive energy and food prices higher than expected and divide the international community in the long term, with a detrimental impact, for example, on trade and climate action. There is a risk that the monetary and fiscal policy responses to inflation are not sufficiently calibrated and will continue to unduly slow an already flagging global economy. Developing countries and emerging economies would suffer in particular. For example, energy and food shortages would be felt to a greater extent in 2023, particularly in those countries that are net importers of both. In addition, countries that are already heavily indebted, including industrialised countries, would suffer more than currently expected from the inevitable further rise in interest rates. Another debt crisis in numerous countries cannot be ruled out. There could also be a sharper slowdown in China’s growth. There is still a high degree of uncertainty about the next stage of the COVID-19 pandemic. Easing COVID-19 restrictions could result in considerable slumps in growth due to sharp rises in confirmed cases. The conflict between China and the USA could intensify, which would push other western countries to more closely scrutinise their trade relations with China. At the same time, disagreements between the EU and the USA could increase and further hinder trade. More rapid exacerbation of the adverse effects of climate change could put further strain on the situation. The slowdown in the global economy as forecast by the IMF could consequently be more severe and affect virtually all regions of the world more than previously anticipated.
KfW expects euro area price-adjusted GDP to stagnate in 2023, after having grown by 3.5 percentage points in the previous year, which is above the 2012–2021 average. If this projection proves accurate, total economic output for 2023 will measure 2.3 percentage points above the pre-pandemic level of price-adjusted GDP, i.e. that of 2019 (see table on gross domestic product at constant prices, year-on-year change). In line with the European Commission, KfW assumes that there will be no disruptions to gas supply in the winters of 2022/2023 or 2023/2024 due, firstly,
KfW Financial Report 2022 Combined Management Report | Forecast and opportunity report | 50
to a price and policy-induced decline in demand and, secondly, to continued diversification of the gas supply. None of the demand-side components of GDP are likely to make a relevant contribution to price-adjusted GDP growth in 2023. This forecast is underpinned by the European Commission’s assessment that growth in consumption demand stemming from private households is likely to be sharply limited by the large inflation-induced decline in real disposable income and net assets. Investment has also been impacted by rising costs, increased interest rates and weak demand. This is likely to be only partially mitigated by the continued implementation of European recovery and resilience plans. Due to the expected decline in global growth, the European Commission expects net exports to make a low positive contribution (0.1 percentage points) to eurozone growth. KfW estimates that, among the four largest eurozone countries, Germany and Italy will record the weakest real GDP growth due to their relatively important industrial sectors, while France and Spain, unlike the eurozone as a whole, can be expected to achieve slightly positive growth.
KfW expects price-adjusted GDP in Germany to decrease by 1.0% year on year in 2023. Price-adjusted GDP in 2023 is therefore expected to be slightly lower than in 2019, the year before the outbreak of the coronavirus pandemic (see table on gross domestic product at constant prices, year-on-year change). In view of the above forecasts for the global economy and assuming persistent strain from the Russia-Ukraine war, such as uncertainties relating to energy supply, rising energy and material costs, and eroding household purchasing power due to headline inflation, KfW assumes that of the value-added GDP components, the price-adjusted gross value added of the two consumer-related economic sectors retail, and transport and hospitality and other services will decrease. The price-adjusted gross value added of the construction and manufacturing sectors are also expected to contract in 2023. Among the expenditure components of GDP, KfW expects corporate investments, housing construction and private consumption expenditure to suffer price-adjusted decreases in 2023. The shortage of skilled workers will contribute to the average annual number of people in employment located in Germany remaining close to the 2022 figure in 2023, despite the negative rate of change of price-adjusted GDP.
Gross domestic product at constant prices, year-on-year change
| | | | | | | | | | | | | | | | | | | | | | | | | | |
| | | | | | | 2022
| | | 2023
forecast | | | | | 2012–2021 average | | | | | 2023 forecast | | | |
| | | | | | | in % | | | in % | | | | | in % | | | | | 2019 index = 100 | | | |
| | | | | | | | | |
| Euro area | | | | | | | 3.5 | | | 0.0 | | | | | | 0.9 | | | | | | 102.4 | | | | |
| Germany | | | | | | | 1.8 | | | -1.0 | | | | | | 1.0 | | | | | | 99.6 | | | | |
USA | | | | | | | 2.1 | | | 0.7 | | | | | | 2.1 | | | | | | 105.9 | | | | |
A further military escalation, such as the war expanding beyond Ukrainian territory, a gas shortage or restrictions reimposed on economic activities due to new coronavirus mutations, could cause a greater contraction in Germany’s price-adjusted GDP than that predicted by KfW for 2023. There is a chance that price-adjusted GDP will contract less than KfW’s forecast for 2023, or even that price-adjusted GDP will grow in 2023, if the substitution of Russian energy and raw materials turns out to proceed better than expected or if there is a widely accepted peace settlement for Ukraine. This would eliminate war-induced uncertainties and provide for additional investment and exports.
The European Central Bank (“ECB”) has raised the deposit rate by a total of 250 basis points to 2.0% (year-end 2022) since July 2022. For the euro area, KfW expects the deposit rate of the European Central Bank (“ECB”) to average 2.8% for the whole of 2023. The purchase programmes that had been running since 2015 and were expanded during the COVID-19 pandemic – the asset purchase programme (“APP”) and the pandemic emergency purchase
51 | KfW Financial Report 2022 Combined Management Report | Forecast and opportunity report
programme (“PEPP”) – were discontinued in the first half of 2022. The principal payments of the released assets of the APP and the PEPP will continue to be reinvested until the end of February 2023 and until the end of 2024, respectively. The ECB plans to reduce its balance sheet volume by EUR 15 billion per month from March 2023 onwards. In order to reconcile the very favourable refinancing conditions for banks created during the COVID-19 pandemic with the changed monetary policy environment, early repayment dates were offered for the targeted longer-term refinancing operations (“TLTRO III”), which will continue to run until June 2023. The ECB has also raised the TLTRO rate to be the average deposit rate between 22 November 2022 and the end date or early repayment date. The still elevated inflation rates are likely to decline over the course of 2023. According to the ECB’s own forecast, its two percent target will not be reached until 2025, however. The slope of the yield curve (the spread between ten and two-year swap rates) is currently inverted due to the rapid key interest rate hikes. KfW expects the inversion to continue on average in 2023.
KfW also foresees interest rates in the USA rising higher in 2023, albeit only moderately, as inflation is slowly dropping, with the economy likely to cool off noticeably. KfW expects the yield curve (the spread between ten and two-year USD swap rates) to steepen sharply on average in 2023 but to continue to remain inverted.
New business projections
Overview
In the central control variable for its net assets, KfW Group projects new business volume of EUR 79.6 billion for 2023. In domestic promotion, this reflects a normalisation of new business development in the primary business and commitment growth in the business sectors KfW Capital, Export and project finance, and DEG. Promotion of EUR 11.4 billion is expected in the business sector KfW Development Bank, which would be in line with the 2022 target. These new business projections may be subject to change due to economic and political measures of the German Federal Government (e.g. execution of mandated transactions).
KfW is careful to avoid potential adverse effects and risks to society and the environment in its promotional activities, and where possible attempts to reduce or offset such effects via suitable measures (inside-out perspective). Furthermore, KfW considers environmental changes, such as to the climate and biodiversity, social transformation and governance standards with an impact on the credit rating of KfW clients, as well as the effects of various climate scenarios on KfW’s business model and risk profile (outside-in perspective). We do not expect these considerations to have any impact on the new commitment volume projected for 2023.
Domestic business
After the exceptional period from 2020 to 2022, which was characterised by non-recurring effects, the business sector Mittelstandsbank & Private Kunden (SME Bank & Private Clients) is currently assuming a normalisation of new business development in its primary business for 2023 (target of EUR 35.1 billion, including a EUR 1 billion UBR [Ukraine, Belarus, Russia] special programme). This is expected to be buoyed in particular by the continued demand for housing-related financing and utilisation of long-term commercial financing loans (addressing the investment backlog).
The last few years were characterised by projects aimed at firmly establishing KfW’s medium and long-term anchoring in important promotional areas as well as client contact via market standard interfaces. This will enable the business sector to continue the UBR support measures set up as a result of the Ukraine war in 2022 into 2023, if necessary. Moreover, the promotional lending portfolio will be aligned as comprehensively as possible with KfW’s climate neutrality goals in a process lasting several years by gradually adapting promotional policies to the sectoral guidelines and new promotional initiatives. Another focus is on the reorganisation of Federal Funding for Efficient Buildings. To this end, a new programme, Climate-Friendly New Construction, will be introduced in 2023 for residential and non-residential buildings. The energy-efficient refurbishment of residential and non-residential buildings will continue in a modified form. There are also plans to integrate a social component directly into the Climate-Friendly New Construction programme
KfW Financial Report 2022 Combined Management Report | Forecast and opportunity report | 52
and, in the foreseeable future, also into the promotional programme for refurbishment. Demand in the Renewable Energy – Standard programme is expected to increase significantly due to the shortage and sharp price increases of fossil fuels. Furthermore, the TUMO education centre in Berlin will continue its roll-out to other locations in Germany.
Financial year 2022 was largely characterised by non-recurring effects for the business sector Individualfinanzierung & Öffentliche Kunden (Customised Finance & Public Clients). Large-volume transactions were mandated on behalf of the Federal Government in order to secure the energy supply in the face of the Ukraine war. As mandated transactions are not part of commitment projections, because of their unpredictable nature, they are not discussed further below.
The effects of the COVID-19 pandemic, the Ukraine war and the current inflation trends are expected to have a detrimental impact on economic growth in 2023. Demand for long-term loans, which are primarily used to finance investment projects, is likely to be dampened by high uncertainty, rising interest rates and high energy costs. However, the high price increases for capital goods are also driving the need for financing. The business sector anticipates a moderate rise in demand for loans in both municipal investments and customised finance of companies, banks and promotional institutions of the German federal states. Promotion with a total new business volume of EUR 9.8 billion is planned for 2023 (excluding any special programmes).
With regard to customised financing for companies, the impact of the COVID-19 pandemic on corporate willingness and capacity to take on debt for new investments cannot yet be definitively predicted. At the same time, potentially lower risk tolerance on the part of partner banks cannot be ruled out and could lead to greater demand for KfW’s risk participation.
The demand for investment remains high from the perspective of the Municipal and Social Infrastructure segment, given the central role of municipalities and municipal enterprises in meeting the challenges posed by climate change, the need for digitalisation, the COVID-19 pandemic and the war in Ukraine. However, the strained budget and debt situation of some municipalities continues to restrict their investment opportunities. Individual financing with financing partners in Germany and Europe, as well as the general funding of promotional institutions of the federal states, will continue to be characterised by a sound funding situation at partner banks. The ECB’s approach to fighting inflation and its ongoing tightening of monetary policy play an important role for global loans leasing/Europe loans and the funding of promotional institutions of the federal states, as well as for the customised financing of corporates.
The subsidiary KfW Capital projects a commitment volume of around EUR 1.4 billion in financial year 2023 (of which EUR 0.6 billion at its own risk). Germany’s venture capital (“VC”) market has experienced a considerable upward trend in recent years. Despite the COVID-19 pandemic, 2021 ended up being a record year. Never before were so many VC investments made in Germany. In 2022, however, the VC market was dealt a heavy blow by the Ukraine war, high inflation and rising interest rates. Despite this deteriorating environment, VC investment activity still proved to be rather robust in the first half of 2022, albeit lagging behind that of 2021, and greater than in previous years. The VC sentiment indicator initially took a downward turn in 2022, with business expectations deteriorating even further than the actual business situation. In the third quarter of 2022, however, business sentiment in the German VC market stabilised. The German VC market still needs strengthening to tackle the deficit in the amount of VC investment in future technologies by international comparison. KfW Capital will thus continue to play a key role in 2023 as a reliable VC market partner. The focus of KfW Capital’s promotion and financing activities remains on making equity investments in VC and venture debt funds. Moreover, KfW Capital’s role as central coordinator for the Future Fund will be expanded. The GFF EIF Growth Facility (EUR 0.4 billion in 2023), which was launched in 2022, will be supplemented by various other components, including the Deep Tech Climate Fund and the first module of so-called Separate Managed Accounts. Separate Managed Accounts is a Future Fund component designed to provide venture capital for selected target groups or technology areas and is conceived as a series of different modules to be developed gradually. Additionally, a climate action facility (EUR 0.1 billion) will be launched at the bank’s own risk for the first time in 2023. Furthermore, as part of the Future Fund, KfW Capital will develop a market-based concept for financing key technologies.
53 | KfW Financial Report 2022 Combined Management Report | Forecast and opportunity report
Financial markets
The business sector Financial markets plans new investments of EUR 0.5 billion in its green bond portfolio for financial year 2023 in order to stabilise its volume within the target corridor of EUR 2.0 to 2.5��billion set from 2021 to the end of 2023, taking into account maturing bonds.
International business
Despite the globally deteriorating economic outlook, there are still regions with growth potential in Europe, as well as among developing countries and emerging markets relevant for the Export and project finance business sector. Economic stimulus programmes can also generate stimulus for financing demand (e.g. PPPs), particularly in the area of infrastructure investments and projects relating to the transformation to a climate-neutral economy. Health risks (COVID-19) and geopolitical risks remain relevant to the business sector Export and project finance, and are currently manifesting themselves primarily in lower country ratings. At the same time, protectionist efforts could have a noticeable adverse effect on world trade and thus on investment and financing opportunities. On the other hand, adapting supply chains in response to the COVID-19 pandemic and the war in Ukraine could create opportunities for lending. Although development remains fraught with uncertainties, from the current perspective, there is sufficient overall potential for German and European exporters and companies investing in transformation and digitalisation to boost their international competitiveness. Financing approaches can be derived from this for the business sector Export and project finance.
With the sectoral realignment based on transformation areas, the business sector is resuming its charted growth course and pursuing a significant increase in the volume of new commitments to a total of EUR 19.6 billion for 2023. Of this amount, EUR 18.1 billion is expected to be attributable to the primary business export and project finance, and EUR 1.5 billion to the commercial interest reference rate (“CIRR”) business. After two years of COVID-19 and restricted travel, as well as the impact of the Ukraine war, the business sector is finding its way back to its long-term strategic growth path.
The business sector KfW Development Bank expects commitments to remain at a consistently high level for the next few years. KfW Development Bank will continue to support projects of the German Federal Government and international institutions for development policy and international cooperation in 2023. Issues such as support for partner countries in combating the COVID-19 pandemic and its socio-economic consequences, the effects of the war in Ukraine and the international energy transition, alleviating poverty and mitigating crises and causes of displacement are high on the political agenda. The German Federal Government and the European Commission are assuming responsibility in the area of international climate action and environmental protection and are involved in a large number of climate initiatives.
The Federal Government’s budget funds for development cooperation in 2023 will likely be above the pre-pandemic level. The future priorities of the German Federal Ministry for Economic Cooperation and Development (“BMZ”), as KfW Development Bank’s most important contracting authority, are derived from long-term core areas based on the UN’s Sustainable Development Goals (“SDGs”) as well as initiative areas that inspire action. KfW Development Bank faces greater political expectations as well as opportunities to boost its profile. The BMZ expects further scaling of climate finance, particularly for climate adaptation, greater mobilisation of private capital, contributions to loss and damage and sustainable finance. There is potential for KfW Development Bank to play a part in international energy/ climate/infrastructure partnerships.
The need to accelerate the energy transition in Germany has intensified collaboration with the Federal Ministry for Economic Affairs and Climate Action (“BMWK”) (hydrogen portfolio creation). Within the context of the Multiannual Financial Framework for 2021–2027, the European Commission and the EU Member States have further developed the funding instruments for European development cooperation. In light of geographical expansion and the increase in funding for guarantees from the expanded European Fund for Sustainable Development Plus (EFSD+), cooperation with the EU will gain more significance in the coming years. The mobilisation of public and private funds for global infrastructure initiatives has become significantly more important at both the EU and G7 levels (European Commission Global Gateway projects and G7 Partnership for Global Infrastructure and Investment (“PGII”)).
KfW Financial Report 2022 Combined Management Report | Forecast and opportunity report | 54
Against the backdrop of planned projects of the German Federal Government and international institutions, KfW Development Bank currently expects a new business volume of EUR 11.4 billion for 2023.
The subsidiary DEG is assigned to the DEG business sector of the same name. Economic growth in 2023 in the developing countries and emerging markets relevant to DEG’s activities is expected to be determined by further recovery from the COVID-19 pandemic, the Ukraine war, high inflation and the associated monetary tightening measures as well as sovereign debt problems. The aim continues to be to provide support to existing customers as a reliable partner in times of crisis to secure contributions to local development (labour force, local income, and contributions to local communities). DEG aims to achieve net impact contributions through its financing, including through transformative support for its customers and investments in high-impact sectors. Specific promotional programmes, including in environmental and social management, climate and resource protection, and training, support the companies financed by DEG in implementing international good practices.
In view of the robust quality of its assets and its high portfolio diversification, DEG decided in spring 2022 to start growing its new business as early as 2023 – this was originally not planned until 2025. This means a new commitment volume of EUR 1.8 billion is already expected to be achieved in 2023. The growth is intended to enable larger tickets to be realised through hedging and by attracting bigger customers. New business in all three customer clusters, banking, infrastructure and energy, and industries and services, is already being focused more heavily on climate and development impacts. The aim is to boost performance through a stronger sectoral focus and a more global management in the cluster. Three strategically important cross-sectoral focal areas, Africa, German business, and equity investments, are also being systematically developed. The wholly owned subsidiary DEG Impulse gGmbH, which was spun off on 1 September 2022, boosts DEG’s advisory and promotional business , which is an important element of its work, in order to secure quality customers by providing additional added value and to promote customer transformation to achieve a greater developmental and social impact, good governance and a lower carbon footprint.
Funding projections
KfW issues bonds to fund its promotional activities worldwide. It issues these in a large number of currencies and with differing maturities, thereby addressing a variety of target groups. Thanks to the explicit direct guarantee of the Federal Government, rating agencies have assigned KfW bonds a triple A rating, signifying top credit quality. KfW has achieved a stable position in the capital markets with its diversified long term-oriented funding strategy. The funding volume of around EUR 90 billion in financial year 2022 set a new record. This was due in particular to the exceptionally high demand for promotional loans, particularly from the domestic market. The product offering in the bond issuance business will continue to be focused on investors’ needs. KfW’s benchmark bonds in euros and US dollars will continue to constitute the largest share of total volume. Further diversification of the product range depends on the market.
Long-term borrowing via the capital markets of EUR 80 to 85 billion is planned for 2023. “Green Bonds – Made by KfW” will remain an important component of KfW’s funding mix because of their strategic importance. KfW currently anticipates issuing liquid large-volume green bonds in various currencies with a total volume of at least EUR 10 billion in the coming year.
Since the end of October 2022, KfW has been able to draw on funds from the Economic Stabilisation Fund (“WSF”) to refinance its transactions related to the energy industry and supply, mandated to it by the Federal Government in accordance with Article 2 (4) of the Law Concerning KfW (KfW-Gesetz – “KfW Law”), meaning that the WSF is able to grant funds to KfW beyond the refinancing of COVID-19 support programmes. The extent to which KfW will utilise the additional funding option via the WSF depends largely on the further development of the energy crisis.
55 | KfW Financial Report 2022 Combined Management Report | Forecast and opportunity report
Earnings projections
In the group earnings projections for 2023, KfW expects Consolidated profit of approximately EUR 950 million. This puts projected earnings at just below the strategic target level of EUR 1 billion.
Net interest income (before promotional expense) of EUR 2.5 to 2.6 billion is expected for 2023. Interest margins in the lending business are expected to be slightly down on prior-year projections. This development was offset by significantly higher income from the return on equity, resulting from a significant increase in interest rates which are expected to continue to rise in 2023. Opportunities and risks for Consolidated profit may arise, primarily with respect to the structure contribution, from market conditions deviating from projections in conjunction with KfW’s positioning.
KfW projects Net commission income totalling EUR 0.6 billion for 2023, the same level as in the previous year. This includes remuneration for the implementation of promotional programmes in Germany on behalf of the Federal Government as well as remuneration based on the General Agreement on Financial Cooperation (the legal basis between the Federal Government and KfW on the implementation of bilateral Financial Cooperation) (“FZ-Generalvertrag”).
Administrative expense is likely to increase to EUR 1.6 billion in 2023. This includes the launch of company policy projects such as processing and development of promotion in domestic business, further development of the business sectors Export and project finance, and DEG, along with modernisation, digitalisation and regulation projects, as well as inflation-induced adjustments.
Overall, the operating result before valuation is expected to be higher than projections for the prior-year.
At EUR 0.5 billion, KfW expects the standard risk costs for 2023 to be at the level of the risk provisions projected for 2022.
For 2023, Net income of EUR 0.2 billion and Net other operating income of EUR 0.1 billion are expected for operational level equity investments (included in Net gains/losses from other financial instruments at fair value and the Net gains/losses from investments accounted for using the equity method).
In this regard, the risk provisions for the lending business and the valuation result depend on the further development of the macroeconomic impact of the current geopolitical situation, as well as any further effects resulting from the COVID-19 pandemic. The continued uncertain situation may lead to significant positive or negative deviations in the projected result.
KfW expects promotional expense of EUR 0.4 billion in 2023.
Overall conclusion
In light of the economic environment and expected demand, KfW projects new business volume of EUR 79.6 billion and consolidated profit of around EUR 1 billion for 2023.
The various crises and their effects pose considerable risks to German and global economic output in 2023, which may affect the achievement of KfW’s objectives set for financial year 2023. A forecast of the overall effects on KfW’s net assets, financial and earnings position is only possible to a very limited extent at present given the uncertain political and economic development. KfW will continue to closely monitor the development of the war on Ukraine and its effects on KfW’s business.
KfW Financial Report 2022 Combined Management Report | Forecast and opportunity report | 56
Notes to the KfW annual financial statements prepared in accordance with the German Commercial Code
Overall activities of KfW
| | | | | | | | | | | | | | | | | | | | |
| | | | | | | 2022 | | | | | | | | | | 2021 | | | | |
| Financial statements | | | | | | EUR in millions | | | | | | | | | | EUR in millions | | | | |
| | | | | | | |
| Volume of business | | | | | | 718,361 | | | | | | | | | | 667,398 | | | | |
| | | | | | | |
| Total assets | | | | | | 596,985 | | | | | | | | | | 562,355 | | | | |
| | | | | | | |
| Bonds and notes issued | | | | | | 455,107 | | | | | | | | | | 443,617 | | | | |
| | | | | | | |
| Own funds1) | | | | | | 30,841 | | | | | | | | | | 29,816 | | | | |
| | | | | | | |
| Net interest income (before promotional expense) | | | | | | 1,923 | | | | | | | | | | 2,068 | | | | |
| | | | | | | |
| Net commission income (before promotional expense) | | | | | | 475 | | | | | | | | | | 493 | | | | |
| | | | | | | |
| Administrative expense (before promotional expense) | | | | | | 1,209 | | | | | | | | | | 1,130 | | | | |
| | | | | | | |
| Promotional expense | | | | | | 305 | | | | | | | | | | 188 | | | | |
| | | | | | | |
Profit for the year | | | | | | 1,026 | | | | | | | | | | 1,784 | | | | |
| 1) | Including Section 340g HGB |
Development of KfW
KfW’s earnings in financial year 2022 declined year on year. Net interest income before promotional expense was below that of the previous year. Net commission income before promotional expense was lower than in the previous year as a result of a change in methods for recognition of interest-like loan fees. The cost/income ratio before promotional expense increased to 50.4% (2021: 44.1%) due to the rise in administrative expense and a decline in income. KfW strengthened its capital base due to its earnings position, with a profit for the year of EUR 1,026 million.
KfW’s total assets increased by EUR 34.6 billion to EUR 597.0 billion in financial year 2022, in particular due to the mandated transactions to secure the energy supply, with business volume increasing from EUR 667.4 billion to EUR 718.4 billion.
KfW’s promotional business volume amounted to EUR 153.2 billion, lower than the Group’s promotional business volume of EUR 166.9 billion. The difference relates to the international business and results from DEG and Export and project finance of IPEX-Bank GmbH.
Development of earnings position
KfW’s operating result before valuation and promotional expense was EUR 1,243 million, which was lower (by EUR 149 million) than the previous year’s figure of EUR 1,392 million.
57 | KfW Financial Report 2022 Combined Management Report | Notes to the KfW annual financial statements prepared in accordance with the German Commercial Code
Reconciliation of internal earnings position before promotional expense
to external earnings position after promotional expense for financial year 2022
| | | | | | | | | | | | | | | | | | | | |
| Earnings position | | | | | | | | Reconciliation | | | | | | | | | | German Commercial Code income statement form | | |
| | | | | EUR in millions | | | | EUR in millions | | | | | | EUR in millions | | | | | | |
| | | | | | | | | | |
Net interest income (before promotional expense) | | | | 1,923 | | | | –267 | | | | | | 1,656 | | | | Total of interest income and current income less interest expense | | |
| | | | | | | | | | |
Net commission income (before promotional expense) | | | | 475 | | | | –12 | | | | | | 463 | | | | Commission income less Commission expense | | |
| | | | | | | | | | |
Administrative expense (before promotional expense) | | | | 1,209 | | | | 16 | | | | | | 1,225 | | | | Total general administrative expense and depreciation, amortisation and impairments on property, plant and equipment and intangible assets | | |
| | | | | | | | | | |
Other operating income and expenses (before promotional expense) | | | | 55 | | | | –10 | | | | | | 45 | | | | Other operating income less Other operating expense | | |
| | | | | | | | | | |
Operating result (before risk provisions/valuation/ promotional expense) | | | | 1,243 | | | | –305 | | | | | | 938 | | | | Subtotal of Interest income, Current income, Commission income, Net other operating income less Interest expense, Commission expense, General administrative expense, Depreciation, amortisation and impairments on property, plant and equipment and intangible assets, Other operating expense | | |
| | | | | | | | | | |
| Valuation result | | | | –2 | | | | 1 | | | | | | 2 | | | | Impairments of and valuation allowances on equity investments, shares in affiliated companies and securities held as fixed assets | | |
| | | | | | | | | | |
Risk provisions for lending business | | | | 96 | | | | –1 | | | | | | 95 | | | | Income from the reversal of impairment losses on receivables and certain securities and the reversal of provisions for loan losses | | |
| | | | | | | | | | |
Net result from transfer agreements | | | | –1 | | | | 0 | | | | | | 1 | | | | Cost of loss absorption | | |
| | | | | | | | | | |
Profit/loss from operating activities (before promotional expense) | | | | 1,336 | | | | –305 | | | | | | 1,031 | | | | Profit/loss from operating activities | | |
| | | | | | | | | | |
| Promotional expense | | | | 305 | | | | –305 | | | | | | 0 | | | | - | | |
| | | | | | | | | | |
| Taxes on income | | | | 3 | | | | 0 | | | | | | 3 | | | | Taxes on income | | |
| | | | | | | | | | |
| Other taxes | | | | 3 | | | | 0 | | | | | | 3 | | | | Other taxes | | |
| | | | | | | | | | |
Profit for the year | | | | 1,026 | | | | 0 | | | | | | 1,026 | | | | Profit for the year | | |
KfW Financial Report 2022 Combined Management Report | Notes to the KfW annual financial statements prepared in accordance with the German Commercial Code | 58
Reconciliation of internal earnings position before promotional expense
to external earnings position after promotional expense for financial year 2021
| | | | | | | | | | | | | | | | | | | | |
| Earnings position | | | | | | | | Reconciliation | | | | | | | | | | German Commercial Code income statement form | | |
| | | | | EUR in millions | | | | EUR in millions | | | | | | EUR in millions | | | | | | |
| | | | | | | | | | |
Net interest income (before promotional expense) | | | | 2,068 | | | | –144 | | | | | | 1,923 | | | | Total of interest income and current income less interest expense | | |
| | | | | | | | | | |
Net commission income (before promotional expense) | | | | 493 | | | | –12 | | | | | | 482 | | | | Commission income less Commission expense | | |
| | | | | | | | | | |
Administrative expense (before promotional expense) | | | | 1,130 | | | | 14 | | | | | | 1,144 | | | | Total general administrative expense and depreciation, amortisation and impairments on property, plant and equipment and intangible assets | | |
| | | | | | | | | | |
Other operating income and expenses (before promotional expense) | | | | –39 | | | | –18 | | | | | | –57 | | | | Other operating income less Other operating expense | | |
| | | | | | | | | | |
Operating result (before risk provisions/valuation/ promotional expense) | | | | 1,392 | | | | –188 | | | | | | 1,204 | | | | Subtotal of Interest income, Current income, Commission income, Net other operating income less Interest expense, Commission expense, General administrative expense, Depreciation, amortisation and impairments on property, plant and equipment and intangible assets, Other operating expense | | |
| | | | | | | | | | |
| Valuation result | | | | 32 | | | | –1 | | | | | | 31 | | | | Income from reversals of write-downs of equity investments, shares in affiliated companies and securities held as fixed assets | | |
| | | | | | | | | | |
Risk provisions for lending business | | | | 113 | | | | 1 | | | | | | 113 | | | | Income from the reversal of impairment losses on receivables and certain securities and the reversal of provisions for loan losses | | |
| | | | | | | | | | |
Net result from transfer agreements | | | | 41 | | | | 0 | | | | | | 41 | | | | Income from profit pooling, profit and loss transfer and partial profit transfer agreements | | |
| | | | | | | | | | |
Reversal of the fund for general banking risks | | | | 400 | | | | 0 | | | | | | 400 | | | | Reversal of the fund for general banking risks | | |
| | | | | | | | | | |
Profit/loss from operating activities (before promotional expense) | | | | 1,978 | | | | –188 | | | | | | 1,790 | | | | Profit/loss from operating activities | | |
| | | | | | | | | | |
| Promotional expense | | | | 188 | | | | –188 | | | | | | 0 | | | | - | | |
| | | | | | | | | | |
| Taxes on income | | | | 4 | | | | 0 | | | | | | 4 | | | | Taxes on income | | |
| | | | | | | | | | |
| Other taxes | | | | 2 | | | | 0 | | | | | | 2 | | | | Other taxes | | |
| | | | | | | | | | |
Profit for the year | | | | 1,784 | | | | 0 | | | | | | 1,784 | | | | Profit for the year | | |
At EUR 1,923 million, Net interest income (before promotional expense) was down on the previous year (EUR 2,068 million) by EUR 145 million. The decrease was due to higher interest income in the lending and money market business being more than offset by a rise in interest expense.
Net commission income (before promotional expense) of EUR 475 million was EUR 19 million below the previous year’s level of EUR 493 million. The decline was due to a change in methods in the collection of interest-like loan fees now amortised in interest income. The impact on financial year 2022 amounted to EUR 90 million. In addition, commission income from the KfW Special Programme for coronavirus aid fell to EUR 42 million (2021: EUR 61 million), with commission income from the “Baukindergeld” scheme also falling to EUR 27 million (2021: EUR 48 million). In contrast, KfW recorded a rise in commission income of EUR 17 million from remuneration from the Federal Government for the Energy-efficient Construction and Refurbishment Programme and its successor, the Federal Funding for Efficient Buildings, from a total of EUR 119 million to EUR 136 million. The programmes for charging stations for electric cars also recorded an increase of EUR 23 million, from EUR 29 million to EUR 52 million. Commission income generated by the administration of German Financial Cooperation (“FC”) in the business sector Promotion of developing countries and emerging economies increased to EUR 231 million (2021: EUR 229 million). The remuneration from the Federal Government was offset by related administrative expenses.
59 | KfW Financial Report 2022 Combined Management Report | Notes to the KfW annual financial statements prepared in accordance with the German Commercial Code
Administrative expense (before promotional expense) increased by EUR 79 million to EUR 1,209 million. The increase was mainly due to higher expenses for wages and salaries.
Other operating income and expense (before promotional expense) amounted to EUR 55 million (2021: EUR 39 million expense) due mainly to effects from the change in the interest rate used to measure pensions in accordance with the German Commercial Code (EUR +100 million), which were partially offset by negative valuation effects in the foreign currency item.
The valuation result of EUR –2 million (2021: EUR 32 million income) was essentially balanced in the financial year.
Risk provisions for lending business generated net income of EUR 96 million (2021: EUR 113 million net income). Net reversals of specific value allowances, particularly in the business sector Export and project finance, as well as income from the successful recovery of loans previously written off, were offset only by a minor net recognition of general valuation allowances. There was an increase in specific valuation allowances and specific provisions for the lending business from EUR 503 million to EUR 765 million. As of financial year 2022, this also includes specific valuation allowances for interest receivables at risk of default amounting to EUR 329 million. There was a decline in the general valuation allowances and general provisions for the lending business from EUR 532 million to EUR 511 million. Non-performing loans in the amount of EUR 61 million in connection with specific valuation allowances were written off in financial year 2022 (2021: EUR 121 million).
KfW’s domestic promotional expense, which has a negative impact on its earnings position, amounted to EUR 305 million in 2022, compared to EUR 188 million in 2021. The key component of KfW’s promotional expense are interest rate reductions of EUR 267 million granted during the first fixed interest rate period in addition to passing on its favourable funding conditions. Moreover, promotional expenses reported in net commission income and administrative expense were incurred in the amount of EUR 28 million (2021: EUR 26 million). Among other things, this spending was aimed at the sale of KfW’s promotional products. Other operating expenses include EUR 10 million (2021: EUR 18 million) in promotional grants awarded as a supplement to the lending business as a promotional expense.
The net result from transfer agreements includes KfW Capital GmbH’s loss transfer in the amount of just EUR 1 million.
Financial year 2022 closed with a profit for the period of EUR 1,026 million (2021: EUR 1,784 million), which was fully allocated to retained earnings in accordance with Article 10 (3) KfW Law.
Development of net assets
KfW saw both its total assets and its volume of business increase in financial year 2022.
Volume of receivables
| | | | | | | | | | | | | | |
| | | | | | | |
| | | | | | | 31 Dec. 2022 | | | | | | 31 Dec. 2021 | | |
| | | | | | | EUR in millions | | | | | | EUR in millions | | |
| | | | | | | |
| Loans and advances to banks | | | | | | 389,076 | | | | | | 334,064 | | |
| | | | | | | |
| Loans and advances to customers | | | | | | 135,414 | | | | | | 110,489 | | |
| | | | | | | |
| Loans held in trust | | | | | | 10,271 | | | | | | 10,561 | | |
| | | | | | | |
| Contingent liabilities from financial guarantees | | | | | | 704 | | | | | | 711 | | |
| | | | | | | |
| Irrevocable loan commitments | | | | | | 120,671 | | | | | | 104,332 | | |
| | | | | | | |
Total | | | | | | 656,137 | | | | | | 560,157 | | |
The volume of receivables (loans and advances to banks and customers, including irrevocable loan commitments, loans held in trust and guarantees) increased from EUR 560.2 billion to EUR 656.1 billion. The increase in loans and advances to banks of EUR 55.0 billion was due to the change in deposits at Deutsche Bundesbank from the minimum reserve to overnight deposits.
KfW Financial Report 2022 Combined Management Report | Notes to the KfW annual financial statements prepared in accordance with the German Commercial Code | 60
The change in loans and advances to customers from the previous year was mainly due to loans in connection with the energy supply amounting to EUR 22.4 billion.
The volume of loans held in trust, which primarily comprise loans to promote developing countries financed by budget funds provided by the Federal Republic of Germany, declined to EUR 10.3 billion in 2022 (2021: EUR 10.6 billion).
Contingent liabilities from financial guarantees remained unchanged at EUR 0.7 billion, while irrevocable loan commitments rose by EUR 16.4 billion, from EUR 104.3 billion to EUR 120.7 billion. The increase in irrevocable loan commitments was due to new commitments in aid loans to the energy industry in the amount of EUR 20.0 billion.
Total bonds and other fixed-income securities rose by EUR 0.5 billion to EUR 40.4 billion (2021: EUR 39.9 billion). Holdings of repurchased own issues remained unchanged at EUR 3.9 billion (2021 EUR 3.9 billion). This was equivalent to 1.0% of bonds issued.
At a total amount of EUR 36.6 billion, holdings of securities of other issuers, which make up 90.4% of the total holdings of all bonds and other fixed-income securities, exceeded the previous year’s level of EUR 36.0 billion by EUR 0.6 billion. Of the securities from other issuers, 75.9% is eligible as collateral for funding operations with the European Central Bank (ECB).
In addition to the Treasury securities portfolios, KfW holds asset backed securities (ABS) with a carrying amount of EUR 6.0 billion, (previous year: EUR 6.1 billion), related to its securitisation and SME finance activities. Potential risks are sufficiently addressed by appropriate risk provisioning.
The value of shares in affiliated companies amounted to EUR 4.0 billion (2021: EUR 3.8 billion). KfW’s assets held in trust rose by EUR 0.3 billion to EUR 18.6 billion (2021: EUR 18.3 billion).
Development of financial position
KfW raised EUR 89.4 billion in the capital markets to fund its business activities in 2022 (2021: EUR 82.6 billion). A total of 206 bonds were issued in 13 currencies. The 20 Green Bond transactions (including 7 top-ups) with a volume of EUR 10.6 billion made a 11.8% contribution to funding.
Borrowings increased by EUR 37.3 billion to EUR 540.1 billion.
Borrowings
| | | | | | | | | | | | | | |
| | | | | | | |
| | | | | | | 31 Dec. 2022 | | | | | | 31 Dec. 2021 | | |
| | | | | | | EUR in millions | | | | | | EUR in millions | | |
| | | | | | | |
| Federal Republic of Germany | | | | | | | | | | | | | | |
| | | | | | | |
– ERP Special Fund | | | | | | 283 | | | | | | 138 | | |
| | | | | | | |
– Federal budget | | | | | | 7,887 | | | | | | 4,343 | | |
| | | | | | | |
– Economic Stabilisation Fund (WSF) | | | | | | 52,807 | | | | | | 35,400 | | |
| | | | | | | |
| | | | | | | 60,976 | | | | | | 39,881 | | |
| | | | | | | |
| Other lenders | | | | | | 4,537 | | | | | | 4,006 | | |
| | | | | | | |
| Liabilities to customers | | | | | | 65,514 | | | | | | 43,886 | | |
| | | | | | | |
| Liabilities to banks | | | | | | 19,463 | | | | | | 15,271 | | |
| | | | | | | |
| Long-term debt securities1) | | | | | | 414,507 | | | | | | 394,012 | | |
| | | | | | | |
| Commercial papers1) | | | | | | 39,007 | | | | | | 48,066 | | |
| | | | | | | |
| Accrued interest and interest payable | | | | | | 1,593 | | | | | | 1,539 | | |
| | | | | | | |
| Bonds and notes issued | | | | | | 455,107 | | | | | | 443,617 | | |
| | | | | | | |
Total | | | | | | 540,083 | | | | | | 502,774 | | |
1) Breakdown of bonds issued and previous year’s amounts adjusted.
61 | KfW Financial Report 2022 Combined Management Report | Notes to the KfW annual financial statements prepared in accordance with the German Commercial Code
Bonds issued increased by EUR 11.5 billion year on year and totalled EUR 455.1 billion as of 31 December 2022. New issuances and maturities as well as fluctuations in foreign exchange rates, particularly of the US dollar, had an impact on portfolio development.
Bonds issued accounted for 84.3% of borrowed funds, which was less than the previous year’s level (88.2%). Proportionally, they therefore remain KfW’s largest source of funding. The share of bonds denominated in euros was 65% in 2022 (2021: 55%), those denominated in US dollars amounted to 19% (2021: 26%). The share of bonds denominated in pounds sterling was 9% (2021: 8%).
As of 31 December 2022, KfW’s funds raised via the Economic Stabilisation Fund (“WSF”) by means of promissory note loans increased by EUR 17.4 billion, to EUR 52.8 billion. WSF funding of EUR 22.4 billion was used to finance programmes to ensure the liquidity of energy sector companies and the necessary infrastructure and EUR 30.4 billion to fund the coronavirus special programme.
The share of funds from banks and customers (excluding federal budget funds) increased slightly year on year to 4.4% (2021: 3.8%). This includes cash collateral received primarily to reduce counterparty risk from the derivatives business in the amount of EUR 11.6 billion (2021: EUR 8.8 billion).
KfW’s own funds amounted to EUR 30.8 billion as of 31 December 2022, up 3.4% compared to the previous year. This increase was exclusively due to the net profit of EUR 1,026 million allocated to retained earnings. The fund for general banking risks remained unchanged from the previous year at EUR 0.2 billion.
Own funds
| | | | | | | | | | | | | | |
| | | | | | | |
| | | | | | | 31 Dec. 2022 | | | | | | 31 Dec. 2021 | | |
| | | | | | | EUR in millions | | | | | | EUR in millions | | |
| | | | | | | |
| Subscribed capital | | | | | | 3,750 | | | | | | 3,750 | | |
| | | | | | | |
| Uncalled contributions outstanding | | | | | | –450 | | | | | | –450 | | |
| | | | | | | |
| Capital reserve | | | | | | 8,447 | | | | | | 8,447 | | |
| | | | | | | |
| Reserve from the ERP Special Fund | | | | | | 1,191 | | | | | | 1,191 | | |
| | | | | | | |
| Retained earnings | | | | | | | | | | | | | | |
| | | | | | | |
a) Statutory reserve under Article 10 (2) KfW Law | | | | | | 1,875 | | | | | | 1,875 | | |
| | | | | | | |
b) Special reserve under Article 10 (3) KfW Law | | | | | | 15,781 | | | | | | 14,755 | | |
| | | | | | | |
c) Special reserve under Section 17 (4) D-Mark Balance Sheet Act1) | | | | | | 48 | | | | | | 48 | | |
| | | | | | | |
| Fund for general banking risks under Section 340g HGB | | | | | | 200 | | | | | | 200 | | |
| | | | | | | |
Total | | | | | | 30,841 | | | | | | 29,816 | | |
| 1) | To be adjusted by the special loss account shown on the assets side in accordance with Section 17 (4) of the D-Mark Balance Sheet Act (EUR 26 million). |
KfW Financial Report 2022 Combined Management Report | Notes to the KfW annual financial statements prepared in accordance with the German Commercial Code | 62
Declaration of compliance
The Executive Board and Board of Supervisory Directors of KfW have resolved to recognise the principles of the Federal Public Corporate Governance Code (Public Corporate Governance Kodex des Bundes – “PCGK”) and apply them at KfW. The Corporate Governance Report of KfW contains the declaration of compliance with the recommendations of the PCGK.
Non-financial statements
Information on the “Combined non-financial statements of KfW as the parent company and of KfW Group” can be found in the separate Global Reporting Initiative (GRI) standard report of the 2022 Sustainability report. This can be accessed online at:
www.kfw.de/Sustainability
63 | KfW Financial Report 2022 Combined Management Report | Declaration of compliance | Non-financial statements
65 | KfW Financial Report 2022 Consolidated financial statements
KfW Financial Report 2022 Consolidated financial statements | 66
Consolidated statement of
comprehensive income
Income statement
| | | | | | | | | | | | | | | | | | |
| | | | | | | | |
| | | | | Notes | | | | 2022 | | | | | | 2021 | | |
| | | | | | | | | EUR in millions | | | | | | EUR in millions | | |
| | | | | | | | |
Interest income from the effective interest method | | | | | | | | | | 3,065 | | | | | | 615 | | |
Other interest income | | | | | | | | | | 721 | | | | | | 446 | | |
Interest income, total | | | | | | (23) | | | | 3,786 | | | | | | 1,061 | | |
Interest expense | | | | | | (23) | | | | 1,638 | | | | | | –1,325 | | |
Net interest income1) | | | | | | | | | | 2,148 | | | | | | 2,386 | | |
Net gains/losses from risk provisions | | | | | | (7), (24) | | | | –124 | | | | | | 196 | | |
Net interest income after risk provisions | | | | | | | | | | 2,024 | | | | | | 2,582 | | |
Commission income | | | | | | (11), (25) | | | | 649 | | | | | | 647 | | |
Commission expense | | | | | | (25) | | | | 32 | | | | | | 24 | | |
Net commission income | | | | | | | | | | 617 | | | | | | 623 | | |
Net gains/losses from hedge accounting | | | | | | (8), (26), (58), (59) | | | | 150 | | | | | | –110 | | |
Net gains/losses from other financial instruments at fair value through profit or loss | | | | | | (27) | | | | 64 | | | | | | 767 | | |
Net gains/losses from disposal of financial assets at amortised cost | | | | | | (28) | | | | –1 | | | | | | –4 | | |
Net gains/losses from investments accounted for using the equity method | | | | | | (6), (29) | | | | 43 | | | | | | 14 | | |
Administrative expense | | | | | | (30) | | | | 1,525 | | | | | | 1,466 | | |
Net other operating income or loss | | | | | | (31) | | | | –8 | | | | | | –53 | | |
Profit/loss from operating activities | | | | | | | | | | 1,365 | | | | | | 2,353 | | |
Taxes on income | | | | | | (20), (32) | | | | –1 | | | | | | 137 | | |
Consolidated profit | | | | | | | | | | 1,365 | | | | | | 2,215 | | |
| |
1) Refer to Note 23 for a gross presentation of Interest income and Interest expense related to reporting of negative interest income and positive interest expense. | | |
| | | | | | |
Consolidated statement of comprehensive income | | | | | | | | | | | | |
| | | | | | | | | | | | | | | | | | | |
| | | | 2022 | | | | | | 2021 | | |
| | | | EUR in millions | | | | | | EUR in millions | | |
| | | | | | |
Consolidated profit | | | | 1,365 | | | | | | 2,215 | | |
Other comprehensive income | | | | 1,007 | | | | | | 195 | | |
| | | | | | |
Change in own credit risk of liabilities designated at fair value through profit or loss | | | | 137 | | | | | | 23 | | |
| | | | | | |
Defined benefit pension obligations (before taxes) | | | | 922 | | | | | | 182 | | |
| | | | | | |
Deferred taxes on defined benefit pension obligations | | | | –53 | | | | | | –10 | | |
| | | | | | |
| Consolidated comprehensive income | | | | 2,372 | | | | | | 2,410 | | |
Other comprehensive income comprises amounts recognised directly in equity under Revaluation reserves. These amounts include income and expense from the change in own credit risk of liabilities designated at fair value through profit or loss, changes in actuarial gains and losses for defined benefit pension obligations, and changes in deferred taxes reported depending on the underlying transaction.
67 | KfW Financial Report 2022 Consolidated financial statements | Consolidated statement of comprehensive income
Consolidated statement of
financial position
| | | | | | | | | | | | | | | | | | |
Assets |
| | | | | | | | | | | | | | | | | | | |
| | | | | Notes | | | | | | 31 Dec. 2022 | | | | | | 31 Dec. 2021 | | |
| | | | | | | | | | | EUR in millions | | | | | | EUR in millions | | |
| | | | | | | | | |
| Cash reserves | | | | (35) | | | | | | 51,848 | | | | | | 42,439 | | |
| | | | | | | | | |
Financial assets at amortised cost | | | | (7), (12), (36), (37), (38), (58), (59) | | | | | | 500,265 | | | | | | 473,221 | | |
| | | | | | | | | |
Financial assets at fair value | | | | (7), (39), (60) | | | | | | 16,624 | | | | | | 19,085 | | |
| | | | | | | | | |
Value adjustments from macro fair value hedge accounting | | | | (8), (40), (60) | | | | | | –25,859 | | | | | | 4,609 | | |
| | | | | | | | | |
Derivatives designated for hedge accounting | | | | (8), (41), (58), (59), (60) | | | | | | 9,005 | | | | | | 8,478 | | |
| | | | | | | | | |
Investments accounted for using the equity method | | | | (6), (42) | | | | | | 642 | | | | | | 597 | | |
| | | | | | | | | |
Non-current assets held for sale | | | | (13), (43) | | | | | | 64 | | | | | | 119 | | |
| | | | | | | | | |
Property, plant and equipment | | | | (16), (44) | | | | | | 929 | | | | | | 971 | | |
| | | | | | | | | |
Intangible assets | | | | (18), (45) | | | | | | 100 | | | | | | 144 | | |
| | | | | | | | | |
Income tax assets | | | | (20), (46) | | | | | | 239 | | | | | | 2361) | | |
| | | | | | | | | |
Other assets | | | | (11), (47) | | | | | | 771 | | | | | | 794 | | |
| Total | | | | | | | | | | 554,628 | | | | | | 550,6921) | | |
1) Adjustments to corresponding prior-year figures as detailed under “Changes to significant accounting policies and estimates” in the Notes. Liabilities and equity |
| | | | | | | | | | | | | | | | | | | |
| | | | | | | | | |
| | | | | Notes | | | | | | 31 Dec. 2022 | | | | | | 31 Dec. 2021 | | |
| | | | | | | | | | | EUR in millions | | | | | | EUR in millions | | |
| | | | | | | | | |
Financial liabilities at amortised cost | | | | (7), (48), (58), (59) | | | | | | 492,579 | | | | | | 496,385 | | |
Financial liabilities at fair value | | | | (7), (49), (60), (62) | | | | | | 11,401 | | | | | | 11,484 | | |
Value adjustments from macro fair value hedge accounting | | | | (8), (50), (60) | | | | | | 18 | | | | | | 37 | | |
Derivatives designated for hedge accounting | | | | (8), (51), (58), (59), (60) | | | | | | 10,819 | | | | | | 4,554 | | |
Provisions | | | | (7), (19), (52) | | | | | | 2,672 | | | | | | 3,576 | | |
Income tax liabilities | | | | (20), (53) | | | | | | 61 | | | | | | 671) | | |
Other liabilities | | | | (11), (54) | | | | | | 501 | | | | | | 382 | | |
Equity | | | | (21), (55) | | | | | | 36,579 | | | | | | 34,207 | | |
Paid-in subscribed capital | | | | | | | | | | 3,300 | | | | | | 3,300 | | |
Capital reserve | | | | | | | | | | 8,447 | | | | | | 8,447 | | |
Reserve from the ERP Special Fund | | | | | | | | | | 1,191 | | | | | | 1,191 | | |
Retained earnings | | | | | | | | | | 23,391 | | | | | | 22,026 | | |
Fund for general banking risks | | | | | | | | | | 200 | | | | | | 200 | | |
Revaluation reserves | | | | (7), (21), (55) | | | | | | 50 | | | | | | –957 | | |
| Total | | | | | | | | | | 554,628 | | | | | | 550,6921) | | |
| | 1) | Adjustments to corresponding prior-year figures as detailed under “Changes to significant accounting policies and estimates” in the Notes. |
KfW Financial Report 2022 Consolidated financial statements | Consolidated statement of financial position | 68
Consolidated statement of
changes in equity
Consolidated statement of changes in equity
| | | | | | | | | | | | | | | | | | | | | | | | | | | | | | | | | | | | | | | | | | | | | | | | |
| | | | | Subscribed capital | | | | | | Capital reserve | | | | | | Reserve from the ERP Special Fund | | | | | | Retained earnings | | | | | | Fund for general banking risks | | | | | | Revalua- tion reserves | | | | | | | | | | Total | | | | |
| | | | | EUR in millions | | | | | | EUR in millions | | | | | | EUR in millions | | | | | | EUR in millions | | | | | | EUR in millions | | | | | | EUR in millions | | | | | | | | | | EUR in millions | | | | |
| | | | | | | | | | | | | | | | | |
As of 1 Jan. 2021 | | | | 3,300 | | | | | | 8,447 | | | | | | 1,191 | | | | | | 19,411 | | | | | | 600 | | | | | | –1,151 | | | | | | | | | | 31,797 | | | | |
Consolidated comprehensive income | | | | 0 | | | | | | 0 | | | | | | 0 | | | | | | 2,215 | | | | | | 0 | | | | | | 195 | | | | | | | | | | 2,410 | | | | |
Consolidated profit | | | | 0 | | | | | | 0 | | | | | | 0 | | | | | | 2,215 | | | | | | 0 | | | | | | 0 | | | | | | | | | | 2,215 | | | | |
Other comprehensive income | | | | 0 | | | | | | 0 | | | | | | 0 | | | | | | 0 | | | | | | 0 | | | | | | 195 | | | | | | | | | | 195 | | | | |
| Reclassifications within Equity | | | | 0 | | | | | | 0 | | | | | | 0 | | | | | | 400 | | | | | | –400 | | | | | | 0 | | | | | | | | | | 0 | | | | |
As of 31 Dec. 2021 | | | | 3,300 | | | | | | 8,447 | | | | | | 1,191 | | | | | | 22,026 | | | | | | 200 | | | | | | –957 | | | | | | | | | | 34,207 | | | | |
| | | | | | | | | | | | | | | | | |
Consolidated comprehensive income | | | | 0 | | | | | | 0 | | | | | | 0 | | | | | | 1,365 | | | | | | 0 | | | | | | 1,007 | | | | | | | | | | 2,372 | | | | |
Consolidated profit | | | | 0 | | | | | | 0 | | | | | | 0 | | | | | | 1,365 | | | | | | 0 | | | | | | 0 | | | | | | | | | | 1,365 | | | | |
Other comprehensive income | | | | 0 | | | | | | 0 | | | | | | 0 | | | | | | 0 | | | | | | 0 | | | | | | 1,007 | | | | | | | | | | 1,007 | | | | |
| Reclassifications within Equity | | | | 0 | | | | | | 0 | | | | | | 0 | | | | | | 0 | | | | | | 0 | | | | | | 0 | | | | | | | | | | 0 | | | | |
As of 31 Dec. 2022 | | | | 3,300 | | | | | | 8,447 | | | | | | 1,191 | | | | | | 23,391 | | | | | | 200 | | | | | | 50 | | | | | | | | | | 36,579 | | | | |
The reclassifications within Equity in the previous year are due to the partial reversal of EUR 400 million from the fund for general banking risks recorded in KfW’s financial statements in accordance with the provisions of the German Commercial Code (HGB), which result in a corresponding increase in Retained earnings.
The difference to the consolidated comprehensive income is allocated to Other retained earnings or – if recognised directly in equity – to Revaluation reserves.
Note 55 provides details on the consolidated statement of changes in equity and also discloses the development of revaluation reserves as of financial year 2022.
69 | KfW Financial Report 2022 Consolidated financial statements | Consolidated statement of changes in equity
Consolidated statement
of cash flows
| | | | | | | | | | | | | | | | | | | | | | | | |
| | | | | | | | | | | | | | | | | | | | |
| | | | | | | |
| | | | | | | | 2022 | | | | | | | | 2021 | | | |
| | | | | | | | EUR in millions | | | | | | | | EUR in millions | | | |
| | | | | | | |
Consolidated profit | | | | | | | | | | 1,365 | | | | | | | | | | 2,215 | | | | |
Non-cash items included in consolidated profit and reconciliation to cash flow from operating activities: | | | | | | | | | | | | | | | | | | | | | | | | |
| Depreciation, amortisation, impairment and reversal of impairment losses (assets) and | | | | | | | | | | 399 | | | | | | | | | | 42 | | | | |
changes in risk provisions for lending business | | | | | | | | | | | | | | | | | | | | |
Changes in provisions for pensions and similar commitments and Other provisions | | | | | | | | | | 161 | | | | | | | | | | 359 | | | | |
Other non-cash expenses and income | | | | | | | | | | –47 | | | | | | | | | | 88 | | | | |
Profit/loss from the disposal of assets | | | | | | | | | | 0 | | | | | | | | | | 0 | | | | |
Other adjustments | | | | | | | | | | –2,102 | | | | | | | | | | –2,337 | | | | |
Subtotal | | | | | | | | | | –224 | | | | | | | | | | 368 | | | | |
Changes in assets and liabilities from operating activities after adjustment for non-cash items: | | | | | | | | | | | | | | | | | | | | | | | | |
Financial assets at amortised cost | | | | | | | | | | –27,304 | | | | | | | | | | –12,555 | | | | |
Financial assets at fair value | | | | | | | | | | –431 | | | | | | | | | | –955 | | | | |
Other assets relating to operating activities | | | | | | | | | | 33,277 | | | | | | | | | | 7,4971) | | | | |
Financial liabilities at amortised cost | | | | | | | | | | –3,806 | | | | | | | | | | 12,519 | | | | |
Financial liabilities at fair value | | | | | | | | | | –1,818 | | | | | | | | | | –2,794 | | | | |
Other liabilities relating to operating activities | | | | | | | | | | 7,697 | | | | | | | | | | –8,0711) | | | | |
Interest and dividends received | | | | | | | | | | 3,786 | | | | | | | | | | 1,061 | | | | |
Interest paid | | | | | | | | | | –1,638 | | | | | | | | | | 1,325 | | | | |
Income tax paid | | | | | | | | | | –46 | | | | | | | | | | –49 | | | | |
Cash flow from operating activities | | | | | | | | | | –9,492 | | | | | | | | | | –1,655 | | | | |
Property, plant and equipment/Intangible assets: | | | | | | | | | | | | | | | | | | | | | | | | |
Cash proceeds from disposals | | | | | | | | | | 10 | | | | | | | | | | 3 | | | | |
Cash payments for acquisitions | | | | | | | | | | –41 | | | | | | | | | | –72 | | | | |
Securities and investments (equity investments): | | | | | | | | | | | | | | | | | | | | | | | | |
Cash proceeds from disposals/Cash payments for acquisitions | | | | | | | | | | –53 | | | | | | | | | | –15 | | | | |
Cash flow from investing activities | | | | | | | | | | –83 | | | | | | | | | | –84 | | | | |
Cash proceeds from/Cash payments for capital increases/decreases | | | | | | | | | | 0 | | | | | | | | | | 0 | | | | |
Changes from other financing activities | | | | | | | | | | 0 | | | | | | | | | | 0 | | | | |
Cash flow from financing activities | | | | | | | | | | 0 | | | | | | | | | | 0 | | | | |
Cash and cash equivalents as of the end of the previous period | | | | | | | | | | 42,439 | | | | | | | | | | 44,178 | | | | |
Cash flow from operating activities | | | | | | | | | | 9,492 | | | | | | | | | | –1,655 | | | | |
Cash flow from investing activities | | | | | | | | | | –83 | | | | | | | | | | –84 | | | | |
| Cash flow from financing activities | | | | | | | | | | 0 | | | | | | | | | | 0 | | | | |
Cash and cash equivalents as of the end of the period | | | | | | | | | | 51,848 | | | | | | | | | | 42,439 | | | | |
| | 1) | Adjustments to prior-year figures as detailed under “Changes to significant accounting policies and estimates” in the Notes. |
KfW Financial Report 2022 Consolidated financial statements | Consolidated statement of cash flows | 70
The balance of Cash and cash equivalents reported in the statement of cash flows in accordance with IAS 7 is identical to the statement of financial position item Cash reserves and thus comprises cash on hand and balances with central banks.
The statement of cash flows shows the changes in Cash and cash equivalents in the financial year classified as the Cash flows from operating activities, investing activities and financing activities. The item Other adjustments largely comprises the adjustment for net interest income in the amount of EUR –2,148 million (2021: EUR –2,386 million). The cash payments for the repayment portion of lease liabilities included in Cash flow from operating activities amounted to EUR 13 million in financial year 2022 (2021: EUR 13 million). The cash payments for the interest portion of lease liabilities are reported under Interest paid.
For more information on KfW Group’s liquidity risk management, see the section on liquidity risk in the combined management report.
71 | KfW Financial Report 2022 Consolidated financial statements | Consolidated statement of cash flows

Accounting policies
(1) Basis of presentation
As the parent company of KfW Group, KfW (hereinafter “KfW”) is the promotional bank of the Federal Republic of Germany and was founded in 1948 as a public law institution based in Frankfurt am Main (Palmengartenstrasse 5–9, 60325 Frankfurt am Main, Germany). KfW promotes sustainable improvement of economic, environmental and social conditions around the world, with an emphasis on the German economy.
The Executive Board of KfW is responsible for the preparation of the consolidated financial statements and the combined management report. After the recommendation of the Audit Committee, the consolidated financial statements and the combined management report are submitted to KfW’s Board of Supervisory Directors for approval.
As of the reporting date, KfW Group comprises KfW and six subsidiaries that are fully consolidated. One joint venture and three associated companies are accounted for using the equity method.
Pursuant to Section 315e (1) of the German Commercial Code (Handelsgesetzbuch – “HGB”), the consolidated financial statements as of 31 December 2022 have been prepared in accordance with the International Financial Reporting Standards (“IFRS”), as adopted by the European Union (“EU”), and with the interpretations set out by the IFRS Interpretations Committee (“IFRS IC”), as mandatory consolidated accounts in accordance with Article 4 of Regulation (EC) No. 1606/2002 (“IAS Regulation”) of the European Parliament and of the Council of 19 July 2002, as well as further regulations on the adoption of certain international accounting standards. The standards and interpretations that apply are those that have been published and endorsed by the European Union as of the reporting date.
The supplementary provisions of the German Commercial Code that also apply to IFRS consolidated financial statements have been taken into account. The combined management report prepared in accordance with Section 315 of the German Commercial Code includes the risk report with risk-oriented information on financial instruments as set out in IFRS 7, as well as information on capital and capital management as set out in IAS 1.134.
The consolidated financial statements were prepared in accordance with accounting policies that are consistent across KfW Group and are prepared on a going concern basis. The companies included in the consolidated financial statements have prepared their annual financial statements as of 31 December 2022, except for some associated companies accounted for using the equity method, where financial statements as of 30 September 2022 were used. Material events for the latter companies as of the reporting date were also taken into account.
The accounting policies in the consolidated financial statements were applied consistently with the exception of the items listed in Note 3.
The reporting currency is the euro. Unless otherwise specified, all amounts are stated in millions of euros (EUR in millions).
(2) Accounting standards that are new, amended or to be adopted for the first time
A. Impact of new or amended IFRS/IFRIC interpretations adopted for the first time in financial year 2022
The update to IFRS 3 mainly relates to the reference to the revised conceptual framework. In addition, IFRS 3 was amended to require an acquirer to apply IAS 37 or IFRIC 21 instead of the conceptual framework to identify the obligations it has assumed that are within the scope of IAS 37 or IFRIC 21. Furthermore, IFRS 3 was amended to explicitly prohibit the recognition of acquired contingent assets.
73 | KfW Financial Report 2022 Consolidated financial statements | Notes – Accounting policies
The amendment to IAS 37 clarified that in determining an onerous contract, in addition to incremental costs, directly related costs are also to be taken into account.
The amendment to IAS 16 clarified that in future proceeds generated from the sale of any items produced while bringing an item of property, plant and equipment (“PPE”) into use must be directly recognised in profit or loss. Such proceeds can no longer be deducted from the cost of the PPE item.
Amendments were made to IFRS 1, IAS 41, IFRS 9 and IFRS 16 in May 2020 as part of the Annual Improvements to IFRS (2018–2020 Cycle). The aim of the Annual Improvements is to improve the quality of the standards by clarifying requirements or wording.
The amendments and improvements described were endorsed into European law in June 2021 and are effective for financial years beginning on or after 1 January 2022. They do not have any impact on KfW Group’s net assets, financial and earnings position.
B. Impact of new or amended IFRS/IFRIC interpretations to be adopted in the future that were endorsed by the EU into European law before the reporting date
| | | | | | | | |
Standard concerned | | | | Mandatory application for financial years from | | | | Description |
| | | | | | | | |
| | | | |
| IAS 1 | | | | 1 Jan. 2023 | | | | The February 2021 amendments to IAS 1 and IFRS Practice Statement 2 specify the extent to which accounting policy information must be disclosed in IFRS financial statements (notes). This shifts the focus to company-specific information instead of standardised information and primarily affects the disclosure requirements set out in IAS 1.117. In the future, entities will be required to disclose material accounting policy information rather than their significant accounting policies; immaterial transactions, other events or conditions need not be disclosed. In applying the “materiality” concept, in addition to the absolute amount involved, the type of transaction, of other events, and conditions must be considered. The amendments also explain when an accounting policy is to be considered material. |
| | | | | | | | |
| IAS 8 | | | | 1 Jan. 2023 | | | | The changes to IAS 8 focus solely on accounting estimates and are intended to provide guidance on how to distinguish between accounting policies and accounting estimates. The amendment for the first time includes a definition of accounting estimate. Moreover, it clarifies that accounting estimates based on changes and new developments or circumstances do not constitute errors requiring rectification. |
| | | | | | | | |
| IAS 12 | | | | 1 Jan. 2023 | | | | The amendment to IAS 12 limits the scope of the initial recognition exemption, according to which deferred tax assets or liabilities are not to be recognised at the time the asset or liability is acquired. In the future, deferred taxes are to be recognised for transactions that give rise to equal taxable and deductible temporary differences. The amendment is particularly relevant for IFRS 16 applications. |
| | | | | | | | |
| IFRS 17 | | | | 1 Jan. 2023 | | | | IFRS 17 “Insurance Contracts” was issued in May 2017 with the intention of replacing IFRS 4 “Insurance Contracts” in the future. It sets out principles for the recognition, measurement, presentation and disclosure of insurance contracts within the scope of the standard. The IASB adopted amendments and clarifications to IFRS 17 at the end of June 2020, thereby delaying the date of mandatory first-time application of IFRS 17 by two years, to 1 January 2023. The amendments of December 2021 relate to financial assets of entities that are applying IFRS 17 and IFRS 9 in their accounting for the first time and presenting comparative information that has not been restated for IFRS 9. Entities have the option of presenting comparative information about a financial asset as if IFRS 9 classification and measurement requirements had been applied to that financial asset before. The option may be applied to each individual instrument. |
KfW Financial Report 2022 Consolidated financial statements | Notes – Accounting policies | 74
KfW is not using the permitted option of early application of standard amendments. The future amendments to the standards described above are not expected to have any significant impact on KfW’s net assets, financial and earnings position.
C. New or amended IFRS/IFRIC interpretations to be applied in the future that were published by the EU before the reporting date but have not yet been endorsed into European law
| | | | |
| | |
Standard concerned | | Mandatory application for financial years from | | Description |
| | | | |
| | |
IAS 1 | | 1 Jan. 2024 | | The January 2020 amendments serve to clarify the criteria for classifying liabilities as current or non-current. In the future, the classification of liabilities as current or non-current will be based on the rights held by the entity on the reporting date. A liability is classified as non-current if, at the end of the reporting period, the entity has a substantial right to defer settlement of the liability for at least 12 months after the reporting date. Further guidance on the interpretation of specific criteria and explanatory notes have also been included. The amendment to IAS 1 published in October 2022 clarifies when debt is to be classified as current or non-current, taking into account agreed covenants. It stipulates that only covenants that must be complied with on or before the reporting date affect the classification as current or non-current liabilities. For liabilities classified as non-current with covenants which are due within 12 months after the reporting date, additional disclosures must be made in the notes to enable users of the financial statements to assess the risk of a possible early repayment of the liability. |
| | | | |
| IFRS 16 | | 1 Jan. 2024 | | The amendment to IFRS 16 introduces rules on subsequent measurement for seller-lessees in the case of leases in a sale and leaseback transaction. It stipulates that in the subsequent measurement, the lease liability is to be measured in a way that does not recognise any gain or loss that relates to the right of use it retains. |
KfW does not intend to utilise any permitted options to apply standard amendments early. The amendments described above are likely to have only minor effects, if any, on KfW’s net assets, financial and earnings position.
(3) Changes to material accounting policies
The method of calculating valuation adjustments induced by credit rating changes (xVAs) for derivative financial instruments was adjusted for KfW IPEX-Bank in the beginning of 2022. From the point at which this change was implemented, this resulted in a decrease of EUR 11 million, which was already anticipated in the consolidated financial statements as of 31 December 2021. Further developing the xVA calculation enables more precise determination of the ineffectiveness from economic hedges at group companies.
Against this backdrop, the method for calculating deferred taxes for derivatives in the taxable companies was also analysed and adjusted. This impacted the statement of financial position with regard to temporary differences in the derivatives business of the taxable companies. In one group company, the resulting decrease of deferred tax assets induced changes in impairments, which also affected other items, not related to derivatives.
Moreover, from financial year 2022, deferred income tax assets will be offset against corresponding deferred income tax liabilities at group company level. The adjustments to deferred taxes reduced KfW Group’s total assets by EUR 270 million in financial year 2021. The adjustments did not have any significant impact on the consolidated income statement or group equity in financial year 2021.
The change was made by retroactive adjustment as follows:
75 | KfW Financial Report 2022 Consolidated financial statements | Notes – Accounting policies
Statement of financial position – assets (excerpt)
| | | | | | | | | | | | | | | | | | | | | | | | |
| | | | | | Before adjustment | | | | | | Adjustment | | | | | | After adjustment | |
| | | | | | | | 31 Dec. 2021 | | | | | | | | | | | | | | | | 31 Dec. 2021 | |
| | | | | EUR in millions | | | | | | EUR in millions | | | | | | EUR in millions | |
| | | | | | |
| Deferred income tax assets | | | | | | | 490 | | | | | | | | –268 | | | | | | | | 222 | |
of which Financial assets (at amortised cost and at fair value) | | | | | | | 105 | | | | | | | | –2 | | | | | | | | 103 | |
of which Intangible assets | | | | | | | 5 | | | | | | | | 0 | | | | | | | | 5 | |
of which Financial liabilities at fair value | | | | | | | 270 | | | | | | | | –252 | | | | | | | | 18 | |
of which Provisions | | | | | | | 77 | | | | | | | | 3 | | | | | | | | 80 | |
of which other statement of financial position items | | | | | | | 17 | | | | | | | | –17 | | | | | | | | 0 | |
of which Loss carryforwards | | | | | | | 16 | | | | | | | | 0 | | | | | | | | 16 | |
| Subtotal | | | | | | | 490 | | | | | | | | –268 | | | | | | | | 222 | |
Offset against deferred tax liabilities | | | | | | | 0 | | | | | | | | 2 | | | | | | | | 2 | |
Total | | | | | | | 490 | | | | | | | | –270 | | | | | | | | 220 | |
| | | | | | | 0 | | | | | | | | | | | | | | | | 0 | |
| |
Total assets | | | | | | | 550,962 | | | | | | | | –270 | | | | | | | | 550,692 | |
Statement of financial position – liabilities and equity (excerpt)
| | | | | | | | | | | | | | | | | | | | | | | | |
| | | | | | Before adjustment | | | | | | Adjustment | | | | | | After adjustment | |
| | | | | | | | 31 Dec. 2021 | | | | | | | | | | | | | | | | 31 Dec. 2021 | |
| | | | | | | | EUR in millions | | | | | | | | EUR in millions | | | | | | | | EUR in millions | |
| | | | | | |
| Deferred income tax liabilities | | | | | | | 308 | | | | | | | | –268 | | | | | | | | 40 | |
of which Financial assets at fair value – Other derivatives | | | | | | | 275 | | | | | | | | –275 | | | | | | | | 0 | |
of which Financial assets at fair value – Securities and investments | | | | | | | 0 | | | | | | | | 39 | | | | | | | | 39 | |
of which other statement of financial position items | | | | | | | 33 | | | | | | | | –32 | | | | | | | | 1 | |
Subtotal | | | | | | | 308 | | | | | | | | –268 | | | | | | | | 40 | |
Offset against deferred tax assets | | | | | | | 0 | | | | | | | | 2 | | | | | | | | 2 | |
Total | | | | | | | 308 | | | | | | | | –270 | | | | | | | | 38 | |
| | | | | | | | | | | | | | | | | | | | | | | | |
| |
Total liabilities and equity | | | | | | | 550,962 | | | | | | | | –270 | | | | | | | | 550,692 | |
(4) Judgements and accounting estimates
The consolidated financial statements include amounts based on management’s judgements and/or estimates and assumptions which are determined to the best of our ability and in accordance with the applicable accounting standard. Actual results realised in a future period may differ from these estimates. Material judgements, estimates and assumptions are required, in particular, for calculating risk provisions (including risk provisions for lending business), recognising and measuring provisions (primarily for pension liabilities and legal risks), measuring the fair value of financial instruments based on valuation models (including determining the existence of an active market), determining remaining terms of leases, assessing and measuring impairment of assets, and assessing the utilisation of deferred tax assets. The estimates and the assumptions underlying these estimates are reviewed on an ongoing basis and are based, among other things, on historical experience or expected future events that appear likely given the particular circumstances. Where judgements as well as estimates and their underlying assumptions were required, the assumptions made are explained in the relevant notes.
KfW Financial Report 2022 Consolidated financial statements | Notes – Accounting policies | 76
KfW does not expect any deviations from its assumptions and does not foresee any uncertainties in its estimates that could result in a material adjustment to the related assets and liabilities within the next financial year. Given the strong dependency on the development of the economy and financial markets, however, such deviations and uncertainties cannot be fully ruled out. These risks are nevertheless low because valuation models – especially those involving the use of inputs not based on observable market data – are employed to measure only small parts of receivables, securities, investments and borrowings measured at fair value, on the one hand, and only a small portion of financial derivatives used to economically hedge risk, on the other hand.
The anticipated impact of the Russia-Ukraine war as well as the fading COVID-19 pandemic were taken into account in calculating risk provisions and fair values for equity investments within the framework of the established accounting policies. The procedure and the minor adjustments are presented as follows:
Risk provisions for performing loans (stages 1 and 2) and, in the retail business, also for non-performing loans (stage 3) are calculated using risk parameters which are geared to regulatory and internal credit risk models for the parameterisation of probability of default (“PD”), loss given default (“LGD”) and exposure at default (“EAD”). In the first half of 2022, there was a transition to a new system for the provision of these risk parameters, combined with the adoption of further developed models, particularly for the LGDs. The expected effects, calculated as a lump sum at the end of the year and already manually included in advance, were reduced accordingly.
In addition to the new models, it was possible to transition to best estimate parameters, which resulted in a reversal of risk provisions for performing loans in stages 1 and 2. This relief effect on risk provisions is partially compensated by the further development of the transfer criterion for non-retail business in good and medium rating classes. In addition, expected effects of methodological developments in bank rating, the EAD non-retail model as well as the LGD model of DEG were taken into account in the second half of 2022. Overall, this resulted in a total reduction in risk provisions for the business affected of EUR 14 million.
The economic effects of the Russia-Ukraine war and the energy crisis were taken into account as of 31 December 2022 mainly by means of adjusting the probabilities of default and of a more conservative treatment of loss ratios (inclusion of downturn components). The deteriorated macroeconomic expectations compared to the previous year are primarily reflected in the point in time adjustment of probabilities of default, which overall resulted in an increase in risk provisions for performing loans in financial year 2022.
Environmental, Social und Governance risks (“ESG risks”) do not present any new risks for KfW that need to be taken into account, as Risk Management already addresses ESG risks in the context of borrower ratings, credit assessments and portfolio analyses as part of the group’s risk strategy. These risks are therefore already reflected in risk provisions for lending business; they do not have a material impact on the determination of any individual risk provisions.
The subsequent assessment of equity investments at fair value is based on recognised standard valuation methods such as discounted cash flow (“DCF”) or net asset value (“NAV”). Due to the three-month time lag between the KfW Group reporting date (31 December 2022) and the reporting date for the equity funds (30 September 2022), the net asset values are adjusted, if necessary, in the event of short-term changes in the economic environment or new information regarding individual investments. The economic impact of the Russia-Ukraine war is taken into account in such assessment.
KfW Group adjusted the basis for deriving the discount rate for pension obligations in accordance with IFRS, effective 30 June 2022. The previously used Mercer Yield Curve has been replaced by a differentiated interest rate recommendation from KfW Group’s actuary Heubeck. The negative transition effect of EUR 23 million was recognised in equity with no effect on profit or loss.
77 | KfW Financial Report 2022 Consolidated financial statements | Notes – Accounting policies
(5) Group of consolidated companies
All significant subsidiaries, joint ventures and associated companies are included in the consolidated financial statements.
Subsidiaries are all business units (including structured entities) over which the group exercises control. Control exists when a group is exposed or entitled to variable cash flows through its relationship and has the opportunity to use its power of disposal to influence the amount of such cash flows. Subsidiaries are included in the consolidated financial statements (full consolidation) from the point at which control is transferred to the group. They are deconsolidated when control is lost.
Joint ventures and associated companies are included in the consolidated financial statements in accordance with IFRS 11/IAS 28 if a joint agreement is in place or the group has significant influence. Significant influence exists when KfW can participate in financial and business policy decisions regarding the associated company even if it does not have sole or joint control.
The composition of the consolidated group is presented in the Notes under “List of KfW Group shareholdings”.
(6) Basis of consolidation
Consolidation involves revaluing the total assets and liabilities of the subsidiaries at the acquisition date, irrespective of the equity interest held, and incorporating them into the consolidated statement of financial position. The resulting adjustments from hidden reserves and hidden burdens are treated in accordance with the applicable standards during the initial assessment. If the revaluation adjustments result in an excess compared to acquisition cost, this excess amount is capitalised as goodwill. No goodwill is currently recognised.
Any intercompany assets and liabilities as well as expenses and revenues from transactions between consolidated group companies are eliminated through debt consolidation, or earnings and expenses consolidation, respectively. Intercompany profits between fully consolidated companies are also eliminated.
Investments in associates and joint ventures are accounted for using the equity method. The group’s share of the profits or losses of associates and joint ventures is recognised in the “Net gains/losses from investments accounted for using the equity method” line item in the income statement.
There are no minority interests within KfW Group.
(7) Financial instruments
A. Classification and measurement
A financial instrument is any contract that gives rise to a financial asset of one entity and a financial liability or equity instrument of another entity. The rules under IFRS 9 “Financial Instruments” serve as the basis for recognition and measurement of financial instruments.
Classification of financial assets at initial recognition thus determines their subsequent measurement. Classification and subsequent measurement of debt instruments is based on the business model and characteristics of the contractual cash flows (solely payments of principal and interest, or “SPPI” criterion). Equity instruments, on the other hand, must always be measured at fair value.
IFRS 9 distinguishes between four categories of measurement for financial assets:
1. At amortised cost
2. At fair value through profit or loss (“FVTPL”), with the two sub-categories: mandatory and designated
3. At fair value through other comprehensive income (“FVTOCI”) with no recycling into profit or loss (not used at KfW)
4. At fair value through other comprehensive income (“FVTOCI”) with recycling into profit or loss (not used at KfW)
KfW Financial Report 2022 Consolidated financial statements | Notes – Accounting policies | 78
Instruments are assigned to business models on a portfolio basis. IFRS 9 provides for three business models to manage financial assets:
| 1. | Hold to collect – financial assets are held with the objective of collecting contractual cash flows. |
| 2. | Hold to collect and sell – financial assets are held with the objective of both collecting the contractual cash flows and selling the financial assets (not used at KfW). |
| 3. | Hold to sell – financial assets held with the objective of selling, or which do not fulfil the “hold to collect” or “hold to collect and sell” criteria. |
The cash flow criterion is assessed for each individual financial asset as the second step. The cash flows of financial instruments are then checked for consistency with a basic lending arrangement and as to whether they thus constitute SPPIs on the outstanding loan balance. IFRS 9 defines interest as compensation for the time value of money and credit risk assumed, although it can also include a premium for liquidity risk. As is customary for the sector, compensation (e.g. for equity or administrative costs) and a profit margin may also be included.
If payments contain payments beyond SPPIs, they must be measured at fair value. This also applies to non-recourse financing where the cash flows of the financed asset are increased or limited in such a way that they no longer constitute interest or principal payments in economic terms and the bank is consequently not exposed to a credit risk but rather to a project or investment risk.
A financing agreement condition does not affect classification if its effect on the contractual cash flows of the financial asset is only minor (de minimis). KfW employs group-wide rules and a standardised classification of contractual covenants in assessing the SPPI criterion. For sustainability-linked loans in which the interest rate varies depending on compliance with defined ESG criteria, a de minimis threshold value is taken as the basis for assessing the SPPI criterion.
An assessment is made in non-recourse loans as to whether mitigation of the property or project risks creates a sufficient risk buffer and whether this then outweighs the credit risk.
A financial asset must have been allocated to a portfolio with the “hold to collect” business model and meet the cash flow criterion for measurement at amortised cost. The KfW business model is focused on a long-term sustainability approach. As KfW does not enter into any transactions with the intention of generating a short-term profit, the Executive Board has decided on the “hold to collect” business model for all credit portfolios (except for the two cases mentioned below). Moreover, the group’s lending business is largely consistent with the definition of a basic lending arrangement, and thus meets the SPPI criterion. The two exceptions to the “hold to collect” business model in the lending business are as follows:
| – | Holding arrangements for the Federal Republic of Germany: Holdings KfW maintains by mandate for the Federal Republic of Germany are not subject to KfW management. Sales are to be executed upon the Federal Government’s instruction. As KfW cannot assume that these positions will remain in the portfolio for the long term, it cannot assume a “hold to collect” intention. |
| – | KfW IPEX-Bank’s syndication business: This business focuses on short-term sales and not on the objective of holding and selling the assets in equal measure. |
Both cases of exception are assigned to the “hold to sell” business model. The holdings are measured at FVTPL.
Securities portfolios are also assigned to the “hold to collect” business model. This applies to KfW’s liquidity portfolio as well. As KfW places minimum requirements on the ECB-eligibility of securities with regard to its liquidity portfolio, liquidity is secured by means of repo transactions. This therefore means that sales from the liquidity portfolio are unnecessary. The ancillary agreements are recorded and evaluated in the system to check the SPPI criterion. Securitisations are checked on a case-by-case basis to address the special rules for “contractually linked instruments”. Consequently, KfW securities portfolios are largely measured at amortised cost using the effective interest method, as is its lending business.
KfW’s investments from equity finance are accounted for at fair value through profit or loss, as these are either equity instruments or debt instruments with no fixed interest or principal payments. KfW does not exercise the option of FVTOCI for equity instruments.
79 | KfW Financial Report 2022 Consolidated financial statements | Notes – Accounting policies
Consequently, KfW only applies the first two categories for financial assets: amortised cost and FVTPL.
IFRS 9 only provides for two categories for financial liabilities: amortised cost and FVTPL. Financial liabilities are accounted for at FVTPL if they are classified as held for trading (mandatory fair value) or assigned to this measurement category at initial recognition through application of the fair value option (designated fair value); otherwise they are accounted for at amortised cost. The classification must be irrevocably determined at initial recognition. Reclassification is not permitted.
All non-derivative financial liabilities are held for non-trading purposes at KfW. All non-derivative financial liabilities for which the fair value option has not been exercised are classified as liabilities at amortised cost. These are thus measured at amortised cost using the effective interest method. For the group, this category covers funding reported in Financial liabilities at amortised cost (Liabilities to banks, Liabilities to customers and Certificated liabilities). The fair value option is exercised for some structured liabilities such as promissory note loans (Schuldscheindarlehen) and certificated liabilities. This concerns liabilities with bifurcated structures as well as liabilities with non-bifurcated structures for which there is an accounting mismatch unless they meet the requirements for application of hedge accounting. In exercising the fair value option, valuation effects resulting from changes in own credit risk are recognised directly in equity in the revaluation reserve.
Derivatives are concluded at KfW solely for hedging purposes and measured at FVTPL.
Derivatives are recognised as of the trade date, and all other financial assets as of the settlement date. They are derecognised when the contractual rights from the assets have expired, the power of disposal or control has been transferred, or a substantial portion of the risks and rewards has been transferred to a third party unrelated to KfW Group. Financial liabilities are derecognised if the obligations specified in the contract have been discharged or cancelled, or have expired.
Financial instruments are initially recognised at fair value. Directly attributable transaction costs are included as incidental acquisition costs.
Financial instruments subsequently measured at amortised cost are measured based on the fair value at initial recognition, taking into account any principal repayments, impairments, and where applicable, contractual amendments. The amortisation of premiums and discounts, transaction costs and fees is performed in accordance with the effective interest method on the basis of the contractual cash flows. Discounts are amortised in the promotional lending business until the end of the first fixed interest rate period (generally five to ten years).
Subsequent measurement at fair value for recognition in the financial statements or for the disclosure of financial instruments in the Notes is presented in Section D. Fair value.
In accordance with Article 2 (4) of the KfW Law, the German Federal Government may mandate transactions to KfW on a case-by-case basis if there is a public interest on the part of the Federal Republic of Germany. Such transactions are referred to as mandated transactions. This means that KfW is mandated by the Federal Government to enter into or acquire certain financial instruments. Both equity and debt instruments can be used for such purposes. Mandated transactions are accounted for by applying the generally accepted IFRS rules on additions and disposals, but also on the receipt of income.
Due to the supplemental agreements with the Federal Government often associated with mandated transactions, the disposal criteria and, in particular, the existence of on-lending agreements must also be checked, in addition to the review of the initial recognition of the relevant financial instruments. On-lending agreements ensure that cash flows between KfW and the respective party to the agreement are ultimately passed on to the Federal Government. While the disposal criteria are normally not met with respect to debt instruments, they are generally met when applied to equity instruments, and the financial instrument is thus de-recognised immediately after initial recognition in the statement of financial position. Equity instruments resulting from mandated transactions are therefore not recognised in the financial statements, but are included in disclosures on trust activities in the notes.
KfW Financial Report 2022 Consolidated financial statements | Notes – Accounting policies | 80
B. Impairments
At KfW Group, provisions for loan losses are accounted for in accordance with IFRS 9 requirements and applied to the following financial instruments:
| – | Loans and receivables as well as third-party securities measured at amortised cost | |
| – | Loan commitments not measured at fair value through profit or loss | |
| – | Financial guarantees not measured at fair value through profit or loss | |
Impairments are calculated based on a three-stage model. All assets are assigned to stage 1 at initial recognition and an impairment is calculated that is equivalent to the 12-month expected credit loss (“ECL”).
Subsequently, expected credit losses are calculated based on changes in a financial instrument’s credit risk since initial recognition. If there has been a significant deterioration of the credit risk (stage 2) or objective evidence of impairment is identified (stage 3), expected credit losses are to be calculated over the remaining lifetime (lifetime ECLs). If, in contrast, there has been no significant increase in credit risk, the financial instrument is still assigned to stage 1 and only the ECLs for the term of the instrument resulting within the next 12 months from potential loss events are taken into account.
A lifetime ECL is recognised for financial instruments in stage 2 as risk provisioning. This is based on risk parameters oriented to regulatory and internal credit risk models for parameterisation of probability of default (“PD”), loss given default (“LGD”) and exposure at default (“EAD”). Interest income for financial instruments in stage 2 is recorded using the effective interest method based on the gross carrying amount.
A lifetime ECL is also recognised for financial instruments in stage 3 as risk provisioning. Assignment to stage 3 and thus classification as impaired is undertaken in line with the group-wide default definition, which reflects the definition of “default of an obligor” in accordance with Article 178 of the Capital Requirements Regulation (“CRR”). The definition distinguishes between the 90 days past due and unlikely to pay criteria. A distinction is made in calculating impairment in stage 3 between significant (non-retail) and non-significant (retail) financial instruments. Impairment for retail business in stage 3 is calculated based on risk parameters and applying a PD of 1. Individual impairment is recognised for incurred losses and is computed on the basis of individual loans for significant portfolios in the lending business. The amount of the impairment loss equals the difference between the carrying amount of the loan and the present value of discounted expected future cash flows from interest, redemption payments and collateral cash flows. Any reversals of individual impairment losses are accounted for through profit or loss. Interest income for these financial instruments is recognised based on the net carrying amount.
In contrast to the lending business, expected losses for defaulted securities are not calculated based on cash flow but instead on market values in stage 3. This is due to the assumption that the market value in the case of impairment is primarily influenced by credit rating factors.
Purchased or originated credit-impaired financial assets (“POCI”) are not significant due to KfW’s business model. The bank has therefore decided not to separately disclose these special requirements. If there are individual cases that meet the POCI definition, they will be assigned to stage 3 based on the default rating at the time of purchase.
KfW takes a nuanced approach to assignment to stages that takes both rating and qualitative information into account.
The bank uses the rating at initial recognition, taking account of the migration expected until the time of measurement (initial forward rating) to assess whether a transaction can migrate from stage 1 to stage 2. This rating, which is relevant for pricing, is compared with the rating at the time of measurement. This ensures that only transactions for which there is a significant deviation from the originally expected migration are transferred to stage 2. Concessions (contractual modifications) made to the obligor for economic or legal reasons (forbearance), are also considered as a factor in transfer to a subsequent stage.
As there is no individual rating specific to an obligor in the retail business, transfers from stage 1 to stage 2 are based on other credit deterioration indicators, such as negative factors or 30-days-past-due status.
81 | KfW Financial Report 2022 Consolidated financial statements | Notes – Accounting policies
KfW does not exercise the option of waiving assessment on whether there has been a significant increase in credit risk, if the instrument is determined to have ‘low credit risk’ at the reporting date (low credit risk exemption).
The IFRS 9 impairment model takes a symmetrical approach to migration, meaning that forward migration to stage 2 or stage 3 as well as reversion back from stages 2 and 3 are possible. Periods of good conduct are defined for the retail business, based on previous past-due status (> 30 days) or default. These range from 90 days to two years, depending on the specifics of the case. This accounts for the fact that no rating-based transfer criterion is applied to the retail business, and therefore, for example, in the absence of a payment default (> 30 days) without a good conduct period, there would be an immediate reversion to stage 1.
Expected credit losses for stage 1 and stage 2 and the retail business in stage 3 are calculated based on individual transactions using statistical risk parameters. The regulatory and internal credit risk models for parametrisation of PD, EAD and LGD that KfW uses in risk management serve as the basis for this calculation. These parameters are adequately adjusted to determine expected credit losses in accordance with IFRS 9. This enables largely uniform credit risk modelling in line with supervisory law, risk management and IFRS requirements even though they may individually differ somewhat in scope.
Calculation of one-year PD is based on the internal rating system, in which every exposure is assigned a PD score that corresponds to a rating scale of 18 levels for non-defaulted transactions (“PL”) and two levels for defaulted transactions (“NPL”). The lifetime PDs are derived from the one-year PD via migration matrices. For IFRS 9-compliant PD modelling, the internal credit risk parameters are adjusted by placing a greater weight on macroeconomic factors from a point-in-time (“PIT”) perspective. The adjustment is made through segment and rating-specific modelling of PD premiums and discounts on regulatory PD (through-the-cycle PD). This is based on expert estimates of the economic situation of sectors and countries, with assessment of expected effects, taking into account forward-looking information. This approach differs for the retail business, for which premiums and discounts are calculated applying an expert model based on econometric factors.
LGD is the loss ratio that results in the event of default after taking collateral into account. In accordance with IFRS 9 impairment requirements, a multi-year view without taking internal costs into account is generally required. The regulatory LGD parameters are adjusted accordingly in order that internal costs for IFRS 9 are not included in the calculation of expected credit losses.
The EAD per time bucket corresponds to the loan drawdown expected at the time of default, taking into account additional drawings on open lines of credit. For the off-balance sheet portion, the expected drawdown is calculated based on credit conversion factors (“CCFs”).
Risk provisions for on-balance sheet lending and securities business are deducted directly from the statement of financial position item Financial assets at amortised cost. Risk provisions for the off-balance sheet lending business are accounted for on the liabilities side as Provisions (sub-item: Provisions for credit risks).
The credit risks resulting from the on and off-balance sheet lending business and from financial assets measured at amortised cost are accounted for through impairments recognised in profit or loss in the amount of the one-year expected credit loss (stage 1) or the lifetime expected credit loss (stage 2 and stage 3). Additions to and reversals of risk provisions are recognised in Net gains/losses from risk provisions in the income statement.
An asset is written off in the event that it, or a portion thereof, is estimated as irrecoverable (write-off). In the non-retail business, this is not performed until there is no longer a prospect of recovery, as, for instance, all collateral has been realised or, in the event of insolvency, creditor quotas have been distributed or insolvency proceedings have been discontinued for lack of assets. Write-offs in the retail business are performed pursuant to defined criteria such as insolvency or a fixed default period, which are both related to termination of the loan. Recovery is pursued as long as it is economically viable.
In the case of a write-off, the gross carrying amount is reduced by the amount of the write-off. Current provisions for loan losses are utilised first, and any remaining amount is written off directly. Similar to recoveries on loans already written off, this direct write-off is also reported through profit or loss in the Net gains/losses from risk provisions item.
KfW Financial Report 2022 Consolidated financial statements | Notes – Accounting policies | 82
C. Contractual modifications
IFRS 9 defines contractual modifications as modifications of contractual cash flows. These can be caused by the credit rating or the market. In contrast, an adjustment of contractual payments agreed at the time the contract was concluded and thus intrinsic to the contract is not deemed a contractual modification.
Substantial contractual modifications result in derecognition of financial assets even if the same or the modified contract legally remains valid. The modified financial instrument is treated in accordance with IFRS 9 as a new contract and reclassified on the basis of general IFRS 9 classification criteria. Derecognition resulting from substantial modification is not relevant for the “hold to collect” business model. In the case of substantial modification of credit-impaired financial assets (non-performing loans – “NPLs”), the impairment loss is adjusted at derecognition. The amount of adjustment is the difference between the previous net carrying amount of the derecognised asset and the fair value of the newly recorded asset. The reduction in loan loss provisions is then recorded as utilisation at the time of derecognition. There are no further gains or losses resulting from the derecognition.
There is no write-off for non-substantial contractual modifications. A revaluation of the gross carrying amount of the modified financial instrument is performed instead. The resulting valuation difference is recognised in profit or loss as a modification gain or loss. The modification gain or loss reflects the effects on net present value of the contractually agreed upon change in cash flows. The original effective interest rate is applied for discounting cash flows. Then, on subsequent reporting dates, the original effective interest rate is applied to what is at that time the current (modified) cash flow for discounting. An amortisation result, which is reported as part of Net interest income, is calculated as the delta to the amortised costs of the previous reporting date on the basis of the amortised costs calculated using this method. This therefore yields an amortisation amount that partially represents the original premium/discount but also includes amortisation of the modification gain/loss.
The modification list serves as the group-wide basis for identification of relevant contractual modifications. A distinction is to be made between substantial and non-substantial modifications. This distinction is normally made based on qualitative criteria such as contractual amendments that result in a violation of the cash flow criterion within the meaning of IFRS 9.4.1.1(b).
Changes in currency without a contractual currency change option and changes in borrowers are also deemed substantial modifications. Since a substantial modification results in a failure to fulfil the cash flow criterion, the newly recorded financial assets are subsequently measured at fair value and reported under the statement of financial position item Financial assets at fair value.
In the event of a non-substantial modification, an assessment must be made of whether the credit risk has increased significantly and whether a stage transfer may consequently be necessary. This ensures that a credit risk-related contractual modification triggers an ad hoc rating as an early warning signal or at least a documented review of the need for an ad hoc rating in accordance with requirements for early detection of risks. This current rating is taken into account accordingly in the assignment to stages.
D. Fair value
Subsequent measurement at fair value, which, depending on the measurement category, is regularly determined either for recognition in the statement of financial position or for the disclosure of financial instruments in the Notes, is based on the following hierarchy at KfW Group:
Active market – allocation to level 1 (Quoted market price)
The best objective evidence of fair value is provided by published price quotations in an active market. A financial instrument is regarded as quoted in an active market if quoted prices are readily and regularly available and those prices represent current – i.e. traded on the reporting date or shortly before – and regularly occurring market transactions on an arm’s length basis. Together with the traded nominal volumes, the contract sizes and the number of contracts, this assessment takes into account in particular the bid-ask spreads observed which in the event of a significant increase indicate the absence of an active market.
83 | KfW Financial Report 2022 Consolidated financial statements | Notes – Accounting policies
No active market – allocation to level 2 (Valuation methods based on observable market data [model]) or level 3 (Valuation methods based in part on data not observable in a market).
If the financial instrument is not quoted in an active market, valuation techniques are used. The valuation techniques applied include, in particular, the discounted cash flow (“DCF”) method and option pricing models, as well as a comparison to the fair value of a financial instrument with almost identical characteristics (e.g. multiple-based models). The valuation techniques take account of all input parameters that the market participants would include in the pricing of that financial instrument, e.g. market interest rates, risk-free interest rates, credit spreads or swap curves. As these input parameters can generally be observed in the market and are usually the only significant parameters for measuring financial instruments using valuation techniques, the level for the financial instruments measured at fair value using valuation methods is usually level 2. This allocation also generally applies for prices quoted on inactive markets published by price service agencies.
If significant input parameters that are not observable on the market, such as expected risk-free customer margins or capital costs, are used in valuation techniques, the financial instrument is allocated to level 3.
If, at the date of initial recognition, differences arise between the market-based transaction price and the model price resulting from a valuation technique that makes significant use of unobservable parameters, an analysis is performed to determine whether there are economic reasons for these initial differences (e.g. conclusion of a transaction on a market that is not the main market for this transaction). These economic reasons only apply to a small part of the derivative portfolio of KfW Group, which comprises a hedging instrument for customers with respect to the export and project financing business. In relation to this, OTC (over the counter) derivatives in line with the market are not concluded on the main market (OTC interbank market) relevant to valuation. The initial differences determined upon conclusion of these derivatives are amortised through profit or loss over the life of the financial instruments, as the valuation parameters unobservable on the market are relevant to the valuation procedure. The reliability of this valuation technique is ensured via regular model validations.
This (valuation) hierarchy is applied in the group as follows:
Fair values are derived from active markets, in particular, for bonds and other fixed-income securities – unless there are inactive markets, and valuation techniques or prices quoted on inactive markets published by price service agencies are therefore used – as well as own issues reported on the liabilities side. Valuation techniques for non-derivative financial instruments are used primarily for products reported under Financial assets at fair value (loans and advances to banks, loans and advances to customers, and equity investments) and Financial liabilities at fair value (liabilities to banks, liabilities to customers, and certificated liabilities). Valuation techniques are also used for OTC derivatives.
The steps detailed below are taken for certain product groups:
For securities in the Securities and investments line item, the group examines whether a financial instrument is quoted on an active market on the basis of homogeneous portfolios. Market activity is assessed based on the following criteria:
| – | There is more than one market maker. |
| – | Prices are set on a regular basis. |
| – | Prices deviate only slightly between market makers. |
| – | The bid-ask spread is narrow. |
Prices on active markets are used to determine the fair value of the group’s asset securities as of the reporting date. In addition, for parts of the portfolio, prices from price service agencies are used that do not qualify as prices quoted on active markets. Should these not be available in individual cases, valuation techniques are used to determine fair value taking into account observable market parameters. The input parameters include, in particular, changes in creditworthiness and risk-free interest rates, but they also take into account general and financial instrument-specific tightening of the market due to lower liquidity.
KfW Financial Report 2022 Consolidated financial statements | Notes – Accounting policies | 84
In measuring OTC derivatives, KfW determines valuation adjustments for counterparty risks (credit valuation adjustments – “CVA”), own default risk (debt valuation adjustments – “DVA”), collateral costs under credit support annexes (“CSA”) (collateral valuation adjustments – “ColVa”) and funding cost adjustments (“FCA”). KfW’s institute-specific funding costs are used to calculate the FCA. Value adjustments are not calculated separately for each transaction but for the portfolio of transactions on which a framework agreement is based. The allocation to individual transactions is based on the relative credit adjustment approach. The resulting adjustment amounts are very low as KfW generally pledges collateral for positive market values in accordance with standard market collateral agreements. In accordance with market practices, risk-free overnight interest rates are used for the valuation of the derivatives portfolio.
The fair value of Loans to banks and customers is calculated using the discounted cash flow (“DCF”) method based on the discounting of the risk-adjusted cash flows. The expected loss calculated for the respective reporting date is used to correct the contractual cash flows.
The holding arrangements for the Federal Republic of Germany are accounted for as receivables from the Federal Government. The receivables comprise the KfW-funded purchase price of the items held for the Federal Republic of Germany as well as an additional benefit from the sales proceeds of the items. The receivables are measured at fair value, with the additional benefit being accounted for as a key value driver using current market prices of the items held.
Valuation methods based on net asset value are also used in addition to the discounted cash flow method for valuation of equity investments. If net asset value does not appropriately reflect extraordinary economic developments, necessary adjustments are made as of the balance sheet date.
The Federal Republic of Germany’s liability for specific KfW liabilities in accordance with Article 1a of the KfW Law has an advantageous effect on KfW’s ability to fund itself. In determining the fair value of KfW’s liabilities, the effect of this explicit direct state guarantee is also taken into account. The state guarantee does not represent an independent unit of account.
The fair value of financial instruments due on demand, such as Cash reserves or receivables and liabilities due on demand, is their carrying amount.
When no prices from liquid markets are available and prices on inactive markets cannot be provided by price service agencies, recognised valuation models and methods are used. The DCF method is used for securities, swaps, and currency and money market transactions with no embedded options or complex coupons. Stand-alone options, as well as derivatives with embedded options, triggers, guaranteed interest rates and/or complex coupon agreements, are measured using recognised models (e.g. Hull & White) unless they are listed on a stock exchange.
The aforementioned models are calibrated, if possible, on the basis of observable market data for instruments that are similar in terms of the type of transaction, maturity, and credit quality.
85 | KfW Financial Report 2022 Consolidated financial statements | Notes – Accounting policies
E. Financial guarantee contracts
A financial guarantee contract is a contract that requires the guarantor to make specified payments that compensate the holder for a loss it incurs because a specified debtor fails to meet its contractual payment obligations. For the guarantor, a financial guarantee contract is to be measured at fair value at initial recognition, which is zero at contract conclusion, as the value of the premium on fair value contracts is equal to the value of the guarantee obligation (net presentation). Moreover, fair value at initial recognition is no longer carried forward in such net presentation, but rather incoming premium payments are recognised through profit or loss in Net commission income. If a financial guarantee contract is not designated to the fair value measurement category at initial recognition, a provision is recognised for expected losses from a financial guarantee as part of a subsequent assessment, applying IFRS 9 rules for risk provisioning. KfW Group does not voluntarily designate financial guarantee contracts for measurement at fair value.
For the holder, on the other hand, this is a contingent asset that may not be capitalised. However, a (non-impaired) financial guarantee contract is, for the holder, collateral that may be included in calculating risk provisions for the recognised reference asset.
Provisions for expected losses from financial guarantees are reported under Provisions for credit risks.
F. Reporting and Notes
Current interest and similar income from a financial asset are generally recorded under Interest income. If, due to the low interest environment, negative interest rates arise from a financial asset, these are also recorded in Interest income, with a minus sign. Premiums, discounts, processing fees and charges are amortised in Interest income using the effective interest method. Processing fees that are not amortised under the effective interest method are recognised under Commission income.
Any fair value changes of financial assets at fair value through profit or loss are recognised in Net gains/losses from other financial instruments at fair value through profit or loss.
Current interest arising from a financial liability is recorded in Interest expense. This also applies in the case of negative interest resulting from a low interest rate environment. Premiums and discounts are also amortised in Interest expense using the effective interest method over the expected life.
Results from the repurchase of own issues categorised as liabilities measured at amortised cost are recognised at the repurchase date in Net other operating income.
Classes for financial instruments have been largely defined in agreement with the group’s business model which is focused on the lending business. The definition is based in particular on the national requirements for balance sheet classification at banks and financial services institutions. The following classes (and sub-classes) were defined for financial assets and financial liabilities:
KfW Financial Report 2022 Consolidated financial statements | Notes – Accounting policies | 86
Transition of the statement of financial position items for financial instruments to classes
in accordance with IFRS 7.6
| | | | | | | | | | | | | | |
| | | | | | | |
| | | Statement of financial position item | | | | | | Class | | | | Sub-class | | |
| | | | | | | |
| | | | | | | | | | | | Money-market transactions | | |
| | | | | | | | Loans and advances to banks | | | | Loans and advances | | |
| | | | | | | | | | | | Promissory note loans | | |
| | Financial assets | | | | | | | | | | Other receivables | | |
| | at amortised cost | | | | | | | | | | Money-market transactions | | |
| | | | | | | | Loans and advances to customers | | | | Loans and advances | | |
| | | | | | | | | | Promissory note loans | | |
| | | | | | | | | | | | Other receivables | | |
| | | | | | | | Securities and investments | | | | Bonds and other fixed-income securities | | |
| | | | | | | | | | | | Money-market transactions | | |
| | | | | | | | Loans and advances to banks | | | | Loans and advances | | |
| | | | | | | | | | | | Promissory note loans | | |
| | | | | | | | | | | | Other receivables | | |
| | | | | | | | | | | | Money-market transactions | | |
| | | | | | | | Loans and advances to customers | | | | Loans and advances | | |
| | | | | | | | | | | | Promissory note loans | | |
| | Financial assets | | | | | | | | | | Other receivables | | |
| | at fair value | | | | | | | | | | Bonds and other fixed-income securities | | |
| | | | | | | | Securities and investments | | | | Shares and other non-fixed income securities | | |
| | | | | | | | | | | | Equity investments | | |
| | | | | | | | | | | | Shares in non-consolidated subsidiaries | | |
| | | | | | | | | | | | Interest-related derivatives | | |
| | | | | | | | Other derivatives | | | | Cross-currency derivatives | | |
| | | | | | | | | | | | Other derivatives | | |
| | | | | | | | | | | | Money-market transactions | | |
| | | | | | | | Liabilities to banks | | | | Promissory note loans | | |
| | | | | | | | | | | | Other financial liabilities | | |
| | Financial liabilities | | | | | | | | | | Money-market transactions | | |
| | at amortised cost | | | | | | Liabilities to customers | | | | Promissory note loans | | |
| | | | | | | | | | | | Other financial liabilities | | |
| | | | | | | | Certificated liabilities | | | | Money-market issues | | |
| | | | | | | | | | | | Bonds and notes | | |
| | | | | | | | | | | | Money-market transactions | | |
| | | | | | | | Liabilities to banks | | | | Promissory note loans | | |
| | | | | | | | | | | | Other financial liabilities | | |
| | | | | | | | | | | | Money-market transactions | | |
| | | | | | | | Liabilities to customers | | | | Promissory note loans | | |
| | Financial liabilities | | | | | | | | | | Other financial liabilities | | |
| | at fair value | | | | | | Certificated liabilities | | | | Money-market issues | | |
| | | | | | | | | | Bonds and notes | | |
| | | | | | | | | | | | Interest-related derivatives | | |
| | | | | | | | Other derivatives | | | | Cross-currency derivatives | | |
| | | | | | | | | | | | | Other derivatives | | |
87 | KfW Financial Report 2022 Consolidated financial statements | Notes – Accounting policies
In addition, the items from the asset and liability sides of the statement of financial position, Value adjustments from macro fair value hedge accounting, Derivatives designated for hedge accounting, and Off-balance sheet transactions each form a separate class.
The Loans and advances to banks class primarily consists of the promotional lending business, in which loans are typically granted to the final borrowers through accredited commercial banks. These assets are presented in this class when the commercial banks underwrite part of the liability. Promotional loans that commercial banks on-lend without underwriting of liability are recognised in the class Loans and advances to customers.
The Loans and advances to banks and Loans and advances to customers classes also include loans that benefit from a subsidy (interest rate reductions) granted by KfW under the ERP economic promotion programme. The promotional grants awarded annually to KfW through the ERP Special Fund based on the ERP Economic Planning Act (ERP-Wirtschaftsplangesetz) for the purpose of executing the ERP economic promotion programme are recognised as deferred income in Other liabilities and are amortised in profit or loss under Interest income as the underlying funding expenses occur.
The Securities and investments class mainly comprises bonds and other fixed-income securities held in securities portfolios that belong to KfW and its subsidiaries, along with equity investments.
The securities portfolios mainly serve to support KfW’s liquidity position and to stabilise and ensure the group’s promotional capacity in the long term.
To achieve the same accounting treatment for equity investments with and without significant influence, individual group business areas that provide equity finance as part of their promotional mandate are considered as venture capital organisations for accounting purposes provided they meet the respective requirements. These equity investments, like other equity investments, are allocated to the Securities and investments class.
The Liabilities to banks and Liabilities to customers classes largely comprise KfW Group borrowings and money-market transactions.
Issued bonds, notes and money market securities are allocated to the Certificated liabilities class. Own issues repurchased in the open market are deducted from the liabilities as of the repurchase date.
In some of the Notes, these classes are broken down into additional sub-classes that relate mainly to products (for example, Loans and advances to banks are reported separately for money-market transactions and loans and advances).
Information about the type and extent of risks associated with financial instruments is also provided in the risk report section of the combined management report.
(8) Derivatives and hedging relationships
A. Hedging transactions/Hedge accounting
KfW Group enters into financial derivatives to economically hedge interest rate fluctuation and currency risks, particularly those related to funding, lending and securities activities. Interest rate swaps, interest rate/currency swaps and base currency swaps are mainly used for this purpose. Interest rate swaps are used to convert fixed rate interest payments of the issuances or lending transactions into variable payments. In the case of refinancing in a foreign currency, payments are also converted into the functional currency (EUR). The hedge ratio for the issues is normally 1:1. Ineffectiveness therefore results exclusively from unhedged risks such as counterparty risk or tenor or basis spread risks.
KfW Financial Report 2022 Consolidated financial statements | Notes – Accounting policies | 88
Economic hedging relationships are designated as hedge accounting relationships or designated as fair value through profit or loss by using the fair value option when the IFRS requirements are met. Economic hedging relationships can also be recognised in the financial statements through bifurcation of separable embedded derivatives on the liabilities side that are accounted for through profit or loss. In these cases, if the hedges are economically effective, the impact on the financial statements, with respect to the hedged risks, from the instruments used for hedging purposes and the hedged transactions will substantially offset each other, so that the group’s income statement substantially reflects the risk-mitigating impact of these hedging relationships.
However, not all economic hedging relationships qualify for hedge accounting or the fair value option. In these cases, the risk-mitigating impact of the derivatives used for hedging purposes is not reflected in the accounts because the hedged risk associated with the underlying transactions is not recognised in profit or loss under IFRS. The applicable recognition requirements may therefore lead to one-sided valuation results from the derivatives used for hedging purposes in the group’s income statement – as well as volatility in profit or loss – despite an economically effective hedging relationship.
Hedge accounting in the group is used solely in the form of fair value hedges to recognise economic hedging relationships. The hedging relationship is designated, firstly, at individual transaction and group level in the form of micro fair value hedge accounting, and, secondly, at portfolio level in the form of macro fair value hedge accounting. KfW has exercised the option of applying IAS 39 rules for hedge accounting. If risk-free overnight interest rates are used in the valuation of the derivatives, this market practice is also subject to micro fair value hedge accounting for the measurement of the hedged risk related to the hedged item. The hedged risk in macro fair value hedge accounting generally relates to the variable interest rates of the derivative portfolio. The effectiveness of the hedging relationships is assessed using the dollar offset method and a regression analysis (80%–125% range for assessing effectiveness).
In micro fair value hedge accounting, interest and currency risks from bonds allocated to Securities and investments (in the Financial assets at amortised cost item) and, above all, from borrowings (in the Financial liabilities at amortised cost item) are hedged. In micro fair value hedging relationships at individual transaction level, the fair value changes attributable to the hedged risks are reported as an adjustment of the carrying amount of the hedged items with the corresponding gain or loss recognised under Net gains/losses from hedge accounting. The hedging instruments used for this purpose are recognised at fair value in Derivatives designated for hedge accounting. Changes in the value of the hedging instruments are also recognised in Net gains/losses from hedge accounting, largely compensating the profit or loss effects of the hedged items.
Macro fair value hedge accounting is used to hedge against interest risks primarily from loan receivables (in the Financial assets at amortised cost item) and firm obligations via future fixed-rate financing that are hedged against interest risks as part of dynamic asset liability management in the group. The fair value changes attributable to the hedged risks in the hedged portfolios in the Amortised cost category (loans and advances / liabilities) are accounted for in Value adjustments from macro fair value hedge accounting on the assets or liabilities side. Fair value changes attributable to the hedged risks from the hedged portfolios are reported in Net gains/losses from hedge accounting.
The hedging instruments are reported at fair value in Derivatives designated for hedge accounting. Changes in the value of these instruments are also recognised in Net gains/losses from hedge accounting, with the effect that they almost fully offset the earnings effects from the valuation of the hedged portfolios.
The portfolio of hedged items is updated monthly in the context of a dynamic hedge de-designation and designation process. The resulting fair value adjustments are amortised over the residual term of the maturity period in Net gains/losses from hedge accounting. Disposals from the hedged portfolios result in a proportional amortisation of the related fair value adjustments in Net gains/losses from hedge accounting. When cash flows from hedging instruments are derecognised while the economic hedge based on non-derivative financial instruments remains, the related fair value adjustments from the hedged portfolios are amortised in Net interest income.
89 | KfW Financial Report 2022 Consolidated financial statements | Notes – Accounting policies
If the strict hedge accounting requirements for the designation of hedging relationships between derivatives and financial assets/liabilities are not fulfilled within KfW Group, the fair value option is used in certain circumstances. The fair values of the hedging instruments are presented in Financial assets at fair value or Financial liabilities at fair value, and the changes are presented in Net gains/losses from other financial instruments at fair value through profit or loss. These are largely offset by valuation effects from the hedged transactions. Fair value changes in liabilities resulting from changes in KfW’s own credit risk are directly recognised in Other comprehensive income (“OCI”).
Further derivative financial instruments are used to hedge risks, but their economic hedging relationships are not reflected in the accounts. The fair values of these hedging instruments are also presented in Financial assets at fair value or Financial liabilities at fair value, and the changes are presented in Net gains/losses from other financial instruments at fair value through profit or loss.
KfW Group neither uses derivatives for trading purposes nor does it enter into derivatives acting as a broker or intermediary on behalf of third parties.
B. Embedded derivatives
Derivative financial instruments can be part of a hybrid (combined) financial liability as embedded derivatives. Under certain conditions, they are accounted for separately from the host contract, similar to stand-alone derivatives. They must be bifurcated if the economic characteristics and risks of the embedded derivative are not closely related to the economic characteristics and risks of the host contract. The host contract is accounted for according to its classification at inception.
KfW Group enters into contracts with separable embedded derivatives particularly with respect to its own funding. In the case of these products, the embedded derivatives must be bifurcated and recognised separately. Changes in fair value are then recognised in Net gains/losses from other financial instruments at fair value through profit or loss in the sub-line item Financial derivatives not qualifying for hedge accounting, where they have a compensatory effect on the valuation of the economic hedging derivatives.
The fair value option was selected for certificated liabilities with bifurcated (embedded) derivatives recorded prior to bifurcation.
(9) Offsetting of financial instruments
KfW uses the EUREX central clearing system to settle part of its derivative transactions. This form of settling derivative transactions results in the recognition of a net amount in the statement of financial position for the transactions affected, as the involvement of EUREX as the central counterparty (CCP) meets all of the requirements for offsetting as set out in the relevant IFRS standard. This means that positive and negative fair values of derivatives for which EUREX acts as the central counterparty are offset against the corresponding collateral and reported in a net item in the statement of financial position.
In the case of reverse repo and repo transactions, for which EUREX acts as the central counterparty, receivables and liabilities are also offset if the currencies and the value dates are the same.
In addition, framework agreements featuring netting agreements are in place between KfW and its business partners for OTC derivatives and securities repo transactions.
One form of netting is close-out netting, which provides for the elimination of all rights and obligations relating to individual transactions under the framework agreement upon termination of said framework agreement by the contractual partner, or upon the latter’s insolvency, with the rights and obligations replaced by a single compensation claim (or obligation) in the amount of the net replacement costs of the terminated individual transactions. This does not represent a present legal claim for offsetting.
KfW Financial Report 2022 Consolidated financial statements | Notes – Accounting policies | 90
Close-out netting is not to be confused with the offsetting of payments in normal business. The same framework agreement may provide for the latter, i.e., that payments due on the same day and in the same currency may be offset and a net payment made instead of each individual payment (payment netting). This represents a present legal claim for offsetting.
All of KfW’s framework agreements relating to bilateral OTC derivatives (not in central clearing) include close-out netting agreements with the business partners. Payment netting is limited in the agreement to the relevant individual transaction, so that multiple transaction payment netting does not occur. The requirements for offsetting financial assets and financial liabilities are therefore not met for these KfW OTC derivatives.
KfW’s framework agreements for repo transactions include close-out netting agreements and, in some cases, payment netting agreements with the business partners as well. However, as KfW does not, as a rule, perform multiple transaction payment netting with repo transactions, the requirements for the offsetting of financial assets and financial liabilities are not met for such KfW repo transactions.
In accordance with the collateral agreements concluded for OTC derivatives and repo transactions, the values of the available collateral are used in determining the single compensation claim (or obligation) in close-out netting. Both cash and securities are permitted forms of collateral under the existing collateral agreements between KfW and its business partners. The collateral agreements provide for a transfer of title in the case of securities as collateral. Consequently, the transferred securities are not subject to any selling or pledging restrictions.
(10) Foreign currency translation
The functional currency of KfW and its consolidated subsidiaries is the euro. Monetary assets and liabilities denominated in a foreign currency are converted at the spot rate as of the reporting date.
Non-monetary assets and liabilities denominated in a foreign currency are normally converted at historical rates if they are measured at (amortised) cost. Translation is made using the European Central Bank reference rates.
The changes in value resulting from foreign currency translation are reported in the income statement under Net gains/losses from other financial instruments at fair value through profit or loss.
(11) Revenue from contracts with customers
IFRS 15 defines the nature, amount and timing of revenue arising from contracts with customers. Such revenue includes fees which are not an integral part of the effective interest rate and which are reported under Commission income. In this context, a five-step principle-based model is to be applied to relevant customer contracts. Moreover, the Notes are to include comprehensive detailed quantitative and qualitative information. IFRS 15 does not apply to fees and charges that are an integral part of the effective interest rate as they fall under the scope of IFRS 9.
There are primarily mandate contractual arrangements with the Federal Government as contracting authority within the meaning of IFRS 15. They include fees for the administration of German Financial Cooperation for the promotion of developing countries and emerging economies, fees for the administration of certain programmes subsidised by the Federal Government, and fees for debt collection on certain loans. KfW also charges fees for administrative services for other mandate agreements as well as for processing services and to a limited extent for services for lending and trust activities. Individual services may be grouped together into a bundle of services that qualifies as a separate performance obligation within the meaning of IFRS 15. The value of the transaction is therefore not broken down.
As performance obligations are mostly satisfied over time, revenue from customer contracts is recognised according to the measure of progress and is thus normally recognised over time.
KfW Group has no items that require recognising customer acquisition or contract fulfilment costs as assets. One-time advance payments to be allocated are deferred and recognised as contract liabilities in the statement of financial position under Other liabilities.
91 | KfW Financial Report 2022 Consolidated financial statements | Notes – Accounting policies
If the service has already been performed but fees have not yet been paid or if there is not yet any claim to payment, a contract asset is to be recognised in the statement of financial position under Other assets. If the claim becomes unconditional, the contract asset is to be reclassified as a Trade receivable adjusting the carrying amount where applicable. This rule is applied to fees for administration of certain programmes subsidised by the Federal Government. Based on the credit rating and short remaining life, no expected credit loss is calculated.
(12) Promotional lending business at KfW
The general promotional loans market, which distinguishes itself from the market for general lending business, is relevant for KfW’s promotional lending business conducted as part of its legal promotional mandate. This market is characterised by the fact that promotional banks, as part of their legal mandate, pass on all funding advantages to the ultimate borrowers in financing projects eligible for promotion. In setting the terms and conditions of the corresponding promotional loans, KfW uses its current term-differentiated refinancing rates.
At initial recognition of such loans, the fair value is thus equivalent to the transaction value.
KfW also grants promotional loans which include additional subsidies granted during the first fixed interest rate period, in the form of interest rate reductions impacting KfW’s earnings position. The fair value of these promotional loans – measured using the parameters of the general promotional loan market – is thus not equivalent to the transaction value at initial recognition as in this case the interest rate is below the market rate.
The difference that normally results from such loan commitments – present value of the nominal scheduled interest rate reductions during the first fixed interest rate period – is recognised in profit or loss as an interest expense and accounted for as an adjustment to the carrying amount in loans and advances under the item Financial assets at amortised cost. The adjustment to the carrying amount is amortised in Net interest income using the effective interest rate method. In the event of unscheduled repayment in full, this is recognised in profit or loss under Interest income.
Differences that relate to irrevocable loan commitments are reported in Provisions. Changes to the portfolio are offset via the adjustments to the carrying amounts of already disbursed promotional loans recognised on the assets side.
(13) Non-current assets held for sale
Under IFRS 5, separate presentation and measurement requirements apply to non-current assets held for sale if the assets are available for immediate sale and such sale is highly probable. Assets that meet the IFRS 5 criteria are reported in the separate statement of financial position item: Non-current assets held for sale. The IFRS 5 measurement requirements are not applied if they relate to financial assets. In this case, the IFRS 9 measurement requirements continue to apply instead.
(14) Repurchase agreements and securities lending
KfW Group enters into repurchase agreements as standardised repos or reverse repos. These are combinations of simultaneous spot and forward transactions on interest-bearing securities with the same counterparty. The terms and modalities of collateral and its use follow common market practice. Credit claims are also an eligible type of collateral for open-market transactions.
The interest-bearing securities sold under repo transactions (spot sales) continue to be recognised and measured under Financial assets at amortised cost. The repayment obligation towards the counterparty is carried under Financial liabilities at amortised cost for the amount of cash consideration received. The repo rate as a fee for borrowing is recorded by KfW, as the borrower, under Interest expense over the term of the agreement. The borrower is entitled to the coupon on the security. A repayment claim is recognised and measured under Financial assets at amortised cost for the amount of cash outflow generated by reverse repos. The securities received (spot purchases) are not recognised or measured. The repo rate as a fee for lending is recorded by KfW as the lender under Interest income over the term of the agreement.
KfW Financial Report 2022 Consolidated financial statements | Notes – Accounting policies | 92
The term ‘securities lending’ refers to transactions in which securities are transferred from the lender to the borrower with the obligation that the borrower transfer back securities of the same type, quality and quantity at the end of the agreed term and pay a usage fee for the duration of the loan. IFRS 9 does not distinguish between collateralised and uncollateralised securities lending. The cash collateral generally to be pledged to the lender is to be capitalised as receivable by the borrower under the item Financial assets at amortised cost. The securities are accounted for by the lender, which bears the credit and market risk.
With respect to the refinancing of the loans mandated to it for the energy sector support measures, KfW acts as both borrower and lender in essentially uncollateralised securities lending transactions in dealing with the German Finance Agency, although as a lender it does not recognise the securities. They remain capitalised at the German Finance Agency. KfW recognises the cash collateral received under the item Financial liabilities at amortised cost.
The fee received or paid is recognised in Net interest income.
(15) Government grants
With regard to the pandemic-induced special programmes, KfW funded its activities among other sources via the ECB’s TLTRO. It raised EUR 13.4 billion in June 2020 via TLTRO III operation 4, and EUR 1.4 billion in March 2021 via TLTRO III operation 7. The maximum term of TLTRO III transactions is three years. Participants whose eligible net lending in a prescribed reporting period is equal to or higher than their individual benchmark will receive an interest rate reduced by 50 bp (financing of overall –1%) for a specified period.
These additional reduced interest grants are to be accounted for in accordance with the accounting policies of IAS 20 “Accounting for Government Grants and Disclosure of Government Assistance”. The negative interest rate benefit made possible by the grant is not to be recognised until there is reasonable assurance that KfW will meet the attached conditions and that the grants will be issued. The bank repaid the TLTRO III operation 4 early, in December 2021, and the TLTRO III operation 7 early, in March 2022. No reduced interest grants in accordance with IAS 20 were received in financial year 2022.
(16) Property, plant and equipment
The land and buildings and the plant and equipment reported by KfW Group are carried at cost less depreciation on a straight-line basis and any impairment, both recognised in Administrative expense. In accordance with the requirements in IAS 36, an impairment is recognised if there are indications of impairment and the carrying amount of the asset exceeds the recoverable amount, i.e. the lower of fair value less costs of disposal and value in use. The useful life is determined based on expected wear and tear. KfW Group assumes an estimated useful life of 40 to 50 years for buildings, four years for workstation computer equipment and five to 15 years for other property, plant and equipment. Gains and losses from the sale of property, plant and equipment are recognised in Net other operating income.
Payments in advance and assets under construction are recognised in Other property, plant and equipment and are not subject to depreciation.
(17) Leases
In accordance with IFRS 16 “Leases”, KfW as lessee reports each right of use in Property, plant and equipment and the associated lease obligation in Other liabilities. The lessee shall measure the lease liabilities at the present value of the lease payments not paid at that date, discounted at the lessee’s incremental borrowing rate. The incremental borrowing rate is the rate of interest that a lessee would have to pay to borrow over a similar term, and with a similar security, the funds necessary to obtain an asset of a similar value to the right-of-use asset in a similar economic environment. Accordingly, KfW determines the incremental borrowing rate of the basis of the refinancing rate it uses for its own issues.
93 | KfW Financial Report 2022 Consolidated financial statements | Notes – Accounting policies
KfW applies IAS 36 “Impairment of Assets” to rights of use to determine whether the right of use is impaired and to recognise any impairment loss identified. Depreciation, amortisation and impairments of rights of use are reported in Administrative expense. Interest expense from discounting the rights of use and the interest compounded on lease liabilities are included in Other interest expense.
The only minimal effects on net assets, financial and earnings position arise exclusively from the “leasing buildings” class.
For short-term leases with a maximum term of 12 months and leases in which the underlying asset is of low value, KfW utilises the relief provided for in IFRS 16.5 and does not recognise a right of use.
The small number of contracts in which KfW Group acts as a lessor are classified as operating leases. The leased asset is recognised under Property, plant and equipment and the corresponding rental income in Other operating income.
(18) Intangible assets
Under Intangible assets, KfW Group reports purchased and internally generated software at cost, less straight-line amortisation and impairments, both recognised in Administrative expense. The useful life is determined based on expected wear and tear. KfW Group assumes a useful life of five years.
Assets are impaired when the carrying amount of an asset exceeds the recoverable amount. An impairment is recorded when no future economic benefits can be identified.
Internally generated software under development is reported under Other intangible assets and is not subject to amortisation.
(19) Risk provisions
Provisions include provisions for pensions and similar commitments, credit risks, interest rate reductions in irrevocable loan commitments granted by KfW in the promotional lending business and negatively impacting its earnings position, as well as other obligations of uncertain amount and timing involving a probable outflow of funds.
The employees of KfW Group participate in a company pension plan that pays retirement, long-term disability and survivor benefits. KfW Group has various pension plans, consisting exclusively of defined-benefit schemes. The benefits largely depend on the length of company service and salary. The pension plan that was applied for new hires until 1985 offered a full pension (Gesamtversorgung), in which a certain portion of the income paid before the benefits were due was allocated as a benefit after deducting the state pension. Apart from employer-financed pension plans there are also plans in place involving contributions by employees.
KfW Group pension plans are subject to the following risks in particular: longevity, interest rate fluctuation, pension adjustment risk as well as the risk of future changes to the assessment bases.
Longevity risk is the risk that higher expenses will be incurred for the company pension plan if the pensioners live longer than projected. In general, this risk is balanced out across all pensioners and would only have an impact if life expectancy were to rise faster in the future than anticipated.
Due to the long term of the company pension plan, provisions for pension obligations are subject to general interest rate fluctuation risks.
KfW Financial Report 2022 Consolidated financial statements | Notes – Accounting policies | 94
Pension adjustment risk largely relates to the pension plan offering a full pension (Gesamtversorgung). In this scheme, benefits are recalculated as soon as there is a change in the base income eligible for pension or the state pension to be offset. Another pension plan must be examined regularly in terms of forecast and actual pension adjustments, undertaking such adjustments if necessary.
The amount of the benefits promised under the existing pension plans at KfW Group depends, among other things, on development of the income eligible for benefits and the social security contribution ceiling (Beitragsbemessungsgrenze). There is a risk that the basis of assessment will develop differently than was assumed.
Pension obligations are calculated by an independent qualified actuary in accordance with the projected unit credit method on the basis of group-wide uniform parameters such as age, length of company service and salary. The pension provision is recognised at the present value of the defined-benefit obligations as of the reporting date. The discount factor is based on current market conditions for a portfolio of high quality corporate bonds/bonds from supranational issuers with a maturity matching that of the obligations. The definition of the portfolio takes into account current market conditions. Additional demographic factors (including the 2018 G Heubeck actuarial tables) and actuarial assumptions (rate of salary and pension increases, rate of staff turnover, etc.) are taken into account.
No plan assets were defined for the pension obligations of KfW Group, so the related special accounting rules do not apply. Provisions for pensions and similar obligations are financed in-house with sufficient assets with corresponding maturities.
Actuarial gains and losses are immediately recognised at the time they occur. They occur as a result of remeasurement of pension obligations as of the reporting date compared to the figures forecast at the beginning of the year.
Additions to pension provisions distinguish between service cost and interest expense. Service cost is reported under Administrative expense; interest expense is reported under Other interest expense. The pension provision changes recognised directly in equity comprise the actuarial gains and losses reported in Revaluation reserves; these are reported in Other comprehensive income.
Pension-like obligations include commitments for deferred compensation, early retirement and partial retirement. Actuarial reports are prepared and a provision is recognised accordingly for these types of commitments as well. No actuarial gains or losses are incurred.
Other provisions, including those for obligations to employees and for audit and consultancy services, are recognised at the estimated expenditure. Long-term provisions are discounted where the effect is material. Added to this are obligations arising from the assumption of the tasks of the State Insurance Company of the German Democratic Republic in liquidation (Staatliche Versicherung der Deutschen Demokratischen Republik in Abwicklung – “SinA” institution under public law), which are offset by receivables in the same amount from the Federal Agency for Special Tasks Associated with Unification (Bundesanstalt für vereinigungsbedingte Sonderaufgaben – “BvS”) reported under Other assets. If the provision is not required in full or if the reason for creating the provision no longer applies, the provision is reversed via the same income statement item that was used in creating the provision.
(20) Income tax assets and liabilities
Income taxes are accounted for and measured in accordance with IAS 12. Current and deferred income tax assets are reported in the item Income tax assets; current and deferred income tax liabilities under Income tax liabilities. Current income tax assets and liabilities are recognised in the amount expected to be returned or paid in the future.
The tax rates applicable are those in effect on the reporting date or those that can be assumed with sufficient certainty to be in effect on the reporting date. KfW itself is exempt from income taxes pursuant to Section 5 (1) no. 2 of the German Corporation Tax Act (Körperschaftsteuergesetz – KStG) and Section 3 no. 2 of the German Trade Tax Act (Gewerbesteuergesetz – GewStG).
95 | KfW Financial Report 2022 Consolidated financial statements | Notes – Accounting policies
Deferred income tax assets and liabilities are generally recognised on temporary differences between the carrying amounts of assets and liabilities in accordance with IFRS and the corresponding tax value. Deferred tax assets are only recognised for temporary differences from items and for unused tax loss carryforwards if their realisation is sufficiently probable; the impairment test is carried out on the basis of group business sector planning for each group company. Deferred taxes are measured at the tax rates that have been set at the respective reporting date and that are relevant to the timing of realisation of the deferred taxes. Deferred income tax assets and liabilities are offset on the assumption that they relate to the same taxable entity, the same tax type and the same tax authority.
If temporary differences have arisen from transactions recognised directly in equity, the resulting deferred income tax assets and liabilities are also recognised directly in equity. Income from and expenses for current and deferred income taxes is recognised in the income statement under Income taxes.
(21) Equity
The equity structure is determined, in particular, by the KfW Law and the requirements of IFRS.
Pursuant to Article 10 (2) and (3) of the KfW Law, KfW’s net income for the period determined in accordance with the German Commercial Code is transferred to reserves and is included in equity under IFRS.
KfW Group reports a fund for general banking risks in equity. Additions to or reductions of the fund are presented in accordance with IFRS as an addition to or reduction of retained earnings.
Under IFRS, any remaining consolidated net income is allocated to Other retained earnings in the same period.
Revaluation reserves comprise transactions to be recognised directly in equity in accordance with IFRS. These include valuation results from the change in own credit risk of liabilities measured at fair value through profit or loss and from defined benefit pension obligations. They also may include deferred taxes, depending on the underlying transaction.
(22) Trust activities
Assets and liabilities held by KfW Group in its own name but for the account of third parties are not recognised if the trustor retains all risks and opportunities. At KfW, this applies in particular to loans and equity investments made by KfW on behalf of the Federal Government. Both opportunities and risks remain with the Federal Government in such transactions.
Fees from trust activities are recognised under Commission income.
Further information can be found in the note “Financial instruments” in section “A. Classification and measurement” in the comments on mandated transactions.
KfW Financial Report 2022 Consolidated financial statements | Notes – Accounting policies | 96
Notes to the statement of
comprehensive income
(23) Net interest income
Analysis of Net interest income
| | | | | | | | | | | | | | | | | | | | |
| | | | | | | 2022 | | | | | | | | 2021 | | | | | |
| | | | | | | EUR in millions | | | | | | | | EUR in millions | | | | | |
| | | | | |
Interest and similar income from loans and advances to banks and customers | | | | | | | 4,620 | | | | | | | | 4,092 | | | | | |
Similar income from off-balance sheet transactions | | | | | | | 33 | | | | | | | | 25 | | | | | |
Interest income from securities and investments | | | | | | | 113 | | | | | | | | 58 | | | | | |
Interest income from hedges recognised in the statement of financial position | | | | | | | –1,763 | | | | | | | | –3,350 | | | | | |
Other interest income | | | | | | | 63 | | | | | | | | –210 | | | | | |
Interest income from the effective interest method | | | | | | | 3,065 | | | | | | | | 615 | | | | | |
Interest and similar income from loans and advances to banks and customers | | | | | | | 2 | | | | | | | | –40 | | | | | |
Interest income from securities and investments | | | | | | | 87 | | | | | | | | 73 | | | | | |
Interest income from Other derivatives | | | | | | | 632 | | | | | | | | 412 | | | | | |
Other interest income | | | | | | | 721 | | | | | | | | 446 | | | | | |
Interest income, total | | | | | | | 3,786 | | | | | | | | 1,061 | | | | | |
Interest and similar expense for liabilities to banks and customers | | | | | | | 120 | | | | | | | | –200 | | | | | |
Interest expense for certificated liabilities | | | | | | | 4,194 | | | | | | | | 3,652 | | | | | |
Interest expense from hedges recognised in the statement of financial position | | | | | | | –2,935 | | | | | | | | –4,761 | | | | | |
Interest expense from Other derivatives | | | | | | | –65 | | | | | | | | –180 | | | | | |
Other interest expense | | | | | | | 323 | | | | | | | | 164 | | | | | |
Interest expense, total | | | | | | | 1,638 | | | | | | | | –1,325 | | | | | |
Net interest income | | | | | | | 2,148 | | | | | | | | 2,386 | | | | | |
Expenses for granting promotional loans below market rates – due to additional promotional funds in the form of interest rate reductions with an impact on KfW’s earnings position – amount to EUR 267 million (2021: EUR 144 million) and are reported in Other interest expense. In addition to the charges resulting from the present value of the nominal scheduled interest rate reductions in new lending business, the Other interest expense item also comprises the expenses arising from amortisation at a constant effective interest rate. Interest and similar income from loans and advances to banks and customers also comprises income from accrual-based amortisation in the amount of the pro-rata nominal planned interest rate reductions for these promotional loans of EUR 186 million (2021: EUR 200 million).
Interest income from stage 3 loan receivables in an amount of EUR 36 million (2021: EUR 33 million) is reported under Interest and similar income from loans and advances to banks and customers.
97 | KfW Financial Report 2022 Consolidated financial statements | Notes – Notes to the statement of comprehensive income
Interest income from hedges recognised in the statement of financial position comprises interest income from derivatives designated for hedge accounting as well as interest income from amortisation of value adjustments from hedge accounting. Interest income or interest expense from derivatives designated for hedge accounting is recognised depending on the related hedged item in the interest income or interest expense from hedges recognised in the statement of financial position for related financial assets or liabilities.
The group generated an atypical interest expense from liability hedges (floating rate liabilities) in financial year 2021, largely comprising certificated liabilities with corresponding swap transactions. This atypical interest expense was not allocated to the negative interest to be separately reported, as the hedged item contributes a typical interest expense. Due to the low interest rate environment at that time, the interest expense of the hedged items was overcompensated by the interest income from the corresponding hedging instruments, resulting in the total interest expense for financial year 2021 having been atypical. Negative interest income and interest expense declined sharply in financial year 2022 due to the ECB’s key rate hikes.
Including the interest income or expense from the hedged items and derivatives in hedge accounting means that the presentation is based on the economic substance of the hedged financial assets (floating rate financial assets) or hedged financial liabilities (floating rate financial liabilities).
Gross analysis of negative interest contributions
| | | | | | | | | | | | | | | | | | |
| | | | | | | |
| | | | | | | 2022 | | | | | | | | | | 2021 | | |
| | | | | | | EUR in millions | | | | | | | | | | EUR in millions | | |
| | | | | | | |
| Interest income, total | | | | | | 3,786 | | | | | | | | | | 1,061 | | |
| Negative interest from the lending business | | | | | | 203 | | | | | | | | | | 360 | | |
| Interest income from the deposit-taking business | | | | | | 418 | | | | | | | | | | 647 | | |
| Interest income (gross) | | | | | | 4,408 | | | | | | | | | | 2,067 | | |
| Interest expense, total | | | | | | 1,638 | | | | | | | | | | –1,325 | | |
| Negative interest from the deposit-taking business | | | | | | 418 | | | | | | | | | | 647 | | |
| Interest expense from the lending business | | | | | | 203 | | | | | | | | | | 360 | | |
| | | | | | | |
Interest expense (gross) | | | | | | 2,259 | | | | | | | | | | –319 | | |
The negative interest contributions included in Interest income resulted from balances with central banks, loans and advances to banks and loans and advances to customers, and securities and investments.
The positive interest contributions in Interest expense are largely due to liabilities to banks and liabilities to customers and certificated liabilities.
KfW Financial Report 2022 Consolidated financial statements | Notes – Notes to the statement of comprehensive income | 98
(24) Net gains/losses from risk provisions
Analysis of Risk provisions by transaction
| | | | | | | | | | | | |
| | | | | |
| | | | | 2022 | | | | | | 2021 | | |
| | | | | EUR in millions | | | | | | EUR in millions | | |
| | | | | |
| Expenses for risk provisions for lending business | | | | | | | | | | | | |
| (Loans and advances to banks/customers and off-balance sheet lending transactions) | | | | 1,193 | | | | | | 898 | | |
Expenses for additions to risk provisions | | | | 1,163 | | | | | | 865 | | |
Direct write-offs | | | | 30 | | | | | | 33 | | |
| Expenses for risk provisions for securities and investments | | | | 10 | | | | | | 12 | | |
Expenses for additions to risk provisions | | | | 10 | | | | | | 12 | | |
| Expenses for risk provisions | | | | 1,203 | | | | | | 910 | | |
| Income from risk provisions for lending business | | | | | | | | | | | | |
| (Loans and advances to banks/customers and off-balance sheet lending transactions) | | | | 1,078 | | | | | | 1,143 | | |
Income from the reversal of risk provisions | | | | 1,016 | | | | | | 1,060 | | |
Income from recoveries of amounts previously written off | | | | 62 | | | | | | 83 | | |
| Income from risk provisions for securities and investments | | | | 9 | | | | | | 13 | | |
Income from the reversal of risk provisions | | | | 9 | | | | | | 13 | | |
| Income from risk provisions | | | | 1,086 | | | | | | 1,155 | | |
| Net gains/losses from non-substantial contractual modifications | | | | 2 | | | | | | –22 | | |
| Other risk provisions for lending business | | | | –10 | | | | | | –27 | | |
Total | | | | –124 | | | | | | 196 | | |
(25) Net commission income
Analysis of Commission income
| | | | | | | | | | |
| | | | | |
| | | | | 2022 | | | | 2021 | | |
| | | | | EUR in millions | | | | EUR in millions | | |
| | | | | |
| Revenue from contracts with customers | | | | 639 | | | | 637 | | |
From mandate contractual arrangements with the Federal Government1) | | | | 584 | | | | 582 | | |
Fee income from mandate agreements, processing activities and services | | | | 17 | | | | 16 | | |
Fee income from the lending business | | | | 38 | | | | 39 | | |
| Other commission income | | | | 9 | | | | 10 | | |
Financial guarantee contracts | | | | 0 | | | | 0 | | |
Other | | | | 9 | | | | 10 | | |
Commission income, total | | | | 649 | | | | 647 | | |
| 1) | Includes commission income in an amount of EUR 69 million (2021: EUR 74 million) from mandate contractual arrangements with the Federal Government in trust activities. |
99 | KfW Financial Report 2022 Consolidated financial statements | Notes – Notes to the statement of comprehensive income
Commission income by segment in financial year 2022
| | | | | | | | | | | | | | | | | | |
2022 | | | | Mittelstandsbank & Private Kunden (SME Bank & Private Clients) | | | | Individualfinanzierung & Öffentliche Kunden (Customised Finance & Public Clients) | | | | KfW Capital | | | | Export and project finance | | |
| | | | | EUR in millions | | | | EUR in millions | | | | EUR in millions | | | | EUR in millions | | |
| | | | | | | | | |
| Commission income | | | | 308 | | | | 43 | | | | 4 | | | | 30 | | |
| of which Federal Government | | | | 305 | | | | 38 | | | | 4 | | | | 0 | | |
% | | | | 99% | | | | 89% | | | | 100% | | | | 0% | | |
| | | | | | | | | | | | | | | | | | | | | | | | |
2022 | | | | | | KfW Development Bank | | | | DEG | | | | Financial markets | | | | Head office | | | | KfW Group | | |
| | | | | | | EUR in millions | | | | EUR in millions | | | | EUR in millions | | | | EUR in millions | | | | EUR in millions | | |
| | | | | | | | | | | | |
| Commission income | | | | | | 249 | | | | 10 | | | | 0 | | | | 4 | | | | 649 | | |
| of which Federal Government | | | | | | 231 | | | | 2 | | | | 0 | | | | 3 | | | | 584 | | |
% | | | | | | 93% | | | | 26% | | | | 0% | | | | 72% | | | | 90% | | |
Commission income by segment in financial year 2021
| | | | | | | | | | | | | | | | | | |
2021 | | | | Mittelstandsbank & Private Kunden (SME Bank & Private Clients) | | | | Individualfinanzierung & Öffentliche Kunden (Customised Finance & Public Clients) | | | | KfW Capital | | | | Export and project finance | | |
| | | | | EUR in millions | | | | EUR in millions | | | | EUR in millions | | | | EUR in millions | | |
| | | | | | | | | |
| Commission income | | | | 310 | | | | 36 | | | | 6 | | | | 33 | | |
| of which Federal Government | | | | 307 | | | | 33 | | | | 6 | | | | 0 | | |
% | | | | 99% | | | | 92% | | | | 100% | | | | 0% | | |
| | | | | | | | | | | | | | | | | | | | | | | | |
2021 | | | | | | KfW Development Bank1) | | | | DEG1) | | | | Financial markets | | | | Head office | | | | KfW Group | | |
| | | | | | | EUR in millions | | | | EUR in millions | | | | EUR in millions | | | | EUR in millions | | | | EUR in millions | | |
| | | | | | | | | | | | |
| Commission income | | | | | | 245 | | | | 14 | | | | 0 | | | | 3 | | | | 647 | | |
| of which Federal Government | | | | | | 229 | | | | 7 | | | | 0 | | | | 0 | | | | 582 | | |
% | | | | | | 94% | | | | 47% | | | | 0% | | | | 0% | | | | 90% | | |
| 1) | As of financial year 2022, the former business sector Promotion of developing countries and emerging economies has been divided into the two separate segments of KfW Development Bank and Deutsche Investitions- und Entwicklungsgesellschaft mbH (DEG).; see Note 33. |
KfW Financial Report 2022 Consolidated financial statements | Notes – Notes to the statement of comprehensive income | 100
Out-of-period income
| | | | | | | | | | | | | | | | |
| | | | | |
| | | | | 2022 | | | | | 2021 | | | |
| | | | | EUR in millions | | | | | EUR in millions | | | |
| | | | | |
Revenue in current period resulting from services performed in the previous period(s) | | | | | | 31 | | | | | | 31 | | | | |
|
Analysis of Commission expense | |
| | | | | |
| | | | | 2022 | | | | | 2021 | | | |
| | | | | EUR in millions | | | | | EUR in millions | | | |
| | | | | |
Commission expense for lending business | | | | | | 10 | | | | | | 10 | | | | |
| | | | | |
Other commission expense | | | | | | 22 | | | | | | 14 | | | | |
| | | | | |
Commission expense | | | | | | 32 | | | | | | 24 | | | | |
(26) Net gains/losses from hedge accounting
Analysis of Net gains/losses from hedge accounting by type of hedging relationship
| | | | | | | | | | | | | | | | | | | | | | | | | | |
| | | | | | Hedge ineffectiveness | | | | | | Items in the income statement that contain cases of hedge ineffectiveness | | | |
| | | | | | | | | | | | | | | | | | | | | | | | | | |
| | | | | | | | |
| | | | | 2022 | | | | | 2021 | | | | | | | | | | | |
| | | | | EUR in millions | | | | | EUR in millions | | | | | | | | | | | |
| | | | | | | | |
Micro fair value hedges | | | | | | 18 | | | | | | –5 | | | | | | | | | | Net gains/losses from hedge accounting | | | | |
| | | | | | | | |
Interest risk | | | | | | 29 | | | | | | 14 | | | | | | | | | | – | | | | |
| | | | | | | | |
Interest-currency risk | | | | | | –11 | | | | | | –19 | | | | | | | | | | – | | | | |
| | | | | | | | |
Macro fair value hedges | | | | | | 131 | | | | | | –105 | | | | | | | | | | Net gains/losses from hedge accounting | | | | |
Interest risk | | | | | | 131 | | | | | | –105 | | | | | | | | | | – | | | | |
| | | | | | | | |
Total | | | | | | 150 | | | | | | –110 | | | | | | | | | | Net gains/losses from hedge accounting | | | | |
101 | KfW Financial Report 2022 Consolidated financial statements | Notes – Notes to the statement of comprehensive income
Analysis of Net gains/losses from micro fair value hedge accounting by hedged item
| | | | | | | | | | | | | | | | |
| | | | | |
| | | | | 2022 | | | | | 2021 | | | |
| | | | | EUR in millions | | | | | EUR in millions | | | |
| | | | | |
Hedging of securities and investments | | | | | | –1 | | | | | | 4 | | | | |
| | | | | |
Hedging of liabilities to banks and customers | | | | | | 2 | | | | | | –1 | | | | |
| | | | | |
Hedging of certificated liabilities | | | | | | 17 | | | | | | –8 | | | | |
| | | | | |
Subtotal: Effectiveness of hedges | | | | | | 18 | | | | | | –5 | | | | |
| | | | | |
Amortisation of value adjustments | | | | | | 0 | | | | | | 0 | | | | |
| | | | | |
Total | | | | | | 18 | | | | | | –5 | | | | |
Gross analysis of valuation gains/losses from micro fair value hedge accounting:
Comparison of hedged items and hedging instruments in financial year 2022
| | | | | | | | | | | | | | | | |
| | | | | | | | | | | Hedging | | | | Effectiveness | | |
| | | | | | Hedged items | | | | instruments | | | | of hedges | | |
| | | | | | EUR in millions | | | | EUR in millions | | | | EUR in millions | | |
| | | | | | | | |
Hedging of securities and investments | | | | | | –2,550 | | | | 2,550 | | | | –1 | | |
| | | | | | | | |
Hedging of liabilities to banks and customers | | | | | | 2,195 | | | | –2,193 | | | | 2 | | |
| | | | | | | | |
Hedging of certificated liabilities | | | | | | 30,856 | | | | –30,839 | | | | 17 | | |
| | | | | | | | |
Total | | | | | | 30,501 | | | | –30,482 | | | | 18 | | |
Gross analysis of valuation gains/losses from micro fair value hedge accounting:
Comparison of hedged items and hedging instruments in financial year 2021
| | | | | | | | | | | | | | | | |
| | | | | | | | | | | Hedging | | | | Effectiveness | | |
| | | | | | Hedged items | | | | instruments | | | | of hedges | | |
| | | | | | EUR in millions | | | | EUR in millions | | | | EUR in millions | | |
| | | | | | | | |
Hedging of securities and investments | | | | | | –510 | | | | 514 | | | | 4 | | |
| | | | | | | | |
Hedging of liabilities to banks and customers | | | | | | 481 | | | | –482 | | | | –1 | | |
| | | | | | | | |
Hedging of certificated liabilities | | | | | | 8,628 | | | | –8,637 | | | | –8 | | |
| | | | | | | | |
Total | | | | | | 8,600 | | | | –8,605 | | | | –5 | | |
KfW Financial Report 2022 Consolidated financial statements | Notes – Notes to the statement of comprehensive income | 102
Gross analysis of net gains/losses from macro fair value hedge accounting:
Comparison of hedged items and hedging instruments in financial year 2022
| | | | | | | | | | | | | | |
| | | | | Hedged items | | | | Hedging | | | | Effectiveness | | |
| | | | | | | | instruments | | | | of hedges | | |
| | | | EUR in millions | | | | EUR in millions | | | | EUR in millions | | |
| | | | | | | |
Valuation result | | | | –32,696 | | | | 31,555 | | | | –1,142 | | |
| | | | | | | |
Amortisation | | | | 2,290 | | | | –1,050 | | | | 1,241 | | |
| | | | | | | |
Realisation | | | | 32 | | | | 0 | | | | 32 | | |
| | | | | | | |
Net gains/losses from macro fair value hedge accounting | | | | –30,374 | | | | 30,505 | | | | 131 | | |
Gross analysis of net gains/losses from macro fair value hedge accounting:
Comparison of hedged items and hedging instruments in financial year 2021
| | | | | | | | | | | | | | |
| | | | | Hedged items | | | | Hedging | | | | Effectiveness | | |
| | | | | | | | instruments | | | | of hedges | | |
| | | | EUR in millions | | | | EUR in millions | | | | EUR in millions | | |
| | | | | | | |
Valuation result | | | | –5,580 | | | | 5,614 | | | | 34 | | |
| | | | | | | |
Amortisation | | | | –1,701 | | | | 1,693 | | | | –8 | | |
| | | | | | | |
Realisation | | | | –131 | | | | 0 | | | | –131 | | |
| | | | | | | |
Net gains/losses from macro fair value hedge accounting | | | | –7,412 | | | | 7,307 | | | | –105 | | |
Net gains/losses from macro fair value hedge accounting comprise the valuation of hedging instruments and the valuation of hedged risks from the hedged portfolios. It also includes the amortisation of the value adjustments from the dynamic hedge designation and de-designation and the pro rata reversal of value adjustments in the event of derecognition of financial instruments from the underlying portfolios as well as the pull-to-par effect of the hedging derivatives.
103 | KfW Financial Report 2022 Consolidated financial statements | Notes – Notes to the statement of comprehensive income
(27) Net gains/losses from other financial instruments at fair value through profit or loss
Analysis of Net gains/losses from other financial instruments at fair value through profit or loss
| | | | | | | | | | | | | | | | | | | | |
| | | | | | | 2022 | | | | | | | | 2021 | | | | | |
| | | | | | | EUR in millions | | | | | | | | EUR in millions | | | | | |
| | | | | |
Loans and advances to banks/customers | | | | | | | –10 | | | | | | | | 28 | | | | | |
| | | | | |
Loans and advances | | | | | | | 3 | | | | | | | | 28 | | | | | |
| | | | | |
Miscellaneous receivables (money market transactions, promissory note loans and Other receivables) | | | | | | | –13 | | | | | | | | 0 | | | | | |
| | | | | |
Securities and investments | | | | | | | –46 | | | | | | | | 611 | | | | | |
| | | | | |
Bonds and other fixed-income securities | | | | | | | 0 | | | | | | | | 0 | | | | | |
| | | | | |
Shares and other non-fixed income securities | | | | | | | 0 | | | | | | | | 0 | | | | | |
| | | | | |
Equity investments | | | | | | | –46 | | | | | | | | 6121) | | | | | |
| | | | | |
Liabilities to banks and customers | | | | | | | 257 | | | | | | | | 78 | | | | | |
| | | | | |
Certificated liabilities | | | | | | | 1,593 | | | | | | | | 536 | | | | | |
| | | | | |
Other derivatives | | | | | | | –1,820 | | | | | | | | –620 | | | | | |
| | | | | |
Financial derivatives not qualifying for hedge accounting | | | | | | | –1,820 | | | | | | | | –620 | | | | | |
| | | | | |
| Foreign currency translation | | | | | | | 91 | | | | | | | | 1331) | | | | | |
| | | | | |
| | | | | |
Total | | | | | | | 64 | | | | | | | | 767 | | | | | |
| 1) | The foreign currency result from the equity investments of DEG of EUR 140 million was recorded in Net gains/losses from securities and investments (equity investments) in the previous year. As of financial year 2022, it will be recognised in the result from foreign currency translation. | |
Net gains/losses from assets include the net gains/losses from holding arrangements for the Federal Republic of Germany – if attributable to KfW, KfW IPEX-Bank’s syndication business with a focus on short-term placement, loans that do not meet the SPPI criterion (loans and advances to banks and loans and advances to customers), and equity investments (securities and investments).
The gains realised from the disposal of non-current assets held for sale included in net gains/losses from securities and investments amounted to EUR 11 million in financial year 2022 (2021: EUR 1 million).
Net gains/losses from liabilities measured at fair value include the results from promissory note loans (liabilities to banks/liabilities to customers) and bonds and notes (certificated liabilities).
Net gains/losses from financial derivatives not qualifying for hedge accounting are mainly attributable to derivatives in economic hedges. Economic hedges are recognised by exercising the fair value option for the hedged items. The hedged items include, in particular, borrowings in the form of Certificated liabilities, Liabilities to banks and Liabilities to customers.
Furthermore, this line item includes gains/losses from bifurcated embedded derivatives resulting from hybrid contracts under financial liabilities. The net gains/losses from the valuation of the associated hedging derivatives are thus compensated for.
KfW Financial Report 2022 Consolidated financial statements | Notes – Notes to the statement of comprehensive income | 104
Gross analysis of results from economically hedged borrowings:
Comparison of hedged items and hedging instruments
| | | | | | | | | | | | | | |
| | | | | |
| | | | | | | 2022 | | | | | | 2021 | | |
| | | | | | | EUR in millions | | | | | | EUR in millions | | |
| | | | | |
| Borrowings | | | | | | 1,850 | | | | | | 614 | | |
| | | | | |
| Hedging instruments | | | | | | –1,826 | | | | | | –716 | | |
| | | | | |
| Total (effectiveness of economic hedges) | | | | | | 24 | | | | | | –102 | | |
(28) Net gains/losses from disposal of financial assets at amortised cost
| | | | | | | | | | | | | | |
| | | | | |
| | | | | | | 2022 | | | | | | 2021 | | |
| | | | | | | EUR in millions | | | | | | EUR in millions | | |
| | | | | |
| Expense from the disposal of financial assets at amortised cost | | | | | | 1 | | | | | | 4 | | |
| | | | | |
| Total | | | | | | –1 | | | | | | –4 | | |
Income and expense from the disposal of financial assets at amortised cost resulted from the sale of loans on the secondary market.
(29) Net gains/losses from investments accounted for using the equity method
| | | | | | | | | | | | |
| | | | | |
| | | | | 2022 | | | | | | 2021 | | |
| | | | | EUR in millions | | | | | | EUR in millions | | |
| | | | | |
| Net gains/losses from investments accounted for using the equity method | | | | 43 | | | | | | 14 | | |
105 | KfW Financial Report 2022 Consolidated financial statements | Notes – Notes to the statement of comprehensive income
(30) Administrative expense
Analysis of Administrative expense
| | | | | | | | | | | | | | |
| | | | | | | 2022 | | | | | | 2021 | | |
| | | | | | | EUR in millions | | | | | | EUR in millions | | |
| | | | | | |
| Wages and salaries | | | | | | 700 | | | | | | 657 | | |
| Social security contributions | | | | | | 99 | | | | | | 98 | | |
| Expenses for pension provision and other employee benefits | | | | | | 88 | | | | | | 88 | | |
| Personnel expense | | | | | | 887 | | | | | | 842 | | |
| Other administrative expenses | | | | | | 521 | | | | | | 499 | | |
| Depreciation, amortisation and impairment of property, plant and equipment and intangible assets | | | | | | 117 | | | | | | 125 | | |
of which impairments of rights of use arising from leases | | | | | | 10 | | | | | | 10 | | |
| Non-personnel expense | | | | | | 638 | | | | | | 624 | | |
| | | | | | |
| Total | | | | | | 1,525 | | | | | | 1,466 | | |
(31) Net other operating income or loss
Analysis of Net other operating income or loss
| | | | | | | | | | | | | | |
| | | | | | | 2022 | | | | | | 2021 | | |
| | | | | | | EUR in millions | | | | | | EUR in millions | | |
| | | | | | |
| Other operating income | | | | | | 41 | | | | | | 34 | | |
| | | | | | |
| Other operating expense | | | | | | 50 | | | | | | 86 | | |
| | |
| | | | | | |
| Total | | | | | | –8 | | | | | | –53 | | |
Other operating income primarily includes income from the reversal of other provisions in an amount of EUR 17 million (2021: EUR 12 million).
The Other operating expense item includes contributions payable by KfW IPEX-Bank to the restructuring fund for banks in an amount of EUR 21 million (2021: EUR 14 million). KfW is not obligated to contribute to the fund in accordance with Section 2 of the Restructuring Fund Act (Restrukturierungsfondsgesetz – “RStrukFG”).
KfW Financial Report 2022 Consolidated financial statements | Notes – Notes to the statement of comprehensive income | 106
(32) Taxes on income
Analysis of Taxes on income by component
| | | | | | | | | | | | |
| | | | | | | 2022 | | | | 2021 | | |
| | | | | | | EUR in millions | | | | EUR in millions | | |
| | | | | | |
| Current taxes on income | | | | | | 46 | | | | 49 | | |
| Deferred taxes | | | | | | –47 | | | | 88 | | |
| | | | | | |
| Total | | | | | | –1 | | | | 137 | | |
Current taxes include taxes on income for group companies and non-deductible investment income tax recorded at KfW level.
The reconciliation presents the relationship between the calculated income tax expense for the financial year and reported taxes on income.
Income tax reconciliation
| | | | | | | | | | | | | | |
| | | | | | | 2022 | | | | | | 2021 | | |
| | | | | | | EUR in millions | | | | | | EUR in millions | | |
| | | | | | |
| Profit/loss from operating activities (before taxes) | | | | | | 1,365 | | | | | | 2,353 | | |
| | | | | | |
| Group income tax rate | | | | | | 0% | | | | | | 0% | | |
| | | | | | |
| Calculated income tax expense in the financial year | | | | | | 0 | | | | | | 0 | | |
| | | | | | |
| Effects of tax rate differentials within the group | | | | | | 244 | | | | | | 129 | | |
| | | | | | |
| Effect of tax rate changes | | | | | | 0 | | | | | | 0 | | |
| | | | | | |
| Effects of previous year taxes recorded in the reporting year | | | | | | 1 | | | | | | 6 | | |
| | | | | | |
| Effects of non-deductible taxes on income | | | | | | 2 | | | | | | 2 | | |
| | | | | | |
| Effects of non-deductible business expenses | | | | | | 5 | | | | | | 4 | | |
| | | | | | |
| Effects of tax-free income | | | | | | –20 | | | | | | –67 | | |
| | | | | | |
| Trade tax add-ons/reductions | | | | | | 4 | | | | | | 1 | | |
| | | | | | |
| Permanent accounting differences | | | | | | –113 | | | | | | 111 | | |
| | | | | | |
| Effects of changes in recognised deferred tax assets | | | | | | –124 | | | | | | –49 | | |
| | | | | | |
| Reported taxes on income | | | | | | –1 | | | | | | 137 | | |
KfW’s applicable income tax rate of 0%, on which the reconciliation is based, takes into account the tax status of KfW as a non-taxable public-law institution and the fact that this status predominantly determines profit/loss from operating activities.
The effects of tax rate differentials result from individual group companies being taxable and the related different tax rates. The tax rates continue to range from 0% to 32%.
107 | KfW Financial Report 2022 Consolidated financial statements | Notes – Notes to the statement of comprehensive income
Segment reporting
(33) Segment reporting by business sector
In accordance with the provisions of IFRS 8, segment reporting follows the internal management reporting system, which is used by the group’s main decision-makers to assess each segment’s performance and to allocate resources to segments.
As of financial year 2022, the former business sector Promotion of developing countries and emerging economies has been divided into the segments it was previously comprised of, but that now report separately: KfW Development Bank and Deutsche Investitions- und Entwicklungsgesellschaft mbH (DEG). Presentation in the segment report therefore follows the new structure as of 2022 in the internal management reporting system. The corresponding prior-year figures for 2021 were adjusted to reflect the new structure.
In accordance with the business sector structure for KfW Group, the segments and their products and services can now be presented as follows:
| | | | |
| | | | – Start-up financing |
Mittelstandsbank & Private Kunden (SME Bank & Private Clients) | | | | – Financing of general corporate investments and investments in innovation, energy and environmental protection |
| | | | – Education financing |
| | | | – Financing for housing construction, conversion and refurbishment |
| | | | – Financing of municipal and social infrastructure |
| Individualfinanzierung & Öffentliche Kunden | | | | – Customised corporate financing with equity and debt capital |
| (Customised Finance & Public Clients) | | | | – Customised financing of banks and promotional institutions of the federal states |
| | | | – Mandated transactions for energy supply |
KfW Capital | | | | – Investments in German and European venture capital and venture debt funds |
| | | | – Financing of German and European export activities |
Export and project finance | | | | – Financing of projects and investments which are of special interest for Germany and Europe |
KfW Development Bank | | | | – Promotion of developing countries and emerging economies on behalf of the Federal Government with budget funds and complementary market funds raised by KfW |
DEG | | | | – Financing provided by DEG – Deutsche Investitions- und Entwicklungs- gesellschaft mbH in developing countries and emerging economies (private enterprise financing) |
| | | | – Securities and money market investments |
| Financial markets | | | | – Holding arrangements for the Federal Republic of Germany |
| | | | – Transactions mandated by the Federal Government, loan granted to Greece |
| | | | – Funding |
| | | | – Central interest rate and currency management |
| Head office | | | | – Strategic equity investments |
The business sectors are measured on the basis of their contribution to consolidated profit. The individual line items are based on the following methods:
| | – | Net interest income (before promotional expense) comprises the net interest generated from lending business calculated on the basis of the market interest rate method1). The item also includes the imputed return on equity allocated according to the business sectors’ planned regulatory capital. Head office also includes the treasury result, which largely comprises the income/loss from interest rate and spread management. The profit contribution from KfW funding2) is allocated to the Financial markets business sector. |
| | 1) | Funding at matching maturities using KfW’s internal refinancing curve is assumed for the calculation of net interest income in this method. |
| | 2) | The difference between the realised refinancing rates and the maturity-matched refinancing rates, calculated in-house. |
KfW Financial Report 2022 Consolidated financial statements | Notes – Segment reporting | 108
| | – | Promotional expense included in Interest, Commission and Administrative expense and Other operating expense in the income statement is reported separately pursuant to the internal management report due to the special relevance of promotional expense as a management variable. |
Promotional expense is understood to mean certain expenses from the two business sectors Mittelstandsbank & Private Kunden (SME Bank & Private Clients) and Individualfinanzierung & Öffentliche Kunden (Customised Finance & Public Clients) that have a positive impact on the achievement of KfW’s promotional objectives. Promotional expense primarily consists of additions of the interest rate reductions accounted for at present value3) from new commitments as well as from the compounding effect. Additional promotional components are the expenses for upfront fees paid to sales partners for the processing of small and micro loans (included in Commission expense), for innovative digital promotional approaches (included in Commission and Administrative expense), for available and product-related marketing and sales measures (included in Administrative expense), and for promotional grants awarded as a supplement to the lending business (included in Other operating expense).
| | – | The allocation of Administrative expense (before promotional expense) is based on the results from activity-based accounting by cost centres4). Administrative expense (before promotional expense) includes depreciation on property, plant and equipment and amortisation of intangible assets. |
| | – | In the Risk provisions for lending business item, net impairment charges, direct write-offs, recoveries on loans written off and the net gains/losses from non-substantial contractual modifications are distributed among the segments according to the underlying loan. |
| | – | The valuation result (before promotional expense) comprises the net gains/losses from hedge accounting, the net gains/losses from other financial instruments at fair value, net gains/losses from risk provisions in the securities business, the net gains/losses from the disposal of financial instruments measured at amortised cost, the net gains/losses from investments accounted for using the equity method and net other operating income (before promotional expense). |
| | – | When taxes on income are allocated to the business sectors (excluding the Head office), only the current taxes on income are taken into account. Deferred taxes are allocated to the Head office. |
| | – | In accordance with the internal management reporting system, segment assets are not reported as they are used neither to assess each segment’s performance nor to allocate resources to segments. |
| | – | The presentation of segment income and expense is based on consolidated figures. Administrative and commission expense as well as commission income and other operating income resulting from service relationships within KfW Group are adjusted in segment reporting. Any remaining negligible consolidation effects are reported in the reconciliation/consolidation column. |
| | 3) | See Note 11 for details of KfW’s interest rate reductions in the promotional lending business. |
| | 4) | The costs incurred in the organisational units are largely allocated to the products by means of core services. |
109 | KfW Financial Report 2022 Consolidated financial statements | Notes – Segment reporting
Segment reporting by business sector for financial year 2022
| | | | | | | | | | | | | | | | | | | | | | |
| | | | | Mittelstandsbank & Private Kunden (SME Bank & Private Clients) | | | | Individualfinanzi- erung & Öffentli- che Kunden1) (Customised Finance & Public Clients) | | | | KfW Capital1) | | | | Export and project finance1) | | | | KfW Development Bank1) | | |
| | | | | EUR in millions | | | | EUR in millions | | | | EUR in millions | | | | EUR in millions | | | | EUR in millions | | |
| | | | | | | | | | | |
Volume of new commitments | | | | 64,839 | | | | 69,970 | | | | 1,259 | | | | 18,120 | | | | 10,931 | | |
Net interest income
(before promotional expense) | | | | 465 | | | | 165 | | | | 0 | | | | 781 | | | | 175 | | |
Net commission income
(before promotional expense) | | | | 307 | | | | 42 | | | | 1 | | | | 30 | | | | 249 | | |
Administrative expense
(before promotional expense) | | | | 432 | | | | 84 | | | | 15 | | | | 282 | | | | 403 | | |
Operating result before valuation
(before promotional expense) | | | | 340 | | | | 124 | | | | –14 | | | | 529 | | | | 21 | | |
Risk provisions for lending business | | | | –37 | | | | 2 | | | | 0 | | | | 24 | | | | –4 | | |
Valuation result
(before promotional expense) | | | | 0 | | | | 40 | | | | 34 | | | | 52 | | | | –59 | | |
Profit/loss from operating activities (before promotional expense) | | | | 303 | | | | 166 | | | | 20 | | | | 605 | | | | –43 | | |
| Promotional expense | | | | 278 | | | | 27 | | | | 0 | | | | 0 | | | | 0 | | |
| Taxes on income | | | | 0 | | | | 0 | | | | 0 | | | | 28 | | | | 0 | | |
| Consolidated profit | | | | 25 | | | | 139 | | | | 20 | | | | 578 | | | | –43 | | |
| | | | | | | | | | | | | | | | | | | | | | | |
| | | | | | | | | | | |
| | | | | DEG | | | | Financial markets | | | | Head office | | | | Reconciliation/ consolidation | | | | KfW Group | | |
| | | | | EUR in millions | | | | EUR in millions | | | | EUR in millions | | | | EUR in millions | | | | EUR in millions | | |
| | | | | | | | | | | |
Volume of new commitments | | | | 1,644 | | | | 415 | | | | 0 | | | | –241 | | | | 166,938 | | |
Net interest income
(before promotional expense) | | | | 242 | | | | 497 | | | | 90 | | | | 0 | | | | 2,416 | | |
Net commission income
(before promotional expense) | | | | –1 | | | | –4 | | | | 4 | | | | 0 | | | | 629 | | |
Administrative expense
(before promotional expense) | | | | 139 | | | | 97 | | | | 57 | | | | 0 | | | | 1,509 | | |
Operating result before valuation
(before promotional expense) | | | | 103 | | | | 396 | | | | 37 | | | | 0 | | | | 1,536 | | |
| Risk provisions for lending business | | | | –113 | | | | 5 | | | | 2 | | | | 0 | | | | –122 | | |
Valuation result
(before promotional expense) | | | | 26 | | | | 8 | | | | 156 | | | | –1 | | | | 256 | | |
Profit/loss from operating activities
(before promotional expense) | | | | 16 | | | | 409 | | | | 195 | | | | –1 | | | | 1,669 | | |
| Promotional expense | | | | 0 | | | | 0 | | | | 0 | | | | 0 | | | | 305 | | |
| Taxes on income | | | | 16 | | | | 0 | | | | –44 | | | | 0 | | | | –1 | | |
| Consolidated profit | | | | 0 | | | | 409 | | | | 239 | | | | –1 | | | | 1,365 | | |
| 1) | The valuation result of the business sectors includes the following net gains/losses from investments accounted for using the equity method: |
| KfW | Capital EUR 6.6 million, Export and project finance EUR 36.4 million and KfW Development Bank EUR 0.3 million. |
KfW Financial Report 2022 Consolidated financial statements | Notes – Segment reporting | 110
Segment reporting by business sector for financial year 2021
| | | | | | | | | | | | | | | | | | | | | | | | | | | | | | | | | | |
| | | | | | | Mittelstandsbank & Private Kunden (SME Bank & Private Clients) | | | | | | Individualfinanzi- erung & Öffentli- che Kunden1) (Customised Finance & Public Clients) | | | | | | KfW Capital1) | | | | | | Export and project finance1) | | | | | | KfW Development Bank1) | | | | |
| | | | | | | EUR in millions | | | | | | EUR in millions | | | | | | EUR in millions | | | | | | EUR in millions | | | | | | EUR in millions | | | | |
| | | | | | | | | | | |
Volume of new commitments | | | | | | 72,980 | | | | | | 9,465 | | | | | | 502 | | | | | | 13,644 | | | | | | 8,611 | | | | |
Net interest income
(before promotional expense) | | | | | | 463 | | | | | | 107 | | | | | | 0 | | | | | | 797 | | | | | | 173 | | | | |
Net commission income
(before promotional expense) | | | | | | 309 | | | | | | 35 | | | | | | 6 | | | | | | 33 | | | | | | 245 | | | | |
Administrative expense
(before promotional expense) | | | | | | 430 | | | | | | 77 | | | | | | 11 | | | | | | 289 | | | | | | 365 | | | | |
Operating result before valuation (before promotional expense) | | | | | | 342 | | | | | | 65 | | | | | | –6 | | | | | | 540 | | | | | | 53 | | | | |
| Risk provisions for lending business | | | | | | –2 | | | | | | 5 | | | | | | 0 | | | | | | 94 | | | | | | 35 | | | | |
Valuation result
(before promotional expense) | | | | | | 1 | | | | | | 63 | | | | | | 211 | | | | | | 29 | | | | | | 30 | | | | |
Profit/loss from operating activities
(before promotional expense) | | | | | | 341 | | | | | | 133 | | | | | | 205 | | | | | | 663 | | | | | | 118 | | | | |
| Promotional expense | | | | | | 182 | | | | | | 6 | | | | | | 0 | | | | | | 0 | | | | | | 0 | | | | |
| Taxes on income | | | | | | 0 | | | | | | 0 | | | | | | 0 | | | | | | 40 | | | | | | 0 | | | | |
| Consolidated profit | | | | | | 159 | | | | | | 127 | | | | | | 205 | | | | | | 622 | | | | | | 118 | | | | |
| | | | | | | | | | | | | | | | | | | | | | | | | | | | | | | | | | | |
| | | | | | | | | | | |
| | | | | | | DEG | | | | | | Financial markets | | | | | | Head office | | | | | | Reconciliation/ consolidation | | | | | | KfW Group | | | | |
| | | | | | | EUR in millions | | | | | | EUR in millions | | | | | | EUR in millions | | | | | | EUR in millions | | | | | | EUR in millions | | | | |
| | | | | | | | | | | |
Volume of new commitments | | | | | | 1,534 | | | | | | 527 | | | | | | 0 | | | | | | –212 | | | | | | 107,050 | | | | |
Net interest income
(before promotional expense) | | | | | | 240 | | | | | | 347 | | | | | | 405 | | | | | | 0 | | | | | | 2,531 | | | | |
Net commission income
(before promotional expense) | | | | | | 8 | | | | | | –4 | | | | | | 2 | | | | | | 0 | | | | | | 634 | | | | |
Administrative expense
(before promotional expense) | | | | | | 132 | | | | | | 97 | | | | | | 50 | | | | | | 0 | | | | | | 1,452 | | | | |
Operating result before valuation
(before promotional expense) | | | | | | 117 | | | | | | 246 | | | | | | 357 | | | | | | 0 | | | | | | 1,712 | | | | |
| Risk provisions for lending business | | | | | | 67 | | | | | | –4 | | | | | | 0 | | | | | | 0 | | | | | | 196 | | | | |
Valuation result
(before promotional expense) | | | | | | 440 | | | | | | 21 | | | | | | –163 | | | | | | 0 | | | | | | 633 | | | | |
Profit/loss from operating activities
(before promotional expense) | | | | | | 624 | | | | | | 263 | | | | | | 194 | | | | | | –1 | | | | | | 2,541 | | | | |
| Promotional expense | | | | | | 0 | | | | | | 0 | | | | | | 0 | | | | | | 0 | | | | | | 188 | | | | |
| Taxes on income | | | | | | 5 | | | | | | 0 | | | | | | 92 | | | | | | 0 | | | | | | 137 | | | | |
| Consolidated profit | | | | | | 619 | | | | | | 263 | | | | | | 102 | | | | | | –1 | | | | | | 2,215 | | | | |
| 1) | The valuation result of the business sectors includes the following net gains/losses from investments accounted for using the equity method: |
| | KfW Capital EUR 16.4 million, Export and project finance EUR 8.3 million and KfW Development Bank EUR 6.1 million. |
111 | KfW Financial Report 2022 Consolidated financial statements | Notes – Segment reporting
The reconciliation/consolidation column includes all adjustments that were necessary to reconcile segment information with the aggregated information for KfW Group. The consolidation effects reported for “Volume of new commitments” relate to commitments for programme loans made by Mittelstandsbank & Private Kunden (SME Bank & Private Clients) and Individualfinanzierung & Öffentliche Kunden (Customised Finance & Public Clients) for which KfW IPEX-Bank acts as on-lending bank. The other amounts in this column result from minimal consolidation effects.
(34) Segment reporting by region
Net interest and commission income are allocated on the basis of the customers’ geographical location. The imputed return on equity included in net interest income, the profit contribution from KfW funding and the treasury result are allocated to Germany. KfW receives commission income from the Federal Government for supporting developing countries and emerging economies using budget funds of the Federal Government. These funds are allocated according to the region of the country receiving the investment.
Property, plant and equipment and intangible assets are not reported according to region because, apart from immaterial amounts, these assets relate to Germany.
Segment reporting by region for financial year 2022
| | | | | | | | | | | | | | | | | | | | | | | | | | | | | | | | |
| | | | | | | Germany | | | | | | Europe (excl. Germany) | | | | | | Rest of the world | | | | | | Reconciliation/ consolidation | | | | KfW Group | | | | |
| | | | | | | EUR in millions | | | | | | EUR in millions | | | | | | EUR in millions | | | | | | EUR in millions | | | | EUR in millions | | | |
| | | | | | | | | | | | | | | |
Net interest income | | | | | | 1,078 | | | | | | 427 | | | | | | 644 | | | | | | 0 | | | | 2,148 | | | | |
Net commission income | | | | | | 349 | | | | | | 39 | | | | | | 229 | | | | | | 0 | | | | 617 | | | | |
Segment income | | | | | | 1,427 | | | | | | 465 | | | | | | 873 | | | | | | 0 | | | | 2,766 | | | | |
Segment reporting by region for financial year 2021 | |
| |
| | | | | | | Germany | | | | | | Europe (excl. Germany) | | | | | | Rest of the world | | | | | | Reconciliation/ consolidation | | | | KfW Group | | | | |
| | | | | | | EUR in millions | | | | | | EUR in millions | | | | | | EUR in millions | | | | | | EUR in millions | | | | EUR in millions | | | |
| | | | | | | | | | | | | | | |
Net interest income | | | | | | 1,343 | | | | | | 423 | | | | | | 620 | | | | | | 0 | | | | 2,386 | | | | |
Net commission income | | | | | | 343 | | | | | | 32 | | | | | | 247 | | | | | | 0 | | | | 623 | | | | |
Segment income | | | | | | 1,687 | | | | | | 455 | | | | | | 867 | | | | | | 0 | | | | 3,009 | | | | |
The reconciliation/consolidation column includes all adjustments that were necessary to reconcile segment information with the aggregated information for KfW Group. The amounts in this column result solely from minimal consolidation effects.
KfW Financial Report 2022 Consolidated financial statements | Notes – Segment reporting | 112
Notes to the statement
of financial position
(35) Cash reserves
Analysis of Cash reserves
| | | | | | | | | | | | | | | | | | |
| | | | | | 31 Dec. 2022 | | | | | | | 31 Dec. 2021 | | | |
| | | | | | EUR in millions | | | | | | | EUR in millions | | | |
| | | | | | |
| Cash | | | | | | 0 | | | | | | | | 0 | | | | |
| | | | | | |
Balances with central banks | | | | | | 51,848 | | | | | | | | 42,439 | | | | |
Total | | | | | | 51,848 | | | | | | | | 42,439 | | | | |
(36) Financial assets at amortised cost Analysis of Financial assets at amortised cost by class | | | | | | | | | | | | | | | | | | |
| | | | | | | | | | | | | | | | | | |
| | | | | | 31 Dec. 2022 | | | | | | | 31 Dec. 2021 | | | |
| | | | | | EUR in millions | | | | | | | EUR in millions | | | |
| | | | | | |
| Loans and advances to banks | | | | | | | | | | | | | | | | | | |
| | | | | | |
Money market transactions | | | | | | 5,211 | | | | | | | | 5,510 | | | | |
| | | | | | |
Loans and advances | | | | | | 304,194 | | | | | | | | 301,759 | | | | |
| | | | | | |
Promissory note loans | | | | | | 0 | | | | | | | | 22 | | | | |
| | | | | | |
Other receivables | | | | | | 4,762 | | | | | | | | 1,197 | | | | |
| | | | | | |
Loans and advances to customers | | | | | | | | | | | | | | | | | | |
| | | | | | |
Money market transactions | | | | | | 406 | | | | | | | | 0 | | | | |
| | | | | | |
Loans and advances | | | | | | 151,780 | | | | | | | | 129,278 | | | | |
| | | | | | |
Promissory note loans | | | | | | 1,018 | | | | | | | | 1,205 | | | | |
| | | | | | |
Other receivables | | | | | | 1,273 | | | | | | | | 420 | | | | |
| | | | | | |
Securities and investments | | | | | | | | | | | | | | | | | | |
| | | | | | |
Bonds and other fixed-income securities | | | | | | 33,733 | | | | | | | | 35,784 | | | | |
| | | | | | |
Total gross | | | | | | 502,378 | | | | | | | | 475,175 | | | | |
| | | | | | |
| Less risk provisions for | | | | | | | | | | | | | | | | | | |
| | | | | | |
Loans and advances to banks | | | | | | –248 | | | | | | | | –238 | | | | |
| | | | | | |
Loans and advances to customers | | | | | | –1,853 | | | | | | | | –1,705 | | | | |
| | | | | | |
Securities and investments | | | | | | –12 | | | | | | | | –10 | | | | |
| | | | | | |
Total net | | | | | | 500,265 | | | | | | | | 473,221 | | | | |
The receivables from reverse repurchase agreements (reverse “repos”) and cash collateral pledged are included in Loans and advances to the banks – Other receivables.
Cash collateral provided in an amount of EUR 5,154 million (2021: EUR 829 million) is allocated to cash collateral against derivatives.
Receivables from securities lending transactions with the German Finance Agency are included in Loans and advances to customers – Other receivables.
113 | KfW Financial Report 2022 Consolidated financial statements | Notes – Notes to the statement of financial position
Analysis of Loans and advances by underwriting liability type
| | | | | | | | | | | | | | | | | | | | | | | | | | |
| | | | | | | Loans and advances to banks | | | | | | Loans and advances to customers | | |
| | | | | | | 31 Dec. 2022 | | | | | | 31 Dec. 2021 | | | | | | 31 Dec. 2022 | | | | | | 31 Dec. 2021 | | |
| | | | | | | EUR in millions | | | | | | EUR in millions | | | | | | EUR in millions | | | | | | EUR in millions | | |
| | | | | | | | | | | | | |
| Direct loans | | | | | | 70,173 | | | | | | 73,170 | | | | | | 141,272 | | | | | | 118,608 | | |
| | | | | | | | | | | | | |
| On-lent customer loans with full underwriting borne by the on-lending commercial bank | | | | | | 208,729 | | | | | | 201,027 | | | | | | 0 | | | | | | 0 | | |
| | | | | | | | | | | | | |
| On-lent customer loans with partial underwriting borne by the on-lending commercial bank | | | | | | 25,617 | | | | | | 27,894 | | | | | | 0 | | | | | | 0 | | |
| | | | | | | | | | | | | |
| On-lent customer loans without underwriting borne by the on-lending commercial bank | | | | | | 0 | | | | | | 0 | | | | | | 8,137 | | | | | | 8,205 | | |
| | | | | | | | | | | | | |
| Customer loans on-lent through insurance companies with full underwriting borne by the on-lending insurance company | | | | | | 0 | | | | | | 0 | | | | | | 1,218 | | | | | | 1,210 | | |
| | | | | | | | | | | | | |
| Direct and on-lent subordinated loans | | | | | | 318 | | | | | | 279 | | | | | | 1,191 | | | | | | 1,287 | | |
| | | | | | | | | | | | | |
| Adjustment to the carrying amount due to the interest rate being below the market rate for promotional loans paid out with additional promotional funds in the form of interest rate reductions with an impact on KfW’s earnings position. | | | | | | –644 | | | | | | –610 | | | | | | –39 | | | | | | –32 | | |
| | | | | | | | | | | | | |
Total | | | | | | 304,194 | | | | | | 301,759 | | | | | | 151,780 | | | | | | 129,278 | | |
Direct loans to banks include in particular global loans granted as part of financing for domestic housing construction and SMEs.
Direct loans to customers include in particular loans granted under export and project financing, municipal financing and education financing. The item also includes loans connected with certain transactions mandated by the Federal Government in accordance with the KfW Law.
KfW Financial Report 2022 Consolidated financial statements | Notes – Notes to the statement of financial position | 114
(37) Gross carrying amounts
Development of gross carrying amounts of financial assets at amortised cost – Loans and advances to banks
| | | | | | | | | | | | | | | | | | | | | | | | | | | | | | | | | | | | | | | | | | | | | | | | | | | | | | | | | | | | | | | | |
| | | | | | Financial year 2022 | | | | | Financial year 2021 | | | | |
| | | | | | | | | | | | | | | | | |
| | | | | Stage 1 | | | | | | Stage 2 | | | | | | Stage 3 | | | | | Total | | | | | Stage 1 | | | | | | Stage 2 | | | | | | Stage 3 | | | | | | Total | | | | |
| | | | | EUR in
millions | | | | | | EUR in
millions | | | | | | EUR in
millions | | | | | EUR in
millions | | | | | EUR in
millions | | | | | | EUR in
millions | | | | | | EUR in
millions | | | | | | EUR in
millions | | | | |
| | | | | | | | | | | | | | | | | |
As of 1 Jan. | | | | | | | 305,962 | | | | | | | | 1,880 | | | | | | | | 648 | | | | | | 308,489 | | | | | | 294,009 | | | | | | | | 1,522 | | | | | | | | 235 | | | | | | | | 295,766 | | | | | |
| | | | | | | | | | | | | | | | | |
Transfer from stage 2 and stage 3 to stage 1 | | | | | | | 451 | | | | | | | | –451 | | | | | | | | 0 | | | | | | 0 | | | | | | 544 | | | | | | | | –544 | | | | | | | | 0 | | | | | | | | 0 | | | | | |
| | | | | | | | | | | | | | | | | |
Transfer from stage 1 and stage 3 to stage 2 | | | | | | | –1,863 | | | | | | | | 1,872 | | | | | | | | –9 | | | | | | 0 | | | | | | –843 | | | | | | | | 849 | | | | | | | | –5 | | | | | | | | 0 | | | | | |
| | | | | | | | | | | | | | | | | |
Transfer from stage 1 and stage 2 to stage 3 | | | | | | | –646 | | | | | | | | –48 | | | | | | | | 694 | | | | | | 0 | | | | | | –464 | | | | | | | | –72 | | | | | | | | 536 | | | | | | | | 0 | | | | | |
| | | | | | | | | | | | | | | | | |
Additions – New business and increased utilisation | | | | | | | 83,945 | | | | | | | | 234 | | | | | | | | 22 | | | | | | 84,202 | | | | | | 101,850 | | | | | | | | 397 | | | | | | | | 23 | | | | | | | | 102,270 | | | | | |
| | | | | | | | | | | | | | | | | |
Disposals | | | | | | | –77,402 | | | | | | | | –654 | | | | | | | | –411 | | | | | | –78,466 | | | | | | –90,135 | | | | | | | | –281 | | | | | | | | –168 | | | | | | | | –90,584 | | | | | |
| | | | | | | | | | | | | | | | | |
of which financial assets written off | | | | | | | –77,402 | | | | | | | | –654 | | | | | | | | –403 | | | | | | –78,459 | | | | | | –90,135 | | | | | | | | –281 | | | | | | | | –160 | | | | | | | | –90,576 | | | | | |
| | | | | | | | | | | | | | | | | |
of which default on receivables | | | | | | | 0 | | | | | | | | 0 | | | | | | | | –7 | | | | | | –7 | | | | | | 0 | | | | | | | | 0 | | | | | | | | –8 | | | | | | | | –8 | | | | | |
| | | | | | | | | | | | | | | | | |
Changes from non-substantial contractual modification | | | | | | | 0 | | | | | | | | 0 | | | | | | | | 0 | | | | | | 0 | | | | | | –13 | | | | | | | | 0 | | | | | | | | 2 | | | | | | | | –11 | | | | | |
| | | | | | | | | | | | | | | | | |
Exchange rate and other changes | | | | | | | –133 | | | | | | | | 2 | | | | | | | | 75 | | | | | | –57 | | | | | | 1,013 | | | | | | | | 8 | | | | | | | | 26 | | | | | | | | 1,047 | | | | | |
| As of 31 Dec. | | | | | | | 310,314 | | | | | | | | 2,836 | | | | | | | | 1,018 | | | | | | 314,168 | | | | | | 305,962 | | | | | | | | 1,880 | | | | | | | | 648 | | | | | | | | 308,489 | | | | | |
115 | KfW Financial Report 2022 Consolidated financial statements | Notes – Notes to the statement of financial position
Development of gross carrying amounts of financial assets at amortised cost – Loans and advances to customers
| | | | | | | | | | | | | | | | | | | | | | | | | | | | | | | | | | | | | | | | | | | | | | | | | | | | | | | | | | | | | | | | |
| | | | | | Financial year 2022 | | | | | Financial year 2021 | | | | |
| | | | | | | | | | | | | | | | | |
| | | | | Stage 1 | | | | | | Stage 2 | | | | | | Stage 3 | | | | | Total | | | | | Stage 1 | | | | | | Stage 2 | | | | | | Stage 3 | | | | | | Total | | | | |
| | | | | EUR in
millions | | | | | | EUR in
millions | | | | | | EUR in
millions | | | | | EUR in
millions | | | | | EUR in
millions | | | | | | EUR in
millions | | | | | | EUR in
millions | | | | | | EUR in
millions | | | | |
| | | | | | | | | | | | | | | | | |
As of 1 Jan. | | | | | | | 101,598 | | | | | | | | 24,773 | | | | | | | | 4,531 | | | | | | 130,902 | | | | | | 100,069 | | | | | | | | 12,474 | | | | | | | | 18,656 | | | | | | | | 131,199 | | | | | |
| | | | | | | | | | | | | | | | | |
Transfer from stage 2 and stage 3 to stage 1 | | | | | | | 19,351 | | | | | | | | –19,351 | | | | | | | | 0 | | | | | | 0 | | | | | | 2,041 | | | | | | | | –2,015 | | | | | | | | –26 | | | | | | | | 0 | | | | | |
| | | | | | | | | | | | | | | | | |
Transfer from stage 1 and stage 3 to stage 2 | | | | | | | –4,372 | | | | | | | | 4,651 | | | | | | | | –279 | | | | | | 0 | | | | | | –5,123 | | | | | | | | 19,969 | | | | | | | | –14,846 | 1) | | | | | | | 0 | | | | | |
| | | | | | | | | | | | | | | | | |
Transfer from stage 1 and stage 2 to stage 3 | | | | | | | –2,175 | | | | | | | | –310 | | | | | | | | 2,485 | | | | | | 0 | | | | | | –953 | | | | | | | | –813 | | | | | | | | 1,766 | | | | | | | | 0 | | | | | |
| | | | | | | | | | | | | | | | | |
Additions – New business and increased utilisation | | | | | | | 54,423 | | | | | | | | 415 | | | | | | | | 380 | | | | | | 55,218 | | | | | | 26,151 | | | | | | | | 714 | | | | | | | | 117 | | | | | | | | 26,982 | | | | | |
| | | | | | | | | | | | | | | | | |
Disposals | | | | | | | –30,847 | | | | | | | | –1,921 | | | | | | | | –2,320 | | | | | | –35,087 | | | | | | –22,383 | | | | | | | | –6,070 | | | | | | | | –1,253 | | | | | | | | –29,707 | | | | | |
| | | | | | | | | | | | | | | | | |
of which financial assets written off | | | | | | | –30,842 | | | | | | | | –1,920 | | | | | | | | –2,243 | | | | | | –35,006 | | | | | | –22,379 | | | | | | | | –6,070 | | | | | | | | –1,123 | | | | | | | | –29,571 | | | | | |
| | | | | | | | | | | | | | | | | |
of which default on receivables | | | | | | | –5 | | | | | | | | 0 | | | | | | | | –77 | | | | | | –82 | | | | | | –4 | | | | | | | | –1 | | | | | | | | –131 | | | | | | | | –136 | | | | | |
| | | | | | | | | | | | | | | | | |
Changes from non-substantial contractual modification | | | | | | | 0 | | | | | | | | 1 | | | | | | | | 1 | | | | | | 3 | | | | | | 0 | | | | | | | | –13 | | | | | | | | 0 | | | | | | | | –13 | | | | | |
| | | | | | | | | | | | | | | | | |
Exchange rate and other changes | | | | | | | 2,333 | | | | | | | | 568 | | | | | | | | 541 | | | | | | 3,442 | | | | | | 1,796 | | | | | | | | 528 | | | | | | | | 116 | | | | | | | | 2,440 | | | | | |
| As of 31 Dec. | | | | | | | 140,311 | | | | | | | | 8,827 | | | | | | | | 5,339 | | | | | | 154,478 | | | | | | 101,598 | | | | | | | | 24,773 | | | | | | | | 4,531 | | | | | | | | 130,902 | | | | | |
| 1) | The transfer from stage 3 to stage 2 is primarily due to a loan guaranteed by the Federal Government. |
KfW Financial Report 2022 Consolidated financial statements | Notes – Notes to the statement of financial position | 116
Development of gross carrying amounts of financial assets at amortised cost – Securities and investments
| | | | | | | | | | | | | | | | | | | | | | | | | | | | | | | | | | | | | | | | | | | | | | | | | | | | | | | | | | | | | | | | |
| | | | | | Financial year 2022 | | | | | Financial year 2021 | | | | |
| | | | | | | | | | | | | | | | | |
| | | | | Stage 1 | | | | | | Stage 2 | | | | | | Stage 3 | | | | | Total | | | | | Stage 1 | | | | | | Stage 2 | | | | | | Stage 3 | | | | | | Total | | | | |
| | | | | EUR in
millions | | | | | | EUR in
millions | | | | | | EUR in
millions | | | | | EUR in
millions | | | | | EUR in
millions | | | | | | EUR in
millions | | | | | | EUR in
millions | | | | | | EUR in
millions | | | | |
| | | | | | | | | | | | | | | | | |
As of 1 Jan. | | | | | | | 35,784 | | | | | | | | 0 | | | | | | | | 0 | | | | | | 35,784 | | | | | | 35,725 | | | | | | | | 0 | | | | | | | | 65 | | | | | | | | 35,790 | | | | | |
| | | | | | | | | | | | | | | | | |
Transfer from stage 1 and stage 3 to stage 2 | | | | | | | –8 | | | | | | | | 8 | | | | | | | | 0 | | | | | | 0 | | | | | | 0 | | | | | | | | 0 | | | | | | | | 0 | | | | | | | | 0 | | | | | |
| | | | | | | | | | | | | | | | | |
Additions – New business and increased utilisation | | | | | | | 26,530 | | | | | | | | 0 | | | | | | | | 0 | | | | | | 26,530 | | | | | | 23,330 | | | | | | | | 0 | | | | | | | | 0 | | | | | | | | 23,330 | | | | | |
| | | | | | | | | | | | | | | | | |
Disposals | | | | | | | –25,914 | | | | | | | | –1 | | | | | | | | 0 | | | | | | –25,915 | | | | | | –22,866 | | | | | | | | 0 | | | | | | | | –65 | | | | | | | | –22,931 | | | | | |
| | | | | | | | | | | | | | | | | |
of which financial assets written off | | | | | | | –25,914 | | | | | | | | –1 | | | | | | | | 0 | | | | | | –25,915 | | | | | | –22,866 | | | | | | | | 0 | | | | | | | | –65 | | | | | | | | –22,931 | | | | | |
| | | | | | | | | | | | | | | | | |
Exchange rate and other changes | | | | | | | –2,666 | | | | | | | | 0 | | | | | | | | 0 | | | | | | –2,666 | | | | | | –405 | | | | | | | | 0 | | | | | | | | 0 | | | | | | | | –406 | | | | | |
| | | | | | | | | | | | | | | | | |
As of 31 Dec. | | | | | | | 33,725 | | | | | | | | 8 | | | | | | | | 0 | | | | | | 33,733 | | | | | | 35,784 | | | | | | | | 0 | | | | | | | | 0 | | | | | | | | 35,784 | | | | | |
117 | KfW Financial Report 2022 Consolidated financial statements | Notes – Notes to the statement of financial position
Development of gross carrying amounts of off-balance sheet lending transactions
| | | | | | | | | | | | | | | | | | | | | | | | | | | | | | | | | | | | | | | | | | | | | | | | | | | | | | | | | | | | | | | | |
| | | | | | Financial year 2022 | | | | | Financial year 2021 | | | | |
| | | | | | | | | | | | | | | | | |
| | | | | Stage 1 | | | | | | Stage 2 | | | | | | Stage 3 | | | | | Total | | | | | Stage 1 | | | | | | Stage 2 | | | | | | Stage 3 | | | | | | Total | | | | |
| | | | | EUR in
millions | | | | | | EUR in
millions | | | | | | EUR in
millions | | | | | EUR in
millions | | | | | EUR in
millions | | | | | | EUR in
millions | | | | | | EUR in
millions | | | | | | EUR in
millions | | | | |
| | | | | | | | | | | | | | | | | |
As of 1 Jan. | | | | | | | 109,184 | | | | | | | | 4,725 | | | | | | | | 312 | | | | | | 114,220 | | | | | | 102,790 | | | | | | | | 5,103 | | | | | | | | 257 | | | | | | | | 108,151 | | | | | |
| | | | | | | | | | | | | | | | | |
Transfer from stage 2 and stage 3 to stage 1 | | | | | | | 86 | | | | | | | | –86 | | | | | | | | 0 | | | | | | 0 | | | | | | 253 | | | | | | | | –225 | | | | | | | | –28 | | | | | | | | 0 | | | | | |
| | | | | | | | | | | | | | | | | |
Transfer from stage 1 and stage 3 to stage 2 | | | | | | | –218 | | | | | | | | 218 | | | | | | | | 0 | | | | | | 0 | | | | | | –86 | | | | | | | | 86 | | | | | | | | 0 | | | | | | | | 0 | | | | | |
| | | | | | | | | | | | | | | | | |
Transfer from stage 1 and stage 2 to stage 3 | | | | | | | –15 | | | | | | | | –168 | | | | | | | | 183 | | | | | | 0 | | | | | | –19 | | | | | | | | –35 | | | | | | | | 53 | | | | | | | | 0 | | | | | |
| | | | | | | | | | | | | | | | | |
Additions – New business and increased utilisation | | | | | | | 67,791 | | | | | | | | 336 | | | | | | | | 156 | | | | | | 68,283 | | | | | | 1,233 | | | | | | | | 51 | | | | | | | | 3 | | | | | | | | 1,287 | | | | | |
| | | | | | | | | | | | | | | | | |
Disposals | | | | | | | –47,237 | | | | | | | | –2,239 | | | | | | | | –116 | | | | | | –49,592 | | | | | | –718 | | | | | | | | –120 | | | | | | | | –18 | | | | | | | | –857 | | | | | |
| | | | | | | | | | | | | | | | | |
Exchange rate and other changes | | | | | | | 104 | | | | | | | | –9 | | | | | | | | –3 | | | | | | 91 | | | | | | 5,730 | | | | | | | | –136 | | | | | | | | 45 | | | | | | | | 5,640 | | | | | |
| | | | | | | | | | | | | | | | | |
As of 31 Dec. | | | | | | | 129,693 | | | | | | | | 2,777 | | | | | | | | 532 | | | | | | 133,002 | | | | | | 109,184 | | | | | | | | 4,725 | | | | | | | | 312 | | | | | | | | 114,220 | | | | | |
The gross carrying amount of financial assets for which risk provisioning at the time of modification was assigned to stages 2 or 3 and was transferred back to stage 1 during the reporting period amounted to EUR 3,639 million as of the reporting date (31 Dec. 2021: EUR 253 million).
KfW Financial Report 2022 Consolidated financial statements | Notes – Notes to the statement of financial position | 118
(38) Risk provisions
Development of risk provisions for financial assets at amortised cost – Loans and advances to banks
| | | | | | | | | | | | | | | | | | | | | | | | | | | | | | | | | | | | | | | | | | | | | | | | | | | | | | | | | | | | | | | | |
| | | | | | Financial year 2022 | | | | | Financial year 2021 | | | | |
| | | | | | | | | | | | | | | | | |
| | | | | Stage 1 | | | | | | Stage 2 | | | | | | Stage 3 | | | | | Total | | | | | Stage 1 | | | | | | Stage 2 | | | | | | Stage 3 | | | | | | Total | | | | |
| | | | | EUR in
millions | | | | | | EUR in
millions | | | | | | EUR in
millions | | | | | EUR in
millions | | | | | EUR in
millions | | | | | | EUR in
millions | | | | | | EUR in
millions | | | | | | EUR in
millions | | | | |
| | | | | | | | | | | | | | | | | |
As of 1 Jan. | | | | | | | 104 | | | | | | | | 33 | | | | | | | | 101 | | | | | | 238 | | | | | | 143 | | | | | | | | 95 | | | | | | | | 68 | | | | | | | | 306 | | | | | |
| | | | | | | | | | | | | | | | | |
Transfer from stage 2 and stage 3 to stage 1 | | | | | | | 6 | | | | | | | | –6 | | | | | | | | 0 | | | | | | 0 | | | | | | 27 | | | | | | | | –27 | | | | | | | | 0 | | | | | | | | 0 | | | | | |
| | | | | | | | | | | | | | | | | |
Transfer from stage 1 and stage 3 to stage 2 | | | | | | | –12 | | | | | | | | 12 | | | | | | | | –1 | | | | | | 0 | | | | | | –4 | | | | | | | | 4 | | | | | | | | 0 | | | | | | | | 0 | | | | | |
| | | | | | | | | | | | | | | | | |
Transfer from stage 1 and stage 2 to stage 3 | | | | | | | 0 | | | | | | | | –2 | | | | | | | | 2 | | | | | | 0 | | | | | | –1 | | | | | | | | –6 | | | | | | | | 7 | | | | | | | | 0 | | | | | |
| | | | | | | | | | | | | | | | | |
Additions | | | | | | | 37 | | | | | | | | 30 | | | | | | | | 30 | | | | | | 98 | | | | | | 46 | | | | | | | | 16 | | | | | | | | 38 | | | | | | | | 99 | | | | | |
| | | | | | | | | | | | | | | | | |
Utilisation | | | | | | | 0 | | | | | | | | 0 | | | | | | | | –5 | | | | | | –5 | | | | | | 0 | | | | | | | | 0 | | | | | | | | –7 | | | | | | | | –7 | | | | | |
| | | | | | | | | | | | | | | | | |
Reversals | | | | | | | –57 | | | | | | | | –27 | | | | | | | | –9 | | | | | | –94 | | | | | | –111 | | | | | | | | –50 | | | | | | | | –11 | | | | | | | | –172 | | | | | |
| | | | | | | | | | | | | | | | | |
Net present value effect | | | | | | | 0 | | | | | | | | 0 | | | | | | | | 5 | | | | | | 5 | | | | | | 0 | | | | | | | | 0 | | | | | | | | 3 | | | | | | | | 3 | | | | | |
| | | | | | | | | | | | | | | | | |
Exchange rate and other changes | | | | | | | 3 | | | | | | | | 0 | | | | | | | | 3 | | | | | | 6 | | | | | | 3 | | | | | | | | 2 | | | | | | | | 3 | | | | | | | | 9 | | | | | |
| | | | | | | | | | | | | | | | | |
As of 31 Dec. | | | | | | | 81 | | | | | | | | 40 | | | | | | | | 128 | | | | | | 248 | | | | | | 104 | | | | | | | | 33 | | | | | | | | 101 | | | | | | | | 238 | | | | | |
Development of risk provisions for financial assets at amortised cost – Loans and advances to customers
| | | | | | | | | | | | | | | | | | | | | | | | | | | | | | | | | | | | | | | | | | | | | | | | | | | | | | | | | | | | | | | | |
| | | | | | Financial year 2022 | | | | | Financial year 2021 | | | | |
| | | | | | | | | | | | | | | | | |
| | | | | Stage 1 | | | | | | Stage 2 | | | | | | Stage 3 | | | | | Total | | | | | Stage 1 | | | | | | Stage 2 | | | | | | Stage 3 | | | | | | Total | | | | |
| | | | | EUR in
millions | | | | | | EUR in
millions | | | | | | EUR in
millions | | | | | EUR in
millions | | | | | EUR in
millions | | | | | | EUR in
millions | | | | | | EUR in
millions | | | | | | EUR in
millions | | | | |
| | | | | | | | | | | | | | | | | |
As of 1 Jan. | | | | | | | 192 | | | | | | | | 275 | | | | | | | | 1,238 | | | | | | 1,705 | | | | | | 243 | | | | | | | | 326 | | | | | | | | 1,255 | | | | | | | | 1,824 | | | | | |
| | | | | | | | | | | | | | | | | |
Transfer from stage 2 and stage 3 to stage 1 | | | | | | | 78 | | | | | | | | –78 | | | | | | | | 0 | | | | | | 0 | | | | | | 88 | | | | | | | | –89 | | | | | | | | 1 | | | | | | | | 0 | | | | | |
| | | | | | | | | | | | | | | | | |
Transfer from stage 1 and stage 3 to stage 2 | | | | | | | –37 | | | | | | | | 87 | | | | | | | | –49 | | | | | | 0 | | | | | | –3 | | | | | | | | 25 | | | | | | | | –21 | | | | | | | | 0 | | | | | |
| | | | | | | | | | | | | | | | | |
Transfer from stage 1 and stage 2 to stage 3 | | | | | | | –13 | | | | | | | | –61 | | | | | | | | 74 | | | | | | 0 | | | | | | –10 | | | | | | | | –78 | | | | | | | | 88 | | | | | | | | 0 | | | | | |
| | | | | | | | | | | | | | | | | |
Additions | | | | | | | 214 | | | | | | | | 336 | | | | | | | | 384 | | | | | | 934 | | | | | | 149 | | | | | | | | 249 | | | | | | | | 242 | | | | | | | | 641 | | | | | |
| | | | | | | | | | | | | | | | | |
Utilisation | | | | | | | 0 | | | | | | | | 0 | | | | | | | | –135 | | | | | | –135 | | | | | | –1 | | | | | | | | 0 | | | | | | | | –171 | | | | | | | | –172 | | | | | |
| | | | | | | | | | | | | | | | | |
Reversals | | | | | | | –201 | | | | | | | | –156 | | | | | | | | –455 | | | | | | –812 | | | | | | –283 | | | | | | | | –169 | | | | | | | | –276 | | | | | | | | –727 | | | | | |
| | | | | | | | | | | | | | | | | |
Net present value effect | | | | | | | 0 | | | | | | | | 0 | | | | | | | | 119 | | | | | | 119 | | | | | | 0 | | | | | | | | 0 | | | | | | | | 82 | | | | | | | | 82 | | | | | |
| | | | | | | | | | | | | | | | | |
Exchange rate and other changes | | | | | | | 3 | | | | | | | | 4 | | | | | | | | 35 | | | | | | 42 | | | | | | 8 | | | | | | | | 11 | | | | | | | | 39 | | | | | | | | 57 | | | | | |
| | | | | | | | | | | | | | | | | |
As of 31 Dec. | | | | | | | 237 | | | | | | | | 406 | | | | | | | | 1,211 | | | | | | 1,853 | | | | | | 192 | | | | | | | | 275 | | | | | | | | 1,238 | | | | | | | | 1,705 | | | | | |
119 | KfW Financial Report 2022 Consolidated financial statements | Notes – Notes to the statement of financial position
Development of risk provisions for financial assets at amortised cost – Securities and investments
| | | | | | | | | | | | | | | | | | | | | | | | | | | | | | | | | | | | | | | | | | | | | | | | | | | | | | | | | | | | | | | | |
| | | | | | Financial year 2022 | | | | | Financial year 2021 | | | | |
| | | | | | | | | | | | | | | | | |
| | | | | Stage 1 | | | | | | Stage 2 | | | | | | Stage 3 | | | | | Total | | | | | Stage 1 | | | | | | Stage 2 | | | | | | Stage 3 | | | | | | Total | | | | |
| | | | | EUR in
millions | | | | | | EUR in
millions | | | | | | EUR in
millions | | | | | EUR in
millions | | | | | EUR in
millions | | | | | | EUR in
millions | | | | | | EUR in
millions | | | | | | EUR in
millions | | | | |
| | | | | | | | | | | | | | | | | |
As of 1 Jan. | | | | | | | 10 | | | | | | | | 0 | | | | | | | | 0 | | | | | | 10 | | | | | | 11 | | | | | | | | 0 | | | | | | | | 0 | | | | | | | | 11 | | | | | |
| | | | | | | | | | | | | | | | | |
Additions | | | | | | | 8 | | | | | | | | 2 | | | | | | | | 0 | | | | | | 10 | | | | | | 12 | | | | | | | | 0 | | | | | | | | 0 | | | | | | | | 12 | | | | | |
| | | | | | | | | | | | | | | | | |
Reversals | | | | | | | –7 | | | | | | | | –1 | | | | | | | | 0 | | | | | | –8 | | | | | | –13 | | | | | | | | 0 | | | | | | | | 0 | | | | | | | | –13 | | | | | |
| | | | | | | | | | | | | | | | | |
As of 31 Dec. | | | | | | | 11 | | | | | | | | 1 | | | | | | | | 0 | | | | | | 12 | | | | | | 10 | | | | | | | | 0 | | | | | | | | 0 | | | | | | | | 10 | | | | | |
Development of Risk provisions for lending business (off-balance sheet lending transactions)
| | | | | | | | | | | | | | | | | | | | | | | | | | | | | | | | | | | | | | | | | | | | | | | | | | | | | | | | | | | | | | | | |
| | | | | | Financial year 2022 | | | | | Financial year 2021 | | | | |
| | | | | | | | | | | | | | | | | |
| | | | | Stage 1 | | | | | | Stage 2 | | | | | | Stage 3 | | | | | Total | | | | | Stage 1 | | | | | | Stage 2 | | | | | | Stage 3 | | | | | | Total | | | | |
| | | | | EUR in
millions | | | | | | EUR in
millions | | | | | | EUR in
millions | | | | | EUR in
millions | | | | | EUR in
millions | | | | | | EUR in
millions | | | | | | EUR in
millions | | | | | | EUR in
millions | | | | |
| | | | | | | | | | | | | | | | | |
As of 1 Jan. | | | | | | | 32 | | | | | | | | 48 | | | | | | | | 15 | | | | | | 94 | | | | | | 49 | | | | | | | | 58 | | | | | | | | 19 | | | | | | | | 126 | | | | | |
| | | | | | | | | | | | | | | | | |
Transfer from stage 2 and stage 3 to stage 1 | | | | | | | 4 | | | | | | | | –4 | | | | | | | | 0 | | | | | | 0 | | | | | | 21 | | | | | | | | –21 | | | | | | | | 0 | | | | | | | | 0 | | | | | |
| | | | | | | | | | | | | | | | | |
Transfer from stage 1 and stage 3 to stage 2 | | | | | | | 1 | | | | | | | | 0 | | | | | | | | 0 | | | | | | 0 | | | | | | –2 | | | | | | | | 2 | | | | | | | | 0 | | | | | | | | 0 | | | | | |
| | | | | | | | | | | | | | | | | |
Transfer from stage 1 and stage 2 to stage 3 | | | | | | | 0 | | | | | | | | –29 | | | | | | | | 29 | | | | | | 0 | | | | | | 0 | | | | | | | | –13 | | | | | | | | 13 | | | | | | | | 0 | | | | | |
| | | | | | | | | | | | | | | | | |
Additions | | | | | | | 80 | | | | | | | | 39 | | | | | | | | 12 | | | | | | 131 | | | | | | 60 | | | | | | | | 59 | | | | | | | | 5 | | | | | | | | 125 | | | | | |
| | | | | | | | | | | | | | | | | |
Reversals | | | | | | | –76 | | | | | | | | –26 | | | | | | | | –9 | | | | | | –110 | | | | | | –98 | | | | | | | | –39 | | | | | | | | –23 | | | | | | | | –160 | | | | | |
| | | | | | | | | | | | | | | | | |
Exchange rate and other changes | | | | | | | 0 | | | | | | | | –1 | | | | | | | | 0 | | | | | | 0 | | | | | | 1 | | | | | | | | 2 | | | | | | | | 0 | | | | | | | | 3 | | | | | |
| | | | | | | | | | | | | | | | | |
As of 31 Dec. | | | | | | | 42 | | | | | | | | 26 | | | | | | | | 47 | | | | | | 115 | | | | | | 32 | | | | | | | | 48 | | | | | | | | 15 | | | | | | | | 94 | | | | | |
Provisions for losses on loans and advances also include money market investments and reverse repos.
In the reporting year, EUR 124 million (2021: EUR 86 million) in interest income was not collected for impaired loans and advances.
The contractual balance outstanding of financial assets that were written off during the reporting period and that are still subject to enforcement measures amounted to EUR 63 million as of the reporting date. (31 Dec. 2021: EUR 62 million).
KfW Financial Report 2022 Consolidated financial statements | Notes – Notes to the statement of financial position | 120
(39) Financial assets at fair value
Analysis of Financial assets at fair value by class
| | | | | | | | | | | | | | | | |
| | | | |
| | | | | 31 Dec. 2022 | | | 31 Dec. 2021 | | | | |
| | | | | EUR in millions | | | EUR in millions | | | | |
| | | | |
Loans and advances to banks – FVM | | | | | | | | | | | | | | | | |
| | | | |
Loans and advances | | | | | | | 0 | | | | 14 | | | | | |
| | | | |
Other receivables | | | | | | | 38 | | | | 35 | | | | | |
| | | | |
Loans and advances to customers – FVM | | | | | | | | | | | | | | | | |
| | | | |
Loans and advances | | | | | | | 9,681 | | | | 9,572 | | | | | |
| | | | |
Securities and investments – FVM | | | | | | | | | | | | | | | | |
| | | | |
Equity investments | | | | | | | 4,342 | | | | 4,015 | | | | | |
| | | | |
Shares in non-consolidated subsidiaries | | | | | | | 80 | | | | 68 | | | | | |
| | | | |
Other derivatives – FVM | | | | | | | | | | | | | | | | |
| | | | |
Interest-related derivatives | | | | | | | 1,787 | | | | 3,122 | | | | | |
| | | | |
Cross-currency derivatives | | | | | | | 695 | | | | 2,259 | | | | | |
| | | | |
Total | | | | | | | 16,624 | | | | 19,085 | | | | | |
Cross-currency swaps are presented under Cross-currency derivatives.
Other derivatives include derivatives with positive fair values of EUR 163 million (31 Dec. 2021: EUR 21 million) attributable to embedded derivatives that are bifurcated.
(40) Value adjustments from macro fair value hedge accounting
| | | | | | | | | | | | |
| | | | |
| | | | 31 Dec. 2022 | | | 31 Dec. 2021 | | | |
| | | | EUR in millions | | | EUR in millions | | | |
| | | | |
Value adjustments to assets under macro fair value hedge accounting | | | | | –25,859 | | | | 4,609 | | | |
The fair values attributable to hedged risks in the hedged portfolios in the at amortised cost measurement category are included in this item.
(41) Derivatives designated for hedge accounting
Analysis of derivatives with positive fair values designated for hedge accounting
by type of hedging relationship
| | | | | | | | | | | | | | | | |
| | | | |
| | | | | 31 Dec. 2022 | | | 31 Dec. 2021 | | | | |
| | | | | EUR in millions | | | EUR in millions | | | | |
| | | | |
Micro fair value hedge accounting | | | | | | | 6,699 | | | | 8,449 | | | | | |
| | | | |
Macro fair value hedge accounting | | | | | | | 2,306 | | | | 29 | | | | | |
| | | | |
Total | | | | | | �� | 9,005 | | | | 8,478 | | | | | |
121 | KfW Financial Report 2022 Consolidated financial statements | Notes – Notes to the statement of financial position
Analysis of derivatives with positive fair values designated for hedge accounting
by type of hedging instrument
| | | | | | | | | | | | | | | | |
| | | | |
| | | | | 31 Dec. 2022 | | | 31 Dec. 2021 | | | | |
| | | | | EUR in millions | | | EUR in millions | | | | |
| | | | |
Interest-related derivatives | | | | | | | 2,817 | | | | 2,990 | | | | | |
| | | | |
Cross-currency derivatives | | | | | | | 6,188 | | | | 5,488 | | | | | |
| | | | |
Total | | | | | | | 9,005 | | | | 8,478 | | | | | |
Only Interest-related derivatives are designated for macro fair value hedge accounting. Cross-currency swaps are presented under Cross-currency derivatives.
(42) Investments accounted for using the equity method
| | | | | | | | | | | | | | | | |
| | | | |
| | | | | 31 Dec. 2022 | | | 31 Dec. 2021 | | | | |
| | | | | EUR in millions | | | EUR in millions | | | | |
| | | | |
Investments accounted for using the equity method | | | | | | | 642 | | | | 597 | | | | | |
| | | | |
Total | | | | | | | 642 | | | | 597 | | | | | |
The note regarding “Disclosures on shareholdings” includes a list of Investments accounted for using the equity method.
(43) Non-current assets held for sale
This item from the statement of financial position includes equity investments of DEG with a fair value of EUR 64 million (31 Dec. 2021: EUR 119 million), as in the previous year, in banks and companies and in the regions of Asia, Africa and North America, which meet the criteria under IFRS 5 as “non-current assets held for sale”, and are therefore to be reported separately. These equity investments are recognised in the business sector DEG.
Disposal of the equity investments within the next twelve months is highly likely.
It was not possible in 2022 to sell, as planned, four equity investments recognised as assets held for sale in the consolidated financial statements as of 31 December 2021 (31 Dec. 2020: two equity investments). This was due to the deteriorated market environment in the wake of the coronavirus pandemic and to the Russia-Ukraine war. This decreased probability of sale resulted in an accounting reclassification, but had no impact on the earnings position.
KfW Financial Report 2022 Consolidated financial statements | Notes – Notes to the statement of financial position | 122
(44) Property, plant and equipment
Analysis of Property, plant and equipment by class
| | | | | | | | | | | | | | | | |
| | | | |
| | | | | 31 Dec. 2022 | | | 31 Dec. 2021 | | | | |
| | | | | EUR in millions | | | EUR in millions | | | | |
| | | | |
Land and buildings | | | | | | | 823 | | | | 839 | | | | | |
| | | | |
Plant and equipment | | | | | | | 60 | | | | 80 | | | | | |
| | | | |
Rights of use arising from leases | | | | | | | 39 | | | | 50 | | | | | |
| | | | |
Other property, plant and equipment | | | | | | | 7 | | | | 2 | | | | | |
| | | | |
Total | | | | | | | 929 | | | | 971 | | | | | |
Additions to rights of use arising from leases amounted to EUR 0 million (2021: EUR 0 million). Payments in advance and assets under construction are presented in Other property, plant and equipment.
Development of Property, plant and equipment in financial year 2022
| | | | | | | | | | | | | | | | | | | | |
| | | | | |
| | | | | Acquisition/
production cost
| | | Accumulated
amortisation,
impairment and
reversal of
impairment
losses | | | Net carrying
amount
| | | | |
| | | | | EUR in millions | | | EUR in millions | | | EUR in millions | | | | |
| | | | | |
Carrying amount as of 1 Jan. 2022 | | | | | | | 1,513 | | | | –541 | | | | 971 | | | | | |
| | | | | |
Additions/reversals of impairment losses | | | | | | | 26 | | | | 0 | | | | 26 | | | | | |
| | | | | |
Disposals | | | | | | | –42 | | | | 32 | | | | –10 | | | | | |
| | | | | |
Amortisation | | | | | | | 0 | | | | –58 | | | | –58 | | | | | |
| | | | | |
Carrying amount as of 31 Dec. 2022 | | | | | | | 1,496 | | | | –568 | | | | 929 | | | | | |
Development of Property, plant and equipment in financial year 2021
| | | | | | | | | | | | | | | | | | | | |
| | | | | |
| | | | | Acquisition/
production cost
| | | Accumulated
amortisation,
impairment and
reversal of
impairment
losses | | | Net carrying
amount
| | | | |
| | | | | EUR in millions | | | EUR in millions | | | EUR in millions | | | | |
| | | | | |
Carrying amount as of 1 Jan. 2021 | | | | | | | 1,527 | | | | –528 | | | | 999 | | | | | |
| | | | | |
Additions/reversals of impairment losses | | | | | | | 37 | | | | 0 | | | | 37 | | | | | |
| | | | | |
Disposals | | | | | | | –51 | | | | 50 | | | | –1 | | | | | |
| | | | | |
Amortisation | | | | | | | 0 | | | | –63 | | | | –63 | | | | | |
| | | | | |
Carrying amount as of 31 Dec. 2021 | | | | | | | 1,513 | | | | –541 | | | | 971 | | | | | |
123 | KfW Financial Report 2022 Consolidated financial statements | Notes – Notes to the statement of financial position
(45) Intangible assets
Analysis of Intangible assets by class
| | | | | | | | | | | | | | | | |
| | | | |
| | | | | 31 Dec. 2022 | | | 31 Dec. 2021 | | | | |
| | | | | EUR in millions | | | EUR in millions | | | | |
| | | | |
Software | | | | | | | 95 | | | | 135 | | | | | |
| | | | |
Purchased software | | | | | | | 37 | | | | 66 | | | | | |
| | | | |
Internally generated software | | | | | | | 58 | | | | 69 | | | | | |
| | | | |
Other intangible assets | | | | | | | 5 | | | | 9 | | | | | |
| | | | |
Total | | | | | | | 100 | | | | 144 | | | | | |
Other intangible assets include, in particular, software under development.
Development of Intangible assets in financial year 2022
| | | | | | | | | | | | | | | | | | | | |
| | | | | Acquisition/
production cost
| | | Accumulated
amortisation,
impairment and
reversal of
impairment
losses | | | Net carrying
amount
| | | | |
| | | | | EUR in millions | | | EUR in millions | | | EUR in millions | | | | |
| | | | | |
Carrying amount as of 1 Jan. 2022 | | | | | | | 446 | | | | –302 | | | | 144 | | | | | |
| | | | | |
Additions/reversals of impairment losses | | | | | | | 14 | | | | 0 | | | | 14 | | | | | |
| | | | | |
Disposals | | | | | | | –3 | | | | 3 | | | | 0 | | | | | |
| | | | | |
Amortisation | | | | | | | 0 | | | | –58 | | | | –58 | | | | | |
| | | | | |
Impairment losses | | | | | | | 0 | | | | 0 | | | | 0 | | | | | |
| | | | | |
Carrying amount as of 31 Dec. 2022 | | | | | | | 457 | | | | –357 | | | | 100 | | | | | |
Development of Intangible assets in financial year 2021
| | | | | | | | | | | | | | | | | | | | |
| | | | | Acquisition/
production cost
| | | Accumulated
amortisation,
impairment and
reversal of
impairment
losses | | | Net carrying
amount
| | | | |
| | | | | EUR in millions | | | EUR in millions | | | EUR in millions | | | | |
| | | | | |
Carrying amount as of 1 Jan. 2021 | | | | | | | 498 | | | | –326 | | | | 172 | | | | | |
| | | | | |
Additions/reversals of impairment losses | | | | | | | 35 | | | | 0 | | | | 35 | | | | | |
| | | | | |
Disposals | | | | | | | –87 | | | | 85 | | | | –2 | | | | | |
| | | | | |
Amortisation | | | | | | | 0 | | | | –60 | | | | –60 | | | | | |
| | | | | |
Impairment losses | | | | | | | 0 | | | | –2 | | | | –2 | | | | | |
| | | | | |
Carrying amount as of 31 Dec. 2021 | | | | | | | 446 | | | | –302 | | | | 144 | | | | | |
KfW Financial Report 2022 Consolidated financial statements | Notes – Notes to the statement of financial position | 124
(46) Income tax assets
Analysis of Income tax assets
| | | | | | | | | | | | | | | | |
| | | | |
| | | | | 31 Dec. 2022 | | | 31 Dec. 2021 | | | | |
| | | | | EUR in millions | | | EUR in millions | | | | |
| | | | |
Current income tax assets | | | | | | | 22 | | | | 16 | | | | | |
| | | | |
Deferred income tax assets | | | | | | | 218 | | | | 220 | 1) | | | | |
| | | | |
Total | | | | | | | 239 | | | | 236 | 1) | | | | |
1) Adjustments to corresponding prior-year figures as detailed under “Changes to significant accounting policies and estimates” in the Notes.
Current income tax assets result from creditable taxes (investment income tax/solidarity surcharge) and tax receivables from advance tax payments during financial year 2022.
Deferred income tax assets mostly result from valuation differences relating to the statement of financial position items listed below. Deferred tax assets relating to loss carryforwards are based on the business plan for 2023–2026. As of 31 December 2022, the volume of deferred tax assets not recognised was EUR 3 million (31 Dec. 2021: EUR 111 million) relating to loss carryforwards, and EUR 0 million (31 Dec. 2021: EUR 14 million) relating to accounting issues.
Further information on the amount recognised directly in equity as deferred taxes under Revaluation reserves can be found in the note “Equity”.
Composition of deferred tax assets by statement of financial position item1)
| | | | | | | | | | | | | | | | |
| | | | |
| | | | | 31 Dec. 2022 | | | 31 Dec. 2021 | | | | |
| | | | | EUR in millions | | | EUR in millions | | | | |
| | | | |
Financial assets (at amortised cost and at fair value) | | | | | | | 113 | | | | 103 | | | | | |
| | | | |
Intangible assets | | | | | | | 0 | | | | 5 | | | | | |
| | | | |
Financial liabilities at fair value – Other derivatives | | | | | | | 2 | | | | 18 | | | | | |
| | | | |
Provisions | | | | | | | 37 | | | | 80 | | | | | |
| | | | |
Tax loss carryforwards | | | | | | | 76 | | | | 16 | | | | | |
| | | | |
Subtotal | | | | | | | 228 | | | | 222 | | | | | |
| | | | |
Offset against deferred tax liabilities | | | | | | | 10 | | | | 2 | | | | | |
| | | | |
Total | | | | | | | 218 | | | | 220 | | | | | |
1) Adjustments to corresponding prior-year figures as detailed under “Changes to significant accounting policies and estimates” in the Notes.
(47) Other assets
Analysis of Other assets
| | | | | | | | | | | | | | | | |
| | | | |
| | | | | 31 Dec. 2022 | | | 31 Dec. 2021 | | | | |
| | | | | EUR in millions | | | EUR in millions | | | | |
| | | | |
Other assets and receivables | | | | | | | 706 | | | | 725 | | | | | |
| | | | |
Prepaid expenses and deferred charges | | | | | | | 65 | | | | 69 | | | | | |
| | | | |
Total | | | | | | | 771 | | | | 794 | | | | | |
125 | KfW Financial Report 2022 Consolidated financial statements | Notes – Notes to the statement of financial position
Other assets and receivables include primarily the receivables from the Federal Agency for Special Tasks Associated with Unification (Bundesanstalt für vereinigungsbedingte Sonderaufgaben – “BvS”), which are offset in equal amount by provisions arising from the assumption of the operations of the State Insurance Company of the German Democratic Republic in liquidation (Staatliche Versicherung der Deutschen Demokratischen Republik in Abwicklung – “SInA”), an institution under public law.
Prepaid expenses and deferred charges include financial assets resulting from contractual rights (“contract assets” in accordance with IFRS 15). These developed as follows:
Development of assets from contractual rights
| | | | | | | | | | | | | | | | |
| | | | |
| | | | | 2022 | | | 2021 | | | | |
| | | | | EUR in millions | | | EUR in millions | | | | |
| | | | |
As of 1 Jan. | | | | | | | 2 | | | | 1 | | | | | |
| | | | |
Additions | | | | | | | 0 | | | | 2 | | | | | |
| | | | |
Disposals | | | | | | | –2 | | | | –1 | | | | | |
| | | | |
As of 31 Dec. | | | | | | | 0 | | | | 2 | | | | | |
(48) Financial liabilities at amortised cost
Analysis of Financial liabilities at amortised cost by class
| | | | | | | | | | | | | | | | |
| | | | | |
| | | | | 31 Dec. 2022 | | | | 31 Dec. 2021 | | | | |
| | | | | EUR in millions | | | | EUR in millions | | | | |
| | | | | |
Liabilities to banks | | | | | | | | | | | | | | | | |
| | | | | |
Money market transactions | | | | | | 4,453 | | | | | 1,327 | | | | | |
| | | | | |
Promissory note loans | | | | | | 1,456 | | | | | 1,203 | | | | | |
| | | | | |
Other financial liabilities | | | | | | 5,545 | | | | | 10,968 | | | | | |
| | | | | |
Liabilities to customers | | | | | | | | | | | | | | | | |
| | | | | |
Money market transactions | | | | | | 299 | | | | | 269 | | | | | |
| | | | | |
Promissory note loans | | | | | | 51,038 | | | | | 38,372 | | | | | |
| | | | | |
Other financial liabilities | | | | | | 11,619 | | | | | 5,053 | | | | | |
| | | | | |
Certificated liabilities | | | | | | | | | | | | | | | | |
| | | | | |
Money market issues | | | | | | 39,058 | | | | | 49,992 | | | | | |
| | | | | |
Bonds and notes | | | | | | 379,111 | | | | | 389,202 | | | | | |
| | | | | |
Total | | | | | | 492,579 | | | | | 496,385 | | | | | |
KfW Financial Report 2022 Consolidated financial statements | Notes – Notes to the statement of financial position | 126
Liabilities from cash collateral received are included in Other financial liabilities.
New securities (money market issues, bonds and notes) under sub-item certificated liabilities, with a nominal volume of EUR 268.2 billion and which are measured at amortised cost, were issued during the current financial year (2021: EUR 217.5 billion). The volume of repayments due to maturity during the same period amounted to EUR 262.9 billion (nominal) (2021: EUR 194.5 billion) and the volume of early repurchases to EUR 0.1 billion (nominal) (2021: EUR 0.7 billion).
Liabilities include liabilities from repurchase agreements and securities lending transactions under “Other financial liabilities”.
(49) Financial liabilities at fair value
Analysis of Financial liabilities at fair value by class
| | | | | | | | | | | | | | | | |
| | | | | |
| | | | | 31 Dec. 2022 | | | | 31 Dec. 2021 | | | | |
| | | | | EUR in millions | | | | EUR in millions | | | | |
| | | | | |
Liabilities to banks – FVD | | | | | | | | | | | | | | | | |
| | | | | |
Promissory note loans | | | | | | 208 | | | | | 255 | | | | | |
| | | | | |
Liabilities to customers – FVD | | | | | | | | | | | | | | | | |
| | | | | |
Promissory note loans | | | | | | 812 | | | | | 1,003 | | | | | |
| | | | | |
Certificated liabilities – FVD | | | | | | | | | | | | | | | | |
| | | | | |
Bonds and notes | | | | | | 6,699 | | | | | 8,416 | | | | | |
| | | | | |
Other derivatives – FVM | | | | | | | | | | | | | | | | |
| | | | | |
Interest-related derivatives | | | | | | 2,018 | | | | | 877 | | | | | |
| | | | | |
Cross-currency derivatives | | | | | | 1,664 | | | | | 933 | | | | | |
| | | | | |
Total | | | | | | 11,401 | | | | | 11,484 | | | | | |
As in the previous year, there were no new issues in the current financial year under sub-item certificated liabilities to be measured at fair value. The volume of repayments due to maturity during the same period amounted to EUR 0.1 billion (nominal) (2021: EUR 2.6 billion) and the volume of early repurchases to EUR 0.0 billion (nominal) (2021: EUR 0.0 billion).
Cross-currency swaps are presented under Cross-currency derivatives.
Other derivatives include derivatives with negative fair values of EUR 5 million (31 Dec. 2021: EUR 12 million) attributable to embedded derivatives that are bifurcated.
127 | KfW Financial Report 2022 Consolidated financial statements | Notes – Notes to the statement of financial position
(50) Value adjustments from macro fair value hedge accounting
| | | | | | | | | | | | | | |
| | | | | | | 31 Dec. 2022 | | | | | | 31 Dec. 2021 | | |
| | | | | | | EUR in millions | | | | | | EUR in millions | | |
| | | | | | | |
Value adjustments to liabilities under macro fair value hedge accounting | | | | | | 18 | | | | | | 37 | | |
The fair values attributable to hedged risks in the hedged portfolios in the at amortised cost measurement category are included in this item.
(51) Derivatives designated for hedge accounting
Analysis of derivatives with negative fair values designated for hedge accounting
by type of hedging relationship
| | | | | | | | | | | | | | |
| | | | | | | 31 Dec. 2022 | | | | | | 31 Dec. 2021 | | |
| | | | | | | EUR in millions | | | | | | EUR in millions | | |
| | | | | | | |
Micro fair value hedge accounting | | | | | | 10,600 | | | | | | 2,181 | | |
| | | | | | | |
Macro fair value hedge accounting | | | | | | 219 | | | | | | 2,373 | | |
| | | | | | | |
Total | | | | | | 10,819 | | | | | | 4,554 | | |
Analysis of derivatives with negative fair values designated for hedge accounting
by type of hedging instrument
| | | | | | | | | | | | | | |
| | | | | | | 31 Dec. 2022 | | | | | | 31 Dec. 2021 | | |
| | | | | | | EUR in millions | | | | | | EUR in millions | | |
| | | | | | | |
Interest-related derivatives | | | | | | 7,252 | | | | | | 3,163 | | |
| | | | | | | |
Cross-currency derivatives | | | | | | 3,567 | | | | | | 1,390 | | |
| | | | | | | |
Total | | | | | | 10,819 | | | | | | 4,554 | | |
(52) Risk provisions
Analysis of Provisions by class
| | | | | | | | | | | | | | |
| | | | | | | 31 Dec. 2022 | | | | | | 31 Dec. 2021 | | |
| | | | | | | EUR in millions | | | | | | EUR in millions | | |
| | | | | | | |
Provisions for pensions and similar commitments | | | | | | 1,683 | | | | | | 2,556 | | |
| | | | | | | |
Provisions for credit risks | | | | | | 115 | | | | | | 94 | | |
| | | | | | | |
Other provisions | | | | | | 873 | | | | | | 926 | | |
| | | | | | | |
Total | | | | | | 2,672 | | | | | | 3,576 | | |
KfW Financial Report 2022 Consolidated financial statements | Notes - Notes to the statement of financial position | 128
Development of Provisions for pensions and similar commitments in financial year 2022
| | | | | | | | | | | | | | | | | | | | | | | | | | | | |
| | | | | | | Defined benefit obligations | | | | | | Early retirement | | | | | | Partial retirement | | | | | | Total | | | | |
| | | | | | | EUR in millions | | | | | | EUR in millions | | | | | | EUR in millions | | | | | | EUR in millions | | | | |
| | | | | | | | | |
| As of 1 Jan. 2022 | | | | | | 2,496 | | | | | | 53 | | | | | | 7 | | | | | | 2,556 | | | | |
| | | | | | | | | |
Additions | | | | | | 118 | | | | | | –4 | | | | | | 1 | | | | | | 115 | | | | |
| | | | | | | | | |
Current service cost | | | | | | 85 | | | | | | 0 | | | | | | 1 | | | | | | 86 | | | | |
| | | | | | | | | |
Interest cost | | | | | | 34 | | | | | | –4 | | | | | | 0 | | | | | | 29 | | | | |
| | | | | | | | | |
Actuarial gains and losses | | | | | | –922 | | | | | | 0 | | | | | | 0 | | | | | | –922 | | | | |
| | | | | | | | | |
Changes in demographic assumptions | | | | | | –2 | | | | | | 0 | | | | | | 0 | | | | | | –2 | | | | |
| | | | | | | | | |
Changes in financial assumptions | | | | | | –925 | | | | | | 0 | | | | | | 0 | | | | | | –925 | | | | |
| | | | | | | | | |
Changes in experience adjustments | | | | | | 4 | | | | | | 0 | | | | | | 0 | | | | | | 4 | | | | |
| | | | | | | | | |
Utilisation | | | | | | –60 | | | | | | –7 | | | | | | –4 | | | | | | –71 | | | | |
| | | | | | | | | |
Contributions by members (recognised in equity) | | | | | | 5 | | | | | | 0 | | | | | | 0 | | | | | | 5 | | | | |
| | | | | | | | | |
As of 31 Dec. 2022 | | | | | | 1,638 | | | | | | 42 | | | | | | 3 | | | | | | 1,683 | | | | |
The average expected residual term of the defined-benefit pension obligations is 15.9 years as of 31 December 2022 (31 Dec. 2021: 20.3 years).
Development of Provisions for pensions and similar commitments in financial year 2021
| | | | | | | | | | | | | | | | | | | | | | | | | | | | |
| | | | | | | Defined benefit obligations | | | | | | Early retirement | | | | | | Partial retirement | | | | | | Total | | | | |
| | | | | | | EUR in millions | | | | | | EUR in millions | | | | | | EUR in millions | | | | | | EUR in millions | | | | |
| | | | | | | | | |
| As of 1 Jan. 2021 | | | | | | 2,616 | | | | | | 60 | | | | | | 11 | | | | | | 2,687 | | | | |
| | | | | | | | | |
Additions | | | | | | 113 | | | | | | 0 | | | | | | 1 | | | | | | 114 | | | | |
| | | | | | | | | |
Current service cost | | | | | | 86 | | | | | | 0 | | | | | | 1 | | | | | | 87 | | | | |
| | | | | | | | | |
Interest cost | | | | | | 27 | | | | | | 0 | | | | | | 0 | | | | | | 27 | | | | |
| | | | | | | | | |
Actuarial gains and losses | | | | | | –182 | | | | | | 0 | | | | | | 0 | | | | | | –182 | | | | |
| | | | | | | | | |
Changes in financial assumptions | | | | | | –155 | | | | | | 0 | | | | | | 0 | | | | | | –155 | | | | |
| | | | | | | | | |
Changes in experience adjustments | | | | | | –27 | | | | | | 0 | | | | | | 0 | | | | | | –27 | | | | |
| | | | | | | | | |
Utilisation | | | | | | –55 | | | | | | –8 | | | | | | –5 | | | | | | –68 | | | | |
| | | | | | | | | |
Reversals | | | | | | 0 | | | | | | 0 | | | | | | 0 | | | | | | 0 | | | | |
| | | | | | | | | |
Transfers | | | | | | 0 | | | | | | 0 | | | | | | 0 | | | | | | 0 | | | | |
| | | | | | | | | |
Contributions by members (recognised in equity) | | | | | | 5 | | | | | | 0 | | | | | | 0 | | | | | | 5 | | | | |
| | | | | | | | | |
As of 31 Dec. 2021 | | | | | | 2,496 | | | | | | 53 | | | | | | 7 | | | | | | 2,556 | | | | |
Provisions for pensions and similar commitments are calculated on the basis of the 2018 G Heubeck actuarial tables and the following other actuarial assumptions:
129 | KfW Financial Report 2022 Consolidated financial statements | Notes – Notes to the statement of financial position
Actuarial assumptions in % p. a.
| | | | | | | | | | | | | | | | |
| | | | | | | 31 Dec. 2022 | | | | | | 31 Dec. 2021 | | |
| | | | | | | |
Technical discount rate | | | | | | | | 3.89 | | | | | | 1.32 | | |
| | | | | | | |
Rate of salary increases | | | | | | | | 2.20 | | | | | | 2.20 | | |
| | | | | | | |
Rate of pension increases | | | | | | | | 2.50 | | | | | | 2.50 | | |
| | | | | | | |
Rate of staff turnover | | | | | | | | 3.17 | | | | | | 2.29 | | |
The technical discount rate as of 31 December 2022 reflects an adjustment to the average residual term of the defined benefit pension obligations translating into an adjustment to the average capital commitment period used.
Sensitivity of defined benefit pension obligations as of 31 December 2022
| | | | | | | | | | | | | | | | | | | | | | | | | | |
| | | | | | | Difference | | | | | | Change in | | | | | | Difference | | | | | | Change in | | |
| | | | | | | | | | | | | defined benefit | | | | | | | | | | | | defined benefit | | |
| | | | | | | | | | | | obligations | | | | | | | | | | | | obligations | | |
| | | | | | | | | | | | EUR in millions | | | | | | | | | | | | EUR in millions | | |
| | | | | | | | | | | | | |
Life expectancy | | | | | | +1 year | | | | | | 60 | | | | | | –1 year | | | | | | –62 | | |
| | | | | | | | | | | | | |
Technical discount rate | | | | | | +0.25% | | | | | | –61 | | | | | | –0.25% | | | | | | 65 | | |
| | | | | | | | | | | | | |
Rate of salary increases | | | | | | +0.50% | | | | | | 7 | | | | | | –0.50% | | | | | | –7 | | |
| | | | | | | | | | | | | |
Rate of pension increases | | | | | | +0.50% | | | | | | 88 | | | | | | –0.50% | | | | | | –52 | | |
| | | | | | | | | | | | | |
Rate of staff turnover | | | | | | +1.00% | | | | | | –1 | | | | | | –1.00% | | | | | | 1 | | |
Sensitivity of defined benefit pension obligations as of 31 December 2021
| | | | | | | | | | | | | | | | | | | | | | | | | | |
| | | | | | | Difference | | | | | | Change in | | | | | | Difference | | | | | | Change in | | |
| | | | | | | | | | | | | defined benefit | | | | | | | | | | | | defined benefit | | |
| | | | | | | | | | | | obligations | | | | | | | | | | | | obligations | | |
| | | | | | | | | | | | EUR in millions | | | | | | | | | | | | EUR in millions | | |
| | | | | | | | | | | | | |
Life expectancy | | | | | | +1 year | | | | | | 120 | | | | | | –1 year | | | | | | –120 | | |
| | | | | | | | | | | | | |
Technical discount rate | | | | | | +0.25% | | | | | | –121 | | | | | | –0.25% | | | | | | 130 | | |
| | | | | | | | | | | | | |
Rate of salary increases | | | | | | +0.50% | | | | | | 15 | | | | | | –0.50% | | | | | | –14 | | |
| | | | | | | | | | | | | |
Rate of pension increases | | | | | | +0.50% | | | | | | 176 | | | | | | –0.50% | | | | | | –94 | | |
| | | | | | | | | | | | | |
Rate of staff turnover | | | | | | +1.00% | | | | | | –2 | | | | | | –1.00% | | | | | | 3 | | |
Development of Risk provisions for lending business
For the development of Risk provisions for lending business (off-balance sheet transactions) see the note regarding “Risk provisions”.
KfW Financial Report 2022 Consolidated financial statements | Notes – Notes to the statement of financial position | 130
Development of Other provisions in financial year 2022
| | | | | | | | | | | | | | | | | | | | | | |
| | | | | Obligations to employees | | | | | Other provisions | | | | | Total | | | |
| | | | | EUR in millions | | | | | EUR in millions | | | | | EUR in millions | | | |
| | | | | | | |
As of 1 Jan. 2022 | | | | | | 36 | | | | | | 890 | | | | | | 926 | | | | |
| | | | | | | |
Additions | | | | | | 3 | | | | | | 65 | | | | | | 68 | | | | |
| | | | | | | |
Utilisation | | | | | | –4 | | | | | | –95 | | | | | | –99 | | | | |
| | | | | | | |
| Reversals | | | | | | –4 | | | | | | –18 | | | | | | –22 | | | | |
As of 31 Dec. 2022 | | | | | | 32 | | | | | | 842 | | | | | | 873 | | | | |
The Obligations to employees column shows other long-term employee benefits including provisions for service anniversaries. Corresponding actuarial reports have been prepared for these obligations.
An Other provision item in an amount of EUR 95 million (31 Dec. 2021: EUR 69 million) is reported due to the interest rate being below the market rate for irrevocable promotional loan commitments with additional promotional funds in the form of interest rate reductions impacting KfW’s earnings position. Changes to existing provisions are presented as net additions or, in the case of a decline, as a transfer via the adjustments to the carrying amounts of already disbursed promotional loans recognised on the assets side under Financial assets at amortised cost – Loans and advances to banks or customers.
Other provisions also comprise obligations arising from the assumption of the operations of the State Insurance Company of the German Democratic Republic in liquidation (Staatliche Versicherung der Deutschen Demokratischen Republik in Abwicklung – “SInA”, an institution under public law), which are offset by receivables in the same amount from the Federal Agency for Special Tasks Associated with Unification (Bundesanstalt für vereinigungsbedingte Sonderaufgaben – “BvS”) recognised in Other assets. Other provisions also include provisions for legal risks offset by receivables from the Federal Government in the same amount.
Development of Other provisions in financial year 2021
| | | | | | | | | | | | | | | | | | | | | | |
| | | | | Obligations to employees | | | | | Other provisions | | | | | Total | | | |
| | | | | EUR in millions | | | | | EUR in millions | | | | | EUR in millions | | | |
| | | | | | | |
As of 1 Jan. 2021 | | | | | | 37 | | | | | | 694 | | | | | | 731 | | | | |
| | | | | | | |
Additions | | | | | | 4 | | | | | | 254 | | | | | | 258 | | | | |
| | | | | | | |
Utilisation | | | | | | –4 | | | | | | –46 | | | | | | –50 | | | | |
| | | | | | | |
| Reversals | | | | | | 0 | | | | | | –12 | | | | | | –12 | | | | |
As of 31 Dec. 2021 | | | | | | 36 | | | | | | 890 | | | | | | 926 | | | | |
131 | KfW Financial Report 2022 Consolidated financial statements | Notes – Notes to the statement of financial position
(53) Income tax liabilities
Analysis of Income tax liabilities
| | | | | | | | | | | | | | | | | | | | | | |
| | | | | 31 Dec. 2022 | | | | | | | | | | 31 Dec. 2021 | | | |
| | | | | EUR in millions | | | | | | | | | | EUR in millions | | | |
| | | | | | | |
Current income tax liabilities | | | | | | 19 | | | | | | | | | | | | 29 | | | | |
| | | | | | | |
Deferred income tax liabilities | | | | | | 42 | | | | | | | | | | | | 381) | | | | |
| | | | | | | |
Total | | | | | | 61 | | | | | | | | | | | | 671) | | | | |
| 1) | Adjustments to corresponding prior-year figures as detailed under “Changes to significant accounting policies and estimates” in the Notes. |
Current income tax liabilities as of 31 December 2022 primarily consist of tax provisions at the level of taxable companies included in KfW Group.
Deferred income tax liabilities mostly resulted from valuation differences relating to the statement of financial position items listed below. A transition in calculating deferred taxes for derivatives, pursuant to IAS 8, was undertaken in financial year 2022.This resulted in a deferred tax liability of EUR 8 million as of 31 December 2022. Application of the method as of 31 December 2021 resulted in deferred tax assets of EUR 18 million (also note on “Income tax assets”).
Composition of deferred tax liabilities by statement of financial position item1)
| | | | | | | | | | | | | | | | | | | | | | |
| | | | | 31 Dec. 2022 | | | | | | | | | | 31 Dec. 2021 | | | |
| | | | | EUR in millions | | | | | | | | | | EUR in millions | | | |
| | | | | | | |
Financial assets at fair value – Other derivatives | | | | | | 8 | | | | | | | | | | | | 0 | | | | |
| | | | | | | |
Securities and investments | | | | | | 43 | | | | | | | | | | | | 39 | | | | |
| | | | | | | |
Other statement of financial position items | | | | | | 1 | | | | | | | | | | | | 1 | | | | |
| | | | | | | |
Subtotal | | | | | | 52 | | | | | | | | | | | | 40 | | | | |
| | | | | | | |
Offset against deferred tax assets | | | | | | 10 | | | | | | | | | | | | 2 | | | | |
| | | | | | | |
Total | | | | | | 42 | | | | | | | | | | | | 38 | | | | |
| 1) | Adjustments to corresponding prior-year figures as detailed under “Changes to significant accounting policies and estimates” in the Notes. |
(54) Other liabilities
Analysis of Other liabilities
| | | | | | | | | | | | | | | | | | | | | | |
| | | | | 31 Dec. 2022 | | | | | | | | | | 31 Dec. 2021 | | | |
| | | | | EUR in millions | | | | | | | | | | EUR in millions | | | |
| | | | | | | |
Other financial liabilities | | | | | | 413 | | | | | | | | | | | | 273 | | | | |
| | | | | | | |
Deferred income | | | | | | 43 | | | | | | | | | | | | 50 | | | | |
| | | | | | | |
Lease liabilities | | | | | | 45 | | | | | | | | | | | | 59 | | | | |
| | | | | | | |
Total | | | | | | 501 | | | | | | | | | | | | 382 | | | | |
KfW Financial Report 2022 Consolidated financial statements | Notes – Notes to the statement of financial position | 132
Deferred income includes liabilities resulting from contractual obligations (“contract liabilities” in accordance with IFRS 15). These developed as follows:
Development of liabilities from contractual obligations
| | | | | | | | | | | | | | | | | | | | | | |
| | | | | | | | 2022 | | | | | | | | 2021 | | |
| | | | | | | | EUR in millions | | | | | | | | EUR in millions | | |
| | | | | | | |
As of 1 Jan. | | | | | | | | | | 41 | | | | | | | | | | 38 | | |
| | | | | | | |
Additions | | | | | | | | | | 13 | | | | | | | | | | 17 | | |
| | | | | | | |
Disposals | | | | | | | | | | –16 | | | | | | | | | | –15 | | |
| | | | | | | |
As of 31 Dec. | | | | | | | | | | 38 | | | | | | | | | | 41 | | |
(55) Equity
Analysis of Equity
| | | | | | | | | | | | | | | | | | | | | | | | |
| | | | | | | | | | 31 Dec. 2022 | | | | | | | | | | 31 Dec. 2021 | | | | |
| | | | | | | | | | | EUR in millions | | | | | | | | | | EUR in millions | | | | |
| | | | | | | |
Subscribed capital | | | | | | | | | | 3,750 | | | | | | | | | | 3,750 | | | | |
| | | | | | | |
less uncalled outstanding contributions | | | | | | | | | | –450 | | | | | | | | | | –450 | | | | |
| | | | | | | |
Paid-in subscribed capital | | | | | | | | | | 3,300 | | | | | | | | | | 3,300 | | | | |
| | | | | | | |
Capital reserve | | | | | | | | | | 8,447 | | | | | | | | | | 8,447 | | | | |
| | | | | | | |
Reserve from the ERP Special Fund | | | | | | | | | | 1,191 | | | | | | | | | | 1,191 | | | | |
| | | | | | | |
Retained earnings | | | | | | | | | | 23,391 | | | | | | | | | | 22,026 | | | | |
| | | | | | | |
Statutory reserve under Article 10 (2) KfW Law | | | | | | | | | | 1,875 | | | | | | | | | | 1,875 | | | | |
| | | | | | | |
Special reserve under Article 10 (3) KfW Law | | | | | | | | | | 15,781 | | | | | | | | | | 14,755 | | | | |
| | | | | | | |
Special reserve less the special loss account from provisioning pursuant to Section 17 (4) of the D-Mark Balance Sheet Law | | | | | | | | | | 21 | | | | | | | | | | 21 | | | | |
| | | | | | | |
Other retained earnings | | | | | | | | | | 5,714 | | | | | | | | | | 5,374 | | | | |
| | | | | | | |
Fund for general banking risks | | | | | | | | | | 200 | | | | | | | | | | 200 | | | | |
| | | | | | | |
Revaluation reserves | | | | | | | | | | 50 | | | | | | | | | | –957 | | | | |
| | | | | | | |
Valuation result from the change in own credit risk of liabilities designated at fair value through profit or loss | | | | | | | | | | 6 | | | | | | | | | | –131 | | | | |
| | | | | | | |
Actuarial gains and losses from defined-benefit pension obligations (after tax) | | | | | | | | | | 44 | | | | | | | | | | –826 | | | | |
| | | | | | | |
Total | | | | | | | | | | 36,579 | | | | | | | | | | 34,207 | | | | |
133 | KfW Financial Report 2022 Consolidated financial statements | Notes – Notes to the statement of financial position
The Federal Government owns 80% of KfW’s share capital, the German federal states 20%. In accordance with Article 1a of the KfW Law, the Federal Republic of Germany is liable for certain of KfW’s liabilities. There is no profit distribution in accordance with Article 10 (1) of the KfW Law. KfW’s net income amounting to EUR 1,026 million (2021: EUR 1,784 million) was used to increase the special reserve under Article 10 (3) KfW Law.
Equity forms the basis for the capital available for covering risks, which is matched against the capital requirements derived from internal management.
For information concerning Equity in relation to risk-bearing capacity, see the risk report in the combined management report.
The revaluation reserves developed as follows:
Development of revaluation reserves
| | | | | | | | | | | | | | | | | | | | | | | | |
| | | | | Valuation result
from the change
in own credit
risk of liabilities
designated at fair
value through
profit or loss | | | Actuarial gains
and losses from
defined benefit
pension obligations | | | Effects of
deferred taxes | | | Total | | | | |
| | | | | EUR in millions | | | EUR in millions | | | EUR in millions | | | EUR in millions | | | | |
| | | | | | |
As of 1 Jan. 2021 | | | | | | | –153 | | | | –1,052 | | | | 54 | | | | –1,151 | | | | | |
| | | | | | |
Consolidated comprehensive income | | | | | | | 23 | | | | 182 | | | | –10 | | | | 195 | | | | | |
| | | | | | |
Other comprehensive income | | | | | | | 23 | | | | 182 | | | | –10 | | | | 195 | | | | | |
| | | | | | |
As of 31 Dec. 2021 | | | | | | | –131 | | | | –870 | | | | 44 | | | | –957 | | | | | |
| | | | | | |
Consolidated comprehensive income | | | | | | | 137 | | | | 922 | | | | –53 | | | | 1,007 | | | | | |
| | | | | | |
Other comprehensive income | | | | | | | 137 | | | | 922 | | | | –53 | | | | 1,007 | | | | | |
| | | | | | |
As of 31 Dec. 2022 | | | | | | | 6 | | | | 52 | | | | –9 | | | | 50 | | | | | |
KfW Financial Report 2022 Consolidated financial statements | Notes – Notes to the statement of financial position | 134
Notes to financial instruments
The different IFRS 9 measurement categories are abbreviated as follows in the Notes to financial instruments:
| | | | |
| ACO | | = | | Financial instruments measured at amortised cost |
| FVM | | = | | Financial instruments measured at fair value |
| FVD | | = | | Financial instruments designated at fair value |
(56) Gains and losses from financial instruments by measurement category
The following tables show the results from financial instruments included in the different statement of comprehensive income items presented by measurement category. The result from foreign currency translation is not included.
Gains and losses from financial instruments by measurement category in financial year 2022
| | | | | | | | | | | | | | | | | | | | | | | | | | | | | | | | | | | | | | | | | | | | |
| | | | | | | | | | | | | |
| | | | | | | | | | | | | | | | | | | | | |
| Financial liabilities
at fair value |
| | | | | | | | | | | | | | |
| | | |
| Financial
assets at amortised cost |
| | | |
| Financial
liabilities at amortised cost |
| | | |
| Financial
assets at fair value – FVM |
| | | |
| FVM
|
| | | |
| FVD
|
| | | |
| Derivatives
designated for hedge accounting |
| | | | Total | | | | |
| | | |
| EUR in
millions |
| | | |
| EUR in
millions |
| | | |
| EUR in
millions |
| | | |
| EUR in
millions |
| | | |
| EUR in
millions |
| | | |
| EUR in
millions |
| | | | EUR in millions | | | | |
| | | | | | | | | | | | | | | |
Interest income | | | | | 4,7371) | | | | | | 0 | | | | | | 110 | | | | | | 610 | | | | | | 0 | | | | | | –1,672 | | | | | 3,786 | | | | |
| | | | | | | | | | | | | | | |
Interest expense | | | | | –268 | | | | | | –3,789 | | | | | | 57 | | | | | | 7 | | | | | | –349 | | | | | | 2,738 | | | | | –1,603 | | | | |
| | | | | | | | | | | | | | | |
Net gains/losses from risk provisions | | | | | –124 | | | | | | 0 | | | | | | 0 | | | | | | 0 | | | | | | 0 | | | | | | 0 | | | | | –124 | | | | |
| | | | | | | | | | | | | | | |
Commission income | | | | | 9 | | | | | | 0 | | | | | | 1 | | | | | | 0 | | | | | | 0 | | | | | | 0 | | | | | 9 | | | | |
| | | | | | | | | | | | | | | |
Commission expense | | | | | –10 | | | | | | –5 | | | | | | –1 | | | | | | 0 | | | | | | 0 | | | | | | 0 | | | | | –16 | | | | |
| | | | | | | | | | | | | | | |
Net gains/losses from hedge accounting | | | | | –32,943 | | | | | | 33,070 | | | | | | 0 | | | | | | 0 | | | | | | 0 | | | | | | 23 | | | | | 150 | | | | |
| | | | | | | | | | | | | | | |
Net gains/losses from other financial instruments at fair value through profit or loss | | | | | 0 | | | | | | 0 | | | | | | 470 | | | | | | –2,254 | | | | | | 1,850 | | | | | | 0 | | | | | 65 | | | | |
| | | | | | | | | | | | | | | |
Net gains/losses from disposal of financial assets at amortised cost | | | | | –1 | | | | | | 0 | | | | | | 0 | | | | | | 0 | | | | | | 0 | | | | | | 0 | | | | | –1 | | | | |
| | | | | | | | | | | | | | | |
Net other operating income | | | | | 0 | | | | | | 0 | | | | | | 0 | | | | | | 0 | | | | | | 0 | | | | | | 0 | | | | | 0 | | | | |
| | | | | | | | | | | | | | | |
| Change in revaluation reserves | | | | | 0 | | | | | | 0 | | | | | | 0 | | | | | | 0 | | | | | | 137 | | | | | | 0 | | | | | 137 | | | | |
| | | | | | | | | | | | | | | |
| Total | | | | | –28,600 | | | | | | 29,277 | | | | | | 636 | | | | | | –1,637 | | | | | | 1,638 | | | | | | 1,089 | | | | | 2,403 | | | | |
| 1) | Includes interest income from financial guarantees of EUR 33 million. |
135 | KfW Financial Report 2022 Consolidated financial statements | Notes – Notes to financial instruments
Gains and losses from financial instruments by measurement category in financial year 2021
| | | | | | | | | | | | | | | | | | | | | | | | | | | | | | | | | | | | | | | | | | | | |
| | | | | | | | | | | | | |
| | | | | | | | | | | | | | | | | | | | | |
| Financial liabilities
at fair value |
| | | | | | | | | | | | | | |
| | | |
| Financial
assets at amortised cost |
| | | |
| Financial
liabilities at amortised cost |
| | | |
| Financial
assets at fair value – FVM |
| | | |
| FVM
|
| | | |
| FVD
|
| | | |
| Derivatives
designated for hedge accounting |
| | | | Total | | | | |
| | | |
| EUR in
millions |
| | | |
| EUR in
millions |
| | | |
| EUR in
millions |
| | | |
| EUR in
millions |
| | | |
| EUR in
millions |
| | | |
| EUR in
millions |
| | | | EUR in millions | | | | |
| | | | | | | | | | | | | | | |
Interest income | | | | | 3,7641) | | | | | | 0 | | | | | | 326 | | | | | | 120 | | | | | | 0 | | | | | | –3,149 | | | | | 1,061 | | | | |
| | | | | | | | | | | | | | | |
Interest expense | | | | | –145 | | | | | | –2,877 | | | | | | 382 | | | | | | –203 | | | | | | –386 | | | | | | 4,582 | | | | | 1,354 | | | | |
| | | | | | | | | | | | | | | |
Net gains/losses from risk provisions | | | | | 196 | | | | | | 0 | | | | | | 0 | | | | | | 0 | | | | | | 0 | | | | | | 0 | | | | | 196 | | | | |
| | | | | | | | | | | | | | | |
Commission income | | | | | 8 | | | | | | 0 | | | | | | 0 | | | | | | 0 | | | | | | 0 | | | | | | 0 | | | | | 8 | | | | |
| | | | | | | | | | | | | | | |
Commission expense | | | | | –10 | | | | | | –4 | | | | | | –1 | | | | | | 0 | | | | | | 0 | | | | | | 0 | | | | | –15 | | | | |
| | | | | | | | | | | | | | | |
Net gains/losses from hedge accounting | | | | | –7,940 | | | | | | 9,128 | | | | | | 0 | | | | | | 0 | | | | | | 0 | | | | | | –1,297 | | | | | –110 | | | | |
| | | | | | | | | | | | | | | |
Net gains/losses from other financial instruments at fair value through profit or loss | | | | | 0 | | | | | | 0 | | | | | | –389 | | | | | | 549 | | | | | | 614 | | | | | | 0 | | | | | 774 | | | | |
| | | | | | | | | | | | | | | |
Net gains/losses from disposal of financial assets at amortised cost | | | | | –4 | | | | | | 0 | | | | | | 0 | | | | | | 0 | | | | | | 0 | | | | | | 0 | | | | | –4 | | | | |
| | | | | | | | | | | | | | | |
Net other operating income | | | | | 0 | | | | | | 0 | | | | | | 0 | | | | | | 0 | | | | | | 0 | | | | | | 0 | | | | | 0 | | | | |
| | | | | | | | | | | | | | | |
| Change in revaluation reserves | | | | | 0 | | | | | | 0 | | | | | | 0 | | | | | | 0 | | | | | | 23 | | | | | | 0 | | | | | 23 | | | | |
| | | | | | | | | | | | | | | |
| Total | | | | | –4,131 | | | | | | 6,247 | | | | | | 318 | | | | | | 465 | | | | | | 251 | | | | | | 137 | | | | | 3,286 | | | | |
| 1) | Includes interest income from financial guarantees of EUR 25 million. |
(57) Disclosures on fair value
The following tables show the financial instruments measured at fair value or for which the fair value is indicated in the Notes according to the valuation methods used. There is also a comparison of fair value and carrying amount.
KfW Financial Report 2022 Consolidated financial statements | Notes – Notes to financial instruments | 136
Fair value of financial instruments by valuation method as of 31 December 2022
| | | | | | | | | | | | | | | | | | | | | | | | | | | | | | | | | | | | |
| | | | | | | | | | Fair value | | | | | | | | | | | |
| | | | | Carrying
amount
(statement
of financial
position) | | | | | Level 1 | | | | | Level 2 | | | | | Level 3 | | | | | Total | | | | | Difference
from
carrying
amount | |
| | | | | EUR in
millions | | | | | EUR in
millions | | | | | EUR in
millions | | | | | EUR in
millions | | | | | EUR in
millions | | | | | EUR in
millions | |
| | | | | | | | | | | | |
Assets | | | | | | | | | | | | | | | | | | | | | | | | | | | | | | | | | | | | |
| | | | | | | | | | | | |
Cash reserves | | | | | 51,848 | | | | | | 51,848 | | | | | | 0 | | | | | | 0 | | | | | | 51,848 | | | | | | 0 | |
| | | | | | | | | | | | |
Financial assets at amortised cost | | | | | | | | | | | | | | | | | | | | | | | | | | | | | | | | | | | | |
| | | | | | | | | | | | |
Loans and advances to banks | | | | | 313,919 | | | | | | 0 | | | | | | 9,354 | | | | | | 275,683 | | | | | | 285,037 | | | | | | –28,882 | |
| | | | | | | | | | | | |
Loans and advances to customers | | | | | 152,624 | | | | | | 0 | | | | | | 1,334 | | | | | | 146,636 | | | | | | 147,970 | | | | | | –4,655 | |
| | | | | | | | | | | | |
Securities and investments | | | | | 33,721 | | | | | | 26,453 | | | | | | 3,257 | | | | | | 3,954 | | | | | | 33,664 | | | | | | –57 | |
| | | | | | | | | | | | |
Financial assets at fair value | | | | | | | | | | | | | | | | | | | | | | | | | | | | | | | | | | | | |
| | | | | | | | | | | | |
Loans and advances to banks – FVM | | | | | 38 | | | | | | 0 | | | | | | 0 | | | | | | 38 | | | | | | 38 | | | | | | 0 | |
| | | | | | | | | | | | |
Loans and advances to customers – FVM | | | | | 9,682 | | | | | | 0 | | | | | | 9,480 | | | | | | 202 | | | | | | 9,682 | | | | | | 0 | |
| | | | | | | | | | | | |
Securities and investments – FVM | | | | | 4,422 | | | | | | 87 | | | | | | 3,336 | | | | | | 1,000 | | | | | | 4,422 | | | | | | 0 | |
| | | | | | | | | | | | |
Other derivatives – FVM | | | | | 2,482 | | | | | | 0 | | | | | | 2,481 | | | | | | 1 | | | | | | 2,482 | | | | | | 0 | |
| | | | | | | | | | | | |
Value adjustments from macro fair value hedge accounting | | | | | –25,859 | | | | | | n.a. | | | | | | n.a. | | | | | | n.a. | | | | | | n.a. | | | | | | 25,859 | |
| | | | | | | | | | | | |
Derivatives designated for hedge accounting | | | | | 9,005 | | | | | | 0 | | | | | | 9,005 | | | | | | 0 | | | | | | 9,005 | | | | | | 0 | |
| | | | | | | | | | | | |
| Non-current assets held for sale | | | | | 64 | | | | | | 0 | | | | | | 16 | | | | | | 49 | | | | | | 64 | | | | | | 0 | |
| | | | | | | | | | | | |
| Total | | | | | 551,948 | | | | | | 78,388 | | | | | | 38,262 | | | | | | 427,562 | | | | | | 544,213 | | | | | | –7,735 | |
| | | | | | | | | | | | |
Liabilities and equity | | | | | | | | | | | | | | | | | | | | | | | | | | | | | | | | | | | | |
| | | | | | | | | | | | |
Financial liabilities at amortised cost | | | | | | | | | | | | | | | | | | | | | | | | | | | | | | | | | | | | |
| | | | | | | | | | | | |
Liabilities to banks | | | | | 11,454 | | | | | | 0 | | | | | | 11,408 | | | | | | 4 | | | | | | 11,412 | | | | | | –42 | |
| | | | | | | | | | | | |
Liabilities to customers | | | | | 62,956 | | | | | | 0 | | | | | | 61,784 | | | | | | 42 | | | | | | 61,826 | | | | | | –1,130 | |
| | | | | | | | | | | | |
Certificated liabilities | | | | | 418,169 | | | | | | 355,134 | | | | | | 55,595 | | | | | | 0 | | | | | | 410,729 | | | | | | –7,440 | |
| | | | | | | | | | | | |
Financial liabilities at fair value | | | | | | | | | | | | | | | | | | | | | | | | | | | | | | | | | | | | |
| | | | | | | | | | | | |
Liabilities to banks – FVD | | | | | 208 | | | | | | 0 | | | | | | 208 | | | | | | 0 | | | | | | 208 | | | | | | 0 | |
| | | | | | | | | | | | |
Liabilities to customers – FVD | | | | | 812 | | | | | | 0 | | | | | | 812 | | | | | | 0 | | | | | | 812 | | | | | | 0 | |
| | | | | | | | | | | | |
Certificated liabilities – FVD | | | | | 6,699 | | | | | | 4,257 | | | | | | 2,442 | | | | | | 0 | | | | | | 6,699 | | | | | | 0 | |
| | | | | | | | | | | | |
Other derivatives – FVM | | | | | 3,682 | | | | | | 0 | | | | | | 3,639 | | | | | | 43 | | | | | | 3,682 | | | | | | 0 | |
| | | | | | | | | | | | |
Value adjustments from macro fair value hedge accounting | | | | | 18 | | | | | | n.a. | | | | | | n.a. | | | | | | n.a. | | | | | | n.a. | | | | | | –18 | |
| | | | | | | | | | | | |
| Derivatives designated for hedge accounting | | | | | 10,819 | | | | | | 0 | | | | | | 10,819 | | | | | | 0 | | | | | | 10,819 | | | | | | 0 | |
| | | | | | | | | | | | |
| Total | | | | | 514,816 | | | | | | 359,391 | | | | | | 146,705 | | | | | | 90 | | | | | | 506,186 | | | | | | –8,630 | |
137 | KfW Financial Report 2022 Consolidated financial statements | Notes – Notes to financial instruments
Fair value of financial instruments by valuation method as of 31 December 2021
| | | | | | | | | | | | | | | | | | | | | | | | | | | | | | | | | | | | |
| | | | | | | | | | Fair value | | | | | | | | | | | |
| | | | | Carrying
amount
(statement
of financial
position) | | | | | Level 1 | | | | | Level 2 | | | | | Level 3 | | | | | Total | | | | | Difference
from
carrying
amount | |
| | | | | EUR in
millions | | | | | EUR in
millions | | | | | EUR in
millions | | | | | EUR in
millions | | | | | EUR in
millions | | | | | EUR in
millions | |
| | | | | | | | | | | | |
Assets | | | | | | | | | | | | | | | | | | | | | | | | | | | | | | | | | | | | |
| | | | | | | | | | | | |
Cash reserves | | | | | 42,439 | | | | | | 42,439 | | | | | | 0 | | | | | | 0 | | | | | | 42,439 | | | | | | 0 | |
| | | | | | | | | | | | |
Financial assets at amortised cost | | | | | | | | | | | | | | | | | | | | | | | | | | | | | | | | | | | | |
| | | | | | | | | | | | |
Loans and advances to banks | | | | | 308,251 | | | | | | 0 | | | | | | 6,270 | | | | | | 305,404 | | | | | | 311,675 | | | | | | 3,424 | |
| | | | | | | | | | | | |
Loans and advances to customers | | | | | 129,197 | | | | | | 0 | | | | | | 0 | | | | | | 133,323 | | | | | | 133,323 | | | | | | 4,126 | |
| | | | | | | | | | | | |
Securities and investments | | | | | 35,774 | | | | | | 28,578 | | | | | | 3,485 | | | | | | 3,809 | | | | | | 35,872 | | | | | | 98 | |
| | | | | | | | | | | | |
Financial assets at fair value | | | | | | | | | | | | | | | | | | | | | | | | | | | | | | | | | | | | |
| | | | | | | | | | | | |
Loans and advances to banks – FVM | | | | | 49 | | | | | | 0 | | | | | | 0 | | | | | | 49 | | | | | | 49 | | | | | | 0 | |
| | | | | | | | | | | | |
Loans and advances to customers – FVM | | | | | 9,572 | | | | | | 0 | | | | | | 9,437 | | | | | | 135 | | | | | | 9,572 | | | | | | 0 | |
| | | | | | | | | | | | |
Securities and investments – FVM | | | | | 4,083 | | | | | | 111 | | | | | | 3,352 | | | | | | 619 | | | | | | 4,083 | | | | | | 0 | |
| | | | | | | | | | | | |
Other derivatives – FVM | | | | | 5,381 | | | | | | 0 | | | | | | 4,765 | | | | | | 616 | | | | | | 5,381 | | | | | | 0 | |
| | | | | | | | | | | | |
Value adjustments from macro fair value hedge accounting | | | | | 4,609 | | | | | | n.a. | | | | | | n.a. | | | | | | n.a. | | | | | | n.a. | | | | | | –4,609 | |
| | | | | | | | | | | | |
Derivatives designated for hedge accounting | | | | | 8,478 | | | | | | 0 | | | | | | 8,478 | | | | | | 0 | | | | | | 8,478 | | | | | | 0 | |
| | | | | | | | | | | | |
| Non-current assets held for sale | | | | | 119 | | | | | | 0 | | | | | | 68 | | | | | | 51 | | | | | | 119 | | | | | | 0 | |
| | | | | | | | | | | | |
| Total | | | | | 547,951 | | | | | | 71,128 | | | | | | 35,855 | | | | | | 444,007 | | | | | | 550,990 | | | | | | 3,040 | |
| | | | | | | | | | | | |
Liabilities and equity | | | | | | | | | | | | | | | | | | | | | | | | | | | | | | | | | | | | |
| | | | | | | | | | | | |
Financial liabilities at amortised cost | | | | | | | | | | | | | | | | | | | | | | | | | | | | | | | | | | | | |
| | | | | | | | | | | | |
Liabilities to banks | | | | | 13,498 | | | | | | 0 | | | | | | 13,537 | | | | | | 2 | | | | | | 13,539 | | | | | | 41 | |
| | | | | | | | | | | | |
Liabilities to customers | | | | | 43,694 | | | | | | 0 | | | | | | 43,694 | | | | | | 42 | | | | | | 43,736 | | | | | | 43 | |
| | | | | | | | | | | | |
Certificated liabilities | | | | | 439,194 | | | | | | 378,227 | | | | | | 62,389 | | | | | | 0 | | | | | | 440,616 | | | | | | 1,422 | |
| | | | | | | | | | | | |
Financial liabilities at fair value | | | | | | | | | | | | | | | | | | | | | | | | | | | | | | | | | | | | |
| | | | | | | | | | | | |
Liabilities to banks – FVD | | | | | 255 | | | | | | 0 | | | | | | 255 | | | | | | 0 | | | | | | 255 | | | | | | 0 | |
| | | | | | | | | | | | |
Liabilities to customers – FVD | | | | | 1,003 | | | | | | 0 | | | | | | 1,003 | | | | | | 0 | | | | | | 1,003 | | | | | | 0 | |
| | | | | | | | | | | | |
Certificated liabilities – FVD | | | | | 8,416 | | | | | | 5,223 | | | | | | 3,193 | | | | | | 0 | | | | | | 8,416 | | | | | | 0 | |
| | | | | | | | | | | | |
Other derivatives – FVM | | | | | 1,810 | | | | | | 0 | | | | | | 1,723 | | | | | | 86 | | | | | | 1,810 | | | | | | 0 | |
| | | | | | | | | | | | |
Value adjustments from macro fair value hedge accounting | | | | | 37 | | | | | | n.a. | | | | | | n.a. | | | | | | n.a. | | | | | | n.a. | | | | | | –37 | |
| | | | | | | | | | | | |
| Derivatives designated for hedge accounting | | | | | 4,554 | | | | | | 0 | | | | | | 4,554 | | | | | | 0 | | | | | | 4,554 | | | | | | 0 | |
| | | | | | | | | | | | |
| Total | | | | | 512,459 | | | | | | 383,449 | | | | | | 130,349 | | | | | | 130 | | | | | | 513,928 | | | | | | 1,469 | |
Interest-related changes in value are also included in measuring the fair value of the financial instruments. Accordingly, when the comparison is made with the carrying amount, it is necessary to take into account the changes in value (interest-related) resulting from the recognition of Loans and advances and borrowings in macro fair value hedge accounting.
KfW Financial Report 2022 Consolidated financial statements | Notes – Notes to financial instruments | 138
Change of valuation method used for financial instruments measured at fair value
with a transfer between levels 1 and 2 in financial year 2022
| | | | | | | | |
| | | Transfer | | | Transfer | |
| | | from level 1 | | | from level 2 | |
| | to level 2 | | | to level 1 | |
| | EUR in millions | | | EUR in millions | |
| | |
Assets | | | | | | | | |
| | |
Financial assets at fair value | | | | | | | | |
| | |
Loans and advances to banks – FVM | | | 0 | | | | 0 | |
| | |
Loans and advances to customers – FVM | | | 0 | | | | 0 | |
| | |
Securities and investments – FVM | | | 0 | | | | 5 | |
| | |
Other derivatives – FVM | | | 0 | | | | 0 | |
| | |
Derivatives designated for hedge accounting | | | 0 | | | | 0 | |
| | |
Non-current assets held for sale | | | 0 | | | | 0 | |
| | |
Total | | | 0 | | | | 5 | |
| | |
Liabilities and equity | | | | | | | | |
| | |
Financial liabilities at fair value | | | | | | | | |
| | |
Liabilities to banks – FVD | | | 0 | | | | 0 | |
| | |
Liabilities to customers – FVD | | | 0 | | | | 0 | |
| | |
Certificated liabilities – FVD | | | 0 | | | | 186 | |
| | |
Other derivatives – FVM | | | 0 | | | | 0 | |
| | |
Derivatives designated for hedge accounting | | | 0 | | | | 0 | |
| | |
Total | | | 0 | | | | 186 | |
KfW carried out transfers from level 2 to level 1 in financial year 2022, in cases where quoted market prices from active markets were available again for these transactions. In contrast, there were transfers from level 1 to level 2 in financial year 2021 where there were no quoted market prices from active markets available for the respective financial instruments.
139 | KfW Financial Report 2022 Consolidated financial statements | Notes – Notes to financial instruments
Change of valuation method used for financial instruments measured at fair value
with a transfer between levels 1 and 2 in financial year 2021
| | | | | | | | |
| | | Transfer | | | Transfer | |
| | | from level 1 | | | from level 2 | |
| | to level 2 | | | to level 1 | |
| | EUR in millions | | | EUR in millions | |
| | |
Assets | | | | | | | | |
| | |
Financial assets at fair value | | | | | | | | |
| | |
Loans and advances to banks – FVM | | | 0 | | | | 0 | |
| | |
Loans and advances to customers – FVM | | | 0 | | | | 0 | |
| | |
Securities and investments – FVM | | | 0 | | | | 0 | |
| | |
Other derivatives – FVM | | | 0 | | | | 0 | |
| | |
Derivatives designated for hedge accounting | | | 0 | | | | 0 | |
| | |
Non-current assets held for sale | | | 0 | | | | 0 | |
| | |
Total | | | 0 | | | | 0 | |
| | |
Liabilities and equity | | | | | | | | |
| | |
Financial liabilities at fair value | | | | | | | | |
| | |
Liabilities to banks – FVD | | | 0 | | | | 0 | |
| | |
Liabilities to customers – FVD | | | 0 | | | | 0 | |
| | |
Certificated liabilities – FVD | | | 38 | | | | 0 | |
| | |
Other derivatives – FVM | | | 0 | | | | 0 | |
| | |
Derivatives designated for hedge accounting | | | 0 | | | | 0 | |
| | |
Total | | | 38 | | | | 0 | |
KfW Financial Report 2022 Consolidated financial statements | Notes – Notes to financial instruments | 140
Development of financial assets measured at fair value assigned to level 3 in financial year 2022
| | | | | | | | | | | | | | | | | | | | | | | | |
| | | Financial assets at fair value | | | | | | | | |
| | | Loans and | | | Loans and | | | Securities | | | Other | | | Non-current | | | Total | | |
| | | advances to | | | advances to | | | and | | | derivatives | | | assets held | | | | | |
| | | banks | | | customers | | | investments | | | – FVM | | | for sale | | | | | |
| | – FVM | | | – FVM | | | – FVM | | | | | | | | | | | |
| | | EUR in | | | EUR in | | | EUR in | | | EUR in | | | EUR in | | | EUR in | | |
| | millions | | | millions | | | millions | | | millions | | | millions | | | millions | | |
| | | | | | | |
As of 1 Jan. 2022 | | | 49 | | | | 135 | | | | 619 | | | | 616 | | | | 51 | | | 1,471 | | |
| | | | | | | |
A. Changes recognised in the income statement | | | | | | | | | | | | | | | | | | | | | | | | |
| | | | | | | |
Net interest and commission income | | | 0 | | | | –2 | | | | 0 | | | | –5 | | | | 0 | | | –7 | | |
| | | | | | | |
Contracts still valid at year-end | | | 0 | | | | 0 | | | | 0 | | | | 0 | | | | 0 | | | –1 | | |
| | | | | | | |
Net gains/losses from hedge accounting | | | 0 | | | | 0 | | | | 0 | | | | 0 | | | | 0 | | | 0 | | |
| | | | | | | |
Contracts still valid at year-end | | | 0 | | | | 0 | | | | 0 | | | | 0 | | | | 0 | | | 0 | | |
| | | | | | | |
Net gains/losses from other financial instruments at fair value through profit or loss | | | –13 | | | | –7 | | | | –117 | | | | –746 | | | | 11 | | | –872 | | |
| | | | | | | |
Contracts still valid at year-end | | | –12 | | | | 7 | | | | –111 | | | | –8 | | | | –1 | | | –125 | | |
| | | | | | | |
Total changes recognised in the income statement | | | –13 | | | | –9 | | | | –117 | | | | –751 | | | | 11 | | | –878 | | |
| | | | | | | |
B. Changes recognised directly in equity | | | | | | | | | | | | | | | | | | | | | | | | |
| | | | | | | |
Changes in level assignment | | | 0 | | | | 0 | | | | 457 | | | | –28 | | | | –11 | | | 418 | | |
| | | | | | | |
Transfer from level 1 and level 2 | | | 0 | | | | 0 | | | | 522 | | | | 1 | | | | 0 | | | 524 | | |
| | | | | | | |
Transfer to level 1 and level 2 | | | 0 | | | | 0 | | | | –65 | | | | –30 | | | | –11 | | | –106 | | |
| | | | | | | |
Additions | | | 0 | | | | 155 | | | | 67 | | | | 0 | | | | 0 | | | 222 | | |
| | | | | | | |
Disposals | | | –2 | | | | –87 | | | | –55 | | | | 0 | | | | –16 | | | –160 | | |
| | | | | | | |
Total changes recognised directly in equity | | | –2 | | | | 69 | | | | 469 | | | | –28 | | | | –27 | | | 481 | | |
| | | | | | | |
Changes in consolidated group | | | 0 | | | | 0 | | | | –1 | | | | 0 | | | | 0 | | | –1 | | |
| | | | | | | |
Exchange rate changes | | | 3 | | | | 7 | | | | 40 | | | | 8 | | | | 2 | | | 60 | | |
| | | | | | | |
Other changes | | | 0 | | | | 0 | | | | –11 | | | | 156 | | | | 11 | | | 156 | | |
| | | | | | | |
As of 31 Dec. 2022 | | | 38 | | | | 202 | | | | 1,000 | | | | 1 | | | | 49 | | | 1,289 | | |
141 | KfW Financial Report 2022 Consolidated financial statements | Notes – Notes to financial instruments
Development of financial liabilities measured at fair value assigned to level 3 in financial year 2022
| | | | | | | | | | | | | | | | | | | | | | |
| | | Financial liabilities at fair value | | | | | | | |
| | | Liabilities | | | Liabilities | | | Certificated | | | Other | | | | | Total | | |
| | | to banks | | | to customers | | | liabilities | | | derivatives | | | | | | | |
| | – FVD | | | – FVD | | | – FVD | | | – FVM | | | | | | | |
| | EUR in millions | | | EUR in millions | | | EUR in millions | | | EUR in millions | | | | | EUR in millions | | |
| | | | | | | |
As of 1 Jan. 2022 | | | 0 | | | | 0 | | | | 0 | | | | 86 | | | | | 86 | | |
| | | | | | | |
A. Changes recognised in the income statement | | | | | | | | | | | | | | | | | | | | | | |
| | | | | | | |
Net interest and commission income | | | 0 | | | | 0 | | | | 0 | | | | 28 | | | | | 28 | | |
| | | | | | | |
Contracts still valid at year-end | | | 0 | | | | 0 | | | | 0 | | | | 0 | | | | | 0 | | |
| | | | | | | |
Net gains/losses from hedge accounting | | | 0 | | | | 0 | | | | 0 | | | | 0 | | | | | 0 | | |
| | | | | | | |
Contracts still valid at year-end | | | 0 | | | | 0 | | | | 0 | | | | 0 | | | | | 0 | | |
| | | | | | | |
Net gains/losses from other financial instruments at fair value through profit or loss | | | 0 | | | | 0 | | | | 0 | | | | 918 | | | | | 918 | | |
| | | | | | | |
Contracts still valid at year-end | | | 0 | | | | 0 | | | | 0 | | | | 40 | | | | | 40 | | |
| | | | | | | |
Total changes recognised in the income statement | | | 0 | | | | 0 | | | | 0 | | | | 946 | | | | | 946 | | |
| | | | | | | |
B. Changes recognised directly in equity | | | | | | | | | | | | | | | | | | | | | | |
| | | | | | | |
Change in revaluation reserves | | | 0 | | | | 0 | | | | 0 | | | | 0 | | | | | 0 | | |
| | | | | | | |
Contracts still valid at year-end | | | 0 | | | | 0 | | | | 0 | | | | 0 | | | | | 0 | | |
| | | | | | | |
Changes in level assignment | | | 0 | | | | 0 | | | | 0 | | | | –1,113 | | | | | –1,113 | | |
| | | | | | | |
Transfer from level 1 and level 2 | | | 0 | | | | 0 | | | | 0 | | | | 2 | | | | | 2 | | |
| | | | | | | |
Transfer to level 1 and level 2 | | | 0 | | | | 0 | | | | 0 | | | | –1,115 | | | | | –1,115 | | |
| | | | | | | |
Additions | | | 0 | | | | 0 | | | | 0 | | | | 0 | | | | | 0 | | |
| | | | | | | |
Disposals | | | 0 | | | | 0 | | | | 0 | | | | –3 | | | | | –3 | | |
| | | | | | | |
Total changes recognised directly in equity | | | 0 | | | | 0 | | | | 0 | | | | –1,116 | | | | | –1,116 | | |
| | | | | | | |
Exchange rate changes | | | 0 | | | | 0 | | | | 0 | | | | –19 | | | | | –19 | | |
| | | | | | | |
Other changes | | | 0 | | | | 0 | | | | 0 | | | | 146 | | | | | 146 | | |
| | | | | | | |
As of 31 Dec. 2022 | | | 0 | | | | 0 | | | | 0 | | | | 43 | | | | | 43 | | |
KfW carried out transfers from levels 1 and 2 to level 3 because in financial years 2022 and 2021 quoted prices on the active market or observable market parameters were no longer available or their effect on fair value was deemed to be material. In contrast, KfW carried out transfers from level 3 to levels 1 and 2 if quoted prices on the active market or observable market parameters were available again or if the effect of non-observable parameters on fair value was deemed to be immaterial.
KfW Financial Report 2022 Consolidated financial statements | Notes – Notes to financial instruments | 142
Derivative transactions concluded as hedging instruments with customers were transferred from level 3 to level 2 in financial year 2022 primarily due to changes in the materiality assessment concerning unobservable data.
Development of financial assets measured at fair value assigned to level 3 in financial year 2021
| | | | | | | | | | | | | | | | | | | | | | | | | | |
| | | Financial assets at fair value | | | | | | | | | | |
| | | Loans and | | | Loans and | | | Securities | | | Other | | | Non-current | | | | | Total | | |
| | | advances to | | | advances to | | | and | | | derivatives | | | assets held | | | | | | | |
| | | banks | | | customers | | | investments | | | – FVM | | | for sale | | | | | | | |
| | – FVM | | | – FVM | | | – FVM | | | | | | | | | | | | | |
| | | EUR in | | | EUR in | | | EUR in | | | EUR in | | | EUR in | | | | | EUR in | | |
| | millions | | | millions | | | millions | | | millions | | | millions | | | | | millions | | |
| | | | | | | | |
As of 1 Jan. 2021 | | | 38 | | | | 191 | | | | 710 | | | | 1,177 | | | | 59 | | | | | 2,174 | | |
| | | | | | | | |
A. Changes recognised in the income statement | | | | | | | | | | | | | | | | | | | | | | | | | | |
| | | | | | | | |
Net interest and commission income | | | 0 | | | | –1 | | | | 0 | | | | 10 | | | | 0 | | | | | 9 | | |
| | | | | | | | |
Contracts still valid at year-end | | | 0 | | | | –1 | | | | 0 | | | | 10 | | | | 0 | | | | | 9 | | |
| | | | | | | | |
Net gains/losses from hedge accounting | | | 0 | | | | 0 | | | | 0 | | | | 0 | | | | 0 | | | | | 0 | | |
| | | | | | | | |
Contracts still valid at year-end | | | 0 | | | | 0 | | | | 0 | | | | 0 | | | | 0 | | | | | 0 | | |
| | | | | | | | |
Net gains/losses from other financial instruments at fair value through profit or loss | | | 8 | | | | –5 | | | | 53 | | | | –648 | | | | 11 | | | | | –581 | | |
| | | | | | | | |
Contracts still valid at year-end | | | 8 | | | | –8 | | | | 39 | | | | –573 | | | | 11 | | | | | –523 | | |
| | | | | | | | |
Total changes recognised in the income statement | | | 8 | | | | –6 | | | | 53 | | | | –639 | | | | 11 | | | | | –573 | | |
| | | | | | | | |
B. Changes recognised directly in equity | | | | | | | | | | | | | | | | | | | | | | | | | | |
| | | | | | | | |
Changes in level assignment | | | 0 | | | | 0 | | | | –149 | | | | 0 | | | | –27 | | | | | –177 | | |
| | | | | | | | |
Transfer from level 1 and level 2 | | | 0 | | | | 0 | | | | 64 | | | | 0 | | | | 8 | | | | | 72 | | |
| | | | | | | | |
Transfer to level 1 and level 2 | | | 0 | | | | 0 | | | | –213 | | | | 0 | | | | –36 | | | | | –249 | | |
| | | | | | | | |
Additions | | | 9 | | | | 49 | | | | 55 | | | | 0 | | | | 0 | | | | | 113 | | |
| | | | | | | | |
Disposals | | | –8 | | | | –104 | | | | –60 | | | | 0 | | | | –7 | | | | | –179 | | |
| | | | | | | | |
Total changes recognised directly in equity | | | 0 | | | | –55 | | | | –155 | | | | 0 | | | | –35 | | | | | –243 | | |
| | | | | | | | |
Changes in consolidated group | | | 0 | | | | 0 | | | | 0 | | | | 0 | | | | 0 | | | | | 0 | | |
| | | | | | | | |
Exchange rate changes | | | 3 | | | | 5 | | | | 24 | | | | 45 | | | | 3 | | | | | 80 | | |
| | | | | | | | |
Other changes | | | 0 | | | | 0 | | | | –14 | | | | 33 | | | | 14 | | | | | 33 | | |
| | | | | | | | |
As of 31 Dec. 2021 | | | 49 | | | | 135 | | | | 619 | | | | 616 | | | | 51 | | | | | 1,471 | | |
143 | KfW Financial Report 2022 Consolidated financial statements | Notes – Notes to financial instruments
Development of financial liabilities measured at fair value assigned to level 3 in financial year 2021
| | | | | | | | | | | | | | | | | | | | | | | | | | | | |
| | | Financial liabilities at fair value | | | | | | | | | | | |
| | | Liabilities | | | Liabilities | | | Certificated | | | Other | | | | | | | | Total | | | |
| | | to banks | | | to customers | | | liabilities | | | derivatives | | | | | | | | | | | |
| | – FVD | | | – FVD | | | – FVD | | | – FVM | | | | | | | | | | | |
| | EUR in millions | | | EUR in millions | | | EUR in millions | | | EUR in millions | | | | | | | | EUR in millions | | | |
| | | | | | | | |
As of 1 Jan. 2021 | | | 0 | | | | 0 | | | | 3 | | | | 18 | | | | | | | | | 21 | | | | |
| | | | | | | | |
A. Changes recognised in the income statement | | | | | | | | | | | | | | | | | | | | | | | | | | | | |
| | | | | | | | |
Net interest and commission income | | | 0 | | | | 0 | | | | 0 | | | | –1 | | | | | | | | | –1 | | | | |
| | | | | | | | |
Contracts still valid at year-end | | | 0 | | | | 0 | | | | 0 | | | | –4 | | | | | | | | | –4 | | | | |
| | | | | | | | |
Net gains/losses from hedge accounting | | | 0 | | | | 0 | | | | 0 | | | | 0 | | | | | | | | | 0 | | | | |
| | | | | | | | |
Contracts still valid at year-end | | | 0 | | | | 0 | | | | 0 | | | | 0 | | | | | | | | | 0 | | | | |
| | | | | | | | |
Net gains/losses from other financial instruments at fair value through profit or loss | | | 0 | | | | 0 | | | | 0 | | | | 36 | | | | | | | | | 36 | | | | |
| | | | | | | | |
Contracts still valid at year-end | | | 0 | | | | 0 | | | | 0 | | | | 6 | | | | | | | | | 6 | | | | |
| | | | | | | | |
Total changes recognised in the income statement | | | 0 | | | | 0 | | | | 0 | | | | 35 | | | | | | | | | 35 | | | | |
| | | | | | | | |
B. Changes recognised directly in equity | | | | | | | | | | | | | | | | | | | | | | | | | | | | |
| | | | | | | | |
Change in revaluation reserves | | | 0 | | | | 0 | | | | 0 | | | | 0 | | | | | | | | | 0 | | | | |
| | | | | | | | |
Contracts still valid at year-end | | | 0 | | | | 0 | | | | 0 | | | | 0 | | | | | | | | | 0 | | | | |
| | | | | | | | |
Changes in level assignment | | | 0 | | | | 0 | | | | –4 | | | | 0 | | | | | | | | | –4 | | | | |
| | | | | | | | |
Transfer from level 1 and level 2 | | | 0 | | | | 0 | | | | 0 | | | | 0 | | | | | | | | | 0 | | | | |
| | | | | | | | |
Transfer to level 1 and level 2 | | | 0 | | | | 0 | | | | –4 | | | | 0 | | | | | | | | | –4 | | | | |
| | | | | | | | |
Additions | | | 0 | | | | 0 | | | | 0 | | | | 2 | | | | | | | | | 2 | | | | |
| | | | | | | | |
Disposals | | | 0 | | | | 0 | | | | 0 | | | | –3 | | | | | | | | | –3 | | | | |
| | | | | | | | |
Total changes recognised directly in equity | | | 0 | | | | 0 | | | | –3 | | | | –1 | | | | | | | | | –4 | | | | |
| | | | | | | | |
Exchange rate changes | | | 0 | | | | 0 | | | | 0 | | | | 1 | | | | | | | | | 1 | | | | |
| | | | | | | | |
Other changes | | | 0 | | | | 0 | | | | 0 | | | | 33 | | | | | | | | | 33 | | | | |
| | | | | | | | |
As of 31 Dec. 2021 | | | 0 | | | | 0 | | | | 0 | | | | 86 | | | | | | | | | 86 | | | | |
KfW Financial Report 2022 Consolidated financial statements | Notes – Notes to financial instruments | 144
The following tables show how an alternative determination of relevant unobservable data, i.e. values in best and worst case scenarios, would impact fair values for significant products allocated to this level.
Information on unobservable data as of 31 December 2022
| | | | | | | | | | | | |
Major classes | | | | Valuation method used | | | | Relevant unobservable data with alternative determination | | | | Range |
| Loans and advances to banks and loans and advances to customers – FVM1) | | | | Discounted cash flow method | | | | Risk costs | | | | +/– 10% |
| Securities and investments from equity finance business – FVM | | | | Discounted cash flow method2) | | | | Cost of capital | | | | 0.5% to 1.5% (absolute fluctuation) |
| | | | | | |
| | | | | | | | Long-term result | | | | 5% (relative fluctuation) |
| | | | | | |
| | | | | | | | | Risk costs | | | | +/– 10% |
| Non-current assets held for sale | | | | Discounted cash flow | | | | Cost of capital | | | | 0.5% to 1.5% |
| | | | method | | | | | | | | (absolute fluctuation) |
| | | | | | |
| | | | | | | | Long-term result | | | | 5% |
| | | | | | | | | | | | | (relative fluctuation) |
Other derivatives – derivatives with positive or negative fair values, which comprise a hedging instrument for customers with respect to export and project finance – FVM | | | | Discounted cash flow method | | | | Expected loss | | | | +/– 30% |
| 1) | As of reporting year 2022, the sensitivities for the classes Loans and advances to banks and Loans and advances to customers – FVM are calculated on the basis of the cost of risk, given that the credit spread and internal spread are no longer available. | |
| 2) | If the cost of capital and the long-term result could not be used for valuation, the sensitivities were calculated on the basis of the cost of risk. | |
145 | KfW Financial Report 2022 Consolidated financial statements | Notes – Notes to financial instruments
Information on unobservable data as of 31 December 2021
| | | | | | | | | | | | |
Major classes | | | | Valuation method used | | | | Relevant unobservable data with
alternative determination | | | | Range |
| Loans and advances to banks and loans and advances to customers – FVM | | | | Discounted cash flow method1) | | | | Credit spread | | | | –600 to +2,600 basis points |
| | | | | | |
| | | | | | | | Internal spread | | | | –11 to +11 basis points |
| | | | | | |
| | | | | | | | | Risk costs | | | | +/– 10% |
| Securities and investments from equity finance business – FVM | | | | Discounted cash flow method2) | | | | Cost of capital | | | | 0.5% to 1.5% (absolute fluctuation) |
| | | | | | |
| | | | | | | | Long-term result | | | | 5% |
| | | | | | | | | | | | (relative fluctuation) |
| | | | | | |
| | | | | | | | | Risk costs | | | | +/– 10% |
| Non-current assets held for sale | | | | Discounted cash flow | | | | Cost of capital | | | | 0.5% to 1.5% |
| | | | method | | | | | | | | (absolute fluctuation) |
| | | | | | |
| | | | | | | | Long-term result | | | | 5% |
| | | | | | | | | | | | | (relative fluctuation) |
| Other derivatives – derivatives with positive or negative fair values, which comprise a hedging instrument for customers with respect to export and project finance – FVM | | | | Discounted cash flow method | | | | Expected risk-free customer margin | | | | 7% to 13% |
| 1) | If the credit spread and the internal spread could not be used for valuation purposes, the sensitivities were calculated on the basis of the cost of risk. |
| 2) | If the cost of capital and the long-term result could not be used for valuation, the sensitivities were calculated on the basis of the cost of risk. |
Sensitivity analysis for the financial assets measured at fair value
assigned to level 3 as of 31 December 2022
| | | | | | | | | | | | |
| | | Best case | | | Reported value | | | Worst case | |
| | scenario | | | | | | scenario | |
| | EUR in millions | | | EUR in millions | | | EUR in millions | |
| | | |
Financial assets at fair value | | | | | | | | | | | | |
| | | |
Loans and advances to banks – FVM | | | 41 | | | | 38 | | | | 35 | |
| | | |
Loans and advances to customers – FVM | | | 212 | | | | 202 | | | | 191 | |
| | | |
Securities and investments – FVM | | | 1,115 | | | | 1,000 | | | | 896 | |
| | | |
Other derivatives – FVM | | | 1 | | | | 1 | | | | 1 | |
| | | |
Non-current assets held for sale | | | 56 | | | | 49 | | | | 43 | |
| |
| | | |
Total | | | 1,425 | | | | 1,289 | | | | 1,166 | |
KfW Financial Report 2022 Consolidated financial statements | Notes – Notes to financial instruments | 146
Sensitivity analysis for the financial liabilities measured at fair value
assigned to level 3 as of 31 December 2022
| | | | | | | | | | | | |
| | | Best case | | | Reported value | | | Worst case | |
| | scenario | | | | | | scenario | |
| | EUR in millions | | | EUR in millions | | | EUR in millions | |
| | | |
Financial liabilities at fair value | | | | | | | | | | | | |
| | | |
Other derivatives – FVM | | | 43 | | | | 43 | | | | 43 | |
| | | |
Total | | | 43 | | | | 43 | | | | 43 | |
Sensitivity analysis for the financial assets measured at fair value
assigned to level 3 as of 31 December 2021
| | | | | | | | | | | | |
| | | Best case | | | Reported value | | | Worst case | |
| | scenario | | | | | | scenario | |
| | EUR in millions | | | EUR in millions | | | EUR in millions | |
| | | |
Financial assets at fair value | | | | | | | | | | | | |
| | | |
Loans and advances to banks – FVM | | | 52 | | | | 49 | | | | 47 | |
| | | |
Loans and advances to customers – FVM | | | 146 | | | | 135 | | | | 123 | |
| | | |
Securities and investments – FVM | | | 704 | | | | 619 | | | | 548 | |
| | | |
Other derivatives – FVM | | | 622 | | | | 616 | | | | 610 | |
| | | |
Non-current assets held for sale | | | 61 | | | | 51 | | | | 44 | |
| | | |
Total | | | 1,585 | | | | 1,471 | | | | 1,372 | |
Sensitivity analysis for the financial liabilities measured at fair value
assigned to level 3 as of 31 December 2021
| | | | | | | | | | | | |
| | | Best case | | | Reported value | | | Worst case | |
| | scenario | | | | | | scenario | |
| | EUR in millions | | | EUR in millions | | | EUR in millions | |
| | | |
Financial liabilities at fair value | | | | | | | | | | | | |
| | | |
Other derivatives – FVM | | | 86 | | | | 86 | | | | 87 | |
| | | |
Total | | | 86 | | | | 86 | | | | 87 | |
147 | KfW Financial Report 2022 Consolidated financial statements | Notes – Notes to financial instruments
(58) Disclosures on micro fair value hedge accounting
Disclosures on hedged items in micro fair value hedge accounting by risk type – 2022
| | | | | | | | | | | | | | | | | | | | | | |
| | Carrying
amount of
hedged items | | | Accumulated
hedge fair value
adjustment
(fair value of
the hedged
risk for the
hedged item) | | | Hedge fair value
adjustment to
be amortised
(discontinued
hedge
relationships) | | | Statement of financial
position items
in which the
hedged items
are reported | | | Fair value changes in
hedged items to
determine hedge
ineffectiveness
(income statement
effect – hedged items) | | | |
| | EUR in millions | | | EUR in millions | | | EUR in millions | | | | | | EUR in millions | | | |
| | | | | | |
Assets | | | | | | | | | | | | | | | | | | | | | | |
Interest risk | | | | | | | | | | | | | | | | | | | | | | |
Securities and investments – Bonds and other fixed-income securities | | | 26,960 | | | | –2,453 | | | | 0 | | |
| Financial assets
at amortised cost |
| | | –2,548 | | | |
Interest-currency risk | | | | | | | | | | | | | | | | | | | | | | |
Securities and investments – Bonds and other fixed-income securities | | | 101 | | | | –1 | | | | 0 | | |
| Financial assets
at amortised cost |
| | | –2 | | | |
| | | | | | |
Liabilities and equity | | | | | | | | | | | | | | | | | | | | | | |
Interest risk | | | | | | | | | | | | | | | | | | | | | | |
Liabilities to banks/customers – promissory note loans | | | 27,249 | | | | –2,176 | | | | 2 | | |
| Financial
liabilities at
amortised cost |
| | | 2,195 | | | |
Certificated liabilities | | | 192,316 | | | | –21,947 | | | | 184 | | |
| Financial
liabilities at
amortised cost |
| | | 23,783 | | | |
Interest-currency risk | | | | | | | | | | | | | | | | | | | | | | |
Liabilities to banks/customers – promissory note loans | | | 0 | | | | 0 | | | | 0 | | |
| Financial
liabilities at
amortised cost |
| | | 0 | | | |
Certificated liabilities | | | 102,770 | | | | –5,645 | | | | 803 | | |
| Financial
liabilities at
amortised cost |
| | | 7,074 | | | |
KfW Financial Report 2022 Consolidated financial statements | Notes – Notes to financial instruments | 148
Disclosures on hedged items in micro fair value hedge accounting by risk type – 2021
| | | | | | | | | | | | | | | | | | | | | | |
| | | | | | |
| | Carrying
amount of
hedged items | | | Accumulated
hedge fair
value
adjustment
(fair value of
the hedged
risk for the
hedged item) | | | Hedge
fair value
adjustment to
be amortised
(discontinued
hedge
relationships) | | | Statement
of financial
position items
in which the
hedged items
are reported | | | Fair value changes in
hedged items to
determine hedge
ineffectiveness
(income statement
effect – hedged items) | | | |
| | EUR in millions | | | EUR in millions | | | EUR in millions | | | | | | EUR in millions | | | |
| | | | | | |
Assets | | | | | | | �� | | | | | | | | | | | | | | | |
Interest risk | | | | | | | | | | | | | | | | | | | | | | |
Securities and investments – Bonds and other fixed-income securities | | | 28,636 | | | | 94 | | | | 1 | | |
| Financial assets
at amortised cost |
| | | –508 | | | |
Interest-currency risk | | | | | | | | | | | | | | | | | | | | | | |
Securities and investments – Bonds and other fixed-income securities | | | 116 | | | | 1 | | | | 0 | | |
| Financial assets
at amortised cost |
| | | –3 | | | |
| | | | | | |
Liabilities and equity | | | | | | | | | | | | | | | | | | | | | | |
Interest risk | | | | | | | | | | | | | | | | | | | | | | |
Liabilities to banks/customers – promissory note loans | | | 30,537 | | | | 18 | | | | 2 | | |
| Financial
liabilities at
amortised cost |
| | | 481 | | | |
Certificated liabilities | | | 183,746 | | | | 1,799 | | | | 261 | | |
| Financial
liabilities at
amortised cost |
| | | 5,053 | | | |
Interest-currency risk | | | | | | | | | | | | | | | | | | | | | | |
Liabilities to banks/customers – promissory note loans | | | 0 | | | | 0 | | | | 0 | | |
| Financial
liabilities at
amortised cost |
| | | 0 | | | |
Certificated liabilities | | | 120,051 | | | | 939 | | | | 1,309 | | |
| Financial
liabilities at
amortised cost |
| | | 3,576 | | | |
149 | KfW Financial Report 2022 Consolidated financial statements | Notes – Notes to financial instruments
Disclosures on hedging instruments in micro fair value hedge accounting by risk type – 2022
| | | | | | | | | | | | | | | | | | | | |
| | Par value
of hedging
instruments | | | Carrying
amount
of hedging
instruments | | | Statement of
financial
position items
in which the
hedging
instruments
are reported | | | Fair value changes in
hedging instruments
to determine hedge
ineffectiveness
(income statement
effect – hedging
instruments) | | | Average
interest rate
of hedging
instruments1)
| |
| | | EUR in millions | | | | EUR in millions | | | | | | | | EUR in millions | | | | % | |
| | | | | |
Assets | | | | | | | | | | | | | | | | | | | | |
Interest risk | | | | | | | | | | | | | | | | | | | | |
Interest-related transactions:
interest rate swap | | | 37,838 | | | | 511 | | |
| Derivatives
designated for
hedge accounting |
| | | 2,547 | | | | –0.9 | |
Interest-currency risk | | | | | | | | | | | | | | | | | | | | |
Cross-currency transactions:
cross-currency interest rate swap | | | 69,391 | | | | 6,188 | | |
| Derivatives
designated for
hedge accounting |
| | | 2 | | | | 3.02) | |
| | | | | |
Liabilities and equity | | | | | | | | | | | | | | | | | | | | |
Interest risk | | | | | | | | | | | | | | | | | | | | |
Interest-related transactions:
interest rate swap | | | 233,512 | | | | 7,033 | | |
| Derivatives
designated for
hedge accounting |
| | | –25,947 | | | | –2.7 | |
Interest-currency risk | | | | | | | | | | | | | | | | | | | | |
Cross-currency transactions:
cross-currency interest rate swap | | | 101,100 | | | | 3,567 | | |
| Derivatives
designated for
hedge accounting |
| | | –7,085 | | | | 0.62) | |
| 1) | Average interest rate based on the coupon of the fixed leg of the derivatives weighted with nominal volume. |
| 2) | Cross-currency interest rate swaps are primarily used to hedge interest risks, but also to hedge foreign currency risks. The difference between the average interest rate of the interest rate swaps and the cross-currency interest rate swaps results from the different interest rates of the hedged currencies, among other factors. |
KfW Financial Report 2022 Consolidated financial statements | Notes – Notes to financial instruments | 150
Disclosures on hedging instruments in micro fair value hedge accounting by risk type – 2021
| | | | | | | | | | | | | | | | | | | | |
| | Par value
of hedging
instruments | | | Carrying
amount
of hedging
instruments | | | Statement of
financial
position items
in which the
hedging
instruments
are reported | | | Fair value changes in
hedging instruments
to determine hedge
ineffectiveness
(income statement
effect – hedging
instruments) | | | Average
interest rate
of hedging
instruments1)
| |
| | | EUR in millions | | | | EUR in millions | | | | | | | | EUR in millions | | | | % | |
| | | | | |
Assets | | | | | | | | | | | | | | | | | | | | |
Interest risk | | | | | | | | | | | | | | | | | | | | |
Interest-related transactions:
interest rate swap | | | 183,537 | | | | 2,961 | | |
| Derivatives
designated for
hedge accounting |
| | | 512 | | | | 0.1 | |
Interest-currency risk | | | | | | | | | | | | | | | | | | | | |
Cross-currency transactions:
cross-currency interest rate swap | | | 134,963 | | | | 5,488 | | |
| Derivatives
designated for
hedge accounting |
| | | 3 | | | | 0.22) | |
| | | | | |
Liabilities and equity | | | | | | | | | | | | | | | | | | | | |
Interest risk | | | | | | | | | | | | | | | | | | | | |
Interest-related transactions:
interest rate swap | | | 54,655 | | | | 790 | | |
| Derivatives
designated for
hedge accounting |
| | | –5,524 | | | | 0.7 | |
Interest-currency risk | | | | | | | | | | | | | | | | | | | | |
Cross-currency transactions:
cross-currency interest rate swap | | | 54,166 | | | | 1,390 | | |
| Derivatives
designated for
hedge accounting |
| | | –3,594 | | | | 0.32) | |
| 1) | Average interest rate based on the coupon of the fixed leg of the derivatives weighted with nominal volume. |
| 2) | Cross-currency interest rate swaps are primarily used to hedge interest risks, but also to hedge foreign currency risks. The difference between the average interest rate of the interest rate swaps and the cross-currency interest rate swaps results from the different interest rates of the hedged currencies, among other factors. |
151 | KfW Financial Report 2022 Consolidated financial statements | Notes – Notes to financial instruments
Analysis of par values of hedging instruments by hedge relationship
according to remaining terms as of 31 December 2022
| | | | | | | | | | | | | | | | | | | | |
| | | In up to | | | Between | | | Between | | | Between 1 year | | | In more than | |
| | | 1 month | | | 1 and 3 months | | | 3 months | | | and 5 years | | | 5 years | |
Due | | | | | | | | and 1 year | | | | | | | |
| | EUR in millions | | | EUR in millions | | | EUR in millions | | | EUR in millions | | | EUR in millions | |
| | | | | |
Assets | | | | | | | | | | | | | | | | | | | | |
Interest risk | | | | | | | | | | | | | | | | | | | | |
Interest-related transactions: | | | | | | | | | | | | | | | | | | | | |
interest rate swap | | | 2,860 | | | | 1,215 | | | | 4,519 | | | | 16,837 | | | | 12,406 | |
Interest-currency risk | | | | | | | | | | | | | | | | | | | | |
Cross-currency transactions: | | | | | | | | | | | | | | | | | | | | |
cross-currency interest rate swap | | | 4,094 | | | | 5,378 | | | | 10,199 | | | | 40,755 | | | | 8,966 | |
| | | | | |
Liabilities and equity | | | | | | | | | | | | | | | | | | | | |
Interest risk | | | | | | | | | | | | | | | | | | | | |
Interest-related transactions: | | | | | | | | | | | | | | | | | | | | |
interest rate swap | | | 914 | | | | 7,228 | | | | 16,609 | | | | 131,059 | | | | 77,702 | |
Interest-currency risk | | | | | | | | | | | | | | | | | | | | |
Cross-currency transactions: | | | | | | | | | | | | | | | | | | | | |
cross-currency interest rate swap | | | 3,873 | | | | 4,486 | | | | 14,205 | | | | 67,921 | | | | 10,615 | |
Analysis of par values of hedging instruments by hedge relationship
according to remaining terms as of 31 December 2021
| | | | | | | | | | | | | | | | | | | | |
| | | In up to | | | Between | | | Between | | | Between 1 year | | | In more than | |
| | | 1 month | | | 1 and 3 months | | | 3 months | | | and 5 years | | | 5 years | |
Due | | | | | | | | and 1 year | | | | | | | |
| | EUR in millions | | | EUR in millions | | | EUR in millions | | | EUR in millions | | | EUR in millions | |
| | | | | |
Assets | | | | | | | | | | | | | | | | | | | | |
Interest risk | | | | | | | | | | | | | | | | | | | | |
Interest-related transactions: | | | | | | | | | | | | | | | | | | | | |
interest rate swap | | | 177 | | | | 3,075 | | | | 31,063 | | | | 88,042 | | | | 61,180 | |
Interest-currency risk | | | | | | | | | | | | | | | | | | | | |
Cross-currency transactions: | | | | | | | | | | | | | | | | | | | | |
cross-currency interest rate swap | | | 5,336 | | | | 11,898 | | | | 22,248 | | | | 81,928 | | | | 13,553 | |
| | | | | |
Liabilities and equity | | | | | | | | | | | | | | | | | | | | |
Interest risk | | | | | | | | | | | | | | | | | | | | |
Interest-related transactions: | | | | | | | | | | | | | | | | | | | | |
interest rate swap | | | 576 | | | | 765 | | | | 3,323 | | | | 25,216 | | | | 24,774 | |
Interest-currency risk | | | | | | | | | | | | | | | | | | | | |
Cross-currency transactions: | | | | | | | | | | | | | | | | | | | | |
cross-currency interest rate swap | | | 730 | | | | 5,464 | | | | 6,760 | | | | 34,848 | | | | 6,365 | |
KfW Financial Report 2022 Consolidated financial statements | Notes – Notes to financial instruments | 152
(59) Disclosures on macro fair value hedge accounting
Disclosures on hedged items in macro fair value hedge accounting by risk type – 2022
| | | | | | | | | | | | | | | | | | | | | | | | |
| | | | | | | | | | | | Statement of financial position | | | | |
| | | | | | | | | | | | items in which the hedged items | | | | |
| | | | | | | | | | | | are reported | | | | |
| | Carrying
amount of
hedged
items | | | Value
adjustment
from macro
fair value
hedge
accounting | | | Value adjustment
from macro fair
value hedge
accounting to be
amortised
(discontinued
hedge
relationships) | | | Carrying
amount before
value adjust-
ment from
macro fair
value hedge
accounting | | | Value adjust-
ment from
macro fair
value hedge
accounting | | | Fair value changes
in hedged items to
determine hedge
ineffectiveness
(income statement
effect – hedged
items) | |
| | EUR in
millions | | | EUR in
millions | | | EUR in
millions | | | | | | | | | EUR in
millions | |
| | | | | | |
Interest risk | | | | | | | | | | | | | | | | | | | | | | | | |
| | | | | | |
Assets | | | 262,713 | | | | –25,859 | | | | 105 | | |
| Financial
assets at
amortised cost |
| |
| Value
adjustment from
macro fair value
hedge accounting |
| | | –30,393 | |
Liabilities and equity | | | 0 | | | | 18 | | | | 18 | | |
| Financial
liabilities at
amortised cost |
| |
| Value
adjustment from
macro fair value
hedge accounting |
| | | 19 | |
Disclosures on hedged items in macro fair value hedge accounting by risk type – 2021
| | | | | | | | | | | | | | | | | | | | | | | | |
| | | | | | | | | | | | Statement of financial position | | | | |
| | | | | | | | | | | | items in which the hedged items | | | | |
| | | | | | | | | | | | are reported | | | | |
| | Carrying
amount of
hedged
items | | | Value
adjustment
from macro
fair value
hedge
accounting | | | Value adjustment
from macro fair
value hedge
accounting to be
amortised
(discontinued
hedge
relationships) | | | Carrying
amount before
value adjust-
ment from
macro fair
value hedge
accounting | | | Value adjust-
ment from
macro fair
value hedge
accounting | | | Fair value changes
in hedged items to
determine hedge
ineffectiveness
(income statement
effect – hedged
items) | |
| | EUR in
millions | | | EUR in
millions | | | EUR in
millions | | | | | | | | | EUR in
millions | |
| | | | | | |
Interest risk | | | | | | | | | | | | | | | | | | | | | | | | |
| | | | | | |
Assets | | | 222,782 | | | | 4,609 | | | | 195 | | | | Financial assets at amortised cost | | |
| Value
adjustment from macro fair value hedge accounting |
| | | –7,430 | |
Liabilities and equity | | | 0 | | | | 37 | | | | 37 | | | | Financial liabilities at amortised cost | | |
| Value
adjustment from macro fair value hedge accounting |
| | | 18 | |
153 | KfW Financial Report 2022 Consolidated financial statements | Notes – Notes to financial instruments
Disclosures on hedging instruments in macro fair value hedge accounting by risk type – 2022
| | | | | | | | | | | | | | | | |
| | Par value of
hedging
instruments | | | Carrying
amount of
hedging
instruments | | | Statement of
financial
position items
in which the
hedging
instruments are
reported | | | Fair value changes
in hedging
instruments to
determine hedge
ineffectiveness
(income statement
effect – hedging
instruments) | |
| | EUR in millions | | | EUR in millions | | | | | | EUR in millions | |
| | | | |
Assets | | | | | | | | | | | | | | | | |
Interest risk | | | | | | | | | | | | | | | | |
Interest-related transactions:
interest rate swap | | | 211,820 | | | | 2,306 | | |
| Derivatives
designated for
hedge accounting |
| | | 28,932 | |
| | | | |
Liabilities and equity | | | | | | | | | | | | | | | | |
Interest risk | | | | | | | | | | | | | | | | |
Interest-related transactions:
interest rate swap | | | 21,863 | | | | 219 | | |
| Derivatives
designated for
hedge accounting |
| | | 1,573 | |
Disclosures on hedging instruments in macro fair value hedge accounting by risk type – 2021
| | | | | | | | | | | | | | | | |
| | Par value of
hedging
instruments | | | Carrying
amount of
hedging
instruments | | | Statement of
financial
position items
in which the
hedging
instruments are
reported | | | Fair value changes
in hedging
instruments to
determine hedge
ineffectiveness
(income statement
effect – hedging
instruments) | |
| | EUR in millions | | | EUR in millions | | | | | | EUR in millions | |
| | | | |
Assets | | | | | | | | | | | | | | | | |
Interest risk | | | | | | | | | | | | | | | | |
Interest-related transactions:
interest rate swap | | | 77,829 | | | | 29 | | |
| Derivatives
designated for
hedge accounting |
| | | 2,003 | |
| | | | |
Liabilities and equity | | | | | | | | | | | | | | | | |
Interest risk | | | | | | | | | | | | | | | | |
Interest-related transactions:
interest rate swap | | | 151,426 | | | | 2,373 | | |
| Derivatives
designated for
hedge accounting |
| | | 5,304 | |
KfW Financial Report 2022 Consolidated financial statements | Notes – Notes to financial instruments | 154
Analysis of par values of hedging instruments by remaining terms as of 31 December 2022
| | | | | | | | | | | | | | | | | | | | |
Due | | In up to
1 month | | | Between
1 and 3 months | | | Between
3 months
and 1 year | | | Between 1 year
and 5 years | | | In more than
5 years | |
| | EUR in millions | | | EUR in millions | | | EUR in millions | | | EUR in millions | | | EUR in millions | |
| | | | | |
Assets | | | | | | | | | | | | | | | | | | | | |
Interest risk | | | | | | | | | | | | | | | | | | | | |
Interest-related transactions: | | | | | | | | | | | | | | | | | | | | |
interest rate swap | | | 0 | | | | 488 | | | | 12,015 | | | | 94,337 | | | | 104,981 | |
| | | | | |
Liabilities and equity | | | | | | | | | | | | | | | | | | | | |
Interest risk | | | | | | | | | | | | | | | | | | | | |
Interest-related transactions: | | | | | | | | | | | | | | | | | | | | |
interest rate swap | | | 6,850 | | | | 450 | | | | 4,088 | | | | 7,763 | | | | 2,712 | |
Analysis of par values of hedging instruments by remaining terms as of 31 December 2021
| | | | | | | | | | | | | | | | | | | | |
Due | | In up to
1 month | | | Between
1 and 3 months | | | Between
3 months
and 1 year | | | Between 1 year
and 5 years | | | In more than
5 years | |
| | EUR in millions | | | EUR in millions | | | EUR in millions | | | EUR in millions | | | EUR in millions | |
| | | | | |
Assets | | | | | | | | | | | | | | | | | | | | |
Interest risk | | | | | | | | | | | | | | | | | | | | |
Interest-related transactions: | | | | | | | | | | | | | | | | | | | | |
interest rate swap | | | 0 | | | | 0 | | | | 1,838 | | | | 17,610 | | | | 58,381 | |
| | | | | |
Liabilities and equity | | | | | | | | | | | | | | | | | | | | |
Interest risk | | | | | | | | | | | | | | | | | | | | |
Interest-related transactions: | | | | | | | | | | | | | | | | | | | | |
interest rate swap | | | 6,782 | | | | 4,100 | | | | 16,406 | | | | 81,116 | | | | 43,022 | |
(60) Additional disclosures on derivatives
Analysis of derivatives by type of hedge
| | | | | | | | | | | | | | | | | | | | | | | | | | |
| | | | | Par value | | | Fair value | | | Fair value | |
| | | | | | | 31 Dec. 2022 | | | 31 Dec. 2021 | |
| | | | | | | | | | | | |
| | | | 31 Dec. 2022 | | | 31 Dec. 2021 | | | positive | | | negative | | | positive | | | negative | |
| | | | | EUR in | | | EUR in | | | EUR in | | | EUR in | | | EUR in | | | EUR in | |
| | | | millions | | | millions | | | millions | | | millions | | | millions | | | millions | |
| | | | | | | |
Interest-related derivatives | | | | | 621,417 | | | | 584,335 | | | | 4,478 | | | | 9,268 | | | | 6,111 | | | | 4,040 | |
| | | | | | | |
Cross-currency derivatives | | | | | 148,515 | | | | 165,569 | | | | 6,846 | | | | 5,227 | | | | 7,727 | | | | 2,311 | |
| | | | | | | |
Credit derivatives | | | | | 0 | | | | 0 | | | | 0 | | | | 0 | | | | 0 | | | | 0 | |
Total | | | | | 769,932 | | | | 749,904 | | | | 11,324 | | | | 14,496 | | | | 13,838 | | | | 6,351 | |
Cross-currency swaps are presented under Cross-currency derivatives.
155 | KfW Financial Report 2022 Consolidated financial statements | Notes – Notes to financial instruments
Analysis of derivatives by counterparty
| | | | | | | | | | | | | | | | | | | | | | | | | | |
| | | | | Par value | | | Fair value | | | Fair value | |
| | | | | | | 31 Dec. 2022 | | | 31 Dec. 2021 | |
| | | | | | | | | | | | |
| | | | 31 Dec. 2022 | | | 31 Dec. 2021 | | | positive | | | negative | | | positive | | | negative | |
| | | | | EUR in | | | EUR in | | | EUR in | | | EUR in | | | EUR in | | | EUR in | |
| | | | millions | | | millions | | | millions | | | millions | | | millions | | | millions | |
| | | | | | | |
OECD banks | | | | | 736,340 | | | | 737,960 | | | | 10,685 | | | | 11,700 | | | | 13,222 | | | | 6,261 | |
| | | | | | | |
Non-OECD banks | | | | | 172 | | | | 161 | | | | 4 | | | | 6 | | | | 0 | | | | 3 | |
| | | | | | | |
Other counterparties | | | | | 33,308 | | | | 11,676 | | | | 635 | | | | 2,762 | | | | 598 | | | | 85 | |
| | | | | | | |
Public sector | | | | | 112 | | | | 107 | | | | 0 | | | | 27 | | | | 18 | | | | 2 | |
Total | | | | | 769,932 | | | | 749,904 | | | | 11,324 | | | | 14,496 | | | | 13,838 | | | | 6,351 | |
The analysis includes financial and credit derivatives which are presented in Derivatives designated for hedge accounting and the sub-item Other derivatives under Financial assets at fair value or Financial liabilities at fair value. Embedded derivatives that must be bifurcated are not included.
The economic hedge effect of financial derivatives with an aggregate principal amount of EUR 688.0 billion (31 Dec. 2021: EUR 669.2 billion) is reflected in the accounts; it was not possible to reflect the risk-mitigating impact of the remaining financial derivatives in the accounts (hedge accounting).
Unchanged from 31 December 2021, KfW Group did not pledge any collateral (in the form of securities) under derivative transactions that can be resold or repledged at any time without payments being past due.
However, liquid collateral totalling EUR 5,154 million (31 Dec. 2021: EUR 829 million) was provided, which is recognised under Financial assets at amortised cost – Loans and advances to banks or customers.
Unchanged from 31 December 2021, KfW Group did not receive any collateral (in the form of securities) under derivative transactions that can be resold or repledged at any time without payments by the protection seller being past due.
However, liquid collateral totalling EUR 3,922 million (31 Dec. 2021: EUR 7,717 million) was accepted, which was reported under Financial liabilities at amortised cost – Liabilities to banks or Liabilities to customers.
The volume of initial differences between the transaction price and model value arising from the use of a valuation technique that makes significant use of unobservable data which have yet to be amortised over the life of the financial instrument developed as follows during the reporting period:
KfW Financial Report 2022 Consolidated financial statements | Notes – Notes to financial instruments | 156
Day one profit or loss
| | | | | | | | | | | | |
| | | | |
2022 | | | 2021 | |
| | | | | EUR in millions | | | EUR in millions | |
| | | |
As of 1 Jan. | | | | | | | –108 | | | | –101 | |
Addition | | | | | | | –15 | | | | –20 | |
Reversal | | | | | | | 17 | | | | 18 | |
Exchange rate changes | | | | | | | –1 | | | | –5 | |
As of 31 Dec. | | | | | | | –108 | | | | –108 | |
The net gains/losses from financial derivatives not qualifying for hedge accounting includes amortisation effects in an amount of EUR 10 million (2021: EUR 10 million).
(61) Management of the transition to new reference rates
With respect to the transition to new alternative risk-free reference rates, KfW is relying on a group-wide project structure that was set up at an early stage and covers the main areas of focus. In addition to defining a transition strategy in line with supervisory requirements, the procedural and IT conditions have been established to satisfy the complex requirements of a transition of derivatives and spot transactions. These comprehensive adjustment measures result from the complex requirements relating to valuation models, risk management and accounting.
All inter-bank derivatives referencing GBP, CHF and JPY LIBOR were transitioned into the new interest-rate environment either actively or passively via the ISDA fallback protocol as planned.
Regarding loans, a large share of the floating rate transactions in GBP, CHF and JPY were also converted to alternative reference rates in 2022. Some USD LIBOR transitions have already been carried out as well. This involved a transition to forward-looking term rates in addition to transitioning to rates compounded overnight in arrears.
Key assumptions relating to benchmark reform
| – | KfW assumes that EURIBOR-based reference rates will be admissible for the foreseeable future. | |
| | A transition is therefore not necessary for these instruments in the medium term. | |
| – | The main reference rates affected by the transition that are relevant for KfW’s financial instruments are: | |
| | – | USD LIBOR: transition to SOFR | |
| | – | GBP LIBOR: transition to SONIA | |
| | – | CHF LIBOR: transition to SARON | |
| | – | JPY LIBOR: transition to TONA | |
For the USD LIBOR reference rates, derivatives were also designated for hedge accounting effective 31 December 2022. USD LIBOR derivatives are being actively converted and passively transitioned via the ISDA fallback protocol. The transition is expected to be completed in 2023. This has no accounting impact. The hedges, in particular, remain unaffected.
The following holdings are affected by the benchmark reform:
157 | KfW Financial Report 2022 Consolidated financial statements | Notes – Notes to financial instruments
Risk exposure/carrying amounts and nominal amounts
| | | | | | | | | | | | | | |
| | | Non-derivative
financial assets | | Non-derivative
financial
liabilities | | Derivative financial
instruments
designated for
hedge accounting | | | | | Derivative financial
instruments not
designated for
hedge accounting | | |
| | Carrying amount | | Carrying amount | | Nominal volumes (gross) | | | | | Nominal volumes (gross) | | |
Reference rate (floating leg) | | 31 Dec. 2022 | | 31 Dec. 2022 | | 31 Dec. 2022 | | | | | 31 Dec. 2022 | | |
| | EUR in millions | | EUR in millions | | EUR in millions | | | | | EUR in millions | | |
USD LIBOR | | 13,382 | | 0 | | 112,374 | | | | | | 13,566 | | |
GBP LIBOR | | 60 | | 0 | | 0 | | | | | | 0 | | |
EUR LIBOR | | 23 | | 0 | | 0 | | | | | | 0 | | |
(62) Additional disclosures on financial liabilities at fair value
Disclosures on financial liabilities at fair value as of 31 December 2022
| | | | | | | | | | | | | | |
| | | Financial liabilities at fair value | | | | | | | |
| | Liabilities to banks | | Liabilities to customers | | Certificated liabilities | | | | | Total | | |
| | EUR in millions | | EUR in millions | | EUR in millions | | | | | EUR in millions | | |
| | | | | | |
Carrying amount | | 208 | | 812 | | 6,699 | | | | | | 7,718 | | |
| | | | | | |
Repayment amount at maturity | | 245 | | 1,187 | | 9,321 | | | | | | 10,752 | | |
| | | | | | |
Difference | | 37 | | 375 | | 2,622 | | | | | | 3,034 | | |
| | | | | | |
thereof borrowings for which the repayment amount builds up as a result of the capitalisation over time of interest due | | 0 | | 371 | | 2,755 | | | | | | 3,126 | | |
Disclosures on financial liabilities at fair value as of 31 December 2021
| | | | | | | | | | | | | | |
| | | Financial liabilities at fair value | | | | | | | |
| | Liabilities to banks | | Liabilities to customers | | Certificated liabilities | | | | | Total | | |
| | EUR in millions | | EUR in millions | | EUR in millions | | | | | EUR in millions | | |
| | | | | | |
Carrying amount | | 255 | | 1,003 | | 8,416 | | | | | | 9,674 | | |
| | | | | | |
Repayment amount at maturity | | 245 | | 1,187 | | 9,330 | | | | | | 10,762 | | |
| | | | | | |
Difference | | –10 | | 184 | | 915 | | | | | | 1,088 | | |
| | | | | | |
thereof borrowings for which the repayment amount builds up as a result of the capitalisation over time of interest due | | 0 | | 185 | | 1,735 | | | | | | 1,919 | | |
KfW Financial Report 2022 Consolidated financial statements | Notes – Notes to financial instruments | 158
(63) Contractual payment obligations arising from financial instruments
Analysis of payment obligations by maturity range as of 31 December 20221)
| | | | | | | | | | | | | | | | | | | | | | | | | | | | |
| | | | | | | Up to 1 month | | | | More than 1 and up to 3 months | | | | More than 3 months and up to 1 year | | | | More than 1 and up to 5 years | | | | More than 5 years | | | | Total | | |
| | | | | | | EUR in millions | | | | EUR in millions | | | | EUR in millions | | | | EUR in millions | | | | EUR in millions | | | | EUR in millions | | |
| | | | | | | | | | | | | | |
| Financial liabilities at amortised cost | | | | | | | | | | | | | | | | | | | | | | | | | | | | |
| | | | | | | | | | | | | | |
Liabilities to banks | | | | | | 8,046 | | | | 1,962 | | | | 60 | | | | 738 | | | | 959 | | | | 11,764 | | |
| | | | | | | | | | | | | | |
Liabilities to customers | | | | | | 9,906 | | | | 6,007 | | | | 14,682 | | | | 29,388 | | | | 6,130 | | | | 66,113 | | |
| | | | | | | | | | | | | | |
Certificated liabilities | | | | | | 19,519 | | | | 38,837 | | | | 54,425 | | | | 231,400 | | | | 115,403 | | | | 459,584 | | |
| | | | | | | | | | | | | | |
Financial liabilities at fair value | | | | | | | | | | | | | | | | | | | | | | | | | | | | |
| | | | | | | | | | | | | | |
Liabilities to banks | | | | | | 0 | | | | 0 | | | | 1 | | | | 5 | | | | 247 | | | | 254 | | |
| | | | | | | | | | | | | | |
Liabilities to customers | | | | | | 0 | | | | 53 | | | | 6 | | | | 69 | | | | 1,202 | | | | 1,330 | | |
| | | | | | | | | | | | | | |
Certificated liabilities | | | | | | 24 | | | | 14 | | | | 298 | | | | 1,298 | | | | 9,767 | | | | 11,400 | | |
| | | | | | | | | | | | | | |
Net obligations arising from derivative financial instruments | | | | | | –441 | | | | 167 | | | | –863 | | | | –2,987 | | | | 407 | | | | –3,718 | | |
| | | | | | | | | | | | | | |
thereof Gross obligations arising from derivative financial instruments | | | | | | 17,920 | | | | 22,773 | | | | 23,898 | | | | 85,172 | | | | 28,573 | | | | 178,336 | | |
| | | | | | | | | | | | | | |
| Obligations arising from on-balance sheet financial instruments | | | | | | 37,053 | | | | 47,040 | | | | 68,608 | | | | 259,911 | | | | 134,115 | | | | 546,727 | | |
| | | | | | | | | | | | | | |
| Obligations arising from off-balance sheet transactions | | | | | | 135,695 | | | | 0 | | | | 0 | | | | 0 | | | | 0 | | | | 135,695 | | |
| | | | | | | | | | | | | | |
| Total | | | | | | 172,748 | | | | 47,040 | | | | 68,608 | | | | 259,911 | | | | 134,115 | | | | 682,422 | | |
| 1) | Net obligations arising from derivative financial instruments comprise payment obligations which are offset against the corresponding payment claims from derivative contracts; gross obligations are reported as obligations arising from derivative financial instruments. Off-balance sheet transactions are generally allocated to the first maturity range. |
159 | KfW Financial Report 2022 Consolidated financial statements | Notes – Notes to financial instruments
Analysis of payment obligations by maturity range as of 31 December 20211)
| | | | | | | | | | | | | | | | | | | | | | | | | | | | |
| | | | | | | Up to 1 month | | | | More than 1 and up to 3 months | | | | More than 3 months and up to 1 year | | | | More than 1 and up to 5 years | | | | More than 5 years | | | | Total | | |
| | | | | | | EUR in millions | | | | EUR in millions | | | | EUR in millions | | | | EUR in millions | | | | EUR in millions | | | | EUR in millions | | |
| | | | | | | | | | | | | | |
| Financial liabilities at amortised cost | | | | | | | | | | | | | | | | | | | | | | | | | | | | |
| | | | | | | | | | | | | | |
Liabilities to banks | | | | | | 9,614 | | | | 1,332 | | | | 40 | | | | 1,876 | | | | 709 | | | | 13,572 | | |
| | | | | | | | | | | | | | |
Liabilities to customers | | | | | | 3,434 | | | | 2,706 | | | | 15,442 | | | | 13,496 | | | | 8,739 | | | | 43,817 | | |
| | | | | | | | | | | | | | |
Certificated liabilities | | | | | | 17,813 | | | | 33,326 | | | | 69,178 | | | | 215,374 | | | | 109,035 | | | | 444,726 | | |
| | | | | | | | | | | | | | |
Financial liabilities at fair value | | | | | | | | | | | | | | | | | | | | | | | | | | | | |
| | | | | | | | | | | | | | |
Liabilities to banks | | | | | | 0 | | | | 0 | | | | 1 | | | | 5 | | | | 249 | | | | 255 | | |
| | | | | | | | | | | | | | |
Liabilities to customers | | | | | | 0 | | | | 3 | | | | 6 | | | | 121 | | | | 1,209 | | | | 1,339 | | |
| | | | | | | | | | | | | | |
Certificated liabilities | | | | | | 38 | | | | 8 | | | | 203 | | | | 1,122 | | | | 10,054 | | | | 11,425 | | |
| | | | | | | | | | | | | | |
Net obligations arising from derivative financial instruments | | | | | | –621 | | | | –817 | | | | –2,819 | | | | –7,099 | | | | –5,979 | | | | –17,335 | | |
| | | | | | | | | | | | | | |
thereof Gross obligations arising from derivative financial instruments | | | | | | 11,116 | | | | 26,219 | | | | 34,170 | | | | 75,345 | | | | 21,312 | | | | 168,163 | | |
| | | | | | | | | | | | | | |
| Obligations arising from on-balance sheet financial instruments | | | | | | 30,278 | | | | 36,558 | | | | 82,051 | | | | 224,896 | | | | 124,015 | | | | 497,798 | | |
| | | | | | | | | | | | | | |
| Obligations arising from off-balance sheet transactions | | | | | | 116,290 | | | | 0 | | | | 0 | | | | 0 | | | | 0 | | | | 116,290 | | |
| | | | | | | | | | | | | | |
| Total | | | | | | 146,568 | | | | 36,558 | | | | 82,051 | | | | 224,896 | | | | 124,015 | | | | 614,088 | | |
| 1) | Net obligations arising from derivative financial instruments comprise payment obligations which are offset against the corresponding payment claims from derivative contracts; gross obligations are reported as obligations arising from derivative financial instruments. Off-balance sheet transactions are generally allocated to the first maturity range. |
The maturity analysis of lease liabilities as lessee is reported under Other notes (in the “Leasing transactions as lessee” section).
KfW Financial Report 2022 Consolidated financial statements | Notes – Notes to financial instruments | 160
(64) Disclosures on repurchase agreements
Disclosures on repo transactions
| | | | | | | | | | | | | | |
| | | | | | 31 Dec. 2022 | | | | | | 31 Dec. 2021 | | |
| | | | | | EUR in millions | | | | | | EUR in millions | | |
| | | | | | | |
Carrying amount of securities sold under repo transactions that continue to be recognised in Financial assets at amortised cost – Securities and investments | | | | | | 498 | | | | | | 2,086 | | |
Financial liabilities at amortised cost – Liabilities to banks (countervalue) | | | | | | 501 | | | | | | 2,052 | | |
| | | | | | | |
| Financial liabilities at amortised cost – Liabilities to customers (German Finance Agency) | | | | | | 2,367 | | | | | | 0 | | |
The fair value of interest-bearing securities sold under repo transactions that continue to be recognised in Financial assets at amortised cost totalled EUR 498 million (31 Dec. 2021: EUR 2,088 million). The fair value of the corresponding repayment obligations was EUR 501 million (31 Dec. 2021: EUR 2,052 million).
Under Liabilities to customers, the group reported repo transactions with the German Finance Agency in an amount of EUR 2,367 million (31 Dec. 2021: EUR 0 million), under which securities sold under repo transactions were available, with KfW acting as borrower in securities lending transactions.
Moreover, as in 2021, KfW Group did not pledge any collateral (in the form of securities) under repo transactions that can be resold or repledged at any time without payments being past due.
As in 2021, the group did not receive any collateral (in the form of securities) under repo transactions that can be resold or repledged at any time without payments being past due.
As in 2021, the group neither pledged nor accepted any liquid collateral.
Disclosures on reverse repo transactions
| | | | | | | | | | | | | | |
| | | | | | 31 Dec. 2022 | | | | | | 31 Dec. 2021 | | |
| | | | | | EUR in millions | | | | | | EUR in millions | | |
| | | | | | | |
Financial assets at amortised cost – Loans and advances to banks (countervalue) | | | | | | 0 | | | | | | 0 | | |
| Financial assets at amortised cost – Loans and advances to customers (countervalue) | | | | | | 0 | | | | | | 0 | | |
| | |
| | | | | | | |
| Total | | | | | | 0 | | | | | | 0 | | |
The fair value of interest-bearing securities purchased under reverse repos that are not recognised amounted to EUR 0 million (31 Dec. 2021: EUR 0 million).
Moreover, unchanged from 31 December 2021, KfW Group did not receive any collateral (in the form of securities) under reverse repo transactions that can be resold or repledged at any time without payments by the protection seller being past due.
161 | KfW Financial Report 2022 Consolidated financial statements | Notes – Notes to financial instruments
Unchanged from 31 December 2021, the group did not pledge any collateral (in the form of securities) under reverse repo transactions that can be resold or repledged at any time without payments being past due.
Unchanged from 31 December 2021, the group neither pledged nor accepted any liquid collateral.
(65) Disclosure on offsetting financial instruments
Disclosures on financial assets with netting agreements as of 31 December 2022
| | | | | | | | | | | | | | | | | | | | | | | | | | | | | | | | | | | | | | | | | | | | | | | | | | | | | | | | | | |
| | | | | | | | Carrying amount of financial assets before offsetting (gross amount) | | | | | | | | Netted figure as carrying amount of financial liabilities (gross amount) | | | | | | | | Reported financial
assets
(net amount) | | | | | | | | Carrying amount of non- offsettable financial liabilities | | | | | | | | Fair value of collateral received | | | | | Total net amount | | |
| | | | | | | | | | EUR in millions | | | | | | | | | | EUR in millions | | | | | | | | | |
| EUR in
millions |
| | | | | | | | EUR in millions | | | | | | | | | | EUR in millions | | | | | | EUR in millions | | |
| | | | | | | | | | | | | | | | | | |
OTC derivatives | | | | | | | | | | 38,602 | | | | | | | | | | 27,3001) | | | | | | | | | | | 11,302 | | | | | | | | | 7,745 | | | | | | | | | | 3,542 | | | | | | 15 | | |
| | | | | | | | | | | | | | | | | | |
Reverse repos | | | | | | | | | | 0 | | | | | | | | | | 0 | | | | | | | | | | | 0 | | | | | | | | | 0 | | | | | | | | | | 0 | | | | | | 0 | | |
| | |
| | | | | | | | | | | | | | | | | | |
Total | | | | | | | | | | 38,602 | | | | | | | | | | 27,300 | | | | | | | | | | | 11,302 | | | | | | | | | 7,745 | | | | | | | | | | 3,542 | | | | | | 15 | | |
| 1) | Thereof obligations from cash collateral for OTC derivatives with EUREX as the central counterparty in an amount of EUR 6,563 million. |
Disclosures on financial liabilities with netting agreements as of 31 December 2022
| | | | | | | | | | | | | | | | | | | | | | | | | | | | | | | | | | | | | | | | | | | | | | | | | | | | | | | | | | |
| | | | | | | | Carrying amount of financial liabilities before offsetting (gross amount) | | | | | | | | Netted figure as carrying amount of financial assets (gross amount) | | | | | | | | Reported financial
liabilities
(net amount) | | | | | | | | Carrying amount of non- offsettable financial assets | | | | | | | | Fair value of collateral pledged | | | | | Total net amount | | |
| | | | | | | | | | EUR in millions | | | | | | | | | | EUR in millions | | | | | | | | | |
| EUR in
millions |
| | | | | | | | EUR in millions | | | | | | | | | | EUR in millions | | | | | | EUR in millions | | |
| | | | | | | | | | | | | | | | | | |
OTC derivatives | | | | | | | | | | 33,977 | | | | | | | | | | 20,737 | | | | | | | | | | | 13,240 | | | | | | | | | 7,745 | | | | | | | | | | 5,149 | | | | | | 345 | | |
| | | | | | | | | | | | | | | | | | |
Repos | | | | | | | | | | 2,868 | | | | | | | | | | 0 | | | | | | | | | | | 2,868 | | | | | | | | | 0 | | | | | | | | | | 2,850 | | | | | | 18 | | |
| | |
| | | | | | | | | | | | | | | | | | |
Total | | | | | | | | | | 36,845 | | | | | | | | | | 20,737 | | | | | | | | | | | 16,108 | | | | | | | | | 7,745 | | | | | | | | | | 8,000 | | | | | | 363 | | |
The disclosures on financial instruments with netting agreements only include gross and net amounts for financial assets and financial liabilities with netting agreements. The Notes on the two classes Derivatives designated for hedge accounting and Other derivatives also include financial assets with a carrying amount of EUR 185 million (31 Dec. 2021: EUR 631 million) and financial liabilities with a carrying amount of EUR 1,261 million (31 Dec. 2021: EUR 49 million), in particular from bifurcated embedded derivatives and derivatives not subject to netting agreements.
KfW Financial Report 2022 Consolidated financial statements | Notes – Notes to financial instruments | 162
Disclosures on financial assets with netting agreements as of 31 December 2021
| | | | | | | | | | | | | | | | | | | | | | | | | | | | | | | | | | | | | | | | | | | | | | | | | | | | | | | | | | |
| | | | | | | | Carrying amount of financial assets before offsetting (gross amount) | | | | | | | | Netted figure as carrying amount of financial liabilities (gross amount) | | | | | | | | Reported financial assets (net amount) | | | | | | | | | Carrying amount of non- offsettable financial liabilities | | | | | | | | Fair value of collateral received | | | | | Total net amount | | |
| | | | | | | | | | EUR in millions | | | | | | | | | | EUR in millions | | | | | | | | | | EUR in millions | | | | | | | | | | EUR in millions | | | | | | | | | | EUR in millions | | | | | | EUR in millions | | |
| | | | | | | | | | | | | | | | | | | |
OTC derivatives | | | | | | | | | | 19,127 | | | | | | | | | | 5,8991) | | | | | | | | | | 13,228 | | | | | | | | | | 5,417 | | | | | | | | | | 7,644 | | | | | | 168 | | |
| | | | | | | | | | | | | | | | | | | |
Reverse repos | | | | | | | | | | 0 | | | | | | | | | | 0 | | | | | | | | | | 0 | | | | | | | | | | 0 | | | | | | | | | | 0 | | | | | | 0 | | |
| | |
| | | | | | | | | | | | | | | | | | | |
Total | | | | | | | | | | 19,127 | | | | | | | | | | 5,899 | | | | | | | | | | 13,228 | | | | | | | | | | 5,417 | | | | | | | | | | 7,644 | | | | | | 168 | | |
| 1) | Thereof obligations from cash collateral for OTC derivatives with EUREX as the central counterparty in an amount of EUR 282 million. |
Disclosures on financial liabilities with netting agreements as of 31 December 2021
| | | | | | | | | | | | | | | | | | | | | | | | | | | | | | | | | | | | | | | | | | | | | | | | | | | | | | | | | | |
| | | | | | | | Carrying amount of financial liabilities before offsetting (gross amount) | | | | | | | | Netted figure as carrying amount of financial assets (gross amount) | | | | | | | | Reported financial liabilities (net amount) | | | | | | | | | Carrying amount of non- offsettable financial assets | | | | | | | | Fair value of collateral pledged | | | | | Total net amount | | |
| | | | | | | | | | EUR in millions | | | | | | | | | | EUR in millions | | | | | | | | | | EUR in millions | | | | | | | | | | EUR in millions | | | | | | | | | | EUR in millions | | | | | | EUR in millions | | |
| | | | | | | | | | | | | | | | | | | |
OTC derivatives | | | | | | | | | | 11,932 | | | | | | | | | | 5,617 | | | | | | | | | | 6,315 | | | | | | | | | | 5,417 | | | | | | | | | | 790 | | | | | | 108 | | |
| | | | | | | | | | | | | | | | | | | |
Repos | | | | | | | | | | 698 | | | | | | | | | | 0 | | | | | | | | | | 698 | | | | | | | | | | 0 | | | | | | | | | | 698 | | | | | | 0 | | |
| | |
| | | | | | | | | | | | | | | | | | | |
Total | | | | | | | | | | 12,630 | | | | | | | | | | 5,617 | | | | | | | | | | 7,013 | | | | | | | | | | 5,417 | | | | | | | | | | 1,488 | | | | | | 108 | | |
The Note “Disclosures on repurchase agreements”, as of 31 December 2021, also includes financial liabilities with a carrying amount of EUR 1,354 million from funding via TLTRO III that is not subject to netting agreements. Receivables from reverse repo transactions are reported under Financial assets at amortised cost – Loans and advances to banks and Loans and advances to customers.
163 | KfW Financial Report 2022 Consolidated financial statements | Notes – Notes to financial instruments
Other notes
(66) Off-balance sheet transactions
Analysis by class
| | | | | | | | | | | | | | | | | | |
| | | | | | | 31 Dec. 2022 | | | | | | | | 31 Dec. 2021 | | | | |
| | | | | | | EUR in millions | | | | | | | | EUR in millions | | | | |
| | | | | | | |
| Irrevocable loan commitments | | | | | | 129,648 | | | | | | | | 111,640 | | | | |
| | | | | | | |
| Financial guarantee contracts | | | | | | 2,054 | | | | | | | | 1,737 | | | | |
| | | | | | | |
| Contingent liabilities from financial guarantees | | | | | | 1,490 | | | | | | | | 1,441 | | | | |
| | | | | | | |
| Other contingent liabilities | | | | | | 2,388 | | | | | | | | 2,065 | | | | |
| Total | | | | | | 135,580 | | | | | | | | 116,883 | | | | |
All off-balance-sheet transactions are disclosed in the Notes at their par values less any related provisions.
Other contingent liabilities include payment obligations attributable to equity investments which are not fully paid up and do not have to be consolidated.
As part of the sale of its stake in Deutsche Industriebank (“IKB”) in 2008, KfW agreed to indemnify IKB for certain legal risks up to a certain amount after IKB’s excess. As of the end of the reporting period, no proceedings are pending against IKB which are relevant in this context.
In accordance with IAS 37.92, no further disclosures on contingent liabilities were made.
(67) Trust activities and administered loans
Analysis of trust activities (transactions in KfW’s own name but for the account of third parties)
| | | | | | | | | | | | | | | | | | |
| | | | | | | 31 Dec. 2022 | | | | | | | | 31 Dec. 2021 | | | | |
| | | | | | | EUR in millions | | | | | | | | EUR in millions | | | | |
| | | | | | | |
| Loans and advances to banks | | | | | | 724 | | | | | | | | 761 | | | | |
| | | | | | | |
| Loans and advances to customers | | | | | | 9,957 | | | | | | | | 10,239 | | | | |
| | | | | | | |
| Securities and investments | | | | | | 8,692 | | | | | | | | 8,056 | | | | |
| | | | | | | |
| Assets held in trust | | | | | | 19,374 | | | | | | | | 19,056 | | | | |
| | | | | | | |
| Liabilities to banks | | | | | | 0 | | | | | | | | 0 | | | | |
| | | | | | | |
| Liabilities to customers | | | | | | 19,374 | | | | | | | | 19,056 | | | | |
| Liabilities held in trust | | | | | | 19,374 | | | | | | | | 19,056 | | | | |
KfW Financial Report 2022 Consolidated financial statements | Notes – Other Notes | 164
EUR 13,348 million (31 Dec. 2021: EUR 13,337 million) of the assets held in trust is attributable to the group companies KfW and DEG. Additional transactions with the Federal Government as trustor in an amount of EUR 4,352 million (31 Dec. 2021: EUR 4,302 million) are transactions mandated by the German Federal Government in accordance with Article 2 (4) of the KfW Law and are included in Securities and investments.
Moreover, KfW held guarantees of EUR 145 million (31 Dec. 2021: EUR 80 million) issued under the European Fund for Sustainable Development (EFSD), in trust for the European Union.
Volume of administered loans granted (loans in the name and for the account of third parties)
| | | | | | | | | | | | | | | | |
| | | | | | | 31 Dec. 2022 | | | | | | 31 Dec. 2021 | | | | |
| | | | | | | EUR in millions | | | | | | EUR in millions | | | | |
| | | | | | | |
| Administered loans | | | | | | 19,657 | | | | | | 20,189 | | | | |
(68) Leasing transactions as lessee
Disclosures on lessee agreements as of 31 December 2022
| | | | | | | | | | | | | | | | | | | | | | | | | | |
| | | | | | | Due within one year | | | | | | Due in between one and five years | | | | | | Due in more than five years | | | | | | Total | | |
| | | | | | | EUR in millions | | | | | | EUR in millions | | | | | | EUR in millions | | | | | | EUR in millions | | |
| Lease liabilities (undiscounted) | | | | | | 11 | | | | | | 25 | | | | | | 9 | | | | | | 45 | | |
Disclosures on lessee agreements as of 31 December 2021
| | | | | | | | | | | | | | | | | | | | | | | | | | |
| | | | | | | Due within one year | | | | | | Due in between one and five years | | | | | | Due in more than five years | | | | | | Total | | |
| | | | | | | EUR in millions | | | | | | EUR in millions | | | | | | EUR in millions | | | | | | EUR in millions | | |
| Lease liabilities (undiscounted) | | | | | | 13 | | | | | | 33 | | | | | | 13 | | | | | | 59 | | |
Lease payments in an amount of EUR 1 million (2021: EUR 1 million) were incurred for short-term leases in the reporting period. For leases in which the underlying asset is of low value, lease payments amounted to EUR 2 million (2021: EUR 0 million). KfW does not apply recognition requirements in either case as provided for in IFRS 16.5.
165 | KfW Financial Report 2022 Consolidated financial statements | Notes – Other Notes
(69) Average number of employees during the financial year
| | | | | | | | | | | | | | |
| | | | | | | 2022 | | | | | | 2021 | | |
| | | | | | | |
| Female employees | | | | | | 3,843 | | | | | | 3,740 | | |
| Male employees | | | | | | 4,140 | | | | | | 3,994 | | |
| Sex not known | | | | | | 1 | | | | | | 0 | | |
| Total | | | | | | 7,984 | | | | | | 7,734 | | |
Staff not covered by collective agreements | | | | | | 5,242 | | | | | | 5,047 | | |
Staff covered by collective agreements | | | | | | 2,325 | | | | | | 2,276 | | |
Staff in external offices | | | | | | 417 | | | | | | 411 | | |
(70) Remuneration report
The remuneration report describes the basic structure of the remuneration plan for members of the Executive Board and Board of Supervisory Directors; it also discloses their remuneration on an individual basis. The remuneration report is an integral part of the notes to the consolidated financial statements.
Overview of total remuneration of members of the Executive Board and Board of Supervisory Directors
| | | | | | | | | | | | | | |
| | | | | | | 2022 | | | | | | 20211) | | |
| | | | | | | EUR in thousands | | | | | | EUR in thousands | | |
| | | | | | | |
| Members of the Executive Board | | | | | | 3,255.2 | | | | | | 3,651.0 | | |
Former members of the Executive Board and their surviving dependants | | | | | | 4,868.5 | | | | | | 4,474.5 | | |
Members of the Board of Supervisory Directors | | | | | | 194.8 | | | | | | 197.4 | | |
Total | | | | | | 8,318.5 | | | | | | 8,322.9 | | |
| 1) | The following changes were made in the composition of the Executive Board in financial year 2021: |
– Dr Günther Bräunig stepped down from the Executive Board of KfW as of 31 October 2021.
– Dr Ingrid Hengster stepped down from the Executive Board of KfW as of 31 December 2021.
– Stefan Wintels was appointed to the Executive Board of KfW with effect from 1 October 2021.
– Christiane Laibach was appointed to the Executive Board of KfW with effect from 1 June 2021.
Remuneration of the Executive Board
The remuneration system for KfW’s Executive Board is aimed at appropriately compensating members of the Executive Board for their duties and responsibilities. Executive Board contracts are drawn up based on the 1992 version of the policy for hiring executive board members at credit institutions of the Federal Government (Grundsätze für die Anstellung der Vorstandsmitglieder bei den Kreditinstituten des Bundes). The Federal Public Corporate Governance Code (Public Corporate Governance Kodex des Bundes – “PCGK”) is taken into account when drawing up contracts. Each contract is individualised accordingly on this basis.
Components of remuneration
The Executive Board members receive fixed monetary remuneration paid in equal monthly instalments.
The following table shows total remuneration, broken down into remuneration components and other forms of remuneration, as well as additions to pension provisions for each member of the Executive Board.
KfW Financial Report 2022 Consolidated financial statements | Notes – Other Notes | 166
Annual remuneration of the Executive Board and additions to pension provisions in financial years 2022 and 2021
| | | | | | | | | | | | | | | | | | | | | | | | | | | | | | | | | | | | | | | | | | |
| | | | | | | | | | | |
| | | | | | Salary | | | | Other remuneration | | | | | | Total | | | | | | Additions to pension provisions1) | | | | |
| | | | | | 2022 | | | | 2021 | | | | 2022 | | | | 2021 | | | | | | 2022 | | | | 2021 | | | | | | 2022 | | | | 2021 | | | | |
| | | | | EUR in
thousands | | | | EUR in
thousands | | | | EUR in
thousands | | | | EUR in
thousands | | | | | | EUR in
thousands | | | | EUR in
thousands | | | | | | EUR in
thousands | | | | EUR in
thousands | | | |
| | | | | | | | | | | | | | | | | | | |
Stefan Wintels (Chief Executive Officer)2) | | | | | | 810.3 | | | | 199.6 | | | | 18.8 | | | | 3.4 | | | | | | 829.1 | | | | 203.0 | | | | | | 422.6 | | | | 259.0 | | | | |
Dr Günther Bräunig3) | | | | | | / | | | | 665.3 | | | | / | | | | 22.3 | | | | | | / | | | | 687.6 | | | | | | / | | | | 1,311.7 | | | | |
Dr Ingrid Hengster4) | | | | | | / | | | | 574.3 | | | | / | | | | 39.5 | | | | | | / | | | | 613.8 | | | | | | / | | | | 305.2 | | | | |
Melanie Kehr | | | | | | 560.6 | | | | 541.0 | | | | 12.8 | | | | 14.4 | | | | | | 573.3 | | | | 555.4 | | | | | | –565.5 | | | | 297.5 | | | | |
Christiane Laibach5) | | | | | | 549.1 | | | | 315.6 | | | | 24.8 | | | | 19.9 | | | | | | 573.9 | | | | 335.5 | | | | | | 117.1 | | | | 204.2 | | | | |
Bernd Loewen | | | | | | 649.6 | | | | 640.0 | | | | 27.8 | | | | 25.7 | | | | | | 677.4 | | | | 665.7 | | | | | | –2,200.3 | | | | –123.0 | | | | |
Dr Stefan Peiß | | | | | | 582.9 | | | | 574.3 | | | | 18.6 | | | | 15.7 | | | | | | 601.5 | | | | 590.0 | | | | | | –1,793.8 | | | | –133.3 | | | | |
| Total | | | | | 3,152.5 | | | | 3,510.1 | | | | 102.7 | | | | 140.9 | | | | | | 3,255.2 | | | | 3,651.0 | | | | | | –4,019.9 | | | | 2,121.3 | | | |
| 1) | The discount rate for pension obligations increased in 2022 due to the rise in long-term capital market rates, from 1.32% (31 Dec. 2021) to 3.89% (31 Dec. 2022). |
| 2) | Stefan Wintels was appointed to the Executive Board of KfW with effect from 1 October 2021. Stefan Wintels served as Co-CEO with Dr Günther Bräunig from 1 October until 31 October 2021. Stefan Wintels has served as the sole CEO since 1 November 2021. |
| 3) | As Dr Günther Bräunig stepped down from the Executive Board of KfW as of 31 October 2021, his name will no longer be reported after 2022. |
| 4) | As Dr Ingrid Hengster stepped down from the Executive Board of KfW as of 31 December 2021, her name will no longer be reported after 2022. |
| 5) | Christiane Laibach was appointed to the Executive Board of KfW with effect from 1 June 2021. |
Breakdown of other remuneration of the Executive Board in financial year 2022
| | | | | | | | | | | | | | | | | | | | | | | | | | | | | | | | |
| | | | | | | Company car | | | | Group accident insurance | | | | Health insurance | | | | Long-term care insurance | | | | Cost of maintaining a second home | | | | Other | | | | Total | | |
| | | | | | | EUR in thousands | | | | EUR in thousands | | | | EUR in thousands | | | | EUR in thousands | | | | EUR in thousands | | | | EUR in thousands | | | | EUR in thousands | | |
| | | | | | | | | | | | | | | | |
Stefan Wintels (Chief Executive Officer)1) | | | | | | 12.3 | | | | 0.6 | | | | 4.7 | | | | 0.9 | | | | 0.0 | | | | 0.3 | | | | 18.8 | | |
| | | | | | | | | | | | | | | | |
| Dr Günther Bräunig2) | | | | | | / | | | | / | | | | / | | | | / | | | | / | | | | / | | | | / | | |
| | | | | | | | | | | | | | | | |
| Dr Ingrid Hengster3) | | | | | | / | | | | / | | | | / | | | | / | | | | / | | | | / | | | | / | | |
| | | | | | | | | | | | | | | | |
| Melanie Kehr | | | | | | 7.5 | | | | 0.4 | | | | 4.2 | | | | 0.3 | | | | 0.0 | | | | 0.3 | | | | 12.8 | | |
| | | | | | | | | | | | | | | | |
| Christiane Laibach4) | | | | | | 11.8 | | | | 0.4 | | | | 4.1 | | | | 0.4 | | | | 7.8 | | | | 0.3 | | | | 24.8 | | |
| | | | | | | | | | | | | | | | |
| Bernd Loewen | | | | | | 11.6 | | | | 0.5 | | | | 14.5 | | | | 0.9 | | | | 0.0 | | | | 0.3 | | | | 27.8 | | |
| | | | | | | | | | | | | | | | |
| Dr Stefan Peiß | | | | | | 10.2 | | | | 0.4 | | | | 6.8 | | | | 0.9 | | | | 0.0 | | | | 0.3 | | | | 18.6 | | |
| | | | | | | | | | | | | | | | |
| Total | | | | | | 53.5 | | | | 2.2 | | | | 34.4 | | | | 3.4 | | | | 7.8 | | | | 1.5 | | | | 102.7 | | |
| 1) | Stefan Wintels was appointed to the Executive Board of KfW with effect from 1 October 2021. |
| 2) | Dr Günther Bräunig stepped down from the Executive Board of KfW as of 31 October 2021. |
| 3) | Dr Ingrid Hengster stepped down from the Executive Board of KfW as of 31 December 2021. |
| 4) | Christiane Laibach was appointed to the Executive Board of KfW with effect from 1 June 2021. |
167 | KfW Financial Report 2022 Consolidated financial statements | Notes – Other Notes
Breakdown of other remuneration of the Executive Board in financial year 2021
| | | | | | | | | | | | | | | | | | | | | | | | | | | | | | | | |
| | | | | | | Company car | | | | Group accident insurance | | | | Health insurance | | | | Long-term care insurance | | | | Cost of maintaining a second home | | | | Other | | | | Total | | |
| | | | | | | EUR in thousands | | | | EUR in thousands | | | | EUR in thousands | | | | EUR in thousands | | | | EUR in thousands | | | | EUR in thousands | | | | EUR in thousands | | |
| | | | | | | | | | | | | | | | |
Stefan Wintels (Chief Executive Officer)1) | | | | | | 1.9 | | | | 0.1 | | | | 1.2 | | | | 0.2 | | | | 0.0 | | | | 0.0 | | | | 3.4 | | |
| | | | | | | | | | | | | | | | |
| Dr Günther Bräunig2) | | | | | | 14.9 | | | | 0.5 | | | | 6.2 | | | | 0.7 | | | | 0.0 | | | | 0.0 | | | | 22.3 | | |
| | | | | | | | | | | | | | | | |
| Dr Ingrid Hengster3) | | | | | | 26.3 | | | | 0.4 | | | | 12.0 | | | | 0.8 | | | | 0.0 | | | | 0.0 | | | | 39.5 | | |
| | | | | | | | | | | | | | | | |
| Melanie Kehr | | | | | | 9.3 | | | | 0.4 | | | | 4.2 | | | | 0.5 | | | | 0.0 | | | | 0.0 | | | | 14.4 | | |
| | | | | | | | | | | | | | | | |
| Christiane Laibach4) | | | | | | 6.9 | | | | 0.2 | | | | 2.6 | | | | 0.2 | | | | 10.0 | | | | 0.0 | | | | 19.9 | | |
| | | | | | | | | | | | | | | | |
| Bernd Loewen | | | | | | 11.4 | | | | 0.5 | | | | 13.0 | | | | 0.8 | | | | 0.0 | | | | 0.0 | | | | 25.7 | | |
| | | | | | | | | | | | | | | | |
| Dr Stefan Peiß | | | | | | 7.6 | | | | 0.4 | | | | 6.8 | | | | 0.9 | | | | 0.0 | | | | 0.0 | | | | 15.7 | | |
| | | | | | | | | | | | | | | | |
| Total | | | | | | 78.3 | | | | 2.5 | | | | 46.0 | | | | 4.1 | | | | 10.0 | | | | 0.0 | | | | 140.9 | | |
| 1) | Stefan Wintels was appointed to the Executive Board of KfW with effect from 1 October 2021. |
| 2) | Dr Günther Bräunig stepped down from the Executive Board of KfW as of 31 October 2021. |
| 3) | Dr Ingrid Hengster stepped down from the Executive Board of KfW as of 31 December 2021. |
| 4) | Christiane Laibach was appointed to the Executive Board of KfW with effect from 1 June 2021. |
Breakdown of remuneration of the Executive Board from secondary employment in financial years 2022 and 2021
| | | | | | | | | | | | | | |
| | | | | | | 2022 | | | | | | 2021 | | |
| | | | | | | EUR in thousands | | | | | | EUR in thousands | | |
| | | | | | | |
| Stefan Wintels (Chief Executive Officer)1) | | | | | | 221.8 | | | | | | 0.0 | | |
Melanie Kehr | | | | | | 33.8 | | | | | | 30.6 | | |
Christiane Laibach2) | | | | | | 0.0 | | | | | | 0.0 | | |
Bernd Loewen | | | | | | 16.7 | | | | | | 40.0 | | |
Dr Stefan Peiß | | | | | | 0.0 | | | | | | 0.0 | | |
| 1) | Stefan Wintels was appointed to the Executive Board of KfW with effect from 1 October 2021. Remuneration payments for 2022 will not be made until 2023. |
| 2) | Christiane Laibach was appointed to the Executive Board of KfW with effect from 1 June 2021. |
Responsibilities
The Presidial and Nomination Committee has discussed the Executive Board remuneration system including contract components since the committee structure was modified in accordance with the applicable Section 25d of the German Banking Act (Kreditwesengesetz – “KWG”) and adopts and regularly reviews it. The Presidial and Nomination Committee is advised on these matters by the Remuneration Committee, which in turn works together with the Risk and Credit Committee in order to perform its duties. Likewise after consulting with the Remuneration Committee on the matter, the Board of Supervisory Directors decides upon the basic structure of the Executive Board’s remuneration system.
The Presidial and Nomination Committee most recently discussed remuneration matters on 15 December 2022.
KfW Financial Report 2022 Consolidated financial statements | Notes – Other Notes | 168
Fringe benefits
Other remuneration largely comprises the contractual fringe benefits. Executive Board members are entitled to a company car with driver services for business and personal use. Executive Board members reimburse KfW for using a company car with a driver for private purposes in accordance with applicable tax regulations. They are reimbursed under tax regulations for the cost of maintaining a second home for business reasons.
Executive Board members are insured under a group accident insurance policy. Allowances are provided for health and long-term care insurance. Executive Board members are covered by a directors and officers liability insurance policy, which insures them against the risks of financial loss associated with their actions in their capacity as Executive Board members and by a supplemental legal expenses insurance policy and a contractual protection insurance policy. KfW Executive Board members acting in their management capacity are also protected by a special legal expenses group policy for employees covering criminal activities.
No remuneration is paid to members of the Executive Board for assuming executive body functions at group companies.
As with all other executives, Executive Board members may also opt to participate in the deferred remuneration programme – a supplemental company pension scheme financed via tax-free salary conversion. Moreover, they are entitled to anniversary bonuses in accordance with KfW’s general company policy.
In addition, the fringe benefits include the cost of security systems at Executive Board members’ homes; these benefits are not recognised as Other remuneration, but as Non-personnel expenses.
The contractual fringe benefits are subject to taxation as benefits in money’s worth for Executive Board members if they cannot be granted on a tax-free basis or if this is contractually agreed. No Executive Board member was granted or promised any benefits by a third party during the past financial year with a view to his/her position as a member of the KfW Executive Board.
Pension benefits and other benefits in the case of early retirement
In accordance with Article 1 (3) of the KfW Bylaws, the appointment of an Executive Board member should not generally extend past the legal age of retirement. Upon reaching the age of 65 or statutory retirement age and the expiry of their Executive Board contract, Executive Board members are entitled to claim pension payments; they are also entitled to pension benefits if their employment relationship terminates due to permanent disability.
Pension commitments for Executive Board members as well as their surviving dependants are based on the 1992 version of the Federal Government’s policy for hiring executive board members at credit institutions. The PCGK is taken into account when drawing up the Executive Board contracts.
Executive Board member contracts include a severance pay cap in accordance with the recommendations of the PCGK. In other words, payments to these Executive Board members due to early termination of the Executive Board function without good cause in accordance with Section 626 of the German Civil Code (Bürgerliches Gesetzbuch – “BGB”) should not exceed the equivalent of two years’ salary or remuneration including fringe benefits for the remainder of the contract, depending on which of the amounts is lower.
The full benefit entitlement totalled 49% of the final salary in the reporting year with different contractual arrangements. The retirement benefit entitlement amounted to 70% of the full entitlement for first-time appointment, with an increase per completed year of service of 0.98 to 1.53 percentage points depending on the contract (from an initial 34.3% to a maximum of 49% of the final salary).
169 | KfW Financial Report 2022 Consolidated financial statements | Notes – Other Notes
The Executive Board contracts contain additional individual provisions, in particular concerning vesting of pension benefits. The newer contracts also include provisions on retrospective pension contributions where pension benefits are not yet vested and the member in question has not been reappointed.
Pension payments to former Executive Board members or their surviving dependants were as follows in 2022 and 2021:
Pension payments to former Executive Board members or their surviving dependants
| | | | | | | | | | | | | | | | | | | | | | | | | | | | | | | | | | | | | | | | | | |
| | | | | | | | | 2022 | | | | | | | | | 2021 | | | | |
| | | | | | | | | | | | | | EUR in | | | | | | | | | Headcount | | | | | | EUR in | | | | |
| | | | | | | | | Headcount | | | | | thousands | | | | | | | | | | | | thousands | | | | |
| | | | | | | | | | | |
Former members of the Executive Board | | | | | | | | | | | 19 | | | | | | 4,058.1 | | | | | | | | | | | | 19 | | | | | | | | 3,673.3 | | | | | |
Surviving dependants | | | | | | | | | | | 8 | | | | | | 810.4 | | | | | | | | | | | | 8 | | | | | | | | 801.2 | | | | | |
Total | | | | | | | | | | | 27 | | | | | | 4,868.5 | | | | | | | | | | | | 27 | | | | | | | | 4,474.5 | | | | | |
Provisions for pension obligations to former members of the Executive Board and their surviving dependants in an amount of EUR 60,446 thousand (31 Dec. 2021: EUR 74,578 thousand) were set up at the end of financial year 2022.
Remuneration of members of the Board of Supervisory Directors
The amount of remuneration to members of the Board of Supervisory Directors is determined by the supervisory authority in accordance with Article 7 (10) of the KfW Bylaws. With the last revision in May 2010, remuneration to members of the Federal Government who are members of the Board of Supervisory Directors pursuant to Article 7 (1) No. 1 and No. 2 of the KfW Law was set at EUR 0.
In the reporting year, remuneration for other members of the Board of Supervisory Directors pursuant to Article 7 (1) Nos. 3–7 of the KfW Law amounted to EUR 5,100 p.a.; remuneration for membership of a Board of Supervisory Directors committee was a standard amount of EUR 600 p.a. for each member. Committee chairs did not receive special remuneration.
Members who join during the year receive their remuneration on a pro rata basis.
A daily allowance (EUR 200 per meeting day) is paid and travel expenses and applicable VAT are reimbursed upon request.
The following table provides details on the remuneration paid to the Board of Supervisory Directors in financial year 2022; stated amounts are net amounts in thousands of euros. Travel expenses are reimbursed upon submission of receipts and are not taken into account in the table.
KfW Financial Report 2022 Consolidated financial statements | Notes – Other Notes | 170
Remuneration of members of the Board of Supervisory Directors for financial year 2022
| | | | | | | | | | | | | | | | | | | | | | | | | | | | | | | | | | |
No. | | | | Name | | | | Dates of
membership | | | | Board of
Supervisory
Directors
membership1) | | | | | Committee
membership1)
| | | | | Daily allowance3) | | | | | Total | | | |
| | | | | | | | 2022 | | | | EUR in
thousands | | | | | EUR in
thousands | | | | | EUR in
thousands | | | | | EUR in
thousands | | | |
| | | | | | | | | | | | | |
| 1. | | | | Dr Robert Habeck | | | | 1 Jan. – 31 Dec. | | | | | 0.0 | | | | | | 0.0 | | | | | | 0.0 | | | | | | 0.0 | | | |
| 2. | | | | Christian Lindner | | | | 1 Jan. – 31 Dec. | | | | | 0.0 | | | | | | 0.0 | | | | | | 0.0 | | | | | | 0.0 | | | |
| 3. | | | | Doris Ahnen5) | | | | | | | | | 0.0 | | | | | | 0.0 | | | | | | 0.2 | | | | | | 0.2 | | | |
| 4. | | | | Annalena Baerbock | | | | 1 Jan. – 31 Dec. | | | | | 0.0 | | | | | | 0.0 | | | | | | 0.0 | | | | | | 0.0 | | | |
| 5. | | | | Dr Danyal Bayaz2), 4) | | | | 1 Jan. – 31 Dec. | | | | | 5.1 | | | | | | 0.0 | | | | | | 0.2 | | | | | | 5.3 | | | |
| 6. | | | | Katharina Beck | | | | 13 Jan. – 31 Dec. | | | | | 5.1 | | | | | | 0.5 | | | | | | 0.2 | | | | | | 5.8 | | | |
| 7. | | | | Dr André Berghegger | | | | 1 Jan. – 31 Dec. | | | | | 5.1 | | | | | | 1.8 | | | | | | 0.6 | | | | | | 7.5 | | | |
| 8. | | | | Volker Bouffier2), 4) | | | | 1 Jan. – 31 Dec. | | | | | 5.1 | | | | | | 1.2 | | | | | | 0.2 | | | | | | 6.5 | | | |
| 9. | | | | Dr Andreas Dressel2) | | | | 1 Jan. – 31 Dec. | | | | | 5.1 | | | | | | 0.5 | | | | | | 0.0 | | | | | | 5.6 | | | |
| 10. | | | | Ingeborg Esser | | | | 1 Jan. – 31 Dec. | | | | | 5.1 | | | | | | 0.0 | | | | | | 0.2 | | | | | | 5.3 | | | |
| 11. | | | | Robert Feiger | | | | 1 Jan. – 31 Dec. | | | | | 5.1 | | | | | | 0.6 | | | | | | 0.4 | | | | | | 6.1 | | | |
| 12. | | | | Albert Füracker2), 4) | | | | 1 Jan. – 31 Dec. | | | | | 5.1 | | | | | | 0.0 | | | | | | 0.2 | | | | | | 5.3 | | | |
| 13. | | | | Olav Gutting5) | | | | | | | | | 0.0 | | | | | | 0.0 | | | | | | 0.2 | | | | | | 0.2 | | | |
| 14. | | | | Dr Louis Hagen | | | | 1 Jan. – 31 Dec. | | | | | 5.1 | | | | | | 1.2 | | | | | | 0.4 | | | | | | 6.7 | | | |
| 15. | | | | Prof. Dr Hans-Günter Henneke | | | | 1 Jan. – 31 Dec. | | | | | 5.1 | | | | | | 0.0 | | | | | | 0.4 | | | | | | 5.5 | | | |
| 16. | | | | Reinhold Hilbers2) | | | | 1 Jan. – 31 Dec. | | | | | 5.1 | | | | | | 1.8 | | | | | | 1.2 | | | | | | 8.1 | | | |
| 17. | | | | Reiner Hoffmann4) | | | | 1 Jan. – 31 Dec. | | | | | 5.1 | | | | | | 1.2 | | | | | | 0.6 | | | | | | 6.9 | | | |
| 18. | | | | Gerhard Hofmann | | | | 1 Jan. – 6 Apr. | | | | | 1.5 | | | | | | 0.3 | | | | | | 0.2 | | | | | | 2.0 | | | |
| 19. | | | | Dr Bruno Hollnagel | | | | 1 Jan. – 31 Dec. | | | | | 5.1 | | | | | | 0.0 | | | | | | 0.6 | | | | | | 5.7 | | | |
| 20. | | | | Verena Hubertz | | | | 13 Jan. – 31 Dec. | | | | | 5.1 | | | | | | 1.4 | | | | | | 0.0 | | | | | | 6.5 | | | |
| 21. | | | | Dr Dirk Jandura | | | | 1 Jan. – 31 Dec. | | | | | 5.1 | | | | | | 0.5 | | | | | | 0.8 | | | | | | 6.4 | | | |
| 22. | | | | Alois Karl | | | | 1 Jan. – 31 Dec. | | | | | 5.1 | | | | | | 0.6 | | | | | | 1.7 | | | | | | 7.4 | | | |
| 23. | | | | Andrea Kocsis4) | | | | 1 Jan. – 31 Dec. | | | | | 5.1 | | | | | | 0.0 | | | | | | 0.6 | | | | | | 5.7 | | | |
| 24. | | | | Stefan Körzell | | | | 1 Jan. – 31 Dec. | | | | | 5.1 | | | | | | 1.2 | | | | | | 0.4 | | | | | | 6.7 | | | |
| 25. | | | | Dr Joachim Lang | | | | 1 Jan. – 31 Dec. | | | | | 5.1 | | | | | | 1.2 | | | | | | 0.0 | | | | | | 6.3 | | | |
| 26. | | | | Steffi Lemke | | | | 1 Jan. – 31 Dec. | | | | | 0.0 | | | | | | 0.0 | | | | | | 0.0 | | | | | | 0.0 | | | |
| 27. | | | | Rainer Neske4) | | | | 1 Jan. – 31 Dec. | | | | | 5.1 | | | | | | 0.6 | | | | | | 1.2 | | | | | | 6.9 | | | |
| 28. | | | | Cem Özdemir | | | | 1 Jan. – 31 Dec. | | | | | 0.0 | | | | | | 0.0 | | | | | | 0.0 | | | | | | 0.0 | | | |
| 29. | | | | Dr Hans-Walter Peters | | | | 1 Jan. – 31 Dec. | | | | | 5.1 | | | | | | 2.5 | | | | | | 1.0 | | | | | | 8.6 | | | |
| 30. | | | | Achim Post | | | | 13 Jan. – 31 Dec. | | | | | 5.1 | | | | | | 0.9 | | | | | | 0.4 | | | | | | 6.4 | | | |
| 31. | | | | Daniel Quinten | | | | 7 Apr. – 31 Dec. | | | | | 3.6 | | | | | | 0.9 | | | | | | 0.8 | | | | | | 5.3 | | | |
| 32. | | | | Michael Richter2) | | | | 1 Jan. – 31 Dec. | | | | | 5.1 | | | | | | 0.0 | | | | | | 0.2 | | | | | | 5.3 | | | |
| 33. | | | | Joachim Rukwied | | | | 1 Jan. – 31 Dec. | | | | | 5.1 | | | | | | 0.6 | | | | | | 0.4 | | | | | | 6.1 | | | |
| 34. | | | | Frank Schäffler | | | | 13 Jan. – 31 Dec. | | | | | 5.1 | | | | | | 0.9 | | | | | | 0.2 | | | | | | 6.2 | | | |
| 35. | | | | Helmut Schleweis | | | | 1 Jan. – 31 Dec. | | | | | 5.1 | | | | | | 2.5 | | | | | | 0.0 | | | | | | 7.6 | | | |
| 36. | | | | Svenja Schulze | | | | 1 Jan. – 31 Dec. | | | | | 0.0 | | | | | | 0.0 | | | | | | 0.0 | | | | | | 0.0 | | | |
| 37. | | | | Holger Schwannecke4) | | | | 1 Jan. – 31 Dec. | | | | | 5.1 | | | | | | 1.4 | | | | | | 1.2 | | | | | | 7.7 | | | |
| 38. | | | | Dietmar Strehl2) | | | | 1 Jan. – 31 Dec. | | | | | 5.1 | | | | | | 0.9 | | | | | | 0.8 | | | | | | 6.8 | | | |
| 39. | | | | Dr Martin Wansleben4) | | | | 1 Jan. – 31 Dec. | | | | | 5.1 | | | | | | 0.5 | | | | | | 0.6 | | | | | | 6.2 | | | |
| | | | | | | | | | | | | |
| 40. | | | | Dr Volker Wissing | | | | 1 Jan. – 31 Dec. | | | | | 0.0 | | | | | | 0.0 | | | | | | 0.0 | | | | | | 0.0 | | | |
| Total | | | | | | | | | | | | | 153.0 | | | | | | 25.7 | | | | | | 16.1 | | | | | | 194.8 | | | |
| 1) | The amounts had not yet been paid out as of the reporting date 31 December 2022. |
| 2) | Amount governed by state law. |
| 3) | Amounts for financial year 2022 until the date of assessment. Any later claims will be included in the next report. |
| 4) | The daily allowance includes payments for 2021. |
| 5) | Payments for meeting attendance for 2021. |
171 | KfW Financial Report 2022 Consolidated financial statements | Notes – Other Notes
Remuneration of members of the Board of Supervisory Directors for financial year 2021
| | | | | | | | | | | | | | | | | | | | | | | | | | | | | | | | | | |
No. | | | | Name | | | | Dates of
membership | | | | Board of
Supervisory
Directors
membership1) | | | | | Committee
membership1)
| | | | | Daily allowance3) | | | | | Total | | | |
| | | | | �� | | | 2021 | | | | EUR in
thousands | | | | | EUR in
thousands | | | | | EUR in
thousands | | | | | EUR in
thousands | | | |
| | | | | | | | | | | | | |
| 1. | | | | Olaf Scholz | | | | 1 Jan. – 8 Dec. | | | | | 0.0 | | | | | | 0.0 | | | | | | 0.0 | | | | | | 0.0 | | | |
| 2. | | | | Christian Lindner | | | | 8 Dec. – 31 Dec. | | | | | 0.0 | | | | | | 0.0 | | | | | | 0.0 | | | | | | 0.0 | | | |
| 3. | | | | Peter Altmaier | | | | 1 Jan. – 8 Dec. | | | | | 0.0 | | | | | | 0.0 | | | | | | 0.0 | | | | | | 0.0 | | | |
| 4. | | | | Dr Robert Habeck | | | | 8 Dec. – 31 Dec. | | | | | 0.0 | | | | | | 0.0 | | | | | | 0.0 | | | | | | 0.0 | | | |
| 5. | | | | Doris Ahnen2) | | | | 1 Jan. – 31 Dec. | | | | | 5.1 | | | | | | 0.6 | | | | | | 0.2 | | | | | | 5.9 | | | |
| 6. | | | | Annalena Baerbock | | | | 8 Dec. – 31 Dec. | | | | | 0.0 | | | | | | 0.0 | | | | | | 0.0 | | | | | | 0.0 | | | |
| 7. | | | | Sören Bartol | | | | 1 Jan. – 13 Dec. | | | | | 5.1 | | | | | | 1.8 | | | | | | 0.8 | | | | | | 7.8 | | | |
| 8. | | | | Dr Danyal Bayaz | | | | 8 Oct. – 31 Dec. | | | | | 1.3 | | | | | | 0.0 | | | | | | 0.0 | | | | | | 1.3 | | | |
| 9. | | | | Dr André Berghegger | | | | 1 Jan. – 31 Dec. | | | | | 5.1 | | | | | | 1.8 | | | | | | 0.8 | | | | | | 7.8 | | | |
| 10. | | | | Dr Holger Bingmann4) | | | | 1 Jan. – 31 Dec. | | | | | 5.1 | | | | | | 0.6 | | | | | | 1.4 | | | | | | 7.1 | | | |
| 11. | | | | Volker Bouffier2) | | | | 1 Jan. – 31 Dec. | | | | | 5.1 | | | | | | 1.2 | | | | | | 0.4 | | | | | | 6.7 | | | |
| 12. | | | | Ingeborg Esser4) | | | | 1 Jan. – 31 Dec. | | | | | 5.1 | | | | | | 0.0 | | | | | | 0.8 | | | | | | 5.9 | | | |
| 13. | | | | Robert Feiger | | | | 6 Jan. – 31 Dec. | | | | | 5.1 | | | | | | 0.6 | | | | | | 0.4 | | | | | | 6.1 | | | |
| 14. | | | | Albert Füracker2) | | | | 1 Jan. – 31 Dec. | | | | | 5.1 | | | | | | 0.0 | | | | | | 0.2 | | | | | | 5.3 | | | |
| 15. | | | | Verena Göppert | | | | 1 Jan. – 31 Dec. | | | | | 5.1 | | | | | | 0.0 | | | | | | 0.4 | | | | | | 5.5 | | | |
| 16. | | | | Olav Gutting | | | | 1 Jan. – 31 Dec. | | | | | 5.1 | | | | | | 0.6 | | | | | | 0.8 | | | | | | 6.5 | | | |
| 17. | | | | Dr Louis Hagen | | | | 1 Jan. – 31 Dec. | | | | | 5.1 | | | | | | 1.2 | | | | | | 1.4 | | | | | | 7.7 | | | |
| 18. | | | | Reinhold Hilbers2) | | | | 1 Jan. – 31 Dec. | | | | | 5.1 | | | | | | 1.8 | | | | | | 1.0 | | | | | | 8.0 | | | |
| 19. | | | | Reiner Hoffmann | | | | 6 Jan. – 31 Dec. | | | | | 5.1 | | | | | | 1.0 | | | | | | 0.4 | | | | | | 6.5 | | | |
| 20. | | | | Gerhard Hofmann | | | | 1 Jan. – 31 Dec. | | | | | 5.1 | | | | | | 1.2 | | | | | | 1.2 | | | | | | 7.5 | | | |
| 21. | | | | Dr Bruno Hollnagel | | | | 1 Jan. – 31 Dec. | | | | | 5.1 | | | | | | 0.0 | | | | | | 0.6 | | | | | | 5.7 | | | |
| 22. | | | | Johannes Kahrs | | | | 1 Jan. – 19 Nov. | | | | | 4.7 | | | | | | 1.1 | | | | | | 0.0 | | | | | | 5.8 | | | |
| 23. | | | | Alois Karl4) | | | | 1 Jan. – 31 Dec. | | | | | 5.1 | | | | | | 0.6 | | | | | | 1.4 | | | | | | 7.1 | | | |
| 24. | | | | Julia Klöckner | | | | 1 Jan. – 8 Dec. | | | | | 0.0 | | | | | | 0.0 | | | | | | 0.0 | | | | | | 0.0 | | | |
| 25. | | | | Andrea Kocsis4) | | | | 1 Jan. – 31 Dec. | | | | | 5.1 | | | | | | 0.0 | | | | | | 0.6 | | | | | | 5.7 | | | |
| 26. | | | | Stefan Körzell | | | | 6 Jan. – 31 Dec. | | | | | 5.1 | | | | | | 1.0 | | | | | | 0.6 | | | | | | 6.7 | | | |
| 27. | | | | Dr Joachim Lang | | | | 6 Jan. – 31 Dec. | | | | | 5.1 | | | | | | 1.0 | | | | | | 0.2 | | | | | | 6.3 | | | |
| 28. | | | | Steffi Lemke | | | | 8 Dec. – 31 Dec. | | | | | 0.0 | | | | | | 0.0 | | | | | | 0.0 | | | | | | 0.0 | | | |
| 29. | | | | Heiko Maas | | | | 1 Jan. – 8 Dec. | | | | | 0.0 | | | | | | 0.0 | | | | | | 0.0 | | | | | | 0.0 | | | |
| 30. | | | | Dr Gerd Müller | | | | 1 Jan. – 8 Dec. | | | | | 0.0 | | | | | | 0.0 | | | | | | 0.0 | | | | | | 0.0 | | | |
| 31. | | | | Rainer Neske | | | | 6 Jan. – 31 Dec. | | | | | 5.1 | | | | | | 0.6 | | | | | | 1.2 | | | | | | 6.9 | | | |
| 32. | | | | Cem Özdemir | | | | 8 Dec. – 31 Dec. | | | | | 0.0 | | | | | | 0.0 | | | | | | 0.0 | | | | | | 0.0 | | | |
| 33. | | | | Dr Hans-Walter Peters | | | | 6 Jan. – 31 Dec. | | | | | 5.1 | | | | | | 2.2 | | | | | | 1.2 | | | | | | 8.5 | | | |
| 34. | | | | Joachim Rukwied4) | | | | 1 Jan. – 31 Dec. | | | | | 5.1 | | | | | | 0.6 | | | | | | 0.6 | | | | | | 6.3 | | | |
| 35. | | | | Andreas Scheuer | | | | 1 Jan. – 8 Dec. | | | | | 0.0 | | | | | | 0.0 | | | | | | 0.0 | | | | | | 0.0 | | | |
| 36. | | | | Helmut Schleweis | | | | 6 Jan. – 31 Dec. | | | | | 5.1 | | | | | | 2.2 | | | | | | 0.0 | | | | | | 7.3 | | | |
| 37. | | | | Svenja Schulze (until 8 Dec. BMU, since 8 Dec. BMZ) | | | | 1 Jan. – 31 Dec. | | | | | 0.0 | | | | | | 0.0 | | | | | | 0.0 | | | | | | 0.0 | | | |
| 38. | | | | Holger Schwannecke | | | | 1 Jan. – 31 Dec. | | | | | 5.1 | | | | | | 1.8 | | | | | | 0.4 | | | | | | 7.4 | | | |
| 39. | | | | Edith Sitzmann2) | | | | 1 Jan. – 11 May | | | | | 2.1 | | | | | | 0.0 | | | | | | 0.0 | | | | | | 2.1 | | | |
| 40. | | | | Peter Strobel2) | | | | 1 Jan. – 31 Dec. | | | | | 5.1 | | | | | | 1.2 | | | | | | 1.0 | | | | | | 7.3 | | | |
| 41. | | | | Heike Taubert2) | | | | 1 Jan. – 31 Dec. | | | | | 5.1 | | | | | | 0.0 | | | | | | 0.4 | | | | | | 5.5 | | | |
| 42. | | | | Michael Theurer4) | | | | 1 Jan. – 15 Dec. | | | | | 5.1 | | | | | | 1.1 | | | | | | 0.2 | | | | | | 6.4 | | | |
| 43. | | | | Dr Martin Wansleben | | | | 1 Jan. – 31 Dec. | | | | | 5.1 | | | | | | 0.6 | | | | | | 0.8 | | | | | | 6.5 | | | |
| | | | | | | | | | | | | |
| 44. | | | | Dr Volker Wissing | | | | 8 Dec. – 31 Dec. | | | | | 0.0 | | | | | | 0.0 | | | | | | 0.0 | | | | | | 0.0 | | | |
| Total | | | | | | | | | | | | | 151.0 | | | | | | 26.7 | | | | | | 19.4 | | | | | | 197.4 | | | |
| 1) | The amounts had not yet been paid out as of the reporting date 31 December 2021. |
| 2) | Amount governed by state law. |
| 3) | Amounts for financial year 2021 until the date of assessment. Any later claims will be included in the next report. |
| 4) | The daily allowance includes payments for 2020. |
KfW Financial Report 2022 Consolidated financial statements | Notes – Other Notes | 172
There are no pension obligations for members of the Board of Supervisory Directors.
Members of the Board of Supervisory Directors did not receive remuneration in the reporting year for personal services provided.
Members of the Board of Supervisory Directors are also covered by a directors and officers liability insurance policy, which insures them against the risks of financial loss associated with their actions in their capacity as Supervisory Directors and by a supplemental legal expenses insurance policy and a contractual protection insurance policy. There are currently no deductibles agreed. KfW Supervisory Directors acting in that capacity are also protected by both a special legal expenses group policy for employees covering criminal action brought against Supervisory Directors and by a group accident insurance policy.
(71) Related party disclosures
Transactions between related parties and KfW Group must be disclosed in accordance with IAS 24 requirements. KfW Group’s related parties include its subsidiaries, which are not consolidated for reasons of immateriality, joint ventures, associates, KfW shareholders, interests held by the Federal Government over which it directly has significant influence, key management personnel and their family members. Natural persons in key management positions considered to be related parties in accordance with IAS 24 include the members of the Executive Board, the Directors of KfW, the members of the Board of Supervisory Directors, members of the management boards and, if applicable, of the supervisory boards of all consolidated subsidiaries and their close family members. Transactions with related parties are normally concluded at arm’s length as part of operating activities.
KfW has exercised the relief option in accordance with IAS 24.25 for government-related entities.
Transactions with shareholders
KfW is a public-law institution in which the Federal Republic of Germany (Federal Government) holds an 80% stake and the Federal States hold a 20% stake. Any transactions with the Federal Government and the Federal States in financial year 2022 are covered by the rules and regulations set forth in the KfW Law. This also includes guarantees received for operations in which the Federal Republic of Germany has a state interest and for which the Federal Government has mandated KfW (mandated transactions in accordance with article 2 (4) of the KfW Law). Transactions with the Federal Government are, as a rule, offset by countertrade transactions with a third party. They do not constitute transactions within the meaning of IAS 24. For this reason, the treatment under IAS 24 is exclusively limited to business relationships with the Federal Government.
KfW Group reported receivables in an amount of EUR 19.3 billion (31 Dec. 2021: EUR 19.9 billion) arising from business relationships with shareholders, resulting in particular from the promotional mandate. These include, for example, the holding arrangements and the BAföG government loans. Notes from the liquidity portfolio are held in “Financial assets at amortised cost” under Securities and investments in an amount of EUR 3.3 billion (31 Dec. 2021: EUR 3.9 billion). Under Other assets, KfW mainly reported claims for reimbursement from the Federal Government in an amount of EUR 626 million (31 Dec. 2021: EUR 643 million); these were offset in the same amount by provisions relating to agency agreements. Assets are offset by liabilities of EUR 8.2 billion (31 Dec. 2021: EUR 4.5 billion). These primarily included the liquidity made available to KfW in its paying agent role relating to the gas price cap (Emergency aid Gas & Heat), but which has not yet been drawn, and the liabilities from dividend income to be paid to the Federal Government.
173 | KfW Financial Report 2022 Consolidated financial statements | Notes – Other Notes
Irrevocable loan commitments of around EUR 12.1 billion (31 Dec. 2021: EUR 12.4 billion) were granted under the BAföG government loans. On the other hand, the group received loan commitments and guarantees from the shareholders in an amount of EUR 158.0 billion (31 Dec. 2021: EUR 118.3 billion), including for stabilisation measures through extensive liquidity assistance for businesses during the coronavirus pandemic, for the market funds business of the business sector KfW Development Bank and for project and real estate financing. Companies affected by the Russia-Ukraine war or sanctions against Russia and Belarus were able to obtain low interest-rate funding under the “KfW Special Programme UBR 2022” launched in May 2022. The Federal Government assumed the guarantee for the risks relating to this programme. The Federal Government mandated further transactions in 2022 for measures to support the energy sector and to mitigate the impact of the Russia-Ukraine crisis on affected companies. These are secured in full by federal guarantees. They include liquidity support for collateral pledged by companies trading on futures exchanges in electricity, natural gas and emission certificates (see “Development of KfW Group” in the management report).
Transactions with shareholders resulted in Net interest income of EUR 48 million as of 31 December 2022 (31 Dec. 2021: EUR 19 million). This also included EUR 23 million (31 Dec. 2021: EUR 30 million) reimbursed by the Federal Government for interest not charged to end borrowers of student loans due to the coronavirus pandemic. The Federal Government will continue its reimbursements until 30 September 2022. There were also agency agreements between the Federal Government and KfW, which are reflected in Net commission income, in particular. Please refer to the information provided in the Notes on “Net commission income” and “Trust activities”.
Transactions with interests held by the Federal Government
As of 31 December 2022, KfW maintained credit balances at Deutsche Bundesbank in an amount of EUR 51.8 billion (31 Dec. 2021: EUR 42.4 billion). This resulted in interest income of EUR 54 million (2021: EUR –210 million).
Overall, KfW recognised liabilities to the German Finance Agency of EUR 50.8 billion (31 Dec. 2021: EUR 35.7 billion).
In the course of financial year 2022, the German Finance Agency transferred German government securities in an amount of EUR 36.1 billion to KfW for funding under the Energy security package via uncollateralised securities lending transactions. Collateralised repo transactions for a par value totalling EUR 2.4 billion were then concluded with the German Finance Agency, based on the previously transferred German government securities, which were not recognised by KfW. Following collateralisation of the repo transactions with the German Finance Agency, cash collateral of EUR 2.4 billion went to KfW which it recognised in Financial liabilities – Liabilities to costumers (see notes on “Repurchase agreements and securities lending” and “Disclosures on repurchase agreements”).
Funding for the KfW Special Programme 2020, with which KfW had been mandated by the Federal Government to support the German economy during the COVID-19 crisis, was provided via the Economic Stabilisation Fund (“WSF”). The same applies to the funding of measures to support the energy sector via allocated lending. The WSF is administered by the German Finance Agency, which also performs the tasks in its own name. KfW reported promissory note loans under liabilities in this context. The promissory note loans are hedged against interest risk by means of a micro hedge. This resulted in a net gain from hedge accounting in an amount of EUR 1.9 billion (31 Dec. 2021: EUR 0.4 billion). Transactions with the remainder of the interests held by the Federal Government primarily include loans in an amount of EUR 449 million (31 Dec. 2021: EUR 638 million) in connection with corporate financing.
Transactions with group companies
Transactions with group companies largely resulted in liabilities of EUR 66 million to tbg Technologie-Beteiligungsgesellschaft mbH (31 Dec. 2021: EUR 57 million).
KfW Financial Report 2022 Consolidated financial statements | Notes – Other Notes | 174
Transactions with key persons
The business relationships between KfW and natural persons considered to be related parties are primarily determined by the KfW Bylaws and by applying the principles of the Federal Public Corporate Governance Code. Under its promotional mandate, KfW primarily disbursed direct loans, totalling EUR 54 thousand (31 Dec. 2021: EUR 53 thousand), for education financing and financing grants for electric vehicle charging stations. The conditions and prices reflect market conditions or are concluded in accordance with KfW’s general conditions for its loan programmes open to the general public.
Please refer to the remuneration report for details on remuneration of the Executive Board and the Board of Supervisory Directors.
(72) Auditor’s fees
| | | | | | | | | | | | | | | | | | |
| | | | | | | | | | | 2022 | | | | | | 2021 | | |
| | | | | | | | | | | EUR in thousands | | | | | | EUR in thousands | | |
| | | | | | | |
Audit | | | | | | | | | | 7,163 | | | | | | 6,027 | | |
Other attestation services | | | | | | | | | | 828 | | | | | | 1,067 | | |
| Total | | | | | | | | | | 7,991 | | | | | | 7,095 | | |
(73) Disclosures on unconsolidated structured entities
KfW Group’s unconsolidated structured entities within the meaning of IFRS 12 relate to the following business sectors:
Structured entities in the business sector Financial markets
KfW makes investments in ABS and ABCP transactions as part of its liquidity management and to promote the financing of climate and environmental protection projects. Moreover, the business sector Financial markets also manages an existing portfolio to which no further investments are added. This portfolio currently consists of securities issued since 2004.
As of 31 December 2022, the carrying amount of the positions held totalled EUR 5.9 billion (31 Dec. 2021: EUR 5.8 billion).
Structured entities in the business sector Export and project finance
Tailored leasing/financing concepts are structured via property leasing companies, primarily in the “Aviation and Rail” and “Maritime Industries” sector departments. A separate entity is created for each transaction, with KfW Group participating as the lender. In the case of some of these business partners, the sponsoring banks act as managers of trust companies, but in the majority of cases, these business partners are set up as separate legal entities. KfW Group provides loans to these companies, generally together with other credit institutions. KfW also has credit relationships with some structured entities as market participants in the commodities financing business, where KfW Group supports these customers with pre-export financing structures.
As of 31 December 2022, the carrying amount of the positions held totalled EUR 2.1 billion (31 Dec. 2021: EUR 2.4 billion).
175 | KfW Financial Report 2022 Consolidated financial statements | Notes – Other Notes
Structured entities in the business sector DEG
As a finance and advisory institution, DEG provides support within its development mandate in line with its business activity guidelines. DEG’s mandate is to promote the development of the private sector of a) developing countries, b) central and eastern European countries and New Independent States (NIS), and c) other countries approved by its shareholder KfW in agreement with the Federal Government. In certain isolated cases this is undertaken via investments in structured entities in the form of equity investments and loans. In accordance with the applied risk principles, the risk of loss is limited to the volume invested or committed.
As of 31 December 2022, the carrying amount of the positions held totalled EUR 0.2 billion (31 Dec. 2021: EUR 0.2 billion).
The following table shows the carrying amounts of assets relating to unconsolidated structured entities and the maximum possible loss that could result from these exposures.
Maximum risk of loss as of 31 December 2022
| | | | | | | | | | | | | | | | | | | | | | | | | | | | | | | | |
| | | | | | Loans and
advances to
customers | | | | | | | Securities and
investments | | | | | | | Other assets | | | | | | | Contingent
liabilities;
irrevocable loan commitments | | |
| | | | | | | | EUR in millions | | | | | | | | EUR in millions | | | | | | | | EUR in millions | | | | | | | EUR in millions | | |
| | | | | | | | | | | | | |
Carrying amount | | | | | | 1,924 | | | | | | | 5,926 | | | | | | | 0 | | | | | | | 351 | | |
| Risk and other provisions | | | | | | 35 | | | | | | | 1 | | | | | | | 0 | | | | | | | 0 | | |
| Max. risk of loss | | | | | | 1,889 | | | | | | | 5,925 | | | | | | | 0 | | | | | | | 351 | | |
Maximum risk of loss as of 31 December 2021
| | | | | | | | | | | | | | | | | | | | | | | | | | | | | | | | |
| | | | | | Loans and
advances to
customers | | | | | | | Securities and
investments | | | | | | | Other assets | | | | | | | Contingent
liabilities;
irrevocable loan
commitments | | |
| | | | | | | | EUR in millions | | | | | | | | EUR in millions | | | | | | | | EUR in millions | | | | | | | EUR in millions | | |
| | | | | | | | | | | | | |
Carrying amount | | | | | | 2,378 | | | | | | | 5,846 | | | | | | | 9 | | | | | | | 139 | | |
| Risk and other provisions | | | | | | 46 | | | | | | | 1 | | | | | | | 0 | | | | | | | 0 | | |
| Max. risk of loss | | | | | | 2,332 | | | | | | | 5,845 | | | | | | | 9 | | | | | | | 139 | | |
KfW Financial Report 2022 Consolidated financial statements | Notes – Other Notes | 176
The maximum risk of loss is equal to the nominal amount for credit lines, (financial) guarantees and other liquidity facilities less the provisions for credit risks recognised in the statement of financial position. The maximum risk of loss relating to KfW Group’s investments is their carrying amount (net). The maximum risk of loss does not include effects from KfW Group’s hedging instruments used to reduce the maximum risk of loss.
No support is provided to structured entities in KfW Group beyond the respective financing.
In exceptional cases, KfW Group acts as the sponsor for structured entities in which it holds shares purely on a trust basis on behalf of the Federal Government. The risk of these structured entities lies exclusively with the Federal Government. In such cases, KfW Group is considered as the sponsor of the structured entities because the entities were initiated and/or structured by KfW Group on behalf of the Federal Government.
(74) Disclosures on shareholdings
Subsidiaries included in the consolidated financial statements
| | | | | | | | | | | | | | | | | | | | | | | | | | |
| Name/registered office | | | | | | Capital share | | | | | | Equity (IFRS) | | | | | | | | Equity (IFRS) | | | | |
| | | | | | | | | | | | | as of 31 Dec. 2022 | | | | | | | | | | as of 31 Dec. 2021 | | | | |
| | | | | | | % | | | | | | EUR in millions | | | | | | | | EUR in millions | | | | |
| | | | | | | | | | | |
KfW IPEX-Bank GmbH, Frankfurt am Main, Germany | | | | | | 100.0 | | | | | | 4,498 | | | | | | | | | | 3,881 | | | | |
DEG – Deutsche Investitions- und Entwicklungsgesellschaft mbH, Cologne, Germany | | | | | | 100.0 | | | | | | 3,067 | | | | | | | | | | 2,987 | | | | |
KfW Beteiligungsholding GmbH, Bonn, Germany | | | | | | 100.0 | | | | | | 3,182 | | | | | | | | | | 3,082 | | | | |
Interkonnektor GmbH, Frankfurt am Main, Germany | | | | | | 100.0 | | | | | | 70 | | | | | | | | | | 95 | | | | |
| KfW Capital GmbH & Co. KG, Frankfurt am Main, Germany | | | | | | 100.0 | | | | | | 857 | | | | | | | | | | 665 | | | | |
IPEX Asia Ltd., Singapore | | | | | | 100.0 | | | | | | 12 | | | | | | | | | | – | | | | |
The newly founded IPEX Asia Ltd., Singapore was included in the consolidated financial statements as a fully consolidated company for the first time in financial year 2022. Subsidiary KfW IPEX-Bank holds a 100% equity interest in this company.
Associates included in the consolidated financial statements using the equity method
| | | | | | | | | | | | | | | | | | | | | | | | | | |
| Name/registered office | | | | | | Capital share | | | | | | Equity | | | | | | | | Equity | | | | |
| | | | | | | | | | | | | as of 30 Sept. 2022 | | | | | | | | | | as of 30 Sept. 2021 | | | | |
| | | | | | | % | | | | | | EUR in millions | | | | | | | | EUR in millions | | | | |
| | | | | | | | | | | |
| Microfinance Enhancement Facility S. A., Luxembourg | | | | | | 16.5 | | | | | | 516 | | | | | | | | | | 472 | | | | |
| Green for Growth Fund, Southeast Europe S. A., Luxembourg | | | | | | 10.2 | | | | | | 557 | | | | | | | | | | 524 | | | | |
| coparion GmbH & Co. KG, Cologne, Germany | | | | | | 16.4 | | | | | | 350 | | | | | | | | | | 284 | | | | |
| Name/registered office | | | | | | Capital share | | | | | | Equity | | | | | | | | Equity | | | | |
| | | | | | | | | | | | | as of 31 Dec. 2022 | | | | | | | | | | as of 31 Dec. 2021 | | | | |
| | | | | | | % | | | | | | EUR in millions | | | | | | | | EUR in millions | | | | |
| DC Nordseekabel GmbH und Co. KG, Bayreuth, Germany | | | | | | 50.0 | | | | | | 805 | | | | | | | | | | 839 | | | | |
177 | KfW Financial Report 2022 Consolidated financial statements | Notes – Other Notes
Microfinance Enhancement Facility S.A. (MEF) has been accounted for using the equity method since 2009. MEF, a KfW investment in a refinancing facility for microfinance institutions, is part of the business sector KfW Development Bank.
Green for Growth Fund, Southeast Europe S.A. (GGF) has been included in the consolidated financial statements using the equity method since 2010. GGF is a fund to promote SME and private household investment in energy efficiency and renewable energy in the Western Balkans and Turkey (KfW’s investment in GGF is also part of the business sector KfW Development Bank).
DC Nordseekabel GmbH und Co. KG (DC Nordseekabel) was accounted for using the equity method, as a joint venture of Interkonnektor GmbH (NordLink project; business sector Export and project finance), for the first time in financial year 2015. The NordLink project is one of the major projects in the European energy sector and comprises an investment volume of around EUR 1.5 to 2 billion. As it will primarily serve as a conduit for renewably sourced energy, the underwater cable will play an important role in the success of Germany’s energy transition. Norwegian state-owned power grid operator Statnett, KfW and the transmission systems operator TenneT, which is responsible for the German territory of the North Sea, concluded a cooperation agreement in February 2015 to construct an underwater cable between Germany and Norway. The NordLink project will be realised by a syndicate in which Statnett and DC Nordseekabel each hold a 50% stake. KfW – via its subsidiary Interkonnektor GmbH – and TenneT each hold a 50% stake in DC Nordseekabel, which is responsible for the construction and obtaining permits in Germany.
coparion GmbH & Co. KG (coparion; business sector KfW Capital) as an associated company was accounted for using the equity method for the first time in financial year 2016.
This co-investment fund by KfW and the German Federal Ministry for Economic Affairs and Climate Action (BMWK) participates in young technology companies by offering venture capital, together with private lead investors.
Entities not included in the consolidated financial statements
Six subsidiaries, two joint ventures, seven associated companies and three special purpose vehicles (including structured entities) of minor significance to the presentation of the net assets, financial and earnings position of KfW Group have not been consolidated; instead, they are presented in the statement of financial position under Securities and investments or Loans and advances. These companies account for approximately 0.05% of KfW Group’s total assets.
KfW Financial Report 2022 Consolidated financial statements | Notes – Other Notes | 178
List of KfW Group shareholdings as of 31 December 2022
| | | | | | | | | | | | | | | | | | | | | | | | | | | | |
| No. | | | | Name | | | | Place | | | | Capital | | | | CC1) | | | | Exchange rate | | | | Equity in | | | | Net income in |
| | | | | | | | | | | | | share | | | | | | | | EUR 1.00 | | | | TCU2), 3) | | | | TCU2), 3) |
| | | | | | | | | | | | | in % | | | | | | | | = CU as of | | | | | | | | |
| | | | | | | | | | | | | | | | | | | | 31 Dec. 20222) | | | | | | | | |
| | | | | | | |
KfW shareholdings | | | | | | | | | | | | | | |
|
A. Fully consolidated subsidiaries included in the consolidated financial statements | | | | | | |
|
| 1 | | | | DEG – Deutsche Investitions- und Entwicklungsgesellschaft mbH6) | | | | Cologne | | | | 100.0 | | | | EUR | | | | 1.0000 | | | | 2,516,872 | | | | 10,250 |
| | | | | | | | | | | | | | | | | | | | | | | | | | | | |
| 2 | | | | Interkonnektor GmbH6) | | | | Frankfurt am Main | | | | 100.0 | | | | EUR | | | | 1.0000 | | | | 71,780 | | | | –9,887 |
| | | | | | | | | | | | | | | | | | | | | | | | | | | | |
| 3 | | | | KfW Beteiligungsholding GmbH6) | | | | Bonn | | | | 100.0 | | | | EUR | | | | 1.0000 | | | | 1,770,628 | | | | 165,933 |
| | | | | | | | | | | | | | | | | | | | | | | | | | | | |
| 4 | | | | KfW Capital GmbH & Co. KG6) | | | | Frankfurt am Main | | | | 100.0 | | | | EUR | | | | 1.0000 | | | | 662,601 | | | | 0 |
|
B. Subsidiaries not included in the consolidated financial statements | | | | | | | | | | |
|
| 5 | | | | Finanzierungs- und Beratungsgesellschaft mbH6) | | | | Berlin | | | | 100.0 | | | | EUR | | | | 1.0000 | | | | 5,669 | | | | 15 |
| | | | | | | | | | | | | | | | | | | | | | | | | | | | |
| 6 | | | | tbg Technologie- Beteiligungsgesellschaft mbH6) | | | | Bonn | | | | 100.0 | | | | EUR | | | | 1.0000 | | | | 71,878 | | | | 4,705 |
|
C. Joint ventures not included in the consolidated financial statements | | | | | | | | | | |
|
| 7 | | | | Deutsche Energie-Agentur GmbH (dena)5) | | | | Berlin | | | | 26.0 | | | | EUR | | | | 1.0000 | | | | 6,995 | | | | 923 |
|
D. Other shareholdings (only capital shares totalling at least 20%) | | | | | | | | | | |
|
| 8 | | | | Berliner Energieagentur GmbH5) | | | | Berlin | | | | 25.0 | | | | EUR | | | | 1.0000 | | | | 7,937 | | | | 534 |
|
| | | | | | | |
Shareholdings of KfW IPEX-Bank GmbH | | | | | | | | | | | | | | |
|
A. Fully consolidated subsidiaries included in the consolidated financial statements | | | | | | |
|
| 1 | | | | KfW IPEX-Bank Asia Ltd.6) | | | | Singapore, Singapore | | | | 100.0 | | | | SGD | | | | 1.4300 | | | | 16,818 | | | | 1,478 |
|
B. Subsidiaries not included in the consolidated financial statements | | | | | | | | | | |
|
| 2 | | | | Bussard Air Leasing Ltd. i. L.5) | | | | Dublin, Ireland | | | | 100.0 | | | | USD | | | | 1.0666 | | | | –2,152 | | | | 165 |
| | | | | | | | | | | | | | | | | | | | | | | | | | | | |
| 3 | | | | Sperber Rail Holdings Inc.5) | | | | Wilmington, USA | | | | 100.0 | | | | USD | | | | 1.0666 | | | | 456 | | | | 6 |
|
| | | | | | | |
Shareholdings of KfW Beteiligungsholding GmbH | | | | | | | | | | | | | | |
|
A. Fully consolidated subsidiaries included in the consolidated financial statements | | | | | | |
|
| 1 | | | | KfW IPEX-Bank GmbH6) | | | | Frankfurt am Main | | | | 100.0 | | | | EUR | | | | 1.0000 | | | | 3,206,313 | | | | 0 |
| | | | | | | | | | | | | | | | | | | | | | | | | | | | | |
|
179 | KfW Financial Report 2022 Consolidated financial statements | Notes – Other Notes
List of KfW Group shareholdings as of 31 December 2022
| | | | | | | | | | | | | | | | | | | | | | | | | | | | |
| No. | | | | Name | | | | Place | | | | Capital | | | | CC1) | | | | Exchange rate | | | | Equity in | | | | Net income in |
| | | | | | | | | | | | | share | | | | | | | | EUR 1.00 | | | | TCU2), 3) | | | | TCU2), 3) |
| | | | | | | | | | | | | in % | | | | | | | | = CU as of | | | | | | | | |
| | | | | | | | | | | | | | | | | | | | 31 Dec. 20222) | | | | | | | | |
| | | | |
Shareholdings of DEG – Deutsche Investitions- und Entwicklungsgesellschaft mbH | | | | | | | | |
|
A. Subsidiaries not included in the consolidated financial statements | | | | | | | | | | |
|
| 1 | | | | DEG Impact GmbH | | | | Cologne | | | | 100.0 | | | | EUR | | | | 1.0000 | | | | 1,646 | | | | 352 |
| | | | | | | | | | | | | | | | | | | | | | | | | | | | |
| 2 | | | | DEG Impulse GmbH | | | | Cologne | | | | 100.0 | | | | EUR | | | | 1.0000 | | | | 5) | | | | 5) |
|
B. Other shareholdings (only capital shares totalling at least 20%) | | | | | | | | | | |
|
| 3 | | | | Aavishkaar Frontier Fund | | | | Mumbai, India | | | | 20.8 | | | | USD | | | | 1.0666 | | | | 38,100 | | | | –2,102 |
| | | | | | | | | | | | | | | | | | | | | | | | | | | | |
| 4 | | | | AC Capitales Infrastructure Fund II L.P. | | | | Toronto, Canada | | | | 32.4 | | | | USD | | | | 1.0666 | | | | –185 | | | | –1,582 |
| | | | | | | | | | | | | | | | | | | | | | | | | | | | |
| 5 | | | | Ace Power Embilipitiya Pvt Ltd. | | | | Colombo, Sri Lanka | | | | 26.0 | | | | LKR | | | | 391.7555 | | | | 4,435,069 | | | | 254,189 |
| | | | | | | | | | | | | | | | | | | | | | | | | | | | |
| 6 | | | | ACON Latin America Opportunities Fund IV-A, L.P. | | | | Washington, D.C., USA | | | | 39.9 | | | | USD | | | | 1.0666 | | | | 61,643 | | | | –8,402 |
| | | | | | | | | | | | | | | | | | | | | | | | | | | | |
| 7 | | | | Acon Latin America Opportunities Fund-A, L.P. | | | | Washington, USA | | | | 40.0 | | | | USD | | | | 1.0666 | | | | 20,660 | | | | –110 |
| | | | | | | | | | | | | | | | | | | | | | | | | | | | |
| 8 | | | | ACON Retail MXD, L.P. | | | | Toronto, Canada | | | | 100.0 | | | | USD | | | | 1.0666 | | | | 16,724 | | | | –26 |
| | | | | | | | | | | | | | | | | | | | | | | | | | | | |
| 9 | | | | Adobe Social Mezzanine Fund I, L.P. | | | | Mexico City, Mexico | | | | 32.9 | | | | USD | | | | 1.0666 | | | | 5,198 | | | | –3,029 |
| | | | | | | | | | | | | | | | | | | | | | | | | | | | |
| 10 | | | | ADP Enterprises W.L.L. | | | | Manama, Bahrain | | | | 23.3 | | | | EUR | | | | 1.0000 | | | | 187,299 | | | | –37,195 |
| | | | | | | | | | | | | | | | | | | | | | | | | | | | |
| 11 | | | | ADP II Holding 11 S.A.R.L. | | | | Luxembourg, Luxembourg | | | | 22.2 | | | | USD | | | | 1.0666 | | | | 53,878 | | | | 50 |
| | | | | | | | | | | | | | | | | | | | | | | | | | | | |
| 12 | | | | Advent Latin American Private Equity Fund III-B, L.P. | | | | Wilmington, USA | | | | 100.0 | | | | USD | | | | 1.0666 | | | | 575 | | | | –49 |
| | | | | | | | | | | | | | | | | | | | | | | | | | | | |
| 13 | | | | AEP China Hydro Ltd. | | | | Ebène Cyber- City, Mauritius | | | | 30.2 | | | | USD | | | | 1.0666 | | | | 5) | | | | 5) |
| | | | | | | | | | | | | | | | | | | | | | | | | | | | |
| 14 | | | | AfricInvest III – SPV 1 | | | | Port Louis, Mauritius | | | | 21.8 | | | | EUR | | | | 1.0000 | | | | 48,623 | | | | 15,874 |
| | | | | | | | | | | | | | | | | | | | | | | | | | | | |
| 15 | | | | Agrofundo Brasil VI Fundo de Investimento em Participações Multiestratégia | | | | São Paulo, Brazil | | | | 29.9 | | | | BRL | | | | 5.6386 | | | | 53,971 | | | | –10,459 |
| | | | | | | | | | | | | | | | | | | | | | | | | | | | |
| 16 | | | | AO Bucharagips | | | | Kogon, Uzbekistan | | | | 24.9 | | | | UZS | | | | 11,999.2300 | | | | 5) | | | | 5) |
| | | | | | | | | | | | | | | | | | | | | | | | | | | | |
| 17 | | | | Apis Growth 2 Ltd. | | | | Ebène Cyber- City, Mauritius | | | | 25.6 | | | | USD | | | | 1.0666 | | | | 38,777 | | | | –273 |
| | | | | | | | | | | | | | | | | | | | | | | | | | | | |
| 18 | | | | Banque Nationale de Développement Agricole S. A. | | | | Bamako, Mali | | | | 21.4 | | | | XOF | | | | 655.9570 | | | | 73,215,000 | | | | 11,649,000 |
| | | | | | | | | | | | | | | | | | | | | | | | | | | | |
| 19 | | | | BanyanTree Growth Capital, LLC | | | | Ebène Cyber- City, Mauritius | | | | 27.0 | | | | USD | | | | 1.0666 | | | | 33,999 | | | | –292 |
| | | | | | | | | | | | | | | | | | | | | | | | | | | | |
| 20 | | | | Benetex Industries Ltd. | | | | Dhaka, Bangladesh | | | | 28.3 | | | | BDT | | | | 109.9047 | | | | 5) | | | | 5) |
| | | | | | | | | | | | | | | | | | | | | | | | | | | | |
| 21 | | | | Berkeley Energy Wind Mauritius Ltd. | | | | Ebène Cyber- City, Mauritius | | | | 25.8 | | | | EUR | | | | 1.0000 | | | | –14,545 | | | | –26,777 |
| | | | | | | | | | | | | | | | | | | | | | | | | | | | |
| 22 | | | | Catalyst MENA Clean Energy Fund, L.P. | | | | Amman, Jordan | | | | 24.6 | | | | USD | | | | 1.0666 | | | | 43,791 | | | | 7,979 |
| | | | | | | | | | | | | | | | | | | | | | | | | | | | |
| 23 | | | | CGFT Capital Pooling GmbH & Co. KG | | | | Berlin, Germany | | | | 40.0 | | | | EUR | | | | 1.0000 | | | | 5,641 | | | | –393 |
| | | | | | | | | | | | | | | | | | | | | | | | | | | | | |
|
KfW Financial Report 2022 Consolidated financial statements | Notes – Other Notes | 180
List of KfW Group shareholdings as of 31 December 2022
| | | | | | | | | | | | | | | | | | | | | | | | | | | | |
| No. | | | | Name | | | | Place | | | | Capital | | | | CC1) | | | | Exchange rate | | | | Equity in | | | | Net income in |
| | | | | | | | | | | | | share | | | | | | | | EUR 1.00 | | | | TCU2), 3) | | | | TCU2), 3) |
| | | | | | | | | | | | | in % | | | | | | | | = CU as of | | | | | | | | |
| | | | | | | | | | | | | | | | | | | | 31 Dec. 20222) | | | | | | | | |
| | | | | | | |
Shareholdings of DEG – Deutsche Investitions- und Entwicklungsgesellschaft mbH | | | | | | | | | | | | | | |
|
B. Other shareholdings (only capital shares totalling at least 20%) | | | | | | | | | | |
|
| 24 | | | | CoreCo Central America Fund I, L.P. | | | | Wilmington, USA | | | | 22.0 | | | | USD | | | | 1.0666 | | | | 12,832 | | | | –6,782 |
| | | | | | | | | | | | | | | | | | | | | | | | | | | | |
| 25 | | | | Crescera Growth Capital Fund V-A, L.P. | | | | Toronto, Canada | | | | 24.2 | | | | USD | | | | 1.0666 | | | | 5) | | | | 5) |
| | | | | | | | | | | | | | | | | | | | | | | | | | | | |
| 26 | | | | Crescera Investimentos Growth Capital, Fund I-B, L.P. | | | | Wilmington, USA | | | | 20.0 | | | | USD | | | | 1.0666 | | | | 48,072 | | | | –4,524 |
| | | | | | | | | | | | | | | | | | | | | | | | | | | | |
| 27 | | | | Da Vinci Emerging Technologies Fund III L.P. | | | | St. Peter Port, Guernsey | | | | 20.0 | | | | USD | | | | 1.0666 | | | | 5) | | | | 5) |
| | | | | | | | | | | | | | | | | | | | | | | | | | | | |
| 28 | | | | Darby Latin American Private Debt Fund IIIA, L.P. | | | | Toronto, Canada | | | | 37.6 | | | | USD | | | | 1.0666 | | | | 28,565 | | | | 2,116 |
| | | | | | | | | | | | | | | | | | | | | | | | | | | | |
| 29 | | | | ECP Africa Fund IV LLC | | | | Ebène Cyber- City, Mauritius | | | | 34.5 | | | | USD | | | | 1.0666 | | | | 327,378 | | | | –11,194 |
| | | | | | | | | | | | | | | | | | | | | | | | | | | | |
| 30 | | | | Elbrus Capital Fund III B, S.C.Sp. | | | | Luxembourg, Luxembourg | | | | 23.8 | | | | USD | | | | 1.0666 | | | | 5) | | | | 5) |
| | | | | | | | | | | | | | | | | | | | | | | | | | | | |
| 31 | | | | Emerald Sri Lanka Fund I Ltd. | | | | Ebène Cyber- City, Mauritius | | | | 23.5 | | | | USD | | | | 1.0666 | | | | 14,794 | | | | –255 |
| | | | | | | | | | | | | | | | | | | | | | | | | | | | |
| 32 | | | | EMF NEIF I (A), L.P. | | | | Fareham, United Kingdom | | | | 28.1 | | | | USD | | | | 1.0666 | | | | 38,624 | | | | –4,309 |
| | | | | | | | | | | | | | | | | | | | | | | | | | | | |
| 33 | | | | EMX Capital Partners, L.P. | | | | Mexico City, Mexico | | | | 20.1 | | | | USD | | | | 1.0666 | | | | 413 | | | | –16,191 |
| | | | | | | | | | | | | | | | | | | | | | | | | | | | |
| 34 | | | | Evonik Lanxing (Rizhao) Chemical Industrial Co. Ltd. | | | | Rizhao, China | | | | 41.0 | | | | CNY | | | | 7.3582 | | | | 184,601 | | | | 1,359 |
| | | | | | | | | | | | | | | | | | | | | | | | | | | | |
| 35 | | | | Fortio Co. Ltd. | | | | George Town, Grand Cayman, Cayman Islands | | | | 46.2 | | | | USD | | | | 1.0666 | | | | 9,000 | | | | 0 |
| | | | | | | | | | | | | | | | | | | | | | | | | | | | |
| 36 | | | | Frontier Bangladesh II, L.P. | | | | George Town, Cayman Islands | | | | 27.2 | | | | USD | | | | 1.0666 | | | | 25,806 | | | | 7,044 |
| | | | | | | | | | | | | | | | | | | | | | | | | | | | |
| 37 | | | | Grand Bremner Corp Pte. Ltd. | | | | Singapore, Singapore | | | | 24.7 | | | | USD | | | | 1.0666 | | | | 44,990 | | | | –470 |
| | | | | | | | | | | | | | | | | | | | | | | | | | | | |
| 38 | | | | Grassland Finance Ltd. | | | | Hong Kong, Hong Kong | | | | 24.9 | | | | CNY | | | | 7.3582 | | | | 439,896 | | | | 2,714 |
| | | | | | | | | | | | | | | | | | | | | | | | | | | | |
| 39 | | | | Kandeo Fund II (A), L.P. | | | | Bogota, Colombia | | | | 53.1 | | | | USD | | | | 1.0666 | | | | 30,764 | | | | –5,362 |
| | | | | | | | | | | | | | | | | | | | | | | | | | | | |
| 40 | | | | Knauf Gips Buchara OOO | | | | Bukhara, Uzbekistan | | | | 25.0 | | | | USD | | | | 1.0666 | | | | 5) | | | | 5) |
| | | | | | | | | | | | | | | | | | | | | | | | | | | | |
| 41 | | | | Knauf Gypsum Philippines Inc. | | | | Calaca, Philippines | | | | 20.8 | | | | PHP | | | | 59.3200 | | | | 1,250,773 | | | | –155,365 |
| | | | | | | | | | | | | | | | | | | | | | | | | | | | |
| 42 | | | | Landsberg Investments S.L. | | | | Barcelona, Spain | | | | 49.8 | | | | EUR | | | | 1.0000 | | | | 5) | | | | 5) |
| | | | | | | | | | | | | | | | | | | | | | | | | | | | |
| 43 | | | | Lereko Metier REIPPP Fund Trust | | | | Dunkeld, South Africa | | | | 32.3 | | | | ZAR | | | | 18.0986 | | | | 476,290 | | | | 61,556 |
| | | | | | | | | | | | | | | | | | | | | | | | | | | | |
| 44 | | | | Lereko Metier Solafrica Fund I Trust | | | | Johannesburg, South Africa | | | | 47.5 | | | | ZAR | | | | 18.0986 | | | | 203,621 | | | | 13,817 |
| | | | | | | | | | | | | | | | | | | | | | | | | | | | |
| 45 | | | | MC II Pasta Ltd. | | | | Ta’ Xbiex, Malta | | | | 32.2 | | | | EUR | | | | 1.0000 | | | | 5) | | | | 5) |
| | | | | | | | | | | | | | | | | | | | | | | | | | | | | |
|
181 | KfW Financial Report 2022 Consolidated financial statements | Notes – Other Notes
List of KfW Group shareholdings as of 31 December 2022
| | | | | | | | | | | | | | | | | | | | | | | | | | | | |
| No. | | | | Name | | | | Place | | | | Capital | | | | CC1) | | | | Exchange rate | | | | Equity in | | | | Net income in |
| | | | | | | | | | | | | share | | | | | | | | EUR 1.00 | | | | TCU2), 3) | | | | TCU2), 3) |
| | | | | | | | | | | | | in % | | | | | | | | = CU as of | | | | | | | | |
| | | | | | | | | | | | | | | | | | | | 31 Dec. 20222) | | | | | | | | |
| | | | | | | |
Shareholdings of DEG – Deutsche Investitions- und Entwicklungsgesellschaft mbH | | | �� | | | | | | | | | | | |
|
B. Other shareholdings (only capital shares totalling at least 20%) | | | | | | | | | | |
|
| 46 | | | | Metier Retailability en Commandite Partnership | | | | Dunkeld, South Africa | | | | 22.1 | | | | ZAR | | | | 18.0986 | | | | 1,254,830 | | | | 319,140 |
| | | | | | | | | | | | | | | | | | | | | | | | | | | | |
| 47 | | | | Navegar II (Netherlands) B.V. | | | | Amsterdam, Netherlands | | | | 29.2 | | | | USD | | | | 1.0666 | | | | 5) | | | | 5) |
| | | | | | | | | | | | | | | | | | | | | | | | | | | | |
| 48 | | | | Novel Sky Global Limited | | | | Road Town, Brit. Virgin Islands | | | | 25.0 | | | | USD | | | | 1.0666 | | | | 5) | | | | 5) |
| | | | | | | | | | | | | | | | | | | | | | | | | | | | |
| 49 | | | | OAO Belgips | | | | Minsk, Belarus | | | | 50.0 | | | | BYN | | | | 3.5735 | | | | 5) | | | | 5) |
| | | | | | | | | | | | | | | | | | | | | | | | | | | | |
| 50 | | | | Onstar Galaxy SPV Pte. Ltd. | | | | Singapore, Singapore | | | | 33.1 | | | | USD | | | | 1.0666 | | | | 5) | | | | 5) |
| | | | | | | | | | | | | | | | | | | | | | | | | | | | |
| 51 | | | | Operadora de Servicios Mega, S.A. de C.V., SOFOM E.R. | | | | Zapopan, Mexico | | | | 21.9 | | | | MXN | | | | 20.8560 | | | | 2,449,642 | | | | –48,018 |
| | | | | | | | | | | | | | | | | | | | | | | | | | | | |
| 52 | | | | Russia Partners Technology Fund, L.P. | | | | George Town, Cayman Islands | | | | 21.6 | | | | USD | | | | 1.0666 | | | | 245,642 | | | | 3,118 |
| | | | | | | | | | | | | | | | | | | | | | | | | | | | |
| 53 | | | | SEAF Central and Eastern Europe Growth Fund LLC | | | | Wilmington, USA | | | | 23.9 | | | | USD | | | | 1.0666 | | | | 5) | | | | 5) |
| | | | | | | | | | | | | | | | | | | | | | | | | | | | |
| 54 | | | | Sierra Madre Philippines I, L.P. | | | | George Town, Cayman Islands | | | | 20.0 | | | | USD | | | | 1.0666 | | | | 69,569 | | | | 10,578 |
| | | | | | | | | | | | | | | | | | | | | | | | | | | | |
| 55 | | | | Siguler Guff Global Emerging Markets Co-Investment Opportunities (AIF), LP | | | | London, United Kingdom | | | | 100.0 | | | | USD | | | | 1.0666 | | | | 24,919 | | | | 386 |
| | | | | | | | | | | | | | | | | | | | | | | | | | | | |
| 56 | | | | Stratus SCP Fleet Fundo de Investimento em Participaçőes – Multiestratégia | | | | São Paulo, Brazil | | | | 39.7 | | | | BRL | | | | 5.6386 | | | | 81,277 | | | | 32,082 |
| | | | | | | | | | | | | | | | | | | | | | | | | | | | |
| 57 | | | | Stratus SCP II Investors – B LP | | | | São Paulo, Brazil | | | | 75.0 | | | | USD | | | | 1.0666 | | | | 13,960 | | | | –3,904 |
| | | | | | | | | | | | | | | | | | | | | | | | | | | | |
| 58 | | | | Takura II Feeder Fund Partnership | | | | Cape Town, South Africa | | | | 25.0 | | | | USD | | | | 1.0666 | | | | 45,968 | | | | –21 |
| | | | | | | | | | | | | | | | | | | | | | | | | | | | |
| 59 | | | | Tolstoi Investimentos S.A. | | | | São Paulo, Brazil | | | | 31.1 | | | | BRL | | | | 5.6386 | | | | 5) | | | | 5) |
| | | | | | | | | | | | | | | | | | | | | | | | | | | | |
| 60 | | | | TOO Isi Gips Inder | | | | Inderborskij, Kazakhstan | | | | 40.0 | | | | KZT | | | | 493.7700 | | | | 5) | | | | 5) |
| | | | | | | | | | | | | | | | | | | | | | | | | | | | |
| 61 | | | | TOO Knauf Gips Kaptschagaj. Enterprise with share of DEG LLP | | | | Kapchagay, Kazakhstan | | | | 40.0 | | | | KZT | | | | 493.7700 | | | | 5) | | | | 5) |
| | | | | | | | | | | | | | | | | | | | | | | | | | | | |
| 62 | | | | Triple P SEA Financial Inclusion Fund LP | | | | Singapore, Singapore | | | | 25.2 | | | | USD | | | | 1.0666 | | | | 52,637 | | | | –464 |
| | | | | | | | | | | | | | | | | | | | | | | | | | | | |
| 63 | | | | VI (Vietnam Investments) Fund IV, L.P. | | | | George Town, Cayman Islands | | | | 21.4 | | | | USD | | | | 1.0666 | | | | 5) | | | | 5) |
| | | | | | | | | | | | | | | | | | | | | | | | | | | | |
| 64 | | | | Vietnam Opportunity Fund II PTE. LTD. | | | | Singapore, Singapore | | | | 32.0 | | | | USD | | | | 1.0666 | | | | 33,142 | | | | 3,037 |
| | | | | | | | | | | | | | | | | | | | | | | | | | | | |
| 65 | | | | Vinci Impact and Return IV A, LP | | | | Toronto, Canada | | | | 51.8 | | | | USD | | | | 1.0666 | | | | 4,280 | | | | –937 |
| | | | | | | | | | | | | | | | | | | | | | | | | | | | |
| 66 | | | | Whitlam Holding PTE. Ltd. | | | | Singapore, Singapore | | | | 38.7 | | | | USD | | | | 1.0666 | | | | 65,636 | | | | 9,312 |
| | | | | | | | | | | | | | | | | | | | | | | | | | | | | |
|
KfW Financial Report 2022 Consolidated financial statements | Notes – Other Notes | 182
List of KfW Group shareholdings as of 31 December 2022
| | | | | | | | | | | | | | | | | | | | | | | | | | | | |
| No. | | | | Name | | | | Place | | | | Capital | | | | CC1) | | | | Exchange rate | | | | Equity in | | | | Net income in |
| | | | | | | | | | | | | share | | | | | | | | EUR 1.00 | | | | TCU2), 3) | | | | TCU2), 3) |
| | | | | | | | | | | | | in % | | | | | | | | = CU as of | | | | | | | | |
| | | | | | | | | | | | | | | | | | | | 31 Dec. 20222) | | | | | | | | |
| | | | | | | |
Shareholdings of DEG – Deutsche Investitions- und Entwicklungsgesellschaft mbH | | | | | | | | | | | | | | |
|
B. Other shareholdings (only capital shares totalling at least 20%) | | | | | | | | | | |
|
| 67 | | | | Worldwide Group, Inc | | | | Charlestown, Saint Kitts and Nevis | | | | 33.4 | | | | USD | | | | 1.0666 | | | | 25,762 | | | | –651 |
| | | | | | | | | | | | | | | | | | | | | | | | | | | | |
| 68 | | | | wpd Duqueco S.p.A. | | | | Santiago de Chile, Chile | | | | 24.5 | | | | USD | | | | 1.0666 | | | | 17,487 | | | | –83 |
| | | | | | | | | | | | | | | | | | | | | | | | | | | | |
| 69 | | | | wpd Malleco S.p.A. | | | | Santiago Providencia, Chile | | | | 24.5 | | | | MUR | | | | 46.9050 | | | | 88,781 | | | | 13,356 |
| | | | | | | | | | | | | | | | | | | | | | | | | | | | |
| 70 | | | | wpd Negrete S.p.A. | | | | Santiago de Chile, Chile | | | | 24.5 | | | | USD | | | | 1.0666 | | | | 13,189 | | | | 2,235 |
|
| | | | | | | |
Shareholdings of Interkonnektor GmbH | | | | | | | | | | | | | | |
|
A. Joint ventures included in the consolidated financial statements | | | | | | | | | | |
|
| 1 | | | | DC Nordseekabel GmbH & Co. KG | | | | Bayreuth | | | | 50.0 | | | | EUR | | | | 1.0000 | | | | 805,532 | | | | 30,463 |
|
B. Joint ventures not included in the consolidated financial statements | | | | | | | | | | |
|
| 2 | | | | DC Nordseekabel Beteiligungs GmbH | | | | Bayreuth | | | | 50.0 | | | | EUR | | | | 1.0000 | | | | 69 | | | | 2 |
|
| | | | | | | |
Shareholdings of KfW Capital GmbH & Co. KG | | | | | | | | | | | | | | |
|
A. Subsidiaries not included in the consolidated financial statements | | | | | | | | | | |
|
| 1 | | | | KfW Capital Verwaltungs GmbH | | | | Frankfurt am Main | | | | 100.0 | | | | EUR | | | | 1.0000 | | | | 40 | | | | 1 |
| | | | | | | | | | | | | | | | | | | | | | | | | | | | | |
|
| 2) | CU = currency units in local currency; TCU = thousand currency units in local currency |
| 3) | Financial statements prepared in accordance with local financial reporting framework |
| 4) | The company is in the start-up phase, no annual financial statements have been prepared yet. |
| 5) | No current annual financial statements are available. |
| 6) | Preliminary data is available as of 31 December 2022. |
| The | data is based on the most recent annual financial statements of the investee (where available). |
(75) Events after the balance sheet date
No events of particular impact on KfW’s net assets, financial and earnings position occurred after the end of the financial year (as of 9 March 2023, date of Executive Board approval of publication).
183 | KfW Financial Report 2022 Consolidated financial statements | Notes – Other Notes
Frankfurt am Main, 28 February 2023
KfW
The Executive Board

Stefan Wintels
(Chief Executive Officer)
| | |

| |  |
| |
Melanie Kehr | | Christiane Laibach |
| | |
 | |  |
Bernd Loewen | | Dr Stefan Peiß |
KfW Financial Report 2022 Consolidated financial statements | Notes – Other Notes | 184
185 | KfW Financial Report 2022 Consolidated financial statements | Notes – Other Notes

Attestations Responsibility statement 187 Independent auditor’s report 188
Responsibility statement
To the best of our knowledge, and in accordance with the applicable accounting principles, the consolidated financial statements give a true and fair view of the net assets, financial position and results of operations of KfW Group, and the combined management report includes a fair review of the development and performance of the business and the position of KfW Group, together with a description of the principal risks and rewards associated with the expected development of KfW Group.
Frankfurt am Main, 28 February 2023
KfW
The Executive Board
Stefan Wintels
(Chief Executive Officer)
| | |
| | |
Melanie Kehr | | Christiane Laibach |
| | |
Bernd Loewen | | Dr Stefan Peiß |
187 | KfW Financial Report 2022 Consolidated financial statements | Attestations – Responsibility statement
Independent auditor’s report1)
To Kreditanstalt für Wiederaufbau Anstalt des öffentlichen Rechts, Frankfurt am Main/Germany
REPORT ON THE AUDIT OF THE CONSOLIDATED FINANCIAL STATEMENTS AND OF THE COMBINED MANAGEMENT REPORT
Audit Opinions
We have audited the consolidated financial statements of Kreditanstalt für Wiederaufbau Anstalt des öffentlichen Rechts, Frankfurt am Main/Germany, and its subsidiaries (the Group), which comprise the statement of financial position as at 31 December 2022, the statement of comprehensive income, the statement of changes in equity and the statement of cash flows for the financial year from 1 January to 31 December 2022, and the notes to the consolidated financial statements, including a summary of significant accounting policies. In addition, we have audited the combined management report of Kreditanstalt für Wiederaufbau Anstalt des öffentlichen Rechts, Frankfurt am Main/Germany, for the financial year from 1 January to 31 December 2022. In accordance with the German legal requirements, we have not audited the content of the separate combined non-financial report of KfW as the parent company and the group in accordance with Section 289b (3), Sections 315c in conjunction with 289b (3) German Commercial Code (HGB), which is in turn part of the sustainability report of KfW Group and which is referred to in the section “Non-financial statement” of the combined management report, nor the other parts of the sustainability report.
In our opinion, on the basis of the knowledge obtained in the audit,
| | • | | the accompanying consolidated financial statements comply, in all material respects, with the IFRS as adopted by the EU and the additional requirements of German commercial law pursuant to Section 315e (1) HGB and, in compliance with these requirements, give a true and fair view of the assets, liabilities and financial position of the Group as at 31 December 2022 and of its financial performance for the financial year from 1 January to 31 December 2022, and |
| | • | | the accompanying combined management report as a whole provides an appropriate view of the Group’s position. In all material respects, this combined management report is consistent with the consolidated financial statements, complies with German legal requirements and appropriately presents the opportunities and risks of future development. Our audit opinion on the combined management report does not cover the content of the above-mentioned combined non-financial report of KfW as the parent company and the group in accordance with Section 289b (3), Sections 315c in conjunction with 289b (3) HGB, nor the other parts of the sustainability report of KfW Group. |
Pursuant to Section 322 (3) sentence 1 HGB, we declare that our audit has not led to any reservations relating to the legal compliance of the consolidated financial statements and of the combined management report.
| | 1) | Translation – German version prevails |
KfW Financial Report 2022 Consolidated financial statements | Attestations – Independent auditor’s report | 188
Basis for the Audit Opinions
We conducted our audit of the consolidated financial statements and of the combined management report in accordance with Section 317 HGB and in compliance with German Generally Accepted Standards for Financial Statement Audits promulgated by the Institut der Wirtschaftsprüfer (IDW). Our responsibilities under those requirements and principles are further described in the “Auditor’s Responsibilities for the Audit of the Consolidated Financial Statements and of the Combined Management Report” section of our auditor’s report. We are independent of the group entities in accordance with the requirements of German commercial and professional law, and we have fulfilled our other German professional responsibilities in accordance with these requirements. We believe that the audit evidence we have obtained is sufficient and appropriate to provide a basis for our audit opinions on the consolidated financial statements and on the combined management report.
Other information
The executive directors and/or the board of supervisory directors are responsible for the other information. The other information comprises
| | • | | the separate combined non-financial report of KfW as the parent company and the group in accordance with Section 289b (3), Sections 315c in conjunction with 289b (3) HGB, which is in turn part of the sustainability report of KfW Group and which is referred to in the section “Non-financial statement” of the combined management report, and which is expected to be presented to us after the date of this auditor’s report, |
| | • | | the corporate governance report, which also includes the “Declaration of compliance”, which is referred to in the section “Declaration of compliance” in the combined management report and which is expected to be presented to us after the date of this auditor’s report, |
| | • | | the executive directors’ confirmation regarding the consolidated financial statements and the combined management report pursuant to Section 297 (2) sentence 4 and Section 315 (1) sentence 5 HGB, and |
| | • | | all other parts of the annual report, |
| | • | | but not the consolidated financial statements, not the audited content of the combined management report and not our auditor’s report thereon. |
The board of supervisory directors is responsible for the report of the board of supervisory directors. In accordance with Section 19 of the KfW Bylaws, the executive directors and the board of supervisory directors are required to annually declare that they recognise the Federal Public Corporate Governance Code as amended and to publish the declaration of compliance as part of the corporate governance report. Otherwise, the executive directors are responsible for the other information.
Our audit opinions on the consolidated financial statements and on the combined management report do not cover the other information, and consequently we do not express an audit opinion or any other form of assurance conclusion thereon.
In connection with our audit, our responsibility is to read the other information identified above and, in doing so, to consider whether the other information
189 | KfW Financial Report 2022 Consolidated financial statements | Attestations – Independent auditor’s report
| | • | | is materially inconsistent with the consolidated financial statements, with the audited content of the combined management report or our knowledge obtained in the audit, or |
| | • | | otherwise appears to be materially misstated. |
Responsibilities of the Executive Directors and the Board of Supervisory Directors for the Consolidated Financial Statements and the Combined Management Report
The executive directors are responsible for the preparation of the consolidated financial statements that comply, in all material respects, with IFRS as adopted by the EU and the additional requirements of German commercial law pursuant to Section 315e (1) HGB, and that the consolidated financial statements, in compliance with these requirements, give a true and fair view of the assets, liabilities, financial position and financial performance of the Group. In addition, the executive directors are responsible for such internal control as they have determined necessary to enable the preparation of consolidated financial statements that are free from material misstatement, whether due to fraud (i.e., fraudulent financial reporting and misappropriation of assets) or error.
In preparing the consolidated financial statements, the executive directors are responsible for assessing the Group’s ability to continue as a going concern. They also have the responsibility for disclosing, as applicable, matters related to going concern. In addition, they are responsible for financial reporting based on the going concern basis of accounting unless there is an intention to liquidate the Group or to cease operations, or there is no realistic alternative but to do so.
Furthermore, the executive directors are responsible for the preparation of the combined management report that as a whole provides an appropriate view of the Group’s position and is, in all material respects, consistent with the consolidated financial statements, complies with German legal requirements, and appropriately presents the opportunities and risks of future development. In addition, the executive directors are responsible for such arrangements and measures (systems) as they have considered necessary to enable the preparation of a combined management report that is in accordance with the applicable German legal requirements, and to be able to provide sufficient appropriate evidence for the assertions in the combined management report.
The board of supervisory directors is responsible for overseeing the Group’s financial reporting process for the preparation of the consolidated financial statements and of the combined management report.
The Board of Supervisory Directors is responsible for overseeing the Group’s financial reporting process for the preparation of the consolidated financial statements and of the group management report.
Auditor’s Responsibilities for the Audit of the Consolidated Financial Statements and of the Combined Management Report
Our objectives are to obtain reasonable assurance about whether the consolidated financial statements as a whole are free from material misstatement, whether due to fraud or error, and whether the combined management report as a whole provides an appropriate view of the Group’s position and, in all material respects, is consistent with the consolidated financial statements and the knowledge obtained in the audit, complies with the German legal requirements and appropriately presents the opportunities and risks of future development, as well as to issue an auditor’s report that includes our audit opinions on the consolidated financial statements and on the combined management report.
KfW Financial Report 2022 Consolidated financial statements | Attestations – Independent auditor’s report | 190
Reasonable assurance is a high level of assurance, but is not a guarantee that an audit conducted in accordance with Section 317 HGB and in compliance with German Generally Accepted Standards for Financial Statement Audits promulgated by the Institut der Wirtschaftsprüfer (IDW) will always detect a material misstatement. Misstatements can arise from fraud or error and are considered material if, individually or in the aggregate, they could reasonably be expected to influence the economic decisions of users taken on the basis of these consolidated financial statements and this combined management report.
We exercise professional judgement and maintain professional scepticism throughout the audit. We also
| | • | | identify and assess the risks of material misstatement of the consolidated financial statements and of the combined management report, whether due to fraud or error, design and perform audit procedures responsive to those risks, and obtain audit evidence that is sufficient and appropriate to provide a basis for our audit opinions. The risk of not detecting a material misstatement resulting from fraud is higher than the risk of not detecting a material misstatement resulting from error, as fraud may involve collusion, forgery, intentional omissions, misrepresentations, or the override of internal controls. |
| | • | | obtain an understanding of internal control relevant to the audit of the consolidated financial statements and of arrangements and measures relevant to the audit of the combined management report in order to design audit procedures that are appropriate in the circumstances, but not for the purpose of expressing an audit opinion on the effectiveness of these systems. |
| | • | | evaluate the appropriateness of accounting policies used by the executive directors and the reasonableness of estimates made by the executive directors and related disclosures. |
| | • | | conclude on the appropriateness of the executive directors’ use of the going concern basis of accounting and, based on the audit evidence obtained, whether a material uncertainty exists related to events or conditions that may cast significant doubt on the Group’s ability to continue as a going concern. If we conclude that a material uncertainty exists, we are required to draw attention in the auditor’s report to the related disclosures in the consolidated financial statements and in the combined management report or, if such disclosures are inadequate, to modify our respective audit opinions. Our conclusions are based on the audit evidence obtained up to the date of our auditor’s report. However, future events or conditions may cause the Group to cease to be able to continue as a going concern. |
| | • | | evaluate the overall presentation, structure and content of the consolidated financial statements, including the disclosures, and whether the consolidated financial statements present the underlying transactions and events in a manner that the consolidated financial statements give a true and fair view of the assets, liabilities, financial position and financial performance of the Group in compliance with IFRS as adopted by the EU and with the additional requirements of German commercial law pursuant to Section 315e (1) HGB. |
| | • | | obtain sufficient appropriate audit evidence regarding the financial information of the entities or business activities within the Group to express audit opinions on the consolidated financial statements and on the combined management report. We are responsible for the direction, supervision and performance of the group audit. We remain solely responsible for our audit opinions. |
| | • | | evaluate the consistency of the combined management report with the consolidated financial statements, its conformity with German law, and the view of the Group’s position it provides. |
191 | KfW Financial Report 2022 Consolidated financial statements | Attestations – Independent auditor’s report
| | • | | perform audit procedures on the prospective information presented by the executive directors in the combined management report. On the basis of sufficient appropriate audit evidence we evaluate, in particular, the significant assumptions used by the executive directors as a basis for the prospective information, and evaluate the proper derivation of the prospective information from these assumptions. We do not express a separate audit opinion on the prospective information and on the assumptions used as a basis. There is a substantial unavoidable risk that future events will differ materially from the prospective information. |
We communicate with those charged with governance regarding, among other matters, the planned scope and timing of the audit and significant audit findings, including any significant deficiencies in internal control that we identify during our audit.
OTHER LEGAL AND REGULATORY REQUIREMENTS
Report on the Audit of the Electronic Reproductions of the Consolidated Financial Statements and of the Combined Management Report Prepared for Publication Pursuant to Section 317 (3a) HGB
Audit Opinion
We have performed an audit in accordance with Section 317 (3a) HGB to obtain reasonable assurance whether the electronic reproductions of the consolidated financial statements and of the combined management report (hereinafter referred to as “ESEF documents”) prepared for publication, contained in the file, which has the SHA-256 value 15a2b4c9f7b663a7979019912bd2d407fc98ab82476bbdd05c641b644c2bdf85, meet, in all material respects, the requirements for the electronic reporting format pursuant to Section 328 (1) HGB (“ESEF format”). In accordance with the German legal requirements, this audit only covers the conversion of the information contained in the consolidated financial statements and the combined management report into the ESEF format, and therefore covers neither the information contained in these electronic reproductions nor any other information contained in the file identified above.
In our opinion, the electronic reproductions of the consolidated financial statements and of the combined management report prepared for publication contained in the file identified above meet, in all material respects, the requirements for the electronic reporting format pursuant to Section 328 (1) HGB. Beyond this audit opinion and our audit opinions on the accompanying consolidated financial statements and on the accompanying combined management report for the financial year from 1 January to 31 December 2022 contained in the “Report on the Audit of the Consolidated Financial Statements and of the Combined Management Report” above, we do not express any assurance opinion on the information contained within these electronic reproductions or on any other information contained in the file identified above.
Basis for the Audit Opinion
We conducted our audit of the electronic reproductions of the consolidated financial statements and of the combined management report contained in the file identified above in accordance with Section 317 (3a) HGB and on the basis of the IDW Auditing Standard: Audit of the Electronic Reproductions of Financial Statements and Management Reports Prepared for Publication Purposes Pursuant to Section 317 (3a) HGB (IDW AuS 410 (06.2022)). Our responsibilities in this context are further described in the “Group Auditor’s Responsibilities for the Audit of the ESEF Documents” section. Our audit firm has applied the IDW Standard on Quality Management: Requirements for Quality Management in the Audit Firm (IDW QS 1).
KfW Financial Report 2022 Consolidated financial statements | Attestations – Independent auditor’s report | 192
Responsibilities of the Executive Directors and the Board of Supervisory Directors for the ESEF Documents
The executive directors of the parent are responsible for the preparation of the ESEF documents based on the electronic files of the consolidated financial statements and of the combined management report according to Section 328 (1) sentence 4 no. 1 HGB and for the tagging of the consolidated financial statements according to Section 328 (1) sentence 4 no. 2 HGB.
In addition, the executive directors of the parent are responsible for such internal controls that they have considered necessary to enable the preparation of ESEF documents that are free from material intentional or unintentional non-compliance with the requirements for the electronic reporting format pursuant to Section 328 (1) HGB.
The board of supervisory directors is responsible for overseeing the process for preparing the ESEF documents as part of the financial reporting process.
Group Auditor’s Responsibilities for the Audit of the ESEF Documents
Our objective is to obtain reasonable assurance about whether the ESEF documents are free from material intentional or unintentional non-compliance with the requirements of Section 328 (1) HGB. We exercise professional judgement and maintain professional scepticism throughout the audit. We also
| | • | | identify and assess the risks of material intentional or unintentional non-compliance with the requirements of Section 328 (1) HGB, design and perform audit procedures responsive to those risks, and obtain audit evidence that is sufficient and appropriate to provide a basis for our audit opinion. |
| | • | | obtain an understanding of internal control relevant to the audit on the ESEF documents in order to design audit procedures that are appropriate in the circumstances, but not for the purpose of expressing an assurance opinion on the effectiveness of these controls. |
| | • | | evaluate the technical validity of the ESEF documents, i.e. whether the file containing the ESEF documents meets the requirements of the Delegated Regulation (EU) 2019/815, in the version in force at the reporting date, on the technical specification for this electronic file. |
| | • | | evaluate whether the ESEF documents enable a XHTML reproduction with content equivalent to the audited consolidated financial statements and to the audited combined management report. |
| | • | | evaluate whether the tagging of the ESEF documents with Inline XBRL technology (iXBRL) in accordance with the requirements of Articles 4 and 6 of the Delegated Regulation (EU) 2019/815, in the version in force at the reporting date, enables an appropriate and complete machine-readable XBRL copy of the XHTML reproduction. |
193 | KfW Financial Report 2022 Consolidated financial statements | Attestations – Independent auditor’s report
OTHER MATTER – USE OF THE AUDITOR’S REPORT
Our auditor’s report must always be read together with the audited consolidated financial statements and the audited combined management report as well as with the audited ESEF documents. The consolidated financial statements and the combined management report converted into the ESEF format – including the versions to be submitted for inclusion in the Company Register – are merely electronic reproductions of the audited consolidated financial statements and the audited combined management report and do not take their place. In particular, the ESEF report and our audit opinion contained therein are to be used solely together with the audited ESEF documents made available in electronic form.
Frankfurt am Main/Germany, 9 March 2023
Deloitte GmbH
Wirtschaftsprüfungsgesellschaft
| | | | |
| Signed: | | Signed: | | |
| Prof. Dr Carl-Friedrich Leuschner | | Christian Schweitzer | | |
| Wirtschaftsprüfer | | Wirtschaftsprüfer | | |
| (German Public Auditor) | | (German Public Auditor) | | |
KfW Financial Report 2022 Consolidated financial statements | Attestations – Independent auditor’s report | 194