As filed with the Securities and Exchange Commission on June 8, 2009
UNITED STATES
SECURITIES AND EXCHANGE COMMISSION
Washington, D.C. 20549
FORM N-CSR
CERTIFIED SHAREHOLDER REPORT OF REGISTERED
MANAGEMENT INVESTMENT COMPANIES
Investment Company Act file number (811-05339)
Concorde Funds, Inc.
(Exact name of registrant as specified in charter)
1000 Three Lincoln Centre
5430 LBJ Freeway LB3
Dallas, TX 75240-2650
(Address of principal executive offices) (Zip code)
Gary B. Wood
1000 Three Lincoln Centre, 5430 LBJ Freeway LB3, Dallas, TX 75240-2650
(Name and address of agent for service)
(972)-701-5400
Registrant's telephone number, including area code
Date of fiscal year end: 09/30/2009
Date of reporting period: 03/31/2009
Item 1. Reports to Stockholders.
A NO-LOAD
MUTUAL FUND
SEMI-ANNUAL REPORT
Dated March 31, 2009
May 15, 2009
Dear Shareholders,
We are pleased to present the Semi-Annual report of Concorde Funds, Inc. for the six month period ending March 31, 2009.
Concorde Value Fund
Concorde Value Fund, managed by Concorde Investment Management, incurred a total return loss including capital gains distribution in December 2008 of -34.41% for the first half of fiscal year ending September 30, 2009. As seen below, this dismal performance tracks closely the broad domestic indices. The broad and negative impact of the global financial crises, which reached crescendo during that period, impacted virtually all sectors and markets uniformly and indiscriminately.
| | | Six Months Ended | Annualized | Annualized | Annualized |
| | | 03/31/09 | 1 Year Ending | 5 Years Ending | 10 Years Ending |
| | | (Unaudited) | 03/31/2009 | 03/31/2009 | 03/31/2009 |
| | Concorde Value Fund | -34.41% | -43.16% | -6.78% | -1.07% |
| | Russell 3000 Value Total Return | -35.60% | -42.14% | -4.97% | -0.24% |
| | S&P 500 | -30.54% | -38.09% | -4.76% | -3.00% |
| | Russell 2000 | -37.17% | -37.50% | -5.24% | 1.93% |
| | Lipper Multi-Cap Value | -30.44% | -38.70% | -5.42% | -0.02% |
| | Wilshire 4500 | -33.35% | -38.69% | -3.78% | 0.68% |
| | NASDAQ | -25.98% | -32.07% | -4.57% | -4.41% |
This six month period incurred the most volatile and significant market selling waves of the bear market that began in the fall of 2007. As has been well documented, the financial crisis that began with the US residential real estate market spread through to major financial institutions and ultimately to the general economy as a result of a severe credit crunch and asset price devaluations. This period contained parts of two significant sell offs from September through late November and from early January through early March. The broad market rallied briefly but strongly in December and also through most of March into the beginning of the second half of the Fund fiscal year in April.
Among the sectors with the largest fund allocations, Capital Goods and Media had the worst returns. Terex, General Electric and Textron suffered significant losses as the realization of the worldwide impact of the slowdown was recognized in sudden loss of business and backlogs. General Electric and Textron were also impacted by their financial subsidiaries and the significant drain that the liquidity crunch and credit risks has on their portfolios. The Fund exited these two positions before period end as near term prospects appear dismal even at the adjusted stock prices. In the Media group, all three holdings — Comcast, Walt Disney and Live Nation — dropped significantly as prospects for the domestic consumer have dropped. We believe Disney and Live Nation have business models and franchises that should hold up relatively well even in a severe recession and will meaningfully recover over time. Live Nation is in discussions with Ticketmaster to merge and, if consummated, would create a very strong entertainment business.
Two sectors with significant Fund allocations which incurred smaller than overall fund losses were Software and Services and Technology Hardware. Fiserv and Oracle dropped moderately as their company performance reported so far during the recession show strong resistance to weak business trends. The franchise products and defensive posture of these businesses is rewarding shareholders at this time. We continue to hold and add to those positions along with EMC Corp. which has similar characteristics in the technology hardware industry. Dell, Inc. and Diebold have held up the best among the remaining hardware holdings as Agilent had the weakest relative performance. We continued to hold all of these positions at period end.
All three of the Fund’s Energy holdings dropped significantly as energy commodity prices dropped from highs reached in mid 2008. We have sold Cimarex Energy during the period to focus and add to the newer ConocoPhillips holding and our long term Devon Energy position. Current valuations in these equities do not recognize the quality assets, much less the potential as prices likely rise even modestly over the next several years.
Two stocks that did produce gains during the period are relatively new holdings: Travelers Companies and Potash Corporation of Saskatchewan. Travelers is the large property and casualty insurer that is benefiting from maintaining a very conservative investment portfolio unlike many competitors. They should be in good position to increase yield in their investments and also take advantage of weaker competition and a potentially firming premium pricing environment. Potash is a dominant fertilizer producer in the world and the bear market produced a very attractive entry point for the Fund despite lower pricing for its product. Long term trends point toward favorable pricing with potential for significant earnings gains and price appreciation from current levels.
The Fund registered mixed results in the two diversified financials holdings, a sector which has borne the brunt of the market weakness. Bank New York Mellon, a relatively new holding, held up well as the market correctly perceived that this firm derives revenue and profit primarily from corporate and trust custody and processing. The money management portion of the business has taken a hit with the equity and credit market weakness. CIT Group, a focused commercial lender, is a new holding that we think is ahead of many other financials in shoring up their balance sheet; however, the stock has fallen substantially after our initial purchases which were taken well below recent highs. We continue to hold both of these financials which have long term entrenched positions in their specialties.
Quest Diagnostics and Johnson & Johnson, two large holdings with business units in primarily defensive products and services, performed well on a relative basis although still dropping in price. We believe both should excel in whatever healthcare regulatory environment evolves with the new shift in political power at the Federal level.
Three holdings which are sensitive to economic activity and yet have very strong franchise type industry positions are United Parcel Service, Lowes Companies and Waste Management. The stock performance of these three holdings all held up better than the overall Fund for the period. UPS has certainly reported lower business activity so far during the recession, but has the financial strength to continue building systems and infrastructure to benefit when the inevitable worldwide trade growth resumes. Waste Management has seen a slowdown, particularly related to residential and commercial construction, but is managing for profitability and cash flow and continues to maximize its dominant domestic position with ownership of scarce landfill assets. Lowes, which we purchased initially two
years ago at prices close to current levels, is still reporting relatively weak sales but continues to produce good cash flow and is in a position to gain share from weaker competitors and benefit when business eventually picks up.
Hanesbrands was a new holding earlier in 2008 and was marked down rapidly as the market has expressed concern with all companies with significant debt on the balance sheet. Hanesbrands has recently addressed debt covenant issues and reassured investors with solid results during the recession and projections of excellent cash flow and debt paydowns for 2009. The stock has reacted favorably to this in recent months and we believe has significant upside.
Lastly, General Mills is a new holding which is a good example, along with Travelers and ConocoPhillips, of very high quality companies which have become available at excellent valuations as a result of the market weakness. Business at General Mills has held up well as might be expected in a weak economy but we believe has above average growth potential for its industry as a result of strong positions in healthy snacks and yogurt (Yoplait) and potential leverage from weakness in raw materials costs. The stock also has a significant dividend yield at current market prices, with potential for growth.
In summary, recent history was both challenging and disappointing to all managers, regardless of style or approach. The widespread and indiscriminate decline in the valuations of most publicly traded companies, good and bad, was unique in its uniformity and abruptness. In spite of the mostly defensive characteristics of Concorde’s value-based methodology, the Fund suffered the same fate as most indices. That said, one unique period does not discredit our style and approach, and we will stay the course in search of good returns and a defensive and less volatile performance.
Thank you for your continued support. We will continue to strive for the highest professional standards of performance and stewardship in the management of the Value Fund.
| | Best regards, |
| | |
| |  |
| | |
| | Gary B. Wood, Ph.D. |
| | President |
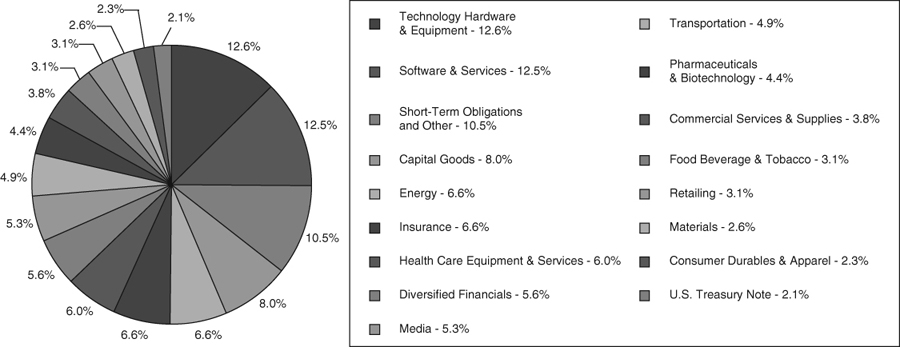
Portfolio Holdings by Sector at March 31, 2009 (Unaudited)
The portfolio’s holdings and allocations are subject to change. The percentages are of net assets as of March 31, 2009.
FUND EXPENSES (Unaudited)
As a shareholder of the FUND, you incur two types of costs: (1) transaction costs and exchange fees; and (2) ongoing costs, including management fees and other FUND expenses. This Example is intended to help you understand your ongoing costs (in dollars) of investing in the FUND and to compare these costs with the ongoing costs of investing in other mutual funds.
The Example is based on an investment of $1,000 invested at the beginning of the period and held for the entire six month period ended March 31, 2009.
Actual Expenses
The first line of the table below provides information about actual account values and actual expenses. You may use the information in this line, together with the amount you invested, to estimate the expenses that you paid over the period. Simply divide your account value by $1,000 (for example, an $8,600 account value divided by $1,000 = 8.6), then multiply the result by the number in the first line under the heading entitled “Expenses Paid During Period” to estimate the expenses you paid on your account during this period.
Hypothetical Example for Comparison Purposes
The second line of the table below provides information about hypothetical account values and hypothetical expenses based on the FUND’s actual expense ratio and an assumed rate of return of 5% per year before expenses, which is not the FUND’s actual return. The hypothetical account values and expenses may not be used to estimate the actual ending account balance or expenses you paid for the period. You may use this information to compare the ongoing costs of investing in the FUND and other funds. To do so, compare this 5% hypothetical example with the 5% hypothetical examples that appear in the shareholder reports of the other funds.
Please note that the expenses shown in the table are meant to highlight your ongoing costs only and do not reflect any transactional costs or exchange fees. While the FUND does not currently assess sales charges, redemption or exchange fees, other funds do, and those costs will not be reflected in their expense tables. Therefore, the second line of the table is useful in comparing ongoing costs only, and will not help you determine the relative total costs of owning different funds.
| | Beginning Account | Ending Account | Expenses Paid During Period* – |
| | Value – 10/1/08 | Value – 3/31/09 | Six Months Ended 3/31/09 |
| Actual | $1,000.00 | $655.90 | $8.60 |
| Hypothetical (5% return before expenses) | $1,000.00 | $1,014.55 | $10.46 |
| * | Expenses are equal to the FUND’s annualized expense ratio of 2.082%, multiplied by the average account value over the period, multiplied by 182/365 (to reflect the one-half year period ended March 31, 2009). |
SCHEDULE OF INVESTMENTS IN SECURITIES
March 31, 2009 (Unaudited)
| | | Shares or | | | | | | | |
| | | Principal | | | | | | Percent of | |
| | | Amount | | | Value | | | Net Assets | |
| COMMON STOCKS - 87.34% | | | | | | | | | |
| CAPITAL GOODS | | | | | | | | | |
| CAE, Inc. (b) | | | 45,700 | | | $ | 278,313 | | | | 2.93 | % |
| Deere & Co. | | | 9,000 | | | | 295,830 | | | | 3.12 | |
| Terex Corp. (a) | | | 20,000 | | | | 185,000 | | | | 1.95 | |
| | | | | | | | 759,143 | | | | 8.00 | |
| COMMERCIAL SERVICES & SUPPLIES | | | | | | | | | | | | |
| Waste Management, Inc. | | | 14,000 | | | | 358,400 | | | | 3.77 | |
| | | | | | | | | | | | | |
| CONSUMER DURABLES & APPAREL | | | | | | | | | | | | |
| Hanesbrands, Inc. (a) | | | 23,000 | | | | 220,110 | | | | 2.32 | |
| | | | | | | | | | | | | |
| DIVERSIFIED FINANCIALS | | | | | | | | | | | | |
| Bank of New York Mellon Corp. | | | 12,000 | | | | 339,000 | | | | 3.57 | |
| CIT Group, Inc. | | | 66,500 | | | | 189,525 | | | | 2.00 | |
| | | | | | | | 528,525 | | | | 5.57 | |
| ENERGY | | | | | | | | | | | | |
| ConocoPhillips | | | 10,800 | | | | 422,928 | | | | 4.45 | |
| Devon Energy Corp. | | | 4,500 | | | | 201,105 | | | | 2.12 | |
| | | | | | | | 624,033 | | | | 6.57 | |
| FOOD BEVERAGE & TOBACCO | | | | | | | | | | | | |
| General Mills, Inc. | | | 6,000 | | | | 299,280 | | | | 3.15 | |
| | | | | | | | | | | | | |
| HEALTH CARE EQUIPMENT & SERVICES | | | | | | | | | | | | |
| Quest Diagnostics | | | 12,000 | | | | 569,760 | | | | 6.00 | |
| | | | | | | | | | | | | |
| INSURANCE | | | | | | | | | | | | |
| Delphi Financial Group | | | 16,500 | | | | 222,090 | | | | 2.34 | |
| Travelers Companies, Inc. | | | 10,000 | | | | 406,400 | | | | 4.28 | |
| | | | | | | | 628,490 | | | | 6.62 | |
| MATERIALS | | | | | | | | | | | | |
| Potash Corp of Saskatchewan (b) | | | 3,000 | | | | 242,430 | | | | 2.55 | |
| | | | | | | | | | | | | |
| MEDIA | | | | | | | | | | | | |
| Comcast Corp. | | | 12,000 | | | | 154,440 | | | | 1.63 | |
| Live Nation, Inc. (a) | | | 44,000 | | | | 117,480 | | | | 1.24 | |
| The Walt Disney Co. | | | 12,500 | | | | 227,000 | | | | 2.39 | |
| | | | | | | | 498,920 | | | | 5.26 | |
| PHARMACEUTICALS & BIOTECHNOLOGY | | | | | | | | | | | | |
| Johnson & Johnson | | | 8,000 | | | | 420,800 | | | | 4.43 | |
| | | | | | | | | | | | | |
| RETAILING | | | | | | | | | | | | |
| Lowe’s Cos., Inc. | | | 16,000 | | | | 292,000 | | | | 3.08 | |
The accompanying notes are an integral part of these financial statements.
SCHEDULE OF INVESTMENTS IN SECURITIES (continued)
March 31, 2009 (Unaudited)
| | | Shares or | | | | | | | |
| | | Principal | | | | | | Percent of | |
| | | Amount | | | Value | | | Net Assets | |
| COMMON STOCKS (continued) | | | | | | | | | |
| SOFTWARE & SERVICES | | | | | | | | | |
| Fiserv, Inc. (a) | | | 12,000 | | | $ | 437,520 | | | | 4.61 | % |
| Microsoft Corp. | | | 24,000 | | | | 440,880 | | | | 4.64 | |
| Oracle Corp. (a) | | | 17,000 | | | | 307,190 | | | | 3.24 | |
| | | | | | | | 1,185,590 | | | | 12.49 | |
| TECHNOLOGY HARDWARE & EQUIPMENT | | | | | | | | | | | | |
| Agilent Technologies, Inc. (a) | | | 18,000 | | | | 276,660 | | | | 2.91 | |
| Dell, Inc. (a) | | | 25,000 | | | | 237,000 | | | | 2.50 | |
| Diebold, Inc. | | | 12,000 | | | | 256,200 | | | | 2.70 | |
| EMC Corp. (a) | | | 37,500 | | | | 427,500 | | | | 4.50 | |
| | | | | | | | 1,197,360 | | | | 12.61 | |
| TRANSPORTATION | | | | | | | | | | | | |
| United Parcel Service, Inc. | | | 9,500 | | | | 467,590 | | | | 4.92 | |
| TOTAL COMMON STOCKS (Cost $10,379,132) | | | | | | | 8,292,431 | | | | 87.34 | |
| | | | | | | | | | | | | |
| U.S. TREASURY NOTE - 2.15% | | | | | | | | | | | | |
| U.S. Treasury Note, Due 09/30/2010 | | $ | 200,000 | | | | 203,992 | | | | 2.15 | |
| TOTAL U.S. TREASURY OBLIGATIONS (Cost $201,484) | | | | | | | 203,992 | | | | 2.15 | |
| | | | | | | | | | | | | |
| SHORT TERM INVESTMENTS - 7.64% | | | | | | | | | | | | |
| INVESTMENT COMPANIES | | | | | | | | | | | | |
| Fidelity Institutional Prime Money Market Portfolio | | | 666,245 | | | | 666,245 | | | | 7.02 | |
| | | | | | | | | | | | | |
| VARIABLE RATE DEMAND NOTES (c) | | | | | | | | | | | | |
| American Family Demand Note, 0.10% | | | 59,157 | | | | 59,157 | | | | 0.62 | |
| TOTAL SHORT TERM INVESTMENTS (Cost $725,402) | | | | | | | 725,402 | | | | 7.64 | |
| Total Investments (Cost $11,306,018) - 97.13% | | | | | | | 9,221,825 | | | | 97.13 | |
| Other Assets in Excess of Liabilities - 2.87% | | | | | | | 272,280 | | | | 2.87 | |
| TOTAL NET ASSETS - 100.00% | | | | | | $ | 9,494,105 | | | | 100.00 | % |
Notes:
| (a) | Presently non-income producing. |
| (b) | Foreign issued security listed directly on a U.S. securities exchange. |
| (c) | Variable rate demand notes are considered short-term obligations and are payable on demand. Interest rate change periodically on specified dates. The rate listed are as of March 31, 2009. |
The accompanying notes are an integral part of these financial statements.
SCHEDULE OF INVESTMENTS IN SECURITIES (continued)
March 31, 2009 (Unaudited)
FAS 157 - Summary of Fair Value Exposure at March 31, 2009 (Unaudited)
Various inputs are used in determining the value of the Fund’s investments. These inputs are summarized in the three broad levels listed below:
Level 1 - Quoted prices in active markets for identical securities.
Level 2 - Other significant observable inputs (including quoted prices for similar securities, interest rates, prepayment speeds, credit risk, etc.)
Level 3 - Significant unobservable inputs (including the Fund’s own assumptions in determining the fair value of investments)
The inputs or methodology used for valuing securities are not an indication of the risk associated with investing in those securities.
The following is a summary of the inputs used to value the Fund’s net assets as of March 31, 2009 (Unaudited):
| | | Investments in | | | Other Financial | |
| Description | | Securities | | | Instruments* | |
| Level 1 - Quoted prices | | $ | 8,958,676 | | | $ | — | |
| Level 2 - Other significant observable inputs | | | 263,149 | | | | — | |
| Level 3 - Significant unobservable inputs | | | — | | | | — | |
| Total | | $ | 9,221,825 | | | $ | — | |
| * | Other financial instruments are derivative instruments not reflected in the Schedule of Investments, such as futures, forwards and swap contracts, which are valued at the unrealized appreciation / depreciation on the instrument. |
The accompanying notes are an integral part of these financial statements.
STATEMENT OF ASSETS AND LIABILITIES
March 31, 2009 (Unaudited)
| ASSETS | | | |
| Investments in securities, at value (cost $11,306,018) | | $ | 9,221,825 | |
| Receivables | | | | |
| Investment securities sold | | | 423,059 | |
| Dividends | | | 3,584 | |
| Interest | | | 392 | |
| Other assets | | | 5,808 | |
| TOTAL ASSETS | | | 9,654,668 | |
| LIABILITIES | | | | |
| Payables | | | | |
| Securities purchased | | | 123,740 | |
| Investment advisory fee payable | | | 6,830 | |
| Accrued expenses | | | 29,993 | |
| TOTAL LIABILITIES | | | 160,563 | |
| NET ASSETS | | $ | 9,494,105 | |
| Composition of Net Assets: | | | | |
| Net capital paid in on shares of capital stock | | $ | 13,263,137 | |
| Accumulated net investment loss | | | (2,962 | ) |
| Accumulated net realized gains (losses) | | | (1,681,895 | ) |
| Net unrealized appreciation (depreciation) on investments | | | (2,084,175 | ) |
| NET ASSETS | | $ | 9,494,105 | |
| Capital shares outstanding | | | 1,212,245 | |
| | | | | |
| Net asset value, offering price and redemption price per share | | $ | 7.83 | |
The accompanying notes are an integral part of these financial statements.
STATEMENT OF OPERATIONS
For the Six Month Period Ended March 31, 2009 (Unaudited)
| Investment income | | | |
| Dividends (net of foreign taxes withheld of $360) | | $ | 96,537 | |
| Interest | | | 9,249 | |
| Total investment income | | | 105,786 | |
| Expenses | | | | |
| Investment advisory fees (Note 4) | | | 47,015 | |
| Administration fees | | | 16,840 | |
| Fund accounting fees | | | 11,984 | |
| Professional Fees | | | 9,615 | |
| Transfer agent fees | | | 8,281 | |
| Printing, postage and delivery | | | 5,836 | |
| Other expenses | | | 3,915 | |
| Custodian fees | | | 2,545 | |
| Federal and state registration fees | | | 1,470 | |
| Directors fees | | | 1,247 | |
| Total expenses | | | 108,748 | |
| NET INVESTMENT LOSS | | | (2,962 | ) |
| REALIZED GAIN AND UNREALIZED | | | | |
| APPRECIATION FROM INVESTMENTS | | | | |
| Net realized gain (loss) on investments in securities | | | (1,681,849 | ) |
| Net change in unrealized appreciation (depreciation) on investments in securities | | | (3,225,495 | ) |
| NET LOSS FROM INVESTMENTS | | | (4,907,344 | ) |
| NET DECREASE IN NET ASSETS RESULTING FROM OPERATIONS | | $ | (4,910,306 | ) |
The accompanying notes are an integral part of these financial statements.
STATEMENTS OF CHANGES IN NET ASSETS
| | | Six Months Ended | | | | |
| | | March 31, 2009 | | | Year Ended | |
| | | (Unaudited) | | | Sept. 30, 2008 | |
| CHANGE IN NET ASSETS FROM OPERATIONS | | | | | | |
| Net investment income (loss) | | $ | (2,962 | ) | | $ | 5,351 | |
| Net realized gain (loss) on investments | | | (1,681,849 | ) | | | 713,145 | |
| Net change in unrealized appreciation (depreciation) on investments | | | (3,225,495 | ) | | | (4,947,877 | ) |
| Net increase (decrease) in net assets resulting from operations | | | (4,910,306 | ) | | | (4,229,381 | ) |
| DISTRIBUTIONS TO SHAREHOLDERS FROM | | | | | | | | |
| Net investment income | | | — | | | | — | |
| Net realized gains on investments | | | (689,438 | ) | | | (1,790,056 | ) |
| Total distributions to shareholders | | | (689,438 | ) | | | (1,790,056 | ) |
| CAPITAL SHARE TRANSACTIONS — NET | | | 978,581 | | | | 1,162,969 | |
| Total increase (decrease) in net assets | | | (4,621,163 | ) | | | (4,856,468 | ) |
| NET ASSETS | | | | | | | | |
| Beginning of period | | | 14,115,268 | | | | 18,971,736 | |
| End of period (including accumulated net investment | | | | | | | | |
| income (loss) of ($2,962) and $0, respectively) | | $ | 9,494,105 | | | $ | 14,115,268 | |
The accompanying notes are an integral part of these financial statements.
FINANCIAL HIGHLIGHTS
| | | Six Months | | | | | | | | | | | | | | | | |
| | | Ended | | | | | | | | | | | | | | | | |
| | | March 31, | | | | | | | | | | | | | | | | |
| | | 2009(2) | | | Year ended September 30, | |
| | | (Unaudited) | | | 2008 | | | 2007 | | | 2006 | | | 2005 | | | 2004 | |
PER SHARE DATA(1): | | | | | | | | | | | | | | | | | | |
| Net asset value, beginning of year | | $ | 12.74 | | | $ | 18.39 | | | $ | 17.94 | | | $ | 17.06 | | | $ | 15.66 | | | $ | 14.07 | |
| Income (loss) from investment operations: | | | | | | | | | | | | | | | | | | | | | | | | |
| Net investment income (loss) | | | (0.01 | ) | | | 0.01 | | | | 0.04 | | | | 0.09 | | | | (0.11 | ) | | | (0.12 | ) |
| Net realized and unrealized | | | | | | | | | | | | | | | | | | | | | | | | |
| gain (loss) on investments | | | (4.30 | ) | | | (3.88 | ) | | | 1.93 | | | | 1.71 | | | | 2.34 | | | | 1.94 | |
| Total income (loss) from | | | | | | | | | | | | | | | | | | | | | | | | |
| investment operations | | | (4.31 | ) | | | (3.87 | ) | | | 1.97 | | | | 1.80 | | | | 2.23 | | | | 1.82 | |
| Less distributions: | | | | | | | | | | | | | | | | | | | | | | | | |
| Distributions from | | | | | | | | | | | | | | | | | | | | | | | | |
| net investment income | | | — | | | | — | | | | (0.15 | ) | | | — | | | | — | | | | — | |
| Distributions from net realized gains | | | (0.60 | ) | | | (1.78 | ) | | | (1.37 | ) | | | (0.92 | ) | | | (0.83 | ) | | | (0.23 | ) |
| Total from distributions | | | (0.60 | ) | | | (1.78 | ) | | | (1.52 | ) | | | (0.92 | ) | | | (0.83 | ) | | | (0.23 | ) |
| Net asset value, end of year | | $ | 7.83 | | | $ | 12.74 | | | $ | 18.39 | | | $ | 17.94 | | | $ | 17.06 | | | $ | 15.66 | |
| TOTAL RETURN | | | (34.41 | %) | | | (22.98 | %) | | | 11.24 | % | | | 11.00 | % | | | 14.50 | % | | | 13.01 | % |
| RATIOS/SUPPLEMENTAL DATA: | | | | | | | | | | | | | | | | | | | | | | | | |
| Net assets, end of year (in thousands) | | $ | 9,494 | | | $ | 14,115 | | | $ | 18,972 | | | $ | 17,886 | | | $ | 16,622 | | | $ | 14,778 | |
| Ratio of expenses to average net assets | | | 2.08 | % | | | 1.62 | % | | | 1.60 | % | | | 1.61 | % | | | 2.12 | % | | | 2.08 | % |
| Ratio of net investment income (loss) | | | | | | | | | | | | | | | | | | | | | | | | |
| to average net assets | | | (0.06 | %) | | | 0.03 | % | | | 0.20 | % | | | 0.54 | % | | | (0.69 | %) | | | 0.76 | % |
| Portfolio turnover rate | | | 22 | % | | | 34 | % | | | 29 | % | | | 31 | % | | | 22 | % | | | 35 | % |
| (1) | Per share information has been calculated using the average number of shares outstanding. |
| (2) | Other than the ratios of expenses and net investment (loss) to average net assets, financial highlights have not been annualized. |
The accompanying notes are an integral part of these financial highlights.
NOTES TO FINANCIAL STATEMENTS (Unaudited)
Note 1 – Nature of Business and Summary of Significant Accounting Policies
NATURE OF BUSINESS
Concorde Value Fund (Fund) is a separate series of shares of common stock of Concorde Funds, Inc. (Company). The Company was incorporated in the state of Texas in September of 1987, and is registered under the Investment Company Act of 1940, as amended, as a diversified, open-end management investment company. The Fund is subject to various investment restrictions as set forth in the Statement of Additional Information. The effective date of the Fund’s Registration Statement under the Securities Act of 1933 was December 4, 1987. The primary investment objective of the Fund is to produce long-term growth of capital. The Company may designate one or more series of common stock. The Company presently has no series other than the Fund. Each capital share in the Fund represents an equal, proportionate interest in the net assets of the Fund with each other capital share in such series and no interest in any other series.
SIGNIFICANT ACCOUNTING POLICIES
The following is a summary of significant accounting policies followed by the Fund in the preparation of its financial statements. These policies are in conformity with accounting principles generally accepted in the United States.
USE OF ESTIMATES
The preparation of financial statements in conformity with generally accepted accounting principles requires management to make estimates and assumptions that affect the reported amounts of the assets and liabilities and disclosure of contingent assets and liabilities at the date of the financial statements and the reported amounts of increases and decreases in net assets from operations during the reporting period. Actual results could differ from those estimates.
VALUATION OF SECURITIES
Securities are valued at the close of each business day. Bonds and notes are valued at the last quoted bid price obtained from independent pricing services. Securities traded on national securities exchanges or on the national market systems are valued at the last quoted sales price on the day of valuation, except for call options written for which the last quoted bid price is used. Short-term demand notes and certificates of deposit are stated at amortized cost, which approximates fair value. Short-term investments in fixed income securities with maturities of less than 60 days when acquired, or which subsequently are within 60 days of maturity, are valued by using the amortized cost method of valuation, which the Board has determined will represent fair value. Securities for which representative market quotations are not readily available are valued at fair value as determined in good faith by the Board of Directors.
NOTES TO FINANCIAL STATEMENTS (Unaudited) (continued)
Note 1 – Nature of Business and Summary of Significant Accounting Policies (continued)
SECURITY TRANSACTIONS AND RELATED INCOME
Security transactions are accounted for on the date the securities are purchased or sold. Realized gains and losses from securities transactions are reported on an identified cost basis. Dividend income is recognized on the ex-dividend date, and interest income is recognized on the accrual basis. Discounts and premiums on securities purchased are amortized over the life of the respective securities.
OPTION WRITING
When the Fund writes an option, an amount equal to the premium received by the Fund is recorded as a liability and is subsequently adjusted to the current fair value of the option written. The Fund treats premiums received from writing options that expire unexercised on the expiration date as realized gains from investments. The difference between the premium and the amount paid on effecting a closing purchase transaction, including brokerage commissions, is also treated as a realized gain, or, if the premium is less than the amount paid for the closing purchase transaction, as a realized loss. If a call option is exercised, the premium is added to the proceeds from the sale of the underlying security or currency in determining whether the Fund has realized a gain or loss. The Fund as writer of an option bears the market risk of an unfavorable change in the price of the security underlying the written option.
FEDERAL INCOME TAXES
The Fund’s policy is to continue to qualify as a regulated investment company under Subchapter M of the Internal Revenue Code of 1986, as amended, by distributing substantially all of its net investment income and net realized capital gains to its shareholders. Therefore, no federal income tax provision is required.
Net investment income (loss), net realized gains (losses) and the cost of investments in securities may differ for financial statement and income tax purposes. The character of distributions from net investment income or net realized gains may differ from their ultimate characterization for income tax purposes. Accounting principles generally accepted in the United States of America require that certain components of net assets relating to permanent differences be reclassified between financial and tax reporting. For the year ended September 30, 2008, the Fund decreased accumulated net investment income by $5,351 and increased undistributed net realized gains by $5,351. These reclassifications have no effect on net assets, results of operations or net asset value per share. The permanent differences primarily relate to reclasses of distributions. Also, due to the timing of dividend distributions, the fiscal year in which amounts are distributed may differ from the year that the income or realized gains were recorded by the Fund.
NOTES TO FINANCIAL STATEMENTS (Unaudited) (continued)
Note 1 – Nature of Business and Summary of Significant Accounting Policies (continued)
DIVIDENDS AND DISTRIBUTIONS
Distributions to shareholders, which are determined in accordance of income tax regulations, are recorded on the ex-date. The Fund intends to distribute substantially all of its net investment income as dividends to its shareholders on an annual basis. The Fund intends to distribute its net realized long-term capital gains and its net realized short-term capital gains at least once a year. The treatment for financial reporting purposes of distributions made to shareholders during the year from net investment income or net realized capital gains may differ from their ultimate treatment for federal tax purposes. These differences are caused primarily by differences in the timing of the recognition of certain components of income, expense or realized capital gain for federal income tax purposes. Where such differences are permanent in nature, they are reclassified in the components of the net assets based on their ultimate characterization for federal income tax purposes. Any such reclassifications will have no effect on net assets, results of operations or net assets values per share of the Fund.
NEW ACCOUNTING PRONOUNCEMENTS
Effective March 30, 2008, the Fund adopted Financial Accounting Standards Board (FASB) Interpretation No. 48 “Accounting for Uncertainty in Income Taxes”. FIN 48 requires the evaluation of tax positions taken on previously filed tax returns or expected to be taken on future returns. These positions must meet a “more likely than not” standard that, based on the technical merits, have a more than fifty percent likelihood of being sustained upon examination. In evaluating whether a tax position has met the recognition threshold, the Fund must presume that the position will be examined by the appropriate taxing authority that has full knowledge of all relevant information. Tax positions not deemed to meet the “more-likely-than-not” threshold are recorded as a tax expense in the current year.
FIN 48 requires the Fund to analyze all open tax years, as defined by the Statue of Limitations, for all major jurisdictions. Open tax years are those that are open for exam by taxing authorities. Major jurisdiction for the Fund include Federal. As of March 31, 2009, open Federal tax years include the tax years ended September 30, 2006 through 2008. The Fund has no examination in progress.
The Fund has reviewed all open tax years and major jurisdictions and concluded that the adoption of FIN 48 resulted in no effect to the Fund’s financial position or results of operations. There is no tax liability resulting from unrecognized tax benefits relating to uncertain income tax positions taken or expected to be taken on the tax return for the fiscal year-end September 30, 2008. The Fund is also not aware of any tax positions for which it is reasonably possible that the total amounts of unrecognized tax benefits will significantly change in the next twelve months.
NOTES TO FINANCIAL STATEMENTS (Unaudited) (continued)
Note 1 – Nature of Business and Summary of Significant Accounting Policies (continued)
RECENTLY ISSUED ACCOUNTING PRONOUNCEMENTS
In September 2006, the Financial Accounting Standards Board (FASB) issued Statement on Financial Accounting Standards (SFAS) No. 157, “Fair Value Measurements.” This standard establishes a single authoritative definition of fair value measurements. SFAS No. 157 applies to fair value measurements already required or permitted by existing standards. SFAS No. 157 is effective for financial statements issued for the fiscal years beginning after November 15, 2007 and interim periods within those fiscal years. The changes to current generally accepted accounting principles form the application of this Statement relate to the definition of fair value, the methods used to measure fair value, and the expanded disclosures about fair value measurements. As of March 31, 2009, the Fund does not believe the adoption of SFAS No.157 will impact the financial statements amounts, however, additional disclosures may be required about the inputs used to develop the measurements and the effect of certain of the measurements on changes in net assets for the period.
In March 2008, Statement of Financial Accounting Standards No. 161, “Disclosures about Derivative Instruments and Hedging Activities” (“SFAS 161”) was issued and is effective for fiscal years beginning after November 15, 2008. SFAS 161 is intended to improve financial reporting for derivative instruments by requiring enhanced disclosure that enables investors to understand how and why an entity uses derivatives, how derivatives are accounted for, and how derivative instruments affect an entity’s results of operations and financial position. Management is currently evaluating the implications of SFAS 161. The impact on the Fund’s financial statement disclosures, if any, is currently being assessed.
Note 2 – Capital Share Transactions
As of March 31, 2009, there were 30,000,000 shares of $1 par value capital stock authorized of which 9,841,293 shares are classified as the Fund’s series and the remaining balance is unallocated for future use. As of March 31, 2009, capital paid-in aggregated $13,263,137.
Transactions in shares of capital stock for the six months ended March 31, 2009 and year ended September 30, 2008 were as follows:
| | | Six Months Ended | | | | | | | |
| | | March 31, 2009 | | | Year Ended | |
| | | (Unaudited) | | | September 30, 2008 | |
| | | Shares | | | Amount | | | Shares | | | Amount | |
| Shares sold | | | 71,047 | | | $ | 674,759 | | | | 28,938 | | | $ | 420,676 | |
| Shares issued in reinvestment of dividends | | | 76,946 | | | | 689,438 | | | | 112,300 | | | | 1,790,056 | |
| | | | 147,993 | | | | 1,364,197 | | | | 141,238 | | | | 2,210,732 | |
| Shares redeemed | | | (43,849 | ) | | | (385,616 | ) | | | (64,870 | ) | | | (1,047,763 | ) |
| Net increase | | | 104,144 | | | $ | 978,581 | | | | 76,368 | | | $ | 1,162,969 | |
NOTES TO FINANCIAL STATEMENTS (Unaudited) (continued)
Note 3 – Investment Transactions
Cost of purchases and proceeds from sales of investment securities aggregated $2,633,331 and $2,151,324, respectively, for common stock, and cost of purchases and proceeds from sales of short-term securities and U.S. government obligations aggregated $3,721,397 and $4,194,413, respectively, for the six months ended March 31, 2009. There were no differences between the financial reporting basis and the income tax basis in the cost or the net unrealized appreciation or depreciation of the Fund’s investments as of September 30, 2008. As of March 31, 2009 and September 30, 2008, respectively, the aggregate unrealized appreciation and depreciation of investment securities was as follows:
| | | March 31, 2009 | | | | |
| | | (Unaudited) | | | September 30, 2008 | |
| Unrealized appreciation | | $ | 820,249 | | | $ | 2,583,464 | |
| Unrealized depreciation | | | (2,904,424 | ) | | | (1,442,172 | ) |
| Net unrealized appreciation | | $ | (2,084,175 | ) | | $ | 1,141,292 | |
Note 4 – Investment Advisory Fees and Other Transactions with Affiliates
The Fund has an Investment Advisory Agreement (Advisory Agreement) with Concorde Financial Corporation dba Concorde Investment Management (Concorde) to act as the Fund’s investment advisor. Concorde provides the Fund with investment advice and recommendations consistent with the Fund’s investment objectives, policies and restrictions, and supervises the purchase and sale of investment transactions on behalf of the Fund. For such services, Concorde receives an annual fee of 0.9% of the Fund’s average daily net assets, computed daily and paid on a monthly basis. The investment advisory fee was $47,015 for the six months ended March 31, 2009, of which $6,830 was payable at March 31, 2009.
Certain directors and officers of the Company are also directors, officers and/or employees of Concorde.
CONCORDE VALUE FUND
NOTES TO FINANCIAL STATEMENTS (Unaudited) (continued)
Note 5 – Federal Tax Information
At September 30, 2008, the Fund’s most recent fiscal year end, the components of accumulated earnings (losses) on a tax basis were as follows:
| Cost of Investments | | $ | 12,996,021 | |
| Gross tax unrealized appreciation | | $ | 2,583,464 | |
| Gross tax unrealized depreciation | | | (1,442,172 | ) |
| Net tax unrealized appreciation (depreciation) | | $ | 1,141,292 | |
| Undistributed ordinary income | | $ | 82,269 | |
| Undistributed long-term capital gain | | | 607,151 | |
| Total distributable earnings | | $ | 689,420 | |
| Other accumulated gains (losses) | | $ | — | |
| Total accumulated earnings (losses) | | $ | 1,830,712 | |
There were no differences between the financial reporting basis and the income tax basis in the cost or the net unrealized appreciation of the Fund’s investments as of September 30, 2008.
A distribution to shareholders of $0.60 per share aggregating $689,438 was declared on December 9, 2008 from net realized gains from investment transactions. The tax character of distributions paid during the six months ended March 31, 2009 and year ended September 30, 2008 was as follows:
| | | March 31, 2009 | | | | |
| | | (Unaudited) | | | September 30, 2008 | |
| Distributions paid from: | | | | | | |
| Long-term capital gain | | $ | 607,160 | | | $ | 1,790,056 | |
| Short-term capital gain | | | 82,278 | | | | — | |
Note 6 – Federal Tax Distribution Information
The Fund has designated 0% of the dividends declared from net investment income during the year ended September 30, 2008 as qualified dividend income under the Jobs Growth and Tax Reconciliation Act of 2003.
For the year ended September 30, 2008, 0% of the ordinary distributions paid by the Fund qualify for the dividend received deduction available to corporate shareholders.
BOARD APPROVAL OF CONTINUATION OF INVESTMENT ADVISORY AGREEMENT
At its meeting held on November 19, 2008, the Board of Directors (the “Board”) of Concorde Funds, Inc. (the “Company”) including all the Directors who are not “interested persons” (as defined in the Investment Company Act of 1940) considered and then voted to re-approve the current investment advisory agreement (the “Advisory Agreement”) between Concorde Financial Corporation (the “Advisor”) and the Company, on behalf of the Concorde Value Fund (the “Fund”). In connection with its re-approval of the Advisory Agreement, the Board reviewed and discussed the specific services provided by the Advisor. The Board considered the following factors:
The Advisor:
| 1) | Provides daily investment management for the Concorde Value Fund. In providing investment management, Concorde Financial Corporation will oversee the trading of securities and the rebalancing of the portfolio. |
| 2) | Retains the services of the Fund’s Chief Compliance Officer and will make all reasonable efforts to insure that the Fund is in compliance with the securities laws. |
| 3) | Provide responsive customer and shareholder servicing which consists of responding to shareholder inquiries received, including specific mutual fund account information, in addition to calls directed to the transfer agent call center. |
| 4) | Oversees distribution of the Fund through third-party broker/dealers and independent financial institutions. |
| 5) | Oversees those third party service providers that support the Fund in providing fund accounting, fund administration, transfer agency and custodial services. |
The Board also: (i) compared the performance of the Fund to benchmark indices over various periods of time and concluded that the performance of the Fund, articulately on a risk-adjusted basis, warranted the continuation of the Advisory Agreement; (ii) compared the expense ratios of funds similar in asset size and investment objective to those of the Fund and concluded the expenses of the Fund were reasonable and warranted continuation of the Advisory Agreement; (iii) considered the fees charged by Concorde Financial Corporation to those of funds similar in asset size and investment objective to the Fund and concluded the advisory fees of the Fund were reasonable and warranted continuation of the Advisory Agreement; and (iv) considered the profitability of Concorde Financial Corporation with respect to the Fund, and concluded that the profits were reasonable and not excessive when compared to profitability guidelines set forth in relevant court cases.
The Board then discussed economies of scale and breakpoints and determined that the Fund, managed by Concorde Financial Corporation, has not yet grown in size, nor has the marketplace demonstrated significant rapid potential growth to any extent, that would warrant the imposition of breakpoints.
The Board reviewed the Fund’s expense ratios and comparable expense ratios for similar funds. The Board used data from Lipper, as presented in the charts in the Board Materials, showing funds
BOARD APPROVAL OF CONTINUATION OF INVESTMENT ADVISORY AGREEMENT (continued)
classified by Lipper as Multi-Cap Value Funds, similar in nature to the Concorde Value Fund. The Board determined that the total expense ratio of the Fund falls within the range of the ratios of other funds in the Multi-Cap Value classification. The Board also referenced Concorde Financial Corporation’s Form ADV and a copy of the current Investment Advisory Agreement. They also referenced a Concorde Investment Management Fee and Service Agreement to compare fees charged by the Advisor to their other clients versus what they charge the Fund. After further discussion and upon a motion duly made and seconded, the Directors, including a majority of Directors who are not “interested persons,” as defined by the 1940 Act, of the Corporation unanimously approved the Continuation of Investment Advisory Agreement.
ADDITIONAL INFORMATION
PROXY VOTING POLICIES AND PROCEDURES
For a description of the policies and procedures that the Fund uses to determine how to vote proxies relating to the portfolio securities, please call (972) 701-5400 and request a Statement of Additional Information. One will be mailed to you free of charge. The Statement of Additional Information is also available on the website of the Securities and Exchange Commission at http://www.sec.gov.
PROXY VOTING RECORDS
Information on how the Fund voted proxies relating to portfolio securities during the twelve month period ending June 30, 2008 is available without charge, upon request, by calling (972) 701-5400. Furthermore, you can obtain the Fund’s proxy voting records on the Securities and Exchange Commission’s website at http://www.sec.gov.
QUARTERLY FILINGS ON FORM N-Q
The Fund files its complete schedule of portfolio holdings with the Securities and Exchange Commission for the first and third quarters of each fiscal quarter on Form N-Q. The Fund’s Form N-Q is available (i) without charge, upon request, by calling (972) 701-5400, (ii) on the Securities and Exchange Commission’s website at http://www.sec.gov, or (iii) at the Securities and Exchange Commission’s public reference room.
(This Page Intentionally Left Blank.)
INVESTMENT ADVISOR
Concorde Investment Management
1000 Three Lincoln Centre
5430 LBJ Freeway LB3
Dallas, Texas 75240
OFFICERS
Gary B. Wood, Ph.D.
President and Treasurer
John A. Stetter
Secretary
DIRECTORS
William Marcy
John H. Wilson
Gary B. Wood, Ph.D.
CUSTODIAN
U.S. Bank, N.A.
Custody Operations
1555 North RiverCenter Drive, Suite 302
Milwaukee, Wisconsin 53212
TRANSFER AGENT AND
DIVIDEND DISBURSING AGENT
U.S. Bancorp Fund Services, LLC
Mutual Fund Services, 3rd Floor
615 East Michigan Street
Milwaukee, Wisconsin 53202
INDEPENDENT REGISTERED
PUBLIC ACCOUNTING FIRM
Brad A. Kinder, CPA
815 Parker Square
Flower Mound, Texas 75028
LEGAL COUNSEL
Foley & Lardner LLP
777 East Wisconsin Avenue
Milwaukee, Wisconsin 53202
TELEPHONE
(972) 701-5400
(Fund information)
(800) 294-1699
(Shareholder account information)

Item 2. Code of Ethics.
Not applicable for semi-annual reports.
Item 3. Audit Committee Financial Expert.
Not applicable for semi-annual reports.
Item 4. Principal Accountant Fees and Services.
Not applicable for semi-annual reports.
Item 5. Audit Committee of Listed Registrants.
Not applicable to registrants who are not listed issuers (as defined in Rule 10A-3 under the Securities Exchange Act of 1934).
Item 6. Investments.
Schedule of Investments is included as part of the report to shareholders filed under Item 1 of this Form.
Item 7. Disclosure of Proxy Voting Policies and Procedures for Closed-End Management Investment Companies.
Not applicable to open-end investment companies.
Item 8. Portfolio Managers of Closed-End Management Investment Companies.
Not applicable to open-end investment companies.
Item 9. Purchases of Equity Securities by Closed-End Management Investment Company and Affiliated Purchasers.
Not applicable to open-end investment companies.
Item 10. Submission of Matters to a Vote of Security Holders.
Not Applicable
Item 11. Controls and Procedures.
| (a) | The Registrant’s President and Principal Financial Officer have reviewed the Registrant's disclosure controls and procedures (as defined in Rule 30a-3(c) under the Investment Company Act of 1940 (the “Act”)) as of a date within 90 days of the filing of this report, as required by Rule 30a-3(b) under the Act and Rules 13a-15(b) or 15d-15(b) under the Securities Exchange Act of 1934. Based on their review, such officers have concluded that the disclosure controls and procedures are effective in ensuring that information required to be disclosed in this report is appropriately recorded, processed, summarized and reported and made known to them by others within the Registrant and by the Registrant’s service provider. |
| (b) | There were no changes in the Registrant's internal control over financial reporting (as defined in Rule 30a-3(d) under the Act) that occurred during the second fiscal quarter of the period covered by this report that has materially affected, or is reasonably likely to materially affect, the Registrant's internal control over financial reporting. |
Item 12. Exhibits.
| (a) | (1) Any code of ethics or amendment thereto, that is the subject of the disclosure required by Item 2, to the extent that the registrant intends to satisfy Item 2 requirements through filing an exhibit. Not Applicable for semi-annual reports. |
(2) A separate certification for each principal executive and principal financial officer pursuant to Section 302 of the Sarbanes-Oxley Act of 2002. Filed herewith.
(3) Any written solicitation to purchase securities under Rule 23c-1 under the Act sent or given during the period covered by the report by or on behalf of the registrant to 10 or more persons. Not applicable to open-end investment companies.
| (b) | Certifications pursuant to Section 906 of the Sarbanes-Oxley Act of 2002. Furnished herewith. |
SIGNATURES
Pursuant to the requirements of the Securities Exchange Act of 1934 and the Investment Company Act of 1940, the registrant has duly caused this report to be signed on its behalf by the undersigned, thereunto duly authorized.
(Registrant) Concorde Funds, Inc.
By (Signature and Title)* /s/Gary B. Wood
Gary B. Wood, President
Date June 8, 2009
Pursuant to the requirements of the Securities Exchange Act of 1934 and the Investment Company Act of 1940, this report has been signed below by the following persons on behalf of the registrant and in the capacities and on the dates indicated.
By (Signature and Title)* /s/Gary B. Wood
Gary B. Wood, Principal Executive Officer
Date June 8, 2009
By (Signature and Title)* /s/Gary B. Wood
Gary B. Wood, Principal Financial Officer
Date June 8, 2009
* Print the name and title of each signing officer under his or her signature.