As filed with the Securities and Exchange Commission on December 3, 2010.
UNITED STATES
SECURITIES AND EXCHANGE COMMISSION
Washington, D.C. 20549
FORM N-CSR
CERTIFIED SHAREHOLDER REPORT OF REGISTERED
MANAGEMENT INVESTMENT COMPANIES
Investment Company Act file number (811-05339)
Concorde Funds, Inc.
(Exact name of registrant as specified in charter)
1000 Three Lincoln Centre
5430 LBJ Freeway LB3
Dallas, TX 75240-2650
(Address of principal executive offices) (Zip code)
Gary B. Wood
1000 Three Lincoln Centre, 5430 LBJ Freeway LB3, Dallas, TX 75240-2650
(Name and address of agent for service)
(972)-701-5400
Registrant's telephone number, including area code
Date of fiscal year end: 09/30/2010
Date of reporting period: 09/30/2010
Item 1. Reports to Stockholders.
A NO-LOAD
MUTUAL FUND
ANNUAL REPORT
Dated September 30, 2010
November 17, 2010
Dear Shareholders,
We are pleased to present the Annual report of Concorde Funds, Inc. for the fiscal year ended September 30, 2010.
Concorde Value Fund
Concorde Value Fund, managed by Concorde Investment Management, generated a net return of 6.71% for the year ending September 30, 2010. The Fund slightly outperformed the benchmark indices S&P 500 and Russell 3000 Value Index for the last six months of the year and underperformed them for the full year, as shown below.
| Annualized* | Annualized* | ||||||||||||||||
| 6 Months* | Full Fiscal Year* | 5 Years Ending | 10 Years Ending | ||||||||||||||
| April 2010-Sept 2010 | Oct 2009-Sept 2010 | Sept 2010 | Sept 2010 | ||||||||||||||
| Concorde Value Fund | -0.84 | % | 6.71 | % | -3.23 | % | 0.08 | % | |||||||||
| S&P 500 | -1.42 | % | 10.16 | % | 0.64 | % | -0.43 | % | |||||||||
| Russell 3000 Value Total Return | -2.11 | % | 9.15 | % | -0.39 | % | 2.96 | % | |||||||||
| Russell 2000 Total Return | 0.25 | % | 13.35 | % | 1.60 | % | 4.00 | % | |||||||||
| Lipper Multi-Cap Value | -2.67 | % | 7.96 | % | -0.78 | % | 2.95 | % | |||||||||
| NASDAQ National Composite | -1.24 | % | 11.93 | % | 2.50 | % | -4.10 | % | |||||||||
* Source – Morningstar, Inc.; US Bancorp Fund Services, LLC | |||||||||||||||||
The primary reasons for underperformance for the year were the cash and short term bond holdings of the fund and underweighting and stock selection in sectors of the market which performed better during the year. Sectors of the S&P 500 which were underweighted on average were the consumer discretionary, financials, healthcare and information technology. The Fund opted for more defensive stock selections in light of the economic uncertainty and therefore, to some extent, sacrificed near term performance for safety. These average weightings, along with individual selection, contributed to the relative performance. During the second half of the year, lower cash and bond balances along with better relative stock selection, caused the modest outperformance. Although the performance for the ye ar was clearly positive, analysis of the various industry and stock holdings reflects a variety of positive and negative returns.
The sectors displaying the largest positive results include energy, materials, capital goods, transportation, consumer durables, media and food, beverage and tobacco. Industry groups that contributed negative results for the year include office machinery, manufacturing, healthcare equipment, financials and utilities.
Among the groups with the largest percentage of fund assets, energy contributed nicely, where two of three holdings had meaningful returns. Conoco Phillips and Penn West Energy, a new purchase, rose as commodity pricing and good operating results assisted reported financials. Devon Energy dropped slightly for the year as the company transitioned to a primarily on shore natural gas and shale oil business. Their decision to sell valuable deep water GOM oil assets at premium prices was timely. All capital goods holdings including CAE, Deere and Illinois Tool Works rose as the world economy recovered, spurring activity in their respective product areas. All of these businesses hold very strong market positions in most of their product areas and are poised to do well even in a sluggish growth scenario.
The other broad industry sectors that are among the largest fund holdings are technology hardware and software and services. Within hardware, Dell Inc. and Diebold both generated small total return losses for the year, but recovered some in the second half. Although business at these companies has struggled during the past recession, they are both undervalued from a long term perspective. Agilent Technologies and EMC Corp. both contributed meaningful gains in the hardware sector as their market leading offerings recovered nicely as business improved worldwide.
All three software holdings advanced for the year although Microsoft increased only slightly. Fiserv and Oracle both took advantage of their financial strength to gain market advantages over weaker competitors during the recent downturn. The ability to continue to spend heavily on new product development should enable their continued growth even in the slow and competitive environment we see going forward.
Two groups with significant percentages of fund assets that were down for the year were healthcare equipment and financials, each with one fund holding at year end. Quest Diagnostics, a leading provider of a variety of medical testing products, fell slightly for the year as business results have lagged with employer testing and doctor office visits continuing to show some weakness. In addition, stocks in defensive businesses have tended to lag those in economically sensitive areas. Bank New York Mellon, the Fund’s lone financial service investment at year end, dropped approximately ten percent as their primarily fee-generated business providing custodial, treasury and asset management services have recovered only modestly after the 2007-2009 financial crises. We believe they have very strong industry positions with an excellent operational structure and will benefit in the long run as stability and growth in financial assets continue to recover.
The remaining individual holdings that detracted from performance include Scientific Games, Exelon and Iberdrola, SA. Scientific Games operations have struggled in the short term with issues ranging from maintaining some long term contracts to disposing of some non-core businesses. Progress has been made, the cost structure has been improved considerably, and there are signs that the future terms of traditional instant ticket contracts may evolve into more favorable incentive driven formats. The company continues to generate nice free cash flow in this transition with upside and we continue to believe the stock is undervalued. Exelon stock was down modestly, offset by a good dividend payout. The market trend away from defensive issues and the weak natural gas pricing environment, which keeps competing utility rates lower, weighed on its performance. Exelon represents a low cost electric provider and a good hedge against potentially higher inflation in the future. Iberdrola, a Spanish based diversified utility, suffered primarily as a result of the western European market turmoil and weakness. The company’s operating results have held up fairly well in most areas. We reduced our position earlier in the year because of the systemic risks; however, we are maintaining the smaller position as the current market price is still below our estimate of intrinsic value.
Several other individual positions which rose during the year include Potash Corporation, Waste Management (sold during the year), transportation holdings Knightsbridge Tankers and UPS, Hanesbrands, Walt Disney Co., Anheuser-Busch InBev, General Mills and insurance stocks Delphi Financial Group and Travelers Companies.
Potash Corporation rose around 50% for the year as demand and pricing increased and the company received an unsolicited purchase offer during mid-2010. We believe current value is greater than the purchase offer and are holding. Waste Management was sold as the stock approached our short term valuation levels; however we will monitor it for future repurchase if the stock retreats as their business and operations are attractive. Knightsbridge and UPS both benefitted from the economic recovery, particularly in the regions outside the developed core areas of North America and Western Europe. Knightsbridge is a niche asset play based on continued commodity demand in the developing regions and UPS has committed significant assets to increase this business, particularly in Asia. Hanesbrands stock rose for the year, although ending at less than peak levels. Market share gains and balance sheet improvements have been positive, but rising cotton prices are becoming a challenge to increasing profits.
2
Walt Disney results have bounced back modestly with consumer activity and the stock rose around 25% for the year. Disney’s businesses, led by the ESPN franchises, have held up well in the challenging advertising and consumer spending environment. Despite the appreciation, we believe the stock is still a significant discount to long term value and warrants continued holding.
Anheuser-Busch InBev, a new fund position, rose significantly in only three months as the market began to realize the near term operating and cash flow generating strength and the potential for share purchases and dividend increases over the next several years. The company’s well respected management has had a large impact on the Anheuser Busch North American operations and growth potential in emerging markets is still significant. General Mills contributed a near 17% total return as the company continued to benefit from excellent operations, increased demand in developed countries from consumers managing their budgets closely and from growth in developing and emerging markets. The strong balance sheet enables continued aggressive marketing and product development, key in an increasingly competit ive environment.
Delphi Financial Group stock continued to recover as investors became more comfortable with the more conservative balance sheet despite slower growth in some product areas. Delphi still maintains leading market positions in their excess workers compensation (Safety National) and long and short term disability coverage (Reliance Standard) and continues to utilize strong underwriting discipline even at the expense of missing some business. Travelers continues to produce good operating results as their conservative investing culture and diversified commercial and personal insurance lines are an excellent combination in today’s marketplace. Prospects for the future appear excellent as current results reflect a weak, competitive pricing environment that will likely improve in the near future.
In summary, the current equity investing environment still contains greater risk than normal as the US transitions to a likely slower growth path and federal and local governments deal with serious fiscal issues. Despite the recovery in prices since the bear market low in March 2009, we believe that valuations for many stocks are attractive even based on a muted growth scenario over the next several years and relative to long term historical valuation metrics. We continue to configure the portfolio to include a higher percentage of equities involved in defensive industries and companies that are taking advantage of weaker competitors as a result of strong balance sheets and superior cost structures. We will continue to manage the portfolio selection based on fundamental analysis and are diligent about the need to be more nimble in this challenging environment. Generally an attitude of defensiveness in the current period of heightened uncertainty and preservation of capital remain key features in the management objectives of the Fund. At the time of this writing, the Fund has no plans to make a capital gain distribution for calendar year end 2010.
Thank you for your continued support. We will continue to strive for the highest professional standards of performance and stewardship in the management of the Value Fund.
Best regards, | |
 | |
| Gary B. Wood, Ph.D. | |
| President |
3
| Concorde Value Fund |
| Performance Comparison |
| 9/30/2010 Value of $10,000 Invested on 9/30/2000 |
| AVERAGE ANNUAL TOTAL RETURN | |
| 1 Year | 6.71% |
| 3 Years | (11.76%) |
| 5 Years | (3.23%) |
| 10 Years | 0.08% |
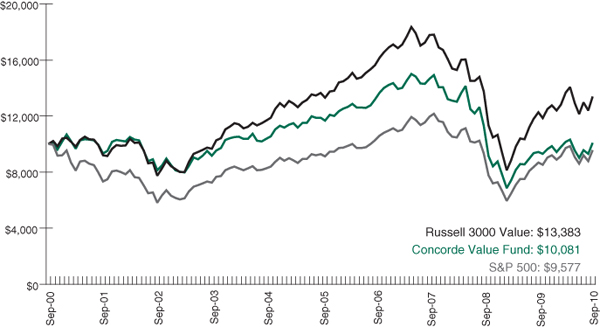
| NOTE: | TheRussell 3000 Value Index measures the performance of the Russell 3000 Index companies with lower price-to-book ratios and lower forecasted growth values. The S&P 500 consists of 500 selected stocks, most of which are listed on the New York Stock Exchange. It is a widely recognized unmanaged index of stock prices. Past performance is not predictive of future performance. The graph and table do not reflect the deduction of taxes that a shareholder would pay on fund distributions or the redemption of fund shares. |
4
Portfolio Holdings by Sector at September 30, 2010

The portfolio’s holdings and allocations are subject to change. The percentages are of net assets as of September 30, 2010.
5
CONCORDE VALUE FUND
SCHEDULE OF INVESTMENTS IN SECURITIES
September 30, 2010
| Shares or | ||||||||||||
| Principal | Fair | Percent of | ||||||||||
| Amount | Value | Net Assets | ||||||||||
| COMMON STOCKS - 93.70% | ||||||||||||
| AMUSEMENT & THEME PARKS | ||||||||||||
| The Walt Disney Co. | 8,500 | $ | 281,435 | 2.68 | % | |||||||
| BREAKFAST CEREAL MANUFACTURING | ||||||||||||
| General Mills, Inc. | 10,000 | 365,400 | 3.48 | |||||||||
| BREWERIES | ||||||||||||
| Anheuser Busch InBev NV - ADR (b) | 5,200 | 305,500 | 2.91 | |||||||||
| CLOTHING ACCESSORIES STORES | ||||||||||||
| Hanesbrands, Inc. (a) | 13,500 | 349,110 | 3.33 | |||||||||
| COMMERCIAL BANKING | ||||||||||||
| Bank of New York Mellon Corp. | 16,000 | 418,080 | 3.98 | |||||||||
| COMPUTER STORAGE DEVICE MANUFACTURING | ||||||||||||
| EMC Corp. (a) | 18,000 | 365,580 | 3.49 | |||||||||
| COMPUTER TERMINAL MANUFACTURING | ||||||||||||
| Dell, Inc. (a) | 20,000 | 259,200 | 2.47 | |||||||||
| CRUDE PETROLEUM & NATURAL GAS EXTRACTION | ||||||||||||
| Devon Energy Corp. | 6,000 | 388,440 | 3.70 | |||||||||
| DATA PROCESSING | ||||||||||||
| Fiserv, Inc. (a) | 10,000 | 538,200 | 5.13 | |||||||||
| DEEP SEA FREIGHT TRANSPORTATION | ||||||||||||
| Knightsbridge Tankers Ltd. (b) | 14,000 | 264,600 | 2.52 | |||||||||
| DIRECT LIFE INSURANCE CARRIERS | ||||||||||||
| Delphi Financial Group | 11,000 | 274,890 | 2.62 | |||||||||
| DIRECT PROPERTY & CASUALTY | ||||||||||||
| INSURANCE CARRIERS | ||||||||||||
| Travelers Companies, Inc. | 10,000 | 521,000 | 4.97 | |||||||||
| FARM MACHINERY & | ||||||||||||
| EQUIPMENT MANUFACTURING | ||||||||||||
| Deere & Co. | 4,300 | 300,054 | 2.86 | |||||||||
| HOME CENTERS | ||||||||||||
| Lowes Cos., Inc. | 10,000 | 222,900 | 2.12 | |||||||||
| HYDROELECTRIC POWER GENERATION | ||||||||||||
| Iberdrola SA - ADR (b) | 7,000 | 214,620 | 2.04 | |||||||||
| INSTRUMENT MANUFACTURING FOR MEASURING | ||||||||||||
| Agilent Technologies, Inc. (a) | 8,500 | 283,645 | 2.70 | |||||||||
| LOCAL MESSENGERS & LOCAL DELIVERY | ||||||||||||
| United Parcel Service, Inc. | 4,500 | 300,105 | 2.86 | |||||||||
The accompanying notes are an integral part of these financial statements.
6
CONCORDE VALUE FUND
SCHEDULE OF INVESTMENTS IN SECURITIES (continued)
September 30, 2010
| Shares or | ||||||||||||
| Principal | Fair | Percent of | ||||||||||
| Amount | Value | Net Assets | ||||||||||
| COMMON STOCKS (continued) | ||||||||||||
| MEDICAL LABORATORIES | ||||||||||||
| Quest Diagnostics | 8,000 | $ | 403,760 | 3.85 | % | |||||||
| NUCLEAR ELECTRIC POWER GENERATION | ||||||||||||
| Exelon Corp. | 9,000 | 383,220 | 3.66 | |||||||||
| OFFICE MACHINERY MANUFACTURING | ||||||||||||
| Scientific Games Corp. (a) | 20,000 | 194,000 | 1.85 | |||||||||
| OTHER COMPUTER PERIPHERAL | ||||||||||||
| EQUIPMENT MANUFACTURING | ||||||||||||
| Diebold, Inc. | 10,000 | 310,900 | 2.96 | |||||||||
| PACKAGING MACHINERY MANUFACTURING | ||||||||||||
| Illinois Tool Works, Inc. | 5,500 | 258,610 | 2.46 | |||||||||
| PETROLEUM REFINERIES | ||||||||||||
| ConocoPhillips | 8,000 | 459,440 | 4.38 | |||||||||
| PHARMACEUTICAL | ||||||||||||
| PREPARATION MANUFACTURING | ||||||||||||
| Johnson & Johnson | 8,000 | 495,680 | 4.72 | |||||||||
| POTASH, SODA, & BORATE MINERAL MINING | ||||||||||||
| Potash Corp. Saskatchewan (b) | 2,750 | 396,110 | 3.77 | |||||||||
| PROMOTERS OF PERFORMING ARTS, | ||||||||||||
| SPORTS & SIMILAR EVENTS WITH FACILITIES | ||||||||||||
| Live Nation Entertainment, Inc. (a) | 15,000 | 148,200 | 1.41 | |||||||||
| SERVICE INDUSTRY MACHINERY MANUFACTURING | ||||||||||||
| CAE, Inc. (b) | 40,000 | 412,400 | 3.93 | |||||||||
| SOFTWARE PUBLISHERS | ||||||||||||
| Microsoft Corp. | 14,000 | 342,860 | 3.27 | |||||||||
| Oracle Corp. | 14,000 | 375,900 | 3.58 | |||||||||
| 718,760 | 6.85 | |||||||||||
| TOTAL COMMON STOCKS ( Cost $7,550,750) | 9,833,839 | 93.70 | ||||||||||
| TRUSTS - 1.82% | ||||||||||||
| Penn West Energy Trust (b) | 9,500 | 190,665 | 1.82 | |||||||||
| TOTAL TRUSTS (Cost $187,695) | 190,665 | 1.82 | ||||||||||
| U.S. TREASURY OBLIGATIONS - 0.96% | ||||||||||||
| U.S. Treasury Note, 1.00%, due 12/31/2011 | $ | 100,000 | 100,844 | 0.96 | ||||||||
| TOTAL U.S. TREASURY OBLIGATIONS (Cost $100,099) | 100,844 | 0.96 | ||||||||||
The accompanying notes are an integral part of these financial statements.
7
CONCORDE VALUE FUND
SCHEDULE OF INVESTMENTS IN SECURITIES (continued)
September 30, 2010
| Shares or | ||||||||||||
| Principal | Fair | Percent of | ||||||||||
| Amount | Value | Net Assets | ||||||||||
| SHORT-TERM INVESTMENTS - 3.83% | ||||||||||||
| INVESTMENT COMPANIES | ||||||||||||
| Fidelity Institutional Money Market | ||||||||||||
| Portfolio - Select Class, 0.20% (c) | 402,103 | $ | 402,103 | 3.83 | % | |||||||
| TOTAL SHORT-TERM INVESTMENTS (Cost $402,103) | 402,103 | 3.83 | ||||||||||
| Total Investments (Cost $8,240,647) - 100.31% | 10,527,451 | 100.31 | ||||||||||
| Liabilities in Excess of Other Assets - (0.31)% | (32,077 | ) | (0.31 | ) | ||||||||
| TOTAL NET ASSETS - 100.00% | $ | 10,495,374 | 100.00 | % | ||||||||
Notes:
ADR American Depository Receipt
| (a) | Presently non-income producing. |
| (b) | Foreign issued security listed directly on a U.S. securities exchange. |
| (c) | Rate shown is the 7-day yield as of September 30, 2010. |
The accompanying notes are an integral part of these financial statements.
8
CONCORDE VALUE FUND
STATEMENT OF ASSETS AND LIABILITIES
September 30, 2010
| ASSETS | ||||
| Investments in securities, at fair value (cost $8,240,647) | $ | 10,527,451 | ||
| Receivables | ||||
| Dividends | 5,988 | |||
| Interest | 320 | |||
| Other assets | 4,002 | |||
| TOTAL ASSETS | 10,537,761 | |||
| LIABILITIES | ||||
| Investment advisory fee payable | 7,630 | |||
| Accrued expenses | 34,757 | |||
| TOTAL LIABILITIES | 42,387 | |||
| NET ASSETS | $ | 10,495,374 | ||
| Composition of Net Assets: | ||||
| Net capital paid in on shares of capital stock | $ | 10,787,485 | ||
| Accumulated net realized loss | (2,578,915 | ) | ||
| Net unrealized appreciation | 2,286,804 | |||
| NET ASSETS | $ | 10,495,374 | ||
| Capital shares outstanding | 985,341 | |||
| Net asset value, offering price and redemption price per share | $ | 10.65 | ||
The accompanying notes are an integral part of these financial statements.
9
CONCORDE VALUE FUND
STATEMENT OF OPERATIONS
Year Ended September 30, 2010
| Investment income | ||||
| Dividends (net of foreign taxes withheld of $3,226) | $ | 188,110 | ||
| Interest | 8,692 | |||
| Total investment income | 196,802 | |||
| Expenses | ||||
| Investment advisory fees (Note 4) | 103,972 | |||
| Administration fees | 38,596 | |||
| Fund accounting fees | 24,966 | |||
| Professional fees | 23,650 | |||
| Transfer agent fees | 16,446 | |||
| Printing, postage and delivery | 14,905 | |||
| Other expenses | 4,413 | |||
| Custodian fees | 2,739 | |||
| Directors fees | 2,124 | |||
| Federal and state registration fees | 1,976 | |||
| Total expenses | 233,787 | |||
| NET INVESTMENT LOSS | (36,985 | ) | ||
| REALIZED LOSS AND UNREALIZED | ||||
| APPRECIATION FROM INVESTMENTS | ||||
| Net realized loss on investments in securities | (422,761 | ) | ||
| Net increase in unrealized appreciation on investments in securities | 1,216,999 | |||
| NET GAIN FROM INVESTMENTS | 794,238 | |||
| NET INCREASE IN NET ASSETS RESULTING FROM OPERATIONS | $ | 757,253 | ||
The accompanying notes are an integral part of these financial statements.
10
CONCORDE VALUE FUND
STATEMENTS OF CHANGES IN NET ASSETS
| Year Ended | Year Ended | |||||||
| Sept. 30, 2010 | Sept. 30, 2009 | |||||||
| INCREASE (DECREASE) IN NET ASSETS FROM OPERATIONS | ||||||||
| Net investment loss | $ | (36,985 | ) | $ | (26,674 | ) | ||
| Net realized loss on investments | (422,761 | ) | (2,160,993 | ) | ||||
| Net change in unrealized appreciation of investments | 1,216,999 | (71,487 | ) | |||||
| Net increase (decrease) in net assets resulting from operations | 757,253 | (2,259,154 | ) | |||||
| DISTRIBUTIONS TO SHAREHOLDERS FROM | ||||||||
| Net realized gains on investments | — | (689,438 | ) | |||||
CAPITAL SHARE TRANSACTIONS — NET (Note 2) | (2,748,553 | ) | 1,319,998 | |||||
| Total decrease in net assets | (1,991,300 | ) | (1,628,594 | ) | ||||
| NET ASSETS | ||||||||
| Beginning of year | 12,486,674 | 14,115,268 | ||||||
| End of year (including accumulated net investment | ||||||||
| income (loss) of $0 and ($16), respectively) | $ | 10,495,374 | $ | 12,486,674 | ||||
The accompanying notes are an integral part of these financial statements.
11
CONCORDE VALUE FUND
FINANCIAL HIGHLIGHTS
| Year ended September 30, | ||||||||||||||||||||
| 2010 | 2009 | 2008 | 2007 | 2006 | ||||||||||||||||
PER SHARE DATA(1): | ||||||||||||||||||||
| Net asset value, beginning of year | $ | 9.98 | $ | 12.74 | $ | 18.39 | $ | 17.94 | $ | 17.06 | ||||||||||
| Income (loss) from investment operations: | ||||||||||||||||||||
| Net investment income (loss) | (0.03 | ) | (0.02 | ) | 0.01 | 0.04 | 0.09 | |||||||||||||
| Net realized and unrealized | ||||||||||||||||||||
| gain (loss) on investments | 0.70 | (2.14 | ) | (3.88 | ) | 1.93 | 1.71 | |||||||||||||
| Total income (loss) from | ||||||||||||||||||||
| investment operations | 0.67 | (2.16 | ) | (3.87 | ) | 1.97 | 1.80 | |||||||||||||
| Less distributions: | ||||||||||||||||||||
| Distributions from net | ||||||||||||||||||||
| investment income | — | — | — | (0.15 | ) | — | ||||||||||||||
| Distributions from net realized gains | — | (0.60 | ) | (1.78 | ) | (1.37 | ) | (0.92 | ) | |||||||||||
| Total distributions | — | (0.60 | ) | (1.78 | ) | (1.52 | ) | (0.92 | ) | |||||||||||
| Net asset value, end of year | $ | 10.65 | $ | 9.98 | $ | 12.74 | $ | 18.39 | $ | 17.94 | ||||||||||
| TOTAL RETURN | 6.71% | (16.40% | ) | (22.98% | ) | 11.24% | 11.00% | |||||||||||||
| RATIOS/SUPPLEMENTAL DATA: | ||||||||||||||||||||
| Net assets, end of year (in thousands) | $ | 10,495 | $ | 12,487 | $ | 14,115 | $ | 18,972 | $ | 17,886 | ||||||||||
| Ratio of expenses to average net assets | 2.02% | 2.00% | 1.62% | 1.60% | 1.61% | |||||||||||||||
| Ratio of net investment income (loss) | ||||||||||||||||||||
| to average net assets | (0.32% | ) | (0.24% | ) | 0.03% | 0.20% | 0.54% | |||||||||||||
| Portfolio turnover rate | 33% | 51% | 34% | 29% | 31% | |||||||||||||||
| (1) | Per share information has been calculated using the average number of shares outstanding. |
The accompanying notes are an integral part of these financial highlights.
12
CONCORDE VALUE FUND
NOTES TO FINANCIAL STATEMENTS
Note 1 – Nature of Business and Summary of Significant Accounting Policies
NATURE OF BUSINESS
Concorde Value Fund (Fund) is a separate series of shares of common stock of Concorde Funds, Inc. (Company). The Company was incorporated in the state of Texas in September of 1987, and is registered under the Investment Company Act of 1940, as amended, as a diversified, open-end management investment company. The Fund is subject to various investment restrictions as set forth in the Statement of Additional Information. The effective date of the Fund’s Registration Statement under the Securities Act of 1933 was December 4, 1987. The primary investment objective of the Fund is to produce long-term growth of capital. The Company may designate one or more series of common stock. The Company presently has no series other than the Fund. Each capital share in the Fund represents an equal, proportionate interest in the net assets of th e Fund with each other capital share in such series and no interest in any other series.
SIGNIFICANT ACCOUNTING POLICIES
The following is a summary of significant accounting policies followed by the Fund in the preparation of its financial statements. These policies are in conformity with accounting principles generally accepted in the United States.
USE OF ESTIMATES
The preparation of financial statements in conformity with generally accepted accounting principles requires management to make estimates and assumptions that affect the reported amounts of the assets and liabilities and disclosure of contingent assets and liabilities at the date of the financial statements and the reported amounts of increases and decreases in net assets from operations during the reporting period. Actual results could differ from those estimates.
VALUATION OF SECURITIES
Equity securities (common stocks and trusts) are valued at the close of each business day. Bonds and notes are valued at the last quoted bid price obtained from independent pricing services. Securities traded on national securities exchanges or on the national market systems are valued at the last quoted sales price on the day of valuation, except for call options written for which the last quoted bid price is used. Short-term demand notes and certificates of deposit are stated at amortized cost, which approximates fair value. Short-term investments in fixed income securities with maturities of less than 60 days when acquired, or which subsequently are within 60 days of maturity, are valued by using the amortized cost method of valuation, which the Board has determined will represent fair value. Securi ties for which representative market quotations are not readily available are valued at fair value as determined in good faith by the Board of Directors.
13
CONCORDE VALUE FUND
NOTES TO FINANCIAL STATEMENTS (continued)
Note 1 – Nature of Business and Summary of Significant Accounting Policies (continued)
SECURITY TRANSACTIONS AND RELATED INCOME
Security transactions are accounted for on the date the securities are purchased or sold. Realized gains and losses from securities transactions are reported on an identified cost basis. Dividend income is recognized on the ex-dividend date, and interest income is recognized on the accrual basis. Discounts and premiums on securities purchased are amortized, over the life of the respective securities.
OPTION WRITING
When the Fund writes an option, an amount equal to the premium received by the Fund is recorded as a liability and is subsequently adjusted to the current fair value of the option written. The Fund treats premiums received from writing options that expire unexercised on the expiration date as realized gains from investments. The difference between the premium and the amount paid on effecting a closing purchase transaction, including brokerage commissions, is also treated as a realized gain, or, if the premium is less than the amount paid for the closing purchase transaction, as a realized loss. If a call option is exercised, the premium is added to the proceeds from the sale of the underlying security or currency in determining whether the Fund has realized a gain or loss. The Fund as writer of an option bears the market risk of an un favorable change in the price of the security underlying the written option.
FEDERAL INCOME TAXES
The Fund’s policy is to continue to qualify as a regulated investment company under Subchapter M of the Internal Revenue Code of 1986, as amended, by distributing substantially all of its net investment income and net realized capital gains to its shareholders. The Fund also intends to distribute sufficient net investment income and net realized capital gains, if any, so that it will not be subject to excise tax on undistributed investment income and capital gains. Therefore, no federal income or excise tax provision is required.
Net investment income (loss), net realized gains (losses) and the cost of investments in securities may differ for financial statement and income tax purposes. The character of distributions from net investment income or net realized gains may differ from their ultimate characterization for income tax purposes. Accounting principles generally accepted in the United States of America require that certain components of net assets relating to permanent differences be reclassified between financial and tax reporting. For the year ended September 30, 2010, the Fund decreased accumulated net investment loss by $37,001, decreased undistributed net realized loss by $8 and decreased net capital paid in on shares of capital stock by $37,009. These reclassifications have no effect on net assets, results of operat ions or net asset value per share. The permanent differences primarily relate to foreign currency and net operating loss reclassifications. Also, due to the timing of dividend distributions, the fiscal year in which amounts are distributed may differ from the year that the income or realized gains were recorded by the Fund.
14
CONCORDE VALUE FUND
NOTES TO FINANCIAL STATEMENTS (continued)
Note 1 – Nature of Business and Summary of Significant Accounting Policies (continued)
DIVIDENDS AND DISTRIBUTIONS
Distributions to shareholders, which are determined in accordance of income tax regulations, are recorded on the ex-date. The Fund intends to distribute substantially all of its net investment income as dividends to its shareholders on an annual basis. The Fund intends to distribute substantially all of its net realized long-term capital gains and its net realized short-term capital gains at least once a year. The treatment for financial reporting purposes of distributions made to shareholders during the year from net investment income or net realized capital gains may differ from their ultimate treatment for federal tax purposes. These differences are caused primarily by differences in the timing of the recognition of certain components of income, expense or realized capital gain for federal income tax purposes. ;Where such differences are permanent in nature, they are reclassified in the components of the net assets based on their ultimate characterization for federal income tax purposes. Any such reclassifications will have no effect on net assets, results of operations or net assets values per share.
ACCOUNTING FOR UNCERTAINTY IN INCOME TAXES
The Fund has adopted financial reporting rules regarding recognition and measurement of tax positions taken or expected to be taken on a tax return. The Fund has reviewed all open tax years and major jurisdictions (major jurisdictions for the Fund include Federal and the State of Texas) and concluded that there is no impact on the Fund’s net assets and no tax liability resulting from unrecognized tax benefits relating to uncertain income tax positions taken or expected to be taken on a tax return. As of September 30, 2010, open Federal tax years include the tax years ended September 30, 2007 through 2009.
EVENTS SUBSEQUENT TO THE FISCAL PERIOD END
The Fund has adopted financial reporting rules regarding subsequent events, which requires an entity to recognize in the financial statements the effects of all subsequent events that provide additional evidence about conditions that existed at the date of the balance sheet. Management has evaluated the Fund’s events and transactions that occurred subsequent to September 30, 2010, through November 17, 2010, the date which the financial statements were available to be issued. There were no events or transactions that occurred during this period that materially impacted the amounts or disclosures in the Fund’s financial statements.
NEW ACCOUNTING PRONOUNCEMENT
In January 2010, Financial Accounting Standards Board (FASB) issued Accounting Standards Update (“ASU”) No. 2010-06 “Improving Disclosures about Fair Value Measurements”. ASU 2010-06 amends FASB Accounting Standards Codification Topic 820, Fair Value Measurements and Disclosures, to require additional disclosures regarding fair value measurements. Certain disclosures required by ASU No. 2010-06 are effective for interim and annual reporting periods beginning after December 15, 2009, and other required disclosures are effective for fiscal years beginning after
15
CONCORDE VALUE FUND
NOTES TO FINANCIAL STATEMENTS (continued)
Note 1 – Nature of Business and Summary of Significant Accounting Policies (continued)
December 15, 2010, and for interim periods within those fiscal years. Management is currently evaluating the impact ASU No. 2010-06, but does not expect it will have an impact on the Funds’ statement disclosures.
Note 2 – Capital Share Transactions
As of September 30, 2010, there were 30,000,000 shares of $1 par value capital stock authorized of which 9,841,293 shares are classified as the Fund’s series and the remaining balance is unallocated for future use. As of September 30, 2010, capital paid-in aggregated $10,787,485.
Transactions in shares of capital stock for the year ended September 30, 2010 and September 30, 2009 were as follows:
| Year Ended | Year Ended | |||||||||||||||
| September 30, 2010 | September 30, 2009 | |||||||||||||||
| Shares | Amount | Shares | Amount | |||||||||||||
| Shares sold | 33,481 | $ | 350,419 | 136,615 | $ | 1,258,629 | ||||||||||
| Shares issued in reinvestment of dividends | — | — | 76,946 | 689,437 | ||||||||||||
| 33,481 | 350,419 | 213,561 | 1,948,066 | |||||||||||||
| Shares redeemed | (299,387 | ) | (3,098,972 | ) | (70,415 | ) | (628,068 | ) | ||||||||
| Net increase (decrease) | (265,906 | ) | $ | (2,748,553 | ) | 143,146 | $ | 1,319,998 | ||||||||
Note 3 – Investment Transactions
The aggregate cost of purchases and proceeds from sales of investment securities, excluding short-term investments and U.S. Government securities, were $2,073,935 and $2,437,228, respectively. The cost of purchases and proceeds from sales of long-term U.S. Government securities were $1,502,346 and $2,921,000, respectively. The cost of purchases and proceeds from sales of short-term securities aggregated $4,226,506 and $5,323,743, respectively, for the year ended September 30, 2010.
Note 4 – Investment Advisory Fees and Other Transactions with Affiliates
The Fund has an Investment Advisory Agreement (Advisory Agreement) with Concorde Financial Corporation dba Concorde Investment Management (Concorde) to act as the Fund’s investment advisor. Concorde provides the Fund with investment advice and recommendations consistent with the Fund’s investment objectives, policies and restrictions, and supervises the purchase and sale of investment transactions on behalf of the Fund. For such services, Concorde receives an annual fee of 0.90% of the Fund’s average daily net assets, computed daily and paid on a monthly basis. The investment advisory fee was $103,972 for the year ended September 30, 2010, of which $7,630 was payable at September 30, 2010.
Certain directors and officers of the Company are also directors, officers and/or employees of Concorde.
16
CONCORDE VALUE FUND
NOTES TO FINANCIAL STATEMENTS (continued)
Note 5 – Federal Tax Information
At September 30, 2010, the Fund’s most recent fiscal year end, the components of accumulated earnings (losses) on a tax basis were as follows:
| Cost of Investments (a) | $ | 8,289,819 | |||
| Gross tax unrealized appreciation | 2,701,685 | ||||
| Gross tax unrealized depreciation | (464,053 | ) | |||
| Net tax unrealized appreciation (depreciation) | $ | 2,237,632 | |||
| Undistributed ordinary income | — | ||||
| Undistributed long-term capital gain | — | ||||
| Total distributable earnings | $ | — | |||
| Other accumulated gains (losses) | $ | (2,529,743 | ) | ||
| Total accumulated earnings (losses) | $ | (292,111 | ) |
| (a) | Represents cost for federal income tax purposes and differs from the cost for financial reporting purposes primarily due to wash sale adjustments. |
At September 30, 2010, the Fund’s most recent fiscal year end, the Fund had tax basis capital losses of $2,161,397, which may be carried over to offset future capital gains, of which $381,456 expires on September 30, 2017 and $1,779,941 expires on September 30, 2018. Additionally, the Fund had a post-October capital loss of $368,346. The post-October capital loss is treated as occurring on October 1, 2010 for tax purposes.
The tax character of distributions paid during the year ended September 30, 2010 and September 30, 2009 was as follows:
| September 30, 2010 | September 30, 2009 | ||||||||
| Ordinary income | $ | — | $ | 72,123 | |||||
| Long-term capital gain | — | 617,297 | |||||||
| Return of capital | — | 18 | |||||||
| $ | — | $ | 689,438 | ||||||
17
CONCORDE VALUE FUND
NOTES TO FINANCIAL STATEMENTS (continued)
Note 6 – Summary of Fair Value Exposure
The Fund has adopted authoritative fair valuation accounting standards which establish an authoritative definition of fair value and set out a hierarchy for measuring fair value. These standards require additional disclosures about the various inputs and valuation techniques used to develop the measurements of fair value and a discussion in changes in valuation techniques and related inputs during the period. These inputs are summarized in the three broad levels listed below:
| Level 1 – | Quoted unadjusted prices for identical instruments in active markets to which the Fund has access at the date of measurement. | |
| Level 2 – | Quoted prices for similar instruments in active markets; quoted prices for identical or similar instruments in markets that are not active; and model-derived valuations in which all significant inputs and significant value drivers are observable in active markets. Level 2 inputs are those in markets for which there are few transactions, the prices are not current, little public information exists or instances where prices vary substantially over time or among brokered market makers. | |
| Level 3 – | Model derived valuations in which one or more significant inputs or significant value drivers are unobservable. Unobservable inputs are those inputs that reflect the Fund’s own assumptions that market participants would use to price the asset or liability based on the best available information. |
The inputs or methodology used for valuing securities are not an indication of the risk associated with investing in those securities.
The following is a summary of the inputs used to value the Fund’s net assets as of September 30, 2010:
| Level 1 | Level 2 | Level 3 | Total | ||||||||||||||
| Equity Securities | $ | 9,833,839 | $ | — | $ | — | $ | 9,833,839 | |||||||||
| Trusts | 190,665 | — | — | 190,665 | |||||||||||||
| Fixed Income Securities | — | 100,844 | — | 100,844 | |||||||||||||
| Short-Term Securities | 402,103 | — | — | 402,103 | |||||||||||||
| Total Investments in Securities | $ | 10,426,607 | $ | 100,844 | $ | — | $ | 10,527,451 | |||||||||
For further information regarding security characteristics, see the Schedule of Investments in Securities.
18
REPORT OF INDEPENDENT REGISTERED PUBLIC ACCOUNTING FIRM
To the Shareholders and
Board of Directors of
Concorde Funds, Inc.
We have audited the accompanying statement of assets and liabilities of the Concorde Value Fund portfolio of Concorde Funds, Inc. (Fund), including the schedule of investments in securities, as of September 30, 2010, and the related statement of operations for the year then ended, the statements of changes in net assets for each of the two years in the period then ended, and the financial highlights for each of the five years in the period then ended. These financial statements and financial highlights are the responsibility of the Fund’s management. Our responsibility is to express an opinion on these financial statements and financial highlights based on our audits.
We conducted our audits in accordance with the standards of the Public Company Accounting Oversight Board (United States). Those standards require that we plan and perform the audit to obtain reasonable assurance about whether the financial statements and financial highlights are free of material misstatement. An audit includes examining, on a test basis, evidence supporting the amounts and disclosures in the financial statements. Our procedures included confirmation of securities owned as of September 30, 2010, by correspondence with the custodian. An audit also includes assessing the accounting principles used and significant estimates made by management, as well as evaluating the overall financial statement presentation. We believe that our audits provide a reasonable basis for our opinion.
In our opinion, the financial statements and financial highlights referred to above present fairly, in all material respects, the financial position of the Concorde Value Fund portfolio of Concorde Funds, Inc. as of September 30, 2010, the results of its operations for the year then ended, the changes in its net assets for each of the two years in the period then ended, and the financial highlights for each of the five years in the period then ended, in conformity with accounting principles generally accepted in the United States of America.
 | |
| BRAD A. KINDER, CPA | |
| Flower Mound, Texas | |
| November 17, 2010 |
19
ADDITIONAL INFORMATION (Unaudited)
PROXY VOTING POLICIES AND PROCEDURES
For a description of the policies and procedures that the Fund uses to determine how to vote proxies relating to the portfolio securities, please call (972) 701-5400 and request a Statement of Additional Information. One will be mailed to you free of charge. The Statement of Additional Information is also available on the website of the Securities and Exchange Commission at http://www.sec.gov.
PROXY VOTING RECORDS
Information on how the Fund voted proxies relating to portfolio securities during the twelve month period ending June 30, 2010 is available without charge, upon request, by calling (972) 701-5400. Furthermore, you can obtain the Fund’s proxy voting records on the Securities and Exchange Commission’s website at http://www.sec.gov.
QUARTERLY FILINGS ON FORM N-Q
The Fund files its complete schedule of portfolio holdings with the Securities and Exchange Commission for the first and third quarters of each fiscal quarter on Form N-Q. The Fund’s Form N-Q is available (i) without charge, upon request, by calling (972) 701-5400, (ii) on the Securities and Exchange Commission’s website at http://www.sec.gov, or (iii) at the Securities and Exchange Commission’s public reference room.
20
FUND EXPENSES (Unaudited)
As a shareholder of the FUND, you incur two types of costs: (1) transaction costs and exchange fees; and (2) ongoing costs, including management fees and other FUND expenses. This Example is intended to help you understand your ongoing costs (in dollars) of investing in the FUND and to compare these costs with the ongoing costs of investing in other mutual funds.
The Example is based on an investment of $1,000 invested at the beginning of the period and held for the entire six month period ended September 30, 2010.
Actual Expenses
The first line of the table below provides information about actual account values and actual expenses. You may use the information in this line, together with the amount you invested, to estimate the expenses that you paid over the period. Simply divide your account value by $1,000 (for example, an $8,600 account value divided by $1,000 = 8.6), then multiply the result by the number in the first line under the heading entitled “Expenses Paid During Period” to estimate the expenses you paid on your account during this period.
Hypothetical Example for Comparison Purposes
The second line of the table below provides information about hypothetical account values and hypothetical expenses based on the FUND’s actual expense ratio and an assumed rate of return of 5% per year before expenses, which is not the FUND’s actual return. The hypothetical account values and expenses may not be used to estimate the actual ending account balance or expenses you paid for the period. You may use this information to compare the ongoing costs of investing in the FUND and other funds. To do so, compare this 5% hypothetical example with the 5% hypothetical examples that appear in the shareholder reports of the other funds.
Please note that the expenses shown in the table are meant to highlight your ongoing costs only and do not reflect any transactional costs or exchange fees. While the FUND does not currently assess sales charges, redemption or exchange fees, other funds do, and those costs will not be reflected in their expense tables. Therefore, the second line of the table is useful in comparing ongoing costs only, and will not help you determine the relative total costs of owning different funds.
Beginning Account | Ending Account | Expenses Paid During Period* – | ||||||||||
| Value – 4/1/10 | Value – 9/30/10 | Six Months Ended 9/30/10 | ||||||||||
| Actual | $1,000.00 | $ 991.60 | $10.48 | |||||||||
| Hypothetical (5% return before expenses) | $1,000.00 | $1,014.54 | $10.61 | |||||||||
| * | Expenses are equal to the FUND’s annualized expense ratio of 2.10%, multiplied by the average account value over the period, multiplied by 183/365 (to reflect the one-half year period ended September 30, 2010). |
21
DIRECTORS AND OFFICERS (Unaudited)
DIRECTORS AND OFFICERS
The Fund’s Statement of Additional Information includes additional information about the Fund’s Directors and Officers and is available, without charge, upon request by calling (972) 701-5400.
| Position(s) | Term of Office | Other | ||
| Held with | and Length | Principal Occupation(s) | Directorships | |
| Name, Address and Age | the Fund | of Time Served | During Past 5 Years | Held by Director |
| “Disinterested Persons” | ||||
| William Marcy | Director | Indefinite, until | Executive Director of the Murdough | None |
| Age: 68 | successor elected | Center for Engineering Professionalism | ||
| Address: 4607 27th Street | and the National Institute for | |||
| Lubbock, Texas 79410 | Since 2006 | Engineering Ethics, Texas Tech | ||
| University. He is a former Provost | ||||
| and Senior Vice President for | ||||
| Academic Affairs, Texas Tech | ||||
| University. | ||||
| John H. Wilson | Chairman | Indefinite, until | President of U.S. Equity Corporation, | Capital Southwest |
| Age: 68 | and Director | successor elected | a venture capital firm since 1983. | Corporation, Encore |
| Address: | Wire Corporation, | |||
| 1000 Three Lincoln Centre | Since 1992 | Palm Harbor | ||
| 5430 LBJ Freeway LB3 | Homes, Inc. | |||
| Dallas, Texas 75240 | ||||
| “Interested Persons” | ||||
| Gary B. Wood, Ph.D.* | President, | Indefinite, until | President, Secretary, Treasurer | OmniMed Corporation |
| Age: 61 | Chief | successor elected | and a Director of the Advisor and | eOriginal, Inc., |
| Address: | Compliance | (as Director) | Concorde Capital Corporation, a | COMM Group, Inc. |
| 1000 Three Lincoln Centre | Officer, | former investment advisory firm | ||
| 5430 LBJ Freeway LB3 | Treasurer | One-year term | affiliated with the Advisor. He is | |
| Dallas, Texas 75240 | and Director | (as officer) | also Chairman of the Board and | |
| Interim CEO of International | ||||
| Since 1987 | Hospital Corporation and its | |||
| subsidiaries, which owns, develops | ||||
| and manages private healthcare | ||||
| facilities in Mexico, Central America | ||||
| and Brazil. | ||||
| John A. Stetter | Secretary | One-year term | Vice President and Portfolio | |
| Age: 55 | Manager for the Advisor. | |||
| Address: | Since 1998 | |||
| 1000 Three Lincoln Centre | ||||
| 5430 LBJ Freeway LB3 | ||||
| Dallas, Texas 75240 |
| * | Dr. Wood is a director who is an “interested person” of FUND as that term is defined in the Investment Company Act of 1940. |
22
CONCORDE FUNDS, INC.
PRIVACY POLICY
We collect the following nonpublic personal information about you:
| • | Information we receive from you or in applications or other forms, correspondence, or conversations, including, but not limited to, your name, address, phone number, social security number, assets, income and date of birth; and |
| • | Information about your transactions with us, our affiliates, or others, including, but not limited to, your account number and balance, payments history, parties to transactions, cost basis information, and other financial information. |
We do not disclose any nonpublic personal information about our current or former shareholders to nonaffiliated third parties, except as permitted by law. For example, we are permitted by law to disclose all the information we collect, as described above, to our transfer agent to process your transactions. Furthermore, we restrict access to your nonpublic personal information to those persons who require such information to provide products and services to you. We maintain physical, electronic, and procedural safeguards that comply with federal standards to guard your nonpublic personal information.
In the event that you hold shares of the fund(s) through a financial intermediary, including, but not limited to, a broker-dealer, bank or trust company, the privacy policy of your financial intermediary would govern how your nonpublic personal information would be shared with nonaffiliated third parties.
23
INVESTMENT ADVISOR
Concorde Investment Management
1000 Three Lincoln Centre
5430 LBJ Freeway LB3
Dallas, Texas 75240
OFFICERS
Gary B. Wood, Ph.D.
President and Treasurer
John A. Stetter
Secretary
DIRECTORS
William Marcy
John H. Wilson
Gary B. Wood, Ph.D.
CUSTODIAN
U.S. Bank, N.A.
Custody Operations
1555 North RiverCenter Drive, Suite 302
Milwaukee, Wisconsin 53212
TRANSFER AGENT AND
DIVIDEND DISBURSING AGENT
U.S. Bancorp Fund Services, LLC
Mutual Fund Services, 3rd Floor
615 East Michigan Street
Milwaukee, Wisconsin 53202
INDEPENDENT REGISTERED
PUBLIC ACCOUNTING FIRM
Brad A. Kinder, CPA
815 Parker Square
Flower Mound, Texas 75028
LEGAL COUNSEL
Foley & Lardner LLP
777 East Wisconsin Avenue
Milwaukee, Wisconsin 53202
TELEPHONE
(972) 701-5400
(Fund information)
(800) 294-1699
(Shareholder account information)
Item 2. Code of Ethics.
The registrant has adopted a code of ethics that applies to the registrant’s principal executive officer and principal financial officer. The registrant has not made any amendments to its code of ethics during the period covered by this report. The registrant has not granted any waivers from any provisions of the code of ethics during the period covered by this report. The registrant undertakes to provide to any person without charge, upon request, a copy of its code of ethics by mail when they call the registrant at 1-800-294-1699.
Item 3. Audit Committee Financial Expert.
The registrant’s board of directors has determined that it does not have an audit committee financial expert serving on its audit committee. At this time, the registrant believes that the experience provided by each member of the audit committee together offers the registrant adequate oversight for the registrant’s level of financial complexity.
Item 4. Principal Accountant Fees and Services.
The registrant has engaged its principal accountant to perform audit services, audit-related services, tax services and other services during the past two fiscal years. “Audit services” refer to performing an audit of the registrant's annual financial statements or services that are normally provided by the accountant in connection with statutory and regulatory filings or engagements for those fiscal years. “Audit-related services” refer to the assurance and related services by the principal accountant that are reasonably related to the performance of the audit. “Tax services” refer to professional services rendered by the principal accountant for tax compliance, tax advice, and tax planning. There were no “other services” provided by the principal accountant. The following table details the aggregate fees billed or expected to be billed for each of the last two fiscal years for audit fees, audit-related fees, tax fees and other fees by the principal accountant.
| FYE 09/30/2010 | FYE 09/30/2009 | |
| Audit Fees | $17,000 | $17,000 |
| Audit-Related Fees | None | None |
| Tax Fees | $1,000 | $1,000 |
| All Other Fees | None | None |
The audit committee has adopted pre-approval policies and procedures that require the audit committee to pre-approve all audit and non-audit services of the registrant, including services provided to any entity affiliated with the registrant.
The percentage of fees billed by Brad A. Kinder, CPA applicable to non-audit services pursuant to waiver of pre-approval requirement were as follows:
| FYE 09/30/2010 | FYE 09/30/2009 | |
| Audit-Related Fees | 0% | 0% |
| Tax Fees | 0% | 0% |
| All Other Fees | 0% | 0% |
All of the principal accountant’s hours spent on auditing the registrant’s financial statements were attributed to work performed by full-time permanent employees of the principal accountant. (If more than 50 percent of the accountant’s hours were spent to audit the registrant's financial statements for the most recent fiscal year, state how many hours were attributed to work performed by persons other than the principal accountant's full-time, permanent employees.)
The following table indicates the non-audit fees billed or expected to be billed by the registrant’s accountant for services to the registrant and to the registrant’s investment adviser (and any other controlling entity, etc.—not sub-adviser) for the last two years. The audit committee of the board of trustees/directors has considered whether the provision of non-audit services that were rendered to the registrant's investment adviser is compatible with maintaining the principal accountant's independence and has concluded that the provision of such non-audit services by the accountant has not compromised the accountant’s independence.
| Non-Audit Related Fees | FYE 09/30/2010 | FYE 09/30/2009 |
| Registrant | None | None |
| Registrant’s Investment Adviser | $1,000 | $1,000 |
Item 5. Audit Committee of Listed Registrants.
Not applicable to registrants who are not listed issuers (as defined in Rule 10A-3 under the Securities Exchange Act of 1934).
Item 6. Investments.
Schedule of Investments is included as part of the report to shareholders filed under Item 1 of this Form.
Item 7. Disclosure of Proxy Voting Policies and Procedures for Closed-End Management Investment Companies.
Not applicable to open-end investment companies.
Item 8. Portfolio Managers of Closed-End Management Investment Companies.
Not applicable to open-end investment companies.
Item 9. Purchases of Equity Securities by Closed-End Management Investment Company and Affiliated Purchasers.
Not applicable to open-end investment companies.
Item 10. Submission of Matters to a Vote of Security Holders.
Not Applicable.
Item 11. Controls and Procedures.
| (a) | The Registrant’s President/Principal Executive Officer and Treasurer/Principal Financial Officer have reviewed the Registrant's disclosure controls and procedures (as defined in Rule 30a-3(c) under the Investment Company Act of 1940 (the “Act”)) as of a date within 90 days of the filing of this report, as required by Rule 30a-3(b) under the Act and Rules 13a-15(b) or 15d-15(b) under the Securities Exchange Act of 1934. Based on their review, such officers have concluded that the disclosure controls and procedures are effective in ensuring that information required to be disclosed in this report is appropriately recorded, processed, summarized and reported and made known to them by others within the Registrant and by the Registrant’s service provider. |
| (b) | There were no changes in the Registrant's internal control over financial reporting (as defined in Rule 30a-3(d) under the Act) that occurred during the second fiscal quarter of the period covered by this report that has materially affected, or is reasonably likely to materially affect, the Registrant's internal control over financial reporting. |
Item 12. Exhibits.
| (a) | (1) Any code of ethics or amendment thereto, that is the subject of the disclosure required by Item 2, to the extent that the registrant intends to satisfy Item 2 requirements through filing an exhibit. Incorporated by reference to previous Form N-CSR filed November 18, 2004. |
| (2) | A separate certification for each principal executive and principal financial officer pursuant to Section 302 of the Sarbanes-Oxley Act of 2002. Filed herewith. |
| (3) | Any written solicitation to purchase securities under Rule 23c-1 under the Act sent or given during the period covered by the report by or on behalf of the registrant to 10 or more persons. Not applicable to open-end investment companies. |
| (b) | Certifications pursuant to Section 906 of the Sarbanes-Oxley Act of 2002. Furnished herewith. |
SIGNATURES
Pursuant to the requirements of the Securities Exchange Act of 1934 and the Investment Company Act of 1940, the registrant has duly caused this report to be signed on its behalf by the undersigned, thereunto duly authorized.
(Registrant) Concorde Funds, Inc.
By (Signature and Title)*/s/ Gary B. Wood
Gary B. Wood, President
Date: 11/30/2010
Pursuant to the requirements of the Securities Exchange Act of 1934 and the Investment Company Act of 1940, this report has been signed below by the following persons on behalf of the registrant and in the capacities and on the dates indicated.
By (Signature and Title)* /s/ Gary B. Wood
Gary B. Wood, Principal Executive Officer
Date: 11/30/2010
By (Signature and Title)* /s/ Gary B. Wood
Gary B. Wood, Principal Financial Officer
Date: 11/30/2010
* Print the name and title of each signing officer under his or her signature.