A NO-LOAD
MUTUAL FUND
SEMI-ANNUAL REPORT
Dated March 31, 2023
(Unaudited)
Dear Shareholders,
Concorde Wealth Management Fund (the “Fund” or “CONWX”), managed by Concorde Investment Management, produced a net return of 4.77% for the six months ended March 31, 2023, the six months after the fiscal year ending September 31, 2022. This compares the various equity, fixed income and blended indices below.
According to US Bank, the Fund’s administrator, as compared to approximately 735 balanced (which means not pure equity or pure bonds, but a “balanced” mix of asset classes) public mutual funds of all sizes, CONWX performance was in the 4th quartile for this short period but performed in the top decile for the trailing 3 year and 5 year periods.
Asset allocations as of March 31, 2023, were approximately 50.1% equities, including 8.4% in private equity, 28.7% in fixed income and cash equivalents and 20.5% in defensive/non-equity market correlated securities.
| | Six Months Ended | | Annualized | Annualized |
| | March 31, 2023 | 1 Year Ended | 5 Years Ended | 10 Years Ended |
| | (Unaudited) | March 31, 2023 | March 31, 2023 | March 31, 2023 |
| Concorde Wealth Management Fund | 4.77% | -5.94% | 7.14% | 6.71% |
| Concorde Wealth Management | | | | |
| Blended Index | 8.46% | -3.89% | 4.41% | 4.99% |
| Bloomberg Barclays | | | | |
| U.S. Aggregate Bond Index | 4.89% | -4.78% | 0.91% | 1.36% |
| Russell 1000 Value Index | 13.55% | -5.91% | 7.50% | 9.13% |
Note: The Concorde Wealth Management Blended Index consists of 45% equities represented by the Russell 1000 Value Index, 45% bonds represented by the Barclays Intermediate Aggregate Bond Index, 5% short-term investments represented by Bank of America Merrill Lynch 1-3 Year Treasuries, and 5% commodities represented by Barclays U.S. Treasury Inflation Protection Security. The Russell 1000 Value Index measures the performance of those Russell 1000 companies with lower price-to-book ratios and lower forecasted growth values. The Barclays Aggregate Bond Index measures the investment grade, U.S. dollar denominated, fixed-rate taxable bond market, including Treasuries, government-related and corporate securities, mortgage-backed securities (agency fixed-rate and hybrid adjustable rate mortgage pass throughs), asset backed securities, and commercial mortgage backed securities.
Open End Funds
The Cohen & Steers Institutional Realty Shares and Absolute Convertible Arbitrage Funds were open end structure holdings at period end. Cohen & Steers contributed over 7.00% total return as domestic public REITs held recovered from the down market earlier in 2022. This actively managed strategy has taken advantage of the stronger commercial real estate sectors in recent years as wide divergences have surfaced in performance among sectors. The Absolute Convertible fund is a new holding that generated a modest positive return during the short holding period. We expect this strategy to provide returns of Treasury Bills plus 2-4% over full fixed income cycles as it has historically, providing stable returns with income from multiple sources utilized in the strategy.
Closed End Funds
The PIMCO Flexible Credit Income Fund, which performed poorly for the first 3 quarters of 2022 as bond yields rose and credit risk spreads widened, recovered modestly between October and
March with a 2.4% positive return. This fund, which invests in both public and private credit securities, distributes a monthly cash dividend of around 8.5% not including year-end special distributions (which as 6% for 2022). The Pioneer ILS Interval Fund had essentially flat performance for the first half of the year as it has been a solid performer with low correlation to public equity and bond markets. The Sprott Physical Gold Trust, a significant allocation towards the precious metals exposure within our wealth management strategy, gained 20% for the period as spot gold prices rose as the U.S. dollar retreated and continued geopolitical, financial institution and inflation concerns persisted. Franco Nevada, listed in the mining, quarrying & oil and gas sector, is the other precious metals exposure and rose over 23%.
U.S. Government and Agency Obligations
The Fund held positions in short term (less than 2 year maturity) U.S. Treasury Notes as of March 31. Combined these holdings account for about 10% of Fund assets. Despite their short duration, they continue to represent a meaningful part of our income strategy as market yields are now high enough to generate significant income with little price risk. The yield to maturity on these notes were between 4.00% and 4.60-% at March 31.
Corporate Bonds
This asset class, which includes primarily shorter-term corporate issues and a couple institutional floating rate pfd. Holdings, collectively provided a mid-single digit gain including coupon interest as market yields and spreads to Treasury market levels stabilized. Specifically, the JP Morgan and BP Capital Markets floating rate preferreds gained less than 1% and the new Cheniere C.C. Holdings 5.875% bond also had a very small gain. The Discover Financial Services 3.75% notes had a total return loss of around 1.5%. The Freeport-McMoRan 4.125% and Motorola Solutions 7.5% short-term corporates were the best performers with 7.7% and 3.4% positive returns for the 6 month period.
Exchange Traded Funds
The Fund currently utilizes two EFTs for a portion of our short-term fixed income allocation. The JP Morgan Ultra-Short Income and the PIMCO Enhanced Short Maturity Active EFTs each returned around 2.20% for the six-month period and are currently providing a monthly cash dividend of 4.2% to 4.3% on an annualized basis. They provide income and liquidity for potential portfolio transactions.
Sector and Stock Performance Discussion
In this discussion we will highlight sectors and individual holdings which either enhanced or detracted from performance for the Fund during the six months following year ended September 30, 2022.
Finance & Insurance
The two stocks held in this group include JP Morgan Chase and Chubb Ltd. Both provided total return gains for the 6 months ending March 31. JP Morgan stock rose 24% and held up well in March when the recent banking stress appeared. The bank is well capitalized with good risk management and a diversified business model. Weakness in the banking sector may increase the advantages that the largest banks already have. Chubb Ltd. reported good results and the stock rose 6%. The property and casualty industry is currently in a firm pricing market and increasing inflation can help insurance premiums based on asset prices. Chubb has a reputation for good underwriting standards.
Information
Three equities in this sector had widely divergent performance for the first half. Lumen, primarily a commercial fiber infrastructure provider with a smaller residential internet and video business, fell over 70% as the company cut their dividend in order to accelerate debt repayment and increase capital expenditures for the residential offering. Lumen has recently sold some significant international and non-core domestic assets at prices greater than the current market valuation. Warner Brothers Discovery increased 29% as some clarity is being revealed on the recent merger regarding free cash flow, expense levels and debt forecasts. Microsoft, a long-term core Fund holding, rose 21% as the stock recovered from some recent weakness and announced results continued to be strong.
Manufacturing
The manufacturing sector holdings, with a wide representation of industry sectors, contributed generally positive results although Johnson & Johnson and Northrop had single digit losses. These two holdings were reflective of the recent performance among defensive company stocks that had held up well in the bear market between late 2021 and fall of 2022. They have lagged while many stocks and groups that had fallen significantly began to recover in late 2022 and early 2023. Stocks in our manufacturing holdings that fit this description included Abbvie (+13%) and Moderna (+29%) in health care, DuPont (+43%), Hubbell (+10%) and Louisiana Pacific (+7%) in industrial products and Exxon Mobil (+25%) in energy. This manufacturing group represents our largest public equity allocation and these companies are generally market leaders with established market positions, good financials and innovate development strategies. They should be in a position to weather any near-term economic weakness and be positioned to thrive if and when above trend growth returns.
Mining, Quarrying and Oil & Gas Extraction
This sector includes traditional energy industry stocks, securities with primarily royalty investments and Martin Marietta Materials which is a leading producer of aggregates used in constructions and infrastructure in the domestic market. Pioneer Natural Resources, a large domestic oil & gas producer, had a flat performance although rising to close to an all-time high in October and November before gradually dropping through the end of March. Black Stone Minerals, Dorchester Minerals and Texas Pacific Land Trust derive most of their value and income from traditional energy royalties and provided mixed investment returns for the fiscal first half. Texas Pacific lost almost 4% after reaching highs in November. Black Stone Minerals, currently providing greater than 10% cash dividend yield, had a total return of 3.7%. Dorchester Minerals, also distributing a significant cash dividend, was the highlight with a positive 24% total return. Martin Marietta Materials contributed a 10.5% return as demand remained steady in many of the regional markets where they hold leading supply positions.
REITS and Real Estate & Rental
The two Fund REIT investments, Medical Properties Trust and First Industrial Realty, had offsetting performance results for the period. Medical Properties had a 27% total return loss and First Industrial gained almost 22%. Investor concerns resurfaced around operator concentration and dividend sustainability however reported results were fairly good. First Industrial is benefitting from several positive domestic tracks that support demand growth in basic industrial warehouse property and the stock recovered along with the broader market.
The Howard Hughes Corporation, an owner and developer of high quality commercial real estate and master planned communities, investment is listed in our Real Estate & Rental sector and rose 45%
between October and March. The company has made recent attempts to buy back shares with a modified Dutch trader offer which was undersubscribed, implying that public investors generally believe the stock is undervalued. We agree with this analysis.
Retail Trade
The three holdings in this sector, TJX Companies, Lowe’s and Amazon had mixed results. Amazon fell 10% for the first half as the market continued to adjust valuation for the lack of free cash flow in the recent year as high expense levels spurred by quick expansion during the pandemic have yet to be reined in. We believe this is occurring in 2023 and along with the substantial non-retail AWS cloud business position the company for a rebound in reported results later this year and in 2024. TJX and Lowe’s rose 27% and 5% respectively as business continued to generate good results for these market leaders. We believe these two business models and product offerings should do well even in a weaker growth scenario.
Position Changes – Common Stocks
The Fund had multiple exits in the prior 6 months. We exited Comcast, Enhabit, Encompass Health, Hanesbrands, Inc., and Schlumberger. We also reduced our exposure in Microsoft, Texas Pacific Land, and Northrop Grumman as the positions had grown in concentrations.
Private Funds
The seven private equity investments held in the Fund at March 31, 2023 are LLR Equity Partners V, L.P. (“LLR V”), LRVHealth, L.P. (“LRVHealth”), RCP Select Capital Fund, LP, SPAC Opportunity Partners LLC, Moran Tice 2020 Fund, the Hayman Hong Kong Opportunities Onshore Fund, and a new holding, CLI Capital.
LLR Partners is a lower middle market private equity firm committed to creating long-term value by growing portfolio companies. They invest in a targeted set of industries, with a focus on technology and services businesses. Founded in 1999 and with more than $3 billion raised across five funds, LLR Partners is a flexible provider of capital for growth, recapitalizations, and buyouts. LLR V is a $1 billion fund that the Fund has committed $1 million to invest. The Fund has had 97% of its commitment called and the investment returned 20.69% net IRR and a 1.72x net multiple of capital contributed through 12/31/22. Concorde has been thrilled with this investment and recently committed to their new Fund.
The Fund has a commitment to a health care related venture firm called LRVHealth. LRVHealth is an “Inside Healthcare” venture capital platform that was established in 2000 by an experienced team of healthcare investors, operators, and advisors. LRVHealth’s investors include leading provider, payer, and vendor organizations who collaborate to identify, invest in, and adopt innovative solutions to the industry’s most pressing needs. The Fund has committed $500,000 to LRVHealth and has had 83% of the capital called thus far and has had some meaningful results. LRV has exited the 5 position and they’ve made multiple investments and the portfolio now has 14 active investments with a cost of $66.3mm and current value of $102.8mm.
Moran Tice 2020 Fund is a commitment and is related to the investment theory of a dislocated price between small gold miners and the price of gold itself. In additional to our defensive positioning in the Sprott Physical Gold Trust, this position, which is less than 1% of the Fund’s assets, is to take advantage of the underpricing of gold as it relates to deficit spending and specifically the additional price dislocation between small and large precious metal miners. It is up 17.5% for the last 6 months.
RCP Select Capital is a real estate investment fund focusing on multi-family development. It is fully called and the fund commitment is $500k or 1.3% of the fund assets as of 3/31/2023. The Fund holds the investment at cost given the long-term nature of real estate holdings and the development cycle. While interest rates have moved rapidly, the underlying assets are in development and therefore still held at cost.
SPAC Opportunity Partners is run out of Atlanta and the principals are known to Concorde. The SPAC market itself has effectively folded and while our holding in the Opportunity Partners Fund holds direct exposure to the General Partner, the performance has been abysmal. They do have a few transactions pending but are also under pressure. As of 3/31/23 the value of the CONWX holding is $171k and is down 78.6% in the last 6 months. We do not expect any meaningful recovery in this investment.
Hong Kong Opportunities Fund is a new investment made by CONWX in the last 12 months. The General Partner of the Fund is Kyle Bass, a well-known investor that is known to Concorde. The investment strategy of the Fund is that benefits from the stresses imposed on the Hong Kong Monetary Authority’s Linked Exchange Rate System from the Chinese financial and monetary system as well as the United States’ inflationary and monetary environment. While down since we’ve made our investment there are stresses impacting the Hong Kong dollar that could have a material positive impact on the Fund’s investment in the near term.
Thank you for your continued support. We will continue to strive for the highest professional standards of performance and stewardship in the management of the Fund.
Best regards,
| |  |
| | |
| | Gregory B. Wood |
| | Managing Director |
| | Concorde Investment Management |
| | |
| |  |
| | |
| | Gary B. Wood |
| | Managing Director |
| | Concorde Investment Management |
| | |
| |  |
| | |
| | John A. Stetter |
| | Managing Director |
| | Concorde Investment Management |
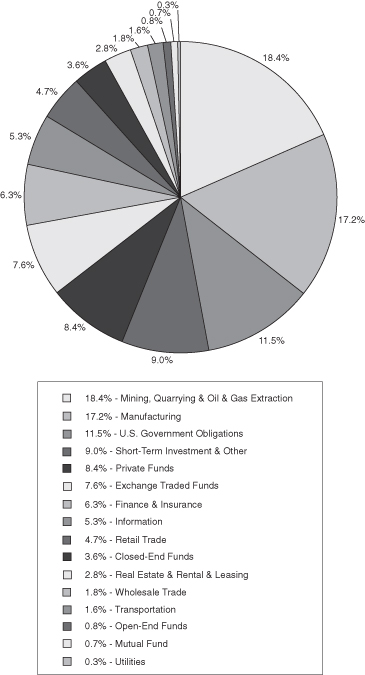
CONCORDE WEALTH MANAGEMENT FUND
PORTFOLIO HOLDINGS BY SECTOR
March 31, 2023 (Unaudited)
The portfolio’s holdings and allocations are subject to change. The percentages are of net assets as of March 31, 2023. Percentages expressed exclude written options.
CONCORDE WEALTH MANAGEMENT FUND
SCHEDULE OF INVESTMENTS IN SECURITIES
March 31, 2023 (Unaudited)
| | | | | | Fair | | | Percent of | |
| | | Shares | | | Value | | | Net Assets | |
| COMMON STOCKS - 53.04% | | | | | | | | | |
FINANCE & INSURANCE | | | | | | | | | |
Chubb Ltd. - ADR (a) | | | 2,700 | | | $ | 524,286 | | | | 1.44 | % |
JPMorgan Chase & Co. | | | 7,000 | | | | 912,170 | | | | 2.50 | |
| | | | | | | | 1,436,456 | | | | 3.94 | |
INFORMATION | | | | | | | | | | | | |
Lumen Technologies, Inc. | | | 99,000 | | | | 262,350 | | | | 0.72 | |
Microsoft Corp. | | | 3,200 | | | | 922,560 | | | | 2.53 | |
Warner Bros Discovery, Inc. (b) | | | 50,250 | | | | 758,775 | | | | 2.08 | |
| | | | | | | | 1,943,685 | | | | 5.33 | |
MANUFACTURING | | | | | | | | | | | | |
AbbVie, Inc. | | | 5,200 | | | | 828,724 | | | | 2.28 | |
Bunge Ltd. - ADR (a) | | | 6,050 | | | | 577,896 | | | | 1.59 | |
DuPont de Nemours, Inc. | | | 6,500 | | | | 466,505 | | | | 1.28 | |
Exxon Mobil Corp. | | | 6,800 | | | | 745,688 | | | | 2.04 | |
Hubbell, Inc. | | | 2,300 | | | | 559,613 | | | | 1.53 | |
Johnson & Johnson | | | 4,800 | | | | 744,000 | | | | 2.04 | |
Louisiana-Pacific Corp. | | | 9,100 | | | | 493,311 | | | | 1.35 | |
Moderna, Inc. (b) | | | 3,200 | | | | 491,456 | | | | 1.35 | |
Northrop Grumman Corp. | | | 1,000 | | | | 461,720 | | | | 1.27 | |
Texas Instruments, Inc. | | | 2,200 | | | | 409,222 | | | | 1.12 | |
The Hershey Co. | | | 1,590 | | | | 404,512 | | | | 1.11 | |
| | | | | | | | 6,182,647 | | | | 16.96 | |
MINING, QUARRYING & OIL & GAS EXTRACTION | | | | | | | | | | | | |
Black Stone Minerals LP | | | 68,668 | | | | 1,077,401 | | | | 2.95 | |
Dorchester Minerals, LP | | | 23,500 | | | | 711,815 | | | | 1.95 | |
Franco-Nevada Corp. - ADR (a) | | | 5,600 | | | | 816,480 | | | | 2.24 | |
Martin Marietta Materials, Inc. | | | 1,100 | | | | 390,566 | | | | 1.07 | |
Pioneer Natural Resources Co. | | | 4,750 | | | | 970,140 | | | | 2.66 | |
Texas Pacific Land Corp. | | | 1,445 | | | | 2,457,974 | | | | 6.74 | |
| | | | | | | | 6,424,376 | | | | 17.61 | |
REAL ESTATE & RENTAL & LEASING | | | | | | | | | | | | |
The Howard Hughes Corp. (b) | | | 5,000 | | | | 400,000 | | | | 1.10 | |
| | | | | | | | | | | | | |
RETAIL TRADE | | | | | | | | | | | | |
Amazon.com, Inc. (b) | | | 5,200 | | | | 537,108 | | | | 1.47 | |
Lowe’s Companies, Inc. | | | 3,000 | | | | 599,910 | | | | 1.64 | |
The TJX Companies, Inc. | | | 7,500 | | | | 587,700 | | | | 1.61 | |
| | | | | | | | 1,724,718 | | | | 4.72 | |
The accompanying notes are an integral part of these financial statements.
CONCORDE WEALTH MANAGEMENT FUND
SCHEDULE OF INVESTMENTS IN SECURITIES (continued)
March 31, 2023 (Unaudited)
| | | | | | Fair | | | Percent of | |
| | | Shares | | | Value | | | Net Assets | |
| COMMON STOCKS (continued) | | | | | | | | | |
TRANSPORTATION AND WAREHOUSING | | | | | | | | | |
Canadian Pacific Railway Ltd. - ADR (a) | | | 7,500 | | | $ | 577,050 | | | | 1.58 | % |
| | | | | | | | | | | | | |
WHOLESALE TRADE | | | | | | | | | | | | |
Energy Transfer LP | | | 52,500 | | | | 654,675 | | | | 1.80 | |
TOTAL COMMON STOCKS (Cost $11,798,453) | | | | | | | 19,343,607 | | | | 53.04 | |
| | | | | | | | | | | | | |
| EXCHANGE TRADED FUNDS - 4.39% | | | | | | | | | | | | |
JPMorgan Ultra-Short Income ETF | | | 20,000 | | | | 1,006,400 | | | | 2.76 | |
PIMCO Enhanced Short Maturity Active | | | | | | | | | | | | |
Exchange-Traded Fund | | | 6,000 | | | | 595,500 | | | | 1.63 | |
TOTAL EXCHANGE TRADED FUNDS (Cost $1,619,857) | | | | | | | 1,601,900 | | | | 4.39 | |
| | | | | | | | | | | | | |
| MUTUAL FUND - 0.69% | | | | | | | | | | | | |
Absolute Convertible Arbitrage Fund | | | 23,020 | | | | 250,921 | | | | 0.69 | |
TOTAL MUTUAL FUND (Cost $250,000) | | | | | | | 250,921 | | | | 0.69 | |
| | | | | | | | | | | | | |
| CLOSED-END FUNDS - 6.76% | | | | | | | | | | | | |
PIMCO Flexible Credit Income Fund - Institutional Class (c) | | | 47,619 | | | | 329,050 | | | | 0.90 | |
Pioneer ILS Interval Fund (c) | | | 117,583 | | | | 982,993 | | | | 2.70 | |
Sprott Physical Gold Trust (a)(b) | | | 74,500 | | | | 1,151,770 | | | | 3.16 | |
TOTAL CLOSED-END FUNDS (Cost $2,398,110) | | | | | | | 2,463,813 | | | | 6.76 | |
| | | | | | | | | | | | | |
| OPEN-END FUND - 0.82% | | | | | | | | | | | | |
Cohen & Steers Institutional Realty Shares | | | 6,895 | | | | 298,336 | | | | 0.82 | |
TOTAL OPEN-END FUND (Cost $283,653) | | | | | | | 298,336 | | | | 0.82 | |
| | | | | | | | | | | | | |
| | | Capital | | | | | | | | | |
| | | Contributions | | | | | | | | | |
| PRIVATE FUNDS - 8.39% | | | | | | | | | | | | |
CLI Capital (b)(c)(d) | | | 45,455 | | | | 250,000 | | | | 0.69 | |
Hayman Hong Kong Opportunities Fund, L.P. (b)(c)(d) | | | 500,000 | | | | 85,648 | | | | 0.23 | |
LLR Equity Partners V, L.P. (b)(c)(d) | | | 970,000 | | | | 1,356,439 | | | | 3.72 | |
LRVHealth, L.P. (b)(c)(d) | | | 415,000 | | | | 477,400 | | | | 1.31 | |
Moran Tice 20:20 Fund, L.P. (b)(c)(d) | | | 250,000 | | | | 219,326 | | | | 0.60 | |
RCP Select Capital Fund, L.P. (b)(c)(d) | | | 500,000 | | | | 500,000 | | | | 1.37 | |
SPAC Opportunity Partners, LLC - Class A (b)(c)(d) | | | 1,000,000 | | | | 170,868 | | | | 0.47 | |
TOTAL PRIVATE FUNDS (Cost $3,676,882) | | | | | | | 3,059,681 | | | | 8.39 | |
The accompanying notes are an integral part of these financial statements.
CONCORDE WEALTH MANAGEMENT FUND
SCHEDULE OF INVESTMENTS IN SECURITIES (continued)
March 31, 2023 (Unaudited)
| | | | | | Fair | | | Percent of | |
| | | Shares | | | Value | | | Net Assets | |
| REITS - 3.31% | | | | | | | | | |
FINANCE & INSURANCE | | | | | | | | | |
Medical Properties Trust, Inc. | | | 69,000 | | | $ | 567,180 | | | | 1.56 | % |
| | | | | | | | | | | | | |
REAL ESTATE & RENTAL & LEASING | | | | | | | | | | | | |
First Industrial Realty Trust, Inc. | | | 12,000 | | | | 638,400 | | | | 1.75 | |
TOTAL REITS (Cost $1,223,783) | | | | | | | 1,205,580 | | | | 3.31 | |
| | | | | | | | | | | | | |
| | | Principal | | | | | | | | | |
| | | Amounts | | | | | | | | | |
| CORPORATE BONDS - 2.14% | | | | | | | | | | | | |
FINANCE AND INSURANCE | | | | | | | | | | | | |
Discover Financial Services, 3.75%, 03/04/2025 | | | 150,000 | | | | 143,811 | | | | 0.39 | |
JPMorgan Chase & Co., 6.10% to 10/01/2023 then | | | | | | | | | | | | |
3 Month SOFR USD + 3.330%, Perpetual (e) | | | 150,000 | | | | 146,531 | | | | 0.40 | |
| | | | | | | | 290,342 | | | | 0.79 | |
MANUFACTURING | | | | | | | | | | | | |
Motorola Solutions, Inc., 7.50%, 05/15/2025 | | | 100,000 | | | | 104,108 | | | | 0.29 | |
| | | | | | | | | | | | | |
MINING, QUARRYING & OIL & GAS EXTRACTION | | | | | | | | | | | | |
BP Capital Markets PLC, 4.38% to 09/22/2023 then | | | | | | | | | | | | |
5 Year CMT Rate + 4.036%, Perpetual (a)(e) | | | 150,000 | | | | 142,860 | | | | 0.39 | |
Freeport-McMoRan, Inc., 4.13%, 03/01/2028 | | | 150,000 | | | | 140,575 | | | | 0.39 | |
| | | | | | | | 283,435 | | | | 0.78 | |
UTILITIES | | | | | | | | | | | | |
Cheniere Corpus Christi Holdings LLC, 5.88%, 03/31/2025 | | | 100,000 | | | | 100,668 | | | | 0.28 | |
TOTAL CORPORATE BONDS (Cost $801,710) | | | | | | | 778,553 | | | | 2.14 | |
| | | | | | | | | | | | | |
| U.S. GOVERNMENT OBLIGATIONS - 11.45% | | | | | | | | | | | | |
United States Treasury Note, 2.25%, 11/15/2024 | | | 1,000,000 | | | | 968,242 | | | | 2.65 | |
United States Treasury Note, 2.38%, 08/15/2024 | | | 3,300,000 | | | | 3,211,055 | | | | 8.80 | |
TOTAL U.S. GOVERNMENT OBLIGATIONS | | | | | | | | | | | | |
(Cost $4,178,973) | | | | | | | 4,179,297 | | | | 11.45 | |
The accompanying notes are an integral part of these financial statements.
CONCORDE WEALTH MANAGEMENT FUND
SCHEDULE OF INVESTMENTS IN SECURITIES (continued)
March 31, 2023 (Unaudited)
| | | Principal | | | Fair | | | Percent of | |
| | | Amounts | | | Value | | | Net Assets | |
| SHORT-TERM INVESTMENTS - 10.12% | | | | | | | | | |
United States Treasury Bill, 4.941%, 08/10/2023 (f) | | | 1,500,000 | | | $ | 1,474,912 | | | | 4.04 | % |
| | | | | | | | | | | | | |
MONEY MARKET FUNDS | | | | | | | | | | | | |
Invesco Government & Agency | | | | | | | | | | | | |
Portfolio - Institutional Class, 4.74% (g) | | | 427,580 | | | | 427,580 | | | | 1.17 | |
Morgan Stanley Institutional Liquidity Fund Government | | | | | | | | | | | | |
Portfolio - Institutional Class, 4.74% (g) | | | 1,791,539 | | | | 1,791,540 | | | | 4.91 | |
| | | | | | | | 2,219,120 | | | | 6.08 | |
TOTAL SHORT-TERM INVESTMENTS (Cost $3,693,448) | | | | | | | 3,694,032 | | | | 10.12 | |
| | | | | | | | | | | | | |
Total Investments (Cost $29,924,869) - 101.11% | | | | | | | 36,875,720 | | | | 101.11 | |
Liabilities in Excess of Other Assets - (1.11)% | | | | | | | (406,194 | ) | | | (1.11 | ) |
TOTAL NET ASSETS - 100.00% | | | | | | $ | 36,469,526 | | | | 100.00 | % |
______________
ADR American Depository Receipt
REIT Real Estate Investment Trust
| (a) | Foreign issued security listed directly on a U.S. securities exchange. |
| (b) | Presently non-income producing. |
| (c) | Restricted securities may be subject to restrictions on disposition imposed by the issuer. At March 31, 2023, restricted securities represented 11.99% of net assets of the Fund. |
| (d) | Securities for which market quotations are not readily available are valued at fair value determined by the Advisor. |
| (e) | Security is a perpetual bond and has no definite maturity date. |
| (f) | Rate shown is effective yield based on purchase price. The calculation assumes the security is held to maturity. |
| (g) | This security has a fluctuating yield; rate disclosed is the 7-day yield as of March 31, 2023. |
| + | Rates for variable rate securities will typically have interest rates that redetermine periodically by reference to a base lending rate plus a spread. Variable rate securities that reference SOFR may be subject to a credit spread adjustment, particularly to legacy LIBOR bank loans or lines of credit that have transitioned to SOFR as the base lending rate. |
The accompanying notes are an integral part of these financial statements.
CONCORDE WEALTH MANAGEMENT FUND
SCHEDULE OF WRITTEN OPTIONS
March 31, 2023 (Unaudited)
| | | Notional | | | Number of | | | Fair | | | Percent of | |
| | | Amount | | | Contracts (a) | | | Value | | | Net Assets | |
| WRITTEN OPTIONS - (0.03)% | | | | | | | | | | | | |
| WRITTEN PUT OPTIONS (0.03)% | | | | | | | | | | | | |
Energy Transfer LP | | | | | | | | | | | | |
Expiration: April 2023, Exercise Price: $12.00 | | $ | 249,400 | | | | 200 | | | $ | 1,800 | | | | 0.00 | %(b) |
Hershey Co. | | | | | | | | | | | | | | | | |
Expiration: April 2023, Exercise Price: $250.00 | | | 178,087 | | | | 7 | | | | 1,295 | | | | 0.00 | %(b) |
JPMorgan Chase & Co. | | | | | | | | | | | | | | | | |
Expiration: April 2023, Exercise Price: $130.00 | | | 156,372 | | | | 12 | | | | 4,596 | | | | 0.01 | % |
Medical Properties Trust, Inc. | | | | | | | | | | | | | | | | |
Expiration: April 2023, Exercise Price: $8.50 | | | 123,300 | | | | 150 | | | | 8,850 | | | | 0.02 | % |
Texas Instruments, Inc. | | | | | | | | | | | | | | | | |
Expiration: April 2023, Exercise Price: $180.00 | | | 186,010 | | | | 10 | | | | 1,430 | | | | 0.00 | %(b) |
TOTAL WRITTEN PUT OPTIONS | | | | | | | | | | | | | | | | |
(Premiums received $29,201) | | | | | | | | | | | 17,971 | | | | 0.03 | % |
TOTAL WRITTEN OPTIONS | | | | | | | | | | | | | | | | |
(Premiums received $29,201) | | | | | | | | | | $ | 17,971 | | | | 0.03 | % |
______________
| (a) | Each contract is equivalent to 100 shares of common stock. |
| (b) | Amount is less than (0.05)%. |
The accompanying notes are an integral part of these financial statements.
CONCORDE WEALTH MANAGEMENT FUND
STATEMENT OF ASSETS AND LIABILITIES
March 31, 2023 (Unaudited)
| ASSETS | | | |
| Investments in securities, at fair value (cost $29,924,869) | | $ | 36,875,720 | |
| Dividends and interest receivable | | | 67,076 | |
| Prepaid expenses | | | 8,945 | |
| TOTAL ASSETS | | | 36,951,741 | |
| | | | | |
| LIABILITIES | | | | |
| Investments in written options, at fair value (premiums received $29,201) | | | 17,971 | |
| Due to broker | | | 15 | |
| Investment advisory fee payable | | | 24,526 | |
| Investment securities purchased | | | 386,921 | |
| Accrued audit fees | | | 14,844 | |
| Accrued directors fees and expenses | | | 373 | |
| Accrued other expenses | | | 37,565 | |
| TOTAL LIABILITIES | | | 482,215 | |
| NET ASSETS | | $ | 36,469,526 | |
| Composition of Net Assets: | | | | |
| Net capital paid in on shares of capital stock | | $ | 29,523,793 | |
| Total distributable earnings | | | 6,945,733 | |
| NET ASSETS | | $ | 36,469,526 | |
Capital shares outstanding | | | 2,136,320 | |
Net asset value, offering price and redemption price per share | | $ | 17.07 | |
The accompanying notes are an integral part of these financial statements.
CONCORDE WEALTH MANAGEMENT FUND
STATEMENT OF OPERATIONS
For the Six Month Period Ended March 31, 2023 (Unaudited)
| Investment Income | | | |
| Dividends (net of foreign withholding taxes of $2,430) | | $ | 314,128 | |
| Interest | | | 170,195 | |
| Total investment income | | | 484,323 | |
| Expenses | | | | |
| Investment advisory fees (Note 6) | | $ | 148,647 | |
| Professional fees | | | 30,564 | |
| Administration fees (Note 7) | | | 25,467 | |
| Sub-transfer agent fees (Note 7) | | | 21,734 | |
| Fund accounting fees (Note 7) | | | 12,118 | |
| Transfer agent fees (Note 7) | | | 7,859 | |
| Custody fees (Note 7) | | | 5,407 | |
| Insurance expense | | | 3,675 | |
| Printing, postage and delivery | | | 3,673 | |
| Federal and state registration fees | | | 2,294 | |
| Directors fees and expenses | | | 830 | |
| Other expenses | | | 8,222 | |
| Total expenses | | | 270,490 | |
| NET INVESTMENT INCOME | | | 213,833 | |
| REALIZED AND UNREALIZED GAIN (LOSS) | | | | |
| Net realized gain from: | | | | |
| Investments | | | 1,606,399 | |
| Written options | | | 105,651 | |
| Capital gain distribution from investment companies | | | 5,034 | |
| Net realized gain | | | 1,717,083 | |
| Net change in unrealized appreciation (depreciation) on: | | | | |
| Investments | | | (251,627 | ) |
| Written options | | | 11,230 | |
| Net change in unrealized depreciation | | | (240,397 | ) |
| NET REALIZED AND UNREALIZED GAIN | | | 1,476,687 | |
| NET INCREASE IN NET ASSETS RESULTING FROM OPERATIONS | | $ | 1,690,520 | |
The accompanying notes are an integral part of these financial statements.
CONCORDE WEALTH MANAGEMENT FUND
STATEMENTS OF CHANGES IN NET ASSETS
| | | Six Months Ended | | | | |
| | | March 31, 2023 | | | Year Ended | |
| | | (Unaudited) | | | Sep. 30, 2022 | |
| INCREASE (DECREASE) IN NET ASSETS FROM OPERATIONS | | | | | | |
| Net investment income | | $ | 213,833 | | | $ | 731,210 | |
| Net realized gain from investments, written options and | | | | | | | | |
| capital gain distributions from investment companies | | | 1,717,084 | | | | 800,984 | |
| Net change in unrealized depreciation | | | | | | | | |
| on investments and written options | | | (240,397 | ) | | | (3,640,816 | ) |
| Net increase (decrease) in net assets resulting from operations | | | 1,690,520 | | | | (2,108,622 | ) |
| DISTRIBUTIONS TO SHAREHOLDERS | | | (2,749,057 | ) | | | (1,428,813 | ) |
| CAPITAL SHARE TRANSACTIONS | | | | | | | | |
| Proceeds from shares sold | | | 922,261 | | | | 1,246,539 | |
| Dividends reinvested | | | 2,749,057 | | | | 1,428,812 | |
| Cost of shares redeemed | | | (769,695 | ) | | | (3,585,355 | ) |
| Net increase (decrease) in net assets derived | | | | | | | | |
| from capital share transactions | | | 2,901,623 | | | | (910,004 | ) |
| Total increase (decrease) in net assets | | | 1,843,086 | | | | (4,447,439 | ) |
| NET ASSETS | | | | | | | | |
| Beginning of year | | | 34,626,440 | | | | 39,073,879 | |
| End of year | | $ | 36,469,526 | | | $ | 34,626,440 | |
| CHANGES IN SHARES OUTSTANDING | | | | | | | | |
| Shares sold | | | 49,694 | | | | 64,483 | |
| Shares issued in reinvestment of distributions | | | 154,789 | | | | 74,109 | |
| Shares redeemed | | | (43,092 | ) | | | (189,309 | ) |
| Net increase (decrease) | | | 161,391 | | | | (50,717 | ) |
The accompanying notes are an integral part of these financial statements.
CONCORDE WEALTH MANAGEMENT FUND
FINANCIAL HIGHLIGHTS
| | | Six Months | | | | | | | | | | | | | | | | |
| | | Ended | | | | | | | | | | | | | | | | |
| | | March 31, | | | | | | | | | | | | | | | | |
| | | 2023(1) | | | Year Ended September 30, | |
| | | (Unaudited) | | | 2022 | | | 2021 | | | 2020 | | | 2019 | | | 2018 | |
| PER SHARE OPERATING | | | | | | | | | | | | | | | | | | |
| PERFORMANCE: | | | | | | | | | | | | | | | | | | |
(for a share of capital stock outstanding | | | | | | | | | | | | | | | | | | |
throughout the period): | | | | | | | | | | | | | | | | | | |
Net asset value, beginning of period | | $ | 17.53 | | | $ | 19.29 | | | $ | 15.79 | | | $ | 15.58 | | | $ | 16.49 | | | $ | 15.13 | |
Income (loss) from investment operations: | |
Net investment income(2) | | | 0.10 | | | | 0.36 | | | | 0.06 | | | | 0.12 | | | | 0.09 | | | | 0.06 | |
| Net realized and unrealized gain (loss) | | | | | | | | | | | | | | | | | | | | | | | | |
| on investment transactions | | | 0.77 | | | | (1.41 | ) | | | 4.09 | | | | 0.44 | | | | (0.29 | ) | | | 1.67 | |
Total from investment operations | | | 0.87 | | | | (1.05 | ) | | | 4.15 | | | | 0.56 | | | | (0.20 | ) | | | 1.73 | |
Less distributions from: | | | | | | | | | | | | | | | | | | | | | | | | |
| Net investment income | | | (0.06 | ) | | | (0.26 | ) | | | (0.17 | ) | | | (0.22 | ) | | | (0.06 | ) | | | — | |
| Net realized gains | | | (1.32 | ) | | | (0.45 | ) | | | (0.48 | ) | | | (0.13 | ) | | | (0.65 | ) | | | (0.37 | ) |
| Total distributions | | | (1.38 | ) | | | (0.71 | ) | | | (0.65 | ) | | | (0.35 | ) | | | (0.71 | ) | | | (0.37 | ) |
Net asset value, end of period | | $ | 17.07 | | | $ | 17.53 | | | $ | 19.29 | | | $ | 15.79 | | | $ | 15.58 | | | $ | 16.49 | |
TOTAL RETURN(3) | | | 4.77 | % | | | (5.40 | )% | | | 26.61 | % | | | 3.54 | % | | | (0.91 | )% | | | 11.75 | % |
| RATIOS/SUPPLEMENTAL DATA: | | | | | | | | | | | | | | | | | | | | | | | | |
Net assets, end of period (in thousands) | | $ | 36,470 | | | $ | 34,626 | | | $ | 39,074 | | | $ | 25,925 | | | $ | 25,457 | | | $ | 25,623 | |
Ratio of expenses to average net assets | | | 1.46 | % | | | 1.41 | % | | | 1.46 | % | | | 1.68 | % | | | 1.68 | % | | | 1.70 | % |
Ratio of net investment income (loss) | |
to average net assets | | | 1.15 | % | | | 1.88 | % | | | 0.32 | % | | | 0.77 | % | | | 0.60 | % | | | 0.39 | % |
Portfolio turnover rate | | | 30 | % | | | 28 | % | | | 12 | % | | | 36 | % | | | 24 | % | | | 20 | % |
______________
| (1) | Other than the ratios of expenses and net investment income (loss) to average net assets, financial highlights have not been annualized. |
| (2) | Based on average shares outstanding during the year. |
| (3) | The return for the period does not include adjustments made related to valuation information obtained subsequent to period end. |
The accompanying notes are an integral part of these financial highlights.
CONCORDE WEALTH MANAGEMENT FUND
NOTES TO FINANCIAL STATEMENTS
Note 1 – Nature of Business and Summary of Significant Accounting Policies
NATURE OF BUSINESS AND REORGANIZATION
Concorde Wealth Management Fund (the “Fund), is a diversified separate series of Concorde Funds, Inc. (the “Company”). Each series of the Company is organized as a class of common stock under the Company’s articles of incorporation. The Company was incorporated in the state of Texas in September of 1987, and is registered under the Investment Company Act of 1940, as amended, as an open-end management investment company. Each capital share in the Fund represents an equal, proportionate interest in the net assets of the Fund with each other capital share in such series and no interest in any other series. The Company may establish multiple series, each of which would be organized as a class of common stock under the Company’s articles of incorporation. The Company presently has no series other than the Fund.
The primary investment objective of the Fund is to seek total return, from both appreciation of value and generation of current income, within the context of preservation of capital. The Fund is subject to various investment restrictions as set forth in the Statement of Additional Information.
SIGNIFICANT ACCOUNTING POLICIES
The following is a summary of significant accounting policies followed by the Fund. These policies are in conformity with accounting principles generally accepted in the United States of America (“U.S. GAAP”). The Fund follows the investment company accounting and reporting guidance of the Financial Accounting Standards Board (“FASB”) Accounting Standards Codification (“ASC”) Topic 946, Financial Services – Investment Companies.
VALUATION OF SECURITIES
All investments in securities are recorded at their estimated fair value, as described in Note 2.
FEDERAL INCOME TAXES
The Company’s policy is to continue to comply with the requirements of the Internal Revenue Code that are applicable to regulated investment companies and to distribute all its taxable income to its shareholders. The Company also intends to distribute sufficient net investment income and net capital gains, if any, so that it will not be subject to excise tax on undistributed income and gains. Therefore, no federal income tax or excise provision is required.
Net investment income (loss), net realized gains (losses) and the cost of investments in securities may differ for financial statement and income tax purposes. The character of distributions from net investment income or net realized gains may differ from their ultimate characterization for income tax purposes. Also, due to the timing of dividend distributions, the year in which amounts are distributed may differ from the year that the income or realized gains were recorded by the Fund. Permanent book and tax basis differences, if any, result in reclassifications to certain components of net assets. Any such reclassifications have no effect on net assets, results of operations or net asset value (“NAV”) per share.
CONCORDE WEALTH MANAGEMENT FUND
NOTES TO FINANCIAL STATEMENTS (continued)
Note 1 – Nature of Business and Summary of Significant Accounting Policies (continued)
Management has reviewed all open tax years and major tax jurisdictions and concluded that no liability for unrecognized tax benefits should be recorded related to uncertain tax positions taken on returns filed or expected to be taken on a tax return. The tax returns of the Company for the prior three years are open for examination.
SECURITY TRANSACTIONS AND RELATED INCOME
Security transactions are accounted for on the trade date, the day securities are purchased or sold. Realized gains and losses from securities transactions are reported on the specific identification basis. Dividend income is recognized on the ex-dividend date, and interest income is recognized on an accrual basis. Discounts and premiums on securities purchased are accreted and amortized over the lives of the respective securities. Withholding taxes on foreign dividends have been provided for in accordance with the Fund’s understanding of the applicable country’s tax rules and rates.
DIVIDENDS AND DISTRIBUTIONS TO SHAREHOLDERS
Distributions to shareholders are determined in accordance with Federal income tax regulations and recorded on the ex-dividend date. The Fund intends to distribute all of its net investment income as dividends to its shareholders on an annual basis. The Fund intends to distribute all of its capital gains, as dividends to its shareholders on an annual basis. Distributions from net investment income and capital gains are generally declared and paid annually in December. The treatment for financial reporting purposes of distributions made to shareholders during the year from net investment income or capital gains may differ from their ultimate treatment for Federal income tax purposes. These differences are caused primarily by differences in the timing of the recognition of certain components of income, expense or realized capital gain for Federal income tax purposes.
USE OF ESTIMATES
The preparation of financial statements in conformity with U.S. GAAP requires management to make estimates and assumptions that affect the reported amounts of assets and liabilities and disclosure of contingent assets and liabilities at the date of the financial statements and the reported amounts of increases and decreases in net assets from operations during the reporting period. Actual results could differ from those estimates.
OPTION WRITING
To generate additional income or hedge against a possible decline in the value of securities it holds, the Fund may write covered call options and write put options. When the Fund writes an option, an amount equal to the premium received by the Fund is recorded as a liability and subsequently adjusted to the current fair value of the option written. Premiums received from writing options that expire unexercised are treated by the Fund on the expiration date as realized gains from options written. The difference between the premium and amount paid on effecting a closing purchase transaction, including brokerage commissions, is also treated as a realized gain or, if the premium is
CONCORDE WEALTH MANAGEMENT FUND
NOTES TO FINANCIAL STATEMENTS (continued)
Note 1 – Nature of Business and Summary of Significant Accounting Policies (continued)
less than the amount paid for the closing purchase transaction, as a realized loss. If a call option is exercised, the premium is added to the proceeds from the sale of the underlying security in determining whether the Fund has realized a gain or loss. If a put option is exercised, the premium reduces the cost basis of the securities purchased by the Fund. The Fund as writer of an option bears the market risk of an unfavorable change in the price of the security underlying the written option.
The objective, as stated above, is to hedge against a possible decline in the value of securities it holds or to generate additional income when certain securities are locked in a trading range. With regards to hedging against a possible decline, the Fund may sell covered calls with strike prices below the price of a security at the time of writing the call. Regarding additional income, the Fund may sell calls on certain securities that are within a trading range, generally selling calls on securities where the strike prices are above the fair value price of the subject security.
NEW ACCOUNTING PRONOUNCEMENTS AND RULE ISSUANCES
In March 2020, FASB issued Accounting Standards Update (“ASU”) 2020-04, Reference Rate Reform (Topic 848) - Facilitation of the Effects of Reference Rate Reform on Financial Reporting. The amendments in ASU 2020-04 provides optional temporary financial reporting relief from the effect of certain types of contract modifications due to the planned discontinuation of LIBOR and other interbank-offered based reference rates as of the end of 2021. ASU 2020-04 is effective for certain reference rate-related contract modifications that occur during the period March 12, 2020 through December 31, 2022. Management has adopted the ASU as of March 31, 2023.
COMMITMENTS
On February 23, 2018, the Fund executed an agreement to invest in LLR Equity Partners V, L.P., a limited partnership. The capital commitment of this investment is $1,000,000. The remaining commitment as of March 31, 2023, is $80,000 and distributions subject to recall total $124,692.
On March 15, 2019, the Fund executed an agreement to invest in LRVHealth, L.P., a limited partnership. The capital commitment of this investment is $500,000. The remaining commitment as of March 31, 2023 is $125,000.
Note 2 – Securities Valuation
Concorde Financial Corporation d/b/a Concorde Investment Management (“Concorde” or the “Advisor”) has established fair value methodologies for determining and calculating the fair value of Fund investments, in its capacity as the “valuation designee” under Rule 2a-5 of the Investment Company Act of 1940. The Company’s Board of Directors (the “Board”) oversees the valuation designee.
CONCORDE WEALTH MANAGEMENT FUND
NOTES TO FINANCIAL STATEMENTS (continued)
Note 2 – Securities Valuation (continued)
The Fund utilizes various methods to measure the fair value of most of its investments on a recurring basis. FASB ASC Topic 820, Fair Value Measurements and Disclosures (“ASC 820”) defines fair value, establishes a hierarchy that prioritizes inputs to valuation techniques used to measure fair value in accordance with U.S. GAAP and requires disclosure about fair value measurements. Under ASC 820, various inputs are used in determining the value of the Fund’s investments. The three levels of inputs are as follows:
| Level 1 – | Unadjusted quoted prices in active markets for identical assets or liabilities that the Fund has the ability to access at the date of measurement. |
| | |
| Level 2 – | Observable inputs other than quoted prices included in Level 1 that are observable for the asset or liability, either directly or indirectly. These inputs may include quoted prices for the identical instrument on an inactive market, prices for similar instruments in active markets, interest rates, credit risk, yield curves, default rates and similar data. |
| | |
| Level 3 – | Model derived valuations in which one or more significant inputs or significant value drivers are unobservable. Unobservable inputs are those inputs that reflect the Fund’s own assumptions that market participants would use in valuing the asset or liability at the measurement date and would be based on the best available information. |
The availability of observable inputs can vary from security to security and is affected by a wide variety of factors, including, for example, the type of security, whether the security is new and not yet established in the marketplace, the liquidity of markets, and other characteristics particular to the security. To the extent that valuation is based on models or inputs that are less observable or unobservable in the market, the determination of fair value requires more judgment. Accordingly, the degree of judgment exercised in determining fair value is greatest for instruments categorized in Level 3.
The inputs used to measure fair value may fall into different levels of the fair value hierarchy. In such cases, for disclosure purposes, the level in the fair value hierarchy within which the fair value measurement falls in its entirety is determined based on the lowest level input that is significant to the fair value measurement in its entirety.
Following is a description of the valuation techniques applied to the Fund’s major categories of assets and liabilities measured at fair value on a recurring basis.
Equity Securities – Equity securities, usually common stocks, foreign issued common stocks, exchange traded funds (“ETFs”), real estate investment trusts (“REITs”), royalty trusts, master limited partnerships and preferred stocks traded on a national securities exchange are valued at the last sale price on the exchange on which such securities are traded, as of the close of business on the day the securities are being valued or, lacking any reported sales, at the mean between the last available bid and asked price. To the extent these securities are actively traded and valuation adjustments are not applied, they are categorized in Level 1 of the fair value hierarchy.
CONCORDE WEALTH MANAGEMENT FUND
NOTES TO FINANCIAL STATEMENTS (continued)
Note 2 – Securities Valuation (continued)
Mutual Funds – Mutual funds, including open and closed-end funds, are generally priced at the ending NAV provided by the service agent of the mutual funds and are categorized in Level 1 of the fair value hierarchy.
Investment Funds – Investment funds that are private funds can be difficult to value, particularly to the extent that their underlying investments are not publicly traded. In the event a private fund does not report a value to the Fund on a timely basis, the Advisor will determine the fair value of the Fund’s investment based on the most recent NAV reported by the private fund, as well as any other relevant information available at the time the Fund values its investments. It is anticipated that fair value, portfolio holdings and other value information of the private funds could be available on no more than a semi-annual basis, with up to a 90 day lag. In the absence of specific transaction activity in a particular investment fund, the Advisor will consider whether it is appropriate, in light of all relevant circumstances, to value the Fund’s investment at the NAV reported by the private fund at the time of valuation or to adjust the value to reflect a premium or discount. Certain investment funds may include adjustments made subsequent to period end related to subsequent valuation information obtained. Therefore, the net assets and NAV reflected for financial statement purposes may differ from the reported NAV of the Fund as of March 31, 2023. Investment funds are categorized in Level 3 of the fair value hierarchy unless measured at fair value using the NAV per share (or its equivalent), in which case, practical expedient is used for private funds and are not categorized in the fair value hierarchy.
Debt Securities – Bonds, notes, and U.S. government obligations are valued at an evaluated bid price obtained from an independent pricing service that uses a matrix pricing method or other analytical models. Demand notes are valued at amortized cost, which approximates fair value. These securities will generally be categorized in Level 2 of the fair value hierarchy.
Short-Term Securities – Short-term equity investments, including money market funds, are valued in the manner specified above for equity securities. Fixed income securities with maturities of less than 60 days when acquired, or which subsequently are within 60 days of maturity, are valued by an independent pricing service that uses a matrix pricing method or other analytical models. Short-term securities are generally classified in Level 1 or Level 2 of the fair value hierarchy depending on the inputs used and market activity levels for specific securities.
Derivative Instruments – Listed derivatives, including options, rights, and warrants that are actively traded are valued based on quoted prices from the exchange. If there is no such reported sale on the valuation date, the mean between the highest bid and lowest asked quotations at the close of the exchanges will be used. These securities will generally be categorized in Level 1 of the fair value hierarchy.
All other assets of the Fund are valued in such manner as the Advisor in good faith deems appropriate to reflect their fair value.
CONCORDE WEALTH MANAGEMENT FUND
NOTES TO FINANCIAL STATEMENTS (continued)
Note 2 – Securities Valuation (continued)
As a general matter, the fair value of the Fund’s interest in investment funds that are private funds (“Non-Traded Funds”), will represent the amount that the Fund could reasonably expect to receive from the Non-Traded Fund if the Fund’s interest was redeemed at the time of valuation, based on information reasonably available at the time the valuation is made and that the Fund believes to be reliable. Investments in Non-Traded Funds are recorded at fair value, using the Non-Traded Fund’s net asset value as a practical expedient. Based on guidance provided by FASB, investments for which fair value is measured using the NAV practical expedient are not required to be categorized in the fair value hierarchy. In the event a Non-Traded Fund does not report a value to the Fund on a timely basis, the Advisor will determine the fair value of the Fund’s investment based on the most recent value reported by the Non-Traded Fund, as well as any other relevant information available at the time the Fund values its investments. In the absence of specific transaction activity in a particular investment fund, the Advisor will consider whether it is appropriate, in light of all relevant circumstances, to value the Fund’s investment at the NAV reported by the Non-Traded Fund at the time of valuation or to adjust the value to reflect a fair value.
Securities for which market quotations are not readily available or if the closing price does not represent fair value, are valued at fair value as determined in good faith by the Advisor. Factors used in determining fair value vary by investment type and may include: trading volume of security and markets, value of other like securities and news events with direct bearing to security or market. Depending on the relative significance of the valuation inputs, these securities may be categorized in either Level 2 or Level 3 of the fair value hierarchy.
Certain restricted securities may be considered illiquid. Restricted securities are often purchased in private placement transactions, are not registered under the Securities Act of 1933, may have contractual restrictions on resale, and may be valued under methods established by the Advisor as reflecting fair value. Certain restricted securities eligible for resale to qualified institutional investors, including Rule 144A securities, are not subject to the limitation on the Funds’ investments in illiquid securities if they are determined to be liquid in accordance with procedures adopted by the Board.
CONCORDE WEALTH MANAGEMENT FUND
NOTES TO FINANCIAL STATEMENTS (continued)
Note 2 – Securities Valuation (continued)
Additional information on each illiquid restricted security held by the Fund on March 31, 2023 is as follows:
| | | Initial | | Shares/ | | | | | | | | | % of | |
| | | Acquisition | | Capital | | | | | | | | | Net | |
| | Security | Date | | Contributions | | | Cost | | | Fair Value | | | Assets | |
| | LLR Equity Partners | | | | | | | | | | | | | |
| | Parallel V, L.P. | March 14, 2018 | | | 970,000 | | | $ | 818,583 | | | $ | 1,356,439 | | | | 3.72 | % |
| | PIMCO Flexible Credit Income | | | | | | | | | | | | | | | | | |
| | Fund – Institutional Class | March 15, 2018 | | | 47,619 | | | | 500,000 | | | | 329,050 | | | | 0.90 | |
| | Pioneer ILS Interval Fund | August 27, 2018 | | | 117,583 | | | | 1,140,000 | | | | 982,993 | | | | 2.70 | |
| | LRVHealth, L.P. | July 16, 2019 | | | 415,000 | | | | 358,299 | | | | 477,400 | | | | 1.31 | |
| | Moran Tice 20:20 Fund, L.P. | July 31, 2020 | | | 250,000 | | | | 250,000 | | | | 219,326 | | | | 0.60 | |
| | SPAC Opportunity | | | | | | | | | | | | | | | | | |
| | Partners, LLC – Class A | March 24,2021 | | | 1,000,000 | | | | 1,000,000 | | | | 170,868 | | | | 0.47 | |
| | RCP Select Capital Fund, L.P. | June 7, 2021 | | | 500,000 | | | | 500,000 | | | | 500,000 | | | | 1.37 | |
| | Hayman Hong Kong | | | | | | | | | | | | | | | | | |
| | Opportunities Fund, L.P. | May 6, 2022 | | | 500,000 | | | | 500,000 | | | | 85,648 | | | | 0.23 | |
| | CLI Capital | December 20, 2022 | | | 45,455 | | | | 250,000 | | | | 250,000 | | | | 0.69 | |
| | | | | | | | | $ | 5,316,882 | | | $ | 4,371,724 | | | | 11.99 | % |
The following table summarizes the inputs used to value the Fund’s investments measured at fair value as of March 31, 2023.
| | | | Practical | | | | | | | | | | | | Total | |
| | Investments – Assets: | | Expedient* | | | Level 1 | | | Level 2 | | | Level 3 | | | Fair Value | |
| | Common Stocks** | | $ | — | | | $ | 19,343,607 | | | $ | — | | | $ | — | | | $ | 19,343,607 | |
| | Exchange Traded Funds | | | — | | | | 2,753,670 | | | | — | | | | — | | | | 2,753,670 | |
| | Mutual Fund | | | — | | | | 250,921 | | | | — | | | | — | | | | 250,921 | |
| | Closed-End Funds | | | — | | | | 1,312,043 | | | | — | | | | — | | | | 1,312,043 | |
| | Open-End Funds | | | — | | | | 298,336 | | | | — | | | | — | | | | 298,336 | |
| | Private Funds | | 3,059,681 | ^
| | | — | | | | — | | | | — | | | | 3,059,681 | |
| | REITs** | | | — | | | | 1,205,580 | | | | — | | | | — | | | | 1,205,580 | |
| | Corporate Bonds** | | | — | | | | — | | | | 778,553 | | | | — | | | | 778,553 | |
| | U.S. Government Obligations | | | — | | | | — | | | | 4,179,297 | | | | — | | | | 4,179,297 | |
| | Treasury Bill | | | — | | | | — | | | | 1,474,912 | | | | — | | | | 1,474,912 | |
| | Money Market Funds | | | — | | | | 2,219,120 | | | | — | | | | — | | | | 2,219,120 | |
| | Total Investments | | $ | 3,059,681 | | | $ | 27,383,277 | | | $ | 6,432,762 | | | $ | — | | | $ | 36,875,720 | |
| | Other Financial Instruments — Liabilities: | | | | | | | | | | | | | | | | | | | | |
| | Written Options | | $ | — | | | $ | 17,971 | | | $ | — | | | $ | — | | | $ | 17,971 | |
| * | | Certain investments that are measured at fair value using the net asset value per share (or its equivalent) practical expedient have not been categorized in the fair value hierarchy. The fair value amounts presented in this table are intended to permit reconciliation of the fair value hierarchy to the amounts present in the schedule of investments. |
| ** | | See Schedule of Investments for industry classifications. |
CONCORDE WEALTH MANAGEMENT FUND
NOTES TO FINANCIAL STATEMENTS (continued)
Note 2 – Securities Valuation (continued)
| | | Withdrawals | Redemption | Investment | Investment | Lock Up |
| | ^Security | Permitted | Notice Period | Objective | Strategy | Period |
| | CLI Capital | No | Not | To generate | Real estate investment | None |
| | | | Applicable | income from | trust (REIT) that primarily | |
| | | | | the various | invests in direct mortgage loans | |
| | | | | loans and bonds | and other debt obligations | |
| | | | | purchased. | secured by real estate assets. | |
| | | | | | They concentrate in providing | |
| | | | | | mortgage financing and | |
| | | | | | investing in mortgage loans of | |
| | | | | | niche markets with limited | |
| | | | | | competition for short-term | |
| | | | | | to mid-term lending needs. | |
| | | | | | The Company makes interim | |
| | | | | | construction and short-term to | |
| | | | | | mid-term loans for the acquisition, | |
| | | | | | renovation and construction of | |
| | | | | | facilities in these markets. | |
| | | | | | | |
| | Hayman Hong Kong | Yes | 30 Days | To generate | Non-diversified portfolio | None |
| | Opportunities Fund, L.P. | | | superior risk- | investing in foreign currency | |
| | | | | adjusted rates | forward and option contracts | |
| | | | | of return | and options of East Asia | |
| | | | | | Countries, may invest in | |
| | | | | | interest rate derivatives to | |
| | | | | | benefit from the stresses imposed | |
| | | | | | on the Hong Kong Monetary | |
| | | | | | Authority’s Linked Exchange | |
| | | | | | Rate System. Will seek to exploit | |
| | | | | | opportunities in the foreign | |
| | | | | | exchange and interest rate | |
| | | | | | markets in Asia. | |
| | | | | | | |
| | LLR Equity | No | Not | Capital | Diversified portfolio of equity | Not |
| | Partners Parallel V, L.P. | | Applicable | Appreciation | investments in lower middle | Applicable |
| | | | | | market growth companies | |
| | | | | | primarily focused on software | |
| | | | | | and services. | |
| | | | | | | |
| | LRVHealth, L.P. | No | Not | Capital | Non-diversified portfolio of | Not |
| | | | Applicable | Appreciation | insurance-linked securities. | Applicable |
| | | | | | | |
| | Moran Tice | Yes | 30 days | Value | Diversified portfolio of | None |
| | 20:20 Fund L.P. | | | | investments the Investment | |
| | | | | | Manager believes will be | |
| | | | | | influenced by macro-economic | |
| | | | | | trends and/or event-driven | |
| | | | | | situations. | |
CONCORDE WEALTH MANAGEMENT FUND
NOTES TO FINANCIAL STATEMENTS (continued)
Note 2 – Securities Valuation (continued)
| | | Withdrawals | Redemption | Investment | Investment | Lock Up |
| | ^Security | Permitted | Notice Period | Objective | Strategy | Period |
| | SPAC Opportunity | Yes | 93 days | Capital | Diversified portfolio of | 2 years |
| | Partners, LLC - Class A | | | Appreciation | special purpose acquisition | |
| | | | | | companies, or “SPACs”. | |
| | | | | | | |
| | RCP Select | No | Not | Total Return | Diversified portfolio of | Not |
| | Capital Fund, L.P. | | Applicable | | ground-up development, | Applicable |
| | | | | | value-add and income | |
| | | | | | producing real estate projects | |
| | | | | | and real estate financings the | |
| | | | | | Investment Manager expects | |
| | | | | | to achieve high internal | |
| | | | | | rates of return. | |
LEVEL 3 RECONCILIATION DISCLOSURE
The following is a reconciliation of Level 3 assets for which significant unobservable inputs were used to determine fair value:
| | | | Closed-End Funds | | | Open-End Funds | | | Total | |
| | Balance as of September 30, 2022 | | $ | — | | | $ | — | | | $ | — | |
| | Accrued discounts/premiums | | | — | | | | — | | | | — | |
| | Realized gain (loss) | | | — | | | | — | | | | — | |
| | Change in unrealized appreciation (depreciation) | | | — | | | | — | | | | — | |
| | Purchases | | | — | | | | — | | | | — | |
| | (Sales) | | | — | | | | — | | | | — | |
| | Transfer in and/or (out) of Level 3 | | | — | | | | — | | | | — | |
| | Balance as of March 31, 2023 | | $ | — | | | $ | — | | | $ | — | |
| | Change in unrealized appreciation | | | | | | | | | | | | |
| | (depreciation during the period for | | | | | | | | | | | | |
| | Level 3 investments held at March 31, 2023 | | $ | — | | | $ | — | | | $ | — | |
| | | | | | | | | | | | | | |
The Level 3 investments as of March 31, 2023 represented 0.00% of net assets and did not warrant a disclosure of significant unobservable valuation inputs.
Note 3 – Derivative Instruments
The average monthly value outstanding of options written during the fiscal year ended March 31, 2023 for the Fund was $26,000.
The following is a summary of the effect of derivative instruments on the Fund’s Statements of Assets and Liabilities as of March 31, 2023:
| | Asset Derivatives, | Liability Derivatives, |
Equity Risk Contracts | Investments, at value | Written Options, at value |
| Written Options | $ — | $17,971 |
CONCORDE WEALTH MANAGEMENT FUND
NOTES TO FINANCIAL STATEMENTS (continued)
Note 3 – Derivative Instruments (continued)
The following is a summary of the effect of derivative instruments on the Fund’s Statements of Operations as of March 31, 2023:
| | Realized | Change in Unrealized |
Equity Risk Contracts | Gain (Loss) | Appreciation (Depreciation) |
| Written Options | $105,651 | $(11,230) |
Note 4 – Investment Transactions
Purchases and sales of investment securities, excluding U.S. government obligations and short-term investments, for the Fund during the year ended March 31, 2023, were $5,708,742 and $5,940,400, respectively.
The Fund did not have any purchases or sales/maturities of long-term U.S. government obligations during the year ended March 31, 2023.
Note 5 – Principal Risks
The Fund in the normal course of business makes investments in financial instruments and derivatives where the risk of potential loss exists due to changes in the market (market risk), or failure or inability of the counterparty to a transaction to perform (credit and counterparty risk). See below for a detailed description of select principal risks.
American Depositary Receipts (“ADRs”) and Global Depository Receipts (“GDRs”) Risk. ADRs and GDRs may be subject to some of the same risks as direct investment in foreign companies, which includes international trade, currency, political, regulatory and diplomatic risks. In a sponsored ADR arrangement, the foreign issuer assumes the obligation to pay some or all of the depositary’s transaction fees. Under an unsponsored ADR arrangement, the foreign issuer assumes no obligations and the depositary’s transaction fees are paid directly by the ADR holders. Because unsponsored ADR arrangements are organized independently and without the cooperation of the issuer of the underlying securities, available information concerning the foreign issuer may not be as current as for sponsored ADRs and voting rights with respect to the deposited securities are not passed through. GDRs can involve currency risk since, unlike ADRs, they may not be U.S. dollar-denominated.
Convertible Securities Risk. A convertible security is a fixed-income security (a debt instrument or a preferred stock) which may be converted at a stated price within a specified period of time into a certain quantity of the common stock of the same or a different issuer. Convertible securities are senior to common stock in an issuer’s capital structure, but they are subordinated to any senior debt securities. While providing a fixed-income stream (generally higher in yield than the income derivable from common stock but lower than that afforded by a similar non-convertible security), a convertible security also gives an investor the opportunity, through its conversion feature, to participate in the capital appreciation of the issuing company depending upon a market price advance in the convertible security’s underlying common stock.
CONCORDE WEALTH MANAGEMENT FUND
NOTES TO FINANCIAL STATEMENTS (continued)
Note 5 – Principal Risks (continued)
Counterparty Risk. When the Fund enters into an investment contract, such as a derivative or a repurchase agreement, the Fund is exposed to the risk that the other party may be unable or unwilling to fulfill its obligations, which could adversely impact the value of the Fund. Contractual provisions and applicable law may prevent or delay the Fund from exercising its rights to terminate an investment or transaction with a financial institution experiencing financial difficulties, or to realize on collateral, and another institution may be substituted for that financial institution without the consent of the Fund. If the credit rating of a derivatives counterparty declines, the Fund may nonetheless choose or be required to keep existing transactions in place with the counterparty, in which event the Fund would be subject to any increased credit risk associated with those transactions.
Credit Risk. In connection with the Fund’s investments in fixed income securities, the value of the Fund may change in response to the credit ratings of the Fund’s portfolio securities. The degree of risk for a particular security may be reflected in its credit rating. Generally, investment risk and price volatility increase as a security’s credit rating declines. Credit risk is the risk that the issuer of a bond will fail to make payments when due or default completely. If the issuer of the bond experiences an actual or anticipated deterioration in credit quality, the price of the bond may be negatively impacted. The degree of credit risk depends on the financial condition of the issuer and the terms of the bond.
Debt/Fixed Income Securities Risk. An increase in interest rates typically causes a fall in the value of the debt securities in which the Fund may invest. The value of your investment in the Fund may change in response to changes in the credit ratings of the Fund’s portfolio of debt securities. Interest rates in the United States are at, or near, historic lows, which may increase the Fund’s exposure to risks associated with rising interest rates. Moreover, rising interest rates or lack of market participants may lead to decreased liquidity in the bond and loan markets, making it more difficult for the Fund to sell its holdings at a time when the Fund’s manager might wish to sell. Lower rated securities (“junk bonds”) are generally subject to greater risk of loss of your money than higher rated securities. Debt securities are also subject to prepayment risk when interest rates decrease. Prepayment risk is the risk that the borrower will prepay some or all of the principal owed to the issuer. If prepayment occurs, the Fund may have to replace the security by investing the proceeds in a less attractive security. Many debt securities utilize LIBOR as the reference or benchmark rate for variable interest rate calculations. However, the use of LIBOR has come under pressure following manipulation allegations. If LIBOR in its current form does not survive or if an alternative index is chosen, the market value and/or liquidity of securities with distributions or interest rates based on LIBOR could be adversely affected.
Emerging Markets Risk. The Fund may invest in emerging markets, which may carry more risk than investing in developed foreign markets. Risks associated with investing in emerging markets include limited information about companies in these countries, greater political and economic uncertainties compared to developed foreign markets, underdeveloped securities markets and legal systems, potentially high inflation rates, and the influence of foreign governments over the private sector.
CONCORDE WEALTH MANAGEMENT FUND
NOTES TO FINANCIAL STATEMENTS (continued)
Note 5 – Principal Risks (continued)
Equity and General Market Risk. Equities, such as common stocks, or other equity related investments are susceptible to general stock market fluctuations and to volatile increases and decreases in value. The stock market may experience declines or stocks in the Fund’s portfolio may not increase their earnings at the rate anticipated. The Fund’s NAV and investment return will fluctuate based upon changes in the value of its portfolio securities. A rise in protectionist trade policies, slowing global economic growth, risks associated with the United Kingdom’s exit from the European Union, the trade dispute between the United States and China, the risk of trade disputes with other countries, and the possibility of changes to some international trade agreements, could affect the economies of many nations, including the United States, in ways that cannot necessarily be foreseen at the present time, and may negatively impact the financial markets.
These developments as well as other events could result in further market volatility and negatively affect financial asset prices, the liquidity of fixed income or other securities held by the Fund and the normal operations of securities exchanges and other markets, despite government efforts to address market disruptions. In addition, the Fund may face challenges with respect to its day-to-day operations if key personnel of the investment adviser or other service providers are unavailable due to quarantines and restrictions on travel related to the recent COVID-19 outbreak. As a result, the risk environment remains elevated. The investment adviser will monitor developments and seek to manage the Fund in a manner consistent with achieving the Fund’s investment objective, but there can be no assurance that it will be successful in doing so.
Exchange Traded Fund Risk. ETFs may trade at a discount to the aggregate value of the underlying securities and although expense ratios for ETFs are generally low, frequent trading of ETFs by the Fund can generate brokerage expenses. Shareholders of the Fund will indirectly be subject to the fees and expenses of the individual ETFs in which the Fund invests, in addition to the Fund’s own fees and expenses.
Foreign Securities Risk. The Fund may invest in foreign securities and, if so, it will be subject to risks associated with foreign markets, such as adverse political, currency, social and economic developments; accounting standards or governmental supervision that are not consistent with that to which U.S. companies are subject; limited information about foreign companies; less liquidity in foreign markets; and less protection. In addition, policy and legislative changes in foreign countries and other events affecting global markets, such as the United Kingdom’s exit from the European Union (or Brexit), may contribute to decreased liquidity and increased volatility in the financial markets.
High Yield Risk. The Fund’s investment program permits it to invest in non-investment grade debt obligations, sometimes referred to as “junk bonds” (hereinafter referred to as “lower-quality securities”). Lower-quality securities are those securities that are rated lower than investment grade and unrated securities believed by the Advisor to be of comparable quality. Although these securities generally offer higher yields than investment grade securities with similar maturities, lower-quality securities involve greater risks, including the possibility of default or bankruptcy. In general, they are regarded to be more speculative with respect to the issuer’s capacity to pay interest and repay principal.
CONCORDE WEALTH MANAGEMENT FUND
NOTES TO FINANCIAL STATEMENTS (continued)
Note 5 – Principal Risks (continued)
Investments in Other Investment Companies Risk. Shareholders of the Fund will indirectly be subject to the fees and expenses of the other investment companies in which the Fund invests and these fees and expenses are in addition to the fees and expenses that Fund shareholders directly bear in connection with the Fund’s own operations. In addition, shareholders will be exposed to the investment risks associated with investments in other investment companies.
Liquidity Risk. Certain securities held by the Fund may be difficult (or impossible) to sell at the time and at the price the Fund would like. As a result, the Fund may have to hold these securities longer than it would like and may forego other investment opportunities. There is the possibility that the Fund may lose money or be prevented from realizing capital gains if it cannot sell a security at a particular time and price.
Private Funds Risk. The sale or transfer of investments in private funds may be limited or prohibited by contract or law. Private funds are generally fair valued in good faith by the Advisor, as they are not traded frequently. The Fund may be required to hold such positions for several years, if not longer, regardless of valuation, which may cause the Fund to be less liquid.
Private Placement Risk. The Fund may invest in privately issued securities of domestic common and preferred stock, convertible debt securities, ADRs and REITs, including those which may be resold only in accordance with Rule 144A under the Securities Act of 1933, as amended. Privately issued securities are restricted securities that are not publicly traded. Delay or difficulty in selling such securities may result in a loss to the Fund. Privately issued securities and other restricted securities will have the effect of increasing the level of Fund illiquidity to the extent that the Fund finds it difficult to sell these securities when the Advisor believes it is desirable to do so, especially under adverse market or economic conditions or in the event of adverse changes in the financial condition of the issuer, and the prices realized could be less than those originally paid or less than the fair market value. At times, the illiquidity of the market, as well as the lack of publicly available information regarding these securities also may make it difficult to determine the fair value of such securities for purposes of computing the NAV of the Fund.
Real Estate Investment Trust and Real Estate Risk. The value of the Fund’s investments in REITS may change in response to changes in the real estate market such as declines in the value of real estate, lack of available capital or financing opportunities, and increases in property taxes or operating costs.
Security Selection Risk. The Advisor may misjudge the risk and/or return potential of a security. This misjudgment can result in a loss or a significant deviation relative to its benchmarks.
Smaller and Medium Capitalization Company Risk. Securities of smaller and medium-sized companies may be more volatile and more difficult to liquidate during market downturns than securities of larger companies. Additionally, the price of smaller companies may decline more in response to selling pressures.
CONCORDE WEALTH MANAGEMENT FUND
NOTES TO FINANCIAL STATEMENTS (continued)
Note 5 – Principal Risks (continued)
Style Risk. The Advisor generally follows an investing style that favors value investments. The value investing style may, over time, go in and out of favor. At time when the value investing style is out of favor, the Fund may underperform other funds that use different investing styles. Investors should be prepared to tolerate volatility in Fund returns.
Note 6 – Investment Advisory Fees and Transactions with Affiliate
The Company has an Investment Advisory Agreement with Concorde to act as the Fund’s investment advisor. The Advisor provides the Fund with investment management and advisory services consistent with the Fund’s investment objectives, policies and restrictions, supervises the purchase and sale of investment transactions and administers the business and administrative operations of the Fund. For such services, for the period ended March 31, 2023, Concorde received an annual fee of 0.80% of the Fund’s average daily net assets, computed daily and paid on a monthly basis. The investment advisory fee was $148,647 for the year ended March 31, 2023, of which $24,526 was payable at March 31, 2023. Certain officers and directors of the Company are also officers and directors of Concorde.
Note 7 – Service Organizations
U.S. Bancorp Fund Services, LLC, doing business as U.S. Bank Global Fund Services (“Fund Services”), provides the Fund with administrative, fund accounting, and transfer agent services. U.S. Bank, N.A., (“USB”) an affiliate of Fund Services, serves as the Fund’s custodian. Fees incurred by the Fund to Fund Services and USB during the period ended March 31, 2023, were $45,444 and $5,407, respectively, of which $14,745 and $2,480, respectively, were payable at March 31, 2023.
The Company has an administrative agreement with National Financial Services, LLC (“NFS”). The agreement provides for monthly payments by the Fund to NFS for providing certain shareholder services (sub-transfer agent fees). Sub-transfer agent fees incurred by the Fund to NFS for the year ended March 31, 2023 were $21,734, of which $3,548 was payable at March 31, 2023.
CONCORDE WEALTH MANAGEMENT FUND
NOTES TO FINANCIAL STATEMENTS (continued)
Note 8 – Federal Tax Information
At September 30, 2022, the Fund’s most recent fiscal year end, the Fund’s investments and components of total distributable earnings on a tax basis were as follows:
| | Federal Tax Cost of Investments | | $ | 27,799,544 | |
| | Gross Tax Unrealized Appreciation | | $ | 9,794,621 | |
| | Gross Tax Unrealized Depreciation | | | (3,017,539 | ) |
| | Net Tax Unrealized Appreciation | | | 6,777,262 | |
| | Undistributed Ordinary Income | | | 171,755 | |
| | Undistributed Long-Term Gains | | | 1,055,253 | |
| | Other Accumulated Gain | | | 0 | |
| | Total Distributable Earnings | | $ | 8,004,270 | |
The difference between book-basis and tax-basis net unrealized appreciation is primarily attributable to the realization for tax purposes of the unrealized gains on an investment in a passive foreign investment company and adjustments to the tax basis of investments in partnerships.
At September 30, 2022, the Fund’s fiscal year end, the Fund had no tax basis capital loss carryovers to offset future capital gains. The Fund did not utilize a capital loss carryover during the year ended September 30, 2022, the Fund’s fiscal year end. The Fund had no late year loss deferrals and no post-October loss.
The tax character of distributions paid during the year ended September 30, 2022 and year ended September 30, 2021 was as follows:
| | | | September 30, 2022 | | | September 30, 2021 | |
| | Ordinary income(1) | | $ | 587,003 | | | $ | 364,457 | |
| | Long-term capital gain | | | 841,810 | | | | 687,020 | |
| | | | $ | 1,428,813 | | | $ | 1,051,477 | |
(1) Ordinary income includes short-term capital gains.
Note 9 – Subsequent Events
Management has evaluated the Fund’s events and transactions that occurred subsequent March 31, 2023, through the date of issuance of the Fund’s financial statements. There were no events or transactions that occurred during this period that materially impacted the amounts or disclosures in the Fund’s financial statements.
ADDITIONAL INFORMATION (Unaudited)
PROXY VOTING POLICIES AND PROCEDURES
For a description of the policies and procedures that the Fund uses to determine how to vote proxies relating to the portfolio securities, please call (972) 701-5400 and request a Statement of Additional Information. One will be mailed to you free of charge. The Statement of Additional Information is also available on the website of the Securities and Exchange Commission (“SEC”) at http://www.sec.gov.
PROXY VOTING RECORDS
Information on how the Fund voted proxies relating to portfolio securities during the twelve-month period ending June 30 is available without charge, upon request, by calling (972) 701-5400. Furthermore, you can obtain the Fund’s proxy voting records on the SEC’s website at http://www.sec.gov.
QUARTERLY PORTFOLIO HOLDINGS INFORMATION
The Fund files its complete schedule of portfolio holdings with the SEC for the first and third fiscal quarters as an exhibit to its report on Form N-PORT. The Fund’s Part F of Form N-PORT is available without charge, upon request, by calling (972) 701-5400. Furthermore, you can obtain the Fund’s complete schedule of portfolio holdings on the SEC’s website at http://www.sec.gov.
HOUSEHOLD DELIVERY OF SHAREHOLDER DOCUMENTS
In an effort to decrease costs, the Fund intends to reduce the number of duplicate prospectuses and Annual and Semi-Annual Reports you receive by sending only one copy of each to those addresses shared by two or more accounts and to shareholders we reasonably believe are from the same family or household. Once implemented, if you would like to discontinue householding for your accounts, please call toll-free at 1-800-294-1699 to request individual copies of these documents. Once the Fund receives notice to stop householding, we will begin sending individual copies thirty days after receiving your request. This policy does not apply to account statements.
FEDERAL TAX DISTRIBUTION INFORMATION
The Fund has designated 100.00% of the dividends declared from net investment income during the year ended September 30, 2022, as qualified dividend income under the Jobs Growth and Tax Reconciliation Act of 2003. Additionally, for corporate shareholders, the percent of ordinary income distributions qualifying for the corporate dividends received deduction for the fiscal year ended September 30, 2022 was 77.27%.
FUND EXPENSES (Unaudited)
As a shareholder of the Fund, you incur two types of costs: (1) transaction costs and exchange fees; and (2) ongoing costs, including management fees and other Fund expenses. This Example is intended to help you understand your ongoing costs (in dollars) of investing in the Fund and to compare these costs with the ongoing costs of investing in other mutual Funds.
The Example is based on an investment of $1,000 invested at the beginning of the period and held for the entire six month period ended March 31, 2023.
Actual Expenses
The first line of the table below provides information about actual account values and actual expenses. You may use the information in this line, together with the amount you invested, to estimate the expenses that you paid over the period. Simply divide your account value by $1,000 (for example, an $8,600 account value divided by $1,000 = 8.6), then multiply the result by the number in the first line under the heading entitled “Expenses Paid During Period” to estimate the expenses you paid on your account during this period.
Hypothetical Example for Comparison Purposes
The second line of the table below provides information about hypothetical account values and hypothetical expenses based on the Fund’s actual expense ratio and an assumed rate of return of 5% per year before expenses, which is not the Fund’s actual return. The hypothetical account values and expenses may not be used to estimate the actual ending account balance or expenses you paid for the period. You may use this information to compare the ongoing costs of investing in the Fund and other Funds. To do so, compare this 5% hypothetical example with the 5% hypothetical examples that appear in the shareholder reports of the other Funds.
Please note that the expenses shown in the table are meant to highlight your ongoing costs only and do not reflect any transactional costs or exchange fees. While the Fund does not currently assess sales charges, redemption or exchange fees, other funds do, and those costs will not be reflected in their expense tables. Therefore, the second line of the table is useful in comparing ongoing costs only, and will not help you determine the relative total costs of owning different Funds. In addition, if these transaction costs were included, your costs would have been higher.
| | Beginning Account | Ending Account | Expenses Paid During Period* – |
| | Value – 10/1/22 | Value – 3/31/23 | Six Months Ended 3/31/23 |
| Actual | $1,000.00 | $1,047.70 | $7.43 |
| Hypothetical | | | |
(5% return before expenses) | $1,000.00 | $1,017.67 | $7.32 |
______________
| * | Expenses are equal to the Fund’s annualized expense ratio of 1.46%, multiplied by the average account value over the period, multiplied by 182/365 (to reflect the one-half year period ended March 31,2023). |
(This Page Intentionally Left Blank.)
INVESTMENT ADVISOR
Concorde Investment Management
8383 Preston Center Plaza
Suite 360
Dallas, Texas 75225
OFFICERS
Gary B. Wood, Ph.D.
President
Gregory B. Wood
Treasurer
John A. Stetter
Secretary
DIRECTORS
William Marcy, P.E., Ph.D.
Harold E. Schneider
Gary B. Wood, Ph.D.
CUSTODIAN
U.S. Bank, N.A.
Custody Operations
1555 North RiverCenter Drive, Suite 302
Milwaukee, Wisconsin 53212
TRANSFER AGENT AND
DIVIDEND DISBURSING AGENT
U.S. Bancorp Fund Services, LLC
doing business as
U.S. Bank Global Fund Services
Mutual Fund Services, 3rd Floor
615 East Michigan Street
Milwaukee, Wisconsin 53202
INDEPENDENT REGISTERED
PUBLIC ACCOUNTING FIRM
Brad A. Kinder, CPA
815 Parker Square
Flower Mound, Texas 75028
LEGAL COUNSEL
Foley & Lardner LLP
777 East Wisconsin Avenue
Milwaukee, Wisconsin 53202
TELEPHONE
(972) 701-5400
(Fund information)
(800) 294-1699
(Shareholder account information)

Item 2. Code of Ethics.
Not applicable for semi-annual reports.
Item 3. Audit Committee Financial Expert.
Not applicable for semi-annual reports.
Item 4. Principal Accountant Fees and Services.
Not applicable for semi-annual reports.
Item 5. Audit Committee of Listed Registrants.
Not applicable to registrants who are not listed issuers (as defined in Rule 10A-3 under the Securities Exchange Act of 1934).
(b) Not applicable.
Item 6. Investments.
| (a) | Schedule of Investments is included as part of the report to shareholders filed under Item 1 of this Form. |
Item 7. Disclosure of Proxy Voting Policies and Procedures for Closed-End Management Investment Companies.
Not applicable to open-end investment companies.
Item 8. Portfolio Managers of Closed-End Management Investment Companies.
Not applicable to open-end investment companies.
Item 9. Purchases of Equity Securities by Closed‑End Management Investment Company and Affiliated Purchasers.
Not applicable to open-end investment companies.
Item 10. Submission of Matters to a Vote of Security Holders.
There have been no material changes to the procedures by which shareholders may recommend nominees to the registrant’s board of directors.
Item 11. Controls and Procedures.
| (a) | The Registrant’s President and Treasurer have reviewed the Registrant's disclosure controls and procedures (as defined in Rule 30a-3(c) under the Investment Company Act of 1940 (the “Act”)) as of a date within 90 days of the filing of this report, as required by Rule 30a-3(b) under the Act and Rules 13a-15(b) or 15d‑15(b) under the Securities Exchange Act of 1934. Based on their review, such officers have concluded that the disclosure controls and procedures are effective in ensuring that information required to be disclosed in this report is appropriately recorded, processed, summarized and reported and made known to them by others within the Registrant and by the Registrant’s service provider. |
| (b) | There were no changes in the Registrant's internal control over financial reporting (as defined in Rule 30a-3(d) under the Act) that occurred during the period covered by this report that have materially affected, or are reasonably likely to materially affect, the Registrant's internal control over financial reporting. |
Item 12. Disclosure of Securities Lending Activities for Closed-End Management Investment Companies
Not applicable to open-end investment companies.
Item 13. Exhibits.
| (a) | (1) Any code of ethics or amendment thereto, that is the subject of the disclosure required by Item 2, to the extent that the registrant intends to satisfy Item 2 requirements through filing an exhibit. Not Applicable for semi-annual reports. |
(3) Any written solicitation to purchase securities under Rule 23c‑1 under the Act sent or given during the period covered by the report by or on behalf of the registrant to 10 or more persons. Not applicable to open-end investment companies.
(4) Change in the registrant’s independent public accountant. There was no change in the registrant’s independent public accountant for the period covered by this report.
SIGNATURES
Pursuant to the requirements of the Securities Exchange Act of 1934 and the Investment Company Act of 1940, the registrant has duly caused this report to be signed on its behalf by the undersigned, thereunto duly authorized.
(Registrant) Concorde Funds, Inc.
By (Signature and Title)* /s/Gary B. Wood
Gary B. Wood, President/Principal Executive Officer
Date June 1, 2023
Pursuant to the requirements of the Securities Exchange Act of 1934 and the Investment Company Act of 1940, this report has been signed below by the following persons on behalf of the registrant and in the capacities and on the dates indicated.
By (Signature and Title)* /s/Gary B. Wood
Gary B. Wood, President/Principal Executive Officer
Date June 1, 2023
By (Signature and Title)* /s/Gregory B. Wood
Gregory B. Wood, Treasurer/Principal Financial Officer
Date June 1, 2023
* Print the name and title of each signing officer under his or her signature.