UNITED STATES
SECURITIES AND EXCHANGE COMMISSION
Washington, D.C. 20549
Form N-CSR
CERTIFIED SHAREHOLDER REPORT OF REGISTERED
MANAGEMENT INVESTMENT COMPANIES
Investment Company Act File Number 811-5344
William Blair Funds
(Exact name of registrant as specified in charter)
| 222 West Adams Street, Chicago, IL | | 60606 |
| (Address of principal executive offices) | | (Zip Code) |
Michelle R. Seitz
William Blair Funds
222 West Adams Street, Chicago, IL 60606
(Name and address of agent for service)
Registrant’s telephone number, including area code: 312-236-1600
Date of fiscal year end: December 31
Date of reporting period: June 30, 2016
Form N-CSR is to be used by management investment companies to file reports with the Commission not later than 10 days after the transmission to stockholders of any report that is required to be transmitted to stockholders under Rule 30e-1 under the Investment Company Act of 1940 (17 CFR 270.30e-1). The Commission may use the information provided on Form N-CSR in its regulatory, disclosure review, inspection, and policymaking roles.
A registrant is required to disclose the information specified by Form N-CSR, and the Commission will make this information public. A Registrant is not required to respond to the collection of information contained in Form N-CSR unless the form displays a currently valid Office of Management and Budget (“OMB”) control number. Please direct comments concerning the accuracy of the information collection burden estimates and any suggestions for reducing the burden to Secretary, Securities and Exchange Commission, 100 F Street, NE, Washington, DC 20549. The OMB has reviewed this collection of information under the clearance requirements of 44 U.S.C. (ss) 3507.
| Item 1. | June 30, 2016 Semi Annual Reports transmitted to shareholders. |
 | |
| | |
| | |
| | |
| | |
| | June 30, 2016 |
William Blair Funds Semiannual Report | |
| June 30, 2016 | William Blair Funds | 1 |
The views expressed in the commentary for each Fund reflect those of the portfolio management team only through the end of the period of the report as stated on the cover. The portfolio management team’s views are subject to change at any time based on market and other conditions and should not be construed as a recommendation. Statements involving predictions, assessments, analyses, or outlook for individual securities, industries, market sectors, and/or markets involve risks and uncertainties, and there is no guarantee they will come to pass.
This report is submitted for the general information of the shareholders of William Blair Funds. It is not authorized for distribution to prospective investors unless accompanied or preceded by a prospectus of William Blair Funds. Please carefully consider the Funds’ investment objectives, risks, charges, and expenses before investing. This and other information is contained in the Funds’ prospectus, which you may obtain by calling 1-800-742-7272. Read it carefully before you invest or send money.
| 2 | Semiannual Report | June 30, 2016 |
Performance as of June 30, 2016—Class N Shares (Unaudited)
| | | | | | | | | | | 10 yr | | | | Overall |
| | | Year | | | | | | | | (or since | | Inception | | Morningstar |
| | | To Date | | 1 yr | | 3 yr | | 5 yr | | inception) | | Date | | Rating |
| Growth Fund | | | | | | | | | | | | | | | | | | | |
| Class N | | (1.92 | ) | | 0.26 | | | 10.04 | | | 9.79 | | | 7.55 | | | 3/20/1946 | | *** |
| Morningstar Large Growth | | (1.93 | ) | | (2.33 | ) | | 10.58 | | | 9.98 | | | 7.20 | | | | | Among 1,483 |
| Russell 3000® Growth Index | | 1.14 | | | 1.88 | | | 12.65 | | | 12.04 | | | 8.65 | | | | | Large Growth Funds |
| S&P 500® Index | | 3.84 | | | 3.99 | | | 11.66 | | | 12.10 | | | 7.42 | | | | | |
| | | | | | | | | | | | | | | | | | | | |
| Large Cap Growth Fund | | | | | | | | | | | | | | | | | | | |
| Class N | | (0.39 | ) | | 0.84 | | | 14.02 | | | 12.26 | | | 7.48 | | | 12/27/1999 | | **** |
| Morningstar Large Growth | | (1.93 | ) | | (2.33 | ) | | 10.58 | | | 9.98 | | | 7.20 | | | | | Among 1,483 |
| Russell 1000® Growth Index | | 1.36 | | | 3.02 | | | 13.07 | | | 12.35 | | | 8.78 | | | | | Large Growth Funds |
| | | | | | | | | | | | | | | | | | | | |
| Mid Cap Growth Fund | | | | | | | | | | | | | | | | | | | |
| Class N | | (0.71 | ) | | (5.31 | ) | | 6.85 | | | 6.67 | | | 7.43 | | | 2/1/2006 | | **** |
| Morningstar Mid-Cap Growth | | 0.04 | | | (6.43 | ) | | 8.21 | | | 7.93 | | | 6.79 | | | | | Among 650 |
| Russell Midcap® Growth Index | | 2.15 | | | (2.14 | ) | | 10.52 | | | 9.98 | | | 8.12 | | | | | Mid-Cap Growth Funds |
| | | | | | | | | | | | | | | | | | | | |
| Mid Cap Value Fund | | | | | | | | | | | | | | | | | | | |
| Class N | | 6.15 | | | 1.52 | | | 9.50 | | | 10.10 | | | 10.55 | | | 5/3/2010 | | **** |
| Morningstar Mid-Cap Value | | 4.89 | | | (2.16 | ) | | 7.85 | | | 8.77 | | | — | | | | | Among 408 |
| Russell Midcap® Value Index | | 8.87 | | | 3.25 | | | 11.00 | | | 11.70 | | | 11.79 | | | | | Mid-Cap Value Funds |
| | | | | | | | | | | | | | | | | | | | |
| Small-Mid Cap Growth Fund | | | | | | | | | | | | | | | | | | | |
| Class N | | 0.97 | | | (3.15 | ) | | 10.74 | | | 10.16 | | | 8.84 | | | 12/29/2003 | | **** |
| Morningstar Mid-Cap Growth | | 0.04 | | | (6.43 | ) | | 8.21 | | | 7.93 | | | 6.79 | | | | | Among 650 |
| Russell 2500TM Growth Index | | (0.03 | ) | | (7.69 | ) | | 9.06 | | | 9.27 | | | 7.96 | | | | | Mid-Cap Growth Funds |
| | | | | | | | | | | | | | | | | | | | |
| Small-Mid Cap Value Fund | | | | | | | | | | | | | | | | | | | |
| Class N | | 6.14 | | | 0.89 | | | 7.90 | | | — | | | 12.61 | | | 12/15/2011 | | **** |
| Morningstar Small Blend | | 2.98 | | | (5.78 | ) | | 6.37 | | | — | | | — | | | | | Among 654 |
| Russell 2500® Value Index | | 7.84 | | | 0.22 | | | 8.14 | | | — | | | 13.92 | | | | | Small Blend Funds |
| | | | | | | | | | | | | | | | | | | | |
| Small Cap Growth Fund | | | | | | | | | | | | | | | | | | | |
| Class N | | 3.92 | | | (3.86 | ) | | 7.98 | | | 9.48 | | | 5.82 | | | 12/27/1999 | | *** |
| Morningstar Small Growth | | (0.66 | ) | | (9.86 | ) | | 6.46 | | | 7.26 | | | 6.55 | | | | | Among 655 |
| Russell 2000® Growth Index | | (1.59 | ) | | (10.75 | ) | | 7.74 | | | 8.51 | | | 7.14 | | | | | Small Growth Funds |
| | | | | | | | | | | | | | | | | | | | |
| Small Cap Value Fund | | | | | | | | | | | | | | | | | | | |
| Class N | | 6.83 | | | (0.06 | ) | | 7.51 | | | 8.40 | | | 7.10 | | | 12/23/1996 | | *** |
| Morningstar Small Blend | | 2.98 | | | (5.78 | ) | | 6.37 | | | 7.62 | | | 5.87 | | | | | Among 654 |
| Russell 2000® Value Index | | 6.08 | | | (2.58 | ) | | 6.36 | | | 8.15 | | | 5.15 | | | | | Small Blend Funds |
| | | | | | | | | | | | | | | | | | | | |
| June 30, 2016 | William Blair Funds | 3 |
Performance as of June 30, 2016—Class N Shares (Unaudited)—continued
| | | | | | | | | | | 10 yr | | | | Overall |
| | | Year | | | | | | | | (or since | | Inception | | Morningstar |
| | | To Date | | 1 yr | | 3 yr | | 5 yr | | inception) | | Date | | Rating |
| Global Leaders Fund | | | | | | | | | | | | | | | | | | | |
| Class N | | (1.64 | ) | | (3.82 | ) | | 6.50 | | | 6.14 | | | 2.21 | | | 10/15/2007 | | *** |
| Morningstar World Stock | | 0.40 | | | (4.17 | ) | | 5.63 | | | 5.33 | | | — | | | | | Among 940 |
| MSCI ACW IMI (net) | | 1.36 | | | (3.87 | ) | | 6.13 | | | 5.43 | | | 1.84 | | | | | World Stock Funds |
| | | | | | | | | | | | | | | | | | | | |
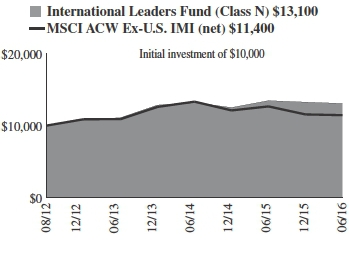
| International Leaders Fund | | | | | | | | | | | | | | | | | | | |
| Class N | | (1.40 | ) | | (2.92 | ) | | 5.64 | | | — | | | 7.15 | | | 8/16/2012 | | **** |
| Morningstar Foreign Large Growth | | (2.29 | ) | | (7.50 | ) | | 3.19 | | | — | | | — | | | | | Among 320 |
| MSCI ACW Ex-U.S. IMI (net) | | (0.91 | ) | | (9.61 | ) | | 1.65 | | | — | | | 3.54 | | | | | Foreign Large Growth Funds |
| | | | | | | | | | | | | | | | | | | | |
| International Equity Fund | | | | | | | | | | | | | | | | | | | |
| Class N | | (1.88 | ) | | (6.29 | ) | | 3.88 | | | 2.74 | | | 1.86 | | | 5/24/2004 | | *** |
| Morningstar Foreign Large Growth | | (2.29 | ) | | (7.50 | ) | | 3.19 | | | 2.54 | | | 2.92 | | | | | Among 320 |
| MSCI World Ex-U.S. Index (net) | | (2.98 | ) | | (9.84 | ) | | 1.88 | | | 1.23 | | | 1.63 | | | | | Foreign Large Growth Funds |
| | | | | | | | | | | | | | | | | | | | |
| International Growth Fund | | | | | | | | | | | | | | | | | | | |
| Class N | | (3.81 | ) | | (9.52 | ) | | 2.60 | | | 2.69 | | | 2.67 | | | 10/1/1992 | | *** |
| Morningstar Foreign Large Growth | | (2.29 | ) | | (7.50 | ) | | 3.19 | | | 2.54 | | | 2.92 | | | | | Among 320 |
| MSCI ACW Ex-U.S. IMI (net) | | (0.91 | ) | | (9.61 | ) | | 1.65 | | | 0.39 | | | 2.16 | | | | | Foreign Large Growth Funds |
| | | | | | | | | | | | | | | | | | | | |
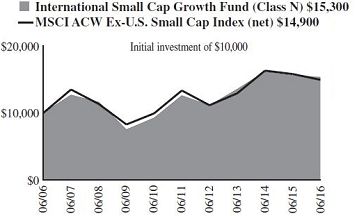
| International Small Cap Growth Fund | | | | | | | | | | | | | | | | | | | |
| Class N | | (4.22 | ) | | (1.77 | ) | | 4.22 | | | 4.01 | | | 4.36 | | | 11/1/2005 | | *** |
| Morningstar Foreign Small/Mid Growth | | (3.01 | ) | | (4.98 | ) | | 5.17 | | | 4.77 | | | 4.67 | | | | | Among 122 |
| MSCI ACW Ex-U.S. Small Cap Index (net) | | (0.20 | ) | | (5.46 | ) | | 4.93 | | | 2.28 | | | 4.09 | | | | | Foreign Small/Mid Growth Funds |
| | | | | | | | | | | | | | | | | | | | |
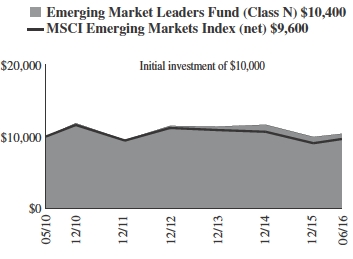
| Emerging Markets Leaders Fund | | | | | | | | | | | | | | | | | | | |
| Class N | | 4.40 | | | (11.68 | ) | | (0.74 | ) | | (2.14 | ) | | 0.60 | | | 5/3/2010 | | **** |
| Morningstar Diversified Emerging Markets | | 6.22 | | | (9.89 | ) | | (1.30 | ) | | (3.19 | ) | | — | | | | | Among 590 |
| MSCI Emerging Markets Index (net) | | 6.41 | | | (12.05 | ) | | (1.56 | ) | | (3.78 | ) | | (0.58 | ) | | | | Diversified Emerging Markets Funds |
| | | | | | | | | | | | | | | | | | | | |
| Emerging Markets Growth Fund | | | | | | | | | | | | | | | | | | | |
| Class N | | 5.07 | | | (12.81 | ) | | (0.16 | ) | | (1.28 | ) | | 3.22 | | | 6/6/2005 | | **** |
| Morningstar Diversified Emerging Markets | | 6.22 | | | (9.89 | ) | | (1.30 | ) | | (3.19 | ) | | 3.21 | | | | | Among 590 |
| MSCI Emerging Markets IMI (net) | | 5.69 | | | (12.16 | ) | | (1.36 | ) | | (3.59 | ) | | 3.87 | | | | | Diversified Emerging Markets Funds |
| | | | | | | | | | | | | | | | | | | | |
| Emerging Markets Small Cap Growth Fund | | | | | | | | | | | | | | | | | | | |
| Class N | | 0.88 | | | (10.56 | ) | | 5.68 | | | — | | | 11.17 | | | 10/24/2011 | | ***** |
| Morningstar Diversified Emerging Markets | | 6.22 | | | (9.89 | ) | | (1.30 | ) | | — | | | — | | | | | Among 590 |
| MSCI Emerging Markets Small Cap Index (net) | | 1.38 | | | (12.76 | ) | | (0.01 | ) | | — | | | 2.12 | | | | | Diversified Emerging Markets Funds |
| | | | | | | | | | | | | | | | | | | | |
| 4 | Semiannual Report | June 30, 2016 |
Performance as of June 30, 2016—Class N Shares (Unaudited)—continued
| | | | | | | | | | | 10 yr | | | | Overall |
| | | Year | | | | | | | | (or since | | Inception | | Morningstar |
| | | To Date | | 1 yr | | 3 yr | | 5 yr | | inception) | | Date | | Rating |
| Bond Fund | | | | | | | | | | | | | | | | | | | |
| Class N | | 5.37 | | | 4.76 | | | 4.09 | | | 4.27 | | | 5.24 | | | 5/1/2007 | | **** |
| Morningstar Intermediate-Term Bond | | 4.92 | | | 4.63 | | | 3.59 | | | 3.64 | | | — | | | | | Among 953 |
| Barclays U.S. Aggregate Bond Index | | 5.31 | | | 6.00 | | | 4.06 | | | 3.76 | | | 4.81 | | | | | Intermediate-Term Bond Funds |
| | | | | | | | | | | | | | | | | | | | |
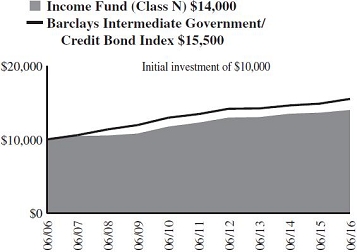
| Income Fund | | | | | | | | | | | | | | | | | | | |
| Class N | | 2.94 | | | 2.70 | | | 2.42 | | | 2.67 | | | 3.40 | | | 10/1/1990 | | ***** |
| Morningstar Short-Term Bond | | 2.04 | | | 1.49 | | | 1.42 | | | 1.54 | | | 2.97 | | | | | Among 493 |
| Barclays Intermediate Government/Credit Bond Index | | 4.07 | | | 4.33 | | | 2.95 | | | 2.90 | | | 4.48 | | | | | Short-Term Bond Funds |
| | | | | | | | | | | | | | | | | | | | |
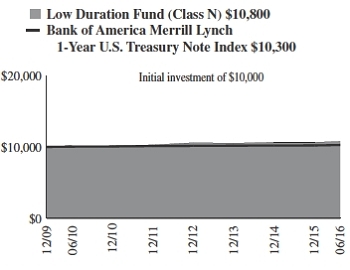
| Low Duration Fund | | | | | | | | | | | | | | | | | | | |
| Class N | | 1.13 | | | 1.08 | | | 1.00 | | | 1.02 | | | 1.13 | | | 12/1/2009 | | **** |
| Morningstar Ultra Short Bond | | 0.67 | | | 0.54 | | | 0.56 | | | 0.73 | | | — | | | | | Among 123 |
| Bank of America Merrill Lynch 1-Year U.S. Treasury Note Index | | 0.65 | | | 0.59 | | | 0.38 | | | 0.34 | | | 0.41 | | | | | Ultrashort Bond Funds |
| | | | | | | | | | | | | | | | | | | | |
| Macro Allocation Fund | | | | | | | | | | | | | | | | | | | |
| Class N | | 0.27 | | | (9.64 | ) | | 1.63 | | | — | | | 5.50 | | | 11/29/2011 | | *** |
| Morningstar Multialternative | | 0.30 | | | (2.55 | ) | | 1.45 | | | — | | | — | | | | | Among 251 |
| Bank of America Merrill Lynch 3-Month U.S. Treasury Bill Index | | 0.15 | | | 0.19 | | | 0.09 | | | — | | | 0.09 | | | | | Multialternative Funds |
| Long-Term Comparative Index | | 2.67 | | | 1.56 | | | 3.61 | | | — | | | 4.06 | | | | | |
Performance cited represents past performance. Past performance does not guarantee future results and current performance may be lower or higher than the data quoted. Results shown are average annual total returns, which assume reinvestment of dividends and capital gains. Investment returns and principal will fluctuate and you may have a gain or a loss when you sell shares. For the most current month-end performance information, please call 1-800-742-7272, or visit our Web site at www.williamblairfunds.com. From time to time, the investment adviser may waive fees or reimburse expenses for the Fund. Without these waivers, performance would be lower. Investing in smaller companies involves special risks, including higher volatility and lower liquidity. International and emerging markets investing involves special risk considerations, including currency fluctuations, lower liquidity, economic and political risk. As interest rates rise, bond prices will typically fall and bond funds may become more volatile. Class N shares are available to the general public without a sales load.
Morningstar RatingsTM are as of 06/30/2016 and are subject to change every month. The ratings are based on a risk-adjusted return measure that accounts for variation in a fund’s monthly performance, placing more emphasis on downward variations and rewarding consistent performance. The top 10% of funds in each Category receive 5 stars, the next 22.5% receive 4 stars, the middle 35% receive 3 stars, the next 22.5% receive 2 stars, and the bottom 10% receive 1 star. The Overall Morningstar Rating for a fund is derived from a weighted-average of the performance figures associated with its three-, five- and ten-year (if applicable) Morningstar Rating metrics. The 3/5/10 year Morningstar ratings were as follows: Growth Fund ***/***/*** and Large Cap Growth Fund *****/****/***, out of 1,483/1,289/931 large growth funds; Mid Cap Growth Fund ***/***/**** and Small-Mid Cap Growth Fund ****/****/**** out of 650/573/429 mid-cap growth funds; Mid Cap Value Fund ****/****/NA, out of 408/348/NA mid-cap value funds; Small Cap Growth Fund ****/****/**, out of 655/591/431 small growth funds; Small-Mid Cap Value Fund ****/NA/NA and Small Cap Value Fund ***/***/**** out of 654/559/381 small blend funds; Global Leaders Fund ***/***/NA out of 940/731/NA world stock funds; International Equity Fund ****/***/**, International Growth Fund ***/***/**, and International Leaders Fund ****/NA/NA out of 320/275/189 foreign large growth funds; International Small Cap Growth Fund ***/***/*** out of 122/105/63 foreign small/mid growth funds; Emerging Markets Leaders Fund ***/**** /NA, Emerging Markets Growth Fund ****/****/***, and Emerging Markets Small Cap Growth *****/NA/NA out of 590/416/186 diversified emerging markets funds; Bond Fund ****/****/NA out of 953/836/NA intermediate-term bond funds; Income Fund *****/*****/**** out of 493/405/284 short-term bond funds; Low Duration Fund ****/****/NA out of 123/88/NA ultrashort bond funds; and Macro Allocation Fund ***/NA/NA out of 251/NA/NA multialternative funds.
Please carefully consider the Funds’ investment objectives, risks, charges, and expenses before investing. This and other information is contained in the Funds’ prospectus, which you may obtain by calling 1-800-742-7272. Read it carefully before you invest or send money.
| June 30, 2016 | William Blair Funds | 5 |
U.S. Growth Market Review and Outlook
U.S. equities ended the first half of 2016 mostly positive after a dismal first six weeks of the year. Broad-based selling early in the year was driven by investor concern that the U.S. could be headed into a recession after several economic indicators, such as retail sales and durable goods orders, showed weakness. The risk-off trade then gave way to optimism beginning in mid-February as the price of oil rebounded from its low point of the year and investor concern about growth outside of the U.S. eased. Market drivers shifted significantly as the rebound began. Cyclical companies rallied starting in late January and led the rebound through the end of the first quarter.
Optimism continued into the second quarter as several economic indicators in the U.S. showed positive signals in April and May. First-quarter U.S. GDP was revised upward, the ISM Manufacturing Index rose in three straight months from March to May and oil rallied to nearly $50 per barrel. Globally, central banks in Europe and Japan continued their accommodative monetary policies which helped their domestic economies and aided the rally in U.S. stocks. These factors all helped ease fears of a U.S. economic slowdown until early June when a lackluster jobs report called into question the sustainability of the recent positive economic momentum. Following the weak jobs report, uncertainty rose as investors waited until later in the month for the outcome of the U.S. Federal Reserve Board’s Federal Open Market Committee (FOMC) meeting and the vote by citizens of the United Kingdom to stay in or leave the European Union, known as the “Brexit” vote. While the outcome of the FOMC meeting was positive for stocks – interest rates were left unchanged – the result of the Brexit vote initially sent U.S. stocks into a sharp, three day decline as U.K. citizens voted to leave the European Union. Following the initial sell-off, U.S. stocks rallied during the final three days of the second quarter thereby recouping most, if not all, of their post-Brexit losses.
After implementing its first interest rate hike in late 2015, the Fed has yet to raise rates so far in 2016 as there have been mixed signals as to which direction the U.S. economy is heading. U.S. first quarter GDP growth was better than originally feared, after being revised upward in April and June, but job growth and business spending showed signs of a slowdown late in the second quarter. We believe these mixed signals will continue as the rebound in the U.S. economy, which began over seven years ago, continues to proceed in a slow fashion with lingering concerns about its stability. It is likely the Fed will be cautious when deciding the appropriate time to raise interest rates in 2016, if at all. Adding to the uncertainty in the U.S. is the looming U.S. presidential election. Following the primaries, it is clear that anti-establishment sentiment is present in the minds of voters. How this sentiment plays out in the election and the impact on financial markets is unknown.
Globally, risks have been heightened by the results of the Brexit vote and uncertainty regarding how it could affect the economy of the United Kingdom, the fifth largest in the world by GDP, and more importantly the broader European economy. The increased volatility during the last two weeks of the second quarter caused by the Brexit vote is likely to persist as Europe navigates through an unfamiliar process. Similar to the nationalistic sentiment which propelled the “Leave” campaign to victory in the Brexit vote, populism and anti-establishment political candidates have garnered increased support across many European countries that will hold elections in 2016 or 2017. Many of these candidates are running on economic nationalism and anti-globalism policies which will not be conducive for global growth if they are put into practice. In China, investor fears of a further slowdown in growth have subsided after GDP growth was reported in-line with expectations in the second quarter and the portion of growth coming from consumption grew significantly when compared with the prior year. Looking forward, the risk of growth slowing remains as the transformation from an infrastructure-build-based economy to a consumer-based economy continues.
With uncertainty present around the world, we believe corporate earnings growth will be more challenging. In the aggregate, companies are near peak profit margin levels and many are returning capital to shareholders in the form of dividends and share buybacks. We believe companies that can create value for shareholders by allocating capital in an efficient manner will be increasingly rewarded by the market. As investors seek companies with long-term growth opportunities with an emphasis on sustainability, we believe we are well positioned. Companies that can control their own destiny by being less dependent on the macroeconomic environment should be rewarded over time.
| 6 | Semiannual Report | June 30, 2016 |
U.S. Value Market Review and Outlook
During the first quarter of 2016, investor concern about slowing global growth, continued declines in commodity prices, and extreme recession fears prompted one of the worst starts to a new year for the domestic equity markets. The tide seemed to turn in mid-February as solid domestic economic data improved slightly and a rebound in commodity prices helped alleviate near-term recessionary fears. In addition, dovish comments by the Federal Reserve helped fuel a market rally that was led by some of the smaller capitalization, lower quality, more beaten down stocks.
A disappointing employment report during the middle of the second quarter that shocked investors and the pending vote by citizens of the United Kingdom to stay in or leave the European Union (Brexit) that was scheduled for late in the quarter encouraged the Federal Reserve to stay on the sidelines and postpone a potential interest rate hike. Late in the second quarter, the Brexit vote in favor of the United Kingdom leaving the European Union seemed to catch investors off guard, even as most polls indicated the vote could go either way. In the face of additional uncertainty, domestic equity volatility spiked and investors gravitated to the higher quality, more defensive segments of the market. Outside of equities, the U.S. dollar and the 10-year Treasury Note rallied following the Brexit vote, adding to investor concerns about potential slowing global growth. Equity markets rallied during the last few days of the second quarter, recuperating most of the losses subsequent to the Brexit vote, as investors seemed to have resolved their concerns about Europe while the credit and currency markets hinted at a much slower global growth trajectory.
We remain cautiously optimistic on the domestic equity markets in the near-term as the bull market continues its seven-plus year run, fueled by historically low interest rates and volatility. The current cycle seems to be getting extended and we remain mindful that the probability of a recession in the not-to-distant future is higher than it has been. However, recent inflation and wage data seem to be in-check and global headwinds may encourage continued accommodative monetary policy by global central banks; potentially extending the current bull market.
With the recent Brexit vote results still fresh in investor psyche, it will take time to fully ascertain what the ultimate outcome will be and what the implications will be on currencies, global growth expectations, and financial markets. We anticipate higher volatility going forward given the uncertainty of the implications of Brexit and the outcome of the U.S. Presidential election, concerns over a slowdown in China’s economic growth, geopolitical tensions, and a more challenging backdrop for corporate earnings growth. Historically, there has been a strong correlation between volatility and outperformance of high quality stocks, thus higher volatility should provide a tailwind for our value oriented strategies given our portfolios’ higher quality bias.
While we are cognizant of these macroeconomic variables, our focus remains on identifying attractive risk reward opportunities based on individual company fundamentals. From our bottom up perspective, we remain constructive on corporate earnings, albeit against a backdrop of lower revenue growth and increasing margin pressure from higher wages. As always, our focus remains on identifying quality companies at discount prices and corporate transformation opportunities, and we continue to find good ideas across sectors. Given our investment approach, we believe the funds are well-suited to withstand a variety of market scenarios and add value over the long-term.
| June 30, 2016 | William Blair Funds | 7 |
| | Growth Fund |
| | |
| | The Growth Fund seeks long-term capital appreciation. |
| | |
| | AN OVERVIEW FROM THE PORTFOLIO MANAGERS |
| | |

David C. Fording 
John F. Jostrand | The William Blair Growth Fund (Class N shares) posted a 1.92% decrease, net of fees, for the six months ended June 30, 2016. By comparison, the Fund’s benchmark index, the Russell 3000® Growth Index (the “Index”), increased 1.14%. For the six month period ended June 30, 2016, the Fund underperformed the Index. The most significant factor contributing to the Fund’s underperformance was the Fund’s higher growth bias, as high dividend-yielding stocks outperformed low dividend-yielding stocks. Companies that pay large dividends are typically mature companies with relatively modest growth profiles that pay out a majority of earnings in the form of a dividend. The Fund tends to be significantly underweight such companies, instead seeking companies which have significant reinvestment opportunities that enable superior, durable long-term growth. As such, the Fund’s underweight in the Consumer Staples sector and select high dividend-yielding stocks held in the Index, such as Verizon, negatively impacted the Fund’s relative returns. BorgWarner and Perrigo were the top individual stock detractors from the Fund’s performance for the six month period ended June 30, 2016. BorgWarner, a global supplier of highly engineered automotive systems and components for engine and drivetrain applications, underperformed due to slowing growth and concern about its European business following the Brexit vote. Drug and nutritional product manufacturer Perrigo underperformed following turnover at its CEO post and lower forward-earnings guidance. Other top detractors were Biogen (Health Care), MasterCard (Information Technology) and Kroger (Consumer Staples). Conversely, top contributors to Fund performance for the period were Dollar General and Vantiv. Discount retailer Dollar General reported better-than-expected results in both the first and second quarters, making the stock the top contributor to the Fund’s relative performance. Payment processor Vantiv outperformed after reporting strong fundamentals in both the first and second quarter, which was driven by management execution and strength in areas such as e-commerce and integrated payments. Other top contributors were Texas Instruments (Information Technology), Union Pacific (Industrials) and TransDigm (Industrials). Also, the Fund did not hold Apple, the largest position in the Index, which provided a positive contribution to the Fund’s relative performance given the stock’s weakness in the second quarter. Please refer to the U.S. Growth Market Review and Outlook relating to the Fund on page 6. |
| 8 | Semiannual Report | June 30, 2016 |
Growth Fund
Performance Highlights (Unaudited)
| Average Annual Total Return at 6/30/2016 |
| | | Year | | | | | | | | | | | | |
| | | to Date | | 1 Year | | 3 Year | | 5 Year | | 10 Year |
| Class N | | | (1.92 | )% | | | 0.26 | % | | | 10.04 | % | | | 9.79 | % | | | 7.55 | % |
| Class I | | | (1.78 | ) | | | 0.60 | | | | 10.40 | | | | 10.15 | | | | 7.90 | |
| Russell 3000® Growth Index | | | 1.14 | | | | 1.88 | | | | 12.65 | | | | 12.04 | | | | 8.65 | |
| S&P 500® Index | | | 3.84 | | | | 3.99 | | | | 11.66 | | | | 12.10 | | | | 7.42 | |
Performance cited represents past performance. Past performance does not guarantee future results and current performance may be lower or higher than the data quoted. Results shown are average annual returns, which assume reinvestment of dividends and capital gains. Investment returns and principal will fluctuate and you may have a gain or loss when you sell shares. For the most current month-end performance information, please call 1-800-742-7272, or visit our Web site at www.williamblairfunds.com. Class N shares are available to the general public without a sales load. Class I shares are available to certain institutional investors and advisory clients of William Blair Investment Management, LLC and William Blair & Company, L.L.C., without a sales load or distribution (12b-1) or service fees.
The performance highlights and graph presented above do not reflect the deduction of taxes that a shareholder would pay on fund distributions or the redemption of fund shares.
The Russell 3000® Growth Index consists of large, medium, and small capitalization companies with above average price-to-book ratios and forecasted growth rates. The index is weighted by market capitalization and large/medium/small companies make up approximately 80%/15%/5% of the index.
The S&P 500® Index indicates broad larger capitalization equity market performance.
This report identifies the Fund’s investments on June 30, 2016. These holdings are subject to change. Not all stocks in the Fund performed the same, nor is there any guarantee that these stocks will perform as well in the future. Market forecasts provided in this report may not necessarily come to pass.
Sector Diversification (Unaudited)

The sector diversification shown is based on the total long-term securities.
| June 30, 2016 | William Blair Funds | 9 |
Growth Fund
Portfolio of Investments, June 30, 2016 (all dollar amounts in thousands) (unaudited)
| | | | | | | |
| | | | | | | |
| Issuer | | Shares | | | Value | |
| | | | | | | | | |
| | Common Stocks | | | | | | | | |
| | | | | | | | | | |
| | Information Technology—30.8% | | | | | | | | |
| * | Adobe Systems, Inc. | | | 112,700 | | | $ | 10,796 | |
| * | Akamai Technologies, Inc. | | | 241,987 | | | | 13,534 | |
| * | Alphabet, Inc. Class “A” | | | 42,780 | | | | 30,097 | |
| * | Alphabet, Inc. Class “C” | | | 29,638 | | | | 20,513 | |
| | Booz Allen Hamilton Holding Corporation | | | 214,522 | | | | 6,358 | |
| * | CoStar Group, Inc. | | | 39,257 | | | | 8,584 | |
| | CSRA, Inc. | | | 352,900 | | | | 8,268 | |
| * | Facebook, Inc. | | | 216,500 | | | | 24,742 | |
| * | Guidewire Software, Inc. | | | 109,400 | | | | 6,757 | |
| | j2 Global, Inc. | | | 104,400 | | | | 6,595 | |
| | Mastercard, Inc. | | | 276,200 | | | | 24,322 | |
| | Microsoft Corporation | | | 641,900 | | | | 32,846 | |
| * | NeuStar, Inc. | | | 287,078 | | | | 6,749 | |
| * | Red Hat, Inc. | | | 120,006 | | | | 8,712 | |
| | Texas Instruments, Inc. | | | 333,200 | | | | 20,875 | |
| * | Vantiv, Inc. | | | 261,001 | | | | 14,773 | |
| | | | | | | | 244,521 | |
| | Consumer Discretionary—19.8% | | | | | | | | |
| * | Amazon.com, Inc. | | | 44,400 | | | | 31,774 | |
| | Dollar General Corporation | | | 375,700 | | | | 35,316 | |
| | Lowe’s Cos., Inc. | | | 427,700 | | | | 33,861 | |
| | Newell Brands, Inc. | | | 275,900 | | | | 13,400 | |
| * | Sally Beauty Holdings, Inc. | | | 338,500 | | | | 9,955 | |
| | Starbucks Corporation | | | 248,000 | | | | 14,166 | |
| * | Steven Madden, Ltd. | | | 232,800 | | | | 7,957 | |
| | VF Corporation | | | 169,000 | | | | 10,392 | |
| | | | | | | | 156,821 | |
| | Health Care—16.2% | | | | | | | | |
| * | Align Technology, Inc. | | | 86,500 | | | | 6,968 | |
| * | Biogen, Inc. | | | 51,100 | | | | 12,357 | |
| * | BioMarin Pharmaceutical, Inc. | | | 80,200 | | | | 6,240 | |
| | Bristol-Myers Squibb Co. | | | 361,400 | | | | 26,581 | |
| * | Cerner Corporation | | | 363,700 | | | | 21,313 | |
| | Gilead Sciences, Inc. | | | 219,870 | | | | 18,341 | |
| * | Mednax, Inc. | | | 219,500 | | | | 15,898 | |
| | Shire plc—ADR | | | 47,100 | | | | 8,670 | |
| | Zoetis, Inc. | | | 257,900 | | | | 12,240 | |
| | | | | | | | 128,608 | |
| | Industrials—13.7% | | | | | | | | |
| | Danaher Corporation | | | 212,500 | | | | 21,462 | |
| | Equifax, Inc. | | | 80,804 | | | | 10,375 | |
| | Fastenal Co. | | | 196,300 | | | | 8,714 | |
| | Rockwell Collins, Inc. | | | 92,700 | | | | 7,892 | |
| | The Dun & Bradstreet Corporation | | | 79,200 | | | | 9,650 | |
| * | TransDigm Group, Inc. | | | 66,280 | | | | 17,477 | |
| | Union Pacific Corporation | | | 261,600 | | | | 22,825 | |
| * | Verisk Analytics, Inc. | | | 124,920 | | | | 10,129 | |
| | | | | | | | 108,524 | |
| | | Shares or | | | | |
| | | Principal | | | | |
| Issuer | | Amount | | | Value | |
| |
| | Common Stocks—(continued) | | | | | | | | |
| | | | | | | | | |
| | Financials—6.7% | | | | | | | | |
| * | Affiliated Managers Group, Inc. | | | 43,000 | | | $ | 6,053 | |
| | Intercontinental Exchange, Inc. | | | 88,800 | | | | 22,729 | |
| * | Signature Bank | | | 66,300 | | | | 8,282 | |
| | Willis Towers Watson plc† | | | 131,300 | | | | 16,322 | |
| | | | | | | | 53,386 | |
| | Consumer Staples—6.0% | | | | | | | | |
| | Costco Wholesale Corporation | | | 126,300 | | | | 19,834 | |
| | The Kroger Co. | | | 542,800 | | | | 19,970 | |
| | Tyson Foods, Inc. | | | 118,700 | | | | 7,928 | |
| | | | | | | | 47,732 | |
| | Materials—1.5% | | | | | | | | |
| | PPG Industries, Inc. | | | 114,900 | | | | 11,967 | |
| | | | | | | | | | |
| | Energy—1.4% | | | | | | | | |
| | Schlumberger, Ltd.† | | | 145,300 | | | | 11,490 | |
| | | | | | | | | | |
| | Total Common Stocks—96.1%
(cost $607,644) | | | | | | | 763,049 | |
| | |
| | Repurchase Agreement | | | | | | | | |
| | Fixed Income Clearing Corporation, 0.030% dated 6/30/16, due 7/1/16, repurchase price $40,582, collateralized by U.S. Treasury Note, 2.000%, due 8/15/25 | | | $40,582 | | | | 40,582 | |
| | | | | | | | | | |
| | Total Repurchase Agreement—5.1%
(cost $40,582) | | | | | | | 40,582 | |
| | | | | | | | | | |
| | Total Investments—101.2%
(cost $648,226) | | | | | | | 803,631 | |
| | | | | | | | | | |
| | Liabilities, plus cash and other assets—(1.2)% | | | | | | | (9,184 | ) |
| | Net assets—100.0% | | | | | | $ | 794,447 | |
|
ADR = American Depository Receipt
* = Non-income producing security
† = U.S. listed foreign security
See accompanying Notes to Financial Statements.
| 10 | Semiannual Report | June 30, 2016 |
| | Large Cap Growth Fund |
| | |
| | The Large Cap Growth Fund seeks long-term capital appreciation. |
| | |
| | AN OVERVIEW FROM THE PORTFOLIO MANAGERS |
| | |

James S. Golan 
David P. Ricci | The William Blair Large Cap Growth Fund (Class N shares) posted a 0.39% decrease, net of fees, for the six months ended June 30, 2016. By comparison, the Fund’s benchmark index, the Russell 1000® Growth Index (the “Index”), increased 1.36%. For the six month period ended June 30, 2016, the Fund underperformed the Index. From a style perspective, a significant headwind to performance was the Fund’s higher growth bias, as high dividend-yielding stocks outperformed low dividend-yielding stocks. Companies that pay large dividends are typically mature companies with relatively modest growth profiles that pay out a majority of earnings in the form of a dividend. The Fund tends to be significantly underweight such companies, instead seeking companies which have significant reinvestment opportunities that enable superior, durable long-term growth. The top individual stock detractor from the Fund’s relative returns was biotechnology company Biogen. The company, which has a strong focus in neurological disease treatment and is a dominant player in the multiple sclerosis (MS) market, underperformed after an unsuccessful trial of a next-generation MS drug and investor concerns surrounding drug pricing, which put pressure on biotechnology stocks overall. Grocery retailer Kroger was also a top detractor during the period as concern about the lack of inflation in the US economy, which hurts Kroger’s ability to raise prices and offset increased labor costs, weighed on the stock. Other top detractors during the period were BorgWarner (Consumer Discretionary), Chipotle Mexican Grill (Consumer Discretionary) and Red Hat (Information Technology). Conversely, the top contributor to the Fund’s relative performance was discount retailer Dollar General. The company reported better-than-expected results in both the first and second quarters which caused the stock to outperform. Dollar General benefitted from a combination of increased sales of consumable items (grocery, health & beauty, etc.) and various merchandising and labor initiatives that management put in place last year. UnitedHealth Group, which provides health care coverage, software and data consultancy services, outperformed after reporting strong revenue growth in back-to-back quarters. Other top contributors to Fund performance for the period were Texas Instruments (Information Technology), IDEXX Laboratories (Health Care) and Union Pacific (Industrials). Please refer to the U.S. Growth Market Review and Outlook relating to the Fund on page 6. |
| June 30, 2016 | William Blair Funds | 11 |
Large Cap Growth Fund
Performance Highlights (Unaudited)
| Average Annual Total Return at 6/30/2016 |
| | | Year | | | | | | | | |
| | | to Date | | 1 Year | | 3 Year | | 5 Year | | 10 Year |
| Class N | | | (0.39 | )% | | | 0.84 | % | | | 14.02 | % | | | 12.26 | % | | | 7.78 | % |
| Class I | | | (0.28 | ) | | | 0.99 | | | | 14.28 | | | | 12.51 | | | | 7.74 | |
| Russell 1000® Growth Index | | | 1.36 | | | | 3.02 | | | | 13.07 | | | | 12.35 | | | | 8.78 | |
Performance cited represents past performance. Past performance does not guarantee future results and current performance may be lower or higher than the data quoted. Results shown are average annual total returns, which assume reinvestment of dividends and capital gains. Investment returns and principal will fluctuate and you may have a gain or loss when you sell shares. For the most current month-end performance information, please call 1-800-742-7272, or visit our Web site at www.williamblairfunds.com. From time to time, the investment adviser may waive fees or reimburse expenses for the Fund. Without these waivers/reimbursements, performance would be lower. Class N shares are available to the general public without a sales load. Class I shares are available to certain institutional investors and advisory clients of William Blair Investment Management, LLC and William Blair & Company, L.L.C., without a sales load or distribution (12b-1) or service fees.
The performance highlights and graph presented above do not reflect the deduction of taxes that a shareholder would pay on fund distributions or the redemption of fund shares.
The Russell 1000® Growth Index consists of large capitalization companies with above average price-to-book ratios and forecasted growth rates.
This report identifies the Fund’s investments on June 30, 2016. These holdings are subject to change. Not all stocks in the Fund performed the same, nor is there any guarantee that these stocks will perform as well in the future. Market forecasts provided in this report may not necessarily come to pass.
Sector Diversification (Unaudited)

The sector diversification shown is based on the total long-term securities.
| 12 | Semiannual Report | June 30, 2016 |
Large Cap Growth Fund
Portfolio of Investments, June 30, 2016 (all dollar amounts in thousands) (unaudited)
| | | | | | | |
| | | | | | | |
| Issuer | | Shares | | | Value | |
| |
| | Common Stocks | | | | | | | | |
| | | | | | | | | | |
| | Information Technology—30.5% | | | | | | | | |
| | Accenture plc† | | | 12,790 | | | $ | 1,449 | |
| * | Adobe Systems, Inc. | | | 24,650 | | | | 2,361 | |
| * | Alphabet, Inc. Class “A” | | | 4,990 | | | | 3,511 | |
| * | Alphabet, Inc. Class “C” | | | 3,206 | | | | 2,219 | |
| | Apple, Inc. | | | 33,325 | | | | 3,186 | |
| * | Facebook, Inc. | | | 25,230 | | | | 2,883 | |
| | Mastercard, Inc. | | | 26,020 | | | | 2,291 | |
| | Microsoft Corporation | | | 66,860 | | | | 3,421 | |
| * | Red Hat, Inc. | | | 25,400 | | | | 1,844 | |
| | Texas Instruments, Inc. | | | 47,360 | | | | 2,967 | |
| | | | | | | | 26,132 | |
| | Consumer Discretionary—22.7% | | | | | | | | |
| * | Amazon.com, Inc. | | | 6,180 | | | | 4,423 | |
| * | Chipotle Mexican Grill, Inc. | | | 3,620 | | | | 1,458 | |
| | Dollar General Corporation | | | 39,960 | | | | 3,756 | |
| * | O’Reilly Automotive, Inc. | | | 8,200 | | | | 2,223 | |
| | Starbucks Corporation | | | 26,450 | | | | 1,511 | |
| | The Home Depot, Inc. | | | 34,080 | | | | 4,352 | |
| | VF Corporation | | | 28,010 | | | | 1,722 | |
| | | | | | | | 19,445 | |
| | Health Care—17.3% | | | | | | | | |
| * | Biogen, Inc. | | | 8,390 | | | | 2,029 | |
| | Bristol-Myers Squibb Co. | | | 38,980 | | | | 2,867 | |
| * | Cerner Corporation | | | 44,650 | | | | 2,616 | |
| * | IDEXX Laboratories, Inc. | | | 16,140 | | | | 1,499 | |
| | UnitedHealth Group, Inc. | | | 22,520 | | | | 3,180 | |
| | Zoetis, Inc. | | | 55,180 | | | | 2,619 | |
| | | | | | | | 14,810 | |
| | Consumer Staples—9.6% | | | | | | | | |
| | Mead Johnson Nutrition Co. | | | 15,250 | | | | 1,384 | |
| * | Monster Beverage Corporation | | | 8,680 | | | | 1,395 | |
| | The Estee Lauder Cos., Inc. | | | 20,960 | | | | 1,908 | |
| | The Kroger Co. | | | 95,690 | | | | 3,520 | |
| | | | | | | | 8,207 | |
| | Industrials—9.4% | | | | | | | | |
| | Danaher Corporation | | | 11,690 | | | | 1,180 | |
| * | TransDigm Group, Inc. | | | 8,460 | | | | 2,231 | |
| | Union Pacific Corporation | | | 40,410 | | | | 3,526 | |
| * | Verisk Analytics, Inc. | | | 13,680 | | | | 1,109 | |
| | | | | | | | 8,046 | |
| | Financials—3.9% | | | | | | | | |
| * | Affiliated Managers Group, Inc. | | | 11,740 | | | | 1,653 | |
| | Moody’s Corporation | | | 17,640 | | | | 1,653 | |
| | | | | | | | 3,306 | |
| | Energy—2.0% | | | | | | | | |
| | Schlumberger, Ltd.† | | | 22,010 | | | | 1,741 | |
| | | Shares or | | | | |
| | | Principal | | | | |
| Issuer | | Amount | | | Value | |
| |
| | Common Stocks—(continued) | | | | | | | | |
| | | | | | | | | |
| | Materials—1.9% | | | | | | | | |
| | PPG Industries, Inc. | | | 15,450 | | | $ | 1,609 | |
| | | | | | | | | | |
| | Telecommunication Services—1.4% | | | | | | | | |
| * | SBA Communications Corporation | | | 11,250 | | | | 1,214 | |
| | Total Common Stocks—98.7%
(cost $70,483) | | | | | | | 84,510 | |
| |
| | Repurchase Agreement | | | | | | | | |
| | Fixed Income Clearing Corporation, 0.030% dated 6/30/16, due 7/1/16, repurchase price $922, collateralized by FFCB, 3.090%, due 8/19/25 | | | $922 | | | | 922 | |
| | | | | | | | | | |
| | Total Repurchase Agreement—1.1%
(cost $922) | | | | | | | 922 | |
| | | | | | | | | | |
| | Total Investments—99.8%
(cost $71,405) | | | | | | | 85,432 | |
| | Cash and other assets, less liabilities—0.2% | | | | | | | 141 | |
| | Net assets—100.0% | | | | | | $ | 85,573 | |
| | |
| | | |
| † = U.S. listed foreign security |
| * = Non-income producing security |
See accompanying Notes to Financial Statements.
| June 30, 2016 | William Blair Funds | 13 |
| | Mid Cap Growth Fund |
| | |
| | The Mid Cap Growth Fund seeks long-term capital appreciation. |
| | |
| | AN OVERVIEW FROM THE PORTFOLIO MANAGERS |
| | |

Daniel Crowe 
Robert C. Lanphier, IV 
David P. Ricci | The William Blair Mid Cap Growth Fund (Class N shares) posted a 0.71% decrease, net of fees, for the six months ended June 30, 2016. By comparison, the Fund’s benchmark index, the Russell Midcap® Growth Index (the “Index”), increased 2.15%. For the six month period ended June 30, 2016, the Fund underperformed the Index from a combination of style and stock-specific factors. Style factors had an overall negative impact on the Fund’s relative performance. While our typical bias toward companies with less volatile fundamentals was a benefit during the sell-off in the first six weeks of the year, this was more than offset during that time period by the negative impact from our higher growth bias and the resulting lower exposure to high dividend yielding stocks, as high dividend-yielding stocks outperformed low dividend-yielding stocks. The Fund tends to be significantly underweight such companies, instead seeking companies which have significant reinvestment opportunities that enable superior, durable long-term growth. Another style-related dynamic was the Fund’s underweight in Consumer Staples and overweight in Health Care. This exposure is driven by our bottom-up analysis which has found better growth prospects and more attractive valuations in Health Care stocks with similar levels of economic sensitivity as stocks within the Consumer Staples sector. Unfortunately, while we believe these Health Care stocks are better long-term investments, the Fund’s overweight in Health Care and underweight in Consumer Staples detracted from relative performance. From a stock specific standpoint, the top detractors from Fund performance were BorgWarner and Perrigo. BorgWarner, a global supplier of highly engineered automotive systems and components for engine and drivetrain applications, underperformed due to slowing growth and concern about its European business following the Brexit vote. Drug and nutritional product manufacturer Perrigo underperformed following turnover at its CEO post and lower forward-earnings guidance. Other top detractors from Fund performance were Signature Bank (Financials), CSRA (Information Technology) and Hanesbrands (Consumer Discretionary). Conversely, top contributors to Fund performance in the period were Dollar General and Vulcan Materials. Discount retailer Dollar General reported better-than-expected results in both the first and second quarters causing the stock to outperform. Aggregates producer Vulcan Materials outperformed after volume and pricing growth accelerated due to pent-up demand for its products. Other top contributors were Vantiv (Information Technology), Newell Brands (Consumer Discretionary) and Align Technology (Health Care). Please refer to the U.S. Growth Market Review and Outlook relating to the Fund on page 6. |
| 14 | Semiannual Report | June 30, 2016 |
Mid Cap Growth Fund
Performance Highlights (Unaudited)
Average Annual Total Return at 6/30/2016
| | | Year | | | | | | | | |
| | | to Date | | 1 Year | | 3 Year | | 5 Year | | 10 Year |
| Class N | | | (0.71 | )% | | | (5.31 | )% | | | 6.85 | % | | | 6.67 | % | | | 7.43 | % |
| Class I | | | (0.60 | ) | | | (5.06 | ) | | | 7.10 | | | | 6.96 | | | | 7.73 | |
| Russell Midcap® Growth Index | | | 2.15 | | | | (2.14 | ) | | | 10.52 | | | | 9.98 | | | | 8.12 | |
Performance cited represents past performance. Past performance does not guarantee future results and current performance may be lower or higher than the data quoted. Results shown are average annual total returns, which assume reinvestment of dividends and capital gains. Investment returns and principal will fluctuate and you may have a gain or loss when you sell shares. For the most current month-end performance information, please call 1-800-742-7272, or visit our Web site at www.williamblairfunds.com. Investing in medium capitalization companies involves special risks, including higher volatility and lower liquidity. Medium capitalization stocks are also more sensitive to purchase/sale transactions and changes in the issuer’s financial condition. From time to time, the investment adviser may waive fees or reimburse expenses for the Fund. Without these waivers/reimbursements, performance would be lower. Class N shares are available to the general public without a sales load. Class I shares are available to certain institutional investors and advisory clients of William Blair Investment Management, LLC and William Blair & Company, L.L.C., without a sales load or distribution (12b-1) or service fees.
The performance highlights and graph presented above do not reflect the deduction of taxes that a shareholder would pay on fund distributions or the redemption of fund shares.
The Russell Midcap® Growth Index is an index that is constructed to provide a comprehensive and unbiased barometer of the mid-cap growth market.
This report identifies the Fund’s investments on June 30, 2016. These holdings are subject to change. Not all stocks in the Fund performed the same, nor is there any guarantee that these stocks will perform as well in the future. Market forecasts provided in this report may not necessarily come to pass.
Sector Diversification (Unaudited)

The sector diversification shown is based on the total long-term securities.
| June 30, 2016 | William Blair Funds | 15 |
Mid Cap Growth Fund
Portfolio of Investments, June 30, 2016 (all dollar amounts in thousands) (unaudited)
| | | | | | | | |
| | | | | | | | |
| Issuer | | Shares | | | Value | |
| | | | | | | | | | |
| | Common Stocks | | | | | | | | |
| | | | | | | | | | |
| | Consumer Discretionary—21.2% | | | | | | | | |
| | BorgWarner, Inc. | | | 67,143 | | | $ | 1,982 | |
| | Brunswick Corporation | | | 28,400 | | | | 1,287 | |
| * | Chipotle Mexican Grill, Inc. | | | 3,390 | | | | 1,366 | |
| | Dollar General Corporation | | | 52,865 | | | | 4,969 | |
| | Hanesbrands, Inc. | | | 125,900 | | | | 3,164 | |
| | Newell Brands, Inc. | | | 110,000 | | | | 5,343 | |
| * | O’Reilly Automotive, Inc. | | | 11,784 | | | | 3,195 | |
| | Ross Stores, Inc. | | | 79,700 | | | | 4,518 | |
| * | Sally Beauty Holdings, Inc. | | | 58,901 | | | | 1,732 | |
| | Six Flags Entertainment Corporation | | | 42,180 | | | | 2,444 | |
| | Tractor Supply Co. | | | 24,400 | | | | 2,225 | |
| | | | | | | | | 32,225 | |
| | Information Technology—19.8% | | | | | | | | |
| * | Akamai Technologies, Inc. | | | 64,579 | | | | 3,612 | |
| | Booz Allen Hamilton Holding Corporation | | | 86,100 | | | | 2,552 | |
| * | CoStar Group, Inc. | | | 19,677 | | | | 4,303 | |
| | CSRA, Inc. | | | 99,100 | | | | 2,322 | |
| * | Genpact, Ltd.† | | | 127,052 | | | | 3,410 | |
| * | Guidewire Software, Inc. | | | 57,220 | | | | 3,534 | |
| | MAXIMUS, Inc. | | | 43,686 | | | | 2,419 | |
| * | Red Hat, Inc. | | | 47,030 | | | | 3,414 | |
| * | Vantiv, Inc. Class “A” | | | 79,824 | | | | 4,518 | |
| | | | | | | | | 30,084 | |
| | Health Care—19.2% | | | | | | | | |
| * | Align Technology, Inc. | | | 24,780 | | | | 1,996 | |
| * | BioMarin Pharmaceutical, Inc. | | | 28,731 | | | | 2,235 | |
| * | Centene Corporation | | | 57,000 | | | | 4,068 | |
| * | Cerner Corporation | | | 69,100 | | | | 4,049 | |
| | DENTSPLY SIRONA, Inc. | | | 46,459 | | | | 2,882 | |
| * | IDEXX Laboratories, Inc. | | | 21,340 | | | | 1,982 | |
| * | Mednax, Inc. | | | 75,060 | | | | 5,437 | |
| * | Mettler-Toledo International, Inc. | | | 7,520 | | | | 2,744 | |
| | Perrigo Co. plc† | | | 16,300 | | | | 1,478 | |
| | Zoetis, Inc. | | | 49,300 | | | | 2,340 | |
| | | | | | | | | 29,211 | |
| | Industrials—14.0% | | | | | | | | |
| * | Copart, Inc. | | | 31,300 | | | | 1,534 | |
| | Equifax, Inc. | | | 14,700 | | | | 1,887 | |
| * | Old Dominion Freight Line, Inc. | | | 76,586 | | | | 4,619 | |
| | Rockwell Collins, Inc. | | | 34,370 | | | | 2,926 | |
| | The Dun & Bradstreet Corporation | | | 12,300 | | | | 1,499 | |
| * | The Middleby Corporation | | | 19,670 | | | | 2,267 | |
| * | TransDigm Group, Inc. | | | 10,400 | | | | 2,742 | |
| * | Verisk Analytics, Inc. | | | 47,480 | | | | 3,850 | |
| | | | | | | | | 21,324 | |
| | | | Shares or | | | | |
| | | | Principal | | | | |
| Issuer | | Amount | | | Value | |
| | | | | | | | | | |
| | Common Stocks—(continued) | | | | | | | | |
| | | | | | | | | | |
| | Financials—8.5% | | | | | | | | |
| * | Affiliated Managers Group, Inc. | | | 15,355 | | | $ | 2,162 | |
| | Intercontinental Exchange, Inc. | | | 14,515 | | | | 3,715 | |
| * | Signature Bank | | | 29,656 | | | | 3,705 | |
| | Willis Towers Watson plc† | | | 26,590 | | | | 3,305 | |
| | | | | | | | | 12,887 | |
| | Materials—5.7% | | | | | | | | |
| * | Axalta Coating Systems, Ltd.† | | | 67,000 | | | | 1,777 | |
| | Ball Corporation | | | 48,400 | | | | 3,499 | |
| | Vulcan Materials Co. | | | 28,300 | | | | 3,406 | |
| | | | | | | | | 8,682 | |
| | Consumer Staples—5.5% | | | | | | | | |
| * | Herbalife, Ltd.† | | | 20,000 | | | | 1,170 | |
| | Mead Johnson Nutrition Co. | | | 38,300 | | | | 3,476 | |
| | Tyson Foods, Inc. | | | 56,100 | | | | 3,747 | |
| | | | | | | | | 8,393 | |
| | Telecommunication Services—2.2% | | | | | | | | |
| * | SBA Communications Corporation | | | 31,350 | | | | 3,384 | |
| | | | | | | | | | |
| | Energy—0.8% | | | | | | | | |
| * | Concho Resources, Inc. | | | 10,720 | | | | 1,279 | |
| | | | | | | | | | |
| | Total Common Stocks—96.9%
(cost $132,050) | | | | | | | 147,469 | |
| | | | | | | | | | |
| | Repurchase Agreement | | | | | | | | |
| | Fixed Income Clearing Corporation, 0.030% dated 6/30/16, due 7/1/16, repurchase price $5,673, collateralized by FFCB, 3.090%, due 8/19/25 | | $ | 5,673 | | | | 5,673 | |
| | | | | | | | | | |
| | Total Repurchase Agreement—3.7%
(cost $5,673) | | | | | | | 5,673 | |
| | | | | | | | | | |
| | Total Investments—100.6%
(cost $137,723) | | | | | | | 153,142 | |
| | | | | | | | | | |
| | Liabilities, plus cash and other assets—(0.6)% | | | | | | | (956 | ) |
| | Net assets-100.0% | | | | | | $ | 152,186 | |
* = Non-income producing security
† = U.S. listed foreign security
See accompanying Notes to Financial Statements.
| 16 | Semiannual Report | June 30, 2016 |
| | Mid Cap Value Fund |
| | |
| | The Mid Cap Value Fund seeks long-term capital appreciation. |
| | |
| | AN OVERVIEW FROM THE PORTFOLIO MANAGERS |
| | |

Chad M. Kilmer 
Mark T. Leslie 
David S. Mitchell | The William Blair Mid Cap Value Fund (Class N shares) posted a 6.15% increase, net of fees, for the six months ended June 30, 2016. By comparison, the Fund’s benchmark index, the Russell Midcap® Value Index (the “Index”), increased 8.87%. The Fund’s underperformance relative to the Index during the first half of 2016 was due to a combination of style headwinds and stock selection. Broadly speaking, from a style perspective, the Fund’s higher growth profile relative to the index was a headwind during the period as higher growth stocks underperformed slower growth stocks. In addition, investor appetite for yield drove the outperformance of high dividend-yielding stocks, which was a headwind given the Fund’s underweight to this segment relative to the Index. The Fund’s largest sector detractor from relative performance during the period was in Financials and was driven by stock selection within Real Estate Services, Property REITs, and Regional Banks. Bank stocks, such as East West Bancorp, were generally weaker after a surprisingly disappointing jobs report confirmed that the Fed would hold off on raising interest rates in the near-term. After the Brexit vote late in the second quarter, bank stocks further sold off as they further pushed out expectations for any increase in interest rates. The Materials sector was a meaningful detractor from relative performance given the Fund’s lack of exposure to Gold and Diversified Metals & Mining relative to the Index. This lack of exposure offset positive stock selection within Fertilizers & Agricultural Chemicals. The largest contributor to relative performance at the sector level was Industrials. The Fund’s outperformance within Industrials was the result of broad-based positive stock selection throughout most of the industries within the sector. Information Technology was another significant contributor to relative performance during the period, driven by strong stock selection within Application Software and Electronic Components. Looking specifically at stock selection, the Fund’s largest detractors from relative performance were Jones Lang LaSalle (Financials), H&R Block (Consumer Discretionary), and Kroger (Consumer Staples). The largest contributors to relative performance were the Fund’s investments in Ingredion (Consumer Staples), Steel Dynamics (Materials), and American Water Works (Utilities). Please refer to the U.S. Value Market Review and Outlook relating to the Fund on page 7. |
| June 30, 2016 | William Blair Funds | 17 |
Mid Cap Value Fund
Performance Highlights (Unaudited)
Average Annual Total Return at 6/30/2016
| | | Year | | | | | | | | Since |
| | | to Date | | 1 Year | | 3 Year | | 5 Year | | Inception(a) |
| Class N | | | 6.15 | % | | | 1.52 | % | | | 9.50 | % | | | 10.10 | % | | | 10.55 | % |
| Class I | | | 6.24 | | | | 1.79 | | | | 9.79 | | | | 10.38 | | | | 10.82 | |
| Russell Midcap® Value Index | | | 8.87 | | | | 3.25 | | | | 11.00 | | | | 11.70 | | | | 11.79 | |
| (a) | For the period from May 3, 2010 (Commencement of Operations) to June 30, 2016. |
Performance cited represents past performance. Past performance does not guarantee future results and current performance may be lower or higher than the data quoted. Results shown are average annual total returns, which assume reinvestment of dividends and capital gains. Investment returns and principal will fluctuate and you may have a gain or loss when you sell shares. For the most current month-end performance information, please call 1-800-742-7272, or visit our Web site at www.williamblairfunds.com. Investing in smaller and medium capitalization companies involves special risks, including higher volatility and lower liquidity. Medium capitalization stocks are also more sensitive to purchase/sale transactions and changes in the issuer’s financial condition. From time to time, the investment adviser may waive fees or reimburse expenses for the Fund. Without these waivers/reimbursements, performance would be lower. Class N shares are available to the general public without a sales load. Class I shares are available to certain institutional investors and advisory clients of William Blair Investment Management, LLC and William Blair & Company, L.L.C., without a sales load or distribution (12b-1) or service fees.
The performance highlights and graph presented above do not reflect the deduction of taxes that a shareholder would pay on fund distributions or the redemption of fund shares.
The Russell Midcap® Value Index consists of midcap-capitalization companies with below average price-to-book ratios and forecasted growth rates.
This report identifies the Fund’s investments on June 30, 2016. These holdings are subject to change. Not all stocks in the Fund performed the same, nor is there any guarantee that these stocks will perform as well in the future. Market forecasts provided in this report may not necessarily come to pass.
Sector Diversification (Unaudited)

The sector diversification shown is based on the total long-term securities.
| 18 | Semiannual Report | June 30, 2016 |
Mid Cap Value Fund
Portfolio of Investments, June 30, 2016 (all dollar amounts in thousands) (unaudited)
| | | | | | | |
| | | | | |
| Issuer | | Shares | | | Value | |
| | | | | | | | | | |
| | Common Stocks | | | | | | | | |
| | | | | | | | | | |
| | Financials—31.8% | | | | | | | | |
| | Allied World Assurance Co.Holdings, Ltd.† | | | 1,018 | | | $ | 36 | |
| | American Campus Communities, Inc. | | | 1,148 | | | | 61 | |
| | Ameriprise Financial, Inc. | | | 289 | | | | 26 | |
| * | Arch Capital Group, Ltd.† | | | 574 | | | | 41 | |
| | Assured Guaranty, Ltd.† | | | 1,148 | | | | 29 | |
| | Camden Property Trust | | | 459 | | | | 41 | |
| | DDR Corporation | | | 2,133 | | | | 39 | |
| | Douglas Emmett, Inc. | | | 1,302 | | | | 46 | |
| * | E*TRADE Financial Corporation | | | 1,154 | | | | 27 | |
| | East West Bancorp, Inc. | | | 1,197 | | | | 41 | |
| * | Equity Commonwealth | | | 875 | | | | 26 | |
| | Essex Property Trust, Inc. | | | 229 | | | | 52 | |
| | FNF Group | | | 999 | | | | 37 | |
| | General Growth Properties, Inc. | | | 1,475 | | | | 44 | |
| | Hanover Insurance Group, Inc. | | | 548 | | | | 46 | |
| | Hartford Financial Services Group, Inc. | | | 1,108 | | | | 49 | |
| | Jones Lang LaSalle, Inc. | | | 330 | | | | 32 | |
| | National Retail Properties, Inc. | | | 758 | | | | 39 | |
| | Northern Trust Corporation | | | 761 | | | | 50 | |
| | PacWest Bancorp | | | 1,006 | | | | 40 | |
| | Pebblebrook Hotel Trust | | | 680 | | | | 18 | |
| | Principal Financial Group, Inc. | | | 857 | | | | 35 | |
| | Prologis, Inc. | | | 805 | | | | 40 | |
| * | Signature Bank | | | 202 | | | | 25 | |
| | SL Green Realty Corporation | | | 344 | | | | 37 | |
| | SunTrust Banks, Inc. | | | 870 | | | | 36 | |
| * | SVB Financial Group | | | 288 | | | | 27 | |
| | Taubman Centers, Inc. | | | 387 | | | | 29 | |
| | Ventas, Inc. | | | 644 | | | | 47 | |
| | Zions Bancorporation | | | 1,235 | | | | 31 | |
| | | | | | | | | 1,127 | |
| | Utilities—11.9% | | | | | | | | |
| | American Water Works Co., Inc. | | | 657 | | | | 55 | |
| | Aqua America, Inc. | | | 1,266 | | | | 45 | |
| | Atmos Energy Corporation | | | 577 | | | | 47 | |
| | CMS Energy Corporation | | | 1,127 | | | | 52 | |
| | Eversource Energy | | | 858 | | | | 51 | |
| | Pinnacle West Capital Corporation | | | 581 | | | | 47 | |
| | WEC Energy Group, Inc. | | | 934 | | | | 61 | |
| | Xcel Energy, Inc. | | | 1,419 | | | | 64 | |
| | | | | | | | | 422 | |
| | Industrials—10.3% | | | | | | | | |
| | Carlisle Cos., Inc. | | | 385 | | | | 41 | |
| | Flowserve Corporation | | | 724 | | | | 33 | |
| | Fortune Brands Home & Security, Inc. | | | 648 | | | | 37 | |
| | Hubbell, Inc. | | | 366 | | | | 38 | |
| | Ingersoll-Rand plc† | | | 694 | | | | 44 | |
| | Kansas City Southern | | | 463 | | | | 42 | |
| | KAR Auction Services, Inc. | | | 862 | | | | 36 | |
| | The Toro Co. | | | 386 | | | | 34 | |
| | Valmont Industries, Inc. | | | 221 | | | | 30 | |
| | Wabtec Corporation | | | 425 | | | | 30 | |
| | | | | | | | | 365 | |
| | | | | | | | |
| | | | | | |
| | Issuer | | Shares | | | Value | |
| | | | | | | | | | |
| | Common Stocks—(continued) | | | | | | | | |
| | | | | | | | | | |
| | Energy—10.2% | | | | | | | | |
| | Baker Hughes, Inc. | | | 378 | | | $ | 17 | |
| | Cimarex Energy Co. | | | 316 | | | | 38 | |
| * | Gulfport Energy Corporation | | | 1,096 | | | | 34 | |
| | Hess Corporation | | | 806 | | | | 49 | |
| * | Memorial Resource Development Corporation | | | 2,274 | | | | 36 | |
| | Noble Energy, Inc. | | | 1,367 | | | | 49 | |
| | Patterson-UTI Energy, Inc. | | | 1,470 | | | | 31 | |
| | Pioneer Natural Resources Co. | | | 357 | | | | 54 | |
| * | Rice Energy, Inc. | | | 1,164 | | | | 26 | |
| | Rowan Cos. plc† | | | 1,006 | | | | 18 | |
| * | Whiting Petroleum Corporation | | | 1,018 | | | | 9 | |
| | | | | | | | | 361 | |
| | Information Technology—9.2% | | | | | | | | |
| * | Akamai Technologies, Inc. | | | 509 | | | | 29 | |
| | Belden, Inc. | | | 676 | | | | 41 | |
| * | Cadence Design Systems, Inc. | | | 2,194 | | | | 53 | |
| * | CommScope Holding Co., Inc. | | | 1,124 | | | | 35 | |
| * | Genpact, Ltd.† | | | 991 | | | | 27 | |
| | Juniper Networks, Inc. | | | 1,144 | | | | 26 | |
| * | NXP Semiconductors N.V.† | | | 500 | | | | 39 | |
| | TE Connectivity, Ltd.† | | | 672 | | | | 38 | |
| * | Trimble Navigation, Ltd. | | | 1,659 | | | | 40 | |
| | | | | | | | | 328 | |
| | Consumer Discretionary—7.9% | | | | | | | | |
| | Autoliv, Inc. | | | 297 | | | | 32 | |
| | Darden Restaurants, Inc. | | | 526 | | | | 33 | |
| | L Brands, Inc. | | | 515 | | | | 35 | |
| | Lennar Corporation | | | 806 | | | | 37 | |
| | Newell Brands, Inc. | | | 730 | | | | 36 | |
| * | The Michaels Cos., Inc. | | | 1,205 | | | | 34 | |
| | Vail Resorts, Inc. | | | 263 | | | | 36 | |
| | VF Corporation | | | 614 | | | | 38 | |
| | | | | | | | | 281 | |
| | Health Care—5.9% | | | | | | | | |
| | CIGNA Corporation | | | 216 | | | | 27 | |
| * | Hologic, Inc. | | | 1,095 | | | | 38 | |
| * | Mednax, Inc. | | | 617 | | | | 45 | |
| * | Mettler-Toledo International, Inc. | | | 126 | | | | 46 | |
| | Zimmer Biomet Holdings, Inc. | | | 439 | | | | 53 | |
| | | | | | | | | 209 | |
| | Materials—5.7% | | | | | | | | |
| | Carpenter Technology Corporation | | | 1,335 | | | | 44 | |
| | Eastman Chemical Co. | | | 780 | | | | 53 | |
| | FMC Corporation | | | 980 | | | | 45 | |
| | Steel Dynamics, Inc. | | | 2,397 | | | | 59 | |
| | | | | | | | | 201 | |
| | Consumer Staples—4.2% | | | | | | | | |
| | ConAgra Foods, Inc. | | | 947 | | | | 45 | |
| | Ingredion, Inc. | | | 422 | | | | 55 | |
| | The Kroger Co. | | | 1,380 | | | | 51 | |
| | | | | | | | | 151 | |
| | Total Common Stocks—97.1%
(cost $2,926) | | | | | | | 3,445 | |
See accompanying Notes to Financial Statements.
| June 30, 2016 | William Blair Funds | 19 |
Mid Cap Value Fund
Portfolio of Investments, June 30, 2016 (all dollar amounts in thousands) (unaudited)
| | | | | | | |
| | | Principal | | | |
| Issuer | | Amount | | | Value | |
| | | | | | | | | |
| Repurchase Agreement | | | | | | | | |
| Fixed Income Clearing Corporation, 0.030% dated 6/30/16, due 7/1/16, repurchase price $104, collateralized by FHLB, 5.500%, due 7/15/36 | | | $104 | | | $ | 104 | |
| | | | | | | | | |
Total Repurchase Agreement—2.9%
(cost $104) | | | | | | | 104 | |
| | | | | | | | | |
Total Investments—100.0%
(cost $3,030) | | | | | | | 3,549 | |
| Net assets—100.0% | | | | | | $ | 3,549 | |
† = U.S. listed foreign security
* = Non-income producing security
See accompanying Notes to Financial Statements.
| 20 | Semiannual Report | June 30, 2016 |
| | Small-Mid Cap Growth Fund |
| | |
| | The Small-Mid Cap Growth Fund seeks long-term capital appreciation. |
| | |
| | AN OVERVIEW FROM THE PORTFOLIO MANAGERS |
| | |

Karl W. Brewer 
Daniel Crowe 
Robert C. Lanphier, IV | The William Blair Small-Mid Cap Growth Fund (Class N shares) posted a 0.97% increase, net of fees, for the six months ended June 30, 2016. By comparison, the Fund’s benchmark index, the Russell 2500™ Growth Index (the “Index”), decreased 0.03%. Against this backdrop, the Fund outperformed the Index in the first six months of 2016. Style factors had an overall positive impact on the Fund’s relative performance. Our typical bias toward companies with less volatile fundamentals benefited the Fund’s relative performance as the market sold off in the first six weeks of the year and again in June. Stock selection in Health Care and an underweight to Biotechnology and Pharmaceutical companies were particularly beneficial to the Fund’s relative performance. Independent medical exam provider ExamWorks was the Fund’s strongest performing stock within Health Care for the year-to-date period. The stock was a top contributor to the Fund’s relative performance after a private equity firm acquired ExamWorks in the second quarter. Oil and natural gas company Diamondback Energy (Energy) was also a top relative contributor to the Fund’s performance due to positive results from its operations in the Permian Basin and the price of oil rebounding to nearly $50 per barrel. Other top contributors for the period were Ulta Salon, Cosmetics & Fragrances (Consumer Discretionary), First Cash Financial Services (Financials) and Vantiv (Information Technology). Detracting from the Fund’s relative performance for the period was stock selection in Information Technology (IT). Two top detractors both within the sector and for the Fund overall were j2 Global and Cvent. j2 Global, which provides communication services and manages online media properties, underperformed following a negative report released by a well-known short seller in March that criticized the company and put pressure on the stock price. Cloud-based enterprise event management platform company Cvent underperformed due to concerns surrounding a decrease in business travel and general negative sentiment towards cloud-related stocks early in the year. Other top detractors for the period were Jones Lang LaSalle (Financials), CSRA (IT) and Tyler Technologies (IT). Please refer to the U.S. Growth Market Review and Outlook relating to the Fund on page 6. |
| June 30, 2016 | William Blair Funds | 21 |
Small-Mid Cap Growth Fund
Performance Highlights (Unaudited)
| Average Annual Total Return at 6/30/2016 |
| | | Year
to Date | | 1 Year | | 3 Year | | 5 Year | | 10 Year |
| Class N | | | 0.97 | % | | | (3.15 | )% | | | 10.74 | % | | | 10.16 | % | | | 8.84 | % |
| Class I | | | 1.09 | | | | (2.90 | ) | | | 11.02 | | | | 10.42 | | | | 9.12 | |
| Russell 2500TM Growth Index | | | (0.03 | ) | | | (7.69 | ) | | | 9.06 | | | | 9.27 | | | | 7.96 | |
Performance cited represents past performance. Past performance does not guarantee future results and current performance may be lower or higher than the data quoted. Results shown are average annual total returns, which assume reinvestment of dividends and capital gains. Investment returns and principal will fluctuate and you may have a gain or loss when you sell shares. For the most current month-end performance information, please call 1-800-742-7272, or visit our Web site at www.williamblairfunds.com. Investing in smaller and medium capitalization companies involves special risks, including higher volatility and lower liquidity. Smaller and medium capitalization stocks are also more sensitive to purchase/sale transactions and changes in the issuer’s financial condition. From time to time, the investment adviser may waive fees or reimburse expenses for the Fund. Without these waivers/reimbursements, performance would be lower. Class N shares are available to the general public without a sales load. Class I shares are available to certain institutional investors and advisory clients of William Blair Investment Management, LLC and William Blair & Company, L.L.C., without a sales load or distribution (12b-1) or service fees.
The performance highlights and graph presented above do not reflect the deduction of taxes that a shareholder would pay on fund distributions or the redemption of fund shares.
The Russell 2500TM Growth Index measures the performance of those Russell 2500 companies with above average price-to-book ratios and forecasted growth rates.
This report identifies the Fund’s investments on June 30, 2016. These holdings are subject to change. Not all stocks in the Fund performed the same, nor is there any guarantee that these stocks will perform as well in the future. Market forecasts provided in this report may not necessarily come to pass.
Sector Diversification (Unaudited)

The sector diversification shown is based on the total long-term securities.
| 22 | Semiannual Report | June 30, 2016 |
Small-Mid Cap Growth Fund
Portfolio of Investments, June 30, 2016 (all dollar amounts in thousands) (unaudited)
| | | | | | | | |
| | | | | | | | |
| | Issuer | | Shares | | | Value | |
| | | | | | | | | | |
| | Common Stocks | | | | | | | | |
| | | | | | | | | | |
| | Health Care—21.0% | | | | | | | | |
| * | ABIOMED, Inc. | | | 169,758 | | | $ | 18,553 | |
| * | Akorn, Inc. | | | 356,300 | | | | 10,149 | |
| * | Align Technology, Inc. | | | 232,153 | | | | 18,700 | |
| * | Amedisys, Inc. | | | 145,600 | | | | 7,350 | |
| * | Cambrex Corporation | | | 408,850 | | | | 21,150 | |
| * | Centene Corporation | | | 367,850 | | | | 26,253 | |
| | DENTSPLY SIRONA, Inc. | | | 24,847 | | | | 1,541 | |
| * | Exact Sciences Corporation | | | 996,300 | | | | 12,205 | |
| | HealthSouth Corporation | | | 546,454 | | | | 21,213 | |
| * | IDEXX Laboratories, Inc. | | | 208,512 | | | | 19,362 | |
| * | Ligand Pharmaceuticals, Inc. | | | 259,889 | | | | 30,997 | |
| * | Mednax, Inc. | | | 397,428 | | | | 28,786 | |
| * | Mettler-Toledo International, Inc. | | | 84,040 | | | | 30,668 | |
| * | Repligen Corporation | | | 103,435 | | | | 2,830 | |
| * | Veeva Systems, Inc. | | | 457,900 | | | | 15,624 | |
| | | | | | | | | 265,381 | |
| | Information Technology—20.7% | | | | | | | | |
| * | 2U, Inc. | | | 503,995 | | | | 14,823 | |
| * | Akamai Technologies, Inc. | | | 307,300 | | | | 17,187 | |
| | Booz Allen Hamilton Holding Corporation | | | 781,548 | | | | 23,165 | |
| * | CoStar Group, Inc. | | | 151,420 | | | | 33,110 | |
| | CSRA, Inc. | | | 693,140 | | | | 16,240 | |
| * | Gartner, Inc. | | | 189,020 | | | | 18,413 | |
| * | Guidewire Software, Inc. | | | 604,014 | | | | 37,304 | |
| | j2 Global, Inc. | | | 367,725 | | | | 23,229 | |
| | MAXIMUS, Inc. | | | 494,930 | | | | 27,404 | |
| * | NeuStar, Inc. | | | 372,791 | | | | 8,764 | |
| * | Pandora Media, Inc. | | | 644,273 | | | | 8,021 | |
| * | Vantiv, Inc. Class “A” | | | 394,920 | | | | 22,353 | |
| * | WNS Holdings, Ltd.—ADR | | | 420,120 | | | | 11,343 | |
| | | | | | | | | 261,356 | |
| | Industrials—15.6% | | | | | | | | |
| | CEB, Inc. | | | 297,798 | | | | 18,368 | |
| * | Copart, Inc. | | | 262,500 | | | | 12,865 | |
| | Healthcare Services Group, Inc. | | | 463,675 | | | | 19,187 | |
| | HEICO Corporation | | | 230,600 | | | | 12,372 | |
| | Hexcel Corporation | | | 364,350 | | | | 15,172 | |
| | Manpowergroup, Inc. | | | 194,130 | | | | 12,490 | |
| * | Old Dominion Freight Line, Inc. | | | 430,081 | | | | 25,938 | |
| * | Stericycle, Inc. | | | 103,880 | | | | 10,816 | |
| | The Dun & Bradstreet Corporation | | | 114,600 | | | | 13,963 | |
| * | The Middleby Corporation | | | 170,752 | | | | 19,679 | |
| | The Toro Co. | | | 148,963 | | | | 13,139 | |
| * | TransDigm Group, Inc. | | | 87,755 | | | | 23,140 | |
| | | | | | | | | 197,129 | |
| | Consumer Discretionary—13.7% | | | | | | | | |
| | Cable One, Inc. | | | 12,500 | | | | 6,393 | |
| | DeVry Education Group, Inc. | | | 34,937 | | | | 623 | |
| * | Fiesta Restaurant Group, Inc. | | | 309,300 | | | | 6,746 | |
| * | IMAX Corporation† | | | 523,223 | | | | 15,425 | |
| * | Sally Beauty Holdings, Inc. | | | 598,490 | | | | 17,602 | |
| | ServiceMaster Global Holdings, Inc. | | | 394,228 | | | | 15,690 | |
| | Six Flags Entertainment Corporation | | | 574,696 | | | | 33,304 | |
| * | Steven Madden, Ltd. | | | 282,665 | | | | 9,661 | |
| | Tractor Supply Co. | | | 307,230 | | | | 28,013 | |
| | | | Shares/ | | | | |
| | | | Principal | | | | |
| | Issuer | | Amount | | | Value | |
| | | | | | | | | | |
| | Common Stocks—(continued) | | | | | | | | |
| | | | | | | | | | |
| | Consumer Discretionary—(continued) | | | | | | | | |
| ** | Ulta Salon Cosmetics & Fragrance, Inc. | | | 123,110 | | | $ | 29,994 | |
| * | Universal Electronics, Inc. | | | 126,534 | | | | 9,146 | |
| | | | | | | | | 172,597 | |
| | Financials—13.1% | | | | | | | | |
| * | Affiliated Managers Group, Inc. | | | 158,251 | | | | 22,277 | |
| | CBOE Holdings, Inc. | | | 389,800 | | | | 25,968 | |
| * | Colliers International Group, Inc.† | | | 226,064 | | | | 7,718 | |
| * | Encore Capital Group, Inc. | | | 407,541 | | | | 9,589 | |
| | FactSet Research Systems, Inc. | | | 96,654 | | | | 15,602 | |
| | First Cash Financial Services, Inc. | | | 310,023 | | | | 15,914 | |
| * | FirstService Corporation† | | | 493,682 | | | | 22,625 | |
| | Jones Lang LaSalle, Inc. | | | 114,511 | | | | 11,159 | |
| | OM Asset Management plc† | | | 653,928 | | | | 8,730 | |
| * | Signature Bank | | | 138,630 | | | | 17,318 | |
| | Virtu Financial, Inc. | | | 428,122 | | | | 7,706 | |
| | | | | | | | | 164,606 | |
| | Materials—4.7% | | | | | | | | |
| * | Axalta Coating Systems, Ltd.† | | | 551,000 | | | | 14,618 | |
| | Ball Corporation | | | 233,730 | | | | 16,896 | |
| | Celanese Corporation | | | 244,170 | | | | 15,981 | |
| | Martin Marietta Materials, Inc. | | | 62,600 | | | | 12,019 | |
| | | | | | | | | 59,514 | |
| | Consumer Staples—4.5% | | | | | | | | |
| * | Herbalife, Ltd.† | | | 214,200 | | | | 12,537 | |
| | Nu Skin Enterprises, Inc. | | | 324,264 | | | | 14,978 | |
| * | Sprouts Farmers Market, Inc. | | | 499,200 | | | | 11,432 | |
| | WD-40 Co. | | | 148,090 | | | | 17,393 | |
| | | | | | | | | 56,340 | |
| | Energy—2.2% | | | | | | | | |
| * | Carrizo Oil & Gas, Inc. | | | 259,250 | | | | 9,294 | |
| * | Diamondback Energy, Inc. | | | 198,210 | | | | 18,079 | |
| | | | | | | | | 27,373 | |
| | Telecommunication Services—1.9% | | | | | | | | |
| * | SBA Communications Corporation | | | 227,200 | | | | 24,524 | |
| | | | | | | | | | |
| | Total Common Stocks—97.4%
(cost $1,073,248) | | | | | | | 1,228,820 | |
| | |
| | Repurchase Agreement | | | | | | | | |
| | Fixed Income Clearing Corporation, 0.030% dated 6/30/16, due 7/1/16, repurchase price $26,223, collateralized by U.S. Treasury Note, 2.000%, due 8/15/25 | | | $26,223 | | | $ | 26,223 | |
| | | | | | | | | | |
| | Total Repurchase Agreement—2.1%
(cost $26,223) | | | | | | | 26,223 | |
| | | | | | | | | | |
| | Total Investments—99.5%
(cost $1,099,471) | | | | | | | 1,255,043 | |
| | | | | | | | | | |
| | Cash and other assets, less liabilities—0.5% | | | | | | | 5,826 | |
| | Net assets—100.0% | | | | | | $ | 1,260,869 | |
ADR = American Depository Receipt
* = Non-income producing security
† = U.S. listed foreign security
See accompanying Notes to Financial Statements.
| June 30, 2016 | William Blair Funds | 23 |
| | Small-Mid Cap Value Fund |
| | |
| | The Small-Mid Cap Value Fund seeks long-term capital appreciation. |
| | |
| | AN OVERVIEW FROM THE PORTFOLIO MANAGERS |
| | |

Chad M. Kilmer 
Mark T. Leslie 
David S. Mitchell | The William Blair Small-Mid Cap Value Fund (Class N shares) posted a 6.14% increase, net of fees, for the six months ended June 30, 2016. By comparison, the Fund’s benchmark index, the Russell 2500™ Value Index (the “Index”), increased 7.84%. The Fund’s underperformance relative to the Index during the first half of 2016 was due to a combination of style headwinds and stock selection. Broadly speaking, from a style perspective, the Fund’s higher growth profile was a headwind during the period as higher growth stocks underperformed slower growth stocks. In addition, investor appetite for yield drove the outperformance of high dividend-yielding stocks, which was a headwind given the Fund’s underweight to this segment relative to the Index. The Fund’s largest sector detractor from performance during the period was within Financials and was driven by stock selection within REITs, Regional Banks, and Real Estate Management & Development. Bank stocks, such as Bank of the Ozarks, were generally weaker after a surprisingly disappointing jobs report confirmed that the Fed would hold off on raising interest rates in the near-term. After the Brexit vote late in the second quarter bank stocks further sold off as they further pushed out expectations for any increase in interest rates. The Materials sector was a meaningful detractor from the Fund’s relative performance given the Fund’s lack of exposure to Gold and Diversified Metals & Mining relative to the Index. This lack of exposure offset positive stock selection within Fertilizers & Agricultural Chemicals. Notable stock level detractors from relative performance included Integer (Health Care) and J2 Global (Information Technology). The largest contributor to relative performance at the sector level was Information Technology. The Fund’s outperformance within Information Technology was the result of broad-based positive stock selection throughout most of the industries within the sector. The Consumer Discretionary sector was another significant contributor to the Fund’s relative performance during the period. Strong stock selection within Apparel Retail and Restaurants, helped by the announced acquisition of portfolio holding Krispy Kreme Doughnuts in the second quarter, drove the Fund’s relative outperformance within the sector. Other notable positive contributors to the Fund’s relative performance included Children’s Place (Consumer Discretionary) and Southwest Gas (Utilities). Please refer to the U.S. Value Market Review and Outlook relating to the Fund on page 7. |
| 24 | Semiannual Report | June 30, 2016 |
Small-Mid Cap Value Fund
Performance Highlights (Unaudited)
| Average Annual Total Return at 6/30/2016 |
| | | Year
to Date | | 1 Year | | 3 Year | | Since
Inception(a) |
| Class N | | | 6.14 | % | | | 0.89 | % | | | 7.90 | % | | | 12.61 | % |
| Class I | | | 6.30 | | | | 1.19 | | | | 8.21 | | | | 12.92 | |
| Russell 2500TM Value Index | | | 7.84 | | | | 0.22 | | | | 8.14 | | | | 13.92 | |
| (a) | For the period from December 15, 2011 (Commencement of Operations) to June 30, 2016. |
Performance cited represents past performance. Past performance does not guarantee future results and current performance may be lower or higher than the data quoted. Results shown are average annual total returns, which assume reinvestment of dividends and capital gains. Investment returns and principal will fluctuate and you may have a gain or loss when you sell shares. For the most current month-end performance information, please call 1-800-742-7272, or visit our Web site at www.williamblairfunds.com. Investing in smaller and medium capitalization companies involves special risks, including higher volatility and lower liquidity. Smaller and medium capitalization stocks are also more sensitive to purchase/sale transactions and changes in the issuer’s financial condition. From time to time, the investment adviser may waive fees or reimburse expenses for the Fund. Without these waivers/reimbursements, performance would be lower. Class N shares are available to the general public without a sales load. Class I shares are available to certain institutional investors and advisory clients of William Blair Investment Management, LLC and William Blair & Company, L.L.C., without a sales load or distribution (12b-1) or service fees.
The performance highlights and graph presented above do not reflect the deduction of taxes that a shareholder would pay on fund distributions or the redemption of fund shares.
Russell 2500TM Value Index consists of midcap-capitalization companies with below average price-to-book ratios and forecasted growth rates.
This report identifies the Fund’s investments on June 30, 2016. These holdings are subject to change. Not all stocks in the Fund performed the same, nor is there any guarantee that these stocks will perform as well in the future. Market forecasts provided in this report may not necessarily come to pass.
Sector Diversification (Unaudited)
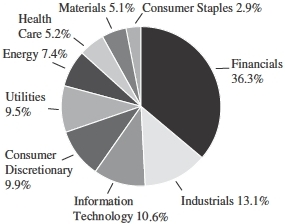
The sector diversification shown is based on the total long-term securities.
| June 30, 2016 | William Blair Funds | 25 |
Small-Mid Cap Value Fund
Portfolio of Investments, June 30, 2016 (all dollar amounts in thousands) (unaudited)
| | | | | | | | |
| | | | | | | | |
| | Issuer | | Shares | | | Value | |
| | | | | | | | | | |
| | Common Stocks | | | | | | | | |
| | | | | | | | | | |
| | Financials—35.8% | | | | | | | | |
| | Acadia Realty Trust | | | 1,054 | | | $ | 38 | |
| | Allied World Assurance Co. Holdings, Ltd.† . | | | 1,195 | | | | 42 | |
| | American Assets Trust, Inc. | | | 992 | | | | 42 | |
| | American Campus Communities, Inc. | | | 921 | | | | 49 | |
| * | Arch Capital Group, Ltd.† | | | 775 | | | | 56 | |
| | Assured Guaranty, Ltd.† | | | 1,430 | | | | 36 | |
| | Bank of the Ozarks, Inc. | | | 821 | | | | 31 | |
| | Boston Private Financial Holdings, Inc. | | | 1,320 | | | | 16 | |
| | Camden Property Trust | | | 680 | | | | 60 | |
| | Care Capital Properties, Inc. | | | 1,199 | | | | 31 | |
| | CNO Financial Group, Inc. | | | 2,352 | | | | 41 | |
| | CVB Financial Corporation | | | 1,039 | | | | 17 | |
| | DDR Corporation | | | 1,939 | | | | 35 | |
| | Douglas Emmett, Inc. | | | 1,553 | | | | 55 | |
| * | E*TRADE Financial Corporation | | | 1,839 | | | | 43 | |
| | East West Bancorp, Inc. | | | 1,264 | | | | 43 | |
| | Education Realty Trust, Inc. | | | 919 | | | | 42 | |
| | EPR Properties | | | 548 | | | | 44 | |
| * | Equity Commonwealth | | | 1,068 | | | | 31 | |
| | Equity One, Inc. | | | 1,018 | | | | 33 | |
| | First American Financial Corporation | | | 1,125 | | | | 45 | |
| | Glacier Bancorp, Inc. | | | 1,536 | | | | 41 | |
| | Hanover Insurance Group, Inc. | | | 614 | | | | 52 | |
| | Highwoods Properties, Inc. | | | 694 | | | | 37 | |
| | Home BancShares, Inc. | | | 1,480 | | | | 29 | |
| | Iberiabank Corporation | | | 600 | | | | 36 | |
| | Jones Lang LaSalle, Inc. | | | 333 | | | | 33 | |
| | National Retail Properties, Inc. | | | 722 | | | | 37 | |
| | PacWest Bancorp | | | 1,029 | | | | 41 | |
| | Pebblebrook Hotel Trust | | | 1,008 | | | | 27 | |
| | Prosperity Bancshares, Inc. | | | 733 | | | | 37 | |
| | Radian Group, Inc. | | | 3,215 | | | | 34 | |
| | Renasant Corporation | | | 860 | | | | 28 | |
| | Selective Insurance Group, Inc. | | | 1,223 | | | | 47 | |
| * | Signature Bank | | | 267 | | | | 33 | |
| | Sunstone Hotel Investors, Inc. | | | 2,297 | | | | 28 | |
| * | SVB Financial Group | | | 270 | | | | 26 | |
| | Taubman Centers, Inc. | | | 535 | | | | 40 | |
| | Umpqua Holdings Corporation | | | 1,991 | | | | 31 | |
| * | Western Alliance Bancorp | | | 894 | | | | 29 | |
| | WSFS Financial Corporation | | | 1,287 | | | | 41 | |
| | Yadkin Financial Corporation | | | 1,007 | | | | 25 | |
| | Zions Bancorporation | | | 1,569 | | | | 39 | |
| | | | | | | | | 1,601 | |
| | Industrials—13.0% | | | | | | | | |
| | Carlisle Cos., Inc. | | | 425 | | | | 45 | |
| | CIRCOR International, Inc. | | | 459 | | | | 26 | |
| | Curtiss-Wright Corporation | | | 455 | | | | 38 | |
| | EMCOR Group, Inc. | | | 800 | | | | 40 | |
| | Flowserve Corporation | | | 582 | | | | 26 | |
| | Fortune Brands Home & Security, Inc. | | | 641 | | | | 37 | |
| * | FTI Consulting, Inc. | | | 668 | | | | 27 | |
| | G&K Services, Inc. | | | 436 | | | | 34 | |
| | | | | | | | |
| | | | | | | | |
| | Issuer | | Shares | | | Value | |
| | | | | | | | | | |
| | Common Stocks—(continued) | | | | | | | | |
| | | | | | | | | | |
| | Industrials—(continued) | | | | | | | | |
| | Hubbell, Inc. | | | 400 | | | $ | 42 | |
| | Interface, Inc. | | | 1,913 | | | | 29 | |
| | KAR Auction Services, Inc. | | | 1,134 | | | | 47 | |
| * | Lydall, Inc. | | | 696 | | | | 27 | |
| | Matson, Inc. | | | 869 | | | | 28 | |
| | Standex International Corporation | | | 319 | | | | 27 | |
| | The Toro Co. | | | 468 | | | | 41 | |
| | Valmont Industries, Inc. | | | 223 | | | | 30 | |
| | Wabtec Corporation | | | 509 | | | | 36 | |
| | | | | | | | | 580 | |
| | | | | | | | | | |
| | Information Technology—10.5% | | | | | | | | |
| * | Acxiom Corporation | | | 2,830 | | | | 62 | |
| | ADTRAN, Inc. | | | 1,050 | | | | 20 | |
| | Belden, Inc. | | | 875 | | | | 53 | |
| | Booz Allen Hamilton Holding Corporation | | | 1,443 | | | | 43 | |
| * | Cadence Design Systems, Inc. | | | 2,796 | | | | 68 | |
| * | CommScope Holding Co., Inc. | | | 1,107 | | | | 34 | |
| * | Genpact, Ltd.† | | | 1,475 | | | | 40 | |
| * | Inphi Corporation | | | 1,685 | | | | 54 | |
| | Intersil Corporation | | | 1,841 | | | | 25 | |
| | j2 Global, Inc. | | | 779 | | | | 49 | |
| | Littelfuse, Inc. | | | 174 | | | | 20 | |
| | | | | | | | | 468 | |
| | Consumer Discretionary—9.8% | | | | | | | | |
| | Autoliv, Inc. | | | 268 | | | | 29 | |
| | Children’s Place, Inc. | | | 503 | | | | 40 | |
| | Churchill Downs, Inc. | | | 141 | | | | 18 | |
| | Dana Holding Corporation | | | 1,965 | | | | 21 | |
| | Darden Restaurants, Inc. | | | 456 | | | | 29 | |
| * | Dave & Buster’s Entertainment, Inc. | | | 604 | | | | 28 | |
| | Ethan Allen Interiors, Inc. | | | 690 | | | | 23 | |
| * | Express, Inc. | | | 1,961 | | | | 28 | |
| * | Genesco, Inc. | | | 413 | | | | 27 | |
| * | Krispy Kreme Doughnuts, Inc. | | | 1,461 | | | | 31 | |
| | Lennar Corporation | | | 787 | | | | 36 | |
| | Meredith Corporation | | | 697 | | | | 36 | |
| * | The Michaels Cos., Inc. | | | 1,018 | | | | 29 | |
| | Vail Resorts, Inc. | | | 257 | | | | 35 | |
| | Wolverine World Wide, Inc. | | | 1,379 | | | | 28 | |
| | | | | | | | | 438 | |
| | | | | | | | | | |
| | Utilities—9.4% | | | | | | | | |
| | American Water Works Co., Inc. | | | 527 | | | | 45 | |
| | Aqua America, Inc. | | | 1,397 | | | | 50 | |
| | Atmos Energy Corporation | | | 664 | | | | 54 | |
| | CMS Energy Corporation | | | 952 | | | | 44 | |
| | IDACORP, Inc. | | | 550 | | | | 45 | |
| | Pinnacle West Capital Corporation | | | 566 | | | | 46 | |
| | PNM Resources, Inc. | | | 918 | | | | 32 | |
| | Portland General Electric Co. | | | 739 | | | | 33 | |
| | Southwest Gas Corporation | | | 450 | | | | 35 | |
| | Spire, Inc. | | | 515 | | | | 36 | |
| | | | | | | | | 420 | |
See accompanying Notes to Financial Statements.
| 26 | Semiannual Report | June 30, 2016 |
Small-Mid Cap Value Fund
Portfolio of Investments, June 30, 2016 (all dollar amounts in thousands) (unaudited)
| | | | | | | | |
| | | | | | | | |
| | Issuer | | Shares | | | Value | |
| | |
| | Common Stocks—(continued) | | | | | | | | |
| | | | | | | | | | |
| | Energy—7.3% | | | | | | | | |
| * | Exterran Corporation | | | 575 | | | $ | 7 | |
| * | Gulfport Energy Corporation | | | 1,768 | | | | 55 | |
| * | Helix Energy Solutions Group, Inc. | | | 2,851 | | | | 19 | |
| * | Memorial Resource Development Corporation | | | 2,446 | | | | 39 | |
| * | Parsley Energy, Inc. | | | 1,992 | | | | 54 | |
| | Patterson-UTI Energy, Inc. | | | 1,055 | | | | 23 | |
| * | PDC Energy, Inc. | | | 892 | | | | 51 | |
| * | Rice Energy, Inc. | | | 1,474 | | | | 33 | |
| * | TETRA Technologies, Inc. | | | 4,167 | | | | 27 | |
| * | Whiting Petroleum Corporation | | | 2,286 | | | | 21 | |
| | | | | | | | | 329 | |
| | Health Care—5.1% | | | | | | | | |
| | CONMED Corporation | | | 525 | | | | 25 | |
| | HealthSouth Corporation | | | 967 | | | | 37 | |
| * | Hologic, Inc. | | | 664 | | | | 23 | |
| * | Integer Holdings Corporation | | | 655 | | | | 20 | |
| * | Magellan Health, Inc. | | | 361 | | | | 24 | |
| * | Mednax, Inc. | | | 673 | | | | 49 | |
| * | Mettler-Toledo International, Inc. | | | 137 | | | | 50 | |
| | | | | | | | | 228 | |
| | Materials—5.1% | | | | | | | | |
| | Carpenter Technology Corporation | | | 673 | | | | 22 | |
| | FMC Corporation | | | 528 | | | | 24 | |
| | Minerals Technologies, Inc. | | | 642 | | | | 36 | |
| | PolyOne Corporation | | | 1,328 | | | | 47 | |
| | Sensient Technologies Corporation | | | 518 | | | | 37 | |
| | Silgan Holdings, Inc. | | | 452 | | | | 23 | |
| | Steel Dynamics, Inc. | | | 1,530 | | | | 38 | |
| | | | | | | | | 227 | |
| | Consumer Staples—2.9% | | | | | | | | |
| * | Darling Ingredients, Inc. | | | 1,331 | | | | 20 | |
| | Ingredion, Inc. | | | 576 | | | | 75 | |
| | J&J Snack Foods Corporation | | | 295 | | | | 35 | |
| | | | | | | | | 130 | |
| | Total Common Stocks—98.9%
(cost $3,818) | | | | | | | 4,421 | |
| | | | | | | | |
| | | | Principal | | | | |
| | Issuer | | Amount | | | Value | |
| | | | | | | | | | |
| | Repurchase Agreement | | | | | | | | |
| | State Street Bank and Trust Company, 0.030% dated 6/30/16, due 7/1/16, repurchase price $112, collateralized by U.S. Treasury Note, 2.125%, due 9/30/21 | | | $112 | | | $ | 112 | |
| | | | | | | | | | |
| | Total Repurchase Agreement—2.5%
(cost $112) | | | | | | | 112 | |
| | | | | | | | | | |
| | Total Investments—101.4%
(cost $3,930) | | | | | | | 4,533 | |
| | | | | | | | | | |
| | Liabilities, plus cash and other assets—(1.4)% | | | | | | | (61 | ) |
| | Net assets—100.0% | | | | | | $ | 4,472 | |
† = U.S. listed foreign security
* = Non-income producing security
See accompanying Notes to Financial Statements.
| June 30, 2016 | William Blair Funds | 27 |
| | Small Cap Growth Fund |
| | |
| | The Small Cap Growth Fund seeks long-term capital appreciation. |
| | |
| | AN OVERVIEW FROM THE PORTFOLIO MANAGERS |
| | |

Michael P. Balkin  Karl W. Brewer | The William Blair Small Cap Growth Fund (Class N shares) posted a 3.92% increase, net of fees, for the six months ended June 30, 2016. By comparison, the Fund’s benchmark index, the Russell 2000® Growth Index (the “Index”), decreased 1.59%. Against this backdrop, the Fund significantly outperformed the Index in the first six months of 2016. The most notable contribution to the Fund’s relative performance came in the Health Care sector. Within Health Care, the Fund’s style-driven underweight to Biotechnology and Pharmaceuticals added significant value – mostly during the first two months of the year – as the industry group corrected after a multi-year period of outperformance. From a stock selection perspective, independent medical exam provider ExamWorks was the largest contributor to the Fund’s relative performance within the Health Care sector after a private equity firm acquired ExamWorks in the second quarter. Universal Electronics, a developer and manufacturer of remote control devices and software, was the top individual stock contributor to the Fund’s relative performance during the period. The stock outperformed after the company announced an agreement with Comcast that implied a meaningful expansion of the business relationship between the two companies, including Comcast’s use of Universal’s voice-enabled remote. Other top relative contributors were Xactly (Information Technology), ORBCOMM (Telecommunication Services) and First Cash Financial Services (Financials). Conversely, the top relative detracting stocks during the period were Information Technology companies Hortonworks and j2 Global. Data management platform provider Hortonworks underperformed due to a dilutive secondary offering and signs that the company’s Hadoop platform could see pricing pressure in the near future. j2 Global, which provides communication services and manages online media properties, underperformed following a negative report released by a well-known short seller in March that criticized the company and put pressure on the stock price. Other top detractors were AtriCure (Health Care), Akorn (Health Care) and Fiesta Restaurant Group (Consumer Discretionary). Please refer to the U.S. Growth Market Review and Outlook relating to the Fund on page 6. |
| 28 | Semiannual Report | June 30, 2016 |
Small Cap Growth Fund
Performance Highlights (Unaudited)
| Average Annual Total Return at 6/30/2016 |
| | | Year | | | | | | | | |
| | | to Date | | 1 Year | | 3 Year | | 5 Year | | 10 Year |
| Class N | | | 3.92 | % | | | (3.86 | )% | | | 7.98 | % | | | 9.48 | % | | | 5.82 | % |
| Class I | | | 4.05 | | | | (3.60 | ) | | | 8.23 | | | | 9.75 | | | | 6.11 | |
| Russell 2000® Growth Index | | | (1.59 | ) | | | (10.75 | ) | | | 7.74 | | | | 8.51 | | | | 7.14 | |
Performance cited represents past performance. Past performance does not guarantee future results and current performance may be lower or higher than the data quoted. Results shown are average annual total returns, which assume reinvestment of dividends and capital gains. Investment returns and principal will fluctuate and you may have a gain or loss when you sell shares. For the most current month-end performance information, please call 1-800-742-7272, or visit our Web site at www.williamblairfunds.com. Investing in smaller companies involves special risks, including higher volatility and lower liquidity. Smaller capitalization stocks are also more sensitive to purchase/sale transactions and changes in the issuer’s financial condition. From time to time, the investment adviser may waive fees or reimburse expenses for the Fund. Without these waivers/reimbursements, performance would be lower. Class N shares are available to the general public without a sales load. Class I shares are available to certain institutional investors and advisory clients of William Blair Investment Management, LLC and William Blair & Company, L.L.C., without a sales load or distribution (12b-1) or service fees.
The performance highlights and graph presented above do not reflect the deduction of taxes that a shareholder would pay on fund distributions or the redemption of fund shares.
The Russell 2000® Growth Index is an unmanaged composite of the smallest 2000 stocks of the Russell 3000® Growth Index.
This report identifies the Fund’s investments on June 30, 2016. These holdings are subject to change. Not all stocks in the Fund performed the same, nor is there any guarantee that these stocks will perform as well in the future. Market forecasts provided in this report may not necessarily come to pass.
Sector Diversification (Unaudited)

The sector diversification shown is based on the total long-term securities.
| June 30, 2016 | William Blair Funds | 29 |
Small Cap Growth Fund
Portfolio of Investments, June 30, 2016 (all dollar amounts in thousands) (unaudited)
| | | | | | | | |
| | | | | | |
| | Issuer | | Shares | | | Value | |
| | | | | | | | | | |
| | Common Stocks | | | | | | | | |
| | | | | | | | | | |
| | Information Technology—23.8% | | | | | | | | |
| * | 2U, Inc. | | | 157,520 | | | $ | 4,633 | |
| * | Acxiom Corporation | | | 257,850 | | | | 5,670 | |
| * | Callidus Software, Inc. | | | 237,467 | | | | 4,745 | |
| | CSRA, Inc. | | | 140,600 | | | | 3,294 | |
| * | Envestnet, Inc. | | | 96,290 | | | | 3,207 | |
| * | Guidewire Software, Inc. | | | 89,626 | | | | 5,535 | |
| * | Inphi Corporation | | | 124,410 | | | | 3,985 | |
| | j2 Global, Inc. | | | 134,691 | | | | 8,509 | |
| | MAXIMUS, Inc. | | | 60,890 | | | | 3,372 | |
| * | MaxLinear, Inc. | | | 280,641 | | | | 5,046 | |
| * | NeuStar, Inc. | | | 158,958 | | | | 3,737 | |
| * | OSI Systems, Inc. | | | 70,590 | | | | 4,103 | |
| * | Pandora Media, Inc. | | | 347,150 | | | | 4,322 | |
| * | Q2 Holdings, Inc. | | | 192,230 | | | | 5,386 | |
| * | RealPage, Inc. | | | 159,390 | | | | 3,559 | |
| * | Ultimate Software Group, Inc. | | | 24,302 | | | | 5,111 | |
| * | USA Technologies, Inc. | | | 1,283,150 | | | | 5,479 | |
| * | WNS Holdings, Ltd.—ADR | | | 173,234 | | | | 4,677 | |
| * | Xactly Corporation | | | 207,180 | | | | 2,654 | |
| | | | | | | | | 87,024 | |
| | Health Care—18.0% | | | | | | | | |
| * | ABIOMED, Inc. | | | 35,360 | | | | 3,864 | |
| * | Accelerate Diagnostics, Inc. | | | 258,889 | | | | 3,725 | |
| * | Air Methods Corporation | | | 146,820 | | | | 5,261 | |
| * | Akorn, Inc. | | | 122,750 | | | | 3,496 | |
| * | Amedisys, Inc. | | | 53,745 | | | | 2,713 | |
| * | AtriCure, Inc. | | | 226,483 | | | | 3,200 | |
| * | Cambrex Corporation | | | 101,615 | | | | 5,257 | |
| * | Exact Sciences Corporation | | | 373,520 | | | | 4,576 | |
| * | Glaukos Corporation | | | 76,379 | | | | 2,227 | |
| | HealthSouth Corporation | | | 124,745 | | | | 4,843 | |
| | LeMaitre Vascular, Inc. | | | 245,425 | | | | 3,502 | |
| * | Ligand Pharmaceuticals, Inc. | | | 64,030 | | | | 7,637 | |
| * | NxStage Medical, Inc. | | | 306,056 | | | | 6,635 | |
| * | Repligen Corporation | | | 191,070 | | | | 5,228 | |
| * | Veeva Systems, Inc. | | | 105,180 | | | | 3,589 | |
| | | | | | | | | 65,753 | |
| | Industrials—16.1% | | | | | | | | |
| | Albany International Corporation | | | 44,820 | | | | 1,790 | |
| | CEB, Inc. | | | 42,100 | | | | 2,597 | |
| | ESCO Technologies, Inc. | | | 121,230 | | | | 4,842 | |
| * | Franklin Covey Co. | | | 307,079 | | | | 4,707 | |
| * | GP Strategies Corporation | | | 190,258 | | | | 4,127 | |
| | Healthcare Services Group, Inc. | | | 166,620 | | | | 6,895 | |
| | HEICO Corporation | | | 105,580 | | | | 5,664 | |
| * | Hudson Technologies, Inc. | | | 1,854,894 | | | | 6,678 | |
| * | ICF International, Inc. | | | 110,381 | | | | 4,514 | |
| | John Bean Technologies Corporation | | | 87,125 | | | | 5,334 | |
| * | Mercury Systems, Inc. | | | 255,680 | | | | 6,356 | |
| * | NV5 Global, Inc. | | | 82,062 | | | | 2,334 | |
| | The Dun & Bradstreet Corporation | | | 25,070 | | | | 3,054 | |
| | | | | | | | | 58,892 | |
| | | | | | | | |
| | | | | | | | |
| | Issuer | | Shares | | | Value | |
| | |
| | Common Stocks—(continued) | | | | | | | | |
| | | | | | | | | | |
| | Consumer Discretionary—15.0% | | | | | | | | |
| | Cable One, Inc. | | | 7,910 | | | $ | 4,045 | |
| | Collectors Universe, Inc. | | | 174,586 | | | | 3,448 | |
| | DeVry Education Group, Inc. | | | 12,018 | | | | 214 | |
| * | Fiesta Restaurant Group, Inc. | | | 115,210 | | | | 2,513 | |
| * | Gentherm, Inc. | | | 155,880 | | | | 5,339 | |
| * | IMAX Corporation† | | | 173,877 | | | | 5,126 | |
| | Lithia Motors, Inc. | | | 40,970 | | | | 2,912 | |
| * | Mattress Firm Holding Corporation | | | 36,450 | | | | 1,223 | |
| | Nutrisystem, Inc. | | | 220,730 | | | | 5,598 | |
| | Six Flags Entertainment Corporation | | | 147,522 | | | | 8,549 | |
| * | Steven Madden, Ltd. | | | 115,550 | | | | 3,949 | |
| * | U.S. Auto Parts Network, Inc. | | | 1,288,211 | | | | 5,088 | |
| * | Universal Electronics, Inc. | | | 92,972 | | | | 6,720 | |
| | | | | | | | | 54,724 | |
| | Financials—9.3% | | | | | | | | |
| | B. Riley Financial, Inc. | | | 271,254 | | | | 2,599 | |
| * | BofI Holding, Inc. | | | 89,800 | | | | 1,590 | |
| * | Colliers International Group, Inc. † | | | 70,723 | | | | 2,415 | |
| * | Cowen Group, Inc. | | | 903,164 | | | | 2,673 | |
| * | Encore Capital Group, Inc. | | | 77,436 | | | | 1,822 | |
| | First Cash Financial Services, Inc. | | | 149,576 | | | | 7,678 | |
| * | FirstService Corporation† | | | 98,979 | | | | 4,536 | |
| | OM Asset Management plc† | | | 369,557 | | | | 4,934 | |
| | Virtu Financial, Inc. | | | 318,962 | | | | 5,741 | |
| | | | | | | | | 33,988 | |
| | Consumer Staples—4.2% | | | | | | | | |
| * | Amplify Snack Brands, Inc. | | | 143,458 | | | | 2,116 | |
| * | Herbalife, Ltd.† | | | 26,300 | | | | 1,539 | |
| | Nu Skin Enterprises, Inc. | | | 107,785 | | | | 4,979 | |
| * | Sprouts Farmers Market, Inc. | | | 142,610 | | | | 3,266 | |
| | WD-40 Co. | | | 28,961 | | | | 3,401 | |
| | | | | | | | | 15,301 | |
| | Materials—3.0% | | | | | | | | |
| * | Codexis, Inc. | | | 371,180 | | | | 1,496 | |
| * | Headwaters, Inc. | | | 227,422 | | | | 4,080 | |
| * | Stillwater Mining Co. | | | 461,237 | | | | 5,470 | |
| | | | | | | | | 11,046 | |
| | Energy—2.2% | | | | | | | | |
| * | Carrizo Oil & Gas, Inc. | | | 73,763 | | | | 2,644 | |
| * | Gulfport Energy Corporation | | | 61,507 | | | | 1,923 | |
| * | Hornbeck Offshore Services, Inc. | | | 109,710 | | | | 915 | |
| * | Parsley Energy, Inc. | | | 90,630 | | | | 2,453 | |
| | | | | | | | | 7,935 | |
| | Telecommunication Services—1.8% | | | | | | | | |
| * | ORBCOMM, Inc. | | | 638,922 | | | | 6,357 | |
| | | | | | | | | | |
| | Total Common Stocks—93.4%
(cost $286,745) | | | | | | | 341,020 | |
| | |
| | Exchange-Traded Fund | | | | | | | | |
| | iShares Russell 2000 Growth Index Fund | | | 55,210 | | | | 7,574 | |
| | | | | | | | | | |
| | Total Exchange-Traded Fund—2.1%
(cost $6,665) | | | | | | | 7,574 | |
See accompanying Notes to Financial Statements.
| 30 | Semiannual Report | June 30, 2016 |
Small Cap Growth Fund
Portfolio of Investments, June 30, 2016 (all dollar amounts in thousands) (unaudited)
| | | | | | | | |
| | | | Principal | | | | |
| | Issuer | | Amount | | | Value | |
| | | | | | | | |
| | Repurchase Agreement | | | | | | |
| | Fixed Income Clearing Corporation, 0.030% dated 6/30/16, due 7/1/16, repurchase price $10,008, collateralized by FFCB, 3.020%, due 1/12/26 | | | $10,008 | | | $ | 10,008 | |
| | | | | | | | | | |
| | Total Repurchase Agreement—2.7%
(cost $10,008) | | | | | | | 10,008 | |
| | | | | | | | | | |
| | Total Investments—98.2%
(cost $303,418) | | | | | | | 358,602 | |
| | Cash and other assets, less liabilities—-1.8% | | | | | | | 6,585 | |
| | Net assets—100.0% | | | | | | $ | 365,187 | |
ADR = American Depository Receipt
* = Non-income producing security
† = U.S. listed foreign security
If a fund’s portfolio holdings represent ownership of 5% or more of the voting securities of a company, the company is deemed to be an affiliate as defined in the Investment Company Act of 1940, as amended. The Fund had the following transactions during the period ended June 30, 2016 with companies deemed affiliated during the period or at June 30, 2016.
| | | | Share Activity | | Period Ended June 30, 2016 |
| | Security Name | | Balance
12/31/2015 | | Purchases | | Sales | | Balance
6/30/2016 | | Value | | Dividend
Income | | Net realized
gain (loss) | | Change in net
unrealized
appreciation
(depreciation) |
| ᴫ | Hudson Technologies, Inc. | | | 1,681,784 | | | | 173,110 | | | | — | | | | 1,854,894 | | | | $ | 6,678 | | | | $ | — | | | | $ | — | | | | $ | 1,079 | |
| | | | | | | | | | | | | | | | | | | | | $ | 6,678 | | | | $ | — | | | | $ | — | | | | $ | 1,079 | |
ᴫ = Affiliated company at June 30, 2016. The Fund’s total value in companies deemed to be affiliated at June 30, 2016 was $6,678.
See accompanying Notes to Financial Statements.
| June 30, 2016 | William Blair Funds | 31 |
| | Small Cap Value Fund |
| | |
| | The Small Cap Value Fund seeks long-term capital appreciation. |
| | |
| | AN OVERVIEW FROM THE PORTFOLIO MANAGERS |
| | |
 Chad M. Kilmer  Mark T. Leslie  David S. Mitchell | The William Blair Small Cap Value Fund (Class N shares) posted a 6.83% increase, net of fees, for the six months ended June 30, 2016. By comparison, the Fund’s benchmark index, the Russell 2000® Value Index (the “Index”), increased 6.08%. The Fund’s outperformance relative to the Index during the first half of 2016 was primarily driven by strong stock selection across most sectors. Broadly speaking, from a style perspective, the Fund’s larger market cap bias relative to the Index provided a tailwind during the period as larger cap stocks outperformed smaller caps in the first six months of the year. At the sector level, Consumer Discretionary was the most significant contributor to the Fund’s relative performance. Strong stock selection within the Consumer Discretionary sector, specifically Apparel Retail and Restaurants, helped by the announced acquisition of portfolio holding Krispy Kreme Doughnuts in the second quarter, drove the Fund’s relative outperformance within the sector. The combination of higher oil prices and strong stock selection within the Energy sector drove the Fund’s relative outperformance within the sector during the period. Other notable contributors to relative performance at the stock level included Children’s Place (Consumer Discretionary) and Southwest Gas (Utilities). Materials, the best performing sector of the market, was the largest detractor from relative performance due to the Fund’s lack of exposure to the more commodity exposed companies. Specifically, the strong performance of companies exposed to silver was a notable detractor to the Fund’s performance within the Materials sector and more than offset the Fund’s positive stock selection within Specialty Chemicals. The Fund’s relative underperformance within Financials was driven by stock selection within Regional Banks. Banking stocks, such as Bank of the Ozarks, were generally weaker after a surprisingly disappointing jobs report confirmed that the Fed would hold off on raising interest rates in the near-term. These stocks further declined after the Brexit vote late in the second quarter further pushed out expectations for any increase in interest rates. Other notable detractors from relative performance at the stock level included Integer (Health Care) and J2 Global (Information Technology). Please refer to the U.S. Value Market Review and Outlook relating to the Fund on page 7. |
| 32 | Semiannual Report | June 30, 2016 |
Small Cap Value Fund
Performance Highlights (Unaudited)
Average Annual Total Return at 6/30/2015
| | | Year
to Date | | 1 Year | | 3 Year | | 5 Year | | 10 Year |
| Class N | | | 6.83 | % | | | (0.06 | )% | | | 7.51 | % | | | 8.40 | % | | | 7.10 | % |
| Class I | | | 6.97 | | | | 0.23 | | | | 7.79 | | | | 8.68 | | | | 7.35 | |
| Russell 2000® Value Index | | | 6.08 | | | | (2.58 | ) | | | 6.36 | | | | 8.15 | | | | 5.15 | |
Performance cited represents past performance. Past performance does not guarantee future results and current performance may be lower or higher than the data quoted. Results shown are average annual total returns, which assume reinvestment of dividends and capital gains. Investment returns and principal will fluctuate and you may have a gain or loss when you sell shares. For the most current month-end performance information, please call 1-800-742-7272, or visit our Web site at www.williamblairfunds.com. Investing in smaller companies involves special risks, including higher volatility and lower liquidity. Smaller capitalization stocks are also more sensitive to purchase/sale transactions and changes in the issuer’s financial condition. From time to time, the investment adviser may waive fees or reimburse expenses for the Fund. Without these waivers/reimbursements, performance would be lower. Class N shares are available to the general public without a sales load. Class I shares are available to certain institutional investors and advisory clients of William Blair Investment Management, LLC and William Blair & Company, L.L.C., without a sales load or distribution (12b-1) or service fees.
The performance highlights and graph presented above do not reflect the deduction of taxes that a shareholder would pay on fund distributions or the redemption of fund shares.
The Russell 2000® Value Index consists of small-capitalization companies with below average price-to-book ratios and forecasted growth rates.
This report identifies the Fund’s investments on June 30, 2016. These holdings are subject to change. Not all stocks in the Fund performed the same, nor is there any guarantee that these stocks will perform as well in the future. Market forecasts provided in this report may not necessarily come to pass.
Sector Diversification (Unaudited)
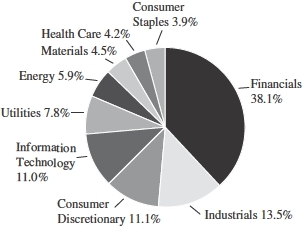
The sector diversification shown is based on the total long-term securities.
| June 30, 2016 | William Blair Funds | 33 |
Small Cap Value Fund
Portfolio of Investments, June 30, 2016 (all dollar amounts in thousands) (unaudited)
| | | | | | | | |
| | | | | | | | |
| | Issuer | | Shares | | | Value | |
| | |
| | Common Stocks | | | | | | | | |
| | | | | | | | | | |
| | Financials—36.7% | | | | | | | | |
| | Acadia Realty Trust | | | 192,016 | | | $ | 6,820 | |
| | American Assets Trust, Inc. | | | 177,757 | | | | 7,544 | |
| | American Campus Communities, Inc. | | | 180,851 | | | | 9,562 | |
| | Bank of the Ozarks, Inc. | | | 154,210 | | | | 5,786 | |
| | Banner Corporation | | | 69,445 | | | | 2,954 | |
| | Berkshire Hills Bancorp, Inc. | | | 208,927 | | | | 5,624 | |
| | Boston Private Financial Holdings, Inc. | | | 309,193 | | | | 3,642 | |
| | Care Capital Properties, Inc. | | | 158,821 | | | | 4,163 | |
| * | Cascade Bancorp | | | 672,334 | | | | 3,725 | |
| | CNO Financial Group, Inc. | | | 483,926 | | | | 8,449 | |
| | CoBiz Financial, Inc. | | | 538,476 | | | | 6,300 | |
| | CVB Financial Corporation | | | 203,735 | | | | 3,339 | |
| | Education Realty Trust, Inc. | | | 199,489 | | | | 9,205 | |
| | EPR Properties | | | 108,114 | | | | 8,723 | |
| * | Equity Commonwealth | | | 146,581 | | | | 4,270 | |
| | Equity One, Inc. | | | 143,820 | | | | 4,628 | |
| | First American Financial Corporation | | | 181,402 | | | | 7,296 | |
| | Glacier Bancorp, Inc. | | | 289,514 | | | | 7,695 | |
| | Hanover Insurance Group, Inc. | | | 92,083 | | | | 7,792 | |
| | Highwoods Properties, Inc. | | | 121,992 | | | | 6,441 | |
| | Home BancShares, Inc. | | | 307,088 | | | | 6,077 | |
| | Iberiabank Corporation | | | 135,086 | | | | 8,069 | |
| | National Bank Holdings Corporation | | | 201,632 | | | | 4,105 | |
| | PacWest Bancorp | | | 181,601 | | | | 7,224 | |
| | Pebblebrook Hotel Trust | | | 204,952 | | | | 5,380 | |
| | Prosperity Bancshares, Inc. | | | 137,405 | | | | 7,006 | |
| | Radian Group, Inc. | | | 599,800 | | | | 6,250 | |
| | Renasant Corporation | | | 211,582 | | | | 6,841 | |
| * | Safeguard Scientifics, Inc. | | | 276,584 | | | | 3,455 | |
| | Selective Insurance Group, Inc. | | | 210,368 | | | | 8,038 | |
| | Sunstone Hotel Investors, Inc. | | | 405,984 | | | | 4,900 | |
| | Umpqua Holdings Corporation | | | 450,913 | | | | 6,976 | |
| * | Western Alliance Bancorp | | | 224,959 | | | | 7,345 | |
| | WSFS Financial Corporation | | | 218,549 | | | | 7,035 | |
| | Yadkin Financial Corporation | | | 255,359 | | | | 6,407 | |
| | | | | | | | | 219,066 | |
| | Industrials—13.0% | | | | | | | | |
| | CIRCOR International, Inc. | | | 115,300 | | | | 6,571 | |
| | Curtiss-Wright Corporation | | | 96,372 | | | | 8,120 | |
| | EMCOR Group, Inc. | | | 147,885 | | | | 7,285 | |
| * | FTI Consulting, Inc. | | | 137,740 | | | | 5,603 | |
| | G&K Services, Inc. | | | 104,404 | | | | 7,994 | |
| | Interface, Inc. | | | 362,127 | | | | 5,523 | |
| | Kadant, Inc. | | | 119,477 | | | | 6,154 | |
| * | Lydall, Inc. | | | 124,850 | | | | 4,814 | |
| | Matson, Inc. | | | 154,763 | | | | 4,997 | |
| * | Northwest Pipe Co. | | | 235,082 | | | | 2,534 | |
| | Standex International Corporation | | | 68,269 | | | | 5,641 | |
| | The Toro Co. | | | 84,338 | | | | 7,439 | |
| | Valmont Industries, Inc. | | | 35,915 | | | | 4,858 | |
| | | | | | | | | 77,533 | |
| | | | | | | | |
| | | | | | | | |
| | Issuer | | Shares | | | Value | |
| | |
| | Common Stocks—(continued) | | | | | | | | |
| | | | | | | | | | |
| | Consumer Discretionary—10.7% | | | | | | | | |
| * | Cavco Industries, Inc. | | | 48,750 | | | $ | 4,568 | |
| | Children’s Place, Inc. | | | 91,832 | | | | 7,363 | |
| | Churchill Downs, Inc. | | | 33,605 | | | | 4,246 | |
| | Dana Holding Corporation | | | 376,208 | | | | 3,973 | |
| * | Dave & Buster’s Entertainment, Inc. | | | 94,750 | | | | 4,433 | |
| | Ethan Allen Interiors, Inc. | | | 136,721 | | | | 4,517 | |
| * | Express, Inc. | | | 331,500 | | | | 4,810 | |
| * | Genesco, Inc. | | | 88,443 | | | | 5,688 | |
| * | Krispy Kreme Doughnuts, Inc. | | | 287,414 | | | | 6,024 | |
| | Meredith Corporation | | | 111,317 | | | | 5,779 | |
| | Vail Resorts, Inc. | | | 52,221 | | | | 7,219 | |
| | Wolverine World Wide, Inc. | | | 255,614 | | | | 5,194 | |
| | | | | | | | | 63,814 | |
| | Information Technology—10.6% | | | | | | | | |
| * | Acxiom Corporation | | | 437,547 | | | | 9,622 | |
| | ADTRAN, Inc. | | | 219,432 | | | | 4,092 | |
| | Belden, Inc. | | | 118,392 | | | | 7,147 | |
| | Booz Allen Hamilton Holding Corporation | | | 234,596 | | | | 6,953 | |
| * | Cadence Design Systems, Inc. | | | 254,509 | | | | 6,185 | |
| * | CommScope Holding Co., Inc. | | | 150,349 | | | | 4,665 | |
| * | Inphi Corporation | | | 227,708 | | | | 7,294 | |
| | Intersil Corporation | | | 243,445 | | | | 3,296 | |
| * | Intralinks Holdings, Inc. | | | 474,059 | | | | 3,081 | |
| | j2 Global, Inc. | | | 108,002 | | | | 6,823 | |
| | Littelfuse, Inc. | | | 36,860 | | | | 4,357 | |
| | | | | | | | | 63,515 | |
| | Utilities—7.6% | | | | | | | | |
| | Chesapeake Utilities Corporation | | | 81,465 | | | | 5,391 | |
| | IDACORP, Inc. | | | 101,702 | | | | 8,274 | |
| | PNM Resources, Inc. | | | 228,386 | | | | 8,094 | |
| | Portland General Electric Co. | | | 176,318 | | | | 7,779 | |
| | Southwest Gas Corporation | | | 106,165 | | | | 8,356 | |
| | Spire, Inc. | | | 102,013 | | | | 7,227 | |
| | | | | | | | | 45,121 | |
| | Energy—5.7% | | | | | | | | |
| | Archrock, Inc. | | | 401,058 | | | | 3,778 | |
| * | Exterran Corporation | | | 182,400 | | | | 2,344 | |
| * | Helix Energy Solutions Group, Inc. | | | 479,655 | | | | 3,242 | |
| * | Memorial Resource Development Corporation | | | 215,276 | | | | 3,418 | |
| * | Parsley Energy, Inc. | | | 266,875 | | | | 7,222 | |
| * | PDC Energy, Inc. | | | 103,973 | | | | 5,990 | |
| * | Rice Energy, Inc. | | | 194,655 | | | | 4,290 | |
| * | TETRA Technologies, Inc. | | | 570,188 | | | | 3,632 | |
| | | | | | | | | 33,916 | |
| | Materials—4.3% | | | | | | | | |
| | Minerals Technologies, Inc. | | | 105,571 | | | | 5,996 | |
| | PolyOne Corporation | | | 200,527 | | | | 7,067 | |
| | Sensient Technologies Corporation | | | 99,268 | | | | 7,052 | |
| | Silgan Holdings, Inc. | | | 109,043 | | | | 5,611 | |
| | | | | | | | | 25,726 | |
See accompanying Notes to Financial Statements.
| 34 | Semiannual Report | June 30, 2016 |
Small Cap Value Fund
Portfolio of Investments, June 30, 2016 (all dollar amounts in thousands) (unaudited)
| | | | Shares or | | | | |
| | | | Principal | | | | |
| | Issuer | | Amount | | | Value | |
| | |
| | Common Stocks—(continued) | | | | | | | | |
| | | | | | | | | | |
| | Health Care—4.1% | | | | | | | | |
| | CONMED Corporation | | | 167,915 | | | $ | 8,015 | |
| | HealthSouth Corporation | | | 163,605 | | | | 6,351 | |
| * | Integer Holdings Corporation | | | 177,644 | | | | 5,494 | |
| * | Magellan Health, Inc. | | | 69,753 | | | | 4,588 | |
| | | | | | | | | 24,448 | |
| | Consumer Staples-3.7% | | | | | | | | |
| * | Darling Ingredients, Inc. | | | 456,330 | | | | 6,799 | |
| | J&J Snack Foods Corporation | | | 69,424 | | | | 8,280 | |
| | SpartanNash Co. | | | 237,538 | | | | 7,264 | |
| | | | | | | | | 22,343 | |
| | Total Common Stocks—96.4%
(cost $477,863) | | | | | | | 575,482 | |
| | |
| | Repurchase Agreement | | | | | | | | |
| | Fixed Income Clearing Corporation, 0.030% dated 6/30/16, due 7/1/16, repurchase price $16,816, collateralized by FFCB, 3.090%, due 8/19/25 | | | $16,816 | | | | 16,816 | |
| | | | | | | | | | |
| | Total Repurchase Agreement—2.8%
(cost $16,816) | | | | | | | 16,816 | |
| | | | | | | | | | |
| | Total Investments—99.2%
(cost $494,679) | | | | | | | 592,298 | |
| | Cash and other assets, less liabilities—0.8% | | | | | | | 4,910 | |
| | Net assets—100.0% | | | | | | $ | 597,208 | |
* = Non-income producing security
See accompanying Notes to Financial Statements.
| June 30, 2016 | William Blair Funds | 35 |
Global Markets Review and Outlook
Equity markets were highly volatile throughout the first half of 2016, buffeted by the continued fragile global growth environment and tremendous sentiment swings around the United Kingdom’s historic vote on June 23 to secede from the European Union (“Brexit”). The MSCI ACWI IMI (net) advanced 1.36% in U.S. Dollar (“USD”) terms during the six-month period, benefiting from expectations that central banks around the world would maintain or increase stimulus measures to combat weaker growth prospects. After suffering major equity market declines in the initial trading days following the Brexit vote, investor hopes of expanded quantitative easing by the European Central Bank, interest rate cuts by the Bank of England, and delayed tightening of monetary policy by the Federal Reserve Board’s Federal Open Market Committee (FOMC) together ignited a broad equity rally during the final week of June.
Although recovering most of their initial Brexit losses in a matter of days, the environment for equities remained tenuous heading into the second half of 2016 as investors were left grappling with the short and longer term ramifications for U.K. and European economic activity. U.S. equities were a relative safe haven against this backdrop. In the wake of a poor U.S. jobs report and political turbulence across the Atlantic, the growing consensus of “lower for longer” for FOMC interest rate policy significantly bolstered investor sentiment. Although similarly underpinned by central bank policy hopes, U.K. and European equity markets ended the first six months of the year in negative territory. U.K. equities were actually positive for the six-month period in local currency terms, as measured by the MSCI UK IMI (net), but pound sterling’s 9% decline versus the USD was a significant offset. Concerns about the U.K.’s worsening twins deficit (i.e. fiscal deficit and current account deficit) was further exacerbated by Brexit and the ensuing political upheaval - sending the British Pound down to levels not seen since 1985.
Among other primary economies, Japanese equities endured their worst six-month decline since the global financial crisis. Yen strength was a persistent headwind to performance for Japanese equities as investors became increasingly worried about the detrimental impact of the stronger Yen on corporate profits for export-oriented companies. Reflecting these concerns, Daiwa Securities estimated that pretax profits for Japan’s biggest companies would decline approximately 10% for the upcoming financial quarter, a view which was widely expressed by sell side analysts via negative earnings revisions that stood out on a global basis.Yen strength has complicated the reflation efforts of Japanese policymakers by lowering the cost of imports. Further weighing on investor sentiment has been recent economic data showing weaker industrial output and consumer spending.
Emerging market equities outperformed during the six-month period, benefiting from relatively attractive valuations coming into 2016, stabilizing domestic currencies and fund flows, and the FOMC’s delayed interest rate hike timeline. Improved perceptions of China’s growth and stimulus prospects also supported emerging market equities broadly. The MSCI EM IMI (net) advanced 5.69% during the period in USD terms. Among the major EM regions, Latin America was the strongest performer over the six-month period, driven by sharp rebounds in Brazilian equities and Brazilian currency (the Real), firmer commodity prices, and the movement to impeach Dilma Rousseff from the presidency. Within Europe, the Middle East and Africa, Russia was a standout performer for the period, benefiting from the oil price recovery and related currency strength. Country performance was mixed across the Emerging Asia region, with strength in Thailand, Indonesia and the Philippines offset by China’s negative return.
From a global sector perspective, Energy was the standout performer for the six-month period. In the environment of weaker global growth and falling bond yields, there was a renewed preference for defensive, yield-oriented sectors, which supported Utilities, Consumer Staples, Healthcare and Telecom to varying degrees. In contrast, the more cyclically-oriented Consumer Discretionary, Financials and Information Technology sectors experienced negative returns. From a market cap perspective, small cap stocks outpaced their mid/large cap counterparts on a global basis, driven primarily by the strong performance of U.S. small cap stocks. The reverse was true in emerging markets, however, as larger cap, more liquid companies led the rally during the first half of the year, after lagging their small cap counterparts in recent years.
| 36 | Semiannual Report | June 30, 2016 |
| | Global Leaders Fund |
| | |
| | The Global Leaders Fund seeks long-term capital appreciation. |
| | |
| | AN OVERVIEW FROM THE PORTFOLIO MANAGERS |
| | |

Andrew G. Flynn 
Kenneth J. McAtamney | The William Blair Global Leaders Fund (Class N shares) posted a 1.64% decrease, net of fees, for the six months ended June 30, 2016. By comparison, the Fund’s benchmark index, the MSCI All Country World IMI Index (net) (the “Index”), increased 1.36%. The Fund underperformed the Index for the six-month period. Style headwinds during the first quarter adversely impacted six-month performance, as higher growth companies with relatively strong earnings trends which the Fund focuses on, significantly lagged lower valuation companies with weaker earnings trends. This effect was most pronounced during the month of February and persisted to a smaller degree through April, before reversing in May. The Fund’s relative performance also suffered from a combination of negative sector allocation and stock selection effects. The Fund’s Consumer Discretionary, Healthcare, and Information Technology (IT) sector overweightings, combined with underweightings to the market-leading Consumer Staples, Energy, Materials, Telecommunication Services, and Utilities sectors, were the largest detractors from the Fund’s relative performance. Stock selection in the Consumer Staples sector also detracted from Fund performance, hampered by the Fund’s lack of exposure to Tobacco and Food Products companies, in addition to share price weakness for Costco Wholesale (U.S.) and Alimentation Couche-Tard (Canada). Costco suffered from lower monthly sales trends due to food deflation and the company’s ongoing credit card transition. Alimentation Couche-Tard was impacted by a weaker average road transportation fuel selling price in its U.S. business. These negative effects were partially mitigated by IT stock selection, as Keyence (Japan) and Taiwan Semiconductor Manufacturing (TSM) posted strong six-month gains. Keyence’s share price benefited from solid financial results that stood out relative to its industrial automation peers, and TSM was supported by expectations of continued incremental market share gains for its microchips at Apple. From a geographic perspective, U.S. stock selection was the primary detractor from six-month performance, weighed down by Financials, Consumer Staples, and IT stock selection. This more than offset positive stock selection in Japan, China, and Taiwan. Please refer to the Global Markets Review and Outlook relating to the Fund on page 36. |
| June 30, 2016 | William Blair Funds | 37 |
Global Leaders Fund
Performance Highlights (Unaudited)
| Average Annual Total Return at 6/30/2016 |
| | | Year
to Date | | 1 Year | | 3 Year | | 5 Year | | Since
Inception |
| Class N(a) | | | (1.64 | )% | | | (3.82 | )% | | | 6.50 | % | | | 6.14 | % | | | 2.21 | % |
| Class I(a) | | | (1.47 | ) | | | (3.46 | ) | | | 6.83 | | | | 6.44 | | | | 2.49 | |
| MSCI ACW IMI (net)(a) | | | 1.36 | | | | (3.87 | ) | | | 6.13 | | | | 5.43 | | | | 1.84 | |
| Institutional Class(b) | | | (1.47 | ) | | | (3.47 | ) | | | 6.93 | | | | — | | | | 7.16 | |
| MSCI ACW IMI (net)(b) | | | 1.36 | | | | (3.87 | ) | | | 6.13 | | | | — | | | | 6.94 | |
| | |
| (a) | Since inception is for the period from October 15, 2007 (Commencement of Operations) to June 30, 2016. |
| (b) | Since inception is for the period from December 19, 2012 (Commencement of Operations) to June 30, 2016. |
Performance cited represents past performance. Past performance does not guarantee future results and current performance may be lower or higher than the data quoted. Results shown are average annual total returns, which assume reinvestment of dividends and capital gains. Investment returns and principal will fluctuate and you may have a gain or loss when you sell shares. For the most current month-end performance information, please call 1-800-742-7272, or visit our Web site at www.williamblairfunds.com. Investing in smaller and medium capitalization companies involves special risks, including higher volatility and lower liquidity. Smaller and medium capitalization stocks are also more sensitive to purchase/sale transactions and changes in the issuer’s financial condition. International investing involves special risk considerations, including currency fluctuations, lower liquidity, economic and political risk. From time to time, the investment adviser may waive fees or reimburse expenses for the Fund. Without these waivers/reimbursements, performance would be lower. Class N shares are available to the general public without a sales load. Class I shares are available to certain institutional investors and advisory clients of William Blair Investment Management, LLC and William Blair & Company, L.L.C., without a sales load or distribution fees (12b-1). Institutional Class shares are available to institutional investors without a sales load or distribution (12b-1) or service fees.
The performance highlights and graph presented above do not reflect the deduction of taxes that a shareholder would pay on fund distributions or the redemption of fund shares.
The Morgan Stanley Capital International (MSCI) All Country World (ACW) Investable Market Index (IMI) (net) is a free float-adjusted market capitalization weighted index that is designed to measure the equity market of developed and emerging markets. This series approximates the minimum possible dividend reinvestment.
This report identifies the Fund’s investments on June 30, 2016. These holdings are subject to change. Not all stocks in the Fund performed the same, nor is there any guarantee that these stocks will perform as well in the future. Market forecasts provided in this report may not necessarily come to pass.
Sector Diversification (Unaudited)

The sector diversification shown is based on the total long-term securities.
| 38 | Semiannual Report | June 30, 2016 |
Global Leaders Fund
Portfolio of Investments, June 30, 2016 (all dollar amounts in thousands) (unaudited)
| | | | | | | | |
| | | | | | | | |
| | Issuer | | Shares | | | Value | |
| | | | | | | | | | |
| | Common Stocks | | | | | | | | |
| | | | | | | | | | |
| | Western Hemisphere—54.8% | | | | | | | | |
| | Canada—5.1% | | | | | | | | |
| | Alimentation Couche Tard, Inc. Class “B” (Food & staples retailing) | | | 41,531 | | | $ | 1,783 | |
| | Brookfield Asset Management, Inc. Class “A” (Real estate management & development)† | | | 69,418 | | | | 2,296 | |
| | Intact Financial Corporation (Insurance) | | | 30,460 | | | | 2,176 | |
| | Suncor Energy, Inc. (Oil, gas & consumable fuels) | | | 100,208 | | | | 2,780 | |
| | | | | | | | | 9,035 | |
| | United States—49.7% | | | | | | | | |
| * | Affiliated Managers Group, Inc. (Capital markets) | | | 12,024 | | | | 1,693 | |
| * | Align Technology, Inc. (Health care equipment & supplies) | | | 24,109 | | | | 1,942 | |
| * | Alphabet, Inc. Class “A” (Internet software & services) | | | 5,524 | | | | 3,886 | |
| * | Amazon.com, Inc. (Internet & catalog retail) | | | 6,968 | | | | 4,986 | |
| * | ANSYS, Inc. (Software) | | | 20,541 | | | | 1,864 | |
| | Apogee Enterprises, Inc. (Building products) | | | 33,405 | | | | 1,548 | |
| | BlackRock, Inc. (Capital markets) | | | 9,114 | | | | 3,122 | |
| | Bristol-Myers Squibb Co. (Pharmaceuticals) | | | 49,338 | | | | 3,629 | |
| * | Centene Corporation (Health care providers & services) | | | 47,577 | | | | 3,396 | |
| * | CoStar Group, Inc. (Internet software & services) | | | 5,629 | | | | 1,231 | |
| | Costco Wholesale Corporation (Food & staples retailing) | | | 5,990 | | | | 941 | |
| | Danaher Corporation (Industrial conglomerates) | | | 27,472 | | | | 2,775 | |
| * | Edwards Lifesciences Corporation (Health care equipment & supplies) | | | 20,858 | | | | 2,080 | |
| | EOG Resources, Inc. (Oil, gas & consumable fuels) | | | 19,109 | | | | 1,594 | |
| | Equifax, Inc. (Professional services) | | | 19,515 | | | | 2,506 | |
| * | Facebook, Inc. Class “A” (Internet software & services) | | | 22,649 | | | | 2,588 | |
| | General Electric Co. (Industrial conglomerates) | | | 109,190 | | | | 3,437 | |
| | Intercontinental Exchange, Inc. (Diversified financial services) | | | 9,421 | | | | 2,411 | |
| | Jones Lang LaSalle, Inc. (Real estate management & development) | | | 5,083 | | | | 495 | |
| | Mastercard, Inc. Class “A” (IT services) | | | 28,157 | | | | 2,480 | |
| | Moody’s Corporation (Diversified financial services) | | | 18,605 | | | | 1,743 | |
| | NIKE, Inc. Class “B” (Textiles, apparel & luxury goods) | | | 41,684 | | | | 2,301 | |
| * | O’Reilly Automotive, Inc. (Specialty retail) | | | 6,604 | | | | 1,790 | |
| | Pioneer Natural Resources Co. (Oil, gas & consumable fuels) | | | 7,761 | | | | 1,174 | |
| | PPG Industries, Inc. (Chemicals) | | | 29,474 | | | | 3,070 | |
| | | | | | | | |
| | | | | | | | |
| | Issuer | | Shares | | | Value | |
| | | | | | | | | | |
| | Common Stocks—(continued) | | | | | | | | |
| | | | | | | | | | |
| | Western Hemisphere—(continued) | | | | | | | | |
| | United States—(continued) | | | | | | | | |
| | Raytheon Co. (Aerospace & defense) | | | 19,732 | | | $ | 2,683 | |
| * | Red Hat, Inc. (Software) | | | 24,684 | | | | 1,792 | |
| * | salesforce.com, Inc. (Software) | | | 10,997 | | | | 873 | |
| | Schlumberger, Ltd. (Energy equipment & services)† | | | 27,754 | | | | 2,195 | |
| | Simon Property Group, Inc. (Real estate investment trusts (REITs)) | | | 11,970 | | | | 2,596 | |
| | The Home Depot, Inc. (Specialty retail) | | | 42,161 | | | | 5,384 | |
| | The Sherwin-Williams Co. (Chemicals) | | | 8,578 | | | | 2,519 | |
| | Thermo Fisher Scientific, Inc. (Life sciences tools & services) | | | 15,432 | | | | 2,280 | |
| * | Ulta Salon Cosmetics & Fragrance, Inc. (Specialty retail) | | | 9,409 | | | | 2,292 | |
| | Vail Resorts, Inc. (Hotels, restaurants & leisure) | | | 12,663 | | | | 1,750 | |
| * | Vantiv, Inc. Class “A” (IT services) | | | 22,538 | | | | 1,276 | |
| * | VCA Antech, Inc. (Health care providers & services) | | | 35,351 | | | | 2,390 | |
| | Watsco, Inc. (Trading companies & distributors) | | | 15,847 | | | | 2,230 | |
| | | | | | | | | 88,942 | |
| | | | | | | | | | |
| | Europe, Mid-East—16.3% | | | | | | | | |
| | Denmark—1.7% | | | | | | | | |
| | Novo Nordisk A/S Class “B” (Pharmaceuticals) | | | 57,447 | | | | 3,094 | |
| | | | | | | | | | |
| | France—3.7% | | | | | | | | |
| | Cap Gemini S.A. (IT services) | | | 48,669 | | | | 4,200 | |
| | Valeo S.A. (Auto components) | | | 54,822 | | | | 2,434 | |
| | | | | | | | | 6,634 | |
| | Germany—1.0% | | | | | | | | |
| | Continental AG (Auto components) | | | 9,712 | | | | 1,838 | |
| | | | | | | | | | |
| | Ireland—1.0% | | | | | | | | |
| | Paddy Power Betfair PLC (Hotels, restaurants & leisure) | | | 16,306 | | | | 1,714 | |
| | | | | | | | | | |
| | Israel—1.4% | | | | | | | | |
| | Teva Pharmaceutical Industries, Ltd.—ADR (Pharmaceuticals) | | | 49,059 | | | | 2,464 | |
| | | | | | | | | | |
| | Netherlands—3.3% | | | | | | | | |
| * | NXP Semiconductors N.V. (Semiconductors & semiconductor equipment)† | | | 36,233 | | | | 2,838 | |
| | Royal Dutch Shell plc Class “A” (Oil, gas & consumable fuels) | | | 114,097 | | | | 3,130 | |
| | | | | | | | | 5,968 | |
| | Spain—1.5% | | | | | | | | |
| | Industria de Diseno Textil S.A. (Specialty retail) | | | 81,037 | | | | 2,722 | |
| | | | | | | | | | |
| | Sweden—1.1% | | | | | | | | |
| | Assa Abloy AB Class “B” (Building products) | | | 93,851 | | | | 1,931 | |
See accompanying Notes to Financial Statements.
| June 30, 2016 | William Blair Funds | 39 |
Global Leaders Fund
Portfolio of Investments, June 30, 2016 (all dollar amounts in thousands) (unaudited)
| | | | | | | | |
| | | | | | | | |
| | Issuer | | Shares | | | Value | |
| | | | | | | | | | |
| | Common Stocks—(continued) | | | | | | | | |
| | | | | | | | | | |
| | Europe, Mid-East—(continued) | | | | | | | | |
| | Switzerland—1.6% | | | | | | | | |
| | Partners Group Holding AG (Capital markets) | | | 6,590 | | | $ | 2,824 | |
| | | | | | | | | | |
| | Japan—8.1% | | | | | | | | |
| | Daikin Industries, Ltd. (Building products) | | | 34,900 | | | | 2,933 | |
| | Fuji Heavy Industries, Ltd. (Automobiles) | | | 52,200 | | | | 1,795 | |
| | Kao Corporation (Personal products) | | | 50,700 | | | | 2,953 | |
| | Keyence Corporation (Electronic equipment, instruments & components) | | | 3,500 | | | | 2,388 | |
| | ORIX Corporation (Diversified financial services) | | | 206,400 | | | | 2,671 | |
| | Shimano, Inc. (Leisure products) | | | 11,100 | | | | 1,697 | |
| | | | | | | | | 14,437 | |
| | | | | | | | | | |
| | Emerging Asia—8.0% | | | | | | | | |
| | China—3.8% | | | | | | | | |
| * | Baidu, Inc.—ADR (Internet software & services) | | | 13,387 | | | | 2,211 | |
| | China Overseas Land & Investment, Ltd. (Real estate management & development) | | | 566,000 | | | | 1,804 | |
| | Tencent Holdings, Ltd. (Internet software & services) | | | 119,300 | | | | 2,740 | |
| | | | | | | | | 6,755 | |
| | India—1.7% | | | | | | | | |
| | HDFC Bank, Ltd.—ADR (Banks) | | | 45,295 | | | | 3,005 | |
| | | | | | | | | | |
| | Taiwan—2.5% | | | | | | | | |
| | Taiwan Semiconductor Manufacturing Co., Ltd.—ADR (Semiconductors & semiconductor equipment) | | | 169,888 | | | | 4,456 | |
| | | | | | | | | | |
| | United Kingdom—5.3% | | | | | | | | |
| | ARM Holdings plc (Semiconductors & semiconductor equipment) | | | 57,022 | | | | 866 | |
| | Compass Group plc (Hotels, restaurants & leisure) | | | 187,404 | | | | 3,565 | |
| | Reckitt Benckiser Group plc (Household products) | | | 30,667 | | | | 3,075 | |
| | WPP plc (Media) | | | 98,595 | | | | 2,055 | |
| | | | | | | | | 9,561 | |
| | | | | | | | | | |
| | Asia—4.4% | | | | | | | | |
| | Australia—1.3% | | | | | | | | |
| | Macquarie Group, Ltd. (Capital markets) | | | 42,698 | | | | 2,223 | |
| | | | | | | | | | |
| | Hong Kong—1.5% | | | | | | | | |
| | AIA Group, Ltd. (Insurance) | | | 459,600 | | | | 2,758 | |
| | | | | | | | | | |
| | Singapore—1.6% | | | | | | | | |
| | Broadcom, Ltd. (Semiconductors & semiconductor equipment)† | | | 18,777 | | | | 2,918 | |
| | | | Shares or | | | | |
| | | | Principal | | | | |
| | Issuer | | Amount | | | Value | |
| | | | | | | | | | |
| | Common Stocks—(continued) | | | | | | | | |
| | | | | | | | | | |
| | Emerging Europe, Mid-East, Africa—1.5% | | | | | | | | |
| | South Africa-1.5% | | | | | | | | |
| * | Bid Corporation, Ltd. (Food & staples retailing) | | | 37,340 | | | $ | 700 | |
| | Steinhoff International Holdings N.V. (Household durables) | | | 358,470 | | | | 2,056 | |
| | | | | | | | | 2,756 | |
| | Total Common Stocks—98.4%
(cost $158,318) | | | | | | | 176,035 | |
| | | | | | | | | | |
| | Repurchase Agreement | | | | | | | | |
| | Fixed Income Clearing Corporation, 0.030% dated 6/30/16, due 7/1/16, repurchase price $3,535, collateralized by FNMA, 7.125%, due 1/15/30 | | | $3,535 | | | | 3,535 | |
| | | | | | | | | | |
| | Total Repurchase Agreement—2.0%
(cost $3,535) | | | | | | | 3,535 | |
| | | | | | | | | | |
| | Total Investments—100.4%
(cost $161,853) | | | | | | | 179,570 | |
| | Liabilities, plus cash and other assets—(0.4)% | | | | | | | (729 | ) |
| | Net assets—100.0% | | | | | | $ | 178,841 | |
ADR = American Depository Receipt
† = U.S. listed foreign security
* = Non-income producing security
For securities primarily traded on exchanges or markets that close before the close of regular trading on the New York Stock Exchange, the Fund may use an independent pricing service to fair value price the securities pursuant to Valuation Procedures approved by the Board of Trustees.
At June 30, 2016, the Fund’s Portfolio of Investments includes the following industry categories (as a percentage of long-term investments):
| Consumer Discretionary | | | 21.8 | % |
| Information Technology | | | 21.8 | % |
| Financials | | | 18.1 | % |
| Health Care | | | 12.1 | % |
| Industrials | | | 11.4 | % |
| Energy | | | 6.2 | % |
| Consumer Staples | | | 5.4 | % |
| Materials | | | 3.2 | % |
| Total | | | 100.0 | % |
At June 30, 2016, the Fund’s Portfolio of Investments includes the following currency categories (as a percentage of long-term investments):
| U.S. Dollar | | | 62.0 | % |
| Euro | | | 9.1 | % |
| Japanese Yen | | | 8.2 | % |
| British Pound Sterling | | | 5.4 | % |
| Hong Kong Dollar | | | 4.1 | % |
| Canadian Dollar | | | 3.8 | % |
| Danish Krone | | | 1.8 | % |
| Swiss Franc | | | 1.6 | % |
| South African Rand | | | 1.6 | % |
| Australian Dollar | | | 1.3 | % |
| Swedish Krona | | | 1.1 | % |
| Total | | | 100.0 | % |
See accompanying Notes to Financial Statements.
| 40 | Semiannual Report | June 30, 2016 |
| | International Leaders Fund |
| | |
| | The International Leaders Fund seeks long-term capital appreciation. |
| | |
| | AN OVERVIEW FROM THE PORTFOLIO MANAGERS |
| | |

Simon Fennell 
Kenneth J. McAtamney | The William Blair International Leaders Fund (Class N shares) posted a 1.40% decrease, net of fees, for the six months ended June 30, 2016. By comparison, the Fund’s benchmark index, the MSCI All Country World ex-U.S. IMI Index (net) (the “Index”), decreased 0.91%. The Fund underperformed the Index for the first half of 2016. Style headwinds during the first quarter adversely impacted six-month performance, as higher growth companies with relatively strong earnings trends, which the Fund focuses on, significantly lagged lower valuation companies with weaker earnings trends. From a sector perspective, the Fund’s six-month relative performance suffered primarily from a negative allocation effect: the Consumer Discretionary overweighting combined with underweightings to the market-leading Consumer Staples, Energy, Materials, Telecommunication Services and Utilities sectors. Consumer Staples stock selection also detracted from the Fund’s relative performance, hampered by the lack of exposure to Tobacco and Food Products companies, in addition to share price weakness for Alimentation Couche-Tard (Canada), which was impacted by a weaker average road transportation fuel selling price in the U.S. business. Within Materials, the Fund’s relative weakness during the six-month period was driven by its lack of exposure to Metals & Mining companies, which led the Index. Automobile catalysts chemical maker Johnson Matthey (U.K.) also detracted from the Fund’s relative performance, as the shares were hit by concerns surrounding the outcome and impact of the U.K. Brexit vote and the impact of weaker platinum prices on the company’s metals refining business. These negative effects were partially mitigated by good stock selection in the Consumer Discretionary, Financials and Information Technology (IT) sectors. Within Consumer Discretionary, Tata Motors (India) benefited from positive sales trends in key Jaguar models. The Fund’s IT stock selection effect was bolstered by Keyence (Japan) and Taiwan Semiconductor Manufacturing (TSM). Keyence’s share price benefited from solid financial results that stood out relative to its industrial automation peers, and TSM was supported by expectations of continued incremental share gains for its chips at Apple. From a geographic perspective, Canada and Developed Asia ex-Japan stock selection were the primary detractors from six-month performance, offsetting positive stock selection in Japan, the U.K., India, Korea and Taiwan. Please refer to the Global Markets Review and Outlook relating to the Fund on page 36. |
| June 30, 2016 | William Blair Funds | 41 |
| International Leaders Fund |
| |
| Performance Highlights (Unaudited) |
| Average Annual Total Return at 6/30/2016 |
| | | Year
to Date | | 1 Year | | 3 Year | | Since
Inception |
| Class N(a) | | | (1.40 | )% | | | (2.92 | )% | | | 5.64 | % | | | 7.15 | % |
| Class I(a) | | | (1.32 | ) | | | (2.76 | ) | | | 5.84 | | | | 7.39 | |
| MSCI ACW Ex-U.S. IMI (net)(a) | | | (0.91 | ) | | | (9.61 | ) | | | 1.65 | | | | 3.54 | |
| Institutional Class(b) | | | (1.32 | ) | | | (2.70 | ) | | | 5.98 | | | | 7.27 | |
| MSCI ACW Ex-U.S. IMI (net)(b) | | | (0.91 | ) | | | (9.61 | ) | | | 1.65 | | | | 2.69 | |
| (a) | Since inception is for the period from August 16, 2012 (Commencement of Operations) to June 30, 2016. |
| (b) | Since inception is for the period from November 2, 2012 (Commencement of Operations) to June 30, 2016. |
Performance cited represents past performance. Past performance does not guarantee future results and current performance may be lower or higher than the data quoted. Results shown are average annual returns, which assume reinvestment of dividends and capital gains. Investment returns and principal will fluctuate and you may have a gain or loss when you sell shares. For the most current month-end performance information, please call 1-800-742-7272, or visit our Web site at www.williamblairfunds.com. From time to time the investment adviser may waive fees or reimburse expenses for the Fund. Without these waivers/reimbursements, performance would be lower. International investing involves special risk considerations, including currency fluctuations, lower liquidity, economic and political risk. Class N shares are available to the general public without a sales load. Class I shares are available to certain institutional investors and advisory clients of William Blair Investment Management, LLC and William Blair & Company, L.L.C., without a sales load or distribution (12b-1) fees. Institutional Class shares are available to institutional investors without a sales load or distribution (12b-1) or service fees.
The performance highlights presented above do not reflect the deduction of taxes that a shareholder would pay on fund distributions or the redemption of fund shares.
The Morgan Stanley Capital International (MSCI) All Country World (ACW) Ex-U.S. Investable Market Index (IMI) (net) is a free float-adjusted market capitalization weighted index that is designed to measure the equity market performance of developed and emerging markets, excluding the United States. This series approximates the minimum possible dividend reinvestment.
This report identifies the Fund’s investments on June 30, 2016. These holdings are subject to change. Not all stocks in the Fund performed the same, nor is there any guarantee that these stocks will perform as well in the future. Market forecasts provided in this report may not necessarily come to pass.
Sector Diversification (Unaudited)
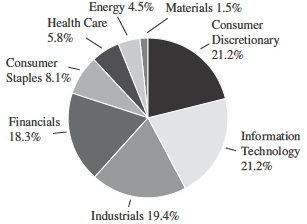
The sector diversification shown is based on the total long-term securities.
| 42 | Semiannual Report | June 30, 2016 |
| International Leaders Fund |
Portfolio of Investments, June 30, 2016 (all dollar amounts in thousands) (unaudited)
| | | | | | | | |
| | Issuer | | Shares | | | Value | |
| | | | | | | | | | |
| | Common Stocks | | | | | | | | |
| | | | | | | | | | |
| | Europe, Mid-East—36.1% | | | | | | | | |
| | Denmark—2.2% | | | | | | | | |
| | Novo Nordisk A/S Class “B” (Pharmaceuticals) | | | 72,638 | | | $ | 3,912 | |
| | Vestas Wind Systems A/S (Electrical equipment) | | | 7,075 | | | | 477 | |
| | | | | | | | | 4,389 | |
| | Finland—2.7% | | | | | | | | |
| | Kone Oyj Class “B” (Machinery) | | | 54,991 | | | | 2,538 | |
| | Sampo Oyj Class “A” (Insurance) | | | 71,435 | | | | 2,921 | |
| | | | | | | | | 5,459 | |
| | France—9.7% | | | | | | | | |
| | Cap Gemini S.A. (IT services) | | | 53,263 | | | | 4,596 | |
| | JCDecaux S.A. (Media) | | | 68,752 | | | | 2,318 | |
| | Safran S.A. (Aerospace & defense) | | | 39,302 | | | | 2,647 | |
| | Total S.A. (Oil, gas & consumable fuels) | | | 67,436 | | | | 3,234 | |
| | Valeo S.A. (Auto components) | | | 76,189 | | | | 3,382 | |
| | Vinci S.A. (Construction & engineering) | | | 47,068 | | | | 3,322 | |
| | | | | | | | | 19,499 | |
| | Germany—1.5% | | | | | | | | |
| | Continental AG (Auto components) | | | 9,876 | | | | 1,869 | |
| | Rational AG (Machinery) | | | 2,681 | | | | 1,241 | |
| | | | | | | | | 3,110 | |
| | Ireland—3.0% | | | | | | | | |
| | Paddy Power Betfair PLC (Hotels, restaurants & leisure) | | | 22,877 | | | | 2,404 | |
| | Ryanair Holdings plc—ADR (Airlines) | | | 51,003 | | | | 3,547 | |
| | | | | | | | | 5,951 | |
| | Israel—1.1% | | | | | | | | |
| | Teva Pharmaceutical Industries, Ltd.—ADR (Pharmaceuticals) | | | 43,323 | | | | 2,176 | |
| | | | | | | | | | |
| | Netherlands—3.3% | | | | | | | | |
| * | NXP Semiconductors N.V. (Semiconductors & semiconductor equipment)† | | | 47,355 | | | | 3,710 | |
| | Royal Dutch Shell plc Class “A” (Oil, gas & consumable fuels) | | | 109,259 | | | | 2,997 | |
| | | | | | | | | 6,707 | |
| | Spain—3.1% | | | | | | | | |
| | Amadeus IT Holding S.A. Class “A” (IT services) | | | 54,333 | | | | 2,394 | |
| | Industria de Diseno Textil S.A. (Specialty retail) | | | 112,360 | | | | 3,775 | |
| | | | | | | | | 6,169 | |
| | Sweden—2.5% | | | | | | | | |
| | Atlas Copco AB Class “A” (Machinery) | | | 94,113 | | | | 2,444 | |
| | Hexagon AB Class “B” (Electronic equipment, instruments & components) | | | 69,437 | | | | 2,541 | |
| | | | | | | | | 4,985 | |
| | Switzerland—7.0% | | | | | | | | |
| | Actelion, Ltd. (Biotechnology) | | | 29,836 | | | | 5,024 | |
| | Geberit AG (Building products) | | | 5,527 | | | | 2,093 | |
| | | | | | | | |
| | Issuer | | Shares | | | Value | |
| | | | | | | | | | |
| | Common Stocks—(continued) | | | | | | | | |
| | | | | | | | | | |
| | Europe, Mid-East—(continued) | | | | | | | | |
| | Switzerland—(continued) | | | | | | | | |
| | Partners Group Holding AG (Capital markets) | | | 9,680 | | | $ | 4,149 | |
| | SGS S.A. (Professional services) | | | 1,230 | | | | 2,818 | |
| | | | | | | | | 14,084 | |
| | | | | | | | | | |
| | United Kingdom—17.1% | | | | | | | | |
| | ARM Holdings plc (Semiconductors & semiconductor equipment) | | | 86,300 | | | | 1,311 | |
| | Compass Group plc (Hotels, restaurants & leisure) | | | 289,532 | | | | 5,509 | |
| | Experian plc (Professional services) | | | 204,456 | | | | 3,879 | |
| | IG Group Holdings plc (Diversified financial services) | | | 200,676 | | | | 2,173 | |
| | Johnson Matthey plc (Chemicals) | | | 77,955 | | | | 2,924 | |
| | Micro Focus International plc (Software) | | | 86,549 | | | | 1,867 | |
| | Reckitt Benckiser Group plc (Household products) | | | 38,257 | | | | 3,836 | |
| | RELX plc (Media) | | | 228,025 | | | | 4,199 | |
| | St James’s Place plc (Insurance) | | | 174,675 | | | | 1,842 | |
| | Wolseley plc (Trading companies & distributors) | | | 66,765 | | | | 3,457 | |
| | WPP plc (Media) | | | 159,223 | | | | 3,318 | |
| | | | | | | | | 34,315 | |
| | | | | | | | | | |
| | Japan—15.7% | | | | | | | | |
| | Daikin Industries, Ltd. (Building products) | | | 44,700 | | | | 3,757 | |
| | Fuji Heavy Industries, Ltd. (Automobiles) | | | 73,559 | | | | 2,528 | |
| | Kao Corporation (Personal products) | | | 64,300 | | | | 3,745 | |
| | Keyence Corporation (Electronic equipment, instruments & components) | | | 5,500 | | | | 3,753 | |
| | Makita Corporation (Machinery) | | | 43,400 | | | | 2,881 | |
| | Murata Manufacturing Co., Ltd. (Electronic equipment, instruments & components) | | | 19,900 | | | | 2,231 | |
| | Nippon Prologis REIT, Inc. (Real estate investment trusts (REITs)) | | | 1,029 | | | | 2,514 | |
| | Nitori Holdings Co., Ltd. (Specialty retail) | | | 25,900 | | | | 3,141 | |
| | ORIX Corporation (Diversified financial services) | | | 243,100 | | | | 3,146 | |
| | Shimano, Inc. (Leisure products) | | | 16,100 | | | | 2,462 | |
| | SMC Corporation (Machinery) | | | 6,100 | | | | 1,501 | |
| | | | | | | | | 31,659 | |
| | | | | | | | | | |
| | Emerging Asia—15.3% | | | | | | | | |
| | China—6.9% | | | | | | | | |
| * | Baidu, Inc.—ADR (Internet software & services) | | | 19,664 | | | | 3,247 | |
| | China Overseas Land & Investment, Ltd. (Real estate management & development) | | | 1,134,000 | | | | 3,615 | |
| | NetEase, Inc.—ADR (Internet software & services) | | | 19,153 | | | | 3,701 | |
| | Tencent Holdings, Ltd. (Internet software & services) | | | 138,900 | | | | 3,190 | |
| | | | | | | | | 13,753 | |
See accompanying Notes to Financial Statements.
| June 30, 2016 | William Blair Funds | 43 |
| International Leaders Fund |
Portfolio of Investments, June 30, 2016 (all dollar amounts in thousands) (unaudited)
| | | | | | | | |
| | Issuer | | Shares | | Value | |
| | |
| | Common Stocks—(continued) | | | | |
| | |
| | Emerging Asia—(continued) | | | | | | | | |
| | India—4.3% | | | | | | | | |
| | Hero MotoCorp, Ltd. (Automobiles) | | | 70,083 | | | $ | 3,287 | |
| | Housing Development Finance Corporation, Ltd. (Thrifts & mortgage finance) | | | 128,990 | | | | 2,401 | |
| * | Tata Motors, Ltd.—ADR (Automobiles) | | | 85,049 | | | | 2,949 | |
| | | | | | | | | 8,637 | |
| | South Korea—1.5% | | | | | | | | |
| | Samsung Electronics Co., Ltd. (Technology hardware, storage & peripherals) | | | 2,454 | | | | 3,056 | |
| | | | | | | | | | |
| | Taiwan—2.6% | | | | | | | | |
| | Taiwan Semiconductor Manufacturing Co., Ltd. (Semiconductors & semiconductor equipment) | | | 1,049,000 | | | | 5,287 | |
| | |
| | Canada—4.9% | | | | | | | | |
| | Alimentation Couche Tard, Inc. Class “B” (Food & staples retailing) | | | 70,112 | | | | 3,011 | |
| | Brookfield Asset Management, Inc. Class “A” (Real estate management & development)† | | | 135,957 | | | | 4,496 | |
| | Suncor Energy, Inc. (Oil, gas & consumable fuels) | | | 86,527 | | | | 2,400 | |
| | | | | | | | | 9,907 | |
| | |
| | Asia—3.5% | | | | | | | | |
| | Australia—1.4% | | | | | | | | |
| | Macquarie Group, Ltd. (Capital markets) | | | 55,575 | | | | 2,893 | |
| | | | | | | | | | |
| | Hong Kong—2.1% | | | | | | | | |
| | AIA Group, Ltd. (Insurance) | | | 698,000 | | | | 4,188 | |
| | |
| | Emerging Europe, Mid-East, Africa—1.8% | | | | | | | | |
| | South Africa—1.8% | | | | | | | | |
| | *Bid Corporation, Ltd. (Food & staples retailing) | | | 91,282 | | | | 1,711 | |
| | Bidvest Group, Ltd. (Industrial conglomerates) | | | 91,282 | | | | 861 | |
| | Discovery, Ltd. (Insurance) | | | 117,060 | | | | 978 | |
| | | | | | | | | 3,550 | |
| | |
| | Emerging Latin America—1.7% | | | | | | | | |
| | Mexico—1.7% | | | | | | | | |
| | Wal-Mart de Mexico S.A.B. de C.V. (Food & staples retailing) | | | 1,398,000 | | | | 3,363 | |
| | | | | | | | | | |
| | Total Common Stocks—96.1% | | | | | | | | |
| | (cost $181,387) | | | | | | | 193,137 | |
| | | | Principal | | | | | |
| | Issuer | | Amount | | | Value | |
| | |
| | Repurchase Agreement | | | | | | | | |
| | Fixed Income Clearing Corporation, 0.030% dated 6/30/16, due 7/1/16, repurchase price $3,735, collateralized by FFCB, 3.020%, due 1/12/26 | | $ | 3,735 | | | $ | 3,735 | |
| | | | | | | | | | |
| | Total Repurchase Agreement—1.9% | | | | | | | | |
| | (cost $3,735) | | | | | | | 3,735 | |
| | | | | | | | | | |
| | Total Investments—98.0% | | | | | | | | |
| | (cost $185,122) | | | | | | | 196,872 | |
| | Cash and other assets, less liabilities—2.0% | | | | | | | 4,073 | |
| | Net assets—100.0% | | | | | | $ | 200,945 | |
ADR = American Depository Receipt
* = Non-income producing security
† = U.S. listed foreign security
For securities primarily traded on exchanges or markets that close before the close of regular trading on the New York Stock Exchange, the Fund may use an independent pricing service to fair value price the securities pursuant to Valuation Procedures approved by the Board of Trustees.
At June 30, 2016, the Fund’s Portfolio of Investments includes the following industry categories (as a percentage of long-term investments):
| Consumer Discretionary | | | 21.2 | % |
| Information Technology | | | 21.2 | % |
| Industrials | | | 19.4 | % |
| Financials | | | 18.3 | % |
| Consumer Staples | | | 8.1 | % |
| Health Care | | | 5.8 | % |
| Energy | | | 4.5 | % |
| Materials | | | 1.5 | % |
| Total | | | 100.0 | % |
| | | | | |
| At June 30, 2016, the Fund’s Portfolio of Investments includes the following currency categories (as a percentage of long-term investments): |
| | | | | |
| Euro | | | 20.5 | % |
| British Pound Sterling | | | 17.8 | % |
| Japanese Yen | | | 16.4 | % |
| U.S. Dollar | | | 12.3 | % |
| Swiss Franc | | | 7.3 | % |
| Hong Kong Dollar | | | 5.7 | % |
| Indian Rupee | | | 3.0 | % |
| Canadian Dollar | | | 2.8 | % |
| New Taiwan Dollar | | | 2.7 | % |
| Swedish Krona | | | 2.6 | % |
| Danish Krone | | | 2.3 | % |
| South African Rand | | | 1.8 | % |
| Mexican Peso | | | 1.7 | % |
| South Korean Won | | | 1.6 | % |
| Australian Dollar | | | 1.5 | % |
| Total | | | 100.0 | % |
See accompanying Notes to Financial Statements.
| 44 | Semiannual Report | June 30, 2016 |
| | International Equity Fund |
| | |
| | The International Equity Fund seeks long-term capital appreciation. |
| | |
| | AN OVERVIEW FROM THE PORTFOLIO MANAGERS |
| | |

David Merjan 
John C. Murphy | The William Blair International Equity Fund (Class N shares) posted a 1.88% decrease, net of fees, for the six months ended June 30, 2016. By comparison, the Fund’s benchmark index, the MSCI World ex-U.S. Index (net) (the “Index”), decreased 2.98%. The Fund outpaced the Index for the first six months of 2016, benefiting from positive stock selection effects across most sectors. Stock selection in the Financials sector was the key driver of outperformance during the period, as the Fund’s Capital Markets and Real Estate Investment Trust (REIT) holdings achieved positive returns and its Bank holdings held up better than Index peers amid the low interest rate environment. Peruvian banking leader Credicorp was a notable contributor to the Fund’s relative performance, supported by solid earnings results that were highlighted by core net income growth of 25% year-over-year and Return on Equity of 20%. Another notable contributor was Japan’s Nihon M&A Center, which provides advisory services to small and medium enterprises (SMEs) facing succession-oriented challenges. The share price was bolstered by good underlying growth in transactions and a healthy deal pipeline. In addition to outperformance in the Financials sector, the Fund benefited from good stock selection in the Consumer Discretionary and Energy sectors. Partially offsetting these positive effects was the Fund’s overweighting to Industrials and weak stock selection in U.K. and European Industrials. Concerns surrounding the outcome and impact of the U.K. Brexit vote weighed on U.K. building merchant Travis Perkins’s share price during the period, although the company citied improving conditions in the repairs, maintenance and improvements markets as part of its quarterly trading (sales) update. Low cost airline Ryanair (Ireland) was another key detractor from the Fund’s performance due to a combination of softer yields post the Paris and Belgium terrorist attacks, and the negative ripple effect of rival EasyJet’s profit warning following the Brexit outcome. Utilities stock selection also weighed on the Fund’s relative performance, as Veolia Environnement (France) reported weaker revenues due to lower energy prices and reduced construction activity in its water technologies division. From a geographic perspective, the biggest contributors to relative performance during the period was stock selection in Japan and Canada, and exposure to non-Index holdings in Emerging Asia (India, Taiwan and Thailand). Please refer to the Global Markets Review and Outlook relating to the Fund on page 36. |
| June 30, 2016 | William Blair Funds | 45 |
| International Equity Fund |
Performance Highlights (Unaudited)
| Average Annual Total Return at 6/30/2016 |
| | | Year | | | | | | | | | | | | | | | | |
| | | to Date | | 1 Year | | 3 Year | | 5 Year | | 10 Year |
| Class N | | | (1.88 | )% | | | (6.29 | )% | | | 3.88 | % | | | 2.74 | % | | | 1.86 | % |
| Class I | | | (1.79 | ) | | | (6.10 | ) | | | 4.11 | | | | 2.99 | | | | 2.10 | |
| MSCI World Ex-U.S. Index (net) | | | (2.98 | ) | | | (9.84 | ) | | | 1.88 | | | | 1.23 | | | | 1.63 | |
Performance cited represents past performance. Past performance does not guarantee future results and current performance may be lower or higher than the data quoted. Results shown are average annual returns, which assume reinvestment of dividends and capital gains. Investment returns and principal will fluctuate and you may have a gain or loss when you sell shares. For the most current month-end performance information, please call 1-800-742-7272, or visit our Web site at www.williamblairfunds.com. From time to time the investment adviser may waive fees or reimburse expenses for the Fund. Without these waivers/reimbursements, performance would be lower. International investing involves special risk considerations, including currency fluctuations, lower liquidity, economic and political risk. Class N shares are available to the general public without a sales load. Class I shares are available to certain institutional investors and advisory clients of William Blair Investment Management, LLC and William Blair & Company, L.L.C., without a sales load or distribution (12b-1) or service fees.
The performance highlights and graph presented above do not reflect the deduction of taxes that a shareholder would pay on fund distributions or the redemption of fund shares.
The Morgan Stanley Capital International (MSCI) World Ex-U.S. Index (net) is a free float-adjusted market capitalization weighted index that is designed to measure the equity market performance of developed markets, excluding the United States. This series approximates the minimum possible dividend reinvestment.
This report identifies the Fund’s investments on June 30, 2016. These holdings are subject to change. Not all stocks in the Fund performed the same, nor is there any guarantee that these stocks will perform as well in the future. Market forecasts provided in this report may not necessarily come to pass.
Sector Diversification (Unaudited)
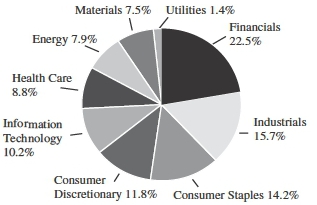
The sector diversification shown is based on the total long-term securities.
| 46 | Semiannual Report | June 30, 2016 |
| International Equity Fund |
Portfolio of Investments, June 30, 2016 (all dollar amounts in thousands) (unaudited)
| | | | | | | | |
| | Issuer | | Shares | | | Value | |
| | |
| | Common Stocks | | | | | | | | |
| | |
| | Europe—32.5% | | | | | | | | |
| | Belgium—3.6% | | | | | | | | |
| | Anheuser-Busch InBev N.V. (Beverages) | | | 11,251 | | | $ | 1,488 | |
| | UCB S.A. (Pharmaceuticals) | | | 13,929 | | | | 1,046 | |
| | | | | | | | | 2,534 | |
| | Denmark—1.9% | | | | | | | | |
| | Novo Nordisk A/S Class “B” (Pharmaceuticals) | | | 14,183 | | | | 764 | |
| | Vestas Wind Systems A/S (Electrical equipment) | | | 8,150 | | | | 554 | |
| | | | | | | | | 1,318 | |
| | Finland—1.1% | | | | | | | | |
| | Kone Oyj Class “B” (Machinery) | | | 17,223 | | | | 795 | |
| | | | | | | | | | |
| | France—7.9% | | | | | | | | |
| | AXA S.A. (Insurance) | | | 45,230 | | | | 894 | |
| | Cap Gemini S.A. (IT services) | | | 10,687 | | | | 922 | |
| | Essilor International S.A. (Health care equipment & supplies) | | | 5,527 | | | | 727 | |
| | Thales S.A. (Aerospace & defense) | | | 10,642 | | | | 884 | |
| | Total S.A. (Oil, gas & consumable fuels) | | | 25,621 | | | | 1,229 | |
| | Veolia Environnement S.A. (Multi-utilities) | | | 44,377 | | | | 958 | |
| | | | | | | | | 5,614 | |
| | Germany—4.8% | | | | | | | | |
| | Continental AG (Auto components) | | | 4,339 | | | | 821 | |
| | Fresenius Medical Care AG & Co. KGaA (Health care providers & services) | | | 10,020 | | | | 873 | |
| | Fresenius SE & Co. KGaA (Health care providers & services) | | | 12,070 | | | | 887 | |
| | Infineon Technologies AG (Semiconductors & semiconductor equipment) | | | 56,352 | | | | 815 | |
| | | | | | | | | 3,396 | |
| | Ireland—1.1% | | | | | | | | |
| | Ryanair Holdings plc—ADR (Airlines) | | | 11,637 | | | | 809 | |
| | | | | | | | | | |
| | Italy—0.7% | | | | | | | | |
| | Intesa Sanpaolo SpA (Banks) | | | 255,441 | | | | 486 | |
| | | | | | | | | | |
| | Netherlands—4.3% | | | | | | | | |
| * | NXP Semiconductors N.V. (Semiconductors & semiconductor equipment)† | | | 10,879 | | | | 852 | |
| | Royal Dutch Shell plc Class “A” (Oil, gas & consumable fuels) | | | 55,708 | | | | 1,528 | |
| * | Sensata Technologies Holding N.V. (Electrical equipment)† | | | 18,362 | | | | 641 | |
| | | | | | | | | 3,021 | |
| | Spain—1.3% | | | | | | | | |
| | Industria de Diseno Textil S.A. (Specialty retail) | | | 27,562 | | | | 926 | |
| | | | | | | | | | |
| | Sweden—3.8% | | | | | | | | |
| | Assa Abloy AB Class “B” (Building products) | | | 42,286 | | | | 870 | |
| | Boliden AB (Metals & mining) | | | 39,100 | | | | 764 | |
| | Swedbank AB Class “A” (Banks) | | | 50,194 | | | | 1,054 | |
| | | | | | | | | 2,688 | |
| | | | | | | | |
| | Issuer | | Shares | | | Value | |
| | |
| | Common Stocks—(continued) | | | | |
| | |
| | Europe—(continued) | | | | | | | | |
| | Switzerland—2.0% | | | | | | | | |
| | Roche Holding AG (Pharmaceuticals) | | | 5,449 | | | $ | 1,438 | |
| | |
| | United Kingdom—24.3% | | | | | | | | |
| | Babcock International Group plc (Commercial services & supplies) | | | 75,425 | | | | 912 | |
| | Compass Group plc (Hotels, restaurants & leisure) | | | 91,453 | | | | 1,740 | |
| | Diageo plc (Beverages) | | | 51,800 | | | | 1,447 | |
| | Experian plc (Professional services) | | | 60,585 | | | | 1,149 | |
| | Johnson Matthey plc (Chemicals) | | | 25,145 | | | | 943 | |
| | Prudential plc (Insurance) | | | 46,791 | | | | 794 | |
| | Reckitt Benckiser Group plc (Household products) | | | 14,336 | | | | 1,437 | |
| | RELX plc (Media) | | | 74,758 | | | | 1,377 | |
| | Rio Tinto plc (Metals & mining) | | | 52,916 | | | | 1,644 | |
| | Travis Perkins plc (Trading companies & distributors) | | | 33,999 | | | | 671 | |
| | UBM plc (Media) | | | 56,579 | | | | 485 | |
| | Unilever N.V. (Personal products) | | | 45,358 | | | | 2,118 | |
| | Whitbread plc (Hotels, restaurants & leisure) | | | 9,681 | | | | 453 | |
| | Wolseley plc (Trading companies & distributors) | | | 20,502 | | | | 1,062 | |
| | WPP plc (Media) | | | 48,215 | | | | 1,005 | |
| | | | | | | | | 17,237 | |
| | Japan—16.7% | | | | | | | | |
| | Astellas Pharma, Inc. (Pharmaceuticals) | | | 29,300 | | | | 460 | |
| | Daikin Industries, Ltd. (Building products) | | | 7,318 | | | | 615 | |
| | Fuji Heavy Industries, Ltd. (Automobiles) | | | 25,072 | | | | 862 | |
| | GLP J-Reit (Real estate investment trusts (REITs)) | | | 694 | | | | 876 | |
| | Hitachi Capital Corporation (Consumer finance) | | | 32,100 | | | | 637 | |
| | Japan Exchange Group, Inc. (Diversified financial services) | | | 49,800 | | | | 573 | |
| | Kao Corporation (Personal products) | | | 23,589 | | | | 1,374 | |
| | Keyence Corporation (Electronic equipment, instruments & components) | | | 1,305 | | | | 890 | |
| | Mitsubishi UFJ Financial Group, Inc. (Banks) | | | 88,700 | | | | 398 | |
| | Nihon M&A Center, Inc. (Capital markets) | | | 9,570 | | | | 622 | |
| | Nippon Prologis REIT, Inc. (Real estate investment trusts (REITs)) | | | 511 | | | | 1,248 | |
| | Nitori Holdings Co., Ltd. (Specialty retail) | | | 5,000 | | | | 606 | |
| | ORIX Corporation (Diversified financial services) | | | 65,729 | | | | 851 | |
| | SCSK Corporation (IT services) | | | 23,763 | | | | 890 | |
| | Suruga Bank, Ltd. (Banks) | | | 42,600 | | | | 963 | |
| | | | | | | | | 11,865 | |
| | Canada—11.8% | | | | | | | | |
| | Agrium, Inc. (Chemicals)† | | | 9,202 | | | | 832 | |
| | Alimentation Couche Tard, Inc. Class “B” (Food & staples retailing) | | | 11,341 | | | | 487 | |
See accompanying Notes to Financial Statements.
| June 30, 2016 | William Blair Funds | 47 |
| International Equity Fund |
Portfolio of Investments, June 30, 2016 (all dollar amounts in thousands) (unaudited)
| | | | | | | | | | |
| | Issuer | | Shares | | | Value | |
| | |
| | Common Stocks—(continued) | | | | | | | | |
| | |
| | Canada—(continued) | | | | | | | | |
| | Canadian National Railway Co. (Road & rail)† | | | 16,673 | | | $ | 985 | |
| | Canadian Natural Resources, Ltd. (Oil, gas & consumable fuels) | | | 44,090 | | | | 1,360 | |
| | Enerplus Corporation (Oil, gas & consumable fuels) | | | 123,059 | | | | 811 | |
| | Intact Financial Corporation (Insurance) | | | 7,911 | | | | 565 | |
| | Peyto Exploration & Development Corporation (Oil, gas & consumable fuels) | | | 23,708 | | | | 636 | |
| | Silver Wheaton Corporation (Metals & mining)† | | | 48,017 | | | | 1,130 | |
| | The Toronto-Dominion Bank (Banks)† | | | 36,002 | | | | 1,546 | |
| | | | | | | | | 8,352 | |
| | Emerging Asia—7.2% | | | | | | | | |
| | China—0.8% | | | | | | | | |
| | China Everbright International, Ltd. (Commercial services & supplies) | | | 531,765 | | | | 595 | |
| | | | | | | | | | |
| | India—1.3% | | | | | | | | |
| | HDFC Bank, Ltd.—ADR (Banks) | | | 14,140 | | | | 938 | |
| | | | | | | | | | |
| | Taiwan—3.9% | | | | | | | | |
| | Largan Precision Co., Ltd. (Electronic equipment, instruments & components) | | | 11,000 | | | | 1,017 | |
| | Novatek Microelectronics Corporation (Semiconductors & semiconductor equipment) | | | 143,000 | | | | 536 | |
| | Taiwan Semiconductor Manufacturing Co., Ltd.—ADR (Semiconductors & semiconductor equipment) | | | 46,962 | | | | 1,232 | |
| | | | | | | | | 2,785 | |
| | Thailand—1.2% | | | | | | | | |
| | CP ALL PCL (Food & staples retailing) | | | 578,900 | | | | 830 | |
| | |
| | Emerging Latin America—3.9% | | | | | | | | |
| | Mexico—2.8% | | | | | | | | |
| | Grupo Aeroportuario del Pacifico S.A.B. de C.V. Class “B” (Transportation infrastructure) | | | 47,600 | | | | 489 | |
| | Grupo Financiero Santander Mexico S.A.B. de C.V. Class “B” (Banks) | | | 386,400 | | | | 701 | |
| | Wal-Mart de Mexico S.A.B. de C.V. (Food & staples retailing) | | | 343,300 | | | | 826 | |
| | | | | | | | | 2,016 | |
| | Peru—1.1% | | | | | | | | |
| | Credicorp, Ltd. (Banks)† | | | 5,279 | | | | 815 | |
| | |
| | Asia—2.8% | | | | | | | | |
| | Australia—1.0% | | | | | | | | |
| | Macquarie Group, Ltd. (Capital markets) | | | 13,380 | | | | 697 | |
| | | | | | | | | | |
| | Hong Kong—1.8% | | | | | | | | |
| | AIA Group, Ltd. (Insurance) | | | 208,386 | | | | 1,250 | |
| | | | | | | | | | |
| | Total Common Stocks—99.2% | �� | | | | | | | |
| | (cost $65,024) | | | | | | | 70,405 | |
| | | | Principal | | | | | |
| | Issuer | | Amount | | | Value | |
| | |
| | Repurchase Agreement | | | | | | | | |
| | Fixed Income Clearing Corporation, 0.030% dated 6/30/16, due 7/1/16, repurchase price $320, collateralized by FFCB, 3.020%, due 1/12/2016 | | | $320 | | | $ | 320 | |
| | | | | | | | | | |
| | Total Repurchase Agreement—0.5% | | | | | | | | |
| | (cost $320) | | | | | | | 320 | |
| | | | | | | | | | |
| | Total Investments—99.7% | | | | | | | | |
| | (cost $65,344) | | | | | | | 70,725 | |
| | Cash and other assets, less liabilities—0.3% | | | | | | | 219 | |
| | Net assets—100.0% | | | | | | $ | 70,944 | |
ADR = American Depository Receipt
* = Non-income producing security
† = U.S. listed foreign security
For securities primarily traded on exchanges or markets that close before the close of regular trading on the New York Stock Exchange, the Fund may use an independent pricing service to fair value price the securities pursuant to Valuation Procedures approved by the Board of Trustees.
At June 30, 2016, the Fund’s Portfolio of Investments includes the following industry categories (as a percentage of long-term investments):
| Financials | | | 22.5 | % |
| Industrials | | | 15.7 | % |
| Consumer Staples | | | 14.2 | % |
| Consumer Discretionary | | | 11.8 | % |
| Information Technology | | | 10.2 | % |
| Health Care | | | 8.8 | % |
| Energy | | | 7.9 | % |
| Materials | | | 7.5 | % |
| Utilities | | | 1.4 | % |
| Total | | | 100.0 | % |
At June 30, 2016, the Fund’s Portfolio of Investments includes the following currency categories (as a percentage of long-term investments):
| Euro | | | 24.7 | % |
| British Pound Sterling | | | 21.5 | % |
| Japanese Yen | | | 16.8 | % |
| U.S. Dollar | | | 13.9 | % |
| Canadian Dollar | | | 5.5 | % |
| Swedish Krona | | | 3.8 | % |
| Mexican Peso | | | 2.9 | % |
| Hong Kong Dollar | | | 2.6 | % |
| New Taiwan Dollar | | | 2.2 | % |
| Swiss Franc | | | 2.0 | % |
| Danish Krone | | | 1.9 | % |
| Thai Baht | | | 1.2 | % |
| All Other Currencies | | | 1.0 | % |
| Total | | | 100.0 | % |
See accompanying Notes to Financial Statements.
| 48 | Semiannual Report | June 30, 2016 |
| | Institutional International Equity Fund |
| | |
| | The Institutional International Equity Fund seeks long-term capital appreciation. |
| | |
| | AN OVERVIEW FROM THE PORTFOLIO MANAGERS |
| | |

David Merjan 
John C. Murphy | The William Blair Institutional International Equity Fund (Institutional Class shares) posted a 1.73% decrease, net of fees, for the six months ended June 30, 2016. By comparison, the Fund’s benchmark index, the MSCI World ex-U.S. Index (net) (the “Index”), decreased 2.98%. The Fund outpaced the Index for the first six months of 2016, benefiting from positive stock selection effects across most sectors. Stock selection in the Financials sector was the key driver of outperformance during the period, as the Fund’s Capital Markets and Real Estate Investment Trust (REIT) holdings achieved positive returns and its Bank holdings held up better than Index peers amid the low interest rate environment. Peruvian banking leader Credicorp was a notable contributor to the Fund’s relative performance, supported by solid earnings results that were highlighted by core net income growth of 25% year-over-year and Return on Equity of 20%. Another notable contributor was Japan’s Nihon M&A Center, which provides advisory services to small and medium enterprises (SMEs) facing succession-oriented challenges. The share price was bolstered by good underlying growth in transactions and a healthy deal pipeline. In addition to outperformance in the Financials sector, the Fund benefited from good stock selection in the Consumer Discretionary and Energy sectors. Partially offsetting these positive effects was the Fund’s overweighting to Industrials and weak stock selection in U.K. and European Industrials. Concerns surrounding the outcome and impact of the U.K. Brexit vote weighed on U.K. building merchant Travis Perkins’s share price during the period, although the company citied improving conditions in the repairs, maintenance and improvements markets as part of its quarterly trading (sales) update. Low cost airline Ryanair (Ireland) was another key detractor from the Fund’s performance due to a combination of softer yields post the Paris and Belgium terrorist attacks, and the negative ripple effect of rival EasyJet’s profit warning following the Brexit outcome. Utilities stock selection also weighed on the Fund’s relative performance, as Veolia Environnement (France) reported weaker revenues due to lower energy prices and reduced construction activity in its water technologies division. From a geographic perspective, the biggest contributors to relative performance during the period was stock selection in Japan and Canada, and exposure to non-Index holdings in Emerging Asia (India, Taiwan and Thailand). Please refer to the Global Markets Review and Outlook relating to the Fund on page 36. |
| June 30, 2016 | William Blair Funds | 49 |
Institutional International Equity Fund
Performance Highlights (Unaudited)
| Average Annual Total Return at 6/30/2016 |
| | | Year | | | | | | | | | | | | |
| | | to Date | | 1 Year | | 3 Year | | 5 Year | | 10 Year |
| Institutional Class | | | (1.73 | )% | | | (6.03 | )% | | | 3.92 | % | | | 3.04 | % | | | 2.03 | % |
| MSCI World Ex-U.S. Index (net) | | | (2.98 | ) | | | (9.84 | ) | | | 1.88 | | | | 1.23 | | | | 1.63 | |
Performance cited represents past performance. Past performance does not guarantee future results and current performance may be lower or higher than the data quoted. Results shown are average annual returns, which assume reinvestment of dividends and capital gains. Investment returns and principal will fluctuate and you may have a gain or loss when you sell shares. For the most current month end performance information, please call 1-800-742-7272, or visit our Web site at www.williamblairfunds.com. From time to time, the investment adviser may waive fees or reimburse expenses for the Fund. Without these waivers/reimbursements, performance would be lower. International investing involves special risk considerations, including currency fluctuations, lower liquidity, economic and political risk. Shares of the Fund are available without a sales load or distribution (12b-1) or service fees.
The performance highlights and graph presented above do not reflect the deduction of taxes that a shareholder would pay on fund distributions or the redemption of fund shares.
The Morgan Stanley Capital International (MSCI) World Ex-U.S. Index (net) is a free float-adjusted market capitalization weighted index that is designed to measure the equity market performance of developed markets, excluding the United States. This series approximates the minimum possible dividend reinvestment.
This report identifies the Fund’s investments on June 30, 2016. These holdings are subject to change. Not all stocks in the Fund performed the same, nor is there any guarantee that these stocks will perform as well in the future. Market forecasts provided in this report may not necessarily come to pass.
Sector Diversification (Unaudited)
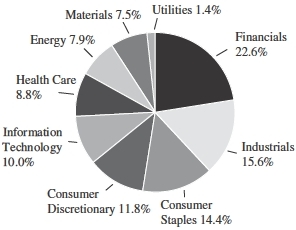
The sector diversification shown is based on the total long-term securities.
| 50 | Semiannual Report | June 30, 2016 |
Institutional International Equity Fund
Portfolio of Investments, June 30, 2016 (all dollar amounts in thousands) (unaudited)
| | | | | | | | |
| | | | | | | | |
| Issuer | | Shares | | | Value | |
| | | | | | | | | | |
| | Common Stocks | | | | | | | | |
| | | | | | | | | | |
| | Europe—32.4% | | | | | | | | |
| | Belgium—3.6% | | | | | | | | |
| | Anheuser-Busch InBev N.V. (Beverages) | | | 2,503 | | | $ | 331 | |
| | UCB S.A. (Pharmaceuticals) | | | 3,098 | | | | 233 | |
| | | | | | | | | 564 | |
| | Denmark—1.8% | | | | | | | | |
| | Novo Nordisk A/S Class “B” (Pharmaceuticals) | | | 3,155 | | | | 170 | |
| | Vestas Wind Systems A/S (Electrical equipment) | | | 1,800 | | | | 122 | |
| | | | | | | | | 292 | |
| | Finland—1.1% | | | | | | | | |
| | Kone Oyj Class “B” (Machinery) | | | 3,831 | | | | 177 | |
| | | | | | | | | | |
| | France—7.9% | | | | | | | | |
| | AXA S.A. (Insurance) | | | 10,061 | | | | 199 | |
| | Cap Gemini S.A. (IT services) | | | 2,377 | | | | 205 | |
| | Essilor International S.A. (Health care equipment & supplies) | | | 1,230 | | | | 162 | |
| | Thales S.A. (Aerospace & defense) | | | 2,378 | | | | 198 | |
| | Total S.A. (Oil, gas & consumable fuels) | | | 5,700 | | | | 273 | |
| | Veolia Environnement S.A. (Multi-utilities) | | | 9,871 | | | | 213 | |
| | | | | | | | | 1,250 | |
| | Germany—4.8% | | | | | | | | |
| | Continental AG (Auto components) | | | 965 | | | | 183 | |
| | Fresenius Medical Care AG & Co. KGaA (Health care providers & services) | | | 2,229 | | | | 194 | |
| | Fresenius SE & Co. KGaA (Health care providers & services) | | | 2,685 | | | | 197 | |
| | Infineon Technologies AG (Semiconductors & semiconductor equipment) | | | 12,535 | | | | 182 | |
| | | | | | | | | 756 | |
| | Ireland—1.1% | | | | | | | | |
| | Ryanair Holdings plc—ADR (Airlines) | | | 2,585 | | | | 180 | |
| | | | | | | | | | |
| | Italy—0.7% | | | | | | | | |
| | Intesa Sanpaolo SpA (Banks) | | | 56,891 | | | | 108 | |
| | | | | | | | | | |
| | Netherlands—4.3% | | | | | | | | |
| * | NXP Semiconductors N.V. (Semiconductors & semiconductor equipment)† | | | 2,426 | | | | 190 | |
| | Royal Dutch Shell plc Class “A” (Oil, gas & consumable fuels) | | | 12,391 | | | | 340 | |
| * | Sensata Technologies Holding N.V. (Electrical equipment)† | | | 4,085 | | | | 142 | |
| | | | | | | | | 672 | |
| | Spain—1.3% | | | | | | | | |
| | Industria de Diseno Textil S.A. (Specialty retail) | | | 6,131 | | | | 206 | |
| | | | | | | | | | |
| | Sweden—3.8% | | | | | | | | |
| | Assa Abloy AB Class “B” (Building products) | | | 9,406 | | | | 193 | |
| | Boliden AB (Metals & mining) | | | 8,698 | | | | 170 | |
| | Swedbank AB Class “A” (Banks) | | | 11,180 | | | | 235 | |
| | | | | | | | | 598 | |
| | | | | | | | |
| | | | | | | | |
| Issuer | | Shares | | | Value | |
| | | | | | | | | | |
| | Common Stocks—(continued) | | | | | | | | |
| | | | | | | | | | |
| | Europe—(continued) | | | | | | | | |
| | Switzerland—2.0% | | | | | | | | |
| | Roche Holding AG (Pharmaceuticals) | | | 1,212 | | | $ | 320 | |
| | | | | | | | | | |
| | United Kingdom—24.3% | | | | | | | | |
| | Babcock International Group plc (Commercial services & supplies) | | | 16,810 | | | | 203 | |
| | Compass Group plc (Hotels, restaurants & leisure) | | | 20,382 | | | | 388 | |
| | Diageo plc (Beverages) | | | 11,596 | | | | 324 | |
| | Experian plc (Professional services) | | | 13,477 | | | | 256 | |
| | Johnson Matthey plc (Chemicals) | | | 5,594 | | | | 210 | |
| | Prudential plc (Insurance) | | | 10,408 | | | | 177 | |
| | Reckitt Benckiser Group plc (Household products) | | | 3,189 | | | | 320 | |
| | RELX plc (Media) | | | 16,630 | | | | 306 | |
| | Rio Tinto plc (Metals & mining) | | | 11,771 | | | | 366 | |
| | Travis Perkins plc (Trading companies & distributors) | | | 7,582 | | | | 150 | |
| | UBM plc (Media) | | | 12,586 | | | | 108 | |
| | Unilever N.V. (Personal products) | | | 10,090 | | | | 471 | |
| | Whitbread plc (Hotels, restaurants & leisure) | | | 2,166 | | | | 101 | |
| | Wolseley plc (Trading companies & distributors) | | | 4,561 | | | | 236 | |
| | WPP plc (Media) | | | 10,725 | | | | 223 | |
| | | | | | | | | 3,839 | |
| | Japan—16.7% | | | | | | | | |
| | Astellas Pharma, Inc. (Pharmaceuticals) | | | 6,538 | | | | 102 | |
| | Daikin Industries, Ltd. (Building products) | | | 1,606 | | | | 135 | |
| | Fuji Heavy Industries, Ltd. (Automobiles) | | | 5,600 | | | | 192 | |
| | GLP J-Reit (Real estate investment trusts (REITs)) | | | 154 | | | | 194 | |
| | Hitachi Capital Corporation (Consumer finance) | | | 7,100 | | | | 141 | |
| | Japan Exchange Group, Inc. (Diversified financial services) | | | 11,100 | | | | 128 | |
| | Kao Corporation (Personal products) | | | 5,200 | | | | 303 | |
| | Keyence Corporation (Electronic equipment, instruments & components) | | | 300 | | | | 205 | |
| | Mitsubishi UFJ Financial Group, Inc. (Banks) | | | 19,800 | | | | 89 | |
| | Nihon M&A Center, Inc. (Capital markets) | | | 2,100 | | | | 136 | |
| | Nippon Prologis REIT, Inc. (Real estate investment trusts (REITs)) | | | 114 | | | | 278 | |
| | Nitori Holdings Co., Ltd. (Specialty retail) | | | 1,200 | | | | 146 | |
| | ORIX Corporation (Diversified financial services) | | | 14,612 | | | | 189 | |
| | SCSK Corporation (IT services) | | | 5,283 | | | | 198 | |
| | Suruga Bank, Ltd. (Banks) | | | 9,500 | | | | 215 | |
| | | | | | | | | 2,651 | |
| | Canada—11.9% | | | | | | | | |
| | Agrium, Inc. (Chemicals)† | | | 2,047 | | | | 185 | |
| | Alimentation Couche Tard, Inc. Class “B” (Food & staples retailing) | | | 3,097 | | | | 133 | |
See accompanying Notes to Financial Statements.
| June 30, 2016 | William Blair Funds | 51 |
Institutional International Equity Fund
Portfolio of Investments, June 30, 2016 (all dollar amounts in thousands) (unaudited)
| | | | | | | | |
| | | | | | | | |
| Issuer | | Shares | | | Value | |
| | | | | | | | | | |
| | Common Stocks—(continued) | | | | | | | | |
| | | | | | | | | | |
| | Canada—(continued) | | | | | | | | |
| | Canadian National Railway Co. (Road & rail)† | | | 3,709 | | | $ | 219 | |
| | Canadian Natural Resources, Ltd. (Oil, gas & consumable fuels) | | | 9,808 | | | | 303 | |
| | Enerplus Corporation (Oil, gas & consumable fuels) | | | 27,374 | | | | 180 | |
| | Intact Financial Corporation (Insurance) | | | 1,760 | | | | 126 | |
| | Peyto Exploration & Development Corporation (Oil, gas & consumable fuels) | | | 5,267 | | | | 141 | |
| | Silver Wheaton Corporation (Metals & mining)† | | | 10,681 | | | | 251 | |
| | The Toronto-Dominion Bank (Banks)† | | | 8,009 | | | | 344 | |
| | | | | | | | | 1,882 | |
| | Emerging Asia—7.0% | | | | | | | | |
| | China—0.8% | | | | | | | | |
| | China Everbright International, Ltd. (Commercial services & supplies) | | | 118,037 | | | | 132 | |
| | | | | | | | | | |
| | India—1.3% | | | | | | | | |
| | HDFC Bank, Ltd.—ADR (Banks) | | | 3,145 | | | | 209 | |
| | | | | | | | | | |
| | Taiwan—3.7% | | | | | | | | |
| | Largan Precision Co., Ltd. (Electronic equipment, instruments & components) | | | 2,000 | | | | 185 | |
| | Novatek Microelectronics Corporation (Semiconductors & semiconductor equipment) | | | 32,000 | | | | 120 | |
| | Taiwan Semiconductor Manufacturing Co., Ltd.—ADR (Semiconductors & semiconductor equipment) | | | 10,471 | | | | 275 | |
| | | | | | | | | 580 | |
| | Thailand—1.2% | | | | | | | | |
| | CP ALL PCL (Food & staples retailing) | | | 128,600 | | | | 184 | |
| | | | | | | | | | |
| | Emerging Latin America—4.0% | | | | | | | | |
| | Mexico—2.8% | | | | | | | | |
| | Grupo Aeroportuario del Pacifico S.A.B. de C.V. Class “B” (Transportation infrastructure) | | | 10,500 | | | | 108 | |
| | Grupo Financiero Santander Mexico S.A.B. de C.V. Class “B” (Banks) | | | 86,500 | | | | 157 | |
| | Wal-Mart de Mexico S.A.B. de C.V. (Food & staples retailing) | | | 76,800 | | | | 185 | |
| | | | | | | | | 450 | |
| | Peru—1.2% | | | | | | | | |
| | Credicorp, Ltd. (Banks)† | | | 1,177 | | | | 181 | |
| | | | | | | | | | |
| | Asia—2.7% | | | | | | | | |
| | Australia—1.0% | | | | | | | | |
| | Macquarie Group, Ltd. (Capital markets) | | | 2,976 | | | | 155 | |
| | | | | | | | | | |
| | Hong Kong—1.7% | | | | | | | | |
| | AIA Group, Ltd. (Insurance) | | | 46,271 | | | | 278 | |
| | Total Common Stocks—99.0%
(cost $14,731) | | | | | | | 15,664 | |
| | | | | | | | |
| | | | Principal | | | | |
| Issuer | | Amount | | | Value | |
| | | | | | | | | | |
| | Repurchase Agreement | | | | | | | | |
| | Fixed Income Clearing Corporation, 0.030% dated 6/30/16, due 7/1/16, repurchase price $117, collateralized by FNMA, 7.125%, due 1/15/30 | | $ | 117 | | | $ | 117 | |
| | | | | | | | | | |
| | Total Repurchase Agreement—0.8%
(cost $117) | | | | | | | 117 | |
| | | | | | | | | | |
| | Total Investments—99.8%
(cost $14,848) | | | | | | | 15,781 | |
| | Cash and other assets, less liabilities—0.2% | | | | | | | 37 | |
| | Net assets—100.0% | | | | | | $ | 15,818 | |
ADR = American Depository Receipt
* = Non-income producing security
† = U.S. listed foreign security
For securities primarily traded on exchanges or markets that close before the close of regular trading on the New York Stock Exchange, the Fund may use an independent pricing service to fair value price the securities pursuant to Valuation Procedures approved by the Board of Trustees.
At June 30, 2016, the Fund’s Portfolio of Investments includes the following industry categories (as a percentage of long-term investments):
| Financials | 22.6% |
| Industrials | 15.6% |
| Consumer Staples | 14.4% |
| Consumer Discretionary | 11.8% |
| Information Technology | 10.0% |
| Health Care | 8.8% |
| Energy | 7.9% |
| Materials | 7.5% |
| Utilities | 1.4% |
| Total | 100.0% |
| |
At June 30, 2016, the Fund’s Portfolio of Investments includes the following currency categories (as a percentage of long-term investments):
| Euro | 24.7% |
| British Pound Sterling | 21.5% |
| Japanese Yen | 16.9% |
| U.S. Dollar | 13.9% |
| Canadian Dollar | 5.6% |
| Swedish Krona | 3.8% |
| Mexican Peso | 2.9% |
| Hong Kong Dollar | 2.6% |
| Swiss Franc | 2.0% |
| New Taiwan Dollar | 2.0% |
| Danish Krone | 1.9% |
| Thai Baht | 1.2% |
| All Other Currencies | 1.0% |
| Total | 100.0% |
See accompanying Notes to Financial Statements.
| 52 | Semiannual Report | June 30, 2016 |
| | International Growth Fund |
| | |
| | The International Growth Fund seeks long-term capital appreciation. |
| | |
| | AN OVERVIEW FROM THE PORTFOLIO MANAGERS |
| | |
 Stephanie G. Braming 
Simon Fennell 
Jeffrey A. Urbina | The William Blair International Growth Fund (Class N shares) posted a 3.81% decrease, net of fees, for the six months ended June 30, 2016. By comparison, the Fund’s benchmark index, the MSCI All Country World ex-U.S. IMI Index (net) (the “Index”), decreased 0.91%. Style headwinds during the February-April timeframe were a broad detractor from the Fund’s relative performance during the six-month period, as higher growth, higher valuation companies with stronger earnings trends, which the Fund focuses on, significantly underperformed lower valuation companies with relatively weak earnings trends. From a sector perspective, Materials stock selection was the largest detractor from the Fund’s relative performance year to date. The Fund’s Chemicals holdings lagged the Index, as Korea-based LG Chem was adversely impacted by weaker sales trends in its LCD/smartphone business. The lack of exposure to Metals & Mining companies also detracted from the Fund’s overall Materials sector performance. Among other sectors, stock selection in Financials, Consumer Finance, and Real Estate, combined with the Fund’s Insurance industry overweighting, detracted from the Fund’s relative performance during the six-month period. These effects were partially mitigated by good stock selection in Consumer Staples, Healthcare, Industrials and Telecommunication Services. Within Consumer Staples, Japanese cosmetics/personal care company Kao was a leading contributor to the Fund’s performance, supported by improved domestic cosmetic and household sales trends, continued strong growth in China (+48% revenue growth for 1Q versus the prior year) and lower costs. From a geographic perspective, the Fund’s overweightings to Europe and the U.K., combined with the underweighting to Emerging Markets compared to the Index, detracted from the Fund’s relative performance. Stock selection in the U.K. also detracted from the Fund’s performance, principally in the Financials and Materials sectors, offsetting the positive impacts of the Fund’s Japanese and Latin American stock selection. Please refer to the Global Markets Review and Outlook relating to the Fund on page 36. |
| | |
| June 30, 2016 | William Blair Funds | 53 |
International Growth Fund
Performance Highlights (Unaudited)
| Average Annual Total Return at 6/30/2016 |
| | | Year
to Date | | 1 Year | | 3 Year | | 5 Year | | 10 Year |
| Class N | | | (3.81 | )% | | | (9.52 | )% | | | 2.60 | % | | | 2.69 | % | | | 2.67 | % |
| Class I | | | (3.65 | ) | | | (9.26 | ) | | | 2.91 | | | | 2.99 | | | | 2.97 | |
| MSCI ACW Ex-U.S. IMI (net) | | | (0.91 | ) | | | (9.61 | ) | | | 1.65 | | | | 0.39 | | | | 2.16 | |
Performance cited represents past performance. Past performance does not guarantee future results and current performance may be lower or higher than the data quoted. Results shown are average annual total returns, which assume reinvestment of dividends and capital gains. Investment returns and principal will fluctuate and you may have a gain or loss when you sell shares. For the most current month-end performance information, please call 1-800-742-7272, or visit our Web site at www.williamblairfunds.com. From time to time, the investment adviser may waive fees or reimburse expenses for the Fund. Without these waivers/reimbursements, performance would be lower. International investing involves special risk considerations, including currency fluctuations, lower liquidity, economic and political risk. Class N shares are available to the general public without a sales load. Class I shares are available to certain institutional investors and advisory clients of William Blair Investment Management, LLC and William Blair & Company, L.L.C., without a sales load or distribution (12b-1) or service fees.
The performance highlights and graph presented above do not reflect the deduction of taxes that a shareholder would pay on fund distributions or the redemption of fund shares.
The Morgan Stanley Capital International (MSCI) All Country World (ACW) Ex-U.S. Investable Market Index (IMI) (net) is a free float-adjusted market capitalization weighted index that is designed to measure the equity market performance of developed and emerging markets, excluding the United States. This series approximates the minimum possible dividend reinvestment.
This report identifies the Fund’s investments on June 30, 2016. These holdings are subject to change. Not all stocks in the Fund performed the same, nor is there any guarantee that these stocks will perform as well in the future. Market forecasts provided in this report may not necessarily come to pass.
Sector Diversification (Unaudited)
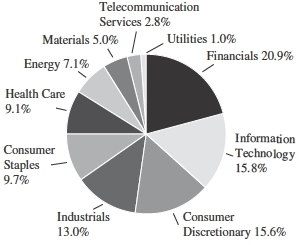
The sector diversification shown is based on the total long-term securities.
| 54 | Semiannual Report | June 30, 2016 |
International Growth Fund
Portfolio of Investments, June 30, 2016 (all dollar amounts in thousands) (unaudited)
| | | | | | | |
| | | | | | | | |
| Issuer | | Shares | | | Value | |
| | |
| | Common Stocks | | | | | | |
| | |
| | Europe, Mid-East—39.2% | | | | | | | | |
| | Belgium—0.6% | | | | | | | | |
| | Colruyt S.A. (Food & staples retailing) | | | 138,177 | | | $ | 7,647 | |
| * | Telenet Group Holding N.V. (Media) | | | 262,155 | | | | 11,987 | |
| | | | | | | | | 19,634 | |
| | Denmark—3.2% | | | | | | | | |
| | Coloplast A/S Class “B” (Health care equipment & supplies) | | | 165,033 | | | | 12,353 | |
| | DSV A/S (Road & rail) | | | 325,618 | | | | 13,692 | |
| | ISS A/S (Commercial services & supplies) | | | 344,389 | | | | 12,953 | |
| | Novo Nordisk A/S Class “B” (Pharmaceuticals) | | | 518,471 | | | | 27,921 | |
| | Pandora A/S (Textiles, apparel & luxury goods) | | | 154,549 | | | | 21,049 | |
| | Vestas Wind Systems A/S (Electrical equipment) | | | 235,253 | | | | 15,990 | |
| | | | | | | | | 103,958 | |
| | Finland—1.5% | | | | | | | | |
| | Elisa Oyj (Diversified telecommunication services) | | | 181,589 | | | | 6,977 | |
| | Huhtamaki Oyj (Containers & packaging) | | | 153,103 | | | | 6,354 | |
| | Kone Oyj Class “B” (Machinery) | | | 753,795 | | | | 34,788 | |
| | | | | | | | | 48,119 | |
| | France—11.1% | | | | | | | | |
| | Atos SE (IT services) | | | 186,865 | | | | 15,407 | |
| | Cap Gemini S.A. (IT services) | | | 276,225 | | | | 23,836 | |
| | Christian Dior SE (Textiles, apparel & luxury goods) | | | 86,204 | | | | 13,809 | |
| | Essilor International S.A. (Health care equipment & supplies) | | | 106,759 | | | | 14,031 | |
| | Hermes International (Textiles, apparel & luxury goods) | | | 28,781 | | | | 10,729 | |
| | Ipsen S.A. (Pharmaceuticals) | | | 80,761 | | | | 4,948 | |
| | Nexity S.A. (Real estate management & development) | | | 93,526 | | | | 4,731 | |
| | Orpea (Health care providers & services) | | | 65,154 | | | | 5,342 | |
| | Plastic Omnium S.A. (Auto components) | | | 254,103 | | | | 7,104 | |
| | Rubis SCA (Gas utilities) | | | 64,596 | | | | 4,938 | |
| | Safran S.A. (Aerospace & defense) | | | 469,869 | | | | 31,642 | |
| | SEB S.A. (Household durables) | | | 48,214 | | | | 5,814 | |
| | Sodexo S.A. (Hotels, restaurants & leisure) | | | 147,170 | | | | 15,766 | |
| | Technicolor S.A. (Media) | | | 628,955 | | | | 3,895 | |
| | Thales S.A. (Aerospace & defense) | | | 228,287 | | | | 18,958 | |
| | Total S.A. (Oil, gas & consumable fuels) | | | 1,329,389 | | | | 63,752 | |
| | Unibail-Rodamco SE (Real estate investment trusts (REITs)) | | | 74,560 | | | | 19,288 | |
| | Valeo S.A. (Auto components) | | | 669,450 | | | | 29,720 | |
| | Veolia Environnement S.A. (Multi-utilities) | | | 832,400 | | | | 17,975 | |
| | Vinci S.A. (Construction & engineering) | | | 658,706 | | | | 46,483 | |
| | | | | | | | | 358,168 | |
| | Germany—3.7% | | | | | | | | |
| | Continental AG (Auto components) | | | 138,043 | | | | 26,121 | |
| | Deutsche Wohnen AG (Real estate management & development) | | | 263,854 | | | | 8,984 | |
| | | | | | | |
| | | | | | | | |
| Issuer | | Shares | | | Value | |
| | |
| | Common Stocks—(continued) | | | | | | |
| | |
| | Europe, Mid-East—(continued) | | | | | | | | |
| | Germany—(continued) | | | | | | | | |
| | Evonik Industries AG (Chemicals) | | | 209,692 | | | $ | 6,251 | |
| | Gerresheimer AG (Life sciences tools & services) | | | 64,340 | | | | 4,956 | |
| | KION Group AG (Machinery) | | | 85,064 | | | | 4,123 | |
| | ProSiebenSat.1 Media SE (Media) | | | 527,360 | | | | 23,068 | |
| | SAP SE (Software) | | | 369,214 | | | | 27,730 | |
| | TUI AG (Hotels, restaurants & leisure) | | | 956,812 | | | | 10,868 | |
| | Vonovia SE (Real estate management & development) | | | 236,788 | | | | 8,646 | |
| | | | | | | | | 120,747 | |
| | Ireland—3.0% | | | | | | | | |
| | CRH plc (Construction materials) | | | 909,130 | | | | 26,492 | |
| | Greencore Group plc (Food products) | | | 927,738 | | | | 3,818 | |
| * | ICON plc (Life sciences tools & services)† | | | 238,273 | | | | 16,682 | |
| | Kingspan Group plc (Building products) | | | 276,423 | | | | 5,989 | |
| | Shire plc (Biotechnology) | | | 738,304 | | | | 45,629 | |
| | | | | | | | | 98,610 | |
| | Israel—1.5% | | | | | | | | |
| * | Check Point Software Technologies, Ltd. (Software)† | | | 379,124 | | | | 30,209 | |
| | Teva Pharmaceutical Industries, Ltd.—ADR (Pharmaceuticals) | | | 392,681 | | | | 19,724 | |
| | | | | | | | | 49,933 | |
| | Italy—0.9% | | | | | | | | |
| | Azimut Holding SpA (Capital markets) | | | 400,615 | | | | 6,536 | |
| | Banca Generali SpA (Capital markets) | | | 425,523 | | | | 8,529 | |
| | Brembo SpA (Auto components) | | | 83,166 | | | | 4,581 | |
| | Interpump Group SpA (Machinery) | | | 137,569 | | | | 2,156 | |
| | Recordati SpA (Pharmaceuticals) | | | 185,967 | | | | 5,594 | |
| * | Yoox Net-A-Porter Group SpA (Internet & catalog retail) | | | 58,042 | | | | 1,347 | |
| | | | | | | | | 28,743 | |
| | Luxembourg—0.4% | | | | | | | | |
| | Eurofins Scientific SE (Life sciences tools & services) | | | 27,385 | | | | 10,145 | |
| * | RTL Group (Media) | | | 54,610 | | | | 4,460 | |
| | | | | | | | | 14,605 | |
| | Netherlands—3.6% | | | | | | | | |
| | GrandVision N.V.—144A (Specialty retail) | | | 157,281 | | | | 4,068 | |
| * | NXP Semiconductors N.V. (Semiconductors & semiconductor equipment)† | | | 350,343 | | | | 27,446 | |
| | Royal Dutch Shell plc Class “A” (Oil, gas & consumable fuels) | | | 2,002,254 | | | | 54,923 | |
| | Wolters Kluwer N.V. (Media) | | | 756,189 | | | | 30,619 | |
| | | | | | | | | 117,056 | |
| | Norway—0.4% | | | | | | | | |
| | Gjensidige Forsikring ASA (Insurance) | | | 684,861 | | | | 11,410 | |
| | | | | | | | | | |
| | Portugal—0.4% | | | | | | | | |
| | Jeronimo Martins SGPS S.A. (Food & staples retailing) | | | 738,057 | | | | 11,641 | |
See accompanying Notes to Financial Statements.
| June 30, 2016 | William Blair Funds | 55 |
International Growth Fund
Portfolio of Investments, June 30, 2016 (all dollar amounts in thousands) (unaudited)
| | | | | | | |
| | | | | | | |
| Issuer | | Shares | | | Value | |
| | |
| | Common Stocks—(continued) | | | | | | |
| | |
| | Europe, Mid-East—(continued) | | | | | | | | |
| | Spain—1.9% | | | | | | | | |
| | Amadeus IT Holding S.A. Class “A” (IT services) | | | 530,621 | | | $ | 23,378 | |
| | Bankinter S.A. (Banks) | | | 1,998,809 | | | | 12,903 | |
| | Industria de Diseno Textil S.A. (Specialty retail) | | | 765,203 | | | | 25,706 | |
| | | | | | | | | 61,987 | |
| | Sweden—2.7% | | | | | | | | |
| | Assa Abloy AB Class “B” (Building products) | | | 714,484 | | | | 14,699 | |
| | BillerudKorsnas AB (Containers & packaging) | | | 277,607 | | | | 4,143 | |
| | Boliden AB (Metals & mining) | | | 271,408 | | | | 5,304 | |
| | Fabege AB (Real estate management & development) | | | 136,488 | | | | 2,321 | |
| | Hexagon AB Class “B” (Electronic equipment, instruments & components) | | | 423,596 | | | | 15,502 | |
| | Hexpol AB (Chemicals) | | | 531,578 | | | | 5,459 | |
| | Intrum Justitia AB (Commercial services & supplies) | | | 227,981 | | | | 7,150 | |
| | Swedbank AB Class “A” (Banks) | | | 1,540,402 | | | | 32,353 | |
| | | | | | | | | 86,931 | |
| | Switzerland—4.3% | | | | | | | | |
| | Actelion, Ltd. (Biotechnology) | | | 203,534 | | | | 34,275 | |
| * | Cembra Money Bank AG (Consumer finance) | | | 53,791 | | | | 3,762 | |
| * | Clariant AG (Chemicals) | | | 824,083 | | | | 13,926 | |
| | dorma+kaba Holding AG (Commercial services & supplies) | | | 6,843 | | | | 4,781 | |
| | Logitech International S.A. (Technology hardware, storage & peripherals) | | | 502,947 | | | | 8,177 | |
| * | Lonza Group AG (Life sciences tools & services) | | | 133,508 | | | | 22,177 | |
| * | Luxoft Holding, Inc. (IT services)† | | | 72,194 | | | | 3,756 | |
| | Partners Group Holding AG (Capital markets) | | | 92,978 | | | | 39,847 | |
| | Straumann Holding AG (Health care equipment & supplies) | | | 17,713 | | | | 6,988 | |
| | | | | | | | | 137,689 | |
| | Japan—14.2% | | | | | | | | |
| | Ain Pharmaciez, Inc. (Food & staples retailing) | | | 68,600 | | | | 5,321 | |
| | Alps Electric Co., Ltd. (Electronic equipment, instruments & components) | | | 275,800 | | | | 5,240 | |
| | Asahi Intecc Co., Ltd. (Health care equipment & supplies) | | | 98,800 | | | | 4,828 | |
| | Daicel Corporation (Chemicals) | | | 438,700 | | | | 4,546 | |
| | Daifuku Co., Ltd. (Machinery) | | | 323,426 | | | | 5,792 | |
| | Daikin Industries, Ltd. (Building products) | | | 416,000 | | | | 34,963 | |
| | Daito Trust Construction Co., Ltd. (Real estate management & development) | | | 56,900 | | | | 9,238 | |
| | Daiwa House Industry Co., Ltd. (Real estate management & development) | | | 1,033,900 | | | | 30,363 | |
| | | | | | | | |
| | | | | | | | |
| Issuer | | Shares | | | Value | |
| | |
| | Common Stocks—(continued) | | | | | | |
| | |
| | Japan—(continued) | | | | | | | | |
| | Fuji Heavy Industries, Ltd. (Automobiles) | | | 729,900 | | | $ | 25,089 | |
| | Haseko Corporation (Household durables) | | | 411,600 | | | | 4,144 | |
| | IT Holdings Corporation (IT services) | | | 218,900 | | | | 5,041 | |
| | Kao Corporation (Personal products) | | | 646,500 | | | | 37,654 | |
| | KDDI Corporation (Wireless telecommunication services) | | | 1,534,000 | | | | 46,649 | |
| | Keyence Corporation (Electronic equipment, instruments & components) | | | 57,400 | | | | 39,166 | |
| | Lawson, Inc. (Food & staples retailing) | | | 95,300 | | | | 7,608 | |
| | M3, Inc. (Health care technology) | | | 346,900 | | | | 12,107 | |
| | Makita Corporation (Machinery) | | | 163,400 | | | | 10,849 | |
| | Nihon M&A Center, Inc. (Capital markets) | | | 76,400 | | | | 4,962 | |
| | Nippon Prologis REIT, Inc. (Real estate investment trusts (REITs)) | | | 2,400 | | | | 5,863 | |
| | Nissan Chemical Industries, Ltd. (Chemicals) | | | 255,000 | | | | 7,440 | |
| | Nitori Holdings Co., Ltd. (Specialty retail) | | | 142,500 | | | | 17,283 | |
| | ORIX Corporation (Diversified financial services) | | | 3,023,500 | | | | 39,126 | |
| | Park24 Co., Ltd. (Commercial services & supplies) | | | 143,300 | | | | 4,924 | |
| | Pola Orbis Holdings, Inc. (Personal products) | | | 97,000 | | | | 9,129 | |
| | Sawai Pharmaceutical Co., Ltd. (Pharmaceuticals) | | | 74,900 | | | | 5,806 | |
| | SCSK Corporation (IT services) | | | 181,100 | | | | 6,784 | |
| | Shionogi & Co., Ltd. (Pharmaceuticals) | | | 541,000 | | | | 29,574 | |
| | Taisei Corporation (Construction & engineering) | | | 2,404,000 | | | | 19,753 | |
| | Temp Holdings Co., Ltd. (Professional services) | | | 341,500 | | | | 5,917 | |
| | Tsuruha Holdings, Inc. (Food & staples retailing) | | | 96,700 | | | | 11,709 | |
| | Zenkoku Hosho Co., Ltd. (Diversified financial services) | | | 119,000 | | | | 4,346 | |
| | | | | | | | | 461,214 | |
| | United Kingdom—14.1% | | | | | | | | |
| | Admiral Group plc (Insurance) | | | 403,908 | | | | 10,982 | |
| | Babcock International Group plc (Commercial services & supplies) | | | 589,137 | | | | 7,123 | |
| | Berkeley Group Holdings plc (Household durables) | | | 273,696 | | | | 9,242 | |
| | Bunzl plc (Trading companies & distributors) | | | 564,999 | | | | 17,384 | |
| | Cineworld Group plc (Media) | | | 618,632 | | | | 4,513 | |
| | Compass Group plc (Hotels, restaurants & leisure) | | | 2,086,333 | | | | 39,693 | |
| | Croda International plc (Chemicals) | | | 174,984 | | | | 7,346 | |
| | Derwent London plc (Real estate investment trusts (REITs)) | | | 161,618 | | | | 5,639 | |
| | Domino’s Pizza Group plc (Hotels, restaurants & leisure) | | | 1,079,922 | | | | 4,798 | |
| | Essentra plc (Chemicals) | | | 542,840 | | | | 3,725 | |
| | Experian plc (Professional services) | | | 1,702,137 | | | | 32,293 | |
See accompanying Notes to Financial Statements.
| 56 | Semiannual Report | June 30, 2016 |
International Growth Fund
Portfolio of Investments, June 30, 2016 (all dollar amounts in thousands) (unaudited)
| | | | | | | |
| | | | | | | |
| Issuer | | Shares | | | Value | |
| | |
| | Common Stocks—(continued) | | | | | | |
| | |
| | United Kingdom—(continued) | | | | | | | | |
| | Halma plc (Electronic equipment, instruments & components) | | | 654,978 | | | $ | 8,908 | |
| | Hiscox, Ltd. (Insurance) | | | 678,448 | | | | 9,368 | |
| | Intermediate Capital Group plc (Capital markets) | | | 469,811 | | | | 3,078 | |
| | Intertek Group plc (Professional services) | | | 326,502 | | | | 15,213 | |
| | Johnson Matthey plc (Chemicals) | | | 432,593 | | | | 16,225 | |
| | Jupiter Fund Management plc (Capital markets) | | | 785,068 | | | | 3,855 | |
| | Micro Focus International plc (Software) | | | 410,298 | | | | 8,852 | |
| | Moneysupermarket.com Group plc (Internet software & services) | | | 1,015,858 | | | | 3,681 | |
| | Provident Financial plc (Consumer finance) | | | 248,102 | | | | 7,650 | |
| | Prudential plc (Insurance) | | | 1,212,927 | | | | 20,582 | |
| | Reckitt Benckiser Group plc (Household products) | | | 471,204 | | | | 47,248 | |
| | Rio Tinto, Ltd. (Metals & mining) | | | 837,534 | | | | 28,971 | |
| | Spirax-Sarco Engineering plc (Machinery) | | | 164,383 | | | | 8,231 | |
| | The Sage Group plc (Software) | | | 1,662,192 | | | | 14,367 | |
| | UBM plc (Media) | | | 1,014,817 | | | | 8,703 | |
| | Unilever plc (Personal products) | | | 1,027,799 | | | | 49,247 | |
| | WH Smith plc (Specialty retail) | | | 194,117 | | | | 4,078 | |
| | Wolseley plc (Trading companies & distributors) | | | 485,795 | | | | 25,156 | |
| | WPP plc (Media) | | | 1,401,011 | | | | 29,199 | |
| | | | | | | | | 455,350 | |
| | Emerging Asia—12.0% | | | | | | | | |
| | China—3.0% | | | | | | | | |
| | China Overseas Land & Investment, Ltd. (Real estate management & development) | | | 4,964,000 | | | | 15,824 | |
| | ENN Energy Holdings, Ltd. (Gas utilities) | | | 1,744,000 | | | | 8,661 | |
| | NetEase, Inc.—ADR (Internet software & services) | | | 126,396 | | | | 24,422 | |
| | PICC Property & Casualty Co., Ltd. Class “H” (Insurance) | | | 7,428,000 | | | | 11,731 | |
| | Tencent Holdings, Ltd. (Internet software & services) | | | 1,644,300 | | | | 37,763 | |
| | | | | | | | | 98,401 | |
| | India—3.0% | | | | | | | | |
| | Axis Bank, Ltd. (Banks) | | | 1,635,464 | | | | 12,996 | |
| | Bharat Petroleum Corporation, Ltd. (Oil, gas & consumable fuels) | | | 395,557 | | | | 6,322 | |
| | Eicher Motors, Ltd. (Machinery) | | | 16,637 | | | | 4,735 | |
| | HDFC Bank, Ltd. (Banks) | | | 874,234 | | | | 15,249 | |
| | IndusInd Bank, Ltd. (Banks) | | | 609,309 | | | | 10,058 | |
| | Maruti Suzuki India, Ltd. (Automobiles) | | | 140,188 | | | | 8,741 | |
| | Tata Consultancy Services, Ltd. (IT services) | | | 670,401 | | | | 25,357 | |
| | Yes Bank, Ltd. (Banks) | | | 760,720 | | | | 12,476 | |
| | | | | | | | | 95,934 | |
| | Indonesia—0.5% | | | | | | | | |
| | PT Bank Central Asia Tbk (Banks) | | | 15,762,200 | | | | 15,960 | |
| | | | | | | |
| | | | | | | |
| Issuer | | Shares | | | Value | |
| | |
| | Common Stocks—(continued) | | | | | | |
| | |
| | Emerging Asia—(continued) | | | | | | | | |
| | South Korea—3.6% | | | | | | | | |
| | Amorepacific Corporation (Personal products) | | | 35,787 | | | $ | 13,491 | |
| | KT&G Corporation (Tobacco) | | | 107,019 | | | | 12,675 | |
| | LG Chem, Ltd. (Chemicals) | | | 58,280 | | | | 13,309 | |
| | NAVER Corporation (Internet software & services) | | | 13,307 | | | | 8,244 | |
| | Samsung Electronics Co., Ltd. (Technology hardware, storage & peripherals) | | | 45,391 | | | | 56,528 | |
| | SK Hynix, Inc. (Semiconductors & semiconductor equipment) | | | 470,060 | | | | 13,376 | |
| | | | | | | | | 117,623 | |
| | Taiwan—1.9% | | | | | | | | |
| | Largan Precision Co., Ltd. (Electronic equipment, instruments & components) | | | 184,000 | | | | 17,017 | |
| | Taiwan Semiconductor Manufacturing Co., Ltd.—ADR (Semiconductors & semiconductor equipment) | | | 1,632,476 | | | | 42,820 | |
| | | | | | | | | 59,837 | |
| | Canada—6.9% | | | | | | | | |
| | Alimentation Couche Tard, Inc. Class “B” (Food & staples retailing) | | | 248,500 | | | | 10,671 | |
| | Brookfield Asset Management, Inc. Class “A” (Real estate management & development)† | | | 865,392 | | | | 28,619 | |
| | Canadian Natural Resources, Ltd. (Oil, gas & consumable fuels) | | | 824,022 | | | | 25,423 | |
| | Constellation Software, Inc. (Software) | | | 14,656 | | | | 5,672 | |
| | Dollarama, Inc. (Multiline retail) | | | 260,076 | | | | 18,158 | |
| | Enbridge, Inc. (Oil, gas & consumable fuels) | | | 940,406 | | | | 39,838 | |
| | Intact Financial Corporation (Insurance) | | | 149,812 | | | | 10,702 | |
| | Suncor Energy, Inc. (Oil, gas & consumable fuels) | | | 1,157,540 | | | | 32,111 | |
| | The Toronto-Dominion Bank (Banks) | | | 1,210,101 | | | | 51,965 | |
| | | | | | | | | 223,159 | |
| | Asia—5.1% | | | | | | | | |
| | Australia—2.2% | | | | | | | | |
| | Domino’s Pizza Enterprises, Ltd. (Hotels, restaurants & leisure) | | | 64,986 | | | | 3,344 | |
| | James Hardie Industries plc (Construction materials) | | | 584,159 | | | | 9,047 | |
| | JB Hi-Fi, Ltd. (Specialty retail) | | | 277,580 | | | | 5,030 | |
| | LendLease Group (Real estate management & development) | | | 1,089,322 | | | | 10,348 | |
| | Macquarie Group, Ltd. (Capital markets) | | | 737,897 | | | | 38,411 | |
| | Vicinity Centres (Real estate investment trusts (REITs)) | | | 2,104,755 | | | | 5,251 | |
| | | | | | | | | 71,431 | |
See accompanying Notes to Financial Statements.
| June 30, 2016 | William Blair Funds | 57 |
International Growth Fund
Portfolio of Investments, June 30, 2016 (all dollar amounts in thousands) (unaudited)
| | | | | | | |
| | | | | | | |
| | | | | | | |
| Issuer | | Shares | | | Value | |
| | |
| | Common Stocks—(continued) | | | | | | |
| | |
| | Asia—(continued) | | | | | | | | |
| | Hong Kong—1.7% | | | | | | | | |
| | AIA Group, Ltd. (Insurance) | | | 6,486,200 | | | $ | 38,922 | |
| * | China High Precision Automation Group, Ltd. (Electronic equipment, instruments & components)**§ | | | 6,597,000 | | | | — | |
| | Techtronic Industries Co., Ltd. (Household durables) | | | 4,083,500 | | | | 17,053 | |
| | | | | | | | | 55,975 | |
| | New Zealand—0.2% | | | | | | | | |
| | Fisher & Paykel Healthcare Corp., Ltd. (Health care equipment & supplies) | | | 665,851 | | | | 4,784 | |
| | | | | | | | | | |
| | Singapore—1.0% | | | | | | | | |
| | Singapore Telecommunications, Ltd. (Diversified telecommunication services) | | | 10,691,100 | | | | 33,020 | |
| | |
| | Emerging Latin America—3.2% | | | | | | | | |
| | Brazil—1.9% | | | | | | | | |
| | AMBEV S.A.—ADR (Beverages) | | | 7,647,822 | | | | 45,199 | |
| | BB Seguridade Participacoes S.A. (Insurance) | | | 1,670,600 | | | | 14,619 | |
| | | | | | | | | 59,818 | |
| | Mexico—0.6% | | | | | | | | |
| | Arca Continental S.A.B. de C.V. (Beverages) | | | 1,656,982 | | | | 11,892 | |
| | Fomento Economico Mexicano S.A.B.de C.V.—ADR (Beverages) | | | 75,919 | | | | 7,021 | |
| | | | | | | | | 18,913 | |
| | Peru—0.7% | | | | | | | | |
| | Credicorp, Ltd. (Banks)† | | | 153,291 | | | | 23,657 | |
| | |
| | Emerging Europe, Mid-East, Africa—2.6% | | | | | | | | |
| | South Africa—1.9% | | | | | | | | |
| * | Bid Corporation, Ltd. (Food & staples retailing) | | | 317,313 | | | | 5,946 | |
| | Bidvest Group, Ltd. (Industrial conglomerates) | | | 317,313 | | | | 2,994 | |
| | Naspers, Ltd. (Media) | | | 163,940 | | | | 25,033 | |
| | Sanlam, Ltd. (Insurance) | | | 1,686,936 | | | | 6,969 | |
| | Steinhoff International Holdings N.V. (Household durables) | | | 2,701,602 | | | | 15,498 | |
| | The Spar Group, Ltd. (Food & staples retailing) | | | 510,000 | | | | 7,003 | |
| | | | | | | | | 63,443 | |
| | Turkey—0.4% | | | | | | | | |
| | Turkiye Garanti Bankasi A.S. (Banks) | | | 4,572,452 | | | | 12,078 | |
| | | | | | | | | | |
| | United Arab Emirates—0.3% | | | | | | | | |
| | Dubai Islamic Bank PJSC (Banks) | | | 6,892,499 | | | | 9,632 | |
| | | | | | | | | | |
| | Total Common Stocks—97.3%
(cost $2,919,142) | | | | | | | 3,149,460 | |
| | | | | | | | |
| | | | Shares or | | | | |
| | | | Principal | | | | |
| Issuer | | Amount | | | Value | |
| | |
| | Affiliated Fund | | | | | | | | |
| | China—0.0% | | | | | | | | |
| | William Blair China A-Share Fund, LLC§ | | | 10,158 | | | $ | 174 | |
| | Total Affiliated Fund—0.0%
(cost $102) | | | | | | | 174 | |
| | |
| | Repurchase Agreement | | | | | | | | |
| | Fixed Income Clearing Corporation, 0.030% dated 6/30/16, due 7/1/16, repurchase price $84,835, collateralized by FFCB, 3.020%, due 1/12/26, and FNMA, 6.250%-7.125%, due 5/15/29-1/15/30. | | | $84,835 | | | | 84,835 | |
| | | | | | | | | | |
| | Total Repurchase Agreement—2.6%
(cost $84,835) | | | | | | | 84,835 | |
| | | | | | | | | | |
| | Total Investments—99.9%
(cost $3,004,079) | | | | | | | 3,234,469 | |
| | Cash and other assets, less liabilities—0.1% | | | | | | | 1,871 | |
| | Net assets—100.0% | | | | | | $ | 3,236,340 | |
ADR = American Depository Receipt
* = Non-income producing security
† = U.S. listed foreign security
** = Fair valued pursuant to Valuation Procedures approved by the Board of Trustees. This holding represents 0.00% of the Fund’s net assets at June 30, 2016.
§ = Deemed illiquid pursuant to Liquidity Procedures approved by the Board of Trustees. This holding represents 0.01% of the Fund’s net assets at June 30, 2016.
For securities primarily traded on exchanges or markets that close before the close of regular trading on the New York Stock Exchange, the Fund may use an independent pricing service to fair value price the securities pursuant to Valuation Procedures approved by the Board of Trustees.
See accompanying Notes to Financial Statements.
| 58 | Semiannual Report | June 30, 2016 |
International Growth Fund
Portfolio of Investments, June 30, 2016 (all dollar amounts in thousands) (unaudited)
At June 30, 2016, the Fund’s Portfolio of Investments includes the following industry categories (as a percentage of long-term investments):
| Financials | | 20.9 | % |
| Information Technology | | 15.8 | % |
| Consumer Discretionary | | 15.6 | % |
| Industrials | | 13.0 | % |
| Consumer Staples | | 9.7 | % |
| Health Care | | 9.1 | % |
| Energy | | 7.1 | % |
| Materials | | 5.0 | % |
| Telecommunication Services | | 2.8 | % |
| Utilities | | 1.0 | % |
| Total | | 100.0 | % |
At June 30, 2016, the Fund’s Portfolio of Investments includes the following currency categories (as a percentage of long-term investments):
| Euro | | 24.9 | % |
| British Pound Sterling | | 15.1 | % |
| Japanese Yen | | 14.6 | % |
| U.S. Dollar | | 8.6 | % |
| Canadian Dollar | | 6.2 | % |
| Swiss Franc | | 4.3 | % |
| Hong Kong Dollar | | 4.1 | % |
| South Korean Won | | 3.7 | % |
| Danish Krone | | 3.3 | % |
| Australian Dollar | | 3.2 | % |
| Indian Rupee | | 3.0 | % |
| Swedish Krona | | 2.8 | % |
| South African Rand | | 2.0 | % |
| Singapore Dollar | | 1.1 | % |
| All Other Currencies | | 3.1 | % |
| Total | | 100.0 | % |
As of June 30, 2016, the Fund invested in William Blair China A-Share Fund, LLC, an affiliated fund. There are no unfunded commitments to the affiliated fund. The Fund may redeem its investment weekly, but is subject to monthly repatriation and other redemption restrictions imposed on the William Blair China A-Share Fund, LLC by the Chinese government.
| | | Share Activity | | | Period ended June 30, 2016 |
| | | | | | | | | | | | | | | | | | | | | | | | Change in net |
| | | | | | | | | | | | | | | | | | | | | | | | unrealized |
| | | Balance | | | | | | | | | Balance | | | | | Dividend | | Net realized | | appreciation |
| Security Name | | 12/31/2015 | | Purchases | | | Sales | | | 6/30/2016 | | Value | | Income | | gain (loss) | | (depreciation) |
| William Blair China A-Share Fund, LLC | | | 223,614 | | | | — | | | | 213,456 | | | | 10,158 | | | | $174 | | | | $— | | | | $1,574 | | | | $(1,620) | |
See accompanying Notes to Financial Statements.
| June 30, 2016 | William Blair Funds | 59 |
| | Institutional International Growth Fund |
| | |
| | The Institutional International Growth Fund seeks long-term capital appreciation. |
| | |
| | AN OVERVIEW FROM THE PORTFOLIO MANAGERS |
| | |

Stephanie G. Braming 
Simon Fennell 
Jeffrey A. Urbina | The William Blair Institutional International Growth Fund (Institutional Class shares) posted a 3.58% decrease, net of fees, for the six months ended June 30, 2016. By comparison, the Fund’s benchmark index, the MSCI All Country World ex-U.S. IMI Index (net) (the “Index”), decreased 0.91%. Style headwinds during the February-April timeframe were a broad detractor from the Fund’s relative performance during the six-month period, as higher growth, higher valuation companies with stronger earnings trends, which the Fund focuses on, significantly underperformed lower valuation companies with relatively weak earnings trends. From a sector perspective, Materials stock selection was the largest detractor from the Fund’s relative performance year to date. The Fund’s Chemicals holdings lagged the Index, as Korea-based LG Chem was adversely impacted by weaker sales trends in its LCD/smartphone business. The lack of exposure to Metals & Mining companies also detracted from the Fund’s overall Materials sector performance. Among other sectors, stock selection in Financials, Consumer Finance, and Real Estate, combined with the Fund’s Insurance industry overweighting, detracted from the Fund’s relative performance during the six-month period. These effects were partially mitigated by good stock selection in Consumer Staples, Healthcare, Industrials and Telecommunication Services. Within Consumer Staples, Japanese cosmetics/personal care company Kao was a leading contributor to the Fund’s performance, supported by improved domestic cosmetic and household sales trends, continued strong growth in China (+48% revenue growth for 1Q versus the prior year) and lower costs. From a geographic perspective, the Fund’s overweightings to Europe and the U.K., combined with the underweighting to Emerging Markets compared to the Index, detracted from the Fund’s relative performance. Stock selection in the U.K. also detracted from the Fund’s performance, principally in the Financials and Materials sectors, offsetting the positive impacts of the Fund’s Japanese and Latin American stock selection. Please refer to the Global Markets Review and Outlook relating to the Fund on page 36. |
| | |
| 60 | Semiannual Report | June 30, 2016 |
Institutional International Growth Fund
Performance Highlights (Unaudited)
Average Annual Total Return at 6/30/2016
| | | Year | | | | | | | | |
| | | to Date | | 1 Year | | 3 Year | | 5 Year | | 10 Year |
| Institutional Class | | | (3.58 | )% | | | (9.09 | )% | | | 3.00 | % | | | 3.22 | % | | | 3.12 | % |
| MSCI ACW Ex-U.S. IMI (net) | | | (0.91 | ) | | | (9.61 | ) | | | 1.65 | | | | 0.39 | | | | 2.16 | |
Performance cited represents past performance. Past performance does not guarantee future results and current performance may be lower or higher than the data quoted. Results shown are average annual returns, which assume reinvestment of dividends and capital gains. Investment returns and principal will fluctuate and you may have a gain or loss when you sell shares. For the most current month-end performance information, please call 1-800-742-7272, or visit our Web site at www.williamblairfunds.com. International investing involves special risk considerations, including currency fluctuations, lower liquidity, economic and political risk. Shares of the Fund are available without a sales load or distribution (12b-1) or service fees.
The performance highlights and graph presented above do not reflect the deduction of taxes that a shareholder would pay on fund distributions or the redemption of fund shares.
The Morgan Stanley Capital International (MSCI) All Country World (ACW) Ex-U.S. Investable Market Index (IMI) (net) is a free float-adjusted market capitalization weighted index that is designed to measure the equity market performance of developed and emerging markets, excluding the United States. This series approximates the minimum possible dividend reinvestment.
This report identifies the Fund’s investments on June 30, 2016. These holdings are subject to change. Not all stocks in the Fund performed the same, nor is there any guarantee that these stocks will perform as well in the future. Market forecasts provided in this report may not necessarily come to pass.
Sector Diversification (Unaudited)

The sector diversification shown is based on the total long-term securities.
| June 30, 2016 | William Blair Funds | 61 |
Institutional International Growth Fund
Portfolio of Investments, June 30, 2016 (all dollar amounts in thousands) (unaudited)
| | | | | | |
| | | | | | |
| Issuer | | Shares | | Value |
| | | | | | | | | | |
| | Common Stocks | | | | | | | | |
| | | | | | | | | | |
| | Europe, Mid-East—38.9% | | | | | | | | |
| | Belgium—0.6% | | | | | | | | |
| | Colruyt S.A. (Food & staples retailing) | | | 85,829 | | | $ | 4,750 | |
| * | Telenet Group Holding N.V. (Media) | | | 163,394 | | | | 7,471 | |
| | | | | | | | | 12,221 | |
| | Denmark—3.2% | | | | | | | | |
| | Coloplast A/S Class “B” (Health care equipment & supplies) | | | 103,020 | | | | 7,712 | |
| | DSV A/S (Road & rail) | | | 202,524 | | | | 8,516 | |
| | ISS A/S (Commercial services & supplies) | | | 216,326 | | | | 8,136 | |
| | Novo Nordisk A/S Class “B” (Pharmaceuticals) | | | 323,148 | | | | 17,402 | |
| | Pandora A/S (Textiles, apparel & luxury goods) | | | 95,012 | | | | 12,941 | |
| | Vestas Wind Systems A/S (Electrical equipment) | | | 146,616 | | | | 9,965 | |
| | | | | | | | | 64,672 | |
| | Finland—1.5% | | | | | | | | |
| | Elisa Oyj (Diversified telecommunication services) | | | 113,179 | | | | 4,349 | |
| | Huhtamaki Oyj (Containers & packaging) | | | 95,155 | | | | 3,949 | |
| | Kone Oyj Class “B” (Machinery) | | | 469,813 | | | | 21,682 | |
| | | | | | | | | 29,980 | |
| | France—11.0% | | | | | | | | |
| | Atos SE (IT services) | | | 116,232 | | | | 9,583 | |
| | Cap Gemini S.A. (IT services) | | | 172,525 | | | | 14,888 | |
| | Christian Dior SE (Textiles, apparel & luxury goods) | | | 53,728 | | | | 8,607 | |
| | Essilor International S.A. (Health care equipment & supplies) | | | 66,531 | | | | 8,744 | |
| | Hermes International (Textiles, apparel & luxury goods) | | | 17,938 | | | | 6,687 | |
| | Ipsen S.A. (Pharmaceuticals) | | | 50,240 | | | | 3,078 | |
| | Nexity S.A. (Real estate management & development) | | | 58,181 | | | | 2,943 | |
| | Orpea (Health care providers & services) | | | 40,609 | | | | 3,330 | |
| | Plastic Omnium S.A. (Auto components) | | | 158,066 | | | | 4,419 | |
| | Rubis SCA (Gas utilities) | | | 40,261 | | | | 3,078 | |
| | Safran S.A. (Aerospace & defense) | | | 293,391 | | | | 19,757 | |
| | SEB S.A. (Household durables) | | | 30,038 | | | | 3,622 | |
| | Sodexo S.A. (Hotels, restaurants & leisure) | | | 91,727 | | | | 9,827 | |
| | Technicolor S.A. (Media) | | | 392,010 | | | | 2,427 | |
| | Thales S.A. (Aerospace & defense) | | | 142,571 | | | | 11,840 | |
| | Total S.A. (Oil, gas & consumable fuels) | | | 830,553 | | | | 39,830 | |
| | Unibail-Rodamco SE (Real estate investment trusts (REITs)) | | | 46,471 | | | | 12,022 | |
| | Valeo S.A. (Auto components) | | | 417,249 | | | | 18,523 | |
| | Veolia Environnement S.A. (Multi-utilities) | | | 518,931 | | | | 11,206 | |
| | Vinci S.A. (Construction & engineering) | | | 410,648 | | | | 28,978 | |
| | | | | | | | | 223,389 | |
| | Germany—3.7% | | | | | | | | |
| | Continental AG (Auto components) | | | 85,874 | | | | 16,250 | |
| | Deutsche Wohnen AG (Real estate management & development) | | | 164,452 | | | | 5,599 | |
| | | | | | |
| | | | | | |
| Issuer | | Shares | | Value |
| | | | | | | | | | |
| | Common Stocks—(continued) | | | | | | | | |
| | | | | | | | | | |
| | Europe, Mid-East—(continued) | | | | | | | | |
| | Germany—(continued) | | | | | | | | |
| | Evonik Industries AG (Chemicals) | | | 130,695 | | | $ | 3,896 | |
| | Gerresheimer AG (Life sciences tools & services) | | | 40,102 | | | | 3,089 | |
| | KION Group AG (Machinery) | | | 52,458 | | | | 2,543 | |
| * | ProSiebenSat.1 Media SE (Media) | | | 328,688 | | | | 14,377 | |
| | SAP SE (Software) | | | 230,174 | | | | 17,287 | |
| | TUI AG (Hotels, restaurants & leisure) | | | 596,354 | | | | 6,774 | |
| | Vonovia SE (Real estate management & development) | | | 147,583 | | | | 5,389 | |
| | | | | | | | | 75,204 | |
| | Ireland—3.0% | | | | | | | | |
| | CRH plc (Construction materials) | | | 564,689 | | | | 16,455 | |
| | Greencore Group plc (Food products) | | | 577,127 | | | | 2,375 | |
| * | ICON plc (Life sciences tools & services)† | | | 148,509 | | | | 10,397 | |
| | Kingspan Group plc (Building products) | | | 172,286 | | | | 3,733 | |
| | Shire plc (Biotechnology) | | | 461,151 | | | | 28,500 | |
| | | | | | | | | 61,460 | |
| | Israel—1.5% | | | | | | | | |
| * | Check Point Software Technologies, Ltd. (Software)† | | | 236,352 | | | | 18,833 | |
| | Teva Pharmaceutical Industries, Ltd.—ADR (Pharmaceuticals) | | | 244,803 | | | | 12,296 | |
| | | | | | | | | 31,129 | |
| | Italy—0.9% | | | | | | | | |
| | Azimut Holding SpA (Capital markets) | | | 249,698 | | | | 4,074 | |
| | Banca Generali SpA (Capital markets) | | | 265,217 | | | | 5,316 | |
| | Brembo SpA (Auto components) | | | 51,162 | | | | 2,818 | |
| | Interpump Group SpA (Machinery) | | | 85,885 | | | | 1,346 | |
| | Recordati SpA (Pharmaceuticals) | | | 115,686 | | | | 3,480 | |
| * | Yoox Net-A-Porter Group SpA (Internet & catalog retail) | | | 36,176 | | | | 839 | |
| | | | | | | | | 17,873 | |
| | Luxembourg—0.4% | | | | | | | | |
| | Eurofins Scientific SE (Life sciences tools & services) | | | 17,068 | | | | 6,323 | |
| * | RTL Group (Media) | | | 34,094 | | | | 2,785 | |
| | | | | | | | | 9,108 | |
| | Netherlands—3.6% | | | | | | | | |
| | GrandVision N.V.—144A (Specialty retail) | | | 98,029 | | | | 2,536 | |
| * | NXP Semiconductors N.V. (Semiconductors & semiconductor equipment)† | | | 218,359 | | | | 17,106 | |
| | Royal Dutch Shell plc Class “A” (Oil, gas & consumable fuels) | | | 1,247,949 | | | | 34,232 | |
| | Wolters Kluwer N.V. (Media) | | | 471,311 | | | | 19,084 | |
| | | | | | | | | 72,958 | |
| | Norway—0.3% | | | | | | | | |
| | Gjensidige Forsikring ASA (Insurance) | | | 425,378 | | | | 7,087 | |
| | | | | | | | | | |
| | Portugal—0.4% | | | | | | | | |
| | Jeronimo Martins SGPS S.A. (Food & staples retailing) | | | 460,010 | | | | 7,255 | |
See accompanying Notes to Financial Statements.
| 62 | Semiannual Report | June 30, 2016 |
Institutional International Growth Fund
Portfolio of Investments, June 30, 2016 (all dollar amounts in thousands) (unaudited)
| | | | | | |
| | | | | | |
| Issuer | | Shares | | Value |
| | | | | | | | | | |
| | Common Stocks—(continued) | | | | | | | | |
| | | | | | | | | | |
| | Europe, Mid-East—(continued) | | | | | | | | |
| | Spain—1.9% | | | | | | | | |
| | Amadeus IT Holding S.A. Class “A” (IT services) | | | 330,797 | | | $ | 14,574 | |
| | Bankinter S.A. (Banks) | | | 1,245,801 | | | | 8,042 | |
| | Industria de Diseno Textil S.A. (Specialty retail) | | | 475,788 | | | | 15,984 | |
| | | | | | | | | 38,600 | |
| | Sweden—2.7% | | | | | | | | |
| | Assa Abloy AB Class “B” (Building products) | | | 445,318 | | | | 9,161 | |
| | BillerudKorsnas AB (Containers & packaging) | | | 173,025 | | | | 2,582 | |
| | Boliden AB (Metals & mining) | | | 168,587 | | | | 3,295 | |
| | Fabege AB (Real estate management & development) | | | 84,780 | | | | 1,442 | |
| | Hexagon AB Class “B” (Electronic equipment, instruments & components) | | | 264,077 | | | | 9,664 | |
| | Hexpol AB (Chemicals) | | | 331,318 | | | | 3,402 | |
| | Intrum Justitia AB (Commercial services & supplies) | | | 142,099 | | | | 4,457 | |
| | Swedbank AB Class “A” (Banks) | | | 958,204 | | | | 20,125 | |
| | | | | | | | | 54,128 | |
| | Switzerland—4.2% | | | | | | | | |
| | Actelion, Ltd. (Biotechnology) | | | 126,857 | | | | 21,362 | |
| | Cembra Money Bank AG (Consumer finance) | | | 33,411 | | | | 2,337 | |
| | Clariant AG (Chemicals) | | | 513,628 | | | | 8,680 | |
| | dorma+kaba Holding AG (Commercial services & supplies) | | | 4,258 | | | | 2,975 | |
| | Logitech International S.A. (Technology hardware, storage & peripherals) | | | 313,479 | | | | 5,096 | |
| | Lonza Group AG (Life sciences tools & services) | | | 83,338 | | | | 13,844 | |
| * | Luxoft Holding, Inc. (IT services)† | | | 44,997 | | | | 2,341 | |
| | Partners Group Holding AG (Capital markets) | | | 58,057 | | | | 24,881 | |
| | Straumann Holding AG (Health care equipment & supplies) | | | 11,040 | | | | 4,355 | |
| | | | | | | | | 85,871 | |
| | Japan—14.1% | | | | | | | | |
| | Ain Pharmaciez, Inc. (Food & staples retailing) | | | 42,500 | | | | 3,297 | |
| | Alps Electric Co., Ltd. (Electronic equipment, instruments & components) | | | 71,900 | | | | 3,266 | |
| | Asahi Intecc Co., Ltd. (Health care equipment & supplies) | | | 61,400 | | | | 3,000 | |
| | Daicel Corporation (Chemicals) | | | 272,500 | | | | 2,824 | |
| | Daifuku Co., Ltd. (Machinery) | | | 201,600 | | | | 3,611 | |
| | Daikin Industries, Ltd. (Building products) | | | 259,300 | | | | 21,793 | |
| | Daito Trust Construction Co., Ltd. (Real estate management & development) | | | 35,400 | | | | 5,748 | |
| | Daiwa House Industry Co., Ltd. (Real estate management & development) | | | 644,000 | | | | 18,912 | |
| | | | | | |
| | | | | | |
| Issuer | | Shares | | Value |
| | | | | | | | | | |
| | Common Stocks—(continued) | | | | | | | | |
| | | | | | | | | | |
| | Japan—(continued) | | | | | | | | |
| | Fuji Heavy Industries, Ltd. (Automobiles) | | | 454,000 | | | $ | 15,605 | |
| | Haseko Corporation (Household durables) | | | 256,500 | | | | 2,582 | |
| | IT Holdings Corporation (IT services) | | | 136,400 | | | | 3,141 | |
| | Kao Corporation (Personal products) | | | 402,100 | | | | 23,419 | |
| | KDDI Corporation (Wireless telecommunication services) | | | 956,100 | | | | 29,075 | |
| | Keyence Corporation (Electronic equipment, instruments & components) | | | 35,600 | | | | 24,291 | |
| | Lawson, Inc. (Food & staples retailing) | | | 59,400 | | | | 4,742 | |
| | M3, Inc. (Health care technology) | | | 216,200 | | | | 7,545 | |
| | Makita Corporation (Machinery) | | | 101,800 | | | | 6,759 | |
| | Nihon M&A Center, Inc. (Capital markets) | | | 47,500 | | | | 3,085 | |
| | Nippon Prologis REIT, Inc. (Real estate investment trusts (REITs)) | | | 1,496 | | | | 3,655 | |
| | Nissan Chemical Industries, Ltd. (Chemicals) | | | 158,900 | | | | 4,636 | |
| | Nitori Holdings Co., Ltd. (Specialty retail) | | | 88,500 | | | | 10,734 | |
| | ORIX Corporation (Diversified financial services) | | | 1,884,400 | | | | 24,385 | |
| | Park24 Co., Ltd. (Commercial services & supplies) | | | 89,400 | | | | 3,072 | |
| | Pola Orbis Holdings, Inc. (Personal products) | | | 60,300 | | | | 5,675 | |
| | Sawai Pharmaceutical Co., Ltd. (Pharmaceuticals) | | | 46,700 | | | | 3,620 | |
| | SCSK Corporation (IT services) | | | 112,900 | | | | 4,229 | |
| | Shionogi & Co., Ltd. (Pharmaceuticals) | | | 336,400 | | | | 18,390 | |
| | Taisei Corporation (Construction & engineering) | | | 1,498,000 | | | | 12,309 | |
| | Temp Holdings Co., Ltd. (Professional services) | | | 212,800 | | | | 3,687 | |
| | Tsuruha Holdings, Inc. (Food & staples retailing) | | | 60,300 | | | | 7,302 | |
| | Zenkoku Hosho Co., Ltd. (Diversified financial services) | | | 73,900 | | | | 2,699 | |
| | | | | | | | | 287,088 | |
| | United Kingdom—13.9% | | | | | | | | |
| | Admiral Group plc (Insurance) | | | 251,745 | | | | 6,845 | |
| | Babcock International Group plc (Commercial services & supplies) | | | 367,063 | | | | 4,438 | |
| | Berkeley Group Holdings plc (Household durables) | | | 170,587 | | | | 5,760 | |
| | Bunzl plc (Trading companies & distributors) | | | 352,148 | | | | 10,835 | |
| | Cineworld Group plc (Media) | | | 384,266 | | | | 2,803 | |
| | Compass Group plc (Hotels, restaurants & leisure) | | | 1,300,353 | | | | 24,740 | |
| | Croda International plc (Chemicals) | | | 109,063 | | | | 4,578 | |
| | Derwent London plc (Real estate investment trusts (REITs)) | | | 100,732 | | | | 3,514 | |
| | Domino’s Pizza Group plc (Hotels, restaurants & leisure) | | | 673,928 | | | | 2,994 | |
| | Essentra plc (Chemicals) | | | 337,673 | | | | 2,317 | |
| | Experian plc (Professional services) | | | 1,058,613 | | | | 20,084 | |
See accompanying Notes to Financial Statements.
| June 30, 2016 | William Blair Funds | 63 |
Institutional International Growth Fund
Portfolio of Investments, June 30, 2016 (all dollar amounts in thousands) (unaudited)
| | | | | | |
| | | | | | |
| Issuer | | Shares | | Value |
| | | | | | | | | | |
| | Common Stocks—(continued) | | | | | | | | |
| | | | | | | | | | |
| | United Kingdom—(continued) | | | | | | | | |
| | Halma plc (Electronic equipment, instruments & components) | | | 408,229 | | | $ | 5,552 | |
| | Hiscox, Ltd. (Insurance) | | | 422,892 | | | | 5,839 | |
| | Intermediate Capital Group plc (Capital markets) | | | 292,191 | | | | 1,914 | |
| | Intertek Group plc (Professional services) | | | 203,872 | | | | 9,499 | |
| | Johnson Matthey plc (Chemicals) | | | 268,710 | | | | 10,079 | |
| | Jupiter Fund Management plc (Capital markets) | | | 488,377 | | | | 2,398 | |
| | Micro Focus International plc (Software) | | | 255,727 | | | | 5,517 | |
| | Moneysupermarket.com Group plc (Internet software & services) | | | 633,156 | | | | 2,294 | |
| | Provident Financial plc (Consumer finance) | | | 154,634 | | | | 4,768 | |
| | Prudential plc (Insurance) | | | 755,983 | | | | 12,828 | |
| | Reckitt Benckiser Group plc (Household products) | | | 294,318 | | | | 29,512 | |
| | Rio Tinto, Ltd. (Metals & mining) | | | 520,991 | | | | 18,021 | |
| | Spirax-Sarco Engineering plc (Machinery) | | | 102,236 | | | | 5,120 | |
| | The Sage Group plc (Software) | | | 1,037,606 | | | | 8,969 | |
| | UBM plc (Media) | | | 632,520 | | | | 5,425 | |
| | Unilever plc (Personal products) | | | 641,972 | | | | 30,760 | |
| | WH Smith plc (Specialty retail) | | | 120,988 | | | | 2,542 | |
| | Wolseley plc (Trading companies & distributors) | | | 302,521 | | | | 15,666 | |
| | WPP plc (Media) | | | 873,413 | | | | 18,203 | |
| | | | | | | | | 283,814 | |
| | Emerging Asia—11.9% | | | | | | | | |
| | China—3.0% | | | | | | | | |
| | China Overseas Land & Investment, Ltd. (Real estate management & development) | | | 3,092,000 | | | | 9,857 | |
| | ENN Energy Holdings, Ltd. (Gas utilities) | | | 1,086,000 | | | | 5,393 | |
| | NetEase, Inc.—ADR (Internet software & services) | | | 78,779 | | | | 15,222 | |
| | PICC Property & Casualty Co., Ltd. Class “H” (Insurance) | | | 4,626,000 | | | | 7,305 | |
| | Tencent Holdings, Ltd. (Internet software & services) | | | 1,023,100 | | | | 23,496 | |
| | | | | | | | | 61,273 | |
| | India—3.0% | | | | | | | | |
| | Axis Bank, Ltd. (Banks) | | | 1,017,344 | | | | 8,084 | |
| | Bharat Petroleum Corporation, Ltd. (Oil, gas & consumable fuels) | | | 246,540 | | | | 3,941 | |
| | Eicher Motors, Ltd. (Machinery) | | | 10,371 | | | | 2,951 | |
| | HDFC Bank, Ltd. (Banks) | | | 544,885 | | | | 9,504 | |
| | IndusInd Bank, Ltd. (Banks) | | | 378,474 | | | | 6,248 | |
| | Maruti Suzuki India, Ltd. (Automobiles) | | | 87,375 | | | | 5,448 | |
| | Tata Consultancy Services, Ltd. (IT services) | | | 418,738 | | | | 15,838 | |
| | Yes Bank, Ltd. (Banks) | | | 474,244 | | | | 7,778 | |
| | | | | | | | | 59,792 | |
| | | | | | |
| | | | | | |
| Issuer | | Shares | | Value |
| | | | | | | | | | |
| | Common Stocks—(continued) | | | | | | | | |
| | | | | | | | | | |
| | Emerging Asia—(continued) | | | | | | | | |
| | Indonesia—0.5% | | | | | | | | |
| | PT Bank Central Asia Tbk (Banks) | | | 9,824,100 | | | $ | 9,947 | |
| | | | | | | | | | |
| | South Korea—3.6% | | | | | | | | |
| | Amorepacific Corporation (Personal products) | | | 22,257 | | | | 8,391 | |
| | KT&G Corporation (Tobacco) | | | 66,477 | | | | 7,873 | |
| | LG Chem, Ltd. (Chemicals) | | | 36,329 | | | | 8,296 | |
| | NAVER Corporation (Internet software & services) | | | 8,308 | | | | 5,147 | |
| | Samsung Electronics Co., Ltd. (Technology hardware, storage & peripherals) | | | 28,298 | | | | 35,241 | |
| | SK Hynix, Inc. (Semiconductors & semiconductor equipment) | | | 293,480 | | | | 8,352 | |
| | | | | | | | | 73,300 | |
| | Taiwan—1.8% | | | | | | | | |
| | Largan Precision Co., Ltd. (Electronic equipment, instruments & components) | | | 115,000 | | | | 10,636 | |
| | Taiwan Semiconductor Manufacturing Co., Ltd.—ADR (Semiconductors & semiconductor equipment) | | | 1,014,011 | | | | 26,597 | |
| | | | | | | | | 37,233 | |
| | Canada—6.8% | | | | | | | | |
| | Alimentation Couche Tard, Inc. Class “B” (Food & staples retailing) | | | 154,883 | | | | 6,651 | |
| | Brookfield Asset Management, Inc. Class “A” (Real estate management & development)† | | | 539,375 | | | | 17,837 | |
| | Canadian Natural Resources, Ltd. (Oil, gas & consumable fuels) | | | 513,642 | | | | 15,847 | |
| | Constellation Software, Inc. (Software) | | | 9,135 | | | | 3,536 | |
| | Dollarama, Inc. (Multiline retail) | | | 161,292 | | | | 11,261 | |
| | Enbridge, Inc. (Oil, gas & consumable fuels) | | | 586,262 | | | | 24,836 | |
| | Intact Financial Corporation (Insurance) | | | 93,374 | | | | 6,670 | |
| | Suncor Energy, Inc. (Oil, gas & consumable fuels) | | | 721,542 | | | | 20,016 | |
| | The Toronto-Dominion Bank (Banks) | | | 754,397 | | | | 32,396 | |
| | | | | | | | | 139,050 | |
| | Asia—5.0% | | | | | | | | |
| | Australia—2.2% | | | | | | | | |
| | Domino’s Pizza Enterprises, Ltd. (Hotels, restaurants & leisure) | | | 40,367 | | | | 2,077 | |
| | James Hardie Industries plc (Construction materials) | | | 364,090 | | | | 5,639 | |
| | JB Hi-Fi, Ltd. (Specialty retail) | | | 172,573 | | | | 3,127 | |
| | LendLease Group (Real estate management & development) | | | 645,212 | | | | 6,129 | |
| | Macquarie Group, Ltd. (Capital markets) | | | 458,363 | | | | 23,860 | |
| | Vicinity Centres (Real estate investment trusts (REITs)) | | | 1,311,834 | | | | 3,273 | |
| | | | | | | | | 44,105 | |
See accompanying Notes to Financial Statements.
| 64 | Semiannual Report | June 30, 2016 |
Institutional International Growth Fund
Portfolio of Investments, June 30, 2016 (all dollar amounts in thousands) (unaudited)
| | | | | | |
| | | | | | |
| Issuer | | Shares | | Value |
| | | | | | | | | | |
| | Common Stocks—(continued) | | | | | | | | |
| | | | | | | | | | |
| | Asia—(continued) | | | | | | | | |
| | Hong Kong—1.7% | | | | | | | | |
| | AIA Group, Ltd. (Insurance) | | | 4,034,663 | | | $ | 24,211 | |
| * | China High Precision Automation Group, Ltd. (Electronic equipment, instruments & components)**§ | | | 3,373,000 | | | | — | |
| | Techtronic Industries Co., Ltd. (Household durables) | | | 2,545,000 | | | | 10,628 | |
| | | | | | | | | 34,839 | |
| | New Zealand—0.1% | | | | | | | | |
| | Fisher & Paykel Healthcare Corp., Ltd. (Health care equipment & supplies) | | | 413,597 | | | | 2,971 | |
| | | | | | | | | | |
| | Singapore—1.0% | | | | | | | | |
| | Singapore Telecommunications, Ltd. (Diversified telecommunication services) | | | 6,675,100 | | | | 20,617 | |
| | | | | | | | | | |
| | Emerging Latin America—3.1% | | | | | | | | |
| | Brazil—1.8% | | | | | | | | |
| | AMBEV S.A.—ADR (Beverages) | | | 4,776,893 | | | | 28,232 | |
| | BB Seguridade Participacoes S.A. (Insurance) | | | 1,041,200 | | | | 9,111 | |
| | | | | | | | | 37,343 | |
| | Mexico—0.6% | | | | | | | | |
| | Arca Continental S.A.B. de C.V. (Beverages) | | | 1,029,030 | | | | 7,385 | |
| | Fomento Economico Mexicano S.A.B. de C.V.—ADR (Beverages) | | | 47,318 | | | | 4,377 | |
| | | | | | | | | 11,762 | |
| | Peru—0.7% | | | | | | | | |
| | Credicorp, Ltd. (Banks)† | | | 95,563 | | | | 14,748 | |
| | | | | | | | | | |
| | Emerging Europe, Mid-East, Africa—2.6% | | | | | | | | |
| | South Africa—1.9% | | | | | | | | |
| * | Bid Corporation, Ltd. (Food & staples retailing) | | | 197,772 | | | | 3,706 | |
| | Bidvest Group, Ltd. (Industrial conglomerates) | | | 197,772 | | | | 1,866 | |
| | Naspers, Ltd. (Media) | | | 102,179 | | | | 15,602 | |
| | Sanlam, Ltd. (Insurance) | | | 1,051,444 | | | | 4,344 | |
| | Steinhoff International Holdings N.V. (Household durables) | | | 1,683,833 | | | | 9,660 | |
| | The Spar Group, Ltd. (Food & staples retailing) | | | 317,200 | | | | 4,355 | |
| | | | | | | | | 39,533 | |
| | Turkey—0.4% | | | | | | | | |
| | Turkiye Garanti Bankasi A.S. (Banks) | | | 2,850,538 | | | | 7,529 | |
| | | | | | | | | | |
| | United Arab Emirates—0.3% | | | | | | | | |
| | Dubai Islamic Bank PJSC (Banks) | | | 4,283,256 | | | | 5,986 | |
| | | | | | | | | | |
| | Total Common Stocks—96.3%
(cost $1,833,013) | | | | | | | 1,961,865 | |
| | | | Shares or | | |
| | | | Principal | | |
| Issuer | | Amount | | Value |
| | | | | | | | | | |
| | Affiliated Fund | | | | | | | | |
| | China—0.0% | | | | | | | | |
| | William Blair China A-Share Fund, LLC§ | | | 6,312 | | | $ | 108 | |
| | Total Affiliated Fund—0.0%
(cost $63) | | | | | | | 108 | |
| | | | | | | | | | |
| | Repurchase Agreement | | | | | | | | |
| | Fixed Income Clearing Corporation, 0.030% dated 6/30/16, due 7/1/16, repurchase price $64,947, collateralized by U.S. Treasury Note, 2.000%, due 8/15/25 | | $ | 64,947 | | | | 64,947 | |
| | | | | | | | | | |
| | Total Repurchase Agreement—3.2%
(cost $64,947) | | | | | | | 64,947 | |
| | | | | | | | | | |
| | Total Investments—99.5%
(cost $1,898,023) | | | | | | | 2,026,920 | |
| | Cash and other assets, less liabilities—0.5% | | | | | | | 9,447 | |
| | Net assets—100.0% | | | | | | $ | 2,036,367 | |
ADR = American Depository Receipt
* = Non-income producing security
† = U.S. listed foreign security
** = Fair valued pursuant to Valuation Procedures approved by the Board of Trustees. This holding represents 0.00% of the Fund’s net assets at June 30, 2016.
§ = Deemed illiquid pursuant to Liquidity Procedures approved by the Board of Trustees. These holdings represent 0.01% of the Fund’s net assets at June 30, 2016.
For securities primarily traded on exchanges or markets that close before the close of regular trading on the New York Stock Exchange, the Fund may use an independent pricing service to fair value price the securities pursuant to Valuation Procedures approved by the Board of Trustees.
See accompanying Notes to Financial Statements.
| June 30, 2016 | William Blair Funds | 65 |
Institutional International Growth Fund
Portfolio of Investments, June 30, 2016 (all dollar amounts in thousands) (unaudited)
At June 30, 2016, the Fund’s Portfolio of Investments includes the following industry categories (as a percentage of long-term investments):
| Financials | | | 20.9 | % |
| Information Technology | | | 15.8 | % |
| Consumer Discretionary | | | 15.6 | % |
| Industrials | | | 13.0 | % |
| Consumer Staples | | | 9.7 | % |
| Health Care | | | 9.1 | % |
| Energy | | | 7.1 | % |
| Materials | | | 5.0 | % |
| Telecommunication Services | | | 2.8 | % |
| Utilities | | | 1.0 | % |
| Total | | | 100.0 | % |
At June 30, 2016, the Fund’s Portfolio of Investments includes the following currency categories (as a percentage of long-term investments):
| Euro | | | 25.0 | % |
| British Pound Sterling | | | 15.1 | % |
| Japanese Yen | | | 14.6 | % |
| U.S. Dollar | | | 8.6 | % |
| Canadian Dollar | | | 6.2 | % |
| Swiss Franc | | | 4.3 | % |
| Hong Kong Dollar | | | 4.1 | % |
| South Korean Won | | | 3.7 | % |
| Danish Krone | | | 3.3 | % |
| Australian Dollar | | | 3.2 | % |
| Indian Rupee | | | 3.0 | % |
| Swedish Krona | | | 2.8 | % |
| South African Rand | | | 2.0 | % |
| Singapore Dollar | | | 1.0 | % |
| All Other Currencies | | | 3.1 | % |
| Total | | | 100.0 | % |
As of June 30, 2016, the Fund invested in William Blair China A-Share Fund, LLC, an affiliated fund. There are no unfunded commitments to the affiliated fund. The Fund may redeem its investment weekly, but is subject to monthly repatriation and other redemption restrictions imposed on the William Blair China A-Share Fund, LLC by the Chinese government.
| | | Share Activity | | Period ended June 30, 2016 |
| | | | | | | | | | | | | | | | | Change in net |
| | | | | | | | | | | | | | | | | unrealized |
| | | Balance | | | | | | Balance | | | | Dividend | | Net realized | | appreciation |
| Security Name | | 12/31/2015 | | Purchases | | Sales | | 6/30/2016 | | Value | | Income | | gain (loss) | | (depreciation) |
| William Blair China A-Share Fund, LLC | | 138,952 | | — | | 132,640 | | 6,312 | | $108 | | $— | | $978 | | $(1,006) |
See accompanying Notes to Financial Statements.
| 66 | Semiannual Report | June 30, 2016 |
| | International Small Cap Growth Fund |
| | |
| | The International Small Cap Growth Fund seeks long-term capital appreciation. |
| | |
| | AN OVERVIEW FROM THE PORTFOLIO MANAGERS |
| | |

Stephanie G. Braming 
Andrew G. Flynn | The William Blair International Small Cap Growth Fund (Class N shares) posted a 4.22% decrease, net of fees, for the six months ended June 30, 2016. By comparison, the Fund’s benchmark index, the MSCI All Country World ex-U.S. Small Cap Index (net) (the “Index”), decreased 0.20%. The Fund’s exposure to higher growth companies broadly detracted from six-month performance, as lower growth, lower valuation companies led the market. From a sector perspective, stock selection in Consumer Discretionary, Financials, Information Technology (IT) and Materials weighed significantly on the Fund’s relative performance, offsetting relative strength in Energy, Healthcare and Industrials. The Fund’s Consumer Discretionary stock selection was hampered by Casio Computer (Japan), which posted disappointing earnings results driven by foreign currency headwinds in Emerging Markets countries, lower sales to inbound tourists and higher-than-expected costs associated with a recently launched outdoor watch. Within Financials, U.K. Real Estate Investment Trust (REIT) Workspace Group was adversely affected by uncertainty and negative sentiment surrounding the United Kingdom’s Brexit vote and the potentially detrimental impact to U.K. real estate activity. Within the IT sector, U.K. Internet Software & Services holdings failed to meet expectations, while the Fund’s performance within the Materials sector was hampered by its lack of exposure to the Metals & Mining industry, which performed well amid the commodity price rally. These negative effects were partially mitigated by good stock selection in the Energy, Healthcare and Industrials sectors. Canadian oil & gas exploration holdings were key contributors to the Fund’s performance within the Energy sector. Within Healthcare, Japanese medical information services provider M3 and Swiss-based dental implant provider Straumann exceeded expectations and provided a positive contribution to Fund performance. Bolstering the Fund’s performance in the Industrials sector were Hoshizaki Corp, Japan’s leading ice machine and commercial refrigeration manufacturer, and Grupo Aeroportuario Del Centro Norte, Mexico’s fourth largest airport operator. All of these holdings benefited from strong fundamental business trends and solid financial results during the period. Please refer to the Global Markets Review and Outlook relating to the Fund on page 36. |
| June 30, 2016 | William Blair Funds | 67 |
International Small Cap Growth Fund
Performance Highlights (Unaudited)
| Average Annual Total Return at 6/30/2016 |
| | | Year
to Date | | 1 Year | | 3 Year | | 5 Year | | 10 Year |
| Class N | | | (4.22 | )% | | | (1.77 | )% | | | 4.22 | % | | | 4.01 | % | | | 4.36 | % |
| Class I | | | (4.10 | ) | | | (1.42 | ) | | | 4.52 | | | | 4.31 | | | | 4.69 | |
| Institutional Class | | | (4.08 | ) | | | (1.41 | ) | | | 4.68 | | | | 4.50 | | | | 4.87 | |
| MSCI ACW Ex-U.S. Small Cap Index (net) | | | (0.20 | ) | | | (5.46 | ) | | | 4.93 | | | | 2.28 | | | | 4.09 | |
Performance cited represents past performance. Past performance does not guarantee future results and current performance may be lower or higher than the data quoted. Results shown are average annual returns, which assume reinvestment of dividends and capital gains. Investment returns and principal will fluctuate and you may have a gain or loss when you sell shares. For the most current month-end performance information, please call 1-800-742-7272, or visit our Web site at www.williamblairfunds.com. From time to time, the investment adviser may waive fees or reimburse expenses for the Fund. Without these waivers/reimbursements, performance would be lower. Smaller capitalization stocks are also more sensitive to purchase/sale transactions and changes in the issuer’s financial condition. International investing involves special risk considerations, including currency fluctuations, lower liquidity, economic and political risk. Class N shares are available to the general public without a sales load. Class I shares are available to certain institutional investors and advisory clients of William Blair Investment Management, LLC and William Blair & Company, L.L.C., without a sales load or distribution (12b-1) fees. Institutional Class shares are available to institutional investors without a sales load or distribution (12b-1) or service fees.
The performance highlights and graph presented above do not reflect the deduction of taxes that a shareholder would pay on fund distributions or the redemption of fund shares.
The Morgan Stanley Capital International (MSCI) All Country World (ACW) Ex-U.S. Small Cap Index (net) is a free float-adjusted market capitalization weighted index that is designed to measure the equity market performance of small capitalization developed and emerging markets, excluding the United States. This series approximates the minimum possible dividend reinvestment.
This report identifies the Fund’s investments on June 30, 2016. These holdings are subject to change. Not all stocks in the Fund performed the same, nor is there any guarantee that these stocks will perform as well in the future. Market forecasts provided in this report may not necessarily come to pass.
Sector Diversification (Unaudited)

The sector diversification shown is based on the total long-term securities.
| 68 | Semiannual Report | June 30, 2016 |
International Small Cap Growth Fund
Portfolio of Investments, June 30, 2016 (all dollar amounts in thousands) (unaudited)
| | | | | | |
| | | | | | |
| Issuer | | Shares | | Value | |
| | | | | | | | | | |
| | Common Stocks | | | | | | | | |
| | | | | | | | | | |
| | Europe, Mid-East—33.7% | | | | | | | | |
| | Denmark—1.4% | | | | | | | | |
| | Royal Unibrew A/S (Beverages) | | | 165,675 | | | $ | 7,411 | |
| | | | | | | | | | |
| | Finland—1.6% | | | | | | | | |
| | Huhtamaki Oyj (Containers & packaging) | | | 115,523 | | | | 4,794 | |
| | Tieto Oyj (IT services) | | | 143,362 | | | | 3,927 | |
| | | | | | | | | 8,721 | |
| | France—7.5% | | | | | | | | |
| | Alten S.A. (IT services) | | | 94,238 | | | | 5,532 | |
| | Ipsen S.A. (Pharmaceuticals) | | | 109,745 | | | | 6,724 | |
| | Metropole Television S.A. (Media) | | | 280,168 | | | | 4,658 | |
| | Orpea (Health care providers & services) | | | 60,529 | | | | 4,963 | |
| | Rubis SCA (Gas utilities) | | | 68,081 | | | | 5,204 | |
| | SEB S.A. (Household durables) | | | 35,535 | | | | 4,285 | |
| | Technicolor S.A. (Media) | | | 571,754 | | | | 3,541 | |
| | Teleperformance (Professional services) | | | 66,257 | | | | 5,644 | |
| | | | | | | | | 40,551 | |
| | Germany—5.0% | | | | | | | | |
| | Aareal Bank AG (Thrifts & mortgage finance) | | | 36,241 | | | | 1,144 | |
| | Aurelius SE & Co KGaA (Capital markets) | | | 143,229 | | | | 8,418 | |
| | CTS Eventim AG & Co KGaA (Media) | | | 126,815 | | | | 3,877 | |
| | Gerresheimer AG (Life sciences tools & services) | | | 75,723 | | | | 5,833 | |
| | KION Group AG (Machinery) | | | 58,339 | | | | 2,827 | |
| | Norma Group SE (Machinery) | | | 104,009 | | | | 4,928 | |
| | | | | | | | | 27,027 | |
| | Ireland—2.0% | | | | | | | | |
| * | ICON plc (Life sciences tools & services)† | | | 98,887 | | | | 6,923 | |
| | Irish Continental Group plc (Marine) | | | 278,380 | | | | 1,300 | |
| | Kingspan Group plc (Building products) | | | 131,072 | | | | 2,840 | |
| | | | | | | | | 11,063 | |
| | Israel—1.7% | | | | | | | | |
| | Elbit Systems, Ltd. (Aerospace & defense) | | | 73,584 | | | | 6,664 | |
| | Frutarom Industries, Ltd. (Chemicals) | | | 54,442 | | | | 2,513 | |
| | | | | | | | | 9,177 | |
| | Italy—5.4% | | | | | | | | |
| | Banca IFIS SpA (Diversified financial services) | | | 130,445 | | | | 2,643 | |
| | Brembo SpA (Auto components) | | | 122,780 | | | | 6,763 | |
| | Cerved Information Solutions SpA (Diversified financial services) | | | 707,710 | | | | 5,576 | |
| | DiaSorin SpA (Health care equipment & supplies) | | | 53,888 | | | | 3,295 | |
| | Industria Macchine Automatiche SpA (Machinery) | | | 78,118 | | | | 4,702 | |
| | Recordati SpA (Pharmaceuticals) | | | 179,125 | | | | 5,388 | |
| * | Yoox Net-A-Porter Group SpA (Internet & catalog retail) | | | 43,485 | | | | 1,009 | |
| | | | | | | | | 29,376 | |
| | | | | | |
| | | | | | |
| Issuer | | Shares | | Value | |
| | | | | | |
| | Common Stocks—(continued) | | | | | | | | |
| | | | | | | | | | |
| | Europe, Mid-East—(continued) | | | | | | | | |
| | Luxembourg—0.6% | | | | | | | | |
| | Grand City Properties S.A. (Real estate management & development) | | | 162,121 | | | $ | 3,336 | |
| | | | | | | | | | |
| | Netherlands—0.4% | | | | | | | | |
| | GrandVision N.V.—144A (Specialty retail) | | | 89,274 | | | | 2,309 | |
| | | | | | | | | | |
| | Spain—0.7% | | | | | | | | |
| | Cia de Distribucion Integral Logista Holdings S.A. (Air freight & logistics) | | | 181,150 | | | | 3,828 | |
| | | | | | | | | | |
| | Sweden—5.7% | | | | | | | | |
| | Bilia AB Class “A” (Specialty retail) | | | 94,467 | | | | 2,336 | |
| | BillerudKorsnas AB (Containers & packaging) | | | 249,728 | | | | 3,726 | |
| | Boliden AB (Metals & mining) | | | 282,677 | | | | 5,525 | |
| | Hexpol AB (Chemicals) | | | 325,068 | | | | 3,338 | |
| | Indutrade AB (Trading companies & distributors) | | | 168,752 | | | | 3,337 | |
| | Intrum Justitia AB (Commercial services & supplies) | | | 184,232 | | | | 5,778 | |
| | Loomis AB Class “B” (Commercial services & supplies) | | | 111,487 | | | | 2,726 | |
| * | NetEnt AB (Internet software & services) | | | 438,891 | | | | 4,346 | |
| | | | | | | | | 31,112 | |
| | Switzerland—1.7% | | | | | | | | |
| * | Cembra Money Bank AG (Consumer finance) | | | 57,469 | | | | 4,019 | |
| * | Luxoft Holding, Inc. (IT services)† | | | 40,058 | | | | 2,084 | |
| | Straumann Holding AG (Health care equipment & supplies) | | | 7,832 | | | | 3,090 | |
| | | | | | | | | 9,193 | |
| | Japan—17.3% | | | | | | | | |
| | ABC-Mart, Inc. (Specialty retail) | | | 75,300 | | | | 5,053 | |
| | Daicel Corporation (Chemicals) | | | 294,900 | | | | 3,056 | |
| | Daifuku Co., Ltd. (Machinery) | | | 233,300 | | | | 4,178 | |
| | Daiichikosho Co., Ltd. (Media) | | | 109,300 | | | | 4,582 | |
| | GLP J-Reit (Real estate investment trusts (REITs)) | | | 7,173 | | | | 9,054 | |
| | Haseko Corporation (Household durables) | | | 481,200 | | | | 4,845 | |
| | Hoshizaki Electric Co., Ltd. (Machinery) | | | 38,500 | | | | 3,769 | |
| | IT Holdings Corporation (IT services) | | | 215,100 | | | | 4,954 | |
| | M3, Inc. (Health care technology) | | | 112,200 | | | | 3,916 | |
| | Meitec Corporation (Professional services) | | | 158,500 | | | | 5,388 | |
| | Nihon M&A Center, Inc. (Capital markets) | | | 59,900 | | | | 3,891 | |
| | Nissan Chemical Industries, Ltd. (Chemicals) | | | 301,100 | | | | 8,785 | |
| | Pola Orbis Holdings, Inc. (Personal products) | | | 29,100 | | | | 2,739 | |
| | Relo Holdings, Inc. (Real estate management & development) | | | 28,200 | | | | 4,991 | |
| | Sawai Pharmaceutical Co., Ltd. (Pharmaceuticals) | | | 79,400 | | | | 6,155 | |
| | Skylark Co., Ltd. (Hotels, restaurants & leisure) | | | 296,300 | | | | 3,755 | |
See accompanying Notes to Financial Statements.
| June 30, 2016 | William Blair Funds | 69 |
International Small Cap Growth Fund
Portfolio of Investments, June 30, 2016 (all dollar amounts in thousands) (unaudited)
| | | | | | |
| | | | | | |
| Issuer | | Shares | | Value | |
| | | | | | |
| | Common Stocks—(continued) | | | | | | | | |
| | | | | | | | | | |
| | Japan—(continued) | | | | | | | | |
| | Suruga Bank, Ltd. (Banks) | | | 193,200 | | | $ | 4,366 | |
| | Temp Holdings Co., Ltd. (Professional services) | | | 395,000 | | | | 6,844 | |
| | Zenkoku Hosho Co., Ltd. (Diversified financial services) | | | 102,400 | | | | 3,740 | |
| | | | | | | | | 94,061 | |
| | United Kingdom—15.3% | | | | | | | | |
| | Abcam plc (Biotechnology) | | | 162,551 | | | | 1,675 | |
| | Beazley plc (Insurance) | | | 1,282,473 | | | | 6,235 | |
| | Berendsen plc (Commercial services & supplies) | | | 334,897 | | | | 5,441 | |
| | Big Yellow Group plc (Real estate investment trusts (REITs)) | | | 297,059 | | | | 3,093 | |
| | Close Brothers Group plc (Capital markets) | | | 105,618 | | | | 1,601 | |
| | Domino’s Pizza Group plc (Hotels, restaurants & leisure) | | | 904,689 | | | | 4,019 | |
| | Halfords Group plc (Specialty retail) | | | 544,142 | | | | 2,340 | |
| | Halma plc (Electronic equipment, instruments & components) | | | 478,989 | | | | 6,515 | |
| | IG Group Holdings plc (Diversified financial services) | | | 333,823 | | | | 3,615 | |
| | Inchcape plc (Distributors) | | | 467,581 | | | | 3,932 | |
| | Intermediate Capital Group plc (Capital markets) | | | 293,227 | | | | 1,921 | |
| | Jupiter Fund Management plc (Capital markets) | | | 702,727 | | | | 3,451 | |
| | Micro Focus International plc (Software) | | | 405,729 | | | | 8,753 | |
| | Moneysupermarket.com Group plc (Internet software & services) | | | 961,820 | | | | 3,485 | |
| | OneSavings Bank plc (Thrifts & mortgage finance) | | | 231,828 | | | | 655 | |
| | Provident Financial plc (Consumer finance) | | | 28,082 | | | | 866 | |
| | Rentokil Initial plc (Commercial services & supplies) | | | 2,292,235 | | | | 5,919 | |
| | Rightmove plc (Internet software & services) | | | 50,044 | | | | 2,444 | |
| | Senior plc (Aerospace & defense) | | | 273,470 | | | | 752 | |
| | Spirax-Sarco Engineering plc (Machinery) | | | 21,207 | | | | 1,062 | |
| | SSP Group plc (Hotels, restaurants & leisure) | | | 1,110,290 | | | | 4,167 | |
| | Ted Baker plc (Textiles, apparel & luxury goods) | | | 67,129 | | | | 2,182 | |
| | The UNITE Group plc (Real estate management & development) | | | 440,518 | | | | 3,644 | |
| | Ultra Electronics Holdings plc (Aerospace & defense) | | | 162,756 | | | | 3,787 | |
| | Workspace Group plc (Real estate investment trusts (REITs)) | | | 154,244 | | | | 1,423 | |
| | | | | | | | | 82,977 | |
| | | | | | |
| | | | | | | | | | |
| Issuer | | Shares | | Value | |
| | | | | | | | | | |
| | Common Stocks—(continued) | | | | | | | | |
| | | | | | | | | | |
| | Asia—10.6% | | | | | | | | |
| | Australia—6.8% | | | | | | | | |
| | Challenger, Ltd. (Diversified financial services) | | | 545,804 | | | $ | 3,566 | |
| | Domino’s Pizza Enterprises, Ltd. (Hotels, restaurants & leisure) | | | 55,474 | | | | 2,855 | |
| | DuluxGroup, Ltd. (Chemicals) | | | 1,213,828 | | | | 5,777 | |
| | JB Hi-Fi, Ltd. (Specialty retail) | | | 251,596 | | | | 4,559 | |
| | Magellan Financial Group, Ltd. (Capital markets) | | | 264,299 | | | | 4,455 | |
| | Orora, Ltd. (Containers & packaging) | | | 3,667,817 | | | | 7,616 | |
| | The Star Entertainment Group, Ltd. (Hotels, restaurants & leisure) | | | 1,977,481 | | | | 8,058 | |
| | | | | | | | | 36,886 | |
| | Hong Kong—0.8% | | | | | | | | |
| | Man Wah Holdings, Ltd. (Household durables) | | | 2,942,000 | | | | 4,237 | |
| | | | | | | | | | |
| | New Zealand—0.6% | | | | | | | | |
| | Fisher & Paykel Healthcare Corp., Ltd. (Health care equipment & supplies) | | | 437,237 | | | | 3,141 | |
| | | | | | | | | | |
| | Singapore—2.4% | | | | | | | | |
| | ComfortDelGro Corporation, Ltd. (Road & rail) | | | 3,095,000 | | | | 6,356 | |
| | SATS, Ltd. (Transportation infrastructure) | | | 2,283,000 | | | | 6,980 | |
| | | | | | | | | 13,336 | |
| | Emerging Asia—7.0% | | | | | | | | |
| | China—2.1% | | | | | | | | |
| | ANTA Sports Products, Ltd. (Textiles, apparel & luxury goods) | | | 1,258,000 | | | | 2,538 | |
| | Beijing Capital International Airport Co., Ltd. Class “H” (Transportation infrastructure) | | | 2,630,000 | | | | 2,861 | |
| | China Lodging Group, Ltd.—ADR (Hotels, restaurants & leisure) | | | 78,886 | | | | 2,874 | |
| * | Hollysys Automation Technologies, Ltd. (Electronic equipment, instruments & components)† | | | 190,426 | | | | 3,308 | |
| | | | | | | | | 11,581 | |
| | India—2.0% | | | | | | | | |
| | Indiabulls Housing Finance, Ltd. (Thrifts & mortgage finance) | | | 376,856 | | | | 3,773 | |
| | Yes Bank, Ltd. (Banks) | | | 421,062 | | | | 6,905 | |
| | | | | | | | | 10,678 | |
| | Indonesia—0.5% | | | | | | | | |
| | PT Bank Negara Indonesia Persero Tbk (Banks) | | | 7,452,900 | | | | 2,953 | |
| | | | | | | | | | |
| | South Korea—0.7% | | | | | | | | |
| | Kangwon Land, Inc. (Hotels, restaurants & leisure) | | | 98,710 | | | | 3,582 | |
See accompanying Notes to Financial Statements.
| 70 | Semiannual Report | June 30, 2016 |
International Small Cap Growth Fund
Portfolio of Investments, June 30, 2016 (all dollar amounts in thousands) (unaudited)
| | | | | | |
| | | | | | |
| | | | | | |
| Issuer | | Shares | | Value | |
| | | | | | |
| | Common Stocks—(continued) | | | | | | | | |
| | | | | | | | | | |
| | Emerging Asia—(continued) | | | | | | | | |
| | Taiwan—1.0% | | | | | | | | |
| | Advantech Co., Ltd. (Technology hardware, storage & peripherals) | | | 322,000 | | | $ | 2,455 | |
| | E.Sun Financial Holding Co., Ltd. (Banks) | | | 5,073,769 | | | | 3,006 | |
| | | | | | | | | 5,461 | |
| | Thailand—0.7% | | | | | | | | |
| | Minor International PCL (Hotels, restaurants & leisure) | | | 3,105,800 | | | | 3,570 | |
| | | | | | | | | | |
| | Emerging Latin America—5.6% | | | | | | | | |
| | Brazil—0.8% | | | | | | | | |
| | Localiza Rent a Car S.A. (Road & rail) | | | 425,300 | | | | 4,568 | |
| | | | | | | | | | |
| | Mexico—4.7% | | | | | | | | |
| | Alsea S.A.B. de C.V. (Hotels, restaurants & leisure) | | | 881,830 | | | | 3,357 | |
| | Gentera S.A.B. de C.V. (Consumer finance) | | | 3,817,900 | | | | 6,839 | |
| | Gruma S.A.B. de C.V. Class “B” (Food products) | | | 192,500 | | | | 2,769 | |
| | Grupo Aeroportuario del Centro Norte S.A.B. de C.V. (Transportation infrastructure) | | | 895,900 | | | | 5,339 | |
| | Grupo Aeroportuario del Sureste S.A.B. de C.V.—ADR (Transportation infrastructure) | | | 27,562 | | | | 4,397 | |
| | Promotora y Operadora de Infraestructura S.A.B. de C.V. (Transportation infrastructure) | | | 231,800 | | | | 2,853 | |
| | | | | | | | | 25,554 | |
| | Panama—0.1% | | | | | | | | |
| | Copa Holdings S.A. Class “A” (Airlines)† | | | 8,263 | | | | 432 | |
| | | | | | | | | | |
| | Emerging Europe, Mid-East, Africa—4.0% | | | | | | | | |
| | Hungary—0.5% | | | | | | | | |
| | Richter Gedeon Nyrt (Pharmaceuticals) | | | 133,434 | | | | 2,654 | |
| | | | | | | | | | |
| | South Africa—2.0% | | | | | | | | |
| | AVI, Ltd. (Food products) | | | 465,334 | | | | 2,626 | |
| | Clicks Group, Ltd. (Food & staples retailing) | | | 704,886 | | | | 5,860 | |
| | Rand Merchant Investment Holdings, Ltd. (Insurance) | | | 812,435 | | | | 2,278 | |
| | | | | | | | | 10,764 | |
| | Turkey—1.5% | | | | | | | | |
| | Arcelik A.S. (Household durables) | | | 418,418 | | | | 2,755 | |
| | Ford Otomotiv Sanayi A.S. (Automobiles) | | | 266,903 | | | | 2,840 | |
| | Turkiye Sinai Kalkinma Bankasi A.S. (Banks) | | | 5,549,339 | | | | 2,567 | |
| | | | | | | | | 8,162 | |
| | | | | | |
| Issuer | | Shares or
Principal
Amount | | Value | |
| | | | | | |
| | Common Stocks—(continued) | | | | | | | | |
| | | | | | | | | | |
| | Canada—3.3% | | | | | | | | |
| | Canadian Energy Services & Technology Corporation (Energy equipment & services) | | | 619,396 | | | $ | 1,951 | |
| | Linamar Corporation (Auto components) | | | 71,281 | | | | 2,539 | |
| | Peyto Exploration & Development Corporation (Oil, gas & consumable fuels) | | | 196,738 | | | | 5,281 | |
| * | Raging River Exploration, Inc. (Oil, gas & consumable fuels) | | | 548,413 | | | | 4,364 | |
| | Whitecap Resources, Inc. (Oil, gas & consumable fuels) | | | 452,371 | | | | 3,460 | |
| | | | | | | | | 17,595 | |
| | Total Common Stocks—96.8%
(cost $476,372) | | | | | | | 525,296 | |
| | | | | | | | | | |
| | Repurchase Agreement | | | | | | | | |
| | Fixed Income Clearing Corporation, 0.030% dated 6/30/16, due 7/1/16, repurchase price $19,794, collateralized by FNMA, 7.125%, due 1/15/30 | | | $19,794 | | | | 19,794 | |
| | | | | | | | | | |
| | Total Repurchase Agreement—3.6%
(cost $19,794) | | | | | | | 19,794 | |
| | | | | | | | | | |
| | Total Investments—100.4%
(cost $496,166) | | | | | | | 545,090 | |
| | Liabilities, plus cash and other assets—(0.4)% | | | | | | | (2,293 | ) |
| | Net assets—100.0% | | | | | | $ | 542,797 | |
ADR = American Depository Receipt
* = Non-income producing security
† = U.S. listed foreign security
For securities primarily traded on exchanges or markets that close before the close of regular trading on the New York Stock Exchange, the Fund may use an independent pricing service to fair value price the securities pursuant to Valuation Procedures approved by the Board of Trustees.
See accompanying Notes to Financial Statements.
| June 30, 2016 | William Blair Funds | 71 |
International Small Cap Growth Fund
Portfolio of Investments, June 30, 2016 (all dollar amounts in thousands) (unaudited)
At June 30, 2016, the Fund’s Portfolio of Investments includes the following industry categories (as a percentage of long-term investments):
| Industrials | | 22.0 | % |
| Financials | | 21.7 | % |
| Consumer Discretionary | | 20.4 | % |
| Health Care | | 10.2 | % |
| Information Technology | | 9.1 | % |
| Materials | | 8.6 | % |
| Consumer Staples | | 4.1 | % |
| Energy | | 2.9 | % |
| Utilities | | 1.0 | % |
| Total | | 100.0 | % |
At June 30, 2016, the Fund’s Portfolio of Investments includes the following currency categories (as a percentage of long-term investments):
| Euro | | 22.7 | % |
| Japanese Yen | | 17.9 | % |
| British Pound Sterling | | 15.8 | % |
| Australian Dollar | | 7.0 | % |
| Swedish Krona | | 5.9 | % |
| Mexican Peso | | 4.0 | % |
| U.S. Dollar | | 3.8 | % |
| Canadian Dollar | | 3.4 | % |
| Singapore Dollar | | 2.5 | % |
| South African Rand | | 2.1 | % |
| Indian Rupee | | 2.0 | % |
| Hong Kong Dollar | | 1.8 | % |
| Israeli Shekel | | 1.8 | % |
| Turkish Lira | | 1.6 | % |
| Danish Krone | | 1.4 | % |
| Swiss Franc | | 1.4 | % |
| New Taiwan Dollar | | 1.0 | % |
| All Other Currencies | | 3.9 | % |
| Total | | 100.0 | % |
See accompanying Notes to Financial Statements.
| 72 | Semiannual Report | June 30, 2016 |
| | Emerging Markets Leaders Fund |
| | |
| | The Emerging Markets Leaders Fund seeks long-term capital appreciation. |
| | |
| | AN OVERVIEW FROM THE PORTFOLIO MANAGERS |
| | |
 Todd M. McClone 
Jeffrey A. Urbina | The William Blair Emerging Markets Leaders Fund (Class N shares) posted a 4.40% increase, net of fees, for the six months ended June 30, 2016. By comparison, the Fund’s benchmark index, the MSCI Emerging Markets Index (net) (the “Index”) increased 6.41%. The Fund underperformed Index for the six-month period. Style headwinds during the first quarter were a significant detractor from the Fund’s relative performance, as lower valuation companies with weaker earnings trends strongly outperformed higher growth, higher valuation companies with stronger earnings trends, which the Fund focuses on. Sector positioning was the biggest detractor from the Fund’s relative performance in this environment—primarily due to the Fund’s underweighting to Energy and the overweighting to Consumer Discretionary. Additionally, within the Materials sector, the Fund’s exclusion of Metals & Mining stocks significantly hampered relative performance amid the commodity price rally. The Fund’s position in LG Chem (Korea) also weighed on sector performance as the stock price languished on concerns about decelerating trends in its LCD/smartphone business. These negative effects were mitigated by positive stock selection in Industrials, Consumer Discretionary, and Energy. Within Industrials, Bidvest Corp (South Africa) was a leading contributor to the Fund’s relative performance, as the share price rallied after the spinoff of its food service businesses. From a geographic perspective, disappointing stock selection in Russia, South Africa, and Brazil was mitigated by positive stock selection in China and Taiwan, in addition to the favorable impact of the Fund’s underweighting of Chinese stocks. Please refer to the Global Markets Review and Outlook relating to the Fund on page 36. |
| June 30, 2016 | William Blair Funds | 73 |
Emerging Markets Leaders Fund
Performance Highlights (Unaudited)
| Average Annual Total Return at 6/30/2016 |
| | | Year
to Date | | 1 Year | | 3 Year | | 5 Year | | Since
Inception |
| Class N(b) | | | 4.40 | % | | | (11.68 | )% | | | (0.74 | )% | | | (2.14 | )% | | | 0.60 | % |
| MSCI Emerging Markets Index – (net)(b) | | | 6.41 | | | | (12.05 | ) | | | (1.56 | ) | | | (3.78 | ) | | | (0.58 | ) |
| Class I(a) | | | 4.65 | | | | (11.36 | ) | | | (0.43 | ) | | | (1.84 | ) | | | (0.74 | ) |
| Institutional Class(a) | | | 4.65 | | | | (11.23 | ) | | | (0.31 | ) | | | (1.72 | ) | | | (0.61 | ) |
| MSCI Emerging Markets Index (net)(a) | | | 6.41 | | | | (12.05 | ) | | | (1.56 | ) | | | (3.78 | ) | | | (0.96 | ) |
| | |
| (a) | Since inception is for the period from March 26, 2008 (Commencement of Operations) to June 30, 2016. |
| | |
| (b) | Since inception is for the period from May 3, 2010 (Commencement of Operations) to June 30, 2016. |
Performance cited represents past performance. Past performance does not guarantee future results and current performance may be lower or higher than the data quoted. Results shown are average annual total returns, which assume reinvestment of dividends and capital gains. Investment returns and principal will fluctuate and you may have a gain or loss when you sell shares. For the most current month-end performance information, please call 1-800-742-7272, or visit our Web site at www.williamblairfunds.com. International investing involves special risk considerations, including currency fluctuations, lower liquidity, economic and political risk. From time to time, the investment adviser may waive fees or reimburse expenses for the Fund. Without these waivers/reimbursements, performance would be lower. Class N shares are available to the general public without a sales load. Class I shares are available to certain institutional investors and advisory clients of William Blair Investment Management, LLC and William Blair & Company, L.L.C., without a sales load or distribution (12b-1) fees. Institutional Class shares are available to institutional investors without a sales load or distribution (12b-1) or service fees.
The performance highlights and graph presented above do not reflect the deduction of taxes that a shareholder would pay on fund distributions or the redemption of fund shares.
The Morgan Stanley Capital International (MSCI) Emerging Markets Index (net) is a free float-adjusted market-capitalization-weighted index that is designed to measure equity market performance of emerging markets. This series approximates the minimum possible dividend reinvestment.
This report identifies the Fund’s investments on June 30, 2016. These holdings are subject to change. Not all stocks in the Fund performed the same, nor is there any guarantee that these stocks will perform as well in the future. Market forecasts provided in this report may not necessarily come to pass.
Sector Diversification (Unaudited)

The sector diversification shown is based on the total long-term securities.
| 74 | Semiannual Report | June 30, 2016 |
Emerging Markets Leaders Fund
Portfolio of Investments, June 30, 2016 (all dollar amounts in thousands) (unaudited)
| | | | | | | | |
| | | | | | | | |
| Issuer | | Shares | | | Value | |
| | |
| | Common Stocks | | | | | | | | |
| | | | | | | | | | |
| | Emerging Asia—67.7% | | | | | | | | |
| | China—18.8% | | | | | | | | |
| * | Alibaba Group Holding, Ltd.—ADR (Internet software & services) | | | 37,377 | | | $ | 2,973 | |
| | China Mobile, Ltd. (Wireless telecommunication services) | | | 313,500 | | | | 3,626 | |
| | China Overseas Land & Investment, Ltd. (Real estate management & development) | | | 452,000 | | | | 1,441 | |
| | CNOOC, Ltd. (Oil, gas & consumable fuels) | | | 3,560,000 | | | | 4,448 | |
| | Dali Foods Group Co., Ltd.—144A (Food products) | | | 2,822,000 | | | | 1,619 | |
| | NetEase, Inc.—ADR (Internet software & services) | | | 14,987 | | | | 2,896 | |
| | New Oriental Education & Technology Group, Inc.—ADR (Diversified consumer services) | | | 17,020 | | | | 713 | |
| | PICC Property & Casualty Co., Ltd. Class “H” (Insurance) | | | 1,236,000 | | | | 1,952 | |
| * | TAL Education Group—ADR (Diversified consumer services) | | | 12,858 | | | | 798 | |
| | Tencent Holdings, Ltd. (Internet software & services) | | | 305,200 | | | | 7,009 | |
| | Zhuzhou CSR Times Electric Co., Ltd. Class “H” (Electrical equipment) | | | 169,500 | | | | 939 | |
| | | | | | | | | 28,414 | |
| | India—17.7% | | | | | | | | |
| | Asian Paints, Ltd. (Chemicals) | | | 144,550 | | | | 2,140 | |
| | Bharat Petroleum Corporation, Ltd. (Oil, gas & consumable fuels) | | | 146,943 | | | | 2,349 | |
| | HDFC Bank, Ltd.—ADR (Banks) | | | 12,630 | | | | 838 | |
| | HDFC Bank, Ltd. (Banks) | | | 194,392 | | | | 3,391 | |
| | Hero MotoCorp, Ltd. (Automobiles) | | | 61,953 | | | | 2,905 | |
| | Hindustan Unilever, Ltd. (Household products) | | | 220,220 | | | | 2,935 | |
| | Housing Development Finance Corporation, Ltd. (Thrifts & mortgage finance) | | | 81,178 | | | | 1,511 | |
| | Infosys, Ltd. (IT services) | | | 230,506 | | | | 4,004 | |
| | Maruti Suzuki India, Ltd. (Automobiles) | | | 23,054 | | | | 1,437 | |
| * | Tata Motors, Ltd. (Automobiles) | | | 437,190 | | | | 2,988 | |
| | Zee Entertainment Enterprises, Ltd. (Media) | | | 322,367 | | | | 2,185 | |
| | | | | | | | | 26,683 | |
| | Indonesia—3.7% | | | | | | | | |
| | PT Bank Rakyat Indonesia Persero Tbk (Banks) | | | 1,871,900 | | | | 1,540 | |
| | PT Kalbe Farma Tbk (Pharmaceuticals) | | | 8,622,500 | | | | 1,003 | |
| | PT Telekomunikasi Indonesia Persero Tbk (Diversified telecommunication services) | | | 5,248,000 | | | | 1,597 | |
| | PT Unilever Indonesia Tbk (Household products) | | | 411,000 | | | | 1,405 | |
| | | | | | | | | 5,545 | |
| | Malaysia—1.5% | | | | | | | | |
| | Public Bank Bhd (Banks) | | | 470,400 | | | | 2,267 | |
| | | | | | | | |
| | | | | | | | |
| Issuer | | Shares | | | Value | |
| | | | | | | | | | |
| | Common Stocks—(continued) | | | | | | | | |
| | | | | | | | | | |
| | Emerging Asia—(continued) | | | | | | | | |
| | Philippines—1.1% | | | | | | | | |
| | SM Prime Holdings, Inc. (Real estate management & development) | | | 1,527,000 | | | $ | 892 | |
| | Universal Robina Corporation (Food products) | | | 162,890 | | | | 723 | |
| | | | | | | | | 1,615 | |
| | South Korea—13.7% | | | | | | | | |
| | Amorepacific Corporation (Personal products) | | | 4,093 | | | | 1,543 | |
| | Coway Co., Ltd. (Household durables) | | | 18,069 | | | | 1,645 | |
| | Hankook Tire Co., Ltd. (Auto components) | | | 31,498 | | | | 1,401 | |
| | KT&G Corporation (Tobacco) | | | 20,470 | | | | 2,425 | |
| | LG Chem, Ltd. (Chemicals) | | | 8,183 | | | | 1,869 | |
| | LG Household & Health Care, Ltd. (Personal products) | | | 2,462 | | | | 2,404 | |
| | NAVER Corporation (Internet software & services) | | | 4,741 | | | | 2,937 | |
| | Samsung Electronics Co., Ltd. (Technology hardware, storage & peripherals) | | | 5,172 | | | | 6,441 | |
| | | | | | | | | 20,665 | |
| | Taiwan—9.1% | | | | | | | | |
| | Chunghwa Telecom Co., Ltd. (Diversified telecommunication services) | | | 849,000 | | | | 3,071 | |
| | Largan Precision Co., Ltd. (Electronic equipment, instruments & components) | | | 21,000 | | | | 1,942 | |
| | Taiwan Semiconductor Manufacturing Co., Ltd.—ADR (Semiconductors & semiconductor equipment) | | | 228,764 | | | | 6,000 | |
| | Uni-President Enterprises Corporation (Food products) | | | 1,432,000 | | | | 2,828 | |
| | | | | | | | | 13,841 | |
| | Thailand—2.1% | | | | | | | | |
| | Airports of Thailand PCL (Transportation infrastructure) | | | 118,300 | | | | 1,315 | |
| | Bangkok Dusit Medical Services PCL Class “F” (Health care providers & services) | | | 1,584,200 | | | | 1,080 | |
| | CP ALL PCL (Food & staples retailing) | | | 517,900 | | | | 743 | |
| | | | | | | | | 3,138 | |
| | Emerging Europe, Mid-East, Africa—16.0% | | | | | | | | |
| | Czech Republic—0.6% | | | | | | | | |
| | Komercni banka A.S. (Banks) | | | 23,837 | | | | 894 | |
| | | | | | | | | | |
| | Hungary—0.4% | | | | | | | | |
| | OTP Bank plc (Banks) | | | 27,550 | | | | 616 | |
| | | | | | | | | | |
| | Russia—2.8% | | | | | | | | |
| | Magnit PJSC—GDR (Food & staples retailing) | | | 41,054 | | | | 1,368 | |
| * | Mail.Ru Group, Ltd.—GDR (Internet software & services) | | | 71,529 | | | | 1,302 | |
| * | Yandex N.V. Class “A” (Internet software & services)† | | | 73,000 | | | | 1,595 | |
| | | | | | | | | 4,265 | |
See accompanying Notes to Financial Statements.
| June 30, 2016 | William Blair Funds | 75 |
Emerging Markets Leaders Fund
Portfolio of Investments, June 30, 2016 (all dollar amounts in thousands) (unaudited)
| | | | | | | | |
| | | | | | | | |
| | | | | | | | |
| Issuer | | Shares | | | Value | |
| | | | | | | | | | |
| | Common Stocks—(continued) | | | | | | | | |
| | | | | | | | | | |
| | Emerging Europe, Mid-East, Africa—(continued) | | | | | | | | |
| | South Africa—9.3% | | | | | | | | |
| * | Bid Corporation, Ltd. (Food & staples retailing) | | | 63,521 | | | $ | 1,190 | |
| | Bidvest Group, Ltd. (Industrial conglomerates) | | | 62,815 | | | | 593 | |
| | FirstRand, Ltd. (Diversified financial services) | | | 660,746 | | | | 2,017 | |
| | Naspers, Ltd. (Media) | | | 32,243 | | | | 4,923 | |
| | Sasol, Ltd. (Oil, gas & consumable fuels) | | | 47,352 | | | | 1,281 | |
| | Steinhoff International Holdings N.V. (Household durables) | | | 446,402 | | | | 2,561 | |
| | Vodacom Group, Ltd. (Wireless telecommunication services) | | | 130,931 | | | | 1,492 | |
| | | | | | | | | 14,057 | |
| | Turkey—2.9% | | | | | | | | |
| | BIM Birlesik Magazalar A.S. (Food & staples retailing) | | | 70,162 | | | | 1,368 | |
| | KOC Holding A.S. (Industrial conglomerates) | | | 327,041 | | | | 1,496 | |
| | Turkiye Garanti Bankasi A.S. (Banks) | | | 573,131 | | | | 1,514 | |
| | | | | | | | | 4,378 | |
| | Emerging Latin America—12.6% | | | | | | | | |
| | Brazil—4.9% | | | | | | | | |
| | AMBEV S.A.—ADR (Beverages) | | | 574,127 | | | | 3,393 | |
| | BB Seguridade Participacoes S.A. (Insurance) | | | 92,200 | | | | 807 | |
| | Cielo S.A. (IT services) | | | 92,640 | | | | 977 | |
| | Lojas Renner S.A. (Multiline retail) | | | 132,800 | | | | 979 | |
| | Ultrapar Participacoes S.A. (Oil, gas & consumable fuels) | | | 58,000 | | | | 1,284 | |
| | | | | | | | | 7,440 | |
| | Mexico—5.6% | | | | | | | | |
| | Fomento Economico Mexicano S.A.B. de C.V.—ADR (Beverages) | | | 16,352 | | | | 1,512 | |
| | Grupo Financiero Banorte S.A.B. de C.V. Class “O” (Banks) | | | 407,100 | | | | 2,275 | |
| | Kimberly-Clark de Mexico S.A.B. de C.V. Class “A” (Household products) | | | 765,612 | | | | 1,809 | |
| | Wal-Mart de Mexico S.A.B. de C.V. (Food & staples retailing) | | | 1,210,200 | | | | 2,911 | |
| | | | | | | | | 8,507 | |
| | Peru—2.1% | | | | | | | | |
| | Credicorp, Ltd. (Banks)† | | | 19,975 | | | | 3,083 | |
| | Total Common Stocks—96.3% (cost $134,784) | | | | | | | 145,408 | |
| | | | | | | | |
| | | | Shares or | | | | |
| | | | Principal | | | | |
| Issuer | | Amount | | | Value | |
| | |
| | Preferred Stock | | | | | | | | |
| | Brazil—1.0% | | | | | | | | |
| | Itau Unibanco Holding S.A. (Banks) | | | 166,000 | | | $ | 1,566 | |
| | | | | | | | | | |
| | Total Preferred Stock—1.0%
(cost $1,425) | | | | | | | 1,566 | |
| | | | | | | | | | |
| | Repurchase Agreement | | | | | | | | |
| | Fixed Income Clearing Corporation, 0.030% dated 6/30/16, due 7/1/16, repurchase price $3,835, collateralized by FHLMC, 4.125%, due 10/11/33 | | | $3,835 | | | | 3,835 | |
| | | | | | | | | | |
| | Total Repurchase Agreement—2.6%
(cost $3,835) | | | | | | | 3,835 | |
| | | | | | | | | | |
| | Total Investments—99.9%
(cost $140,044) | | | | | | | 150,809 | |
| | Cash and other assets, less liabilities—0.1% | | | | | | | 158 | |
| | Net assets—100.0% | | | | | | $ | 150,967 | |
ADR = American Depository Receipt
GDR = Global Depository Receipt
* = Non-income producing security
† = U.S. listed foreign security
For securities primarily traded on exchanges or markets that close before the close of regular trading on the New York Stock Exchange, the Fund may use an independent pricing service to fair value price the securities pursuant to Valuation Procedures approved by the Board of Trustees.
At June 30, 2016, the Fund’s Portfolio of Investments includes the following industry categories (as a percentage of long-term investments):
| Information Technology | 25.9% |
| Consumer Staples | 20.5% |
| Financials | 18.1% |
| Consumer Discretionary | 15.3% |
| Telecommunication Services | 6.7% |
| Energy | 6.4% |
| Industrials | 3.0% |
| Materials | 2.7% |
| Health Care | 1.4% |
| Total | 100.0% |
See accompanying Notes to Financial Statements.
| 76 | Semiannual Report | June 30, 2016 |
Emerging Markets Leaders Fund
Portfolio of Investments, June 30, 2016 (all dollar amounts in thousands) (unaudited)
At June 30, 2016, the Fund’s Portfolio of Investments includes the following currency categories (as a percentage of long-term investments):
| U.S. Dollar | 18.0% |
| Indian Rupee | 17.6% |
| Hong Kong Dollar | 14.3% |
| South Korean Won | 14.1% |
| South African Rand | 9.6% |
| New Taiwan Dollar | 5.3% |
| Mexican Peso | 4.8% |
| Brazilian Real | 3.8% |
| Indonesian Rupiah | 3.8% |
| Turkish Lira | 3.0% |
| Thai Baht | 2.1% |
| Malaysian Ringgit | 1.5% |
| Philippine Peso | 1.1% |
| All Other Currencies | 1.0% |
| Total | 100.0% |
See accompanying Notes to Financial Statements.
| June 30, 2016 | William Blair Funds | 77 |
| | Emerging Markets Growth Fund |
| | |
| | The Emerging Markets Growth Fund seeks long-term capital appreciation. |
| | |
| | AN OVERVIEW FROM THE PORTFOLIO MANAGERS |
| | |

Todd M. McClone 
Casey K. Preyss 
Jeffrey A. Urbina | The William Blair Emerging Markets Growth Fund (Class N shares) posted a 5.07% increase, net of fees, for the six months ended June 30, 2016. By comparison, the Fund’s benchmark index, the MSCI Emerging Markets IMI (net) (the “Index”), increased 5.69%. The Fund underperformed the Index for the six-month period. Style headwinds during the first quarter were a significant detractor from performance, as higher growth, higher valuation companies with stronger earnings trends substantially underperformed lower valuation companies with weaker earnings trends, which the Fund focuses on. Sector positioning was the biggest detractor from the Fund’s relative performance in this environment primarily due to the Fund’s underweightings in the Energy, Telecommunication Services, and Utilities sectors, and its overweighting in Information Technology (IT). Additionally, within the Materials sector, the Fund’s exclusion of Metals & Mining stocks significantly hampered relative performance amid the commodity price rally. The Fund’s position in LG Chem (Korea) also weighed on sector performance as the stock price languished on concerns about decelerating trends in its LCD/smartphone business. These negative effects were mitigated by positive stock selection in Consumer Discretionary, Energy, Financials, Industrials, and IT. Within Industrials, Bidvest Corp (South Africa) was a leading contributor to the Fund’s relative performance, as the share price rallied after the spinoff of its food service business. From a geographic perspective, disappointing stock selection in Russia, South Africa, and Brazil was mostly offset by positive stock selection in India, Taiwan and Thailand, in addition to the Fund’s underweighting of Chinese stocks. Please refer to the Global Markets Review and Outlook relating to the Fund on page 36. |
| | |
| 78 | Semiannual Report | June 30, 2016 |
Emerging Markets Growth Fund
Performance Highlights (Unaudited)
| Average Annual Total Return at 6/30/2016 |
| | | Year | | | | | | | | |
| | | to Date | | 1 Year | | 3 Year | | 5 Year | | 10 Year |
| Class N | | | 5.07 | % | | | (12.81 | )% | | | (0.16 | )% | | | (1.28 | )% | | | 3.22 | % |
| Class I | | | 5.20 | | | | (12.56 | ) | | | 0.07 | | | | (1.01 | ) | | | 3.48 | |
| Institutional Class | | | 5.16 | | | | (12.54 | ) | | | 0.22 | | | | (0.85 | ) | | | 3.65 | |
| MSCI Emerging Markets IMI (net) | | | 5.69 | | | | (12.16 | ) | | | (1.36 | ) | | | (3.59 | ) | | | 3.87 | |
Performance cited represents past performance. Past performance does not guarantee future results and current performance may be lower or higher than the data quoted. Results shown are average annual returns, which assume reinvestment of dividends and capital gains. Investment returns and principal will fluctuate and you may have a gain or loss when you sell shares. For the most current month-end performance information, please call 1-800-742-7272, or visit our Web site at www.williamblairfunds.com. From time to time, the investment adviser may waive fees or reimburse expenses for the Fund. Without these waivers/reimbursements, performance would be lower. International investing involves special risk considerations, including currency fluctuations, lower liquidity, economic and political risk. Class N shares are available to the general public without a sales load. Class I shares are available to certain institutional investors and advisory clients of William Blair Investment Management, LLC and William Blair & Company, L.L.C., without a sales load or distribution (12b-1) fees. Institutional Class shares are available to institutional investors without a sales load or distribution (12b-1) or service fees.
The performance highlights and graph presented above do not reflect the deduction of taxes that a shareholder would pay on fund distributions or the redemption of fund shares.
The Morgan Stanley Capital International (MSCI) Emerging Markets Investable Market Index (IMI) (net) is a free float-adjusted market capitalization weighted index that is designed to measure the equity market performance of emerging markets. This series approximates the minimum possible dividend reinvestment.
This report identifies the Fund’s investments on June 30, 2016. These holdings are subject to change. Not all stocks in the Fund performed the same, nor is there any guarantee that these stocks will perform as well in the future. Market forecasts provided in this report may not necessarily come to pass.
Sector Diversification (Unaudited)

The sector diversification shown is based on the total long-term securities.
| June 30, 2016 | William Blair Funds | 79 |
Emerging Markets Growth Fund
Portfolio of Investments, June 30, 2016 (all dollar amounts in thousands) (unaudited)
| | | | | | | | |
| | | | | | | | |
| | Issuer | | Shares | | | Value | |
| | | | | | | | | | |
| | Common Stocks | | | | | | | | |
| | | | | | | | | | |
| | Emerging Asia—63.6% | | | | | | | | |
| | China—16.1% | | | | | | | | |
| * | Alibaba Group Holding, Ltd.—ADR (Internet software & services) | | | 258,156 | | | $ | 20,531 | |
| * | Baidu, Inc.—ADR (Internet software & services) | | | 85,520 | | | | 14,124 | |
| | China Mobile, Ltd. (Wireless telecommunication services) | | | 846,000 | | | | 9,786 | |
| | China Overseas Land & Investment, Ltd. (Real estate management & development) | | | 1,526,000 | | | | 4,865 | |
| | CNOOC, Ltd. (Oil, gas & consumable fuels) | | | 23,549,000 | | | | 29,425 | |
| * | Ctrip.com International, Ltd.—ADR (Internet & catalog retail) | | | 150,589 | | | | 6,204 | |
| | Dali Foods Group Co., Ltd.—144A (Food products) | | | 4,624,000 | | | | 2,653 | |
| | Huaneng Renewables Corporation, Ltd. Class “H” (Independent power & renewable electricity producers) | | | 10,487,932 | | | | 3,496 | |
| | NetEase, Inc.—ADR (Internet software & services) | | | 49,195 | | | | 9,505 | |
| | New Oriental Education & Technology Group, Inc.—ADR (Diversified consumer services) | | | 58,491 | | | | 2,450 | |
| | PICC Property & Casualty Co., Ltd. Class “H” (Insurance) | | | 5,530,000 | | | | 8,733 | |
| | Ping An Insurance Group Co. of China, Ltd. Class “H” (Insurance) | | | 2,228,500 | | | | 9,874 | |
| * | TAL Education Group—ADR (Diversified consumer services) | | | 46,788 | | | | 2,904 | |
| | Tencent Holdings, Ltd. (Internet software & services) | | | 1,606,460 | | | | 36,893 | |
| | Zhuzhou CSR Times Electric Co., Ltd. Class “H” (Electrical equipment) | | | 393,500 | | | | 2,180 | |
| | | | | | | | | 163,623 | |
| | India—17.0% | | | | | | | | |
| | Apollo Hospitals Enterprise, Ltd. (Health care providers & services) | | | 130,496 | | | | 2,549 | |
| | Asian Paints, Ltd. (Chemicals) | | | 322,010 | | | | 4,766 | |
| | Bajaj Finance, Ltd. (Consumer finance) | | | 21,428 | | | | 2,539 | |
| | Bharat Petroleum Corporation, Ltd. (Oil, gas & consumable fuels) | | | 355,760 | | | | 5,686 | |
| | Bharti Infratel, Ltd. (Wireless telecommunication services) | | | 517,766 | | | | 2,662 | |
| | Britannia Industries, Ltd. (Food products) | | | 55,726 | | | | 2,279 | |
| | Dabur India, Ltd. (Personal products) | | | 797,444 | | | | 3,647 | |
| | Eicher Motors, Ltd. (Machinery) | | | 14,778 | | | | 4,206 | |
| | Godrej Consumer Products, Ltd. (Personal products) | | | 163,913 | | | | 3,904 | |
| | Havells India, Ltd. (Electrical equipment) | | | 683,323 | | | | 3,661 | |
| | HDFC Bank, Ltd. (Banks) | | | 1,088,325 | | | | 18,983 | |
| | Hero MotoCorp, Ltd. (Automobiles) | | | 162,173 | | | | 7,606 | |
| | Hindustan Unilever, Ltd. (Household products) | | | 743,816 | | | | 9,914 | |
| | Housing Development Finance Corporation, Ltd. (Thrifts & mortgage finance) | | | 572,085 | | | | 10,650 | |
| | IndusInd Bank, Ltd. (Banks) | | | 796,562 | | | | 13,149 | |
| | | | | | | | |
| | | | | | | | |
| | Issuer | | Shares | | | Value | |
| | | | | | | | | | |
| | Common Stocks—(continued) | | | | | | | | |
| | | | | | | | | | |
| | Emerging Asia—(continued) | | | | | | | | |
| | India—(continued) | | | | | | | | |
| | Infosys, Ltd. (IT services) | | | 948,581 | | | $ | 16,477 | |
| | Maruti Suzuki India, Ltd. (Automobiles) | | | 117,864 | | | | 7,349 | |
| | Motherson Sumi Systems, Ltd. (Auto components) | | | 803,689 | | | | 3,482 | |
| | Pidilite Industries, Ltd. (Chemicals) | | | 252,292 | | | | 2,690 | |
| * | SKS Microfinance, Ltd. (Consumer finance) | | | 294,409 | | | | 3,233 | |
| * | Tata Motors, Ltd. (Automobiles) | | | 3,437,446 | | | | 23,494 | |
| | UPL, Ltd. (Chemicals) | | | 456,128 | | | | 3,740 | |
| | Yes Bank, Ltd. (Banks) | | | 668,712 | | | | 10,967 | |
| | Zee Entertainment Enterprises, Ltd. (Media) | | | 731,350 | | | | 4,957 | |
| | | | | | | | | 172,590 | |
| | Indonesia—5.1% | | | | | | | | |
| | PT Astra International Tbk (Automobiles) | | | 14,367,700 | | | | 8,100 | |
| | PT Bank Rakyat Indonesia Persero Tbk (Banks) | | | 12,036,621 | | | | 9,904 | |
| | PT Gudang Garam Tbk (Tobacco) | | | 960,500 | | | | 5,026 | |
| | PT Indofood CBP Sukses Makmur Tbk (Food products) | | | 1,975,900 | | | | 2,598 | |
| | PT Kalbe Farma Tbk (Pharmaceuticals) | | | 28,532,715 | | | | 3,320 | |
| | PT Matahari Department Store Tbk (Multiline retail) | | | 3,439,500 | | | | 5,242 | |
| | PT Telekomunikasi Indonesia Persero Tbk (Diversified telecommunication services) | | | 40,472,100 | | | | 12,313 | |
| | PT Unilever Indonesia Tbk (Household products) | | | 1,537,200 | | | | 5,254 | |
| | | | | | | | | 51,757 | |
| | Malaysia—1.3% | | | | | | | | |
| | Public Bank Bhd (Banks) | | | 2,717,200 | | | | 13,093 | |
| | | | | | | | | | |
| | Papua New Guinea—0.5% | | | | | | | | |
| | Oil Search, Ltd. (Oil, gas & consumable fuels) | | | 926,391 | | | | 4,678 | |
| | | | | | | | | | |
| | Philippines—3.1% | | | | | | | | |
| | Ayala Land, Inc. (Real estate management & development) | | | 9,708,000 | | | | 8,053 | |
| | BDO Unibank, Inc. (Banks) | | | 3,288,260 | | | | 7,856 | |
| | GT Capital Holdings, Inc. (Diversified financial services) | | | 49,830 | | | | 1,532 | |
| | International Container Terminal Services, Inc. (Transportation infrastructure) | | | 1,859,120 | | | | 2,438 | |
| | Jollibee Foods Corporation (Hotels, restaurants & leisure) | | | 671,910 | | | | 3,465 | |
| | SM Investments Corporation (Industrial conglomerates) | | | 234,530 | | | | 4,849 | |
| | Universal Robina Corporation (Food products) | | | 826,360 | | | | 3,665 | |
| | | | | | | | | 31,858 | |
See accompanying Notes to Financial Statements.
| 80 | Semiannual Report | June 30, 2016 |
Emerging Markets Growth Fund
Portfolio of Investments, June 30, 2016 (all dollar amounts in thousands) (unaudited)
| | | | | | | | |
| | | | | | | | |
| | Issuer | | Shares | | | Value | |
| | | | | | | | | | |
| | Common Stocks—(continued) | | | | | | | | |
| | | | | | | | | | |
| | Emerging Asia—(continued) | | | | | | | | |
| | South Korea—8.7% | | | | | | | | |
| | Amorepacific Corporation (Personal products) | | | 13,920 | | | $ | 5,248 | |
| | Coway Co., Ltd. (Household durables) | | | 66,213 | | | | 6,029 | |
| | Halla Visteon Climate Control Corporation (Auto components) | | | 350,802 | | | | 3,210 | |
| | Hankook Tire Co., Ltd. (Auto components) | | | 75,199 | | | | 3,345 | |
| | Kangwon Land, Inc. (Hotels, restaurants & leisure) | | | 144,440 | | | | 5,241 | |
| | KT&G Corporation (Tobacco) | | | 68,645 | | | | 8,130 | |
| | LG Household & Health Care, Ltd. (Personal products) | | | 10,916 | | | | 10,660 | |
| * | Loen Entertainment, Inc. (Media) | | | 33,035 | | | | 2,109 | |
| | Medy-Tox, Inc. (Biotechnology) | | | 6,102 | | | | 2,308 | |
| | NAVER Corporation (Internet software & services) | | | 16,112 | | | | 9,982 | |
| | Samsung Electronics Co., Ltd. (Technology hardware, storage & peripherals) | | | 25,909 | | | | 32,266 | |
| | | | | | | | | 88,528 | |
| | Taiwan—8.4% | | | | | | | | |
| | Advantech Co., Ltd. (Technology hardware, storage & peripherals) | | | 488,145 | | | | 3,722 | |
| | Chunghwa Telecom Co., Ltd. (Diversified telecommunication services) | | | 3,551,000 | | | | 12,843 | |
| | Cub Elecparts, Inc. (Auto components) | | | 274,168 | | | | 3,089 | |
| | E.Sun Financial Holding Co., Ltd. (Banks) | | | 9,513,146 | | | | 5,636 | |
| | Ennoconn Corporation (Technology hardware, storage & peripherals) | | | 215,000 | | | | 2,889 | |
| | Hota Industrial Manufacturing Co., Ltd. (Auto components) | | | 501,000 | | | | 2,351 | |
| | Largan Precision Co., Ltd. (Electronic equipment, instruments & components) | | | 72,000 | | | | 6,659 | |
| | St Shine Optical Co., Ltd. (Health care equipment & supplies) | | | 143,000 | | | | 3,231 | |
| | Taiwan Semiconductor Manufacturing Co., Ltd. (Semiconductors & semiconductor equipment) | | | 2,264,000 | | | | 11,410 | |
| | Taiwan Semiconductor Manufacturing Co., Ltd.—ADR (Semiconductors & semiconductor equipment) | | | 990,650 | | | | 25,985 | |
| | Uni-President Enterprises Corporation (Food products) | | | 3,694,000 | | | | 7,296 | |
| | | | | | | | | 85,111 | |
| | Thailand—3.4% | | | | | | | | |
| | Airports of Thailand PCL (Transportation infrastructure) | | | 402,800 | | | | 4,479 | |
| | Bangkok Dusit Medical Services PCL Class “F” (Health care providers & services) | | | 7,081,300 | | | | 4,827 | |
| | Central Pattana PCL (Real estate management & development) | | | 4,154,400 | | | | 7,079 | |
| | CP ALL PCL (Food & staples retailing) | | | 5,286,600 | | | | 7,583 | |
| | Home Product Center PCL (Specialty retail) | | | 7,113,500 | | | | 2,011 | |
| | | | | | | | |
| | | | | | | | |
| | Issuer | | Shares | | | Value | |
| | | | | | | | | | |
| | Common Stocks—(continued) | | | | | | | | |
| | | | | | | | | | |
| | Emerging Asia—(continued) | | | | | | | | |
| | Thailand—(continued) | | | | | | | | |
| | Minor International PCL (Hotels, restaurants & leisure) | | | 2,195,200 | | | $ | 2,523 | |
| | Thai Beverage PCL (Beverages) | | | 9,224,500 | | | | 6,255 | |
| | | | | | | | | 34,757 | |
| | Emerging Europe, Mid-East, Africa—18.4% | | | | | | | | |
| | Czech Republic—0.4% | | | | | | | | |
| | Komercni banka A.S. (Banks) | | | 107,972 | | | | 4,048 | |
| | | | | | | | | | |
| | Hungary—0.6% | | | | | | | | |
| | OTP Bank plc (Banks) | | | 185,936 | | | | 4,161 | |
| | Richter Gedeon Nyrt (Pharmaceuticals) | | | 111,118 | | | | 2,210 | |
| | | | | | | | | 6,371 | |
| | Poland—0.3% | | | | | | | | |
| | Eurocash S.A. (Food & staples retailing) | | | 215,324 | | | | 2,523 | |
| | | | | | | | | | |
| | Qatar—0.5% | | | | | | | | |
| | Qatar National Bank S.A.Q. (Banks) | | | 121,367 | | | | 4,677 | |
| | | | | | | | | | |
| | Russia—1.6% | | | | | | | | |
| | Magnit PJSC—GDR (Food & staples retailing) | | | 229,721 | | | | 7,658 | |
| * | Yandex N.V. Class “A” (Internet software & services)† | | | 411,843 | | | | 8,999 | |
| | | | | | | | | 16,657 | |
| | South Africa—8.2% | | | | | | | | |
| * | Aspen Pharmacare Holdings, Ltd. (Pharmaceuticals) | | | 162,387 | | | | 4,006 | |
| * | Bid Corporation, Ltd. (Food & staples retailing) | | | 390,940 | | | | 7,326 | |
| | Bidvest Group, Ltd. (Industrial conglomerates) | | | 313,214 | | | | 2,955 | |
| | Capitec Bank Holdings, Ltd. (Banks) | | | 89,000 | | | | 3,610 | |
| | Discovery, Ltd. (Insurance) | | | 346,011 | | | | 2,891 | |
| | FirstRand, Ltd. (Diversified financial services) | | | 3,139,176 | | | | 9,580 | |
| | Naspers, Ltd. (Media) | | | 200,714 | | | | 30,648 | |
| | Sasol, Ltd. (Oil, gas & consumable fuels) | | | 227,147 | | | | 6,145 | |
| | Steinhoff International Holdings N.V. (Household durables) | | | 1,662,556 | | | | 9,538 | |
| | Vodacom Group, Ltd. (Wireless telecommunication services) | | | 573,260 | | | | 6,532 | |
| | | | | | | | | 83,231 | |
| | Turkey—3.5% | | | | | | | | |
| | Arcelik A.S. (Household durables) | | | 739,668 | | | | 4,870 | |
| | BIM Birlesik Magazalar A.S. (Food & staples retailing) | | | 191,180 | | | | 3,728 | |
| | KOC Holding A.S. (Industrial conglomerates) | | | 2,197,053 | | | | 10,048 | |
| | Tofas Turk Otomobil Fabrikasi A.S. (Automobiles) | | | 588,698 | | | | 4,841 | |
| | Turkiye Garanti Bankasi A.S. (Banks) | | | 3,599,809 | | | | 9,509 | |
| | Ulker Biskuvi Sanayi A.S. (Food products) | | | 367,487 | | | | 2,685 | |
| | | | | | | | | 35,681 | |
See accompanying Notes to Financial Statements.
| June 30, 2016 | William Blair Funds | 81 |
Emerging Markets Growth Fund
Portfolio of Investments, June 30, 2016 (all dollar amounts in thousands) (unaudited)
| | | | | | | | |
| | | | | | | | |
| | Issuer | | Shares | | | Value | |
| | | | | | | | | | |
| | Common Stocks—(continued) | | | | | | | | |
| | | | | | | | | | |
| | Emerging Europe, Mid-East, Africa—(continued) | | | | | | | | |
| | United Arab Emirates—3.3% | | | | | | | | |
| | DP World, Ltd. (Transportation infrastructure)† | | | 242,282 | | | $ | 4,027 | |
| | Dubai Islamic Bank PJSC (Banks) | | | 3,347,898 | | | | 4,679 | |
| | Emaar Malls Group PJSC (Real estate management & development) | | | 3,113,053 | | | | 2,397 | |
| | Emaar Properties PJSC (Real estate management & development) | | | 5,951,432 | | | | 10,123 | |
| | Emirates Telecommunications Group Co. PJSC (Diversified telecommunication services) | | | 1,261,311 | | | | 6,516 | |
| | First Gulf Bank PJSC (Banks) | | | 1,777,559 | | | | 6,111 | |
| | | | | | | | | 33,853 | |
| | Emerging Latin America—15.8% | | | | | | | | |
| | Argentina—1.6% | | | | | | | | |
| | Banco Macro S.A.—ADR (Banks) | | | 38,017 | | | | 2,822 | |
| | MercadoLibre, Inc. (Internet software & services)† | | | 28,793 | | | | 4,050 | |
| * | YPF S.A.—ADR (Oil, gas & consumable fuels) | | | 466,211 | | | | 8,951 | |
| | | | | | | | | 15,823 | |
| | Brazil—5.1% | | | | | | | | |
| | AMBEV S.A.—ADR (Beverages) | | | 3,870,073 | | | | 22,872 | |
| | BB Seguridade Participacoes S.A. (Insurance) | | | 934,300 | | | | 8,176 | |
| | Cielo S.A. (IT services) | | | 374,720 | | | | 3,950 | |
| | Lojas Renner S.A. (Multiline retail) | | | 967,700 | | | | 7,137 | |
| | Raia Drogasil S.A. (Food & staples retailing) | | | 178,800 | | | | 3,514 | |
| | Ultrapar Participacoes S.A. (Oil, gas & consumable fuels) | | | 271,700 | | | | 6,014 | |
| | | | | | | | | 51,663 | |
| | Chile—1.1% | | | | | | | | |
| | Banco Santander Chile—ADR (Banks) | | | 286,829 | | | | 5,556 | |
| | S.A.C.I. Falabella (Multiline retail) | | | 795,680 | | | | 6,056 | |
| | | | | | | | | 11,612 | |
| | Mexico—6.6% | | | | | | | | |
| | Fibra Uno Administracion S.A. de C.V. (Real estate investment trusts (REITs)) | | | 3,279,669 | | | | 6,987 | |
| | Fomento Economico Mexicano S.A.B. de C.V.—ADR (Beverages) | | | 106,590 | | | | 9,859 | |
| | Gruma S.A.B. de C.V. Class “B” (Food products) | | | 172,500 | | | | 2,482 | |
| | Grupo Aeroportuario del Pacifico S.A.B. de C.V. Class “B” (Transportation infrastructure) | | | 490,200 | | | | 5,039 | |
| | Grupo Aeroportuario del Sureste S.A.B. de C.V.—ADR (Transportation infrastructure) | | | 27,267 | | | | 4,350 | |
| | Grupo Bimbo S.A.B. de C.V. Class “A” (Food products) | | | 1,117,100 | | | | 3,504 | |
| | Grupo Financiero Inbursa S.A.B. de C.V. Class “O” (Banks) | | | 1,718,300 | | | | 2,922 | |
| | | | Shares or | | | | |
| | | | Principal | | | | |
| | Issuer | | Amount | | | Value | |
| | | | | | | | | | |
| | Common Stocks—(continued) | | | | | | | | |
| | | | | | | | | | |
| | Emerging Latin America—(continued) | | | | | | | | |
| | Mexico—(continued) | | | | | | | | |
| | Grupo Financiero Santander Mexico S.A.B. de C.V. Class “B” (Banks) | | | 3,329,300 | | | $ | 6,042 | |
| | Grupo Lala S.A.B. de C.V. (Food products) | | | 881,900 | | | | 1,944 | |
| | Nemak S.A.B. de C.V.—144A (Auto components) | | | 2,433,500 | | | | 2,850 | |
| | Promotora y Operadora de Infraestructura S.A.B. de C.V. (Transportation infrastructure) | | | 299,700 | | | | 3,689 | |
| | Wal-Mart de Mexico S.A.B. de C.V. (Food & staples retailing) | | | 7,214,800 | | | | 17,356 | |
| | | | | | | | | 67,024 | |
| | Peru—1.4% | | | | | | | | |
| | Credicorp, Ltd. (Banks)† | | | 91,788 | | | | 14,166 | |
| | | | | | | | | | |
| | Total Common Stocks—97.8%
(cost $914,051) | | | | | | | 993,324 | |
| | | | | | | | | | |
| | Preferred Stock | | | | | | | | |
| | Brazil—0.5% | | | | | | | | |
| | Itau Unibanco Holding S.A. (Banks) | | | 588,700 | | | | 5,553 | |
| | | | | | | | | | |
| | Total Preferred Stock—0.5%
(cost $4,120) | | | | | | | 5,553 | |
| | | | | | | | | | |
| | Affiliated Fund | | | | | | | | |
| | | | | | | | | | |
| | Emerging Asia—0.0% | | | | | | | | |
| | China—0.0% | | | | | | | | |
| | William Blair China A-Share Fund, LLC§ | | | 12,462 | | | | 213 | |
| | Total Affiliated Fund—0.0%
(cost $125) | | | | | | | 213 | |
| | | | | | | | | | |
| | Repurchase Agreement | | | | | | | | |
| | Fixed Income Clearing Corporation, 0.030% dated 6/30/16, due 7/1/16, repurchase price $6,993, collateralized by FNMA, 6.250%, due 5/15/29 | | | $6,993 | | | | 6,993 | |
| | Total Repurchase Agreement—0.7%
(cost $6,993) | | | | | | | 6,993 | |
| | Total Investments—99.0%
(cost $925,289) | | | | | | | 1,006,083 | |
| | Cash and other assets, less liabilities—1.0% | | | | | | | 9,774 | |
| | Net assets—100.0% | | | | | | $ | 1,015,857 | |
See accompanying Notes to Financial Statements.
| 82 | Semiannual Report | June 30, 2016 |
Emerging Markets Growth Fund
Portfolio of Investments, June 30, 2016 (all dollar amounts in thousands) (unaudited)
ADR = American Depository Receipt
GDR = Global Depository Receipt
* = Non-income producing securities
† = U.S. listed foreign security
§ = Deemed illiquid pursuant to Liquidity Procedures approved by the Board of Trustees. This holding represents 0.02% of the Fund’s net assets at June 30, 2016.
For securities primarily traded on exchanges or markets that close before the close of regular trading on the New York Stock Exchange, the Fund may use an independent pricing service to fair value price the securities pursuant to Valuation Procedures approved by the Board of Trustees.
At June 30, 2016, the Fund’s Portfolio of Investments includes the following industry categories (as a percentage of long-term investments):
| Financials | | | 25.1 | % |
| Information Technology | | | 20.8 | % |
| Consumer Discretionary | | | 17.1 | % |
| Consumer Staples | | | 17.0 | % |
| Energy | | | 6.1 | % |
| Industrials | | | 5.2 | % |
| Telecommunication Services | | | 5.1 | % |
| Health Care | | | 2.2 | % |
| Materials | | | 1.1 | % |
| Utilities | | | 0.3 | % |
| Total | | | 100.0 | % |
At June 30, 2016, the Fund’s Portfolio of Investments includes the following currency categories (as a percentage of long-term investments):
| U.S. Dollar | | | 17.5 | % |
| Indian Rupee | | | 17.3 | % |
| Hong Kong Dollar | | | 10.8 | % |
| South Korean Won | | | 8.9 | % |
| South African Rand | | | 8.3 | % |
| New Taiwan Dollar | | | 5.9 | % |
| Mexican Peso | | | 5.3 | % |
| Indonesian Rupiah | | | 5.2 | % |
| Turkish Lira | | | 3.6 | % |
| Brazilian Real | | | 3.4 | % |
| Philippine Peso | | | 3.2 | % |
| UAE Dirham | | | 3.0 | % |
| Thai Baht | | | 2.8 | % |
| Malaysian Ringgit | | | 1.3 | % |
| All Other Currencies | | | 3.5 | % |
| Total | | | 100.0 | % |
As of June 30, 2016, the Fund invested in William Blair China A-Share Fund, LLC, an affiliated fund. There are no unfunded commitments to the affiliated fund. The Fund may redeem its investment weekly, but is subject to monthly repatriation and other redemption restrictions imposed on the William Blair China A-Share Fund, LLC by the Chinese government.
| | | Share Activity | | Period Ended June 30, 2016 | |
| Security Name | | | Balance
12/31/2015 | | Purchases | | Sales | | Balance
06/30/2016 | | Value | | Dividend
Income | | Net realized
gain (loss) | | Change in net
unrealized
appreciation
(depreciation) | |
| William Blair China A-Share Fund, LLC | | 274,339 | | — | | 261,877 | | 12,462 | | $213 | | $— | | $1,931 | | $(1,988) | |
See accompanying Notes to Financial Statements.
| June 30, 2016 | William Blair Funds | 83 |
| | Emerging Markets Small Cap Growth Fund |
| | |
| | The Emerging Markets Small Cap Growth Fund seeks long-term capital appreciation. |
| | |
| | AN OVERVIEW FROM THE PORTFOLIO MANAGERS |
| | |
 Todd M. McClone 
Casey K. Preyss | The William Blair Emerging Markets Small Cap Growth Fund (Class N shares) posted a 0.88% increase, net of fees, for the six months ended June 30, 2016. By comparison, the Fund’s benchmark index, the MSCI Emerging Markets Small Cap Index (net) (the “Index”), increased 1.38%. From a sector attribution perspective, the Fund’s six-month relative performance was adversely impacted by Healthcare and Materials stock selection, combined with an underweighting to Materials. Within the Healthcare sector, Chinese Biotechnology and Pharmaceutical holdings were significant detractors from the Fund’s relative performance. China Biologic Products reported solid sales growth supported by favorable market dynamics with growth in plasma collection/demand, but concerns about the impact of the weaker Chinese RMB currency and margin pressures weighed on the share price. Sino Biopharmaceutical was another notable detractor from Fund performance, as investors reacted negatively to news that the company had purchased an asset management company and was seeking to expand beyond its core capabilities into hospitals, insurance and medical devices. These negative effects were partially mitigated by positive stock selection in the Consumer Discretionary, Consumer Staples and Information Technology (IT) sectors during the six-month period. Thailand cosmetics retailer Beauty Community’s share price was supported by solid sales growth achieved through good same store sales trends, new store openings and higher sales in 7-Eleven stores. Within Consumer Staples, Raia Drogasil (Brazil drugstore) was the leading contributor to the Fund’s performance in that sector, bolstered by the stabilizing macroeconomic and political backdrop in Brazil, along with solid execution on management’s store expansion strategy. Stock selection effect in the IT sector was driven primarily by the Fund’s position in Yandex, Russia’s leading search engine, on strong revenue growth and EBITDA margin that were ahead of consensus expectations. Investors reacted favorably to management’s decision to start breaking out results for different business categories, which highlighted the company’s growing presence in eCommerce. From a geographic perspective, stock selection in Korea, China and Malaysia were key detractors to the Fund’s relative performance during the six-month period. These effects were mitigated by good stock selection in India and Brazil, and overall country positioning; particularly the underweightings to Korea and China and overweighting to Brazil. Please refer to the Global Markets Review and Outlook relating to the Fund on page 36. |
| 84 | Semiannual Report | June 30, 2016 |
Emerging Markets Small Cap Growth Fund
Performance Highlights (Unaudited)
| Average Annual Total Return at 6/30/2016 |
| | | Year | | | | | | | | Since |
| | | to Date | | 1 Year | | 3 Year | | Inception |
| Class N(a) | | | 0.88 | % | | | (10.56 | )% | | | 5.68 | % | | | 11.17 | % |
| Class I(a) | | | 0.94 | | | | (10.31 | ) | | | 6.00 | | | | 11.47 | |
| MSCI Emerging Markets Small Cap Index (net)(a) | | | 1.38 | | | | (12.76 | ) | | | (0.01 | ) | | | 2.12 | |
| Institutional Class(b) | | | 1.01 | | | | (10.19 | ) | | | 6.12 | | | | 7.60 | |
| MSCI Emerging Markets Small Cap Index (net)(b) | | | 1.38 | | | | (12.76 | ) | | | (0.01 | ) | | | (0.64 | ) |
| (a) | Since inception is for the period from October 24, 2011 (Commencement of Operations) to June 30, 2016. |
| | |
| (b) | Since inception is for the period from December 20, 2012 (Commencement of Operations) to June 30, 2016. |
Performance cited represents past performance. Past performance does not guarantee future results and current performance may be lower or higher than the data quoted. Results shown are average annual returns, which assume reinvestment of dividends and capital gains. Investment returns and principal will fluctuate and you may have a gain or loss when you sell shares. For the most current month-end performance information, please call 1-800-742-7272, or visit our Web site at www.williamblairfunds.com. From time to time, the investment adviser may waive fees or reimburse expenses for the Fund. Without these waivers/reimbursements, performance would be lower. International investing involves special risk considerations, including currency fluctuations, lower liquidity, economic and political risk. Smaller capitalization stocks are also more sensitive to purchase/sale transactions and changes in the issuer’s financial condition. Class N shares are available to the general public without a sales load. Class I shares are available to certain institutional investors and advisory clients of William Blair Investment Management, LLC and William Blair & Company, L.L.C., without a sales load or distribution (12b-1) fees. Institutional Class shares are available to institutional investors without a sales load or distribution (12b-1) or service fees.
The performance highlights and graph presented above do not reflect the deduction of taxes that a shareholder would pay on fund distributions or the redemption of fund shares.
The Morgan Stanley Capital International (MSCI) Emerging Markets Small Cap Index (net) is a free float-adjusted market capitalization weighted index that is designed to measure the equity market performance of emerging markets. This series approximates the minimum possible dividend reinvestment.
This report identifies the Fund’s investments on June 30, 2016. These holdings are subject to change. Not all stocks in the Fund performed the same, nor is there any guarantee that these stocks will perform as well in the future. Market forecasts provided in this report may not necessarily come to pass.
Sector Diversification (Unaudited)
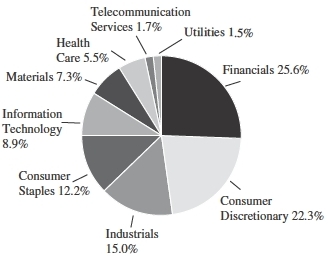
The sector diversification shown is based on the total long-term securities.
| June 30, 2016 | William Blair Funds | 85 |
Emerging Markets Small Cap Growth Fund
Portfolio of Investments, June 30, 2016 (all dollar amounts in thousands) (unaudited)
| | | | | | | | |
| | | | | | | | |
| | Issuer | | Shares | | | Value | |
| | | | | | | | | | |
| | Common Stocks | | | | | | | | |
| | | | | | | | | | |
| | Emerging Asia—67.7% | | | | | | | | |
| | China—6.8% | | | | | | | | |
| | Beijing Capital International Airport Co., Ltd. Class “H” (Transportation infrastructure) | | | 1,704,000 | | | $ | 1,854 | |
| | Beijing Enterprises Water Group, Ltd. (Water utilities) | | | 2,092,000 | | | | 1,270 | |
| | Bloomage BioTechnology Corporation, Ltd. (Chemicals) | | | 92,500 | | | | 144 | |
| * | China Biologic Products, Inc. (Biotechnology)† | | | 1,318 | | | | 140 | |
| | China Lilang, Ltd. (Textiles, apparel & luxury goods) | | | 826,000 | | | | 525 | |
| | China Lodging Group, Ltd.—ADR (Hotels, restaurants & leisure) | | | 79,711 | | | | 2,904 | |
| | CT Environmental Group, Ltd. (Water utilities) | | | 7,830,000 | | | | 2,288 | |
| | Fuyao Glass Industry Group Co. Ltd.—144A Class “H” (Auto components) | | | 678,000 | | | | 1,578 | |
| * | IMAX China Holding, Inc.—144A (Media) | | | 140,900 | | | | 696 | |
| | Minth Group, Ltd. (Auto components) | | | 900,000 | | | | 2,921 | |
| * | Noah Holdings, Ltd.—ADR (Capital markets) | | | 42,585 | | | | 1,027 | |
| | Shenzhen Investment, Ltd. (Real estate management & development) | | | 2,282,000 | | | | 919 | |
| | Silergy Corporation (Semiconductors & semiconductor equipment) | | | 108,000 | | | | 1,277 | |
| * | TAL Education Group—ADR (Diversified consumer services) | | | 20,579 | | | | 1,277 | |
| | Travelsky Technology, Ltd. Class “H” (IT services) | | | 1,065,000 | | | | 2,050 | |
| | | | | | | | | 20,870 | |
| | India—19.7% | | | | | | | | |
| | Apollo Hospitals Enterprise, Ltd. (Health care providers & services) | | | 37,164 | | | | 726 | |
| | Bajaj Finance, Ltd. (Consumer finance) | | | 41,572 | | | | 4,927 | |
| | Blue Dart Express, Ltd. (Air freight & logistics) | | | 19,751 | | | | 1,748 | |
| | Cholamandalam Investment and Finance Co., Ltd. (Consumer finance) | | | 100,239 | | | | 1,404 | |
| | Dabur India, Ltd. (Personal products) | | | 465,454 | | | | 2,129 | |
| | Eicher Motors, Ltd. (Machinery) | | | 12,049 | | | | 3,429 | |
| | Finolex Industries, Ltd. (Chemicals) | | | 148,157 | | | | 939 | |
| | Godrej Consumer Products, Ltd. (Personal products) | | | 140,818 | | | | 3,354 | |
| | Gruh Finance, Ltd. (Thrifts & mortgage finance) | | | 657,052 | | | | 2,805 | |
| | Havells India, Ltd. (Electrical equipment) | | | 692,162 | | | | 3,708 | |
| | Indiabulls Housing Finance, Ltd. (Thrifts & mortgage finance) | | | 285,939 | | | | 2,862 | |
| | IndusInd Bank, Ltd. (Banks) | | | 264,950 | | | | 4,374 | |
| | Kajaria Ceramics, Ltd. (Building products) | | | 158,960 | | | | 2,841 | |
| | Marico, Ltd. (Personal products) | | | 311,906 | | | | 1,224 | |
| * | Max India, Ltd. (Health care providers & services)**§ | | | 181,994 | | | | 485 | |
| | Page Industries, Ltd. (Textiles, apparel & luxury goods) | | | 5,365 | | | | 1,115 | |
| | | | | | | | |
| | | | | | | | |
| | Issuer | | Shares | | | Value | |
| | | | | | | | | | |
| | Common Stocks—(continued) | | | | | | | | |
| | | | | | | | | | |
| | Emerging Asia—(continued) | | | | | | | | |
| | India—(continued) | | | | | | | | |
| | PI Industries, Ltd. (Chemicals) | | | 63,735 | | | $ | 684 | |
| | Pidilite Industries, Ltd. (Chemicals) | | | 243,645 | | | | 2,598 | |
| | Repco Home Finance, Ltd. (Consumer finance) | | | 98,297 | | | | 1,119 | |
| | Sadbhav Engineering, Ltd. (Construction & engineering) | | | 68,257 | | | | 295 | |
| * | SKS Microfinance, Ltd. (Consumer finance) | | | 443,597 | | | | 4,871 | |
| | Supreme Industries, Ltd. (Chemicals) | | | 112,282 | | | | 1,520 | |
| | UPL, Ltd. (Chemicals) | | | 259,328 | | | | 2,127 | |
| | Voltas, Ltd. (Construction & engineering) | | | 409,932 | | | | 1,968 | |
| | Yes Bank, Ltd. (Banks) | | | 324,091 | | | | 5,315 | |
| | Zee Entertainment Enterprises, Ltd. (Media) | | | 232,483 | | | | 1,576 | |
| | | | | | | | | 60,143 | |
| | Indonesia—5.6% | | | | | | | | |
| | PT Ace Hardware Indonesia Tbk (Specialty retail) | | | 14,559,400 | | | | 1,023 | |
| | PT Bank Tabungan Negara Persero Tbk (Banks) | | | 24,387,600 | | | | 3,184 | |
| | PT Gudang Garam Tbk (Tobacco) | | | 116,500 | | | | 610 | |
| | PT Indofood CBP Sukses Makmur Tbk (Food products) | | | 1,350,300 | | | | 1,775 | |
| | PT Matahari Department Store Tbk (Multiline retail) | | | 2,041,500 | | | | 3,112 | |
| | PT Pakuwon Jati Tbk (Real estate management & development) | | | 78,578,500 | | | | 3,689 | |
| * | PT Summarecon Agung Tbk (Real estate management & development) | | | 18,319,700 | | | | 2,533 | |
| | PT Waskita Karya Persero Tbk (Construction & engineering) | | | 6,074,200 | | | | 1,179 | |
| | | | | | | | | 17,105 | |
| | Pakistan—5.4% | | | | | | | | |
| | D.G. Khan Cement Co., Ltd. (Construction materials) | | | 1,908,000 | | | | 3,487 | |
| | Engro Corporation, Ltd. (Chemicals) | | | 1,223,500 | | | | 3,886 | |
| * | Engro Foods, Ltd. (Food products) | | | 1,545,500 | | | | 2,406 | |
| | Lucky Cement, Ltd. (Construction materials) | | | 417,900 | | | | 2,586 | |
| | Maple Leaf Cement Factory, Ltd. (Construction materials) | | | 2,424,621 | | | | 2,440 | |
| | United Bank, Ltd. (Banks) | | | 1,019,500 | | | | 1,725 | |
| | | | | | | | | 16,530 | |
| | Philippines—5.1% | | | | | | | | |
| | D&L Industries, Inc. (Chemicals) | | | 7,151,700 | | | | 1,524 | |
| | GT Capital Holdings, Inc. (Diversified financial services) | | | 140,585 | | | | 4,322 | |
| | Jollibee Foods Corporation (Hotels, restaurants & leisure) | | | 516,850 | | | | 2,666 | |
| | Puregold Price Club, Inc. (Food & staples retailing) | | | 213,500 | | | | 191 | |
| | Robinsons Land Corporation (Real estate management & development) | | | 3,843,400 | | | | 2,419 | |
See accompanying Notes to Financial Statements.
| 86 | Semiannual Report | June 30, 2016 |
Emerging Markets Small Cap Growth Fund
Portfolio of Investments, June 30, 2016 (all dollar amounts in thousands) (unaudited)
| | | | | | | | |
| | | | | | | | |
| | Issuer | | Shares | | | Value | |
| | | | | | | | | | |
| | Common Stocks—(continued) | | | | | | | | |
| | | | | | | | | | |
| | Emerging Asia—(continued) | | | | | | | | |
| | Philippines—(continued) | | | | | | | | |
| | Security Bank Corporation (Banks) | | | 477,670 | | | $ | 1,954 | |
| | Universal Robina Corporation (Food products) | | | 563,080 | | | | 2,497 | |
| | | | | | | | | 15,573 | |
| | South Korea—5.7% | | | | | | | | |
| | BGF retail Co., Ltd. (Food & staples retailing) | | | 14,234 | | | | 2,650 | |
| | Cell Biotech Co., Ltd. (Biotechnology) | | | 13,938 | | | | 728 | |
| | CJ CGV Co., Ltd. (Media) | | | 12,706 | | | | 1,152 | |
| | Halla Climate Control Corporation (Auto components) | | | 149,843 | | | | 1,371 | |
| * | Hugel, Inc. (Biotechnology) | | | 6,080 | | | | 1,687 | |
| | Kangwon Land, Inc. (Hotels, restaurants & leisure) | | | 41,460 | | | | 1,504 | |
| | Korea Kolmar Co., Ltd. (Personal products) | | | 35,024 | | | | 3,063 | |
| * | Loen Entertainment, Inc. (Media) | | | 18,753 | | | | 1,197 | |
| | Mando Corporation (Auto components) | | | 5,695 | | | | 1,082 | |
| | Medy-Tox, Inc. (Biotechnology) | | | 5,119 | | | | 1,936 | |
| | Vieworks Co., Ltd. (Health care equipment & supplies) | | | 24,461 | | | | 1,065 | |
| | | | | | | | | 17,435 | |
| | Taiwan—13.4% | | | | | | | | |
| | Actron Technology Corporation (Auto components) | | | 402,000 | | | | 1,545 | |
| | Advantech Co., Ltd. (Technology hardware, storage & peripherals) | | | 191,000 | | | | 1,456 | |
| | ASPEED Technology, Inc. (Semiconductors & semiconductor equipment) | | | 40,000 | | | | 372 | |
| | Bizlink Holding, Inc. (Electrical equipment) | | | 249,000 | | | | 1,536 | |
| | Chin-Poon Industrial Co., Ltd. (Electronic equipment, instruments & components) | | | 559,000 | | | | 1,210 | |
| | Cleanaway Co., Ltd. (Commercial services & supplies) | | | 83,000 | | | | 447 | |
| | Cub Elecparts, Inc. (Auto components) | | | 59,080 | | | | 666 | |
| | E.Sun Financial Holding Co., Ltd. (Banks) | | | 2,605,611 | | | | 1,544 | |
| | Ennoconn Corporation (Technology hardware, storage & peripherals) | | | 249,000 | | | | 3,346 | |
| | Hota Industrial Manufacturing Co., Ltd. (Auto components) | | | 340,000 | | | | 1,595 | |
| | Kung Long Batteries Industrial Co., Ltd. (Electrical equipment) | | | 254,000 | | | | 1,155 | |
| | Macauto Industrial Co., Ltd. (Auto components) | | | 336,000 | | | | 1,718 | |
| * | PharmaEngine, Inc. (Biotechnology) | | | 133,000 | | | | 918 | |
| | Posiflex Technology, Inc. (Electronic equipment, instruments & components) . | | | 264,000 | | | | 1,276 | |
| | Poya Co., Ltd. (Multiline retail) | | | 146,100 | | | | 1,629 | |
| | Shin Zu Shing Co., Ltd. (Machinery) | | | 743,000 | | | | 2,451 | |
| | Silicon Motion Technology Corporation-— ADR (Semiconductors & semiconductor equipment) | | | 63,415 | | | | 3,031 | |
| | Sinbon Electronics Co., Ltd. (Electronic equipment, instruments & components) | | | 1,031,000 | | | | 2,328 | |
| | | | | | | | |
| | | | | | | | |
| | Issuer | | Shares | | | Value | |
| | | | | | | | | | |
| | Common Stocks—(continued) | | | | | | | | |
| | | | | | | | | | |
| | Emerging Asia—(continued) | | | | | | | | |
| | Taiwan—(continued) | | | | | | | | |
| | Sporton International, Inc. (Professional services) | | | 439,757 | | | $ | 2,279 | |
| | St Shine Optical Co., Ltd. (Health care equipment & supplies) | | | 85,000 | | | | 1,921 | |
| | Sunny Friend Environmental Technology Co., Ltd. (Commercial services & supplies) | | | 542,000 | | | | 2,568 | |
| | Tung Thih Electronic Co., Ltd. (Auto components) | | | 108,000 | | | | 1,739 | |
| * | Visual Photonics Epitaxy Co., Ltd. (Semiconductors & semiconductor equipment) | | | 1,109,000 | | | | 1,695 | |
| | Voltronic Power Technology Corporation (Electrical equipment) | | | 78,103 | | | | 1,092 | |
| | Win Semiconductors Corporation (Semiconductors & semiconductor equipment) | | | 751,539 | | | | 1,538 | |
| | | | | | | | | 41,055 | |
| | Thailand—6.0% | | | | | | | | |
| | Bangkok Chain Hospital PCL (Health care providers & services) | | | 4,742,900 | | | | 1,678 | |
| | Beauty Community PCL (Specialty retail) | | | 14,719,100 | | | | 3,465 | |
| | Carabao Group PCL Class “F” (Beverages) | | | 821,400 | | | | 1,234 | |
| | Central Plaza Hotel PCL (Hotels, restaurants & leisure) | | | 1,322,400 | | | | 1,408 | |
| | Chularat Hospital PCL Class “F” (Health care providers & services) | | | 15,116,200 | | | | 1,336 | |
| | Home Product Center PCL (Specialty retail) | | | 2,550,500 | | | | 721 | |
| | KCE Electronics PCL (Electronic equipment, instruments & components) | | | 853,900 | | | | 2,030 | |
| | Kiatnakin Bank PCL (Banks) | | | 355,400 | | | | 441 | |
| | Major Cineplex Group PCL (Media) | | | 1,294,200 | | | | 1,219 | |
| | Minor International PCL (Hotels, restaurants & leisure) | | | 2,614,701 | | | | 3,005 | |
| | Srisawad Power 1979 PCL Class “F” (Consumer finance) | | | 1,535,412 | | | | 1,667 | |
| | | | | | | | | 18,204 | |
| | Emerging Europe, Mid-East, Africa—15.3% | | | | | | | | |
| | Georgia—0.6% | | | | | | | | |
| * | BGEO Group plc (Banks) | | | 50,639 | | | | 1,773 | |
| | | | | | | | | | |
| | Hungary—1.0% | | | | | | | | |
| | Magyar Telekom Telecommunications plc (Diversified telecommunication services) | | | 1,161,980 | | | | 1,823 | |
| | Richter Gedeon Nyrt (Pharmaceuticals) | | | 58,586 | | | | 1,165 | |
| | | | | | | | | 2,988 | |
| | Kenya—1.1% | | | | | | | | |
| | Safaricom, Ltd. (Wireless telecommunication services) | | | 19,398,500 | | | | 3,372 | |
See accompanying Notes to Financial Statements.
| June 30, 2016 | William Blair Funds | 87 |
Emerging Markets Small Cap Growth Fund
Portfolio of Investments, June 30, 2016 (all dollar amounts in thousands) (unaudited)
| | | | | | | | |
| | | | | | | | |
| | Issuer | | Shares | | | Value | |
| | | | | | | | | | |
| | Common Stocks—(continued) | | | | | | | | |
| | | | | | | | | | |
| | Emerging Europe, Mid-East, Africa—(continued) | | | | |
| | Poland—0.9% | | | | | | | | |
| | Eurocash S.A. (Food & staples retailing) | | | 45,885 | | | $ | 538 | |
| * | KRUK S.A. (Consumer finance) | | | 41,478 | | | | 2,124 | |
| | | | | | | | | 2,662 | |
| | Romania—0.9% | | | | | | | | |
| | Banca Transilvania S.A. (Banks) | | | 5,281,203 | | | | 2,699 | |
| | | | | | | | | | |
| | Russia—1.6% | | | | | | | | |
| * | Yandex N.V. Class “A” (Internet software & services)† | | | 225,776 | | | | 4,933 | |
| | | | | | | | | | |
| | South Africa—4.8% | | | | | | | | |
| | AVI, Ltd. (Food products) | | | 387,527 | | | | 2,187 | |
| | Capitec Bank Holdings, Ltd. (Banks) | | | 37,708 | | | | 1,530 | |
| | Cashbuild, Ltd. (Specialty retail) | | | 75,399 | | | | 1,818 | |
| | Clicks Group, Ltd. (Food & staples retailing) | | | 344,283 | | | | 2,862 | |
| | JSE, Ltd. (Diversified financial services) | | | 188,317 | | | | 2,372 | |
| | Pioneer Foods Group, Ltd. (Food products) | | | 132,472 | | | | 1,554 | |
| | PSG Group, Ltd. (Diversified financial services) | | | 82,563 | | | | 1,091 | |
| | The Spar Group, Ltd. (Food & staples retailing) | | | 86,000 | | | | 1,181 | |
| | | | | | | | | 14,595 | |
| | Turkey—3.1% | | | | | | | | |
| | Arcelik A.S. (Household durables) | | | 379,171 | | | | 2,496 | |
| | Aselsan Elektronik Sanayi Ve Ticaret A.S. (Aerospace & defense) | | | 247,868 | | | | 812 | |
| | Tofas Turk Otomobil Fabrikasi A.S. (Automobiles) | | | 519,917 | | | | 4,275 | |
| | Turkiye Sinai Kalkinma Bankasi A.S. (Banks) | | | 1,738,648 | | | | 804 | |
| | Ulker Biskuvi Sanayi A.S. (Food products) | | | 135,757 | | | | 992 | |
| | | | | | | | | 9,379 | |
| | United Arab Emirates—1.3% | | | | | | | | |
| | Emaar Malls Group PJSC (Real estate management & development) | | | 2,103,252 | | | | 1,620 | |
| | NMC Health plc (Health care providers & services) | | | 147,984 | | | | 2,555 | |
| | | | | | | | | 4,175 | |
| | Emerging Latin America—15.0% | | | | | | | | |
| | Argentina—0.4% | | | | | | | | |
| | Banco Macro S.A.—ADR (Banks) | | | 15,583 | | | | 1,157 | |
| | | | | | | | | | |
| | Brazil—6.2% | | | | | | | | |
| * | BR Malls Participacoes S.A. (Real estate management & development) | | | 611,590 | | | | 2,446 | |
| | CVC Brasil Operadora e Agencia de Viagens S.A. (Hotels, restaurants & leisure) | | | 246,200 | | | | 1,754 | |
| * | EcoRodovias Infraestrutura e Logistica S.A. (Transportation infrastructure) | | | 578,700 | | | | 1,510 | |
| | | | | | | | |
| | | | | | | | |
| | Issuer | | Shares | | | Value | |
| | |
| | Common Stocks—(continued) | | | | | | | | |
| | |
| | Emerging Latin America—(continued) | | | | | | | | |
| | Brazil—(continued) | | | | | | | | |
| | Kroton Educacional S.A. (Diversified consumer services) | | | 618,800 | | | $ | 2,620 | |
| | Localiza Rent a Car S.A. (Road & rail) | | | 161,800 | | | | 1,738 | |
| | Lojas Renner S.A. (Multiline retail) | | | 479,100 | | | | 3,533 | |
| | Raia Drogasil S.A. (Food & staples retailing) | | | 281,200 | | | | 5,527 | |
| | | | | | | | | 19,128 | |
| | Chile—0.3% | | | | | | | | |
| | Aguas Andinas S.A. Class “A” (Water utilities) | | | 1,774,672 | | | | 1,019 | |
| | | | | | | | | | |
| | Mexico—8.1% | | | | | | | | |
| | Alsea S.A.B. de C.V. (Hotels, restaurants & leisure) | | | 919,400 | | | | 3,500 | |
| | Banregio Grupo Financiero S.A.B. de C.V. (Banks) | | | 703,808 | | | | 4,061 | |
| * | Controladora Vuela Cia de Aviacion S.A.B. de C.V.—ADR (Airlines) | | | 70,340 | | | | 1,315 | |
| | Grupo Aeroportuario del Centro Norte S.A.B. de C.V. (Transportation infrastructure) | | | 812,309 | | | | 4,841 | |
| | Grupo Aeroportuario del Pacifico S.A.B. de C.V. Class “B” (Transportation infrastructure) | | | 386,300 | | | | 3,971 | |
| | Grupo Financiero Santander Mexico S.A.B. de C.V. Class “B” (Banks) | | | 559,501 | | | | 1,015 | |
| | Grupo Lala S.A.B. de C.V. (Food products) | | | 318,590 | | | | 703 | |
| | Megacable Holdings S.A.B. de C.V. (Media) | | | 181,400 | | | | 736 | |
| | Nemak S.A.B. de C.V.—144A (Auto components) | | | 1,355,400 | | | | 1,587 | |
| | Promotora y Operadora de Infraestructura S.A.B. de C.V. (Transportation infrastructure) | | | 176,300 | | | | 2,170 | |
| | Unifin Financiera SAPI de C.V. SOFOM E.N.R. (Consumer finance) | | | 299,600 | | | | 751 | |
| | | | | | | | | 24,650 | |
| | Total Common Stocks—98.0%
(cost $266,478) | | | | | | | 299,445 | |
See accompanying Notes to Financial Statements.
| 88 | Semiannual Report | June 30, 2016 |
Emerging Markets Small Cap Growth Fund
Portfolio of Investments, June 30, 2016 (all dollar amounts in thousands) (unaudited)
| | | | | | | | |
| | | | Principal | | | | |
| | Issuer | | Amount | | | Value | |
| | | | | | | | | | |
| | Repurchase Agreement | | | | | | | | |
| | Fixed Income Clearing Corporation, 0.030% dated 6/30/16, due 7/1/16, repurchase price $1,579, collateralized by FHLMC, 4.125%, due 10/11/33 | | $ | 1,579 | | | $ | 1,579 | |
| | | | | | | | | | |
| | Total Repurchase Agreement—0.5%
(cost $1,579) | | | | | | | 1,579 | |
| | | | | | | | | | |
| | Total Investments—98.5%
(cost $268,057) | | | | | | | 301,024 | |
| | | | | | | | | | |
| | Cash and other assets, less liabilities—1.5% | | | | | | | 4,510 | |
| | | | | | | | | | |
| | Net assets—100.0% | | | | | | $ | 305,534 | |
ADR = American Depository Receipt
* = Non-income producing security
† = U.S. listed foreign security
** = Fair valued pursuant to Valuation Procedures approved by the Board of Trustees. This holding represents 0.16% of the Fund’s net assets at June 30, 2016.
§ = Deemed illiquid pursuant to Liquidity Procedures approved by the Board of Trustees. This holding represents 0.16% of the Fund’s net assets at June 30, 2016.
For securities primarily traded on exchanges or markets that close before the close of regular trading on the New York Stock Exchange, the Fund may use an independent pricing service to fair value price the securities pursuant to Valuation Procedures approved by the Board of Trustees.
At June 30, 2016, the Fund’s Portfolio of Investments includes the following industry categories (as a percentage of long-term investments):
| Financials | 25.6% |
| Consumer Discretionary | 22.3% |
| Industrials | 15.0% |
| Consumer Staples | 12.2% |
| Information Technology | 8.9% |
| Materials | 7.3% |
| Health Care | 5.5% |
| Telecommunication Services | 1.7% |
| Utilities | 1.5% |
| Total | 100.0% |
At June 30, 2016, the Fund’s Portfolio of Investments includes the following currency categories (as a percentage of long-term investments):
| Indian Rupee | 20.1% |
| New Taiwan Dollar | 13.1% |
| Mexican Peso | 7.8% |
| Brazilian Real | 6.4% |
| Thai Baht | 6.1% |
| South Korean Won | 5.8% |
| Indonesian Rupiah | 5.7% |
| Pakistan Rupee | 5.5% |
| U.S. Dollar | 5.3% |
| Philippine Peso | 5.2% |
| South African Rand | 4.9% |
| Hong Kong Dollar | 4.8% |
| Turkish Lira | 3.1% |
| British Pound Sterling | 1.4% |
| Kenyan Shilling | 1.1% |
| All Other Currencies | 3.7% |
| Total | 100.0% |
See accompanying Notes to Financial Statements.
| June 30, 2016 | William Blair Funds | 89 |
Fixed Income Market Review and Outlook
The first six months of 2016 were accommodative for fixed income investors, as a combination of factors resulted in strong returns. Longer-term interest rates declined to record-low levels. In addition, corporate bonds produced stronger gains than Treasuries as risk spreads narrowed. Agency mortgage-backed securities underperformed Treasury securities of similar duration, but the underperformance has not been extreme when compared to historical returns.
U.S. Treasuries demonstrated their haven-like feature as longer-term interest rates collapsed as uncertainty over global growth prospects and populist challenges to free-trade institutions emerged. The yield curve flattened to a level not experienced since before the Global Financial Crisis of 2008. In spite of the favorable performance of longer-term Treasuries, the U.S. Federal Reserve appears poised to raise the federal funds rate during 2016, as U.S. employment statistics show signs of strength. However, it is unlikely that the Federal Reserve will raise the federal funds rate four times during the calendar year, as the Eurodollar futures market implied at the beginning of the year.
Corporate bonds of all credit qualities produced gains year-to-date. Corporate bond risk spreads widened at the beginning of the year, but risk spreads began to narrow in March after the European Central Bank announced that U.S. corporate bonds would be eligible instruments for their large-scale asset purchase program. High yield corporate bonds outperformed investment-grade corporate bonds year-to-date. On a sector basis, Industrial corporate bonds performed well while Financials lagged. Financials have been the only major segment of the market to experience widening risk spreads year-to-date. Emerging market corporate bonds have performed well year-to-date. Despite the outperformance of corporate bonds, risk spreads remain at attractive levels relative to their historical averages.
Agency mortgage-backed securities (MBS) have lagged comparable-duration Treasuries year-to-date. However, agency MBS underperformance is largely explained by the relatively weak performance of lower-coupon, 30-year MBS that comprise the majority of the Barclays U.S. MBS Index. One reason these securities performed poorly is that they are most sensitive to concerns over the increase in prepayments resulting from a decline in interest rates to historically low levels. The performance of other 30-year coupon segments was less severely impacted year-to-date.
We believe that the Federal Reserve Board’s Federal Open Market Committee (FOMC) will stick to its plan to raise the federal funds rate gradually throughout 2016. The U.S. economy is growing; estimates indicate that GDP grew by 2.0–2.5% in real terms during 2015, and forecasters predict a similar pace of growth during 2016. In addition, the U.S. labor market is adding jobs at a robust pace. However, wage inflation remains at lower levels than many predicted given the prevailing conditions. Macroeconomic theory predicts that a robust labor market creates wage inflation, which in turn spurs broader inflation. However, inflationary pressures have weakened. Price indexes such as the CPI and PCE showed that inflation is below the FOMC’s stated target range of 2.0%–2.5%, and forward-looking, market-implied inflation expectations decreased below the FOMC’s target range. We believe that the FOMC will pay careful attention to its price stability objective when it decides whether to raise the federal funds rate, as the FOMC will want to ensure that doing so will not spur disinflationary pressures.
We believe that agency mortgage-backed securities and high-quality corporate bonds are poised to generate attractive returns over the longer term. Corporate bond risk premiums are at levels above their longer-term averages, and risk premiums of higher-coupon segments of the agency MBS market remain attractive. In addition, we believe U.S. Treasuries are likely to struggle as the FOMC embarks on a tightening cycle.
We believe that higher-coupon segments (coupon rates of 5.0% and above for 30-year terms) of the agency MBS market offer compelling value. These segments of the agency MBS market offer attractive spreads and a defensive duration profile. The key risk of these securities is that the underlying borrowers have mortgage loan rates well above current rates available for refinancing. We believe this risk can be mitigated by focusing on mortgage pools comprised of borrowers that do not have the economic incentive to refinance their loans, specifically low-loan balance pools.
We believe that the corporate bond market remains attractive. Although fundamentals have deteriorated lately, valuations have also increased. We observed an increase in leverage among industrial companies over the past year as companies secured financing at low nominal yields in the robust new issue market for corporate bonds. Corporate risk spreads have adjusted to reflect these changes, and we find current valuation levels to be appealing. We remain concerned about idiosyncratic risks, including shareholder-friendly activities such as leveraged finance mergers and acquisitions, large share repurchases, and special dividends. Importantly, we do not believe the market will enter a period of excessive LBO activity.
| 90 | Semiannual Report | June 30, 2016 |
| | Bond Fund |
| | |
| | The Bond Fund seeks to outperform the Barclays Capital U.S. Aggregate Bond Index by maximizing total return through a combination of income and capital appreciation. |
| | |
| | AN OVERVIEW FROM THE PORTFOLIO MANAGERS |
| | |

Paul J. Sularz 
Christopher T. Vincent | The William Blair Bond Fund (Class N shares) posted a 5.37% return, net of fees, for the six months ended June 30, 2016. By comparison, the Fund’s benchmark, the Barclays U.S. Aggregate Index (the “Index”), returned 5.31%. A couple of factors contributed to the Fund’s outperformance relative to the Index year-to-date. Sector allocation had a favorable impact on the Fund’s relative performance, as the Fund was underweight in U.S. Treasuries and overweight in corporate bonds. The Fund’s corporate bond holdings additionally contributed to outperformance through positive security selection effect. In particular, the Fund’s position in bonds issued by ConocoPhillips contributed. There were a couple of factors that detracted from the Fund’s relative performance during the period. The Fund’s overweight in mortgage-backed securities (MBS) detracted from performance as comparable-duration U.S. Treasuries outperformed MBS year-to-date. In addition, the Fund’s exposure to 30-year, 5.5% coupon pools also underperformed U.S. Treasuries after controlling for duration. Please refer to the Fixed Income Market Review and Outlook relating to the Fund on page 90. |
| June 30, 2016 | William Blair Funds | 91 |
Bond Fund
Performance Highlights (Unaudited)
| Average Annual Total Return at 6/30/2016 |
| | | Year | | | | | | | | | | | Since |
| | | to Date | | 1 Year | | 3 Year | | 5 Year | | Inception(a) |
| Class N | | | 5.37 | % | | | 4.76 | % | | | 4.09 | % | | | 4.27 | % | | | 5.24 | % |
| Class I | | | 5.40 | | | | 4.98 | | | | 4.25 | | | | 4.43 | | | | 5.41 | |
| Institutional Class | | | 5.43 | | | | 5.05 | | | | 4.36 | | | | 4.56 | | | | 5.55 | |
| Barclays U.S. Aggregate Bond Index | | | 5.31 | | | | 6.00 | | | | 4.06 | | | | 3.76 | | | | 4.81 | |
| (a) | For the period from May 1, 2007 (Commencement of Operations) to June 30, 2016. |
Performance cited represents past performance. Past performance does not guarantee future results and current performance may be lower or higher than the data quoted. Results shown are average annual total returns, which assume reinvestment of dividends and capital gains. Investment returns and principal will fluctuate and you may have a gain or loss when you sell shares. For the most current month-end performance information, please call 1-800-742-7272, or visit our Web site at www.williamblairfunds.com. From time to time, the investment adviser may waive fees or reimburse expenses for the Fund. Without these waivers/reimbursements, performance would be lower. Class N shares are available to the general public without a sales load. Class I shares are available to certain institutional investors and advisory clients of William Blair Investment Management, LLC and William Blair & Company, L.L.C., without a sales load or distribution (12b-1) fees. Institutional Class shares are available to institutional investors without a sales load or distribution (12b-1) or service fees.
The performance highlights and graph presented above do not reflect the deduction of taxes that a shareholder would pay on fund distributions or the redemption of fund shares.
The Barclays U.S. Aggregate Bond Index indicates broad intermediate government/corporate bond market performance.
This report identifies the Fund’s investments on June 30, 2016. These holdings are subject to change. Not all investments in the Fund performed the same, nor is there any guarantee that these investments will perform as well in the future. Market forecasts provided in this report may not necessarily come to pass.
Sector Diversification (Unaudited)
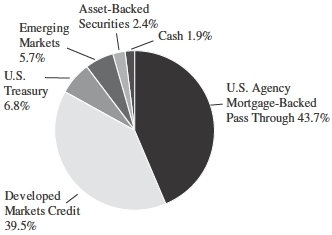
The sector diversification shown is based on the total investments.
| 92 | Semiannual Report | June 30, 2016 |
Bond Fund
Portfolio of Investments, June 30, 2016 (all dollar amounts in thousands) (unaudited)
| | | | | | | | |
| | | | Principal | | | | |
| | Issuer | | Amount | | | Value | |
| | | | | | | | | | |
| | U.S. Government and U.S. Government Agency—50.2% |
| | | | | | | | | | |
| | U.S. Treasury Inflation Indexed Notes/Bonds—6.0% | | | | | | | | |
| | U.S. Treasury Inflation Indexed Note,
1.875%, due 7/15/19 (a) | | $ | 4,930 | | | $ | 5,337 | |
| | U.S. Treasury Inflation Indexed Bond,
3.875%, due 4/15/29 | | | 20,009 | | | | 28,861 | |
| | Total U.S. Treasury Inflation Indexed Notes/Bonds | | | | | | | 34,198 | |
| | | | | | | | | | |
| | U.S. Treasury—0.7% | | | | | | | | |
| | U.S. Treasury Strip Principal,
0.000%, due 5/15/20 | | | 3,925 | | | | 3,793 | |
| | | | | | | | | | |
| | Government National Mortgage
Association (GNMA)—0.3% | | | | | | | | |
| | #623162, 6.500%, due 7/15/18 | | | 10 | | | | 10 | |
| | #589335, 6.500%, due 10/15/22 | | | 24 | | | | 27 | |
| | #357322, 7.000%, due 9/15/23 | | | 9 | | | | 9 | |
| | #616250, 6.000%, due 2/15/24 | | | 3 | | | | 3 | |
| | #509405, 7.500%, due 8/15/29 | | | 1 | | | | 1 | |
| | GNR 2004-2 M5, 4.891%, due 7/16/34 | | | 15 | | | | 15 | |
| | #699118, 6.000%, due 9/15/38 | | | 1,421 | | | | 1,643 | |
| | Total GNMA Mortgage Obligations | | | | | | | 1,708 | |
| | | | | | | | | | |
| | Federal Home Loan Mortgage Corp. (FHLMC)—13.7% | | | | | | | | |
| | #J04096, 6.500%, due 1/1/17 | | | 2 | | | | 2 | |
| | #E90398, 7.000%, due 5/1/17 | | | 6 | | | | 6 | |
| | #G90027, 6.000%, due 11/17/17 | | | 2 | | | | 2 | |
| | #G30093, 7.000%, due 12/1/17 | | | 2 | | | | 2 | |
| | #O20005, 6.500%, due 1/1/18 | | | 2 | | | | 2 | |
| | #E96940, 4.500%, due 6/1/18 | | | 16 | | | | 16 | |
| | #B13747, 5.000%, due 4/1/19 | | | 200 | | | | 207 | |
| | #G30254, 6.500%, due 5/1/19 | | | 4 | | | | 4 | |
| | #G11697, 5.500%, due 4/1/20 | | | 359 | | | | 376 | |
| | #G12113, 5.500%, due 5/1/21 | | | 344 | | | | 367 | |
| | #J02986, 6.500%, due 7/1/21 | | | 15 | | | | 16 | |
| | #G30255, 7.000%, due 7/1/21 | | | 3 | | | | 3 | |
| | #G30243, 6.000%, due 12/1/21 | | | 4 | | | | 4 | |
| | #G12720, 5.500%, due 6/1/22 | | | 41 | | | | 44 | |
| | #D95621, 6.500%, due 7/1/22 | | | 28 | | | | 32 | |
| | #G14150, 4.500%, due 4/1/26 | | | 2,056 | | | | 2,220 | |
| | #J16051, 4.500%, due 7/1/26 | | | 897 | | | | 968 | |
| | #G02183, 6.500%, due 3/1/30 | | | 28 | | | | 32 | |
| | #G01728, 7.500%, due 7/1/32 | | | 125 | | | | 155 | |
| | #C01385, 6.500%, due 8/1/32 | | | 100 | | | | 119 | |
| | #G01551, 6.000%, due 4/1/33 | | | 2,265 | | | | 2,661 | |
| | #C01623, 5.500%, due 9/1/33 | | | 126 | | | | 142 | |
| | #A15039, 5.500%, due 10/1/33 | | | 2 | | | | 3 | |
| | #A17603, 5.500%, due 1/1/34 | | | 2,213 | | | | 2,553 | |
| | #G01705, 5.500%, due 6/1/34 | | | 896 | | | | 1,035 | |
| | #G01843, 6.000%, due 6/1/35 | | | 23 | | | | 27 | |
| | #G02141, 6.000%, due 3/1/36 | | | 650 | | | | 764 | |
| | #A62179, 6.000%, due 6/1/37 | | | 279 | | | | 327 | |
| | #G03711, 6.000%, due 6/1/37 | | | 861 | | | | 997 | |
| | #G04126, 6.000%, due 6/1/37 | | | 2,338 | | | | 2,736 | |
| | #A63539, 6.000%, due 7/1/37 | | | 357 | | | | 419 | |
| | #A62858, 6.500%, due 7/1/37 | | | 136 | | | | 160 | |
| | #G03170, 6.500%, due 8/1/37 | | | 291 | | | | 353 | |
| | | | | | | | |
| | | | Principal | | | | |
| | Issuer | | Amount | | | Value | |
| | | | | | | | | | |
| | U.S. Government and U.S. Government Agency—(continued) |
| | | | | | | | | | |
| | Federal Home Loan Mortgage Corp.
(FHLMC)—(continued) | | | | | | | | |
| | #A66843, 6.500%, due 10/1/3 | | $ | 71,028 | | | $ | 1,190 | |
| | #G07837, 6.500%, due 2/1/38 | | | 3,345 | | | | 4,094 | |
| | #G04053, 5.500%, due 3/1/38 | | | 652 | | | | 744 | |
| | #A78138, 5.500%, due 6/1/38 | | | 392 | | | | 449 | |
| | #G04466, 5.500%, due 7/1/38 | | | 17,786 | | | | 20,525 | |
| | #G04544, 6.000%, due 8/1/38 | | | 796 | | | | 923 | |
| | #A81799, 6.500%, due 9/1/38 | | | 679 | | | | 834 | |
| | #G05723, 6.500%, due 11/1/38 | | | 1,739 | | | | 2,127 | |
| | #A86143, 5.000%, due 5/1/39 | | | 61 | | | | 68 | |
| | #G05810, 5.000%, due 2/1/40 | | | 16,080 | | | | 18,149 | |
| | #G05875, 5.500%, due 2/1/40 | | | 802 | | | | 915 | |
| | #G07300, 6.000%, due 4/1/40 | | | 7,058 | | | | 8,298 | |
| | #G06017, 5.500%, due 6/1/40 | | | 192 | | | | 218 | |
| | #C03665, 9.000%, due 4/1/41 | | | 819 | | | | 1,035 | |
| | #G06583, 5.000%, due 6/1/41 | | | 2,070 | | | | 2,345 | |
| | Total FHLMC Mortgage Obligations | | | | | | | 78,668 | |
| | | | | | | | | | |
| | Federal National Mortgage Association (FNMA)—29.5% | | | | | | | | |
| | #679247, 7.000%, due 8/1/17 | | | 1 | | | | 1 | |
| | #683100, 5.500%, due 2/1/18 | | | 60 | | | | 62 | |
| | #689612, 5.000%, due 5/1/18 | | | 29 | | | | 29 | |
| | #695910, 5.000%, due 5/1/18 | | | 79 | | | | 81 | |
| | #697593, 5.000%, due 5/1/18 | | | 69 | | | | 71 | |
| | #704049, 5.500%, due 5/1/18 | | | 160 | | | | 163 | |
| | #735357, 5.500%, due 5/1/18 | | | 201 | | | | 206 | |
| | #735003, 5.500%, due 7/1/18 | | | 208 | | | | 213 | |
| | #251960, 6.000%, due 9/1/18 | | | 1 | | | | 1 | |
| | #745498, 7.000%, due 11/1/18 | | | 77 | | | | 78 | |
| | #770395, 5.000%, due 4/1/19 | | | 2 | | | | 2 | |
| | #788424, 5.500%, due 9/1/19 | | | 13 | | | | 13 | |
| | #835563, 7.000%, due 10/1/20 | | | 14 | | | | 14 | |
| | #900725, 6.000%, due 8/1/21 | | | 35 | | | | 38 | |
| | #888555, 5.500%, due 9/1/21 | | | 3,803 | | | | 4,057 | |
| | #893325, 7.000%, due 9/1/21 | | | 12 | | | | 13 | |
| | #735104, 7.000%, due 5/1/22 | | | 2 | | | | 2 | |
| | #949589, 5.500%, due 8/1/22 | | | 2,659 | | | | 2,892 | |
| | #949592, 6.000%, due 8/1/22 | | | 4,271 | | | | 4,706 | |
| | #AA2924, 4.500%, due 4/1/24 | | | 251 | | | | 270 | |
| | #931299, 4.500%, due 6/1/24 | | | 588 | | | | 636 | |
| | #AC1848, 4.500%, due 9/1/24 | | | 376 | | | | 406 | |
| | #AC5410, 4.500%, due 10/1/24 | | | 293 | | | | 317 | |
| | #932095, 4.000%, due 11/1/24 | | | 1,376 | | | | 1,482 | |
| | #932100, 4.500%, due 11/1/24 | | | 246 | | | | 266 | |
| | #AC9560, 5.000%, due 1/1/25 | | | 1,750 | | | | 1,883 | |
| | #AD8164, 4.000%, due 8/1/25 | | | 617 | | | | 665 | |
| | #AB1459, 4.000%, due 9/1/25 | | | 274 | | | | 295 | |
| | #255956, 5.500%, due 10/1/25 | | | 19 | | | | 21 | |
| | #AH2671, 4.000%, due 1/1/26 | | | 1,092 | | | | 1,174 | |
| | #AI4872, 4.500%, due 6/1/26 | | | 398 | | | | 431 | |
| | #AL2851, 4.000%, due 8/1/26 | | | 1,941 | | | | 2,091 | |
| | #AI9811, 4.500%, due 8/1/26 | | | 317 | | | | 342 | |
| | #AJ3203, 4.000%, due 10/1/26 | | | 109 | | | | 118 | |
| | #AJ7724, 4.000%, due 12/1/26 | | | 824 | | | | 886 | |
| | #AJ9402, 4.000%, due 12/1/26 | | | 1,183 | | | | 1,275 | |
| | #AK7384, 4.000%, due 3/1/27 | | | 965 | | | | 1,034 | |
See accompanying Notes to Financial Statements.
| June 30, 2016 | William Blair Funds | 93 |
Bond Fund
Portfolio of Investments, June 30, 2016 (all dollar amounts in thousands) (unaudited)
| | | | | | | |
| | | Principal | | | | |
| Issuer | | Amount | | | Value | |
| | | | | | | | | |
| U.S. Government and U.S. Government Agency—(continued) |
| | | | | | | | | |
Federal National Mortgage Association
(FNMA)—(continued) | | | | | | | | |
| #AB4818, 4.000%, due 4/1/27 | | $ | 645 | | | $ | 695 | |
| #AL2590, 4.000%, due 7/1/27 | | | 4,206 | | | | 4,523 | |
| #AV6413, 4.000%, due 2/1/29 | | | 3,303 | | | | 3,557 | |
| #252925, 7.500%, due 12/1/29 | | | 1 | | | | 2 | |
| #535977, 6.500%, due 4/1/31 | | | 9 | | | | 10 | |
| #253907, 7.000%, due 7/1/31 | | | 2 | | | | 2 | |
| #545339, 6.500%, due 11/1/31 | | | 49 | | | | 59 | |
| #587849, 6.500%, due 11/1/31 | | | 13 | | | | 15 | |
| #618547, 6.500%, due 11/1/31 | | | 5,303 | | | | 6,446 | |
| #545437, 7.000%, due 2/1/32 | | | 58 | | | | 72 | |
| #545759, 6.500%, due 7/1/32 | | | 523 | | | | 621 | |
| #545869, 6.500%, due 7/1/32 | | | 1,638 | | | | 1,925 | |
| #678007, 6.000%, due 9/1/32 | | | 8 | | | | 10 | |
| #670385, 6.500%, due 9/1/32 | | | 829 | | | | 1,006 | |
| #254548, 5.500%, due 12/1/32 | | | 54 | | | | 61 | |
| #677290, 6.000%, due 1/1/33 | | | 2,329 | | | | 2,698 | |
| #684601, 6.000%, due 3/1/33 | | | 552 | | | | 645 | |
| #703391, 5.000%, due 5/1/33 | | | 182 | | | | 205 | |
| #708993, 5.000%, due 6/1/33 | | | 30 | | | | 34 | |
| #730131, 5.000%, due 8/1/33 | | | 61 | | | | 69 | |
| #741850, 5.500%, due 9/1/33 | | | 610 | | | | 701 | |
| #739243, 6.000%, due 9/1/33 | | | 702 | | | | 824 | |
| #739331, 6.000%, due 9/1/33 | | | 383 | | | | 449 | |
| #555800, 5.500%, due 10/1/33 | | | 61 | | | | 69 | |
| #555946, 5.500%, due 11/1/33 | | | 470 | | | | 545 | |
| #756153, 5.500%, due 11/1/33 | | | 622 | | | | 717 | |
| #AL3455, 5.500%, due 11/1/33 | | | 7,240 | | | | 8,392 | |
| #725017, 5.500%, due 12/1/33 | | | 59 | | | | 69 | |
| #AL3380, 5.500%, due 1/1/34 | | | 911 | | | | 1,055 | |
| #763798, 5.500%, due 3/1/34 | | | 95 | | | | 110 | |
| #725611, 5.500%, due 6/1/34 | | | 127 | | | | 144 | |
| #783786, 5.500%, due 7/1/34 | | | 125 | | | | 144 | |
| #786546, 6.000%, due 7/1/34 | | | 457 | | | | 534 | |
| #787816, 6.000%, due 7/1/34 | | | 370 | | | | 434 | |
| #745563, 5.500%, due 8/1/34 | | | 712 | | | | 820 | |
| #794474, 6.000%, due 10/1/34 | | | 50 | | | | 58 | |
| #745092, 6.500%, due 7/1/35 | | | 402 | | | | 479 | |
| #357944, 6.000%, due 9/1/35 | | | 24 | | | | 28 | |
| #829306, 6.000%, due 9/1/35 | | | 280 | | | | 325 | |
| #836140, 5.500%, due 10/1/35 | | | 61 | | | | 70 | |
| #843487, 6.000%, due 10/1/35 | | | 116 | | | | 136 | |
| #849191, 6.000%, due 1/1/36 | | | 147 | | | | 168 | |
| #745349, 6.500%, due 2/1/36 | | | 364 | | | | 433 | |
| #888305, 7.000%, due 3/1/36 | | | 12 | | | | 14 | |
| #895637, 6.500%, due 5/1/36 | | | 92 | | | | 106 | |
| #831540, 6.000%, due 6/1/36 | | | 33 | | | | 39 | |
| #745802, 6.000%, due 7/1/36 | | | 183 | | | | 216 | |
| #886220, 6.000%, due 7/1/36 | | | 356 | | | | 416 | |
| #AL3449, 6.000%, due 7/1/36 | | | 1,829 | | | | 2,160 | |
| #893318, 6.500%, due 8/1/36 | | | 33 | | | | 38 | |
| #310037, 6.500%, due 10/1/36 | | | 226 | | | | 267 | |
| #831926, 6.000%, due 12/1/36 | | | 11 | | | | 12 | |
| #902974, 6.000%, due 12/1/36 | | | 262 | | | | 303 | |
| #909480, 6.000%, due 2/1/37 | | | 304 | | | | 355 | |
| #AB0265, 6.000%, due 2/1/37 | | | 17,379 | | | | 20,260 | |
| #888418, 5.500%, due 5/1/37 | | | 1,404 | | | | 1,626 | |
| | | | | | | | | |
| | | NRSRO | | Principal | | | | |
| Issuer | | Rating | | Amount | | | Value | |
| | | | | | | | | | | |
| U.S. Government and U.S. Government Agency—(continued) |
| | | | | | | | | | | |
Federal National Mortgage Association
(FNMA)—(continued) | | | | | | | | | | |
| #938440, 6.000%, due 7/1/37 | | | | $ | 116 | | | $ | 134 | |
| #928561, 6.000%, due 8/1/37 | | | | | 250 | | | | 293 | |
| #948689, 6.000%, due 8/1/37 | | | | | 218 | | | | 252 | |
| #888703, 6.500%, due 8/1/37 | | | | | 4,842 | | | | 5,757 | |
| #946646, 6.000%, due 9/1/37 | | | | | 72 | | | | 83 | |
| #888967, 6.000%, due 12/1/37 | | | | | 837 | | | | 984 | |
| #AL0904, 5.500%, due 1/1/38 | | | | | 63 | | | | 73 | |
| #889371, 6.000%, due 1/1/38 | | | | | 4,035 | | | | 4,727 | |
| #889385, 6.000%, due 2/1/38 | | | | | 195 | | | | 227 | |
| #962058, 6.500%, due 3/1/38 | | | | | 1,554 | | | | 1,881 | |
| #889774, 6.000%, due 7/1/38 | | | | | 500 | | | | 584 | |
| #934006, 6.500%, due 9/1/38 | | | | | 459 | | | | 563 | |
| #986856, 6.500%, due 9/1/38 | | | | | 238 | | | | 292 | |
| #AL5817, 6.000%, due 11/1/38 | | | | | 1,753 | | | | 2,048 | |
| #991911, 7.000%, due 11/1/38 | | | | | 282 | | | | 346 | |
| #AL3775, 5.000%, due 1/1/39 | | | | | 2,059 | | | | 2,335 | |
| #AD0752, 7.000%, due 1/1/39 | | | | | 942 | | | | 1,207 | |
| #AA7611, 5.000%, due 5/1/39 | | | | | 946 | | | | 1,073 | |
| #AA8443, 5.000%, due 6/1/39 | | | | | 237 | | | | 269 | |
| #AA8587, 5.500%, due 7/1/39 | | | | | 3,852 | | | | 4,461 | |
| #931492, 6.000%, due 7/1/39 | | | | | 207 | | | | 242 | |
| #AA6898, 6.000%, due 7/1/39 | | | | | 772 | | | | 903 | |
| #931801, 5.000%, due 8/1/39 | | | | | 886 | | | | 998 | |
| #AC1619, 5.500%, due 8/1/39 | | | | | 535 | | | | 613 | |
| #AD0315, 6.500%, due 8/1/39 | | | | | 3,293 | | | | 3,942 | |
| #AC0505, 5.500%, due 9/1/39 | | | | | 423 | | | | 488 | |
| #932279, 5.000%, due 12/1/39 | | | | | 102 | | | | 115 | |
| #AC9569, 5.000%, due 2/1/40 | | | | | 1,767 | | | | 2,011 | |
| #932638, 5.000%, due 3/1/40 | | | | | 187 | | | | 210 | |
| #932751, 5.000%, due 4/1/40 | | | | | 4,443 | | | | 5,058 | |
| #AE0082, 5.000%, due 5/1/40 | | | | | 541 | | | | 609 | |
| #AB1146, 5.000%, due 6/1/40 | | | | | 108 | | | | 122 | |
| #AD7531, 5.500%, due 6/1/40 | | | | | 269 | | | | 310 | |
| #AD8810, 5.500%, due 6/1/40 | | | | | 705 | | | | 815 | |
| #AB1200, 5.500%, due 7/1/40 | | | | | 1,412 | | | | 1,632 | |
| #AD7137, 5.500%, due 7/1/40 | | | | | 4,953 | | | | 5,736 | |
| #AD9169, 5.500%, due 8/1/40 | | | | | 430 | | | | 496 | |
| #AH0955, 5.000%, due 12/1/40 | | | | | 5,583 | | | | 6,336 | |
| #AH5585, 5.000%, due 2/1/41 | | | | | 194 | | | | 222 | |
| #AL0028, 5.000%, due 2/1/41 | | | | | 2,768 | | | | 3,126 | |
| #AL5815, 5.500%, due 4/1/41 | | | | | 3,987 | | | | 4,624 | |
| #AI6071, 5.000%, due 6/1/41 | | | | | 2,121 | | | | 2,421 | |
| #AI4222, 5.000%, due 7/1/41 | | | | | 149 | | | | 167 | |
| #AL0672, 5.000%, due 7/1/41 | | | | | 3,353 | | | | 3,823 | |
| #AL0913, 6.000%, due 7/1/41 | | | | | 2,408 | | | | 2,774 | |
| #AK2733, 5.000%, due 2/1/42 | | | | | 2,166 | | | | 2,473 | |
| Total FNMA Mortgage Obligations | | | | | | | | | 169,260 | |
| | | | | | | | | | | |
| Asset-Backed Securities—2.4% | | | | | | |
| Hertz Vehicle Financing LLC—144A, 2013-1A, Tranche B1, 1.860%, 8/25/17 | | Baa1 | | | 1,150 | | | | 1,149 | |
| GE Capital Credit Card Master Note Trust, 2012-6, Tranche B, 1.830%, 8/17/20 | | AA+ | | | 3,000 | | | | 3,001 | |
See accompanying Notes to Financial Statements.
| 94 | Semiannual Report | June 30, 2016 |
Bond Fund
Portfolio of Investments, June 30, 2016 (all dollar amounts in thousands) (unaudited)
| | | | | | | | | |
| | | NRSRO | | Principal | | | | |
| Issuer | | Rating | | Amount | | | Value | |
| | | | | | | | | | | |
| Asset-Backed Securities—(continued) | | | | | |
American Express Credit Account Master Trust, 2008-2, Tranche A,
1.702%, 9/15/20, VRN | | AAA | | $ | 4,800 | | | $ | 4,876 | |
| Centre Point Funding LLC—144A, 2012-2A, Tranche 1, 2.610%, 8/20/21 | | Baa2 | | | 2,792 | | | | 2,765 | |
SLM Private Education Loan Trust—144A, 2011-A, Tranche A3,
2.942%, 1/15/43, VRN | | AAA | | | 2,000 | | | | 2,014 | |
| Total Asset-Backed Securities | | | | | | | | | 13,805 | |
| | | | | | | | | | | |
| Corporate Obligations—44.8% | | | | | |
Penske Truck Leasing Co. L.P.—144A,
3.750%, due 5/11/17 | | BBB+ | | | 3,000 | | | | 3,057 | |
Toll Brothers Finance Corporation,
8.910%, due 10/15/17 | | BBB- | | | 1,050 | | | | 1,145 | |
Morgan Stanley,
6.625%, due 4/1/18 | | A | | | 3,400 | | | | 3,686 | |
Bank of America Corporation,
6.875%, due 11/15/18 | | A | | | 1,100 | | | | 1,225 | |
Glencore Funding LLC—144A,
1.988%, due 1/15/19, VRN | | BBB- | | | 1,500 | | | | 1,421 | |
Petrobras Global Finance BV,
2.768%, due 1/15/19, VRN | | BB | | | 4,000 | | | | 3,624 | |
Cemex S.A.B. de C.V.—144A,
5.875%, due 3/25/19 | | BB- | | | 3,000 | | | | 3,098 | |
Baidu, Inc.,
2.750%, due 6/9/19 | | A | | | 5,250 | | | | 5,346 | |
Roper Industries, Inc.,
6.250%, due 9/1/19 | | BBB | | | 2,195 | | | | 2,474 | |
Republic Services, Inc.,
5.500%, due 9/15/19 | | BBB+ | | | 1,725 | | | | 1,928 | |
Boston Properties L.P.,
5.875%, due 10/15/19 | | A- | | | 4,000 | | | | 4,500 | |
Toll Brothers Finance Corporation,
6.750%, due 11/1/19 | | BBB- | | | 500 | | | | 565 | |
Ford Motor Credit Co. LLC,
8.125%, due 1/15/20 | | BBB | | | 4,000 | | | | 4,774 | |
Georgia-Pacific LLC—144A,
5.400%, due 11/1/20 | | A+ | | | 4,000 | | | | 4,535 | |
United Continental Holdings, Inc.,
6.000%, due 12/1/20 | | BB- | | | 2,500 | | | | 2,625 | |
UBS Group AG,
6.875%, due 3/22/21, VRN | | BB+ | | | 2,000 | | | | 1,963 | |
JBS USA LLC / JBS USA Finance, Inc.—144A,
7.250%, due 6/1/21 | | BB+ | | | 3,000 | | | | 3,120 | |
Discovery Communications LLC,
4.375%, due 6/15/21 | | BBB- | | | 3,100 | | | | 3,332 | |
Capital One Financial Corporation,
4.750%, due 7/15/21 | | A- | | | 3,375 | | | | 3,761 | |
O’Reilly Automotive, Inc.,
4.625%, due 9/15/21 | | BBB+ | | | 2,855 | | | | 3,156 | |
| Fresenius Medical Care US Finance II, Inc.—144A, 5.875%, due 1/31/22 | | BB+ | | | 2,760 | | | | 3,039 | |
Post Holdings, Inc.,
7.375%, due 2/15/22 | | B | | | 3,000 | | | | 3,165 | |
| | | | | | | | | |
| | | NRSRO | | Principal | | | | |
| Issuer | | Rating | | Amount | | | Value | |
| | | | | | |
| Corporate Obligations—(continued) | | | | | |
Ball Corporation,
5.000%, due 3/15/22 | | BB+ | | $ | 2,500 | | | $ | 2,666 | |
Masco Corporation,
5.950%, due 3/15/22 | | BBB | | | 3,800 | | | | 4,258 | |
United Rentals North America, Inc.,
7.625%, due 4/15/22 | | BB- | | | 2,500 | | | | 2,681 | |
Discover Financial Services,
5.200%, due 4/27/22 | | BBB+ | | | 3,000 | | | | 3,295 | |
The Goodyear Tire & Rubber Co.,
7.000%, due 5/15/22 | | BB | | | 2,000 | | | | 2,138 | |
Triumph Group, Inc.,
5.250%, due 6/1/22 | | Ba3 | | | 2,000 | | | | 1,850 | |
Penske Automotive Group, Inc.,
5.750%, due 10/1/22 | | B+ | | | 2,000 | | | | 2,010 | |
American Axle & Manufacturing, Inc.,
6.625%, due 10/15/22 | | BB- | | | 3,000 | | | | 3,225 | |
Jones Lang LaSalle, Inc.,
4.400%, due 11/15/22 | | BBB+ | | | 4,218 | | | | 4,410 | |
Jaguar Land Rover Automotive plc—144A,
5.625%, due 2/1/23 | | BB | | | 3,225 | | | | 3,362 | |
Wyndham Worldwide Corporation,
3.900%, due 3/1/23 | | BBB- | | | 3,500 | | | | 3,588 | |
MGM Resorts International,
6.000%, due 3/15/23 | | BB | | | 3,000 | | | | 3,173 | |
Avis Budget Car Rental LLC,
5.500%, due 4/1/23 | | B+ | | | 2,500 | | | | 2,472 | |
Toll Brothers Finance Corporation,
4.375%, due 4/15/23 | | BBB- | | | 3,375 | | | | 3,341 | |
Wells Fargo & Co.,
4.480%, due 1/16/24 | | A+ | | | 5,000 | | | | 5,486 | |
Fibria Overseas Finance, Ltd.,
5.250%, due 5/12/24 | | BBB- | | | 4,000 | | | | 4,100 | |
BRF S.A.—144A,
4.750%, due 5/22/24 | | BBB | | | 2,500 | | | | 2,494 | |
Banco Inbursa S.A. Institucion de Banca Multiple—144A,
4.125%, due 6/6/24 | | BBB+ | | | 2,500 | | | | 2,513 | |
Grupo Bimbo S.A.B. de C.V.—144A,
3.875%, due 6/27/24 | | BBB | | | 2,500 | | | | 2,611 | |
Synchrony Financial,
4.250%, due 8/15/24 | | BBB- | | | 5,000 | | | | 5,183 | |
HSBC Holdings plc,
6.375%, due 9/17/24, VRN | | BBB | | | 3,500 | | | | 3,312 | |
BNP Paribas S.A.,
4.250%, due 10/15/24 | | A | | | 4,000 | | | | 4,119 | |
Owens Corning,
4.200%, due 12/1/24 | | BBB- | | | 3,200 | | | | 3,354 | |
Credit Suisse Group AG—144A,
6.250%, due 12/18/24, VRN | | BB | | | 2,000 | | | | 1,891 | |
USG Corp.—144A,
5.500%, due 3/1/25 | | BB+ | | | 3,000 | | | | 3,154 | |
Simon Property Group L.P.,
3.300%, due 1/15/26 | | A | | | 4,500 | | | | 4,813 | |
Brookfield Finance, Inc.,
4.250%, due 6/2/26 | | A- | | | 4,775 | | | | 4,890 | |
The Kroger Co.,
8.000%, due 9/15/29 | | Baa1 | | | 3,323 | | | | 4,783 | |
See accompanying Notes to Financial Statements.
| June 30, 2016 | William Blair Funds | 95 |
Bond Fund
Portfolio of Investments, June 30, 2016 (all dollar amounts in thousands) (unaudited)
| | | | | | | | | | |
| | | NRSRO | | Principal | | | | | |
| Issuer | | Rating | | Amount | | | Value | |
| | | | | | | | | | |
| Corporate Obligations—(continued) | | | | | |
Comcast Corporation,
6.450%, due 3/15/37 | | A- | | $ | 4,000 | | | $ | 5,515 | |
Yum! Brands, Inc.,
6.875%, due 11/15/37 | | B+ | | | 1,500 | | | | 1,493 | |
JPMorgan Chase & Co.,
6.400%, due 5/15/38 | | A+ | | | 3,500 | | | | 4,803 | |
Philip Morris International, Inc.,
6.375%, due 5/16/38 | | A | | | 2,175 | | | | 3,014 | |
ConocoPhillips,
6.500%, due 2/1/39 | | A- | | | 4,125 | | | | 5,340 | |
Burlington Northern Santa Fe LLC,
5.750%, due 5/1/40 | | A | | | 4,000 | | | | 5,142 | |
Petroleos Mexicanos,
6.500%, due 6/2/41 | | BBB+ | | | 2,500 | | | | 2,544 | |
Express Scripts Holding Co.,
6.125%, due 11/15/41 | | BBB+ | | | 4,700 | | | | 5,622 | |
Gilead Sciences, Inc.,
5.650%, due 12/1/41 | | A | | | 4,500 | | | | 5,644 | |
Citigroup, Inc.,
5.875%, due 1/30/42 | | A | | | 4,000 | | | | 5,082 | |
Bank of America Corporation,
5.875%, due 2/7/42 | | A | | | 4,000 | | | | 5,067 | |
Mexichem S.A.B. de C.V.—144A,
5.875%, due 9/17/44 | | BBB | | | 3,500 | | | | 3,237 | |
Northrop Grumman Corporation,
3.850%, due 4/15/45 | | BBB+ | | | 4,500 | | | | 4,705 | |
ERP Operating L.P.,
4.500%, due 6/1/45 | | A- | | | 4,500 | | | | 4,993 | |
The Goldman Sachs Group, Inc.,
4.750%, due 10/21/45 | | A | | | 3,500 | | | | 3,874 | |
Anheuser-Busch InBev Finance, Inc.,
4.900%, due 2/1/46 | | A- | | | 5,000 | | | | 5,883 | |
Apple, Inc.,
4.650%, due 2/23/46 | | AA+ | | | 5,000 | | | | 5,662 | |
Exxon Mobil Corporation,
4.114%, due 3/1/46 | | Aaa | | | 2,275 | | | | 2,573 | |
PepsiCo, Inc.,
4.450%, due 4/14/46 | | A1 | | | 4,500 | | | | 5,265 | |
AT&T, Inc.,
4.750%, due 5/15/46 | | A- | | | 5,000 | | | | 5,145 | |
Microsoft Corporation,
4.750%, due 11/3/55 | | AAA | | | 4,950 | | | | 5,617 | |
| Total Corporate Obligations | | | | | | | | | 256,931 | |
| | | | | | | | | | | |
Total Long-Term Investments—97.4%
(cost $537,348) | | | | | | | | | 558,363 | |
| | | Principal | | | | |
| | | Amount/ | | | | |
| Issuer | | Contracts | | | Value | |
| | | | | | | |
| Repurchase Agreements | | | | | | |
| Fixed Income Clearing Corporation, 0.030% dated 6/30/16, due 7/1/16, repurchase price $5,763, collateralized by FFCB, 3.020%, due 1/12/26 | | $ | 5,763 | | | $ | 5,763 | |
| | | | | | | | | |
Total Repurchase Agreement—1.0%
(cost $5,763) | | | | | | | 5,763 | |
| | | | | | | | | |
| U.S. Government and U.S. Government Agency | | | | | |
| U.S. Treasury Bill, 0.278%, due 7/14/16 (a) | | | 500 | | | | 500 | |
Total U.S. Government and U.S. Government Agency—0.1%
(cost $500) | | | | | | | 500 | |
| | | | | | | | | |
| Commercial Paper | | | | | | | | |
| Johnson Controls, 0.550%, due 7/1/16 | | | 5,000 | | | | 5,000 | |
| | | | | | | | | |
Total Commercial Paper—0.9%
(cost $5,000) | | | | | | | 5,000 | |
| | | | | | | | | |
| Purchased Option—0.0% | | | | | | | | |
| Eurodollar Future, September 2016, Strike $97, Put | | | 300 | | | | 2 | |
| | | | | | | | | |
Total Purchased Option—0.0%
(cost $95) | | | | | | | 2 | |
| | | | | | | | | |
Total Investments—99.4%
(cost $548,706) | | | | | | | 569,628 | |
| | | | | | | | | |
| Cash and other assets, less liabilities—0.6% | | | | | | | 3,496 | |
| Net assets—100.0% | | | | | | $ | 573,124 | |
144A = Security exempt from registration under Rule 144A of the Securities Act of 1933. These securities may be resold in transactions exempt from registration, normally to qualified institutional buyers.
NRSRO = Nationally Recognized Statistical Rating Organization—The credit quality ratings of the securities in the Fund reflect the highest category rating by any of Fitch Ratings, Moody’s Investors Service Inc., or Standard & Poor’s, a division of the McGraw-Hill Companies, Inc.
The obligations of certain U.S. Government-sponsored securities are neither issued nor guaranteed by the U.S. Treasury.
VRN = Variable Rate Note
(a) Security, or a portion of security, is segregated as collateral for the centrally cleared credit default swap, aggregating a total of $268.
Centrally Cleared Credit Default Swap
| | | | | | | | | | | | | Unrealized |
| | | Buy/Sell | | Fixed Deal | | Maturity | | | | Notional | | Appreciation |
| Reference Entity | | Protection | | Pay Rate | | Date | | Cleared Exchange | | Amount | | (Depreciation) |
| CDX.IG-26 | | Buy | | 1.000% | | June 2021 | | CME | | $25,000 | | $(10) |
See accompanying Notes to Financial Statements.
| 96 | Semiannual Report | June 30, 2016 |
Income Fund
The Income Fund seeks a high level of current income with relative stability of principal.
AN OVERVIEW FROM THE PORTFOLIO MANAGER

Christopher T. Vincent
The William Blair Income Fund (Class N shares) returned 2.94%, net of fees, for the six months ended June 30, 2016. By comparison, the Fund’s benchmark, the Barclays Intermediate Government/Credit Bond Index (the “Index”), returned 4.07%.
A couple of factors contributed to the Fund’s underperformance relative to the Index year-to-date. Interest rate positioning detracted from performance as the Fund was structured with a defensive duration posture and interest rates declined. In addition, the Fund’s overweight in mortgage-backed securities (MBS) detracted from performance as comparable-duration U. S. Treasuries outperformed MBS year-to-date.
Security selection provided a positive contribution to the Fund’s relative performance year-to-date. The Fund’s positions in investment-grade corporate bonds domiciled in the developed markets, specifically ConocoPhillips, J.P. Morgan Chase, Simon Property Group, and Masco, were notable performers.
Please refer to the Fixed Income Market Review and Outlook relating to the Fund on page 90.
| June 30, 2016 | William Blair Funds | 97 |
Income Fund
Performance Highlights (Unaudited)
Average Annual Total Return at 6/30/2016
| | | Year
to Date | | 1 Year | | 3 Year | | 5 Year | | 10 Year |
| Class N | | | 2.94 | % | | | 2.70 | % | | | 2.42 | % | | | 2.67 | % | | | 3.40 | % |
| Class I | | | 3.19 | | | | 3.08 | | | | 2.67 | | | | 2.92 | | | | 3.62 | |
| Barclays Intermediate | | | | | | | | | | | | | | | | | | | | |
| Government/Credit | | | | | | | | | | | | | | | | | | | | |
| Bond Index | | | 4.07 | | | | 4.33 | | | | 2.95 | | | | 2.90 | | | | 4.48 | |
Performance cited represents past performance. Past performance does not guarantee future results and current performance may be lower or higher than the data quoted. Results shown are average annual total returns, which assume reinvestment of dividends and capital gains. Investment returns and principal will fluctuate and you may have a gain or loss when you sell shares. For the most current month-end performance information, please call 1-800-742-7272, or visit our Web site at www.williamblairfunds.com. From time to time, the investment adviser may waive fees or reimburse expenses for the Fund. Without these waivers/reimbursements, performance would be lower. Class N shares are available to the general public without a sales load. Class I shares are available to certain institutional investors and advisory clients of William Blair Investment Management, LLC and William Blair & Company, L.L.C., without a sales load or distribution (12b-1) or service fees.
The performance highlights and graph presented above do not reflect the deduction of taxes that a shareholder would pay on fund distributions or the redemption of fund shares.
The Barclays Intermediate Government/Credit Bond Index indicates broad intermediate government/corporate bond market performance.
This report identifies the Fund’s investments on June 30, 2016. These holdings are subject to change. Not all investments in the Fund performed the same, nor is there any guarantee that these investments will perform as well in the future. Market forecasts provided in this report may not necessarily come to pass.
Sector Diversification (Unaudited)

The sector diversification shown is based on the total investments.
| 98 | Semiannual Report | June 30, 2016 |
Income Fund
Portfolio of Investments, June 30, 2016 (all dollar amounts in thousands) (unaudited)
| | | | | | | | | | |
| Issuer | | | Principal
Amount | | | | Value | |
| | | | | | | | | | |
| U.S. Government and U.S. Government Agency—57.5% | |
| | | | | | | | | | |
U.S. Treasury Inflation Indexed
Notes/Bonds—5.1% | | | | | | | | |
U.S. Treasury Inflation Indexed Note,
1.875%, due 7/15/19 | | $ | 1,120 | | | $ | 1,213 | |
U.S. Treasury Inflation Indexed Note,
1.125%, due 1/15/21 | | | 3,281 | | | | 3,512 | |
| Total U.S. Treasury Inflation Indexed Notes/Bonds | | | | | | | 4,725 | |
| | | | | | | | | | |
| U.S. Treasury—1.0% | | | | | | | | |
U.S. Treasury Strip Principal,
0.000%, due 5/15/20 | | | 1,000 | | | | 966 | |
| | | | | | | | | | |
Government National Mortgage
Association (GNMA)—0.0% | | | | | | | | |
| # | 780405, 9.500%, due 11/15/17 | | | 2 | | | | 2 | |
| # | 357322, 7.000%, due 9/15/23 | | | 30 | | | | 33 | |
| Total GNMA Mortgage Obligations | | | | | | | 35 | |
| | | | | | | | | | |
Federal Home Loan Mortgage
Corp. (FHLMC)—10.2% | | | | | | | | |
| # | E90398, 7.000%, due 5/1/17 | | | 43 | | | | 43 | |
| # | E97112, 4.000%, due 5/1/18 | | | 25 | | | | 26 | |
| # | D95621, 6.500%, due 7/1/22 | | | 727 | | | | 825 | |
| # | J13022, 4.000%, due 9/1/25 | | | 507 | | | | 535 | |
| # | J16051, 4.500%, due 7/1/26 | | | 1,028 | | | | 1,109 | |
| # | A17603, 5.500%, due 1/1/34 | | | 775 | | | | 894 | |
| # | A45790, 7.500%, due 5/1/35 | | | 137 | | | | 160 | |
| # | G02141, 6.000%, due 3/1/36 | | | 325 | | | | 382 | |
| # | G03201, 6.500%, due 6/1/37 | | | 196 | | | | 235 | |
| # | A66843, 6.500%, due 10/1/37 | | | 328 | | | | 380 | |
| # | A81799, 6.500%, due 9/1/38 | | | 381 | | | | 468 | |
| # | G06964, 5.500%, due 11/1/38 | | | 1,168 | | | | 1,349 | |
| # | G05875, 5.500%, due 2/1/40 | | | 160 | | | | 183 | |
| # | G07300, 6.000%, due 4/1/40 | | | 561 | | | | 660 | |
| # | C03665, 9.000%, due 4/1/41 | | | 397 | | | | 502 | |
| # | G06583, 5.000%, due 6/1/41 | | | 1,629 | | | | 1,846 | |
| Total FHLMC Mortgage Obligations | | | | | | | 9,597 | |
| | | | | | | | | | |
Federal National Mortgage
Association (FNMA)—41.2% | | | | | | | | |
| # | 643217, 6.500%, due 6/1/17 | | | 22 | | | | 22 | |
| # | 679247, 7.000%, due 8/1/17 | | | 36 | | | | 37 | |
| # | 695910, 5.000%, due 5/1/18 | | | 82 | | | | 84 | |
| # | 740847, 6.000%, due 10/1/18 | | | 53 | | | | 55 | |
| # | 323501, 6.500%, due 1/1/19 | | | 18 | | | | 20 | |
| # | 751313, 5.000%, due 3/1/19 | | | 107 | | | | 111 | |
| # | 852864, 7.000%, due 7/1/20 | | | 348 | | | | 368 | |
| # | 458147, 10.000%, due 8/15/20 | | | 34 | | | | 35 | |
| # | 835563, 7.000%, due 10/1/20 | | | 145 | | | | 155 | |
| # | 831430, 5.500%, due 3/1/21 | | | 236 | | | | 252 | |
| # | 888555, 5.500%, due 9/1/21 | | | 1,521 | | | | 1,623 | |
| # | 735574, 8.000%, due 3/1/22 | | | 121 | | | | 129 | |
| # | 679253, 6.000%, due 10/1/22 | | | 343 | | | | 393 | |
| FNR G93-19 SH, 11.234%, due 4/25/23, VRN | | | 11 | | | | 15 | |
| # | 982878, 4.500%, due 5/1/23 | | | 208 | | | | 224 | |
| # | AC5124, 4.000%, due 11/1/24 | | | 695 | | | | 747 | |
| # | 932095, 4.000%, due 11/1/24 | | | 3,892 | | | | 4,194 | |
| # | 932100, 4.500%, due 11/1/24 | | | 939 | | | | 1,016 | |
| # | AC6257, 4.000%, due 12/1/24 | | | 795 | | | | 855 | |
| | | | | | | | | | | | | | |
| Issuer | | | NRSRO
Rating | | | | Principal
Amount | | | | Value | |
| | | | | | | | | | | | | | |
| U.S. Government and U.S. Government Agency—(continued) |
| | | | | | | | | | | | | | |
Federal National Mortgage
Association (FNMA)—(continued) | | | | | | | |
| # | AC0596, 4.000%, due 12/1/24 | | | | | | $ | 216 | | | $ | 232 | |
| # | AD4073, 4.000%, due 5/1/25 | | | | | | | 103 | | | | 111 | |
| # | AD4677, 4.000%, due 6/1/25 | | | | | | | 668 | | | | 719 | |
| # | 935995, 4.000%, due 6/1/25 | | | | | | | 105 | | | | 113 | |
| # | AE1176, 4.000%, due 8/1/25 | | | | | | | 297 | | | | 314 | |
| # | 255956, 5.500%, due 10/1/25 | | | | | | | 56 | | | | 63 | |
| # | AL2851, 4.000%, due 8/1/26 | | | | | | | 2,426 | | | | 2,614 | |
| # | AI9811, 4.500%, due 8/1/26 | | | | | | | 445 | | | | 481 | |
| # | AJ3203, 4.000%, due 10/1/26 | | | | | | | 1,093 | | | | 1,177 | |
| # | AJ7724, 4.000%, due 12/1/26 | | | | | | | 879 | | | | 945 | |
| # | 256639, 5.000%, due 2/1/27 | | | | | | | 11 | | | | 13 | |
| # | AB4818, 4.000%, due 4/1/27 | | | | | | | 1,994 | | | | 2,149 | |
| # | AL2590, 4.000%, due 7/1/27 | | | | | | | 1,490 | | | | 1,603 | |
| # | 806458, 8.000%, due 6/1/28 | | | | | | | 112 | | | | 125 | |
| # | 880155, 8.500%, due 7/1/29 | | | | | | | 214 | | | | 252 | |
| # | 797846, 7.000%, due 3/1/32 | | | | | | | 97 | | | | 104 | |
| # | 745519, 8.500%, due 5/1/32 | | | | | | | 154 | | | | 184 | |
| # | 654674, 6.500%, due 9/1/32 | | | | | | | 62 | | | | 72 | |
| # | 733897, 6.500%, due 12/1/32 | | | | | | | 236 | | | | 271 | |
| # | 688034, 5.500%, due 3/1/33 | | | | | | | 174 | | | | 201 | |
| # | 254693, 5.500%, due 4/1/33 | | | | | | | 9 | | | | 10 | |
| # | 555531, 5.500%, due 6/1/33 | | | | | | | 89 | | | | 100 | |
| # | 711736, 5.500%, due 6/1/33 | | | | | | | 104 | | | | 119 | |
| # | 555591, 5.500%, due 7/1/33 | | | | | | | 15 | | | | 16 | |
| # | AL3455, 5.500%, due 11/1/33 | | | | | | | 2,127 | | | | 2,465 | |
| # | 762505, 5.500%, due 11/1/33 | | | | | | | 146 | | | | 169 | |
| # | 776964, 5.000%, due 4/1/34 | | | | | | | 398 | | | | 450 | |
| # | 725424, 5.500%, due 4/1/34 | | | | | | | 91 | | | | 104 | |
| # | 824463, 5.500%, due 7/1/35 | | | | | | | 205 | | | | 230 | |
| # | 888884, 5.500%, due 12/1/35 | | | | | | | 192 | | | | 221 | |
| # | 886220, 6.000%, due 7/1/36 | | | | | | | 253 | | | | 296 | |
| # | AL3449, 6.000%, due 7/1/36 | | | | | | | 1,045 | | | | 1,234 | |
| # | 888703, 6.500%, due 8/1/37 | | | | | | | 1,023 | | | | 1,216 | |
| # | 928658, 6.500%, due 9/1/37 | | | | | | | 36 | | | | 45 | |
| # | 889385, 6.000%, due 2/1/38 | | | | | | | 454 | | | | 531 | |
| # | 962058, 6.500%, due 3/1/38 | | | | | | | 538 | | | | 651 | |
| # | AL5817, 6.000%, due 11/1/38 | | | | | | | 1,073 | | | | 1,254 | |
| # | 991911, 7.000%, due 11/1/38 | | | | | | | 180 | | | | 221 | |
| # | AA8587, 5.500%, due 7/1/39 | | | | | | | 883 | | | | 1,022 | |
| # | AD0315, 6.500%, due 8/1/39 | | | | | | | 347 | | | | 416 | |
| # | AC3237, 5.000%, due 10/1/39 | | | | | | | 162 | | | | 182 | |
| # | AC6156, 5.500%, due 11/1/39 | | | | | | | 2,215 | | | | 2,585 | |
| # | AC9569, 5.000%, due 2/1/40 | | | | | | | 236 | | | | 268 | |
| # | AB1200, 5.500%, due 7/1/40 | | | | | | | 471 | | | | 544 | |
| # | AL0028, 5.000%, due 2/1/41 | | | | | | | 1,181 | | | | 1,334 | |
| # | AL5815, 5.500%, due 4/1/41 | | | | | | | 752 | | | | 872 | |
| Total FNMA Mortgage Obligations | | | | | | | | 38,633 | |
| | | | | | | | | | | |
| Asset-Backed Securities—9.2% | | | | | | | | | |
Hertz Vehicle Financing LLC—144A,
2013-1A, Tranche B1,
1.860%, 8/25/17 | | | Baa1 | | | | 333 | | | | 333 | |
Mercedes Benz Auto Lease Trust,
2016-A, Tranche A2B,
1.002%, 7/16/18, VRN | | | Aaa | | | | 1,000 | | | | 1,000 | |
Harley-Davidson Motorcycle Trust,
2015-2, Tranche A2B,
0.692%, 1/15/19, VRN | | | AAA | | | | 970 | | | | 970 | |
See accompanying Notes to Financial Statements.
| June 30, 2016 | William Blair Funds | 99 |
Income Fund
Portfolio of Investments, June 30, 2016 (all dollar amounts in thousands) (unaudited)
| | | | | | | | | | | |
| Issuer | | NRSRO
Rating | | | Principal
Amount | | | | Value | |
| | | | | | | | | | | |
| Asset-Backed Securities—(continued) | | | | | | | |
Citibank Credit Card Issuance Trust,
2008-A2, Tranche A2,
1.601%, 1/23/20, VRN | | AAA | | $ | 1,225 | | | $ | 1,242 | |
GE Capital Credit Card Master
Note Trust, 2012-6, Tranche B,
1.830%, 8/17/20 | | AA+ | | | 1,705 | | | | 1,706 | |
American Express Credit Account
Master Trust, 2008-2, Tranche A,
1.702%, 9/15/20, VRN | | AAA | | | 1,000 | | | | 1,016 | |
Capital One Multi-Asset Execution
Trust, 2016-A1, Tranche A1,
0.900%, 2/15/22, VRN | | AAA | | | 1,850 | | | | 1,854 | |
SLM Private Education Loan
Trust—144A, 2011-A, Tranche A3,
2.942%, 1/15/43, VRN | | AAA | | | 500 | | | | 504 | |
| Total Asset-Backed Securities | | | | | | | | | 8,625 | |
| | | | | | | | | | | |
| Corporate Obligations—31.7% | | | | | | | | | | |
Macquarie Group Ltd.—144A,
4.875%, due 8/10/17 | | A3 | | | 1,000 | | | | 1,032 | |
Morgan Stanley,
6.625%, due 4/1/18 | | A | | | 1,000 | | | | 1,084 | |
Bank of America Corporation,
6.875%, due 11/15/18 | | A | | | 1,000 | | | | 1,114 | |
Honeywell International, Inc.,
5.000%, due 2/15/19 | | A | | | 750 | | | | 827 | |
Burlington Northern Santa Fe LLC,
4.700%, due 10/1/19 | | A | | | 750 | | | | 830 | |
Boston Properties L.P.,
5.875%, due 10/15/19 | | A- | | | 1,000 | | | | 1,125 | |
Petroleos Mexicanos,
6.000%, due 3/5/20 | | BBB+ | | | 500 | | | | 539 | |
PepsiCo, Inc.,
2.150%, due 10/14/20 | | A1 | | | 900 | | | | 926 | |
Georgia-Pacific LLC—144A,
5.400%, due 11/1/20 | | A+ | | | 1,000 | | | | 1,134 | |
Mitsubishi UFJ Financial Group, Inc.,
2.950%, due 3/1/21 | | A1 | | | 1,000 | | | | 1,038 | |
Discovery Communications LLC,
4.375%, due 6/15/21 | | BBB- | | | 750 | | | | 806 | |
Capital One Financial Corporation,
4.750%, due 7/15/21 | | A- | | | 1,000 | | | | 1,114 | |
General Electric Capital Corporation,
4.650%, due 10/17/21 | | AA+ | | | 750 | | | | 859 | |
Verizon Communications, Inc.,
3.500%, due 11/1/21 | | A- | | | 750 | | | | 809 | |
Ryder System, Inc.,
3.450%, due 11/15/21 | | A- | | | 900 | | | | 942 | |
Gilead Sciences, Inc.,
4.400%, due 12/1/21 | | A | | | 1,000 | | | | 1,130 | |
Masco Corporation,
5.950%, due 3/15/22 | | BBB | | | 750 | | | | 840 | |
Jones Lang LaSalle, Inc.,
4.400%, due 11/15/22 | | BBB+ | | | 750 | | | | 784 | |
Wyndham Worldwide Corporation,
3.900%, due 3/1/23 | | BBB- | | | 750 | | | | 769 | |
Toll Brothers Finance Corporation,
4.375%, due 4/15/23 | | BBB- | | | 850 | | | | 842 | |
Wells Fargo & Co.,
4.480%, due 1/16/24 | | A+ | | | 750 | | | | 823 | |
| Issuer | | NRSRO
Rating | | Principal
Amount/
Contracts | | | Value | |
| | | | | | | | | | | |
| Corporate Obligations—(continued) | | | | | | | |
The Goldman Sachs Group, Inc.,
4.000%, due 3/3/24 | | A | | $ | 1,000 | | | $ | 1,071 | |
Fibria Overseas Finance, Ltd.,
5.250%, due 5/12/24 | | BBB- | | | 750 | | | | 769 | |
BRF S.A.—144A,
4.750%, due 5/22/24 | | BBB | | | 750 | | | | 748 | |
Grupo Bimbo S.A.B. de C.V.—144A,
3.875%, due 6/27/24 | | BBB | | | 750 | | | | 783 | |
Synchrony Financial,
4.250%, due 8/15/24 | | BBB- | | | 700 | | | | 726 | |
BNP Paribas S.A.,
4.250%, due 10/15/24 | | A | | | 750 | | | | 772 | |
Brookfield Asset Management,
Inc.,
4.000%, due 1/15/25 | | A- | | | 1,000 | | | | 1,018 | |
ERP Operating L.P.,
3.375%, due 6/1/25 | | A- | | | 750 | | | | 793 | |
Simon Property Group L.P.,
3.300%, due 1/15/26 | | A | | | 750 | | | | 802 | |
ConocoPhillips Co.,
4.950%, due 3/15/26 | | A- | | | 750 | | | | 852 | |
Crown Castle Towers LLC—144A,
6.113%, due 1/15/40 | | A2 | | | 1,000 | | | | 1,113 | |
JPMorgan Chase & Co.,
5.000%, due 12/29/49, VRN | | BBB- | | | 1,000 | | | | 959 | |
| Total Corporate Obligations | | | | | | | | | 29,773 | |
Total Long-Term Investments—98.4%
(cost $90,664) | | | | | | | | | 92,354 | |
| | | | | | | | | | | |
| Repurchase Agreement | | | | | | | | | | |
Fixed Income Clearing Corporation,
0.030% dated 6/30/16, due 7/1/16,
repurchase price $992,
collateralized by FNMA,
7.125%, due 1/15/30 | | | | | 992 | | | | 992 | |
| Total Repurchase Agreement—1.1% (cost $992) | | | | | | | | | 992 | |
| | | | | | | | | | | |
| Purchased Option—0.0% | | | | | | | | | | |
Eurodollar Future, September 2016,
Strike $97, Put | | | | | 150 | | | | 1 | |
| | | | | | | | | | | |
Total Purchased Option—0.0%
(cost $47) | | | | | | | | | 1 | |
| | | | | | | | | | | |
Total Investments—99.5%
(cost $91,703) | | | | | | | | | 93,347 | |
| Cash and other assets, less liabilities—0.5% | | | | 430 | |
| Net assets—100.0% | | | | | | | | $ | 93,777 | |
NRSRO = Nationally Recognized Statistical Rating Organization—The credit quality ratings of the securities in the Fund reflect the highest category rating by any of Fitch Ratings, Moody’s Investors Service Inc., or Standard & Poor’s, a division of the McGraw-Hill Companies, Inc.
The obligations of certain U.S. Government-sponsored securities are neither issued nor guaranteed by the U.S. Treasury.
VRN = Variable Rate Note
See accompanying Notes to Financial Statements.
| 100 | Semiannual Report | June 30, 2016 |
| | Low Duration Fund |
| | |
| | The Low Duration Fund seeks to maximize total return. Total return includes both income and capital appreciation. |
| | |
| | AN OVERVIEW FROM THE PORTFOLIO MANAGERS |
| | |

Paul J. Sularz 
Christopher T. Vincent | The William Blair Low Duration Fund (Class N shares) returned 1.13%, net of fees, for the six months ended June 30, 2016. By comparison, the Fund’s benchmark, the Bank of America/Merrill Lynch 1-Year U.S. Treasury Note Index, returned 0.65%. A couple of factors contributed to the Fund’s outperformance relative to the Index year-to-date. The Fund’s interest rate exposures contributed to outperformance. The Fund’s strategy provides exposure to interest rate risk that is slightly higher than the risk-free rate, and shorter-term interest rates declined year-to-date. In addition, allocations to floating-rate asset-backed and investment-grade corporate securities had a positive impact on performance. The Fund’s agency mortgage-backed securities experienced widening risk spreads year-to-date despite earning positive total returns. This factor was the most significant detractor to the Fund’s relative performance year-to-date. Please refer to the Fixed Income Market Review and Outlook relating to the Fund on page 90. |
| June 30, 2016 | William Blair Funds | 101 |
Low Duration Fund
Performance Highlights (Unaudited)
Average Annual Total Return at 6/30/2016
| | | Year | | | | | | | | Since |
| | | to Date | | 1 Year | | 3 Year | | 5 Year | | Inception(a) |
| Class N | | | 1.13 | % | | | 1.08 | % | | | 1.00 | % | | | 1.02 | % | | | 1.13 | % |
| Class I | | | 1.23 | | | | 1.29 | | | | 1.17 | | | | 1.18 | | | | 1.29 | |
| Institutional Class | | | 1.24 | | | | 1.31 | | | | 1.23 | | | | 1.28 | | | | 1.42 | |
| Bank of America Merrill Lynch 1-Year U.S. Treasury Note Index | | | 0.65 | | | | 0.59 | | | | 0.38 | | | | 0.34 | | | | 0.41 | |
| (a) | For the period from December 1, 2009 (Commencement of Operations) to June 30, 2016. |
Performance cited represents past performance. Past performance does not guarantee future results and current performance may be lower or higher than the data quoted. Results shown are average annual total returns, which assume reinvestment of dividends and capital gains. Investment returns and principal will fluctuate and you may have a gain or loss when you sell shares. For the most current month-end performance information, please call 1-800-742-7272, or visit our Web site at www.williamblairfunds.com. From time to time, the investment adviser may waive fees or reimburse expenses for the Fund. Without these waivers/reimbursements, performance would be lower. Class N shares are available to the general public without a sales load. Class I shares are available to certain institutional investors and advisory clients of William Blair Investment Management, LLC and William Blair & Company, L.L.C., without a sales load or distribution (12b-1) fees. Institutional Class shares are available to institutional investors without a sales load or distribution (12b-1) or service fees.
The performance highlights and graph presented above do not reflect the deduction of taxes that a shareholder would pay on fund distributions or the redemption of fund shares.
The Bank of America Merrill Lynch 1-Year U.S. Treasury Note Index is comprised of a single U.S. Treasury Note issue purchased at the beginning of the month and held for a full month. Each month the index is rebalanced and the issue selected is the outstanding U.S. Treasury Note that matures closest to, but not beyond one year from the rebalancing date.
This report identifies the Fund’s investments on June 30, 2016. These holdings are subject to change. Not all investments in the Fund performed the same, nor is there any guarantee that these investments will perform as well in the future. Market forecasts provided in this report may not necessarily come to pass.
Sector Diversification (Unaudited)

The sector diversification shown is based on the total investments.
| 102 | Semiannual Report | June 30, 2016 |
Low Duration Fund
Portfolio of Investments, June 30, 2016 (all dollar amounts in thousands) (unaudited)
| | | | | | |
| | | | Principal | | | | |
| Issuer | | Amount | | | | Value |
| | | | | | | | | | |
| U.S. Government and U.S. Government Agency—55.6% |
| | | | | | | | | | |
Federal Home Loan Mortgage Corp.
(FHLMC)—22.9% | | | | | | | | |
| # | E95760, 4.500%, due 4/1/18 | | $ | 4 | | | $ | 4 | |
| # | E99582, 5.000%, due 9/1/18 | | | 7 | | | | 8 | |
| # | E99684, 5.000%, due 10/1/18 | | | 182 | | | | 188 | |
| # | B11362, 5.500%, due 12/1/18 | | | 18 | | | | 19 | |
| # | B11849, 5.500%, due 1/1/19 | | | 46 | | | | 47 | |
| # | B13870, 4.500%, due 5/1/19 | | | 37 | | | | 38 | |
| # | G11604, 5.000%, due 7/1/19 | | | 46 | | | | 48 | |
| # | G11596, 5.500%, due 8/1/19 | | | 38 | | | | 40 | |
| # | G11605, 5.500%, due 9/1/19 | | | 22 | | | | 23 | |
| # | B17294, 5.000%, due 11/1/19 | | | 106 | | | | 111 | |
| # | B19222, 4.500%, due 4/1/20 | | | 99 | | | | 102 | |
| # | G11697, 5.500%, due 4/1/20 | | | 101 | | | | 105 | |
| # | J02537, 5.000%, due 9/1/20 | | | 41 | | | | 43 | |
| # | G11836, 5.500%, due 12/1/20 | | | 13 | | | | 14 | |
| # | G12113, 5.500%, due 5/1/21 | | | 122 | | | | 130 | |
| # | G12395, 6.000%, due 10/1/21 | | | 452 | | | | 490 | |
| # | E02322, 5.500%, due 5/1/22 | | | 26 | | | | 28 | |
| # | G12725, 6.000%, due 6/1/22 | | | 173 | | | | 190 | |
| # | G13124, 6.000%, due 12/1/22 | | | 140 | | | | 154 | |
| # | J06871, 5.500%, due 1/1/23 | | | 86 | | | | 93 | |
| # | J08450, 5.500%, due 7/1/23 | | | 40 | | | | 44 | |
| # | J08703, 5.500%, due 9/1/23 | | | 74 | | | | 80 | |
| # | J10351, 4.000%, due 7/1/24 | | | 152 | | | | 163 | |
| # | C00351, 8.000%, due 7/1/24 | | | 57 | | | | 68 | |
| # | J10600, 4.000%, due 8/1/24 | | | 10 | | | | 10 | |
| # | G13695, 4.000%, due 9/1/24 | | | 649 | | | | 697 | |
| # | J11208, 5.000%, due 11/1/24 | | | 90 | | | | 96 | |
| # | G00363, 8.000%, due 6/1/25 | | | 87 | | | | 99 | |
| # | J12853, 4.000%, due 8/1/25 | | | 186 | | | | 199 | |
| # | C80329, 8.000%, due 8/1/25 | | | 19 | | | | 21 | |
| # | J13022, 4.000%, due 9/1/25 | | | 203 | | | | 214 | |
| # | J14491, 4.000%, due 2/1/26 | | | 3,399 | | | | 3,652 | |
| # | J16051, 4.500%, due 7/1/26 | | | 2,319 | | | | 2,503 | |
| # | G30348, 6.000%, due 7/1/27 | | | 1,212 | | | | 1,400 | |
| # | G07837, 6.500%, due 2/1/38 | | | 1,814 | | | | 2,221 | |
| # | G04424, 6.000%, due 6/1/38 | | | 82 | | | | 95 | |
| # | G04778, 6.000%, due 7/1/38 | | | 102 | | | | 120 | |
| # | G04544, 6.000%, due 8/1/38 | | | 398 | | | | 462 | |
| # | G04687, 6.000%, due 9/1/38 | | | 101 | | | | 117 | |
| # | G04745, 6.000%, due 9/1/38 | | | 53 | | | | 61 | |
| # | A81799, 6.500%, due 9/1/38 | | | 357 | | | | 439 | |
| # | G06085, 6.500%, due 9/1/38 | | | 14 | | | | 16 | |
| # | G06964, 5.500%, due 11/1/38 | | | 3,485 | | | | 4,023 | |
| # | G05723, 6.500%, due 11/1/38 | | | 1,581 | | | | 1,934 | |
| # | G07480, 6.000%, due 5/1/39 | | | 3,509 | | | | 4,088 | |
| # | G07300, 6.000%, due 4/1/40 | | | 5,773 | | | | 6,787 | |
| # | G06017, 5.500%, due 6/1/40 | | | 1,257 | | | | 1,425 | |
| # | 4122, Tranche FP, 0.842%, due 10/15/42, VRN | | | 952 | | | | 950 | |
| Total FHLMC Mortgage Obligations | | | | | | | 33,859 | |
| | | | | | | | | |
| Federal National Mortgage Association (FNMA)—32.7% | | | | | | | | |
| # | 672953, 5.000%, due 12/1/17 | | | 5 | | | | 5 | |
| # | 888979, 6.000%, due 12/1/17 | | | 1 | | | | 1 | |
| # | 695838, 5.500%, due 4/1/18 | | | 14 | | | | 15 | |
| # | 697593, 5.000%, due 5/1/18 | | | 46 | | | | 47 | |
| | | | | | |
| | | | Principal | | | |
| Issuer | | Amount | | | | Value | |
| | | | | | | | | | |
| U.S. Government and U.S. Government Agency—(continued) | |
| | | | | | | | | | |
| Federal National Mortgage Association (FNMA)-—continued) | | | | | | | | |
| # | 705741, 5.000%, due 6/1/18 | | $ | 25 | | | $ | 26 | |
| # | 656573, 5.000%, due 6/1/18 | | | 34 | | | | 35 | |
| # | 709848, 5.000%, due 6/1/18 | | | 31 | | | | 32 | |
| # | 728715, 5.000%, due 7/1/18 | | | 59 | | | | 60 | |
| # | 711991, 5.000%, due 8/1/18 | | | 34 | | | | 35 | |
| # | 257378, 5.000%, due 9/1/18 | | | 8 | | | | 8 | |
| # | 743183, 5.000%, due 10/1/18 | | | 16 | | | | 16 | |
| # | 749596, 5.000%, due 11/1/18 | | | 67 | | | | 69 | |
| # | 753866, 6.000%, due 12/1/18 | | | 98 | | | | 101 | |
| # | 761246, 5.000%, due 1/1/19 | | | 90 | | | | 93 | |
| # | 766059, 5.500%, due 2/1/19 | | | 79 | | | | 82 | |
| # | 766276, 5.000%, due 3/1/19 | | | 246 | | | | 254 | |
| # | 751313, 5.000%, due 3/1/19 | | | 47 | | | | 48 | |
| # | 779363, 5.000%, due 6/1/19 | | | 22 | | | | 23 | |
| # | 785259, 5.000%, due 8/1/19 | | | 90 | | | | 94 | |
| # | 788424, 5.500%, due 9/1/19 | | | 52 | | | | 54 | |
| # | 761489, 5.500%, due 9/1/19 | | | 53 | | | | 56 | |
| # | 725953, 5.000%, due 10/1/19 | | | 29 | | | | 31 | |
| # | 745877, 5.000%, due 1/1/20 | | | 64 | | | | 67 | |
| # | AL5831, 5.000%, due 1/1/20 | | | 3,192 | | | | 3,292 | |
| # | 357865, 5.000%, due 7/1/20 | | | 67 | | | | 70 | |
| # | 888105, 5.000%, due 8/1/20 | | | 4 | | | | 4 | |
| # | 357978, 5.000%, due 9/1/20 | | | 644 | | | | 679 | |
| # | 844026, 6.000%, due 11/1/20 | | | 310 | | | | 330 | |
| # | 745735, 5.000%, due 3/1/21 | | | 257 | | | | 271 | |
| # | 879607, 5.500%, due 4/1/21 | | | 43 | | | | 46 | |
| # | 831497, 6.000%, due 4/1/21 | | | 142 | | | | 152 | |
| # | 831525, 5.500%, due 6/1/21 | | | 54 | | | | 58 | |
| # | 888555, 5.500%, due 9/1/21 | | | 1,913 | | | | 2,041 | |
| # | 880993, 6.000%, due 1/1/22 | | | 10 | | | | 11 | |
| # | 888982, 6.000%, due 12/1/22 | | | 171 | | | | 187 | |
| # | 972934, 5.500%, due 2/1/23 | | | 159 | | | | 175 | |
| # | 982878, 4.500%, due 5/1/23 | | | 188 | | | | 203 | |
| # | 889670, 5.500%, due 6/1/23 | | | 55 | | | | 59 | |
| # | 555734, 5.000%, due 7/1/23 | | | 423 | | | | 469 | |
| # | AE0011, 5.500%, due 9/1/23 | | | 67 | | | | 73 | |
| # | 747339, 5.500%, due 10/1/23 | | | 205 | | | | 230 | |
| # | 995395, 6.000%, due 12/1/23 | | | 151 | | | | 165 | |
| # | AA4519, 4.500%, due 3/1/24 | | | 678 | | | | 729 | |
| # | 934808, 4.500%, due 3/1/24 | | | 103 | | | | 109 | |
| # | AA5028, 4.500%, due 4/1/24 | | | 177 | | | | 191 | |
| # | AA5999, 4.500%, due 5/1/24 | | | 1,068 | | | | 1,130 | |
| # | 190988, 9.000%, due 6/1/24 | | | 44 | | | | 48 | |
| # | AC1848, 4.500%, due 9/1/24 | | | 400 | | | | 432 | |
| # | AC6600, 4.500%, due 11/1/24 | | | 40 | | | | 43 | |
| # | AL3422, 5.000%, due 1/1/25 | | | 686 | | | | 744 | |
| # | AL3889, 4.000%, due 5/1/25 | | | 283 | | | | 304 | |
| # | AE1176, 4.000%, due 8/1/25 | | | 556 | | | | 589 | |
| # | AI4872, 4.500%, due 6/1/26 | | | 60 | | | | 65 | |
| # | AI4856, 4.500%, due 6/1/26 | | | 1,498 | | | | 1,621 | |
| # | AL2851, 4.000%, due 8/1/26 | | | 2,329 | | | | 2,509 | |
| # | AK7384, 4.000%, due 3/1/27 | | | 410 | | | | 439 | |
| # | AL2590, 4.000%, due 7/1/27 | | | 2,484 | | | | 2,671 | |
| # | 759336, 6.000%, due 1/1/34 | | | 1,583 | | | | 1,856 | |
| # | AL3449, 6.000%, due 7/1/36 | | | 1,672 | | | | 1,975 | |
| # | 886762, 7.000%, due 9/1/36 | | | 376 | | | | 470 | |
See accompanying Notes to Financial Statements.
| June 30, 2016 | William Blair Funds | 103 |
Low Duration Fund
Portfolio of Investments, June 30, 2016 (all dollar amounts in thousands) (unaudited)
| | | | | | | | | | |
| | | | NRSRO | | Principal | | | | |
| Issuer | | Rating | | Amount | | | Value | |
| | | | | | | | | | | | |
| U.S. Government and U.S. Government Agency—(continued) |
| | | | | | | | | | | | |
Federal National Mortgage Association
(FNMA)—continued) | | | | | | | | | | |
| # | 831926, 6.000%, due 12/1/36 | | | | $ | 705 | | | $ | 819 | |
| # | 899057, 6.000%, due 3/1/37 | | | | | 86 | | | | 100 | |
| # | 928574, 6.000%, due 7/1/37 | | | | | 152 | | | | 176 | |
| # | 888703, 6.500%, due 8/1/37 | | | | | 3,820 | | | | 4,542 | |
| # | 948637, 6.500%, due 8/1/37 | | | | | 474 | | | | 553 | |
| # | 889371, 6.000%, due 1/1/38 | | | | | 922 | | | | 1,081 | |
| # | 965534, 6.000%, due 1/1/38 | | | | | 54 | | | | 63 | |
| # | 889385, 6.000%, due 2/1/38 | | | | | 649 | | | | 758 | |
| # | 975649, 6.000%, due 7/1/38 | | | | | 144 | | | | 166 | |
| # | 889987, 5.500%, due 8/1/38 | | | | | 101 | | | | 117 | |
| # | AD0100, 7.000%, due 12/1/38 | | | | | 1,033 | | | | 1,307 | |
| # | AA8706, 5.500%, due 6/1/39 | | | | | 2,796 | | | | 3,236 | |
| # | AD0315, 6.500%, due 8/1/39 | | | | | 755 | | | | 904 | |
| # | AC3270, 5.500%, due 9/1/39 | | | | | 1,733 | | | | 2,023 | |
| # | AD3360, 5.500%, due 5/1/40 | | | | | 2,225 | | | | 2,571 | |
| # | AL5815, 5.500%, due 4/1/41 | | | | | 3,761 | | | | 4,362 | |
| Total FNMA Mortgage Obligations | | | | | | | | | 48,470 | |
| | | | | | | | | | | | |
| Asset-Backed Securities—24.3% | | | | | | | | | | |
Volvo Financial Equipment LLC—144A, 2015-1A, Tranche A2,
0.950%, 11/15/17 | | Aaa | | | 512 | | | | 512 | |
John Deere Owner Trust 2015, 2015-A, Tranche A2B,
0.712%, 2/15/18, VRN | | Aaa | | | 71 | | | | 71 | |
Ford Credit Auto Owner Trust, 2015-B, Tranche A2B,
0.672%, 3/15/18, VRN | | Aaa | | | 590 | | | | 590 | |
Mercedes Benz Auto Lease Trust, 2016-A, Tranche A2B,
1.002%, 7/16/18, VRN | | Aaa | | | 2,800 | | | | 2,799 | |
Ford Credit Floorplan Master Owner Trust A, 2013-5, Tranche A2,
0.912%, 9/15/18, VRN | | AAA | | | 200 | | | | 200 | |
Ford Credit Auto Lease Trust, 2016-A, Tranche A2B,
0.982%, 11/15/18, VRN | | AAA | | | 650 | | | | 650 | |
Ford Credit Auto Owner Trust, 2016-A, Tranche A2B,
0.842%, 12/15/18, VRN | | AAA | | | 1,550 | | | | 1,552 | |
Citibank Credit Card Issuance Trust, 2006-A8, Tranche A8,
0.668%, 12/17/18, VRN | | AAA | | | 200 | | | | 200 | |
Harley-Davidson Motorcycle Trust, 2015-2, Tranche A2B,
0.692%, 1/15/19, VRN | | AAA | | | 970 | | | | 970 | |
Nissan Auto Receivables 2016-B Owner Trust, 2016-B, Tranche A2B,
0.742%, 4/15/19, VRN | | Aaa | | | 1,000 | | | | 1,001 | |
| Discover Card Master Trust, 2012-A4, Tranche A, 0.370%, 5/15/19, VRN | | AAA | | | 2,000 | | | | 2,003 | |
| American Express Issuance Trust II, 2013-2, Tranche A, 0.872%, 8/15/19, VRN | | AAA | | | 640 | | | | 642 | |
| | | | | | | | | |
| | | NRSRO | | Principal | | | | |
| Issuer | | Rating | | Amount | | | Value | |
| | | | | | | | | | | |
| Asset-Backed Securities—(continued) | | |
Bank of America Credit Card Trust, 2007-A11, Tranche A11,
0.512%, 12/15/19, VRN | | AAA | | $ | 915 | | | $ | 914 | |
Capital One Multi-Asset Execution Trust, 2007-A2, Tranche A2,
0.522%, 12/16/19, VRN | | AAA | | | 715 | | | | 714 | |
Citibank Credit Card Issuance Trust, 2008-A2, Tranche A2,
1.601%, 1/23/20, VRN | | AAA | | | 2,980 | | | | 3,022 | |
Mercedes-Benz Master Owner Trust—144A, 2015-BA, Tranche A,
0.822%, 4/15/20, VRN | | Aaa | | | 1,500 | | | | 1,494 | |
Citibank Credit Card Issuance Trust, 2013-A2, Tranche A2,
0.732%, 5/26/20, VRN | | AAA | | | 1,900 | | | | 1,902 | |
| Chase Issuance Trust, 2013-A6, Tranche A6, 0.862%, 7/15/20, VRN | | AAA | | | 2,000 | | | | 2,003 | |
Discover Card Execution Note Trust, 2015-A1, Tranche A1,
0.792%, 8/17/20, VRN | | AAA | | | 1,950 | | | | 1,955 | |
American Express Credit Account Master Trust, 2008-2, Tranche A,
1.702%, 9/15/20, VRN | | AAA | | | 2,200 | | | | 2,235 | |
| Chase Issuance Trust, 2016-A1, Tranche A, 0.852%, 5/17/21, VRN | | AAA | | | 2,000 | | | | 2,002 | |
Bank of America Credit Card Trust, 2014-A1, Tranche A,
0.822%, 6/15/21, VRN | | AAA | | | 1,000 | | | | 1,000 | |
MBNA Credit Card Master Note Trust, 2004-A3, Tranche A3,
0.702%, 8/16/21, VRN | | AAA | | | 515 | | | | 513 | |
Capital One Multi-Asset Execution Trust, 2014-A3, Tranche A3,
0.822%, 1/18/22, VRN | | AAA | | | 750 | | | | 750 | |
Capital One Multi-Asset Execution Trust, 2016-A1, Tranche A1,
0.900%, 2/15/22, VRN | | AAA | | | 2,750 | | | | 2,756 | |
| SLM Student Loan Trust, 2008-4, Tranche A4, 2.288%, 7/25/22, VRN | | Aaa | | | 1,030 | | | | 1,031 | |
| Sierra Timeshare 2012-2 Receivables Funding LLC—144A, 2012-2A, Tranche A, 2.380%, 3/20/29 | | A+ | | | 273 | | | | 273 | |
SLM Private Education Loan Trust—144A, 2011-A, Tranche A3,
2.942%, 1/15/43, VRN | | AAA | | | 2,250 | | | | 2,266 | |
| Total Asset-Backed Securities | | | | | | | | | 36,020 | |
| | | | | | | | | | | |
| Corporate Obligations—18.9% | | | | | |
Fifth Third Bancorp,
1.067%, due 12/20/16, VRN | | A- | | | 1,000 | | | | 999 | |
JPMorgan Chase & Co.,
1.146%, due 2/15/17, VRN | | A+ | | | 1,000 | | | | 1,001 | |
Barclays Bank plc,
1.208%, due 2/17/17, VRN | | A2 | | | 1,620 | | | | 1,618 | |
See accompanying Notes to Financial Statements.
| 104 | Semiannual Report | June 30, 2016 |
Low Duration Fund
Portfolio of Investments, June 30, 2016 (all dollar amounts in thousands) (unaudited)
| | | | | | | | | |
| | | NRSRO | | Principal | | | | |
| Issuer | | Rating | | Amount | | | Value | |
| | | | | | | | | | | |
| Corporate Obligations—(continued) | | | | | |
Caterpillar Financial Services Corporation,
0.911%, due 3/3/17, VRN | | A | | $ | 2,200 | | | $ | 2,203 | |
Nissan Motor Acceptance Corp.—144A,
1.231%, due 3/3/17, VRN | | A- | | | 1,500 | | | | 1,501 | |
Citigroup, Inc.,
1.198%, due 3/10/17, VRN | | A | | | 1,500 | | | | 1,501 | |
Mizuho Bank Ltd.—144A,
1.063%, due 4/16/17, VRN | | A1 | | | 1,000 | | | | 1,000 | |
Tencent Holdings Ltd.—144A,
2.000%, due 5/2/17 | | A+ | | | 1,200 | | | | 1,207 | |
American Express Credit Corporation,
0.950%, due 6/5/17, VRN | | A2 | | | 1,000 | | | | 999 | |
Standard Chartered plc—144A,
1.001%, due 9/8/17, VRN | | A1 | | | 2,000 | | | | 1,986 | |
Royal Bank of Canada,
0.890%, due 10/13/17, VRN | | AA | | | 1,725 | | | | 1,720 | |
Canadian National Railway Co.,
0.796%, due 11/14/17, VRN | | A | | | 500 | | | | 500 | |
General Electric Capital Corporation,
1.182%, due 12/7/17, VRN | | AA+ | | | 500 | | | | 498 | |
Exxon Mobil Corporation,
1.274%, due 2/28/18, VRN | | Aaa | | | 1,000 | | | | 1,008 | |
Wells Fargo & Co.,
1.268%, due 4/23/18, VRN | | AA- | | | 1,000 | | | | 1,003 | |
Morgan Stanley,
1.918%, due 4/25/18, VRN | | A | | | 2,000 | | | | 2,020 | |
KeyBank NA,
1.193%, due 6/1/18, VRN | | A- | | | 1,200 | | | | 1,198 | |
PNC Bank NA,
1.093%, due 6/1/18, VRN | | A+ | | | 1,035 | | | | 1,034 | |
Toyota Motor Credit Corporation,
1.445%, due 2/19/19, VRN | | AA- | | | 1,000 | | | | 1,000 | |
American Honda Finance Corporation,
1.479%, due 2/22/19, VRN | | A+ | | | 1,000 | | | | 1,011 | |
PepsiCo, Inc.,
1.244%, due 2/22/19, VRN | | A1 | | | 1,000 | | | | 1,007 | |
Johnson & Johnson,
0.943%, due 3/1/19, VRN | | AAA | | | 1,000 | | | | 1,003 | |
Westpac Banking Corporation,
1.337%, due 5/13/19, VRN | | Aa2 | | | 1,000 | | | | 1,002 | |
| Total Corporate Obligations | | | | | | | | | 28,019 | |
| | | | | | | | | | | |
Total Long-Term Investments—98.8%
(cost $145,747) | | | | | | | | | 146,368 | |
| | | Principal | | | | |
| | | Amount/ | | | | |
| Issuer | | Contracts | | | Value | |
| | | | | | | | | |
| Repurchase Agreement | | | | | | | | |
| Fixed Income Clearing Corporation, 0.030% dated 6/30/16, due 7/1/16, repurchase price $1,656, collateralized by FHLB, 5.500%, due 7/15/36 | | $ | 1,656 | | | $ | 1,656 | |
Total Repurchase Agreement—1.1%
(cost $1,656) | | | | | | | 1,656 | |
| | | | | | | | | |
| Purchased Option—0.0% | | | | | | | | |
| Eurodollar Future, September 2016, Strike $97, Put | | | 300 | | | | 2 | |
| | | | | | | | | |
Total Purchased Option—0.0%
(cost $95) | | | | | | | 2 | |
| | | | | | | | | |
Total Investments—99.9%
(cost $147,498) | | | | | | | 148,026 | |
| | | | | | | | | |
| Securities Sold Short, Not Yet Purchased | | | | | | | | |
| | | | | | | | | |
| U.S. Government and U.S. Government Agency—(7.0)% | |
| Federal National Mortgage Association (FNMA)—(7.0)% | | | | | | | | |
| TBA, 2.500%, due 7/1/31 | | $ | (10,000 | ) | | | (10,347 | ) |
| | | | | | | | | |
Total Securities Sold Short, Not Yet Purchased—(7.0)%
(proceeds $10,277) | | | | | | | (10,347 | ) |
| Cash and other assets, less liabilities—7.1% | | | | | | | 10,542 | |
| Net assets—100.0% | | | | | | $ | 148,221 | |
144A = Security exempt from registration under Rule 144A of the Securities Act of 1933. These securities may be resold in transactions exempt from registration, normally to qualified institutional buyers.
NRSRO = Nationally Recognized Statistical Rating Organization—The credit quality ratings of the securities in the Fund reflect the highest category rating by any of Fitch Ratings, Moody’s Investors Service Inc., or Standard & Poor’s, a division of the McGraw-Hill Companies, Inc.
The obligations of certain U.S. Government-sponsored securities are neither issued nor guaranteed by the U.S. Treasury.
TBA = To Be Announced—TBAs are mortgage-backed securities traded under delayed delivery commitments, settling after June 30, 2016. The term TBA comes from the fact that the specific mortgage-backed security that will be delivered to fulfill a TBA trade is not designated at the time the trade is made.
VRN = Variable Rate Note
See accompanying Notes to Financial Statements.
| June 30, 2016 | William Blair Funds | 105 |
| | Macro Allocation Fund |
| | |
| | AN OVERVIEW FROM THE PORTFOLIO MANAGERS |
| | |
 Thomas Clarke 
Brian D. Singer | The William Blair Macro Allocation Fund (Class N shares) posted a 0.27% increase, net of fees, for the six-month period ending June 30, 2016. By comparison, the Fund’s benchmark index the Bank of America/Merrill Lynch 3-month U.S. Treasury Bill Index and the Long-Term Comparative Index (40% Barclays U.S. Aggregate Index, 30% MSCI All Country World Index (net), and 30% Bank of America/Merrill Lynch 3-month U.S. Treasury Bill Index), increased 0.15% and 2.67%, respectively. Capital market volatility was more muted in the second quarter of 2016 than it was in the first quarter, though in June high volatility and uncertainty snapped back to the fore when British voters opted to leave the European Union in a historic referendum (“Brexit”). Even accounting for this development—which was a surprise to market expectations—global equities were essentially flat for the second quarter, with little differentiation between emerging and developed markets. U.S. equities made overall gains, which were offset by losses in Europe and Japan. Bond yields moved even lower, with the average 10-year yield in the eurozone falling to negative territory. The U.S. dollar was generally strong against other developed world currencies, particularly so against the British pound, but the Japanese yen was the strongest major currency indicating demand for its safe-haven credentials. Emerging market currencies were stable overall, with more differentiation and somewhat lower positive correlations than they have exhibited in prior quarters. Throughout the first half of 2016, the Fund maintained a low-risk posture, which was instrumental in minimizing exposure to key macro risks such as the United Kingdom’s Brexit vote in June. During the period, the Fund’s market strategy (e.g., equity and fixed income) detracted from performance while its currency strategy contributed to performance. Within the market strategy, equity exposures contributed negatively in aggregate to the Fund’s relative performance, largely driven by long exposure to European equities, while fixed income was a positive contributor in aggregate to the Fund’s relative performance, mostly due to long exposure to U.S. government bonds and U.S. credit. The Fund was disadvantaged by short exposure to European government bonds. Within currency, emerging markets were strong contributors to the Fund’s relative performance largely driven by long exposures to the Russian ruble, Indonesian rupiah, and Brazilian real, as well as long exposure to the Japanese yen. Currency exposure that detracted from the Fund’s relative performance included long exposure to the Mexican peso and short exposure to the euro. While some macro events have passed, a period of uncertainty surrounding the U.K. exit from the European Union is beginning to set in. Additionally, macro themes, including the rise and fall of commodity prices and an increase in political populism, continue to have a material impact on price movements which are keeping correlations between and within equities and currencies somewhat elevated. We believe that our investment process, dialogue, and decision-making are all well-equipped to meet the challenges we now face. We will continue to use our rigorous investment framework and our experienced judgment to appropriately (and more fully) increase the Fund’s risk posture in addition to the partial steps we have taken so far. We remain vigilant as we assess new and relevant information in our attempt to capture future investment opportunities in a timely manner, and we will continue balancing the relationship between risk taken and compensation expected. |
| 106 | Semiannual Report | June 30, 2016 |
Macro Allocation Fund
Performance Highlights (Unaudited)
| Average Annual Total Return at 6/30/2016 |
| | | Year | | | | | | | | | | Since |
| | | to Date | | 1 Year | | 3 Year | | Inception |
| Class N(a) | | | 0.27 | % | | | (9.64 | )% | | | 1.63 | % | | | 5.50 | % |
| Class I(a) | | | 0.44 | | | | (9.37 | ) | | | 1.92 | | | | 5.77 | |
| BofA Merrill Lynch 3-Month U.S. Treasury Bill Index(a) | | | 0.15 | | | | 0.19 | | | | 0.09 | | | | 0.09 | |
| Long-Term Comparative Index(a) | | | 2.67 | | | | 1.56 | | | | 3.61 | | | | 4.06 | |
| Institutional Class(b) | | | 0.53 | | | | (9.28 | ) | | | — | | | | (0.29 | ) |
| BofA Merrill Lynch 3-Month U.S. Treasury Bill Index(b) | | | 0.15 | | | | 0.19 | | | | — | | | | 0.25 | |
| Long-Term Comparative Index(b) | | | 2.67 | | | | 1.56 | | | | — | | | | 2.55 | |
| (a) | For the period from November 29, 2011 (Commencement of Operations) to June 30, 2016. |
| | |
| (b) | For the period from October 21, 2013 (Commencement of Operations) to June 30, 2016. |
Performance cited represents past performance. Past performance does not guarantee future results and current performance may be lower or higher than the data quoted. Results shown are average annual total returns, which assume reinvestment of dividends and capital gains. Investment returns and principal will fluctuate and you may have a gain or loss when you sell shares. For the most current month-end performance information, please call 1-800-742-7272, or visit our Web site at www.williamblairfunds.com. The Fund involves a high level of risk and may not be appropriate for everyone. You could lose money by investing in the Fund. There can be no assurance that the Fund’s investment objective will be achieved or that the Fund’s investment strategies will be successful. The Fund is not a complete investment program. From time to time, the investment adviser may waive fees or reimburse expenses for the Fund. Without these waivers/reimbursements, performance would be lower. Class N shares are available to the general public without a sales load. Class I shares are available to certain institutional investors and advisory clients of William Blair Investment Management, LLC and William Blair & Company, L.L.C., without a sales load or distribution fee (12b-1 fee). Institutional Class shares are available to institutional investors without a sales load or distribution (12b-1) or service fees.
The performance highlights and graph presented above do not reflect the deduction of taxes that a shareholder would pay on fund distributions or the redemption of fund shares.
The Bank of America (“BofA”) Merrill Lynch 3-Month U.S. Treasury Bill Index measures total return on cash, including price and interest income, based on short-term government Treasury Bills of about 90-day maturity. The Index is unmanaged, does not incur fees or expenses, and cannot be invested in directly.
The Long-Term Comparative Index return is comprised of the following indices: 40% Barclays Capital U.S. Aggregate Index, 30% Morgan Stanley Capital International (MSCI) All Country World Index (net), and 30% BofA Merrill Lynch 3-month U.S. Treasury Bill Index.
This report identifies the Fund’s investments on June 30, 2016. These holdings are subject to change. Not all investments in the Fund performed the same, nor is there any guarantee that these investments will perform as well in the future. Market forecasts provided in this report may not necessarily come to pass.
Portfolio Allocation (Unaudited)
The table below provides the allocation of the Fund’s holdings as a percent of net assets as of June 30, 2016.
| Category | | % | |
| Equity Exchange-Traded Funds | | | 49.7 | % |
| Fixed Income Exchange-Traded Funds | | | 14.1 | % |
| U.S. Government | | | 17.3 | % |
| Purchased Options | | | 0.3 | % |
| Repurchase Agreements | | | 17.7 | % |
| Written Option | | | (0.3 | )% |
| Cash and Other Assets, Less Liabilities | | | 1.2 | % |
| Net Assets | | | 100.0 | % |
| June 30, 2016 | William Blair Funds | 107 |
Macro Allocation Fund
Portfolio of Investments, June 30, 2016 (all dollar amounts in thousands) (unaudited)
| | | Shares or | | | | |
| | | Principal | | | | |
| Issuer | | Amount | | | Value | |
| | | | | | | |
| Exchange-Traded Funds—63.8% | | | | | | | | |
| | | | | | | | | |
| Equity Exchange-Traded Funds—49.7% | | | | | | | | |
| Consumer Staples Select Sector SPDR Fund | | | 672,000 | | | $ | 37,061 | |
| Energy Select Sector SPDR Fund | | | 836,000 | | | | 57,049 | |
| Global X FTSE Greece 20 ETF | | | 2,450,071 | | | | 17,714 | |
| iShares Global Energy ETF | | | 546,000 | | | | 17,641 | |
| iShares MSCI Emerging Markets ETF | | | 634,000 | | | | 21,784 | |
| iShares MSCI India ETF | | | 1,654,000 | | | | 46,180 | |
| iShares MSCI Japan ETF(a) | | | 2,301,000 | | | | 26,461 | |
| iShares MSCI Switzerland Capped ETF(a) . | | | 503,000 | | | | 14,914 | |
| iShares Russell 1000 Growth ETF | | | 299,000 | | | | 30,008 | |
| iShares Russell 1000 Value ETF(a) | | | 2,097,000 | | | | 216,536 | |
| SPDR S&P 500 ETF Trust | | | 1,539,000 | | | | 322,467 | |
| Utilities Select Sector SPDR Fund | | | 677,000 | | | | 35,522 | |
| VanEck Vectors Russia ETF | | | 1,084,000 | | | | 18,883 | |
| Total Equity Exchange-Traded Funds | | | | | | | 862,220 | |
| | | | | | | | | |
| Fixed Income Exchange-Traded Funds—14.1% | | | | | | | | |
| iShares iBoxx $ Investment Grade Corporate Bond ETF | | | 1,128,000 | | | | 138,439 | |
| iShares JP Morgan USD Emerging Markets Bond ETF | | | 312,000 | | | | 35,927 | |
| SPDR Barclays High Yield Bond ETF | | | 1,573,000 | | | | 56,156 | |
| WisdomTree Emerging Markets Local Debt Fund ETF | | | 370,000 | | | | 13,842 | |
| Total Fixed Income Exchange-Traded Funds | | | | | | | 244,364 | |
| | | | | | | | | |
Total Exchange-Traded Funds—63.8%
(cost $1,087,889) | | | | | | | 1,106,584 | |
| | | | | | | | | |
| Repurchase Agreement—17.7% | | | | | | | | |
| Fixed Income Clearing Corporation, 0.030% dated 6/30/16, due 7/1/16, repurchase price $307,110, collateralized by FFCB, 3.120%-3.340%, due 2/8/30-3/14/31, and FHLB, 3.300%-5.500%, due 5/7/32-7/15/36, and FHLMC, 4.125%-6.250%, due 7/15/32-10/11/33, and FNMA, 3.100%-7.125%, due 1/15/30-3/10/31 | | | $307,110 | | | | 307,110 | |
| | | | | | | | | |
Total Repurchase Agreement—17.7%
(cost $307,110) | | | | | | | 307,110 | |
| | | | | | | | | |
| U.S. Government—17.3% | | | | | | | | |
U.S. Treasury Bill,
0.343%, due 7/21/16 (b) | | | 35,000 | | | | 34,997 | |
U.S. Treasury Bill,
0.380%, due 8/18/16 (a)(b) | | | 35,000 | | | | 34,990 | |
U.S. Treasury Bill,
0.403%, due 9/15/16 (a)(b) | | | 35,000 | | | | 34,985 | |
U.S. Treasury Bill,
0.303%, due 10/13/16 (a)(b) | | | 35,000 | | | | 34,978 | |
U.S. Treasury Bill,
0.431%, due 11/10/16 (a)(b) | | | 35,000 | | | | 34,968 | |
U.S. Treasury Bill,
0.536%, due 12/8/16 (a)(b) | | | 35,000 | | | | 34,956 | |
U.S. Treasury Bill,
0.577%, due 1/5/17 (a)(b) | | | 35,000 | | | | 34,939 | |
| | | Principal | | | | |
| | | Amount/ | | | | |
| Issuer | | Contracts | | | Value | |
| | | | | | | |
| U.S. Government—(continued) | | | | | | | | |
| U.S. Treasury Bill, 0.542%, due 2/2/17 | | $ | 10,000 | | | $ | 9,980 | |
| U.S. Treasury Bill, 0.670%, due 3/2/17 | | | 10,000 | | | | 9,974 | |
| U.S. Treasury Bill, 0.617%, due 3/30/17 | | | 10,000 | | | | 9,971 | |
| U.S. Treasury Bill, 0.597%, due 4/27/17 | | | 10,000 | | | | 9,967 | |
| U.S. Treasury Bill, 0.677%, due 5/25/17 | | | 8,000 | | | | 7,971 | |
| U.S. Treasury Bill, 0.577%, due 6/22/17 | | | 8,000 | | | | 7,966 | |
| | | | | | | | | |
Total U.S. Government—17.3%
(cost $300,408) | | | | | | | 300,642 | |
| | | | | | | | | |
| Purchased Options—0.3% | | | | | | | | |
| Energy Select Sector SPDR Fund, July 2016, Strike $63.5, Put | | | 13,187 | | | | 198 | |
| IBEX 8630 OTC, July 2016, Strike 8,630 EUR, Call | | | 7,252 | | | | 208 | |
| IBEX 9769 OTC, July 2016, Strike 9,769 EUR, Call | | | 6,859 | | | | — | (c) |
| iShares MSCI Emerging Markets, September 2016, Strike $31.5, Put | | | 25,956 | | | | 1,376 | |
| iShares Russell 2000 ETF, July 2016, Strike $112, Call | | | 6,308 | | | | 2,019 | |
| iShares Russell 2000 ETF, July 2016, Strike $112, Put | | | 6,308 | | | | 530 | |
| S&P 500 Index, November 2016, Strike $1,900, Put | | | 419 | | | | 1,592 | |
| | | | | | | | | |
Total Purchased Options—0.3%
(cost $14,366) | | | | | | | 5,923 | |
| | | | | | | | | |
Total Investments in Securities—99.1%
(cost $1,709,773) | | | | | | | 1,720,259 | |
| | | | | | | | | |
| Written Options—(0.3)% | | | | | | | | |
| ESTX Bank, July 2016, Strike 97.5 EUR, Call | | | (6,318 | ) | | | (53 | ) |
| EURO STOXX 50 Index, July 2016, Strike 2,975 EUR, Call | | | (2,069 | ) | | | (298 | ) |
| FTSE 100 Index, July 2016, Strike 6,200 GBP, Call | | | (776 | ) | | | (3,192 | ) |
| Utilities Select Sector SPDR Fund, Strike $52, Call | | | (13,838 | ) | | | (1,896 | ) |
| | | | | | | | | |
| Total Written Option—(0.3)% | | | | | | | | |
| (premiums received $6,354) | | | | | | | (5,439 | ) |
| | | | | | | | | |
| Cash and other assets, less liabilities—1.2% | | | | | | | 21,014 | |
| Net assets—100.0% | | | | | | $ | 1,735,834 | |
| (a) | Security, or portion of security, is segregated as collateral for OTC swap contracts, OTC options, and listed written options aggregating a total value of $89,545. |
| | |
| (b) | Security, or portion of security, is pledged as collateral for the credit default swaps and to cover initial margin requirements on open futures contracts aggregating a total value of $61,872. |
| | |
| (c) | Amount rounds to less than minimum amount disclosed |
See accompanying Notes to Financial Statements.
| 108 | Semiannual Report | June 30, 2016 |
Macro Allocation Fund
Portfolio of Investments, June 30, 2016 (all dollar amounts in thousands) (unaudited)
If a fund’s portfolio holdings represent ownership of 5% or more of the voting securities of a company, the company is deemed to be an affiliate as defined in the Investment Company Act of 1940. The Fund had the following transactions during the period ended June 30, 2016 with companies deemed affiliated during the period or at June 30, 2016.
| | | Share Activity | | | Period Ended June 30, 2016 |
| | | | | | | | | | | | | | | | | | | | | | | | | | | | Change in net |
| | | | | | | | | | | | | | | | | | | | | | | | | | | | unrealized |
| | | | Balance | | | | | | | | Balance | | | | | | | | | | | Dividend | | Net realized | | appreciation |
| Security Name | | | 12/31/2015 | | | | Purchases | | | | Sales | | | | 6/30/2016 | | | Value | | | Income | | gain (loss) | | (depreciation) |
| pGlobal X MSCI Greece ETF | | | 1,987,000 | | | | 753,071 | | | | 290,000 | | | | 2,450,071 | | | $ | 17,714 | | | | $ | — | | | | $ | (465 | ) | | | $ | (526 | ) |
| | | | | | | | | | | | | | | | | | | $ | 17,714 | | | | $ | — | | | | $ | (465 | ) | | | $ | (526 | ) |
p = Affiliated company at June 30, 2016. The Fund’s total value in companies deemed to be affiliated at June 30, 2016 was $17,714.
| Forward Foreign Currency Contracts | | | | | | | | | | |
| | | | | | | | | | | | | Net Unrealized |
| Settlement | | | | | | Local Currency | | | | | Appreciation |
| Date | | Deliver/Receive | | Counterparty | | (in thousands) | | Current Value | | (Depreciation) |
| Purchased | | | | | | | | | | | | | | | | | |
| 9/21/16 | | Brazilian Real | | Citibank N.A. London | | | 115,672 | | | $ | 35,114 | | | | $ | 1,954 | |
| 9/21/16 | | Swiss Franc | | Citibank N.A. London | | | 112,535 | | | | 115,794 | | | | | (1,442 | ) |
| 9/21/16 | | Chinese Yuan Renminbi | | Citibank N.A. London | | | 256,714 | | | | 38,372 | | | | | (505 | ) |
| 9/21/16 | | Colombian Peso | | Citibank N.A. London | | | 204,248,435 | | | | 68,715 | | | | | (253 | ) |
| 9/21/16 | | Euro | | Citibank N.A. London | | | 70,468 | | | | 78,440 | | | | | (1,511 | ) |
| 9/21/16 | | British Pound Sterling | | Citibank N.A. London | | | 65,463 | | | | 87,218 | | | | | (7,730 | ) |
| 9/21/16 | | Hungarian Forint | | Citibank N.A. London | | | 15,638,284 | | | | 54,954 | | | | | (2,535 | ) |
| 9/21/16 | | Indonesian Rupiah | | Citibank N.A. London | | | 1,642,108,619 | | | | 123,138 | | | | | 574 | |
| 9/21/16 | | Indian Rupee | | Citibank N.A. London | | | 5,496,500 | | | | 80,291 | | | | | (1,102 | ) |
| 9/21/16 | | Japanese Yen | | Citibank N.A. London | | | 670,691 | | | | 6,514 | | | | | 214 | |
| 9/21/16 | | Mexican Peso | | Citibank N.A. London | | | 1,515,544 | | | | 82,211 | | | | | (441 | ) |
| 9/21/16 | | Malaysian Ringgit | | Citibank N.A. London | | | 352,927 | | | | 88,280 | | | | | 712 | |
| 9/21/16 | | Norwegian Krone | | Citibank N.A. London | | | 144,537 | | | | 17,268 | | | | | (601 | ) |
| 9/21/16 | | Polish Zloty | | Citibank N.A. London | | | 183,134 | | | | 46,332 | | | | | (1,946 | ) |
| 9/21/16 | | Russian Ruble | | Citibank N.A. London | | | 3,654,528 | | | | 55,910 | | | | | (147 | ) |
| 9/21/16 | | Singapore Dollar | | Citibank N.A. London | | | 64,725 | | | | 48,006 | | | | | (21 | ) |
| 9/21/16 | | Thai Baht | | Citibank N.A. London | | | 139,597 | | | | 3,967 | | | | | (10 | ) |
| 9/21/16 | | New Turkish Lira | | Citibank N.A. London | | | 50,259 | | | | 17,140 | | | | | 100 | |
| 9/21/16 | | South African Rand | | Citibank N.A. London | | | 675,607 | | | | 45,108 | | | | | 176 | |
| | | | | | | | | | | | | | | | $ | (14,514 | ) |
| Sold | | | | | | | | | | | | | | | | | |
| 9/21/16 | | Australian Dollar | | Citibank N.A. London | | | 74,678 | | | $ | 55,528 | | | | $ | 85 | |
| 9/21/16 | | Canadian Dollar | | Citibank N.A. London | | | 134,668 | | | | 104,253 | | | | | 1,579 | |
| 9/21/16 | | Swiss Franc | | Citibank N.A. London | | | 285,072 | | | | 293,329 | | | | | 5,337 | |
| 9/21/16 | | Czech Koruna | | Citibank N.A. London | | | 1,917,406 | | | | 78,821 | | | | | 2,281 | |
| 9/21/16 | | Euro | | Citibank N.A. London | | | 131,191 | | | | 146,033 | | | | | 3,170 | |
| 9/21/16 | | British Pound Sterling | | Citibank N.A. London | | | 78,986 | | | | 105,235 | | | | | 8,081 | |
| 9/21/16 | | Hong Kong Dollar | | Citibank N.A. London | | | 724,119 | | | | 93,430 | | | | | (35 | ) |
| 9/21/16 | | Indonesian Rupiah | | Citibank N.A. London | | | 50,023,447 | | | | 3,751 | | | | | 2 | |
| 9/21/16 | | Japanese Yen | | Citibank N.A. London | | | 3,846,998 | | | | 37,361 | | | | | 314 | |
| 9/21/16 | | South Korean Won | | Citibank N.A. London | | | 8,960,418 | | | | 7,766 | | | | | (3 | ) |
| 9/21/16 | | New Zealand Dollar | | Citibank N.A. London | | | 126,381 | | | | 89,859 | | | | | (1,649 | ) |
| 9/21/16 | | Thai Baht | | Citibank N.A. London | | | 4,499,104 | | | | 127,863 | | | | | (68 | ) |
| 9/21/16 | | Taiwan Dollar | | Citibank N.A. London | | | 245,758 | | | | 7,648 | | | | | 2 | |
| | | | | | | | | | | | | | | | $ | 19,096 | |
See accompanying Notes to Financial Statements.
| June 30, 2016 | William Blair Funds | 109 |
Macro Allocation Fund
Portfolio of Investments, June 30, 2016 (all dollar amounts in thousands) (unaudited)
| Futures Contracts | | | | | | | | | | | | | |
| | | | | | | | | Notional Amount | | Net Unrealized |
| Number of | | | | | | | | (Local, | | Appreciation |
| Contracts | | Description | | Expiration Date | | Local Currency | | in thousands) | | (Depreciation) |
| Long | | | | | | | | | | | | | | | |
| 220 | | Amsterdam Index | | July 2016 | | Euro | | | 19,153 | | | | $ | 638 | |
| 165 | | IBEX 35 Index | | July 2016 | | Euro | | | 13,410 | | | | | (117 | ) |
| 2,350 | | OMXS 30 Index | | July 2016 | | Swedish Krona | | | 309,848 | | | | | 798 | |
| 422 | | Euro-Bund Put, Strike 160.50-FSO | | July 2016 | | Euro | | | 4 | | | | | (284 | ) |
| 80 | | HANG SENG Index | | July 2016 | | Hong Kong Dollar | | | 83,788 | | | | | 513 | |
| 1,940 | | MSCI Singapore ETS Index | | July 2016 | | Singapore Dollar | | | 61,556 | | | | | 2,767 | |
| 325 | | MSCI Taiwan Index | | July 2016 | | U.S. Dollar | | | 10,319 | | | | | 312 | |
| 269 | | KOSPI 200 Index | | September 2016 | | South Korean Won | | | 32,851,625 | | | | | (112 | ) |
| 416 | | 10YR JGB Mini | | September 2016 | | Japanese Yen | | | 6,357,728 | | | | | 307 | |
| 275 | | SPI 200 Index | | September 2016 | | Australian Dollar | | | 35,585 | | | | | (67 | ) |
| 18 | | DAX Index | | September 2016 | | Euro | | | 4,351 | | | | | 1 | |
| 1,561 | | EURO STOXX Banks Index | | September 2016 | | Euro | | | 6,447 | | | | | (1,681 | ) |
| 698 | | FTSE 100 Index | | September 2016 | | British Pound Sterling | | | 44,829 | | | | | 2,392 | |
| 385 | | FTSE MIB Index | | September 2016 | | Euro | | | 31,168 | | | | | (717 | ) |
| | | | | | | | | | | | | | $ | 4,750 | |
| Short | | | | | | | | | | | | | | | |
| 92 | | CAC 40 Index | | July 2016 | | Euro | | | 3,895 | | | | $ | (73 | ) |
| 330 | | H-Shares Index | | July 2016 | | Hong Kong Dollar | | | 143,963 | | | | | (839 | ) |
| 184 | | EURO-OAT* | | September 2016 | | Euro | | | 29,585 | | | | | (470 | ) |
| 360 | | NIKKEI 225 Index | | September 2016 | | Japanese Yen | | | 2,799,000 | | | | | 1,619 | |
| 2,332 | | FTSE/JSE Top 40 Index | | September 2016 | | South African Rand | | | 1,083,121 | | | | | 1,377 | |
| 1,414 | | MEX BOLSA Index | | September 2016 | | Mexican Peso | | | 651,995 | | | | | (692 | ) |
| 129 | | S&P TSX 60 Index | | September 2016 | | Canadian Dollar | | | 21,009 | | | | | (64 | ) |
| 92 | | EURO STOXX 50 Index | | September 2016 | | Euro | | | 2,627 | | | | | (142 | ) |
| 496 | | Russell 2000 Mini Index | | September 2016 | | U.S. Dollar | | | 56,911 | | | | | 583 | |
| 4,718 | | S&P 500 E Mini Index | | September 2016 | | U.S. Dollar | | | 493,078 | | | | | (725 | ) |
| 532 | | 10YR Can Bond | | September 2016 | | Canadian Dollar | | | 78,757 | | | | | (1,439 | ) |
| 37 | | 10YR US Treasury Notes* | | September 2016 | | U.S. Dollar | | | 4,920 | | | | | (2 | ) |
| 110 | | Long Gilt | | September 2016 | | British Pound Sterling | | | 14,134 | | | | | (915 | ) |
| 459 | | 5YR US Treasury Notes* | | September 2016 | | U.S. Dollar | | | 56,073 | | | | | (1,006 | ) |
| | | | | | | | | | | | | | $ | (2,788 | ) |
| * | Exposure to Futures Contract is achieved through the use of a swap contract with Credit Suisse. |
| | |
| | FSO = Futures-Style Option |
| Interest Rate Swap | | | | | | | | | | | | | | |
| | | | | | | | | | | Notional | | Unrealized |
| | | Pay/Receive | | | | Maturity | | | | Amount | | Appreciation |
| Floating Rate Reference | | Floating Rate | | Fixed Rates | | Dates | | Counterparty | | (in thousands) | | (Depreciation) |
| 6 Month Swiss Franc LIBOR Rate | | Receive | | 1.250% | | June 2025 | | Credit Suisse International | | 41,330 CHF | | | $ | (3,141 | ) |
| 6 Month Swiss Franc LIBOR Rate | | Receive | | 1.250% | | June 2025 | | Goldman Sachs & Co. | | 4,200 CHF | | | | (201 | ) |
| | | | | | | | | | | | | | $ | (3,342 | ) |
See accompanying Notes to Financial Statements.
| 110 | Semiannual Report | June 30, 2016 |
Macro Allocation Fund
Portfolio of Investments, June 30, 2016 (all dollar amounts in thousands) (unaudited)
| Total Return Swaps | | | | | | | | | | | | | | | |
| | | | | | | | | | | Notional | | | | Unrealized |
| | | Pay/Receive | | | | Maturity | | | | Amount | | | | Appreciation |
| Reference Entity | | Floating Rate | | Floating Rates | | Dates | | Counterparty | | (in thousands) | | | | (Depreciation) |
| Consumer Discretionary Select Sector Total Return Index | | Receive | | 3 Month LIBOR minus 42 bp | | Aug 2016 | | Goldman Sachs International | | $ | 61,658 | | | | $ | (915 | ) |
| Dow Jones US Health Care Total Return Index | | Receive | | 3 Month LIBOR minus 30 bp | | Aug 2016 | | Goldman Sachs International | | | 26,222 | | | | | (1,082 | ) |
| Dow Jones US Telecommunications Total Return Index | | Receive | | 3 Month LIBOR minus 45 bp | | Aug 2016 | | Goldman Sachs International | | | 35,025 | | | | | (4,105 | ) |
| Financial Select Sector Total Return Index | | Receive | | 1 Month LIBOR plus 3 bp | | July 2016 | | Citibank N.A. | | | 34,492 | | | | | (397 | ) |
| Vietnam Equity Basket | | Pay | | 3 Month LIBOR plus 100 bp | | Aug 2016 | | Goldman Sachs International | | | 17,376 | | | | | 106 | |
| MSCI China Small Cap Index (Net) | | Pay | | 1 Month LIBOR plus 125 bp | | Aug 2016 to Nov 2016 | | Goldman Sachs International | | | 20,123 | | | | | (2,696 | ) |
| MSCI China Small Cap Index (Net) | | Pay | | 1 Month LIBOR plus 20 bp - 40bp | | Dec 2016 to June 2017 | | Citibank N.A. | | | 20,581 | | | | | (1,047 | ) |
| MSCI China Small Cap Index (Net) | | Pay | | 1 Month LIBOR plus 75 bp | | Mar 2017 | | Credit Suisse International | | | 3,068 | | | | | 77 | |
| MSCI Emerging Markets Small Cap (Net) | | Pay | | 1 Month LIBOR plus 110 bp - 115 bp | | Aug 2016 to Sep 2016 | | Goldman Sachs International | | | 4,161 | | | | | (492 | ) |
| MSCI Emerging Markets Small Cap (Net) | | Pay | | 1 Month LIBOR plus 94 bp - 96 bp | | Nov 2016 to Mar 2017 | | Credit Suisse International | | | 31,750 | | | | | 562 | |
| MSCI Vietnam Daily Total Return Index | | Pay | | 3 Month LIBOR plus 100 bp | | Aug 2016 | | Goldman Sachs International | | | 17,450 | | | | | (51 | ) |
| | | | | | | | | | | | | | | | $ | (10,040 | ) |
Centrally Cleared Credit Default Swaps
| | | | | | | | | | | Notional | | | Unrealized | |
| | | Buy/Sell | | Fixed Deal | | Maturity | | | | Amount | | | | Appreciation | |
| Reference Entity | | Protection | | Pay Rate | | Date | | Cleared Exchange | | (in thousands) | | | (Depreciation) | |
| iTRAXX Europe S25 | | Sell | | 1.000% | | June 2021 | | ICE | | | 43,630 EUR | | | | $ | (405 | ) |
| iTRAXX Europe Crossover S25 | | Sell | | 5.000% | | June 2021 | | ICE | | | 13,465 EUR | | | | | (516 | ) |
| | | | | | | | | | | | | | | | $ | (921 | ) |
| Variance Swaps | | | | | | | | | | | | | | | | | |
| | | | | | | | | | | Notional | | | Unrealized | |
| | | Pay/Receive | | Variance | | Maturity | | | | Amount | | | Appreciation | |
| Reference Entity | | Floating Rate | | Strike Price | | Date | | Counterparty | | (in thousands) | | | (Depreciation) | |
| Euro Stoxx 50 | | Pay | | 1,030.4100 | | Sep 2016 | | Credit Suisse International | | | 465 | | | | $ | 2,425 | |
| Euro Stoxx 50 | | Pay | | 910.2289 | | Dec 2017 | | Citibank N.A. | | | 757 | | | | | 1,915 | |
| | | | | | | | | | | | | | | | $ | 4,340 | |
| | | | | Total Net Unrealized Appreciation (Depreciation) on Swaps | | | | $ | (9,963 | ) |
See accompanying Notes to Financial Statements.
| June 30, 2016 | William Blair Funds | 111 |
Statements of Assets and Liabilities
As of June 30, 2016 (dollar amounts in thousands) (unaudited)
| | | | | | Large Cap | | | Mid Cap | | | Mid Cap | |
| | | Growth | | | Growth | | | Growth | | | Value | |
| | | Fund | | | Fund | | | Fund | | | Fund | |
| Assets | | | | | | | | | | | | | | | | |
| Investments in securities, at cost | | $ | 648,226 | | | $ | 71,405 | | | $ | 137,723 | | | $ | 3,030 | |
| Investments in securities, at value | | $ | 803,631 | | | $ | 85,432 | | | $ | 153,142 | | | $ | 3,549 | |
| Receivable for securities sold | | | — | | | | — | | | | 947 | | | | 107 | |
| Receivable for fund shares sold | | | 433 | | | | 223 | | | | 66 | | | | 5 | |
| Receivable from Adviser | | | — | | | | 21 | | | | 36 | | | | 20 | |
| Dividend and interest receivable | | | 381 | | | | 36 | | | | 40 | | | | 5 | |
| Total assets | | | 804,445 | | | | 85,712 | | | | 154,231 | | | | 3,686 | |
| Liabilities | | | | | | | | | | | | | | | | |
| Payable for investment securities purchased | | | 8,956 | | | | — | | | | 1,816 | | | | 116 | |
| Payable for fund shares redeemed | | | 307 | | | | 60 | | | | 21 | | | | — | |
| Management fee payable | | | 490 | | | | 49 | | | | 119 | | | | 3 | |
| Distribution fee payable | | | 26 | | | | 3 | | | | 5 | | | | — | |
| Other payables and accrued expenses | | | 219 | | | | 27 | | | | 84 | | | | 18 | |
| Total liabilities | | | 9,998 | | | | 139 | | | | 2,045 | | | | 137 | |
| Net assets | | $ | 794,447 | | | $ | 85,573 | | | $ | 152,186 | | | $ | 3,549 | |
| Capital | | | | | | | | | | | | | | | | |
| Composition of net assets | | | | | | | | | | | | | | | | |
| Par value of shares of beneficial interest | | $ | 61 | | | $ | 8 | | | $ | 13 | | | $ | — | |
| Capital paid in excess of par value | | | 628,136 | | | | 72,547 | | | | 135,523 | | | | 2,861 | |
| Accumulated net investment income (loss) | | | 23 | | | | 107 | | | | (307 | ) | | | 16 | |
| Accumulated net realized gain (loss) | | | 10,822 | | | | (1,116 | ) | | | 1,538 | | | | 153 | |
| Net unrealized appreciation (depreciation) of investments and foreign currencies | | | 155,405 | | | | 14,027 | | | | 15,419 | | | | 519 | |
| Net assets | | $ | 794,447 | | | $ | 85,573 | | | $ | 152,186 | | | $ | 3,549 | |
| | | | | | | | | | | | | | | | | |
| Class N shares | | | | | | | | | | | | | | | | |
| Net assets | | $ | 126,357 | | | $ | 12,305 | | | $ | 22,247 | | | $ | 1,251 | |
| Shares outstanding | | | 10,293,508 | | | | 1,217,219 | | | | 1,986,710 | | | | 118,711 | |
| Net asset value per share | | $ | 12.28 | | | $ | 10.11 | | | $ | 11.20 | | | $ | 10.53 | |
| Class I shares | | | | | | | | | | | | | | | | |
| Net assets | | $ | 668,090 | | | $ | 73,268 | | | $ | 129,939 | | | $ | 2,298 | |
| Shares outstanding | | | 50,396,158 | | | | 6,941,865 | | | | 11,116,423 | | | | 217,590 | |
| Net asset value per share | | $ | 13.26 | | | $ | 10.55 | | | $ | 11.69 | | | $ | 10.56 | |
See accompanying Notes to Financial Statements.
| 112 | Semiannual Report | June 30, 2016 |
Statements of Operations
For the Period Ended June 30, 2016 (all amounts in thousands) (unaudited)
| | | | | | Large Cap | | | Mid Cap | | | Mid Cap | |
| | | Growth | | | Growth | | | Growth | | | Value | |
| | | Fund | | | Fund | | | Fund | | | Fund | |
| Investment income | | | | | | | | | | | | | | | | |
| Dividends | | $ | 3,749 | | | $ | 432 | | | $ | 614 | | | $ | 26 | |
| Interest | | | 1 | | | | — | | | | — | | | | — | |
| Total income | | | 3,750 | | | | 432 | | | | 614 | | | | 26 | |
| Expenses | | | | | | | | | | | | | | | | |
| Investment advisory fees | | | 2,935 | | | | 272 | | | | 810 | | | | 13 | |
| Distribution fees | | | 165 | | | | 14 | | | | 27 | | | | 1 | |
| Custodian fees | | | 14 | | | | 12 | | | | 22 | | | | 12 | |
| Transfer agent fees | | | 51 | | | | 5 | | | | 11 | | | | 1 | |
| Sub-transfer agent fees | | | | | | | | | | | | | | | | |
| Class N | | | 125 | | | | 7 | | | | 14 | | | | — | |
| Class I | | | 299 | | | | 20 | | | | 91 | | | | — | |
| Professional fees | | | 30 | | | | 16 | | | | 20 | | | | 13 | |
| Registration fees | | | 26 | | | | 26 | | | | 29 | | | | 25 | |
| Shareholder reporting fees | | | 14 | | | | 2 | | | | 22 | | | | — | |
| Trustee fees | | | 45 | | | | 4 | | | | 11 | | | | — | |
| Other expenses | | | 23 | | | | 4 | | | | 6 | | | | 3 | |
| Total expenses before expense limitation | | | 3,727 | | | | 382 | | | | 1,063 | | | | 68 | |
| Expenses waived or reimbursed by the Adviser | | | — | | | | (57 | ) | | | (142 | ) | | | (53 | ) |
| Net expenses | | | 3,727 | | | | 325 | | | | 921 | | | | 15 | |
| Net investment income (loss) | | | 23 | | | | 107 | | | | (307 | ) | | | 11 | |
| Realized and unrealized gain (loss) | | | | | | | | | | | | | | | | |
| Net realized gain (loss) on transactions from: | | | | | | | | | | | | | | | | |
| Investments in securities | | | (1,018 | ) | | | (694 | ) | | | (4,131 | ) | | | 72 | |
| Total net realized gain (loss) | | | (1,018 | ) | | | (694 | ) | | | (4,131 | ) | | | 72 | |
| Change in net unrealized appreciation (depreciation) of: | | | | | | | | | | | | | | | | |
| Investments in securities | | | (15,421 | ) | | | 1,208 | | | | 2,276 | | | | 111 | |
| Change in net unrealized appreciation (depreciation) | | | (15,421 | ) | | | 1,208 | | | | 2,276 | | | | 111 | |
| Net increase (decrease) in net assets resulting from operations | | $ | (16,416 | ) | | $ | 621 | | | $ | (2,162 | ) | | $ | 194 | |
See accompanying Notes to Financial Statements.
| June 30, 2016 | William Blair Funds | 113 |
Statements of Changes in Net Assets
For the Period Ended June 30, 2016 (unaudited) and the Year Ended December 31, 2015 (all amounts in thousands)
| | | | | | | | | Large Cap | | | Mid Cap | | | Mid Cap | |
| | | Growth Fund | | | Growth Fund | | | Growth Fund | | | Value Fund | |
| | | 2016 | | | 2015 | | | 2016 | | | 2015 | | | 2016 | | | 2015 | | | 2016 | | | 2015 | |
| Operations | | | | | | | | | | | | | | | | | | | | | | | | | | | | | | | | |
| Net investment income (loss) | | $ | 23 | | | $ | (250 | ) | | $ | 107 | | | $ | (4 | ) | | $ | (307 | ) | | $ | (1,275 | ) | | $ | 11 | | | $ | 22 | |
| Net realized gain (loss) on investments, and other assets and liabilities | | | (1,018 | ) | | | 57,036 | | | | (694 | ) | | | 4,789 | | | | (4,131 | ) | | | 36,493 | | | | 72 | | | | 661 | |
| Change in net unrealized appreciation (depreciation) on investments, and other assets and liabilities | | | (15,421 | ) | | | (9,544 | ) | | | 1,208 | | | | (463 | ) | | | 2,276 | | | | (30,371 | ) | | | 111 | | | | (671 | ) |
| Net increase (decrease) in net assets resulting from operations | | | (16,416 | ) | | | 47,242 | | | | 621 | | | | 4,322 | | | | (2,162 | ) | | | 4,847 | | | | 194 | | | | 12 | |
| Distributions to shareholders from | | | | | | | | | | | | | | | | | | | | | | | | | | | | | | | | |
| Net investment income | | | | | | | | | | | | | | | | | | | | | | | | | | | | | | | | |
| Class N | | | — | | | | — | | | | — | | | | — | | | | — | | | | — | | | | — | | | | (2 | ) |
| Class I | | | — | | | | — | | | | — | | | | — | | | | — | | | | — | | | | — | | | | (10 | ) |
| Net realized gain | | | | | | | | | | | | | | | | | | | | | | | | | | | | | | | | |
| Class N | | | — | | | | (18,526 | ) | | | — | | | | (971 | ) | | | — | | | | (5,530 | ) | | | — | | | | (149 | ) |
| Class I | | | — | | | | (80,435 | ) | | | — | | | | (5,265 | ) | | | — | | | | (35,853 | ) | | | — | | | | (438 | ) |
| Total distributions | | | — | | | | (98,961 | ) | | | — | | | | (6,236 | ) | | | — | | | | (41,383 | ) | | | — | | | | (599 | ) |
| Capital stock transactions | | | | | | | | | | | | | | | | | | | | | | | | | | | | | | | | |
| Net proceeds from sale of shares | | | 43,345 | | | | 122,787 | | | | 23,355 | | | | 17,152 | | | | 8,268 | | | | 33,162 | | | | 789 | | | | 661 | |
| Shares issued in reinvestment of income dividends and capital gain distributions | | | — | | | | 95,837 | | | | — | | | | 5,376 | | | | — | | | | 39,576 | | | | — | | | | 573 | |
| Less cost of shares redeemed | | | (78,980 | ) | | | (281,210 | ) | | | (7,884 | ) | | | (10,742 | ) | | | (53,642 | ) | | | (176,266 | ) | | | (102 | ) | | | (1,747 | ) |
| Net increase (decrease) in net assets resulting from capital share transactions | | | (35,635 | ) | | | (62,586 | ) | | | 15,471 | | | | 11,786 | | | | (45,374 | ) | | | (103,528 | ) | | | 687 | | | | (513 | ) |
| Increase (decrease) in net assets | | | (52,051 | ) | | | (114,305 | ) | | | 16,092 | | | | 9,872 | | | | (47,536 | ) | | | (140,064 | ) | | | 881 | | | | (1,100 | ) |
| Net assets | | | | | | | | | | | | | | | | | | | | | | | | | | | | | | | | |
| Beginning of period | | | 846,498 | | | | 960,803 | | | | 69,481 | | | | 59,609 | | | | 199,722 | | | | 339,786 | | | | 2,668 | | | | 3,768 | |
| End of period | | $ | 794,447 | | | $ | 846,498 | | | $ | 85,573 | | | $ | 69,481 | | | $ | 152,186 | | | $ | 199,722 | | | $ | 3,549 | | | $ | 2,668 | |
| Accumulated net investment income (loss) at the end of the period | | $ | 23 | | | $ | — | | | $ | 107 | | | $ | — | | | $ | (307 | ) | | $ | — | | | $ | 16 | | | $ | 5 | |
See accompanying Notes to Financial Statements.
| 114 | Semiannual Report | June 30, 2016 |
Statements of Assets and Liabilities
As of June 30, 2016 (dollar amounts in thousands) (unaudited)
| | | Small-Mid | | | Small-Mid | | | Small Cap | | | Small Cap | |
| | | Cap Growth | | | Cap Value | | | Growth | | | Value | |
| | | | Fund | | | | Fund | | | Fund | | | Fund | |
| Assets | | | | | | | | | | | | | | | | | | |
| Investments in securities, at cost | | | $ | 1,099,471 | | | | $ | 3,930 | | | $ | 297,936 | | | $ | 494,679 | |
| Investments in affiliated companies, at cost | | | | — | | | | | — | | | | 5,482 | | | | — | |
| Investments in securities, at value | | | $ | 1,255,043 | | | | $ | 4,533 | | | $ | 351,924 | | | $ | 592,298 | |
| Investments in affiliated companies, at value | | | | — | | | | | — | | | | 6,678 | | | | — | |
| Receivable for securities sold | | | | 7,394 | | | | | 32 | | | | 7,533 | | | | 8,605 | |
| Receivable for fund shares sold | | | | 2,658 | | | | | 2 | | | | 215 | | | | 616 | |
| Receivable from Adviser | | | | 101 | | | | | 8 | | | | 20 | | | | 33 | |
| Dividend and interest receivable | | | | 365 | | | | | 6 | | | | 70 | | | | 742 | |
| Total assets | | | | 1,265,561 | | | | | 4,581 | | | | 366,440 | | | | 602,294 | |
| Liabilities | | | | | | | | | | | | | | | | | | |
| Payable for investment securities purchased | | | | 2,970 | | | | | 69 | | | | 462 | | | | 4,137 | |
| Payable for fund shares redeemed | | | | 304 | | | | | — | | | | 230 | | | | 337 | |
| Management fee payable | | | | 1,034 | | | | | 4 | | | | 329 | | | | 534 | |
| Distribution fee payable | | | | 42 | | | | | — | | | | 22 | | | | 6 | |
| Other payables and accrued expenses | | | | 342 | | | | | 36 | | | | 210 | | | | 72 | |
| Total liabilities | | | | 4,692 | | | | | 109 | | | | 1,253 | | | | 5,086 | |
| Net assets | | | $ | 1,260,869 | | | | $ | 4,472 | | | $ | 365,187 | | | $ | 597,208 | |
| Capital | | | | | | | | | | | | | | | | | | |
| Composition of net assets | | | | | | | | | | | | | | | | | | |
| Par value of shares of beneficial interest | | | $ | 65 | | | | $ | — | | | $ | 15 | | | $ | 33 | |
| Capital paid in excess of par value | | | | 1,090,807 | | | | | 3,855 | | | | 311,187 | | | | 492,642 | |
| Accumulated net investment income (loss) | | | | (2,233 | ) | | | | 16 | | | | (1,079 | ) | | | 1,789 | |
| Accumulated net realized gain (loss) | | | | 16,658 | | | | | (2 | ) | | | (120 | ) | | | 5,125 | |
| Net unrealized appreciation (depreciation) of investments and foreign currencies | | | | 155,572 | | | | | 603 | | | | 55,184 | | | | 97,619 | |
| Net assets | | | $ | 1,260,869 | | | | $ | 4,472 | | | $ | 365,187 | | | $ | 597,208 | |
| |
| Class N shares | | | | | | | | | | | | | | | | | | |
| Net assets | | | $ | 206,875 | | | | $ | 915 | | | $ | 105,104 | | | $ | 31,153 | |
| Shares outstanding | | | | 11,055,944 | | | | | 68,718 | | | | 4,501,421 | | | | 1,748,554 | |
| Net asset value per share | | | $ | 18.71 | | | | $ | 13.31 | | | $ | 23.35 | | | $ | 17.82 | |
| Class I shares | | | | | | | | | | | | | | | | | | |
| Net assets | | | $ | 1,053,994 | | | | $ | 3,557 | | | $ | 260,083 | | | $ | 566,055 | |
| Shares outstanding | | | | 54,151,140 | | | | | 266,830 | | | | 10,342,334 | | | | 30,998,243 | |
| Net asset value per share | | | $ | 19.46 | | | | $ | 13.33 | | | $ | 25.15 | | | $ | 18.27 | |
See accompanying Notes to Financial Statements.
| June 30, 2016 | William Blair Funds | 115 |
Statements of Operations
For the Period Ended June 30, 2016 (all amounts in thousands) (unaudited)
| | | Small-Mid | | | Small-Mid | | | Small Cap | | | Small Cap | |
| | | Cap Growth | | | Cap Value | | | Growth | | | Value | |
| | | Fund | | | Fund | | | Fund | | | Fund | |
| Investment income | | | | | | | | | | | | | | | | | | | | |
| Dividends | | | $ | 4,374 | | | | $ | 34 | | | | $ | 1,224 | | | | $ | 5,155 | |
| Less foreign tax withheld | | | | (19 | ) | | | | — | | | | | (4 | ) | | | | — | |
| Interest. | | | | 4 | | | | | — | | | | | 1 | | | | | 2 | |
| Total income | | | | 4,359 | | | | | 34 | | | | | 1,221 | | | | | 5,157 | |
| Expenses | | | | | | | | | | | | | | | | | | | | |
| Investment advisory fees | | | | 5,806 | | | | | 20 | | | | | 1,914 | | | | | 3,137 | |
| Distribution fees | | | | 227 | | | | | 1 | | | | | 128 | | | | | 39 | |
| Custodian fees | | | | 19 | | | | | 16 | | | | | 15 | | | | | 15 | |
| Transfer agent fees | | | | 42 | | | | | — | | | | | 30 | | | | | 16 | |
| Sub-transfer agent fees | | | | | | | | | | | | | | | | | | | | |
| Class N | | | | 103 | | | | | — | | | | | 65 | | | | | 21 | |
| Class I | | | | 546 | | | | | 1 | | | | | 105 | | | | | 350 | |
| Professional fees | | | | 50 | | | | | 16 | | | | | 25 | | | | | 26 | |
| Registration fees | | | | 62 | | | | | 26 | | | | | 34 | | | | | 21 | |
| Shareholder reporting fees | | | | 91 | | | | | — | | | | | 73 | | | | | 24 | |
| Trustee fees | | | | 62 | | | | | — | | | | | 20 | | | | | 32 | |
| Other expenses | | | | 32 | | | | | 3 | | | | | 10 | | | | | 26 | |
| Total expenses before expense limitation | | | | 7,040 | | | | | 83 | | | | | 2,419 | | | | | 3,707 | |
| Expenses waived or reimbursed by the Adviser | | | | (448 | ) | | | | (61 | ) | | | | (119 | ) | | | | (103 | ) |
| Net expenses | | | | 6,592 | | | | | 22 | | | | | 2,300 | | | | | 3,604 | |
| Net investment income (loss) | | | | (2,233 | ) | | | | 12 | | | | | (1,079 | ) | | | | 1,553 | |
| Realized and unrealized gain (loss) | | | | | | | | | | | | | | | | | | | | |
| Net realized gain (loss) on transactions from: | | | | | | | | | | | | | | | | | | | | |
| Investments in securities | | | | (2,938 | ) | | | | (15 | ) | | | | 2,169 | | | | | 1,176 | |
| Redemptions in-kind | | | | 13,849 | | | | | — | | | | | — | | | | | — | |
| Total net realized gain (loss) | | | | 10,911 | | | | | (15 | ) | | | | 2,169 | | | | | 1,176 | |
| Change in net unrealized appreciation (depreciation) of: | | | | | | | | | | | | | | | | | | | | |
| Investments in securities | | | | 7,905 | | | | | 261 | | | | | 12,273 | (1) | | | | 33,203 | |
| Change in net unrealized appreciation (depreciation) | | | | 7,905 | | | | | 261 | | | | | 12,273 | | | | | 33,203 | |
| Net increase (decrease) in net assets resulting from operations | | | $ | 16,583 | | | | $ | 258 | | | | $ | 13,363 | | | | $ | 35,932 | |
| (1) | Includes $1,079 from companies deemed affiliated during the period. |
See accompanying Notes to Financial Statements.
| 116 | Semiannual Report | June 30, 2016 |
Statements of Changes in Net Assets
For the Period Ended June 30, 2016 (unaudited) and the Year Ended December 31, 2015 (all amounts in thousands)
| | | Small-Mid | | | Small-Mid | | | Small Cap | | | Small Cap | |
| | | Cap Growth Fund | | | Cap Value Fund | | | Growth Fund | | | Value Fund | |
| | | 2016 | | | 2015 | | | 2016 | | | 2015 | | | 2016 | | | 2015 | | | 2016 | | | 2015 | |
| Operations | | | | | | | | | | | | | | | | | | | | | | | | | | | | | | | | |
| Net investment income (loss) | | $ | (2,233 | ) | | $ | (3,239 | ) | | $ | 12 | | | $ | 21 | | | $ | (1,079 | ) | | $ | (3,146 | ) | | $ | 1,553 | | | $ | 2,407 | |
| Net realized gain (loss) on investments, and other assets and liabilities | | | 10,911 | | | | 61,943 | | | | (15 | ) | | | 129 | | | | 2,169 | | | | 27,594 | | | | 1,176 | | | | 6,099 | |
| Change in net unrealized appreciation (depreciation) on investments, and other assets and liabilities | | | 7,905 | | | | (21,167 | ) | | | 261 | | | | (280 | ) | | | 12,273 | | | | (39,914 | ) | | | 33,203 | | | | (41,101 | ) |
| Net increase (decrease) in net assets resulting from operations | | | 16,583 | | | | 37,537 | | | | 258 | | | | (130 | ) | | | 13,363 | | | | (15,466 | ) | | | 35,932 | | | | (32,595 | ) |
| Distributions to shareholders from | | | | | | | | | | | | | | | | | | | | | | | | | | | | | | | | |
| Net investment income | | | | | | | | | | | | | | | | | | | | | | | | | | | | | | | | |
| Class N | | | — | | | | — | | | | — | | | | (1 | ) | | | — | | | | — | | | | — | | | | — | |
| Class I | | | — | | | | — | | | | — | | | | (10 | ) | | | — | | | | — | | | | — | | | | (1,363 | ) |
| Net realized gain | | | | | | | | | | | | | | | | | | | | | | | | | | | | | | | | |
| Class N | | | — | | | | (8,564 | ) | | | — | | | | (44 | ) | | | — | | | | (9,437 | ) | | | — | | | | (107 | ) |
| Class I | | | — | | | | (50,588 | ) | | | — | | | | (162 | ) | | | — | | | | (20,150 | ) | | | — | | | | (1,836 | ) |
| Total distributions | | | — | | | | (59,152 | ) | | | — | | | | (217 | ) | | | — | | | | (29,587 | ) | | | — | | | | (3,306 | ) |
| Capital stock transactions | | | | | | | | | | | | | | | | | | | | | | | | | | | | | | | | |
| Net proceeds from sale of shares | | | 263,809 | | | | 428,159 | | | | 289 | | | | 435 | | | | 25,807 | | | | 94,104 | | | | 51,214 | | | | 174,197 | |
| Shares issued in reinvestment of income dividends and capital gain distributions | | | — | | | | 57,336 | | | | — | | | | 136 | | | | — | | | | 28,974 | | | | — | | | | 3,045 | |
| Less cost of shares redeemed | | | (208,662 | ) | | | (151,577 | ) | | | (150 | ) | | | (502 | ) | | | (47,196 | ) | | | (217,254 | ) | | | (102,299 | ) | | | (114,166 | ) |
| Net increase (decrease) in net assets resulting from capital share transactions | | | 55,147 | | | | 333,918 | | | | 139 | | | | 69 | | | | (21,389 | ) | | | (94,176 | ) | | | (51,085 | ) | | | 63,076 | |
| Increase (decrease) in net assets | | | 71,730 | | | | 312,303 | | | | 397 | | | | (278 | ) | | | (8,026 | ) | | | (139,229 | ) | | | (15,153 | ) | | | 27,175 | |
| Net assets | | | | | | | | | | | | | | | | | | | | | | | | | | | | | | | | |
| Beginning of period | | | 1,189,139 | | | | 876,836 | | | | 4,075 | | | | 4,353 | | | | 373,213 | | | | 512,442 | | | | 612,361 | | | | 585,186 | |
| End of period | | $ | 1,260,869 | | | $ | 1,189,139 | | | $ | 4,472 | | | $ | 4,075 | | | $ | 365,187 | | | $ | 373,213 | | | $ | 597,208 | | | $ | 612,361 | |
| Accumulated net investment income (loss) at the end of the period | | $ | (2,233 | ) | | $ | — | | | $ | 16 | | | $ | 4 | | | $ | (1,079 | ) | | $ | — | | | $ | 1,789 | | | $ | 236 | |
See accompanying Notes to Financial Statements.
| June 30, 2016 | William Blair Funds | 117 |
Statements of Assets and Liabilities
As of June 30, 2016 (dollar amounts in thousands) (unaudited)
| | | | | | | | | | | | | | | Institutional | |
| | | Global | | | International | | | International | | | International | |
| | | Leaders | | | Leaders | | | Equity | | | Equity | |
| | | Fund | | | Fund | | | Fund | | | Fund | |
| Assets | | | | | | | | | | | | | | | | | | | | |
| Investments in securities, at cost | | | $ | 161,853 | | | | $ | 185,122 | | | | $ | 65,344 | | | | $ | 14,848 | |
| Investments in securities, at value | | | $ | 179,570 | | | | $ | 196,872 | | | | $ | 70,725 | | | | $ | 15,781 | |
| Foreign currency, at value (cost $29; $37; $26; $7) | | | | 29 | | | | | 37 | | | | | 26 | | | | | 7 | |
| Receivable for securities sold | | | | 2,630 | | | | | 4,957 | | | | | 455 | | | | | 101 | |
| Receivable for fund shares sold | | | | 60 | | | | | 3 | | | | | 40 | | | | | — | |
| Receivable from Adviser | | | | 30 | | | | | 42 | | | | | 30 | | | | | 9 | |
| Dividend and interest receivable | | | | 530 | | | | | 668 | | | | | 368 | | | | | 104 | |
| Total assets | | | | 182,849 | | | | | 202,579 | | | | | 71,644 | | | | | 16,002 | |
| Liabilities | | | | | | | | | | | | | | | | | | | | |
| Payable for investment securities purchased | | | | 3,767 | | | | | 1,347 | | | | | 584 | | | | | 132 | |
| Payable to custodian | | | | 4 | | | | | 7 | | | | | — | | | | | — | |
| Management fee payable | | | | 147 | | | | | 149 | | | | | 58 | | | | | 12 | |
| Shareholder administration fee payable | | | | 6 | | | | | 2 | | | | | — | | | | | — | |
| Distribution fee payable | | | | 1 | | | | | — | | | | | 1 | | | | | — | |
| Other payables and accrued expenses | | | | 83 | | | | | 129 | | | | | 57 | | | | | 40 | |
| Total liabilities | | | | 4,008 | | | | | 1,634 | | | | | 700 | | | | | 184 | |
| Net assets | | | $ | 178,841 | | | | $ | 200,945 | | | | $ | 70,944 | | | | $ | 15,818 | |
| Capital | | | | | | | | | | | | | | | | | | | | |
| Composition of net assets | | | | | | | | | | | | | | | | | | | | |
| Par value of shares of beneficial interest | | | $ | 16 | | | | $ | 16 | | | | $ | 5 | | | | $ | 1 | |
| Capital paid in excess of par value | | | | 164,206 | | | | | 190,585 | | | | | 141,131 | | | | | 105,426 | |
| Accumulated net investment income (loss) | | | | 912 | | | | | 1,585 | | | | | 1,381 | | | | | 153 | |
| Accumulated net realized gain (loss) | | | | (3,997 | ) | | | | (2,930 | ) | | | | (76,946 | ) | | | | (90,692 | ) |
| Net unrealized appreciation (depreciation) of investments and foreign currencies | | | | 17,704 | | | | | 11,689 | | | | | 5,373 | | | | | 930 | |
| Net assets | | | $ | 178,841 | | | | $ | 200,945 | | | | $ | 70,944 | | | | $ | 15,818 | |
| |
| Class N shares | | | | | | | | | | | | | | | | | | | | |
| Net assets | | | $ | 6,054 | | | | $ | 552 | | | | $ | 2,862 | | | | | — | |
| Shares outstanding | | | | 531,554 | | | | | 43,484 | | | | | 210,574 | | | | | — | |
| Net asset value per share | | | $ | 11.39 | | | | $ | 12.71 | | | | $ | 13.59 | | | | | — | |
| Class I shares | | | | | | | | | | | | | | | | | | | | |
| Net assets | | | $ | 46,181 | | | | $ | 20,745 | | | | $ | 68,082 | | | | | — | |
| Shares outstanding | | | | 4,044,962 | | | | | 1,629,645 | | | | | 4,957,315 | | | | | — | |
| Net asset value per share | | | $ | 11.42 | | | | $ | 12.74 | | | | $ | 13.73 | | | | | — | |
| Institutional Class shares | | | | | | | | | | | | | | | | | | | | |
| Net assets | | | $ | 126,606 | | | | $ | 179,648 | | | | | — | | | | $ | 15,818 | |
| Shares outstanding | | | | 11,085,188 | | | | | 14,113,861 | | | | | — | | | | | 1,328,089 | |
| Net asset value per share | | | $ | 11.42 | | | | $ | 12.73 | | | | | — | | | | $ | 11.91 | |
See accompanying Notes to Financial Statements.
| 118 | Semiannual Report | June 30, 2016 |
Statements of Operations
For the Period Ended June 30, 2016 (all amounts in thousands) (unaudited)
| | | | | | | | | | | | | | | Institutional | |
| | | Global | | | International | | | International | | | International | |
| | | Leaders | | | Leaders | | | Equity | | | Equity | |
| | | Fund | | | Fund | | | Fund | | | Fund | |
| Investment income | | | | | | | | | | | | | | | | | | | | |
| Dividends | | | $ | 1,999 | | | | $ | 2,441 | | | | $ | 1,233 | | | | $ | 317 | |
| Less foreign tax withheld | | | | (154 | ) | | | | (239 | ) | | | | (107 | ) | | | | (26 | ) |
| Interest | | | | 1 | | | | | 1 | | | | | — | | | | | — | |
| Total income | | | | 1,846 | | | | | 2,203 | | | | | 1,126 | | | | | 291 | |
| Expenses | | | | | | | | | | | | | | | | | | | | |
| Investment advisory fees | | | | 872 | | | | | 703 | | | | | 313 | | | | | 68 | |
| Distribution fees | | | | 7 | | | | | 1 | | | | | 3 | | | | | — | |
| Shareholder administration fees | | | | 37 | | | | | 12 | | | | | — | | | | | — | |
| Custodian fees | | | | 23 | | | | | 25 | | | | | 21 | | | | | 16 | |
| Transfer agent fees | | | | 5 | | | | | 2 | | | | | 2 | | | | | — | |
| Sub-transfer agent fees | | | | | | | | | | | | | | | | | | | | |
| Class N | | | | 3 | | | | | — | | | | | 1 | | | | | — | |
| Class I | | | | 11 | | | | | 6 | | | | | 26 | | | | | — | |
| Professional fees | | | | 26 | | | | | 33 | | | | | 32 | | | | | 30 | |
| Registration fees | | | | 22 | | | | | 39 | | | | | 26 | | | | | 13 | |
| Shareholder reporting fees | | | | 2 | | | | | — | | | | | 1 | | | | | — | |
| Trustee fees | | | | 10 | | | | | 6 | | | | | 3 | | | | | 1 | |
| Other expenses | | | | 11 | | | | | 9 | | | | | 4 | | | | | 2 | |
| Total expenses before expense limitation | | | | 1,029 | | | | | 836 | | | | | 432 | | | | | 130 | |
| Expenses waived or reimbursed by the Adviser | | | | (135 | ) | | | | (126 | ) | | | | (101 | ) | | | | (54 | ) |
| Net expenses | | | | 894 | | | | | 710 | | | | | 331 | | | | | 76 | |
| Net investment income (loss) | | | | 952 | | | | | 1,493 | | | | | 795 | | | | | 215 | |
| Realized and unrealized gain (loss) | | | | | | | | | | | | | | | | | | | | |
| Net realized gain (loss) on transactions from: | | | | | | | | | | | | | | | | | | | | |
| Investments in securities, net of foreign capital gains taxes, if applicable | | | | (4,151 | ) | | | | (2,739 | ) | | | | (1,989 | ) | | | | (614 | ) |
| Foreign currency transactions | | | | (20 | ) | | | | (24 | ) | | | | (8 | ) | | | | — | |
| Total net realized gain (loss) | | | | (4,171 | ) | | | | (2,763 | ) | | | | (1,997 | ) | | | | (614 | ) |
| Change in net unrealized appreciation (depreciation) of: | | | | | | | | | | | | | | | | | | | | |
| Investments in securities | | | | 42 | | | | | 1,274 | | | | | 197 | | | | | 118 | |
| Foreign currency translations | | | | 13 | | | | | (48 | ) | | | | (1 | ) | | | | — | |
| Change in net unrealized appreciation (depreciation) | | | | 55 | | | | | 1,226 | | | | | 196 | | | | | 118 | |
| Net increase (decrease) in net assets resulting from operations | | | $ | (3,164 | ) | | | $ | (44 | ) | | | $ | (1,006 | ) | | | $ | (281 | ) |
See accompanying Notes to Financial Statements.
| June 30, 2016 | William Blair Funds | 119 |
Statements of Changes in Net Assets
For the Period Ended June 30, 2016 (unaudited) and the Year Ended December 31, 2015 (all amounts in thousands)
| | | | | | | | | | | | | | | | | | | | | Institutional | |
| | | | | | Global | | | International | | | International | | | International | |
| | | Leaders Fund | | | Leaders Fund | | | Equity Fund | | | Equity Fund | |
| | | 2016 | | | 2015 | | | 2016 | | | 2015 | | | 2016 | | | 2015 | | | 2016 | | | 2015 | |
| Operations | | | | | | | | | | | | | | | | | | | | | | | | | | | | | | | | |
| Net investment income (loss) | | $ | 952 | | | $ | 848 | | | $ | 1,493 | | | $ | 857 | | | $ | 795 | | | $ | 875 | | | $ | 215 | | | $ | 194 | |
| Net realized gain (loss) on investments, and other assets and liabilities | | | (4,171 | ) | | | 7,126 | | | | (2,763 | ) | | | (149 | ) | | | (1,997 | ) | | | 1,894 | | | | (614 | ) | | | 417 | |
| Change in net unrealized appreciation (depreciation) on investments, and other assets and liabilities | | | 55 | | | | (3,415 | ) | | | 1,226 | | | | 4,684 | | | | 196 | | | | (1,349 | ) | | | 118 | | | | (426 | ) |
| Net increase (decrease) in net assets resulting from operations | | | (3,164 | ) | | | 4,559 | | | | (44 | ) | | | 5,392 | | | | (1,006 | ) | | | 1,420 | | | | (281 | ) | | | 185 | |
| Distributions to shareholders from | | | | | | | | | | | | | | | | | | | | | | | | | | | | | | | | |
| Net investment income | | | | | | | | | | | | | | | | | | | | | | | | | | | | | | | | |
| Class N | | | — | | | | (3 | ) | | | — | | | | (1 | ) | | | — | | | | (26 | ) | | | — | | | | — | |
| Class I | | | — | | | | (152 | ) | | | — | | | | (22 | ) | | | — | | | | (750 | ) | | | — | | | | — | |
| Institutional Class | | | — | | | | (552 | ) | | | — | | | | (323 | ) | | | — | | | | — | | | | — | | | | (156 | ) |
| Net realized gain | | | | | | | | | | | | | | | | | | | | | | | | | | | | | | | | |
| Class N | | | — | | | | (252 | ) | | | — | | | | (2 | ) | | | — | | | | — | | | | — | | | | — | |
| Class I | | | — | | | | (2,063 | ) | | | — | | | | (73 | ) | | | — | | | | — | | | | — | | | | — | |
| Institutional Class | | | — | | | | (6,144 | ) | | | — | | | | (578 | ) | | | — | | | | — | | | | — | | | | — | |
| Total distributions | | | — | | | | (9,166 | ) | | | — | | | | (999 | ) | | | — | | | | (776 | ) | | | — | | | | (156 | ) |
| Capital stock transactions | | | | | | | | | | | | | | | | | | | | | | | | | | | | | | | | |
| Net proceeds from sale of shares | | | 30,667 | | | | 41,785 | | | | 90,356 | | | | 24,052 | | | | 9,052 | | | | 5,655 | | | | 69 | | | | 2,425 | |
| Shares issued in reinvestment of income dividends and capital gain distributions | | | — | | | | 8,986 | | | | — | | | | 773 | | | | — | | | | 706 | | | | — | | | | 156 | |
| Less cost of shares redeemed | | | (37,630 | ) | | | (20,858 | ) | | | (5,445 | ) | | | (1,102 | ) | | | (1,008 | ) | | $ | (11,608 | ) | | | — | | | | (1,154 | ) |
| Net increase (decrease) in net assets resulting from capital share transactions | | | (6,963 | ) | | | 29,913 | | | | 84,911 | | | | 23,723 | | | | 8,044 | | | | (5,247 | ) | | | 69 | | | | 1,427 | |
| Increase (decrease) in net assets | | | (10,127 | ) | | | 25,306 | | | | 84,867 | | | | 28,116 | | | | 7,038 | | | | (4,603 | ) | | | (212 | ) | | | 1,456 | |
| Net assets | | | | | | | | | | | | | | | | | | | | | | | | | | | | | | | | |
| Beginning of period | | | 188,968 | | | | 163,662 | | | | 116,078 | | | | 87,962 | | | | 63,906 | | | | 68,509 | | | | 16,030 | | | | 14,574 | |
| End of period | | $ | 178,841 | | | $ | 188,968 | | | $ | 200,945 | | | $ | 116,078 | | | $ | 70,944 | | | $ | 63,906 | | | $ | 15,818 | | | $ | 16,030 | |
| Accumulated net investment income (loss) at the end of the period | | $ | 912 | | | $ | (40 | ) | | $ | 1,585 | | | $ | 92 | | | $ | 1,381 | | | $ | 586 | | | $ | 153 | | | $ | (62 | ) |
See accompanying Notes to Financial Statements.
| 120 | Semiannual Report | June 30, 2016 |
Statements of Assets and Liabilities
As of June 30, 2016 (dollar amounts in thousands) (unaudited)
| | | | | | | | Institutional | | | International | |
| | | International | | | International | | | Small Cap | |
| | | Growth | | | Growth | | | Growth | |
| | | Fund | | | Fund | | | Fund | |
| Assets | | | | | | | | | | | | | | | |
| Investments in securities, at cost | | | $ | 3,003,977 | | | | $ | 1,897,960 | | | | $ | 496,166 | |
| Investment in affiliated fund, at cost | | | | 102 | | | | | 63 | | | | | — | |
| Investments in securities, at value | | | $ | 3,234,295 | | | | $ | 2,026,812 | | | | $ | 545,090 | |
| Investment in affiliated fund, at value | | | | 174 | | | | | 108 | | | | | — | |
| Foreign currency, at value (cost $2,031, $1,458, $157) | | | | 2,030 | | | | | 1,459 | | | | | 154 | |
| Receivable for securities sold | | | | 20,648 | | | | | 12,870 | | | | | 8,409 | |
| Receivable for fund shares sold | | | | 2,330 | | | | | 7,845 | | | | | 214 | |
| Receivable from Adviser | | | | — | | | | | — | | | | | 43 | |
| Dividend and interest receivable | | | | 13,925 | | | | | 7,191 | | | | | 1,057 | |
| Total assets | | | | 3,273,402 | | | | | 2,056,285 | | | | | 554,967 | |
| Liabilities | | | | | | | | | | | | | | | |
| Payable for investment securities purchased | | | | 25,107 | | | | | 15,933 | | | | | 11,113 | |
| Payable for fund shares redeemed | | | | 7,034 | | | | | 1,393 | | | | | 197 | |
| Payable to custodian | | | | 56 | | | | | 35 | | | | | — | |
| Management fee payable | | | | 2,686 | | | | | 1,563 | | | | | 463 | |
| Shareholder administration fee payable | | | | — | | | | | — | | | | | 43 | |
| Distribution fee payable | | | | 163 | | | | | — | | | | | 2 | |
| Foreign tax liability | | | | — | | | | | — | | | | | 165 | |
| Other payables and accrued expenses | | | | 2,016 | | | | | 994 | | | | | 187 | |
| Total liabilities | | | | 37,062 | | | | | 19,918 | | | | | 12,170 | |
| Net assets | | | $ | 3,236,340 | | | | $ | 2,036,367 | | | | $ | 542,797 | |
| Capital | | | | | | | | | | | | | | | |
| Composition of net assets | | | | | | | | | | | | | | | |
| Par value of shares of beneficial interest | | | $ | 132 | | | | $ | 140 | | | | $ | 41 | |
| Capital paid in excess of par value | | | | 3,450,305 | | | | | 1,972,333 | | | | | 510,769 | |
| Accumulated net investment income (loss) | | | | 51,979 | | | | | 28,218 | | | | | (2,107 | ) |
| Accumulated net realized gain (loss) | | | | (495,584 | ) | | | | (92,536 | ) | | | | (14,618 | ) |
| Net unrealized appreciation (depreciation) of investments and foreign currencies | | | | 229,508 | | | | | 128,212 | | | | | 48,712 | |
| Net assets | | | $ | 3,236,340 | | | | $ | 2,036,367 | | | | $ | 542,797 | |
| | | | | | | | | | | | | | | | |
| Class N shares | | | | | | | | | | | | | | | |
| Net assets | | | $ | 789,678 | | | | | — | | | | $ | 10,741 | |
| Shares outstanding | | | | 32,927,229 | | | | | — | | | | | 830,745 | |
| Net asset value per share | | | $ | 23.99 | | | | | — | | | | $ | 12.93 | |
| Class I shares | | | | | | | | | | | | | | | |
| Net assets | | | $ | 2,446,662 | | | | | — | | | | $ | 327,339 | |
| Shares outstanding | | | | 99,560,524 | | | | | — | | | | | 25,007,399 | |
| Net asset value per share | | | $ | 24.58 | | | | | — | | | | $ | 13.09 | |
| Institutional Class shares | | | | | | | | | | | | | | | |
| Net assets | | | | — | | | | $ | 2,036,367 | | | | $ | 204,717 | |
| Shares outstanding | | | | — | | | | | 140,057,336 | | | | | 15,553,283 | |
| Net asset value per share | | | | — | | | | $ | 14.54 | | | | $ | 13.16 | |
See accompanying Notes to Financial Statements.
| June 30, 2016 | William Blair Funds | 121 |
Statements of Operations
For the Period Ended June 30, 2016 (all amounts in thousands) (unaudited)
| | | | | | | Institutional | | | International | |
| | | International | | | International | | | Small Cap | |
| | | Growth | | | Growth | | | Growth | |
| | | Fund | | | Fund | | | Fund | |
| Investment income | | | | | | | | | | | | | | | |
| Dividends | | | $ | 56,404 | | | | $ | 34,707 | | | | $ | 9,161 | |
| Less foreign tax withheld | | | | (5,590 | ) | | | | (3,432 | ) | | | | (834 | ) |
| Interest | | | | 9 | | | | | 6 | | | | | 2 | |
| Total income | | | | 50,823 | | | | | 31,281 | | | | | 8,329 | |
| Expenses | | | | | | | | | | | | | | | |
| Investment advisory fees | | | | 16,529 | | | | | 9,643 | | | | | 2,781 | |
| Distribution fees | | | | 1,036 | | | | | — | | | | | 13 | |
| Shareholder administration fees | | | | — | | | | | — | | | | | 260 | |
| Custodian fees | | | | 124 | | | | | 87 | | | | | 46 | |
| Transfer agent fees | | | | 108 | | | | | 29 | | | | | 13 | |
| Sub-transfer agent fees | | | | | | | | | | | | | | | |
| Class N | | | | 549 | | | | | — | | | | | 6 | |
| Class I | | | | 1,039 | | | | | — | | | | | 128 | |
| Professional fees | | | | 150 | | | | | 113 | | | | | 59 | |
| Registration fees | | | | 88 | | | | | 16 | | | | | 31 | |
| Shareholder reporting fees | | | | 151 | | | | | 21 | | | | | 31 | |
| Trustee fees | | | | 194 | | | | | 123 | | | | | 31 | |
| Other expenses | | | | 80 | | | | | 79 | | | | | 15 | |
| Total expenses before expense limitation | | | | 20,048 | | | | | 10,111 | | | | | 3,414 | |
| Expenses waived or reimbursed by the Adviser | | | | — | | | | | — | | | | | (260 | ) |
| Net expenses | | | | 20,048 | | | | | 10,111 | | | | | 3,154 | |
| Net investment income (loss) | | | | 30,775 | | | | | 21,170 | | | | | 5,175 | |
| Realized and unrealized gain (loss) | | | | | | | | | | | | | | | |
| Net realized gain (loss) on transactions from: | | | | | | | | | | | | | | | |
| Investments in securities, net of foreign capital gains taxes, if applicable | | | | (93,792 | )(1) | | | | (71,695 | )(1) | | | | (12,171 | ) |
| Redemptions in-kind | | | | — | | | | | 23,687 | | | | | — | |
| Foreign currency transactions | | | | (397 | ) | | | | (330 | ) | | | | (91 | ) |
| Total net realized gain (loss) | | | | (94,189 | ) | | | | (48,338 | ) | | | | (12,262 | ) |
| Change in net unrealized appreciation (depreciation) of: | | | | | | | | | | | | | | | |
| Investments in securities | | | | (79,755 | )(2) | | | | (61,589 | )(2) | | | | (15,338 | ) |
| Foreign currency translations | | | | (762 | ) | | | | (520 | ) | | | | (131 | ) |
| Change in net unrealized appreciation (depreciation) | | | | (80,517 | ) | | | | (62,109 | ) | | | | (15,469 | ) |
| Net increase (decrease) in net assets resulting from operations | | | $ | (143,931 | ) | | | $ | (89,277 | ) | | | $ | (22,556 | ) |
(1) Includes $1,574 and $978 related to an affiliated fund (William Blair China A-Share Fund, LLC) for International Growth Fund and Institutional International Growth Fund, respectively.
(2) Includes $(1,620) and $(1,006) related to an affiliated fund (William Blair China A-Share Fund, LLC) for International Growth Fund and Institutional International Growth Fund, respectively.
See accompanying Notes to Financial Statements.
| 122 | Semiannual Report | June 30, 2016 |
Statements of Changes in Net Assets
For the Period Ended June 30, 2016 (unaudited) and the Year Ended December 31, 2015 (all amounts in thousands)
| | | | | | | | | Institutional | | | International | |
| | | International | | | International | | | Small Cap | |
| | | Growth Fund | | | Growth Fund | | | Growth Fund | |
| | | 2016 | | | 2015 | | | 2016 | | | 2015 | | | 2016 | | | 2015 | |
| Operations | | | | | | | | | | | | | | | | | | | | | | | | |
| Net investment income (loss) | | $ | 30,775 | | | $ | 35,683 | | | $ | 21,170 | | | $ | 28,606 | | | $ | 5,175 | | | $ | 4,240 | |
| Net realized gain (loss) on investments, and other assets and liabilities | | | (94,189 | ) | | | (23,531 | ) | | | (48,338 | ) | | | (30,439 | ) | | | (12,262 | ) | | | 18,659 | |
| Change in net unrealized appreciation (depreciation) on investments, and other assets and liabilities | | | (80,517 | ) | | | (14,462 | ) | | | (62,109 | ) | | | 6,930 | | | | (15,469 | ) | | | 36,257 | |
| Net increase (decrease) in net assets resulting from operations | | | (143,931 | ) | | | (2,310 | ) | | | (89,277 | ) | | | 5,097 | | | | (22,556 | ) | | | 59,156 | |
| Distributions to shareholders from | | | | | | | | | | | | | | | | | | | | | | | | |
| Net investment income | | | | | | | | | | | | | | | | | | | | | | | | |
| Class N | | | — | | | | (9,482 | ) | | | — | | | | — | | | | — | | | | (195 | ) |
| Class I | | | — | | | | (30,923 | ) | | | — | | | | — | | | | — | | | | (7,300 | ) |
| Institutional Class | | | — | | | | — | | | | — | | | | (13,779 | ) | | | — | | | | (4,603 | ) |
| Net realized gain | | | | | | | | | | | | | | | | | | | | | | | | |
| Class N | | | — | | | | — | | | | — | | | | — | | | | — | | | | (29 | ) |
| Class I | | | — | | | | — | | | | — | | | | — | | | | — | | | | (919 | ) |
| Institutional Class | | | — | | | | — | | | | — | | | | (15,858 | ) | | | — | | | | (557 | ) |
| Total distributions | | | — | | | | (40,405 | ) | | | — | | | | (29,637 | ) | | | — | | | | (13,603 | ) |
| Capital stock transactions | | | | | | | | | | | | | | | | | | | | | | | | |
| Net proceeds from sale of shares | | | 250,409 | | | | 837,025 | | | | 79,080 | | | | 297,180 | | | | 46,519 | | | | 78,346 | |
| Shares issued in reinvestment of income dividends and capital gain distributions | | | — | | | | 36,885 | | | | — | | | | 28,849 | | | | — | | | | 11,877 | |
| Less cost of shares redeemed | | | (548,882 | ) | | | (835,938 | ) | | | (289,068 | ) | | | (305,026 | ) | | | (55,766 | ) | | | (184,116 | ) |
| Net increase (decrease) in net assets resulting from capital share transactions | | | (298,473 | ) | | | 37,972 | | | | (209,988 | ) | | | 21,003 | | | | (9,247 | ) | | | (93,893 | ) |
| Increase (decrease) in net assets | | | (442,404 | ) | | | (4,743 | ) | | | (299,265 | ) | | | (3,537 | ) | | | (31,803 | ) | | | (48,340 | ) |
| Net assets | | | | | | | | | | | | | | | | | | | | | | | | |
| Beginning of period | | | 3,678,744 | | | | 3,683,487 | | | | 2,335,632 | | | | 2,339,169 | | | | 574,600 | | | | 622,940 | |
| End of period | | $ | 3,236,340 | | | $ | 3,678,744 | | | $ | 2,036,367 | | | $ | 2,335,632 | | | $ | 542,797 | | | $ | 574,600 | |
| Accumulated net investment income (loss) at the end of the period | | $ | 51,979 | | | $ | 21,204 | | | $ | 28,218 | | | $ | 7,048 | | | $ | (2,107 | ) | | $ | (7,282 | ) |
See accompanying Notes to Financial Statements.
| June 30, 2016 | William Blair Funds | 123 |
Statements of Assets and Liabilities
As of June 30, 2016 (dollar amounts in thousands) (unaudited)
| | | Emerging | | | Emerging | | | Emerging | |
| | | Markets | | | Markets | | | Markets | |
| | | Leaders | | | Growth | | | Small Cap | |
| | | Fund | | | Fund | | | Growth Fund | |
| Assets | | | | | | | | | | | | | |
| Investments in securities, at cost | | $ | 140,044 | | | $ | 925,164 | | | | $ | 268,057 | |
| Investment in affiliated fund, at cost | | | — | | | | 125 | | | | | — | |
| Investments in securities, at value | | $ | 150,809 | | | $ | 1,005,870 | | | | $ | 301,024 | |
| Investment in affiliated fund, at value | | | — | | | | 213 | | | | | — | |
| Foreign currency, at value (cost $465; $268; $3,792) | | | 465 | | | | 268 | | | | | 3,794 | |
| Receivable for securities sold | | | 400 | | | | 11,177 | | | | | 4,592 | |
| Receivable for fund shares sold | | | 498 | | | | 707 | | | | | 429 | |
| Receivable from Adviser | | | 34 | | | | 14 | | | | | 45 | |
| Dividend and interest receivable | | | 528 | | | | 3,466 | | | | | 1,146 | |
| Total assets | | | 152,734 | | | | 1,021,715 | | | | | 311,030 | |
| Liabilities | | | | | | | | | | | | | |
| Payable for investment securities purchased | | | 1,464 | | | | 3,668 | | | | | 3,812 | |
| Payable for fund shares redeemed | | | 15 | | | | 481 | | | | | 51 | |
| Management fee payable | | | 128 | | | | 895 | | | | | 264 | |
| Shareholder administration fee payable | | | 4 | | | | 14 | | | | | 20 | |
| Distribution fee payable | | | — | | | | 2 | | | | | 2 | |
| Foreign capital gains tax liability | | | — | | | | 177 | | | | | 1,061 | |
| Other payables and accrued expenses | | | 156 | | | | 621 | | | | | 286 | |
| Total liabilities | | | 1,767 | | | | 5,858 | | | | | 5,496 | |
| Net assets | | $ | 150,967 | | | $ | 1,015,857 | | | | $ | 305,534 | |
| Capital | | | | | | | | | | | | | |
| Composition of net assets | | | | | | | | | | | | | |
| Par value of shares of beneficial interest | | $ | 19 | | | $ | 88 | | | | $ | 20 | |
| Capital paid in excess of par value | | | 163,598 | | | | 1,063,191 | | | | | 303,292 | |
| Accumulated net investment income (loss) | | | 841 | | | | 9,179 | | | | | (491 | ) |
| Accumulated net realized gain (loss) | | | (24,252 | ) | | | (137,250 | ) | | | | (29,202 | ) |
| Net unrealized appreciation (depreciation) of investments and foreign currencies | | | 10,761 | | | | 80,649 | | | | | 31,915 | |
| Net assets | | $ | 150,967 | | | $ | 1,015,857 | | | | $ | 305,534 | |
| |
| Class N shares | | | | | | | | | | | | | |
| Net assets | | $ | 1,876 | | | $ | 9,350 | | | | $ | 10,903 | |
| Shares outstanding | | | 232,571 | | | | 820,242 | | | | | 728,354 | |
| Net asset value per share | | $ | 8.07 | | | $ | 11.40 | | | | $ | 14.97 | |
| Class I shares | | | | | | | | | | | | | |
| Net assets | | $ | 27,766 | | | $ | 104,588 | | | | $ | 164,563 | |
| Shares outstanding | | | 3,427,777 | | | | 9,071,638 | | | | | 10,939,254 | |
| Net asset value per share | | $ | 8.10 | | | $ | 11.53 | | | | $ | 15.04 | |
| Institutional Class shares | | | | | | | | | | | | | |
| Net assets | | $ | 121,325 | | | $ | 901,919 | | | | $ | 130,068 | |
| Shares outstanding | | | 14,985,527 | | | | 77,608,984 | | | | | 8,630,686 | |
| Net asset value per share | | $ | 8.10 | | | $ | 11.62 | | | | $ | 15.07 | |
See accompanying Notes to Financial Statements.
| 124 | Semiannual Report | June 30, 2016 |
Statements of Operations
For the Period Ended June 30, 2016 (all amounts in thousands) (unaudited)
| | | Emerging
Markets
Leaders
Fund | | | Emerging
Markets
Growth
Fund | | | Emerging
Markets
Small Cap
Growth
Fund | |
| Investment income | | | | | | | | | | | | |
| Dividends | | $ | 1,756 | | | $ | 12,676 | | | $ | 4,444 | |
| Less foreign tax withheld | | | (183 | ) | | | (1,431 | ) | | | (335 | ) |
| Interest | | | — | | | | 3 | | | | — | |
| Total income | | | 1,573 | | | | 11,248 | | | | 4,109 | |
| Expenses | | | | | | | | | | | | |
| Investment advisory fees | | | 686 | | | | 4,846 | | | | 1,534 | |
| Distribution fees | | | 2 | | | | 11 | | | | 13 | |
| Shareholder administration fees | | | 22 | | | | 83 | | | | 120 | |
| Custodian fees | | | 50 | | | | 146 | | | | 111 | |
| Transfer agent fees | | | 6 | | | | 21 | | | | 27 | |
| Sub-transfer agent fees | | | | | | | | | | | | |
| Class N | | | 1 | | | | 3 | | | | 6 | |
| Class I | | | 7 | | | | 37 | | | | 38 | |
| Professional fees | | | 59 | | | | 80 | | | | 90 | |
| Registration fees | | | 37 | | | | 41 | | | | 32 | |
| Shareholder reporting fees | | | 9 | | | | 6 | | | | 19 | |
| Trustee fees | | | 7 | | | | 47 | | | | 15 | |
| Other expenses | | | 12 | | | | 27 | | | | 14 | |
| Total expenses before expense limitation | | | 898 | | | | 5,348 | | | | 2,019 | |
| Expenses waived or reimbursed by the Adviser | | | (107 | ) | | | (83 | ) | | | (218 | ) |
| Net expenses | | | 791 | | | | 5,265 | | | | 1,801 | |
| Net investment income (loss) | | | 782 | | | | 5,983 | | | | 2,308 | |
| Realized and unrealized gain (loss) | | | | | | | | | | | | |
| Net realized gain (loss) on transactions from: | | | | | | | | | | | | |
| Investments in securities, net of foreign capital gains taxes, if applicable | | | (12,429 | ) | | | (71,295 | )(1) | | | (24,422 | ) |
| Foreign currency transactions | | | (85 | ) | | �� | (244 | ) | | | (508 | ) |
| Total net realized gain (loss) | | | (12,514 | ) | | | (71,539 | ) | | | (24,930 | ) |
| Change in net unrealized appreciation (depreciation) of: | | | | | | | | | | | | |
| Investments in securities | | | 16,862 | | | | 111,916 | (2) | | | 26,245 | |
| Foreign currency translations | | | (2 | ) | | | (141 | ) | | | (871 | ) |
| Change in net unrealized appreciation (depreciation) | | | 16,860 | | | | 111,775 | | | | 25,374 | |
| Net increase (decrease) in net assets resulting from operations | | $ | 5,128 | | | $ | 46,219 | | | $ | 2,752 | |
| (1) | Includes $1,931 related to an affiliated fund (William Blair China A-Share Fund, LLC). |
| (2) | Includes $(1,988) related to an affiliated fund (William Blair China A-Share Fund, LLC). |
See accompanying Notes to Financial Statements.
| June 30, 2016 | William Blair Funds | 125 |
Statements of Changes in Net Assets
For the Period Ended June 30, 2016 (unaudited) and the Year Ended December 31, 2015 (all amounts in thousands)
| | | Emerging Markets
Leaders Fund | | Emerging Markets
Growth Fund | | Emerging Markets
Small Cap
Growth Fund |
| | | 2016 | | 2015 | | 2016 | | 2015 | | 2016 | | 2015 |
| Operations | | | | | | | | | | | | | | | | | | | | | | | | |
| Net investment income (loss) | | $ | 782 | | | $ | 575 | $ | | | 5,983 | | | $ | 5,753 | | | $ | 2,308 | | | $ | 902 | |
| Net realized gain (loss) on investments, and other assets and liabilities | | | (12,514 | ) | | | (10,580 | ) | | | (71,539 | ) | | | (53,698 | ) | | | (24,930 | ) | | | 3,803 | |
| Change in net unrealized appreciation (depreciation) on investments, and other assets and liabilities | | | 16,860 | | | | (9,023 | ) | | | 111,775 | | | | (91,961 | ) | | | 25,374 | | | | (24,287 | ) |
| Net increase (decrease) in net assets resulting from operations | | | 5,128 | | | | (19,028 | ) | | | 46,219 | | | | (139,906 | ) | | | 2,752 | | | | (19,582 | ) |
| Distributions to shareholders from | | | | | | | | | | | | | | | | | | | | | | | | |
| Net investment income | | | | | | | | | | | | | | | | | | | | | | | | |
| Class N | | | — | | | | — | | | | — | | | | — | | | | — | | | | — | |
| Class I | | | — | | | | (105 | ) | | | — | | | | — | | | | — | | | | — | |
| Institutional Class | | | — | | | | (331 | ) | | | — | | | | — | | | | — | | | | (1 | ) |
| Net realized gain | | | | | | | | | | | | | | | | | | | | | | | | |
| Class N | | | — | | | | (2 | ) | | | — | | | | (107 | ) | | | — | | | | (474 | ) |
| Class I | | | — | | | | (44 | ) | | | — | | | | (1,427 | ) | | | — | | | | (6,262 | ) |
| Institutional Class | | | — | | | | (126 | ) | | | — | | | | (8,324 | ) | | | — | | | | (4,988 | ) |
| Total distributions | | | — | | | | (608 | ) | | | — | | | | (9,858 | ) | | | — | | | | (11,725 | ) |
| Capital stock transactions | | | | | | | | | | | | | | | | | | | | | | | | |
| Net proceeds from sale of shares | | | 48,480 | | | | 81,180 | | | | 184,013 | | | | 315,208 | | | | 26,957 | | | | 123,362 | |
| Shares issued in reinvestment of income dividends and capital gain distributions | | | — | | | | 549 | | | | — | | | | 8,609 | | | | — | | | | 9,559 | |
| Less cost of shares redeemed | | | (30,319 | ) | | | (40,597 | ) | | | (93,486 | ) | | | (280,776 | ) | | | (21,016 | ) | | | (58,676 | ) |
| Net increase (decrease) in net assets resulting from capital share transactions | | | 18,161 | | | | 41,132 | | | | 90,527 | | | | 43,041 | | | | 5,941 | | | | 74,245 | |
| Increase (decrease) in net assets | | | 23,289 | | | | 21,496 | | | | 136,746 | | | | (106,723 | ) | | | 8,693 | | | | 42,938 | |
| Net assets | | | | | | | | | | | | | | | | | | | | | | | | |
| Beginning of period | | | 127,678 | | | | 106,182 | | | | 879,111 | | | | 985,834 | | | | 296,841 | | | | 253,903 | |
| End of period | | $ | 150,967 | | | $ | 127,678 | | | $ | 1,015,857 | | | $ | 879,111 | | | $ | 305,534 | | | $ | 296,841 | |
| Accumulated net investment income (loss) at the end of the period | | $ | 841 | | | $ | 59 | | | $ | 9,179 | | | $ | 3,196 | | | $ | (491 | ) | | $ | (2,799 | ) |
See accompanying Notes to Financial Statements.
| 126 | Semiannual Report | June 30, 2016 |
Statements of Assets and Liabilities
As of June 30, 2016 (dollar amounts in thousands) (unaudited)
| | | Bond
Fund | | | Income
Fund | | | Low
Duration
Fund | | | Macro
Allocation
Fund | |
| Assets | | | | | | | | | | | | | | | | |
| Investments in securities, at cost | | $ | 542,943 | | | $ | 90,711 | | | $ | 145,842 | | | $ | 1,380,859 | |
| Investments in affiliated companies, at cost | | | — | | | | — | | | | — | | | | 21,804 | |
| Repurchase agreement, at cost | | | 5,763 | | | | 992 | | | | 1,656 | | | | 307,110 | |
| Investments in securities, at value | | $ | 563,865 | | | $ | 92,355 | | | $ | 146,370 | | | $ | 1,395,435 | |
| Investments in affiliated companies, at value | | | — | | | | — | | | | — | | | | 17,714 | |
| Repurchase agreement, at value | | | 5,763 | | | | 992 | | | | 1,656 | | | | 307,110 | |
| Receivable for securities sold | | | — | | | | — | | | | 10,277 | | | | 35,565 | |
| Receivable for fund shares sold | | | 606 | | | | 360 | | | | 125 | | | | 7,247 | |
| Receivable for variation margin on centrally cleared swaps | | | — | | | | — | | | | — | | | | 63 | |
| Receivable from Adviser | | | 91 | | | | — | | | | 25 | | | | 149 | |
| Dividend and interest receivable | | | 4,186 | | | | 541 | | | | 392 | | | | 2,003 | |
| Unrealized appreciation on swap contracts | | | — | | | | — | | | | — | | | | 471 | |
| Unrealized appreciation on forward foreign currency contracts | | | — | | | | — | | | | — | | | | 4,582 | |
| Total assets | | | 574,511 | | | | 94,248 | | | | 158,845 | | | | 1,770,339 | |
| Liabilities | | | | | | | | | | | | | | | | |
| Securities sold, not yet purchased (proceeds $—; $—; $10,277; $—) | | | — | | | | — | | | | 10,347 | | | | — | |
| Option written, at value (proceeds $—; $—; $—; $6,354) | | | — | | | | — | | | | — | | | | 5,439 | |
| Payable for futures variation margin | | | — | | | | — | | | | — | | | | 5,401 | |
| Payable for variation margin on centrally cleared swaps | | | 38 | | | | — | | | | — | | | | — | |
| Payable for investment securities purchased | | | — | | | | — | | | | — | | | | 4,934 | |
| Payable for fund shares redeemed | | | 942 | | | | 376 | | | | 171 | | | | 2,800 | |
| Swap premium received | | | — | | | | — | | | | — | | | | 4,541 | |
| Unrealized depreciation on swap contracts | | | — | | | | — | | | | — | | | | 9,513 | |
| Management fee payable | | | 139 | | | | 31 | | | | 36 | | | | 1,145 | |
| Shareholder administration fee payable | | | 56 | | | | — | | | | 15 | | | | 149 | |
| Distribution fee payable | | | 19 | | | | 4 | | | | 1 | | | | 22 | |
| Distributions payable to shareholders | | | 130 | | | | 12 | | | | 7 | | | | — | |
| Other payables and accrued expenses | | | 63 | | | | 48 | | | | 47 | | | | 561 | |
| Total liabilities | | | 1,387 | | | | 471 | | | | 10,624 | | | | 34,505 | |
| Net assets | | $ | 573,124 | | | $ | 93,777 | | | $ | 148,221 | | | $ | 1,735,834 | |
| Capital | | | | | | | | | | | | | | | | |
| Composition of net assets | | | | | | | | | | | | | | | | |
| Par value of shares of beneficial interest | | $ | 54 | | | $ | 10 | | | $ | 16 | | | $ | 152 | |
| Capital paid in excess of par value | | | 559,561 | | | | 113,664 | | | | 166,141 | | | | 1,899,254 | |
| Accumulated net investment income (loss) | | | (2,546 | ) | | | (486 | ) | | | (756 | ) | | | (7,175 | ) |
| Accumulated net realized gain (loss) | | | (4,857 | ) | | | (21,055 | ) | | | (17,638 | ) | | | (164,275 | ) |
| Net unrealized appreciation (depreciation) of investments and foreign currencies | | | 20,912 | | | | 1,644 | | | | 458 | | | | 7,878 | |
| Net assets | | $ | 573,124 | | | $ | 93,777 | | | $ | 148,221 | | | $ | 1,735,834 | |
| Class N shares | | | | | | | | | | | | | | | | |
| Net assets | | $ | 151,711 | | | $ | 35,122 | | | $ | 6,561 | | | $ | 102,369 | |
| Shares outstanding | | | 14,179,156 | | | | 3,889,307 | | | | 716,010 | | | | 9,018,717 | |
| Net asset value per share | | $ | 10.70 | | | $ | 9.03 | | | $ | 9.16 | | | $ | 11.35 | |
| Class I shares | | | | | | | | | | | | | | | | |
| Net assets | | $ | 313,945 | | | $ | 58,655 | | | $ | 116,168 | | | $ | 1,100,027 | |
| Shares outstanding | | | 29,641,378 | | | | 6,542,238 | | | | 12,680,265 | | | | 96,244,825 | |
| Net asset value per share | | $ | 10.59 | | | $ | 8.97 | | | $ | 9.16 | | | $ | 11.43 | |
| Institutional Class shares | | | | | | | | | | | | | | | | |
| Net assets | | $ | 107,468 | | | | — | | | $ | 25,492 | | | $ | 533,438 | |
| Shares outstanding | | | 10,154,228 | | | | — | | | | 2,782,839 | | | | 46,591,394 | |
| Net asset value per share | | $ | 10.58 | | | | — | | | $ | 9.16 | | | $ | 11.45 | |
See accompanying Notes to Financial Statements.
| June 30, 2016 | William Blair Funds | 127 |
Statements of Operations
For the Period Ended June 30, 2016 (all amounts in thousands) (unaudited)
| | | Bond
Fund | | | Income
Fund | | | Low
Duration
Fund | | | Macro
Allocation
Fund | |
| Investment income | | | | | | | | | | | | | | | | |
| Dividends | | $ | — | | | $ | — | | | $ | — | | | $ | 11,457 | |
| Interest | | | 8,698 | | | | 1,297 | | | | 1,279 | | | | 725 | |
| Total income | | | 8,698 | | | | 1,297 | | | | 1,279 | | | | 12,182 | |
| Expenses | | | | | | | | | | | | | | | | |
| Investment advisory fees | | | 788 | | | | 183 | | | | 212 | | | | 6,864 | |
| Distribution fees | | | 108 | | | | 25 | | | | 4 | | | | 155 | |
| Shareholder administration fees | | | 315 | | | | — | | | | 86 | | | | 911 | |
| Custodian fees | | | 31 | | | | 18 | | | | 26 | | | | 62 | |
| Transfer agent fees | | | 23 | | | | 7 | | | | 8 | | | | 228 | |
| Sub-transfer agent fees | | | | | | | | | | | | | | | | |
| Class N | | | 91 | | | | 20 | | | | 2 | | | | 69 | |
| Class I | | | 82 | | | | 9 | | | | 11 | | | | 475 | |
| Professional fees | | | 21 | | | | 17 | | | | 23 | | | | 128 | |
| Registration fees | | | 54 | | | | 19 | | | | 24 | | | | 143 | |
| Shareholder reporting fees | | | 13 | | | | 4 | | | | 1 | | | | 79 | |
| Trustee fees | | | 25 | | | | 5 | | | | 7 | | | | 93 | |
| Other expenses | | | 15 | | | | 5 | | | | 9 | | | | 187 | |
| Total expenses before expense limitation | | | 1,566 | | | | 312 | | | | 413 | | | | 9,394 | |
| Expenses waived or reimbursed by the Adviser | | | (370 | ) | | | — | | | | (114 | ) | | | (911 | ) |
| Net expenses | | | 1,196 | | | | 312 | | | | 299 | | | | 8,483 | |
| Net investment income (loss) | | | 7,502 | | | | 985 | | | | 980 | | | | 3,699 | |
| Realized and unrealized gain (loss) | | | | | | | | | | | | | | | | |
| Net realized gain (loss) on transactions from: | | | | | | | | | | | | | | | | |
| Investments in securities | | | (2,489 | ) | | | 22 | | | | (303 | ) | | | (4,675 | )(1) |
| Options | | | — | | | | — | | | | — | | | | (7,569 | ) |
| Futures contracts | | | — | | | | — | | | | — | | | | (54,651 | ) |
| Swaps | | | (121 | ) | | | — | | | | — | | | | (4,365 | ) |
| Forward foreign currency contracts | | | — | | | | — | | | | — | | | | 24,603 | |
| Foreign currency transactions | | | — | | | | — | | | | — | | | | 29 | |
| Total net realized gain (loss) | | | (2,610 | ) | | | 22 | | | | (303 | ) | | | (46,628 | ) |
| Change in net unrealized appreciation (depreciation) of: | | | | | | | | | | | | | | | | |
| Investments in securities | | | 23,242 | | | | 1,909 | | | | 1,042 | | | | 51,890 | (2) |
| Options | | | — | | | | — | | | | — | | | | 1,432 | |
| Futures contracts | | | — | | | | — | | | | — | | | | (666 | ) |
| Swaps | | | 27 | | | | — | | | | — | | | | (6,179 | ) |
| Forward foreign currency contracts | | | — | | | | — | | | | — | | | | 2,849 | |
| Foreign currency translations | | | — | | | | — | | | | — | | | | 39 | |
| Change in net unrealized appreciation (depreciation) | | | 23,269 | | | | 1,909 | | | | 1,042 | | | | 49,365 | |
| Net increase (decrease) in net assets resulting from operations | | $ | 28,161 | | | $ | 2,916 | | | $ | 1,719 | | | $ | 6,436 | |
(1) Includes $(465) from companies deemed affiliated during the period.
(2) Includes $(526) from companies deemed affiliated during the period.
See accompanying Notes to Financial Statements.
| 128 | Semiannual Report | June 30, 2016 |
Statements of Changes in Net Assets
For the Period Ended June 30, 2016 (unaudited) and the Year Ended December 31, 2015 (all amounts in thousands)
| | | Bond Fund | | | Income Fund | | | Low Duration
Fund | | | Macro Allocation
Fund | |
| | | 2016 | | | 2015 | | | 2016 | | | 2015 | | | 2016 | | | 2015 | | | 2016 | | | 2015 | |
| | | | | | | | | | | | | | | | | |
| Operations | | | | | | | | | | | | | | | | | | | | | | | | | | | | | | | | |
| Net investment income (loss) | | $ | 7,502 | | | $ | 9,519 | | | $ | 985 | | | $ | 1,862 | | | $ | 980 | | | $ | 1,409 | | | $ | 3,699 | | | $ | 10,368 | |
| Net realized gain (loss) on investments, and other assets and liabilities | | | (2,610 | ) | | | 514 | | | | 22 | | | | (88 | ) | | | (303 | ) | | | (652 | ) | | | (46,628 | ) | | | (107,732 | ) |
| Change in net unrealized appreciation (depreciation) on investments, and other assets and liabilities | | | 23,269 | | | | (11,340 | ) | | | 1,909 | | | | (1,268 | ) | | | 1,042 | | | | (267 | ) | | | 49,365 | | | | (40,618 | ) |
| Net increase (decrease) in net assets resulting from operations | | | 28,161 | | | | (1,307 | ) | | | 2,916 | | | | 506 | | | | 1,719 | | | | 490 | | | | 6,436 | | | | (137,982 | ) |
| Distributions to shareholders from | | | | | | | | | | | | | | | | | | | | | | | | | | |
| Net investment income | | | | | | | | | | | | | | | | | | | | | | | | | | | | | | | | |
| Class N | | | (2,653 | ) | | | (1,822 | ) | | | (500 | ) | | | (1,007 | ) | | | (65 | ) | | | (95 | ) | | | — | | | | (915 | ) |
| Class I | | | (5,350 | ) | | | (6,812 | ) | | | (981 | ) | | | (1,971 | ) | | | (1,364 | ) | | | (2,839 | ) | | | — | | | | (10,747 | ) |
| Institutional Class | | | (2,069 | ) | | | (3,598 | ) | | | — | | | | — | | | | (329 | ) | | | (1,185 | ) | | | — | | | | (4,368 | ) |
| Total distributions | | | (10,072 | ) | | | (12,232 | ) | | | (1,481 | ) | | | (2,978 | ) | | | (1,758 | ) | | | (4,119 | ) | | | — | | | | (16,030 | ) |
| Capital stock transactions | | | | | | | | | | | | | | | | | | | | | | | | | | | |
| Net proceeds from sale of shares | | | 129,387 | | | | 300,131 | | | | 8,147 | | | | 24,005 | | | | 34,631 | | | | 47,534 | | | | 394,582 | | | | 1,559,297 | |
| Shares issued in reinvestment of income dividends and capital gain distributions | | | 8,761 | | | | 9,535 | | | | 1,338 | | | | 2,686 | | | | 1,467 | | | | 3,096 | | | | — | | | | 14,020 | |
| Less cost of shares redeemed | | | (63,907 | ) | | | (78,860 | ) | | | (12,807 | ) | | | (27,409 | ) | | | (19,550 | ) | | | (92,786 | ) | | | (397,071 | ) | | | (646,104 | ) |
| Net increase (decrease) in net assets resulting from capital share transactions | | | 74,241 | | | | 230,806 | | | | (3,322 | ) | | | (718 | ) | | | 16,548 | | | | (42,156 | ) | | | (2,489 | ) | | | 927,213 | |
| Increase (decrease) in net assets | | | 92,330 | | | | 217,267 | | | | (1,887 | ) | | | (3,190 | ) | | | 16,509 | | | | (45,785 | ) | | | 3,947 | | | | 773,201 | |
| Net assets | | | | | | | | | | | | | | | | | | | | | | | | | | | | | | | | |
| Beginning of period | | | 480,794 | | | | 263,527 | | | | 95,664 | | | | 98,854 | | | | 131,712 | | | | 177,497 | | | | 1,731,887 | | | | 958,686 | |
| End of period | | $ | 573,124 | | | $ | 480,794 | | | $ | 93,777 | | | $ | 95,664 | | | $ | 148,221 | | | $ | 131,712 | | | $ | 1,735,834 | | | $ | 1,731,887 | |
| Accumulated net investment income (loss) at the end of the period | | $ | (2,546 | ) | | $ | 24 | | | $ | (486 | ) | | $ | 10 | | | $ | (756 | ) | | $ | 22 | | | $ | (7,175 | ) | | $ | (10,874 | ) |
See accompanying Notes to Financial Statements.
| June 30, 2016 | William Blair Fund | 129 |
Notes to Financial Statements
(1) Organization
(a) Description of the Trust
William Blair Funds (the “Trust”) is a mutual fund registered under the Investment Company Act of 1940 (the “1940 Act”), as amended, as an open-end management investment company. The Trust currently consists of the following twenty-two funds (the “Funds”), each with its own investment objective and policies. For each Fund, the number of shares authorized is unlimited.
| Domestic Equity Funds | International Equity Funds |
| Growth | International Leaders |
| Large Cap Growth | International Equity |
| Mid Cap Growth | Institutional International Equity |
| Mid Cap Value | International Growth |
| Small-Mid Cap Growth | Institutional International Growth |
| Small-Mid Cap Value | International Small Cap Growth |
| Small Cap Growth | Emerging Markets Leaders |
| Small Cap Value | Emerging Markets Growth |
| Global Equity Fund | Emerging Markets Small Cap Growth |
| Global Leaders | Fixed Income Funds |
| Multi-Asset and Alternative Fund | Bond |
| Macro Allocation | Income |
| | Low Duration |
Prior to July 1, 2015, William Blair & Company, L.L.C. (“WBC” or the “Distributor”) served as both the Trust’s investment adviser and the Trust’s principal underwriter and distributor. Effective July 1, 2015, WBC transferred the management agreement for the Trust to William Blair Investment Management, LLC (“WBIM”). There were no changes to the Funds’ portfolio management teams or principal investment strategies as a result of the transfer. Any reference to the “Adviser” prior to July 1, 2015 should be read to mean WBC; any reference to the “Adviser” subsequent to July 1, 2015 should be read to mean WBIM. WBC continues to serve as the principal underwriter and distributor of the Trust.
(b) Share Classes
Three different classes of shares currently exist: N, I and Institutional.
Class N shares are offered to the general public, either directly through the Trust’s distributor or through a select number of financial intermediaries. Class N shares are sold without any sales load, and carry an annual 12b-1 distribution fee (0.25% for the Domestic Equity, Global Equity, International Equity and Multi-Asset and Alternative Funds and 0.15% for the Fixed Income Funds), a sub-transfer agent fee that is not a fixed rate and may vary by Fund and class, and an annual shareholder administration fee (0.15% for Global Leaders, International Leaders, International Small Cap Growth, Emerging Markets Leaders, Emerging Markets Growth, Emerging Markets Small Cap Growth, Bond, Low Duration and Macro Allocation Funds). The shareholder administration fee is currently being waived. This waiver will not be removed without approval of the Board of Trustees.
Class I shares are offered to a limited group of investors. They do not carry any sales load or distribution fees and generally have lower ongoing expenses than Class N shares. Class I shares have a sub-transfer agent fee that is not a fixed rate and may vary by Fund and class, and an annual shareholder administration fee (0.15% for Global Leaders, International Leaders, International Small Cap Growth, Emerging Markets Leaders, Emerging Markets Growth, Emerging Markets Small Cap Growth, Bond, Low Duration and Macro Allocation Funds). The shareholder administration fee is currently being waived. This waiver will not be removed without approval of the Board of Trustees.
Institutional Class shares are offered to institutional investors, including but not limited to employee benefit plans, endowments, foundations, trusts and corporations, who are able to meet the share class’s high minimum investment requirement. The minimum initial investment required is $5 million.
| 130 | Semiannual Report | June 30, 2016 |
Sub-transfer agent fees: For Class N and Class I shares, the Funds may reimburse WBC for fees paid to intermediaries such as banks, broker-dealers, financial advisers or other financial institutions for sub-administration, sub-transfer agency and other services provided to investors whose shares are held of record in omnibus, other group accounts, retirement plans or accounts traded through registered securities clearing agents. These fees may vary based on, for example, the nature of services provided, but generally range up to 0.15% of the assets of the class serviced or maintained by the intermediary or up to $15 per sub-account maintained by the intermediary.
(c) Fund Objectives
The investment objectives of the Funds are as follows:
| Domestic Equity | Long-term capital appreciation. |
| Global Equity | Long-term capital appreciation. |
| International Equity | Long-term capital appreciation. |
| Fixed Income | High level of current income with relative stability of principal. |
| | (Maximize total return-Low Duration). |
| Multi-Asset and Alternative | Maximize long-term risk-adjusted total return. |
(2) Significant Accounting Policies
The following is a summary of the Trust’s significant accounting policies in effect during the periods covered by the financial statements, which are in accordance with U.S. generally accepted accounting principles, which includes the accounting and reporting guidelines under Accounting Standards Topic 946, Financial Services—Investment Companies.
(a) Investment income and transactions
Investment income, realized and unrealized gains and losses, and certain Fund level expenses and expense reductions, if any, are allocated based on the relative net assets of each class, except for certain class specific expenses, which are charged directly to the appropriate class. Differences in class expenses may result in the payment of different per share dividends by class. All share classes of the Funds have equal rights with respect to voting, subject to class specific arrangements.
Dividend income and expense are recorded on the ex-dividend date, except for those dividends from certain foreign securities that are recorded when the information is available.
Interest income is recorded on an accrual basis, adjusted for amortization of premium or accretion of discount. Variable rate bonds and floating rate notes earn interest at coupon rates that fluctuate at specific time intervals. The interest rates shown in the Portfolio of Investments for the Bond, Income, Low Duration and Macro Allocation Funds were the rates in effect on June 30, 2016. Put bonds may be redeemed at the discretion of the holder on specified dates prior to maturity.
Premiums and discounts are amortized and accreted on a straight-line basis for short-term investments and on an effective interest method for long-term investments.
Paydown gains and losses on mortgage-backed and asset-backed securities are treated as an adjustment to interest income. For the period ended June 30, 2016, the Bond, Income and Low Duration Funds recognized a reduction of interest income and a corresponding decrease of net realized loss of $2,651, $487 and $779, respectively (in thousands). This reclassification had no effect on the net asset value or the net assets of the Funds.
| June 30, 2016 | William Blair Funds | 131 |
The Funds do not isolate the portion of operations resulting from fluctuations in foreign currency exchange rates on investments from the fluctuations arising from changes in the value of securities held. Such currency fluctuations are included with the net realized and unrealized gain or loss from investments.
Reported net realized foreign currency gains or losses arise from disposition of foreign currency, the difference in the foreign exchange rates between the trade and settlement dates on securities transactions, and the difference between the amounts of dividends, interest and foreign withholding taxes recorded on the ex-date or accrual date and the U.S. dollar equivalent of the amounts actually received or paid. Net unrealized foreign exchange gains and losses arise from changes (due to the changes in the exchange rate) in the value of foreign currency and other assets and liabilities denominated in foreign currencies held at year end.
Security and shareholder transactions are accounted for no later than one business day following the trade date. However, for financial reporting purposes, security and shareholder transactions are accounted for on the trade date of the last business day of the reporting period. Realized gains and losses from securities transactions are recognized on a specifically identified cost basis.
Awards from class action litigation may be recorded as a reduction of cost. If the Funds no longer own the applicable securities, the proceeds are recorded as realized gains.
(b) Share Valuation and Distributions to Shareholders
Shares are sold and redeemed on a continuous basis at net asset value. The net asset value per share is determined separately for each class by dividing the Fund’s net assets attributable to that class by the number of shares of the class outstanding as of the close of regular trading on the New York Stock Exchange (the “NYSE”), which is generally 4:00 p.m. Eastern time, on each day the NYSE is open.
Distributions from net investment income, if any, for all Equity and Multi-Asset and Alternative Funds are declared and paid at least annually. Distributions from net investment income for the Bond, Income and Low Duration Funds are declared daily and paid monthly. Capital gain distributions, if any, for all Funds, are declared and paid at least annually in December. Distributions payable to shareholders are recorded on the ex-dividend date.
(c) Foreign Currency Translation
The Funds may invest in securities denominated in foreign currencies. As such, assets and liabilities denominated in foreign currencies are translated into U.S. dollar amounts at the current exchange rate on the date of valuation. The values of foreign investments, open forward foreign currency contracts, and cash denominated in foreign currencies are translated into U.S. dollars using a spot market rate of exchange as of the time of the determination of each Fund’s Net Asset Value, typically 4:00 p.m. Eastern time on days when there is regular trading on the NYSE. Payables and receivables for securities transactions, dividends, interest income and tax reclaims are translated into U.S. dollars using a spot market rate of exchange as of 4:00 p.m. Eastern time. Settlement of purchases and sales and dividend and interest receipts are translated into U.S. dollars using a spot market rate of exchange as of 11:00 a.m. Eastern time.
(d) Income Taxes
Each Fund intends to comply with the provisions of Subchapter M of the Internal Revenue Code, as amended (the “Code”) available to regulated investment companies. Each Fund intends to make the requisite distributions of income and capital gains to its shareholders sufficient to relieve it from all, or substantially all, federal income and excise taxes. No provision for federal income and excise taxes has been made.
Certain Funds may be subject to foreign income taxes imposed on realized gains on securities of issuers from certain foreign countries. Such taxes, if applicable, are included within net realized gain (loss) on transactions from investments in securities on the Statement of Operations.
Management has evaluated all of the uncertain tax positions of the Funds and has determined that no liability is required to be recorded in the financial statements.
The statute of limitations on the Funds’ prior three years tax returns remain open and the returns are subject to examination.
| 132 | Semiannual Report | June 30, 2016 |
Adjustments to the cost of investments for tax purposes are due to the deferred loss associated with current and prior year wash sales, income recognition from investments in real estate investment trusts and partnerships, and the Funds’ election to mark-to-market their investments in Passive Foreign Investment Companies (“PFICs”). The cost of investments for federal income tax purposes and related gross unrealized appreciation (depreciation) and net unrealized appreciation/(depreciation) at June 30, 2016, were as follows (in thousands):
| | | | | | | | | Net |
| | | | | Gross | | Gross | | Unrealized |
| | | Cost of | | Unrealized | | Unrealized | | Appreciation/ |
| Fund | | Investments | | Appreciation | | Depreciation | | (Depreciation) |
| Growth | | $608,935 | | $168,237 | | $(14,123) | | $154,114 |
| Large Cap Growth | | 70,861 | | 15,008 | | (1,359) | | 13,649 |
| Mid Cap Growth | | 133,436 | | 19,367 | | (5,334) | | 14,033 |
| Mid Cap Value | | 2,957 | | 593 | | (105) | | 488 |
| Small-Mid Cap Growth | | 1,078,076 | | 183,912 | | (33,168) | | 150,744 |
| Small-Mid Cap Value | | 3,837 | | 780 | | (196) | | 584 |
| Small Cap Growth | | 299,241 | | 61,450 | | (12,097) | | 49,353 |
| Small Cap Value | | 482,103 | | 116,754 | | (23,375) | | 93,379 |
| Global Leaders | | 160,449 | | 19,636 | | (4,050) | | 15,586 |
| International Leaders | | 181,687 | | 16,400 | | (4,950) | | 11,450 |
| International Equity | | 65,205 | | 8,280 | | (3,080) | | 5,200 |
| Institutional International Equity | | 14,776 | | 1,650 | | (762) | | 888 |
| International Growth | | 2,928,534 | | 335,748 | | (114,648) | | 221,100 |
| Institutional International Growth | | 1,835,812 | | 203,503 | | (77,342) | | 126,161 |
| International Small Cap Growth | | 478,049 | | 69,897 | | (22,650) | | 47,247 |
| Emerging Markets Leaders | | 139,577 | | 9,380 | | (1,983) | | 7,397 |
| Emerging Markets Growth | | 940,601 | | 76,299 | | (17,810) | | 58,489 |
| Emerging Markets Small Cap Growth | | 268,751 | | 34,432 | | (3,738) | | 30,694 |
| Bond | | 543,078 | | 22,222 | | (1,435) | | 20,787 |
| Income | | 90,710 | | 2,018 | | (374) | | 1,644 |
| Low Duration | | 135,569 | | 1,207 | | (753) | | 454 |
| Macro Allocation | | 1,400,992 | | 30,680 | | (23,962) | | 6,718 |
In addition, the Funds may periodically record reclassifications among certain capital accounts to reflect differences between financial reporting and income tax basis distributions. The reclassifications were reported in order to reflect the tax treatment for certain permanent differences that exist between income tax regulations and U.S. generally accepted accounting principles. The reclassifications generally relate to net operating losses, Section 988 currency gains and losses, PFIC gains and losses, expiration of capital loss carryforward, paydown gains and losses, investments in real estate investment trusts and partnerships, and utilization of earnings and profits distributed to shareholders on redemption of shares. These reclassifications have no impact on the net asset values of the Funds. Accordingly, at December 31, 2015, the following reclassifications were recorded (in thousands):
| June 30, 2016 | William Blair Funds | 133 |
| | | Accumulated | | Accumulated | | |
| | | Undistributed | | Undistributed | | Capital Paid |
| | | Net Investment | | Net Realized | | in Excess |
| Fund | | Income (Loss) | | Gain/(Loss) | | of Par Value |
| Growth | | | $ 250 | | | | $ 118 | | | | $ (368 | ) |
| Large Cap Growth | | | 4 | | | | (4 | ) | | | — | |
| Mid Cap Growth | | | 1,275 | | | | 13 | | | | (1,288 | ) |
| Mid Cap Value | | | (5 | ) | | | 4 | | | | 1 | |
| Small-Mid Cap Growth | | | 3,239 | | | | 513 | | | | (3,752 | ) |
| Small-Mid Cap Value | | | (6 | ) | | | 7 | | | | (1 | ) |
| Small Cap Growth | | | 3,146 | | | | 193 | | | | (3,339 | ) |
| Small Cap Value | | | (808 | ) | | | 808 | | | | — | |
| Global Leaders | | | (187 | ) | | | 187 | | | | — | |
| International Leaders | | | (34 | ) | | | 34 | | | | — | |
| International Equity | | | (4 | ) | | | 3 | | | | 1 | |
| Institutional International Equity | | | (1 | ) | | | 3 | | | | (2 | ) |
| International Growth | | | 3,097 | | | | (3,097 | ) | | | — | |
| Institutional International Growth | | | 1,512 | | | | (1,512 | ) | | | — | |
| International Small Cap Growth | | | 6,190 | | | | (6,188 | ) | | | (2 | ) |
| Emerging Markets Leaders | | | 150 | | | | (147 | ) | | | (3 | ) |
| Emerging Markets Growth | | | 1,131 | | | | (1,134 | ) | | | 3 | |
| Emerging Markets Small Cap Growth | | | (1,847 | ) | | | 2,305 | | | | (458 | ) |
| Bond | | | 2,735 | | | | (2,734 | ) | | | (1 | ) |
| Income | | | 1,116 | | | | 8,074 | | | | (9,190 | ) |
| Low Duration | | | 2,732 | | | | (2,732 | ) | | | — | |
| Macro Allocation | | | (9,335 | ) | | | 9,335 | | | | — | |
The timing and characterization of certain income and capital gain distributions are determined annually in accordance with federal income tax regulations that may differ from U.S. generally accepted accounting principles. As a result, net investment income or loss and net realized gain or loss for a reporting period may differ from the amount distributed during such period.
Distributions from net realized gains for book purposes may include short-term capital gains, which are included as ordinary income for tax purposes. The tax character of distributions paid during 2015 and 2014 was as follows (in thousands):
| | | Distributions Paid in 2015 | | | Distributions Paid in 2014 | |
| | | Ordinary | | | Long-Term | | | Ordinary | | | Long-Term | |
| | | Income | | | Capital Gains | | | Income | | | Capital Gains | |
| Fund | | Class N | | | Class I | | | Class N | | | Class I | | | Class N | | | Class I | | | Class N | | | Class I | |
| Growth | | | $ 416 | | | | $ 1,808 | | | | $ 18,110 | | | | $ 78,627 | | | | $2,675 | | | | $ 6,408 | | | | $35,886 | | | | $85,974 | |
| Large Cap Growth | | | 17 | | | | 89 | | | | 954 | | | | 5,176 | | | | 60 | | | | 342 | | | | 706 | | | | 4,053 | |
| Mid Cap Growth | | | — | | | | — | | | | 5,530 | | | | 35,853 | | | | — | | | | — | | | | 4,943 | | | | 43,297 | |
| Mid Cap Value | | | 2 | | | | 10 | | | | 149 | | | | 438 | | | | 2 | | | | 50 | | | | 23 | | | | 442 | |
| Small-Mid Cap Growth | | | 13 | | | | 75 | | | | 8,551 | | | | 50,513 | | | | — | | | | — | | | | 6,031 | | | | 62,751 | |
| Small-Mid Cap Value | | | 1 | | | | 10 | | | | 44 | | | | 162 | | | | 12 | | | | 54 | | | | 64 | | | | 224 | |
| Small Cap Growth | | | — | | | | — | | | | 9,437 | | | | 20,150 | | | | 940 | | | | 2,145 | | | | 24,996 | | | | 56,995 | |
| Small Cap Value | | | — | | | | 1,363 | | | | 107 | | | | 1,836 | | | | 34 | | | | 1,020 | | | | 1,401 | | | | 18,381 | |
| Global Leaders | | | 3 | | | | 152 | | | | 252 | | | | 2,063 | | | | — | | | | 75 | | | | 8 | | | | 85 | |
| International Leaders | | | 1 | | | | 22 | | | | 2 | | | | 73 | | | | 1 | | | | 71 | | | | — | | | | 1 | |
| International Equity | | | 26 | | | | 750 | | | | — | | | | — | | | | 21 | | | | 576 | | | | — | | | | — | |
| International Growth | | | 9,482 | | | | 30,923 | | | | — | | | | — | | | | 8,591 | | | | 33,318 | | | | — | | | | — | |
| International Small Cap Growth | | | 195 | | | | 7,300 | | | | 29 | | | | 919 | | | | 153 | | | | 5,751 | | | | 1,829 | | | | 53,860 | |
| 134 | Semiannual Report | June 30, 2016 |
| | | Distributions Paid in 2015 | | | Distributions Paid in 2014 | |
| | | Ordinary | | | Long-Term | | | Ordinary | | | Long-Term | |
| | | Income | | | Capital Gains | | | Income | | | Capital Gains | |
| Fund | | Class N | | | Class I | | | Class N | | | Class I | | | Class N | | | Class I | | | Class N | | | Class I | |
| Emerging Markets Leaders | | $ | — | | | $ | 105 | | | $ | 2 | | | $ | 44 | | | $ | — | | | $ | 69 | | | $ | 33 | | | $ | 718 | |
| Emerging Markets Growth | | | — | | | | — | | | | 107 | | | | 1,427 | | | | 75 | | | | 1,350 | | | | 688 | | | | 8,980 | |
| Emerging Markets Small Cap Growth | | | — | | | | — | | | | 474 | | | | 6,262 | | | | 15 | | | | 558 | | | | 434 | | | | 4,997 | |
| Bond | | | 1,822 | | | | 6,812 | | | | — | | | | — | | | | 463 | | | | 5,570 | | | | — | | | | 3 | |
| Income | | | 1,007 | | | | 1,971 | | | | — | | | | — | | | | 1,089 | | | | 1,984 | | | | — | | | | — | |
| Low Duration | | | 95 | | | | 2,839 | | | | — | | | | — | | | | 138 | | | | 3,119 | | | | — | | | | — | |
| Macro Allocation | | | 915 | | | | 10,747 | | | | — | | | | — | | | | 7,774 | | | | 32,682 | | | | — | | | | — | |
| | | Distributions Paid in 2015 | | Distributions Paid in 2014 |
| | | Ordinary | | Long-Term | | Ordinary | | Long-Term |
| | | Income | | Capital Gains | | Income | | Capital Gains |
| | | Institutional | | Institutional | | Institutional | | Institutional |
| Global Leaders | | | $ 552 | | | | $ 6,144 | | | | $ 301 | | | | $ 165 | |
| International Leaders | | | 323 | | | | 578 | | | | 738 | | | | 8 | |
| Institutional International Equity | | | 156 | | | | — | | | | 293 | | | | — | |
| Institutional International Growth | | | 13,779 | | | | 15,858 | | | | 47,484 | | | | 186,607 | |
| International Small Cap Growth | | | 4,603 | | | | 557 | | | | 4,140 | | | | 32,999 | |
| Emerging Markets Leaders | | | 331 | | | | 126 | | | | 303 | | | | 1,894 | |
| Emerging Markets Growth | | | — | | | | 8,324 | | | | 7,711 | | | | 42,214 | |
| Emerging Markets Small Cap Growth | | | 1 | | | | 4,988 | | | | 732 | | | | 5,385 | |
| Bond | | | 3,598 | | | | — | | | | 3,958 | | | | 2 | |
| Low Duration | | | 1,185 | | | | — | | | | 1,371 | | | | — | |
| Macro Allocation | | | 4,368 | | | | — | | | | 8,256 | | | | — | |
As of December 31, 2015, the components of distributable earnings on a tax basis were as follows (in thousands):
| | | | | Accumulated | | | Undistributed | | Net Unrealized |
| | | Undistributed | | Capital and | | | Long-Term | | Appreciation/ |
| Fund | | Ordinary Income | | Other Losses | | | Capital Gain | | (Depreciation) |
| Growth | | | $ — | | | | $ — | | | | $13,627 | | | | $ 169,039 | |
| Large Cap Growth | | | 57 | | | | (301 | ) | | | — | | | | 12,641 | |
| Mid Cap Growth | | | — | | | | — | | | | 7,330 | | | | 11,482 | |
| Mid Cap Value | | | 6 | | | | — | | | | 108 | | | | 380 | |
| Small-Mid Cap Growth | | | — | | | | — | | | | 8,148 | | | | 145,266 | |
| Small-Mid Cap Value | | | 4 | | | | — | | | | 28 | | | | 327 | |
| Small Cap Growth | | | — | | | | — | | | | 4,135 | | | | 36,487 | |
| Small Cap Value | | | 237 | | | | — | | | | 6,259 | | | | 62,105 | |
| Global Leaders | | | — | | | | (23 | ) | | | 794 | | | | 17,012 | |
| International Leaders | | | 595 | | | | (65 | ) | | | — | | | | 9,858 | |
| International Equity | | | 850 | | | | (74,849 | ) | | | — | | | | 4,813 | |
| Institutional International Equity | | | 2 | | | | (90,033 | ) | | | — | | | | 703 | |
| International Growth | | | 34,033 | | | | (395,163 | ) | | | — | | | | 290,964 | |
| Institutional International Growth | | | 14,993 | | | | (38,368 | ) | | | — | | | | 176,546 | |
| International Small Cap Growth | | | — | | | | (1,400 | ) | | | 96 | | | | 55,847 | |
| Emerging Markets Leaders | | | 77 | | | | (8,757 | ) | | | — | | | | (9,098 | ) |
| Emerging Markets Growth | | | 4,462 | | | | (51,589 | ) | | | — | | | | (46,514 | ) |
| Emerging Markets Small Cap Growth | | | — | | | | (2,116 | ) | | | 796 | | | | 790 | |
| Bond | | | 2 | | | | (2,339 | ) | | | — | | | | (2,243 | ) |
| Income | | | 15 | | | | (21,125 | ) | | | — | | | | (219 | ) |
| Low Duration | | | 65 | | | | (17,424 | ) | | | — | | | | (495 | ) |
| Macro Allocation | | | — | | | | (122,596 | ) | | | — | | | | (47,412 | ) |
| June 30, 2016 | William Blair Funds | 135 |
As of December 31, 2015, the Funds have unused capital loss carryforwards available for federal income tax purposes to be applied against future capital gains, if any. If not applied, the carryforwards will expire as follows (in thousands):
| Fund | | 2016 | | | 2017 | | | 2018 | | | Total | |
| International Equity | | $ | — | | | $ | 74,815 | | | $ | — | | | $ | 74,815 | |
| Institutional International Equity | | | — | | | | 90,030 | | | | — | | | | 90,030 | |
| International Growth | | | — | | | | 358,606 | | | | — | | | | 358,606 | |
| Income | | | 14,459 | | | | 4,577 | | | | — | | | | 19,036 | |
| Low Duration | | | — | | | | — | | | | 955 | | | | 955 | |
Income Fund had $9,190 (in thousands) of capital loss carryforward that expired in 2015 unused.
Under current law, the Funds may carry forward net capital losses indefinitely to use to offset capital gains realized in future years. Previous law limited the carry forward of capital losses to the eight tax years following the year in which the capital loss was realized. If a Fund has capital losses that are subject to current law and also has capital losses subject to prior law, the losses realized under current law will be utilized to offset capital gains before any of the losses governed by prior law can be used. As a result of these ordering rules, capital losses realized under previous law may be more likely to expire unused. Capital losses realized under current law will carry forward retaining their classification as long-term or short-term losses; as compared to under prior law in which all capital losses were carried forward as short term capital losses.
As of December 31, 2015, the Funds incurred the following capital losses which will not expire (in thousands):
| | | Short- | | | Long- | |
| Fund | | Term | | | Term | |
| International Leaders | | $ | 65 | | | $ | — | |
| International Growth | | | 36,557 | | | | — | |
| Institutional International Growth | | | 34,229 | | | | — | |
| Emerging Markets Leaders | | | 5,694 | | | | — | |
| Emerging Markets Growth | | | 27,954 | | | | — | |
| Bond | | | 1,545 | | | | 794 | |
| Income | | | 787 | | | | 1,194 | |
| Low Duration | | | 8,090 | | | | 8,099 | |
| Macro Allocation | | | 75,778 | | | | 37,778 | |
In order to meet certain excise tax distribution requirements, the Funds are required to measure and distribute annually, net capital gains realized during a twelve month period ending October 31 and net investment income earned during a twelve month period ending December 31. In connection with this, the Funds are permitted for tax purposes to defer into their next fiscal year qualified late year losses. Qualified late year capital losses are any short term or long term capital losses incurred between November 1 and the end of their fiscal year, December 31, 2015. Qualified late year ordinary losses are comprised of losses related to foreign currency and PFICs incurred between November 1 and the end of their fiscal year, December 31, 2015.
As of December 31, 2015, the following Funds deferred, on a tax basis, qualified late year losses of (in thousands):
| | | Qualified Late Year Losses |
| Fund | | Ordinary
Income | | Short-Term
Capital | | Long-Term
Capital |
| Large Cap Growth | | $ | — | | | $ | 141 | | | $ | 160 | |
| Global Leaders | | | 23 | | | | — | | | | — | |
| International Equity | | | — | | | | 34 | | | | — | |
| Institutional International Equity | | | 3 | | | | — | | | | — | |
| Institutional International Growth | | | — | | | | 4,139 | | | | — | |
| International Small Cap Growth | | | 1,400 | | | | — | | | | — | |
| Emerging Markets Leaders | | | — | | | | 2,797 | | | | 266 | |
| Emerging Markets Growth | | | — | | | | 20,829 | | | | 2,806 | |
| Emerging Markets Small Cap Growth | | | — | | | | 2,116 | | | | — | |
| Income | | | — | | | | 75 | | | | 33 | |
| Low Duration | | | — | | | | 115 | | | | 165 | |
| Macro Allocation | | | 9,040 | | | | — | | | | — | |
| 136 | Semiannual Report | June 30, 2016 |
(e) Repurchase Agreements
In a repurchase agreement, a Fund buys a security at one price and at the time of sale, the seller agrees to repurchase the security at a mutually agreed upon time and price (usually within seven days). The repurchase agreement thereby determines the yield during the purchaser’s holding period, while the seller’s obligation to repurchase is secured by the value of the underlying collateral. The Adviser monitors, on an ongoing basis, the value of the underlying collateral to ensure that the value always equals or exceeds the repurchase price plus accrued interest. Repurchase agreements may involve certain risks in the event of a default or insolvency of the other party to the agreement, including possible delays or restrictions upon a Fund’s ability to dispose of the underlying collateral. The risk to a Fund is limited to the ability of the seller to pay the agreed upon sum on the delivery date. In the event of default, a repurchase agreement provides that a Fund is entitled to sell the underlying collateral. The loss, if any, to a Fund will be the difference between the proceeds from the sale and the repurchase price. However, if bankruptcy proceedings are commenced with respect to the seller of the security, disposition of the collateral by the Fund may be delayed or limited. The Funds have master repurchase agreements which allow the Funds to offset amounts owed to a counterparty with amounts owed from the same counterparty, including any collateral, in the event the counterparty defaults. As of June 30, 2016, each Fund’s outstanding repurchase agreements, if any, and related collateral, are shown on the Fund’s Portfolio of Investments. Although no definitive creditworthiness criteria are used, the Adviser reviews the creditworthiness of the banks and non-bank dealers with which a Fund enters into repurchase agreements to evaluate those risks. A Fund may, for tax purposes, deem repurchase agreements collateralized by U.S. Government securities to be investments in U.S. Government securities.
(f) TBA Securities
The Fixed Income Funds may invest in mortgage pass-through securities eligible to be sold in the “to-be announced” market (“TBAs”). TBAs provide for the forward or delayed delivery of the underlying instrument with settlement up to 180 days. The term TBA comes from the fact that the specific mortgage-backed security that will be delivered to fulfill a TBA trade is not designated at the time the trade is made, but rather is generally announced 48 hours before the settlement date. When a Fund sells TBAs, it incurs a risk of loss because it could have to purchase the securities at a price that is higher than the price at which it sold the securities. A Fund generally has the ability to close out a TBA obligation on or before the settlement date, rather than take delivery of the security.
(g) Securities Sold, Not Yet Purchased
A Fund may sell a security it does not own in anticipation of a decline in the fair value of that security. When a fund sells a security short, it must borrow the security sold short and deliver it to the broker through which it made the short sale. A gain, limited to the price at which the fund sold the security short, or a loss, unlimited in size, will be recognized upon the termination of the short sale. A fund is also subject to the risk that it may be unable to reacquire a security to terminate a short position except at a price substantially in excess of the price it sold the security short.
(h) Use of Estimates
The preparation of financial statements in conformity with U.S. generally accepted accounting principles requires management to make estimates and assumptions that affect the amounts reported in the financial statements. Actual results may differ from those estimates.
(i) Indemnification
In the normal course of business, the Funds have entered into contracts in which the Funds agree to indemnify the other party or parties against various potential costs or liabilities. The Funds’ maximum exposure under these arrangements is unknown. No claim has been made for indemnification pursuant to any such agreement of the Funds.
(j) Redemption In-Kind
In accordance with the Trust’s prospectus, the Funds may distribute portfolio securities rather than cash as payment for a redemption of fund shares (in-kind redemption). For financial reporting purposes, the Fund recognizes a gain or loss on the transfer of securities depending on the value of those securities on the date of redemption. Gains and losses realized on in-kind redemptions may not be recognized for tax purposes and are reclassified from accumulated net realized gain (loss) to capital paid in excess of par value. During the period ended June 30, 2016, the Small-Mid Cap Growth and Institutional International Growth Funds redeemed in-kind fund share redemptions of $47,902 and $210,330 (in thousands), respectively, with securities rather than cash and recognized net realized gains of $13,849 and $23,687 (in thousands), respectively, on the securities distributed to shareholders.
| June 30, 2016 | William Blair Funds | 137 |
(3) Valuation
(a) Investment Valuation
The value of domestic equity securities, including exchange-traded funds, is determined by valuing securities traded on national securities markets or in the over-the-counter markets at the last sale price or, if applicable, the official closing price or, in the absence of a recent sale on the date of determination, at the mean between the last reported bid and ask prices.
The value of foreign equity securities is generally determined based upon the last sale price on the foreign exchange or market on which it is primarily traded and in the currency of that market as of the close of the appropriate exchange or, if there have been no sales during that day, at the mean between the last reported bid and ask prices. The Board of Trustees has determined that the passage of time between when the foreign exchanges or markets close and when the Funds compute their net asset values could cause the value of foreign equity securities to no longer be representative or accurate and, as a result, may necessitate that such securities be fair valued. Accordingly, for foreign equity securities, the Funds may use an independent pricing service to fair value price the security as of the close of regular trading on the NYSE. As a result, a Fund’s value for a security may be different from the last sale price (or the mean between the last reported bid and ask prices).
Fixed income securities are generally valued using evaluated prices provided by an independent pricing service. The evaluated prices are formed using various market inputs that the pricing service believes accurately represent the market value of a security at a particular point in time. The pricing service determines evaluated prices for fixed income securities using inputs including, but not limited to, recent transaction prices, dealer quotes, transaction prices for securities with similar characteristics, collateral characteristics, credit quality, payment history, liquidity and market conditions.
Repurchase agreements are valued at cost, which approximates fair value.
Option contracts on securities, currencies and other financial instruments traded on one or more exchanges are valued at their most recent sale price on the exchange on which they are traded most extensively. Option contracts on foreign indices are valued at the settlement price. Futures contracts (and options and swaps thereon) are valued at the most recent settlement price on the exchange on which they are traded most extensively. Forward foreign currency contracts are valued on the basis of the value of the underlying currencies at the prevailing currency exchange rate as supplied by an independent pricing service.
Over-the-Counter (“OTC”) swap contracts are valued by an independent pricing service. Depending on the product and the terms of the transaction, the independent pricing service may use a series of techniques, including simulation pricing models. The pricing models use inputs that are observed from actively quoted markets such as issuer details, indices, spreads, interest rates, yield curves, dividends and exchange rates.
Centrally cleared swaps listed or settled on a multilateral or trade facility platform, such as a registered exchange, are valued at the daily settlement price determined by the respective exchange. For centrally cleared credit default swaps the clearing facility requires its members to provide actionable price levels across complete term structures. These levels along with external third-party prices are used to produce daily settlement prices.
Investments in other investment funds that are not exchange-traded funds are valued at the underlying fund’s ending net asset value on the date of valuation.
Securities, and other assets, for which a market price is not available or is deemed unreliable (e.g., securities affected by unusual or extraordinary events, such as natural disasters or securities affected by market or economic events, such as bankruptcy filings), or the value of which is affected by a significant valuation event, are valued at a fair value as determined in good faith by, or under the direction of, the Board of Trustees and in accordance with the Valuation Procedures approved by the Board of Trustees. The value of fair valued securities may be different from the last sale price (or the mean between the last reported bid and ask prices), and there is no guarantee that a fair valued security will be sold at the price at which a Fund is carrying the security.
As of June 30, 2016, there were securities held in the International Growth, Institutional International Growth and Emerging Markets Small Cap Growth Funds requiring fair valuation pursuant to the Valuation Procedures.
(b) Fair Value Measurements
Fair value is defined as the price that a Fund would receive upon selling a security in an orderly transaction to an independent buyer in the principal or most advantageous market for the investment. Various inputs are used in determining the value of a Fund’s investments. A three-tier hierarchy of inputs is used to classify fair value measurements for disclosure purposes. The three-tier hierarchy of inputs is summarized in the three broad levels listed below:
| | • | Level 1—Quoted prices (unadjusted) in active markets for an identical security. |
| | | |
| 138 | Semiannual Report | June 30, 2016 |
| | • | Level 2—Prices determined using other significant observable inputs. Observable inputs are inputs that other market participants would use in pricing a security. These may include quoted prices for similar securities, interest rates, prepayment speeds, credit risk, and others. In addition, other observable inputs such as foreign exchange rates, benchmark securities indices and foreign futures contracts may be utilized in the valuation of certain foreign securities when significant events occur between the last sale on the foreign securities exchange and the time at which the net asset value of the Fund is calculated. |
| | | |
| | • | Level 3—Prices determined using significant unobservable inputs. In situations where quoted prices or observable inputs are unavailable (for example, when there is little or no market activity for an investment), unobservable inputs may be used. Unobservable inputs reflect the Fund’s own assumptions about the factors market participants would use in pricing an investment, and would be based on the best information available. |
The inputs or methodology used for valuing an investment are not necessarily an indication of the risk associated with investing in those securities.
A description of the valuation technique applied to the Funds’ major categories of assets and liabilities measured at fair value on a recurring basis as follows:
Exchange-Traded Securities
Securities traded on a national securities exchange (or reported on the NASDAQ national market), including exchange-traded funds, are stated at the last reported sales price on the day of valuation. Other securities traded in the over-the-counter market and listed securities for which no sale was reported on that date are stated at the mean between the last reported bid and ask prices. To the extent these securities are actively traded and valuation adjustments are not applied, they are categorized as Level 1 of the fair value hierarchy. Securities traded on inactive markets or valued by reference to similar instruments are generally categorized as Level 2 of the fair value hierarchy.
Fixed Income Securities
Fixed income securities including corporate, convertible and municipal bonds and notes, U.S. government agencies, U.S. treasury obligations, sovereign issues, bank loans, convertible preferred securities and non-U.S. bonds are generally valued using evaluated prices provided by an independent pricing service. The evaluated prices are formed using various market inputs that the pricing service believes accurately represent the fair value of a security at a particular point in time. The pricing service determines evaluated prices for fixed income securities using inputs including, but not limited to, recent transaction prices, dealer quotes, transaction prices for securities with similar characteristics, collateral characteristics, credit quality, payment history, liquidity and market conditions. Securities that use similar valuation techniques and observable inputs as described above are categorized as Level 2 of the fair value hierarchy.
Short-Term Investments
Repurchase agreements are valued at cost, which approximates fair value. These investments are categorized as Level 2 of the fair value hierarchy.
Derivative Instruments
Listed derivatives, such as certain options and futures contracts, that are actively traded are valued based on quoted prices from the exchange on which they are traded most extensively and are categorized as Level 1 of the fair value hierarchy. OTC derivative contracts include forward foreign currency contracts, swap and certain option contracts related to interest rates, foreign currencies, credit standing of reference entities, equity prices, or commodity prices. Depending on the product and the terms of the transaction, the fair value of OTC derivative products can be modeled taking into account the counterparties’ creditworthiness and using a series of techniques, including simulation models. Many pricing models do not entail material subjectivity because the methodologies employed do not necessitate significant judgments and the pricing inputs are observed from actively quoted markets, as is the case of forward foreign currency contracts and interest rate swaps. A substantial majority of OTC derivative products valued by a Fund using pricing models fall into this category and are categorized as Level 2 of the fair value hierarchy.
Any transfers between Level 1 and Level 2 are disclosed, effective as of the beginning of the period, in the following tables with the reasons for the transfers disclosed in a note to the tables, if applicable. Transfer amounts are based on end of period values.
| June 30, 2016 | William Blair Funds | 139 |
As of June 30, 2016, the hierarchical input levels of securities in each Fund, segregated by security class or other financial instruments, are as follows (in thousands):
| Investments in securities | | | | Growth | | | | Large Cap
Growth | | | | Mid Cap
Growth | | | | Mid Cap
Value | |
| Level 1—Quoted prices | | | | | | | | | | | | | | | | | |
| Common Stocks | | | | $763,049 | | | | $84,510 | | | | $147,469 | | | | $3,445 | |
| Level 2—Other significant observable inputs | | | | | | | | | | | | | | | | | |
| Short-Term Investments | | | | 40,582 | | | | 922 | | | | 5,673 | | | | 104 | |
| Level 3—Significant unobservable inputs | | | | | | | | | | | | | | | | | |
| None | | | | — | | | | — | | | | — | | | | — | |
| Total investments in securities | | | | $803,631 | | | | $85,432 | | | | $153,142 | | | | $3,549 | |
| | | | | | | | | | | | | | | | | | |
| Investments in securities | | | | Small-Mid
Cap Growth | | | | Small-Mid
Cap Value | | | | Small Cap
Growth | | | | Small Cap
Value | |
| Level 1—Quoted prices | | | | | | | | | | | | | | | | | |
| Common Stocks | | | | $1,228,820 | | | | $4,421 | | | | $341,020 | | | | $575,482 | |
| Exchange-Traded Fund | | | | — | | | | — | | | | 7,574 | | | | — | |
| Level 2—Other significant observable inputs | | | | | | | | | | | | | | | | | |
| Short-Term Investments | | | | 26,223 | | | | 112 | | | | 10,008 | | | | 16,816 | |
| Level 3—Significant unobservable inputs | | | | | | | | | | | | | | | | | |
| None | | | | — | | | | — | | | | — | | | | — | |
| Total investments in securities | | | | $1,255,043 | | | | $4,533 | | | | $358,602 | | | | $592,298 | |
| | | | | | | | | | | | | | | | | | | | | |
| Investments in securities | | | Global
Leaders | | | | International
Leaders | | | | International
Equity | | | | Institutional
International
Equity | | | | International
Growth | |
| Level 1—Quoted prices | | | | | | | | | | | | | | | | | | | | |
| Common Stocks | | | $116,570 | | | | $ 34,788 | | | | $16,209 | | | | $ 3,632 | | | | $ 568,455 | |
| Level 2—Other significant observable inputs | | | | | | | | | | | | | | | | | | | | |
| Affiliated Fund | | | — | | | | — | | | | — | | | | — | | | | 174 | |
| Common Stocks | | | 59,465 | | | | 158,349 | | | | 54,196 | | | | 12,032 | | | | 2,581,005 | |
| Short-Term Investments | | | 3,535 | | | | 3,735 | | | | 320 | | | | 117 | | | | 84,835 | |
| Level 3—Significant unobservable inputs | | | | | | | | | | | | | | | | | | | | |
| Common Stocks | | | — | | | | — | | | | — | | | | — | | | | — | |
| Total investments in securities | | | $179,570 | | | | $196,872 | | | | $70,725 | | | | $15,781 | | | | $3,234,469 | |
| Level 1 and Level 2 transfers | | | | | | | | | | | | | | | | | | | | |
| Transfers from Level 1 to Level 2 (a) | | | $ 50,539 | | | | $126,833 | | | | $45,195 | | | | $10,017 | | | | $2,003,629 | |
| Transfers from Level 2 to Level 1 | | | — | | | | — | | | | — | | | | — | | | | — | |
| | | | | | | | | | | | | | | | | | | | | |
| Investments in securities | | | Institutional
International
Growth | | | | International
Small Cap
Growth | | | | Emerging
Markets
Leaders | | | | Emerging
Markets
Growth | | | | Emerging
Markets
Small Cap
Growth | |
| Level 1—Quoted prices | | | | | | | | | | | | | | | | | | | | |
| Common Stocks | | | $ 354,135 | | | | $ 67,896 | | | | $ 38,458 | | | | $ 266,445 | | | | $ 59,458 | |
| Preferred Stock | | | — | | | | — | | | | 1,566 | | | | 5,553 | | | | — | |
| Level 2—Other significant observable inputs | | | | | | | | | | | | | | | | | | | | |
| Affiliated Fund | | | 108 | | | | — | | | | — | | | | 213 | | | | — | |
| Common Stocks | | | 1,607,730 | | | | 457,400 | | | | 106,950 | | | | 726,879 | | | | 239,502 | |
| Short-Term Investments | | | 64,947 | | | | 19,794 | | | | 3,835 | | | | 6,993 | | | | 1,579 | |
| Level 3—Significant unobservable inputs | | | | | | | | | | | | | | | | | | | | |
| Common Stocks | | | — | | | | — | | | | — | | | | — | | | | 485 | |
| Total investments in securities | | | $2,026,920 | | | | $545,090 | | | | $150,809 | | | | $1,006,083 | | | | $301,024 | |
| Level 1 and Level 2 transfers | | | | | | | | | | | | | | | | | | | | |
| Transfers from Level 1 to Level 2 (a) | | | $1,248,106 | | | | $344,994 | | | | $ 69,028 | | | | $ 473,724 | | | | $156,056 | |
| Transfers from Level 2 to Level 1 | | | — | | | | — | | | | — | | | | — | | | | — | |
| 140 | Semiannual Report | June 30, 2016 |
| Investments in securities | | Bond | | | Income | | | Low
Duration | | | Macro
Allocation | |
| Assets | | | | | | | | | | | | | | | | |
| Level 1—Quoted Prices | | | | | | | | | | | | | | | | |
| Exchange-Traded Funds | | $ | — | | | $ | — | | | $ | — | | | $ | 1,106,584 | |
| Purchased Options | | | 2 | | | | 1 | | | | 2 | | | | 5,715 | |
| Level 2—Other significant observable inputs | | | | | | | | | | | | | | | | |
| Asset-Backed Securities | | | 13,805 | | | | 8,625 | | | | 36,020 | | | | — | |
| Commercial Paper | | | 5,000 | | | | — | | | | — | | | | — | |
| Corporate Obligation/Notes | | | 256,931 | | | | 29,773 | | | | 28,019 | | | | — | |
| Purchased Options | | | — | | | | — | | | | — | | | | 208 | |
| Short-Term Investments | | | 5,763 | | | | 992 | | | | 1,656 | | | | 307,110 | |
| U.S. Government and U.S. Government Agency | | | 288,127 | | | | 53,956 | | | | 82,329 | | | | 300,642 | |
| Level 3—Significant unobservable inputs | | | | | | | | | | | | | | | | |
| None | | | — | | | | — | | | | — | | | | — | |
| Liabilities | | | | | | | | | | | | | | | | |
| Level 1 - Quoted Prices | | | | | | | | | | | | | | | | |
| Written Options | | | — | | | | — | | | | — | | | | (5,439 | ) |
| Level 2 - Other significant observable inputs | | | | | | | | | | | | | | | | |
| None | | | — | | | | — | | | | — | | | | — | |
| Level 3 - Significant unobservable inputs | | | | | | | | | | | | | | | | |
| None | | | — | | | | — | | | | — | | | | — | |
| Total investments in securities | | $ | 569,628 | | | $ | 93,347 | | | $ | 148,026 | | | $ | 1,714,820 | |
| Other financial instruments | | | | | | | | | | | | | | | | |
| Assets | | | | | | | | | | | | | | | | |
| Level 1—Quoted Prices | | | | | | | | | | | | | | | | |
| Futures Contracts | | $ | — | | | $ | — | | | $ | — | | | $ | 11,307 | |
| Level 2—Other significant observable inputs | | | | | | | | | | | | | | | | |
| Forward Foreign Currency Contracts | | | — | | | | — | | | | — | | | | 24,581 | |
| Swaps | | | — | | | | — | | | | — | | | | 5,085 | |
| Level 3—Significant unobservable inputs | | | | | | | | | | | | | | | | |
| None | | | — | | | | — | | | | — | | | | — | |
| Liabilities | | | | | | | | | | | | | | | | |
| Level 1—Quoted Prices | | | | | | | | | | | | | | | | |
| Futures Contracts | | | — | | | | — | | | | — | | | | (7,867 | ) |
| Level 2—Other significant observable inputs | | | | | | | | | | | | | | | | |
| Forward Foreign Currency Contracts | | | — | | | | — | | | | — | | | | (19,999 | ) |
| Futures Contracts | | | — | | | | — | | | | — | | | | (1,478 | ) |
| Swaps | | | (10 | ) | | | — | | | | — | | | | (15,048 | ) |
| U.S Government and U.S. Government Agency | | | — | | | | — | | | | (10,347 | ) | | | — | |
| Level 3—Significant unobservable inputs | | | | | | | | | | | | | | | | |
| None | | | — | | | | — | | | | — | | | | — | |
| Total other financial instruments | | $ | (10 | ) | | $ | — | | | $ | (10,347 | ) | | $ | (3,419 | ) |
| (a) | Fair valuation estimates were obtained from the Funds’ pricing vendor and applied to certain foreign securities at June 30, 2016, but not at December 31, 2015. |
Level 1 Common Stocks are exchange-traded securities with a quoted price. See Portfolio of Investments for Sector Classification.
The fair value estimates for the Level 3 securities in the International Growth, Institutional International Growth and Emerging Markets Small Cap Growth Funds were determined in good faith by the Pricing Committee, pursuant to the Valuation Procedures approved by the Board of Trustees. There were various factors considered in reaching this fair value determination, including, but not limited to, the following: the type of security, the extent of public trading of the security, information obtained from a broker-dealer for the security, analysis of the company’s performance and market trends that influence its performance. Level 3 securities represented 0.00%, 0.00%, and 0.16% as a percentage of net assets in the International Growth, Institutional International Growth and Emerging Markets Small Cap Growth Funds, respectively. The change in net unrealized gain (loss) related to those securities held at June 30, 2016 is included in the change in net unrealized appreciation (depreciation) of investments on the Statements of Operations.
| June 30, 2016 | William Blair Funds | 141 |
(4) Transactions with Affiliates
(a) Management and Expense Limitation Agreements
Each Fund has a management agreement with the Adviser for investment management, clerical, bookkeeping and administrative services. Each Fund pays the Adviser an annual fee, payable monthly, based on a specified percentage of its average daily net assets. A summary of the annual rates expressed as a percentage of average daily net assets is as follows:
| Domestic Equity Funds | | | |
| Growth | | | 0.75 | % |
| Large Cap Growth | | | 0.70 | % |
| Mid Cap Growth | | | 0.95 | % |
| Mid Cap Value | | | 0.95 | % |
| Small-Mid Cap Growth | | | 1.00 | % |
| Small-Mid Cap Value | | | 1.00 | % |
| Small Cap Growth | | | 1.10 | % |
| Small Cap Value | | | 1.10 | % |
| | | | | |
| Fixed Income Funds | | | | |
| Bond | | | 0.30 | % |
| Income1: | | | | |
| First $250 million | | | 0.25 | % |
| In excess of $250 million | | | 0.20 | % |
| Low Duration | | | 0.30 | % |
| | | | | |
| Multi-Asset and Alternative Fund | | | | |
| Macro Allocation | | | 0.80 | % |
| | | | | |
| Global Equity Fund | | | | |
| Global Leaders | | | 1.00 | % |
| International Equity Funds | | | |
| International Leaders | | | 0.95 | % |
| International Equity: | | | | |
| First $250 million | | | 1.00 | % |
| In excess of $250 million | | | 0.90 | % |
| Institutional International Equity: | | | | |
| First $500 million | | | 0.90 | % |
| Next $500 million | | | 0.85 | % |
| In excess of $1 billion | | | 0.80 | % |
| International Growth: | | | | |
| First $250 million | | | 1.10 | % |
| Next $2.25 billion | | | 1.00 | % |
| Next $2.5 billion | | | 0.975 | % |
| Next $5 billion | | | 0.95 | % |
| Next $5 billion | | | 0.925 | % |
| In excess of $15 billion | | | 0.90 | % |
| Institutional International Growth: | | | | |
| First $500 million | | | 1.00 | % |
| Next $500 million | | | 0.95 | % |
| Next $1.5 billion | | | 0.90 | % |
| Next $2.5 billion | | | 0.875 | % |
| Next $5 billion | | | 0.85 | % |
| Next $5 billion | | | 0.825 | % |
| In excess of $15 billion | | | 0.80 | % |
| International Small Cap Growth | | | 1.00 | % |
| Emerging Markets Leaders | | | 1.10 | % |
| Emerging Markets Growth | | | 1.10 | % |
| Emerging Markets Small Cap Growth | | | 1.10 | % |
| 1 | Management fee also includes a charge of 5% of gross income. |
| 142 | Semiannual Report | June 30, 2016 |
Some of the Funds have also entered into an Amended and Restated Expense Limitation Agreement with the Adviser. Under the terms of the agreement, the Adviser will waive its management fee and/or reimburse a Fund for expenses in excess of the agreed upon rate. The amount the Adviser owes a Fund as of the reporting date is recorded as Receivable from Adviser on the Statements of Assets and Liabilities. The Adviser reimburses the Funds on a monthly basis. Under the terms of the agreement, the Adviser has agreed to waive its management fees and/or absorb other operating expenses through April 30, 2017, if total expenses for each class of the following Funds exceed the following rates (as a percentage of average daily net assets):
| | | Class N | | Class I | | Institutional Class |
| Fund | | Effective
May 1, 2016
through
April 30,
2017 | | Effective
May 1, 2015
through
April 30,
2016 | | Effective
May 1, 2016
through
April 30,
2017 | | Effective
May 1, 2015
through
April 30,
2016 | | Effective
May 1, 2016
through
April 30,
2017 | | Effective
May 1, 2015
through
April 30,
2016 |
| Growth | | N/A | | | N/A | | | N/A | | | N/A | | | N/A | | | N/A | |
| Large Cap Growth | | 1.05 | % | | 1.05 | % | | 0.80 | % | | 0.80 | % | | N/A | | | N/A | |
| Mid Cap Growth | | 1.30 | % | | 1.30 | % | | 1.05 | % | | 1.05 | % | | N/A | | | N/A | |
| Mid Cap Value | | 1.30 | % | | 1.30 | % | | 1.05 | % | | 1.05 | % | | N/A | | | N/A | |
| Small-Mid Cap Growth | | 1.35 | % | | 1.35 | % | | 1.10 | % | | 1.10 | % | | N/A | | | N/A | |
| Small-Mid Cap Value | | 1.35 | % | | 1.35 | % | | 1.10 | % | | 1.10 | % | | N/A | | | N/A | |
| Small Cap Growth | | 1.50 | % | | 1.50 | % | | 1.25 | % | | 1.25 | % | | N/A | | | N/A | |
| Small Cap Value | | 1.50 | % | | 1.50 | % | | 1.25 | % | | 1.25 | % | | N/A | | | N/A | |
| Global Leaders | | 1.40 | % | | 1.40 | % | | 1.15 | % | | 1.15 | % | | 1.00 | % | | 1.00 | % |
| International Leaders | | 1.35 | % | | 1.35 | % | | 1.10 | % | | 1.10 | % | | 0.95 | % | | 0.95 | % |
| International Equity | | 1.30 | % | | 1.30 | % | | 1.05 | % | | 1.05 | % | | N/A | | | N/A | |
| Institutional International Equity | | N/A | | | N/A | | | N/A | | | N/A | | | 1.00 | % | | 1.00 | % |
| International Growth | | 1.45 | % | | 1.45 | % | | 1.20 | % | | 1.20 | % | | N/A | | | N/A | |
| Institutional International Growth | | N/A | | | N/A | | | N/A | | | N/A | | | N/A | | | N/A | |
| International Small Cap Growth | | 1.65 | % | | 1.65 | % | | 1.40 | % | | 1.40 | % | | 1.25 | % | | 1.25 | % |
| Emerging Markets Leaders | | 1.65 | % | | 1.65 | % | | 1.40 | % | | 1.40 | % | | 1.25 | % | | 1.25 | % |
| Emerging Markets Growth | | 1.70 | % | | 1.70 | % | | 1.45 | % | | 1.45 | % | | 1.30 | % | | 1.30 | % |
| Emerging Markets Small Cap Growth | | 1.65 | % | | 1.65 | % | | 1.40 | % | | 1.40 | % | | 1.25 | % | | 1.25 | % |
| Bond | | 0.65 | % | | 0.65 | % | | 0.50 | % | | 0.50 | % | | 0.35 | % | | 0.35 | % |
| Income | | 0.85 | % | | 0.85 | % | | 0.70 | % | | 0.70 | % | | N/A | | | N/A | |
| Low Duration | | 0.70 | % | | 0.70 | % | | 0.55 | % | | 0.55 | % | | 0.40 | % | | 0.40 | % |
| Macro Allocation | | 1.35 | % | | 1.35 | %(a) | | 1.10 | % | | 1.10 | %(a) | | 0.95 | % | | 0.95 | %(a) |
| (a) | Effective March 1, 2015 through April 30, 2016. |
| June 30, 2016 | William Blair Funds | 143 |
For the period ended June 30, 2016, the fee waivers and/or reimbursements received by each Fund (including the expense limitation described above and the shareholder administration fee waiver described below) were as follows (in thousands):
| Fund | | Fund
Level
Waiver | | Class N
Specific
Waiver | | Class I
Specific
Waiver | | Total
Waiver |
| Large Cap Growth | | 30 | | 7 | | 20 | | 57 |
| Mid Cap Growth | | 37 | | 14 | | 91 | | 142 |
| Mid Cap Value | | 53 | | — | | — | | 53 |
| Small-Mid Cap Growth | | — | | 71 | | 377 | | 448 |
| Small-Mid Cap Value | | 60 | | — | | 1 | | 61 |
| Small Cap Growth | | — | | 50 | | 69 | | 119 |
| Small Cap Value | | — | | 7 | | 96 | | 103 |
| Global Leaders | | 98 | | 4 | | 33 | | 135 |
| International Leaders | | 114 | | — | | 12 | | 126 |
| International Equity | | 74 | | 1 | | 26 | | 101 |
| Institutional International Equity | | 54 | | — | | — | | 54 |
| International Small Cap Growth | | — | | 8 | | 252 | | 260 |
| Emerging Markets Leaders | | 85 | | 1 | | 21 | | 107 |
| Emerging Markets Growth | | — | | 7 | | 76 | | 83 |
| Emerging Markets Small Cap Growth | | 98 | | 8 | | 112 | | 218 |
| Bond | | 52 | | 111 | | 207 | | 370 |
| Low Duration | | 28 | | 4 | | 82 | | 114 |
| Macro Allocation | | — | | 93 | | 818 | | 911 |
(b) Underwriting, Distribution Services, and Shareholder Administration Agreements
Pursuant to separate Underwriting and Distribution Agreements, WBC is the principal underwriter and distributor for the continuous offering of shares of the Trust and acts as agent of the Trust in the sale of its shares. The Underwriting Agreement provides that the Distributor will use its best efforts to distribute the Trust’s shares. The Distributor is not compensated under the Underwriting Agreement.
Each Fund, except the Institutional International Equity Fund and Institutional International Growth Fund, has a Distribution Agreement with WBC for distribution services to the Funds’ Class N shares. Each Fund pays WBC an annual fee, payable monthly, based on a specified percentage of its average daily net assets of Class N shares. The annual rate expressed as a percentage of average daily net assets for Class N is 0.25% for all Funds except the Bond, Income and Low Duration Funds, which is 0.15%. Pursuant to the Distribution Agreement, WBC enters into related selling group agreements with various firms at various rates for sales of the Funds’ Class N shares.
The Global Leaders, International Leaders, International Small Cap Growth, Emerging Markets Leaders, Emerging Markets Growth, Emerging Markets Small Cap Growth, Bond, Low Duration and Macro Allocation Funds have a Shareholder Administration Agreement with WBC to provide shareholder administration services to Class N and Class I shares. Class N and Class I shares of the Funds have agreed to pay an annual fee, payable monthly, of 0.15% of average daily net assets attributable to each class, respectively. Beginning in 2013, the SEC conducted a limited scope examination of a number of mutual fund sponsors, including WBC, regarding distribution and servicing of mutual fund shares through intermediaries. In November 2014, the SEC informed WBC that it had opened a non-public investigation with respect to shareholder administration fees paid by the applicable Funds. The investigation does not involve the investment management operations of the Funds. In December 2015, the SEC staff sent WBC a notification that staff intended to recommend an enforcement action against WBC to the SEC Commissioners (Wells Notice), and WBC has submitted a response. At this time, it is unclear whether or not the Commission will allow the matter to enter enforcement proceedings. While WBC believes that any possible claims made by the staff would be without merit, WBC cannot predict the outcome of any enforcement proceeding the SEC may choose to bring. The shareholder administration fee for each Fund is currently being waived by WBC. This waiver will not be removed without approval of the Board of Trustees.
| 144 | Semiannual Report | June 30, 2016 |
For the period ended June 30, 2016, the following shareholder administration fees were incurred and waived (in thousands):
| Fund | | Class N | | | Class I | | | Total | | | Total
Waived | | | Net Total
Shareholder
Administration
Fee | |
| Global Leaders | | $ | 4 | | | $ | 33 | | | $ | 37 | | | $ 37 | | | | $— | |
| International Leaders | | | — | | | | 12 | | | | 12 | | | 12 | | | | — | |
| International Small Cap Growth | | | 8 | | | | 252 | | | | 260 | | | 260 | | | | — | |
| Emerging Markets Leaders | | | 1 | | | | 21 | | | | 22 | | | 22 | | | | — | |
| Emerging Markets Growth | | | 7 | | | | 76 | | | | 83 | | | 83 | | | | — | |
| Emerging Markets Small Cap Growth | | | 8 | | | | 112 | | | | 120 | | | 120 | | | | — | |
| Bond | | | 108 | | | | 207 | | | | 315 | | | 315 | | | | — | |
| Low Duration | | | 4 | | | | 82 | | | | 86 | | | 86 | | | | — | |
| Macro Allocation | | | 93 | | | | 818 | | | | 911 | | | 911 | | | | — | |
(5) Investment Transactions
Investment transactions, excluding money market instruments, repurchase agreements and U.S. government securities for the period ended June 30, 2016, were as follows (in thousands):
| Fund | | Purchases | | | Sales | |
| Growth | | $ | 192,367 | | | $ | 248,140 | |
| Large Cap Growth | | | 28,132 | | | | 12,420 | |
| Mid Cap Growth | | | 58,434 | | | | 107,475 | |
| Mid Cap Value | | | 1,122 | | | | 529 | |
| Small-Mid Cap Growth | | | 440,793 | | | | 410,955 | |
| Small-Mid Cap Value | | | 756 | | | | 594 | |
| Small Cap Growth | | | 180,155 | | | | 208,702 | |
| Small Cap Value | | | 80,926 | | | | 133,781 | |
| Global Leaders | | | 74,459 | | | | 78,865 | |
| International Leaders | | | 109,048 | | | | 25,656 | |
| International Equity | | | 30,131 | | | | 20,548 | |
| Institutional International Equity | | | 5,464 | | | | 5,235 | |
| International Growth | | | 1,462,185 | | | | 1,694,947 | |
| Institutional International Growth | | | 910,787 | | | | 1,096,978 | |
| International Small Cap Growth | | | 204,175 | | | | 203,849 | |
| Emerging Markets Leaders | | | 99,405 | | | | 82,538 | |
| Emerging Markets Growth | | | 546,942 | | | | 456,423 | |
| Emerging Markets Small Cap Growth | | | 224,187 | | | | 218,973 | |
| Bond | | | 174,744 | | | | 50,230 | |
| Income | | | 17,793 | | | | 10,532 | |
| Low Duration | | | 110,723 | | | | 77,544 | |
| Macro Allocation | | | 237,264 | | | | 299,507 | |
Transactions in written call and put options for Macro Allocation Fund for the period ended June 30, 2016 were as follows:
| | | | # of
Contracts | | | Premium
(in thousands) | |
| Balance at December 31, 2015 | | | 4,746 | | | | $ | 652 | |
| Sales | | | 41,664 | | | | | 12,654 | |
| Closing Buys | | | (17,694 | ) | | | | (5,575 | ) |
| Expirations | | | (5,715 | ) | | | | (1,377 | ) |
| Balance at June 30, 2016 | | | 23,001 | | | | $ | 6,354 | |
| June 30, 2016 | William Blair Funds | 145 |
(6) Financial Derivative Instruments
Each Fund may use derivative instruments to maintain liquidity, to provide hedging, or in anticipation of changes in the composition of its portfolio holdings or as otherwise provided in each Fund’s prospectus. Macro Allocation Fund may also use derivative instruments to obtain investment exposures. The derivative instruments held as of June 30, 2016, as disclosed in each Fund’s Portfolios of Investments, are representative of each Fund’s derivative instrument trading activity during the period ended June 30, 2016.
Derivative transactions carry counterparty risk as they are based on contracts between a Fund and the applicable counterparty. For exchange-traded or cleared derivative contracts, such counterparty risk is limited due to the role of the exchange or clearinghouse. OTC derivative contracts, however, are exposed to counterparty risk in the amount of unrealized gains, net of collateral held, for the duration of the contract.
Macro Allocation Fund is subject to certain netting arrangements through International Swaps and Derivatives Association, Inc. Master Agreements and Credit Support Annexes (“ISDAs”). The ISDAs maintain provisions for general obligations, representations, agreements, collateral and events of default or termination. The ISDAs cover certain OTC derivative securities entered into by Macro Allocation Fund with various counterparties and allow Macro Allocation Fund to close out and net its total exposure to a counterparty in the event of a default.
Futures Contracts
A futures contract provides for the future sale by one party and purchase by another party of a specified amount of a specific financial instrument for a specified price at a designated date, time and place. An index futures contract is an agreement pursuant to which the parties agree to take or make delivery of an amount of cash equal to the difference between the value of the index at the close of the last trading day of the contract and the price at which the index futures contract was originally written. If the offsetting purchase price is less than the original sale price, a Fund realizes a gain; if it is more, a Fund realizes a loss. Conversely, if the offsetting sale price is more than the original purchase price, a Fund realizes a gain; if it is less, a Fund realizes a loss. The transaction costs must also be included in these calculations. There can be no assurance, however, that a Fund will be able to enter into an offsetting transaction with respect to a particular futures contract at a particular time. If a Fund is not able to enter into an offsetting transaction, a Fund will continue to be required to maintain the margin deposits on the futures contract.
Upon entering into a futures contract, a Fund is required to pledge to the broker an amount of cash, U.S. government securities, or other liquid assets equal to a certain percentage of the contract amount (“initial margin deposit”). Futures contracts are marked to market daily and an appropriate payable or receivable for the change in value (“variation margin”) is recorded by a Fund and a cash payment is either made to or received from the broker. Futures held through swaps are marked to market daily, however, a Fund does not make or receive cash payments to/from the broker. Gains or losses are recognized but not considered realized until the contracts expire or are closed and are included in the Statement of Operations.
Options
The purchase or sale of an option by a Fund involves the payment or receipt of a premium by the investor and the corresponding right or obligation, as the case may be, either to purchase or sell the underlying security, commodity, or other instrument for a specific price at a certain time or during a certain period. Purchasing options involves the risk that the underlying instrument will not change price in the manner expected, so the investor loses its premium. Writing options involves potentially greater risk because the investor is exposed to the extent of the actual price movement in the underlying security rather than only the amount of the premium paid (which could result in a potentially unlimited loss). OTC options also involve counterparty credit risk. Purchased options are shown as an asset on the Statement of Assets and Liabilities and are included in Investments in securities. Premiums received for written options are shown as a liability on the Statement of Assets and Liabilities. Realized gains and losses on the sale, expiration or assignment of an option are disclosed on the Statement of Operations.
Forward Foreign Currency Contracts
The Global Equity, International Equity and Multi-Asset and Alternative Funds may enter into forward foreign currency contracts. When entering into a forward foreign currency contract, a Fund agrees to receive or deliver a fixed quantity of foreign currency for an agreed-upon price on an agreed future date. A Fund’s net equity therein, representing unrealized gain or loss on the contracts as measured by the difference between the forward foreign exchange rates at the dates of entry into the contracts and the forward rates at the reporting date, is included in the Statement of Assets and Liabilities. Realized and unrealized gains and losses are included in the Statement of Operations. These instruments may involve market risk, credit risk, or both kinds of risks in excess of the amount recognized in the Statement of Assets and Liabilities. Risks arise from the possible inability of counterparties to meet the terms of their contracts and from the price movements in currencies.
| 146 | Semiannual Report | June 30, 2016 |
Swap Contracts
Swap agreements may include total return, interest rate, securities index, commodity, security, currency exchange rate, credit default index, volatility and variance swaps. Swap agreements typically are two-party contracts entered into primarily by institutional investors for periods ranging from a few weeks to several years. Cleared swaps are transacted through futures commission merchants that are members of central clearing houses with the clearing house serving as a central counterparty similar to transactions in futures contracts. In a standard “swap” transaction, two parties agree to exchange the returns (or differentials in rates of return) earned or realized on particular predetermined investments or instruments. The gross returns to be exchanged or “swapped” between the parties are calculated with respect to a “notional amount” (i.e., the change in the value of a particular dollar amount invested at a particular interest rate, in a particular foreign currency, or in a “basket” of securities representing a particular index). Swap agreements are subject to the risk that the counterparty to the swap will default on its obligation to pay a Fund and the risk that a Fund will not be able to meet its obligations to pay the counterparty to the swap. Swap agreements may also involve fees, commissions or other costs that may reduce a Fund’s gains from a swap agreement or may cause a Fund to lose money. To the extent permitted by its investment policies and restrictions, a Fund may invest in the following types of swaps:
Credit Default Swaps—A Fund may invest in credit default swaps as a means of “buying” credit protection (i.e., attempting to mitigate the risk of default or credit quality deterioration in some portion of a Fund’s holdings) or “selling” credit protection (i.e., attempting to gain exposure to an underlying issuer’s credit quality characteristics without directly investing in that issuer). A credit default swap is a contract between a buyer and a seller of protection against a pre-defined credit event (e.g., a ratings downgrade or default) on an underlying reference obligation, which may be a single debt instrument or baskets or indices of securities. A Fund may be a buyer or seller of a credit default swap. As a seller of protection on credit default swap agreements, a Fund will generally receive from the buyer of protection a fixed rate of income throughout the term of the swap provided that there is no credit event. A Fund adds leverage to its portfolio because the Fund is subject to investment exposure on the notional amount of the swap. The maximum potential amount of future payments that a Fund as a seller of protection could be required to make under a credit default swap agreement equals the notional amount of the agreement. Notional amounts of each individual credit default swap agreement outstanding as of period end for which a Fund is the seller of protection are disclosed in Portfolio of Investments. These potential amounts would be partially offset by any recovery values of the respective referenced obligations, upfront payments received upon entering into the agreement, or net amounts received from the settlement of buy protection credit default swap agreements entered into by a Fund for the same referenced entity or entities. For credit default swap contracts on credit indices, the quoted market prices and resulting values serve as an indicator of the payment performance risk. Increasing market values, in absolute terms when compared to the notional amount of the swap, represent deterioration of the referenced entities’ credit soundness and a greater likelihood or risk of default or other credit event occurring as defined under the terms of the swap.
Interest Rate Swap—A Fund may invest in interest rate swaps to gain or mitigate exposure to changes in interest rates. Interest rate swap agreements involve a commitment between parties to pay either a fixed interest rate or a floating interest rate based on a notional amount of principal. The parties make payments at predetermined intervals throughout the life of the swap. As a payer, a Fund would make the fixed payment and receive the floating payment. As a receiver, a Fund would make the floating payment and receive the fixed payment.
Total Return Swap—A Fund may invest in total return swaps to gain or mitigate exposure to an underlying security, or securities. Total return swap agreements may involve commitments to pay interest in exchange for the return on the underlying security, or securities. At maturity, a net cash flow is exchanged between the parties based on the total return of the underlying security, or securities, less a financing rate. As a receiver, a Fund would receive a payment for a positive return and would make a payment for a negative return. As a payer, a Fund would make a payment for a positive return and would receive a payment for a negative return.
Variance Swap—A Fund may invest in variance swaps in order to gain or mitigate its exposure to an underlying reference entity such as a broad based index. A variance swap is an agreement between two parties to exchange cash flows based on the measured variance of a reference entity. The payer agrees to exchange the fixed rate, or the variance strike price of the reference entity, to the receiver for the floating rate, or realized variance price of the reference entity. At the time the trade is originated, the agreed upon variance strike price is generally set so that the fair value of the swap is near zero. At maturity, a net cash flow is exchanged between the parties based on the difference between the final realized variance price of the swap and the variance strike price multiplied by the notional, or vega amount. As a receiver of the floating rate, a Fund would receive a payment if the final realized variance price is greater than the variance strike price and would make a payment if the final realized variance price is less than the variance strike price. As a payer of the floating rate, a Fund would receive a payment if the final realized variance price is
| June 30, 2016 | William Blair Funds | 147 |
less than the variance strike price and would make a payment if the final realized variance price is greater than the variance strike price.
The following table presents the value of financial derivative instruments, by primary risk exposure, as of June 30, 2016 and their respective location on the Statements of Assets and Liabilities (in thousands):
| | | Assets | | | Liabilities | |
| Primary Risk Exposure | | Statements of Assets
and Liabilities | | Value | | | Statements of Assets
and Liabilities | | Value | |
| Bond | | | | | | | | | | | | | | |
| Interest rate | | Investments in securities, at value | | | $ | 2 | | | None | | | $ | — | |
| Credit | | Receivable for variation margin on centrally cleared swaps | | | | — | | | Payable for variation margin on centrally cleared swaps | | | | 10 | |
| Income | | | | | | | | | | | | | | |
| Interest rate | | Investments in securities, at value | | | | 1 | | | None | | | | — | |
| Low Duration | | | | | | | | | | | | | | |
| Interest rate | | Investments in securities, at value | | | | 2 | | | None | | | | — | |
| Macro Allocation | | | | | | | | | | | | | | |
| Credit | | Receivable for variation margin on centrally cleared swaps | | | | — | | | Payable for variation margin on centrally cleared swaps | | | | 921 | |
| Currency | | Unrealized appreciation on forward currency contracts | | | | 24,581 | | | Unrealized depreciation on forward currency contracts | | | | 19,999 | |
| Equity | | Investments in securities, at value | | | | 5,923 | | | Options written, at value | | | | 5,439 | |
| Equity | | Receivable for variation margin on futures | | | | 11,000 | | | Payable for variation margin on futures | | | | 5,229 | |
| Equity | | Unrealized appreciation on swap contract | | | | 5,085 | | | Unrealized depreciation on swap contract | | | | 10,785 | |
| Interest rate | | Receivable for variation margin on futures | | | | 307 | | | Payable for variation margin on futures | | | | 4,116 | |
| Interest rate | | Unrealized appreciation on swap contract | | | | — | | | Unrealized depreciation on swap contract | | | | 3,342 | |
| | | | | | | | | | | | | | | |
| 148 | Semiannual Report | June 30, 2016 |
The following table indicates the effect of derivatives, by primary risk exposure, on the Statements of Operations for the period ended June 30, 2016 (in thousands):
| | | Realized Gain (Loss) | | | Change in Net Unrealized
Appreciation (Depreciation) | |
| Primary Risk Exposure | | Statements of Operations | | Value | | | Statements of Operations | | Value | |
| Bond | | | | | | | | | | | | | | |
| Interest Rate | | Options | | | $ | — | | | Options | | | $ | — | |
| Credit | | Swaps | | | | (121 | ) | | Swaps | | | | 27 | |
| Income | | | | | | | | | | | | | | |
| Interest Rate | | Options | | | | — | | | Options | | | | — | |
| Low Duration | | | | | | | | | | | | | | |
| Interest Rate | | Options | | | | — | | | Options | | | | — | |
| Macro Allocation | | | | | | | | | | | | | | |
| Credit | | Swaps | | | | 1,067 | | | Swaps | | | | (1,078 | ) |
| Currency | | Forward foreign currency contracts | | | | 24,603 | | | Forward foreign currency contracts | | | | 2,849 | |
| Currency | | Options | | | | 1,233 | | | Options | | | | 1,355 | |
| Equity | | Futures Contracts | | | | (48,906 | ) | | Futures Contracts | | | | 2,674 | |
| Equity | | Options | | | | (6,190 | ) | | Options | | | | (718 | ) |
| Equity | | Swaps | | | | (4,081 | ) | | Swaps | | | | (2,555 | ) |
| Interest rate | | Futures Contracts | | | | (5,745 | ) | | Futures Contracts | | | | (3,340 | ) |
| Interest Rate | | Options | | | | (2,612 | ) | | Options | | | | 795 | |
| Interest Rate | | Swaps | | | | (1,351 | ) | | Swaps | | | | (2,546 | ) |
The following table indicates gross OTC derivative asset exposure, by investment type, included in the Statements of Assets and Liabilities at June 30, 2016 (in thousands):
| | | | | | | | | Net Amounts of | | | Gross Amounts Not Offset | | | | |
| | | | | | Gross Amounts | | | Assets | | | in the Statements | | | | |
| | | Gross | | | Offset in the | | | Presented in the | | | of Assets and Liabilities | | | | |
| | | Amounts of | | | Statements of | | | Statements of | | | | | | Cash | | | | |
| | | Recognized | | | Assets and | | | Assets and | | | Financial | | | Collateral | | | Net | |
| Description | | Assets | | | Liabilities | | | Liabilities | | | Instruments | | | Received | | | Amount | |
| Macro Allocation | | | | | | | | | | | | | | | | | | | | | | | | |
| Citibank N.A. | | | | | | | | | | | | | | | | | | | | | | | | |
| Forward foreign currency contracts | | | $24,581 | | | | $(19,999 | ) | | | $4,582 | | | | $ — | | | | $ — | | | | $4,582 | |
| Swaps | | | 1,915 | | | | (1,444 | ) | | | 471 | | | | — | | | | — | | | | 471 | |
| Credit Suisse | | | | | | | | | | | | | | | | | | | | | | | | |
| Option | | | 208 | | | | — | | | | 208 | | | | — | | | | — | | | | 208 | |
| Swaps | | | 3,064 | | | | (3,064 | ) | | | — | | | | — | | | | — | | | | — | |
| Goldman Sachs | | | | | | | | | | | | | | | | | | | | | | | | |
| Option | | | — | (a) | | | — | | | | — | | | | — | | | | — | | | | — | |
| Swaps | | | 106 | | | | (106 | ) | | | — | | | | — | | | | — | | | | — | |
(a) Amount rounds to less than minimum amount disclosed.
The following table indicates gross OTC derivative liability exposure, by investment type, included in the Statements of Assets and Liabilities at June 30, 2016 (in thousands):
| | | | | | | | | Net Amounts of | | | Gross Amounts Not Offset | | | | |
| | | | | | Gross Amounts | | | Liabilities | | | in the Statements | | | | |
| | | Gross | | | Offset in the | | | Presented in the | | | of Assets and Liabilities | | | | |
| | | Amounts of | | | Statements of | | | Statements of | | | | | | Cash | | | Net Amount | |
| | | Recognized | | | Assets and | | | Assets and | | | Financial | | | Collateral | | | (not less | |
| Description | | Liabilities | | | Liabilities | | | Liabilities | | | Instruments | | | Pledged | | | than zero) | |
| Macro Allocation | | | | | | | | | | | | | | | | | | | | | | | | |
| Citibank N.A. | | | | | | | | | | | | | | | | | | | | | | | | |
| Forward foreign currency contracts | | | $19,999 | | | | $(19,999 | ) | | $ | — | | | $ | — | | | $ | — | | | $ | — | |
| Swaps | | | 1,444 | | | | (1,444 | ) | | | — | | | | — | | | | — | | | | — | |
| Credit Suisse | | | | | | | | | | | | | | | | | | | | | | | | |
| Swaps | | | 3,141 | | | | (3,064 | ) | | | 77 | | | | 9,695 | | | | — | | | | — | |
| Goldman Sachs | | | | | | | | | | | | | | | | | | | | | | | | |
| Swaps | | | 9,542 | | | | (106 | ) | | | 9,436 | | | | 8,941 | | | | — | | | | — | |
| | | |
| June 30, 2016 | William Blair Funds | 149 |
(7) Fund Share Transactions
The following tables summarize the activity in capital shares of each Fund for the period ended June 30, 2016 (in thousands):
| | | | | | | | | | | | | | | | | | | | | | | | Class N | |
| | | | | | | | | | | | Dollars | | | | | | | | | | | | Shares | |
| Fund | | Sales | | | Reinvest | | | Redemptions | | | Total | | | Sales | | | Reinvest | | | Redemptions | | | Total | |
| Growth | | $ | 6,543 | | | $ | — | | | $ | 26,478 | | | $ | (19,935 | ) | | | 555 | | | | — | | | | 2,224 | | | | (1,669 | ) |
| Large Cap Growth | | | 3,474 | | | | — | | | | 1,678 | | | | 1,796 | | | | 358 | | | | — | | | | 170 | | | | 188 | |
| Mid Cap Growth | | | 1,813 | | | | — | | | | 4,378 | | | | (2,565 | ) | | | 169 | | | | — | | | | 407 | | | | (238 | ) |
| Mid Cap Value | | | 568 | | | | — | | | | 73 | | | | 495 | | | | 56 | | | | — | | | | 7 | | | | 49 | |
| Small-Mid Cap Growth | | | 64,575 | | | | — | | | | 31,238 | | | | 33,337 | | | | 3,672 | | | | — | | | | 1,766 | | | | 1,906 | |
| Small-Mid Cap Value | | | 42 | | | | — | | | | 38 | | | | 4 | | | | 4 | | | | — | | | | 3 | | | | 1 | |
| Small Cap Growth | | | 3,816 | | | | — | | | | 14,279 | | | | (10,463 | ) | | | 180 | | | | — | | | | 660 | | | | (480 | ) |
| Small Cap Value | | | 3,600 | | | | — | | | | 7,873 | | | | (4,273 | ) | | | 218 | | | | — | | | | 468 | | | | (250 | ) |
| Global Leaders | | | 905 | | | | — | | | | 351 | | | | 554 | | | | 81 | | | | — | | | | 32 | | | | 49 | |
| International Leaders | | | 234 | | | | — | | | | 64 | | | | 170 | | | | 19 | | | | — | | | | 5 | | | | 14 | |
| International Equity | | | 303 | | | | — | | | | 400 | | | | (97 | ) | | | 23 | | | | — | | | | 30 | | | | (7 | ) |
| International Growth | | | 78,039 | | | | — | | | | 264,495 | | | | (186,456 | ) | | | 3,424 | | | | — | | | | 11,547 | | | | (8,123 | ) |
| International Small Cap Growth | | | 706 | | | | — | | | | 842 | | | | (136 | ) | | | 55 | | | | — | | | | 65 | | | | (10 | ) |
| Emerging Markets Leaders | | | 2,761 | | | | — | | | | 2,585 | | | | 176 | | | | 359 | | | | — | | | | 333 | | | | 26 | |
| Emerging Markets Growth | | | 103 | | | | — | | | | 552 | | | | (449 | ) | | | 10 | | | | — | | | | 53 | | | | (43 | ) |
| Emerging Markets Small Cap Growth | | | 946 | | | | — | | | | 1,408 | | | | (462 | ) | | | 66 | | | | — | | | | 100 | | | | (34 | ) |
| Bond | | | 32,645 | | | | 2,598 | | | | 27,732 | | | | 7,511 | | | | 3,105 | | | | 246 | | | | 2,641 | | | | 710 | |
| Income | | | 4,495 | | | | 475 | | | | 3,301 | | | | 1,669 | | | | 501 | | | | 53 | | | | 368 | | | | 186 | |
| Low Duration | | | 5,154 | | | | 56 | | | | 1,353 | | | | 3,857 | | | | 562 | | | | 6 | | | | 148 | | | | 420 | |
| Macro Allocation | | | 13,613 | | | | — | | | | 61,771 | | | | (48,158 | ) | | | 1,220 | | | | — | | | | 5,509 | | | | (4,289 | ) |
| | | | | | | | | | | | | | | | | | | | | | | | | | | | | | | | | |
| | | | | | | | | | | | | | | | | | | | | | | | Class I | |
| | | | | | | | | | | | Dollars | | | | | | | | | | | | Shares | |
| Fund | | Sales | | | Reinvest | | | Redemptions | | | Total | | | Sales | | | Reinvest | | | Redemptions | | | Total | |
| Growth | | $ | 36,802 | | | $ | — | | | $ | 52,502 | | | $ | (15,700 | ) | | | 2,880 | | | | — | | | | 4,111 | | | | (1,231 | ) |
| Large Cap Growth | | | 19,881 | | | | — | | | | 6,206 | | | | 13,675 | | | | 1,968 | | | | — | | | | 605 | | | | 1,363 | |
| Mid Cap Growth | | | 6,455 | | | | — | | | | 49,264 | | | | (42,809 | ) | | | 573 | | | | — | | | | 4,303 | | | | (3,730 | ) |
| Mid Cap Value | | | 221 | | | | — | | | | 29 | | | | 192 | | | | 22 | | | | — | | | | 3 | | | | 19 | |
| Small-Mid Cap Growth | | | 199,234 | | | | — | | | | 177,424 | | | | 21,810 | | | | 10,969 | | | | — | | | | 9,767 | | | | 1,202 | |
| Small-Mid Cap Value | | | 247 | | | | — | | | | 112 | | | | 135 | | | | 19 | | | | — | | | | 9 | | | | 10 | |
| Small Cap Growth | | | 21,991 | | | | — | | | | 32,917 | | | | (10,926 | ) | | | 982 | | | | — | | | | 1,448 | | | | (466 | ) |
| Small Cap Value | | | 47,614 | | | | — | | | | 94,426 | | | | (46,812 | ) | | | 2,824 | | | | — | | | | 5,733 | | | | (2,909 | ) |
| Global Leaders | | | 5,191 | | | | — | | | | 4,174 | | | | 1,017 | | | | 485 | | | | — | | | | 397 | | | | 88 | |
| International Leaders | | | 12,878 | | | | — | | | | 5,366 | | | | 7,512 | | | | 1,018 | | | | — | | | | 432 | | | | 586 | |
| International Equity | | | 8,749 | | | | — | | | | 608 | | | | 8,141 | | | | 646 | | | | — | | | | 45 | | | | 601 | |
| International Growth | | | 172,370 | | | | — | | | | 284,387 | | | | (112,017 | ) | | | 7,253 | | | | — | | | | 11,765 | | | | (4,512 | ) |
| International Small Cap Growth | | | 37,573 | | | | — | | | | 39,043 | | | | (1,470 | ) | | | 2,916 | | | | — | | | | 2,984 | | | | (68 | ) |
| Emerging Markets Leaders | | | 1,921 | | | | — | | | | 7,950 | | | | (6,029 | ) | | | 257 | | | | — | | | | 1,072 | | | | (815 | ) |
| Emerging Markets Growth | | | 9,858 | | | | — | | | | 37,490 | | | | (27,632 | ) | | | 920 | | | | — | | | | 3,749 | | | | (2,829 | ) |
| Emerging Markets Small Cap Growth | | | 19,800 | | | | — | | | | 18,635 | | | | 1,165 | | | | 1,378 | | | | — | | | | 1,342 | | | | 36 | |
| Bond | | | 91,899 | | | | 4,222 | | | | 29,381 | | | | 66,740 | | | | 8,853 | | | | 404 | | | | 2,824 | | | | 6,433 | |
| Income | | | 3,652 | | | | 863 | | | | 9,506 | | | | (4,991 | ) | | | 410 | | | | 97 | | | | 1,067 | | | | (560 | ) |
| Low Duration | | | 20,477 | | | | 1,086 | | | | 12,508 | | | | 9,055 | | | | 2,234 | | | | 118 | | | | 1,364 | | | | 988 | |
| Macro Allocation | | | 247,938 | | | | — | | | | 305,818 | | | | (57,880 | ) | | | 21,918 | | | | — | | | | 27,173 | | | | (5,255 | ) |
| | | | | | | | | | | | | | | | | | | | | | | | | | | | | | | | | |
| 150 | Semiannual Report | June 30, 2016 |
| | | | | | | | | | | | | | | | | | | | | Institutional Class | |
| | | | | | | | | | | | Dollars | | | | | | | | | | | | Shares | |
| Fund | | Sales | | | Reinvest | | | Redemptions | | | Total | | | Sales | | | Reinvest | | | Redemptions | | | Total | |
| Global Leaders | | $ | 24,571 | | | $ | — | | | $ | 33,105 | | | $ | (8,534 | ) | | | 2,205 | | | | — | | | | 2,987 | | | | (782 | ) |
| International Leaders | | | 77,244 | | | | — | | | | 15 | | | | 77,229 | | | | 6,190 | | | | — | | | | — | | | | 6,190 | |
| Institutional International Equity | | | 69 | | | | — | | | | — | | | | 69 | | | | 6 | | | | — | | | | — | | | | 6 | |
| Institutional International Growth | | | 79,080 | | | | — | | | | 289,068 | | | | (209,988 | ) | | | 5,551 | | | | — | | | | 20,420 | | | | (14,869 | ) |
| International Small Cap Growth | | | 8,240 | | | | — | | | | 15,881 | | | | (7,641 | ) | | | 628 | | | | — | | | | 1,185 | | | | (557 | ) |
| Emerging Markets Leaders | | | 43,798 | | | | — | | | | 19,784 | | | | 24,014 | | | | 5,646 | | | | — | | | | 2,705 | | | | 2,941 | |
| Emerging Markets Growth | | | 174,052 | | | | — | | | | 55,444 | | | | 118,608 | | | | 16,099 | | | | — | | | | 5,408 | | | | 10,691 | |
| Emerging Markets Small Cap Growth | | | 6,211 | | | | — | | | | 973 | | | | 5,238 | | | | 442 | | | | — | | | | 68 | | | | 374 | |
| Bond | | | 4,843 | | | | 1,941 | | | | 6,794 | | | | (10 | ) | | | 466 | | | | 186 | | | | 655 | | | | (3 | ) |
| Low Duration | | | 9,000 | | | | 325 | | | | 5,689 | | | | 3,636 | | | | 982 | | | | 36 | | | | 621 | | | | 397 | |
| Macro Allocation | | | 133,031 | | | | — | | | | 29,482 | | | | 103,549 | | | | 11,812 | | | | — | | | | 2,629 | | | | 9,183 | |
| | | | | | | | | | | | | | | | | | | | | | | | | | | | | | | | | |
| | | Net Change in Net Assets Relating to Fund Share Activity | |
| | | Dollars | | | | | | Shares | |
| Fund | | Sales | | | Reinvest | | | Redemptions | | | Total | | | Sales | | | Reinvest | | | Redemptions | | | Total | |
| Growth | | $ | 43,345 | | | $ | — | | | $ | 78,980 | | | $ | (35,635 | ) | | | 3,435 | | | | — | | | | 6,335 | | | | (2,900 | ) |
| Large Cap Growth | | | 23,355 | | | | — | | | | 7,884 | | | | 15,471 | | | | 2,326 | | | | — | | | | 775 | | | | 1,551 | |
| Mid Cap Growth | | | 8,268 | | | | — | | | | 53,642 | | | | (45,374 | ) | | | 742 | | | | — | | | | 4,710 | | | | (3,968 | ) |
| Mid Cap Value | | | 789 | | | | — | | | | 102 | | | | 687 | | | | 78 | | | | — | | | | 10 | | | | 68 | |
| Small-Mid Cap Growth | | | 263,809 | | | | — | | | | 208,662 | | | | 55,147 | | | | 14,641 | | | | — | | | | 11,533 | | | | 3,108 | |
| Small-Mid Cap Value | | | 289 | | | | — | | | | 150 | | | | 139 | | | | 23 | | | | — | | | | 12 | | | | 11 | |
| Small Cap Growth | | | 25,807 | | | | — | | | | 47,196 | | | | (21,389 | ) | | | 1,162 | | | | — | | | | 2,108 | | | | (946 | ) |
| Small Cap Value | | | 51,214 | | | | — | | | | 102,299 | | | | (51,085 | ) | | | 3,042 | | | | — | | | | 6,201 | | | | (3,159 | ) |
| Global Leaders | | | 30,667 | | | | — | | | | 37,630 | | | | (6,963 | ) | | | 2,771 | | | | — | | | | 3,416 | | | | (645 | ) |
| International Leaders | | | 90,356 | | | | — | | | | 5,445 | | | | 84,911 | | | | 7,227 | | | | — | | | | 437 | | | | 6,790 | |
| International Equity | | | 9,052 | | | | — | | | | 1,008 | | | | 8,044 | | | | 669 | | | | — | | | | 75 | | | | 594 | |
| Institutional International Equity | | | 69 | | | | — | | | | — | | | | 69 | | | | 6 | | | | — | | | | — | | | | 6 | |
| International Growth | | | 250,409 | | | | — | | | | 548,882 | | | | (298,473 | ) | | | 10,677 | | | | — | | | | 23,312 | | | | (12,635 | ) |
| Institutional International Growth | | | 79,080 | | | | — | | | | 289,068 | | | | (209,988 | ) | | | 5,551 | | | | — | | | | 20,420 | | | | (14,869 | ) |
| International Small Cap Growth | | | 46,519 | | | | — | | | | 55,766 | | | | (9,247 | ) | | | 3,599 | | | | — | | | | 4,234 | | | | (635 | ) |
| Emerging Markets Leaders | | | 48,480 | | | | — | | | | 30,319 | | | | 18,161 | | | | 6,262 | | | | — | | | | 4,110 | | | | 2,152 | |
| Emerging Markets Growth | | | 184,013 | | | | — | | | | 93,486 | | | | 90,527 | | | | 17,029 | | | | — | | | | 9,210 | | | | 7,819 | |
| Emerging Markets Small Cap Growth | | | 26,957 | | | | — | | | | 21,016 | | | | 5,941 | | | | 1,886 | | | | — | | | | 1,510 | | | | 376 | |
| Bond | | | 129,387 | | | | 8,761 | | | | 63,907 | | | | 74,241 | | | | 12,424 | | | | 836 | | | | 6,120 | | | | 7,140 | |
| Income | | | 8,147 | | | | 1,338 | | | | 12,807 | | | | (3,322 | ) | | | 911 | | | | 150 | | | | 1,435 | | | | (374 | ) |
| Low Duration | | | 34,631 | | | | 1,467 | | | | 19,550 | | | | 16,548 | | | | 3,778 | | | | 160 | | | | 2,133 | | | | 1,805 | |
| Macro Allocation | | | 394,582 | | | | — | | | | 397,071 | | | | (2,489 | ) | | | 34,950 | | | | — | | | | 35,311 | | | | (361 | ) |
| | | | | | | | | | | | | | | | | | | | | | | | | | | | | | | | | |
| June 30, 2016 | William Blair Funds | 151 |
The following tables summarize the activity in capital shares of each Fund for the year ended December 31, 2015 (in thousands):
| | | Class N | |
| | | Dollars | | | Shares | |
| Fund | | Sales | | | Reinvest | | | Redemptions | | | Total | | | Sales | | | Reinvest | | | Redemptions | | | Total | |
| Growth | | $ | 20,920 | | | $ | 18,415 | | | $ | 155,588 | | | $ | (116,253 | ) | | | 1,510 | | | | 1,477 | | | | 11,153 | | | | (8,166 | ) |
| Large Cap Growth | | | 3,479 | | | | 966 | | | | 2,462 | | | | 1,983 | | | | 315 | | | | 96 | | | | 226 | | | | 185 | |
| Mid Cap Growth | | | 5,086 | | | | 4,873 | | | | 16,859 | | | | (6,900 | ) | | | 358 | | | | 436 | | | | 1,203 | | | | (409 | ) |
| Mid Cap Value | | | 632 | | | | 151 | | | | 127 | | | | 656 | | | | 50 | | | | 15 | | | | 10 | | | | 55 | |
| Small-Mid Cap Growth | | | 113,394 | | | | 8,500 | | | | 28,874 | | | | 93,020 | | | | 5,722 | | | | 460 | | | | 1,469 | | | | 4,713 | |
| Small-Mid Cap Value | | | 72 | | | | 7 | | | | 100 | | | | (21 | ) | | | 5 | | | | 1 | | | | 7 | | | | (1 | ) |
| Small Cap Growth | | | 11,167 | | | | 9,324 | | | | 41,312 | | | | (20,821 | ) | | | 440 | | | | 416 | | | | 1,662 | | | | (806 | ) |
| Small Cap Value | | | 5,971 | | | | 107 | | | | 10,763 | | | | (4,685 | ) | | | 344 | | | | 6 | | | | 616 | | | | (266 | ) |
| Global Leaders | | | 766 | | | | 246 | | | | 275 | | | | 737 | | | | 61 | | | | 21 | | | | 22 | | | | 60 | |
| International Leaders | | | 226 | | | | 2 | | | | 8 | | | | 220 | | | | 18 | | | | — | | | | 1 | | | | 17 | |
| International Equity | | | 279 | | | | 26 | | | | 830 | | | | (525 | ) | | | 19 | | | | 2 | | | | 57 | | | | (36 | ) |
| International Growth | | | 359,131 | | | | 9,388 | | | | 312,397 | | | | 56,122 | | | | 14,223 | | | | 378 | | | | 12,310 | | | | 2,291 | |
| International Small Cap Growth | | | 2,310 | | | | 205 | | | | 5,668 | | | | (3,153 | ) | | | 176 | | | | 15 | | | | 439 | | | | (248 | ) |
| Emerging Markets Leaders | | | 6,520 | | | | 2 | | | | 6,488 | | | | 34 | | | | 751 | | | | — | | | | 746 | | | | 5 | |
| Emerging Markets Growth | | | 2,105 | | | | 97 | | | | 3,386 | | | | (1,184 | ) | | | 164 | | | | 9 | | | | 289 | | | | (116 | ) |
| Emerging Markets Small Cap Growth | | | 5,302 | | | | 473 | | | | 3,847 | | | | 1,928 | | | | 319 | | | | 32 | | | | 240 | | | | 111 | |
| Bond | | | 137,843 | | | | 1,819 | | | | 14,345 | | | | 125,317 | | | | 13,112 | | | | 173 | | | | 1,372 | | | | 11,913 | |
| Income | | | 13,105 | | | | 972 | | | | 14,256 | | | | (179 | ) | | | 1,439 | | | | 107 | | | | 1,574 | | | | (28 | ) |
| Low Duration | | | 1,525 | | | | 49 | | | | 3,744 | | | | (2,170 | ) | | | 164 | | | | 5 | | | | 403 | | | | (234 | ) |
| Macro Allocation | | | 180,974 | | | | 898 | | | | 162,486 | | | | 19,386 | | | | 14,474 | | | | 79 | | | | 13,669 | | | | 884 | |
| | | | | | | | | | | | | | | | | | | | | | | | | | | | | | | | | |
| | | | | | | | | | | | | | | | | | | | | | | | Class I | |
| | | | | | | | | | | | Dollars | | | | | | | | | | | | Shares | |
| Fund | | Sales | | | Reinvest | | | Redemptions | | | Total | | | Sales | | | Reinvest | | | Redemptions | | | Total | |
| Growth | | $ | 101,867 | | | $ | 77,422 | | | $ | 125,622 | | | $ | 53,667 | | | | 6,840 | | | | 5,761 | | | | 8,641 | | | | 3,960 | |
| Large Cap Growth | | | 13,673 | | | | 4,410 | | | | 8,280 | | | | 9,803 | | | | 1,213 | | | | 418 | | | | 736 | | | | 895 | |
| Mid Cap Growth | | | 28,076 | | | | 34,703 | | | | 159,407 | | | | (96,628 | ) | | | 1,907 | | | | 2,974 | | | | 10,676 | | | | (5,795 | ) |
| Mid Cap Value | | | 29 | | | | 422 | | | | 1,620 | | | | (1,169 | ) | | | 2 | | | | 43 | | | | 124 | | | | (79 | ) |
| Small-Mid Cap Growth | | | 314,765 | | | | 48,836 | | | | 122,703 | | | | 240,898 | | | | 15,422 | | | | 2,545 | | | | 6,027 | | | | 11,940 | |
| Small-Mid Cap Value | | | 363 | | | | 129 | | | | 402 | | | | 90 | | | | 27 | | | | 10 | | | | 30 | | | | 7 | |
| Small Cap Growth | | | 82,937 | | | | 19,650 | | | | 175,942 | | | | (73,355 | ) | | | 3,105 | | | | 816 | | | | 6,445 | | | | (2,524 | ) |
| Small Cap Value | | | 168,226 | | | | 2,938 | | | | 103,403 | | | | 67,761 | | | | 9,544 | | | | 173 | | | | 5,798 | | | | 3,919 | |
| Global Leaders | | | 11,928 | | | | 2,130 | | | | 19,402 | | | | (5,344 | ) | | | 963 | | | | 185 | | | | 1,586 | | | | (438 | ) |
| International Leaders | | | 4,408 | | | | 96 | | | | 1,095 | | | | 3,409 | | | | 340 | | | | 7 | | | | 83 | | | | 264 | |
| International Equity | | | 5,376 | | | | 680 | | | | 10,778 | | | | (4,722 | ) | | | 365 | | | | 49 | | | | 730 | | | | (316 | ) |
| International Growth | | | 477,894 | | | | 27,497 | | | | 523,541 | | | | (18,150 | ) | | | 17,911 | | | | 1,082 | | | | 19,687 | | | | (694 | ) |
| International Small Cap Growth | | | 62,196 | | | | 6,895 | | | | 116,983 | | | | (47,892 | ) | | | 4,698 | | | | 511 | | | | 8,807 | | | | (3,598 | ) |
| Emerging Markets Leaders | | | 15,832 | | | | 113 | | | | 5,667 | | | | 10,278 | | | | 1,800 | | | | 15 | | | | 709 | | | | 1,106 | |
| Emerging Markets Growth | | | 46,581 | | | | 1,207 | | | | 55,599 | | | | (7,811 | ) | | | 3,709 | | | | 109 | | | | 4,716 | | | | (898 | ) |
| Emerging Markets Small Cap Growth | | | 107,086 | | | | 4,486 | | | | 51,918 | | | | 59,654 | | | | 6,516 | | | | 302 | | | | 3,162 | | | | 3,656 | |
| Bond | | | 136,906 | | | | 4,457 | | | | 45,989 | | | | 95,374 | | | | 13,136 | | | | 426 | | | | 4,406 | | | | 9,156 | |
| Income | | | 10,900 | | | | 1,714 | | | | 13,153 | | | | (539 | ) | | | 1,216 | | | | 191 | | | | 1,466 | | | | (59 | ) |
| Low Duration | | | 41,356 | | | | 1,978 | | | | 38,076 | | | | 5,258 | | | | 4,452 | | | | 213 | | | | 4,113 | | | | 552 | |
| Macro Allocation | | | 1,054,314 | | | | 8,797 | | | | 456,003 | | | | 607,108 | | | | 85,643 | | | | 772 | | | | 38,103 | | | | 48,312 | |
| | | | | | | | | | | | | | | | | | | | | | | | | | | | | | | | | |
| 152 | Semiannual Report | June 30, 2016 |
| | | | | | | | | | | | | | | | | | | | | Institutional Class | |
| | | | | | | | | | | | Dollars | | | | | | | | | | | | Shares | |
| Fund | | Sales | | | Reinvest | | | Redemptions | | | Total | | | Sales | | | Reinvest | | | Redemptions | | | Total | |
| Global Leaders | | $ | 29,091 | | | $ | 6,610 | | | $ | 1,181 | | | $ | 34,520 | | | | 2,398 | | | | 574 | | | | 95 | | | | 2,877 | |
| International Leaders | | | 19,418 | | | | 675 | | | | (1 | ) | | | 20,094 | | | | 1,480 | | | | 53 | | | | — | | | | 1,533 | |
| Institutional International Equity | | | 2,425 | | | | 156 | | | | 1,154 | | | | 1,427 | | | | 187 | | | | 13 | | | | 91 | | | | 109 | |
| Institutional International Growth | | | 297,180 | | | | 28,849 | | | | 305,026 | | | | 21,003 | | | | 18,912 | | | | 1,922 | | | | 19,237 | | | | 1,597 | |
| International Small Cap Growth | | | 13,840 | | | | 4,777 | | | | 61,465 | | | | (42,848 | ) | | | 1,040 | | | | 352 | | | | 4,482 | | | | (3,090 | ) |
| Emerging Markets Leaders | | | 58,828 | | | | 434 | | | | 28,442 | | | | 30,820 | | | | 6,983 | | | | 56 | | | | 3,358 | | | | 3,681 | |
| Emerging Markets Growth | | | 266,522 | | | | 7,305 | | | | 221,791 | | | | 52,036 | | | | 22,032 | | | | 656 | | | | 17,376 | | | | 5,312 | |
| Emerging Markets Small Cap Growth | | | 10,974 | | | | 4,600 | | | | 2,911 | | | | 12,663 | | | | 660 | | | | 309 | | | | 186 | | | | 783 | |
| Bond | | | 25,382 | | | | 3,259 | | | | 18,526 | | | | 10,115 | | | | 2,443 | | | | 311 | | | | 1,756 | | | | 998 | |
| Low Duration | | | 4,653 | | | | 1,069 | | | | 50,966 | | | | (45,244 | ) | | | 497 | | | | 115 | | | | 5,489 | | | | (4,877 | ) |
| Macro Allocation | | | 324,009 | | | | 4,325 | | | | 27,615 | | | | 300,719 | | | | 26,463 | | | | 379 | | | | 2,365 | | | | 24,477 | |
| | | | | | | | | | | | | | | | | | | | | | | | | | | | | | | | | |
| | | Net Change in Net Assets Relating to Fund Share Activity | |
| | | Dollars | | | Shares | |
| Fund | | Sales | | | Reinvest | | | Redemptions | | | Total | | | Sales | | | Reinvest | | | Redemptions | | | Total | |
| Growth | | $ | 122,787 | | | $ | 95,837 | | | $ | 281,210 | | | $ | (62,586 | ) | | | 8,350 | | | | 7,238 | | | | 19,794 | | | | (4,206 | ) |
| Large Cap Growth | | | 17,152 | | | | 5,376 | | | | 10,742 | | | | 11,786 | | | | 1,528 | | | | 514 | | | | 962 | | | | 1,080 | |
| Mid Cap Growth | | | 33,162 | | | | 39,576 | | | | 176,266 | | | | (103,528 | ) | | | 2,265 | | | | 3,410 | | | | 11,879 | | | | (6,204 | ) |
| Mid Cap Value | | | 661 | | | | 573 | | | | 1,747 | | | | (513 | ) | | | 52 | | | | 58 | | | | 134 | | | | (24 | ) |
| Small-Mid Cap Growth | | | 428,159 | | | | 57,336 | | | | 151,577 | | | | 333,918 | | | | 21,144 | | | | 3,005 | | | | 7,496 | | | | 16,653 | |
| Small-Mid Cap Value | | | 435 | | | | 136 | | | | 502 | | | | 69 | | | | 32 | | | | 11 | | | | 37 | | | | 6 | |
| Small Cap Growth | | | 94,104 | | | | 28,974 | | | | 217,254 | | | | (94,176 | ) | | | 3,545 | | | | 1,232 | | | | 8,107 | | | | (3,330 | ) |
| Small Cap Value | | | 174,197 | | | | 3,045 | | | | 114,166 | | | | 63,076 | | | | 9,888 | | | | 179 | | | | 6,414 | | | | 3,653 | |
| Global Leaders | | | 41,785 | | | | 8,986 | | | | 20,858 | | | | 29,913 | | | | 3,422 | | | | 780 | | | | 1,703 | | | | 2,499 | |
| International Leaders | | | 24,052 | | | | 773 | | | | 1,102 | | | | 23,723 | | | | 1,838 | | | | 60 | | | | 84 | | | | 1,814 | |
| International Equity | | | 5,655 | | | | 706 | | | | 11,608 | | | | (5,247 | ) | | | 384 | | | | 51 | | | | 787 | | | | (352 | ) |
| Institutional International Equity | | | 2,425 | | | | 156 | | | | 1,154 | | | | 1,427 | | | | 187 | | | | 13 | | | | 91 | | | | 109 | |
| International Growth | | | 837,025 | | | | 36,885 | | | | 835,938 | | | | 37,972 | | | | 32,134 | | | | 1,460 | | | | 31,997 | | | | 1,597 | |
| Institutional International Growth | | | 297,180 | | | | 28,849 | | | | 305,026 | | | | 21,003 | | | | 18,912 | | | | 1,922 | | | | 19,237 | | | | 1,597 | |
| International Small Cap Growth | | | 78,346 | | | | 11,877 | | | | 184,116 | | | | (93,893 | ) | | | 5,914 | | | | 878 | | | | 13,728 | | | | (6,936 | ) |
| Emerging Markets Leaders | | | 81,180 | | | | 549 | | | | 40,597 | | | | 41,132 | | | | 9,534 | | | | 71 | | | | 4,813 | | | | 4,792 | |
| Emerging Markets Growth | | | 315,208 | | | | 8,609 | | | | 280,776 | | | | 43,041 | | | | 25,905 | | | | 774 | | | | 22,381 | | | | 4,298 | |
| Emerging Markets Small Cap Growth | | | 123,362 | | | | 9,559 | | | | 58,676 | | | | 74,245 | | | | 7,495 | | | | 643 | | | | 3,588 | | | | 4,550 | |
| Bond | | | 300,131 | | | | 9,535 | | | | 78,860 | | | | 230,806 | | | | 28,691 | | | | 910 | | | | 7,534 | | | | 22,067 | |
| Income | | | 24,005 | | | | 2,686 | | | | 27,409 | | | | (718 | ) | | | 2,655 | | | | 298 | | | | 3,040 | | | | (87 | ) |
| Low Duration | | | 47,534 | | | | 3,096 | | | | 92,786 | | | | (42,156 | ) | | | 5,113 | | | | 333 | | | | 10,005 | | | | (4,559 | ) |
| Macro Allocation | | | 1,559,297 | | | | 14,020 | | | | 646,104 | | | | 927,213 | | | | 126,580 | | | | 1,230 | | | | 54,137 | | | | 73,673 | |
| | | | | | | | | | | | | | | | | | | | | | | | | | | | | | | | | |
| June 30, 2016 | William Blair Funds | 153 |
Financial Highlights
Growth Fund
| | Class N | |
| | | (unaudited)
Period Ended
June 30, | | | Years Ended December 31, | |
| | | | 2016 | | | 2015 | | | 2014 | | | 2013 | | | 2012 | | | 2011 | |
| Net asset value, beginning of year | | | $ | 12.52 | | | $ | 13.55 | | | $ | 14.79 | | | $ | 12.05 | | | $ | 10.73 | | | $ | 11.28 | |
| Income (loss) from investment operations: | | | | | | | | | | | | | | | | | | | | | | | | | |
| Net investment income (loss) | | | | (0.02 | ) | | | (0.04 | ) | | | (0.07 | ) | | | (0.07 | ) | | | (0.01 | ) | | | (0.04 | ) |
| Net realized and unrealized gain (loss) on investments | | | | (0.22 | ) | | | 0.75 | | | | 1.03 | | | | 4.25 | | | | 1.69 | | | | (0.19 | ) |
| Total from investment operations | | | | (0.24 | ) | | | 0.71 | | | | 0.96 | | | | 4.18 | | | | 1.68 | | | | (0.23 | ) |
| Less distributions from: | | | | | | | | | | | | | | | | | | | | | | | | | |
| Net investment income | | | | — | | | | — | | | | — | | | | — | | | | 0.00 | ^ | | | — | |
| Net realized gain | | | | — | | | | 1.74 | | | | 2.20 | | | | 1.44 | | | | 0.36 | | | | 0.32 | |
| Total distributions | | | | — | | | | 1.74 | | | | 2.20 | | | | 1.44 | | | | 0.36 | | | | 0.32 | |
| Net asset value, end of year | | | $ | 12.28 | | | $ | 12.52 | | | $ | 13.55 | | | $ | 14.79 | | | $ | 12.05 | | | $ | 10.73 | |
| Total return (%)* | | | | (1.92 | ) | | | 5.31 | | | | 6.59 | | | | 35.00 | | | | 15.67 | | | | (1.93 | ) |
| Ratios to average daily net assets (%):** | | | | | | | | | | | | | | | | | | | | | | | | | |
| Expenses | | | | 1.24 | | | | 1.19 | | | | 1.18 | | | | 1.19 | | | | 1.20 | | | | 1.21 | |
| Net investment income (loss) | | | | (0.29 | ) | | | (0.29 | ) | | | (0.50 | ) | | | (0.51 | ) | | | (0.06 | ) | | | (0.37 | ) |
| Class N net assets at end of year (in thousands) | | | $ | 126,357 | | | $ | 149,754 | | | $ | 272,765 | | | $ | 291,326 | | | $ | 248,121 | | | $ | 204,476 | |
| Portfolio turnover rate (%)* | | | | 76 | | | | 78 | | | | 100 | | | | 52 | | | | 73 | | | | 59 | |
| | | | | | | | | | | | | | | | | | | | | | | | | | |
| | | Class I | |
| | | (unaudited)
Period Ended
June 30, | | | Years Ended December 31, | |
| | | | 2016 | | | 2015 | | | 2014 | | | 2013 | | | 2012 | | | 2011 | |
| Net asset value, beginning of year | | | $ | 13.50 | | | $ | 14.43 | | | $ | 15.56 | | | $ | 12.58 | | | $ | 11.18 | | | $ | 11.71 | |
| Income (loss) from investment operations: | | | | | | | | | | | | | | | | | | | | | | | | | |
| Net investment income (loss) | | | | (0.00 | )^ | | | 0.01 | | | | (0.03 | ) | | | (0.03 | ) | | | 0.04 | | | | 0.00 | ^ |
| Net realized and unrealized gain (loss) on investments | | | | (0.24 | ) | | | 0.80 | | | | 1.10 | | | | 4.45 | | | | 1.75 | | | | (0.20 | ) |
| Total from investment operations | | | | (0.24 | ) | | | 0.81 | | | | 1.07 | | | | 4.42 | | | | 1.79 | | | | (0.20 | ) |
| Less distributions from: | | | | | | | | | | | | | | | | | | | | | | | | | |
| Net investment income | | | | — | | | | — | | | | — | | | | 0.00 | ^ | | | 0.03 | | | | 0.01 | |
| Net realized gain | | | | — | | | | 1.74 | | | | 2.20 | | | | 1.44 | | | | 0.36 | | | | 0.32 | |
| Total distributions | | | | — | | | | 1.74 | | | | 2.20 | | | | 1.44 | | | | 0.39 | | | | 0.33 | |
| Net asset value, end of year | | | $ | 13.26 | | | $ | 13.50 | | | $ | 14.43 | | | $ | 15.56 | | | $ | 12.58 | | | $ | 11.18 | |
| Total return (%)* | | | | (1.78 | ) | | | 5.69 | | | | 6.96 | | | | 35.43 | | | | 16.03 | | | | (1.60 | ) |
| Ratios to average daily net assets (%):** | | | | | | | | | | | | | | | | | | | | | | | | | |
| Expenses | | | | 0.89 | | | | 0.89 | | | | 0.86 | | | | 0.85 | | | | 0.89 | | | | 0.86 | |
| Net investment income (loss) | | | | 0.07 | | | | 0.06 | | | | (0.20 | ) | | | (0.17 | ) | | | 0.30 | | | | (0.03 | ) |
| Class I net assets at end of year (in thousands) | | | $ | 668,090 | | | $ | 696,744 | | | $ | 688,038 | | | $ | 623,225 | | | $ | 468,124 | | | $ | 362,266 | |
| Portfolio turnover rate (%)* | | | | 76 | | | | 78 | | | | 100 | | | | 52 | | | | 73 | | | | 59 | |
| * | Not annualized for periods less than a year. |
| ** | Annualized for periods less than a year. |
| ^ | Amount is less than $0.005 per share. |
Note: Net investment income (loss) per share is based on the average shares outstanding during the year.
Performance cited represents past performance. Past performance does not guarantee future results and current performance may be lower or higher than the data quoted. Results shown are annual returns, which assume reinvestment of dividends and capital gains. Investment returns and principal will fluctuate and you may have a gain or loss when you sell shares. For the most current month-end performance information, please call 1-800-742-7272 or visit our Web site at www.williamblairfunds.com.
See accompanying Notes to Financial Statements.
| 154 | Semiannual Report | June 30, 2016 |
Financial Highlights
Large Cap Growth Fund
| | | Class N | |
| | | (unaudited)
Period Ended
June 30, | | | Years Ended December 31, | |
| | | | 2016 | | | 2015 | | | 2014 | | | 2013 | | | 2012 | | | 2011 | |
| Net asset value, beginning of year | | | $ | 10.15 | | | $ | 10.46 | | | $ | 10.03 | | | $ | 8.14 | | | $ | 6.88 | | | $ | 7.14 | |
| Income (loss) from investment operations: | | | | | | | | | | | | | | | | | | | | | | | | | |
| Net investment income (loss) | | | | 0.00 | ^ | | | (0.02 | ) | | | (0.02 | ) | | | (0.03 | ) | | | (0.02 | ) | | | (0.01 | ) |
| Net realized and unrealized gain (loss) on investments | | | | (0.04 | ) | | | 0.75 | | | | 1.46 | | | | 2.70 | | | | 1.28 | | | | (0.25 | ) |
| Total from investment operations | | | | (0.04 | ) | | | 0.73 | | | | 1.44 | | | | 2.67 | | | | 1.26 | | | | (0.26 | ) |
| Less distributions from: | | | | | | | | | | | | | | | | | | | | | | | | | |
| Net investment income | | | | — | | | | — | | | | — | | | | — | | | | — | | | | — | |
| Net realized gain | | | | — | | | | 1.04 | | | | 1.01 | | | | 0.78 | | | | — | | | | — | |
| Total distributions | | | | — | | | | 1.04 | | | | 1.01 | | | | 0.78 | | | | — | | | | — | |
| Net asset value, end of year | | | $ | 10.11 | | | $ | 10.15 | | | $ | 10.46 | | | $ | 10.03 | | | $ | 8.14 | | | $ | 6.88 | |
| Total return (%)* | | | | (0.39 | ) | | | 7.04 | | | | 14.29 | | | | 33.00 | | | | 18.31 | | | | (3.64 | ) |
| Ratios to average daily net assets (%):** | | | | | | | | | | | | | | | | | | | | | | | | | |
| Expenses, net of waivers and reimbursements | | | | 1.05 | | | | 1.07 | | | | 1.13 | | | | 1.20 | | | | 1.20 | | | | 1.20 | |
| Expenses, before waivers and reimbursements | | | | 1.25 | | | | 1.28 | | | | 1.31 | | | | 1.46 | | | | 1.57 | | | | 1.51 | |
| Net investment income (loss), net of waivers and reimbursements | | | | 0.06 | | | | (0.22 | ) | | | (0.23 | ) | | | (0.36 | ) | | | (0.21 | ) | | | (0.13 | ) |
| Net investment income (loss), before waivers and reimbursements | | | | (0.14 | ) | | | (0.43 | ) | | | (0.41 | ) | | | (0.62 | ) | | | (0.58 | ) | | | (0.44 | ) |
| Class N net assets at end of year (in thousands) | | | $ | 12,305 | | | $ | 10,443 | | | $ | 8,831 | | | $ | 6,678 | | | $ | 4,238 | | | $ | 3,387 | |
| Portfolio turnover rate (%)* | | | | 34 | | | | 38 | | | | 50 | | | | 48 | | | | 50 | | | | 67 | |
| | | | | | | | | | | | | | | | | | | | | | | | | | |
| | | Class I | |
| | | (unaudited)
Period Ended
June 30, | | | Years Ended December 31, | |
| | | | 2016 | | | 2015 | | | 2014 | | | 2013 | | | 2012 | | | 2011 | |
| Net asset value, beginning of year | | | $ | 10.58 | | | $ | 10.84 | | | $ | 10.33 | | | $ | 8.35 | | | $ | 7.03 | | | $ | 7.30 | |
| Income (loss) from investment operations: | | | | | | | | | | | | | | | | | | | | | | | | | |
| Net investment income (loss) | | | | 0.02 | | | | (0.00 | )^ | | | 0.00 | ^ | | | (0.01 | ) | | | 0.00 | ^ | | | 0.01 | |
| Net realized and unrealized gain (loss) on investments | | | | (0.05 | ) | | | 0.78 | | | | 1.52 | | | | 2.77 | | | | 1.32 | | | | (0.27 | ) |
| Total from investment operations | | | | (0.03 | ) | | | 0.78 | | | | 1.52 | | | | 2.76 | | | | 1.32 | | | | (0.26 | ) |
| Less distributions from: | | | | | | | | | | | | | | | | | | | | | | | | | |
| Net investment income | | | | — | | | | — | | | | — | | | | — | | | | — | | | | 0.01 | |
| Net realized gain | | | | — | | | | 1.04 | | | | 1.01 | | | | 0.78 | | | | — | | | | — | |
| Total distributions | | | | — | | | | 1.04 | | | | 1.01 | | | | 0.78 | | | | — | | | | 0.01 | |
| Net asset value, end of year | | | $ | 10.55 | | | $ | 10.58 | | | $ | 10.84 | | | $ | 10.33 | | | $ | 8.35 | | | $ | 7.03 | |
| Total return (%)* | | | | (0.28 | ) | | | 7.26 | | | | 14.65 | | | | 33.24 | | | | 18.78 | | | | (3.54 | ) |
| Ratios to average daily net assets (%):** | | | | | | | | | | | | | | | | | | | | | | | | | |
| Expenses, net of waivers and reimbursements | | | | 0.80 | | | | 0.82 | | | | 0.88 | | | | 0.95 | | | | 0.95 | | | | 0.95 | |
| Expenses, before waivers and reimbursements | | | | 0.94 | | | | 0.95 | | | | 1.00 | | | | 1.11 | | | | 1.23 | | | | 1.16 | |
| Net investment income (loss), net of waivers and reimbursements | | | | 0.32 | | | | 0.03 | | | | 0.02 | | | | (0.11 | ) | | | 0.03 | | | | 0.11 | |
| Net investment income (loss), before waivers and reimbursements | | | | 0.18 | | | | (0.10 | ) | | | (0.10 | ) | | | (0.27 | ) | | | (0.25 | ) | | | (0.10 | ) |
| Class I net assets at end of year (in thousands) | | | $ | 73,268 | | | $ | 59,038 | | | $ | 50,778 | | | $ | 40,513 | | | $ | 24,175 | | | $ | 21,562 | |
| Portfolio turnover rate (%)* | | | | 34 | | | | 38 | | | | 50 | | | | 48 | | | | 50 | | | | 67 | |
| * | Not annualized for periods less than a year. |
| ** | Annualized for periods less than a year. |
| ^ | Amount is less than $0.005 per share. |
Note: Net investment income (loss) per share is based on the average shares outstanding during the year.
Performance cited represents past performance. Past performance does not guarantee future results and current performance may be lower or higher than the data quoted. Results shown are annual returns, which assume reinvestment of dividends and capital gains. Investment returns and principal will fluctuate and you may have a gain or loss when you sell shares. For the most current month-end performance information, please call 1-800-742-7272 or visit our Web site at www.williamblairfunds.com.
| June 30, 2016 | William Blair Funds | 155 |
Financial Highlights
Mid Cap Growth Fund
| | | Class N | |
| | | (unaudited)
Period Ended
June 30, | | | Years Ended December 31, | |
| | | | 2016 | | | 2015 | | | 2014 | | | 2013 | | | 2012 | | | 2011 | |
| Net asset value, beginning of year | | | $ | 11.28 | | | $ | 14.20 | | | $ | 15.21 | | | $ | 12.65 | | | $ | 11.66 | | | $ | 12.50 | |
| Income (loss) from investment operations: | | | | | | | | | | | | | | | | | | | | | | | | | |
| Net investment income (loss) | | | | (0.03 | ) | | | (0.09 | ) | | | (0.12 | ) | | | (0.13 | ) | | | (0.02 | ) | | | (0.08 | ) |
| Net realized and unrealized gain (loss) on investments | | | | (0.05 | ) | | | 0.04 | | | | 1.26 | | | | 3.74 | | | | 1.29 | | | | 0.25 | |
| Total from investment operations | | | | (0.08 | ) | | | (0.05 | ) | | | 1.14 | | | | 3.61 | | | | 1.27 | | | | 0.17 | |
| Less distributions from: | | | | | | | | | | | | | | | | | | | | | | | | | |
| Net investment income | | | | — | | | | — | | | | — | | | | — | | | | — | | | | — | |
| Net realized gain | | | | — | | | | 2.87 | | | | 2.15 | | | | 1.05 | | | | 0.28 | | | | 1.01 | |
| Total distributions | | | | — | | | | 2.87 | | | | 2.15 | | | | 1.05 | | | | 0.28 | | | | 1.01 | |
| Net asset value, end of year | | | $ | 11.20 | | | $ | 11.28 | | | $ | 14.20 | | | $ | 15.21 | | | $ | 12.65 | | | $ | 11.66 | |
| Total return (%)* | | | | (0.71 | ) | | | (0.20 | ) | | | 7.53 | | | | 28.77 | | | | 10.90 | | | | 1.65 | |
| Ratios to average daily net assets (%):** | | | | | | | | | | | | | | | | | | | | | | | | | |
| Expenses, net of waivers and reimbursements | | | | 1.30 | | | | 1.32 | | | | 1.35 | | | | 1.35 | | | | 1.35 | | | | 1.35 | |
| Expenses, before waivers and reimbursements | | | | 1.48 | | | | 1.43 | | | | 1.35 | | | | 1.42 | | | | 1.42 | | | | 1.43 | |
| Net investment income (loss), net of waivers and reimbursements | | | | (0.57 | ) | | | (0.65 | ) | | | (0.80 | ) | | | (0.90 | ) | | | (0.15 | ) | | | (0.65 | ) |
| Net investment income (loss), before waivers and reimbursements | | | | (0.75 | ) | | | (0.76 | ) | | | (0.80 | ) | | | (0.97 | ) | | | (0.22 | ) | | | (0.73 | ) |
| Class N net assets at end of year (in thousands) | | | $ | 22,247 | | | $ | 25,105 | | | $ | 37,413 | | | $ | 41,849 | | | $ | 40,940 | | | $ | 30,093 | |
| Portfolio turnover rate (%)* | | | | 79 | | | | 65 | | | | 81 | | | | 83 | | | | 62 | | | | 70 | |
| | | Class I | |
| | | (unaudited)
Period Ended
June 30, | | | Years Ended December 31, | |
| | | | 2016 | | | 2015 | | | 2014 | | | 2013 | | | 2012 | | | 2011 | |
| Net asset value, beginning of year | | | $ | 11.76 | | | $ | 14.65 | | | $ | 15.58 | | | $ | 12.91 | | | $ | 11.87 | | | $ | 12.68 | |
| Income (loss) from investment operations: | | | | | | | | | | | | | | | | | | | | | | | | | |
| Net investment income (loss) | | | | (0.02 | ) | | | (0.06 | ) | | | (0.09 | ) | | | (0.10 | ) | | | 0.03 | | | | (0.05 | ) |
| Net realized and unrealized gain (loss) on investments | | | | (0.05 | ) | | | 0.04 | | | | 1.31 | | | | 3.82 | | | | 1.31 | | | | 0.25 | |
| Total from investment operations | | | | (0.07 | ) | | | (0.02 | ) | | | 1.22 | | | | 3.72 | | | | 1.34 | | | | 0.20 | |
| Less distributions from: | | | | | | | | | | | | | | | | | | | | | | | | | |
| Net investment income | | | | — | | | | — | | | | — | | | | — | | | | 0.02 | | | | — | |
| Net realized gain | | | | — | | | | 2.87 | | | | 2.15 | | | | 1.05 | | | | 0.28 | | | | 1.01 | |
| Total distributions | | | | — | | | | 2.87 | | | | 2.15 | | | | 1.05 | | | | 0.30 | | | | 1.01 | |
| Net asset value, end of year | | | $ | 11.69 | | | $ | 11.76 | | | $ | 14.65 | | | $ | 15.58 | | | $ | 12.91 | | | $ | 11.87 | |
| Total return (%)* | | | | (0.60 | ) | | | 0.00 | | | | 7.87 | | | | 29.04 | | | | 11.30 | | | | 1.86 | |
| Ratios to average daily net assets (%):** | | | | | | | | | | | | | | | | | | | | | | | | | |
| Expenses, net of waivers and reimbursements | | | | 1.05 | | | | 1.07 | | | | 1.10 | | | | 1.10 | | | | 1.07 | | | | 1.10 | |
| Expenses, before waivers and reimbursements | | | | 1.21 | | | | 1.14 | | | | 1.10 | | | | 1.15 | | | | 1.07 | | | | 1.13 | |
| Net investment income (loss), net of waivers and reimbursements | | | | (0.33 | ) | | | (0.41 | ) | | | (0.55 | ) | | | (0.65 | ) | | | 0.19 | | | | (0.42 | ) |
| Net investment income (loss), before waivers and reimbursements | | | | (0.49 | ) | | | (0.48 | ) | | | (0.55 | ) | | | (0.70 | ) | | | 0.19 | | | | (0.45 | ) |
| Class I net assets at end of year (in thousands) | | | $ | 129,939 | | | $ | 174,617 | | | $ | 302,373 | | | $ | 385,779 | | | $ | 329,295 | | | $ | 115,661 | |
| Portfolio turnover rate (%)* | | | | 79 | | | | 65 | | | | 81 | | | | 83 | | | | 62 | | | | 70 | |
| * | Not annualized for periods less than a year. |
| ** | Annualized for periods less than a year. |
Note: Net investment income (loss) per share is based on the average shares outstanding during the year.
Performance cited represents past performance. Past performance does not guarantee future results and current performance may be lower or higher than the data quoted. Results shown are annual returns, which assume reinvestment of dividends and capital gains. Investment returns and principal will fluctuate and you may have a gain or loss when you sell shares. For the most current month-end performance information, please call 1-800-742-7272 or visit our Web site at www.williamblairfunds.com.
| 156 | Semiannual Report | June 30, 2016 |
Financial Highlights
Mid Cap Value Fund
| | | Class N | |
| | | (unaudited)
Period Ended
June 30, | | | Years Ended December 31, | |
| | | | 2016 | | | 2015 | | | 2014 | | | 2013 | | | 2012 | | | 2011 | |
| Net asset value, beginning of year | | | $ | 9.92 | | | $ | 12.88 | | | $ | 13.39 | | | $ | 11.39 | | | $ | 10.48 | | | $ | 10.75 | |
| Income (loss) from investment operations: | | | | | | | | | | | | | | | | | | | | | | | | | |
| Net investment income (loss) | | | | 0.03 | | | | 0.07 | | | | 0.03 | | | | 0.05 | | | | 0.08 | | | | 0.12 | |
| Net realized and unrealized gain (loss) on investments | | | | 0.58 | | | | (0.36 | ) | | | 1.40 | | | | 3.50 | | | | 1.34 | | | | (0.17 | ) |
| Total from investment operations | | | | 0.61 | | | | (0.29 | ) | | | 1.43 | | | | 3.55 | | | | 1.42 | | | | (0.05 | ) |
| Less distributions from: | | | | | | | | | | | | | | | | | | | | | | | | | |
| Net investment income | | | | — | | | | 0.03 | | | | 0.04 | | | | 0.06 | | | | 0.08 | | | | 0.09 | |
| Net realized gain | | | | — | | | | 2.64 | | | | 1.90 | | | | 1.49 | | | | 0.43 | | | | 0.13 | |
| Total distributions | | | | — | | | | 2.67 | | | | 1.94 | | | | 1.55 | | | | 0.51 | | | | 0.22 | |
| Net asset value, end of year | | | $ | 10.53 | | | $ | 9.92 | | | $ | 12.88 | | | $ | 13.39 | | | $ | 11.39 | | | $ | 10.48 | |
| Total return (%)* | | | | 6.15 | | | | (2.13 | ) | | | 10.83 | | | | 31.46 | | | | 13.54 | | | | (0.34 | ) |
| Ratios to average daily net assets (%):** | | | | | | | | | | | | | | | | | | | | | | | | | |
| Expenses, net of waivers and reimbursements | | | | 1.30 | | | | 1.32 | | | | 1.35 | | | | 1.35 | | | | 1.35 | | | | 1.35 | |
| Expenses, before waivers and reimbursements | | | | 5.08 | | | | 4.14 | | | | 3.77 | | | | 3.37 | | | | 3.40 | | | | 3.85 | |
| Net investment income (loss), net of waivers and reimbursements | | | | 0.57 | | | | 0.59 | | | | 0.23 | | | | 0.36 | | | | 0.70 | | | | 1.15 | |
| Net investment income (loss), before waivers and reimbursements | | | | (3.21 | ) | | | (2.23 | ) | | | (2.19 | ) | | | (1.66 | ) | | | (1.35 | ) | | | (1.35 | ) |
| Class N net assets at end of year (in thousands) | | | $ | 1,251 | | | $ | 694 | | | $ | 189 | | | $ | 232 | | | $ | 79 | | | $ | 58 | |
| Portfolio turnover rate (%)* | | | | 61 | | | | 53 | | | | 33 | | | | 42 | | | | 63 | | | | 69 | |
| | | Class I | |
| | | (unaudited)
Period Ended
June 30, | | | Years Ended December 31, | |
| | | | 2016 | | | 2015 | | | 2014 | | | 2013 | | | 2012 | | | 2011 | |
| Net asset value, beginning of year | | | $ | 9.94 | | | $ | 12.88 | | | $ | 13.40 | | | $ | 11.39 | | | $ | 10.48 | | | $ | 10.76 | |
| Income (loss) from investment operations: | | | | | | | | | | | | | | | | | | | | | | | | | |
| Net investment income (loss) | | | | 0.04 | | | | 0.08 | | | | 0.07 | | | | 0.08 | | | | 0.10 | | | | 0.13 | |
| Net realized and unrealized gain (loss) on investments | | | | 0.58 | | | | (0.32 | ) | | | 1.39 | | | | 3.51 | | | | 1.35 | | | | (0.17 | ) |
| Total from investment operations | | | | 0.62 | | | | (0.24 | ) | | | 1.46 | | | | 3.59 | | | | 1.45 | | | | (0.04 | ) |
| Less distributions from: | | | | | | | | | | | | | | | | | | | | | | | | | |
| Net investment income | | | | — | | | | 0.06 | | | | 0.08 | | | | 0.09 | | | | 0.11 | | | | 0.11 | |
| Net realized gain | | | | — | | | | 2.64 | | | | 1.90 | | | | 1.49 | | | | 0.43 | | | | 0.13 | |
| Total distributions | | | | — | | | | 2.70 | | | | 1.98 | | | | 1.58 | | | | 0.54 | | | | 0.24 | |
| Net asset value, end of year | | | $ | 10.56 | | | $ | 9.94 | | | $ | 12.88 | | | $ | 13.40 | | | $ | 11.39 | | | $ | 10.48 | |
| Total return (%)* | | | | 6.24 | | | | (1.73 | ) | | | 11.04 | | | | 31.82 | | | | 13.77 | | | | (0.25 | ) |
| Ratios to average daily net assets (%):** | | | | | | | | | | | | | | | | | | | | | | | | | |
| Expenses, net of waivers and reimbursements | | | | 1.05 | | | | 1.07 | | | | 1.10 | | | | 1.10 | | | | 1.10 | | | | 1.10 | |
| Expenses, before waivers and reimbursements | | | | 4.75 | | | | 3.77 | | | | 3.08 | | | | 3.04 | | | | 3.13 | | | | 3.60 | |
| Net investment income (loss), net of waivers and reimbursements | | | | 0.76 | | | | 0.65 | | | | 0.49 | | | | 0.59 | | | | 0.92 | | | | 1.20 | |
| Net investment income (loss), before waivers and reimbursements | | | | (2.94 | ) | | | (2.05 | ) | | | (1.49 | ) | | | (1.35 | ) | | | (1.11 | ) | | | (1.30 | ) |
| Class I net assets at end of year (in thousands) | | | $ | 2,298 | | | $ | 1,974 | | | $ | 3,579 | | | $ | 4,225 | | | $ | 4,058 | | | $ | 4,515 | |
| Portfolio turnover rate (%)* | | | | 61 | | | | 53 | | | | 33 | | | | 42 | | | | 63 | | | | 69 | |
| * | Not annualized for periods less than a year. |
| ** | Annualized for periods less than a year. |
Note: Net investment income (loss) per share is based on the average shares outstanding during the year.
Performance cited represents past performance. Past performance does not guarantee future results and current performance may be lower or higher than the data quoted. Results shown are annual returns, which assume reinvestment of dividends and capital gains. Investment returns and principal will fluctuate and you may have a gain or loss when you sell shares. For the most current month-end performance information, please call 1-800-742-7272 or visit our Web site at www.williamblairfunds.com.
| June 30, 2016 | William Blair Funds | 157 |
Financial Highlights
Small-Mid Cap Growth Fund
| | | Class N | |
| | | (unaudited)
Period Ended
June 30, | | | Years Ended December 31, | |
| | | | 2016 | | | 2015 | | | 2014 | | | 2013 | | | 2012 | | | 2011 | |
| Net asset value, beginning of year | | | $ | 18.53 | | | $ | 18.72 | | | $ | 18.80 | | | $ | 14.21 | | | $ | 13.00 | | | $ | 14.40 | |
| Income (loss) from investment operations: | | | | | | | | | | | | | | | | | | | | | | | | | |
| Net investment income (loss) | | | | (0.05 | ) | | | (0.10 | ) | | | (0.12 | ) | | | (0.15 | ) | | | 0.02 | | | | (0.11 | ) |
| Net realized and unrealized gain (loss) on investments | | | | 0.23 | | | | 0.93 | | | | 1.68 | | | | 6.01 | | | | 1.57 | | | | 0.03 | |
| Total from investment operations | | | | 0.18 | | | | 0.83 | | | | 1.56 | | | | 5.86 | | | | 1.59 | | | | (0.08 | ) |
| Less distributions from: | | | | | | | | | | | | | | | | | | | | | | | | | |
| Net investment income | | | | — | | | | — | | | | — | | | | — | | | | 0.02 | | | | — | |
| Net realized gain | | | | — | | | | 1.02 | | | | 1.64 | | | | 1.27 | | | | 0.36 | | | | 1.32 | |
| Total distributions | | | | — | | | | 1.02 | | | | 1.64 | | | | 1.27 | | | | 0.38 | | | | 1.32 | |
| Net asset value, end of year | | | $ | 18.71 | | | $ | 18.53 | | | $ | 18.72 | | | $ | 18.80 | | | $ | 14.21 | | | $ | 13.00 | |
| Total return (%)* | | | | 0.97 | | | | 4.47 | | | | 8.33 | | | | 41.49 | | | | 12.20 | | | | (0.27 | ) |
| Ratios to average daily net assets (%):** | | | | | | | | | | | | | | | | | | | | | | | | | |
| Expenses, net of waivers and reimbursements | | | | 1.35 | | | | 1.35 | | | | 1.35 | | | | 1.35 | | | | 1.35 | | | | 1.35 | |
| Expenses, before waivers and reimbursements | | | | 1.42 | | | | 1.42 | | | | 1.38 | | | | 1.46 | | | | 1.47 | | | | 1.46 | |
| Net investment income (loss), net of waivers and reimbursements | | | | (0.59 | ) | | | (0.51 | ) | | | (0.63 | ) | | | (0.88 | ) | | | 0.16 | | | | (0.77 | ) |
| Net investment income (loss), before waivers and reimbursements | | | | (0.66 | ) | | | (0.58 | ) | | | (0.66 | ) | | | (0.99 | ) | | | 0.04 | | | | (0.88 | ) |
| Class N net assets at end of year (in thousands) | | | $ | 206,875 | | | $ | 169,595 | | | $ | 83,047 | | | $ | 73,207 | | | $ | 42,015 | | | $ | 34,123 | |
| Portfolio turnover rate (%)* | | | | 58 | | | | 44 | | | | 49 | | | | 53 | | | | 82 | | | | 76 | |
| | | Class I | |
| | | (unaudited)
Period Ended
June 30, | | | Years Ended December 31, | |
| | | | 2016 | | | 2015 | | | 2014 | | | 2013 | | | 2012 | | | 2011 | |
| Net asset value, beginning of year | | | $ | 19.25 | | | $ | 19.36 | | | $ | 19.34 | | | $ | 14.55 | | | $ | 13.32 | | | $ | 14.68 | |
| Income (loss) from investment operations: | | | | | | | | | | | | | | | | | | | | | | | | | |
| Net investment income (loss) | | | | (0.03 | ) | | | (0.06 | ) | | | (0.08 | ) | | | (0.11 | ) | | | 0.07 | | | | (0.08 | ) |
| Net realized and unrealized gain (loss) on investments | | | | 0.24 | | | | 0.97 | | | | 1.74 | | | | 6.17 | | | | 1.58 | | | | 0.04 | |
| Total from investment operations | | | | 0.21 | | | | 0.91 | | | | 1.66 | | | | 6.06 | | | | 1.65 | | | | (0.04 | ) |
| Less distributions from: | | | | | | | | | | | | | | | | | | | | | | | | | |
| Net investment income | | | | — | | | | — | | | | — | | | | — | | | | 0.06 | | | | — | |
| Net realized gain | | | | — | | | | 1.02 | | | | 1.64 | | | | 1.27 | | | | 0.36 | | | | 1.32 | |
| Total distributions | | | | — | | | | 1.02 | | | | 1.64 | | | | 1.27 | | | | 0.42 | | | | 1.32 | |
| Net asset value, end of year | | | $ | 19.46 | | | $ | 19.25 | | | $ | 19.36 | | | $ | 19.34 | | | $ | 14.55 | | | $ | 13.32 | |
| Total return (%)* | | | | 1.09 | | | | 4.74 | | | | 8.62 | | | | 41.89 | | | | 12.36 | | | | 0.01 | |
| Ratios to average daily net assets (%):** | | | | | | | | | | | | | | | | | | | | | | | | | |
| Expenses, net of waivers and reimbursements | | | | 1.10 | | | | 1.10 | | | | 1.10 | | | | 1.10 | | | | 1.10 | | | | 1.10 | |
| Expenses, before waivers and reimbursements | | | | 1.17 | | | | 1.15 | | | | 1.15 | | | | 1.10 | | | | 1.20 | | | | 1.12 | |
| Net investment income (loss), net of waivers and reimbursements | | | | (0.35 | ) | | | (0.28 | ) | | | (0.38 | ) | | | (0.62 | ) | | | 0.48 | | | | (0.54 | ) |
| Net investment income (loss), before waivers and reimbursements | | | | (0.42 | ) | | | (0.33 | ) | | | (0.43 | ) | | | (0.62 | ) | | | 0.38 | | | | (0.56 | ) |
| Class I net assets at end of year (in thousands) | | | $ | 1,053,994 | | | $ | 1,019,544 | | | $ | 793,789 | | | $ | 617,374 | | | $ | 349,345 | | | $ | 219,474 | |
| Portfolio turnover rate (%)* | | | | 58 | | | | 44 | | | | 49 | | | | 53 | | | | 82 | | | | 76 | |
| * | Not annualized for periods less than a year. |
| ** | Annualized for periods less than a year. |
Note: Net investment income (loss) per share is based on the average shares outstanding during the year.
Performance cited represents past performance. Past performance does not guarantee future results and current performance may be lower or higher than the data quoted. Results shown are annual returns, which assume reinvestment of dividends and capital gains. Investment returns and principal will fluctuate and you may have a gain or loss when you sell shares. For the most current month-end performance information, please call 1-800-742-7272 or visit our Web site at www.williamblairfunds.com.
| 158 | Semiannual Report | June 30, 2016 |
Financial Highlights
Small-Mid Cap Value Fund
| | | Class N | |
| | | (unaudited)
Period Ended
June 30, | | | Years Ended December 31, | |
| | | | 2016 | | | 2015 | | | 2014 | | | 2013 | | | 2012 | | | 2011(a) | |
| Net asset value, beginning of year | | | $ | 12.54 | | | $ | 13.63 | | | $ | 14.11 | | | $ | 11.29 | | | $ | 10.45 | | | $ | 10.00 | |
| Income (loss) from investment operations: | | | | | | | | | | | | | | | | | | | | | | | | | |
| Net investment income (loss) | | | | 0.03 | | | | 0.04 | | | | 0.00 | ^ | | | 0.00 | ^ | | | 0.10 | | | | 0.00 | ^ |
| Net realized and unrealized gain (loss) on investments | | | | 0.74 | | | | (0.47 | ) | | | 0.64 | | | | 4.06 | | | | 1.15 | | | | 0.45 | |
| Total from investment operations | | | | 0.77 | | | | (0.43 | ) | | | 0.64 | | | | 4.06 | | | | 1.25 | | | | 0.45 | |
| Less distributions from: | | | | | | | | | | | | | | | | | | | | | | | | | |
| Net investment income | | | | — | | | | 0.01 | | | | — | | | | — | | | | 0.09 | | | | — | |
| Net realized gain | | | | — | | | | 0.65 | | | | 1.12 | | | | 1.24 | | | | 0.32 | | | | — | |
| Total distributions | | | | — | | | | 0.66 | | | | 1.12 | | | | 1.24 | | | | 0.41 | | | | — | |
| Net asset value, end of year | | | $ | 13.31 | | | $ | 12.54 | | | $ | 13.63 | | | $ | 14.11 | | | $ | 11.29 | | | $ | 10.45 | |
| Total return (%)* | | | | 6.14 | | | | (3.13 | ) | | | 4.66 | | | | 36.29 | | | | 11.95 | | | | 4.50 | |
| Ratios to average daily net assets (%):** | | | | | | | | | | | | | | | | | | | | | | | | | |
| Expenses, net of waivers and reimbursements | | | | 1.35 | | | | 1.37 | | | | 1.40 | | | | 1.40 | | | | 1.40 | | | | 1.40 | |
| Expenses, before waivers and reimbursements | | | | 4.33 | | | | 3.93 | | | | 4.50 | | | | 4.50 | | | | 6.34 | | | | 18.68 | |
| Net investment income (loss), net of waivers and reimbursements | | | | 0.41 | | | | 0.27 | | | | 0.02 | | | | (0.04 | ) | | | 0.87 | | | | 0.53 | |
| Net investment income (loss), before waivers and reimbursements | | | | (2.57 | ) | | | (2.29 | ) | | | (3.08 | ) | | | (3.14 | ) | | | (4.07 | ) | | | (16.75 | ) |
| Class N net assets at end of year (in thousands) | | | $ | 915 | | | $ | 855 | | | $ | 946 | | | $ | 1,205 | | | $ | 950 | | | $ | 860 | |
| Portfolio turnover rate (%)* | | | | 36 | | | | 35 | | | | 69 | | | | 61 | | | | 56 | | | | 1 | |
| | | Class I | |
| | | (unaudited)
Period Ended
June 30, | | | Years Ended December 31, | |
| | | | 2016 | | | 2015 | | | 2014 | | | 2013 | | | 2012 | | | 2011 | |
| Net asset value, beginning of year | | | $ | 12.54 | | | $ | 13.63 | | | $ | 14.12 | | | $ | 11.29 | | | $ | 10.45 | | | $ | 10.00 | |
| Income (loss) from investment operations: | | | | | | | | | | | | | | | | | | | | | | | | | |
| Net investment income (loss) | | | | 0.04 | | | | 0.07 | | | | 0.05 | | | | 0.03 | | | | 0.13 | | | | 0.00 | ^ |
| Net realized and unrealized gain (loss) on investments | | | | 0.75 | | | | (0.47 | ) | | | 0.63 | | | | 4.07 | | | | 1.15 | | | | 0.45 | |
| Total from investment operations | | | | 0.79 | | | | (0.40 | ) | | | 0.68 | | | | 4.10 | | | | 1.28 | | | | 0.45 | |
| Less distributions from: | | | | | | | | | | | | | | | | | | | | | | | | | |
| Net investment income | | | | — | | | | 0.04 | | | | 0.05 | | | | 0.03 | | | | 0.12 | | | | — | |
| Net realized gain | | | | — | | | | 0.65 | | | | 1.12 | | | | 1.24 | | | | 0.32 | | | | — | |
| Total distributions | | | | — | | | | 0.69 | | | | 1.17 | | | | 1.27 | | | | 0.44 | | | | — | |
| Net asset value, end of year | | | $ | 13.33 | | | $ | 12.54 | | | $ | 13.63 | | | $ | 14.12 | | | $ | 11.29 | | | $ | 10.45 | |
| Total return (%)* | | | | 6.30 | | | | (2.86 | ) | | | 4.96 | | | | 36.69 | | | | 12.22 | | | | 4.50 | |
| Ratios to average daily net assets (%):** | | | | | | | | | | | | | | | | | | | | | | | | | |
| Expenses, net of waivers and reimbursements | | | | 1.10 | | | | 1.12 | | | | 1.15 | | | | 1.15 | | | | 1.15 | | | | 1.15 | |
| Expenses, before waivers and reimbursements | | | | 4.12 | | | | 3.72 | | | | 4.16 | | | | 4.24 | | | | 5.88 | | | | 18.43 | |
| Net investment income (loss), net of waivers and reimbursements | | | | 0.67 | | | | 0.52 | | | | 0.36 | | | | 0.21 | | | | 1.12 | | | | 0.79 | |
| Net investment income (loss), before waivers and reimbursements | | | | (2.35 | ) | | | (2.08 | ) | | | (2.65 | ) | | | (2.88 | ) | | | (3.61 | ) | | | (16.49 | ) |
| Class I net assets at end of year (in thousands) | | | $ | 3,557 | | | $ | 3,220 | | | $ | 3,407 | | | $ | 2,073 | | | $ | 1,442 | | | $ | 1,296 | |
| Portfolio turnover rate (%)* | | | | 36 | | | | 35 | | | | 69 | | | | 61 | | | | 56 | | | | 1 | |
| (a) | For the period from December 15, 2011 (Commencement of Operations) to December 31, 2011. |
| * | Not annualized for periods less than a year. |
| ** | Annualized for periods less than a year. |
| ^ | Amount is less than $0.005 per share. |
Note: Net investment income (loss) per share is based on the average shares outstanding during the year.
Performance cited represents past performance. Past performance does not guarantee future results and current performance may be lower or higher than the data quoted. Results shown are annual returns, which assume reinvestment of dividends and capital gains. Investment returns and principal will fluctuate and you may have a gain or loss when you sell shares. For the most current month-end performance information, please call 1-800-742-7272 or visit our Web site at www.williamblairfunds.com.
| June 30, 2016 | William Blair Funds | 159 |
Financial Highlights
Small Cap Growth Fund
| | | Class N | |
| | | (unaudited)
Period Ended
June 30, | | | Years Ended December 31, | |
| | | | 2016 | | | 2015 | | | 2014 | | | 2013 | | | 2012 | | | 2011 | |
| Net asset value, beginning of year | | | $ | 22.47 | | | $ | 25.61 | | | $ | 30.02 | | | $ | 23.68 | | | $ | 20.13 | | | $ | 23.22 | |
| Income (loss) from investment operations: | | | | | | | | | | | | | | | | | | | | | | | | | |
| Net investment income (loss) | | | | (0.09 | ) | | | (0.22 | ) | | | (0.30 | ) | | | (0.26 | ) | | | (0.22 | ) | | | (0.28 | ) |
| Net realized and unrealized gain (loss) on investments | | | | 0.97 | | | | (0.93 | ) | | | 1.02 | | | | 12.52 | | | | 3.87 | | | | (2.81 | ) |
| Total from investment operations | | | | 0.88 | | | | (1.15 | ) | | | 0.72 | | | | 12.26 | | | | 3.65 | | | | (3.09 | ) |
| Less distributions from: | | | | | | | | | | | | | | | | | | | | | | | | | |
| Net investment income | | | | — | | | | — | | | | — | | | | — | | | | — | | | | — | |
| Net realized gain | | | | — | | | | 1.99 | | | | 5.13 | | | | 5.92 | | | | 0.10 | | | | — | |
| Total distributions | | | | — | | | | 1.99 | | | | 5.13 | | | | 5.92 | | | | 0.10 | | | | — | |
| Net asset value, end of year | | | $ | 23.35 | | | $ | 22.47 | | | $ | 25.61 | | | $ | 30.02 | | | $ | 23.68 | | | $ | 20.13 | |
| Total return (%)* | | | | 3.92 | | | | (4.44 | ) | | | 2.62 | | | | 52.76 | | | | 18.15 | | | | (13.31 | ) |
| Ratios to average daily net assets (%):** | | | | | | | | | | | | | | | | | | | | | | | | | |
| Expenses, net of waivers and reimbursements | | | | 1.50 | | | | 1.50 | | | | 1.50 | | | | 1.50 | | | | 1.50 | | | | 1.50 | |
| Expenses, before waivers and reimbursements | | | | 1.60 | | | | 1.59 | | | | 1.56 | | | | 1.57 | | | | 1.59 | | | | 1.59 | |
| Net investment income (loss), net of waivers and reimbursements | | | | (0.80 | ) | | | (0.85 | ) | | | (1.00 | ) | | | (0.87 | ) | | | (0.96 | ) | | | (1.25 | ) |
| Net investment income (loss), before waivers and reimbursements | | | | (0.90 | ) | | | (0.94 | ) | | | (1.06 | ) | | | (0.94 | ) | | | (1.05 | ) | | | (1.34 | ) |
| Class N net assets at end of year (in thousands) | | | $ | 105,104 | | | $ | 111,944 | | | $ | 148,201 | | | $ | 211,562 | | | $ | 130,382 | | | $ | 202,341 | |
| Portfolio turnover rate (%)* | | | | 107 | | | | 91 | | | | 82 | | | | 91 | | | | 89 | | | | 97 | |
| | | Class I | |
| | | (unaudited)
Period Ended
June 30, | | | Years Ended December 31, | |
| | | | 2016 | | | 2015 | | | 2014 | | | 2013 | | | 2012 | | | 2011 | |
| Net asset value, beginning of year | | | $ | 24.17 | | | $ | 27.32 | | | $ | 31.61 | | | $ | 24.66 | | | $ | 20.91 | | | $ | 24.07 | |
| Income (loss) from investment operations: | | | | | | | | | | | | | | | | | | | | | | | | | |
| Net investment income (loss) | | | | (0.06 | ) | | | (0.17 | ) | | | (0.23 | ) | | | (0.19 | ) | | | (0.16 | ) | | | (0.23 | ) |
| Net realized and unrealized gain (loss) on investments | | | | 1.04 | | | | (0.99 | ) | | | 1.07 | | | | 13.06 | | | | 4.01 | | | | (2.93 | ) |
| Total from investment operations | | | | 0.98 | | | | (1.16 | ) | | | 0.84 | | | | 12.87 | | | | 3.85 | | | | (3.16 | ) |
| Less distributions from: | | | | | | | | | | | | | | | | | | | | | | | | | |
| Net investment income | | | | — | | | | — | | | | — | | | | — | | | | — | | | | — | |
| Net realized gain | | | | — | | | | 1.99 | | | | 5.13 | | | | 5.92 | | | | 0.10 | | | | — | |
| Total distributions | | | | — | | | | 1.99 | | | | 5.13 | | | | 5.92 | | | | 0.10 | | | | — | |
| Net asset value, end of year | | | $ | 25.15 | | | $ | 24.17 | | | $ | 27.32 | | | $ | 31.61 | | | $ | 24.66 | | | $ | 20.91 | |
| Total return (%)* | | | | 4.05 | | | | (4.20 | ) | | | 2.87 | | | | 53.13 | | | | 18.43 | | | | (13.13 | ) |
| Ratios to average daily net assets (%):** | | | | | | | | | | | | | | | | | | | | | | | | | |
| Expenses, net of waivers and reimbursements | | | | 1.25 | | | | 1.25 | | | | 1.25 | | | | 1.25 | | | | 1.25 | | | | 1.25 | |
| Expenses, before waivers and reimbursements | | | | 1.30 | | | | 1.30 | | | | 1.30 | | | | 1.27 | | | | 1.35 | | | | 1.35 | |
| Net investment income (loss), net of waivers and reimbursements | | | | (0.55 | ) | | | (0.61 | ) | | | (0.75 | ) | | | (0.63 | ) | | | (0.71 | ) | | | (1.00 | ) |
| Net investment income (loss), before waivers and reimbursements | | | | (0.60 | ) | | | (0.66 | ) | | | (0.80 | ) | | | (0.65 | ) | | | (0.81 | ) | | | (1.10 | ) |
| Class I net assets at end of year (in thousands) | | | $ | 260,083 | | | $ | 261,269 | | | $ | 364,241 | | | $ | 415,797 | | | $ | 266,431 | | | $ | 352,397 | |
| Portfolio turnover rate (%)* | | | | 107 | | | | 91 | | | | 82 | | | | 91 | | | | 89 | | | | 97 | |
| * | Not annualized for periods less than a year. |
| ** | Annualized for periods less than a year. |
Note: Net investment income (loss) per share is based on the average shares outstanding during the year.
Performance cited represents past performance. Past performance does not guarantee future results and current performance may be lower or higher than the data quoted. Results shown are annual returns, which assume reinvestment of dividends and capital gains. Investment returns and principal will fluctuate and you may have a gain or loss when you sell shares. For the most current month-end performance information, please call 1-800-742-7272 or visit our Web site at www.williamblairfunds.com.
| 160 | Semiannual Report | June 30, 2016 |
Financial Highlights
Small Cap Value Fund
| | | Class N | |
| | | (unaudited)
Period Ended
June 30, | | | Years Ended December 31, | |
| | | | 2016 | | | 2015 | | | 2014 | | | 2013 | | | 2012 | | | 2011 | |
| Net asset value, beginning of year | | | $ | 16.68 | | | $ | 17.76 | | | $ | 17.63 | | | $ | 13.65 | | | $ | 12.26 | | | $ | 13.71 | |
| Income (loss) from investment operations: | | | | | | | | | | | | | | | | | | | | | | | | | |
| Net investment income (loss) | | | | 0.03 | | | | 0.02 | | | | (0.03 | ) | | | (0.05 | ) | | | 0.10 | | | | 0.00 | ^ |
| Net realized and unrealized gain (loss) on investments | | | | 1.11 | | | | (1.05 | ) | | | 0.81 | | | | 5.32 | | | | 1.43 | | | | (0.97 | ) |
| Total from investment operations | | | | 1.14 | | | | (1.03 | ) | | | 0.78 | | | | 5.27 | | | | 1.53 | | | | (0.97 | ) |
| Less distributions from: | | | | | | | | | | | | | | | | | | | | | | | | | |
| Net investment income | | | | — | | | | — | | | | — | | | | — | | | | 0.08 | | | | 0.02 | |
| Net realized gain | | | | — | | | | 0.05 | | | | 0.65 | | | | 1.29 | | | | 0.06 | | | | 0.46 | |
| Return of capital | | | | — | | | | — | | | | — | | | | — | | | | — | | | | 0.00 | ^ |
| Total distributions | | | | — | | | | 0.05 | | | | 0.65 | | | | 1.29 | | | | 0.14 | | | | 0.48 | |
| Net asset value, end of year | | | $ | 17.82 | | | $ | 16.68 | | | $ | 17.76 | | | $ | 17.63 | | | $ | 13.65 | | | $ | 12.26 | |
| Total return (%)* | | | | 6.83 | | | | (5.77 | ) | | | 4.49 | | | | 38.91 | | | | 12.49 | | | | (6.95 | ) |
| Ratios to average daily net assets (%):** | | | | | | | | | | | | | | | | | | | | | | | | | |
| Expenses, net of waivers and reimbursements | | | | 1.50 | | | | 1.50 | | | | 1.50 | | | | 1.49 | | | | 1.43 | | | | 1.38 | |
| Expenses, before waivers and reimbursements | | | | 1.54 | | | | 1.54 | | | | 1.53 | | | | 1.55 | | | | 1.60 | | | | 1.60 | |
| Net investment income (loss), net of waivers and reimbursements | | | | 0.32 | | | | 0.14 | | | | (0.17 | ) | | | (0.33 | ) | | | 0.78 | | | | (0.01 | ) |
| Net investment income (loss), before waivers and reimbursements | | | | 0.28 | | | | 0.10 | | | | (0.20 | ) | | | (0.39 | ) | | | 0.61 | | | | (0.23 | ) |
| Class N net assets at end of year (in thousands) | | | $ | 31,153 | | | $ | 33,351 | | | $ | 40,223 | | | $ | 55,464 | | | $ | 39,084 | | | $ | 40,712 | |
| Portfolio turnover rate (%)* | | | | 37 | | | | 30 | | | | 39 | | | | 51 | | | | 51 | | | | 65 | |
| | | Class I | |
| | | (unaudited)
Period Ended
June 30, | | | Years Ended December 31, | |
| | | | 2016 | | | 2015 | | | 2014 | | | 2013 | | | 2012 | | | 2011 | |
| Net asset value, beginning of year | | | $ | 17.08 | | | $ | 18.17 | | | $ | 18.00 | | | $ | 13.88 | | | $ | 12.47 | | | $ | 13.93 | |
| Income (loss) from investment operations: | | | | | | | | | | | | | | | | | | | | | | | | | |
| Net investment income (loss) | | | | 0.05 | | | | 0.08 | | | | 0.02 | | | | (0.01 | ) | | | 0.14 | | | | 0.03 | |
| Net realized and unrealized gain (loss) on investments | | | | 1.14 | | | | (1.08 | ) | | | 0.82 | | | | 5.42 | | | | 1.45 | | | | (0.98 | ) |
| Total from investment operations | | | | 1.19 | | | | (1.00 | ) | | | 0.84 | | | | 5.41 | | | | 1.59 | | | | (0.95 | ) |
| Less distributions from: | | | | | | | | | | | | | | | | | | | | | | | | | |
| Net investment income | | | | — | | | | 0.04 | | | | 0.02 | | | | 0.00 | ^ | | | 0.12 | | | | 0.03 | |
| Net realized gain | | | | — | | | | 0.05 | | | | 0.65 | | | | 1.29 | | | | 0.06 | | | | 0.46 | |
| Return of capital | | | | — | | | | — | | | | — | | | | — | | | | — | | | | 0.02 | |
| Total distributions | | | | — | | | | 0.09 | | | | 0.67 | | | | 1.29 | | | | 0.18 | | | | 0.51 | |
| Net asset value, end of year | | | $ | 18.27 | | | $ | 17.08 | | | $ | 18.17 | | | $ | 18.00 | | | $ | 13.88 | | | $ | 12.47 | |
| Total return (%)* | | | | 6.97 | | | | (5.47 | ) | | | 4.73 | | | | 39.31 | | | | 12.73 | | | | (6.68 | ) |
| Ratios to average daily net assets (%):** | | | | | | | | | | | | | | | | | | | | | | | | | |
| Expenses, net of waivers and reimbursements | | | | 1.25 | | | | 1.24 | | | | 1.23 | | | | 1.24 | | | | 1.18 | | | | 1.14 | |
| Expenses, before waivers and reimbursements | | | | 1.29 | | | | 1.24 | | | | 1.23 | | | | 1.25 | | | | 1.29 | | | | 1.30 | |
| Net investment income (loss), net of waivers and reimbursements | | | | 0.56 | | | | 0.43 | | | | 0.12 | | | | (0.07 | ) | | | 1.02 | | | | 0.26 | |
| Net investment income (loss), before waivers and reimbursements | | | | 0.52 | | | | 0.43 | | | | 0.12 | | | | (0.08 | ) | | | 0.91 | | | | 0.10 | |
| Class I net assets at end of year (in thousands) | | | $ | 566,055 | | | $ | 579,010 | | | $ | 544,963 | | | $ | 352,832 | | | $ | 196,184 | | | $ | 190,686 | |
| Portfolio turnover rate (%)* | | | | 37 | | | | 30 | | | | 39 | | | | 51 | | | | 51 | | | | 65 | |
| * | Not annualized for periods less than a year. |
| ** | Annualized for periods less than a year. |
| ^ | Amount is less than $0.005 per share. |
Note: Net investment income (loss) per share is based on the average shares outstanding during the year.
Performance cited represents past performance. Past performance does not guarantee future results and current performance may be lower or higher than the data quoted. Results shown are annual returns, which assume reinvestment of dividends and capital gains. Investment returns and principal will fluctuate and you may have a gain or loss when you sell shares. For the most current month-end performance information, please call 1-800-742-7272 or visit our Web site at www.williamblairfunds.com.
| June 30, 2016 | William Blair Funds | 161 |
Financial Highlights
Global Leaders Fund
| | | Class N | |
| | | (unaudited)
Period Ended
June 30, | | | Years Ended December 31, | |
| | | | 2016 | | | 2015 | | | 2014 | | | 2013 | | | 2012 | | | 2011 | |
| Net asset value, beginning of year | | | $ | 11.58 | | | $ | 11.84 | | | $ | 11.43 | | | $ | 9.47 | | | $ | 8.10 | | | $ | 8.40 | |
| Income (loss) from investment operations: | | | | | | | | | | | | | | | | | | | | | | | | | |
| Net investment income (loss) | | | | 0.05 | | | | 0.02 | | | | 0.02 | | | | 0.02 | | | | 0.03 | | | | 0.02 | |
| Net realized and unrealized gain (loss) on investments | | | | (0.24 | ) | | | 0.27 | | | | 0.41 | | | | 1.96 | | | | 1.37 | | | | (0.31 | ) |
| Total from investment operations | | | | (0.19 | ) | | | 0.29 | | | | 0.43 | | | | 1.98 | | | | 1.40 | | | | (0.29 | ) |
| Less distributions from: | | | | | | | | | | | | | | | | | | | | | | | | | |
| Net investment income | | | | — | | | | 0.01 | | | | — | | | | 0.02 | | | | 0.03 | | | | 0.01 | |
| Net realized gain | | | | — | | | | 0.54 | | | | 0.02 | | | | — | | | | — | | | | — | |
| Total distributions | | | | — | | | | 0.55 | | | | 0.02 | | | | 0.02 | | | | 0.03 | | | | 0.01 | |
| Net asset value, end of year | | | $ | 11.39 | | | $ | 11.58 | | | $ | 11.84 | | | $ | 11.43 | | | $ | 9.47 | | | $ | 8.10 | |
| Total return (%)* | | | | (1.64 | ) | | | 2.49 | | | | 3.76 | | | | 20.86 | | | | 17.25 | | | | (3.47 | ) |
| Ratios to average daily net assets (%):** | | | | | | | | | | | | | | | | | | | | | | | | | |
| Expenses, net of waivers and reimbursements | | | | 1.34 | | | | 1.39 | | | | 1.50 | | | | 1.50 | | | | 1.50 | | | | 1.50 | |
| Expenses, before waivers and reimbursements | | | | 1.61 | | | | 1.61 | | | | 1.62 | | | | 1.63 | | | | 1.84 | | | | 1.82 | |
| Net investment income (loss), net of waivers and reimbursements | | | | 0.82 | | | | 0.12 | | | | 0.16 | | | | 0.18 | | | | 0.29 | | | | 0.29 | |
| Net investment income (loss), before waivers and reimbursements | | | | 0.55 | | | | (0.10 | ) | | | 0.04 | | | | 0.05 | | | | (0.05 | ) | | | (0.03 | ) |
| Class N net assets at end of year (in thousands) | | | $ | 6,054 | | | $ | 5,588 | | | $ | 5,007 | | | $ | 6,403 | | | $ | 5,215 | | | $ | 3,740 | |
| Portfolio turnover rate (%)* | | | | 71 | | | | 55 | | | | 60 | | | | 70 | | | | 73 | | | | 75 | |
| | | Class I | |
| | | (unaudited)
Period Ended
June 30, | | | Years Ended December 31, | |
| | | | 2016 | | | 2015 | | | 2014 | | | 2013 | | | 2012 | | | 2011 | |
| Net asset value, beginning of year | | | $ | 11.59 | | | $ | 11.85 | | | $ | 11.42 | | | $ | 9.47 | | | $ | 8.09 | | | $ | 8.40 | |
| Income (loss) from investment operations: | | | | | | | | | | | | | | | | | | | | | | | | | |
| Net investment income (loss) | | | | 0.06 | | | | 0.06 | | | | 0.04 | | | | 0.04 | | | | 0.05 | | | | 0.04 | |
| Net realized and unrealized gain (loss) on investments | | | | (0.23 | ) | | | 0.26 | | | | 0.43 | | | | 1.95 | | | | 1.38 | | | | (0.31 | ) |
| Total from investment operations | | | | (0.17 | ) | | | 0.32 | | | | 0.47 | | | | 1.99 | | | | 1.43 | | | | (0.27 | ) |
| Less distributions from: | | | | | | | | | | | | | | | | | | | | | | | | | |
| Net investment income | | | | — | | | | 0.04 | | | | 0.02 | | | | 0.04 | | | | 0.05 | | | | 0.04 | |
| Net realized gain | | | | — | | | | 0.54 | | | | 0.02 | | | | — | | | | — | | | | — | |
| Total distributions | | | | — | | | | 0.58 | | | | 0.04 | | | | 0.04 | | | | 0.05 | | | | 0.04 | |
| Net asset value, end of year | | | $ | 11.42 | | | $ | 11.59 | | | $ | 11.85 | | | $ | 11.42 | | | $ | 9.47 | | | $ | 8.09 | |
| Total return (%)* | | | | (1.47 | ) | | | 2.77 | | | | 4.08 | | | | 21.05 | | | | 17.64 | | | | (3.26 | ) |
| Ratios to average daily net assets (%):** | | | | | | | | | | | | | | | | | | | | | | | | | |
| Expenses, net of waivers and reimbursements | | | | 1.05 | | | | 1.10 | | | | 1.25 | | | | 1.25 | | | | 1.25 | | | | 1.25 | |
| Expenses, before waivers and reimbursements | | | | 1.32 | | | | 1.32 | | | | 1.33 | | | | 1.35 | | | | 1.56 | | | | 1.55 | |
| Net investment income (loss), net of waivers and reimbursements | | | | 1.10 | | | | 0.45 | | | | 0.38 | | | | 0.40 | | | | 0.54 | | | | 0.52 | |
| Net investment income (loss), before waivers and reimbursements | | | | 0.83 | | | | 0.23 | | | | 0.30 | | | | 0.30 | | | | 0.23 | | | | 0.22 | |
| Class I net assets at end of year (in thousands) | | | $ | 46,181 | | | $ | 45,853 | | | $ | 52,090 | | | $ | 53,562 | | | $ | 45,757 | | | $ | 38,834 | |
| Portfolio turnover rate (%)* | | | | 71 | | | | 55 | | | | 60 | | | | 70 | | | | 73 | | | | 75 | |
| * | Not annualized for periods less than a year. |
| ** | Annualized for periods less than a year. |
Note: Net investment income (loss) per share is based on the average shares outstanding during the year.
Performance cited represents past performance. Past performance does not guarantee future results and current performance may be lower or higher than the data quoted. Results shown are annual returns, which assume reinvestment of dividends and capital gains. Investment returns and principal will fluctuate and you may have a gain or loss when you sell shares. For the most current month-end performance information, please call 1-800-742-7272 or visit our Web site at www.williamblairfunds.com.
| 162 | Semiannual Report | June 30, 2016 |
Financial Highlights
Global Leaders Fund
| | | | Institutional Class | |
| | | (unaudited)
Period Ended
June 30, | | | Periods Ended December 31, | |
| | | | 2016 | | | 2015 | | | 2014 | | | 2013 | | | 2012(a) | |
| Net asset value, beginning of year | | | $ | 11.59 | | | $ | 11.85 | | | $ | 11.42 | | | $ | 9.47 | | | $ | 9.50 | |
| Income (loss) from investment operations: | | | | | | | | | | | | | | | | | | | | | |
| Net investment income (loss) | | | | 0.06 | | | | 0.06 | | | | 0.06 | | | | 0.04 | | | | 0.00 | ^ |
| Net realized and unrealized gain (loss) on investments | | | | (0.23 | ) | | | 0.27 | | | | 0.43 | | | | 1.97 | | | | (0.03 | ) |
| Total from investment operations | | | | (0.17 | ) | | | 0.33 | | | | 0.49 | | | | 2.01 | | | | (0.03 | ) |
| Less distributions from: | | | | | | | | | | | | | | | | | | | | | |
| Net investment income | | | | — | | | | 0.05 | | | | 0.04 | | | | 0.06 | | | | — | |
| Net realized gain | | | | — | | | | 0.54 | | | | 0.02 | | | | — | | | | — | |
| Total distributions | | | | — | | | | 0.59 | | | | 0.06 | | | | 0.06 | | | | — | |
| Net asset value, end of year | | | $ | 11.42 | | | $ | 11.59 | | | $ | 11.85 | | | $ | 11.42 | | | $ | 9.47 | |
| Total return (%)* | | | | (1.47 | ) | | | 2.85 | | | | 4.24 | | | | 21.23 | | | | (0.32 | ) |
| Ratios to average daily net assets (%):** | | | | | | | | | | | | | | | | | | | | | |
| Expenses, net of waivers and reimbursements | | | | 1.00 | | | | 1.03 | | | | 1.10 | | | | 1.10 | | | | 1.10 | |
| Expenses, before waivers and reimbursements | | | | 1.11 | | | | 1.11 | | | | 1.13 | | | | 1.14 | | | | 1.26 | |
| Net investment income (loss), net of waivers and reimbursements | | | | 1.10 | | | | 0.47 | | | | 0.51 | | | | 0.37 | | | | (0.91 | ) |
| Net investment income (loss), before waivers and reimbursements | | | | 0.99 | | | | 0.39 | | | | 0.48 | | | | 0.33 | | | | (1.07 | ) |
| Institutional Class net assets at end of year (in thousands) | | | $ | 126,606 | | | $ | 137,527 | | | $ | 106,565 | | | $ | 87,118 | | | $ | 16,022 | |
| Portfolio turnover rate (%)* | | | | 71 | | | | 55 | | | | 60 | | | | 70 | | | | 73 | |
| (a) | For the period from December 19, 2012 (Commencement of Operations) to December 31, 2012. |
| * | Not annualized for periods less than a year. |
| ** | Annualized for periods less than a year. |
| ^ | Amount is less than $0.005 per share. |
Note: Net investment income (loss) per share is based on the average shares outstanding during the year.
Performance cited represents past performance. Past performance does not guarantee future results and current performance may be lower or higher than the data quoted. Results shown are annual returns, which assume reinvestment of dividends and capital gains. Investment returns and principal will fluctuate and you may have a gain or loss when you sell shares. For the most current month-end performance information, please call 1-800-742-7272 or visit our Web site at www.williamblairfunds.com.
| June 30, 2016 | William Blair Funds | 163 |
Financial Highlights
International Leaders Fund
| | | Class N | |
| | | (unaudited) | | | | | | | | | | | | | |
| | | Period Ended | | | | | | | | | | | | | |
| | | June 30, | | | Periods Ended December 31, | |
| | | | 2016 | | | 2015 | | | 2014 | | | 2013 | | | 2012(a) | |
| Net asset value, beginning of year | | | $ | 12.89 | | | $ | 12.25 | | | $ | 12.65 | | | $ | 10.81 | | | | $ | 10.00 | |
| Income (loss) from investment operations: | | | | | | | | | | | | | | | | | | | | | | |
| Net investment income (loss) | | | | 0.10 | | | | 0.07 | | | | 0.13 | | | | 0.03 | | | | | 0.00 | ^ |
| Net realized and unrealized gain (loss) on investments | | | | (0.28 | ) | | | 0.66 | | | | (0.47 | ) | | | 1.99 | | | | | 0.82 | |
| Total from investment operations | | | | (0.18 | ) | | | 0.73 | | | | (0.34 | ) | | | 2.02 | | | | | 0.82 | |
| Less distributions from: | | | | | | | | | | | | | | | | | | | | | | |
| Net investment income | | | | — | | | | 0.02 | | | | 0.06 | | | | 0.18 | | | | | 0.01 | |
| Net realized gain | | | | — | | | | 0.07 | | | | — | | | | — | | | | | — | |
| Total distributions | | | | — | | | | 0.09 | | | | 0.06 | | | | 0.18 | | | | | 0.01 | |
| Net asset value, end of year | | | $ | 12.71 | | | $ | 12.89 | | | $ | 12.25 | | | $ | 12.65 | | | | $ | 10.81 | |
| Total return (%)* | | | | (1.40 | ) | | | 6.01 | | | | (2.67 | ) | | | 18.75 | | | | | 8.16 | |
| Ratios to average daily net assets (%):** | | | | | | | | | | | | | | | | | | | | | | |
| Expenses, net of waivers and reimbursements | | | | 1.28 | | | | 1.24 | | | | 1.45 | | | | 1.45 | | | | | 1.45 | |
| Expenses, before waivers and reimbursements | | | | 1.58 | | | | 1.56 | | | | 1.59 | | | | 1.73 | | | | | 4.98 | |
| Net investment income (loss), net of waivers and reimbursements | | | | 1.58 | | | | 0.51 | | | | 1.00 | | | | 0.29 | | | | | 0.00 | |
| Net investment income (loss), before waivers and reimbursements | | | | 1.28 | | | | 0.19 | | | | 0.86 | | | | 0.01 | | | | | (3.53 | ) |
| Class N net assets at end of year (in thousands) | | | $ | 552 | | | $ | 377 | | | $ | 150 | | | $ | 154 | | | | $ | 542 | |
| Portfolio turnover rate (%)* | | | | 31 | | | | 29 | | | | 79 | | | | 73 | | | | 16 | |
| |
| | | Class I | |
| | | (unaudited) | | | | | | | | | | | | | | | | | |
| | | Period Ended | | | | | | | | | | | | | | | | | |
| | | June 30, | | | Periods Ended December 31, | |
| | | | 2016 | | | 2015 | | | 2014 | | | 2013 | | | 2012(a) | |
| Net asset value, beginning of year | | | $ | 12.91 | | | $ | 12.25 | | | $ | 12.65 | | | $ | 10.81 | | | | $ | 10.00 | |
| Income (loss) from investment operations: | | | | | | | | | | | | | | | | | | | | | | |
| Net investment income (loss) | | | | 0.11 | | | | 0.10 | | | | 0.16 | | | | 0.12 | | | | | 0.01 | |
| Net realized and unrealized gain (loss) on investments | | | | (0.28 | ) | | | 0.65 | | | | (0.47 | ) | | | 1.94 | | | | | 0.82 | |
| Total from investment operations | | | | (0.17 | ) | | | 0.75 | | | | (0.31 | ) | | | 2.06 | | | | | 0.83 | |
| Less distributions from: | | | | | | | | | | | | | | | | | | | | | | |
| Net investment income | | | | — | | | | 0.02 | | | | 0.09 | | | | 0.22 | | | | | 0.02 | |
| Net realized gain | | | | — | | | | 0.07 | | | | — | | | | — | | | | | — | |
| Total distributions | | | | — | | | | 0.09 | | | | 0.09 | | | | 0.22 | | | | | 0.02 | |
| Net asset value, end of year | | | $ | 12.74 | | | $ | 12.91 | | | $ | 12.25 | | | $ | 12.65 | | | | $ | 10.81 | |
| Total return (%)* | | | | (1.32 | ) | | | 6.18 | | | | (2.43 | ) | | | 19.10 | | | | | 8.26 | |
| Ratios to average daily net assets (%):** | | | | | | | | | | | | | | | | | | | | | | |
| Expenses, net of waivers and reimbursements | | | | 1.03 | | | | 1.13 | | | | 1.20 | | | | 1.20 | | | | | 1.20 | |
| Expenses, before waivers and reimbursements | | | | 1.34 | | | | 1.46 | | | | 1.29 | | | | 1.40 | | | | | 4.56 | |
| Net investment income (loss), net of waivers and reimbursements | | | | 1.84 | | | | 0.75 | | | | 1.25 | | | | 1.06 | | | | | 0.22 | |
| Net investment income (loss), before waivers and reimbursements | | | | 1.53 | | | | 0.42 | | | | 1.16 | | | | 0.86 | | | | | (3.14 | ) |
| Class I net assets at end of year (in thousands) | | | $ | 20,745 | | | $ | 13,474 | | | $ | 9,561 | | | $ | 11,629 | | | | $ | 4,336 | |
| Portfolio turnover rate (%)* | | | | 31 | | | | 29 | | | | 79 | | | | 73 | | | | | 16 | |
| | | | | | | | | | | | | | | | | | | | | | | |
| (a) | For the period from August 16, 2012 (Commencement of Operations) to December 31, 2012. |
| * | Not annualized for periods less than a year. |
| ** | Annualized for periods less than a year. |
| ^ | Amount is less than $0.005 per share. |
Note: Net investment income (loss) per share is based on the average shares outstanding during the year.
Performance cited represents past performance. Past performance does not guarantee future results and current performance may be lower or higher than the data quoted. Results shown are annual returns, which assume reinvestment of dividends and capital gains. Investment returns and principal will fluctuate and you may have a gain or loss when you sell shares. For the most current month-end performance information, please call 1-800-742-7272 or visit our Web site at www.williamblairfunds.com.
| 164 | Semiannual Report | June 30, 2016 |
Financial Highlights
International Leaders Fund
| | | Institutional Class | |
| | | (unaudited) | | | | | | | | | | | | | |
| | | Period Ended | | | | | | | | | | | | | |
| | | June 30, | | | Periods Ended December 31, | |
| | | | 2016 | | | 2015 | | | 2014 | | | 2013 | | | 2012(a) | |
| Net asset value, beginning of year | | | $ | 12.90 | | | $ | 12.24 | | | $ | 12.65 | | | $ | 10.80 | | | | $ | 10.24 | |
| Income (loss) from investment operations: | | | | | | | | | | | | | | | | | | | | | | |
| Net investment income (loss) | | | | 0.13 | | | | 0.11 | | | | 0.17 | | | | 0.15 | | | | | 0.00 | ^ |
| Net realized and unrealized gain (loss) on investments | | | | (0.30 | ) | | | 0.66 | | | | (0.47 | ) | | | 1.94 | | | | | 0.58 | |
| Total from investment operations | | | | (0.17 | ) | | | 0.77 | | | | (0.30 | ) | | | 2.09 | | | | | 0.58 | |
| Less distributions from: | | | | | | | | | | | | | | | | | | | | | | |
| Net investment income | | | | — | | | | 0.04 | | | | 0.11 | | | | 0.24 | | | | | 0.02 | |
| Net realized gain | | | | — | | | | 0.07 | | | | — | | | | — | | | | | — | |
| Total distributions | | | | — | | | | 0.11 | | | | 0.11 | | | | 0.24 | | | | | 0.02 | |
| Net asset value, end of year | | | $ | 12.73 | | | $ | 12.90 | | | $ | 12.24 | | | $ | 12.65 | | | | $ | 10.80 | |
| Total return (%)* | | | | (1.32 | ) | | | 6.33 | | | | (2.34 | ) | | | 19.39 | | | | | 5.67 | |
| Ratios to average daily net assets (%):** | | | | | | | | | | | | | | | | | | | | | | |
| Expenses, net of waivers and reimbursements | | | | 0.95 | | | | 0.98 | | | | 1.05 | | | | 1.05 | | | | | 1.05 | |
| Expenses, before waivers and reimbursements | | | | 1.10 | | | | 1.15 | | | | 1.14 | | | | 1.25 | | | | | 1.84 | |
| Net investment income (loss), net of waivers and reimbursements | | | | 2.04 | | | | 0.88 | | | | 1.33 | | | | 1.31 | | | | | 0.01 | |
| Net investment income (loss), before waivers and reimbursements | | | | 1.89 | | | | 0.71 | | | | 1.24 | | | | 1.11 | | | | | (0.78 | ) |
| Institutional Class net assets at end of year (in thousands) | | | $ | 179,648 | | | $ | 102,227 | | | $ | 78,251 | | | $ | 56,991 | | | | $ | 5,286 | |
| Portfolio turnover rate (%)* | | | | 31 | | | | 29 | | | | 79 | | | | 73 | | | | | 16 | |
| (a) | For the period from November 2, 2012 (Commencement of Operations) to December 31, 2012. |
| * | Not annualized for periods less than a year. |
| ** | Annualized for periods less than a year. |
| ^ | Amount is less than $0.005 per share. |
Note: Net investment income (loss) per share is based on the average shares outstanding during the year.
Performance cited represents past performance. Past performance does not guarantee future results and current performance may be lower or higher than the data quoted. Results shown are annual returns, which assume reinvestment of dividends and capital gains. Investment returns and principal will fluctuate and you may have a gain or loss when you sell shares. For the most current month-end performance information, please call 1-800-742-7272 or visit our Web site at www.williamblairfunds.com.
| June 30, 2016 | William Blair Funds | 165 |
Financial Highlights
International Equity Fund
| | | Class N | |
| | | (unaudited) | | | | | | | | | | | | | |
| | | Period Ended | | | | | | | | | | | | | |
| | | June 30, | | | Years Ended December 31, | |
| | | | 2016 | | | 2015 | | | 2014 | | | 2013 | | | 2012 | | | 2011 | |
| Net asset value, beginning of year | | | $ | 13.85 | | | $ | 13.76 | | | $ | 14.28 | | | $ | 12.05 | | | $ | 10.56 | | | $ | 12.12 | |
| Income (loss) from investment operations: | | | | | | | | | | | | | | | | | | | | | | | | | |
| Net investment income (loss) | | | | 0.15 | | | | 0.15 | | | | 0.16 | | | | 0.09 | | | | 0.11 | | | | 0.13 | |
| Net realized and unrealized gain (loss) on investments | | | | (0.41 | ) | | | 0.06 | | | | (0.60 | ) | | | 2.25 | | | | 1.75 | | | | (1.69 | ) |
| Total from investment operations | | | | (0.26 | ) | | | 0.21 | | | | (0.44 | ) | | | 2.34 | | | | 1.86 | | | | (1.56 | ) |
| Less distributions from: | | | | | | | | | | | | | | | | | | | | | | | | | |
| Net investment income | | | | — | | | | 0.12 | | | | 0.08 | | | | 0.11 | | | | 0.37 | | | | — | |
| Net realized gain | | | | — | | | | — | | | | — | | | | — | | | | — | | | | — | |
| Total distributions | | | | — | | | | 0.12 | | | | 0.08 | | | | 0.11 | | | | 0.37 | | | | — | |
| Net asset value, end of year | | | $ | 13.59 | | | $ | 13.85 | | | $ | 13.76 | | | $ | 14.28 | | | $ | 12.05 | | | $ | 10.56 | |
| Total return (%)* | | | | (1.88 | ) | | | 1.54 | | | | (3.09 | ) | | | 19.47 | | | | 17.57 | | | | (12.87 | ) |
| Ratios to average daily net assets (%):** | | | | | | | | | | | | | | | | | | | | | | | | | |
| Expenses, net of waivers and reimbursements | | | | 1.30 | | | | 1.32 | | | | 1.38 | | | | 1.45 | | | | 1.45 | | | | 1.45 | |
| Expenses, before waivers and reimbursements | | | | 1.64 | | | | 1.60 | | | | 1.56 | | | | 1.65 | | | | 1.71 | | | | 1.60 | |
| Net investment income (loss), net of waivers and reimbursements | | | | 2.28 | | | | 1.01 | | | | 1.11 | | | | 0.73 | | | | 0.95 | | | | 1.09 | |
| Net investment income (loss), before waivers and reimbursements | | | | 1.94 | | | | 0.73 | | | | 0.93 | | | | 0.53 | | | | 0.69 | | | | 0.94 | |
| Class N net assets at end of year (in thousands) | | | $ | 2,862 | | | $ | 3,020 | | | $ | 3,497 | | | $ | 4,307 | | | $ | 5,648 | | | $ | 6,773 | |
| Portfolio turnover rate (%)* | | | | 59 | | | | 54 | | | | 73 | | | | 88 | | | | 80 | | | | 99 | |
| | | | | | | | | | | | | | | | | | | | | | | | | | |
| | | Class I | |
| | | (unaudited) | | | | | | | | | | | | | | | | | | | | | |
| | | Period Ended | | | | | | | | | | | | | | | | | | | | | |
| | | June 30, | | | Years Ended December 31, | |
| | | | 2016 | | | 2015 | | | | 2014 | | | 2013 | | | 2012 | | | 2011 | |
| Net asset value, beginning of year | | | $ | 13.98 | | | $ | 13.91 | | | $ | 14.43 | | | $ | 12.18 | | | $ | 10.67 | | | $ | 12.22 | |
| Income (loss) from investment operations: | | | | | | | | | | | | | | | | | | | | | | | | | |
| Net investment income (loss) | | | | 0.17 | | | | 0.18 | | | | 0.19 | | | | 0.14 | | | | 0.14 | | | | 0.17 | |
| Net realized and unrealized gain (loss) on investments | | | | (0.42 | ) | | | 0.07 | | | | (0.59 | ) | | | 2.26 | | | | 1.77 | | | | (1.72 | ) |
| Total from investment operations | | | | (0.25 | ) | | | 0.25 | | | | (0.40 | ) | | | 2.40 | | | | 1.91 | | | | (1.55 | ) |
| Less distributions from: | | | | | | | | | | | | | | | | | | | | | | | | | |
| Net investment income | | | | — | | | | 0.18 | | | | 0.12 | | | | 0.15 | | | | 0.40 | | | | — | |
| Net realized gain | | | | — | | | | — | | | | — | | | | — | | | | — | | | | — | |
| Total distributions | | | | — | | | | 0.18 | | | | 0.12 | | | | 0.15 | | | | 0.40 | | | | — | |
| Net asset value, end of year | | | $ | 13.73 | | | $ | 13.98 | | | $ | 13.91 | | | $ | 14.43 | | | $ | 12.18 | | | $ | 10.67 | |
| Total return (%)* | | | | (1.79 | ) | | | 1.80 | | | | (2.80 | ) | | | 19.74 | | | | 17.89 | | | | (12.68 | ) |
| Ratios to average daily net assets (%):** | | | | | | | | | | | | | | | | | | | | | | | | | |
| Expenses, net of waivers and reimbursements | | | | 1.05 | | | | 1.07 | | | | 1.13 | | | | 1.20 | | | | 1.20 | | | | 1.20 | |
| Expenses, before waivers and reimbursements | | | | 1.37 | | | | 1.34 | | | | 1.32 | | | | 1.41 | | | | 1.44 | | | | 1.33 | |
| Net investment income (loss), net of waivers and reimbursements | | | | 2.55 | | | | 1.26 | | | | 1.35 | | | | 1.07 | | | | 1.17 | | | | 1.43 | |
| Net investment income (loss), before waivers and reimbursements | | | | 2.23 | | | | 0.99 | | | | 1.16 | | | | 0.86 | | | | 0.93 | | | | 1.30 | |
| Class I net assets at end of year (in thousands) | | | $ | 68,082 | | | $ | 60,886 | | | $ | 65,012 | | | $ | 75,271 | | | $ | 64,536 | | | $ | 68,884 | |
| Portfolio turnover rate (%)* | | | | 59 | | | | 54 | | | | 73 | | | | 88 | | | | 80 | | | | 99 | |
| * | Not annualized for periods less than a year. |
| ** | Annualized for periods less than a year. |
Note: Net investment income (loss) per share is based on the average shares outstanding during the year.
Performance cited represents past performance. Past performance does not guarantee future results and current performance may be lower or higher than the data quoted. Results shown are annual returns, which assume reinvestment of dividends and capital gains. Investment returns and principal will fluctuate and you may have a gain or loss when you sell shares. For the most current month-end performance information, please call 1-800-742-7272 or visit our Web site at www.williamblairfunds.com.
| 166 | Semiannual Report | June 30, 2016 |
Financial Highlights
Institutional International Equity Fund
| | | Institutional Class | |
| | | (unaudited) | | | | | | | | | | | | | | | | |
| | | Period Ended | | | | | | | | | | | | | | | | |
| | | June 30, | | | Years Ended December 31, | |
| | | | 2016 | | | 2015 | | | 2014 | | | 2013 | | | 2012 | | | 2011 | |
| Net asset value, beginning of year | | | $ | 12.12 | | | $ | 12.01 | | | $ | 12.70 | | | $ | 10.82 | | | $ | 9.27 | | | $ | 10.78 | |
| Income (loss) from investment operations: | | | | | | | | | | | | | | | | | | | | | | | | | |
| Net investment income (loss) | | | | 0.16 | | | | 0.15 | | | | 0.21 | | | | 0.13 | | | | 0.13 | | | | 0.16 | |
| Net realized and unrealized gain (loss) on investments | | | | (0.37 | ) | | | 0.08 | | | | (0.65 | ) | | | 2.00 | | | | 1.57 | | | | (1.47 | ) |
| Total from investment operations | | | | (0.21 | ) | | | 0.23 | | | | (0.44 | ) | | | 2.13 | | | | 1.70 | | | | (1.31 | ) |
| Less distributions from: | | | | | | | | | | | | | | | | | | | | | | | | | |
| Net investment income | | | | — | | | | 0.12 | | | | 0.25 | | | | 0.25 | | | | 0.15 | | | | 0.20 | |
| Net realized gain | | | | — | | | | — | | | | — | | | | — | | | | — | | | | — | |
| Total distributions | | | | — | | | | 0.12 | | | | 0.25 | | | | 0.25 | | | | 0.15 | | | | 0.20 | |
| Net asset value, end of year | | | $ | 11.91 | | | $ | 12.12 | | | $ | 12.01 | | | $ | 12.70 | | | $ | 10.82 | | | $ | 9.27 | |
| Total return (%)* | | | | (1.73 | ) | | | 1.91 | | | | (3.50 | ) | | | 19.78 | | | | 18.31 | | | | (12.12 | ) |
| Ratios to average daily net assets (%):** | | | | | | | | | | | | | | | | | | | | | | | | | |
| Expenses, net of waivers and reimbursements | | | | 1.00 | | | | 1.00 | | | | 1.03 | | | | 1.10 | | | | 1.10 | | | | 1.10 | |
| Expenses, before waivers and reimbursements | | | | 1.71 | | | | 1.76 | | | | 1.63 | | | | 1.12 | | | | 1.16 | | | | 1.10 | |
| Net investment income (loss), net of waivers and reimbursements | | | | 2.83 | | | | 1.23 | | | | 1.61 | | | | 1.12 | | | | 1.28 | | | | 1.48 | |
| Net investment income (loss), before waivers and reimbursements | | | | 2.12 | | | | 0.47 | | | | 1.01 | | | | 1.10 | | | | 1.22 | | | | 1.48 | |
| Institutional Class net assets at end of year (in thousands) | | | $ | 15,818 | | | $ | 16,030 | | | $ | 14,574 | | | $ | 100,805 | | | $ | 109,690 | | | $ | 111,474 | |
| Portfolio turnover rate (%)* | | | | 56 | | | | 54 | | | | 61 | | | | 84 | | | | 86 | | | | 91 | |
| * | Not annualized for periods less than a year. |
| ** | Annualized for periods less than a year. |
Note: Net investment income (loss) per share is based on the average shares outstanding during the year.
Performance cited represents past performance. Past performance does not guarantee future results and current performance may be lower or higher than the data quoted. Results shown are annual returns, which assume reinvestment of dividends and capital gains. Investment returns and principal will fluctuate and you may have a gain or loss when you sell shares. For the most current month-end performance information, please call 1-800-742-7272 or visit our Web site at www.williamblairfunds.com.
| June 30, 2016 | William Blair Funds | 167 |
Financial Highlights
International Growth Fund
| | | Class N | |
| | | (unaudited) | | | | | | | | | | | | | |
| | | Period Ended | | | | | | | | | | | | | |
| | | June 30, | | | Years Ended December 31, | |
| | | | 2016 | | | 2015 | | | 2014 | | | 2013 | | | 2012 | | | 2011 | |
| Net asset value, beginning of year | | | $ | 24.94 | | | $ | 25.24 | | | $ | 26.30 | | | $ | 22.43 | | | $ | 18.68 | | | $ | 21.85 | |
| Income (loss) from investment operations: | | | | | | | | | | | | | | | | | | | | | | | | | |
| Net investment income (loss) | | | | 0.19 | | | | 0.18 | | | | 0.31 | | | | 0.27 | | | | 0.26 | | | | 0.26 | |
| Net realized and unrealized gain (loss) on investments | | | | (1.14 | ) | | | (0.25 | ) | | | (1.15 | ) | | | 3.89 | | | | 4.16 | | | | (3.43 | ) |
| Total from investment operations | | | | (0.95 | ) | | | (0.07 | ) | | | (0.84 | ) | | | 4.16 | | | | 4.42 | | | | (3.17 | ) |
| Less distributions from: | | | | | | | | | | | | | | | | | | | | | | | | | |
| Net investment income | | | | — | | | | 0.23 | | | | 0.22 | | | | 0.29 | | | | 0.67 | | | | — | |
| Net realized gain | | | | — | | | | — | | | | — | | | | — | | | | — | | | | — | |
| Total distributions | | | | — | | | | 0.23 | | | | 0.22 | | | | 0.29 | | | | 0.67 | | | | — | |
| Net asset value, end of year | | | $ | 23.99 | | | $ | 24.94 | | | $ | 25.24 | | | $ | 26.30 | | | $ | 22.43 | | | $ | 18.68 | |
| Total return (%)* | | | | (3.81 | ) | | | (0.27 | ) | | | (3.19 | ) | | | 18.57 | | | | 23.67 | | | | (14.51 | ) |
| Ratios to average daily net assets (%):** | | | | | | | | | | | | | | | | | | | | | | | | | |
| Expenses, net of waivers and reimbursements | | | | 1.44 | | | | 1.42 | | | | 1.44 | | | | 1.44 | | | | 1.44 | | | | 1.45 | |
| Expenses, before waivers and reimbursements. | | | | 1.44 | | | | 1.42 | | | | 1.44 | | | | 1.44 | | | | 1.44 | | | | 1.46 | |
| Net investment income (loss), net of waivers and reimbursements | | | | 1.58 | | | | 0.71 | | | | 1.17 | | | | 1.13 | | | | 1.25 | | | | 1.22 | |
| Net investment income (loss), before waivers and reimbursements | | | | 1.58 | | | | 0.71 | | | | 1.17 | | | | 1.13 | | | | 1.25 | | | | 1.21 | |
| Class N net assets at end of year (in thousands) | | | $ | 789,678 | | | $ | 1,023,588 | | | $ | 978,433 | | | $ | 1,418,083 | | | $ | 1,269,736 | | | $ | 1,277,534 | |
| Portfolio turnover rate (%)* | | | 84 | | | | 70 | | | | 79 | | | | 97 | | | | 81 | | | | 103 | |
| | | | | | | | | | | | | | | | | | | | | | | | | |
| | | Class I | |
| | | (unaudited) | | | | | | | | | | | | | | | | | | | | | |
| | | Period Ended | | | | | | | | | | | | | | | | | | | | | |
| | | June 30, | | | Years Ended December 31, | |
| | | | 2016 | | | 2015 | | | 2014 | | | 2013 | | | 2012 | | | 2011 | |
| Net asset value, beginning of year | | | $ | 25.51 | | | $ | 25.82 | | | $ | 26.91 | | | $ | 22.94 | | | $ | 19.10 | | | $ | 22.34 | |
| Income (loss) from investment operations: | | | | | | | | | | | | | | | | | | | | | | | | | |
| Net investment income (loss) | | | | 0.24 | | | | 0.27 | | | | 0.36 | | | | 0.35 | | | | 0.32 | | | | 0.30 | |
| Net realized and unrealized gain (loss) on investments | | | | (1.17 | ) | | | (0.28 | ) | | | (1.13 | ) | | | 3.99 | | | | 4.25 | | | | (3.48 | ) |
| Total from investment operations | | | | (0.93 | ) | | | (0.01 | ) | | | (0.77 | ) | | | 4.34 | | | | 4.57 | | | | (3.18 | ) |
| Less distributions from: | | | | | | | | | | | | | | | | | | | | | | | | | |
| Net investment income | | | | — | | | | 0.30 | | | | 0.32 | | | | 0.37 | | | | 0.73 | | | | 0.06 | |
| Net realized gain | | | | — | | | | — | | | | — | | | | — | | | | — | | | | — | |
| Total distributions | | | | — | | | | 0.30 | | | | 0.32 | | | | 0.37 | | | | 0.73 | | | | 0.06 | |
| Net asset value, end of year | | | $ | 24.58 | | | $ | 25.51 | | | $ | 25.82 | | | $ | 26.91 | | | $ | 22.94 | | | $ | 19.10 | |
| Total return (%)* | | | | (3.65 | ) | | | (0.03 | ) | | | (2.86 | ) | | | 18.96 | | | | 23.96 | | | | (14.23 | ) |
| Ratios to average daily net assets (%):** | | | | | | | | | | | | | | | | | | | | | | | | | |
| Expenses | | | | 1.14 | | | | 1.14 | | | | 1.14 | | | | 1.11 | | | | 1.15 | | | | 1.15 | |
| Net investment income (loss) | | | | 1.96 | | | | 1.02 | | | | 1.36 | | | | 1.43 | | | | 1.51 | | | | 1.40 | |
| Class I net assets at end of year (in thousands) | | | $ | 2,446,662 | | | $ | 2,655,156 | | | $ | 2,705,054 | | | $ | 2,877,541 | | | $ | 2,402,897 | | | $ | 1,951,368 | |
| Portfolio turnover rate (%)* | | | | 84 | | | | 70 | | | | 79 | | | | 97 | | | | 81 | | | | 103 | |
| * | Not annualized for periods less than a year. |
| ** | Annualized for periods less than a year. |
Note: Net investment income (loss) per share is based on the average shares outstanding during the year.
Performance cited represents past performance. Past performance does not guarantee future results and current performance may be lower or higher than the data quoted. Results shown are annual returns, which assume reinvestment of dividends and capital gains. Investment returns and principal will fluctuate and you may have a gain or loss when you sell shares. For the most current month-end performance information, please call 1-800-742-7272 or visit our Web site at www.williamblairfunds.com.
| 168 | Semiannual Report | June 30, 2016 |
Financial Highlights
Institutional International Growth Fund
| | | Institutional Class | |
| | | (unaudited) | | | | | | | | | | | | | | | | |
| | | Period Ended | | | | | | | | | | | | | | | | |
| | | June 30, | | | Years Ended December 31, | |
| | | | 2016 | | | 2015 | | | 2014 | | | 2013 | | | 2012 | | | 2011 | |
| Net asset value, beginning of year | | | $ | 15.08 | | | $ | 15.26 | | | $ | 17.40 | | | $ | 14.89 | | | $ | 12.39 | | | $ | 14.37 | |
| Income (loss) from investment operations: | | | | | | | | | | | | | | | | | | | | | | | | | |
| Net investment income (loss) | | | | 0.15 | | | | 0.19 | | | | 0.26 | | | | 0.25 | | | | 0.23 | | | | 0.21 | |
| Net realized and unrealized gain (loss) on investments | | | | (0.69 | ) | | | (0.18 | ) | | | (0.71 | ) | | | 2.56 | | | | 2.76 | | | | (2.17 | ) |
| Total from investment operations | | | | (0.54 | ) | | | 0.01 | | | | (0.45 | ) | | | 2.81 | | | | 2.99 | | | | (1.96 | ) |
| Less distributions from: | | | | | | | | | | | | | | | | | | | | | | | | | |
| Net investment income | | | | — | | | | 0.09 | | | | 0.32 | | | | 0.30 | | | | 0.49 | | | | 0.02 | |
| Net realized gain | | | | — | | | | 0.10 | | | | 1.37 | | | | — | | | | — | | | | — | |
| Total distributions | | | | — | | | | 0.19 | | | | 1.69 | | | | 0.30 | | | | 0.49 | | | | 0.02 | |
| Net asset value, end of year | | | $ | 14.54 | | | $ | 15.08 | | | $ | 15.26 | | | $ | 17.40 | | | $ | 14.89 | | | $ | 12.39 | |
| Total return (%)* | | | | (3.58 | ) | | | 0.09 | | | | (2.66 | ) | | | 18.90 | | | | 24.11 | | | | (13.66 | ) |
| Ratios to average daily net assets (%):** | | | | | | | | | | | | | | | | | | | | | | | | | |
| Expenses | | | | 0.98 | | | | 0.96 | | | | 0.97 | | | | 0.97 | | | | 0.98 | | | | 0.99 | |
| Net investment income (loss) | | | | 2.06 | | | | 1.18 | | | | 1.50 | | | | 1.58 | | | | 1.64 | | | | 1.51 | |
| Institutional Class net assets at end of year (in thousands) | | | $ | 2,036,367 | | | $ | 2,335,632 | | | $ | 2,339,169 | | | $ | 2,440,149 | | | $ | 1,974,130 | | | $ | 1,542,594 | |
| Portfolio turnover rate (%)* | | | | 85 | | | | 70 | | | | 83 | | | | 97 | | | | 83 | | | | 111 | |
| * | Not annualized for periods less than a year. |
| ** | Annualized for periods less than a year. |
Note: Net investment income (loss) per share is based on the average shares outstanding during the year.
Performance cited represents past performance. Past performance does not guarantee future results and current performance may be lower or higher than the data quoted. Results shown are annual returns, which assume reinvestment of dividends and capital gains. Investment returns and principal will fluctuate and you may have a gain or loss when you sell shares. For the most current month-end performance information, please call 1-800-742-7272 or visit our Web site at www.williamblairfunds.com.
| June 30, 2016 | William Blair Funds | 169 |
Financial Highlights
International Small Cap Growth Fund
| | | | Class N | |
| | | (unaudited) | | | | | | | | | | |
| | | Period Ended | | | | | | | | | | |
| | | June 30, | | | Years Ended December 31, | |
| | | | 2016 | | | 2015 | | | 2014 | | | 2013 | | | 2012 | | | 2011 | |
| Net asset value, beginning of year | | | $ | 13.50 | | | $ | 12.56 | | | $ | 16.08 | | | $ | 13.46 | | | $ | 11.36 | | | $ | 13.07 | |
| Income (loss) from investment operations: | | | | | | | | | | | | | | | | | | | | | | | | | |
| Net investment income (loss) | | | | 0.10 | | | | 0.05 | | | | 0.03 | | | | 0.10 | | | | 0.08 | | | | 0.07 | |
| Net realized and unrealized gain (loss) on investments | | | | (0.67 | ) | | | 1.16 | | | | (1.38 | ) | | | 3.35 | | | | 2.27 | | | | (1.66 | ) |
| Total from investment operations | | | | (0.57 | ) | | | 1.21 | | | | (1.35 | ) | | | 3.45 | | | | 2.35 | | | | (1.59 | ) |
| Less distributions from: | | | | | | | | | | | | | | | | | | | | | | | | | |
| Net investment income | | | | — | | | | 0.24 | | | | 0.18 | | | | 0.16 | | | | 0.25 | | | | 0.12 | |
| Net realized gain | | | | — | | | | 0.03 | | | | 1.99 | | | | 0.67 | | | | — | | | | — | |
| Total distributions | | | | — | | | | 0.27 | | | | 2.17 | | | | 0.83 | | | | 0.25 | | | | 0.12 | |
| Net asset value, end of year | | | $ | 12.93 | | | $ | 13.50 | | | $ | 12.56 | | | $ | 16.08 | | | $ | 13.46 | | | $ | 11.36 | |
| Total return (%)* | | | | (4.22 | ) | | | 9.67 | | | | (8.43 | ) | | | 25.80 | | | | 20.73 | | | | (12.16 | ) |
| Ratios to average daily net assets (%):** | | | | | | | | | | | | | | | | | | | | | | | | | |
| Expenses, net of waivers and reimbursements | | | | 1.45 | | | | 1.47 | | | | 1.58 | | | | 1.59 | | | | 1.61 | | | | 1.64 | |
| Expenses, before waivers and reimbursements | | | | 1.60 | | | | 1.62 | | | | 1.58 | | | | 1.59 | | | | 1.61 | | | | 1.64 | |
| Net investment income (loss), net of waivers and reimbursements | | | | 1.55 | | | | 0.34 | | | | 0.20 | | | | 0.67 | | | | 0.65 | | | | 0.55 | |
| Net investment income (loss), before waivers and reimbursements | | | | 1.40 | | | | 0.19 | | | | 0.20 | | | | 0.67 | | | | 0.65 | | | | 0.55 | |
| Class N net assets at end of year (in thousands) | | | $ | 10,741 | | | $ | 11,350 | | | $ | 13,676 | | | $ | 18,910 | | | $ | 14,771 | | | $ | 18,991 | |
| Portfolio turnover rate (%)* | | | | 69 | | | | 90 | | | | 127 | | | | 111 | | | | 76 | | | | 85 | |
| | | | | | | | | | | | | | | | | | | | | | | | | | |
| | | Class I | |
| | | (unaudited) | | | | | | | | | | |
| | | Period Ended | | | | | | | | | | |
| | | June 30, | | | Years Ended December 31, | |
| | | | 2016 | | | 2015 | | | 2014 | | | 2013 | | | 2012 | | | 2011 | |
| Net asset value, beginning of year | | | $ | 13.65 | | | $ | 12.70 | | | $ | 16.23 | | | $ | 13.58 | | | $ | 11.46 | | | $ | 13.19 | |
| Income (loss) from investment operations: | | | | | | | | | | | | | | | | | | | | | | | | | |
| Net investment income (loss) | | | | 0.12 | | | | 0.09 | | | | 0.09 | | | | 0.15 | | | | 0.12 | | | | 0.12 | |
| Net realized and unrealized gain (loss) on investments | | | | (0.68 | ) | | | 1.18 | | | | (1.40 | ) | | | 3.37 | | | | 2.30 | | | | (1.69 | ) |
| Total from investment operations | | | | (0.56 | ) | | | 1.27 | | | | (1.31 | ) | | | 3.52 | | | | 2.42 | | | | (1.57 | ) |
| Less distributions from: | | | | | | | | | | | | | | | | | | | | | | | | | |
| Net investment income | | | | — | | | | 0.29 | | | | 0.23 | | | | 0.20 | | | | 0.30 | | | | 0.16 | |
| Net realized gain | | | | — | | | | 0.03 | | | | 1.99 | | | | 0.67 | | | | — | | | | — | |
| Total distributions | | | | — | | | | 0.32 | | | | 2.22 | | | | 0.87 | | | | 0.30 | | | | 0.16 | |
| Net asset value, end of year | | | $ | 13.09 | | | $ | 13.65 | | | $ | 12.70 | | | $ | 16.23 | | | $ | 13.58 | | | $ | 11.46 | |
| Total return (%)* | | | | (4.10 | ) | | | 10.00 | | | | (8.10 | ) | | | 26.11 | | | | 21.10 | | | | (11.84 | ) |
| Ratios to average daily net assets (%):** | | | | | | | | | | | | | | | | | | | | | | | | | |
| Expenses, net of waivers and reimbursements | | | | 1.16 | | | | 1.16 | | | | 1.28 | | | | 1.30 | | | | 1.30 | | | | 1.28 | |
| Expenses, before waivers and reimbursements | | | | 1.31 | | | | 1.31 | | | | 1.28 | | | | 1.30 | | | | 1.30 | | | | 1.28 | |
| Net investment income (loss), net of waivers and reimbursements | | | | 1.84 | | | | 0.66 | | | | 0.56 | | | | 0.96 | | | | 0.95 | | | | 0.92 | |
| Net investment income (loss), before waivers and reimbursements | | | | 1.69 | | | | 0.51 | | | | 0.56 | | | | 0.96 | | | | 0.95 | | | | 0.92 | |
| Class I net assets at end of year (in thousands) | | | $ | 327,339 | | | $ | 342,232 | | | $ | 364,161 | | | $ | 508,758 | | | $ | 359,557 | | | $ | 364,574 | |
| Portfolio turnover rate (%)* | | | | 69 | | | | 90 | | | | 127 | | | | 111 | | | | 76 | | | | 85 | |
| * | Not annualized for periods less than a year. |
| ** | Annualized for periods less than a year. |
Note: Net investment income (loss) per share is based on the average shares outstanding during the year.
Performance cited represents past performance. Past performance does not guarantee future results and current performance may be lower or higher than the data quoted. Results shown are annual returns, which assume reinvestment of dividends and capital gains. Investment returns and principal will fluctuate and you may have a gain or loss when you sell shares. For the most current month-end performance information, please call 1-800-742-7272 or visit our Web site at www.williamblairfunds.com.
| 170 | Semiannual Report | June 30, 2016 |
Financial Highlights
International Small Cap Growth Fund
| | | Institutional Class | |
| | | (unaudited) | | | | | | | | | | |
| | | Period Ended | | | | | | | | | | |
| | | June 30, | | | | | | | | | Years Ended December 31, | |
| | | | 2016 | | | 2015 | | | 2014 | | | 2013 | | | 2012 | | | 2011 | |
| Net asset value, beginning of year | | | $ | 13.72 | | | $ | 12.77 | | | $ | 16.32 | | | $ | 13.64 | | | $ | 11.51 | | | $ | 13.24 | |
| Income (loss) from investment operations: | | | | | | | | | | | | | | | | | | | | | | | | | |
| Net investment income (loss) | | | | 0.12 | | | | 0.10 | | | | 0.12 | | | | 0.18 | | | | 0.15 | | | | 0.14 | |
| Net realized and unrealized gain (loss) on investments | | | | (0.68 | ) | | | 1.18 | | | | (1.41 | ) | | | 3.41 | | | | 2.31 | | | | (1.68 | ) |
| Total from investment operations | | | | (0.56 | ) | | | 1.28 | | | | (1.29 | ) | | | 3.59 | | | | 2.46 | | | | (1.54 | ) |
| Less distributions from: | | | | | | | | | | | | | | | | | | | | | | | | | |
| Net investment income | | | | — | | | | 0.30 | | | | 0.27 | | | | 0.24 | | | | 0.33 | | | | 0.19 | |
| Net realized gain | | | | — | | | | 0.03 | | | | 1.99 | | | | 0.67 | | | | — | | | | — | |
| Total distributions | | | | — | | | | 0.33 | | | | 2.26 | | | | 0.91 | | | | 0.33 | | | | 0.19 | |
| Net asset value, end of year | | | $ | 13.16 | | | $ | 13.72 | | | $ | 12.77 | | | $ | 16.32 | | | $ | 13.64 | | | $ | 11.51 | |
| Total return (%)* | | | | (4.08 | ) | | | 10.03 | | | | (7.91 | ) | | | 26.49 | | | | 21.36 | | | | (11.60 | ) |
| Ratios to average daily net assets (%):** | | | | | | | | | | | | | | | | | | | | | | | | | |
| Expenses | | | | 1.08 | | | | 1.08 | | | | 1.06 | | | | 1.06 | | | | 1.08 | | | | 1.08 | |
| Net investment income (loss), | | | | 1.92 | | | | 0.76 | | | | 0.74 | | | | 1.20 | | | | 1.14 | | | | 1.10 | |
| Institutional Class net assets at end of year (in thousands) | | | $ | 204,717 | | | $ | 221,018 | | | $ | 245,103 | | | $ | 408,524 | | | $ | 345,180 | | | $ | 334,656 | |
| Portfolio turnover rate (%)* | | | | 69 | | | | 90 | | | | 127 | | | | 111 | | | | 76 | | | | 85 | |
| * | Not annualized for periods less than a year. |
| ** | Annualized for periods less than a year. |
Note: Net investment income (loss) per share is based on the average shares outstanding during the year.
Performance cited represents past performance. Past performance does not guarantee future results and current performance may be lower or higher than the data quoted. Results shown are annual returns, which assume reinvestment of dividends and capital gains. Investment returns and principal will fluctuate and you may have a gain or loss when you sell shares. For the most current month-end performance information, please call 1-800-742-7272 or visit our Web site at www.williamblairfunds.com.
| June 30, 2016 | William Blair Funds | 171 |
Financial Highlights
Emerging Markets Leaders Fund
| | | Class N | |
| | | (unaudited) | | | | | | | | | | |
| | | Period Ended | | | | | | | | | | |
| | | June 30, | | | | | | | | | Years Ended December 31, | |
| | | | 2016 | | | 2015 | | | 2014 | | | 2013 | | | 2012 | | | 2011 | |
| Net asset value, beginning of year | | | $ | 7.73 | | | $ | 9.06 | | | $ | 9.10 | | | $ | 9.20 | | | $ | 7.68 | | | $ | 10.34 | |
| Income (loss) from investment operations: | | | | | | | | | | | | | | | | | | | | | | | | | |
| Net investment income (loss) | | | | 0.03 | | | | 0.02 | | | | 0.05 | | | | (0.02 | ) | | | 0.02 | | | | 0.04 | |
| Net realized and unrealized gain (loss) on investments | | | | 0.31 | | | | (1.34 | ) | | | 0.14 | | | | (0.05 | ) | | | 1.54 | | | | (2.08 | ) |
| Total from investment operations | | | | 0.34 | | | | (1.32 | ) | | | 0.19 | | | | (0.07 | ) | | | 1.56 | | | | (2.04 | ) |
| Less distributions from: | | | | | | | | | | | | | | | | | | | | | | | | | |
| Net investment income | | | | — | | | | — | | | | 0.00 | ^ | | | 0.03 | | | | 0.04 | | | | — | |
| Net realized gain | | | | — | | | | 0.01 | | | | 0.23 | | | | — | | | | — | | | | 0.62 | |
| Total distributions | | | | — | | | | 0.01 | | | | 0.23 | | | | 0.03 | | | | 0.04 | | | | 0.62 | |
| Net asset value, end of year | | | $ | 8.07 | | | $ | 7.73 | | | $ | 9.06 | | | $ | 9.10 | | | $ | 9.20 | | | $ | 7.68 | |
| Total return (%)* | | | | 4.40 | | | | (14.56 | ) | | | 2.17 | | | | (0.74 | ) | | | 20.37 | | | | (19.55 | ) |
| Ratios to average daily net assets (%):** | | | | | | | | | | | | | | | | | | | | | | | | | |
| Expenses, net of waivers and reimbursements | | | | 1.65 | | | | 1.64 | | | | 1.65 | | | | 1.65 | | | | 1.65 | | | | 1.65 | |
| Expenses, before waivers and reimbursements | | | | 1.94 | | | | 1.89 | | | | 1.82 | | | | 1.83 | | | | 2.10 | | | | 1.83 | |
| Net investment income (loss), net of waivers and reimbursements | | | | 0.82 | | | | 0.18 | | | | 0.51 | | | | (0.23 | ) | | | 0.26 | | | | 0.44 | |
| Net investment income (loss), before waivers and reimbursements | | | | 0.53 | | | | (0.07 | ) | | | 0.34 | | | | (0.41 | ) | | | (0.19 | ) | | | 0.26 | |
| Class N net assets at end of year (in thousands) | | | $ | 1,876 | | | $ | 1,599 | | | $ | 1,832 | | | $ | 1,959 | | | $ | 249 | | | $ | 46 | |
| Portfolio turnover rate (%)* | | | | 113 | | | | 110 | | | | 131 | | | | 131 | | | | 94 | | | | 142 | |
| | | | | | | | | | | | | | | | | | | | | | | | | | |
| | | Class I | |
| | | (unaudited) | | | | | | | | | | |
| | | Period Ended | | | | | | | | | | |
| | | June 30, | | | | | | | | | Years Ended December 31, | |
| | | | 2016 | | | 2015 | | | 2014 | | | 2013 | | | 2012 | | | 2011 | |
| Net asset value, beginning of year | | | $ | 7.74 | | | $ | 9.08 | | | $ | 9.10 | | | $ | 9.18 | | | $ | 7.66 | | | $ | 10.35 | |
| Income (loss) from investment operations: | | | | | | | | | | | | | | | | | | | | | | | | | |
| Net investment income (loss) | | | | 0.04 | | | | 0.05 | | | | 0.08 | | | | 0.05 | | | | 0.07 | | | | 0.06 | |
| Net realized and unrealized gain (loss) on investments | | | | 0.32 | | | | (1.36 | ) | | | 0.15 | | | | (0.10 | ) | | | 1.51 | | | | (2.08 | ) |
| Total from investment operations | | | | 0.36 | | | | (1.31 | ) | | | 0.23 | | | | (0.05 | ) | | | 1.58 | | | | (2.02 | ) |
| Less distributions from: | | | | | | | | | | | | | | | | | | | | | | | | | |
| Net investment income | | | | — | | | | 0.02 | | | | 0.02 | | | | 0.03 | | | | 0.06 | | | | 0.05 | |
| Net realized gain | | | | — | | | | 0.01 | | | | 0.23 | | | | — | | | | — | | | | 0.62 | |
| Return of capital | | | | — | | | | — | | | | — | | | | — | | | | — | | | | 0.00 | ^ |
| Total distributions | | | | — | | | | 0.03 | | | | 0.25 | | | | 0.03 | | | | 0.06 | | | | 0.67 | |
| Net asset value, end of year | | | $ | 8.10 | | | $ | 7.74 | | | $ | 9.08 | | | $ | 9.10 | | | $ | 9.18 | | | $ | 7.66 | |
| Total return (%)* | | | | 4.65 | | | | (14.37 | ) | | | 2.62 | | | | (0.60 | ) | | | 20.64 | | | | (19.34 | ) |
| Ratios to average daily net assets (%):** | | | | | | | | | | | | | | | | | | | | | | | | | |
| Expenses, net of waivers and reimbursements | | | | 1.30 | | | | 1.29 | | | | 1.40 | | | | 1.40 | | | | 1.40 | | | | 1.40 | |
| Expenses, before waivers and reimbursements | | | | 1.59 | | | | 1.54 | | | | 1.60 | | | | 1.58 | | | | 1.75 | | | | 1.58 | |
| Net investment income (loss), net of waivers and reimbursements | | | | 1.09 | | | | 0.53 | | | | 0.84 | | | | 0.51 | | | | 0.83 | | | | 0.69 | |
| Net investment income (loss), before waivers and reimbursements | | | | 0.80 | | | | 0.28 | | | | 0.64 | | | | 0.33 | | | | 0.48 | | | | 0.51 | |
| Class I net assets at end of year (in thousands) | | | $ | 27,766 | | | $ | 32,862 | | | $ | 28,475 | | | $ | 34,590 | | | $ | 25,628 | | | $ | 21,610 | |
| Portfolio turnover rate (%)* | | | | 113 | | | | 110 | | | | 131 | | | | 131 | | | | 94 | | | | 142 | |
| * | Not annualized for periods less than a year. |
| ** | Annualized for periods less than a year. |
| ^ | Amount is less than $0.005 per share. |
Note: Net investment income (loss) per share is based on the average shares outstanding during the year.
Performance cited represents past performance. Past performance does not guarantee future results and current performance may be lower or higher than the data quoted. Results shown are annual returns, which assume reinvestment of dividends and capital gains. Investment returns and principal will fluctuate and you may have a gain or loss when you sell shares. For the most current month-end performance information, please call 1-800-742-7272 or visit our Web site at www.williamblairfunds.com.
| 172 | Semiannual Report | June 30, 2016 |
Financial Highlights
Emerging Markets Leaders Fund
| | | Institutional Class | |
| | | (unaudited) | | | | | | | |
| | | Period Ended | | | | | | | |
| | | June 30, | | | | | | | | | Years Ended December 31, | |
| | | | 2016 | | | 2015 | | | 2014 | | | 2013 | | | 2012 | | | 2011 | |
| Net asset value, beginning of year | | | $ | 7.74 | | | $ | 9.07 | | | $ | 9.10 | | | $ | 9.18 | | | $ | 7.65 | | | $ | 10.35 | |
| Income (loss) from investment operations: | | | | | | | | | | | | | | | | | | | | | | | | | |
| Net investment income (loss) | | | | 0.05 | | | | 0.04 | | | | 0.08 | | | | 0.06 | | | | 0.08 | | | | 0.09 | |
| Net realized and unrealized gain (loss) on investments | | | | 0.31 | | | | (1.33 | ) | | | 0.16 | | | | (0.10 | ) | | | 1.52 | | | | (2.10 | ) |
| Total from investment operations | | | | 0.36 | | | | (1.29 | ) | | | 0.24 | | | | (0.04 | ) | | | 1.60 | | | | (2.01 | ) |
| Less distributions from: | | | | | | | | | | | | | | | | | | | | | | | | | |
| Net investment income | | | | — | | | | 0.03 | | | | 0.04 | | | | 0.04 | | | | 0.07 | | | | 0.06 | |
| Net realized gain | | | | — | | | | 0.01 | | | | 0.23 | | | | — | | | | — | | | | 0.63 | |
| Return of capital | | | | — | | | | — | | | | — | | | | — | | | | — | | | | 0.00 | ^ |
| Total distributions | | | | — | | | | 0.04 | | | | 0.27 | | | | 0.04 | | | | 0.07 | | | | 0.69 | |
| Net asset value, end of year | | | $ | 8.10 | | | $ | 7.74 | | | $ | 9.07 | | | $ | 9.10 | | | $ | 9.18 | | | $ | 7.65 | |
| Total return (%)* | | | | 4.65 | | | | (14.24 | ) | | | 2.68 | | | | (0.46 | ) | | | 20.97 | | | | (19.30 | ) |
| Ratios to average daily net assets (%):** | | | | | | | | | | | | | | | | | | | | | | | | | |
| Expenses, net of waivers and reimbursements | | | | 1.25 | | | | 1.25 | | | | 1.25 | | | | 1.25 | | | | 1.25 | | | | 1.25 | |
| Expenses, before waivers and reimbursements | | | | 1.39 | | | | 1.35 | | | | 1.42 | | | | 1.42 | | | | 1.59 | | | | 1.41 | |
| Net investment income (loss), net of waivers and reimbursements | | | | 1.31 | | | | 0.49 | | | | 0.83 | | | | 0.68 | | | | 0.90 | | | | 0.90 | |
| Net investment income (loss), before waivers and reimbursements | | | | 1.17 | | | | 0.39 | | | | 0.66 | | | | 0.51 | | | | 0.56 | | | | 0.74 | |
| Institutional Class net assets at end of year (in thousands) | | | $ | 121,325 | | | $ | 93,217 | | | $ | 75,875 | | | $ | 36,509 | | | $ | 43,102 | | | $ | 26,166 | |
| Portfolio turnover rate (%)* | | | | 113 | | | | 110 | | | | 131 | | | | 131 | | | | 94 | | | | 142 | |
| * | Not annualized for periods less than a year. |
| ** | Annualized for periods less than a year. |
| ^ | Amount is less than $0.005 per share. |
Note: Net investment income (loss) per share is based on the average shares outstanding during the year.
Performance cited represents past performance. Past performance does not guarantee future results and current performance may be lower or higher than the data quoted. Results shown are annual returns, which assume reinvestment of dividends and capital gains. Investment returns and principal will fluctuate and you may have a gain or loss when you sell shares. For the most current month-end performance information, please call 1-800-742-7272 or visit our Web site at www.williamblairfunds.com.
| June 30, 2016 | William Blair Funds | 173 |
Financial Highlights
Emerging Markets Growth Fund
| | | Class N | |
| | | (unaudited) | | | | | | | | | | |
| | | Period Ended | | | | | | | | | | |
| | | June 30, | | | | | | | | | Years Ended December 31, | |
| | | | 2016 | | | 2015 | | | 2014 | | | 2013 | | | 2012 | | | 2011 | |
| Net asset value, beginning of year | | | $ | 10.85 | | | $ | 12.91 | | | $ | 13.28 | | | $ | 13.40 | | | $ | 11.16 | | | $ | 15.76 | |
| Income (loss) from investment operations: | | | | | | | | | | | | | | | | | | | | | | | | | |
| Net investment income (loss) | | | | 0.05 | | | | 0.04 | | | | 0.08 | | | | 0.05 | | | | 0.07 | | | | 0.07 | |
| Net realized and unrealized gain (loss) on investments | | | | 0.50 | | | | (1.98 | ) | | | 0.37 | | | | 0.09 | | | | 2.24 | | | | (2.84 | ) |
| Total from investment operations | | | | 0.55 | | | | (1.94 | ) | | | 0.45 | | | | 0.14 | | | | 2.31 | | | | (2.77 | ) |
| Less distributions from: | | | | | | | | | | | | | | | | | | | | | | | | | |
| Net investment income | | | | — | | | | — | | | | 0.08 | | | | 0.01 | | | | 0.07 | | | | — | |
| Net realized gain | | | | — | | | | 0.12 | | | | 0.74 | | | | 0.25 | | | | — | | | | 1.83 | |
| Total distributions | | | | — | | | | 0.12 | | | | 0.82 | | | | 0.26 | | | | 0.07 | | | | 1.83 | |
| Net asset value, end of year | | | $ | 11.40 | | | $ | 10.85 | | | $ | 12.91 | | | $ | 13.28 | | | $ | 13.40 | | | $ | 11.16 | |
| Total return (%)* | | | | 5.07 | | | | (15.03 | ) | | | 3.40 | | | | 1.05 | | | | 20.70 | | | | (17.29 | ) |
| Ratios to average daily net assets (%):** | | | | | | | | | | | | | | | | | | | | | | | | | |
| Expenses, net of waivers and reimbursements | | | | 1.50 | | | | 1.50 | | | | 1.64 | | | | 1.68 | | | | 1.69 | | | | 1.68 | |
| Expenses, before waivers and reimbursements | | | | 1.65 | | | | 1.65 | | | | 1.64 | | | | 1.68 | | | | 1.69 | | | | 1.68 | |
| Net investment income (loss), net of waivers and reimbursements | | | | 0.98 | | | | 0.33 | | | | 0.55 | | | | 0.39 | | | | 0.59 | | | | 0.48 | |
| Net investment income (loss), before waivers and reimbursements | | | | 0.83 | | | | 0.18 | | | | 0.55 | | | | 0.39 | | | | 0.59 | | | | 0.48 | |
| Class N net assets at end of year (in thousands) | | | $ | 9,350 | | | $ | 9,367 | | | $ | 12,638 | | | $ | 13,723 | | | $ | 16,724 | | | $ | 17,474 | |
| Portfolio turnover rate (%)* | | | | 115 | | | | 121 | | | | 101 | | | | 118 | | | | 90 | | | | 104 | |
| | | | | | | | | | | | | | | | | | | | | | | | | | |
| | | Class I | |
| | | (unaudited) | | | | | | | | | | |
| | | Period Ended | | | | | | | | | | |
| | | June 30, | | | | | | | | | Years Ended December 31, | |
| | | | 2016 | | | 2015 | | | 2014 | | | 2013 | | | 2012 | | | 2011 | |
| Net asset value, beginning of year | | | $ | 10.96 | | | $ | 13.01 | | | $ | 13.38 | | | $ | 13.50 | | | $ | 11.25 | | | $ | 15.87 | |
| Income (loss) from investment operations: | | | | | | | | | | | | | | | | | | | | | | | | | |
| Net investment income (loss) | | | | 0.06 | | | | 0.07 | | | | 0.11 | | | | 0.08 | | | | 0.11 | | | | 0.11 | |
| Net realized and unrealized gain (loss) on investments | | | | 0.51 | | | | (2.00 | ) | | | 0.37 | | | | 0.10 | | | | 2.25 | | | | (2.85 | ) |
| Total from investment operations | | | | 0.57 | | | | (1.93 | ) | | | 0.48 | | | | 0.18 | | | | 2.36 | | | | (2.74 | ) |
| Less distributions from: | | | | | | | | | | | | | | | | | | | | | | | | | |
| Net investment income | | | | — | | | | — | | | | 0.11 | | | | 0.05 | | | | 0.11 | | | | 0.05 | |
| Net realized gain | | | | — | | | | 0.12 | | | | 0.74 | | | | 0.25 | | | | — | | | | 1.83 | |
| Total distributions | | | | — | | | | 0.12 | | | | 0.85 | | | | 0.30 | | | | 0.11 | | | | 1.88 | |
| Net asset value, end of year | | | $ | 11.53 | | | $ | 10.96 | | | $ | 13.01 | | | $ | 13.38 | | | $ | 13.50 | | | $ | 11.25 | |
| Total return (%)* | | | | 5.20 | | | | (14.83 | ) | | | 3.65 | | | | 1.36 | | | | 21.01 | | | | (17.00 | ) |
| Ratios to average daily net assets (%):** | | | | | | | | | | | | | | | | | | | | | | | | | |
| Expenses, net of waivers and reimbursements | | | | 1.26 | | | | 1.25 | | | | 1.40 | | | | 1.41 | | | | 1.41 | | | | 1.38 | |
| Expenses, before waivers and reimbursements | | | | 1.41 | | | | 1.40 | | | | 1.40 | | | | 1.41 | | | | 1.41 | | | | 1.38 | |
| Net investment income (loss), net of waivers and reimbursements | | | | 1.17 | | | | 0.58 | | | | 0.79 | | | | 0.62 | | | | 0.86 | | | | 0.77 | |
| Net investment income (loss), before waivers and reimbursements | | | | 1.02 | | | | 0.43 | | | | 0.79 | | | | 0.62 | | | | 0.86 | | | | 0.77 | |
| Class I net assets at end of year (in thousands) | | | $ | 104,588 | | | $ | 130,491 | | | $ | 166,488 | | | $ | 152,588 | | | $ | 144,942 | | | $ | 124,739 | |
| Portfolio turnover rate (%)* | | | | 115 | | | | 121 | | | | 101 | | | | 118 | | | | 90 | | | | 104 | |
| * | Not annualized for periods less than a year. |
| ** | Annualized for periods less than a year. |
Note: Net investment income (loss) per share is based on the average shares outstanding during the year.
Performance cited represents past performance. Past performance does not guarantee future results and current performance may be lower or higher than the data quoted. Results shown are annual returns, which assume reinvestment of dividends and capital gains. Investment returns and principal will fluctuate and you may have a gain or loss when you sell shares. For the most current month-end performance information, please call 1-800-742-7272 or visit our Web site at www.williamblairfunds.com.
| 174 | Semiannual Report | June 30, 2016 |
Financial Highlights
Emerging Markets Growth Fund
| | | Institutional Class | |
| | | (unaudited) | | | | | | | | | | |
| | | Period Ended | | | | | | | | | | |
| | | June 30, | | | | | | | | | Years Ended December 31, | |
| | | | 2016 | | | 2015 | | | 2014 | | | 2013 | | | 2012 | | | 2011 | |
| Net asset value, beginning of year | | | $ | 11.05 | | | $ | 13.09 | | | $ | 13.46 | | | $ | 13.59 | | | $ | 11.32 | | | $ | 15.96 | |
| Income (loss) from investment operations: | | | | | | | | | | | | | | | | | | | | | | | | | |
| Net investment income (loss) | | | | 0.07 | | | | 0.08 | | | | 0.14 | | | | 0.12 | | | | 0.14 | | | | 0.14 | |
| Net realized and unrealized gain (loss) on investments | | | | 0.50 | | | | (2.00 | ) | | | 0.37 | | | | 0.08 | | | | 2.27 | | | | (2.87 | ) |
| Total from investment operations | | | | 0.57 | | | | (1.92 | ) | | | 0.51 | | | | 0.20 | | | | 2.41 | | | | (2.73 | ) |
| Less distributions from: | | | | | | | | | | | | | | | | | | | | | | | | | |
| Net investment income | | | | — | | | | — | | | | 0.14 | | | | 0.08 | | | | 0.14 | | | | 0.08 | |
| Net realized gain | | | | — | | | | 0.12 | | | | 0.74 | | | | 0.25 | | | | — | | | | 1.83 | |
| Total distributions | | | | — | | | | 0.12 | | | | 0.88 | | | | 0.33 | | | | 0.14 | | | | 1.91 | |
| Net asset value, end of year | | | $ | 11.62 | | | $ | 11.05 | | | $ | 13.09 | | | $ | 13.46 | | | $ | 13.59 | | | $ | 11.32 | |
| Total return (%)* | | | | 5.16 | | | | (14.67 | ) | | | 3.85 | | | | 1.49 | | | | 21.28 | | | | (16.82 | ) |
| Ratios to average daily net assets (%):** | | | | | | | | | | | | | | | | | | | | | | | | | |
| Expenses | | | | 1.18 | | | | 1.17 | | | | 1.18 | | | | 1.19 | | | | 1.20 | | | | 1.19 | |
| Net investment income (loss) | | | | 1.39 | | | | 0.61 | | | | 1.00 | | | | 0.87 | | | | 1.12 | | | | 0.93 | |
| Institutional Class net assets at end of year (in thousands) | | | $ | 901,919 | | | $ | 739,253 | | | $ | 806,708 | | | $ | 833,711 | | | $ | 802,571 | | | $ | 675,633 | |
| Portfolio turnover rate (%)* | | | | 115 | | | | 121 | | | | 101 | | | | 118 | | | | 90 | | | | 104 | |
| * | Not annualized for periods less than a year. |
| ** | Annualized for periods less than a year. |
Note: Net investment income (loss) per share is based on the average shares outstanding during the year.
Performance cited represents past performance. Past performance does not guarantee future results and current performance may be lower or higher than the data quoted. Results shown are annual returns, which assume reinvestment of dividends and capital gains. Investment returns and principal will fluctuate and you may have a gain or loss when you sell shares. For the most current month-end performance information, please call 1-800-742-7272 or visit our Web site at www.williamblairfunds.com.
| June 30, 2016 | William Blair Funds | 175 |
Financial Highlights
Emerging Markets Small Cap Growth Fund
| | | Class N | |
| | | (unaudited) | | | | | | | |
| | | Period Ended | | | | | | | |
| | | June 30, | | | | | | | | | Years Ended December 31, | |
| | | | 2016 | | | 2015 | | | 2014 | | | 2013 | | | 2012 | | | 2011(a) | |
| Net asset value, beginning of year | | | $ | 14.84 | | | $ | 16.52 | | | $ | 15.12 | | | $ | 12.99 | | | $ | 9.73 | | | $ | 10.00 | |
| Income (loss) from investment operations: | | | | | | | | | | | | | | | | | | | | | | | | | |
| Net investment income (loss) | | | | 0.09 | | | | (0.01 | ) | | | 0.04 | | | | 0.05 | | | | 0.06 | | | | 0.00 | ^ |
| Net realized and unrealized gain (loss) on investments | | | | 0.04 | | | | (1.05 | ) | | | 2.13 | | | | 2.08 | | | | 3.27 | | | | (0.27 | ) |
| Total from investment operations | | | | 0.13 | | | | (1.06 | ) | | | 2.17 | | | | 2.13 | | | | 3.33 | | | | (0.27 | ) |
| Less distributions from: | | | | | | | | | | | | | | | | | | | | | | | | | |
| Net investment income | | | | — | | | | — | | | | 0.03 | | | | — | | | | 0.07 | | | | — | |
| Net realized gain | | | | — | | | | 0.62 | | | | 0.74 | | | | 0.00 | ^ | | | — | | | | — | |
| Total distributions | | | | — | | | | 0.62 | | | | 0.77 | | | | 0.00 | ^ | | | 0.07 | | | | — | |
| Net asset value, end of year | | | $ | 14.97 | | | $ | 14.84 | | | $ | 16.52 | | | $ | 15.12 | | | $ | 12.99 | | | $ | 9.73 | |
| Total return (%)* | | | | 0.88 | | | | (6.40 | ) | | | 14.41 | | | | 16.42 | | | | 34.23 | | | | (2.70 | ) |
| Ratios to average daily net assets (%):** | | | | | | | | | | | | | | | | | | | | | | | | | |
| Expenses, net of waivers and reimbursements | | | | 1.61 | | | | 1.65 | | | | 1.65 | | | | 1.65 | | | | 1.65 | | | | 1.65 | |
| Expenses, before waivers and reimbursements | | | | 1.83 | | | | 1.94 | | | | 1.74 | | | | 2.19 | | | | 4.76 | | | | 9.53 | |
| Net investment income (loss), net of waivers and reimbursements | | | | 1.32 | | | | (0.06 | ) | | | 0.21 | | | | 0.38 | | | | 0.56 | | | | 0.08 | |
| Net investment income (loss), before waivers and reimbursements | | | | 1.10 | | | | (0.35 | ) | | | 0.12 | | | | (0.16 | ) | | | (2.54 | ) | | | (7.80 | ) |
| Class N net assets at end of year (in thousands) | | | $ | 10,903 | | | $ | 11,306 | | | $ | 10,745 | | | $ | 9,313 | | | $ | 3,016 | | | $ | 1,012 | |
| Portfolio turnover rate (%)* | | | | 148 | | | | 167 | | | | 124 | | | | 138 | | | | 78 | | | | 17 | |
| | | | | | | | | | | | | | | | | | | | | | | | | | |
| | | Class I | |
| | | (unaudited) | | | | | | | |
| | | Period Ended | | | | | | | |
| | | June 30, | | | | | | | | | Years Ended December 31, | |
| | | | 2016 | | | 2015 | | | 2014 | | | 2013 | | | 2012 | | | 2011(a) | |
| Net asset value, beginning of year | | | $ | 14.90 | | | $ | 16.52 | | | $ | 15.13 | | | $ | 12.99 | | | $ | 9.73 | | | $ | 10.00 | |
| Income (loss) from investment operations: | | | | | | | | | | | | | | | | | | | | | | | | | |
| Net investment income (loss) | | | | 0.12 | | | | 0.05 | | | | 0.02 | | | | 0.05 | | | | 0.08 | | | | 0.01 | |
| Net realized and unrealized gain (loss) on investments | | | | 0.02 | | | | (1.05 | ) | | | 2.20 | | | | 2.12 | | | | 3.29 | | | | (0.28 | ) |
| Total from investment operations | | | | 0.14 | | | | (1.00 | ) | | | 2.22 | | | | 2.17 | | | | 3.37 | | | | (0.27 | ) |
| Less distributions from: | | | | | | | | | | | | | | | | | | | | | | | | | |
| Net investment income | | | | — | | | | — | | | | 0.09 | | | | 0.03 | | | | 0.11 | | | | — | |
| Net realized gain | | | | — | | | | 0.62 | | | | 0.74 | | | | 0.00 | ^ | | | — | | | | — | |
| Total distributions | | | | — | | | | 0.62 | | | | 0.83 | | | | 0.03 | | | | 0.11 | | | | — | |
| Net asset value, end of year | | | $ | 15.04 | | | $ | 14.90 | | | $ | 16.52 | | | $ | 15.13 | | | $ | 12.99 | | | $ | 9.73 | |
| Total return (%)* | | | | 0.94 | | | | (6.03 | ) | | | 14.73 | | | | 16.70 | | | | 34.62 | | | | (2.70 | ) |
| Ratios to average daily net assets (%):** | | | | | | | | | | | | | | | | | | | | | | | | | |
| Expenses, net of waivers and reimbursements | | | | 1.30 | | | | 1.31 | | | | 1.40 | | | | 1.40 | | | | 1.40 | | | | 1.40 | |
| Expenses, before waivers and reimbursements | | | | 1.52 | | | | 1.52 | | | | 1.49 | | | | 1.72 | | | | 4.40 | | | | 9.28 | |
| Net investment income (loss), net of waivers and reimbursements | | | | 1.63 | | | | 0.30 | | | | 0.15 | | | | 0.35 | | | | 0.70 | | | | 0.33 | |
| Net investment income (loss), before waivers and reimbursements | | | | 1.41 | | | | 0.09 | | | | 0.06 | | | | 0.03 | | | | (2.30 | ) | | | (7.55 | ) |
| Class I net assets at end of year (in thousands) | | | $ | 164,563 | | | $ | 162,375 | | | $ | 119,662 | | | $ | 58,123 | | | $ | 8,763 | | | $ | 2,260 | |
| Portfolio turnover rate (%)* | | | | 148 | | | | 167 | | | | 124 | | | | 138 | | | | 78 | | | | 17 | |
| (a) | For the period from October 24, 2011 (Commencement of Operations) to December 31, 2011. |
| * | Not annualized for periods that are less than a year. |
| ** | Annualized for periods that are less than a year. |
| ^ | Amount is less than $0.005 per share. |
Note: Net investment income (loss) per share is based on the average shares outstanding during the year.
Performance cited represents past performance. Past performance does not guarantee future results and current performance may be lower or higher than the data quoted. Results shown are annual returns, which assume reinvestment of dividends and capital gains. Investment returns and principal will fluctuate and you may have a gain or loss when you sell shares. For the most current month-end performance information, please call 1-800-742-7272 or visit our Web site at www.williamblairfunds.com.
| 176 | Semiannual Report | June 30, 2016 |
Financial Highlights
Emerging Markets Small Cap Growth Fund
| | | Institutional Class | |
| | | (unaudited) | | | | | | | | | | | | | |
| | | Period Ended | | | | | | | | | | | | | |
| | | June 30, | | | Periods Ended December 31, | |
| | | | 2016 | | | 2015 | | | 2014 | | | 2013 | | | 2012(a) | |
| Net asset value, beginning of year | | | $ | 14.92 | | | $ | 16.53 | | | $ | 15.14 | | | $ | 13.00 | | | $ | 12.79 | |
| Income (loss) from investment operations: | | | | | | | | | | | | | | | | | | | | | |
| Net investment income (loss) | | | | 0.12 | | | | 0.06 | | | | 0.06 | | | | 0.07 | | | | 0.00 | ^ |
| Net realized and unrealized gain (loss) on investments | | | | 0.03 | | | | (1.05 | ) | | | 2.18 | | | | 2.11 | | | | 0.21 | |
| Total from investment operations | | | | 0.15 | | | | (0.99 | ) | | | 2.24 | | | | 2.18 | | | | 0.21 | |
| Less distributions from: | | | | | | | | | | | | | | | | | | | | | |
| Net investment income | | | | — | | | | 0.00 | ^ | | | 0.11 | | | | 0.04 | | | | — | |
| Net realized gain | | | | — | | | | 0.62 | | | | 0.74 | | | | 0.00 | ^ | | | — | |
| Total distributions | | | | — | | | | 0.62 | | | | 0.85 | | | | 0.04 | | | | — | |
| Net asset value, end of year | | | $ | 15.07 | | | $ | 14.92 | | | $ | 16.53 | | | $ | 15.14 | | | $ | 13.00 | |
| Total return (%)* | | | | 1.01 | | | | (5.97 | ) | | | 14.85 | | | | 16.80 | | | | 1.64 | |
| Ratios to average daily net assets (%):** | | | | | | | | | | | | | | | | | | | | | |
| Expenses, net of waivers and reimbursements | | | | 1.25 | | | | 1.25 | | | | 1.25 | | | | 1.25 | | | | 1.25 | |
| Expenses, before waivers and reimbursements | | | | 1.32 | | | | 1.31 | | | | 1.34 | | | | 1.56 | | | | 2.32 | |
| Net investment income (loss), net of waivers and reimbursements | | | | 1.72 | | | | 0.34 | | | | 0.37 | | | | 0.47 | | | | (0.87 | ) |
| Net investment income (loss), before waivers and reimbursements | | | | 1.65 | | | | 0.28 | | | | 0.28 | | | | 0.16 | | | | (1.93 | ) |
| Institutional Class net assets at end of year (in thousands) | | | $ | 130,068 | | | $ | 123,160 | | | $ | 123,496 | | | $ | 91,663 | | | $ | 15,242 | |
| Portfolio turnover rate (%)* | | | | 148 | | | | 167 | | | | 124 | | | | 138 | | | | 78 | |
| (a) | For the period from December 20, 2012 (Commencement of Operations) to December 31, 2012. |
| * | Not annualized for periods less than a year. |
| ** | Annualized for periods less than a year. |
| ^ | Amount is less than $0.005 per share. |
Note: Net investment income (loss) per share is based on the average shares outstanding during the year.
Performance cited represents past performance. Past performance does not guarantee future results and current performance may be lower or higher than the data quoted. Results shown are annual returns, which assume reinvestment of dividends and capital gains. Investment returns and principal will fluctuate and you may have a gain or loss when you sell shares. For the most current month-end performance information, please call 1-800-742-7272 or visit our Web site at www.williamblairfunds.com.
| June 30, 2016 | William Blair Funds | 177 |
Financial Highlights
Bond Fund
| | | Class N | |
| | | (unaudited) | | | | | | | | | | | | | | | | |
| | | Period Ended | | | | | | | | | | | | | | | | |
| | | June 30, | | | Years Ended December 31, | |
| | | | 2016 | | | 2015 | | | 2014 | | | 2013 | | | 2012 | | | 2011 | |
| Net asset value, beginning of year | | | $ | 10.34 | | | $ | 10.74 | | | $ | 10.60 | | | $ | 11.28 | | | $ | 10.91 | | | $ | 10.70 | |
| Income (loss) from investment operations: | | | | | | | | | | | | | | | | | | | | | | | | | |
| Net investment income (loss) | | | | 0.14 | | | | 0.27 | | | | 0.31 | | | | 0.32 | | | | 0.36 | | | | 0.43 | |
| Net realized and unrealized gain (loss) on investments | | | | 0.41 | | | | (0.29 | ) | | | 0.23 | | | | (0.47 | ) | | | 0.53 | | | | 0.34 | |
| Total from investment operations | | | | 0.55 | | | | (0.02 | ) | | | 0.54 | | | | (0.15 | ) | | | 0.89 | | | | 0.77 | |
| Less distributions from: | | | | | | | | | | | | | | | | | | | | | | | | | |
| Net investment income | | | | 0.19 | | | | 0.38 | | | | 0.40 | | | | 0.42 | | | | 0.45 | | | | 0.47 | |
| Net realized gain | | | | — | | | | — | | | | 0.00 | ^ | | | 0.11 | | | | 0.07 | | | | 0.09 | |
| Total distributions | | | | 0.19 | | | | 0.38 | | | | 0.40 | | | | 0.53 | | | | 0.52 | | | | 0.56 | |
| Net asset value, end of year | | | $ | 10.70 | | | $ | 10.34 | | | $ | 10.74 | | | $ | 10.60 | | | $ | 11.28 | | | $ | 10.91 | |
| Total return (%)* | | | | 5.37 | | | | (0.23 | ) | | | 5.10 | | | | (1.37 | ) | | | 8.33 | | | | 7.41 | |
| Ratios to average daily net assets (%):** | | | | | | | | | | | | | | | | | | | | | | | | | |
| Expenses, net of waivers and reimbursements | | | | 0.62 | | | | 0.61 | | | | 0.65 | | | | 0.65 | | | | 0.65 | | | | 0.65 | |
| Expenses, before waivers and reimbursements | | | | 0.80 | | | | 0.79 | | | | 0.85 | | | | 0.82 | | | | 0.81 | | | | 0.76 | |
| Net investment income (loss), net of waivers and reimbursements | | | | 2.69 | | | | 2.60 | | | | 2.90 | | | | 2.89 | | | | 3.25 | | | | 3.97 | |
| Net investment income (loss), before waivers and reimbursements | | | | 2.51 | | | | 2.42 | | | | 2.70 | | | | 2.72 | | | | 3.09 | | | | 3.86 | |
| Class N net assets at end of year (in thousands) | | | $ | 151,711 | | | $ | 139,303 | | | $ | 16,720 | | | $ | 11,389 | | | $ | 32,867 | | | $ | 8,345 | |
| Portfolio turnover rate (%)* | | | | 24 | | | | 32 | | | | 35 | | | | 41 | | | | 25 | | | | 28 | |
| | | | | | | | | | | | | | | | | | | | | | | | | | |
| | | Class I | |
| | | | (unaudited) | | | | | | | | | | | | | | | | | | | | | |
| | | | Period Ended | | | | | | | | | | | | | | | | | | | | | |
| | | June 30, | | | | Years Ended December 31, | |
| | | | 2016 | | | 2015 | | | 2014 | | | 2013 | | | 2012 | | | 2011 | |
| Net asset value, beginning of year | | | $ | 10.24 | | | $ | 10.64 | | | $ | 10.49 | | | $ | 11.17 | | | $ | 10.80 | | | $ | 10.59 | |
| Income (loss) from investment operations: | | | | | | | | | | | | | | | | | | | | | | | | | |
| Net investment income (loss) | | | | 0.15 | | | | 0.31 | | | | 0.33 | | | | 0.33 | | | | 0.38 | | | | 0.45 | |
| Net realized and unrealized gain (loss) on investments | | | | 0.40 | | | | (0.31 | ) | | | 0.23 | | | | (0.48 | ) | | | 0.52 | | | | 0.33 | |
| Total from investment operations | | | | 0.55 | | | | — | | | | 0.56 | | | | (0.15 | ) | | | 0.90 | | | | 0.78 | |
| Less distributions from: | | | | | | | | | | | | | | | | | | | | | | | | | |
| Net investment income | | | | 0.20 | | | | 0.40 | | | | 0.41 | | | | 0.42 | | | | 0.46 | | | | 0.48 | |
| Net realized gain | | | | — | | | | — | | | | 0.00 | ^ | | | 0.11 | | | | 0.07 | | | | 0.09 | |
| Total distributions | | | | 0.20 | | | | 0.40 | | | | 0.41 | | | | 0.53 | | | | 0.53 | | | | 0.57 | |
| Net asset value, end of year | | | $ | 10.59 | | | $ | 10.24 | | | $ | 10.64 | | | $ | 10.49 | | | $ | 11.17 | | | $ | 10.80 | |
| Total return (%)* | | | | 5.40 | | | | (0.05 | ) | | | 5.37 | | | | (1.28 | ) | | | 8.54 | | | | 7.62 | |
| Ratios to average daily net assets (%):** | | | | | | | | | | | | | | | | | | | | | | | | | |
| Expenses, net of waivers and reimbursements | | | | 0.41 | | | | 0.41 | | | | 0.50 | | | | 0.50 | | | | 0.50 | | | | 0.50 | |
| Expenses, before waivers and reimbursements | | | | 0.58 | | | | 0.59 | | | | 0.60 | | | | 0.58 | | | | 0.56 | | | | 0.55 | |
| Net investment income (loss), net of waivers and reimbursements | | | | 2.90 | | | | 2.93 | | | | 3.07 | | | | 3.05 | | | | 3.45 | | | | 4.17 | |
| Net investment income (loss), before waivers and reimbursements | | | | 2.73 | | | | 2.75 | | | | 2.97 | | | | 2.97 | | | | 3.39 | | | | 4.12 | |
| Class I net assets at end of year (in thousands) | | | $ | 313,945 | | | $ | 237,587 | | | $ | 149,466 | | | $ | 145,939 | | | $ | 172,836 | | | $ | 154,224 | |
| Portfolio turnover rate (%)* | | | | 24 | | | | 32 | | | | 35 | | | | 41 | | | | 25 | | | | 28 | |
| * | Not annualized for periods less than a year. |
| ** | Annualized for periods less than a year. |
| ^ | Amount is less than $0.005 per share. |
Note: Net investment income (loss) per share is based on the average shares outstanding during the year.
Performance cited represents past performance. Past performance does not guarantee future results and current performance may be lower or higher than the data quoted. Results shown are annual returns, which assume reinvestment of dividends and capital gains. Investment returns and principal will fluctuate and you may have a gain or loss when you sell shares. For the most current month-end performance information, please call 1-800-742-7272 or visit our Web site at www.williamblairfunds.com.
| 178 | Semiannual Report | June 30, 2016 |
Financial Highlights
Bond Fund
| | | Institutional Class | |
| | | (unaudited) | | | | | | | | | | | | | |
| | | Period Ended | | | | | | | | | | | | | |
| | | June 30, | | | Years Ended December 31, | |
| | | | 2016 | | | 2015 | | | 2014 | | | 2013 | | | 2012 | | | 2011 | |
| Net asset value, beginning of year | | | $ | 10.23 | | | $ | 10.63 | | | $ | 10.48 | | | $ | 11.16 | | | $ | 10.80 | | | $ | 10.58 | |
| Income (loss) from investment operations: | | | | | | | | | | | | | | | | | | | | | | | | | |
| Net investment income (loss) | | | | 0.15 | | | | 0.32 | | | | 0.34 | | | | 0.35 | | | | 0.40 | | | | 0.45 | |
| Net realized and unrealized gain (loss) on investments | | | | 0.40 | | | | (0.31 | ) | | | 0.23 | | | | (0.48 | ) | | | 0.51 | | | | 0.36 | |
| Total from investment operations | | | | 0.55 | | | | 0.01 | | | | 0.57 | | | | (0.13 | ) | | | 0.91 | | | | 0.81 | |
| Less distributions from: | | | | | | | | | | | | | | | | | | | | | | | | | |
| Net investment income | | | | 0.20 | | | | 0.41 | | | | 0.42 | | | | 0.44 | | | | 0.48 | | | | 0.50 | |
| Net realized gain | | | | — | | | | — | | | | 0.00 | ^ | | | 0.11 | | | | 0.07 | | | | 0.09 | |
| Total distributions | | | | 0.20 | | | | 0.41 | | | | 0.42 | | | | 0.55 | | | | 0.55 | | | | 0.59 | |
| Net asset value, end of year | | | $ | 10.58 | | | $ | 10.23 | | | $ | 10.63 | | | $ | 10.48 | | | $ | 11.16 | | | $ | 10.80 | |
| Total return (%)* | | | | 5.43 | | | | 0.01 | | | | 5.53 | | | | (1.13 | ) | | | 8.61 | | | | 7.88 | |
| Ratios to average daily net assets (%):** | | | | | | | | | | | | | | | | | | | | | | | | | |
| Expenses, net of waivers and reimbursements | | | | 0.35 | | | | 0.35 | | | | 0.35 | | | | 0.35 | | | | 0.35 | | | | 0.35 | |
| Expenses, before waivers and reimbursements | | | | 0.37 | | | | 0.38 | | | | 0.41 | | | | 0.39 | | | | 0.38 | | | | 0.39 | |
| Net investment income (loss), net of waivers and reimbursements | | | | 2.97 | | | | 3.01 | | | | 3.23 | | | | 3.19 | | | | 3.60 | | | | 4.24 | |
| Net investment income (loss), before waivers and reimbursements | | | | 2.95 | | | | 2.98 | | | | 3.17 | | | | 3.15 | | | | 3.57 | | | | 4.20 | |
| Institutional Class net assets at end of year (in thousands) | | | $ | 107,468 | | | $ | 103,904 | | | $ | 97,341 | | | $ | 87,527 | | | $ | 91,039 | | | $ | 69,447 | |
| Portfolio turnover rate (%)* | | | | 24 | | | | 32 | | | | 35 | | | | 41 | | | | 25 | | | | 28 | |
| * | Not annualized for periods less than a year. |
| ** | Annualized for periods less than a year. |
| ^ | Amount is less than $0.005 per share. |
Note: Net investment income (loss) per share is based on the average shares outstanding during the year.
Performance cited represents past performance. Past performance does not guarantee future results and current performance may be lower or higher than the data quoted. Results shown are annual returns, which assume reinvestment of dividends and capital gains. Investment returns and principal will fluctuate and you may have a gain or loss when you sell shares. For the most current month-end performance information, please call 1-800-742-7272 or visit our Web site at www.williamblairfunds.com.
| June 30, 2016 | William Blair Funds | 179 |
Financial Highlights
Income Fund
| | | Class N | |
| | | (unaudited) | | | | | | | | | | | | | | | | |
| | | Period Ended | | | | | | | | | | | | | | | | |
| | | June 30, | | | Years Ended December 31, | |
| | | | 2016 | | | 2015 | | | 2014 | | | 2013 | | | 2012 | | | 2011 | |
| Net asset value, beginning of year | | | $ | 8.90 | | | $ | 9.12 | | | $ | 9.11 | | | $ | 9.55 | | | $ | 9.32 | | | $ | 9.22 | |
| Income (loss) from investment operations: | | | | | | | | | | | | | | | | | | | | | | | | | |
| Net investment income (loss) | | | | 0.09 | | | | 0.15 | | | | 0.18 | | | | 0.20 | | | | 0.24 | | | | 0.32 | |
| Net realized and unrealized gain (loss) on investments | | | | 0.17 | | | | (0.11 | ) | | | 0.10 | | | | (0.35 | ) | | | 0.31 | | | | 0.15 | |
| Total from investment operations | | | | 0.26 | | | | 0.04 | | | | 0.28 | | | | (0.15 | ) | | | 0.55 | | | | 0.47 | |
| Less distributions from: | | | | | | | | | | | | | | | | | | | | | | | | | |
| Net investment income | | | | 0.13 | | | | 0.26 | | | | 0.27 | | | | 0.29 | | | | 0.32 | | | | 0.37 | |
| Net realized gain | | | | — | | | | — | | | | — | | | | — | | | | — | | | | — | |
| Total distributions | | | | 0.13 | | | | 0.26 | | | | 0.27 | | | | 0.29 | | | | 0.32 | | | | 0.37 | |
| Net asset value, end of year | | | $ | 9.03 | | | $ | 8.90 | | | $ | 9.12 | | | $ | 9.11 | | | $ | 9.55 | | | $ | 9.32 | |
| Total return (%)* | | | | 2.94 | | | | 0.39 | | | | 3.06 | | | | (1.61 | ) | | | 6.00 | | | | 5.21 | |
| Ratios to average daily net assets (%):** | | | | | | | | | | | | | | | | | | | | | | | | | |
| Expenses, net of waivers and reimbursements | | | | 0.81 | | | | 0.81 | | | | 0.84 | | | | 0.85 | | | | 0.83 | | | | 0.85 | |
| Expenses, before waivers and reimbursements | | | | 0.81 | | | | 0.81 | | | | 0.84 | | | | 1.03 | | | | 0.83 | | | | 0.91 | |
| Net investment income (loss), net of waivers and reimbursements | | | | 1.91 | | | | 1.71 | | | | 1.99 | | | | 2.13 | | | | 2.49 | | | | 3.40 | |
| Net investment income (loss), before waivers and reimbursements | | | | 1.91 | | | | 1.71 | | | | 1.99 | | | | 1.95 | | | | 2.49 | | | | 3.34 | |
| Class N net assets at end of year (in thousands) | | | $ | 35,122 | | | $ | 32,942 | | | $ | 34,020 | | | $ | 41,662 | | | $ | 68,947 | | | $ | 44,802 | |
| Portfolio turnover rate (%)* | | | | 27 | | | | 21 | | | | 30 | | | | 41 | | | | 33 | | | | 39 | |
| | | | | | | | | | | | | | | | | | | | | | | | | | |
| | | Class I | |
| | | (unaudited) | | | | | | | | | | | | | | | | | | | | | |
| | | Period Ended | | | | | | | | | | | | | | | | | | | | | |
| | | June 30, | | | | Years Ended December 31, | |
| | | | | 2016 | | | 2015 | | | 2014 | | | 2013 | | | 2012 | | | 2011 | |
| Net asset value, beginning of year | | | $ | 8.83 | | | $ | 9.05 | | | $ | 9.05 | | | $ | 9.48 | | | $ | 9.25 | | | $ | 9.15 | |
| Income (loss) from investment operations: | | | | | | | | | | | | | | | | | | | | | | | | | |
| Net investment income (loss) | | | | 0.10 | | | | 0.18 | | | | 0.20 | | | | 0.21 | | | | 0.26 | | | | 0.34 | |
| Net realized and unrealized gain (loss) on investments | | | | 0.18 | | | | (0.12 | ) | | | 0.09 | | | | (0.34 | ) | | | 0.31 | | | | 0.15 | |
| Total from investment operations | | | | 0.28 | | | | 0.06 | | | | 0.29 | | | | (0.13 | ) | | | 0.57 | | | | 0.49 | |
| Less distributions from: | | | | | | | | | | | | | | | | | | | | | | | | | |
| Net investment income | | | | 0.14 | | | | 0.28 | | | | 0.29 | | | | 0.30 | | | | 0.34 | | | | 0.39 | |
| Net realized gain | | | | — | | | | — | | | | — | | | | — | | | | — | | | | — | |
| Total distributions | | | | 0.14 | | | | 0.28 | | | | 0.29 | | | | 0.30 | | | | 0.34 | | | | 0.39 | |
| Net asset value, end of year | | | $ | 8.97 | | | $ | 8.83 | | | $ | 9.05 | | | $ | 9.05 | | | $ | 9.48 | | | $ | 9.25 | |
| Total return (%)* | | | | 3.19 | | | | 0.63 | | | | 3.20 | | | | (1.41 | ) | | | 6.28 | | | | 5.46 | |
| Ratios to average daily net assets (%):** | | | | | | | | | | | | | | | | | | | | | | | | | |
| Expenses, net of waivers and reimbursements | | | | 0.57 | | | | 0.55 | | | | 0.59 | | | | 0.70 | | | | 0.58 | | | | 0.64 | |
| Expenses, before waivers and reimbursements | | | | 0.57 | | | | 0.55 | | | | 0.59 | | | | 0.77 | | | | 0.58 | | | | 0.64 | |
| Net investment income (loss), net of waivers and reimbursements | | | | 2.15 | | | | 1.97 | | | | 2.24 | | | | 2.30 | | | | 2.78 | | | | 3.66 | |
| Net investment income (loss), before waivers and reimbursements | | | | 2.15 | | | | 1.97 | | | | 2.24 | | | | 2.23 | | | | 2.78 | | | | 3.66 | |
| Class I net assets at end of year (in thousands) | | | $ | 58,655 | | | $ | 62,722 | | | $ | 64,834 | | | $ | 64,152 | | | $ | 72,830 | | | $ | 67,183 | |
| Portfolio turnover rate (%)* | | | | 27 | | | | 21 | | | | 30 | | | | 41 | | | | 33 | | | | 39 | |
| * | Not annualized for periods less than a year. |
| ** | Annualized for periods less than a year. |
Note: Net investment income (loss) per share is based on the average shares outstanding during the year.
Performance cited represents past performance. Past performance does not guarantee future results and current performance may be lower or higher than the data quoted. Results shown are annual returns, which assume reinvestment of dividends and capital gains. Investment returns and principal will fluctuate and you may have a gain or loss when you sell shares. For the most current month-end performance information, please call 1-800-742-7272 or visit our Web site at www.williamblairfunds.com.
| 180 | Semiannual Report | June 30, 2016 |
Financial Highlights
Low Duration Fund
| | | Class N | |
| | | (unaudited) | | | | | | | | | | | | | | | | |
| | | Period Ended | | | | | | | | | | | | | | | | |
| | | June 30, | | | Years Ended December 31, | |
| | | | 2016 | | | 2015 | | | 2014 | | | 2013 | | | 2012 | | | 2011 | |
| Net asset value, beginning of year | | | $ | 9.16 | | | $ | 9.38 | | | $ | 9.52 | | | $ | 9.83 | | | $ | 9.82 | | | $ | 9.90 | |
| Income (loss) from investment operations: | | | | | | | | | | | | | | | | | | | | | | | | | |
| Net investment income (loss) | | | | 0.05 | | | | 0.07 | | | | 0.11 | | | | 0.10 | | | | 0.13 | | | | 0.15 | |
| Net realized and unrealized gain (loss) on investments | | | | 0.05 | | | | (0.07 | ) | | | (0.00 | )^ | | | (0.16 | ) | | | 0.14 | | | | 0.02 | |
| Total from investment operations | | | | 0.10 | | | | — | | | | 0.11 | | | | (0.06 | ) | | | 0.27 | | | | 0.17 | |
| Less distributions from: | | | | | | | | | | | | | | | | | | | | | | | | | |
| Net investment income | | | | 0.10 | | | | 0.22 | | | | 0.25 | | | | 0.25 | | | | 0.26 | | | | 0.25 | |
| Net realized gain | | | | — | | | | — | | | | — | | | | — | | | | — | | | | — | |
| Total distributions | | | | 0.10 | | | | 0.22 | | | | 0.25 | | | | 0.25 | | | | 0.26 | | | | 0.25 | |
| Net asset value, end of year | | | $ | 9.16 | | | $ | 9.16 | | | $ | 9.38 | | | $ | 9.52 | | | $ | 9.83 | | | $ | 9.82 | |
| Total return (%)* | | | | 1.13 | | | | 0.01 | | | | 1.20 | | | | (0.62 | ) | | | 2.80 | | | | 1.73 | |
| Ratios to average daily net assets (%):** | | | | | | | | | | | | | | | | | | | | | | | | | |
| Expenses, net of waivers and reimbursements | | | | 0.63 | | | | 0.60 | | | | 0.70 | | | | 0.70 | | | | 0.70 | | | | 0.70 | |
| Expenses, before waivers and reimbursements | | | | 0.82 | | | | 0.77 | | | | 0.75 | | | | 0.71 | | | | 0.74 | | | | 0.73 | |
| Net investment income (loss), net of waivers and reimbursements | | | | 1.18 | | | | 0.71 | | | | 1.19 | | | | 1.06 | | | | 1.37 | | | | 1.52 | |
| Net investment income (loss), before waivers and reimbursements | | | | 0.99 | | | | 0.54 | | | | 1.14 | | | | 1.05 | | | | 1.33 | | | | 1.49 | |
| Class N net assets at end of year (in thousands) | | | $ | 6,561 | | | $ | 2,712 | | | $ | 4,969 | | | $ | 5,158 | | | $ | 11,216 | | | $ | 6,260 | |
| Portfolio turnover rate (%)* | | | | 112 | | | | 106 | | | | 83 | | | | 56 | | | | 20 | | | | 43 | |
| | | | | | | | | | | | | | | | | | | | | | | | | | |
| | | Class I | |
| | | (unaudited) | | | | | | | | | | | | | | | | | | | | | |
| | | Period Ended | | | | | | | | | | | | | | | | | | | | | |
| | | June 30, | | | | Years Ended December 31, | |
| | | | | 2016 | | | | 2015 | | | | 2014 | | | | 2013 | | | | 2012 | | | | 2011 | |
| Net asset value, beginning of year | | | $ | 9.16 | | | $ | 9.37 | | | $ | 9.52 | | | $ | 9.83 | | | $ | 9.82 | | | $ | 9.89 | |
| Income (loss) from investment operations: | | | | | | | | | | | | | | | | | | | | | | | | | |
| Net investment income (loss) | | | | 0.06 | | | | 0.08 | | | | 0.13 | | | | 0.12 | | | | 0.15 | | | | 0.17 | |
| Net realized and unrealized gain (loss) on investments | | | | 0.05 | | | | (0.05 | ) | | | (0.01 | ) | | | (0.17 | ) | | | 0.14 | | | | 0.02 | |
| Total from investment operations | | | | 0.11 | | | | 0.03 | | | | 0.12 | | | | (0.05 | ) | | | 0.29 | | | | 0.19 | |
| Less distributions from: | | | | | | | | | | | | | | | | | | | | | | | | | |
| Net investment income | | | | 0.11 | | | | 0.24 | | | | 0.27 | | | | 0.26 | | | | 0.28 | | | | 0.26 | |
| Net realized gain | | | | — | | | | — | | | | — | | | | — | | | | — | | | | — | |
| Total distributions | | | | 0.11 | | | | 0.24 | | | | 0.27 | | | | 0.26 | | | | 0.28 | | | | 0.26 | |
| Net asset value, end of year | | | $ | 9.16 | | | $ | 9.16 | | | $ | 9.37 | | | $ | 9.52 | | | $ | 9.83 | | | $ | 9.82 | |
| Total return (%)* | | | | 1.23 | | | | 0.30 | | | | 1.24 | | | | (0.47 | ) | | | 2.96 | | | | 1.99 | |
| Ratios to average daily net assets (%):** | | | | | | | | | | | | | | | | | | | | | | | | | |
| Expenses, net of waivers and reimbursements | | | | 0.42 | | | | 0.42 | | | | 0.55 | | | | 0.55 | | | | 0.55 | | | | 0.55 | |
| Expenses, before waivers and reimbursements | | | | 0.61 | | | | 0.59 | | | | 0.60 | | | | 0.56 | | | | 0.57 | | | | 0.58 | |
| Net investment income (loss), net of waivers and reimbursements | | | | 1.39 | | | | 0.87 | | | | 1.35 | | | | 1.24 | | | | 1.52 | | | | 1.67 | |
| Net investment income (loss), before waivers and reimbursements | | | | 1.20 | | | | 0.70 | | | | 1.30 | | | | 1.23 | | | | 1.50 | | | | 1.64 | |
| Class I net assets at end of year (in thousands) | | | $ | 116,168 | | | $ | 107,137 | | | $ | 104,433 | | | $ | 122,583 | | | $ | 157,213 | | | $ | 82,828 | |
| Portfolio turnover rate (%)* | | | | 112 | | | | 106 | | | | 83 | | | | 56 | | | | 20 | | | | 43 | |
| * | Not annualized for periods less than a year. |
| ** | Annualized for periods less than a year. |
| ^ | Amount is less than $0.005 per share. |
Note: Net investment income (loss) per share is based on the average shares outstanding during the year.
Performance cited represents past performance. Past performance does not guarantee future results and current performance may be lower or higher than the data quoted. Results shown are annual returns, which assume reinvestment of dividends and capital gains. Investment returns and principal will fluctuate and you may have a gain or loss when you sell shares. For the most current month-end performance information, please call 1-800-742-7272 or visit our Web site at www.williamblairfunds.com.
| June 30, 2016 | William Blair Funds | 181 |
Financial Highlights
Low Duration Fund
| | | Institutional Class | |
| | | (unaudited) | | | | | | | | | | | | | | | | |
| | | Period Ended | | | | | | | | | | | | | | | | |
| | | June 30, | | | Years Ended December 31, | |
| | | | 2016 | | | 2015 | | | 2014 | | | 2013 | | | 2012 | | | 2011 | |
| Net asset value, beginning of year | | | $ | 9.16 | | | $ | 9.38 | | | $ | 9.53 | | | $ | 9.83 | | | $ | 9.83 | | | $ | 9.90 | |
| Income (loss) from investment operations: | | | | | | | | | | | | | | | | | | | | | | | | | |
| Net investment income (loss) | | | | 0.06 | | | | 0.09 | | | | 0.14 | | | | 0.13 | | | | 0.17 | | | | 0.18 | |
| Net realized and unrealized gain (loss) on investments | | | | 0.05 | | | | (0.07 | ) | | | (0.01 | ) | | | (0.15 | ) | | | 0.12 | | | | 0.03 | |
| Total from investment operations | | | | 0.11 | | | | 0.02 | | | | 0.13 | | | | (0.02 | ) | | | 0.29 | | | | 0.21 | |
| Less distributions from: | | | | | | | | | | | | | | | | | | | | | | | | | |
| Net investment income | | | | 0.11 | | | | 0.24 | | | | 0.28 | | | | 0.28 | | | | 0.29 | | | | 0.28 | |
| Net realized gain | | | | — | | | | — | | | | — | | | | — | | | | — | | | | — | |
| Total distributions | | | | 0.11 | | | | 0.24 | | | | 0.28 | | | | 0.28 | | | | 0.29 | | | | 0.28 | |
| Net asset value, end of year | | | $ | 9.16 | | | $ | 9.16 | | | $ | 9.38 | | | $ | 9.53 | | | $ | 9.83 | | | $ | 9.83 | |
| Total return (%)* | | | | 1.24 | | | | 0.22 | | | | 1.40 | | | | (0.20 | ) | | | 3.01 | | | | 2.14 | |
| Ratios to average daily net assets (%):** | | | | | | | | | | | | | | | | | | | | | | | | | |
| Expenses, net of waivers and reimbursements | | | | 0.40 | | | | 0.40 | | | | 0.40 | | | | 0.39 | | | | 0.40 | | | | 0.40 | |
| Expenses, before waivers and reimbursements | | | | 0.44 | | | | 0.42 | | | | 0.43 | | | | 0.39 | | | | 0.41 | | | | 0.42 | |
| Net investment income (loss), net of waivers and reimbursements | | | | 1.41 | | | | 0.94 | | | | 1.45 | | | | 1.37 | | | | 1.68 | | | | 1.81 | |
| Net investment income (loss), before waivers and reimbursements | | | | 1.37 | | | | 0.92 | | | | 1.42 | | | | 1.37 | | | | 1.67 | | | | 1.79 | |
| Institutional Class net assets at end of year (in thousands) | | | $ | 25,492 | | | $ | 21,863 | | | $ | 68,095 | | | $ | 46,485 | | | $ | 118,401 | | | $ | 68,059 | |
| Portfolio turnover rate (%)* | | | | 112 | | | | 106 | | | | 83 | | | | 56 | | | | 20 | | | | 43 | |
| * | Not annualized for periods less than a year. |
| ** | Annualized for periods less than a year. |
Note: Net investment income (loss) per share is based on the average shares outstanding during the year.
Performance cited represents past performance. Past performance does not guarantee future results and current performance may be lower or higher than the data quoted. Results shown are annual returns, which assume reinvestment of dividends and capital gains. Investment returns and principal will fluctuate and you may have a gain or loss when you sell shares. For the most current month-end performance information, please call 1-800-742-7272 or visit our Web site at www.williamblairfunds.com.
| 182 | Semiannual Report | June 30, 2016 |
Financial Highlights
Macro Allocation Fund
| | | Class N | |
| | | (unaudited) | | | | | | | | | | | | | |
| | | Period Ended | | | Periods Ended | | | Periods Ended | |
| | | June 30, | | | December 31, | | | October 31, | |
| | | | 2016 | | | 2015 | | | 2014(b) | | | 2014 | | | 2013 | | | 2012(a) | |
| Net asset value, beginning of year | | | $ | 11.32 | | | $ | 12.14 | | | $ | 13.07 | | | $ | 12.61 | | | $ | 11.28 | | | $ | 10.00 | |
| Income (loss) from investment operations: | | | | | | | | | | | | | | | | | | | | | | | | | |
| Net investment income (loss) | | | | 0.00 | ^ | | | 0.04 | | | | 0.04 | | | | 0.02 | | | | 0.05 | | | | 0.11 | |
| Net realized and unrealized gain (loss) on investments | | | | 0.03 | | | | (0.80 | ) | | | (0.31 | ) | | | 0.76 | | | | 1.59 | | | | 1.24 | |
| Total from investment operations | | | | 0.03 | | | | (0.76 | ) | | | (0.27 | ) | | | 0.78 | | | | 1.64 | | | | 1.35 | |
| Less distributions from: | | | | | | | | | | | | | | | | | | | | | | | | | |
| Net investment income | | | | — | | | | 0.06 | | | | 0.66 | | | | 0.09 | | | | 0.11 | | | | 0.07 | |
| Net realized gain | | | | — | | | | — | | | | — | | | | 0.23 | | | | 0.20 | | | | — | |
| Total distributions | | | | — | | | | 0.06 | | | | 0.66 | | | | 0.32 | | | | 0.31 | | | | 0.07 | |
| Net asset value, end of year | | | $ | 11.35 | | | $ | 11.32 | | | $ | 12.14 | | | $ | 13.07 | | | $ | 12.61 | | | $ | 11.28 | |
| Total return (%)* | | | | 0.27 | | | | (6.24 | ) | | | (2.00 | ) | | | 6.34 | | | | 14.87 | | | | 13.61 | |
| Ratios to average daily net assets (%)**: | | | | | | | | | | | | | | | | | | | | | | | | | |
| Expenses (excluding short dividend expense), net of waivers and reimbursements | | | | 1.27 | | | | 1.27 | | | | 1.35 | | | | 1.35 | | | | 1.35 | | | | 1.35 | |
| Expenses, net of waivers and reimbursements | | | | 1.27 | | | | 1.27 | | | | 1.38 | | | | 1.47 | | | | 1.49 | | | | 1.41 | |
| Expenses, before waivers and reimbursements | | | | 1.42 | | | | 1.42 | | | | 1.46 | | | | 1.60 | | | | 1.78 | | | | 2.95 | |
| Net investment income (loss), net of waivers and reimbursements | | | | 0.08 | | | | 0.32 | | | | 2.06 | | | | 0.20 | | | | 0.37 | | | | 1.18 | |
| Net investment income (loss), before waivers and reimbursements | | | | (0.07 | ) | | | 0.17 | | | | 1.98 | | | | 0.07 | | | | 0.08 | | | | (0.36 | ) |
| Class N net assets at end of year (in thousands) | | | $ | 102,369 | | | $ | 150,606 | | | $ | 150,778 | | | $ | 150,785 | | | $ | 97,498 | | | $ | 10,045 | |
| Portfolio turnover rate (%)* | | | | 57 | | | | 34 | | | | 17 | | | | 59 | | | | 10 | | | | 40 | |
| | | | | | | | | | | | | | | | | | | | | | | | | | |
| | | Class I | |
| | | (unaudited) | | | | | | | | | | | | | | | | | | | | | |
| | | Period Ended | | | Periods Ended | | | | Periods Ended | |
| | | June 30, | | | | December 31, | | | | October 31, | |
| | | | 2016 | | | 2015 | | | 2014(b) | | | 2014 | | | 2013 | | | 2012(a) | |
| Net asset value, beginning of year | | | $ | 11.38 | | | $ | 12.22 | | | $ | 13.15 | | | $ | 12.66 | | | $ | 11.31 | | | $ | 10.00 | |
| Income (loss) from investment operations: | | | | | | | | | | | | | | | | | | | | | | | | | |
| Net investment income (loss) | | | | 0.02 | | | | 0.09 | | | | 0.05 | | | | 0.04 | | | | 0.07 | | | | 0.16 | |
| Net realized and unrealized gain (loss) on investments | | | | 0.03 | | | | (0.82 | ) | | | (0.31 | ) | | | 0.78 | | | | 1.60 | | | | 1.22 | |
| Total from investment operations | | | | 0.05 | | | | (0.73 | ) | | | (0.26 | ) | | | 0.82 | | | | 1.67 | | | | 1.38 | |
| Less distributions from: | | | | | | | | | | | | | | | | | | | | | | | | | |
| Net investment income | | | | — | | | | 0.11 | | | | 0.67 | | | | 0.10 | | | | 0.12 | | | | 0.07 | |
| Net realized gain | | | | — | | | | — | | | | — | | | | 0.23 | | | | 0.20 | | | | — | |
| Total distributions | | | | — | | | | 0.11 | | | | 0.67 | | | | 0.33 | | | | 0.32 | | | | 0.07 | |
| Net asset value, end of year | | | $ | 11.43 | | | $ | 11.38 | | | $ | 12.22 | | | $ | 13.15 | | | $ | 12.66 | | | $ | 11.31 | |
| Total return (%)* | | | | 0.44 | | | | (6.00 | ) | | | (1.94 | ) | | | 6.60 | | | | 15.06 | | | | 13.91 | |
| Ratios to average daily net assets (%)**: | | | | | | | | | | | | | | | | | | | | | | | | | |
| Expenses (excluding short dividend expense), net of waivers and reimbursements | | | | 0.99 | | | | 0.98 | | | | 1.07 | | | | 1.10 | | | | 1.10 | | | | 1.10 | |
| Expenses, net of waivers and reimbursements | | | | 0.99 | | | | 0.99 | | | | 1.10 | | | | 1.22 | | | | 1.24 | | | | 1.18 | |
| Expenses, before waivers and reimbursements | | | | 1.14 | | | | 1.14 | | | | 1.10 | | | | 1.27 | | | | 1.41 | | | | 2.94 | |
| Net investment income (loss), net of waivers and reimbursements | | | | 0.42 | | | | 0.73 | | | | 2.33 | | | | 0.32 | | | | 0.62 | | | | 1.67 | |
| Net investment income (loss), before waivers and reimbursements | | | | 0.27 | | | | 0.58 | | | | 2.33 | | | | 0.27 | | | | 0.45 | | | | (0.09 | ) |
| Class I net assets at end of year (in thousands) | | | | $1,100,027 | | | $1,155,051 | | | $ | 649,756 | | | $ | 617,531 | | | $ | 224,860 | | | $ | 23,095 | |
| Portfolio turnover rate (%)* | | | | 57 | | | | 34 | | | | 17 | | | | 59 | | | | 10 | | | | 40 | |
| (a) | For the period from November 29, 2011 (Commencement of Operations) to October 31, 2012. |
| (b) | For the period from November 1, 2014 to December 31, 2014. |
| * | Not annualized for periods less than a year. |
| ** | Annualized for periods less than a year. |
Note: Net investment income (loss) per share is based on the average shares outstanding during the year.
Performance cited represents past performance. Past performance does not guarantee future results and current performance may be lower or higher than the data quoted. Results shown are annual returns, which assume reinvestment of dividends and capital gains. Investment returns and principal will fluctuate and you may have a gain or loss when you sell shares. For the most current month-end performance information, please call 1-800-742-7272 or visit our Web site at www.williamblairfunds.com.
| June 30, 2016 | William Blair Funds | 183 |
Financial Highlights
Macro Allocation Fund
| | | Institutional Class | |
| | | (unaudited) | | | | | | | | | | | | | |
| | | Period Ended | | | Periods Ended | | | Periods Ended | |
| | | June 30, | | | December 31, | | | October 31, | |
| | | | 2016 | | | 2015 | | | 2014(b) | | | 2014 | | | 2013(a) | |
| | | | | | | | | | | | | | | | | | | | | | |
| Net asset value, beginning of year | | | $ | 11.39 | | | $ | 12.23 | | | $ | 13.16 | | | $ | 12.66 | | | $ | 12.63 | |
| Income (loss) from investment operations: | | | | | | | | | | | | | | | | | | | | | |
| Net investment income (loss) | | | | 0.03 | | | | 0.12 | | | | 0.05 | | | | 0.04 | | | | 0.00 | ^ |
| Net realized and unrealized gain (loss) on investments | | | | 0.03 | | | | (0.84 | ) | | | (0.31 | ) | | | 0.79 | | | | 0.03 | |
| Total from investment operations | | | | 0.06 | | | | (0.72 | ) | | | (0.26 | ) | | | 0.83 | | | | 0.03 | |
| Less distributions from: | | | | | | | | | | | | | | | | | | | | | |
| Net investment income | | | | — | | | | 0.12 | | | | 0.67 | | | | 0.10 | | | | — | |
| Net realized gain | | | | — | | | | — | | | | — | | | | 0.23 | | | | — | |
| Total distributions | | | | — | | | | 0.12 | | | | 0.67 | | | | 0.33 | | | | — | |
| Net asset value, end of year | | | $ | 11.45 | | | $ | 11.39 | | | $ | 12.23 | | | $ | 13.16 | | | $ | 12.66 | |
| Total return (%)* | | | | 0.53 | | | | (5.92 | ) | | | (1.91 | ) | | | 6.71 | | | | 0.24 | |
| Ratios to average daily net assets (%)**: | | | | | | | | | | | | | | | | | | | | | |
| Expenses (excluding short dividend expense), net of waivers and reimbursements | | | | 0.91 | | | | 0.90 | | | | 0.88 | | | | 0.93 | | | | 0.95 | |
| Expenses, net of waivers and reimbursements | | | | 0.91 | | | | 0.90 | | | | 0.91 | | | | 1.05 | | | | 1.00 | |
| Expenses, before waivers and reimbursements | | | | 0.91 | | | | 0.90 | | | | 0.91 | | | | 1.05 | | | | 1.11 | |
| Net investment income (loss), net of waivers and reimbursements | | | | 0.54 | | | | 0.95 | | | | 2.54 | | | | 0.32 | | | | (0.99 | ) |
| Net investment income (loss), before waivers and reimbursements | | | | 0.54 | | | | 0.95 | | | | 2.54 | | | | 0.32 | | | | (1.10 | ) |
| Institutional Class net assets at end of year (in thousands) | | | $ | 533,438 | | | $ | 426,230 | | | $ | 158,152 | | | $ | 150,447 | | | $ | 5,014 | |
| Portfolio turnover rate (%)* | | | | 57 | | | | 34 | | | | 17 | | | | 59 | | | | 10 | |
| (a) | For the period from October 21, 2013 (Commencement of Share Class) to October 31, 2013. |
| (b) | For the period from November 1, 2014 to December 31, 2014. |
| * | Not annualized for periods less than a year. |
| ** | Annualized for periods less than a year. |
| ^ | Amount is less than $0.005 per share. |
Note: Net investment income (loss) per share is based on the average shares outstanding during the year.
Performance cited represents past performance. Past performance does not guarantee future results and current performance may be lower or higher than the data quoted. Results shown are annual returns, which assume reinvestment of dividends and capital gains. Investment returns and principal will fluctuate and you may have a gain or loss when you sell shares. For the most current month-end performance information, please call 1-800-742-7272 or visit our Web site at www.williamblairfunds.com.
| 184 | Semiannual Report | June 30, 2016 |
Renewal of the Management Agreement
On April 26, 2016, the Board of Trustees (the “Board”) of the William Blair Funds (the “Trust”) including the Trustees who are not “interested persons” of the Trust as defined by the Investment Company Act of 1940, as amended (the “Independent Trustees”), approved the renewal for an additional one-year term of the Trust’s Management Agreement with William Blair Investment Management, LLC (“WBIM” or the “Adviser”) on behalf of each of the William Blair Funds (each, a “Fund” and collectively, the “Funds”). In deciding to approve the renewal of the Management Agreement, the Board did not identify any single factor or group of factors as all important or controlling and considered all factors together. The Board did not allot a particular weight to any one factor or group of factors.
The information in this summary outlines the Board’s considerations associated with its renewal of the Management Agreement. In connection with its deliberations regarding the continuation of the Management Agreement, the Board considered such information and factors as it believed to be relevant. As described below, the Board considered the nature, quality and extent of the services performed by the Adviser under the existing Management Agreement; comparative management fees and expense ratios as prepared by an independent provider (Broadridge); the estimated profits realized by the Adviser; the extent to which the Adviser realizes economies of scale as a Fund grows; and whether any fall-out benefits are being realized by the Adviser. In addition, the Independent Trustees discussed the renewal of the Management Agreement with Trust management and in private sessions with independent legal counsel at which no representatives of the Adviser were present.
The Board, including the Independent Trustees, considered the renewal of the Management Agreement pursuant to a process that concluded at the Board’s April 26, 2016 meeting. In preparation for the review process, the Independent Trustees met with independent legal counsel and discussed the type and nature of information to be requested, and independent legal counsel sent a formal request for information to the Adviser. The Adviser provided extensive information in response to the request. After reviewing the information received, the Independent Trustees requested supplemental information, which the Adviser provided. The Independent Trustees also received a memorandum from independent legal counsel advising them of their duties and responsibilities in connection with the consideration of the Management Agreement. The Independent Trustees reviewed comparative performance for a performance peer universe of funds and comparative management fees and expense ratios for an expense peer group and an expense peer universe of funds provided by Broadridge for each Fund. In addition, the Independent Trustees considered: (1) the nature, quality and extent of services provided by the Adviser; (2) information comparing the performance of each Fund to one or more relevant securities indexes; (3) information comparing management fees of each Fund to fees charged by the Adviser to other funds and client accounts with similar investment strategies; (4) the estimated allocated direct or indirect costs of services provided and estimated profits realized by the Adviser for both the Trust as a whole and each Fund individually; and (5) information describing other benefits to the Adviser and its affiliate, William Blair & Company, L.L.C. (the “Distributor”), resulting from its relationship with the Funds. The Independent Trustees also noted that they receive information from the Adviser regarding the Funds throughout the year in connection with regular Board meetings, including presentations from portfolio managers. In addition, the Adviser made an in-person presentation to the Independent Trustees regarding the contract review information, including addressing the supplemental information request, and answered questions from the Independent Trustees. The Board determined that, given the totality of the information provided with respect to the Management Agreement, the Board had received sufficient information to renew the Management Agreement.
On April 15 and 25-26, 2016, the Independent Trustees met independently of Trust management and of the interested Trustees to review and discuss with independent legal counsel the information provided by the Adviser, Broadridge and independent legal counsel. The Independent Trustees noted that in evaluating the Management Agreement, they were taking into account their accumulated experience as Board members in working with the Adviser on matters relating to the Funds. Based on their review, the Independent Trustees concluded that it was in the best interest of each Fund to renew the Management Agreement and, accordingly, recommended to the Board of the Trust the renewal of the Management Agreement for each Fund. The Board considered the recommendation of the Independent Trustees along with the other factors that the Board deemed relevant.
Nature, Quality and Extent of Services. In evaluating the nature, quality and extent of the services provided by the Adviser to the Funds, the Board noted that the Adviser is a quality firm with a reputation for integrity and honesty that employs high-quality people and has a long association with the Funds, in each case other than the Growth Fund, since the inception of the Funds. The Board believes that a long-term relationship with a capable, conscientious adviser is in the best interests of shareholders and that shareholders have invested in the Funds knowing that the Adviser managed the Funds and knowing the management fees. The Board considered biographical information about the Trust’s officers, other Adviser personnel and the Funds’ portfolio managers, including information on the portfolio managers’ personal investments in the Fund(s) they manage. The Board also considered the administrative services performed by the Adviser, financial information regarding the Adviser, the Adviser’s execution quality and use of soft dollars, the Adviser’s risk management activities, the compliance program and the Adviser’s expense limitations in place for a number of the Funds’ share classes. The Board noted that the Adviser pays the
| June 30, 2016 | William Blair Funds | 185 |
compensation of all of the officers and the interested Trustees of the Trust. Based upon all relevant factors, the Board concluded that the nature, quality and extent of the services provided by the Adviser to each Fund were appropriate.
Performance. The Board reviewed information on the annualized total returns of the Class N shares of each Fund (except for Institutional International Equity Fund and Institutional International Growth Fund, which do not have Class N shares) for the one-, three-, five- and ten-year periods ended December 31, 2015, as applicable, along with annualized total return information for a performance peer universe of funds provided by Broadridge and one or more benchmark securities indexes. The Broadridge performance peer universe for each Fund included funds with a similar investment style as classified by Broadridge regardless of asset size or primary channel of distribution. Based on the information provided, the Board considered the following with respect to the total returns of each Fund.
Growth Fund. The Board considered that the Fund’s total return was above the average of its Broadridge performance peer universe for the one-, three- and five year periods ended December 31, 2015. The Board also considered that the Fund outperformed the benchmark (Russell 3000® Growth Index) for the one-year period and underperformed the benchmark index for the three- and five-year periods.
Large Cap Growth Fund. The Board considered that the Fund’s total return was above the average of its Broadridge performance peer universe for the one-, three- and five-year periods ended December 31, 2015. The Board also considered that the Fund outperformed the benchmark (Russell 1000® Growth Index) for the one- and three-year periods and underperformed the benchmark index for the five-year period ended December 31, 2015.
Large Cap Value Fund. The Board considered that the Adviser proposed to liquidate and terminate the Fund on or about June 15, 2016 and that the Board was asked to renew the Management Agreement to allow the Adviser to manage the Fund through its liquidation and termination date.
Mid Cap Growth Fund. The Board considered that the Fund’s total return was above the average of its Broadridge performance peer universe for the one-year period and below the average of its Broadridge performance peer universe for the three- and five-year periods ended December 31, 2015. The Board also considered that the Fund was in line with the benchmark (Russell Midcap® Growth Index) for the one-year period and underperformed the benchmark index for the three- and five-year periods ended December 31, 2015. The Board considered the Adviser’s view that the Fund’s relative underperformance was due primarily to market conditions not favoring the Adviser’s investment style for the Fund during the three- and five-year periods and to stock selection. The Adviser noted meaningful style headwinds of the past five years including higher growth orientation, higher valuation exposure and typical industry biases.
Mid Cap Value Fund. The Board considered that the Fund’s total return was above the average of its Broadridge performance peer universe for the one-, three- and five-year periods ended December 31, 2015. The Board also considered that the Fund outperformed the benchmark (Russell Midcap® Value Index) for the one-year period and underperformed the benchmark index for the three- and five-year periods ended December 31, 2015.
Small-Mid Cap Growth Fund. The Board considered that the Fund’s total return was above the average of its Broadridge performance peer universe and the benchmark (Russell 2500TM Growth Index) for the one-, three- and five-year periods ended December 31, 2015.
Small-Mid Cap Value Fund. The Board considered that the Fund’s total return was above the average of its Broadridge performance peer universe and the benchmark (Russell 2500® Value Index) for the one- and three-year periods ended December 31, 2015.
Small Cap Growth Fund. The Board considered that the Fund’s total return was above the average of its Broadridge performance peer universe for the three-year period and below the average of its Broadridge performance peer universe for the one- and five-year periods ended December 31, 2015. The Board also considered that the Fund outperformed the benchmark (Russell 2000® Growth Index) for the three-year period and underperformed the benchmark index for the one- and five-year periods ended December 31, 2015.
Small Cap Value Fund. The Board considered that the Fund’s total return was above the average of its Broadridge performance peer universe for the three-year period and below the average of its Broadridge performance peer universe for the one- and five-year periods ended December 31, 2015. The Board also considered that the Fund outperformed the benchmark (Russell 2000® Value Index) for the one- and three-year periods and underperformed the benchmark index for the five-year period ended December 31, 2015.
| 186 | Semiannual Report | June 30, 2016 |
Global Leaders Fund. The Board considered that the Fund’s total return was above the average of its Broadridge performance peer universe for the one- and five-year periods and below the average of its Broadridge performance peer universe for the three-year period ended December 31, 2015. The Board also considered that the Fund outperformed the benchmark (MSCI All Country World IMI (net) Index) for the one-, three- and five-year periods ended December 31, 2015.
International Leaders Fund. The Board considered that the Fund’s total return was above the average of its Broadridge performance peer universe and the benchmark (MSCI All Country World Ex-U.S. IMI (net) Index) for the one- and three-year periods ended December 31, 2015.
International Equity Fund. The Board considered that the Fund’s total return was above the average of its Broadridge performance peer universe and the benchmark (MSCI World Ex-U.S. (net) Index) for the one-, three- and five-year periods ended December 31, 2015.
Institutional International Equity Fund. The Board considered that the Fund’s total return was above the average of its Broadridge performance peer universe and the benchmark (MSCI World Ex-U.S. (net) Index) for the one-, three- and five-year periods ended December 31, 2015.
International Growth Fund. The Board considered that the Fund’s total return was above the average of its Broadridge performance peer universe for the five-year period and below the average of its Broadridge performance peer universe for the one- and three-year periods ended December 31, 2015. The Board also considered that the Fund outperformed the benchmark (MSCI All Country World Ex-U.S. IMI (net) Index) for the one-, three- and five-year periods ended December 31, 2015.
Institutional International Growth Fund. The Board considered that the Fund’s total return was above the average of its Broadridge performance peer universe for the three- and five-year periods and below the average of its Broadridge performance peer universe for the one-year period ended December 31, 2015. The Board also considered that the Fund outperformed the benchmark (MSCI All Country World Ex-U.S. IMI (net) Index) for the one-, three- and five-year periods ended December 31, 2015.
International Small Cap Growth Fund. The Board considered that the Fund’s total return was above the average of its Broadridge performance peer universe and the benchmark (MSCI All Country World Ex-U.S. Small Cap (net) Index) for the one-, three- and five-year periods ended December 31, 2015.
Emerging Markets Leaders Fund. The Board considered that the Fund’s total return was above the average of its Broadridge performance peer universe for the three- and five-year periods and below the average of its Broadridge performance peer universe for the one-year period ended December 31, 2015. The Board also considered that the Fund outperformed the benchmark (MSCI Emerging Markets (net) Index) for the one-, three- and five-year periods ended December 31, 2015.
Emerging Markets Growth Fund. The Board considered that the Fund’s total return was above the average of its Broadridge performance peer universe for the three- and five-year periods and below the average of its Broadridge performance peer universe for the one-year period ended December 31, 2015. The Board also considered that the Fund outperformed the benchmark (MSCI Emerging Markets IMI (net) Index) for the three- and five-year periods and underperformed the benchmark index for the one-year period ended December 31, 2015.
Emerging Markets Small Cap Growth Fund. The Board considered that the Fund’s total return was above the average of its Broadridge performance peer universe and the benchmark (MSCI Emerging Markets Small Cap (net) Index) for the one- and three-year periods ended December 31, 2015.
Bond Fund. The Board considered that the Fund’s total return was above the average of its Broadridge performance peer universe for the three- and five-year periods and below the average of its Broadridge performance peer universe for the one-year period ended December 31, 2015. The Board also considered that the Fund outperformed the benchmark (Barclays U.S. Aggregate Bond Index) for the five-year period and underperformed the benchmark index for the one- and three-year periods ended December 31, 2015.
Income Fund. The Board considered that the Fund’s total return was above the average of its Broadridge performance peer universe for the one-and five-year periods and in line with the average of its Broadridge performance peer universe for the three-year period ended December 31, 2015. The Board also considered that the Fund underperformed the benchmark (Barclays Intermediate Government/Credit Bond Index) for the one- and three- year periods and was in line with the benchmark index for the five- year period ended December 31, 2015.
| June 30, 2016 | William Blair Funds | 187 |
Low Duration Fund. The Board considered that the Fund’s total return was above the average of its Broadridge performance peer universe for the five-year period and below the average of its Broadridge performance peer universe for the one- and three-year periods ended December 31, 2015. The Board also considered that the Fund outperformed the benchmark (Bank of America Merrill Lynch 1-Year U.S. Treasury Note Index) for the five-year period, was in line with the benchmark index for the three-year period and underperformed the benchmark index for the one-year period ended December 31, 2015.
Macro Allocation Fund. The Board considered that the Fund’s total return was above the average of its Broadridge performance peer universe for the three-year period and below the average of its Broadridge performance peer universe for the one-year period ended December 31, 2015. The Board also considered that the Fund underperformed the custom benchmark (Long-Term Comparative Index) for the one- and three-year periods ended December 31, 2015. The Board considered the Adviser’s opinion that the Fund is distinguishable from its peers because it takes a top-down only and long-term fundamental approach to its strategy. In addition, the Board considered the Adviser’s view that the second-half of 2015 experienced a dramatic price move away from fundamental value in both markets and currencies resulting in a challenging environment for the Fund’s investment philosophy. Given the environment, the Board considered the Adviser’s view that it was prudent risk management to de-risk the portfolio.
The Board considered that the Adviser seeks to provide superior performance over the long term and was committed to managing each Fund consistently with the Fund’s stated investment strategies and that at times relative performance will be affected by whether the market environment favors or disfavors particular investments, styles and/or market capitalizations and concluded that the Adviser’s services benefitted the Funds.
Fees and Expenses. Class N and Class I shares. The Board reviewed each Fund’s management fee and expense ratios for Class N and Class I shares and reviewed information comparing the management fee and expense ratios to those of an expense peer group and an expense peer universe of funds provided by Broadridge for Class N and Class I shares of each Fund. The Broadridge expense peer group for Class N and Class I shares of each Fund (“Class N and Class I Broadridge Expense Group”) consisted of a group of retail no-load funds with a similar investment style and asset size as classified by Broadridge. The Broadridge expense peer universe for Class N and Class I shares of each Fund consisted of the Fund’s Class N and Class I Broadridge Expense Group and other retail no-load funds with an investment style as classified by Broadridge similar to the Fund’s. In considering the Broadridge information, the Board noted that the contractual management fees for the Growth Fund, the Large Cap Growth Fund, the Large Cap Value Fund, the International Small Cap Growth Fund, the Bond Fund, the Income Fund, the Low Duration Fund and the Macro Allocation Fund were at or below the average contractual management fee of their Class N and Class I Broadridge Expense Group. The Board also noted that the contractual management fees for the Mid Cap Growth Fund, the Mid Cap Value Fund, the Small-Mid Cap Growth Fund, the Small Mid-Cap Value Fund, the Small Cap Growth Fund, the Small Cap Value Fund, the Global Leaders Fund, the International Leaders Fund, the International Equity Fund, the International Growth Fund, the Emerging Markets Leaders Fund, the Emerging Markets Growth Fund and the Emerging Markets Small Cap Growth Fund were above the average contractual management fee of their Class N and Class I Broadridge Expense Group.
Institutional shares. The Board reviewed each Fund’s management fee and expense ratio for institutional shares and reviewed information comparing the management fee and expense ratio to those of an expense peer group and an expense peer universe of funds provided by Broadridge for institutional shares of each Fund. The Broadridge expense peer group for institutional shares of each Fund (“Institutional Broadridge Expense Group”) consisted of a group of institutional funds with a similar investment style and asset size as classified by Broadridge. The Broadridge expense peer universe for institutional shares of each Fund consisted of the Fund’s Institutional Broadridge Expense Group and other institutional funds with an investment style as classified by Broadridge similar to the Fund’s. In considering the Broadridge information, the Board noted that the contractual management fees for the International Small Cap Growth Fund, the Bond Fund and the Low Duration Fund were below the average contractual management fee of their Institutional Broadridge Expense Group. The Board also noted that the contractual management fees for the Global Leaders Fund, the International Leaders Fund, the Institutional International Equity Fund, the Institutional International Growth Fund, the Emerging Markets Leaders Fund, the Emerging Markets Growth Fund, the Emerging Markets Small Cap Growth Fund and the Macro Allocation Fund were above the average contractual management fee of their Institutional Broadridge Expense Group.
The Board noted the contractual expense limitations in place for all of the Funds, except the Growth Fund and the Institutional International Growth Fund, and considered the management fees waived and other expenses reimbursed by the Adviser on behalf of the Funds in 2015, noting that, for the Large Cap Value Fund, the Mid Cap Value Fund and the Small-Mid Cap Value Fund, the Adviser waived its entire management fee for each Fund and reimbursed other expenses to each Fund. The Board also considered that the Adviser had proposed to continue to contractually limit operating expenses until April 30, 2017 for the Large Cap Growth Fund, the Large Cap Value Fund, the Mid Cap Growth Fund, the Mid Cap Value Fund, the Small-Mid Cap Growth Fund, the Small-Mid Cap Value Fund, the Small Cap Growth Fund, the Small Cap Value Fund, the Global Leaders Fund, the International Leaders Fund, the International Equity Fund, the Institutional International Equity Fund, the International Growth Fund, the International
| 188 | Semiannual Report | June 30, 2016 |
Small Cap Growth Fund, the Emerging Markets Leaders Fund, the Emerging Markets Growth Fund, the Emerging Markets Small Cap Growth Fund, the Bond Fund, the Income Fund, the Low Duration Fund and the Macro Allocation Fund.
For each Fund, the Board also reviewed amounts charged by the Adviser to other pooled investment vehicles, including other registered funds for which the Adviser acts as a sub-adviser, and the Adviser’s fee schedule for institutional accounts. With respect to other pooled investment vehicles and institutional accounts, the Board considered the Adviser’s statement that both the mix of services provided to the Funds and the additional regulatory responsibilities associated with sponsoring registered investment companies were greater as compared to the work involved for other pooled investment vehicles, including other registered funds for which the Adviser acts as a sub-adviser, and institutional accounts. In addition, the Board considered the Adviser’s statement that institutional accounts are distributed differently, operate under different investment and regulatory structures and have different business risks as compared to the Funds and that there are responsibilities and duties involved in sponsoring a registered fund that are not present in sub-advising a registered fund.
On the basis of all the information provided, the Board concluded that each Fund’s management fee, coupled with applicable expense limitations, was reasonable.
Profitability. With respect to the profitability of the Management Agreement to the Adviser, the Board considered the overall fees paid under the Management Agreement, including the estimated allocated costs of the services provided, management fees waived and other expenses reimbursed, if any, and profits realized by the Adviser from its relationship with the Trust as a whole and each Fund individually. The Board concluded that the estimated profits realized by the Adviser were not unreasonable.
Economies of Scale. The Board considered the extent to which economies of scale would be realized as the Funds grow and whether fee levels reflect these economies of scale for the benefit of investors. The Board noted the Adviser’s view that the resources required for the Adviser’s fundamental investment process and the liquidity constraints of some of the markets in which the Adviser seeks to invest (other than for the Large Cap Growth Fund) may subject the Funds to capacity constraints which limit the Adviser’s ability to achieve economies of scale. In considering whether fee levels reflect economies of scale for the benefit of Fund investors, the Board considered each Fund’s asset size, breakpoints for those Funds with breakpoints in the management fee schedule, the expense limitations in place for all but two of the Funds and each Fund’s total and net expense ratios, and concluded that in the aggregate they reasonably reflect appropriate recognition of any economies of scale.
Other Benefits. The Board considered benefits derived by the Adviser and its affiliates from their relationship with the Funds, including (1) receipt of research from brokerage firms; (2) soft dollars, which pertain primarily to the Funds investing in equity securities; (3) reimbursement of some intermediary fees in the nature of sub-transfer agency fees; (4) non-management fee revenue from the Funds in the form of shareholder administration fees (which the Board noted that William Blair & Co, L.L.C. was currently waiving); (5) fees from Class N shares of the Funds to the Distributor pursuant to the Rule 12b-1 Plan, the majority of which are paid to third parties; and (6) favorable media coverage. The Board determined that the management fee was reasonable in light of these benefits.
Conclusion. Based upon all of the information considered and the conclusions reached, the Board determined that the terms of the Management Agreement continue to be fair and reasonable and that the continuation of the Management Agreement is in the best interests of each Fund.
| June 30, 2016 | William Blair Funds | 189 |
Trustees and Officers (Unaudited).† The trustees and officers of the William Blair Funds, their year of birth, their principal occupations during the last five years, their affiliations, if any, with William Blair, and other significant affiliations are set forth below. The address of each officer and trustee is 222 West Adams Street, Chicago, Illinois 60606.
Name and Year of Birth
| | Position(s)
Held with
Trust | | Term of
Office and
Length of
Time
Served | | Principal
Occupation(s)
During Past 5 Years | | Number of
Portfolios
in Trust
Complex
Overseen
by Trustee | | Other Directorships
Held by Trustee |
| Interested Trustees | | | | | | | | | | |
Michelle R. Seitz,
1965* | | Chairman of the Board of Trustees and President | | Trustee since 2002; Chairman since 2010 and President since 2007 | | Partner, William Blair: Limited Partner, WBC Holdings, L.P. (since 2008); Member, WBC GP L.L.P. (since November 2008); Director, William Blair International, Ltd. (U.K.) (since 2012) | | | 22 | | | Chairman, William Blair SICAV; Director, William Blair MAS Ltd.; Financial Accounting Foundation (FAF) |
Richard W. Smirl,
1967* | | Trustee and Senior Vice President | | Trustee since 2010 and Senior Vice President since 2008 | | Partner, William Blair; Limited Partner, WBC Holdings, L.P. (since 2008); Member, WBC GP L.L.P. (since November 2008); Director, William Blair International, Ltd. (U.K.) (since 2012) | | | 22 | | | Director, William Blair SICAV; Director, William Blair MAS Ltd. |
| Non-Interested Trustees | | | | | | | | | | | | |
Vann A. Avedisian,
19642 | | Trustee | | Since 2012 | | Principal, Highgate Holdings (hotel investments) since 2009; formerly co-founder and Managing Director, Oxford Capital Partners Inc., 1994 to 2006 | | | 22 | | | Potbelly Corporation (2001 to 2015) |
Kathleen T. Barr,
1955 | | Trustee | | Since 2013 | | Retired; formerly, President, Productive Capital Management, Inc. (registered investment adviser to public entities) and Owner, KT Barr Consulting, LLC (mutual fund and investment management consulting) 2010 to 2013; prior thereto, Chief Administrative Officer, Senior Vice President and Senior Managing Director of Allegiant Asset Management Company (merged with PNC Capital Advisors, LLC in 2009) from 2004 to 2010; Chief Administrative Officer, Chief Compliance Officer and Senior Vice President of PNC Funds and PNC Advantage Funds (f/k/a Allegiant Funds) from 2003 to 2010 | | | 22 | | | AmericaFirst Quantitative Funds (5 portfolios); Council Member, Independent Directors Council |
Daniel N. Leib,
19663 | | Trustee | | Since 2016 | | Executive Vice President and Chief Financial Officer (since 2011) and Group Chief Financial Officer (2009 to 2011), R.R. Donnelley & Sons Company | | | 22 | | | None |
| † | William Blair Investment Management, LLC and William Blair & Company, L.L.C. are collectively referred to in this section as “William Blair”, each of which is a wholly owned subsidiary of WBC Holdings, L.P., which is wholly owned by certain William Blair employees (employee owners are referred to as ‘partners’). |
| * | Ms. Seitz and Mr. Smirl are interested persons of the Trust because they are partners of William Blair. |
See accompanying Notes to Financial Statements.
| 190 | Semiannual Report | June 30, 2016 |
| Name and Year of Birth | | Position(s)
Held with
Trust | | Term of Office and
Length of
Time
Served1 | | Principal
Occupation(s)
During Past 5 Years | | Number of
Portfolios
in Trust
Complex
Overseen
by Trustee | | Other Directorships
Held by Trustee |
Phillip O. Peterson,
1944 | | Trustee | | Since 2007 | | Retired; formerly, President, Strong Mutual Funds, 2004 to 2005; formerly, Partner, KPMG LLP | | | 22 | | | The Hartford Group of Mutual Funds (66 portfolios); Symetra Mutual Funds Trust (variable annuity funds) (2012 to 2014) |
Donald J. Reaves,
19464 | | Trustee | | Since 2004 | | Retired; formerly, Chancellor of Winston-Salem State University, 2007 to 2014; prior thereto, Vice President for Administration and Chief Financial Officer, University of Chicago, 2002 to 2007 | | | 22 | | | American Student Assistance Corp., guarantor of student loans; Amica Mutual Insurance Company |
Donald L. Seeley,
1944 | | Trustee | | Since 2003 | | Retired; formerly Director, Applied Investment Management Program, University of Arizona Department of Finance; prior thereto, Vice Chairman and Chief Financial Officer, True North Communications, Inc. (marketing communications and advertising firm) | | | 22 | | | Warnaco Group, Inc., intimate apparel, sportswear, and swimwear manufacturer (2005 to 2013); Beverly Enterprises, Inc., provider of elder care and rehabilitative services (2002 to 2006) |
Thomas J. Skelly,
1951 | | Trustee | | Since 2007 | | Advisory Board Member for various U.S. companies; prior to 2005, Managing Partner of various divisions at Accenture | | | 22 | | | Mutual Trust Financial Group, provider of insurance and investment products; Board Member, First MetLife Insurance Company, NY chartered company for Metropolitan Life Insurance; Clayton Holdings, Inc., provider of information-based analytics, consulting and outsourced services to various financial institutions and investors (2007 to 2008) |
| (1) | Each Trustee serves until the election and qualification of a successor, or until death, resignation or retirement, or removal as provided in the Trust’s Declaration of Trust. Retirement for Non-Interested Trustees occurs no later than at the conclusion of the first regularly scheduled Board meeting of the calendar year that occurs after the earlier of (a) the Non-Interested Trustee’s 72nd birthday or (b) the 15th anniversary of the date that the Non-Interested Trustee became a member of the Board of Trustees. |
| (2) | Mr. Avedisian served as a member of the Board of Directors of Potbelly Corporation (“Potbelly”) from 2001 to 2015. In October 2013, Potbelly completed an underwritten initial public offering of its common stock (the “Offering”). William Blair served as a member of the underwriting syndicate. At the time of the Offering, Mr. Avedisian, through entities he owns or controls, indirectly beneficially owned 1,607,448 shares of Potbelly common stock and warrants to purchase 241,704 shares of common stock representing approximately 8.9% of the shares before the Offering. Mr. Avedisian disclaimed beneficial ownership of the shares except to the extent of his pecuniary interest therein. Potbelly sold 8,474,869 shares and certain stockholders, including two entities affiliated with William Blair, sold 150,131 shares in the Offering at a price to the public of $14.00 per share. Neither Mr. Avedisian nor the entities he owns or controls was a selling stockholder in the Offering. A portion of the net proceeds received by Potbelly from the Offering was used to pay a previously declared cash dividend, in an aggregate amount of approximately $49.9 million, on Potbelly common and preferred shares outstanding immediately prior to the closing of the Offering, which included the outstanding shares indirectly beneficially owned by Mr. Avedisian, William Blair and the two entities affiliated with William Blair. |
| (3) | The Funds and William Blair use R.R. Donnelley & Sons Company (“RRD”) for financial printing and other services. The Funds and William Blair paid RRD approximately $370,000 and $194,000 in 2014 and 2015, respectively, for the services provided. RRD’s revenue was over $11 billion in each of 2014 and 2015. Mr. Leib, as an Executive Vice President and the Chief Financial Officer of RRD, is not involved in any of the services provided to the Funds or William Blair and his compensation is not directly affected by the fees RRD receives from the Funds and William Blair. |
| (4) | In his former role as chief financial officer at the University of Chicago, Mr. Reaves had a working relationship with E. David Coolidge III, Vice Chairman of William Blair who is also a trustee of the University of Chicago. |
| See accompanying Notes to Financial Statements. |
| |
| June 30, 2016 | | William Blair Funds | 191 |
| Name and Year of Birth | | Position(s) Held
with Trust | | Term of Office
and Length of
Time Served1 | | Principal Occupation(s)
During Past 5 Years2 |
| | | | | | | |
| Officers | | | | | | |
| | | | | | | |
Michael P. Balkin,
1959 | | Senior Vice President | | Since 2008 | | Partner, William Blair |
| | | | | | | |
Stephanie G. Braming,
1970 | | Senior Vice President | | Since 2014 | | Partner, William Blair |
| | | | | | | |
Karl W. Brewer,
1966 | | Senior Vice President | | Since 2000 | | Partner, William Blair |
| | | | | | | |
Thomas Clarke,
1968 | | Senior Vice President | | Since 2011 | | Partner, William Blair (since 2014); prior thereto, Associate, William Blair (2011-2014); Managing Partner, Singer Partners, LLC (2009-2011) |
| | | | | | | |
Daniel Crowe,
1972 | | Senior Vice President | | Since 2016 | | Partner, William Blair (since 2015); prior thereto, Associate, William Blair |
| | | | | | | |
Simon Fennell,
1969 | | Senior Vice President | | Since 2013 | | Partner, William Blair (since 2013); prior thereto, Associate, William Blair (2011-2013); Goldman Sachs (1997-2011) |
| | | | | | | |
Andrew G. Flynn,
1961 | | Senior Vice President | | Since 2013 | | Partner, William Blair |
| | | | | | | |
David C. Fording,
1967 | | Senior Vice President | | Since 2006 | | Partner, William Blair |
| | | | | | | |
James S. Golan,
1961 | | Senior Vice President | | Since 2005 | | Partner, William Blair |
| | | | | | | |
Michael A. Jancosek,
1959 | | Senior Vice President | | Since 2000 | | Partner, William Blair |
| | | | | | | |
John F. Jostrand,
1954 | | Senior Vice President | | Since 1999 | | Partner, William Blair |
| | | | | | | |
Chad M. Kilmer,
1975 | | Senior Vice President | | Since 2006 | | Partner, William Blair (since 2011); prior thereto, Associate, William Blair |
| | | | | | | |
Robert C. Lanphier IV,
1956 | | Senior Vice President | | Since 2003 | | Partner, William Blair |
| | | | | | | |
Mark T. Leslie,
1967 | | Senior Vice President | | Since 2005 | | Partner, William Blair |
| | | | | | | |
Kenneth J. McAtamney,
1966 | | Senior Vice President | | Since 2008 | | Partner, William Blair |
| | | | | | | |
Todd M. McClone,
1968 | | Senior Vice President | | Since 2005 | | Partner, William Blair |
| | | | | | | |
David Merjan,
1960 | | Senior Vice President | | Since 2008 | | Partner, William Blair |
| | | | | | | |
David S. Mitchell,
1960 | | Senior Vice President | | Since 2003 | | Partner, William Blair |
| | | | | | | |
John C. Murphy,
1969 | | Senior Vice President | | Since 2014 | | Partner, William Blair |
| | | | | | | |
Casey K. Preyss,
1976 | | Senior Vice President | | Since 2015 | | Partner, William Blair |
See accompanying Notes to Financial Statements.
| 192 | Semiannual Report | June 30, 2016 |
| Name and Year of Birth | | Position(s) Held
with Trust | | Term of Office
and Length of
Time Served1 | | Principal Occupation(s)
During Past 5 Years |
| | | | | | | |
David P. Ricci,
1958 | | Senior Vice President | | Since 2006 | | Partner, William Blair |
| | | | | | | |
Brian D. Singer,
1960 | | Senior Vice President | | Since 2011 | | Partner, William Blair (since 2012); prior thereto, Associate, William Blair (2011-2012); Managing Partner, Singer Partners, LLC (2009-2011) |
| | | | | | | |
Jeffrey A. Urbina,
1955 | | Senior Vice President | | Since 1998 | | Partner, William Blair |
| | | | | | | |
Christopher T. Vincent,
1956 | | Senior Vice President | | Since 2002 | | Partner, William Blair |
| | | | | | | |
Paul J. Sularz,
1967 | | Vice President | | Since 2009 | | Associate, William Blair (2006-2012 and since 2014); Partner, William Blair (2012-2014) |
| | | | | | | |
Colette M. Garavalia,
1961 | | Treasurer | | Since 2000 | | Associate, William Blair |
| | | | | | | |
Andrew T. Pfau,
1970 | | Secretary | | Since 2009 | | Associate, William Blair |
| | | | | | | |
John M. Raczek,
1970 | | Assistant Treasurer | | Since 2010 | | Associate, William Blair |
Walter R. Randall, Jr.,
1960 | | Chief Compliance Officer and Assistant Secretary | | Since 2009 | | Associate, William Blair |
| (1) | The Trust’s officers, except the Chief Compliance Officer, are elected annually by the Board of Trustees. The Trust’s Chief Compliance Officer is designated by the Board of Trustees and may only be removed by action of the Board of Trustees, including a majority of independent trustees. Length of Time Served for all officers indicates the year the individual became an officer of the Trust. |
The Statement of Additional Information for the William Blair Funds includes additional information about the trustees and is available without charge by calling 1-800-635-2886 (in Massachusetts 1-800-635-2840) or by writing the Fund.
See accompanying Notes to Financial Statements.
| June 30, 2016 | William Blair Funds | 193 |
(Unaudited)
Proxy Voting
A description of the policies and procedures that the Funds use to determine how to vote proxies relating to portfolio securities and information regarding how the Funds voted proxies relating to portfolio securities for the most recent 12-month period ended December 31 are available without charge, upon request, by calling 1-800-635-2886 (in Massachusetts 1-800-635-2840), at www.williamblairfunds.com and on the SEC’s website at http://www.sec.gov.
Quarterly Portfolio Schedules
Each Fund files its complete schedule of portfolio holdings with the SEC for the first and third fiscal quarters of each fiscal year (quarters ended March 31 and September 30) on Form N-Q. The Fund’s Forms N-Q are available on the SEC’s website at http://www.sec.gov and may be reviewed and copied at the SEC’s Public Reference Room in Washington, D.C. Information on the operation of the SEC’s Public Reference Room may be obtained by calling 1-800-SEC-0330.
Additional Federal Income Tax Information: (unaudited)
Under Section 852(b)(3)(C) of the Code, the Funds hereby designate the following amounts as capital gain dividends for the fiscal year ended December 31, 2015 (in thousands):
| Fund | | Capital Gain Dividend |
| Growth | | $ | 96,737 | |
| Large Cap Growth | | | 6,130 | |
| Mid Cap Growth | | | 41,383 | |
| Mid Cap Value | | | 587 | |
| Small-Mid Cap Growth | | | 59,064 | |
| Small-Mid Cap Value | | | 206 | |
| Small Cap Growth | | | 29,587 | |
| Small Cap Value | | | 1,943 | |
| Global Leaders | | | 8,459 | |
| International Leaders | | | 653 | |
| Institutional International Growth | | | 15,858 | |
| International Small Cap Growth | | | 1,505 | |
| Emerging Markets Leaders | | | 172 | |
| Emerging Markets Growth | | | 9,858 | |
| Emerging Markets Small Cap Growth | | | 11,724 | |
| 194 | Semiannual Report | June 30, 2016 |
| | Useful Information About Your Report (Unaudited) |
| | |
| | Please refer to this information when reviewing the Expense Example for each Fund. |
| | |
| | Expense Example |
| | |
| | As a shareholder of a Fund, you incur two types of costs: (1) transaction costs and (2) ongoing costs, including management fees, distribution (12b-1) fees (for Class N shares except for the Institutional International Growth Fund and the Institutional International Equity Fund), shareholder administration fees (for Class N and Class I shares of the Global Leaders Fund, the International Leaders Fund, the International Small Cap Growth Fund, the Emerging Markets Leaders Fund, the Emerging Markets Growth Fund, the Emerging Markets Small Cap Growth Fund, the Bond Fund, the Low Duration Fund and the Macro Allocation Fund) and other Fund expenses. The example is intended to help you understand your ongoing costs (in dollars) of investing in the Fund and to compare these costs with the ongoing costs of investing in other mutual funds. To do so, compare the Fund’s 5% hypothetical example with the 5% hypothetical examples that appear in the shareholder reports of other funds. The example is based on an investment of $1,000 invested at the beginning of the period and held for the entire six-month period from January 1, 2016 to June 30, 2016. |
| | |
| | Actual Expenses |
| | |
| | In each example, the first line for each share class in the table provides information about the actual account values and actual expenses. These expenses reflect the effect of any expense cap applicable to the share class during the period. Without this expense cap, the costs shown in the table would have been higher. You may use the information in this line, together with the amount you invested, to estimate the expenses that you paid over the period. Simply divide your account value by $1,000 (example, an $8,600 account value divided by $1,000 = 8.6), then multiply the result by the number in the first line under the heading entitled “Expenses Paid During the Period” to estimate the expenses you paid on your account during the period. |
| | |
| | Hypothetical Example for Comparison Purposes |
| | |
| | In each example, the second line for each share class in the table provides information about hypothetical account values and hypothetical expenses based on the Fund’s actual expense ratio and an assumed rate of return of 5% per year before expenses. This is not the Fund’s actual return. The hypothetical account values and expenses may not be used to estimate the actual ending account balance or expenses you paid for the period. You may use this information to compare the ongoing costs of investing in the Fund to other funds. To do so, compare this 5% hypothetical example with the 5% hypothetical examples that appear in the shareholder reports of other funds. |
| | |
| | Please note that the expenses shown in both examples are meant to highlight your ongoing costs only and do not reflect any transactional costs or account type fees, such as IRA Fiduciary Administration fees. These fees are fully described in the prospectus. Therefore, the second line of each share class in the table is useful in comparing ongoing costs only and will not help you determine the relative costs of owning different funds. In addition, if these transactional costs or account fees were included, your costs would have been higher. |
| June 30, 2016 | William Blair Funds | 195 |
Fund Expenses (Unaudited)
| Expense Example | | Beginning
Account Value
1/1/2016 | | Ending
Account Value
6/30/2016 | | Expenses Paid
During
the Period (a) | | Annualized
Expense Ratio |
| Growth Fund | | | | | | | | |
| Class N-actual return | | $1,000.00 | | $980.83 | | $6.11 | | 1.24 |
| Class N-hypothetical 5% return | | $1,000.00 | | $1,043.83 | | $6.30 | | 1.24 |
| Class I-actual return | | $1,000.00 | | $982.22 | | $4.39 | | 0.89 |
| Class I-hypothetical 5% return | | $1,000.00 | | $1,045.57 | | $4.53 | | 0.89 |
| Large Cap Growth Fund | | | | | | | | |
| Class N-actual return | | $1,000.00 | | $996.06 | | $5.21 | | 1.05 |
| Class N-hypothetical 5% return | | $1,000.00 | | $1,044.78 | | $5.34 | | 1.05 |
| Class I-actual return | | $1,000.00 | | $997.16 | | $3.97 | | 0.80 |
| Class I-hypothetical 5% return | | $1,000.00 | | $1,046.02 | | $4.07 | | 0.80 |
| Mid Cap Growth Fund | | | | | | | | |
| Class N-actual return | | $1,000.00 | | $992.91 | | $6.44 | | 1.30 |
| Class N-hypothetical 5% return | | $1,000.00 | | $1,043.54 | | $6.61 | | 1.30 |
| Class I-actual return | | $1,000.00 | | $994.05 | | $5.21 | | 1.05 |
| Class I-hypothetical 5% return | | $1,000.00 | | $1,044.78 | | $5.34 | | 1.05 |
| Mid Cap Value Fund | | | | | | | | |
| Class N-actual return. | | $1,000.00 | | $1,061.49 | | $6.66 | | 1.30 |
| Class N-hypothetical 5% return | | $1,000.00 | | $1,043.54 | | $6.61 | | 1.30 |
| Class I-actual return. | | $1,000.00 | | $1,062.37 | | $5.38 | | 1.05 |
| Class I-hypothetical 5% return | | $1,000.00 | | $1,044.78 | | $5.34 | | 1.05 |
| Small-Mid Cap Growth Fund | | | | | | | | |
| Class N-actual return | | $1,000.00 | | $1,009.71 | | $6.75 | | 1.35 |
| Class N-hypothetical 5% return | | $1,000.00 | | $1,043.29 | | $6.86 | | 1.35 |
| Class I-actual return | | $1,000.00 | | $1,010.91 | | $5.50 | | 1.10 |
| Class I-hypothetical 5% return | | $1,000.00 | | $1,044.53 | | $5.59 | | 1.10 |
| Small-Mid Cap Value Fund | | | | | | | | |
| Class N-actual return | | $1,000.00 | | $1,061.40 | | $6.92 | | 1.35 |
| Class N-hypothetical 5% return | | $1,000.00 | | $1,043.29 | | $6.86 | | 1.35 |
| Class I-actual return | | $1,000.00 | | $1,063.00 | | $5.64 | | 1.10 |
| Class I-hypothetical 5% return | | $1,000.00 | | $1,044.53 | | $5.59 | | 1.10 |
| Small Cap Growth Fund | | | | | | | | |
| Class N-actual return | | $1,000.00 | | $1,039.16 | | $7.61 | | 1.50 |
| Class N-hypothetical 5% return | | $1,000.00 | | $1,042.54 | | $7.62 | | 1.50 |
| Class I-actual return | | $1,000.00 | | $1,040.55 | | $6.34 | | 1.25 |
| Class I-hypothetical 5% return | | $1,000.00 | | $1,043.78 | | $6.35 | | 1.25 |
| Small Cap Value Fund | | | | | | | | |
| Class N-actual return | | $1,000.00 | | $1,068.35 | | $7.71 | | 1.50 |
| Class N-hypothetical 5% return | | $1,000.00 | | $1,042.54 | | $7.62 | | 1.50 |
| Class I-actual return | | $1,000.00 | | $1,069.67 | | $6.43 | | 1.25 |
| Class I-hypothetical 5% return | | $1,000.00 | | $1,043.78 | | $6.35 | | 1.25 |
| Global Leaders Fund | | | | | | | | |
| Class N-actual return | | $1,000.00 | | $983.59 | | $6.61 | | 1.34 |
| Class N-hypothetical 5% return | | $1,000.00 | | $1,043.34 | | $6.81 | | 1.34 |
| Class I-actual return | | $1,000.00 | | $985.33 | | $5.18 | | 1.05 |
| Class I-hypothetical 5% return | | $1,000.00 | | $1,044.78 | | $5.34 | | 1.05 |
| Institutional Class-actual return | | $1,000.00 | | $985.33 | | $5.08 | | 1.00 |
| Institutional Class-hypothetical 5% return | | $1,000.00 | | $1,045.03 | | $5.08 | | 1.00 |
| International Leaders Fund | | | | | | | | |
| Class N-actual return | | $1,000.00 | | $986.04 | | $6.32 | | 1.28 |
| Class N-hypothetical 5% return | | $1,000.00 | | $1,043.63 | | $6.50 | | 1.28 |
| Class I-actual return | | $1,000.00 | | $986.83 | | $5.09 | | 1.03 |
| Class I-hypothetical 5% return | | $1,000.00 | | $1,044.88 | | $5.24 | | 1.03 |
| Institutional Class-actual return | | $1,000.00 | | $986.82 | | $4.69 | | 0.95 |
| Institutional Class-hypothetical 5% return | | $1,000.00 | | $1,045.28 | | $4.83 | | 0.95 |
| 196 | Semiannual Report | June 30, 2016 |
Fund Expenses (Unaudited)
| Expense Example | | Beginning
Account Value
1/1/2016 | | Ending
Account Value
6/30/2016 | | Expenses Paid
During
the Period (a) | | Annualized
Expense Ratio |
| International Equity Fund | | | | | | | | |
| Class N-actual return | | $1,000.00 | | $981.23 | | $6.40 | | 1.30 |
| Class N-hypothetical 5% return | | $1,000.00 | | $1,043.54 | | $6.61 | | 1.30 |
| Class I-actual return | | $1,000.00 | | $982.12 | | $5.17 | | 1.05 |
| Class I-hypothetical 5% return | | $1,000.00 | | $1,044.78 | | $5.34 | | 1.05 |
| Institutional International Equity Fund | | | | | | | | |
| Institutional Class-actual return | | $1,000.00 | | $982.67 | | $4.93 | | 1.00 |
| Institutional Class-hypothetical 5% return | | $1,000.00 | | $1,045.03 | | $5.08 | | 1.00 |
| International Growth Fund | | | | | | | | |
| Class N-actual return | | $1,000.00 | | $961.91 | | $7.02 | | 1.44 |
| Class N-hypothetical 5% return | | $1,000.00 | | $1,042.84 | | $7.31 | | 1.44 |
| Class I-actual return | | $1,000.00 | | $963.54 | | $5.57 | | 1.14 |
| Class I-hypothetical 5% return | | $1,000.00 | | $1,044.33 | | $5.79 | | 1.14 |
| Institutional International Growth Fund | | | | | | | | |
| Institutional Class-actual return | | $1,000.00 | | $964.19 | | $4.79 | | 0.98 |
| Institutional Class-hypothetical 5% return | | $1,000.00 | | $1,045.13 | | $4.98 | | 0.98 |
| International Small Cap Growth Fund | | | | | | | | |
| Class N-actual return | | $1,000.00 | | $957.78 | | $7.06 | | 1.45 |
| Class N-hypothetical 5% return | | $1,000.00 | | $1,042.79 | | $7.36 | | 1.45 |
| Class I-actual return | | $1,000.00 | | $958.97 | | $5.65 | | 1.16 |
| Class I-hypothetical 5% return | | $1,000.00 | | $1,044.23 | | $5.90 | | 1.16 |
| Institutional Class-actual return | | $1,000.00 | | $959.18 | | $5.26 | | 1.08 |
| Institutional Class-hypothetical 5% return | | $1,000.00 | | $1,044.63 | | $5.49 | | 1.08 |
| Emerging Markets Leaders Fund | | | | | | | | |
| Class N-actual return | | $1,000.00 | | $1,043.98 | | $8.39 | | 1.65 |
| Class N-hypothetical 5% return | | $1,000.00 | | $1,041.80 | | $8.38 | | 1.65 |
| Class I-actual return | | $1,000.00 | | $1,046.51 | | $6.61 | | 1.30 |
| Class I-hypothetical 5% return | | $1,000.00 | | $1,043.54 | | $6.61 | | 1.30 |
| Institutional Class-actual return | | $1,000.00 | | $1,046.51 | | $6.36 | | 1.25 |
| Institutional Class-hypothetical 5% return | | $1,000.00 | | $1,043.78 | | $6.35 | | 1.25 |
| Emerging Markets Growth Fund | | | | | | | | |
| Class N-actual return | | $1,000.00 | | $1,050.69 | | $7.65 | | 1.50 |
| Class N-hypothetical 5% return | | $1,000.00 | | $1,042.54 | | $7.62 | | 1.50 |
| Class I-actual return | | $1,000.00 | | $1,052.01 | | $6.43 | | 1.26 |
| Class I-hypothetical 5% return | | $1,000.00 | | $1,043.73 | | $6.40 | | 1.26 |
| Institutional Class-actual return | | $1,000.00 | | $1,051.58 | | $6.02 | | 1.18 |
| Institutional Class-hypothetical 5% return | | $1,000.00 | | $1,044.13 | | $6.00 | | 1.18 |
| Emerging Markets Small Cap Growth Fund | | | | | | | | |
| Class N-actual return | | $1,000.00 | | $1,008.76 | | $8.04 | | 1.61 |
| Class N-hypothetical 5% return | | $1,000.00 | | $1,041.99 | | $8.17 | | 1.61 |
| Class I-actual return | | $1,000.00 | | $1,009.40 | | $6.49 | | 1.30 |
| Class I-hypothetical 5% return | | $1,000.00 | | $1,043.54 | | $6.61 | | 1.30 |
| Institutional Class-actual return | | $1,000.00 | | $1,010.05 | | $6.25 | | 1.25 |
| Institutional Class-hypothetical 5% return | | $1,000.00 | | $1,043.78 | | $6.35 | | 1.25 |
| Bond Fund | | | | | | | | |
| Class N-actual return | | $1,000.00 | | $1,053.67 | | $3.17 | | 0.62 |
| Class N-hypothetical 5% return | | $1,000.00 | | $1,046.92 | | $3.16 | | 0.62 |
| Class I-actual return | | $1,000.00 | | $1,053.98 | | $2.09 | | 0.41 |
| Class I-hypothetical 5% return | | $1,000.00 | | $1,047.96 | | $2.09 | | 0.41 |
| Institutional Class-actual return | | $1,000.00 | | $1,054.33 | | $1.79 | | 0.35 |
| Institutional Class-hypothetical 5% return | | $1,000.00 | | $1,048.26 | | $1.78 | | 0.35 |
| Income Fund | | | | | | | | |
| Class N-actual return | | $1,000.00 | | $1,029.39 | | $4.09 | | 0.81 |
| Class N-hypothetical 5% return | | $1,000.00 | | $1,045.97 | | $4.12 | | 0.81 |
| Class I-actual return | | $1,000.00 | | $1,031.86 | | $2.88 | | 0.57 |
| Class I-hypothetical 5% return | | $1,000.00 | | $1,047.17 | | $2.90 | | 0.57 |
| June 30, 2016 | William Blair Funds | 197 |
Fund Expenses (Unaudited)
| Expense Example | | Beginning
Account Value
1/1/2016 | | Ending
Account Value
6/30/2016 | | Expenses Paid
During
the Period (a) | | Annualized
Expense Ratio |
| Low Duration Fund | | | | | | | | |
| Class N-actual return | | $1,000.00 | | $1,011.26 | | $3.15 | | 0.63 |
| Class N-hypothetical 5% | | $1,000.00 | | $1,046.87 | | $3.21 | | 0.63 |
| Class I-actual return | | $1,000.00 | | $1,012.30 | | $2.10 | | 0.42 |
| Class I-hypothetical 5% | | $1,000.00 | | $1,047.91 | | $2.14 | | 0.42 |
| Institutional Class-actual return | | $1,000.00 | | $1,012.41 | | $2.00 | | 0.40 |
| Institutional Class-hypothetical 5% return | | $1,000.00 | | $1,048.01 | | $2.04 | | 0.40 |
| Macro Allocation Fund | | | | | | | | |
| Class N-actual return | | $1,000.00 | | $1,002.65 | | $6.32 | | 1.27 |
| Class N-hypothetical 5% | | $1,000.00 | | $1,043.68 | | $6.45 | | 1.27 |
| Class I-actual return | | $1,000.00 | | $1,004.39 | | $4.93 | | 0.99 |
| Class I-hypothetical 5% | | $1,000.00 | | $1,045.08 | | $5.03 | | 0.99 |
| Institutional Class-actual return | | $1,000.00 | | $1,005.27 | | $4.54 | | 0.91 |
| Institutional Class-hypothetical 5% return | | $1,000.00 | | $1,045.52 | | $4.63 | | 0.91 |
| (a) | Expenses are equal to the annualized expense ratio, multiplied by the average account value over the period, multiplied by the number of days in the period, 182, and divided by 366 (to reflect the one-half year period). |
| 198 | Semiannual Report | June 30, 2016 |
| | BOARD OF TRUSTEES |
| | |
| | Vann A. Avedisian |
| | Principal, Highgate Holdings |
| | Kathleen T. Barr |
| | Retired Senior Managing Director, PNC Capital Advisors, LLC |
| | Daniel N. Leib |
| | Executive Vice President and Chief Financial Officer, R.R. Donnelley & Sons Company |
| | Phillip O. Peterson |
| | Retired Partner, KPMG LLP |
| | Donald J. Reaves |
| | Retired Chancellor, Winston-Salem State University |
| | Donald L. Seeley |
| | Retired Adjunct Lecturer and Director, University of Arizona Department of Finance |
| | Michelle R. Seitz, Chairman and President |
| | Partner, William Blair |
| | Thomas J. Skelly |
| | Retired Managing Partner, Accenture |
| | Richard W. Smirl, Senior Vice President |
| | Partner, William Blair |
| | Officers |
| | Michael P. Balkin, Senior Vice President |
| | Stephanie G. Braming, Senior Vice President |
| | Karl W. Brewer, Senior Vice President |
| | Thomas Clarke, Senior Vice President |
| | Daniel Crowe, Senior Vice President |
| | Simon Fennell, Senior Vice President |
| | Andrew G. Flynn, Senior Vice President |
| | David C. Fording, Senior Vice President |
| | James S. Golan, Senior Vice President |
| | Michael A. Jancosek, Senior Vice President |
| | John F. Jostrand, Senior Vice President |
| | Chad M. Kilmer, Senior Vice President |
| | Robert C. Lanphier, IV, Senior Vice President |
| | Mark T. Leslie, Senior Vice President |
| | Kenneth J. McAtamney, Senior Vice President |
| | Todd M. McClone, Senior Vice President |
| | David Merjan, Senior Vice President |
| | David S. Mitchell, Senior Vice President |
| | John C. Murphy, Senior Vice President |
| | Casey K. Preyss, Senior Vice President |
| | David P. Ricci, Senior Vice President |
| | Brian D. Singer, Senior Vice President |
| | Jeffrey A. Urbina, Senior Vice President |
| | Christopher T. Vincent, Senior Vice President |
| | Paul J. Sularz, Vice President |
| | Colette M. Garavalia, Treasurer |
| | Andrew T. Pfau, Secretary |
| | John M. Raczek, Assistant Treasurer |
| | Walter R. Randall, Jr., Chief Compliance Officer and Assistant Secretary |
| | Investment Adviser |
| | William Blair Investment Management, LLC |
| | Distributor |
| | William Blair & Company, L.L.C. |
| | Independent Registered Public Accounting Firm |
| | Ernst & Young LLP |
| | Legal Counsel |
| | Vedder Price P.C. |
| | Transfer Agent |
| | Boston Financial Data Services, Inc. |
| | P.O. Box 8506 |
| | Boston, MA 02266-8506 |
| | For customer assistance, call 1-800-635-2886 |
| | (Massachusetts 1-800-635-2840) |
| | |
| June 30, 2016 | William Blair Funds | 199 |
| | | | | | |
| | William Blair Funds | | | |
| | | | | | |
| | DOMESTIC EQUITY | | GLOBAL EQUITY | | FIXED INCOME |
| | Growth Fund | | Global Leaders Fund | | Bond Fund |
| | Large Cap Growth Fund | | | | Income Fund |
| | Mid Cap Growth Fund | | INTERNATIONAL EQUITY | | Low Duration Fund |
| | Mid Cap Value Fund | | International Leaders Fund | | |
| | Small-Mid Cap Growth Fund | | International Equity Fund | | MULTI-ASSET AND |
| | Small-Mid Cap Value Fund | | Institutional International Equity Fund | | ALTERNATIVE |
| | Small Cap Growth Fund | | International Growth Fund | | Macro Allocation Fund |
| | Small Cap Value Fund | | Institutional International Growth Fund | | |
| | | | International Small Cap Growth Fund | | |
| | | | Emerging Markets Leaders Fund | | |
| | | | Emerging Markets Growth Fund | | |
| | | | Emerging Markets Small Cap Growth Fund | | |
 | | © | William Blair & Company, L.L.C., distributor | |
| +1 800 742 7272 | | 222 West Adams Street | |
| williamblairfunds.com | | Chicago, Illinois 60606 | 00103188 |
Not applicable to this filing.
| Item 3. | Audit Committee Financial Expert |
Not applicable to this filing.
| Item 4. | Principal Accountant Fees and Services |
Not applicable to this filing.
| Item 5. | Audit Committee of Listed Registrants |
Not Applicable to this Registrant, insofar as the Registrant is not a listed company.
| Item 6. | Schedule of Investments |
See Schedule of Investments in Item 1.
| Item 7. | Disclosure of Proxy Voting Policies and Procedures for Closed-End Management Investment Companies |
Not applicable to this Registrant, insofar as the Registrant is not a closed-end management investment company.
| Item 8. | Portfolio Managers of Closed-End Management Investment Companies |
Not applicable to this Registrant, insofar as the Registrant is not a closed-end management investment company.
| Item 9. | Purchase of Equity Securities by Closed-End Management Investment Companies and Affiliated Purchasers |
Not applicable to this Registrant, insofar as the Registrant is not a closed-end management investment company.
| Item 10. | Submission of Matters to a Vote of Security Holders |
There have been no material changes to the procedures by which shareholders may recommend nominees to the Registrant’s Board of Trustees since the Registrant last provided disclosure in response to this item.
Controls and Procedures
(a) The Registrant’s principal executive and principal financial officer, or persons performing similar functions, have concluded that the Registrant’s Disclosure Controls and Procedures (as defined in Rule 30a-3(c) under the Investment Company Act of 1940, as amended (the “1940 Act”) (17 CFR 270.30a-3(c)) are effective, as of a date within 90 days of the filing date of this report that includes the disclosure required by this paragraph, based on their evaluation of these controls and procedures required by Rule 30a-3 (b) under the 1940 Act (17 CFR 270.30a-3(b) and Rules 13a-15(b) or 15d-15(b) under the Exchange Act (17 CFR 240.13a-15(b) or 240.15d-15(b)).
(b) There were no changes in the Registrant’s internal control over financial reporting (as defined in Rule 30a-3(d) under the 1940 Act (17 CFR 270.30a-3(d)) that occurred during the final quarter of the period covered by this report that has materially affected, or is reasonably likely to materially affect, the Registrant’s internal control over financial reporting.
12. (a) (1) Code of Ethics
Not applicable because it is posted on Registrant’s website.
12. (a) (2) (1)
Certification of Principal Executive Officer Required by Rule 30a-2(a) of the Investment Company Act
12. (a) (2) (2)
Certification of Principal Financial Officer Required by Rule 30a-2(a) of the Investment Company Act.
12. (a) (3)
Not applicable to this Registrant.
12. (b)
Certification of Chief Executive Officer and Certification of Chief Financial Officer Required by Rule 30a-2(b) of the Investment Company Act
Pursuant to the requirements of the Securities Exchange Act of 1934 and the Investment Company Act of 1940, the Registrant has duly caused this report to be signed on its behalf by the undersigned, thereunto duly authorized.
| | | William Blair Funds | |
| | | |
| | | /s/ Michelle R. Seitz | |
| By: | | Michelle R. Seitz | |
| | | President (Chief Executive Officer) | |
Date: August 19, 2016
Pursuant to the requirements of the Securities Exchange Act of 1934 and the Investment Company Act of 1940, this report has been signed below by the following persons on behalf of the Registrant and in the capacities and on the dates indicated
| | | /s/ Michelle R. Seitz | |
| By: | | Michelle R. Seitz | |
| | | President (Chief Executive Officer) | |
Date: August 19, 2016
| | | /s/ Colette M. Garavalia | |
| By: | | Colette M. Garavalia | |
| | | Treasurer (Chief Financial Officer) | |
Date: August 19, 2016