UNITED STATES
SECURITIES AND EXCHANGE COMMISSION
Washington, D.C. 20549
Form N-CSR
CERTIFIED SHAREHOLDER REPORT OF REGISTERED
MANAGEMENT INVESTMENT COMPANIES
Investment Company Act File Number 811-5344
William Blair Funds
(Exact name of registrant as specified in charter)
| 150 North Riverside Plaza, Chicago, IL | | 60606 |
| (Address of principal executive offices) | | (Zip Code) |
Stephanie G. Braming, Principal Executive Officer
William Blair Funds
150 North Riverside Plaza, Chicago, IL 60606
(Name and address of agent for service)
Registrant’s telephone number, including area code: 312-236-1600
Date of fiscal year end: December 31
Date of reporting period: June 30, 2018
Form N-CSR is to be used by management investment companies to file reports with the Commission not later than 10 days after the transmission to stockholders of any report that is required to be transmitted to stockholders under Rule 30e-1 under the Investment Company Act of 1940 (17 CFR 270.30e-1). The Commission may use the information provided on Form N-CSR in its regulatory, disclosure review, inspection, and policymaking roles.
A registrant is required to disclose the information specified by Form N-CSR, and the Commission will make this information public. A Registrant is not required to respond to the collection of information contained in Form N-CSR unless the form displays a currently valid Office of Management and Budget (“OMB”) control number. Please direct comments concerning the accuracy of the information collection burden estimates and any suggestions for reducing the burden to Secretary, Securities and Exchange Commission, 100 F Street, NE, Washington, DC 20549. The OMB has reviewed this collection of information under the clearance requirements of 44 U.S.C. (ss) 3507.
Item 1. June 30, 2018 Semiannual Reports transmitted to shareholders.

| | June 30, 2018 |
William Blair Funds Semiannual Report | |
Table of Contents
| June 30, 2018 | William Blair Funds | 1 |
The views expressed in the commentary for each Fund reflect those of the portfolio management team only through the end of the period of the report as stated on the cover. The portfolio management team’s views are subject to change at any time based on market and other conditions and should not be construed as a recommendation. Statements involving predictions, assessments, analyses, or outlook for individual securities, industries, market sectors, and/or markets involve risks and uncertainties, and there is no guarantee they will come to pass.
This report is submitted for the general information of the shareholders of William Blair Funds. It is not authorized for distribution to prospective Fund investors unless accompanied or preceded by the Fund’s prospectus. Please carefully consider a Fund’s investment objectives, risks, charges, and expenses before investing. This and other information is contained in the Fund’s prospectus, which you may obtain by calling 1-800-742-7272. Read it carefully before you invest or send money.
| 2 | Semiannual Report | June 30, 2018 |
Performance as of June 30, 2018—Class N Shares (Unaudited)
| | | | | | | | | | | | | | | 10 yr | | | | Overall |
| | | Year | | | | | | | | | | | (or since | | Inception | | Morningstar |
| | | to Date | | 1 yr | | 3 yr | | 5 yr | | inception) | | Date | | Rating |
| Growth Fund | | | | | | | | | | | | | | | | | | | |
| Class N | | 12.76 | | | 26.06 | | | 12.38 | | | 13.53 | | | 9.77 | | | 3/20/1946 | | ««« |
| Morningstar Large Growth | | 7.51 | | | 20.58 | | | 12.21 | | | 14.37 | | | 10.23 | | | | | Among 1,265 |
| Russell 3000® Growth Index | | 7.44 | | | 22.47 | | | 14.63 | | | 16.14 | | | 11.78 | | | | | Large Growth Funds |
| S&P 500® Index | | 2.65 | | | 14.37 | | | 11.93 | | | 13.42 | | | 10.17 | | | | | |
| | | | | | | | | | | | | | | | | | | | |
| Large Cap Growth Fund | | | | | | | | | | | | | | | | | | | |
| Class N | | 12.28 | | | 30.77 | | | 14.90 | | | 17.40 | | | 11.18 | | | 12/27/1999 | | «««« |
| Morningstar Large Growth | | 7.51 | | | 20.58 | | | 12.21 | | | 14.37 | | | 10.23 | | | | | Among 1,265 |
| Russell 1000® Growth Index | | 7.25 | | | 22.51 | | | 14.98 | | | 16.36 | | | 11.83 | | | | | Large Growth Funds |
| | | | | | | | | | | | | | | | | | | | |
| Mid Cap Growth Fund | | | | | | | | | | | | | | | | | | | |
| Class N | | 11.63 | | | 22.45 | | | 8.85 | | | 10.69 | | | 9.63 | | | 2/1/2006 | | ««« |
| Morningstar Mid-Cap Growth | | 6.39 | | | 18.06 | | | 9.68 | | | 12.31 | | | 9.45 | | | | | Among 541 |
| Russell Midcap® Growth Index | | 5.40 | | | 18.52 | | | 10.73 | | | 13.37 | | | 10.45 | | | | | Mid-Cap Growth Funds |
| | | | | | | | | | | | | | | | | | | | |
| Small-Mid Cap Growth Fund | | | | | | | | | | | | | | | | | | | |
| Class N | | 10.74 | | | 22.81 | | | 13.28 | | | 15.31 | | | 13.04 | | | 12/29/2003 | | ««««« |
| Morningstar Mid-Cap Growth | | 6.39 | | | 18.06 | | | 9.68 | | | 12.31 | | | 9.45 | | | | | Among 541 |
| Russell 2500TM Growth Index | | 8.04 | | | 21.53 | | | 10.86 | | | 13.87 | | | 11.38 | | | | | Mid-Cap Growth Funds |
| | | | | | | | | | | | | | | | | | | | |
| Small-Mid Cap Value Fund | | | | | | | | | | | | | | | | | | | |
| Class N | | 0.84 | | | 10.21 | | | 8.23 | | | 9.56 | | | 12.46 | | | 12/15/2011 | | «« |
| Morningstar Small Blend | | 5.26 | | | 14.67 | | | 9.41 | | | 11.02 | | | — | | | | | Among 639 |
| Russell 2500TM Value Index | | 3.00 | | | 11.49 | | | 9.76 | | | 10.78 | | | 14.21 | | | | | Small Blend Funds |
| | | | | | | | | | | | | | | | | | | | |
| Small Cap Growth Fund | | | | | | | | | | | | | | | | | | | |
| Class N | | 15.41 | | | 26.65 | | | 17.16 | | | 16.06 | | | 12.81 | | | 12/27/1999 | | ««««« |
| Morningstar Small Growth | | 11.05 | | | 22.70 | | | 11.04 | | | 12.76 | | | 10.85 | | | | | Among 606 |
| Russell 2000® Growth Index | | 9.70 | | | 21.86 | | | 10.60 | | | 13.65 | | | 11.24 | | | | | Small Growth Funds |
| | | | | | | | | | | | | | | | | | | | |
| Small Cap Value Fund | | | | | | | | | | | | | | | | | | | |
| Class N | | 1.09 | | | 9.40 | | | 8.68 | | | 9.80 | | | 9.82 | | | 12/23/1996 | | ««« |
| Morningstar Small Blend | | 5.26 | | | 14.67 | | | 9.41 | | | 11.02 | | | 9.73 | | | | | Among 639 |
| Russell 2000® Value Index | | 5.44 | | | 13.10 | | | 11.22 | | | 11.18 | | | 9.88 | | | | | Small Blend Funds |
| | | | | | | | | | | | | | | | | | | | |
| Global Leaders Fund | | | | | | | | | | | | | | | | | | | |
| Class N | | 6.33 | | | 21.58 | | | 10.88 | | | 11.36 | | | 6.52 | | | 10/15/2007 | | «««« |
| Morningstar World Stock | | 0.18 | | | 10.28 | | | 7.91 | | | 9.21 | | | 6.18 | | | | | Among 721 |
| MSCI ACW IMI (net) | | (0.18 | ) | | 11.14 | | | 8.34 | | | 9.60 | | | 6.14 | | | | | World Large Stock Funds |
| | | | | | | | | | | | | | | | | | | | |
| International Leaders Fund | | | | | | | | | | | | | | | | | | | |
| Class N | | 1.04 | | | 13.69 | | | 9.17 | | | 9.58 | | | 10.01 | | | 8/16/2012 | | «««« |
| Morningstar Foreign Large Growth | | (0.43 | ) | | 10.53 | | | 6.62 | | | 7.72 | | | — | | | | | Among 344 |
| MSCI ACW Ex-U.S. IMI (net) | | (3.65 | ) | | 7.75 | | | 5.46 | | | 6.39 | | | 6.96 | | | | | Foreign Large Growth Funds |
| June 30, 2018 | William Blair Funds | 3 |
Performance as of June 30, 2018—Class N Shares (Unaudited)—continued
| | | Year
to Date | | 1 yr | | 3 yr | | 5 yr | | 10 yr
(or since
inception) | | Inception
Date | | Overall
Morningstar
Rating |
| International Developed Plus Fund | | | | | | | | | | | | | | | | | | | |
| Class N | | (2.59 | ) | | 7.50 | | | 4.62 | | | 6.50 | | | 2.04 | | | 5/24/2004 | | «« |
| Morningstar Foreign Large Growth | | (0.43 | ) | | 10.53 | | | 6.62 | | | 7.72 | | | 3.92 | | | | | Among 344 |
| MSCI World Ex-U.S. Index (net) | | (2.77 | ) | | 7.04 | | | 4.87 | | | 6.23 | | | 2.63 | | | | | Foreign Large Growth Funds |
| | | | | | | | | | | | | | | | | | | | |
| International Growth Fund | | | | | | | | | | | | | | | | | | | |
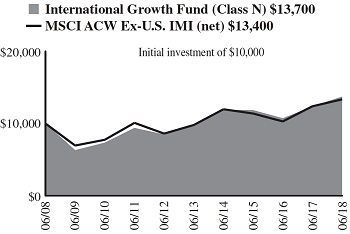
| Class N | | (1.78 | ) | | 10.92 | | | 5.03 | | | 6.70 | | | 3.23 | | | 10/1/1992 | | «« |
| Morningstar Foreign Large Growth | | (0.43 | ) | | 10.53 | | | 6.62 | | | 7.72 | | | 3.92 | | | | | Among 344 |
| MSCI ACW Ex-U.S. IMI (net) | | (3.65 | ) | | 7.75 | | | 5.46 | | | 6.39 | | | 2.93 | | | | | Foreign Large Growth Funds |
| | | | | | | | | | | | | | | | | | | | |
| International Small Cap Growth Fund | | | | | | | | | | | | | | | | | | | |
| Class N | | (4.26 | ) | | 8.49 | | | 7.38 | | | 7.36 | | | 5.21 | | | 11/1/2005 | | «« |
| Morningstar Foreign Small/Mid Growth | | 0.51 | | | 15.26 | | | 9.30 | | | 10.19 | | | 6.71 | | | | | Among 108 |
| MSCI ACW Ex-U.S. Small Cap Index (net) | | (2.94 | ) | | 10.57 | | | 7.94 | | | 8.98 | | | 5.77 | | | | | Foreign Small/Mid Growth Funds |
| | | | | | | | | | | | | | | | | | | | |
| Emerging Markets Leaders Fund | | | | | | | | | | | | | | | | | | | |
| Class N | | (6.96 | ) | | 9.71 | | | 4.19 | | | 4.60 | | | 3.54 | | | 5/3/2010 | | ««« |
| Morningstar Diversified Emerging Markets | | (7.05 | ) | | 6.09 | | | 4.76 | | | 4.05 | | | — | | | | | Among 688 |
| MSCI Emerging Markets Index (net) | | (6.66 | ) | | 8.20 | | | 5.60 | | | 5.01 | | | 3.19 | | | | | Diversified Emerging Markets Funds |
| | | | | | | | | | | | | | | | | | | | |
| Emerging Markets Growth Fund | | | | | | | | | | | | | | | | | | | |
| Class N | | (7.35 | ) | | 10.96 | | | 5.04 | | | 5.76 | | | 1.87 | | | 6/6/2005 | | ««« |
| Morningstar Diversified Emerging Markets | | (7.05 | ) | | 6.09 | | | 4.76 | | | 4.05 | | | 2.09 | | | | | Among 688 |
| MSCI Emerging Markets IMI (net) | | (6.86 | ) | | 7.90 | | | 5.19 | | | 4.93 | | | 2.52 | | | | | Diversified Emerging Markets Funds |
| | | | | | | | | | | | | | | | | | | | |
| Emerging Markets Small Cap Growth Fund | | | | | | | | | | | | | | | | | | | |
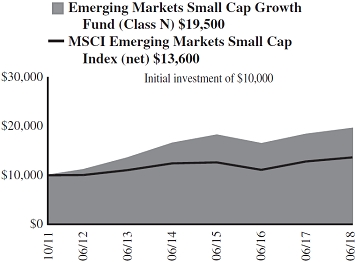
| Class N | | (9.49 | ) | | 6.22 | | | 2.10 | | | 7.03 | | | 10.54 | | | 10/24/2011 | | «««« |
| Morningstar Diversified Emerging Markets | | (7.05 | ) | | 6.09 | | | 4.76 | | | 4.05 | | | — | | | | | Among 688 |
| MSCI Emerging Markets Small Cap Index (net) | | (8.45 | ) | | 5.64 | | | 2.55 | | | 4.32 | | | 4.75 | | | | | Diversified Emerging Markets Funds |
| | | | | | | | | | | | | | | | | | | | |
| Bond Fund | | | | | | | | | | | | | | | | | | | |
| Class N | | (2.28 | ) | | (0.62 | ) | | 1.74 | | | 2.54 | | | 4.41 | | | 5/1/2007 | | «««« |
| Morningstar Intermediate-Term Bond | | (1.55 | ) | | (0.36 | ) | | 1.68 | | | 2.20 | | | 3.89 | | | | | Among 878 |
| Bloomberg Barclays U.S. Aggregate Index | | (1.62 | ) | | (0.40 | ) | | 1.72 | | | 2.27 | | | 3.72 | | | | | Intermediate-Term Bond Funds |
| | | | | | | | | | | | | | | | | | | | |
| Income Fund | | | | | | | | | | | | | | | | | | | |
| Class N | | (1.12 | ) | | (0.61 | ) | | 0.83 | | | 1.41 | | | 2.88 | | | 10/1/1990 | | ««« |
| Morningstar Short-Term Bond | | (0.06 | ) | | 0.44 | | | 1.18 | | | 1.27 | | | 2.29 | | | | | Among 447 |
| Bloomberg Barclays Intermediate Government/Credit Bond Index | | (0.97 | ) | | (0.58 | ) | | 1.16 | | | 1.60 | | | 3.08 | | | | | Short-Term Bond Funds |
| 4 | Semiannual Report | June 30, 2018 |
Performance as of June 30, 2018—Class N Shares (Unaudited)—continued
| | | Year
to Date | | 1 yr | | 3 yr | | 5 yr | | 10 yr
(or since
inception) | | Inception
Date | | Overall
Morningstar
Rating |
| Low Duration Fund | | | | | | | | | | | | | | | | | | | |
| Class N | | 0.30 | | | 0.87 | | | 0.75 | | | 0.83 | | | 1.01 | | | 12/1/2009 | | ««« |
| Morningstar Ultrashort Bond | | 0.74 | | | 1.41 | | | 1.14 | | | 0.92 | | | — | | | | | Among 139 |
| Bank of America Merrill Lynch 1-Year U.S. Treasury Note Index | | 0.65 | | | 0.92 | | | 0.64 | | | 0.49 | | | 0.47 | | | | | Ultrashort Bond Funds |
| | | | | | | | | | | | | | | | | | | | |
| Macro Allocation Fund | | | | | | | | | | | | | | | | | | | |
| Class N | | (1.60 | ) | | 0.63 | | | (1.68 | ) | | 2.00 | | | 4.60 | | | 11/29/2011 | | ««« |
| Morningstar Multialternative | | (1.19 | ) | | 2.00 | | | 1.09 | | | 2.02 | | | — | | | | | Among 288 |
| Bank of America Merrill Lynch 3-Month U.S. Treasury Bill Index | | 0.81 | | | 1.36 | | | 0.68 | | | 0.42 | | | 0.34 | | | | | Multialternative Funds |
Performance cited represents past performance. Past performance does not guarantee future results and current performance may be lower or higher than the data quoted. Results shown are average annual total returns, which assume reinvestment of dividends and capital gains. Investment returns and principal will fluctuate and you may have a gain or a loss when you sell shares. For the most current month-end performance information, please call 1-800-742-7272, or visit our Web site at www.williamblairfunds.com. From time to time, the investment adviser may waive fees or reimburse expenses for the Fund. Without these waivers, performance would be lower. Investing in smaller companies involves special risks, including higher volatility and lower liquidity. International and emerging markets investing involves special risk considerations, including currency fluctuations, lower liquidity, economic and political risk. As interest rates rise, bond prices will typically fall and bond funds may become more volatile. Class N shares are available to the general public without a sales load.
Morningstar RatingsTM are as of 06/30/2018 and are subject to change every month. The ratings are based on a risk-adjusted return measure that accounts for variation in a fund’s monthly performance, placing more emphasis on downward variations and rewarding consistent performance. The top 10% of funds in each Category receive 5 stars, the next 22.5% receive 4 stars, the middle 35% receive 3 stars, the next 22.5% receive 2 stars, and the bottom 10% receive 1 star. The Overall Morningstar Rating for a fund is derived from a weighted-average of the performance figures associated with its three-, five- and ten-year (if applicable) Morningstar Rating metrics. The 3/5/10 year Morningstar ratings were as follows: Growth Fund «««/«««/««« and Large Cap Growth Fund ««««/«««««/«««« out of 1,265/1,141/825 large growth funds; Mid Cap Growth Fund «««/««/««« and Small-Mid Cap Growth Fund «««««/«««««/««««« out of 541/480/344 mid-cap growth funds; Small Cap Growth Fund «««««/«««««/««««, out of 606/534/404 small growth funds; Small-Mid Cap Value Fund «««/««/NA and Small Cap Value Fund «««/««/««« out of 639/539/393 small blend funds; Global Leaders Fund ««««/««««/««« out of 721/596/343 world large stock funds; International Developed Plus Fund ««/««/««, International Growth Fund ««/««/««, and International Leaders Fund ««««/««««/NA out of 344/304/218 foreign large growth funds; International Small Cap Growth Fund ««/««/«« out of 108/103/63 foreign small/mid growth funds; Emerging Markets Leaders Fund «««/«««/«««, Emerging Markets Growth Fund «««/««««/«««, and Emerging Markets Small Cap Growth Fund ««/«««««/NA out of 688/489/203 diversified emerging markets funds; Bond Fund «««/««««/«««« out of 878/778/563 intermediate-term bond funds; Income Fund ««/«««/«««« out of 447/378/250 short-term bond funds; Low Duration Fund ««/«««/ NA out of 139/109/NA ultrashort bond funds; and Macro Allocation Fund ««/«««/NA out of 288/148/NA multialternative funds.
Please carefully consider a Fund’s investment objectives, risks, charges, and expenses before investing. This and other information is contained in the Fund’s prospectus, which you may obtain by calling 1-800-742-7272. Read it carefully before you invest or send money.
| June 30, 2018 | William Blair Funds | 5 |
U.S. Growth Market Review and Outlook
Strong second quarter performance across U.S. growth equity benchmarks placed them among the strongest performing investment styles year-to-date. In contrast, first quarter returns were more muted. After robust market performance in January, inflationary fears arose causing market volatility to spike and most major equity benchmarks to retreat in February. While companies generally reported strong financial results for the prior quarter and economic data was mostly positive, trade tensions and building inflationary pressures weighed on returns for the duration of the first quarter.
In the second quarter, growth style indices were broadly positive and volatility moderated from elevated first quarter levels. Higher stock prices and declining volatility were supported by a healthy U.S. economy. Retail spending rebounded, housing starts increased and manufacturing activity remained robust despite an appreciating U.S. dollar. In addition, consumer and business confidence remained elevated. With unemployment reaching 3.8%, its lowest level since 2000, and core inflation just over 2%, in June the Federal Reserve (“Fed”) announced its second rate increase of 2018 and communicated expectations for two more rate increases before year end.
With a strong fundamental backdrop and a positive tax impact, U.S. corporations generally posted robust earnings growth. As a gauge, corporations in the S&P 500 Index reported first quarter earnings growth of approximately 25%, as compared to the same period in the prior year, with over 80% of companies in the Index topping investor expectations. However, aggregate forward P/E ratios contracted as investors appeared to be mindful of risks on the horizon. Notably, trade tensions between the U.S. and China were a focus for investors over the course of the second quarter, and as more countries became involved, anxiety grew that tariffs could potentially escalate into a trade war.
Despite the Fed pursuing monetary tightening and the potential for a global trade war, optimism still persists across consumers, businesses and investors as we enter the tenth year of the current economic expansion. While interest rates remain low relative to history, the Fed has telegraphed a path of rate increases, and its ability to navigate the economy in the face of inflationary pressures from a potential trade war remains a risk. Further, continued uncertainty around the ultimate outcome of proposed tariffs could disrupt business planning and dampen overall productivity. However, the impact of fiscal stimulus in the form of lower corporate tax rates has largely overwhelmed trade concerns thus far. One early benefit of corporate tax reform in the U.S. has been an increase in capital expenditures, which in turn has the potential to boost productivity and create jobs longer-term. In addition, the current administration has been aggressive in reducing regulation on businesses, which could be a continued tailwind for companies.
It remains to be seen how long the expansion can persist given the unprecedented fiscal stimulus at this point of the economic cycle. Broadly speaking, corporate earnings trends and forward-looking guidance are reflective of the strong economy. But to the extent that rising wages, raw materials prices and freight costs begin to compress margins for the average company, we believe our portfolio companies, which generally offer strong value propositions to their customers and have more pricing flexibility, are better positioned to withstand these pressures. Our focus remains on identifying companies with durable growth drivers, independent of the economic backdrop, whose stocks present compelling risk/reward opportunities.
| 6 | Semiannual Report | June 30, 2018 |
U.S. Value Market Review and Outlook
After a strong start to the year, a spike in market volatility in February, stemming from investor anxiety over higher inflation, wiped out solid market returns in January. While volatility quickly retreated, inflationary concerns continued. The combination of investor concerns about higher inflation and heightened fears of a trade war seemed to overshadow positive economic data and generally strong corporate earnings results, even excluding the positive impact from tax reform.
In contrast to the more muted returns during the first quarter, robust corporate earnings growth and solid domestic economic data contributed to the strong second quarter performance across the domestic equity indices, pushing virtually all into positive territory for the year. Higher stock prices and more moderate volatility were supported by a generally strong U.S. economy, which is expected to grow about 3% this year. Some of the more notable economic data points included a rebound in retail spending, increased housing starts, and strong manufacturing activity, despite appreciation in the U.S. dollar. Consumer, corporate, and investor confidence remained elevated, contributing to higher U.S. Treasury yields. Supported by continued strong domestic economic data, an unemployment rate that dropped to 3.8%, and inflation that was slightly above 2%, the Federal Reserve (Fed) announced its second rate increase for the year and telegraphed expectations for another two rate increases before the end of the year.
Increased trade concerns seemed to motivate investors to rapidly move into smaller cap stocks, as small cap ETFs experienced an inflow of over $9 billion during the second quarter, contributing to the outperformance of this asset class during the period. Smaller cap stocks can be viewed as a safe haven and somewhat insulated in a trade war due to less revenue generation exposure overseas.
As the current bull market enters its tenth year, the U.S. markets have been resilient despite the increased risks posed by the potential for a global trade war, geopolitical tensions, emerging market turmoil, and a possible slowdown in global growth. While the Fed has laid the groundwork for future rate increases, current interest rates remain low relative to history. While global trade tensions continue to fluctuate, an escalation into a full-blown trade war would negatively impact global market activity and may disrupt business planning and dampen overall productivity. To date, the positive impact from lower corporate tax rates has largely overshadowed these trade concerns. In addition, the current administration has been aggressive in reducing regulation on businesses, which could continue to provide a tailwind for companies.
We continue to be mindful about the increased debt levels that companies face, and believe investors should place more of an emphasis on corporate balance sheets. Small cap companies have taken on a considerable amount of debt over the years as a result of a perpetually low interest rate environment. However, with the Fed tightening monetary policy and the potential for higher interest rates on the horizon, this will become a concern at some point. We believe those lower quality companies that are either more highly levered or lack the cash flow necessary to service their debt in a higher interest rate environment should struggle, and the stocks of higher quality companies with solid cash flow should outperform.
From our bottom up perspective, we remain constructive on corporate earnings. Although many companies may face increasing margin pressure from higher wages, raw materials, and freight, some of this year’s pressure will be offset by the lower corporate tax rate. We are also mindful and concerned about rising input costs and are focused on owning companies that have pricing power and are able to mitigate inflationary pressures via new products and price increases. As always, our focus remains on identifying quality companies at discount prices and corporate transformation opportunities, and we continue to find good ideas across sectors. Given our investment approach, we believe our portfolios are well-suited to withstand a variety of market scenarios and add value over the long-term.
| June 30, 2018 | William Blair Funds | 7 |
| | | Growth Fund |
| | | |
| | | The Growth Fund seeks long-term capital appreciation. |
| | | |
| | | AN OVERVIEW FROM THE PORTFOLIO MANAGERS |
| | | |

David C. Fording 
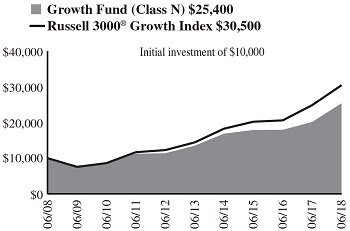
John F. Jostrand | | The William Blair Growth Fund (Class N shares) posted a 12.76% increase, net of fees, for the six months ended June 30, 2018. By comparison, the Fund’s benchmark index, the Russell 3000® Growth Index (the “Index”), increased 7.44%. For the year-to-date period ended June 30, 2018, the Fund outperformed the Index, driven by both positive stock selection and a style tailwind. Stock selection was positive across many sectors, most notably Industrials, Health Care, and Consumer Discretionary. The top contributor to the Fund’s performance was global payments company Mastercard, Inc. (Information Technology), which reported strong financial results amid strong underlying business momentum. Amazon.com, Inc. (Consumer Discretionary) was also a top contributor to the Fund’s performance. Amazon reported strong financial results which reflected accelerating trends across many of its business segments. Other top contributors to the Fund’s performance were CoStar Group, Inc. (Industrials), Domino’s Pizza, Inc. (Consumer Discretionary), and Red Hat, Inc. (Information Technology). Conversely, top detractors from the Fund’s performance were MaxLinear, Inc. (Information Technology) and Monster Beverage Corporation (Consumer Staples). MaxLinear, which produces mixed-signal radio frequency semiconductors used in broadband communications, experienced slowing growth in several of its more mature products, while newer and higher-growth products have yet to offset the slowing growth in some mature products. Energy drink company Monster Beverage reported early in the year that sales growth and earnings missed expectations, as its international distributors reduced inventory. Other top detractors were Newell Brands Inc. (Consumer Discretionary), The Middleby Corporation (Industrials), and Starbucks Corporation (Consumer Discretionary). Additionally, not owning Netflix, Inc. (Consumer Discretionary), a strong relative performer year-to-date, detracted from the Fund’s performance. From a style perspective, as investors became more focused on the potential implications of inflation-related cost pressures on businesses, our higher and more sustainable growth bias, which leads us to companies with value-added products and services and flexible pricing, was a tailwind. Please refer to the U.S. Growth Market Review and Outlook relating to the Fund on page 6 for additional information. |
| 8 | Semiannual Report | June 30, 2018 |
| Performance Highlights (Unaudited) |
Average Annual Total Return through 6/30/2018
| | | Year
to Date | | 1 Year | | 3 Year | | 5 Year | | 10 Year |
| Class N | | | 12.76 | % | | | 26.06 | % | | | 12.38 | % | | | 13.53 | % | | | 9.77 | % |
| Class I | | | 12.95 | | | | 26.39 | | | | 12.71 | | | | 13.88 | | | | 10.12 | |
| Russell 3000® Growth Index | | | 7.44 | | | | 22.47 | | | | 14.63 | | | | 16.14 | | | | 11.78 | |
| S&P 500® Index | | | 2.65 | | | | 14.37 | | | | 11.93 | | | | 13.42 | | | | 10.17 | |
Performance cited represents past performance. Past performance does not guarantee future results and current performance may be lower or higher than the data quoted. Results shown are average annual returns, which assume reinvestment of dividends and capital gains. Investment returns and principal will fluctuate and you may have a gain or loss when you sell shares. For the most current month-end performance information, please call 1-800-742-7272, or visit our Web site at www.williamblairfunds.com. From time to time, the investment adviser may waive fees or reimburse expenses for the Fund. Without these waivers/reimbursements, performance would be lower. Class N shares are available to the general public without a sales load. Class I shares are available to certain institutional investors, and advisory clients of William Blair & Company, L.L.C., without a sales load or distribution (12b-1) or service fees.
The performance highlights and graph presented above do not reflect the deduction of taxes that a shareholder would pay on fund distributions or the redemption of fund shares.
The Russell 3000® Growth Index consists of large, medium, and small capitalization companies with above average price-to-book ratios and forecasted growth rates. The index is weighted by market capitalization and large/medium/small companies make up approximately 80%/15%/5% of the index.
The S&P 500® Index indicates broad larger capitalization equity market performance.
This report identifies the Fund’s investments on June 30, 2018. These holdings are subject to change. Not all stocks in the Fund performed the same, nor is there any guarantee that these stocks will perform as well in the future. Market forecasts provided in this report may not necessarily come to pass.
| Sector Diversification (Unaudited) |
The sector diversification shown is based on the total long-term securities.
| June 30, 2018 | William Blair Funds | 9 |
Portfolio of Investments, June 30, 2018 (all dollar amounts in thousands) (unaudited)
| | | | | | | | |
| | | | | | | | |
| | Issuer | | Shares | | | Value | |
| | |
| | Common Stocks | | | | | | | | |
| | | | | | | | | | |
| | Information Technology—37.6% | | | | | | | | |
| * | Adobe Systems, Inc. | | | 20,303 | | | $ | 4,950 | |
| * | Akamai Technologies, Inc. | | | 69,344 | | | | 5,078 | |
| * | Alphabet, Inc. Class “A” | | | 20,989 | | | | 23,701 | |
| | Booz Allen Hamilton Holding Corporation | | | 85,892 | | | | 3,756 | |
| * | Carbon Black, Inc. | | | 84,270 | | | | 2,191 | |
| * | Cars.com, Inc. | | | 66,656 | | | | 1,893 | |
| * | Facebook, Inc. Class “A” | | | 52,935 | | | | 10,286 | |
| * | Guidewire Software, Inc. | | | 25,786 | | | | 2,289 | |
| | Mastercard, Inc. Class “A” | | | 77,317 | | | | 15,194 | |
| * | MaxLinear, Inc. | | | 96,044 | | | | 1,497 | |
| | Microsoft Corporation | | | 243,354 | | | | 23,997 | |
| | National Instruments Corporation | | | 67,277 | | | | 2,824 | |
| * | Pure Storage, Inc. | | | 166,241 | | | | 3,970 | |
| * | Red Hat, Inc. | | | 37,310 | | | | 5,013 | |
| * | Rogers Corporation | | | 15,297 | | | | 1,705 | |
| | Sabre Corporation | | | 142,675 | | | | 3,516 | |
| | Texas Instruments, Inc. | | | 57,478 | | | | 6,337 | |
| * | Ultimate Software Group, Inc. | | | 13,442 | | | | 3,459 | |
| * | Worldpay, Inc. | | | 89,545 | | | | 7,323 | |
| | | | | | | | | 128,979 | |
| | Consumer Discretionary—19.2% | | | | | | | | |
| * | Amazon.com, Inc. | | | 13,359 | | | | 22,708 | |
| | Domino’s Pizza, Inc. | | | 18,819 | | | | 5,310 | |
| * | Grand Canyon Education, Inc. | | | 36,619 | | | | 4,087 | |
| * | Hilton Grand Vacations, Inc. | | | 120,668 | | | | 4,187 | |
| * | Laureate Education, Inc. | | | 157,471 | | | | 2,256 | |
| * | Live Nation Entertainment, Inc. | | | 89,554 | | | | 4,350 | |
| | Six Flags Entertainment Corporation | | | 68,232 | | | | 4,780 | |
| | Starbucks Corporation | | | 98,640 | | | | 4,819 | |
| | Steven Madden, Ltd. | | | 55,828 | | | | 2,964 | |
| * | Ulta Salon Cosmetics & Fragrance, Inc. | | | 27,534 | | | | 6,428 | |
| | Vail Resorts, Inc. | | | 14,277 | | | | 3,915 | |
| | | | | | | | | 65,804 | |
| | Health Care—15.6% | | | | | | | | |
| | Agilent Technologies, Inc. | | | 71,847 | | | | 4,443 | |
| * | Charles River Laboratories International, Inc. | | | 30,964 | | | | 3,476 | |
| * | Codexis, Inc. | | | 163,098 | | | | 2,349 | |
| * | Ligand Pharmaceuticals, Inc. | | | 12,793 | | | | 2,650 | |
| | Stryker Corporation | | | 40,791 | | | | 6,888 | |
| | Teleflex, Inc. | | | 12,237 | | | | 3,282 | |
| | UnitedHealth Group, Inc. | | | 55,160 | | | | 13,533 | |
| * | Veeva Systems, Inc. | | | 36,640 | | | | 2,816 | |
| | West Pharmaceutical Services, Inc. | | | 37,324 | | | | 3,706 | |
| | Zoetis, Inc. | | | 121,909 | | | | 10,386 | |
| | | | | | | | | 53,529 | |
| | Industrials—11.5% | | | | | | | | |
| | BWX Technologies, Inc. | | | 102,580 | | | | 6,393 | |
| * | Copart, Inc. | | | 75,092 | | | | 4,247 | |
| * | CoStar Group, Inc. | | | 13,002 | | | | 5,365 | |
| | Healthcare Services Group, Inc. | | | 88,998 | | | | 3,844 | |
| | Raytheon Co. | | | 33,374 | | | | 6,447 | |
| * | The Middleby Corporation | | | 19,839 | | | | 2,072 | |
| * | Verisk Analytics, Inc. | | | 72,190 | | | | 7,771 | |
| | Wabtec Corporation | | | 34,950 | | | | 3,445 | |
| | | | | | | | | 39,584 | |
| | Issuer | | Shares or
Principal
Amount | | | Value | |
| | |
| | Common Stocks—(continued) | | | | | | | | |
| | | | | | | | | | |
| | Financials—6.6% | | | | | | | | |
| | East West Bancorp, Inc. | | | 48,764 | | | $ | 3,179 | |
| * | Encore Capital Group, Inc. | | | 64,894 | | | | 2,375 | |
| | Intercontinental Exchange, Inc. | | | 133,312 | | | | 9,805 | |
| | The Progressive Corporation | | | 125,524 | | | | 7,425 | |
| | | | | | | | | 22,784 | |
| | Consumer Staples—5.0% | | | | | | | | |
| | Costco Wholesale Corporation | | | 31,706 | | | | 6,626 | |
| * | Monster Beverage Corporation | | | 98,547 | | | | 5,647 | |
| | The Estee Lauder Cos., Inc. | | | 33,189 | | | | 4,735 | |
| | | | | | | | | 17,008 | |
| | Materials—3.5% | | | | | | | | |
| | Ball Corporation | | | 136,742 | | | | 4,861 | |
| | Praxair, Inc. | | | 44,499 | | | | 7,037 | |
| | | | | | | | | 11,898 | |
| | Total Common Stocks—99.0%
(cost $224,778) | | | | | | | 339,586 | |
| | | | | | | | | | |
| | Repurchase Agreement | | | | | | | | |
| | Fixed Income Clearing Corporation, 0.350% dated 6/29/18, due 7/2/18, repurchase price $2,559, collateralized by U.S. Treasury Note, 2.000%, due 4/30/24 | | | $2,559 | | | | 2,559 | |
| | Total Repurchase Agreement—0.8%
(cost $2,559) | | | | | | | 2,559 | |
| | Total Investments—99.8%
(cost $227,337) | | | | | | | 342,145 | |
| | Cash and other assets, less liabilities—0.2% | | | | | | | 758 | |
| | Net assets—100.0% | | | | | | $ | 342,903 | |
* = Non-income producing security
See accompanying Notes to Financial Statements.
| 10 | Semiannual Report | June 30, 2018 |
| | | Large Cap Growth Fund |
| | | |
| | | The Large Cap Growth Fund seeks long-term capital appreciation. |
| | | |
| | | AN OVERVIEW FROM THE PORTFOLIO MANAGERS |
| | | |

James S. Golan 
David P. Ricci | | The William Blair Large Cap Growth Fund (Class N shares) posted a 12.28% increase, net of fees, for the six months ended June 30, 2018. By comparison, the Fund’s benchmark index, the Russell 1000® Growth Index (the “Index”), increased 7.25%. For the year-to-date period ended June 30, 2018, the Fund outperformed the Index, driven by both positive stock selection and a style tailwind. Stock selection was positive across many sectors, most notably Industrials, Information Technology and Consumer Discretionary. The top contributor to the Fund’s performance for the period was online retailer Amazon.com, Inc. (Consumer Discretionary), which reported strong financial results that reflected accelerating trends across many of its business segments. Digital marketing and media solutions provider Adobe Systems, Inc. (Information Technology) was also a top contributor. Adobe Systems reported earnings and revenue growth that exceeded expectations in the first and second quarter and the stock outperformed. Other top contributors to the Fund’s performance were Mastercard, Inc. (Information Technology), Netflix, Inc. (Consumer Discretionary), and Intuit, Inc. (Information Technology). Conversely, top detractors were Monster Beverage Corporation (Consumer Staples) and Starbucks Corporation (Consumer Discretionary). Energy drink company Monster Beverage reported sales growth and earnings in the first quarter that missed expectations, as its international distributors reduced inventory. Shares of Starbucks underperformed in part due to sluggish same-store sales growth in the U.S., but also in reaction to the company’s pre-announcement of weaker-than-expected second quarter comparable sales which were partially due to weakness in China. Other top detractors were Affiliated Managers Group, Inc. (Financials), Biogen, Inc. (Health Care), and PPG Industries, Inc. (Materials). From a style perspective, as investors became more focused on the potential implications of inflation-related cost pressures on businesses, our higher and more sustainable growth bias, which leads us to companies with value-added products and services and flexible pricing, was a tailwind. Please refer to the U.S. Growth Market Review and Outlook relating to the Fund on page 6 for additional information. |
| June 30, 2018 | William Blair Funds | 11 |
| Performance Highlights (Unaudited) |
Average Annual Total Return through 6/30/2018
| | | Year
to Date | | 1 Year | | 3 Year | | 5 Year | | 10 Year |
| Class N | | | 12.28 | % | | | 30.77 | % | | | 14.90 | % | | | 17.40 | % | | | 11.18 | % |
| Class I | | | 12.38 | | | | 31.02 | | | | 15.17 | | | | 17.69 | | | | 11.46 | |
| Russell 1000® Growth Index | | | 7.25 | | | | 22.51 | | | | 14.98 | | | | 16.36 | | | | 11.83 | |
Performance cited represents past performance. Past performance does not guarantee future results and current performance may be lower or higher than the data quoted. Results shown are average annual total returns, which assume reinvestment of dividends and capital gains. Investment returns and principal will fluctuate and you may have a gain or loss when you sell shares. For the most current month-end performance information, please call 1-800-742-7272, or visit our Web site at www.williamblairfunds.com. From time to time, the investment adviser may waive fees or reimburse expenses for the Fund. Without these waivers/reimbursements, performance would be lower. Class N shares are available to the general public without a sales load. Class I shares are available to certain institutional investors, and advisory clients of William Blair & Company, L.L.C., without a sales load or distribution (12b-1) or service fees.
The performance highlights and graph presented above do not reflect the deduction of taxes that a shareholder would pay on fund distributions or the redemption of fund shares.
The Russell 1000® Growth Index consists of large capitalization companies with above average price-to-book ratios and forecasted growth rates.
This report identifies the Fund’s investments on June 30, 2018. These holdings are subject to change. Not all stocks in the Fund performed the same, nor is there any guarantee that these stocks will perform as well in the future. Market forecasts provided in this report may not necessarily come to pass.
| Sector Diversification (Unaudited) |

The sector diversification shown is based on the total long-term securities.
| 12 | Semiannual Report | June 30, 2018 |
Portfolio of Investments, June 30, 2018 (all dollar amounts in thousands) (unaudited)
| | | | | | | | |
| | | | | | | | |
| | Issuer | | Shares | | | Value | |
| | | | | | | | | | |
| | Common Stocks | | | | | | | | |
| | | | | | | | | | |
| | Information Technology—38.2% | | | | | | | | |
| | Accenture plc† | | | 53,100 | | | $ | 8,687 | |
| * | Adobe Systems, Inc. | | | 28,070 | | | | 6,844 | |
| * | Alphabet, Inc. Class “A” | | | 9,910 | | | | 11,190 | |
| * | Alphabet, Inc. Class “C” | | | 5,026 | | | | 5,607 | |
| * | Facebook, Inc. | | | 53,310 | | | | 10,359 | |
| | Intuit, Inc. | | | 28,300 | | | | 5,782 | |
| | Mastercard, Inc. | | | 43,200 | | | | 8,490 | |
| | Microsoft Corporation | | | 184,960 | | | | 18,239 | |
| * | PayPal Holdings, Inc. | | | 59,870 | | | | 4,985 | |
| * | Red Hat, Inc. | | | 38,010 | | | | 5,107 | |
| | Texas Instruments, Inc. | | | 62,110 | | | | 6,848 | |
| | | | | | | | | 92,138 | |
| | Consumer Discretionary—16.5% | | | | | | | | |
| * | Amazon.com, Inc. | | | 10,440 | | | | 17,746 | |
| * | Live Nation Entertainment, Inc. | | | 130,590 | | | | 6,343 | |
| | McDonald’s Corporation | | | 36,330 | | | | 5,693 | |
| * | Netflix, Inc. | | | 12,680 | | | | 4,963 | |
| | Starbucks Corporation | | | 105,250 | | | | 5,141 | |
| | | | | | | | | 39,886 | |
| | Health Care—15.1% | | | | | | | | |
| * | ABIOMED, Inc. | | | 9,590 | | | | 3,923 | |
| * | Biogen, Inc. | | | 11,500 | | | | 3,338 | |
| | Danaher Corporation | | | 25,300 | | | | 2,496 | |
| | Stryker Corporation | | | 38,370 | | | | 6,479 | |
| | UnitedHealth Group, Inc. | | | 45,630 | | | | 11,195 | |
| | Zoetis, Inc. | | | 104,440 | | | | 8,897 | |
| | | | | | | | | 36,328 | |
| | Industrials—10.2% | | | | | | | | |
| * | Copart, Inc. | | | 84,410 | | | | 4,774 | |
| | Fortive Corporation | | | 58,900 | | | | 4,542 | |
| | Raytheon Co. | | | 29,300 | | | | 5,660 | |
| | TransDigm Group, Inc. | | | 10,800 | | | | 3,727 | |
| * | Verisk Analytics, Inc. | | | 55,600 | | | | 5,985 | |
| | | | | | | | | 24,688 | |
| | Consumer Staples—6.6% | | | | | | | | |
| * | Monster Beverage Corporation | | | 115,740 | | | | 6,632 | |
| | The Coca-Cola Co. | | | 106,600 | | | | 4,676 | |
| | The Estee Lauder Cos., Inc. | | | 32,540 | | | | 4,643 | |
| | | | | | | | | 15,951 | |
| | Financials—5.3% | | | | | | | | |
| | Intercontinental Exchange, Inc. | | | 80,400 | | | | 5,914 | |
| | The Progressive Corporation | | | 115,120 | | | | 6,809 | |
| | | | | | | | | 12,723 | |
| | Materials—3.6% | | | | | | | | |
| | PPG Industries, Inc. | | | 23,460 | | | | 2,433 | |
| | Praxair, Inc. | | | 40,010 | | | | 6,328 | |
| | | | | | | | | 8,761 | |
| | | | Shares or | | | | |
| | | | Principal | | | | |
| | Issuer | | Amount | | | Value | |
| | | | | | | | |
| | Common Stocks—(continued) | | | | | | | | |
| | | | | | | | | | |
| | Real Estate—1.9% | | | | | | | | |
| * | SBA Communications Corporation | | | 27,130 | | | $ | 4,480 | |
| | Energy—1.6% | | | | | | | | |
| | EOG Resources, Inc. | | | 31,240 | | | | 3,887 | |
| | Total Common Stocks—99.0%
(cost $170,213) | | | | | | | 238,842 | |
| | | | | | | | | | |
| | Repurchase Agreement | | | | | | | | |
| | Fixed Income Clearing Corporation, 0.350% dated 6/29/18, due 7/2/18, repurchase price $1,883, collateralized by U.S. Treasury Note, 2.000%, due 4/30/24 | | | $1,883 | | | | 1,883 | |
| | Total Repurchase Agreement—0.8%
(cost $1,883) | | | | | | | 1,883 | |
| | Total Investments—99.8%
(cost $172,096) | | | | | | | 240,725 | |
| | Cash and other assets, less liabilities—0.2% | | | | | | | 486 | |
| | Net assets—100.0% | | | | | | $ | 241,211 | |
† = U.S. listed foreign security
* = Non-income producing security
See accompanying Notes to Financial Statements.
| June 30, 2018 | William Blair Funds | 13 |
| | | Mid Cap Growth Fund |
| | | |
| | | The Mid Cap Growth Fund seeks long-term capital appreciation. |
| | | |
| | | AN OVERVIEW FROM THE PORTFOLIO MANAGERS |
| | | |

Daniel Crowe 
Robert C. Lanphier, IV 
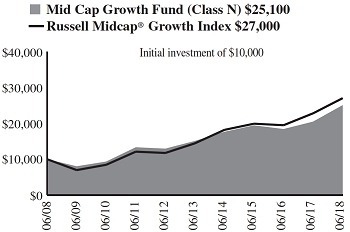
David P. Ricci | | The William Blair Mid Cap Growth Fund (Class N shares) posted a 11.63% increase, net of fees, for the six months ended June 30, 2018. By comparison, the Fund’s benchmark index, the Russell Midcap® Growth Index (the “Index”), increased 5.40%. For the year-to-date period ended June 30, 2018, the Fund outperformed the Index, driven by both positive stock selection and a style tailwind. Stock selection was positive across many sectors, most notably Industrials, including positions in Copart, Inc. and CoStar Group, Inc., and Health Care, including our positions in ABIOMED, Inc. and Encompass Health Corporation. The top individual contributors to the Fund’s performance were ABIOMED and CoStar. ABIOMED develops, manufactures, and markets advanced medical technologies designed to assist or replace the pumping function of a failing heart. The company reported strong results as its Impella heart pump is increasingly becoming the standard of care for acute heart failure patients. Real estate information provider CoStar outperformed due to accelerating growth in both the commercial real estate and multifamily housing segments of its businesses. Another top contributor was Domino’s Pizza, Inc. (Consumer Discretionary). The Middleby Corporation (Industrials) was the top detractor from the Fund’s performance for the year-to-date period. Middleby Corporation reported revenue and earnings that were below expectations primarily due to weakness in its commercial foodservice segment. Coherent, Inc. (Information Technology), which designs and manufactures lasers used to manufacture OLED displays, was also a top detractor. Coherent’s stock came under pressure due to questions surrounding how quickly and to what extent smartphone manufacturers will adopt OLED screens going forward. Other top detractors were Newell Brands Inc. (Consumer Discretionary), Mohawk Industries, Inc. (Consumer Discretionary), and Ball Corporation (Materials). From a style perspective, as investors became more focused on the potential implications of inflation-related cost pressures on businesses, our higher and more sustainable growth bias, which leads us to companies with value-added products and services and flexible pricing, was a tailwind. Please refer to the U.S. Growth Market Review and Outlook relating to the Fund on page 6 for additional information. |
| 14 | Semiannual Report | June 30, 2018 |
| Performance Highlights (Unaudited) |
Average Annual Total Return through 6/30/2018
| | | Year
to Date | | 1 Year | | 3 Year | | 5 Year | | 10 Year |
| Class N | | | 11.63 | % | | | 22.45 | % | | | 8.85 | % | | | 10.69 | % | | | 9.63 | % |
| Class I | | | 11.75 | | | | 22.72 | | | | 9.13 | | | | 10.96 | | | | 9.91 | |
| Russell Midcap® Growth Index | | | 5.40 | | | | 18.52 | | | | 10.73 | | | | 13.37 | | | | 10.45 | |
Performance cited represents past performance. Past performance does not guarantee future results and current performance may be lower or higher than the data quoted. Results shown are average annual total returns, which assume reinvestment of dividends and capital gains. Investment returns and principal will fluctuate and you may have a gain or loss when you sell shares. For the most current month-end performance information, please call 1-800-742-7272, or visit our Web site at www.williamblairfunds.com. Investing in medium capitalization companies involves special risks, including higher volatility and lower liquidity. Medium capitalization stocks are also more sensitive to purchase/sale transactions and changes in the issuer’s financial condition. From time to time, the investment adviser may waive fees or reimburse expenses for the Fund. Without these waivers/reimbursements, performance would be lower. Class N shares are available to the general public without a sales load. Class I shares are available to certain institutional investors, and advisory clients of William Blair & Company, L.L.C., without a sales load or distribution (12b-1) or service fees.
The performance highlights and graph presented above do not reflect the deduction of taxes that a shareholder would pay on fund distributions or the redemption of fund shares.
The Russell Midcap® Growth Index is an index that is constructed to provide a comprehensive and unbiased barometer of the mid-cap growth market.
This report identifies the Fund’s investments on June 30, 2018. These holdings are subject to change. Not all stocks in the Fund performed the same, nor is there any guarantee that these stocks will perform as well in the future. Market forecasts provided in this report may not necessarily come to pass.
| Sector Diversification (Unaudited) |

The sector diversification shown is based on the total long-term securities.
| June 30, 2018 | William Blair Funds | 15 |
Portfolio of Investments, June 30, 2018 (all dollar amounts in thousands) (unaudited)
| | | | | | | | |
| | | | | | | | |
| | Issuer | | Shares | | | Value | |
| | |
| | Common Stocks | | | | | | | | |
| | | | | | | | | | |
| | Information Technology—23.6% | | | | | | | | |
| * | Akamai Technologies, Inc. | | | 15,445 | | | $ | 1,131 | |
| | Analog Devices, Inc. | | | 7,575 | | | | 727 | |
| | Booz Allen Hamilton Holding Corporation | | | 35,424 | | | | 1,549 | |
| | Global Payments, Inc. | | | 12,450 | | | | 1,388 | |
| * | GoDaddy, Inc. | | | 15,640 | | | | 1,104 | |
| * | Guidewire Software, Inc. | | | 9,536 | | | | 847 | |
| | j2 Global, Inc. | | | 7,605 | | | | 659 | |
| | Microchip Technology, Inc. | | | 9,585 | | | | 872 | |
| * | Red Hat, Inc. | | | 6,685 | | | | 898 | |
| | Sabre Corporation | | | 27,809 | | | | 690 | |
| * | Tyler Technologies, Inc. | | | 3,770 | | | | 837 | |
| * | Ultimate Software Group, Inc. | | | 5,835 | | | | 1,501 | |
| * | WEX, Inc. | | | 6,240 | | | | 1,189 | |
| * | Worldpay, Inc. | | | 17,659 | | | | 1,444 | |
| | | | | | | | | 14,836 | |
| | Industrials—21.7% | | | | | | | | |
| | BWX Technologies, Inc. | | | 26,714 | | | | 1,665 | |
| * | Copart, Inc. | | | 37,650 | | | | 2,130 | |
| * | CoStar Group, Inc. | | | 5,269 | | | | 2,174 | |
| | Equifax, Inc. | | | 10,975 | | | | 1,373 | |
| | Fortive Corporation | | | 15,330 | | | | 1,182 | |
| * | The Middleby Corporation | | | 10,490 | | | | 1,095 | |
| * | Verisk Analytics, Inc. | | | 18,815 | | | | 2,025 | |
| | Wabtec Corporation | | | 11,045 | | | | 1,089 | |
| | Xylem, Inc. | | | 13,630 | | | | 919 | |
| | | | | | | | | 13,652 | |
| | Consumer Discretionary—18.6% | | | | | | | | |
| | Aptiv plc† | | | 9,990 | | | | 915 | |
| * | CarMax, Inc. | | | 10,480 | | | | 764 | |
| | Domino’s Pizza, Inc. | | | 5,385 | | | | 1,520 | |
| * | Live Nation Entertainment, Inc. | | | 28,965 | | | | 1,407 | |
| * | Mohawk Industries, Inc. | | | 3,670 | | | | 786 | |
| | Ross Stores, Inc. | | | 23,100 | | | | 1,958 | |
| | Six Flags Entertainment Corporation | | | 22,260 | | | | 1,559 | |
| * | Ulta Salon Cosmetics & Fragrance, Inc. | | | 6,340 | | | | 1,480 | |
| | Vail Resorts, Inc. | | | 4,790 | | | | 1,313 | |
| | | | | | | | | 11,702 | |
| | Health Care—16.7% | | | | | | | | |
| * | ABIOMED, Inc. | | | 2,185 | | | | 894 | |
| | Agilent Technologies, Inc. | | | 16,150 | | | | 999 | |
| * | Centene Corporation | | | 9,778 | | | | 1,205 | |
| * | Charles River Laboratories International, Inc. | | | 7,585 | | | | 851 | |
| * | DexCom, Inc. | | | 8,020 | | | | 762 | |
| | Encompass Health Corporation | | | 20,750 | | | | 1,405 | |
| * | IDEXX Laboratories, Inc. | | | 3,025 | | | | 659 | |
| * | Mettler-Toledo International, Inc. | | | 2,170 | | | | 1,256 | |
| | Teleflex, Inc. | | | 3,180 | | | | 853 | |
| * | Veeva Systems, Inc. | | | 11,076 | | | | 851 | |
| | West Pharmaceutical Services, Inc. | | | 7,830 | | | | 777 | |
| | | | | | | | | 10,512 | |
| | | | Shares or | | | | |
| | | | Principal | | | | |
| | Issuer | | Amount | | | Value | |
| | |
| | Common Stocks—(continued) | | | | | | | | |
| | | | | | | | | | |
| | Materials—7.0% | | | | | | | | |
| * | Axalta Coating Systems, Ltd.† | | | 18,815 | | | $ | 570 | |
| | Ball Corporation | | | 47,460 | | | | 1,687 | |
| | Celanese Corporation | | | 5,825 | | | | 647 | |
| | Vulcan Materials Co. | | | 11,390 | | | | 1,470 | |
| | | | | | | | | 4,374 | |
| | Financials—5.9% | | | | | | | | |
| | Cboe Global Markets, Inc. | | | 7,715 | | | | 803 | |
| | East West Bancorp, Inc. | | | 17,585 | | | | 1,146 | |
| | The Progressive Corporation | | | 29,280 | | | | 1,732 | |
| | | | | | | | | 3,681 | |
| | Real Estate—1.9% | | | | | | | | |
| * | SBA Communications Corporation | | | 7,400 | | | | 1,222 | |
| | Energy—1.7% | | | | | | | | |
| * | Parsley Energy, Inc. | | | 34,760 | | | | 1,053 | |
| | Consumer Staples—1.2% | | | | | | | | |
| | Conagra Brands, Inc. | | | 20,205 | | | | 723 | |
| | Total Common Stocks—98.3%
(cost $48,340) | | | | | | | 61,755 | |
| | | | | | | | | | |
| | Repurchase Agreement | | | | | | | | |
| | Fixed Income Clearing Corporation, 0.350% dated 6/29/18, due 7/2/18, repurchase price $1,406, collateralized by U.S. Treasury Note, 2.000%, due 4/30/24 | | | $1,406 | | | | 1,406 | |
| | Total Repurchase Agreement—2.3%
(cost $1,406) | | | | | | | 1,406 | |
| | Total Investments—100.6%
(cost $49,746) | | | | | | | 63,161 | |
| | Liabilities, plus cash and other assets—(0.6)% | | | | | | | (361 | ) |
| | Net assets—100.0% | | | | | | $ | 62,800 | |
* = Non-income producing security
† = U.S. listed foreign security
See accompanying Notes to Financial Statements.
| 16 | Semiannual Report | June 30, 2018 |
| | | Small-Mid Cap Growth Fund |
| | | |
| | | The Small-Mid Cap Growth Fund seeks long-term capital appreciation. |
| | | |
| | | AN OVERVIEW FROM THE PORTFOLIO MANAGERS |
| | | |

Daniel Crowe 
Robert C. Lanphier, IV | | The William Blair Small-Mid Cap Growth Fund (Class N shares) posted a 10.74% increase, net of fees, for the six months ended June 30, 2018. By comparison, the Fund’s benchmark index, the Russell 2500™ Growth Index (the “Index”), increased 8.04%.
The Fund’s outperformance for the year-to-date period was driven by a combination of positive stock selection and a tailwind for our investment style. From a style perspective, our higher and more sustainable growth bias, which leads us to companies with value-added products and services and flexible pricing, provided a tailwind. This dynamic was most evident in the first quarter as investors digested the potential for inflation-related cost pressures on businesses. On a stock specific basis, selection was strong across several sectors, most notably in Health Care and Industrials. The top two individual contributors to the Fund’s performance were Health Care holdings ABIOMED, Inc. and Ligand Pharmaceuticals, Inc. ABIOMED develops, manufactures and markets advanced medical technologies designed to assist or replace the pumping function of a failing heart. The stock outperformed as the company reported two quarters of strong patient utilization results in support of our thesis that ABIOMED’s product Impella, the world’s smallest heart pump, will become the standard of care in the markets it serves. Ligand Pharmaceuticals, a biotechnology company focused on the acquisition and development of a portfolio of royalty generating assets, outperformed on strong revenue trends. Other top performing holdings were Copart, Inc. and CoStar Group, Inc. (Industrials) and Domino’s Pizza (Consumer Discretionary). Conversely, Information Technology stock selection detracted from performance, including the Fund’s positions in Rogers Corporation, MaxLinear, Inc. and Coherent, Inc. Shares of advanced materials company Rogers Corporation declined on disappointing results and near term forward looking guidance, as operational challenges, strong product demand against limited manufacturing capacity and rising raw material costs dampened margins. Other notable laggards included LendingTree in Financials and The Middleby Corporation in Industrials. LendingTree, Inc. provides targeted online marketing that generates qualified leads for loan originators and underperformed on decreased optimism for its mortgage business.
Please refer to the U.S. Growth Market Review and Outlook relating to the Fund on page 6 for additional information. |
| June 30, 2018 | William Blair Funds | 17 |
| Small-Mid Cap Growth Fund |
| Performance Highlights (Unaudited) |
Average Annual Total Return through 6/30/2018
| | | Year
to Date | | 1 Year | | 3 Year | | 5 Year | | 10 Year |
| Class N | | | 10.74 | % | | | 22.81 | % | | | 13.28 | % | | | 15.31 | % | | | 13.04 | % |
| Class I | | | 10.91 | | | | 23.10 | | | | 13.59 | | | | 15.61 | | | | 13.33 | |
| Russell 2500TM Growth Index | | | 8.04 | | | | 21.53 | | | | 10.86 | | | | 13.87 | | | | 11.38 | |
Performance cited represents past performance. Past performance does not guarantee future results and current performance may be lower or higher than the data quoted. Results shown are average annual total returns, which assume reinvestment of dividends and capital gains. Investment returns and principal will fluctuate and you may have a gain or loss when you sell shares. For the most current month-end performance information, please call 1-800-742-7272, or visit our Web site at www.williamblairfunds.com. Investing in smaller and medium capitalization companies involves special risks, including higher volatility and lower liquidity. Smaller and medium capitalization stocks are also more sensitive to purchase/sale transactions and changes in the issuer’s financial condition. From time to time, the investment adviser may waive fees or reimburse expenses for the Fund. Without these waivers/reimbursements, performance would be lower. Class N shares are available to the general public without a sales load. Class I shares are available to certain institutional investors, and advisory clients of William Blair & Company, L.L.C., without a sales load or distribution (12b-1) or service fees.
The performance highlights and graph presented above do not reflect the deduction of taxes that a shareholder would pay on fund distributions or the redemption of fund shares.
The Russell 2500TM Growth Index measures the performance of those Russell 2500 companies with above average price-to-book ratios and forecasted growth rates.
This report identifies the Fund’s investments on June 30, 2018. These holdings are subject to change. Not all stocks in the Fund performed the same, nor is there any guarantee that these stocks will perform as well in the future. Market forecasts provided in this report may not necessarily come to pass.
| Sector Diversification (Unaudited) |

The sector diversification shown is based on the total long-term securities.
| 18 | Semiannual Report | June 30, 2018 |
| Small-Mid Cap Growth Fund |
Portfolio of Investments, June 30, 2018 (all dollar amounts in thousands) (unaudited)
| | | | | | | | |
| | | | | | | | |
| | Issuer | | Shares | | | Value | |
| | |
| | Common Stocks | | | | | | | | |
| | | | | | | | | | |
| | Industrials—23.6% | | | | | | | | |
| | BWX Technologies, Inc. | | | 1,035,736 | | | $ | 64,547 | |
| * | Copart, Inc. | | | 1,311,115 | | | | 74,157 | |
| * | CoStar Group, Inc. | | | 186,216 | | | | 76,838 | |
| | Donaldson Co., Inc. | | | 379,300 | | | | 17,114 | |
| * | Genesee & Wyoming, Inc. | | | 323,900 | | | | 26,339 | |
| | Healthcare Services Group, Inc. | | | 864,020 | | | | 37,317 | |
| | HEICO Corporation | | | 669,089 | | | | 40,781 | |
| | Hexcel Corporation | | | 692,162 | | | | 45,946 | |
| | Ritchie Bros Auctioneers, Inc.† | | | 745,913 | | | | 25,451 | |
| * | SiteOne Landscape Supply, Inc. | | | 332,463 | | | | 27,917 | |
| * | Teledyne Technologies, Inc. | | | 193,909 | | | | 38,599 | |
| * | The Middleby Corporation | | | 319,805 | | | | 33,394 | |
| | Toro Co. | | | 253,224 | | | | 15,257 | |
| | TransUnion | | | 798,740 | | | | 57,222 | |
| | | | | | | | | 580,879 | |
| | Health Care—19.7% | | | | | | | | |
| * | Cambrex Corporation | | | 507,126 | | | | 26,523 | |
| * | Catalent, Inc. | | | 814,969 | | | | 34,139 | |
| * | Charles River Laboratories International, Inc. | | | 312,854 | | | | 35,121 | |
| * | DexCom, Inc. | | | 421,951 | | | | 40,077 | |
| | Encompass Health Corporation | | | 838,727 | | | | 56,798 | |
| * | Exact Sciences Corporation | | | 474,824 | | | | 28,390 | |
| * | Glaukos Corporation | | | 642,198 | | | | 26,099 | |
| * | Horizon Pharma plc† | | | 2,268,765 | | | | 37,571 | |
| * | Insulet Corporation | | | 311,100 | | | | 26,661 | |
| * | Ligand Pharmaceuticals, Inc. | | | 268,018 | | | | 55,525 | |
| * | Repligen Corporation | | | 427,341 | | | | 20,102 | |
| | Teleflex, Inc. | | | 113,425 | | | | 30,422 | |
| * | Veeva Systems, Inc. | | | 497,873 | | | | 38,266 | |
| | West Pharmaceutical Services, Inc. | | | 300,664 | | | | 29,853 | |
| | | | | | | | | 485,547 | |
| | Information Technology—19.3% | | | | | | | | |
| * | 2U, Inc. | | | 247,345 | | | | 20,668 | |
| * | Aspen Technology, Inc. | | | 256,600 | | | | 23,797 | |
| | Booz Allen Hamilton Holding Corporation | | | 1,180,443 | | | | 51,621 | |
| * | Coherent, Inc. | | | 113,487 | | | | 17,752 | |
| * | Euronet Worldwide, Inc. | | | 313,698 | | | | 26,278 | |
| * | Fortinet, Inc. | | | 311,400 | | | | 19,441 | |
| * | GoDaddy, Inc. | | | 512,720 | | | | 36,198 | |
| * | Guidewire Software, Inc. | | | 421,326 | | | | 37,405 | |
| | j2 Global, Inc. | | | 377,083 | | | | 32,659 | |
| * | MaxLinear, Inc. | | | 626,863 | | | | 9,773 | |
| | National Instruments Corporation | | | 567,545 | | | | 23,826 | |
| * | Nice, Ltd.—ADR | | | 214,803 | | | | 22,290 | |
| * | Novanta, Inc.† | | | 224,226 | | | | 13,969 | |
| * | Pure Storage, Inc. | | | 1,821,381 | | | | 43,495 | |
| * | Rogers Corporation | | | 320,538 | | | | 35,727 | |
| * | Tyler Technologies, Inc. | | | 109,927 | | | | 24,415 | |
| * | WEX, Inc. | | | 179,053 | | | | 34,106 | |
| | | | | | | | | 473,420 | |
| | Consumer Discretionary—15.6% | | | | | | | | |
| * | Adtalem Global Education, Inc. | | | 976,035 | | | | 46,947 | |
| * | Burlington Stores, Inc. | | | 162,000 | | | | 24,386 | |
| | Cable One, Inc. | | | 17,922 | | | | 13,142 | |
| | Domino’s Pizza, Inc. | | | 161,980 | | | | 45,706 | |
| * | Floor & Decor Holdings, Inc. | | | 631,321 | | | | 31,143 | |
| * | Grand Canyon Education, Inc. | | | 366,535 | | | | 40,909 | |
| | | | Shares or | | | | |
| | | | Principal | | | | |
| | Issuer | | Amount | | | Value | |
| | | | | | | | |
| | Common Stocks—(continued) | | | | | | | | |
| | | | | | | | | | |
| | Consumer Discretionary—(continued) | | | | | | | | |
| * | Hilton Grand Vacations, Inc. | | | 904,488 | | | $ | 31,386 | |
| * | Live Nation Entertainment, Inc. | | | 940,285 | | | | 45,670 | |
| | Six Flags Entertainment Corporation | | | 775,177 | | | | 54,301 | |
| * | Universal Electronics, Inc. | | | 402,400 | | | | 13,299 | |
| | Vail Resorts, Inc. | | | 132,996 | | | | 36,466 | |
| | | | | | | | | 383,355 | |
| | Financials—7.9% | | | | | | | | |
| | Bank of the Ozarks, Inc. | | | 594,302 | | | | 26,767 | |
| | BrightSphere Investment Group plc† | | | 936,476 | | | | 13,354 | |
| | Cboe Global Markets, Inc. | | | 300,956 | | | | 31,321 | |
| | East West Bancorp, Inc. | | | 276,221 | | | | 18,010 | |
| * | Encore Capital Group, Inc. | | | 637,827 | | | | 23,344 | |
| | FirstCash, Inc. | | | 450,527 | | | | 40,480 | |
| * | LendingTree, Inc. | | | 79,288 | | | | 16,952 | |
| | Virtu Financial, Inc. | | | 863,537 | | | | 22,927 | |
| | | | | | | | | 193,155 | |
| | Materials—6.5% | | | | | | | | |
| * | Axalta Coating Systems, Ltd.† | | | 734,811 | | | | 22,272 | |
| | Ball Corporation | | | 1,175,559 | | | | 41,791 | |
| | Celanese Corporation | | | 349,458 | | | | 38,811 | |
| | Martin Marietta Materials, Inc. | | | 253,219 | | | | 56,551 | |
| | | | | | | | | 159,425 | |
| | Real Estate—2.9% | | | | | | | | |
| | Colliers International Group, Inc.† | | | 249,545 | | | | 18,891 | |
| | FirstService Corporation†§ | | | 313,098 | | | | 23,808 | |
| | Jones Lang LaSalle, Inc. | | | 169,481 | | | | 28,132 | |
| | | | | | | | | 70,831 | |
| | Energy—1.7% | | | | | | | | |
| | Diamondback Energy, Inc. | | | 130,460 | | | | 17,165 | |
| * | Parsley Energy, Inc. | | | 797,936 | | | | 24,161 | |
| | | | | | | | | 41,326 | |
| | Consumer Staples—0.8% | | | | | | | | |
| | Nu Skin Enterprises, Inc. | | | 266,722 | | | | 20,855 | |
| | Total Common Stocks—98.0%
(cost $2,010,049) | | | | | | | 2,408,793 | |
| | | | | | | | | | |
| | Repurchase Agreement | | | | | | | | |
| | Fixed Income Clearing Corporation, 0.350% dated 6/29/18, due 7/2/18, repurchase price $17,258, collateralized by U.S. Treasury Note, 2.000%, due 4/30/24 | | | $17,257 | | | | 17,257 | |
| | Total Repurchase Agreement—0.7%
(cost $17,257) | | | | | | | 17,257 | |
| | Total Investments—98.7%
(cost $2,027,306) | | | | | | | 2,426,050 | |
| | Cash and other assets, less liabilities—1.3% | | | | | | | 32,217 | |
| | Net assets—100.0% | | | | | | $ | 2,458,267 | |
ADR = American Depository Receipt * = Non-income producing security
† = U.S. listed foreign security
§ = Deemed illiquid pursuant to Liquidity Procedures approved by the Board of Trustees. This holding represents 0.97% of the Fund’s net assets at June 30, 2018.
See accompanying Notes to Financial Statements.
| June 30, 2018 | William Blair Funds | 19 |
| | | Small-Mid Cap Value Fund |
| | | |
| | | The Small-Mid Cap Value Fund seeks long-term capital appreciation. |
| | | |
| | | AN OVERVIEW FROM THE PORTFOLIO MANAGERS |
| | | |

Chad M. Kilmer 
Mark T. Leslie 
David S. Mitchell | | The William Blair Small-Mid Cap Value Fund (Class N shares) posted a 0.84% increase, net of fees, for the six months ended June 30, 2018. By comparison, the Fund’s benchmark index, the Russell 2500™ Value Index (the “Index”), increased 3.00%. The Fund’s underperformance relative to the Index was driven by the combination of stock selection and a negative style headwind given the strategy’s larger market cap bias. At the sector level, the most significant detractor from relative performance was Energy, the best performing sector of the market during the period, due to stock selection and the Fund’s lack of exposure to the Oil & Gas Drilling and the Oil & Gas Refining & Marketing sub-industries. The Fund’s relative underperformance within the Industrials sector was due to stock selection within Machinery, as market cycle concerns generally overshadowed positive corporate earnings for the Fund’s more cyclical portfolio holdings. Within Financials, the relative underperformance within the sector was driven by stock selection within Insurance and Banks; pressured by declining interest rates and a flattening yield curve late in the second quarter. The Fund’s relative outperformance within Consumer Discretionary was the result of strong stock selection within the Leisure Facilities, Education Services and Apparel, Accessories & Luxury Goods sub-industries. Within Information Technology, the relative outperformance was driven by stock selection within IT Services and benefitted from General Dynamics’ acquisition of portfolio holding CSRA, Inc. Looking specifically at stock selection, the Fund’s largest detractors from relative performance were Crane Co. (Industrials), Commscope Holding Co., Inc. (Information Technology), and Acuity Brands, Inc. (Industrials). Offsetting these detractors were the Fund’s investments in lululemon athletica (Consumer Discretionary), CSRA (Information Technology), and Vail Resorts, Inc. (Consumer Discretionary). Please refer to the U.S. Value Market Review and Outlook relating to the Fund on page 7 for additional information. |
| 20 | Semiannual Report | June 30, 2018 |
| Performance Highlights (Unaudited) |
Average Annual Total Return through 6/30/2018
| | | Year
to Date | | 1 Year | | 3 Year | | 5 Year | | Since
Inception(a) |
| Class N | | | 0.84 | % | | | 10.21 | % | | | 8.23 | % | | | 9.56 | % | | | 12.46 | % |
| Class I | | | 0.98 | | | | 10.46 | | | | 8.51 | | | | 9.85 | | | | 12.75 | |
| Russell 2500TM Value Index | | | 3.00 | | | | 11.49 | | | | 9.76 | | | | 10.78 | | | | 14.21 | |
| (a) | Since inception is for the period from December 15, 2011 (Commencement of Operations) to June 30, 2018. |
Performance cited represents past performance. Past performance does not guarantee future results and current performance may be lower or higher than the data quoted. Results shown are average annual total returns, which assume reinvestment of dividends and capital gains. Investment returns and principal will fluctuate and you may have a gain or loss when you sell shares. For the most current month-end performance information, please call 1-800-742-7272, or visit our Web site at www.williamblairfunds.com. Investing in smaller and medium capitalization companies involves special risks, including higher volatility and lower liquidity. Smaller and medium capitalization stocks are also more sensitive to purchase/sale transactions and changes in the issuer’s financial condition. From time to time, the investment adviser may waive fees or reimburse expenses for the Fund. Without these waivers/reimbursements, performance would be lower. Class N shares are available to the general public without a sales load. Class I shares are available to certain institutional investors, and advisory clients of William Blair & Company, L.L.C., without a sales load or distribution (12b-1) or service fees.
The performance highlights and graph presented above do not reflect the deduction of taxes that a shareholder would pay on fund distributions or the redemption of fund shares.
The Russell 2500TM Value Index consists of small to mid-capitalization companies with below average price-to-book ratios and forecasted growth rates.
This report identifies the Fund’s investments on June 30, 2018. These holdings are subject to change. Not all stocks in the Fund performed the same, nor is there any guarantee that these stocks will perform as well in the future. Market forecasts provided in this report may not necessarily come to pass.
| Sector Diversification (Unaudited) |
The sector diversification shown is based on the total long-term securities.
| June 30, 2018 | William Blair Funds | 21 |
Portfolio of Investments, June 30, 2018 (all dollar amounts in thousands) (unaudited)
| | | | | | | | |
| | | | | | | | |
| | Issuer | | Shares | | | Value | |
| | |
| | Common Stocks | | | | | | | | |
| | | | | | | | | | |
| | Financials—22.0% | | | | | | | | |
| | American Financial Group, Inc. | | | 186 | | | $ | 20 | |
| | CNO Financial Group, Inc. | | | 812 | | | | 16 | |
| * | E*TRADE Financial Corporation | | | 549 | | | | 34 | |
| | East West Bancorp, Inc. | | | 445 | | | | 29 | |
| | First American Financial Corporation | | | 311 | | | | 16 | |
| | FNB Corporation | | | 1,594 | | | | 21 | |
| | Hancock Whitney Corporation | | | 412 | | | | 19 | |
| | Hanover Insurance Group, Inc. | | | 196 | | | | 23 | |
| | Home BancShares, Inc. | | | 999 | | | | 23 | |
| | Iberiabank Corporation | | | 320 | | | | 24 | |
| | PacWest Bancorp | | | 541 | | | | 27 | |
| | Radian Group, Inc. | | | 1,262 | | | | 21 | |
| | Selective Insurance Group, Inc. | | | 367 | | | | 20 | |
| | Sterling Bancorp | | | 1,198 | | | | 28 | |
| * | SVB Financial Group | | | 104 | | | | 30 | |
| | Umpqua Holdings Corporation | | | 921 | | | | 21 | |
| | Voya Financial, Inc. | | | 465 | | | | 22 | |
| * | Western Alliance Bancorp | | | 379 | | | | 21 | |
| | WSFS Financial Corporation | | | 470 | | | | 25 | |
| | Zions Bancorporation | | | 254 | | | | 13 | |
| | | | | | | | | 453 | |
| | Real Estate—14.5% | | | | | | | | |
| | Acadia Realty Trust | | | 1,007 | | | | 28 | |
| | American Assets Trust, Inc. | | | 633 | | | | 24 | |
| | American Campus Communities, Inc. | | | 677 | | | | 29 | |
| | Camden Property Trust | | | 241 | | | | 22 | |
| | Columbia Property Trust, Inc. | | | 1,172 | | | | 27 | |
| | Douglas Emmett, Inc. | | | 494 | | | | 20 | |
| | EPR Properties | | | 452 | | | | 29 | |
| * | Equity Commonwealth | | | 696 | | | | 22 | |
| | Equity LifeStyle Properties, Inc. | | | 230 | | | | 21 | |
| | Healthcare Realty Trust, Inc. | | | 914 | | | | 27 | |
| | Pebblebrook Hotel Trust | | | 736 | | | | 28 | |
| | Terreno Realty Corporation | | | 613 | | | | 23 | |
| | | | | | | | | 300 | |
| | Industrials—12.7% | | | | | | | | |
| | Acuity Brands, Inc. | | | 220 | | | | 25 | |
| | Crane Co. | | | 300 | | | | 24 | |
| * | Gardner Denver Holdings, Inc. | | | 878 | | | | 26 | |
| | GrafTech International, Ltd. | | | 1,759 | | | | 32 | |
| | IDEX Corporation | | | 203 | | | | 28 | |
| | Lennox International, Inc. | | | 145 | | | | 29 | |
| | Old Dominion Freight Line, Inc. | | | 179 | | | | 27 | |
| | Toro Co. | | | 437 | | | | 26 | |
| | UniFirst Corporation | | | 149 | | | | 26 | |
| * | WABCO Holdings, Inc. | | | 170 | | | | 20 | |
| | | | | | | | | 263 | |
| | Consumer Discretionary—10.0% | | | | | | | | |
| | Churchill Downs, Inc. | | | 86 | | | | 25 | |
| | Dunkin’ Brands Group, Inc. | | | 644 | | | | 44 | |
| | Gentex Corporation | | | 1,290 | | | | 30 | |
| * | Michael Kors Holdings, Ltd.† | | | 414 | | | | 28 | |
| | Six Flags Entertainment Corporation | | | 511 | | | | 36 | |
| | Vail Resorts, Inc. | | | 156 | | | | 43 | |
| | | | | | | | | 206 | |
| | | | | | | | |
| | | | | | | | |
| | Issuer | | Shares | | | Value | |
| | |
| | Common Stocks—(continued) | | | | | | | | |
| | | | | | | | | | |
| | Information Technology—9.3% | | | | | | | | |
| * | Acxiom Corporation | | | 791 | | | $ | 24 | |
| | Avnet, Inc. | | | 507 | | | | 22 | |
| | Belden, Inc. | | | 456 | | | | 28 | |
| | Booz Allen Hamilton Holding Corporation | | | 782 | | | | 34 | |
| * | Cadence Design Systems, Inc. | | | 679 | | | | 30 | |
| | j2 Global, Inc. | | | 362 | | | | 31 | |
| | MAXIMUS, Inc. | | | 375 | | | | 23 | |
| | | | | | | | | 192 | |
| | Energy—8.0% | | | | | | | | |
| * | Forum Energy Technologies, Inc. | | | 1,727 | | | | 21 | |
| * | Parsley Energy, Inc. | | | 990 | | | | 30 | |
| | Patterson-UTI Energy, Inc. | | | 1,251 | | | | 23 | |
| | Range Resources Corporation | | | 1,679 | | | | 28 | |
| | Targa Resources Corporation | | | 637 | | | | 32 | |
| * | WPX Energy, Inc. | | | 1,799 | | | | 32 | |
| | | | | | | | | 166 | |
| | Utilities—6.1% | | | | | | | | |
| | Alliant Energy Corporation | | | 625 | | | | 26 | |
| | Atmos Energy Corporation | | | 339 | | | | 31 | |
| | IDACORP, Inc. | | | 250 | | | | 23 | |
| | NiSource, Inc. | | | 957 | | | | 25 | |
| * | Vistra Energy Corporation | | | 885 | | | | 21 | |
| | | | | | | | | 126 | |
| | Materials—6.0% | | | | | | | | |
| | Carpenter Technology Corporation | | | 482 | | | | 25 | |
| | FMC Corporation | | | 223 | | | | 20 | |
| | Minerals Technologies, Inc. | | | 234 | | | | 17 | |
| | PolyOne Corporation | | | 527 | | | | 23 | |
| | Sensient Technologies Corporation | | | 209 | | | | 15 | |
| | Steel Dynamics, Inc. | | | 521 | | | | 24 | |
| | | | | | | | | 124 | |
| | Health Care—5.1% | | | | | | | | |
| | CONMED Corporation | | | 192 | | | | 14 | |
| | Encompass Health Corporation | | | 393 | | | | 27 | |
| * | Hologic, Inc. | | | 583 | | | | 23 | |
| * | Magellan Health, Inc. | | | 183 | | | | 17 | |
| | PerkinElmer, Inc. | | | 311 | | | | 23 | |
| | | | | | | | | 104 | |
| | Consumer Staples—3.3% | | | | | | | | |
| | Ingredion, Inc. | | | 186 | | | | 20 | |
| | J&J Snack Foods Corporation | | | 122 | | | | 19 | |
| | Lamb Weston Holdings, Inc. | | | 411 | | | | 28 | |
| | | | | | | | | 67 | |
| | Total Common Stocks—97.0%
(cost $1,658) | | | | | | | 2,001 | |
See accompanying Notes to Financial Statements.
| 22 | Semiannual Report | June 30, 2018 |
Portfolio of Investments, June 30, 2018 (all dollar amounts in thousands) (unaudited)
| | | | | | | | |
| | | | | | | | |
| | Issuer | | Shares | | | Value | |
| | | | | | | | |
| | Exchange-Traded Fund | | | | | | | | |
| | iShares Russell 2000 Value ETF | | | 471 | | | $ | 62 | |
| | Total Exchange-Traded Fund—3.0%
(cost $62) | | | | | | | 62 | |
| | Total Investments—100.0%
(cost $1,720) | | | | | | | 2,063 | |
| | Cash and other assets, less liabilities—0.0% | | | | | | | — | |
| | Net assets—100.0% | | | | | | $ | 2,063 | |
* = Non-income producing security
† = U.S. listed foreign security
See accompanying Notes to Financial Statements.
| June 30, 2018 | William Blair Funds | 23 |
| | | Small Cap Growth Fund |
| | | |
| | | The Small Cap Growth Fund seeks long-term capital appreciation. |
| | | |
| | | AN OVERVIEW FROM THE PORTFOLIO MANAGERS |
| | | |

Michael P. Balkin 
Ward D. Sexton | | The William Blair Small Cap Growth Fund (Class N shares) posted a 15.41% increase, net of fees, for the six months ended June 30, 2018. By comparison, the Fund’s benchmark index, the Russell 2000® Growth Index (the “Index”), increased 9.70%. Outperformance versus the Index for the year-to-date period ended June 30, 2018 was driven by positive stock selection across several sectors, most notably Health Care, Industrials, and Financials. At the individual stock level, top contributors to the Fund’s performance included Codexis Inc. (Health Care) and Virtu Financial Inc. (Financials). Codexis, a protein engineering company whose CodeEvolver platform enables faster and more cost-effective enzyme manufacturing, outperformed on strong demand for CodeEvolver and the company’s announced partnership with Nestle Health Science, which represents a significant revenue opportunity for the company going forward. Shares of Virtu Financial, a technology driven high-frequency trading and market-making firm, advanced significantly during the first quarter driven by strong trading volume and expense synergies from a recent acquisition. Other top performing holdings included Varonis Systems, Inc. and LivePerson, Inc. in Information Technology, and AxoGen, Inc. in Health Care. In addition, our sustainable growth bias, which leads us to companies with value-added products and services and flexible pricing, provided a tailwind. This dynamic was most evident in the first quarter, as investors digested the potential for inflation-related cost pressures on businesses. Conversely, Consumer Discretionary stock selection detracted from the Fund’s results in part due to positions in Universal Electronics, Inc., Golden Entertainment, Inc., and Hilton Grand Vacations, Inc. Remote control developer Universal Electronics underperformed as delays from its cable and satellite TV provider customers in deploying next generation remotes negatively impacted first quarter results and second quarter guidance. Elsewhere in the Fund’s portfolio, notable underperformers included MaxLinear, Inc. (Information Technology) and Mercury Systems, Inc. (Industrials). Semiconductor provider MaxLinear underperformed due to weakness in some of its more mature business segments, while some of the company’s new products in more diverse and higher growth end markets have yet to fully take hold. Please refer to the U.S. Growth Market Review and Outlook relating to the Fund on page 6 for additional information. |
| 24 | Semiannual Report | June 30, 2018 |
| Performance Highlights (Unaudited) |
Average Annual Total Return through 6/30/2018
| | | Year
to Date | | 1 Year | | 3 Year | | 5 Year | | 10 Year |
| Class N | | | 15.41 | % | | | 26.65 | % | | | 17.16 | % | | | 16.06 | % | | | 12.81 | % |
| Class I | | | 15.57 | | | | 27.02 | | | | 17.47 | | | | 16.35 | | | | 13.11 | |
| Russell 2000® Growth Index | | | 9.70 | | | | 21.86 | | | | 10.60 | | | | 13.65 | | | | 11.24 | |
Performance cited represents past performance. Past performance does not guarantee future results and current performance may be lower or higher than the data quoted. Results shown are average annual total returns, which assume reinvestment of dividends and capital gains. Investment returns and principal will fluctuate and you may have a gain or loss when you sell shares. For the most current month-end performance information, please call 1-800-742-7272, or visit our Web site at www.williamblairfunds.com. Investing in smaller companies involves special risks, including higher volatility and lower liquidity. Smaller capitalization stocks are also more sensitive to purchase/sale transactions and changes in the issuer’s financial condition. From time to time, the investment adviser may waive fees or reimburse expenses for the Fund. Without these waivers/reimbursements, performance would be lower. Class N shares are available to the general public without a sales load. Class I shares are available to certain institutional investors, and advisory clients of William Blair & Company, L.L.C., without a sales load or distribution (12b-1) or service fees.
The performance highlights and graph presented above do not reflect the deduction of taxes that a shareholder would pay on fund distributions or the redemption of fund shares.
The Russell 2000® Growth Index is an unmanaged composite of the smallest 2000 stocks of the Russell 3000® Growth Index.
This report identifies the Fund’s investments on June 30, 2018. These holdings are subject to change. Not all stocks in the Fund performed the same, nor is there any guarantee that these stocks will perform as well in the future. Market forecasts provided in this report may not necessarily come to pass.
| Sector Diversification (Unaudited) |

The sector diversification shown is based on the total long-term securities.
| June 30, 2018 | William Blair Funds | 25 |
Portfolio of Investments, June 30, 2018 (all dollar amounts in thousands) (unaudited)
| | | | | | | | |
| | | | | | | | |
| | Issuer | | Shares | | | Value | |
| | |
| | Common Stocks | | | | | | | | |
| | | | | | | | | | |
| | Information Technology—21.0% | | | | | | | | |
| * | 2U, Inc. | | | 65,880 | | | $ | 5,505 | |
| * | Agilysys, Inc. | | | 376,460 | | | | 5,835 | |
| * | Carbon Black, Inc. | | | 230,550 | | | | 5,994 | |
| * | Cars.com, Inc. | | | 208,368 | | | | 5,916 | |
| * | Coherent, Inc. | | | 15,776 | | | | 2,468 | |
| * | EPAM Systems, Inc. | | | 48,664 | | | | 6,050 | |
| * | Etsy, Inc. | | | 180,804 | | | | 7,628 | |
| * | Guidewire Software, Inc. | | | 98,067 | | | | 8,706 | |
| | j2 Global, Inc. | | | 125,972 | | | | 10,911 | |
| | Littelfuse, Inc. | | | 29,193 | | | | 6,661 | |
| * | LivePerson, Inc. | | | 401,837 | | | | 8,479 | |
| * | MaxLinear, Inc. | | | 291,019 | | | | 4,537 | |
| * | Nice, Ltd.—ADR | | | 61,633 | | | | 6,396 | |
| * | Novanta, Inc.† | | | 50,159 | | | | 3,125 | |
| * | Pure Storage, Inc. | | | 379,526 | | | | 9,063 | |
| * | RealPage, Inc. | | | 110,871 | | | | 6,109 | |
| * | Rogers Corporation | | | 41,985 | | | | 4,680 | |
| * | USA Technologies, Inc. | | | 571,225 | | | | 7,997 | |
| * | Varonis Systems, Inc. | | | 118,510 | | | | 8,829 | |
| * | WNS Holdings, Ltd.—ADR | | | 134,502 | | | | 7,018 | |
| | | | | | | | | 131,907 | |
| | Consumer Discretionary—19.5% | | | | | | | | |
| * | Adtalem Global Education, Inc. | | | 171,628 | | | | 8,255 | |
| * | At Home Group, Inc. | | | 190,298 | | | | 7,450 | |
| * | Boot Barn Holdings, Inc. | | | 420,724 | | | | 8,730 | |
| | Cable One, Inc. | | | 9,810 | | | | 7,194 | |
| * | Carvana Co. | | | 99,820 | | | | 4,153 | |
| * | Floor & Decor Holdings, Inc. | | | 131,008 | | | | 6,463 | |
| * | Gentherm, Inc. | | | 181,583 | | | | 7,136 | |
| * | Golden Entertainment, Inc. | | | 245,995 | | | | 6,639 | |
| * | Grand Canyon Education, Inc. | | | 59,643 | | | | 6,657 | |
| * | Hilton Grand Vacations, Inc. | | | 216,144 | | | | 7,500 | |
| * | IMAX Corporation† | | | 314,677 | | | | 6,970 | |
| * | Laureate Education, Inc. | | | 504,023 | | | | 7,223 | |
| | LCI Industries | | | 60,891 | | | | 5,489 | |
| | Lithia Motors, Inc. | | | 50,159 | | | | 4,744 | |
| | Nutrisystem, Inc. | | | 174,185 | | | | 6,706 | |
| | Six Flags Entertainment Corporation | | | 125,573 | | | | 8,796 | |
| | Steven Madden, Ltd. | | | 148,725 | | | | 7,897 | |
| * | Universal Electronics, Inc. | | | 143,063 | | | | 4,728 | |
| | | | | | | | | 122,730 | |
| | Health Care—17.8% | | | | | | | | |
| * | AxoGen, Inc. | | | 133,253 | | | | 6,696 | |
| * | Cambrex Corporation | | | 180,509 | | | | 9,441 | |
| * | Catalent, Inc. | | | 149,108 | | | | 6,246 | |
| * | Codexis, Inc. | | | 511,503 | | | | 7,365 | |
| * | CryoLife, Inc. | | | 260,517 | | | | 7,255 | |
| | Encompass Health Corporation | | | 188,307 | | | | 12,752 | |
| * | Glaukos Corporation | | | 154,131 | | | | 6,264 | |
| * | Hanger, Inc. | | | 181,383 | | | | 3,076 | |
| * | Horizon Pharma plc† | | | 641,570 | | | | 10,624 | |
| * | Intersect ENT, Inc. | | | 148,973 | | | | 5,579 | |
| * | LHC Group, Inc. | | | 84,095 | | | | 7,198 | |
| * | Ligand Pharmaceuticals, Inc. | | | 56,299 | | | | 11,664 | |
| * | Repligen Corporation | | | 112,091 | | | | 5,273 | |
| | | | | | | | |
| | | | | | | | |
| | Issuer | | Shares | | | Value | |
| | | | | | | | |
| | Common Stocks—(continued) | | | | | | | | |
| | | | | | | | | | |
| | Health Care—(continued) | | | | | | | | |
| | Simulations Plus, Inc. | | | 231,030 | | | $ | 5,140 | |
| * | Supernus Pharmaceuticals, Inc. | | | 119,959 | | | | 7,180 | |
| | | | | | | | | 111,753 | |
| | Industrials—17.8% | | | | | | | | |
| | Albany International Corporation | | | 102,325 | | | | 6,155 | |
| * | Armstrong World Industries, Inc. | | | 108,803 | | | | 6,876 | |
| * | Blue Bird Corporation | | | 461,654 | | | | 10,318 | |
| * | BlueLinx Holdings, Inc. | | | 70,620 | | | | 2,650 | |
| | BWX Technologies, Inc. | | | 154,469 | | | | 9,626 | |
| | Douglas Dynamics, Inc. | | | 194,145 | | | | 9,319 | |
| | ESCO Technologies, Inc. | | | 104,556 | | | | 6,033 | |
| * | Genesee & Wyoming, Inc. | | | 76,987 | | | | 6,261 | |
| | Healthcare Services Group, Inc. | | | 194,117 | | | | 8,384 | |
| | ICF International, Inc. | | | 84,471 | | | | 6,002 | |
| | John Bean Technologies Corporation | | | 88,841 | | | | 7,898 | |
| * | Mercury Systems, Inc. | | | 156,116 | | | | 5,942 | |
| | Ritchie Bros Auctioneers, Inc.† | | | 219,595 | | | | 7,493 | |
| * | SiteOne Landscape Supply, Inc. | | | 71,868 | | | | 6,035 | |
| * | WageWorks, Inc. | | | 132,870 | | | | 6,643 | |
| * | Willdan Group, Inc. | | | 189,374 | | | | 5,865 | |
| | | | | | | | | 111,500 | |
| | Financials—8.5% | | | | | | | | |
| * | BofI Holding, Inc. | | | 107,811 | | | | 4,411 | |
| * | Encore Capital Group, Inc. | | | 260,188 | | | | 9,523 | |
| | FirstCash, Inc. | | | 98,948 | | | | 8,890 | |
| | Glacier Bancorp, Inc. | | | 140,995 | | | | 5,454 | |
| | Home BancShares, Inc. | | | 337,204 | | | | 7,607 | |
| | Meta Financial Group, Inc. | | | 64,160 | | | | 6,249 | |
| * | Triumph Bancorp, Inc. | | | 144,308 | | | | 5,881 | |
| | Virtu Financial, Inc. | | | 202,374 | | | | 5,373 | |
| | | | | | | | | 53,388 | |
| | Consumer Staples—5.0% | | | | | | | | |
| | Calavo Growers, Inc. | | | 91,831 | | | | 8,830 | |
| | MGP Ingredients, Inc. | | | 83,093 | | | | 7,379 | |
| | Nu Skin Enterprises, Inc. | | | 81,248 | | | | 6,353 | |
| * | Primo Water Corporation | | | 497,363 | | | | 8,699 | |
| | | | | | | | | 31,261 | |
| | Real Estate—3.1% | | | | | | | | |
| | Colliers International Group, Inc.† | | | 90,284 | | | | 6,834 | |
| | CoreSite Realty Corporation | | | 55,644 | | | | 6,166 | |
| | FirstService Corporation† | | | 82,727 | | | | 6,291 | |
| | | | | | | | | 19,291 | |
| | Energy—2.0% | | | | | | | | |
| * | Callon Petroleum Co. | | | 377,803 | | | | 4,058 | |
| * | Carrizo Oil & Gas, Inc. | | | 156,242 | | | | 4,351 | |
| * | Centennial Resource Development, Inc. | | | 227,860 | | | | 4,115 | |
| | | | | | | | | 12,524 | |
| | Telecommunication Services—1.2% | | | | | | | | |
| * | ORBCOMM, Inc. | | | 725,545 | | | | 7,328 | |
| | Materials—0.9% | | | | | | | | |
| | Orion Engineered Carbons S.A.† | | | 189,162 | | | | 5,836 | |
| | Total Common Stocks—96.8%
(cost $455,847) | | | | | | | 607,518 | |
See accompanying Notes to Financial Statements.
| 26 | Semiannual Report | June 30, 2018 |
Portfolio of Investments, June 30, 2018 (all dollar amounts in thousands) (unaudited)
| | Issuer | | Shares or
Principal
Amount | | | Value | |
| | |
| | Exchange-Traded Fund | | | | | | | | |
| | iShares Russell 2000 Growth ETF | | | 28,269 | | | $ | 5,776 | |
| | Total Exchange-Traded Fund—0.9%
(cost $5,403) | | | | | | | 5,776 | |
| | |
| | Repurchase Agreement | | | | | | | | |
| | Fixed Income Clearing Corporation, 0.350% dated 6/29/18, due 7/2/18, repurchase price $9,561, collateralized by U.S. Treasury Inflation Index Bond, 0.250%, due 1/15/25 | | | $9,560 | | | | 9,560 | |
| | Total Repurchase Agreement—1.5%
(cost $9,560) | | | | | | | 9,560 | |
| | Total Investments—99.2%
(cost $470,810) | | | | | | | 622,854 | |
| | Cash and other assets, less liabilities—0.8% | | | | | | | 4,947 | |
| | Net assets—100.0% | | | | | | $ | 627,801 | |
ADR = American Depository Receipt
* = Non-income producing security
† = U.S. listed foreign security
See accompanying Notes to Financial Statements.
| June 30, 2018 | William Blair Funds | 27 |
| | Small Cap Value Fund |
| | |
| | The Small Cap Value Fund seeks long-term capital appreciation. |
| | |
| | AN OVERVIEW FROM THE PORTFOLIO MANAGERS |
| | |
 Chad M. Kilmer 
Mark T. Leslie | The William Blair Small Cap Value Fund (Class N shares) posted a 1.09% increase, net of fees, for the six months ended June 30, 2018. By comparison, the Fund’s benchmark index, the Russell 2000® Value Index (the “Index”), increased 5.44%. The Fund’s underperformance relative to the Index was driven by a combination of stock selection and style headwinds, given the outperformance of smaller cap stocks and the strategy’s bias in favor of the larger market cap stocks within the Fund’s small cap universe. At the sector level, the most significant detractor from relative performance was Industrials due to stock selection within Machinery as market cycle concerns generally overshadowed positive corporate earnings for our more cyclical portfolio holdings. The Fund’s relative underperformance within the Consumer Discretionary sector was the result of stock selection in Auto Parts & Equipment, Apparel Retail, Automobile Manufacturers, and Restaurants. Within the sector, these stock selection detractors more than offset positive contribution from stock selection within Homebuilding and Education Services. Health Care, the best performing sector of the market during the first half of 2018, was the largest contributor to relative performance as strong stock selection within the sector was able to more than offset negative contribution from the Fund’s lack of exposure to Biotechnology stocks. Within the Information Technology sector, the Fund’s relative outperformance was driven by stock selection within IT Services and also General Dynamics’ acquisition of portfolio holding CSRA, Inc. Looking specifically at stock selection, the largest detractors from the Fund’s relative performance were Dana, Inc. (Consumer Discretionary), Halcon Resources Corporation (Energy), and Winnebago Industries, Inc. (Consumer Discretionary). Offsetting these detractors were the Fund’s investments in CSRA (Information Technology), Encompass Health Corporation (Health Care), and CONMED Corporation (Health Care). Please refer to the U.S. Value Market Review and Outlook relating to the Fund on page 7 for additional information. |
 David S. Mitchell | |
| 28 | Semiannual Report | June 30, 2018 |
Small Cap Value Fund
Performance Highlights (Unaudited)
| |
| Average Annual Total Return through 6/30/2018 |
| | | | Year
to Date | | | 1 Year | | | 3 Year | | | 5 Year | | | 10 Year |
| Class N | | | 1.09 | % | | | 9.40 | % | | | 8.68 | % | | | 9.80 | % | | | 9.82 | % |
| Class I | | | 1.21 | | | | 9.68 | | | | 8.96 | | | | 10.08 | | | | 10.08 | |
| Russell 2000® Value Index | | | 5.44 | | | | 13.10 | | | | 11.22 | | | | 11.18 | | | | 9.88 | |
Performance cited represents past performance. Past performance does not guarantee future results and current performance may be lower or higher than the data quoted. Results shown are average annual total returns, which assume reinvestment of dividends and capital gains. Investment returns and principal will fluctuate and you may have a gain or loss when you sell shares. For the most current month-end performance information, please call 1-800-742-7272, or visit our Web site at www.williamblairfunds.com. Investing in smaller companies involves special risks, including higher volatility and lower liquidity. Smaller capitalization stocks are also more sensitive to purchase/sale transactions and changes in the issuer’s financial condition. From time to time, the investment adviser may waive fees or reimburse expenses for the Fund. Without these waivers/reimbursements, performance would be lower. Class N shares are available to the general public without a sales load. Class I shares are available to certain institutional investors, and advisory clients of William Blair & Company, L.L.C., without a sales load or distribution (12b-1) or service fees.
The performance highlights and graph presented above do not reflect the deduction of taxes that a shareholder would pay on fund distributions or the redemption of fund shares.
The Russell 2000® Value Index consists of small-capitalization companies with below average price-to-book ratios and forecasted growth rates.
This report identifies the Fund’s investments on June 30, 2018. These holdings are subject to change. Not all stocks in the Fund performed the same, nor is there any guarantee that these stocks will perform as well in the future. Market forecasts provided in this report may not necessarily come to pass.
Sector Diversification (Unaudited)
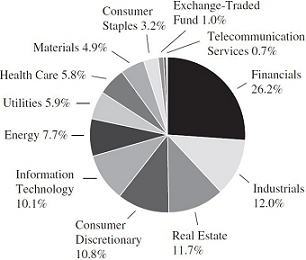
The sector diversification shown is based on the total long-term securities.
| June 30, 2018 | William Blair Funds | 29 |
Small Cap Value Fund
Portfolio of Investments, June 30, 2018 (all dollar amounts in thousands) (unaudited)
| | | | | | | | |
| | | | | | | | |
| Issuer | | Shares | | | Value | |
| | | | | | | | |
| | Common Stocks | | | | | | | | |
| | | | | | | | | | |
| | Financials—26.2% | | | | | | | | |
| | Banner Corporation | | | 126,403 | | | $ | 7,601 | |
| | Boston Private Financial Holdings, Inc. | | | 427,424 | | | | 6,796 | |
| | CNO Financial Group, Inc. | | | 258,205 | | | | 4,916 | |
| | CoBiz Financial, Inc. | | | 421,619 | | | | 9,056 | |
| | CVB Financial Corporation | | | 222,734 | | | | 4,994 | |
| | FNB Corporation | | | 615,443 | | | | 8,259 | |
| | Glacier Bancorp, Inc. | | | 165,062 | | | | 6,385 | |
| | Green Bancorp, Inc. | | | 44,390 | | | | 959 | |
| | Hancock Whitney Corporation | | | 151,085 | | | | 7,048 | |
| | Hanover Insurance Group, Inc. | | | 73,684 | | | | 8,810 | |
| | Home BancShares, Inc. | | | 364,530 | | | | 8,224 | |
| | Iberiabank Corporation | | | 115,259 | | | | 8,737 | |
| | National Bank Holdings Corporation | | | 161,344 | | | | 6,226 | |
| | OceanFirst Financial Corporation | | | 214,948 | | | | 6,440 | |
| | Radian Group, Inc. | | | 515,965 | | | | 8,369 | |
| | Renasant Corporation | | | 169,306 | | | | 7,707 | |
| | Sandy Spring Bancorp, Inc. | | | 144,803 | | | | 5,938 | |
| * | Seacoast Banking Corporation of Florida | | | 251,923 | | | | 7,956 | |
| | Selective Insurance Group, Inc. | | | 168,331 | | | | 9,258 | |
| | Sterling Bancorp | | | 421,850 | | | | 9,913 | |
| | Umpqua Holdings Corporation | | | 277,844 | | | | 6,276 | |
| * | Western Alliance Bancorp | | | 147,370 | | | | 8,343 | |
| | WSFS Financial Corporation | | | 174,881 | | | | 9,321 | |
| | | | | | | | | 167,532 | |
| | Industrials—12.1% | | | | | | | | |
| | Acuity Brands, Inc. | | | 40,515 | | | | 4,695 | |
| | Brady Corporation | | | 202,336 | | | | 7,800 | |
| * | Continental Building Products, Inc. | | | 164,195 | | | | 5,180 | |
| | EMCOR Group, Inc. | | | 62,697 | | | | 4,776 | |
| | GrafTech International, Ltd. | | | 344,399 | | | | 6,196 | |
| | Interface, Inc. | | | 248,441 | | | | 5,702 | |
| | Kadant, Inc. | | | 32,906 | | | | 3,164 | |
| | Matson, Inc. | | | 132,595 | | | | 5,089 | |
| | Moog, Inc. | | | 74,925 | | | | 5,841 | |
| * | MRC Global, Inc. | | | 159,135 | | | | 3,448 | |
| * | Northwest Pipe Co. | | | 183,371 | | | | 3,552 | |
| * | Rexnord Corporation | | | 214,240 | | | | 6,226 | |
| * | Saia, Inc. | | | 60,595 | | | | 4,899 | |
| | Simpson Manufacturing Co., Inc. | | | 85,802 | | | | 5,336 | |
| | UniFirst Corporation | | | 29,456 | | | | 5,211 | |
| | | | | | | | | 77,115 | |
| | Real Estate—11.7% | | | | | | | | |
| | Acadia Realty Trust | | | 308,360 | | | | 8,440 | |
| | Agree Realty Corporation | | | 109,600 | | | | 5,784 | |
| | American Assets Trust, Inc. | | | 197,702 | | | | 7,570 | |
| | Columbia Property Trust, Inc. | | | 295,800 | | | | 6,718 | |
| | Education Realty Trust, Inc. | | | 211,020 | | | | 8,757 | |
| * | Equity Commonwealth | | | 169,570 | | | | 5,341 | |
| | Healthcare Realty Trust, Inc. | | | 238,036 | | | | 6,922 | |
| | Highwoods Properties, Inc. | | | 132,331 | | | | 6,713 | |
| | Pebblebrook Hotel Trust | | | 167,182 | | | | 6,487 | |
| | Sunstone Hotel Investors, Inc. | | | 290,405 | | | | 4,826 | |
| | Terreno Realty Corporation | | | 188,768 | | | | 7,111 | |
| | | | | | | | | 74,669 | |
| | | | | | | | |
| | | | | | | | |
| Issuer | | Shares | | | Value | |
| | | | | | | | | | |
| | Common Stocks—(continued) | | | | | | | | |
| | | | | | | | | | |
| | Consumer Discretionary—10.8% | | | | | | | | |
| | Abercrombie & Fitch Co. | | | 153,650 | | | $ | 3,761 | |
| * | Adtalem Global Education, Inc. | | | 143,616 | | | | 6,908 | |
| * | Cavco Industries, Inc. | | | 33,685 | | | | 6,995 | |
| | Dana, Inc. | | | 263,513 | | | | 5,320 | |
| * | Dave & Buster’s Entertainment, Inc. | | | 143,390 | | | | 6,825 | |
| | Meredith Corporation | | | 98,275 | | | | 5,012 | |
| | Nutrisystem, Inc. | | | 147,370 | | | | 5,674 | |
| * | Penn National Gaming, Inc. | | | 203,010 | | | | 6,819 | |
| | Six Flags Entertainment Corporation | | | 99,335 | | | | 6,959 | |
| * | TopBuild Corporation | | | 78,019 | | | | 6,112 | |
| | Wolverine World Wide, Inc. | | | 253,691 | | | | 8,821 | |
| | | | | | | | | 69,206 | |
| | Information Technology—10.1% | | | | | | | | |
| * | Acxiom Corporation | | | 240,230 | | | | 7,195 | |
| | Avnet, Inc. | | | 155,420 | | | | 6,666 | |
| | Belden, Inc. | | | 139,672 | | | | 8,537 | |
| | Booz Allen Hamilton Holding Corporation | | | 198,693 | | | | 8,689 | |
| * | Ciena Corporation | | | 190,885 | | | | 5,060 | |
| * | Inphi Corporation | | | 173,004 | | | | 5,642 | |
| | j2 Global, Inc. | | | 103,230 | | | | 8,941 | |
| * | Semtech Corporation | | | 133,125 | | | | 6,263 | |
| * | Viavi Solutions, Inc. | | | 726,845 | | | | 7,443 | |
| | | | | | | | | 64,436 | |
| | Energy—7.7% | | | | | | | | |
| | Archrock, Inc. | | | 526,758 | | | | 6,321 | |
| * | Callon Petroleum Co. | | | 739,019 | | | | 7,937 | |
| * | Forum Energy Technologies, Inc. | | | 393,810 | | | | 4,864 | |
| * | Halcon Resources Corporation | | | 908,820 | | | | 3,990 | |
| * | Newpark Resources, Inc. | | | 475,809 | | | | 5,163 | |
| * | PDC Energy, Inc. | | | 131,003 | | | | 7,919 | |
| | Range Resources Corporation | | | 390,270 | | | | 6,529 | |
| * | RSP Permian, Inc. | | | 47,944 | | | | 2,110 | |
| * | Solaris Oilfield Infrastructure, Inc. | | | 324,936 | | | | 4,643 | |
| | | | | | | | | 49,476 | |
| | Utilities—5.9% | | | | | | | | |
| | ALLETE, Inc. | | | 64,220 | | | | 4,971 | |
| | Chesapeake Utilities Corporation | | | 55,798 | | | | 4,461 | |
| | El Paso Electric Co. | | | 111,190 | | | | 6,571 | |
| | IDACORP, Inc. | | | 82,970 | | | | 7,653 | |
| | ONE Gas, Inc. | | | 91,552 | | | | 6,843 | |
| | Southwest Gas Holdings, Inc. | | | 97,266 | | | | 7,419 | |
| | | | | | | | | 37,918 | |
| | Health Care—5.9% | | | | | | | | |
| | CONMED Corporation | | | 134,367 | | | | 9,836 | |
| | Encompass Health Corporation | | | 150,286 | | | | 10,177 | |
| * | Integer Holdings Corporation | | | 158,868 | | | | 10,271 | |
| * | Magellan Health, Inc. | | | 73,774 | | | | 7,078 | |
| | | | | | | | | 37,362 | |
See accompanying Notes to Financial Statements.
| 30 | Semiannual Report | June 30, 2018 |
Small Cap Value Fund
Portfolio of Investments, June 30, 2018 (all dollar amounts in thousands) (unaudited)
| Issuer | | Shares or
Principal
Amount | | | Value | |
| | | | | | | | |
| | Common Stocks—(continued) | | | | | | | | |
| | | | | | | | | | |
| | Materials—4.9% | | | | | | | | |
| | Carpenter Technology Corporation | | | 130,471 | | | $ | 6,859 | |
| | Minerals Technologies, Inc. | | | 86,068 | | | | 6,485 | |
| | PolyOne Corporation | | | 151,259 | | | | 6,537 | |
| | Sensient Technologies Corporation | | | 91,112 | | | | 6,519 | |
| | Silgan Holdings, Inc. | | | 174,508 | | | | 4,682 | |
| | | | | | | | | 31,082 | |
| | Consumer Staples—3.2% | | | | | | | | |
| * | Darling Ingredients, Inc. | | | 365,148 | | | | 7,259 | |
| | J&J Snack Foods Corporation | | | 55,553 | | | | 8,470 | |
| | SpartanNash Co. | | | 190,073 | | | | 4,851 | |
| | | | | | | | | 20,580 | |
| | | | | | | | | | |
| | Telecommunication Services—0.7% | | | | | | | | |
| * | Cincinnati Bell, Inc. | | | 293,320 | | | | 4,605 | |
| | Total Common Stocks—99.2% | | | | | | | | |
| | (cost $477,126) | | | | | | | 633,981 | |
| | Exchange-Traded Fund | | | | | | | | |
| | iShares Russell 2000 Value ETF | | | 49,000 | | | | 6,464 | |
| | Total Exchange-Traded Fund—1.0% | | | | | | | | |
| | (cost $6,502) | | | | | | | 6,464 | |
| | | | | | | | | | |
| | Repurchase Agreement | | | | | | | | |
| | Fixed Income Clearing Corporation, 0.350% dated 6/29/18, due 7/2/18, repurchase price $12,056, collateralized by U.S. Treasury Note, 2.000%, due 4/30/24 | | | $12,056 | | | | 12,056 | |
| | Total Repurchase Agreement—1.9%
(cost $12,056) | | | | | | | 12,056 | |
| | Total Investments—102.1%
(cost $495,684) | | | | | | | 652,501 | |
| | Liabilities, plus cash and other assets—(2.1)% | | | | | | | (13,664 | ) |
| | Net assets—100.0% | | | | | | $ | 638,837 | |
* = Non-income producing security
See accompanying Notes to Financial Statements.
| June 30, 2018 | William Blair Funds | 31 |
Global Markets Review and Outlook
Global equity markets posted mixed results for the first half of 2018, buffeted by escalating trade tensions, the U.S. Federal Reserve’s continued tightening bias and U.S. dollar strength. In contrast to the global synchronized expansion environment of 2017, equity performance in the first six months of 2018 reflected a growing divergence, with the U.S.’s economy, corporate earnings and share prices maintaining positive momentum while the rest of the world rolled over.
The benign 2017 environment of low volatility and uninterrupted monthly gains abruptly reversed course in late January 2018, as worries about the extended bull market culminated in heavy selling pressure following reports that a handful of niche equity volatility-linked ETF products had suffered significant losses, stoking fears of broader risk contagion.
As the first half of the year progressed, investors became increasingly concerned that the Trump administration’s pursuit of protectionist measures would ignite a trade war with China and potentially derail the U.S. expansion. The slowing pace of economic activity in Europe combined with increased turbulence in emerging markets also weighed on investor sentiment.
U.S. equities extended their gains during the first half of 2018 and significantly outpaced non-U.S. markets, bolstered by strong corporate earnings and tax reform. From a market cap perspective, U.S. small caps outperformed their large cap counterparts by approximately 3.5% during the period, as measured by the MSCI USA (net) and MSCI USA Small Cap (net) indices. In addition to being less exposed to trade disputes given lower overseas revenues, U.S. small caps were expected to benefit more from tax reform: according to Bloomberg, for the three years ended December 2017, S&P SmallCap 600 Index companies had an average effective tax rate 4.3% higher than that of S&P 500 Index companies.
Non-U.S. developed market equity performance was hampered by negative returns in Europe, amid softening economic data and renewed political turmoil in Italy. The euro depreciated approximately 3% versus the dollar in the first half of 2018, reflecting these concerns in addition to expectations for prolonged monetary stimulus from the European Central Bank, which announced that interest rates would remain at record lows through the summer of 2019.
Harkening back to the 2013 taper tantrum episode, emerging markets equities and currencies were hit by a significant rise in investor outflows during the first half of the year. The stronger dollar and prospect of higher U.S. interest rates had a particularly detrimental effect on countries with larger current account deficits and dollar-denominated debt, including Argentina and Turkey.
Political uncertainty and a deteriorating economic growth outlook also weighed on emerging markets returns in the first half of 2018. Brazil’s nationwide truckers’ strike was projected to shave a full percentage point off 2018 GDP growth, threatening the country’s nascent economic recovery and further clouding the reform outlook ahead of the presidential election this fall.
Although Chinese equities held up better than most emerging market countries for the six-month period, investors became increasingly wary of escalating trade tensions as the first wave of U.S. tariffs on $34 billion of Chinese exports was scheduled to take effect on July 6.
Information Technology and Energy were the top performing sectors on a global basis during the first half of 2018, while Telecommunication Services, Financials and Consumer Staples underperformed. Within emerging markets, Energy was the only sector in positive territory for the first six-months of 2018, benefiting from the rebound in oil prices.
There is now a great deal of uncertainty about how the recently announced trade tariffs will impact intermediate term economic activity. Despite some market skepticism, global growth remains broad based and robust as we head into the second half of 2018. While global manufacturing Purchasing Managers’ Indexes (“PMIs”) declined from unsustainably elevated levels in February and March, the latest readings suggest that we are nearing the end of the deceleration to PMI levels in line with ongoing growth. Near-term economic fundamentals indicate that the current economic expansion has further to run. In times of economic expansion such as the current one, we expect companies to continue to post robust earnings growth. However, earnings growth cannot continue to accelerate at the same pace we experienced over the past several quarters, especially in the U.S., where acceleration has been quite pronounced. European companies have also enjoyed relatively strong earnings growth, which is also likely to continue but at moderately slower rates in the near term.
While the underlying economy remains robust and economic indicators continue to signal positive momentum, escalating trade war rhetoric will likely have substantial consequences on market volatility, inflation, and growth dynamics over the coming quarters. As examples, tariffs on Canadian lumber are adding to higher costs for wood, which are fueling price increases of up to $9,000 for a new single-family home, according to the National Association of Homebuilders. Elsewhere, prices of washing machines sold in the U.S. surged by nearly 8.5% this year—the first increase since 2012—after the U.S. administration restricted imports earlier this year.
More broadly, some U.S. companies are reportedly using the threat of new tariffs as a reason to raise prices. In short, tariffs amount to either a tax on consumption or corporate margin deterioration if firms choose to absorb some portion of the cost of the tariffs. In aggregate, tariffs worsen the tradeoff between growth and inflation, and will likely lead to tighter monetary policy. Much of this has not played out yet, because the U.S. administration has moved only recently. However, the effects of these
| 32 | Semiannual Report | June 30, 2018 |
Global Markets Review and Outlook
new tariffs will begin to manifest themselves over the coming quarters, and it is quite possible that the new tariffs will bring us closer to the end of the current economic expansion cycle.
Longer term, we fear the U.S. administration’s unilateral view of trade policy is suggesting an end to the decades-long building of integrated global markets and supply chains. If the U.S. chooses to limit or regulate trade however it sees fit, regardless of what agreements it may have signed in the past, trade and investment will become more volatile and more politicized. Multinationals from around the world will be more inclined to disentangle their operations from the U.S. The impact of this will only be revealed gradually over the next several years, but could imply meaningful changes to competition, quality, and innovation.
From a portfolio strategy perspective, we believe emerging markets (“EMs”) are susceptible to further downside volatility in the second half of 2018, amid persistent dollar strength as interest rates and growth differentials continue to favor the U.S. and as the Federal Reserve maintains its tightening bias. Positioning within our all county world index-oriented strategies has generally reflected our more cautious outlook, with reduced EM weightings in favor of increased developed market exposure, primarily in Europe. Within our dedicated EM strategies, we have maintained overweighted positions in China and India, and moderated exposures to Brazil and South Africa. Within China, our positioning continues to emphasize domestically-oriented consumer, Health Care and Information Technology companies that we believe are well positioned to benefit from the Chinese economy’s ongoing transition to a consumption and services-driven growth model.
| June 30, 2018 | William Blair Funds | 33 |
| | | Global Leaders Fund |
| | | |
| | | The Global Leaders Fund seeks long-term capital appreciation. |
| | | |
| | | AN OVERVIEW FROM THE PORTFOLIO MANAGERS |
| | | |

Andrew G. Flynn 
Kenneth J. McAtamney | | The William Blair Global Leaders Fund (Class N shares) posted a 6.33% increase, net of fees, for the six months ended June 30, 2018. By comparison, the Fund’s benchmark index, the MSCI All Country World IMI Index (net) (the “Index”), decreased 0.18%. Outperformance versus the Index was primarily driven by positive stock selection across most sectors. The Consumer Staples, Health Care and Consumer Discretionary sectors were the most notable sources of the Fund’s relative return. Within Consumer Staples, leading global prestige cosmetics company Estee Lauder contributed to relative results. The company continues to benefit from the rapid growth of recently acquired brands, expansion in the specialty retail and online channels, and strong growth from China. Health Care company ABIOMED, Inc., the creator of the world’s smallest heart pump, is benefiting from strong sales in an underpenetrated market. Its Impella family of devices is designed to provide temporary blood circulation support to heart failure patients. The small pump takes on the pumping function of the heart enabling it to rest and recover. It is the first blood circulation support device to receive FDA approval, which should lead to increased utilization, and we do not see any material competition on the horizon. Within the Consumer Discretionary sector, Amazon.com propelled the Fund’s relative performance on the back of strong results. Amazon’s gross profit and operating income improved, driven by strong performance in North American retail and Amazon Web Services (AWS). Partially offsetting these positive stock selection effects were the Fund’s underweight allocations to the Consumer Staples and Utilities sectors. Given above average stock selection in each sector, the Fund’s overall underweight to these sectors detracted from the Fund’s performance over the period. Please refer to the Global Markets Review and Outlook relating to the Fund beginning on page 32 for additional information. |
| 34 | Semiannual Report | June 30, 2018 |
Global Leaders Fund
Performance Highlights (Unaudited)
Average Annual Total Return through 6/30/2018
| | | Year
to Date | | 1 Year | | 3 Year | | 5 Year | | 10 Year | | Since
Inception |
| Class N | | 6.33 | % | | 21.58 | % | | 10.88 | % | | 11.36 | % | | 6.52 | % | | — | |
| Class I | | 6.46 | | | 21.92 | | | 11.24 | | | 11.69 | | | 6.80 | | | — | |
| MSCI ACW IMI (net) | | (0.18 | ) | | 11.14 | | | 8.34 | | | 9.60 | | | 6.14 | | | — | |
| Institutional Class(a) | | 6.52 | | | 22.08 | | | 11.30 | | | 11.80 | | | — | | | 11.47 | % |
| MSCI ACW IMI (net)(a) | | (0.18 | ) | | 11.14 | | | 8.34 | | | 9.60 | | | — | | | 9.79 | |
| (a) | Since inception is for the period from December 19, 2012 (Commencement of Operations) to June 30, 2018. |
Performance cited represents past performance. Past performance does not guarantee future results and current performance may be lower or higher than the data quoted. Results shown are average annual total returns, which assume reinvestment of dividends and capital gains. Investment returns and principal will fluctuate and you may have a gain or loss when you sell shares. For the most current month-end performance information, please call 1-800-742-7272, or visit our Web site at www.williamblairfunds.com. Investing in smaller and medium capitalization companies involves special risks, including higher volatility and lower liquidity. Smaller and medium capitalization stocks are also more sensitive to purchase/sale transactions and changes in the issuer’s financial condition. International investing involves special risk considerations, including currency fluctuations, lower liquidity, economic and political risk. From time to time, the investment adviser may waive fees or reimburse expenses for the Fund. Without these waivers/reimbursements, performance would be lower. Class N shares are available to the general public without a sales load. Class I shares are available to certain institutional investors, and advisory clients of William Blair & Company, L.L.C., without a sales load or distribution fees (12b-1). Institutional Class shares are available to institutional investors without a sales load or distribution (12b-1) or service fees.
The performance highlights and graph presented above do not reflect the deduction of taxes that a shareholder would pay on fund distributions or the redemption of fund shares.
The Morgan Stanley Capital International (MSCI) All Country World (ACW) Investable Market Index (IMI) (net) is a free float-adjusted market capitalization weighted index that is designed to measure the equity market of developed and emerging markets. This index approximates the minimum possible dividend reinvestment by deducting for the highest possible withholding tax rates of those markets.
This report identifies the Fund’s investments on June 30, 2018. These holdings are subject to change. Not all stocks in the Fund performed the same, nor is there any guarantee that these stocks will perform as well in the future. Market forecasts provided in this report may not necessarily come to pass.
Sector Diversification (Unaudited)

The sector diversification shown is based on the total long-term securities.
| June 30, 2018 | William Blair Funds | 35 |
Global Leaders Fund
Portfolio of Investments, June 30, 2018 (all dollar amounts in thousands) (unaudited)
| | | | | | | | | | |
| | | | | | | | | | |
| | Issuer | | Shares | | | Value | |
| | | | | | | | | | |
| | Common Stocks | | | | | | | | |
| | | | | | | | | | |
| | Western Hemisphere—57.6% | | | | | | | | |
| | Canada—2.6% | | | | | | | | |
| | Brookfield Asset Management, Inc. Class “A” (Capital markets)† | | 54,368 | | | $ | 2,204 | |
| | Suncor Energy, Inc. (Oil, gas & consumable fuels) | | | 78,818 | | | | 3,208 | |
| | | | | | | | | 5,412 | |
| | United States—55.0% | | | | | | | | |
| * | ABIOMED, Inc. (Health care equipment & supplies) | | | 4,984 | | | | 2,039 | |
| * | Adobe Systems, Inc. (Software) | | | 18,805 | | | | 4,585 | |
| * | Align Technology, Inc. (Health care equipment & supplies) | | | 8,056 | | | | 2,756 | |
| * | Alphabet, Inc. Class “A” (Internet software & services) | | | 4,754 | | | | 5,368 | |
| * | Amazon.com, Inc. (Internet & direct marketing retail) | | | 3,364 | | | | 5,718 | |
| | BlackRock, Inc. (Capital markets) | | | 8,101 | | | | 4,043 | |
| | Carnival Corporation (Hotels, restaurants & leisure)† | | | 39,444 | | | | 2,261 | |
| * | CoStar Group, Inc. (Professional services) | | | 3,945 | | | | 1,628 | |
| | Domino’s Pizza, Inc. (Hotels, restaurants & leisure) | | | 8,828 | | | | 2,491 | |
| | EOG Resources, Inc. (Oil, gas & consumable fuels) | | | 23,610 | | | | 2,938 | |
| * | Facebook, Inc. Class “A” (Internet software & services) | | | 17,340 | | | | 3,370 | |
| | Fifth Third Bancorp (Banks) | | | 112,889 | | | | 3,240 | |
| * | Guidewire Software, Inc. (Software) | | | 11,427 | | | | 1,014 | |
| | Halliburton Co. (Energy equipment & services) | | | 31,053 | | | | 1,399 | |
| | Intercontinental Exchange, Inc. (Capital markets) | | | 46,861 | | | | 3,447 | |
| * | Intuitive Surgical, Inc. (Health care equipment & supplies) | | | 3,396 | | | | 1,625 | |
| | JPMorgan Chase & Co. (Banks) | | | 40,451 | | | | 4,215 | |
| | Lam Research Corporation (Semiconductors & semiconductor equipment) | | | 10,710 | | | | 1,851 | |
| | Mastercard, Inc. Class “A” (IT services) | | | 19,877 | | | | 3,906 | |
| | NextEra Energy, Inc. (Electric utilities) | | | 15,284 | | | | 2,553 | |
| | Pioneer Natural Resources Co. (Oil, gas & consumable fuels) | | | 8,297 | | | | 1,570 | |
| | Prologis, Inc. (Equity REIT) | | | 28,166 | | | | 1,850 | |
| | Raytheon Co. (Aerospace & defense) | | | 15,825 | | | | 3,057 | |
| | Roper Technologies, Inc. (Industrial conglomerates) | | | 7,457 | | | | 2,057 | |
| * | salesforce.com, Inc. (Software) | | | 20,828 | | | | 2,841 | |
| | Southwest Airlines Co. (Airlines) | | | 39,135 | | | | 1,991 | |
| | The Boeing Co. (Aerospace & defense) | | | 11,075 | | | | 3,716 | |
| | The Estee Lauder Cos., Inc. Class “A” (Personal products) | | | 25,895 | | | | 3,695 | |
| | The Goldman Sachs Group, Inc. (Capital markets) | | | 11,830 | | | | 2,609 | |
| | The Home Depot, Inc. (Specialty retail) | | | 20,250 | | | | 3,951 | |
| | Thermo Fisher Scientific, Inc. (Life sciences tools & services) | | | 12,879 | | | | 2,668 | |
| | | | | | | | | | |
| | | | | | | | | | |
| | Issuer | | Shares | | | Value | |
| | | | | | | | | | |
| | Common Stocks—(continued) | | | | | | | | |
| | | | | | | | | | |
| | Western Hemisphere—(continued) | | | | | | | | |
| | United States—(continued) | | | | | | | | |
| * | Ulta Salon Cosmetics & Fragrance, Inc. (Specialty retail) | | | 6,969 | | | $ | 1,627 | |
| | Union Pacific Corporation (Road & rail) | | | 22,316 | | | | 3,162 | |
| | UnitedHealth Group, Inc. (Health care providers & services) | | | 19,013 | | | | 4,665 | |
| | Vail Resorts, Inc. (Hotels, restaurants & leisure) | | | 9,568 | | | | 2,623 | |
| | Watsco, Inc. (Trading companies & distributors) | | | 10,239 | | | | 1,825 | |
| * | Weight Watchers International, Inc. (Diversified consumer services) | | | 20,118 | | | | 2,034 | |
| * | Worldpay, Inc. Class “A” (IT services) | | | 40,659 | | | | 3,325 | |
| | Zoetis, Inc. (Pharmaceuticals) | | | 27,598 | | | | 2,351 | |
| | | | | | | | | 112,064 | |
| | Europe—13.1% | | | | | | | | |
| | Denmark—2.4% | | | | | | | | |
| | Chr Hansen Holding A/S (Chemicals) | | | 11,460 | | | | 1,055 | |
| | DSV A/S (Road & rail) | | | 18,850 | | | | 1,517 | |
| | Novo Nordisk A/S Class “B” (Pharmaceuticals) | | | 48,753 | | | | 2,252 | |
| | | | | | | | | 4,824 | |
| | France—3.5% | | | | | | | | |
| | BNP Paribas S.A. (Banks) | | | 25,934 | | | | 1,604 | |
| | LVMH Moet Hennessy Louis Vuitton SE (Textiles, apparel & luxury goods) | | | 10,534 | | | | 3,497 | |
| | Valeo S.A. (Auto components) | | | 39,078 | | | | 2,131 | |
| | | | | | | | | 7,232 | |
| | Germany—1.1% | | | | | | | | |
| | Infineon Technologies AG (Semiconductors & semiconductor equipment) | | | 87,848 | | | | 2,231 | |
| | Ireland—0.5% | | | | | | | | |
| | Allegion plc (Building products)† | | | 12,100 | | | | 936 | |
| | Netherlands—1.5% | | | | | | | | |
| | Royal Dutch Shell plc Class “A” (Oil, gas & consumable fuels) | | | 89,118 | | | | 3,093 | |
| | Sweden—1.5% | | | | | | | | |
| | Atlas Copco AB Class “A” (Machinery) | | | 67,945 | | | | 1,968 | |
| * | Epiroc AB Class “A” (Machinery) | | | 103,380 | | | | 1,085 | |
| | | | | | | | | 3,053 | |
| | Switzerland—2.6% | | | | | | | | |
| * | Lonza Group AG (Life sciences tools & services) | | | 9,709 | | | | 2,566 | |
| | Partners Group Holding AG (Capital markets) | | | 3,718 | | | | 2,718 | |
| | | | | | | | | 5,284 | |
| | | | | | | | | | |
| | Japan—9.8% | | | | | | | | |
| | Daikin Industries, Ltd. (Building products) | | | 27,300 | | | | 3,263 | |
| | FANUC Corporation (Machinery) | | | 7,900 | | | | 1,566 | |
| | Keyence Corporation (Electronic equipment, instruments & components) | | | 5,800 | | | | 3,271 | |
See accompanying Notes to Financial Statements.
| 36 | Semiannual Report | June 30, 2018 |
Global Leaders Fund
Portfolio of Investments, June 30, 2018 (all dollar amounts in thousands) (unaudited)
| | | | | | | | | | |
| | | | | | | | | | |
| | Issuer | | Shares | | | Value | |
| | | | | | | | | | |
| | Common Stocks—(continued) | | | | | | | | |
| | | | | | | | | | |
| | Japan—(continued) | | | | | | | | |
| | Komatsu, Ltd. (Machinery) | | | 92,600 | | | $ | 2,636 | |
| | MISUMI Group, Inc. (Machinery) | | | 35,400 | | | | 1,030 | |
| | Nihon M&A Center, Inc. (Professional services) | | | 32,200 | | | | 933 | |
| | Nissan Chemical Industries, Ltd. (Chemicals) | | | 27,000 | | | | 1,258 | |
| | ORIX Corporation (Diversified financial services) | | | 143,200 | | | | 2,257 | |
| | Shin-Etsu Chemical Co., Ltd. (Chemicals) | | | 24,200 | | | | 2,150 | |
| | Start Today Co., Ltd. (Internet & direct marketing retail) | | | 46,400 | | | | 1,679 | |
| | | | | | | | | 20,043 | |
| | | | | | | | | | |
| | Emerging Asia—8.4% | | | | | | | | |
| | China—5.7% | | | | | | | | |
| * | Alibaba Group Holding, Ltd.—ADR (Internet software & services) | | | 19,747 | | | | 3,664 | |
| | Huazhu Group, Ltd.—ADR (Hotels, restaurants & leisure) | | | 27,238 | | | | 1,144 | |
| | Shenzhou International Group Holdings, Ltd. (Textiles, apparel & luxury goods) | | | 101,000 | | | | 1,243 | |
| | Tencent Holdings, Ltd. (Internet software & services) | | | 67,700 | | | | 3,399 | |
| | Yum China Holdings, Inc. (Hotels, restaurants & leisure) | | | 56,141 | | | | 2,159 | |
| | | | | | | | | 11,609 | |
| | India—1.4% | | | | | | | | |
| | HDFC Bank, Ltd.—ADR (Banks) | | | 27,014 | | | | 2,837 | |
| | Taiwan—1.3% | | | | | | | | |
| | Taiwan Semiconductor Manufacturing Co., Ltd.—ADR (Semiconductors & semiconductor equipment) | | | 72,320 | | | | 2,644 | |
| | | | | | | | | | |
| | Asia—6.4% | | | | | | | | |
| | Australia—3.4% | | | | | | | | |
| | CSL, Ltd. (Biotechnology) | | | 24,851 | | | | 3,537 | |
| | Macquarie Group, Ltd. (Capital markets) | | | 36,765 | | | | 3,351 | |
| | | | | | | | | 6,888 | |
| | Hong Kong—3.0% | | | | | | | | |
| | AIA Group, Ltd. (Insurance) | | | 427,600 | | | | 3,725 | |
| | Galaxy Entertainment Group, Ltd. (Hotels, restaurants & leisure) | | | 309,000 | | | | 2,382 | |
| | | | | | | | | 6,107 | |
| | | | | | | | | | |
| | United Kingdom—4.3% | | | | | | | | |
| | Aptiv plc (Auto components)† | | | 22,226 | | | | 2,037 | |
| | BHP Billiton plc (Metals & mining) | | | 137,733 | | | | 3,091 | |
| | Compass Group plc (Hotels, restaurants & leisure) | | | 104,292 | | | | 2,223 | |
| | Fevertree Drinks plc (Beverages) | | | 34,333 | | | | 1,530 | |
| | | | | | | | | 8,881 | |
| | Total Common Stocks—99.6%
(cost $145,805) | | | | | | | 203,138 | |
| | | | | | | | |
| | | | Principal | | | | |
| | Issuer | | Amount | | | Value | |
| | | | | | | | | | |
| | Repurchase Agreement | | | | | | | | |
| | Fixed Income Clearing Corporation, 0.350% dated 6/29/18, due 7/2/18, repurchase price $4,055, collateralized by U.S. Treasury Inflation Index Bond, 0.250%, due 1/15/25 | | | $4,055 | | | $ | 4,055 | |
| | Total Repurchase Agreement—2.0%
(cost $4,055) | | | | | | | 4,055 | |
| | Total Investments—101.6%
(cost $149,860) | | | | | | | 207,193 | |
| | Liabilities, plus cash and other assets—(1.6)% | | | | | | | (3,326 | ) |
| | Net assets—100.0% | | | | | | $ | 203,867 | |
ADR = American Depository Receipt
REIT = Real Estate Investment Trust
† = U.S. listed foreign security
* = Non-income producing security
For securities primarily traded on exchanges or markets that close before the close of regular trading on the New York Stock Exchange, the Fund may use an independent pricing service to fair value price the securities pursuant to Valuation Procedures approved by the Board of Trustees.
At June 30, 2018, the Fund’s Portfolio of Investments includes the following industry categories (as a percentage of long-term investments):
| Information Technology | | | 20.5 | % |
| Consumer Discretionary | | | 19.3 | % |
| Financials | | | 17.8 | % |
| Industrials | | | 15.9 | % |
| Health Care | | | 12.0 | % |
| Energy | | | 6.0 | % |
| Materials | | | 3.7 | % |
| Consumer Staples | | | 2.6 | % |
| Utilities | | | 1.3 | % |
| Real Estate | | | 0.9 | % |
| Total | | | 100.0 | % |
At June 30, 2018, the Fund’s Portfolio of Investments includes the following currency categories (as a percentage of long-term investments):
| U.S. Dollar | | | 63.8 | % |
| Japanese Yen | | | 9.8 | % |
| Euro | | | 6.2 | % |
| Hong Kong Dollar | | | 5.3 | % |
| Australian Dollar | | | 3.4 | % |
| British Pound Sterling | | | 3.4 | % |
| Swiss Franc | | | 2.6 | % |
| Danish Krone | | | 2.4 | % |
| Canadian Dollar | | | 1.6 | % |
| Swedish Krona | | | 1.5 | % |
| Total | | | 100.0 | % |
See accompanying Notes to Financial Statements.
| June 30, 2018 | William Blair Funds | 37 |
| | | International Leaders Fund |
| | | |
| | | The International Leaders Fund seeks long-term capital appreciation. |
| | | |
| | | AN OVERVIEW FROM THE PORTFOLIO MANAGERS |
| | | |

Simon Fennell 
Kenneth J. McAtamney | | The William Blair International Leaders Fund (Class N shares) posted a 1.04% increase, net of fees, for the six months ended June 30, 2018. By comparison, the Fund’s benchmark index, the MSCI All Country World ex-U.S. IMI Index (net) (the “Index”), decreased 3.65%. Outperformance versus the Index was primarily driven by positive stock selection across most sectors. The Consumer Staples and Financials sectors were the most significant contributors to relative return. Within Consumer Staples, Japanese Cosmetics holding Shiseido Co., Ltd. propelled the Fund’s relative results as new management has reformed the organizational structure to place more responsibility in the hands of local managers, improved strategy execution, accelerated product development, and concentrated Shiseido’s investment on prestige brands. Within Financials, Australia-based Macquarie Group is a global provider of banking, financial, advisory, investment, and fund management services with approximately $500 billion AUD in total assets. Management has focused the business, particularly on the attractive asset management segment. Also, it is the global leader in infrastructure funds management, a highly profitable business with robust secular trends, which should lead to expanding performance fees over the next few years. Partially offsetting these effects were underweight allocations to the Consumer Staples and Materials sectors. Given above average stock selection in each sector, the underweight positions detracted from the Fund’s performance over the period. Please refer to the Global Markets Review and Outlook relating to the Fund beginning on page 32 for additional information. |
| 38 | Semiannual Report | June 30, 2018 |
International Leaders Fund
Performance Highlights (Unaudited)
Average Annual Total Return through 6/30/2018
| | | Year
to Date | | 1 Year | | 3 Year | | 5 Year | | Since
Inception |
| Class N(a) | | 1.04 | % | | 13.69 | % | | 9.17 | % | | 9.58 | % | | | 10.01 | % |
| Class I(a) | | 1.16 | | | 13.99 | | | 9.43 | | | 9.83 | | | | 10.28 | |
| MSCI ACW Ex-U.S. IMI (net)(a) | | (3.65 | ) | | 7.75 | | | 5.46 | | | 6.39 | | | | 6.96 | |
| Institutional Class(b) | | 1.22 | | | 14.09 | | | 9.54 | | | 9.97 | | | | 10.35 | |
| MSCI ACW Ex-U.S. IMI (net)(b) | | (3.65 | ) | | 7.75 | | | 5.46 | | | 6.39 | | | | 6.52 | |
| (a) | Since inception is for the period from August 16, 2012 (Commencement of Operations) to June 30, 2018. |
| (b) | Since inception is for the period from November 2, 2012 (Commencement of Operations) to June 30, 2018. |
Performance cited represents past performance. Past performance does not guarantee future results and current performance may be lower or higher than the data quoted. Results shown are average annual returns, which assume reinvestment of dividends and capital gains. Investment returns and principal will fluctuate and you may have a gain or loss when you sell shares. For the most current month-end performance information, please call 1-800-742-7272, or visit our Web site at www.williamblairfunds.com. Investing in smaller and medium capitalization companies involves special risks, including higher volatility and lower liquidity. Smaller and medium capitalization stocks are also more sensitive to purchase/sale transactions and changes in the issuer’s financial condition. International investing involves special risk considerations, including currency fluctuations, lower liquidity, economic and political risk. From time to time the investment adviser may waive fees or reimburse expenses for the Fund. Without these waivers/reimbursements, performance would be lower. Class N shares are available to the general public without a sales load. Class I shares are available to certain institutional investors, and advisory clients of William Blair & Company, L.L.C., without a sales load or distribution (12b-1) fees. Institutional Class shares are available to institutional investors without a sales load or distribution (12b-1) or service fees.
The performance highlights presented above do not reflect the deduction of taxes that a shareholder would pay on fund distributions or the redemption of fund shares.
The Morgan Stanley Capital International (MSCI) All Country World (ACW) Ex-U.S. Investable Market Index (IMI) (net) is a free float-adjusted market capitalization weighted index that is designed to measure the equity market performance of developed and emerging markets, excluding the United States. This index approximates the minimum possible dividend reinvestment by deducting for the highest possible withholding tax rates of those markets.
This report identifies the Fund’s investments on June 30, 2018. These holdings are subject to change. Not all stocks in the Fund performed the same, nor is there any guarantee that these stocks will perform as well in the future. Market forecasts provided in this report may not necessarily come to pass.
Sector Diversification (Unaudited)

The sector diversification shown is based on the total long-term securities.
| June 30, 2018 | William Blair Funds | 39 |
International Leaders Fund
Portfolio of Investments, June 30, 2018 (all dollar amounts in thousands) (unaudited)
| | | | | | | | |
| | | | | | | | |
| | Issuer | | Shares | | | Value | |
| | | | | | | | | | |
| | Common Stocks | | | | | | | | |
| | | | | | | | | | |
| | Europe—39.9% | | | | | | | | |
| | Belgium—1.5% | | | | | | | | |
| | KBC Group N.V. (Banks) | | | 81,517 | | | $ | 6,261 | |
| | Denmark—2.5% | | | | | | | | |
| | Novo Nordisk A/S Class “B” (Pharmaceuticals) | | | 137,325 | | | | 6,343 | |
| | Orsted A/S (Electric utilities) | | | 67,304 | | | | 4,067 | |
| | | | | | | | | 10,410 | |
| | France—13.4% | | | | | | | | |
| | Airbus SE (Aerospace & defense) | | | 58,872 | | | | 6,870 | |
| | Arkema S.A. (Chemicals) | | | 49,108 | | | | 5,795 | |
| | BNP Paribas S.A. (Banks) | | | 72,679 | | | | 4,496 | |
| | Capgemini SE (IT services) | | | 46,625 | | | | 6,248 | |
| | Cie Generale des Etablissements Michelin SCA (Auto components) | | | 24,371 | | | | 2,948 | |
| | LVMH Moet Hennessy Louis Vuitton SE (Textiles, apparel & luxury goods) | | | 35,075 | | | | 11,646 | |
| | Safran S.A. (Aerospace & defense) | | | 60,285 | | | | 7,301 | |
| | Total S.A. (Oil, gas & consumable fuels) | | | 108,480 | | | | 6,587 | |
| | Valeo S.A. (Auto components) | | | 90,315 | | | | 4,924 | |
| | | | | | | | | 56,815 | |
| | Germany—2.6% | | | | | | | | |
| | Infineon Technologies AG (Semiconductors & semiconductor equipment) | | | 275,892 | | | | 7,008 | |
| | Rational AG (Machinery) | | | 6,112 | | | | 3,980 | |
| | | | | | | | | 10,988 | |
| | Ireland—2.0% | | | | | | | | |
| | Kingspan Group plc (Building products) | | | 171,441 | | | | 8,570 | |
| | Luxembourg—1.0% | | | | | | | | |
| | Tenaris S.A. (Energy equipment & services) | | | 225,034 | | | | 4,107 | |
| | Netherlands—3.8% | | | | | | | | |
| | Koninklijke Philips N.V. (Health care equipment & supplies) | | | 183,544 | | | | 7,776 | |
| | Royal Dutch Shell plc Class “A” (Oil, gas & consumable fuels) | | | 241,383 | | | | 8,377 | |
| | | | | | | | | 16,153 | |
| | Spain—3.2% | | | | | | | | |
| | ACS Actividades de Construccion y Servicios S.A. (Construction & engineering) | | | 149,309 | | | | 6,024 | |
| | Amadeus IT Group S.A. (IT services) | | | 93,346 | | | | 7,340 | |
| | | | | | | | | 13,364 | |
| | Sweden—3.6% | | | | | | | | |
| | Atlas Copco AB Class “A” (Machinery) | | | 209,730 | | | | 6,074 | |
| | *Epiroc AB Class “A” (Machinery) | | | 319,124 | | | | 3,349 | |
| | Hexagon AB Class “B” (Electronic equipment, instruments & components) | | | 107,736 | | | | 5,986 | |
| | | | | | | | | 15,409 | |
| | Switzerland—6.3% | | | | | | | | |
| | Geberit AG (Building products) | | | 12,101 | | | | 5,181 | |
| * | Lonza Group AG (Life sciences tools & services) | | | 30,148 | | | | 7,967 | |
| | | | | | | | |
| | | | | | | | |
| | Issuer | | Shares | | | Value | |
| | | | | | | | | | |
| | Common Stocks—(continued) | | | | | | | | |
| | | | | | | | | | |
| | Europe—(continued) | | | | | | | | |
| | Switzerland—(continued) | | | | | | | | |
| | Partners Group Holding AG (Capital markets) | | | 8,814 | | | $ | 6,444 | |
| * | Temenos AG (Software) | | | 48,072 | | | | 7,229 | |
| | | | | | | | | 26,821 | |
| | | | | | | | | | |
| | Emerging Asia—12.7% | | | | | | | | |
| | China—9.4% | | | | | | | | |
| * | Alibaba Group Holding, Ltd.—ADR (Internet software & services) | | | 60,584 | | | | 11,240 | |
| | China Merchants Bank Co., Ltd. Class “H” (Banks) | | | 1,830,500 | | | | 6,733 | |
| | NetEase, Inc.—ADR (Internet software & services) | | | 17,287 | | | | 4,368 | |
| | Tencent Holdings, Ltd. (Internet software & services) | | | 219,200 | | | | 11,007 | |
| | Yum China Holdings, Inc. (Hotels, restaurants & leisure) | | | 168,995 | | | | 6,500 | |
| | | | | | | | | 39,848 | |
| | India—1.3% | | | | | | | | |
| | Housing Development Finance Corporation, Ltd. (Thrifts & mortgage finance) | | | 197,569 | | | | 5,505 | |
| | Taiwan—2.0% | | | | | | | | |
| | Taiwan Semiconductor Manufacturing Co., Ltd. (Semiconductors & semiconductor equipment) | | | 1,149,000 | | | | 8,159 | |
| | | | | | | | | | |
| | Japan—11.9% | | | | | | | | |
| | Daikin Industries, Ltd. (Building products) | | | 76,100 | | | | 9,095 | |
| | Keyence Corporation (Electronic equipment, instruments & components) | | | 18,100 | | | | 10,209 | |
| | Komatsu, Ltd. (Machinery) | | | 191,300 | | | | 5,446 | |
| | Nitori Holdings Co., Ltd. (Specialty retail) | | | 39,300 | | | | 6,114 | |
| | ORIX Corporation (Diversified financial services) | | | 441,100 | | | | 6,953 | |
| | Shiseido Co., Ltd. (Personal products) | | | 106,700 | | | | 8,467 | |
| | Suzuki Motor Corporation (Automobiles) | | | 71,600 | | | | 3,946 | |
| | | | | | | | | 50,230 | |
| | | | | | | | | | |
| | United Kingdom—11.8% | | | | | | | | |
| | BHP Billiton plc (Metals & mining) | | | 420,256 | | | | 9,432 | |
| | Compass Group plc (Hotels, restaurants & leisure) | | | 361,627 | | | | 7,708 | |
| | Experian plc (Professional services) | | | 312,929 | | | | 7,720 | |
| | Ferguson plc (Trading companies & distributors) | | | 65,672 | | | | 5,313 | |
| | London Stock Exchange Group plc (Capital markets) | | | 95,845 | | | | 5,642 | |
| | RELX plc (Professional services) | | | 278,245 | | | | 5,942 | |
| | Segro plc (Equity REIT) | | | 488,588 | | | | 4,303 | |
| | St James’s Place plc (Capital markets) | | | 267,326 | | | | 4,033 | |
| | | | | | | | | 50,093 | |
See accompanying Notes to Financial Statements.
| 40 | Semiannual Report | June 30, 2018 |
International Leaders Fund
Portfolio of Investments, June 30, 2018 (all dollar amounts in thousands) (unaudited)
| | | | Shares or | | | |
| | | | Principal | | | |
| | Issuer | | Amount | | Value | |
| | | | | | | | | | |
| | Common Stocks—(continued) | | | | | | | | |
| | | | | | | | | | |
| | Canada—10.7% | | | | | | | | |
| | Brookfield Asset Management, Inc. Class “A” (Capital markets)† | | | 186,449 | | | $ | 7,559 | |
| | Canadian National Railway Co. (Road & rail) | | | 113,643 | | | | 9,295 | |
| | Constellation Software, Inc. (Software) | | | 11,340 | | | | 8,795 | |
| | Dollarama, Inc. (Multiline retail) | | | 117,057 | | | | 4,537 | |
| | Suncor Energy, Inc. (Oil, gas & consumable fuels) | | | 174,659 | | | | 7,108 | |
| | The Toronto-Dominion Bank (Banks) | | | 139,245 | | | | 8,059 | |
| | | | | | | | | 45,353 | |
| | | | | | | | | | |
| | Asia—10.1% | | | | | | | | |
| | Australia—5.5% | | | | | | | | |
| | Aristocrat Leisure, Ltd. (Hotels, restaurants & leisure) | | | 190,118 | | | | 4,342 | |
| | CSL, Ltd. (Biotechnology) | | | 66,375 | | | | 9,448 | |
| | Macquarie Group, Ltd. (Capital markets) | | | 100,766 | | | | 9,183 | |
| | | | | | | | | 22,973 | |
| | | | | | | | | | |
| | Hong Kong—4.6% | | | | | | | | |
| | AIA Group, Ltd. (Insurance) | | | 1,361,200 | | | | 11,858 | |
| | Galaxy Entertainment Group, Ltd. (Hotels, restaurants & leisure) | | | 1,002,000 | | | | 7,724 | |
| | | | | | | | | 19,582 | |
| | | | | | | | | | |
| | Emerging Europe, Mid-East, Africa—0.7% | | | | | |
| | South Africa—0.7% | | | | | | | | |
| | Bid Corporation, Ltd. (Food & staples retailing) | | | 155,491 | | | | 3,114 | |
| | Total Common Stocks—97.8%
(cost $331,235) | | | | | | | 413,755 | |
| | | | | | | | | | |
| | Repurchase Agreement | | | | | | | | |
| | Fixed Income Clearing Corporation, 0.350% dated 6/29/18, due 7/2/18, repurchase price $5,855, collateralized by U.S. Treasury Note, 2.000%, due 4/30/24 | | | $5,855 | | | | 5,855 | |
| | Total Repurchase Agreement—1.4%
(cost $5,855) | | | | | | | 5,855 | |
| | Total Investments—99.2%
(cost $337,090) | | | | | | | 419,610 | |
| | Cash and other assets, less liabilities—0.8% | | | | | | | 3,237 | |
| | Net assets—100.0% | | | | | | $ | 422,847 | |
ADR = American Depository Receipt
REIT = Real Estate Investment Trust
* = Non-income producing security
† = U.S. listed foreign security
For securities primarily traded on exchanges or markets that close before the close of regular trading on the New York Stock Exchange, the Fund may use an independent pricing service to fair value price the securities pursuant to Valuation Procedures approved by the Board of Trustees.
At June 30, 2018, the Fund’s Portfolio of Investments includes the following industry categories (as a percentage of long-term investments):
| Industrials | | | 21.8 | % |
| Information Technology | | | 21.2 | % |
| Financials | | | 20.0 | % |
| Consumer Discretionary | | | 14.6 | % |
| Health Care | | | 7.6 | % |
| Energy | | | 6.3 | % |
| Materials | | | 3.7 | % |
| Consumer Staples | | | 2.8 | % |
| Real Estate | | | 1.0 | % |
| Utilities | | | 1.0 | % |
| Total | | | 100.0 | % |
At June 30, 2018, the Fund’s Portfolio of Investments includes the following currency categories (as a percentage of long-term investments):
| Euro | | | 28.1 | % |
| Japanese Yen | | | 12.1 | % |
| British Pound Sterling | | | 12.1 | % |
| Canadian Dollar | | | 9.1 | % |
| Hong Kong Dollar | | | 9.0 | % |
| U.S. Dollar | | | 7.2 | % |
| Swiss Franc | | | 6.5 | % |
| Australian Dollar | | | 5.6 | % |
| Swedish Krona | | | 3.7 | % |
| Danish Krone | | | 2.5 | % |
| New Taiwan Dollar | | | 2.0 | % |
| Indian Rupee | | | 1.3 | % |
| All Other Currencies | | | 0.8 | % |
| Total | | | 100.0 | % |
See accompanying Notes to Financial Statements.
| June 30, 2018 | William Blair Funds | 41 |
| | International Developed Plus Fund |
| | |
| | The International Developed Plus Fund seeks long-term capital appreciation. |
| | |
| | AN OVERVIEW FROM THE PORTFOLIO MANAGERS |
| | |

David Merjan 
John C. Murphy | The William Blair International Developed Plus Fund (Class N shares) posted a 2.59% decrease, net of fees, for the six months ended June 30, 2018. By comparison, the Fund’s benchmark index, the MSCI World ex-U.S. Index (net) (the “Index”), decreased 2.77%. Outperformance versus the Index was driven by a combination of allocation and stock selection effects. More specifically, the Fund’s underweight allocation to Utilities, coupled with above average stock selection within the Financials and Consumer Staples sectors, boosted relative returns. Within the Financials sector, Japan-based M&A Capital Partners Co., Ltd. outperformed. M&A Capital Partners is a high-quality, small-cap growth company in Japan that provides merger and acquisition advisory services to small and medium-sized enterprises (“SMEs”). The company’s addressable market is significant; industry fragmentation coupled with aging demographics has resulted in succession challenges for many businesses. M&A Capital Partners has a strong track record of growth, generated in part by its industry expertise in dispensing pharmacies, combined with its success in attracting new consultants, thereby expanding internal capacity. Within the Consumer Staples sector, Shiseido Co., Ltd. was a strong contributor. Shiseido is the largest cosmetics company in Japan and fifth largest in the world. We expect a continued rebound in Shiseido’s earnings growth after a ten year period of operational underperformance and market share loss. New management has reformed the organizational structure to place more responsibility in the hands of local managers, improved strategy execution, accelerated product development, and concentrated Shiseido’s investment on prestige brands. Shiseido experienced robust sales growth in the first quarter of 2018, which was mainly driven by rapid growth in high-priced cosmetics and successful new product launches. Partially offsetting these positive effects was negative stock selection within the Materials and Utilities sectors. Within Materials, Norsk Hydro ASA, the Norwegian integrated aluminum producer, detracted from the Fund’s performance. Flooding at the company’s Alunorte facility in Brazil weighed on the share price amid investor concerns that the resulting production disruption would meaningfully impact 2018 earnings. We liquidated the position as a result. Within the Utilities sector, Veolia Environnement S.A., the France-based waste management and water treatment company, detracted from performance. Veolia’s shares were negatively affected by expectations of rising interest rates and disappointing earnings results at competitor Suez Environnement. Veolia continues to see strong trends in organic growth driven by new contract wins and accelerating contributions from new businesses (e.g., toxic waste, recycling and energy management), which now account for 30% of total revenue. Please refer to the Global Markets Review and Outlook relating to the Fund beginning on page 32 for additional information. |
| 42 | Semiannual Report | June 30, 2018 |
International Developed Plus Fund
Performance Highlights (Unaudited)
| Average Annual Total Return through 6/30/2018 |
| | | | Year
to Date | | | 1 Year | | | 3 Year | | | 5 Year | | | 10 Year |
| Class N | | | (2.59 | )% | | | 7.50 | % | | | 4.62 | % | | | 6.50 | % | | | 2.04 | % |
| Class I | | | (2.45 | ) | | | 7.82 | | | | 4.88 | | | | 6.75 | | | | 2.30 | |
| MSCI World Ex-U.S. Index (net) | | | (2.77 | ) | | | 7.04 | | | | 4.87 | | | | 6.23 | | | | 2.63 | |
Performance cited represents past performance. Past performance does not guarantee future results and current performance may be lower or higher than the data quoted. Results shown are average annual returns, which assume reinvestment of dividends and capital gains. Investment returns and principal will fluctuate and you may have a gain or loss when you sell shares. For the most current month-end performance information, please call 1-800-742-7272, or visit our Web site at www.williamblairfunds.com. Investing in smaller and medium capitalization companies involves special risks, including higher volatility and lower liquidity. Smaller and medium capitalization stocks are also more sensitive to purchase/sale transactions and changes in the issuer’s financial condition. International investing involves special risk considerations, including currency fluctuations, lower liquidity, economic and political risk. From time to time the investment adviser may waive fees or reimburse expenses for the Fund. Without these waivers/reimbursements, performance would be lower. Class N shares are available to the general public without a sales load. Class I shares are available to certain institutional investors, and advisory clients of William Blair & Company, L.L.C., without a sales load or distribution (12b-1) or service fees.
The performance highlights and graph presented above do not reflect the deduction of taxes that a shareholder would pay on fund distributions or the redemption of fund shares.
The Morgan Stanley Capital International (MSCI) World Ex-U.S. Index (net) is a free float-adjusted market capitalization weighted index that is designed to measure the equity market performance of developed markets, excluding the United States. This index approximates the minimum possible dividend reinvestment by deducting for the highest possible withholding tax rates of those markets.
This report identifies the Fund’s investments on June 30, 2018. These holdings are subject to change. Not all stocks in the Fund performed the same, nor is there any guarantee that these stocks will perform as well in the future. Market forecasts provided in this report may not necessarily come to pass.
Sector Diversification (Unaudited)
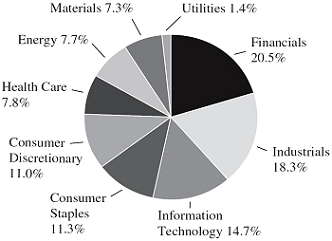
The sector diversification shown is based on the total long-term securities.
| June 30, 2018 | William Blair Funds | 43 |
International Developed Plus Fund
Portfolio of Investments, June 30, 2018 (all dollar amounts in thousands) (unaudited)
| | | | | | | | |
| | | | | | | | |
| | Issuer | | Shares | | | Value | |
| | | | | | | | | | |
| | Common Stocks | | | | | | | | |
| | | | | | | | | | |
| | Europe—30.9% | | | | | | | | |
| | France—7.1% | | | | | | | | |
| | Capgemini SE (IT services) | | | 24,109 | | | $ | 3,231 | |
| | Legrand S.A. (Electrical equipment) | | | 21,944 | | | | 1,607 | |
| | LVMH Moet Hennessy Louis Vuitton SE (Textiles, apparel & luxury goods) | | | 5,029 | | | | 1,670 | |
| | Veolia Environnement S.A. (Multi-utilities) | | | 72,068 | | | | 1,540 | |
| | | | | | | | | 8,048 | |
| | Germany—7.3% | | | | | | | | |
| | Covestro AG (Chemicals) | | | 20,767 | | | | 1,846 | |
| | Infineon Technologies AG (Semiconductors & semiconductor equipment) | | | 65,494 | | | | 1,663 | |
| | MTU Aero Engines AG (Aerospace & defense) | | | 18,485 | | | | 3,541 | |
| * | QIAGEN N.V. (Life sciences tools & services)† | | | 33,183 | | | | 1,200 | |
| | | | | | | | | 8,250 | |
| | Ireland—1.9% | | | | | | | | |
| | Kerry Group plc Class “A” (Food products) | | | 21,033 | | | | 2,199 | |
| | Netherlands—3.1% | | | | | | | | |
| | Royal Dutch Shell plc Class “A” (Oil, gas & consumable fuels) | | | 100,820 | | | | 3,499 | |
| | Sweden—5.2% | | | | | | | | |
| | Atlas Copco AB Class “A” (Machinery) | | | 90,459 | | | | 2,620 | |
| | Boliden AB (Metals & mining) | | | 63,531 | | | | 2,050 | |
| * | Epiroc AB Class “A” (Machinery) | | | 112,573 | | | | 1,181 | |
| | | | | | | | | 5,851 | |
| | Switzerland—6.3% | | | | | | | | |
| | Geberit AG (Building products) | | | 3,976 | | | | 1,702 | |
| | Partners Group Holding AG (Capital markets) | | | 3,200 | | | | 2,339 | |
| | Straumann Holding AG (Health care equipment & supplies) | | | 2,681 | | | | 2,033 | |
| | Tecan Group AG (Life sciences tools & services) | | | 4,115 | | | | 999 | |
| | | | | | | | | 7,073 | |
| | | | | | | | | | |
| | United Kingdom—23.6% | | | | | | | | |
| | AstraZeneca plc (Pharmaceuticals) | | | 35,370 | | | | 2,446 | |
| | Compass Group plc (Hotels, restaurants & leisure) | | | 183,710 | | | | 3,916 | |
| | Diageo plc (Beverages) | | | 102,862 | | | | 3,695 | |
| | Halma plc (Electronic equipment, instruments & components) | | | 129,544 | | | | 2,333 | |
| | Legal & General Group plc (Insurance) | | | 440,167 | | | | 1,540 | |
| * | Metro Bank plc (Banks) | | | 26,230 | | | | 1,116 | |
| | Prudential plc (Insurance) | | | 112,469 | | | | 2,564 | |
| | RELX plc (Professional services) | | | 98,112 | | | | 2,095 | |
| | Rio Tinto plc (Metals & mining) | | | 22,445 | | | | 1,237 | |
| | Schroders plc (Capital markets) | | | 63,254 | | | | 2,625 | |
| | Unilever N.V. (Personal products) | | | 55,861 | | | | 3,112 | |
| | | | | | | | | 26,679 | |
| | | | | | | | |
| | | | | | | | |
| | Issuer | | Shares | | | Value | |
| | | | | | | | | | |
| | Common Stocks—(continued) | | | | | | | | |
| | | | | | | | | | |
| | Japan—16.7% | | | | | | | | |
| | Asahi Group Holdings, Ltd. (Beverages) | | | 39,500 | | | $ | 2,026 | |
| | Daikin Industries, Ltd. (Building products) | | | 21,018 | | | | 2,512 | |
| | Harmonic Drive Systems, Inc. (Machinery) | | | 17,000 | | | | 717 | |
| | Keyence Corporation (Electronic equipment, instruments & components) | | | 3,200 | | | | 1,805 | |
| * | M&A Capital Partners Co., Ltd. (Capital markets) | | | 11,936 | | | | 1,062 | |
| | Nihon M&A Center, Inc. (Professional services) | | | 47,480 | | | | 1,376 | |
| | Nitori Holdings Co., Ltd. (Specialty retail) | | | 12,000 | | | | 1,867 | |
| | Omron Corporation (Electronic equipment, instruments & components) | | | 29,400 | | | | 1,370 | |
| | ORIX Corporation (Diversified financial services) | | | 115,629 | | | | 1,822 | |
| | Seria Co., Ltd. (Multiline retail) | | | 38,900 | | | | 1,864 | |
| | Shimadzu Corporation (Electronic equipment, instruments & components) | | | 33,800 | | | | 1,020 | |
| | Shiseido Co., Ltd. (Personal products) | | | 17,200 | | | | 1,365 | |
| | | | | | | | | 18,806 | |
| | | | | | | | | | |
| | Canada—13.5% | | | | | | | | |
| | Canadian National Railway Co. (Road & rail)† | | | 33,747 | | | | 2,759 | |
| | Canadian Natural Resources, Ltd. (Oil, gas & consumable fuels) | | | 73,542 | | | | 2,654 | |
| | Canadian Natural Resources, Ltd. (Oil, gas & consumable fuels)† | | | 10,116 | | | | 365 | |
| | Enerplus Corporation (Oil, gas & consumable fuels) | | | 152,798 | | | | 1,927 | |
| | First Quantum Minerals, Ltd. (Metals & mining) | | | 64,039 | | | | 944 | |
| | Lundin Mining Corporation (Metals & mining) | | | 344,361 | | | | 1,915 | |
| | Magna International, Inc. (Auto components) | | | 31,982 | | | | 1,860 | |
| | The Toronto-Dominion Bank (Banks)† | | | 48,661 | | | | 2,815 | |
| | | | | | | | | 15,239 | |
| | | | | | | | | | |
| | Emerging Asia—6.3% | | | | | | | | |
| | China—2.9% | | | | | | | | |
| * | Alibaba Group Holding, Ltd.—ADR (Internet software & services) | | | 12,871 | | | | 2,388 | |
| | Yum China Holdings, Inc. (Hotels, restaurants & leisure) | | | 22,421 | | | | 862 | |
| | | | | | | | | 3,250 | |
| | India—1.3% | | | | | | | | |
| | HDFC Bank, Ltd.—ADR (Banks) | | | 14,749 | | | | 1,549 | |
| | Taiwan—2.1% | | | | | | | | |
| | Taiwan Semiconductor Manufacturing Co., Ltd.—ADR (Semiconductors & semiconductor equipment) | | | 64,127 | | | | 2,345 | |
See accompanying Notes to Financial Statements.
| 44 | Semiannual Report | June 30, 2018 |
International Developed Plus Fund
Portfolio of Investments, June 30, 2018 (all dollar amounts in thousands) (unaudited)
| | | | Shares or
Principal | | | | |
| | Issuer | | Amount | | | Value | |
| | | | | | | | | | |
| | Common Stocks—(continued) | | | | | | | | |
| | | | | | | | | | |
| | Asia—4.9% | | | | | | | | |
| | Australia—1.7% | | | | | | | | |
| | CSL, Ltd. (Biotechnology) | | | 13,544 | | | $ | 1,928 | |
| | Hong Kong—3.2% | | | | | | | | |
| | AIA Group, Ltd. (Insurance) | | | 417,586 | | | | 3,638 | |
| | | | | | | | | | |
| | Emerging Latin America—1.2% | | | | | | | | |
| | Peru—1.2% | | | | | | | | |
| | Credicorp, Ltd. (Banks)† | | | 5,836 | | | | 1,314 | |
| | Total Common Stocks—97.1%
(cost $92,151) | | | | | | | 109,668 | |
| | | | | | | | | | |
| | Repurchase Agreement | | | | | | | | |
| | Fixed Income Clearing Corporation, 0.350% dated 6/29/18, due 7/2/18, repurchase price $2,837, collateralized by U.S. Treasury Note, 2.000%, due 4/30/24 | | | $2,837 | | | | 2,837 | |
| | Total Repurchase Agreement—2.5%
(cost $2,837) | | | | | | | 2,837 | |
| | Total Investments—99.6%
(cost $94,988) | | | | | | | 112,505 | |
| | Cash and other assets, less liabilities—0.4% | | | | | | | 491 | |
| | Net assets—100.0% | | | | | | $ | 112,996 | |
ADR = American Depository Receipt
* = Non-income producing security
† = U.S. listed foreign security
For securities primarily traded on exchanges or markets that close before the close of regular trading on the New York Stock Exchange, the Fund may use an independent pricing service to fair value price the securities pursuant to Valuation Procedures approved by the Board of Trustees.
At June 30, 2018, the Fund’s Portfolio of Investments includes the following industry categories (as a percentage of long-term investments):
| Financials | | | 20.5 | % |
| Industrials | | | 18.3 | % |
| Information Technology | | | 14.7 | % |
| Consumer Staples | | | 11.3 | % |
| Consumer Discretionary | | | 11.0 | % |
| Health Care | | | 7.8 | % |
| Energy | | | 7.7 | % |
| Materials | | | 7.3 | % |
| Utilities | | | 1.4 | % |
| Total | | | 100.0 | % |
At June 30, 2018, the Fund’s Portfolio of Investments includes the following currency categories (as a percentage of long-term investments):
| Euro | | | 21.8 | % |
| British Pound Sterling | | | 21.5 | % |
| Japanese Yen | | | 17.1 | % |
| U.S. Dollar | | | 14.2 | % |
| Canadian Dollar | | | 8.5 | % |
| Swiss Franc | | | 6.5 | % |
| Swedish Krona | | | 5.3 | % |
| Hong Kong Dollar | | | 3.3 | % |
| Australian Dollar | | | 1.8 | % |
| Total | | | 100.0 | % |
See accompanying Notes to Financial Statements.
| June 30, 2018 | William Blair Funds | 45 |
| | | Institutional International Developed Plus Fund |
| | | |
| | | The Institutional International Developed Plus Fund seeks long-term capital appreciation. |
| | | |
| | | AN OVERVIEW FROM THE PORTFOLIO MANAGERS |
| | | |

David Merjan 
John C. Murphy | | The William Blair Institutional International Developed Plus Fund (Institutional Class shares) posted a 0.96% decrease, net of fees, for the six months ended June 30, 2018. By comparison, the Fund’s benchmark index, the MSCI World ex-U.S. Index (net) (the “Index”), decreased 2.77%. Outperformance versus the Index was driven by a combination of allocation and stock selection effects. More specifically, the Fund’s underweight allocation to Utilities, coupled with above average stock selection within the Financials and Consumer Staples sectors, boosted relative returns. Within the Financials sector, Japan-based M&A Capital Partners Co., Ltd. outperformed. M&A Capital Partners is a high-quality, small-cap growth company in Japan that provides merger and acquisition advisory services to small and medium sized enterprises (“SMEs”). The company’s addressable market is significant; industry fragmentation coupled with aging demographics has resulted in succession challenges for many businesses. M&A Capital Partners has a strong track record of growth, generated in part by its industry expertise in dispensing pharmacies, combined with its success in attracting new consultants, thereby expanding internal capacity. Within the Consumer Staples sector, Shiseido Co., Ltd. was a strong contributor. Shiseido is the largest cosmetics company in Japan and fifth largest in the world. We expect a continued rebound in Shiseido’s earnings growth after a ten year period of operational underperformance and market share loss. New management has reformed the organizational structure to place more responsibility in the hands of local managers, improved strategy execution, accelerated product development, and concentrated Shiseido’s investment on prestige brands. Shiseido experienced robust sales growth in the first quarter of 2018, which was mainly driven by rapid growth in high-priced cosmetics and successful new product launches. Partially offsetting these positive effects was negative stock selection within the Materials and Utilities sectors. Within Materials, Norsk Hydro ASA, the Norwegian integrated aluminum producer, detracted from the Fund’s performance. Flooding at the company’s Alunorte facility in Brazil weighed on the share price amid investor concerns that the resulting production disruption would meaningfully impact 2018 earnings. We liquidated the position as a result. Within the Utilities sector, Veolia Environnement S.A., the France-based waste management and water treatment company, detracted from performance. Veolia’s shares were negatively affected by expectations of rising interest rates and disappointing earnings results at competitor Suez Environnement. Veolia continues to see strong trends in organic growth driven by new contract wins and accelerating contributions from new businesses (e.g. toxic waste, recycling and energy management), which now account for 30% of total revenue. Please refer to the Global Markets Review and Outlook relating to the Fund beginning on page 32 for additional information. |
| | | |
| 46 | Semiannual Report | June 30, 2018 |
| Institutional International Developed Plus Fund |
| Performance Highlights (Unaudited) |
| |
| |
| Average Annual Total Return through 6/30/2018 |
| | | Year
to Date | | 1 Year | | 3 Year | | 5 Year | | 10 Year |
| Institutional International Developed Plus Fund | | | (0.96 | )% | | | 9.65 | % | | | 5.49 | % | | | 6.99 | % | | | 2.36 | % |
| MSCI World Ex-U.S. Index (net) | | | (2.77 | ) | | | 7.04 | | | | 4.87 | | | | 6.23 | | | | 2.63 | |
During the first quarter of 2018, the Fund received a litigation settlement that positively impacted the Fund’s performance. This was a one-time event that is not likely to be repeated. With the passage of time the impact of this settlement on the Fund’s performance is likely to diminish.
Performance cited represents past performance. Past performance does not guarantee future results and current performance may be lower or higher than the data quoted. Results shown are average annual returns, which assume reinvestment of dividends and capital gains. Investment returns and principal will fluctuate and you may have a gain or loss when you sell shares. For the most current month end performance information, please call 1-800-742-7272, or visit our Web site at www.williamblairfunds.com. Investing in smaller and medium capitalization companies involves special risks, including higher volatility and lower liquidity. Smaller and medium capitalization stocks are also more sensitive to purchase/sale transactions and changes in the issuer’s financial condition. International investing involves special risk considerations, including currency fluctuations, lower liquidity, economic and political risk. From time to time, the investment adviser may waive fees or reimburse expenses for the Fund. Without these waivers/reimbursements, performance would be lower. Shares of the Fund are available without a sales load or distribution (12b-1) or service fees.
The performance highlights and graph presented above do not reflect the deduction of taxes that a shareholder would pay on fund distributions or the redemption of fund shares.
The Morgan Stanley Capital International (MSCI) World Ex-U.S. Index (net) is a free float-adjusted market capitalization weighted index that is designed to measure the equity market performance of developed markets, excluding the United States. This index approximates the minimum possible dividend reinvestment by deducting for the highest possible withholding tax rates of those markets.
This report identifies the Fund’s investments on June 30, 2018. These holdings are subject to change. Not all stocks in the Fund performed the same, nor is there any guarantee that these stocks will perform as well in the future. Market forecasts provided in this report may not necessarily come to pass.
| Sector Diversification (Unaudited) |
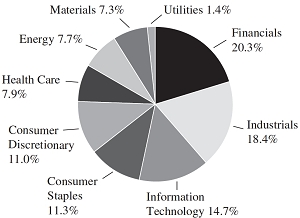
The sector diversification shown is based on the total long-term securities.
| June 30, 2018 | William Blair Funds | 47 |
| Institutional International Developed Plus Fund |
Portfolio of Investments, June 30, 2018 (all dollar amounts in thousands) (unaudited)
| | | | | | | | |
| | | | | | | | |
| | Issuer | | Shares | | | Value | |
| | | | | | | | | | |
| | Common Stocks | | | | | | | | |
| | | | | | | | | | |
| | Europe—30.8% | | | | | | | | |
| | France—7.1% | | | | | | | | |
| | Capgemini SE (IT services) | | | 4,012 | | | $ | 538 | |
| | Legrand S.A. (Electrical equipment) | | | 3,653 | | | | 268 | |
| | LVMH Moet Hennessy Louis Vuitton SE (Textiles, apparel & luxury goods) | | | 842 | | | | 279 | |
| | Veolia Environnement S.A. (Multi-utilities) | | | 11,752 | | | | 251 | |
| | | | | | | | | 1,336 | |
| | Germany—7.2% | | | | | | | | |
| | Covestro AG (Chemicals) | | | 3,456 | | | | 307 | |
| | Infineon Technologies AG (Semiconductors & semiconductor equipment) | | | 10,659 | | | | 271 | |
| | MTU Aero Engines AG (Aerospace & defense) | | | 3,057 | | | | 585 | |
| * | QIAGEN N.V. (Life sciences tools & services)† | | | 5,525 | | | | 200 | |
| | | | | | | | | 1,363 | |
| | Ireland—1.9% | | | | | | | | |
| | Kerry Group plc Class “A” (Food products) | | | 3,478 | | | | 364 | |
| | Netherlands—3.1% | | | | | | | | |
| | Royal Dutch Shell plc Class “A” (Oil, gas & consumable fuels) | | | 16,671 | | | | 578 | |
| | Sweden—5.2% | | | | | | | | |
| | Atlas Copco AB Class “A” (Machinery) | | | 15,158 | | | | 439 | |
| | Boliden AB (Metals & mining) | | | 10,588 | | | | 342 | |
| * | Epiroc AB Class “A” (Machinery) | | | 18,863 | | | | 198 | |
| | | | | | | | | 979 | |
| | Switzerland—6.3% | | | | | | | | |
| | Geberit AG (Building products) | | | 666 | | | | 285 | |
| | Partners Group Holding AG (Capital markets) | | | 533 | | | | 390 | |
| | Straumann Holding AG (Health care equipment & supplies) | | | 446 | | | | 338 | |
| | Tecan Group AG (Life sciences tools & services) | | | 685 | | | | 166 | |
| | | | | | | | | 1,179 | |
| | | | | | | | | | |
| | United Kingdom—23.5% | | | | | | | | |
| | AstraZeneca plc (Pharmaceuticals) | | | 5,901 | | | | 408 | |
| | Compass Group plc (Hotels, restaurants & leisure) | | | 30,638 | | | | 653 | |
| | Diageo plc (Beverages) | | | 17,155 | | | | 616 | |
| | Halma plc (Electronic equipment, instruments & components) | | | 21,690 | | | | 391 | |
| | Legal & General Group plc (Insurance) | | | 73,355 | | | | 257 | |
| * | Metro Bank plc (Banks) | | | 4,269 | | | | 182 | |
| | Prudential plc (Insurance) | | | 18,598 | | | | 424 | |
| | RELX plc (Professional services) | | | 16,223 | | | | 346 | |
| | Rio Tinto plc (Metals & mining) | | | 3,653 | | | | 201 | |
| | Schroders plc (Capital markets) | | | 10,549 | | | | 438 | |
| | Unilever N.V. (Personal products) | | | 9,316 | | | | 519 | |
| | | | | | | | | 4,435 | |
| | | | | | | | |
| | | | | | | | |
| | Issuer | | Shares | | | Value | |
| | | | | | | | | | |
| | Common Stocks—(continued) | | | | | | | | |
| | | | | | | | | | |
| | Japan—16.5% | | | | | | | | |
| | Asahi Group Holdings, Ltd. (Beverages) | | | 6,500 | | | $ | 334 | |
| | Daikin Industries, Ltd. (Building products) | | | 3,506 | | | | 419 | |
| | Harmonic Drive Systems, Inc. (Machinery) | | | 2,800 | | | | 118 | |
| | Keyence Corporation (Electronic equipment, instruments & components) | | | 500 | | | | 282 | |
| * | M&A Capital Partners Co., Ltd. (Capital markets) | | | 1,969 | | | | 175 | |
| | Nihon M&A Center, Inc. (Professional services) | | | 7,800 | | | | 226 | |
| | Nitori Holdings Co., Ltd. (Specialty retail) | | | 2,000 | | | | 311 | |
| | Omron Corporation (Electronic equipment, instruments & components) | | | 4,900 | | | | 228 | |
| | ORIX Corporation (Diversified financial services) | | | 19,112 | | | | 301 | |
| | Seria Co., Ltd. (Multiline retail) | | | 6,500 | | | | 312 | |
| | Shimadzu Corporation (Electronic equipment, instruments & components) | | | 5,600 | | | | 169 | |
| | Shiseido Co., Ltd. (Personal products) | | | 2,900 | | | | 230 | |
| | | | | | | | | 3,105 | |
| | | | | | | | | | |
| | Canada—13.4% | | | | | | | | |
| | Canadian National Railway Co. (Road & rail)† | | | 5,580 | | | | 456 | |
| | Canadian Natural Resources, Ltd. (Oil, gas & consumable fuels) | | | 12,161 | | | | 439 | |
| | Canadian Natural Resources, Ltd. (Oil, gas & consumable fuels)† | | | 1,684 | | | | 61 | |
| | Enerplus Corporation (Oil, gas consumable fuels) | | | 24,867 | | | | 314 | |
| | First Quantum Minerals, Ltd. (Metals & mining) | | | 10,663 | | | | 157 | |
| | Lundin Mining Corporation (Metals & mining) | | | 57,694 | | | | 321 | |
| | Magna International, Inc. (Auto components) | | | 5,205 | | | | 303 | |
| | The Toronto-Dominion Bank (Banks)† | | | 8,046 | | | | 465 | |
| | | | | | | | | 2,516 | |
| | | | | | | | | | |
| | Emerging Asia—6.3% | | | | | | | | |
| | China—2.9% | | | | | | | | |
| * | Alibaba Group Holding, Ltd.—ADR (Internet software & services) | | | 2,156 | | | | 400 | |
| | Yum China Holdings, Inc. (Hotels, restaurants & leisure) | | | 3,736 | | | | 144 | |
| | | | | | | | | 544 | |
| | India—1.3% | | | | | | | | |
| | HDFC Bank, Ltd.—ADR (Banks) | | | 2,460 | | | | 258 | |
| | Taiwan—2.1% | | | | | | | | |
| | Taiwan Semiconductor Manufacturing Co., Ltd.—ADR (Semiconductors & semiconductor equipment) | | | 10,701 | | | | 391 | |
See accompanying Notes to Financial Statements.
| 48 | Semiannual Report | June 30, 2018 |
| Institutional International Developed Plus Fund |
Portfolio of Investments, June 30, 2018 (all dollar amounts in thousands) (unaudited)
| | Issuer | | Shares or
Principal
Amount | | | Value | |
| | | | | | | | | | |
| | Common Stocks—(continued) | | | | | | | | |
| | | | | | | | | | |
| | Asia—4.9% | | | | | | | | |
| | Australia—1.7% | | | | | | | | |
| | CSL, Ltd. (Biotechnology) | | | 2,264 | | | $ | 322 | |
| | Hong Kong—3.2% | | | | | | | | |
| | AIA Group, Ltd. (Insurance) | | | 69,071 | | | | 602 | |
| | | | | | | | | | |
| | Emerging Latin America—1.1% | | | | | | | | |
| | Peru—1.1% | | | | | | | | |
| | Credicorp, Ltd. (Banks)† | | | 950 | | | | 214 | |
| | Total Common Stocks—96.5%
(cost $15,017) | | | | | | | 18,186 | |
| | | | | | | | | | |
| | Repurchase Agreement | | | | | | | | |
| | Fixed Income Clearing Corporation, 0.350% dated 6/29/18, due 7/2/18, repurchase price $624, collateralized by U.S. Treasury Note, 2.000%, due 4/30/24 | | | $624 | | | | 624 | |
| | Total Repurchase Agreement—3.3%
(cost $624) | | | | | | | 624 | |
| | Total Investments—99.8%
(cost $15,641) | | | | | | | 18,810 | |
| | Cash and other assets, less liabilities—0.2% | | | | | | | 44 | |
| | Net assets—100.0% | | | | | | $ | 18,854 | |
ADR = American Depository Receipt
* = Non-income producing security
† = U.S. listed foreign security
For securities primarily traded on exchanges or markets that close before the close of regular trading on the New York Stock Exchange, the Fund may use an independent pricing service to fair value price the securities pursuant to Valuation Procedures approved by the Board of Trustees.
At June 30, 2018, the Fund’s Portfolio of Investments includes the following industry categories (as a percentage of long-term investments):
| Financials | | | 20.3 | % |
| Industrials | | | 18.4 | % |
| Information Technology | | | 14.7 | % |
| Consumer Staples | | | 11.3 | % |
| Consumer Discretionary | | | 11.0 | % |
| Health Care | | | 7.9 | % |
| Energy | | | 7.7 | % |
| Materials | | | 7.3 | % |
| Utilities | | | 1.4 | % |
| Total | | | 100.0 | % |
At June 30, 2018, the Fund’s Portfolio of Investments includes the following currency categories (as a percentage of long-term investments):
| Euro | | | 21.8 | % |
| British Pound Sterling | | | 21.5 | % |
| Japanese Yen | | | 17.1 | % |
| U.S. Dollar | | | 14.2 | % |
| Canadian Dollar | | | 8.4 | % |
| Swiss Franc | | | 6.5 | % |
| Swedish Krona | | | 5.4 | % |
| Hong Kong Dollar | | | 3.3 | % |
| Australian Dollar | | | 1.8 | % |
| Total | | | 100.0 | % |
See accompanying Notes to Financial Statements.
| June 30, 2018 | William Blair Funds | 49 |
| | | International Growth Fund |
| | | |
| | | The International Growth Fund seeks long-term capital appreciation. |
| | | |
| | | AN OVERVIEW FROM THE PORTFOLIO MANAGERS |
| | | |

Simon Fennell 
Kenneth J. McAtamney | | The William Blair International Growth Fund (Class N shares) posted a 1.78% decrease, net of fees, for the six months ended June 30, 2018. By comparison, the Fund’s benchmark index, the MSCI All Country World ex-U.S. IMI Index (net) (the “Index”), decreased 3.65%. Outperformance versus the Index was primarily driven by positive stock selection across most sectors. The Consumer Staples and Financials sectors were the largest sources of relative return. Within the Consumer Staples sector, Japanese cosmetics holding Shiseido Co., Ltd. boosted the Fund’s relative performance. Shiseido is the largest cosmetics company in Japan and fifth largest in the world. We expect a continued rebound in Shiseido’s earnings growth after a ten year period of operational underperformance and market share loss. New management has reformed the organizational structure to place more responsibility in the hands of local managers, improved strategy execution, accelerated product development, and concentrated Shiseido’s investment on prestige brands. Shiseido experienced robust sales growth in the first quarter of 2018, which was mainly driven by rapid growth in high-priced cosmetics and successful new product launches. Within Financials, Switzerland-based asset manager Partners Group Holding AG bolstered the Fund’s performance. Partners Group manages approximately $78 billion in assets for over 1,000 institutional investors globally, investing in private equity, private real estate, private infrastructure and private debt. Partners Group has benefitted from strong structural demand and continues to stand out for its global footprint (in terms of its distribution, investments, and client base), breadth of private market investment solutions, investment performance, and cash flow generation. Positive operating momentum at the company has been driven by growth in base management fees and performance fees. Partially offsetting these positive effects was negative stock selection within the Telecommunication Services and Information Technology sectors. Within Telecommunication Services, Canadian wireless and cable company Rogers Communications detracted from performance. The company’s share price was hampered by investors’ concerns about rising competitive pressures in the wireless business. While Rogers remains a leader with high quality customers and a favorable spectrum position in Canada, we exited the position in favor of more compelling opportunities. Within the Information Technology sector, U.K. software company Micro Focus International plc’s share price weakened significantly in March after the company provided disappointing revenue guidance for 2018 due to problems integrating the recently acquired Hewlett Packard Enterprise software business, and the announcement that its CEO would resign after only six months in his position. We liquidated the position as a result of these issues. Please refer to the Global Markets Review and Outlook relating to the Fund beginning on page 32 for additional information. |
| 50 | Semiannual Report | June 30, 2018 |
| International Growth Fund |
| Performance Highlights (Unaudited) |
| Average Annual Total Return through 6/30/2018 |
| | | Year
to Date | | 1 Year | | 3 Year | | 5 Year | | 10 Year |
| Class N | | | (1.78 | )% | | | 10.92 | % | | | 5.03 | % | | | 6.70 | % | | | 3.23 | % |
| Class I | | | (1.64 | ) | | | 11.28 | | | | 5.34 | | | | 7.02 | | | | 3.54 | |
| MSCI ACW Ex-U.S. IMI (net) | | | (3.65 | ) | | | 7.75 | | | | 5.46 | | | | 6.39 | | | | 2.93 | |
Performance cited represents past performance. Past performance does not guarantee future results and current performance may be lower or higher than the data quoted. Results shown are average annual total returns, which assume reinvestment of dividends and capital gains. Investment returns and principal will fluctuate and you may have a gain or loss when you sell shares. For the most current month-end performance information, please call 1-800-742-7272, or visit our Web site at www.williamblairfunds.com. Investing in smaller and medium capitalization companies involves special risks, including higher volatility and lower liquidity. Smaller and medium capitalization stocks are also more sensitive to purchase/sale transactions and changes in the issuer’s financial condition. International investing involves special risk considerations, including currency fluctuations, lower liquidity, economic and political risk. From time to time, the investment adviser may waive fees or reimburse expenses for the Fund. Without these waivers/reimbursements, performance would be lower. Class N shares are available to the general public without a sales load. Class I shares are available to certain institutional investors, and advisory clients of William Blair & Company, L.L.C., without a sales load or distribution (12b-1) or service fees.
The performance highlights and graph presented above do not reflect the deduction of taxes that a shareholder would pay on fund distributions or the redemption of fund shares.
The Morgan Stanley Capital International (MSCI) All Country World (ACW) Ex-U.S. Investable Market Index (IMI) (net) is a free float-adjusted market capitalization weighted index that is designed to measure the equity market performance of developed and emerging markets, excluding the United States. This index approximates the minimum possible dividend reinvestment by deducting for the highest possible withholding tax rates of those markets.
This report identifies the Fund’s investments on June 30, 2018. These holdings are subject to change. Not all stocks in the Fund performed the same, nor is there any guarantee that these stocks will perform as well in the future. Market forecasts provided in this report may not necessarily come to pass.
| Sector Diversification (Unaudited) |

The sector diversification shown is based on the total long-term securities.
| June 30, 2018 | William Blair Funds | 51 |
| International Growth Fund |
| Portfolio of Investments, June 30, 2018 (all dollar amounts in thousands) (unaudited) |
| | | | | | | | |
| | | | | | | | |
| | Issuer | | Shares | | | Value | |
| | | | | | | | | | |
| | Common Stocks | | | | | | | | |
| | | | | | | | | | |
| | Europe, Mid-East—41.3% | | | | | | | | |
| | Belgium—1.1% | | | | | | | | |
| | KBC Group N.V. (Banks) | | | 414,677 | | | $ | 31,847 | |
| | Denmark—3.3% | | | | | | | | |
| | Ambu A/S Class “B” (Health care equipment & supplies) | | | 119,484 | | | | 4,019 | |
| | DSV A/S (Road & rail) | | | 414,618 | | | | 33,378 | |
| | Novo Nordisk A/S Class “B” (Pharmaceuticals) | | | 730,758 | | | | 33,754 | |
| | Orsted A/S (Electric utilities) | | | 291,625 | | | | 17,620 | |
| | Royal Unibrew A/S (Beverages) | | | 77,677 | | | | 6,173 | |
| | | | | | | | | 94,944 | |
| | Finland—0.4% | | | | | | | | |
| | Neste Oyj (Oil, gas & consumable fuels) | | | 132,850 | | | | 10,394 | |
| | France—13.4% | | | | | | | | |
| | Airbus SE (Aerospace & defense) | | | 254,443 | | | | 29,692 | |
| | Arkema S.A. (Chemicals) | | | 234,648 | | | | 27,689 | |
| | BNP Paribas S.A. (Banks) | | | 311,370 | | | | 19,260 | |
| | Capgemini SE (IT services) | | | 220,047 | | | | 29,488 | |
| | Cie Plastic Omnium S.A. (Auto components) | | | 94,007 | | | | 3,964 | |
| | Dassault Systemes S.A. (Software) | | | 250,583 | | | | 35,068 | |
| | Hermes International (Textiles, apparel & luxury goods) | | | 28,560 | | | | 17,446 | |
| | Ipsen S.A. (Pharmaceuticals) | | | 59,954 | | | | 9,377 | |
| | Kering S.A. (Textiles, apparel & luxury goods) | | | 84,958 | | | | 47,857 | |
| | Nexity S.A. (Real estate management & development) | | | 79,001 | | | | 4,987 | |
| | Orpea (Health care providers & services) | | | 69,866 | | | | 9,306 | |
| | Rubis SCA (Gas utilities) | | | 90,847 | | | | 5,663 | |
| | Teleperformance (Professional services) | | | 53,101 | | | | 9,372 | |
| | Thales S.A. (Aerospace & defense) | | | 215,537 | | | | 27,730 | |
| | Total S.A. (Oil, gas & consumable fuels) | | | 1,032,519 | | | | 62,700 | |
| | Valeo S.A. (Auto components) | | | 291,535 | | | | 15,896 | |
| | Vinci S.A. (Construction & engineering) | | | 357,972 | | | | 34,362 | |
| | | | | | | | | 389,857 | |
| | Germany—4.4% | | | | | | | | |
| | Carl Zeiss Meditec AG (Health care equipment & supplies) | | | 112,827 | | | | 7,699 | |
| | KION Group AG (Machinery) | | | 80,557 | | | | 5,782 | |
| | MTU Aero Engines AG (Aerospace & defense) | | | 140,737 | | | | 26,957 | |
| | Norma Group SE (Machinery) | | | 56,805 | | | | 3,881 | |
| | Puma SE (Textiles, apparel & luxury goods) | | | 11,670 | | | | 6,818 | |
| * | QIAGEN N.V. (Life sciences tools & services)† | | | 251,618 | | | | 9,099 | |
| | Siltronic AG (Semiconductors & semiconductor equipment) | | | 34,175 | | | | 4,856 | |
| | Vonovia SE (Real estate management & development) | | | 639,146 | | | | 30,378 | |
| | Washtec AG (Machinery) | | | 24,328 | | | | 2,145 | |
| | Wirecard AG (IT services) | | | 190,991 | | | | 30,562 | |
| | | | | | | | | 128,177 | |
| | | | | | | | |
| | | | | | | | |
| | Issuer | | Shares | | | Value | |
| | | | | | | | | | |
| | Common Stocks—(continued) | | | | | | | | |
| | | | | | | | | | |
| | Europe, Mid-East—(continued) | | | | | | | | |
| | Ireland—1.5% | | | | | | | | |
| * | ICON plc (Life sciences tools & services)† | | | 112,048 | | | $ | 14,850 | |
| | Kingspan Group plc (Building products) | | | 253,849 | | | | 12,689 | |
| | Smurfit Kappa Group plc (Containers & packaging) | | | 428,579 | | | | 17,302 | |
| | | | | | | | | 44,841 | |
| | Israel—0.3% | | | | | | | | |
| * | Wix.com, Ltd. (Internet software & services)† | | | 77,381 | | | | 7,761 | |
| | Italy—2.5% | | | | | | | | |
| | Banca Generali SpA (Capital markets) | | | 356,954 | | | | 8,860 | |
| | Brembo SpA (Auto components) | | | 286,489 | | | | 3,864 | |
| | DiaSorin SpA (Health care equipment & supplies) | | | 22,975 | | | | 2,611 | |
| | Ferrari N.V. (Automobiles) | | | 124,102 | | | | 16,775 | |
| | FinecoBank Banca Fineco SpA (Banks) | | | 1,096,394 | | | | 12,342 | |
| | Interpump Group SpA (Machinery) | | | 154,963 | | | | 4,804 | |
| | Moncler SpA (Textiles, apparel & luxury goods) | | | 172,699 | | | | 7,836 | |
| | Recordati SpA (Pharmaceuticals) | | | 253,221 | | | | 10,034 | |
| | Technogym SpA (Leisure products) | | | 371,069 | | | | 4,379 | |
| | | | | | | | | 71,505 | |
| | Luxembourg—1.2% | | | | | | | | |
| | Eurofins Scientific SE (Life sciences tools & services) | | | 30,594 | | | | 16,968 | |
| | Tenaris S.A. (Energy equipment & services) | | | 1,038,841 | | | | 18,959 | |
| | | | | | | | | 35,927 | |
| | Netherlands—3.5% | | | | | | | | |
| | ASML Holding N.V. (Semiconductors & semiconductor equipment) | | | 168,818 | | | | 33,407 | |
| | Euronext N.V. (Capital markets) | | | 60,398 | | | | 3,827 | |
| | Royal Dutch Shell plc Class “A” (Oil, gas & consumable fuels) | | | 1,069,388 | | | | 37,112 | |
| | Wolters Kluwer N.V. (Professional services) | | | 473,463 | | | | 26,598 | |
| | | | | | | | | 100,944 | |
| | Norway—0.6% | | | | | | | | |
| | Norsk Hydro ASA (Metals & mining) | | | 1,971,000 | | | | 11,766 | |
| | TGS Nopec Geophysical Co. ASA (Energy equipment & services) | | | 138,249 | | | | 5,077 | |
| | | | | | | | | 16,843 | |
| | Spain—1.7% | | | | | | | | |
| | Amadeus IT Group S.A. (IT services) | | | 397,928 | | | | 31,290 | |
| | Bankinter S.A. (Banks) | | | 1,762,395 | | | | 17,100 | |
| | | | | | | | | 48,390 | |
See accompanying Notes to Financial Statements.
| 52 | Semiannual Report | June 30, 2018 |
| International Growth Fund |
Portfolio of Investments, June 30, 2018 (all dollar amounts in thousands) (unaudited)
| | | | | | | | |
| | | | | | | | |
| | Issuer | | Shares | | | Value | |
| | | | | | | | | | |
| | Common Stocks—(continued) | | | | | | | | |
| | | | | | | | | | |
| | Europe, Mid-East—(continued) | | | | | | | | |
| | Sweden—3.5% | | | | | | | | |
| | Alfa Laval AB (Machinery) | | | 627,288 | | | $ | 14,809 | |
| | Atlas Copco AB Class “A” (Machinery) | | | 824,512 | | | | 23,878 | |
| | Boliden AB (Metals & mining) | | | 461,431 | | | | 14,892 | |
| * | Epiroc AB Class “A” (Machinery) | | | 1,327,782 | | | | 13,934 | |
| | Fabege AB (Real estate management & development) | | | 403,763 | | | | 4,802 | |
| | Hexagon AB Class “B” (Electronic equipment, instruments & components) | | | 407,062 | | | | 22,619 | |
| | Husqvarna AB Class “B” (Household durables) | | | 414,726 | | | | 3,923 | |
| | Nolato AB Class “B” (Industrial conglomerates) | | | 54,900 | | | | 4,418 | |
| | | | | | | | | 103,275 | |
| | Switzerland—3.9% | | | | | | | | |
| | Belimo Holding AG (Building products) | | | 634 | | | | 2,756 | |
| * | Glencore plc (Metals & mining) | | | 4,651,674 | | | | 22,085 | |
| | Logitech International S.A. (Technology hardware, storage & peripherals) | | | 218,507 | | | | 9,573 | |
| * | Lonza Group AG (Life sciences tools & services) | | | 135,177 | | | | 35,720 | |
| | Partners Group Holding AG (Capital markets) | | | 39,782 | | | | 29,083 | |
| | Straumann Holding AG (Health care equipment & supplies) | | | 20,864 | | | | 15,823 | |
| | | | | | | | | 115,040 | |
| | | | | | | | | | |
| | Emerging Asia—17.6% | | | | | | | | |
| | China—10.2% | | | | | | | | |
| | 3SBio, Inc. (Biotechnology) | | | 2,368,000 | | | | 5,351 | |
| * | 51job, Inc.—ADR (Professional services) | | | 61,018 | | | | 5,958 | |
| * | Alibaba Group Holding, Ltd.-ADR (Internet software & services) | | | 304,275 | | | | 56,452 | |
| | Anhui Conch Cement Co., Ltd. Class “H” (Construction materials) | | | 3,115,000 | | | | 17,765 | |
| * | Baozun, Inc.—ADR (Internet software & services) | | | 101,562 | | | | 5,555 | |
| * | China Mengniu Dairy Co., Ltd. (Food products) | | | 4,904,000 | | | | 16,540 | |
| | China Overseas Land & Investment, Ltd. (Real estate management & development) | | | 4,954,000 | | | | 16,260 | |
| | CSPC Pharmaceutical Group, Ltd. (Pharmaceuticals) | | | 4,660,000 | | | | 13,993 | |
| | Huazhu Group, Ltd.—ADR (Hotels, restaurants & leisure) | | | 217,886 | | | | 9,149 | |
| | Industrial and Commercial Bank of China, Ltd. Class “H” (Banks) | | | 47,182,000 | | | | 35,190 | |
| | Ping An Insurance Group Co. of China, Ltd. Class “H” (Insurance) | | | 2,723,000 | | | | 24,936 | |
| | Shenzhou International Group Holdings, Ltd. (Textiles, apparel & luxury goods) | | | 833,000 | | | | 10,250 | |
| | Tencent Holdings, Ltd. (Internet software & services) | | | 1,034,200 | | | | 51,933 | |
| | | | | | | | |
| | | | | | | | |
| | Issuer | | Shares | | | Value | |
| | | | | | | | | | |
| | Common Stocks—(continued) | | | | | | | | |
| | | | | | | | | | |
| | Emerging Asia—(continued) | | | | | | | | |
| | China—(continued) | | | | | | | | |
| | Tingyi Cayman Islands Holding Corporation (Food products) | | | 4,246,000 | | | $ | 9,836 | |
| * | Weibo Corporation—ADR (Internet software & services) | | | 109,645 | | | | 9,732 | |
| * | Wuxi Biologics Cayman, Inc. (Life sciences tools & services) | | | 676,500 | | | | 7,505 | |
| | | | | | | | | 296,405 | |
| | India—2.9% | | | | | | | | |
| | Britannia Industries, Ltd. (Food products) | | | 93,558 | | | | 8,519 | |
| | HDFC Bank, Ltd. (Banks) | | | 505,181 | | | | 15,581 | |
| | IndusInd Bank, Ltd. (Banks) | | | 352,178 | | | | 9,969 | |
| | InterGlobe Aviation, Ltd. (Airlines) | | | 197,308 | | | | 3,142 | |
| * | MakeMyTrip, Ltd. (Internet & direct marketing retail)† | | | 204,994 | | | | 7,410 | |
| | Maruti Suzuki India, Ltd. (Automobiles) | | | 119,424 | | | | 15,374 | |
| | Motherson Sumi Systems, Ltd. (Auto components) | | | 1,057,046 | | | | 4,381 | |
| | Pidilite Industries, Ltd. (Chemicals) | | | 282,211 | | | | 4,385 | |
| | Titan Co., Ltd. (Textiles, apparel & luxury goods) | | | 401,923 | | | | 5,145 | |
| | Yes Bank, Ltd. (Banks) | | | 2,270,997 | | | | 11,270 | |
| | | | | | | | | 85,176 | |
| | Indonesia—0.8% | | | | | | | | |
| | PT Bank Central Asia Tbk (Banks) | | | 15,556,700 | | | | 23,233 | |
| | South Korea—1.4% | | | | | | | | |
| | Hotel Shilla Co., Ltd. (Specialty retail) | | | 55,050 | | | | 6,098 | |
| * | Hugel, Inc. (Biotechnology) | | | 7,416 | | | | 3,207 | |
| | Samsung Electronics Co., Ltd. (Technology hardware, storage & peripherals) | | | 524,213 | | | | 21,959 | |
| | Samsung SDI Co., Ltd. (Electronic equipment, instruments & components) | | | 53,390 | | | | 10,241 | |
| | | | | | | | | 41,505 | |
| | Taiwan—2.3% | | | | | | | | |
| | Airtac International Group (Machinery) | | | 294,000 | | | | 4,173 | |
| | Eclat Textile Co., Ltd. (Textiles, apparel & luxury goods) | | | 365,000 | | | | 4,335 | |
| | Hiwin Technologies Corporation (Machinery) | | | 419,000 | | | | 4,936 | |
| | MediaTek, Inc. (Semiconductors & semiconductor equipment) | | | 1,497,000 | | | | 14,695 | |
| | Taiwan Semiconductor Manufacturing Co., Ltd.—ADR (Semiconductors & semiconductor equipment) | | | 1,041,010 | | | | 38,059 | |
| | | | | | | | | 66,198 | |
| | | | | | | | | | |
| | Japan—14.8% | | | | | | | | |
| | Asahi Group Holdings, Ltd. (Beverages) | | | 631,400 | | | | 32,383 | |
| | Asahi Intecc Co., Ltd. (Health care equipment & supplies) | | | 218,300 | | | | 8,242 | |
| | Daikin Industries, Ltd. (Building products) | | | 317,300 | | | | 37,922 | |
| | Hoshizaki Corporation (Machinery) | | | 58,500 | | | | 5,912 | |
See accompanying Notes to Financial Statements.
| June 30, 2018 | William Blair Funds | 53 |
| International Growth Fund |
Portfolio of Investments, June 30, 2018 (all dollar amounts in thousands) (unaudited)
| | | | | | | | |
| | | | | | | | |
| | Issuer | | Shares | | | Value | |
| | | | | | | | | | |
| | Common Stocks—(continued) | | | | | | | | |
| | | | | | | | | | |
| | Japan—(continued) | | | | | | | | |
| | Japan Lifeline Co., Ltd. (Health care providers & services) | | | 136,400 | | | $ | 3,344 | |
| | Keyence Corporation (Electronic equipment, instruments & components) | | | 63,700 | | | | 35,928 | |
| | Kobayashi Pharmaceutical Co., Ltd. (Personal products) | | | 66,700 | | | | 5,757 | |
| | Koito Manufacturing Co., Ltd. (Auto components) | | | 236,800 | | | | 15,641 | |
| | Kose Corporation (Personal products) | | | 59,300 | | | | 12,755 | |
| | MinebeaMitsumi, Inc. (Machinery) | | | 270,000 | | | | 4,550 | |
| | MISUMI Group, Inc. (Machinery) | | | 374,800 | | | | 10,905 | |
| | Nichias Corporation (Building products) | | | 343,000 | | | | 4,289 | |
| | Nihon M&A Center, Inc. (Professional services) | | | 329,600 | | | | 9,549 | |
| | Nintendo Co., Ltd. (Software) | | | 88,200 | | | | 28,791 | |
| | Nitori Holdings Co., Ltd. (Specialty retail) | | | 98,200 | | | | 15,278 | |
| | Nomura Research Institute, Ltd. (IT services) | | | 169,800 | | | | 8,215 | |
| | Otsuka Corporation (IT services) | | | 239,000 | | | | 9,356 | |
| | Pola Orbis Holdings, Inc. (Personal products) | | | 278,700 | | | | 12,248 | |
| | Sankyu, Inc. (Road & rail) | | | 103,320 | | | | 5,423 | |
| | Shimadzu Corporation (Electronic equipment, instruments & components) | | | 531,300 | | | | 16,030 | |
| | Shiseido Co., Ltd. (Personal products) | | | 580,800 | | | | 46,090 | |
| | Start Today Co., Ltd. (Internet & direct marketing retail) | | | 305,400 | | | | 11,050 | |
| | Taisei Corporation (Construction & engineering) | | | 216,600 | | | | 11,928 | |
| | TechnoPro Holdings, Inc. (Professional services) | | | 150,500 | | | | 9,241 | |
| | Terumo Corporation (Health care equipment & supplies) | | | 497,500 | | | | 28,481 | |
| | TIS, Inc. (IT services) | | | 207,100 | | | | 9,517 | |
| | Topcon Corporation (Electronic equipment, instruments & components) | | | 341,600 | | | | 5,848 | |
| | Toray Industries, Inc. (Chemicals) | | | 1,244,300 | | | | 9,821 | |
| | Tsuruha Holdings, Inc. (Food & staples retailing) | | | 39,200 | | | | 4,910 | |
| | Ulvac, Inc. (Semiconductors & semiconductor equipment) | | | 158,400 | | | | 6,042 | |
| | Zenkoku Hosho Co., Ltd. (Diversified financial services) | | | 128,700 | | | | 5,827 | |
| | | | | | | | | 431,273 | |
| | | | | | | | | | |
| | United Kingdom—12.3% | | | | | | | | |
| | 3i Group plc (Capital markets) | | | 1,421,982 | | | | 16,835 | |
| | Abcam plc (Biotechnology) | | | 274,082 | | | | 4,815 | |
| | Ashtead Group plc (Trading companies & distributors) | | | 812,349 | | | | 24,191 | |
| | AVEVA Group plc (Software) | | | 141,071 | | | | 4,989 | |
| | Beazley plc (Insurance) | | | 961,547 | | | | 7,410 | |
| | Big Yellow Group plc (Equity REIT) | | | 468,692 | | | | 5,875 | |
| | Carnival plc (Hotels, restaurants & leisure) | | | 405,853 | | | | 23,197 | |
| | Close Brothers Group plc (Capital markets) | | | 188,621 | | | | 3,682 | |
| | | | | | | | |
| | | | | | | | |
| | Issuer | | Shares | | | Value | |
| | | | | | | | | | |
| | Common Stocks—(continued) | | | | | | | | |
| | | | | | | | | | |
| | United Kingdom—(continued) | | | | | | | | |
| | Compass Group plc (Hotels, restaurants & leisure) | | | 1,650,812 | | | $ | 35,188 | |
| | Croda International plc (Chemicals) | | | 242,293 | | | | 15,307 | |
| | Dechra Pharmaceuticals plc (Pharmaceuticals) | | | 170,225 | | | | 6,230 | |
| | easyJet plc (Airlines) | | | 220,066 | | | | 4,841 | |
| | Electrocomponents plc (Electronic equipment, instruments & components) | | | 605,614 | | | | 6,038 | |
| | Experian plc (Professional services) | | | 996,542 | | | | 24,583 | |
| | Fevertree Drinks plc (Beverages) | | | 184,516 | | | | 8,226 | |
| | Greggs plc (Hotels, restaurants & leisure) | | | 269,637 | | | | 3,536 | |
| | Halma plc (Electronic equipment, instruments & components) | | | 482,412 | | | | 8,686 | |
| | Hiscox, Ltd. (Insurance) | | | 582,077 | | | | 11,682 | |
| | Intermediate Capital Group plc (Capital markets) | | | 541,155 | | | | 7,840 | |
| | Intertek Group plc (Professional services) | | | 186,672 | | | | 14,036 | |
| | Kindred Group plc (Hotels, restaurants & leisure) | | | 552,003 | | | | 6,915 | |
| | London Stock Exchange Group plc (Capital markets) | | | 393,201 | | | | 23,148 | |
| | Melrose Industries plc (Electrical equipment) | | | 3,793,850 | | | | 10,615 | |
| * | Metro Bank plc (Banks) | | | 89,293 | | | | 3,799 | |
| | Renishaw plc (Electronic equipment, instruments & components) | | | 81,980 | | | | 5,715 | |
| | Rentokil Initial plc (Commercial services & supplies) | | | 3,070,631 | | | | 14,158 | |
| | Rotork plc (Machinery) | | | 962,285 | | | | 4,238 | |
| | Segro plc (Equity REIT) | | | 1,704,727 | | | | 15,013 | |
| | Spirax-Sarco Engineering plc (Machinery) | | | 148,866 | | | | 12,766 | |
| | Synthomer plc (Chemicals) | | | 589,591 | | | | 4,086 | |
| | Victrex plc (Chemicals) | | | 258,549 | | | | 9,898 | |
| | WH Smith plc (Specialty retail) | | | 417,880 | | | | 10,999 | |
| | | | | | | | | 358,537 | |
| | | | | | | | | | |
| | Canada—5.5% | | | | | | | | |
| | Constellation Software, Inc. (Software) | | | 18,804 | | | | 14,583 | |
| | Dollarama, Inc. (Multiline retail) | | | 321,222 | | | | 12,452 | |
| | Finning International, Inc. (Trading companies & distributors) | | | 163,810 | | | | 4,043 | |
| * | Lululemon Athletica, Inc. (Textiles, apparel & luxury goods) | | | 139,784 | | | | 17,452 | |
| * | Shopify, Inc. Class “A” (Internet software & services)† | | | 145,505 | | | | 21,228 | |
| | Suncor Energy, Inc. (Oil, gas & consumable fuels) | | | 1,112,811 | | | | 45,286 | |
| | The Toronto—Dominion Bank (Banks) | | | 780,795 | | | | 45,191 | |
| | | | | | | | | 160,235 | |
See accompanying Notes to Financial Statements.
| 54 | Semiannual Report | June 30, 2018 |
| International Growth Fund |
Portfolio of Investments, June 30, 2018 (all dollar amounts in thousands) (unaudited)
| | | | | | | | |
| | | | | | | | |
| | Issuer | | Shares | | | Value | |
| | | | | | | | | | |
| | Common Stocks—(continued) | | | | | | | | |
| | | | | | | | | | |
| | Asia—4.4% | | | | | | | | |
| | Australia—1.6% | | | | | | | | |
| | Aristocrat Leisure, Ltd. (Hotels, restaurants & leisure) | | | 853,791 | | | $ | 19,498 | |
| | CSL, Ltd. (Biotechnology) | | | 194,864 | | | | 27,738 | |
| | | | | | | | | 47,236 | |
| | Hong Kong—2.7% | | | | | | | | |
| | AIA Group, Ltd. (Insurance) | | | 5,321,200 | | | | 46,355 | |
| * | China High Precision Automation Group, Ltd. (Electronic equipment, instruments & components)**§ | | | 6,597,000 | | | | — | |
| | Galaxy Entertainment Group, Ltd. (Hotels, restaurants & leisure) | | | 4,107,000 | | | | 31,659 | |
| | | | | | | | | 78,014 | |
| | Singapore—0.1% | | | | | | | | |
| | Venture Corporation, Ltd. (Electronic equipment, instruments & components) | | | 283,000 | | | | 3,697 | |
| | | | | | | | | | |
| | Emerging Europe, Mid-East, Africa—1.1% | | | | | | | | |
| | Russia—0.3% | | | | | | | | |
| | Globaltrans Investment plc-GDR (Road & rail) | | | 284,606 | | | | 2,902 | |
| * | Yandex N.V. Class “A” (Internet software & services)† | | | 177,086 | | | | 6,357 | |
| | | | | | | | | 9,259 | |
| | South Africa—0.8% | | | | | | | | |
| | Bid Corporation, Ltd. (Food & staples retailing) | | | 217,320 | | | | 4,352 | |
| | Bidvest Group, Ltd. (Industrial conglomerates) | | | 217,320 | | | | 3,112 | |
| | Mr. Price Group, Ltd. (Specialty retail) | | | 449,818 | | | | 7,382 | |
| | RMB Holdings, Ltd. (Diversified financial services) | | | 1,360,256 | | | | 7,484 | |
| | | | | | | | | 22,330 | |
| | | | | | | | | | |
| | Emerging Latin America—0.9% | | | | | | | | |
| | Argentina—0.1% | | | | | | | | |
| | Grupo Financiero Galicia S.A.—ADR (Banks) | | | 78,143 | | | | 2,577 | |
| | Brazil—0.2% | | | | | | | | |
| | M Dias Branco S.A. (Food products) | | | 335,300 | | | | 3,235 | |
| | Via Varejo S.A. (Specialty retail) | | | 632,200 | | | | 3,036 | |
| | | | | | | | | 6,271 | |
| | Mexico—0.1% | | | | | | | | |
| | Arca Continental S.A.B. de C.V. (Beverages) | | | 137,383 | | | | 844 | |
| | Peru—0.5% | | | | | | | | |
| | Credicorp, Ltd. (Banks)† | | | 67,942 | | | | 15,295 | |
| | Total Common Stocks—97.9%
(cost $2,377,004) | | | | | | | 2,847,830 | |
| | Issuer | | Shares or
Principal
Amount | | | Value | |
| | | | | | | | |
| | Preferred Stock | | | | | | |
| | Germany—0.3% | | | | | | | | |
| | Fuchs Petrolub SE (Chemicals) | | | 169,591 | | | $ | 8,345 | |
| | Total Preferred Stock—0.3%
(cost $8,420) | | | | | | | 8,345 | |
| | | | | | | | | | |
| | Repurchase Agreement | | | | | | | | |
| | Fixed Income Clearing Corporation, 0.350% dated 6/29/18, due 7/2/18, repurchase price $7,204, collateralized by U.S. Treasury Inflation Index Bond, 0.250%, due 1/15/25 | | | $7,204 | | | | 7,204 | |
| | Total Repurchase Agreement—0.3%
(cost $7,204) | | | | | | | 7,204 | |
| | Total Investments—98.5%
(cost $2,392,628) | | | | | | | 2,863,379 | |
| | Cash and other assets, less liabilities—1.5% | | | | | | | 45,050 | |
| | Net assets—100.0% | | | | | | $ | 2,908,429 | |
ADR = American Depository Receipt
GDR = Global Depository Receipt
REIT = Real Estate Investment Trust
* = Non-income producing security
† = U.S. listed foreign security
** = Fair valued pursuant to Valuation Procedures approved by the Board of Trustees. Fair Value was determined using significant unobservable inputs. This holding represents 0.00% of the Fund’s net assets at June 30, 2018.
§ = Deemed illiquid pursuant to Liquidity Procedures approved by the Board of Trustees. This holding represents 0.00% of the Fund’s net assets at June 30, 2018.
For securities primarily traded on exchanges or markets that close before the close of regular trading on the New York Stock Exchange, the Fund may use an independent pricing service to fair value price the securities pursuant to Valuation Procedures approved by the Board of Trustees.
See accompanying Notes to Financial Statements.
| June 30, 2018 | William Blair Funds | 55 |
| International Growth Fund |
Portfolio of Investments, June 30, 2018 (unaudited)
At June 30, 2018, the Fund’s Portfolio of Investments includes the following industry categories (as a percentage of long-term investments):
| Information Technology | | | 21.2 | % |
| Industrials | | | 18.0 | % |
| Financials | | | 15.4 | % |
| Consumer Discretionary | | | 14.2 | % |
| Health Care | | | 9.7 | % |
| Energy | | | 6.3 | % |
| Consumer Staples | | | 6.0 | % |
| Materials | | | 5.7 | % |
| Real Estate | | | 2.7 | % |
| Utilities | | | 0.8 | % |
| Total | | | 100.0 | % |
At June 30, 2018, the Fund’s Portfolio of Investments includes the following currency categories (as a percentage of long-term investments):
| Euro | | | 29.6 | % |
| Japanese Yen | | | 15.1 | % |
| British Pound Sterling | | | 13.1 | % |
| Hong Kong Dollar | | | 10.1 | % |
| U.S. Dollar | | | 8.0 | % |
| Canadian Dollar | | | 4.3 | % |
| Swedish Krona | | | 3.9 | % |
| Danish Krone | | | 3.3 | % |
| Swiss Franc | | | 3.3 | % |
| Indian Rupee | | | 2.7 | % |
| Australian Dollar | | | 1.7 | % |
| South Korean Won | | | 1.4 | % |
| All Other Currencies | | | 3.5 | % |
| Total | | | 100.0 | % |
See accompanying Notes to Financial Statements.
| 56 | Semiannual Report | June 30, 2018 |
| | Institutional International Growth Fund |
| | |
| | The Institutional International Growth Fund seeks long-term capital appreciation. |
| | |
| | AN OVERVIEW FROM THE PORTFOLIO MANAGERS |
| | |
 Simon Fennell  Kenneth J. McAtamney | The William Blair Institutional International Growth Fund (Institutional Class shares) posted a 1.60% decrease, net of fees, for the six months ended June 30, 2018. By comparison, the Fund’s benchmark index, the MSCI All Country World ex-U.S. IMI Index (net) (the “Index”), decreased 3.65%. Outperformance versus the Index was primarily driven by positive stock selection across most sectors. The Consumer Staples and Financials sectors were the largest sources of relative return. Within the Consumer Staples sector, Japanese cosmetics holding Shiseido Co., Ltd. boosted the Fund’s relative performance. Shiseido is the largest cosmetics company in Japan and fifth largest in the world. We expect a continued rebound in Shiseido’s earnings growth after a ten year period of operational underperformance and market share loss. New management has reformed the organizational structure to place more responsibility in the hands of local managers, improved strategy execution, accelerated product development, and concentrated Shiseido’s investment on prestige brands. Shiseido experienced robust sales growth in the first quarter of 2018, which was mainly driven by rapid growth in high-priced cosmetics and successful new product launches. Within Financials, Switzerland-based asset manager Partners Group Holding AG bolstered the Fund’s performance. Partners Group manages approximately $78 billion in assets for over 1,000 institutional investors globally, investing in private equity, private real estate, private infrastructure and private debt. Partners Group has benefitted from strong structural demand and continues to stand out for its global footprint (in terms of its distribution, investments, and client base), breadth of private market investment solutions, investment performance, and cash flow generation. Positive operating momentum at the company has been driven by growth in base management fees and performance fees. Partially offsetting these positive effects was negative stock selection within the Telecommunication Services and Information Technology sectors. Within Telecommunication Services, Canadian wireless and cable company Rogers Communications detracted from performance. The company’s share price was hampered by investors’ concerns about rising competitive pressures in the wireless business. While Rogers remains a leader with high quality customers and a favorable spectrum position in Canada, we exited the position in favor of more compelling opportunities. Within the Information Technology sector, U.K. software company Micro Focus International plc’s share price weakened significantly in March after the company provided disappointing revenue guidance for 2018 due to problems integrating the recently acquired Hewlett Packard Enterprise software business, and the announcement that its CEO would resign after only six months in his position. We liquidated the position as a result of these issues. Please refer to the Global Markets Review and Outlook relating to the Fund beginning on page 32 for additional information. |
| June 30, 2018 | William Blair Funds | 57 |
Institutional International Growth Fund
Performance Highlights (Unaudited)
Average Annual Total Return through 6/30/2018
| | | Year | | | | | | | | |
| | | to Date | | 1 Year | | 3 Year | | 5 Year | | 10 Year |
| Institutional International Growth Fund | | | (1.60 | )% | | | 11.31 | % | | | 5.46 | % | | | 7.11 | % | | | 3.68 | % |
| MSCI ACW Ex-U.S. IMI (net) | | | (3.65 | ) | | | 7.75 | | | | 5.46 | | | | 6.39 | | | | 2.93 | |
Performance cited represents past performance. Past performance does not guarantee future results and current performance may be lower or higher than the data quoted. Results shown are average annual returns, which assume reinvestment of dividends and capital gains. Investment returns and principal will fluctuate and you may have a gain or loss when you sell shares. For the most current month-end performance information, please call 1-800-742-7272, or visit our Web site at www.williamblairfunds.com. From time to time, the investment adviser may waive fees or reimburse expenses for the Fund. Without these waivers/reimbursements, performance would be lower. Investing in smaller and medium capitalization companies involves special risks, including higher volatility and lower liquidity. Smaller and medium capitalization stocks are also more sensitive to purchase/sale transactions and changes in the issuer’s financial condition. International investing involves special risk considerations, including currency fluctuations, lower liquidity, economic and political risk. Shares of the Fund are available without a sales load or distribution (12b-1) or service fees.
The performance highlights and graph presented above do not reflect the deduction of taxes that a shareholder would pay on fund distributions or the redemption of fund shares.
The Morgan Stanley Capital International (MSCI) All Country World (ACW) Ex-U.S. Investable Market Index (IMI) (net) is a free float-adjusted market capitalization weighted index that is designed to measure the equity market performance of developed and emerging markets, excluding the United States. This index approximates the minimum possible dividend reinvestment by deducting for the highest possible withholding tax rates of those markets.
This report identifies the Fund’s investments on June 30, 2018. These holdings are subject to change. Not all stocks in the Fund performed the same, nor is there any guarantee that these stocks will perform as well in the future. Market forecasts provided in this report may not necessarily come to pass.
Sector Diversification (Unaudited)
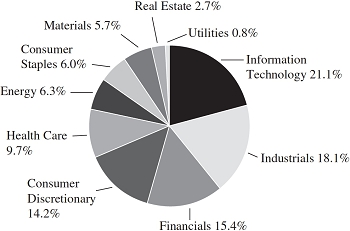
The sector diversification shown is based on the total long-term securities.
| 58 | Semiannual Report | June 30, 2018 |
Institutional International Growth Fund
Portfolio of Investments, June 30, 2018 (all dollar amounts in thousands) (unaudited)
| | | | | | | | |
| | | | | | | | |
| | Issuer | | Shares | | | Value | |
| | |
| | Common Stocks | | | | | | | | |
| | |
| | Europe, Mid-East—41.3% | | | | | | | | |
| | Belgium—1.1% | | �� | | | | | | |
| | KBC Group N.V. (Banks) | | | 310,097 | | | $ | 23,816 | |
| | Denmark—3.3% | | | | | | | | |
| | Ambu A/S Class “B” (Health care equipment & supplies) | | | 89,350 | | | | 3,006 | |
| | DSV A/S (Road & rail) | | | 310,074 | | | | 24,961 | |
| | Novo Nordisk A/S Class “B” (Pharmaceuticals) | | | 546,464 | | | | 25,241 | |
| | Orsted A/S (Electric utilities) | | | 218,078 | | | | 13,177 | |
| | Royal Unibrew A/S (Beverages) | | | 58,087 | | | | 4,616 | |
| | | | | | | | | 71,001 | |
| | Finland—0.4% | | | | | | | | |
| | Neste Oyj (Oil, gas & consumable fuels) | | | 99,345 | | | | 7,773 | |
| | France—13.4% | | | | | | | | |
| | Airbus SE (Aerospace & defense) | | | 190,273 | | | | 22,204 | |
| | Arkema S.A. (Chemicals) | | | 175,471 | | | | 20,706 | |
| | BNP Paribas S.A. (Banks) | | | 231,117 | | | | 14,296 | |
| | Capgemini SE (IT services) | | | 164,552 | | | | 22,052 | |
| | Cie Plastic Omnium S.A. (Auto components) | | | 70,299 | | | | 2,964 | |
| | Dassault Systemes S.A. (Software) | | | 187,387 | | | | 26,224 | |
| | Hermes International (Textiles, apparel & luxury goods) | | | 21,358 | | | | 13,047 | |
| | Ipsen S.A. (Pharmaceuticals) | | | 44,834 | | | | 7,012 | |
| | Kering S.A. (Textiles, apparel & luxury goods) | | | 63,532 | | | | 35,787 | |
| | Nexity S.A. (Real estate management & development) | | | 58,793 | | | | 3,712 | |
| | Orpea (Health care providers & services) | | | 52,246 | | | | 6,959 | |
| | Rubis SCA (Gas utilities) | | | 67,936 | | | | 4,235 | |
| | Teleperformance (Professional services) | | | 39,709 | | | | 7,008 | |
| | Thales S.A. (Aerospace & defense) | | | 161,180 | | | | 20,736 | |
| | Total S.A. (Oil, gas & consumable fuels) | | | 772,122 | | | | 46,888 | |
| | Valeo S.A. (Auto components) | | | 218,150 | | | | 11,894 | |
| | Vinci S.A. (Construction & engineering) | | | 267,693 | | | | 25,696 | |
| | | | | | | | | 291,420 | |
| | Germany—4.4% | | | | | | | | |
| | Carl Zeiss Meditec AG (Health care equipment & supplies) | | | 84,372 | | | | 5,757 | |
| | KION Group AG (Machinery) | | | 60,241 | | | | 4,324 | |
| | MTU Aero Engines AG (Aerospace & defense) | | | 105,244 | | | | 20,159 | |
| | Norma Group SE (Machinery) | | | 42,479 | | | | 2,902 | |
| | Puma SE (Textiles, apparel & luxury goods) | | | 8,705 | | | | 5,085 | |
| * | QIAGEN N.V. (Life sciences tools & services)† | | | 188,161 | | | | 6,804 | |
| | Siltronic AG (Semiconductors & semiconductor equipment) | | | 25,556 | | | | 3,631 | |
| | Vonovia SE (Real estate management & development) | | | 477,956 | | | | 22,717 | |
| | Washtec AG (Machinery) | | | 18,193 | | | | 1,604 | |
| | Wirecard AG (IT services) | | | 142,824 | | | | 22,855 | |
| | | | | | | | | 95,838 | |
| | | | | | | | |
| | | | | | | | |
| | Issuer | | Shares | | | Value | |
| | |
| | Common Stocks—(continued) | | | | | | | | |
| | |
| | Europe, Mid-East—(continued) | | | | | | | | |
| | Ireland—1.5% | | | | | | | | |
| * | ICON plc (Life sciences tools & services)† | | | 83,790 | | | $ | 11,105 | |
| | Kingspan Group plc (Building products) | | | 189,830 | | | | 9,489 | |
| | Smurfit Kappa Group plc (Containers & packaging) | | | 320,493 | | | | 12,938 | |
| | | | | | | | | 33,532 | |
| | Israel—0.3% | | | | | | | | |
| * | Wix.com, Ltd. (Internet software & services)† | | | 57,866 | | | | 5,804 | |
| | Italy—2.5% | | | | | | | | |
| | Banca Generali SpA (Capital markets) | | | 266,932 | | | | 6,625 | |
| | Brembo SpA (Auto components) | | | 214,238 | | | | 2,890 | |
| | DiaSorin SpA (Health care equipment & supplies) | | | 17,143 | | | | 1,948 | |
| | Ferrari N.V. (Automobiles) | | | 92,804 | | | | 12,544 | |
| | FinecoBank Banca Fineco SpA (Banks) | | | 819,888 | | | | 9,230 | |
| | Interpump Group SpA (Machinery) | | | 115,882 | | | | 3,592 | |
| | Moncler SpA (Textiles, apparel & luxury goods) | | | 129,145 | | | | 5,860 | |
| | Recordati SpA (Pharmaceuticals) | | | 189,359 | | | | 7,503 | |
| | Technogym SpA (Leisure products) | | | 277,487 | | | | 3,275 | |
| | | | | | | | | 53,467 | |
| | Luxembourg—1.2% | | | | | | | | |
| | Eurofins Scientific SE (Life sciences tools & services) | | | 22,878 | | | | 12,688 | |
| | Tenaris S.A. (Energy equipment & services) | | | 776,849 | | | | 14,178 | |
| | | | | | | | | 26,866 | |
| | Netherlands—3.5% | | | | | | | | |
| | ASML Holding N.V. (Semiconductors & semiconductor equipment) | | | 126,243 | | | | 24,981 | |
| | Euronext N.V. (Capital markets) | | | 45,166 | | | | 2,862 | |
| | Royal Dutch Shell plc Class “A” (Oil, gas & consumable fuels) | | | 799,693 | | | | 27,753 | |
| | Wolters Kluwer N.V. (Professional services) | | | 354,058 | | | | 19,890 | |
| | | | | | | | | 75,486 | |
| | Norway—0.6% | | | | | | | | |
| | Norsk Hydro ASA (Metals & mining) | | | 1,473,922 | | | | 8,798 | |
| | TGS NOPEC Geophysical Co. ASA (Energy equipment & services) | | | 103,383 | | | | 3,797 | |
| | | | | | | | | 12,595 | |
| | Spain—1.7% | | | | | | | | |
| | Amadeus IT Group S.A. (IT services) | | | 297,572 | | | | 23,399 | |
| | Bankinter S.A. (Banks) | | | 1,317,926 | | | | 12,788 | |
| | | | | | | | | 36,187 | |
| | Sweden—3.5% | | | | | | | | |
| | Alfa Laval AB (Machinery) | | | 469,089 | | | | 11,074 | |
| | Atlas Copco AB Class “A” (Machinery) | | | 616,573 | | | | 17,856 | |
| | Boliden AB (Metals & mining) | | | 345,060 | | | | 11,136 | |
| * | Epiroc AB Class “A” (Machinery) | | | 992,921 | | | | 10,420 | |
| | Fabege AB (Real estate management & development) | | | 301,936 | | | | 3,591 | |
See accompanying Notes to Financial Statements.
| June 30, 2018 | William Blair Funds | 59 |
Institutional International Growth Fund
Portfolio of Investments, June 30, 2018 (all dollar amounts in thousands) (unaudited)
| | | | | | | | |
| | | | | | | | |
| | Issuer | | Shares | | | Value | |
| | |
| | Common Stocks—(continued) | | | | | | | | |
| | |
| | Europe, Mid-East—(continued) | | | | | | | | |
| | Sweden—(continued) | | | | | | | | |
| | Hexagon AB Class “B” (Electronic equipment, instruments & components) | | | 304,402 | | | $ | 16,915 | |
| | Husqvarna AB Class “B” (Household durables) | | | 310,134 | | | | 2,934 | |
| | Nolato AB Class “B” (Industrial conglomerates) | | | 41,055 | | | | 3,304 | |
| | | | | | | | | 77,230 | |
| | Switzerland—3.9% | | | | | | | | |
| | Belimo Holding AG (Building products) | | | 474 | | | | 2,061 | |
| * | Glencore plc (Metals & mining) | | | 3,478,541 | | | | 16,515 | |
| | Logitech International S.A. (Technology hardware, storage & peripherals) | | | 163,400 | | | | 7,159 | |
| * | Lonza Group AG (Life sciences tools & services) | | | 101,086 | | | | 26,712 | |
| | Partners Group Holding AG (Capital markets) | | | 29,749 | | | | 21,748 | |
| | Straumann Holding AG (Health care equipment & supplies) | | | 15,602 | | | | 11,832 | |
| | | | | | | | | 86,027 | |
| | |
| | Emerging Asia—17.6% | | | | | | | | |
| | China—10.2% | | | | | | | | |
| | 3SBio, Inc. (Biotechnology) | | | 1,770,500 | | | | 4,001 | |
| * | 51job, Inc.—ADR (Professional services) | | | 45,630 | | | | 4,455 | |
| * | Alibaba Group Holding, Ltd.-ADR (Internet software & services) | | | 227,538 | | | | 42,215 | |
| | Anhui Conch Cement Co., Ltd. Class “H” (Construction materials) | | | 2,329,500 | | | | 13,285 | |
| * | Baozun, Inc.—ADR (Internet software & services) | | | 75,948 | | | | 4,154 | |
| * | China Mengniu Dairy Co., Ltd. (Food products) | | | 3,667,000 | | | | 12,368 | |
| | China Overseas Land & Investment, Ltd. (Real estate management & development) | | | 3,704,000 | | | | 12,157 | |
| | CSPC Pharmaceutical Group, Ltd. (Pharmaceuticals) | | | 3,484,000 | | | | 10,462 | |
| | Huazhu Group, Ltd.—ADR (Hotels, restaurants & leisure) | | | 162,936 | | | | 6,842 | |
| | Industrial and Commercial Bank of China, Ltd. Class “H” (Banks) | | | 35,283,000 | | | | 26,316 | |
| | Ping An Insurance Group Co. of China, Ltd. Class “H” (Insurance) | | | 2,036,000 | | | | 18,645 | |
| | Shenzhou International Group Holdings, Ltd. (Textiles, apparel & luxury goods) | | | 623,000 | | | | 7,666 | |
| | Tencent Holdings, Ltd. (Internet software & services) | | | 773,400 | | | | 38,837 | |
| | Tingyi Cayman Islands Holding Corporation (Food products) | | | 3,174,000 | | | | 7,352 | |
| * | Weibo Corporation—ADR (Internet software & services) | | | 81,993 | | | | 7,278 | |
| * | Wuxi Biologics Cayman, Inc. (Life sciences tools & services) | | | 506,000 | | | | 5,613 | |
| | | | | | | | | 221,646 | |
| | | | | | | | |
| | | | | | | | |
| | Issuer | | Shares | | | Value | |
| | |
| | Common Stocks—(continued) | | | | | | | | |
| | |
| | Emerging Asia—(continued) | | | | | | | | |
| | India—2.9% | | | | | | | | |
| | Britannia Industries, Ltd. (Food products) | | | 69,963 | | | $ | 6,371 | |
| | HDFC Bank, Ltd. (Banks) | | | 377,776 | | | | 11,651 | |
| | IndusInd Bank, Ltd. (Banks) | | | 263,360 | | | | 7,455 | |
| | InterGlobe Aviation, Ltd. (Airlines) | | | 147,548 | | | | 2,349 | |
| * | MakeMyTrip, Ltd. (Internet & direct marketing retail)† | | | 153,295 | | | | 5,542 | |
| | Maruti Suzuki India, Ltd. (Automobiles) | | | 89,306 | | | | 11,497 | |
| | Motherson Sumi Systems, Ltd. (Auto components) | | | 790,463 | | | | 3,276 | |
| | Pidilite Industries, Ltd. (Chemicals) | | | 211,039 | | | | 3,279 | |
| | Titan Co., Ltd. (Textiles, apparel & luxury goods) | | | 300,560 | | | | 3,848 | |
| | Yes Bank, Ltd. (Banks) | | | 1,698,261 | | | | 8,427 | |
| | | | | | | | | 63,695 | |
| | Indonesia—0.8% | | | | | | | | |
| | PT Bank Central Asia Tbk (Banks) | | | 11,633,300 | | | | 17,373 | |
| | South Korea—1.4% | | | | | | | | |
| | Hotel Shilla Co., Ltd. (Specialty retail) | | | 41,166 | | | | 4,560 | |
| * | Hugel, Inc. (Biotechnology) | | | 5,546 | | | | 2,398 | |
| | Samsung Electronics Co., Ltd. (Technology hardware, storage & peripherals) | | | 392,009 | | | | 16,421 | |
| | Samsung SDI Co., Ltd. (Electronic equipment, instruments & components) | | | 39,925 | | | | 7,658 | |
| | | | | | | | | 31,037 | |
| | Taiwan—2.3% | | | | | | | | |
| | Airtac International Group (Machinery) | | | 220,000 | | | | 3,123 | |
| | Eclat Textile Co., Ltd. (Textiles, apparel & luxury goods) | | | 273,000 | | | | 3,242 | |
| | Hiwin Technologies Corporation (Machinery) | | | 313,000 | | | | 3,688 | |
| | MediaTek, Inc. (Semiconductors & semiconductor equipment) | | | 1,119,000 | | | | 10,984 | |
| | Taiwan Semiconductor Manufacturing Co., Ltd.—ADR (Semiconductors & semiconductor equipment) | | | 778,472 | | | | 28,461 | |
| | | | | | | | | 49,498 | |
| | |
| | Japan—14.8% | | | | | | | | |
| | Asahi Group Holdings, Ltd. (Beverages) | | | 472,200 | | | | 24,218 | |
| | Asahi Intecc Co., Ltd. (Health care equipment & supplies) | | | 163,200 | | | | 6,162 | |
| | Daikin Industries, Ltd. (Building products) | | | 237,300 | | | | 28,361 | |
| | Hoshizaki Corporation (Machinery) | | | 43,800 | | | | 4,427 | |
| | Japan Lifeline Co., Ltd. (Health care providers & services) | | | 102,000 | | | | 2,501 | |
| | Keyence Corporation (Electronic equipment, instruments & components) | | | 47,600 | | | | 26,847 | |
| | Kobayashi Pharmaceutical Co., Ltd. (Personal products) | | | 49,900 | | | | 4,307 | |
| | Koito Manufacturing Co., Ltd. (Auto components) | | | 177,100 | | | | 11,698 | |
| | Kose Corporation (Personal products) | | | 44,400 | | | | 9,550 | |
See accompanying Notes to Financial Statements.
| 60 | Semiannual Report | June 30, 2018 |
Institutional International Growth Fund
Portfolio of Investments, June 30, 2018 (all dollar amounts in thousands) (unaudited)
| | | | | | | | |
| | | | | | | | |
| | Issuer | | Shares | | | Value | |
| | |
| | Common Stocks—(continued) | | | | | | | | |
| | |
| | Japan—(continued) | | | | | | | | |
| | MinebeaMitsumi, Inc. (Machinery) | | | 201,900 | | | $ | 3,402 | |
| | MISUMI Group, Inc. (Machinery) | | | 280,300 | | | | 8,155 | |
| | Nichias Corporation (Building products) | | | 256,000 | | | | 3,201 | |
| | Nihon M&A Center, Inc. (Professional services) | | | 246,500 | | | | 7,142 | |
| | Nintendo Co., Ltd. (Software) | | | 65,900 | | | | 21,512 | |
| | Nitori Holdings Co., Ltd. (Specialty retail) | | | 73,500 | | | | 11,435 | |
| | Nomura Research Institute, Ltd. (IT services) | | | 127,000 | | | | 6,144 | |
| | Otsuka Corporation (IT services) | | | 178,700 | | | | 6,996 | |
| | Pola Orbis Holdings, Inc. (Personal products) | | | 208,400 | | | | 9,158 | |
| | Sankyu, Inc. (Road & rail) | | | 77,260 | | | | 4,055 | |
| | Shimadzu Corporation (Electronic equipment, instruments & components) | | | 397,300 | | | | 11,987 | |
| | Shiseido Co., Ltd. (Personal products) | | | 434,300 | | | | 34,464 | |
| | Start Today Co., Ltd. (Internet & direct marketing retail) | | | 228,400 | | | | 8,264 | |
| | Taisei Corporation (Construction & engineering) | | | 162,000 | | | | 8,921 | |
| | TechnoPro Holdings, Inc. (Professional services) | | | 112,500 | | | | 6,908 | |
| | Terumo Corporation (Health care equipment & supplies) | | | 372,000 | | | | 21,296 | |
| | TIS, Inc. (IT services) | | | 154,900 | | | | 7,119 | |
| | Topcon Corporation (Electronic equipment, instruments & components) | | | 255,400 | | | | 4,372 | |
| | Toray Industries, Inc. (Chemicals) | | | 930,500 | | | | 7,344 | |
| | Tsuruha Holdings, Inc. (Food & staples retailing) | | | 29,300 | | | | 3,670 | |
| | Ulvac, Inc. (Semiconductors & semiconductor equipment) | | | 118,500 | | | | 4,520 | |
| | Zenkoku Hosho Co., Ltd. (Diversified financial services) | | | 96,300 | | | | 4,360 | |
| | | | | | | | | 322,496 | |
| | |
| | United Kingdom—12.3% | | | | | | | | |
| | 3i Group plc (Capital markets) | | | 1,063,364 | | | | 12,589 | |
| | Abcam plc (Biotechnology) | | | 204,959 | | | | 3,601 | |
| | Ashtead Group plc (Trading companies & distributors) | | | 607,478 | | | | 18,090 | |
| | AVEVA Group plc (Software) | | | 105,494 | | | | 3,730 | |
| | Beazley plc (Insurance) | | | 719,049 | | | | 5,541 | |
| | Big Yellow Group plc (Equity REIT) | | | 350,490 | | | | 4,394 | |
| | Carnival plc (Hotels, restaurants & leisure) | | | 303,499 | | | | 17,346 | |
| | Close Brothers Group plc (Capital markets) | | | 141,051 | | | | 2,754 | |
| | Compass Group plc (Hotels, restaurants & leisure) | | | 1,234,484 | | | | 26,314 | |
| | Croda International plc (Chemicals) | | | 181,188 | | | | 11,447 | |
| | Dechra Pharmaceuticals plc (Pharmaceuticals) | | | 127,295 | | | | 4,659 | |
| | easyJet plc (Airlines) | | | 164,566 | | | | 3,620 | |
| | Electrocomponents plc (Electronic equipment, instruments & components) | | | 452,880 | | | | 4,515 | |
| | Experian plc (Professional services) | | | 745,218 | | | | 18,384 | |
| | | | | | | | |
| | | | | | | | |
| | Issuer | | Shares | | | Value | |
| | |
| | Common Stocks—(continued) | | | | | | | | |
| | |
| | United Kingdom—(continued) | | | | | | | | |
| | Fevertree Drinks plc (Beverages) | | | 137,982 | | | $ | 6,151 | |
| | Greggs plc (Hotels, restaurants & leisure) | | | 201,636 | | | | 2,644 | |
| | Halma plc (Electronic equipment, instruments & components) | | | 360,750 | | | | 6,496 | |
| | Hiscox, Ltd. (Insurance) | | | 435,280 | | | | 8,736 | |
| | Intermediate Capital Group plc (Capital markets) | | | 404,678 | | | | 5,863 | |
| | Intertek Group plc (Professional services) | | | 139,594 | | | | 10,496 | |
| | Kindred Group plc (Hotels, restaurants & leisure) | | | 412,790 | | | | 5,171 | |
| | London Stock Exchange Group plc (Capital markets) | | | 294,037 | | | | 17,310 | |
| | Melrose Industries plc (Electrical equipment) | | | 2,837,057 | | | | 7,938 | |
| * | Metro Bank plc (Banks) | | | 66,774 | | | | 2,841 | |
| | Renishaw plc (Electronic equipment, instruments & components) | | | 61,305 | | | | 4,274 | |
| | Rentokil Initial plc (Commercial services & supplies) | | | 2,296,230 | | | | 10,587 | |
| | Rotork plc (Machinery) | | | 719,601 | | | | 3,169 | |
| | Segro plc (Equity REIT) | | | 1,274,802 | | | | 11,227 | |
| | Spirax-Sarco Engineering plc (Machinery) | | | 111,323 | | | | 9,546 | |
| | Synthomer plc (Chemicals) | | | 440,899 | | | | 3,055 | |
| | Victrex plc (Chemicals) | | | 193,344 | | | | 7,402 | |
| | WH Smith plc (Specialty retail) | | | 312,493 | | | | 8,225 | |
| | | | | | | | | 268,115 | |
| | |
| | Canada—5.5% | | | | | | | | |
| | Constellation Software, Inc. (Software) | | | 14,061 | | | | 10,905 | |
| | Dollarama, Inc. (Multiline retail) | | | 240,212 | | | | 9,311 | |
| | Finning International, Inc. (Trading companies & distributors) | | | 122,498 | | | | 3,024 | |
| * | Lululemon Athletica, Inc. (Textiles, apparel & luxury goods) | | | 104,531 | | | | 13,051 | |
| * | Shopify, Inc. Class “A” (Internet software & services)† | | | 108,809 | | | | 15,874 | |
| | Suncor Energy, Inc. (Oil, gas & consumable fuels) | | | 832,165 | | | | 33,865 | |
| | The Toronto-Dominion Bank (Banks) | | | 583,882 | | | | 33,794 | |
| | | | | | | | | 119,824 | |
| | |
| | Asia—4.4% | | | | | | | | |
| | Australia—1.6% | | | | | | | | |
| | Aristocrat Leisure, Ltd. (Hotels, restaurants & leisure) | | | 638,468 | | | | 14,581 | |
| | CSL, Ltd. (Biotechnology) | | | 145,720 | | | | 20,742 | |
| | | | | | | | | 35,323 | |
| | Hong Kong—2.7% | | | | | | | | |
| | AIA Group, Ltd. (Insurance) | | | 3,979,263 | | | | 34,665 | |
| * | China High Precision Automation Group, Ltd. (Electronic equipment, instruments & components)**§ | | | 3,373,000 | | | | — | |
| | Galaxy Entertainment Group, Ltd. (Hotels, restaurants & leisure) | | | 3,071,000 | | | | 23,673 | |
| | | | | | | | | 58,338 | |
See accompanying Notes to Financial Statements.
| June 30, 2018 | William Blair Funds | 61 |
Institutional International Growth Fund
Portfolio of Investments, June 30, 2018 (all dollar amounts in thousands) (unaudited)
| | | | | | | | |
| | | | | | | | |
| | Issuer | | Shares | | | Value | |
| | |
| | Common Stocks—(continued) | | | | | | | | |
| | |
| | Asia—(continued) | | | | | | | | |
| | Singapore—0.1% | | | | | | | | |
| | Venture Corporation, Ltd. (Electronic equipment, instruments & components) | | | 211,700 | | | $ | 2,766 | |
| | |
| | Emerging Europe, Mid-East, Africa—1.1% | | | | |
| | Russia—0.3% | | | | | | | | |
| | Globaltrans Investment plc-GDR (Road & rail) | | | 212,830 | | | | 2,170 | |
| * | Yandex N.V. Class “A” (Internet software & services)† | | | 127,729 | | | | 4,585 | |
| | | | | | | | | 6,755 | |
| | South Africa—0.8% | | | | | | | | |
| | Bid Corporation, Ltd. (Food & staples retailing) | | | 162,513 | | | | 3,254 | |
| | Bidvest Group, Ltd. (Industrial conglomerates) | | | 162,513 | | | | 2,327 | |
| | Mr. Price Group, Ltd. (Specialty retail) | | | 336,376 | | | | 5,521 | |
| | RMB Holdings, Ltd. (Diversified financial services) | | | 1,017,205 | | | | 5,597 | |
| | | | | | | | | 16,699 | |
| | |
| | Emerging Latin America—0.9% | | | | | | | | |
| | Argentina—0.1% | | | | | | | | |
| | Grupo Financiero Galicia S.A.—ADR (Banks) | | | 58,435 | | | | 1,927 | |
| | Brazil—0.2% | | | | | | | | |
| | M Dias Branco S.A. (Food products) | | | 250,700 | | | | 2,419 | |
| | Via Varejo S.A. (Specialty retail) | | | 472,800 | | | | 2,270 | |
| | | | | | | | | 4,689 | |
| | Mexico—0.1% | | | | | | | | |
| | Arca Continental S.A.B. de C.V. (Beverages) | | | 101,974 | | | | 626 | |
| | Peru—0.5% | | | | | | | | |
| | Credicorp, Ltd. (Banks)† | | | 50,807 | | | | 11,438 | |
| | Total Common Stocks—97.9%
(cost $1,790,748) | | | | | | | 2,129,287 | |
| | |
| | Preferred Stock | | | | | | | | |
| | Germany—0.3% | | | | | | | | |
| | Fuchs Petrolub SE (Chemicals) | | | 126,821 | | | | 6,240 | |
| | Total Preferred Stock—0.3%
(cost $6,374) | | | | | | | 6,240 | |
| | | | | | | | |
| | | | Principal | | | | |
| | Issuer | | Amount | | | Value | |
| | |
| | Repurchase Agreement | | | | | | | | |
| | Fixed Income Clearing Corporation, 0.350% dated 6/29/18, due 7/2/18, repurchase price $8,051, collateralized by U.S. Treasury Inflation Index Bond, 0.250%, due 1/15/25 | | | $8,051 | | | $ | 8,051 | |
| | Total Repurchase Agreement—0.4%
(cost $8,051) | | | | | | | 8,051 | |
| | Total Investments—98.6%
(cost $1,805,173) | | | | | | | 2,143,578 | |
| | Cash and other assets, less liabilities—1.4% | | | | | | | 31,194 | |
| | Net assets—100.0% | | | | | | $ | 2,174,772 | |
ADR = American Depository Receipt
GDR = Global Depository Receipt
REIT = Real Estate Investment Trust
* = Non-income producing security
† = U.S. listed foreign security
** = Fair valued pursuant to Valuation Procedures approved by the Board of Trustees. Fair Value was determined using significant unobservable inputs. This holding represents 0.00% of the Fund’s net assets at June 30, 2018.
§ = Deemed illiquid pursuant to Liquidity Procedures approved by the Board of Trustees. This holding represents 0.00% of the Fund’s net assets at June 30, 2018.
For securities primarily traded on exchanges or markets that close before the close of regular trading on the New York Stock Exchange, the Fund may use an independent pricing service to fair value price the securities pursuant to Valuation Procedures approved by the Board of Trustees.
See accompanying Notes to Financial Statements.
| 62 | Semiannual Report | June 30, 2018 |
Institutional International Growth Fund
Portfolio of Investments, June 30, 2018 (unaudited)
At June 30, 2018, the Fund’s Portfolio of Investments includes the following industry categories (as a percentage of long-term investments):
| Information Technology | | | 21.1 | % |
| Industrials | | | 18.1 | % |
| Financials | | | 15.4 | % |
| Consumer Discretionary | | | 14.2 | % |
| Health Care | | | 9.7 | % |
| Energy | | | 6.3 | % |
| Consumer Staples | | | 6.0 | % |
| Materials | | | 5.7 | % |
| Real Estate | | | 2.7 | % |
| Utilities | | | 0.8 | % |
| Total | | | 100.0 | % |
At June 30, 2018, the Fund’s Portfolio of Investments includes the following currency categories (as a percentage of long-term investments):
| Euro | | | 29.6 | % |
| Japanese Yen | | | 15.1 | % |
| British Pound Sterling | | | 13.1 | % |
| Hong Kong Dollar | | | 10.1 | % |
| U.S. Dollar | | | 8.0 | % |
| Canadian Dollar | | | 4.3 | % |
| Swedish Krona | | | 3.9 | % |
| Danish Krone | | | 3.3 | % |
| Swiss Franc | | | 3.3 | % |
| Indian Rupee | | | 2.7 | % |
| Australian Dollar | | | 1.7 | % |
| South Korean Won | | | 1.4 | % |
| All Other Currencies | | | 3.5 | % |
| Total | | | 100.0 | % |
See accompanying Notes to Financial Statements.
| June 30, 2018 | William Blair Funds | 63 |
| | International Small Cap Growth Fund |
| | |
| | The International Small Cap Growth Fund seeks long-term capital appreciation. |
| | |
| | AN OVERVIEW FROM THE PORTFOLIO MANAGERS |
| | |

Simon Fennell 
Andrew G. Flynn | The William Blair International Small Cap Growth Fund (Class N shares) posted a 4.26% decrease, net of fees, for the six months ended June 30, 2018. By comparison, the Fund’s benchmark index, the MSCI All Country World ex-U.S. Small Cap Index (net) (the “Index”), decreased 2.94%. The Fund’s six-month underperformance versus the Index was driven by a combination of allocation and stock selection effects. An underweight allocation to Real Estate, coupled with below average stock selection within the Consumer Discretionary and Energy sectors, hampered relative returns. Within the Consumer Discretionary sector, MGM China Holdings, Ltd. detracted from the Fund’s relative performance. MGM China is a leading developer, owner and operator of gaming and lodging resorts in the Greater China region. MGM China is among the most profitable major casino operators in Macau despite its relatively low market share. MGM China’s share price dropped in the later part of the six-month period along with other Macau-related names after weaker casino revenues for the month of May. Nevertheless, we believe the company will continue to benefit from its strong mass market exposure, differentiated property positioning and solid execution. Within Energy, Canada-based CES Energy Solutions Corporation, a quickly growing, asset-light oil service company, was a detractor for the first half of the year. The company reported record high revenue, however, gross margin weakness amid rising input costs drove below-consensus EBITDA performance. While the operating environment was incrementally more challenging, we believe CES remains a compelling investment. Partially offsetting these negative effects was the Fund’s underweight allocation to Canada coupled with above average stock selection within the Consumer Staples and Materials sectors. Within Consumer Staples, beverage companies Fevertree Drinks plc and Royal Unibrew A/S bolstered the Fund’s relative returns. Fevertree produces premium mixers, including tonic water, ginger beer, cola, and lemonade. We expect that the company will experience rapid growth due to its expanding geographic presence, increased product mix, and the trend towards premium spirits. Royal Unibrew, based in Denmark, benefited from strong earnings in the fourth quarter of 2017 that exceeded estimates. We believe the company is well positioned for future growth through a combination of organic growth (via distribution expansion and a wider product range) and small acquisitions to leverage established distribution and logistics networks. Please refer to the Global Markets Review and Outlook relating to the Fund beginning on page 32 for additional information. |
| 64 | Semiannual Report | June 30, 2018 |
International Small Cap Growth Fund
Performance Highlights (Unaudited)
Average Annual Total Return through 6/30/2018
| | | Year | | | | | | | | |
| | | to Date | | 1 Year | | 3 Year | | 5 Year | | 10 Year |
| Class N | | | (4.26 | )% | | | 8.49 | % | | | 7.38 | % | | | 7.36 | % | | | 5.21 | % |
| Class I | | | (4.09 | ) | | | 8.92 | | | | 7.74 | | | | 7.69 | | | | 5.56 | |
| Institutional Class | | | (4.01 | ) | | | 8.96 | | | | 7.81 | | | | 7.83 | | | | 5.73 | |
| MSCI ACW Ex-U.S. Small Cap Index (net) | | | (2.94 | ) | | | 10.57 | | | | 7.94 | | | | 8.98 | | | | 5.77 | |
Performance cited represents past performance. Past performance does not guarantee future results and current performance may be lower or higher than the data quoted. Results shown are average annual returns, which assume reinvestment of dividends and capital gains. Investment returns and principal will fluctuate and you may have a gain or loss when you sell shares. For the most current month-end performance information, please call 1-800-742-7272, or visit our Web site at www.williamblairfunds.com. From time to time, the investment adviser may waive fees or reimburse expenses for the Fund. Without these waivers/reimbursements, performance would be lower. Investing in smaller companies involves special risks, including higher volatility and lower liquidity. Smaller capitalization stocks are also more sensitive to purchase/sale transactions and changes in the issuer’s financial condition. International investing involves special risk considerations, including currency fluctuations, lower liquidity, economic and political risk. Class N shares are available to the general public without a sales load. Class I shares are available to certain institutional investors, and advisory clients of William Blair & Company, L.L.C., without a sales load or distribution (12b-1) fees. Institutional Class shares are available to institutional investors without a sales load or distribution (12b-1) or service fees.
The performance highlights and graph presented above do not reflect the deduction of taxes that a shareholder would pay on fund distributions or the redemption of fund shares.
The Morgan Stanley Capital International (MSCI) All Country World (ACW) Ex-U.S. Small Cap Index (net) is a free float-adjusted market capitalization weighted index that is designed to measure the equity market performance of small capitalization developed and emerging markets, excluding the United States. This index approximates the minimum possible dividend reinvestment by deducting for the highest possible withholding tax rates of those markets.
This report identifies the Fund’s investments on June 30, 2018. These holdings are subject to change. Not all stocks in the Fund performed the same, nor is there any guarantee that these stocks will perform as well in the future. Market forecasts provided in this report may not necessarily come to pass.
Sector Diversification (Unaudited)

The sector diversification shown is based on the total long-term securities.
| June 30, 2018 | William Blair Funds | 65 |
International Small Cap Growth Fund
Portfolio of Investments, June 30, 2018 (all dollar amounts in thousands) (unaudited)
| | | | | | | | |
| | | | | | | | |
| | Issuer | | Shares | | | Value | |
| | |
| | Common Stocks | | | | | | |
| | |
| | Europe, Mid-East—33.0% | | | | | | | | |
| | Austria—0.5% | | | | | | | | |
| | Schoeller-Bleckmann Oilfield Equipment AG (Energy equipment & services) | | | 24,907 | | | $ | 2,989 | |
| | Belgium—1.0% | | | | | | | | |
| | Melexis N.V. (Semiconductors & semiconductor equipment) | | | 65,032 | | | | 6,020 | |
| | Denmark—1.9% | | | | | | | | |
| | Royal Unibrew A/S (Beverages) | | | 134,535 | | | | 10,691 | |
| | France—3.9% | | | | | | | | |
| | Alten S.A. (IT services) | | | 40,087 | | | | 4,121 | |
| | Nexity S.A. (Real estate management & development) | | | 81,851 | | | | 5,167 | |
| | Rubis SCA (Gas utilities) | | | 113,483 | | | | 7,074 | |
| * | Worldline S.A. (IT services) | | | 105,851 | | | | 5,985 | |
| | | | | | | | | 22,347 | |
| | Germany—4.0% | | | | | | | | |
| | AURELIUS Equity Opportunities SE & Co KGaA (Capital markets) | | | 79,710 | | | | 4,718 | |
| | CTS Eventim AG & Co KGaA (Media) | | | 132,462 | | | | 6,504 | |
| | GRENKE AG (Diversified financial services) | | | 51,275 | | | | 5,845 | |
| | Norma Group SE (Machinery) | | | 90,392 | | | | 6,176 | |
| | | | | | | | | 23,243 | |
| | Ireland—1.7% | | | | | | | | |
| | Kingspan Group plc (Building products) | | | 86,202 | | | | 4,309 | |
| | UDG Healthcare plc (Health care providers & services) | | | 504,797 | | | | 5,486 | |
| | | | | | | | | 9,795 | |
| | Israel—3.3% | | | | | | | | |
| | Frutarom Industries, Ltd. (Chemicals) | | | 70,362 | | | | 6,920 | |
| | Mizrahi Tefahot Bank, Ltd. (Banks) | | | 276,958 | | | | 5,096 | |
| * | Wix.com, Ltd. (Internet software & services)† | | | 73,094 | | | | 7,331 | |
| | | | | | | | | 19,347 | |
| | Italy—5.5% | | | | | | | | |
| | Amplifon SpA (Health care providers & services) | | | 339,768 | | | | 7,025 | |
| | Autogrill SpA (Hotels, restaurants & leisure) | | | 255,480 | | | | 3,156 | |
| | Banca IFIS SpA (Diversified financial services) | | | 97,892 | | | | 2,936 | |
| | Brunello Cucinelli SpA (Textiles, apparel & luxury goods) | | | 37,457 | | | | 1,668 | |
| | Cerved Group SpA (Diversified financial services) | | | 317,297 | | | | 3,398 | |
| | DiaSorin SpA (Health care equipment & supplies) | | | 71,958 | | | | 8,178 | |
| | Gima TT SpA (Machinery) | | | 174,344 | | | | 2,863 | |
| | IMA Industria Macchine Automatiche SpA (Machinery) | | | 27,966 | | | | 2,427 | |
| | | | | | | | | 31,651 | |
| | Jersey—0.8% | | | | | | | | |
| | Sanne Group plc (Capital markets) | | | 529,536 | | | | 4,710 | |
| | | | | | | | |
| | | | | | | | |
| | Issuer | | Shares | | | Value | |
| | |
| | Common Stocks—(continued) | | | | | | | | |
| | |
| | Europe, Mid-East—(continued) | | | | | | | | |
| | Luxembourg—0.8% | | | | | | | | |
| | Stabilus S.A. (Machinery) | | | 53,885 | | | $ | 4,841 | |
| | Netherlands—1.1% | | | | | | | | |
| | Euronext N.V. (Capital markets) | | | 101,243 | | | | 6,415 | |
| | Norway—0.7% | | | | | | | | |
| | TGS Nopec Geophysical Co. ASA (Energy equipment & services) | | | 110,410 | | | | 4,055 | |
| | Sweden—6.3% | | | | | | | | |
| | Dometic Group AB (Auto components) | | | 575,379 | | | | 5,631 | |
| | Evolution Gaming Group AB (Hotels, restaurants & leisure) | | | 119,796 | | | | 7,413 | |
| | Indutrade AB (Trading companies & distributors) | | | 252,038 | | | | 5,999 | |
| | Loomis AB Class “B” (Commercial services & supplies) | | | 58,425 | | | | 2,024 | |
| | Nolato AB Class “B” (Industrial conglomerates) | | | 33,468 | | | | 2,693 | |
| * | Swedish Orphan Biovitrum AB (Biotechnology) | | | 168,022 | | | | 3,659 | |
| | Thule Group AB (Leisure products) | | | 357,754 | | | | 8,868 | |
| | | | | | | | | 36,287 | |
| | Switzerland—1.5% | | | | | | | | |
| * | Kardex AG (Machinery) | | | 22,900 | | | | 3,169 | |
| | Tecan Group AG (Life sciences tools & services) | | | 22,011 | | | | 5,341 | |
| | | | | | | | | 8,510 | |
| | |
| | United Kingdom—20.2% | | | | | | | | |
| | Abcam plc (Biotechnology) | | | 451,141 | | | | 7,925 | |
| | Arrow Global Group plc (Consumer finance) | | | 710,264 | | | | 2,262 | |
| | AVEVA Group plc (Software) | | | 178,545 | | | | 6,314 | |
| | Beazley plc (Insurance) | | | 1,337,392 | | | | 10,306 | |
| | Burford Capital, Ltd. (Capital markets) | | | 344,279 | | | | 6,771 | |
| | CVS Group plc (Health care providers & services) | | | 81,959 | | | | 1,227 | |
| | Dechra Pharmaceuticals plc (Pharmaceuticals) | | | 200,477 | | | | 7,337 | |
| | Diploma plc (Trading companies & distributors) | | | 327,550 | | | | 5,650 | |
| | Domino’s Pizza Group plc (Hotels, restaurants & leisure) | | | 1,171,251 | | | | 5,345 | |
| | Electrocomponents plc (Electronic equipment, instruments & components) | | | 610,779 | | | | 6,089 | |
| | Fevertree Drinks plc (Beverages) | | | 161,241 | | | | 7,188 | |
| | Halma plc (Electronic equipment, instruments & components) | | | 226,337 | | | | 4,075 | |
| | Hill & Smith Holdings plc (Metals & mining) | | | 202,831 | | | | 3,946 | |
| | Intermediate Capital Group plc (Capital markets) | | | 377,412 | | | | 5,468 | |
| | Rotork plc (Machinery) | | | 772,253 | | | | 3,401 | |
| | Scapa Group plc (Chemicals) | | | 511,465 | | | | 2,933 | |
See accompanying Notes to Financial Statements.
| 66 | Semiannual Report | June 30, 2018 |
International Small Cap Growth Fund
Portfolio of Investments, June 30, 2018 (all dollar amounts in thousands) (unaudited)
| | | | | | | | |
| | | | | | | | |
| | Issuer | | Shares | | | | Value | |
| | |
| | Common Stocks—(continued) | | | | | | | | |
| | |
| | United Kingdom—(continued) | | | | | | | | |
| | Spirax-Sarco Engineering plc (Machinery) | | | 64,614 | | | $ | 5,541 | |
| | SSP Group plc (Hotels, restaurants & leisure) | | | 1,006,471 | | | | 8,398 | |
| | The UNITE Group plc (Real estate management & development) | | | 598,000 | | | | 6,786 | |
| | Victrex plc (Chemicals) | | | 87,801 | | | | 3,361 | |
| | Workspace Group plc (Equity REIT) | | | 480,489 | | | | 6,830 | |
| | | | | | | | | 117,153 | |
| | |
| | Japan—18.1% | | | | | | | | |
| | Asahi Intecc Co., Ltd. (Health care equipment & supplies) | | | 197,000 | | | | 7,438 | |
| | Benefit One, Inc. (Professional services) | | | 78,200 | | | | 2,205 | |
| | en-japan, Inc. (Professional services) | | | 122,300 | | | | 6,154 | |
| | Japan Lifeline Co., Ltd. (Health care providers & services) | | | 94,300 | | | | 2,312 | |
| | Kose Corporation (Personal products) | | | 33,200 | | | | 7,141 | |
| | Maeda Corporation (Construction & engineering) | | | 352,100 | | | | 4,035 | |
| | Matsumotokiyoshi Holdings Co., Ltd. (Food & staples retailing) | | | 133,100 | | | | 5,973 | |
| | Meitec Corporation (Professional services) | | | 63,500 | | | | 3,044 | |
| | Nihon M&A Center, Inc. (Professional services) | | | 254,300 | | | | 7,368 | |
| | Nihon Unisys, Ltd. (IT services) | | | 5,000 | | | | 125 | |
| | Nissan Chemical Industries, Ltd. (Chemicals) | | | 132,900 | | | | 6,191 | |
| | PALTAC Corporation (Distributors) | | | 125,600 | | | | 7,223 | |
| | Pola Orbis Holdings, Inc. (Personal products) | | | 83,200 | | | | 3,656 | |
| | Sankyu, Inc. (Road & rail) | | | 95,520 | | | | 5,013 | |
| | Seria Co., Ltd. (Multiline retail) | | | 51,200 | | | | 2,454 | |
| | Stanley Electric Co., Ltd. (Auto components) | | | 103,100 | | | | 3,510 | |
| | TechnoPro Holdings, Inc. (Professional services) | | | 79,100 | | | | 4,857 | |
| | TIS, Inc. (IT services) | | | 166,000 | | | | 7,629 | |
| | Tokyo Century Corporation (Diversified financial services) | | | 132,100 | | | | 7,478 | |
| | Topcon Corporation (Electronic equipment, instruments & components) | | | 280,000 | | | | 4,793 | |
| | Tsuruha Holdings, Inc. (Food & staples retailing) | | | 22,600 | | | | 2,831 | |
| * | UT Group Co., Ltd. (Professional services) | | | 88,537 | | | | 3,307 | |
| | | | | | | | | 104,737 | |
| | |
| | Emerging Asia—13.7% | | | | | | | | |
| | Cambodia—0.5% | | | | | | | | |
| | NagaCorp, Ltd. (Hotels, restaurants & leisure) | | | 2,958,000 | | | | 2,679 | |
| | | | | | | | |
| | | | | | | | |
| | Issuer | | Shares | | | Value | |
| | |
| | Common Stocks—(continued) | | | | | | | | |
| | |
| | Emerging Asia—(continued) | | | | | | | | |
| | China—4.7% | | | | | | | | |
| | 3SBio, Inc. (Biotechnology) | | | 1,943,000 | | | $ | 4,391 | |
| * | 51job, Inc.—ADR (Professional services) | | | 35,986 | | | | 3,514 | |
| * | Baozun, Inc.—ADR (Internet software & services) | | | 48,108 | | | | 2,631 | |
| | China Medical System Holdings, Ltd. (Pharmaceuticals) | | | 1,070,000 | | | | 2,131 | |
| | Fuyao Glass Industry Group Co., Ltd. Class “H” (Auto components) | | | 367,600 | | | | 1,242 | |
| | Kingsoft Corporation, Ltd. (Software) | | | 1,525,000 | | | | 4,603 | |
| * | Li Ning Co., Ltd. (Textiles, apparel & luxury goods) | | | 2,623,500 | | | | 2,886 | |
| * | Noah Holdings, Ltd.—ADR (Capital markets) | | | 60,331 | | | | 3,146 | |
| | Travelsky Technology, Ltd. Class “H” (IT services) | | | 970,000 | | | | 2,816 | |
| | | | | | | | | 27,360 | |
| | India—3.6% | | | | | | | | |
| | Balkrishna Industries, Ltd. (Auto components) | | | 109,411 | | | | 1,665 | |
| | Crompton Greaves Consumer Electricals, Ltd. (Household durables) | | | 1,002,368 | | | | 3,302 | |
| | Cyient, Ltd. (Software) | | | 240,700 | | | | 2,694 | |
| | Indiabulls Housing Finance, Ltd. (Thrifts & mortgage finance) | | | 169,139 | | | | 2,819 | |
| | Jubilant Foodworks, Ltd. (Hotels, restaurants & leisure) | | | 223,104 | | | | 4,540 | |
| | KEC International, Ltd. (Construction & engineering) | | | 467,800 | | | | 2,290 | |
| | MindTree, Ltd. (IT services) | | | 236,315 | | | | 3,401 | |
| | | | | | | | | 20,711 | |
| | South Korea—0.8% | | | | | | | | |
| | Hana Tour Service, Inc. (Hotels, restaurants & leisure) | | | 33,585 | | | | 2,631 | |
| * | Hugel, Inc. (Biotechnology) | | | 5,083 | | | | 2,198 | |
| | | | | | | | | 4,829 | |
| | Taiwan—3.3% | | | | | | | | |
| | Chailease Holding Co., Ltd. (Diversified financial services) | | | 2,110,000 | | | | 6,900 | |
| | Eclat Textile Co., Ltd. (Textiles, apparel & luxury goods) | | | 240,000 | | | | 2,851 | |
| | Globalwafers Co., Ltd. (Semiconductors & semiconductor equipment) | | | 309,000 | | | | 5,116 | |
| | Silicon Motion Technology Corporation— ADR (Semiconductors & semiconductor equipment) | | | 77,962 | | | | 4,123 | |
| | | | | | | | | 18,990 | |
| | Thailand—0.8% | | | | | | | | |
| | Tisco Financial Group PCL (Banks) | | | 1,760,600 | | | | 4,460 | |
See accompanying Notes to Financial Statements.
| June 30, 2018 | William Blair Funds | 67 |
International Small Cap Growth Fund
Portfolio of Investments, June 30, 2018 (all dollar amounts in thousands) (unaudited)
| | | | | | | | |
| | | | | | | | |
| | Issuer | | Shares | | | Value | |
| | |
| | Common Stocks—(continued) | | | | | | | | |
| | |
| | Asia—4.7% | | | | | | | | |
| | Australia—3.0% | | | | | | | | |
| | Corporate Travel Management, Ltd. (Hotels, restaurants & leisure) | | | 87,628 | | | $ | 1,768 | |
| | Costa Group Holdings, Ltd. (Food products) | | | 619,441 | | | | 3,774 | |
| | DuluxGroup, Ltd. (Chemicals) | | | 733,275 | | | | 4,146 | |
| | Orora, Ltd. (Containers & packaging) | | | 1,669,594 | | | | 4,410 | |
| | SmartGroup Corporation, Ltd. (Commercial services & supplies) | | | 80,815 | | | | 698 | |
| | The Star Entertainment Group, Ltd. (Hotels, restaurants & leisure) | | | 635,845 | | | | 2,316 | |
| | | | | | | | | 17,112 | |
| | Hong Kong—1.0% | | | | | | | | |
| | MGM China Holdings, Ltd. (Hotels, restaurants & leisure) | | | 2,548,400 | | | | 5,893 | |
| | New Zealand—0.7% | | | | | | | | |
| | Fisher & Paykel Healthcare Corp., Ltd. (Health care equipment & supplies) | | | 390,538 | | | | 3,935 | |
| | |
| | Canada—2.8% | | | | | | | | |
| | Reliance Worldwide Corporation, Ltd. (Building products) | | | 730,269 | | | | 2,891 | |
| | Canadian Western Bank (Banks) | | | 169,756 | | | | 4,474 | |
| | CES Energy Solutions Corporation (Energy equipment & services) | | | 679,495 | | | | 2,321 | |
| | Finning International, Inc. (Trading companies & distributors) | | | 232,521 | | | | 5,739 | |
| | Intertape Polymer Group, Inc. (Containers & packaging) | | | 49,515 | | | | 681 | |
| | | | | | | | | 16,106 | |
| | |
| | Emerging Europe, Mid-East, Africa—2.0% | | | | |
| | South Africa—2.0% | | | | | | | | |
| | AVI, Ltd. (Food products) | | | 468,759 | | | | 3,703 | |
| | Bidvest Group, Ltd. (Industrial conglomerates) | | | 210,760 | | | | 3,018 | |
| | Clicks Group, Ltd. (Food & staples retailing) | | | 352,167 | | | | 5,028 | |
| | | | | | | | | 11,749 | |
| | |
| | Emerging Latin America—1.9% | | | | | | | | |
| | Argentina—0.8% | | | | | | | | |
| * | Globant S.A. (Software)† | | | 73,185 | | | | 4,156 | |
| | Grupo Supervielle S.A.—ADR (Banks) | | | 50,689 | | | | 536 | |
| | | | | | | | | 4,692 | |
| | Brazil—1.1% | | | | | | | | |
| | CVC Brasil Operadora e Agencia de Viagens S.A. (Hotels, restaurants & leisure) | | | 256,600 | | | | 2,992 | |
| | Localiza Rent a Car S.A. (Road & rail) | | | 518,985 | | | | 3,178 | |
| | | | | | | | | 6,170 | |
| | Total Common Stocks—96.4%
(cost $486,449) | | | | | | | 557,477 | |
| | | | | | | | |
| | | | Principal | | | | |
| | Issuer | | Amount | | | Value | |
| | |
| | Repurchase Agreement | | | | | | | | |
| | Fixed Income Clearing Corporation, 0.350% dated 6/29/18, due 7/2/18, repurchase price $21,691, collateralized by U.S. Treasury Note, 2.000%, due 4/30/24 | | | $21,690 | | | $ | 21,690 | |
| | Total Repurchase Agreement—3.7%
(cost $21,690) | | | | | | | 21,690 | |
| | Total Investments—100.1%
(cost $508,139) | | | | | | | 579,167 | |
| | Liabilities, plus cash and other assets—(0.1)% | | | | | | | (670 | ) |
| | Net assets—100.0% | | | | | | $ | 578,497 | |
ADR = American Depository Receipt
REIT = Real Estate Investment Trust
* = Non-income producing security
† = U.S. listed foreign security
For securities primarily traded on exchanges or markets that close before the close of regular trading on the New York Stock Exchange, the Fund may use an independent pricing service to fair value price the securities pursuant to Valuation Procedures approved by the Board of Trustees.
At June 30, 2018, the Fund’s Portfolio of Investments includes the following industry categories (as a percentage of long-term investments):
| Industrials | | | 19.1 | % |
| Consumer Discretionary | | | 17.0 | % |
| Financials | | | 15.7 | % |
| Information Technology | | | 14.7 | % |
| Health Care | | | 12.3 | % |
| Consumer Staples | | | 9.0 | % |
| Materials | | | 5.8 | % |
| Real Estate | | | 3.4 | % |
| Energy | | | 1.7 | % |
| Utilities | | | 1.3 | % |
| Total | | | 100.0 | % |
At June 30, 2018, the Fund’s Portfolio of Investments includes the following currency categories (as a percentage of long-term investments):
| British Pound Sterling | | | 22.8 | % |
| Japanese Yen | | | 18.8 | % |
| Euro | | | 18.3 | % |
| Swedish Krona | | | 6.5 | % |
| Hong Kong Dollar | | | 4.8 | % |
| U.S. Dollar | | | 4.6 | % |
| Indian Rupee | | | 3.7 | % |
| Australian Dollar | | | 3.6 | % |
| New Taiwan Dollar | | | 2.7 | % |
| Canadian Dollar | | | 2.4 | % |
| Israeli Shekel | | | 2.1 | % |
| South African Rand | | | 2.1 | % |
| Danish Krone | | | 1.9 | % |
| Swiss Franc | | | 1.5 | % |
| Brazilian Real | | | 1.1 | % |
| All Other Currencies | | | 3.1 | % |
| Total | | | 100.0 | % |
See accompanying Notes to Financial Statements.
| 68 | Semiannual Report | June 30, 2018 |
| | Emerging Markets Leaders Fund |
| | |
| | The Emerging Markets Leaders Fund seeks long-term capital appreciation. |
| | |
| | AN OVERVIEW FROM THE PORTFOLIO MANAGERS |
| | |

Todd M. McClone 
John C. Murphy | The William Blair Emerging Markets Leaders Fund (Class N shares) posted a 6.96% decrease, net of fees, for the six months ended June 30, 2018. By comparison, the Fund’s benchmark index, the MSCI Emerging Markets Index (net) (the “Index”) decreased 6.66%. Underperformance versus the Index was driven by negative stock selection within the Energy and Industrials sectors. Within Energy, YPF S.A., the Argentinean oil company, weighed on the Fund’s relative results amid broad market weakness and sharp Argentinean Peso depreciation. YPF retains a dominant position in one of the most promising shale resources outside of North America in our view. The combination of a recovery in oil prices and a move toward full liberalization of oil prices should accelerate foreign investment in this resource base and drive long-term volume growth. YPF shares trade at a considerable discount despite its dominant position in the world-class shale resource in Vaca Muerta. While macro risk remains a near-term headwind, international oil companies’ continued interest in participating in the development of Argentinian shale assets underscores the long-term opportunity for YPF shareholders. Within Industrials, KOC Holding A.S., the Turkish industrial conglomerate, dragged down sector performance. KOC maintains leading positions in Turkey’s automotive, consumer durables, energy, and finance sectors. With five of the top ten industrial companies in Turkey under its umbrella, KOC revenues account for approximately 7% of Turkey’s gross domestic product. KOC’s share price decline during the first half of 2018 was driven by the company’s decelerating growth after a strong 2017, deteriorating sentiment towards Turkey, and depreciation of the Turkish Lira. We exited the position amid these increased headwinds. Mitigating these effects were positive contributions from the Consumer Discretionary and Health Care sectors. Consumer Discretionary results were bolstered by the stock selection within the Textile, Apparel and Luxury Goods as well as Hotels, Restaurants and Leisure industries. Shenzhou International Group Holdings, Ltd., the Chinese textile manufacturer, drove strong results as the share price advanced steadily on the back of the company’s robust operating momentum. Shenzhou’s core business is in original equipment manufacturing for sportswear and apparel brands including Nike, Adidas, Uniqlo, and Puma. We expect Shenzhou to benefit from strong volume growth prospectively, supported by capacity expansion and order share gain with key clients. We also foresee margin expansion opportunities driven by a favorable product mix shift, efficiency gains (due to automation in Ningbo, China and capacity ramp-up in Vietnam) and easing cost pressures. Within the Health Care sector, CSPC Pharmaceutical Group, Ltd., the Chinese pharmaceutical company, boosted relative returns. CSPC has evolved from manufacturing low margin bulk products to a high quality pharma company focused on branded generics. CSPC’s share price strengthened amid accelerating operating performance and improving growth outlook supported by its strong product pipeline and growth in innovative drugs, coupled with a favorable regulatory backdrop. Please refer to the Global Markets Review and Outlook relating to the Fund beginning on page 32 for additional information. |
| June 30, 2018 | William Blair Funds | 69 |
Emerging Markets Leaders Fund
Performance Highlights (Unaudited)
| |
| Average Annual Total Return through 6/30/2018 |
| | | Year | | | | | | | | | | | | | | Since |
| | | to Date | | 1 Year | | 3 Year | | 5 Year | | 10 Year | | Inception |
| Class N(a) | | | (6.96 | )% | | | 9.71 | % | | | 4.19 | % | | | 4.60 | % | | | — | | | | 3.54 | % |
| MSCI Emerging Markets Index (net)(a) | | | (6.66 | ) | | | 8.20 | | | | 5.60 | | | | 5.01 | | | | — | | | | 3.19 | |
| Class I | | | (6.76 | ) | | | 9.95 | | | | 4.49 | | | | 4.91 | | | | 2.31 | % | | | — | |
| Institutional Class | | | (6.76 | ) | | | 10.01 | | | | 4.58 | | | | 5.00 | | | | 2.42 | | | | — | |
| MSCI Emerging Markets Index (net) | | | (6.66 | ) | | | 8.20 | | | | 5.60 | | | | 5.01 | | | | 2.26 | | | | — | |
| | |
| (a) | Since inception is for the period from May 3, 2010 (Commencement of Operations) to June 30, 2018. |
Performance cited represents past performance. Past performance does not guarantee future results and current performance may be lower or higher than the data quoted. Results shown are average annual total returns, which assume reinvestment of dividends and capital gains. Investment returns and principal will fluctuate and you may have a gain or loss when you sell shares. For the most current month-end performance information, please call 1-800-742-7272, or visit our Web site at www.williamblairfunds.com. International investing involves special risk considerations, including currency fluctuations, lower liquidity, economic and political risk. These risks may be magnified when investing in emerging markets. From time to time, the investment adviser may waive fees or reimburse expenses for the Fund. Without these waivers/reimbursements, performance would be lower. Class N shares are available to the general public without a sales load. Class I shares are available to certain institutional investors, and advisory clients of William Blair & Company, L.L.C., without a sales load or distribution (12b-1) fees. Institutional Class shares are available to institutional investors without a sales load or distribution (12b-1) or service fees.
The performance highlights and graph presented above do not reflect the deduction of taxes that a shareholder would pay on fund distributions or the redemption of fund shares.
The Morgan Stanley Capital International (MSCI) Emerging Markets Index (net) is a free float-adjusted market-capitalization-weighted index that is designed to measure equity market performance of emerging markets. This index approximates the minimum possible dividend reinvestment by deducting for the highest possible withholding tax rates of those markets.
This report identifies the Fund’s investments on June 30, 2018. These holdings are subject to change. Not all stocks in the Fund performed the same, nor is there any guarantee that these stocks will perform as well in the future. Market forecasts provided in this report may not necessarily come to pass.
Sector Diversification (Unaudited)

The sector diversification shown is based on the total long-term securities.
| 70 | Semiannual Report | June 30, 2018 |
Emerging Markets Leaders Fund
Portfolio of Investments, June 30, 2018 (all dollar amounts in thousands) (unaudited)
| | | | | | | | |
| | | | | | | | |
| | Issuer | | Shares | | | Value | |
| | | | | | | | | | |
| | Common Stocks | | | | | | | | |
| | | | | | | | | | |
| | Emerging Asia—74.2% | | | | | | | | |
| | China—38.1% | | | | | | | | |
| * | Alibaba Group Holding, Ltd.—ADR (Internet software & services) | | | 149,141 | | | $ | 27,670 | |
| | ANTA Sports Products, Ltd. (Textiles, apparel & luxury goods) | | | 830,000 | | | | 4,377 | |
| | Autohome, Inc.—ADR (Internet software & services) | | | 50,385 | | | | 5,089 | |
| | Brilliance China Automotive Holdings, Ltd. (Automobiles) | | | 1,996,000 | | | | 3,581 | |
| | China International Travel Service Corporation, Ltd. Class “A” (Hotels, restaurants & leisure) | | | 501,314 | | | | 4,868 | |
| | China Merchants Bank Co., Ltd. Class “H” (Banks) | | | 1,200,000 | | | | 4,414 | |
| | CNOOC, Ltd. (Oil, gas & consumable fuels) | | | 3,741,000 | | | | 6,410 | |
| | CSPC Pharmaceutical Group, Ltd. (Pharmaceuticals) | | | 2,600,000 | | | | 7,807 | |
| * | Ctrip.com International, Ltd.—ADR (Internet & direct marketing retail) | | | 108,162 | | | | 5,152 | |
| | ENN Energy Holdings, Ltd. (Gas utilities) | | | 457,000 | | | | 4,476 | |
| | Haier Electronics Group Co., Ltd. (Household durables) | | | 2,055,000 | | | | 7,011 | |
| | Huazhu Group, Ltd.—ADR (Hotels, restaurants & leisure) | | | 154,105 | | | | 6,471 | |
| | Jiangsu Hengrui Medicine Co., Ltd. Class “A” (Pharmaceuticals) | | | 618,860 | | | | 7,062 | |
| | Kweichow Moutai Co., Ltd. Class “A” (Beverages) | | | 58,859 | | | | 6,482 | |
| | Ping An Insurance Group Co. of China, Ltd. Class “H” (Insurance) | | | 1,060,000 | | | | 9,707 | |
| | Shenzhou International Group Holdings, Ltd. (Textiles, apparel & luxury goods) | | | 647,000 | | | | 7,962 | |
| | Sunny Optical Technology Group Co., Ltd. (Electronic equipment, instruments & components) | | | 156,000 | | | | 2,893 | |
| * | TAL Education Group—ADR (Diversified consumer services) | | | 87,634 | | | | 3,225 | |
| | Tencent Holdings, Ltd. (Internet software & services) | | | 574,300 | | | | 28,839 | |
| | Tingyi Cayman Islands Holding Corporation (Food products) | | | 2,550,000 | | | | 5,907 | |
| | Yum China Holdings, Inc. (Hotels, restaurants & leisure) | | | 171,607 | | | | 6,600 | |
| | | | | | | | | 166,003 | |
| | India—16.0% | | | | | | | | |
| | Asian Paints, Ltd. (Chemicals) | | | 204,952 | | | | 3,782 | |
| | Bajaj Finance, Ltd. (Consumer finance) | | | 203,916 | | | | 6,857 | |
| | Britannia Industries, Ltd. (Food products) | | | 45,062 | | | | 4,103 | |
| | HDFC Bank, Ltd.—ADR (Banks) | | | 15,302 | | | | 1,607 | |
| | HDFC Bank, Ltd. (Banks) | | | 191,556 | | | | 5,908 | |
| | HDFC Standard Life Insurance Co. Ltd. (Insurance) | | | 685,575 | | | | 4,561 | |
| | Hindustan Unilever, Ltd. (Household products) | | | 203,393 | | | | 4,857 | |
| | | | | | | | |
| | | | | | | | |
| | Issuer | | Shares | | | Value | |
| | | | | | | | | | |
| | Common Stocks—(continued) | | | | | | | | |
| | | | | | | | | | |
| | Emerging Asia—(continued) | | | | | | | | |
| | India—(continued) | | | | | | | | |
| | Housing Development Finance Corporation, Ltd. (Thrifts & mortgage finance) | | | 377,921 | | | $ | 10,531 | |
| | IndusInd Bank, Ltd. (Banks) | | | 195,649 | | | | 5,538 | |
| | Infosys, Ltd. (IT services) | | | 523,062 | | | | 10,054 | |
| | Maruti Suzuki India, Ltd. (Automobiles) | | | 43,885 | | | | 5,649 | |
| | MRF, Ltd. (Auto components) | | | 5,526 | | | | 6,058 | |
| | | | | | | | | 69,505 | |
| | Indonesia—3.8% | | | | | | | | |
| | PT Bank Rakyat Indonesia Persero Tbk (Banks) | | | 27,970,900 | | | | 5,533 | |
| | PT Telekomunikasi Indonesia Persero Tbk (Diversified telecommunication services) | | | 25,480,000 | | | | 6,673 | |
| | PT Unilever Indonesia Tbk (Household products) | | | 1,309,500 | | | | 4,208 | |
| | | | | | | | | 16,414 | |
| | South Korea—6.1% | | | | | | | | |
| | LG Chem, Ltd. (Chemicals) | | | 18,450 | | | | 5,522 | |
| | LG Household & Health Care, Ltd. (Personal products) | | | 2,517 | | | | 3,154 | |
| | Samsung Electronics Co., Ltd. (Technology hardware, storage & peripherals) | | | 429,696 | | | | 18,000 | |
| | | | | | | | | 26,676 | |
| | Taiwan—6.8% | | | | | | | | |
| | Taiwan Semiconductor Manufacturing Co. Ltd.—ADR (Semiconductors & semiconductor equipment) | | | 620,616 | | | | 22,690 | |
| | Uni-President Enterprises Corporation (Food products) | | | 2,714,000 | | | | 6,879 | |
| | | | | | | | | 29,569 | |
| | Thailand—3.4% | | | | | | | | |
| | Airports of Thailand PCL (Transportation infrastructure) | | | 3,808,100 | | | | 7,239 | |
| | CP ALL PCL (Food & staples retailing) | | | 3,340,500 | | | | 7,404 | |
| | | | | | | | | 14,643 | |
| | | | | | | | | | |
| | Emerging Europe, Mid-East, Africa—11.2% | | | | | | | | |
| | Hungary—1.4% | | | | | | | | |
| | OTP Bank Nyrt (Banks) | | | 169,976 | | | | 6,137 | |
| | Russia—1.5% | | | | | | | | |
| * | Yandex N.V. Class “A” (Internet software & services)† | | | 187,472 | | | | 6,730 | |
| | South Africa—7.6% | | | | | | | | |
| | Bid Corporation, Ltd. (Food & staples retailing) | | | 183,396 | | | | 3,672 | |
| | Bidvest Group, Ltd. (Industrial conglomerates) | | | 278,082 | | | | 3,982 | |
| | Capitec Bank Holdings, Ltd. (Banks) | | | 94,188 | | | | 5,934 | |
| | FirstRand, Ltd. (Diversified financial services) | | | 1,170,377 | | | | 5,437 | |
| | Naspers, Ltd. (Media) | | | 55,458 | | | | 13,984 | |
| | | | | | | | | 33,009 | |
See accompanying Notes to Financial Statements.
| June 30, 2018 | William Blair Funds | 71 |
Emerging Markets Leaders Fund
Portfolio of Investments, June 30, 2018 (all dollar amounts in thousands) (unaudited)
| | | | | | | | |
| | | | | | | | |
| | Issuer | | Shares | | | Value | |
| | | | | | | | | | |
| | Common Stocks—(continued) | | | | | | | | |
| | | | | | | | | | |
| | Emerging Europe, Mid-East, Africa—(continued) | | | | | | | | |
| | Turkey—0.7% | | | | | | | | |
| | KOC Holding A.S. (Industrial conglomerates) | | | 972,014 | | | $ | 3,004 | |
| | | | | | | | | | |
| | Emerging Latin America—11.1% | | | | | | | | |
| | Argentina—1.0% | | | | | | | | |
| | Grupo Financiero Galicia S.A.—ADR (Banks) | | | 50,517 | | | | 1,666 | |
| | YPF S.A.—ADR (Oil, gas & consumable fuels) | | | 186,923 | | | | 2,538 | |
| | | | | | | | | 4,204 | |
| | Brazil—3.3% | | | | | | | | |
| | AMBEV S.A.—ADR (Beverages) | | | 854,813 | | | | 3,958 | |
| | B3 S.A. - Brasil Bolsa Balcao (Capital markets) | | | 787,700 | | | | 4,156 | |
| | Lojas Renner S.A. (Multiline retail) | | | 278,900 | | | | 2,114 | |
| | Raia Drogasil S.A. (Food & staples retailing) | | | 253,500 | | | | 4,343 | |
| | | | | | | | | 14,571 | |
| | Chile—0.9% | | | | | | | | |
| | Sociedad Quimica y Minera de Chile S.A.— ADR (Chemicals) | | | 80,492 | | | | 3,868 | |
| | Mexico—3.1% | | | | | | | | |
| | Grupo Aeroportuario del Pacifico S.A.B. de C.V. Class “B” (Transportation infrastructure) | | | 496,800 | | | | 4,610 | |
| | Grupo Financiero Banorte S.A.B. de C.V. Class “O” (Banks) | | | 1,507,600 | | | | 8,865 | |
| | | | | | | | | 13,475 | |
| | Peru—2.8% | | | | | | | | |
| | Credicorp, Ltd. (Banks)† | | | 36,543 | | | | 8,226 | |
| | Southern Copper Corporation (Metals & mining) | | | 86,982 | | | | 4,077 | |
| | | | | | | | | 12,303 | |
| | Total Common Stocks—96.5%
(cost $360,701) | | | | | | | 420,111 | |
| | | | | | | | | | |
| | Preferred Stocks | | | | | | | | |
| | Brazil—2.2% | | | | | | | | |
| | Itau Unibanco Holding S.A. (Banks) | | | 625,450 | | | | 6,510 | |
| | Petroleo Brasileiro S.A. (Oil, gas & consumable fuels) | | | 683,000 | | | | 3,029 | |
| | | | | | | | | 9,539 | |
| | Total Preferred Stocks—2.2%
(cost $9,254) | | | | | | | 9,539 | |
| | | | | | | | |
| | | | Principal | | | | |
| | Issuer | | Amount | | | Value | |
| | | | | | | | | | |
| | Repurchase Agreement | | | | | | | | |
| | Fixed Income Clearing Corporation, 0.350% dated 6/29/18, due 7/2/18, repurchase price $5,745, collateralized by U.S. Treasury Inflation Index Bond, 0.250%, due 1/15/25 | | | $5,744 | | | $ | 5,744 | |
| | Total Repurchase Agreement—1.3%
(cost $5,744) | | | | | | | 5,744 | |
| | Total Investments—100.0%
(cost $375,699) | | | | | | | 435,394 | |
| | Cash and other assets, less liabilities—0.0% | | | | | | | 44 | |
| | Net assets—100.0% | | | | | | $ | 435,438 | |
ADR = American Depository Receipt
* = Non-income producing security
† = U.S. listed foreign security
For securities primarily traded on exchanges or markets that close before the close of regular trading on the New York Stock Exchange, the Fund may use an independent pricing service to fair value price the securities pursuant to Valuation Procedures approved by the Board of Trustees.
At June 30, 2018, the Fund’s Portfolio of Investments includes the following industry categories (as a percentage of long-term investments):
| Information Technology | | | 28.4 | % |
| Financials | | | 23.6 | % |
| Consumer Discretionary | | | 17.9 | % |
| Consumer Staples | | | 12.8 | % |
| Industrials | | | 4.4 | % |
| Materials | | | 4.0 | % |
| Health Care | | | 3.5 | % |
| Energy | | | 2.8 | % |
| Telecommunication Services | | | 1.6 | % |
| Utilities | | | 1.0 | % |
| Total | | | 100.0 | % |
At June 30, 2018, the Fund’s Portfolio of Investments includes the following currency categories (as a percentage of long-term investments):
| U.S. Dollar | | | 25.5 | % |
| Hong Kong Dollar | | | 21.7 | % |
| Indian Rupee | | | 15.8 | % |
| South African Rand | | | 7.7 | % |
| South Korean Won | | | 6.2 | % |
| Brazilian Real | | | 4.7 | % |
| Yuan Renminbi | | | 4.3 | % |
| Indonesian Rupiah | | | 3.8 | % |
| Thai Baht | | | 3.4 | % |
| Mexican Peso | | | 3.2 | % |
| New Taiwan Dollar | | | 1.6 | % |
| Hungarian Forint | | | 1.4 | % |
| All Other Currencies | | | 0.7 | % |
| Total | | | 100.0 | % |
See accompanying Notes to Financial Statements.
| 72 | Semiannual Report | June 30, 2018 |
| | Emerging Markets Growth Fund |
| | |
| | The Emerging Markets Growth Fund seeks long-term capital appreciation. |
| | |
| | AN OVERVIEW FROM THE PORTFOLIO MANAGERS |
| | |
 Todd M. McClone 
Casey K. Preyss | The William Blair Emerging Markets Growth Fund (Class N shares) posted a 7.35% decrease, net of fees, for the six months ended June 30, 2018. By comparison, the Fund’s benchmark index, the MSCI Emerging Markets IMI (net) (the “Index”), decreased 6.86%. Underperformance versus the Index was driven primarily by Consumer Discretionary and Energy stock selection. Within Consumer Discretionary, automobile-related names were notable detractors. The shares of Maruti Suzuki India, Ltd., the largest passenger car manufacturer in India, weakened after a strong rally in 2017 as deteriorating investor sentiment and softer operating performance weighed on the stock. Despite weakness during the first half of 2018, we believe the outlook remains compelling for Maruti, supported by improving volumes and increasing first time buyers. The company has a significant advantage with its dealership reach and breadth of models. Within Energy, stock selection was a key detractor mainly due to the lack of exposure to top performing Index holdings. In addition, Petronet LNG, Ltd., the dominant importer of liquefied natural gas in India, weighed on relative performance. We expect India to become increasingly dependent on imports over the next few years, as domestic sources of gas cannot keep pace with demand growth. Petronet’s shares weakened during the first half of 2018 amid concerns about medium term supply/demand fundamentals and the potential for domestic gas to take share from imported liquefied natural gas. Mitigating these negative effects was favorable stock selection within Health Care and Information Technology. Within the Health Care sector, CSPC Pharmaceutical Group, Ltd., the Chinese pharmaceutical company, boosted the Fund’s relative returns. CSPC has evolved from manufacturing low margin bulk products to a high quality pharma company focused on branded generics. CSPC’s share price strengthened amid accelerating operating performance and improving growth outlook supported by its strong pipeline and growth in innovative drugs, coupled with a favorable regulatory backdrop. Within the Information Technology sector, Taiwanese passive components manufacturer Yageo Corporation outperformed. Yageo is a beneficiary of rising demand for high-end passive components, which in turn is driven by increasing complexity in wireless communication and electronic content gains in automotive and industrial applications. Favorable industry dynamics (tight supply and strong demand in passive components) coupled with capacity expansion and recent acquisitions drove Yageo’s share price higher during the first half of the year. Please refer to the Global Markets Review and Outlook relating to the Fund beginning on page 32 for additional information. |
| June 30, 2018 | William Blair Funds | 73 |
Emerging Markets Growth Fund
Performance Highlights (Unaudited)
| |
| Average Annual Total Return through 6/30/2018 |
| | | Year
to Date | | 1 Year | | 3 Year | | 5 Year | | 10 Year |
| Class N | | | (7.35 | )% | | | 10.96 | % | | | 5.04 | % | | | 5.76 | % | | | 1.87 | % |
| Class I | | | (7.21 | ) | | | 11.16 | | | | 5.30 | | | | 6.00 | | | | 2.13 | |
| Institutional Class | | | (7.16 | ) | | | 11.31 | | | | 5.39 | | | | 6.14 | | | | 2.29 | |
| MSCI Emerging Markets IMI (net) | | | (6.86 | ) | | | 7.90 | | | | 5.19 | | | | 4.93 | | | | 2.52 | |
Performance cited represents past performance. Past performance does not guarantee future results and current performance may be lower or higher than the data quoted. Results shown are average annual returns, which assume reinvestment of dividends and capital gains. Investment returns and principal will fluctuate and you may have a gain or loss when you sell shares. For the most current month-end performance information, please call 1-800-742-7272, or visit our Web site at www.williamblairfunds.com. From time to time, the investment adviser may waive fees or reimburse expenses for the Fund. Without these waivers/reimbursements, performance would be lower. International investing involves special risk considerations, including currency fluctuations, lower liquidity, economic and political risk. These risks may be magnified when investing in emerging markets. Class N shares are available to the general public without a sales load. Class I shares are available to certain institutional investors, and advisory clients of William Blair & Company, L.L.C., without a sales load or distribution (12b-1) fees. Institutional Class shares are available to institutional investors without a sales load or distribution (12b-1) or service fees.
The performance highlights and graph presented above do not reflect the deduction of taxes that a shareholder would pay on fund distributions or the redemption of fund shares.
The Morgan Stanley Capital International (MSCI) Emerging Markets Investable Market Index (IMI) (net) is a free float-adjusted market capitalization weighted index that is designed to measure the equity market performance of emerging markets. This index approximates the minimum possible dividend reinvestment by deducting for the highest possible withholding tax rates of those markets.
This report identifies the Fund’s investments on June 30, 2018. These holdings are subject to change. Not all stocks in the Fund performed the same, nor is there any guarantee that these stocks will perform as well in the future. Market forecasts provided in this report may not necessarily come to pass.
Sector Diversification (Unaudited)

The sector diversification shown is based on the total long-term securities.
| 74 | Semiannual Report | June 30, 2018 |
Emerging Markets Growth Fund
Portfolio of Investments, June 30, 2018 (all dollar amounts in thousands) (unaudited)
| | | | | | | | |
| | | | | | | | |
| | Issuer | | Shares | | | Value | |
| | | | | | | | | | |
| | Common Stocks | | | | | | | | |
| | | | | | | | | | |
| | Emerging Asia—79.7% | | | | | | | | |
| | China—33.4% | | | | | | | | |
| * | 51job, Inc.—ADR (Professional services) | | | 39,927 | | | $ | 3,898 | |
| * | Alibaba Group Holding, Ltd.—ADR (Internet software & services) | | | 401,025 | | | | 74,402 | |
| | Anhui Conch Cement Co., Ltd. Class “H” (Construction materials) | | | 963,500 | | | | 5,495 | |
| | ANTA Sports Products, Ltd. (Textiles, apparel & luxury goods) | | | 1,464,000 | | | | 7,720 | |
| | Autohome, Inc.—ADR (Internet software & services) | | | 62,503 | | | | 6,313 | |
| * | Baozun, Inc.—ADR (Internet software & services) | | | 86,310 | | | | 4,721 | |
| * | BeiGene, Ltd.—ADR (Biotechnology) | | | 14,624 | | | | 2,248 | |
| | China International Travel Service Corporation, Ltd. Class “A” (Hotels, restaurants & leisure) | | | 1,117,922 | | | | 10,857 | |
| * | Chinasoft International, Ltd. (IT services) | | | 3,960,000 | | | | 3,079 | |
| | Chongqing Zhifei Biological Products Co., Ltd. Class “A” (Biotechnology) | | | 430,000 | | | | 2,960 | |
| | CIFI Holdings Group Co., Ltd. (Real estate management & development) | | | 2,106,000 | | | | 1,334 | |
| | CSPC Pharmaceutical Group, Ltd. (Pharmaceuticals) | | | 5,278,000 | | | | 15,849 | |
| | ENN Energy Holdings, Ltd. (Gas utilities) | | | 788,000 | | | | 7,717 | |
| | Foshan Haitian Flavouring & Food Co., Ltd. Class “A” (Food products) | | | 714,580 | | | | 7,922 | |
| | Gree Electric Appliances, Inc. of Zhuhai Class “A” (Household durables) | | | 595,015 | | | | 4,220 | |
| | Hangzhou Hikvision Digital Technology Co., Ltd. Class “A” (Electronic equipment, instruments & components) | | | 683,374 | | | | 3,819 | |
| | Hangzhou Tigermed Consulting Co., Ltd. Class “A” (Life sciences tools & services) | | | 342,400 | | | | 3,188 | |
| | Hua Hong Semiconductor Ltd. (Semiconductors & semiconductor equipment) | | | 943,000 | | | | 3,223 | |
| | Huadong Medicine Co., Ltd. Class “A” (Health care providers & services) | | | 435,956 | | | | 3,168 | |
| | Huazhu Group, Ltd.—ADR (Hotels, restaurants & leisure) | | | 239,143 | | | | 10,042 | |
| | Jiangsu Hengrui Medicine Co., Ltd. Class “A” (Pharmaceuticals) | | | 463,599 | | | | 5,290 | |
| | Jiangsu Yangnong Chemical Co., Ltd. Class “A” (Chemicals) | | | 317,050 | | | | 2,672 | |
| | Kingdee International Software Group Co., Ltd. (Software) | | | 4,092,000 | | | | 4,168 | |
| | Kweichow Moutai Co., Ltd. Class “A” (Beverages) | | | 101,348 | | | | 11,162 | |
| * | MMG, Ltd. (Metals & mining) | | | 4,472,000 | | | | 3,113 | |
| * | Momo, Inc.—ADR (Internet software & services) | | | 116,850 | | | | 5,083 | |
| | New Oriental Education & Technology Group, Inc.—ADR (Diversified consumer services) | | | 55,808 | | | | 5,283 | |
| | Ping An Insurance Group Co. of China, Ltd. Class “H” (Insurance) | | | 1,737,000 | | | | 15,907 | |
| | | | | | | | |
| | | | | | | | |
| | Issuer | | Shares | | | Value | |
| | | | | | | | | | |
| | Common Stocks—(continued) | | | | | | | | |
| | | | | | | | | | |
| | Emerging Asia—(continued) | | | | | | | | |
| | China—(continued) | | | | | | | | |
| | Shandong Hualu Hengsheng Chemical Co., Ltd. Class “A” (Chemicals) | | | 988,300 | | | $ | 2,614 | |
| | Shanghai International Airport Co., Ltd. Class “A” (Transportation infrastructure) | | | 627,274 | | | | 5,237 | |
| | Shimao Property Holdings, Ltd. (Real estate management & development) | | | 448,000 | | | | 1,168 | |
| | Silergy Corporation (Semiconductors & semiconductor equipment) | | | 106,000 | | | | 2,576 | |
| | Sino Biopharmaceutical, Ltd. (Pharmaceuticals) | | | 5,474,000 | | | | 8,360 | |
| | Sunny Optical Technology Group Co., Ltd. (Electronic equipment, instruments & components) | | | 606,000 | | | | 11,240 | |
| * | TAL Education Group—ADR (Diversified consumer services) | | | 126,257 | | | | 4,646 | |
| | Tencent Holdings, Ltd. (Internet software & services) | | | 1,337,360 | | | | 67,156 | |
| * | Weibo Corporation—ADR (Internet software & services) | | | 61,259 | | | | 5,437 | |
| * | Wuxi Biologics Cayman, Inc. (Life sciences tools & services) | | | 542,000 | | | | 6,012 | |
| | Zhangzhou Pientzehuang Pharmaceutical Co., Ltd. Class “A” (Pharmaceuticals) | | | 223,784 | | | | 3,771 | |
| | Zhejiang Supor Cookware Co., Ltd. Class “A” (Household durables) | | | 538,428 | | | | 4,173 | |
| | Zhejiang Weixing New Building Materials Co., Ltd. Class “A” (Chemicals) | | | 947,580 | | | | 2,526 | |
| | | | | | | | | 359,769 | |
| | India—16.7% | | | | | | | | |
| | Bajaj Finance, Ltd. (Consumer finance) | | | 562,622 | | | | 18,920 | |
| | Bajaj Finserv, Ltd. (Insurance) | | | 60,710 | | | | 5,173 | |
| * | Bharat Financial Inclusion, Ltd. (Consumer finance) | | | 232,513 | | | | 3,946 | |
| | Britannia Industries, Ltd. (Food products) | | | 52,891 | | | | 4,816 | |
| | Godrej Consumer Products, Ltd. (Personal products) | | | 245,958 | | | | 4,384 | |
| | Havells India, Ltd. (Electrical equipment) | | | 360,186 | | | | 2,856 | |
| | HDFC Bank, Ltd. (Banks) | | | 1,098,457 | | | | 33,879 | |
| | HDFC Standard Life Insurance Co. Ltd. (Insurance) | | | 843,271 | | | | 5,610 | |
| | Hindustan Unilever, Ltd. (Household products) | | | 370,349 | | | | 8,843 | |
| | Housing Development Finance Corporation, Ltd. (Thrifts & mortgage finance) | | | 974,561 | | | | 27,156 | |
| | Indiabulls Housing Finance, Ltd. (Thrifts & mortgage finance) | | | 329,155 | | | | 5,487 | |
| | IndusInd Bank, Ltd. (Banks) | | | 684,691 | | | | 19,381 | |
| | Maruti Suzuki India, Ltd. (Automobiles) | | | 46,223 | | | | 5,950 | |
| | Page Industries, Ltd. (Textiles, apparel & luxury goods) | | | 6,297 | | | | 2,548 | |
| | Tata Consultancy Services, Ltd. (IT services) | | | 621,932 | | | | 16,748 | |
| | Titan Co., Ltd. (Textiles, apparel & luxury goods) | | | 218,294 | | | | 2,794 | |
See accompanying Notes to Financial Statements.
| June 30, 2018 | William Blair Funds | 75 |
Emerging Markets Growth Fund
Portfolio of Investments, June 30, 2018 (all dollar amounts in thousands) (unaudited)
| | | | | | | | |
| | | | | | | | |
| | Issuer | | Shares | | | Value | |
| | | | | | | | | | |
| | Common Stocks—(continued) | | | | | | | | |
| | | | | | | | | | |
| | Emerging Asia—(continued) | | | | | | | | |
| | India—(continued) | | | | | | | | |
| | Yes Bank, Ltd. (Banks) | | | 2,306,728 | | | $ | 11,447 | |
| | | | | | | | | 179,938 | |
| | Indonesia—1.1% | | | | | | | | |
| | PT Bank Negara Indonesia Persero Tbk (Banks) | | | 1,285,500 | | | | 632 | |
| | PT Bank Rakyat Indonesia Persero Tbk (Banks) | | | 37,512,505 | | | | 7,420 | |
| | PT United Tractors Tbk (Oil, gas & consumable fuels) | | | 1,905,800 | | | | 4,196 | |
| | | | | | | | | 12,248 | |
| | Malaysia—1.0% | | | | | | | | |
| | Public Bank Bhd (Banks) | | | 1,529,700 | | | | 8,849 | |
| | Top Glove Corporation Bhd (Health care equipment & supplies) | | | 599,800 | | | | 1,799 | |
| | | | | | | | | 10,648 | |
| | South Korea—10.6% | | | | | | | | |
| | Amorepacific Corporation (Personal products) | | | 15,467 | | | | 4,477 | |
| | Douzone Bizon Co., Ltd. (Software) | | | 13,756 | | | | 764 | |
| | Hana Financial Group, Inc. (Banks) | | | 219,530 | | | | 8,430 | |
| | Hotel Shilla Co., Ltd. (Specialty retail) | | | 51,363 | | | | 5,689 | |
| | Korea Investment Holdings Co., Ltd. (Capital markets) | | | 68,947 | | | | 5,199 | |
| | LG Household & Health Care, Ltd. (Personal products) | | | 6,389 | | | | 8,006 | |
| | Orion Corporation (Food products) | | | 66,262 | | | | 8,847 | |
| * | Samsung Biologics Co., Ltd. (Life sciences tools & services) | | | 17,378 | | | | 6,504 | |
| | Samsung Electro-Mechanics Co., Ltd. (Electronic equipment, instruments & components) | | | 44,458 | | | | 5,919 | |
| | Samsung Electronics Co., Ltd. (Technology hardware, storage & peripherals) | | | 992,770 | | | | 41,587 | |
| | SK Hynix, Inc. (Semiconductors & semiconductor equipment) | | | 241,336 | | | | 18,525 | |
| | | | | | | | | 113,947 | |
| | Taiwan—12.7% | | | | | | | | |
| | ASPEED Technology, Inc. (Semiconductors & semiconductor equipment) | | | 92,000 | | | | 2,409 | |
| | Chailease Holding Co., Ltd. (Diversified financial services) | | | 3,137,000 | | | | 10,259 | |
| | Chroma ATE, Inc. (Electronic equipment, instruments & components) | | | 557,000 | | | | 2,990 | |
| | E.Sun Financial Holding Co., Ltd. (Banks) | | | 16,001,255 | | | | 11,141 | |
| | Eclat Textile Co., Ltd. (Textiles, apparel & luxury goods) | | | 293,000 | | | | 3,480 | |
| | Globalwafers Co., Ltd. (Semiconductors & semiconductor equipment) | | | 661,000 | | | | 10,943 | |
| | Hiwin Technologies Corporation (Machinery) | | | 753,780 | | | | 8,880 | |
| * | Macronix International (Semiconductors & semiconductor equipment) | | | 1,793,000 | | | | 2,543 | |
| | | | | | | | |
| | | | | | | | |
| | Issuer | | Shares | | | Value | |
| | | | | | | | | | |
| | Common Stocks—(continued) | | | | | | | | |
| | | | | | | | | | |
| | Emerging Asia—(continued) | | | | | | | | |
| | Taiwan—(continued) | | | | | | | | |
| | Nanya Technology Corporation (Semiconductors & semiconductor equipment) | | | 1,209,000 | | | $ | 3,282 | |
| | President Chain Store Corporation (Food & staples retailing) | | | 428,000 | | | | 4,850 | |
| | Silicon Motion Technology Corporation— ADR (Semiconductors & semiconductor equipment) | | | 62,601 | | | | 3,311 | |
| | Taiwan Semiconductor Manufacturing Co., Ltd.—ADR (Semiconductors & semiconductor equipment) | | | 717,003 | | | | 26,213 | |
| | Taiwan Semiconductor Manufacturing Co., Ltd. (Semiconductors & semiconductor equipment) | | | 2,464,000 | | | | 17,497 | |
| | TCI Co., Ltd. (Personal products) | | | 192,000 | | | | 2,959 | |
| | Walsin Technology Corporation (Electronic equipment, instruments & components) | | | 392,000 | | | | 5,351 | |
| | Win Semiconductors Corporation (Semiconductors & semiconductor equipment) | | | 378,000 | | | | 2,707 | |
| * | Yageo Corporation (Electronic equipment, instruments & components) | | | 487,000 | | | | 17,899 | |
| | | | | | | | | 136,714 | |
| | Thailand—2.8% | | | | | | | | |
| | Airports of Thailand PCL (Transportation infrastructure) | | | 5,501,500 | | | | 10,459 | |
| | Bangkok Dusit Medical Services PCL Class “F” (Health care providers & services) | | | 6,777,600 | | | | 5,108 | |
| | CP ALL PCL (Food & staples retailing) | | | 4,797,300 | | | | 10,632 | |
| | Home Product Center PCL (Specialty retail) | | | 8,131,500 | | | | 3,293 | |
| | | | | | | | | 29,492 | |
| | Vietnam—1.4% | | | | | | | | |
| * | Hoa Phat Group JSC (Metals & mining) | | | 1,999,984 | | | | 3,332 | |
| | Vietjet Aviation JSC (Airlines) | | | 421,344 | | | | 2,593 | |
| | Vietnam Dairy Products JSC (Food products) | | | 498,150 | | | | 3,674 | |
| * | Vincom Retail JSC (Real estate management & development) | | | 1,283,920 | | | | 2,161 | |
| * | Vingroup JSC (Real estate management & development) | | | 786,088 | | | | 3,661 | |
| | | | | | | | | 15,421 | |
| | | | | | | | | | |
| | Emerging Europe, Mid-East, Africa—8.8% | | | | | | | | |
| | Greece—0.2% | | | | | | | | |
| | JUMBO S.A. (Specialty retail) | | | 142,776 | | | | 2,349 | |
| | Hungary—0.9% | | | | | | | | |
| | OTP Bank Nyrt (Banks) | | | 261,058 | | | | 9,426 | |
| | Kenya—0.5% | | | | | | | | |
| | Safaricom plc (Wireless telecommunication services) | | | 19,382,454 | | | | 5,620 | |
See accompanying Notes to Financial Statements.
| 76 | Semiannual Report | June 30, 2018 |
Emerging Markets Growth Fund
Portfolio of Investments, June 30, 2018 (all dollar amounts in thousands) (unaudited)
| | | | | | | | |
| | | | | | | | |
| | Issuer | | Shares | | | Value | |
| | | | | | | | |
| | Common Stocks—(continued) | | | | | | | | |
| | | | | | | | | | |
| | Emerging Europe, Mid-East, Africa—(continued) | | | | | | | | |
| | South Africa—5.9% | | | | | | | | |
| | Capitec Bank Holdings, Ltd. (Banks) | | | 86,947 | | | $ | 5,478 | |
| | Clicks Group, Ltd. (Food & staples retailing) | | | 433,612 | | | | 6,191 | |
| | FirstRand, Ltd. (Diversified financial services) | | | 1,784,650 | | | | 8,290 | |
| | JSE, Ltd. (Capital markets) | | | 197,322 | | | | 2,325 | |
| | Mr. Price Group, Ltd. (Specialty retail) | | | 292,698 | | | | 4,804 | |
| | Naspers, Ltd. (Media) | | | 125,264 | | | | 31,585 | |
| | Sanlam, Ltd. (Insurance) | | | 984,366 | | | | 5,001 | |
| | | | | | | | | 63,674 | |
| | United Arab Emirates—1.3% | | | | | | | | |
| | DP World, Ltd. (Transportation infrastructure)† | | | 127,564 | | | | 2,936 | |
| | NMC Health plc (Health care providers & services) | | | 236,507 | | | | 11,132 | |
| | | | | | | | | 14,068 | |
| | | | | | | | | | |
| | Emerging Latin America—7.3% | | | | | | | | |
| | Brazil—3.0% | | | | | | | | |
| | B3 S.A. - Brasil Bolsa Balcao (Capital markets) | | | 1,916,000 | | | | 10,110 | |
| | Iochpe-Maxion S.A. (Machinery) | | | 422,300 | | | | 2,278 | |
| | IRB Brasil Resseguros S.A. (Insurance) | | | 268,900 | | | | 3,355 | |
| | Localiza Rent a Car S.A. (Road & rail) | | | 1,349,120 | | | | 8,260 | |
| | Magazine Luiza S.A. (Multiline retail) | | | 117,500 | | | | 3,880 | |
| | Via Varejo S.A. (Specialty retail) | | | 506,500 | | | | 2,432 | |
| | WEG S.A. (Machinery) | | | 579,920 | | | | 2,431 | |
| | | | | | | | | 32,746 | |
| | Chile—1.0% | | | | | | | | |
| | Banco Santander Chile—ADR (Banks) | | | 328,871 | | | | 10,336 | |
| | Mexico—2.4% | | | | | | | | |
| | Grupo Financiero Banorte S.A.B. de C.V. Class “O” (Banks) | | | 1,221,500 | | | | 7,183 | |
| | Wal-Mart de Mexico S.A.B. de C.V. (Food & staples retailing) | | | 6,987,800 | | | | 18,444 | |
| | | | | | | | | 25,627 | |
| | Peru—0.9% | | | | | | | | |
| | Credicorp, Ltd. (Banks)† | | | 42,269 | | | | 9,516 | |
| | Total Common Stocks—95.8%
(cost $828,904) | | | | | | | 1,031,539 | |
| | | | | | | | | | |
| | Preferred Stock | | | | | | | | |
| | Brazil—1.0% | | | | | | | | |
| | Itau Unibanco Holding S.A. (Banks) | | | 980,860 | | | | 10,209 | |
| | Total Preferred Stock—1.0%
(cost $15,310) | | | | | | | 10,209 | |
| | | | | | | | |
| | Issuer | | Principal
Amount | | | Value | |
| | | | | | | | | | |
| | Repurchase Agreement | | | | | | | | |
| | Fixed Income Clearing Corporation, 0.350% dated 6/29/18, due 7/2/18, repurchase price $26,280, collateralized by U.S. Treasury Inflation Indexed Bond, 0.250%, due 1/15/25 | | | $26,279 | | | $ | 26,279 | |
| | Total Repurchase Agreement—2.4%
(cost $26,279) | | | | | | | 26,279 | |
| | Total Investments—99.2%
(cost $870,493) | | | | | | | 1,068,027 | |
| | Cash and other assets, less liabilities—0.8% | | | | | | | 8,900 | |
| | Net assets—100.0% | | | | | | $ | 1,076,927 | |
ADR = American Depository Receipt
* = Non-income producing security
† = U.S. listed foreign security
For securities primarily traded on exchanges or markets that close before the close of regular trading on the New York Stock Exchange, the Fund may use an independent pricing service to fair value price the securities pursuant to Valuation Procedures approved by the Board of Trustees.
At June 30, 2018, the Fund’s Portfolio of Investments includes the following industry categories (as a percentage of long-term investments):
| Information Technology | | | 35.6 | % |
| Financials | | | 26.9 | % |
| Consumer Discretionary | | | 11.1 | % |
| Consumer Staples | | | 10.1 | % |
| Health Care | | | 7.2 | % |
| Industrials | | | 4.8 | % |
| Materials | | | 1.9 | % |
| Real Estate | | | 0.8 | % |
| Utilities | | | 0.7 | % |
| Telecommunication Services | | | 0.5 | % |
| Energy | | | 0.4 | % |
| Total | | | 100.0 | % |
At June 30, 2018, the Fund’s Portfolio of Investments includes the following currency categories (as a percentage of long-term investments):
| Indian Rupee | | | 17.3 | % |
| U.S. Dollar | | | 16.7 | % |
| Hong Kong Dollar | | | 15.5 | % |
| South Korean Won | | | 10.9 | % |
| New Taiwan Dollar | | | 10.5 | % |
| Yuan Renminbi | | | 7.1 | % |
| South African Rand | | | 6.1 | % |
| Brazilian Real | | | 4.1 | % |
| Thai Baht | | | 2.8 | % |
| Mexican Peso | | | 2.5 | % |
| Viet Nam Dong | | | 1.5 | % |
| Indonesian Rupiah | | | 1.2 | % |
| British Pound Sterling | | | 1.1 | % |
| Malaysian Ringgit | | | 1.0 | % |
| All Other Currencies | | | 1.7 | % |
| Total | | | 100.0 | % |
See accompanying Notes to Financial Statements.
| June 30, 2018 | William Blair Funds | 77 |
| | Emerging Markets Small Cap Growth Fund |
| | |
| | The Emerging Markets Small Cap Growth Fund seeks long-term capital appreciation. |
| | |
| | AN OVERVIEW FROM THE PORTFOLIO MANAGERS |
| | |

Todd M. McClone 
Casey K. Preyss | The William Blair Emerging Markets Small Cap Growth Fund (Class N shares) posted a 9.49% decrease, net of fees, for the six months ended June 30, 2018. By comparison, the Fund’s benchmark index, the MSCI Emerging Markets Small Cap Index (net) (the “Index”), decreased 8.45%. Underperformance versus the Index was primarily driven by negative stock selection across most sectors. Stock selection within the Consumer Discretionary sector was particularly detrimental to performance, notably hindered by Minth Group and Via Varejo S.A. Minth Group, the Chinese auto supplier, has diverse exposure to original equipment manufacturers covering 80% of global auto production, including Nissan, Toyota, Honda, GM, Ford, and Volkswagen. Investor sentiment deteriorated on the back of the company’s disappointing fiscal year 2017 results, broad automobile weakness and concerns over trade war rhetoric. We exited the position in favor of more compelling opportunities. Via Varejo is Brazil’s largest electronics and home retailer. Despite the company’s solid operating performance, the stock weakened amid concerns about Brazil’s economic and political outlook, truck strike disruption, and currency weakness. Partially offsetting these effects was positive stock selection within the Information Technology and Health Care sectors. Within Information Technology, Yageo Corporation, the Taiwanese passive components manufacturer, propelled the Fund’s relative results. Yageo’s share price was boosted by favorable industry dynamics (tight supply and strong demand in passive components), which allowed the company to raise prices, coupled with the positive effects of capacity expansion and recent acquisitions. Wuxi Biologics Cayman, Inc., a contract development and manufacturing organization for biological drugs in China, boosted the Fund’s returns within the Health Care sector. Wuxi’s share price accelerated amid the company’s strong operating performance and growth outlook supported by strong demand, market share gains, capacity expansion, and a strong pipeline of compounds likely to translate into significant manufacturing contracts in the future. Please refer to the Global Markets Review and Outlook relating to the Fund beginning on page 32 for additional information. |
| 78 | Semiannual Report | June 30, 2018 |
Emerging Markets Small Cap Growth Fund
Performance Highlights (Unaudited)
| Average Annual Total Return through 6/30/2018 |
| | | Year | | | | | | | | Since |
| | | to Date | | 1 Year | | 3 Year | | 5 Year | | Inception |
| Class N(a) | | | (9.49 | )% | | | 6.22 | % | | | 2.10 | % | | | 7.03 | % | | | 10.54 | % |
| Class I(a) | | | (9.34 | ) | | | 6.52 | | | | 2.42 | | | | 7.37 | | | | 10.86 | |
| MSCI Emerging Markets Small Cap Index (net)(a) | | | (8.45 | ) | | | 5.64 | | | | 2.55 | | | | 4.32 | | | | 4.75 | |
| Institutional Class(b) | | | (9.28 | ) | | | 6.63 | | | | 2.51 | | | | 7.46 | | | | 8.29 | |
| MSCI Emerging Markets Small Cap Index (net)(b) | | | (8.45 | ) | | | 5.64 | | | | 2.55 | | | | 4.32 | | | | 3.48 | |
| (a) | Since inception is for the period from October 24, 2011 (Commencement of Operations) to June 30, 2018. |
| (b) | Since inception is for the period from December 20, 2012 (Commencement of Operations) to June 30, 2018. |
Performance cited represents past performance. Past performance does not guarantee future results and current performance may be lower or higher than the data quoted. Results shown are average annual returns, which assume reinvestment of dividends and capital gains. Investment returns and principal will fluctuate and you may have a gain or loss when you sell shares. For the most current month-end performance information, please call 1-800-742-7272, or visit our Web site at www.williamblairfunds.com. From time to time, the investment adviser may waive fees or reimburse expenses for the Fund. Without these waivers/reimbursements, performance would be lower. International investing involves special risk considerations, including currency fluctuations, lower liquidity, economic and political risk. These risks may be magnified when investing in emerging markets. Smaller capitalization stocks are also more sensitive to purchase/sale transactions and changes in the issuer’s financial condition. Class N shares are available to the general public without a sales load. Class I shares are available to certain institutional investors, and advisory clients of William Blair & Company, L.L.C., without a sales load or distribution (12b-1) fees. Institutional Class shares are available to institutional investors without a sales load or distribution (12b-1) or service fees.
The performance highlights and graph presented above do not reflect the deduction of taxes that a shareholder would pay on fund distributions or the redemption of fund shares.
The Morgan Stanley Capital International (MSCI) Emerging Markets Small Cap Index (net) is a free float-adjusted market capitalization index that is designed to measure the equity market performance of emerging markets. This index approximates the minimum possible dividend reinvestment by deducting for the highest possible withholding tax rates of those markets.
This report identifies the Fund’s investments on June 30, 2018. These holdings are subject to change. Not all stocks in the Fund performed the same, nor is there any guarantee that these stocks will perform as well in the future. Market forecasts provided in this report may not necessarily come to pass.
Sector Diversification (Unaudited)
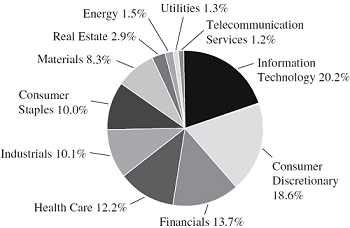
The sector diversification shown is based on the total long-term securities.
| June 30, 2018 | William Blair Funds | 79 |
Emerging Markets Small Cap Growth Fund
Portfolio of Investments, June 30, 2018 (all dollar amounts in thousands) (unaudited)
| | | | | | | | |
| | | | | | | | |
| | Issuer | | Shares | | | Value | |
| | | | | | | | | | |
| | Common Stocks | | | | | | | | |
| | | | | | | | | | |
| | Emerging Asia—81.0% | | | | | | | | |
| | Cambodia—0.5% | | | | | | | | |
| | NagaCorp, Ltd. (Hotels, restaurants & leisure) | | | 2,742,000 | | | $ | 2,483 | |
| | China—29.8% | | | | | | | | |
| | 3SBio, Inc. (Biotechnology) | | | 2,954,000 | | | | 6,675 | |
| * | 51job, Inc.—ADR (Professional services) | | | 69,707 | | | | 6,806 | |
| * | A-Living Services Co. Ltd. (Commercial |services & supplies) | | | 1,005,500 | | | | 1,833 | |
| | Angel Yeast Co., Ltd. (Food products) | | | 497,185 | | | | 2,669 | |
| * | Baozun, Inc.—ADR (Internet software & services) | | | 105,135 | | | | 5,751 | |
| * | China Education Group Holdings, Ltd. (Diversified consumer services) | | | 2,014,000 | | | | 3,377 | |
| | China Everbright Greentech Ltd. (Independent power & renewable electricity producers) | | | 2,090,554 | | | | 2,180 | |
| | China Lilang, Ltd. (Textiles, apparel & luxury goods) | | | 1,243,000 | | | | 1,781 | |
| | China Maple Leaf Educational Systems, Ltd. (Diversified consumer services) | | | 2,490,000 | | | | 4,471 | |
| | China Resources Cement Holdings, Ltd. (Construction materials) | | | 2,434,000 | | | | 2,449 | |
| | China Suntien Green Energy Corporation, Ltd. Class “H” (Oil, gas & consumable fuels) | | | 7,546,000 | | | | 2,175 | |
| * | Chinasoft International, Ltd. (IT services) | | | 4,054,000 | | | | 3,152 | |
| | Chongqing Zhifei Biological Products Co., Ltd. (Biotechnology) | | | 432,810 | | | | 2,980 | |
| | CIFI Holdings Group Co., Ltd. (Real estate management & development) | | | 5,194,000 | | | | 3,290 | |
| | Dali Foods Group Co., Ltd. (Food products) | | | 4,221,500 | | | | 3,248 | |
| | Fu Shou Yuan International Group, Ltd. (Diversified consumer services) | | | 3,350,000 | | | | 3,770 | |
| | Fuyao Glass Industry Group Co. Ltd. Class “H” (Auto components) | | | 484,800 | | | | 1,638 | |
| | Greentown Service Group Co., Ltd. (Commercial services & supplies) | | | 3,218,000 | | | | 2,913 | |
| | Hangzhou Tigermed Consulting Co., Ltd. (Life sciences tools & services) | | | 293,115 | | | | 2,729 | |
| * | Health and Happiness H&H International Holdings, Ltd. (Food products) | | | 594,000 | | | | 4,092 | |
| | Hua Hong Semiconductor Ltd. (Semiconductors & semiconductor equipment) | | | 1,563,600 | | | | 5,344 | |
| * | Huifu Payment Ltd. (IT services) | | | 2,145,600 | | | | 1,860 | |
| * | HUYA, Inc.—ADR (Internet software & services) | | | 31,788 | | | | 1,045 | |
| | Jiangsu Yangnong Chemical Co., Ltd. (Chemicals) | | | 294,223 | | | | 2,479 | |
| | JNBY Design, Ltd. (Textiles, apparel & luxury goods) | | | 902,000 | | | | 2,061 | |
| | Kingdee International Software Group Co., Ltd. (Software) | | | 5,784,000 | | | | 5,891 | |
| | Kingsoft Corporation, Ltd. (Software) | | | 411,000 | | | | 1,240 | |
| | KWG Property Holding, Ltd. (Real estate management & development) | | | 1,393,500 | | | | 1,741 | |
| | | | | | | | |
| | | | | | | | |
| | Issuer | | Shares | | | Value | |
| | | | | | | | | | |
| | Common Stocks—(continued) | | | | | | | | |
| | | | | | | | | | |
| | Emerging Asia—(continued) | | | | | | | | |
| | China—(continued) | | | | | | | | |
| | Lonking Holdings, Ltd. (Machinery) | | | 3,395,000 | | | $ | 1,555 | |
| * | Noah Holdings, Ltd.—ADR (Capital markets) | | | 60,303 | | | | 3,145 | |
| * | Ping An Healthcare and Technology Co. Ltd. (Health care technology) | | | 420,900 | | | | 2,680 | |
| | Shanghai Jinjiang International Hotels Development Co., Ltd. (Hotels, restaurants & leisure) | | | 338,103 | | | | 1,884 | |
| | Silergy Corporation (Semiconductors & semiconductor equipment) | | | 112,000 | | | | 2,722 | |
| | SSY Group, Ltd. (Pharmaceuticals) | | | 3,410,000 | | | | 3,776 | |
| | Tianneng Power International, Ltd. (Auto components) | | | 1,356,000 | | | | 2,105 | |
| * | Towngas China Co., Ltd. (Gas utilities) | | | 1,474,000 | | | | 1,426 | |
| | Travelsky Technology, Ltd. Class “H” (IT services) | | | 251,000 | | | | 729 | |
| * | Wuxi Biologics Cayman, Inc. (Life sciences tools & services) | | | 418,000 | | | | 4,637 | |
| | Xiabuxiabu Catering Management China Holdings Co. Ltd. (Hotels, restaurants & leisure) | | | 1,991,500 | | | | 4,374 | |
| | Yantai Jereh Oilfield Services Group Co., Ltd. (Energy equipment & services) | | | 817,476 | | | | 2,000 | |
| | Yihai International Holding, Ltd. (Food products) | | | 1,290,000 | | | | 2,451 | |
| | Yuzhou Properties Co., Ltd. (Real estate management & development) | | | 5,231,000 | | | | 3,074 | |
| | Zhangzhou Pientzehuang Pharmaceutical Co., Ltd. (Pharmaceuticals) | | | 173,316 | | | | 2,920 | |
| | Zhejiang Supor Cookware Co., Ltd. (Household durables) | | | 436,272 | | | | 3,381 | |
| | Zhejiang Weixing New Building Materials Co., Ltd. (Chemicals) | | | 1,739,589 | | | | 4,638 | |
| | Zhongsheng Group Holdings, Ltd. (Specialty retail) | | | 1,222,500 | | | | 3,660 | |
| | | | | | | | | 140,797 | |
| | India—17.7% | | | | | | | | |
| | Aarti Industries (Chemicals) | | | 137,290 | | | | 2,453 | |
| | APL Apollo Tubes, Ltd. (Metals & mining) | | | 28,510 | | | | 690 | |
| | Astral Polytechnik, Ltd. (Building products) | | | 212,159 | | | | 3,099 | |
| | Biocon, Ltd. (Biotechnology) | | | 216,865 | | | | 1,955 | |
| | Cholamandalam Investment and Finance Co., Ltd. (Consumer finance) | | | 141,727 | | | | 3,135 | |
| | Cyient, Ltd. (Software) | | | 338,765 | | | | 3,792 | |
| | Dilip Buildcon Ltd. (Construction & engineering) | | | 139,904 | | | | 1,357 | |
| | Edelweiss Financial Services, Ltd. (Capital markets) | | | 936,812 | | | | 4,059 | |
| | Endurance Technologies Ltd. (Auto components) | | | 102,449 | | | | 1,868 | |
| | Escorts, Ltd. (Machinery) | | | 256,883 | | | | 3,266 | |
| | Graphite India, Ltd. (Electrical equipment) | | | 197,432 | | | | 2,421 | |
| | Gruh Finance, Ltd. (Thrifts & mortgage finance) | | | 1,007,330 | | | | 4,488 | |
See accompanying Notes to Financial Statements.
| 80 | Semiannual Report | June 30, 2018 |
Emerging Markets Small Cap Growth Fund
Portfolio of Investments, June 30, 2018 (all dollar amounts in thousands) (unaudited)
| | | | | | | | |
| | | | | | | | |
| | Issuer | | Shares | | | Value | |
| | | | | | | | | | |
| | Common Stocks—(continued) | | | | | | | | |
| | | | | | | | | | |
| | Emerging Asia—(continued) | | | | | | | | |
| | India—(continued) | | | | | | | | |
| | Hexaware Technologies, Ltd. (IT services) | | | 479,007 | | | $ | 3,204 | |
| | IIFL Holdings Ltd. (Capital markets) | | | 230,711 | | | | 2,251 | |
| | InterGlobe Aviation, Ltd. (Airlines) | | | 114,950 | | | | 1,830 | |
| | Jubilant Foodworks, Ltd. (Hotels, restaurants & leisure) | | | 177,968 | | | | 3,623 | |
| | KEC International, Ltd. (Construction & engineering) | | | 826,911 | | | | 4,047 | |
| | KEI Industries, Ltd. (Electrical equipment) | | | 565,674 | | | | 3,361 | |
| | Minda Industries, Ltd. (Auto components) | | | 91,489 | | | | 1,689 | |
| | MindTree, Ltd. (IT services) | | | 167,818 | | | | 2,415 | |
| | NIIT Technologies, Ltd. (Software) | | | 239,382 | | | | 3,861 | |
| | Oberoi Realty, Ltd. (Real estate management & development) | | | 298,568 | | | | 2,079 | |
| | Page Industries, Ltd. (Textiles, apparel & luxury goods) | | | 8,165 | | | | 3,304 | |
| | Pidilite Industries, Ltd. (Chemicals) | | | 114,968 | | | | 1,786 | |
| | Radico Khaitan, Ltd. (Beverages) | | | 761,819 | | | | 4,593 | |
| | Sterlite Technologies, Ltd. (Communications equipment) | | | 482,405 | | | | 1,939 | |
| | Sundram Fasteners, Ltd. (Auto components) | | | 225,051 | | | | 2,053 | |
| | Tata Elxsi, Ltd. (Software) | | | 187,882 | | | | 3,672 | |
| | The Phoenix Mills, Ltd. (Real estate management & development) | | | 316,114 | | | | 3,052 | |
| | Titan Co., Ltd. (Textiles, apparel & luxury goods) | | | 168,120 | | | | 2,152 | |
| | | | | | | | | 83,494 | |
| | Indonesia—1.3% | | | | | | | | |
| | PT Ace Hardware Indonesia Tbk (Specialty retail) | | | 39,830,700 | | | | 3,530 | |
| | PT Bank Tabungan Negara Persero Tbk (Banks) | | | 15,763,501 | | | | 2,690 | |
| | | | | | | | | 6,220 | |
| | Malaysia—3.9% | | | | | | | | |
| | Dialog Group Bhd (Energy equipment & services) | | | 3,564,200 | | | | 2,722 | |
| | Hartalega Holdings Bhd (Health care equipment & supplies) | | | 2,452,300 | | | | 3,639 | |
| | Hong Leong Bank Bhd (Banks) | | | 731,200 | | | | 3,297 | |
| | Inari Amertron Bhd (Electronic equipment, instruments & components) | | | 4,710,400 | | | | 2,626 | |
| | My EG Services Bhd (IT services) | | | 3,890,700 | | | | 928 | |
| | Top Glove Corporation Bhd (Health care equipment & supplies) | | | 1,789,600 | | | | 5,366 | |
| | | | | | | | | 18,578 | |
| | Philippines—0.8% | | | | | | | | |
| | Bloomberry Resorts Corporation (Hotels, restaurants & leisure) | | | 7,463,900 | | | | 1,362 | |
| | Jollibee Foods Corporation (Hotels, restaurants & leisure) | | | 439,080 | | | | 2,165 | |
| | | | | | | | | 3,527 | |
| | | | | | | | |
| | | | | | | | |
| | Issuer | | Shares | | | Value | |
| | | | | | | | | | |
| | Common Stocks—(continued) | | | | | | | | |
| | | | | | | | | | |
| | Emerging Asia—(continued) | | | | | | | | |
| | South Korea—12.3% | | | | | | | | |
| | Aekyung Industrial Co., Ltd. (Household products) | | | 7,760 | | | $ | 516 | |
| * | Cafe24 Corporation (Internet software & services) | | | 19,625 | | | | 3,155 | |
| | Cosmax, Inc. (Personal products) | | | 36,678 | | | | 5,347 | |
| | Dentium Co., Ltd. (Health care equipment & supplies) | | | 45,028 | | | | 3,602 | |
| | Douzone Bizon Co., Ltd. (Software) | | | 49,011 | | | | 2,724 | |
| | Fila Korea, Ltd. (Textiles, apparel & luxury goods) | | | 135,520 | | | | 4,078 | |
| | Hana Tour Service, Inc. (Hotels, restaurants & leisure) | | | 18,072 | | | | 1,416 | |
| * | Hugel, Inc. (Biotechnology) | | | 5,752 | | | | 2,487 | |
| | Koh Young Technology, Inc. (Semiconductors & semiconductor equipment) | | | 42,371 | | | | 3,874 | |
| | Korea Investment Holdings Co., Ltd. (Capital markets) | | | 100,883 | | | | 7,606 | |
| | LOTTE Fine Chemical Co., Ltd. (Chemicals) | | | 36,199 | | | | 2,110 | |
| | Medy-Tox, Inc. (Biotechnology) | | | 6,820 | | | | 4,689 | |
| | Modetour Network, Inc. (Hotels, restaurants & leisure) | | | 103,575 | | | | 2,526 | |
| | Orion Corporation (Food products) | | | 49,094 | | | | 6,555 | |
| | POSCO Chemtech Co., Ltd. (Construction materials) | | | 33,764 | | | | 1,330 | |
| | SKCKOLONPI, Inc. (Chemicals) | | | 69,974 | | | | 3,104 | |
| | WONIK IPS Co., Ltd. (Semiconductors & semiconductor equipment) | | | 114,238 | | | | 2,877 | |
| | | | | | | | | 57,996 | |
| | Taiwan—9.5% | | | | | | | | |
| | ASPEED Technology, Inc. (Semiconductors & semiconductor equipment) | | | 125,000 | | | | 3,273 | |
| | Chailease Holding Co., Ltd. (Diversified financial services) | | | 1,504,000 | | | | 4,919 | |
| | Chroma ATE, Inc. (Electronic equipment, instruments & components) | | | 811,000 | | | | 4,354 | |
| | Eclat Textile Co., Ltd. (Textiles, apparel & luxury goods) | | | 266,000 | | | | 3,159 | |
| | Globalwafers Co., Ltd. (Semiconductors & semiconductor equipment) | | | 437,000 | | | | 7,235 | |
| | Gourmet Master Co., Ltd. (Hotels, restaurants & leisure) | | | 128,622 | | | | 1,243 | |
| * | Macronix International (Semiconductors & semiconductor equipment) | | | 1,423,000 | | | | 2,018 | |
| | TCI Co., Ltd. (Personal products) | | | 417,000 | | | | 6,426 | |
| | Voltronic Power Technology Corporation (Electrical equipment) | | | 60,000 | | | | 1,024 | |
| * | Wafer Works Corporation (Semiconductors & semiconductor equipment) | | | 2,448,672 | | | | 4,982 | |
| | Walsin Technology Corporation (Electronic equipment, instruments & components) | | | 464,000 | | | | 6,334 | |
| | | | | | | | | 44,967 | |
See accompanying Notes to Financial Statements.
| June 30, 2018 | William Blair Funds | 81 |
Emerging Markets Small Cap Growth Fund
Portfolio of Investments, June 30, 2018 (all dollar amounts in thousands) (unaudited)
| | | | | | | | |
| | | | | | | | |
| | Issuer | | Shares | | | Value | |
| | | | | | | | | | |
| | Common Stocks—(continued) | | | | | | | | |
| | | | | | | | | | |
| | Emerging Asia—(continued) | | | | | | | | |
| | Thailand—3.5% | | | | | | | | |
| | Bangkok Chain Hospital PCL (Health care providers & services) | | | 5,703,200 | | | $ | 2,631 | |
| | Beauty Community PCL (Specialty retail) | | | 4,652,000 | | | | 1,711 | |
| | Home Product Center PCL (Specialty retail) | | | 8,231,900 | | | | 3,334 | |
| | Indorama Ventures PCL (Chemicals) | | | 2,901,010 | | | | 4,790 | |
| | Tisco Financial Group PCL (Banks) | | | 818,500 | | | | 2,073 | |
| | TOA Paint Thailand PCL (Chemicals) | | | 1,596,700 | | | | 1,832 | |
| | | | | | | | | 16,371 | |
| | Vietnam—1.7% | | | | | | | | |
| * | Hoa Phat Group JSC (Metals & mining) | | | 1,853,362 | | | | 3,087 | |
| | PetroVietnam Gas JSC (Gas utilities) | | | 559,560 | | | | 2,146 | |
| | Vietjet Aviation JSC (Airlines) | | | 423,540 | | | | 2,607 | |
| | | | | | | | | 7,840 | |
| | | | | | | | | | |
| | Emerging Europe, Mid-East, Africa—7.7% | | | | | | | | |
| | Kenya—1.2% | | | | | | | | |
| | Safaricom, Ltd. (Wireless telecommunication services) | | | 19,691,700 | | | | 5,710 | |
| | Poland—1.7% | | | | | | | | |
| * | Dino Polska S.A. (Food & staples retailing) | | | 205,206 | | | | 5,666 | |
| | ING Bank Slaski S.A. (Banks) | | | 47,726 | | | | 2,275 | |
| | | | | | | | | 7,941 | |
| | Romania—0.8% | | | | | | | | |
| | Banca Transilvania S.A. (Banks) | | | 5,965,371 | | | | 3,582 | |
| | Russia—0.6% | | | | | | | | |
| | TCS Group Holding plc—GDR (Banks) | | | 150,200 | | | | 3,093 | |
| | South Africa—2.3% | | | | | | | | |
| | AVI, Ltd. (Food products) | | | 218,554 | | | | 1,726 | |
| | Clicks Group, Ltd. (Food & staples retailing) | | | 183,907 | | | | 2,626 | |
| | JSE, Ltd. (Capital markets) | | | 265,591 | | | | 3,130 | |
| | Mr Price Group, Ltd. (Specialty retail) | | | 130,219 | | | | 2,137 | |
| | Santam, Ltd. (Insurance) | | | 56,120 | | | | 1,164 | |
| | | | | | | | | 10,783 | |
| | United Arab Emirates—1.1% | | | | | | | | |
| | NMC Health plc (Health care providers & services) | | | 113,233 | | | | 5,329 | |
| | | | | | | | | | |
| | Emerging Latin America—7.7% | | | | | | | | |
| | Argentina—0.6% | | | | | | | | |
| | Grupo Supervielle S.A.—ADR (Banks) | | | 251,766 | | | | 2,664 | |
| | Brazil—4.3% | | | | | | | | |
| * | Construtora Tenda S.A. (Household durables) | | | 239,336 | | | | 1,469 | |
| | CVC Brasil Operadora e Agencia de Viagens S.A. (Hotels, restaurants & leisure) | | | 216,600 | | | | 2,526 | |
| | Iochpe-Maxion S.A. (Machinery) | | | 401,800 | | | | 2,168 | |
| | IRB Brasil Resseguros S.A. (Insurance) | | | 171,200 | | | | 2,136 | |
| | Linx S.A. (Software) | | | 453,500 | | | | 2,071 | |
| | Localiza Rent a Car S.A. (Road & rail) | | | 584,195 | | | | 3,577 | |
| | Magazine Luiza S.A. (Multiline retail) | | | 104,300 | | | | 3,444 | |
| | Tegma Gestao Logistica S.A. (Road & rail) | | | 359,100 | | | | 1,428 | |
| | | | Shares or | | | | |
| | | | Principal | | | | |
| | Issuer | | Amount | | | Value | |
| | | | | | | | | | |
| | Common Stocks—(continued) | | | | | | | | |
| | | | | | | | | | |
| | Emerging Latin America—(continued) | | | | | | | | |
| | Brazil—(continued) | | | | | | | | |
| | Via Varejo S.A. (Specialty retail) | | | 334,800 | | | $ | 1,607 | |
| | | | | | | | | 20,426 | |
| | Chile—0.3% | | | | | | | | |
| | Sociedad Matriz del Banco de Chile S.A. Class “B” (Banks) | | | 2,480,899 | | | | 1,192 | |
| | Mexico—2.1% | | | | | | | | |
| | Banco del Bajio S.A. (Banks) | | | 2,494,200 | | | | 5,244 | |
| | Grupo Aeroportuario del Centro Norte S.A.B. de C.V. (Transportation infrastructure) | | | 339,100 | | | | 1,771 | |
| | Grupo Cementos de Chihuahua S.A.B. de C.V. (Construction materials) | | | 484,000 | | | | 3,133 | |
| | | | | | | | | 10,148 | |
| | Peru—0.4% | | | | | | | | |
| | Cia de Minas Buenaventura SAA—ADR (Metals & mining) | | | 140,827 | | | | 1,920 | |
| | Total Common Stocks—96.4%
(cost $438,237) | | | | | | | 455,061 | |
| | | | | | | | | | |
| | Preferred Stocks | | | | | | | | |
| | Brazil—1.0% | | | | | | | | |
| | Banco ABC Brasil S.A. (Banks) | | | 183,200 | | | | 712 | |
| | Metalurgica Gerdau S.A. (Metals & mining) | | | 1,573,400 | | | | 2,509 | |
| | Randon Participacoes S.A. (Machinery) | | | 977,500 | | | | 1,556 | |
| | | | | | | | | 4,777 | |
| | Total Preferred Stocks—1.0%
(cost $7,028) | | | | | | | 4,777 | |
| | | | | | | | | | |
| | Repurchase Agreement | | | | | | | | |
| | Fixed Income Clearing Corporation, 0.350% dated 6/29/18, due 7/2/18, repurchase price $9,844, collateralized by U.S. Treasury Inflation Index Bond, 0.250%, due 1/15/25 | | | $9,844 | | | | 9,844 | |
| | Total Repurchase Agreement—2.1%
(cost $9,844) | | | | | | | 9,844 | |
| | Total Investments—99.5%
(cost $455,109) | | | | | | | 469,682 | |
| | Cash and other assets, less liabilities—0.5% | | | | | | | 2,269 | |
| | Net assets—100.0% | | | | | | $ | 471,951 | |
ADR = American Depository Receipt
GDR = Global Depository Receipt
* = Non-income producing security
For securities primarily traded on exchanges or markets that close before the close of regular trading on the New York Stock Exchange, the Fund may use an independent pricing service to fair value price the securities pursuant to Valuation Procedures approved by the Board of Trustees.
See accompanying Notes to Financial Statements.
| 82 | Semiannual Report | June 30, 2018 |
Emerging Markets Small Cap Growth Fund
Portfolio of Investments, June 30, 2018 (unaudited)
At June 30, 2018, the Fund’s Portfolio of Investments includes the following industry categories (as a percentage of long-term investments):
| Information Technology | 20.2% |
| Consumer Discretionary | 18.6% |
| Financials | 13.7% |
| Health Care | 12.2% |
| Industrials | 10.1% |
| Consumer Staples | 10.0% |
| Materials | 8.3% |
| Real Estate | 2.9% |
| Energy | 1.5% |
| Utilities | 1.3% |
| Telecommunication Services | 1.2% |
| Total | 100.0% |
At June 30, 2018, the Fund’s Portfolio of Investments includes the following currency categories (as a percentage of long-term investments):
| Hong Kong Dollar | 21.3% |
| Indian Rupee | 18.2% |
| South Korean Won | 12.6% |
| New Taiwan Dollar | 10.4% |
| Yuan Renminbi | 5.6% |
| Brazilian Real | 5.5% |
| U.S. Dollar | 5.3% |
| Malaysian Ringgit | 4.0% |
| Thai Baht | 3.6% |
| South African Rand | 2.3% |
| Mexican Peso | 2.2% |
| Polish Zloty | 1.7% |
| Viet Nam Dong | 1.7% |
| Indonesian Rupiah | 1.4% |
| Kenyan Shilling | 1.2% |
| British Pound Sterling | 1.2% |
| All Other Currencies | 1.8% |
| Total | 100.0% |
See accompanying Notes to Financial Statements.
| June 30, 2018 | William Blair Funds | 83 |
Fixed Income Market Review and Outlook
Investment-grade bonds declined 1.62% during the first half of 2018, as interest rates rose and risk spreads widened. While the combination of rising interest rates and increasing risk spreads is not unprecedented, risk spreads increased by a magnitude that was larger than any other half-year period when interest rates rose simultaneously over the past 30 years.
The Federal Open Market Committee (“FOMC”) increased policy rates twice during the past six months, and short-term interest rates have risen in coordination with actual and perceived FOMC rate hikes. The Fed Funds futures market carried an implied probability that the FOMC will increase the federal funds rate two additional times during calendar year 2018: in September and in December.
Meanwhile, the FOMC has simultaneously reduced its balance sheet and purchased Treasury and agency mortgage-backed securities (“MBS”). Although the Fed has ended its formal quantitative easing programs, the FOMC continues to purchase agency MBS as it receives principal and interest payments from its balance sheet holdings, a practice known as “FedTrade.” The pace of purchases has slowed considerably since the FOMC began its program to reduce the size of the balance sheet. Beginning in July 2018, the FOMC will allow the balance sheet to shrink by no more than $40 billion per month, and that amount is $10 billion more than the pace of reductions during the second quarter of 2018. Recently released FOMC minutes revealed that reinvestment purchases of agency MBS are projected to fall to zero beginning in the fourth quarter of 2018.
Longer-term Treasury rates rose year-to-date, but they rose by a smaller magnitude than short-term rates rose. As a result, the yield curve flattened and several measures indicated that the yield curve was at risk of inverting (when shorter-term rates are higher than longer-term rates). The yield curve’s dynamics can be partially explained by the FOMC’s simultaneous actions of raising the federal funds rate (short-term rates rose) and purchasing Treasury and agency MBS (longer-term rates suppressed). U.S. Treasury Inflation-Protected Securities (“TIPS”) outperformed similar-maturity fixed-rate Treasury notes and bonds as market-implied inflation expectations increased year-to-date.
Agency MBS experienced negative total returns and increasing risk spreads. The best-performing segments of the market were higher-coupon 30-year pools. Segments that the FOMC targeted in “FedTrade,” such as 30-year 3.0%, 3.5%, and 4.0% pools, were among the weakest-performing segments of the MBS market year-to-date.
Corporate bonds also experienced negative total returns and increasing risk spreads year-to-date. While risk spreads widened, the most speculative areas of the market, specifically B- and CCC-rated bonds, generated gains and outperformed higher-quality securities. Corporate bonds tied to emerging markets underperformed those domiciled in domestic markets. The most distinguishable trend in the corporate bond market during the first half of 2018 was the magnitude by which longer-term corporate bonds underperformed shorter-term corporate bonds. Corporate bond curves steepened year-to-date, which may be an indication that credit market participants are demanding higher risk premiums to protect against the rising-rate regime.
We believe that the FOMC will continue to raise the federal funds rate at a measured pace over the next 12 months. The U.S. economy is growing; forecasters predict a real GDP growth rate of approximately 2.5% to 3.0% during 2018. In addition, the U.S. labor market is adding jobs and the unemployment rate is at 3.9%. Estimates of wage inflation are roughly 3.0%, while estimates of core personal consumption expenditures have been roughly 2.0%. Macroeconomic theory predicts that a robust labor market creates wage inflation, which in turn spurs broader inflation. We believe that the FOMC will raise rates so long as inflationary pressures do not deteriorate.
We believe that the FOMC’s plans to reduce the size of the Fed’s balance sheet will be executed with little disruption to the markets. We believe this is attributable, in part, to strong communication efforts, adequate advance notice, and the absence of security sales to reduce the balance sheet. However, we believe the lower-coupon agency MBS that were purchased by the Fed will underperform higher-coupon alternatives when the FOMC ends its campaign of purchasing agency MBS.
U.S. TIPS have market-implied break-even inflation rates that are at levels within the FOMC’s stated target range of 2.0% to 2.5%. We believe TIPS are an attractive alternative to fixed-rate Treasuries to mitigate the effects of rising interest rates driven by accelerating inflationary pressures.
We believe that agency mortgage-backed securities and corporate bonds remain attractive relative to Treasuries over the intermediate to long term. Corporate risk premiums are at levels near their longer-term averages, and we believe opportunities remain after risk spreads increased year-to-date. Risk premiums of higher-coupon segments of the agency MBS market remain
| 84 | Semiannual Report | June 30, 2018 |
Fixed Income Market Review and Outlook
attractive. In addition, we believe Treasuries are likely to struggle as the FOMC tightens the federal funds rate and reduces the scale of its asset purchases.
We believe that higher-coupon segments (30-year MBS coupon rates of 5.0% and above) of the agency MBS market offer compelling value. These segments of the agency MBS market offer attractive spreads and a defensive duration profile. The key risk of these securities is that the underlying borrowers are in-the-money to refinance their loan. We believe this risk can be mitigated by focusing on pools comprised of borrowers that do not have the economic incentive to refinance their loans: low loan-balance pools.
We believe that there are opportunities in the corporate bond market as risk spreads increase to levels close to the Index’s longer-term average. We remain concerned about company-specific risks, including shareholder-friendly activities such as leveraged finance mergers and acquisitions, large share repurchases, and special dividends. Importantly, we do not believe the market will enter a period of excessive leveraged buyout activity.
| June 30, 2018 | William Blair Funds | 85 |
| | Bond Fund |
| | |
| | The Bond Fund seeks to outperform the Bloomberg Barclays U.S. Aggregate Index by maximizing total return through a combination of income and capital appreciation. |
| | |
| | AN OVERVIEW FROM THE PORTFOLIO MANAGERS |
| | |
 Paul J. Sularz 
Christopher T. Vincent | The William Blair Bond Fund (Class N shares) posted a 2.28% decrease, net of fees, for the six months ended June 30, 2018. By comparison, the Fund’s benchmark, the Bloomberg Barclays U.S. Aggregate Index (the “Index”), decreased 1.62%. Multiple factors detracted from the Fund’s performance relative to the Index year-to-date. The Fund experienced negative selection results within its investment-grade corporate bond holdings, as the Fund was overweight to longer-maturity corporate bonds. The Fund held positions in long-maturity bonds issued by AbbVie, Inc., Citigroup, Inc., The Goldman Sachs Group, Inc., and Bank of America Corporation that detracted from performance. The Fund’s allocation to high yield corporate bonds also detracted, as higher-quality segments of the high yield market underperformed. The Fund’s sector allocation also detracted from performance, as the Fund emphasized corporate and agency mortgage-backed securities, and fixed-rate Treasuries outperformed those sectors year-to-date. There were a couple of factors that contributed to the Fund’s relative performance year-to-date. The Fund experienced favorable selection results from its agency mortgage-backed securities holdings, as the Fund was overweight to higher-coupon segments that performed well year-to-date. An allocation to U.S. Treasury Inflation-Protected Securities (TIPS) was also additive to performance. Finally, positions in bonds issued by AT&T, Inc., JBS, and Jaguar Land Rover Automotive plc experienced gains and contributed to results. Please refer to the Fixed Income Market Review and Outlook relating to the Fund beginning on page 84 for additional information. |
| 86 | Semiannual Report | June 30, 2018 |
| Performance Highlights (Unaudited) |
| Average Annual Total Return through 6/30/2018 |
| | | Year
to Date | | 1 Year | | 3 Year | | 5 Year | | 10 Year |
| Class N | | | (2.28 | )% | | | (0.62 | )% | | | 1.74 | % | | | 2.54 | % | | | 4.41 | % |
| Class I | | | (2.22 | ) | | | (0.37 | ) | | | 1.97 | | | | 2.73 | | | | 4.59 | |
| Institutional Class | | | (2.19 | ) | | | (0.29 | ) | | | 2.04 | | | | 2.83 | | | | 4.72 | |
| Bloomberg Barclays U.S. Aggregate Index | | | (1.62 | ) | | | (0.40 | ) | | | 1.72 | | | | 2.27 | | | | 3.72 | |
Performance cited represents past performance. Past performance does not guarantee future results and current performance may be lower or higher than the data quoted. Results shown are average annual total returns, which assume reinvestment of dividends and capital gains. Investment returns and principal will fluctuate and you may have a gain or loss when you sell shares. For the most current month-end performance information, please call 1-800-742-7272, or visit our Web site at www.williamblairfunds.com. From time to time, the investment adviser may waive fees or reimburse expenses for the Fund. Without these waivers/reimbursements, performance would be lower. Class N shares are available to the general public without a sales load. Class I shares are available to certain institutional investors, and advisory clients of William Blair & Company, L.L.C., without a sales load or distribution (12b-1) fees. Institutional Class shares are available to institutional investors without a sales load or distribution (12b-1) or service fees.
The performance highlights and graph presented above do not reflect the deduction of taxes that a shareholder would pay on fund distributions or the redemption of fund shares.
The Bloomberg Barclays U.S. Aggregate Index indicates broad intermediate government/corporate bond market performance.
This report identifies the Fund’s investments on June 30, 2018. These holdings are subject to change. Not all investments in the Fund performed the same, nor is there any guarantee that these investments will perform as well in the future. Market forecasts provided in this report may not necessarily come to pass.
| Sector Diversification (Unaudited) |
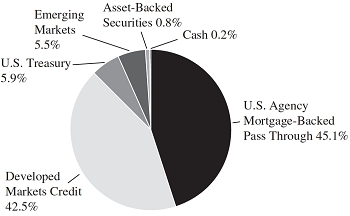
The sector diversification shown is based on the total investments.
| June 30, 2018 | William Blair Funds | 87 |
Portfolio of Investments, June 30, 2018 (all dollar amounts in thousands) (unaudited)
| | | | | | | | |
| | Issuer | | Principal
Amount | | | Value | |
| | | | | | | | | | |
| | U.S. Government and U.S. Government Agency—50.9% | |
| | | |
| | U.S. Treasury Inflation Indexed Notes/Bonds—5.7% | |
| | U.S. Treasury Inflation Indexed Bond, 3.875%, due 4/15/29 | | $ | 22,706 | | | $ | 29,963 | |
| | U.S. Treasury—0.1% | | | | | | | | |
| | U.S. Treasury Floating Rate Note, 3M Treasury money market yield + 0.070%, 1.979%, due 4/30/19(a) | | | 500 | | | | 500 | |
| | Federal Home Loan Mortgage Corp. (FHLMC)—16.0% | | | | | | | | |
| | #B13747, 5.000%, due 4/1/19 | | | 30 | | | | 30 | |
| | #G12113, 5.500%, due 5/1/21 | | | 116 | | | | 118 | |
| | #J02986, 6.500%, due 7/1/21 | | | 8 | | | | 8 | |
| | #G30255, 7.000%, due 7/1/21 | | | 1 | | | | 1 | |
| | #G30243, 6.000%, due 12/1/21 | | | 1 | | | | 1 | |
| | #G12720, 5.500%, due 6/1/22 | | | 19 | | | | 20 | |
| | #D95621, 6.500%, due 7/1/22 | | | 421 | | | | 441 | |
| | #G16026, 4.000%, due 11/1/25 | | | 6,112 | | | | 6,299 | |
| | #G14150, 4.500%, due 4/1/26 | | | 1,194 | | | | 1,248 | |
| | #J16051, 4.500%, due 7/1/26 | | | 668 | | | | 695 | |
| | #G02210, 7.000%, due 12/1/28 | | | 52 | | | | 58 | |
| | #G02183, 6.500%, due 3/1/30 | | | 13 | | | | 15 | |
| | #G01728, 7.500%, due 7/1/32 | | | 85 | | | | 99 | |
| | #C01385, 6.500%, due 8/1/32 | | | 69 | | | | 78 | |
| | #C01623, 5.500%, due 9/1/33 | | | 79 | | | | 86 | |
| | #A15039, 5.500%, due 10/1/33 | | | 2 | | | | 2 | |
| | #A17603, 5.500%, due 1/1/34 | | | 1,836 | | | | 2,036 | |
| | #G01843, 6.000%, due 6/1/35 | | | 15 | | | | 17 | |
| | #G03711, 6.000%, due 6/1/37 | | | 531 | | | | 587 | |
| | #G04126, 6.000%, due 6/1/37 | | | 1,607 | | | | 1,798 | |
| | #A62858, 6.500%, due 7/1/37 | | | 94 | | | | 106 | |
| | #G03170, 6.500%, due 8/1/37 | | | 171 | | | | 190 | |
| | #A66843, 6.500%, due 10/1/37 | | | 685 | | | | 774 | |
| | #G07837, 6.500%, due 2/1/38 | | | 2,202 | | | | 2,497 | |
| | #G04053, 5.500%, due 3/1/38 | | | 629 | | | | 689 | |
| | #A78138, 5.500%, due 6/1/38 | | | 275 | | | | 305 | |
| | #G04641, 6.000%, due 6/1/38 | | | 1,179 | | | | 1,306 | |
| | #G04466, 5.500%, due 7/1/38 | | | 12,601 | | | | 13,976 | |
| | #G04544, 6.000%, due 8/1/38 | | | 699 | | | | 775 | |
| | #A81799, 6.500%, due 9/1/38 | | | 353 | | | | 393 | |
| | #G06964, 5.500%, due 11/1/38 | | | 1,848 | | | | 2,048 | |
| | #G05723, 6.500%, due 11/1/38 | | | 1,118 | | | | 1,262 | |
| | #G07480, 6.000%, due 5/1/39 | | | 1,121 | | | | 1,235 | |
| | #G60366, 6.000%, due 10/1/39 | | | 13,679 | | | | 15,185 | |
| | #G05810, 5.000%, due 2/1/40 | | | 10,931 | | | | 11,746 | |
| | #G05875, 5.500%, due 2/1/40 | | | 499 | | | | 547 | |
| | #G61450, 6.000%, due 4/1/40 | | | 13,143 | | | | 14,787 | |
| | #C03665, 9.000%, due 4/1/41 | | | 453 | | | | 522 | |
| | #G06583, 5.000%, due 6/1/41 | | | 1,468 | | | | 1,585 | |
| | Total FHLMC Mortgage Obligations | | | | | | | 83,565 | |
| | Federal National Mortgage Association (FNMA)—29.1% | | | | | | | | |
| | #788424, 5.500%, due 9/1/19 | | | 3 | | | | 3 | |
| | #900725, 6.000%, due 8/1/21 | | | 17 | | | | 17 | |
| | #893325, 7.000%, due 9/1/21 | | | 5 | | | | 5 | |
| | #949589, 5.500%, due 8/1/22 | | | 1,437 | | | | 1,488 | |
| | | | | | | | |
| | Issuer | | Principal
Amount | | | Value | |
| | | | | | | | | | |
| | U.S. Government and U.S. Government Agency—(continued) | |
| | | |
| | Federal National Mortgage Association (FNMA)—(continued) | |
| | #949592, 6.000%, due 8/1/22 | | $ | 2,184 | | | $ | 2,281 | |
| | #AC5410, 4.500%, due 10/1/24 | | | 246 | | | | 256 | |
| | #AL8529, 6.000%, due 11/1/24 | | | 3,342 | | | | 3,495 | |
| | #AC9560, 5.000%, due 1/1/25 | | | 1,005 | | | | 1,029 | |
| | #255956, 5.500%, due 10/1/25 | | | 11 | | | | 12 | |
| | #AL2853, 4.500%, due 6/1/26 | | | 5,136 | | | | 5,366 | |
| | #AL9730, 4.500%, due 2/1/27 | | | 1,643 | | | | 1,716 | |
| | #AL2134, 4.000%, due 7/1/27 | | | 244 | | | | 251 | |
| | #AL9857, 4.000%, due 2/1/29 | | | 10,549 | | | | 10,866 | |
| | #252925, 7.500%, due 12/1/29 | | | 1 | | | | 1 | |
| | #AD0729, 7.500%, due 12/1/30 | | | 8,124 | | | | 9,309 | |
| | #535977, 6.500%, due 4/1/31 | | | 6 | | | | 7 | |
| | #253907, 7.000%, due 7/1/31 | | | 1 | | | | 1 | |
| | #545339, 6.500%, due 11/1/31 | | | 34 | | | | 38 | |
| | #587849, 6.500%, due 11/1/31 | | | 7 | | | | 8 | |
| | #618547, 6.500%, due 11/1/31 | | | 4,189 | | | | 4,658 | |
| | #545437, 7.000%, due 2/1/32 | | | 41 | | | | 46 | |
| | #545759, 6.500%, due 7/1/32 | | | 348 | | | | 390 | |
| | #545869, 6.500%, due 7/1/32 | | | 1,121 | | | | 1,261 | |
| | #670385, 6.500%, due 9/1/32 | | | 563 | | | | 629 | |
| | #254548, 5.500%, due 12/1/32 | | | 34 | | | | 37 | |
| | #703391, 5.000%, due 5/1/33 | | | 129 | | | | 139 | |
| | #708993, 5.000%, due 6/1/33 | | | 22 | | | | 24 | |
| | #730131, 5.000%, due 8/1/33 | | | 48 | | | | 52 | |
| | #741850, 5.500%, due 9/1/33 | | | 379 | | | | 414 | |
| | #555800, 5.500%, due 10/1/33 | | | 38 | | | | 41 | |
| | #756153, 5.500%, due 11/1/33 | | | 427 | | | | 467 | |
| | #AL3455, 5.500%, due 11/1/33 | | | 5,331 | | | | 5,915 | |
| | #AL3401, 5.500%, due 2/1/34 | | | 712 | | | | 789 | |
| | #763798, 5.500%, due 3/1/34 | | | 68 | | | | 75 | |
| | #725611, 5.500%, due 6/1/34 | | | 83 | | | | 90 | |
| | #745563, 5.500%, due 8/1/34 | | | 502 | | | | 550 | |
| | #794474, 6.000%, due 10/1/34 | | | 39 | | | | 43 | |
| | #745092, 6.500%, due 7/1/35 | | | 269 | | | | 300 | |
| | #357944, 6.000%, due 9/1/35 | | | 13 | | | | 15 | |
| | #AD0979, 7.500%, due 10/1/35 | | | 63 | | | | 72 | |
| | #745349, 6.500%, due 2/1/36 | | | 217 | | | | 245 | |
| | #888305, 7.000%, due 3/1/36 | | | 9 | | | | 10 | |
| | #895637, 6.500%, due 5/1/36 | | | 60 | | | | 66 | |
| | #831540, 6.000%, due 6/1/36 | | | 17 | | | | 18 | |
| | #893318, 6.500%, due 8/1/36 | | | 10 | | | | 12 | |
| | #310037, 6.500%, due 10/1/36 | | | 145 | | | | 162 | |
| | #831926, 6.000%, due 12/1/36 | | | 530 | | | | 591 | |
| | #902974, 6.000%, due 12/1/36 | | | 143 | | | | 157 | |
| | #AB0265, 6.000%, due 2/1/37 | | | 11,206 | | | | 12,603 | |
| | #938440, 6.000%, due 7/1/37 | | | 74 | | | | 82 | |
| | #948689, 6.000%, due 8/1/37 | | | 162 | | | | 179 | |
| | #888703, 6.500%, due 8/1/37 | | | 3,315 | | | | 3,776 | |
| | #AL0904, 5.500%, due 1/1/38 | | | 105 | | | | 115 | |
| | #889371, 6.000%, due 1/1/38 | | | 2,466 | | | | 2,777 | |
| | #962058, 6.500%, due 3/1/38 | | | 1,107 | | | | 1,257 | |
| | #934006, 6.500%, due 9/1/38 | | | 284 | | | | 322 | |
| | #986856, 6.500%, due 9/1/38 | | | 122 | | | | 140 | |
| | #991911, 7.000%, due 11/1/38 | | | 172 | | | | 196 | |
| | #AL3775, 5.000%, due 1/1/39 | | | 1,475 | | | | 1,596 | |
| | #AD0752, 7.000%, due 1/1/39 | | | 517 | | | | 589 | |
| | #AA7611, 5.000%, due 5/1/39 | | | 599 | | | | 643 | |
See accompanying Notes to Financial Statements.
| 88 | Semiannual Report | June 30, 2018 |
Portfolio of Investments, June 30, 2018 (all dollar amounts in thousands) (unaudited)
| | | | | | | | | |
| Issuer | | NRSRO
Rating | | Principal
Amount | | | Value | |
| | | | | | | | | | | |
| U.S. Government and U.S. Government Agency—(continued) | |
| | |
| Federal National Mortgage Association (FNMA)—(continued) | |
| #AA8443, 5.000%, due 6/1/39 | | | | $ | 160 | | | $ | 173 | |
| #AC1619, 5.500%, due 8/1/39 | | | | | 374 | | | | 408 | |
| #AD0315, 6.500%, due 8/1/39 | | | | | 1,832 | | | | 2,068 | |
| #AC9569, 5.000%, due 2/1/40 | | | | | 1,267 | | | | 1,371 | |
| #AD0761, 5.000%, due 2/1/40 | | | | | 206 | | | | 223 | |
| #AD1594, 5.000%, due 2/1/40 | | | | | 213 | | | | 230 | |
| #932751, 5.000%, due 4/1/40 | | | | | 3,042 | | | | 3,292 | |
| #AD7137, 5.500%, due 7/1/40 | | | | | 3,720 | | | | 4,127 | |
| #BM1689, 5.500%, due 8/1/40 | | | | | 3,130 | | | | 3,433 | |
| #AH0955, 5.000%, due 12/1/40 | | | | | 3,863 | | | | 4,168 | |
| #AH5585, 5.000%, due 2/1/41 | | | | | 141 | | | | 152 | |
| #AI1201, 5.500%, due 4/1/41 | | | | | 4,658 | | | | 5,068 | |
| #AL5815, 5.500%, due 4/1/41 | | | | | 2,808 | | | | 3,117 | |
| #BM3525, 6.000%, due 4/1/41 | | | | | 13,245 | | | | 14,954 | |
| #AI6071, 5.000%, due 6/1/41 | | | | | 1,339 | | | | 1,449 | |
| #AI4222, 5.000%, due 7/1/41 | | | | | 105 | | | | 114 | |
| #AL0672, 5.000%, due 7/1/41 | | | | | 2,332 | | | | 2,522 | |
| #AL0913, 6.000%, due 7/1/41 | | | | | 1,415 | | | | 1,567 | |
| #AL9226, 5.500%, due 12/1/41 | | | | | 14,959 | | | | 16,605 | |
| #AL9225, 6.000%, due 1/1/42 | | | | | 6,970 | | | | 7,854 | |
| #AK2733, 5.000%, due 2/1/42 | | | | | 1,548 | | | | 1,675 | |
| Total FNMA Mortgage Obligations | | | | | | | | | 152,262 | |
| | | | | | | | | | | |
| Asset-Backed Securities—0.8% | | | | | | | | | | |
| Tesla Auto Lease Trust—144A, 2018-A, Tranche D, 3.300%, 5/20/20 | | Baa2 | | | 500 | | | | 499 | |
| Centre Point Funding LLC—144A, 2012-2A, Tranche 1, 2.610%, 8/20/21 | | Baa1 | | | 1,677 | | | | 1,658 | |
| SLM Private Education Loan Trust— 144A, 2011-A, Tranche A3, 1M USD LIBOR + 2.500%, 4.573%, 1/15/43, VRN | | AAA | | | 2,000 | | | | 2,050 | |
| Total Asset-Backed Securities | | | | | | | | | 4,207 | |
| | | | | | | | | | | |
| Corporate Obligations—47.5% | | | | | | | | | | |
| Boston Properties L.P., 5.875%, due 10/15/19 | | A- | | | 3,000 | | | | 3,091 | |
| Ford Motor Credit Co. LLC, 8.125%, due 1/15/20 | | BBB | | | 4,000 | | | | 4,285 | |
| Georgia-Pacific LLC—144A, 5.400%, due 11/1/20 | | A+ | | | 4,000 | | | | 4,192 | |
| UBS Group Funding Switzerland AG, 5 year USD ICE Swap + 5.497%, 6.875%, due 3/22/21, VRN | | BBB- | | | 2,000 | �� | | | 2,054 | |
| JBS USA LUX SA / JBS USA Finance, Inc.—144A, 7.250%, due 6/1/21 | | BB- | | | 3,000 | | | | 3,045 | |
| O’Reilly Automotive, Inc., 4.625%, due 9/15/21 | | Baa1 | | | 2,943 | | | | 3,042 | |
| Fresenius Medical Care US Finance II, Inc.—144A, 5.875%, due 1/31/22 | | BBB- | | | 2,760 | | | | 2,928 | |
| Masco Corporation, 5.950%, due 3/15/22 | | BBB | | | 4,050 | | | | 4,336 | |
| | | | | | | | | |
| Issuer | | NRSRO
Rating | | Principal
Amount | | | Value | |
| | | | | | | | | |
| Corporate Obligations—(continued) | | | | | | | | | | |
| Discover Financial Services, 5.200%, due 4/27/22 | | BBB+ | | $ | 3,000 | | | $ | 3,132 | |
| Triumph Group, Inc., 5.250%, due 6/1/22 | | B- | | | 2,500 | | | | 2,419 | |
| Embraer S.A., 5.150%, due 6/15/22 | | BBB | | | 3,400 | | | | 3,504 | |
| Jones Lang LaSalle, Inc., 4.400%, due 11/15/22 | | Baa1 | | | 4,900 | | | | 5,016 | |
| Navient Corporation, 5.500%, due 1/25/23 | | BB | | | 2,000 | | | | 1,973 | |
| Jaguar Land Rover Automotive plc- 144A, 5.625%, due 2/1/23 | | BB+ | | | 3,225 | | | | 3,281 | |
| Toll Brothers Finance Corporation, 4.375%, due 4/15/23 | | BBB- | | | 3,875 | | | | 3,812 | |
| Itau Unibanco Holding S.A.—144A, 5.125%, due 5/13/23 | | Ba3 | | | 2,500 | | | | 2,481 | |
| Wells Fargo & Co., 4.480%, due 1/16/24 | | A | | | 5,000 | | | | 5,106 | |
| Lennar Corporation, 4.500%, due 4/30/24 | | BB+ | | | 2,450 | | | | 2,367 | |
| Banco Inbursa S.A. Institucion de Banca Multiple—144A, 4.125%, due 6/6/24 | | BBB+ | | | 2,500 | | | | 2,419 | |
| Grupo Bimbo S.A.B. de C.V.—144A, 3.875%, due 6/27/24 | | BBB | | | 2,500 | | | | 2,451 | |
| Iron Mountain, Inc., 5.750%, due 8/15/24 | | B | | | 575 | | | | 565 | |
| Synchrony Financial, 4.250%, due 8/15/24 | | BBB- | | | 5,000 | | | | 4,908 | |
| SBA Communications Corporation, 4.875%, due 9/1/24 | | B+ | | | 3,000 | | | | 2,877 | |
| HSBC Holdings plc, 5 year USD ICE Swap + 3.705%, 6.375%, due 9/17/24, VRN | | BBB | | | 5,000 | | | | 4,958 | |
| JPMorgan Chase & Co., 3M USD LIBOR + 3.330%, 6.100%, due 10/1/24, VRN | | BBB | | | 4,265 | | | | 4,409 | |
| BNP Paribas S.A., 4.250%, due 10/15/24 | | A | | | 4,000 | | | | 3,952 | |
| Owens Corning, 4.200%, due 12/1/24 | | BBB | | | 5,015 | | | | 4,955 | |
| Cemex S.A.B. de C.V.—144A, 5.700%, due 1/11/25 | | BB | | | 3,000 | | | | 2,973 | |
| Centene Corporation, 4.750%, due 1/15/25 | | BB+ | | | 2,000 | | | | 1,995 | |
| Penske Truck Leasing Co. L.P. / PTL Finance Corporation—144A, 3.950%, due 3/10/25 | | BBB+ | | | 3,800 | | | | 3,761 | |
| Booz Allen Hamilton, Inc.—144A, 5.125%, due 5/1/25 | | B+ | | | 3,000 | | | | 2,940 | |
| Simon Property Group L.P., 3.300%, due 1/15/26 | | A | | | 4,500 | | | | 4,322 | |
| Penske Automotive Group, Inc., 5.500%, due 5/15/26 | | B+ | | | 2,000 | | | | 1,965 | |
| Vale Overseas, Ltd., 6.250%, due 8/10/26 | | BBB+ | | | 3,025 | | | | 3,284 | |
| Post Holdings, Inc.—144A, 5.000%, due 8/15/26 | | B | | | 3,000 | | | | 2,805 | |
See accompanying Notes to Financial Statements.
| June 30, 2018 | William Blair Funds | 89 |
Portfolio of Investments, June 30, 2018 (all dollar amounts in thousands) (unaudited)
| | | | | | | | | |
| Issuer | | NRSRO
Rating | | Principal
Amount | | | Value | |
| | | | | | | | | |
| Corporate Obligations—(continued) | | | | | | | | | | |
| United Rentals North America, Inc., 5.875%, due 9/15/26 | | BB | | $ | 2,500 | | | $ | 2,534 | |
| Xylem, Inc., 3.250%, due 11/1/26 | | BBB | | | 1,950 | | | | 1,836 | |
| Glencore Funding LLC—144A, 4.000%, due 3/27/27 | | BBB+ | | | 5,000 | | | | 4,728 | |
| Hess Corporation, 4.300%, due 4/1/27 | | BBB- | | | 5,310 | | | | 5,138 | |
| The Chemours Co., 5.375%, due 5/15/27 | | BB- | | | 4,000 | | | | 3,880 | |
| Sirius XM Radio, Inc.—144A, 5.000%, due 8/1/27 | | BB | | | 2,500 | | | | 2,353 | |
| Lear Corporation, 3.800%, due 9/15/27 | | BBB- | | | 3,000 | | | | 2,822 | |
| L Brands, Inc., 5.250%, due 2/1/28 | | BB+ | | | 3,400 | | | | 3,026 | |
| Motorola Solutions, Inc., 4.600%, due 2/23/28 | | BBB- | | | 5,250 | | | | 5,232 | |
| Anheuser-Busch InBev Worldwide, Inc., 4.000%, due 4/13/28 | | A- | | | 4,600 | | | | 4,599 | |
| The Kroger Co., 8.000%, due 9/15/29 | | Baa1 | | | 4,100 | | | | 5,153 | |
| Yum! Brands, Inc., 6.875%, due 11/15/37 | | B+ | | | 4,000 | | | | 3,960 | |
| ConocoPhillips, 6.500%, due 2/1/39 | | A- | | | 4,125 | | | | 5,285 | |
| Petroleos Mexicanos, 6.500%, due 6/2/41 | | BBB+ | | | 2,500 | | | | 2,357 | |
| Express Scripts Holding Co., 6.125%, due 11/15/41 | | BBB+ | | | 4,200 | | | | 4,732 | |
| Citigroup, Inc., 5.875%, due 1/30/42 | | A | | | 4,000 | | | | 4,636 | |
| Bank of America Corporation, 5.875%, due 2/7/42 | | A+ | | | 4,000 | | | | 4,692 | |
| Morgan Stanley, 6.375%, due 7/24/42 | | A | | | 3,248 | | | | 3,958 | |
| Cox Communications, Inc.—144A, 4.700%, due 12/15/42 | | BBB+ | | | 4,300 | | | | 3,779 | |
| Mexichem S.A.B. de C.V.—144A, 5.875%, due 9/17/44 | | BBB | | | 3,500 | | | | 3,238 | |
| AbbVie, Inc., 4.700%, due 5/14/45 | | A- | | | 5,000 | | | | 4,965 | |
| ERP Operating L.P., 4.500%, due 6/1/45 | | A | | | 4,500 | | | | 4,558 | |
| | | | | | | | | |
| Issuer | | NRSRO
Rating | | Principal
Amount | | | Value | |
| | | | | | | | | |
| Corporate Obligations—(continued) | | | | | | | | | | |
| The Goldman Sachs Group, Inc., 4.750%, due 10/21/45 | | A | | $ | 3,500 | | | $ | 3,472 | |
| Apple, Inc., 4.650%, due 2/23/46 | | AA+ | | | 5,000 | | | | 5,399 | |
| PepsiCo, Inc., 4.450%, due 4/14/46 | | A+ | | | 4,500 | | | | 4,732 | |
| Verizon Communications, Inc., 4.125%, due 8/15/46 | | A- | | | 5,000 | | | | 4,306 | |
| BAT Capital Corporation—144A, 4.540%, due 8/15/47 | | BBB+ | | | 4,500 | | | | 4,218 | |
| Brookfield Finance, Inc., 4.700%, due 9/20/47 | | A- | | | 5,250 | | | | 4,987 | |
| CVS Health Corporation, 5.050%, due 3/25/48 | | Baa1 | | | 5,000 | | | | 5,108 | |
| Microsoft Corporation, 4.750%, due 11/3/55 | | AAA | | | 4,500 | | | | 5,130 | |
| Union Pacific Corporation, 4.800%, due 9/10/58 | | A- | | | 5,300 | | | | 5,506 | |
| Petrobras Global Finance BV, 6.850%, due 6/5/15 | | Ba2 | | | 3,325 | | | | 2,806 | |
| Total Corporate Obligations | | | | | | | | | 248,728 | |
Total Investments—99.2%
(cost $528,265) | | | | | | | | | 519,225 | |
| Cash and other assets, less liabilities—0.8% | | | | | | | | | 4,079 | |
| Net assets—100.0% | | | | | | | | $ | 523,304 | |
The obligations of certain U.S. Government-sponsored securities are neither issued nor guaranteed by the U.S. Treasury.
144A = Security exempt from registration under Rule 144A of the Securities Act of 1933. These securities may be resold in transactions exempt from registration, normally to qualified institutional buyers.
NRSRO = Nationally Recognized Statistical Rating Organization-The credit quality ratings of the securities in the Fund reflect the highest category rating by any of Fitch Ratings, Moody’s Investors Service Inc., or Standard & Poor’s, a division of the McGraw-Hill Companies, Inc.
VRN = Variable Rate Note
(a) Security, or a portion of security, is segregated as collateral for the centrally cleared credit default swap, aggregating a total of $218.
Centrally Cleared Credit Default Swaps
| Reference Entity | | Buy/Sell
Protection | | Fixed Deal
Pay Rate | | Payment
Frequency | | Maturity
Date | | Cleared
Exchange | | Notional
Amount
(in thousands) | | Upfront
Payment
Received
(Paid) | | Value | | Unrealized
Appreciation
(Depreciation) |
| CDX.IG-30 | | Buy | | 1.000% | | 3M | | June 2023 | | Intercontinental
Exchange | | $25,000 | | $(434) | | $(378) | | $56 |
See accompanying Notes to Financial Statements.
| 90 | Semiannual Report | June 30, 2018 |
| | Income Fund |
| | |
| | The Income Fund seeks a high level of current income with relative stability of principal. |
| | |
| | AN OVERVIEW FROM THE PORTFOLIO MANAGER |
| | |

Christopher T. Vincent | The William Blair Income Fund (Class N shares) posted a 1.12% decrease, net of fees, for the six months ended June 30, 2018. By comparison, the Fund’s benchmark, the Bloomberg Barclays Intermediate Government/Credit Bond Index (the “Index”), decreased 0.97%. Multiple factors detracted from the Fund’s performance relative to the Index year-to-date. An overweight position to bonds issued by companies domiciled in emerging markets hindered results. The Fund also experienced negative selection results from its corporate bond holdings, and those effects stemmed from the Fund’s emphasis on corporate bonds with longer maturities. The Fund held positions in longer-maturity bonds issued by BNP Paribas S.A. and AbbVie, Inc. that hindered results. There were a couple of factors that contributed to relative performance year-to-date. Interest rate positioning contributed to results, as the Fund had less duration than the Index and rates rose. The Fund’s positioning in high-coupon agency mortgage-backed securities and U.S. Treasury Inflation-Protected Securities (TIPS) were also additive. Please refer to the Fixed Income Market Review and Outlook relating to the Fund beginning on page 84 for additional information. |
| June 30, 2018 | William Blair Funds | 91 |
| Performance Highlights (Unaudited) |
| Average Annual Total Return through 6/30/2018 |
| | | Year
to Date | | 1 Year | | 3 Year | | 5 Year | | 10 Year |
| Class N | | | (1.12 | )% | | | (0.61 | )% | | | 0.83 | % | | | 1.41 | % | | | 2.88 | % |
| Class I | | | (1.03 | ) | | | (0.42 | ) | | | 1.09 | | | | 1.64 | | | | 3.11 | |
| Bloomberg Barclays Intermediate Government/ Credit Bond Index | | | (0.97 | ) | | | (0.58 | ) | | | 1.16 | | | | 1.60 | | | | 3.08 | |
Performance cited represents past performance. Past performance does not guarantee future results and current performance may be lower or higher than the data quoted. Results shown are average annual total returns, which assume reinvestment of dividends and capital gains. Investment returns and principal will fluctuate and you may have a gain or loss when you sell shares. For the most current month-end performance information, please call 1-800-742-7272, or visit our Web site at www.williamblairfunds.com. From time to time, the investment adviser may waive fees or reimburse expenses for the Fund. Without these waivers/reimbursements, performance would be lower. Class N shares are available to the general public without a sales load. Class I shares are available to certain institutional investors, and advisory clients of William Blair & Company, L.L.C., without a sales load or distribution (12b-1) or service fees.
The performance highlights and graph presented above do not reflect the deduction of taxes that a shareholder would pay on fund distributions or the redemption of fund shares.
The Bloomberg Barclays Intermediate Government/Credit Bond Index indicates broad intermediate government/corporate bond market performance.
This report identifies the Fund’s investments on June 30, 2018. These holdings are subject to change. Not all investments in the Fund performed the same, nor is there any guarantee that these investments will perform as well in the future. Market forecasts provided in this report may not necessarily come to pass.
| Sector Diversification (Unaudited) |

The sector diversification shown is based on the total investments.
| 92 | Semiannual Report | June 30, 2018 |
Portfolio of Investments, June 30, 2018 (all dollar amounts in thousands) (unaudited)
| | | | | | | |
| Issuer | | Principal
Amount | | | Value | |
| | | | | | | |
| U.S. Government and U.S. Government Agency—61.5% | |
| | |
| U.S. Treasury Inflation Indexed Notes/Bonds—2.8% | |
| U.S. Treasury Inflation Indexed Bond, 3.875%, due 4/15/29 | | $ | 1,371 | | | $ | 1,810 | |
| Federal Home Loan Mortgage Corp. (FHLMC)—12.3% | |
| #J05444, 6.000%, due 8/1/22 | | | 25 | | | | 26 | |
| #E02388, 6.000%, due 9/1/22 | | | 43 | | | | 45 | |
| #E02490, 6.000%, due 4/1/23 | | | 53 | | | | 55 | |
| #J13022, 4.000%, due 9/1/25 | | | 246 | | | | 254 | |
| #J16051, 4.500%, due 7/1/26 | | | 692 | | | | 720 | |
| #A17603, 5.500%, due 1/1/34 | | | 531 | | | | 589 | |
| #G01705, 5.500%, due 6/1/34 | | | 983 | | | | 1,091 | |
| #A45790, 7.500%, due 5/1/35 | | | 119 | | | | 132 | |
| #G04126, 6.000%, due 6/1/37 | | | 245 | | | | 274 | |
| #G03201, 6.500%, due 6/1/37 | | | 141 | | | | 157 | |
| #A66843, 6.500%, due 10/1/37 | | | 219 | | | | 247 | |
| #G04564, 6.000%, due 12/1/37 | | | 202 | | | | 224 | |
| #A81799, 6.500%, due 9/1/38 | | | 198 | | | | 220 | |
| #G60366, 6.000%, due 10/1/39 | | | 1,020 | | | | 1,132 | |
| #G05875, 5.500%, due 2/1/40 | | | 100 | | | | 109 | |
| #G61450, 6.000%, due 4/1/40 | | | 1,000 | | | | 1,125 | |
| #C03665, 9.000%, due 4/1/41 | | | 220 | | | | 253 | |
| #G06583, 5.000%, due 6/1/41 | | | 1,156 | | | | 1,248 | |
| Total FHLMC Mortgage Obligations | | | | | | | 7,901 | |
| Federal National Mortgage Association (FNMA)—46.4% | |
| #740847, 6.000%, due 10/1/18 | | | 1 | | | | 1 | |
| #323501, 6.500%, due 1/1/19 | | | 1 | | | | 1 | |
| #751313, 5.000%, due 3/1/19 | | | 16 | | | | 16 | |
| #458147, 10.000%, due 8/15/20 | | | 2 | | | | 2 | |
| #897937, 6.000%, due 8/1/21 | | | 129 | | | | 133 | |
| #888555, 5.500%, due 9/1/21 | | | 736 | | | | 750 | |
| #880991, 5.500%, due 1/1/22 | | | 59 | | | | 61 | |
| #735574, 8.000%, due 3/1/22 | | | 50 | | | | 52 | |
| #679253, 6.000%, due 10/1/22 | | | 207 | | | | 226 | |
| FNR G93-19 SH, 1M LIBOR + 56.169%, 11.234%, due 4/25/23, VRN | | | 11 | | | | 13 | |
| #982885, 5.000%, due 5/1/23 | | | 239 | | | | 249 | |
| #AL0955, 6.000%, due 5/1/23 | | | 142 | | | | 147 | |
| #933985, 5.500%, due 8/1/23 | | | 148 | | | | 154 | |
| #AL8529, 6.000%, due 11/1/24 | | | 2,848 | | | | 2,979 | |
| #255956, 5.500%, due 10/1/25 | | | 34 | | | | 36 | |
| #AH0971, 4.000%, due 12/1/25 | | | 370 | | | | 382 | |
| #AL2853, 4.500%, due 6/1/26 | | | 561 | | | | 587 | |
| #AL9730, 4.500%, due 2/1/27 | | | 887 | | | | 927 | |
| #256639, 5.000%, due 2/1/27 | | | 7 | | | | 8 | |
| #806458, 8.000%, due 6/1/28 | | | 81 | | | | 89 | |
| #AL9857, 4.000%, due 2/1/29 | | | 7,469 | | | | 7,693 | |
| #880155, 8.500%, due 7/1/29 | | | 188 | | | | 210 | |
| #797846, 7.000%, due 3/1/32 | | | 51 | | | | 52 | |
| #745519, 8.500%, due 5/1/32 | | | 53 | | | | 60 | |
| #654674, 6.500%, due 9/1/32 | | | 49 | | | | 54 | |
| #254693, 5.500%, due 4/1/33 | | | 6 | | | | 6 | |
| #711736, 5.500%, due 6/1/33 | | | 77 | | | | 84 | |
| #555531, 5.500%, due 6/1/33 | | | 55 | | | | 60 | |
| #555591, 5.500%, due 7/1/33 | | | 9 | | | | 10 | |
| | | | | | | | | |
| Issuer | | NRSRO
Rating | | Principal
Amount | | | Value | |
| | | | | | | | | |
| U.S. Government and U.S. Government Agency—(continued) | |
| | |
| Federal National Mortgage Association (FNMA)—(continued) | |
| #AL3455, 5.500%, due 11/1/33 | | | | $ | 1,566 | | | $ | 1,737 | |
| #776964, 5.000%, due 4/1/34 | | | | | 269 | | | | 290 | |
| #725424, 5.500%, due 4/1/34 | | | | | 59 | | | | 64 | |
| #888884, 5.500%, due 12/1/35 | | | | | 126 | | | | 137 | |
| #888703, 6.500%, due 8/1/37 | | | | | 700 | | | | 798 | |
| #928658, 6.500%, due 9/1/37 | | | | | 22 | | | | 24 | |
| #AL6411, 7.000%, due 12/1/37 | | | | | 728 | | | | 816 | |
| #962058, 6.500%, due 3/1/38 | | | | | 358 | | | | 407 | |
| #991911, 7.000%, due 11/1/38 | | | | | 110 | | | | 125 | |
| #AC9569, 5.000%, due 2/1/40 | | | | | 169 | | | | 183 | |
| #BM1689, 5.500%, due 8/1/40 | | | | | 423 | | | | 464 | |
| #AL5815, 5.500%, due 4/1/41 | | | | | 530 | | | | 588 | |
| #BM3525, 6.000%, due 4/1/41 | | | | | 1,175 | | | | 1,327 | |
| #AL9226, 5.500%, due 12/1/41 | | | | | 5,011 | | | | 5,563 | |
| #AL9225, 6.000%, due 1/1/42 | | | | | 1,917 | | | | 2,160 | |
| Total FNMA Mortgage Obligations | | | | | | | | | 29,725 | |
| | | | | | | | | | | |
| Asset-Backed Securities—1.6% | | | | | | | | | | |
| Capital One Multi-Asset Execution Trust, 2016-A1, Tranche A1, 1M LIBOR + 0.450%, 2.523%, 2/15/22, VRN | | AAA | | | 500 | | | | 501 | |
| SLM Private Education Loan Trust—144A, 2011-A, Tranche A3, 1M USD LIBOR + 2.500%, 4.573%, 1/15/43, VRN | | AAA | | | 500 | | | | 513 | |
| Total Asset-Backed Securities | | | | | | | | | 1,014 | |
| | | | | | | | | | | |
| Corporate Obligations—34.6% | | | | | | | | | | |
| JPMorgan Chase & Co., 3M USD LIBOR + 3.320%, 5.000%, due 7/1/19, VRN | | BBB | | | 500 | | | | 503 | |
| Burlington Northern Santa Fe LLC, 4.700%, due 10/1/19 | | A+ | | | 650 | | | | 665 | |
| Boston Properties L.P., 5.875%, due 10/15/19 | | A- | | | 650 | | | | 670 | |
| Citigroup, Inc., 2.450%, due 1/10/20 | | A | | | 650 | | | | 643 | |
| Branch Banking & Trust Co., 3M USD LIBOR + 0.450%, 2.798%, due 1/15/20, VRN | | A1 | | | 500 | | | | 502 | |
| Petroleos Mexicanos, 6.000%, due 3/5/20 | | BBB+ | | | 400 | | | | 413 | |
| American Express Credit Corporation, 3M USD LIBOR + 0.730%, 3.049%, due 5/26/20, VRN | | A2 | | | 500 | | | | 504 | |
| Georgia-Pacific LLC—144A, 5.400%, due 11/1/20 | | A+ | | | 600 | | | | 629 | |
| Mitsubishi UFJ Financial Group, Inc., 2.950%, due 3/1/21 | | A1 | | | 575 | | | | 569 | |
| HSBC Holdings plc, 3M USD LIBOR + 2.240%, 4.561%, due 3/8/21, VRN | | AA- | | | 500 | | | | 523 | |
| Westpac Banking Corporation, 3M USD LIBOR + 1.000%, 3.355%, due 5/13/21, VRN | | AA- | | | 500 | | | | 509 | |
See accompanying Notes to Financial Statements.
| June 30, 2018 | William Blair Funds | 93 |
Portfolio of Investments, June 30, 2018 (all dollar amounts in thousands) (unaudited)
| | | | | | | | | |
| Issuer | | NRSRO
Rating | | Principal
Amount | | | Value | |
| | | | | | | | | |
| Corporate Obligations—(continued) | | | | | | | | | | |
| Chevron Corporation, 3M USD LIBOR + 0.950%, 3.280%, due 5/16/21, VRN | | Aa2 | | $ | 500 | | | $ | 512 | |
| The Charles Schwab Corporation, 3M USD LIBOR + 0.320%, 2.649%, due 5/21/21, VRN | | A | | | 500 | | | | 502 | |
| Capital One Financial Corporation, 4.750%, due 7/15/21 | | A- | | | 650 | | | | 672 | |
| Apple, Inc., 1.550%, due 8/4/21 | | AA+ | | | 650 | | | | 623 | |
| Verizon Communications, Inc., 3.500%, due 11/1/21 | | A- | | | 650 | | | | 653 | |
| Lloyds Banking Group plc, 3.000%, due 1/11/22 | | A+ | | | 500 | | | | 487 | |
| Vale Overseas, Ltd., 4.375%, due 1/11/22 | | BBB+ | | | 400 | | | | 406 | |
| Embraer S.A., 5.150%, due 6/15/22 | | BBB | | | 400 | | | | 412 | |
| Bancolombia S.A., 5.125%, due 9/11/22 | | BBB- | | | 400 | | | | 411 | |
| Jones Lang LaSalle, Inc., 4.400%, due 11/15/22 | | Baa1 | | | 625 | | | | 640 | |
| Toll Brothers Finance Corporation, 4.375%, due 4/15/23 | | BBB- | | | 400 | | | | 394 | |
| Ryder System, Inc., 3.750%, due 6/9/23 | | A- | | | 500 | | | | 500 | |
| Wells Fargo & Co., 4.480%, due 1/16/24 | | A | | | 650 | | | | 664 | |
| The Goldman Sachs Group, Inc., 4.000%, due 3/3/24 | | A | | | 650 | | | | 651 | |
| Grupo Bimbo S.A.B. de C.V.—144A, 3.875%, due 6/27/24 | | BBB | | | 500 | | | | 490 | |
| BNP Paribas S.A., 4.250%, due 10/15/24 | | A | | | 650 | | | | 642 | |
| AbbVie, Inc., 3.600%, due 5/14/25 | | A- | | | 650 | | | | 630 | |
| ERP Operating L.P., 3.375%, due 6/1/25 | | A | | | 650 | | | | 635 | |
| Intercontinental Exchange, Inc., 3.750%, due 12/1/25 | | A | | | 650 | | | | 646 | |
| Simon Property Group L.P., 3.300%, due 1/15/26 | | A | | | 650 | | | | 624 | |
| ConocoPhillips Co., 4.950%, due 3/15/26 | | A- | | | 650 | | | | 702 | |
| Brookfield Finance, Inc., 4.250%, due 6/2/26 | | A- | | | 650 | | | | 641 | |
| Amazon.com, Inc., 3.150%, due 8/22/27 | | AA- | | | 650 | | | | 624 | |
| Tencent Holdings, Ltd.—144A, 3.595%, due 1/19/28 | | A+ | | | 650 | | | | 616 | |
| Motorola Solutions, Inc., 4.600%, due 2/23/28 | | BBB- | | | 400 | | | | 399 | |
| Anheuser-Busch InBev Worldwide, Inc., 4.000%, due 4/13/28 | | A- | | | 650 | | | | 650 | |
| Morgan Stanley, 3M USD LIBOR + 1.140%, 3.772%, due 1/24/29, VRN | | A | | | 650 | | | | 627 | |
| | | | | | | | | |
| Issuer | | NRSRO
Rating | | Principal
Amount | | | Value | |
| | | | | | | | | |
| Corporate Obligations—(continued) | | | | | | | | | | |
| The Kroger Co., 8.000%, due 9/15/29 | | Baa1 | | $ | 500 | | | $ | 628 | |
| Total Corporate Obligations | | | | | | | | | 22,211 | |
Total Long-Term Investments—97.7%
(cost $64,202) | | | | | | | | | 62,661 | |
| | | | | | | | | | | |
| Repurchase Agreement | | | | | | | | | | |
| Fixed Income Clearing Corporation, 0.350% dated 6/29/18, due 7/2/18, repurchase price $690, collateralized by U.S. Treasury Note, 2.000%, due 4/30/24 | | | | | 690 | | | | 690 | |
Total Repurchase Agreement—1.1%
(cost $690) | | | | | | | | | 690 | |
| | | | | | | | | | | |
| Commercial Paper | | | | | | | | | | |
| Societe Generale S.A., 1.815%, 7/2/18 | | | | | 600 | | | | 600 | |
Total Commercial Paper—0.9%
(cost $600) | | | | | | | | | 600 | |
Total Investments—99.7%
(cost $65,492) | | | | | | | | | 63,951 | |
| | | | | | | | | | | |
| Securities Sold, Not Yet Purchased | | | | | | | | | | |
| | | | | | | | | | | |
| U.S. Government Agency—(7.6)% | | | | | | | | | | |
| Federal National Mortgage Association (FNMA)—(7.6)% | | | | | | | | |
| TBA, 2.500%, due 7/1/33 | | | (5,000 | ) | | | (4,860 | ) |
Total Securities Sold, Not Yet Purchased—(7.6)%
(proceeds $4,834) | | | | | | | (4,860 | ) |
| Cash and other assets, less liabilities—7.9% | | | | | | | | | 5,071 | |
| Net assets—100.0% | | | | | | | | $ | 64,162 | |
The obligations of certain U.S. Government-sponsored securities are neither issued nor guaranteed by the U.S. Treasury.
144A = Security exempt from registration under Rule 144A of the Securities Act of 1933. These securities may be resold in transactions exempt from registration, normally to qualified institutional buyers.
NRSRO = Nationally Recognized Statistical Rating Organization—The credit quality ratings of the securities in the Fund reflect the highest category rating by any of Fitch Ratings, Moody’s Investors Service Inc., or Standard & Poor’s, a division of the McGraw-Hill Companies, Inc.
TBA = To Be Announced—TBAs are mortgage-backed securities traded under delayed delivery commitments, settling after June 30, 2018. The term TBA comes from the fact that the specific mortgage-backed security that will be delivered to fulfill a TBA trade is not designated at the time the trade is made.
VRN = Variable Rate Note
See accompanying Notes to Financial Statements.
| 94 | Semiannual Report | June 30, 2018 |
| | Low Duration Fund |
| | |
| | The Low Duration Fund seeks to maximize total return. Total return includes both income and capital appreciation. |
| | |
| | AN OVERVIEW FROM THE PORTFOLIO MANAGERS |
| | |

Paul J. Sularz 
Christopher T. Vincent | The William Blair Low Duration Fund (Class N shares) posted a 0.30% increase, net of fees, for the six months ended June 30, 2018. By comparison, the Fund’s benchmark, the Bank of America/Merrill Lynch 1-Year U.S. Treasury Note Index, increased 0.65%. The Fund’s interest rate exposure hindered performance year-to-date, as the Fund had some exposure to short-term rates that rose higher than the Index. Positioning within mortgage-backed securities detracted from the Fund’s performance, as the Fund held positions in higher-coupon segments of the market that underperformed the Index. The Fund held positions in floating-rate corporate and asset-backed securities that contributed to results year-to-date. Please refer to the Fixed Income Market Review and Outlook relating to the Fund beginning on page 84 for additional information. |
| June 30, 2018 | William Blair Funds | 95 |
Low Duration Fund
Performance Highlights (Unaudited)
Average Annual Total Return through 6/30/2018
| | | Year | | | | | | | | Since |
| | | to Date | | 1 Year | | 3 Year | | 5 Year | | Inception(a) |
| Class N | | | 0.30 | % | | | 0.87 | % | | | 0.75 | % | | | 0.83 | % | | | 1.01 | % |
| Class I | | | 0.41 | | | | 1.04 | | | | 0.92 | | | | 1.00 | | | | 1.16 | |
| Institutional Class | | | 0.44 | | | | 0.97 | | | | 0.96 | | | | 1.05 | | | | 1.27 | |
| Bank of America Merrill Lynch 1-Year U.S. Treasury Note Index | | | 0.65 | | | | 0.92 | | | | 0.64 | | | | 0.49 | | | | 0.47 | |
| | |
| (a) | Since inception is for the period from December 1, 2009 (Commencement of Operations) to June 30, 2018. |
Performance cited represents past performance. Past performance does not guarantee future results and current performance may be lower or higher than the data quoted. Results shown are average annual total returns, which assume reinvestment of dividends and capital gains. Investment returns and principal will fluctuate and you may have a gain or loss when you sell shares. For the most current month-end performance information, please call 1-800-742-7272, or visit our Web site at www.williamblairfunds.com. From time to time, the investment adviser may waive fees or reimburse expenses for the Fund. Without these waivers/reimbursements, performance would be lower. Class N shares are available to the general public without a sales load. Class I shares are available to certain institutional investors, and advisory clients of William Blair & Company, L.L.C., without a sales load or distribution (12b-1) fees. Institutional Class shares are available to institutional investors without a sales load or distribution (12b-1) or service fees.
The performance highlights and graph presented above do not reflect the deduction of taxes that a shareholder would pay on fund distributions or the redemption of fund shares.
The Bank of America Merrill Lynch 1-Year U.S. Treasury Note Index is comprised of a single U.S. Treasury Note issue purchased at the beginning of the month and held for a full month. Each month the index is rebalanced and the issue selected is the outstanding U.S. Treasury Note that matures closest to, but not beyond one year from the rebalancing date.
This report identifies the Fund’s investments on June 30, 2018. These holdings are subject to change. Not all investments in the Fund performed the same, nor is there any guarantee that these investments will perform as well in the future. Market forecasts provided in this report may not necessarily come to pass.
Sector Diversification (Unaudited)

The sector diversification shown is based on the total investments.
| 96 | Semiannual Report | June 30, 2018 |
Low Duration Fund
Portfolio of Investments, June 30, 2018 (all dollar amounts in thousands) (unaudited)
| | | | | | | |
| | | Principal | | | | |
| Issuer | | Amount | | | Value | |
| | | | | | | |
| U.S. Government and U.S. Government Agency—47.7% |
| |
| Federal Home Loan Mortgage Corp. (FHLMC)—13.7% |
| #E99684, 5.000%, due 10/1/18 | | $ | 9 | | | $ | 9 | |
| #B11362, 5.500%, due 12/1/18 | | | 2 | | | | 2 | |
| #B11849, 5.500%, due 1/1/19 | | | 5 | | | | 5 | |
| #B13870, 4.500%, due 5/1/19 | | | 5 | | | | 5 | |
| #G11604, 5.000%, due 7/1/19 | | | 5 | | | | 5 | |
| #G11596, 5.500%, due 8/1/19 | | | 7 | | | | 7 | |
| #B17294, 5.000%, due 11/1/19 | | | 27 | | | | 27 | |
| #B19222, 4.500%, due 4/1/20 | | | 29 | | | | 29 | |
| #J02537, 5.000%, due 9/1/20 | | | 14 | | | | 15 | |
| #G11836, 5.500%, due 12/1/20 | | | 5 | | | | 5 | |
| #G12113, 5.500%, due 5/1/21 | | | 41 | | | | 42 | |
| #G12395, 6.000%, due 10/1/21 | | | 299 | | | | 309 | |
| #E02322, 5.500%, due 5/1/22 | | | 17 | | | | 18 | |
| #G12725, 6.000%, due 6/1/22 | | | 81 | | | | 84 | |
| #G13124, 6.000%, due 12/1/22 | | | 187 | | | | 194 | |
| #J06871, 5.500%, due 1/1/23 | | | 34 | | | | 35 | |
| #J08450, 5.500%, due 7/1/23 | | | 26 | | | | 26 | |
| #J08703, 5.500%, due 9/1/23 | | | 39 | | | | 40 | |
| #C00351, 8.000%, due 7/1/24 | | | 37 | | | | 40 | |
| #J11208, 5.000%, due 11/1/24 | | | 56 | | | | 59 | |
| #G00363, 8.000%, due 6/1/25 | | | 54 | | | | 57 | |
| #C80329, 8.000%, due 8/1/25 | | | 12 | | | | 13 | |
| #G30348, 6.000%, due 7/1/27 | | | 739 | | | | 808 | |
| #G04821, 8.500%, due 7/1/31 | | | 1,831 | | | | 2,167 | |
| #G07837, 6.500%, due 2/1/38 | | | 1,195 | | | | 1,354 | |
| #G04424, 6.000%, due 6/1/38 | | | 434 | | | | 486 | |
| #G04641, 6.000%, due 6/1/38 | | | 1,383 | | | | 1,532 | |
| #A81372, 6.000%, due 8/1/38 | | | 211 | | | | 235 | |
| #G04687, 6.000%, due 9/1/38 | | | 58 | | | | 64 | |
| #G04745, 6.000%, due 9/1/38 | | | 203 | | | | 226 | |
| #A81799, 6.500%, due 9/1/38 | | | 186 | | | | 207 | |
| #G06085, 6.500%, due 9/1/38 | | | 58 | | | | 64 | |
| #G05723, 6.500%, due 11/1/38 | | | 1,016 | | | | 1,147 | |
| #G07480, 6.000%, due 5/1/39 | | | 2,286 | | | | 2,519 | |
| #G61450, 6.000%, due 4/1/40 | | | 10,000 | | | | 11,251 | |
| #4122, Tranche FP, 1M LIBOR + 0.400%, 2.473%, due 10/15/42, VRN | | | 705 | | | | 706 | |
| Total FHLMC Mortgage Obligations | | | | | | | 23,792 | |
| | | |
| Federal National Mortgage Association (FNMA)—34.0% | | |
| #711991, 5.000%, due 8/1/18 | | | 1 | | | | 1 | |
| #743183, 5.000%, due 10/1/18 | | | 1 | | | | 1 | |
| #749596, 5.000%, due 11/1/18 | | | 6 | | | | 6 | |
| #753866, 6.000%, due 12/1/18 | | | 7 | | | | 7 | |
| #761246, 5.000%, due 1/1/19 | | | 10 | | | | 10 | |
| #766059, 5.500%, due 2/1/19 | | | 9 | | | | 9 | |
| #766276, 5.000%, due 3/1/19 | | | 28 | | | | 28 | |
| #751313, 5.000%, due 3/1/19 | | | 7 | | | | 7 | |
| #779363, 5.000%, due 6/1/19 | | | 3 | | | | 3 | |
| #785259, 5.000%, due 8/1/19 | | | 18 | | | | 19 | |
| #761530, 5.500%, due 8/1/19 | | | 28 | | | | 28 | |
| #788424, 5.500%, due 9/1/19 | | | 12 | | | | 12 | |
| #761489, 5.500%, due 9/1/19 | | | 12 | | | | 12 | |
| #725953, 5.000%, due 10/1/19 | | | 7 | | | | 7 | |
| | | | | | | | | |
| | | NRSRO | | Principal | | | | |
| Issuer | | Rating | | Amount | | | Value | |
| | | | | | | | | | | |
| U.S. Government and U.S. Government Agency—(continued) |
| |
| Federal National Mortgage Association (FNMA)—(continued) |
| #357865, 5.000%, due 7/1/20 | | | | $ | 23 | | | $ | 23 | |
| #879607, 5.500%, due 4/1/21 | | | | | 16 | | | | 16 | |
| #831497, 6.000%, due 4/1/21 | | | | | 68 | | | | 70 | |
| #831525, 5.500%, due 6/1/21 | | | | | 20 | | | | 20 | |
| #880993, 6.000%, due 1/1/22 | | | | | 4 | | | | 4 | |
| #888982, 6.000%, due 12/1/22 | | | | | 84 | | | | 87 | |
| #972934, 5.500%, due 2/1/23 | | | | | 108 | | | | 111 | |
| #889670, 5.500%, due 6/1/23 | | | | | 24 | | | | 25 | |
| #AE0011, 5.500%, due 9/1/23 | | | | | 28 | | | | 29 | |
| #747339, 5.500%, due 10/1/23 | | | | | 122 | | | | 131 | |
| #995395, 6.000%, due 12/1/23 | | | | | 72 | | | | 74 | |
| #190988, 9.000%, due 6/1/24 | | | | | 17 | | | | 18 | |
| #AL8529, 6.000%, due 11/1/24 | | | | | 15,563 | | | | 16,276 | |
| #AL2853, 4.500%, due 6/1/26 | | | | | 2,003 | | | | 2,093 | |
| #AL9730, 4.500%, due 2/1/27 | | | | | 4,665 | | | | 4,873 | |
| #AL9857, 4.000%, due 2/1/29 | | | | | 3,956 | | | | 4,075 | |
| #555933, 7.000%, due 6/1/32 | | | | | 481 | | | | 538 | |
| #886762, 7.000%, due 9/1/36 | | | | | 259 | | | | 303 | |
| #948637, 6.500%, due 8/1/37 | | | | | 271 | | | | 303 | |
| #888703, 6.500%, due 8/1/37 | | | | | 2,615 | | | | 2,979 | |
| #AL6411, 7.000%, due 12/1/37 | | | | | 3,183 | | | | 3,570 | |
| #AD0100, 7.000%, due 12/1/38 | | | | | 693 | | | | 786 | |
| #AD0315, 6.500%, due 8/1/39 | | | | | 420 | | | | 474 | |
| #AE0934, 6.500%, due 10/1/39 | | | | | 2,194 | | | | 2,487 | |
| #AL5815, 5.500%, due 4/1/41 | | | | | 2,649 | | | | 2,941 | |
| #BM3525, 6.000%, due 4/1/41 | | | | | 5,172 | | | | 5,839 | |
| #AL9226, 5.500%, due 12/1/41 | | | | | 5,609 | | | | 6,227 | |
| #AL9225, 6.000%, due 1/1/42 | | | | | 4,182 | | | | 4,713 | |
| Total FNMA Mortgage Obligations | | | | | | | | | 59,235 | |
| | | | | | | | | | | |
| Asset-Backed Securities—15.8% | | | | | | | | | | |
| Tesla Auto Lease Trust —144A, 2018-A, Tranche A, 2.320%, 12/20/19 | | Aaa | | | 319 | | | | 318 | |
GM Financial Automobile Leasing Trust, 2017-3, Tranche A2B, 1M LIBOR + 0.240%,
2.324%, 1/21/20, VRN | | Aaa | | | 421 | | | | 421 | |
Ford Credit Auto Owner Trust, 2017-B, Tranche A2B, 1M USD LIBOR + 0.070%,
2.143%, 5/15/20, VRN | | AAA | | | 743 | | | | 744 | |
Chase Issuance Trust, 2016-A1, Tranche A, 1M LIBOR + 0.410%,
2.483%, 5/17/21, VRN | | AAA | | | 2,024 | | | | 2,030 | |
Bank of America Credit Card Trust, 2014-A1, Tranche A, 1M LIBOR + 0.380%,
2.453%, 6/15/21, VRN | | AAA | | | 2,000 | | | | 2,003 | |
MBNA Credit Card Master Note Trust, 2004-A3, Tranche A3, 1M LIBOR + 0.260%,
2.333%, 8/16/21, VRN | | AAA | | | 3,000 | | | | 3,003 | |
See accompanying Notes to Financial Statements.
| June 30, 2018 | William Blair Funds | 97 |
Low Duration Fund
Portfolio of Investments, June 30, 2018 (all dollar amounts in thousands) (unaudited)
| | | | | | | | | |
| | | NRSRO | | Principal | | | | |
| Issuer | | Rating | | Amount | | | Value | |
| | | | | | | | | | | |
| Asset-Backed Securities—(continued) | | | | | | | | | | |
Capital One Multi-Asset Execution Trust, 2014-A3, Tranche A3, 1M LIBOR + 0.380%,
2.453%, 1/18/22, VRN | | AAA | | $ | 1,110 | | | $ | 1,112 | |
Chase Issuance Trust, 2017-A1, Tranche A, 1M LIBOR + 0.300%,
2.373%, 1/18/22, VRN | | AAA | | | 1,000 | | | | 1,004 | |
Capital One Multi-Asset Execution Trust, 2016-A1, Tranche A1, 1M LIBOR + 0.450%,
2.523%, 2/15/22, VRN | | AAA | | | 3,212 | | | | 3,221 | |
PFS Financing Corporation—144A, 2018-A, Tranche A, 1M LIBOR + 0.400%,
2.319%, 2/15/22, VRN | | AAA | | | 1,500 | | | | 1,499 | |
Citibank Credit Card Issuance Trust, 2017-A4, Tranche A4, 1M LIBOR + 0.220%,
2.245%, 4/7/22, VRN | | AAA | | | 850 | | | | 851 | |
Verizon Owner Trust—144A, 2017-3A, Tranche A1B, 1M LIBOR + 0.270%,
2.354%, 4/20/22, VRN | | AAA | | | 3,500 | | | | 3,506 | |
Mercedes-Benz Master Owner Trust —144A, 2017-BA, Tranche A, 1M LIBOR + 0.420%,
2.493%, 5/16/22, VRN | | Aaa | | | 2,280 | | | | 2,287 | |
GMF Floorplan Owner Revolving Trust—144A, 2017-2, Tranche A2, 1M LIBOR + 0.430%,
2.503%, 7/15/22, VRN | | Aaa | | | 2,500 | | | | 2,508 | |
SLM Student Loan Trust, 2008-4, Tranche A4, 3M USD LIBOR + 1.650%,
4.010%, 7/25/22, VRN | | A | | | 746 | | | | 762 | |
SLM Private Education Loan Trust— 144A, 2011-A, Tranche A3, 1M USD LIBOR + 2.500%,
4.573%, 1/15/43, VRN | | AAA | | | 2,250 | | | | 2,307 | |
| Total Asset-Backed Securities | | | | | | | | | 27,576 | |
| |
| Corporate Obligations—34.7% | | | | | | | | | | |
PNC Bank NA, 3M USD LIBOR + 0.400%,
2.719%, due 12/7/18, VRN | | A+ | | | 1,000 | | | | 1,002 | |
Morgan Stanley, 3M USD LIBOR + 1.375%,
3.733%, due 2/1/19, VRN | | A | | | 2,185 | | | | 2,200 | |
USAA Capital Corporation—144A, 3M USD LIBOR + 0.230%,
2.588%, due 2/1/19, VRN | | Aa1 | | | 1,500 | | | | 1,502 | |
Toyota Motor Credit Corporation, 3M USD LIBOR + 0.820%,
3.151%, due 2/19/19, VRN | | AA- | | | 1,000 | | | | 1,005 | |
American Honda Finance Corporation, 3M USD LIBOR + 0.825%,
3.154%, due 2/22/19, VRN | | A+ | | | 1,616 | | | | 1,624 | |
| | | | | | | | | |
| | | NRSRO | | Principal | | | | |
| Issuer | | Rating | | Amount | | | Value | |
| | | | | | | | | | | |
| Corporate Obligations—(continued) | | | | | | | | | | |
Apple, Inc., 3M USD LIBOR + 0.820%,
3.150%, due 2/22/19, VRN | | AA+ | | $ | 1,000 | | | $ | 1,006 | |
PepsiCo, Inc., 3M USD LIBOR + 0.590%,
2.919%, due 2/22/19, VRN | | A+ | | | 1,000 | | | | 1,004 | |
Bank of America Corporation, 3M USD LIBOR + 0.870%,
3.207%, due 4/1/19, VRN | | A+ | | | 2,000 | | | | 2,012 | |
Westpac Banking Corporation, 3M USD LIBOR + 0.710%,
3.065%, due 5/13/19, VRN | | AA- | | | 1,000 | | | | 1,005 | |
QUALCOMM, Inc., 3M USD LIBOR + 0.360%,
2.691%, due 5/20/19, VRN | | A1 | | | 1,000 | | | | 1,010 | |
Bank of Montreal, 3M USD LIBOR + 0.650%,
3.005%, due 7/18/19, VRN | | AA- | | | 1,000 | | | | 1,005 | |
American Express Credit Corporation, 3M USD LIBOR + 0.490%,
2.833%, due 8/15/19, VRN | | A2 | | | 1,000 | | | | 1,004 | |
Shell International Finance BV, 3M USD LIBOR + 0.350%,
2.676%, due 9/12/19, VRN | | Aa2 | | | 1,000 | | | | 1,004 | |
Sumitomo Mitsui Trust Bank Ltd.— 144A, 3M USD LIBOR + 0.440%,
2.766%, due 9/19/19, VRN | | A1 | | | 750 | | | | 751 | |
Gilead Sciences, Inc., 3M USD LIBOR + 0.250%,
2.575%, due 9/20/19, VRN | | A | | | 1,000 | | | | 1,001 | |
Mondelez International Holdings Netherlands BV—144A, 3M USD LIBOR + 0.610%,
2.969%, due 10/28/19, VRN | | A3 | | | 3,000 | | | | 3,012 | |
Daimler Finance North America LLC —144A, 3M USD LIBOR + 0.620%,
2.979%, due 10/30/19, VRN | | A | | | 1,600 | | | | 1,609 | |
United Technologies Corporation, 3M USD LIBOR + 0.350%,
2.708%, due 11/1/19, VRN | | A- | | | 1,175 | | | | 1,179 | |
Citigroup, Inc., 3M USD LIBOR + 0.790%,
3.128%, due 1/10/20, VRN | | A | | | 2,000 | | | | 2,014 | |
Branch Banking & Trust Co., 3M USD LIBOR + 0.450%,
2.798%, due 1/15/20, VRN | | A1 | | | 1,700 | | | | 1,707 | |
Capital One Financial Corporation, 3M USD LIBOR + 0.760%,
3.115%, due 5/12/20, VRN | | A- | | | 2,000 | | | | 2,009 | |
Diageo Capital plc, 3M USD LIBOR + 0.240%,
2.566%, due 5/18/20, VRN | | A- | | | 1,950 | | | | 1,951 | |
Harley-Davidson Financial Services, Inc. —144A, 3M USD LIBOR + 0.500%,
2.831%, due 5/21/20, VRN | | A | | | 1,000 | | | | 1,002 | |
National Australia Bank Ltd.—144A, 3M USD LIBOR + 0.510%,
2.839%, due 5/22/20, VRN | | AA- | | | 2,000 | | | | 2,005 | |
See accompanying Notes to Financial Statements.
| 98 | Semiannual Report | June 30, 2018 |
Low Duration Fund
Portfolio of Investments, June 30, 2018 (all dollar amounts in thousands) (unaudited)
| | | | | | | | | |
| | | NRSRO | | Principal | | | | |
| Issuer | | Rating | | Amount | | | Value | |
| | | | | | | | | | | |
| Corporate Obligations—(continued) | | | | | | | | | | |
John Deere Capital Corporation, 3M USD LIBOR + 0.290%,
2.622%, due 6/22/20, VRN | | A | | $ | 1,000 | | | $ | 1,002 | |
Nissan Motor Acceptance Corp.— 144A, 3M USD LIBOR + 0.390%,
2.732%, due 7/13/20, VRN | | A | | | 1,250 | | | | 1,252 | |
Caterpillar Financial Services Corporation, 3M USD LIBOR + 0.290%,
2.611%, due 9/4/20, VRN | | A | | | 2,000 | | | | 2,006 | |
IBM Credit LLC, 3M USD LIBOR + 0.260%,
2.619%, due 1/20/21, VRN | | A+ | | | 2,000 | | | | 2,010 | |
JPMorgan Chase & Co., 3M USD LIBOR + 1.480%,
3.780%, due 3/1/21, VRN | | AA- | | | 3,000 | | | | 3,084 | |
Wells Fargo & Co., 3M USD LIBOR + 1.340%,
3.661%, due 3/4/21, VRN | | A+ | | | 3,000 | | | | 3,072 | |
HSBC Holdings plc, 3M USD LIBOR + 2.240%,
4.561%, due 3/8/21, VRN | | AA- | | | 3,000 | | | | 3,138 | |
Bank of America Corporation, 3M USD LIBOR + 1.420%,
3.775%, due 4/19/21, VRN | | A+ | | | 1,000 | | | | 1,027 | |
The Goldman Sachs Group, Inc., 3M USD LIBOR + 1.360%,
3.720%, due 4/23/21, VRN | | A | | | 1,000 | | | | 1,022 | |
PACCAR Financial Corporation, 3M USD LIBOR + 0.260%,
2.613%, due 5/10/21, VRN | | A+ | | | 1,000 | | | | 1,000 | |
Westpac Banking Corporation, 3M USD LIBOR + 1.000%,
3.355%, due 5/13/21, VRN | | AA- | | | 2,000 | | | | 2,035 | |
The Charles Schwab Corporation, 3M USD LIBOR + 0.320%,
2.649%, due 5/21/21, VRN | | A | | | 1,000 | | | | 1,005 | |
The Toronto-Dominion Bank, 3M USD LIBOR + 0.430%,
2.756%, due 6/11/21, VRN | | Aa2 | | | 1,000 | | | | 1,000 | |
Barclays plc, 3M USD LIBOR + 2.110%,
4.463%, due 8/10/21, VRN | | A | | | 3,000 | | | | 3,115 | |
| Total Corporate Obligations | | | | | | | | | 60,391 | |
Total Long-Term Investments—98.2%
(cost $173,321) | | | | | | | | | 170,994 | |
| | | | | | | |
| | | Principal | | | | |
| Issuer | | Amount | | | Value | |
| | | | | | | | | |
| Commercial Paper | | | | | | | | |
| Societe Generale S.A., 1.815%, due 7/2/18 | | $ | 2,750 | | | $ | 2,750 | |
Total Commercial Paper—1.6%
(cost $2,750) | | | | | | | 2,750 | |
Total Investments—99.8%
(cost $176,071) | | | | | | | 173,744 | |
| | | | | | | | | |
| Securities Sold, Not Yet Purchased | | | | | | | | |
| | | | | | | | | |
| U.S. Government Agency Discount Note | | | | | | | | |
| Federal National Mortgage Association (FNMA)—(8.4)% | | | | | | | | |
| TBA, 2.500%, due 7/1/33 | | | (15,000 | ) | | | (14,579 | ) |
Total Securities Sold, Not Yet Purchased—(8.4)%
(proceeds $14,503) | | | | | | | (14,579 | ) |
| Cash and other assets, less liabilities—8.6% | | | | | | | 14,977 | |
| Net assets—100.0% | | | | | | $ | 174,142 | |
The obligations of certain U.S. Government-sponsored securities are neither issued nor guaranteed by the U.S. Treasury.
144A = Security exempt from registration under Rule 144A of the Securities Act of 1933. These securities may be resold in transactions exempt from registration, normally to qualified institutional buyers.
NRSRO = Nationally Recognized Statistical Rating Organization—The credit quality ratings of the securities in the Fund reflect the highest category rating by any of Fitch Ratings, Moody’s Investors Service Inc., or Standard & Poor’s, a division of the McGraw-Hill Companies, Inc.
TBA = To Be Announced — TBAs are mortgage-backed securities traded under delayed delivery commitments, settling after June 30, 2018. The term TBA comes from the fact that the specific mortgage-backed security that will be delivered to fulfill a TBA trade is not designated at the time the trade is made.
VRN = Variable Rate Note
See accompanying Notes to Financial Statements.
| June 30, 2018 | William Blair Funds | 99 |
| | Macro Allocation Fund |
| | |
| | AN OVERVIEW FROM THE PORTFOLIO MANAGERS |
| | |

Thomas Clarke 
Brian D. Singer | The William Blair Macro Allocation Fund (Class N shares) posted a 1.60% decrease, net of fees, for the six-month period ending June 30, 2018. By comparison, the Fund’s benchmark, the Bank of America/Merrill Lynch 3-Month U.S. Treasury Bill Index (the “Index”) increased 0.81%. The first half of 2018 began with a fairly benign risk environment but then was followed by a turbulent late January and early February with increased market volatility and short-term sharp down movements in equity markets. Global equities made modest gains in the second quarter and did not revisit the year’s low point from the end of the first quarter. Within developed equities, the U.S. and European markets were strong performers. From a sector perspective, Consumer Discretionary and Information Technology led the way within the U.S. while Europe saw strong performance from Energy and Information Technology. Within emerging markets, the equity space underperformed, specifically in Argentina, Indonesia, and Turkey. The fixed income markets’ performance was in most part characterized by lackluster performance in both rates and credit. U.S. bonds struggled relative to European bonds, while credit performed similarly with U.S. investment grade and high yield (the spread component, specifically) underperforming relative to global credit. Currencies were largely influenced by a general appreciation of the U.S. dollar against most other currencies. Top performers included the Colombian peso, Mexican peso, and Norwegian krone while the Argentine peso, Turkish lira, and Brazilian real depreciated significantly. During this six-month period, the Fund’s currency strategy positively contributed to the Fund’s performance. The currency strategy was particularly bolstered by short exposures to the euro, Thai Baht, New Zealand dollar, and Taiwan dollar. Negative contributors within the currency strategy were long exposures to the Turkish lira, Philippine peso, South African rand, and Indian rupee. The Fund’s market strategy was a detractor from the Fund’s performance in aggregate, mostly due to U.S. sector allocations and (generally) long exposures to emerging market equities such as Argentina and Brazil. Positive equity performance was driven from long exposures to UK, Italy and France equities. The contribution from fixed income was negative, driven in most part by long exposure to U.S. investment grade bonds and short exposure to high yield spreads. Trade disputes are one of the central headwinds to the macro environment, as uncertainties rise and risk is increased by the deliberate actions of the players, even though their encompassing best interests would be better served by not escalating the situation. For these reasons, we are negative on trade-sensitive markets and have reflected this in our portfolios-we are less long of Chinese equities and the Mexican peso than fundamentals (alone) suggest, and we are more short of Canadian equities than we would be without this elevated risk. We do not, however, expect a dramatic and negative trade war as a base case-this is due to the “best interests” noted above. In this vein, the dialing down of trade threats (U.S.-China) and/or delaying their implementation have been features of political maneuvers in recent months. However, the bottom line is that this aspect of global policy is producing increased uncertainty (a headwind) that was not present in recent years. Looking forward, it is our view that the challenge of navigating these risks continues to be among the most significant shifts in the investment landscape to have occurred in the last decade. However, we feel that our investment process, dialogue, and decision-making is well equipped to meet the challenges we now face. We remain vigilant as we assess new and relevant information to capture future investment opportunities in a timely manner, and we will continue balancing the relationship between risk taken and compensation expected. |
| 100 | Semiannual Report | June 30, 2018 |
Macro Allocation Fund
Performance Highlights (Unaudited)
Average Annual Total Return through 6/30/2018
| | | Year | | | | | | | | Since |
| | | to Date | | 1 Year | | 3 Year | | 5 Year | | Inception |
| Class N(a) | | | (1.60 | )% | | | 0.63 | % | | | (1.68 | )% | | | 2.00 | % | | | 4.60 | % |
| Class I(a) | | | (1.52 | ) | | | 0.97 | | | | (1.40 | ) | | | 2.29 | | | | 4.87 | |
| BofA Merrill Lynch 3-Month U.S. Treasury Bill Index(a) | | | 0.81 | | | | 1.36 | | | | 0.68 | | | | 0.42 | | | | 0.34 | |
| Institutional Class(b) | | | (1.43 | ) | | | 1.07 | | | | (1.30 | ) | | | — | | | | 1.08 | |
| BofA Merrill Lynch 3-Month U.S. Treasury Bill Index(b) | | | 0.81 | | | | 1.36 | | | | 0.68 | | | | — | | | | 0.45 | |
| | |
| (a) | Since inception is for the period from November 29, 2011 (Commencement of Operations) to June 30, 2018. |
| | |
| (b) | Since inception is for the period from October 21, 2013 (Commencement of Operations) to June 30, 2018. |
Performance cited represents past performance. Past performance does not guarantee future results and current performance may be lower or higher than the data quoted. Results shown are average annual total returns, which assume reinvestment of dividends and capital gains. Investment returns and principal will fluctuate and you may have a gain or loss when you sell shares. For the most current month-end performance information, please call 1-800-742-7272, or visit our Web site at www.williamblairfunds.com. The Fund involves a high level of risk and may not be appropriate for everyone. You could lose money by investing in the Fund. There can be no assurance that the Fund’s investment objective will be achieved or that the Fund’s investment strategies will be successful. The Fund is not a complete investment program. From time to time, the investment adviser may waive fees or reimburse expenses for the Fund. Without these waivers/reimbursements, performance would be lower. Class N shares are available to the general public without a sales load. Class I shares are available to certain institutional investors, and advisory clients of William Blair & Company, L.L.C., without a sales load or distribution fee (12b-1 fee). Institutional Class shares are available to institutional investors without a sales load or distribution (12b-1) or service fees.
The performance highlights and graph presented above do not reflect the deduction of taxes that a shareholder would pay on fund distributions or the redemption of fund shares.
The Bank of America (“BofA”) Merrill Lynch 3-Month U.S. Treasury Bill Index measures total return on cash, including price and interest income, based on short-term government Treasury Bills of about 90-day maturity. The Index is unmanaged, does not incur fees or expenses, and cannot be invested in directly.
This report identifies the Fund’s investments on June 30, 2018. These holdings are subject to change. Not all investments in the Fund performed the same, nor is there any guarantee that these investments will perform as well in the future. Market forecasts provided in this report may not necessarily come to pass.
Portfolio Allocation (Unaudited)
The table below provides the allocation of the Fund’s holdings as a percent of net assets as of June 30, 2018.
| | | % of net |
| Category | | assets |
| Equity Exchange-Traded Funds | | | 63.5 | % |
| Fixed Income Exchange-Traded Funds | | | 4.2 | |
| Common Stocks | | | 0.6 | |
| Foreign Government Bond | | | 2.2 | |
| Repurchase Agreement | | | 2.7 | |
| U.S. Government | | | 25.9 | |
| Purchased Options | | | 0.2 | |
| Cash and Other Assets, Less Liabilities | | | 0.7 | |
| Net Assets | | | 100.0 | % |
See accompanying Notes to Financial Statements.
| June 30, 2018 | William Blair Funds | 101 |
Macro Allocation Fund
Portfolio of Investments, June 30, 2018 (all dollar amounts in thousands) (unaudited)
| | | | | | | | |
| | | | | | | | |
| | Issuer | | Shares | | | Value | |
| | |
| | Exchange-Traded Funds—67.7% | | | | | | | | |
| | Equity Exchange-Traded Funds—63.5% | | | | | | | | |
| | Dragon Capital - Vietnam Enterprise | | | | | | | | |
| | Investments, Ltd. Class “C” | | | 2,100,900 | | | $ | 11,607 | |
| | Energy Select Sector SPDR Fund | | | 188,300 | | | | 14,299 | |
| | Financial Select Sector SPDR Fund | | | 420,300 | | | | 11,176 | |
| | Global X MSCI Argentina ETF | | | 163,400 | | | | 4,407 | |
| | Global X MSCI Greece ETF | | | 2,084,800 | | | | 19,034 | |
| | iShares Core MSCI Emerging Markets ETF . | | | 470,800 | | | | 24,722 | |
| | iShares Global Energy ETF | | | 316,800 | | | | 11,842 | |
| | iShares MSCI Brazil ETF | | | 1,540,000 | | | | 49,357 | |
| | iShares MSCI India ETF | | | 1,150,000 | | | | 38,283 | |
| | iShares MSCI Japan ETF | | | 317,400 | | | | 18,381 | |
| | iShares MSCI Malaysia ETF | | | 390,100 | | | | 12,163 | |
| | iShares Russell 1000 Value ETF | | | 916,000 | | | | 111,184 | |
| | SPDR S&P 500 ETF Trust | | | 1,548,100 | | | | 419,969 | |
| | Utilities Select Sector SPDR Fund | | | 476,800 | | | | 24,775 | |
| | VanEck Vectors Russia ETF | | | 131,800 | | | | 2,799 | |
| | Total Equity Exchange-Traded Funds | | | | | | | 773,998 | |
| | Fixed Income Exchange-Traded Funds-4.2% | | | | | | | | |
| | iShares iBoxx $ Investment Grade Corporate Bond ETF | | | 320,800 | | | | 36,754 | |
| | SPDR Bloomberg Barclays High Yield Bond ETF | | | 412,900 | | | | 14,650 | |
| | Total Fixed Income Exchange-Traded Funds . | | | | | | | 51,404 | |
| | Total Exchange-Traded Funds—67.7%
(cost $761,376) | | | | | | | 825,402 | |
| | |
| | Common Stocks—0.6% | | | | | | | | |
| | | | | | | | | | |
| | Emerging Latin America—0.6% | | | | | | | | |
| | | | | | | | | | |
| | Argentina—0.6% | | | | | | | | |
| * | Adecoagro S.A. (Food products)† | | | 47,794 | | | | 380 | |
| | Banco Macro S.A.—ADR (Banks) | | | 6,259 | | | | 368 | |
| | BBVA Banco Frances S.A.—ADR (Banks) | | | 11,675 | | | | 144 | |
| * | Cablevision Holding S.A.—GDR (Media)†§ | | | 125,367 | | | | 1,308 | |
| | Cresud SACIF y A—ADR (Real estate management & development) | | | 12,617 | | | | 187 | |
| * | Empresa Distribuidora Y Comercializadora Norte—ADR (Electric utilities) | | | 4,828 | | | | 157 | |
| * | Globant S.A. (Software)† | | | 4,718 | | | | 268 | |
| | Grupo Clarin S.A. Class B,—GDR (Media)†**§ | | | 55,562 | | | | 222 | |
| | Grupo Financiero Galicia S.A.—ADR (Banks) | | | 23,429 | | | | 773 | |
| | Grupo Supervielle S.A.—ADR (Banks) | | | 15,357 | | | | 163 | |
| | IRSA Inversiones y Representaciones S.A. —ADR (Real estate management & development) | | | 8,512 | | | | 147 | |
| | MercadoLibre, Inc. (Internet software & services) | | | 1,906 | | | | 570 | |
| * | Pampa Energia S.A.—ADR (Electric utilities) | | | 21,258 | | | | 760 | |
| | Telecom Argentina S.A.—ADR (Diversified telecommunication services) | | | 15,615 | | | | 277 | |
| | YPF S.A.—ADR (Oil, gas & consumable fuels) | | | 79,580 | | | | 1,081 | |
| | Total Argentina | | | | | | | 6,805 | |
| | | | Shares or | | | | |
| | | | Principal | | | | |
| | Issuer | | Amount | | | Value | |
| | |
| | Common Stocks—(continued) | | | | | | | | |
| | | | | | | | | | |
| | Emerging Latin America—(continued) | | | | | | | | |
| | | | | | | | | | |
| | Uruguay—0.0% | | | | | | | | |
| | Arcos Dorados Holdings, Inc. Class “A” (Hotels, restaurants & leisure)† | | | 71,123 | | | $ | 494 | |
| | Total Common Stocks—0.6%
(cost $13,405) | | | | | | | 7,299 | |
| | |
| | Foreign Government Bond—2.2% | | | | | | | | |
| | | | | | | | | | |
| | Malaysia | | | | | | | | |
| | Malaysia Government Bond, 3.580%, due 9/28/18 | | MYR | 109,179 | | | | 27,041 | |
| | Total Foreign Government Bonds—2.2%
(cost $24,697) | | | | | | | 27,041 | |
| | |
| | Repurchase Agreement—2.7% | | | | | | | | |
| | Fixed Income Clearing Corporation, 0.350% dated 6/29/18, due 7/2/18, repurchase price $32,992, collateralized by U.S. Treasury Inflation Index Bond, 0.250%, due 1/15/25, and U.S. Treasury Notes, 2.000%, due 4/30/24 | | $ | 32,991 | | | | 32,991 | |
| | Total Repurchase Agreement—2.7%
(cost $32,991) | | | | | | | 32,991 | |
| | |
| | U.S. Government—25.9% | | | | | | | | |
| | U.S. Treasury Bill,
1.134%, due 7/19/18(a) | | | 35,900 | | | | 35,871 | |
| | U.S. Treasury Bill,
1.218%, due 8/16/18(a) | | | 38,500 | | | | 38,413 | |
| | U.S. Treasury Bill,
1.242%, due 9/13/18(a)(b) | | | 20,000 | | | | 19,924 | |
| | U.S. Treasury Bill,
1.376%, due 10/11/18(a) | | | 29,500 | | | | 29,341 | |
| | U.S. Treasury Bill,
1.642%, due 11/8/18 | | | 23,000 | | | | 22,836 | |
| | U.S. Treasury Bill,
1.688%, due 12/6/18(b) | | | 23,000 | | | | 22,797 | |
| | U.S. Treasury Bill,
1.789%, due 1/3/19(b) | | | 23,000 | | | | 22,761 | |
| | U.S. Treasury Bill,
1.868%, due 1/31/19 | | | 23,000 | | | | 22,721 | |
| | U.S. Treasury Bill,
2.055%, due 2/28/19 | | | 23,000 | | | | 22,673 | |
| | U.S. Treasury Bill,
2.093%, due 3/28/19 | | | 23,000 | | | | 22,627 | |
| | U.S. Treasury Bill,
2.250%, due 4/25/19 | | | 23,000 | | | | 22,582 | |
| | U.S. Treasury Bill,
2.325%, due 5/23/19 | | | 23,000 | | | | 22,539 | |
| | U.S. Treasury
Bill, 2.330%, due 6/20/19 | | | 10,000 | | | | 9,780 | |
| | Total U.S. Government—25.9%
(cost $315,122) | | | | | | | 314,865 | |
See accompanying Notes to Financial Statements.
| 102 | Semiannual Report | June 30, 2018 |
Macro Allocation Fund
Portfolio of Investments, June 30, 2018 (all dollar amounts in thousands) (unaudited)
| | | | | | | | | |
| | | | | | | | | |
| | Issuer | | | | | | Value | |
| | | | | | | | | |
| | Total Purchased Options—0.2%
(cost $3,371) | | | | | | $ | 3,018 | |
| | Total Investments in Securities—99.3%
(cost $1,150,962) | | | | | | | 1,210,616 | |
| | Total Written Options—0.00%
(premiums received $683) | | | | | | | (509 | ) |
| | Cash and other assets, less liabilities—0.7% | | | | | | | 9,241 | |
| | Net assets—100.0% | | | | | | $ | 1,219,348 | |
* = Non-income producing security
† = U.S. listed foreign security
(a) Security, or portion of security, is segregated as collateral for centrally cleared swaps and to cover initial margin requirements on open futures contracts aggregating a total value of $56,256.
(b) Security, or portion of security, is pledged as collateral for OTC swap contracts and OTC options aggregating a total value of $5,629.
ADR = American Depository Receipt
GDR = Global Depository Receipt
** = Fair valued pursuant to Valuation Procedures approved by the Board of Trustees. This holding represents 0.02% of the Fund’s net assets at June 30, 2018.
§ = Deemed illiquid pursuant to Liquidity Procedures approved by the Board of Trustees. These holdings represent 0.13% of the Fund’s net assets at June 30, 2018.
For securities primarily traded on exchanges or markets that close before the close of regular trading on the New York Stock Exchange, the Fund may use an independent pricing service to fair value price the securities pursuant to Valuation Procedures approved by the Board of Trustees.
Purchased Options Contracts
| | | | | | | | | | | | | | | | Premiums | | | | |
| | | | | Exercise | | | | | | | | | | | Paid | | Unrealized |
| | | | | Price/ | | Expiration | | Number of | | Notional | | Market | | (Received) | | Appreciation/ |
| Description | | Counterparty | | FX Rate | | Date | | Contracts | | Amount | | Value | | by Fund | | (Depreciation) |
| Calls | | | | | | | | | | | | | | | | | | | | | | | | |
| Call USD/Put INR | | Citibank N.A. | | 70.34 | | 09/28/18 | | 60,781,319 | | $ | 60,781 | | | $ | 492 | | | $ | 363 | | | $ | 129 | |
| Call USD/Put PHP | | Citibank N.A. | | 55.35 | | 09/28/18 | | 59,284,661 | | | 59,285 | | | | 192 | | | | 324 | | | | (132 | ) |
| Call USD/Put CNY | | Citibank N.A. | | 6.7525 | | 09/28/18 | | 59,326,768 | | | 59,327 | | | | 428 | | | | 316 | | | | 112 | |
| | | | | | | | | | | | | | | $ | 1,112 | | | $ | 1,003 | | | $ | 109 | |
| Puts | | | | | | | | | | | | | | | | | | | | | | | | |
| | | Credit Suisse | | | | | | | | | | | | | | | | | | | | | | |
| STXE Small 200 | | International | | 281.00 | | 09/21/18 | | 183,277 | | EUR | 51,501 | | | $ | 833 | | | $ | 1,231 | | | $ | (398 | ) |
| iShares iBoxx $ High Yield Bond | | Citibank N.A. | | 82.00 | | 09/21/18 | | 14,987 | | $ | 122,893 | | | | 1,073 | | | | 1,137 | | | | (64 | ) |
| | | | | | | | | | | | | | | $ | 1,906 | | | $ | 2,368 | | | $ | (462 | ) |
| Total Purchased Options Contracts | | | | | | $ | 3,018 | | | $ | 3,371 | | | $ | (353 | ) |
Written Options Contracts
| | | | | | | | | | | | | | | | Premiums | | | | |
| | | | | | | | | | | | | | | | Paid | | Unrealized |
| | | | | Exercise | | Expiration | | Number of | | Notional | | | Market | | (Received) | | Appreciation/ |
| Description | | Counterparty | | Price | | Date | | Contracts | | Amount | | | Value | | by Fund | | (Depreciation) |
| Puts | | | | | | | | | | | | | | | | | | | | | | | | |
| iShares iBoxx $ Investment Grade | | Citibank N.A. | | 112.00 | | 09/21/18 | | (11,196) | | $ | (125,395 | ) | | $ | (509 | ) | | $ | (683 | ) | | $ | 174 | |
See accompanying Notes to Financial Statements.
| June 30, 2018 | William Blair Funds | 103 |
Macro Allocation Fund
Portfolio of Investments, June 30, 2018 (all dollar amounts in thousands) (unaudited)
Forward Foreign Currency Contracts
| | | | | | | | | USD (Base) | | | | | | Net Unrealized | |
| Settlement | | | | | | Local Currency | | Purchased | | | Current | | Appreciation | |
| Date | | Deliver/Receive | | Counterparty | | (in thousands) | | or Sold | | | Value | | (Depreciation) | |
| Purchased | | | | | | | | | | | | | | | | | | | |
| 9/19/18 | | Argentinean Peso | | Citibank N.A. London | | 273,796 | | $ | 9,178 | | | $ | 8,758 | | | | $ | (420 | ) |
| 9/19/18 | | British Pound Sterling | | Citibank N.A. London | | 65,065 | | | 87,068 | | | | 86,166 | | | | | (902 | ) |
| 9/19/18 | | Chinese Yuan Renminbi | | Citibank N.A. London | | 180,093 | | | 28,019 | | | | 27,044 | | | | | (975 | ) |
| 9/19/18 | | Colombian Peso | | Citibank N.A. London | | 147,634,739 | | | 51,344 | | | | 50,195 | | | | | (1,149 | ) |
| 9/19/18 | | Euro | | Citibank N.A. London | | 2,286 | | | 2,685 | | | | 2,685 | | | | | — | |
| 9/19/18 | | Indian Rupee | | Citibank N.A. London | | 4,878,252 | | | 71,588 | | | | 70,498 | | | | | (1,090 | ) |
| 9/19/18 | | Japanese Yen | | Citibank N.A. London | | 6,505,743 | | | 59,628 | | | | 59,078 | | | | | (550 | ) |
| 9/19/18 | | Mexican Peso | | Citibank N.A. London | | 2,103,999 | | | 101,506 | | | | 104,662 | | | | | 3,156 | |
| 9/19/18 | | New Turkish Lira | | Citibank N.A. London | | 581,173 | | | 123,434 | | | | 122,387 | | | | | (1,047 | ) |
| 9/19/18 | | Philippine Peso | | Citibank N.A. London | | 7,659,217 | | | 143,029 | | | | 142,617 | | | | | (412 | ) |
| 9/19/18 | | Polish Zloty | | Citibank N.A. London | | 138,021 | | | 38,273 | | | | 36,894 | | | | | (1,379 | ) |
| 9/19/18 | | Russian Ruble | | Citibank N.A. London | | 1,405,851 | | | 22,274 | | | | 22,207 | | | | | (67 | ) |
| 9/19/18 | | Singapore Dollar | | Citibank N.A. London | | 109,416 | | | 82,136 | | | | 80,439 | | | | | (1,697 | ) |
| 9/19/18 | | South African Rand | | Citibank N.A. London | | 483,425 | | | 36,266 | | | | 34,889 | | | | | (1,377 | ) |
| 9/19/18 | | Swedish Krona | | Citibank N.A. London | | 348,506 | | | 40,517 | | | | 39,140 | | | | | (1,377 | ) |
| 9/19/18 | | Swiss Franc | | Citibank N.A. London | | 4,074 | | | 4,141 | | | | 4,141 | | | | | — | |
| 9/19/18 | | Taiwan Dollar | | Citibank N.A. London | | 80,102 | | | 2,645 | | | | 2,641 | | | | | (4 | ) |
| | | | | | | | | | | | | | | | | | $ | (9,290 | ) |
| Sold | | | | | | | | | | | | | | | | | | | |
| 9/19/18 | | Argentinean Peso | | Citibank N.A. London | | 623,009 | | $ | 22,458 | | | $ | 19,929 | | | | $ | 2,529 | |
| 9/19/18 | | Australian Dollar | | Citibank N.A. London | | 68,103 | | | 51,868 | | | | 50,412 | | | | | 1,456 | |
| 9/19/18 | | Brazilian Real | | Citibank N.A. London | | 53,255 | | | 14,328 | | | | 13,631 | | | | | 697 | |
| 9/19/18 | | Chinese Yuan Renminbi | | Citibank N.A. London | | 232,594 | | | 35,097 | | | | 34,928 | | | | | 169 | |
| 9/19/18 | | Colombian Peso | | Citibank N.A. London | | 38,812,879 | | | 13,148 | | | | 13,196 | | | | | (48 | ) |
| 9/19/18 | | Czech Koruna | | Citibank N.A. London | | 1,197,771 | | | 55,360 | | | | 54,070 | | | | | 1,290 | |
| 9/19/18 | | Euro | | Citibank N.A. London | | 108,791 | | | 129,294 | | | | 127,788 | | | | | 1,506 | |
| 9/19/18 | | Hong Kong Dollar | | Citibank N.A. London | | 306,968 | | | 39,175 | | | | 39,176 | | | | | (1 | ) |
| 9/19/18 | | Hungarian Forint | | Citibank N.A. London | | 6,938,658 | | | 25,841 | | | | 24,718 | | | | | 1,123 | |
| 9/19/18 | | Indonesian Rupiah | | Citibank N.A. London | | 895,127,652 | | | 63,624 | | | | 61,835 | | | | | 1,789 | |
| 9/19/18 | | Japanese Yen | | Citibank N.A. London | | 501,088 | | | 4,549 | | | | 4,550 | | | | | (1 | ) |
| 9/19/18 | | New Zealand Dollar | | Citibank N.A. London | | 165,451 | | | 116,651 | | | | 112,068 | | | | | 4,583 | |
| 9/19/18 | | South Korean Won | | Citibank N.A. London | | 59,662,962 | | | 55,651 | | | | 53,701 | | | | | 1,950 | |
| 9/19/18 | | Swiss Franc | | Citibank N.A. London | | 89,618 | | | 91,708 | | | | 91,102 | | | | | 606 | |
| 9/19/18 | | Taiwan Dollar | | Citibank N.A. London | | 2,229,440 | | | 75,182 | | | | 73,511 | | | | | 1,671 | |
| 9/19/18 | | Thai Baht | | Citibank N.A. London | | 4,889,107 | | | 151,738 | | | | 147,907 | | | | | 3,831 | |
| 9/20/18 | | Israeli Shekel | | Citibank N.A. London | | 140,803 | | | 39,600 | | | | 38,703 | | | | | 897 | |
| | | | | | | | | | | | | | | | | | $ | 24,047 | |
See accompanying Notes to Financial Statements.
| 104 | Semiannual Report | June 30, 2018 |
Macro Allocation Fund
Portfolio of Investments, June 30, 2018 (all dollar amounts in thousands) (unaudited)
Futures Contracts
| | | | | | | | | Notional Amount | | Notional | | | Notional | | Net Unrealized | |
| Number of | | | | | | | | (Local, | | Amount | | | Value | | Appreciation | |
| Contracts | | Description | | Expiration Date | | Local Currency | | in Thousands) | | (USD) | | | (USD) | | (Depreciation) | |
| Long | | | | | | | | | | | | | | | | | | | | |
| 652 | | CAC 40 Index | | July 2018 | | Euro | | 34,690 | | $ | 41,531 | | | $ | 40,511 | | | $ | (1,020 | ) |
| 773 | | IBEX 35 Index | | July 2018 | | Euro | | 74,222 | | | 88,369 | | | | 86,676 | | | | (1,693 | ) |
| 356 | | OMXS 30 Index | | July 2018 | | Swedish Krona | | 55,572 | | | 6,185 | | | | 6,204 | | | | 19 | |
| 115 | | HSCEI Future | | July 2018 | | Hong Kong Dollar | | 62,497 | | | 8,006 | | | | 7,966 | | | | (40 | ) |
| 1,773 | | MSCI Singapore | | July 2018 | | Singapore Dollar | | 64,892 | | | 47,565 | | | | 47,627 | | | | 62 | |
| 13 | | EURO-BTP | | September 2018 | | Euro | | 1,654 | | | 1,937 | | | | 1,932 | | | | (5 | ) |
| 261 | | KOSPI 200 Index | | September 2018 | | South Korean Won | | 19,575,000 | | | 18,502 | | | | 17,564 | | | | (938 | ) |
| 8 | | SPI 200 Index | | September 2018 | | Australian Dollar | | 1,230 | | | 901 | | | | 910 | | | | 9 | |
| 3,981 | | EURO STOXX 600 Banks Index | | September 2018 | | Euro | | 31,928 | | | 38,544 | | | | 37,285 | | | | (1,259 | ) |
| 699 | | FTSE 100 Index | | September 2018 | | British Pound Sterling | | 53,134 | | | 70,354 | | | | 70,124 | | | | (230 | ) |
| 202 | | FTSE MIB Index | | September 2018 | | Euro | | 21,784 | | | 25,065 | | | | 25,439 | | | | 374 | |
| | | | | | | | | | | | | | | | | | | $ | (4,721 | ) |
| Short | | | | | | | | | | | | | | | | | | | | |
| 148 | | Amsterdam Index | | July 2018 | | Euro | | 16,327 | | $ | 19,460 | | | $ | 19,067 | | | $ | 393 | |
| 61 | | HANG SENG Index | | July 2018 | | Hong Kong Dollar | | 87,614 | | | 11,122 | | | | 11,167 | | | | (45 | ) |
| 207 | | MSCI Taiwan Index | | July 2018 | | U.S. Dollar | | 8,023 | | | 7,949 | | | | 8,023 | | | | (74 | ) |
| 368 | | NIKKEI 225 Index | | September 2018 | | Japanese Yen | | 4,092,160 | | | 37,304 | | | | 36,961 | | | | 343 | |
| 161 | | TOPIX Index | | September 2018 | | Japanese Yen | | 2,786,105 | | | 25,773 | | | | 25,165 | | | | 608 | |
| 141 | | 10YR Can Bond | | September 2018 | | Canadian Dollar | | 19,276 | | | 14,360 | | | | 14,663 | | | | (303 | ) |
| 814 | | FTSE/JSE Top 40 Index | | September 2018 | | South African Rand | | 420,724 | | | 30,800 | | | | 30,671 | | | | 129 | |
| 316 | | S&P TSX 60 Index | | September 2018 | | Canadian Dollar | | 60,881 | | | 46,130 | | | | 46,309 | | | | (179 | ) |
| 34 | | DAX Index | | September 2018 | | Euro | | 10,462 | | | 12,667 | | | | 12,218 | | | | 449 | |
| 868 | | EURO STOXX 50 Index | | September 2018 | | Euro | | 29,434 | | | 35,140 | | | | 34,373 | | | | 767 | |
| 3,531 | | S&P 500 E Mini Index | | September 2018 | | U.S. Dollar | | 480,498 | | | 490,262 | | | | 480,498 | | | | 9,764 | |
| 699 | | XAK Technology | | September 2018 | | U.S. Dollar | | 48,916 | | | 50,339 | | | | 48,916 | | | | 1,423 | |
| 222 | | XAV Health Care | | September 2018 | | U.S. Dollar | | 18,624 | | | 18,816 | | | | 18,624 | | | | 192 | |
| 390 | | XAY Cons Discret | | September 2018 | | U.S. Dollar | | 43,130 | | | 43,233 | | | | 43,130 | | | | 103 | |
| 74 | | Long Gilt | | September 2018 | | British Pound Sterling | | 9,106 | | | 11,892 | | | | 12,018 | | | | (126 | ) |
| | | | | | | | | | | | | | | | | | | $ | 13,444 | |
Centrally Cleared Interest Rate Swap
| | | | | | | | | | | | | | | Upfront | | | | | | |
| | | | | | | Pay/Receive | | | | | | Notional | | Payment | | | | Unrealized | |
| Floating Rate | | Pay/Receive | | Fixed | | Payment | | Maturity | | Cleared | | Amount | | Paid | | | | Appreciation | |
| Reference | | Floating Rate | | Rate | | Frequency | | Date | | Exchange | | (in thousands) | | (Received) | | Value | | (Depreciation) | |
| 3 Month STIBOR | | Receive | | 1.350% | | 1YR/3M | | March 2028 | | LCH | | SEK 218,910 | | $(51) | | $(691) | | | | $(640 | ) |
Centrally Cleared Credit Default Swap
| | | | | | | | | | | | | | | Upfront | | | | | | |
| | | | | | | | | | | | | Notional | | Payment | | | | Unrealized | |
| Reference | | Buy/Sell | | Fixed Deal | | Payment | | Maturity | | Cleared | | Amount | | Paid | | | | Appreciation | |
| Entity | | Protection | | Pay Rate | | Frequency | | Date | | Exchange | | (in thousands) | | (Received) | | Value | | (Depreciation) | |
| iTRAXX Europe S29 | | Sell | | 1.000% | | 3M | | June 2023 | | Intercontinental Exchange | | EUR 22,301 | | $622 | | $348 | | | | $(274 | ) |
See accompanying Notes to Financial Statements.
| June 30, 2018 | William Blair Funds | 105 |
Macro Allocation Fund
Portfolio of Investments, June 30, 2018 (all dollar amounts in thousands) (unaudited)
| | | Pay/ | | | | | | | | | | | | | | |
| | | Receive | | | | | | | | Notional | | | | Unrealized | |
| Reference | | Floating | | | | Maturity | | | | Amount | | Market | | Appreciation | |
| Entity | | Rate | | Floating Rates | | Dates | | Counterparty | | (in thousands) | | Value | | (Depreciation) | |
| Euro STOXX Bank Gross Return Index | | Receive | | 3 Month EURIBOR plus 0 bp | | Sep 2018 | | Goldman Sachs International | | EUR 5,250 | | $ | 81 | | | $ | 81 | |
| Swiss Market Index (Total Return) | | Receive | | 3 Month CHF LIBOR minus 25 bp | | Sep 2018 | | Goldman Sachs International | | CHF 17,663 | | | 62 | | | | 62 | |
| MSCI Daily Total Return Greece (Net) | | Pay | | 3 Month LIBOR plus 95 bp | | Sep 2018 | | Citibank N.A. | | $6,011 | | | 153 | | | | 153 | |
| MSCI Emerging Markets Mexico Net Total Return Index | | Receive | | 3 Month LIBOR plus 17 bp | | Sep 2018 | | Goldman Sachs International | | 25,209 | | | (1,825 | ) | | | (1,825 | ) |
| Euro Bund Future | | Receive | | 0 bp | | Sep 2018 | | Credit Suisse International | | EUR 50,881 | | | (566 | ) | | | (566 | ) |
| 10YR T-Note Future | | Receive | | 0 bp | | Sep 2018 | | Credit Suisse International | | $72,869 | | | (686 | ) | | | (686 | ) |
| 5YR T-Note Future | | Receive | | 0 bp | | Sep 2018 | | Credit Suisse International | | 14,473 | | | (70 | ) | | | (70 | ) |
| MSCI International Indonesia Gross Return Index | | Pay | | 3 Month LIBOR plus 90 bp | | Sep 2018 | | Citibank N.A. | | 11,725 | | | (1,162 | ) | | | (1,162 | ) |
| | | | | | | | | | | | | | | | | | $ | (4,013 | ) |
| Total Net Unrealized Appreciation (Depreciation) on Swaps | | | $ | (4,927 | ) |
See accompanying Notes to Financial Statements.
| 106 | Semiannual Report | June 30, 2018 |
Statements of Assets and Liabilities
As of June 30, 2018 (dollar amounts in thousands) (unaudited)
| | | Growth
Fund | | | Large Cap
Growth
Fund | | | Mid Cap
Growth
Fund | |
| Assets | | | | | | | | | |
| Investments in securities, at cost | | $ | 227,337 | | | | $ | 172,096 | | | | $ | 49,746 | |
| Investments in securities, at value | | $ | 342,145 | | | | $ | 240,725 | | | | $ | 63,161 | |
| Receivable for securities sold | | | 2,193 | | | | | 1,166 | | | | | 502 | |
| Receivable for fund shares sold | | | 152 | | | | | 690 | | | | | 70 | |
| Receivable from Adviser | | | — | | | | | 13 | | | | | 19 | |
| Dividend and interest receivable | | | 40 | | | | | 58 | | | | | 12 | |
| Total assets | | | 344,530 | | | | | 242,652 | | | | | 63,764 | |
| Liabilities | | | | | | | | | | | | | | |
| Payable for investment securities purchased | | | 1,209 | | | | | 1,218 | | | | | 846 | |
| Payable for fund shares redeemed | | | 73 | | | | | 40 | | | | | 3 | |
| Management fee payable | | | 218 | | | | | 140 | | | | | 50 | |
| Distribution fee payable | | | 10 | | | | | 8 | | | | | 1 | |
| Other payables and accrued expenses | | | 117 | | | | | 35 | | | | | 64 | |
| Total liabilities | | | 1,627 | | | | | 1,441 | | | | | 964 | |
| Net assets | | $ | 342,903 | | | | $ | 241,211 | | | | $ | 62,800 | |
| Capital | | | | | | | | | | | | | | |
| Composition of net assets | | | | | | | | | | | | | | |
| Par value of shares of beneficial interest | | $ | 27 | | | | $ | 15 | | | | $ | 5 | |
| Capital paid in excess of par value | | | 186,503 | | | | | 159,018 | | | | | 37,947 | |
| Accumulated net investment income (loss) | | | (27 | ) | | | | 266 | | | | | (95 | ) |
| Accumulated net realized gain (loss) | | | 41,592 | | | | | 13,283 | | | | | 11,528 | |
| Net unrealized appreciation (depreciation) of investments and foreign currencies | | | 114,808 | | | | | 68,629 | | | | | 13,415 | |
| Net assets | | $ | 342,903 | | | | $ | 241,211 | | | | $ | 62,800 | |
| | | | | | | | | | | | | | | |
| Class N shares | | | | | | | | | | | | | | |
| Net assets | | $ | 45,879 | | | | $ | 39,594 | | | | $ | 6,006 | |
| Shares outstanding | | | 3,960,679 | | | | | 2,641,461 | | | | | 492,899 | |
| Net asset value per share | | $ | 11.58 | | | | $ | 14.99 | | | | $ | 12.19 | |
| Class I shares | | | | | | | | | | | | | | |
| Net assets | | $ | 297,024 | | | | $ | 201,617 | | | | $ | 56,794 | |
| Shares outstanding | | | 22,844,088 | | | | | 12,840,392 | | | | | 4,393,364 | |
| Net asset value per share | | $ | 13.00 | | | | $ | 15.70 | | | | $ | 12.93 | |
See accompanying Notes to Financial Statements.
| June 30, 2018 | William Blair Funds | 107 |
Statements of Operations
For the Period Ended June 30, 2018 (all amounts in thousands) (unaudited)
| | | Growth
Fund | | | Large Cap
Growth
Fund | | | Mid Cap
Growth
Fund | |
| Investment income | | | | | | | | | | | | | | |
| Dividends | | $ | 1,605 | | | | $ | 1,038 | | | | $ | 251 | |
| Interest | | | 4 | | | | | 2 | | | | | 1 | |
| Total income | | | 1,609 | | | | | 1,040 | | | | | 252 | |
| Expenses | | | | | | | | | | | | | | |
| Investment advisory fees | | | 1,318 | | | | | 779 | | | | | 318 | |
| Distribution fees | | | 48 | | | | | 40 | | | | | 7 | |
| Custodian fees | | | 16 | | | | | 13 | | | | | 21 | |
| Transfer agent fees | | | 34 | | | | | 11 | | | | | 7 | |
| Sub-transfer agent fees | | | | | | | | | | | | | | |
| Class N | | | 25 | | | | | 21 | | | | | 4 | |
| Class I | | | 124 | | | | | 91 | | | | | 43 | |
| Professional fees | | | 27 | | | | | 20 | | | | | 18 | |
| Registration fees | | | 19 | | | | | 19 | | | | | 19 | |
| Shareholder reporting fees | | | 12 | | | | | 6 | | | | | 1 | |
| Trustee fees | | | 16 | | | | | 6 | | | | | 4 | |
| Other expenses | | | 3 | | | | | 4 | | | | | 1 | |
| Total expenses before expense limitation | | | 1,642 | | | | | 1,010 | | | | | 443 | |
| Expenses waived or reimbursed by the Adviser | | | — | | | | | (79 | ) | | | | (96 | ) |
| Net expenses | | | 1,642 | | | | | 931 | | | | | 347 | |
| Net investment income (loss) | | | (33 | ) | | | | 109 | | | | | (95 | ) |
| Realized and unrealized gain (loss) | | | | | | | | | | | | | | |
| Net realized gain (loss) on transactions from: | | | | | | | | | | | | | | |
| Investments in securities | | | 33,130 | | | | | 11,307 | | | | | 9,905 | |
| Total net realized gain (loss) | | | 33,130 | | | | | 11,307 | | | | | 9,905 | |
| Change in net unrealized appreciation (depreciation) of: | | | | | | | | | | | | | | |
| Investments in securities | | | 10,664 | | | | | 14,100 | | | | | (2,194 | ) |
| Change in net unrealized appreciation (depreciation) | | | 10,664 | | | | | 14,100 | | | | | (2,194 | ) |
| Net increase (decrease) in net assets resulting from operations | | $ | 43,761 | | | | $ | 25,516 | | | | $ | 7,616 | |
See accompanying Notes to Financial Statements.
| 108 | Semiannual Report | June 30, 2018 |
Statements of Changes in Net Assets
For the Period Ended June 30, 2018 (unaudited) and the Year Ended December 31, 2017 (all amounts in thousands)
| | | Growth Fund | | | Large Cap
Growth Fund | | | Mid Cap
Growth Fund | |
| | | 2018 | | | 2017 | | | 2018 | | | 2017 | | | 2018 | | | 2017 | |
| Operations | | | | | | | | | | | | | | | | | | | | | | | | |
| Net investment income (loss) | | $ | (33 | ) | | $ | 372 | | | $ | 109 | | | $ | 157 | | | $ | (95 | ) | | $ | (455 | ) |
| Net realized gain (loss) on investments, and other assets and liabilities | | | 33,130 | | | | 93,613 | | | | 11,307 | | | | 3,192 | | | | 9,905 | | | | 20,258 | |
| Change in net unrealized appreciation (depreciation) on investments, and other assets and liabilities | | | 10,664 | | | | 4,895 | | | | 14,100 | | | | 40,329 | | | | (2,194 | ) | | | 499 | |
| Net increase (decrease) in net assets resulting from operations | | | 43,761 | | | | 98,880 | | | | 25,516 | | | | 43,678 | | | | 7,616 | | | | 20,302 | |
| Distributions to shareholders from | | | | | | | | | | | | | | | | | | | | | | | | |
| Net investment income | | | | | | | | | | | | | | | | | | | | | | | | |
| Class N | | | — | | | | — | | | | — | | | | — | | | | — | | | | — | |
| Class I | | | — | | | | (366 | ) | | | — | | | | — | | | | — | | | | — | |
| Net realized gain | | | | | | | | | | | | | | | | | | | | | | | | |
| Class N | | | — | | | | (10,662 | ) | | | — | | | | (146 | ) | | | — | | | | (986 | ) |
| Class I | | | — | | | | (83,448 | ) | | | — | | | | (993 | ) | | | — | | | | (10,476 | ) |
| Total distributions | | | — | | | | (94,476 | ) | | | — | | | | (1,139 | ) | | | — | | | | (11,462 | ) |
| Capital stock transactions | | | | | | | | | | | | | | | | | | | | | | | | |
| Net proceeds from sale of shares | | | 20,646 | | | | 28,218 | | | | 29,380 | | | | 62,963 | | | | 4,858 | | | | 10,841 | |
| Shares issued in reinvestment of income dividends and capital gain distributions | | | — | | | | 91,558 | | | | — | | | | 1,030 | | | | — | | | | 11,050 | |
| Less cost of shares redeemed | | | (75,238 | ) | | | (348,252 | ) | | | (17,248 | ) | | | (25,304 | ) | | | (27,209 | ) | | | (88,854 | ) |
| Net increase (decrease) in net assets resulting from capital share transactions | | | (54,592 | ) | | | (228,476 | ) | | | 12,132 | | | | 38,689 | | | | (22,351 | ) | | | (66,963 | ) |
| Increase (decrease) in net assets | | | (10,831 | ) | | | (224,072 | ) | | | 37,648 | | | | 81,228 | | | | (14,735 | ) | | | (58,123 | ) |
| Net assets | | | | | | | | | | | | | | | | | | | | | | | | |
| Beginning of period | | | 353,734 | | | | 577,806 | | | | 203,563 | | | | 122,335 | | | | 77,535 | | | | 135,658 | |
| End of period | | $ | 342,903 | | | $ | 353,734 | | | $ | 241,211 | | | $ | 203,563 | | | $ | 62,800 | | | $ | 77,535 | |
| Accumulated net investment income (loss) at the end of the period | | $ | (27 | ) | | $ | 6 | | | $ | 266 | | | $ | 157 | | | $ | (95 | ) | | $ | — | |
See accompanying Notes to Financial Statements.
| June 30, 2018 | William Blair Funds | 109 |
Statements of Assets and Liabilities
As of June 30, 2018 (dollar amounts in thousands) (unaudited)
| | | Small-Mid | | | Small-Mid | | | Small Cap | | | Small Cap | |
| | | Cap Growth | | | Cap Value | | | Growth | | | Value | |
| | | Fund | | | Fund | | | Fund | | | Fund | |
| Assets | | | | | | | | | | | | | | |
| Investments in securities, at cost | | | $ | 2,027,306 | | | | $ | 1,720 | | | $ | 470,810 | | | $ | 495,684 | |
| Investments in securities, at value | | | $ | 2,426,050 | | | | $ | 2,063 | | | $ | 622,854 | | | $ | 652,501 | |
| Cash | | | | — | | | | | 44 | | | | — | | | | — | |
| Receivable for securities sold | | | | 7,849 | | | | | 26 | | | | 86 | | | | 1,278 | |
| Receivable for fund shares sold | | | | 26,887 | | | | | 4 | | | | 5,445 | | | | 272 | |
| Receivable from Adviser | | | | 106 | | | | | 7 | | | | — | | | | 19 | |
| Dividend and interest receivable | | | | 507 | �� | | | | 2 | | | | 184 | | | | 515 | |
| Total assets | | | | 2,461,399 | | | | | 2,146 | | | | 628,569 | | | | 654,585 | |
| Liabilities | | | | | | | | | | | | | | | | | | |
| Payable for investment securities purchased | | | | — | | | | | 42 | | | | 1 | | | | 5,976 | |
| Payable for fund shares redeemed | | | | 663 | | | | | — | | | | 45 | | | | 9,047 | |
| Management fee payable | | | | 1,996 | | | | | 2 | | | | 558 | | | | 595 | |
| Distribution fee payable | | | | 101 | | | | | — | | | | 39 | | | | 6 | |
| Other payables and accrued expenses | | | | 372 | | | | | 39 | | | | 125 | | | | 124 | |
| Total liabilities | | | | 3,132 | | | | | 83 | | | | 768 | | | | 15,748 | |
| Net assets | | | $ | 2,458,267 | | | | $ | 2,063 | | | $ | 627,801 | | | $ | 638,837 | |
| Capital | | | | | | | | | | | | | | | | | | |
| Composition of net assets | | | | | | | | | | | | | | | | | | |
| Par value of shares of beneficial interest | | | $ | 91 | | | | $ | — | | | $ | 19 | | | $ | 31 | |
| Capital paid in excess of par value | | | | 1,851,090 | | | | | 1,268 | | | | 433,629 | | | | 446,398 | |
| Accumulated net investment income (loss) | | | | (5,485 | ) | | | | 10 | | | | (2,029 | ) | | | 580 | |
| Accumulated net realized gain (loss) | | | | 213,827 | | | | | 442 | | | | 44,138 | | | | 35,011 | |
| Net unrealized appreciation (depreciation) of investments and foreign currencies | | | | 398,744 | | | | | 343 | | | | 152,044 | | | | 156,817 | |
| Net assets | | | $ | 2,458,267 | | | | $ | 2,063 | | | $ | 627,801 | | | $ | 638,837 | |
| | | | | | | | | | | | | | | | | | | |
| Class N shares | | | | | | | | | | | | | | | | | | |
| Net assets | | | $ | 491,568 | | | | $ | 304 | | | $ | 196,810 | | | $ | 26,142 | |
| Shares outstanding | | | | 18,998,857 | | | | | 21,074 | | | | 6,346,439 | | | | 1,283,580 | |
| Net asset value per share | | | $ | 25.87 | | | | $ | 14.43 | | | $ | 31.01 | | | $ | 20.37 | |
| Class I shares | | | | | | | | | | | | | | | | | | |
| Net assets | | | $ | 1,966,699 | | | | $ | 1,759 | | | $ | 430,991 | | | $ | 612,695 | |
| Shares outstanding | | | | 72,433,384 | | | | | 122,342 | | | | 12,594,934 | | | | 29,250,191 | |
| Net asset value per share | | | $ | 27.15 | | | | $ | 14.38 | | | $ | 34.22 | | | $ | 20.95 | |
See accompanying Notes to Financial Statements.
| 110 | Semiannual Report | June 30, 2018 |
Statements of Operations
For the Period Ended June 30, 2018 (all amounts in thousands) (unaudited)
| | | Small-Mid | | | Small-Mid | | | Small Cap | | | Small Cap | |
| | | Cap Growth | | | Cap Value | | | Growth | | | Value | |
| | | Fund | | | Fund | | | Fund | | | Fund | |
| Investment income | | | | | | | | | | | | | | | | | | |
| Dividends | | | $ | 6,890 | | | | $ | 20 | | | $ | 1,469 | | | $ | 4,631 | |
| Less foreign tax withheld | | | | (33 | ) | | | | — | | | | (18 | ) | | | — | |
| Interest | | | | 76 | | | | | — | | | | 19 | | | | 11 | |
| Total income | | | | 6,933 | | | | | 20 | | | | 1,470 | | | | 4,642 | |
| Expenses | | | | | | | | | | | | | | | | | | |
| Investment advisory fees | | | | 10,818 | | | | | 12 | | | | 2,937 | | | | 3,544 | |
| Distribution fees | | | | 519 | | | | | — | | | | 194 | | | | 35 | |
| Custodian fees | | | | 20 | | | | | 16 | | | | 17 | | | | 18 | |
| Transfer agent fees | | | | 66 | | | | | — | | | | 19 | | | | 28 | |
| Sub-transfer agent fees | | | | | | | | | | | | | | | | | | |
| Class N | | | | 248 | | | | | — | | | | 99 | | | | 21 | |
| Class I | | | | 962 | | | | | 1 | | | | 173 | | | | 437 | |
| Professional fees | | | | 65 | | | | | 14 | | | | 25 | | | | 34 | |
| Registration fees | | | | 39 | | | | | 20 | | | | 21 | | | | 19 | |
| Shareholder reporting fees | | | | 120 | | | | | 1 | | | | 4 | | | | 31 | |
| Trustee fees | | | | 63 | | | | | — | | | | 18 | | | | 27 | |
| Other expenses | | | | 25 | | | | | 1 | | | | 7 | | | | 7 | |
| Total expenses before expense limitation | | | | 12,945 | | | | | 65 | | | | 3,514 | | | | 4,201 | |
| Expenses waived or reimbursed by the Adviser | | | | (527 | ) | | | | (53 | ) | | | (15 | ) | | | (139 | ) |
| Net expenses | | | | 12,418 | | | | | 12 | | | | 3,499 | | | | 4,062 | |
| Net investment income (loss) | | | | (5,485 | ) | | | | 8 | | | | (2,029 | ) | | | 580 | |
| Realized and unrealized gain (loss) | | | | | | | | | | | | | | | | | | |
| Net realized gain (loss) on transactions from: | | | | | | | | | | | | | | | | | | |
| Investments in securities | | | | 148,199 | | | | | 462 | | | | 35,636 | | | | 34,356 | |
| Redemptions in-kind | | | | 11,209 | | | | | — | | | | 2,300 | | | | — | |
| Total net realized gain (loss) | | | | 159,408 | | | | | 462 | | | | 37,936 | | | | 34,356 | |
| Change in net unrealized appreciation (depreciation) of: | | | | | | | | | | | | | | | | | | |
| Investments in securities | | | | 58,345 | | | | | (491 | ) | | | 41,488 | | | | (27,859 | ) |
| Change in net unrealized appreciation (depreciation) | | | | 58,345 | | | | | (491 | ) | | | 41,488 | | | | (27,859 | ) |
| Net increase (decrease) in net assets resulting from operations | | | $ | 212,268 | | | | $ | (21 | ) | | $ | 77,395 | | | $ | 7,077 | |
See accompanying Notes to Financial Statements.
| June 30, 2018 | William Blair Funds | 111 |
Statements of Changes in Net Assets
For the Period Ended June 30, 2018 (unaudited) and the Year Ended December 31, 2017 (all amounts in thousands)
| | Small-Mid
Cap Growth Fund | | | Small-Mid
Cap Value Fund | | | Small Cap
Growth Fund | | | Small Cap
Value Fund | |
| | | 2018 | | | 2017 | | | 2018 | | | 2017 | | | 2018 | | | 2017 | | | 2018 | | | 2017 | |
| Operations | | | | | | | | | | | | | | | | | | | | | | | | | | | | | | | | |
| Net investment income (loss) | | $ | (5,485 | ) | | $ | (8,378 | ) | | $ | 8 | | | $ | 17 | | | $ | (2,029 | ) | | $ | (3,241 | ) | | $ | 580 | | | $ | 1,911 | |
| Net realized gain (loss) on investments, and other assets and liabilities | | | 159,408 | | | | 227,204 | | | | 462 | | | | 339 | | | | 37,936 | | | | 72,283 | | | | 34,356 | | | | 47,593 | |
| Change in net unrealized appreciation (depreciation) on investments, and other assets and liabilities | | | 58,345 | | | | 179,918 | | | | (491 | ) | | | (30 | ) | | | 41,488 | | | | 37,293 | | | | (27,859 | ) | | | 2,493 | |
| Net increase (decrease) in net assets resulting from operations | | | 212,268 | | | | 398,744 | | | | (21 | ) | | | 326 | | | | 77,395 | | | | 106,335 | | | | 7,077 | | | | 51,997 | |
| Distributions to shareholders from | | | | | | | | | | | | | | | | | | | | | | | | | | | | | | | | |
| Net investment income | | | | | | | | | | | | | | | | | | | | | | | | | | | | | | | | |
| Class N | | | — | | | | — | | | | — | | | | — | | | | — | | | | — | | | | — | | | | — | |
| Class I | | | — | | | | — | | | | — | | | | (12 | ) | | | — | | | | — | | | | — | | | | (1,332 | ) |
| Net realized gain | | | | | | | | | | | | | | | | | | | | | | | | | | | | | | | | |
| Class N | | | — | | | | (11,906 | ) | | | — | | | | (28 | ) | | | — | | | | (23,520 | ) | | | — | | | | (2,098 | ) |
| Class I | | | — | | | | (81,736 | ) | | | — | | | | (320 | ) | | | — | | | | (49,518 | ) | | | — | | | | (46,240 | ) |
| Total distributions | | | — | | | | (93,642 | ) | | | — | | | | (360 | ) | | | — | | | | (73,038 | ) | | | — | | | | (49,670 | ) |
| Capital stock transactions | | | | | | | | | | | | | | | | | | | | | | | | | | | | | | | | |
| Net proceeds from sale of shares | | | 668,724 | | | | 639,389 | | | | 177 | | | | 628 | | | | 130,039 | | | | 127,343 | | | | 39,447 | | | | 95,517 | |
| Shares issued in reinvestment of income dividends and capital gain distributions | | | — | | | | 92,785 | | | | — | | | | 360 | | | | — | | | | 72,609 | | | | — | | | | 47,791 | |
| Less cost of shares redeemed | | | (227,733 | ) | | | (494,845 | ) | | | (1,736 | ) | | | (764 | ) | | | (69,043 | ) | | | (132,737 | ) | | | (81,707 | ) | | | (180,246 | ) |
| Net increase (decrease) in net assets resulting from capital share transactions | | | 440,991 | | | | 237,329 | | | | (1,559 | ) | | | 224 | | | | 60,996 | | | | 67,215 | | | | (42,260 | ) | | | (36,938 | ) |
| Increase (decrease) in net assets | | | 653,259 | | | | 542,431 | | | | (1,580 | ) | | | 190 | | | | 138,391 | | | | 100,512 | | | | (35,183 | ) | | | (34,611 | ) |
| Net assets | | | | | | | | | | | | | | | | | | | | | | | | | | | | | | | | |
| Beginning of period | | | 1,805,008 | | | | 1,262,577 | | | | 3,643 | | | | 3,453 | | | | 489,410 | | | | 388,898 | | | | 674,020 | | | | 708,631 | |
| End of period | | $ | 2,458,267 | | | $ | 1,805,008 | | | $ | 2,063 | | | $ | 3,643 | | | $ | 627,801 | | | $ | 489,410 | | | $ | 638,837 | | | $ | 674,020 | |
| Accumulated net investment income (loss) at the end of the period | | $ | (5,485 | ) | | $ | — | | | $ | 10 | | | $ | 2 | | | $ | (2,029 | ) | | $ | — | | | $ | 580 | | | $ | — | |
See accompanying Notes to Financial Statements.
| 112 | Semiannual Report | June 30, 2018 |
Statements of Assets and Liabilities
As of June 30, 2018 (dollar amounts in thousands) (unaudited)
| | | Global
Leaders
Fund | | | International
Leaders
Fund | | | International
Developed
Plus Fund | | | Institutional
International
Developed
Plus Fund | |
| Assets | | | | | | | | | | | | | | | | | | | | |
| Investments in securities, at cost | | | $ | 149,860 | | | | $ | 337,090 | | | | $ | 94,988 | | | | $ | 15,641 | |
| Investments in securities, at value | | | $ | 207,193 | | | | $ | 419,610 | | | | $ | 112,505 | | | | $ | 18,810 | |
| Cash | | | | 2 | | | | | — | | | | | — | | | | | — | |
| Foreign currency, at value (cost $55; $267; $13; $2) | | | | 55 | | | | | 267 | | | | | 13 | | | | | 2 | |
| Receivable for securities sold | | | | — | | | | | 2,020 | | | | | 339 | | | | | 56 | |
| Receivable for fund shares sold | | | | 74 | | | | | 108 | | | | | — | | | | | — | |
| Receivable from Adviser | | | | 9 | | | | | 10 | | | | | 16 | | | | | 9 | |
| Dividend and interest receivable | | | | 347 | | | | | 1,280 | | | | | 303 | | | | | 57 | |
| Total assets | | | | 207,680 | | | | | 423,295 | | | | | 113,176 | | | | | 18,934 | |
| Liabilities | | | | | | | | | | | | | | | | | | | | |
| Payable for investment securities purchased | | | | 3,571 | | | | | — | | | | | — | | | | | — | |
| Payable for fund shares redeemed | | | | — | | | | | 2 | | | | | — | | | | | — | |
| Management fee payable | | | | 161 | | | | | 319 | | | | | 85 | | | | | 14 | |
| Distribution fee payable | | | | 2 | | | | | 2 | | | | | 1 | | | | | — | |
| Foreign capital gains tax liability | | | | — | | | | | 6 | | | | | — | | | | | — | |
| Other payables and accrued expenses | | | | 79 | | | | | 119 | | | | | 94 | | | | | 66 | |
| Total liabilities | | | | 3,813 | | | | | 448 | | | | | 180 | | | | | 80 | |
| Net assets | | | $ | 203,867 | | | | $ | 422,847 | | | | $ | 112,996 | | | | $ | 18,854 | |
| Capital | | | | | | | | | | | | | | | | | | | | |
| Composition of net assets | | | | | | | | | | | | | | | | | | | | |
| Par value of shares of beneficial interest | | | $ | 13 | | | | $ | 25 | | | | $ | 7 | | | | $ | 1 | |
| Capital paid in excess of par value | | | | 128,698 | | | | | 331,742 | | | | | 92,719 | | | | | 15,129 | |
| Accumulated net investment income (loss) | | | | 723 | | | | | 1,461 | | | | | 873 | | | | | 113 | |
| Accumulated net realized gain (loss) | | | | 17,103 | | | | | 7,116 | | | | | 1,883 | | | | | 443 | |
| Net unrealized appreciation (depreciation) of investments and foreign currencies | | | | 57,330 | | | | | 82,503 | | | | | 17,514 | | | | | 3,168 | |
| Net assets | | | $ | 203,867 | | | | $ | 422,847 | | | | $ | 112,996 | | | | $ | 18,854 | |
| | | | | | | | | | | | | | | | | | | | | |
| Class N shares | | | | | | | | | | | | | | | | | | | | |
| Net assets | | | $ | 8,613 | | | | $ | 10,207 | | | | $ | 2,494 | | | | | — | |
| Shares outstanding | | | | 557,404 | | | | | 617,110 | | | | | 154,202 | | | | | — | |
| Net asset value per share | | | $ | 15.45 | | | | $ | 16.54 | | | | $ | 16.17 | | | | | — | |
| Class I shares | | | | | | | | | | | | | | | | | | | | |
| Net assets | | | $ | 70,116 | | | | $ | 76,666 | | | | $ | 110,502 | | | | | — | |
| Shares outstanding | | | | 4,523,373 | | | | | 4,609,352 | | | | | 6,758,141 | | | | | — | |
| Net asset value per share | | | $ | 15.50 | | | | $ | 16.63 | | | | $ | 16.35 | | | | | — | |
| Institutional Class shares | | | | | | | | | | | | | | | | | | | | |
| Net assets | | | $ | 125,138 | | | | $ | 335,974 | | | | | — | | | | $ | 18,854 | |
| Shares outstanding | | | | 8,068,733 | | | | | 20,196,211 | | | | | — | | | | | 1,308,158 | |
| Net asset value per share | | | $ | 15.51 | | | | $ | 16.63 | | | | | — | | | | $ | 14.41 | |
See accompanying Notes to Financial Statements.
| June 30, 2018 | William Blair Funds | 113 |
Statements of Operations
For the Period Ended June 30, 2018 (all amounts in thousands) (unaudited)
| | | Global
Leaders
Fund | | | International
Leaders
Fund | | | International
Developed
Plus Fund | | | Institutional
International
Developed
Plus Fund | |
| Investment income | | | | | | | | | | | | | | | | | | | | |
| Dividends | | | $ | 1,877 | | | | $ | 6,664 | | | | $ | 2,007 | | | | $ | 331 | |
| Less foreign tax withheld | | | | (117 | ) | | | | (639 | ) | | | | (211 | ) | | | | (35 | ) |
| Interest | | | | 4 | | | | | 14 | | | | | 3 | | | | | 1 | |
| Total income | | | | 1,764 | | | | | 6,039 | | | | | 1,799 | | | | | 297 | |
| Expenses | | | | | | | | | | | | | | | | | | | | |
| Investment advisory fees | | | | 1,005 | | | | | 1,890 | | | | | 562 | | | | | 86 | |
| Distribution fees | | | | 10 | | | | | 13 | | | | | 4 | | | | | — | |
| Custodian fees | | | | 24 | | | | | 30 | | | | | 25 | | | | | 21 | |
| Transfer agent fees | | | | 7 | | | | | 7 | | | | | 2 | | | | | — | |
| Sub-transfer agent fees | | | | | | | | | | | | | | | | | | | | |
| Class N | | | | 5 | | | | | 7 | | | | | 2 | | | | | — | |
| Class I | | | | 22 | | | | | 30 | | | | | 59 | | | | | — | |
| Professional fees | | | | 28 | | | | | 36 | | | | | 31 | | | | | 29 | |
| Registration fees | | | | 24 | | | | | 31 | | | | | 19 | | | | | 11 | |
| Shareholder reporting fees | | | | 3 | | | | | 7 | | | | | 1 | | | | | 1 | |
| Trustee fees | | | | 8 | | | | | 12 | | | | | 4 | | | | | 1 | |
| Other expenses | | | | 4 | | | | | 7 | | | | | 2 | | | | | 1 | |
| Total expenses before expense limitation | | | | 1,140 | | | | | 2,070 | | | | | 711 | | | | | 150 | |
| Expenses waived or reimbursed by the Adviser | | | | (82 | ) | | | | (100 | ) | | | | (108 | ) | | | | (63 | ) |
| Net expenses | | | | 1,058 | | | | | 1,970 | | | | | 603 | | | | | 87 | |
| Net investment income (loss) | | | | 706 | | | | | 4,069 | | | | | 1,196 | | | | | 210 | |
| Realized and unrealized gain (loss) | | | | | | | | | | | | | | | | | | | | |
| Net realized gain (loss) on transactions from: | | | | | | | | | | | | | | | | | | | | |
| Investments in securities, net of foreign taxes, if applicable | | | | 16,233 | | | | | 3,253 | | | | | 2,053 | | | | | 688 | |
| Foreign currency transactions | | | | (19 | ) | | | | (87 | ) | | | | (20 | ) | | | | (4 | ) |
| Total net realized gain (loss) | | | | 16,214 | | | | | 3,166 | | | | | 2,033 | | | | | 684 | |
| Change in net unrealized appreciation (depreciation) of: | | | | | | | | | | | | | | | | | | | | |
| Investments in securities | | | | (3,194 | ) | | | | (3,233 | ) | | | | (6,125 | ) | | | | (1,080 | ) |
| Foreign currency translations | | | | (5 | ) | | | | 3 | | | | | (5 | ) | | | | (1 | ) |
| Change in net unrealized appreciation (depreciation) | | | | (3,199 | ) | | | | (3,230 | ) | | | | (6,130 | ) | | | | (1,081 | ) |
| Net increase (decrease) in net assets resulting from operations | | | $ | 13,721 | | | | $ | 4,005 | | | | $ | (2,901 | ) | | | $ | (187 | ) |
See accompanying Notes to Financial Statements.
| 114 | Semiannual Report | June 30, 2018 |
Statements of Changes in Net Assets
For the Period Ended June 30, 2018 (unaudited) and the Year Ended December 31, 2017 (all amounts in thousands)
| | | Global
Leaders Fund | | | International
Leaders Fund | | | International
Developed
Plus Fund | | | Institutional
International
Developed
Plus Fund | |
| | | | 2018 | | | | 2017 | | | | 2018 | | | | 2017 | | | | 2018 | | | | 2017 | | | | 2018 | | | | 2017 | |
| Operations | | | | | | | | | | | | | | | | | | | | | | | | | | | | | | | | |
| Net investment income (loss) | | $ | 706 | | | $ | 1,399 | | | $ | 4,069 | | | $ | 3,738 | | | $ | 1,196 | | | $ | 964 | | | $ | 210 | | | $ | 206 | |
| Net realized gain (loss) on investments, and other assets and liabilities | | | 16,214 | | | | 10,326 | | | | 3,166 | | | | 7,160 | | | | 2,033 | | | | 3,974 | | | | 684 | | | | 679 | |
| Change in net unrealized appreciation (depreciation) on investments, and other assets and liabilities | | | (3,199 | ) | | | 40,729 | | | | (3,230 | ) | | | 72,854 | | | | (6,130 | ) | | | 16,673 | | | | (1,081 | ) | | | 2,922 | |
| Net increase (decrease) in net assets resulting from operations | | | 13,721 | | | | 52,454 | | | | 4,005 | | | | 83,752 | | | | (2,901 | ) | | | 21,611 | | | | (187 | ) | | | 3,807 | |
| Distributions to shareholders from | | | | | | | | | | | | | | | | | | | | | | | | | | | | | | | | |
| Net investment income | | | | | | | | | | | | | | | | | | | | | | | | | | | | | | | | |
| Class N | | | — | | | | (50 | ) | | | — | | | | (117 | ) | | | — | | | | (55 | ) | | | — | | | | — | |
| Class I | | | — | | | | (566 | ) | | | — | | | | (844 | ) | | | — | | | | (2,202 | ) | | | — | | | | — | |
| Institutional Class | | | — | | | | (1,427 | ) | | | — | | | | (4,501 | ) | | | — | | | | — | | | | — | | | | (212 | ) |
| Net realized gain | | | | | | | | | | | | | | | | | | | | | | | | | | | | | | | | |
| Class N | | | — | | | | (236 | ) | | | — | | | | (71 | ) | | | — | | | | — | | | | — | | | | — | |
| Class I | | | — | | | | (1,911 | ) | | | — | | | | (437 | ) | | | — | | | | — | | | | — | | | | — | |
| Institutional Class | | | — | | | | (4,506 | ) | | | — | | | | (2,201 | ) | | | — | | | | — | | | | — | | | | — | |
| Total distributions | | | — | | | | (8,696 | ) | | | — | | | | (8,171 | ) | | | — | | | | (2,257 | ) | | | — | | | | (212 | ) |
| Capital stock transactions | | | | | | | | | | | | | | | | | | | | | | | | | | | | | | | | |
| Net proceeds from sale of shares | | | 11,442 | | | | 8,432 | | | | 57,732 | | | | 70,308 | | | | 764 | | | | 22,611 | | | | — | | | | 150 | |
| Shares issued in reinvestment of income dividends and capital gain distributions | | | — | | | | 8,355 | | | | — | | | | 6,325 | | | | — | | | | 2,153 | | | | — | | | | 212 | |
| Less cost of shares redeemed | | | (32,645 | ) | | | (25,927 | ) | | | (17,718 | ) | | | (28,608 | ) | | | (5,606 | ) | | | (10,716 | ) | | | (49 | ) | | | (1,432 | ) |
| Net increase (decrease) in net assets resulting from capital share transactions | | | (21,203 | ) | | | (9,140 | ) | | | 40,014 | | | | 48,025 | | | | (4,842 | ) | | | 14,048 | | | | (49 | ) | | | (1,070 | ) |
| Increase (decrease) in net assets | | | (7,482 | ) | | | 34,618 | | | | 44,019 | | | | 123,606 | | | | (7,743 | ) | | | 33,402 | | | | (236 | ) | | | 2,525 | |
| Net assets | | | | | | | | | | | | | | | | | | | | | | | | | | | | | | | | |
| Beginning of period | | | 211,349 | | | | 176,731 | | | | 378,828 | | | | 255,222 | | | | 120,739 | | | | 87,337 | | | | 19,090 | | | | 16,565 | |
| End of period | | $ | 203,867 | | | $ | 211,349 | | | $ | 422,847 | | | $ | 378,828 | | | $ | 112,996 | | | $ | 120,739 | | | $ | 18,854 | | | $ | 19,090 | |
| Accumulated net investment income (loss) at the end of the period | | $ | 723 | | | $ | 17 | | | $ | 1,461 | | | $ | (2,608 | ) | | $ | 873 | | | $ | (323 | ) | | $ | 113 | | | $ | (97 | ) |
See accompanying Notes to Financial Statements.
| June 30, 2018 | William Blair Funds | 115 |
Statements of Assets and Liabilities
As of June 30, 2018 (dollar amounts in thousands) (unaudited)
| | | International
Growth
Fund | | | Institutional
International
Growth
Fund | | | International
Small Cap
Growth
Fund | |
| Assets | | | | | | | | | | | | | | | |
| Investments in securities, at cost | | | $ | 2,392,628 | | | | $ | 1,805,173 | | | | $ | 508,139 | |
| Investments in securities, at value | | | $ | 2,863,379 | | | | $ | 2,143,578 | | | | $ | 579,167 | |
| Cash | | | | — | | | | | — | | | | | 27 | |
| Foreign currency, at value (cost $1,929; $1,472; $297) | | | | 1,929 | | | | | 1,472 | | | | | 297 | |
| Receivable for securities sold | | | | 41,510 | | | | | 20,151 | | | | | 3,193 | |
| Receivable for fund shares sold | | | | 2,470 | | | | | 8,905 | | | | | 123 | |
| Dividend and interest receivable | | | | 9,584 | | | | | 6,727 | | | | | 1,192 | |
| Total assets | | | | 2,918,872 | | | | | 2,180,833 | | | | | 583,999 | |
| Liabilities | | | | | | | | | | | | | | | |
| Payable for investment securities purchased | | | | 4,380 | | | | | 3,304 | | | | | 4,491 | |
| Payable for fund shares redeemed | | | | 1,899 | | | | | 223 | | | | | 285 | |
| Management fee payable | | | | 2,478 | | | | | 1,718 | | | | | 488 | |
| Distribution fee payable | | | | 148 | | | | | — | | | | | 1 | |
| Foreign capital gains tax liability | | | | 359 | | | | | 243 | | | | | — | |
| Other payables and accrued expenses | | | | 1,179 | | | | | 573 | | | | | 237 | |
| Total liabilities | | | | 10,443 | | | | | 6,061 | | | | | 5,502 | |
| Net assets | | | $ | 2,908,429 | | | | $ | 2,174,772 | | | | $ | 578,497 | |
| Capital | | | | | | | | | | | | | | | |
| Composition of net assets | | | | | | | | | | | | | | | |
| Par value of shares of beneficial interest | | | $ | 96 | | | | $ | 122 | | | | $ | 38 | |
| Capital paid in excess of par value | | | | 2,284,097 | | | | | 1,688,357 | | | | | 468,922 | |
| Accumulated net investment income (loss) | | | | 23,275 | | | | | 7,854 | | | | | (7,107 | ) |
| Accumulated net realized gain (loss) | | | | 130,617 | | | | | 140,329 | | | | | 45,626 | |
| Net unrealized appreciation (depreciation) of investments and foreign currencies | | | | 470,344 | | | | | 338,110 | | | | | 71,018 | |
| Net assets | | | $ | 2,908,429 | | | | $ | 2,174,772 | | | | $ | 578,497 | |
| | | | | | | | | | | | | | | | |
| Class N shares | | | | | | | | | | | | | | | |
| Net assets | | | $ | 701,999 | | | | | — | | | | $ | 5,695 | |
| Shares outstanding | | | | 23,504,008 | | | | | — | | | | | 384,004 | |
| Net asset value per share | | | $ | 29.87 | | | | | — | | | | $ | 14.83 | |
| Class I shares | | | | | | | | | | | | | | | |
| Net assets | | | $ | 2,206,430 | | | | | — | | | | $ | 339,935 | |
| Shares outstanding | | | | 72,048,784 | | | | | — | | | | | 22,653,967 | |
| Net asset value per share | | | $ | 30.62 | | | | | — | | | | $ | 15.01 | |
| Institutional Class shares | | | | | | | | | | | | | | | |
| Net assets | | | | — | | | | $ | 2,174,772 | | | | $ | 232,867 | |
| Shares outstanding | | | | — | | | | | 122,263,379 | | | | | 15,424,927 | |
| Net asset value per share | | | | — | | | | $ | 17.79 | | | | $ | 15.10 | |
See accompanying Notes to Financial Statements.
| 116 | Semiannual Report | June 30, 2018 |
Statements of Operations
For the Period Ended June 30, 2018 (all amounts in thousands) (unaudited)
| | | International
Growth
Fund | | | Institutional
International
Growth
Fund | | | International
Small Cap
Growth
Fund | |
| Investment income | | | | | | | | | | | | | | | |
| Dividends | | | $ | 47,672 | | | | $ | 35,931 | | | | $ | 7,313 | |
| Less foreign tax withheld | | | | (4,877 | ) | | | | (3,674 | ) | | | | (680 | ) |
| Interest | | | | 46 | | | | | 41 | | | | | 18 | |
| Total income | | | | 42,841 | | | | | 32,298 | | | | | 6,651 | |
| Expenses | | | | | | | | | | | | | | | |
| Investment advisory fees | | | | 15,298 | | | | | 10,759 | | | | | 2,992 | |
| Distribution fees | | | | 921 | | | | | — | | | | | 8 | |
| Custodian fees | | | | 189 | | | | | 138 | | | | | 67 | |
| Transfer agent fees | | | | 92 | | | | | 40 | | | | | 14 | |
| Sub-transfer agent fees | | | | | | | | | | | | | | | |
| Class N | | | | 563 | | | | | — | | | | | 5 | |
| Class I | | | | 879 | | | | | — | | | | | 133 | |
| Professional fees | | | | 134 | | | | | 102 | | | | | 54 | |
| Registration fees | | | | 20 | | | | | 13 | | | | | 27 | |
| Shareholder reporting fees | | | | 124 | | | | | 1 | | | | | 19 | |
| Trustee fees | | | | 124 | | | | | 88 | | | | | 22 | |
| Other expenses | | | | 33 | | | | | 20 | | | | | 8 | |
| Total expenses before expense limitation | | | | 18,377 | | | | | 11,161 | | | | | 3,349 | |
| Expenses waived or reimbursed by the Adviser | | | | (12 | ) | | | | — | | | | | — | |
| Net expenses | | | | 18,365 | | | | | 11,161 | | | | | 3,349 | |
| Net investment income (loss) | | | | 24,476 | | | | | 21,137 | | | | | 3,302 | |
| Realized and unrealized gain (loss) | | | | | | | | | | | | | | | |
| Net realized gain (loss) on transactions from: | | | | | | | | | | | | | | | |
| Investments in securities, net of foreign taxes, if applicable | | | | 134,842 | | | | | 104,410 | | | | | 29,826 | |
| Foreign currency transactions | | | | (1,042 | ) | | | | (909 | ) | | | | (424 | ) |
| Total net realized gain (loss) | | | | 133,800 | | | | | 103,501 | | | | | 29,402 | |
| Change in net unrealized appreciation (depreciation) of: | | | | | | | | | | | | | | | |
| Investments in securities | | | | (206,943 | ) | | | | (159,442 | ) | | | | (57,073 | ) |
| Foreign currency translations | | | | 1,464 | | | | | 1,147 | | | | | 324 | |
| Change in net unrealized appreciation (depreciation) | | | | (205,479 | ) | | | | (158,295 | ) | | | | (56,749 | ) |
| Net increase (decrease) in net assets resulting from operations | | | $ | (47,203 | ) | | | $ | (33,657 | ) | | | $ | (24,045 | ) |
See accompanying Notes to Financial Statements.
| June 30, 2018 | William Blair Funds | 117 |
Statements of Changes in Net Assets
For the Period Ended June 30, 2018 (unaudited) and the Year Ended December 31, 2017 (all amounts in thousands)
| | | International
Growth Fund | | | Institutional
International
Growth Fund | | | International
Small Cap
Growth Fund | |
| | | 2018 | | | 2017 | | | 2018 | | | 2017 | | | 2018 | | | 2017 | |
| Operations | | | | | | | | | | | | | | | | | | | | | | | | |
| Net investment income (loss) | | $ | 24,476 | | | $ | 31,589 | | | $ | 21,137 | | | $ | 27,430 | | | $ | 3,302 | | | $ | 5,395 | |
| Net realized gain (loss) on investments, and other assets and liabilities | | | 133,800 | | | | 302,999 | | | | 103,501 | | | | 175,181 | | | | 29,402 | | | | 58,596 | |
| Change in net unrealized appreciation (depreciation) on investments, and other assets and liabilities | | | (205,479 | ) | | | 473,662 | | | | (158,295 | ) | | | 369,046 | | | | (56,749 | ) | | | 95,412 | |
| Net increase (decrease) in net assets resulting from operations | | | (47,203 | ) | | | 808,250 | | | | (33,657 | ) | | | 571,657 | | | | (24,045 | ) | | | 159,403 | |
| Distributions to shareholders from | | | | | | | | | | | | | | | | | | | | | | | | |
| Net investment income | | | | | | | | | | | | | | | | | | | | | | | | |
| Class N | | | — | | | | (9,771 | ) | | | — | | | | — | | | | — | | | | (118 | ) |
| Class I | | | — | | | | (36,754 | ) | | | — | | | | — | | | | — | | | | (8,043 | ) |
| Institutional Class | | | — | | | | — | | | | — | | | | (54,743 | ) | | | — | | | | (6,106 | ) |
| Net realized gain | | | | | | | | | | | | | | | | | | | | | | | | |
| Class N | | | — | | | | — | | | | — | | | | — | | | | — | | | | (428 | ) |
| Class I | | | — | | | | — | | | | — | | | | — | | | | — | | | | (23,404 | ) |
| Institutional Class | | | — | | | | — | | | | — | | | | (39,224 | ) | | | — | | | | (17,151 | ) |
| Total distributions | | | — | | | | (46,525 | ) | | | — | | | | (93,967 | ) | | | — | | | | (55,250 | ) |
| Capital stock transactions | | | | | | | | | | | | | | | | | | | | | | | | |
| Net proceeds from sale of shares | | | 145,156 | | | | 246,035 | | | | 156,011 | | | | 192,850 | | | | 72,259 | | | | 58,793 | |
| Shares issued in reinvestment of income dividends and capital gain distributions | | | — | | | | 43,593 | | | | — | | | | 90,689 | | | | — | | | | 50,424 | |
| Less cost of shares redeemed | | | (328,590 | ) | | | (893,532 | ) | | | (277,881 | ) | | | (524,901 | ) | | | (71,470 | ) | | | (128,250 | ) |
| Net increase (decrease) in net assets resulting from capital share transactions | | | (183,434 | ) | | | (603,904 | ) | | | (121,870 | ) | | | (241,362 | ) | | | 789 | | | | (19,033 | ) |
| Increase (decrease) in net assets | | | (230,637 | ) | | | 157,821 | | | | (155,527 | ) | | | 236,328 | | | | (23,256 | ) | | | 85,120 | |
| Net assets | | | | | | | | | | | | | | | | | | | | | | | | |
| Beginning of period | | | 3,139,066 | | | | 2,981,245 | | | | 2,330,299 | | | | 2,093,971 | | | | 601,753 | | | | 516,633 | |
| End of period | | $ | 2,908,429 | | | $ | 3,139,066 | | | $ | 2,174,772 | | | $ | 2,330,299 | | | $ | 578,497 | | | $ | 601,753 | |
| Accumulated net investment income (loss) at the end of the period | | $ | 23,275 | | | $ | (1,201 | ) | | $ | 7,854 | | | $ | (13,283 | ) | | $ | (7,107 | ) | | $ | (10,409 | ) |
See accompanying Notes to Financial Statements.
| 118 | Semiannual Report | June 30, 2018 |
Statements of Assets and Liabilities
As of June 30, 2018 (dollar amounts in thousands) (unaudited)
| | | Emerging
Markets
Leaders
Fund | | | Emerging
Markets
Growth
Fund | | | Emerging
Markets
Small Cap
Growth Fund | |
| Assets | | | | | | | | | | | | | |
| Investments in securities, at cost | | $ | 375,699 | | | $ | 870,493 | | | | $ | 455,109 | |
| Investments in securities, at value | | $ | 435,394 | | | $ | 1,068,027 | | | | $ | 469,682 | |
| Foreign currency, at value (cost $306; $2,009; $1,908) | | | 306 | | | | 2,008 | | | | | 1,908 | |
| Receivable for securities sold | | | 3,249 | | | | 19,762 | | | | | 5,353 | |
| Receivable for fund shares sold | | | 112 | | | | 74 | | | | | 632 | |
| Receivable from Adviser | | | — | | | | — | | | | | 26 | |
| Dividend and interest receivable | | | 1,493 | | | | 3,393 | | | | | 1,533 | |
| Total assets | | | 440,554 | | | | 1,093,264 | | | | | 479,134 | |
| Liabilities | | | | | | | | | | | | | |
| Payable for investment securities purchased | | | 3,918 | | | | 7,542 | | | | | 4,978 | |
| Payable for fund shares redeemed | | | 5 | | | | 4,716 | | | | | 607 | |
| Management fee payable | | | 407 | | | | 1,039 | | | | | 444 | |
| Distribution fee payable | | | 1 | | | | 2 | | | | | 3 | |
| Foreign capital gains tax liability | | | 460 | | | | 2,191 | | | | | 728 | |
| Other payables and accrued expenses | | | 325 | | | | 847 | | | | | 423 | |
| Total liabilities | | | 5,116 | | | | 16,337 | | | | | 7,183 | |
| Net assets | | $ | 435,438 | | | $ | 1,076,927 | | | | $ | 471,951 | |
| Capital | | | | | | | | | | | | | |
| Composition of net assets | | | | | | | | | | | | | |
| Par value of shares of beneficial interest | | $ | 42 | | | $ | 70 | | | | $ | 28 | |
| Capital paid in excess of par value | | | 355,336 | | | | 794,271 | | | | | 433,688 | |
| Accumulated net investment income (loss) | | | (219 | ) | | | 383 | | | | | (9,617 | ) |
| Accumulated net realized gain (loss) | | | 21,051 | | | | 86,863 | | | | | 34,043 | |
| Net unrealized appreciation (depreciation) of investments and foreign currencies | | | 59,228 | | | | 195,340 | | | | | 13,809 | |
| Net assets | | $ | 435,438 | | | $ | 1,076,927 | | | | $ | 471,951 | |
| Class N shares | | | | | | | | | | | | | |
| Net assets | | $ | 2,471 | | | $ | 9,977 | | | | $ | 11,892 | |
| Shares outstanding | | | 240,110 | | | | 664,868 | | | | | 704,122 | |
| Net asset value per share | | $ | 10.29 | | | $ | 15.01 | | | | $ | 16.89 | |
| Class I shares | | | | | | | | | | | | | |
| Net assets | | $ | 45,601 | | | $ | 116,444 | | | | $ | 284,122 | |
| Shares outstanding | | | 4,409,637 | | | | 7,670,855 | | | | | 16,730,404 | |
| Net asset value per share | | $ | 10.34 | | | $ | 15.18 | | | | $ | 16.98 | |
| Institutional Class shares | | | | | | | | | | | | | |
| Net assets | | $ | 387,366 | | | $ | 950,506 | | | | $ | 175,937 | |
| Shares outstanding | | | 37,458,123 | | | | 62,108,903 | | | | | 10,339,026 | |
| Net asset value per share | | $ | 10.34 | | | $ | 15.31 | | | | $ | 17.02 | |
See accompanying Notes to Financial Statements.
| June 30, 2018 | William Blair Funds | 119 |
Statements of Operations
For the Period Ended June 30, 2018 (all amounts in thousands) (unaudited)
| | | Emerging
Markets
Leaders
Fund | | | Emerging
Markets
Growth
Fund | | | Emerging
Markets
Small Cap
Growth
Fund | |
| Investment income | | | | | | | | | | | | | | | |
| Dividends | | | $ | 5,836 | | | | $ | 13,440 | | | | $ | 4,251 | |
| Less foreign tax withheld | | | | (631 | ) | | | | (1,470 | ) | | | | (344 | ) |
| Interest | | | | 3 | | | | | 8 | | | | | 10 | |
| Total income | | | | 5,208 | | | | | 11,978 | | | | | 3,917 | |
| Expenses | | | | | | | | | | | | | | | |
| Investment advisory fees | | | | 2,625 | | | | | 7,075 | | | | | 2,686 | |
| Distribution fees | | | | 3 | | | | | 14 | | | | | 17 | |
| Custodian fees | | | | 78 | | | | | 208 | | | | | 166 | |
| Transfer agent fees | | | | 9 | | | | | 27 | | | | | 41 | |
| Sub-transfer agent fees | | | | | | | | | | | | | | | |
| Class N | | | | 2 | | | | | 4 | | | | | 9 | |
| Class I | | | | 16 | | | | | 51 | | | | | 95 | |
| Professional fees | | | | 54 | | | | | 112 | | | | | 119 | |
| Registration fees | | | | 17 | | | | | 26 | | | | | 34 | |
| Shareholder reporting fees | | | | 5 | | | | | 1 | | | | | 25 | |
| Trustee fees | | | | 16 | | | | | 48 | | | | | 15 | |
| Other expenses | | | | 10 | | | | | 19 | | | | | 6 | |
| Total expenses before expense limitation | | | | 2,835 | | | | | 7,585 | | | | | 3,213 | |
| Expenses waived or reimbursed by the Adviser | | | | (1 | ) | | | | — | | | | | (55 | ) |
| Net expenses | | | | 2,834 | | | | | 7,585 | | | | | 3,158 | |
| Net investment income (loss) | | | | 2,374 | | | | | 4,393 | | | | | 759 | |
| Realized and unrealized gain (loss) | | | | | | | | | | | | | | | |
| Net realized gain (loss) on transactions from: | | | | | | | | | | | | | | | |
| Investments in securities, net of foreign taxes, if applicable | | | | 20,746 | | | | | 115,887 | | | | | 29,191 | |
| Foreign currency transactions | | | | (228 | ) | | | | (1,598 | ) | | | | (669 | ) |
| Total net realized gain (loss) | | | | 20,518 | | | | | 114,289 | | | | | 28,522 | |
| Change in net unrealized appreciation (depreciation) of: | | | | | | | | | | | | | | | |
| Investments in securities | | | | (54,846 | ) | | | | (210,331 | ) | | | | (81,093 | ) |
| Foreign currency translations | �� | | | (465 | ) | | | | 2,953 | | | | | 3,639 | |
| Change in net unrealized appreciation (depreciation) | | | | (55,311 | ) | | | | (207,378 | ) | | | | (77,454 | ) |
| Net increase (decrease) in net assets resulting from operations | | | $ | (32,419 | ) | | | $ | (88,696 | ) | | | $ | (48,173 | ) |
See accompanying Notes to Financial Statements.
| 120 | Semiannual Report | June 30, 2018 |
Statements of Changes in Net Assets
For the Period Ended June 30, 2018 (unaudited) and the Year Ended December 31, 2017 (all amounts in thousands)
| | | Emerging Markets
Leaders Fund | | | Emerging Markets
Growth Fund | | | Emerging Markets
Small Cap
Growth Fund | |
| | | 2018 | | | 2017 | | | 2018 | | | 2017 | | | 2018 | | | 2017 | |
| Operations | | | | | | | | | | | | | | | | | | | | | | | | |
| Net investment income (loss) | | $ | 2,374 | | | $ | 1,292 | | | $ | 4,393 | | | $ | 1,937 | | | $ | 759 | | | $ | 1,951 | |
| Net realized gain (loss) on investments, and other assets and liabilities | | | 20,518 | | | | 26,835 | | | | 114,289 | | | | 119,365 | | | | 28,522 | | | | 46,298 | |
| Change in net unrealized appreciation (depreciation) on investments, and other assets and liabilities | | | (55,311 | ) | | | 108,551 | | | | (207,378 | ) | | | 350,540 | | | | (77,454 | ) | | | 77,357 | |
| Net increase (decrease) in net assets resulting from operations | | | (32,419 | ) | | | 136,678 | | | | (88,696 | ) | | | 471,842 | | | | (48,173 | ) | | | 125,606 | |
| Distributions to shareholders from | | | | | | | | | | | | | | | | | | | | | | | | |
| Net investment income | | | | | | | | | | | | | | | | | | | | | | | | |
| Class N | | | — | | | | (12 | ) | | | — | | | | (77 | ) | | | — | | | | (391 | ) |
| Class I | | | — | | | | (327 | ) | | | — | | | | (1,188 | ) | | | — | | | | (8,028 | ) |
| Institutional Class | | | — | | | | (3,069 | ) | | | — | | | | (11,908 | ) | | | — | | | | (4,880 | ) |
| Net realized gain | | | | | | | | | | | | | | | | | | | | | | | | |
| Class N | | | — | | | | — | | | | — | | | | — | | | | — | | | | (35 | ) |
| Class I | | | — | | | | — | | | | — | | | | — | | | | — | | | | (651 | ) |
| Institutional Class | | | — | | | | — | | | | — | | | | — | | | | — | | | | (389 | ) |
| Total distributions | | | — | | | | (3,408 | ) | | | — | | | | (13,173 | ) | | | — | | | | (14,374 | ) |
| Capital stock transactions | | | | | | | | | | | | | | | | | | | | | | | | |
| Net proceeds from sale of shares | | | 33,688 | | | | 77,729 | | | | 113,083 | | | | 320,170 | | | | 105,111 | | | | 130,660 | |
| Shares issued in reinvestment of income dividends and capital gain distributions | | | — | | | | 3,396 | | | | — | | | | 11,322 | | | | — | | | | 13,084 | |
| Less cost of shares redeemed | | | (43,743 | ) | | | (41,986 | ) | | | (266,273 | ) | | | (405,091 | ) | | | (49,616 | ) | | | (73,209 | ) |
| Net increase (decrease) in net assets resulting from capital share transactions | | | (10,055 | ) | | | 39,139 | | | | (153,190 | ) | | | (73,599 | ) | | | 55,495 | | | | 70,535 | |
| Increase (decrease) in net assets | | | (42,474 | ) | | | 172,409 | | | | (241,886 | ) | | | 385,070 | | | | 7,322 | | | | 181,767 | |
| Net assets | | | | | | | | | | | | | | | | | | | | | | | | |
| Beginning of period | | | 477,912 | | | | 305,503 | | | | 1,318,813 | | | | 933,743 | | | | 464,629 | | | | 282,862 | |
| End of period | | $ | 435,438 | | | $ | 477,912 | | | $ | 1,076,927 | | | $ | 1,318,813 | | | $ | 471,951 | | | $ | 464,629 | |
| Accumulated net investment income (loss) at the end of the period | | $ | (219 | ) | | $ | (2,593 | ) | | $ | 383 | | | $ | (4,010 | ) | | $ | (9,617 | ) | | $ | (10,376 | ) |
See accompanying Notes to Financial Statements.
| June 30, 2018 | William Blair Funds | 121 |
Statements of Assets and Liabilities
As of June 30, 2018 (dollar amounts in thousands) (unaudited)
| | | Bond
Fund | | | Income
Fund | | | Low
Duration
Fund | | | Macro
Allocation
Fund | |
| Assets | | | | | | | | | | | | | |
| Investments in securities, at cost | | $ | 528,265 | | | $ | 65,492 | | | $ | 176,071 | | | | $ | 1,150,962 | |
| Investments in securities, at value | | $ | 519,225 | | | $ | 63,951 | | | $ | 173,744 | | | | $ | 1,210,616 | |
| Cash | | | — | | | | — | | | | 92 | | | | | 2,250 | |
| Receivable for securities sold | | | 1,043 | | | | 4,834 | | | | 14,503 | | | | | 30,838 | |
| Receivable for fund shares sold | | | 349 | | | | 22 | | | | — | | | | | 1,067 | |
| Receivable for variation margin on centrally cleared swaps | | | — | | | | — | | | | — | | | | | 19 | |
| Receivable from Adviser | | | 4 | | | | 2 | | | | 8 | | | | | — | |
| Dividend and interest receivable | | | 4,498 | | | | 396 | | | | 662 | | | | | 2,268 | |
| Unrealized appreciation on forward foreign currency contracts | | | — | | | | — | | | | — | | | | | 14,757 | |
| Total assets | | | 525,119 | | | | 69,205 | | | | 189,009 | | | | | 1,261,815 | |
| Liabilities | | | | | | | | | | | | | | | | | |
| Security sold, not yet purchased (proceeds $—; $4,834; $14,503; $—) | | | — | | | | 4,860 | | | | 14,579 | | | | | — | |
| Options written, at value (proceeds $—; $—; $—; $683) | | | — | | | | — | | | | — | | | | | 509 | |
| Payable for futures variation margin | | | — | | | | — | | | | — | | | | | 236 | |
| Payable for variation margin on centrally cleared swaps | | | 6 | | | | — | | | | — | | | | | — | |
| Payable for investment securities purchased | | | — | | | | — | | | | — | | | | | 18,260 | |
| Payable for fund shares redeemed | | | 1,219 | | | | 89 | | | | 126 | | | | | 1,505 | |
| Payable to custodian | | | 269 | | | | — | | | | — | | | | | — | |
| Cash received as collateral, due to broker | | | — | | | | — | | | | — | | | | | 16,840 | |
| Unrealized depreciation on swap contracts | | | — | | | | — | | | | — | | | | | 4,013 | |
| Management fee payable | | | 131 | | | | 22 | | | | 44 | | | | | 818 | |
| Distribution fee payable | | | 11 | | | | 3 | | | | — | | | | | 7 | |
| Distributions payable to shareholders | | | 92 | | | | 3 | | | | 48 | | | | | — | |
| Other payables and accrued expenses | | | 87 | | | | 66 | | | | 70 | | | | | 279 | |
| Total liabilities | | | 1,815 | | | | 5,043 | | | | 14,867 | | | | | 42,467 | |
| Net assets | | $ | 523,304 | | | $ | 64,162 | | | $ | 174,142 | | | | $ | 1,219,348 | |
| Capital | | | | | | | | | | | | | | | | | |
| Composition of net assets | | | | | | | | | | | | | | | | | |
| Par value of shares of beneficial interest | | $ | 53 | | | $ | 8 | | | $ | 20 | | | | $ | 104 | |
| Capital paid in excess of par value | | | 548,095 | | | | 70,813 | | | | 201,042 | | | | | 1,341,655 | |
| Accumulated net investment income (loss) | | | (2,685 | ) | | | (478 | ) | | | (1,248 | ) | | | | 5,325 | |
| Accumulated net realized gain (loss) | | | (13,176 | ) | | | (4,614 | ) | | | (23,269 | ) | | | | (206,126 | ) |
| Net unrealized appreciation (depreciation) of investments and foreign currencies | | | (8,983 | ) | | | (1,567 | ) | | | (2,403 | ) | | | | 78,390 | |
| Net assets | | $ | 523,304 | | | $ | 64,162 | | | $ | 174,142 | | | | $ | 1,219,348 | |
| Class N shares | | | | | | | | | | | | | | | | | |
| Net assets | | $ | 85,812 | | | $ | 25,897 | | | $ | 2,217 | | | | $ | 35,442 | |
| Shares outstanding | | | 8,605,303 | | | | 3,053,965 | | | | 251,745 | | | | | 3,044,308 | |
| Net asset value per share | | $ | 9.97 | | | $ | 8.48 | | | $ | 8.81 | | | | $ | 11.65 | |
| Class I shares | | | | | | | | | | | | | | | | | |
| Net assets | | $ | 354,249 | | | $ | 38,265 | | | $ | 71,877 | | | | $ | 724,578 | |
| Shares outstanding | | | 35,894,933 | | | | 4,544,379 | | | | 8,166,830 | | | | | 61,953,047 | |
| Net asset value per share | | $ | 9.87 | | | $ | 8.42 | | | $ | 8.80 | | | | $ | 11.70 | |
| Institutional Class shares | | | | | | | | | | | | | | | | | |
| Net assets | | $ | 83,243 | | | | — | | | $ | 100,048 | | | | $ | 459,328 | |
| Shares outstanding | | | 8,441,339 | | | | — | | | | 11,363,866 | | | | | 39,208,747 | |
| Net asset value per share | | $ | 9.86 | | | | — | | | $ | 8.80 | | | | $ | 11.72 | |
See accompanying Notes to Financial Statements.
| 122 | Semiannual Report | June 30, 2018 |
Statements of Operations
For the Period Ended June 30, 2018 (all amounts in thousands) (unaudited)
| | | Bond
Fund | | | Income
Fund | | | Low
Duration
Fund | | | Macro
Allocation
Fund | |
| Investment income | | | | | | | | | | | | | | | | | | | |
| Dividends | | $ | — | | | | $ | — | | | | $ | — | | | | $ | 7,815 | |
| Interest | | | 10,005 | | | | | 1,124 | | | | | 2,276 | | | | | 2,792 | |
| Total income | | | 10,005 | | | | | 1,124 | | | | | 2,276 | | | | | 10,607 | |
| Expenses | | | | | | | | | | | | | | | | | | | |
| Investment advisory fees | | | 814 | | | | | 154 | | | | | 285 | | | | | 5,151 | |
| Distribution fees | | | 65 | | | | | 26 | | | | | 1 | | | | | 48 | |
| Custodian fees | | | 35 | | | | | 20 | | | | | 33 | | | | | 72 | |
| Transfer agent fees | | | 31 | | | | | 5 | | | | | 6 | | | | | 142 | |
| Sub-transfer agent fees | | | | | | | | | | | | | | | | | | | |
| Class N | | | 66 | | | | | 29 | | | | | 1 | | | | | 30 | |
| Class I | | | 147 | | | | | 10 | | | | | 21 | | | | | 328 | |
| Professional fees | | | 29 | | | | | 19 | | | | | 22 | | | | | 73 | |
| Registration fees | | | 32 | | | | | 12 | | | | | 28 | | | | | 33 | |
| Shareholder reporting fees | | | 27 | | | | | 6 | | | | | 3 | | | | | 40 | |
| Trustee fees | | | 22 | | | | | 4 | | | | | 10 | | | | | 59 | |
| Other expenses | | | 9 | | | | | 2 | | | | | 5 | | | | | 173 | |
| Total expenses before expense limitation | | | 1,277 | | | | | 287 | | | | | 415 | | | | | 6,149 | |
| Expenses waived or reimbursed by the Adviser | | | (38 | ) | | | | (7 | ) | | | | (59 | ) | | | | — | |
| Net expenses | | | 1,239 | | | | | 280 | | | | | 356 | | | | | 6,149 | |
| Net investment income (loss) | | | 8,766 | | | | | 844 | | | | | 1,920 | | | | | 4,458 | |
| Realized and unrealized gain (loss) | | | | | | | | | | | | | | | | | | | |
| Net realized gain (loss) on transactions from: | | | | | | | | | | | | | | | | | | | |
| Investments in securities | | | (308 | ) | | | | (528 | ) | | | | (396 | ) | | | | 39,723 | |
| Options | | | — | | | | | — | | | | | — | | | | | (5,516 | ) |
| Futures contracts | | | — | | | | | — | | | | | — | | | | | (38,593 | ) |
| Swaps | | | (51 | ) | | | | — | | | | | — | | | | | 8,284 | |
| Forward foreign currency contracts | | | — | | | | | — | | | | | — | | | | | 5,537 | |
| Foreign currency transactions | | | — | | | | | — | | | | | — | | | | | (75 | ) |
| Total net realized gain (loss) | | | (359 | ) | | | | (528 | ) | | | | (396 | ) | | | | 9,360 | |
| Change in net unrealized appreciation (depreciation) of: | | | | | | | | | | | | | | | | | | | |
| Investments in securities | | | (20,757 | ) | | | | (1,173 | ) | | | | (673 | ) | | | | (62,585 | ) |
| Options | | | — | | | | | — | | | | | — | | | | | 311 | |
| Futures contracts | | | — | | | | | — | | | | | — | | | | | 24,028 | |
| Swaps | | | 102 | | | | | — | | | | | — | | | | | (10,051 | ) |
| Forward foreign currency contracts | | | — | | | | | — | | | | | — | | | | | 14,792 | |
| Foreign currency translations | | | — | | | | | — | | | | | — | | | | | 169 | |
| Change in net unrealized appreciation (depreciation) | | | (20,655 | ) | | | | (1,173 | ) | | | | (673 | ) | | | | (33,336 | ) |
| Net increase (decrease) in net assets resulting from operations | | $ | (12,248 | ) | | | $ | (857 | ) | | | $ | 851 | | | | $ | (19,518 | ) |
See accompanying Notes to Financial Statements.
| June 30, 2018 | William Blair Funds | 123 |
Statements of Changes in Net Assets
For the Period Ended June 30, 2018 (unaudited) and the Year Ended December 31, 2017 (all amounts in thousands)
| | | Bond Fund | | | Income Fund | | | Low Duration
Fund | | | Macro Allocation
Fund | |
| | 2018 | | | 2017 | | | 2018 | | | 2017 | | | 2018 | | | 2017 | | | 2018 | | | 2017 | |
| Operations | | | | | | | | | | | | | | | | | | | | | | | | | | | | | | | | |
| Net investment income (loss) | | $ | 8,766 | | | $ | 15,301 | | | $ | 844 | | | $ | 1,994 | | | $ | 1,920 | | | $ | 3,799 | | | $ | 4,458 | | | $ | 14,153 | |
| Net realized gain (loss) on investments, and other assets and liabilities | | | (359 | ) | | | 1,364 | | | | (528 | ) | | | 81 | | | | (396 | ) | | | (343 | ) | | | 9,360 | | | | 17,469 | |
| Change in net unrealized appreciation (depreciation) on investments, and other assets and liabilities | | | (20,655 | ) | | | 5,503 | | | | (1,173 | ) | | | (391 | ) | | | (673 | ) | | | (914 | ) | | | (33,336 | ) | | | 48,676 | |
| Net increase (decrease) in net assets resulting from operations | | | (12,248 | ) | | | 22,168 | | | | (857 | ) | | | 1,684 | | | | 851 | | | | 2,542 | | | | (19,518 | ) | | | 80,298 | |
| Distributions to shareholders from | | | | | | | | | | | | | | | | | | | | | | | | | | | | | | | | |
| Net investment income | | | | | | | | | | | | | | | | | | | | | | | | | | | | | | | | |
| Class N | | | (1,749 | ) | | | (3,978 | ) | | | (584 | ) | | | (1,426 | ) | | | (26 | ) | | | (96 | ) | | | — | | | | (260 | ) |
| Class I | | | (7,849 | ) | | | (14,049 | ) | | | (749 | ) | | | (1,849 | ) | | | (1,469 | ) | | | (4,594 | ) | | | — | | | | (8,252 | ) |
| Institutional Class | | | (1,896 | ) | | | (3,890 | ) | | | — | | | | — | | | | (1,682 | ) | | | (2,290 | ) | | | — | | | | (6,654 | ) |
| Total distributions | | | (11,494 | ) | | | (21,917 | ) | | | (1,333 | ) | | | (3,275 | ) | | | (3,177 | ) | | | (6,980 | ) | | | — | | | | (15,166 | ) |
| Capital stock transactions | | | | | | | | | | | | | | | | | | | | | | | | | | | | | | | | |
| Net proceeds from sale of shares | | | 68,848 | | | | 159,870 | | | | 3,751 | | | | 19,220 | | | | 10,146 | | | | 141,778 | | | | 166,942 | | | | 305,541 | |
| Shares issued in reinvestment of income dividends and capital gain distributions | | | 10,521 | | | | 20,161 | | | | 1,274 | | | | 3,136 | | | | 2,797 | | | | 6,334 | | | | — | | | | 13,878 | |
| Less cost of shares redeemed | | | (92,078 | ) | | | (163,783 | ) | | | (29,451 | ) | | | (40,857 | ) | | | (69,552 | ) | | | (190,670 | ) | | | (236,716 | ) | | | (656,829 | ) |
| Net increase (decrease) in net assets resulting from capital share transactions | | | (12,709 | ) | | | 16,248 | | | | (24,426 | ) | | | (18,501 | ) | | | (56,609 | ) | | | (42,558 | ) | | | (69,774 | ) | | | (337,410 | ) |
| Increase (decrease) in net assets | | | (36,451 | ) | | | 16,499 | | | | (26,616 | ) | | | (20,092 | ) | | | (58,935 | ) | | | (46,996 | ) | | | (89,292 | ) | | | (272,278 | ) |
| Net assets | | | | | | | | | | | | | | | | | | | | | | | | | | | | | | | | |
| Beginning of period | | | 559,755 | | | | 543,256 | | | | 90,778 | | | | 110,870 | | | | 233,077 | | | | 280,073 | | | | 1,308,640 | | | | 1,580,918 | |
| End of period | | $ | 523,304 | | | $ | 559,755 | | | $ | 64,162 | | | $ | 90,778 | | | $ | 174,142 | | | $ | 233,077 | | | $ | 1,219,348 | | | $ | 1,308,640 | |
| Accumulated net investment income (loss) at the end of the period | | $ | (2,685 | ) | | $ | 43 | | | $ | (478 | ) | | $ | 11 | | | $ | (1,248 | ) | | $ | 9 | | | $ | 5,325 | | | $ | 867 | |
See accompanying Notes to Financial Statements.
| 124 | Semiannual Report | June 30, 2018 |
Notes to Financial Statements (information as of June 30, 2018 is unaudited)
(1) Organization
(a) Description of the Trust
William Blair Funds (the “Trust”) is a mutual fund registered under the Investment Company Act of 1940, as amended (the “1940 Act”), as an open-end management investment company. The Trust currently consists of the following twenty-one funds (the “Funds”), each with its own investment objective and policies. For each Fund, the number of shares authorized is unlimited.
Domestic Equity Funds Growth Large Cap Growth Mid Cap Growth Small-Mid Cap Growth Small-Mid Cap Value Small Cap Growth Small Cap Value Global Equity Fund Global Leaders Multi-Asset and Alternative Fund Macro Allocation | International Equity Funds International Leaders International Developed Plus Institutional International Developed Plus International Growth Institutional International Growth International Small Cap Growth Emerging Markets Leaders Emerging Markets Growth Emerging Markets Small Cap Growth Fixed Income Funds Bond Income Low Duration |
William Blair Investment Management, LLC (the “Adviser”) serves as the Trust’s investment adviser. William Blair & Company, L.L.C. (“WBC” or the “Distributor”), an affiliate of the Adviser, serves as the Trust’s principal underwriter and distributor.
(b) Share Classes
Three different classes of shares currently exist: N, I and Institutional.
Class N shares are offered to the general public, either directly through the Trust’s distributor or through a select number of financial intermediaries. Class N shares are sold without any sales load and carry an annual 12b-1 distribution fee at a fixed rate (0.25% for the Domestic Equity, Global Equity, International Equity and Multi-Asset and Alternative Funds and 0.15% for the Fixed Income Funds as discussed in Note 4(b) – Transactions with Affiliates – Underwriting Distribution Services and Shareholder Administration Agreements) and a sub-transfer agent fee that is not a fixed rate and may vary by Fund and class, as discussed below.
Class I shares are offered to a limited group of investors, either directly through the Trust’s distributor or through a select number of financial intermediaries. They do not carry any sales load or distribution fees and generally have lower ongoing expenses than Class N shares. Class I shares have a sub-transfer agent fee that is not a fixed rate and may vary by Fund and class, as discussed below.
Institutional Class shares are offered to institutional investors, including but not limited to employee benefit plans, endowments, foundations, trusts and corporations, who are able to meet the share class’s high minimum investment requirement. The minimum initial investment required is generally $5 million, subject to certain exceptions. Institutional Class shares do not carry any sales load, distribution fees or sub-transfer agents fees and generally have lower ongoing expenses than Class N and Class I shares.
Sub-transfer agent fees: For Class N and Class I shares, the Funds may reimburse WBC for fees paid to intermediaries such as banks, broker-dealers, financial advisers or other financial institutions for sub-administration, sub-transfer agency and other services provided to investors whose shares of record are held in omnibus, other group accounts, retirement plans or accounts traded through registered securities clearing agents. These fees may vary based on, for example, the nature of services provided, but generally range up to 0.15% of the assets of the class serviced or maintained by the intermediary or up to $15 per sub-account maintained by the intermediary, depending on the method by which the intermediary charges for the services.
| June 30, 2018 | William Blair Funds | 125 |
Notes to Financial Statements (information as of June 30, 2018 is unaudited)
(c) Fund Objectives
The investment objectives of the Funds are as follows:
| Domestic Equity Funds | | Long-term capital appreciation. |
| Global Equity Funds | | Long-term capital appreciation. |
| International Equity Funds | | Long-term capital appreciation. |
| Bond Fund | | Outperform the Bloomberg Barclays U.S. Aggregate Index by maximizing total return through a combination of income and capital appreciation. |
| Income Fund | | High level of current income with relative stability of principal. |
| Low Duration Fund | | Maximize total return. Total return includes both income and capital appreciation. |
| Macro Allocation Fund | | Maximize long-term risk-adjusted total return. |
(2) Significant Accounting Policies
The following is a summary of the Trust’s significant accounting policies in effect during the periods covered by the financial statements, which are in accordance with U.S. generally accepted accounting principles (“US GAAP”), which includes the accounting and reporting guidelines under Accounting Standards Topic 946, Financial Services—Investment Companies.
(a) Investment income and transactions
Investment income, realized and unrealized gains and losses, and certain Fund level expenses and expense reductions, if any, are allocated based on the relative net assets of each class, except for certain class specific expenses, which are charged directly to the appropriate class. Differences in class expenses may result in the payment of different per share dividends by class. All share classes of the Funds have equal rights with respect to voting, subject to class specific arrangements.
Dividend income and expenses are recorded on the ex-dividend date, except for those dividends from certain foreign securities that are recorded when the information is available.
Interest income is recorded on an accrual basis, adjusted for amortization of premium or accretion of discount. Variable rate bonds and floating rate notes earn interest at coupon rates that fluctuate at specific time intervals. The interest rates shown in the Portfolio of Investments for the Bond, Income, Low Duration and Macro Allocation Funds were the rates in effect on June 30, 2018. Put bonds may be redeemed at the discretion of the holder on specified dates prior to maturity.
Premiums and discounts are amortized and accreted on a straight-line basis for short-term investments and on an effective interest method for long-term investments.
Paydown gains and losses on mortgage-backed and asset-backed securities are treated as an adjustment to interest income. For the period ended June 30, 2018, the Bond, Income and Low Duration Funds recognized a reduction of interest income and a corresponding increase in net realized gain of $2,852, $488 and $1,257, respectively (in thousands). This reclassification had no effect on the net asset value or the net assets of the Funds.
| 126 | Semiannual Report | June 30, 2018 |
Notes to Financial Statements (information as of June 30, 2018 is unaudited)
The Funds do not isolate the portion of operations resulting from fluctuations in foreign currency exchange rates on investments from the fluctuations arising from changes in the value of securities held. Such currency fluctuations are included with the net realized and unrealized gain or loss from investments.
Reported net realized foreign currency gains or losses arise from disposition of foreign currency, the difference in the foreign exchange rates between the trade and settlement dates on securities transactions, and the difference between the amounts of dividends, interest and foreign withholding taxes recorded on the ex-date or accrual date and the U.S. dollar equivalent of the amounts actually received or paid. Net unrealized foreign exchange gains and losses arise from changes (due to the changes in the exchange rate) in the value of foreign currency and other assets and liabilities denominated in foreign currencies held at period end.
For financial reporting purposes, security and shareholder transactions are recorded on trade date in accordance with US GAAP. Realized gains and losses from securities transactions are recognized on a specifically identified cost basis.
Awards from class action litigation may be recorded as a reduction of cost. If the Funds no longer own the applicable securities, the proceeds are recorded as realized gains.
(b) Share Valuation and Distributions to Shareholders
Shares are sold and redeemed on a continuous basis at net asset value. The net asset value per share is determined separately for each class by dividing the Fund’s net assets attributable to that class by the number of shares of the class outstanding as of the close of regular trading on the New York Stock Exchange (the “NYSE”), which is generally 4:00 p.m. Eastern time, on each day the NYSE is open.
Distributions from net investment income, if any, for all Equity and Multi-Asset and Alternative Funds are declared and paid at least annually. Distributions from net investment income for the Fixed Income Funds are declared daily and paid monthly. Capital gain distributions, if any, for all Funds, are declared and paid at least annually in December. Distributions payable to shareholders are recorded on the ex-dividend date.
(c) Foreign Currency Translation
The Funds may invest in securities denominated in foreign currencies. As such, assets and liabilities denominated in foreign currencies are translated into U.S. dollar amounts at the current exchange rate on the date of valuation. The values of foreign investments, open forward foreign currency contracts, and cash denominated in foreign currencies are translated into U.S. dollars using a spot market rate of exchange as of the time of the determination of each Fund’s net asset value, typically 4:00 p.m. Eastern time on days when there is regular trading on the NYSE. Payables and receivables for securities transactions, dividends, interest income and tax reclaims are translated into U.S. dollars using a spot market rate of exchange as of 4:00 p.m. Eastern time. Settlement of purchases and sales and dividend and interest receipts are translated into U.S. dollars using a spot market rate of exchange as of 11:00 a.m. Eastern time.
(d) Income Taxes
Each Fund intends to comply with the provisions of Subchapter M of the Internal Revenue Code of 1986, as amended (the “Code”), in order to qualify as regulated investment companies. Each Fund intends to make the requisite distributions of income and capital gains to its shareholders sufficient to relieve it from all, or substantially all, federal income and excise taxes. No provision for federal income and excise taxes has been made.
Certain Funds may be subject to foreign income taxes imposed on realized gains on securities of issuers from certain foreign countries. Such taxes, if applicable, are included within Net realized gain (loss) on transactions from Investments in securities in the Statement of Operations.
Management has evaluated all of the uncertain tax positions of the Funds and has determined that no liability is required to be recorded in the financial statements.
The statute of limitations on the Funds’ tax returns for the prior three years remains open and the returns are subject to examination.
| June 30, 2018 | William Blair Funds | 127 |
Notes to Financial Statements (information as of June 30, 2018 is unaudited)
Adjustments to the cost of investments for tax purposes may be due to the deferred loss associated with current and prior year wash sales, income recognition from investments in real estate investment trusts and partnerships, and the Funds’ election to mark-to-market their investments in Passive Foreign Investment Companies (“PFICs”). The cost of investments, including derivatives, for federal income tax purposes and related gross unrealized appreciation (depreciation) and net unrealized appreciation/(depreciation) at June 30, 2018, were as follows (in thousands):
| | | | | | | | | | | | | Net | |
| | | | | | | Gross | | | | Gross | | | | Unrealized | |
| | | | Cost of | | | | Unrealized | | | | Unrealized | | | | Appreciation/ | |
| Fund | | | Investments | | | | Appreciation | | | | Depreciation | | | | (Depreciation) | |
| Growth | | | $227,954 | | | | $118,156 | | | | $3,965 | | | | $114,191 | |
| Large Cap Growth | | | 172,275 | | | | 69,679 | | | | 1,229 | | | | 68,450 | |
| Mid Cap Growth | | | 50,091 | | | | 13,706 | | | | 636 | | | | 13,070 | |
| Small-Mid Cap Growth | | | 2,035,659 | | | | 463,125 | | | | 72,734 | | | | 390,391 | |
| Small-Mid Cap Value | | | 1,739 | | | | 346 | | | | 22 | | | | 324 | |
| Small Cap Growth | | | 472,347 | | | | 160,334 | | | | 9,827 | | | | 150,507 | |
| Small Cap Value | | | 498,054 | | | | 162,136 | | | | 7,689 | | | | 154,447 | |
| Global Leaders | | | 151,359 | | | | 58,554 | | | | 2,720 | | | | 55,834 | |
| International Leaders | | | 340,158 | | | | 81,911 | | | | 2,459 | | | | 79,452 | |
| International Developed Plus | | | 95,608 | | | | 18,517 | | | | 1,620 | | | | 16,897 | |
| Institutional International Developed Plus | | | 15,767 | | | | 3,290 | | | | 247 | | | | 3,043 | |
| International Growth | | | 2,418,151 | | | | 511,517 | | | | 66,289 | | | | 445,228 | |
| Institutional International Growth | | | 1,824,062 | | | | 368,331 | | | | 48,815 | | | | 319,516 | |
| International Small Cap Growth | | | 521,036 | | | | 73,157 | | | | 15,026 | | | | 58,131 | |
| Emerging Markets Leaders | | | 379,636 | | | | 70,973 | | | | 15,215 | | | | 55,758 | |
| Emerging Markets Growth | | | 888,427 | | | | 213,454 | | | | 33,854 | | | | 179,600 | |
| Emerging Markets Small Cap Growth | | | 466,989 | | | | 34,113 | | | | 31,420 | | | | 2,693 | |
| Bond | | | 528,399 | | | | 6,080 | | | | 15,198 | | | | (9,118 | ) |
| Income | | | 65,504 | | | | 201 | | | | 1,754 | | | | (1,553 | ) |
| Low Duration | | | 176,071 | | | | 260 | | | | 2,587 | | | | (2,327 | ) |
| Macro Allocation | | | 1,155,613 | | | | 114,067 | | | | 41,021 | | | | 73,046 | |
In addition, the Funds may periodically record reclassifications among certain capital accounts to reflect differences between financial reporting and income tax basis distributions. The reclassifications were reported in order to reflect the tax treatment for certain permanent differences that exist between income tax regulations and US GAAP. The reclassifications generally relate to the tax treatment of net operating losses, Section 988 currency gains and losses, PFIC gains and losses, expiration of capital loss carryforwards, paydown gains and losses, investments in real estate investment trusts and partnerships, redemptions in-kind, distribution reclassifications, income on derivatives, capital gain taxes, and utilization of earnings and profits distributed to shareholders on redemption of shares. These reclassifications have no impact on the net asset values of the Funds. Accordingly, at December 31, 2017 (the Funds’ most recent fiscal year end), the following reclassifications were recorded (in thousands):
| 128 | Semiannual Report | June 30, 2018 |
Notes to Financial Statements (information as of June 30, 2018 is unaudited)
| | | Accumulated | | Accumulated | | | |
| | | Undistributed | | Undistributed | | Capital Paid |
| | | Net Investment | | Net Realized | | in Excess |
| Fund | | Income (Loss) | | Gain/(Loss) | | of Par Value |
| Growth | | $ | — | | | $ | (24,796 | ) | | $ | 24,796 | |
| Large Cap Growth | | | — | | | | — | | | | — | |
| Mid Cap Growth | | | 455 | | | | (3,650 | ) | | | 3,195 | |
| Small-Mid Cap Growth | | | 8,378 | | | | (78,018 | ) | | | 69,640 | |
| Small-Mid Cap Value | | | (3 | ) | | | 3 | | | | — | |
| Small Cap Growth | | | 3,241 | | | | (3,241 | ) | | | — | |
| Small Cap Value | | | (579 | ) | | | 579 | | | | — | |
| Global Leaders | | | 173 | | | | (173 | ) | | | — | |
| International Leaders | | | 72 | | | | (72 | ) | | | — | |
| International Developed Plus | | | 154 | | | | 73,341 | | | | (73,495 | ) |
| Institutional International Developed Plus | | | 21 | | | | 90,009 | | | | (90,030 | ) |
| International Growth | | | 3,854 | | | | 130,343 | | | | (134,197 | ) |
| Institutional International Growth | | | 360 | | | | (360 | ) | | | — | |
| International Small Cap Growth | | | 1,197 | | | | (1,197 | ) | | | — | |
| Emerging Markets Leaders | | | (87 | ) | | | 87 | | | | — | |
| Emerging Markets Growth | | | 3,078 | | | | (3,078 | ) | | | — | |
| Emerging Markets Small Cap Growth | | | 8,754 | | | | (8,761 | ) | | | 7 | |
| Bond | | | 6,624 | | | | (6,624 | ) | | | — | |
| Income | | | 1,282 | | | | 3,295 | | | | (4,577 | ) |
| Low Duration | | | 3,170 | | | | (3,170 | ) | | | — | |
| Macro Allocation | | | 8,464 | | | | (8,053 | ) | | | (411 | ) |
The timing and characterization of certain income and capital gain distributions are determined annually in accordance with federal income tax regulations that may differ from US GAAP. As a result, net investment income or loss and net realized gain or loss for a reporting period may differ from the amount distributed during such period.
Distributions from net realized gains for book purposes may include short-term capital gains, which are included as ordinary income for tax purposes. The tax character of distributions paid during 2017 and 2016 was as follows (in thousands):
| | | Distributions Paid in 2017 | | | Distributions Paid in 2016 | |
| | | Ordinary | | | Long-Term | | | Ordinary | | | Long-Term | |
| | | Income | | | Capital Gains | | | Income | | | Capital Gains | |
| Fund | | Class N | | | Class I | | | Class N | | | Class I | | | Class N | | | Class I | | | Class N | | | Class I | |
| Growth | | $ | 351 | | | $ | 3,113 | | | $ | 10,311 | | | $ | 80,701 | | | $ | — | | | $ | 1,075 | | | $ | 5,224 | | | $ | 38,868 | |
| Large Cap Growth | | | — | | | | — | | | | 146 | | | | 993 | | | | 8 | | | | 313 | | | | 99 | | | | 884 | |
| Mid Cap Growth | | | — | | | | — | | | | 986 | | | | 10,476 | | | | — | | | | — | | | | 912 | | | | 6,417 | |
| Small-Mid Cap Growth | | | — | | | | — | | | | 11,906 | | | | 81,736 | | | | — | | | | — | | | | 5,332 | | | | 28,097 | |
| Small-Mid Cap Value | | | — | | | | 12 | | | | 28 | | | | 320 | | | | 1 | | | | 24 | | | | 9 | | | | 129 | |
| Small Cap Growth | | | 4,158 | | | | 8,754 | | | | 19,362 | | | | 40,764 | | | | — | | | | — | | | | 6,573 | | | | 14,099 | |
| Small Cap Value | | | 46 | | | | 2,095 | | | | 2,057 | | | | 45,472 | | | | 105 | | | | 3,363 | | | | 1,287 | | | | 25,920 | |
| Global Leaders | | | 71 | | | | 739 | | | | 215 | | | | 1,738 | | | | — | | | | 124 | | | | 27 | | | | 206 | |
| International Leaders | | | 117 | | | | 844 | | | | 71 | | | | 437 | | | | 23 | | | | 293 | | | | — | | | | — | |
| International Developed Plus | | | 55 | | | | 2,202 | | | | — | | | | — | | | | 29 | | | | 823 | | | | — | | | | — | |
| International Growth | | | 9,771 | | | | 36,754 | | | | — | | | | — | | | | 10,938 | | | | 40,501 | | | | — | | | | — | |
| International Small Cap Growth | | | 121 | | | | 8,233 | | | | 425 | | | | 23,214 | | | | 5 | | | | 1,063 | | | | 2 | | | | 57 | |
| | | |
| June 30, 2018 | William Blair Funds | 129 |
Notes to Financial Statements (information as of June 30, 2018 is unaudited)
| | | Distributions Paid in 2017 | | | Distributions Paid in 2016 | |
| | | Ordinary | | | Long-Term | | | Ordinary | | | Long-Term | |
| | | Income | | | Capital Gains | | | Income | | | Capital Gains | |
| Fund | | Class N | | | Class I | | | Class N | | | Class I | | | Class N | | | Class I | | | Class N | | | Class I | |
| Emerging Markets Leaders | | $ | 12 | | | $ | 327 | | | $ | — | | | $ | — | | | $ | — | | | $ | 41 | | | $ | — | | | $ | — | |
| Emerging Markets Growth | | | 77 | | | | 1,188 | | | | — | | | | — | | | | 18 | | | | 416 | | | | — | | | | — | |
| Emerging Markets Small Cap Growth | | | 391 | | | | 8,028 | | | | 35 | | | | 651 | | | | 210 | | | | 4,177 | | | | — | | | | — | |
| Bond | | | 3,978 | | | | 14,049 | | | | — | | | | — | | | | 5,237 | | | | 11,452 | | | | — | | | | — | |
| Income | | | 1,426 | | | | 1,849 | | | | — | | | | — | | | | 1,079 | | | | 1,868 | | | | — | | | | — | |
| Low Duration | | | 96 | | | | 4,594 | | | | — | | | | — | | | | 149 | | | | 3,331 | | | | — | | | | — | |
| Macro Allocation | | | 260 | | | | 8,252 | | | | — | | | | — | | | | 1,182 | | | | 21,809 | | | | — | | | | — | |
| | | | Distributions Paid in 2017 | | Distributions Paid in 2016 | |
| | | | Ordinary | | Long-Term | | Ordinary | | Long-Term | |
| | | | Income | | Capital Gains | | Income | | Capital Gains | |
| | | | Institutional | | Institutional | | Institutional | | Institutional | |
| Global Leaders | | | $ 1,836 | | | | $ 4,097 | | | | $ 403 | | | | $559 | | |
| International Leaders | | | 4,501 | | | | 2,201 | | | | 2,350 | | | | — | | |
| Institutional International | | | | | | | | | | | | | | | | | |
| Developed Plus | | | 212 | | | | — | | | | 336 | | | | — | | |
| Institutional International Growth | | | 54,743 | | | | 39,224 | | | | 23,809 | | | | — | | |
| International Small Cap Growth | | | 6,246 | | | | 17,011 | | | | 845 | | | | 37 | | |
| Emerging Markets Leaders | | | 3,069 | | | | — | | | | 513 | | | | — | | |
| Emerging Markets Growth | | | 11,908 | | | | — | | | | 4,354 | | | | — | | |
| Emerging Markets Small Cap Growth | | | 4,880 | | | | 389 | | | | 3,339 | | | | — | | |
| Bond | | | 3,890 | | | | — | | | | 3,903 | | | | — | | |
| Low Duration | | | 2,290 | | | | — | | | | 694 | | | | — | | |
| Macro Allocation | | | 6,654 | | | | — | | | | 13,553 | | | | — | | |
As of December 31, 2017, the components of distributable earnings on a tax basis were as follows (in thousands):
| | | | | | Accumulated | | | Undistributed | | Net Unrealized |
| | | Undistributed | | Capital and | | | Long-Term | | Appreciation/ |
| Fund | | Ordinary Income | | Other Losses | | | Capital Gain | | (Depreciation) |
| Growth | | $ | 938 | | | $ | — | | | $ | 7,904 | | | $ | 103,770 | |
| Large Cap Growth | | | 158 | | | | — | | | | 2,522 | | | | 53,982 | |
| Mid Cap Growth | | | — | | | | — | | | | 2,258 | | | | 14,974 | |
| Small-Mid Cap Growth | | | 3,042 | | | | — | | | | 58,088 | | | | 333,688 | |
| Small-Mid Cap Value | | | — | | | | — | | | | 3 | | | | 813 | |
| Small Cap Growth | | | 1,275 | | | | — | | | | 7,217 | | | | 108,266 | |
| Small Cap Value | | | — | | | | (4,103 | ) | | | 7,467 | | | | 181,967 | |
| Global Leaders | | | 293 | | | | — | | | | 2,002 | | | | 59,140 | |
| International Leaders | | | 33 | | | | — | | | | 4,318 | | | | 82,724 | |
| International Developed Plus | | | 151 | | | | — | | | | — | | | | 23,020 | |
| Institutional International Developed Plus | | | 3 | | | | (213 | ) | | | — | | | | 4,121 | |
| International Growth | | | 21,442 | | | | — | | | | — | | | | 649,997 | |
| Institutional International Growth | | | 3,400 | | | | — | | | | 38,723 | | | | 477,827 | |
| International Small Cap Growth | | | 5,236 | | | | — | | | | 13,824 | | | | 114,522 | |
| Emerging Markets Leaders | | | 258 | | | | — | | | | 1,625 | | | | 110,596 | |
| Emerging Markets Growth | | | 10,202 | | | | (21,970 | ) | | | — | | | | 383,050 | |
| Emerging Markets Small Cap Growth | | | 560 | | | | — | | | | 6,408 | | | | 79,440 | |
| Bond | | | 99 | | | | (12,682 | ) | | | — | | | | 11,575 | |
| Income | | | 11 | | | | (4,066 | ) | | | — | | | | (414 | ) |
| Low Duration | | | 43 | | | | (22,873 | ) | | | — | | | | (1,730 | ) |
| Macro Allocation | | | — | | | | (218,413 | ) | | | — | | | | 115,520 | |
| 130 | Semiannual Report | June 30, 2018 |
Notes to Financial Statements (information as of June 30, 2018 is unaudited)
As of December 31, 2017, the Funds may have unused capital loss carryforwards available for federal income tax purposes to be applied against future capital gains, if any. Under current law, the Funds may carry forward net capital losses indefinitely to use to offset capital gains realized in future years. Previous law limited the carry forward of capital losses to the eight tax years following the year the capital loss was realized. If a Fund has capital losses that are subject to current law and also has capital losses subject to prior law, the losses realized under current law will be utilized to offset capital gains before any of the losses governed by prior law can be used. As a result of these ordering rules, capital losses realized under previous law may be more likely to expire unused. Capital losses realized under current law will carry forward retaining their classification as long-term or short-term losses; as compared to under prior law in which all capital losses were carried forward as short term capital losses.
The following table details the Funds’ available capital loss carryforwards as of December 31, 2017, the capital loss carryforwards utilized by the Funds in 2017, and the capital loss carryforwards that expired in 2017 (in thousands):
| | | Available Capital Loss Carryforwards | | Capital Loss | | Capital Loss |
| | | Limited by Year of Expiration | | Unlimited | | Total | | Carryforwards | | Carryforwards |
| Fund | | | 2018 | | | Short Term | | Long Term | | Available | | Utilized in 2017 | | Expired in 2017 |
| Mid Cap Growth | | | $ | — | | | | $ | — | | | $ | — | | | $ | — | | | $ | 2,038 | | | $ | — | |
| Global Leaders | | | | — | | | | | — | | | | — | | | | — | | | | 986 | | | | — | |
| International Leaders | | | | — | | | | | — | | | | — | | | | — | | | | 144 | | | | — | |
| International Developed Plus | | | | — | | | | | — | | | | — | | | | — | | | | 3,696 | | | | 73,495 | |
| Institutional International Developed Plus | | | | — | | | | | 213 | | | | — | | | | 213 | | | | 579 | | | | 90,030 | |
| International Growth | | | | — | | | | | — | | | | — | | | | — | | | | 294,238 | | | | 134,197 | |
| Institutional International Growth | | | | — | | | | | — | | | | — | | | | — | | | | 94,970 | | | | — | |
| Emerging Markets Leaders | | | | — | | | | | — | | | | — | | | | — | | | | 22,497 | | | | — | |
| Emerging Markets Growth | | | | — | | | | | 21,970 | | | | — | | | | 21,970 | | | | 94,493 | | | | — | |
| Emerging Markets Small Cap Growth | | | | — | | | | | — | | | | — | | | | — | | | | 19,850 | | | | — | |
| Bond | | | | — | | | | | 7,985 | | | | 4,697 | | | | 12,682 | | | | — | | | | — | |
| Income | | | | — | | | | | 1,742 | | | | 2,162 | | | | 3,904 | | | | — | | | | 4,577 | |
| Low Duration | | | | 955 | | | | | 11,239 | | | | 10,679 | | | | 22,873 | | | | — | | | | — | |
| Macro Allocation | | | | — | | | | | 166,163 | | | | 52,250 | | | | 218,413 | | | | — | | | | — | |
In order to meet certain excise tax distribution requirements, the Funds are required to measure and distribute annually, net capital gains realized during a twelve month period ending October 31 and net investment income earned during a twelve month period ending December 31. In connection with this, the Funds are permitted for tax purposes to defer into their next fiscal year qualified late year losses. Qualified late year capital losses are any short term or long term capital losses incurred between November 1 and the end of their fiscal year, December 31, 2017. Qualified late year ordinary losses are comprised of losses related to foreign currency and PFICs incurred between November 1 and the end of their fiscal year, December 31, 2017.
As of December 31, 2017, the following Funds deferred, on a tax basis, qualified late year losses of (in thousands):
| | | Qualified Late Year Losses | |
| | | Ordinary | | | Net | |
| Fund | | Income | | | | Capital | |
| Small Cap Value | | $ | — | | | $ | 4,103 | |
| Income | | | — | | | | 162 | |
| June 30, 2018 | William Blair Funds | 131 |
Notes to Financial Statements (information as of June 30, 2018 is unaudited)
(e) Repurchase Agreements
In a repurchase agreement, a Fund buys a security at one price and at the time of sale, the seller agrees to repurchase the security at a mutually agreed upon time and price (usually within seven days). The repurchase agreement thereby determines the yield during the purchaser’s holding period, while the seller’s obligation to repurchase is secured by the value of the underlying collateral. The Adviser monitors, on an ongoing basis, the value of the underlying collateral to ensure that the value always equals or exceeds the repurchase price plus accrued interest. Repurchase agreements may involve certain risks in the event of a default or insolvency of the other party to the agreement, including possible delays or restrictions upon a Fund’s ability to dispose of the underlying collateral. The risk to a Fund is limited to the ability of the seller to pay the agreed upon sum on the delivery date. In the event of default, a repurchase agreement provides that a Fund is entitled to sell the underlying collateral. The loss, if any, to a Fund will be the difference between the proceeds from the sale and the repurchase price. However, if bankruptcy proceedings are commenced with respect to the seller of the security, disposition of the collateral by the Fund may be delayed or limited. The Funds have master repurchase agreements which allow the Funds to offset amounts owed to a counterparty with amounts owed from the same counterparty, including any collateral, in the event the counterparty defaults. As of June 30, 2018, each Fund’s outstanding repurchase agreements, if any, and related collateral, are shown on the Fund’s Portfolio of Investments. Although no definitive creditworthiness criteria are used, the Adviser reviews the creditworthiness of the banks and non-bank dealers with which a Fund enters into repurchase agreements to evaluate those risks. A Fund may, for tax purposes, deem repurchase agreements collateralized by U.S. Government securities to be investments in U.S. Government securities.
(f) TBA Securities
The Fixed Income Funds may invest in mortgage pass-through securities eligible to be sold in the “to-be announced” market (“TBAs”). TBAs provide for the forward or delayed delivery of the underlying instrument with settlement in up to 180 days. The term TBA comes from the fact that the specific mortgage-backed security that will be delivered to fulfill a TBA trade is not designated at the time the trade is made, but rather is generally announced 48 hours before the settlement date. A Fund generally has the ability to close out a TBA obligation on or before the settlement date, rather than take delivery of the security. When a Fund sells TBAs, it incurs risks similar to those incurred in short sales. For example, when a Fund sells TBAs without owning or having the right to obtain the deliverable securities it incurs a risk of loss because it could have to purchase the securities at a price that is higher than the price at which it sold the securities.
(g) Securities Sold, Not Yet Purchased
A Fund may sell a security it does not own (known as selling a security short) in anticipation of a decline in the fair value of that security. When a Fund sells a security short, it must borrow the security sold short and deliver it to the broker through which it made the short sale. A gain, limited to the price at which the fund sold the security short, or a loss, unlimited in size, will be recognized upon the termination of the short sale. A Fund is also subject to the risk that it may be unable to acquire a security to terminate a short position except at a price substantially in excess of the price at which it sold the security short.
(h) Use of Estimates
The preparation of financial statements in conformity with US GAAP requires management to make estimates and assumptions that affect the amounts reported in the financial statements. Actual results may differ from those estimates.
(i) Indemnification
In the normal course of business, the Funds have entered into contracts in which the Funds agree to indemnify the other party or parties against various potential costs or liabilities. The Funds’ maximum exposure under these arrangements is unknown. No claim has been made for indemnification pursuant to any such agreement of the Funds.
(j) Redemption In-Kind
In accordance with the Trust’s prospectus, the Funds may distribute portfolio securities rather than cash as payment for a redemption of Fund shares (in-kind redemption). For financial reporting purposes, the Fund recognizes a gain or loss on the transfer of securities depending on the value of those securities on the date of redemption. Gains and losses realized on in-kind redemptions may not be recognized for tax purposes and are reclassified from accumulated net realized gain (loss) to capital paid in excess of par value. During the period ended June 30, 2018, the Small-Mid Cap Growth and Small Cap Growth Funds redeemed $34,789 and $6,298 (in thousands), respectively, of Fund shares in-kind rather than with cash and recognized net realized gains of $11,209 and $2,300 (in thousands), respectively, on the securities distributed to shareholders.
| 132 | Semiannual Report | June 30, 2018 |
Notes to Financial Statements (information as of June 30, 2018 is unaudited)
(3) Valuation
(a) Investment Valuation
The value of domestic equity securities, including exchange-traded funds, is determined by valuing securities traded on national securities markets or in the over-the-counter markets at the last sale price or, if applicable, the official closing price or, in the absence of a recent sale on the date of determination, at the mean between the last reported bid and ask prices.
The value of foreign equity securities is generally determined based upon the last sale price on the foreign exchange or market on which it is primarily traded and in the currency of that market as of the close of the appropriate exchange or, if there have been no sales during that day, at the mean between the last reported bid and ask prices. The Board of Trustees has determined that the passage of time between when the foreign exchanges or markets close and when the Funds compute their net asset values could cause the value of foreign equity securities to no longer be representative or accurate and, as a result, may necessitate that such securities be fair valued. Accordingly, for foreign equity securities, the Funds may use an independent pricing service to fair value price the security as of the close of regular trading on the NYSE. As a result, a Fund’s value for a foreign security may be different from the last sale price (or the mean between the last reported bid and ask prices). As of June 30, 2018, fair valuation estimates for foreign equity securities were obtained.
Fixed income securities are generally valued using evaluated prices provided by an independent pricing service. The evaluated prices are formed using various market inputs that the pricing service believes accurately represent the market value of a security at a particular point in time. The pricing service determines evaluated prices for fixed income securities using inputs including, but not limited to, recent transaction prices for such securities, dealer quotes, transaction prices for other securities with similar characteristics, collateral characteristics, credit quality, payment history, liquidity and market conditions.
Repurchase agreements are valued at cost, which approximates fair value.
Option contracts on securities, currencies and other financial instruments traded on one or more exchanges are valued at their most recent sale price on the exchange on which they are traded most extensively. Option contracts on foreign indices are valued at the settlement price. If there were no sales that day or if no settlement price is available, such option contracts are valued at the mean between the last reported bid and ask prices. Option contracts traded in the Over-the-Counter (“OTC”) market shall be valued by an independent pricing service. Futures contracts are valued at the most recent settlement price on the exchange on which they are traded most extensively, or if no settlement price is available, at the last sale price as of the close of the exchange. Forward foreign currency contracts are valued on the basis of the value of the underlying currencies at the prevailing currency exchange rate as supplied by an independent pricing service.
Swaps that are centrally cleared through an exchange are valued at the most recent settlement price provided by the exchange on which they are cleared. Total return swaps on equities, equity baskets, indices and other financial instruments are valued by an independent pricing service, or if unavailable, based on the security’s or instrument’s underlying reference asset. All other swap contracts are valued by an independent pricing service. Depending on the product and the terms of the transaction, the independent pricing service may use a series of techniques, including simulation pricing models. The pricing models use inputs that are observed from actively quoted markets such as issuer details, indices, spreads, interest rates, yield curves, dividends and exchange rates.
Securities, and other assets, for which a market price is not available or is deemed unreliable (e.g., securities affected by unusual or extraordinary events, such as natural disasters or securities affected by market or economic events, such as bankruptcy filings), or the value of which is affected by a significant valuation event, are valued at a fair value as determined in good faith by, or under the direction of, the Board of Trustees and in accordance with the Valuation Procedures approved by the Board of Trustees. The value of these fair valued securities may be different from the last sale price (or the mean between the last reported bid and ask prices), and there is no guarantee that a fair valued security will be sold at the price at which a Fund is carrying the security.
As of June 30, 2018, there were securities held in the International Growth, Institutional International Growth, and Macro Allocation Funds for which a reliable market price was not available and that were fair valued pursuant to the Valuation Procedures approved by the Board of Trustees.
(b) Fair Value Measurements
Fair value is defined as the price that a Fund would receive upon selling a security in an orderly transaction to an independent buyer in the principal or most advantageous market for the investment. Various inputs are used in determining the value of a Fund’s investments. A three-tier hierarchy of inputs is used to classify fair value measurements for disclosure purposes. The three-tier hierarchy of inputs is summarized in the three broad levels listed below:
| June 30, 2018 | William Blair Funds | 133 |
Notes to Financial Statements (information as of June 30, 2018 is unaudited)
| • | Level 1—Quoted prices (unadjusted) in active markets for an identical security. |
| | |
| • | Level 2—Prices determined using other significant observable inputs. Observable inputs are inputs that other market participants would use in pricing a security. These may include quoted prices for similar securities, interest rates, prepayment speeds, credit risk, and others. In addition, other observable inputs such as foreign exchange rates, benchmark securities indices and foreign futures contracts may be utilized in the valuation of certain foreign securities when significant events occur between the last sale on the foreign securities exchange and the time at which the net asset value of the Fund is calculated. |
| | |
| • | Level 3—Prices determined using significant unobservable inputs. In situations where quoted prices or observable inputs are unavailable (for example, when there is little or no market activity for an investment), unobservable inputs may be used. Unobservable inputs reflect the Fund’s own assumptions about the factors market participants would use in pricing an investment, and are based on the best information available. |
The inputs or methodology used for valuing an investment are not necessarily an indication of the risk associated with investing in those securities.
A description of the valuation methodologies applied to the Funds’ major categories of assets and liabilities measured at fair value on a recurring basis is as follows:
Exchange-Traded Securities
Securities traded on a national securities exchange (or reported on the NASDAQ national market), including exchange-traded funds, are stated at the last reported sales price on the day of valuation. Other securities traded in the over-the-counter market and listed securities for which no sale was reported on that date are stated at the mean between the last reported bid and ask prices. To the extent these securities are actively traded and valuation adjustments are not applied, they are categorized as Level 1 of the fair value hierarchy. Securities traded on inactive markets or valued by reference to similar instruments are generally categorized as Level 2 of the fair value hierarchy.
Fixed Income Securities
Fixed income securities including corporate, convertible and municipal bonds and notes, U.S. government agency obligations, U.S. treasury obligations, sovereign issues, bank loans, convertible preferred securities, asset-backed securities and non-U.S. bonds are generally valued using evaluated prices provided by an independent pricing service. The evaluated prices are formed using various market inputs that the pricing service believes accurately represent the fair value of a security at a particular point in time. The pricing service determines evaluated prices for fixed income securities using inputs including, but not limited to, recent transaction prices for such securities, dealer quotes, transaction prices for other securities with similar characteristics, collateral characteristics, credit quality, payment history, liquidity and market conditions. Securities that use similar valuation techniques and observable inputs as described above are categorized as Level 2 of the fair value hierarchy.
Short-Term Investments
Repurchase agreements and commercial paper are valued at cost, which approximates fair value. These investments are categorized as Level 2 of the fair value hierarchy.
Derivative Instruments
Listed derivatives, such as certain options and futures contracts, that are actively traded are valued based on quoted prices from the exchange on which they are traded most extensively and are categorized as Level 1 of the fair value hierarchy. OTC derivative contracts include forward foreign currency contracts, swap and certain option contracts related to interest rates, foreign currencies, the credit standing of reference entities, equity prices, or commodity prices. Depending on the product and the terms of the transaction, the fair value of OTC derivative products can be modeled taking into account the counterparties’ creditworthiness and using a series of techniques, including simulation models. Many pricing models do not entail material subjectivity because the methodologies employed do not necessitate significant judgments and the pricing inputs are observed from actively quoted markets, as is the case of forward foreign currency contracts and interest rate swaps. A substantial majority of OTC derivative products valued by a Fund using pricing models fall into this category and are categorized as Level 2 of the fair value hierarchy.
| 134 | Semiannual Report | June 30, 2018 |
Notes to Financial Statements (information as of June 30, 2018 is unaudited)
As of June 30, 2018, the value of securities and other assets, segregated by their hierarchical input levels used in determining fair value and by security class or other financial instruments, are shown below (in thousands).
| Investments in securities | | | | | | | | | | Growth | | | Large Cap
Growth | | | Mid Cap
Growth | |
| Level 1—Quoted prices | | | | | | | | | | | | | | | | | | | | |
| Common Stocks | | | | | | | | | | $ | 339,586 | | | $ | 238,842 | | | $ | 61,755 | |
| Level 2—Other significant observable inputs | | | | | | | | | | | | | | | | | | | | |
| Short-Term Investments | | | | | | | | | | | 2,559 | | | | 1,883 | | | | 1,406 | |
| Level 3—Significant unobservable inputs | | | | | | | | | | | | | | | | | | | | |
| None | | | | | | | | | | | — | | | | — | | | | — | |
| Total investments in securities | | | | | | | | | | $ | 342,145 | | | $ | 240,725 | | | $ | 63,161 | |
| | | | | | | | | | | | | | | | | | | | | |
| Investments in securities | | | | | | Small-Mid
Cap Growth | | | Small-Mid
Cap Value | | | Small Cap
Growth | | | Small Cap
Value | |
| Level 1—Quoted prices | | | | | | | | | | | | | | | | | | | | |
| Common Stocks | | | | | | $ | 2,408,793 | | | $ | 2,001 | | | $ | 607,518 | | | $ | 633,981 | |
| Exchange-Traded Fund | | | | | | | — | | | | 62 | | | | 5,776 | | | | 6,464 | |
| Level 2—Other significant observable inputs | | | | | | | | | | | | | | | | | | | | |
| Short-Term Investments | | | | | | | 17,257 | | | | — | | | | 9,560 | | | | 12,056 | |
| Level 3—Significant unobservable inputs | | | | | | | | | | | | | | | | | | | | |
| None | | | | | | | — | | | | — | | | | — | | | | — | |
| Total investments in securities | | | | | | $ | 2,426,050 | | | $ | 2,063 | | | $ | 622,854 | | | $ | 652,501 | |
| | | | | | | | | | | | | | | | | | | | | |
| Investments in securities | | Global
Leaders | | | International
Leaders | | | International
Developed
Plus | | | Institutional
International
Developed
Plus | | | International
Growth | |
| Level 1—Quoted prices | | | | | | | | | | | | | | | | | | | | |
| Common Stocks | | $ | 133,981 | | | $ | 70,810 | | | $ | 26,078 | | | $ | 4,321 | | | $ | 369,538 | |
| Level 2—Other significant observable inputs | | | | | | | | | | | | | | | | | | | | |
| Common Stocks | | | 69,157 | | | | 342,945 | | | | 83,590 | | | | 13,865 | | | | 2,478,292 | |
| Preferred Stocks | | | — | | | | — | | | | — | | | | — | | | | 8,345 | |
| Short-Term Investments | | | 4,055 | | | | 5,855 | | | | 2,837 | | | | 624 | | | | 7,204 | |
| Level 3—Significant unobservable inputs | | | | | | | | | | | | | | | | | | | | |
| Common Stocks | | | — | | | | — | | | | — | | | | — | | | | — | |
| Total investments in securities | | $ | 207,193 | | | $ | 419,610 | | | $ | 112,505 | | | $ | 18,810 | | | $ | 2,863,379 | |
| | | | | | | | | | | | | | | | | | | | | |
| Investments in securities | | Institutional
International
Growth | | | International
Small Cap
Growth | | | Emerging
Markets
Leaders | | | Emerging
Markets
Growth | | | Emerging
Markets
Small Cap
Growth | |
| Level 1—Quoted prices | | | | | | | | | | | | | | | | | | | | |
| Common Stocks | | $ | 276,168 | | | $ | 47,093 | | | $ | 133,655 | | | $ | 229,824 | | | $ | 59,948 | |
| Preferred Stocks | | | — | | | | — | | | | 9,539 | | | | 10,209 | | | | 4,777 | |
| Level 2—Other significant observable inputs | | | | | | | | | | | | | | | | | | | | |
| Common Stocks | | | 1,853,119 | | | | 510,384 | | | | 286,456 | | | | 801,715 | | | | 395,113 | |
| Preferred Stocks | | | 6,240 | | | | — | | | | — | | | | — | | | | — | |
| Short-Term Investments | | | 8,051 | | | | 21,690 | | | | 5,744 | | | | 26,279 | | | | 9,844 | |
| Level 3—Significant unobservable inputs | | | | | | | | | | | | | | | | | | | | |
| Common Stocks | | | — | | | | — | | | | — | | | | — | | | | — | |
| Total investments in securities | | $ | 2,143,578 | | | $ | 579,167 | | | $ | 435,394 | | | $ | 1,068,027 | | | $ | 469,682 | |
| June 30, 2018 | William Blair Funds | 135 |
Notes to Financial Statements (information as of June 30, 2018 is unaudited)
| Investments in securities | | Bond | | | Income | | | Low
Duration | | | Macro
Allocation | |
| Assets | | | | | | | | | | | | | | | | |
| Level 1—Quoted Prices | | | | | | | | | | | | | | | | |
| Common Stocks | | $ | — | | | $ | — | | | $ | — | | | $ | 7,299 | |
| Exchange-Traded Funds | | | — | | | | — | | | | — | | | | 825,402 | |
| Level 2—Other significant observable inputs | | | | | | | | | | | | | | | | |
| Asset-Backed Securities | | | 4,207 | | | | 1,014 | | | | 27,576 | | | | — | |
| Commercial Paper | | | — | | | | 600 | | | | 2,750 | | | | — | |
| Corporate Obligation/Notes | | | 248,728 | | | | 22,211 | | | | 60,391 | | | | — | |
| Foreign Government | | | — | | | | — | | | | — | | | | 27,041 | |
| Purchased Options | | | — | | | | — | | | | — | | | | 3,018 | |
| Short-Term Investments | | | — | | | | 690 | | | | — | | | | 32,991 | |
| U.S. Government and U.S. Agency | | | 266,290 | | | | 39,436 | | | | 83,027 | | | | 314,865 | |
| Level 3—Significant unobservable inputs | | | | | | | | | | | | | | | | |
| None | | | — | | | | — | | | | — | | | | — | |
| Liabilities | | | | | | | | | | | | | | | | |
| Level 1—Quoted Prices | | | | | | | | | | | | | | | | |
| None | | | — | | | | — | | | | — | | | | — | |
| Level 2—Other significant observable inputs | | | | | | | | | | | | | | | | |
| Written Options | | | — | | | | — | | | | — | | | | (509 | ) |
| Level 3—Significant unobservable inputs | | | | | | | | | | | | | | | | |
| None | | | — | | | | — | | | | — | | | | — | |
| Total investments in securities | | $ | 519,225 | | | $ | 63,951 | | | $ | 173,744 | | | $ | 1,210,107 | |
| Other financial instruments | | | | | | | | | | | | | | | | |
| Assets | | | | | | | | | | | | | | | | |
| Level 1—Quoted Prices | | | | | | | | | | | | | | | | |
| Futures Contracts | | $ | — | | | $ | — | | | $ | — | | | $ | 14,635 | |
| Level 2—Other significant observable inputs | | | | | | | | | | | | | | | | |
| Forward Foreign Currency Contracts | | | — | | | | — | | | | — | | | | 27,253 | |
| Swaps | | | 56 | | | | — | | | | — | | | | 296 | |
| Level 3—Significant unobservable inputs | | | | | | | | | | | | | | | | |
| None | | | — | | | | — | | | | — | | | | — | |
| Liabilities | | | | | | | | | | | | | | | | |
| Level 1—Quoted Prices | | | | | | | | | | | | | | | | |
| Futures Contracts | | | — | | | | — | | | | — | | | | (5,912 | ) |
| Level 2—Other significant observable inputs | | | | | | | | | | | | | | | | |
| Forward Foreign Currency Contracts | | | — | | | | — | | | | — | | | | (12,496 | ) |
| Swaps | | | — | | | | — | | | | — | | | | (5,223 | ) |
| U.S. Government Agency | | | — | | | | (4,860 | ) | | | (14,579 | ) | | | — | |
| Level 3—Significant unobservable inputs | | | | | | | | | | | | | | | | |
| None | | | — | | | | — | | | | — | | | | — | |
| Total Other Financial Instruments | | $ | 56 | | | $ | (4,860 | ) | | $ | (14,579 | ) | | $ | 18,553 | |
Level 1 Common Stocks are exchange-traded securities with a quoted price. See Portfolio of Investments for Sector Classification.
The fair value estimates for the Level 3 securities in the International Growth and Institutional International Growth Funds were determined in good faith by the Pricing Committee, pursuant to the Valuation Procedures approved by the Board of Trustees. There were various factors considered in reaching these fair value determinations, including, but not limited to, the following: the type of security, the extent of public trading of the security, information obtained from a broker-dealer for the security, and analysis of the company’s performance and market trends that influence its performance. Level 3 securities represented 0.00% and 0.00% as a percentage of net assets in the International Growth and Institutional International Growth Funds, respectively. The change in net unrealized gain (loss) related to those securities held at June 30, 2018 is included in the Change in net unrealized appreciation (depreciation) of Investments in the Statements of Operations.
| 136 | Semiannual Report | June 30, 2018 |
Notes to Financial Statements (information as of June 30, 2018 is unaudited)
(4) Transactions with Affiliates
(a) Management and Expense Limitation Agreements
Each Fund has a management agreement with the Adviser for investment management, clerical, bookkeeping and administrative services. Each Fund pays the Adviser an annual management fee, which is accrued daily and paid monthly, based on a specified percentage of the Fund’s average daily net assets. Each Fund’s annual management fee rate is as follows:
| Domestic Equity Funds | | |
| Growth | | | 0.75 | % |
| Large Cap Growth | | | 0.70 | % |
| Mid Cap Growth | | | 0.95 | % |
| Small-Mid Cap Growth | | | 1.00 | % |
| Small-Mid Cap Value | | | 1.00 | % |
| Small Cap Growth | | | 1.10 | % |
| Small Cap Value | | | 1.10 | % |
| | | | | |
| Fixed Income Funds | | | | |
| Bond | | | 0.30 | % |
| Income1: | | | | |
| First $250 million | | | 0.25 | % |
| In excess of $250 million | | | 0.20 | % |
| Low Duration | | | 0.30 | % |
| | | | | |
| Multi-Asset and Alternative Fund | | | | |
| Macro Allocation | | | 0.80 | % |
| | | | | |
| Global Equity Fund | | | | |
| Global Leaders2 | | | 0.95 | % |
| International Equity Funds | | |
| International Leaders3 | | | 0.90 | % |
| International Developed Plus4 | | | 0.90 | % |
| Institutional International Developed Plus: | | | | |
| First $500 million | | | 0.90 | % |
| Next $500 million | | | 0.85 | % |
| In excess of $1 billion | | | 0.80 | % |
| International Growth: | | | | |
| First $250 million | | | 1.10 | % |
| Next $2.25 billion | | | 1.00 | % |
| Next $2.5 billion | | | 0.975 | % |
| Next $5 billion | | | 0.95 | % |
| Next $5 billion | | | 0.925 | % |
| In excess of $15 billion | | | 0.90 | % |
| Institutional International Growth: | | | | |
| First $500 million | | | 1.00 | % |
| Next $500 million | | | 0.95 | % |
| Next $1.5 billion | | | 0.90 | % |
| Next $2.5 billion | | | 0.875 | % |
| Next $5 billion | | | 0.85 | % |
| Next $5 billion | | | 0.825 | % |
| In excess of $15 billion | | | 0.80 | % |
| International Small Cap Growth | | | 1.00 | % |
| Emerging Markets Leaders | | | 1.10 | % |
| Emerging Markets Growth | | | 1.10 | % |
| Emerging Markets Small Cap Growth | | | 1.10 | % |
| 1 | Management fee also includes a charge of 5% of gross income. |
| 2 | Prior to May 1, 2018, the Global Leaders Fund paid a management fee at a rate of 1.00% of the Fund’s average daily net assets. Effective May 1, 2018, the management fee paid to the Adviser was reduced to 0.95%. |
| 3 | Prior to May 1, 2018, the International Leaders Fund paid a management fee at a rate of 0.95% of the Fund’s average daily net assets. Effective May 1, 2018, the management fee paid to the Adviser was reduced to 0.90%. |
| 4 | Prior to May 1, 2018, the International Developed Plus Fund paid a management fee at a rate of 1.00% of the first $250 million of the Fund’s average daily net assets; plus 0.90% of the Fund’s average daily net assets over $250 million. Effective May 1, 2018, the management fee paid to the Adviser was reduced to 0.90% of the Fund’s average daily net assets. |
| June 30, 2018 | William Blair Funds | 137 |
Notes to Financial Statements (information as of June 30, 2018 is unaudited)
The Funds have also entered into an Amended and Restated Expense Limitation Agreement with the Adviser. Under the terms of the agreement, the Adviser will waive its management fee and/or reimburse a Fund for certain operating expenses, subject to certain excluded expenses, in excess of the agreed upon rate through April 30, 2019. The amount the Adviser owes a Fund as of the reporting date is recorded as Receivable from Adviser in the Statements of Assets and Liabilities. The Adviser reimburses the Funds on a monthly basis. The Adviser will waive fees and/or reimburse expenses to the extent that the total operating expenses for the stated class of the Funds, subject to certain excluded expenses, exceed the following rates (as a percentage of average daily net assets):
| | | Class N | | Class I | | Institutional Class |
| Fund | | Effective
May 1, 2018
through
April 30,
2019 | | Effective
May 1, 2017
through
April 30,
2018 | | Effective
May 1, 2018
through
April 30,
2019 | | Effective
May 1, 2017
through
April 30,
2018 | | Effective
May 1, 2018
through
April 30,
2019 | | Effective
May 1, 2017
through
April 30,
2018 |
| Growth | | 1.20 | % | | 1.20 | % | | 0.95 | % | | 0.95 | % | | N/A | | | N/A | |
| Large Cap Growth | | 1.05 | % | | 1.05 | % | | 0.80 | % | | 0.80 | % | | N/A | | | N/A | |
| Mid Cap Growth | | 1.20 | % | | 1.30 | % | | 0.95 | % | | 1.05 | % | | N/A | | | N/A | |
| Small-Mid Cap Growth | | 1.35 | % | | 1.35 | % | | 1.10 | % | | 1.10 | % | | N/A | | | N/A | |
| Small-Mid Cap Value | | 1.25 | % | | 1.35 | % | | 1.00 | % | | 1.10 | % | | N/A | | | N/A | |
| Small Cap Growth | | 1.50 | % | | 1.50 | % | | 1.25 | % | | 1.25 | % | | N/A | | | N/A | |
| Small Cap Value | | 1.50 | % | | 1.50 | % | | 1.25 | % | | 1.25 | % | | N/A | | | N/A | |
| Global Leaders | | 1.30 | % | | 1.40 | % | | 1.05 | % | | 1.15 | % | | 1.00 | % | | 1.00 | % |
| International Leaders | | 1.25 | % | | 1.35 | % | | 1.00 | % | | 1.10 | % | | 0.95 | % | | 0.95 | % |
| International Developed Plus | | 1.25 | % | | 1.30 | % | | 1.00 | % | | 1.05 | % | | N/A | | | N/A | |
| Institutional International Developed Plus | | N/A | | | N/A | | | N/A | | | N/A | | | 0.90 | % | | 0.90 | % |
| International Growth | | 1.45 | % | | 1.45 | % | | 1.20 | % | | 1.20 | % | | N/A | | | N/A | |
| Institutional International Growth | | N/A | | | N/A | | | N/A | | | N/A | | | 1.05 | % | | 1.05 | % |
| International Small Cap Growth | | 1.55 | % | | 1.65 | % | | 1.30 | % | | 1.40 | % | | 1.25 | % | | 1.25 | % |
| Emerging Markets Leaders | | 1.55 | % | | 1.65 | % | | 1.30 | % | | 1.40 | % | | 1.25 | % | | 1.25 | % |
| Emerging Markets Growth | | 1.60 | % | | 1.70 | % | | 1.35 | % | | 1.45 | % | | 1.30 | % | | 1.30 | % |
| Emerging Markets Small Cap Growth | | 1.55 | % | | 1.65 | % | | 1.30 | % | | 1.40 | % | | 1.25 | % | | 1.25 | % |
| Bond | | 0.60 | % | | 0.65 | % | | 0.45 | % | | 0.50 | % | | 0.40 | % | | 0.35 | % |
| Income | | 0.85 | % | | 0.85 | % | | 0.70 | % | | 0.70 | % | | N/A | | | N/A | |
| Low Duration | | 0.55 | % | | 0.65 | % | | 0.40 | % | | 0.50 | % | | 0.35 | % | | 0.35 | % |
| Macro Allocation | | 1.25 | % | | 1.35 | % | | 1.00 | % | | 1.10 | % | | 0.95 | % | | 0.95 | % |
| 138 | Semiannual Report | June 30, 2018 |
Notes to Financial Statements (information as of June 30, 2018 is unaudited)
For the period ended June 30, 2018, the fee waivers and/or expense reimbursements received by each Fund were as follows (in thousands):
| Fund | | Fund
Level
Waiver | | Class N
Specific
Waiver | | Class I
Specific
Waiver | | Total
Waiver |
| Growth | | $ — | | $ — | | $ — | | $ — |
| Large Cap Growth | | — | | 16 | | 63 | | 79 |
| Mid Cap Growth | | 49 | | 4 | | 43 | | 96 |
| Small-Mid Cap Growth | | — | | 115 | | 412 | | 527 |
| Small-Mid Cap Value | | 52 | | — | | 1 | | 53 |
| Small Cap Growth | | — | | 15 | | — | | 15 |
| Small Cap Value | | — | | 8 | | 131 | | 139 |
| Global Leaders | | 79 | | 1 | | 2 | | 82 |
| International Leaders | | 94 | | 2 | | 4 | | 100 |
| International Developed Plus | | 47 | | 2 | | 59 | | 108 |
| Institutional International Developed Plus | | 63 | | — | | — | | 63 |
| International Growth | | — | | 12 | | — | | 12 |
| Institutional International Growth | | — | | — | | — | | — |
| International Small Cap Growth | | — | | — | | — | | — |
| Emerging Markets Leaders | | — | | 1 | | — | | 1 |
| Emerging Markets Growth | | — | | — | | — | | — |
| Emerging Markets Small Cap Growth | | 40 | | 2 | | 13 | | 55 |
| Bond | | 3 | | 16 | | 19 | | 38 |
| Income | | — | | 7 | | — | | 7 |
| Low Duration | | 59 | | — | | — | | 59 |
| Macro Allocation | | — | | — | | — | | — |
(b) Underwriting, Distribution Services, and Shareholder Administration Agreements
Pursuant to separate Underwriting and Distribution Agreements, WBC is the principal underwriter and distributor for the continuous offering of shares of the Trust and acts as agent of the Trust in the sale of its shares. The Underwriting Agreement provides that the Distributor will use its best efforts to distribute the Trust’s shares. The Distributor is not compensated under the Underwriting Agreement.
Each Fund, except the Institutional International Developed Plus Fund and Institutional International Growth Fund, has a Distribution Agreement with WBC for distribution services to the Funds’ Class N shares. Each Fund pays WBC an annual fee, payable monthly, based on a specified percentage of its average daily net assets of Class N shares. The annual rate expressed as a percentage of average daily net assets for Class N is 0.25% for all Funds except the Bond, Income and Low Duration Funds, which is 0.15%. Pursuant to the Distribution Agreement, WBC enters into related selling group agreements with various firms at various rates for sales of the Funds’ Class N shares.
The Global Leaders, International Leaders, International Small Cap Growth, Emerging Markets Leaders, Emerging Markets Growth, Emerging Markets Small Cap Growth, Bond, Low Duration and Macro Allocation Funds have a Shareholder Administration Agreement with WBC to provide shareholder administration services to Class N and Class I shares. Class N and Class I shares of the Funds previously agreed to pay an annual fee, payable monthly, of 0.15% of average daily net assets attributable to each class, respectively, all of which had been waived by WBC since January 2015. Effective January 1, 2018, the fee was reduced to 0.00%. WBC has provided, and continues to provide, shareholder administration services pursuant to the Shareholder Administration Agreements.
| June 30, 2018 | William Blair Funds | 139 |
Notes to Financial Statements (information as of June 30, 2018 is unaudited)
(5) Investment Transactions
Investment transactions, excluding U.S. government securities and securities whose maturities or expiration dates at the time of purchase were one year or less, for the period ended June 30, 2018, were as follows (in thousands):
| Fund | | Purchases | | | Sales | |
| Growth | | $ | 87,051 | | | $ | 143,522 | |
| Large Cap Growth | | | 53,788 | | | | 43,413 | |
| Mid Cap Growth | | | 19,185 | | | | 42,357 | |
| Small-Mid Cap Growth | | | 1,045,317 | | | | 608,711 | |
| Small-Mid Cap Value | | | 1,553 | | | | 3,043 | |
| Small Cap Growth | | | 240,311 | | | | 186,508 | |
| Small Cap Value | | | 232,862 | | | | 277,528 | |
| Global Leaders | | | 41,824 | | | | 60,269 | |
| International Leaders | | | 89,322 | | | | 49,379 | |
| International Developed Plus | | | 35,541 | | | | 38,282 | |
| Institutional International Developed Plus | | | 6,354 | | | | 6,100 | |
| International Growth | | | 1,083,922 | | | | 1,250,858 | |
| Institutional International Growth | | | 877,380 | | | | 1,001,172 | |
| International Small Cap Growth | | | 285,883 | | | | 287,651 | |
| Emerging Markets Leaders | | | 155,339 | | | | 159,624 | |
| Emerging Markets Growth | | | 695,040 | | | | 863,591 | |
| Emerging Markets Small Cap Growth | | | 492,953 | | | | 445,425 | |
| Bond | | | 100,844 | | | | 87,982 | |
| Income | | | 35,684 | | | | 51,962 | |
| Low Duration | | | 117,308 | | | | 164,886 | |
| Macro Allocation | | | 165,582 | | | | 252,343 | |
Investment transactions in U.S. government securities whose maturities at the time of purchase were greater than one year for the period ended June 30, 2018, were as follows (in thousands):
| Fund | | Purchases | | | Sales | |
| Bond | | $ | — | | | $ | 712 | |
| Income | | | 2,336 | | | | 2,975 | |
| Low Duration | | | — | | | | — | |
| 140 | Semiannual Report | June 30, 2018 |
Notes to Financial Statements (information as of June 30, 2018 is unaudited)
(6) Financial Derivative Instruments
Each Fund may use derivative instruments to maintain liquidity, to provide hedging, or in anticipation of changes in the composition of its portfolio holdings or as otherwise provided in each Fund’s prospectus. Macro Allocation Fund may also use derivative instruments to obtain investment exposures. The derivative instruments held as of June 30, 2018, as disclosed in each Fund’s Portfolios of Investments, are representative of each Fund’s derivative instrument trading activity during the period ended June 30, 2018.
Derivative transactions carry counterparty risk as they are based on contracts between a Fund and the applicable counterparty. For exchange-traded or cleared derivative contracts, such counterparty risk is limited due to the role of the exchange or clearinghouse. OTC derivative contracts, however, are exposed to counterparty risk in the amount of unrealized gains, net of collateral held, for the duration of the contract.
Macro Allocation Fund is subject to certain netting arrangements through International Swaps and Derivatives Association, Inc. Master Agreements and Credit Support Annexes (“ISDAs”). The ISDAs maintain provisions for general obligations, representations, agreements, collateral and events of default or termination. The ISDAs cover certain OTC derivative securities entered into by Macro Allocation Fund with various counterparties and allow Macro Allocation Fund to close out and net its total exposure to a counterparty in the event of a default.
Futures Contracts
A futures contract provides for the future sale by one party and purchase by another party of a specified amount of a specific financial instrument for a specified price at a designated date, time and place. An index futures contract is an agreement pursuant to which the parties agree to take or make delivery of an amount of cash equal to the difference between the value of the index at the close of the last trading day of the contract and the price at which the index futures contract was originally written. A futures contract can be closed out prior to delivery by entering into an offsetting transaction in a matching futures contract. Although the value of an index might be a function of the value of certain specified securities, no physical delivery of those securities is made. If the offsetting purchase price is less than the original sale price, a Fund realizes a gain; if it is more, a Fund realizes a loss. Conversely, if the offsetting sale price is more than the original purchase price, a Fund realizes a gain; if it is less, a Fund realizes a loss. The transaction costs must also be included in these calculations. There can be no assurance, however, that a Fund will be able to enter into an offsetting transaction with respect to a particular futures contract at a particular time. If a Fund is not able to enter into an offsetting transaction, a Fund will continue to be required to maintain the margin deposits on the futures contract.
Upon entering into a futures contract, a Fund is required to pledge to the broker an amount of cash, U.S. government securities, or other liquid assets equal to a certain percentage of the contract amount (“initial margin deposit”). Futures contracts are marked to market daily and an appropriate payable or receivable for the change in value (“variation margin”) is recorded by a Fund and a cash payment is either made to or received from the broker each day. Gains or losses on futures contracts are recognized but not considered realized until the contracts expire or are closed and are included in the Statement of Operations.
Options
The purchase or sale of an option by a Fund involves the payment or receipt of a premium by the investor and the corresponding right or obligation, as the case may be, either to purchase or sell the underlying security, commodity, or other instrument for a specific price at a certain time or during a certain period. Purchasing options involves the risk that the underlying instrument will not change price in the manner expected, so the investor loses its premium. Writing options involves potentially greater risk because the investor is exposed to the extent of the actual price movement in the underlying security rather than only the amount of the premium paid (which could result in a potentially unlimited loss). OTC options also involve counterparty credit risk. Purchased options are shown as an asset in the Statement of Assets and Liabilities and are included in Investments in securities. Premiums received for written options are shown as a liability in the Statement of Assets and Liabilities. Realized gains and losses on the sale, expiration or assignment of an option are disclosed in the Statement of Operations.
Forward Foreign Currency Contracts
The Global Equity, International Equity and Multi-Asset and Alternative Funds may enter into forward foreign currency contracts. When entering into a forward foreign currency contract, a Fund agrees to receive or deliver a fixed quantity of foreign currency for an agreed-upon price on an agreed future date. A Fund’s net equity therein, representing unrealized gain or loss on the contracts as measured by the difference between the forward foreign exchange rates at the dates of entry into the contracts and
| June 30, 2018 | William Blair Funds | 141 |
Notes to Financial Statements (information as of June 30, 2018 is unaudited)
the forward rates at the reporting date, is included in the Statement of Assets and Liabilities as unrealized appreciation/depreciation on forward foreign currency contracts. Realized and unrealized gains and losses are included in the Statement of Operations. These instruments may involve market risk, credit risk, or both kinds of risks in excess of the amount recognized in the Statement of Assets and Liabilities. Risks arise from the possible inability of counterparties to meet the terms of their contracts and from the price movements in currencies.
Swap Contracts
Swap agreements may include total return, interest rate, securities index, commodity, security, currency exchange rate, credit default index, volatility and variance swaps. Cleared swaps are transacted through futures commission merchants that are members of central clearing houses with the clearing house serving as a central counterparty similar to transactions in futures contracts. In a standard “swap” transaction, two parties agree to exchange the returns (or differentials in rates of return) earned or realized on particular predetermined investments or instruments. The gross returns to be exchanged or “swapped” between the parties are calculated with respect to a “notional amount” (i.e., the change in the value of a particular dollar amount invested, for example, at a particular interest rate, in a particular foreign currency, or in a “basket” of securities representing a particular index). Swap agreements are subject to the risk that the counterparty to the swap will default on its obligation to pay a Fund and the risk that a Fund will not be able to meet its obligations to pay the counterparty to the swap. Swap agreements may also involve fees, commissions or other costs that may reduce a Fund’s gains from a swap agreement or may cause a Fund to lose money. To the extent permitted by its investment policies and restrictions, a Fund may invest in the following types of swaps:
Credit Default Swaps—A Fund may invest in credit default swaps as a means of “buying” credit protection (i.e., attempting to mitigate the risk of default or credit quality deterioration in some portion of a Fund’s holdings) or “selling” credit protection (i.e., attempting to gain exposure to an underlying issuer’s credit quality characteristics without directly investing in that issuer). A credit default swap is a contract between a buyer and a seller of protection against a pre-defined credit event (e.g., a ratings downgrade or default) on an underlying reference obligation, which may be a single debt instrument or baskets or indices of securities. A Fund may be a buyer or seller of a credit default swap. As a seller of protection on credit default swap agreements, a Fund will generally receive from the buyer of protection a fixed rate of income throughout the term of the swap provided that there is no credit event. A Fund adds leverage to its portfolio because the Fund is subject to investment exposure on the notional amount of the swap. The maximum potential amount of future payments that a Fund as a seller of protection could be required to make under a credit default swap agreement equals the notional amount of the agreement. Notional amounts of each individual credit default swap agreement outstanding as of the period end for which a Fund is the seller of protection are disclosed in the Fund’s Portfolio of Investments. These potential amounts would be partially offset by any recovery values of the respective referenced obligations, upfront payments received upon entering into the agreement, or net amounts received from the settlement of buy protection credit default swap agreements entered into by the same Fund for the same referenced entity or entities. For credit default swap contracts on credit indices, the quoted market prices and resulting values serve as an indicator of the payment performance risk. Increasing market values, in absolute terms when compared to the notional amount of the swap, typically represent deterioration of the referenced entities’ credit soundness and a greater likelihood or risk of default or other credit event occurring as defined under the terms of the swap.
Interest Rate Swap—A Fund may invest in interest rate swaps to gain or mitigate exposure to changes in interest rates. Interest rate swap agreements involve a commitment between parties to pay either a fixed interest rate or a floating interest rate based on a notional amount of principal. The parties make payments at predetermined intervals throughout the life of the swap. As a payer, a Fund would make the fixed payment and receive the floating payment. As a receiver, a Fund would make the floating payment and receive the fixed payment.
Total Return Swap—A Fund may invest in total return swaps to gain or mitigate exposure to an underlying security, or securities. Total return swap agreements may involve commitments to pay interest in exchange for the return on the underlying security, or securities. At maturity, a net cash flow is exchanged between the parties based on the total return of the underlying security, or securities, less a financing rate. As a receiver in the transaction, a Fund would receive a payment for a positive return and would make a payment for a negative return. As a payer in the transaction, a Fund would make a payment for a positive return and would receive a payment for a negative return.
Variance Swap—A Fund may invest in variance swaps in order to gain or mitigate its exposure to an underlying reference entity such as a broad based index. A variance swap is an agreement between two parties to exchange cash flows based on the measured variance of a reference entity. The payer agrees to exchange the fixed rate, which is the variance strike price of the reference
| 142 | Semiannual Report | June 30, 2018 |
Notes to Financial Statements (information as of June 30, 2018 is unaudited)
entity, to the receiver for the floating rate, which is the realized variance price of the reference entity. At the time the trade is originated, the agreed upon variance strike price is generally set so that the fair value of the swap is near zero. At maturity, a net cash flow is exchanged between the parties based on the difference between the final realized variance price of the swap and the variance strike price multiplied by the notional, or vega amount. As a receiver of the floating rate, a Fund would receive a payment if the final realized variance price is greater than the variance strike price and would make a payment if the final realized variance price is less than the variance strike price. As a payer of the floating rate, a Fund would receive a payment if the final realized variance price is less than the variance strike price and would make a payment if the final realized variance price is greater than the variance strike price.
The following table presents the value of financial derivative instruments, by Fund and primary risk exposure, as of June 30, 2018 and their respective location in the Statements of Assets and Liabilities (in thousands):
| | | Assets | | | Liabilities | |
Fund and
Primary Risk Exposure | | Statements of Assets
and Liabilities | | Value | | | Statements of Assets
and Liabilities | | Value | |
| Bond | | | | | | | | | | | | | | |
| Credit | | Receivable for variation margin on centrally cleared swaps | | | $ | 56 | | | Payable for variation margin on centrally cleared swaps | | | $ | — | |
| Macro Allocation | | | | | | | | | | | | | | |
| Credit | | Receivable for variation margin on centrally cleared swaps | | | | — | | | Payable for variation margin on centrally cleared swaps | | | | 274 | |
| Currency | | Unrealized appreciation on forward foreign currency contracts | | | | 27,253 | | | Unrealized depreciation on forward foreign currency contracts | | | | 12,496 | |
| Currency | | Investments in securities, at value | | | | 1,112 | | | Options written, at value | | | | — | |
| Equity | | Receivable for variation margin on futures | | | | 14,635 | | | Payable for variation margin on futures | | | | 5,478 | |
| Equity | | Investments in securities, at value | | | | 833 | | | Options written, at value | | | | — | |
| Equity | | Unrealized appreciation on swap contracts | | | | 296 | | | Unrealized depreciation on swap contracts | | | | 2,987 | |
| Interest rate | | Investments in securities, at value | | | | 1,073 | | | Options written, at value | | | | 509 | |
| Interest rate | | Unrealized appreciation on swap contracts | | | | — | | | Unrealized depreciation on swap contracts | | | | 1,322 | |
| Interest rate | | Receivable for variation margin on futures | | | | — | | | Payable for variation margin on futures | | | | 434 | |
| Interest rate | | Receivable for variation margin on centrally cleared swaps | | | | — | | | Payable for variation margin on centrally cleared swaps | | | | 640 | |
The table above includes cumulative appreciation/(depreciation) on futures contracts and centrally cleared swaps as reported in the applicable Fund’s Portfolio of Investments. Variation margin receivable/payable on futures contracts and centrally cleared swaps is reported within the Statements of Assets and Liabilities.
| June 30, 2018 | William Blair Funds | 143 |
Notes to Financial Statements (information as of June 30, 2018 is unaudited)
The following table indicates the effect of derivatives, by Fund and primary risk exposure, in the Statements of Operations for the period ended June 30, 2018 (in thousands):
| | | Realized Gain (Loss) | | | Change in Net Unrealized
Appreciation (Depreciation) | |
Fund and
Primary Risk Exposure | | Statements of Operations | | Value | | | Statements of Operations | | Value | |
| Bond | | | | | | | | | | | | | | |
| Credit | | Swaps | | | $ | (51 | ) | | Swaps | | | $ | 102 | |
| Macro Allocation | | | | | | | | | | | | | | |
| Credit | | Swaps | | | | 176 | | | Swaps | | | | (397 | ) |
| Currency | | Forward foreign currency contracts | | | | 5,537 | | | Forward foreign currency contracts | | | | 14,792 | |
| Currency | | Options | | | | 1,458 | | | Options | | | | 109 | |
| Equity | | Futures contracts | | | | (39,047 | ) | | Futures contracts | | | | 24,560 | |
| Equity | | Options | | | | (1,711 | ) | | Options | | | | (176 | ) |
| Equity | | Swaps | | | | 5,644 | | | Swaps | | | | (7,264 | ) |
| Interest rate | | Futures contracts | | | | 454 | | | Futures contracts | | | | (532 | ) |
| Interest rate | | Options | | | | (5,263 | ) | | Options | | | | 378 | |
| Interest rate | | Swaps | | | | 2,464 | | | Swaps | | | | (2,390 | ) |
The following table is a summary by counterparty of the derivative instruments and collateral pledged/(received) included in the Macro Allocation Fund’s Statement of Assets and Liabilities at June 30, 2018 (in thousands):
| | | Financial Derivative Assets | | Financial Derivative Liabilities | | | | | | | | | |
| | | Forward | | | | | | | | | | | Forward | | | | | | | | | | | | | | | | | | |
| | | Foreign | | | | | | | | | | | Foreign | | | | | | | | | | | Net | | Collateral | | | |
| | | Currency | | Purchased | | | | | | | | Currency | | Written | | | | | | | | Market | | Pledged | | Net |
| Counterparty | | Contracts | | Options | | Swaps | | Total | | Contracts | | Options | | Swaps | | Total | | Value | | (Received) | | Exposure |
| Citibank N.A. | | | $27,253 | | | | $2,185 | | | | $153 | | | $ | 29,591 | | | | $(12,496 | ) | | | $(509 | ) | | $ | (1,162 | ) | | $ | (14,167 | ) | | $ | 15,424 | | | | $(16,840 | ) | | | $(1,416 | ) |
| Credit Suisse | | | — | | | | 833 | | | | — | | | | 833 | | | | — | | | | — | | | | (1,322 | ) | | | (1,322 | ) | | | (489 | ) | | | 5,133 | | | | 4,644 | |
| Goldman Sachs | | | — | | | | — | | | | 143 | | | | 143 | | | | — | | | | — | | | | (1,825 | ) | | | (1,825 | ) | | | (1,682 | ) | | | 496 | | | | (1,186 | ) |
The net exposure represents the amount due from/(due to) the counterparty in the event of default. Any net exposure is generally due to changes in market value of the underlying derivative instruments on the last day of the period as timing of collateral movement occurs the following day. For Credit Suisse, the exposure is due to initial margin requirements of approximately $4,555 (in thousands) for total return swaps on futures.
| 144 | Semiannual Report | June 30, 2018 |
Notes to Financial Statements (information as of June 30, 2018 is unaudited)
(7) Fund Share Transactions
The following tables summarize the activity in capital shares of each Fund for the period ended June 30, 2018 (in thousands):
| | | Class N | |
| | | Dollars | | | Shares | |
| Fund | | Sales | | | Reinvest | | | Redemptions | | | Total | | | Sales | | | Reinvest | | | Redemptions | | | Total | |
| Growth | | $ | 13,146 | | | $ | — | | | $ | 6,799 | | | $ | 6,347 | | | | 1,174 | | | | — | | | | 610 | | | | 564 | |
| Large Cap Growth | | | 15,388 | | | | — | | | | 4,887 | | | | 10,501 | | | | 1,063 | | | | — | | | | 339 | | | | 724 | |
| Mid Cap Growth | | | 396 | | | | — | | | | 1,172 | | | | (776 | ) | | | 34 | | | | — | | | | 105 | | | | (71 | ) |
| Small-Mid Cap Growth | | | 272,376 | | | | — | | | | 45,981 | | | | 226,395 | | | | 11,057 | | | | — | | | | 1,853 | | | | 9,204 | |
| Small-Mid Cap Value | | | 19 | | | | — | | | | 3 | | | | 16 | | | | 1 | | | | — | | | | — | | | | 1 | |
| Small Cap Growth | | | 57,697 | | | | — | | | | 29,622 | | | | 28,075 | | | | 1,951 | | | | — | | | | 1,050 | | | | 901 | |
| Small Cap Value | | | 1,438 | | | | — | | | | 4,829 | | | | (3,391 | ) | | | 73 | | | | — | | | | 241 | | | | (168 | ) |
| Global Leaders | | | 982 | | | | — | | | | 610 | | | | 372 | | | | 63 | | | | — | | | | 40 | | | | 23 | |
| International Leaders | | | 2,008 | | | | — | | | | 1,539 | | | | 469 | | | | 119 | | | | — | | | | 92 | | | | 27 | |
| International Developed Plus | | | 207 | | | | — | | | | 868 | | | | (661 | ) | | | 12 | | | | — | | | | 52 | | | | (40 | ) |
| International Growth | | | 33,030 | | | | — | | | | 83,026 | | | | (49,996 | ) | | | 1,069 | | | | — | | | | 2,678 | | | | (1,609 | ) |
| International Small Cap Growth | | | 45 | | | | — | | | | 373 | | | | (328 | ) | | | 3 | | | | — | | | | 24 | | | | (21 | ) |
| Emerging Markets Leaders | | | 1,944 | | | | — | | | | 2,085 | | | | (141 | ) | | | 176 | | | | — | | | | 186 | | | | (10 | ) |
| Emerging Markets Growth | | | 1,779 | | | | — | | | | 1,460 | | | | 319 | | | | 109 | | | | — | | | | 91 | | | | 18 | |
| Emerging Markets Small Cap Growth | | | 2,232 | | | | — | | | | 4,265 | | | | (2,033 | ) | | | 121 | | | | — | | | | 225 | | | | (104 | ) |
| Bond | | | 17,285 | | | | 1,743 | | | | 13,147 | | | | 5,881 | | | | 1,694 | | | | 172 | | | | 1,296 | | | | 570 | |
| Income | | | 1,478 | | | | 577 | | | | 14,794 | | | | (12,739 | ) | | | 173 | | | | 67 | | | | 1,730 | | | | (1,490 | ) |
| Low Duration | | | 1,134 | | | | 25 | | | | 898 | | | | 261 | | | | 128 | | | | 3 | | | | 101 | | | | 30 | |
| Macro Allocation | | | 4,916 | | | | — | | | | 10,343 | | | | (5,427 | ) | | | 413 | | | | — | | | | 872 | | | | (459 | ) |
| | | | |
| | | Class I | |
| | | Dollars | | | Shares | |
| Fund | | Sales | | | Reinvest | | | Redemptions | | | Total | | | Sales | | | Reinvest | | | Redemptions | | | Total | |
| Growth | | $ | 7,500 | | | $ | — | | | $ | 68,439 | | | $ | (60,939 | ) | | | 599 | | | | — | | | | 5,451 | | | | (4,852 | ) |
| Large Cap Growth | | | 13,992 | | | | — | | | | 12,361 | | | | 1,631 | | | | 924 | | | | — | | | | 822 | | | | 102 | |
| Mid Cap Growth | | | 4,462 | | | | — | | | | 26,037 | | | | (21,575 | ) | | | 357 | | | | — | | | | 2,130 | | | | (1,773 | ) |
| Small-Mid Cap Growth | | | 396,348 | | | | — | | | | 181,752 | | | | 214,596 | | | | 15,087 | | | | — | | | | 7,029 | | | | 8,058 | |
| Small-Mid Cap Value | | | 158 | | | | — | | | | 1,733 | | | | (1,575 | ) | | | 11 | | | | — | | | | 125 | | | | (114 | ) |
| Small Cap Growth | | | 72,342 | | | | — | | | | 39,421 | | | | 32,921 | | | | 2,256 | | | | — | | | | 1,249 | | | | 1,007 | |
| Small Cap Value | | | 38,009 | | | | — | | | | 76,878 | | | | (38,869 | ) | | | 1,866 | | | | — | | | | 3,761 | | | | (1,895 | ) |
| Global Leaders | | | 9,231 | | | | — | | | | 3,030 | | | | 6,201 | | | | 595 | | | | — | | | | 198 | | | | 397 | |
| International Leaders | | | 22,820 | | | | — | | | | 7,079 | | | | 15,741 | | | | 1,364 | | | | — | | | | 422 | | | | 942 | |
| International Developed Plus | | | 557 | | | | — | | | | 4,738 | | | | (4,181 | ) | | | 33 | | | | — | | | | 285 | | | | (252 | ) |
| International Growth | | | 112,126 | | | | — | | | | 245,564 | | | | (133,438 | ) | | | 3,513 | | | | — | | | | 7,761 | | | | (4,248 | ) |
| International Small Cap Growth | | | 61,841 | | | | — | | | | 47,124 | | | | 14,717 | | | | 3,941 | | | | — | | | | 2,949 | | | | 992 | |
| Emerging Markets Leaders | | | 7,155 | | | | — | | | | 5,918 | | | | 1,237 | | | | 640 | | | | — | | | | 526 | | | | 114 | |
| Emerging Markets Growth | | | 23,149 | | | | — | | | | 26,479 | | | | (3,330 | ) | | | 1,393 | | | | — | | | | 1,635 | | | | (242 | ) |
| Emerging Markets Small Cap Growth | | | 65,809 | | | | — | | | | 35,005 | | | | 30,804 | | | | 3,535 | | | | — | | | | 1,893 | | | | 1,642 | |
| Bond | | | 47,838 | | | | 6,925 | | | | 68,825 | | | | (14,062 | ) | | | 4,756 | | | | 691 | | | | 6,860 | | | | (1,413 | ) |
| Income | | | 2,273 | | | | 697 | | | | 14,657 | | | | (11,687 | ) | | | 265 | | | | 82 | | | | 1,712 | | | | (1,365 | ) |
| Low Duration | | | 5,197 | | | | 1,421 | | | | 64,853 | | | | (58,235 | ) | | | 587 | | | | 161 | | | | 7,304 | | | | (6,556 | ) |
| Macro Allocation | | | 127,338 | | | | — | | | | 171,359 | | | | (44,021 | ) | | | 10,656 | | | | — | | | | 14,375 | | | | (3,719 | ) |
| June 30, 2018 | William Blair Funds | 145 |
Notes to Financial Statements (information as of June 30, 2018 is unaudited)
| | | Institutional Class | |
| | | Dollars | | | Shares | |
| Fund | | Sales | | | Reinvest | | | Redemptions | | | Total | | | Sales | | | Reinvest | | | Redemptions | | | Total | |
| Global Leaders | | $ | 1,229 | | | $ | — | | | $ | 29,005 | | | $ | (27,776 | ) | | | 80 | | | | — | | | | 1,866 | | | | (1,786 | ) |
| International Leaders | | | 32,904 | | | | — | | | | 9,100 | | | | 23,804 | | | | 1,941 | | | | — | | | | 543 | | | | 1,398 | |
| Institutional International Developed Plus | | | — | | | | — | | | | 49 | | | | (49 | ) | | | — | | | | — | | | | 4 | | | | (4 | ) |
| Institutional International Growth | | | 156,011 | | | | — | | | | 277,881 | | | | (121,870 | ) | | | 8,551 | | | | — | | | | 15,168 | | | | (6,617 | ) |
| International Small Cap Growth | | | 10,373 | | | | — | | | | 23,973 | | | | (13,600 | ) | | | 649 | | | | — | | | | 1,529 | | | | (880 | ) |
| Emerging Markets Leaders | | | 24,589 | | | | — | | | | 35,740 | | | | (11,151 | ) | | | 2,183 | | | | — | | | | 3,268 | | | | (1,085 | ) |
| Emerging Markets Growth | | | 88,155 | | | | — | | | | 238,334 | | | | (150,179 | ) | | | 5,258 | | | | — | | | | 14,634 | | | | (9,376 | ) |
| Emerging Markets Small Cap Growth | | | 37,070 | | | | — | | | | 10,346 | | | | 26,724 | | | | 1,993 | | | | — | | | | 550 | | | | 1,443 | |
| Bond | | | 3,725 | | | | 1,853 | | | | 10,106 | | | | (4,528 | ) | | | 374 | | | | 185 | | | | 1,017 | | | | (458 | ) |
| Low Duration | | | 3,815 | | | | 1,351 | | | | 3,801 | | | | 1,365 | | | | 430 | | | | 153 | | | | 429 | | | | 154 | |
| Macro Allocation | | | 34,688 | | | | — | | | | 55,014 | | | | (20,326 | ) | | | 2,917 | | | | — | | | | 4,663 | | | | (1,746 | ) |
| | | | |
| | | Net Change in Net Assets Relating to Fund Share Activity | |
| | | Dollars | | | Shares | |
| Fund | | Sales | | | Reinvest | | | Redemptions | | | Total | | | Sales | | | Reinvest | | | Redemptions | | | Total | |
| Growth | | $ | 20,646 | | | $ | — | | | $ | 75,238 | | | $ | (54,592 | ) | | | 1,773 | | | | — | | | | 6,061 | | | | (4,288 | ) |
| Large Cap Growth | | | 29,380 | | | | — | | | | 17,248 | | | | 12,132 | | | | 1,987 | | | | — | | | | 1,161 | | | | 826 | |
| Mid Cap Growth | | | 4,858 | | | | — | | | | 27,209 | | | | (22,351 | ) | | | 391 | | | | — | | | | 2,235 | | | | (1,844 | ) |
| Small-Mid Cap Growth | | | 668,724 | | | | — | | | | 227,733 | | | | 440,991 | | | | 26,144 | | | | — | | | | 8,882 | | | | 17,262 | |
| Small-Mid Cap Value | | | 177 | | | | — | | | | 1,736 | | | | (1,559 | ) | | | 12 | | | | — | | | | 125 | | | | (113 | ) |
| Small Cap Growth | | | 130,039 | | | | — | | | | 69,043 | | | | 60,996 | | | | 4,207 | | | | — | | | | 2,299 | | | | 1,908 | |
| Small Cap Value | | | 39,447 | | | | — | | | | 81,707 | | | | (42,260 | ) | | | 1,939 | | | | — | | | | 4,002 | | | | (2,063 | ) |
| Global Leaders | | | 11,442 | | | | — | | | | 32,645 | | | | (21,203 | ) | | | 738 | | | | — | | | | 2,104 | | | | (1,366 | ) |
| International Leaders | | | 57,732 | | | | — | | | | 17,718 | | | | 40,014 | | | | 3,424 | | | | — | | | | 1,057 | | | | 2,367 | |
| International Developed Plus | | | 764 | | | | — | | | | 5,606 | | | | (4,842 | ) | | | 45 | | | | — | | | | 337 | | | | (292 | ) |
| Institutional International Developed Plus | | | — | | | | — | | | | 49 | | | | (49 | ) | | | — | | | | — | | | | 4 | | | | (4 | ) |
| International Growth | | | 145,156 | | | | — | | | | 328,590 | | | | (183,434 | ) | | | 4,582 | | | | — | | | | 10,439 | | | | (5,857 | ) |
| Institutional International Growth | | | 156,011 | | | | — | | | | 277,881 | | | | (121,870 | ) | | | 8,551 | | | | — | | | | 15,168 | | | | (6,617 | ) |
| International Small Cap Growth | | | 72,259 | | | | — | | | | 71,470 | | | | 789 | | | | 4,593 | | | | — | | | | 4,502 | | | | 91 | |
| Emerging Markets Leaders | | | 33,688 | | | | — | | | | 43,743 | | | | (10,055 | ) | | | 2,999 | | | | — | | | | 3,980 | | | | (981 | ) |
| Emerging Markets Growth | | | 113,083 | | | | — | | | | 266,273 | | | | (153,190 | ) | | | 6,760 | | | | — | | | | 16,360 | | | | (9,600 | ) |
| Emerging Markets Small Cap Growth | | | 105,111 | | | | — | | | | 49,616 | | | | 55,495 | | | | 5,649 | | | | — | | | | 2,668 | | | | 2,981 | |
| Bond | | | 68,848 | | | | 10,521 | | | | 92,078 | | | | (12,709 | ) | | | 6,824 | | | | 1,048 | | | | 9,173 | | | | (1,301 | ) |
| Income | | | 3,751 | | | | 1,274 | | | | 29,451 | | | | (24,426 | ) | | | 438 | | | | 149 | | | | 3,442 | | | | (2,855 | ) |
| Low Duration | | | 10,146 | | | | 2,797 | | | | 69,552 | | | | (56,609 | ) | | | 1,145 | | | | 317 | | | | 7,834 | | | | (6,372 | ) |
| Macro Allocation | | | 166,942 | | | | — | | | | 236,716 | | | | (69,774 | ) | | | 13,986 | | | | — | | | | 19,910 | | | | (5,924 | ) |
| 146 | Semiannual Report | June 30, 2018 |
Notes to Financial Statements (information as of June 30, 2018 is unaudited)
The following tables summarize the activity in capital shares of each Fund for the year ended December 31, 2017 (in thousands):
| | | Class N | |
| | | Dollars | | | Shares | |
| Fund | | Sales | | | Reinvest | | | Redemptions | | | Total | | | Sales | | | Reinvest | | | Redemptions | | | Total | |
| Growth | | $ | 2,767 | | | $ | 10,496 | | | $ | 41,517 | | | $ | (28,254 | ) | | | 220 | | | | 1,026 | | | | 3,364 | | | | (2,118 | ) |
| Large Cap Growth | | | 12,606 | | | | 146 | | | | 3,699 | | | | 9,053 | | | | 1,059 | | | | 11 | | | | 309 | | | | 761 | |
| Mid Cap Growth | | | 1,284 | | | | 919 | | | | 13,722 | | | | (11,519 | ) | | | 113 | | | | 85 | | | | 1,153 | | | | (955 | ) |
| Small-Mid Cap Growth | | | 87,018 | | | | 11,824 | | | | 76,905 | | | | 21,937 | | | | 3,871 | | | | 514 | | | | 3,528 | | | | 857 | |
| Small-Mid Cap Value | | | 19 | | | | 28 | | | | 27 | | | | 20 | | | | 2 | | | | 2 | | | | 2 | | | | 2 | |
| Small Cap Growth | | | 66,284 | | | | 23,270 | | | | 69,840 | | | | 19,714 | | | | 2,362 | | | | 884 | | | | 2,439 | | | | 807 | |
| Small Cap Value | | | 4,125 | | | | 2,069 | | | | 10,395 | | | | (4,201 | ) | | | 203 | | | | 104 | | | | 508 | | | | (201 | ) |
| Global Leaders | | | 1,070 | | | | 279 | | | | 780 | | | | 569 | | | | 78 | | | | 19 | | | | 59 | | | | 38 | |
| International Leaders | | | 6,217 | | | | 188 | | | | 1,194 | | | | 5,211 | | | | 432 | | | | 12 | | | | 81 | | | | 363 | |
| International Developed Plus | | | 691 | | | | 55 | | | | 1,088 | | | | (342 | ) | | | 45 | | | | 3 | | | | 70 | | | | (22 | ) |
| International Growth | | | 50,070 | | | | 9,669 | | | | 210,605 | | | | (150,866 | ) | | | 1,863 | | | | 324 | | | | 7,645 | | | | (5,458 | ) |
| International Small Cap Growth | | | 708 | | | | 513 | | | | 7,355 | | | | (6,134 | ) | | | 50 | | | | 34 | | | | 484 | | | | (400 | ) |
| Emerging Markets Leaders | | | 2,641 | | | | 12 | | | | 3,440 | | | | (787 | ) | | | 271 | | | | 1 | | | | 338 | | | | (66 | ) |
| Emerging Markets Growth | | | 682 | | | | 70 | | | | 2,510 | | | | (1,758 | ) | | | 49 | | | | 4 | | | | 179 | | | | (126 | ) |
| Emerging Markets Small Cap Growth | | | 5,081 | | | | 423 | | | | 2,964 | | | | 2,540 | | | | 295 | | | | 24 | | | | 186 | | | | 133 | |
| Bond | | | 20,164 | | | | 3,940 | | | | 66,445 | | | | (42,341 | ) | | | 1,934 | | | | 378 | | | | 6,372 | | | | (4,060 | ) |
| Income | | | 8,700 | | | | 1,377 | | | | 22,470 | | | | (12,393 | ) | | | 986 | | | | 156 | | | | 2,546 | | | | (1,404 | ) |
| Low Duration | | | 786 | | | | 85 | | | | 6,068 | | | | (5,197 | ) | | | 87 | | | | 9 | | | | 672 | | | | (576 | ) |
| Macro Allocation | | | 8,704 | | | | 257 | | | | 31,131 | | | | (22,170 | ) | | | 745 | | | | 22 | | | | 2,675 | | | | (1,908 | ) |
| | | | |
| | | Class I | |
| | | Dollars | | | Shares | |
| Fund | | Sales | | | Reinvest | | | Redemptions | | | Total | | | Sales | | | Reinvest | | | Redemptions | | | Total | |
| Growth | | $ | 25,451 | | | $ | 81,062 | | | $ | 306,735 | | | $ | (200,222 | ) | | | 1,915 | | | | 7,067 | | | | 22,849 | | | | (13,867 | ) |
| Large Cap Growth | | | 50,357 | | | | 884 | | | | 21,605 | | | | 29,636 | | | | 4,124 | | | | 63 | | | | 1,774 | | | | 2,413 | |
| Mid Cap Growth | | | 9,557 | | | | 10,131 | | | | 75,132 | | | | (55,444 | ) | | | 795 | | | | 886 | | | | 6,181 | | | | (4,500 | ) |
| Small-Mid Cap Growth | | | 552,371 | | | | 80,961 | | | | 417,940 | | | | 215,392 | | | | 24,056 | | | | 3,359 | | | | 17,523 | | | | 9,892 | |
| Small-Mid Cap Value | | | 609 | | | | 332 | | | | 737 | | | | 204 | | | | 42 | | | | 24 | | | | 50 | | | | 16 | |
| Small Cap Growth | | | 61,059 | | | | 49,339 | | | | 62,897 | | | | 47,501 | | | | 2,010 | | | | 1,702 | | | | 2,068 | | | | 1,644 | |
| Small Cap Value | | | 91,392 | | | | 45,722 | | | | 169,851 | | | | (32,737 | ) | | | 4,386 | | | | 2,237 | | | | 8,131 | | | | (1,508 | ) |
| Global Leaders | | | 4,803 | | | | 2,421 | | | | 4,692 | | | | 2,532 | | | | 369 | | | | 169 | | | | 351 | | | | 187 | |
| International Leaders | | | 25,424 | | | | 1,177 | | | | 9,441 | | | | 17,160 | | | | 1,779 | | | | 73 | | | | 580 | | | | 1,272 | |
| International Developed Plus | | | 21,920 | | | | 2,098 | | | | 9,628 | | | | 14,390 | | | | 1,398 | | | | 128 | | | | 628 | | | | 898 | |
| International Growth | | | 195,965 | | | | 33,924 | | | | 682,927 | | | | (453,038 | ) | | | 7,092 | | | | 1,111 | | | | 24,114 | | | | (15,911 | ) |
| International Small Cap Growth | | | 49,384 | | | | 26,655 | | | | 104,367 | | | | (28,328 | ) | | | 3,353 | | | | 1,752 | | | | 7,013 | | | | (1,908 | ) |
| Emerging Markets Leaders | | | 12,824 | | | | 317 | | | | 8,364 | | | | 4,777 | | | | 1,302 | | | | 30 | | | | 893 | | | | 439 | |
| Emerging Markets Growth | | | 16,176 | | | | 1,017 | | | | 23,951 | | | | (6,758 | ) | | | 1,115 | | | | 65 | | | | 1,707 | | | | (527 | ) |
| Emerging Markets Small Cap Growth | | | 94,539 | | | | 8,107 | | | | 31,293 | | | | 71,353 | | | | 5,769 | | | | 453 | | | | 1,876 | | | | 4,346 | |
| Bond | | | 134,250 | | | | 12,422 | | | | 84,447 | | | | 62,225 | | | | 13,010 | | | | 1,203 | | | | 8,184 | | | | 6,029 | |
| Income | | | 10,520 | | | | 1,759 | | | | 18,387 | | | | (6,108 | ) | | | 1,201 | | | | 201 | | | | 2,103 | | | | (701 | ) |
| Low Duration | | | 84,636 | | | | 4,341 | | | | 174,620 | | | | (85,643 | ) | | | 9,393 | | | | 483 | | | | 19,383 | | | | (9,507 | ) |
| Macro Allocation | | | 214,907 | | | | 7,674 | | | | 417,802 | | | | (195,221 | ) | | | 18,321 | | | | 651 | | | | 35,612 | | | | (16,640 | ) |
| June 30, 2018 | William Blair Funds | 147 |
Notes to Financial Statements (information as of June 30, 2018 is unaudited)
| | | Institutional Class | |
| | | Dollars | | | Shares | |
| Fund | | Sales | | | Reinvest | | | Redemptions | | | Total | | | Sales | | | Reinvest | | | Redemptions | | | Total | |
| Global Leaders | | $ | 2,559 | | | | $ 5,655 | | | | $ 20,455 | | | $ | (12,241 | ) | | | 198 | | | | 394 | | | | 1,511 | | | | (919 | ) |
| International Leaders | | | 38,667 | | | | 4,960 | | | | 17,973 | | | | 25,654 | | | | 2,552 | | | | 307 | | | | 1,200 | | | | 1,659 | |
| Institutional International Developed Plus | | | 150 | | | | 212 | | | | 1,432 | | | | (1,070 | ) | | | 10 | | | | 15 | | | | 112 | | | | (87 | ) |
| Institutional International Growth | | | 192,850 | | | | 90,689 | | | | 524,901 | | | | (241,362 | ) | | | 11,839 | | | | 5,115 | | | | 32,006 | | | | (15,052 | ) |
| International Small Cap Growth | | | 8,701 | | | | 23,256 | | | | 16,528 | | | | 15,429 | | | | 558 | | | | 1,520 | | | | 1,054 | | | | 1,024 | |
| Emerging Markets Leaders | | | 62,264 | | | | 3,067 | | | | 30,182 | | | | 35,149 | | | | 6,513 | | | | 288 | | | | 2,936 | | | | 3,865 | |
| Emerging Markets Growth | | | 303,312 | | | | 10,235 | | | | 378,630 | | | | (65,083 | ) | | | 22,768 | | | | 645 | | | | 26,296 | | | | (2,883 | ) |
| Emerging Markets Small Cap Growth | | | 31,040 | | | | 4,554 | | | | 38,952 | | | | (3,358 | ) | | | 1,822 | | | | 254 | | | | 2,289 | | | | (213 | ) |
| Bond | | | 5,456 | | | | 3,799 | | | | 12,891 | | | | (3,636 | ) | | | 530 | | | | 368 | | | | 1,251 | | | | (353 | ) |
| Low Duration | | | 56,356 | | | | 1,908 | | | | 9,982 | | | | 48,282 | | | | 6,253 | | | | 213 | | | | 1,112 | | | | 5,354 | |
| Macro Allocation | | | 81,930 | | | | 5,947 | | | | 207,896 | | | | (120,019 | ) | | | 6,962 | | | | 504 | | | | 17,587 | | | | (10,121 | ) |
| | | | |
| | | Net Change in Net Assets Relating to Fund Share Activity | |
| | | Dollars | | | Shares | |
| Fund | | Sales | | | Reinvest | | | Redemptions | | | Total | | | Sales | | | Reinvest | | | Redemptions | | | Total | |
| Growth | | $ | 28,218 | | | | $91,558 | | | | $ 348,252 | | | $ | (228,476 | ) | | | 2,135 | | | | 8,093 | | | | 26,213 | | | | (15,985 | ) |
| Large Cap Growth | | | 62,963 | | | | 1,030 | | | | 25,304 | | | | 38,689 | | | | 5,183 | | | | 74 | | | | 2,083 | | | | 3,174 | |
| Mid Cap Growth | | | 10,841 | | | | 11,050 | | | | 88,854 | | | | (66,963 | ) | | | 908 | | | | 971 | | | | 7,334 | | | | (5,455 | ) |
| Small-Mid Cap Growth | | | 639,389 | | | | 92,785 | | | | 494,845 | | | | 237,329 | | | | 27,927 | | | | 3,873 | | | | 21,051 | | | | 10,749 | |
| Small-Mid Cap Value | | | 628 | | | | 360 | | | | 764 | | | | 224 | | | | 44 | | | | 26 | | | | 52 | | | | 18 | |
| Small Cap Growth | | | 127,343 | | | | 72,609 | | | | 132,737 | | | | 67,215 | | | | 4,372 | | | | 2,586 | | | | 4,507 | | | | 2,451 | |
| Small Cap Value | | | 95,517 | | | | 47,791 | | | | 180,246 | | | | (36,938 | ) | | | 4,589 | | | | 2,341 | | | | 8,639 | | | | (1,709 | ) |
| Global Leaders | | | 8,432 | | | | 8,355 | | | | 25,927 | | | | (9,140 | ) | | | 645 | | | | 582 | | | | 1,921 | | | | (694 | ) |
| International Leaders | | | 70,308 | | | | 6,325 | | | | 28,608 | | | | 48,025 | | | | 4,763 | | | | 392 | | | | 1,861 | | | | 3,294 | |
| International Developed Plus | | | 22,611 | | | | 2,153 | | | | 10,716 | | | | 14,048 | | | | 1,443 | | | | 131 | | | | 698 | | | | 876 | |
| Institutional International Developed Plus | | | 150 | | | | 212 | | | | 1,432 | | | | (1,070 | ) | | | 10 | | | | 15 | | | | 112 | | | | (87 | ) |
| International Growth | | | 246,035 | | | | 43,593 | | | | 893,532 | | | | (603,904 | ) | | | 8,955 | | | | 1,435 | | | | 31,759 | | | | (21,369 | ) |
| Institutional International Growth | | | 192,850 | | | | 90,689 | | | | 524,901 | | | | (241,362 | ) | | | 11,839 | | | | 5,115 | | | | 32,006 | | | | (15,052 | ) |
| International Small Cap Growth | | | 58,793 | | | | 50,424 | | | | 128,250 | | | | (19,033 | ) | | | 3,961 | | | | 3,306 | | | | 8,551 | | | | (1,284 | ) |
| Emerging Markets Leaders | | | 77,729 | | | | 3,396 | | | | 41,986 | | | | 39,139 | | | | 8,086 | | | | 319 | | | | 4,167 | | | | 4,238 | |
| Emerging Markets Growth | | | 320,170 | | | | 11,322 | | | | 405,091 | | | | (73,599 | ) | | | 23,932 | | | | 714 | | | | 28,182 | | | | (3,536 | ) |
| Emerging Markets Small Cap Growth | | | 130,660 | | | | 13,084 | | | | 73,209 | | | | 70,535 | | | | 7,886 | | | | 731 | | | | 4,351 | | | | 4,266 | |
| Bond | | | 159,870 | | | | 20,161 | | | | 163,783 | | | | 16,248 | | | | 15,474 | | | | 1,949 | | | | 15,807 | | | | 1,616 | |
| Income | | | 19,220 | | | | 3,136 | | | | 40,857 | | | | (18,501 | ) | | | 2,187 | | | | 357 | | | | 4,649 | | | | (2,105 | ) |
| Low Duration | | | 141,778 | | | | 6,334 | | | | 190,670 | | | | (42,558 | ) | | | 15,733 | | | | 705 | | | | 21,167 | | | | (4,729 | ) |
| Macro Allocation | | | 305,541 | | | | 13,878 | | | | 656,829 | | | | (337,410 | ) | | | 26,028 | | | | 1,177 | | | | 55,874 | | | | (28,669 | ) |
(8) Subsequent Events
The Funds have evaluated subsequent events through the date of issuance of the Funds’ financial statements and have determined there is no impact to the Funds’ financial statements.
| 148 | Semiannual Report | June 30, 2018 |
Financial Highlights — For a share outstanding throughout each period
Growth Fund
| | | Class N | |
| | | (unaudited) | | | | | | | | | | | | | | | | |
| | | Period Ended | | | | | | | | | | | | | | | | |
| | | June 30, | | Years Ended December 31, | |
| | | | 2018 | | | 2017 | | | 2016 | | | 2015 | | | 2014 | | | 2013 | |
| Net asset value, beginning of year | | | $ | 10.27 | | | $ | 11.41 | | | $ | 12.52 | | | $ | 13.55 | | | $ | 14.79 | | | $ | 12.05 | |
| Income (loss) from investment operations: | | | | | | | | | | | | | | | | | | | | | | | | | |
| Net investment income (loss) | | | | (0.02 | ) | | | (0.02 | ) | | | (0.02 | ) | | | (0.04 | ) | | | (0.07 | ) | | | (0.07 | ) |
| Net realized and unrealized gain (loss) on investments | | | | 1.33 | | | | 2.78 | | | | (0.08 | ) | | | 0.75 | | | | 1.03 | | | | 4.25 | |
| Total from investment operations | | | | 1.31 | | | | 2.76 | | | | (0.10 | ) | | | 0.71 | | | | 0.96 | | | | 4.18 | |
| Less distributions from: | | | | | | | | | | | | | | | | | | | | | | | | | |
| Net investment income | | | | — | | | | — | | | | — | | | | — | | | | — | | | | — | |
| Net realized gain | | | | — | | | | 3.90 | | | | 1.01 | | | | 1.74 | | | | 2.20 | | | | 1.44 | |
| Total distributions | | | | — | | | | 3.90 | | | | 1.01 | | | | 1.74 | | | | 2.20 | | | | 1.44 | |
| Net asset value, end of year | | | $ | 11.58 | | | $ | 10.27 | | | $ | 11.41 | | | $ | 12.52 | | | $ | 13.55 | | | $ | 14.79 | |
| Total return (%)* | | | | 12.76 | | | | 24.35 | | | | (0.98 | ) | | | 5.31 | | | | 6.59 | | | | 35.00 | |
| Ratios to average daily net assets (%)**: | | | | | | | | | | | | | | | | | | | | | | | | | |
| Expenses | | | | 1.20 | | | | 1.20 | | | | 1.21 | | | | 1.19 | | | | 1.18 | | | | 1.19 | |
| Net investment income (loss) | | | | (0.28 | ) | | | (0.14 | ) | | | (0.15 | ) | | | (0.29 | ) | | | (0.50 | ) | | | (0.51 | ) |
| Class N net assets at the end of the year (in thousands) | | | $ | 45,879 | | | $ | 34,886 | | | $ | 62,936 | | | $ | 149,754 | | | $ | 272,765 | | | $ | 291,326 | |
| Portfolio turnover rate (%)* | | | | 25 | | | | 38 | | | | 79 | | | | 78 | | | | 100 | | | | 52 | |
| |
| | | Class I | |
| | | (unaudited) | | | | | | | | | | | | | | | | |
| | | Period Ended | | | | | | | | | | | | | | | | |
| | | June 30, | | Years Ended December 31, | |
| | | | 2018 | | | 2017 | | | 2016 | | | 2015 | | | 2014 | | | 2013 | |
| Net asset value, beginning of year | | | $ | 11.51 | | | $ | 12.39 | | | $ | 13.50 | | | $ | 14.43 | | | $ | 15.56 | | | $ | 12.58 | |
| Income (loss) from investment operations: | | | | | | | | | | | | | | | | | | | | | | | | | |
| Net investment income (loss) | | | | 0.00 | ^ | | | 0.02 | | | | 0.03 | | | | 0.01 | | | | (0.03 | ) | | | (0.03 | ) |
| Net realized and unrealized gain (loss) on investments | | | | 1.49 | | | | 3.02 | | | | (0.10 | ) | | | 0.80 | | | | 1.10 | | | | 4.45 | |
| Total from investment operations | | | | 1.49 | | | | 3.04 | | | | (0.07 | ) | | | 0.81 | | | | 1.07 | | | | 4.42 | |
| Less distributions from: | | | | | | | | | | | | | | | | | | | | | | | | | |
| Net investment income | | | | — | | | | 0.02 | | | | 0.03 | | | | — | | | | — | | | | 0.00 | ^ |
| Net realized gain | | | | — | | | | 3.90 | | | | 1.01 | | | | 1.74 | | | | 2.20 | | | | 1.44 | |
| Total distributions | | | | — | | | | 3.92 | | | | 1.04 | | | | 1.74 | | | | 2.20 | | | | 1.44 | |
| Net asset value, end of year | | | $ | 13.00 | | | $ | 11.51 | | | $ | 12.39 | | | $ | 13.50 | | | $ | 14.43 | | | $ | 15.56 | |
| Total return (%)* | | | | 12.95 | | | | 24.64 | | | | (0.69 | ) | | | 5.69 | | | | 6.96 | | | | 35.43 | |
| Ratios to average daily net assets (%)**: | | | | | | | | | | | | | | | | | | | | | | | | | |
| Expenses | | | | 0.90 | | | | 0.92 | | | | 0.90 | | | | 0.89 | | | | 0.86 | | | | 0.85 | |
| Net investment income (loss) | | | | 0.01 | | | | 0.12 | | | | 0.20 | | | | 0.06 | | | | (0.20 | ) | | | (0.17 | ) |
| Class I net assets at the end of the year (in thousands) | | | $ | 297,024 | | | $ | 318,848 | | | $ | 514,870 | | | $ | 696,744 | | | $ | 688,038 | | | $ | 623,225 | |
| Portfolio turnover rate (%)* | | | | 25 | | | | 38 | | | | 79 | | | | 78 | | | | 100 | | | | 52 | |
| * | Rates are not annualized for periods less than a year. |
| ** | Rates are annualized for periods less than a year. |
| ^ | Amount is less than $0.005 per share. |
Note: Net investment income (loss) per share is based on the average shares outstanding during the year.
Performance cited represents past performance. Past performance does not guarantee future results and current performance may be lower or higher than the data quoted. Results shown are annual returns, which assume reinvestment of dividends and capital gains. Investment returns and principal will fluctuate and you may have a gain or loss when you sell shares. For the most current month-end performance information, please call 1-800-742-7272 or visit our Web site at www.williamblairfunds.com.
See accompanying Notes to Financial Statements.
| June 30, 2018 | William Blair Funds | 149 |
Financial Highlights — For a share outstanding throughout each period
Large Cap Growth Fund
| | | Class N | |
| | | (unaudited) | | | | | | | | | | | | | | | | |
| | | Period Ended | | | | | | | | | | | | | | | | |
| | | June 30, | | | Years Ended December 31, | |
| | | | 2018 | | | 2017 | | | 2016 | | | 2015 | | | 2014 | | | 2013 | |
| Net asset value, beginning of year | | | $ | 13.35 | | | $ | 10.26 | | | $ | 10.15 | | | $ | 10.46 | | | $ | 10.03 | | | $ | 8.14 | |
| Income (loss) from investment operations: | | | | | | | | | | | | | | | | | | | | | | | | | |
| Net investment income (loss) | | | | (0.01 | ) | | | (0.02 | ) | | | 0.02 | | | | (0.02 | ) | | | (0.02 | ) | | | (0.03 | ) |
| Net realized and unrealized gain (loss) on investments | | | | 1.65 | | | | 3.19 | | | | 0.18 | | | | 0.75 | | | | 1.46 | | | | 2.70 | |
| Total from investment operations | | | | 1.64 | | | | 3.17 | | | | 0.20 | | | | 0.73 | | | | 1.44 | | | | 2.67 | |
| Less distributions from: | | | | | | | | | | | | | | | | | | | | | | | | | |
| Net investment income | | | | — | | | | — | | | | 0.01 | | | | — | | | | — | | | | — | |
| Net realized gain | | | | — | | | | 0.08 | | | | 0.08 | | | | 1.04 | | | | 1.01 | | | | 0.78 | |
| Total distributions | | | | — | | | | 0.08 | | | | 0.09 | | | | 1.04 | | | | 1.01 | | | | 0.78 | |
| Net asset value, end of year | | | $ | 14.99 | | | $ | 13.35 | | | $ | 10.26 | | | $ | 10.15 | | | $ | 10.46 | | | $ | 10.03 | |
| Total return (%)* | | | | 12.28 | | | | 30.88 | | | | 1.97 | | | | 7.04 | | | | 14.29 | | | | 33.00 | |
| Ratios to average daily net assets (%)**: | | | | | | | | | | | | | | | | | | | | | | | | | |
| Expenses, net of waivers and reimbursements | | | | 1.05 | | | | 1.05 | | | | 1.05 | | | | 1.07 | | | | 1.13 | | | | 1.20 | |
| Expenses, before waivers and reimbursements | | | | 1.15 | | | | 1.19 | | | | 1.23 | | | | 1.28 | | | | 1.31 | | | | 1.46 | |
| Net investment income (loss), net of waivers and reimbursements | | | | (0.12 | ) | | | (0.13 | ) | | | 0.17 | | | | (0.22 | ) | | | (0.23 | ) | | | (0.36 | ) |
| Net investment income (loss), before waivers and reimbursements | | | | (0.22 | ) | | | (0.27 | ) | | | (0.01 | ) | | | (0.43 | ) | | | (0.41 | ) | | | (0.62 | ) |
| Class N net assets at the end of the year (in thousands) | | | $ | 39,594 | | | $ | 25,604 | | | $ | 11,860 | | | $ | 10,443 | | | $ | 8,831 | | | $ | 6,678 | |
| Portfolio turnover rate (%)* | | | | 19 | | | | 29 | | | | 44 | | | | 38 | | | | 50 | | | | 48 | |
| | | | |
| | | Class I | |
| | | (unaudited) | | | | | | | | | | | | | | | | |
| | | Period Ended | | | | | | | | | | | | | | | | |
| | | June 30, | | | Years Ended December 31, | |
| | | | 2018 | | | 2017 | | | 2016 | | | 2015 | | | 2014 | | | 2013 | |
| Net asset value, beginning of year | | | $ | 13.97 | | | $ | 10.70 | | | $ | 10.58 | | | $ | 10.84 | | | $ | 10.33 | | | $ | 8.35 | |
| Income (loss) from investment operations: | | | | | | | | | | | | | | | | | | | | | | | | | |
| Net investment income (loss) | | | | 0.01 | | | | 0.02 | | | | 0.04 | | | | (0.00 | )^ | | | 0.00 | ^ | | | (0.01 | ) |
| Net realized and unrealized gain (loss) on investments | | | | 1.72 | | | | 3.33 | | | | 0.19 | | | | 0.78 | | | | 1.52 | | | | 2.77 | |
| Total from investment operations | | | | 1.73 | | | | 3.35 | | | | 0.23 | | | | 0.78 | | | | 1.52 | | | | 2.76 | |
| Less distributions from: | | | | | | | | | | | | | | | | | | | | | | | | | |
| Net investment income | | | | — | | | | — | | | | 0.03 | | | | — | | | | — | | | | — | |
| Net realized gain | | | | — | | | | 0.08 | | | | 0.08 | | | | 1.04 | | | | 1.01 | | | | 0.78 | |
| Total distributions | | | | — | | | | 0.08 | | | | 0.11 | | | | 1.04 | | | | 1.01 | | | | 0.78 | |
| Net asset value, end of year | | | $ | 15.70 | | | $ | 13.97 | | | $ | 10.70 | | | $ | 10.58 | | | $ | 10.84 | | | $ | 10.33 | |
| Total return (%)* | | | | 12.38 | | | | 31.29 | | | | 2.22 | | | | 7.26 | | | | 14.65 | | | | 33.24 | |
| Ratios to average daily net assets (%)**: | | | | | | | | | | | | | | | | | | | | | | | | | |
| Expenses, net of waivers and reimbursements | | | | 0.80 | | | | 0.80 | | | | 0.80 | | | | 0.82 | | | | 0.88 | | | | 0.95 | |
| Expenses, before waivers and reimbursements | | | | 0.87 | | | | 0.90 | | | | 0.91 | | | | 0.95 | | | | 1.00 | | | | 1.11 | |
| Net investment income (loss), net of waivers and reimbursements | | | | 0.13 | | | | 0.13 | | | | 0.41 | | | | 0.03 | | | | 0.02 | | | | (0.11 | ) |
| Net investment income (loss), before waivers and reimbursements | | | | 0.06 | | | | 0.03 | | | | 0.30 | | | | (0.10 | ) | | | (0.10 | ) | | | (0.27 | ) |
| Class I net assets at the end of the year (in thousands) | | | $ | 201,617 | | | $ | 177,959 | | | $ | 110,475 | | | $ | 59,038 | | | $ | 50,778 | | | $ | 40,513 | |
| Portfolio turnover rate (%)* | | | | 19 | | | | 29 | | | | 44 | | | | 38 | | | | 50 | | | | 48 | |
| * | Rates are not annualized for periods less than a year. |
| ** | Rates are annualized for periods less than a year. |
| ^ | Amount is less than $0.005 per share. |
Note: Net investment income (loss) per share is based on the average shares outstanding during the year.
Performance cited represents past performance. Past performance does not guarantee future results and current performance may be lower or higher than the data quoted. Results shown are annual returns, which assume reinvestment of dividends and capital gains. Investment returns and principal will fluctuate and you may have a gain or loss when you sell shares. For the most current month-end performance information, please call 1-800-742-7272 or visit our Web site at www.williamblairfunds.com.
| 150 | Semiannual Report | June 30, 2018 |
Financial Highlights — For a share outstanding throughout each period
Mid Cap Growth Fund
| | | Class N | |
| | | (unaudited) | | | | | | | | | | | | | | | | |
| | | Period Ended | | | | | | | | | | | | | | | | |
| | | June 30, | | | Years Ended December 31, | |
| | | | 2018 | | | 2017 | | | 2016 | | | 2015 | | | 2014 | | | 2013 | |
| Net asset value, beginning of year | | | $ | 10.92 | | | $ | 10.69 | | | $ | 11.28 | | | $ | 14.20 | | | $ | 15.21 | | | $ | 12.65 | |
| Income (loss) from investment operations: | | | | | | | | | | | | | | | | | | | | | | | | | |
| Net investment income (loss) | | | | (0.03 | ) | | | (0.08 | ) | | | (0.06 | ) | | | (0.09 | ) | | | (0.12 | ) | | | (0.13 | ) |
| Net realized and unrealized gain (loss) on investments | | | | 1.30 | | | | 2.29 | | | | 0.09 | | | | 0.04 | | | | 1.26 | | | | 3.74 | |
| Total from investment operations | | | | 1.27 | | | | 2.21 | | | | 0.03 | | | | (0.05 | ) | | | 1.14 | | | | 3.61 | |
| Less distributions from: | | | | | | | | | | | | | | | | | | | | | | | | | |
| Net investment income | | | | — | | | | — | | | | — | | | | — | | | | — | | | | — | |
| Net realized gain | | | | — | | | | 1.98 | | | | 0.62 | | | | 2.87 | | | | 2.15 | | | | 1.05 | |
| Total distributions | | | | — | | | | 1.98 | | | | 0.62 | | | | 2.87 | | | | 2.15 | | | | 1.05 | |
| Net asset value, end of year | | | $ | 12.19 | | | $ | 10.92 | | | $ | 10.69 | | | $ | 11.28 | | | $ | 14.20 | | | $ | 15.21 | |
| Total return (%)* | | | | 11.63 | | | | 20.88 | | | | 0.23 | | | | (0.20 | ) | | | 7.53 | | | | 28.77 | |
| Ratios to average daily net assets (%)**: | | | | | | | | | | | | | | | | | | | | | | | | | |
| Expenses, net of waivers and reimbursements | | | | 1.27 | | | | 1.30 | | | | 1.30 | | | | 1.32 | | | | 1.35 | | | | 1.35 | |
| Expenses, before waivers and reimbursements | | | | 1.57 | | | | 1.49 | | | | 1.45 | | | | 1.43 | | | | 1.35 | | | | 1.42 | |
| Net investment income (loss), net of waivers and reimbursements | | | | (0.52 | ) | | | (0.65 | ) | | | (0.53 | ) | | | (0.65 | ) | | | (0.80 | ) | | | (0.90 | ) |
| Net investment income (loss), before waivers and reimbursements | | | | (0.82 | ) | | | (0.84 | ) | | | (0.68 | ) | | | (0.76 | ) | | | (0.80 | ) | | | (0.97 | ) |
| Class N net assets at the end of the year (in thousands) | | | $ | 6,006 | | | $ | 6,166 | | | $ | 16,234 | | | $ | 25,105 | | | $ | 37,413 | | | $ | 41,849 | |
| Portfolio turnover rate (%)* | | | | 30 | | | | 59 | | | | 60 | | | | 65 | | | | 81 | | | | 83 | |
| | | | |
| | | Class I | |
| | | (unaudited) | | | | | | | | | | | | | | | | |
| | | Period Ended | | | | | | | | | | | | | | | | |
| | | June 30, | | | Years Ended December 31, | |
| | | | 2018 | | | 2017 | | | 2016 | | | 2015 | | | 2014 | | | 2013 | |
| Net asset value, beginning of year | | | $ | 11.57 | | | $ | 11.20 | | | $ | 11.76 | | | $ | 14.65 | | | $ | 15.58 | | | $ | 12.91 | |
| Income (loss) from investment operations: | | | | | | | | | | | | | | | | | | | | | | | | | |
| Net investment income (loss) | | | | (0.02 | ) | | | (0.05 | ) | | | (0.03 | ) | | | (0.06 | ) | | | (0.09 | ) | | | (0.10 | ) |
| Net realized and unrealized gain (loss) on investments | | | | 1.38 | | | | 2.40 | | | | 0.09 | | | | 0.04 | | | | 1.31 | | | | 3.82 | |
| Total from investment operations | | | | 1.36 | | | | 2.35 | | | | 0.06 | | | | (0.02 | ) | | | 1.22 | | | | 3.72 | |
| Less distributions from: | | | | | | | | | | | | | | | | | | | | | | | | | |
| Net investment income | | | | — | | | | — | | | | — | | | | — | | | | — | | | | — | |
| Net realized gain | | | | — | | | | 1.98 | | | | 0.62 | | | | 2.87 | | | | 2.15 | | | | 1.05 | |
| Total distributions | | | | — | | | | 1.98 | | | | 0.62 | | | | 2.87 | | | | 2.15 | | | | 1.05 | |
| Net asset value, end of year | | | $ | 12.93 | | | $ | 11.57 | | | $ | 11.20 | | | $ | 11.76 | | | $ | 14.65 | | | $ | 15.58 | |
| Total return (%)* | | | | 11.75 | | | | 21.18 | | | | 0.48 | | | | 0.00 | | | | 7.87 | | | | 29.04 | |
| Ratios to average daily net assets (%)**: | | | | | | | | | | | | | | | | | | | | | | | | | |
| Expenses, net of waivers and reimbursements | | | | 1.02 | | | | 1.05 | | | | 1.05 | | | | 1.07 | | | | 1.10 | | | | 1.10 | |
| Expenses, before waivers and reimbursements | | | | 1.30 | | | | 1.23 | | | | 1.18 | | | | 1.14 | | | | 1.10 | | | | 1.15 | |
| Net investment income (loss), net of waivers and reimbursements | | | | (0.26 | ) | | | (0.40 | ) | | | (0.26 | ) | | | (0.41 | ) | | | (0.55 | ) | | | (0.65 | ) |
| Net investment income (loss), before waivers and reimbursements | | | | (0.54 | ) | | | (0.58 | ) | | | (0.39 | ) | | | (0.48 | ) | | | (0.55 | ) | | | (0.70 | ) |
| Class I net assets at the end of the year (in thousands) | | | $ | 56,794 | | | $ | 71,369 | | | $ | 119,424 | | | $ | 174,617 | | | $ | 302,373 | | | $ | 385,779 | |
| Portfolio turnover rate (%)* | | | | 30 | | | | 59 | | | | 60 | | | | 65 | | | | 81 | | | | 83 | |
| * | Rates are not annualized for periods less than a year. |
| ** | Rates are annualized for periods less than a year. |
Note: Net investment income (loss) per share is based on the average shares outstanding during the year.
Performance cited represents past performance. Past performance does not guarantee future results and current performance may be lower or higher than the data quoted. Results shown are annual returns, which assume reinvestment of dividends and capital gains. Investment returns and principal will fluctuate and you may have a gain or loss when you sell shares. For the most current month-end performance information, please call 1-800-742-7272 or visit our Web site at www.williamblairfunds.com.
| June 30, 2018 | William Blair Funds | 151 |
Financial Highlights — For a share outstanding throughout each period
Small-Mid Cap Growth Fund
| | | Class N | |
| | | (unaudited) | | | | | | | | | | | | | | | | |
| | | Period Ended | | | | | | | | | | | | | | | | |
| | | June 30, | | | Years Ended December 31, | |
| | | | 2018 | | | 2017 | | | 2016 | | | 2015 | | | 2014 | | | 2013 | |
| Net asset value, beginning of year | | | $ | 23.36 | | | $ | 19.20 | | | $ | 18.53 | | | $ | 18.72 | | | $ | 18.80 | | | $ | 14.21 | |
| Income (loss) from investment operations: | | | | | | | | | | | | | | | | | | | | | | | | | |
| Net investment income (loss) | | | | (0.09 | ) | | | (0.16 | ) | | | (0.09 | ) | | | (0.10 | ) | | | (0.12 | ) | | | (0.15 | ) |
| Net realized and unrealized gain (loss) on investments | | | | 2.60 | | | | 5.62 | | | | 1.29 | | | | 0.93 | | | | 1.68 | | | | 6.01 | |
| Total from investment operations | | | | 2.51 | | | | 5.46 | | | | 1.20 | | | | 0.83 | | | | 1.56 | | | | 5.86 | |
| Less distributions from: | | | | | | | | | | | | | | | | | | | | | | | | | |
| Net investment income | | | | — | | | | — | | | | — | | | | — | | | | — | | | | — | |
| Net realized gain | | | | — | | | | 1.30 | | | | 0.53 | | | | 1.02 | | | | 1.64 | | | | 1.27 | |
| Total distributions | | | | — | | | | 1.30 | | | | 0.53 | | | | 1.02 | | | | 1.64 | | | | 1.27 | |
| Net asset value, end of year | | | $ | 25.87 | | | $ | 23.36 | | | $ | 19.20 | | | $ | 18.53 | | | $ | 18.72 | | | $ | 18.80 | |
| Total return (%)* | | | | 10.74 | | | | 28.57 | | | | 6.45 | | | | 4.47 | | | | 8.33 | | | | 41.49 | |
| Ratios to average daily net assets (%)**: | | | | | | | | | | | | | | | | | | | | | | | | | |
| Expenses, net of waivers and reimbursements | | | | 1.35 | | | | 1.35 | | | | 1.35 | | | | 1.35 | | | | 1.35 | | | | 1.35 | |
| Expenses, before waivers and reimbursements. | | | | 1.41 | | | | 1.43 | | | | 1.43 | | | | 1.42 | | | | 1.38 | | | | 1.46 | |
| Net investment income (loss), net of waivers and reimbursements | | | | (0.70 | ) | | | (0.74 | ) | | | (0.51 | ) | | | (0.51 | ) | | | (0.63 | ) | | | (0.88 | ) |
| Net investment income (loss), before waivers and reimbursements | | | | (0.76 | ) | | | (0.82 | ) | | | (0.59 | ) | | | (0.58 | ) | | | (0.66 | ) | | | (0.99 | ) |
| Class N net assets at the end of the year (in thousands) | | | $ | 491,568 | | | $ | 228,828 | | | $ | 171,638 | | | $ | 169,595 | | | $ | 83,047 | | | $ | 73,207 | |
| Portfolio turnover rate (%)* | | | | 28 | | | | 64 | | | | 66 | | | | 44 | | | | 49 | | | | 53 | |
| | | | | | | | | | | | | | | | | | | | |
| | | Class I | |
| | | (unaudited) | | | | | | | | | | | | | | | | |
| | | Period Ended | | | | | | | | | | | | | | | | |
| | | June 30, | | | Years Ended December 31, | |
| | | | 2018 | | | 2017 | | | 2016 | | | 2015 | | | 2014 | | | 2013 | |
| Net asset value, beginning of year | | | $ | 24.48 | | | $ | 20.02 | | | $ | 19.25 | | | $ | 19.36 | | | $ | 19.34 | | | $ | 14.55 | |
| Income (loss) from investment operations: | | | | | | | | | | | | | | | | | | | | | | | | | |
| Net investment income (loss) | | | | (0.06 | ) | | | (0.11 | ) | | | (0.05 | ) | | | (0.06 | ) | | | (0.08 | ) | | | (0.11 | ) |
| Net realized and unrealized gain (loss) on investments | | | | 2.73 | | | | 5.87 | | | | 1.35 | | | | 0.97 | | | | 1.74 | | | | 6.17 | |
| Total from investment operations | | | | 2.67 | | | | 5.76 | | | | 1.30 | | | | 0.91 | | | | 1.66 | | | | 6.06 | |
| Less distributions from: | | | | | | | | | | | | | | | | | | | | | | | | | |
| Net investment income | | | | — | | | | — | | | | — | | | | — | | | | — | | | | — | |
| Net realized gain | | | | — | | | | 1.30 | | | | 0.53 | | | | 1.02 | | | | 1.64 | | | | 1.27 | |
| Total distributions | | | | — | | | | 1.30 | | | | 0.53 | | | | 1.02 | | | | 1.64 | | | | 1.27 | |
| Net asset value, end of year | | | $ | 27.15 | | | $ | 24.48 | | | $ | 20.02 | | | $ | 19.25 | | | $ | 19.36 | | | $ | 19.34 | |
| Total return (%)* | | | | 10.91 | | | | 28.90 | | | | 6.72 | | | | 4.74 | | | | 8.62 | | | | 41.89 | |
| Ratios to average daily net assets (%)**: | | | | | | | | | | | | | | | | | | | | | | | | | |
| Expenses, net of waivers and reimbursements | | | | 1.10 | | | | 1.10 | | | | 1.10 | | | | 1.10 | | | | 1.10 | | | | 1.10 | |
| Expenses, before waivers and reimbursements | | | | 1.15 | | | | 1.16 | | | | 1.16 | | | | 1.15 | | | | 1.15 | | | | 1.10 | |
| Net investment income (loss), net of waivers and reimbursements | | | | (0.46 | ) | | | (0.49 | ) | | | (0.28 | ) | | | (0.28 | ) | | | (0.38 | ) | | | (0.62 | ) |
| Net investment income (loss), before waivers and reimbursements | | | | (0.51 | ) | | | (0.55 | ) | | | (0.34 | ) | | | (0.33 | ) | | | (0.43 | ) | | | (0.62 | ) |
| Class I net assets at the end of the year (in thousands) | | | $ | 1,966,699 | | | $ | 1,576,180 | | | $ | 1,090,939 | | | $ | 1,019,544 | | | $ | 793,789 | | | $ | 617,374 | |
| Portfolio turnover rate (%)* | | | | 28 | | | | 64 | | | | 66 | | | | 44 | | | | 49 | | | | 53 | |
| * | Rates are not annualized for periods less than a year. |
| ** | Rates are annualized for periods less than a year. |
Note: Net investment income (loss) per share is based on the average shares outstanding during the year.
Performance cited represents past performance. Past performance does not guarantee future results and current performance may be lower or higher than the data quoted. Results shown are annual returns, which assume reinvestment of dividends and capital gains. Investment returns and principal will fluctuate and you may have a gain or loss when you sell shares. For the most current month-end performance information, please call 1-800-742-7272 or visit our Web site at www.williamblairfunds.com.
| 152 | Semiannual Report | June 30, 2018 |
Financial Highlights — For a share outstanding throughout each period
Small-Mid Cap Value Fund
| | | Class N | |
| | | (unaudited) | | | | | | | | | | | | | | | | |
| | | Period Ended | | | | | | | | | | | | | | | | |
| | | June 30, | | | Years Ended December 31, | |
| | | | 2018 | | | 2017 | | | 2016 | | | 2015 | | | 2014 | | | 2013 | |
| Net asset value, beginning of year | | | $ | 14.31 | | | $ | 14.53 | | | $ | 12.54 | | | $ | 13.63 | | | $ | 14.11 | | | $ | 11.29 | |
| Income (loss) from investment operations: | | | | | | | | | | | | | | | | | | | | | | | | | |
| Net investment income (loss) | | | | 0.03 | | | | 0.04 | | | | 0.04 | | | | 0.04 | | | | 0.00 | ^ | | | 0.00 | ^ |
| Net realized and unrealized gain (loss) on investments | | | | 0.09 | | | | 1.33 | | | | 2.55 | | | | (0.47 | ) | | | 0.64 | | | | 4.06 | |
| Total from investment operations | | | | 0.12 | | | | 1.37 | | | | 2.59 | | | | (0.43 | ) | | | 0.64 | | | | 4.06 | |
| Less distributions from: | | | | | | | | | | | | | | | | | | | | | | | | | |
| Net investment income | | | | — | | | | 0.02 | | | | 0.01 | | | | 0.01 | | | | — | | | | — | |
| Net realized gain | | | | — | | | | 1.57 | | | | 0.59 | | | | 0.65 | | | | 1.12 | | | | 1.24 | |
| Total distributions | | | | — | | | | 1.59 | | | | 0.60 | | | | 0.66 | | | | 1.12 | | | | 1.24 | |
| Net asset value, end of year | | | $ | 14.43 | | | $ | 14.31 | | | $ | 14.53 | | | $ | 12.54 | | | $ | 13.63 | | | $ | 14.11 | |
| Total return (%)* | | | | 0.84 | | | | 9.59 | | | | 20.69 | | | | (3.13 | ) | | | 4.66 | | | | 36.29 | |
| Ratios to average daily net assets (%)**: | | | | | | | | | | | | | | | | | | | | | | | | | |
| Expenses, net of waivers and reimbursements | | | | 1.32 | | | | 1.35 | | | | 1.35 | | | | 1.37 | | | | 1.40 | | | | 1.40 | |
| Expenses, before waivers and reimbursements | | | | 5.61 | | | | 4.83 | | | | 4.15 | | | | 3.93 | | | | 4.50 | | | | 4.50 | |
| Net investment income (loss), net of waivers and reimbursements | | | | 0.41 | | | | 0.27 | | | | 0.29 | | | | 0.27 | | | | 0.02 | | | | (0.04 | ) |
| Net investment income (loss), before waivers and reimbursements | | | | (3.88 | ) | | | (3.21 | ) | | | (2.51 | ) | | | (2.29 | ) | | | (3.08 | ) | | | (3.14 | ) |
| Class N net assets at the end of the year (in thousands) | | | $ | 304 | | | $ | 284 | | | $ | 267 | | | $ | 855 | | | $ | 946 | | | $ | 1,205 | |
| Portfolio turnover rate (%)* | | | | 64 | | | | 70 | | | | 45 | | | | 35 | | | | 69 | | | | 61 | |
| | | | | | | | | | | | | | | | | | | | | | | | | | |
| | | Class I | |
| | | (unaudited) | | | | | | | | | | | | | | | | |
| | | Period Ended | | | | | | | | | | | | | | | | |
| | | June 30, | | | Years Ended December 31, | |
| | | | 2018 | | | 2017 | | | 2016 | | | 2015 | | | 2014 | | | 2013 | |
| Net asset value, beginning of year | | | $ | 14.24 | | | $ | 14.47 | | | $ | 12.54 | | | $ | 13.63 | | | $ | 14.12 | | | $ | 11.29 | |
| Income (loss) from investment operations: | | | | | | | | | | | | | | | | | | | | | | | | | |
| Net investment income (loss) | | | | 0.04 | | | | 0.07 | | | | 0.08 | | | | 0.07 | | | | 0.05 | | | | 0.03 | |
| Net realized and unrealized gain (loss) on investments | | | | 0.10 | | | | 1.33 | | | | 2.55 | | | | (0.47 | ) | | | 0.63 | | | | 4.07 | |
| Total from investment operations | | | | 0.14 | | | | 1.40 | | | | 2.63 | | | | (0.40 | ) | | | 0.68 | | | | 4.10 | |
| Less distributions from: | | | | | | | | | | | | | | | | | | | | | | | | | |
| Net investment income | | | | — | | | | 0.06 | | | | 0.11 | | | | 0.04 | | | | 0.05 | | | | 0.03 | |
| Net realized gain | | | | — | | | | 1.57 | | | | 0.59 | | | | 0.65 | | | | 1.12 | | | | 1.24 | |
| Total distributions | | | | — | | | | 1.63 | | | | 0.70 | | | | 0.69 | | | | 1.17 | | | | 1.27 | |
| Net asset value, end of year | | | $ | 14.38 | | | $ | 14.24 | | | $ | 14.47 | | | $ | 12.54 | | | $ | 13.63 | | | $ | 14.12 | |
| Total return (%)* | | | | 0.98 | | | | 9.84 | | | | 21.00 | | | | (2.86 | ) | | | 4.96 | | | | 36.69 | |
| Ratios to average daily net assets (%)**: | | | | | | | | | | | | | | | | | | | | | | | | | |
| Expenses, net of waivers and reimbursements | | | | 1.07 | | | | 1.10 | | | | 1.10 | | | | 1.12 | | | | 1.15 | | | | 1.15 | |
| Expenses, before waivers and reimbursements | | | | 5.32 | | | | 4.55 | | | | 3.92 | | | | 3.72 | | | | 4.16 | | | | 4.24 | |
| Net investment income (loss), net of waivers and reimbursements | | | | 0.55 | | | | 0.51 | | | | 0.62 | | | | 0.52 | | | | 0.36 | | | | 0.21 | |
| Net investment income (loss), before waivers and reimbursements | | | | (3.70 | ) | | | (2.94 | ) | | | (2.20 | ) | | | (2.08 | ) | | | (2.65 | ) | | | (2.88 | ) |
| Class I net assets at the end of the year (in thousands) | | | $ | 1,759 | | | $ | 3,359 | | | $ | 3,186 | | | $ | 3,220 | | | $ | 3,407 | | | $ | 2,073 | |
| Portfolio turnover rate (%)* | | | | 64 | | | | 70 | | | | 45 | | | | 35 | | | | 69 | | | | 61 | |
| * | Rates are not annualized for periods less than a year. |
| ** | Rates are annualized for periods less than a year. |
| ^ | Amount is less than $0.005 per share. |
Note: Net investment income (loss) per share is based on the average shares outstanding during the year.
Performance cited represents past performance. Past performance does not guarantee future results and current performance may be lower or higher than the data quoted. Results shown are annual returns, which assume reinvestment of dividends and capital gains. Investment returns and principal will fluctuate and you may have a gain or loss when you sell shares. For the most current month-end performance information, please call 1-800-742-7272 or visit our Web site at www.williamblairfunds.com.
| June 30, 2018 | William Blair Funds | 153 |
Financial Highlights — For a share outstanding throughout each period
Small Cap Growth Fund
| | | Class N | |
| | | (unaudited)
Period Ended
June 30, | | | Years Ended December 31, | |
| | | | 2018 | | | 2017 | | | 2016 | | | 2015 | | | 2014 | | | 2013 | |
| Net asset value, beginning of year | | | $ | 26.87 | | | $ | 25.24 | | | $ | 22.47 | | | $ | 25.61 | | | $ | 30.02 | | | $ | 23.68 | |
| Income (loss) from investment operations: | | | | | | | | | | | | | | | | | | | | | | | | | |
| Net investment income (loss) | | | | (0.14 | ) | | | (0.25 | ) | | | (0.18 | ) | | | (0.22 | ) | | | (0.30 | ) | | | (0.26 | ) |
| Net realized and unrealized gain (loss) on investments | | | | 4.28 | | | | 6.88 | | | | 4.43 | | | | (0.93 | ) | | | 1.02 | | | | 12.52 | |
| Total from investment operations | | | | 4.14 | | | | 6.63 | | | | 4.25 | | | | (1.15 | ) | | | 0.72 | | | | 12.26 | |
| Less distributions from: | | | | | | | | | | | | | | | | | | | | | | | | | |
| Net investment income | | | | — | | | | — | | | | — | | | | — | | | | — | | | | — | |
| Net realized gain | | | | — | | | | 5.00 | | | | 1.48 | | | | 1.99 | | | | 5.13 | | | | 5.92 | |
| Total distributions | | | | — | | | | 5.00 | | | | 1.48 | | | | 1.99 | | | | 5.13 | | | | 5.92 | |
| Net asset value, end of year | | | $ | 31.01 | | | $ | 26.87 | | | $ | 25.24 | | | $ | 22.47 | | | $ | 25.61 | | | $ | 30.02 | |
| Total return (%)* | | | | 15.41 | | | | 26.70 | | | | 18.89 | | | | (4.44 | ) | | | 2.62 | | | | 52.76 | |
| Ratios to average daily net assets (%)**: | | | | | | | | | | | | | | | | | | | | | | | | | |
| Expenses, net of waivers and reimbursements | | | | 1.50 | | | | 1.50 | | | | 1.50 | | | | 1.50 | | | | 1.50 | | | | 1.50 | |
| Expenses, before waivers and reimbursements | | | | 1.52 | | | | 1.54 | | | | 1.55 | | | | 1.59 | | | | 1.56 | | | | 1.57 | |
| Net investment income (loss), net of waivers and reimbursements | | | | (0.95 | ) | | | (0.89 | ) | | | (0.79 | ) | | | (0.85 | ) | | | (1.00 | ) | | | (0.87 | ) |
| Net investment income (loss), before waivers and reimbursements | | | | (0.97 | ) | | | (0.93 | ) | | | (0.84 | ) | | | (0.94 | ) | | | (1.06 | ) | | | (0.94 | ) |
| Class N net assets at the end of the year (in thousands) | | | $ | 196,810 | | | $ | 146,291 | | | $ | 117,068 | | | $ | 111,944 | | | $ | 148,201 | | | $ | 211,562 | |
| Portfolio turnover rate (%)* | | | | 35 | | | | 81 | | | | 90 | | | | 91 | | | | 82 | | | | 91 | |
| | | | | | | | | | | | | | | | | | | | | | | | | | |
| | | Class I | |
| | | (unaudited)
Period Ended
June 30, | | | Years Ended December 31, | |
| | | | 2018 | | | 2017 | | | 2016 | | | 2015 | | | 2014 | | | 2013 | |
| Net asset value, beginning of year | | | $ | 29.61 | | | $ | 27.34 | | | $ | 24.17 | | | $ | 27.32 | | | $ | 31.61 | | | $ | 24.66 | |
| Income (loss) from investment operations: | | | | | | | | | | | | | | | | | | | | | | | | | |
| Net investment income (loss) | | | | (0.11 | ) | | | (0.20 | ) | | | (0.13 | ) | | | (0.17 | ) | | | (0.23 | ) | | | (0.19 | ) |
| Net realized and unrealized gain (loss) on investments | | | | 4.72 | | | | 7.47 | | | | 4.78 | | | | (0.99 | ) | | | 1.07 | | | | 13.06 | |
| Total from investment operations | | | | 4.61 | | | | 7.27 | | | | 4.65 | | | | (1.16 | ) | | | 0.84 | | | | 12.87 | |
| Less distributions from: | | | | | | | | | | | | | | | | | | | | | | | | | |
| Net investment income | | | | — | | | | — | | | | — | | | | — | | | | — | | | | — | |
| Net realized gain | | | | — | | | | 5.00 | | | | 1.48 | | | | 1.99 | | | | 5.13 | | | | 5.92 | |
| Total distributions | | | | — | | | | 5.00 | | | | 1.48 | | | | 1.99 | | | | 5.13 | | | | 5.92 | |
| Net asset value, end of year | | | $ | 34.22 | | | $ | 29.61 | | | $ | 27.34 | | | $ | 24.17 | | | $ | 27.32 | | | $ | 31.61 | |
| Total return (%)* | | | | 15.57 | | | | 26.99 | | | | 19.22 | | | | (4.20 | ) | | | 2.87 | | | | 53.13 | |
| Ratios to average daily net assets (%)**: | | | | | | | | | | | | | | | | | | | | | | | | | |
| Expenses, net of waivers and reimbursements | | | | 1.23 | | | | 1.25 | | | | 1.25 | | | | 1.25 | | | | 1.25 | | | | 1.25 | |
| Expenses, before waivers and reimbursements | | | | 1.23 | | | | 1.25 | | | | 1.27 | | | | 1.30 | | | | 1.30 | | | | 1.27 | |
| Net investment income (loss), net of waivers and reimbursements | | | | (0.68 | ) | | | (0.64 | ) | | | (0.54 | ) | | | (0.61 | ) | | | (0.75 | ) | | | (0.63 | ) |
| Net investment income (loss), before waivers and reimbursements | | | | (0.68 | ) | | | (0.64 | ) | | | (0.56 | ) | | | (0.66 | ) | | | (0.80 | ) | | | (0.65 | ) |
| Class I net assets at the end of the year (in thousands) | | | $ | 430,991 | | | $ | 343,119 | | | $ | 271,830 | | | $ | 261,269 | | | $ | 364,241 | | | $ | 415,797 | |
| Portfolio turnover rate (%)* | | | | 35 | | | | 81 | | | | 90 | | | | 91 | | | | 82 | | | | 91 | |
| * | Rates are not annualized for periods less than a year. |
| ** | Rates are annualized for periods less than a year. |
Note: Net investment income (loss) per share is based on the average shares outstanding during the year.
Performance cited represents past performance. Past performance does not guarantee future results and current performance may be lower or higher than the data quoted. Results shown are annual returns, which assume reinvestment of dividends and capital gains. Investment returns and principal will fluctuate and you may have a gain or loss when you sell shares. For the most current month-end performance information, please call 1-800-742-7272 or visit our Web site at www.williamblairfunds.com.
| 154 | Semiannual Report | June 30, 2018 |
Financial Highlights — For a share outstanding throughout each period
Small Cap Value Fund
| | | Class N | |
| | | (unaudited)
Period Ended
June 30, | | | Years Ended December 31, | |
| | | | 2018 | | | 2017 | | | 2016 | | | 2015 | | | 2014 | | | 2013 | |
| Net asset value, beginning of year | | | $ | 20.15 | | | $ | 20.18 | | | $ | 16.68 | | | $ | 17.76 | | | $ | 17.63 | | | $ | 13.65 | |
| Income (loss) from investment operations: | | | | | | | | | | | | | | | | | | | | | | | | | |
| Net investment income (loss) | | | | (0.01 | ) | | | 0.01 | | | | 0.04 | | | | 0.02 | | | | (0.03 | ) | | | (0.05 | ) |
| Net realized and unrealized gain (loss) on investments | | | | 0.23 | | | | 1.50 | | | | 4.34 | | | | (1.05 | ) | | | 0.81 | | | | 5.32 | |
| Total from investment operations | | | | 0.22 | | | | 1.51 | | | | 4.38 | | | | (1.03 | ) | | | 0.78 | | | | 5.27 | |
| Less distributions from: | | | | | | | | | | | | | | | | | | | | | | | | | |
| Net investment income | | | | — | | | | — | | | | 0.04 | | | | — | | | | — | | | | — | |
| Net realized gain | | | | — | | | | 1.54 | | | | 0.84 | | | | 0.05 | | | | 0.65 | | | | 1.29 | |
| Total distributions | | | | — | | | | 1.54 | | | | 0.88 | | | | 0.05 | | | | 0.65 | | | | 1.29 | |
| Net asset value, end of year | | | $ | 20.37 | | | $ | 20.15 | | | $ | 20.18 | | | $ | 16.68 | | | $ | 17.76 | | | $ | 17.63 | |
| Total return (%)* | | | | 1.09 | | | | 7.57 | | | | 26.19 | | | | (5.77 | ) | | | 4.49 | | | | 38.91 | |
| Ratios to average daily net assets (%)**: | | | | | | | | | | | | | | | | | | | | | | | | | |
| Expenses, net of waivers and reimbursements | | | | 1.50 | | | | 1.50 | | | | 1.50 | | | | 1.50 | | | | 1.50 | | | | 1.49 | |
| Expenses, before waivers and reimbursements | | | | 1.55 | | | | 1.55 | | | | 1.53 | | | | 1.54 | | | | 1.53 | | | | 1.55 | |
| Net investment income (loss), net of waivers and reimbursements | | | | (0.06 | ) | | | 0.04 | | | | 0.22 | | | | 0.14 | | | | (0.17 | ) | | | (0.33 | ) |
| Net investment income (loss), before waivers and reimbursements | | | | (0.11 | ) | | | (0.01 | ) | | | 0.19 | | | | 0.10 | | | | (0.20 | ) | | | (0.39 | ) |
| Class N net assets at the end of the year (in thousands) | | | $ | 26,142 | | | $ | 29,271 | | | $ | 33,359 | | | $ | 33,351 | | | $ | 40,223 | | | $ | 55,464 | |
| Portfolio turnover rate (%)* | | | | 37 | | | | 38 | | | | 33 | | | | 30 | | | | 39 | | | | 51 | |
| | | | | | | | | | | | | | | | | | | | | | | | | | |
| | | Class I | |
| | | (unaudited)
Period Ended
June 30, | | | Years Ended December 31, | |
| | | | 2018 | | | 2017 | | | 2016 | | | 2015 | | | 2014 | | | 2013 | |
| Net asset value, beginning of year | | | $ | 20.70 | | | $ | 20.68 | | | $ | 17.08 | | | $ | 18.17 | | | $ | 18.00 | | | $ | 13.88 | |
| Income (loss) from investment operations: | | | | | | | | | | | | | | | | | | | | | | | | | |
| Net investment income (loss) | | | | 0.02 | | | | 0.06 | | | | 0.09 | | | | 0.08 | | | | 0.02 | | | | (0.01 | ) |
| Net realized and unrealized gain (loss) on investments | | | | 0.23 | | | | 1.54 | | | | 4.44 | | | | (1.08 | ) | | | 0.82 | | | | 5.42 | |
| Total from investment operations | | | | 0.25 | | | | 1.60 | | | | 4.53 | | | | (1.00 | ) | | | 0.84 | | | | 5.41 | |
| Less distributions from: | | | | | | | | | | | | | | | | | | | | | | | | | |
| Net investment income | | | | — | | | | 0.04 | | | | 0.09 | | | | 0.04 | | | | 0.02 | | | | 0.00 | ^ |
| Net realized gain | | | | — | | | | 1.54 | | | | 0.84 | | | | 0.05 | | | | 0.65 | | | | 1.29 | |
| Total distributions | | | | — | | | | 1.58 | | | | 0.93 | | | | 0.09 | | | | 0.67 | | | | 1.29 | |
| Net asset value, end of year | | | $ | 20.95 | | | $ | 20.70 | | | $ | 20.68 | | | $ | 17.08 | | | $ | 18.17 | | | $ | 18.00 | |
| Total return (%)* | | | | 1.21 | | | | 7.85 | | | | 26.46 | | | | (5.47 | ) | | | 4.73 | | | | 39.31 | |
| Ratios to average daily net assets (%)**: | | | | | | | | | | | | | | | | | | | | | | | | | |
| Expenses, net of waivers and reimbursements | | | | 1.25 | | | | 1.25 | | | | 1.25 | | | | 1.24 | | | | 1.23 | | | | 1.24 | |
| Expenses, before waivers and reimbursements | | | | 1.29 | | | | 1.29 | | | | 1.29 | | | | 1.24 | | | | 1.23 | | | | 1.25 | |
| Net investment income (loss), net of waivers and reimbursements | | | | 0.19 | | | | 0.29 | | | | 0.47 | | | | 0.43 | | | | 0.12 | | | | (0.07 | ) |
| Net investment income (loss), before waivers and reimbursements | | | | 0.15 | | | | 0.25 | | | | 0.43 | | | | 0.43 | | | | 0.12 | | | | (0.08 | ) |
| Class I net assets at the end of the year (in thousands) | | | $ | 612,695 | | | $ | 644,749 | | | $ | 675,272 | | | $ | 579,010 | | | $ | 544,963 | | | $ | 352,832 | |
| Portfolio turnover rate (%)* | | | | 37 | | | | 38 | | | | 33 | | | | 30 | | | | 39 | | | | 51 | |
| * | Rates are not annualized for periods less than a year. |
| ** | Rates are annualized for periods less than a year. |
| ^ | Amount is less than $0.005 per share. |
Note: Net investment income (loss) per share is based on the average shares outstanding during the year.
Performance cited represents past performance. Past performance does not guarantee future results and current performance may be lower or higher than the data quoted. Results shown are annual returns, which assume reinvestment of dividends and capital gains. Investment returns and principal will fluctuate and you may have a gain or loss when you sell shares. For the most current month-end performance information, please call 1-800-742-7272 or visit our Web site at www.williamblairfunds.com.
| June 30, 2018 | William Blair Funds | 155 |
Financial Highlights — For a share outstanding throughout each period
Global Leaders Fund
| | | Class N | |
| | | (unaudited)
Period Ended
June 30, | | | Years Ended December 31, | |
| | | | 2018 | | | 2017 | | | 2016 | | | 2015 | | | 2014 | | | 2013 | |
| Net asset value, beginning of year | | | $ | 14.53 | | | $ | 11.60 | | | $ | 11.58 | | | $ | 11.84 | | | $ | 11.43 | | | $ | 9.47 | |
| Income (loss) from investment operations: | | | | | | | | | | | | | | | | | | | | | | | | | |
| Net investment income (loss) | | | | 0.03 | | | | 0.05 | | | | 0.03 | | | | 0.02 | | | | 0.02 | | | | 0.02 | |
| Net realized and unrealized gain (loss) on investments | | | | 0.89 | | | | 3.46 | | | | 0.04 | | | | 0.27 | | | | 0.41 | | | | 1.96 | |
| Total from investment operations | | | | 0.92 | | | | 3.51 | | | | 0.07 | | | | 0.29 | | | | 0.43 | | | | 1.98 | |
| Less distributions from: | | | | | | | | | | | | | | | | | | | | | | | | | |
| Net investment income | | | | — | | | | 0.10 | | | | — | | | | 0.01 | | | | — | | | | 0.02 | |
| Net realized gain | | | | — | | | | 0.48 | | | | 0.05 | | | | 0.54 | | | | 0.02 | | | | — | |
| Total distributions | | | | — | | | | 0.58 | | | | 0.05 | | | | 0.55 | | | | 0.02 | | | | 0.02 | |
| Net asset value, end of year | | | $ | 15.45 | | | $ | 14.53 | | | $ | 11.60 | | | $ | 11.58 | | | $ | 11.84 | | | $ | 11.43 | |
| Total return (%)* | | | | 6.33 | | | | 30.31 | | | | 0.62 | | | | 2.49 | | | | 3.76 | | | | 20.86 | |
| Ratios to average daily net assets (%)**: | | | | | | | | | | | | | | | | | | | | | | | | | |
| Expenses, net of waivers and reimbursements | | | | 1.35 | | | | 1.37 | | | | 1.36 | | | | 1.39 | | | | 1.50 | | | | 1.50 | |
| Expenses, before waivers and reimbursements | | | | 1.45 | | | | 1.63 | | | | 1.62 | | | | 1.61 | | | | 1.62 | | | | 1.63 | |
| Net investment income (loss), net of waivers and reimbursements | | | | 0.42 | | | | 0.35 | | | | 0.23 | | | | 0.12 | | | | 0.16 | | | | 0.18 | |
| Net investment income (loss), before waivers and reimbursements | | | | 0.32 | | | | 0.09 | | | | (0.03 | ) | | | (0.10 | ) | | | 0.04 | | | | 0.05 | |
| Class N net assets at the end of the year (in thousands) | | | $ | 8,613 | | | $ | 7,761 | | | $ | 5,760 | | | $ | 5,588 | | | $ | 5,007 | | | $ | 6,403 | |
| Portfolio turnover rate (%)* | | | | 21 | | | | 41 | | | | 75 | | | | 55 | | | | 60 | | | | 70 | |
| | | | | | | | | | | | | | | | | | | | | | | | | | |
| | | Class I | |
| | | (unaudited)
Period Ended
June 30, | | | Years Ended December 31, | |
| | | | 2018 | | | 2017 | | | 2016 | | | 2015 | | | 2014 | | | 2013 | |
| Net asset value, beginning of year | | | $ | 14.56 | | | $ | 11.62 | | | $ | 11.59 | | | $ | 11.85 | | | $ | 11.42 | | | $ | 9.47 | |
| Income (loss) from investment operations: | | | | | | | | | | | | | | | | | | | | | | | | | |
| Net investment income (loss) | | | | 0.05 | | | | 0.09 | | | | 0.06 | | | | 0.06 | | | | 0.04 | | | | 0.04 | |
| Net realized and unrealized gain (loss) on investments | | | | 0.89 | | | | 3.47 | | | | 0.05 | | | | 0.26 | | | | 0.43 | | | | 1.95 | |
| Total from investment operations | | | | 0.94 | | | | 3.56 | | | | 0.11 | | | | 0.32 | | | | 0.47 | | | | 1.99 | |
| Less distributions from: | | | | | | | | | | | | | | | | | | | | | | | | | |
| Net investment income | | | | — | | | | 0.14 | | | | 0.03 | | | | 0.04 | | | | 0.02 | | | | 0.04 | |
| Net realized gain | | | | — | | | | 0.48 | | | | 0.05 | | | | 0.54 | | | | 0.02 | | | | — | |
| Total distributions | | | | — | | | | 0.62 | | | | 0.08 | | | | 0.58 | | | | 0.04 | | | | 0.04 | |
| Net asset value, end of year | | | $ | 15.50 | | | $ | 14.56 | | | $ | 11.62 | | | $ | 11.59 | | | $ | 11.85 | | | $ | 11.42 | |
| Total return (%)* | | | | 6.46 | | | | 30.69 | | | | 0.98 | | | | 2.77 | | | | 4.08 | | | | 21.05 | |
| Ratios to average daily net assets (%)**: | | | | | | | | | | | | | | | | | | | | | | | | | |
| Expenses, net of waivers and reimbursements | | | | 1.06 | | | | 1.07 | | | | 1.05 | | | | 1.10 | | | | 1.25 | | | | 1.25 | |
| Expenses, before waivers and reimbursements | | | | 1.14 | | | | 1.33 | | | | 1.31 | | | | 1.32 | | | | 1.33 | | | | 1.35 | |
| Net investment income (loss), net of waivers and reimbursements | | | | 0.71 | | | | 0.65 | | | | 0.54 | | | | 0.45 | | | | 0.38 | | | | 0.40 | |
| Net investment income (loss), before waivers and reimbursements | | | | 0.63 | | | | 0.39 | | | | 0.28 | | | | 0.23 | | | | 0.30 | | | | 0.30 | |
| Class I net assets at the end of the year (in thousands) | | | $ | 70,116 | | | $ | 60,067 | | | $ | 45,772 | | | $ | 45,853 | | | $ | 52,090 | | | $ | 53,562 | |
| Portfolio turnover rate (%)* | | | | 21 | | | | 41 | | | | 75 | | | | 55 | | | | 60 | | | | 70 | |
| * | Rates are not annualized for periods less than a year. |
| ** | Rates are annualized for periods less than a year. |
Note: Net investment income (loss) per share is based on the average shares outstanding during the year.
Performance cited represents past performance. Past performance does not guarantee future results and current performance may be lower or higher than the data quoted. Results shown are annual returns, which assume reinvestment of dividends and capital gains. Investment returns and principal will fluctuate and you may have a gain or loss when you sell shares. For the most current month-end performance information, please call 1-800-742-7272 or visit our Web site at www.williamblairfunds.com.
| 156 | Semiannual Report | June 30, 2018 |
Financial Highlights — For a share outstanding throughout each period
Global Leaders Fund
| | | Institutional Class | |
| | | (unaudited)
Period Ended
June 30, | | | Years Ended December 31, | |
| | | | 2018 | | | 2017 | | | 2016 | | | 2015 | | | 2014 | | | 2013 | |
| Net asset value, beginning of year | | | $ | 14.56 | | | $ | 11.62 | | | $ | 11.59 | | | $ | 11.85 | | | $ | 11.42 | | | $ | 9.47 | |
| Income (loss) from investment operations: | | | | | | | | | | | | | | | | | | | | | | | | | |
| Net investment income (loss) | | | | 0.05 | | | | 0.10 | | | | 0.07 | | | | 0.06 | | | | 0.06 | | | | 0.04 | |
| Net realized and unrealized gain (loss) on investments | | | | 0.90 | | | | 3.47 | | | | 0.05 | | | | 0.27 | | | | 0.43 | | | | 1.97 | |
| Total from investment operations | | | | 0.95 | | | | 3.57 | | | | 0.12 | | | | 0.33 | | | | 0.49 | | | | 2.01 | |
| Less distributions from: | | | | | | | | | | | | | | | | | | | | | | | | | |
| Net investment income | | | | — | | | | 0.15 | | | | 0.04 | | | | 0.05 | | | | 0.04 | | | | 0.06 | |
| Net realized gain | | | | — | | | | 0.48 | | | | 0.05 | | | | 0.54 | | | | 0.02 | | | | — | |
| Total distributions | | | | — | | | | 0.63 | | | | 0.09 | | | | 0.59 | | | | 0.06 | | | | 0.06 | |
| Net asset value, end of year | | | $ | 15.51 | | | $ | 14.56 | | | $ | 11.62 | | | $ | 11.59 | | | $ | 11.85 | | | $ | 11.42 | |
| Total return (%)* | | | | 6.52 | | | | 30.78 | | | | 1.03 | | | | 2.85 | | | | 4.24 | | | | 21.23 | |
| Ratios to average daily net assets (%)**: | | | | | | | | | | | | | | | | | | | | | | | | | |
| Expenses, net of waivers and reimbursements | | | | 1.00 | | | | 1.00 | | | | 1.00 | | | | 1.03 | | | | 1.10 | | | | 1.10 | |
| Expenses, before waivers and reimbursements | | | | 1.08 | | | | 1.10 | | | | 1.11 | | | | 1.11 | | | | 1.13 | | | | 1.14 | |
| Net investment income (loss), net of waivers and reimbursements | | | | 0.70 | | | | 0.75 | | | | 0.59 | | | | 0.47 | | | | 0.51 | | | | 0.37 | |
| Net investment income (loss), before waivers and reimbursements | | | | 0.62 | | | | 0.65 | | | | 0.48 | | | | 0.39 | | | | 0.48 | | | | 0.33 | |
| Institutional Class net assets at the end of the year (in thousands) | | | $ | 125,138 | | | $ | 143,521 | | | $ | 125,199 | | | $ | 137,527 | | | $ | 106,565 | | | $ | 87,118 | |
| Portfolio turnover rate (%)* | | | | 21 | | | | 41 | | | | 75 | | | | 55 | | | | 60 | | | | 70 | |
| * | Rates are not annualized for periods less than a year. |
| ** | Rates are annualized for periods less than a year. |
Note: Net investment income (loss) per share is based on the average shares outstanding during the year.
Performance cited represents past performance. Past performance does not guarantee future results and current performance may be lower or higher than the data quoted. Results shown are annual returns, which assume reinvestment of dividends and capital gains. Investment returns and principal will fluctuate and you may have a gain or loss when you sell shares. For the most current month-end performance information, please call 1-800-742-7272 or visit our Web site at www.williamblairfunds.com.
| June 30, 2018 | William Blair Funds | 157 |
Financial Highlights — For a share outstanding throughout each period
International Leaders Fund
| | | Class N | |
| | | (unaudited)
Period Ended
June 30, | | | Years Ended December 31, | |
| | | | 2018 | | | 2017 | | | 2016 | | | 2015 | | | 2014 | | | 2013 | |
| Net asset value, beginning of year | | | $ | 16.37 | | | $ | 12.88 | | | $ | 12.89 | | | $ | 12.25 | | | $ | 12.65 | | | $ | 10.81 | |
| Income (loss) from investment operations: | | | | | | | | | | | | | | | | | | | | | | | | | |
| Net investment income (loss) | | | | 0.14 | | | | 0.11 | | | | 0.03 | | | | 0.07 | | | | 0.13 | | | | 0.03 | |
| Net realized and unrealized gain (loss) on investments | | | | 0.03 | | | | 3.70 | | | | 0.08 | | | | 0.66 | | | | (0.47 | ) | | | 1.99 | |
| Total from investment operations | | | | 0.17 | | | | 3.81 | | | | 0.11 | | | | 0.73 | | | | (0.34 | ) | | | 2.02 | |
| Less distributions from: | | | | | | | | | | | | | | | | | | | | | | | | | |
| Net investment income | | | | — | | | | 0.20 | | | | 0.12 | | | | 0.02 | | | | 0.06 | | | | 0.18 | |
| Net realized gain | | | | — | | | | 0.12 | | | | — | | | | 0.07 | | | | — | | | | — | |
| Total distributions | | | | — | | | | 0.32 | | | | 0.12 | | | | 0.09 | | | | 0.06 | | | | 0.18 | |
| Net asset value, end of year | | | $ | 16.54 | | | $ | 16.37 | | | $ | 12.88 | | | $ | 12.89 | | | $ | 12.25 | | | $ | 12.65 | |
| Total return (%)* | | | | 1.04 | | | | 29.65 | | | | 0.88 | | | | 6.01 | | | | (2.67 | ) | | | 18.75 | |
| Ratios to average daily net assets (%)**: | | | | | | | | | | | | | | | | | | | | | | | | | |
| Expenses, net of waivers and reimbursements | | | | 1.31 | | | | 1.35 | | | | 1.30 | | | | 1.24 | | | | 1.45 | | | | 1.45 | |
| Expenses, before waivers and reimbursements | | | | 1.39 | | | | 1.59 | | | | 1.56 | | | | 1.56 | | | | 1.59 | | | | 1.73 | |
| Net investment income (loss), net of waivers and reimbursements | | | | 1.65 | | | | 0.72 | | | | 0.24 | | | | 0.51 | | | | 1.00 | | | | 0.29 | |
| Net investment income (loss), before waivers and reimbursements | | | | 1.57 | | | | 0.48 | | | | (0.02 | ) | | | 0.19 | | | | 0.86 | | | | 0.01 | |
| Class N net assets at the end of the year (in thousands) | | | $ | 10,207 | | | $ | 9,651 | | | $ | 2,922 | | | $ | 377 | | | $ | 150 | | | $ | 154 | |
| Portfolio turnover rate (%)* | | | | 12 | | | | 41 | | | | 59 | | | | 29 | | | | 79 | | | | 73 | |
| | | | | | | | | | | | | | | | | | | | | | | | | | |
| | | Class I | |
| | | (unaudited)
Period Ended
June 30, | | | Years Ended December 31, | |
| | | | 2018 | | | 2017 | | | 2016 | | | 2015 | | | 2014 | | | 2013 | |
| Net asset value, beginning of year | | | $ | 16.44 | | | $ | 12.92 | | | $ | 12.91 | | | $ | 12.25 | | | $ | 12.65 | | | $ | 10.81 | |
| Income (loss) from investment operations: | | | | | | | | | | | | | | | | | | | | | | | | | |
| Net investment income (loss) | | | | 0.17 | | | | 0.16 | | | | 0.10 | | | | 0.10 | | | | 0.16 | | | | 0.12 | |
| Net realized and unrealized gain (loss) on investments | | | | 0.02 | | | | 3.71 | | | | 0.04 | | | | 0.65 | | | | (0.47 | ) | | | 1.94 | |
| Total from investment operations | | | | 0.19 | | | | 3.87 | | | | 0.14 | | | | 0.75 | | | | (0.31 | ) | | | 2.06 | |
| Less distributions from: | | | | | | | | | | | | | | | | | | | | | | | | | |
| Net investment income | | | | — | | | | 0.23 | | | | 0.13 | | | | 0.02 | | | | 0.09 | | | | 0.22 | |
| Net realized gain | | | | — | | | | 0.12 | | | | — | | | | 0.07 | | | | — | | | | — | |
| Total distributions | | | | — | | | | 0.35 | | | | 0.13 | | | | 0.09 | | | | 0.09 | | | | 0.22 | |
| Net asset value, end of year | | | $ | 16.63 | | | $ | 16.44 | | | $ | 12.92 | | | $ | 12.91 | | | $ | 12.25 | | | $ | 12.65 | |
| Total return (%)* | | | | 1.16 | | | | 30.05 | | | | 1.10 | | | | 6.18 | | | | (2.43 | ) | | | 19.10 | |
| Ratios to average daily net assets (%)**: | | | | | | | | | | | | | | | | | | | | | | | | | |
| Expenses, net of waivers and reimbursements | | | | 1.02 | | | | 1.05 | | | | 1.04 | | | | 1.13 | | | | 1.20 | | | | 1.20 | |
| Expenses, before waivers and reimbursements | | | | 1.08 | | | | 1.28 | | | | 1.30 | | | | 1.46 | | | | 1.29 | | | | 1.40 | |
| Net investment income (loss), net of waivers and reimbursements | | | | 2.05 | | | | 1.09 | | | | 0.74 | | | | 0.75 | | | | 1.25 | | | | 1.06 | |
| Net investment income (loss), before waivers and reimbursements | | | | 1.99 | | | | 0.86 | | | | 0.48 | | | | 0.42 | | | | 1.16 | | | | 0.86 | |
| Class I net assets at the end of the year (in thousands) | | | $ | 76,666 | | | $ | 60,279 | | | $ | 30,944 | | | $ | 13,474 | | | $ | 9,561 | | | $ | 11,629 | |
| Portfolio turnover rate (%)* | | | | 12 | | | | 41 | | | | 59 | | | | 29 | | | | 79 | | | | 73 | |
| * | Rates are not annualized for periods less than a year. |
| ** | Rates are annualized for periods less than a year. |
Note: Net investment income (loss) per share is based on the average shares outstanding during the year.
Performance cited represents past performance. Past performance does not guarantee future results and current performance may be lower or higher than the data quoted. Results shown are annual returns, which assume reinvestment of dividends and capital gains. Investment returns and principal will fluctuate and you may have a gain or loss when you sell shares. For the most current month-end performance information, please call 1-800-742-7272 or visit our Web site at www.williamblairfunds.com.
| 158 | Semiannual Report | June 30, 2018 |
Financial Highlights — For a share outstanding throughout each period
International Leaders Fund
| | | Institutional Class | |
| | | (unaudited)
Period Ended
June 30, | | | Years Ended December 31, | |
| | | | 2018 | | | 2017 | | | 2016 | | | 2015 | | | 2014 | | | 2013 | |
| Net asset value, beginning of year | | | $ | 16.43 | | | $ | 12.92 | | | $ | 12.90 | | | $ | 12.24 | | | $ | 12.65 | | | $ | 10.80 | |
| Income (loss) from investment operations: | | | | | | | | | | | | | | | | | | | | | | | | | |
| Net investment income (loss) | | | | 0.17 | | | | 0.18 | | | | 0.12 | | | | 0.11 | | | | 0.17 | | | | 0.15 | |
| Net realized and unrealized gain (loss) on investments | | | | 0.03 | | | | 3.70 | | | | 0.04 | | | | 0.66 | | | | (0.47 | ) | | | 1.94 | |
| Total from investment operations | | | | 0.20 | | | | 3.88 | | | | 0.16 | | | | 0.77 | | | | (0.30 | ) | | | 2.09 | |
| Less distributions from: | | | | | | | | | | | | | | | | | | | | | | | | | |
| Net investment income | | | | — | | | | 0.25 | | | | 0.14 | | | | 0.04 | | | | 0.11 | | | | 0.24 | |
| Net realized gain | | | | — | | | | 0.12 | | | | — | | | | 0.07 | | | | — | | | | — | |
| Total distributions | | | | — | | | | 0.37 | | | | 0.14 | | | | 0.11 | | | | 0.11 | | | | 0.24 | |
| Net asset value, end of year | | | $ | 16.63 | | | $ | 16.43 | | | $ | 12.92 | | | $ | 12.90 | | | $ | 12.24 | | | $ | 12.65 | |
| Total return (%)* | | | | 1.22 | | | | 30.08 | | | | 1.25 | | | | 6.33 | | | | (2.34 | ) | | | 19.39 | |
| Ratios to average daily net assets (%)**: | | | | | | | | | | | | | | | | | | | | | | | | | |
| Expenses, net of waivers and reimbursements | | | | 0.95 | | | | 0.95 | | | | 0.95 | | | | 0.98 | | | | 1.05 | | | | 1.05 | |
| Expenses, before waivers and reimbursements | | | | 1.00 | | | | 1.03 | | | | 1.06 | | | | 1.15 | | | | 1.14 | | | | 1.25 | |
| Net investment income (loss), net of waivers and reimbursements | | | | 2.01 | | | | 1.18 | | | | 0.92 | | | | 0.88 | | | | 1.33 | | | | 1.31 | |
| Net investment income (loss), before waivers and reimbursements | | | | 1.96 | | | | 1.10 | | | | 0.81 | | | | 0.71 | | | | 1.24 | | | | 1.11 | |
| Institutional Class net assets at the end of the year (in thousands) | | | $ | 335,974 | | | $ | 308,898 | | | $ | 221,356 | | | $ | 102,227 | | | $ | 78,251 | | | $ | 56,991 | |
| Portfolio turnover rate (%)* | | | | 12 | | | | 41 | | | | 59 | | | | 29 | | | | 79 | | | | 73 | |
| * | Rates are not annualized for periods less than a year. |
| ** | Rates are annualized for periods less than a year. |
Note: Net investment income (loss) per share is based on the average shares outstanding during the year.
Performance cited represents past performance. Past performance does not guarantee future results and current performance may be lower or higher than the data quoted. Results shown are annual returns, which assume reinvestment of dividends and capital gains. Investment returns and principal will fluctuate and you may have a gain or loss when you sell shares. For the most current month-end performance information, please call 1-800-742-7272 or visit our Web site at www.williamblairfunds.com.
| June 30, 2018 | William Blair Funds | 159 |
Financial Highlights — For a share outstanding throughout each period
International Developed Plus Fund
| | | Class N | |
| | | (unaudited)
Period Ended
June 30, | | | Years Ended December 31, | |
| | | | 2018 | | | 2017 | | | 2016 | | | 2015 | | | 2014 | | | 2013 | |
| Net asset value, beginning of year | | | $ | 16.60 | | | $ | 13.68 | | | $ | 13.85 | | | $ | 13.76 | | | $ | 14.28 | | | $ | 12.05 | |
| Income (loss) from investment operations: | | | | | | | | | | | | | | | | | | | | | | | | | |
| Net investment income (loss) | | | | 0.15 | | | | 0.12 | | | | 0.18 | | | | 0.15 | | | | 0.16 | | | | 0.09 | |
| Net realized and unrealized gain (loss) on investments | | | | (0.58 | ) | | | 3.08 | | | | (0.22 | ) | | | 0.06 | | | | (0.60 | ) | | | 2.25 | |
| Total from investment operations | | | | (0.43 | ) | | | 3.20 | | | | (0.04 | ) | | | 0.21 | | | | (0.44 | ) | | | 2.34 | |
| Less distributions from: | | | | | | | | | | | | | | | | | | | | | | | | | |
| Net investment income | | | | — | | | | 0.28 | | | | 0.13 | | | | 0.12 | | | | 0.08 | | | | 0.11 | |
| Net realized gain | | | | — | | | | — | | | | — | | | | — | | | | — | | | | — | |
| Total distributions | | | | — | | | | 0.28 | | | | 0.13 | | | | 0.12 | | | | 0.08 | | | | 0.11 | |
| Net asset value, end of year | | | $ | 16.17 | | | $ | 16.60 | | | $ | 13.68 | | | $ | 13.85 | | | $ | 13.76 | | | $ | 14.28 | |
| Total return (%)* | | | | (2.59 | ) | | | 23.43 | | | | (0.27 | ) | | | 1.54 | | | | (3.09 | ) | | | 19.47 | |
| Ratios to average daily net assets (%)**: | | | | | | | | | | | | | | | | | | | | | | | | | |
| Expenses, net of waivers and reimbursements | | | | 1.29 | | | | 1.30 | | | | 1.30 | | | | 1.32 | | | | 1.38 | | | | 1.45 | |
| Expenses, before waivers and reimbursements | | | | 1.50 | | | | 1.54 | | | | 1.60 | | | | 1.60 | | | | 1.56 | | | | 1.65 | |
| Net investment income (loss), net of waivers and reimbursements | | | | 1.85 | | | | 0.78 | | | | 1.30 | | | | 1.01 | | | | 1.11 | | | | 0.73 | |
| Net investment income (loss), before waivers and reimbursements | | | | 1.64 | | | | 0.54 | | | | 1.00 | | | | 0.73 | | | | 0.93 | | | | 0.53 | |
| Class N net assets at the end of the year (in thousands) | | | $ | 2,494 | | | $ | 3,219 | | | $ | 2,954 | | | $ | 3,020 | | | $ | 3,497 | | | $ | 4,307 | |
| Portfolio turnover rate (%)* | | | | 31 | | | | 80 | | | | 70 | | | | 54 | | | | 73 | | | | 88 | |
| | | | | | | | | | | | | | | | | | | | | | | | | | |
| | | Class I | |
| | | (unaudited)
Period Ended
June 30, | | | Years Ended December 31, | |
| | | | 2018 | | | 2017 | | | 2016 | | | 2015 | | | 2014 | | | 2013 | |
| Net asset value, beginning of year | | | $ | 16.76 | | | $ | 13.81 | | | $ | 13.98 | | | $ | 13.91 | | | $ | 14.43 | | | $ | 12.18 | |
| Income (loss) from investment operations: | | | | | | | | | | | | | | | | | | | | | | | | | |
| Net investment income (loss) | | | | 0.17 | | | | 0.15 | | | | 0.21 | | | | 0.18 | | | | 0.19 | | | | 0.14 | |
| Net realized and unrealized gain (loss) on investments | | | | (0.58 | ) | | | 3.12 | | | | (0.22 | ) | | | 0.07 | | | | (0.59 | ) | | | 2.26 | |
| Total from investment operations | | | | (0.41 | ) | | | 3.27 | | | | (0.01 | ) | | | 0.25 | | | | (0.40 | ) | | | 2.40 | |
| Less distributions from: | | | | | | | | | | | | | | | | | | | | | | | | | |
| Net investment income | | | | — | | | | 0.32 | | | | 0.16 | | | | 0.18 | | | | 0.12 | | | | 0.15 | |
| Net realized gain | | | | — | | | | — | | | | — | | | | — | | | | — | | | | — | |
| Total distributions | | | | — | | | | 0.32 | | | | 0.16 | | | | 0.18 | | | | 0.12 | | | | 0.15 | |
| Net asset value, end of year | | | $ | 16.35 | | | $ | 16.76 | | | $ | 13.81 | | | $ | 13.98 | | | $ | 13.91 | | | $ | 14.43 | |
| Total return (%)* | | | | (2.45 | ) | | | 23.72 | | | | (0.02 | ) | | | 1.80 | | | | (2.80 | ) | | | 19.74 | |
| Ratios to average daily net assets (%)**: | | | | | | | | | | | | | | | | | | | | | | | | | |
| Expenses, net of waivers and reimbursements | | | | 1.03 | | | | 1.05 | | | | 1.05 | | | | 1.07 | | | | 1.13 | | | | 1.20 | |
| Expenses, before waivers and reimbursements | | | | 1.22 | | | | 1.26 | | | | 1.34 | | | | 1.34 | | | | 1.32 | | | | 1.41 | |
| Net investment income (loss), net of waivers and reimbursements | | | | 2.06 | | | | 0.93 | | | | 1.52 | | | | 1.26 | | | | 1.35 | | | | 1.07 | |
| Net investment income (loss), before waivers and reimbursements | | | | 1.87 | | | | 0.72 | | | | 1.23 | | | | 0.99 | | | | 1.16 | | | | 0.86 | |
| Class I net assets at the end of the year (in thousands) | | | $ | 110,502 | | | $ | 117,520 | | | $ | 84,383 | | | $ | 60,886 | | | $ | 65,012 | | | $ | 75,271 | |
| Portfolio turnover rate (%)* | | | | 31 | | | | 80 | | | | 70 | | | | 54 | | | | 73 | | | | 88 | |
| * | Rates are not annualized for periods less than a year. |
| ** | Rates are annualized for periods less than a year. |
Note: Net investment income (loss) per share is based on the average shares outstanding during the year.
Performance cited represents past performance. Past performance does not guarantee future results and current performance may be lower or higher than the data quoted. Results shown are annual returns, which assume reinvestment of dividends and capital gains. Investment returns and principal will fluctuate and you may have a gain or loss when you sell shares. For the most current month-end performance information, please call 1-800-742-7272 or visit our Web site at www.williamblairfunds.com.
| 160 | Semiannual Report | June 30, 2018 |
Financial Highlights — For a share outstanding throughout each period
Institutional International Developed Plus Fund
| | | Institutional Class | |
| | | (unaudited)
Period Ended
June 30, | | | Years Ended December 31, | |
| | | | 2018 | | | 2017 | | | 2016 | | | 2015 | | | 2014 | | | 2013 | |
| Net asset value, beginning of year | | | $ | 14.55 | | | $ | 11.84 | | | $ | 12.12 | | | $ | 12.01 | | | $ | 12.70 | | | $ | 10.82 | |
| Income (loss) from investment operations: | | | | | | | | | | | | | | | | | | | | | | | | | |
| Net investment income (loss) | | | | 0.16 | | | | 0.16 | | | | 0.20 | | | | 0.15 | | | | 0.21 | | | | 0.13 | |
| Net realized and unrealized gain (loss) on investments | | | | (0.30 | ) | | | 2.71 | | | | (0.24 | ) | | | 0.08 | | | | (0.65 | ) | | | 2.00 | |
| Total from investment operations | | | | (0.14 | ) | | | 2.87 | | | | (0.04 | ) | | | 0.23 | | | | (0.44 | ) | | | 2.13 | |
| Less distributions from: | | | | | | | | | | | | | | | | | | | | | | | | | |
| Net investment income | | | | — | | | | 0.16 | | | | 0.24 | | | | 0.12 | | | | 0.25 | | | | 0.25 | |
| Net realized gain | | | | — | | | | — | | | | — | | | | — | | | | — | | | | — | |
| Total distributions | | | | — | | | | 0.16 | | | | 0.24 | | | | 0.12 | | | | 0.25 | | | | 0.25 | |
| Net asset value, end of year | | | $ | 14.41 | | | $ | 14.55 | | | $ | 11.84 | | | $ | 12.12 | | | $ | 12.01 | | | $ | 12.70 | |
| Total return (%)* | | | | (0.96 | ) | | | 24.28 | | | | (0.27 | ) | | | 1.91 | | | | (3.50 | ) | | | 19.78 | |
| Ratios to average daily net assets (%)**: | | | | | | | | | | | | | | | | | | | | | | | | | |
| Expenses, net of waivers and reimbursements | | | | 0.90 | | | | 0.93 | | | | 1.00 | | | | 1.00 | | | | 1.03 | | | | 1.10 | |
| Expenses, before waivers and reimbursements | | | | 1.55 | | | | 1.68 | | | | 1.77 | | | | 1.76 | | | | 1.63 | | | | 1.12 | |
| Net investment income (loss), net of waivers and reimbursements | | | | 2.19 | | | | 1.16 | | | | 1.69 | | | | 1.23 | | | | 1.61 | | | | 1.12 | |
| Net investment income (loss), before waivers and reimbursements | | | | 1.54 | | | | 0.41 | | | | 0.92 | | | | 0.47 | | | | 1.01 | | | | 1.10 | |
| Institutional Class net assets at the end of the year (in thousands) | | | $ | 18,854 | | | $ | 19,090 | | | $ | 16,565 | | | $ | 16,030 | | | $ | 14,574 | | | $ | 100,805 | |
| Portfolio turnover rate (%)* | | | | 33 | | | | 73 | | | | 75 | | | | 54 | | | | 61 | | | | 84 | |
| * | Rates are not annualized for periods less than a year. |
| ** | Rates are annualized for periods less than a year. |
Note: Net investment income (loss) per share is based on the average shares outstanding during the year.
Performance cited represents past performance. Past performance does not guarantee future results and current performance may be lower or higher than the data quoted. Results shown are annual returns, which assume reinvestment of dividends and capital gains. Investment returns and principal will fluctuate and you may have a gain or loss when you sell shares. For the most current month-end performance information, please call 1-800-742-7272 or visit our Web site at www.williamblairfunds.com.
| June 30, 2018 | William Blair Funds | 161 |
Financial Highlights — For a share outstanding throughout each period
International Growth Fund
| | | Class N | |
| | | (unaudited)
Period Ended
June 30, | | | Years Ended December 31, | |
| | | | 2018 | | | 2017 | | | 2016 | | | 2015 | | | 2014 | | | 2013 | |
| Net asset value, beginning of year | | | $ | 30.41 | | | $ | 23.86 | | | $ | 24.94 | | | $ | 25.24 | | | $ | 26.30 | | | $ | 22.43 | |
| Income (loss) from investment operations: | | | | | | | | | | | | | | | | | | | | | | | | | |
| Net investment income (loss) | | | | 0.21 | | | | 0.21 | | | | 0.20 | | | | 0.18 | | | | 0.31 | | | | 0.27 | |
| Net realized and unrealized gain (loss) on investments | | | | (0.75 | ) | | | 6.73 | | | | (0.92 | ) | | | (0.25 | ) | | | (1.15 | ) | | | 3.89 | |
| Total from investment operations | | | | (0.54 | ) | | | 6.94 | | | | (0.72 | ) | | | (0.07 | ) | | | (0.84 | ) | | | 4.16 | |
| Less distributions from: | | | | | | | | | | | | | | | | | | | | | | | | | |
| Net investment income | | | | — | | | | 0.39 | | | | 0.36 | | | | 0.23 | | | | 0.22 | | | | 0.29 | |
| Net realized gain | | | | — | | | | — | | | | — | | | | — | | | | — | | | | — | |
| Total distributions | | | | — | | | | 0.39 | | | | 0.36 | | | | 0.23 | | | | 0.22 | | | | 0.29 | |
| Net asset value, end of year | | | $ | 29.87 | | | $ | 30.41 | | | $ | 23.86 | | | $ | 24.94 | | | $ | 25.24 | | | $ | 26.30 | |
| Total return (%)* | | | | (1.78 | ) | | | 29.11 | | | | (2.88 | ) | | | (0.27 | ) | | | (3.19 | ) | | | 18.57 | |
| Ratios to average daily net assets (%)**: | | | | | | | | | | | | | | | | | | | | | | | | | |
| Expenses, net of waivers and reimbursements | | | | 1.45 | | | | 1.45 | | | | 1.43 | | | | 1.42 | | | | 1.44 | | | | 1.44 | |
| Expenses, before waivers and reimbursements | | | | 1.45 | | | | 1.47 | | | | 1.43 | | | | 1.42 | | | | 1.44 | | | | 1.44 | |
| Net investment income (loss), net of waivers and reimbursements | | | | 1.36 | | | | 0.78 | | | | 0.84 | | | | 0.71 | | | | 1.17 | | | | 1.13 | |
| Net investment income (loss), before waivers and reimbursements | | | | 1.36 | | | | 0.76 | | | | 0.84 | | | | 0.71 | | | | 1.17 | | | | 1.13 | |
| Class N net assets at the end of the year (in thousands) | | | $ | 701,999 | | | $ | 763,740 | | | $ | 729,544 | | | $ | 1,023,588 | | | $ | 978,433 | | | $ | 1,418,083 | |
| Portfolio turnover rate (%)* | | | | 36 | | | | 82 | | | | 101 | | | | 70 | | | | 79 | | | | 97 | |
| | | | | | | | | | | | | | | | | | | | | | | | | | |
| | | Class I | |
| | | (unaudited)
Period Ended
June 30, | | | Years Ended December 31, | |
| | | | 2018 | | | 2017 | | | 2016 | | | 2015 | | | 2014 | | | 2013 | |
| Net asset value, beginning of year | | | $ | 31.13 | | | $ | 24.42 | | | $ | 25.51 | | | $ | 25.82 | | | $ | 26.91 | | | $ | 22.94 | |
| Income (loss) from investment operations: | | | | | | | | | | | | | | | | | | | | | | | | | |
| Net investment income (loss) | | | | 0.26 | | | | 0.30 | | | | 0.29 | | | | 0.27 | | | | 0.36 | | | | 0.35 | |
| Net realized and unrealized gain (loss) on investments | | | | (0.77 | ) | | | 6.89 | | | | (0.94 | ) | | | (0.28 | ) | | | (1.13 | ) | | | 3.99 | |
| Total from investment operations | | | | (0.51 | ) | | | 7.19 | | | | (0.65 | ) | | | (0.01 | ) | | | (0.77 | ) | | | 4.34 | |
| Less distributions from: | | | | | | | | | | | | | | | | | | | | | | | | | |
| Net investment income | | | | — | | | | 0.48 | | | | 0.44 | | | | 0.30 | | | | 0.32 | | | | 0.37 | |
| Net realized gain | | | | — | | | | — | | | | — | | | | — | | | | — | | | | — | |
| Total distributions | | | | — | | | | 0.48 | | | | 0.44 | | | | 0.30 | | | | 0.32 | | | | 0.37 | |
| Net asset value, end of year | | | $ | 30.62 | | | $ | 31.13 | | | $ | 24.42 | | | $ | 25.51 | | | $ | 25.82 | | | $ | 26.91 | |
| Total return (%)* | | | | (1.64 | ) | | | 29.49 | | | | (2.54 | ) | | | (0.03 | ) | | | (2.86 | ) | | | 18.96 | |
| Ratios to average daily net assets (%)**: | | | | | | | | | | | | | | | | | | | | | | | | | |
| Expenses | | | | 1.13 | | | | 1.14 | | | | 1.13 | | | | 1.14 | | | | 1.14 | | | | 1.11 | |
| Net investment income (loss) | | | | 1.68 | | | | 1.08 | | | | 1.16 | | | | 1.02 | | | | 1.36 | | | | 1.43 | |
| Class I net assets at the end of the year (in thousands) | | | $ | 2,206,430 | | | $ | 2,375,326 | | | $ | 2,251,701 | | | $ | 2,655,156 | | | $ | 2,705,054 | | | $ | 2,877,541 | |
| Portfolio turnover rate (%)* | | | | 36 | | | | 82 | | | | 101 | | | | 70 | | | | 79 | | | | 97 | |
| * | Rates are not annualized for periods less than a year. |
| ** | Rates are annualized for periods less than a year. |
Note: Net investment income (loss) per share is based on the average shares outstanding during the year.
Performance cited represents past performance. Past performance does not guarantee future results and current performance may be lower or higher than the data quoted. Results shown are annual returns, which assume reinvestment of dividends and capital gains. Investment returns and principal will fluctuate and you may have a gain or loss when you sell shares. For the most current month-end performance information, please call 1-800-742-7272 or visit our Web site at www.williamblairfunds.com.
| 162 | Semiannual Report | June 30, 2018 |
Financial Highlights — For a share outstanding throughout each period
Institutional International Growth Fund
| | | Institutional Class | |
| | | (unaudited)
Period Ended
June 30, | | | Years Ended December 31, | |
| | | | 2018 | | | 2017 | | | 2016 | | | 2015 | | | 2014 | | | 2013 | |
| Net asset value, beginning of year | | | $ | 18.08 | | | $ | 14.55 | | | $ | 15.08 | | | $ | 15.26 | | | $ | 17.40 | | | $ | 14.89 | |
| Income (loss) from investment operations: | | | | | | | | | | | | | | | | | | | | | | | | | |
| Net investment income (loss) | | | | 0.17 | | | | 0.21 | | | | 0.18 | | | | 0.19 | | | | 0.26 | | | | 0.25 | |
| Net realized and unrealized gain (loss) on investments | | | | (0.46 | ) | | | 4.07 | | | | (0.54 | ) | | | (0.18 | ) | | | (0.71 | ) | | | 2.56 | |
| Total from investment operations | | | | (0.29 | ) | | | 4.28 | | | | (0.36 | ) | | | 0.01 | | | | (0.45 | ) | | | 2.81 | |
| Less distributions from: | | | | | | | | | | | | | | | | | | | | | | | | | |
| Net investment income | | | | — | | | | 0.44 | | | | 0.17 | | | | 0.09 | | | | 0.32 | | | | 0.30 | |
| Net realized gain | | | | — | | | | 0.31 | | | | — | | | | 0.10 | | | | 1.37 | | | | — | |
| Total distributions | | | | — | | | | 0.75 | | | | 0.17 | | | | 0.19 | | | | 1.69 | | | | 0.30 | |
| Net asset value, end of year | | | $ | 17.79 | | | $ | 18.08 | | | $ | 14.55 | | | $ | 15.08 | | | $ | 15.26 | | | $ | 17.40 | |
| Total return (%)* | | | | (1.60 | ) | | | 29.53 | | | | (2.40 | ) | | | 0.09 | | | | (2.66 | ) | | | 18.90 | |
| Ratios to average daily net assets (%)**: | | | | | | | | | | | | | | | | | | | | | | | | | |
| Expenses | | | | 0.97 | | | | 0.97 | | | | 0.98 | | | | 0.96 | | | | 0.97 | | | | 0.97 | |
| Net investment income (loss) | | | | 1.83 | | | | 1.22 | | | | 1.25 | | | | 1.18 | | | | 1.50 | | | | 1.58 | |
| Institutional Class net assets at the end of the year (in thousands) | | | $ | 2,174,772 | | | $ | 2,330,299 | | | $ | 2,093,971 | | | $ | 2,335,632 | | | $ | 2,339,169 | | | $ | 2,440,149 | |
| Portfolio turnover rate (%)* | | | | 39 | | | | 84 | | | | 105 | | | | 70 | | | | 83 | | | | 97 | |
| * | Rates are not annualized for periods less than a year. |
| ** | Rates are annualized for periods less than a year. |
Note: Net investment income (loss) per share is based on the average shares outstanding during the year.
Performance cited represents past performance. Past performance does not guarantee future results and current performance may be lower or higher than the data quoted. Results shown are annual returns, which assume reinvestment of dividends and capital gains. Investment returns and principal will fluctuate and you may have a gain or loss when you sell shares. For the most current month-end performance information, please call 1-800-742-7272 or visit our Web site at www.williamblairfunds.com.
| June 30, 2018 | William Blair Funds | 163 |
Financial Highlights — For a share outstanding throughout each period
International Small Cap Growth Fund
| | | Class N | |
| | | (unaudited)
Period Ended
June 30, | | | Years Ended December 31, | |
| | | | 2018 | | | 2017 | | | 2016 | | | 2015 | | | 2014 | | | 2013 | |
| Net asset value, beginning of year | | | $ | 15.49 | | | $ | 12.87 | | | $ | 13.50 | | | $ | 12.56 | | | $ | 16.08 | | | $ | 13.46 | |
| Income (loss) from investment operations: | | | | | | | | | | | | | | | | | | | | | | | | | |
| Net investment income (loss) | | | | 0.06 | | | | 0.12 | | | | 0.10 | | | | 0.05 | | | | 0.03 | | | | 0.10 | |
| Net realized and unrealized gain (loss) on investments | | | | (0.72 | ) | | | 3.98 | | | | (0.72 | ) | | | 1.16 | | | | (1.38 | ) | | | 3.35 | |
| Total from investment operations | | | | (0.66 | ) | | | 4.10 | | | | (0.62 | ) | | | 1.21 | | | | (1.35 | ) | | | 3.45 | |
| Less distributions from: | | | | | | | | | | | | | | | | | | | | | | | | | |
| Net investment income | | | | — | | | | 0.32 | | | | 0.01 | | | | 0.24 | | | | 0.18 | | | | 0.16 | |
| Net realized gain | | | | — | | | | 1.16 | | | | 0.00 | ^ | | | 0.03 | | | | 1.99 | | | | 0.67 | |
| Total distributions | | | | — | | | | 1.48 | | | | 0.01 | | | | 0.27 | | | | 2.17 | | | | 0.83 | |
| Net asset value, end of year | | | $ | 14.83 | | | $ | 15.49 | | | $ | 12.87 | | | $ | 13.50 | | | $ | 12.56 | | | $ | 16.08 | |
| Total return (%)* | | | | (4.26 | ) | | | 32.17 | | | | (4.60 | ) | | | 9.67 | | | | (8.43 | ) | | | 25.80 | |
| Ratios to average daily net assets (%)**: | | | | | | | | | | | | | | | | | | | | | | | | | |
| Expenses, net of waivers and reimbursements | | | | 1.47 | | | | 1.47 | | | | 1.44 | | | | 1.47 | | | | 1.58 | | | | 1.59 | |
| Expenses, before waivers and reimbursements | | | | 1.47 | | | | 1.62 | | | | 1.59 | | | | 1.62 | | | | 1.58 | | | | 1.59 | |
| Net investment income (loss), net of waivers and reimbursements | | | | 0.73 | | | | 0.85 | | | | 0.77 | | | | 0.34 | | | | 0.20 | | | | 0.67 | |
| Net investment income (loss), before waivers and reimbursements | | | | 0.73 | | | | 0.70 | | | | 0.62 | | | | 0.19 | | | | 0.20 | | | | 0.67 | |
| Class N net assets at the end of the year (in thousands) | | | $ | 5,695 | | | $ | 6,275 | | | $ | 10,361 | | | $ | 11,350 | | | $ | 13,676 | | | $ | 18,910 | |
| Portfolio turnover rate (%)* | | | | 49 | | | | 64 | | | | 73 | | | | 90 | | | | 127 | | | | 111 | |
| | | | | | | | | | | | | | | | | | | | | | | | | | |
| | | Class I | |
| | | (unaudited)
Period Ended
June 30, | | | | Years Ended December 31, | |
| | | | 2018 | | | 2017 | | | 2016 | | | 2015 | | | 2014 | | | 2013 | |
| Net asset value, beginning of year | | | $ | 15.65 | | | $ | 13.00 | | | $ | 13.65 | | | $ | 12.70 | | | $ | 16.23 | | | $ | 13.58 | |
| Income (loss) from investment operations: | | | | | | | | | | | | | | | | | | | | | | | | | |
| Net investment income (loss) | | | | 0.09 | | | | 0.14 | | | | 0.14 | | | | 0.09 | | | | 0.09 | | | | 0.15 | |
| Net realized and unrealized gain (loss) on investments | | | | (0.73 | ) | | | 4.07 | | | | (0.75 | ) | | | 1.18 | | | | (1.40 | ) | | | 3.37 | |
| Total from investment operations | | | | (0.64 | ) | | | 4.21 | | | | (0.61 | ) | | | 1.27 | | | | (1.31 | ) | | | 3.52 | |
| Less distributions from: | | | | | | | | | | | | | | | | | | | | | | | | | |
| Net investment income | | | | — | | | | 0.40 | | | | 0.04 | | | | 0.29 | | | | 0.23 | | | | 0.20 | |
| Net realized gain | | | | — | | | | 1.16 | | | | 0.00 | ^ | | | 0.03 | | | | 1.99 | | | | 0.67 | |
| Total distributions | | | | — | | | | 1.56 | | | | 0.04 | | | | 0.32 | | | | 2.22 | | | | 0.87 | |
| Net asset value, end of year | | | $ | 15.01 | | | $ | 15.65 | | | $ | 13.00 | | | $ | 13.65 | | | $ | 12.70 | | | $ | 16.23 | |
| Total return (%)* | | | | (4.09 | ) | | | 32.70 | | | | (4.41 | ) | | | 10.00 | | | | (8.10 | ) | | | 26.11 | |
| Ratios to average daily net assets (%)**: | | | | | | | | | | | | | | | | | | | | | | | | | |
| Expenses, net of waivers and reimbursements | | | | 1.15 | | | | 1.16 | | | | 1.15 | | | | 1.16 | | | | 1.28 | | | | 1.30 | |
| Expenses, before waivers and reimbursements | | | | 1.15 | | | | 1.31 | | | | 1.30 | | | | 1.31 | | | | 1.28 | | | | 1.30 | |
| Net investment income (loss), net of waivers and reimbursements | | | | 1.10 | | | | 0.92 | | | | 1.06 | | | | 0.66 | | | | 0.56 | | | | 0.96 | |
| Net investment income (loss), before waivers and reimbursements | | | | 1.10 | | | | 0.77 | | | | 0.91 | | | | 0.51 | | | | 0.56 | | | | 0.96 | |
| Class I net assets at the end of the year (in thousands) | | | $ | 339,935 | | | $ | 338,920 | | | $ | 306,526 | | | $ | 342,232 | | | $ | 364,161 | | | $ | 508,758 | |
| Portfolio turnover rate (%)* | | | | 49 | | | | 64 | | | | 73 | | | | 90 | | | | 127 | | | | 111 | |
| * | Rates are not annualized for periods less than a year. |
| ** | Rates are annualized for periods less than a year. |
| ^ | Amount is less than $0.005 per share. |
Note: Net investment income (loss) per share is based on the average shares outstanding during the year.
Performance cited represents past performance. Past performance does not guarantee future results and current performance may be lower or higher than the data quoted. Results shown are annual returns, which assume reinvestment of dividends and capital gains. Investment returns and principal will fluctuate and you may have a gain or loss when you sell shares. For the most current month-end performance information, please call 1-800-742-7272 or visit our Web site at www.williamblairfunds.com.
| 164 | Semiannual Report | June 30, 2018 |
Financial Highlights — For a share outstanding throughout each period
International Small Cap Growth Fund
| | | Institutional Class | |
| | | (unaudited)
Period Ended
June 30, | | | Years Ended December 31, | |
| | | | 2018 | | | 2017 | | | 2016 | | | 2015 | | | 2014 | | | 2013 | |
| Net asset value, beginning of year | | | $ | 15.73 | | | $ | 13.07 | | | $ | 13.72 | | | $ | 12.77 | | | $ | 16.32 | | | $ | 13.64 | |
| Income (loss) from investment operations: | | | | | | | | | | | | | | | | | | | | | | | | | |
| Net investment income (loss) | | | | 0.09 | | | | 0.15 | | | | 0.15 | | | | 0.10 | | | | 0.12 | | | | 0.18 | |
| Net realized and unrealized gain (loss) on investments | | | | (0.72 | ) | | | 4.08 | | | | (0.74 | ) | | | 1.18 | | | | (1.41 | ) | | | 3.41 | |
| Total from investment operations | | | | (0.63 | ) | | | 4.23 | | | | (0.59 | ) | | | 1.28 | | | | (1.29 | ) | | | 3.59 | |
| Less distributions from: | | | | | | | | | | | | | | | | | | | | | | | | | |
| Net investment income | | | | — | | | | 0.41 | | | | 0.06 | | | | 0.30 | | | | 0.27 | | | | 0.24 | |
| Net realized gain | | | | — | | | | 1.16 | | | | 0.00 | ^ | | | 0.03 | | | | 1.99 | | | | 0.67 | |
| Total distributions | | | | — | | | | 1.57 | | | | 0.06 | | | | 0.33 | | | | 2.26 | | | | 0.91 | |
| Net asset value, end of year | | | $ | 15.10 | | | $ | 15.73 | | | $ | 13.07 | | | $ | 13.72 | | | $ | 12.77 | | | $ | 16.32 | |
| Total return (%)* | | | | (4.01 | ) | | | 32.70 | | | | (4.31 | ) | | | 10.03 | | | | (7.91 | ) | | | 26.49 | |
| Ratios to average daily net assets (%)**: | | | | | | | | | | | | | | | | | | | | | | | | | |
| Expenses | | | | 1.07 | | | | 1.08 | | | | 1.07 | | | | 1.08 | | | | 1.06 | | | | 1.06 | |
| Net investment income (loss) | | | | 1.12 | | | | 0.99 | | | | 1.13 | | | | 0.76 | | | | 0.74 | | | | 1.20 | |
| Institutional Class net assets at the end of the year (in thousands) | | | $ | 232,867 | | | $ | 256,558 | | | $ | 199,746 | | | $ | 221,018 | | | $ | 245,103 | | | $ | 408,524 | |
| Portfolio turnover rate (%)* | | | | 49 | | | | 64 | | | | 73 | | | | 90 | | | | 127 | | | | 111 | |
| * | Rates are not annualized for periods less than a year. |
| ** | Rates are annualized for periods less than a year. |
| ^ | Amount is less than $0.005 per share. |
Note: Net investment income (loss) per share is based on the average shares outstanding during the year.
Performance cited represents past performance. Past performance does not guarantee future results and current performance may be lower or higher than the data quoted. Results shown are annual returns, which assume reinvestment of dividends and capital gains. Investment returns and principal will fluctuate and you may have a gain or loss when you sell shares. For the most current month-end performance information, please call 1-800-742-7272 or visit our Web site at www.williamblairfunds.com.
| June 30, 2018 | William Blair Funds | 165 |
Financial Highlights — For a share outstanding throughout each period
Emerging Markets Leaders Fund
| | | Class N | |
| | | (unaudited)
Period Ended
June 30, | | | Years Ended December 31, | |
| | | | 2018 | | | 2017 | | | 2016 | | | 2015 | | | 2014 | | | 2013 | |
| Net asset value, beginning of year | | | $ | 11.06 | | | $ | 7.84 | | | $ | 7.73 | | | $ | 9.06 | | | $ | 9.10 | | | $ | 9.20 | |
| Income (loss) from investment operations: | | | | | | | | | | | | | | | | | | | | | | | | | |
| Net investment income (loss) | | | | 0.04 | | | | 0.01 | | | | 0.02 | | | | 0.02 | | | | 0.05 | | | | (0.02 | ) |
| Net realized and unrealized gain (loss) on investments | | | | (0.81 | ) | | | 3.26 | | | | 0.09 | | | | (1.34 | ) | | | 0.14 | | | | (0.05 | ) |
| Total from investment operations | | | | (0.77 | ) | | | 3.27 | | | | 0.11 | | | | (1.32 | ) | | | 0.19 | | | | (0.07 | ) |
| Less distributions from: | | | | | | | | | | | | | | | | | | | | | | | | | |
| Net investment income | | | | — | | | | 0.05 | | | | — | | | | — | | | | 0.00 | ^ | | | 0.03 | |
| Net realized gain | | | | — | | | | — | | | | — | | | | 0.01 | | | | 0.23 | | | | — | |
| Total distributions | | | | — | | | | 0.05 | | | | — | | | | 0.01 | | | | 0.23 | | | | 0.03 | |
| Net asset value, end of year | | | $ | 10.29 | | | $ | 11.06 | | | $ | 7.84 | | | $ | 7.73 | | | $ | 9.06 | | | $ | 9.10 | |
| Total return (%)* | | | | (6.96 | ) | | | 41.68 | | | | 1.42 | | | | (14.56 | ) | | | 2.17 | | | | (0.74 | ) |
| Ratios to average daily net assets (%)**: | | | | | | | | | | | | | | | | | | | | | | | | | |
| Expenses, net of waivers and reimbursements | | | | 1.56 | | | | 1.47 | | | | 1.57 | | | | 1.64 | | | | 1.65 | | | | 1.65 | |
| Expenses, before waivers and reimbursements | | | | 1.58 | | | | 1.62 | | | | 1.81 | | | | 1.89 | | | | 1.82 | | | | 1.83 | |
| Net investment income (loss), net of waivers and reimbursements | | | | 0.66 | | | | 0.14 | | | | 0.29 | | | | 0.18 | | | | 0.51 | | | | (0.23 | ) |
| Net investment income (loss), before waivers and reimbursements | | | | 0.64 | | | | (0.01 | ) | | | 0.05 | | | | (0.07 | ) | | | 0.34 | | | | (0.41 | ) |
| Class N net assets at the end of the year (in thousands) | | | $ | 2,471 | | | $ | 2,766 | | | $ | 2,479 | | | $ | 1,599 | | | $ | 1,832 | | | $ | 1,959 | |
| Portfolio turnover rate (%)* | | | | 33 | | | | 59 | | | | 135 | | | | 110 | | | | 131 | | | | 131 | |
| | | | | | | | | | | | | | | | | | | | | | | | | | |
| | | Class I | |
| | | (unaudited)
Period Ended
June 30, | | | | Years Ended December 31, | |
| | | | 2018 | | | 2017 | | | 2016 | | | 2015 | | | 2014 | | | 2013 | |
| Net asset value, beginning of year | | | $ | 11.09 | | | $ | 7.87 | | | $ | 7.74 | | | $ | 9.08 | | | $ | 9.10 | | | $ | 9.18 | |
| Income (loss) from investment operations: | | | | | | | | | | | | | | | | | | | | | | | | | |
| Net investment income (loss) | | | | 0.05 | | | | 0.02 | | | | 0.04 | | | | 0.05 | | | | 0.08 | | | | 0.05 | |
| Net realized and unrealized gain (loss) on investments | | | | (0.80 | ) | | | 3.27 | | | | 0.10 | | | | (1.36 | ) | | | 0.15 | | | | (0.10 | ) |
| Total from investment operations | | | | (0.75 | ) | | | 3.29 | | | | 0.14 | | | | (1.31 | ) | | | 0.23 | | | | (0.05 | ) |
| Less distributions from: | | | | | | | | | | | | | | | | | | | | | | | | | |
| Net investment income | | | | — | | | | 0.07 | | | | 0.01 | | | | 0.02 | | | | 0.02 | | | | 0.03 | |
| Net realized gain | | | | — | | | | — | | | | — | | | | 0.01 | | | | 0.23 | | | | — | |
| Total distributions | | | | — | | | | 0.07 | | | | 0.01 | | | | 0.03 | | | | 0.25 | | | | 0.03 | |
| Net asset value, end of year | | | $ | 10.34 | | | $ | 11.09 | | | $ | 7.87 | | | $ | 7.74 | | | $ | 9.08 | | | $ | 9.10 | |
| Total return (%)* | | | | (6.76 | ) | | | 41.89 | | | | 1.82 | | | | (14.37 | ) | | | 2.62 | | | | (0.60 | ) |
| Ratios to average daily net assets (%)**: | | | | | | | | | | | | | | | | | | | | | | | | | |
| Expenses, net of waivers and reimbursements | | | | 1.24 | | | | 1.25 | | | | 1.30 | | | | 1.29 | | | | 1.40 | | | | 1.40 | |
| Expenses, before waivers and reimbursements | | | | 1.24 | | | | 1.40 | | | | 1.54 | | | | 1.54 | | | | 1.60 | | | | 1.58 | |
| Net investment income (loss), net of waivers and reimbursements | | | | 0.96 | | | | 0.24 | | | | 0.52 | | | | 0.53 | | | | 0.84 | | | | 0.51 | |
| Net investment income (loss), before waivers and reimbursements | | | | 0.96 | | | | 0.09 | | | | 0.28 | | | | 0.28 | | | | 0.64 | | | | 0.33 | |
| Class I net assets at the end of the year (in thousands) | | | $ | 45,601 | | | $ | 47,666 | | | $ | 30,346 | | | $ | 32,862 | | | $ | 28,475 | | | $ | 34,590 | |
| Portfolio turnover rate (%)* | | | | 33 | | | | 59 | | | | 135 | | | | 110 | | | | 131 | | | | 131 | |
| * | Rates are not annualized for periods less than a year. |
| ** | Rates are annualized for periods less than a year. |
| ^ | Amount is less than $0.005 per share. |
Note: Net investment income (loss) per share is based on the average shares outstanding during the year.
Performance cited represents past performance. Past performance does not guarantee future results and current performance may be lower or higher than the data quoted. Results shown are annual returns, which assume reinvestment of dividends and capital gains. Investment returns and principal will fluctuate and you may have a gain or loss when you sell shares. For the most current month-end performance information, please call 1-800-742-7272 or visit our Web site at www.williamblairfunds.com.
| 166 | Semiannual Report | June 30, 2018 |
Financial Highlights — For a share outstanding throughout each period
Emerging Markets Leaders Fund
| | | Institutional Class | |
| | | (unaudited)
Period Ended
June 30, | | | Years Ended December 31, | |
| | | | 2018 | | | 2017 | | | 2016 | | | 2015 | | | 2014 | | | 2013 | |
| Net asset value, beginning of year | | | $ | 11.09 | | | $ | 7.86 | | | $ | 7.74 | | | $ | 9.07 | | | $ | 9.10 | | | $ | 9.18 | |
| Income (loss) from investment operations: | | | | | | | | | | | | | | | | | | | | | | | | | |
| Net investment income (loss) | | | | 0.06 | | | | 0.03 | | | | 0.03 | | | | 0.04 | | | | 0.08 | | | | 0.06 | |
| Net realized and unrealized gain (loss) on investments | | | | (0.81 | ) | | | 3.28 | | | | 0.10 | | | | (1.33 | ) | | | 0.16 | | | | (0.10 | ) |
| Total from investment operations | | | | (0.75 | ) | | | 3.31 | | | | 0.13 | | | | (1.29 | ) | | | 0.24 | | | | (0.04 | ) |
| Less distributions from: | | | | | | | | | | | | | | | | | | | | | | | | | |
| Net investment income | | | | — | | | | 0.08 | | | | 0.01 | | | | 0.03 | | | | 0.04 | | | | 0.04 | |
| Net realized gain | | | | — | | | | — | | | | — | | | | 0.01 | | | | 0.23 | | | | — | |
| Total distributions | | | | — | | | | 0.08 | | | | 0.01 | | | | 0.04 | | | | 0.27 | | | | 0.04 | |
| Net asset value, end of year | | | $ | 10.34 | | | $ | 11.09 | | | $ | 7.86 | | | $ | 7.74 | | | $ | 9.07 | | | $ | 9.10 | |
| Total return (%)* | | | | (6.76 | ) | | | 42.15 | | | | 1.74 | | | | (14.24 | ) | | | 2.68 | | | | (0.46 | ) |
| Ratios to average daily net assets (%)**: | | | | | | | | | | | | | | | | | | | | | | | | | |
| Expenses, net of waivers and reimbursements | | | | 1.18 | | | | 1.19 | | | | 1.25 | | | | 1.25 | | | | 1.25 | | | | 1.25 | |
| Expenses, before waivers and reimbursements | | | | 1.18 | | | | 1.19 | | | | 1.34 | | | | 1.35 | | | | 1.42 | | | | 1.42 | |
| Net investment income (loss), net of waivers and reimbursements | | | | 1.00 | | | | 0.33 | | | | 0.39 | | | | 0.49 | | | | 0.83 | | | | 0.68 | |
| Net investment income (loss), before waivers and reimbursements | | | | 1.00 | | | | 0.33 | | | | 0.30 | | | | 0.39 | | | | 0.66 | | | | 0.51 | |
| Institutional Class net assets at the end of the year (in thousands) | | | $ | 387,366 | | | $ | 427,480 | | | $ | 272,678 | | | $ | 93,217 | | | $ | 75,875 | | | $ | 36,509 | |
| Portfolio turnover rate (%)* | | | | 33 | | | | 59 | | | | 135 | | | | 110 | | | | 131 | | | | 131 | |
| * | Rates are not annualized for periods less than a year. |
| ** | Rates are annualized for periods less than a year. |
Note: Net investment income (loss) per share is based on the average shares outstanding during the year.
Performance cited represents past performance. Past performance does not guarantee future results and current performance may be lower or higher than the data quoted. Results shown are annual returns, which assume reinvestment of dividends and capital gains. Investment returns and principal will fluctuate and you may have a gain or loss when you sell shares. For the most current month-end performance information, please call 1-800-742-7272 or visit our Web site at www.williamblairfunds.com.
| June 30, 2018 | William Blair Funds | 167 |
Financial Highlights — For a share outstanding throughout each period
Emerging Markets Growth Fund
| | | Class N | |
| | | (unaudited)
Period Ended
June 30, | | | Years Ended December 31, | |
| | | | 2018 | | | 2017 | | | 2016 | | | 2015 | | | 2014 | | | 2013 | |
| Net asset value, beginning of year | | | $ | 16.20 | | | $ | 10.99 | | | $ | 10.85 | | | $ | 12.91 | | | $ | 13.28 | | | $ | 13.40 | |
| Income (loss) from investment operations: | | | | | | | | | | | | | | | | | | | | | | | | | |
| Net investment income (loss) | | | | 0.03 | | | | (0.02 | ) | | | 0.03 | | | | 0.04 | | | | 0.08 | | | | 0.05 | |
| Net realized and unrealized gain (loss) on investments | | | | (1.22 | ) | | | 5.35 | | | | 0.13 | | | | (1.98 | ) | | | 0.37 | | | | 0.09 | |
| Total from investment operations | | | | (1.19 | ) | | | 5.33 | | | | 0.16 | | | | (1.94 | ) | | | 0.45 | | | | 0.14 | |
| Less distributions from: | | | | | | | | | | | | | | | | | | | | | | | | | |
| Net investment income | | | | — | | | | 0.12 | | | | 0.02 | | | | — | | | | 0.08 | | | | 0.01 | |
| Net realized gain | | | | — | | | | — | | | | — | | | | 0.12 | | | | 0.74 | | | | 0.25 | |
| Total distributions | | | | — | | | | 0.12 | | | | 0.02 | | | | 0.12 | | | | 0.82 | | | | 0.26 | |
| Net asset value, end of year | | | $ | 15.01 | | | $ | 16.20 | | | $ | 10.99 | | | $ | 10.85 | | | $ | 12.91 | | | $ | 13.28 | |
| Total return (%)* | | | | (7.35 | ) | | | 48.53 | | | | 1.49 | | | | (15.03 | ) | | | 3.40 | | | | 1.05 | |
| Ratios to average daily net assets (%)**: | | | | | | | | | | | | | | | | | | | | | | | | | |
| Expenses, net of waivers and reimbursements | | | | 1.50 | | | | 1.50 | | | | 1.50 | | | | 1.50 | | | | 1.64 | | | | 1.68 | |
| Expenses, before waivers and reimbursements | | | | 1.50 | | | | 1.65 | | | | 1.65 | | | | 1.65 | | | | 1.64 | | | | 1.68 | |
| Net investment income (loss), net of waivers and reimbursements | | | | 0.40 | | | | (0.14 | ) | | | 0.28 | | | | 0.33 | | | | 0.55 | | | | 0.39 | |
| Net investment income (loss), before waivers and reimbursements | | | | 0.40 | | | | (0.29 | ) | | | 0.13 | | | | 0.18 | | | | 0.55 | | | | 0.39 | |
| Class N net assets at the end of the year (in thousands) | | | $ | 9,977 | | | $ | 10,479 | | | $ | 8,488 | | | $ | 9,367 | | | $ | 12,638 | | | $ | 13,723 | |
| Portfolio turnover rate (%)* | | | | 55 | | | | 91 | | | | 105 | | | | 121 | | | | 101 | | | | 118 | |
| | | | | | | | | | | | | | | | | | | | | | | | | | |
| | | Class I | |
| | | (unaudited)
Period Ended
June 30, | | | | Years Ended December 31, | |
| | | | 2018 | | | 2017 | | | 2016 | | | 2015 | | | 2014 | | | 2013 | |
| Net asset value, beginning of year | | | $ | 16.36 | | | $ | 11.10 | | | $ | 10.96 | | | $ | 13.01 | | | $ | 13.38 | | | $ | 13.50 | |
| Income (loss) from investment operations: | | | | | | | | | | | | | | | | | | | | | | | | | |
| Net investment income (loss) | | | | 0.05 | | | | 0.01 | | | | 0.06 | | | | 0.07 | | | | 0.11 | | | | 0.08 | |
| Net realized and unrealized gain (loss) on investments | | | | (1.23 | ) | | | 5.40 | | | | 0.13 | | | | (2.00 | ) | | | 0.37 | | | | 0.10 | |
| Total from investment operations | | | | (1.18 | ) | | | 5.41 | | | | 0.19 | | | | (1.93 | ) | | | 0.48 | | | | 0.18 | |
| Less distributions from: | | | | | | | | | | | | | | | | | | | | | | | | | |
| Net investment income | | | | — | | | | 0.15 | | | | 0.05 | | | | — | | | | 0.11 | | | | 0.05 | |
| Net realized gain | | | | — | | | | — | | | | — | | | | 0.12 | | | | 0.74 | | | | 0.25 | |
| Total distributions | | | | — | | | | 0.15 | | | | 0.05 | | | | 0.12 | | | | 0.85 | | | | 0.30 | |
| Net asset value, end of year | | | $ | 15.18 | | | $ | 16.36 | | | $ | 11.10 | | | $ | 10.96 | | | $ | 13.01 | | | $ | 13.38 | |
| Total return (%)* | | | | (7.21 | ) | | | 48.83 | | | | 1.73 | | | | (14.83 | ) | | | 3.65 | | | | 1.36 | |
| Ratios to average daily net assets (%)**: | | | | | | | | | | | | | | | | | | | | | | | | | |
| Expenses, net of waivers and reimbursements | | | | 1.25 | | | | 1.27 | | | | 1.26 | | | | 1.25 | | | | 1.40 | | | | 1.41 | |
| Expenses, before waivers and reimbursements | | | | 1.25 | | | | 1.42 | | | | 1.41 | | | | 1.40 | | | | 1.40 | | | | 1.41 | |
| Net investment income (loss), net of waivers and reimbursements | | | | 0.65 | | | | 0.08 | | | | 0.53 | | | | 0.58 | | | | 0.79 | | | | 0.62 | |
| Net investment income (loss), before waivers and reimbursements | | | | 0.65 | | | | (0.07 | ) | | | 0.38 | | | | 0.43 | | | | 0.79 | | | | 0.62 | |
| Class I net assets at the end of the year (in thousands) | | | $ | 116,444 | | | $ | 129,481 | | | $ | 93,668 | | | $ | 130,491 | | | $ | 166,488 | | | $ | 152,588 | |
| Portfolio turnover rate (%)* | | | | 55 | | | | 91 | | | | 105 | | | | 121 | | | | 101 | | | | 118 | |
| * | Rates are not annualized for periods less than a year. |
| ** | Rates are annualized for periods less than a year. |
Note: Net investment income (loss) per share is based on the average shares outstanding during the year.
Performance cited represents past performance. Past performance does not guarantee future results and current performance may be lower or higher than the data quoted. Results shown are annual returns, which assume reinvestment of dividends and capital gains. Investment returns and principal will fluctuate and you may have a gain or loss when you sell shares. For the most current month-end performance information, please call 1-800-742-7272 or visit our Web site at www.williamblairfunds.com.
| 168 | Semiannual Report | June 30, 2018 |
Financial Highlights — For a share outstanding throughout each period
Emerging Markets Growth Fund
| | | Institutional Class | |
| | | (unaudited)
Period Ended
June 30, | | | Years Ended December 31, | |
| | | | 2018 | | | 2017 | | | 2016 | | | 2015 | | | 2014 | | | 2013 | |
| Net asset value, beginning of year | | | $ | 16.49 | | | $ | 11.18 | | | $ | 11.05 | | | $ | 13.09 | | | $ | 13.46 | | | $ | 13.59 | |
| Income (loss) from investment operations: | | | | | | | | | | | | | | | | | | | | | | | | | |
| Net investment income (loss) | | | | 0.06 | | | | 0.02 | | | | 0.07 | | | | 0.08 | | | | 0.14 | | | | 0.12 | |
| Net realized and unrealized gain (loss) on investments | | | | (1.24 | ) | | | 5.46 | | | | 0.12 | | | | (2.00 | ) | | | 0.37 | | | | 0.08 | |
| Total from investment operations | | | | (1.18 | ) | | | 5.48 | | | | 0.19 | | | | (1.92 | ) | | | 0.51 | | | | 0.20 | |
| Less distributions from: | | | | | | | | | | | | | | | | | | | | | | | | | |
| Net investment income | | | | — | | | | 0.17 | | | | 0.06 | | | | — | | | | 0.14 | | | | 0.08 | |
| Net realized gain | | | | — | | | | — | | | | — | | | | 0.12 | | | | 0.74 | | | | 0.25 | |
| Total distributions | | | | — | | | | 0.17 | | | | 0.06 | | | | 0.12 | | | | 0.88 | | | | 0.33 | |
| Net asset value, end of year | | | $ | 15.31 | | | $ | 16.49 | | | $ | 11.18 | | | $ | 11.05 | | | $ | 13.09 | | | $ | 13.46 | |
| Total return (%)* | | | | (7.16 | ) | | | 49.06 | | | | 1.71 | | | | (14.67 | ) | | | 3.85 | | | | 1.49 | |
| Ratios to average daily net assets (%)**: | | | | | | | | | | | | | | | | | | | | | | | | | |
| Expenses | | | | 1.17 | | | | 1.17 | | | | 1.19 | | | | 1.17 | | | | 1.18 | | | | 1.19 | |
| Net investment income (loss) | | | | 0.69 | | | | 0.17 | | | | 0.60 | | | | 0.61 | | | | 1.00 | | | | 0.87 | |
| Institutional Class net assets at the end of the year (in thousands) | | | $ | 950,506 | | | $ | 1,178,853 | | | $ | 831,587 | | | $ | 739,253 | | | $ | 806,708 | | | $ | 833,711 | |
| Portfolio turnover rate (%)* | | | | 55 | | | | 91 | | | | 105 | | | | 121 | | | | 101 | | | | 118 | |
| * | Rates are not annualized for periods less than a year. |
| ** | Rates are annualized for periods less than a year. |
Note: Net investment income (loss) per share is based on the average shares outstanding during the year.
Performance cited represents past performance. Past performance does not guarantee future results and current performance may be lower or higher than the data quoted. Results shown are annual returns, which assume reinvestment of dividends and capital gains. Investment returns and principal will fluctuate and you may have a gain or loss when you sell shares. For the most current month-end performance information, please call 1-800-742-7272 or visit our Web site at www.williamblairfunds.com.
| June 30, 2018 | William Blair Funds | 169 |
Financial Highlights — For a share outstanding throughout each period
Emerging Markets Small Cap Growth Fund
| | | Class N | |
| | | (unaudited)
Period Ended
June 30, | | Years Ended December 31, | |
| | | | 2018 | | | 2017 | | | 2016 | | | 2015 | | | 2014 | | | 2013 | |
| Net asset value, beginning of year | | | $ | 18.66 | | | $ | 13.73 | | | $ | 14.84 | | | $ | 16.52 | | | $ | 15.12 | | | $ | 12.99 | |
| Income (loss) from investment operations: | | | | | | | | | | | | | | | | | | | | | | | | | |
| Net investment income (loss) | | | | (0.00 | )^ | | | 0.01 | | | | 0.09 | | | | (0.01 | ) | | | 0.04 | | | | 0.05 | |
| Net realized and unrealized gain (loss) on investments | | | | (1.77 | ) | | | 5.46 | | | | (0.88 | ) | | | (1.05 | ) | | | 2.13 | | | | 2.08 | |
| Total from investment operations | | | | (1.77 | ) | | | 5.47 | | | | (0.79 | ) | | | (1.06 | ) | | | 2.17 | | | | 2.13 | |
| Less distributions from: | | | | | | | | | | | | | | | | | | | | | | | | | |
| Net investment income | | | | — | | | | 0.50 | | | | 0.32 | | | | — | | | | 0.03 | | | | — | |
| Net realized gain | | | | — | | | | 0.04 | | | | — | | | | 0.62 | | | | 0.74 | | | | 0.00 | ^ |
| Total distributions | | | | — | | | | 0.54 | | | | 0.32 | | | | 0.62 | | | | 0.77 | | | | 0.00 | ^ |
| Net asset value, end of year | | | $ | 16.89 | | | $ | 18.66 | | | $ | 13.73 | | | $ | 14.84 | | | $ | 16.52 | | | $ | 15.12 | |
| Total return (%)* | | | | (9.49 | ) | | | 40.09 | | | | (5.33 | ) | | | (6.40 | ) | | | 14.41 | | | | 16.42 | |
| Ratios to average daily net assets (%)**: | | | | | | | | | | | | | | | | | | | | | | | | | |
| Expenses, net of waivers and reimbursements | | | | 1.61 | | | | 1.64 | | | | 1.61 | | | | 1.65 | | | | 1.65 | | | | 1.65 | |
| Expenses, before waivers and reimbursements | | | | 1.66 | | | | 1.83 | | | | 1.82 | | | | 1.94 | | | | 1.74 | | | | 2.19 | |
| Net investment income (loss), net of waivers and reimbursements | | | | (0.05 | ) | | | 0.08 | | | | 0.62 | | | | (0.06 | ) | | | 0.21 | | | | 0.38 | |
| Net investment income (loss), before waivers and reimbursements | | | | (0.10 | ) | | | (0.11 | ) | | | 0.41 | | | | (0.35 | ) | | | 0.12 | | | | (0.16 | ) |
| Class N net assets at the end of the year (in thousands) | | | $ | 11,892 | | | $ | 15,082 | | | $ | 9,263 | | | $ | 11,306 | | | $ | 10,745 | | | $ | 9,313 | |
| Portfolio turnover rate (%)* | | | | 92 | | | | 183 | | | | 157 | | | | 167 | | | | 124 | | | | 138 | |
| | | | | | | | | | | | | | | | | | | | | | | | | | |
| | | Class I | |
| | | (unaudited)
Period Ended
June 30, | | Years Ended December 31, | |
| | | | 2018 | | | 2017 | | | 2016 | | | 2015 | | | 2014 | | | 2013 | |
| Net asset value, beginning of year | | | $ | 18.73 | | | $ | 13.77 | | | $ | 14.90 | | | $ | 16.52 | | | $ | 15.13 | | | $ | 12.99 | |
| Income (loss) from investment operations: | | | | | | | | | | | | | | | | | | | | | | | | | |
| Net investment income (loss) | | | | 0.03 | | | | 0.08 | | | | 0.13 | | | | 0.05 | | | | 0.02 | | | | 0.05 | |
| Net realized and unrealized gain (loss) on investments | | | | (1.78 | ) | | | 5.47 | | | | (0.89 | ) | | | (1.05 | ) | | | 2.20 | | | | 2.12 | |
| Total from investment operations | | | | (1.75 | ) | | | 5.55 | | | | (0.76 | ) | | | (1.00 | ) | | | 2.22 | | | | 2.17 | |
| Less distributions from: | | | | | | | | | | | | | | | | | | | | | | | | | |
| Net investment income | | | | — | | | | 0.55 | | | | 0.37 | | | | — | | | | 0.09 | | | | 0.03 | |
| Net realized gain | | | | — | | | | 0.04 | | | | — | | | | 0.62 | | | | 0.74 | | | | 0.00 | ^ |
| Total distributions | | | | — | | | | 0.59 | | | | 0.37 | | | | 0.62 | | | | 0.83 | | | | 0.03 | |
| Net asset value, end of year | | | $ | 16.98 | | | $ | 18.73 | | | $ | 13.77 | | | $ | 14.90 | | | $ | 16.52 | | | $ | 15.13 | |
| Total return (%)* | | | | (9.34 | ) | | | 40.53 | | | | (5.11 | ) | | | (6.03 | ) | | | 14.73 | | | | 16.70 | |
| Ratios to average daily net assets (%)**: | | | | | | | | | | | | | | | | | | | | | | | | | |
| Expenses, net of waivers and reimbursements | | | | 1.31 | | | | 1.31 | | | | 1.30 | | | | 1.31 | | | | 1.40 | | | | 1.40 | |
| Expenses, before waivers and reimbursements | | | | 1.33 | | | | 1.50 | | | | 1.51 | | | | 1.52 | | | | 1.49 | | | | 1.72 | |
| Net investment income (loss), net of waivers and reimbursements | | | | 0.29 | | | | 0.49 | | | | 0.87 | | | | 0.30 | | | | 0.15 | | | | 0.35 | |
| Net investment income (loss), before waivers and reimbursements | | | | 0.27 | | | | 0.30 | | | | 0.66 | | | | 0.09 | | | | 0.06 | | | | 0.03 | |
| Class I net assets at the end of the year (in thousands) | | | $ | 284,122 | | | $ | 282,620 | | | $ | 147,949 | | | $ | 162,375 | | | $ | 119,662 | | | $ | 58,123 | |
| Portfolio turnover rate (%)* | | | | 92 | | | | 183 | | | | 157 | | | | 167 | | | | 124 | | | | 138 | |
| * | Rates are not annualized for periods less than a year. |
| ** | Rates are annualized for periods less than a year. |
| ^ | Amount is less than $0.005 per share. |
Note: Net investment income (loss) per share is based on the average shares outstanding during the year.
Performance cited represents past performance. Past performance does not guarantee future results and current performance may be lower or higher than the data quoted. Results shown are annual returns, which assume reinvestment of dividends and capital gains. Investment returns and principal will fluctuate and you may have a gain or loss when you sell shares. For the most current month-end performance information, please call 1-800-742-7272 or visit our Web site at www.williamblairfunds.com.
| 170 | Semiannual Report | June 30, 2018 |
Financial Highlights — For a share outstanding throughout each period
Emerging Markets Small Cap Growth Fund
| | | Institutional Class | |
| | | (unaudited)
Period Ended
June 30, | | Years Ended December 31, | |
| | | | 2018 | | | 2017 | | | 2016 | | | 2015 | | | 2014 | | | 2013 | |
| Net asset value, beginning of year | | | $ | 18.76 | | | $ | 13.79 | | | $ | 14.92 | | | $ | 16.53 | | | $ | 15.14 | | | $ | 13.00 | |
| Income (loss) from investment operations: | | | | | | | | | | | | | | | | | | | | | | | | | |
| Net investment income (loss) | | | | 0.03 | | | | 0.10 | | | | 0.14 | | | | 0.06 | | | | 0.06 | | | | 0.07 | |
| Net realized and unrealized gain (loss) on investments | | | | (1.77 | ) | | | 5.47 | | | | (0.89 | ) | | | (1.05 | ) | | | 2.18 | | | | 2.11 | |
| Total from investment operations | | | | (1.74 | ) | | | 5.57 | | | | (0.75 | ) | | | (0.99 | ) | | | 2.24 | | | | 2.18 | |
| Less distributions from: | | | | | | | | | | | | | | | | | | | | | | | | | |
| Net investment income | | | | — | | | | 0.56 | | | | 0.38 | | | | 0.00 | ^ | | | 0.11 | | | | 0.04 | |
| Net realized gain | | | | — | | | | 0.04 | | | | — | | | | 0.62 | | | | 0.74 | | | | 0.00 | ^ |
| Total distributions | | | | — | | | | 0.60 | | | | 0.38 | | | | 0.62 | | | | 0.85 | | | | 0.04 | |
| Net asset value, end of year | | | $ | 17.02 | | | $ | 18.76 | | | $ | 13.79 | | | $ | 14.92 | | | $ | 16.53 | | | $ | 15.14 | |
| Total return (%)* | | | | (9.28 | ) | | | 40.62 | | | | (5.05 | ) | | | (5.97 | ) | | | 14.85 | | | | 16.80 | |
| Ratios to average daily net assets (%)**: | | | | | | | | | | | | | | | | | | | | | | | | | |
| Expenses, net of waivers and reimbursements | | | | 1.25 | | | | 1.25 | | | | 1.25 | | | | 1.25 | | | | 1.25 | | | | 1.25 | |
| Expenses, before waivers and reimbursements | | | | 1.27 | | | | 1.29 | | | | 1.31 | | | | 1.31 | | | | 1.34 | | | | 1.56 | |
| Net investment income (loss), net of waivers and reimbursements | | | | 0.37 | | | | 0.57 | | | | 0.94 | | | | 0.34 | | | | 0.37 | | | | 0.47 | |
| Net investment income (loss), before waivers and reimbursements | | | | 0.35 | | | | 0.53 | | | | 0.88 | | | | 0.28 | | | | 0.28 | | | | 0.16 | |
| Institutional Class net assets at the end of the year (in thousands) | | | $ | 175,937 | | | $ | 166,927 | | | $ | 125,650 | | | $ | 123,160 | | | $ | 123,496 | | | $ | 91,663 | |
| Portfolio turnover rate (%)* | | | | 92 | | | | 183 | | | | 157 | | | | 167 | | | | 124 | | | | 138 | |
| * | Rates are not annualized for periods less than a year. |
| ** | Rates are annualized for periods less than a year. |
| ^ | Amount is less than $0.005 per share. |
Note: Net investment income (loss) per share is based on the average shares outstanding during the year.
Performance cited represents past performance. Past performance does not guarantee future results and current performance may be lower or higher than the data quoted. Results shown are annual returns, which assume reinvestment of dividends and capital gains. Investment returns and principal will fluctuate and you may have a gain or loss when you sell shares. For the most current month-end performance information, please call 1-800-742-7272 or visit our Web site at www.williamblairfunds.com.
| June 30, 2018 | William Blair Funds | 171 |
Financial Highlights — For a share outstanding throughout each period
Bond Fund
| | | Class N | |
| | | (unaudited)
Period Ended
June 30, | | Years Ended December 31, | |
| | | | 2018 | | | 2017 | | | 2016 | | | 2015 | | | 2014 | | | 2013 | |
| Net asset value, beginning of year | | | $ | 10.41 | | | $ | 10.41 | | | $ | 10.34 | | | $ | 10.74 | | | $ | 10.60 | | | $ | 11.28 | |
| Income (loss) from investment operations: | | | | | | | | | | | | | | | | | | | | | | | | | |
| Net investment income (loss) | | | | 0.15 | | | | 0.27 | | | | 0.27 | | | | 0.27 | | | | 0.31 | | | | 0.32 | |
| Net realized and unrealized gain (loss) on investments | | | | (0.39 | ) | | | 0.12 | | | | 0.18 | | | | (0.29 | ) | | | 0.23 | | | | (0.47 | ) |
| Total from investment operations | | | | (0.24 | ) | | | 0.39 | | | | 0.45 | | | | (0.02 | ) | | | 0.54 | | | | (0.15 | ) |
| Less distributions from: | | | | | | | | | | | | | | | | | | | | | | | | | |
| Net investment income | | | | 0.20 | | | | 0.39 | | | | 0.38 | | | | 0.38 | | | | 0.40 | | | | 0.42 | |
| Net realized gain | | | | — | | | | — | | | | — | | | | — | | | | 0.00 | ^ | | | 0.11 | |
| Total distributions | | | | 0.20 | | | | 0.39 | | | | 0.38 | | | | 0.38 | | | | 0.40 | | | | 0.53 | |
| Net asset value, end of year | | | $ | 9.97 | | | $ | 10.41 | | | $ | 10.41 | | | $ | 10.34 | | | $ | 10.74 | | | $ | 10.60 | |
| Total return (%)* | | | | (2.28 | ) | | | 3.83 | | | | 4.40 | | | | (0.23 | ) | | | 5.10 | | | | (1.37 | ) |
| Ratios to average daily net assets (%)**: | | | | | | | | | | | | | | | | | | | | | | | | | |
| Expenses, net of waivers and reimbursements | | | | 0.63 | | | | 0.65 | | | | 0.65 | | | | 0.61 | | | | 0.65 | | | | 0.65 | |
| Expenses, before waivers and reimbursements | | | | 0.67 | | | | 0.82 | | | | 0.82 | | | | 0.79 | | | | 0.85 | | | | 0.82 | |
| Net investment income (loss), net of waivers and reimbursements | | | | 3.05 | | | | 2.57 | | | | 2.60 | | | | 2.60 | | | | 2.90 | | | | 2.89 | |
| Net investment income (loss), before waivers and reimbursements | | | | 3.01 | | | | 2.40 | | | | 2.43 | | | | 2.42 | | | | 2.70 | | | | 2.72 | |
| Class N net assets at the end of the year (in thousands) | | | $ | 85,812 | | | $ | 83,662 | | | $ | 125,866 | | | $ | 139,303 | | | $ | 16,720 | | | $ | 11,389 | |
| Portfolio turnover rate (%)* | | | | 16 | | | | 17 | | | | 17 | | | | 32 | | | | 35 | | | | 41 | |
| | | | | | | | | | | | | | | | | | | | | | | | | | |
| | | Class I | |
| | | (unaudited)
Period Ended
June 30, | | Years Ended December 31, | |
| | | | 2018 | | | 2017 | | | 2016 | | | 2015 | | | 2014 | | | 2013 | |
| Net asset value, beginning of year | | | $ | 10.31 | | | $ | 10.30 | | | $ | 10.24 | | | $ | 10.64 | | | $ | 10.49 | | | $ | 11.17 | |
| Income (loss) from investment operations: | | | | | | | | | | | | | | | | | | | | | | | | | |
| Net investment income (loss) | | | | 0.16 | | | | 0.29 | | | | 0.30 | | | | 0.31 | | | | 0.33 | | | | 0.33 | |
| Net realized and unrealized gain (loss) on investments | | | | (0.39 | ) | | | 0.13 | | | | 0.16 | | | | (0.31 | ) | | | 0.23 | | | | (0.48 | ) |
| Total from investment operations | | | | (0.23 | ) | | | 0.42 | | | | 0.46 | | | | — | | | | 0.56 | | | | (0.15 | ) |
| Less distributions from: | | | | | | | | | | | | | | | | | | | | | | | | | |
| Net investment income | | | | 0.21 | | | | 0.41 | | | | 0.40 | | | | 0.40 | | | | 0.41 | | | | 0.42 | |
| Net realized gain | | | | — | | | | — | | | | — | | | | — | | | | 0.00 | ^ | | | 0.11 | |
| Total distributions | | | | 0.21 | | | | 0.41 | | | | 0.40 | | | | 0.40 | | | | 0.41 | | | | 0.53 | |
| Net asset value, end of year | | | $ | 9.87 | | | $ | 10.31 | | | $ | 10.30 | | | $ | 10.24 | | | $ | 10.64 | | | $ | 10.49 | |
| Total return (%)* | | | | (2.22 | ) | | | 4.16 | | | | 4.55 | | | | (0.05 | ) | | | 5.37 | | | | (1.28 | ) |
| Ratios to average daily net assets (%)**: | | | | | | | | | | | | | | | | | | | | | | | | | |
| Expenses, net of waivers and reimbursements | | | | 0.44 | | | | 0.43 | | | | 0.41 | | | | 0.41 | | | | 0.50 | | | | 0.50 | |
| Expenses, before waivers and reimbursements | | | | 0.45 | | | | 0.60 | | | | 0.58 | | | | 0.59 | | | | 0.60 | | | | 0.58 | |
| Net investment income (loss), net of waivers and reimbursements | | | | 3.25 | | | | 2.79 | | | | 2.83 | | | | 2.93 | | | | 3.07 | | | | 3.05 | |
| Net investment income (loss), before waivers and reimbursements | | | | 3.24 | | | | 2.62 | | | | 2.66 | | | | 2.75 | | | | 2.97 | | | | 2.97 | |
| Class I net assets at the end of the year (in thousands) | | | $ | 354,249 | | | $ | 384,464 | | | $ | 322,174 | | | $ | 237,587 | | | $ | 149,466 | | | $ | 145,939 | |
| Portfolio turnover rate (%)* | | | | 16 | | | | 17 | | | | 17 | | | | 32 | | | | 35 | | | | 41 | |
| * | Rates are not annualized for periods less than a year. |
| ** | Rates are annualized for periods less than a year. |
| ^ | Amount is less than $0.005 per share. |
Note: Net investment income (loss) per share is based on the average shares outstanding during the year.
Performance cited represents past performance. Past performance does not guarantee future results and current performance may be lower or higher than the data quoted. Results shown are annual returns, which assume reinvestment of dividends and capital gains. Investment returns and principal will fluctuate and you may have a gain or loss when you sell shares. For the most current month-end performance information, please call 1-800-742-7272 or visit our Web site at www.williamblairfunds.com.
| 172 | Semiannual Report | June 30, 2018 |
Financial Highlights — For a share outstanding throughout each period
Bond Fund
| | | Institutional Class | |
| | | (unaudited)
Period Ended
June 30, | | Years Ended December 31, | |
| | | | 2018 | | | 2017 | | | 2016 | | | 2015 | | | 2014 | | | 2013 | |
| Net asset value, beginning of year | | | $ | 10.30 | | | $ | 10.29 | | | $ | 10.23 | | | $ | 10.63 | | | $ | 10.48 | | | $ | 11.16 | |
| Income (loss) from investment operations: | | | | | | | | | | | | | | | | | | | | | | | | | |
| Net investment income (loss) | | | | 0.17 | | | | 0.30 | | | | 0.30 | | | | 0.32 | | | | 0.34 | | | | 0.35 | |
| Net realized and unrealized gain (loss) on investments | | | | (0.39 | ) | | | 0.13 | | | | 0.17 | | | | (0.31 | ) | | | 0.23 | | | | (0.48 | ) |
| Total from investment operations | | | | (0.22 | ) | | | 0.43 | | | | 0.47 | | | | 0.01 | | | | 0.57 | | | | (0.13 | ) |
| Less distributions from: | | | | | | | | | | | | | | | | | | | | | | | | | |
| Net investment income | | | | 0.22 | | | | 0.42 | | | | 0.41 | | | | 0.41 | | | | 0.42 | | | | 0.44 | |
| Net realized gain | | | | — | | | | — | | | | — | | | | — | | | | 0.00 | ^ | | | 0.11 | |
| Total distributions | | | | 0.22 | | | | 0.42 | | | | 0.41 | | | | 0.41 | | | | 0.42 | | | | 0.55 | |
| Net asset value, end of year | | | $ | 9.86 | | | $ | 10.30 | | | $ | 10.29 | | | $ | 10.23 | | | $ | 10.63 | | | $ | 10.48 | |
| Total return (%)* | | | | (2.19 | ) | | | 4.24 | | | | 4.61 | | | | 0.01 | | | | 5.53 | | | | (1.13 | ) |
| Ratios to average daily net assets (%)**: | | | | | | | | | | | | | | | | | | | | | | | | | |
| Expenses, net of waivers and reimbursements | | | | 0.37 | | | | 0.35 | | | | 0.35 | | | | 0.35 | | | | 0.35 | | | | 0.35 | |
| Expenses, before waivers and reimbursements | | | | 0.37 | | | | 0.37 | | | | 0.37 | | | | 0.38 | | | | 0.41 | | | | 0.39 | |
| Net investment income (loss), net of waivers and reimbursements | | | | 3.32 | | | | 2.87 | | | | 2.90 | | | | 3.01 | | | | 3.23 | | | | 3.19 | |
| Net investment income (loss), before waivers and reimbursements | | | | 3.32 | | | | 2.85 | | | | 2.88 | | | | 2.98 | | | | 3.17 | | | | 3.15 | |
| Institutional Class net assets at the end of the year (in thousands) | | | $ | 83,243 | | | $ | 91,629 | | | $ | 95,216 | | | $ | 103,904 | | | $ | 97,341 | | | $ | 87,527 | |
| Portfolio turnover rate (%)* | | | | 16 | | | | 17 | | | | 17 | | | | 32 | | | | 35 | | | | 41 | |
| * | Rates are not annualized for periods less than a year. |
| ** | Rates are annualized for periods less than a year. |
| ^ | Amount is less than $0.005 per share. |
Note: Net investment income (loss) per share is based on the average shares outstanding during the year.
Performance cited represents past performance. Past performance does not guarantee future results and current performance may be lower or higher than the data quoted. Results shown are annual returns, which assume reinvestment of dividends and capital gains. Investment returns and principal will fluctuate and you may have a gain or loss when you sell shares. For the most current month-end performance information, please call 1-800-742-7272 or visit our Web site at www.williamblairfunds.com.
| June 30, 2018 | William Blair Funds | 173 |
Financial Highlights — For a share outstanding throughout each period
Income Fund
| | | Class N | |
| | | (unaudited)
Period Ended
June 30, | | Years Ended December 31, | |
| | | | 2018 | | | 2017 | | | 2016 | | | 2015 | | | 2014 | | | 2013 | |
| Net asset value, beginning of year | | | $ | 8.72 | | | $ | 8.86 | | | $ | 8.90 | | | $ | 9.12 | | | $ | 9.11 | | | $ | 9.55 | |
| Income (loss) from investment operations: | | | | | | | | | | | | | | | | | | | | | | | | | |
| Net investment income (loss) | | | | 0.09 | | | | 0.16 | | | | 0.16 | | | | 0.15 | | | | 0.18 | | | | 0.20 | |
| Net realized and unrealized gain (loss) on investments | | | | (0.19 | ) | | | (0.03 | ) | | | 0.06 | | | | (0.11 | ) | | | 0.10 | | | | (0.35 | ) |
| Total from investment operations | | | | (0.10 | ) | | | 0.13 | | | | 0.22 | | | | 0.04 | | | | 0.28 | | | | (0.15 | ) |
| Less distributions from: | | | | | | | | | | | | | | | | | | | | | | | | | |
| Net investment income | | | | 0.14 | | | | 0.27 | | | | 0.26 | | | | 0.26 | | | | 0.27 | | | | 0.29 | |
| Net realized gain | | | | — | | | | — | | | | — | | | | — | | | | — | | | | — | |
| Total distributions | | | | 0.14 | | | | 0.27 | | | | 0.26 | | | | 0.26 | | | | 0.27 | | | | 0.29 | |
| Net asset value, end of year | | | $ | 8.48 | | | $ | 8.72 | | | $ | 8.86 | | | $ | 8.90 | | | $ | 9.12 | | | $ | 9.11 | |
| Total return (%)* | | | | (1.12 | ) | | | 1.46 | | | | 2.44 | | | | 0.39 | | | | 3.06 | | | | (1.61 | ) |
| Ratios to average daily net assets (%)**: | | | | | | | | | | | | | | | | | | | | | | | | | |
| Expenses, net of waivers and reimbursements | | | | 0.85 | | | | 0.85 | | | | 0.79 | | | | 0.81 | | | | 0.84 | | | | 0.85 | |
| Expenses, before waivers and reimbursements | | | | 0.89 | | | | 0.88 | | | | 0.79 | | | | 0.81 | | | | 0.84 | | | | 1.03 | |
| Net investment income (loss), net of waivers and reimbursements | | | | 2.07 | | | | 1.80 | | | | 1.80 | | | | 1.71 | | | | 1.99 | | | | 2.13 | |
| Net investment income (loss), before waivers and reimbursements | | | | 2.03 | | | | 1.77 | | | | 1.80 | | | | 1.71 | | | | 1.99 | | | | 1.95 | |
| Class N net assets at the end of the year (in thousands) | | | $ | 25,897 | | | $ | 39,625 | | | $ | 52,710 | | | $ | 32,942 | | | $ | 34,020 | | | $ | 41,662 | |
| Portfolio turnover rate (%)* | | | | 47 | | | | 37 | | | | 22 | | | | 21 | | | | 30 | | | | 41 | |
| | | | | | | | | | | | | | | | | | | | | | | | | | |
| | | Class I | |
| | | (unaudited)
Period Ended
June 30, | | Years Ended December 31, | |
| | | | 2018 | | | 2017 | | | 2016 | | | 2015 | | | 2014 | | | 2013 | |
| Net asset value, beginning of year | | | $ | 8.66 | | | $ | 8.80 | | | $ | 8.83 | | | $ | 9.05 | | | $ | 9.05 | | | $ | 9.48 | |
| Income (loss) from investment operations: | | | | | | | | | | | | | | | | | | | | | | | | | |
| Net investment income (loss) | | | | 0.10 | | | | 0.18 | | | | 0.18 | | | | 0.18 | | | | 0.20 | | | | 0.21 | |
| Net realized and unrealized gain (loss) on investments | | | | (0.19 | ) | | | (0.03 | ) | | | 0.06 | | | | (0.12 | ) | | | 0.09 | | | | (0.34 | ) |
| Total from investment operations | | | | (0.09 | ) | | | 0.15 | | | | 0.24 | | | | 0.06 | | | | 0.29 | | | | (0.13 | ) |
| Less distributions from: | | | | | | | | | | | | | | | | | | | | | | | | | |
| Net investment income | | | | 0.15 | | | | 0.29 | | | | 0.27 | | | | 0.28 | | | | 0.29 | | | | 0.30 | |
| Net realized gain | | | | — | | | | — | | | | — | | | | — | | | | — | | | | — | |
| Total distributions | | | | 0.15 | | | | 0.29 | | | | 0.27 | | | | 0.28 | | | | 0.29 | | | | 0.30 | |
| Net asset value, end of year | | | $ | 8.42 | | | $ | 8.66 | | | $ | 8.80 | | | $ | 8.83 | | | $ | 9.05 | | | $ | 9.05 | |
| Total return (%)* | | | | (1.03 | ) | | | 1.68 | | | | 2.78 | | | | 0.63 | | | | 3.20 | | | | (1.41 | ) |
| Ratios to average daily net assets (%)**: | | | | | | | | | | | | | | | | | | | | | | | | | |
| Expenses, net of waivers and reimbursements | | | | 0.62 | | | | 0.62 | | | | 0.57 | | | | 0.55 | | | | 0.59 | | | | 0.70 | |
| Expenses, before waivers and reimbursements | | | | 0.62 | | | | 0.62 | | | | 0.57 | | | | 0.55 | | | | 0.59 | | | | 0.77 | |
| Net investment income (loss), net of waivers and reimbursements | | | | 2.30 | | | | 2.03 | | | | 2.05 | | | | 1.97 | | | | 2.24 | | | | 2.30 | |
| Net investment income (loss), before waivers and reimbursements | | | | 2.30 | | | | 2.03 | | | | 2.05 | | | | 1.97 | | | | 2.24 | | | | 2.23 | |
| Class I net assets at the end of the year (in thousands) | | | $ | 38,265 | | | $ | 51,153 | | | $ | 58,160 | | | $ | 62,722 | | | $ | 64,834 | | | $ | 64,152 | |
| Portfolio turnover rate (%)* | | | | 47 | | | | 37 | | | | 22 | | | | 21 | | | | 30 | | | | 41 | |
| * | Rates are not annualized for periods less than a year. |
| ** | Rates are annualized for periods less than a year. |
Note: Net investment income (loss) per share is based on the average shares outstanding during the year.
Performance cited represents past performance. Past performance does not guarantee future results and current performance may be lower or higher than the data quoted. Results shown are annual returns, which assume reinvestment of dividends and capital gains. Investment returns and principal will fluctuate and you may have a gain or loss when you sell shares. For the most current month-end performance information, please call 1-800-742-7272 or visit our Web site at www.williamblairfunds.com.
| 174 | Semiannual Report | June 30, 2018 |
Financial Highlights — For a share outstanding throughout each period
Low Duration Fund
| | | Class N | |
| | | (unaudited)
Period Ended
June 30, | | Years Ended December 31, | |
| | | | 2018 | | | 2017 | | | 2016 | | | 2015 | | | 2014 | | | 2013 | |
| Net asset value, beginning of year | | | $ | 8.92 | | | $ | 9.07 | | | $ | 9.16 | | | $ | 9.38 | | | $ | 9.52 | | | $ | 9.83 | |
| Income (loss) from investment operations: | | | | | | | | | | | | | | | | | | | | | | | | | |
| Net investment income (loss) | | | | 0.08 | | | | 0.11 | | | | 0.09 | | | | 0.07 | | | | 0.11 | | | | 0.10 | |
| Net realized and unrealized gain (loss) on investments | | | | (0.05 | ) | | | (0.04 | ) | | | 0.02 | | | | (0.07 | ) | | | (0.00 | )^ | | | (0.16 | ) |
| Total from investment operations | | | | 0.03 | | | | 0.07 | | | | 0.11 | | | | — | | | | 0.11 | | | | (0.06 | ) |
| Less distributions from: | | | | | | | | | | | | | | | | | | | | | | | | | |
| Net investment income | | | | 0.14 | | | | 0.22 | | | | 0.20 | | | | 0.22 | | | | 0.25 | | | | 0.25 | |
| Net realized gain | | | | — | | | | — | | | | — | | | | — | | | | — | | | | — | |
| Total distributions | | | | 0.14 | | | | 0.22 | | | | 0.20 | | | | 0.22 | | | | 0.25 | | | | 0.25 | |
| Net asset value, end of year | | | $ | 8.81 | | | $ | 8.92 | | | $ | 9.07 | | | $ | 9.16 | | | $ | 9.38 | | | $ | 9.52 | |
| Total return (%)* | | | | 0.30 | | | | 0.84 | | | | 1.16 | | | | 0.01 | | | | 1.20 | | | | (0.62 | ) |
| Ratios to average daily net assets (%)**: | | | | | | | | | | | | | | | | | | | | | | | | | |
| Expenses, net of waivers and reimbursements | | | | 0.62 | | | | 0.61 | | | | 0.68 | | | | 0.60 | | | | 0.70 | | | | 0.70 | |
| Expenses, before waivers and reimbursements | | | | 0.72 | | | | 0.79 | | | | 0.83 | | | | 0.77 | | | | 0.75 | | | | 0.71 | |
| Net investment income (loss), net of waivers and reimbursements | | | | 1.77 | | | | 1.22 | | | | 0.98 | | | | 0.71 | | | | 1.19 | | | | 1.06 | |
| Net investment income (loss), before waivers and reimbursements | | | | 1.67 | | | | 1.04 | | | | 0.83 | | | | 0.54 | | | | 1.14 | | | | 1.05 | |
| Class N net assets at the end of the year (in thousands) | | | $ | 2,217 | | | $ | 1,979 | | | $ | 7,237 | | | $ | 2,712 | | | $ | 4,969 | | | $ | 5,158 | |
| Portfolio turnover rate (%)* | | | | 59 | | | | 109 | | | | 81 | | | | 106 | | | | 83 | | | | 56 | |
| | | | | | | | | | | | | | | | | | | | | | | | | | |
| | | Class I | |
| | | (unaudited)
Period Ended
June 30, | | Years Ended December 31, | |
| | | | 2018 | | | 2017 | | | 2016 | | | 2015 | | | 2014 | | | 2013 | |
| Net asset value, beginning of year | | | $ | 8.91 | | | $ | 9.07 | | | $ | 9.16 | | | $ | 9.37 | | | $ | 9.52 | | | $ | 9.83 | |
| Income (loss) from investment operations: | | | | | | | | | | | | | | | | | | | | | | | | | |
| Net investment income (loss) | | | | 0.09 | | | | 0.13 | | | | 0.11 | | | | 0.08 | | | | 0.13 | | | | 0.12 | |
| Net realized and unrealized gain (loss) on investments | | | | (0.05 | ) | | | (0.05 | ) | | | 0.02 | | | | (0.05 | ) | | | (0.01 | ) | | | (0.17 | ) |
| Total from investment operations | | | | 0.04 | | | | 0.08 | | | | 0.13 | | | | 0.03 | | | | 0.12 | | | | (0.05 | ) |
| Less distributions from: | | | | | | | | | | | | | | | | | | | | | | | | | |
| Net investment income | | | | 0.15 | | | | 0.24 | | | | 0.22 | | | | 0.24 | | | | 0.27 | | | | 0.26 | |
| Net realized gain | | | | — | | | | — | | | | — | | | | — | | | | — | | | | — | |
| Total distributions | | | | 0.15 | | | | 0.24 | | | | 0.22 | | | | 0.24 | | | | 0.27 | | | | 0.26 | |
| Net asset value, end of year | | | $ | 8.80 | | | $ | 8.91 | | | $ | 9.07 | | | $ | 9.16 | | | $ | 9.37 | | | $ | 9.52 | |
| Total return (%)* | | | | 0.41 | | | | 0.91 | | | | 1.40 | | | | 0.30 | | | | 1.24 | | | | (0.47 | ) |
| Ratios to average daily net assets (%)**: | | | | | | | | | | | | | | | | | | | | | | | | | |
| Expenses, net of waivers and reimbursements | | | | 0.40 | | | | 0.41 | | | | 0.44 | | | | 0.42 | | | | 0.55 | | | | 0.55 | |
| Expenses, before waivers and reimbursements | | | | 0.46 | | | | 0.59 | | | | 0.59 | | | | 0.59 | | | | 0.60 | | | | 0.56 | |
| Net investment income (loss), net of waivers and reimbursements | | | | 1.98 | | | | 1.45 | | | | 1.20 | | | | 0.87 | | | | 1.35 | | | | 1.24 | |
| Net investment income (loss), before waivers and reimbursements | | | | 1.92 | | | | 1.27 | | | | 1.05 | | | | 0.70 | | | | 1.30 | | | | 1.23 | |
| Class I net assets at the end of the year (in thousands) | | | $ | 71,877 | | | $ | 131,186 | | | $ | 219,714 | | | $ | 107,137 | | | $ | 104,433 | | | $ | 122,583 | |
| Portfolio turnover rate (%)* | | | | 59 | | | | 109 | | | | 81 | | | | 106 | | | | 83 | | | | 56 | |
| * | Rates are not annualized for periods less than a year. |
| ** | Rates are annualized for periods less than a year. |
| ^ | Amount is less than $0.005 per share. |
Note: Net investment income (loss) per share is based on the average shares outstanding during the year.
Performance cited represents past performance. Past performance does not guarantee future results and current performance may be lower or higher than the data quoted. Results shown are annual returns, which assume reinvestment of dividends and capital gains. Investment returns and principal will fluctuate and you may have a gain or loss when you sell shares. For the most current month-end performance information, please call 1-800-742-7272 or visit our Web site at www.williamblairfunds.com.
| June 30, 2018 | William Blair Funds | 175 |
Financial Highlights — For a share outstanding throughout each period
Low Duration Fund
| | | Institutional Class | |
| | | (unaudited)
Period Ended
June 30, | | Years Ended December 31, | |
| | | | 2018 | | | 2017 | | | 2016 | | | 2015 | | | 2014 | | | 2013 | |
| Net asset value, beginning of year | | | $ | 8.91 | | | $ | 9.07 | | | $ | 9.16 | | | $ | 9.38 | | | $ | 9.53 | | | $ | 9.83 | |
| Income (loss) from investment operations: | | | | | | | | | | | | | | | | | | | | | | | | | |
| Net investment income (loss) | | | | 0.09 | | | | 0.14 | | | | 0.11 | | | | 0.09 | | | | 0.14 | | | | 0.13 | |
| Net realized and unrealized gain (loss) on investments | | | | (0.05 | ) | | | (0.05 | ) | | | 0.02 | | | | (0.07 | ) | | | (0.01 | ) | | | (0.15 | ) |
| Total from investment operations | | | | 0.04 | | | | 0.09 | | | | 0.13 | | | | 0.02 | | | | 0.13 | | | | (0.02 | ) |
| Less distributions from: | | | | | | | | | | | | | | | | | | | | | | | | | |
| Net investment income | | | | 0.15 | | | | 0.25 | | | | 0.22 | | | | 0.24 | | | | 0.28 | | | | 0.28 | |
| Net realized gain | | | | — | | | | — | | | | — | | | | — | | | | — | | | | — | |
| Total distributions | | | | 0.15 | | | | 0.25 | | | | 0.22 | | | | 0.24 | | | | 0.28 | | | | 0.28 | |
| Net asset value, end of year | | | $ | 8.80 | | | $ | 8.91 | | | $ | 9.07 | | | $ | 9.16 | | | $ | 9.38 | | | $ | 9.53 | |
| Total return (%)* | | | | 0.44 | | | | 0.96 | | | | 1.43 | | | | 0.22 | | | | 1.40 | | | | (0.20 | ) |
| Ratios to average daily net assets (%)**: | | | | | | | | | | | | | | | | | | | | | | | | | |
| Expenses, net of waivers and reimbursements | | | | 0.35 | | | | 0.37 | | | | 0.40 | | | | 0.40 | | | | 0.40 | | | | 0.39 | |
| Expenses, before waivers and reimbursements | | | | 0.41 | | | | 0.40 | | | | 0.40 | | | | 0.42 | | | | 0.43 | | | | 0.39 | |
| Net investment income (loss), net of waivers and reimbursements | | | | 2.06 | | | | 1.51 | | | | 1.25 | | | | 0.94 | | | | 1.45 | | | | 1.37 | |
| Net investment income (loss), before waivers and reimbursements | | | | 2.00 | | | | 1.48 | | | | 1.25 | | | | 0.92 | | | | 1.42 | | | | 1.37 | |
| Institutional Class net assets at the end of the year (in thousands) | | | $ | 100,048 | | | $ | 99,912 | | | $ | 53,122 | | | $ | 21,863 | | | $ | 68,095 | | | $ | 46,485 | |
| Portfolio turnover rate (%)* | | | | 59 | | | | 109 | | | | 81 | | | | 106 | | | | 83 | | | | 56 | |
| * | Rates are not annualized for periods less than a year. |
| ** | Rates are annualized for periods less than a year. |
Note: Net investment income (loss) per share is based on the average shares outstanding during the year.
Performance cited represents past performance. Past performance does not guarantee future results and current performance may be lower or higher than the data quoted. Results shown are annual returns, which assume reinvestment of dividends and capital gains. Investment returns and principal will fluctuate and you may have a gain or loss when you sell shares. For the most current month-end performance information, please call 1-800-742-7272 or visit our Web site at www.williamblairfunds.com.
| 176 | Semiannual Report | June 30, 2018 |
Financial Highlights — For a share outstanding throughout each period
Macro Allocation Fund
| | | Class N | |
| | | (unaudited)
Period Ended
June 30, | | Periods Ended December 31, | | | Years Ended
October 31, | |
| | | | | 2018 | | | | 2017 | | | | 2016 | | | | 2015 | | | | 2014(a) | | | | 2014 | | | | 2013 | |
| Net asset value, beginning of year | | | $ | 11.84 | | | $ | 11.34 | | | $ | 11.32 | | | $ | 12.14 | | | $ | 13.07 | | | $ | 12.61 | | | $ | 11.28 | |
| Income (loss) from investment operations: | | | | | | | | | | | | | | | | | | | | | | | | | | | | | |
| Net investment income (loss) | | | | 0.02 | | | | 0.06 | | | | 0.04 | | | | 0.04 | | | | 0.04 | | | | 0.02 | | | | 0.05 | |
| Net realized and unrealized gain (loss) on investments | | | | (0.21 | ) | | | 0.51 | | | | 0.19 | | | | (0.80 | ) | | | (0.31 | ) | | | 0.76 | | | | 1.59 | |
| Total from investment operations | | | | (0.19 | ) | | | 0.57 | | | | 0.23 | | | | (0.76 | ) | | | (0.27 | ) | | | 0.78 | | | | 1.64 | |
| Less distributions from: | | | | | | | | | | | | | | | | | | | | | | | | | | | | | |
| Net investment income | | | | — | | | | 0.07 | | | | 0.21 | | | | 0.06 | | | | 0.66 | | | | 0.09 | | | | 0.11 | |
| Net realized gain | | | | — | | | | — | | | | — | | | | — | | | | — | | | | 0.23 | | | | 0.20 | |
| Total distributions | | | | — | | | | 0.07 | | | | 0.21 | | | | 0.06 | | | | 0.66 | | | | 0.32 | | | | 0.31 | |
| Net asset value, end of year | | | $ | 11.65 | | | $ | 11.84 | | | $ | 11.34 | | | $ | 11.32 | | | $ | 12.14 | | | $ | 13.07 | | | $ | 12.61 | |
| Total return (%)* | | | | (1.60 | ) | | | 5.06 | | | | 2.01 | | | | (6.24 | ) | | | (2.00 | ) | | | 6.34 | | | | 14.87 | |
| Ratios to average daily net assets (%)**: | | | | | | | | | | | | | | | | | | | | | | | | | | | | | |
| Expenses (excluding interest or short dividend expense), net of waivers and reimbursements | | | | 1.28 | | | | 1.31 | | | | 1.23 | | | | 1.27 | | | | 1.35 | | | | 1.35 | | | | 1.35 | |
| Expenses, net of waivers and reimbursements | | | | 1.30 | | | | 1.37 | | | | 1.23 | | | | 1.27 | | | | 1.38 | | | | 1.47 | | | | 1.49 | |
| Expenses, before waivers and reimbursements | | | | 1.30 | | | | 1.52 | | | | 1.38 | | | | 1.42 | | | | 1.46 | | | | 1.60 | | | | 1.78 | |
| Net investment income (loss), net of waivers and reimbursements | | | | 0.32 | | | | 0.50 | | | | 0.32 | | | | 0.32 | | | | 2.06 | | | | 0.20 | | | | 0.37 | |
| Net investment income (loss), before waivers and reimbursements | | | | 0.32 | | | | 0.35 | | | | 0.17 | | | | 0.17 | | | | 1.98 | | | | 0.07 | | | | 0.08 | |
| Class N net assets at the end of the year (in thousands) | | | $ | 35,442 | | | $ | 41,483 | | | $ | 61,376 | | | $ | 150,606 | | | $ | 150,778 | | | $ | 150,785 | | | $ | 97,498 | |
| Portfolio turnover rate (%)* | | | | 18 | | | | 43 | | | | 50 | | | | 34 | | | | 17 | | | | 59 | | | | 10 | |
| | | | | | | | | | | | | | | | | | | | | | | | | | | | | | |
| | | Class I | |
| | | (unaudited)
Period Ended
June 30, | | Periods Ended December 31, | | | Years Ended October 31, | |
| | | | | 2018 | | | | 2017 | | | | 2016 | | | | 2015 | | | | 2014(a) | | | | 2014 | | | | 2013 | |
| Net asset value, beginning of year | | | $ | 11.88 | | | $ | 11.38 | | | $ | 11.38 | | | $ | 12.22 | | | $ | 13.15 | | | $ | 12.66 | | | $ | 11.31 | |
| Income (loss) from investment operations: | | | | | | | | | | | | | | | | | | | | | | | | | | | | | |
| Net investment income (loss) | | | | 0.04 | | | | 0.11 | | | | 0.08 | | | | 0.09 | | | | 0.05 | | | | 0.04 | | | | 0.07 | |
| Net realized and unrealized gain (loss) on investments | | | | (0.22 | ) | | | 0.51 | | | | 0.18 | | | | (0.82 | ) | | | (0.31 | ) | | | 0.78 | | | | 1.60 | |
| Total from investment operations | | | | (0.18 | ) | | | 0.62 | | | | 0.26 | | | | (0.73 | ) | | | (0.26 | ) | | | 0.82 | | | | 1.67 | |
| Less distributions from: | | | | | | | | | | | | | | | | | | | | | | | | | | | | | |
| Net investment income | | | | — | | | | 0.12 | | | | 0.26 | | | | 0.11 | | | | 0.67 | | | | 0.10 | | | | 0.12 | |
| Net realized gain | | | | — | | | | — | | | | — | | | | — | | | | — | | | | 0.23 | | | | 0.20 | |
| Total distributions | | | | — | | | | 0.12 | | | | 0.26 | | | | 0.11 | | | | 0.67 | | | | 0.33 | | | | 0.32 | |
| Net asset value, end of year | | | $ | 11.70 | | | $ | 11.88 | | | $ | 11.38 | | | $ | 11.38 | | | $ | 12.22 | | | $ | 13.15 | | | $ | 12.66 | |
| Total return (%)* | | | | (1.52 | ) | | | 5.50 | | | | 2.26 | | | | (6.00 | ) | | | (1.94 | ) | | | 6.60 | | | | 15.06 | |
| Ratios to average daily net assets (%)**: | | | | | | | | | | | | | | | | | | | | | | | | | | | | | |
| Expenses (excluding interest or short dividend expense), net of waivers and reimbursements | | | | 0.96 | | | | 0.96 | | | | 0.97 | | | | 0.98 | | | | 1.07 | | | | 1.10 | | | | 1.10 | |
| Expenses, net of waivers and reimbursements | | | | 0.98 | | | | 1.02 | | | | 0.97 | | | | 0.99 | | | | 1.10 | | | | 1.22 | | | | 1.24 | |
| Expenses, before waivers and reimbursements | | | | 0.98 | | | | 1.17 | | | | 1.12 | | | | 1.14 | | | | 1.10 | | | | 1.27 | | | | 1.41 | |
| Net investment income (loss), net of waivers and reimbursements | | | | 0.66 | | | | 0.90 | | | | 0.67 | | | | 0.73 | | | | 2.33 | | | | 0.32 | | | | 0.62 | |
| Net investment income (loss), before waivers and reimbursements | | | | 0.66 | | | | 0.75 | | | | 0.52 | | | | 0.58 | | | | 2.33 | | | | 0.27 | | | | 0.45 | |
| Class I net assets at the end of the year (in thousands) | | | $ | 724,578 | | | $ | 780,075 | | | $ | 937,244 | | | $ | 1,155,051 | | | $ | 649,756 | | | $ | 617,531 | | | $ | 224,860 | |
| Portfolio turnover rate (%)* | | | | 18 | | | | 43 | | | | 50 | | | | 34 | | | | 17 | | | | 59 | | | | 10 | |
| (a) | For the period November 1, 2014 to December 31, 2014. |
| * | Rates are not annualized for periods that are less than a year. |
| ** | Rates are annualized for periods that are less than a year. |
Note: Net investment income (loss) per share is based on the average shares outstanding during the year.
Performance cited represents past performance. Past performance does not guarantee future results and current performance may be lower or higher than the data quoted. Results shown are annual returns, which assume reinvestment of dividends and capital gains. Investment returns and principal will fluctuate and you may have a gain or loss when you sell shares. For the most current month-end performance information, please call 1-800-742-7272 or visit our Web site at www.williamblairfunds.com.
| June 30, 2018 | William Blair Funds | 177 |
Financial Highlights — For a share outstanding throughout each period
Macro Allocation Fund
| | | Institutional Class | |
| | | (unaudited)
Period Ended
June 30, | | Periods Ended December 31, | | | Years Ended
October 31, | |
| | | | | 2018 | | | | 2017 | | | | 2016 | | | | 2015 | | | | 2014(b) | | | | 2014 | | | 2013(a) | |
| Net asset value, beginning of year | | | $ | 11.89 | | | $ | 11.40 | | | $ | 11.39 | | | $ | 12.23 | | | $ | 13.16 | | | $ | 12.66 | | | $ | 12.63 | |
| Income (loss) from investment operations: | | | | | | | | | | | | | | | | | | | | | | | | | | | | | |
| Net investment income (loss) | | | | 0.05 | | | | 0.12 | | | | 0.09 | | | | 0.12 | | | | 0.05 | | | | 0.04 | | | | 0.00 | ^ |
| Net realized and unrealized gain (loss) on investments | | | | (0.22 | ) | | | 0.51 | | | | 0.19 | | | | (0.84 | ) | | | (0.31 | ) | | | 0.79 | | | | 0.03 | |
| Total from investment operations | | | | (0.17 | ) | | | 0.63 | | | | 0.28 | | | | (0.72 | ) | | | (0.26 | ) | | | 0.83 | | | | 0.03 | |
| Less distributions from: | | | | | | | | | | | | | | | | | | | | | | | | | | | | | |
| Net investment income | | | | — | | | | 0.14 | | | | 0.27 | | | | 0.12 | | | | 0.67 | | | | 0.10 | | | | — | |
| Net realized gain | | | | — | | | | — | | | | — | | | | — | | | | — | | | | 0.23 | | | | — | |
| Total distributions | | | | — | | | | 0.14 | | | | 0.27 | | | | 0.12 | | | | 0.67 | | | | 0.33 | | | | — | |
| Net asset value, end of year | | | $ | 11.72 | | | $ | 11.89 | | | $ | 11.40 | | | $ | 11.39 | | | $ | 12.23 | | | $ | 13.16 | | | $ | 12.66 | |
| Total return (%)* | | | | (1.43 | ) | | | 5.51 | | | | 2.44 | | | | (5.92 | ) | | | (1.91 | ) | | | 6.71 | | | | 0.24 | |
| Ratios to average daily net assets (%)**: | | | | | | | | | | | | | | | | | | | | | | | | | | | | | |
| Expenses (excluding interest or short dividend expense), net of waivers and reimbursements | | | | 0.87 | | | | 0.86 | | | | 0.89 | | | | 0.90 | | | | 0.88 | | | | 0.93 | | | | 0.95 | |
| Expenses, net of waivers and reimbursements | | | | 0.89 | | | | 0.92 | | | | 0.89 | | | | 0.90 | | | | 0.91 | | | | 1.05 | | | | 1.00 | |
| Expenses, before waivers and reimbursements | | | | 0.89 | | | | 0.92 | | | | 0.89 | | | | 0.90 | | | | 0.91 | | | | 1.05 | | | | 1.11 | |
| Net investment income (loss), net of waivers and reimbursements | | | | 0.77 | | | | 1.04 | | | | 0.81 | | | | 0.95 | | | | 2.54 | | | | 0.32 | | | | (0.99 | ) |
| Net investment income (loss), before waivers and reimbursements | | | | 0.77 | | | | 1.04 | | | | 0.81 | | | | 0.95 | | | | 2.54 | | | | 0.32 | | | | (1.10 | ) |
| Institutional Class net assets at the end of the year (in thousands) | | | $ | 459,328 | | | $ | 487,082 | | | $ | 582,298 | | | $ | 426,230 | | | $ | 158,152 | | | $ | 150,447 | | | $ | 5,014 | |
| Portfolio turnover rate (%)* | | | | 18 | | | | 43 | | | | 50 | | | | 34 | | | | 17 | | | | 59 | | | | 10 | |
| (a) | For the period October 21, 2013 (Commencement of Operations) to October 31, 2013. |
| (b) | For the period November 1, 2014 to December 31, 2014. |
| * | Rates are not annualized for periods that are less than a year. |
| ** | Rates are annualized for periods that are less than a year. |
| ^ | Amount is less than $0.005 per share. |
Note: Net investment income (loss) per share is based on the average shares outstanding during the year.
Performance cited represents past performance. Past performance does not guarantee future results and current performance may be lower or higher than the data quoted. Results shown are annual returns, which assume reinvestment of dividends and capital gains. Investment returns and principal will fluctuate and you may have a gain or loss when you sell shares. For the most current month-end performance information, please call 1-800-742-7272 or visit our Web site at www.williamblairfunds.com.
| 178 | Semiannual Report | June 30, 2018 |
Renewal of the Management Agreement
On April 24, 2018, the Board of Trustees (the “Board”) of the William Blair Funds (the “Trust”) including the Trustees who are not “interested persons” of the Trust as defined by the Investment Company Act of 1940, as amended (the “Independent Trustees”), approved the renewal for an additional one-year term of the Trust’s Management Agreement with William Blair Investment Management, LLC (“WBIM” or the “Adviser”) on behalf of each of the William Blair Funds (each, a “Fund” and collectively, the “Funds”). In deciding to approve the renewal of the Management Agreement, the Board did not identify any single factor or group of factors as all important or controlling and considered all factors together. The Board did not allot a particular weight to any one factor or group of factors.
The information in this summary outlines the Board’s considerations associated with its renewal of the Management Agreement. In connection with its deliberations regarding the continuation of the Management Agreement, the Board considered such information and factors as it believed to be relevant. As described below, the Board considered the nature, quality and extent of the services performed by the Adviser under the Management Agreement; the investment performance of each Fund and the Adviser; comparative management fees and expense ratios as prepared by an independent provider (Broadridge); the estimated profits realized by the Adviser; the extent to which the Adviser realizes economies of scale as a Fund grows; and whether fallout benefits are being realized by the Adviser. In addition, the Independent Trustees discussed the renewal of the Management Agreement with Trust management and in private sessions with independent legal counsel at which no representatives of the Adviser were present.
The Board, including the Independent Trustees, considered the renewal of the Management Agreement pursuant to a process that concluded at the Board’s April 24, 2018 meeting. In preparation for the review process, the Independent Trustees met with independent legal counsel and discussed the type and nature of information to be requested, and independent legal counsel sent a formal request for information to the Adviser. The Adviser provided extensive information in response to the request. After reviewing the information received, the Independent Trustees requested supplemental information, which the Adviser provided. The Board also received a memorandum from legal counsel advising it of their duties and responsibilities in connection with the consideration of the Management Agreement. The Independent Trustees reviewed comparative performance for a performance peer universe of funds and comparative management fees and expense ratios for an expense peer group and an expense peer universe of funds provided by Broadridge for each Fund. The Independent Trustees also considered supplemental comparative performance for each Fund based on a peer group of comparable funds prepared by FUSE Research Network (“Fuse”) based on each Fund’s investment strategy and portfolio attributes prepared from parameters provided by the Adviser. In addition, the Independent Trustees considered: (1) the nature, quality and extent of services provided by the Adviser; (2) information comparing the performance of each Fund to one or more relevant securities indexes; (3) information comparing management fees of each Fund to fees charged by the Adviser to other funds and client accounts with similar investment strategies; (4) the estimated allocated direct or indirect costs of services provided and estimated profits realized by the Adviser for both the Trust as a whole and each Fund individually; and (5) information describing other benefits to the Adviser and its affiliate, William Blair & Company, L.L.C. (the “Distributor,” and collectively with the Adviser, “William Blair”), resulting from their relationship with the Funds. The Independent Trustees also noted that they receive information from the Adviser regarding the Funds throughout the year in connection with regular Board meetings, including presentations from portfolio managers. In addition, the Adviser made an in-person presentation to the Independent Trustees regarding the contract review information, including addressing the supplemental information request, and answered questions from the Independent Trustees. The Board, including the Independent Trustees, determined that, given the totality of the information provided with respect to the Management Agreement, the Board had received sufficient information to renew the Management Agreement.
Based on this, the Independent Trustees met independently of Trust management and of the interested Trustees to review and discuss with independent legal counsel the information provided by the Adviser, Broadridge, Fuse and independent legal counsel. The Independent Trustees noted that in evaluating the Management Agreement, they were taking into account their accumulated experience as Board members in working with the Adviser on matters relating to the Funds. Based on their review, the Independent Trustees concluded that it was in the best interest of each Fund to renew the Management Agreement and, accordingly, recommended to the Board of the Trust the renewal of the Management Agreement for each Fund. The Board considered the recommendation of the Independent Trustees along with other factors that the Board deemed relevant.
Nature, Quality and Extent of Services. In evaluating the nature, quality and extent of the services provided by the Adviser to the Funds, the Board noted that the Adviser is a quality firm with a reputation for integrity and honesty that employs high-quality people and has a long association with the Funds, in each case other than the Growth Fund, since the inception of the Funds. The Board believes that a long-term relationship with a capable, conscientious adviser is in the best interests of shareholders and that shareholders have invested in the Funds knowing that the Adviser manages the Funds and knowing the management fees. The Board considered biographical information about the Trust’s officers, other Adviser personnel and the
| June 30, 2018 | William Blair Funds | 179 |
Funds’ portfolio managers, including information on the portfolio managers’ personal investments in the Fund(s) they manage. The Board also considered the administrative services performed by the Adviser, financial information regarding the Adviser, the Adviser’s execution quality and use of soft dollars, risk management activities, compliance program and the expense limitations proposed for each of the Funds’ share classes. The Board also considered the nature, quality and extent of services that the Adviser provides to the Funds compared to the services that the Adviser provides to other clients. The Board noted that the Adviser pays the compensation of all of the officers and the interested Trustees of the Trust. Based upon all relevant factors, the Board concluded that the nature, quality and extent of the services provided by the Adviser to each Fund were appropriate.
Performance. The Board reviewed information on the annualized total returns of each share class of the Funds for the one-, three-, five- and ten-year periods ended December 31, 2017, as applicable, along with annualized total return information for a Morningstar performance peer universe of funds and one or more benchmark securities indexes. The Morningstar performance peer universe for each Fund included all funds in the same Morningstar category as the Fund. The Board also reviewed the performance of a peer group of comparable funds prepared by Fuse. For purposes of this report, Class N shares were used for comparison purposes as the Board noted that Class N shares have additional costs related to distribution and shareholder services provided and therefore provide a more conservative representation of Fund performance.
The Board considered that the Adviser seeks to provide superior performance over the long term and was committed to managing each Fund consistently with the Fund’s stated investment strategies and that at times relative performance will be affected by whether the market environment favors or disfavors particular investments, styles and/or market capitalizations and concluded that the Adviser’s services benefitted the Funds. Based on the information provided, the Board considered the following with respect to the total returns of each Fund.
Growth Fund. The Board considered that the Fund’s total return was below the average of its Morningstar performance peer universe for the one-, three- and five-year periods ended December 31, 2017. The Board also considered that the Fund underperformed the benchmark (Russell 3000® Growth Index) for the one-, three- and five-year periods. The Board considered the Adviser’s report noting that negative stock selection in certain sectors and underperforming mid-cap stocks detracted from the Fund’s performance. The Board considered that the Adviser had added analysts and made other investment team modifications over the past three years to align coverage by sector and market capitalization within the broader U.S. Growth team, which the Adviser believes will improve relative performance.
Large Cap Growth Fund. The Board considered that the Fund’s total return was above the average of its Morningstar performance peer universe for the one-, three- and five-year periods ended December 31, 2017. The Board also considered that the Fund underperformed the benchmark (Russell 1000® Growth Index) for the three- and five-year periods and outperformed the benchmark for the one-year period ended December 31, 2017.
Mid Cap Growth Fund. The Board considered that the Fund’s total return was below the average of its Morningstar performance peer universe for the one-, three- and five-year periods ended December 31, 2017. The Board also considered that the Fund underperformed the benchmark (Russell Midcap® Growth Index) for the one-, three- and five-year periods ended December 31, 2017. The Board considered the Adviser’s report that the investment strategy of the Fund’s investment team has historically added substantial value (outperformed) in down markets and performed well in normal markets, but that it has historically struggled in speculative up markets such as the ones experienced in recent years. The Adviser’s report also noted that negative stock selection in certain sectors and an underweight in an industry that had strong performance detracted from the Fund’s performance. The Board considered that the Adviser had added a portfolio manager, added analysts to the investment team and made other investment team modifications over the past three years to align coverage by sector and market capitalization within the broader U.S. Growth team, which the Adviser believes will improve relative performance.
Small-Mid Cap Growth Fund. The Board considered that the Fund’s total return was above the average of its Morningstar performance peer universe and the benchmark (Russell 2500TM Growth Index) for the one-, three- and five-year periods ended December 31, 2017.
Small-Mid Cap Value Fund. The Board considered that the Fund’s total return was below the average of its Morningstar performance peer universe for the one- and five-year periods and was in line with the Morningstar performance peer universe for the three-year period ended December 31, 2017. The Board also considered that the Fund underperformed the benchmark (Russell 2500TM Value Index) for the one-, three- and five-year periods ended December 31, 2017. The Board also considered that the Class I shares outperformed the Morningstar peer universe for the three- and five-year periods ended December 31, 2017.
Small Cap Growth Fund. The Board considered that the Fund’s total return was above the average of its Morningstar performance peer universe and the benchmark (Russell 2000® Growth Index) for the one-, three- and five-year periods ended December 31, 2017.
| 180 | Semiannual Report | June 30, 2018 |
Small Cap Value Fund. The Board considered that the Fund’s total return was below the average of its Morningstar performance peer universe for the one- and three-year periods and was above the average of its Morningstar performance peer universe for the five-year period ended December 31, 2017. The Board also considered that the Fund underperformed the benchmark (Russell 2000® Value Index) for the one- and three-year periods and outperformed the benchmark for the five-year period ended December 31, 2017.
Global Leaders Fund. The Board considered that the Fund’s total return was above the average of its Morningstar performance peer universe for the one-, three- and five-year periods ended December 31, 2017. The Board also considered that the Fund outperformed the benchmark (MSCI All Country World IMI (net) Index) for the one- and three-year periods and performed the same as the benchmark for the five-year period ended December 31, 2017.
International Leaders Fund. The Board considered that the Fund’s total return was above the average of its Morningstar performance peer universe for the three- and five-year periods and was below the average of its Morningstar performance peer universe for the one-year period ended December 31, 2017. The Board also considered that the Fund outperformed the benchmark (MSCI All Country World Ex-U.S. IMI (net) Index) for the one-, three- and five-year period ended December 31, 2017.
International Developed Plus Fund. The Board considered that the Fund’s total return was below the average of its Morningstar performance peer universe for the one-, three- and five-year periods ended December 31, 2017. The Board also considered that the Fund outperformed the benchmark (MSCI World Ex-U.S. (net) Index) for the three- and five-year periods and underperformed the benchmark for the one-year period ended December 31, 2017. The Board considered the Adviser’s report that weak stock selection in certain sectors and countries detracted from performance in 2016. The Adviser’s report noted that the Adviser remains confident that the Fund’s emphasis on high quality growth and low earnings volatility will generate favorable risk-adjusted returns.
Institutional International Developed Plus Fund. The Board considered that the Fund’s total return was below the average of its Morningstar performance peer universe for the one-, three- and five-year periods ended December 31, 2017. The Board also considered that the Fund performed in line with the benchmark (MSCI World Ex-U.S. (net) Index) for the one-year period and outperformed the benchmark for the three- and five-year periods ended December 31, 2017. The Board considered the Adviser’s report that weak stock selection in certain sectors and countries detracted from performance in 2016. The Adviser’s report noted that the Adviser remains confident that the Fund’s emphasis on high quality growth and low earnings volatility will generate favorable risk-adjusted returns.
International Growth Fund. The Board considered that the Fund’s total return was below the average of its Morningstar performance peer universe for the one-, three- and five-year periods ended December 31, 2017. The Board also considered that the Fund outperformed the benchmark (MSCI All Country World Ex-U.S. IMI (net) Index) for the one- and five-year periods and underperformed the benchmark for the three-year period ended December 31, 2017. The Board considered the Adviser’s report that weak stock selection in certain sectors and countries detracted from performance in 2016. The Adviser’s report noted that portfolio repositioning, which was accomplished without compromising the Fund’s high quality growth orientation, contributed to outperformance of the benchmark during 2017.
Institutional International Growth Fund. The Board considered that the Fund’s total return was below the average of its Morningstar performance peer universe for the one-, three- and five-year periods ended December 31, 2017. The Board also considered that the Fund outperformed the benchmark (MSCI All Country World Ex-U.S. IMI (net) Index) for the one- and five-year periods and underperformed the benchmark for the three-year period ended December 31, 2017. The Board considered the Adviser’s report that weak stock selection in certain sectors and countries in 2016 detracted from performance. The Adviser’s report noted that portfolio repositioning, which was accomplished without compromising the Fund’s high quality growth orientation, contributed to outperformance of the benchmark during 2017.
International Small Cap Growth Fund. The Board considered that the Fund’s total return was below the average of its Morningstar performance peer universe for the one-, three- and five-year periods ended December 31, 2017. The Board also considered that the Fund outperformed the benchmark (MSCI All Country World Ex-U.S. Small Cap (net) Index) for the one-year period and underperformed the benchmark for the three- and five-year periods ended December 31, 2017. The Board considered the Adviser’s report that the Fund’s underperformance was driven by relative weakness in calendar years 2016 and 2014 attributable to weak stock selection in certain sectors, offsetting the positive effects of 2015 and 2017 outperformance. The Adviser reported that the Fund’s investment team reduced valuation risk in the Fund through selective positioning adjustments, which were implemented without compromising the Adviser’s quality growth orientation, and which contributed to outperformance versus the benchmark in 2017. The Adviser also reported that the Fund’s investment team is confident that its focus on strong corporate performance will return to favor and contribute to improved relative performance.
| June 30, 2018 | William Blair Funds | 181 |
Emerging Markets Leaders Fund. The Board considered that the Fund’s total return was above the average of its Morningstar performance peer universe for the one- and five-year periods and was below the average of its Morningstar performance peer universe for the three-year period ended December 31, 2017. The Board also considered that the Fund outperformed the benchmark (MSCI Emerging Markets (net) Index) for the one- and five-year periods and underperformed the benchmark for the three-year period ended December 31, 2017.
Emerging Markets Growth Fund. The Board considered that the Fund’s total return was above the average of its Morningstar performance peer universe for the one-, three- and five-year periods ended December 31, 2017. The Board also considered that the Fund outperformed the benchmark (MSCI Emerging Markets IMI (net) Index) for the one- and five-year periods and underperformed the benchmark for the three-year period ended December 31, 2017.
Emerging Markets Small Cap Growth Fund. The Board considered that the Fund’s total return was above the average of its Morningstar performance peer universe for the one- and five-year periods and below the average of its Morningstar performance peer universe for the three-year period ended December 31, 2017. The Board also considered that the Fund outperformed the benchmark (MSCI Emerging Markets Small Cap (net) Index) for the one- and five-year periods and underperformed the benchmark for the three-year period ended December 31, 2017.
Bond Fund. The Board considered that the Fund’s total return was above the average of its Morningstar performance peer universe and the benchmark (Bloomberg Barclays U.S. Aggregate Bond Index) for the one-, three- and five-year periods ended December 31, 2017.
Income Fund. The Board considered that the Fund’s total return was below the average of its Morningstar performance peer universe for the one-year period and in line with its Morningstar performance peer universe for the three- and five-year periods ended December 31, 2017. The Board also considered that the Fund underperformed the benchmark (Bloomberg Barclays Intermediate Government/Credit Bond Index) for the one-, three- and five-year periods ended December 31, 2017.
Low Duration Fund. The Board considered that the Fund’s total return was below the average of its Morningstar performance peer universe for the one-, three- and five-year periods ended December 31, 2017. The Board also considered that the Fund outperformed the benchmark (Bank of America Merrill Lynch 1-Year U.S. Treasury Note Index) for the one-, three- and five-year periods ended December 31, 2017. The Board considered the Adviser’s report that the Fund has a high-quality orientation and restricts its investments to highly rated debt securities, whereas other funds in the peer group hold high yield securities which outperformed over recent years.
Macro Allocation Fund. The Board considered that the Fund’s total return was in line with its Morningstar performance peer universe for the one-year period, below the average of its Morningstar performance peer universe for the three-year period and above the average of its Morningstar performance peer universe for the five-year period ended December 31, 2017. The Board also considered that the Fund outperformed the benchmark (Bank of America Merrill Lynch 3-Month U.S. Treasury Bill Index) for the one- and five-year periods and underperformed the benchmark for the three-year period ended December 31, 2017.
Management Fees. The Board reviewed each Fund’s management fee and reviewed information comparing the management fee to those of an expense peer group and an expense peer universe of funds provided by Broadridge for each share class of the Funds. The Broadridge expense peer group for Class N shares of each Fund (“Class N Broadridge Expense Group”) consisted of a group of retail no-load funds with a similar investment strategy and asset size, as classified by Broadridge. The Broadridge expense peer group for Class I and the Institutional Class of each Fund (“Class I Broadridge Expense Group” and “Institutional Class Broadridge Expense Group,” respectively) consisted of a group of institutional funds with a similar investment strategy and asset size, as classified by Broadridge. The Broadridge expense peer universe for each share class of each Fund consisted of the Fund’s Broadridge expense peer group and all other no-load funds with an investment strategy as classified by Broadridge similar to the Fund’s. In considering the Broadridge information and giving effect to the contractual management fee reductions proposed by the Adviser, the Board noted that the contractual management fees for the Growth Fund, the Large Cap Growth Fund, the Small-Mid Cap Value Fund, the International Leaders Fund, the International Small Cap Growth Fund, the Bond Fund, the Income Fund, the Low Duration Fund and the Macro Allocation Fund were below the average contractual management fee of their Class I Broadridge Expense Group and that the contractual management fees for the Emerging Market Leaders Fund was the same as the average contractual management fee of the Class I Broadridge Expense Group. The Board also noted that the contractual management fees for the Mid Cap Growth Fund, the Small-Mid Cap Growth Fund, the Small Cap Growth Fund, the Small Cap Value Fund, the Global Leaders Fund, the International Developed Plus Fund, the International Growth Fund, the Emerging Markets Growth Fund and the Emerging Markets Small Cap Growth Fund were above the average contractual management fee of their Class I Broadridge Expense Group.
| 182 | Semiannual Report | June 30, 2018 |
In considering the management fee for the Institutional International Developed Plus Fund and the Institutional International Growth Fund, which do not have Class I shares, the Board noted that the contractual management fees for each Fund were above the average contractual management fee of their Institutional Class Broadridge Expense Group.
The Board noted the current and proposed contractual expense limitations for the Funds and further noted that the Adviser proposed reducing the contractual limit on operating expenses for certain Funds. The Board considered that the Adviser proposed to contractually limit operating expenses until April 30, 2019 for each Fund. The Board considered the amount of management fees waived and other expenses reimbursed by the Adviser on behalf of the Funds in 2017, noting that the Adviser waived its entire management fee for and reimbursed other expenses to the Small-Mid Cap Value Fund. The Board also considered that the shareholder administration fee applicable to certain Funds was waived by William Blair in 2017 and that William Blair proposed to contractually reduce the shareholder administration fee to zero.
For each Fund, the Board also reviewed amounts charged by the Adviser to other pooled investment vehicles, including other registered funds for which the Adviser acts as a sub-adviser, and the Adviser’s fee schedule for institutional accounts. With respect to other pooled investment vehicles and institutional accounts, the Board considered the Adviser’s statements to the effect that the level of services provided to the Funds and the regulatory responsibilities associated with sponsoring registered investment companies were greater as compared to the work involved for other pooled investment vehicles, including other registered funds for which the Adviser acts as a sub-adviser, and institutional accounts. In addition, the Board considered the Adviser’s statements to the effect that institutional accounts are distributed differently, operate under different investment and regulatory structures and have different business risks as compared to the Funds and that there are responsibilities and duties involved in sponsoring a registered fund that are not present in sub-advising a registered fund.
On the basis of all the information provided, the Board concluded that each Fund’s management fee, coupled with the applicable expense limitations, was reasonable.
Profitability. With respect to the profitability of the Management Agreement to the Adviser, the Board considered the overall fees paid under the Management Agreement, including the estimated allocated costs of the services provided, management fees waived and other expenses reimbursed, if any, and profits realized by the Adviser from its relationship with the Trust as a whole and each Fund individually. The Board concluded that the estimated profits realized by the Adviser were not unreasonable.
Economies of Scale. The Board considered the extent to which economies of scale would be realized as the Funds grow and whether fee levels reflect these economies of scale for the benefit of investors. The Board noted the Adviser’s statements to the effect that the resources required for the Adviser’s fundamental investment process typically increase as a Fund increases in size and certain investment strategies have limited capacity which limits the Adviser’s ability to achieve economies of scale. In considering whether fee levels reflect economies of scale for the benefit of Fund investors, the Board considered each Fund’s asset size, management fee breakpoints for applicable Funds, the expense limitations in place for each Fund and the proposed reduction in management fees and/or expense limits for certain Funds and each Fund’s expense ratios. The Board concluded that in the aggregate the Funds’ fee levels reasonably reflect appropriate recognition of economies of scale.
Other Benefits. The Board considered benefits derived by the Adviser and its affiliates from their relationship with the Funds, including (1) receipt of research from brokerage firms; (2) soft dollars, which pertain primarily to the Funds investing in equity securities; (3) reimbursement of some intermediary fees in the nature of sub-transfer agency fees; (4) fees from Class N shares of the Funds to the Distributor pursuant to the Rule 12b-1 Plan, nearly all of which are paid to third parties; and (5) favorable media coverage. The Board determined that management fees were reasonable in light of these benefits.
Conclusion. Based upon all of the information considered and the conclusions reached, the Board determined that the terms of the Management Agreement continue to be fair and reasonable and that the continuation of the Management Agreement is in the best interests of each Fund.
| June 30, 2018 | William Blair Funds | 183 |
Trustees and Officers (Unaudited).† The trustees and officers of the William Blair Funds, their year of birth, their principal occupations during the last five years, their affiliations, if any, with William Blair, and their other significant affiliations are set forth below. The address of each officer and trustee is 150 North Riverside Plaza, Chicago, Illinois 60606.
| | | | | | | | | Number of | | |
| | | | | Term of | | | | Portfolios | | |
| | | | | Office(1) and | | | | in Trust | | |
| | | Position(s) | | Length of | | Principal | | Complex | | |
| | | Held with | | Time | | Occupation(s) | | Overseen | | Other Directorships |
| Name and Year of Birth | | Trust | | Served | | During Past 5 Years | | by Trustee | | Held by Trustee |
| Interested Trustees | | | | | |
Stephanie G. Braming,
1970(2) | | Chairman of the Board and President, previously Senior Vice President | | Chairman of the Board and President since 2018, and Senior Vice President 2014-2018 | | Global Head of Investment Management since 2017, portfolio manager (2014– 2017) and Partner, William Blair | | 21 | | Chairman, William Blair SICAV;
Director, William Blair MAS Ltd. |
| | | | | | | | | | | |
Arthur J. Simon,
1954(2) | | Trustee | | Since 2018 | | General Counsel and Partner, William Blair | | 21 | | Director, William Blair SICAV;
Director, William Blair MAS Ltd. |
| | | | | | | | | | | |
| Non-Interested Trustees | | | | |
Vann A. Avedisian,
1964(3) | | Trustee | | Since 2012 | | Principal, Highgate Holdings (hotel investments) (since 2009); formerly, co-founder and Managing Director, Oxford Capital Partners Inc. (1994 to 2006) | | 21 | | Potbelly Corporation (2001 to 2015) |
| | | | | | | | | | | |
Kathleen T. Barr,
1955 | | Trustee | | Since 2013 | | Retired; formerly, President, Productive Capital Management, Inc. (registered investment adviser to public entities) and Owner, KT Barr Consulting, LLC (mutual fund and investment management consulting) (2010 to 2013); prior thereto, Chief Administrative Officer, Senior Vice President and Senior Managing Director of Allegiant Asset Management Company (merged with PNC Capital Advisors, LLC in 2009) (2004 to 2010); Chief Administrative Officer, Chief Compliance Officer and Senior Vice President of PNC Funds and PNC Advantage Funds (f/k/a Allegiant Funds) (2003 to 2010) | | 21 | | Council Member, Independent Directors Council; AmericaFirst Quantitative Funds (5 portfolios) (2012 to 2016) |
| † | William Blair Investment Management, LLC and William Blair & Company, L.L.C. are collectively referred to in this section as “William Blair”, each of which is a wholly owned subsidiary of WBC Holdings, L.P., which is wholly owned by certain William Blair employees (employee owners are referred to as ‘partners’). |
| 184 | Semiannual Report | June 30, 2018 |
| Name and Year of Birth | | Position(s)
Held with
Trust | | Term of
Office(1) and
Length of
Time
Served | | Principal
Occupation(s)
During Past 5 Years | | Number of
Portfolios
in Trust
Complex
Overseen
by Trustee | | Other Directorships
Held by Trustee |
Daniel N. Leib,
1966(4) | | Trustee | | Since 2016 | | Chief Executive Officer, Donnelley Financial Solutions, Inc. (since 2016); formerly, Executive Vice President and Chief Financial Officer, (2011 to 2016) and Group Chief Financial Officer (2009 to 2011), R.R. Donnelley & Sons Company | | 21 | | None |
| | | | | | | | | | | |
Donald J. Reaves,
1946(5) | | Trustee | | Since 2004 | | Retired; formerly, Chancellor of Winston-Salem State University (2007 to 2014); prior thereto, Vice President for Administration and Chief Financial Officer, University of Chicago (2002 to 2007) | | 21 | | American Student Assistance Corp., guarantor of student loans; Amica Mutual Insurance Company |
| | | | | | | | | | | |
Thomas J. Skelly,
1951 | | Trustee | | Since 2007 | | Advisory Board Member for various U.S. companies (since 2005); formerly, Managing Partner of various divisions at Accenture (1994-2004) | | 21 | | Mutual Trust Financial Group, provider of insurance and investment products |
| | | | | | | | | | | |
Steven R. Zenz,
1954 | | Trustee | | Since 2018 | | Consultant, Steven R. Zenz Consulting LLC (merger and acquisition transactions and SEC reporting and filings) (since 2011); formerly, Partner, KPMG LLP (1987-2010)(6) | | 21 | | Frankly Inc. (technology products and services for media industry) (since 2016); RedBrick Health Corporation (health care technology for employee wellness) (since 2015); Insignia Systems, Inc. (in-store advertising services for consumer packaged goods manufacturers) (since 2013) |
| (1) | Each Trustee serves until the election and qualification of a successor, or until death, resignation or retirement, or removal as provided in the Trust’s Declaration of Trust. Retirement for Non-Interested Trustees occurs no later than at the conclusion of the first regularly scheduled Board meeting of the calendar year that occurs after the earlier of (a) the Non-Interested Trustee’s 72nd birthday or (b) the 15th anniversary of the date that the Non-Interested Trustee became a member of the Board of Trustees. |
| (2) | Ms. Braming and Mr. Simon are interested persons of the Trust because they are partners of William Blair, and with respect to Ms. Braming also due to her position as an officer of the Trust. |
| (3) | Mr. Avedisian served as a member of the Board of Directors of Potbelly Corporation (“Potbelly”) from 2001 to 2015. In October 2013, Potbelly completed an underwritten initial public offering of its common stock (the “Offering”). William Blair served as a member of the underwriting syndicate. At the time of the Offering, Mr. Avedisian, through entities he owns or controls, indirectly beneficially owned 1,607,448 shares of Potbelly common stock and warrants to purchase 241,704 shares of common stock representing approximately 8.9% of the shares before the Offering. Mr. Avedisian disclaimed beneficial ownership of the shares except to the extent of his pecuniary interest therein. Potbelly sold 8,474,869 shares and certain stockholders, including two entities affiliated with William Blair, sold 150,131 shares in the Offering at a price to the public of $14.00 per share. Neither Mr. Avedisian nor the entities he owns or controls was a selling stockholder in the Offering. A portion of the net proceeds received by Potbelly from the Offering was used to pay a previously declared cash dividend, in an aggregate amount of approximately $49.9 million, on Potbelly common and preferred shares outstanding immediately prior to the closing of the Offering, which included the outstanding shares indirectly beneficially owned by Mr. Avedisian, William Blair and two entities affiliated with William Blair. |
| (4) | The Funds and William Blair use Donnelley Financial Solutions, Inc. (“DFS”), formerly a company of R.R. Donnelley & Sons Company (“RRD”), for financial printing and other services. DFS was formed as a spin-off from RRD in October 2016 and is a public company. The Funds and William Blair in the aggregate paid DFS approximately $11,000 for the period from spin-off through December 31, 2016 and $172,000 in 2017 for the services provided. DFS’s revenue was $221 million for the period from spin-off through December 31, 2016 and was $1 billion in 2017. Mr. Leib, as the Chief Executive Officer of DFS, is not directly involved in any of the services provided to the Funds or William Blair and his compensation is not materially affected by the fees DFS receives from the Funds and William Blair. The Funds and William Blair in the aggregate paid RRD approximately $129,000 and $919 in 2016 through the date of the DFS spin-off and 2017, respectively, for the services provided. RRD’s revenue was over $8 billion in 2016 for the period from January 1 to September 30, 2016 was $6.9 billion in 2017. Mr. Leib, as former Executive Vice President and Chief Financial Officer of RRD, was not directly involved in any of the services provided to the Funds or William Blair and his compensation was not materially affected by the fees RRD received from the Funds and William Blair. |
| (5) | In his former role as Chief Financial Officer at the University of Chicago, Mr. Reaves had a working relationship with E. David Coolidge III, Vice Chairman of William Blair who is also a trustee of the University of Chicago. |
| (6) | The Funds engage KPMG to provide foreign tax services in Taiwan. KPMG does not provide audit or audit-related services to the Funds. Mr. Zenz is a former partner of KPMG and receives pension/retirement funds from KPMG. |
| June 30, 2018 | William Blair Funds | 185 |
| Name and Year of Birth | | Position(s) Held
with Trust | | Term of Office(1)
and Length of
Time Served | | Principal Occupation(s)
During Past 5 Years |
| Officers | | | | | | |
Michael P. Balkin,
1959 | | Senior Vice President | | Since 2008 | | Partner, William Blair |
| | | | | | | |
Thomas Clarke,
1968 | | Senior Vice President | | Since 2011 | | Partner, William Blair (since 2014); formerly, Associate, William Blair (2011-2014) |
| | | | | | | |
Daniel Crowe,
1972 | | Senior Vice President | | Since 2016 | | Partner, William Blair (since 2015); formerly, Associate, William Blair |
| | | | | | | |
Simon Fennell,
1969 | | Senior Vice President | | Since 2013 | | Partner, William Blair (since 2013); formerly, Associate, William Blair (2011-2013) |
| | | | | | | |
Andrew G. Flynn,
1961 | | Senior Vice President | | Since 2013 | | Partner, William Blair |
| | | | | | | |
David C. Fording,
1967 | | Senior Vice President | | Since 2006 | | Partner, William Blair |
| | | | | | | |
James S. Golan,
1961 | | Senior Vice President | | Since 2005 | | Partner, William Blair |
| | | | | | | |
Michael A. Jancosek,
1959 | | Senior Vice President | | Since 2000 | | Partner, William Blair |
| | | | | | | |
John F. Jostrand,
1954 | | Senior Vice President | | Since 1999 | | Partner, William Blair |
| | | | | | | |
Chad M. Kilmer,
1975 | | Senior Vice President | | Since 2006 | | Partner, William Blair |
| | | | | | | |
Robert C. Lanphier IV,
1956 | | Senior Vice President | | Since 2003 | | Partner, William Blair |
| | | | | | | |
Mark T. Leslie,
1967 | | Senior Vice President | | Since 2005 | | Partner, William Blair |
| 186 | Semiannual Report | June 30, 2018 |
| Name and Year of Birth | | Position(s) Held
with Trust | | Term of Office(1)
and Length of
Time Served | | Principal Occupation(s)
During Past 5 Years |
Kenneth J. McAtamney,
1966 | | Senior Vice President | | Since 2008 | | Partner, William Blair |
| | | | | | | |
Todd M. McClone,
1968 | | Senior Vice President | | Since 2005 | | Partner, William Blair |
| | | | | | | |
David Merjan,
1960 | | Senior Vice President | | Since 2008 | | Partner, William Blair |
| | | | | | | |
David S. Mitchell,
1960 | | Senior Vice President | | Since 2003 | | Partner, William Blair |
| | | | | | | |
John C. Murphy,
1969 | | Senior Vice President | | Since 2014 | | Partner, William Blair |
| | | | | | | |
Casey K. Preyss,
1976 | | Senior Vice President | | Since 2015 | | Partner, William Blair |
| | | | | | | |
David P. Ricci,
1958 | | Senior Vice President | | Since 2006 | | Partner, William Blair |
| | | | | | | |
Ward D. Sexton,
1974 | | Senior Vice President | | Since 2016 | | Partner, William Blair |
| | | | | | | |
Brian D. Singer,
1960 | | Senior Vice President | | Since 2011 | | Partner, William Blair |
| | | | | | | |
Christopher T. Vincent,
1956 | | Senior Vice President | | Since 2002 | | Partner, William Blair |
| | | | | | | |
Paul J. Sularz,
1967 | | Vice President | | Since 2009 | | Associate, William Blair (2006-2012 and since 2014); Partner, William Blair (2012-2014) |
| | | | | | | |
Colette M. Garavalia,
1961 | | Treasurer | | Since 2000 | | Associate, William Blair |
| | | | | | | |
Andrew T. Pfau,
1970 | | Secretary | | Since 2009 | | Associate, William Blair |
| | | | | | | |
John M. Raczek,
1970 | | Assistant Treasurer | | Since 2010 | | Associate, William Blair |
| | | | | | | |
Walter R. Randall, Jr.,
1960 | | Chief Compliance Officer and Assistant Secretary | | Since 2009 | | Associate, William Blair |
| | | | | | | |
Robert J. Toner,
1967 | | Assistant Secretary | | Since 2016 | | Associate, William Blair (since 2015); formerly, Managing Director and Counsel, Wellington Management & Company LLP (2007-2015) |
| (1) | The Trust’s officers, except the Chief Compliance Officer, are elected annually by the Board of Trustees. The Trust’s Chief Compliance Officer is designated by the Board of Trustees and may only be removed by action of the Board of Trustees, including a majority of independent trustees. Length of Time Served for all officers indicates the year the individual became an officer of the Trust. |
The Statement of Additional Information for the William Blair Funds includes additional information about the trustees and is available without charge by calling 1-800-635-2886 (in Massachusetts 1-800-635-2840) or by writing the Fund.
| June 30, 2018 | William Blair Funds | 187 |
(Unaudited)
Proxy Voting
A description of the policies and procedures that the Funds use to determine how to vote proxies relating to portfolio securities and information regarding how the Funds voted proxies relating to portfolio securities for the most recent 12-month period ended December 31 are available without charge, upon request, by calling 1-800-635-2886 (in Massachusetts 1-800-635-2840), at www.williamblairfunds.com and on the SEC’s website at http://www.sec.gov.
Quarterly Portfolio Schedules
Each Fund files its complete schedule of portfolio holdings with the SEC for the first and third fiscal quarters of each fiscal year (quarters ended March 31 and September 30) on Form N-Q. The Funds’ Forms N-Q are available on the SEC’s website at http://www.sec.gov and may be reviewed and copied at the SEC’s Public Reference Room in Washington, D.C. Information on the operation of the SEC’s Public Reference Room may be obtained by calling 1-800-SEC-0330.
Shareholder Meeting Results
A Special Meeting of Shareholders (the “Meeting”) of William Blair Funds (the “Trust”) was held on March 23, 2018 in the 46th Floor Conference Room 4606A at 150 North Riverside Plaza, Chicago, Illinois, 60606. At the Meeting, the following matter was voted upon by shareholders (the resulting votes are presented below).
1. Election of Trustees to the Board of Trustees of the Trust. (“Number of Votes” represents all series of the Trust.)
| | | Number of Votes: |
| Nominee | | For | | Against | | Withheld | | Abstentions |
| Vann A. Avedisian | | 437,811,287.729 | | 1,100,486.008 | | N/A | | 4,164,225.412 |
| Kathleen T. Barr | | 438,054,883.158 | | 1,020,007.648 | | N/A | | 4,001,108.343 |
| Stephanie G. Braming | | 438,018,961.847 | | N/A | | 5,057,037.302 | | N/A |
| Daniel N. Leib | | 437,762,330.411 | | 1,106,934.741 | | N/A | | 4,206,733.997 |
| Donald J. Reaves | | 436,331,108.397 | | 2,556,990.999 | | N/A | | 4,187,899.753 |
| Arthur J. Simon | | 439,249,821.204 | | N/A | | 3,826,177.945 | | N/A |
| Thomas J. Skelly | | 436,597,233.774 | | 2,315,767.841 | | N/A | | 4,162,997.534 |
| Steven R. Zenz | | 437,580,552.945 | | 1,272,687.184 | | N/A | | 4,222,759.020 |
Each Nominee was elected by shareholders to the Board of Trustees at the Meeting.
Additional Federal Income Tax Information: (unaudited)
Under Section 852(b)(3)(C) of the Code, the Funds hereby designate the following amounts as capital gain dividends for the fiscal year ended December 31, 2017 (in thousands):
| Fund | | Capital Gain Dividend |
| Growth | | $ | 115,809 | |
| Large Cap Growth | | | 1,139 | |
| Mid Cap Growth | | | 15,134 | |
| Small-Mid Cap Growth | | | 111,007 | |
| Small-Mid Cap Value | | | 348 | |
| Small Cap Growth | | | 60,126 | |
| Small Cap Value | | | 47,529 | |
| Global Leaders | | | 6,050 | |
| International Leaders | | | 2,709 | |
| Institutional International Growth | | | 39,224 | |
| International Small Cap Growth | | | 40,650 | |
| Emerging Markets Small Cap Growth | | | 1,075 | |
| 188 | Semiannual Report | June 30, 2018 |
Useful Information About Your Report (Unaudited)
Please refer to this information when reviewing the Expense Example for each Fund.
Expense Example
As a shareholder of a Fund, you incur two types of costs: (1) transaction costs and (2) ongoing costs, including management fees, distribution (12b-1) fees (for Class N shares except for the Institutional International Growth Fund and the Institutional International Developed Plus Fund) and other Fund expenses. The example is intended to help you understand your ongoing costs (in dollars) of investing in the Fund and to compare these costs with the ongoing costs of investing in other mutual funds. To do so, compare the Fund’s 5% hypothetical example with the 5% hypothetical examples that appear in the shareholder reports of other funds. The example is based on an investment of $1,000 invested at the beginning of the period and held for the entire six-month period from January 1, 2018 to June 30, 2018.
Actual Expenses
In each example, the first line for each share class in the table provides information about the actual account values and actual expenses. These expenses reflect the effect of any expense cap applicable to the share class during the period. Without this expense cap, the costs shown in the table would have been higher. You may use the information in this line, together with the amount you invested, to estimate the expenses that you paid over the period. Simply divide your account value by $1,000 (example, an $8,600 account value divided by $1,000 = 8.6), then multiply the result by the number in the first line under the heading entitled “Expenses Paid During the Period” to estimate the expenses you paid on your account during the period.
Hypothetical Example for Comparison Purposes
In each example, the second line for each share class in the table provides information about hypothetical account values and hypothetical expenses based on the Fund’s actual expense ratio and an assumed rate of return of 5% per year before expenses. This is not the Fund’s actual return. The hypothetical account values and expenses may not be used to estimate your actual ending account balance or the expenses you paid for the period. You may use this information to compare the ongoing costs of investing in the Fund to the costs of investing in other funds. To do so, compare this 5% hypothetical example with the 5% hypothetical examples that appear in the shareholder reports of other funds.
Please note that the expenses shown in both examples are meant to highlight your ongoing costs only and do not reflect any transactional costs or account type fees, such as IRA administration fees. These fees are discussed in the prospectus. Therefore, the second line of each share class in the table is useful in comparing ongoing costs only and will not help you determine the relative costs of owning different funds. In addition, if these transactional costs or account fees were included, your costs would have been higher.
| June 30, 2018 | William Blair Funds | 189 |
Fund Expenses (Unaudited)
| Expense Example | | Beginning
Account Value
1/1/2018 | | Ending
Account Value
6/30/2018 | | Expenses Paid
During
the Period (a) | | Annualized
Expense Ratio |
| Growth Fund | | | | | | | | |
| Class N-actual return | | $1,000.00 | | $1,127.56 | | $6.33 | | 1.20 |
| Class N-hypothetical 5% return | | $1,000.00 | | $1,044.05 | | $6.08 | | 1.20 |
| Class I-actual return | | $1,000.00 | | $1,129.45 | | $4.75 | | 0.90 |
| Class I-hypothetical 5% return | | $1,000.00 | | $1,045.54 | | $4.56 | | 0.90 |
| Large Cap Growth Fund | | | | | | | | |
| Class N-actual return | | $1,000.00 | | $1,122.85 | | $5.53 | | 1.05 |
| Class N-hypothetical 5% return | | $1,000.00 | | $1,044.79 | | $5.32 | | 1.05 |
| Class I-actual return | | $1,000.00 | | $1,123.84 | | $4.21 | | 0.80 |
| Class I-hypothetical 5% return | | $1,000.00 | | $1,046.03 | | $4.06 | | 0.80 |
| Mid Cap Growth Fund | | | | | | | | |
| Class N-actual return | | $1,000.00 | | $1,116.30 | | $6.66 | | 1.27 |
| Class N-hypothetical 5% return | | $1,000.00 | | $1,043.70 | | $6.44 | | 1.27 |
| Class I-actual return | | $1,000.00 | | $1,117.55 | | $5.36 | | 1.02 |
| Class I-hypothetical 5% return | | $1,000.00 | | $1,044.94 | | $5.17 | | 1.02 |
| Small-Mid Cap Growth Fund | | | | | | | | |
| Class N-actual return | | $1,000.00 | | $1,107.45 | | $7.05 | | 1.35 |
| Class N-hypothetical 5% return | | $1,000.00 | | $1,043.31 | | $6.84 | | 1.35 |
| Class I-actual return | | $1,000.00 | | $1,109.07 | | $5.75 | | 1.10 |
| Class I-hypothetical 5% return | | $1,000.00 | | $1,044.55 | | $5.58 | | 1.10 |
| Small-Mid Cap Value Fund | | | | | | | | |
| Class N-actual return | | $1,000.00 | | $1,008.39 | | $6.57 | | 1.32 |
| Class N-hypothetical 5% return | | $1,000.00 | | $1,043.45 | | $6.69 | | 1.32 |
| Class I-actual return | | $1,000.00 | | $1,009.83 | | $5.33 | | 1.07 |
| Class I-hypothetical 5% return | | $1,000.00 | | $1,044.69 | | $5.42 | | 1.07 |
| Small Cap Growth Fund | | | | | | | | |
| Class N-actual return | | $1,000.00 | | $1,154.08 | | $8.01 | | 1.50 |
| Class N-hypothetical 5% return | | $1,000.00 | | $1,042.56 | | $7.60 | | 1.50 |
| Class I-actual return | | $1,000.00 | | $1,155.69 | | $6.57 | | 1.23 |
| Class I-hypothetical 5% return | | $1,000.00 | | $1,043.90 | | $6.23 | | 1.23 |
| Small Cap Value Fund | | | | | | | | |
| Class N-actual return | | $1,000.00 | | $1,010.92 | | $7.48 | | 1.50 |
| Class N-hypothetical 5% return | | $1,000.00 | | $1,042.56 | | $7.60 | | 1.50 |
| Class I-actual return | | $1,000.00 | | $1,012.08 | | $6.24 | | 1.25 |
| Class I-hypothetical 5% return | | $1,000.00 | | $1,043.80 | | $6.33 | | 1.25 |
| Global Leaders Fund | | | | | | | | |
| Class N-actual return | | $1,000.00 | | $1,063.32 | | $6.91 | | 1.35 |
| Class N-hypothetical 5% return | | $1,000.00 | | $1,043.31 | | $6.84 | | 1.35 |
| Class I-actual return | | $1,000.00 | | $1,064.56 | | $5.43 | | 1.06 |
| Class I-hypothetical 5% return | | $1,000.00 | | $1,044.74 | | $5.37 | | 1.06 |
| Institutional Class-actual return | | $1,000.00 | | $1,065.25 | | $5.12 | | 1.00 |
| Institutional Class-hypothetical 5% return | | $1,000.00 | | $1,045.04 | | $5.07 | | 1.00 |
| International Leaders Fund | | | | | | | | |
| Class N-actual return | | $1,000.00 | | $1,010.38 | | $6.53 | | 1.31 |
| Class N-hypothetical 5% return | | $1,000.00 | | $1,043.50 | | $6.64 | | 1.31 |
| Class I-actual return | | $1,000.00 | | $1,011.56 | | $5.09 | | 1.02 |
| Class I-hypothetical 5% return | | $1,000.00 | | $1,044.94 | | $5.17 | | 1.02 |
| Institutional Class-actual return | | $1,000.00 | | $1,012.17 | | $4.74 | | 0.95 |
| Institutional Class-hypothetical 5% return | | $1,000.00 | | $1,045.29 | | $4.82 | | 0.95 |
| International Developed Plus Fund | | | | | | | | |
| Class N-actual return | | $1,000.00 | | $ 974.10 | | $6.31 | | 1.29 |
| Class N-hypothetical 5% return | | $1,000.00 | | $1,043.60 | | $6.54 | | 1.29 |
| Class I-actual return | | $1,000.00 | | $ 975.54 | | $5.05 | | 1.03 |
| Class I-hypothetical 5% return | | $1,000.00 | | $1,044.89 | | $5.22 | | 1.03 |
| 190 | Semiannual Report | June 30, 2018 |
Fund Expenses (Unaudited)
| Expense Example | | Beginning
Account Value
1/1/2018 | | Ending
Account Value
6/30/2018 | | Expenses Paid
During
the Period (a) | | Annualized
Expense Ratio |
| Institutional International Developed Plus Fund | | | | | | | | |
| Institutional Class-actual return | | $1,000.00 | | $ | 990.38 | | | $4.44 | | 0.90 |
| Institutional Class-hypothetical 5% return | | $1,000.00 | | $ | 1,045.54 | | | $4.56 | | 0.90 |
| International Growth Fund | | | | | | | | | | |
| Class N-actual return | | $1,000.00 | | $ | 982.24 | | | $7.13 | | 1.45 |
| Class N-hypothetical 5% return | | $1,000.00 | | $ | 1,042.81 | | | $7.34 | | 1.45 |
| Class I-actual return | | $1,000.00 | | $ | 983.62 | | | $5.56 | | 1.13 |
| Class I-hypothetical 5% return | | $1,000.00 | | $ | 1,044.40 | | | $5.73 | | 1.13 |
| Institutional International Growth Fund | | | | | | | | | | |
| Institutional Class-actual return | | $1,000.00 | | $ | 983.96 | | | $4.77 | | 0.97 |
| Institutional Class-hypothetical 5% return | | $1,000.00 | | $ | 1,045.19 | | | $4.92 | | 0.97 |
| International Small Cap Growth Fund | | | | | | | | | | |
| Class N-actual return | | $1,000.00 | | $ | 957.39 | | | $7.13 | | 1.47 |
| Class N-hypothetical 5% return | | $1,000.00 | | $ | 1,042.71 | | | $7.45 | | 1.47 |
| Class I-actual return | | $1,000.00 | | $ | 959.11 | | | $5.59 | | 1.15 |
| Class I-hypothetical 5% return | | $1,000.00 | | $ | 1,044.30 | | | $5.83 | | 1.15 |
| Institutional Class-actual return | | $1,000.00 | | $ | 959.95 | | | $5.20 | | 1.07 |
| Institutional Class-hypothetical 5% return | | $1,000.00 | | $ | 1,044.69 | | | $5.42 | | 1.07 |
| Emerging Markets Leaders Fund | | | | | | | | | | |
| Class N-actual return | | $1,000.00 | | $ | 930.38 | | | $7.47 | | 1.56 |
| Class N-hypothetical 5% return | | $1,000.00 | | $ | 1,042.26 | | | $7.90 | | 1.56 |
| Class I-actual return | | $1,000.00 | | $ | 932.37 | | | $5.94 | | 1.24 |
| Class I-hypothetical 5% return | | $1,000.00 | | $ | 1,043.85 | | | $6.28 | | 1.24 |
| Institutional Class-actual return | | $1,000.00 | | $ | 932.37 | | | $5.65 | | 1.18 |
| Institutional Class-hypothetical 5% return | | $1,000.00 | | $ | 1,044.15 | | | $5.98 | | 1.18 |
| Emerging Markets Growth Fund | | | | | | | | | | |
| Class N-actual return | | $1,000.00 | | $ | 926.54 | | | $7.17 | | 1.50 |
| Class N-hypothetical 5% return | | $1,000.00 | | $ | 1,042.56 | | | $7.60 | | 1.50 |
| Class I-actual return | | $1,000.00 | | $ | 927.87 | | | $5.98 | | 1.25 |
| Class I-hypothetical 5% return | | $1,000.00 | | $ | 1,043.80 | | | $6.33 | | 1.25 |
| Institutional Class-actual return | | $1,000.00 | | $ | 928.44 | | | $5.59 | | 1.17 |
| Institutional Class-hypothetical 5% return | | $1,000.00 | | $ | 1,044.20 | | | $5.93 | | 1.17 |
| Emerging Markets Small Cap Growth Fund | | | | | | | | | | |
| Class N-actual return | | $1,000.00 | | $ | 905.14 | | | $7.61 | | 1.61 |
| Class N-hypothetical 5% return | | $1,000.00 | | $ | 1,042.02 | | | $8.15 | | 1.61 |
| Class I-actual return | | $1,000.00 | | $ | 906.57 | | | $6.19 | | 1.31 |
| Class I-hypothetical 5% return | | $1,000.00 | | $ | 1,043.50 | | | $6.64 | | 1.31 |
| Institutional Class-actual return | | $1,000.00 | | $ | 907.25 | | | $5.91 | | 1.25 |
| Institutional Class-hypothetical 5% return | | $1,000.00 | | $ | 1,043.80 | | | $6.33 | | 1.25 |
| Bond Fund | | | | | | | | | | |
| Class N-actual return | | $1,000.00 | | $ | 977.25 | | | $3.09 | | 0.63 |
| Class N-hypothetical 5% return | | $1,000.00 | | $ | 1,046.88 | | | $3.20 | | 0.63 |
| Class I-actual return | | $1,000.00 | | $ | 977.79 | | | $2.16 | | 0.44 |
| Class I-hypothetical 5% return | | $1,000.00 | | $ | 1,047.82 | | | $2.23 | | 0.44 |
| Institutional Class-actual return | | $1,000.00 | | $ | 978.08 | | | $1.81 | | 0.37 |
| Institutional Class-hypothetical 5% return | | $1,000.00 | | $ | 1,048.17 | | | $1.88 | | 0.37 |
| Income Fund | | | | | | | | | | |
| Class N-actual return | | $1,000.00 | | $ | 988.78 | | | $4.19 | | 0.85 |
| Class N-hypothetical 5% return | | $1,000.00 | | $ | 1,045.78 | | | $4.31 | | 0.85 |
| Class I-actual return | | $1,000.00 | | $ | 989.71 | | | $3.06 | | 0.62 |
| Class I-hypothetical 5% return | | $1,000.00 | | $ | 1,046.93 | | | $3.15 | | 0.62 |
| Low Duration Fund | | | | | | | | | | |
| Class N-actual return | | $1,000.00 | | $ | 1,003.04 | | | $3.08 | | 0.62 |
| Class N-hypothetical 5% | | $1,000.00 | | $ | 1,046.93 | | | $3.15 | | 0.62 |
| Class I-actual return | | $1,000.00 | | $ | 1,004.14 | | | $1.99 | | 0.40 |
| Class I-hypothetical 5% | | $1,000.00 | | $ | 1,048.02 | | | $2.03 | | 0.40 |
| Institutional Class-actual return | | $1,000.00 | | $ | 1,004.37 | | | $1.74 | | 0.35 |
| Institutional Class-hypothetical 5% return | | $1,000.00 | | $ | 1,048.26 | | | $1.78 | | 0.35 |
| June 30, 2018 | William Blair Funds | 191 |
Fund Expenses (Unaudited)
| Expense Example | | Beginning
Account Value
1/1/2018 | | Ending
Account Value
6/30/2018 | | Expenses Paid
During
the Period (a) | | Annualized
Expense Ratio |
| Macro Allocation Fund | | | | | | | | | | |
| Class N-actual return | | $1,000.00 | | $ | 983.95 | | | $6.39 | | 1.30 |
| Class N-hypothetical 5% | | $1,000.00 | | $ | 1,043.55 | | | $6.59 | | 1.30 |
| Class I-actual return | | $1,000.00 | | $ | 984.85 | | | $4.82 | | 0.98 |
| Class I-hypothetical 5% | | $1,000.00 | | $ | 1,045.14 | | | $4.97 | | 0.98 |
| Institutional Class-actual return | | $1,000.00 | | $ | 985.70 | | | $4.38 | | 0.89 |
| Institutional Class-hypothetical 5% return | | $1,000.00 | | $ | 1,045.59 | | | $4.51 | | 0.89 |
| | |
| (a) | Expenses are equal to the annualized expense ratio, multiplied by the average account value over the period, multiplied by the number of days in the period, 181, and divided by 365 (to reflect the one-half year period). |
| 192 | Semiannual Report | June 30, 2018 |
| | BOARD OF TRUSTEES |
| | Vann A. Avedisian |
| | Principal, Highgate Holdings |
| | Kathleen T. Barr |
| | Retired Senior Managing Director, PNC Capital Advisors, LLC |
| | Stephanie G. Braming, Chairman and President |
| | Partner, William Blair |
| | Daniel N. Leib |
| | Chief Executive Officer, Donnelley Financial Solutions, Inc. |
| | Donald J. Reaves |
| | Retired Chancellor, Winston-Salem State University |
| | Arthur J. Simon |
| | Partner, William Blair |
| | Thomas J. Skelly |
| | Retired Managing Partner, Accenture |
| | Steven R. Zenz |
| | Retired Partner, KPMG LLP |
| | Officers |
| | Michael P. Balkin, Senior Vice President |
| | Thomas Clarke, Senior Vice President |
| | Daniel Crowe, Senior Vice President |
| | Simon Fennell, Senior Vice President |
| | Andrew G. Flynn, Senior Vice President |
| | David C. Fording, Senior Vice President |
| | James S. Golan, Senior Vice President |
| | Michael A. Jancosek, Senior Vice President |
| | John F. Jostrand, Senior Vice President |
| | Chad M. Kilmer, Senior Vice President |
| | Robert C. Lanphier, IV, Senior Vice President |
| | Mark T. Leslie, Senior Vice President |
| | Kenneth J. McAtamney, Senior Vice President |
| | Todd M. McClone, Senior Vice President |
| | David Merjan, Senior Vice President |
| | David S. Mitchell, Senior Vice President |
| | John C. Murphy, Senior Vice President |
| | Casey K. Preyss, Senior Vice President |
| | David P. Ricci, Senior Vice President |
| | Ward D. Sexton, Senior Vice President |
| | Brian D. Singer, Senior Vice President |
| | Christopher T. Vincent, Senior Vice President |
| | Paul J. Sularz, Vice President |
| | Colette M. Garavalia, Treasurer |
| | Andrew T. Pfau, Secretary |
| | John M. Raczek, Assistant Treasurer |
| | Walter R. Randall, Jr., Chief Compliance Officer and Assistant Secretary |
| | Robert J. Toner, Assistant Secretary |
| | Investment Adviser |
| | William Blair Investment Management, LLC |
| | Distributor |
| | William Blair & Company, L.L.C. |
| | Independent Registered Public Accounting Firm |
| | Ernst & Young LLP |
| | Legal Counsel |
| | Vedder Price P.C. |
| | Transfer Agent |
| | DST Asset Manager Solutions, Inc. |
| | (formerly known as Boston Financial Data Services, Inc.) |
| | For customer assistance, call 1-800-635-2886 |
| | Through August 31, 2018 |
| | P.O. Box 8506 |
| | Boston, Massachusetts 02266-8506 |
| | Effective September 1, 2018 |
| | P.O. Box 219137 |
| | Kansas City, Missouri 64121-9137 |
| June 30, 2018 | William Blair Funds | 193 |
| DOMESTIC EQUITY |
| Growth Fund |
| Large Cap Growth Fund |
| Mid Cap Growth Fund |
| Small-Mid Cap Growth Fund |
| Small-Mid Cap Value Fund |
| Small Cap Growth Fund |
| Small Cap Value Fund |
| GLOBAL EQUITY |
| Global Leaders Fund |
| INTERNATIONAL EQUITY |
| International Leaders Fund |
| International Developed Plus Fund |
| Institutional International |
| Developed Plus Fund |
| International Growth Fund |
| Institutional International Growth Fund |
| International Small Cap Growth Fund |
| Emerging Markets Leaders Fund |
| Emerging Markets Growth Fund |
| Emerging Markets Small Cap Growth Fund |
| FIXED INCOME |
| Bond Fund |
| Income Fund |
| Low Duration Fund |
| |
MULTI-ASSET AND
ALTERNATIVE |
| Macro Allocation Fund |
 | | | | ©William Blair & Company, L.L.C., distributor | |
| | +1 800 742 7272 | | 150 North Riverside Plaza | |
| | williamblairfunds.com | | Chicago, Illinois 60606 | 00103188 |
Not applicable to this filing.
| Item 3. | Audit Committee Financial Expert |
Not applicable to this filing.
| Item 4. | Principal Accountant Fees and Services |
Not applicable to this filing.
| Item 5. | Audit Committee of Listed Registrants |
Not Applicable to this Registrant, insofar as the Registrant is not a listed company.
| Item 6. | Schedule of Investments |
See Schedule of Investments in Item 1.
| Item 7. | Disclosure of Proxy Voting Policies and Procedures for Closed-End Management Investment Companies |
Not applicable to this Registrant, insofar as the Registrant is not a closed-end management investment company.
| Item 8. | Portfolio Managers of Closed Investment Companies |
Not applicable to this Registrant, insofar as the Registrant is not a closed-end management investment company.
| Item 9. | Purchase of Equity Securities by Closed-End Management Investment Companies and Affiliated Purchasers |
Not applicable to this Registrant, insofar as the Registrant is not a closed-end management investment company.
| Item 10. | Submission of Matters to a Vote of Security Holders |
There have been no material changes to the procedures by which shareholders may recommend nominees to the Registrant’s Board of Trustees since the Registrant last provided disclosure in response to this item.
Controls and Procedures
(a) The Registrant’s principal executive and principal financial officer, or persons performing similar functions, have concluded that the Registrant’s Disclosure Controls and Procedures (as defined in Rule 30a-3(c) under the Investment Company Act of 1940, as amended (the “1940 Act”) (17 CFR 270.30a-3(c)) are effective, as of a date within 90 days of the filing date of this report that includes the disclosure required by this paragraph, based on their evaluation of these controls and procedures required by Rule 30a-3 (b) under the 1940 Act (17 CFR 270.30a-3(b) and Rules 13a-15(b) or 15d-15(b) under the Exchange Act (17 CFR 240.13a-15(b) or 240.15d-15(b)).
(b) There were no changes in the Registrant’s internal control over financial reporting (as defined in Rule 30a-3(d) under the 1940 Act (17 CFR 270.30a-3(d)) that occurred during the final quarter of the period covered by this report that has materially affected, or is reasonably likely to materially affect, the Registrant’s internal control over financial reporting.
| Item 12. | Disclosure of Securities Lending Activities for Closed-End Management Investment Companies |
Not applicable to this Registrant, insofar as the Registrant is not a closed-end management investment company.
13. (a) (1) Code of Ethics
Not applicable to this filing.
13. (a) (2) (1)
Certification of Principal Executive Officer Required by Rule 30a-2(a) of the Investment Company Act is filed as an exhibit hereto.
13. (a) (2) (2)
Certification of Principal Financial Officer Required by Rule 30a-2(a) of the Investment Company Act is filed as an exhibit hereto.
13. (a) (3)
Not applicable to this Registrant.
13. (b)
Certifications of the Principal Executive Officer and Principal Financial Officer of the issuer as required by Rule 30a-2(b) of the Investment Company Act of 1940 are filed as exhibits hereto.
SIGNATURES
Pursuant to the requirements of the Securities Exchange Act of 1934 and the Investment Company Act of 1940, the Registrant has duly caused this report to be signed on its behalf by the undersigned, thereunto duly authorized.
| | | William Blair Funds |
| | |
| | | /s/ Stephanie G. Braming |
| By: | | Stephanie G. Braming |
| | | President (Principal Executive Officer) |
Date: August 28, 2018
Pursuant to the requirements of the Securities Exchange Act of 1934 and the Investment Company Act of 1940, this report has been signed below by the following persons on behalf of the Registrant and in the capacities and on the dates indicated.
| | | /s/ Stephanie G. Braming |
| By: | | Stephanie G. Braming |
| | | President (Principal Executive Officer) |
Date: August 28, 2018
| | | /s/ Colette M. Garavalia |
| By: | | Colette M. Garavalia |
| | | Treasurer (Principal Financial Officer) |
Date: August 28, 2018