UNITED STATES
SECURITIES AND EXCHANGE COMMISSION
Washington, D.C. 20549
Form N-CSR
CERTIFIED SHAREHOLDER REPORT OF REGISTERED
MANAGEMENT INVESTMENT COMPANIES
Investment Company Act File Number 811-5344
William Blair Funds
(Exact name of registrant as specified in charter)
| 150 North Riverside Plaza, Chicago, IL | | 60606 |
| (Address of principal executive offices) | | (Zip Code) |
Stephanie G. Braming, Principal Executive Officer
William Blair Funds
150 North Riverside Plaza, Chicago, IL 60606
(Name and address of agent for service)
Registrant’s telephone number, including area code: 312-236-1600
Date of fiscal year end: December 31
Date of reporting period: December 31, 2023
Item 1. December 31, 2023 Annual Reports transmitted to shareholders.
 | |
| | |
| | |
| | |
| | |
| | |
| | |
| | |
| | December 31, 2023 |
William Blair Funds
Annual Report | |
| | | | |
| | | | |
| | | | |
| | | | |
| | | | |
| | | | |
| | | | |
| | | | |
| | | | |
| | | | |
| | | | |
| | | | |
| December 31, 2023 | William Blair Funds | 1 |
The views expressed in the commentary for each Fund reflect those of the portfolio management team only through the end of the period of the report as stated on the cover. The portfolio management team’s views are subject to change at any time based on market and other conditions and should not be construed as a recommendation. Statements involving predictions, assessments, analyses, or outlook for individual securities, industries, market sectors, and/or markets involve risks and uncertainties, and there is no guarantee they will come to pass.
This report is submitted for the general information of the shareholders of William Blair Funds. It is not authorized for distribution to prospective Fund investors unless accompanied or preceded by the Fund’s prospectus. Please carefully consider a Fund’s investment objectives, risks, charges, and expenses before investing. This and other information is contained in the Fund’s prospectus, which you may obtain by calling 1-800-742-7272. Read it carefully before you invest or send money.
| 2 | Annual Report | December 31, 2023 |
U.S. Growth & Core Market Review and Outlook
U.S. equity indices had positive returns for the year ended December 31, 2023.
During the first half of the year, there was a wide range of performance across style and size dimensions. Despite investors’ concerns regarding regional bank failures and higher interest rates, positive developments such as robust jobs growth and moderating inflation rates provided a strong counterbalance for the market. Against this backdrop, the U.S. economy produced solid growth in the first half of the year as Gross Domestic Product (GDP) grew at an annualized rate of 2.1% in the second quarter, modestly below the first quarter’s expansion of 2.2%.
Mid-year, a brief equity market rally was fueled by optimism that the Federal Reserve (Fed) had guided the economy to a soft landing and policy tightening would soon come to an end. That enthusiasm, along with stock prices, faded as fears of persistent inflation caused investors to price in the prospect of an extended period of higher interest rates. U.S. Treasury yields marched higher, reaching multi-year highs, and the U.S. dollar strengthened as investors digested the Fed’s interest rate moves and forward-looking commentary.
U.S. equity indices advanced in the fourth quarter, with notable strength in November and December. This followed inflation data indicating continued moderation and a pivot to dovish comments from the Fed, which led to the belief that the Fed had reached peak interest rates, potentially leading to earlier rate cuts in 2024 than previously anticipated. In turn, U.S. Treasury yields retreated and stocks rallied over the final two months of the year.
Moderating U.S. inflation rates and the prospect of easing Fed policy has increased sentiment for a soft landing for the U.S. economy. However, the cumulative effect of the Fed’s two-year rate-hiking cycle is still unfolding. The transition to higher interest rates, and subsequently increased borrowing costs for consumers and businesses, may lead to slower than expected economic growth. Moderation in consumer spending and more limited pricing power for corporations, as inflation eases, pose potential headwinds for topline growth.
Against this backdrop, companies with strong balance sheets, durable business models, sustainable cash flow, and the ability to self-fund growth are likely to be in an advantaged position relative to peers. We believe our philosophy of identifying durable businesses whose stocks present attractive risk/reward opportunities should serve us well in a variety of economic environments, as it has historically.
| December 31, 2023 | William Blair Funds | 3 |
U.S. Value Market Review and Outlook
2023 was a year characterized by uncertainty in which investors faced an environment with little conviction nor a clear direction. After rising sharply in the second and third quarters, interest rates peaked in the fourth quarter fueled by the potential for a more accommodative Fed policy in 2024, which allowed investors to enjoy a broad-based relief rally in the fourth quarter. Similar to interest rates, oil prices peaked in late September and declined sharply throughout the fourth quarter. In the fourth quarter investors bid up cyclicals, small caps and lower quality names which had been lagging substantially in the first three quarters.
While we were pleased to witness the market rally in the fourth quarter, we are concerned that perhaps investors may be too optimistic in the near-term. For example, while the Fed specifically cited the potential for three future rate cuts, several datapoints suggest that the market is discounting six in 2024. Further, it seems inconsistent for the market to expect six rates cuts while at the same time expecting 11% earnings growth for the S&P 500 index. Said another way, if that many cuts do occur in 2024, it is probable that the economy will have significantly deteriorated.
Despite this caution (and the recent market increase), small-to-mid cap stocks trade at a discount to larger peers and we believe they are attractively valued on their own long-term history. We are also encouraged by the recent uptick in merger activity, a trend which typically favors smaller and mid-sized companies. Lastly, as always, we strive to identify high quality companies whose stock prices already reflect an excessive amount of skepticism. Therefore, in an environment where growth may be slowing and earnings estimates could be too high, we believe the Fund is well positioned. Historically, these periods have also provided fertile ground to find attractive investments and we are prepared to act quickly should the opportunity arise.
| 4 | Annual Report | December 31, 2023 |
| | Growth Fund |
| | |
| | The Growth Fund seeks long-term capital appreciation. |
| | |
| | AN OVERVIEW FROM THE PORTFOLIO MANAGER |
| | |

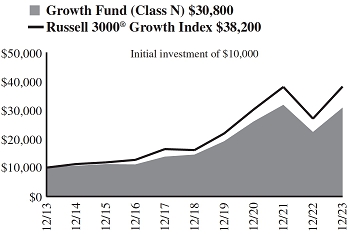
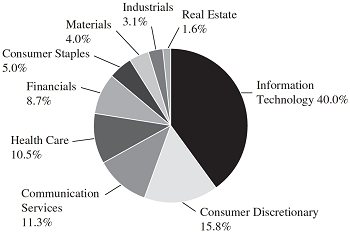
David C. Fording, CFA | The William Blair Growth Fund (Class N shares) (the “Fund”) posted a 37.76% increase, net of fees, for the year ended December 31, 2023. By comparison, the Fund’s benchmark index, the Russell 3000® Growth Index (the “Index”), increased 41.21%. During the year, the Fund trailed the robust 41.21% return of the Index, driven by a combination of style and stock-specific factors. From a style perspective, our typical bias toward small and mid-caps was a headwind as mega caps significantly outperformed. Within the Index, stocks over $100 billion in market capitalization returned 50.5%, as compared to the rest of the Index which returned 25.6%, a spread of approximately 25%. At the stock level, the top detractors were SBA Communications (Real Estate) and Nike (Consumer Discretionary). Shares of SBA Communications, one of the largest independent operators of wireless towers, lagged as carrier spending slowed and higher interest rates weighed on valuation. Shares of Nike lagged due to foreign exchange pressures and macro-economic headwinds, particularly as it relates to the company’s revenue exposure in China. Other notable underperforming holdings included Coca Cola (Consumer Staples), Estee Lauder (Consumer Staples) and UnitedHealth Group (Health Care). Not owning Tesla (Consumer Discretionary) also detracted from full year relative performance. In addition, stock selection in Communication Services and the Consumer sectors dampened performance as our holdings, in aggregate, lagged their sector peers. The top contributors for the year were Palo Alto Networks (Information Technology) and Advanced Micro Devices (Information Technology). Palo Alto, a leading network security company, benefited from strong growth in next generation security products amid a challenging security spend environment. Fabless semiconductor company Advanced Micro Devices outperformed on improvement in its data center segment as well as better investor appreciation of the company’s positioning to capitalize on opportunities in AI (Artificial Intelligence). Cameco (Energy), National Instruments (Information Technology) and MongoDB (Information Technology) were other strong performing holdings. Not owning AbbVie (Health Care) also added relative value as patent cliff concerns for the company’s Humira drug weighed on shares. Finally, positive stock selection in Industrials and among smaller market caps also benefited relative performance. Please refer to the U.S. Growth & Core Market Review and Outlook relating to the Fund on page 3. |
| December 31, 2023 | William Blair Funds | 5 |
Growth Fund
Performance Highlights (Unaudited)
Average Annual Total Returns through 12/31/2023
| | | 1 Year | | 3 Year | | 5 Year | | 10 Year | | Since
Inception(a) |
| Class N | | | 37.76 | % | | | 5.77 | % | | | 16.25 | % | | | 11.92 | % | | | — | % |
| Class I | | | 38.15 | | | | 6.06 | | | | 16.57 | | | | 12.25 | | | | — | |
| Class R6 | | | 38.19 | | | | 6.12 | | | | — | | | | — | | | | 13.50 | |
| Russell 3000® Growth Index | | | 41.21 | | | | 8.08 | | | | 18.85 | | | | 14.33 | | | | 15.60 | |
| S&P 500® Index | | | 26.29 | | | | 10.00 | | | | 15.69 | | | | 12.03 | | | | 12.94 | |
| (a) | Since inception is for the period from May 2, 2019 (Commencement of Operations) to December 31, 2023. |
Performance cited represents past performance. Past performance does not guarantee future results and current performance may be lower or higher than the data quoted. Results shown are average annual total returns, which assume reinvestment of dividends and capital gains. Investment returns and principal will fluctuate and you may have a gain or loss when you sell shares. For the most current month-end performance information, please call 1-800-742-7272, or visit our Web site at www.williamblairfunds.com. From time to time, the investment adviser may waive fees or reimburse expenses for the Fund. Without these waivers/reimbursements, performance would be lower. Class N shares are not subject to a sales load. Class I shares are not subject to a sales load or distribution (Rule 12b-1) fees. Class R6 shares are not subject to a sales load, distribution (Rule 12b-1) fees, or sub-transfer agent fees.
The performance highlights and graph presented above do not reflect the deduction of taxes that a shareholder would pay on fund distributions or the redemption of fund shares.
The Russell 3000® Growth Index consists of large, medium, and small capitalization companies with above average price-to-book ratios and forecasted growth rates. The index is weighted by market capitalization and large/medium/small companies make up approximately 80%/15%/5% of the index.
The S&P 500® Index indicates broad larger capitalization equity market performance.
This report identifies the Fund’s investments on December 31, 2023. These holdings are subject to change. Not all stocks in the Fund performed the same, nor is there any guarantee that these stocks will perform as well in the future. Market forecasts provided in this report may not necessarily come to pass.
Sector Diversification (Unaudited)

The sector diversification shown is based on the total long-term securities.
| 6 | Annual Report | December 31, 2023 |
Growth Fund
Portfolio of Investments, December 31, 2023 (all dollar amounts in thousands)
| | | | | | | | |
| | | | | | | | |
| | Issuer | | Shares | | | Value | |
| | | | | | | | |
| | Common Stocks | | | | | | | | |
| | Information Technology—34.5% | | | | | | | | |
| * | Advanced Micro Devices, Inc. | | | 43,596 | | | $ | 6,426 | |
| * | Dynatrace, Inc. | | | 57,413 | | | | 3,140 | |
| | Microsoft Corp. | | | 63,473 | | | | 23,868 | |
| * | MongoDB, Inc. | | | 3,927 | | | | 1,606 | |
| * | Nice Ltd.—ADR | | | 13,960 | | | | 2,785 | |
| | NVIDIA Corp. | | | 22,505 | | | | 11,145 | |
| * | Palo Alto Networks, Inc. | | | 27,491 | | | | 8,107 | |
| | Power Integrations, Inc. | | | 18,480 | | | | 1,517 | |
| * | Pure Storage, Inc. | | | 83,588 | | | | 2,981 | |
| * | ServiceNow, Inc. | | | 8,324 | | | | 5,881 | |
| | Texas Instruments, Inc. | | | 25,488 | | | | 4,345 | |
| * | Tyler Technologies, Inc. | | | 7,409 | | | | 3,098 | |
| * | Vertex, Inc. | | | 68,484 | | | | 1,845 | |
| * | Workday, Inc. | | | 13,073 | | | | 3,609 | |
| * | Workiva, Inc. | | | 22,961 | | | | 2,331 | |
| | | | | | | | | 82,684 | |
| | Health Care—13.8% | | | | | | | | |
| | Abbott Laboratories | | | 41,707 | | | | 4,591 | |
| * | HealthEquity, Inc. | | | 23,372 | | | | 1,550 | |
| * | Intuitive Surgical, Inc. | | | 17,478 | | | | 5,896 | |
| * | Repligen Corp. | | | 15,047 | | | | 2,705 | |
| * | Treace Medical Concepts, Inc. | | | 149,338 | | | | 1,904 | |
| | UnitedHealth Group, Inc. | | | 18,173 | | | | 9,568 | |
| * | Veeva Systems, Inc. | | | 12,500 | | | | 2,407 | |
| | Zoetis, Inc. | | | 22,513 | | | | 4,443 | |
| | | | | | | | | 33,064 | |
| | Consumer Discretionary—12.6% | | | | | | | | |
| * | Amazon.com, Inc. | | | 116,810 | | | | 17,748 | |
| * | Bright Horizons Family Solutions, Inc. | | | 27,720 | | | | 2,613 | |
| * | Five Below, Inc. | | | 16,678 | | | | 3,555 | |
| | NIKE, Inc. | | | 35,758 | | | | 3,882 | |
| * | Skyline Champion Corp. | | | 31,353 | | | | 2,328 | |
| | | | | | | | | 30,126 | |
| | Communication Services—8.9% | | | | | | | | |
| * | Alphabet, Inc. | | | 122,143 | | | | 17,062 | |
| | Warner Music Group Corp. | | | 89,166 | | | | 3,191 | |
| * | ZipRecruiter, Inc. | | | 68,284 | | | | 949 | |
| | | | | | | | | 21,202 | |
| | Financials—8.7% | | | | | | | | |
| | Apollo Global Management, Inc. | | | 35,672 | | | | 3,324 | |
| | Carlyle Group, Inc. | | | 77,524 | | | | 3,154 | |
| | Everest Group Ltd.† | | | 7,420 | | | | 2,624 | |
| | Mastercard, Inc. | | | 27,548 | | | | 11,750 | |
| | | | | | | | | 20,852 | |
| | | | Shares or | | | | |
| | | | Principal | | | | |
| | Issuer | | Amount | | | Value | |
| | | | | | | | | | |
| | Common Stocks—(continued) | | | | | | | | |
| | Industrials—7.8% | | | | | | | | |
| * | ACV Auctions, Inc. | | | 204,822 | | | $ | 3,103 | |
| | Brink’s Co. | | | 44,826 | | | | 3,942 | |
| * | Chart Industries, Inc. | | | 15,982 | | | | 2,179 | |
| * | Copart, Inc. | | | 106,445 | | | | 5,216 | |
| * | Kornit Digital Ltd.† | | | 70,053 | | | | 1,342 | |
| * | Verra Mobility Corp. | | | 121,692 | | | | 2,803 | |
| | | | | | | | | 18,585 | |
| | Consumer Staples—6.0% | | | | | | | | |
| | Coca-Cola Co. | | | 80,746 | | | | 4,758 | |
| | Estee Lauder Cos., Inc. | | | 9,926 | | | | 1,452 | |
| | Lancaster Colony Corp. | | | 15,791 | | | | 2,627 | |
| * | Performance Food Group Co. | | | 47,086 | | | | 3,256 | |
| * | Vital Farms, Inc. | | | 138,398 | | | | 2,172 | |
| | | | | | | | | 14,265 | |
| | Energy—4.1% | | | | | | | | |
| | Cameco Corp. | | | 86,277 | | | | 3,718 | |
| * | Green Plains, Inc. | | | 62,677 | | | | 1,581 | |
| | New Fortress Energy, Inc. | | | 82,644 | | | | 3,118 | |
| | Whitecap Resources, Inc. | | | 226,335 | | | | 1,522 | |
| | | | | | | | | 9,939 | |
| | Real Estate—1.2% | | | | | | | | |
| * | CoStar Group, Inc. | | | 32,640 | | | | 2,852 | |
| | Materials—1.0% | | | | | | | | |
| | Crown Holdings, Inc. | | | 26,318 | | | | 2,424 | |
| | Total Common Stocks—98.6%
(cost $124,885) | | | | | | | 235,993 | |
| | | | | | | | | | |
| | Repurchase Agreement | | | | | | | | |
| | Fixed Income Clearing Corporation, 2.300% dated 12/29/23, due 01/02/24, repurchase price $2,735, collateralized by U.S. Treasury Note, 4.375%, due 08/15/26, valued at $2,789 | | | $2,734 | | | | 2,734 | |
| | Total Repurchase Agreement—1.1%
(cost $2,734) | | | | | | | 2,734 | |
| | Total Investments—99.7%
(cost $127,619) | | | | | | | 238,727 | |
| | Cash and other assets, less liabilities—0.3% | | | | | | | 665 | |
| | Net assets—100.0% | | | | | | $ | 239,392 | |
ADR = American Depository Receipt
* = Non-income producing security
† = U.S. listed foreign security
See accompanying Notes to Financial Statements.
| December 31, 2023 | William Blair Funds | 7 |
| | Large Cap Growth Fund |
| | |
| | The Large Cap Growth Fund seeks long-term capital appreciation. |
| | |
| | AN OVERVIEW FROM THE PORTFOLIO MANAGERS |
| | |

James S. Golan, CFA 
David P. Ricci, CFA | The William Blair Large Cap Growth Fund (Class N shares) (the “Fund”) posted a 40.11% increase, net of fees, for the year ended December 31, 2023. By comparison, the Fund’s benchmark index, the Russell 1000® Growth Index (the “Index”), increased 42.68%. The Fund lagged the Index for the full year period. Relative performance was primarily driven by stock-specific dynamics. Performance of the Index was dominated by a small number of growth companies with large weights, particularly those perceived to be beneficiaries of Generative Artificial Intelligence (“Generative AI”) whose stocks have appreciated primarily on valuation multiple expansion. Among the larger sources of underperformance as compared to the Index came from our underweight to NVIDIA (Information Technology) and not owning Tesla (Consumer Discretionary). Shares of fabless semiconductor company NVIDIA advanced as artificial intelligence applications were used more broadly and demand is expected to continue to accelerate. While we established a position in the stock during the period, our underweight exposure from earlier in the year was a detractor from relative performance. As it relates to Tesla, while decelerating sales and price cuts have negatively impacted earnings expectations as we expected, the stock appreciated primarily on speculation that Tesla is positioned to be a beneficiary of Generative AI. Within the Fund, our top detractors for the period included Estee Lauder (Consumer Staples), UnitedHealth (Health Care), Nike (Consumer Discretionary) and Costar Group (Real Estate). Estee Lauder, a leader in the prestige beauty market that manufactures and sells premium beauty products in more than 150 countries across a variety of channels, reported decelerating growth in the highly profitable Asia travel retail segment, which put pressure on margins. UnitedHealth, a provider of health care coverage, software and data consultancy services, underperformed due to forward guidance that indicated lower-than-expected Medicare Advantage membership growth and a higher-than-expected medical loss ratio. Our top individual contributors for the period included Palo Alto Networks (Information Technology), Salesforce (Information Technology), Advanced Micro Devices (Information Technology), Amazon (Consumer Discretionary) and Copart (Industrials). Palo Alto, a leading network security company, benefited from strong demand in a challenging security spend environment. Salesforce, the market leader in sales and customer relationship management software, reported strong margin expansion. Furthermore, not owning AbbVie, a pharmaceutical company, was a positive contributor to performance. Please refer to the U.S. Growth & Core Market Review and Outlook relating to the Fund on page 3. |
| 8 | Annual Report | December 31, 2023 |
Large Cap Growth Fund
Performance Highlights (Unaudited)
Average Annual Total Returns through 12/31/2023
| | | 1 Year | | 3 Year | | 5 Year | | 10 Year | | Since
Inception(a) |
| Class N | | | 40.11 | % | | | 6.52 | % | | | 17.51 | % | | | 14.40 | % | | | — | % |
| Class I | | | 40.48 | | | | 6.80 | | | | 17.80 | | | | 14.70 | | | | — | |
| Class R6 | | | 40.56 | | | | 6.86 | | | | — | | | | — | | | | 14.79 | |
| Russell 1000® Growth Index | | | 42.68 | | | | 8.86 | | | | 19.50 | | | | 14.86 | | | | 16.27 | |
| (a) | Since inception is for the period from May 2, 2019 (Commencement of Operations) to December 31, 2023. |
Performance cited represents past performance. Past performance does not guarantee future results and current performance may be lower or higher than the data quoted. Results shown are average annual total returns, which assume reinvestment of dividends and capital gains. Investment returns and principal will fluctuate and you may have a gain or loss when you sell shares. For the most current month-end performance information, please call 1-800-742-7272, or visit our Web site at www.williamblairfunds.com. From time to time, the investment adviser may waive fees or reimburse expenses for the Fund. Without these waivers/reimbursements, performance would be lower. Class N shares are not subject to a sales load. Class I shares are not subject to a sales load or distribution (Rule 12b-1) fees. Class R6 shares are not subject to a sales load, distribution (Rule 12b-1) fees, or sub-transfer agent fees.
The performance highlights and graph presented above do not reflect the deduction of taxes that a shareholder would pay on fund distributions or the redemption of fund shares.
The Russell 1000® Growth Index consists of large capitalization companies with above average price-to-book ratios and forecasted growth rates.
This report identifies the Fund’s investments on December 31, 2023. These holdings are subject to change. Not all stocks in the Fund performed the same, nor is there any guarantee that these stocks will perform as well in the future. Market forecasts provided in this report may not necessarily come to pass.
Sector Diversification (Unaudited)
The sector diversification shown is based on the total long-term securities.
| December 31, 2023 | William Blair Funds | 9 |
Large Cap Growth Fund
Portfolio of Investments, December 31, 2023 (all dollar amounts in thousands)
| | | | | | | | |
| | | | | | | | |
| | Issuer | | Shares | | | Value | |
| | | | | | | | |
| | Common Stocks | | | | | | | | |
| | Information Technology—39.9% | | | | | | | | |
| | Accenture PLC† | | | 170,740 | | | $ | 59,914 | |
| * | Advanced Micro Devices, Inc. | | | 250,358 | | | | 36,905 | |
| | Intuit, Inc. | | | 76,700 | | | | 47,940 | |
| | Lam Research Corp. | | | 44,050 | | | | 34,503 | |
| | Microsoft Corp. | | | 608,630 | | | | 228,869 | |
| | NVIDIA Corp. | | | 187,710 | | | | 92,958 | |
| * | Palo Alto Networks, Inc. | | | 134,850 | | | | 39,765 | |
| * | Salesforce, Inc. | | | 166,680 | | | | 43,860 | |
| * | ServiceNow, Inc. | | | 55,060 | | | | 38,899 | |
| | Texas Instruments, Inc. | | | 164,490 | | | | 28,039 | |
| | | | | | | | | 651,652 | |
| | Consumer Discretionary—15.7% | | | | | | | | |
| * | Amazon.com, Inc. | | | 921,600 | | | | 140,028 | |
| * | Chipotle Mexican Grill, Inc. | | | 17,780 | | | | 40,662 | |
| | NIKE, Inc. | | | 223,560 | | | | 24,272 | |
| * | O’Reilly Automotive, Inc. | | | 30,020 | | | | 28,521 | |
| | Starbucks Corp. | | | 234,390 | | | | 22,504 | |
| | | | | | | | | 255,987 | |
| | Communication Services—11.2% | | | | | | | | |
| * | Alphabet, Inc. | | | 1,110,320 | | | | 155,101 | |
| * | Live Nation Entertainment, Inc. | | | 300,612 | | | | 28,137 | |
| | | | | | | | | 183,238 | |
| | Health Care—10.5% | | | | | | | | |
| | Agilent Technologies, Inc. | | | 117,000 | | | | 16,266 | |
| * | Intuitive Surgical, Inc. | | | 128,310 | | | | 43,287 | |
| | UnitedHealth Group, Inc. | | | 119,800 | | | | 63,071 | |
| * | Veeva Systems, Inc. | | | 79,810 | | | | 15,365 | |
| | Zoetis, Inc. | | | 167,840 | | | | 33,127 | |
| | | | | | | | | 171,116 | |
| | Financials—8.6% | | | | | | | | |
| | Apollo Global Management, Inc. | | | 309,351 | | | | 28,828 | |
| | Carlyle Group, Inc. | | | 696,300 | | | | 28,332 | |
| | Mastercard, Inc. | | | 195,800 | | | | 83,511 | |
| | | | | | | | | 140,671 | |
| | Consumer Staples—4.9% | | | | | | | | |
| | Costco Wholesale Corp. | | | 72,110 | | | | 47,598 | |
| * | Monster Beverage Corp. | | | 579,110 | | | | 33,363 | |
| | | | | | | | | 80,961 | |
| | Materials—4.0% | | | | | | | | |
| | Linde PLC† | | | 88,300 | | | | 36,266 | |
| | Martin Marietta Materials, Inc. | | | 57,870 | | | | 28,872 | |
| | | | | | | | | 65,138 | |
| | Industrials—3.0% | | | | | | | | |
| * | Copart, Inc. | | | 727,220 | | | | 35,634 | |
| * | Uber Technologies, Inc. | | | 232,370 | | | | 14,307 | |
| | | | | | | | | 49,941 | |
| | Real Estate—1.6% | | | | | | | | |
| * | CoStar Group, Inc. | | | 296,830 | | | | 25,940 | |
| | Total Common Stocks—99.4%
(cost $1,134,334) | | | | | | | 1,624,644 | |
| | | | | | | | |
| | Issuer | | Principal
Amount | | | Value | |
| | | | | | | | |
| | Repurchase Agreement | | | | | | |
| | Fixed Income Clearing Corporation, 2.300% dated 12/29/23, due 01/02/24, repurchase price $7,344, collateralized by U.S. Treasury Inflation-Indexed Note, 0.125%, due 07/15/31, valued at $7,489 | | | $7,342 | | | $ | 7,342 | |
| | Total Repurchase Agreement—0.5%
(cost $7,342) | | | | | | | 7,342 | |
| | Total Investments—99.9%
(cost $1,141,676) | | | | | | | 1,631,986 | |
| | Cash and other assets, less liabilities—0.1% | | | | | | | 2,116 | |
| | Net assets—100.0% | | | | | | $ | 1,634,102 | |
† = U.S. listed foreign security
* = Non-income producing security
See accompanying Notes to Financial Statements.
| 10 | Annual Report | December 31, 2023 |
| | Mid Cap Value Fund |
| | |
| | The Mid Cap Value Fund seeks long-term capital appreciation. |
| | |
| | AN OVERVIEW FROM THE PORTFOLIO MANAGERS |
| | |
 William Heaphy, CFA 
Matthew Fleming, CFA | The William Blair Mid Cap Value Fund (Class I shares) (the “Fund”) posted a 13.21% increase, net of fees, for the year ended December 31, 2023. By comparison, the Fund’s benchmark index, the Russell Midcap® Value Index, increased 12.71%. The Fund’s relative outperformance during the year was driven by the combination of stock selection and sector allocations. Specifically, the Fund was positively impacted by its stock selection and sector allocations in 7 of the 11 economic sectors. The Information Technology sector was the largest contributor to relative performance for the year as strong returns from Technology Hardware & Equipment and Semiconductors & Semiconductor Equipment. Jabil Inc. was a top contributor in this sector and increased over 80% during the year upon divesting its mobility business. The divestiture was well received by the market as the business is now much less cyclical, less exposed to Apple, growing faster, and more focused on longer cycle products which we believe will improve margins over time. The Fund also benefitted from strong selection during the year within the Materials, Consumer Staples, and Financials sectors. Stock selection within these sectors was broad-based, but Westlake Chemical Corp, Molson Coors Beverage Co., and KKR & Co. Inc. all contributed meaningfully to relative performance. Conversely, the largest detractor of relative performance during the year was the Fund’s underweight position to the Building Products subsector within Industrials. This subsector soared over 60% for the year on the heels of mortgage rates rising in response to the Federal Reserve’s rate hiking cycle which caused a slowdown in existing housing sales. Unfortunately, the Fund was underweight the Building Products subsector as the valuations for this group were prohibitively elevated. The largest disappointment to relative performance for the year was stock selection within the Consumer Discretionary sector, specifically its Specialty Retailing investments. Specialty retailer Advance Auto Parts, Inc. declined substantially upon its much worse-than-expected quarterly results. While this stock has been disappointing, we continue to believe that the long-term thesis is intact, and that the position has significant future potential given its current valuation and new management team. Please refer to the U.S. Value Market Review and Outlook relating to the Fund on page 4. |
| December 31, 2023 | William Blair Funds | 11 |
Mid Cap Value Fund
Performance Highlights (Unaudited)

| Average Annual Total Returns through 12/31/2023 |
| | | 1 Year | | Since
Inception(a) |
| Class I. | | | 13.21 | % | | | 2.82 | % |
| Class R6 | | | 13.14 | | | | 2.87 | |
| Russell Midcap® Value Index | | | 12.71 | | | | 3.22 | |
| (a) | Since inception is for the period from March 16, 2022 (Commencement of Operations) to December 31, 2023. |
Performance cited represents past performance. Past performance does not guarantee future results and current performance may be lower or higher than the data quoted. Results shown are average annual total returns, which assume reinvestment of dividends and capital gains. Investment returns and principal will fluctuate and you may have a gain or loss when you sell shares. For the most current month-end performance information, please call 1-800-742-7272, or visit our Web site at www.williamblairfunds.com. Investing in smaller and medium capitalization companies involves special risks, including higher volatility and lower liquidity. Smaller and medium capitalization stocks are also more sensitive to purchase/sale transactions and changes in the issuer’s financial condition. From time to time, the investment adviser may waive fees or reimburse expenses for the Fund. Without these waivers/reimbursements, performance would be lower. Class I shares are not subject to a sales load or distribution (Rule 12b-1) fees. Class R6 shares are not subject to a sales load, distribution (Rule 12b-1) fees, or sub-transfer agent fees.
The performance highlights and graph presented above do not reflect the deduction of taxes that a shareholder would pay on fund distributions or the redemption of fund shares.
The Russell Midcap® Value Index measures the performance of the mid-cap value segment of the U.S. equity universe. It includes those Russell Midcap companies with lower price-to-book ratios and lower forecasted growth values.
This report identifies the Fund’s investments on December 31, 2023. These holdings are subject to change. Not all stocks in the Fund performed the same, nor is there any guarantee that these stocks will perform as well in the future. Market forecasts provided in this report may not necessarily come to pass.
Sector Diversification (Unaudited)

The sector diversification shown is based on the total long-term securities.
| 12 | Annual Report | December 31, 2023 |
Mid Cap Value Fund
Portfolio of Investments, December 31, 2023 (all dollar amounts in thousands)
| | | | | | | | |
| | | | | | | | |
| | Issuer | | Shares | | | Value | |
| | | | | | | | | | |
| | Common Stocks | | | | | | | | |
| | Industrials—17.8% | | | | | | | | |
| | Acuity Brands, Inc. | | | 146 | | | $ | 30 | |
| | AGCO Corp. | | | 218 | | | | 26 | |
| * | Alaska Air Group, Inc. | | | 662 | | | | 26 | |
| | Allegion PLC† | | | 187 | | | | 24 | |
| | Flowserve Corp. | | | 684 | | | | 28 | |
| | ITT, Inc. | | | 122 | | | | 14 | |
| | Johnson Controls International PLC† | | | 378 | | | | 22 | |
| | Knight-Swift Transportation Holdings, Inc. | | | 430 | | | | 25 | |
| | Snap-on, Inc. | | | 120 | | | | 35 | |
| | Timken Co. | | | 372 | | | | 30 | |
| | | | | | | | | 260 | |
| | Consumer Discretionary—12.5% | | | | | | | | |
| | Advance Auto Parts, Inc. | | | 345 | | | | 21 | |
| | BorgWarner, Inc. | | | 710 | | | | 26 | |
| | Brunswick Corp. | | | 262 | | | | 25 | |
| | LKQ Corp. | | | 511 | | | | 25 | |
| | Ralph Lauren Corp. | | | 231 | | | | 33 | |
| | Toll Brothers, Inc. | | | 309 | | | | 32 | |
| | Whirlpool Corp. | | | 165 | | | | 20 | |
| | | | | | | | | 182 | |
| | Information Technology—12.4% | | | | | | | | |
| | Amdocs Ltd.† | | | 288 | | | | 25 | |
| * | Check Point Software Technologies Ltd.† | | | 186 | | | | 28 | |
| | Cognizant Technology Solutions Corp. | | | 366 | | | | 28 | |
| * | Flex Ltd.† | | | 906 | | | | 28 | |
| | Hewlett Packard Enterprise Co. | | | 1,493 | | | | 25 | |
| | Jabil, Inc. | | | 164 | | | | 21 | |
| | Skyworks Solutions, Inc. | | | 229 | | | | 26 | |
| | | | | | | | | 181 | |
| | Financials—11.9% | | | | | | | | |
| * | Arch Capital Group Ltd.† | | | 264 | | | | 20 | |
| | East West Bancorp, Inc. | | | 348 | | | | 25 | |
| | Hartford Financial Services Group, Inc. | | | 330 | | | | 26 | |
| | Huntington Bancshares, Inc. | | | 1,571 | | | | 20 | |
| | Invesco Ltd.† | | | 1,440 | | | | 26 | |
| | KKR & Co., Inc. | | | 339 | | | | 28 | |
| | Willis Towers Watson PLC† | | | 117 | | | | 28 | |
| | | | | | | | | 173 | |
| | Health Care—11.5% | | | | | | | | |
| | Cencora, Inc. | | | 138 | | | | 28 | |
| * | Centene Corp. | | | 336 | | | | 25 | |
| | Encompass Health Corp. | | | 361 | | | | 24 | |
| * | Envista Holdings Corp. | | | 805 | | | | 19 | |
| * | Henry Schein, Inc. | | | 196 | | | | 15 | |
| * | Hologic, Inc. | | | 139 | | | | 10 | |
| | Laboratory Corp. of America Holdings | | | 115 | | | | 26 | |
| | Viatris, Inc. | | | 1,789 | | | | 20 | |
| | | | | | | | | 167 | |
| | | | | | | | |
| | | | | | | | |
| | Issuer | | Shares | | | Value | |
| | | | | | | | | | |
| | Common Stocks—(continued) | | | | | | | | |
| | Materials—7.3% | | | | | | | | |
| * | Axalta Coating Systems Ltd.† | | | 827 | | | $ | 28 | |
| | Crown Holdings, Inc. | | | 298 | | | | 27 | |
| | Huntsman Corp. | | | 987 | | | | 25 | |
| | PPG Industries, Inc. | | | 181 | | | | 27 | |
| | | | | | | | | 107 | |
| | Energy—6.9% | | | | | | | | |
| | APA Corp. | | | 636 | | | | 23 | |
| | Coterra Energy, Inc. | | | 777 | | | | 20 | |
| | Diamondback Energy, Inc. | | | 163 | | | | 25 | |
| | Phillips 66 | | | 240 | | | | 32 | |
| | | | | | | | | 100 | |
| | Real Estate—6.7% | | | | | | | | |
| | Camden Property Trust | | | 186 | | | | 18 | |
| | Host Hotels & Resorts, Inc. | | | 1,485 | | | | 29 | |
| | Regency Centers Corp. | | | 378 | | | | 25 | |
| | VICI Properties, Inc. | | | 773 | | | | 25 | |
| | | | | | | | | 97 | |
| | Consumer Staples—5.1% | | | | | | | | |
| | Ingredion, Inc. | | | 266 | | | | 29 | |
| | Molson Coors Beverage Co. | | | 403 | | | | 24 | |
| | Tyson Foods, Inc. | | | 404 | | | | 22 | |
| | | | | | | | | 75 | |
| | Utilities—3.4% | | | | | | | | |
| | Entergy Corp. | | | 243 | | | | 25 | |
| | PPL Corp. | | | 939 | | | | 25 | |
| | | | | | | | | 50 | |
| | Communication Services—0.9% | | | | | | | | |
| * | Warner Bros Discovery, Inc. | | | 1,193 | | | | 14 | |
| | Total Common Stocks—96.4%
(cost $1,332) | | | | | | | 1,406 | |
| | Total Investments—96.4%
(cost $1,332) | | | | | | | 1,406 | |
| | Cash and other assets, | | | | | | | | |
| | less liabilities—3.6% | | | | | | | 52 | |
| | Net assets—100.0% | | | | | | $ | 1,458 | |
* = Non-income producing security
† = U.S. listed foreign security
See accompanying Notes to Financial Statements.
| December 31, 2023 | William Blair Funds | 13 |
| | Small-Mid Cap Core Fund |
| | |
| | The Small-Mid Cap Core Fund seeks long-term capital appreciation. |
| | |
| | AN OVERVIEW FROM THE PORTFOLIO MANAGERS |
| | |
 Daniel Crowe, CFA  Ward D. Sexton, CFA | The William Blair Small-Mid Cap Core Fund (Class I shares) (the “Fund”) posted a 13.26% increase, net of fees, for the year ended December 31, 2023. By comparison, the Fund’s benchmark index, the Russell 2500TM Index (the “Index”), increased 17.42%. During the year, the Fund lagged the Index, primarily driven by stock-specific dynamics. The Fund’s top individual detractors included National Vision Holdings (Consumer Discretionary), Veradigm (Health Care), Globus Medical (Health Care), Mercury Systems (Industrials) and Hannon Armstrong (Financials). National Vision Holdings, the largest value optical retailer in the U.S., was negatively impacted by a shortage in optometrists, resulting in a lack of available exam slots and pressuring revenue and margins in the near term. Additionally, shares of National Vision were pressured as Walmart announced that it had ended its contract with the company. A delay in Veradigm’s, a healthcare information technology company, filings, as well as a management change, weighed on shares of the company. Stock selection in Consumer Discretionary, Information Technology and Health Care also dampened relative performance. In terms of positives, stock selection in Energy, including our position in Cameco, and in Industrials, including our positions in Builders FirstSource and Axon Enterprise, contributed positively to relative returns. Shares of Builders FirstSource, a materials manufacturer and distributor for home builders, benefited from demand strength in the multi-family unit end market, as well as continued share repurchases. Cameco, a company focused on the mining, trading, and processing of uranium, reported strong quarterly results and the company continues to enter favorable long-term contracts against the backdrop of continued upward pressure on uranium spot prices. Other top individual contributors included Verra Mobility (Industrials) and Goosehead Insurance (Financials). Please refer to the U.S. Growth & Core Market Review and Outlook relating to the Fund on page 3. |
| 14 | Annual Report | December 31, 2023 |
Small-Mid Cap Core Fund
Performance Highlights (Unaudited)
| Average Annual Total Returns through 12/31/2023 |
| | | 1 Year | | 3 Year | | Since
Inception(a) |
| Class I | | | 13.26 | % | | | 5.94 | % | | | 10.56 | % |
| Class R6 | | | 13.30 | | | | 5.98 | | | | 10.59 | |
| Russell 2500TM Index | | | 17.42 | | | | 4.24 | | | | 9.57 | |
| (a) | Since inception is for the period from October 1, 2019 (Commencement of Operations) to December 31, 2023. |
Performance cited represents past performance. Past performance does not guarantee future results and current performance may be lower or higher than the data quoted. Results shown are average annual total returns, which assume reinvestment of dividends and capital gains. Investment returns and principal will fluctuate and you may have a gain or loss when you sell shares. For the most current month-end performance information, please call 1-800-742-7272, or visit our Web site at www.williamblairfunds.com. Investing in smaller and medium capitalization companies involves special risks, including higher volatility and lower liquidity. Smaller and medium capitalization stocks are also more sensitive to purchase/sale transactions and changes in the issuer’s financial condition. From time to time, the investment adviser may waive fees or reimburse expenses for the Fund. Without these waivers/reimbursements, performance would be lower. Class I shares are not subject to a sales load or distribution (Rule 12b-1) fees. Class R6 shares are not subject to a sales load, distribution (Rule 12b-1) fees, or sub-transfer agent fees.
The performance highlights and graph presented above do not reflect the deduction of taxes that a shareholder would pay on fund distributions or the redemption of fund shares.
The Russell 2500TMIndex measures the performance of those Russell 2500 companies with above average price-to-book ratios and forecasted growth rates.
This report identifies the Fund’s investments on December 31, 2023. These holdings are subject to change. Not all stocks in the Fund performed the same, nor is there any guarantee that these stocks will perform as well in the future. Market forecasts provided in this report may not necessarily come to pass.
Sector Diversification (Unaudited)

The sector diversification shown is based on the total long-term securities.
| December 31, 2023 | William Blair Funds | 15 |
Small-Mid Cap Core Fund
Portfolio of Investments, December 31, 2023 (all dollar amounts in thousands)
| | | | | | | | |
| | | | | | | | |
| | Issuer | | Shares | | | Value | |
| | | | | | | | | | |
| | Common Stocks | | | | | | | | |
| | Industrials—22.8% | | | | | | | | |
| * | ACV Auctions, Inc. | | | 179,544 | | | $ | 2,720 | |
| * | Atkore, Inc. | | | 10,397 | | | | 1,664 | |
| * | Axon Enterprise, Inc. | | | 12,645 | | | | 3,267 | |
| | Brink’s Co. | | | 34,565 | | | | 3,040 | |
| * | Builders FirstSource, Inc. | | | 17,889 | | | | 2,986 | |
| | BWX Technologies, Inc. | | | 61,904 | | | | 4,750 | |
| * | Casella Waste Systems, Inc. | | | 43,896 | | | | 3,751 | |
| * | Chart Industries, Inc. | | | 19,313 | | | | 2,633 | |
| * | ExlService Holdings, Inc. | | | 69,237 | | | | 2,136 | |
| * | GXO Logistics, Inc. | | | 47,244 | | | | 2,889 | |
| | Lincoln Electric Holdings, Inc. | | | 6,671 | | | | 1,451 | |
| * | Mercury Systems, Inc. | | | 91,745 | | | | 3,355 | |
| * | Shoals Technologies Group, Inc. | | | 78,091 | | | | 1,214 | |
| Tecnoglass, Inc.† | | | 33,391 | | | | 1,526 | |
| * | Trex Co., Inc. | | | 22,422 | | | | 1,856 | |
| * | Verra Mobility Corp. | | | 135,950 | | | | 3,131 | |
| * | WillScot Mobile Mini Holdings Corp. | | | 55,203 | | | | 2,457 | |
| | | | | | | | | 44,826 | |
| | Health Care—14.8% | | | | | | | | |
| * | Acadia Healthcare Co., Inc. | | | 27,411 | | | | 2,131 | |
| * | Avantor, Inc. | | | 50,355 | | | | 1,150 | |
| | Bio-Techne Corp. | | | 25,499 | | | | 1,968 | |
| * | Certara, Inc. | | | 87,337 | | | | 1,536 | |
| | Chemed Corp. | | | 5,926 | | | | 3,465 | |
| | Encompass Health Corp. | | | 54,911 | | | | 3,664 | |
| * | Globus Medical, Inc. | | | 33,983 | | | | 1,811 | |
| * | Insulet Corp. | | | 14,407 | | | | 3,126 | |
| * | Merit Medical Systems, Inc. | | | 52,452 | | | | 3,984 | |
| * | Neogen Corp. | | | 113,682 | | | | 2,286 | |
| * | Repligen Corp. | | | 7,310 | | | | 1,314 | |
| * | Sotera Health Co. | | | 85,237 | | | | 1,436 | |
| * | Veradigm, Inc. | | | 118,473 | | | | 1,243 | |
| | | | | | | | | 29,114 | |
| | Financials—12.9% | | | | | | | | |
| * | BRP Group, Inc. | | | 7,777 | | | | 187 | |
| | Carlyle Group, Inc. | | | 94,817 | | | | 3,858 | |
| | Columbia Banking System, Inc. | | | 109,232 | | | | 2,914 | |
| | East West Bancorp, Inc. | | | 44,894 | | | | 3,230 | |
| * | Euronet Worldwide, Inc. | | | 10,495 | | | | 1,065 | |
| | Everest Group Ltd.† | | | 7,875 | | | | 2,785 | |
| | Tradeweb Markets, Inc. | | | 27,035 | | | | 2,457 | |
| | Virtu Financial, Inc. | | | 128,933 | | | | 2,612 | |
| | Western Alliance Bancorp | | | 56,575 | | | | 3,722 | |
| | Wintrust Financial Corp. | | | 26,082 | | | | 2,419 | |
| | | | | | | | | 25,249 | |
| | Consumer Discretionary—11.9% | | | | | | | | |
| | ADT, Inc. | | | 233,334 | | | | 1,591 | |
| * | Boot Barn Holdings, Inc. | | | 13,612 | | | | 1,045 | |
| * | Bright Horizons Family Solutions, Inc. | | | 40,032 | | | | 3,773 | |
| * | Garrett Motion, Inc. | | | 178,351 | | | | 1,725 | |
| * | Grand Canyon Education, Inc. | | | 15,954 | | | | 2,106 | |
| | Installed Building Products, Inc. | | | 9,349 | | | | 1,709 | |
| * | National Vision Holdings, Inc. | | | 110,614 | | | | 2,315 | |
| | Pool Corp. | | | 7,655 | | | | 3,052 | |
| * | Revolve Group, Inc. | | | 40,592 | | | | 673 | |
| | Signet Jewelers Ltd.† | | | 20,736 | | | | 2,224 | |
| * | Skyline Champion Corp. | | | 41,148 | | | | 3,056 | |
| | | | | | | | | 23,269 | |
| | | | | | | | |
| | | | | | | | |
| | Issuer | | Shares | | | Value | |
| | | | | | | | | | |
| | Common Stocks—(continued) | | | | | | | | |
| | Information Technology—10.0% | | | | | | | | |
| * | Alarm.com Holdings, Inc. | | | 21,162 | | | $ | 1,367 | |
| * | Ambarella, Inc.† | | | 15,920 | | | | 976 | |
| * | Calix, Inc. | | | 36,589 | | | | 1,598 | |
| * | Clearwater Analytics Holdings, Inc. | | | 92,001 | | | | 1,843 | |
| | Cognex Corp. | | | 29,770 | | | | 1,243 | |
| * | Dynatrace, Inc. | | | 48,534 | | | | 2,654 | |
| | Entegris, Inc. | | | 14,775 | | | | 1,770 | |
| * | JFrog Ltd.† | | | 48,377 | | | | 1,674 | |
| * | Lattice Semiconductor Corp. | | | 19,666 | | | | 1,357 | |
| * | Nice Ltd.—ADR | | | 12,980 | | | | 2,590 | |
| * | Onto Innovation, Inc. | | | 8,494 | | | | 1,299 | |
| * | Pure Storage, Inc. | | | 33,696 | | | | 1,202 | |
| | | | | | | | | 19,573 | |
| | Materials—7.9% | | | | | | | | |
| | Berry Global Group, Inc. | | | 47,839 | | | | 3,224 | |
| | CF Industries Holdings, Inc. | | | 31,953 | | | | 2,540 | |
| | Crown Holdings, Inc. | | | 34,302 | | | | 3,159 | |
| | Eagle Materials, Inc. | | | 12,441 | | | | 2,523 | |
| | FMC Corp. | | | 19,919 | | | | 1,256 | |
| | Sylvamo Corp. | | | 58,313 | | | | 2,864 | |
| | | | | | | | | 15,566 | |
| | Real Estate—6.3% | | | | | | | | |
| | Agree Realty Corp. | | | 35,190 | | | | 2,215 | |
| | Americold Realty Trust, Inc. | | | 105,083 | | | | 3,181 | |
| | Equity LifeStyle Properties, Inc. | | | 43,790 | | | | 3,089 | |
| | Healthcare Realty Trust, Inc. | | | 146,318 | | | | 2,521 | |
| | Pebblebrook Hotel Trust | | | 90,524 | | | | 1,447 | |
| | | | | | | | | 12,453 | |
| | Energy—6.1% | | | | | | | | |
| | Cameco Corp. | | | 62,884 | | | | 2,710 | |
| * | Green Plains, Inc. | | | 50,667 | | | | 1,278 | |
| | New Fortress Energy, Inc. | | | 89,349 | | | | 3,371 | |
| | TechnipFMC PLC† | | | 144,563 | | | | 2,912 | |
| | Whitecap Resources, Inc. | | | 246,444 | | | | 1,657 | |
| | | | | | | | | 11,928 | |
| | Consumer Staples—3.9% | | | | | | | | |
| | Inter Parfums, Inc. | | | 17,670 | | | | 2,544 | |
| | Lancaster Colony Corp. | | | 14,380 | | | | 2,393 | |
| | Primo Water Corp. | | | 177,468 | | | | 2,671 | |
| | | | | | | | | 7,608 | |
| | Utilities—1.5% | | | | | | | | |
| | IDACORP, Inc. | | | 29,198 | | | | 2,871 | |
| | Communication Services—1.0% | | | | | | | | |
| * | Live Nation Entertainment, Inc. | | | 10,968 | | | | 1,026 | |
| * | ZipRecruiter, Inc. | | | 64,508 | | | | 897 | |
| | | | | | | | | 1,923 | |
| | Total Common Stocks—99.1%
(cost $177,590) | | | | | | | 194,380 | |
See accompanying Notes to Financial Statements.
| 16 | Annual Report | December 31, 2023 |
Small-Mid Cap Core Fund
Portfolio of Investments, December 31, 2023 (all dollar amounts in thousands)
| | | | | | | |
| Issuer | | Principal
Amount | | | Value | |
| | | | | | | | | |
| Repurchase Agreement | | | | | | | | |
| Fixed Income Clearing Corporation, 2.300% dated 12/29/23, due 01/02/24, repurchase price $1,865, collateralized by U.S. Treasury Note, 3.875%, due 12/31/27, valued at $1,902 | | | $1,864 | | | $ | 1,864 | |
Total Repurchase Agreement—0.9%
(cost $1,864) | | | | | | | 1,864 | |
Total Investments—100.0%
(cost $179,454) | | | | | | | 196,244 | |
| Liabilities, plus cash and other assets—(0.0)% | | | | | | | (64 | ) |
| Net assets—100.0% | | | | | | $ | 196,180 | |
ADR = American Depository Receipt
* = Non-income producing security
† = U.S. listed foreign security
See accompanying Notes to Financial Statements.
| December 31, 2023 | William Blair Funds | 17 |
| | Small-Mid Cap Growth Fund |
| | |
| | The Small-Mid Cap Growth Fund seeks long-term capital appreciation. |
| | |
| | AN OVERVIEW FROM THE PORTFOLIO MANAGERS |
| | |

Daniel Crowe, CFA 
Nicholas Zimmerman, CFA | The William Blair Small-Mid Cap Growth Fund (Class N shares) (the “Fund”) posted a 17.64% increase, net of fees, for the year ended December 31, 2023. By comparison, the Fund’s benchmark index, the Russell 2500TM Growth Index (the “Index”), increased 18.93%. During the year, the Fund’s performance was primarily driven by a combination of style factors and stock-specific dynamics. From a style perspective, our typical underweight to unprofitable companies was a modest tailwind. From a stock-specific perspective, selection in Industrials, including our positions in Builders FirstSource and Axon Enterprise, and in Energy, including our position in Cameco, contributed positively to relative returns. Shares of Builders FirstSource, a materials manufacturer and distributor for home builders, benefited from demand strength in the multi-family unit end market, as well as continued share repurchases. Cameco, a company focused on the mining, trading, and processing of uranium, reported strong quarterly results and the company continues to enter favorable long-term contracts against the backdrop of continued upward pressure on uranium spot prices. Other top contributors included National Instruments (Information Technology) and Guidewire Software (Information Technology). Stock selection in Consumer Discretionary, including our positions in National Vision Holdings and Planet Fitness and Information Technology, including our position in Wolfspeed, Inc. was a detractor in the period. National Vision Holdings, Inc., the largest value optical retailer in the U.S., was negatively impacted by a shortage in optometrists, resulting in a lack of available exam slots and pressuring revenue and margins in the near term. Additionally, shares of National Vision were pressured as Walmart announced that it had ended its contract with the company. Other top individual detractors included Mercury Systems (Industrials) and Lancaster Colony (Consumer Staples). Shares of Mercury Systems, a provider of sensor processing subsystems, declined on near-term profit pressures amidst manufacturing and supply chain challenges. Please refer to the U.S. Growth & Core Market Review and Outlook relating to the Fund on page 3. |
| 18 | Annual Report | December 31, 2023 |
Small-Mid Cap Growth Fund
Performance Highlights (Unaudited)
| Average Annual Total Returns through 12/31/2023 |
| | | 1 Year | | 3 Year | | 5 Year | | 10 Year | | Since
Inception(a) |
| Class N | | | 17.64 | % | | | (0.69 | )% | | | 11.02 | % | | | 9.82 | % | | | — | % |
| Class I | | | 17.93 | | | | (0.44 | ) | | | 11.30 | | | | 10.10 | | | | — | |
| Class R6 | | | 17.95 | | | | (0.39 | ) | | | — | | | | — | | | | 7.73 | |
| Russell 2500TM Growth Index | | | 18.93 | | | | (2.68 | ) | | | 11.43 | | | | 8.78 | | | | 7.65 | |
| (a) | Since inception is for the period from May 2, 2019 (Commencement of Operations) to December 31, 2023. |
Performance cited represents past performance. Past performance does not guarantee future results and current performance may be lower or higher than the data quoted. Results shown are average annual total returns, which assume reinvestment of dividends and capital gains. Investment returns and principal will fluctuate and you may have a gain or loss when you sell shares. For the most current month-end performance information, please call 1-800-742-7272, or visit our Web site at www.williamblairfunds.com. Investing in smaller and medium capitalization companies involves special risks, including higher volatility and lower liquidity. Smaller and medium capitalization stocks are also more sensitive to purchase/sale transactions and changes in the issuer’s financial condition. From time to time, the investment adviser may waive fees or reimburse expenses for the Fund. Without these waivers/reimbursements, performance would be lower. Class N shares are not subject to a sales load. Class I shares are not subject to a sales load or distribution (Rule 12b-1) fees. Class R6 shares are not subject to a sales load, distribution (Rule 12b-1) fees, or sub-transfer agent fees.
The performance highlights and graph presented above do not reflect the deduction of taxes that a shareholder would pay on fund distributions or the redemption of fund shares.
The Russell 2500TM Growth Index measures the performance of those Russell 2500 companies with above average price-to-book ratios and forecasted growth rates.
This report identifies the Fund’s investments on December 31, 2023. These holdings are subject to change. Not all stocks in the Fund performed the same, nor is there any guarantee that these stocks will perform as well in the future. Market forecasts provided in this report may not necessarily come to pass.
Sector Diversification (Unaudited)

The sector diversification shown is based on the total long-term securities.
| December 31, 2023 | William Blair Funds | 19 |
Small-Mid Cap Growth Fund
Portfolio of Investments, December 31, 2023 (all dollar amounts in thousands)
| | | | | | | | |
| | | | | | | | |
| | Issuer | | Shares | | | Value | |
| | | | | | | | | | |
| | Common Stocks | | | | | | | | |
| | Health Care—25.4% | | | | | | | | |
| * | Acadia Healthcare Co., Inc. | | | 419,280 | | | $ | 32,603 | |
| * | Amicus Therapeutics, Inc. | | | 1,712,900 | | | | 24,306 | |
| | Bio-Techne Corp. | | | 359,000 | | | | 27,701 | |
| * | Blueprint Medicines Corp. | | | 277,604 | | | | 25,606 | |
| * | Certara, Inc. | | | 832,083 | | | | 14,636 | |
| * | Charles River Laboratories International, Inc. | | | 71,237 | | | | 16,841 | |
| | Chemed Corp. | | | 75,066 | | | | 43,895 | |
| | Encompass Health Corp. | | | 704,717 | | | | 47,019 | |
| * | Evolent Health, Inc. | | | 726,000 | | | | 23,980 | |
| * | Globus Medical, Inc. | | | 235,395 | | | | 12,544 | |
| * | HealthEquity, Inc. | | | 333,308 | | | | 22,098 | |
| * | Insmed, Inc. | | | 615,951 | | | | 19,088 | |
| * | Inspire Medical Systems, Inc. | | | 121,342 | | | | 24,685 | |
| * | Insulet Corp. | | | 136,346 | | | | 29,584 | |
| * | Merit Medical Systems, Inc. | | | 474,426 | | | | 36,037 | |
| * | Neogen Corp. | | | 1,131,900 | | | | 22,763 | |
| * | Penumbra, Inc. | | | 142,786 | | | | 35,916 | |
| * | Repligen Corp. | | | 148,700 | | | | 26,736 | |
| * | Twist Bioscience Corp. | | | 552,373 | | | | 20,361 | |
| | | | | | | | | 506,399 | |
| | Industrials—19.9% | | | | | | | | |
| | Advanced Drainage Systems, Inc. | | | 266,700 | | | | 37,509 | |
| * | Axon Enterprise, Inc. | | | 159,358 | | | | 41,167 | |
| | Brink’s Co. | | | 360,738 | | | | 31,727 | |
| * | Builders FirstSource, Inc. | | | 179,456 | | | | 29,958 | |
| | BWX Technologies, Inc. | | | 631,052 | | | | 48,420 | |
| * | Casella Waste Systems, Inc. | | | 311,261 | | | | 26,600 | |
| * | Chart Industries, Inc. | | | 168,755 | | | | 23,006 | |
| * | ExlService Holdings, Inc. | | | 501,200 | | | | 15,462 | |
| | HEICO Corp. | | | 207,356 | | | | 29,536 | |
| * | Mercury Systems, Inc. | | | 857,492 | | | | 31,358 | |
| | Regal Rexnord Corp. | | | 93,100 | | | | 13,781 | |
| * | Shoals Technologies Group, Inc. | | | 747,930 | | | | 11,623 | |
| * | SiteOne Landscape Supply, Inc. | | | 100,300 | | | | 16,299 | |
| * | Trex Co., Inc. | | | 324,421 | | | | 26,859 | |
| * | WillScot Mobile Mini Holdings Corp. | | | 304,600 | | | | 13,555 | |
| | | | | | | | | 396,860 | |
| | Information Technology—18.0% | | | | | | | | |
| * | Alarm.com Holdings, Inc. | | | 328,841 | | | | 21,250 | |
| * | Ambarella, Inc.† | | | 213,600 | | | | 13,092 | |
| * | Clearwater Analytics Holdings, Inc. | | | 924,669 | | | | 18,521 | |
| | Cognex Corp. | | | 422,147 | | | | 17,620 | |
| * | Dynatrace, Inc. | | | 710,286 | | | | 38,845 | |
| | Entegris, Inc. | | | 145,776 | | | | 17,467 | |
| * | Guidewire Software, Inc. | | | 377,455 | | | | 41,158 | |
| * | Lattice Semiconductor Corp. | | | 213,500 | | | | 14,729 | |
| * | Nice Ltd. —ADR | | | 158,568 | | | | 31,636 | |
| * | Novanta, Inc.† | | | 148,654 | | | | 25,035 | |
| * | SPS Commerce, Inc. | | | 84,600 | | | | 16,399 | |
| * | Super Micro Computer, Inc. | | | 84,600 | | | | 24,048 | |
| * | Tenable Holdings, Inc. | | | 558,188 | | | | 25,710 | |
| * | Tyler Technologies, Inc. | | | 78,100 | | | | 32,655 | |
| * | Varonis Systems, Inc. | | | 480,932 | | | | 21,777 | |
| | | | | | | | | 359,942 | |
| | Consumer Discretionary—9.6% | | | | | | | | |
| * | Bright Horizons Family Solutions, Inc. | | | 268,278 | | | | 25,283 | |
| * | Burlington Stores, Inc. | | | 89,761 | | | | 17,457 | |
| * | Five Below, Inc. | | | 186,400 | | | | 39,733 | |
| * | National Vision Holdings, Inc. | | | 1,293,276 | | | | 27,068 | |
| | Pool Corp. | | | 106,800 | | | | 42,582 | |
| * | Revolve Group, Inc. | | | 815,092 | | | | 13,514 | |
| * | TopBuild Corp. | | | 69,700 | | | | 26,086 | |
| | | | | | | | | 191,723 | |
| | Issuer | | Shares or
Principal
Amount | | | Value | |
| | | | | | | | | | |
| | Common Stocks—(continued) | | | | | | | | |
| | Financials—8.0% | | | | | | | | |
| | Carlyle Group, Inc. | | | 1,110,300 | | | $ | 45,178 | |
| * | Euronet Worldwide, Inc. | | | 98,280 | | | | 9,974 | |
| | Everest Group Ltd.† | | | 55,400 | | | | 19,588 | |
| * | Flywire Corp. | | | 820,603 | | | | 18,997 | |
| | Tradeweb Markets, Inc. | | | 298,680 | | | | 27,144 | |
| | Virtu Financial, Inc. | | | 968,836 | | | | 19,629 | |
| | Western Alliance Bancorp | | | 292,716 | | | | 19,258 | |
| | | | | | | | | 159,768 | |
| | Consumer Staples—6.2% | | | | | | | | |
| * | elf Beauty, Inc. | | | 300,100 | | | | 43,317 | |
| * | Freshpet, Inc. | | | 505,179 | | | | 43,829 | |
| | Lancaster Colony Corp. | | | 220,030 | | | | 36,611 | |
| | | | | | | | | 123,757 | |
| | Energy—5.7% | | | | | | | | |
| | Cameco Corp. | | | 572,162 | | | | 24,660 | |
| * | Kosmos Energy Ltd. | | | 2,348,900 | | | | 15,761 | |
| | New Fortress Energy, Inc. | | | 871,612 | | | | 32,886 | |
| | Noble Corp. PLC† | | | 298,000 | | | | 14,352 | |
| | TechnipFMC PLC† | | | 585,900 | | | | 11,800 | |
| | Whitecap Resources, Inc. | | | 2,181,800 | | | | 14,668 | |
| | | | | | | | | 114,127 | |
| | Materials—3.8% | | | | | | | | |
| | CF Industries Holdings, Inc. | | | 336,531 | | | | 26,754 | |
| | Crown Holdings, Inc. | | | 340,687 | | | | 31,374 | |
| | Eagle Materials, Inc. | | | 86,400 | | | | 17,526 | |
| | | | | | | | | 75,654 | |
| | Communication Services—1.2% | | | | | | | | |
| * | Live Nation Entertainment, Inc. | | | 261,000 | | | | 24,430 | |
| | Real Estate—1.1% | | | | | | | | |
| | FirstService Corp. | | | 128,968 | | | | 20,904 | |
| | Total Common Stocks—98.9%
(cost $1,661,590) | | | | | | | 1,973,564 | |
| | |
| | Rights | | | | | | | | |
| | Health Care—0.0% | | | | | | | | |
| * | Abiomed, Inc. CVR** | | | 80,133 | | | | — | |
| | Total Rights—0.0%
(cost $82) | | | | | | | — | |
| | |
| | Repurchase Agreement | | | | | | | | |
| | Fixed Income Clearing Corporation, 2.300% dated 12/29/23, due 01/02/24, repurchase price $27,828, collateralized by U.S. Treasury Note, 3.875%, due 12/31/27, valued at $28,377 | | | $27,820 | | | | 27,820 | |
| | Total Repurchase Agreement—1.4%
(cost $27,820) | | | | | | | 27,820 | |
| | Total Investments—100.3%
(cost $1,689,492) | | | | | | | 2,001,384 | |
| | Liabilities, plus cash and other assets—(0.3)% | | | | | | | (6,189 | ) |
| | Net assets—100.0% | | | | | | $ | 1,995,195 | |
ADR = American Depository Receipt
CVR = Contingent Value Right
* = Non-income producing security
** = Fair valued pursuant to the Fund’s Valuation Procedures. This holding represents 0.00% of the Fund’s net assets at December 31, 2023.
† = U.S. listed foreign security
See accompanying Notes to Financial Statements.
| 20 | Annual Report | December 31, 2023 |
| | Small-Mid Cap Value Fund |
| | |
| | The Small-Mid Cap Value seeks long-term capital appreciation. |
| | |
| | AN OVERVIEW FROM THE PORTFOLIO MANAGERS |
| | |

William Heaphy, CFA 
Matthew Fleming, CFA | The William Blair Small-Mid Cap Value Fund (Class I shares) (the “Fund”) posted a 6.45% increase, net of fees, for the period from inception on August 17, 2023 to December 31, 2023. By comparison, the Fund’s benchmark index, the Russell 2500® Value Index (the “Index”), increased 10.56%. The Fund’s relative underperformance during the period was driven by the combination of stock selection and style observations during the partial period. From a style perspective, the Index witnessed a strong rebound in the fourth quarter. This rally gained momentum and continued to broaden out in December in response to an increasingly “soft landing” narrative being priced into equity markets. In fact, the 10-year Treasury yield finished the year below 4% which helped propel small-mid cap value stocks in the fourth quarter. While the Fund delivered strong absolute performance, relative performance was challenged to keep pace with the Index. Strong inflows into the asset class in the back half of the year caused lower capitalization and lower quality stocks to outperform during this more speculative environment. Stock selection was the largest detractor of relative performance for the Fund as investors gravitated to stocks which do not meet our quality bias. At the sector level, the Fund’s Industrial holdings were a large contributor to relative performance in the partial period. Several of the Fund’s Industrials holdings posted significant returns, including Armstrong World Industries Inc., MillerKnoll Inc., and Acuity Brands. The Fund benefitted from a substantial underweight to the poorly performing Utilities, Energy, Communication Services, and Health Care sectors during the partial period. Conversely, the largest source of relative underperformance were the Fund’s Consumer Discretionary holdings. Specifically, the Fund’s Specialty Retail investments were a disappointment, decreasing over 12% in the partial period. The largest source of this underperformance was Advance Auto Parts, Inc. which declined substantially upon its much worse-than-expected quarterly results. While this stock has been disappointing, we continue to believe that the long-term thesis is intact, and that the position has significant future potential given its current valuation and new management team. The Fund’s Information Technology sector holdings struggled to keep pace with Index constituents and was another source of relative underperformance. Software developer Verint Systems suffered a large decline on the heels of reporting a lull in new orders. Like other software companies, many of Verint’s customers are spending more cautiously, but trading now at just eight times more subdued earnings estimates, the shares offer a compelling value. Similarly, electronics manufacturer Methode and communication equipment company NetScout Systems each declined as they incurred operational issues during an already challenging sales environment. Please refer to the U.S. Value Market Review and Outlook relating to the Fund on page 4. |
| December 31, 2023 | William Blair Funds | 21 |
Small-Mid Cap Value Fund
Performance Highlights (Unaudited)
| Average Annual Total Returns through 12/31/2023 |
| | | Since
Inception(a) |
| Class I | | | 6.45 | % |
| Class R6 | | | 6.50 | |
| Russell 2500® Value Index | | | 10.56 | |
| (a) | Since inception is for the period from August 17, 2023 (Commencement of Operations) to December 31, 2023. |
Performance cited represents past performance. Past performance does not guarantee future results and current performance may be lower or higher than the data quoted. Results shown are average annual total returns, which assume reinvestment of dividends and capital gains. Investment returns and principal will fluctuate and you may have a gain or loss when you sell shares. For the most current month-end performance information, please call 1-800-742-7272, or visit our Web site at www.williamblairfunds.com. Investing in smaller and medium capitalization companies involves special risks, including higher volatility and lower liquidity. Smaller and medium capitalization stocks are also more sensitive to purchase/sale transactions and changes in the issuer’s financial condition. From time to time, the investment adviser may waive fees or reimburse expenses for the Fund. Without these waivers/reimbursements, performance would be lower. Class I shares are not subject to a sales load or distribution (Rule 12b-1) fees. Class R6 shares are not subject to a sales load, distribution (Rule 12b-1) fees, or sub-transfer agent fees.
The performance highlights and graph presented above do not reflect the deduction of taxes that a shareholder would pay on fund distributions or the redemption of fund shares.
The Russell 2500® Value Index measures the performance of the small to mid-cap value segment of the U.S. equity universe. It includes those Russell 2500® companies with lower price-to-book ratios and lower forecasted growth values.
This report identifies the Fund’s investments on December 31, 2023. These holdings are subject to change. Not all stocks in the Fund performed the same, nor is there any guarantee that these stocks will perform as well in the future. Market forecasts provided in this report may not necessarily come to pass.
Sector Diversification (Unaudited)

The sector diversification shown is based on the total long-term securities.
| 22 | Annual Report | December 31, 2023 |
Small-Mid Cap Value Fund
Portfolio of Investments, December 31, 2023 (all dollar amounts in thousands)
| | | | | | | | |
| | | | | | | | |
| | Issuer | | Shares | | | Value | |
| | | | | | | | | | |
| | Common Stocks | | | | | | | | |
| | Industrials—22.5% | | | | | | | | |
| | ABM Industries, Inc. | | | 483 | | | $ | 22 | |
| | Acuity Brands, Inc. | | | 116 | | | | 24 | |
| | AGCO Corp. | | | 170 | | | | 21 | |
| * | Alaska Air Group, Inc. | | | 519 | | | | 20 | |
| | Allegion PLC† | | | 136 | | | | 17 | |
| | Armstrong World Industries, Inc. | | | 228 | | | | 22 | |
| | Flowserve Corp. | | | 598 | | | | 25 | |
| | Hillenbrand, Inc. | | | 417 | | | | 20 | |
| * | Hub Group, Inc. | | | 309 | | | | 28 | |
| | Knight-Swift Transportation Holdings, Inc. | | | 357 | | | | 21 | |
| | Korn Ferry | | | 296 | | | | 17 | |
| | Maximus, Inc. | | | 267 | | | | 22 | |
| | MillerKnoll, Inc. | | | 547 | | | | 15 | |
| * | OPENLANE, Inc. | | | 927 | | | | 14 | |
| | Rush Enterprises, Inc. | | | 141 | | | | 7 | |
| | Snap-on, Inc. | | | 78 | | | | 22 | |
| | Terex Corp. | | | 312 | | | | 18 | |
| | Timken Co. | | | 245 | | | | 20 | |
| | | | | | | | | 355 | |
| | Consumer Discretionary—14.7% | | | | | | | | |
| * | Adient PLC† | | | 465 | | | | 17 | |
| | Advance Auto Parts, Inc. | | | 276 | | | | 17 | |
| | Bloomin’ Brands, Inc. | | | 733 | | | | 21 | |
| | BorgWarner, Inc. | | | 558 | | | | 20 | |
| | Brunswick Corp. | | | 206 | | | | 20 | |
| | Carter’s, Inc. | | | 301 | | | | 23 | |
| | Cracker Barrel Old Country Store, Inc. | | | 178 | | | | 14 | |
| | LKQ Corp. | | | 408 | | | | 19 | |
| | Ralph Lauren Corp. | | | 184 | | | | 26 | |
| * | Taylor Morrison Home Corp. | | | 460 | | | | 24 | |
| | Whirlpool Corp. | | | 130 | | | | 16 | |
| | Winnebago Industries, Inc. | | | 220 | | | | 16 | |
| | | | | | | | | 233 | |
| | Information Technology—12.7% | | | | | | | | |
| | Amdocs Ltd.† | | | 226 | | | | 20 | |
| | Belden, Inc. | | | 236 | | | | 18 | |
| * | Check Point Software Technologies Ltd.† | | | 149 | | | | 23 | |
| | Hewlett Packard Enterprise Co. | | | 1,134 | | | | 19 | |
| * | IPG Photonics Corp. | | | 199 | | | | 22 | |
| | Jabil, Inc. | | | 129 | | | | 16 | |
| | Kulicke & Soffa Industries, Inc. | | | 352 | | | | 19 | |
| | Methode Electronics, Inc. | | | 119 | | | | 3 | |
| * | Perficient, Inc. | | | 263 | | | | 17 | |
| * | Qorvo, Inc. | | | 189 | | | | 21 | |
| * | Verint Systems, Inc. | | | 830 | | | | 23 | |
| | | | | | | | | 201 | |
| | Materials—10.4% | | | | | | | | |
| * | Axalta Coating Systems Ltd.† | | | 799 | | | | 27 | |
| | Commercial Metals Co. | | | 414 | | | | 21 | |
| | Crown Holdings, Inc. | | | 240 | | | | 22 | |
| | Greif, Inc. | | | 261 | | | | 17 | |
| | Huntsman Corp. | | | 776 | | | | 20 | |
| | Minerals Technologies, Inc. | | | 254 | | | | 18 | |
| | Orion SA† | | | 768 | | | | 21 | |
| | Silgan Holdings, Inc. | | | 418 | | | | 19 | |
| | | | | | | | | 165 | |
| | | | | | | | |
| | | | | | | | |
| | Issuer | | Shares | | | Value | |
| | | | | | | | | | |
| | Common Stocks—(continued) | | | | | | | | |
| | Real Estate—9.3% | | | | | | | | |
| | Camden Property Trust | | | 128 | | | $ | 13 | |
| | Elme Communities | | | 900 | | | | 13 | |
| | Empire State Realty Trust, Inc. | | | 1,966 | | | | 19 | |
| | Four Corners Property Trust, Inc. | | | 697 | | | | 18 | |
| | Host Hotels & Resorts, Inc. | | | 1,128 | | | | 22 | |
| | Kite Realty Group Trust | | | 932 | | | | 21 | |
| | Regency Centers Corp. | | | 297 | | | | 20 | |
| | STAG Industrial, Inc. | | | 551 | | | | 21 | |
| | | | | | | | | 147 | |
| | Financials—8.5% | | | | | | | | |
| | Ameris Bancorp | | | 412 | | | | 22 | |
| | Eastern Bankshares, Inc. | | | 1,225 | | | | 17 | |
| | Invesco Ltd.† | | | 1,148 | | | | 20 | |
| | Pacific Premier Bancorp, Inc. | | | 632 | | | | 18 | |
| | Pinnacle Financial Partners, Inc. | | | 262 | | | | 23 | |
| * | Texas Capital Bancshares, Inc. | | | 241 | | | | 16 | |
| | Webster Financial Corp. | | | 355 | | | | 18 | |
| | | | | | | | | 134 | |
| | Health Care—6.9% | | | | | | | | |
| | Encompass Health Corp. | | | 317 | | | | 21 | |
| * | Envista Holdings Corp. | | | 640 | | | | 15 | |
| | Laboratory Corp. of America Holdings | | | 92 | | | | 21 | |
| * | Lantheus Holdings, Inc. | | | 265 | | | | 17 | |
| * | QuidelOrtho Corp. | | | 254 | | | | 19 | |
| | Viatris, Inc. | | | 1,501 | | | | 16 | |
| | | | | | | | | 109 | |
| | Energy—4.9% | | | | | | | | |
| * | Expro Group Holdings NV† | | | 1,022 | | | | 16 | |
| | Matador Resources Co. | | | 421 | | | | 24 | |
| | PBF Energy, Inc. | | | 339 | | | | 15 | |
| | SM Energy Co. | | | 587 | | | | 23 | |
| | | | | | | | | 78 | |
| | Consumer Staples—4.9% | | | | | | | | |
| | Ingredion, Inc. | | | 210 | | | | 23 | |
| | Molson Coors Beverage Co. | | | 317 | | | | 20 | |
| | Spectrum Brands Holdings, Inc. | | | 218 | | | | 17 | |
| * | TreeHouse Foods, Inc. | | | 437 | | | | 18 | |
| | | | | | | | | 78 | |
| | Utilities—2.2% | | | | | | | | |
| | Northwestern Energy Group, Inc. | | | 289 | | | | 15 | |
| | Spire, Inc. | | | 306 | | | | 19 | |
| | | | | | | | | 34 | |
| | Communication Services—0.9% | | | | | | | | |
| | John Wiley & Sons, Inc. | | | 437 | | | | 14 | |
| | Total Common Stocks—97.9%
(cost $1,458) | | | | | | | 1,548 | |
| | Total Investments—97.9%
(cost $1,458) | | | | | | | 1,548 | |
| | Cash and other assets, less liabilities—2.1% | | | | | | | 33 | |
| | Net assets—100.0% | | | | | | $ | 1,581 | |
* = Non-income producing security
† = U.S. listed foreign security
See accompanying Notes to Financial Statements.
| December 31, 2023 | William Blair Funds | 23 |
| | Small Cap Growth Fund |
| | |
| | The Small Cap Growth Fund seeks long-term capital appreciation. |
| | |
| | AN OVERVIEW FROM THE PORTFOLIO MANAGERS |
| | |

Ward D. Sexton, CFA 
Mark C. Thompson, CFA | The William Blair Small Cap Growth Fund (Class N shares) (the “Fund”) posted a 16.06% increase, net of fees, for the year ended December 31, 2023. By comparison, the Fund’s benchmark index, the Russell 2000® Growth Index (the “Index”), increased 18.66%. The Fund lagged the Index in the full year period after performing approximately in line over the first 10 months of the year. Relative performance was driven by stock-specific dynamics, as well as style factors late in the year. The Fund lagged in November and December, when the Index was up approximately 22%, in part due to our typical underweight to speculative Biotech. From a stock-specific perspective, our top individual detractors for the year included National Vision Holdings (Consumer Discretionary), Veradigm (Health Care), Globus Medical (Health Care), Treace Medical Concepts (Health Care) and Mercury Systems (Industrials). National Vision Holdings, the largest value optical retailer in the U.S., was negatively impacted by a shortage of optometrists, resulting in a lack of available exam slots which pressured revenue and margins in the near term. Additionally, shares of National Vision Holdings were pressured as Walmart announced that it had ended its contract with the company. Shares of Veradigm, a healthcare information technology company, were impacted by filing delays and management changes. Stock selection in Health Care and Industrials also dampened relative returns. In terms of positives, our top individual contributors included Cameco (Energy), Winmark (Consumer Discretionary), Western Alliance Bancorp (Financials), Brink’s Co. (Industrials) and Vertex (Information Technology). Cameco, a company focused on the mining, trading, and processing of uranium, a key input into nuclear power generation, reported strong results throughout the year and the company continued to enter favorable long-term contracts at attractive prices. Winmark, a franchisor of retail stores, reported strong revenue and store opening growth. Positive stock selection in Information Technology and Energy also aided relative performance. Please refer to the U.S. Growth & Core Market Review and Outlook relating to the Fund on page 3. |
| 24 | Annual Report | December 31, 2023 |
Small Cap Growth Fund
Performance Highlights (Unaudited)
Average Annual Total Returns through 12/31/2023
| | | 1 Year | | 3 Year | | 5 Year | | 10 Year | | Since
Inception(a) |
| Class N | | | 16.06 | % | | | 0.91 | % | | | 11.69 | % | | | 9.65 | % | | | — | % |
| Class I | | | 16.35 | | | | 1.17 | | | | 11.96 | | | | 9.92 | | | | — | |
| Class R6 | | | 16.44 | | | | 1.24 | | | | — | | | | — | | | | 8.75 | |
| Russell 2000® Growth Index | | | 18.66 | | | | (3.50 | ) | | | 9.22 | | | | 7.16 | | | | 5.80 | |
| | |
| (a) | Since inception is for the period from May 2, 2019 (Commencement of Operations) to December 31, 2023. |
Performance cited represents past performance. Past performance does not guarantee future results and current performance may be lower or higher than the data quoted. Results shown are average annual total returns, which assume reinvestment of dividends and capital gains. Investment returns and principal will fluctuate and you may have a gain or loss when you sell shares. For the most current month-end performance information, please call 1-800-742-7272, or visit our Web site at www.williamblairfunds.com. Investing in smaller companies involves special risks, including higher volatility and lower liquidity. Smaller capitalization stocks are also more sensitive to purchase/sale transactions and changes in the issuer’s financial condition. From time to time, the investment adviser may waive fees or reimburse expenses for the Fund. Without these waivers/reimbursements, performance would be lower. Class N shares are not subject to a sales load. Class I shares are not subject to a sales load or distribution (Rule 12b-1) fees. Class R6 shares are not subject to a sales load, distribution (Rule 12b-1) fees, or sub-transfer agent fees.
The performance highlights and graph presented above do not reflect the deduction of taxes that a shareholder would pay on fund distributions or the redemption of fund shares.
The Russell 2000® Growth Index is an unmanaged composite of the smallest 2000 stocks of the Russell 3000® Growth Index.
This report identifies the Fund’s investments on December 31, 2023. These holdings are subject to change. Not all stocks in the Fund performed the same, nor is there any guarantee that these stocks will perform as well in the future. Market forecasts provided in this report may not necessarily come to pass.
Sector Diversification (Unaudited)

The sector diversification shown is based on the total long-term securities.
| December 31, 2023 | William Blair Funds | 25 |
Small Cap Growth Fund
Portfolio of Investments, December 31, 2023 (all dollar amounts in thousands)
| | | | | | | | |
| | | | | | | | |
| | Issuer | | Shares | | | Value | |
| | | | | | | | | | |
| | Common Stocks | | | | | | | | |
| | Health Care—22.6% | | | | | | | | |
| * | Acadia Healthcare Co., Inc. | | | 122,829 | | | $ | 9,551 | |
| * | Alignment Healthcare, Inc. | | | 765,502 | | | | 6,591 | |
| * | Amicus Therapeutics, Inc. | | | 831,140 | | | | 11,794 | |
| * | BioLife Solutions, Inc. | | | 521,000 | | | | 8,466 | |
| * | Blueprint Medicines Corp. | | | 86,150 | | | | 7,946 | |
| * | Certara, Inc. | | | 439,613 | | | | 7,733 | |
| | Encompass Health Corp. | | | 228,090 | | | | 15,218 | |
| * | Globus Medical, Inc. | | | 176,400 | | | | 9,400 | |
| * | Insmed, Inc. | | | 319,570 | | | | 9,903 | |
| * | Inspire Medical Systems, Inc. | | | 53,330 | | | | 10,849 | |
| * | Ligand Pharmaceuticals, Inc. | | | 56,980 | | | | 4,070 | |
| * | Merit Medical Systems, Inc. | | | 171,890 | | | | 13,057 | |
| * | Mirum Pharmaceuticals, Inc. | | | 189,120 | | | | 5,583 | |
| * | OmniAb, Inc. | | | 1,015,049 | | | | 6,263 | |
| * | OmniAb, Inc. 12.50 Earnout (Acquired 11/02/22, Cost $0)**# | | | 23,037 | | | | — | |
| * | OmniAb, Inc. 15.00 Earnout (Acquired 11/02/22, Cost $0)**# | | | 23,037 | | | | — | |
| * | Sotera Health Co. | | | 267,060 | | | | 4,500 | |
| * | Treace Medical Concepts, Inc. | | | 788,890 | | | | 10,058 | |
| * | Twist Bioscience Corp. | | | 205,196 | | | | 7,564 | |
| * | Veracyte, Inc. | | | 223,580 | | | | 6,151 | |
| * | Veradigm, Inc. | | | 501,558 | | | | 5,261 | |
| * | Vericel Corp. | | | 253,940 | | | | 9,043 | |
| | | | | | | | | 169,001 | |
| | Industrials—19.7% | | | | | | | | |
| * | ACV Auctions, Inc. | | | 588,690 | | | | 8,919 | |
| | Albany International Corp. | | | 120,605 | | | | 11,846 | |
| * | Atkore, Inc. | | | 71,790 | | | | 11,486 | |
| | Brink’s Co. | | | 212,296 | | | | 18,671 | |
| | BWX Technologies, Inc. | | | 177,347 | | | | 13,608 | |
| * | Casella Waste Systems, Inc. | | | 196,910 | | | | 16,828 | |
| * | Chart Industries, Inc. | | | 45,696 | | | | 6,230 | |
| | Douglas Dynamics, Inc. | | | 256,033 | | | | 7,599 | |
| * | Ducommun, Inc. | | | 133,042 | | | | 6,926 | |
| * | Energy Recovery, Inc. | | | 142,356 | | | | 2,682 | |
| * | Kornit Digital Ltd.† | | | 247,085 | | | | 4,734 | |
| * | Mercury Systems, Inc. | | | 271,006 | | | | 9,911 | |
| * | Montrose Environmental Group, Inc. | | | 178,088 | | | | 5,722 | |
| * | Shoals Technologies Group, Inc. | | | 269,940 | | | | 4,195 | |
| * | Verra Mobility Corp. | | | 485,929 | | | | 11,191 | |
| * | WNS Holdings Ltd.—ADR | | | 103,790 | | | | 6,559 | |
| | | | | | | | | 147,107 | |
| | Information Technology—18.7% | | | | | | | | |
| * | Alarm.com Holdings, Inc. | | | 146,450 | | | | 9,464 | |
| * | Ambarella, Inc.† | | | 89,840 | | | | 5,506 | |
| * | Calix, Inc. | | | 132,920 | | | | 5,807 | |
| * | Clearwater Analytics Holdings, Inc. | | | 343,651 | | | | 6,883 | |
| * | Guidewire Software, Inc. | | | 107,070 | | | | 11,675 | |
| * | JFrog Ltd.† | | | 315,470 | | | | 10,919 | |
| * | Novanta, Inc.† | | | 58,660 | | | | 9,879 | |
| * | Onto Innovation, Inc. | | | 68,100 | | | | 10,413 | |
| * | PDF Solutions, Inc. | | | 197,081 | | | | 6,334 | |
| | Power Integrations, Inc. | | | 73,840 | | | | 6,063 | |
| * | PROS Holdings, Inc. | | | 208,400 | | | | 8,084 | |
| * | SiTime Corp. | | | 33,145 | | | | 4,047 | |
| | | | | | | | |
| | | | | | | | |
| | Issuer | | Shares | | | Value | |
| | | | | | | | | | |
| | Common Stocks—(continued) | | | | | | | | |
| | Information Technology—(continued) | | | | | | | | |
| * | SPS Commerce, Inc. | | | 42,660 | | | $ | 8,269 | |
| * | Super Micro Computer, Inc. | | | 27,490 | | | | 7,814 | |
| * | Varonis Systems, Inc. | | | 226,740 | | | | 10,267 | |
| * | Vertex, Inc. | | | 367,493 | | | | 9,900 | |
| * | Workiva, Inc. | | | 84,510 | | | | 8,580 | |
| | | | | | | | | 139,904 | |
| | Consumer Discretionary—11.4% | | | | | | | | |
| * | Boot Barn Holdings, Inc. | | | 76,554 | | | | 5,876 | |
| | Cheesecake Factory, Inc. | | | 228,910 | | | | 8,014 | |
| | Golden Entertainment, Inc. | | | 160,810 | | | | 6,421 | |
| * | Grand Canyon Education, Inc. | | | 58,770 | | | | 7,760 | |
| | Installed Building Products, Inc. | | | 40,610 | | | | 7,424 | |
| * | National Vision Holdings, Inc. | | | 458,892 | | | | 9,605 | |
| * | OneSpaWorld Holdings Ltd.† | | | 470,540 | | | | 6,635 | |
| * | Revolve Group, Inc. | | | 147,437 | | | | 2,444 | |
| | Signet Jewelers Ltd.† | | | 72,610 | | | | 7,788 | |
| * | Skyline Champion Corp. | | | 176,810 | | | | 13,130 | |
| | Winmark Corp. | | | 24,200 | | | | 10,105 | |
| | | | | | | | | 85,202 | |
| | Financials—6.9% | | | | | | | | |
| * | BRP Group, Inc. | | | 29,134 | | | | 700 | |
| * | Donnelley Financial Solutions, Inc. | | | 134,560 | | | | 8,392 | |
| * | Euronet Worldwide, Inc. | | | 80,820 | | | | 8,202 | |
| * | Flywire Corp. | | | 171,070 | | | | 3,960 | |
| * | Goosehead Insurance, Inc. | | | 53,162 | | | | 4,030 | |
| | StepStone Group, Inc. | | | 183,380 | | | | 5,837 | |
| | Virtu Financial, Inc. | | | 418,850 | | | | 8,486 | |
| | Western Alliance Bancorp | | | 184,525 | | | | 12,140 | |
| | | | | | | | | 51,747 | |
| | Energy—5.1% | | | | | | | | |
| | ChampionX Corp. | | | 292,910 | | | | 8,556 | |
| * | Green Plains, Inc. | | | 279,332 | | | | 7,045 | |
| | New Fortress Energy, Inc. | | | 264,190 | | | | 9,968 | |
| | TechnipFMC PLC† | | | 308,090 | | | | 6,205 | |
| | Whitecap Resources, Inc. | | | 905,800 | | | | 6,089 | |
| | | | | | | | | 37,863 | |
| | Consumer Staples—3.9% | | | | | | | | |
| * | elf Beauty, Inc. | | | 93,940 | | | | 13,560 | |
| * | Vita Coco Co., Inc. | | | 212,910 | | | | 5,461 | |
| * | Vital Farms, Inc. | | | 648,580 | | | | 10,176 | |
| | | | | | | | | 29,197 | |
| | Materials—3.5% | | | | | | | | |
| | Balchem Corp. | | | 65,230 | | | | 9,703 | |
| | Orion SA† | | | 272,067 | | | | 7,545 | |
| | Sylvamo Corp. | | | 187,890 | | | | 9,227 | |
| | | | | | | | | 26,475 | |
| | Communication Services—2.3% | | | | | | | | |
| * | Gogo, Inc. | | | 579,660 | | | | 5,872 | |
| * | QuinStreet, Inc. | | | 461,925 | | | | 5,922 | |
| * | ZipRecruiter, Inc. | | | 422,540 | | | | 5,873 | |
| | | | | | | | | 17,667 | |
See accompanying Notes to Financial Statements.
| 26 | Annual Report | December 31, 2023 |
Small Cap Growth Fund
Portfolio of Investments, December 31, 2023 (all dollar amounts in thousands)
| | Issuer | | Shares or
Principal
Amount | | | Value | |
| | | | | | | | |
| | Common Stocks—(continued) | | | | | | | | |
| | Real Estate—2.0% | | | | | | | | |
| | Colliers International Group, Inc. | | | 37,048 | | | $ | 4,687 | |
| | FirstService Corp. | | | 62,147 | | | | 10,074 | |
| | | | | | | | | 14,761 | |
| | Total Common Stocks—96.1%
(cost $609,202) | | | | | | | 718,924 | |
| | | | | | | | | | |
| | Exchange-Traded Fund | | | | | | | | |
| | Exchange-Traded Fund—1.0% | | | | | | | | |
| | iShares Russell 2000 Growth ETF | | | 29,870 | | | | 7,534 | |
| | Total Exchange-Traded Fund—1.0%
(cost $6,767) | | | | | | | 7,534 | |
| | | | | | | | | | |
| | Repurchase Agreement | | | | | | | | |
| | Fixed Income Clearing Corporation, 2.300% dated 12/29/23, due 01/02/24, repurchase price $23,475, collateralized by U.S. Treasury Inflation – Indexed Note, 0.125%, due 07/15/31 and U.S. Treasury Note, 3.875%, due 12/31/27, valued at $23,939 | | | $23,469 | | | | 23,469 | |
| | Total Repurchase Agreement—3.2%
(cost $23,469) | | | | | | | 23,469 | |
| | Total Investments—100.3%
(cost $639,438) | | | | | | | 749,927 | |
| | Liabilities, plus cash and other assets—(0.3)% | | | | | | | (2,016 | ) |
| | Net assets—100.0% | | | | | | $ | 747,911 | |
ADR = American Depository Receipt
* = Non-income producing security
** = Fair valued pursuant to the Fund’s Valuation Procedures. These holdings represent 0.00% of the Fund’s net assets at December 31, 2023.
# = Investment in securities not registered under the Securities Act of 1933 (excluding securities acquired pursuant to Rule 144A and Regulation S). The value of such restricted securities represents 0.00% of the Fund’s net assets at December 31, 2023.
† = U.S. listed foreign security
See accompanying Notes to Financial Statements.
| December 31, 2023 | William Blair Funds | 27 |
| | Small Cap Value Fund |
| | |
| | The Small Cap Value Fund seeks long-term capital appreciation. |
| | |
| | AN OVERVIEW FROM THE PORTFOLIO MANAGERS |
| | |

William Heaphy, CFA 
Gary Merwitz | The William Blair Small Cap Value Fund (Class N shares) (the “Fund”) posted a 10.59% increase, net of fees, for the year ended December 31, 2023. By comparison, the Fund’s benchmark index, the Russell 2000® Value Index (the “Index”), increased 14.65%. The Fund’s relative underperformance during the period was driven by the combination of stock selection and style observations during the year. From a style perspective, the Index witnessed a strong rebound in the fourth quarter. This rally gained momentum and continued to broaden out in December in response to an increasingly “soft landing” narrative being priced into equity markets. In fact, the 10-year Treasury yield finished the year below 4% which helped propel small cap value stocks in the fourth quarter. While the Fund delivered strong absolute performance, relative performance was challenged to keep pace with the Index. Strong inflows into the asset class in the back half of the year caused lower capitalization and lower quality stocks to outperform during this more speculative environment. Stock selection was the largest detractor of relative performance for the Fund as investors gravitated to stocks which do not meet our quality bias. Fortunately, the Fund benefitted from its sector positioning in 9 of the 11 economic sectors helping to offset stock selection in the year. At the sector level, the Fund’s Health Care holdings were a large contributor to relative performance in 2023. A lack of exposure to the biotechnology subsector was a major contributor to this result, but several of the Fund’s Health Care holdings posted significant positive returns, including health care supplier Lantheus Holdings Inc., health care equipment company Integer Holdings Corp, and health care technology company Nextgen Healthcare Inc. The Fund was also positively impacted by its sector weightings in the year. The Fund benefitted from a substantial underweight to the poorly performing Utilities sector coupled with its substantial overweighting to the more economically sensitive and procyclical sectors, specifically Industrials, Consumer Discretionary and Information Technology which each rallied nearly 30% in the year. Conversely, the Fund’s Information Technology sector holdings struggled to keep pace with Index constituents and was the largest source of relative underperformance. Software developer Verint Systems suffered a large decline on the heels of reporting a lull in new orders. Like other software companies, many of Verint’s customers are spending more cautiously, but trading now at just eight times more subdued earnings estimates, the shares offer a compelling value. Similarly, electronics manufacturer Methode and communication equipment company NetScout Systems each declined as they incurred operational issues during an already challenging sales environment. Although the Fund benefitted from its underweight position to the regional banking subsector within the Financials sector, the Fund’s stock selection in this subsector detracted from relative performance for the year. The banking subsector increased over 25% in the fourth quarter on the heels of a potential soft landing for the economy. Due to our belief that interest rates would remain higher for longer, and our concern that credit losses would begin to mount, we have maintained an underweight position versus the Index. To date, credit losses have been contained to a few areas such as commercial real estate. 2024 bank earnings are expected to be down approximately 5% on average due to continued net interest income pressures and muted loan growth before inflecting higher in 2025. As such we would anticipate remaining underweight the banking subsector while continuing to seek mispriced opportunities created by credit or macro concerns. Please refer to the U.S. Value Market Review and Outlook relating to the Fund on page 4. |
| 28 | Annual Report | December 31, 2023 |
Small Cap Value Fund
Performance Highlights (Unaudited)
Average Annual Total Returns through 12/31/2023
| | | 1 Year | | 3 Year | | 5 Year | | 10 Year | | Since
Inception(a) |
| Class N | | | 10.59 | % | | | — | % | | | — | % | | | — | % | | | 2.58 | % |
| Class I | | | 10.86 | | | | 8.46 | | | | 10.60 | | | | 7.74 | | | | — | |
| Class R6 | | | 10.96 | | | | — | | | | — | | | | — | | | | 2.94 | |
| Russell 2000® Value Index | | | 14.65 | | | | 7.94 | | | | 10.00 | | | | 6.76 | | | | 2.12 | |
| | |
| (a) | Since inception is for the period from July 17, 2021 (Commencement of Operations) to December 31, 2023. |
Performance cited represents past performance. Past performance does not guarantee future results and current performance may be lower or higher than the data quoted. Results shown are average annual total returns, which assume reinvestment of dividends and capital gains. Investment returns and principal will fluctuate and you may have a gain or loss when you sell shares. For the most current month-end performance information, please call 1-800-742-7272, or visit our Web site at www.williamblairfunds.com. Investing in smaller companies involves special risks, including higher volatility and lower liquidity. Smaller capitalization stocks are also more sensitive to purchase/sale transactions and changes in the issuer’s financial condition. From time to time, the investment adviser may waive fees or reimburse expenses for the Fund. Without these waivers/reimbursements, performance would be lower. Class N shares are not subject to a sales load. Class I shares are not subject to a sales load or distribution (Rule 12b-1) fees. Class R6 shares are not subject to a sales load, distribution (Rule 12b-1) fees, or sub-transfer agent fees.
The performance highlights and graph presented above do not reflect the deduction of taxes that a shareholder would pay on fund distributions or the redemption of fund shares.
The Russell 2000® Value Index consists of small-capitalization companies with below average price-to-book ratios and forecasted growth rates.
This report identifies the Fund’s investments on December 31, 2023. These holdings are subject to change. Not all stocks in the Fund performed the same, nor is there any guarantee that these stocks will perform as well in the future. Market forecasts provided in this report may not necessarily come to pass.
Sector Diversification (Unaudited)

The sector diversification shown is based on the total long-term securities.
| December 31, 2023 | William Blair Funds | 29 |
Small Cap Value Fund
Portfolio of Investments, December 31, 2023 (all dollar amounts in thousands)
| | | | | | | | |
| | | | | | | | |
| | Issuer | | Shares | | | Value | |
| | | | | | | | |
| | Common Stocks | | | | | | | | |
| | Industrials—22.9% | | | | | | | | |
| | ABM Industries, Inc. | | | 324,305 | | | $ | 14,539 | |
| | Albany International Corp. | | | 151,178 | | | | 14,849 | |
| | Armstrong World Industries, Inc. | | | 175,276 | | | | 17,233 | |
| | Brady Corp. | | | 270,375 | | | | 15,868 | |
| * | CBIZ, Inc. | | | 230,396 | | | | 14,420 | |
| * | Conduent, Inc. | | | 2,526,544 | | | | 9,222 | |
| | CSG Systems International, Inc. | | | 242,480 | | | | 12,902 | |
| | Deluxe Corp. | | | 509,825 | | | | 10,936 | |
| | GrafTech International Ltd. | | | 1,784,138 | | | | 3,907 | |
| | Granite Construction, Inc. | | | 411,398 | | | | 20,924 | |
| * | Great Lakes Dredge & Dock Corp. | | | 966,214 | | | | 7,420 | |
| | Hillenbrand, Inc. | | | 311,657 | | | | 14,913 | |
| * | Hub Group, Inc. | | | 165,376 | | | | 15,205 | |
| | Korn Ferry | | | 188,035 | | | | 11,160 | |
| | Marten Transport Ltd. | | | 596,266 | | | | 12,510 | |
| | Maximus, Inc. | | | 173,198 | | | | 14,524 | |
| | MillerKnoll, Inc. | | | 340,611 | | | | 9,087 | |
| * | OPENLANE, Inc. | | | 559,484 | | | | 8,286 | |
| * | PGT Innovations, Inc. | | | 328,979 | | | | 13,389 | |
| | Rush Enterprises, Inc. | | | 99,657 | | | | 5,013 | |
| * | SP Plus Corp. | | | 176,974 | | | | 9,070 | |
| | Terex Corp. | | | 206,817 | | | | 11,884 | |
| * | Thermon Group Holdings, Inc. | | | 283,129 | | | | 9,221 | |
| * | Titan Machinery, Inc. | | | 367,506 | | | | 10,614 | |
| | Werner Enterprises, Inc. | | | 293,910 | | | | 12,453 | |
| | | | | | | | | 299,549 | |
| | Financials—17.9% | | | | | | | | |
| | Ameris Bancorp | | | 312,661 | | | | 16,587 | |
| | Atlantic Union Bankshares Corp. | | | 271,361 | | | | 9,916 | |
| | Banc of California, Inc. | | | 717,004 | | | | 9,629 | |
| | Brightsphere Investment Group, Inc. | | | 475,299 | | | | 9,107 | |
| | Compass Diversified Holdings | | | 680,663 | | | | 15,281 | |
| | Eastern Bankshares, Inc. | | | 992,118 | | | | 14,088 | |
| | Enterprise Financial Services Corp. | | | 276,567 | | | | 12,349 | |
| | First Bancorp | | | 267,962 | | | | 9,917 | |
| | First Merchants Corp. | | | 326,904 | | | | 12,122 | |
| | Hancock Whitney Corp. | | | 236,940 | | | | 11,513 | |
| | MGIC Investment Corp. | | | 726,050 | | | | 14,005 | |
| | Old National Bancorp | | | 824,090 | | | | 13,919 | |
| | Pacific Premier Bancorp, Inc. | | | 332,858 | | | | 9,689 | |
| | Pinnacle Financial Partners, Inc. | | | 173,577 | | | | 15,139 | |
| * | PRA Group, Inc. | | | 419,739 | | | | 10,997 | |
| | Seacoast Banking Corp. of Florida | | | 373,039 | | | | 10,617 | |
| | Stellar Bancorp, Inc. | | | 390,759 | | | | 10,879 | |
| * | Texas Capital Bancshares, Inc. | | | 250,152 | | | | 16,167 | |
| | WaFd, Inc. | | | 370,318 | | | | 12,206 | |
| | | | | | | | | 234,127 | |
| | Consumer Discretionary—13.7% | | | | | | | | |
| * | Adient PLC† | | | 296,234 | | | | 10,771 | |
| | Bloomin’ Brands, Inc. | | | 624,900 | | | | 17,591 | |
| | Carter’s, Inc. | | | 211,706 | | | | 15,855 | |
| | Cracker Barrel Old Country Store, Inc. | | | 121,469 | | | | 9,363 | |
| | Designer Brands, Inc. | | | 341,240 | | | | 3,020 | |
| * | El Pollo Loco Holdings, Inc. | | | 559,889 | | | | 4,938 | |
| | | | | | | | |
| | | | | | | | |
| | Issuer | | Shares | | | Value | |
| | | | | | | | |
| | Common Stocks—(continued) | | | | | | | | |
| | Consumer Discretionary—(continued) | | | | | | | | |
| | La-Z-Boy, Inc. | | | 480,090 | | | $ | 17,725 | |
| | Monro, Inc. | | | 321,479 | | | | 9,432 | |
| | Oxford Industries, Inc. | | | 124,094 | | | | 12,409 | |
| | Standard Motor Products, Inc. | | | 371,736 | | | | 14,799 | |
| | Steven Madden Ltd. | | | 356,384 | | | | 14,968 | |
| * | Taylor Morrison Home Corp. | | | 309,314 | | | | 16,502 | |
| * | Tri Pointe Homes, Inc. | | | 453,438 | | | | 16,052 | |
| * | Universal Electronics, Inc. | | | 210,464 | | | | 1,976 | |
| | Winnebago Industries, Inc. | | | 196,477 | | | | 14,319 | |
| | | | | | | | | 179,720 | |
| | Information Technology—10.3% | | | | | | | | |
| | ADTRAN Holdings, Inc. | | | 1,440,072 | | | | 10,570 | |
| | AudioCodes Ltd.† | | | 553,134 | | | | 6,676 | |
| | Belden, Inc. | | | 165,861 | | | | 12,813 | |
| * | Cognyte Software Ltd.† | | | 1,091,823 | | | | 7,020 | |
| * | Diodes, Inc. | | | 159,434 | | | | 12,838 | |
| * | Knowles Corp. | | | 886,635 | | | | 15,880 | |
| | Kulicke & Soffa Industries, Inc. | | | 281,323 | | | | 15,394 | |
| | Methode Electronics, Inc. | | | 84,931 | | | | 1,930 | |
| * | NetScout Systems, Inc. | | | 444,180 | | | | 9,750 | |
| * | Perficient, Inc. | | | 217,968 | | | | 14,347 | |
| | Progress Software Corp. | | | 217,871 | | | | 11,830 | |
| * | Verint Systems, Inc. | | | 557,180 | | | | 15,061 | |
| | | | | | | | | 134,109 | |
| | Real Estate—9.0% | | | | | | | | |
| | CareTrust REIT, Inc. | | | 624,099 | | | | 13,967 | |
| | Elme Communities | | | 656,503 | | | | 9,585 | |
| | Empire State Realty Trust, Inc. | | | 1,481,412 | | | | 14,355 | |
| | Four Corners Property Trust, Inc. | | | 436,861 | | | | 11,053 | |
| | Kite Realty Group Trust | | | 772,018 | | | | 17,648 | |
| | Pebblebrook Hotel Trust | | | 861,647 | | | | 13,769 | |
| | STAG Industrial, Inc. | | | 372,458 | | | | 14,623 | |
| | Sunstone Hotel Investors, Inc. | | | 950,580 | | | | 10,200 | |
| | UMH Properties, Inc. | | | 793,298 | | | | 12,153 | |
| | | | | | | | | 117,353 | |
| | Materials—7.2% | | | | | | | | |
| | Commercial Metals Co. | | | 269,971 | | | | 13,509 | |
| * | Ecovyst, Inc. | | | 1,309,262 | | | | 12,792 | |
| | Greif, Inc. | | | 180,403 | | | | 11,833 | |
| | Minerals Technologies, Inc. | | | 218,012 | | | | 15,546 | |
| | Myers Industries, Inc. | | | 640,226 | | | | 12,516 | |
| | Orion SA† | | | 577,893 | | | | 16,025 | |
| | Ryerson Holding Corp. | | | 334,777 | | | | 11,610 | |
| | | | | | | | | 93,831 | |
| | Energy—6.2% | | | | | | | | |
| * | Dril-Quip, Inc. | | | 489,532 | | | | 11,391 | |
| * | Expro Group Holdings NV† | | | 742,820 | | | | 11,826 | |
| | Matador Resources Co. | | | 218,576 | | | | 12,428 | |
| | PBF Energy, Inc. | | | 283,825 | | | | 12,477 | |
| | Permian Resources Corp. | | | 1,317,797 | | | | 17,922 | |
| | SM Energy Co. | | | 396,407 | | | | 15,349 | |
| | | | | | | | | 81,393 | |
See accompanying Notes to Financial Statements.
| 30 | Annual Report | December 31, 2023 |
Small Cap Value Fund
Portfolio of Investments, December 31, 2023 (all dollar amounts in thousands)
| | Issuer | | Shares or
Principal
Amount | | | Value | |
| | Common Stocks—(continued) | | | | | | | | |
| | Consumer Staples—5.0% | | | | | | | | |
| | Cal-Maine Foods, Inc. | | | 266,050 | | | $ | 15,269 | |
| * | Central Garden & Pet Co. | | | 344,784 | | | | 15,184 | |
| | Edgewell Personal Care Co. | | | 255,128 | | | | 9,345 | |
| | Spectrum Brands Holdings, Inc. | | | 154,903 | | | | 12,357 | |
| * | TreeHouse Foods, Inc. | | | 308,318 | | | | 12,780 | |
| | | | | | | | | 64,935 | |
| | Health Care—4.4% | | | | | | | | |
| * | ANI Pharmaceuticals, Inc. | | | 193,870 | | | | 10,690 | |
| * | Avanos Medical, Inc. | | | 475,317 | | | | 10,661 | |
| * | Integer Holdings Corp. | | | 184,674 | | | | 18,298 | |
| * | Lantheus Holdings, Inc. | | | 216,248 | | | | 13,407 | |
| * | ModivCare, Inc. | | | 101,960 | | | | 4,485 | |
| | | | | | | | | 57,541 | |
| | Utilities—1.7% | | | | | | | | |
| | Northwestern Energy Group, Inc. | | | 218,303 | | | | 11,110 | |
| | Spire, Inc. | | | 181,970 | | | | 11,344 | |
| | | | | | | | | 22,454 | |
| | Communication Services—0.8% | | | | | | | | |
| | John Wiley & Sons, Inc. | | | 338,924 | | | | 10,757 | |
| | Total Common Stocks—99.1%
(cost $1,191,292) | | | | | | | 1,295,769 | |
| | | | | | | | | | |
| | Repurchase Agreement | | | | | | | | |
| | Fixed Income Clearing Corporation, 2.300% dated 12/29/23, due 01/02/24, repurchase price $9,689, collateralized by U.S. Treasury Note, 3.875%, due 12/31/27, valued at $9,881 | | | $9,687 | | | | 9,687 | |
| | Total Repurchase Agreement—0.7%
(cost $9,687) | | | | | | | 9,687 | |
| | Total Investments—99.8%
(cost $1,200,979) | | | | | | | 1,305,456 | |
| | Cash and other assets, less liabilities—0.2% | | | | | | | 2,590 | |
| | Net assets—100.0% | | | | | | $ | 1,308,046 | |
REIT = Real Estate Investment Trust
* = Non-income producing security
† = U.S. listed foreign security
See accompanying Notes to Financial Statements.
| December 31, 2023 | William Blair Funds | 31 |
Global Markets Review and Outlook
Global equities advanced in the fourth quarter (the MSCI ACWI IMI returned +11.14% for the fourth quarter and +21.58% year-to-date as of December 31, 2023, in USD terms), on speculation that major central banks have sufficiently raised rates to stifle inflation. From a global sector perspective, leading was Information Technology (+17.39% for the fourth quarter and +49.74% year-to-date as of December 31, 2023, as measured by the MSCI ACWI IMI). Alternatively, Energy (-3.00% for the fourth quarter and +5.41% year-to-date as of December 31, 2023, as measured by the MSCI ACWI IMI) lagged during the period. Growth equities outperformed value-oriented equities (the MSCI ACWI IMI Growth returned +12.64% for the fourth quarter and +31.49% year-to-date as of December 31, 2023, while the MSCI ACWI IMI Value returned +9.53% for the fourth quarter and +12.20% year-to-date as of December 31, 2023).
U.S. equities gained during the period (+12.00% for the fourth quarter and +25.64% year-to-date as of December 31, 2023, as measured by the MSCI USA IMI) following a dovish pivot from the Federal Reserve at the December policy meeting. Inflationary pressures continued to ease, and consumer expenditures climbed, showing resilience despite pricing pressure. Importantly, all four major indexes posted gains during the fourth quarter, indicative of broadening market performance, with strength expanding beyond large cap technology that dominated performance for most of the year.
European equities advanced for the fourth quarter (+11.42% for the fourth quarter and +19.52% year-to-date as of December 31, 2023, as measured by the MSCI Europe IMI) similarly fueled on optimism for central bank pivots. Italy and Spain continued their strong performance seen throughout the year (+13.23% for the fourth quarter and +35.86% year-to-date as of December 31, 2023, as measured by MSCI Italy IMI and +12.17% for the fourth quarter and +30.38% year-to-date as of December 31, 2023, as measured by MSCI Spain IMI). Within Germany, PPI data showed signs of disinflation, coming in below expectations and 10-year Bund yield fell below 2%. U.K. equities advanced (+7.73% for the fourth quarter and +14.41% year-to-date as of December 31, 2023, as measured by the MSCI United Kingdom IMI) with the focus on U.K. inflation print which slowed across the board.
Emerging markets posted positive returns (+8.02% for the fourth quarter and +11.67% year-to-date as of December 31, 2023, as measured by the MSCI EM IMI) hindered by continued weakness within China. Chinese equities declined (-4.16% for the fourth quarter and -11.82% year-to-date as of December 31, 2023, as measured by the MSCI China IMI index) amid weaker economic growth and ongoing crisis in the property market. Conversely, Taiwan, Korea, and India were among the top performers within Asia ex-Japan. Latin America returns surged (+17.32% for the fourth quarter and +32.90% year-to-date as of December 31, 2023, as measured by the MSCI EM Latin America IMI), with notable strength from Argentina (+35.68% for the fourth quarter and +65.71% year-to-date as of December 31, 2023, as measured by MSCI Argentina), Brazil (+17.59% for the fourth quarter and +32.64% year-to-date as of December 31, 2023, as measured by MSCI Brazil IMI), and Mexico (+18.54% for the fourth quarter and +41.45% year-to-date as of December 31, 2023, as measured by MSCI Mexico IMI). EMEA lagged (+7.64% for the fourth quarter and +9.03% year-to-date as of December 31, 2023, as measured by the MSCI EM EMEA IMI), despite strong returns from Poland (+36.34% for the fourth quarter and +50.87% year-to-date as of December 31, 2023, as measured by MSCI Poland IMI).
Albeit far from smooth, global markets surpassed expectations in 2023. Growth equities rebounded during the year, led primarily by strength in Information Technology and Communication Services. While markets wrestled with interpretations of inflationary data and central banks’ tone on monetary policy, we believe 2024 is shaping up to be a “normal” expansionary year. Importantly, we believe 2024 may prove to be the very first post-COVID year, with healthy levels of economic growth and inflation, as the economic distortions from the pandemic have normalized. We expect a continuation of broad growth particularly from the U.S., a bit less in Europe, and potential for accelerated strength in Japan.
We believe that inflation post-pandemic was primarily driven by the supply side, following the massive shocks that permeated it in the aftermath of what was a very abrupt medically driven closure of global economies. This in turn led to massive distortions in the supply chains of many goods and increasingly services, resulting in the bouts of inflation that we have experienced: housing in the U.S., energy in Europe, and food prices in Japan, to highlight a few. These supply shocks tend to go away over time as suppliers, companies, and demand adjust. We have been experiencing that in the last several months, and we now believe the lofty levels of inflation are increasingly in the rearview mirror.
We expect developed markets to grow by 2%-plus on a sustainable basis with inflation of 2%-2.5%—a healthy outlook. And while that level of inflation is meaningfully higher than we experienced for the last decade, it should be very manageable and allow central banks to ease monetary policy accordingly. We expect real rates of 1%-1.5% to be sustained eventually.
| 32 | Annual Report | December 31, 2023 |
Global Markets Review and Outlook
With that as a backdrop and as reflected in an economic expansion, we expect accelerating corporate profit growth in most major markets. The U.S. has the highest expected growth of the large developed markets (about 12%), but expectations feel elevated compared to our economic outlook. Japan on the other hand could see further upside to growth expectations (9%) on top of an already strong growth year in 2023, in our view. We believe that Europe should be able to achieve expectations of healthy, albeit lower, profit growth of roughly 6%. Emerging market aggregate earnings growth was negative last year; however, we believe that emerging markets have the potential for the largest rebound in 2024.
Regional valuations are aligned with these growth expectations with the U.S. the highest, above its pre-COVID peak, at 19.3 times next twelve months P/E. This compares to 14.2 times for Japan and 12.7 times for Europe. Emerging markets lag at 11.9 times. Our expectations for realized profit growth versus consensus estimates, combined with these valuation differentials, suggest international markets could be set up for better performance than the U.S.
As we discussed last quarter, Japan continues to be an area where we see potential for acceleration of growth. Government initiatives have been undertaken to increase growth and improve corporate performance. For example, the Tokyo Stock Exchange has been leading reforms by incentivizing all companies trading below their book value to devise a plan to improve capital efficiency; and more recently, the new NISA, Nippon Individual Savings Account, will provide retail investors a tax-exempt investment program beginning in January 2024. These and other developments make us believe that the improvement in Japanese corporate performance can persist and is an area of focus for us.
Within China, the acceleration of economic growth following the abandonment of COVID restrictions failed to materialize compared to what was experienced in many other large economies. While economic growth remains at relatively low levels, we would be remiss to write off China in terms of its future growth potential. For example, automobile exports rose ninefold in just three years. Importantly, more than half of this growth was driven by electric vehicles. We believe that China should continue to close its technological gap in other key areas such as semiconductors, artificial intelligence, quantum computing, material sciences, and healthcare. Government policy and investability issues will remain key to market sentiment.
More broadly, on the back of potentially decreasing interest rates in the U.S. and the likelihood for the dollar to weaken rather than strengthen, we believe international and emerging markets equities are likely beneficiaries. To the extent that we expect growth differentials and interest rate differentials to moderate, the dominance of the dollar should subside, thus paving the way for better international equity performance.
| December 31, 2023 | William Blair Funds | 33 |
| | Global Leaders Fund |
| | |
| | The Global Leaders Fund seeks long-term capital appreciation. |
| | |
| | AN OVERVIEW FROM THE PORTFOLIO MANAGERS |
| | |

Kenneth J. McAtamney 
Hugo Scott-Gall | The William Blair Global Leaders Fund (Class N shares) (the “Fund”) posted a 22.67% increase, net of fees, for the year ended December 31, 2023. By comparison, the Fund’s benchmark index, the MSCI All Country World IMI (net) (the “Index”), increased 21.58%. Outperformance versus the Index was driven by positive selection in the U.S. and Europe, as well as the Communication Services sector including Meta Platforms (“Meta”). Sector allocation effect was positive due to the overweight to Information Technology and underweights in Consumer Staples, Utilities, and Energy. Positive selection effect was broad-based, with the exceptions of Information Technology and Financials, which partially offset relative performance. Regional allocation also detracted from performance, driven by the underweight to the U.S. and overweights to Europe and the U.K. Within the U.S., Watsco and Meta were the primary drivers of relative performance. Watsco is the largest heating, ventilation, and air conditioning (HVAC) and refrigerants distributor in the United States with high network density, great product availability, and strong relationships with over 350,000 contractors and technicians. The company’s fundamental results have driven strong top-line growth and volume improvement while margins improved early in the year on product mix changes following new regulatory efficiency requirements. While we believe the growth outlook remains well underpinned by regulatory tailwinds and support from the Inflation Reduction Act, the position size was trimmed on strong performance. Meta, the leading global social media platform, was the most additive to communication services relative results. The share price outperformance was driven by the company’s continued strong operating momentum as revenue results have accelerated and guidance has exceeded consensus expectations amid improved engagement trends and management’s continued focus on efficiency gains, including artificial intelligence execution and monetization. Positive European stock selection was broad-based, with Ryanair among the largest contributors. Ryanair is the largest low-cost carrier in Europe offering low-fare, no-frills flights primarily catering to leisure travelers. The fare revenue is increasingly supplemented by ancillary revenues from offerings such as checked bag and early boarding fees. The stock appreciated as recent fundamental results exceeded expectations and management increased forward guidance expecting fares prices to increase in the mid-teens in 2024. Additionally, Ryanair’s cost base excluding fuel continues to improve and widen versus its peers as it has capitalized on the opportunities presented by the COVID pandemic, capturing market share and coming out of the crisis with an even-lower and industry-leading cost base in Europe. Within Information Technology, relative performance was partially offset by the omission of certain U.S. technology companies, and the underperformance of Enphase Energy Inc. Enphase produces microinverters (solar), batteries, and electric vehicle chargers for residential consumers. While the company’s first quarter results beat consensus expectations, the weaker-than-expected revenue guidance offered in the second and third quarters raised concerns about the growth outlook in the U.S. residential solar market and weighed on the share price. Within Financials, Adyen was the primary driver of negative selection. Adyen is an international payments company that allows businesses to accept e-commerce, mobile, and point-of-sale payments. It can accept credit cards, debit cards, wire transfers, and real-time bank transfers. During the third quarter, the stock fell after the company reported results that were worse than expected across financial metrics (revenue, earnings, margin). The market was particularly disappointed in the company’s performance in the U.S., which is meant to be a region of growth for the company. Competition has been aggressive on pricing as merchants have focused primarily on cost given the macroeconomic backdrop. At the same time, Adyen’s headcount has increased significantly as the company tries to grow, causing a significant bottom-line miss as well. Near-term fundamentals will be challenged, and the durability of its competitive advantages are in question. We exited the position as a result. Please refer to the Global Markets Review and Outlook relating to the Fund beginning on page 32. |
| 34 | Annual Report | December 31, 2023 |
Global Leaders Fund
Performance Highlights (Unaudited)
Average Annual Total Returns through 12/31/2023
| | | 1 Year | | 3 Year | | 5 Year | | 10 Year |
| Class N | | | 22.67 | % | | | 0.27 | % | | | 11.77 | % | | | 8.36 | % |
| Class I | | | 22.99 | | | | 0.52 | | | | 12.06 | | | | 8.66 | |
| Class R6 | | | 23.13 | | | | 0.58 | | | | 12.12 | | | | 8.73 | |
| MSCI ACW IMI (net) | | | 21.58 | | | | 5.46 | | | | 11.49 | | | | 7.77 | |
Performance cited represents past performance. Past performance does not guarantee future results and current performance may be lower or higher than the data quoted. Results shown are average annual total returns, which assume reinvestment of dividends and capital gains. Investment returns and principal will fluctuate and you may have a gain or loss when you sell shares. For the most current month-end performance information, please call 1-800-742-7272, or visit our Web site at www.williamblairfunds.com. Investing in smaller and medium capitalization companies involves special risks, including higher volatility and lower liquidity. Smaller and medium capitalization stocks are also more sensitive to purchase/sale transactions and changes in the issuer’s financial condition. International investing involves special risk considerations, including currency fluctuations, lower liquidity, economic and political risk. From time to time, the investment adviser may waive fees or reimburse expenses for the Fund. Without these waivers/reimbursements, performance would be lower. Class N shares are not subject to a sales load. Class I shares are not subject to a sales load or distribution (Rule 12b-1) fees. Class R6 shares are not subject to a sales load, distribution (Rule 12b-1) fees, or sub-transfer agent fees.
The performance highlights and graph presented above do not reflect the deduction of taxes that a shareholder would pay on fund distributions or the redemption of fund shares.
The Morgan Stanley Capital International (MSCI) All Country World (ACW) Investable Market Index (IMI) (net) is a free float-adjusted market capitalization weighted index that is designed to measure the equity market of developed and emerging markets. This index approximates the minimum possible dividend reinvestment by deducting for the highest possible withholding tax rates of those markets.
This report identifies the Fund’s investments on December 31, 2023. These holdings are subject to change. Not all stocks in the Fund performed the same, nor is there any guarantee that these stocks will perform as well in the future. Market forecasts provided in this report may not necessarily come to pass.
Sector Diversification (Unaudited)

The sector diversification shown is based on the total long-term securities.
| December 31, 2023 | William Blair Funds | 35 |
Global Leaders Fund
Portfolio of Investments, December 31, 2023 (all dollar amounts in thousands)
| | | | | | | | |
| | | | | | | | |
| | Issuer | | Shares | | | Value | |
| | | | | | | | | | |
| | Common Stocks | | | | | | | | |
| | | | | | | | | | |
| | Western Hemisphere—52.0% | | | | | | | | |
| | Canada—2.6% | | | | | | | | |
| | Canadian Pacific Kansas City Ltd. (Ground transportation) | | | 20,654 | | | $ | 1,633 | |
| * | Lululemon Athletica, Inc. (Textiles, apparel & luxury goods) | | | 2,014 | | | | 1,030 | |
| | | | | | | | | 2,663 | |
| | United States—49.4% | | | | | | | | |
| * | Alphabet, Inc. (Interactive media & services) | | | 26,029 | | | | 3,636 | |
| * | Amazon.com, Inc. (Broadline retail) | | | 18,954 | | | | 2,880 | |
| | Applied Materials, Inc. (Semiconductors & semiconductor equipment) | | | 4,760 | | | | 771 | |
| * | Autodesk, Inc. (Software) | | | 5,992 | | | | 1,459 | |
| | Booz Allen Hamilton Holding Corp. (Professional services) | | | 11,251 | | | | 1,439 | |
| | Chevron Corp. (Oil, gas & consumable fuels) | | | 11,712 | | | | 1,747 | |
| * | Copart, Inc. (Commercial services & supplies) | | | 30,815 | | | | 1,510 | |
| | Crown Holdings, Inc. (Containers & packaging) | | | 15,688 | | | | 1,445 | |
| * | IDEXX Laboratories, Inc. (Health care equipment & supplies) | | | 2,445 | | | | 1,357 | |
| | Intercontinental Exchange, Inc. (Capital markets) | | | 11,442 | | | | 1,470 | |
| * | Intuitive Surgical, Inc. (Health care equipment & supplies) | | | 3,838 | | | | 1,295 | |
| | Mastercard, Inc. (Financial services) | | | 7,980 | | | | 3,404 | |
| * | Meta Platforms, Inc. (Interactive media & services) | | | 7,287 | | | | 2,579 | |
| | Microsoft Corp. (Software) | | | 16,063 | | | | 6,040 | |
| * | Monster Beverage Corp. (Beverages) | | | 17,155 | | | | 988 | |
| | Murphy USA, Inc. (Specialty retail) | | | 4,669 | | | | 1,665 | |
| * | O’Reilly Automotive, Inc. (Specialty retail) | | | 518 | | | | 492 | |
| | Old Dominion Freight Line, Inc. (Ground transportation) | | | 3,730 | | | | 1,512 | |
| | Prologis, Inc. (Industrial REITs) | | | 4,907 | | | | 654 | |
| | Roper Technologies, Inc. (Software) | | | 2,075 | | | | 1,131 | |
| * | Salesforce, Inc. (Software) | | | 6,139 | | | | 1,615 | |
| * | Synopsys, Inc. (Software) | | | 3,700 | | | | 1,905 | |
| | Thermo Fisher Scientific, Inc. (Life sciences tools & services) | | | 1,450 | | | | 770 | |
| * | Ulta Beauty, Inc. (Specialty retail) | | | 4,159 | | | | 2,038 | |
| | UnitedHealth Group, Inc. (Health care providers & services) | | | 4,594 | | | | 2,419 | |
| | Vulcan Materials Co. (Construction materials) | | | 4,679 | | | | 1,062 | |
| | Watsco, Inc. (Trading companies & distributors) | | | 2,326 | | | | 997 | |
| | Zoetis, Inc. (Pharmaceuticals) | | | 6,827 | | | | 1,347 | |
| | | | | | | | | 49,627 | |
| | | | | | | | |
| | | | | | | | |
| | Issuer | | Shares | | | Value | |
| | | | | | | | | | |
| | Common Stocks—(continued) | | | | | | | | |
| | | | | | | | | | |
| | Europe—29.0% | | | | | | | | |
| | Denmark—3.9% | | | | | | | | |
| | DSV AS (Air freight & logistics) | | | 8,509 | | | $ | 1,494 | |
| | Novo Nordisk AS (Pharmaceuticals) | | | 23,730 | | | | 2,453 | |
| | | | | | | | | 3,947 | |
| | France—8.6% | | | | | | | | |
| | Airbus SE (Aerospace & defense) | | | 16,850 | | | | 2,600 | |
| | Dassault Systemes SE (Software) | | | 36,556 | | | | 1,785 | |
| | Hermes International SCA (Textiles, apparel & luxury goods) | | | 775 | | | | 1,642 | |
| | LVMH Moet Hennessy Louis Vuitton SE (Textiles, apparel & luxury goods) | | | 1,540 | | | | 1,247 | |
| | TotalEnergies SE (Oil, gas & consumable fuels) | | | 7,650 | | | | 520 | |
| | Vinci SA (Construction & engineering) | | | 6,953 | | | | 873 | |
| | | | | | | | | 8,667 | |
| | Germany—2.8% | | | | | | | | |
| | Infineon Technologies AG (Semiconductors & semiconductor equipment) | | | 34,294 | | | | 1,431 | |
| | MTU Aero Engines AG (Aerospace & defense) | | | 6,274 | | | | 1,352 | |
| | | | | | | | | 2,783 | |
| | Ireland—5.1% | | | | | | | | |
| * | ICON PLC (Life sciences tools & services)† | | | 2,698 | | | | 764 | |
| | Linde PLC (Chemicals)† | | | 3,460 | | | | 1,421 | |
| * | Ryanair Holdings PLC—ADR (Passenger airlines) | | | 9,241 | | | | 1,232 | |
| | Trane Technologies PLC (Building products)† | | | 6,991 | | | | 1,705 | |
| | | | | | | | | 5,122 | |
| | Italy—0.9% | | | | | | | | |
| | Ferrari NV (Automobiles)† | | | 2,571 | | | | 870 | |
| | Netherlands—1.4% | | | | | | | | |
| | ASML Holding NV (Semiconductors & semiconductor equipment) | | | 1,861 | | | | 1,401 | |
| | Sweden—4.3% | | | | | | | | |
| | Atlas Copco AB (Machinery) | | | 124,179 | | | | 2,137 | |
| | Evolution AB (Hotels, restaurants & leisure) | | | 9,944 | | | | 1,185 | |
| | Indutrade AB (Machinery) | | | 38,213 | | | | 992 | |
| | | | | | | | | 4,314 | |
| | Switzerland—2.0% | | | | | | | | |
| | Partners Group Holding AG (Capital markets) | | | 780 | | | | 1,125 | |
| | Zurich Insurance Group AG (Insurance) | | | 1,643 | | | | 859 | |
| | | | | | | | | 1,984 | |
See accompanying Notes to Financial Statements.
| 36 | Annual Report | December 31, 2023 |
Global Leaders Fund
Portfolio of Investments, December 31, 2023 (all dollar amounts in thousands)
| | | | | | | | |
| | | | | | | | |
| | Issuer | | Shares | | | Value | |
| | | | | | | | | | |
| | Common Stocks—(continued) | | | | | | | | |
| | | | | | | | | | |
| | United Kingdom—8.1% | | | | | | | | |
| | Ashtead Group PLC (Trading companies & distributors) | | | 19,401 | | | $ | 1,351 | |
| | Compass Group PLC (Hotels, restaurants & leisure) | | | 64,681 | | | | 1,769 | |
| | Diageo PLC (Beverages) | | | 26,322 | | | | 958 | |
| | Experian PLC (Professional services) | | | 19,433 | | | | 793 | |
| | Halma PLC (Electronic equipment, instruments & components) | | | 40,898 | | | | 1,191 | |
| | Rentokil Initial PLC (Commercial services & supplies) | | | 194,584 | | | | 1,093 | |
| | Spirax-Sarco Engineering PLC (Machinery) | | | 7,632 | | | | 1,022 | |
| | | | | | | | | 8,177 | |
| | | | | | | | | | |
| | Emerging Asia—6.5% | | | | | | | | |
| | India—2.6% | | | | | | | | |
| | HDFC Bank Ltd.—ADR (Banks) | | | 20,875 | | | | 1,401 | |
| | Reliance Industries Ltd. (Oil, gas & consumable fuels) | | | 39,669 | | | | 1,233 | |
| | | | | | | | | 2,634 | |
| | Taiwan—3.9% | | | | | | | | |
| | MediaTek, Inc. (Semiconductors & semiconductor equipment) | | | 47,000 | | | | 1,554 | |
| | Taiwan Semiconductor Manufacturing Co. Ltd.— ADR (Semiconductors & semiconductor equipment) | | | 22,592 | | | | 2,350 | |
| | | | | | | | | 3,904 | |
| | | | | | | | | | |
| | Japan—1.5% | | | | | | | | |
| | Keyence Corp. (Electronic equipment, instruments & components) | | | 3,400 | | | | 1,498 | |
| | | | | | | | | | |
| | Asia—1.1% | | | | | | | | |
| | Hong Kong—1.1% | | | | | | | | |
| | AIA Group Ltd. (Insurance) | | | 126,000 | | | | 1,098 | |
| | | | | | | | | | |
| | Emerging Latin America—1.0% | | | | | | | | |
| | Brazil—1.0% | | | | | | | | |
| * | MercadoLibre, Inc. (Broadline retail) | | | 613 | | | | 963 | |
| | Total Common Stocks—99.2%
(cost $62,726) | | | | | | | 99,652 | |
| | | | | | | | |
| | Issuer | | Principal
Amount | | | Value | |
| | | | | | | | | | |
| | Repurchase Agreement | | | | | | | | |
| | Fixed Income Clearing Corporation, 2.300% dated 12/29/23, due 01/02/24, repurchase price $526, collateralized by U.S. Treasury Bond, 4.375%, due 05/15/41, valued at $536 | | | $526 | | | $ | 526 | |
| | Total Repurchase Agreement—0.5%
(cost $526) | | | | | | | 526 | |
| | Total Investments—99.7%
(cost $63,252) | | | | | | | 100,178 | |
| | Cash and other assets, less liabilities—0.3% | | | | | | | 277 | |
| | Net assets—100.0% | | | | | | $ | 100,455 | |
ADR = American Depository Receipt
REIT = Real Estate Investment Trust
* = Non-income producing security
† = U.S. listed foreign security
At December 31, 2023, the Fund’s Portfolio of Investments includes the following industry categories (as a percentage of long-term investments):
| Information Technology | | | 24.3 | % |
| Industrials | | | 23.8 | % |
| Consumer Discretionary | | | 15.8 | % |
| Health Care | | | 10.4 | % |
| Financials | | | 9.4 | % |
| Communication Services | | | 6.2 | % |
| Materials | | | 3.9 | % |
| Energy | | | 3.5 | % |
| Consumer Staples | | | 2.0 | % |
| Real Estate | | | 0.7 | % |
| Total | | | 100.0 | % |
At December 31, 2023, the Fund’s Portfolio of Investments includes the following currency categories (as a percentage of long-term investments):
| U.S. Dollar | | | 63.2 | % |
| Euro | | | 12.9 | % |
| British Pound Sterling | | | 8.2 | % |
| Swedish Krona | | | 4.3 | % |
| Danish Krone | | | 4.0 | % |
| Swiss Franc | | | 2.0 | % |
| New Taiwan Dollar | | | 1.6 | % |
| Japanese Yen | | | 1.5 | % |
| Indian Rupee | | | 1.2 | % |
| Hong Kong Dollar | | | 1.1 | % |
| Total | | | 100.0 | % |
See accompanying Notes to Financial Statements.
| December 31, 2023 | William Blair Funds | 37 |
| | International Leaders Fund |
| | |
| | The International Leaders Fund seeks long-term capital appreciation. |
| | |
| | AN OVERVIEW FROM THE PORTFOLIO MANAGERS |
| | |

Simon Fennell Kenneth J. McAtamney 
Alaina Anderson, CFA | The William Blair International Leaders Fund (Class N shares) (the “Fund”) posted a 12.77% increase, net of fees, for the year ended December 31, 2023. By comparison, the Fund’s benchmark index, the MSCI All Country World ex-U.S. IMI (net) (the “Index”), increased 15.62%. Underperformance versus the Index was driven by stock selection on both a sector and regional view. From a sector perspective, allocation effect was positive driven by overweight exposures in Information Technology and Industrials. This was partially offset by negative allocation effect from overweight exposures in Health Care and Consumer Discretionary. Selection effect was negative primarily within Industrials, Information Technology, and Financials, partially offset by positive selection within Materials and Health Care. Within Industrials, Teleperformance and Contemporary Amperex Technology were the primary drivers of underperformance. Teleperformance SE provides outsourced call center and customer relationship management services to enterprise customers globally. The rise of generative artificial intelligence is a direct threat to services provided by Teleperformance and its competitors. Additionally, in the middle of the year Teleperformance announced a proposed cash and stock offer for Majorel, one of its peers in the customer experience provider segment, at a significant premium. This caused short-term weakness in the stock price. Our view is that this acquisition is counter to management’s previously stated mergers and acquisitions strategy given the overlap in business lines and customer base, and we exited the position after the announcement. Contemporary Amperex Technologies (CATL) manufactures batteries primarily for use in electric vehicles (“EV”). After several years of EV sales beating estimates, we believe there will be a slowdown in overall demand, and increased competition. We exited the stock during the fourth quarter. Selection effect was negative within Information Technology in part due to Samsung SDI and Hexagon. Samsung SDI is a South Korea-based EV battery manufacturer. Over the last several years, the growth in EV has beaten most estimates, particularly in China, but we may be in a slower period of growth that could last anywhere from one to three years in our view, and this weighed on the stock. We do not think the slowdown is fully reflected in current estimates for Samsung SDI and exited the position. Hexagon provides technology solutions for geospatial and industrial applications worldwide. The company’s strong portfolio of sensors provides the building blocks for digitalization, while a growing software offering enhances productivity for customers. The negative stock performance was related to a short report by Viceroy accusing Hexagon of aggressive accounting practices, overstating organic growth, and governance concerns. While we believe the allegations in the short report were weak and, in many cases, factually inaccurate, we believe that the response (and actions) from management were subpar and raise questions about corporate governance and management credibility and we therefore exited the position. Within Financials, Adyen was the primary driver of negative selection. Adyen is an international payments company that allows businesses to accept e-commerce, mobile, and point-of-sale payments. It can accept credit cards, debit cards, wire transfers, and real-time bank transfers. During the third quarter, the stock decreased after the company reported results that were worse than expected across financial metrics (revenue, earnings, margin). The market was particularly disappointed in the company’s performance in the U.S., which is meant to be a region of growth for the company. Competition has been aggressive on pricing as merchants have focused primarily on cost given the macro backdrop. At the same time, Adyen’s headcount has increased significantly as the company tries to grow, causing a significant bottom-line miss as well. Near-term fundamentals will be challenged, and the durability of its competitive advantages is in question. We exited the position as a result. |
| 38 | Annual Report | December 31, 2023 |
International Leaders Fund
Positive selection in Materials came from Shin-Etsu Chemical. Shin-Etsu has two core business: polyvinyl chloride (“PVC”) production and semiconductor wafer manufacturing. PVC is a widely used material, but the bulk of demand is for housing/construction-related products such as white PVC pipes seen in home improvement stores. Semiconductor wafers are the base ingredient for computers chips. In our view, Shin-Etsu has a clear scale advantage across its business units, giving it a superior cost advantage relative to its competitors. Manufacturing expertise is its other competitive advantage, with both skill and efficiency leading to overall better products and better corporate results. The stock had a strong fourth quarter as margins have been holding up better than expected and on the positive outlook for the semiconductor industry going forward. Management noted an inflection point in wafer demand, consistent with other segments in the semiconductor value chain.
Novo Nordisk was the primary driver of positive selection within Health Care. The stock rallied this year as the total addressable market for its glucagon-like peptide-1 (“GLP-1”) drugs continued to rise after trials showed positive results in treating diabetes, obesity, and cardiovascular disease. We believe the company will remain a top player in the GLP-1 space well into the 2030s, providing a long runway for growth. We trimmed the position in the fourth quarter on stock price strength.
From a regional perspective, allocation was positive due to an overweight in Europe and underweight in China. Selection effect was negative mostly within China. Following the abandonment of strict COVID policies in China late last year, our belief was that China would see a resurgence in domestic consumer spending, similar to what other countries experienced when they removed COVID restrictions. As such, our exposure within China was exposed to domestic consumption in companies such as Alibaba, Kweichow Moutai, and China Tourism Group Duty Free. However, this consumption story did not unfold as anticipated, and selection effect was negatively impacted.
Please refer to the Global Markets Review and Outlook relating to the Fund beginning on page 32.
| December 31, 2023 | William Blair Funds | 39 |
International Leaders Fund
Performance Highlights (Unaudited)
Average Annual Total Return 12/31/2023
| | | 1 Year | | 3 Year | | 5 Year | | 10 Year |
| Class N | | | 12.77 | % | | | (4.03 | )% | | | 8.00 | % | | | 5.64 | % |
| Class I | | | 13.09 | | | | (3.80 | ) | | | 8.26 | | | | 5.90 | |
| Class R6 | | | 13.20 | | | | (3.74 | ) | | | 8.33 | | | | 5.98 | |
| MSCI ACW ex-U.S. IMI (net) | | | 15.62 | | | | 1.53 | | | | 7.18 | | | | 3.97 | |
Performance cited represents past performance. Past performance does not guarantee future results and current performance may be lower or higher than the data quoted. Results shown are average annual total returns, which assume reinvestment of dividends and capital gains. Investment returns and principal will fluctuate and you may have a gain or loss when you sell shares. For the most current month-end performance information, please call 1-800-742-7272, or visit our Web site at www.williamblairfunds.com. Investing in smaller and medium capitalization companies involves special risks, including higher volatility and lower liquidity. Smaller and medium capitalization stocks are also more sensitive to purchase/sale transactions and changes in the issuer’s financial condition. International investing involves special risk considerations, including currency fluctuations, lower liquidity, economic and political risk. From time to time the investment adviser may waive fees or reimburse expenses for the Fund. Without these waivers/reimbursements, performance would be lower. Class N shares are not subject to a sales load. Class I shares are not subject to a sales load or distribution (Rule 12b-1) fees. Class R6 shares are not subject to a sales load, distribution (Rule 12b-1) fees, or sub-transfer agent fees.
The performance highlights presented above do not reflect the deduction of taxes that a shareholder would pay on fund distributions or the redemption of fund shares.
The Morgan Stanley Capital International (MSCI) All Country World (ACW) ex-U.S. Investable Market Index (IMI) (net) is a free float-adjusted market capitalization weighted index that is designed to measure the equity market performance of developed and emerging markets, excluding the United States. This index approximates the minimum possible dividend reinvestment by deducting for the highest possible withholding tax rates of those markets.
This report identifies the Fund’s investments on December 31, 2023. These holdings are subject to change. Not all stocks in the Fund performed the same, nor is there any guarantee that these stocks will perform as well in the future. Market forecasts provided in this report may not necessarily come to pass.
Sector Diversification (Unaudited)

The sector diversification shown is based on the total long-term securities.
| 40 | Annual Report | December 31, 2023 |
International Leaders Fund
Portfolio of Investments, December 31, 2023 (all dollar amounts in thousands)
| | | | | | | | |
| | | | | | | | |
| | Issuer | | Shares | | | Value | |
| | | | | | | | | | |
| | Common Stocks | | | | | | | | |
| | | | | | | | | | |
| | Europe—46.3% | | | | | | | | |
| | Denmark—4.2% | | | | | | | | |
| | DSV AS (Air freight & logistics) | | | 83,281 | | | $ | 14,621 | |
| | Novo Nordisk AS (Pharmaceuticals) | | | 300,047 | | | | 31,019 | |
| | | | | | | | | 45,640 | |
| | France—15.5% | | | | | | | | |
| | Airbus SE (Aerospace & defense) | | | 133,743 | | | | 20,638 | |
| | Capgemini SE (IT services) | | | 67,121 | | | | 13,986 | |
| | Dassault Systemes SE (Software) | | | 389,964 | | | | 19,043 | |
| | L’Oreal SA (Personal care products) | | | 44,364 | | | | 22,071 | |
| | LVMH Moet Hennessy Louis Vuitton SE (Textiles, apparel & luxury goods) | | | 19,916 | | | | 16,129 | |
| | Safran SA (Aerospace & defense) | | | 102,374 | | | | 18,021 | |
| | Schneider Electric SE (Electrical equipment) | | | 90,552 | | | | 18,172 | |
| | Thales SA (Aerospace & defense) | | | 64,367 | | | | 9,518 | |
| | TotalEnergies SE (Oil, gas & consumable fuels) | | | 189,158 | | | | 12,863 | |
| | Vinci SA (Construction & engineering) | | | 144,580 | | | | 18,148 | |
| | | | | | | | | 168,589 | |
| | Germany—1.8% | | | | | | | | |
| | Infineon Technologies AG (Semiconductors & semiconductor equipment) | | | 455,911 | | | | 19,025 | |
| | Ireland—6.5% | | | | | | | | |
| | CRH PLC (Construction materials)† | | | 194,811 | | | | 13,473 | |
| * | ICON PLC (Life sciences tools & services)† | | | 83,333 | | | | 23,589 | |
| | Kingspan Group PLC (Building products) | | | 159,170 | | | | 13,776 | |
| | Linde PLC (Chemicals)† | | | 47,526 | | | | 19,520 | |
| | | | | | | | | 70,358 | |
| | Italy—2.3% | | | | | | | | |
| | Ferrari NV (Automobiles)† | | | 41,135 | | | | 13,921 | |
| | Moncler SpA (Textiles, apparel & luxury goods) | | | 176,613 | | | | 10,860 | |
| | | | | | | | | 24,781 | |
| | Netherlands—4.4% | | | | | | | | |
| | ASML Holding NV (Semiconductors & semiconductor equipment) | | | 44,874 | | | | 33,770 | |
| | BE Semiconductor Industries NV (Semiconductors & semiconductor equipment) | | | 91,353 | | | | 13,761 | |
| | | | | | | | | 47,531 | |
| | Spain—4.1% | | | | | | | | |
| | Amadeus IT Group SA (Hotels, restaurants & leisure) | | | 300,113 | | | | 21,495 | |
| | Industria de Diseno Textil SA (Specialty retail) | | | 527,048 | | | | 22,942 | |
| | | | | | | | | 44,437 | |
| | Sweden—3.6% | | | | | | | | |
| | Atlas Copco AB (Machinery) | | | 1,376,517 | | | | 23,686 | |
| | Evolution AB (Hotels, restaurants & leisure) | | | 127,471 | | | | 15,194 | |
| | | | | | | | | 38,880 | |
| | | | | | | | |
| | | | | | | | |
| | Issuer | | Shares | | | Value | |
| | | | | | | | | | |
| | Common Stocks—(continued) | | | | | | | | |
| | | | | | | | | | |
| | Europe—(continued) | | | | | | | | |
| | Switzerland—3.9% | | | | | | | | |
| | Partners Group Holding AG (Capital markets) | | | 8,815 | | | $ | 12,714 | |
| | Straumann Holding AG (Health care equipment & supplies) | | | 81,890 | | | | 13,203 | |
| | Zurich Insurance Group AG (Insurance) | | | 31,473 | | | | 16,450 | |
| | | | | | | | | 42,367 | |
| | | | | | | | | | |
| | United Kingdom—13.4% | | | | | | | | |
| | Ashtead Group PLC (Trading companies & distributors) | | | 238,558 | | | | 16,609 | |
| | AstraZeneca PLC (Pharmaceuticals) | | | 177,174 | | | | 23,939 | |
| | BAE Systems PLC (Aerospace & defense) | | | 273,150 | | | | 3,866 | |
| | Compass Group PLC (Hotels, restaurants & leisure) | | | 824,099 | | | | 22,542 | |
| | Experian PLC (Professional services) | | | 435,113 | | | | 17,759 | |
| | Haleon PLC (Personal care products) | | | 1,301,687 | | | | 5,337 | |
| | Halma PLC (Electronic equipment, instruments & components) | | | 378,873 | | | | 11,030 | |
| | London Stock Exchange Group PLC (Capital markets) | | | 205,008 | | | | 24,234 | |
| | Rentokil Initial PLC (Commercial services & supplies) | | | 1,651,404 | | | | 9,279 | |
| | Spirax-Sarco Engineering PLC (Machinery) | | | 75,961 | | | | 10,171 | |
| | | | | | | | | 144,766 | |
| | | | | | | | | | |
| | Emerging Asia—13.1% | | | | | | | | |
| | China—2.3% | | | | | | | | |
| | Kweichow Moutai Co. Ltd. (Beverages) | | | 61,271 | | | | 14,841 | |
| * | PDD Holdings, Inc.—ADR (Broadline retail) | | | 69,482 | | | | 10,166 | |
| | | | | | | | | 25,007 | |
| | India—5.8% | | | | | | | | |
| | HDFC Bank Ltd. (Banks) | | | 1,050,885 | | | | 21,578 | |
| | Infosys Ltd. (IT services) | | | 737,827 | | | | 13,678 | |
| | Reliance Industries Ltd. (Oil, gas & consumable fuels) | | | 886,120 | | | | 27,548 | |
| | | | | | | | | 62,804 | |
| | Taiwan—5.0% | | | | | | | | |
| | MediaTek, Inc. (Semiconductors & semiconductor equipment) | | | 542,000 | | | | 17,925 | |
| | Taiwan Semiconductor Manufacturing Co. Ltd. (Semiconductors & semiconductor equipment) | | | 1,850,000 | | | | 35,746 | |
| | | | | | | | | 53,671 | |
| | | | | | | | | | |
| | Japan—12.1% | | | | | | | | |
| | Daiichi Sankyo Co. Ltd. (Pharmaceuticals) | | | 448,400 | | | | 12,314 | |
| | Hoya Corp. (Health care equipment & supplies) | | | 204,100 | | | | 25,513 | |
| | ITOCHU Corp. (Trading companies & distributors) | | | 132,500 | | | | 5,419 | |
| | Keyence Corp. (Electronic equipment, instruments & components) | | | 34,500 | | | | 15,200 | |
See accompanying Notes to Financial Statements.
| December 31, 2023 | William Blair Funds | 41 |
International Leaders Fund
Portfolio of Investments, December 31, 2023 (all dollar amounts in thousands)
| | | | | | | | |
| | | | | | | | |
| | Issuer | | Shares | | | Value | |
| | | | | | | | | | |
| | Common Stocks—(continued) | | | | | | | | |
| | | | | | | | | | |
| | Japan—(continued) | | | | | | | | |
| | Lasertec Corp. (Semiconductors & semiconductor equipment) | | | 43,200 | | | $ | 11,388 | |
| | Mitsui & Co. Ltd. (Trading companies & distributors) | | | 134,300 | | | | 5,046 | |
| | Shin-Etsu Chemical Co. Ltd. (Chemicals) | | | 669,500 | | | | 28,095 | |
| | SMC Corp. (Machinery) | | | 9,700 | | | | 5,212 | |
| | Tokyo Electron Ltd. (Semiconductors & semiconductor equipment) | | | 128,300 | | | | 22,980 | |
| | | | | | | | | 131,167 | |
| | | | | | | | | | |
| | Canada—9.5% | | | | | | | | |
| | Canadian Pacific Kansas City Ltd. (Ground transportation) | | | 262,121 | | | | 20,723 | |
| | Constellation Software, Inc. (Software) | | | 4,584 | | | | 11,365 | |
| | Dollarama, Inc. (Broadline retail) | | | 305,789 | | | | 22,037 | |
| | Intact Financial Corp. (Insurance) | | | 91,362 | | | | 14,056 | |
| * | Lululemon Athletica, Inc. (Textiles, apparel & luxury goods) | | | 42,461 | | | | 21,710 | |
| | Toronto-Dominion Bank (Banks) | | | 201,753 | | | | 13,037 | |
| | | | | | | | | 102,928 | |
| | | | | | | | | | |
| | Emerging Latin America—2.4% | | | | | | | | |
| | Brazil—2.4% | | | | | | | | |
| | B3 SA - Brasil Bolsa Balcao (Capital markets) | | | 2,816,200 | | | | 8,435 | |
| * | MercadoLibre, Inc. (Broadline retail) | | | 11,538 | | | | 18,133 | |
| | | | | | | | | 26,568 | |
| | | | | | | | | | |
| | Asia—1.1% | | | | | | | | |
| | Hong Kong—1.1% | | | | | | | | |
| | AIA Group Ltd. (Insurance) | | | 1,417,600 | | | | 12,354 | |
| | Total Common Stocks—97.9%
(cost $809,515) | | | | | | | 1,060,873 | |
| | | | | | | | |
| | Issuer | | Principal
Amount | | | Value | |
| | | | | | | | | | |
| | Repurchase Agreement | | | | | | | | |
| | Fixed Income Clearing Corporation, 2.300% dated 12/29/23, due 01/02/24, repurchase price $24,321, collateralized by U.S. Treasury Note, 3.875%, due 12/31/2027 and U.S. Treasury Bond, 4.375%, due 05/15/2041, valued at $24,801 | | | $24,314 | | | $ | 24,314 | |
| | Total Repurchase Agreement—2.2%
(cost $24,314) | | | | | | | 24,314 | |
| | Total Investments—100.1%
(cost $833,829) | | | | | | | 1,085,187 | |
| | Liabilities, plus cash and other assets—(0.1)% | | | | | | | (1,251 | ) |
| | Net assets—100.0% | | | | | | $ | 1,083,936 | |
ADR = American Depository Receipt
† = U.S. listed foreign security
* = Non-income producing security
At December 31, 2023, the Fund’s Portfolio of Investments includes the following industry categories (as a percentage of long-term investments):
| Information Technology | | | 22.5 | % |
| Industrials | | | 21.7 | % |
| Consumer Discretionary | | | 18.4 | % |
| Health Care | | | 12.2 | % |
| Financials | | | 11.6 | % |
| Materials | | | 5.8 | % |
| Consumer Staples | | | 4.0 | % |
| Energy | | | 3.8 | % |
| Total | | | 100.0 | % |
At December 31, 2023, the Fund’s Portfolio of Investments includes the following currency categories (as a percentage of long-term investments):
| Euro | | | 28.7 | % |
| British Pound Sterling | | | 13.6 | % |
| U.S. Dollar | | | 13.3 | % |
| Japanese Yen | | | 12.4 | % |
| Indian Rupee | | | 5.9 | % |
| Canadian Dollar | | | 5.7 | % |
| New Taiwan Dollar | | | 5.0 | % |
| Danish Krone | | | 4.3 | % |
| Swiss Franc | | | 4.0 | % |
| Swedish Krona | | | 3.7 | % |
| Chinese Yuan Renminbi | | | 1.4 | % |
| Hong Kong Dollar | | | 1.2 | % |
| All Other Currencies | | | 0.8 | % |
| Total | | | 100.0 | % |
See accompanying Notes to Financial Statements.
| 42 | Annual Report | December 31, 2023 |
| | International Growth Fund |
| | |
| | The International Growth Fund seeks long-term capital appreciation. |
| | |
| | AN OVERVIEW FROM THE PORTFOLIO MANAGERS |
| | |

Simon Fennell 
Kenneth J. McAtamney 
Andrew Siepker, CFA | The William Blair International Growth Fund (Class N shares) (the “Fund”) posted a 15.12% increase, net of fees, for the year ended December 31, 2023. By comparison, the Fund’s benchmark index, the MSCI All Country World ex-U.S. IMI (net) (the “Index”), increased 15.62%. For the full year, the strategy slightly underperformed its Index. From a sector perspective, allocation effect was positive driven by overweight exposures to Information Technology and Industrials. Stock selection effect was negative, largely due to negative selection within Industrials and Financials. This was offset by positive selection within Consumer Discretionary and Materials. Industrials selection was negatively impacted by Teleperformance and Rentokil. Teleperformance provides outsourced call center and client relationship management services to enterprise customers globally. The rise of generative artificial intelligence is a direct threat to services provided by Teleperformance and its competitors. Additionally, in the middle of the year Teleperformance announced a proposed cash and stock offer for Majorel, one of its peers in the customer experience provider segment, at a significant premium. Our view is that this acquisition is counter to management’s previously stated mergers and acquisitions strategy given the overlap in business lines and customer base, and we exited the position after the announcement. Rentokil is a U.K.-based pest control company with operations in over 60 countries. After a period of acquisitions, Rentokil is undergoing a transformation from a collection of independent businesses into one unified company focused on operating results. Its integration of Terminix in the U.S. is on track to deliver its cost synergy guidance of $60 million per year. While recent results were in line with expectations, the company noted softer demand in the U.S. than previously anticipated, impacting its full-year outlook and weighing on the stock. Within Financials, AIA Group and Adyen were the primary drivers of underperformance. AIA is a leading insurer offering life insurance, accident and health insurance, and wealth management services and is solely focused on Asia. AIA’s competitive advantages are business process, brand distinction and culture, and its strong agency force. We believe the company will benefit from strong growth in the region and higher penetration rates as incomes rise. While fundamentals were resilient, the stock underperformed given its exposure to Chinese growth, which disappointed throughout the year. Adyen is an international payments company that allows businesses to accept e-commerce, mobile, and point-of-sale payments. It can accept credit cards, debit cards, wire transfers, and real-time bank transfers. During the third quarter, the stock decreased after the company reported results that were worse than expected across financial metrics (revenue, earnings, margin). The market was particularly disappointed in the company’s performance in the U.S., which is meant to be a region of growth for the company. Competition has been aggressive on pricing as merchants have focused primarily on cost given the macroeconomic backdrop. At the same time, Adyen’s headcount has increased significantly as the company tries to grow, causing a significant bottom-line miss as well. Near-term fundamentals will be challenged, and the durability of its competitive advantages are in question. We exited the position as a result. Positive selection in Consumer Discretionary was driven by positions in Lululemon and MercadoLibre. Lululemon, an athleisure apparel company, has one of the more attractive business models in the Consumer Discretionary sector, in our view, based on its premium-priced athletic apparel, vertically integrated manufacturing/retail/e-commerce strategy, |
| December 31, 2023 | William Blair Funds | 43 |
International Growth Fund
differentiated grassroots marketing approach, and highly productive small-store format. The stock benefitted from results that beat expectations as well as stronger-than-anticipated economic growth in the U.S. The position was trimmed during the fourth quarter after the recent move in the stock price and an increasing valuation.
MercadoLibre is the leading e-commerce platform in Latin America that has a best-in-class ecosystem of services such as logistics and payments, allowing the company to exploit attractive growth opportunities of the large and underpenetrated total addressable market. Latin America was one of the best performing regions in 2023 as many countries began to ease interest rates amid decreasing inflation rates. Results throughout the year were better than expected with revenue growth accelerating and margins expanding.
Shin-Etsu Chemical helped drive positive selection in Materials. Shin-Etsu has two core businesses: polyvinyl chloride (“PVC”) production and semiconductor wafer manufacturing. PVC is a widely used material, but the bulk of demand is for housing/construction-related products such as white PVC pipes seen in home improvement stores. Semiconductor wafers are the base ingredient for computers chips. In our view, Shin-Etsu has a clear scale advantage across its business units, giving it a superior cost advantage relative to its competitors. Manufacturing expertise is its other competitive advantage, with both skill and efficiency leading to overall better products and better corporate results. The stock had a strong fourth quarter as margins have been holding up better-than-expected and on the positive outlook for the semiconductor industry going forward. Management noted an inflection point in wafer demand, consistent with other segments in the semiconductor value chain.
Please refer to the Global Markets Review and Outlook relating to the Fund beginning on page 32.
| 44 | Annual Report | December 31, 2023 |
International Growth Fund
Performance Highlights (Unaudited)
| Average Annual Total Returns through 12/31/2023 |
| | | 1 Year | | 3 Year | | 5 Year | | 10 Year | | Since
Inception(a) |
| Class N | | | 15.12 | % | | | (3.65 | )% | | | 8.93 | % | | | 4.29 | % | | | — | % |
| Class I | | | 15.38 | | | | (3.40 | ) | | | 9.23 | | | | 4.60 | | | | — | |
| Class R6 | | | 15.47 | | | | (3.34 | ) | | | — | | | | — | | | | 6.36 | |
| MSCI ACW ex-U.S. IMI (net) | | | 15.62 | | | | 1.53 | | | | 7.18 | | | | 3.97 | | | | 4.86 | |
| (a) | Since inception is for the period from May 2, 2019 (Commencement of Operations) to December 31, 2023. |
Performance cited represents past performance. Past performance does not guarantee future results and current performance may be lower or higher than the data quoted. Results shown are average annual total returns, which assume reinvestment of dividends and capital gains. Investment returns and principal will fluctuate and you may have a gain or loss when you sell shares. For the most current month-end performance information, please call 1-800-742-7272, or visit our Web site at www.williamblairfunds.com. Investing in smaller and medium capitalization companies involves special risks, including higher volatility and lower liquidity. Smaller and medium capitalization stocks are also more sensitive to purchase/sale transactions and changes in the issuer’s financial condition. International investing involves special risk considerations, including currency fluctuations, lower liquidity, economic and political risk. From time to time, the investment adviser may waive fees or reimburse expenses for the Fund. Without these waivers/reimbursements, performance would be lower. Class N shares are not subject to a sales load. Class I shares are not subject to a sales load or distribution (Rule 12b-1) fees. Class R6 shares are not subject to a sales load, distribution (Rule 12b-1) fees, or sub-transfer agent fees.
The performance highlights and graph presented above do not reflect the deduction of taxes that a shareholder would pay on fund distributions or the redemption of fund shares.
The Morgan Stanley Capital International (MSCI) All Country World (ACW) ex-U.S. Investable Market Index (IMI) (net) is a free float-adjusted market capitalization weighted index that is designed to measure the equity market performance of developed and emerging markets, excluding the United States. This index approximates the minimum possible dividend reinvestment by deducting for the highest possible withholding tax rates of those markets.
This report identifies the Fund’s investments on December 31, 2023. These holdings are subject to change. Not all stocks in the Fund performed the same, nor is there any guarantee that these stocks will perform as well in the future. Market forecasts provided in this report may not necessarily come to pass.
Sector Diversification (Unaudited)
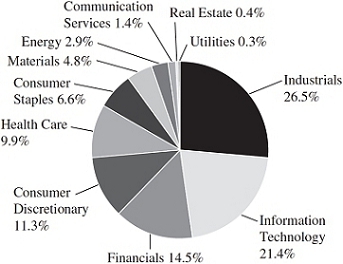
The sector diversification shown is based on the total long-term securities.
| December 31, 2023 | William Blair Funds | 45 |
International Growth Fund
Portfolio of Investments, December 31, 2023 (all dollar amounts in thousands)
| | | | | | | | |
| | | | | | | | |
| | Issuer | | Shares | | | Value | |
| | | | | | | | | | |
| | Common Stocks | | | | | | | | |
| | | | | | | | | | |
| | Europe, Mid-East—38.3% | | | | | | | | |
| | Belgium—0.2% | | | | | | | | |
| | Warehouses De Pauw CVA (Industrial REITs) | | | 74,281 | | | $ | 2,337 | |
| | Denmark—2.9% | | | | | | | | |
| | DSV AS (Air freight & logistics) | | | 75,581 | | | | 13,269 | |
| | Novo Nordisk AS (Pharmaceuticals) | | | 273,723 | | | | 28,298 | |
| | | | | | | | | 41,567 | |
| | Finland—0.3% | | | | | | | | |
| | Metso OYJ (Machinery) | | | 229,193 | | | | 2,320 | |
| | Valmet OYJ (Machinery) | | | 73,288 | | | | 2,113 | |
| | | | | | | | | 4,433 | |
| | France—11.4% | | | | | | | | |
| | Airbus SE (Aerospace & defense) | | | 130,491 | | | | 20,136 | |
| | Capgemini SE (IT services) | | | 44,527 | | | | 9,278 | |
| | Dassault Systemes SE (Software) | | | 406,764 | | | | 19,864 | |
| | Hermes International SCA (Textiles, apparel & luxury goods) | | | 5,513 | | | | 11,678 | |
| | L’Oreal SA (Personal care products) | | | 27,214 | | | | 13,539 | |
| | LVMH Moet Hennessy Louis Vuitton SE (Textiles, apparel & luxury goods) | | | 15,852 | | | | 12,838 | |
| | Publicis Groupe SA (Media) | | | 94,607 | | | | 8,773 | |
| | Safran SA (Aerospace & defense) | | | 97,668 | | | | 17,193 | |
| | SEB SA (Household durables) | | | 18,503 | | | | 2,308 | |
| * | SES-imagotag SA (Electronic equipment, instruments & components) | | | 16,413 | | | | 2,460 | |
| | Thales SA (Aerospace & defense) | | | 99,755 | | | | 14,751 | |
| | TotalEnergies SE (Oil, gas & consumable fuels) | | | 244,504 | | | | 16,627 | |
| | Vinci SA (Construction & engineering) | | | 110,379 | | | | 13,855 | |
| | | | | | | | | 163,300 | |
| | Germany—3.0% | | | | | | | | |
| | CTS Eventim AG & Co. KGaA (Entertainment) | | | 84,956 | | | | 5,871 | |
| | Hannover Rueck SE (Insurance) | | | 41,826 | | | | 9,987 | |
| | Infineon Technologies AG (Semiconductors & semiconductor equipment) | | | 246,817 | | | | 10,299 | |
| | MTU Aero Engines AG (Aerospace & defense) | | | 52,411 | | | | 11,297 | |
| | Nemetschek SE (Software) | | | 35,627 | | | | 3,087 | |
| | Siltronic AG (Semiconductors & semiconductor equipment) | | | 21,686 | | | | 2,118 | |
| | | | | | | | | 42,659 | |
| | Ireland—4.7% | | | | | | | | |
| | CRH PLC (Construction materials)† | | | 109,010 | | | | 7,539 | |
| * | ICON PLC (Life sciences tools & services)† | | | 48,662 | | | | 13,775 | |
| | Kingspan Group PLC (Building products) | | | 185,029 | | | | 16,014 | |
| | Linde PLC (Chemicals)† | | | 40,166 | | | | 16,497 | |
| * | Ryanair Holdings PLC—ADR (Passenger airlines) | | | 96,512 | | | | 12,871 | |
| | | | | | | | | 66,696 | |
| | | | | | | | |
| | | | | | | | |
| | Issuer | | Shares | | | Value | |
| | | | | | | | | | |
| | Common Stocks—(continued) | | | | | | | | |
| | | | | | | | | | |
| | Europe, Mid-East—(continued) | | | | | | | | |
| | Israel—0.3% | | | | | | | | |
| * | Nice Ltd.—ADR (Software) | | | 24,931 | | | $ | 4,974 | |
| | Italy—1.7% | | | | | | | | |
| | Azimut Holding SpA (Capital markets) | | | 82,531 | | | | 2,154 | |
| | Brembo SpA (Automobile components) | | | 128,528 | | | | 1,575 | |
| | Brunello Cucinelli SpA (Textiles, apparel & luxury goods) | | | 53,468 | | | | 5,230 | |
| | Ferrari NV (Automobiles)† | | | 26,222 | | | | 8,874 | |
| | Moncler SpA (Textiles, apparel & luxury goods) | | | 76,325 | | | | 4,693 | |
| | Stevanato Group SpA (Life sciences tools & services)† | | | 62,566 | | | | 1,707 | |
| | | | | | | | | 24,233 | |
| | Netherlands—3.1% | | | | | | | | |
| | ASML Holding NV (Semiconductors & semiconductor equipment) | | | 36,914 | | | | 27,780 | |
| | BE Semiconductor Industries NV (Semiconductors & semiconductor equipment) | | | 53,115 | | | | 8,001 | |
| | IMCD NV (Trading companies & distributors) | | | 35,752 | | | | 6,218 | |
| | JDE Peet’s NV (Food products) | | | 84,573 | | | | 2,275 | |
| | | | | | | | | 44,274 | |
| | Norway—0.4% | | | | | | | | |
| * | AutoStore Holdings Ltd. (Machinery) | | | 1,378,971 | | | | 2,712 | |
| | Gjensidige Forsikring ASA (Insurance) | | | 132,409 | | | | 2,443 | |
| | | | | | | | | 5,155 | |
| | Spain—1.5% | | | | | | | | |
| | Amadeus IT Group SA (Hotels, restaurants & leisure) | | | 155,112 | | | | 11,110 | |
| | Industria de Diseno Textil SA (Specialty retail) | | | 251,296 | | | | 10,938 | |
| | | | | | | | | 22,048 | |
| | Sweden—4.2% | | | | | | | | |
| | Atlas Copco AB (Machinery) | | | 812,737 | | | | 13,985 | |
| | Beijer Ref AB (Trading companies & distributors) | | | 362,785 | | | | 4,852 | |
| | Evolution AB (Hotels, restaurants & leisure) | | | 90,735 | | | | 10,815 | |
| | Fortnox AB (Software) | | | 402,438 | | | | 2,405 | |
| | Hemnet Group AB (Interactive media & services) | | | 125,219 | | | | 2,997 | |
| | Hexagon AB (Electronic equipment, instruments & components) | | | 738,094 | | | | 8,851 | |
| | Indutrade AB (Machinery) | | | 213,592 | | | | 5,544 | |
| | Lifco AB (Industrial conglomerates) | | | 209,408 | | | | 5,133 | |
| | Nibe Industrier AB (Building products) | | | 477,052 | | | | 3,349 | |
| | Sweco AB (Construction & engineering) | | | 158,888 | | | | 2,128 | |
| | | | | | | | | 60,059 | |
See accompanying Notes to Financial Statements.
| 46 | Annual Report | December 31, 2023 |
International Growth Fund
Portfolio of Investments, December 31, 2023 (all dollar amounts in thousands)
| | | | | | | | |
| | | | | | | | |
| | Issuer | | Shares | | | Value | |
| | | | | | | | | | |
| | Common Stocks—(continued) | | | | | | | | |
| | | | | | | | | | |
| | Europe, Mid-East—(continued) | | | | | | | | |
| | Switzerland—4.6% | | | | | | | | |
| | Belimo Holding AG (Building products) | | | 6,747 | | | $ | 3,721 | |
| | Galenica AG (Health care providers & services) | | | 44,717 | | | | 3,868 | |
| | Partners Group Holding AG (Capital markets) | | | 4,471 | | | | 6,448 | |
| | Siegfried Holding AG (Life sciences tools & services) | | | 3,641 | | | | 3,721 | |
| | SIG Group AG (Containers & packaging) | | | 247,898 | | | | 5,703 | |
| | Sika AG (Chemicals) | | | 36,317 | | | | 11,818 | |
| | Straumann Holding AG (Health care equipment & supplies) | | | 39,060 | | | | 6,298 | |
| | Tecan Group AG (Life sciences tools & services) | | | 12,114 | | | | 4,946 | |
| | VAT Group AG (Machinery) | | | 16,849 | | | | 8,444 | |
| | Zurich Insurance Group AG (Insurance) | | | 22,292 | | | | 11,652 | |
| | | | | | | | | 66,619 | |
| | Japan—15.9% | | | | | | | | |
| | Ajinomoto Co., Inc. (Food products) | | | 166,000 | | | | 6,405 | |
| | BayCurrent Consulting, Inc. (Professional services) | | | 80,300 | | | | 2,820 | |
| | Chugai Pharmaceutical Co. Ltd. (Pharmaceuticals) | | | 302,300 | | | | 11,453 | |
| | Daiichi Sankyo Co. Ltd. (Pharmaceuticals) | | | 371,300 | | | | 10,196 | |
| | Daikin Industries Ltd. (Building products) | | | 38,800 | | | | 6,325 | |
| | Disco Corp. (Semiconductors & semiconductor equipment) | | | 31,400 | | | | 7,790 | |
| | Harmonic Drive Systems, Inc. (Machinery) | | | 99,200 | | | | 2,927 | |
| | Hoya Corp. (Health care equipment & supplies) | | | 120,900 | | | | 15,112 | |
| | Internet Initiative Japan, Inc. (Diversified telecommunication services) | | | 81,300 | | | | 1,663 | |
| | ITOCHU Corp. (Trading companies & distributors) | | | 172,400 | | | | 7,051 | |
| | Japan Elevator Service Holdings Co. Ltd. (Commercial services & supplies) | | | 133,000 | | | | 2,205 | |
| | Japan Exchange Group, Inc. (Capital markets) | | | 404,500 | | | | 8,558 | |
| | Keyence Corp. (Electronic equipment, instruments & components) | | | 45,800 | | | | 20,178 | |
| | Lasertec Corp. (Semiconductors & semiconductor equipment) | | | 35,100 | | | | 9,253 | |
| | MatsukiyoCocokara & Co. (Consumer staples distribution & retail) | | | 231,300 | | | | 4,096 | |
| | Mitsui & Co. Ltd. (Trading companies & distributors) | | | 173,700 | | | | 6,527 | |
| | MonotaRO Co. Ltd. (Trading companies & distributors) | | | 370,200 | | | | 4,042 | |
| | Nomura Research Institute Ltd. (IT services) | | | 61,600 | | | | 1,792 | |
| | | | | | | | |
| | | | | | | | |
| | Issuer | | Shares | | | Value | |
| | | | | | | | | | |
| | Common Stocks—(continued) | | | | | | | | |
| | | | | | | | | | |
| | Japan—(continued) | | | | | | | | |
| | Pan Pacific International Holdings Corp. (Broadline retail) | | | 459,300 | | | $ | 10,958 | |
| | Rakus Co. Ltd. (Software) | | | 140,400 | | | | 2,601 | |
| | SCREEN Holdings Co. Ltd. (Semiconductors & semiconductor equipment) | | | 49,500 | | | | 4,188 | |
| * | SHIFT, Inc. (IT services) | | | 14,100 | | | | 3,582 | |
| | Shin-Etsu Chemical Co. Ltd. (Chemicals) | | | 380,000 | | | | 15,947 | |
| | SMC Corp. (Machinery) | | | 8,000 | | | | 4,298 | |
| | SMS Co. Ltd. (Professional services) | | | 64,600 | | | | 1,328 | |
| | Sumitomo Mitsui Financial Group, Inc. (Banks) | | | 312,500 | | | | 15,248 | |
| | Sundrug Co. Ltd. (Consumer staples distribution & retail) | | | 90,100 | | | | 2,896 | |
| | TechnoPro Holdings, Inc. (Professional services) | | | 165,700 | | | | 4,366 | |
| | TIS, Inc. (IT services) | | | 149,900 | | | | 3,303 | |
| | Tokio Marine Holdings, Inc. (Insurance) | | | 529,800 | | | | 13,260 | |
| | Tokyo Electron Ltd. (Semiconductors & semiconductor equipment) | | | 74,100 | | | | 13,272 | |
| | Tsuruha Holdings, Inc. (Consumer staples distribution & retail) | | | 41,200 | | | | 3,777 | |
| | | | | | | | | 227,417 | |
| | Emerging Asia—14.2% | | | | | | | | |
| | China—0.9% | | | | | | | | |
| | Airtac International Group (Machinery) | | | 94,713 | | | | 3,117 | |
| | Kweichow Moutai Co. Ltd. (Beverages) | | | 37,599 | | | | 9,107 | |
| | | | | | | | | 12,224 | |
| | India—5.7% | | | | | | | | |
| | Apollo Hospitals Enterprise Ltd. (Health care providers & services) | | | 44,917 | | | | 3,081 | |
| | Asian Paints Ltd. (Chemicals) | | | 137,161 | | | | 5,596 | |
| | Britannia Industries Ltd. (Food products) | | | 47,137 | | | | 3,025 | |
| | Havells India Ltd. (Electrical equipment) | | | 212,661 | | | | 3,496 | |
| | HDFC Bank Ltd. (Banks) | | | 819,606 | | | | 16,829 | |
| | Infosys Ltd. (IT services) | | | 347,710 | | | | 6,446 | |
| * | InterGlobe Aviation Ltd. (Passenger airlines) | | | 106,203 | | | | 3,771 | |
| | Mahindra & Mahindra Ltd. (Automobiles) | | | 266,906 | | | | 5,533 | |
| | Max Healthcare Institute Ltd. (Health care providers & services) | | | 325,904 | | | | 2,687 | |
| | Nestle India Ltd. (Food products) | | | 7,484 | | | | 2,396 | |
| | Reliance Industries Ltd. (Oil, gas & consumable fuels) | | | 596,597 | | | | 18,547 | |
| | Titan Co. Ltd. (Textiles, apparel & luxury goods) | | | 91,644 | | | | 4,059 | |
| | Varun Beverages Ltd. (Beverages) | | | 209,820 | | | | 3,119 | |
| | Voltas Ltd. (Construction & engineering) | | | 229,452 | | | | 2,698 | |
| | | | | | | | | 81,283 | |
See accompanying Notes to Financial Statements.
| December 31, 2023 | William Blair Funds | 47 |
International Growth Fund
Portfolio of Investments, December 31, 2023 (all dollar amounts in thousands)
| | | | | | | | |
| | | | | | | | |
| | Issuer | | Shares | | | Value | |
| | | | | | | | | | |
| | Common Stocks—(continued) | | | | | | | | |
| | | | | | | | | | |
| | Emerging Asia—(continued) | | | | | | | | |
| | Indonesia—1.2% | | | | | | | | |
| | Bank Central Asia Tbk. PT (Banks) | | | 29,142,600 | | | $ | 17,792 | |
| | South Korea—2.4% | | | | | | | | |
| | Samsung Electronics Co. Ltd. (Technology hardware, storage & peripherals) | | | 369,432 | | | | 22,517 | |
| | SK Hynix, Inc. (Semiconductors & semiconductor equipment) | | | 108,884 | | | | 11,963 | |
| | | | | | | | | 34,480 | |
| | Taiwan—4.0% | | | | | | | | |
| | Alchip Technologies Ltd. (Semiconductors & semiconductor equipment) | | | 33,000 | | | | 3,521 | |
| | Global Unichip Corp. (Semiconductors & semiconductor equipment) | | | 70,000 | | | | 3,969 | |
| | Globalwafers Co. Ltd. (Semiconductors & semiconductor equipment) | | | 159,000 | | | | 3,041 | |
| | MediaTek, Inc. (Semiconductors & semiconductor equipment) | | | 370,000 | | | | 12,237 | |
| | Taiwan Semiconductor Manufacturing Co. Ltd.—ADR (Semiconductors & semiconductor equipment) | | | 310,449 | | | | 32,287 | |
| | Unimicron Technology Corp. (Electronic equipment, instruments & components) | | | 360,000 | | | | 2,064 | |
| | | | | | | | | 57,119 | |
| | United Kingdom—13.8% | | | | | | | | |
| | 3i Group PLC (Capital markets) | | | 458,293 | | | | 14,143 | |
| | Ashtead Group PLC (Trading companies & distributors) | | | 168,774 | | | | 11,750 | |
| | AstraZeneca PLC (Pharmaceuticals) | | | 147,978 | | | | 19,994 | |
| | BAE Systems PLC (Aerospace & defense) | | | 677,075 | | | | 9,584 | |
| | Beazley PLC (Insurance) | | | 474,310 | | | | 3,156 | |
| | Big Yellow Group PLC (Specialized REITs) | | | 184,963 | | �� | | 2,881 | |
| | Compass Group PLC (Hotels, restaurants & leisure) | | | 615,954 | | | | 16,849 | |
| | ConvaTec Group PLC (Health care equipment & supplies) | | | 2,302,823 | | | | 7,168 | |
| | Diploma PLC (Trading companies & distributors) | | | 133,188 | | | | 6,081 | |
| | Experian PLC (Professional services) | | | 186,888 | | | | 7,628 | |
| | Greggs PLC (Hotels, restaurants & leisure) | | | 117,121 | | | | 3,884 | |
| | Haleon PLC (Personal care products) | | | 2,214,006 | | | | 9,077 | |
| | Halma PLC (Electronic equipment, instruments & components) | | | 397,769 | | | | 11,580 | |
| | Intermediate Capital Group PLC (Capital markets) | | | 265,071 | | | | 5,678 | |
| | London Stock Exchange Group PLC (Capital markets) | | | 179,015 | | | | 21,162 | |
| | RELX PLC (Professional services) | | | 284,067 | | | | 11,261 | |
| | Rentokil Initial PLC (Commercial services & supplies) | | | 1,948,200 | | | | 10,946 | |
| | Rotork PLC (Machinery) | | | 963,176 | | | | 3,973 | |
| | | | | | | | |
| | | | | | | | |
| | Issuer | | Shares | | | Value | |
| | | | | | | | | | |
| | Common Stocks—(continued) | | | | | | | | |
| | | | | | | | | | |
| | United Kingdom—(continued) | | | | | | | | |
| | Softcat PLC (IT services) | | | 134,690 | | | $ | 2,335 | |
| | Spectris PLC (Electronic equipment, instruments & components) | | | 86,272 | | | | 4,156 | |
| | Spirax-Sarco Engineering PLC (Machinery) | | | 56,574 | | | | 7,575 | |
| | SSE PLC (Electric utilities) | | | 163,726 | | | | 3,873 | |
| | Weir Group PLC (Machinery) | | | 117,504 | | | | 2,825 | |
| | | | | | | | | 197,559 | |
| | Canada—8.1% | | | | | | | | |
| | Alimentation Couche-Tard, Inc. (Consumer staples distribution & retail) | | | 169,197 | | | | 9,964 | |
| | Boyd Group Services, Inc. (Commercial services & supplies) | | | 12,831 | | | | 2,697 | |
| | Canadian National Railway Co. (Ground transportation) | | | 101,405 | | | | 12,746 | |
| | Canadian Pacific Kansas City Ltd. (Ground transportation) | | | 211,379 | | | | 16,711 | |
| | CCL Industries, Inc. (Containers & packaging) | | | 78,530 | | | | 3,532 | |
| | Constellation Software, Inc. (Software) | | | 2,865 | | | | 7,103 | |
| | Dollarama, Inc. (Broadline retail) | | | 184,081 | | | | 13,266 | |
| | Intact Financial Corp. (Insurance) | | | 75,045 | | | | 11,546 | |
| * | Kinaxis, Inc. (Software) | | | 22,951 | | | | 2,576 | |
| * | Lululemon Athletica, Inc. (Textiles, apparel & luxury goods) | | | 22,246 | | | | 11,374 | |
| | Parkland Corp. (Oil, gas & consumable fuels) | | | 137,893 | | | | 4,445 | |
| | TFI International, Inc. (Ground transportation) | | | 20,160 | | | | 2,742 | |
| | Toromont Industries Ltd. (Trading companies & distributors) | | | 86,244 | | | | 7,557 | |
| | Toronto-Dominion Bank (Banks) | | | 163,157 | | | | 10,542 | |
| | | | | | | | | 116,801 | |
| | Emerging Latin America—3.4% | | | | | | | | |
| | Argentina—0.3% | | | | | | | | |
| * | Globant SA (IT services)† | | | 20,202 | | | | 4,808 | |
| | Brazil—1.9% | | | | | | | | |
| | B3 SA - Brasil Bolsa Balcao (Capital markets) | | | 2,232,700 | | | | 6,687 | |
| * | MercadoLibre, Inc. (Broadline retail) | | | 6,743 | | | | 10,597 | |
| | Raia Drogasil SA (Consumer staples distribution & retail) | | | 689,264 | | | | 4,172 | |
| | Rumo SA (Ground transportation) | | | 612,100 | | | | 2,892 | |
| | WEG SA (Electrical equipment) | | | 408,900 | | | | 3,107 | |
| | | | | | | | | 27,455 | |
| | Mexico—1.0% | | | | | | | | |
| | Grupo Aeroportuario del Sureste SAB de CV—ADR (Transportation infrastructure) | | | 10,292 | | | | 3,029 | |
| | Wal-Mart de Mexico SAB de CV (Consumer staples distribution & retail) | | | 2,471,000 | | | | 10,388 | |
| | | | | | | | | 13,417 | |
See accompanying Notes to Financial Statements.
| 48 | Annual Report | December 31, 2023 |
International Growth Fund
Portfolio of Investments, December 31, 2023 (all dollar amounts in thousands)
| | Issuer | | Shares or
Principal
Amount | | | Value | |
| | | | | | | | | | |
| | Common Stocks—(continued) | | | | | | | | |
| | | | | | | | | | |
| | Emerging Latin America—(continued) | | | | | | | | |
| | Peru—0.2% | | | | | | | | |
| | Credicorp Ltd. (Banks)† | | | 18,490 | | | $ | 2,772 | |
| | | | | | | | | | |
| | Asia—2.2% | | | | | | | | |
| | Australia—0.6% | | | | | | | | |
| | Pro Medicus Ltd. (Health care technology) | | | 70,984 | | | | 4,635 | |
| | Steadfast Group Ltd. (Insurance) | | | 1,015,595 | | | | 4,028 | |
| | | | | | | | | 8,663 | |
| | Hong Kong—0.9% | | | | | | | | |
| | AIA Group Ltd. (Insurance) | | | 791,600 | | | | 6,899 | |
| | Techtronic Industries Co. Ltd. (Machinery) | | | 536,000 | | | | 6,387 | |
| | | | | | | | | 13,286 | |
| | Singapore—0.7% | | | | | | | | |
| | DBS Group Holdings Ltd. (Banks) | | | 364,300 | | | | 9,223 | |
| | | | | | | | | | |
| | Emerging Africa—0.5% | | | | | | | | |
| | South Africa—0.5% | | | | | | | | |
| | Bid Corp. Ltd. (Consumer staples distribution & retail) | | | 218,983 | | | | 5,108 | |
| | Clicks Group Ltd. (Consumer staples distribution & retail) | | | 123,750 | | | | 2,203 | |
| | | | | | | | | 7,311 | |
| | Total Common Stocks—96.4%
(cost $1,001,445) | | | | | | | 1,379,964 | |
| | | | | | | | | | |
| | Repurchase Agreement | | | | | | | | |
| | Fixed Income Clearing Corporation, 2.300% dated 12/29/23, due 01/02/24, repurchase price $46,365, collateralized by U.S. Treasury Note, 3.875%, due 12/31/27, valued at $47,280 | | $ | 46,353 | | | | 46,353 | |
| | Total Repurchase Agreement—3.3%
(cost $46,353) | | | | | | | 46,353 | |
| | Total Investments—99.7%
(cost $1,047,798) | | | | | | | 1,426,317 | |
| | Cash and other assets, less liabilities—0.3% | | | | | | | 4,787 | |
| | Net assets—100.0% | | | | | | $ | 1,431,104 | |
ADR = American Depository Receipt
REIT = Real Estate Investment Trust
* = Non-income producing security
† = U.S. listed foreign security
At December 31, 2023, the Fund’s Portfolio of Investments includes the following industry categories (as a percentage of long-term investments):
| Industrials | | | 26.5 | % |
| Information Technology | | | 21.4 | % |
| Financials | | | 14.5 | % |
| Consumer Discretionary | | | 11.3 | % |
| Health Care | | | 9.9 | % |
| Consumer Staples | | | 6.6 | % |
| Materials | | | 4.8 | % |
| Energy | | | 2.9 | % |
| Communication Services | | | 1.4 | % |
| Real Estate | | | 0.4 | % |
| Utilities | | | 0.3 | % |
| Total | | | 100.0 | % |
At December 31, 2023, the Fund’s Portfolio of Investments includes the following currency categories (as a percentage of long-term investments):
| Euro | | | 22.4 | % |
| Japanese Yen | | | 16.5 | % |
| British Pound Sterling | | | 14.3 | % |
| U.S. Dollar | | | 10.7 | % |
| Canadian Dollar | | | 6.4 | % |
| Indian Rupee | | | 5.9 | % |
| Swiss Franc | | | 4.8 | % |
| Swedish Krona | | | 4.4 | % |
| Danish Krone | | | 3.0 | % |
| South Korean Won | | | 2.5 | % |
| New Taiwan Dollar | | | 2.0 | % |
| Indonesian Rupiah | | | 1.3 | % |
| Brazilian Real | | | 1.2 | % |
| All Other Currencies | | | 4.6 | % |
| Total | | | 100.0 | % |
See accompanying Notes to Financial Statements.
| December 31, 2023 | William Blair Funds | 49 |
| | Institutional International Growth Fund |
| | |
| | The Institutional International Growth Fund seeks long-term capital appreciation. |
| | |
| | AN OVERVIEW FROM THE PORTFOLIO MANAGERS |
| | |

Simon Fennell 
Kenneth J. McAtamney 
Andrew Siepker, CFA | The William Blair Institutional International Growth Fund (the “Fund”) posted a 15.20% increase, net of fees, for the year ended December 31, 2023. By comparison, the Fund’s benchmark index, the MSCI All Country World ex-U.S. IMI (net) (the “Index”), increased 15.62%. For the full year, the Fund slightly underperformed its Index. From a sector perspective, allocation effect was positive driven by overweight exposures to Information Technology and Industrials. Stock selection effect was negative, largely due to negative selection within Industrials and Financials. This was offset by positive selection within Consumer Discretionary and Materials. Industrials selection was negatively impacted by Teleperformance and Rentokil. Teleperformance provides outsourced call center and client relationship management services to enterprise customers globally. The rise of generative artificial intelligence is a direct threat to services provided by Teleperformance and its competitors. Additionally, in the middle of the year Teleperformance announced a proposed cash and stock offer for Majorel, one of its peers in the customer experience provider segment, at a significant premium. Our view is that this acquisition is counter to management’s previously stated mergers and acquisitions strategy given the overlap in business lines and customer base, and we exited the position after the announcement. Rentokil is a U.K.-based pest control company with operations in over 60 countries. After a period of acquisitions, Rentokil is undergoing a transformation from a collection of independent businesses into one unified company focused on operating results. Its integration of Terminix in the U.S. is on track to deliver its cost synergy guidance of $60 million per year. While recent results were in line with expectations, the company noted softer demand in the U.S. than previously anticipated, impacting its full-year outlook and weighing on the stock. Within Financials, AIA Group and Adyen were the primary drivers of underperformance. AIA is a leading insurer offering life insurance, accident and health insurance, and wealth management services and is solely focused on Asia. AIA’s competitive advantages are business process, brand distinction and culture, and its strong agency force. We believe the company will benefit from strong growth in the region and higher penetration rates as incomes rise. While fundamentals were resilient, the stock underperformed given its exposure to Chinese growth, which disappointed throughout the year. Adyen is an international payments company that allows businesses to accept e-commerce, mobile, and point-of-sale payments. It can accept credit cards, debit cards, wire transfers, and real-time bank transfers. During the third quarter, the stock decreased after the company reported results that were worse than expected across financial metrics (revenue, earnings, margin). The market was particularly disappointed in the company’s performance in the U.S., which is meant to be a region of growth for the company. Competition has been aggressive on pricing as merchants have focused primarily on cost given the macroeconomic backdrop. At the same time, Adyen’s headcount has increased significantly as the company tries to grow, causing a significant bottom-line miss as well. Near-term fundamentals will be challenged, and the durability of its competitive advantages are in question. We exited the position as a result. Positive selection in Consumer Discretionary was driven by positions in Lululemon and MercadoLibre. Lululemon, an athleisure apparel company, has one of the more attractive business models in the Consumer Discretionary sector, in our view, based on its premium-priced athletic apparel, vertically integrated manufacturing/retail/e-commerce strategy, differentiated grassroots marketing approach, and highly productive small-store format. |
| 50 | Annual Report | December 31, 2023 |
Institutional International Growth Fund
The stock benefitted from results that beat expectations as well as stronger-than-anticipated economic growth in the U.S. The position was trimmed during the fourth quarter after the recent move in the stock price and an increasing valuation.
MercadoLibre is the leading e-commerce platform in Latin America that has a best-in-class ecosystem of services such as logistics and payments, allowing the company to exploit attractive growth opportunities of the large and underpenetrated total addressable market. Latin America was one of the best performing regions in 2023 as many countries began to ease interest rates amid decreasing inflation rates. Results throughout the year were better than expected with revenue growth accelerating and margins expanding.
Shin-Etsu Chemical helped drive positive selection in Materials. Shin-Etsu has two core businesses: polyvinyl chloride (“PVC”) production and semiconductor wafer manufacturing. PVC is a widely used material, but the bulk of demand is for housing/construction-related products such as white PVC pipes seen in home improvement stores. Semiconductor wafers are the base ingredient for computers chips. In our view, Shin-Etsu has a clear scale advantage across its business units, giving it a superior cost advantage relative to its competitors. Manufacturing expertise is its other competitive advantage, with both skill and efficiency leading to overall better products and better corporate results. The stock had a strong fourth quarter as margins have been holding up better-than-expected and on the positive outlook for the semiconductor industry going forward. Management noted an inflection point in wafer demand, consistent with other segments in the semiconductor value chain.
Please refer to the Global Markets Review and Outlook relating to the Fund beginning on page 32.
| December 31, 2023 | William Blair Funds | 51 |
Institutional International Growth Fund
Performance Highlights (Unaudited)
Average Annual Total Returns through 12/31/2023
| | | 1 Year | | 3 Year | | 5 Year | | 10 Year |
| Institutional International Growth Fund | | | 15.20 | % | | | (3.32 | )% | | | 9.38 | % | | | 4.75 | % |
| MSCI ACW ex-U.S. IMI (net) | | | 15.62 | | | | 1.53 | | | | 7.18 | | | | 3.97 | |
Performance cited represents past performance. Past performance does not guarantee future results and current performance may be lower or higher than the data quoted. Results shown are average annual total returns, which assume reinvestment of dividends and capital gains. Investment returns and principal will fluctuate and you may have a gain or loss when you sell shares. For the most current month-end performance information, please call 1-800-742-7272, or visit our Web site at www.williamblairfunds.com. From time to time, the investment adviser may waive fees or reimburse expenses for the Fund. Without these waivers/reimbursements, performance would be lower. Investing in smaller and medium capitalization companies involves special risks, including higher volatility and lower liquidity. Smaller and medium capitalization stocks are also more sensitive to purchase/sale transactions and changes in the issuer’s financial condition. International investing involves special risk considerations, including currency fluctuations, lower liquidity, economic and political risk. Shares of the Fund are not subject to a sales load, distribution (Rule 12b-1) fees, or sub-transfer agent fees.
The performance highlights and graph presented above do not reflect the deduction of taxes that a shareholder would pay on fund distributions or the redemption of fund shares.
The Morgan Stanley Capital International (MSCI) All Country World (ACW) ex-U.S. Investable Market Index (IMI) (net) is a free float-adjusted market capitalization weighted index that is designed to measure the equity market performance of developed and emerging markets, excluding the United States. This index approximates the minimum possible dividend reinvestment by deducting for the highest possible withholding tax rates of those markets.
This report identifies the Fund’s investments on December 31, 2023. These holdings are subject to change. Not all stocks in the Fund performed the same, nor is there any guarantee that these stocks will perform as well in the future. Market forecasts provided in this report may not necessarily come to pass.
Sector Diversification (Unaudited)

The sector diversification shown is based on the total long-term securities.
| 52 | Annual Report | December 31, 2023 |
Institutional International Growth Fund
Portfolio of Investments, December 31, 2023 (all dollar amounts in thousands)
| | | | | | | | |
| | | | | | | | |
| | Issuer | | Shares | | | Value | |
| | | | | | | | |
| | Common Stocks | | | | | | | | |
| | | | | | | | | | |
| | Europe, Mid-East—38.4% | | | | | | | | |
| | Belgium—0.2% | | | | | | | | |
| | Warehouses De Pauw CVA (Industrial REITs) | | | 48,417 | | | $ | 1,523 | |
| | Denmark—2.9% | | | | | | | | |
| | DSV AS (Air freight & logistics) | | | 49,264 | | | | 8,649 | |
| | Novo Nordisk AS (Pharmaceuticals) | | | 177,858 | | | | 18,387 | |
| | | | | | | | | 27,036 | |
| | Finland—0.3% | | | | | | | | |
| | Metso OYJ (Machinery) | | | 149,389 | | | | 1,512 | |
| | Valmet OYJ (Machinery) | | | 47,769 | | | | 1,377 | |
| | | | | | | | | 2,889 | |
| | France—11.4% | | | | | | | | |
| | Airbus SE (Aerospace & defense) | | | 85,055 | | | | 13,125 | |
| | Capgemini SE (IT services) | | | 29,023 | | | | 6,048 | |
| | Dassault Systemes SE (Software) | | | 265,130 | | | | 12,947 | |
| | Hermes International SCA (Textiles, apparel & luxury goods) | | | 3,593 | | | | 7,611 | |
| | L’Oreal SA (Personal care products) | | | 17,738 | | | | 8,825 | |
| | LVMH Moet Hennessy Louis Vuitton SE (Textiles, apparel & luxury goods) | | | 10,333 | | | | 8,368 | |
| | Publicis Groupe SA (Media) | | | 61,312 | | | | 5,686 | |
| | Safran SA (Aerospace & defense) | | | 63,660 | | | | 11,206 | |
| | SEB SA (Household durables) | | | 12,060 | | | | 1,504 | |
| * | SES-imagotag SA (Electronic equipment, instruments & components) | | | 10,698 | | | | 1,604 | |
| | Thales SA (Aerospace & defense) | | | 65,021 | | | | 9,615 | |
| | TotalEnergies SE (Oil, gas & consumable fuels) | | | 159,369 | | | | 10,838 | |
| | Vinci SA (Construction & engineering) | | | 71,945 | | | | 9,030 | |
| | | | | | | | | 106,407 | |
| | Germany—3.0% | | | | | | | | |
| | CTS Eventim AG & Co. KGaA (Entertainment) | | | 55,296 | | | | 3,821 | |
| | Hannover Rueck SE (Insurance) | | | 27,262 | | | | 6,510 | |
| | Infineon Technologies AG (Semiconductors & semiconductor equipment) | | | 160,876 | | | | 6,713 | |
| | MTU Aero Engines AG (Aerospace & defense) | | | 34,162 | | | | 7,364 | |
| | Nemetschek SE (Software) | | | 23,118 | | | | 2,003 | |
| | Siltronic AG (Semiconductors & semiconductor equipment) | | | 14,135 | | | | 1,380 | |
| | | | | | | | | 27,791 | |
| | Ireland—4.7% | | | | | | | | |
| | CRH PLC (Construction materials)† | | | 71,053 | | | | 4,914 | |
| * | ICON PLC (Life sciences tools & services)† | | | 31,718 | | | | 8,979 | |
| | Kingspan Group PLC (Building products) | | | 120,603 | | | | 10,438 | |
| | Linde PLC (Chemicals)† | | | 26,180 | | | | 10,752 | |
| * | Ryanair Holdings PLC—ADR (Passenger airlines) | | | 62,907 | | | | 8,389 | |
| | | | | | | | | 43,472 | |
| | | | | | | | |
| | | | | | | | |
| | Issuer | | Shares | | | Value | |
| | | | | | | | |
| | Common Stocks—(continued) | | | | | | | | |
| | | | | | | | | | |
| | Europe, Mid-East—(continued) | | | | | | | | |
| | Israel—0.3% | | | | | | | | |
| * | Nice Ltd.—ADR (Software) | | | 16,227 | | | $ | 3,238 | |
| | Italy—1.7% | | | | | | | | |
| | Azimut Holding SpA (Capital markets) | | | 53,794 | | | | 1,404 | |
| | Brembo SpA (Automobile components) | | | 83,775 | | | | 1,027 | |
| | Brunello Cucinelli SpA (Textiles, apparel & luxury goods) | | | 34,694 | | | | 3,393 | |
| | Ferrari NV (Automobiles)† | | | 17,091 | | | | 5,784 | |
| | Moncler SpA (Textiles, apparel & luxury goods) | | | 49,526 | | | | 3,045 | |
| | Stevanato Group SpA (Life sciences tools & services)† | | | 40,781 | | | | 1,113 | |
| | | | | | | | | 15,766 | |
| | Netherlands—3.1% | | | | | | | | |
| | ASML Holding NV (Semiconductors & semiconductor equipment) | | | 24,061 | | | | 18,107 | |
| | BE Semiconductor Industries NV (Semiconductors & semiconductor equipment) | | | 34,582 | | | | 5,209 | |
| | IMCD NV (Trading companies & distributors) | | | 23,303 | | | | 4,053 | |
| | JDE Peet’s NV (Food products) | | | 55,125 | | | | 1,483 | |
| | | | | | | | | 28,852 | |
| | Norway—0.4% | | | | | | | | |
| * | AutoStore Holdings Ltd. (Machinery) | | | 898,820 | | | | 1,767 | |
| | Gjensidige Forsikring ASA (Insurance) | | | 86,304 | | | | 1,593 | |
| | | | | | | | | 3,360 | |
| | Spain—1.5% | | | | | | | | |
| | Amadeus IT Group SA (Hotels, restaurants & leisure) | | | 101,103 | | | | 7,241 | |
| | Industria de Diseno Textil SA (Specialty retail) | | | 163,796 | | | | 7,130 | |
| | | | | | | | | 14,371 | |
| | Sweden—4.2% | | | | | | | | |
| | Atlas Copco AB (Machinery) | | | 529,746 | | | | 9,115 | |
| | Beijer Ref AB (Trading companies & distributors) | | | 235,403 | | | | 3,149 | |
| | Evolution AB (Hotels, restaurants & leisure) | | | 59,141 | | | | 7,049 | |
| | Fortnox AB (Software) | | | 262,311 | | | | 1,568 | |
| | Hemnet Group AB (Interactive media & services) | | | 81,619 | | | | 1,953 | |
| | Hexagon AB (Electronic equipment, instruments & components) | | | 481,093 | | | | 5,769 | |
| | Indutrade AB (Machinery) | | | 139,220 | | | | 3,614 | |
| | Lifco AB (Industrial conglomerates) | | | 135,879 | | | | 3,330 | |
| | Nibe Industrier AB (Building products) | | | 310,945 | | | | 2,183 | |
| | Sweco AB (Construction & engineering) | | | 103,564 | | | | 1,387 | |
| | | | | | | | | 39,117 | |
See accompanying Notes to Financial Statements.
| December 31, 2023 | William Blair Funds | 53 |
Institutional International Growth Fund
Portfolio of Investments, December 31, 2023 (all dollar amounts in thousands)
| | | | | | | | |
| | | | | | | | |
| | Issuer | | Shares | | | Value | |
| | | | | | | | |
| | Common Stocks—(continued) | | | | | | | | |
| | | | | | | | | | |
| | Europe, Mid-East—(continued) | | | | | | | | |
| | Switzerland—4.7% | | | | | | | | |
| | Belimo Holding AG (Building products) | | | 4,378 | | | $ | 2,414 | |
| | Galenica AG (Health care providers & services) | | | 29,016 | | | | 2,510 | |
| | Partners Group Holding AG (Capital markets) | | | 2,910 | | | | 4,197 | |
| | Siegfried Holding AG (Life sciences tools & services) | | | 2,363 | | | | 2,415 | |
| | SIG Group AG (Containers & packaging) | | | 161,351 | | | | 3,712 | |
| | Sika AG (Chemicals) | | | 23,672 | | | | 7,703 | |
| | Straumann Holding AG (Health care equipment & supplies) | | | 25,423 | | | | 4,099 | |
| | Tecan Group AG (Life sciences tools & services) | | | 7,861 | | | | 3,210 | |
| | VAT Group AG (Machinery) | | | 10,982 | | | | 5,504 | |
| | Zurich Insurance Group AG (Insurance) | | | 14,530 | | | | 7,595 | |
| | | | | | | | | 43,359 | |
| | | | | | | | | | |
| | Japan—15.9% | | | | | | | | |
| | Ajinomoto Co., Inc. (Food products) | | | 108,200 | | | | 4,174 | |
| | BayCurrent Consulting, Inc. (Professional services) | | | 52,400 | | | | 1,840 | |
| | Chugai Pharmaceutical Co. Ltd. (Pharmaceuticals) | | | 197,000 | | | | 7,464 | |
| | Daiichi Sankyo Co. Ltd. (Pharmaceuticals) | | | 242,000 | | | | 6,646 | |
| | Daikin Industries Ltd. (Building products) | | | 25,300 | | | | 4,124 | |
| | Disco Corp. (Semiconductors & semiconductor equipment) | | | 20,500 | | | | 5,086 | |
| | Harmonic Drive Systems, Inc. (Machinery) | | | 64,700 | | | | 1,909 | |
| | Hoya Corp. (Health care equipment & supplies) | | | 78,800 | | | | 9,850 | |
| | Internet Initiative Japan, Inc. (Diversified telecommunication services) | | | 51,200 | | | | 1,047 | |
| | ITOCHU Corp. (Trading companies & distributors) | | | 112,400 | | | | 4,597 | |
| | Japan Elevator Service Holdings Co. Ltd. (Commercial services & supplies) | | | 86,700 | | | | 1,438 | |
| | Japan Exchange Group, Inc. (Capital markets) | | | 263,600 | | | | 5,577 | |
| | Keyence Corp. (Electronic equipment, instruments & components) | | | 29,900 | | | | 13,173 | |
| | Lasertec Corp. (Semiconductors & semiconductor equipment) | | | 22,900 | | | | 6,037 | |
| | MatsukiyoCocokara & Co. (Consumer staples distribution & retail) | | | 150,800 | | | | 2,671 | |
| | Mitsui & Co. Ltd. (Trading companies & distributors) | | | 113,200 | | | | 4,253 | |
| | MonotaRO Co. Ltd. (Trading companies & distributors) | | | 240,200 | | | | 2,623 | |
| | Nomura Research Institute Ltd. (IT services) | | | 40,000 | | | | 1,163 | |
| | | | | | | | |
| | | | | | | | |
| | Issuer | | Shares | | | Value | |
| | | | | | | | |
| | Common Stocks—(continued) | | | | | | | | |
| | | | | | | | | | |
| | Japan—(continued) | | | | | | | | |
| | Pan Pacific International Holdings Corp. (Broadline retail) | | | 299,400 | | | $ | 7,143 | |
| | Rakus Co. Ltd. (Software) | | | 91,500 | | | | 1,695 | |
| | SCREEN Holdings Co. Ltd. (Semiconductors & semiconductor equipment) | | | 32,300 | | | | 2,733 | |
| * | SHIFT, Inc. (IT services) | | | 9,200 | | | | 2,337 | |
| | Shin-Etsu Chemical Co. Ltd. (Chemicals) | | | 246,900 | | | | 10,361 | |
| | SMC Corp. (Machinery) | | | 5,000 | | | | 2,687 | |
| | SMS Co. Ltd. (Professional services) | | | 42,100 | | | | 866 | |
| | Sumitomo Mitsui Financial Group, Inc. (Banks) | | | 203,700 | | | | 9,939 | |
| | Sundrug Co. Ltd. (Consumer staples distribution & retail) | | | 58,800 | | | | 1,890 | |
| | TechnoPro Holdings, Inc. (Professional services) | | | 107,500 | | | | 2,832 | |
| | TIS, Inc. (IT services) | | | 97,300 | | | | 2,144 | |
| | Tokio Marine Holdings, Inc. (Insurance) | | | 345,400 | | | | 8,645 | |
| | Tokyo Electron Ltd. (Semiconductors & semiconductor equipment) | | | 48,300 | | | | 8,651 | |
| | Tsuruha Holdings, Inc. (Consumer staples distribution & retail) | | | 26,900 | | | | 2,466 | |
| | | | | | | | | 148,061 | |
| | | | | | | | | | |
| | Emerging Asia—14.2% | | | | | | | | |
| | China—0.9% | | | | | | | | |
| | Airtac International Group (Machinery) | | | 61,204 | | | | 2,014 | |
| | Kweichow Moutai Co. Ltd. (Beverages) | | | 24,500 | | | | 5,935 | |
| | | | | | | | | 7,949 | |
| | India—5.7% | | | | | | | | |
| | Apollo Hospitals Enterprise Ltd. (Health care providers & services) | | | 29,145 | | | | 1,999 | |
| | Asian Paints Ltd. (Chemicals) | | | 89,275 | | | | 3,642 | |
| | Britannia Industries Ltd. (Food products) | | | 30,724 | | | | 1,972 | |
| | Havells India Ltd. (Electrical equipment) | | | 137,990 | | | | 2,268 | |
| | HDFC Bank Ltd. (Banks) | | | 534,223 | | | | 10,969 | |
| | Infosys Ltd. (IT services) | | | 226,316 | | | | 4,196 | |
| * | InterGlobe Aviation Ltd. (Passenger airlines) | | | 69,224 | | | | 2,458 | |
| | Mahindra & Mahindra Ltd. (Automobiles) | | | 173,970 | | | | 3,607 | |
| | Max Healthcare Institute Ltd. (Health care providers & services) | | | 212,426 | | | | 1,751 | |
| | Nestle India Ltd. (Food products) | | | 4,878 | | | | 1,562 | |
| | Reliance Industries Ltd. (Oil, gas & consumable fuels) | | | 388,865 | | | | 12,089 | |
| | Titan Co. Ltd. (Textiles, apparel & luxury goods) | | | 59,465 | | | | 2,634 | |
| | Varun Beverages Ltd. (Beverages) | | | 136,761 | | | | 2,033 | |
| | Voltas Ltd. (Construction & engineering) | | | 149,558 | | | | 1,758 | |
| | | | | | | | | 52,938 | |
See accompanying Notes to Financial Statements.
| 54 | Annual Report | December 31, 2023 |
Institutional International Growth Fund
Portfolio of Investments, December 31, 2023 (all dollar amounts in thousands)
| | | | | | | | |
| | | | | | | | |
| | Issuer | | Shares | | | Value | |
| | | | | | | | |
| | Common Stocks—(continued) | | | | | | | | |
| | | | | | | | | | |
| | Emerging Asia—(continued) | | | | | | | | |
| | Indonesia—1.2% | | | | | | | | |
| | Bank Central Asia Tbk. PT (Banks) | | | 18,995,230 | | | $ | 11,597 | |
| | South Korea—2.4% | | | | | | | | |
| | Samsung Electronics Co. Ltd. (Technology hardware, storage & peripherals) | | | 240,797 | | | | 14,677 | |
| | SK Hynix, Inc. (Semiconductors & semiconductor equipment) | | | 70,971 | | | | 7,797 | |
| | | | | | | | | 22,474 | |
| | Taiwan—4.0% | | | | | | | | |
| | Alchip Technologies Ltd. (Semiconductors & semiconductor equipment) | | | 21,000 | | | | 2,241 | |
| | Global Unichip Corp. (Semiconductors & semiconductor equipment) | | | 46,000 | | | | 2,608 | |
| | Globalwafers Co. Ltd. (Semiconductors & semiconductor equipment) | | | 104,000 | | | | 1,989 | |
| | MediaTek, Inc. (Semiconductors & semiconductor equipment) | | | 241,000 | | | | 7,970 | |
| | Taiwan Semiconductor Manufacturing Co. Ltd.—ADR (Semiconductors & semiconductor equipment) | | | 202,352 | | | | 21,045 | |
| | Unimicron Technology Corp. (Electronic equipment, instruments & components) | | | 235,000 | | | | 1,348 | |
| | | | | | | | | 37,201 | |
| | | | | | | | | | |
| | United Kingdom—13.9% | | | | | | | | |
| | 3i Group PLC (Capital markets) | | | 297,785 | | | | 9,189 | |
| | Ashtead Group PLC (Trading companies & distributors) | | | 110,007 | | | | 7,659 | |
| | AstraZeneca PLC (Pharmaceuticals) | | | 96,453 | | | | 13,032 | |
| | BAE Systems PLC (Aerospace & defense) | | | 441,321 | | | | 6,247 | |
| | Beazley PLC (Insurance) | | | 307,768 | | | | 2,048 | |
| | Big Yellow Group PLC (Specialized REITs) | | | 120,560 | | | | 1,878 | |
| | Compass Group PLC (Hotels, restaurants & leisure) | | | 401,482 | | | | 10,982 | |
| | ConvaTec Group PLC (Health care equipment & supplies) | | | 1,500,991 | | | | 4,672 | |
| | Diploma PLC (Trading companies & distributors) | | | 86,689 | | | | 3,958 | |
| | Experian PLC (Professional services) | | | 121,815 | | | | 4,972 | |
| | Greggs PLC (Hotels, restaurants & leisure) | | | 75,997 | | | | 2,520 | |
| | Haleon PLC (Personal care products) | | | 1,443,099 | | | | 5,917 | |
| | Halma PLC (Electronic equipment, instruments & components) | | | 259,267 | | | | 7,548 | |
| | Intermediate Capital Group PLC (Capital markets) | | | 172,529 | | | | 3,696 | |
| | London Stock Exchange Group PLC (Capital markets) | | | 116,683 | | | | 13,793 | |
| | RELX PLC (Professional services) | | | 185,156 | | | | 7,340 | |
| | Rentokil Initial PLC (Commercial services & supplies) | | | 1,269,846 | | | | 7,135 | |
| | | | | | | | |
| | | | | | | | |
| | Issuer | | Shares | | | Value | |
| | | | | |
| | Common Stocks—(continued) | | | | | | |
| | | | | |
| | United Kingdom—(continued) | | | | | | | | |
| | Rotork PLC (Machinery) | | | 624,981 | | | $ | 2,578 | |
| | Softcat PLC (IT services) | | | 87,792 | | | | 1,522 | |
| | Spectris PLC (Electronic equipment, instruments & components) | | | 55,980 | | | | 2,696 | |
| | Spirax-Sarco Engineering PLC (Machinery) | | | 36,875 | | | | 4,938 | |
| | SSE PLC (Electric utilities) | | | 106,238 | | | | 2,513 | |
| | Weir Group PLC (Machinery) | | | 76,589 | | | | 1,842 | |
| | | | | | | | | 128,675 | |
| | | | | | | | | | |
| | Canada—8.2% | | | | | | | | |
| | Alimentation Couche-Tard, Inc. (Consumer staples distribution & retail) | | | 110,284 | | | | 6,494 | |
| | Boyd Group Services, Inc. (Commercial services & supplies) | | | 8,363 | | | | 1,757 | |
| | Canadian National Railway Co. (Ground transportation) | | | 66,096 | | | | 8,308 | |
| | Canadian Pacific Kansas City Ltd. (Ground transportation) | | | 137,778 | | | | 10,893 | |
| | CCL Industries, Inc. (Containers & packaging) | | | 51,186 | | | | 2,302 | |
| | Constellation Software, Inc. (Software) | | | 1,867 | | | | 4,629 | |
| | Dollarama, Inc. (Broadline retail) | | | 119,985 | | | | 8,647 | |
| | Intact Financial Corp. (Insurance) | | | 48,914 | | | | 7,525 | |
| * | Kinaxis, Inc. (Software) | | | 14,959 | | | | 1,679 | |
| * | Lululemon Athletica, Inc. (Textiles, apparel & luxury goods) | | | 14,500 | | | | 7,414 | |
| | Parkland Corp. (Oil, gas & consumable fuels) | | | 89,475 | | | | 2,884 | |
| | TFI International, Inc. (Ground transportation) | | | 13,100 | | | | 1,782 | |
| | Toromont Industries Ltd. (Trading companies & distributors) | | | 56,214 | | | | 4,925 | |
| | Toronto-Dominion Bank (Banks) | | | 106,346 | | | | 6,872 | |
| | | | | | | | | 76,111 | |
| | | | | | | | | | |
| | Emerging Latin America—3.4% | | | | | | | | |
| | Argentina—0.3% | | | | | | | | |
| * | Globant SA (IT services)† | | | 13,108 | | | | 3,119 | |
| | Brazil—1.9% | | | | | | | | |
| | B3 SA - Brasil Bolsa Balcao (Capital markets) | | | 1,453,200 | | | | 4,353 | |
| * | MercadoLibre, Inc. (Broadline retail) | | | 4,395 | | | | 6,907 | |
| | Raia Drogasil SA (Consumer staples distribution & retail) | | | 447,200 | | | | 2,707 | |
| | Rumo SA (Ground transportation) | | | 397,200 | | | | 1,876 | |
| | WEG SA (Electrical equipment) | | | 265,300 | | | | 2,016 | |
| | | | | | | | | 17,859 | |
| | Mexico—1.0% | | | | | | | | |
| | Grupo Aeroportuario del Sureste SAB de CV—ADR (Transportation infrastructure) | | | 6,708 | | | | 1,974 | |
| | Wal-Mart de Mexico SAB de CV (Consumer staples distribution & retail) | | | 1,610,600 | | | | 6,771 | |
| | | | | | | | | 8,745 | |
See accompanying Notes to Financial Statements.
| December 31, 2023 | William Blair Funds | 55 |
Institutional International Growth Fund
Portfolio of Investments, December 31, 2023 (all dollar amounts in thousands)
| | Issuer | | Shares or
Principal
Amount | | | Value | |
| | | | | | | | |
| | Common Stocks—(continued) | | | | | | | | |
| | | | | | | | | | |
| | Emerging Latin America—(continued) | | | | | | | | |
| | Peru—0.2% | | | | | | | | |
| | Credicorp Ltd. (Banks)† | | | 12,052 | | | $ | 1,807 | |
| | | | | | | | | | |
| | Asia—2.2% | | | | | | | | |
| | Australia—0.6% | | | | | | | | |
| | Pro Medicus Ltd. (Health care technology) | | | 46,060 | | | | 3,008 | |
| | Steadfast Group Ltd. (Insurance) | | | 661,970 | | | | 2,625 | |
| | | | | | | | | 5,633 | |
| | Hong Kong—0.9% | | | | | | | | |
| | AIA Group Ltd. (Insurance) | | | 516,063 | | | | 4,497 | |
| | Techtronic Industries Co. Ltd. (Machinery) | | | 349,000 | | | | 4,159 | |
| | | | | | | | | 8,656 | |
| | Singapore—0.7% | | | | | | | | |
| | DBS Group Holdings Ltd. (Banks) | | | 237,400 | | | | 6,010 | |
| | | | | | | | | | |
| | Emerging Africa—0.5% | | | | | | | | |
| | South Africa—0.5% | | | | | | | | |
| | Bid Corp. Ltd. (Consumer staples distribution & retail) | | | 142,531 | | | | 3,325 | |
| | Clicks Group Ltd. (Consumer staples distribution & retail) | | | 80,661 | | | | 1,436 | |
| | | | | | | | | 4,761 | |
| | Total Common Stocks—96.7%
(cost $661,685) | | | | | | | 898,777 | |
| | | | | | | | | | |
| | Repurchase Agreement | | | | | | | | |
| | Fixed Income Clearing Corporation, 2.300% dated 12/29/23, due 01/02/24, repurchase price $32,155, collateralized by U.S. Treasury Note, 3.875%, due 12/31/27, valued at $32,790 | | $ | 32,147 | | | | 32,147 | |
| | Total Repurchase Agreement—3.5%
(cost $32,147) | | | | | | | 32,147 | |
| | Total Investments—100.2%
(cost $693,832) | | | | | | | 930,924 | |
| | Liabilities, plus cash and other assets—(0.2)% | | | | | | | (1,450 | ) |
| | Net assets—100.0% | | | | | | $ | 929,474 | |
ADR = American Depository Receipt
REIT = Real Estate Investment Trust
* = Non-income producing security
† = U.S. listed foreign security
At December 31, 2023, the Fund’s Portfolio of Investments includes the following industry categories (as a percentage of long-term investments): |
| Industrials | 26.5% |
| Information Technology | 21.4% |
| Financials | 14.5% |
| Consumer Discretionary | 11.3% |
| Health Care | 9.9% |
| Consumer Staples | 6.6% |
| Materials | 4.8% |
| Energy | 2.9% |
| Communication Services | 1.4% |
| Real Estate | 0.4% |
| Utilities | 0.3% |
| Total | 100.0% |
| | |
At December 31, 2023, the Fund’s Portfolio of Investments includes the following currency categories (as a percentage of long-term investments): |
| Euro | 22.4% |
| Japanese Yen | 16.5% |
| British Pound Sterling | 14.3% |
| U.S. Dollar | 10.7% |
| Canadian Dollar | 6.4% |
| Indian Rupee | 5.9% |
| Swiss Franc | 4.8% |
| Swedish Krona | 4.4% |
| Danish Krone | 3.0% |
| South Korean Won | 2.5% |
| New Taiwan Dollar | 2.0% |
| Indonesian Rupiah | 1.3% |
| Brazilian Real | 1.2% |
| All Other Currencies | 4.6% |
| Total | 100.0% |
See accompanying Notes to Financial Statements.
| 56 | Annual Report | December 31, 2023 |
| | International Small Cap Growth Fund |
| | |
| | The International Small Cap Growth Fund seeks long-term capital appreciation. |
| | |
| | AN OVERVIEW FROM THE PORTFOLIO MANAGERS |
| | |

Simon Fennell 
D. J. Neiman, CFA | The William Blair International Small Cap Growth Fund (Class N shares) (the “Fund”) posted a 14.42% increase, net of fees, for the year ended December 31, 2023. By comparison, the Fund’s benchmark index, the MSCI All Country World ex-U.S. Small Cap Index (net) (the “Index”), increased 15.66%. From an attribution perspective, positive stock selection and an underweight allocation to the Energy and Real Estate sectors was offset by weaker stock selection within the Consumer Staples and Consumer Discretionary sectors. An underweight allocation and positive stock selection within the Real Estate sector was also beneficial. Within Real Estate, Corp Inmobiliaria Vesta SAB de CV (Vesta), a full-service real estate company that develops and leases industrial facilities and distribution centers in Mexico, was positive for performance. The company’s expertise is in designing and constructing build-to-suit and park-to-suit projects, as well as traditional inventory buildings, across a variety of industries within manufacturing and logistics. Ongoing nearshoring trends and e-commerce penetration in Mexico are driving strong demand for Industrial Real Estate. Recently, we have seen a shift in that trend, as companies continue to recalibrate their supply chains; we can observe that by looking at the references to near-shoring in company reports. Vesta’s full-service business model (acquisition, construction, maintenance), structural advantage as a C-corporation, strong balance sheet (<35% loan-to-value ratio, 100% fixed rate debt), and quality customer base make it a high-quality company for exposure to the industrial real estate market in Mexico. Positive stock selection within Energy also added to performance, primarily due to Parkland Corp. Parkland Corp is a Canadian retail fuel and convenience store business and has benefitted from consistent acquisitions and the disposal of assets to optimize the portfolio mix, increase market share, and allow for better margins. Management continues to execute well against its fiscal year 2025 targets, which look more achievable each quarter. Results were driven by the recovery in the international markets. In addition, effective cost-optimization programs that the company has put in place and rebranding work with the “On the Run” concept continued to drive growth. Partially offsetting performance was weaker stock selection within Consumer Staples primarily due to ChaCha Food. ChaCha Food is one of the top players in China’s structurally growing snack nuts and seeds industry. ChaCha’s products are premium positioned (20%-30% higher in unit price) and its nuts products are often used as gifts during festivals. The current macroeconomic environment is unfavorable as consumers are more price conscious and there are fewer gifting activities. A difficult macroeconomic backdrop coupled with cost pressures have weighed on margins meaningfully. We exited the position in September. Stock selection was also weaker within Consumer Discretionary primarily due to Ariston. Ariston is an Italian-based thermal comfort seller. The company has a comprehensive portfolio of renewable and high-efficiency comfort solutions such as hot water heaters, heating systems/equipment, and burners and components. Ariston operates in a fragmented global market. Given the relatively low manufacturing footprint, distribution is the key barrier to entry alongside brands that customers trust. The stock price declined on softer quarterly results as weaker demand in Italy and lower visibility into the fourth quarter led management to lower its fiscal year 2023 growth guidance. Please refer to the Global Markets Review and Outlook relating to the Fund beginning on page 32. |
| December 31, 2023 | William Blair Funds | 57 |
International Small Cap Growth Fund
Performance Highlights (Unaudited)
Average Annual Total Returns through 12/31/2023
| | | | | | | | | | | | | |
| | | 1 Year | | 3 Year | | 5 Year | | 10 Year |
| Class N | | | 14.42 | % | | | (6.30 | )% | | | 7.21 | % | | | 3.08 | % |
| Class I | | | 14.70 | | | | (6.06 | ) | | | 7.50 | | | | 3.37 | |
| Class R6 | | | 14.76 | | | | (5.99 | ) | | | 7.60 | | | | 3.47 | |
| MSCI ACW ex-U.S. Small Cap Index (net) | | | 15.66 | | | | 1.49 | | | | 7.89 | | | | 4.88 | |
Performance cited represents past performance. Past performance does not guarantee future results and current performance may be lower or higher than the data quoted. Results shown are average annual total returns, which assume reinvestment of dividends and capital gains. Investment returns and principal will fluctuate and you may have a gain or loss when you sell shares. For the most current month-end performance information, please call 1-800-742-7272, or visit our Web site at www.williamblairfunds.com. From time to time, the investment adviser may waive fees or reimburse expenses for the Fund. Without these waivers/reimbursements, performance would be lower. Investing in smaller companies involves special risks, including higher volatility and lower liquidity. Smaller capitalization stocks are also more sensitive to purchase/sale transactions and changes in the issuer’s financial condition. International investing involves special risk considerations, including currency fluctuations, lower liquidity, economic and political risk. Class N shares are not subject to a sales load. Class I shares are not subject to a sales load or distribution (Rule 12b-1) fees. Class R6 shares are not subject to a sales load, distribution (Rule 12b-1) fees, or sub-transfer agent fees.
The performance highlights and graph presented above do not reflect the deduction of taxes that a shareholder would pay on fund distributions or the redemption of fund shares.
The Morgan Stanley Capital International (MSCI) All Country World (ACW) ex-U.S. Small Cap Index (net) is a free float-adjusted market capitalization weighted index that is designed to measure the equity market performance of small capitalization developed and emerging markets, excluding the United States. This index approximates the minimum possible dividend reinvestment by deducting for the highest possible withholding tax rates of those markets.
This report identifies the Fund’s investments on December 31, 2023. These holdings are subject to change. Not all stocks in the Fund performed the same, nor is there any guarantee that these stocks will perform as well in the future. Market forecasts provided in this report may not necessarily come to pass.
Sector Diversification (Unaudited)

The sector diversification shown is based on the total long-term securities.
| 58 | Annual Report | December 31, 2023 |
International Small Cap Growth Fund
Portfolio of Investments, December 31, 2023 (all dollar amounts in thousands)
| | | | | | | | |
| | | | | | | | |
| | Issuer | | Shares | | | Value | |
| | | | | | | |
| | Common Stocks | | | | | | | | |
| | | | | | | | | | |
| | Europe—32.1% | | | | | | | | |
| | Belgium—1.3% | | | | | | | | |
| | Azelis Group NV (Trading companies & distributors) | | | 12,982 | | | $ | 318 | |
| | D’ieteren Group (Distributors) | | | 14,778 | | | | 2,886 | |
| | | | | | | | | 3,204 | |
| | Finland—1.1% | | | | | | | | |
| | Musti Group OYJ (Specialty retail) | | | 51,815 | | | | 1,494 | |
| | Valmet OYJ (Machinery) | | | 41,665 | | | | 1,201 | |
| | | | | | | | | 2,695 | |
| | France—3.7% | | | | | | | | |
| | Dassault Aviation SA (Aerospace & defense) | | | 19,359 | | | | 3,830 | |
| | Remy Cointreau SA (Beverages) | | | 6,859 | | | | 871 | |
| | SEB SA (Household durables) | | | 10,520 | | | | 1,312 | |
| * | SES-imagotag SA (Electronic equipment, instruments & components) | | | 19,464 | | | | 2,918 | |
| �� | | | | | | | | 8,931 | |
| | Germany—3.8% | | | | | | | | |
| | CTS Eventim AG & Co. KGaA (Entertainment) | | | 49,446 | | | | 3,417 | |
| | Nemetschek SE (Software) | | | 19,097 | | | | 1,655 | |
| | Siltronic AG (Semiconductors & semiconductor equipment) | | | 41,908 | | | | 4,092 | |
| | | | | | | | | 9,164 | |
| | Italy—4.8% | | | | | | | | |
| | Ariston Holding NV (Household durables) | | | 361,636 | | | | 2,501 | |
| | Azimut Holding SpA (Capital markets) | | | 60,032 | | | | 1,567 | |
| | Brunello Cucinelli SpA (Textiles, apparel & luxury goods) | | | 32,086 | | | | 3,139 | |
| | Carel Industries SpA (Building products) | | | 80,404 | | | | 2,201 | |
| | Sanlorenzo SpA (Leisure products) | | | 12,834 | | | | 600 | |
| | Stevanato Group SpA (Life sciences tools & services)† | | | 59,557 | | | | 1,625 | |
| | | | | | | | | 11,633 | |
| | Jersey—0.3% | | | | | | | | |
| | JTC PLC (Capital markets) | | | 58,567 | | | | 609 | |
| | Netherlands—2.4% | | | | | | | | |
| | BE Semiconductor Industries NV (Semiconductors & semiconductor equipment) | | | 35,203 | | | | 5,303 | |
| | JDE Peet’s NV (Food products) | | | 20,775 | | | | 558 | |
| | | | | | | | | 5,861 | |
| | Norway—1.4% | | | | | | | | |
| * | AutoStore Holdings Ltd. (Machinery) | | | 828,708 | | | | 1,629 | |
| | Gjensidige Forsikring ASA (Insurance) | | | 93,410 | | | | 1,724 | |
| | | | | | | | | 3,353 | |
| | | | | | | | |
| | | | | | | | |
| | Issuer | | Shares | | | Value | |
| | | | | | | | |
| | Common Stocks—(continued) | | | | | | | | |
| | | | | | | | | | |
| | Europe—(continued) | | | | | | | | |
| | Sweden—9.8% | | | | | | | | |
| | AddTech AB (Trading companies & distributors) | | | 136,540 | | | $ | 2,997 | |
| | Beijer Ref AB (Trading companies & distributors) | | | 185,572 | | | | 2,482 | |
| | Bravida Holding AB (Commercial services & supplies) | | | 105,116 | | | | 845 | |
| | Bufab AB (Trading companies & distributors) | | | 43,241 | | | | 1,657 | |
| | Fortnox AB (Software) | | | 458,522 | | | | 2,740 | |
| | Hemnet Group AB (Interactive media & services) | | | 80,953 | | | | 1,938 | |
| | Lagercrantz Group AB (Electronic equipment, instruments & components) | | | 179,730 | | | | 2,407 | |
| | Lifco AB (Industrial conglomerates) | | | 115,934 | | | | 2,841 | |
| | MIPS AB (Leisure products) | | | 32,448 | | | | 1,173 | |
| * | Sdiptech AB (Commercial services & supplies) | | | 58,927 | | | | 1,576 | |
| | Sweco AB (Construction & engineering) | | | 135,737 | | | | 1,818 | |
| | Vitec Software Group AB (Software) | | | 16,640 | | | | 966 | |
| | | | | | | | | 23,440 | |
| | Switzerland—3.5% | | | | | | | | |
| | Galenica AG (Health care providers & services) | | | 22,784 | | | | 1,971 | |
| | Kardex Holding AG (Machinery) | | | 14,065 | | | | 3,646 | |
| | Siegfried Holding AG (Life sciences tools & services) | | | 2,664 | | | | 2,722 | |
| | | | | | | | | 8,339 | |
| | | | | | | | | | |
| | Japan—17.8% | | | | | | | | |
| | AZ-COM MARUWA Holdings, Inc. (Air freight & logistics) | | | 168,200 | | | | 1,824 | |
| | BayCurrent Consulting, Inc. (Professional services) | | | 69,300 | | | | 2,433 | |
| | Fukuoka Financial Group, Inc. (Banks) | | | 83,300 | | | | 1,966 | |
| | Internet Initiative Japan, Inc. (Diversified telecommunication services) | | | 49,000 | | | | 1,002 | |
| | Japan Elevator Service Holdings Co. Ltd. (Commercial services & supplies) | | | 212,900 | | | | 3,530 | |
| * | Kokusai Electric Corp. (Semiconductors & semiconductor equipment) | | | 98,600 | | | | 2,143 | |
| | Kotobuki Spirits Co. Ltd. (Food products) | | | 101,300 | | | | 1,553 | |
| | MEITEC Group Holdings, Inc. (Professional services) | | | 183,800 | | | | 3,685 | |
| | PAL GROUP Holdings Co. Ltd. (Specialty retail) | | | 122,600 | | | | 2,142 | |
| | Prestige International, Inc. (Commercial services & supplies) | | | 168,800 | | | | 718 | |
| | Rakus Co. Ltd. (Software) | | | 125,000 | | | | 2,316 | |
| | SBI Sumishin Net Bank Ltd. (Banks) | | | 65,700 | | | | 721 | |
| | Senko Group Holdings Co. Ltd. (Air freight & logistics) | | | 45,800 | | | | 371 | |
| * | SHIFT, Inc. (IT services) | | | 12,100 | | | | 3,074 | |
See accompanying Notes to Financial Statements.
| December 31, 2023 | William Blair Funds | 59 |
International Small Cap Growth Fund
Portfolio of Investments, December 31, 2023 (all dollar amounts in thousands)
| | | | | | | | |
| | | | | | | | |
| | Issuer | | Shares | | | Value | |
| | | | | | | | |
| | Common Stocks—(continued) | | | | | | | | |
| | | | | | | | | | |
| | Japan—(continued) | | | | | | | | |
| | SIGMAXYZ Holdings, Inc. (Professional services) | | | 89,800 | | | $ | 924 | |
| | SMS Co. Ltd. (Professional services) | | | 168,600 | | | | 3,467 | |
| | Socionext, Inc. (Semiconductors & semiconductor equipment) | | | 69,500 | | | | 1,262 | |
| | Sundrug Co. Ltd. (Consumer staples distribution & retail) | | | 82,000 | | | | 2,636 | |
| | TechnoPro Holdings, Inc. (Professional services) | | | 156,500 | | | | 4,123 | |
| | TIS, Inc. (IT services) | | | 82,600 | | | | 1,820 | |
| | Yamazaki Baking Co. Ltd. (Food products) | | | 54,000 | | | | 1,232 | |
| | | | | | | | | 42,942 | |
| | | | | | | | | | |
| | Emerging Asia—16.3% | | | | | | | | |
| | China—1.4% | | | | | | | | |
| | Proya Cosmetics Co. Ltd. (Personal care products) | | | 151,091 | | | | 2,108 | |
| | Silergy Corp. (Semiconductors & semiconductor equipment) | | | 82,000 | | | | 1,336 | |
| | | | | | | | | 3,444 | |
| | India—8.4% | | | | | | | | |
| | AU Small Finance Bank Ltd. (Banks) | | | 375,991 | | | | 3,547 | |
| | Cholamandalam Investment & Finance Co. Ltd. (Consumer finance) | | | 121,360 | | | | 1,838 | |
| | Home First Finance Co. India Ltd. (Financial services) | | | 82,781 | | | | 927 | |
| | Max Healthcare Institute Ltd. (Health care providers & services) | | | 233,331 | | | | 1,924 | |
| | Motherson Sumi Wiring India Ltd. (Automobile components) | | | 2,595,482 | | | | 1,924 | |
| | Polycab India Ltd. (Electrical equipment) | | | 40,255 | | | | 2,661 | |
| | Sundaram Finance Ltd. (Consumer finance) | | | 26,527 | | | | 1,113 | |
| | Tube Investments of India Ltd. (Automobile components) | | | 51,586 | | | | 2,194 | |
| | Varun Beverages Ltd. (Beverages) | | | 274,297 | | | | 4,077 | |
| | | | | | | | | 20,205 | |
| | Indonesia—0.5% | | | | | | | | |
| | Bank Negara Indonesia Persero Tbk. PT (Banks) | | | 3,630,900 | | | | 1,268 | |
| | Taiwan—5.5% | | | | | | | | |
| | ASMedia Technology, Inc. (Semiconductors & semiconductor equipment) | | | 31,000 | | | | 1,833 | |
| | ASPEED Technology, Inc. (Semiconductors & semiconductor equipment) | | | 22,600 | | | | 2,297 | |
| | Global Unichip Corp. (Semiconductors & semiconductor equipment) | | | 46,000 | | | | 2,608 | |
| | Innodisk Corp. (Technology hardware, storage & peripherals) | | | 184,000 | | | | 1,871 | |
| | Lotes Co. Ltd. (Electronic equipment, instruments & components) | | | 36,000 | | | | 1,255 | |
| | Parade Technologies Ltd. (Semiconductors & semiconductor equipment) | | | 31,000 | | | | 1,212 | |
| | | | | | | | |
| | | | | | | | |
| | Issuer | | Shares | | | Value | |
| | | | | | | | |
| | Common Stocks—(continued) | | | | | | | | |
| | | | | | | | | | |
| | Emerging Asia—(continued) | | | | | | | | |
| | Taiwan—(continued) | | | | | | | | |
| | Voltronic Power Technology Corp. (Electrical equipment) | | | 36,451 | | | $ | 2,031 | |
| | | | | | | | | 13,107 | |
| | Thailand—0.5% | | | | | | | | |
| | Tisco Financial Group PCL (Banks) | | | 409,600 | | | | 1,197 | |
| | | | | | | | | | |
| | Emerging Latin America—9.2% | | | | | | | | |
| | Brazil—3.4% | | | | | | | | |
| | Multiplan Empreendimentos Imobiliarios SA (Real estate management & development) | | | 297,200 | | | | 1,739 | |
| | Rumo SA (Ground transportation) | | | 397,800 | | | | 1,880 | |
| | TOTVS SA (Software) | | | 365,700 | | | | 2,536 | |
| | Vivara Participacoes SA (Textiles, apparel & luxury goods) | | | 274,600 | | | | 1,936 | |
| | | | | | | | | 8,091 | |
| | Mexico—5.8% | | | | | | | | |
| | Arca Continental SAB de CV (Beverages) | | | 106,200 | | | | 1,157 | |
| | Corp. Inmobiliaria Vesta SAB de CV (Real estate management & development) | | | 747,000 | | | | 2,962 | |
| | Corp. Inmobiliaria Vesta SAB de CV—ADR (Real estate management & development) | | | 6,060 | | | | 240 | |
| | Grupo Aeroportuario del Centro Norte SAB de CV (Transportation infrastructure) | | | 347,500 | | | | 3,675 | |
| | Grupo Aeroportuario del Sureste SAB de CV (Transportation infrastructure) | | | 82,770 | | | | 2,432 | |
| | Qualitas Controladora SAB de CV (Insurance) | | | 216,100 | | | | 2,188 | |
| | Regional SAB de CV (Banks) | | | 146,500 | | | | 1,401 | |
| | | | | | | | | 14,055 | |
| | | | | | | | | | |
| | United Kingdom—8.3% | | | | | | | | |
| | Beazley PLC (Insurance) | | | 572,854 | | | | 3,812 | |
| | Burford Capital Ltd. (Financial services) | | | 161,072 | | | | 2,490 | |
| | Diploma PLC (Trading companies & distributors) | | | 90,621 | | | | 4,138 | |
| | Greggs PLC (Hotels, restaurants & leisure) | | | 75,845 | | | | 2,515 | |
| | Renishaw PLC (Electronic equipment, instruments & components) | | | 23,043 | | | | 1,051 | |
| | Rotork PLC (Machinery) | | | 825,280 | | | | 3,404 | |
| | Softcat PLC (IT services) | | | 143,176 | | | | 2,482 | |
| | | | | | | | | 19,892 | |
| | | | | | | | | | |
| | Canada—7.5% | | | | | | | | |
| | Boyd Group Services, Inc. (Commercial services & supplies) | | | 13,905 | | | | 2,922 | |
| | EQB, Inc. (Banks) | | | 26,764 | | | | 1,762 | |
| * | Kinaxis, Inc. (Software) | | | 25,043 | | | | 2,811 | |
| | North West Co., Inc. (Consumer staples distribution & retail) | | | 122,164 | | | | 3,620 | |
See accompanying Notes to Financial Statements.
| 60 | Annual Report | December 31, 2023 |
International Small Cap Growth Fund
Portfolio of Investments, December 31, 2023 (all dollar amounts in thousands)
| | Issuer | | Shares or
Principal
Amount | | | Value | |
| | | | | | | | |
| | Common Stocks—(continued) | | | | | | | | |
| | | | | | | | | | |
| | Canada—(continued) | | | | | | | | |
| | Parkland Corp. (Oil, gas & consumable fuels) | | | 107,287 | | | $ | 3,458 | |
| | Richelieu Hardware Ltd. (Trading companies & distributors) | | | 48,427 | | | | 1,754 | |
| | Stella-Jones, Inc. (Paper & forest products) | | | 31,223 | | | | 1,817 | |
| | | | | | | | | 18,144 | |
| | | | | | | | | | |
| | Asia—4.6% | | | | | | | | |
| | Australia—3.0% | | | | | | | | |
| | Pro Medicus Ltd. (Health care technology) | | | 58,208 | | | | 3,801 | |
| | Steadfast Group Ltd. (Insurance) | | | 847,520 | | | | 3,361 | |
| | | | | | | | | 7,162 | |
| | New Zealand—1.3% | | | | | | | | |
| | Mainfreight Ltd. (Air freight & logistics) | | | 70,560 | | | | 3,091 | |
| | Singapore—0.3% | | | | | | | | |
| | Sheng Siong Group Ltd. (Consumer staples distribution & retail) | | | 643,800 | | | | 781 | |
| | | | | | | | | | |
| | Emerging Europe, Africa—3.1% | | | | | | | | |
| | Greece—1.0% | | | | | | | | |
| | JUMBO SA (Specialty retail) | | | 91,655 | | | | 2,542 | |
| | Poland—1.0% | | | | | | | | |
| * | Dino Polska SA (Consumer staples distribution & retail) | | | 19,682 | | | | 2,304 | |
| | South Africa—1.1% | | | | | | | | |
| | Bidvest Group Ltd. (Industrial conglomerates) | | | 83,400 | | | | 1,150 | |
| | Clicks Group Ltd. (Consumer staples distribution & retail) | | | 80,170 | | | | 1,428 | |
| | | | | | | | | 2,578 | |
| | Total Common Stocks—98.9%
(cost $194,330) | | | | | | | 238,032 | |
| | Repurchase Agreement | | | | | | | | |
| | Fixed Income Clearing Corporation, 2.300% dated 12/29/23, due 01/02/24, repurchase price $2,514, collateralized by U.S. Treasury Note, 3.875%, due 12/31/27, valued at $2,564 | | | $2,514 | | | | 2,514 | |
| | Total Repurchase Agreement—1.0%
(cost $2,514) | | | | | | | 2,514 | |
| | Total Investments—99.9%
(cost $196,844) | | | | | | | 240,546 | |
| | Cash and other assets, less liabilities—0.1% | | | | | | | 200 | |
| | Net assets—100.0% | | | | | | $ | 240,746 | |
ADR = American Depository Receipt
* = Non-income producing security
† = U.S. listed foreign security
At December 31, 2023, the Fund’s Portfolio of Investments includes the following industry categories (as a percentage of long-term investments):
| Industrials | | | 32.3 | % |
| Information Technology | | | 21.8 | % |
| Financials | | | 13.2 | % |
| Consumer Discretionary | | | 11.1 | % |
| Consumer Staples | | | 9.4 | % |
| Health Care | | | 5.1 | % |
| Communication Services | | | 2.7 | % |
| Real Estate | | | 2.1 | % |
| Energy | | | 1.5 | % |
| Materials | | | 0.8 | % |
| Total | | | 100.0 | % |
At December 31, 2023, the Fund’s Portfolio of Investments includes the following currency categories (as a percentage of long-term investments):
| Japanese Yen | | | 18.0 | % |
| Euro | | | 17.8 | % |
| Swedish Krona | | | 9.9 | % |
| British Pound Sterling | | | 8.6 | % |
| Indian Rupee | | | 8.5 | % |
| Canadian Dollar | | | 7.6 | % |
| New Taiwan Dollar | | | 6.1 | % |
| Mexican Peso | | | 5.8 | % |
| Swiss Franc | | | 3.5 | % |
| Brazilian Real | | | 3.4 | % |
| Australian Dollar | | | 3.0 | % |
| Norwegian Krone | | | 1.4 | % |
| New Zealand Dollar | | | 1.3 | % |
| South African Rand | | | 1.1 | % |
| All Other Currencies | | | 4.0 | % |
| Total | | | 100.0 | % |
See accompanying Notes to Financial Statements.
| December 31, 2023 | William Blair Funds | 61 |
| | Emerging Markets Leaders Fund |
| | |
| | The Emerging Markets Leaders Fund seeks long-term capital appreciation. |
| | |
| | AN OVERVIEW FROM THE PORTFOLIO MANAGERS |
| | |
 Todd M. McClone, CFA 
Kenneth J. McAtamney 
Hugo Scott-Gall | The William Blair Emerging Markets Leaders Fund (Class N shares) (the “Fund”) posted a 5.85% increase, net of fees, for the year-ended December 31, 2023. By comparison, the Fund’s benchmark index, the MSCI Emerging Markets Index (net) (the “Index”), increased 9.83%. The underperformance versus the Index year-to-date was primarily driven by stock selection in China, while selection in Financials, Industrials, and Energy also detracted from relative performance. Within China, the weaker-than-expected consumer recovery following China’s COVID reopening early in the year drove underperformance in consumer exposure, including China Tourism Group Duty Free and Foshan Haitian Flavouring & Food Co. China Tourism Group Duty Free is the leading Chinese duty-free operator. Following a sharp rally in late 2022, as the government announced the abandonment of COVID lockdowns, the stock weakened amid concerns about the pace of the consumer recovery in China and specifically the slow resumption of international travel. While China Tourism operates non-airport duty-free shopping, foot traffic in those locations has been lighter than expected. Additionally, operational concerns, including gate capacity at arrival airports and maintenance requirements for wide-body jets that were not operated through China’s COVID lockdowns, have reduced near-term expectations for a sales recovery in airport locations. Haitian is the largest Chinese soy sauce producer both in capacity and market share. The share price declined during the period as Haitian’s results missed expectations and underperformed peers on a slower-than-expected recovery of its catering channel. While we believe Haitian has one of the most-attractive long-term growth profiles in China’s packaged foods industry given its leadership in the fast-growing and highly fragmented seasoning and sauce industry, the recovery from COVID lows is now expected to be more prolonged. Both companies were exited during the period. Within Financials, Capitec was the largest detractor. Capitec is a financial services disruptor in the South African market. The company continues to leverage its cost leadership, product expansion, and digital advantage to attract new retail customers and support its outlook for growth and returns. The challenging operating environment in South Africa with electricity outages, weaker macroeconomic backdrop, and higher interest rates weighed on Capitec’s near-term earnings and pressured the stock price. In Industrials, Contemporary Amperex Technology Co Ltd (CATL) was the primary detractor. CATL manufactures batteries primarily for use in electric vehicles (“EVs”), with a small amount used by utility companies and other large power users for stationary power storage. The stock underperformed as higher-than-normal rebates on large customer orders drove a deterioration of margins and given geopolitical concerns for Chinese EVs and components. CATL continues to innovate and maintain a clear edge versus the competition with their fast-charging battery as the latest example. Furthermore, Europe is trending better than expected despite recent trade concerns and has more than offset modest declines in domestic market share. Partially offsetting these effects was strong stock selection in Information Technology and Consumer Staples, as well as an overweight to, and selection within Latin America led by MercadoLibre and Raia Drogasil. MercadoLibre is a leading e-commerce platform in Latin America with a best-in-class ecosystem of services such as logistics and payments, which allows the company to exploit attractive growth opportunities of the large and underpenetrated total addressable market. MercadoLibre continued to deliver strong results in the most recent quarter, with broad-based growth across all key geographies and business segments. Despite strong fundamental results year to date that have pushed valuations lower, we trimmed the position on the rising risk of competition in Latin American e-commerce. Raia Drogasil owns and operates |
| 62 | Annual Report | December 31, 2023 |
Emerging Markets Leaders Fund
a chain of pharmacies, offering skin care, personal care, and cosmetics products in Brazil. The stock outperformed on strong fundamental performance as it continues to take market share and consolidates the fragmented Brazilian pharmacy market. Its operating leverage and cost efficiencies have continued to drive margin expansion and double-digit growth.
Within Information Technology, MediaTek was the strongest performer. MediaTek is a Taiwanese semiconductor company specializing in chips used in wireless communication and mobile devices. MediaTek also benefited from the easing destocking trend. We believe the company is at the end of the cyclical trough in terms of revenue growth, and management’s recently increased guidance of higher growth confirms that thesis. Additionally, improved pricing power alongside a less aggressive competitive backdrop is evidenced by resilient gross margins in the recent period.
Please refer to the Global Markets Review and Outlook relating to the Fund beginning on page 32.
| December 31, 2023 | William Blair Funds | 63 |
Emerging Markets Leaders Fund
Performance Highlights (Unaudited)
| |
| Average Annual Total Returns through 12/31/2023 |
| | | | | | | | | |
| | | 1 Year | | 3 Year | | 5 Year | | 10 Year |
| Class N | | | 5.85 | % | | | (10.29 | )% | | | 3.29 | % | | | 1.95 | % |
| Class I | | | 6.13 | | | | (10.03 | ) | | | 3.57 | | | | 2.25 | |
| Class R6 | | | 6.22 | | | | (9.98 | ) | | | 3.63 | | | | 2.30 | |
| MSCI Emerging Markets Index (net) | | | 9.83 | | | | (5.08 | ) | | | 3.68 | | | | 2.66 | |
Performance cited represents past performance. Past performance does not guarantee future results and current performance may be lower or higher than the data quoted. Results shown are average annual total returns, which assume reinvestment of dividends and capital gains. Investment returns and principal will fluctuate and you may have a gain or loss when you sell shares. For the most current month-end performance information, please call 1-800-742-7272, or visit our Web site at www.williamblairfunds.com. International investing involves special risk considerations, including currency fluctuations, lower liquidity, economic and political risk. These risks may be magnified when investing in emerging markets. From time to time, the investment adviser may waive fees or reimburse expenses for the Fund. Without these waivers/reimbursements, performance would be lower. Class N shares are not subject to a sales load. Class I shares are not subject to a sales load or distribution (Rule 12b-1) fees. Class R6 shares are not subject to a sales load, distribution (Rule 12b-1) fees, or sub-transfer agent fees.
The performance highlights and graph presented above do not reflect the deduction of taxes that a shareholder would pay on fund distributions or the redemption of fund shares.
The Morgan Stanley Capital International (MSCI) Emerging Markets Index (net) is a free float-adjusted market-capitalization-weighted index that is designed to measure equity market performance of emerging markets. This index approximates the minimum possible dividend reinvestment by deducting for the highest possible withholding tax rates of those markets.
This report identifies the Fund’s investments on December 31, 2023. These holdings are subject to change. Not all stocks in the Fund performed the same, nor is there any guarantee that these stocks will perform as well in the future. Market forecasts provided in this report may not necessarily come to pass.
Sector Diversification (Unaudited)

The sector diversification shown is based on the total long-term securities.
| 64 | Annual Report | December 31, 2023 |
Emerging Markets Leaders Fund
Portfolio of Investments, December 31, 2023 (all dollar amounts in thousands)
| | | | | | | | |
| | | | | | | | |
| | Issuer | | Shares | | | Value | |
| | | | | | | | | | |
| | Common Stocks | | | | | | | | |
| | | | | | | | | | |
| | Emerging Asia—76.5% | | | | | | | | |
| | China—20.5% | | | | | | | | |
| | Airtac International Group (Machinery) | | | 148,000 | | | $ | 4,871 | |
| | Alibaba Group Holding Ltd. (Broadline retail) | | | 710,528 | | | | 6,879 | |
| | ANTA Sports Products Ltd. (Textiles, apparel & luxury goods) | | | 243,000 | | | | 2,357 | |
| | Contemporary Amperex Technology Co. Ltd. (Electrical equipment) | | | 124,120 | | | | 2,844 | |
| | Kweichow Moutai Co. Ltd. (Beverages) | | | 32,159 | | | | 7,790 | |
| | Midea Group Co. Ltd. (Household durables) | | | 652,695 | | | | 5,004 | |
| * | PDD Holdings, Inc.—ADR (Broadline retail) | | | 26,022 | | | | 3,807 | |
| | Shenzhen Inovance Technology Co. Ltd. (Machinery) | | | 337,800 | | | | 2,993 | |
| | Silergy Corp. (Semiconductors & semiconductor equipment) | | | 213,000 | | | | 3,470 | |
| | Tencent Holdings Ltd. (Interactive media & services) | | | 227,700 | | | | 8,561 | |
| | Zhangzhou Pientzehuang Pharmaceutical Co. Ltd. (Pharmaceuticals) | | | 96,600 | | | | 3,281 | |
| | | | | | | | | 51,857 | |
| | India—23.3% | | | | | | | | |
| | Apollo Hospitals Enterprise Ltd. (Health care providers & services) | | | 32,669 | | | | 2,241 | |
| | Asian Paints Ltd. (Chemicals) | | | 75,186 | | | | 3,067 | |
| | Bajaj Finance Ltd. (Consumer finance) | | | 14,237 | | | | 1,251 | |
| | Britannia Industries Ltd. (Food products) | | | 35,065 | | | | 2,250 | |
| | Havells India Ltd. (Electrical equipment) | | | 136,668 | | | | 2,246 | |
| | HDFC Bank Ltd. (Banks) | | | 569,519 | | | | 11,694 | |
| | Hindustan Unilever Ltd. (Personal care products) | | | 75,665 | | | | 2,418 | |
| | Infosys Ltd. (IT services) | | | 213,866 | | | | 3,965 | |
| * | InterGlobe Aviation Ltd. (Passenger airlines) | | | 160,698 | | | | 5,707 | |
| | Kotak Mahindra Bank Ltd. (Banks) | | | 172,385 | | | | 3,944 | |
| | Mahindra & Mahindra Ltd. (Automobiles) | | | 180,348 | | | | 3,739 | |
| | Pidilite Industries Ltd. (Chemicals) | | | 79,874 | | | | 2,601 | |
| | Reliance Industries Ltd. (Oil, gas & consumable fuels) | | | 279,028 | | | | 8,675 | |
| | Tata Consumer Products Ltd. (Food products) | | | 63,264 | | | | 828 | |
| | Titan Co. Ltd. (Textiles, apparel & luxury goods) | | | 49,952 | | | | 2,213 | |
| | Varun Beverages Ltd. (Beverages) | | | 155,720 | | | | 2,315 | |
| | | | | | | | | 59,154 | |
| | Indonesia—6.8% | | | | | | | | |
| | Bank Central Asia Tbk. PT (Banks) | | | 16,232,800 | | | | 9,910 | |
| | Bank Rakyat Indonesia Persero Tbk. PT (Banks) | | | 13,109,900 | | | | 4,875 | |
| | Telkom Indonesia Persero Tbk. PT (Diversified telecommunication services) | | | 9,280,600 | | | | 2,381 | |
| | | | | | | | | 17,166 | |
| | | | | | | | |
| | | | | | | | |
| | Issuer | | Shares | | | Value | |
| | | | | | | | | | |
| | Common Stocks—(continued) | | | | | | | | |
| | | | | | | | | | |
| | Emerging Asia—(continued) | | | | | | | | |
| | South Korea—8.7% | | | | | | | | |
| | Samsung Electronics Co. Ltd. (Technology hardware, storage & peripherals) | | | 261,175 | | | $ | 15,919 | |
| | SK Hynix, Inc. (Semiconductors & semiconductor equipment) | | | 56,655 | | | | 6,225 | |
| | | | | | | | | 22,144 | |
| | Taiwan—14.4% | | | | | | | | |
| | Advantech Co. Ltd. (Technology hardware, storage & peripherals) | | | 173,000 | | | | 2,097 | |
| | ASPEED Technology, Inc. (Semiconductors & semiconductor equipment) | | | 17,000 | | | | 1,728 | |
| | eMemory Technology, Inc. (Semiconductors & semiconductor equipment) | | | 32,000 | | | | 2,555 | |
| | MediaTek, Inc. (Semiconductors & semiconductor equipment) | | | 204,000 | | | | 6,747 | |
| | Taiwan Semiconductor Manufacturing Co. Ltd.—ADR (Semiconductors & semiconductor equipment) | | | 196,639 | | | | 20,450 | |
| | Voltronic Power Technology Corp. (Electrical equipment) | | | 52,000 | | | | 2,897 | |
| | | | | | | | | 36,474 | |
| | Thailand—2.8% | | | | | | | | |
| | Airports of Thailand PCL (Transportation infrastructure) | | | 1,935,300 | | | | 3,388 | |
| | Bangkok Dusit Medical Services PCL (Health care providers & services) | | | 4,546,900 | | | | 3,697 | |
| | | | | | | | | 7,085 | |
| | | | | | | | | | |
| | Emerging Latin America—20.2% | | | | | | | | |
| | Argentina—1.6% | | | | | | | | |
| * | Globant SA (IT services)† | | | 17,046 | | | | 4,057 | |
| | Brazil—14.0% | | | | | | | | |
| | B3 SA - Brasil Bolsa Balcao (Capital markets) | | | 1,320,600 | | | | 3,956 | |
| | Banco BTG Pactual SA (Capital markets) | | | 546,700 | | | | 4,233 | |
| * | MercadoLibre, Inc. (Broadline retail) | | | 4,997 | | | | 7,853 | |
| | Raia Drogasil SA (Consumer staples distribution & retail) | | | 694,784 | | | | 4,205 | |
| | Rumo SA (Ground transportation) | | | 863,000 | | | | 4,077 | |
| | TOTVS SA (Software) | | | 746,000 | | | | 5,174 | |
| | WEG SA (Electrical equipment) | | | 808,600 | | | | 6,144 | |
| | | | | | | | | 35,642 | |
| | Mexico—4.6% | | | | | | | | |
| | Grupo Aeroportuario del Pacifico SAB de CV (Transportation infrastructure) | | | 170,700 | | | | 2,994 | |
| | Grupo Financiero Banorte SAB de CV (Banks) | | | 265,400 | | | | 2,674 | |
| | Wal-Mart de Mexico SAB de CV (Consumer staples distribution & retail) | | | 1,426,700 | | | | 5,998 | |
| | | | | | | | | 11,666 | |
See accompanying Notes to Financial Statements.
| December 31, 2023 | William Blair Funds | 65 |
Emerging Markets Leaders Fund
Portfolio of Investments, December 31, 2023 (all dollar amounts in thousands)
| | | | | | | | |
| | | | | | | | |
| | Issuer | | Shares | | | Value | |
| | | | | | | | | | |
| | Common Stocks—(continued) | | | | | | | | |
| | | | | | | | | | |
| | Emerging Europe, Mid-East, Africa—4.6% | | | | | | | | |
| | Saudi Arabia—2.4% | | | | | | | | |
| | Saudi Arabian Oil Co. (Oil, gas & consumable fuels) | | | 696,856 | | | $ | 6,142 | |
| | South Africa—0.8% | | | | | | | | |
| | Capitec Bank Holdings Ltd. (Banks) | | | 18,068 | | | | 2,001 | |
| | Turkey—0.7% | | | | | | | | |
| | BIM Birlesik Magazalar AS (Consumer staples distribution & retail) | | | 180,688 | | | | 1,844 | |
| | United Arab Emirates—0.7% | | | | | | | | |
| | Abu Dhabi National Oil Co. for Distribution PJSC (Specialty retail) | | | 1,757,279 | | | | 1,770 | |
| | | | | | | | | | |
| | Asia—1.4% | | | | | | | | |
| | Hong Kong—1.4% | | | | | | | | |
| | AIA Group Ltd. (Insurance) | | | 397,400 | | | | 3,463 | |
| | Total Common Stocks—102.7%
(cost $216,846) | | | | | | | 260,465 | |
| | Total Investments—102.7%
(cost $216,846) | | | | | | | 260,465 | |
| | Liabilities, plus cash and other assets—(2.7)% | | | | | | | (6,880 | ) |
| | Net assets—100.0% | | | | | | $ | 253,585 | |
ADR = American Depository Receipt
* = Non-income producing security
† = U.S. listed foreign security
At December 31, 2023, the Fund’s Portfolio of Investments includes the following industry categories (as a percentage of long-term investments):
| Information Technology | | | 27.8 | % |
| Financials | | | 18.4 | % |
| Industrials | | | 14.7 | % |
| Consumer Discretionary | | | 12.9 | % |
| Consumer Staples | | | 10.6 | % |
| Energy | | | 5.7 | % |
| Communication Services | | | 4.2 | % |
| Health Care | | | 3.5 | % |
| Materials | | | 2.2 | % |
| Total | | | 100.0 | % |
At December 31, 2023, the Fund’s Portfolio of Investments includes the following currency categories (as a percentage of long-term investments):
| Indian Rupee | | | 22.7 | % |
| U.S. Dollar | | | 13.9 | % |
| Brazilian Real | | | 10.7 | % |
| New Taiwan Dollar | | | 9.3 | % |
| South Korean Won | | | 8.5 | % |
| Chinese Yuan Renminbi | | | 8.4 | % |
| Hong Kong Dollar | | | 8.2 | % |
| Indonesian Rupiah | | | 6.6 | % |
| Mexican Peso | | | 4.5 | % |
| South African Rand | | | 3.1 | % |
| Thai Baht | | | 2.7 | % |
| All Other Currencies | | | 1.4 | % |
| Total | | | 100.0 | % |
See accompanying Notes to Financial Statements.
| 66 | Annual Report | December 31, 2023 |
| | Emerging Markets Growth Fund |
| | |
| | The Emerging Markets Growth Fund seeks long-term capital appreciation. |
| | |
| | AN OVERVIEW FROM THE PORTFOLIO MANAGERS |
| | |

Todd M. McClone, CFA 
Casey K. Preyss, CFA 
Vivian Lin Thurston, CFA | The William Blair Emerging Markets Growth Fund (Class N shares) (the “Fund”) posted a 9.99% increase, net of fees, for the year ended December 31, 2023. By comparison, the Fund’s benchmark index, the MSCI Emerging Markets IMI (net) (the “Index”), increased 11.67%. Performance versus the Index year-to-date was driven by a combination of country allocation and stock selection effects despite continued style headwinds amid strong outperformance of low-valuation stocks. Stock selection was particularly strong within the Consumer Staples, Real Estate, and Information Technology sectors. Within Consumer Staples, Varun Beverages was a notable contributor to relative performance. The share price increase was underpinned by a strong operating momentum as the company continued to deliver better-than-expected results, driven by improving volume growth and margin expansion. In addition, shares jumped in December on the announcement of the company’s acquisition of South Africa’s Beverage Company, which owns PepsiCo’s distribution rights in South Africa. Macrotech Developers (“Lodha”) boosted relative performance within the Real Estate sector. Lodha is one of the largest housing developers in India with multiple brands that cater to different segments. It benefits from a strong brand, above average project execution, large land bank, and the ability to grow through joint ventures. The company delivered very strong operating results and is expected to continue to benefit from favorable dynamics in the India housing market. Within Information Technology, semiconductor and semi equipment companies added the most, in particular, Taiwan Semiconductor Manufacturing (“TSMC”). TSMC is the world-leading independent foundry with unique manufacturing capabilities in leading-edge chips. The stock strengthened despite challenging near-term dynamics including soft demand from China as cutting-edge technology companies globally outperformed on expectations for artificial intelligence (“AI”) to drive long-term demand. The stock climbed in the last quarter amid signs of recovery in select end-markets and continued strength in AI demand. Partially offsetting these effects was negative stock selection within the Financials and Consumer Discretionary sectors. AIA and HDFC bank were key detractors within Financials. AIA Group is a leading provider of life insurance throughout Asia. While overall fundamentals were positive and exceeded expectations in the first half of the year, AIA’s product mix in China deteriorated as consumer weakness has led to a shift to lower-margin savings products from higher-margin lines. Near- and long-term growth trajectories remain strong, driven by AIA’s strong distribution network across Asia which is a unique competitive advantage for the firm and the stock trades at an attractive valuation relative to its history. HDFC Bank is a high-quality Indian banking franchise with a healthy funding and capital base, solid asset quality, and high recurring fee income. The stock was a detractor, primarily due to weakness in the third quarter following the long-expected merger with HDFC Ltd, which led to a slight reduction in reported book value post-merger. While accounting book value was lower, there was no change in economic value. We expect further merger-related noise for the next year or so but expect the company to execute well on the merger and to continue compounding with high and stable returns over the long-term. Within Consumer Discretionary, China Tourism Group Duty Free is the leading Chinese duty-free operator and Li Ning, a leading sports brand in China, drove the sector underperformance. Following a sharp rally in late 2022, as the government announced the abandonment of COVID lockdowns, China Tourism Group’s stock weakened in 2023 amid concerns about the pace of the consumer recovery in China and specifically the slow resumption of international travel. In addition, operational concerns coupled with regulatory headwinds reduced both the near-and long-term outlook for the stock. We exited the position in the second quarter of 2023. Li Ning reported a weaker-than-expected third-quarter trading update and lowered its full year guidance. Investor sentiment was hampered by the weaker results and outlook on a deteriorating wholesale channel coupled with uncertainty on inventory levels through 2024. We liquidated the position during the fourth quarter as a result. Please refer to the Global Markets Review and Outlook relating to the Fund beginning on page 32. |
| December 31, 2023 | William Blair Funds | 67 |
Emerging Markets Growth Fund
Performance Highlights (Unaudited)
| Average Annual Total Returns through 12/31/2023 |
| | | | | | | | | |
| | | 1 Year | | 3 Year | | 5 Year | | 10 Year |
| Class N | | | 9.99 | % | | | (8.94 | )% | | | 6.28 | % | | | 3.48 | % |
| Class I | | | 10.23 | | | | (8.71 | ) | | | 6.55 | | | | 3.74 | |
| Class R6 | | | 10.26 | | | | (8.65 | ) | | | 6.62 | | | | 3.83 | |
| MSCI Emerging Markets IMI (net) | | | 11.67 | | | | (3.71 | ) | | | 4.45 | | | | 3.00 | |
Performance cited represents past performance. Past performance does not guarantee future results and current performance may be lower or higher than the data quoted. Results shown are average annual total returns, which assume reinvestment of dividends and capital gains. Investment returns and principal will fluctuate and you may have a gain or loss when you sell shares. For the most current month-end performance information, please call 1-800-742-7272, or visit our Web site at www.williamblairfunds.com. From time to time, the investment adviser may waive fees or reimburse expenses for the Fund. Without these waivers/reimbursements, performance would be lower. International investing involves special risk considerations, including currency fluctuations, lower liquidity, economic and political risk. These risks may be magnified when investing in emerging markets. Class N shares are not subject to a sales load. Class I shares are not subject to a sales load or distribution (Rule 12b-1) fees. Class R6 shares are not subject to a sales load, distribution (Rule 12b-1) fees, or sub-transfer agent fees.
The performance highlights and graph presented above do not reflect the deduction of taxes that a shareholder would pay on fund distributions or the redemption of fund shares.
The Morgan Stanley Capital International (MSCI) Emerging Markets Investable Market Index (IMI) (net) is a free float-adjusted market capitalization weighted index that is designed to measure the equity market performance of emerging markets. This index approximates the minimum possible dividend reinvestment by deducting for the highest possible withholding tax rates of those markets.
This report identifies the Fund’s investments on December 31, 2023. These holdings are subject to change. Not all stocks in the Fund performed the same, nor is there any guarantee that these stocks will perform as well in the future. Market forecasts provided in this report may not necessarily come to pass.
Sector Diversification (Unaudited)

The sector diversification shown is based on the total long-term securities.
| 68 | Annual Report | December 31, 2023 |
Emerging Markets Growth Fund
Portfolio of Investments, December 31, 2023 (all dollar amounts in thousands)
| | | | | | | | |
| | | | | | | | |
| | Issuer | | Shares | | | Value | |
| | | | | | | | | | |
| | Common Stocks | | | | | | | | |
| | | | | | | | | | |
| | Emerging Asia—77.3% | | | | | | | | |
| | China—13.3% | | | | | | | | |
| | Airtac International Group (Machinery) | | | 230,852 | | | $ | 7,597 | |
| | ANTA Sports Products Ltd. (Textiles, apparel & luxury goods) | | | 231,000 | | | | 2,241 | |
| | Huaming Power Equipment Co. Ltd. (Machinery) | | | 519,600 | | | | 1,030 | |
| | Huaneng Lancang River Hydropower, Inc. (Independent power & renewable electricity producers) | | | 2,422,600 | | | | 2,934 | |
| | Kweichow Moutai Co. Ltd. (Beverages) | | | 66,574 | | | | 16,126 | |
| | NetEase, Inc. (Entertainment) | | | 859,500 | | | | 15,476 | |
| * | PDD Holdings, Inc.—ADR (Broadline retail) | | | 141,147 | | | | 20,651 | |
| | Proya Cosmetics Co. Ltd. (Personal care products) | | | 236,488 | | | | 3,299 | |
| | Shenzhen Inovance Technology Co. Ltd. (Machinery) | | | 245,163 | | | | 2,172 | |
| | Tencent Holdings Ltd. (Interactive media & services) | | | 879,160 | | | | 33,056 | |
| | Wuliangye Yibin Co. Ltd. (Beverages) | | | 108,399 | | | | 2,135 | |
| | Zhangzhou Pientzehuang Pharmaceutical Co. Ltd. (Pharmaceuticals) | | | 85,206 | | | | 2,894 | |
| | | | | | | | | 109,611 | |
| | India—27.1% | | | | | | | | |
| | ABB India Ltd. (Electrical equipment) | | | 112,773 | | | | 6,330 | |
| | APL Apollo Tubes Ltd. (Metals & mining) | | | 189,079 | | | | 3,490 | |
| | Apollo Hospitals Enterprise Ltd. (Health care providers & services) | | | 77,010 | | | | 5,282 | |
| | Asian Paints Ltd. (Chemicals) | | | 74,608 | | | | 3,044 | |
| | Astral Ltd. (Building products) | | | 96,831 | | | | 2,224 | |
| | Bajaj Finance Ltd. (Consumer finance) | | | 91,060 | | | | 8,005 | |
| | Bharat Electronics Ltd. (Aerospace & defense) | | | 2,677,109 | | | | 5,903 | |
| | Britannia Industries Ltd. (Food products) | | | 50,686 | | | | 3,253 | |
| | Central Depository Services India Ltd. (Capital markets) | | | 119,895 | | | | 2,631 | |
| | CG Power & Industrial Solutions Ltd. (Electrical equipment) | | | 672,313 | | | | 3,652 | |
| | Cholamandalam Investment & Finance Co. Ltd. (Consumer finance) | | | 205,145 | | | | 3,106 | |
| | Coforge Ltd. (IT services) | | | 43,782 | | | | 3,307 | |
| | Cummins India Ltd. (Machinery) | | | 124,767 | | | | 2,949 | |
| | Dixon Technologies India Ltd. (Household durables) | | | 69,268 | | | | 5,456 | |
| | Escorts Kubota Ltd. (Machinery) | | | 60,030 | | | | 2,156 | |
| * | Godrej Properties Ltd. (Real estate management & development) | | | 108,676 | | | | 2,621 | |
| | Havells India Ltd. (Electrical equipment) | | | 124,220 | | | | 2,042 | |
| | HDFC Bank Ltd. (Banks) | | | 1,073,338 | | | | 22,039 | |
| | HDFC Life Insurance Co. Ltd. (Insurance) | | | 249,338 | | | | 1,936 | |
| | Indian Hotels Co. Ltd. (Hotels, restaurants & leisure) | | | 847,809 | | | | 4,464 | |
| * | InterGlobe Aviation Ltd. (Passenger airlines) | | | 80,561 | | | | 2,861 | |
| | | | | | | | |
| | | | | | | | |
| | Issuer | | Shares | | | Value | |
| | | | | | | | | | |
| | Common Stocks—(continued) | | | | | | | | |
| | | | | | | | | | |
| | Emerging Asia—(continued) | | | | | | | | |
| | India—(continued) | | | | | | | | |
| | Jindal Stainless Ltd. (Metals & mining) | | | 181,213 | | | $ | 1,241 | |
| | Kajaria Ceramics Ltd. (Building products) | | | 142,536 | | | | 2,240 | |
| * | Kaynes Technology India Ltd. (Electronic equipment, instruments & components) | | | 65,035 | | | | 2,040 | |
| | KEI Industries Ltd. (Electrical equipment) | | | 126,739 | | | | 4,944 | |
| | KPIT Technologies Ltd. (Software) | | | 335,367 | | | | 6,127 | |
| | Macrotech Developers Ltd. (Real estate management & development) | | | 309,713 | | | | 3,807 | |
| | Mahindra & Mahindra Ltd. (Automobiles) | | | 196,361 | | | | 4,071 | |
| | Max Healthcare Institute Ltd. (Health care providers & services) | | | 494,406 | | | | 4,076 | |
| | Motherson Sumi Wiring India Ltd. (Automobile components) | | | 2,699,323 | | | | 2,001 | |
| | Nestle India Ltd. (Food products) | | | 16,866 | | | | 5,400 | |
| | NTPC Ltd. (Independent power & renewable electricity producers) | | | 3,181,948 | | | | 11,873 | |
| | Oberoi Realty Ltd. (Real estate management & development) | | | 152,496 | | | | 2,615 | |
| | Pidilite Industries Ltd. (Chemicals) | | | 66,068 | | | | 2,152 | |
| | Polycab India Ltd. (Electrical equipment) | | | 71,745 | | | | 4,742 | |
| | Reliance Industries Ltd. (Oil, gas & consumable fuels) | | | 629,285 | | | | 19,564 | |
| | Tata Consultancy Services Ltd. (IT services) | | | 49,967 | | | | 2,282 | |
| | Tata Consumer Products Ltd. (Food products) | | | 272,258 | | | | 3,563 | |
| | Tata Motors Ltd. (Automobiles) | | | 472,215 | | | | 4,423 | |
| | Titagarh Rail System Ltd. (Machinery) | | | 287,427 | | | | 3,605 | |
| | Titan Co. Ltd. (Textiles, apparel & luxury goods) | | | 170,737 | | | | 7,563 | |
| | Trent Ltd. (Specialty retail) | | | 164,166 | | | | 6,019 | |
| | Tube Investments of India Ltd. (Automobile components) | | | 88,631 | | | | 3,770 | |
| | TVS Motor Co. Ltd. (Automobiles) | | | 122,730 | | | | 2,991 | |
| | UNO Minda Ltd. (Automobile components) | | | 564,828 | | | | 4,677 | |
| | Varun Beverages Ltd. (Beverages) | | | 674,678 | | | | 10,029 | |
| | | | | | | | | 222,566 | |
| | Indonesia—5.4% | | | | | | | | |
| | Bank Central Asia Tbk. PT (Banks) | | | 38,219,695 | | | | 23,333 | |
| | Bank Rakyat Indonesia Persero Tbk. PT (Banks) | | | 51,020,251 | | | | 18,971 | |
| | Mitra Adiperkasa Tbk. PT (Broadline retail) | | | 15,557,100 | | | | 1,809 | |
| | | | | | | | | 44,113 | |
| | Philippines—1.1% | | | | | | | | |
| | BDO Unibank, Inc. (Banks) | | | 2,189,854 | | | | 5,161 | |
| | International Container Terminal Services, Inc. (Transportation infrastructure) | | | 855,950 | | | | 3,815 | |
| | | | | | | | | 8,976 | |
See accompanying Notes to Financial Statements.
| December 31, 2023 | William Blair Funds | 69 |
Emerging Markets Growth Fund
Portfolio of Investments, December 31, 2023 (all dollar amounts in thousands)
| | | | | | | | |
| | | | | | | | |
| | Issuer | | Shares | | | Value | |
| | | | | | | | | | |
| | Common Stocks—(continued) | | | | | | | | |
| | | | | | | | | | |
| | Emerging Asia—(continued) | | | | | | | | |
| | South Korea—8.7% | | | | | | | | |
| | JYP Entertainment Corp. (Entertainment) | | | 28,472 | | | $ | 2,239 | |
| | Orion Corp. (Food products) | | | 22,577 | | | | 2,035 | |
| * | Samsung Biologics Co. Ltd. (Life sciences tools & services) | | | 3,555 | | | | 2,098 | |
| | Samsung Electronics Co. Ltd. (Technology hardware, storage & peripherals) | | | 784,398 | | | | 47,811 | |
| | SK Hynix, Inc. (Semiconductors & semiconductor equipment) | | | 157,565 | | | | 17,311 | |
| | | | | | | | | 71,494 | |
| | Taiwan—20.6% | | | | | | | | |
| | Accton Technology Corp. (Communications equipment) | | | 363,000 | | | | 6,186 | |
| | Advantech Co. Ltd. (Technology hardware, storage & peripherals) | | | 216,409 | | | | 2,623 | |
| | Alchip Technologies Ltd. (Semiconductors & semiconductor equipment) | | | 118,000 | | | | 12,592 | |
| | ASMedia Technology, Inc. (Semiconductors & semiconductor equipment) | | | 56,000 | | | | 3,312 | |
| | ASPEED Technology, Inc. (Semiconductors & semiconductor equipment) | | | 63,300 | | | | 6,435 | |
| | Delta Electronics, Inc. (Electronic equipment, instruments & components) | | | 631,000 | | | | 6,445 | |
| | E.Sun Financial Holding Co. Ltd. (Banks) | | | 3,576,723 | | | | 3,007 | |
| | Elite Material Co. Ltd. (Electronic equipment, instruments & components) | | | 541,000 | | | | 6,734 | |
| | eMemory Technology, Inc. (Semiconductors & semiconductor equipment) | | | 58,000 | | | | 4,630 | |
| | Faraday Technology Corp. (Semiconductors & semiconductor equipment) | | | 209,000 | | | | 2,431 | |
| | Global Unichip Corp. (Semiconductors & semiconductor equipment) | | | 96,000 | | | | 5,443 | |
| | Innodisk Corp. (Technology hardware, storage & peripherals) | | | 192,000 | | | | 1,952 | |
| | Lotes Co. Ltd. (Electronic equipment, instruments & components) | | | 152,132 | | | | 5,304 | |
| | MediaTek, Inc. (Semiconductors & semiconductor equipment) | | | 419,000 | | | | 13,857 | |
| | Sinbon Electronics Co. Ltd. (Electronic equipment, instruments & components) | | | 249,000 | | | | 2,426 | |
| | Taiwan Semiconductor Manufacturing Co. Ltd. (Semiconductors & semiconductor equipment) | | | 598,000 | | | | 11,554 | |
| | Taiwan Semiconductor Manufacturing Co. Ltd.—ADR (Semiconductors & semiconductor equipment) | | | 563,558 | | | | 58,610 | |
| | Tripod Technology Corp. (Electronic equipment, instruments & components) | | | 572,000 | | | | 3,634 | |
| | Unimicron Technology Corp. (Electronic equipment, instruments & components) | | | 803,000 | | | | 4,605 | |
| | Voltronic Power Technology Corp. (Electrical equipment) | | | 35,586 | | | | 1,983 | |
| | Wiwynn Corp. (Technology hardware, storage & peripherals) | | | 103,000 | | | | 6,125 | |
| | | | | | | | | 169,888 | |
| | | | | | | | |
| | | | | | | | |
| | Issuer | | Shares | | | Value | |
| | | | | | | | | | |
| | Common Stocks—(continued) | | | | | | | | |
| | | | | | | | | | |
| | Emerging Asia—(continued) | | | | | | | | |
| | Thailand—1.1% | | | | | | | | |
| | Bangkok Dusit Medical Services PCL (Health care providers & services) | | | 3,364,100 | | | $ | 2,735 | |
| | Bumrungrad Hospital PCL (Health care providers & services) | | | 574,000 | | | | 3,733 | |
| | Central Pattana PCL (Real estate management & development) | | | 1,322,600 | | | | 2,713 | |
| | | | | | | | | 9,181 | |
| | | | | | | | | | |
| | Emerging Latin America—14.9% | | | | | | | | |
| | Argentina—0.5% | | | | | | | | |
| * | Globant SA (IT services)† | | | 16,033 | | | | 3,816 | |
| | Brazil—8.5% | | | | | | | | |
| | Banco BTG Pactual SA (Capital markets) | | | 861,500 | | | | 6,670 | |
| | Itau Unibanco Holding SA—ADR (Banks) | | | 1,273,457 | | | | 8,850 | |
| | Localiza Rent a Car SA (Ground transportation) | | | 226,600 | | | | 2,967 | |
| * | MercadoLibre, Inc. (Broadline retail) | | | 14,985 | | | | 23,550 | |
| | Multiplan Empreendimentos Imobiliarios SA (Real estate management & development) | | | 428,100 | | | | 2,505 | |
| * | NU Holdings Ltd. (Banks)† | | | 343,243 | | | | 2,859 | |
| | Patria Investments Ltd. (Capital markets)† | | | 120,472 | | | | 1,868 | |
| | Raia Drogasil SA (Consumer staples distribution & retail) | | | 1,005,388 | | | | 6,085 | |
| | Rumo SA (Ground transportation) | | | 808,300 | | | | 3,819 | |
| | TOTVS SA (Software) | | | 715,100 | | | | 4,960 | |
| | Vinci Partners Investments Ltd. (Capital markets)† | | | 155,512 | | | | 1,703 | |
| | WEG SA (Electrical equipment) | | | 503,541 | | | | 3,826 | |
| | | | | | | | | 69,662 | |
| | Mexico—5.9% | | | | | | | | |
| * | Alsea SAB de CV (Hotels, restaurants & leisure) | | | 507,600 | | | | 1,924 | |
| | Arca Continental SAB de CV (Beverages) | | | 657,400 | | | | 7,161 | |
| | Corp. Inmobiliaria Vesta SAB de CV (Real estate management & development) | | | 853,600 | | | | 3,385 | |
| | Corp. Inmobiliaria Vesta SAB de CV—ADR (Real estate management & development) | | | 22,220 | | | | 880 | |
| | Fomento Economico Mexicano SAB de CV—ADR (Beverages) | | | 97,908 | | | | 12,762 | |
| | Grupo Aeroportuario del Centro Norte SAB de CV (Transportation infrastructure) | | | 217,300 | | | | 2,298 | |
| | Grupo Financiero Banorte SAB de CV (Banks) | | | 846,400 | | | | 8,528 | |
| | Prologis Property Mexico SA de CV (Industrial REITs) | | | 1,005,900 | | | | 4,769 | |
| | Wal-Mart de Mexico SAB de CV (Consumer staples distribution & retail) | | | 1,656,500 | | | | 6,964 | |
| | | | | | | | | 48,671 | |
See accompanying Notes to Financial Statements.
| 70 | Annual Report | December 31, 2023 |
Emerging Markets Growth Fund
Portfolio of Investments, December 31, 2023 (all dollar amounts in thousands)
| | | | | | | | |
| | | | | | | | |
| | Issuer | | Shares | | | Value | |
| | | | | | | | | | |
| | Common Stocks—(continued) | | | | | | | | |
| | | | | | | | | | |
| | Emerging Europe, Mid-East, Africa—6.5% | | | | | |
| | Poland—0.6% | | | | | | | | |
| * | Dino Polska SA (Consumer staples distribution & retail) | | | 44,226 | | | $ | 5,178 | |
| | Saudi Arabia—3.5% | | | | | | | | |
| | Aldrees Petroleum & Transport Services Co. (Oil, gas & consumable fuels) | | | 63,589 | | | | 2,998 | |
| | Alinma Bank (Banks) | | | 252,283 | | | | 2,607 | |
| | Arabian Contracting Services Co. (Media) | | | 14,561 | | | | 920 | |
| | Arabian Internet & Communications Services Co. (IT services) | | | 32,774 | | | | 3,026 | |
| | Bupa Arabia for Cooperative Insurance Co. (Insurance) | | | 47,528 | | | �� | 2,702 | |
| | Dr Sulaiman Al Habib Medical Services Group Co. (Health care providers & services) | | | 43,555 | | | | 3,296 | |
| | Elm Co. (IT services) | | | 25,536 | | | | 5,550 | |
| | Leejam Sports Co. JSC (Hotels, restaurants & leisure) | | | 63,623 | | | | 3,431 | |
| | Riyadh Cables Group Co. (Electrical equipment) | | | 98,258 | | | | 2,416 | |
| | Saudia Dairy & Foodstuff Co. (Food products) | | | 22,074 | | | | 1,960 | |
| | | | | | | | | 28,906 | |
| | South Africa—0.9% | | | | | | | | |
| | Bid Corp. Ltd. (Consumer staples distribution & retail) | | | 107,705 | | | | 2,512 | |
| | Bidvest Group Ltd. (Industrial conglomerates) | | | 153,185 | | | | 2,113 | |
| | Clicks Group Ltd. (Consumer staples distribution & retail) | | | 129,252 | | | | 2,301 | |
| | | | | | | | | 6,926 | |
| | Turkey—0.3% | | | | | | | | |
| | BIM Birlesik Magazalar AS (Consumer staples distribution & retail) | | | 258,186 | | | | 2,635 | |
| | United Arab Emirates—1.2% | | | | | | | | |
| | Emaar Properties PJSC (Real estate management & development) | | | 2,618,926 | | | | 5,648 | |
| | Emirates Central Cooling Systems Corp. (Water utilities) | | | 3,917,247 | | | | 1,770 | |
| | Salik Co. PJSC (Transportation infrastructure) | | | 3,124,481 | | | | 2,646 | |
| | | | | | | | | 10,064 | |
| | | | | | | | | | |
| | Asia—1.4% | | | | | | | | |
| | Hong Kong—1.4% | | | | | | | | |
| | AIA Group Ltd. (Insurance) | | | 1,345,800 | | | | 11,728 | |
| | Total Common Stocks—100.1%
(cost $662,749) | | | | | | | 823,415 | |
| | Issuer | | Shares or
Principal
Amount | | | Value | |
| | | | | | | | | | |
| | Rights | | | | | | | | |
| | | | | | | | | | |
| | Emerging Latin America—0.0% | | | | | | | | |
| | Brazil—0.0% | | | | | | | | |
| * | Localiza Rent a Car SA, Expiring 2/5/24 (Ground transportation) | | | 813 | | | $ | 3 | |
| | Total Rights—0.0%
(cost $0) | | | | | | | 3 | |
| | | | | | | | | | |
| | Repurchase Agreement | | | | | | | | |
| | Fixed Income Clearing Corporation, 2.300% dated 12/29/23, due 01/02/24, repurchase price $9,422, collateralized by U.S. Treasury Note, 3.875%, due 12/31/27, valued at $9,608 | | | $9,419 | | | | 9,419 | |
| | Total Repurchase Agreement—1.1%
(cost $9,419) | | | | | | | 9,419 | |
| | Total Investments—101.2%
(cost $672,168) | | | | | | | 832,837 | |
| | Liabilities, plus cash and other assets—(1.2)% | | | | | | | (9,996 | ) |
| | Net assets—100.0% | | | | | | $ | 822,841 | |
ADR = American Depository Receipt
REIT = Real Estate Investment Trust
* = Non-income producing security
† = U.S. listed foreign security
See accompanying Notes to Financial Statements.
| December 31, 2023 | William Blair Funds | 71 |
Emerging Markets Growth Fund
Portfolio of Investments, December 31, 2023
At December 31, 2023, the Fund’s Portfolio of Investments includes the following industry categories (as a percentage of long-term investments):
| Information Technology | | | 31.8 | % |
| Financials | | | 16.5 | % |
| Consumer Discretionary | | | 12.0 | % |
| Consumer Staples | | | 11.3 | % |
| Industrials | | | 9.8 | % |
| Communication Services | | | 6.3 | % |
| Real Estate | | | 3.5 | % |
| Health Care | | | 2.9 | % |
| Energy | | | 2.7 | % |
| Utilities | | | 2.0 | % |
| Materials | | | 1.2 | % |
| Total | | | 100.0 | % |
At December 31, 2023, the Fund’s Portfolio of Investments includes the following currency categories (as a percentage of long-term investments):
| Indian Rupee | | | 27.0 | % |
| U.S. Dollar | | | 16.5 | % |
| New Taiwan Dollar | | | 14.4 | % |
| South Korean Won | | | 8.7 | % |
| Hong Kong Dollar | | | 7.6 | % |
| Indonesian Rupiah | | | 5.4 | % |
| South African Rand | | | 4.4 | % |
| Mexican Peso | | | 4.3 | % |
| Brazilian Real | | | 3.7 | % |
| Chinese Yuan Renminbi | | | 3.7 | % |
| UAE Dirham | | | 1.2 | % |
| Thai Baht | | | 1.1 | % |
| Philippine Peso | | | 1.1 | % |
| All Other Currencies | | | 0.9 | % |
| Total | | | 100.0 | % |
See accompanying Notes to Financial Statements.
| 72 | Annual Report | December 31, 2023 |
| | Emerging Markets ex China Growth Fund |
| | |
| | The Emerging Markets ex China Growth Fund seeks long-term capital appreciation. |
| | |
| | AN OVERVIEW FROM THE PORTFOLIO MANAGERS |
| | |

Todd M. McClone, CFA 
Casey K. Preyss, CFA 
Vivian Lin Thurston, CFA | The William Blair Emerging Markets ex China Growth Fund (Class I shares) posted a 24.75% increase, net of fees, for the year ended December 31, 2023. By comparison, the Fund’s benchmark index, the MSCI Emerging Markets ex-China IMI (the “Index”), increased 21.64%. Outperformance versus the Index year-to-date was driven by a combination of positive stock selection and allocation effects across most sectors. Stock selection was particularly strong within the Consumer Discretionary, Industrials, and Consumer Staples sectors. The Information Technology overweighting and Materials underweighting were also notable contributors to relative results. MercadoLibre and Trent bolstered Consumer Discretionary results. MercadoLibre is a leading e-commerce platform in Latin America with a best-in-class ecosystem of services such as logistics and payments, which allows the company to exploit attractive growth opportunities of the large and underpenetrated total addressable market. MercadoLibre continued to deliver strong results in the most recent quarter, supported by broad-based growth across business segments and share gains across geographies. Trent is one of India’s leading fashion and consumer goods retailers with a high-quality product offering, low-cost proposition, and broad range. The company posted strong fiscal second-quarter results exceeding consensus expectation driven by accelerating same-store sales growth and store expansion coupled with higher operating leverage. Within Industrials, KEI Industries and Polycab India were the most additive to relative performance. KEI Industries is a leading cable and wire manufacturing company that is also engaged in engineering, procurement, and construction activities. The company continued to post robust results driven by strong volume growth. Polycab India is a leading manufacturer and distributor of cables and wires in India. The company continued to deliver strong fundamental results exceeding consensus expectations driven by strong volume growth and margin expansion on favorable product mix and operating leverage. The growth outlook for both companies remained well underpinned amid government and private capital expenditure, and strong tailwinds from real estate sector. Within Consumer Staples, Varun Beverages was a notable contributor to relative performance. The share price acceleration was underpinned by a strong operating momentum as the company continued to deliver better-than-expected results, driven by improving volume growth and margin expansion. In addition, shares increased in December on the announcement of the company’s acquisition of South Africa’s Beverage Company that owns PepsiCo’s distribution rights in South Africa. Partially offsetting these effects was negative stock selection effect within the Health Care and Financials sectors. Energy stock selection and underweighting also detracted during the year. Within Health Care, Bangkok Dusit Medical Services hampered results. Bangkok Dusit Medical Services is the largest private hospital group in Thailand. The company delivered strong earnings growth driven by record revenue growth in the third quarter amid medical tourism recovery and Thai patient revenue due to seasonal epidemics. HDFC bank and Bank Central Asia were key detractors within Financials. HDFC Bank is a high-quality Indian banking franchise with a healthy funding and capital base, solid asset quality, and high recurring fee income. The stock was a detractor, primarily due to weakness in the third quarter following the long-expected merger with HDFC Ltd., which led to a slight reduction in reported book value post-merger. While accounting book value was lower, there was no change in economic value. We expect further merger-related noise for the next year or so but expect the company to execute well on the merger and to continue compounding with high and stable returns over the long term. |
| December 31, 2023 | William Blair Funds | 73 |
Emerging Markets ex China Growth Fund
Bank Central Asia is the highest quality bank in Indonesia with a strong deposit franchise and benefits from a structural growth opportunity underpinned by positive demographics and financial under penetration. The bank continued to deliver healthy loan growth in line with management 2023 guidance and very high credit quality. The stock has lagged amid expectations of lowering interest rates and earnings coupled with high valuation. Within Energy, Reliance Industries detracted from relative performance due to its diversified business model, lower exposure to energy commodities and elevated capital expenditures over the past years, driven by large telecom spends which should be reduced in the coming year. We believe Reliance’s transformation from an asset-heavy, cyclical energy business to a more diversified, end-consumer businesses with a large and expanding total addressable market will continue to drive strong growth and returns over the long term, while the legacy energy business will continue to provide earnings support in the near term.
Please refer to the Global Markets Review and Outlook relating to the Fund beginning on page 32.
| 74 | Annual Report | December 31, 2023 |
Emerging Markets ex China Growth Fund
Performance Highlights (Unaudited)
Average Annual Total Returns through 12/31/2023
| | | 1 Year | | Since
Inception(a) |
| Class I | | | 24.75 | % | | | 11.86 | % |
| Class R6 | | | 24.75 | | | | 11.95 | |
| MSCI Emerging Markets ex-China IMI (net) | | | 21.64 | | | | 13.53 | |
| (a) | Since inception is for the period from July 29, 2022 (Commencement of Operations) to December 31, 2023. |
Performance cited represents past performance. Past performance does not guarantee future results and current performance may be lower or higher than the data quoted. Results shown are average annual total returns, which assume reinvestment of dividends and capital gains. Investment returns and principal will fluctuate and you may have a gain or loss when you sell shares. For the most current month-end performance information, please call 1-800-742-7272, or visit our Web site at www.williamblairfunds.com. From time to time, the investment adviser may waive fees or reimburse expenses for the Fund. Without these waivers/reimbursements, performance would be lower. International investing involves special risk considerations, including currency fluctuations, lower liquidity, economic and political risk. These risks may be magnified when investing in emerging markets. Class I shares are not subject to a sales load or distribution (Rule 12b-1) fees. Class R6 shares are not subject to a sales load, distribution (Rule 12b-1) fees, or sub-transfer agent fees.
The performance highlights and graph presented above do not reflect the deduction of taxes that a shareholder would pay on fund distributions or the redemption of fund shares.
The Morgan Stanley Capital International (MSCI) Emerging Markets ex-China IMI Index (net) is a free float-adjusted market capitalization index that is designed to measure equity market performance of emerging markets excluding China. This series approximates the minimum possible dividend reinvestment.
This report identifies the Fund’s investments on December 31, 2023. These holdings are subject to change. Not all stocks in the Fund performed the same, nor is there any guarantee that these stocks will perform as well in the future. Market forecasts provided in this report may not necessarily come to pass.
Sector Diversification (Unaudited)

The sector diversification shown is based on the total long-term securities.
| December 31, 2023 | William Blair Funds | 75 |
Emerging Markets ex China Growth Fund
Portfolio of Investments, December 31, 2023 (all dollar amounts in thousands)
| | | | | | | | |
| | | | | | | | |
| | Issuer | | Shares | | | Value | |
| | | | | | | | | | |
| | Common Stocks | | | | | | | | |
| | | | | | | | | | |
| | Emerging Asia—70.3% | | | | | | | | |
| | India—27.8% | | | | | | | | |
| | ABB India Ltd. (Electrical equipment) | | | 2,864 | | | $ | 161 | |
| | APL Apollo Tubes Ltd. (Metals & mining) | | | 5,599 | | | | 103 | |
| | Apollo Hospitals Enterprise Ltd. (Health care providers & services) | | | 2,492 | | | | 171 | |
| | Asian Paints Ltd. (Chemicals) | | | 2,749 | | | | 112 | |
| | AU Small Finance Bank Ltd. (Banks) | | | 13,937 | | | | 131 | |
| | Bajaj Finance Ltd. (Consumer finance) | | | 1,446 | | | | 127 | |
| | Bharat Electronics Ltd. (Aerospace & defense) | | | 65,784 | | | | 145 | |
| | Bikaji Foods International Ltd. (Food products) | | | 15,071 | | | | 99 | |
| | Central Depository Services India Ltd. (Capital markets) | | | 3,408 | | | | 75 | |
| | CG Power & Industrial Solutions Ltd. (Electrical equipment) | | | 20,298 | | | | 110 | |
| | Cholamandalam Investment & Finance Co. Ltd. (Consumer finance) | | | 7,434 | | | | 113 | |
| | Coforge Ltd. (IT services) | | | 1,174 | | | | 89 | |
| | Computer Age Management Services Ltd. (Professional services) | | | 2,098 | | | | 67 | |
| | Craftsman Automation Ltd. (Machinery) | | | 1,146 | | | | 74 | |
| | Cummins India Ltd. (Machinery) | | | 4,425 | | | | 105 | |
| | Dixon Technologies India Ltd. (Household durables) | | | 2,073 | | | | 163 | |
| | Havells India Ltd. (Electrical equipment) | | | 5,907 | | | | 97 | |
| | HDFC Bank Ltd. (Banks) | | | 26,675 | | | | 548 | |
| | Home First Finance Co. India Ltd. (Financial services) | | | 6,251 | | | | 70 | |
| | Indian Hotels Co. Ltd. (Hotels, restaurants & leisure) | | | 29,291 | | | | 154 | |
| * | InterGlobe Aviation Ltd. (Passenger airlines) | | | 4,640 | | | | 165 | |
| | Jindal Stainless Ltd. (Metals & mining) | | | 20,824 | | | | 143 | |
| * | Kaynes Technology India Ltd. (Electronic equipment, instruments & components) | | | 2,097 | | | | 66 | |
| | KEI Industries Ltd. (Electrical equipment) | | | 4,883 | | | | 190 | |
| | KPIT Technologies Ltd. (Software) | | | 12,351 | | | | 226 | |
| | Macrotech Developers Ltd. (Real estate management & development) | | | 9,587 | | | | 118 | |
| | Mahindra & Mahindra Ltd. (Automobiles) | | | 5,363 | | | | 111 | |
| | Max Healthcare Institute Ltd. (Health care providers & services) | | | 18,394 | | | | 152 | |
| | Nestle India Ltd. (Food products) | | | 530 | | | | 170 | |
| | NTPC Ltd. (Independent power & renewable electricity producers) | | | 67,524 | | | | 252 | |
| | Polycab India Ltd. (Electrical equipment) | | | 2,084 | | | | 138 | |
| | Reliance Industries Ltd. (Oil, gas & consumable fuels) | | | 5,372 | | | | 167 | |
| | Tata Elxsi Ltd. (Software) | | | 1,189 | | | | 125 | |
| | Tata Motors Ltd. (Automobiles) | | | 12,220 | | | | 114 | |
| | Titagarh Rail System Ltd. (Machinery) | | | 16,538 | | | | 207 | |
| | Titan Co. Ltd. (Textiles, apparel & luxury goods) | | | 3,881 | | | | 172 | |
| | | | | | | | |
| | | | | | | | |
| | Issuer | | Shares | | | Value | |
| | | | | |
| | Common Stocks—(continued) | | | | | | |
| | | | | |
| | Emerging Asia—(continued) | | | | | | | | |
| | India—(continued) | | | | | | | | |
| | Trent Ltd. (Specialty retail) | | | 6,759 | | | $ | 248 | |
| * | Triveni Turbine Ltd. (Electrical equipment) | | | 19,962 | | | | 101 | |
| | Tube Investments of India Ltd. (Automobile components) | | | 2,785 | | | | 118 | |
| | UNO Minda Ltd. (Automobile components) | | | 17,678 | | | | 146 | |
| | Varun Beverages Ltd. (Beverages) | | | 18,149 | | | | 270 | |
| | | | | | | | | 6,113 | |
| | Indonesia—5.4% | | | | | | | | |
| | Bank Central Asia Tbk. PT (Banks) | | | 942,400 | | | | 575 | |
| | Bank Rakyat Indonesia Persero Tbk. PT (Banks) | | | 1,089,100 | | | | 405 | |
| | Indofood CBP Sukses Makmur Tbk. PT (Food products) | | | 102,400 | | | | 70 | |
| | Mitra Adiperkasa Tbk. PT (Broadline retail) | | | 1,141,200 | | | | 133 | |
| | | | | | | | | 1,183 | |
| | Philippines—1.3% | | | | | | | | |
| | BDO Unibank, Inc. (Banks) | | | 67,518 | | | | 159 | |
| | International Container Terminal Services, Inc. (Transportation infrastructure) | | | 29,360 | | | | 131 | |
| | | | | | | | | 290 | |
| | South Korea—9.2% | | | | | | | | |
| | JYP Entertainment Corp. (Entertainment) | | | 1,024 | | | | 81 | |
| | NAVER Corp. (Interactive media & services) | | | 458 | | | | 80 | |
| | Samsung Electronics Co. Ltd. (Technology hardware, storage & peripherals) | | | 24,615 | | | | 1,500 | |
| | SK Hynix, Inc. (Semiconductors & semiconductor equipment) | | | 3,344 | | | | 367 | |
| | | | | | | | | 2,028 | |
| | Taiwan—25.6% | | | | | | | | |
| | Accton Technology Corp. (Communications equipment) | | | 16,000 | | | | 273 | |
| | Alchip Technologies Ltd. (Semiconductors & semiconductor equipment) | | | 2,500 | | | | 267 | |
| | ASMedia Technology, Inc. (Semiconductors & semiconductor equipment) | | | 2,000 | | | | 118 | |
| | ASPEED Technology, Inc. (Semiconductors & semiconductor equipment) | | | 2,100 | | | | 213 | |
| | Chroma ATE, Inc. (Electronic equipment, instruments & components) | | | 15,000 | | | | 104 | |
| | Elite Material Co. Ltd. (Electronic equipment, instruments & components) | | | 8,000 | | | | 100 | |
| | eMemory Technology, Inc. (Semiconductors & semiconductor equipment) | | | 3,300 | | | | 263 | |
| | Faraday Technology Corp. (Semiconductors & semiconductor equipment) | | | 9,000 | | | | 105 | |
| | Global Unichip Corp. (Semiconductors & semiconductor equipment) | | | 3,100 | | | | 176 | |
See accompanying Notes to Financial Statements.
| 76 | Annual Report | December 31, 2023 |
Emerging Markets ex China Growth Fund
Portfolio of Investments, December 31, 2023 (all dollar amounts in thousands)
| | | | | | | | |
| | | | | | | | |
| | Issuer | | Shares | | | Value | |
| | | | | | | | | | |
| | Common Stocks—(continued) | | | | | | | | |
| | | | | | | | | | |
| | Emerging Asia—(continued) | | | | | | | | |
| | Taiwan—(continued) | | | | | | | | |
| | Innodisk Corp. (Technology hardware, storage & peripherals) | | | 9,900 | | | $ | 101 | |
| | Lotes Co. Ltd. (Electronic equipment, instruments & components) | | | 4,103 | | | | 143 | |
| | MediaTek, Inc. (Semiconductors & semiconductor equipment) | | | 9,000 | | | | 298 | |
| | Parade Technologies Ltd. (Semiconductors & semiconductor equipment) | | | 3,000 | | | | 117 | |
| | Sinbon Electronics Co. Ltd. (Electronic equipment, instruments & components) | | | 12,000 | | | | 117 | |
| | Taiwan Semiconductor Manufacturing Co. Ltd. (Semiconductors & semiconductor equipment) | | | 136,000 | | | | 2,628 | |
| | Tripod Technology Corp. (Electronic equipment, instruments & components) | | | 19,400 | | | | 123 | |
| | Unimicron Technology Corp. (Electronic equipment, instruments & components) | | | 17,500 | | | | 100 | |
| | Voltronic Power Technology Corp. (Electrical equipment) | | | 2,600 | | | | 145 | |
| | Wiwynn Corp. (Technology hardware, storage & peripherals) | | | 4,000 | | | | 238 | |
| | | | | | | | | 5,629 | |
| | Thailand—1.0% | | | | | | | | |
| | Bangkok Dusit Medical Services PCL (Health care providers & services) | | | 120,300 | | | | 98 | |
| | Bumrungrad Hospital PCL (Health care providers & services) | | | 20,500 | | | | 133 | |
| | | | | | | | | 231 | |
| | | | | | | | | | |
| | Emerging Latin America—18.6% | | | | | | | | |
| | Argentina—1.3% | | | | | | | | |
| | Arcos Dorados Holdings, Inc. (Hotels, restaurants & leisure)† | | | 11,648 | | | | 147 | |
| * | Globant SA (IT services)† | | | 529 | | | | 126 | |
| | | | | | | | | 273 | |
| | Brazil—10.4% | | | | | | | | |
| | B3 SA - Brasil Bolsa Balcao (Capital markets) | | | 43,000 | | | | 129 | |
| | Banco BTG Pactual SA (Capital markets) | | | 29,400 | | | | 228 | |
| | Itau Unibanco Holding SA—ADR (Banks) | | | 41,112 | | | | 286 | |
| | Localiza Rent a Car SA (Ground transportation) | | | 6,000 | | | | 78 | |
| * | MercadoLibre, Inc. (Broadline retail) | | | 401 | | | | 630 | |
| | Multiplan Empreendimentos Imobiliarios SA (Real estate management & development) | | | 27,900 | | | | 163 | |
| | Raia Drogasil SA (Consumer staples distribution & retail) | | | 29,716 | | | | 180 | |
| | Rumo SA (Ground transportation) | | | 32,200 | | | | 152 | |
| | TOTVS SA (Software) | | | 27,900 | | | | 193 | |
| | | | | | | | |
| | | | | | | | |
| | Issuer | | Shares | | | Value | |
| | | | | | | | | | |
| | Common Stocks—(continued) | | | | | | | | |
| | | | | | | | | | |
| | Emerging Latin America—(continued) | | | | | | | | |
| | Brazil—(continued) | | | | | | | | |
| | Vivara Participacoes SA (Textiles, apparel & luxury goods) | | | 15,700 | | | $ | 111 | |
| | WEG SA (Electrical equipment) | | | 19,300 | | | | 147 | |
| | | | | | | | | 2,297 | |
| | Mexico—6.9% | | | | | | | | |
| * | Alsea SAB de CV (Hotels, restaurants & leisure) | | | 40,800 | | | | 155 | |
| | Arca Continental SAB de CV (Beverages) | | | 10,600 | | | | 115 | |
| | Corp. Inmobiliaria Vesta SAB de CV (Real estate management & development) | | | 71,600 | | | | 284 | |
| | Fomento Economico Mexicano SAB de CV—ADR (Beverages) | | | 2,041 | | | | 266 | |
| | Grupo Aeroportuario del Centro Norte SAB de CV (Transportation infrastructure) | | | 9,200 | | | | 97 | |
| | Grupo Financiero Banorte SAB de CV (Banks) | | | 16,400 | | | | 165 | |
| | Qualitas Controladora SAB de CV (Insurance) | | | 21,500 | | | | 218 | |
| | Wal-Mart de Mexico SAB de CV (Consumer staples distribution & retail) | | | 50,100 | | | | 211 | |
| | | | | | | | | 1,511 | |
| | | | | | | | | | |
| | Emerging Europe, Mid-East, Africa—10.8% | | | | | | | | |
| | Greece—0.4% | | | | | | | | |
| | JUMBO SA (Specialty retail) | | | 3,072 | | | | 85 | |
| | Lithuania—0.5% | | | | | | | | |
| | Baltic Classifieds Group PLC (Interactive media & services) | | | 33,782 | | | | 102 | |
| | Poland—0.6% | | | | | | | | |
| * | Dino Polska SA (Consumer staples distribution & retail) | | | 1,192 | | | | 140 | |
| | Saudi Arabia—6.3% | | | | | | | | |
| | Al Hammadi Holding (Health care providers & services) | | | 4,781 | | | | 76 | |
| | Aldrees Petroleum & Transport Services Co. (Oil, gas & consumable fuels) | | | 3,463 | | | | 163 | |
| | Arabian Contracting Services Co. (Media) | | | 1,914 | | | | 121 | |
| | Arabian Internet & Communications Services Co. (IT services) | | | 974 | | | | 90 | |
| | Bupa Arabia for Cooperative Insurance Co. (Insurance) | | | 1,955 | | | | 111 | |
| | Dr Sulaiman Al Habib Medical Services Group Co. (Health care providers & services) | | | 2,262 | | | | 171 | |
| | Elm Co. (IT services) | | | 677 | | | | 147 | |
| | Leejam Sports Co. JSC (Hotels, restaurants & leisure) | | | 3,315 | | | | 179 | |
| | National Medical Care Co. (Health care providers & services) | | | 1,771 | | | | 82 | |
See accompanying Notes to Financial Statements.
| December 31, 2023 | William Blair Funds | 77 |
Emerging Markets ex China Growth Fund
Portfolio of Investments, December 31, 2023 (all dollar amounts in thousands)
| | Issuer | | Shares or
Principal
Amount | | | Value | |
| | | | | | | | | | |
| | Common Stocks—(continued) | | | | | | | | |
| | | | | | | | | | |
| | Emerging Europe, Mid-East, Africa—(continued) | | | | | | | | |
| | Saudi Arabia—(continued) | | | | | | | | |
| | Riyadh Cables Group Co. (Electrical equipment) | | | 4,739 | | | $ | 117 | |
| | Saudia Dairy & Foodstuff Co. (Food products) | | | 1,528 | | | | 136 | |
| | | | | | | | | 1,393 | |
| | South Africa—0.9% | | | | | | | | |
| | Bidvest Group Ltd. (Industrial conglomerates) | | | 7,855 | | | | 108 | |
| | Naspers Ltd. (Broadline retail) | | | 505 | | | | 87 | |
| | | | | | | | | 195 | |
| | Turkey—0.4% | | | | | | | | |
| | BIM Birlesik Magazalar AS (Consumer staples distribution & retail) | | | 8,270 | | | | 84 | |
| | United Arab Emirates—1.7% | | | | | | | | |
| | Air Arabia PJSC (Passenger airlines) | | | 125,010 | | | | 96 | |
| | Emaar Properties PJSC (Real estate management & development) | | | 75,672 | | | | 163 | |
| | Salik Co. PJSC (Transportation infrastructure) | | | 148,968 | | | | 126 | |
| | | | | | | | | 385 | |
| | Total Common Stocks—99.7%
(cost $17,587) | | | | | | | 21,939 | |
| | | | | | | | | | |
| | Rights | | | | | | | | |
| | | | | | | | | | |
| | Emerging Latin America—0.0% | | | | | | | | |
| | Brazil—0.0% | | | | | | | | |
| * | Localiza Rent a Car SA, Expiring 2/5/24 (Ground transportation) | | | 21 | | | | —(a | ) |
| | Total Rights—0.0%
(cost $0) | | | | | | | —(a | ) |
| | | | | | | | | | |
| | Repurchase Agreement | | | | | | | | |
| | Fixed Income Clearing Corporation, 2.300% dated 12/29/23, due 01/02/24, repurchase price $222, collateralized by U.S. Treasury Note, 0.500%, due 05/31/27, valued at $226 | | | $222 | | | | 222 | |
| | Total Repurchase Agreement—1.0%
(cost $222) | | | | | | | 222 | |
| | Total Investments—100.7%
(cost $17,809) | | | | | | | 22,161 | |
| | Liabilities, plus cash and other assets—(0.7)% | | | | | | | (151 | ) |
| | Net assets—100.0% | | | | | | $ | 22,010 | |
ADR = American Depository Receipt
* = Non-income producing security
† = U.S. listed foreign security
(a) Amount is less than the minimum amount disclosed.
At December 31, 2023, the Fund’s Portfolio of Investments includes the following industry categories (as a percentage of long-term investments):
| Information Technology | | | 38.5 | % |
| Financials | | | 15.2 | % |
| Industrials | | | 12.6 | % |
| Consumer Discretionary | | | 12.6 | % |
| Consumer Staples | | | 7.9 | % |
| Health Care | | | 4.0 | % |
| Real Estate | | | 3.3 | % |
| Communication Services | | | 1.7 | % |
| Materials | | | 1.6 | % |
| Energy | | | 1.5 | % |
| Utilities | | | 1.1 | % |
| Total | | | 100.0 | % |
At December 31, 2023, the Fund’s Portfolio of Investments includes the following currency categories (as a percentage of long-term investments):
| Indian Rupee | | | 27.9 | % |
| New Taiwan Dollar | | | 25.7 | % |
| South Korean Won | | | 9.2 | % |
| South African Rand | | | 7.2 | % |
| U.S. Dollar | | | 6.6 | % |
| Brazilian Real | | | 6.3 | % |
| Mexican Peso | | | 5.7 | % |
| Indonesian Rupiah | | | 5.4 | % |
| UAE Dirham | | | 1.8 | % |
| Philippine Peso | | | 1.3 | % |
| Thai Baht | | | 1.0 | % |
| All Other Currencies | | | 1.9 | % |
| Total | | | 100.0 | % |
See accompanying Notes to Financial Statements.
| 78 | Annual Report | December 31, 2023 |
| | Emerging Markets Small Cap Growth Fund |
| | |
| | The Emerging Markets Small Cap Growth Fund seeks long-term capital appreciation. |
| | |
| | AN OVERVIEW FROM THE PORTFOLIO MANAGERS |
| | |

Todd M. McClone, CFA 
Casey K. Preyss, CFA 
D.J. Neiman, CFA | The William Blair Emerging Markets Small Cap Growth Fund (Class N shares) (the “Fund”) posted a 21.93% increase, net of fees, for the year ended December 31, 2023. By comparison, the Fund’s benchmark index, the MSCI Emerging Markets Small Cap Index (net) (the “Index”), increased 23.92%. Relative performance versus the Index year-to-date was driven by strong stock selection across most sectors, in particular, the Real Estate, Communication Services, and Consumer Discretionary sectors. Within the Real Estate sector, Macrotech Developers (Lodha) was a notable contributor to relative performance as the stock climbed substantially over the year on the back of strong fundamental performance and growth outlook amid a strong India housing market. JYP Entertainment, a South Korean pop (“K-pop”) music groups producer and manager drove strong Communication Services results. The stock rallied amid strong momentum for K-pop bands, a growing fanbase with concerts and merchandising growth, and an expanding presence in the United States. Within Consumer Discretionary, Trent, Cyrela Brazil Realty Sa Empreendimentos, and Leejam Sports Co added the most to relative results. Trent is one of India’s leading fashion and consumer goods retailers with high-quality product offering, low-cost proposition, and a broad range. The company posted strong fiscal second quarter results exceeding consensus expectation driven by acceleration in same-store sales growth and store expansion coupled with higher operating leverage. Cyrela is a Brazilian homebuilder focused on mid/high-income clients and favorable metropolitan supply-demand dynamics. The company delivered robust results outperforming the sector on strong sales and profitability supported by a better launch mix of higher margin projects. Leejam is a Saudi Arabian fitness chain. The stock accelerated on the back of strong operating performance, as the company reported above-consensus results, driven by the rapid increase in the number of members and operating centers, and an attractive growth outlook given that the Saudi Arabian fitness industry remains underpenetrated. Partially offsetting these effects was negative stock selection within the Information Technology, Materials, and Utilities sectors. Within Information Technology, the allocation and stock selection within technology hardware hampered relative performance as the industry rallied during the year. Locaweb Servicos De Internet was also a notable detractor to relative performance. Locaweb’s continued investments for growth, including consolidating the market dragged down near-term return and drove the stock weakness in the first quarter. We sold the position due to deteriorated growth outlook. Indian specialty chemical companies, Gujarat Fluorochemicals and Fine Organic Industries, were among the most notable detractors within the Materials sector. Gujarat Fluorochemicals is a chemicals company with a diversified portfolio of fluoropolymers. The stock weakened amid decreasing raw material prices and impact on its bulk chemical exposure. We exited the position in the third quarter. Fine Organic Industries, the largest manufacturer of oleochemical-based additives in India, was sold in the first quarter due to a weakening fundamental outlook. Within Utilities, Terna Energy, a Greek renewables company, hurt relative performance. The stock weakened as higher financing cost and a relatively smaller fixed debt amount weighed on Terna’s profitability in the near term. Please refer to the Global Markets Review and Outlook relating to the Fund beginning on page 32. |
| December 31, 2023 | William Blair Funds | 79 |
Emerging Markets Small Cap Growth Fund
Performance Highlights (Unaudited)
Average Annual Total Returns through 12/31/2023
| | | 1 Year | | 3 Year | | 5 Year | | 10 Year |
| Class N | | | 21.93 | % | | | 0.33 | % | | | 9.96 | % | | | 5.73 | % |
| Class I | | | 22.25 | | | | 0.59 | | | | 10.23 | | | | 6.02 | |
| Class R6 | | | 22.37 | | | | 0.65 | | | | 10.30 | | | | 6.09 | |
| MSCI Emerging Markets Small Cap Index (net) | | | 23.92 | | | | 6.45 | | | | 9.92 | | | | 5.34 | |
Performance cited represents past performance. Past performance does not guarantee future results and current performance may be lower or higher than the data quoted. Results shown are average annual total returns, which assume reinvestment of dividends and capital gains. Investment returns and principal will fluctuate and you may have a gain or loss when you sell shares. For the most current month-end performance information, please call 1-800-742-7272, or visit our Web site at www.williamblairfunds.com. From time to time, the investment adviser may waive fees or reimburse expenses for the Fund. Without these waivers/reimbursements, performance would be lower. International investing involves special risk considerations, including currency fluctuations, lower liquidity, economic and political risk. These risks may be magnified when investing in emerging markets. Smaller capitalization stocks are also more sensitive to purchase/sale transactions and changes in the issuer’s financial condition. Class N shares are not subject to a sales load. Class I shares are not subject to a sales load or distribution (Rule 12b-1) fees. Class R6 shares are not subject to a sales load, distribution (Rule 12b-1) fees, or sub-transfer agent fees.
The performance highlights and graph presented above do not reflect the deduction of taxes that a shareholder would pay on fund distributions or the redemption of fund shares.
The Morgan Stanley Capital International (MSCI) Emerging Markets Small Cap Index (net) is a free float-adjusted market capitalization index that is designed to measure the equity market performance of emerging markets. This index approximates the minimum possible dividend reinvestment by deducting for the highest possible withholding tax rates of those markets.
This report identifies the Fund’s investments on December 31, 2023. These holdings are subject to change. Not all stocks in the Fund performed the same, nor is there any guarantee that these stocks will perform as well in the future. Market forecasts provided in this report may not necessarily come to pass.
Sector Diversification (Unaudited)
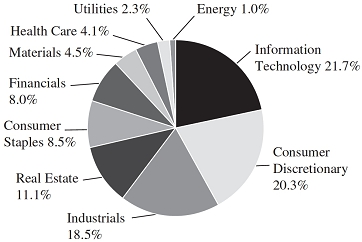
The sector diversification shown is based on the total long-term securities.
| 80 | Annual Report | December 31, 2023 |
Emerging Markets Small Cap Growth Fund
Portfolio of Investments, December 31, 2023 (all dollar amounts in thousands)
| | | | | | | | |
| | | | | | | | |
| | Issuer | | Shares | | | Value | |
| | | | | | | | | | |
| | Common Stocks | | | | | | | | |
| | | | | | | | | | |
| | Emerging Asia—64.2% | | | | | | | | |
| | China—5.2% | | | | | | | | |
| | Airtac International Group (Machinery) | | | 108,158 | | | $ | 3,560 | |
| | Huaming Power Equipment Co. Ltd. (Machinery) | | | 580,800 | | | | 1,151 | |
| | Huaneng Lancang River Hydropower, Inc. (Independent power & renewable electricity producers) | | | 3,251,112 | | | | 3,938 | |
| | Proya Cosmetics Co. Ltd. (Personal care products) | | | 378,388 | | | | 5,278 | |
| | Shenzhen Envicool Technology Co. Ltd. (Machinery) | | | 747,600 | | | | 2,883 | |
| | Yankershop Food Co. Ltd. (Food products) | | | 191,200 | | | | 1,864 | |
| | Zhejiang Shuanghuan Driveline Co. Ltd. (Automobile components) | | | 414,100 | | | | 1,512 | |
| | | | | | | | | 20,186 | |
| | India—38.3% | | | | | | | | |
| | ABB India Ltd. (Electrical equipment) | | | 85,582 | | | | 4,804 | |
| * | Amber Enterprises India Ltd. (Household durables) | | | 66,006 | | | | 2,481 | |
| | APL Apollo Tubes Ltd. (Metals & mining) | | | 227,022 | | | | 4,191 | |
| | Astral Ltd. (Building products) | | | 141,711 | | | | 3,254 | |
| | AU Small Finance Bank Ltd. (Banks) | | | 192,086 | | | | 1,812 | |
| | Bikaji Foods International Ltd. (Food products) | | | 252,860 | | | | 1,662 | |
| | Cera Sanitaryware Ltd. (Building products) | | | 11,715 | | | | 1,105 | |
| | CG Power & Industrial Solutions Ltd. (Electrical equipment) | | | 1,092,799 | | | | 5,936 | |
| * | Chalet Hotels Ltd. (Hotels, restaurants & leisure) | | | 143,009 | | | | 1,200 | |
| | Cholamandalam Investment & Finance Co. Ltd. (Consumer finance) | | | 182,531 | | | | 2,764 | |
| | Coforge Ltd. (IT services) | | | 66,665 | | | | 5,035 | |
| | Craftsman Automation Ltd. (Machinery) | | | 31,100 | | | | 2,016 | |
| | Dixon Technologies India Ltd. (Household durables) | | | 97,353 | | | | 7,668 | |
| | Escorts, Ltd. (Machinery) | | | 32,516 | | | | 1,168 | |
| * | Godrej Properties Ltd. (Real estate management & development) | | | 217,763 | | | | 5,252 | |
| | Home First Finance Co. India Ltd. (Financial services) | | | 152,018 | | | | 1,702 | |
| | JB Chemicals & Pharmaceuticals Ltd. (Pharmaceuticals) | | | 74,445 | | | | 1,449 | |
| | Jindal Stainless Ltd. (Metals & mining) | | | 768,374 | | | | 5,263 | |
| * | Kaynes Technology India Ltd. (Electronic equipment, instruments & components) | | | 50,340 | | | | 1,579 | |
| | KEC International Ltd. (Construction & engineering) | | | 56,863 | | | | 401 | |
| | KEI Industries Ltd. (Electrical equipment) | | | 240,478 | | | | 9,381 | |
| | KPIT Technologies Ltd. (Software) | | | 336,028 | | | | 6,139 | |
| * | Lemon Tree Hotels Ltd. (Hotels, restaurants & leisure) | | | 1,437,963 | | | | 2,073 | |
| | Macrotech Developers Ltd. (Real estate management & development) | | | 599,568 | | | | 7,371 | |
| | | | | | | | |
| | | | | | | | |
| | Issuer | | Shares | | | Value | |
| | | | | | | | | | |
| | Common Stocks—(continued) | | | | | | | | |
| | | | | | | | | | |
| | Emerging Asia—(continued) | | | | | | | | |
| | India—(continued) | | | | | | | | |
| | Max Healthcare Institute Ltd. (Health care providers & services) | | | 379,004 | | | $ | 3,125 | |
| | Metro Brands Ltd. (Specialty retail) | | | 183,069 | | | | 2,781 | |
| | Narayana Hrudayalaya Ltd. (Health care providers & services) | | | 145,293 | | | | 2,095 | |
| | Oberoi Realty Ltd. (Real estate management & development) | | | 264,327 | | | | 4,533 | |
| * | PG Electroplast Ltd. (Electronic equipment, instruments & components) | | | 63,377 | | | | 1,805 | |
| | Polycab India Ltd. (Electrical equipment) | | | 144,608 | | | | 9,558 | |
| | Radico Khaitan Ltd. (Beverages) | | | 151,310 | | | | 3,022 | |
| | Ramkrishna Forgings Ltd. (Metals & mining) | | | 472,555 | | | | 4,134 | |
| | Solar Industries India Ltd. (Chemicals) | | | 22,247 | | | | 1,801 | |
| | Sundram Fasteners Ltd. (Automobile components) | | | 126,533 | | | | 1,897 | |
| | Titagarh Rail System Ltd. (Machinery) | | | 480,322 | | | | 6,024 | |
| | Trent Ltd. (Specialty retail) | | | 139,493 | | | | 5,114 | |
| * | Triveni Turbine Ltd. (Electrical equipment) | | | 551,564 | | | | 2,802 | |
| | Tube Investments of India Ltd. (Automobile components) | | | 49,633 | | | | 2,111 | |
| | UNO Minda Ltd. (Automobile components) | | | 390,665 | | | | 3,235 | |
| | Varun Beverages Ltd. (Beverages) | | | 494,975 | | | | 7,358 | |
| | Venus Pipes & Tubes Ltd. (Metals & mining) | | | 125,403 | | | | 2,114 | |
| | | | | | | | | 149,215 | |
| | Indonesia—3.3% | | | | | | | | |
| | Bank Negara Indonesia Persero Tbk. PT (Banks) | | | 18,699,500 | | | | 6,528 | |
| | Map Aktif Adiperkasa PT (Specialty retail) | | | 8,009,100 | | | | 426 | |
| | Mitra Adiperkasa Tbk. PT (Broadline retail) | | | 50,231,900 | | | | 5,840 | |
| | | | | | | | | 12,794 | |
| | Philippines—0.7% | | | | | | | | |
| | International Container Terminal Services, Inc. (Transportation infrastructure) | | | 582,650 | | | | 2,597 | |
| | South Korea—0.2% | | | | | | | | |
| * | LEENO Industrial, Inc. (Semiconductors & semiconductor equipment) | | | 3,253 | | | | 512 | |
| | Orion Corp. (Food products) | | | 4,441 | | | | 400 | |
| | | | | | | | | 912 | |
| | Taiwan—16.3% | | | | | | | | |
| | Alchip Technologies Ltd. (Semiconductors & semiconductor equipment) | | | 44,000 | | | | 4,695 | |
| | ASMedia Technology, Inc. (Semiconductors & semiconductor equipment) | | | 83,000 | | | | 4,909 | |
| | ASPEED Technology, Inc. (Semiconductors & semiconductor equipment) | | | 57,900 | | | | 5,886 | |
See accompanying Notes to Financial Statements.
| December 31, 2023 | William Blair Funds | 81 |
Emerging Markets Small Cap Growth Fund
Portfolio of Investments, December 31, 2023 (all dollar amounts in thousands)
| | | | | | | | |
| | | | | | | | |
| | Issuer | | Shares | | | Value | |
| | | | | | | | | | |
| | Common Stocks—(continued) | | | | | | | | |
| | | | | | | | | | |
| | Emerging Asia—(continued) | | | | | | | | |
| | Taiwan—(continued) | | | | | | | | |
| | Elite Material Co. Ltd. (Electronic equipment, instruments & components) | | | 165,000 | | | $ | 2,054 | |
| | eMemory Technology, Inc. (Semiconductors & semiconductor equipment) | | | 37,000 | | | | 2,954 | |
| | Faraday Technology Corp. (Semiconductors & semiconductor equipment) | | | 438,000 | | | | 5,095 | |
| | Global Unichip Corporation (Semiconductors & semiconductor equipment) | | | 116,000 | | | | 6,577 | |
| | Great Tree Pharmacy Co. Ltd. (Consumer staples distribution & retail) | | | 316,160 | | | | 3,600 | |
| | Innodisk Corp. (Technology hardware, storage & peripherals) | | | 268,000 | | | | 2,725 | |
| | Lotes Co. Ltd. (Electronic equipment, instruments & components) | | | 121,669 | | | | 4,242 | |
| | Nanya Technology Corp. (Semiconductors & semiconductor equipment) | | | 1,531,000 | | | | 3,891 | |
| | Sinbon Electronics Co. Ltd. (Electronic equipment, instruments & components) | | | 301,000 | | | | 2,932 | |
| | Tripod Technology Corp. (Electronic equipment, instruments & components) | | | 664,000 | | | | 4,219 | |
| | Voltronic Power Technology Corp. (Electrical equipment) | | | 60,507 | | | | 3,371 | |
| | Wiwynn Corp. (Technology hardware, storage & peripherals) | | | 108,000 | | | | 6,422 | |
| | | | | | | | | 63,572 | |
| | Thailand—0.2% | | | | | | | | |
| | Bumrungrad Hospital PCL (Health care providers & services) | | | 147,300 | | | | 958 | |
| | | | | | | | | | |
| | Emerging Latin America—22.7% | | | | | | | | |
| | Argentina—1.6% | | | | | | | | |
| | Arcos Dorados Holdings, Inc. (Hotels, restaurants & leisure)† | | | 483,057 | | | | 6,130 | |
| | Brazil—13.0% | | | | | | | | |
| * | Azul SA–ADR (Passenger airlines) | | | 187,200 | | | | 1,814 | |
| | Companhia Paranaense de Energia (Electric utilities) | | | 1,399,000 | | | | 2,733 | |
| | Cury Construtora e Incorporadora SA (Household durables) | | | 1,241,500 | | | | 4,598 | |
| | Cyrela Brazil Realty SA Empreendimentos e Participacoes (Household durables) | | | 1,946,500 | | | | 9,649 | |
| | Grupo SBF SA (Specialty retail) | | | 404,700 | | | | 977 | |
| | Iguatemi SA (Real estate management & development) | | | 578,000 | | | | 2,901 | |
| | Multiplan Empreendimentos Imobiliarios SA (Real estate management & development) | | | 1,491,600 | | | | 8,727 | |
| * | Oncoclinicas do Brasil Servicos Medicos SA (Health care providers & services) | | | 1,010,000 | | | | 2,703 | |
| | Smartfit Escola de Ginastica e Danca SA (Hotels, restaurants & leisure) | | | 800,800 | | | | 4,291 | |
| | TOTVS SA (Software) | | | 1,036,400 | | | | 7,188 | |
| | Vivara Participacoes SA (Textiles, apparel & luxury goods) | | | 723,500 | | | | 5,101 | |
| | | | | | | | | 50,682 | |
| | | | | | | | |
| | | | | | | | |
| | Issuer | | Shares | | | Value | |
| | | | | | | | | | |
| | Common Stocks—(continued) | | | | | | | | |
| | | | | | | | | | |
| | Emerging Latin America—(continued) | | | | | | |
| | Mexico—8.1% | | | | | | | | |
| * | Alsea SAB de CV (Hotels, restaurants & leisure) | | | 1,495,300 | | | $ | 5,667 | |
| | Banco del Bajio SA (Banks) | | | 962,000 | | | | 3,212 | |
| | Corp. Inmobiliaria Vesta SAB de CV (Real estate management & development) | | | 1,582,200 | | | | 6,274 | |
| | Corp. Inmobiliaria Vesta SAB de CV–ADR (Real estate management & development) | | | 14,970 | | | | 593 | |
| | Grupo Aeroportuario del Centro Norte SAB de CV (Transportation infrastructure) | | | 48,299 | | | | 511 | |
| | Prologis Property Mexico SA de CV (Industrial REITs) | | | 1,598,100 | | | | 7,576 | |
| | Qualitas Controladora SAB de CV (Insurance) | | | 479,200 | | | | 4,851 | |
| | Regional SAB de CV (Banks) | | | 298,900 | | | | 2,859 | |
| | | | | | | | | 31,543 | |
| | | | | | | | | | |
| | Emerging Europe, Mid-East—13.3% | | | | | | | | |
| | Georgia—0.1% | | | | | | | | |
| | Bank of Georgia Group PLC (Banks) | | | 5,517 | | | | 280 | |
| | Greece—0.7% | | | | | | | | |
| | JUMBO SA (Specialty retail) | | | 102,064 | | | | 2,830 | |
| | Kazakhstan—1.1% | | | | | | | | |
| | Kaspi.KZ JSC–GDR (Consumer finance) | | | 48,611 | | | | 4,472 | |
| | Poland—1.4% | | | | | | | | |
| * | Dino Polska SA (Consumer staples distribution & retail) | | | 45,906 | | | | 5,375 | |
| | Saudi Arabia—7.8% | | | | | | | | |
| | Al Hammadi Holding (Health care providers & services) | | | 87,277 | | | | 1,390 | |
| | Aldrees Petroleum & Transport Services Co. (Oil, gas & consumable fuels) | | | 80,152 | | | | 3,779 | |
| | Arabian Internet & Communications Services Co. (IT services) | | | 10,846 | | | | 1,001 | |
| | Bupa Arabia for Cooperative Insurance Co. (Insurance) | | | 47,772 | | | | 2,716 | |
| | Dallah Healthcare Co. (Health care providers & services) | | | 49,813 | | | | 2,279 | |
| | Elm Co. (IT services) | | | 23,509 | | | | 5,109 | |
| | Leejam Sports Co. JSC (Hotels, restaurants & leisure) | | | 70,147 | | | | 3,782 | |
| | National Medical Care Co. (Health care providers & services) | | | 44,592 | | | | 2,074 | |
| | Riyadh Cables Group Co. (Electrical equipment) | | | 145,366 | | | | 3,574 | |
| | Saudia Dairy & Foodstuff Co. (Food products) | | | 53,297 | | | | 4,733 | |
| | | | | | | | | 30,437 | |
See accompanying Notes to Financial Statements.
| 82 | Annual Report | December 31, 2023 |
Emerging Markets Small Cap Growth Fund
Portfolio of Investments, December 31, 2023 (all dollar amounts in thousands)
| | Issuer | | Shares or
Principal
Amount | | | Value | |
| | | | | | | | | | |
| | Common Stocks—(continued) | | | | | | | | |
| | | | | | | | | | |
| | Emerging Europe, Mid-East—(continued) | | | | | | | | |
| | United Arab Emirates—2.2% | | | | | | | | |
| | Air Arabia PJSC (Passenger airlines) | | | 4,476,589 | | | $ | 3,437 | |
| | Emirates Central Cooling Systems Corp. (Water utilities) | | | 5,309,534 | | | | 2,400 | |
| | Salik Co. PJSC (Transportation infrastructure) | | | 3,306,646 | | | | 2,800 | |
| | | | | | | | | 8,637 | |
| | Total Common Stocks–100.2%
(cost $300,409) | | | | | | | 390,620 | |
| | | | | | | | | | |
| | Repurchase Agreement | | | | | | | | |
| | Fixed Income Clearing Corporation, 2.300% dated 12/29/23, due 01/02/24, repurchase price $5,673, collateralized by U.S. Treasury Bond, 4.375%, due 05/15/41, valued at $5,785 | | | $5,671 | | | | 5,671 | |
| | Total Repurchase Agreement–1.5%
(cost $5,671) | | | | | | | 5,671 | |
| | Total Investments–101.7%
(cost $306,080) | | | | | | | 396,291 | |
| | Liabilities, plus cash and other assets—(1.7)% | | | | | | | (6,579 | ) |
| | Net assets—100.0% | | | | | | $ | 389,712 | |
ADR = American Depository Receipt
GDR = Global Depository Receipt
REIT = Real Estate Investment Trust
* = Non-income producing security
† = U.S. listed foreign security
At December 31, 2023, the Fund’s Portfolio of Investments includes the following industry categories (as a percentage of long-term investments):
| Information Technology | | | 21.7 | % |
| Consumer Discretionary | | | 20.3 | % |
| Industrials | | | 18.5 | % |
| Real Estate | | | 11.1 | % |
| Consumer Staples | | | 8.5 | % |
| Financials | | | 8.0 | % |
| Materials | | | 4.5 | % |
| Health Care | | | 4.1 | % |
| Utilities | | | 2.3 | % |
| Energy | | | 1.0 | % |
| Total | | | 100.0 | % |
At December 31, 2023, the Fund’s Portfolio of Investments includes the following currency categories (as a percentage of long-term investments):
| Indian Rupee | | | 38.2 | % |
| New Taiwan Dollar | | | 17.2 | % |
| Brazilian Real | | | 12.5 | % |
| Mexican Peso | | | 7.9 | % |
| South African Rand | | | 7.8 | % |
| Chinese Yuan Renminbi | | | 4.3 | % |
| U.S. Dollar | | | 3.3 | % |
| Indonesian Rupiah | | | 3.3 | % |
| UAE Dirham | | | 2.2 | % |
| Polish Zloty | | | 1.4 | % |
| All Other Currencies | | | 1.9 | % |
| Total | | | 100.0 | % |
See accompanying Notes to Financial Statements.
| December 31, 2023 | William Blair Funds | 83 |
| | China Growth Fund |
| | |
| | The China Growth Fund seeks long-term capital appreciation. |
| | |
| | AN OVERVIEW FROM THE PORTFOLIO MANAGERS |
| | |

Vivian Lin Thurston, CFA 
Casey K. Preyss, CFA | The William Blair China Growth Fund (Class I shares) (the “Fund”) posted a 24.28% decrease, net of fees, for the year ended December 31, 2023. By comparison, the Fund’s benchmark index, the MSCI China All Shares Index (net) (the “Index”), decreased 11.53%. Underperformance versus the Index was driven primarily by below-average stock selection within Consumer Discretionary and Financials. Within Consumer Discretionary, China Tourism Group (CTG) was the primary detractor. CTG underperformed during the period as the recovery of duty-free sales has remained slow throughout the year as the pace of consumer recovery remains tepid and air travel remains well below 2019 levels. We continue to monitor near-term profitability expectations and risk/reward potential as consumption remains under pressure. An underweight allocation to outperforming e-commerce player, PDD Holdings also detracted from performance. Within Financials, stock selection within the banking industry, including Bank of Ningbo, detracted from relative returns. Bank of Ningbo is a leading commercial bank in China by total assets, loans, and deposits. The company continues to stand out for its focused strategy around higher-margin small and midsize enterprises and nonmortgage retail businesses, which we believe will generate superior growth, good asset quality, and profitability relative to its peers. The stock price declined during the period on broad economic weakness due to the slower than expected economic recovery resulting in lower asset yield and higher funding cost in part due to deposit mix deterioration. Partially offsetting these effects was the portfolio’s sector positioning, led by an underweight in Real Estate and Materials, coupled with positive stock selection in Utilities and Communication Services. Huaneng Lancang River Hydropower (HLRH), within Utilities, was additive to relative returns. HLRH owns and operates high-quality hydropower assets. The price of hydroelectricity generated by the company remains very competitive in China. Thus, HLRH enjoys robust demand from Guangdong and Guangxi provinces and benefits from power tariff increases within Yunnan thanks to improving supply and demand dynamics. The stock advanced during the fourth quarter as power generation volumes increased coupled with continuous cost reduction including depreciation costs and finance costs. Within Communication Services, NetEase was additive to relative returns. NetEase operates as a leading internet technology company providing online services including content, community, communication, and commerce. The company develops and operates online games, e-commerce, internet media, innovative business, and other businesses. The company has benefited from reduced regulatory scrutiny versus its peers as well as strong performance this year primarily driven by revenue growth in its legacy gaming portfolio and mobile games growth. Please refer to the Global Markets Review and Outlook relating to the Fund beginning on page 32. |
| 84 | Annual Report | December 31, 2023 |
China Growth Fund
Performance Highlights (Unaudited)
| Average Annual Total Return 12/31/2023 |
| | | 1 Year | | Since
Inception(a) |
| Class I | | | (24.28 | )% | | | (26.26 | )% |
| Class R6 | | | (24.38 | ) | | | (26.32 | ) |
| MSCI China All Shares Index (net) | | | (11.53 | ) | | | (16.59 | ) |
| (a) | Since inception is for the period from August 27, 2021 (Commencement of Operations) to December 31, 2023. |
Performance cited represents past performance. Past performance does not guarantee future results and current performance may be lower or higher than the data quoted. Results shown are average annual total returns, which assume reinvestment of dividends and capital gains. Investment returns and principal will fluctuate and you may have a gain or loss when you sell shares. For the most current month-end performance information, please call 1-800-742-7272, or visit our Web site at www.williamblairfunds.com. From time to time, the investment adviser may waive fees or reimburse expenses for the Fund. Without these waivers/reimbursements, performance would be lower. International investing involves special risk considerations, including currency fluctuations, lower liquidity, economic and political risk. These risks may be magnified when investing in emerging markets. Smaller capitalization stocks are also more sensitive to purchase/sale transactions and changes in the issuer’s financial condition. Class I shares are not subject to a sales load or distribution (Rule 12b-1) fees. Class R6 shares are not subject to a sales load, distribution (Rule 12b-1) fees, or sub-transfer agent fees.
The performance highlights and graph presented above do not reflect the deduction of taxes that a shareholder would pay on fund distributions or the redemption of fund shares.
The MSCI China All Shares Index (net) captures large and mid-cap representation across China A-shares, B-shares, H-shares, Red-chips, P-chips, and foreign listings. The index aims to reflect the opportunity set of China share classes listed in Hong Kong, Shanghai, Shenzhen, and outside of China. The Index is unmanaged, does not incur fees or expenses, and cannot be invested in directly.
This report identifies the Fund’s investments on December 31, 2023. These holdings are subject to change. Not all stocks in the Fund performed the same, nor is there any guarantee that these stocks will perform as well in the future. Market forecasts provided in this report may not necessarily come to pass.
Sector Diversification (Unaudited)

The sector diversification shown is based on the total long-term securities.
| December 31, 2023 | William Blair Funds | 85 |
China Growth Fund
Portfolio of Investments, December 31, 2023 (all dollar amounts in thousands)
| | | | | | | | |
| | | | | | | | |
| | Issuer | | Shares | | | Value | |
| | | | | | | | | | |
| | Common Stcocks | | | | | | | | |
| | | | | | | | | | |
| | Emerging Asia—93.6% | | | | | | | | |
| | China—93.6% | | | | | | | | |
| | Aier Eye Hospital Group Co. Ltd. (Health care providers & services) | | | 16,248 | | | $ | 36 | |
| | Airtac International Group (Machinery) | | | 2,000 | | | | 66 | |
| | Alibaba Group Holding Ltd. (Broadline retail) | | | 7,100 | | | | 69 | |
| | Bank of Chengdu Co. Ltd. (Banks) | | | 11,900 | | | | 19 | |
| | Bank of Ningbo Co. Ltd. (Banks) | | | 7,090 | | | | 20 | |
| | Beijing Kingsoft Office Software, Inc. (Software) | | | 649 | | | | 29 | |
| | Beijing Roborock Technology Co. Ltd. (Household durables) | | | 444 | | | | 18 | |
| | China Tourism Group Duty Free Corp. Ltd. (Specialty retail) | | | 1,400 | | | | 16 | |
| | Chongqing Zhifei Biological Products Co. Ltd. (Biotechnology) | | | 2,600 | | | | 22 | |
| | Contemporary Amperex Technology Co. Ltd. (Electrical equipment) | | | 2,340 | | | | 54 | |
| | East Money Information Co. Ltd. (Capital markets) | | | 16,244 | | | | 32 | |
| | Eastroc Beverage Group Co. Ltd. (Beverages) | | | 1,000 | | | | 26 | |
| | Estun Automation Co. Ltd. (Machinery) | | | 6,500 | | | | 17 | |
| | Fuyao Glass Industry Group Co. Ltd. (Automobile components) | | | 5,600 | | | | 27 | |
| * | Giant Biogene Holding Co. Ltd. (Personal care products) | | | 5,400 | | | | 25 | |
| | Hisense Home Appliances Group Co. Ltd. (Household durables) | | | 8,000 | | | | 17 | |
| | Huaming Power Equipment Co. Ltd. (Machinery) | | | 11,400 | | | | 23 | |
| | Huaneng Lancang River Hydropower, Inc. (Independent power & renewable electricity producers) | | | 50,900 | | | | 62 | |
| | Hundsun Technologies, Inc. (Software) | | | 4,100 | | | | 17 | |
| | Inner Mongolia Yili Industrial Group Co. Ltd. (Food products) | | | 3,900 | | | | 15 | |
| | Jiangsu Hengli Hydraulic Co. Ltd. (Machinery) | | | 1,800 | | | | 14 | |
| * | Kuaishou Technology (Interactive media & services) | | | 3,300 | | | | 22 | |
| | Kweichow Moutai Co. Ltd. (Beverages) | | | 600 | | | | 145 | |
| | Maxscend Microelectronics Co. Ltd. (Electronic equipment, instruments & components) | | | 1,200 | | | | 24 | |
| * | Meituan (Hotels, restaurants & leisure) | | | 2,510 | | | | 26 | |
| | Midea Group Co. Ltd. (Household durables) | | | 3,900 | | | | 30 | |
| | MINISO Group Holding Ltd. (Broadline retail) | | | 2,200 | | | | 11 | |
| | NAURA Technology Group Co. Ltd. (Semiconductors & semiconductor equipment) | | | 1,800 | | | | 62 | |
| | NetEase, Inc. (Entertainment) | | | 6,300 | | | | 113 | |
| * | PDD Holdings, Inc.–ADR (Broadline retail) | | | 553 | | | | 81 | |
| | | | | | | | |
| | | | | | | | |
| | Issuer | | Shares | | | Value | |
| | | | | | | | | | |
| | Common Stocks—(continued) | | | | | | | | |
| | | | | | | | | | |
| | Emerging Asia—(continued) | | | | | | | | |
| | China—(continued) | | | | | | | | |
| | Proya Cosmetics Co. Ltd. (Personal care products) | | | 1,588 | | | $ | 22 | |
| | Shenzhen Inovance Technology Co. Ltd. (Machinery) | | | 3,500 | | | | 31 | |
| | Shenzhen Mindray Bio-Medical Electronics Co. Ltd. (Health care equipment & supplies) | | | 600 | | | | 24 | |
| | Silergy Corp. (Semiconductors & semiconductor equipment) | | | 3,900 | | | | 64 | |
| | Sunresin New Materials Co. Ltd. (Chemicals) | | | 2,200 | | | | 16 | |
| | SUPCON Technology Co. Ltd. (Electronic equipment, instruments & components) | | | 4,125 | | | | 26 | |
| | Tencent Holdings Ltd. (Interactive media & services) | | | 4,900 | | | | 184 | |
| | Topsports International Holdings Ltd. (Specialty retail) | | | 18,000 | | | | 14 | |
| | Weichai Power Co. Ltd. (Machinery) | | | 27,000 | | | | 45 | |
| | Will Semiconductor Co. Ltd. Shanghai (Semiconductors & semiconductor equipment) | | | 1,600 | | | | 24 | |
| | Wuliangye Yibin Co. Ltd. (Beverages) | | | 2,200 | | | | 43 | |
| | Zhangzhou Pientzehuang Pharmaceutical Co. Ltd. (Pharmaceuticals) | | | 1,100 | | | | 37 | |
| | Zhejiang Jingsheng Mechanical & Electrical Co. Ltd. (Semiconductors & semiconductor equipment) | | | 4,300 | | | | 27 | |
| | Zhejiang Shuanghuan Driveline Co. Ltd. (Automobile components) | | | 3,900 | | | | 14 | |
| | Zhongji Innolight Co. Ltd. (Communications equipment) | | | 1,200 | | | | 19 | |
| | | | | | | | | 1,728 | |
| | | | | | | | | | |
| | Asia—4.0% | | | | | | | | |
| | Hong Kong—4.0% | | | | | | | | |
| | AIA Group Ltd. (Insurance) | | | 6,200 | | | | 54 | |
| | Hong Kong Exchanges & Clearing Ltd. (Capital markets) | | | 600 | | | | 21 | |
| | | | | | | | | 75 | |
| | Total Common Stocks—97.6%
(cost $2,026) | | | | | | | 1,803 | |
| | Total Investments—97.6%
(cost $2,026) | | | | | | | 1,803 | |
| | Cash and other assets, less liabilities—2.4% | | | | | | | 44 | |
| | Net assets—100.0% | | | | | | $ | 1,847 | |
ADR = American Depository Receipt
* = Non-income producing security
See accompanying Notes to Financial Statements.
| 86 | Annual Report | December 31, 2023 |
China Growth Fund
Portfolio of Investments, December 31, 2023
At December 31, 2023, the Fund’s Portfolio of Investments includes the following industry categories (as a percentage of long-term investments):
| Consumer Discretionary | | | 17.9 | % |
| Communication Services | | | 17.8 | % |
| Information Technology | | | 16.1 | % |
| Consumer Staples | | | 15.3 | % |
| Industrials | | | 13.8 | % |
| Financials | | | 8.1 | % |
| Health Care | | | 6.7 | % |
| Utilities | | | 3.4 | % |
| Materials | | | 0.9 | % |
| Total | | | 100.0 | % |
At December 31, 2023, the Fund’s Portfolio of Investments includes the following currency categories (as a percentage of long-term investments):
| Chinese Yuan Renminbi | | | 53.5 | % |
| Hong Kong Dollar | | | 34.8 | % |
| New Taiwan Dollar | | | 7.2 | % |
| U.S. Dollar | | | 4.5 | % |
| Total | | | 100.0 | % |
See accompanying Notes to Financial Statements.
| December 31, 2023 | William Blair Funds | 87 |
Emerging Markets Debt Market Review and Outlook
Emerging markets (“EM”) debt performed strongly in 2023 amid supportive market sentiment driven by improving prospects for global economic growth, inflation, interest rates and global liquidity conditions. Investors became increasingly optimistic about the trajectory of global policy rates as the global disinflationary process gained momentum. Further evidence of a global economic soft landing also contributed to the positive sentiment, supporting the performance of asset prices during the year. Improving economic activity in China and resilience growth dynamics in EM countries also helped underpin sentiment towards EM debt.
In this environment, the credit spread of the J.P. Morgan Emerging Markets Bond Index Global Diversified (EMBIGD) tightened by 68 basis points (“bps”), to 384 bps, producing a positive total return of 11.09% for the full year.
We anticipate a strong 2024 for the asset class on the back of a significant improvement in the global macroeconomic backdrop, characterized by still-resilient economic growth, lower global rates, and improving global liquidity conditions.
While it appears likely that the global economy will continue to gradually decelerate, we believe growth should remain close to its long-term potential. In such an environment, we believe central banks in advanced economies have likely reached the end of their interest rate hiking cycles, with monetary policy easing becoming a predominant theme in 2024.
Many EM central banks have already started cutting policy rates, and we expect this process to continue into 2024. Recall that in the global fight against inflation, EM central banks hiked interest rates sooner and faster than their counterparts in the developed world. As a result of such a timely and assertive policy reaction, inflation started to decrease sooner and faster in EM countries.
In our opinion, easier global monetary conditions will be one of the factors supporting economic growth in EM in 2024.
In this context, we believe credit fundamentals should remain well supported in most EM countries. We expect real gross domestic product (“GDP”) growth for our investment universe to be 3.5% in 2024, only marginally lower than in 2023. We also expect stable fiscal and debt dynamics. In our opinion, the budget-balance deficit and total government debt should remain relatively stable at approximately 5.4% and 58.6% of GDP, respectively. From an external account perspective, we expect a basic balance (current account plus foreign direct investments) surplus of approximately 1% of GDP in 2024.
We also believe market technical conditions should gradually improve as developed market central banks approach the end of their monetary-tightening cycles. We anticipate inflows to dedicated EM debt portfolios in 2024 as investors look for opportunities to increase interest-rate duration exposure to potentially benefit from attractive real and nominal yields. And, while we do expect a pickup in activity in the primary bond market, we believe net debt issuance should remain in negative territory (in both the sovereign and corporate credit spaces) as issuers seek alternative sources of funding. High investor cash levels, defensive positioning, and multi-year low foreign ownership of EM local bond markets should also add to a more constructive technical picture in 2024, in our opinion.
Importantly, we believe EM debt valuations continue to overcompensate investors for credit risks, currency and local rate risks, and volatility, and currently offer attractive value to investors with a medium- to long-term horizon and a willingness to tolerate a period of higher volatility.
EM debt credit spreads appear compelling on both an absolute and relative basis, with current levels remaining wider than their historical levels. While EM sovereign high-grade credit spreads appear unattractive, high-yield credit spreads appear compelling, particularly relative to U.S. corporate high-yield levels. In the distressed credit space, we believe current prices continue to overestimate the probability of credit default and underestimating potential restructuring and recovery values.
All in all, we anticipate a benign global macroeconomic backdrop and solid EM credit fundamentals underpinning a positive outlook for EM debt portfolios in 2024.
| 88 | Annual Report | December 31, 2023 |
| | Emerging Markets Debt Fund |
| | |
| | The Emerging Markets Debt Fund seeks to provide attractive risk-adjusted returns relative to the Fund’s benchmark. |
| | |
| | AN OVERVIEW FROM THE PORTFOLIO MANAGERS |
| | |

Marcelo Assalin, CFA 
Marco Ruijer, CFA | The William Blair Emerging Markets Debt Fund (Class I shares) (the “Fund”) posted a 13.41% increase, net of fees, for the year ended December 31, 2023. By comparison, the Fund’s benchmark index, the JPMorgan EMBI Global Diversified (the “Index”), increased 11.09%. Active performance was driven by security and country selection effects, with positive contribution coming from high-, medium-, and low-risk countries. In high-risk countries, the top contributors to relative performance were overweight positions in Pakistan, El Salvador, and Sri Lanka. Conversely, the top detractors from relative performance were overweight positions in Lebanon, Nigeria, and Venezuela. In Pakistan, bond prices rallied as the government reached a staff-level agreement with the International Monetary Fund (“IMF”) for another loan disbursement under the $3 billion program. There is also the prospect of rolling over to another program next year given that Pakistan’s government demonstrated strong commitment in meeting reform targets. We increased the overweight position in our Fund during the year as risk of default in 2024 has substantially decreased. In El Salvador, bond prices rallied, leading El Salvador to be one of the best performing countries in the Index in 2023. President Nayib Bukele’s administration was able to reorganize the country’s debt maturity profile last year through an asset-liability management exercise, resulting in better access to domestic financing sources. This has led to a material decrease in the perception of sovereign default risk and subsequently the strong performance of El Salvadorean bonds. In Sri Lanka, bond prices ascended after the IMF approved a four-year $3 billion Extended Fund Facility Arrangement. The IMF program has helped stabilize Sri Lanka’s economy, lowering inflation and replenishing foreign exchange reserves. Sri Lanka also concluded domestic debt restructuring. Authorities in Sri Lanka have started engaging with creditors on foreign debt restructuring and reached agreements-in-principle with the Official Creditors Committee and the Export-Import Bank of China. As for Lebanon, we attribute the country’s negative performance to the conflict in the Gaza region. The growing uncertainty in the Middle East has eroded any confidence in a resolution to the current political deadlock in Lebanon, and the country’s bonds continue to trade at very weak levels following a brief period of optimism during the year. In Nigeria, credit spreads narrowed sharply following various policy reform announcements by the new administration following the inauguration of President Tinubu in May 2023. These announcements included the removal of fuel subsidies and changes at the central bank including the appointment of a new central bank governor. We chose to take profit on our Nigerian bonds at an early stage of the rally, with a preference to hold Angola over Nigeria given more attractive valuations and a belief that the implementation risks will limit the outperformance of Nigeria. In Venezuela, sanctions were removed on secondary trading in October 2023. Bond prices initially rose precipitously, partly on expectations that Venezuela’s weight in the Index would materially increase and force passive funds to buy. Those expectations were soon tempered as J.P. Morgan announced that the Index phase-in would occur within a six-month watch period, leading to lower prices than existed when sanctions were lifted. |
| December 31, 2023 | William Blair Funds | 89 |
Emerging Markets Debt Fund
In medium-risk countries, the top contributors to relative performance were positions in Dominican Republic, Jordan, and Romania. Conversely, the top detractors from relative performance were positions in Costa Rica, Armenia, and Guatemala.
In the Dominican Republic, outperformance was the result of our investment in local currency instruments, which outperformed U.S.-dollar-denominated bonds. In July we participated in a new Dominican Republic local currency issuance that rose more than 5% on the first day of trading, which helped performance.
In Jordan, we have benefited from an underweight position as investors became concerned about the secondary impact of the Gaza conflict on Jordan’s economy. Although Jordan continues to enjoy a strong relationship with the IMF and is on track to deliver strong fiscal consolidation, it remains unclear how the regional conflicts will impact the country in 2024, and sentiment has weakened in line with this uncertainty.
In Romania, we benefited from our exclusive positioning in the long end of the curve. This positioning was assisted by a strong rally in euro- and U.S.-dollar denominated yields, optimism around domestic fiscal consolidation, and a stronger growth path (stemming from the fact that the central bank looks set to cut interest rates sharply in 2024 following a drop in inflation).
In Costa Rica, our overweight position in the short end of the curve led to underperformance as longer-duration bonds outperformed.
In Armenia, our overweight position at the beginning of the quarter detracted from performance as geopolitical tensions with Azerbaijan continue to weigh on investor sentiment.
In Guatemala, our overweight position was impacted by volatility created by political instability in the country. Political noise has increased following President Juan José Arevalo’s win in the August elections, as some branches of government have taken an aggressive stance toward Arevalo’s Semilla party, raising some concerns about the stability of the transition period.
In low-risk countries, the top contributors to relative performance were positions in China, Saudi Arabia, and United Arab Emirates. Conversely, the top detractors from relative performance were positions in Jamaica, Bermuda, and India.
In China, corporate credit positions contributed positively to our performance in 2023. Positions across Financials, Utilities, and Information Technology performed positively as improving Chinese economic activity supported investor sentiment during the year.
In Saudi Arabia and United Arab Emirates, underweight positions in long-dated securities contributed to performance given these countries’ high sensitivity to rising U.S. Treasury yields during the year. A corporate position in a Saudi real estate company also contributed to performance.
As for Jamaica, it outperformed in 2023. The country has been on a consistently improving fiscal trajectory since engaging in an IMF program early last decade. Fiscal and debt dynamics improved, and Jamaica has not needed to issue securities in international capital markets over the past years. Consequently, Jamaica now has shorter-maturity bonds and thus less sensitivity to fluctuations in interest rates. The strong fundamental trajectory and shorter duration helped Jamaica outperform during the quarter. However, we do not have a position in Jamaica because we think valuations are too tight, and the underweight hurt our performance during the year.
Our overweight position in Bermuda led to underperformance. We were overweight bonds in Bermuda because we preferred valuations and fundamentals there relative to those of other low-risk sovereign credit. Bermuda has similar valuations to Peru and Chile, but a stronger fundamental trajectory with less institutional uncertainty.
In India, our exposure to local currency supranational bonds detracted from performance as the Indian rupee depreciated against the U.S. dollar, in line with broad U.S. dollar strength on the back of robust U.S. economic data. Despite declining core inflation in India, headline inflation increased due to higher food prices, contributing to underperformance in local currency supranational bonds.
Please refer to the Emerging Markets Debt Review and Outlook relating to the Fund on page 88.
| 90 | Annual Report | December 31, 2023 |
Emerging Markets Debt Fund
Performance Highlights (Unaudited)
| Average Annual Total Return 12/31/2023 |
| | | 1 Year | | Since
Inception(a) |
| Class I | | | 13.41 | % | | | (2.79 | )% |
| Class R6 | | | 13.48 | | | | (2.75 | ) |
| JPMorgan EMBI Global Diversified | | | 11.09 | | | | (3.51 | ) |
| (a) | Since inception is for the period from May 25, 2021 (Commencement of Operations) to December 31, 2023. |
Performance cited represents past performance. Past performance does not guarantee future results and current performance may be lower or higher than the data quoted. Results shown are average annual total returns, which assume reinvestment of dividends and capital gains. Investment returns and principal will fluctuate and you may have a gain or loss when you sell shares. For the most current month-end performance information, please call 1-800-742-7272, or visit our Web site at www.williamblairfunds.com. From time to time, the investment adviser may waive fees or reimburse expenses for the Fund. Without these waivers/reimbursements, performance would be lower. Class I shares are not subject to a sales load or distribution (Rule 12b-1) fees. Class R6 shares are not subject to a sales load, distribution (Rule 12b-1) fees, or sub-transfer agent fees.
The performance highlights and graph presented above do not reflect the deduction of taxes that a shareholder would pay on fund distributions or the redemption of fund shares.
The JP Morgan Emerging Markets Bond Index (EMBI) Global Diversified tracks the total return of U.S.-dollar denominated debt instruments issued by sovereign and quasi-sovereign entities.
This report identifies the Fund’s investments on December 31, 2023. These holdings are subject to change. Not all investments in the Fund performed the same, nor is there any guarantee that these investments will perform as well in the future. Market forecasts provided in this report may not necessarily come to pass.
Sector Diversification (Unaudited)

The sector diversification shown is based on the total investments.
| December 31, 2023 | William Blair Funds | 91 |
Emerging Markets Debt Fund
Portfolio of Investments, December 31, 2023 (all dollar amounts in thousands)
| | | | | | | | |
| | Issuer | | Principal
Amount | | | Value | |
| | | | | | | | | | |
| | Foreign Government Bonds—63.1% | | | | | | | | |
| | Angola—2.1% | | | | | | | | |
| | Angolan Government International Bond,
9.125%, due 11/26/49 | | $ | 1,400 | | | $ | 1,143 | |
| | Argentina—1.5% | | | | | | | | |
| | Argentine Government International Bond, | | | | | | | | |
| | 0.750%, due 7/9/30 (a) | | | 1,030 | | | | 411 | |
| | 3.500%, due 7/9/41 (a) | | | 785 | | | | 266 | |
| | 3.750%, due 1/9/38 (a) | | EUR | 320 | | | | 120 | |
| | | | | | | | | 797 | |
| | Azerbaijan—0.3% | | | | | | | | |
| | Republic of Azerbaijan International Bond,
3.500%, due 9/1/32 | | $ | 200 | | | | 173 | |
| | Bahamas—0.3% | | | | | | | | |
| | Bahamas Government International Bond,
6.000%, due 11/21/28 | | | 200 | | | | 176 | |
| | Bahrain—2.2% | | | | | | | | |
| | Bahrain Government International Bond, | | | | | | | | |
| | 5.250%, due 1/25/33 | | | 200 | | | | 178 | |
| | 6.250%, due 1/25/51 | | | 300 | | | | 247 | |
| | 7.000%, due 1/26/26 | | | 200 | | | | 204 | |
| | 7.000%, due 10/12/28 | | | 500 | | | | 520 | |
| | | | | | | | | 1,149 | |
| | Benin—0.4% | | | | | | | | |
| | Benin Government International Bond,
6.875%, due 1/19/52 | | EUR | 250 | | | | 217 | |
| | Bermuda—0.6% | | | | | | | | |
| | Bermuda Government International Bond,
3.375%, due 8/20/50 | | $ | 460 | | | | 321 | |
| | Brazil—1.5% | | | | | | | | |
| | Brazilian Government International Bond,
4.750%, due 1/14/50 | | | 480 | | | | 369 | |
| | Brazil Notas do Tesouro Nacional Serie F, | | | | | | | | |
| | 10.000%, due 1/1/25 | | BRL | 560 | | | | 115 | |
| | 10.000%, due 1/1/33 | | | 1,610 | | | | 325 | |
| | | | | | | | | 809 | |
| | Chile—0.5% | | | | | | | | |
| | Chile Government International Bond,
3.250%, due 9/21/71 | | $ | 400 | | | | 267 | |
| | Colombia—2.2% | | | | | | | | |
| | Colombia Government International Bond, | | | | | | | | |
| | 3.250%, due 4/22/32 | | | 200 | | | | 159 | |
| | 4.125%, due 2/22/42 | | | 330 | | | | 235 | |
| | 4.125%, due 5/15/51 | | | 300 | | | | 199 | |
| | 5.000%, due 6/15/45 | | | 740 | | | | 571 | |
| | | | | | | | | 1,164 | |
| | Costa Rica—0.6% | | | | | | | | |
| | Costa Rica Government International Bond,
4.375%, due 4/30/25 | | | 340 | | | | 336 | |
| | Dominican Republic—1.9% | | | | | | | | |
| | Dominican Republic International Bond, | | | | | | | | |
| | 4.875%, due 9/23/32 | | | 230 | | | | 209 | |
| | 5.300%, due 1/21/41 | | | 250 | | | | 216 | |
| | 5.875%, due 1/30/60 | | | 310 | | | | 268 | |
| | 11.250%, due 9/15/35 (b) | | DOP | 18,000 | | | | 332 | |
| | | | | | | | | 1,025 | |
| | | | | | | | |
| | Issuer | | Principal
Amount | | | Value | |
| | | | | | | | | | |
| | Foreign Government Bonds—(continued) | | | | | | | | |
| | Ecuador—1.4% | | | | | | | | |
| | Ecuador Government International Bond, | | | | | | | | |
| | 0.000%, due 7/31/30 | | $ | 480 | | | $ | 136 | |
| | 2.500%, due 7/31/40 (a) | | | 1,300 | | | | 409 | |
| | 3.500%, due 7/31/35 (a) | | | 380 | | | | 135 | |
| | 6.000%, due 7/31/30 (a) | | | 110 | | | | 51 | |
| | | | | | | | | 731 | |
| | Egypt—3.1% | | | | | | | | |
| | Egypt Government International Bond, | | | | | | | | |
| | 7.300%, due 9/30/33 (b) | | | 250 | | | | 165 | |
| | 7.500%, due 2/16/61 | | | 650 | | | | 378 | |
| | 8.150%, due 11/20/59 | | | 200 | | | | 122 | |
| | 8.750%, due 9/30/51 (b) | | | 250 | | | | 157 | |
| | 8.750%, due 9/30/51 | | | 250 | | | | 157 | |
| | 8.875%, due 5/29/50 | | | 1,025 | | | | 651 | |
| | | | | | | | | 1,630 | |
| | El Salvador—1.3% | | | | | | | | |
| | El Salvador Government International Bond, | | | | | | | | |
| | 7.125%, due 1/20/50 | | | 150 | | | | 106 | |
| | 7.625%, due 2/1/41 | | | 700 | | | | 522 | |
| | 8.625%, due 2/28/29 | | | 60 | | | | 54 | |
| | | | | | | | | 682 | |
| | Ethiopia—0.2% | | | | | | | | |
| | Ethiopia International Bond,
6.625%, due 12/11/24 | | | 200 | | | | 133 | |
| | Gabon—1.2% | | | | | | | | |
| | Gabon Government International Bond, | | | | | | | | |
| | 6.950%, due 6/16/25 | | | 200 | | | | 190 | |
| | 7.000%, due 11/24/31 | | | 550 | | | | 456 | |
| | | | | | | | | 646 | |
| | Ghana—1.9% | | | | | | | | |
| | Ghana Government International Bond, | | | | | | | | |
| | 0.000%, due 4/7/25 (c) | | | 350 | | | | 132 | |
| | 6.375%, due 2/11/27 (c) | | | 600 | | | | 266 | |
| | 7.750%, due 4/7/29 (c) | | | 500 | | | | 215 | |
| | 8.625%, due 4/7/34 (c) | | | 400 | | | | 172 | |
| | 8.950%, due 3/26/51 (c) | | | 550 | | | | 236 | |
| | | | | | | | | 1,021 | |
| | Guatemala—1.6% | | | | | | | | |
| | Guatemala Government Bond, | | | | | | | | |
| | 3.700%, due 10/7/33 | | | 755 | | | | 628 | |
| | 4.650%, due 10/7/41 | | | 280 | | | | 228 | |
| | | | | | | | | 856 | |
| | Hungary—1.6% | | | | | | | | |
| | Hungary Government International Bond, | | | | | | | | |
| | 3.125%, due 9/21/51 | | | 600 | | | | 405 | |
| | 6.750%, due 9/25/52 (b) | | | 400 | | | | 448 | |
| | | | | | | | | 853 | |
| | Indonesia—0.4% | | | | | | | | |
| | Indonesia Government International Bond,
6.500%, due 6/15/25 | | IDR | 3,500,000 | | | | 227 | |
| | Iraq—0.2% | | | | | | | | |
| | Iraq International Bond,
5.800%, due 1/15/28 | | $ | 141 | | | | 131 | |
See accompanying Notes to Financial Statements.
| 92 | Annual Report | December 31, 2023 |
Emerging Markets Debt Fund
Portfolio of Investments, December 31, 2023 (all dollar amounts in thousands)
| | | | | | | | |
| | Issuer | | Principal
Amount | | | Value | |
| | | | | | | | | | |
| | Foreign Government Bonds—(continued) | | | | | | | | |
| | Ivory Coast—0.5% | | | | | | | | |
| | Ivory Coast Government International Bond,
6.625%, due 3/22/48 | | EUR | 300 | | | $ | 263 | |
| | Jamaica—0.4% | | | | | | | | |
| | Jamaica Government International Bond,
9.625%, due 11/3/30 | | JMD | 36,000 | | | | 235 | |
| | Jordan—0.3% | | | | | | | | |
| | Jordan Government International Bond,
5.850%, due 7/7/30 | | $ | 200 | | | | 185 | |
| | Kenya—1.3% | | | | | | | | |
| | Kenya Government International Bond,
6.875%, due 6/24/24 | | | 700 | | | | 679 | |
| | Lebanon—0.6% | | | | | | | | |
| | Lebanon Government International Bond, | | | | | | | | |
| | 5.800%, due 4/14/20 (c) | | | 1,400 | | | | 84 | |
| | 6.600%, due 11/27/26 (c) | | | 800 | | | | 47 | |
| | 6.650%, due 4/22/24 (c) | | | 268 | | | | 16 | |
| | 6.750%, due 11/29/27 (c) | | | 776 | | | | 46 | |
| | 6.850%, due 3/23/27 (c) | | | 600 | | | | 35 | |
| | 7.150%, due 11/20/31 (c) | | | 1,200 | | | | 72 | |
| | 8.200%, due 5/17/33 (c) | | | 600 | | | | 36 | |
| | | | | | | | | 336 | |
| | Mexico—1.2% | | | | | | | | |
| | Mexico Government International Bond,
6.350%, due 2/9/35 | | | 600 | | | | 628 | |
| | Mongolia—0.7% | | | | | | | | |
| | Mongolia Government International Bond, | | | | | | | | |
| | 4.450%, due 7/7/31 | | | 200 | | | | 168 | |
| | 8.650%, due 1/19/28 (b) | | | 200 | | | | 210 | |
| | | | | | | | | 378 | |
| | Morocco—0.3% | | | | | | | | |
| | Morocco Government International Bond,
4.000%, due 12/15/50 | | | 200 | | | | 144 | |
| | Mozambique—0.6% | | | | | | | | |
| | Mozambique International Bond,
9.000%, due 9/15/31 (a) | | | 400 | | | | 339 | |
| | Nigeria—0.8% | | | | | | | | |
| | Nigeria Government International Bond,
8.250%, due 9/28/51 | | | 500 | | | | 410 | |
| | Oman—1.2% | | | | | | | | |
| | Oman Government International Bond, | | | | | | | | |
| | 5.625%, due 1/17/28 | | | 400 | | | | 407 | |
| | 6.750%, due 1/17/48 | | | 200 | | | | 209 | |
| | | | | | | | | 616 | |
| | Pakistan—1.9% | | | | | | | | |
| | Pakistan Government International Bond, | | | | | | | | |
| | 6.000%, due 4/8/26 | | | 300 | | | | 211 | |
| | 6.875%, due 12/5/27 | | | 400 | | | | 271 | |
| | 8.250%, due 4/15/24 | | | 200 | | | | 189 | |
| | 8.875%, due 4/8/51 | | | 550 | | | | 330 | |
| | | | | | | | | 1,001 | |
| | Panama—2.8% | | | | | | | | |
| | Panama Government International Bond, | | | | | | | | |
| | 2.252%, due 9/29/32 | | | 200 | | | | 146 | |
| | 3.870%, due 7/23/60 | | | 710 | | | | 424 | |
| | 4.500%, due 5/15/47 | | | 200 | | | | 142 | |
| | 4.500%, due 4/1/56 | | | 200 | | | | 134 | |
| | | | | | | | |
| | Issuer | | Principal
Amount | | | Value | |
| | | | | | | | | | |
| | Foreign Government Bonds—(continued) | | | | | | | | |
| | Panama—(continued) | | | | | | | | |
| | 4.500%, due 1/19/63 | | $ | 600 | | | $ | 392 | |
| | 6.400%, due 2/14/35 | | | 270 | | | | 263 | |
| | | | | | | | | 1,501 | |
| | Paraguay—2.1% | | | | | | | | |
| | Paraguay Government International Bond, | | | | | | | | |
| | 2.739%, due 1/29/33 | | | 1,060 | | | | 869 | |
| | 3.849%, due 6/28/33 | | | 300 | | | | 265 | |
| | | | | | | | | 1,134 | |
| | Peru—1.0% | | | | | | | | |
| | Peruvian Government International Bond, | | | | | | | | |
| | 2.783%, due 1/23/31 | | | 200 | | | | 174 | |
| | 3.230%, due 7/28/21 | | | 230 | | | | 143 | |
| | 3.600%, due 1/15/72 | | | 300 | | | | 211 | |
| | | | | | | | | 528 | |
| | Philippines—0.8% | | | | | | | | |
| | Philippines Government International Bond,
3.700%, due 2/2/42 | | | 500 | | | | 427 | |
| | Poland—1.6% | | | | | | | | |
| | Poland Government International Bond,
5.500%, due 4/4/53 | | | 800 | | | | 832 | |
| | Qatar—3.4% | | | | | | | | |
| | Qatar Government International Bond, | | | | | | | | |
| | 4.400%, due 4/16/50 | | | 1,750 | | | | 1,615 | |
| | 5.103%, due 4/23/48 | | | 200 | | | | 202 | |
| | | | | | | | | 1,817 | |
| | Romania—1.2% | | | | | | | | |
| | Romania Government International Bond, | | | | | | | | |
| | 2.875%, due 4/13/42 | | EUR | 100 | | | | 75 | |
| | 3.375%, due 1/28/50 | | | 430 | | | | 322 | |
| | 7.625%, due 1/17/53 (b) | | $ | 200 | | | | 223 | |
| | | | | | | | | 620 | |
| | Saudi Arabia—1.0% | | | | | | | | |
| | Saudi Government International Bond,
3.450%, due 2/2/61 | | | 800 | | | | 561 | |
| | Senegal—0.3% | | | | | | | | |
| | Senegal Government International Bond,
5.375%, due 6/8/37 | | EUR | 200 | | | | 163 | |
| | Serbia—0.3% | | | | | | | | |
| | Serbia International Bond,
2.050%, due 9/23/36 | | | 200 | | | | 153 | |
| | South Africa—2.7% | | | | | | | | |
| | South Africa Government International Bond, | | | | | | | | |
| | 4.300%, due 10/12/28 | | $ | 400 | | | | 374 | |
| | 5.750%, due 9/30/49 | | | 650 | | | | 518 | |
| | 8.750%, due 2/28/48 | | ZAR | 13,400 | | | | 539 | |
| | | | | | | | | 1,431 | |
| | Sri Lanka—1.7% | | | | | | | | |
| | Sri Lanka Government International Bond, | | | | | | | | |
| | 5.750%, due 4/18/23 (c) | | $ | 400 | | | | 204 | |
| | 6.350%, due 6/28/24 (c) | | | 400 | | | | 202 | |
| | 6.850%, due 11/3/25 (c) | | | 400 | | | | 204 | |
| | 7.550%, due 3/28/30 (c) | | | 200 | | | | 100 | |
| | 7.850%, due 3/14/29 (c) | | | 400 | | | | 200 | |
| | | | | | | | | 910 | |
See accompanying Notes to Financial Statements.
| December 31, 2023 | William Blair Funds | 93 |
Emerging Markets Debt Fund
Portfolio of Investments, December 31, 2023 (all dollar amounts in thousands)
| | | | | | | | |
| | Issuer | | Principal
Amount | | | Value | |
| | | | | | | | | | |
| | Foreign Government Bonds—(continued) | | | | | | | | |
| | Suriname—0.4% | | | | | | | | |
| | Suriname Government International Bond,
7.950%, due 7/15/33 (b) | | $ | 250 | | | $ | 216 | |
| | Trinidad And Tobago—0.4% | | | | | | | | |
| | Trinidad and Tobago Government International Bond,
5.950%, due 1/14/31 (b) | | 200 | | | | 207 | |
| | Tunisia—0.9% | | | | | | | | |
| | Tunisian Republic, | | | | | | | | |
| | 5.625%, due 2/17/24 | | EUR | 100 | | | | 107 | |
| | 5.750%, due 1/30/25 | | $ | 200 | | | | 163 | |
| | 6.375%, due 7/15/26 | | EUR | 300 | | | | 229 | |
| | | | | | | | | 499 | |
| | Turkey—1.6% | | | | | | | | |
| | Turkiye Government International Bond, | | | | | | | | |
| | 4.875%, due 10/9/26 | | $ | 200 | | | | 192 | |
| | 4.875%, due 4/16/43 | | | 400 | | | | 292 | |
| | 9.375%, due 1/19/33 | | | 200 | | | | 226 | |
| | Turkiye Government Bond,
12.600%, due 10/1/25 | | TRY | 5,000 | | | | 120 | |
| | | | | | | | | 830 | |
| | Ukraine—1.2% | | | | | | | | |
| | Ukraine Government International Bond, | | | | | | | | |
| | 7.253%, due 3/15/35 (c) | | $ | 1,300 | | | | 301 | |
| | 7.750%, due 8/1/41 (a)(c) | | | 600 | | | | 267 | |
| | 9.750%, due 11/1/30 (c) | | | 200 | | | | 57 | |
| | | | | | | | | 625 | |
| | United Arab Emirates—0.6% | | | | | | | | |
| | Abu Dhabi Government International Bond,
3.000%, due 9/15/51 | | | 450 | | | | 321 | |
| | Uruguay—0.5% | | | | | | | | |
| | Uruguay Government International Bond, | | | | | | | | |
| | 4.975%, due 4/20/55 | | | 200 | | | | 195 | |
| | 9.750%, due 7/20/33 | | UYU | 3,788 | | | | 98 | |
| | | | | | | | | 293 | |
| | Uzbekistan—0.3% | | | | | | | | |
| | Republic of Uzbekistan International Bond,
3.900%, due 10/19/31 | | $ | 200 | | | | 168 | |
| | Venezuela—0.5% | | | | | | | | |
| | Venezuela Government International Bond, | | | | | | | | |
| | 8.250%, due 10/13/24 (c) | | | 800 | | | | 115 | |
| | 11.950%, due 8/5/31 (c) | | | 800 | | | | 144 | |
| | | | | | | | | 259 | |
| | Zambia—1.0% | | | | | | | | |
| | Zambia Government International Bond, | | | | | | | | |
| | 5.375%, due 9/20/22 (c) | | | 250 | | | | 139 | |
| | 8.500%, due 4/14/24 (c) | | | 200 | | | | 124 | |
| | 8.970%, due 7/30/27 (c) | | | 400 | | | | 247 | |
| | | | | | | | | 510 | |
| | Total Foreign Government Bonds—63.1%
(cost $33,516) | | | | | | | 33,706 | |
| | | | | | | | | | |
| | Foreign Corporate Bonds—30.6% | | | | | | | | |
| | Brazil—2.7% | | | | | | | | |
| | Aegea Finance SARL,
9.000%, due 1/20/31 (b) | | | 200 | | | | 213 | |
| | Azul Secured Finance LLP,
10.875%, due 5/28/30 (b) | | | 175 | | | | 145 | |
| | | | | | | | |
| | Issuer | | Principal
Amount | | | Value | |
| | | | | | | | | | |
| | Foreign Corporate Bonds—(continued) | | | | | | | | |
| | Brazil—(continued) | | | | | | | | |
| | Banco do Brasil SA,
10 year CMT + 4.398%, 6.250%, due 4/15/24 (d)(e) | | $ | 200 | | | $ | 194 | |
| | CSN Resources SA,
8.875%, due 12/5/30 (b) | | | 200 | | | | 208 | |
| | ERO Copper Corp.,
6.500%, due 2/15/30 | | | 200 | | | | 177 | |
| | Hidrovias International Finance SARL,
4.950%, due 2/8/31 | | | 200 | | | | 157 | |
| | Minerva Luxembourg SA,
4.375%, due 3/18/31 | | | 200 | | | | 164 | |
| | Petrorio Luxembourg Trading SARL,
6.125%, due 6/9/26 | | | 200 | | | | 196 | |
| | | | | | | | | 1,454 | |
| | Chile—2.4% | | | | | | | | |
| | CAP SA,
3.900%, due 4/27/31 | | | 250 | | | | 191 | |
| | Corp. Nacional del Cobre de Chile, | | | | | | | | |
| | 3.750%, due 1/15/31 | | | 400 | | | | 361 | |
| | 3.700%, due 1/30/50 | | | 200 | | | | 144 | |
| | Empresa Nacional del Petroleo,
5.250%, due 11/6/29 | | | 450 | | | | 435 | |
| | Inversiones CMPC SA,
3.000%, due 4/6/31 | | | 200 | | | | 170 | |
| | | | | | | | | 1,301 | |
| | China—1.5% | | | | | | | | |
| | China Evergrande Group,
9.500%, due 3/29/24 (c) | | | 300 | | | | 3 | |
| | China Oil & Gas Group Ltd.,
4.700%, due 6/30/26 | | | 200 | | | | 177 | |
| | ENN Clean Energy International Investment Ltd.,
3.375%, due 5/12/26 | | | 200 | | | | 187 | |
| | Sinochem Offshore Capital Co. Ltd.,
2.375%, due 9/23/31 | | | 500 | | | | 407 | |
| | Yuzhou Group Holdings Co. Ltd.,
7.850%, due 8/12/26 (c) | | | 200 | | | | 12 | |
| | | | | | | | | 786 | |
| | Colombia—0.7% | | | | | | | | |
| | Corp. Andina de Fomento,
6.770%, due 5/24/28 | | COP | 1,000,000 | | | | 216 | |
| | SierraCol Energy Andina LLC,
6.000%, due 6/15/28 | | $ | 200 | | | | 167 | |
| | | | | | | | | 383 | |
| | Costa Rica—0.4% | | | | | | | | |
| | Instituto Costarricense de Electricidad,
6.375%, due 5/15/43 | | | 250 | | | | 222 | |
| | Czech Republic—0.4% | | | | | | | | |
| | Energo-Pro AS,
8.500%, due 2/4/27 | | | 200 | | | | 196 | |
| | Dominican Republic—0.4% | | | | | | | | |
| | Empresa Generadora de Electricidad Haina SA,
5.625%, due 11/8/28 (b) | | | 250 | | | | 227 | |
| | Hong Kong—0.3% | | | | | | | | |
| | Standard Chartered PLC,
5 year CMT + 3.135%, 4.300%, due 8/19/28 (d)(e) | | | 200 | | | | 159 | |
See accompanying Notes to Financial Statements.
| 94 | Annual Report | December 31, 2023 |
Emerging Markets Debt Fund
Portfolio of Investments, December 31, 2023 (all dollar amounts in thousands)
| | | | | | | | |
| | Issuer | | Principal
Amount | | | Value | |
| | | | | | | | | | |
| | Foreign Corporate Bonds—(continued) | | | | | | | | |
| | Hungary—0.4% | | | | | | | | |
| | Magyar Export-Import Bank Zrt,
6.125%, due 12/4/27 | | $ | 200 | | | $ | 203 | |
| | India—2.0% | | | | | | | | |
| | European Bank for Reconstruction & Development,
6.300%, due 10/26/27 | | INR | 20,000 | | | | 235 | |
| | International Bank for Reconstruction & Development,
6.850%, due 4/24/28 | | INR | 20,000 | | | | 238 | |
| | Network i2i Ltd.,
5 year CMT + 4.274%, 5.650%, due 1/15/25 (d)(e) | | $ | 200 | | | | 197 | |
| | Periama Holdings LLC,
5.950%, due 4/19/26 | | | 200 | | | | 197 | |
| | ReNew Wind Energy AP2/ReNew Power Pvt Ltd.,
4.500%, due 7/14/28 | | | 200 | | | | 178 | |
| | | | | | | | | 1,045 | |
| | Indonesia—2.7% | | | | | | | | |
| | European Bank for Reconstruction & Development,
6.000%, due 1/17/30 | | IDR | 3,500,000 | | | | 225 | |
| | Medco Maple Tree Pte. Ltd.,
8.960%, due 4/27/29 (b) | | $ | 250 | | | | 255 | |
| | Pertamina Persero PT, | | | | | | | | |
| | 6.000%, due 5/3/42 | | | 200 | | | | 209 | |
| | 2.300%, due 2/9/31 | | | 200 | | | | 168 | |
| | 3.100%, due 8/27/30 | | | 400 | | | | 359 | |
| | Perusahaan Penerbit SBSN Indonesia III,
4.700%, due 6/6/32 (b) | | 200 | | | | 200 | |
| | | | | | | | | 1,416 | |
| | Kazakhstan—0.6% | | | | | | | | |
| | KazMunayGas National Co. JSC,
3.500%, due 4/14/33 | | | 400 | | | | 332 | |
| | Malaysia—1.2% | | | | | | | | |
| | Dua Capital Ltd.,
2.780%, due 5/11/31 | | | 550 | | | | 479 | |
| | Petronas Capital Ltd.,
4.550%, due 4/21/50 | | | 200 | | | | 184 | |
| | | | | | | | | 663 | |
| | Mexico—5.3% | | | | | | | | |
| | Banco Nacional de Comercio Exterior SNC,
5 year CMT + 2.000%, 2.720%, due 8/11/31 (e) | | | 220 | | | | 185 | |
| | BBVA Bancomer SA,
5 year CMT + 2.650%, 5.125%, due 1/18/33 (e) | | | 200 | | | | 180 | |
| | Credito Real SAB de CV SOFOM ER,
5.000%, due 2/1/27 (c) | | EUR | 200 | | | | 24 | |
| | Grupo Axo SAPI de CV,
5.750%, due 6/8/26 | | $ | 200 | | | | 183 | |
| | Orbia Advance Corp. SAB de CV,
1.875%, due 5/11/26 | | | 200 | | | | 183 | |
| | Petroleos Mexicanos, | | | | | | | | |
| | 6.700%, due 2/16/32 | | | 230 | | | | 190 | |
| | 7.690%, due 1/23/50 | | | 250 | | | | 178 | |
| | 4.750%, due 2/26/29 | | EUR | 200 | | | | 181 | |
| | 6.490%, due 1/23/27 | | $ | 200 | | | | 187 | |
| | 5.950%, due 1/28/31 | | | 1,000 | | | | 794 | |
| | 6.750%, due 9/21/47 | | | 808 | | | | 529 | |
| | | | | | | | | 2,814 | |
| | | | | | | | |
| | Issuer | | Principal
Amount | | | Value | |
| | | | | | | | | | |
| | Foreign Corporate Bonds—(continued) | | | | | | | | |
| | Nigeria—0.3% | | | | | | | | |
| | SEPLAT Energy PLC,
7.750%, due 4/1/26 | | $ | 200 | | | $ | 183 | |
| | Paraguay—0.4% | | | | | | | | |
| | Telefonica Celular del Paraguay SA,
5.875%, due 4/15/27 | | | 200 | | | | 195 | |
| | Peru—1.4% | | | | | | | | |
| | Banco Internacional del Peru SAA Interbank,
5 year CMT + 3.711%, 4.000%, due 7/8/30 (e) | | | 200 | | | | 191 | |
| | Corp. Financiera de Desarrollo SA,
2.400%, due 9/28/27 | | | 420 | | | | 373 | |
| | InRetail Consumer,
3.250%, due 3/22/28 | | | 200 | | | | 178 | |
| | | | | | | | | 742 | |
| | Saudi Arabia—0.5% | | | | | | | | |
| | Gaci First Investment Co.,
5.125%, due 2/14/53 | | | 300 | | | | 271 | |
| | South Africa—0.3% | | | | | | | | |
| | Stillwater Mining Co.,
4.000%, due 11/16/26 | | | 200 | | | | 177 | |
| | Supranational—0.9% | | | | | | | | |
| | Gabon Blue Bond Master Trust,
6.097%, due 8/1/38 (b) | | | 500 | | | | 491 | |
| | Thailand—0.3% | | | | | | | | |
| | Bangkok Bank PCL,
5 year CMT + 2.150%, 3.466%, due 9/23/36 (e) | | 200 | | | | 167 | |
| | Trinidad And Tobago—0.8% | | | | | | | | |
| | Heritage Petroleum Co. Ltd., | | | | | | | | |
| | 9.000%, due 8/12/29 (b) | | | 200 | | | | 210 | |
| | 9.000%, due 8/12/29 | | | 200 | | | | 209 | |
| | | | | | | | | 419 | |
| | Turkey—2.7% | | | | | | | | |
| | Hazine Mustesarligi Varlik Kiralama AS,
7.250%, due 2/24/27 | | | 200 | | | | 203 | |
| | Istanbul Metropolitan Municipality,
10.500%, due 12/6/28 (b) | | | 200 | | | | 212 | |
| | TAV Havalimanlari Holding AS,
8.500%, due 12/7/28 (b) | | | 200 | | | | 204 | |
| | Turkiye Ihracat Kredi Bankasi AS, | | | | | | | | |
| | 5.750%, due 7/6/26 | | | 200 | | | | 194 | |
| | 9.375%, due 1/31/26 (b) | | | 200 | | | | 209 | |
| | Turkiye Vakiflar Bankasi TAO,
9.000%, due 10/12/28 (b) | | | 200 | | | | 210 | |
| | WE Soda Investments Holding PLC,
9.500%, due 10/6/28 (b) | | | 200 | | | | 207 | |
| | | | | | | | | 1,439 | |
| | United Arab Emirates—1.8% | | | | | | | | |
| | Emirates NBD Bank PJSC,
2.625%, due 2/18/25 | | | 200 | | | | 194 | |
| | GEMS MENASA Cayman Ltd./GEMS Education Delaware LLC,
7.125%, due 7/31/26 | | | 200 | | | | 196 | |
| | MAF Global Securities Ltd.,
5 year CMT + 3.539%, 6.375%, due 3/20/26 (d)(e) | | | 200 | | | | 196 | |
See accompanying Notes to Financial Statements.
| December 31, 2023 | William Blair Funds | 95 |
Emerging Markets Debt Fund
Portfolio of Investments, December 31, 2023 (all dollar amounts in thousands)
| | | | | | | | |
| | Issuer | | Principal
Amount | | | Value | |
| | | | | | | | | | |
| | Foreign Corporate Bonds—(continued) | | | | | | | | |
| | United Arab Emirates—(continued) | | | | | | | | |
| | Shelf Drilling Holdings Ltd.,
9.625%, due 4/15/29 (b) | | $ | 200 | | | $ | 194 | |
| | Sobha Sukuk Ltd.,
8.750%, due 7/17/28 | | | 200 | | | | 199 | |
| | | | | | | | | 979 | |
| | Venezuela—0.2% | | | | | | | | |
| | Petroleos de Venezuela SA, | | | | | | | | |
| | 6.000%, due 11/15/26 (c) | | | 250 | | | | 27 | |
| | 9.750%, due 5/17/35 (c) | | | 530 | | | | 65 | |
| | | | | | | | | 92 | |
| | Total Foreign Corporate Bonds—30.6%
(cost $16,830) | | | | | | | 16,356 | |
| | | | | | | | | | |
| | Foreign Municipal Bonds—0.3% | | | | | | | | |
| | Argentina—0.3% | | | | | | | | |
| | Provincia de Buenos Aires, | | | | | | | | |
| | 6.375%, due 9/1/37 (a) | | | 170 | | | | 65 | |
| | 6.375%, due 9/1/37 (a)(b) | | | 50 | | | | 19 | |
| | 5.500%, due 9/1/37 (a)(b) | | | 200 | | | | 58 | |
| | | | | | | | | 142 | |
| | Total Foreign Municipal Bonds—0.3%
(cost $191) | | | | | | | 142 | |
| | | | | | | | | | |
| | Repurchase Agreement | | | | | | | | |
| | Fixed Income Clearing Corporation, 2.300% dated 12/29/23, due 01/02/24, repurchase price $1,351, collateralized by U.S. Treasury Note, 3.875%, due 12/31/27, valued at $1,378 | �� | | 1,351 | | | | 1,351 | |
| | Total Repurchase Agreement—2.5%
(cost $1,351) | | | | | | | 1,351 | |
| | | | | | | | | | |
| | U.S. Government—1.8% | | | | | | | | |
| | U.S. Treasury Bill, | | | | | | | | |
| | 5.260%, due 2/15/24 (f) | | | 760 | | | | 755 | |
| | 5.287%, due 4/25/24 | | | 220 | | | | 217 | |
| | Total U.S. Government—1.8%
(cost $971) | | | | | | | 972 | |
| | Total Investments in Securities—98.3%
(cost $52,859) | | | | | | | 52,527 | |
| | Total Investments—98.3%
(cost $52,859) | | | | | | | 52,527 | |
| | Cash and other assets, less liabilities—1.7% | | | | | | | 909 | |
| | Net assets—100.0% | | | | | | $ | 53,436 | |
(a) Variable/Floating interest rate security. Certain variable/floating interest rate securities are not based on a published reference rate and spread but are determined by the issuer or agent and are based on current market conditions. These securities do not indicate a reference rate and spread in their description above. Rate presented is as of December 31, 2023.
(b) Security exempt from registration under Rule 144A of the Securities Act of 1933. These securities may be resold in transactions exempt from registration, normally to qualified institutional buyers.
(c) Security is currently in default and/or non-income producing.
(d) Security has perpetual maturity. Date shown represents the next contractual call date.
(e) Floating Rate Bond. Rate shown is as of December 31, 2023.
(f) Security, or portion of security, is segregated as collateral to cover initial margin requirements on centrally cleared swaps aggregating a total value of $477 (in thousands).
CMT = Constant Maturity Treasury
EURIBOR = Euro Interbank Offered Rate
SOFR = Secured Overnight Financing Rate
TIIE = Interbank Equilibrium Interest Rate
At December 31, 2023, the Fund’s Portfolio of Investments includes the following currency categories (as a percentage of long-term investments):
| U.S. Dollar | | | 90.7 | % |
| Euro | | | 3.6 | % |
| South African Rand | | | 1.1 | % |
| All Other Currencies | | | 4.6 | % |
| Total | | | 100.0 | % |
| | | | | |
| At December 31, 2023, the Fund’s Portfolio of Investments includes the following industry categories (as a percentage of long-term investments): |
| | | | | |
| Sovereign | | | 69.1 | % |
| Corporate | | | | |
| Financials | | | 3.4 | % |
| Materials | | | 3.0 | % |
| Utilities | | | 2.2 | % |
| Energy | | | 1.9 | % |
| Consumer Discretionary | | | 1.0 | % |
| Communication Services | | | 0.8 | % |
| Industrials | | | 0.7 | % |
| Consumer Staples | | | 0.7 | % |
| Quasi-Sovereign | | | 13.7 | % |
| Supranational | | | 2.8 | % |
| Sub Sovereign | | | 0.7 | % |
| Total | | | 100.0 | % |
| | | | | |
See accompanying Notes to Financial Statements.
| 96 | Annual Report | December 31, 2023 |
Emerging Markets Debt Fund
Portfolio of Investments, December 31, 2023 (all dollar amounts in thousands)
Forward Foreign Currency Contracts
Settlement
Date | | Deliver/Receive | | Counterparty | | Local Currency
(in thousands) | | USD (Base)
Purchased
or Sold | | | Current
Value | | | Net
Unrealized
Appreciation
(Depreciation) | |
| Sold | | | | | | | | | | | | | | | | | | | |
| 3/20/24 | | Euro | | Citibank N.A. | | 1,764 | | | $1,913 | | | | $1,953 | | | | $ | (40 | ) |
| Total net unrealized appreciation (depreciation) on forward foreign currency contracts | | | | | | $ | (40 | ) |
Centrally Cleared Interest Rate Swaps
Floating Rate
Reference | | Pay/Receive
Floating Rate | | Fixed
Rate | | Payment
Frequency | | Maturity
Date | | Cleared
Exchange | | Notional
Amount
(in thousands) | | | Upfront
Payment
Paid
(Received) | | | Value | | Unrealized
Appreciation
(Depreciation) | |
| 1-Day USD SOFR | | Receive | | 3.500% | | 1Y | | June 2063 | | LCH | | $ | 52 | | | $ | — | | | $ | (4 | ) | | $ | (4 | ) |
| 1-Day USD SOFR | | Receive | | 3.750% | | 1Y | | June 2048 | | LCH | | $ | 1,190 | | | | 46 | | | | (55 | ) | | | (101 | ) |
| EUR 6M EURIBOR | | Receive | | 3.500% | | 1Y | | September 2028 | | LCH | | EUR | 90 | | | | (1 | ) | | | (4 | ) | | | (3 | ) |
| EUR 6M EURIBOR | | Receive | | 3.250% | | 1Y | | September 2030 | | LCH | | EUR | 161 | | | | 1 | | | | (9 | ) | | | (10 | ) |
| EUR 6M EURIBOR | | Receive | | 3.250% | | 1Y | | September 2033 | | LCH | | EUR | 174 | | | | 1 | | | | (12 | ) | | | (13 | ) |
| EUR 6M EURIBOR | | Receive | | 3.250% | | 1Y | | September 2038 | | LCH | | EUR | 515 | | | | (2 | ) | | | (47 | ) | | | (45 | ) |
| EUR 6M EURIBOR | | Receive | | 3.000% | | 1Y | | September 2048 | | LCH | | EUR | 248 | | | | 5 | | | | (28 | ) | | | (33 | ) |
| 1-Day USD SOFR | | Pay | | 4.500% | | 1Y | | June 2026 | | LCH | | $ | 3,643 | | | | (20 | ) | | | 35 | | | | 55 | |
| 1-Day USD SOFR | | Pay | | 4.250% | | 1Y | | June 2028 | | LCH | | $ | 4,170 | | | | (11 | ) | | | 92 | | | | 103 | |
| 1-Day USD SOFR | | Pay | | 4.000% | | 1Y | | June 2030 | | LCH | | $ | 474 | | | | (15 | ) | | | 10 | | | | 25 | |
| 1-Day USD SOFR | | Pay | | 4.000% | | 1Y | | June 2033 | | LCH | | $ | 489 | | | | (24 | ) | | | 17 | | | | 41 | |
| 1-Day USD SOFR | | Pay | | 4.000% | | 1Y | | June 2043 | | LCH | | $ | 1,441 | | | | (58 | ) | | | 92 | | | | 150 | |
| MXN 28D TIIE | | Pay | | 10.650% | | 28D | | October 2025 | | LCH | | MXN | 10,000 | | | | — | | | | 8 | | | | 8 | |
| | | | | | | | | | | | | | | | | | | | | | | | | $ | 173 | |
See accompanying Notes to Financial Statements.
| December 31, 2023 | William Blair Funds | 97 |
Emerging Markets Debt Fund
Portfolio of Investments, December 31, 2023 (all dollar amounts in thousands)
Centrally Cleared Credit Default Swaps
Reference
Entity | | Buy/Sell
Protection | | Fixed Rate | | Payment
Frequency | | Maturity
Date | | Cleared
Exchange | | Notional
Amount
(in thousands) | | | Upfront
Payment
Paid
(Received) | | | Value | | Unrealized
Appreciation
(Depreciation) | |
| Kingdom of Saudi Arabia | | Buy | | 1.000% | | 3M | | June 2026 | | ICE | | $ | 400 | | | $ | (8 | ) | | $ | (7 | ) | | $ | 1 | |
| Argentine Republic | | Buy | | 1.000% | | 3M | | December 2025 | | ICE | | | 500 | | | | 304 | | | | 264 | | | | (40 | ) |
| Argentine Republic | | Buy | | 1.000% | | 3M | | June 2027 | | ICE | | | 250 | | | | 205 | | | | 156 | | | | (49 | ) |
| Argentine Republic | | Buy | | 5.000% | | 3M | | June 2033 | | ICE | | | 250 | | | | 186 | | | | 152 | | | | (34 | ) |
| Republic of South Africa | | Buy | | 1.000% | | 3M | | June 2028 | | ICE | | | 450 | | | | 30 | | | | 15 | | | | (15 | ) |
| Argentine Republic | | Buy | | 5.000% | | 3M | | June 2026 | | ICE | | | 300 | | | | 168 | | | | 157 | | | | (11 | ) |
| Republic of Panama | | Buy | | 1.000% | | 3M | | December 2033 | | ICE | | | 270 | | | | 27 | | | | 25 | | | | (2 | ) |
| Argentine Republic | | Sell | | 5.000% | | 3M | | December 2031 | | ICE | | | 500 | | | | (293 | ) | | | (302 | ) | | | (9 | ) |
| Argentine Republic | | Sell | | 5.000% | | 3M | | June 2032 | | ICE | | | 100 | | | | (63 | ) | | | (61 | ) | | | 2 | |
| Argentine Republic | | Sell | | 5.000% | | 3M | | June 2027 | | ICE | | | 250 | | | | (190 | ) | | | (140 | ) | | | 50 | |
| Republic of Colombia | | Sell | | 1.000% | | 3M | | June 2033 | | ICE | | | 100 | | | | (20 | ) | | | (11 | ) | | | 9 | |
| Argentine Republic | | Sell | | 5.000% | | 3M | | June 2025 | | ICE | | | 150 | | | | (68 | ) | | | (59 | ) | | | 9 | |
| Argentine Republic | | Sell | | 5.000% | | 3M | | June 2028 | | ICE | | | 150 | | | | (96 | ) | | | (86 | ) | | | 10 | |
| Argentine Republic | | Sell | | 5.000% | | 3M | | June 2024 | | ICE | | | 50 | | | | (11 | ) | | | (7 | ) | | | 4 | |
| | | | | | | | | | | | | | | | | | | | | | | | | $ | (75 | ) |
| Total net unrealized appreciation (depreciation) on swaps | | | | | | | | | | | | | | $ | 98 | |
Currency Legend
BRL Brazilian Real
COP Colombian Peso
DOP Dominican Peso
EUR Euro
IDR Indonesian Rupiah
INR Indian Rupee
JMD Jamaican Dollar
MXN Mexican Peso
TRY Turkish Lira
USD U.S. Dollar
UYU Uruguayan Peso
ZAR South African Rand
See accompanying Notes to Financial Statements.
| 98 | Annual Report | December 31, 2023 |
Statements of Assets and Liabilities
As of December 31, 2023 (dollar amounts in thousands)
| | | Growth
Fund | | | Large Cap
Growth
Fund | | | Mid Cap
Value
Fund | | | Small-Mid
Cap Core
Fund | |
| Assets | | | | | | | | | | | | |
| Investments in securities, at cost | | $ | 127,619 | | | $ | 1,141,676 | | | $ | 1,332 | | | $ | 179,454 | |
| Investments in securities, at value | | $ | 238,727 | | | $ | 1,631,986 | | | $ | 1,406 | | | $ | 196,244 | |
| Cash | | | — | | | | — | | | | 67 | | | | — | |
| Receivable for securities sold | | | 641 | | | | — | | | | — | | | | — | |
| Receivable for fund shares sold | | | 267 | | | | 3,542 | | | | — | | | | 202 | |
| Receivable from Adviser | | | 2 | | | | 166 | | | | 11 | | | | 27 | |
| Dividend and interest receivable | | | 25 | | | | 1,275 | | | | 3 | | | | 114 | |
| Total assets | | | 239,662 | | | | 1,636,969 | | | | 1,487 | | | | 196,587 | |
| Liabilities | | | | | | | | | | | | | | | | |
| Payable for securities purchased | | | — | | | | — | | | | — | | | | 32 | |
| Payable for fund shares redeemed | | | 51 | | | | 1,717 | | | | — | | | | 163 | |
| Management fee payable | | | 152 | | | | 818 | | | | 1 | | | | 140 | |
| Distribution fee payable | | | 7 | | | | 33 | | | | — | | | | — | |
| Other payables and accrued expenses | | | 60 | | | | 299 | | | | 28 | | | | 72 | |
| Total liabilities | | | 270 | | | | 2,867 | | | | 29 | | | | 407 | |
| Net assets | | $ | 239,392 | | | $ | 1,634,102 | | | $ | 1,458 | | | $ | 196,180 | |
| Capital | | | | | | | | | | | | | | | | |
| Composition of net assets | | | | | | | | | | | | | | | | |
| Paid in capital | | $ | 126,668 | | | $ | 1,219,423 | | | $ | 1,449 | | | $ | 193,556 | |
| Total distributable earnings (loss) | | | 112,724 | | | | 414,679 | | | | 9 | | | | 2,624 | |
| Net assets | | $ | 239,392 | | | $ | 1,634,102 | | | $ | 1,458 | | | $ | 196,180 | |
| | | | | | | | | | | | | | | | | |
| Class N shares | | | | | | | | | | | | | | | | |
| Net assets | | $ | 30,789 | | | $ | 158,351 | | | | — | | | | — | |
| Shares outstanding | | | 3,174,613 | | | | 6,899,307 | | | | — | | | | — | |
| Net asset value per share | | $ | 9.70 | | | $ | 22.95 | | | | — | | | | — | |
| Class I shares | | | | | | | | | | | | | | | | |
| Net assets | | $ | 164,166 | | | $ | 1,106,857 | | | $ | 85 | | | $ | 101,972 | |
| Shares outstanding | | | 12,851,879 | | | | 44,915,616 | | | | 8,349 | | | | 6,671,090 | |
| Net asset value per share | | $ | 12.77 | | | $ | 24.64 | | | $ | 10.25 | | | $ | 15.29 | |
| Class R6 shares | | | | | | | | | | | | | | | | |
| Net assets | | $ | 44,437 | | | $ | 368,894 | | | $ | 1,373 | | | $ | 94,208 | |
| Shares outstanding | | | 3,462,181 | | | | 14,973,894 | | | | 133,977 | | | | 6,155,811 | |
| Net asset value per share | | $ | 12.84 | | | $ | 24.64 | | | $ | 10.25 | | | $ | 15.30 | |
See accompanying Notes to Financial Statements.
| December 31, 2023 | William Blair Funds | 99 |
Statements of Operations
For the Year Ended December 31, 2023 (all amounts in thousands)
| | | Growth
Fund | | | Large Cap
Growth
Fund | | | Mid Cap
Value
Fund | | | Small-Mid
Cap Core
Fund | |
| Investment income | | | | | | | | | | | | | | | | |
| Dividends | | $ | 1,638 | | | $ | 11,081 | | | $ | 34 | | | $ | 1,934 | |
| Less foreign tax withheld | | | (16 | ) | | | — | | | | — | | | | (25 | ) |
| Interest | | | 79 | | | | 225 | | | | 1 | | | | 75 | |
| Total income | | | 1,701 | | | | 11,306 | | | | 35 | | | | 1,984 | |
| Expenses | | | | | | | | | | | | | | | | |
| Investment advisory fees | | | 1,644 | | | | 8,535 | | | | 11 | | | | 1,431 | |
| Distribution fees | | | 71 | | | | 360 | | | | — | | | | — | |
| Custodian fees | | | 68 | | | | 63 | | | | 59 | | | | 71 | |
| Transfer agent fees | | | 69 | | | | 202 | | | | 1 | | | | 9 | |
| Sub-transfer agent fees | | | | | | | | | | | | | | | | |
| Class N | | | 40 | | | | 193 | | | | — | | | | — | |
| Class I | | | 67 | | | | 1,222 | | | | — | | | | 137 | |
| Professional fees | | | 42 | | | | 144 | | | | 29 | | | | 40 | |
| Registration fees | | | 46 | | | | 73 | | | | 37 | | | | 40 | |
| Shareholder reporting fees | | | 11 | | | | 80 | | | | 1 | | | | 2 | |
| Trustee fees | | | 19 | | | | 115 | | | | — | | | | 14 | |
| Other expenses | | | 9 | | | | 57 | | | | 4 | | | | 6 | |
| Total expenses before expense limitation | | | 2,086 | | | | 11,044 | | | | 142 | | | | 1,750 | |
| Expenses waived or reimbursed by the Adviser | | | | | | | | | | | | | | | | |
| Class N | | | (17 | ) | | | (195 | ) | | | — | | | | — | |
| Class I | | | — | | | | (1,237 | ) | | | (7 | ) | | | (199 | ) |
| Class R6 | | | — | | | | (165 | ) | | | (123 | ) | | | (74 | ) |
| Total expenses waived or reimbursed by the Adviser | | | (17 | ) | | | (1,597 | ) | | | (130 | ) | | | (273 | ) |
| Net expenses | | | 2,069 | | | | 9,447 | | | | 12 | | | | 1,477 | |
| Net investment income (loss) | | | (368 | ) | | | 1,859 | | | | 23 | | | | 507 | |
| Realized and unrealized gain (loss) | | | | | | | | | | | | | | | | |
| Net realized gain (loss) on transactions from: | | | | | | | | | | | | | | | | |
| Investments in securities | | | 22,560 | | | | (43,131 | ) | | | (34 | ) | | | (3,377 | ) |
| Total net realized gain (loss) | | | 22,560 | | | | (43,131 | ) | | | (34 | ) | | | (3,377 | ) |
| Change in net unrealized appreciation (depreciation) of: | | | | | | | | | | | | | | | | |
| Investments in securities | | | 47,607 | | | | 516,549 | | | | 179 | | | | 22,648 | |
| Change in net unrealized appreciation (depreciation) | | | 47,607 | | | | 516,549 | | | | 179 | | | | 22,648 | |
| Net increase (decrease) in net assets resulting from operations | | $ | 69,799 | | | $ | 475,277 | | | $ | 168 | | | $ | 19,778 | |
See accompanying Notes to Financial Statements.
| 100 | Annual Report | December 31, 2023 |
Statements of Changes in Net Assets
For the Years Ended December 31, 2023 and 2022 (all amounts in thousands)
| | | Growth Fund | | | Large Cap
Growth Fund | | | Mid Cap
Value Fund | | | Small-Mid Cap
Core Fund | |
| | | 2023 | | | 2022 | | | 2023 | | | 2022 | | | 2023 | | | 2022 (a) | | | 2023 | | | 2022 | |
| Operations | | | | | | | | | | | | | | | | | | | | | | | | | | | | | | | | |
| Net investment income (loss) | | $ | (368 | ) | | $ | (790 | ) | | $ | 1,859 | | | $ | 1,184 | | | $ | 23 | | | $ | 18 | | | $ | 507 | | | $ | (56 | ) |
| Net realized gain (loss) on investments, and other assets and liabilities | | | 22,560 | | | | 7,497 | | | | (43,131 | ) | | | (30,976 | ) | | | (34 | ) | | | (34 | ) | | | (3,377 | ) | | | (4,236 | ) |
| Change in net unrealized appreciation (depreciation) on investments, and other assets and liabilities | | | 47,607 | | | | (104,075 | ) | | | 516,549 | | | | (412,476 | ) | | | 179 | | | | (105 | ) | | | 22,648 | | | | (19,672 | ) |
| Net increase (decrease) in net assets resulting from operations | | | 69,799 | | | | (97,368 | ) | | | 475,277 | | | | (442,268 | ) | | | 168 | | | | (121 | ) | | | 19,778 | | | | (23,964 | ) |
| Distributions to shareholders | | | | | | | | | | | | | | | | | | | | | | | | | | | | | | | | |
| Class N | | | (3,790 | ) | | | (1,055 | ) | | | — | | | | (1,004 | ) | | | — | | | | — | | | | — | | | | — | |
| Class I | | | (14,632 | ) | | | (4,820 | ) | | | — | | | | (5,758 | ) | | | (1 | ) | | | (1 | ) | | | (151 | ) | | | — | |
| Class R6 | | | (3,966 | ) | | | (1,050 | ) | | | — | | | | (2,071 | ) | | | (21 | ) | | | (15 | ) | | | (180 | ) | | | — | |
| Total distributions | | | (22,388 | ) | | | (6,925 | ) | | | — | | | | (8,833 | ) | | | (22 | ) | | | (16 | ) | | | (331 | ) | | | — | |
| Capital stock transactions | | | | | | | | | | | | | | | | | | | | | | | | | | | | | | | | |
| Proceeds from sale of shares | | | 19,855 | | | | 36,716 | | | | 537,063 | | | | 808,663 | | | | 133 | | | | 1,661 | | | | 59,829 | | | | 109,055 | |
| Shares issued in reinvestment of income dividends and capital gain distributions | | | 21,140 | | | | 6,664 | | | | — | | | | 8,463 | | | | 22 | | | | 16 | | | | 317 | | | | — | |
| Less cost of shares redeemed | | | (38,022 | ) | | | (95,779 | ) | | | (451,258 | ) | | | (399,025 | ) | | | (350 | ) | | | (33 | ) | | | (27,634 | ) | | | (33,650 | ) |
| Net increase (decrease) in net assets resulting from capital share transactions | | | 2,973 | | | | (52,399 | ) | | | 85,805 | | | | 418,101 | | | | (195 | ) | | | 1,644 | | | | 32,512 | | | | 75,405 | |
| Increase (decrease) in net assets | | | 50,384 | | | | (156,692 | ) | | | 561,082 | | | | (33,000 | ) | | | (49 | ) | | | 1,507 | | | | 51,959 | | | | 51,441 | |
| Net assets | | | | | | | | | | | | | | | | | | | | | | | | | | | | | | | | |
| Beginning of period | | | 189,008 | | | | 345,700 | | | | 1,073,020 | | | | 1,106,020 | | | | 1,507 | | | | — | | | | 144,221 | | | | 92,780 | |
| End of period | | $ | 239,392 | | | $ | 189,008 | | | $ | 1,634,102 | | | $ | 1,073,020 | | | $ | 1,458 | | | $ | 1,507 | | | $ | 196,180 | | | $ | 144,221 | |
| (a) | For the period from March 16, 2022 (Commencement of Operations) to December 31, 2022. |
See accompanying Notes to Financial Statements.
| December 31, 2023 | William Blair Funds | 101 |
Statements of Assets and Liabilities
As of December 31, 2023 (dollar amounts in thousands)
| | | Small-Mid Cap
Growth Fund | | | Small-Mid Cap
Value Fund | | | Small Cap
Growth Fund | | | Small Cap
Value Fund | |
| Assets | | | | | | | | | | | | |
| Investments in securities, at cost | | $ | 1,689,492 | | | $ | 1,458 | | | $ | 639,438 | | | $ | 1,200,979 | |
| Investments in securities, at value | | $ | 2,001,384 | | | $ | 1,548 | | | $ | 749,927 | | | $ | 1,305,456 | |
| Cash | | | — | | | | 44 | | | | — | | | | — | |
| Receivable for securities sold | | | — | | | | 1 | | | | — | | | | 1,171 | |
| Receivable for fund shares sold | | | 1,301 | | | | — | | | | 2,912 | | | | 1,126 | |
| Receivable from Adviser | | | 176 | | | | 14 | | | | 90 | | | | 9 | |
| Dividend and interest receivable | | | 294 | | | | 3 | | | | 199 | | | | 1,641 | |
| Total assets | | | 2,003,155 | | | | 1,610 | | | | 753,128 | | | | 1,309,403 | |
| Liabilities | | | | | | | | | | | | | | | | |
| Payable for securities purchased | | | — | | | | — | | | | 4,043 | | | | — | |
| Payable for fund shares redeemed | | | 5,900 | | | | — | | | | 415 | | | | 322 | |
| Management fee payable | | | 1,557 | | | | 1 | | | | 573 | | | | 816 | |
| Distribution fee payable | | | 22 | | | | — | | | | 26 | | | | 1 | |
| Other payables and accrued expenses | | | 481 | | | | 28 | | | | 160 | | | | 218 | |
| Total liabilities | | | 7,960 | | | | 29 | | | | 5,217 | | | | 1,357 | |
| Net assets | | $ | 1,995,195 | | | $ | 1,581 | | | $ | 747,911 | | | $ | 1,308,046 | |
| Capital | | | | | | | | | | | | | | | | |
| Composition of net assets | | | | | | | | | | | | | | | | |
| Paid in capital | | $ | 1,720,543 | | | $ | 1,512 | | | $ | 648,441 | | | $ | 1,215,449 | |
| Total distributable earnings (loss) | | | 274,652 | | | | 69 | | | | 99,470 | | | | 92,597 | |
| Net assets | | $ | 1,995,195 | | | $ | 1,581 | | | $ | 747,911 | | | $ | 1,308,046 | |
| Class N shares | | | | | | | | | | | | | | | | |
| Net assets | | $ | 107,791 | | | | — | | | $ | 122,370 | | | $ | 2,591 | |
| Shares outstanding | | | 4,158,450 | | | | — | | | | 4,472,231 | | | | 87,005 | |
| Net asset value per share | | $ | 25.92 | | | | — | | | $ | 27.36 | | | $ | 29.78 | |
| Class I shares | | | | | | | | | | | | | | | | |
| Net assets | | $ | 1,437,622 | | | $ | 84 | | | $ | 445,483 | | | $ | 813,809 | |
| Shares outstanding | | | 50,811,162 | | | | 7,959 | | | | 13,649,541 | | | | 27,368,479 | |
| Net asset value per share | | $ | 28.29 | | | $ | 10.60 | | | $ | 32.64 | | | $ | 29.74 | |
| Class R6 shares | | | | | | | | | | | | | | | | |
| Net assets | | $ | 449,782 | | | $ | 1,497 | | | $ | 180,058 | | | $ | 491,646 | |
| Shares outstanding | | | 15,840,815 | | | | 141,179 | | | | 5,496,978 | | | | 16,538,070 | |
| Net asset value per share | | $ | 28.39 | | | $ | 10.60 | | | $ | 32.76 | | | $ | 29.73 | |
See accompanying Notes to Financial Statements.
| 102 | Annual Report | December 31, 2023 |
Statements of Operations
For the Year Ended December 31, 2023 (all amounts in thousands)
| | | Small-Mid
Cap Growth
Fund | | | Small-Mid
Cap Value
Fund (a) | | | Small Cap
Growth
Fund | | | Small Cap
Value
Fund | |
| Investment income | | | | | | | | | | | | | | | | |
| Dividends | | $ | 12,577 | | | $ | 13 | | | $ | 3,727 | | | $ | 22,932 | |
| Less foreign tax withheld | | | (237 | ) | | | — | | | | (89 | ) | | | (59 | ) |
| Interest | | | 969 | | | | — | | | | 430 | | | | 458 | |
| Total income | | | 13,309 | | | | 13 | | | | 4,068 | | | | 23,331 | |
| Expenses | | | | | | | | | | | | | | | | |
| Investment advisory fees | | | 19,280 | | | | 5 | | | | 6,283 | | | | 9,365 | |
| Distribution fees | | | 274 | | | | — | | | | 295 | | | | 6 | |
| Custodian fees | | | 81 | | | | 23 | | | | 80 | | | | 67 | |
| Transfer agent fees | | | 177 | | | | 3 | | | | 99 | | | | 70 | |
| Sub-transfer agent fees | | | | | | | | | | | | | | | | |
| Class N | | | 151 | | | | — | | | | 162 | | | | 2 | |
| Class I | | | 2,014 | | | | — | | | | 435 | | | | 988 | |
| Professional fees | | | 191 | | | | 29 | | | | 112 | | | | 128 | |
| Registration fees | | | 51 | | | | 2 | | | | 68 | | | | 54 | |
| Shareholder reporting fees | | | 174 | | | | — | | | | 61 | | | | 34 | |
| Trustee fees | | | 194 | | | | — | | | | 55 | | | | 118 | |
| Other expenses | | | 59 | | | | 1 | | | | 23 | | | | 33 | |
| Total expenses before expense limitation | | | 22,646 | | | | 63 | | | | 7,673 | | | | 10,865 | |
| Expenses waived or reimbursed by the Adviser | | | | | | | | | | | | | | | | |
| Class N | | | (128 | ) | | | — | | | | (154 | ) | | | — | |
| Class I | | | (1,701 | ) | | | (3 | ) | | | (405 | ) | | | (210 | ) |
| Class R6 | | | (129 | ) | | | (55 | ) | | | (59 | ) | | | — | |
| Total expenses waived or reimbursed by the Adviser | | | (1,958 | ) | | | (58 | ) | | | (618 | ) | | | (210 | ) |
| Net expenses | | | 20,688 | | | | 5 | | | | 7,055 | | | | 10,655 | |
| Net investment income (loss) | | | (7,379 | ) | | | 8 | | | | (2,987 | ) | | | 12,676 | |
| Realized and unrealized gain (loss) | | | | | | | | | | | | | | | | |
| Net realized gain (loss) on transactions from: | | | | | | | | | | | | | | | | |
| Investments in securities | | | 122,239 | | | | (22 | ) | | | 27,255 | | | | 17,717 | |
| Foreign currency transactions | | | 5 | | | | — | | | | 1 | | | | — | |
| Total net realized gain (loss) | | | 122,244 | | | | (22 | ) | | | 27,256 | | | | 17,717 | |
| Change in net unrealized appreciation (depreciation) of: | | | | | | | | | | | | | | | | |
| Investments in securities | | | 212,044 | | | | 90 | | | | 71,883 | | | | 98,036 | |
| Change in net unrealized appreciation (depreciation) | | | 212,044 | | | | 90 | | | | 71,883 | | | | 98,036 | |
| Net increase (decrease) in net assets resulting from operations | | $ | 326,909 | | | $ | 76 | | | $ | 96,152 | | | $ | 128,429 | |
| (a) | For the period from August 17, 2023 (Commencement of Operations) to December 31, 2023. |
See accompanying Notes to Financial Statements.
| December 31, 2023 | William Blair Funds | 103 |
Statements of Changes in Net Assets
For the Years Ended December 31, 2023 and 2022 (all amounts in thousands)
| | | Small-Mid Cap
Growth Fund | | | Small-Mid
Cap Value
Fund | | | Small Cap
Growth Fund | | | Small Cap
Value Fund | |
| | | 2023 | | | 2022 | | | 2023 (a) | | | 2023 | | | 2022 | | | 2023 | | | 2022 | |
| Operations | | | | | | | | | | | | | | | | | | | | | | | | | | | | |
| Net investment income (loss) | | $ | (7,379 | ) | | $ | (14,658 | ) | | $ | 8 | | | $ | (2,987 | ) | | $ | (4,622 | ) | | $ | 12,676 | | | $ | 10,262 | |
| Net realized gain (loss) on investments, and other assets and liabilities | | | 122,244 | | | | 12,027 | | | | (22 | ) | | | 27,256 | | | | (12,492 | ) | | | 17,717 | | | | 254,754 | |
| Change in net unrealized appreciation (depreciation) on investments, and other assets and liabilities | | | 212,044 | | | | (679,120 | ) | | | 90 | | | | 71,883 | | | | (136,772 | ) | | | 98,036 | | | | (425,307 | ) |
| Net increase (decrease) in net assets resulting from operations | | | 326,909 | | | | (681,751 | ) | | | 76 | | | | 96,152 | | | | (153,886 | ) | | | 128,429 | | | | (160,291 | ) |
| Distributions to shareholders | | | | | | | | | | | | | | | | | | | | | | | | | | | | |
| Class N | | | (8,769 | ) | | | (3,897 | ) | | | — | | | | (2,238 | ) | | | (4,693 | ) | | | (77 | ) | | | (187 | ) |
| Class I | | | (107,708 | ) | | | (49,427 | ) | | | — | | | | (6,617 | ) | | | (10,353 | ) | | | (26,503 | ) | | | (54,725 | ) |
| Class R6 | | | (32,457 | ) | | | (12,748 | ) | | | (7 | ) | | | (2,645 | ) | | | (3,839 | ) | | | (16,439 | ) | | | (33,495 | ) |
| Total distributions | | | (148,934 | ) | | | (66,072 | ) | | | (7 | ) | | | (11,500 | ) | | | (18,885 | ) | | | (43,019 | ) | | | (88,407 | ) |
| Capital stock transactions | | | | | | | | | | | | | | | | | | | | | | | | | | | | |
| Proceeds from sale of shares | | | 275,386 | | | | 509,350 | | | | 1,755 | | | | 254,864 | | | | 137,373 | | | | 147,911 | | | | 229,728 | |
| Shares issued in reinvestment of income dividends and capital gain distributions | | | 144,458 | | | | 64,751 | | | | 7 | | | | 11,299 | | | | 18,519 | | | | 35,896 | | | | 86,757 | |
| Less cost of shares redeemed | | | (614,949 | ) | | | (862,015 | ) | | | (250 | ) | | | (132,741 | ) | | | (163,362 | ) | | | (175,379 | ) | | | (922,977 | ) |
| Net increase (decrease) in net assets resulting from capital share transactions | | | (195,105 | ) | | | (287,914 | ) | | | 1,512 | | | | 133,422 | | | | (7,470 | ) | | | 8,428 | | | | (606,492 | ) |
| Increase (decrease) in net assets | | | (17,130 | ) | | | (1,035,737 | ) | | | 1,581 | | | | 218,074 | | | | (180,241 | ) | | | 93,838 | | | | (855,190 | ) |
| Net assets | | | | | | | | | | | | | | | | | | | | | | | | | | | | |
| Beginning of period | | | 2,012,325 | | | | 3,048,062 | | | | — | | | | 529,837 | | | | 710,078 | | | | 1,214,208 | | | | 2,069,398 | |
| End of period | | $ | 1,995,195 | | | $ | 2,012,325 | | | $ | 1,581 | | | $ | 747,911 | | | $ | 529,837 | | | $ | 1,308,046 | | | $ | 1,214,208 | |
| (a) | For the period from August 17, 2023 (Commencement of Operations) to December 31, 2023. |
See accompanying Notes to Financial Statements.
| 104 | Annual Report | December 31, 2023 |
Statements of Assets and Liabilities
As of December 31, 2023 (dollar amounts in thousands)
| | | Global
Leaders
Fund | | | International
Leaders
Fund | | | International
Growth
Fund | | | Institutional
International
Growth
Fund | |
| Assets | | | | | | | | | | | | | | | | |
| Investments in securities, at cost | | $ | 63,252 | | | $ | 833,829 | | | $ | 1,047,798 | | | $ | 693,832 | |
| Investments in securities, at value | | $ | 100,178 | | | $ | 1,085,187 | | | $ | 1,426,317 | | | $ | 930,924 | |
| Cash | | | 5 | | | | — | | | | 54 | | | | 33 | |
| Foreign currency, at value (cost $— ; $65; $79; $48) | | | — | | | | 65 | | | | 78 | | | | 48 | |
| Receivable for securities sold | | | — | | | | 1,691 | | | | 375 | | | | 246 | |
| Receivable for fund shares sold | | | 261 | | | | 795 | | | | 6,850 | | | | 60 | |
| Receivable from Adviser | | | 19 | | | | 80 | | | | 128 | | | | 43 | |
| Dividend and interest receivable | | | 132 | | | | 1,683 | | | | 3,765 | | | | 2,077 | |
| Total assets | | | 100,595 | | | | 1,089,501 | | | | 1,437,567 | | | | 933,431 | |
| Liabilities | | | | | | | | | | | | | | | | |
| Payable for securities purchased | | | — | | | | 1,799 | | | | 2,996 | | | | 1,960 | |
| Payable for fund shares redeemed | | | — | | | | 1,639 | | | | 140 | | | | — | |
| Management fee payable | | | 71 | | | | 765 | | | | 1,147 | | | | 722 | |
| Distribution fee payable | | | 2 | | | | 7 | | | | 61 | | | | — | |
| Foreign capital gains tax liability | | | 19 | | | | 1,110 | | | | 1,744 | | | | 1,125 | |
| Other payables and accrued expenses | | | 48 | | | | 245 | | | | 375 | | | | 150 | |
| Total liabilities | | | 140 | | | | 5,565 | | | | 6,463 | | | | 3,957 | |
| Net assets | | $ | 100,455 | | | $ | 1,083,936 | | | $ | 1,431,104 | | | $ | 929,474 | |
| Capital | | | | | | | | | | | | | | | | |
| Composition of net assets | | | | | | | | | | | | | | | | |
| Paid in capital | | $ | 61,715 | | | $ | 954,119 | | | $ | 1,038,218 | | | $ | 702,398 | |
| Total distributable earnings (loss) | | | 38,740 | | | | 129,817 | | | | 392,886 | | | | 227,076 | |
| Net assets | | $ | 100,455 | | | $ | 1,083,936 | | | $ | 1,431,104 | | | $ | 929,474 | |
| | | | | | | | | | | | | | | | | |
| Class N shares | | | | | | | | | | | | | | | | |
| Net assets | | $ | 8,253 | | | $ | 34,162 | | | $ | 292,273 | | | | — | |
| Shares outstanding | | | 542,434 | | | | 1,756,199 | | | | 10,539,619 | | | | — | |
| Net asset value per share | | $ | 15.21 | | | $ | 19.45 | | | $ | 27.73 | | | | — | |
| Class I shares | | | | | | | | | | | | | | | | |
| Net assets | | $ | 76,915 | | | $ | 413,373 | | | $ | 992,759 | | | | — | |
| Shares outstanding | | | 5,001,430 | | | | 21,086,084 | | | | 34,621,741 | | | | — | |
| Net asset value per share | | $ | 15.38 | | | $ | 19.60 | | | $ | 28.67 | | | | — | |
| Institutional/Class R6 shares | | | | | | | | | | | | | | | | |
| Net assets | | $ | 15,287 | | | $ | 636,401 | | | $ | 146,072 | | | $ | 929,474 | |
| Shares outstanding | | | 993,561 | | | | 32,443,134 | | | | 5,089,557 | | | | 64,532,154 | |
| Net asset value per share | | $ | 15.39 | | | $ | 19.62 | | | $ | 28.70 | | | $ | 14.40 | |
See accompanying Notes to Financial Statements.
| December 31, 2023 | William Blair Funds | 105 |
Statements of Operations
For the Year Ended December 31, 2023 (all amounts in thousands)
| | | Global
Leaders
Fund | | | International
Leaders
Fund | | | International
Growth
Fund | | | Institutional
International
Growth
Fund | |
| Investment income | | | | | | | | | | | | | | | | |
| Dividends | | $ | 981 | | | $ | 16,853 | | | $ | 25,975 | | | $ | 15,584 | |
| Less foreign tax withheld | | | (71 | ) | | | (2,018 | ) | | | (2,759 | ) | | | (1,654 | ) |
| Interest | | | 46 | | | | 520 | | | | 500 | | | | 352 | |
| Other | | | — | | | | — | | | | 1,801 | | | | — | |
| Total income | | | 956 | | | | 15,355 | | | | 25,517 | | | | 14,282 | |
| Expenses | | | | | | | | | | | | | | | | |
| Investment advisory fees | | | 836 | | | | 9,143 | | | | 13,723 | | | | 8,349 | |
| Distribution fees | | | 23 | | | | 89 | | | | 742 | | | | — | |
| Custodian fees | | | 76 | | | | 169 | | | | 323 | | | | 218 | |
| Transfer agent fees | | | 9 | | | | 65 | | | | 100 | | | | 34 | |
| Sub-transfer agent fees | | | | | | | | | | | | | | | | |
| Class N | | | 11 | | | | 37 | | | | 424 | | | | — | |
| Class I | | | 64 | | | | 544 | | | | 1,039 | | | | — | |
| Professional fees | | | 41 | | | | 127 | | | | 176 | | | | 131 | |
| Registration fees | | | 49 | | | | 84 | | | | 54 | | | | 25 | |
| Shareholder reporting fees | | | 6 | | | | 45 | | | | 72 | | | | 5 | |
| Trustee fees | | | 9 | | | | 100 | | | | 138 | | | | 87 | |
| Other expenses | | | 7 | | | | 40 | | | | 44 | | | | 30 | |
| Total expenses before expense limitation | | | 1,131 | | | | 10,443 | | | | 16,835 | | | | 8,879 | |
| Expenses waived or reimbursed by the Adviser | | | | | | | | | | | | | | | | |
| Class N | | | (25 | ) | | | (39 | ) | | | (460 | ) | | | — | |
| Class I | | | (176 | ) | | | (579 | ) | | | (1,161 | ) | | | — | |
| Institutional/Class R6 | | | (30 | ) | | | (371 | ) | | | (95 | ) | | | (531 | ) |
| Total expenses waived or reimbursed by the Adviser | | | (231 | ) | | | (989 | ) | | | (1,716 | ) | | | (531 | ) |
| Net expenses | | | 900 | | | | 9,454 | | | | 15,119 | | | | 8,348 | |
| Net investment income (loss) | | | 56 | | | | 5,901 | | | | 10,398 | | | | 5,934 | |
| Realized and unrealized gain (loss) | | | | | | | | | | | | | | | | |
| Net realized gain (loss) on transactions from: | | | | | | | | | | | | | | | | |
| Investments in securities (net of foreign capital gains tax paid $— ; $222; $201; $133) | | | 9,175 | | | | (47,580 | ) | | | 59,694 | | | | 26,633 | |
| Redemptions in-kind | | | — | | | | 5,580 | | | | — | | | | — | |
| Foreign currency transactions | | | (11 | ) | | | (441 | ) | | | (410 | ) | | | (155 | ) |
| Total net realized gain (loss) | | | 9,164 | | | | (42,441 | ) | | | 59,284 | | | | 26,478 | |
| Change in net unrealized appreciation (depreciation) of: | | | | | | | | | | | | | | | | |
| Investments in securities (net of foreign capital gains tax accrual $7; $397; $1,123; $725) | | | 10,664 | | | | 162,500 | | | | 136,422 | | | | 95,560 | |
| Foreign currency translations | | | 5 | | | | 74 | | | | (161 | ) | | | 16 | |
| Change in net unrealized appreciation (depreciation) | | | 10,669 | | | | 162,574 | | | | 136,261 | | | | 95,576 | |
| Net increase (decrease) in net assets resulting from operations | | $ | 19,889 | | | $ | 126,034 | | | $ | 205,943 | | | $ | 127,988 | |
See accompanying Notes to Financial Statements.
| 106 | Annual Report | December 31, 2023 |
Statements of Changes in Net Assets
For the Years Ended December 31, 2023 and 2022 (all amounts in thousands)
| | | Global
Leaders Fund | | | International
Leaders Fund | | | International
Growth Fund | | | Institutional
International
Growth Fund | |
| | | 2023 | | | 2022 | | | 2023 | | | 2022 | | | 2023 | | | 2022 | | | 2023 | | | 2022 | |
| Operations | | | | | | | | | | | | | | | | | | | | | | | | | | | | | | | | |
| Net investment income (loss) | | $ | 56 | | | $ | (75 | ) | | $ | 5,901 | | | $ | 4,996 | | | $ | 10,398 | | | $ | 11,837 | | | $ | 5,934 | | | $ | 7,223 | |
| Net realized gain (loss) on investments, and other assets and liabilities | | | 9,164 | | | | 707 | | | | (42,441 | ) | | | (68,687 | ) | | | 59,284 | | | | 62,630 | | | | 26,478 | | | | 44,969 | |
| Change in net unrealized appreciation (depreciation) on investments, and other assets and liabilities | | | 10,669 | | | | (42,397 | ) | | | 162,574 | | | | (337,406 | ) | | | 136,261 | | | | (671,912 | ) | | | 95,576 | | | | (410,590 | ) |
| Net increase (decrease) in net assets resulting from operations | | | 19,889 | | | | (41,765 | ) | | | 126,034 | | | | (401,097 | ) | | | 205,943 | | | | (597,445 | ) | | | 127,988 | | | | (358,398 | ) |
| Distributions to shareholders |
| Class N | | | (535 | ) | | | (174 | ) | | | (64 | ) | | | (68 | ) | | | (9,793 | ) | | | (23,255 | ) | | | — | | | | — | |
| Class I | | | (4,850 | ) | | | (1,502 | ) | | | (1,847 | ) | | | (631 | ) | | | (36,328 | ) | | | (74,123 | ) | | | — | | | | — | |
| Institutional/Class R6 | | | (998 | ) | | | (296 | ) | | | (3,151 | ) | | | (1,130 | ) | | | (5,134 | ) | | | (11,497 | ) | | | (22,859 | ) | | | (56,236 | ) |
| Total distributions | | | (6,383 | ) | | | (1,972 | ) | | | (5,062 | ) | | | (1,829 | ) | | | (51,255 | ) | | | (108,875 | ) | | | (22,859 | ) | | | (56,236 | ) |
| Capital stock transactions |
| Proceeds from sale of shares | | | 4,333 | | | | 14,887 | | | | 149,041 | | | | 455,376 | | | | 146,640 | | | | 539,922 | | | | 59,867 | | | | 142,332 | |
| Shares issued in reinvestment of income dividends and capital gain distributions | | | 6,321 | | | | 1,954 | | | | 4,693 | | | | 1,814 | | | | 49,407 | | | | 104,297 | | | | 22,254 | | | | 56,157 | |
| Less cost of shares redeemed | | | (15,264 | ) | | | (25,327 | ) | | | (194,991 | ) | | | (356,773 | ) | | | (354,267 | ) | | | (626,160 | ) | | | (166,508 | ) | | | (156,966 | ) |
| Net increase (decrease) in net assets resulting from capital share transactions | | | (4,610 | ) | | | (8,486 | ) | | | (41,257 | ) | | | 100,417 | | | | (158,220 | ) | | | 18,059 | | | | (84,387 | ) | | | 41,523 | |
| Increase (decrease) in net assets | | | 8,896 | | | | (52,223 | ) | | | 79,715 | | | | (302,509 | ) | | | (3,532 | ) | | | (688,261 | ) | | | 20,742 | | | | (373,111 | ) |
| Net assets |
| Beginning of period | | | 91,559 | | | | 143,782 | | | | 1,004,221 | | | | 1,306,730 | | | | 1,434,636 | | | | 2,122,897 | | | | 908,732 | | | | 1,281,843 | |
| End of period | | $ | 100,455 | | | $ | 91,559 | | | $ | 1,083,936 | | | $ | 1,004,221 | | | $ | 1,431,104 | | | $ | 1,434,636 | | | $ | 929,474 | | | $ | 908,732 | |
See accompanying Notes to Financial Statements.
| December 31, 2023 | William Blair Funds | 107 |
Statements of Assets and Liabilities
As of December 31, 2023 (dollar amounts in thousands)
| | | International
Small Cap
Growth
Fund | | | Emerging
Markets
Leaders
Fund | | | Emerging
Markets
Growth
Fund | | | Emerging
Markets
ex China
Growth Fund | |
| Assets | | | | | | | | | | | | | | | | |
| Investments in securities, at cost | | $ | 196,844 | | | $ | 216,846 | | | $ | 672,168 | | | $ | 17,809 | |
| Investments in securities, at value | | $ | 240,546 | | | $ | 260,465 | | | $ | 832,837 | | | $ | 22,161 | |
| Foreign currency, at value (cost $1,454; $7; $ — ; $1) | | | 1,454 | | | | 7 | | | | — | | | | 1 | |
| Receivable for securities sold | | | 1,255 | | | | 2,897 | | | | 373 | | | | 62 | |
| Receivable for fund shares sold | | | 15 | | | | 164 | | | | 343 | | | | — | |
| Receivable from Adviser | | | 82 | | | | 42 | | | | 129 | | | | 19 | |
| Dividend and interest receivable | | | 484 | | | | 270 | | | | 1,690 | | | | 35 | |
| Total assets | | | 243,836 | | | | 263,845 | | | | 835,372 | | | | 22,278 | |
| Liabilities | | | | | | | | | | | | | | | | |
| Payable for securities purchased | | | 2,294 | | | | 1,668 | | | | 455 | | | | 3 | |
| Payable for fund shares redeemed | | | 68 | | | | 44 | | | | 3,891 | | | | — | |
| Payable to custodian | | | — | | | | 7,294 | | | | 309 | | | | — | |
| Management fee payable | | | 197 | | | | 207 | | | | 633 | | | | 17 | |
| Distribution fee payable | | | — | | | | — | | | | 3 | | | | — | |
| Foreign capital gains tax liability | | | 424 | | | | 927 | | | | 6,857 | | | | 182 | |
| Other payables and accrued expenses | | | 107 | | | | 120 | | | | 383 | | | | 66 | |
| Total liabilities | | | 3,090 | | | | 10,260 | | | | 12,531 | | | | 268 | |
| Net assets | | $ | 240,746 | | | $ | 253,585 | | | $ | 822,841 | | | $ | 22,010 | |
| Capital | | | | | | | | | | | | | | | | |
| Composition of net assets | | | | | | | | | | | | | | | | |
| Paid in capital | | $ | 259,122 | | | $ | 336,238 | | | $ | 805,530 | | | $ | 19,068 | |
| Total distributable earnings (loss) | | | (18,376 | ) | | | (82,653 | ) | | | 17,311 | | | | 2,942 | |
| Net assets | | $ | 240,746 | | | $ | 253,585 | | | $ | 822,841 | | | $ | 22,010 | |
| | | | | | | | | | | | | | | | | |
| Class N shares | | | | | | | | | | | | | | | | |
| Net assets | | $ | 1,547 | | | $ | 1,007 | | | $ | 13,748 | | | | — | |
| Shares outstanding | | | 126,679 | | | | 115,448 | | | | 1,210,982 | | | | — | |
| Net asset value per share | | $ | 12.21 | | | $ | 8.72 | | | $ | 11.35 | | | | — | |
| Class I shares | | | | | | | | | | | | | | | | |
| Net assets | | $ | 103,520 | | | $ | 13,772 | | | $ | 173,377 | | | $ | 2,841 | |
| Shares outstanding | | | 8,351,646 | | | | 1,572,879 | | | | 14,945,199 | | | | 244,069 | |
| Net asset value per share | | $ | 12.40 | | | $ | 8.76 | | | $ | 11.60 | | | $ | 11.64 | |
| Class R6 shares | | | | | | | | | | | | | | | | |
| Net assets | | $ | 135,679 | | | $ | 238,806 | | | $ | 635,716 | | | $ | 19,169 | |
| Shares outstanding | | | 10,876,748 | | | | 27,298,325 | | | | 54,128,408 | | | | 1,645,345 | |
| Net asset value per share | | $ | 12.47 | | | $ | 8.75 | | | $ | 11.74 | | | $ | 11.65 | |
See accompanying Notes to Financial Statements.
| 108 | Annual Report | December 31, 2023 |
Statements of Operations
For the Year Ended December 31, 2023 (all amounts in thousands)
| | | International
Small Cap
Growth
Fund | | | Emerging
Markets
Leaders
Fund | | | Emerging
Markets
Growth
Fund | | | Emerging
Markets ex
China Growth
Fund | |
| Investment income | | | | | | | | | | | | | | | | |
| Dividends | | $ | 4,556 | | | $ | 6,543 | | | $ | 14,897 | | | $ | 365 | |
| Less foreign tax withheld | | | (521 | ) | | | (696 | ) | | | (1,894 | ) | | | (54 | ) |
| Interest | | | 106 | | | | 67 | | | | 184 | | | | 6 | |
| Total income | | | 4,141 | | | | 5,914 | | | | 13,187 | | | | 317 | |
| Expenses | | | | | | | | | | | | | | | | |
| Investment advisory fees | | | 2,318 | | | | 2,811 | | | | 6,992 | | | | 172 | |
| Distribution fees | | | 4 | | | | 3 | | | | 37 | | | | — | |
| Custodian fees | | | 143 | | | | 213 | | | | 538 | | | | 121 | |
| Transfer agent fees | | | 21 | | | | 22 | | | | 84 | | | | 2 | |
| Sub-transfer agent fees | | | | | | | | | | | | | | | | |
| Class N | | | 2 | | | | 1 | | | | 20 | | | | — | |
| Class I | | | 99 | | | | 21 | | | | 225 | | | | 1 | |
| Professional fees | | | 70 | | | | 81 | | | | 173 | | | | 74 | |
| Registration fees | | | 48 | | | | 54 | | | | 93 | | | | 37 | |
| Shareholder reporting fees | | | 26 | | | | 9 | | | | 29 | | | | 2 | |
| Trustee fees | | | 22 | | | | 33 | | | | 67 | | | | 1 | |
| Other expenses | | | 12 | | | | 16 | | | | 23 | | | | 4 | |
| Total expenses before expense limitation | | | 2,765 | | | | 3,264 | | | | 8,281 | | | | 414 | |
| Expenses waived or reimbursed by the Adviser | | | | | | | | | | | | | | | | |
| Class N | | | (2 | ) | | | (2 | ) | | | (33 | ) | | | — | |
| Class I | | | (80 | ) | | | (39 | ) | | | (379 | ) | | | (20 | ) |
| Class R6 | | | (41 | ) | | | (398 | ) | | | (743 | ) | | | (221 | ) |
| Total expenses waived or reimbursed by the Adviser | | | (123 | ) | | | (439 | ) | | | (1,155 | ) | | | (241 | ) |
| Net expenses | | | 2,642 | | | | 2,825 | | | | 7,126 | | | | 173 | |
| Net investment income (loss) | | | 1,499 | | | | 3,089 | | | | 6,061 | | | | 144 | |
| Realized and unrealized gain (loss) | | | | | | | | | | | | | | | | |
| Net realized gain (loss) on transactions from: | | | | | | | | | | | | | | | | |
| Investments in securities (net of foreign capital gains tax paid $—; $620; $657; $—) | | | (17,085 | ) | | | (45,610 | ) | | | (75,642 | ) | | | (388 | ) |
| Foreign currency transactions | | | (101 | ) | | | (258 | ) | | | (652 | ) | | | (24 | ) |
| Total net realized gain (loss) | | | (17,186 | ) | | | (45,868 | ) | | | (76,294 | ) | | | (412 | ) |
| Change in net unrealized appreciation (depreciation) of: | | | | | | | | | | | | | | | | |
| Investments in securities (net of foreign capital gains tax accrual $349; $104; $5,856; $173) | | | 48,170 | | | | 60,477 | | | | 141,389 | | | | 4,330 | |
| Foreign currency translations | | | 22 | | | | 4 | | | | 7 | | | | — | |
| Change in net unrealized appreciation (depreciation) | | | 48,192 | | | | 60,481 | | | | 141,396 | | | | 4,330 | |
| Net increase (decrease) in net assets resulting from operations | | $ | 32,505 | | | $ | 17,702 | | | $ | 71,163 | | | $ | 4,062 | |
See accompanying Notes to Financial Statements.
| December 31, 2023 | William Blair Funds | 109 |
Statements of Changes in Net Assets
For the Years Ended December 31, 2023 and 2022 (all amounts in thousands)
| | | International Small
Cap Growth Fund | | | Emerging Markets
Leaders Fund | | | Emerging Markets
Growth Fund | | | Emerging Markets
ex China
Growth Fund | |
| | | 2023 | | | 2022 | | | 2023 | | | 2022 | | | 2023 | | | 2022 | | | 2023 | | | 2022(a) | |
| Operations | | | | | | | | | | | | | | | | | | | | | | | | | | | | | | | | |
| Net investment income (loss) | | $ | 1,499 | | | $ | 908 | | | $ | 3,089 | | | $ | 2,435 | | | $ | 6,061 | | | $ | 3,619 | | | $ | 144 | | | $ | 27 | |
| Net realized gain (loss) on investments, and other assets and liabilities | | | (17,186 | ) | | | (40,464 | ) | | | (45,868 | ) | | | (73,852 | ) | | | (76,294 | ) | | | (56,336 | ) | | | (412 | ) | | | (827 | ) |
| Change in net unrealized appreciation (depreciation) on investments, and other assets and liabilities | | | 48,192 | | | | (93,778 | ) | | | 60,481 | | | | (55,424 | ) | | | 141,396 | | | | (283,138 | ) | | | 4,330 | | | | (160 | ) |
| Net increase (decrease) in net assets resulting from operations | | | 32,505 | | | | (133,334 | ) | | | 17,702 | | | | (126,841 | ) | | | 71,163 | | | | (335,855 | ) | | | 4,062 | | | | (960 | ) |
| Distributions to shareholders |
| Class N | | | (10 | ) | | | — | | | | (8 | ) | | | (9 | ) | | | (42 | ) | | | (24 | ) | | | — | | | | — | |
| Class I | | | (911 | ) | | | (202 | ) | | | (107 | ) | | | (289 | ) | | | (900 | ) | | | (278 | ) | | | (23 | ) | | | — | |
| Class R6 | | | (1,252 | ) | | | (406 | ) | | | (2,141 | ) | | | (3,110 | ) | | | (3,523 | ) | | | (716 | ) | | | (161 | ) | | | — | |
| Total distributions | | | (2,173 | ) | | | (608 | ) | | | (2,256 | ) | | | (3,408 | ) | | | (4,465 | ) | | | (1,018 | ) | | | (184 | ) | | | — | |
| Capital stock transactions |
| Proceeds from sale of shares | | | 12,992 | | | | 43,756 | | | | 27,336 | | | | 100,114 | | | | 302,358 | | | | 313,584 | | | | 5,287 | | | | 19,590 | |
| Shares issued in reinvestment of income dividends and capital gain distributions | | | 1,806 | | | | 513 | | | | 2,253 | | | | 3,401 | | | | 3,848 | | | | 956 | | | | 184 | | | | — | |
| Less cost of shares redeemed | | | (39,334 | ) | | | (58,888 | ) | | | (143,543 | ) | | | (94,858 | ) | | | (220,197 | ) | | | (349,371 | ) | | | (372 | ) | | | (5,597 | ) |
| Net increase (decrease) in net assets resulting from capital share transactions | | | (24,536 | ) | | | (14,619 | ) | | | (113,954 | ) | | | 8,657 | | | | 86,009 | | | | (34,831 | ) | | | 5,099 | | | | 13,993 | |
| Increase (decrease) in net assets | | | 5,796 | | | | (148,561 | ) | | | (98,508 | ) | | | (121,592 | ) | | | 152,707 | | | | (371,704 | ) | | | 8,977 | | | | 13,033 | |
| Net assets | | | | | | | | | | | | | | | | | | | | | | | | | | | | | | | | |
| Beginning of period | | | 234,950 | | | | 383,511 | | | | 352,093 | | | | 473,685 | | | | 670,134 | | | | 1,041,838 | | | | 13,033 | | | | — | |
| End of period | | $ | 240,746 | | | $ | 234,950 | | | $ | 253,585 | | | $ | 352,093 | | | $ | 822,841 | | | $ | 670,134 | | | $ | 22,010 | | | $ | 13,033 | |
| (a) | For the period from July 29, 2022 (Commencement of Operations) to December 31, 2022. |
See accompanying Notes to Financial Statements.
| 110 | Annual Report | December 31, 2023 |
Statements of Assets and Liabilities
As of December 31, 2023 (dollar amounts in thousands)
| | | Emerging
Markets
Small Cap
Growth Fund | | | China
Growth
Fund | | | Emerging
Markets
Debt
Fund | |
| Assets | | | | | | | | | | | | |
| Investments in securities, at cost | | $ | 306,080 | | | $ | 2,026 | | | $ | 52,859 | |
| Investments in securities, at value | | $ | 396,291 | | | $ | 1,803 | | | $ | 52,527 | |
| Cash | | | — | | | | 68 | | | | — | |
| Foreign currency, at value (cost $2,718; $—; $—) | | | 2,718 | | | | — | | | | — | |
| Receivable for securities sold | | | 1,743 | | | | — | | | | — | |
| Receivable for fund shares sold | | | 781 | | | | — | | | | 46 | |
| Receivable for variation margin on centrally cleared swaps | | | — | | | | — | | | | 13 | |
| Receivable from Adviser | | | 74 | | | | 11 | | | | 23 | |
| Dividend and interest receivable | | | 352 | | | | — | | | | 960 | |
| Total assets | | | 401,959 | | | | 1,882 | | | | 53,569 | |
| Liabilities | | | | | | | | | | | | |
| Payable for securities purchased | | | 4,809 | | | | — | | | | — | |
| Payable for fund shares redeemed | | | 38 | | | | — | | | | 22 | |
| Payable to custodian | | | — | | | | 1 | | | | — | |
| Unrealized depreciation on forward foreign currency contracts | | | — | | | | — | | | | 40 | |
| Management fee payable | | | 359 | | | | 1 | | | | 29 | |
| Distribution fee payable | | | 1 | | | | — | | | | — | |
| Foreign capital gains tax liability | | | 6,790 | | | | — | | | | — | |
| Other payables and accrued expenses | | | 250 | | | | 33 | | | | 42 | |
| Total liabilities | | | 12,247 | | | | 35 | | | | 133 | |
| Net assets | | $ | 389,712 | | | $ | 1,847 | | | $ | 53,436 | |
| Capital | | | | | | | | | | | | |
| Composition of net assets | | | | | | | | | | | | |
| Paid in capital | | $ | 370,646 | | | $ | 4,922 | | | $ | 64,510 | |
| Total distributable earnings (loss) | | | 19,066 | | | | (3,075 | ) | | | (11,074 | ) |
| Net assets | | $ | 389,712 | | | $ | 1,847 | | | $ | 53,436 | |
| | | | | | | | | | | | | |
| Class N shares | | | | | | | | | | | | |
| Net assets | | $ | 3,857 | | | | — | | | | — | |
| Shares outstanding | | | 196,150 | | | | — | | | | — | |
| Net asset value per share | | $ | 19.66 | | | | — | | | | — | |
| Class I shares | | | | | | | | | | | | |
| Net assets | | $ | 134,297 | | | $ | 160 | | | $ | 3,205 | |
| Shares outstanding | | | 6,726,789 | | | | 32,901 | | | | 406,261 | |
| Net asset value per share | | $ | 19.96 | | | $ | 4.87 | | | $ | 7.89 | |
| Class R6 shares | | | | | | | | | | | | |
| Net assets | | $ | 251,558 | | | $ | 1,687 | | | $ | 50,231 | |
| Shares outstanding | | | 12,566,167 | | | | 347,921 | | | | 6,371,602 | |
| Net asset value per share | | $ | 20.02 | | | $ | 4.85 | | | $ | 7.88 | |
See accompanying Notes to Financial Statements.
| December 31, 2023 | William Blair Funds | 111 |
Statements of Operations
For the Year Ended December 31, 2023 (all amounts in thousands)
| | | Emerging
Markets
Small Cap
Growth Fund | | | China
Growth
Fund | | | Emerging
Markets
Debt
Fund | |
| Investment income | | | | | | | | | | | | |
| Dividends | | $ | 6,298 | | | $ | 28 | | | $ | — | |
| Less foreign tax withheld | | | (694 | ) | | | (1 | ) | | | — | |
| Interest | | | 63 | | | | — | | | | 3,723 | |
| Less foreign tax withheld | | | — | | | | — | | | | (8 | ) |
| Total income | | | 5,667 | | | | 27 | | | | 3,715 | |
| Expenses | | | | | | | | | | | | |
| Investment advisory fees | | | 3,872 | | | | 15 | | | | 314 | |
| Distribution fees | | | 9 | | | | — | | | | — | |
| Custodian fees | | | 446 | | | | 66 | | | | 110 | |
| Transfer agent fees | | | 58 | | | | 1 | | | | 3 | |
| Sub-transfer agent fees | | | | | | | | | | | | |
| Class N | | | 4 | | | | — | | | | — | |
| Class I | | | 130 | | | | — | | | | 2 | |
| Professional fees | | | 148 | | | | 33 | | | | 83 | |
| Registration fees | | | 56 | | | | 37 | | | | 37 | |
| Shareholder reporting fees | | | 26 | | | | 1 | | | | 8 | |
| Trustee fees | | | 32 | | | | — | | | | 4 | |
| Other expenses | | | 14 | | | | 4 | | | | 13 | |
| Total expenses before expense limitation | | | 4,795 | | | | 157 | | | | 574 | |
| Expenses waived or reimbursed by the Adviser | | | | | | | | | | | | |
| Class N | | | (9 | ) | | | — | | | | — | |
| Class I | | | (280 | ) | | | (33 | ) | | | (10 | ) |
| Class R6 | | | (392 | ) | | | (109 | ) | | | (242 | ) |
| Total expenses waived or reimbursed by the Adviser | | | (681 | ) | | | (142 | ) | | | (252 | ) |
| Net expenses | | | 4,114 | | | | 15 | | | | 322 | |
| Net investment income (loss) | | | 1,553 | | | | 12 | | | | 3,393 | |
| Realized and unrealized gain (loss) | | | | | | | | | | | | |
| Net realized gain (loss) on transactions from: | | | | | | | | | | | | |
| Investments in securities (net of foreign capital gains tax paid $1,806; $—; $2) | | | (5,251 | ) | | | (869 | ) | | | (2,914 | ) |
| Swaps | | | — | | | | — | | | | (494 | ) |
| Forward foreign currency contracts | | | — | | | | — | | | | 40 | |
| Foreign currency transactions | | | (508 | ) | | | (1 | ) | | | 2 | |
| Total net realized gain (loss) | | | (5,759 | ) | | | (870 | ) | | | (3,366 | ) |
| Change in net unrealized appreciation (depreciation) of: | | | | | | | | | | | | |
| Investments in securities (net of foreign capital gains tax accrual $4,754; $—; $—) | | | 76,207 | | | | 386 | | | | 6,119 | |
| Swaps | | | — | | | | — | | | | 110 | |
| Forward foreign currency contracts | | | — | | | | — | | | | (34 | ) |
| Foreign currency translations | | | 12 | | | | — | | | | (1 | ) |
| Change in net unrealized appreciation (depreciation) | | | 76,219 | | | | 386 | | | | 6,194 | |
| Net increase (decrease) in net assets resulting from operations | | $ | 72,013 | | | $ | (472 | ) | | $ | 6,221 | |
See accompanying Notes to Financial Statements.
| 112 | Annual Report | December 31, 2023 |
Statements of Changes in Net Assets
For the Years Ended December 31, 2023 and 2022 (all amounts in thousands)
| | | Emerging Markets
Small Cap
Growth Fund | | | China Growth Fund | | | Emerging Markets
Debt Fund | |
| | | 2023 | | | 2022 | | | 2023 | | | 2022 | | | 2023 | | | 2022 | |
| Operations | | | | | | | | | | | | | | | | | | | | | | | | |
| Net investment income (loss) | | $ | 1,553 | | | $ | 857 | | | $ | 12 | | | $ | 13 | | | $ | 3,393 | | | $ | 2,779 | |
| Net realized gain (loss) on investments, and other assets and liabilities | | | (5,759 | ) | | | (56,248 | ) | | | (870 | ) | | | (1,957 | ) | | | (3,366 | ) | | | (7,193 | ) |
| Change in net unrealized appreciation (depreciation) on investments, and other assets and liabilities | | | 76,219 | | | | (81,085 | ) | | | 386 | | | | (178 | ) | | | 6,194 | | | | (4,510 | ) |
| Net increase (decrease) in net assets resulting from operations | | | 72,013 | | | | (136,476 | ) | | | (472 | ) | | | (2,122 | ) | | | 6,221 | | | | (8,924 | ) |
| Distributions to shareholders | | | | | | | | | | | | | | | | | | | | | | | | |
| Class N | | | (2 | ) | | | (145 | ) | | | — | | | | — | | | | — | | | | — | |
| Class I | | | (344 | ) | | | (5,030 | ) | | | (1 | ) | | | — | | | | (119 | )(a) | | | (75 | )(b) |
| Class R6 | | | (781 | ) | | | (9,975 | ) | | | (9 | ) | | | (1 | ) | | | (3,169 | )(a) | | | (3,077 | )(b) |
| Total distributions | | | (1,127 | ) | | | (15,150 | ) | | | (10 | ) | | | (1 | ) | | | (3,288 | ) | | | (3,152 | ) |
| Capital stock transactions | | | | | | | | | | | | | | | | | | | | | | | | |
| Proceeds from sale of shares | | | 66,177 | | | | 121,609 | | | | 1,544 | | | | 420 | | | | 4,429 | | | | 4,347 | |
| Shares issued in reinvestment of income dividends and capital gain distributions | | | 1,113 | | | | 14,983 | | | | 10 | | | | 1 | | | | 3,279 | | | | 3,151 | |
| Less cost of shares redeemed | | | (71,137 | ) | | | (162,701 | ) | | | (1,172 | ) | | | (3,576 | ) | | | (3,031 | ) | | | (1,090 | ) |
| Net increase (decrease) in net assets resulting from capital share transactions | | | (3,847 | ) | | | (26,109 | ) | | | 382 | | | | (3,155 | ) | | | 4,677 | | | | 6,408 | |
| Increase (decrease) in net assets | | | 67,039 | | | | (177,735 | ) | | | (100 | ) | | | (5,278 | ) | | | 7,610 | | | | (5,668 | ) |
| Net assets | | | | | | | | | | | | | | | | | | | | | | | | |
| Beginning of period | | | 322,673 | | | | 500,408 | | | | 1,947 | | | | 7,225 | | | | 45,826 | | | | 51,494 | |
| End of period | | $ | 389,712 | | | $ | 322,673 | | | $ | 1,847 | | | $ | 1,947 | | | $ | 53,436 | | | $ | 45,826 | |
| (a) | Included in the distribution is a tax return of capital in the amount of $7 and $186 (in thousands) for Class I and Class R6, respectively. |
| (b) | Included in the distribution is a tax return of capital in the amount of $1 and $118 (in thousands) for Class I and Class R6, respectively. |
See accompanying Notes to Financial Statements.
| December 31, 2023 | William Blair Funds | 113 |
Notes to Financial Statements
(1) Organization
(a) Description of the Trust
William Blair Funds (the “Trust”) is a Delaware statutory trust registered under the Investment Company Act of 1940, as amended (the “1940 Act”), as an open-end management investment company. As of the date of this report, the Trust has the following nineteen funds (the “Funds”) available for sale, each with its own investment objective and policies. For each Fund, the number of shares authorized is unlimited.
| U.S. Equity Funds | | Global Equity Fund | | Emerging Markets Debt Fund |
Growth Large Cap Growth Mid Cap Value Small-Mid Cap Core Small-Mid Cap Growth Small-Mid Cap Value Small Cap Growth Small Cap Value | | Global Leaders International Equity Funds International Leaders International Growth Institutional International Growth International Small Cap Growth Emerging Markets Leaders Emerging Markets Growth Emerging Markets ex China Growth Emerging Markets Small Cap Growth China Growth | | Emerging Markets Debt |
William Blair Investment Management, LLC (the “Adviser”) serves as the Trust’s investment adviser. William Blair & Company, L.L.C. (“WBC” or the “Distributor”), an affiliate of the Adviser, serves as the Trust’s principal underwriter and distributor.
(b) Share Classes
Each Fund is comprised of Class N, Class I and Class R6 shares, except the Mid Cap Value, Small-Mid Cap Core, Small-Mid Cap Value, Emerging Markets ex China Growth, China Growth and Emerging Markets Debt Funds, which are comprised of Class I and Class R6 shares. Institutional International Growth Fund does not offer multiple classes of shares.
Class N shares are available to the general public, either directly through the Trust’s distributor or through a select number of financial intermediaries. Class N shares are sold without any sales load and carry an annual 12b-1 distribution fee at a fixed rate (0.25% for all Funds as discussed in Note 4(b) – Transactions with Affiliates – Underwriting and Distribution Services Agreements) and a sub-transfer agent fee that is not a fixed rate and varies by Fund and class, as discussed below.
Class I shares are available to certain retirement and deferred compensation plans, clients of certain financial intermediaries, and asset-based fee advisory clients of William Blair. The minimum initial investment for a Class I account is $500,000, subject to certain exceptions. Class I shares do not carry any sales load or distribution fees and generally have lower ongoing expenses than Class N shares. Class I shares have a sub-transfer agent fee that is not a fixed rate and varies by Fund and class, as discussed below.
Class R6 shares are available to certain retirement and deferred compensation plans, clients of certain financial intermediaries, asset-based fee advisory clients of William Blair, and additional types of investors, provided that neither the investor nor the financial intermediary requires the Funds to make any type of servicing or administrative payment. The minimum initial investment for a Class R6 account is $1 million, subject to certain exceptions.
Institutional shares are available only to investors of Institutional International Growth Fund and comprise all of the outstanding shares of this Fund. Institutional shares require a minimum initial investment of $5 million, subject to certain exceptions.
Class R6 shares and Institutional shares of the Institutional International Growth Fund do not carry any sales load, distribution fees or sub-transfer agent fees. Class R6 shares of a Fund generally have lower ongoing expenses than the Fund’s Class N and Class I shares.
| 114 | Annual Report | December 31, 2023 |
Notes to Financial Statements
Sub-transfer agent fees: For Class N and Class I shares, the Funds may reimburse WBC for fees paid to intermediaries such as banks, broker-dealers, financial advisers or other financial institutions for sub-administration, sub-transfer agency and other services provided to investors whose shares of record are held in omnibus, other group accounts, retirement plans or accounts traded through registered securities clearing agents. These fees may vary based on, for example, the nature of services provided, but generally range up to 0.15% of the assets of the class serviced or maintained by the intermediary or up to $15 per sub-account maintained by the intermediary, depending on the method by which the intermediary charges for the services.
(c) Fund Objectives
The investment objectives of the Funds are as follows:
| U.S. Equity Funds | | Long-term capital appreciation. |
| Global Equity Fund | | Long-term capital appreciation. |
| International Equity Funds | | Long-term capital appreciation. |
| Emerging Markets Debt Fund | | Provide attractive risk-adjusted returns relative to the Fund’s benchmark. |
(2) Significant Accounting Policies
The following is a summary of the Trust’s significant accounting policies in effect during the periods covered by the financial statements, which are in accordance with U.S. generally accepted accounting principles (“US GAAP”), which includes the accounting and reporting guidelines under Accounting Standards Topic 946, Financial Services—Investment Companies.
(a) Investment income and transactions
Investment income, realized and unrealized gains and losses, and certain Fund level expenses and expense reductions, if any, are allocated based on the relative net assets of each class, except for certain class-specific expenses, which are charged directly to the appropriate class. Differences in class expenses may result in the payment of different per share dividends by class. All share classes of the Funds have equal rights with respect to voting, subject to class specific arrangements.
Dividend income and expenses are recorded on the ex-dividend date, except for those dividends from certain foreign securities that are recorded when the information is available.
Interest income is recorded on an accrual basis, adjusted for amortization of premium or accretion of discount. Variable rate bonds and floating rate notes earn interest at coupon rates that fluctuate at specific time intervals. The interest rates shown in the Portfolio of Investments for the Emerging Markets Debt Fund were the rates in effect on December 31, 2023. Put bonds may be redeemed at the discretion of the holder on specified dates prior to maturity.
Premiums and discounts are amortized and accreted, respectively, on a straight-line basis for short-term investments and on an effective interest method for long-term investments.
For the year ended December 31, 2023, the International Growth Fund received tax reclaim payments from certain member countries of the European Union, including interest, of $1,801 (in thousands), relating to amounts withheld on dividends received by the Fund during the fiscal years ended December 31, 2018 through 2020. The amounts withheld on dividends were not previously passed through to the Fund’s shareholders in the years the dividends were received by the Fund. The payments received are included within other income in the Statement of Operations.
The Funds do not isolate the portion of operations resulting from fluctuations in foreign currency exchange rates on investments from the fluctuations arising from changes in the value of securities held. Such currency fluctuations are included with the net realized and unrealized gain or loss from investments.
| December 31, 2023 | William Blair Funds | 115 |
Notes to Financial Statements
Reported net realized foreign currency gains or losses arise from disposition of foreign currency, the difference in the foreign exchange rates between the trade and settlement dates on securities transactions, and the difference between the amounts of dividends, interest and foreign withholding taxes recorded on the ex-date or accrual date and the U.S. dollar equivalent of the amounts actually received or paid. Net unrealized foreign exchange gains and losses arise from changes (due to the changes in the exchange rate) in the value of foreign currency and other assets and liabilities denominated in foreign currencies held at period end.
For financial reporting purposes, security and shareholder transactions are recorded on trade date in accordance with US GAAP. Realized gains and losses from securities transactions are recognized on a specifically identified cost basis.
Awards from class action litigation may be recorded as a reduction of cost. If the Funds no longer own the applicable securities, the proceeds are recorded as realized gains.
(b) Share Valuation and Distributions to Shareholders
Shares are sold and redeemed on a continuous basis at net asset value. The net asset value per share is determined separately for each class by dividing the Fund’s net assets attributable to that class by the number of shares of the class outstanding as of the close of regular trading on the New York Stock Exchange (the “NYSE”), which is generally 4:00 p.m. Eastern time, on each day the NYSE is open.
Distributions from net investment income, if any, for all Equity Funds are declared and paid at least annually. Distributions from net investment income for Emerging Markets Debt Fund are declared daily and paid monthly. Capital gain distributions, if any, for all Funds, are declared and paid at least annually in December and/or January. Distributions payable to shareholders are recorded on the ex-dividend date.
(c) Foreign Currency Translation
The Funds may invest in securities denominated in foreign currencies. As such, assets and liabilities denominated in foreign currencies are translated into U.S. dollar amounts at the current exchange rate on the date of valuation. The values of foreign investments, open forward foreign currency contracts, and cash denominated in foreign currencies are translated into U.S. dollars using a spot market rate of exchange as of the time of the determination of each Fund’s net asset value, typically 4:00 p.m. Eastern time on days when there is regular trading on the NYSE. Payables and receivables for securities transactions, dividends, interest income and tax reclaims are translated into U.S. dollars using a spot market rate of exchange as of 4:00 p.m. Eastern time. Settlement of purchases and sales and dividend and interest receipts are translated into U.S. dollars using a spot market rate of exchange as of 11:00 a.m. Eastern time.
(d) Income Taxes
Each Fund intends to comply with the provisions of Subchapter M of the Code, in order to qualify as regulated investment companies. Each Fund intends to make the requisite distributions of income and capital gains to its shareholders sufficient to relieve it from all, or substantially all, federal income and excise taxes. No provision for federal income and excise taxes has been made.
Certain Funds may be subject to foreign income taxes imposed on realized gains on securities of issuers from certain foreign countries. Such taxes, if applicable, are accrued and included within change in net unrealized appreciation (depreciation) and net realized gain (loss) on transactions from investments in securities in the Statement of Operations.
Management evaluates tax positions taken or expected to be taken in the course of preparing the Funds’ tax returns to determine whether it is “more likely than not” that each tax position would be sustained upon examination by a taxing authority based on the technical merits of the positions. Tax positions not deemed to meet the “more likely than not” threshold would be recorded as a tax benefit or expense in the current year. Management has evaluated all of the uncertain tax positions of the Funds and has determined that no liability is required to be recorded in the financial statements.
The statute of limitations on the Funds’ U.S. federal and state tax returns for the prior three years remains open and the returns are subject to examination.
| 116 | Annual Report | December 31, 2023 |
Notes to Financial Statements
Adjustments to the cost of investments for tax purposes may be due to the deferred loss associated with current and prior year wash sales, income recognition from investments in real estate investment trusts, and the Funds’ election to mark-to-market their investments in Passive Foreign Investment Companies (“PFICs”). The cost of investments, including derivatives, for federal income tax purposes and related gross unrealized appreciation (depreciation) and net unrealized appreciation/(depreciation) at December 31, 2023, were as follows (in thousands):
| Fund | | Cost of
Investments | | | Gross
Unrealized
Appreciation | | | Gross
Unrealized
Depreciation | | | Net
Unrealized
Appreciation/
(Depreciation) | |
| Growth | | $ | 130,036 | | | $ | 112,675 | | | $ | 3,984 | | | $ | 108,691 | |
| Large Cap Growth | | | 1,166,862 | | | | 490,310 | | | | 25,186 | | | | 465,124 | |
| Mid Cap Value | | | 1,339 | | | | 168 | | | | 101 | | | | 67 | |
| Small-Mid Cap Core | | | 181,914 | | | | 25,706 | | | | 11,376 | | | | 14,330 | |
| Small-Mid Cap Growth | | | 1,726,732 | | | | 398,892 | | | | 124,240 | | | | 274,652 | |
| Small-Mid Cap Value | | | 1,461 | | | | 125 | | | | 38 | | | | 87 | |
| Small Cap Growth | | | 652,849 | | | | 140,666 | | | | 43,588 | | | | 97,078 | |
| Small Cap Value | | | 1,204,607 | | | | 226,121 | | | | 125,272 | | | | 100,849 | |
| Global Leaders | | | 63,734 | | | | 37,438 | | | | 994 | | | | 36,444 | |
| International Leaders | | | 846,812 | | | | 262,106 | | | | 23,731 | | | | 238,375 | |
| International Growth | | | 1,062,091 | | | | 390,562 | | | | 26,336 | | | | 364,226 | |
| Institutional International Growth | | | 707,077 | | | | 244,366 | | | | 20,519 | | | | 223,847 | |
| International Small Cap Growth | | | 200,389 | | | | 51,586 | | | | 11,429 | | | | 40,157 | |
| Emerging Markets Leaders | | | 231,393 | | | | 52,304 | | | | 23,232 | | | | 29,072 | |
| Emerging Markets Growth | | | 686,974 | | | | 180,276 | | | | 34,413 | | | | 145,863 | |
| Emerging Markets ex China Growth | | | 17,964 | | | | 4,407 | | | | 210 | | | | 4,197 | |
| Emerging Markets Small Cap Growth | | | 308,899 | | | | 92,693 | | | | 5,301 | | | | 87,392 | |
| China Growth | | | 2,271 | | | | 17 | | | | 485 | | | | (468 | ) |
| Emerging Markets Debt | | | 53,351 | | | | 2,720 | | | | 3,544 | | | | (824 | ) |
In addition, the Funds may periodically record reclassifications among certain capital accounts to reflect differences between financial reporting and income tax basis distributions. The reclassifications were reported in order to reflect the tax treatment for certain permanent differences that exist between income tax regulations and US GAAP. The reclassifications generally relate to the tax treatment of net operating losses, redemptions in-kind, and utilization of earnings and profits distributed to shareholders on redemption of shares. These reclassifications have no impact on the net asset values or the net assets of the Funds. Accordingly, at December 31, 2023, the following reclassifications were recorded (in thousands):
| Fund | | Paid in
Capital | | | Total
Distributable
Earnings
(Loss) | |
| Growth | | $ | 1,461 | | | $ | (1,461 | ) |
| Large Cap Growth | | | 1 | | | | (1 | ) |
| Mid Cap Value | | | 1 | | | | (1 | ) |
| Small-Mid Cap Core | | | — | | | | — | |
| Small-Mid Cap Growth | | | (5 | ) | | | 5 | |
| Small-Mid Cap Value | | | — | | | | — | |
| Small Cap Growth | | | (2,971 | ) | | | 2,971 | |
| Small Cap Value | | | 2,604 | | | | (2,604 | ) |
| Global Leaders | | | 410 | | | | (410 | ) |
| International Leaders | | | 4,993 | | | | (4,993 | ) |
| International Growth | | | 5,358 | | | | (5,358 | ) |
| Institutional International Growth | | | 601 | | | | (601 | ) |
| International Small Cap Growth | | | — | | | | — | |
| December 31, 2023 | William Blair Funds | 117 |
Notes to Financial Statements
| Fund | | Paid in
Capital | | | Total
Distributable
Earnings
(Loss) | |
| Emerging Markets Leaders | | $ | — | | | $ | — | |
| Emerging Markets Growth | | | 1 | | | | (1 | ) |
| Emerging Markets ex China Growth | | | (18 | ) | | | 18 | |
| Emerging Markets Small Cap Growth | | | 3 | | | | (3 | ) |
| China Growth | | | (1 | ) | | | 1 | |
| Emerging Markets Debt | | | (194 | ) | | | 194 | |
The timing and characterization of certain income and capital gain distributions are determined annually in accordance with federal income tax regulations that may differ from US GAAP. As a result, net investment income or loss and net realized gain or loss for a reporting period may differ from the amount distributed during such period.
Distributions from net realized gains for book purposes may include short-term capital gains, which are included as ordinary income for tax purposes. The tax character of distributions paid during 2023 and 2022 was as follows (in thousands):
| | | Distributions Paid in 2023 | |
| | | Ordinary
Income | | | Long-Term
Capital Gains | |
| Fund | | Class N | | | Class I | | | Institutional/
Class R6 | | | Class N | | | Class I | | | Institutional/
Class R6 | |
| Growth | | $ | — | | | $ | — | | | $ | — | | | $ | 3,790 | | | $ | 14,632 | | | $ | 3,966 | |
| Large Cap Growth | | | — | | | | — | | | | — | | | | — | | | | — | �� | | | — | |
| Mid Cap Value | | | N/A | | | | 1 | | | | 21 | | | | N/A | | | | — | | | | — | |
| Small-Mid Cap Core | | | N/A | | | | 151 | | | | 180 | | | | N/A | | | | — | | | | — | |
| Small-Mid Cap Growth | | | — | | | | — | | | | — | | | | 8,769 | | | | 107,708 | | | | 32,457 | |
| Small-Mid Cap Value | | | N/A | | | | — | | | | 7 | | | | N/A | | | | — | | | | — | |
| Small Cap Growth | | | — | | | | — | | | | — | | | | 2,238 | | | | 6,617 | | | | 2,645 | |
| Small Cap Value | | | 24 | | | | 9,550 | | | | 6,214 | | | | 53 | | | | 16,953 | | | | 10,225 | |
| Global Leaders | | | — | | | | 31 | | | | 14 | | | | 535 | | | | 4,819 | | | | 984 | |
| International Leaders | | | 64 | | | | 1,847 | | | | 3,151 | | | | — | | | | — | | | | — | |
| International Growth | | | 1,965 | | | | 9,345 | | | | 1,373 | | | | 7,828 | | | | 26,983 | | | | 3,761 | |
| Institutional International Growth | | | N/A | | | | N/A | | | | 8,111 | | | | N/A | | | | N/A | | | | 14,748 | |
| International Small Cap Growth | | | 10 | | | | 911 | | | | 1,252 | | | | — | | | | — | | | | — | |
| Emerging Markets Leaders | | | 8 | | | | 107 | | | | 2,141 | | | | — | | | | — | | | | — | |
| Emerging Markets Growth | | | 42 | | | | 900 | | | | 3,523 | | | | — | | | | — | | | | — | |
| Emerging Markets ex China Growth | | | N/A | | | | 23 | | | | 161 | | | | N/A | | | | — | | | | — | |
| Emerging Markets Small Cap Growth | | | 2 | | | | 344 | | | | 781 | | | | — | | | | — | | | | — | |
| China Growth | | | N/A | | | | 1 | | | | 9 | | | | N/A | | | | — | | | | — | |
| Emerging Markets Debt (a) | | | N/A | | | | 119 | | | | 3,169 | | | | N/A | | | | — | | | | — | |
| | | | | | | | | | | | | | | | | | | | | | | | | |
| | | Distributions Paid in 2022 | |
| | | Ordinary
Income | | | Long-Term
Capital Gains | |
| Fund | | Class N | | | Class I | | | Institutional/
Class R6 | | | Class N | | | Class I | | | Institutional/
Class R6 | |
| Growth | | $ | — | | | $ | — | | | $ | — | | | $ | 1,055 | | | $ | 4,820 | | | $ | 1,050 | |
| Large Cap Growth | | | — | | | | 801 | | | | 396 | | | | 1,004 | | | | 4,957 | | | | 1,675 | |
| Mid Cap Value | | | N/A | | | | 1 | | | | 15 | | | | N/A | | | | — | | | | — | |
| Small-Mid Cap Core | | | N/A | | | | — | | | | — | | | | N/A | | | | — | | | | — | |
| Small-Mid Cap Growth | | | — | | | | — | | | | — | | | | 3,897 | | | | 49,427 | | | | 12,748 | |
| Small Cap Growth | | | — | | | | — | | | | — | | | | 4,693 | | | | 10,353 | | | | 3,839 | |
| Small Cap Value | | | 27 | | | | 9,580 | | | | 6,246 | | | | 160 | | | | 45,145 | | | | 27,249 | |
| Global Leaders | | | — | | | | 51 | | | | 19 | | | | 174 | | | | 1,451 | | | | 277 | |
| International Leaders | | | — | | | | — | | | | — | | | | 68 | | | | 631 | | | | 1,130 | |
| 118 | Annual Report | December 31, 2023 |
Notes to Financial Statements
| | | Distributions Paid in 2022 | |
| | | Ordinary
Income | | | Long-Term
Capital Gains | |
| Fund | | Class N | | | Class I | | | Institutional/
Class R6 | | | Class N | | |
Class I | | | Institutional/
Class R6 | |
| International Growth | | $ | 196 | | | $ | 2,305 | | | $ | 457 | | | $ | 23,059 | | | $ | 71,818 | | | $ | 11,040 | |
| Institutional International Growth | | | N/A | | | | N/A | | | | 3,768 | | | | N/A | | | | N/A | | | | 52,468 | |
| International Small Cap Growth | | | — | | | | 202 | | | | 406 | | | | — | | | | — | | | | — | |
| Emerging Markets Leaders | | | — | | | | — | | | | — | | | | 9 | | | | 289 | | | | 3,110 | |
| Emerging Markets Growth | | | — | | | | — | | | | — | | | | 24 | | | | 278 | | | | 716 | |
| Emerging Markets ex China Growth | | | N/A | | | | — | | | | — | | | | N/A | | | | — | | | | — | |
| Emerging Markets Small Cap Growth | | | — | | | | — | | | | — | | | | 145 | | | | 5,030 | | | | 9,975 | |
| China Growth | | | N/A | | | | — | | | | 1 | | | | N/A | | | | — | | | | — | |
| Emerging Markets Debt (b) | | | N/A | | | | 75 | | | | 3,077 | | | | N/A | | | | — | | | | — | |
| (a) | Included in the distribution is a tax return of capital in the amount of $7 and $186 (in thousands) for Class I and Class R6, respectively. |
| (b) | Included in the distribution is a tax return of capital in the amount of $1 and $118 (in thousands) for Class I and Class R6, respectively. |
As of December 31, 2023, the components of distributable earnings on a tax basis were as follows (in thousands):
| Fund | | Undistributed
Ordinary
Income | | | Accumulated
Capital and
Other Losses | | | Undistributed
Long-Term
Capital Gain | | | Net Unrealized
Appreciation/
(Depreciation) | | | Total | |
| Growth | | $ | — | | | $ | — | | | $ | 4,033 | | | $ | 108,691 | | | $ | 112,724 | |
| Large Cap Growth | | | 1,858 | | | | (52,303 | ) | | | — | | | | 465,124 | | | | 414,679 | |
| Mid Cap Value | | | — | | | | (58 | ) | | | — | | | | 67 | | | | 9 | |
| Small-Mid Cap Core | | | 29 | | | | (11,735 | ) | | | — | | | | 14,330 | | | | 2,624 | |
| Small-Mid Cap Growth | | | — | | | | — | | | | — | | | | 274,652 | | | | 274,652 | |
| Small-Mid Cap Value | | | — | | | | (18 | ) | | | — | | | | 87 | | | | 69 | |
| Small Cap Growth | | | — | | | | — | | | | 2,392 | | | | 97,078 | | | | 99,470 | |
| Small Cap Value | | | — | | | | (8,252 | ) | | | — | | | | 100,849 | | | | 92,597 | |
| Global Leaders | | | — | | | | — | | | | 2,315 | | | | 36,425 | | | | 38,740 | |
| International Leaders | | | 1,052 | | | | (108,554 | ) | | | — | | | | 237,319 | | | | 129,817 | |
| International Growth | | | 8,112 | | | | — | | | | 22,766 | | | | 362,008 | | | | 392,886 | |
| Institutional International Growth | | | 3,296 | | | | — | | | | 1,109 | | | | 222,671 | | | | 227,076 | |
| International Small Cap Growth | | | 899 | | | | (59,007 | ) | | | — | | | | 39,732 | | | | (18,376 | ) |
| Emerging Markets Leaders | | | 504 | | | | (111,294 | ) | | | — | | | | 28,137 | | | | (82,653 | ) |
| Emerging Markets Growth | | | 1,070 | | | | (122,717 | ) | | | — | | | | 138,958 | | | | 17,311 | |
| Emerging Markets ex China Growth | | | — | | | | (1,072 | ) | | | — | | | | 4,014 | | | | 2,942 | |
| Emerging Markets Small Cap Growth | | | — | | | | (61,543 | ) | | | — | | | | 80,609 | | | | 19,066 | |
| China Growth | | | 1 | | | | (2,607 | ) | | | — | | | | (469 | ) | | | (3,075 | ) |
| Emerging Markets Debt | | | — | | | | (10,254 | ) | | | — | | | | (820 | ) | | | (11,074 | ) |
As of December 31, 2023, the Funds may have unused capital loss carryforwards available for federal income tax purposes to be applied against future capital gains, if any. Under current law, the Funds may carry forward net capital losses indefinitely to use to offset capital gains realized in future years. The following table details the Funds’ available capital loss carryforwards as of December 31, 2023, and the capital loss carryforwards utilized by the Funds in 2023 (in thousands):
| | | Available Capital Loss Carryforwards | | Capital Loss
Carryforwards | |
| Fund | | Short Term | | | Long Term | | | Total | | | Utilized in 2023 | |
| Large Cap Growth | | $ | 24,430 | | | $ | 27,873 | | | $ | 52,303 | | | $ | — | |
| Mid Cap Value | | | 58 | | | | — | | | | 58 | | | | — | |
| Small-Mid Cap Core | | | 8,340 | | | | 3,395 | | | | 11,735 | | | | 441 | |
| Small-Mid Cap Value | | | 18 | | | | — | | | | 18 | | | | — | |
| Small Cap Growth | | | — | | | | — | | | | — | | | | 13,269 | |
| International Leaders | | | 91,124 | | | | 17,430 | | | | 108,554 | | | | — | |
| International Small Cap Growth | | | 27,373 | | | | 31,634 | | | | 59,007 | | | | — | |
| Emerging Markets Leaders | | | 48,895 | | | | 62,399 | | | | 111,294 | | | | — | |
| Emerging Markets Growth | | | 102,342 | | | | 20,375 | | | | 122,717 | | | | — | |
| Emerging Markets ex China Growth | | | 1,072 | | | | — | | | | 1,072 | | | | — | |
| Emerging Markets Small Cap Growth | | | 61,388 | | | | — | | | | 61,388 | | | | — | |
| China Growth | | | 1,953 | | | | 654 | | | | 2,607 | | | | — | |
| Emerging Markets Debt | | | 6,186 | | | | 3,981 | | | | 10,167 | | | | — | |
| December 31, 2023 | William Blair Funds | 119 |
Notes to Financial Statements
In order to meet certain excise tax distribution requirements, the Funds are required to measure and distribute annually, net capital gains realized during a twelve month period ending October 31 and net investment income earned during a twelve month period ending December 31. In connection with this, the Funds are permitted for tax purposes to defer into their next fiscal year qualified late year losses. Qualified late year capital losses are any short term or long term capital losses incurred between November 1 and the end of their fiscal year, December 31. Qualified late year ordinary losses are comprised of losses related to swaps, foreign currency and PFICs incurred between November 1 and the end of their fiscal year, December 31.
As of December 31, 2023, the following Funds deferred, on a tax basis, qualified late year losses of (in thousands):
| | | Qualified Late Year Losses | |
| Fund | | Ordinary
Income | | Net
Capital | |
| Small Cap Value | | $ | — | | | $ | 8,252 | |
| Emerging Markets Small Cap Growth | | | 155 | | | | — | |
| Emerging Markets Debt | | | 87 | | | | — | |
(e) Repurchase Agreements
In a repurchase agreement, a Fund buys a security at one price and at the time of sale, the seller agrees to repurchase the security at a mutually agreed upon time and price (usually within seven days). The repurchase agreement thereby determines the yield during the purchaser’s holding period, while the seller’s obligation to repurchase is secured by the value of the underlying collateral. The Adviser monitors, on an ongoing basis, the value of the underlying collateral to ensure that the value always equals or exceeds the repurchase price plus accrued interest. Repurchase agreements may involve certain risks in the event of a default or insolvency of the other party to the agreement, including possible delays or restrictions upon a Fund’s ability to dispose of the underlying collateral. The risk to a Fund is limited to the ability of the seller to pay the agreed upon sum on the delivery date. In the event of default, a repurchase agreement provides that a Fund is entitled to sell the underlying collateral. The loss, if any, to a Fund will be the difference between the proceeds from the sale and the repurchase price. However, if bankruptcy proceedings are commenced with respect to the seller of the security, disposition of the collateral by the Fund may be delayed or limited. The Funds have master repurchase agreements which allow the Funds to offset amounts owed to a counterparty with amounts owed from the same counterparty, including any collateral, in the event the counterparty defaults. Each Fund’s outstanding repurchase agreements, if any, and related collateral, are shown on the Fund’s Portfolio of Investments. Although no definitive creditworthiness criteria are used, the Adviser reviews the creditworthiness of the banks and non-bank dealers with which a Fund enters into repurchase agreements to evaluate those risks. A Fund may, for tax purposes, deem repurchase agreements collateralized by U.S. Government securities to be investments in U.S. Government securities.
(f) Use of Estimates
The preparation of financial statements in conformity with US GAAP requires management to make estimates and assumptions that affect the amounts reported in the financial statements. Actual results may differ from those estimates.
(g) Indemnification
In the normal course of business, the Funds have entered into contracts in which the Funds agree to indemnify the other party or parties against various potential costs or liabilities. The Funds’ maximum exposure under these arrangements is unknown. No claim has been made for indemnification pursuant to any such agreement of the Funds.
(h) Redemption In-Kind
In accordance with the Trust’s prospectus, the Funds may distribute portfolio securities rather than cash as payment for a redemption of Fund shares (in-kind redemption). For financial reporting purposes, the Funds recognize a gain or loss on the transfer of securities depending on the value of those securities on the date of redemption. Gains and losses realized on in-kind redemptions may not be recognized for tax purposes and are reclassified from accumulated net realized gain (loss), a component of distributable earnings (loss), to capital paid in excess of par value. During the year ended December 31, 2023, the International Leaders Fund redeemed $22,968 (in thousands) of Fund shares in-kind rather than with cash and recognized net realized gains of $5,580 (in thousands) on the securities distributed to shareholders.
| 120 | Annual Report | December 31, 2023 |
Notes to Financial Statements
(3) Valuation
(a) Investment Valuation
The value of U.S. equity securities, including exchange-traded funds, is determined by valuing securities traded on national securities markets or in the over-the-counter markets at the last sale price or, if applicable, the official closing price or, in the absence of a recent sale on the date of determination, at the mean between the last reported bid and ask prices.
The value of foreign equity securities is generally determined based upon the last sale price on the foreign exchange or market on which it is primarily traded and in the currency of that market as of the close of the appropriate exchange or, if there have been no sales during that day, at the mean between the last reported bid and ask prices. The Adviser has determined that the passage of time between when the foreign exchanges or markets close and when the Funds compute their net asset values could cause the value of foreign equity securities to no longer be representative or accurate and, as a result, may necessitate that such securities be fair valued. Accordingly, for foreign equity securities, the Funds may use an independent pricing service to fair value price the security as of the close of regular trading on the NYSE. As a result, a Fund’s value for a foreign security may be different from the last sale price (or the mean between the last reported bid and ask prices). As of December 31, 2023, fair valuation estimates for foreign equity securities were not obtained.
Fixed income securities are generally valued using evaluated prices provided by an independent pricing service. The evaluated prices are formed using various market inputs that the pricing service believes accurately represent the market value of a security at a particular point in time. The pricing service determines evaluated prices for fixed income securities using inputs including, but not limited to, recent transaction prices for such securities, dealer quotes, transaction prices for other securities with similar characteristics, collateral characteristics, credit quality, payment history, liquidity and market conditions.
Repurchase agreements are valued at cost, which approximates fair value.
Forward foreign currency contracts are valued on the basis of the value of the underlying currencies at the prevailing currency exchange rate as supplied by an independent pricing service.
Swaps that are centrally cleared through an exchange are valued at the most recent settlement price provided by the exchange on which they are cleared. Total return swaps on equities, equity baskets, indices and other financial instruments are valued by an independent pricing service, or if unavailable, based on the security’s or instrument’s underlying reference asset.
Securities, and other assets, for which a market quotation is not available or is deemed unreliable (e.g., securities affected by unusual or extraordinary events, such as natural disasters or securities affected by market or economic events, such as bankruptcy filings), or the value of which is affected by a significant valuation event, are valued at a fair value. Pursuant to Rule 2a-5 under the 1940 Act, the Board of Trustees has designated the Adviser as the valuation designee to perform fair value determinations for the Funds. The value of these fair valued securities may be different from the last sale price (or the mean between the last reported bid and ask prices), and there is no guarantee that a fair valued security will be sold at the price at which a Fund is carrying the security.
(b) Fair Value Measurements
Fair value is defined as the price that a Fund would receive upon selling a security in an orderly transaction to an independent buyer in the principal or most advantageous market for the investment. Various inputs are used in determining the value of a Fund’s investments. A three-tier hierarchy of inputs is used to classify fair value measurements for disclosure purposes. The three-tier hierarchy of inputs is summarized in the three broad levels listed below:
| | • | Level 1—Quoted prices (unadjusted) in active markets for an identical security. |
| | | |
| | • | Level 2—Prices determined using other significant observable inputs. Observable inputs are inputs that other market participants would use in pricing a security. These may include quoted prices for similar securities, interest rates, prepayment speeds, credit risk, and others. In addition, other observable inputs such as foreign exchange rates, benchmark securities indices and foreign futures contracts may be utilized in the valuation of certain foreign securities when significant events occur between the last sale on the foreign securities exchange and the time at which the net asset value of the Fund is calculated. |
| | | |
| | • | Level 3—Prices determined using significant unobservable inputs. In situations where quoted prices or observable inputs are unavailable (for example, when there is little or no market activity for an investment), unobservable inputs may be used. Unobservable inputs reflect the Fund’s own assumptions about the factors market participants would use in pricing an investment, and are based on the best information available. |
| December 31, 2023 | William Blair Funds | 121 |
Notes to Financial Statements
The inputs or methodology used for valuing an investment are not necessarily an indication of the risk associated with investing in those securities.
A description of the valuation methodologies applied to the Funds’ major categories of assets and liabilities measured at fair value on a recurring basis is as follows:
Exchange-Traded Securities
Securities traded on a national securities exchange (or reported on the NASDAQ national market), including exchange-traded funds, are stated at the last reported sales price on the day of valuation. Other securities traded in the over-the-counter market and listed securities for which no sale was reported on that date are stated at the mean between the last reported bid and ask prices. To the extent these securities are actively traded and valuation adjustments are not applied, they are categorized as Level 1 of the fair value hierarchy. Securities traded on inactive markets or valued by reference to similar instruments are generally categorized as Level 2 of the fair value hierarchy.
Fixed Income Securities
Fixed income securities are generally valued using evaluated prices provided by an independent pricing service. The evaluated prices are formed using various market inputs that the pricing service believes accurately represent the fair value of a security at a particular point in time. The pricing service determines evaluated prices for fixed income securities using inputs including, but not limited to, recent transaction prices for such securities, dealer quotes, transaction prices for other securities with similar characteristics, collateral characteristics, credit quality, payment history, liquidity and market conditions. Securities that use similar valuation techniques and observable inputs as described above are categorized as Level 2 of the fair value hierarchy.
Repurchase Agreements
Repurchase agreements are valued at cost, which approximates fair value. Repurchase agreements are categorized as Level 2 of the fair value hierarchy.
Derivative Instruments
Forward foreign currency contracts and swaps are valued using pricing inputs observed from actively quoted markets and are categorized within Level 2 of the fair value hierarchy.
As of December 31, 2023, the value of investments in securities and other financial instruments, segregated by their hierarchical input levels used in determining fair value and by security class or other financial instruments, are shown below (in thousands).
| Investments in securities | | Growth | | | Large Cap
Growth | | | Mid Cap
Value | | | Small-Mid
Cap Core | |
| Level 1 | | | | | | | | | | | | | | | | |
| Common Stocks | | $ | 235,993 | | | $ | 1,624,644 | | | $ | 1,406 | | | $ | 194,380 | |
| Level 2 | | | | | | | | | | | | | | | | |
| Repurchase Agreements | | | 2,734 | | | | 7,342 | | | | — | | | | 1,864 | |
| Level 3 | | | | | | | | | | | | | | | | |
| None | | | — | | | | — | | | | — | | | | — | |
| Total investments in securities | | $ | 238,727 | | | $ | 1,631,986 | | | $ | 1,406 | | | $ | 196,244 | |
| | | | | | | | | | | | | | | | | |
| Investments in securities | | Small-Mid
Cap Growth | | | Small-Mid
Cap Value | | | Small Cap
Growth | | | Small Cap
Value | |
| Level 1 | | | | | | | | | | | | | | | | |
| Common Stocks | | $ | 1,973,564 | | | $ | 1,548 | | | $ | 718,924 | | | $ | 1,295,769 | |
| Exchange-Traded Funds | | | — | | | | — | | | | 7,534 | | | | — | |
| Level 2 | | | | | | | | | | | | | | | | |
| Repurchase Agreements | | | 27,820 | | | | — | | | | 23,469 | | | | 9,687 | |
| Level 3 | | | | | | | | | | | | | | | | |
| Common Stocks | | | — | | | | — | | | | — | | | | — | |
| Rights | | | — | | | | — | | | | — | | | | — | |
| Total investments in securities | | $ | 2,001,384 | | | $ | 1,548 | | | $ | 749,927 | | | $ | 1,305,456 | |
| 122 | Annual Report | December 31, 2023 |
Notes to Financial Statements
| Investments in securities | | Global
Leaders | | | International
Leaders | | | International
Growth | | | Institutional
International
Growth | |
| Level 1 | | | | | | | | | | | | | | | | |
| Common Stocks | | $ | 99,652 | | | $ | 1,060,873 | | | $ | 1,379,964 | | | $ | 898,777 | |
| Level 2 | | | | | | | | | | | | | | | | |
| Repurchase Agreements | | | 526 | | | | 24,314 | | | | 46,353 | | | | 32,147 | |
| Level 3 | | | | | | | | | | | | | | | | |
| None | | | — | | | | — | | | | — | | | | — | |
| Total investments in securities | | $ | 100,178 | | | $ | 1,085,187 | | | $ | 1,426,317 | | | $ | 930,924 | |
| | | | | | | | | | | | | | | | | |
| Investments in securities | | International
Small Cap
Growth | | | Emerging
Markets
Leaders | | | Emerging
Markets
Growth | | | Emerging
Markets
ex China
Growth | |
| Level 1 | | | | | | | | | | | | | | | | |
| Common Stocks | | $ | 236,835 | | | $ | 253,380 | | | $ | 814,234 | | | $ | 21,708 | |
| Rights | | | — | | | | — | | | | 3 | | | | — | |
| Level 2 | | | | | | | | | | | | | | | | |
| Common Stocks | | | 1,197 | | | | 7,085 | | | | 9,181 | | | | 231 | |
| Repurchase Agreements | | | 2,514 | | | | — | | | | 9,419 | | | | 222 | |
| Level 3 | | | | | | | | | | | | | | | | |
| None | | | — | | | | — | | | | — | | | | — | |
| Total investments in securities | | $ | 240,546 | | | $ | 260,465 | | | $ | 832,837 | | | $ | 22,161 | |
| | | | | | | | | | | | | | | | | |
| Investments in securities | | | | | Emerging
Markets
Small Cap
Growth | | | China
Growth | | | Emerging
Markets
Debt | |
| Level 1 | | | | | | | | | | | | | | | | |
| Common Stocks | | | | | | $ | 389,662 | | | $ | 1,803 | | | $ | — | |
| Level 2 | | | | | | | | | | | | | | | | |
| Common Stocks | | | | | | | 958 | | | | — | | | | — | |
| Foreign Corporate Bonds | | | | | | | — | | | | — | | | | 16,356 | |
| Foreign Government Bonds | | | | | | | — | | | | — | | | | 33,706 | |
| Foreign Municipal Bonds | | | | | | | — | | | | — | | | | 142 | |
| Repurchase Agreements | | | | | | | 5,671 | | | | — | | | | 1,351 | |
| U.S. Government | | | | | | | — | | | | — | | | | 972 | |
| Level 3 | | | | | | | | | | | | | | | | |
| None | | | | | | | — | | | | — | | | | — | |
| Total investments in securities | | | | | | $ | 396,291 | | | $ | 1,803 | | | $ | 52,527 | |
| December 31, 2023 | William Blair Funds | 123 |
Notes to Financial Statements
| Investments in securities | | Emerging
Markets
Small Cap
Growth | | | China
Growth | | | Emerging
Markets
Debt | |
| Other financial instruments | | | | | | | | | | | | |
| Assets | | | | | | | | | | | | |
| Level 1 | | | | | | | | | | | | |
| None | | $ | — | | | $ | — | | | $ | — | |
| Level 2 | | | | | | | | | | | | |
| Swaps | | | — | | | | — | | | | 467 | |
| Level 3 | | | | | | | | | | | | |
| None | | | — | | | | — | | | | — | |
| Liabilities | | | | | | | | | | | | |
| Level 1 | | | | | | | | | | | | |
| None | | | — | | | | — | | | | — | |
| Level 2 | | | | | | | | | | | | |
| Forward Foreign Currency Contracts | | | — | | | | — | | | | (40 | ) |
| Swaps | | | — | | | | — | | | | (369 | ) |
| Level 3 | | | | | | | | | | | | |
| None | | | — | | | | — | | | | — | |
| Total other financial instruments | | $ | — | | | $ | — | | | $ | 58 | |
See Portfolio of Investments for Sector Classification.
The fair value estimates for the Level 3 securities in the Small-Mid Cap Growth and Small Cap Growth Funds were determined in good faith by the Adviser pursuant to the Fund’s Valuation Procedures. There were various factors considered in reaching the fair value determination, including, but not limited to, the following: the type of security, the extent of public trading of the security, information obtained for the security, and analysis of the company’s performance and market trends that influence its performance. The Level 3 securities represented 0.00% and 0.00% as a percentage of net assets in the Small-Mid Cap Growth and Small Cap Growth Funds, respectively.
| 124 | Annual Report | December 31, 2023 |
Notes to Financial Statements
(4) Transactions with Affiliates
(a) Management and Expense Limitation Agreements
Each Fund has a management agreement with the Adviser for investment management, clerical, bookkeeping and administrative services. Each Fund pays the Adviser an annual management fee, which is accrued daily and paid monthly, based on a specified percentage of the Fund’s average daily net assets. Each Fund’s annual management fee rate is as follows:
| U.S. Equity Funds | | | | |
| Growth | | | 0.75 | % |
| Large Cap Growth | | | 0.60 | % |
| Mid Cap Value | | | 0.70 | % |
| Small-Mid Cap Core | | | 0.90 | % |
| Small-Mid Cap Growth1 | | | 0.94 | % |
| Small-Mid Cap Value | | | 0.80 | % |
| Small Cap Growth2 | | | 0.94 | % |
| Small Cap Value | | | 0.75 | % |
| | | | | |
| Emerging Markets Debt Fund | | | | |
| Emerging Markets Debt | | | 0.65 | % |
| | | | | |
| Global Equity Fund | | | | |
| Global Leaders | | | 0.85 | % |
| International Equity Funds | | | | |
| International Leaders | | | 0.85 | % |
| International Growth: | | | | |
| First $3 billion | | | 0.94 | % |
| Next $2 billion | | | 0.90 | % |
| Next $5 billion | | | 0.85 | % |
| Next $5 billion | | | 0.825 | % |
| In excess of $15 billion | | | 0.80 | % |
| Institutional International Growth: | | | | |
| First $1.875 billion | | | 0.94 | % |
| Next $625 million | | | 0.90 | % |
| Next $2.5 billion | | | 0.875 | % |
| Next $5 billion | | | 0.85 | % |
| Next $5 billion | | | 0.825 | % |
| In excess of $15 billion | | | 0.80 | % |
| International Small Cap Growth | | | 1.00 | % |
| Emerging Markets Leaders | | | 0.94 | % |
| Emerging Markets Growth | | | 0.94 | % |
| Emerging Markets ex China Growth | | | 0.94 | % |
| Emerging Markets Small Cap Growth | | | 1.10 | % |
| China Growth | | | 0.94 | % |
| 1 | Prior to May 1, 2023, the Small-Mid Cap Growth Fund paid a management fee at a rate of 1.00% of the Fund’s average daily net assets. Effective May 1, 2023, the management fee paid to the Adviser was reduced to 0.94%. |
| 2 | Prior to May 1, 2023, the Small Cap Growth Fund paid a management fee at a rate of 1.10% of the Fund’s average daily net assets. Effective May 1, 2023, the management fee paid to the Adviser was reduced to 0.94%. |
| December 31, 2023 | William Blair Funds | 125 |
Notes to Financial Statements
The Funds have also entered into an Amended and Restated Expense Limitation Agreement with the Adviser. Under the terms of the agreement, the Adviser will waive its management fee and/or reimburse a Fund for certain operating expenses, subject to certain excluded expenses, in excess of the agreed upon rate through April 30, 2024. Excluded expenses include interest expenses, taxes, brokerage commissions, acquired fund fees and expenses, dividend and interest expenses on short sales, other investment-related costs and extraordinary expenses, such as litigation and other expenses not incurred in the ordinary course of a Fund’s business. The amount the Adviser owes a Fund as of the reporting date is recorded as Receivable from Adviser in the Statements of Assets and Liabilities. The Adviser reimburses the Funds on a monthly basis. The Adviser will waive fees and/or reimburse expenses to the extent that the total operating expenses for the stated class of the Funds, subject to certain excluded expenses, exceed the following rates (as a percentage of average daily net assets):
| | | Class N | | Class I | | Institutional/Class R6 |
| Fund | | Effective
May 1, 2023
through
April 30,
2024 | | Effective
May 1, 2022
through
April 30,
2023 | | Effective
May 1, 2023
through
April 30,
2024 | | Effective
May 1, 2022
through
April 30,
2023 | | Effective
May 1, 2023
through
April 30,
2024 | | Effective
May 1, 2022
through
April 30,
2023 |
| Growth | | | 1.20 | % | | | 1.20 | % | | | 0.95 | % | | | 0.95 | % | | | 0.90 | % | | | 0.90 | % |
| Large Cap Growth | | | 0.90 | % | | | 0.90 | % | | | 0.65 | % | | | 0.65 | % | | | 0.60 | % | | | 0.60 | % |
| Mid Cap Value | | | N/A | | | | N/A | | | | 0.75 | % | | | 0.75 | % | | | 0.70 | % | | | 0.70 | % |
| Small-Mid Cap Core | | | N/A | | | | N/A | | | | 0.95 | % | | | 0.95 | % | | | 0.90 | % | | | 0.90 | % |
| Small-Mid Cap Growth | | | 1.24 | % | | | 1.35 | % | | | 0.99 | % | | | 1.10 | % | | | 0.94 | % | | | 1.05 | % |
| Small-Mid Cap Value | | | N/A | | | | N/A | | | | 0.85 | %1,2 | | | N/A | | | | 0.80 | %1,2 | | | N/A | |
| Small Cap Growth | | | 1.24 | % | | | 1.50 | % | | | 0.99 | % | | | 1.25 | % | | | 0.94 | % | | | 1.20 | % |
| Small Cap Value | | | 1.15 | % | | | 1.15 | % | | | 0.89 | % | | | 0.89 | % | | | 0.85 | % | | | 0.85 | % |
| Global Leaders | | | 1.15 | % | | | 1.15 | % | | | 0.90 | % | | | 0.90 | % | | | 0.85 | % | | | 0.85 | % |
| International Leaders | | | 1.15 | % | | | 1.15 | % | | | 0.90 | % | | | 0.90 | % | | | 0.85 | % | | | 0.85 | % |
| International Growth | | | 1.24 | % | | | 1.24 | % | | | 0.99 | % | | | 0.99 | % | | | 0.94 | % | | | 0.94 | % |
| Institutional International Growth | | | N/A | | | | N/A | | | | N/A | | | | N/A | | | | 0.94 | % | | | 0.94 | % |
| International Small Cap Growth | | | 1.35 | % | | | 1.55 | % | | | 1.10 | % | | | 1.30 | % | | | 1.05 | % | | | 1.25 | % |
| Emerging Markets Leaders | | | 1.24 | % | | | 1.24 | % | | | 0.99 | % | | | 0.99 | % | | | 0.94 | % | | | 0.94 | % |
| Emerging Markets Growth | | | 1.24 | % | | | 1.24 | % | | | 0.99 | % | | | 0.99 | % | | | 0.94 | % | | | 0.94 | % |
| Emerging Markets ex China Growth | | | N/A | | | | N/A | | | | 0.99 | % | | | 0.99 | %3 | | | 0.94 | % | | | 0.94 | %3 |
| Emerging Markets Small Cap Growth | | | 1.40 | % | | | 1.55 | % | | | 1.15 | % | | | 1.30 | % | | | 1.10 | % | | | 1.25 | % |
| China Growth | | | N/A | | | | N/A | | | | 0.99 | % | | | 0.99 | % | | | 0.94 | % | | | 0.94 | % |
| Emerging Markets Debt | | | N/A | | | | N/A | | | | 0.70 | % | | | 0.70 | % | | | 0.65 | % | | | 0.65 | % |
| 1 | Effective August 17, 2023 (Commencement of Operations). |
| 2 | Effective through April 30, 2025. |
| 3 | Effective July 29, 2022 (Commencement of Operations). |
The fee waivers and/or expense reimbursements received by each class are reported in the Statements of Operations.
The Adviser is entitled to recoupment of previously waived fees and reimbursed expenses for a period of three years subsequent to a Fund’s commencement of operations to the extent that such recoupment does not cause the Fund’s annual operating expenses (after the recoupment is taken into account) to exceed both (1) the expense limit in place when such amounts were waived or reimbursed and (2) the Fund’s current expense limitation. The total amounts available for recoupment as of December 31, 2023 were as follows (in thousands):
| Fund | | | Available for
Recoupment | | | Expiration of
Recoupment |
| Mid Cap Value | | | $222 | | | March 16, 2025 |
| Small-Mid Cap Value | | | 58 | | | August 17, 2026 |
| Emerging Markets ex China Growth | | | 357 | | | July 29, 2025 |
| China Growth | | | 360 | | | August 27, 2024 |
| Emerging Markets Debt | | | 640 | | | May 25, 2024 |
| 126 | Annual Report | December 31, 2023 |
Notes to Financial Statements
(b) Underwriting and Distribution Services Agreements
Pursuant to separate Underwriting and Distribution Agreements, WBC is the principal underwriter and distributor for the continuous offering of shares of the Trust and acts as agent of the Trust in the sale of its shares. The Underwriting Agreement provides that the Distributor will use its best efforts to distribute the Trust’s shares. The Distributor is not compensated under the Underwriting Agreement.
Each Fund, except the Mid Cap Value, Small-Mid Cap Core, Small-Mid Cap Value, Emerging Markets ex China Growth, China Growth, Emerging Markets Debt and Institutional International Growth Funds, has a Distribution Agreement with WBC for distribution services to the Funds’ Class N shares. Each Fund pays WBC an annual fee, payable monthly, based on a specified percentage of its average daily net assets of Class N shares. The annual rate expressed as a percentage of average daily net assets for Class N is 0.25% for all Funds. Pursuant to the Distribution Agreement, WBC enters into related selling group agreements with various firms at various rates for sales of the Funds’ Class N shares.
(5) Investment Transactions
Investment transactions, excluding U.S. government securities and short-term securities, for the year ended December 31, 2023, were as follows (in thousands):
| Fund | | Purchases | | | Sales | |
| Growth | | $ | 79,441 | | | $ | 102,005 | |
| Large Cap Growth | | | 691,696 | | | | 601,220 | |
| Mid Cap Value | | | 476 | | | | 707 | |
| Small-Mid Cap Core | | | 98,158 | | | | 64,685 | |
| Small-Mid Cap Growth | | | 961,705 | | | | 1,283,070 | |
| Small-Mid Cap Value (a) | | | 1,990 | | | | 510 | |
| Small Cap Growth | | | 451,243 | | | | 336,881 | |
| Small Cap Value | | | 327,712 | | | | 337,077 | |
| Global Leaders | | | 34,912 | | | | 45,352 | |
| International Leaders | | | 520,988 | | | | 562,947 | |
| International Growth | | | 598,203 | | | | 842,735 | |
| Institutional International Growth | | | 386,127 | | | | 508,181 | |
| International Small Cap Growth | | | 83,467 | | | | 106,325 | |
| Emerging Markets Leaders | | | 129,075 | | | | 233,486 | |
| Emerging Markets Growth | | | 520,567 | | | | 427,678 | |
| Emerging Markets ex China Growth | | | 14,904 | | | | 9,898 | |
| Emerging Markets Small Cap Growth | | | 410,363 | | | | 417,409 | |
| China Growth | | | 1,907 | | | | 1,556 | |
| Emerging Markets Debt | | | 52,575 | | | | 47,550 | |
| (a) | For the period from August 17, 2023 (Commencement of Operations) to December 31, 2023. |
(6) Financial Derivative Instruments
Each Fund may use derivative instruments to maintain liquidity, to provide hedging, or in anticipation of changes in the composition of its portfolio holdings or as otherwise provided in each Fund’s prospectus. The derivative instruments held as of December 31, 2023 as disclosed in each Fund’s Portfolios of Investments, are representative of each Fund’s derivative instrument trading activity during the year ended December 31, 2023.
| December 31, 2023 | William Blair Funds | 127 |
Notes to Financial Statements
Derivative transactions carry counterparty risk as they are based on contracts between a Fund and the applicable counterparty. For exchange-traded or cleared derivative contracts, such counterparty risk is limited due to the role of the exchange or clearinghouse. OTC derivative contracts, however, are exposed to counterparty risk in the amount of unrealized gains, net of collateral held, for the duration of the contract.
The Emerging Markets Debt Fund is subject to certain netting arrangements through International Swaps and Derivatives Association, Inc. Master Agreements and Credit Support Annexes (“ISDAs”). The ISDAs maintain provisions for general obligations, representations, agreements, collateral and events of default or termination. The ISDAs cover certain OTC derivative securities entered into by the Emerging Markets Debt Fund with various counterparties and allow the Emerging Markets Debt Fund to close out and net its total exposure to a counterparty in the event of a default.
Forward Foreign Currency Contracts
The Global Equity, International Equity and Emerging Markets Debt Funds may enter into forward foreign currency contracts. When entering into a forward foreign currency contract, a Fund agrees to receive or deliver a fixed quantity of foreign currency for an agreed-upon price on an agreed future date. A Fund’s net equity therein, representing unrealized gain or loss on the contracts as measured by the difference between the forward foreign exchange rates at the dates of entry into the contracts and the forward rates at the reporting date, is included in the Statement of Assets and Liabilities as unrealized appreciation/depreciation on forward foreign currency contracts. Realized and unrealized gains and losses are included in the Statement of Operations. These instruments may involve market risk, credit risk, or both kinds of risks in excess of the amount recognized in the Statement of Assets and Liabilities. Risks arise from the possible inability of counterparties to meet the terms of their contracts and from the price movements in currencies.
Swap Contracts
Swap agreements may include total return, interest rate, securities index, commodity, security, currency exchange rate, credit default index, volatility and variance swaps. Cleared swaps are transacted through futures commission merchants that are members of central clearing houses with the clearing house serving as a central counterparty similar to transactions in futures contracts. In a standard “swap” transaction, two parties agree to exchange the returns (or differentials in rates of return) earned or realized on particular predetermined investments or instruments. The gross returns to be exchanged or “swapped” between the parties are calculated with respect to a “notional amount” (i.e., the change in the value of a particular dollar amount invested, for example, at a particular interest rate, in a particular foreign currency, or in a “basket” of securities representing a particular index). Swap agreements are subject to the risk that the counterparty to the swap will default on its obligation to pay a Fund and the risk that a Fund will not be able to meet its obligations to pay the counterparty to the swap. Swap agreements may also involve fees, commissions or other costs that may reduce a Fund’s gains from a swap agreement or may cause a Fund to lose money. To the extent permitted by its investment policies and restrictions, a Fund may invest in the following types of swaps:
Credit Default Swaps—A Fund may invest in credit default swaps as a means of “buying” credit protection (i.e., attempting to mitigate the risk of default or credit quality deterioration in some portion of a Fund’s holdings) or “selling” credit protection (i.e., attempting to gain exposure to an underlying issuer’s credit quality characteristics without directly investing in that issuer). A credit default swap is a contract between a buyer and a seller of protection against a pre-defined credit event (e.g., a ratings downgrade or default) on an underlying reference obligation, which may be a single debt instrument or baskets or indices of securities. Under current regulatory requirements, a Fund may be a buyer or seller of a credit default swap. As a seller of protection on credit default swap agreements, a Fund will generally receive from the buyer of protection a fixed rate of income throughout the term of the swap provided that there is no credit event. A Fund adds leverage to its portfolio because the Fund is subject to investment exposure on the notional amount of the swap. The maximum potential amount of future payments that a Fund as a seller of protection could be required to make under a credit default swap agreement equals the notional amount of the agreement. Notional amounts of each individual credit default swap agreement outstanding as of the period end for which a Fund is the seller of protection are disclosed in the Fund’s Portfolio of Investments. These potential amounts would be partially offset by any recovery values of the respective referenced obligations, upfront payments received upon entering into the agreement, or net amounts received from the settlement of buy protection credit default swap agreements entered into by the same Fund for the same referenced entity or entities. For credit default swap contracts on credit indices, the quoted market prices and resulting values serve as an indicator of the payment performance risk. Increasing market values, in absolute terms when compared to the notional amount of the swap, typically represent deterioration of the referenced entities’ credit soundness and a greater likelihood or risk of default or other credit event occurring as defined under the terms of the swap.
| 128 | Annual Report | December 31, 2023 |
Notes to Financial Statements
Interest Rate Swap—A Fund may invest in interest rate swaps to gain or mitigate exposure to changes in interest rates. Interest rate swap agreements involve a commitment between parties to pay either a fixed interest rate or a floating interest rate based on a notional amount of principal. The parties make payments at predetermined intervals throughout the life of the swap. As a payer, a Fund would make the fixed payment and receive the floating payment. As a receiver, a Fund would make the floating payment and receive the fixed payment.
Total Return Swap—A Fund may invest in total return swaps to gain or mitigate exposure to an underlying security, or securities. Total return swap agreements may involve commitments to pay interest in exchange for the return on the underlying security, or securities. At maturity, a net cash flow is exchanged between the parties based on the total return of the underlying security, or securities, less a financing rate. As a receiver in the transaction, a Fund would receive a payment for a positive return and would make a payment for a negative return. As a payer in the transaction, a Fund would make a payment for a positive return and would receive a payment for a negative return.
The following table presents the value of financial derivative instruments, by Fund and primary risk exposure, as of December 31, 2023, and their respective location in the Statements of Assets and Liabilities (in thousands):
| | | Assets | | Liabilities |
Fund and
Primary Risk Exposure | | Statements of Assets
and Liabilities | | Value | | Statements of Assets
and Liabilities | | Value |
| Emerging Markets Debt | | | | | | | | | | | | |
| Credit | | Receivable for variation margin on centrally cleared swaps(1) | | | $85 | | Payable for variation margin on centrally cleared swaps(1) | | | $160 |
| Currency | | Unrealized appreciation on forward foreign currency contracts | | | — | | Unrealized depreciation on forward foreign currency contracts | | | 40 |
| Interest rate | | Receivable for variation margin on centrally cleared swaps(1) | | | 382 | | Payable for variation margin on centrally cleared swaps(1) | | | 209 |
| (1) | The table above includes cumulative appreciation/(depreciation) on centrally cleared swaps as reported in the Fund’s Portfolio of Investments. Receivable/payable for variation margin on centrally cleared swaps as reported in the Fund’s Statement of Assets and Liabilities represents the current day’s variation margin. |
The following table indicates the effect of derivatives, by Fund and primary risk exposure, in the Statements of Operations for the year ended December 31, 2023 (in thousands):
| | | Net Realized Gain (Loss) | | | Change in Net Unrealized
Appreciation (Depreciation) | |
Fund and
Primary Risk Exposure | | Statements of Operations | | Value | | | Statements of Operations | | Value | |
| Emerging Markets Debt | | | | | | | | | | | | |
| Credit | | Swaps | | | $ (98 | ) | | Swaps | | | $(84 | ) |
| Currency | | Forward foreign currency contracts | | | 40 | | | Forward foreign currency contracts | | | (34 | ) |
| Interest rate | | Swaps | | | (396 | ) | | Swaps | | | 194 | |
The following table is a summary by counterparty of the derivative instruments and collateral pledged/(received) included in the Fund’s Statement of Assets and Liabilities at December 31, 2023 (in thousands):
| | | Financial Derivative Assets | | Financial Derivative Liabilities | | | | | | |
| Counterparty | | Forward
Foreign
Currency
Contracts | | Total | | Forward
Foreign
Currency
Contracts | | Total | | Net
Market
Value | | Collateral
Pledged
(Received) | | Net
Exposure |
| Emerging Markets Debt | | | | | | | | | | | | | | | | | | | | | | | | | | | | |
| Citibank N.A. | | $ | — | | | $ | — | | | $ | (40 | ) | | $ | (40 | ) | | $ | (40 | ) | | $ | — | | | $ | (40 | ) |
| | | $ | — | | | $ | — | | | $ | (40 | ) | | $ | (40 | ) | | | | | | | | | | | | |
| December 31, 2023 | William Blair Funds | 129 |
Notes to Financial Statements
The net exposure represents the amount due from/(due to) the counterparty in the event of default. Any net exposure is generally due to changes in market value of the underlying derivative instruments on the last day of the period as timing of collateral movement occurs the following day.
(7) Fund Share Transactions
The following tables summarize the activity in capital shares of each Fund for the year ended December 31, 2023 (in thousands):
| | | Class N |
| | | Dollars | | | Shares |
| Fund | | Sales | | | Reinvest | | | Redemptions | | | Total | | | Sales | | | Reinvest | | | Redemptions | | | Total |
| Growth | | $ | 4,252 | | | $ | 3,599 | | | $ | 6,032 | | | $ | 1,819 | | | | 434 | | | | 376 | | | | 634 | | | | 176 | |
| Large Cap Growth | | | 16,848 | | | | — | | | | 39,379 | | | | (22,531 | ) | | | 875 | | | | — | | | | 2,050 | | | | (1,175 | ) |
| Small-Mid Cap Growth | | | 8,860 | | | | 8,508 | | | | 28,569 | | | | (11,201 | ) | | | 346 | | | | 333 | | | | 1,122 | | | | (443 | ) |
| Small Cap Growth | | | 11,663 | | | | 2,189 | | | | 21,123 | | | | (7,271 | ) | | | 449 | | | | 81 | | | | 819 | | | | (289 | ) |
| Small Cap Value | | | 464 | | | | 75 | | | | 783 | | | | (244 | ) | | | 17 | | | | 3 | | | | 28 | | | | (8 | ) |
| Global Leaders | | | 881 | | | | 503 | | | | 2,660 | | | | (1,276 | ) | | | 59 | | | | 34 | | | | 179 | | | | (86 | ) |
| International Leaders | | | 4,849 | | | | 64 | | | | 10,929 | | | | (6,016 | ) | | | 264 | | | | 3 | | | | 593 | | | | (326 | ) |
| International Growth | | | 5,950 | | | | 9,672 | | | | 56,886 | | | | (41,264 | ) | | | 224 | | | | 356 | | | | 2,138 | | | | (1,558 | ) |
| International Small Cap Growth | | | 24 | | | | 9 | | | | 327 | | | | (294 | ) | | | 2 | | | | 1 | | | | 29 | | | | (26 | ) |
| Emerging Markets Leaders | | | 2,038 | | | | 8 | | | | 2,171 | | | | (125 | ) | | | 239 | | | | 1 | | | | 257 | | | | (17 | ) |
| Emerging Markets Growth | | | 11,707 | | | | 35 | | | | 14,091 | | | | (2,349 | ) | | | 1,100 | | | | 3 | | | | 1,308 | | | | (205 | ) |
| Emerging Markets Small Cap Growth | | | 1,822 | | | | 2 | | | | 1,721 | | | | 103 | | | | 101 | | | | — | | | | 95 | | | | 6 | |
| | | | | | | | | | | | | | | | | | | | | | | | | | | | | | | | | |
| | | Class I |
| | | Dollars | | | Shares |
| Fund | | Sales | | | Reinvest | | | Redemptions | | | Total | | | Sales | | | Reinvest | | | Redemptions | | | Total |
| Growth | | $ | 4,742 | | | $ | 13,575 | | | $ | 25,017 | | | $ | (6,700 | ) | | | 391 | | | | 1,078 | | | | 2,022 | | | | (553 | ) |
| Large Cap Growth | | | 354,428 | | | | — | | | | 269,597 | | | | 84,831 | | | | 17,533 | | | | — | | | | 12,664 | | | | 4,869 | |
| Mid Cap Value | | | 1 | | | | 1 | | | | — | | | | 2 | | | | — | | | | — | | | | — | | | | — | |
| Small-Mid Cap Core | | | 18,885 | | | | 141 | | | | 16,079 | | | | 2,947 | | | | 1,309 | | | | 9 | | | | 1,124 | | | | 194 | |
| Small-Mid Cap Growth | | | 193,616 | | | | 103,605 | | | | 503,290 | | | | (206,069 | ) | | | 6,954 | | | | 3,716 | | | | 18,125 | | | | (7,455 | ) |
| Small-Mid Cap Value (a) | | | 80 | | | | — | | | | — | | | | 80 | | | | 8 | | | | — | | | | — | | | | 8 | |
| Small Cap Growth | | | 177,891 | | | | 6,557 | | | | 92,150 | | | | 92,298 | | | | 5,831 | | | | 204 | | | | 3,022 | | | | 3,013 | |
| Small Cap Value | | | 108,222 | | | | 25,229 | | | | 130,635 | | | | 2,816 | | | | 3,800 | | | | 856 | | | | 4,638 | | | | 18 | |
| Global Leaders | | | 2,164 | | | | 4,820 | | | | 10,335 | | | | (3,351 | ) | | | 145 | | | | 319 | | | | 706 | | | | (242 | ) |
| International Leaders | | | 115,369 | | | | 1,802 | | | | 117,724 | | | | (553 | ) | | | 6,260 | | | | 94 | | | | 6,470 | | | | (116 | ) |
| International Growth | | | 133,882 | | | | 35,091 | | | | 264,406 | | | | (95,433 | ) | | | 4,850 | | | | 1,249 | | | | 9,621 | | | | (3,522 | ) |
| International Small Cap Growth | | | 11,022 | | | | 861 | | | | 19,435 | | | | (7,552 | ) | | | 971 | | | | 71 | | | | 1,711 | | | | (669 | ) |
| Emerging Markets Leaders | | | 3,079 | | | | 105 | | | | 19,943 | | | | (16,759 | ) | | | 359 | | | | 12 | | | | 2,366 | | | | (1,995 | ) |
| Emerging Markets Growth | | | 79,866 | | | | 856 | | | | 97,685 | | | | (16,963 | ) | | | 7,251 | | | | 75 | | | | 8,913 | | | | (1,587 | ) |
| Emerging Markets ex China Growth | | | 2,593 | | | | 23 | | | | 130 | | | | 2,486 | | | | 253 | | | | 2 | | | | 12 | | | | 243 | |
| Emerging Markets Small Cap Growth | | | 36,577 | | | | 332 | | | | 35,416 | | | | 1,493 | | | | 2,081 | | | | 17 | | | | 1,994 | | | | 104 | |
| China Growth | | | 525 | | | | 1 | | | | 754 | | | | (228 | ) | | | 89 | | | | — | | | | 135 | | | | (46 | ) |
| Emerging Markets Debt | | | 4,154 | | | | 119 | | | | 2,113 | | | | 2,160 | | | | 560 | | | | 16 | | | | 294 | | | | 282 | |
| (a) | For the period from August 17, 2023 (Commencement of Operations) to December 31, 2023. |
| 130 | Annual Report | December 31, 2023 |
Notes to Financial Statements
| | | Institutional/Class R6 |
| | | Dollars | | | Shares |
| Fund | | Sales | | | Reinvest | | | Redemptions | | | Total | | | Sales | | | Reinvest | | | Redemptions | | | Total |
| Growth | | $ | 10,861 | | | $ | 3,966 | | | $ | 6,973 | | | $ | 7,854 | | | | 848 | | | | 313 | | | | 558 | | | | 603 | |
| Large Cap Growth | | | 165,787 | | | | — | | | | 142,282 | | | | 23,505 | | | | 7,783 | | | | — | | | | 6,409 | | | | 1,374 | |
| Mid Cap Value | | | 132 | | | | 21 | | | | 350 | | | | (197 | ) | | | 14 | | | | 2 | | | | 38 | | | | (22 | ) |
| Small-Mid Cap Core | | | 40,944 | | | | 176 | | | | 11,555 | | | | 29,565 | | | | 2,767 | | | | 12 | | | | 812 | | | | 1,967 | |
| Small-Mid Cap Growth | | | 72,910 | | | | 32,345 | | | | 83,090 | | | | 22,165 | | | | 2,602 | | | | 1,156 | | | | 3,008 | | | | 750 | |
| Small-Mid Cap Value (a) | | | 1,675 | | | | 7 | | | | 250 | | | | 1,432 | | | | 167 | | | | 1 | | | | 27 | | | | 141 | |
| Small Cap Growth | | | 65,310 | | | | 2,553 | | | | 19,468 | | | | 48,395 | | | | 2,121 | | | | 79 | | | | 640 | | | | 1,560 | |
| Small Cap Value | | | 39,225 | | | | 10,592 | | | | 43,961 | | | | 5,856 | | | | 1,364 | | | | 359 | | | | 1,549 | | | | 174 | |
| Global Leaders | | | 1,288 | | | | 998 | | | | 2,269 | | | | 17 | | | | 88 | | | | 66 | | | | 153 | | | | 1 | |
| International Leaders | | | 28,823 | | | | 2,827 | | | | 66,338 | | | | (34,688 | ) | | | 1,538 | | | | 147 | | | | 3,627 | | | | (1,942 | ) |
| International Growth | | | 6,808 | | | | 4,644 | | | | 32,975 | | | | (21,523 | ) | | | 251 | | | | 165 | | | | 1,201 | | | | (785 | ) |
| Institutional International Growth | | | 59,867 | | | | 22,254 | | | | 166,508 | | | | (84,387 | ) | | | 4,360 | | | | 1,576 | | | | 12,298 | | | | (6,362 | ) |
| International Small Cap Growth | | | 1,946 | | | | 936 | | | | 19,572 | | | | (16,690 | ) | | | 166 | | | | 77 | | | | 1,670 | | | | (1,427 | ) |
| Emerging Markets Leaders | | | 22,219 | | | | 2,140 | | | | 121,429 | | | | (97,070 | ) | | | 2,652 | | | | 251 | | | | 14,260 | | | | (11,357 | ) |
| Emerging Markets Growth | | | 210,785 | | | | 2,957 | | | | 108,421 | | | | 105,321 | | | | 18,636 | | | | 257 | | | | 9,641 | | | | 9,252 | |
| Emerging Markets ex China Growth | | | 2,694 | | | | 161 | | | | 242 | | | | 2,613 | | | | 272 | | | | 14 | | | | 24 | | | | 262 | |
| Emerging Markets Small Cap Growth | | | 27,778 | | | | 779 | | | | 34,000 | | | | (5,443 | ) | | | 1,540 | | | | 40 | | | | 1,885 | | | | (305 | ) |
| China Growth | | | 1,019 | | | | 9 | | | | 418 | | | | 610 | | | | 197 | | | | 2 | | | | 74 | | | | 125 | |
| Emerging Markets Debt | | | 275 | | | | 3,160 | | | | 918 | | | | 2,517 | | | | 37 | | | | 421 | | | | 125 | | | | 333 | |
| | | |
| | | Net Change in Net Assets Relating to Fund Share Activity |
| | | Dollars | | | Shares |
| Fund | | Sales | | | Reinvest | | | Redemptions | | | Total | | | Sales | | | Reinvest | | | Redemptions | | | Total |
| Growth | | $ | 19,855 | | | $ | 21,140 | | | $ | 38,022 | | | $ | 2,973 | | | | 1,673 | | | | 1,767 | | | | 3,214 | | | | 226 | |
| Large Cap Growth | | | 537,063 | | | | — | | | | 451,258 | | | | 85,805 | | | | 26,191 | | | | — | | | | 21,123 | | | | 5,068 | |
| Mid Cap Value | | | 133 | | | | 22 | | | | 350 | | | | (195 | ) | | | 14 | | | | 2 | | | | 38 | | | | (22 | ) |
| Small-Mid Cap Core | | | 59,829 | | | | 317 | | | | 27,634 | | | | 32,512 | | | | 4,076 | | | | 21 | | | | 1,936 | | | | 2,161 | |
| Small-Mid Cap Growth | | | 275,386 | | | | 144,458 | | | | 614,949 | | | | (195,105 | ) | | | 9,902 | | | | 5,205 | | | | 22,255 | | | | (7,148 | ) |
| Small-Mid Cap Value (a) | | | 1,755 | | | | 7 | | | | 250 | | | | 1,512 | | | | 175 | | | | 1 | | | | 27 | | | | 149 | |
| Small Cap Growth | | | 254,864 | | | | 11,299 | | | | 132,741 | | | | 133,422 | | | | 8,401 | | | | 364 | | | | 4,481 | | | | 4,284 | |
| Small Cap Value | | | 147,911 | | | | 35,896 | | | | 175,379 | | | | 8,428 | | | | 5,181 | | | | 1,218 | | | | 6,215 | | | | 184 | |
| Global Leaders | | | 4,333 | | | | 6,321 | | | | 15,264 | | | | (4,610 | ) | | | 292 | | | | 419 | | | | 1,038 | | | | (327 | ) |
| International Leaders | | | 149,041 | | | | 4,693 | | | | 194,991 | | | | (41,257 | ) | | | 8,062 | | | | 244 | | | | 10,690 | | | | (2,384 | ) |
| International Growth | | | 146,640 | | | | 49,407 | | | | 354,267 | | | | (158,220 | ) | | | 5,325 | | | | 1,770 | | | | 12,960 | | | | (5,865 | ) |
| Institutional International Growth | | | 59,867 | | | | 22,254 | | | | 166,508 | | | | (84,387 | ) | | | 4,360 | | | | 1,576 | | | | 12,298 | | | | (6,362 | ) |
| International Small Cap Growth | | | 12,992 | | | | 1,806 | | | | 39,334 | | | | (24,536 | ) | | | 1,139 | | | | 149 | | | | 3,410 | | | | (2,122 | ) |
| Emerging Markets Leaders | | | 27,336 | | | | 2,253 | | | | 143,543 | | | | (113,954 | ) | | | 3,250 | | | | 264 | | | | 16,883 | | | | (13,369 | ) |
| Emerging Markets Growth | | | 302,358 | | | | 3,848 | | | | 220,197 | | | | 86,009 | | | | 26,987 | | | | 335 | | | | 19,862 | | | | 7,460 | |
| Emerging Markets ex China Growth | | | 5,287 | | | | 184 | | | | 372 | | | | 5,099 | | | | 525 | | | | 16 | | | | 36 | | | | 505 | |
| Emerging Markets Small Cap Growth | | | 66,177 | | | | 1,113 | | | | 71,137 | | | | (3,847 | ) | | | 3,722 | | | | 57 | | | | 3,974 | | | | (195 | ) |
| China Growth | | | 1,544 | | | | 10 | | | | 1,172 | | | | 382 | | | | 286 | | | | 2 | | | | 209 | | | | 79 | |
| Emerging Markets Debt | | | 4,429 | | | | 3,279 | | | | 3,031 | | | | 4,677 | | | | 597 | | | | 437 | | | | 419 | | | | 615 | |
| (a) | For the period from August 17, 2023 (Commencement of Operations) to December 31, 2023. |
| December 31, 2023 | William Blair Funds | 131 |
Notes to Financial Statements
The following tables summarize the activity in capital shares of each Fund for the year ended December 31, 2022 (in thousands):
| | | Class N |
| | | Dollars | | | Shares |
| Fund | | Sales | | | Reinvest | | | Redemptions | | | Total | | | Sales | | | Reinvest | | | Redemptions | | | Total |
| Growth | | $ | 3,300 | | | $ | 1,034 | | | $ | 5,457 | | | $ | (1,123 | ) | | | 306 | | | | 128 | | | | 551 | | | | (117 | ) |
| Large Cap Growth | | | 66,244 | | | | 986 | | | | 69,880 | | | | (2,650 | ) | | | 3,478 | | | | 59 | | | | 3,754 | | | | (217 | ) |
| Small-Mid Cap Growth | | | 16,581 | | | | 3,843 | | | | 88,421 | | | | (67,997 | ) | | | 628 | | | | 158 | | | | 3,380 | | | | (2,594 | ) |
| Small Cap Growth | | | 27,063 | | | | 4,597 | | | | 53,914 | | | | (22,254 | ) | | | 973 | | | | 190 | | | | 2,036 | | | | (873 | ) |
| Small Cap Value | | | 438 | | | | 182 | | | | 729 | | | | (109 | ) | | | 13 | | | | 7 | | | | 24 | | | | (4 | ) |
| Global Leaders | | | 224 | | | | 165 | | | | 1,635 | | | | (1,246 | ) | | | 14 | | | | 12 | | | | 113 | | | | (87 | ) |
| International Leaders | | | 18,462 | | | | 68 | | | | 15,537 | | | | 2,993 | | | | 960 | | | | 4 | | | | 827 | | | | 137 | |
| International Growth | | | 156,713 | | | | 22,957 | | | | 61,189 | | | | 118,481 | | | | 5,684 | | | | 905 | | | | 2,302 | | | | 4,287 | |
| International Small Cap Growth | | | 29 | | | | — | | | | 761 | | | | (732 | ) | | | 3 | | | | — | | | | 64 | | | | (61 | ) |
| Emerging Markets Leaders | | | 3,090 | | | | 9 | | | | 3,673 | | | | (574 | ) | | | 317 | | | | 1 | | | | 371 | | | | (53 | ) |
| Emerging Markets Growth | | | 10,620 | | | | 20 | | | | 15,860 | | | | (5,220 | ) | | | 873 | | | | 2 | | | | 1,296 | | | | (421 | ) |
| Emerging Markets Small Cap Growth | | | 584 | | | | 145 | | | | 521 | | | | 208 | | | | 27 | | | | 9 | | | | 27 | | | | 9 | |
| | | | | | | | | | | | | | | | | | | | | | | | | | | | | | | | | |
| | | Class I |
| | | Dollars | | | Shares |
| Fund | | Sales | | | Reinvest | | | Redemptions | | | Total | | | Sales | | | Reinvest | | | Redemptions | | | Total |
| Growth | | $ | 11,551 | | | $ | 4,580 | | | $ | 86,472 | | | $ | (70,341 | ) | | | 938 | | | | 443 | | | | 7,693 | | | | (6,312 | ) |
| Large Cap Growth | | | 606,323 | | | | 5,568 | | | | 281,678 | | | | 330,213 | | | | 28,937 | | | | 313 | | | | 14,763 | | | | 14,487 | |
| Mid Cap Value (a) | | | 108 | | | | 1 | | | | 32 | | | | 77 | | | | 11 | | | | — | | | | 3 | | | | 8 | |
| Small-Mid Cap Core | | | 71,963 | | | | — | | | | 27,550 | | | | 44,413 | | | | 4,695 | | | | — | | | | 1,985 | | | | 2,710 | |
| Small-Mid Cap Growth | | | 280,513 | | | | 48,171 | | | | 693,533 | | | | (364,849 | ) | | | 9,846 | | | | 1,832 | | | | 25,066 | | | | (13,388 | ) |
| Small Cap Growth | | | 79,330 | | | | 10,263 | | | | 90,795 | | | | (1,202 | ) | | | 2,593 | | | | 357 | | | | 3,045 | | | | (95 | ) |
| Small Cap Value | | | 109,607 | | | | 53,312 | | | | 295,065 | | | | (132,146 | ) | | | 3,575 | | | | 1,928 | | | | 9,693 | | | | (4,190 | ) |
| Global Leaders | | | 4,757 | | | | 1,493 | | | | 22,285 | | | | (16,035 | ) | | | 315 | | | | 110 | | | | 1,638 | | | | (1,213 | ) |
| International Leaders | | | 230,076 | | | | 617 | | | | 286,493 | | | | (55,800 | ) | | | 12,574 | | | | 35 | | | | 15,639 | | | | (3,030 | ) |
| International Growth | | | 293,273 | | | | 71,737 | | | | 528,810 | | | | (163,800 | ) | | | 10,345 | | | | 2,738 | | | | 18,956 | | | | (5,873 | ) |
| International Small Cap Growth | | | 40,252 | | | | 182 | | | | 30,096 | | | | 10,338 | | | | 3,553 | | | | 16 | | | | 2,676 | | | | 893 | |
| Emerging Markets Leaders | | | 26,985 | | | | 283 | | | | 27,281 | | | | (13 | ) | | | 2,914 | | | | 34 | | | | 3,152 | | | | (204 | ) |
| Emerging Markets Growth | | | 190,957 | | | | 269 | | | | 130,228 | | | | 60,998 | | | | 15,421 | | | | 25 | | | | 10,961 | | | | 4,485 | |
| Emerging Markets ex China Growth (b) | | | 10 | | | | — | | | | — | | | | 10 | | | | 1 | | | | — | | | | — | | | | 1 | |
| Emerging Markets Small Cap Growth | | | 44,207 | | | | 4,873 | | | | 59,722 | | | | (10,642 | ) | | | 2,315 | | | | 292 | | | | 3,214 | | | | (607 | ) |
| China Growth | | | 12 | | | | — | | | | 3,449 | | | | (3,437 | ) | | | 2 | | | | — | | | | 503 | | | | (501 | ) |
| Emerging Markets Debt | | | 415 | | | | 74 | | | | 708 | | | | (219 | ) | | | 49 | | | | 9 | | | | 89 | | | | (31 | ) |
| (a) | For the period from March 16, 2022 (Commencement of Operations) to December 31, 2022. |
| (b) | For the period from July 29, 2022 (Commencement of Operations) to December 31, 2022. |
| 132 | Annual Report | December 31, 2023 |
Notes to Financial Statements
| | | Institutional/Class R6 |
| | | Dollars | | | Shares |
| Fund | | Sales | | | Reinvest | | | Redemptions | | | Total | | | Sales | | | Reinvest | | | Redemptions | | | Total |
| Growth | | $ | 21,865 | | | $ | 1,050 | | | $ | 3,850 | | | $ | 19,065 | | | | 2,107 | | | | 101 | | | | 352 | | | | 1,856 | |
| Large Cap Growth | | | 136,096 | | | | 1,909 | | | | 47,467 | | | | 90,538 | | | | 6,978 | | | | 107 | | | | 2,430 | | | | 4,655 | |
| Mid Cap Value (a) | | | 1,553 | | | | 15 | | | | 1 | | | | 1,567 | | | | 154 | | | | 2 | | | | — | | | | 156 | |
| Small-Mid Cap Core | | | 37,092 | | | | — | | | | 6,100 | | | | 30,992 | | | | 2,713 | | | | — | | | | 445 | | | | 2,268 | |
| Small-Mid Cap Growth | | | 212,256 | | | | 12,737 | | | | 80,061 | | | | 144,932 | | | | 8,130 | | | | 483 | | | | 2,950 | | | | 5,663 | |
| Small Cap Growth | | | 30,980 | | | | 3,659 | | | | 18,653 | | | | 15,986 | | | | 1,018 | | | | 127 | | | | 604 | | | | 541 | |
| Small Cap Value | | | 119,683 | | | | 33,263 | | | | 627,183 | | | | (474,237 | ) | | | 3,861 | | | | 1,203 | | | | 18,688 | | | | (13,624 | ) |
| Global Leaders | | | 9,906 | | | | 296 | | | | 1,407 | | | | 8,795 | | | | 782 | | | | 22 | | | | 100 | | | | 704 | |
| International Leaders | | | 206,838 | | | | 1,129 | | | | 54,743 | | | | 153,224 | | | | 9,990 | | | | 63 | | | | 3,031 | | | | 7,022 | |
| International Growth | | | 89,936 | | | | 9,603 | | | | 36,161 | | | | 63,378 | | | | 3,526 | | | | 366 | | | | 1,288 | | | | 2,604 | |
| Institutional International Growth | | | 142,332 | | | | 56,157 | | | | 156,966 | | | | 41,523 | | | | 10,211 | | | | 4,307 | | | | 10,970 | | | | 3,548 | |
| International Small Cap Growth | | | 3,475 | | | | 331 | | | | 28,031 | | | | (24,225 | ) | | | 295 | | | | 30 | | | | 2,414 | | | | (2,089 | ) |
| Emerging Markets Leaders | | | 70,039 | | | | 3,109 | | | | 63,904 | | | | 9,244 | | | | 7,781 | | | | 374 | | | | 7,384 | | | | 771 | |
| Emerging Markets Growth | | | 112,007 | | | | 667 | | | | 203,283 | | | | (90,609 | ) | | | 9,621 | | | | 62 | | | | 16,080 | | | | (6,397 | ) |
| Emerging Markets ex China Growth (b) | | | 19,580 | | | | — | | | | 5,597 | | | | 13,983 | | | | 1,970 | | | | — | | | | 587 | | | | 1,383 | |
| Emerging Markets Small Cap Growth | | | 76,818 | | | | 9,965 | | | | 102,458 | | | | (15,675 | ) | | | 4,023 | | | | 595 | | | | 5,344 | | | | (726 | ) |
| China Growth | | | 408 | | | | 1 | | | | 127 | | | | 282 | | | | 64 | | | | — | | | | 18 | | | | 46 | |
| Emerging Markets Debt | | | 3,932 | | | | 3,077 | | | | 382 | | | | 6,627 | | | | 473 | | | | 398 | | | | 49 | | | | 822 | |
| | | | | | | | | | | | | | | | | | | | | | | | | | | | | | | | | |
| | | Net Change in Net Assets Relating to Fund Share Activity |
| | | Dollars | | | Shares |
| Fund | | Sales | | | Reinvest | | | Redemptions | | | Total | | | Sales | | | Reinvest | | | Redemptions | | | Total |
| Growth | | $ | 36,716 | | | $ | 6,664 | | | $ | 95,779 | | | $ | (52,399 | ) | | | 3,351 | | | | 672 | | | | 8,596 | | | | (4,573 | ) |
| Large Cap Growth | | | 808,663 | | | | 8,463 | | | | 399,025 | | | | 418,101 | | | | 39,393 | | | | 479 | | | | 20,947 | | | | 18,925 | |
| Mid Cap Value (a) | | | 1,661 | | | | 16 | | | | 33 | | | | 1,644 | | | | 165 | | | | 2 | | | | 3 | | | | 164 | |
| Small-Mid Cap Core | | | 109,055 | | | | — | | | | 33,650 | | | | 75,405 | | | | 7,408 | | | | — | | | | 2,430 | | | | 4,978 | |
| Small-Mid Cap Growth | | | 509,350 | | | | 64,751 | | | | 862,015 | | | | (287,914 | ) | | | 18,604 | | | | 2,473 | | | | 31,396 | | | | (10,319 | ) |
| Small Cap Growth | | | 137,373 | | | | 18,519 | | | | 163,362 | | | | (7,470 | ) | | | 4,584 | | | | 674 | | | | 5,685 | | | | (427 | ) |
| Small Cap Value | | | 229,728 | | | | 86,757 | | | | 922,977 | | | | (606,492 | ) | | | 7,449 | | | | 3,138 | | | | 28,405 | | | | (17,818 | ) |
| Global Leaders | | | 14,887 | | | | 1,954 | | | | 25,327 | | | | (8,486 | ) | | | 1,111 | | | | 144 | | | | 1,851 | | | | (596 | ) |
| International Leaders | | | 455,376 | | | | 1,814 | | | | 356,773 | | | | 100,417 | | | | 23,524 | | | | 102 | | | | 19,497 | | | | 4,129 | |
| International Growth | | | 539,922 | | | | 104,297 | | | | 626,160 | | | | 18,059 | | | | 19,555 | | | | 4,009 | | | | 22,546 | | | | 1,018 | |
| Institutional International Growth | | | 142,332 | | | | 56,157 | | | | 156,966 | | | | 41,523 | | | | 10,211 | | | | 4,307 | | | | 10,970 | | | | 3,548 | |
| International Small Cap Growth | | | 43,756 | | | | 513 | | | | 58,888 | | | | (14,619 | ) | | | 3,851 | | | | 46 | | | | 5,154 | | | | (1,257 | ) |
| Emerging Markets Leaders | | | 100,114 | | | | 3,401 | | | | 94,858 | | | | 8,657 | | | | 11,012 | | | | 409 | | | | 10,907 | | | | 514 | |
| Emerging Markets Growth | | | 313,584 | | | | 956 | | | | 349,371 | | | | (34,831 | ) | | | 25,915 | | | | 89 | | | | 28,337 | | | | (2,333 | ) |
| Emerging Markets ex China Growth (b) | | | 19,590 | | | | — | | | | 5,597 | | | | 13,993 | | | | 1,971 | | | | — | | | | 587 | | | | 1,384 | |
| Emerging Markets Small Cap Growth | | | 121,609 | | | | 14,983 | | | | 162,701 | | | | (26,109 | ) | | | 6,365 | | | | 896 | | | | 8,585 | | | | (1,324 | ) |
| China Growth | | | 420 | | | | 1 | | | | 3,576 | | | | (3,155 | ) | | | 66 | | | | — | | | | 521 | | | | (455 | ) |
| Emerging Markets Debt | | | 4,347 | | | | 3,151 | | | | 1,090 | | | | 6,408 | | | | 522 | | | | 407 | | | | 138 | | | | 791 | |
| (a) | For the period from March 16, 2022 (Commencement of Operations) to December 31, 2022. |
| (b) | For the period from July 29, 2022 (Commencement of Operations) to December 31, 2022. |
(8) Subsequent Events
The Funds have evaluated subsequent events through the date of issuance of the Funds’ financial statements and have determined there is no impact to the Funds’ financial statements.
| December 31, 2023 | William Blair Funds | 133 |
Financial Highlights — For a share outstanding throughout each period
Growth Fund
| | | Class N | |
| | | Years Ended December 31, | |
| | | 2023 | | | 2022 | | | 2021 | | | 2020 | | | 2019 | |
| Net asset value, beginning of year | | $ | 7.95 | | | $ | 11.81 | | | $ | 11.15 | | | $ | 9.45 | | | $ | 7.91 | |
| Income (loss) from investment operations: | | | | | | | | | | | | | | | | | | | | |
| Net investment income (loss) | | | (0.04 | ) | | | (0.05 | ) | | | (0.08 | ) | | | (0.05 | ) | | | (0.03 | ) |
| Net realized and unrealized gain (loss) on investments | | | 3.03 | | | | (3.44 | ) | | | 2.49 | | | | 3.43 | | | | 2.54 | |
| Total from investment operations | | | 2.99 | | | | (3.49 | ) | | | 2.41 | | | | 3.38 | | | | 2.51 | |
| Less distributions from: | | | | | | | | | | | | | | | | | | | | |
| Net investment income | | | — | | | | — | | | | — | | | | — | | | | — | |
| Net realized gain | | | 1.24 | | | | 0.37 | | | | 1.75 | | | | 1.68 | | | | 0.97 | |
| Total distributions | | | 1.24 | | | | 0.37 | | | | 1.75 | | | | 1.68 | | | | 0.97 | |
| Net asset value, end of year | | $ | 9.70 | | | $ | 7.95 | | | $ | 11.81 | | | $ | 11.15 | | | $ | 9.45 | |
| Total return (%) | | | 37.76 | | | | (29.65 | ) | | | 22.09 | | | | 35.97 | | | | 31.97 | |
| Ratios to average daily net assets (%): | | | | | | | | | | | | | | | | | | | | |
| Expenses, before waivers and reimbursements | | | 1.26 | | | | 1.24 | | | | 1.21 | | | | 1.26 | | | | 1.24 | |
| Expenses, net of waivers and reimbursements | | | 1.20 | | | | 1.20 | | | | 1.20 | | | | 1.20 | | | | 1.20 | |
| Net investment income (loss), before waivers and reimbursements | | | (0.49 | ) | | | (0.60 | ) | | | (0.67 | ) | | | (0.55 | ) | | | (0.35 | ) |
| Net investment income (loss), net of waivers and reimbursements | | | (0.43 | ) | | | (0.56 | ) | | | (0.66 | ) | | | (0.49 | ) | | | (0.31 | ) |
| Class N net assets at the end of the year (in thousands) | | $ | 30,789 | | | $ | 23,829 | | | $ | 36,807 | | | $ | 35,494 | | | $ | 32,710 | |
| Portfolio turnover rate (%) | | | 37 | | | | 41 | | | | 30 | | | | 46 | | | | 39 | |
| | | | | | | | | | | | | | | | | | | | | |
| | | Class I | |
| | | Years Ended December 31, | |
| | | | 2023 | | | | 2022 | | | | 2021 | | | | 2020 | | | | 2019 | |
| Net asset value, beginning of year | | $ | 10.15 | | | $ | 14.91 | | | $ | 13.64 | | | $ | 11.25 | | | $ | 9.25 | |
| Income (loss) from investment operations: | | | | | | | | | | | | | | | | | | | | |
| Net investment income (loss) | | | (0.02 | ) | | | (0.04 | ) | | | (0.05 | ) | | | (0.03 | ) | | | (0.00 | )^ |
| Net realized and unrealized gain (loss) on investments | | | 3.88 | | | | (4.35 | ) | | | 3.07 | | | | 4.10 | | | | 2.97 | |
| Total from investment operations | | | 3.86 | | | | (4.39 | ) | | | 3.02 | | | | 4.07 | | | | 2.97 | |
| Less distributions from: | | | | | | | | | | | | | | | | | | | | |
| Net investment income | | | — | | | | — | | | | — | | | | — | | | | — | |
| Net realized gain | | | 1.24 | | | | 0.37 | | | | 1.75 | | | | 1.68 | | | | 0.97 | |
| Total distributions | | | 1.24 | | | | 0.37 | | | | 1.75 | | | | 1.68 | | | | 0.97 | |
| Net asset value, end of year | | $ | 12.77 | | | $ | 10.15 | | | $ | 14.91 | | | $ | 13.64 | | | $ | 11.25 | |
| Total return (%) | | | 38.15 | | | | (29.52 | ) | | | 22.54 | | | | 36.35 | | | | 32.32 | |
| Ratios to average daily net assets (%): | | | | | | | | | | | | | | | | | | | | |
| Expenses | | | 0.91 | | | | 0.92 | | | | 0.89 | | | | 0.93 | | | | 0.92 | |
| Net investment income (loss) | | | (0.14 | ) | | | (0.29 | ) | | | (0.35 | ) | | | (0.23 | ) | | | (0.03 | ) |
| Class I net assets at the end of the year (in thousands) | | $ | 164,166 | | | $ | 136,051 | | | $ | 293,900 | | | $ | 249,716 | | | $ | 220,660 | |
| Portfolio turnover rate (%) | | | 37 | | | | 41 | | | | 30 | | | | 46 | | | | 39 | |
| ^ | Amount is less than $0.005 per share. |
Note: Net investment income (loss) per share is based on the average shares outstanding during the year.
Performance cited represents past performance. Past performance does not guarantee future results and current performance may be lower or higher than the data quoted. Results shown are annual returns, which assume reinvestment of dividends and capital gains. Investment returns and principal will fluctuate and you may have a gain or loss when you sell shares. For the most current month-end performance information, please call 1-800-742-7272 or visit our Web site at www.williamblairfunds.com.
| 134 | Annual Report | December 31, 2023 |
Financial Highlights — For a share outstanding throughout each period
Growth Fund
| | | Class R6 | |
| | | Years Ended December 31, | |
| | | 2023 | | | 2022 | | | 2021 | | | 2020 | | | 2019(a) | |
| Net asset value, beginning of year | | $ | 10.19 | | | $ | 14.95 | | | $ | 13.67 | | | $ | 11.26 | | | $ | 11.06 | |
| Income (loss) from investment operations: | | | | | | | | | | | | | | | | | | | | |
| Net investment income (loss) | | | (0.01 | ) | | | (0.02 | ) | | | (0.04 | ) | | | (0.03 | ) | | | (0.00 | )^ |
| Net realized and unrealized gain (loss) on investments | | | 3.90 | | | | (4.37 | ) | | | 3.07 | | | | 4.12 | | | | 1.17 | |
| Total from investment operations | | | 3.89 | | | | (4.39 | ) | | | 3.03 | | | | 4.09 | | | | 1.17 | |
| Less distributions from: | | | | | | | | | | | | | | | | | | | | |
| Net investment income | | | — | | | | — | | | | — | | | | — | | | | — | |
| Net realized gain | | | 1.24 | | | | 0.37 | | | | 1.75 | | | | 1.68 | | | | 0.97 | |
| Total distributions | | | 1.24 | | | | 0.37 | | | | 1.75 | | | | 1.68 | | | | 0.97 | |
| Net asset value, end of year | | $ | 12.84 | | | $ | 10.19 | | | $ | 14.95 | | | $ | 13.67 | | | $ | 11.26 | |
| Total return (%)* | | | 38.19 | | | | (29.44 | ) | | | 22.55 | | | | 36.50 | | | | 10.75 | |
| Ratios to average daily net assets (%)**: | | | | | | | | | | | | | | | | | | | | |
| Expenses | | | 0.87 | | | | 0.87 | | | | 0.84 | | | | 0.87 | | | | 0.88 | |
| Net investment income (loss) | | | (0.10 | ) | | | (0.18 | ) | | | (0.29 | ) | | | (0.23 | ) | | | (0.06 | ) |
| Class R6 net assets at the end of the year (in thousands) | | $ | 44,437 | | | $ | 29,128 | | | $ | 14,993 | | | $ | 12,041 | | | $ | 217 | |
| Portfolio turnover rate (%)* | | | 37 | | | | 41 | | | | 30 | | | | 46 | | | | 39 | |
| (a) | For the period from May 2, 2019 (Commencement of Operations) to December 31, 2019. |
| * | Rates are not annualized for periods less than a year. |
| ** | Rates are annualized for periods less than a year. |
| ^ | Amount is less than $0.005 per share. |
Note: Net investment income (loss) per share is based on the average shares outstanding during the year.
Performance cited represents past performance. Past performance does not guarantee future results and current performance may be lower or higher than the data quoted. Results shown are annual returns, which assume reinvestment of dividends and capital gains. Investment returns and principal will fluctuate and you may have a gain or loss when you sell shares. For the most current month-end performance information, please call 1-800-742-7272 or visit our Web site at www.williamblairfunds.com.
| December 31, 2023 | William Blair Funds | 135 |
Financial Highlights — For a share outstanding throughout each period
Large Cap Growth Fund
| | | Class N | |
| | | Years Ended December 31, | |
| | | 2023 | | | 2022 | | | 2021 | | | 2020 | | | 2019 | |
| Net asset value, beginning of year | | $ | 16.38 | | | $ | 24.49 | | | $ | 20.03 | | | $ | 15.27 | | | $ | 11.99 | |
| Income (loss) from investment operations: | | | | | | | | | | | | | | | | | | | | |
| Net investment income (loss) | | | (0.02 | ) | | | (0.03 | ) | | | (0.07 | ) | | | 0.01 | | | | 0.00 | ^ |
| Net realized and unrealized gain (loss) on investments | | | 6.59 | | | | (7.96 | ) | | | 5.65 | | | | 5.52 | | | | 4.29 | |
| Total from investment operations | | | 6.57 | | | | (7.99 | ) | | | 5.58 | | | | 5.53 | | | | 4.29 | |
| Less distributions from: | | | | | | | | | | | | | | | | | | | | |
| Net investment income | | | — | | | | — | | | | — | | | | 0.00 | ^ | | | 0.01 | |
| Net realized gain | | | — | | | | 0.12 | | | | 1.12 | | | | 0.77 | | | | 1.00 | |
| Total distributions | | | — | | | | 0.12 | | | | 1.12 | | | | 0.77 | | | | 1.01 | |
| Net asset value, end of year | | $ | 22.95 | | | $ | 16.38 | | | $ | 24.49 | | | $ | 20.03 | | | $ | 15.27 | |
| Total return (%) | | | 40.11 | | | | (32.61 | ) | | | 28.03 | | | | 36.30 | | | | 36.00 | |
| Ratios to average daily net assets (%): | | | | | | | | | | | | | | | | | | | | |
| Expenses, before waivers and reimbursements | | | 1.04 | | | | 1.03 | | | | 1.05 | | | | 1.09 | | | | 1.12 | |
| Expenses, net of waivers and reimbursements | | | 0.90 | | | | 0.90 | | | | 0.90 | | | | 0.90 | | | | 0.95 | |
| Net investment income (loss), before waivers and reimbursements | | | (0.24 | ) | | | (0.28 | ) | | | (0.46 | ) | | | (0.15 | ) | | | (0.14 | ) |
| Net investment income (loss), net of waivers and reimbursements | | | (0.10 | ) | | | (0.15 | ) | | | (0.31 | ) | | | 0.04 | | | | 0.03 | |
| Class N net assets at the end of the year (in thousands) | | $ | 158,351 | | | $ | 132,225 | | | $ | 203,014 | | | $ | 138,152 | | | $ | 65,314 | |
| Portfolio turnover rate (%) | | | 43 | | | | 29 | | | | 26 | | | | 35 | | | | 37 | |
| | | | | | | | | | | | | | | | | | | | | |
| | | | Class I | |
| | | | Years Ended December 31, | |
| | | | 2023 | | | | 2022 | | | | 2021 | | | | 2020 | | | | 2019 | |
| Net asset value, beginning of year | | $ | 17.54 | | | $ | 26.18 | | | $ | 21.29 | | | $ | 16.19 | | | $ | 12.66 | |
| Income (loss) from investment operations: | | | | | | | | | | | | | | | | | | | | |
| Net investment income (loss) | | | 0.03 | | | | 0.03 | | | | (0.02 | ) | | | 0.06 | | | | 0.04 | |
| Net realized and unrealized gain (loss) on investments | | | 7.07 | | | | (8.53 | ) | | | 6.03 | | | | 5.85 | | | | 4.54 | |
| Total from investment operations | | | 7.10 | | | | (8.50 | ) | | | 6.01 | | | | 5.91 | | | | 4.58 | |
| Less distributions from: | | | | | | | | | | | | | | | | | | | | |
| Net investment income | | | — | | | | 0.02 | | | | — | | | | 0.04 | | | | 0.05 | |
| Net realized gain | | | — | | | | 0.12 | | | | 1.12 | | | | 0.77 | | | | 1.00 | |
| Total distributions | | | — | | | | 0.14 | | | | 1.12 | | | | 0.81 | | | | 1.05 | |
| Net asset value, end of year | | $ | 24.64 | | | $ | 17.54 | | | $ | 26.18 | | | $ | 21.29 | | | $ | 16.19 | |
| Total return (%) | | | 40.48 | | | | (32.46 | ) | | | 28.39 | | | | 36.59 | | | | 36.35 | |
| Ratios to average daily net assets (%): | | | | | | | | | | | | | | | | | | | | |
| Expenses, before waivers and reimbursements | | | 0.78 | | | | 0.79 | | | | 0.75 | | | | 0.80 | | | | 0.81 | |
| Expenses, net of waivers and reimbursements | | | 0.65 | | | | 0.65 | | | | 0.65 | | | | 0.65 | | | | 0.70 | |
| Net investment income (loss), before waivers and reimbursements | | | 0.02 | | | | (0.01 | ) | | | (0.17 | ) | | | 0.16 | | | | 0.16 | |
| Net investment income (loss), net of waivers and reimbursements | | | 0.15 | | | | 0.13 | | | | (0.07 | ) | | | 0.31 | | | | 0.27 | |
| Class I net assets at the end of the year (in thousands) | | $ | 1,106,857 | | | $ | 702,441 | | | $ | 669,060 | | | $ | 397,370 | | | $ | 236,930 | |
| Portfolio turnover rate (%) | | | 43 | | | | 29 | | | | 26 | | | | 35 | | | | 37 | |
| ^ | Amount is less than $0.005 per share. |
Note: Net investment income (loss) per share is based on the average shares outstanding during the year.
Performance cited represents past performance. Past performance does not guarantee future results and current performance may be lower or higher than the data quoted. Results shown are annual returns, which assume reinvestment of dividends and capital gains. Investment returns and principal will fluctuate and you may have a gain or loss when you sell shares. For the most current month-end performance information, please call 1-800-742-7272 or visit our Web site at www.williamblairfunds.com.
| 136 | Annual Report | December 31, 2023 |
Financial Highlights — For a share outstanding throughout each period
Large Cap Growth Fund
| | | Class R6 | |
| | | Years Ended December 31, | |
| | | 2023 | | | 2022 | | | 2021 | | | 2020 | | | 2019(a) | |
| Net asset value, beginning of year | | $ | 17.53 | | | $ | 26.16 | | | $ | 21.27 | | | $ | 16.17 | | | $ | 15.12 | |
| Income (loss) from investment operations: | | | | | | | | | | | | | | | | | | | | |
| Net investment income (loss) | | | 0.04 | | | | 0.04 | | | | (0.00 | )^ | | | 0.01 | | | | 0.04 | |
| Net realized and unrealized gain (loss) on investments | | | 7.07 | | | | (8.52 | ) | | | 6.01 | | | | 5.91 | | | | 2.07 | |
| Total from investment operations | | | 7.11 | | | | (8.48 | ) | | | 6.01 | | | | 5.92 | | | | 2.11 | |
| Less distributions from: | | | | | | | | | | | | | | | | | | | | |
| Net investment income | | | — | | | | 0.03 | | | | 0.00 | ^ | | | 0.05 | | | | 0.06 | |
| Net realized gain | | | — | | | | 0.12 | | | | 1.12 | | | | 0.77 | | | | 1.00 | |
| Total distributions | | | — | | | | 0.15 | | | | 1.12 | | | | 0.82 | | | | 1.06 | |
| Net asset value, end of year | | $ | 24.64 | | | $ | 17.53 | | | $ | 26.16 | | | $ | 21.27 | | | $ | 16.17 | |
| Total return (%)* | | | 40.56 | | | | (32.41 | ) | | | 28.42 | | | | 36.70 | | | | 14.13 | |
| Ratios to average daily net assets (%)**: | | | | | | | | | | | | | | | | | | | | |
| Expenses, before waivers and reimbursements | | | 0.65 | | | | 0.66 | | | | 0.67 | | | | 0.70 | | | | 0.71 | |
| Expenses, net of waivers and reimbursements | | | 0.60 | | | | 0.60 | | | | 0.60 | | | | 0.60 | | | | 0.60 | |
| Net investment income (loss), before waivers and reimbursements | | | 0.14 | | | | 0.13 | | | | (0.08 | ) | | | (0.03 | ) | | | 0.22 | |
| Net investment income (loss), net of waivers and reimbursements | | | 0.19 | | | | 0.19 | | | | (0.01 | ) | | | 0.07 | | | | 0.33 | |
| Class R6 net assets at the end of the year (in thousands) | | $ | 368,894 | | | $ | 238,354 | | | $ | 233,946 | | | $ | 177,347 | | | $ | 1,590 | |
| Portfolio turnover rate (%)* | | | 43 | | | | 29 | | | | 26 | | | | 35 | | | | 37 | |
| (a) | For the period from May 2, 2019 (Commencement of Operations) to December 31, 2019. |
| * | Rates are not annualized for periods less than a year. |
| ** | Rates are annualized for periods less than a year. |
| ^ | Amount is less than $0.005 per share. |
Note: Net investment income (loss) per share is based on the average shares outstanding during the year.
Performance cited represents past performance. Past performance does not guarantee future results and current performance may be lower or higher than the data quoted. Results shown are annual returns, which assume reinvestment of dividends and capital gains. Investment returns and principal will fluctuate and you may have a gain or loss when you sell shares. For the most current month-end performance information, please call 1-800-742-7272 or visit our Web site at www.williamblairfunds.com.
| December 31, 2023 | William Blair Funds | 137 |
Financial Highlights — For a share outstanding throughout each period
Mid Cap Value Fund
| | | Class I | |
| | | Years Ended December 31, | |
| | | | 2023 | | | | 2022(a) | |
| Net asset value, beginning of year | | | $ | 9.19 | | | | $ | 10.00 | |
| Income (loss) from investment operations: | | | | | | | | | | |
| Net investment income (loss) | | | | 0.14 | | | | | 0.12 | |
| Net realized and unrealized gain (loss) on investments | | | | 1.07 | | | | | (0.83 | ) |
| Total from investment operations | | | | 1.21 | | | | | (0.71 | ) |
| Less distributions from: | | | | | | | | | | |
| Net investment income | | | | 0.15 | | | | | 0.10 | |
| Net realized gain | | | | — | | | | | — | |
| Total distributions | | | | 0.15 | | | | | 0.10 | |
| Net asset value, end of year | | | $ | 10.25 | | | | $ | 9.19 | |
| Total return (%)* | | | | 13.21 | | | | | (7.13 | ) |
| Ratios to average daily net assets (%)**: | | | | | | | | | | |
| Expenses, before waivers and reimbursements | | | | 9.08 | | | | | 8.52 | |
| Expenses, net of waivers and reimbursements | | | | 0.75 | | | | | 0.75 | |
| Net investment income (loss), before waivers and reimbursements | | | | (6.85 | ) | | | | (6.14 | ) |
| Net investment income (loss), net of waivers and reimbursements | | | | 1.48 | | | | | 1.63 | |
| Class I net assets at the end of the year (in thousands) | | | $ | 85 | | | | $ | 76 | |
| Portfolio turnover rate (%)* | | | | 32 | | | | | 21 | |
| | | | | | | | | | | |
| | | Class R6 | |
| | | Years Ended December 31, | |
| | | | | 2023 | | | | | 2022(a) | |
| Net asset value, beginning of year | | | $ | 9.19 | | | | $ | 10.00 | |
| Income (loss) from investment operations: | | | | | | | | | | |
| Net investment income (loss) | | | | 0.14 | | | | | 0.11 | |
| Net realized and unrealized gain (loss) on investments | | | | 1.08 | | | | | (0.82 | ) |
| Total from investment operations | | | | 1.22 | | | | | (0.71 | ) |
| Less distributions from: | | | | | | | | | | |
| Net investment income | | | | 0.16 | | | | | 0.10 | |
| Net realized gain | | | | — | | | | | — | |
| Total distributions | | | | 0.16 | | | | | 0.10 | |
| Net asset value, end of year | | | $ | 10.25 | | | | $ | 9.19 | |
| Total return (%)* | | | | 13.14 | | | | | (7.01 | ) |
| Ratios to average daily net assets (%)**: | | | | | | | | | | |
| Expenses, before waivers and reimbursements | | | | 9.02 | | | | | 8.52 | |
| Expenses, net of waivers and reimbursements | | | | 0.70 | | | | | 0.70 | |
| Net investment income (loss), before waivers and reimbursements | | | | (6.82 | ) | | | | (6.35 | ) |
| Net investment income (loss), net of waivers and reimbursements | | | | 1.50 | | | | | 1.47 | |
| Class R6 net assets at the end of the year (in thousands) | | | $ | 1,373 | | | | $ | 1,431 | |
| Portfolio turnover rate (%)* | | | | 32 | | | | | 21 | |
| (a) | For the period from March 16, 2022 (Commencement of Operations) to December 31, 2022. |
| * | Rates are not annualized for periods less than a year. |
| ** | Rates are annualized for periods less than a year. |
Note: Net investment income (loss) per share is based on the average shares outstanding during the year.
Performance cited represents past performance. Past performance does not guarantee future results and current performance may be lower or higher than the data quoted. Results shown are annual returns, which assume reinvestment of dividends and capital gains. Investment returns and principal will fluctuate and you may have a gain or loss when you sell shares. For the most current month-end performance information, please call 1-800-742-7272 or visit our Web site at www.williamblairfunds.com.
| 138 | Annual Report | December 31, 2023 |
Financial Highlights — For a share outstanding throughout each period
Small-Mid Cap Core Fund
| | | Class I | |
| | | Years Ended December 31, | |
| | | 2023 | | | 2022 | | | 2021 | | | 2020 | | | 2019(a) | |
| Net asset value, beginning of year | | $ | 13.52 | | | $ | 16.31 | | | $ | 12.88 | | | $ | 10.68 | | | $ | 10.00 | |
| Income (loss) from investment operations: | | | | | | | | | | | | | | | | | | | | |
| Net investment income (loss) | | | 0.04 | | | | (0.01 | ) | | | (0.03 | ) | | | 0.00 | ^ | | | 0.02 | |
| Net realized and unrealized gain (loss) on investments | | | 1.75 | | | | (2.78 | ) | | | 3.46 | | | | 2.20 | | | | 0.67 | |
| Total from investment operations | | | 1.79 | | | | (2.79 | ) | | | 3.43 | | | | 2.20 | | | | 0.69 | |
| Less distributions from: | | | | | | | | | | | | | | | | | | | | |
| Net investment income | | | 0.02 | | | | — | | | | — | | | | — | | | | 0.01 | |
| Net realized gain | | | — | | | | — | | | | — | | | | — | | | | — | |
| Total distributions | | | 0.02 | | | | — | | | | — | | | | — | | | | 0.01 | |
| Net asset value, end of year | | $ | 15.29 | | | $ | 13.52 | | | $ | 16.31 | | | $ | 12.88 | | | $ | 10.68 | |
| Total return (%)* | | | 13.26 | | | | (17.11 | ) | | | 26.63 | | | | 20.60 | | | | 6.87 | |
| Ratios to average daily net assets (%)**: | | | | | | | | | | | | | | | | | | | | |
| Expenses, before waivers and reimbursements | | | 1.16 | | | | 1.21 | | | | 1.25 | | | | 1.22 | | | | 3.92 | |
| Expenses, net of waivers and reimbursements | | | 0.95 | | | | 0.95 | | | | 0.95 | | | | 0.95 | | | | 0.95 | |
| Net investment income (loss), before waivers and reimbursements | | | 0.09 | | | | (0.32 | ) | | | (0.47 | ) | | | (0.27 | ) | | | (2.23 | ) |
| Net investment income (loss), net of waivers and reimbursements | | | 0.30 | | | | (0.06 | ) | | | (0.17 | ) | | | 0.00 | | | | 0.74 | |
| Class I net assets at the end of the year (in thousands) | | $ | 101,972 | | | $ | 87,540 | | | $ | 61,433 | | | $ | 22,958 | | | $ | 1,655 | |
| Portfolio turnover rate (%)* | | | 41 | | | | 50 | | | | 45 | | | | 244 | | | | 12 | |
| | | | | | | | | | | | | | | | | | | | | |
| | | | Class R6 | |
| | | | Years Ended December 31, | |
| | | | 2023 | | | | 2022 | | | | 2021 | | | | 2020 | | | | 2019(a) | |
| Net asset value, beginning of year | | $ | 13.53 | | | $ | 16.32 | | | $ | 12.88 | | | $ | 10.68 | | | $ | 10.00 | |
| Income (loss) from investment operations: | | | | | | | | | | | | | | | | | | | | |
| Net investment income (loss) | | | 0.05 | | | | 0.00 | ^ | | | (0.02 | ) | | | 0.01 | | | | 0.01 | |
| Net realized and unrealized gain (loss) on investments | | | 1.75 | | | | (2.79 | ) | | | 3.46 | | | | 2.19 | | | | 0.68 | |
| Total from investment operations | | | 1.80 | | | | (2.79 | ) | | | 3.44 | | | | 2.20 | | | | 0.69 | |
| Less distributions from: | | | | | | | | | | | | | | | | | | | | |
| Net investment income | | | 0.03 | | | | — | | | | — | | | | 0.00 | ^ | | | 0.01 | |
| Net realized gain | | | — | | | | — | | | | — | | | | — | | | | — | |
| Total distributions | | | 0.03 | | | | — | | | | — | | | | 0.00 | ^ | | | 0.01 | |
| Net asset value, end of year | | $ | 15.30 | | | $ | 13.53 | | | $ | 16.32 | | | $ | 12.88 | | | $ | 10.68 | |
| Total return (%)* | | | 13.30 | | | | (17.10 | ) | | | 26.71 | | | | 20.60 | | | | 6.88 | |
| Ratios to average daily net assets (%)**: | | | | | | | | | | | | | | | | | | | | |
| Expenses, before waivers and reimbursements | | | 1.01 | | | | 1.05 | | | | 1.16 | | | | 1.07 | | | | 3.92 | |
| Expenses, net of waivers and reimbursements | | | 0.90 | | | | 0.90 | | | | 0.90 | | | | 0.90 | | | | 0.90 | |
| Net investment income (loss), before waivers and reimbursements | | | 0.24 | | | | (0.14 | ) | | | (0.37 | ) | | | (0.11 | ) | | | (2.71 | ) |
| Net investment income (loss), net of waivers and reimbursements | | | 0.35 | | | | 0.01 | | | | (0.11 | ) | | | 0.06 | | | | 0.31 | |
| Class R6 net assets at the end of the year (in thousands) | | $ | 94,208 | | | $ | 56,681 | | | $ | 31,347 | | | $ | 7,087 | | | $ | 4,933 | |
| Portfolio turnover rate (%)* | | | 41 | | | | 50 | | | | 45 | | | | 244 | | | | 12 | |
| (a) | For the period from October 1, 2019 (Commencement of Operations) to December 31, 2019. |
| * | Rates are not annualized for periods less than a year. |
| ** | Rates are annualized for periods less than a year. |
| ^ | Amount is less than $0.005 per share. |
Note: Net investment income (loss) per share is based on the average shares outstanding during the year.
Performance cited represents past performance. Past performance does not guarantee future results and current performance may be lower or higher than the data quoted. Results shown are annual returns, which assume reinvestment of dividends and capital gains. Investment returns and principal will fluctuate and you may have a gain or loss when you sell shares. For the most current month-end performance information, please call 1-800-742-7272 or visit our Web site at www.williamblairfunds.com.
| December 31, 2023 | William Blair Funds | 139 |
Financial Highlights — For a share outstanding throughout each period
Small-Mid Cap Growth Fund
| | | Class N | |
| | | Years Ended December 31, | |
| | | 2023 | | | 2022 | | | 2021 | | | 2020 | | | 2019 | |
| Net asset value, beginning of year | | $ | 23.96 | | | $ | 32.27 | | | $ | 32.96 | | | $ | 25.41 | | | $ | 20.97 | |
| Income (loss) from investment operations: | | | | | | | | | | | | | | | | | | | | |
| Net investment income (loss) | | | (0.16 | ) | | | (0.23 | ) | | | (0.36 | ) | | | (0.24 | ) | | | (0.20 | ) |
| Net realized and unrealized gain (loss) on investments | | | 4.35 | | | | (7.22 | ) | | | 2.90 | | | | 8.37 | | | | 6.56 | |
| Total from investment operations | | | 4.19 | | | | (7.45 | ) | | | 2.54 | | | | 8.13 | | | | 6.36 | |
| Less distributions from: | | | | | | | | | | | | | | | | | | | | |
| Net investment income | | | — | | | | — | | | | — | | | | — | | | | — | |
| Net realized gain | | | 2.23 | | | | 0.86 | | | | 3.23 | | | | 0.58 | | | | 1.92 | |
| Total distributions | | | 2.23 | | | | 0.86 | | | | 3.23 | | | | 0.58 | | | | 1.92 | |
| Net asset value, end of year | | $ | 25.92 | | | $ | 23.96 | | | $ | 32.27 | | | $ | 32.96 | | | $ | 25.41 | |
| Total return (%) | | | 17.64 | | | | (23.11 | ) | | | 8.27 | | | | 32.04 | | | | 30.41 | |
| Ratios to average daily net assets (%): | | | | | | | | | | | | | | | | | | | | |
| Expenses, before waivers and reimbursements | | | 1.39 | | | | 1.43 | | | | 1.43 | | | | 1.45 | | | | 1.43 | |
| Expenses, net of waivers and reimbursements | | | 1.28 | | | | 1.35 | | | | 1.35 | | | | 1.35 | | | | 1.35 | |
| Net investment income (loss), before waivers and reimbursements | | | (0.72 | ) | | | (0.96 | ) | | | (1.10 | ) | | | (1.01 | ) | | | (0.88 | ) |
| Net investment income (loss), net of waivers and reimbursements | | | (0.61 | ) | | | (0.88 | ) | | | (1.02 | ) | | | (0.91 | ) | | | (0.80 | ) |
| Class N net assets at the end of the year (in thousands) | | $ | 107,791 | | | $ | 110,241 | | | $ | 232,166 | | | $ | 314,572 | | | $ | 334,017 | |
| Portfolio turnover rate (%) | | | 49 | | | | 49 | | | | 38 | | | | 55 | | | | 56 | |
| | | | | | | | | | | | | | | | | | | | | |
| | | Class I | |
| | | Years Ended December 31, | |
| | | | 2023 | | | | 2022 | | | | 2021 | | | | 2020 | | | | 2019 | |
| Net asset value, beginning of year | | $ | 25.91 | | | $ | 34.72 | | | $ | 35.13 | | | $ | 26.99 | | | $ | 22.12 | |
| Income (loss) from investment operations: | | | | | | | | | | | | | | | | | | | | |
| Net investment income (loss) | | | (0.10 | ) | | | (0.18 | ) | | | (0.29 | ) | | | (0.19 | ) | | | (0.14 | ) |
| Net realized and unrealized gain (loss) on investments | | | 4.71 | | | | (7.77 | ) | | | 3.11 | | | | 8.91 | | | | 6.93 | |
| Total from investment operations | | | 4.61 | | | | (7.95 | ) | | | 2.82 | | | | 8.72 | | | | 6.79 | |
| Less distributions from: | | | | | | | | | | | | | | | | | | | | |
| Net investment income | | | — | | | | — | | | | — | | | | — | | | | — | |
| Net realized gain | | | 2.23 | | | | 0.86 | | | | 3.23 | | | | 0.58 | | | | 1.92 | |
| Total distributions | | | 2.23 | | | | 0.86 | | | | 3.23 | | | | 0.58 | | | | 1.92 | |
| Net asset value, end of year | | $ | 28.29 | | | $ | 25.91 | | | $ | 34.72 | | | $ | 35.13 | | | $ | 26.99 | |
| Total return (%) | | | 17.93 | | | | (22.92 | ) | | | 8.56 | | | | 32.35 | | | | 30.77 | |
| Ratios to average daily net assets (%): | | | | | | | | | | | | | | | | | | | | |
| Expenses, before waivers and reimbursements | | | 1.14 | | | | 1.17 | | | | 1.16 | | | | 1.17 | | | | 1.16 | |
| Expenses, net of waivers and reimbursements | | | 1.03 | | | | 1.10 | | | | 1.10 | | | | 1.10 | | | | 1.10 | |
| Net investment income (loss), before waivers and reimbursements | | | (0.47 | ) | | | (0.70 | ) | | | (0.83 | ) | | | (0.73 | ) | | | (0.59 | ) |
| Net investment income (loss), net of waivers and reimbursements | | | (0.36 | ) | | | (0.63 | ) | | | (0.77 | ) | | | (0.66 | ) | | | (0.53 | ) |
| Class I net assets at the end of the year (in thousands) | | $ | 1,437,622 | | | $ | 1,509,931 | | | $ | 2,487,862 | | | $ | 3,139,290 | | | $ | 2,531,823 | |
| Portfolio turnover rate (%) | | | 49 | | | | 49 | | | | 38 | | | | 55 | | | | 56 | |
Note: Net investment income (loss) per share is based on the average shares outstanding during the year.
Performance cited represents past performance. Past performance does not guarantee future results and current performance may be lower or higher than the data quoted. Results shown are annual returns, which assume reinvestment of dividends and capital gains. Investment returns and principal will fluctuate and you may have a gain or loss when you sell shares. For the most current month-end performance information, please call 1-800-742-7272 or visit our Web site at www.williamblairfunds.com.
| 140 | Annual Report | December 31, 2023 |
Financial Highlights — For a share outstanding throughout each period
Small-Mid Cap Growth Fund
| | | Class R6 | |
| | | Years Ended December 31, | |
| | | 2023 | | | 2022 | | | 2021 | | | 2020 | | | 2019(a) | |
| Net asset value, beginning of year | | $ | 25.99 | | | $ | 34.79 | | | $ | 35.18 | | | $ | 27.01 | | | $ | 26.76 | |
| Income (loss) from investment operations: | | | | | | | | | | | | | | | | | | | | |
| Net investment income (loss) | | | (0.09 | ) | | | (0.15 | ) | | | (0.26 | ) | | | (0.17 | ) | | | (0.09 | ) |
| Net realized and unrealized gain (loss) on investments | | | 4.72 | | | | (7.79 | ) | | | 3.10 | | | | 8.92 | | | | 2.26 | |
| Total from investment operations | | | 4.63 | | | | (7.94 | ) | | | 2.84 | | | | 8.75 | | | | 2.17 | |
| Less distributions from: | | | | | | | | | | | | | | | | | | | | |
| Net investment income | | | — | | | | — | | | | — | | | | — | | | | — | |
| Net realized gain | | | 2.23 | | | | 0.86 | | | | 3.23 | | | | 0.58 | | | | 1.92 | |
| Total distributions | | | 2.23 | | | | 0.86 | | | | 3.23 | | | | 0.58 | | | | 1.92 | |
| Net asset value, end of year | | $ | 28.39 | | | $ | 25.99 | | | $ | 34.79 | | | $ | 35.18 | | | $ | 27.01 | |
| Total return (%)* | | | 17.95 | | | | (22.84 | ) | | | 8.60 | | | | 32.44 | | | | 8.17 | |
| Ratios to average daily net assets (%)**: | | | | | | | | | | | | | | | | | | | | |
| Expenses, before waivers and reimbursements | | | 1.01 | | | | 1.05 | | | | 1.03 | | | | 1.05 | | | | 1.05 | |
| Expenses, net of waivers and reimbursements | | | 0.97 | | | | 1.05 | | | | 1.03 | | | | 1.05 | | | | 1.05 | |
| Net investment income (loss), before waivers and reimbursements | | | (0.36 | ) | | | (0.55 | ) | | | (0.69 | ) | | | (0.61 | ) | | | (0.46 | ) |
| Net investment income (loss), net of waivers and reimbursements | | | (0.32 | ) | | | (0.55 | ) | | | (0.69 | ) | | | (0.61 | ) | | | (0.46 | ) |
| Class R6 net assets at the end of the year (in thousands) | | $ | 449,782 | | | $ | 392,153 | | | $ | 328,034 | | | $ | 123,220 | | | $ | 39,974 | |
| Portfolio turnover rate (%)* | | | 49 | | | | 49 | | | | 38 | | | | 55 | | | | 56 | |
| (a) | For the period from May 2, 2019 (Commencement of Operations) to December 31, 2019. |
| * | Rates are not annualized for periods less than a year. |
| ** | Rates are annualized for periods less than a year. |
Note: Net investment income (loss) per share is based on the average shares outstanding during the year.
Performance cited represents past performance. Past performance does not guarantee future results and current performance may be lower or higher than the data quoted. Results shown are annual returns, which assume reinvestment of dividends and capital gains. Investment returns and principal will fluctuate and you may have a gain or loss when you sell shares. For the most current month-end performance information, please call 1-800-742-7272 or visit our Web site at www.williamblairfunds.com.
| December 31, 2023 | William Blair Funds | 141 |
Financial Highlights — For a share outstanding throughout each period
Small-Mid Cap Value Fund
| | | Class I | |
| | | Period Ended
December 31, | |
| | | | 2023(a) | |
| Net asset value, beginning of year | | | $ | 10.00 | |
| Income (loss) from investment operations: | | | | | |
| Net investment income (loss) | | | | 0.05 | |
| Net realized and unrealized gain (loss) on investments | | | | 0.60 | |
| Total from investment operations | | | | 0.65 | |
| Less distributions from: | | | | | |
| Net investment income | | | | 0.05 | |
| Net realized gain | | | | — | |
| Total distributions | | | | 0.05 | |
| Net asset value, end of year | | | $ | 10.60 | |
| Total return (%)* | | | | 6.45 | |
| Ratios to average daily net assets (%)**: | | | | | |
| Expenses, before waivers and reimbursements | | | | 10.69 | |
| Expenses, net of waivers and reimbursements | | | | 0.85 | |
| Net investment income (loss), before waivers and reimbursements | | | | (8.48 | ) |
| Net investment income (loss), net of waivers and reimbursements | | | | 1.36 | |
| Class I net assets at the end of the year (in thousands) | | | $ | 84 | |
| Portfolio turnover rate (%)* | | | | 33 | |
| | | | | | |
| | | Class R6 | |
| | | Period Ended
December 31, | |
| | | | 2023(a) | |
| Net asset value, beginning of year | | | $ | 10.00 | |
| Income (loss) from investment operations: | | | | | |
| Net investment income (loss) | | | | 0.05 | |
| Net realized and unrealized gain (loss) on investments | | | | 0.60 | |
| Total from investment operations | | | | 0.65 | |
| Less distributions from: | | | | | |
| Net investment income | | | | 0.05 | |
| Net realized gain | | | | — | |
| Total distributions | | | | 0.05 | |
| Net asset value, end of year | | | $ | 10.60 | |
| Total return (%)* | | | | 6.50 | |
| Ratios to average daily net assets (%)**: | | | | | |
| Expenses, before waivers and reimbursements | | | | 10.66 | |
| Expenses, net of waivers and reimbursements | | | | 0.80 | |
| Net investment income (loss), before waivers and reimbursements | | | | (8.49 | ) |
| Net investment income (loss), net of waivers and reimbursements | | | | 1.37 | |
| Class R6 net assets at the end of the year (in thousands) | | | $ | 1,497 | |
| Portfolio turnover rate (%)* | | | | 33 | |
| (a) | For the period from August 17, 2023 (Commencement of Operations) to December 31, 2023. |
| * | Rates are not annualized for periods less than a year. |
| ** | Rates are annualized for periods less than a year. |
Note: Net investment income (loss) per share is based on the average shares outstanding during the year.
Performance cited represents past performance. Past performance does not guarantee future results and current performance may be lower or higher than the data quoted. Results shown are annual returns, which assume reinvestment of dividends and capital gains. Investment returns and principal will fluctuate and you may have a gain or loss when you sell shares. For the most current month-end performance information, please call 1-800-742-7272 or visit our Web site at www.williamblairfunds.com.
| 142 | Annual Report | December 31, 2023 |
Financial Highlights — For a share outstanding throughout each period
Small Cap Growth Fund
| | | Class N | |
| | | Years Ended December 31, | |
| | | 2023 | | | 2022 | | | 2021 | | | 2020 | | | 2019 | |
| Net asset value, beginning of year | | $ | 24.01 | | | $ | 31.90 | | | $ | 34.49 | | | $ | 27.75 | | | $ | 23.23 | |
| Income (loss) from investment operations: | | | | | | | | | | | | | | | | | | | | |
| Net investment income (loss) | | | (0.18 | ) | | | (0.27 | ) | | | (0.45 | ) | | | (0.29 | ) | | | (0.24 | ) |
| Net realized and unrealized gain (loss) on investments | | | 4.03 | | | | (6.61 | ) | | | 4.56 | | | | 10.86 | | | | 5.40 | |
| Total from investment operations | | | 3.85 | | | | (6.88 | ) | | | 4.11 | | | | 10.57 | | | | 5.16 | |
| Less distributions from: | | | | | | | | | | | | | | | | | | | | |
| Net investment income | | | — | | | | — | | | | — | | | | — | | | | — | |
| Net realized gain | | | 0.50 | | | | 1.01 | | | | 6.70 | | | | 3.83 | | | | 0.64 | |
| Total distributions | | | 0.50 | | | | 1.01 | | | | 6.70 | | | | 3.83 | | | | 0.64 | |
| Net asset value, end of year | | $ | 27.36 | | | $ | 24.01 | | | $ | 31.90 | | | $ | 34.49 | | | $ | 27.75 | |
| Total return (%) | | | 16.06 | | | | (21.59 | ) | | | 12.91 | | | | 38.32 | | | | 22.26 | |
| Ratios to average daily net assets (%): | | | | | | | | | | | | | | | | | | | | |
| Expenses, before waivers and reimbursements | | | 1.46 | | | | 1.55 | | | | 1.56 | | | | 1.58 | | | | 1.54 | |
| Expenses, net of waivers and reimbursements | | | 1.33 | | | | 1.50 | | | | 1.50 | | | | 1.50 | | | | 1.50 | |
| Net investment income (loss), before waivers and reimbursements | | | (0.83 | ) | | | (1.08 | ) | | | (1.24 | ) | | | (1.10 | ) | | | (0.92 | ) |
| Net investment income (loss), net of waivers and reimbursements | | | (0.70 | ) | | | (1.03 | ) | | | (1.18 | ) | | | (1.02 | ) | | | (0.88 | ) |
| Class N net assets at the end of the year (in thousands) | | $ | 122,370 | | | $ | 114,324 | | | $ | 179,739 | | | $ | 180,635 | | | $ | 180,706 | |
| Portfolio turnover rate (%) | | | 55 | | | | 45 | | | | 49 | | | | 71 | | | | 51 | |
| | | | | | | | | | | | | | | | | | | | | |
| | | Class I | |
| | | Years Ended December 31, | |
| | | | 2023 | | | | 2022 | | | | 2021 | | | | 2020 | | | | 2019 | |
| Net asset value, beginning of year | | $ | 28.49 | | | $ | 37.52 | | | $ | 39.36 | | | $ | 31.19 | | | $ | 25.99 | |
| Income (loss) from investment operations: | | | | | | | | | | | | | | | | | | | | |
| Net investment income (loss) | | | (0.13 | ) | | | (0.24 | ) | | | (0.41 | ) | | | (0.24 | ) | | | (0.19 | ) |
| Net realized and unrealized gain (loss) on investments | | | 4.78 | | | | (7.78 | ) | | | 5.27 | | | | 12.24 | | | | 6.03 | |
| Total from investment operations | | | 4.65 | | | | (8.02 | ) | | | 4.86 | | | | 12.00 | | | | 5.84 | |
| Less distributions from: | | | | | | | | | | | | | | | | | | | | |
| Net investment income | | | — | | | | — | | | | — | | | | — | | | | — | |
| Net realized gain | | | 0.50 | | | | 1.01 | | | | 6.70 | | | | 3.83 | | | | 0.64 | |
| Total distributions | | | 0.50 | | | | 1.01 | | | | 6.70 | | | | 3.83 | | | | 0.64 | |
| Net asset value, end of year | | $ | 32.64 | | | $ | 28.49 | | | $ | 37.52 | | | $ | 39.36 | | | $ | 31.19 | |
| Total return (%) | | | 16.35 | | | | (21.39 | ) | | | 13.22 | | | | 38.68 | | | | 22.51 | |
| Ratios to average daily net assets (%): | | | | | | | | | | | | | | | | | | | | |
| Expenses, before waivers and reimbursements | | | 1.18 | | | | 1.28 | | | | 1.25 | | | | 1.30 | | | | 1.27 | |
| Expenses, net of waivers and reimbursements | | | 1.07 | | | | 1.25 | | | | 1.25 | | | | 1.25 | | | | 1.25 | |
| Net investment income (loss), before waivers and reimbursements | | | (0.54 | ) | | | (0.81 | ) | | | (0.93 | ) | | | (0.82 | ) | | | (0.65 | ) |
| Net investment income (loss), net of waivers and reimbursements | | | (0.43 | ) | | | (0.78 | ) | | | (0.93 | ) | | | (0.77 | ) | | | (0.63 | ) |
| Class I net assets at the end of the year (in thousands) | | $ | 445,483 | | | $ | 303,016 | | | $ | 402,629 | | | $ | 390,511 | | | $ | 423,881 | |
| Portfolio turnover rate (%) | | | 55 | | | | 45 | | | | 49 | | | | 71 | | | | 51 | |
Note: Net investment income (loss) per share is based on the average shares outstanding during the year.
Performance cited represents past performance. Past performance does not guarantee future results and current performance may be lower or higher than the data quoted. Results shown are annual returns, which assume reinvestment of dividends and capital gains. Investment returns and principal will fluctuate and you may have a gain or loss when you sell shares. For the most current month-end performance information, please call 1-800-742-7272 or visit our Web site at www.williamblairfunds.com.
| December 31, 2023 | William Blair Funds | 143 |
Financial Highlights — For a share outstanding throughout each period
Small Cap Growth Fund
| | | Class R6 | |
| | | Years Ended December 31, | |
| | | 2023 | | | 2022 | | | 2021 | | | 2020 | | | 2019(a) | |
| Net asset value, beginning of year | | $ | 28.57 | | | $ | 37.60 | | | $ | 39.40 | | | $ | 31.20 | | | $ | 31.00 | |
| Income (loss) from investment operations: | | | | | | | | | | | | | | | | | | | | |
| Net investment income (loss) | | | (0.12 | ) | | | (0.21 | ) | | | (0.37 | ) | | | (0.23 | ) | | | (0.11 | ) |
| Net realized and unrealized gain (loss) on investments | | | 4.81 | | | | (7.81 | ) | | | 5.27 | | | | 12.26 | | | | 0.95 | |
| Total from investment operations | | | 4.69 | | | | (8.02 | ) | | | 4.90 | | | | 12.03 | | | | 0.84 | |
| Less distributions from: | | | | | | | | | | | | | | | | | | | | |
| Net investment income | | | — | | | | — | | | | — | | | | — | | | | — | |
| Net realized gain | | | 0.50 | | | | 1.01 | | | | 6.70 | | | | 3.83 | | | | 0.64 | |
| Total distributions | | | 0.50 | | | | 1.01 | | | | 6.70 | | | | 3.83 | | | | 0.64 | |
| Net asset value, end of year | | $ | 32.76 | | | $ | 28.57 | | | $ | 37.60 | | | $ | 39.40 | | | $ | 31.20 | |
| Total return (%)* | | | 16.44 | | | | (21.35 | ) | | | 13.31 | | | | 38.76 | | | | 2.75 | |
| Ratios to average daily net assets (%)**: | | | | | | | | | | | | | | | | | | | | |
| Expenses, before waivers and reimbursements | | | 1.06 | | | | 1.18 | | | | 1.16 | | | | 1.19 | | | | 1.18 | |
| Expenses, net of waivers and reimbursements | | | 1.02 | | | | 1.18 | | | | 1.16 | | | | 1.19 | | | | 1.18 | |
| Net investment income (loss), before waivers and reimbursements | | | (0.42 | ) | | | (0.70 | ) | | | (0.84 | ) | | | (0.71 | ) | | | (0.51 | ) |
| Net investment income (loss), net of waivers and reimbursements | | | (0.38 | ) | | | (0.70 | ) | | | (0.84 | ) | | | (0.71 | ) | | | (0.51 | ) |
| Class R6 net assets at the end of the year (in thousands) | | $ | 180,058 | | | $ | 112,497 | | | $ | 127,710 | | | $ | 103,462 | | | $ | 69,950 | |
| Portfolio turnover rate (%)* | | | 55 | | | | 45 | | | | 49 | | | | 71 | | | | 51 | |
| (a) | For the period from May 2, 2019 (Commencement of Operations) to December 31, 2019. |
| * | Rates are not annualized for periods less than a year. |
| ** | Rates are annualized for periods less than a year. |
Note: Net investment income (loss) per share is based on the average shares outstanding during the year.
Performance cited represents past performance. Past performance does not guarantee future results and current performance may be lower or higher than the data quoted. Results shown are annual returns, which assume reinvestment of dividends and capital gains. Investment returns and principal will fluctuate and you may have a gain or loss when you sell shares. For the most current month-end performance information, please call 1-800-742-7272 or visit our Web site at www.williamblairfunds.com.
| 144 | Annual Report | December 31, 2023 |
Financial Highlights — For a share outstanding throughout each period
Small Cap Value Fund
| | | | | | Class N | |
| | | Years Ended
December 31, | | | Period Ended
December 31, | | | Period Ended
October 31, | |
| | | 2023 | | | 2022 | | | | 2021(b) | | | | 2021(a) | |
| Net asset value, beginning of year | | $ | 27.76 | | | $ | 33.63 | | | | $ | 33.49 | | | | $ | 32.15 | |
| Income (loss) from investment operations: | | | | | | | | | | | | | | | | | | |
| Net investment income (loss) | | | 0.21 | | | | 0.15 | | | | | 0.00 | ^ | | | | 0.05 | |
| Net realized and unrealized gain (loss) on investments | | | 2.72 | | | | (3.98 | ) | | | | 1.37 | | | | | 1.29 | |
| Total from investment operations | | | 2.93 | | | | (3.83 | ) | | | | 1.37 | | | | | 1.34 | |
| Less distributions from: | | | | | | | | | | | | | | | | | | |
| Net investment income | | | 0.18 | | | | 0.12 | | | | | — | | | | | — | |
| Net realized gain | | | 0.73 | | | | 1.92 | | | | | 1.23 | | | | | — | |
| Total distributions | | | 0.91 | | | | 2.04 | | | | | 1.23 | | | | | — | |
| Net asset value, end of year | | $ | 29.78 | | | $ | 27.76 | | | | $ | 33.63 | | | | $ | 33.49 | |
| Total return (%)* | | | 10.59 | | | | (11.36 | ) | | | | 4.24 | | | | | 4.17 | |
| Ratios to average daily net assets (%)**: | | | | | | | | | | | | | | | | | | |
| Expenses, before waivers and reimbursements | | | 1.11 | | | | 1.15 | | | | | 1.26 | | | | | 1.17 | |
| Expenses, net of waivers and reimbursements | | | 1.11 | | | | 1.15 | | | | | 1.15 | | | | | 1.15 | |
| Net investment income (loss), before waivers and reimbursements | | | 0.76 | | | | 0.48 | | | | | (0.05 | ) | | | | 0.51 | |
| Net investment income (loss), net of waivers and reimbursements | | | 0.76 | | | | 0.48 | | | | | 0.06 | | | | | 0.53 | |
| Class N net assets at the end of the year (in thousands) | | $ | 2,591 | | | $ | 2,648 | | | | $ | 3,313 | | | | $ | 9,805 | |
| Portfolio turnover rate (%)* | | | 27 | | | | 25 | | | | | 7 | | | | | 35 | |
| | | | | | | | | | | | | | | | | | | Class I | |
| | | Years Ended
December 31, | | | Period Ended
December 31, | | | Years Ended
October 31, | |
| | | 2023 | | | 2022 | | | | 2021(b) | | | 2021 | | | 2020 | | | | 2019 | |
| Net asset value, beginning of year | | $ | 27.72 | | | $ | 33.58 | | | | $ | 33.52 | | | $ | 23.79 | | | $ | 28.84 | | | | $ | 31.53 | |
| Income (loss) from investment operations: | | | | | | | | | | | | | | | | | | | | | | | | | | |
| Net investment income (loss) | | | 0.28 | | | | 0.22 | | | | | 0.03 | | | | 0.18 | | | | 0.09 | | | | | 0.18 | |
| Net realized and unrealized gain (loss) on investments | | | 2.72 | | | | (3.96 | ) | | | | 1.35 | | | | 12.91 | | | | (3.89 | ) | | | | 1.59 | |
| Total from investment operations | | | 3.00 | | | | (3.74 | ) | | | | 1.38 | | | | 13.09 | | | | (3.80 | ) | | | | 1.77 | |
| Less distributions from: | | | | | | | | | | | | | | | | | | | | | | | | | | |
| Net investment income | | | 0.25 | | | | 0.20 | | | | | 0.09 | | | | 0.11 | | | | 0.07 | | | | | 0.15 | |
| Net realized gain | | | 0.73 | | | | 1.92 | | | | | 1.23 | | | | 3.25 | | | | 1.18 | | | | | 4.31 | |
| Total distributions | | | 0.98 | | | | 2.12 | | | | | 1.32 | | | | 3.36 | | | | 1.25 | | | | | 4.46 | |
| Net asset value, end of year | | $ | 29.74 | | | $ | 27.72 | | | | $ | 33.58 | | | $ | 33.52 | | | $ | 23.79 | | | | $ | 28.84 | |
| Total return (%)* | | | 10.86 | | | | (11.12 | ) | | | | 4.31 | | | | 55.32 | | | | (13.91 | ) | | | | 8.60 | |
| Ratios to average daily net assets (%)**: | | | | | | | | | | | | | | | | | | | | | | | | | | |
| Expenses, before waivers and reimbursements | | | 0.92 | | | | 0.94 | | | | | 0.82 | | | | 0.86 | | | | 0.89 | | | | | 0.93 | |
| Expenses, net of waivers and reimbursements | | | 0.89 | | | | 0.89 | | | | | 0.82 | | | | 0.86 | | | | 0.89 | | | | | 0.93 | |
| Net investment income (loss), before waivers and reimbursements | | | 0.95 | | | | 0.67 | | | | | 0.55 | | | | 0.52 | | | | 0.37 | | | | | 0.63 | |
| Net investment income (loss), net of waivers and reimbursements | | | 0.98 | | | | 0.72 | | | | | 0.55 | | | | 0.52 | | | | 0.37 | | | | | 0.63 | |
| Class I net assets at the end of the year (in thousands) | | $ | 813,809 | | | $ | 758,104 | | | | $ | 1,059,157 | | | $ | 1,143,150 | | | $ | 1,181,409 | | | | $ | 908,831 | |
| Portfolio turnover rate (%)* | | | 27 | | | | 25 | | | | | 7 | | | | 35 | | | | 27 | | | | | 31 | |
| (a) | For the period from July 17, 2021 (Commencement of Operations) to October 31, 2021. |
| (b) | For the period from November 1, 2021 to December 31, 2021. |
| * | Rates are not annualized for periods less than a year. |
| ** | Rates are annualized for periods less than a year. |
| ^ | Amount is less than $0.005 per share. |
Note: Net investment income (loss) per share is based on the average shares outstanding during the year.
Performance cited represents past performance. Past performance does not guarantee future results and current performance may be lower or higher than the data quoted. Results shown are annual returns, which assume reinvestment of dividends and capital gains. Investment returns and principal will fluctuate and you may have a gain or loss when you sell shares. For the most current month-end performance information, please call 1-800-742-7272 or visit our Web site at www.williamblairfunds.com.
| December 31, 2023 | William Blair Funds | 145 |
Financial Highlights — For a share outstanding throughout each period
Small Cap Value Fund
| | | Class R6 | |
| | | Years Ended
December 31, | | | Period Ended
December 31, | | | Period Ended
October 31, | |
| | | 2023 | | | 2022 | | | | 2021(b) | | | | 2021(a) | |
| Net asset value, beginning of year | | $ | 27.71 | | | $ | 33.58 | | | | $ | 33.53 | | | | $ | 32.15 | |
| Income (loss) from investment operations: | | | | | | | | | | | | | | | | | | |
| Net investment income (loss) | | | 0.30 | | | | 0.26 | | | | | 0.03 | | | | | 0.06 | |
| Net realized and unrealized gain (loss) on investments | | | 2.73 | | | | (3.98 | ) | | | | 1.35 | | | | | 1.32 | |
| Total from investment operations | | | 3.03 | | | | (3.72 | ) | | | | 1.38 | | | | | 1.38 | |
| Less distributions from: | | | | | | | | | | | | | | | | | | |
| Net investment income | | | 0.28 | | | | 0.23 | | | | | 0.10 | | | | | — | |
| Net realized gain | | | 0.73 | | | | 1.92 | | | | | 1.23 | | | | | — | |
| Total distributions | | | 1.01 | | | | 2.15 | | | | | 1.33 | | | | | — | |
| Net asset value, end of year | | $ | 29.73 | | | $ | 27.71 | | | | $ | 33.58 | | | | $ | 33.53 | |
| Total return (%)* | | | 10.96 | | | | (11.06 | ) | | | | 4.33 | | | | | 4.26 | |
| Ratios to average daily net assets (%)**: | | | | | | | | | | | | | | | | | | |
| Expenses | | | 0.79 | | | | 0.81 | | | | | 0.78 | | | | | 0.78 | |
| Net investment income (loss) | | | 1.08 | | | | 0.85 | | | | | 0.59 | | | | | 0.64 | |
| Class R6 net assets at the end of the year (in thousands) | | $ | 491,646 | | | $ | 453,456 | | | | $ | 1,006,928 | | | | $ | 867,272 | |
| Portfolio turnover rate (%)* | | | 27 | | | | 25 | | | | | 7 | | | | | 35 | |
| (a) | For the period from July 17, 2021 (Commencement of Operations) to October 31, 2021. |
| (b) | For the period from November 1, 2021 to December 31, 2021. |
| * | Rates are not annualized for periods less than a year. |
| ** | Rates are annualized for periods less than a year. |
Note: Net investment income (loss) per share is based on the average shares outstanding during the year.
Performance cited represents past performance. Past performance does not guarantee future results and current performance may be lower or higher than the data quoted. Results shown are annual returns, which assume reinvestment of dividends and capital gains. Investment returns and principal will fluctuate and you may have a gain or loss when you sell shares. For the most current month-end performance information, please call 1-800-742-7272 or visit our Web site at www.williamblairfunds.com.
| 146 | Annual Report | December 31, 2023 |
Financial Highlights — For a share outstanding throughout each period
Global Leaders Fund
| | | Class N | |
| | | Years Ended December 31, | |
| | | 2023 | | | 2022 | | | 2021 | | | 2020 | | | 2019 | |
| Net asset value, beginning of year | | $ | 13.24 | | | $ | 19.17 | | | $ | 17.41 | | | $ | 14.92 | | | $ | 11.47 | |
| Income (loss) from investment operations: | | | | | | | | | | | | | | | | | | | | |
| Net investment income (loss) | | | (0.02 | ) | | | (0.04 | ) | | | (0.11 | ) | | | (0.06 | ) | | | 0.01 | |
| Net realized and unrealized gain (loss) on investments | | | 3.01 | | | | (5.61 | ) | | | 2.96 | | | | 4.74 | | | | 3.61 | |
| Total from investment operations | | | 2.99 | | | | (5.65 | ) | | | 2.85 | | | | 4.68 | | | | 3.62 | |
| Less distributions from: | | | | | | | | | | | | | | | | | | | | |
| Net investment income | | | — | | | | — | | | | — | | | | — | | | | 0.03 | |
| Net realized gain | | | 1.02 | | | | 0.28 | | | | 1.09 | | | | 2.19 | | | | 0.14 | |
| Total distributions | | | 1.02 | | | | 0.28 | | | | 1.09 | | | | 2.19 | | | | 0.17 | |
| Net asset value, end of year | | $ | 15.21 | | | $ | 13.24 | | | $ | 19.17 | | | $ | 17.41 | | | $ | 14.92 | |
| Total return (%) | | | 22.67 | | | | (29.49 | ) | | | 16.55 | | | | 31.50 | | | | 31.57 | |
| Ratios to average daily net assets (%): | | | | | | | | | | | | | | | | | | | | |
| Expenses, before waivers and reimbursements | | | 1.42 | | | | 1.45 | | | | 1.38 | | | | 1.45 | | | | 1.39 | |
| Expenses, net of waivers and reimbursements | | | 1.15 | | | | 1.15 | | | | 1.15 | | | | 1.15 | | | | 1.20 | |
| Net investment income (loss), before waivers and reimbursements | | | (0.43 | ) | | | (0.60 | ) | | | (0.79 | ) | | | (0.67 | ) | | | (0.10 | ) |
| Net investment income (loss), net of waivers and reimbursements | | | (0.16 | ) | | | (0.30 | ) | | | (0.56 | ) | | | (0.37 | ) | | | 0.09 | |
| Class N net assets at the end of the year (in thousands) | | $ | 8,253 | | | $ | 8,317 | | | $ | 13,709 | | | $ | 11,861 | | | $ | 8,910 | |
| Portfolio turnover rate (%) | | | 36 | | | | 15 | | | | 18 | | | | 27 | | | | 27 | |
| |
| | | Class I | |
| | | Years Ended December 31, | |
| | | | 2023 | | | | 2022 | | | | 2021 | | | | 2020 | | | | 2019 | |
| Net asset value, beginning of year | | $ | 13.35 | | | $ | 19.28 | | | $ | 17.47 | | | $ | 14.93 | | | $ | 11.47 | |
| Income (loss) from investment operations: | | | | | | | | | | | | | | | | | | | | |
| Net investment income (loss) | | | 0.01 | | | | (0.01 | ) | | | (0.06 | ) | | | (0.01 | ) | | | 0.05 | |
| Net realized and unrealized gain (loss) on investments | | | 3.05 | | | | (5.63 | ) | | | 2.96 | | | | 4.74 | | | | 3.61 | |
| Total from investment operations | | | 3.06 | | | | (5.64 | ) | | | 2.90 | | | | 4.73 | | | | 3.66 | |
| Less distributions from: | | | | | | | | | | | | | | | | | | | | |
| Net investment income | | | 0.01 | | | | 0.01 | | | | — | | | | 0.00 | ^ | | | 0.06 | |
| Net realized gain | | | 1.02 | | | | 0.28 | | | | 1.09 | | | | 2.19 | | | | 0.14 | |
| Total distributions | | | 1.03 | | | | 0.29 | | | | 1.09 | | | | 2.19 | | | | 0.20 | |
| Net asset value, end of year | | $ | 15.38 | | | $ | 13.35 | | | $ | 19.28 | | | $ | 17.47 | | | $ | 14.93 | |
| Total return (%) | | | 22.99 | | | | (29.28 | ) | | | 16.78 | | | | 31.86 | | | | 31.96 | |
| Ratios to average daily net assets (%): | | | | | | | | | | | | | | | | | | | | |
| Expenses, before waivers and reimbursements | | | 1.14 | | | | 1.12 | | | | 1.07 | | | | 1.12 | | | | 1.07 | |
| Expenses, net of waivers and reimbursements | | | 0.90 | | | | 0.90 | | | | 0.90 | | | | 0.90 | | | | 0.95 | |
| Net investment income (loss), before waivers and reimbursements | | | (0.17 | ) | | | (0.27 | ) | | | (0.49 | ) | | | (0.31 | ) | | | 0.22 | |
| Net investment income (loss), net of waivers and reimbursements | | | 0.07 | | | | (0.05 | ) | | | (0.32 | ) | | | (0.09 | ) | | | 0.34 | |
| Class I net assets at the end of the year (in thousands) | | $ | 76,915 | | | $ | 69,987 | | | $ | 124,488 | | | $ | 107,375 | | | $ | 114,666 | |
| Portfolio turnover rate (%) | | | 36 | | | | 15 | | | | 18 | | | | 27 | | | | 27 | |
| ^ | Amount is less than $0.005 per share. |
Note: Net investment income (loss) per share is based on the average shares outstanding during the year.
Performance cited represents past performance. Past performance does not guarantee future results and current performance may be lower or higher than the data quoted. Results shown are annual returns, which assume reinvestment of dividends and capital gains. Investment returns and principal will fluctuate and you may have a gain or loss when you sell shares. For the most current month-end performance information, please call 1-800-742-7272 or visit our Web site at www.williamblairfunds.com.
| December 31, 2023 | William Blair Funds | 147 |
Financial Highlights — For a share outstanding throughout each period
Global Leaders Fund
| | | Class R6 | |
| | | Years Ended December 31, | |
| | | 2023 | | | 2022 | | | 2021 | | | 2020 | | | 2019 | |
| Net asset value, beginning of year | | $ | 13.35 | | | $ | 19.30 | | | $ | 17.47 | | | $ | 14.93 | | | $ | 11.47 | |
| Income (loss) from investment operations: | | | | | | | | | | | | | | | | | | | | |
| Net investment income (loss) | | | 0.02 | | | | (0.01 | ) | | | (0.05 | ) | | | 0.02 | | | | 0.06 | |
| Net realized and unrealized gain (loss) on investments | | | 3.05 | | | | (5.64 | ) | | | 2.97 | | | | 4.72 | | | | 3.61 | |
| Total from investment operations | | | 3.07 | | | | (5.65 | ) | | | 2.92 | | | | 4.74 | | | | 3.67 | |
| Less distributions from: | | | | | | | | | | | | | | | | | | | | |
| Net investment income | | | 0.01 | | | | 0.02 | | | | — | | | | 0.01 | | | | 0.07 | |
| Net realized gain | | | 1.02 | | | | 0.28 | | | | 1.09 | | | | 2.19 | | | | 0.14 | |
| Total distributions | | | 1.03 | | | | 0.30 | | | | 1.09 | | | | 2.20 | | | | 0.21 | |
| Net asset value, end of year | | $ | 15.39 | | | $ | 13.35 | | | $ | 19.30 | | | $ | 17.47 | | | $ | 14.93 | |
| Total return (%) | | | 23.13 | | | | (29.30 | ) | | | 16.90 | | | | 31.91 | | | | 32.02 | |
| Ratios to average daily net assets (%): | | | | | | | | | | | | | | | | | | | | |
| Expenses, before waivers and reimbursements | | | 1.05 | | | | 1.05 | | | | 0.99 | | | | 1.06 | | | | 1.01 | |
| Expenses, net of waivers and reimbursements | | | 0.85 | | | | 0.85 | | | | 0.85 | | | | 0.85 | | | | 0.90 | |
| Net investment income (loss), before waivers and reimbursements | | | (0.08 | ) | | | (0.30 | ) | | | (0.40 | ) | | | (0.10 | ) | | | 0.32 | |
| Net investment income (loss), net of waivers and reimbursements | | | 0.12 | | | | (0.10 | ) | | | (0.26 | ) | | | 0.11 | | | | 0.43 | |
| Class R6 net assets at the end of the year (in thousands) | | $ | 15,287 | | | $ | 13,255 | | | $ | 5,585 | | | $ | 2,946 | | | $ | 48,133 | |
| Portfolio turnover rate (%) | | | 36 | | | | 15 | | | | 18 | | | | 27 | | | | 27 | |
Note: Net investment income (loss) per share is based on the average shares outstanding during the year.
Performance cited represents past performance. Past performance does not guarantee future results and current performance may be lower or higher than the data quoted. Results shown are annual returns, which assume reinvestment of dividends and capital gains. Investment returns and principal will fluctuate and you may have a gain or loss when you sell shares. For the most current month-end performance information, please call 1-800-742-7272 or visit our Web site at www.williamblairfunds.com.
| 148 | Annual Report | December 31, 2023 |
Financial Highlights — For a share outstanding throughout each period
International Leaders Fund
| | | Class N | |
| | | Years Ended December 31, | |
| | | 2023 | | | 2022 | | | 2021 | | | 2020 | | | 2019 | |
| Net asset value, beginning of year | | $ | 17.28 | | | $ | 24.28 | | | $ | 22.69 | | | $ | 18.08 | | | $ | 13.80 | |
| Income (loss) from investment operations: | | | | | | | | | | | | | | | | | | | | |
| Net investment income (loss) | | | 0.05 | | | | 0.04 | | | | (0.12 | ) | | | (0.04 | ) | | | 0.09 | |
| Net realized and unrealized gain (loss) on investments | | | 2.16 | | | | (7.01 | ) | | | 2.35 | | | | 4.82 | | | | 4.25 | |
| Total from investment operations | | | 2.21 | | | | (6.97 | ) | | | 2.23 | | | | 4.78 | | | | 4.34 | |
| Less distributions from: | | | | | | | | | | | | | | | | | | | | |
| Net investment income | | | 0.04 | | | | — | | | | 0.00 | ^ | | | — | | | | 0.06 | |
| Net realized gain | | | — | | | | 0.03 | | | | 0.64 | | | | 0.17 | | | | — | |
| Total distributions | | | 0.04 | | | | 0.03 | | | | 0.64 | | | | 0.17 | | | | 0.06 | |
| Net asset value, end of year | | $ | 19.45 | | | $ | 17.28 | | | $ | 24.28 | | | $ | 22.69 | | | $ | 18.08 | |
| Total return (%) | | | 12.77 | | | | (28.70 | ) | | | 9.93 | | | | 26.45 | | | | 31.46 | |
| Ratios to average daily net assets (%): | | | | | | | | | | | | | | | | | | | | |
| Expenses, before waivers and reimbursements | | | 1.26 | | | | 1.26 | | | | 1.30 | | | | 1.31 | | | | 1.32 | |
| Expenses, net of waivers and reimbursements | | | 1.15 | | | | 1.15 | | | | 1.15 | | | | 1.15 | | | | 1.18 | |
| Net investment income (loss), before waivers and reimbursements | | | 0.17 | | | | 0.09 | | | | (0.65 | ) | | | (0.39 | ) | | | 0.44 | |
| Net investment income (loss), net of waivers and reimbursements | | | 0.28 | | | | 0.20 | | | | (0.50 | ) | | | (0.23 | ) | | | 0.58 | |
| Class N net assets at the end of the year (in thousands) | | $ | 34,162 | | | $ | 35,966 | | | $ | 47,234 | | | $ | 19,586 | | | $ | 11,163 | |
| Portfolio turnover rate (%) | | | 50 | | | | 55 | | | | 18 | | | | 34 | | | | 20 | |
| |
| | | Class I | |
| | | Years Ended December 31, | |
| | | | 2023 | | | | 2022 | | | | 2021 | | | | 2020 | | | | 2019 | |
| Net asset value, beginning of year | | $ | 17.41 | | | $ | 24.41 | | | $ | 22.80 | | | $ | 18.13 | | | $ | 13.84 | |
| Income (loss) from investment operations: | | | | | | | | | | | | | | | | | | | | |
| Net investment income (loss) | | | 0.10 | | | | 0.08 | | | | (0.06 | ) | | | (0.00 | )^ | | | 0.12 | |
| Net realized and unrealized gain (loss) on investments | | | 2.18 | | | | (7.05 | ) | | | 2.36 | | | | 4.85 | | | | 4.27 | |
| Total from investment operations | | | 2.28 | | | | (6.97 | ) | | | 2.30 | | | | 4.85 | | | | 4.39 | |
| Less distributions from: | | | | | | | | | | | | | | | | | | | | |
| Net investment income | | | 0.09 | | | | — | | | | 0.05 | | | | 0.01 | | | | 0.10 | |
| Net realized gain | | | — | | | | 0.03 | | | | 0.64 | | | | 0.17 | | | | — | |
| Total distributions | | | 0.09 | | | | 0.03 | | | | 0.69 | | | | 0.18 | | | | 0.10 | |
| Net asset value, end of year | | $ | 19.60 | | | $ | 17.41 | | | $ | 24.41 | | | $ | 22.80 | | | $ | 18.13 | |
| Total return (%) | | | 13.09 | | | | (28.55 | ) | | | 10.17 | | | | 26.77 | | | | 31.76 | |
| Ratios to average daily net assets (%): | | | | | | | | | | | | | | | | | | | | |
| Expenses, before waivers and reimbursements | | | 1.04 | | | | 1.04 | | | | 0.99 | | | | 1.01 | | | | 1.01 | |
| Expenses, net of waivers and reimbursements | | | 0.90 | | | | 0.90 | | | | 0.90 | | | | 0.90 | | | | 0.93 | |
| Net investment income (loss), before waivers and reimbursements | | | 0.39 | | | | 0.28 | | | | (0.33 | ) | | | (0.11 | ) | | | 0.64 | |
| Net investment income (loss), net of waivers and reimbursements | | | 0.53 | | | | 0.42 | | | | (0.24 | ) | | | (0.00 | ) | | | 0.72 | |
| Class I net assets at the end of the year (in thousands) | | $ | 413,373 | | | $ | 369,171 | | | $ | 591,500 | | | $ | 393,596 | | | $ | 181,617 | |
| Portfolio turnover rate (%) | | | 50 | | | | 55 | | | | 18 | | | | 34 | | | | 20 | |
| ^ | Amount is less than $0.005 per share. |
Note: Net investment income (loss) per share is based on the average shares outstanding during the year.
Performance cited represents past performance. Past performance does not guarantee future results and current performance may be lower or higher than the data quoted. Results shown are annual returns, which assume reinvestment of dividends and capital gains. Investment returns and principal will fluctuate and you may have a gain or loss when you sell shares. For the most current month-end performance information, please call 1-800-742-7272 or visit our Web site at www.williamblairfunds.com.
| December 31, 2023 | William Blair Funds | 149 |
Financial Highlights — For a share outstanding throughout each period
International Leaders Fund
| | | Class R6 | |
| | | Years Ended December 31, | |
| | | 2023 | | | 2022 | | | 2021 | | | 2020 | | | 2019 | |
| Net asset value, beginning of year | | $ | 17.42 | | | $ | 24.41 | | | $ | 22.80 | | | $ | 18.12 | | | $ | 13.83 | |
| Income (loss) from investment operations: | | | | | | | | | | | | | | | | | | | | |
| Net investment income (loss) | | | 0.11 | | | | 0.09 | | | | (0.04 | ) | | | 0.02 | | | | 0.14 | |
| Net realized and unrealized gain (loss) on investments | | | 2.19 | | | | (7.05 | ) | | | 2.35 | | | | 4.85 | | | | 4.26 | |
| Total from investment operations | | | 2.30 | | | | (6.96 | ) | | | 2.31 | | | | 4.87 | | | | 4.40 | |
| Less distributions from: | | | | | | | | | | | | | | | | | | | | |
| Net investment income | | | 0.10 | | | | — | | | | 0.06 | | | | 0.02 | | | | 0.11 | |
| Net realized gain | | | — | | | | 0.03 | | | | 0.64 | | | | 0.17 | | | | — | |
| Total distributions | | | 0.10 | | | | 0.03 | | | | 0.70 | | | | 0.19 | | | | 0.11 | |
| Net asset value, end of year | | $ | 19.62 | | | $ | 17.42 | | | $ | 24.41 | | | $ | 22.80 | | | $ | 18.12 | |
| Total return (%) | | | 13.20 | | | | (28.51 | ) | | | 10.22 | | | | 26.88 | | | | 31.83 | |
| Ratios to average daily net assets (%): | | | | | | | | | | | | | | | | | | | | |
| Expenses, before waivers and reimbursements | | | 0.91 | | | | 0.92 | | | | 0.91 | | | | 0.92 | | | | 0.93 | |
| Expenses, net of waivers and reimbursements | | | 0.85 | | | | 0.85 | | | | 0.85 | | | | 0.85 | | �� | | 0.88 | |
| Net investment income (loss), before waivers and reimbursements | | | 0.52 | | | | 0.44 | | | | (0.24 | ) | | | 0.03 | | | | 0.80 | |
| Net investment income (loss), net of waivers and reimbursements | | | 0.58 | | | | 0.51 | | | | (0.18 | ) | | | 0.10 | | | | 0.85 | |
| Class R6 net assets at the end of the year (in thousands) | | $ | 636,401 | | | $ | 599,084 | | | $ | 667,996 | | | $ | 687,171 | | | $ | 461,124 | |
| Portfolio turnover rate (%) | | | 50 | | | | 55 | | | | 18 | | | | 34 | | | | 20 | |
Note: Net investment income (loss) per share is based on the average shares outstanding during the year.
Performance cited represents past performance. Past performance does not guarantee future results and current performance may be lower or higher than the data quoted. Results shown are annual returns, which assume reinvestment of dividends and capital gains. Investment returns and principal will fluctuate and you may have a gain or loss when you sell shares. For the most current month-end performance information, please call 1-800-742-7272 or visit our Web site at www.williamblairfunds.com.
| 150 | Annual Report | December 31, 2023 |
Financial Highlights — For a share outstanding throughout each period
International Growth Fund
| | | | | | | | | | | | | | | Class N | |
| | | | | | | | | | | Years Ended December 31, | |
| | | 2023 | | | 2022 | | | 2021 | | | 2020 | | | 2019 | |
| Net asset value, beginning of year | | $ | 24.92 | | | $ | 37.57 | | | $ | 38.75 | | | $ | 29.68 | | | $ | 23.04 | |
| Income (loss) from investment operations: | | | | | | | | | | | | | | | | | | | | |
| Net investment income (loss) | | | 0.14 | | | | 0.11 | | | | (0.28 | ) | | | (0.16 | ) | | | 0.09 | |
| Net realized and unrealized gain (loss) on investments | | | 3.61 | | | | (10.78 | ) | | | 3.51 | | | | 9.55 | | | | 6.87 | |
| Total from investment operations | | | 3.75 | | | | (10.67 | ) | | | 3.23 | | | | 9.39 | | | | 6.96 | |
| Less distributions from: | | | | | | | | | | | | | | | | | | | | |
| Net investment income | | | 0.19 | | | | 0.02 | | | | — | | | | 0.06 | | | | 0.32 | |
| Net realized gain | | | 0.75 | | | | 1.96 | | | | 4.41 | | | | 0.26 | | | | — | |
| Total distributions | | | 0.94 | | | | 1.98 | | | | 4.41 | | | | 0.32 | | | | 0.32 | |
| Net asset value, end of year | | $ | 27.73 | | | $ | 24.92 | | | $ | 37.57 | | | $ | 38.75 | | | $ | 29.68 | |
| Total return (%) | | | 15.12 | | | | (28.51 | ) | | | 8.68 | | | | 31.64 | | | | 30.24 | |
| Ratios to average daily net assets (%): | | | | | | | | | | | | | | | | | | | | |
| Expenses, before waivers and reimbursements | | | 1.39 | | | | 1.40 | | | | 1.46 | | | | 1.47 | | | | 1.45 | |
| Expenses, net of waivers and reimbursements | | | 1.24 | | | | 1.31 | | | | 1.45 | | | | 1.45 | | | | 1.45 | |
| Net investment income (loss), before waivers and reimbursements | | | 0.36 | | | | 0.30 | | | | (0.68 | ) | | | (0.56 | ) | | | 0.34 | |
| Net investment income (loss), net of waivers and reimbursements | | | 0.51 | | | | 0.39 | | | | (0.67 | ) | | | (0.54 | ) | | | 0.34 | |
| Class N net assets at the end of the year (in thousands) | | $ | 292,273 | | | $ | 301,485 | | | $ | 293,481 | | | $ | 288,976 | | | $ | 494,788 | |
| Portfolio turnover rate (%) | | | 42 | | | | 50 | | | | 19 | | | | 27 | | | | 34 | |
| | | | | | | | | | | | | | | | | | | | | |
| | | | | | | | | | | | | | | | | | | | Class I | |
| | | | | | | | | | | | | | Years Ended December 31, | |
| | | | 2023 | | | | 2022 | | | | 2021 | | | | 2020 | | | | 2019 | |
| Net asset value, beginning of year | | $ | 25.74 | | | $ | 38.68 | | | $ | 39.65 | | | $ | 30.38 | | | $ | 23.56 | |
| Income (loss) from investment operations: | | | | | | | | | | | | | | | | | | | | |
| Net investment income (loss) | | | 0.21 | | | | 0.24 | | | | (0.15 | ) | | | (0.08 | ) | | | 0.18 | |
| Net realized and unrealized gain (loss) on investments | | | 3.73 | | | | (11.16 | ) | | | 3.59 | | | | 9.79 | | | | 7.03 | |
| Total from investment operations | | | 3.94 | | | | (10.92 | ) | | | 3.44 | | | | 9.71 | | | | 7.21 | |
| Less distributions from: | | | | | | | | | | | | | | | | | | | | |
| Net investment income | | | 0.26 | | | | 0.06 | | | | — | | | | 0.18 | | | | 0.39 | |
| Net realized gain | | | 0.75 | | | | 1.96 | | | | 4.41 | | | | 0.26 | | | | — | |
| Total distributions | | | 1.01 | | | | 2.02 | | | | 4.41 | | | | 0.44 | | | | 0.39 | |
| Net asset value, end of year | | $ | 28.67 | | | $ | 25.74 | | | $ | 38.68 | | | $ | 39.65 | | | $ | 30.38 | |
| Total return (%) | | | 15.38 | | | | (28.33 | ) | | | 9.01 | | | | 31.99 | | | | 30.66 | |
| Ratios to average daily net assets (%): | | | | | | | | | | | | | | | | | | | | |
| Expenses, before waivers and reimbursements | | | 1.10 | | | | 1.12 | | | | 1.14 | | | | 1.16 | | | | 1.14 | |
| Expenses, net of waivers and reimbursements | | | 0.99 | | | | 1.06 | | | | 1.14 | | | | 1.16 | | | | 1.14 | |
| Net investment income (loss), before waivers and reimbursements | | | 0.65 | | | | 0.76 | | | | (0.36 | ) | | | (0.24 | ) | | | 0.65 | |
| Net investment income (loss), net of waivers and reimbursements | | | 0.76 | | | | 0.82 | | | | (0.36 | ) | | | (0.24 | ) | | | 0.65 | |
| Class I net assets at the end of the year (in thousands) | | $ | 992,759 | | | $ | 981,813 | | | $ | 1,702,775 | | | $ | 1,914,460 | | | $ | 1,552,355 | |
| Portfolio turnover rate (%) | | | 42 | | | | 50 | | | | 19 | | | | 27 | | | | 34 | |
Note: Net investment income (loss) per share is based on the average shares outstanding during the year.
Performance cited represents past performance. Past performance does not guarantee future results and current performance may be lower or higher than the data quoted. Results shown are annual returns, which assume reinvestment of dividends and capital gains. Investment returns and principal will fluctuate and you may have a gain or loss when you sell shares. For the most current month-end performance information, please call 1-800-742-7272 or visit our Web site at www.williamblairfunds.com.
| December 31, 2023 | William Blair Funds | 151 |
Financial Highlights — For a share outstanding throughout each period
International Growth Fund
| | | | | | | | | | | | | | Class R6 | |
| | | | | | | | | Years Ended December 31, | |
| | | | 2023 | | | | 2022 | | | | 2021 | | | | 2020 | | | | 2019(a) | |
| Net asset value, beginning of year | | $ | 25.76 | | | $ | 38.72 | | | $ | 39.66 | | | $ | 30.37 | | | $ | 27.56 | |
| Income (loss) from investment operations: | | | | | | | | | | | | | | | | | | | | |
| Net investment income (loss) | | | 0.23 | | | | 0.21 | | | | (0.11 | ) | | | (0.07 | ) | | | (0.05 | ) |
| Net realized and unrealized gain (loss) on investments | | | 3.73 | | | | (11.13 | ) | | | 3.58 | | | | 9.83 | | | | 3.27 | |
| Total from investment operations | | | 3.96 | | | | (10.92 | ) | | | 3.47 | | | | 9.76 | | | | 3.22 | |
| Less distributions from: | | | | | | | | | | | | | | | | | | | | |
| Net investment income | | | 0.27 | | | | 0.08 | | | | — | | | | 0.21 | | | | 0.41 | |
| Net realized gain | | | 0.75 | | | | 1.96 | | | | 4.41 | | | | 0.26 | | | | — | |
| Total distributions | | | 1.02 | | | | 2.04 | | | | 4.41 | | | | 0.47 | | | | 0.41 | |
| Net asset value, end of year | | $ | 28.70 | | | $ | 25.76 | | | $ | 38.72 | | | $ | 39.66 | | | $ | 30.37 | |
| Total return (%)* | | | 15.47 | | | | (28.30 | ) | | | 9.09 | | | | 32.16 | | | | 11.71 | |
| Ratios to average daily net assets (%)**: | | | | | | | | | | | | | | | | | | | | |
| Expenses, before waivers and reimbursements | | | 1.00 | | | | 1.03 | | | | 1.06 | | | | 1.07 | | | | 1.06 | |
| Expenses, net of waivers and reimbursements | | | 0.94 | | | | 1.01 | | | | 1.06 | | | | 1.07 | | | | 1.06 | |
| Net investment income (loss), before waivers and reimbursements | | | 0.76 | | | | 0.69 | | | | (0.25 | ) | | | (0.23 | ) | | | (0.26 | ) |
| Net investment income (loss), net of waivers and reimbursements | | | 0.82 | | | | 0.71 | | | | (0.25 | ) | | | (0.23 | ) | | | (0.26 | ) |
| Class R6 net assets at the end of the year (in thousands) | | $ | 146,072 | | | $ | 151,338 | | | $ | 126,641 | | | $ | 109,214 | | | $ | 61,916 | |
| Portfolio turnover rate (%)* | | | 42 | | | | 50 | | | | 19 | | | | 27 | | | | 34 | |
| (a) | For the period from May 2, 2019 (Commencement of Operations) to December 31, 2019. |
| * | Rates are not annualized for periods less than a year. |
| ** | Rates are annualized for periods less than a year. |
Note: Net investment income (loss) per share is based on the average shares outstanding during the year.
Performance cited represents past performance. Past performance does not guarantee future results and current performance may be lower or higher than the data quoted. Results shown are annual returns, which assume reinvestment of dividends and capital gains. Investment returns and principal will fluctuate and you may have a gain or loss when you sell shares. For the most current month-end performance information, please call 1-800-742-7272 or visit our Web site at www.williamblairfunds.com.
| 152 | Annual Report | December 31, 2023 |
Financial Highlights — For a share outstanding throughout each period
Institutional International Growth Fund
| | | | | | | | | | | | | | | Institutional | |
| | | | | | | | | Years Ended December 31, | |
| | | 2023 | | | 2022 | | | 2021 | | | 2020 | | | 2019 | |
| Net asset value, beginning of year | | $ | 12.82 | | | $ | 19.03 | | | $ | 20.37 | | | $ | 17.35 | | | $ | 13.40 | |
| Income (loss) from investment operations: | | | | | | | | | | | | | | | | | | | | |
| Net investment income (loss) | | | 0.09 | | | | 0.11 | | | | (0.05 | ) | | | (0.01 | ) | | | 0.12 | |
| Net realized and unrealized gain (loss) on investments | | | 1.85 | | | | (5.47 | ) | | | 1.86 | | | | 5.60 | | | | 4.00 | |
| Total from investment operations | | | 1.94 | | | | (5.36 | ) | | | 1.81 | | | | 5.59 | | | | 4.12 | |
| Less distributions from: | | | | | | | | | | | | | | | | | | | | |
| Net investment income | | | 0.13 | | | | 0.06 | | | | — | | | | 0.02 | | | | 0.17 | |
| Net realized gain | | | 0.23 | | | | 0.79 | | | | 3.15 | | | | 2.55 | | | | — | |
| Total distributions | | | 0.36 | | | | 0.85 | | | | 3.15 | | | | 2.57 | | | | 0.17 | |
| Net asset value, end of year | | $ | 14.40 | | | $ | 12.82 | | | $ | 19.03 | | | $ | 20.37 | | | $ | 17.35 | |
| Total return (%) | | | 15.20 | | | | (28.28 | ) | | | 9.39 | | | | 32.47 | | | | 30.75 | |
| Ratios to average daily net assets (%): | | | | | | | | | | | | | | | | | | | | |
| Expenses, before waivers and reimbursements | | | 1.00 | | | | 1.01 | | | | 1.01 | | | | 1.00 | | | | 0.99 | |
| Expenses, net of waivers and reimbursements | | | 0.94 | | | | 0.98 | | | | 1.01 | | | | 1.00 | | | | 0.99 | |
| Net investment income (loss), before waivers and reimbursements | | | 0.61 | | | | 0.71 | | | | (0.22 | ) | | | (0.04 | ) | | | 0.77 | |
| Net investment income (loss), net of waivers and reimbursements | | | 0.67 | | | | 0.74 | | | | (0.22 | ) | | | (0.04 | ) | | | 0.77 | |
| Net assets at the end of the year (in thousands) | | $ | 929,474 | | | $ | 908,732 | | | $ | 1,281,843 | | | $ | 1,326,482 | | | $ | 1,892,911 | |
| Portfolio turnover rate (%) | | | 44 | | | | 55 | | | | 19 | | | | 31 | | | | 35 | |
Note: Net investment income (loss) per share is based on the average shares outstanding during the year.
Performance cited represents past performance. Past performance does not guarantee future results and current performance may be lower or higher than the data quoted. Results shown are annual returns, which assume reinvestment of dividends and capital gains. Investment returns and principal will fluctuate and you may have a gain or loss when you sell shares. For the most current month-end performance information, please call 1-800-742-7272 or visit our Web site at www.williamblairfunds.com.
| December 31, 2023 | William Blair Funds | 153 |
Financial Highlights — For a share outstanding throughout each period
International Small Cap Growth Fund
| | | | | | | | | | | | | | | Class N | |
| | | | | | | | | Years Ended December 31, | |
| | | 2023 | | | 2022 | | | 2021 | | | 2020 | | | 2019 | |
| Net asset value, beginning of year | | $ | 10.74 | | | $ | 16.56 | | | $ | 17.45 | | | $ | 13.85 | | | $ | 10.36 | |
| Income (loss) from investment operations: | | | | | | | | | | | | | | | | | | | | |
| Net investment income (loss) | | | 0.04 | | | | 0.00 | ^ | | | (0.12 | ) | | | (0.05 | ) | | | 0.05 | |
| Net realized and unrealized gain (loss) on investments | | | 1.51 | | | | (5.82 | ) | | | 1.91 | | | | 4.01 | | | | 3.45 | |
| Total from investment operations | | | 1.55 | | | | (5.82 | ) | | | 1.79 | | | | 3.96 | | | | 3.50 | |
| Less distributions from: | | | | | | | | | | | | | | | | | | | | |
| Net investment income | | | 0.08 | | | | — | | | | — | | | | — | | | | 0.01 | |
| Net realized gain | | | — | | | | — | | | | 2.68 | | | | 0.36 | | | | — | |
| Total distributions | | | 0.08 | | | | — | | | | 2.68 | | | | 0.36 | | | | 0.01 | |
| Net asset value, end of year | | $ | 12.21 | | | $ | 10.74 | | | $ | 16.56 | | | $ | 17.45 | | | $ | 13.85 | |
| Total return (%) | | | 14.42 | | | | (35.14 | ) | | | 10.87 | | | | 28.68 | | | | 33.81 | |
| Ratios to average daily net assets (%): | | | | | | | | | | | | | | | | | | | | |
| Expenses, before waivers and reimbursements | | | 1.53 | | | | 1.49 | | | | 1.46 | | | | 1.52 | | | | 1.48 | |
| Expenses, net of waivers and reimbursements | | | 1.42 | | | | 1.49 | | | | 1.46 | | | | 1.52 | | | | 1.48 | |
| Net investment income (loss), before waivers and reimbursements | | | 0.28 | | | | 0.04 | | | | (0.67 | ) | | | (0.36 | ) | | | 0.45 | |
| Net investment income (loss), net of waivers and reimbursements | | | 0.39 | | | | 0.04 | | | | (0.67 | ) | | | (0.36 | ) | | | 0.45 | |
| Class N net assets at the end of the year (in thousands) | | $ | 1,547 | | | $ | 1,638 | | | $ | 3,540 | | | $ | 3,101 | | | $ | 3,650 | |
| Portfolio turnover rate (%) | | | 37 | | | | 51 | | | | 52 | | | | 63 | | | | 38 | |
| | | | | | | | | | | | | | | | | | | | | |
| | | | | | | | | | | | | | | | | | | | Class I | |
| | | | | | | | | | | | Years Ended December 31, | |
| | | | 2023 | | | | 2022 | | | | 2021 | | | | 2020 | | | | 2019 | |
| Net asset value, beginning of year | | $ | 10.90 | | | $ | 16.80 | | | $ | 17.66 | | | $ | 13.98 | | | $ | 10.45 | |
| Income (loss) from investment operations: | | | | | | | | | | | | | | | | | | | | |
| Net investment income (loss) | | | 0.07 | | | | 0.03 | | | | (0.07 | ) | | | (0.01 | ) | | | 0.09 | |
| Net realized and unrealized gain (loss) on investments | | | 1.54 | | | | (5.91 | ) | | | 1.93 | | | | 4.06 | | | | 3.48 | |
| Total from investment operations | | | 1.61 | | | | (5.88 | ) | | | 1.86 | | | | 4.05 | | | | 3.57 | |
| Less distributions from: | | | | | | | | | | | | | | | | | | | | |
| Net investment income | | | 0.11 | | | | 0.02 | | | | 0.04 | | | | 0.01 | | | | 0.04 | |
| Net realized gain | | | — | | | | — | | | | 2.68 | | | | 0.36 | | | | — | |
| Total distributions | | | 0.11 | | | | 0.02 | | | | 2.72 | | | | 0.37 | | | | 0.04 | |
| Net asset value, end of year | | $ | 12.40 | | | $ | 10.90 | | | $ | 16.80 | | | $ | 17.66 | | | $ | 13.98 | |
| Total return (%) | | | 14.70 | | | | (34.99 | ) | | | 11.17 | | | | 29.04 | | | | 34.22 | |
| Ratios to average daily net assets (%): | | | | | | | | | | | | | | | | | | | | |
| Expenses, before waivers and reimbursements | | | 1.25 | | | | 1.23 | | | | 1.19 | | | | 1.25 | | | | 1.21 | |
| Expenses, net of waivers and reimbursements | | | 1.17 | | | | 1.23 | | | | 1.19 | | | | 1.25 | | | | 1.21 | |
| Net investment income (loss), before waivers and reimbursements | | | 0.54 | | | | 0.28 | | | | (0.40 | ) | | | (0.05 | ) | | | 0.75 | |
| Net investment income (loss), net of waivers and reimbursements | | | 0.62 | | | | 0.28 | | | | (0.40 | ) | | | (0.05 | ) | | | 0.75 | |
| Class I net assets at the end of the year (in thousands) | | $ | 103,520 | | | $ | 98,330 | | | $ | 136,573 | | | $ | 145,283 | | | $ | 142,951 | |
| Portfolio turnover rate (%) | | | 37 | | | | 51 | | | | 52 | | | | 63 | | | | 38 | |
| ^ | Amount is less than $0.005 per share. |
Note: Net investment income (loss) per share is based on the average shares outstanding during the year.
Performance cited represents past performance. Past performance does not guarantee future results and current performance may be lower or higher than the data quoted. Results shown are annual returns, which assume reinvestment of dividends and capital gains. Investment returns and principal will fluctuate and you may have a gain or loss when you sell shares. For the most current month-end performance information, please call 1-800-742-7272 or visit our Web site at www.williamblairfunds.com.
| 154 | Annual Report | December 31, 2023 |
Financial Highlights — For a share outstanding throughout each period
International Small Cap Growth Fund
| | | | | | | | | | | | | | Class R6 | |
| | | | | | | | | Years Ended December 31, | |
| | | 2023 | | | 2022 | | | 2021 | | | 2020 | | | 2019 | |
| Net asset value, beginning of year | | $ | 10.97 | | | $ | 16.91 | | | $ | 17.76 | | | $ | 14.05 | | | $ | 10.50 | |
| Income (loss) from investment operations: | | | | | | | | | | | | | | | | | | | | |
| Net investment income (loss) | | | 0.08 | | | | 0.05 | | | | (0.06 | ) | | | 0.00 | ^ | | | 0.11 | |
| Net realized and unrealized gain (loss) on investments | | | 1.54 | | | | (5.96 | ) | | | 1.95 | | | | 4.09 | | | | 3.49 | |
| Total from investment operations | | | 1.62 | | | | (5.91 | ) | | | 1.89 | | | | 4.09 | | | | 3.60 | |
| Less distributions from: | | | | | | | | | | | | | | | | | | | | |
| Net investment income | | | 0.12 | | | | 0.03 | | | | 0.06 | | | | 0.02 | | | | 0.05 | |
| Net realized gain | | | — | | | | — | | | | 2.68 | | | | 0.36 | | | | — | |
| Total distributions | | | 0.12 | | | | 0.03 | | | | 2.74 | | | | 0.38 | | | | 0.05 | |
| Net asset value, end of year | | $ | 12.47 | | | $ | 10.97 | | | $ | 16.91 | | | $ | 17.76 | | | $ | 14.05 | |
| Total return (%) | | | 14.76 | | | | (34.94 | ) | | | 11.27 | | | | 29.23 | | | | 34.32 | |
| Ratios to average daily net assets (%): | | | | | | | | | | | | | | | | | | | | |
| Expenses, before waivers and reimbursements | | | 1.15 | | | | 1.14 | | | | 1.10 | | | | 1.14 | | | | 1.12 | |
| Expenses, net of waivers and reimbursements | | | 1.12 | | | | 1.14 | | | | 1.10 | | | | 1.14 | | | | 1.12 | |
| Net investment income (loss), before waivers and reimbursements | | | 0.64 | | | | 0.38 | | | | (0.31 | ) | | | 0.02 | | | | 0.86 | |
| Net investment income (loss), net of waivers and reimbursements | | | 0.67 | | | | 0.38 | | | | (0.31 | ) | | | 0.02 | | | | 0.86 | |
| Class R6 net assets at the end of the year (in thousands) | | $ | 135,679 | | | $ | 134,982 | | | $ | 243,398 | | | $ | 188,497 | | | $ | 162,465 | |
| Portfolio turnover rate (%) | | | 37 | | | | 51 | | | | 52 | | | | 63 | | | | 38 | |
| ^ | Amount is less than $0.005 per share. |
Note: Net investment income (loss) per share is based on the average shares outstanding during the year.
Performance cited represents past performance. Past performance does not guarantee future results and current performance may be lower or higher than the data quoted. Results shown are annual returns, which assume reinvestment of dividends and capital gains. Investment returns and principal will fluctuate and you may have a gain or loss when you sell shares. For the most current month-end performance information, please call 1-800-742-7272 or visit our Web site at www.williamblairfunds.com.
| December 31, 2023 | William Blair Funds | 155 |
Financial Highlights — For a share outstanding throughout each period
Emerging Markets Leaders Fund
| | | | | | | | | | | | | | Class N | |
| | | | | | | Years Ended December 31, | |
| | | 2023 | | | 2022 | | | 2021 | | | 2020 | | | 2019 | |
| Net asset value, beginning of year | | $ | 8.29 | | | $ | 11.33 | | | $ | 13.26 | | | $ | 10.51 | | | $ | 8.26 | |
| Income (loss) from investment operations: | | | | | | | | | | | | | | | | | | | | |
| Net investment income (loss) | | | 0.05 | | | | 0.02 | | | | (0.06 | ) | | | (0.02 | ) | | | 0.03 | |
| Net realized and unrealized gain (loss) on investments | | | 0.43 | | | | (2.98 | ) | | | (0.98 | ) | | | 2.88 | | | | 2.28 | |
| Total from investment operations | | | 0.48 | | | | (2.96 | ) | | | (1.04 | ) | | | 2.86 | | | | 2.31 | |
| Less distributions from: | | | | | | | | | | | | | | | | | | | | |
| Net investment income | | | 0.05 | | | | — | | | | 0.01 | | | | — | | | | 0.04 | |
| Net realized gain | | | — | | | | 0.08 | | | | 0.88 | | | | 0.11 | | | | 0.02 | |
| Total distributions | | | 0.05 | | | | 0.08 | | | | 0.89 | | | | 0.11 | | | | 0.06 | |
| Net asset value, end of year | | $ | 8.72 | | | $ | 8.29 | | | $ | 11.33 | | | $ | 13.26 | | | $ | 10.51 | |
| Total return (%) | | | 5.85 | | | | (26.11 | ) | | | (7.69 | ) | | | 27.23 | | | | 27.98 | |
| Ratios to average daily net assets (%): | | | | | | | | | | | | | | | | | | | | |
| Expenses, before waivers and reimbursements | | | 1.46 | | | | 1.48 | | | | 1.56 | | | | 1.63 | | | | 1.62 | |
| Expenses, net of waivers and reimbursements | | | 1.24 | | | | 1.29 | | | | 1.40 | | | | 1.40 | | | | 1.45 | |
| Net investment income (loss), before waivers and reimbursements | | | 0.41 | | | | 0.05 | | | | (0.64 | ) | | | (0.45 | ) | | | 0.17 | |
| Net investment income (loss), net of waivers and reimbursements | | | 0.63 | | | | 0.24 | | | | (0.48 | ) | | | (0.22 | ) | | | 0.34 | |
| Class N net assets at the end of the year (in thousands) | | $ | 1,007 | | | $ | 1,092 | | | $ | 2,096 | | | $ | 1,803 | | | $ | 1,856 | |
| Portfolio turnover rate (%) | | | 44 | | | | 42 | | | | 40 | | | | 47 | | | | 33 | |
| | | | | | | | | | | | | | | | | | | | | |
| | | | | | | | | | | | | | | | | | Class I | |
| | | | | | | | | | | | Years Ended December 31, | |
| | | | 2023 | | | | 2022 | | | | 2021 | | | | 2020 | | | | 2019 | |
| Net asset value, beginning of year | | $ | 8.32 | | | $ | 11.33 | | | $ | 13.28 | | | $ | 10.52 | | | $ | 8.27 | |
| Income (loss) from investment operations: | | | | | | | | | | | | | | | | | | | | |
| Net investment income (loss) | | | 0.09 | | | | 0.06 | | | | (0.04 | ) | | | (0.00 | )^ | | | 0.06 | |
| Net realized and unrealized gain (loss) on investments | | | 0.42 | | | | (2.99 | ) | | | (0.98 | ) | | | 2.89 | | | | 2.29 | |
| Total from investment operations | | | 0.51 | | | | (2.93 | ) | | | (1.02 | ) | | | 2.89 | | | | 2.35 | |
| Less distributions from: | | | | | | | | | | | | | | | | | | | | |
| Net investment income | | | 0.07 | | | | — | | | | 0.05 | | | | 0.02 | | | | 0.08 | |
| Net realized gain | | | — | | | | 0.08 | | | | 0.88 | | | | 0.11 | | | | 0.02 | |
| Total distributions | | | 0.07 | | | | 0.08 | | | | 0.93 | | | | 0.13 | | | | 0.10 | |
| Net asset value, end of year | | $ | 8.76 | | | $ | 8.32 | | | $ | 11.33 | | | $ | 13.28 | | | $ | 10.52 | |
| Total return (%) | | | 6.13 | | | | (25.84 | ) | | | (7.48 | ) | | | 27.52 | | | | 28.36 | |
| Ratios to average daily net assets (%): | | | | | | | | | | | | | | | | | | | | |
| Expenses, before waivers and reimbursements | | | 1.18 | | | | 1.19 | | | | 1.28 | | | | 1.33 | | | | 1.29 | |
| Expenses, net of waivers and reimbursements | | | 0.99 | | | | 1.05 | | | | 1.15 | | | | 1.15 | | | | 1.20 | |
| Net investment income (loss), before waivers and reimbursements | | | 0.82 | | | | 0.46 | | | | (0.40 | ) | | | (0.21 | ) | | | 0.53 | |
| Net investment income (loss), net of waivers and reimbursements | | | 1.01 | | | | 0.60 | | | | (0.27 | ) | | | (0.03 | ) | | | 0.62 | |
| Class I net assets at the end of the year (in thousands) | | $ | 13,772 | | | $ | 29,682 | | | $ | 42,750 | | | $ | 62,319 | | | $ | 45,090 | |
| Portfolio turnover rate (%) | | | 44 | | | | 42 | | | | 40 | | | | 47 | | | | 33 | |
| ^ | Amount is less than $0.005 per share. |
Note: Net investment income (loss) per share is based on the average shares outstanding during the year.
Performance cited represents past performance. Past performance does not guarantee future results and current performance may be lower or higher than the data quoted. Results shown are annual returns, which assume reinvestment of dividends and capital gains. Investment returns and principal will fluctuate and you may have a gain or loss when you sell shares. For the most current month-end performance information, please call 1-800-742-7272 or visit our Web site at www.williamblairfunds.com.
| 156 | Annual Report | December 31, 2023 |
Financial Highlights — For a share outstanding throughout each period
Emerging Markets Leaders Fund
| | | | | | | | | | | | | | Class R6 | |
| | | | | | | | | Years Ended December 31, | |
| | | 2023 | | | 2022 | | | 2021 | | | 2020 | | | 2019 | |
| Net asset value, beginning of year | | $ | 8.31 | | | $ | 11.32 | | | $ | 13.26 | | | $ | 10.51 | | | $ | 8.26 | |
| Income (loss) from investment operations: | | | | | | | | | | | | | | | | | | | | |
| Net investment income (loss) | | | 0.09 | | | | 0.06 | | | | (0.02 | ) | | | 0.00 | ^ | | | 0.06 | |
| Net realized and unrealized gain (loss) on investments | | | 0.42 | | | | (2.99 | ) | | | (0.98 | ) | | | 2.89 | | | | 2.29 | |
| Total from investment operations | | | 0.51 | | | | (2.93 | ) | | | (1.00 | ) | | | 2.89 | | | | 2.35 | |
| Less distributions from: | | | | | | | | | | | | | | | | | | | | |
| Net investment income | | | 0.07 | | | | — | | | | 0.06 | | | | 0.03 | | | | 0.08 | |
| Net realized gain | | | — | | | | 0.08 | | | | 0.88 | | | | 0.11 | | | | 0.02 | |
| Total distributions | | | 0.07 | | | | 0.08 | | | | 0.94 | | | | 0.14 | | | | 0.10 | |
| Net asset value, end of year | | $ | 8.75 | | | $ | 8.31 | | | $ | 11.32 | | | $ | 13.26 | | | $ | 10.51 | |
| Total return (%) | | | 6.22 | | | | (25.86 | ) | | | (7.35 | ) | | | 27.50 | | | | 28.45 | |
| Ratios to average daily net assets (%): | | | | | | | | | | | | | | | | | | | | |
| Expenses, before waivers and reimbursements | | | 1.08 | | | | 1.11 | | | | 1.20 | | | | 1.26 | | | | 1.23 | |
| Expenses, net of waivers and reimbursements | | | 0.94 | | | | 1.00 | | | | 1.10 | | | | 1.10 | | | | 1.15 | |
| Net investment income (loss), before waivers and reimbursements | | | 0.90 | | | | 0.50 | | | | (0.26 | ) | | | (0.11 | ) | | | 0.57 | |
| Net investment income (loss), net of waivers and reimbursements | | | 1.04 | | | | 0.61 | | | | (0.16 | ) | | | 0.05 | | | | 0.65 | |
| Class R6 net assets at the end of the year (in thousands) | | $ | 238,806 | | | $ | 321,319 | | | $ | 428,839 | | | $ | 198,015 | | | $ | 191,337 | |
| Portfolio turnover rate (%) | | | 44 | | | | 42 | | | | 40 | | | | 47 | | | | 33 | |
| ^ | Amount is less than $0.005 per share. |
Note: Net investment income (loss) per share is based on the average shares outstanding during the year.
Performance cited represents past performance. Past performance does not guarantee future results and current performance may be lower or higher than the data quoted. Results shown are annual returns, which assume reinvestment of dividends and capital gains. Investment returns and principal will fluctuate and you may have a gain or loss when you sell shares. For the most current month-end performance information, please call 1-800-742-7272 or visit our Web site at www.williamblairfunds.com.
| December 31, 2023 | William Blair Funds | 157 |
Financial Highlights — For a share outstanding throughout each period
Emerging Markets Growth Fund
| | | | | | | | | | | | | | | Class N | |
| | | | | | | | | Years Ended December 31, | |
| | | 2023 | | | 2022 | | | 2021 | | | 2020 | | | 2019 | |
| Net asset value, beginning of year | | $ | 10.35 | | | $ | 15.55 | | | $ | 18.42 | | | $ | 13.67 | | | $ | 11.14 | |
| Income (loss) from investment operations: | | | | | | | | | | | | | | | | | | | | |
| Net investment income (loss) | | | 0.06 | | | | 0.02 | | | | (0.13 | ) | | | (0.09 | ) | | | 0.11 | |
| Net realized and unrealized gain (loss) on investments | | | 0.97 | | | | (5.20 | ) | | | 0.62 | | | | 5.60 | | | | 2.98 | |
| Total from investment operations | | | 1.03 | | | | (5.18 | ) | | | 0.49 | | | | 5.51 | | | | 3.09 | |
| Less distributions from: | | | | | | | | | | | | | | | | | | | | |
| Net investment income | | | 0.03 | | | | — | | | | — | | | | — | | | | 0.16 | |
| Net realized gain | | | — | | | | 0.02 | | | | 3.36 | | | | 0.76 | | | | 0.40 | |
| Total distributions | | | 0.03 | | | | 0.02 | | | | 3.36 | | | | 0.76 | | | | 0.56 | |
| Net asset value, end of year | | $ | 11.35 | | | $ | 10.35 | | | $ | 15.55 | | | $ | 18.42 | | | $ | 13.67 | |
| Total return (%) | | | 9.99 | | | | (33.33 | ) | | | 2.97 | | | | 40.43 | | | | 27.89 | |
| Ratios to average daily net assets (%): | | | | | | | | | | | | | | | | | | | | |
| Expenses, before waivers and reimbursements | | | 1.46 | | | | 1.50 | | | | 1.55 | | | | 1.55 | | | | 1.51 | |
| Expenses, net of waivers and reimbursements | | | 1.24 | | | | 1.36 | | | | 1.55 | | | | 1.55 | | | | 1.51 | |
| Net investment income (loss), before waivers and reimbursements | | | 0.38 | | | | 0.07 | | | | (0.65 | ) | | | (0.60 | ) | | | 0.84 | |
| Net investment income (loss), net of waivers and reimbursements | | | 0.60 | | | | 0.21 | | | | (0.65 | ) | | | (0.60 | ) | | | 0.84 | |
| Class N net assets at the end of the year (in thousands) | | $ | 13,748 | | | $ | 14,664 | | | $ | 28,565 | | | $ | 18,606 | | | $ | 7,804 | |
| Portfolio turnover rate (%) | | | 58 | | | | 92 | | | | 52 | | | | 77 | | | | 79 | |
| | | | | | | | | | | | | | | Class I | |
| | | | | | | | | Years Ended December 31, | |
| | | 2023 | | | 2022 | | | 2021 | | | 2020 | | | 2019 | |
| Net asset value, beginning of year | | $ | 10.58 | | | $ | 15.85 | | | $ | 18.66 | | | $ | 13.82 | | | $ | 11.25 | |
| Income (loss) from investment operations: | | | | | | | | | | | | | | | | | | | | |
| Net investment income (loss) | | | 0.09 | | | | 0.05 | | | | (0.07 | ) | | | (0.05 | ) | | | 0.14 | |
| Net realized and unrealized gain (loss) on investments | | | 0.99 | | | | (5.30 | ) | | | 0.62 | | | | 5.66 | | | | 3.02 | |
| Total from investment operations | | | 1.08 | | | | (5.25 | ) | | | 0.55 | | | | 5.61 | | | | 3.16 | |
| Less distributions from: | | | | | | | | | | | | | | | | | | | | |
| Net investment income | | | 0.06 | | | | — | | | | — | | | | 0.01 | | | | 0.19 | |
| Net realized gain | | | — | | | | 0.02 | | | | 3.36 | | | | 0.76 | | | | 0.40 | |
| Total distributions | | | 0.06 | | | | 0.02 | | | | 3.36 | | | | 0.77 | | | | 0.59 | |
| Net asset value, end of year | | $ | 11.60 | | | $ | 10.58 | | | $ | 15.85 | | | $ | 18.66 | | | $ | 13.82 | |
| Total return (%) | | | 10.23 | | | | (33.14 | ) | | | 3.25 | | | | 40.72 | | | | 28.29 | |
| Ratios to average daily net assets (%): | | | | | | | | | | | | | | | | | | | | |
| Expenses, before waivers and reimbursements | | | 1.20 | | | | 1.24 | | | | 1.27 | | | | 1.30 | | | | 1.26 | |
| Expenses, net of waivers and reimbursements | | | 0.99 | | | | 1.11 | | | | 1.27 | | | | 1.30 | | | | 1.26 | |
| Net investment income (loss), before waivers and reimbursements | | | 0.61 | | | | 0.32 | | | | (0.37 | ) | | | (0.33 | ) | | | 1.06 | |
| Net investment income (loss), net of waivers and reimbursements | | | 0.82 | | | | 0.45 | | | | (0.37 | ) | | | (0.33 | ) | | | 1.06 | |
| Class I net assets at the end of the year (in thousands) | | $ | 173,377 | | | $ | 174,884 | | | $ | 190,985 | | | $ | 113,697 | | | $ | 73,496 | |
| Portfolio turnover rate (%) | | | 58 | | | | 92 | | | | 52 | | | | 77 | | | | 79 | |
Note: Net investment income (loss) per share is based on the average shares outstanding during the year.
Performance cited represents past performance. Past performance does not guarantee future results and current performance may be lower or higher than the data quoted. Results shown are annual returns, which assume reinvestment of dividends and capital gains. Investment returns and principal will fluctuate and you may have a gain or loss when you sell shares. For the most current month-end performance information, please call 1-800-742-7272 or visit our Web site at www.williamblairfunds.com.
| 158 | Annual Report | December 31, 2023 |
Financial Highlights — For a share outstanding throughout each period
Emerging Markets Growth Fund
| | | | | | | | | | | | | | | Class R6 | |
| | | | | | | | | Years Ended December 31, | |
| | | 2023 | | | 2022 | | | 2021 | | | 2020 | | | 2019 | |
| Net asset value, beginning of year | | $ | 10.71 | | | $ | 16.04 | | | $ | 18.84 | | | $ | 13.94 | | | $ | 11.35 | |
| Income (loss) from investment operations: | | | | | | | | | | | | | | | | | | | | |
| Net investment income (loss) | | | 0.09 | | | | 0.06 | | | | (0.05 | ) | | | (0.03 | ) | | | 0.15 | |
| Net realized and unrealized gain (loss) on investments | | | 1.01 | | | | (5.37 | ) | | | 0.63 | | | | 5.71 | | | | 3.04 | |
| Total from investment operations | | | 1.10 | | | | (5.31 | ) | | | 0.58 | | | | 5.68 | | | | 3.19 | |
| Less distributions from: | | | | | | | | | | | | | | | | | | | | |
| Net investment income | | | 0.07 | | | | — | | | | 0.02 | | | | 0.02 | | | | 0.20 | |
| Net realized gain | | | — | | | | 0.02 | | | | 3.36 | | | | 0.76 | | | | 0.40 | |
| Total distributions | | | 0.07 | | | | 0.02 | | | | 3.38 | | | | 0.78 | | | | 0.60 | |
| Net asset value, end of year | | $ | 11.74 | | | $ | 10.71 | | | $ | 16.04 | | | $ | 18.84 | | | $ | 13.94 | |
| Total return (%) | | | 10.26 | | | | (33.13 | ) | | | 3.37 | | | | 40.90 | | | | 28.28 | |
| Ratios to average daily net assets (%): | | | | | | | | | | | | | | | | | | | | |
| Expenses, before waivers and reimbursements | | | 1.08 | | | | 1.14 | | | | 1.17 | | | | 1.20 | | | | 1.19 | |
| Expenses, net of waivers and reimbursements | | | 0.94 | | | | 1.06 | | | | 1.17 | | | | 1.20 | | | | 1.19 | |
| Net investment income (loss), before waivers and reimbursements | | | 0.68 | | | | 0.41 | | | | (0.27 | ) | | | (0.22 | ) | | | 1.17 | |
| Net investment income (loss), net of waivers and reimbursements | | | 0.82 | | | | 0.49 | | | | (0.27 | ) | | | (0.22 | ) | | | 1.17 | |
| Class R6 net assets at the end of the year (in thousands) | | $ | 635,716 | | | $ | 480,586 | | | $ | 822,288 | | | $ | 1,063,433 | | | $ | 708,892 | |
| Portfolio turnover rate (%) | | | 58 | | | | 92 | | | | 52 | | | | 77 | | | | 79 | |
Note: Net investment income (loss) per share is based on the average shares outstanding during the year.
Performance cited represents past performance. Past performance does not guarantee future results and current performance may be lower or higher than the data quoted. Results shown are annual returns, which assume reinvestment of dividends and capital gains. Investment returns and principal will fluctuate and you may have a gain or loss when you sell shares. For the most current month-end performance information, please call 1-800-742-7272 or visit our Web site at www.williamblairfunds.com.
| December 31, 2023 | William Blair Funds | 159 |
Financial Highlights — For a share outstanding throughout each period
Emerging Markets ex China Growth Fund
| | | Class I | |
| | | Years Ended December 31, | |
| | | | 2023 | | | 2022(a) | |
| Net asset value, beginning of year | | | $ | 9.41 | | | $ | 10.00 | |
| Income (loss) from investment operations: | | | | | | | | | |
| Net investment income (loss) | | | | 0.08 | | | | 0.02 | |
| Net realized and unrealized gain (loss) on investments | | | | 2.25 | | | | (0.61 | ) |
| Total from investment operations | | | | 2.33 | | | | (0.59 | ) |
| Less distributions from: | | | | | | | | | |
| Net investment income | | | | 0.10 | | | | — | |
| Net realized gain | | | | — | | | | — | |
| Total distributions | | | | 0.10 | | | | — | |
| Net asset value, end of year | | | $ | 11.64 | | | $ | 9.41 | |
| Total return (%)* | | | | 24.75 | | | | (5.90 | ) |
| Ratios to average daily net assets (%)**: | | | | | | | | | |
| Expenses, before waivers and reimbursements | | | | 2.35 | | | | 2.77 | |
| Expenses, net of waivers and reimbursements | | | | 0.99 | | | | 0.99 | |
| Net investment income (loss), before waivers and reimbursements | | | | (0.58 | ) | | | (1.40 | ) |
| Net investment income (loss), net of waivers and reimbursements | | | | 0.78 | | | | 0.38 | |
| Class I net assets at the end of the year (in thousands) | | | $ | 2,841 | | | $ | 9 | |
| Portfolio turnover rate (%)* | | | | 55 | | | | 64 | |
| | | | | | | | | | |
| | | Class R6 | |
| | | Years Ended December 31, | |
| | | | 2023 | | | 2022(a) | |
| Net asset value, beginning of year | | | $ | 9.42 | | | $ | 10.00 | |
| Income (loss) from investment operations: | | | | | | | | | |
| Net investment income (loss) | | | | 0.08 | | | | 0.02 | |
| Net realized and unrealized gain (loss) on investments | | | | 2.25 | | | | (0.60 | ) |
| Total from investment operations | | | | 2.33 | | | | (0.58 | ) |
| Less distributions from: | | | | | | | | | |
| Net investment income | | | | 0.10 | | | | — | |
| Net realized gain | | | | — | | | | — | |
| Total distributions | | | | 0.10 | | | | — | |
| Net asset value, end of year | | | $ | 11.65 | | | $ | 9.42 | |
| Total return (%)* | | | | 24.75 | | | | (5.80 | ) |
| Ratios to average daily net assets (%)**: | | | | | | | | | |
| Expenses, before waivers and reimbursements | | | | 2.26 | | | | 2.78 | |
| Expenses, net of waivers and reimbursements | | | | 0.94 | | | | 0.94 | |
| Net investment income (loss), before waivers and reimbursements | | | | (0.53 | ) | | | (1.42 | ) |
| Net investment income (loss), net of waivers and reimbursements | | | | 0.79 | | | | 0.42 | |
| Class R6 net assets at the end of the year (in thousands) | | | $ | 19,169 | | | $ | 13,024 | |
| Portfolio turnover rate (%)* | | | | 55 | | | | 64 | |
| (a) | For the period from July 29, 2022 (Commencement of Operations) to December 31, 2022. |
| * | Rates are not annualized for periods less than a year. |
| ** | Rates are annualized for periods less than a year. |
Note: Net investment income (loss) per share is based on the average shares outstanding during the year.
Performance cited represents past performance. Past performance does not guarantee future results and current performance may be lower or higher than the data quoted. Results shown are annual returns, which assume reinvestment of dividends and capital gains. Investment returns and principal will fluctuate and you may have a gain or loss when you sell shares. For the most current month-end performance information, please call 1-800-742-7272 or visit our Web site at www.williamblairfunds.com.
| 160 | Annual Report | December 31, 2023 |
Financial Highlights — For a share outstanding throughout each period
Emerging Markets Small Cap Growth Fund
| | | | | | | | | | | | | | Class N | |
| | | | | | | | | Years Ended December 31, | |
| | | 2023 | | | 2022 | | | 2021 | | | 2020 | | | 2019 | |
| Net asset value, beginning of year | | $ | 16.13 | | | $ | 23.52 | | | $ | 22.22 | | | $ | 16.80 | | | $ | 13.96 | |
| Income (loss) from investment operations: | | | | | | | | | | | | | | | | | | | | |
| Net investment income (loss) | | | 0.03 | | | | (0.01 | ) | | | (0.20 | ) | | | (0.06 | ) | | | 0.00 | ^ |
| Net realized and unrealized gain (loss) on investments | | | 3.51 | | | | (6.59 | ) | | | 3.53 | | | | 5.48 | | | | 2.84 | |
| Total from investment operations | | | 3.54 | | | | (6.60 | ) | | | 3.33 | | | | 5.42 | | | | 2.84 | |
| Less distributions from: | | | | | | | | | | | | | | | | | | | | |
| Net investment income | | | 0.01 | | | | — | | | | — | | | | — | | | | — | |
| Net realized gain | | | — | | | | 0.79 | | | | 2.03 | | | | — | | | | — | |
| Total distributions | | | 0.01 | | | | 0.79 | | | | 2.03 | | | | — | | | | — | |
| Net asset value, end of year | | $ | 19.66 | | | $ | 16.13 | | | $ | 23.52 | | | $ | 22.22 | | | $ | 16.80 | |
| Total return (%) | | | 21.93 | | | | (28.12 | ) | | | 15.23 | | | | 32.26 | | | | 20.34 | |
| Ratios to average daily net assets (%): | | | | | | | | | | | | | | | | | | | | |
| Expenses, before waivers and reimbursements | | | 1.70 | | | | 1.69 | | | | 1.60 | | | | 1.77 | | | | 1.71 | |
| Expenses, net of waivers and reimbursements | | | 1.45 | | | | 1.55 | | | | 1.55 | | | | 1.55 | | | | 1.55 | |
| Net investment income (loss), before waivers and reimbursements | | | (0.07 | ) | | | (0.18 | ) | | | (0.88 | ) | | | (0.58 | ) | | | (0.14 | ) |
| Net investment income (loss), net of waivers and reimbursements | | | 0.18 | | | | (0.04 | ) | | | (0.83 | ) | | | (0.36 | ) | | | 0.02 | |
| Class N net assets at the end of the year (in thousands) | | $ | 3,857 | | | $ | 3,069 | | | $ | 4,262 | | | $ | 3,947 | | | $ | 4,025 | |
| Portfolio turnover rate (%) | | | 117 | | | | 101 | | | | 76 | | | | 119 | | | | 142 | |
| | | | | | | | | | | | | | | | | | | | | |
| | | | | | | | | | | | | | Class I | |
| | | | | | | | | Years Ended December 31, | |
| | | 2023 | | | 2022 | | | 2021 | | | 2020 | | | 2019 | |
| Net asset value, beginning of year | | $ | 16.37 | | | $ | 23.79 | | | $ | 22.40 | | | $ | 16.90 | | | $ | 14.03 | |
| Income (loss) from investment operations: | | | | | | | | | | | | | | | | | | | | |
| Net investment income (loss) | | | 0.07 | | | | 0.04 | | | | (0.14 | ) | | | (0.02 | ) | | | 0.04 | |
| Net realized and unrealized gain (loss) on investments | | | 3.57 | | | | (6.67 | ) | | | 3.56 | | | | 5.53 | | | | 2.86 | |
| Total from investment operations | | | 3.64 | | | | (6.63 | ) | | | 3.42 | | | | 5.51 | | | | 2.90 | |
| Less distributions from: | | | | | | | | | | | | | | | | | | | | |
| Net investment income | | | 0.05 | | | | — | | | | — | | | | 0.01 | | | | 0.03 | |
| Net realized gain | | | — | | | | 0.79 | | | | 2.03 | | | | — | | | | — | |
| Total distributions | | | 0.05 | | | | 0.79 | | | | 2.03 | | | | 0.01 | | | | 0.03 | |
| Net asset value, end of year | | $ | 19.96 | | | $ | 16.37 | | | $ | 23.79 | | | $ | 22.40 | | | $ | 16.90 | |
| Total return (%) | | | 22.25 | | | | (27.93 | ) | | | 15.51 | | | | 32.60 | | | | 20.58 | |
| Ratios to average daily net assets (%): | | | | | | | | | | | | | | | | | | | | |
| Expenses, before waivers and reimbursements | | | 1.43 | | | | 1.40 | | | | 1.31 | | | | 1.45 | | | | 1.40 | |
| Expenses, net of waivers and reimbursements | | | 1.20 | | | | 1.30 | | | | 1.30 | | | | 1.30 | | | | 1.30 | |
| Net investment income (loss), before waivers and reimbursements | | | 0.18 | | | | 0.11 | | | | (0.59 | ) | | | (0.25 | ) | | | 0.18 | |
| Net investment income (loss), net of waivers and reimbursements | | | 0.41 | | | | 0.21 | | | | (0.58 | ) | | | (0.10 | ) | | | 0.28 | |
| Class I net assets at the end of the year (in thousands) | | $ | 134,297 | | | $ | 108,401 | | | $ | 171,994 | | | $ | 151,302 | | | $ | 142,885 | |
| Portfolio turnover rate (%) | | | 117 | | | | 101 | | | | 76 | | | | 119 | | | | 142 | |
| ^ | Amount is less than $0.005 per share. |
Note: Net investment income (loss) per share is based on the average shares outstanding during the year.
Performance cited represents past performance. Past performance does not guarantee future results and current performance may be lower or higher than the data quoted. Results shown are annual returns, which assume reinvestment of dividends and capital gains. Investment returns and principal will fluctuate and you may have a gain or loss when you sell shares. For the most current month-end performance information, please call 1-800-742-7272 or visit our Web site at www.williamblairfunds.com.
| December 31, 2023 | William Blair Funds | 161 |
Financial Highlights — For a share outstanding throughout each period
Emerging Markets Small Cap Growth Fund
| | | | | | | | | | | | | | | Class R6 | |
| | | | | | | | | Years Ended December 31, | |
| | | 2023 | | | 2022 | | | 2021 | | | 2020 | | | 2019 | |
| Net asset value, beginning of year | | $ | 16.41 | | | $ | 23.84 | | | $ | 22.44 | | | $ | 16.93 | | | $ | 14.06 | |
| Income (loss) from investment operations: | | | | | | | | | | | | | | | | | | | | |
| Net investment income (loss) | | | 0.08 | | | | 0.05 | | | | (0.12 | ) | | | (0.00) | ^ | | | 0.05 | |
| Net realized and unrealized gain (loss) on investments | | | 3.59 | | | | (6.69 | ) | | | 3.56 | | | | 5.53 | | | | 2.86 | |
| Total from investment operations | | | 3.67 | | | | (6.64 | ) | | | 3.44 | | | | 5.53 | | | | 2.91 | |
| Less distributions from: | | | | | | | | | | | | | | | | | | | | |
| Net investment income | | | 0.06 | | | | — | | | | 0.01 | | | | 0.02 | | | | 0.04 | |
| Net realized gain | | | — | | | | 0.79 | | | | 2.03 | | | | — | | | | — | |
| Total distributions | | | 0.06 | | | | 0.79 | | | | 2.04 | | | | 0.02 | | | | 0.04 | |
| Net asset value, end of year | | $ | 20.02 | | | $ | 16.41 | | | $ | 23.84 | | | $ | 22.44 | | | $ | 16.93 | |
| Total return (%) | | | 22.37 | | | | (27.91 | ) | | | 15.58 | | | | 32.66 | | | | 20.69 | |
| Ratios to average daily net assets (%): | | | | | | | | | | | | | | | | | | | | |
| Expenses, before waivers and reimbursements | | | 1.32 | | | | 1.31 | | | | 1.23 | | | | 1.36 | | | | 1.33 | |
| Expenses, net of waivers and reimbursements | | | 1.15 | | | | 1.25 | | | | 1.23 | | | | 1.25 | | | | 1.25 | |
| Net investment income (loss), before waivers and reimbursements | | | 0.29 | | | | 0.18 | | | | (0.49 | ) | | | (0.14 | ) | | | 0.27 | |
| Net investment income (loss), net of waivers and reimbursements | | | 0.46 | | | | 0.24 | | | | (0.49 | ) | | | (0.03 | ) | | | 0.35 | |
| Class R6 net assets at the end of the year (in thousands) | | $ | 251,558 | | | $ | 211,203 | | | $ | 324,152 | | | $ | 152,160 | | | $ | 130,711 | |
| Portfolio turnover rate (%) | | | 117 | | | | 101 | | | | 76 | | | | 119 | | | | 142 | |
| ^ | Amount is less than $0.005 per share. |
Note: Net investment income (loss) per share is based on the average shares outstanding during the year.
Performance cited represents past performance. Past performance does not guarantee future results and current performance may be lower or higher than the data quoted. Results shown are annual returns, which assume reinvestment of dividends and capital gains. Investment returns and principal will fluctuate and you may have a gain or loss when you sell shares. For the most current month-end performance information, please call 1-800-742-7272 or visit our Web site at www.williamblairfunds.com.
| 162 | Annual Report | December 31, 2023 |
Financial Highlights — For a share outstanding throughout each period
China Growth Fund
| | | | | | | | | Class I | |
| | | Years Ended December 31, | |
| | | 2023 | | | 2022 | | | 2021(a) | |
| Net asset value, beginning of year | | $ | 6.46 | | | $ | 9.54 | | | $ | 10.00 | |
| Income (loss) from investment operations: | | | | | | | | | | | | |
| Net investment income (loss) | | | 0.05 | | | | 0.03 | | | | (0.04 | ) |
| Net realized and unrealized gain (loss) on investments | | | (1.62 | ) | | | (3.11 | ) | | | (0.42 | ) |
| Total from investment operations | | | (1.57 | ) | | | (3.08 | ) | | | (0.46 | ) |
| Less distributions from: | | | | | | | | | | | | |
| Net investment income | | | 0.02 | | | | — | | | | — | |
| Net realized gain | | | — | | | | — | | | | — | |
| Total distributions | | | 0.02 | | | | — | | | | — | |
| Net asset value, end of year | | $ | 4.87 | | | $ | 6.46 | | | $ | 9.54 | |
| Total return (%)* | | | (24.28 | ) | | | (32.43 | ) | | | (4.40 | ) |
| Ratios to average daily net assets (%)**: | | | | | | | | | | | | |
| Expenses, before waivers and reimbursements | | | 9.78 | | | | 5.31 | | | | 4.74 | |
| Expenses, net of waivers and reimbursements | | | 0.99 | | | | 1.01 | | | | 1.05 | |
| Net investment income (loss), before waivers and reimbursements | | | (7.93 | ) | | | (3.90 | ) | | | (4.69 | ) |
| Net investment income (loss), net of waivers and reimbursements | | | 0.86 | | | | 0.40 | | | | (1.00 | ) |
| Class I net assets at the end of the year (in thousands) | | $ | 160 | | | $ | 509 | | | $ | 5,538 | |
| Portfolio turnover rate (%)* | | | 97 | | | | 36 | | | | 4 | |
| | | | | | | | | Class R6 | |
| | | Years Ended December 31, | |
| | | 2023 | | | 2022 | | | 2021(a) | |
| Net asset value, beginning of year | | $ | 6.45 | | | $ | 9.54 | | | $ | 10.00 | |
| Income (loss) from investment operations: | | | | | | | | | | | | |
| Net investment income (loss) | | | 0.04 | | | | 0.02 | | | | (0.03 | ) |
| Net realized and unrealized gain (loss) on investments | | | (1.61 | ) | | | (3.11 | ) | | | (0.43 | ) |
| Total from investment operations | | | (1.57 | ) | | | (3.09 | ) | | | (0.46 | ) |
| Less distributions from: | | | | | | | | | | | | |
| Net investment income | | | 0.03 | | | | 0.00 | ^ | | | — | |
| Net realized gain | | | — | | | | — | | | | — | |
| Total distributions | | | 0.03 | | | | 0.00 | ^ | | | — | |
| Net asset value, end of year | | $ | 4.85 | | | $ | 6.45 | | | $ | 9.54 | |
| Total return (%)* | | | (24.38 | ) | | | (32.49 | ) | | | (4.40 | ) |
| Ratios to average daily net assets (%)**: | | | | | | | | | | | | |
| Expenses, before waivers and reimbursements | | | 9.75 | | | | 5.27 | | | | 4.72 | |
| Expenses, net of waivers and reimbursements | | | 0.94 | | | | 0.96 | | | | 1.00 | |
| Net investment income (loss), before waivers and reimbursements | | | (8.08 | ) | | | (4.01 | ) | | | (4.61 | ) |
| Net investment income (loss), net of waivers and reimbursements | | | 0.73 | | | | 0.30 | | | | (0.89 | ) |
| Class R6 net assets at the end of the year (in thousands) | | $ | 1,687 | | | $ | 1,438 | | | $ | 1,687 | |
| Portfolio turnover rate (%)* | | | 97 | | | | 36 | | | | 4 | |
| (a) | For the period from August 27, 2021 (Commencement of Operations) to December 31, 2021. |
| * | Rates are not annualized for periods less than a year. |
| ** | Rates are annualized for periods less than a year. |
| ^ | Amount is less than $0.005 per share. |
Note: Net investment income (loss) per share is based on the average shares outstanding during the year.
Performance cited represents past performance. Past performance does not guarantee future results and current performance may be lower or higher than the data quoted. Results shown are annual returns, which assume reinvestment of dividends and capital gains. Investment returns and principal will fluctuate and you may have a gain or loss when you sell shares. For the most current month-end performance information, please call 1-800-742-7272 or visit our Web site at www.williamblairfunds.com.
| December 31, 2023 | William Blair Funds | 163 |
Financial Highlights — For a share outstanding throughout each period
Emerging Markets Debt Fund
| | | | | | | | | Class I | |
| | | Years Ended December 31, | |
| | | 2023 | | | 2022 | | | 2021(a) | |
| Net asset value, beginning of year | | $ | 7.44 | | | $ | 9.59 | | | $ | 10.00 | |
| Income (loss) from investment operations: | | | | | | | | | | | | |
| Net investment income (loss) | | | 0.52 | | | | 0.48 | | | | 0.27 | |
| Net realized and unrealized gain (loss) on investments | | | 0.44 | | | | (2.10 | ) | | | (0.40 | ) |
| Total from investment operations | | | 0.96 | | | | (1.62 | ) | | | (0.13 | ) |
| Less distributions from: | | | | | | | | | | | | |
| Net investment income | | | 0.48 | | | | 0.51 | | | | 0.28 | |
| Net realized gain | | | — | | | | — | | | | — | |
| Return of capital | | | 0.03 | | | | 0.02 | | | | — | |
| Total distributions | | | 0.51 | | | | 0.53 | | | | 0.28 | |
| Net asset value, end of year | | $ | 7.89 | | | $ | 7.44 | | | $ | 9.59 | |
| Total return (%)* | | | 13.41 | | | | (16.93 | ) | | | (1.39 | ) |
| Ratios to average daily net assets (%)**: | | | | | | | | | | | | |
| Expenses, before waivers and reimbursements | | | 1.26 | | | | 1.28 | | | | 1.24 | |
| Expenses, net of waivers and reimbursements | | | 0.70 | | | | 0.70 | | | | 0.70 | |
| Net investment income (loss), before waivers and reimbursements | | | 6.42 | | | | 5.39 | | | | 4.02 | |
| Net investment income (loss), net of waivers and reimbursements | | | 6.98 | | | | 5.97 | | | | 4.56 | |
| Class I net assets at the end of the year (in thousands) | | $ | 3,205 | | | $ | 923 | | | $ | 1,484 | |
| Portfolio turnover rate (%)* | | | 106 | | | | 118 | | | | 72 | |
| | | | | | | | | Class R6 | |
| | | Years Ended December 31, | |
| | | 2023 | | | 2022 | | | 2021(a) | |
| Net asset value, beginning of year | | $ | 7.44 | | | $ | 9.59 | | | $ | 10.00 | |
| Income (loss) from investment operations: | | | | | | | | | | | | |
| Net investment income (loss) | | | 0.53 | | | | 0.48 | | | | 0.28 | |
| Net realized and unrealized gain (loss) on investments | | | 0.42 | | | | (2.09 | ) | | | (0.41 | ) |
| Total from investment operations | | | 0.95 | | | | (1.61 | ) | | | (0.13 | ) |
| Less distributions from: | | | | | | | | | | | | |
| Net investment income | | | 0.48 | | | | 0.52 | | | | 0.28 | |
| Net realized gain | | | — | | | | — | | | | — | |
| Return of capital | | | 0.03 | | | | 0.02 | | | | — | |
| Total distributions | | | 0.51 | | | | 0.54 | | | | 0.28 | |
| Net asset value, end of year | | $ | 7.88 | | | $ | 7.44 | | | $ | 9.59 | |
| Total return (%)* | | | 13.48 | | | | (16.95 | ) | | | (1.32 | ) |
| Ratios to average daily net assets (%)**: | | | | | | | | | | | | |
| Expenses, before waivers and reimbursements | | | 1.17 | | | | 1.20 | | | | 1.17 | |
| Expenses, net of waivers and reimbursements | | | 0.65 | | | | 0.65 | | | | 0.65 | |
| Net investment income (loss), before waivers and reimbursements | | | 6.52 | | | | 5.50 | | | | 4.10 | |
| Net investment income (loss), net of waivers and reimbursements | | | 7.04 | | | | 6.05 | | | | 4.62 | |
| Class R6 net assets at the end of the year (in thousands) | | $ | 50,231 | | | $ | 44,903 | | | $ | 50,010 | |
| Portfolio turnover rate (%)* | | | 106 | | | | 118 | | | | 72 | |
| (a) | For the period from May 25, 2021 (Commencement of Operations) to December 31, 2021. |
| * | Rates are not annualized for periods less than a year. |
| ** | Rates are annualized for periods less than a year. |
Note: Net investment income (loss) per share is based on the average shares outstanding during the year.
Performance cited represents past performance. Past performance does not guarantee future results and current performance may be lower or higher than the data quoted. Results shown are annual returns, which assume reinvestment of dividends and capital gains. Investment returns and principal will fluctuate and you may have a gain or loss when you sell shares. For the most current month-end performance information, please call 1-800-742-7272 or visit our Web site at www.williamblairfunds.com.
| 164 | Annual Report | December 31, 2023 |
REPORT OF INDEPENDENT REGISTERED PUBLIC ACCOUNTING FIRM
To the Shareholders and the Board of Trustees of William Blair Funds
Opinion on the Financial Statements
We have audited the accompanying statements of assets and liabilities of William Blair Funds (the “Trust”) (comprising Growth Fund, Large Cap Growth Fund, Mid Cap Value Fund, Small-Mid Cap Core Fund, Small-Mid Cap Growth Fund, Small-Mid Cap Value Fund, Small Cap Growth Fund, Small Cap Value Fund, Global Leaders Fund, International Leaders Fund, International Growth Fund, Institutional International Growth Fund, International Small Cap Growth Fund, Emerging Markets Leaders Fund, Emerging Markets Growth Fund, Emerging Markets ex China Growth Fund, Emerging Markets Small Cap Growth Fund, China Growth Fund, and Emerging Markets Debt Fund (collectively referred to as the “Funds”)), including the portfolios of investments, as of December 31, 2023, and the related statements of operations and changes in net assets, and the financial highlights for each of the periods indicated in the table below and the related notes (collectively referred to as the “financial statements”). In our opinion, the financial statements present fairly, in all material respects, the financial position of each of the Funds comprising William Blair Funds at December 31, 2023, the results of their operations, changes in net assets and financial highlights for each of the periods indicated in the table below, in conformity with U.S. generally accepted accounting principles.
| Funds comprising the William Blair Funds | Statements
of operations | Statements
of changes
in net assets | Financial
highlights |
Growth Fund
Large Cap Growth Fund
Small-Mid Cap Growth Fund
Small Cap Growth Fund
Global Leaders Fund
International Leaders Fund
International Growth Fund
Institutional International Growth Fund
International Small Cap Growth Fund
Emerging Markets Leaders Fund
Emerging Markets Growth Fund
Emerging Markets Small Cap Growth Fund | For the year ended December 31, 2023 | For each of the two years in the period ended December 31, 2023 | For each of the five years in the period ended December 31, 2023 |
| Small-Mid Cap Core Fund | For the year ended December 31, 2023 | For each of the two years in the period ended December 31, 2023 | For each of the four years in the period ended December 31, 2023 and the period from October 1, 2019 (commencement of operations) through December 31, 2019 |
| China Growth Fund | For the year ended December 31, 2023 | For each of the two years in the period ended December 31, 2023 | For each of the two years in the period ended December 31, 2023 and the period from August 27, 2021 (commencement of operations) through December 31, 2021 |
| Emerging Markets Debt Fund | For the year ended December 31, 2023 | For each of the two years in the period ended December 31, 2023 | For each of the two years in the period ended December 31, 2023 and the period from May 25, 2021 (commencement of operations) through December 31, 2021 |
| December 31, 2023 | William Blair Funds | 165 |
| Funds comprising the William Blair Funds | Statements
of operations | Statements
of changes
in net assets | Financial
highlights |
| Small Cap Value Fund | For the year ended December 31, 2023 | For each of the two years in the period ended December 31, 2023 | For each of the two years in the period ended December 31, 2023 and the period from November 1, 2021 through December 31, 2021 and the year ended October 31, 2021 |
| Mid Cap Value Fund | For the year ended December 31, 2023 | For the year ended December 31, 2023 and the period from March 16, 2022 (commencement of operations) through December 31, 2022 |
| Emerging Markets ex China Growth Fund | For the year ended December 31, 2023 | For the year ended December 31, 2023 and the period from July 29, 2022 (commencement of operations) through December 31, 2022 |
| Small-Mid Cap Value Fund | For the period from August 17, 2023 (commencement of operations) through December 31, 2023 |
The financial highlights for each of the two years in the period ended October 31, 2020 for the Small Cap Value Fund were audited by other auditors whose report dated December 21, 2020, expressed an unqualified opinion on the financial statements and financial highlights.
Basis for Opinion
These financial statements are the responsibility of the Trust’s management. Our responsibility is to express an opinion on each of the Funds’ financial statements based on our audits. We are a public accounting firm registered with the Public Company Accounting Oversight Board (United States) (“PCAOB”) and are required to be independent with respect to the Trust in accordance with the U.S. federal securities laws and the applicable rules and regulations of the Securities and Exchange Commission and the PCAOB.
We conducted our audits in accordance with the standards of the PCAOB. Those standards require that we plan and perform the audit to obtain reasonable assurance about whether the financial statements are free of material misstatement, whether due to error or fraud. The Trust is not required to have, nor were we engaged to perform, an audit of the Trust’s internal control over financial reporting. As part of our audits, we are required to obtain an understanding of internal control over financial reporting but not for the purpose of expressing an opinion on the effectiveness of the Trust’s internal control over financial reporting. Accordingly, we express no such opinion.
Our audits included performing procedures to assess the risks of material misstatement of the financial statements, whether due to error or fraud, and performing procedures that respond to those risks. Such procedures included examining, on a test basis, evidence regarding the amounts and disclosures in the financial statements. Our procedures included confirmation of securities owned as of December 31, 2023, by correspondence with the custodian and brokers, when replies were not received from brokers, we performed other auditing procedures. Our audits also included evaluating the accounting principles used and significant estimates made by management, as well as evaluating the overall presentation of the financial statements. We believe that our audits provide a reasonable basis for our opinion.

We have served as the auditor of one or more William Blair investment companies since 1989.
Chicago, Illinois
February 23, 2024
| 166 | Annual Report | December 31, 2023 |
APPROVAL OF THE MANAGEMENT AGREEMENT FOR THE WILLIAM BLAIR
SMALL-MID CAP VALUE FUND
On April 26, 2023, the Board of Trustees (the “Board”) of William Blair Funds (the “Trust”), including the Trustees who are not interested persons of the Trust as defined by the Investment Company Act of 1940, as amended (the “Independent Trustees”), approved the management agreement between the Trust, on behalf of the William Blair Small-Mid Cap Value Fund (the “Fund”), and William Blair Investment Management, LLC (the “Adviser”). The Independent Trustees met independently of Trust management and the interested Trustees of the Trust to consider the approval of the management agreement. The Independent Trustees reviewed materials provided by the Adviser and Broadridge for the approval of the management agreement and were assisted by independent legal counsel in making their determination. The Board determined that, given the totality of the information provided with respect to the management agreement, the Board had received sufficient information to consider the approval of the management agreement. The Board considered the following factors in making its determination, but did not identify any single factor or group of factors as all important or controlling and considered all factors together.
Nature, Quality and Extent of Services. In evaluating the nature, quality and extent of the services expected to be provided by the Adviser to the Fund, the Board noted that the Adviser is a quality firm with a reputation for integrity and honesty that employs high quality people. The Board considered that the Adviser also manages other series of the Trust and that the Board is familiar with the background and experience of the Fund’s portfolio managers. The Board considered the extensive information it receives from the Adviser in connection with the annual contract renewal process including financial information regarding the Adviser. The Board considered the previous experience of the Fund’s portfolio management team members with value-style investments in small-cap and mid-cap companies. The Board also considered the Adviser’s experience in managing new funds and investing in the proposed Fund’s asset class and that the Adviser serves as investment adviser to the other series of the Trust. Based upon all relevant factors, the Board concluded that the nature, quality and extent of the services to be provided by the Adviser to the Fund were expected to be satisfactory.
Fees and Expenses. The Board reviewed the proposed advisory fee for the Fund and reviewed information comparing the Fund’s advisory fee to an expense peer group and an expense peer universe of institutional funds provided by Broadridge. The Broadridge expense peer group for the Fund consisted of the Fund (which Broadridge classified as a mid-cap value fund), 12 (no-load) institutional small-cap core funds and 2 (no-load) institutional small-cap value funds, as classified by Broadridge. The Broadridge expense peer universe for the Fund consisted of the Fund, the Fund’s Broadridge expense peer group and all other institutional mid-cap value, small-cap core and small-cap value funds, excluding outliers.
In considering the information, the Board noted that the proposed advisory fee for the Fund was below the median and the average contractual management fees of the expense peer group. The Board also considered that the Adviser had proposed to limit total operating expenses, including waiving advisory fees for each share class of the Fund, until April 30, 2025. On the basis of the information provided, the Board concluded that the proposed advisory fee for the Fund was reasonable in light of the nature, quality and extent of services expected to be provided by the Adviser.
Profitability. With respect to the estimated profitability of the Management Agreement to the Adviser with respect to the Fund, the Board considered the Fund’s proposed advisory fee, that the Fund was newly organized and had no assets, the Adviser’s agreement to limit total expenses until April 30, 2025 for Class I and Class R6 shares. The Board also considered that the Adviser will be incurring all expenses related to the organization of the Fund.
Economies of Scale. The Board considered the extent to which economies of scale would be realized as the Fund grows and whether fee levels reflect these economies of scale for the benefit of investors. In considering whether fee levels reflect economies of scale for the benefit of Fund investors, the Board reviewed the Fund’s advisory fee compared to peer funds and the Fund’s estimated expense ratios giving effect to the Adviser’s agreement to limit total expenses until April 30, 2025, and concluded that the advisory fee for the Fund was reasonable.
Other Benefits to the Adviser. The Board considered benefits to be derived by the Adviser from its relationship with the Trust based on information provided during the annual contract renewal process, including receipt of research from brokerage firms, reimbursement of some intermediary fees in the nature of sub-transfer agency fees and favorable media coverage. The Board concluded that, after taking into account these benefits, the proposed advisory fee for the Fund was reasonable.
Conclusion. Based upon the information considered and the conclusions reached, the Board determined that the terms of the Management Agreement are fair and reasonable and that the approval of the Management Agreement is in the best interests of the Fund.
| December 31, 2023 | William Blair Funds | 167 |
Trustees and Officers (Unaudited).† The trustees and officers of the William Blair Funds, their year of birth, their principal occupations during the last five years, their affiliations, if any, with William Blair, and other significant affiliations are set forth below. The address of each officer and trustee is 150 North Riverside Plaza, Chicago, Illinois 60606.
| Name and Year of Birth | | Position(s)
Held with
Trust | | Term of
Office(1) and
Length of
Time
Served | | Principal
Occupation(s)
During Past 5 Years | | Number of
Portfolios
in Trust
Complex
Overseen
by Trustee | | Other Directorships
Held by Trustee
During Past 5 Years* |
| Interested Trustees | | | | | | | | | | |
Stephanie G. Braming, CFA,
1970(2) | | Chairman of the Board and President, previously Senior Vice President | | Chairman of the Board and President since 2018, and Senior Vice President 2014 to 2018 | | Global Head of Investment Management since 2017, portfolio manager (2014 to 2017) and Partner, William Blair | | 19 | | Chairman, William Blair SICAV |
Cissie Citardi,
1975(2) | | Trustee | | Since 2021 | | General Counsel (since 2021), Deputy General Counsel (May 2020 to December 2020) and Partner, William Blair; formerly, General Counsel, PineBridge Investments (2016-2020) | | 19 | | Director, William Blair SICAV |
| Non-Interested Trustees | | | | | | | | | | |
Vann A. Avedisian,
1964 | | Trustee | | Since 2012 | | Co-founder and Partner, Newbond Holdings (real estate operations) (since 2021); formerly, Principal, Highgate Holdings (hotel investments) (2009-2021); co-founder and Managing Director, Oxford Capital Partners Inc. (1994 to 2006) | | 19 | | Potbelly Sandwich Works (2001 to 2015 and since 2021)(3) |
Kathleen T. Barr,
1955 | | Trustee | | Since 2013 | | Retired; Chair Emeritus, Independent Directors Council (since 2022); formerly, Chairman of the Governing Council, Independent Directors Council (2020 to 2022); formerly, President, Productive Capital Management, Inc. (registered investment adviser to public entities) and Owner, KT Barr Consulting, LLC (mutual fund and investment management consulting) (2010 to 2013); prior thereto, Chief Administrative Officer, Senior Vice President and Senior Managing Director of Allegiant Asset Management Company (merged with PNC Capital Advisors, LLC in 2009) (2004 to 2010) | | 19 | | Muzinich BDC, Inc. (since 2019) and Muzinich Corporate Lending Income Fund, Inc. (since 2023); Board of Governors, Investment Company Institute (since 2019); Professionally Managed Portfolios (since 2018) |
| † | William Blair Investment Management, LLC and William Blair & Company, L.L.C. are collectively referred to in this section as “William Blair”, each of which is a wholly owned subsidiary of WBC Holdings, L.P., which is wholly owned by certain William Blair employees (employee owners are referred to as ‘partners’). |
| | |
| * | Includes directorships of public companies and other registered investment companies held during the past five years. |
| 168 | Annual Report | December 31, 2023 |
| Name and Year of Birth | | Position(s)
Held with
Trust | | Term of
Office(1) and
Length of
Time
Served | | Principal
Occupation(s)
During Past 5 Years | | Number of
Portfolios
in Trust
Complex
Overseen
by Trustee | | Other Directorships
Held by Trustee
During Past 5 Years* |
Daniel N. Leib,
1966(4) | | Trustee | | Since 2016 | | Chief Executive Officer, Donnelley Financial Solutions, Inc. (since 2016); formerly, Executive Vice President and Chief Financial Officer (2011 to 2016) and Group Chief Financial Officer (2009 to 2011), R.R. Donnelley & Sons Company | | 19 | | Donnelley Financial Solutions, Inc. (since 2016) |
Dorri C. McWhorter,
1973 | | Trustee | | Since 2019 | | President and Chief Executive Officer, YMCA of Metropolitan Chicago (since 2021); formerly, Chief Executive Officer, YWCA Metropolitan Chicago (2013 to 2021); Partner, Crowe LLP (2008 to 2013)(5) | | 19 | | Highland Funds (since 2022); Skyway Concession Company, LLC (since 2018); Illinois CPA Society (since 2017); Lifeway Foods, Inc. (since 2020); Green Thumb Industries (2022); LanzaTech Global (since 2023) |
Thomas J. Skelly,
1951 | | Trustee | | Since 2007 | | Advisory Board Member for various U.S. companies (since 2005); formerly, Managing Partner of various divisions at Accenture (1994 to 2004) | | 19 | | Mutual Trust Financial Group (provider of insurance and investment products) |
Steven R. Zenz,
1954 | | Trustee | | Since 2018 | | Consultant, Steven R. Zenz Consulting LLC (merger and acquisition transactions and SEC reporting and filings) (since 2011); formerly, Partner, KPMG LLP (1987 to 2010)(6) | | 19 | | Engine Media Holdings, Inc. (media group supporting esports, news streaming and gaming) (2020 to 2021); Frankly Inc. (technology products/services for media industry) (2016 to 2020); Insignia Systems, Inc. (in-store advertising services for consumer packaged goods manufacturers) (2013 to 2019) |
| (1) | Each Trustee serves until the election and qualification of a successor, or until death, resignation or retirement, or removal as provided in the Trust’s Declaration of Trust. Retirement for Independent Trustees occurs no later than at the conclusion of the calendar year that occurs after the earlier of (a) the Independent Trustee’s 75th birthday or (b) the 17th anniversary of the date that the Independent Trustee became a member of the Board of Trustees. |
| (2) | Ms. Braming and Ms. Citardi are interested persons of the Trust because they are partners of William Blair, and with respect to Ms. Braming also due to her position as an officer of the Trust. |
| (3) | On February 9, 2021, Potbelly Corporation (“Potbelly”) entered into a securities purchase agreement with accredited purchasers, pursuant to which Potbelly agreed to issue and sell to the purchasers in a private placement an aggregate of (i) 3,249,668 shares of Potbelly’s common stock, par value $0.01 per share and (ii) warrants to purchase an aggregate of 1,299,861 shares of common stock, for an aggregate purchase price of $15.9 million (the “Offering”). The Offering closed on February 12, 2021. WBC acted as the sole placement agent for the Offering and received fees from Potbelly of approximately $1,025,000. |
| (4) | The Trust and William Blair use Donnelley Financial Solutions, Inc. (“DFS’’) for financial printing and other services. DFS is a public company. The Trust and William Blair in the aggregate paid DFS approximately $252,000 and $295,000 in 2021 and 2022, respectively, for the services provided. DFS’s revenue was approximately $993 million in 2021 and $834 million in 2022. Mr. Leib, as the Chief Executive Officer of DFS, is not directly involved in any of the services provided to the Trust or William Blair and his compensation is not materially affected by the fees DFS receives from the Trust and William Blair. |
| (5) | As a former partner of the audit firm Crowe LLP (formerly, Crowe Horwath LLP), Ms. McWhorter received distributions of her capital in the firm over time and those distributions were completed in March 2021. The Trust and William Blair made no payments to Crowe LLP over the past three years. |
| (6) | The Trust engages KPMG to provide foreign tax services in Taiwan. KPMG does not provide audit or audit-related services to the Trust. Mr. Zenz is a former partner of KPMG and receives pension/retirement funds from KPMG. |
| December 31, 2023 | William Blair Funds | 169 |
| Name and Year of Birth | | Position(s) Held
with Trust | | Term of Office
and Length of
Time Served(1) | | Principal Occupation(s)
During Past 5 Years |
| | | | | | | |
| Officers | | | | | | |
| | | | | | | |
Alaina Anderson, CFA,
1975 | | Senior Vice President | | Since 2021 | | Partner, William Blair |
| | | | | | | |
Marcelo Assalin, CFA,
1973 | | Senior Vice President | | Since 2020 | | Partner, William Blair (since 2022); formerly, Associate, William Blair (2020-2021); NN Investment Partners (formerly, ING Investment Management) (2013-2020) |
| | | | | | | |
Daniel Crowe, CFA,
1972 | | Senior Vice President | | Since 2016 | | Partner, William Blair |
| | | | | | | |
Robert J. Duwa, CFA,
1967 | | Senior Vice President | | Since 2019 | | Partner, William Blair |
| | | | | | | |
Simon Fennell,
1969 | | Senior Vice President | | Since 2013 | | Partner, William Blair |
| | | | | | | |
David C. Fording, CFA,
1967 | | Senior Vice President | | Since 2006 | | Partner, William Blair |
| | | | | | | |
James S. Golan, CFA,
1961 | | Senior Vice President | | Since 2005 | | Partner, William Blair |
| | | | | | | |
William V. Heaphy, CFA,
1967 | | Senior Vice President | | Since 2021 | | Associate, William Blair (since 2021); formerly, Principal, Investment Counselors of Maryland, LLC (1994-2021) |
| | | | | | | |
Kenneth J. McAtamney,
1966 | | Senior Vice President | | Since 2008 | | Partner, William Blair |
| | | | | | | |
Todd M. McClone, CFA,
1968 | | Senior Vice President | | Since 2005 | | Partner, William Blair |
| | | | | | | |
D.J. Neiman, CFA,
1975 | | Senior Vice President | | Since 2021 | | Partner, William Blair |
| | | | | | | |
Casey K. Preyss, CFA,
1976 | | Senior Vice President | | Since 2015 | | Partner, William Blair |
| | | | | | | |
David P. Ricci, CFA,
1958 | | Senior Vice President | | Since 2006 | | Partner, William Blair |
| | | | | | | |
Lisa D. Rusch,
1970 | | Senior Vice President Vice President | | Since 2020 2018-2020 | | Partner, William Blair (since 2020); formerly, Associate, William Blair |
| | | | | | | |
Hugo Scott-Gall,
1971 | | Senior Vice President | | Since 2021 | | Partner, William Blair (since 2018); formerly, Managing Director, Goldman Sachs International (1998-2018) |
| | | | | | | |
Ward D. Sexton, CFA,
1974 | | Senior Vice President | | Since 2016 | | Partner, William Blair |
| | | | | | | |
Andrew Siepker, CFA,
1981 | | Senior Vice President | | Since 2022 | | Partner, William Blair (since 2019); formerly, Associate, William Blair |
| | | | | | | |
| 170 | Annual Report | December 31, 2023 |
| Name and Year of Birth | | Position(s) Held
with Trust | | Term of Office
and Length of
Time Served(1) | | Principal Occupation(s)
During Past 5 Years |
| | | | | | | |
Mark C. Thompson, CFA,
1976 | | Senior Vice President | | Since 2020 | | Partner, William Blair |
| | | | | | | |
Vivian Lin Thurston, CFA,
1972 | | Senior Vice President | | Since 2021 | | Partner, William Blair |
| | | | | | | |
Dan Zelazny,
1971 | | Senior Vice President | | Since 2019 | | Partner, William Blair (since 2024); formerly, Associate, William Blair (2019-2023); formerly, Managing Director, AQR Capital Management (2011-2019) |
| | | | | | | |
Nicholas Zimmerman, CFA,
1980 | | Senior Vice President | | Since 2023 | | Partner, William Blair (since 2022); formerly, Associate, William Blair |
| | | | | | | |
Paul Birchenough,
1982 | | Vice President | | Since 2024 | | Associate, William Blair (since 2024); formerly, Newton Investment Managers (2020-2024); formerly, AXA Investment Managers (2011-2020) |
| | | | | | | |
Matthew Fleming, CFA,
1973 | | Vice President | | Since 2022 | | Associate, William Blair (since 2021); formerly, Investment Counselors of Maryland, LLC (2008-2021) |
| | | | | | | |
Gary J. Merwitz,
1970 | | Vice President | | Since 2021 | | Associate, William Blair (since 2021); formerly, Principal, Investment Counselors of Maryland, LLC (2004-2021) |
| | | | | | | |
Marco Ruijer, CFA,
1975 | | Vice President | | Since 2020 | | Associate, William Blair (since 2020); formerly, NN Investment Partners (formerly, ING Investment Management) (2013-2020) |
| | | | | | | |
Ian Smith,
1978 | | Vice President | | Since 2024 | | Associate, William Blair (since 2024); formerly, Newton Investment Managers (2020-2024); formerly, AXA Investment Managers (2012-2020) |
| | | | | | | |
John M. Raczek,
1970 | | Treasurer Assistant Treasurer | | Since 2019 2010-2019 | | Associate, William Blair |
| | | | | | | |
Andrew T. Pfau,
1970 | | Secretary | | Since 2009 | | Associate, William Blair |
| | | | | | | |
David M. Cihak,
1982 | | Assistant Treasurer | | Since 2019 | | Associate, William Blair |
| | | | | | | |
Walter R. Randall, Jr.,
1960 | | Chief Compliance Officer and Assistant Secretary | | Since 2009 | | Associate, William Blair |
| | | | | | | |
Daniel Carey,
1977 | | Chief Legal Officer and Assistant Secretary | | Since 2023 | | Associate, William Blair |
| (1) | The Trust’s Officers, except the Chief Compliance Officer, are elected annually by the Board of Trustees. The Trust’s Chief Compliance Officer is designated by the Board of Trustees and may only be removed by action of the Board of Trustees, including a majority of Independent Trustees. Length of Time Served for all Officers indicates the year the individual became an Officer of the Trust. |
The Statement of Additional Information for the William Blair Funds includes additional information about the trustees and is available without charge by calling 1-800-635-2886 (in Massachusetts 1-800-635-2840) or by writing the Fund.
| December 31, 2023 | William Blair Funds | 171 |
(Unaudited)
Proxy Voting
A description of the policies and procedures that the Funds use to determine how to vote proxies relating to portfolio securities and information regarding how the Funds voted proxies relating to portfolio securities for the most recent 12-month period ended June 30 are available without charge, upon request, by calling 1-800-635-2886 (in Massachusetts 1-800-635-2840), at www.williamblairfunds.com and on the SEC’s website at http://www.sec.gov.
Quarterly Portfolio Schedules
Each Fund files its complete schedule of portfolio holdings with the SEC for the first and third fiscal quarters of each fiscal year (quarters ended March 31 and September 30) on Form N-PORT. The Funds’ Forms N-PORT are available on the SEC’s website at http://www.sec.gov.
Additional Federal Income Tax Information:
Under Section 852(b)(3)(C) of the Code, the Funds hereby designate the following amounts as capital gain dividends for the fiscal year ended December 31, 2023 (in thousands):
| Fund | | Capital Gain Dividend |
| Growth | | $ | 24,248 | |
| Small-Mid Cap Growth | | | 151,303 | |
| Small Cap Growth | | | 11,518 | |
| Small Cap Value | | | 29,835 | |
| Global Leaders | | | 6,749 | |
| International Growth | | | 43,927 | |
| Institutional International Growth | | | 15,350 | |
| | | | | |
| 172 | Annual Report | December 31, 2023 |
Useful Information About Your Report (Unaudited)
Please refer to this information when reviewing the Expense Example for each Fund.
Expense Example
As a shareholder of a Fund, you incur two types of costs: (1) transaction costs and (2) ongoing costs, including management fees, distribution (12b-1) fees (for Class N shares, as applicable), and other Fund expenses. The example is intended to help you understand your ongoing costs (in dollars) of investing in the Fund and to compare these costs with the ongoing costs of investing in other mutual funds. To do so, compare the Fund’s 5% hypothetical example with the 5% hypothetical examples that appear in the shareholder reports of other funds. The example is based on an investment of $1,000 invested at the beginning of the period and held for the entire six-month period from July 1, 2023 to December 31, 2023.
Actual Expenses
In each example, the first line for each share class in the table provides information about the actual account values and actual expenses. These expenses reflect the effect of any expense cap applicable to the share class during the period. Without this expense cap, the costs shown in the table would have been higher. You may use the information in this line, together with the amount you invested, to estimate the expenses that you paid over the period. Simply divide your account value by $1,000 (example, an $8,600 account value divided by $1,000 = 8.6), then multiply the result by the number in the first line under the heading entitled “Expenses Paid During the Period” to estimate the expenses you paid on your account during the period.
Hypothetical Example for Comparison Purposes
In each example, the second line for each share class in the table provides information about hypothetical account values and hypothetical expenses based on the Fund’s actual expense ratio and an assumed rate of return of 5% per year before expenses. This is not the Fund’s actual return. The hypothetical account values and expenses may not be used to estimate your actual ending account balance or the expenses you paid for the period. You may use this information to compare the ongoing costs of investing in the Fund to the costs of investing in other funds. To do so, compare this 5% hypothetical example with the 5% hypothetical examples that appear in the shareholder reports of other funds.
Please note that the expenses shown in both examples are meant to highlight your ongoing costs only and do not reflect any transactional costs or account type fees. These fees are discussed in the prospectus. Therefore, the second line of each share class in the table is useful in comparing ongoing costs only and will not help you determine the relative costs of owning different funds. In addition, if these transactional costs or account fees were included, your costs would have been higher.
| December 31, 2023 | William Blair Funds | 173 |
Fund Expenses (Unaudited)
| Expense Example | | Beginning
Account Value
7/1/2023 | | Ending
Account Value
12/31/2023 | | Expenses Paid
During
the Period (a) | | Annualized
Expense Ratio |
| Growth Fund | | | | | | | | | | |
| Class N-actual return | | $1,000.00 | | $1,095.21 | | | $6.34 | | 1.20 | % |
| Class N-hypothetical 5% return | | $1,000.00 | | $1,043.95 | | | $6.18 | | 1.20 | |
| Class I-actual return | | $1,000.00 | | $1,095.46 | | | $4.81 | | 0.91 | |
| Class I-hypothetical 5% return | | $1,000.00 | | $1,045.41 | | | $4.69 | | 0.91 | |
| Class R6-actual return | | $1,000.00 | | $1,095.86 | | | $4.60 | | 0.87 | |
| Class R6-hypothetical 5% return | | $1,000.00 | | $1,045.61 | | | $4.49 | | 0.87 | |
| Large Cap Growth Fund | | | | | | | | | | |
| Class N-actual return | | $1,000.00 | | $1,121.15 | | | $4.81 | | 0.90 | |
| Class N-hypothetical 5% return | | $1,000.00 | | $1,045.46 | | | $4.64 | | 0.90 | |
| Class I-actual return | | $1,000.00 | | $1,122.04 | | | $3.48 | | 0.65 | |
| Class I-hypothetical 5% return | | $1,000.00 | | $1,046.72 | | | $3.35 | | 0.65 | |
| Class R6-actual return | | $1,000.00 | | $1,123.06 | | | $3.21 | | 0.60 | |
| Class R6-hypothetical 5% return | | $1,000.00 | | $1,046.98 | | | $3.10 | | 0.60 | |
| Mid Cap Value Fund | | | | | | | | | | |
| Class I-actual return | | $1,000.00 | | $1,069.29 | | | $3.91 | | 0.75 | |
| Class I-hypothetical 5% return | | $1,000.00 | | $1,046.22 | | | $3.87 | | 0.75 | |
| Class R6-actual return | | $1,000.00 | | $1,069.80 | | | $3.65 | | 0.70 | |
| Class R6-hypothetical 5% return | | $1,000.00 | | $1,046.47 | | | $3.61 | | 0.70 | |
| Small-Mid Cap Core Fund | | | | | | | | | | |
| Class I-actual return | | $1,000.00 | | $1,048.08 | | | $4.90 | | 0.95 | |
| Class I-hypothetical 5% return | | $1,000.00 | | $1,045.21 | | | $4.90 | | 0.95 | |
| Class R6-actual return | | $1,000.00 | | $1,047.81 | | | $4.65 | | 0.90 | |
| Class R6-hypothetical 5% return | | $1,000.00 | | $1,045.46 | | | $4.64 | | 0.90 | |
| Small-Mid Cap Growth Fund | | | | | | | | | | |
| Class N-actual return | | $1,000.00 | | $1,053.70 | | | $6.42 | | 1.24 | |
| Class N-hypothetical 5% return | | $1,000.00 | | $1,043.75 | | | $6.39 | | 1.24 | |
| Class I-actual return | | $1,000.00 | | $1,054.75 | | | $5.13 | | 0.99 | |
| Class I-hypothetical 5% return | | $1,000.00 | | $1,045.01 | | | $5.10 | | 0.99 | |
| Class R6-actual return | | $1,000.00 | | $1,054.92 | | | $4.87 | | 0.94 | |
| Class R6-hypothetical 5% return | | $1,000.00 | | $1,045.26 | | | $4.85 | | 0.94 | |
| Small-Mid Cap Value Fund | | | | | | | | | | |
| Class I-actual return (b) | | $1,000.00 | | $1,064.55 | | | $3.27 | | 0.85 | |
| Class I-hypothetical 5% return (6 month period) | | $1,000.00 | | $1,046.83 | | | $3.24 | | 0.85 | |
| Class R6-actual return (b) | | $1,000.00 | | $1,065.01 | | | $3.08 | | 0.80 | |
| Class R6-hypothetical 5% return (6 month period) | | $1,000.00 | | $1,047.02 | | | $3.05 | | 0.80 | |
| Small Cap Growth Fund | | | | | | | | | | |
| Class N-actual return | | $1,000.00 | | $1,044.10 | | | $6.39 | | 1.24 | |
| Class N-hypothetical 5% return | | $1,000.00 | | $1,043.75 | | | $6.39 | | 1.24 | |
| Class I-actual return | | $1,000.00 | | $1,045.32 | | | $5.10 | | 0.99 | |
| Class I-hypothetical 5% return | | $1,000.00 | | $1,045.01 | | | $5.10 | | 0.99 | |
| Class R6-actual return | | $1,000.00 | | $1,045.81 | | | $4.85 | | 0.94 | |
| Class R6-hypothetical 5% return | | $1,000.00 | | $1,045.26 | | | $4.85 | | 0.94 | |
| Small Cap Value Fund | | | | | | | | | | |
| Class N-actual return | | $1,000.00 | | $1,085.17 | | | $5.83 | | 1.11 | |
| Class N-hypothetical 5% return | | $1,000.00 | | $1,044.40 | | | $5.72 | | 1.11 | |
| Class I-actual return | | $1,000.00 | | $1,086.61 | | | $4.68 | | 0.89 | |
| Class I-hypothetical 5% return | | $1,000.00 | | $1,045.51 | | | $4.59 | | 0.89 | |
| Class R6-actual return | | $1,000.00 | | $1,086.89 | | | $4.16 | | 0.79 | |
| Class R6-hypothetical 5% return | | $1,000.00 | | $1,046.02 | | | $4.07 | | 0.79 | |
| Global Leaders Fund | | | | | | | | | | |
| Class N-actual return | | $1,000.00 | | $1,035.17 | | | $5.90 | | 1.15 | |
| Class N-hypothetical 5% return | | $1,000.00 | | $1,044.20 | | | $5.93 | | 1.15 | |
| Class I-actual return | | $1,000.00 | | $1,037.21 | | | $4.62 | | 0.90 | |
| Class I-hypothetical 5% return | | $1,000.00 | | $1,045.46 | | | $4.64 | | 0.90 | |
| Class R6-actual return | | $1,000.00 | | $1,037.08 | | | $4.36 | | 0.85 | |
| Class R6-hypothetical 5% return | | $1,000.00 | | $1,045.72 | | | $4.38 | | 0.85 | |
| | | |
| 174 | Annual Report | December 31, 2023 |
Fund Expenses (Unaudited)
| Expense Example | | Beginning
Account Value
7/1/2023 | | Ending
Account Value
12/31/2023 | | Expenses Paid
During
the Period (a) | | Annualized
Expense Ratio |
| International Leaders Fund | | | | | | | | | | |
| Class N-actual return | | $1,000.00 | | $1,012.31 | | | $5.83 | | 1.15 | % |
| Class N-hypothetical 5% return | | $1,000.00 | | $1,044.20 | | | $5.93 | | 1.15 | |
| Class I-actual return | | $1,000.00 | | $1,013.33 | | | $4.57 | | 0.90 | |
| Class I-hypothetical 5% return | | $1,000.00 | | $1,045.46 | | | $4.64 | | 0.90 | |
| Class R6-actual return | | $1,000.00 | | $1,013.82 | | | $4.31 | | 0.85 | |
| Class R6-hypothetical 5% return | | $1,000.00 | | $1,045.72 | | | $4.38 | | 0.85 | |
| International Growth Fund | | | | | | | | | | |
| Class N-actual return | | $1,000.00 | | $1,036.00 | | | $6.36 | | 1.24 | |
| Class N-hypothetical 5% return | | $1,000.00 | | $1,043.75 | | | $6.39 | | 1.24 | |
| Class I-actual return | | $1,000.00 | | $1,037.01 | | | $5.08 | | 0.99 | |
| Class I-hypothetical 5% return | | $1,000.00 | | $1,045.01 | | | $5.10 | | 0.99 | |
| Class R6-actual return | | $1,000.00 | | $1,037.48 | | | $4.83 | | 0.94 | |
| Class R6-hypothetical 5% return | | $1,000.00 | | $1,045.26 | | | $4.85 | | 0.94 | |
| Institutional International Growth Fund | | | | | | | | | | |
| Institutional Class-actual return | | $1,000.00 | | $1,034.93 | | | $4.82 | | 0.94 | |
| Institutional Class-hypothetical 5% return | | $1,000.00 | | $1,045.26 | | | $4.85 | | 0.94 | |
| International Small Cap Growth Fund | | | | | | | | | | |
| Class N-actual return | | $1,000.00 | | $1,053.01 | | | $6.99 | | 1.35 | |
| Class N-hypothetical 5% return | | $1,000.00 | | $1,043.19 | | | $6.95 | | 1.35 | |
| Class I-actual return | | $1,000.00 | | $1,054.12 | | | $5.70 | | 1.10 | |
| Class I-hypothetical 5% return | | $1,000.00 | | $1,044.45 | | | $5.67 | | 1.10 | |
| Class R6-actual return | | $1,000.00 | | $1,054.34 | | | $5.44 | | 1.05 | |
| Class R6-hypothetical 5% return | | $1,000.00 | | $1,044.71 | | | $5.41 | | 1.05 | |
| Emerging Markets Leaders Fund | | | | | | | | | | |
| Class N-actual return | | $1,000.00 | | $1,010.93 | | | $6.29 | | 1.24 | |
| Class N-hypothetical 5% return | | $1,000.00 | | $1,043.75 | | | $6.39 | | 1.24 | |
| Class I-actual return | | $1,000.00 | | $1,013.78 | | | $5.03 | | 0.99 | |
| Class I-hypothetical 5% return | | $1,000.00 | | $1,045.01 | | | $5.10 | | 0.99 | |
| Class R6-actual return | | $1,000.00 | | $1,013.39 | | | $4.77 | | 0.94 | |
| Class R6-hypothetical 5% return | | $1,000.00 | | $1,045.26 | | | $4.85 | | 0.94 | |
| Emerging Markets Growth Fund | | | | | | | | | | |
| Class N-actual return | | $1,000.00 | | $1,045.33 | | | $6.39 | | 1.24 | |
| Class N-hypothetical 5% return | | $1,000.00 | | $1,043.75 | | | $6.39 | | 1.24 | |
| Class I-actual return | | $1,000.00 | | $1,046.88 | | | $5.11 | | 0.99 | |
| Class I-hypothetical 5% return | | $1,000.00 | | $1,045.01 | | | $5.10 | | 0.99 | |
| Class R6-actual return | | $1,000.00 | | $1,046.86 | | | $4.85 | | 0.94 | |
| Class R6-hypothetical 5% return | | $1,000.00 | | $1,045.26 | | | $4.85 | | 0.94 | |
| Emerging Markets ex China Growth Fund | | | | | | | | | | |
| Class I-actual return | | $1,000.00 | | $1,099.16 | | | $5.24 | | 0.99 | |
| Class I-hypothetical 5% return | | $1,000.00 | | $1,045.01 | | | $5.10 | | 0.99 | |
| Class R6-actual return | | $1,000.00 | | $1,099.33 | | | $4.97 | | 0.94 | |
| Class R6-hypothetical 5% return | | $1,000.00 | | $1,045.26 | | | $4.85 | | 0.94 | |
| Emerging Markets Small Cap Growth Fund | | | | | | | | | | |
| Class N-actual return | | $1,000.00 | | $1,089.63 | | | $7.37 | | 1.40 | |
| Class N-hypothetical 5% return | | $1,000.00 | | $1,042.94 | | | $7.21 | | 1.40 | |
| Class I-actual return | | $1,000.00 | | $1,090.56 | | | $6.06 | | 1.15 | |
| Class I-hypothetical 5% return | | $1,000.00 | | $1,044.20 | | | $5.93 | | 1.15 | |
| Class R6-actual return | | $1,000.00 | | $1,091.36 | | | $5.80 | | 1.10 | |
| Class R6-hypothetical 5% return | | $1,000.00 | | $1,044.45 | | | $5.67 | | 1.10 | |
| China Growth Fund | | | | | | | | | | |
| Class I-actual return | | $1,000.00 | | $890.93 | | | $4.72 | | 0.99 | |
| Class I-hypothetical 5% return | | $1,000.00 | | $1,045.01 | | | $5.10 | | 0.99 | |
| Class R6-actual return | | $1,000.00 | | $891.68 | | | $4.48 | | 0.94 | |
| Class R6-hypothetical 5% return | | $1,000.00 | | $1,045.26 | | | $4.85 | | 0.94 | |
| | | |
| December 31, 2023 | William Blair Funds | 175 |
Fund Expenses (Unaudited)
| Expense Example | | Beginning
Account Value
7/1/2023 | | Ending
Account Value
12/31/2023 | | Expenses Paid
During
the Period (a) | | Annualized
Expense Ratio |
| Emerging Markets Debt Fund | | | | | | | | | | |
| Class I-actual return | | $1,000.00 | | $1,078.89 | | | $3.67 | | 0.70 | % |
| Class I-hypothetical 5% return | | $1,000.00 | | $1,046.47 | | | $3.61 | | 0.70 | |
| Class R6-actual return | | $1,000.00 | | $1,079.27 | | | $3.41 | | 0.65 | |
| Class R6-hypothetical 5% return | | $1,000.00 | | $1,046.72 | | | $3.35 | | 0.65 | |
| (a) | Expenses are equal to the annualized expense ratio, multiplied by the average account value over the period, multiplied by the number of days in the period, 184 and divided by 365 (to reflect the one-half year period). |
| (b) | For the period August 17, 2023 (Commencement of Operations) to December 31, 2023. |
| 176 | Annual Report | December 31, 2023 |
| | BOARD OF TRUSTEES (as of February 23, 2024) |
| | |
| | Vann A. Avedisian |
| | Co-founder and Partner, Newbond Holdings |
| | Kathleen T. Barr |
| | Retired Senior Managing Director, PNC Capital Advisors, LLC |
| | Stephanie G. Braming, CFA, Chairman and President |
| | Partner, William Blair |
| | Cissie Citardi |
| | Partner, William Blair |
| | Daniel N. Leib |
| | Chief Executive Officer, Donnelley Financial Solutions, Inc. |
| | Dorri C. McWhorter |
| | President and Chief Executive Officer, YMCA of Metropolitan Chicago |
| | Thomas J. Skelly |
| | Retired Managing Partner, Accenture |
| | Steven R. Zenz |
| | Retired Partner, KPMG LLP |
| | |
| | Officers |
| | |
| | Alaina Anderson, CFA, Senior Vice President |
| | Marcelo Assalin, CFA, Senior Vice President |
| | Daniel Crowe, CFA, Senior Vice President |
| | Robert J. Duwa, CFA, Senior Vice President |
| | Simon Fennell, Senior Vice President |
| | David C. Fording, CFA, Senior Vice President |
| | James S. Golan, CFA, Senior Vice President |
| | William V. Heaphy, CFA, Senior Vice President |
| | Kenneth J. McAtamney, Senior Vice President |
| | Todd M. McClone, CFA, Senior Vice President |
| | D.J. Neiman, CFA, Senior Vice President |
| | Casey K. Preyss, CFA, Senior Vice President |
| | David P. Ricci, CFA, Senior Vice President |
| | Lisa D. Rusch, Senior Vice President |
| | Hugo Scott-Gall, Senior Vice President |
| | Ward D. Sexton, CFA, Senior Vice President |
| | Andrew Siepker, CFA, Senior Vice President |
| | Mark C. Thompson, CFA, Senior Vice President |
| | Vivian Lin Thurston, CFA, Senior Vice President |
| | Dan Zelazny, Senior Vice President |
| | Nicholas Zimmerman, CFA, Senior Vice President |
| | Paul Birchenough, Vice President |
| | Matthew Fleming, CFA, Vice President |
| | Gary J. Merwitz, Vice President |
| | Marco Ruijer, CFA, Vice President |
| | Ian Smith, Vice President |
| | John M. Raczek, Treasurer |
| | Andrew T. Pfau, Secretary |
| | David M. Cihak, Assistant Treasurer |
| | Walter R. Randall, Jr., Chief Compliance Officer and Assistant Secretary |
| | Daniel Carey, Chief Legal Officer and Assistant Secretary |
| | Investment Adviser |
| | William Blair Investment Management, LLC |
| | Distributor |
| | William Blair & Company, L.L.C. |
| | Independent Registered Public Accounting Firm |
| | Ernst & Young LLP |
| | Transfer Agent |
| | SS&C GIDS, Inc. |
| | For customer assistance, call 1-800-635-2886 |
| | P.O. Box 219137 |
| | Kansas City, Missouri 64121-9137 |
| | | |
| December 31, 2023 | William Blair Funds | 177 |
| | | | | | |
| | William Blair Funds | | | | |
| | | | | | |
| | U.S. EQUITY | | GLOBAL EQUITY | | EMERGING MARKETS DEBT Emerging Markets Debt Fund |
| | Growth Fund | | Global Leaders Fund | |
| | Large Cap Growth Fund | | | |
| | Mid Cap Value Fund | | INTERNATIONAL EQUITY | |
| | Small-Mid Cap Core Fund | | International Leaders Fund | | |
| | Small-Mid Cap Growth Fund | | International Growth Fund | | |
| | Small-Mid Cap Value Fund | | Institutional International Growth Fund | | |
| | Small Cap Growth Fund | | International Small Cap Growth Fund | | |
| | Small Cap Value Fund | | Emerging Markets Leaders Fund | | |
| | | | Emerging Markets Growth Fund | | |
| | | | Emerging Markets ex China Growth Fund | | |
| | | | Emerging Markets Small Cap Growth Fund | | |
| | | | China Growth Fund | | |
| | | © | William Blair & Company, L.L.C., distributor | |
 | +1 800 742 7272 williamblairfunds.com | | 150 North Riverside Plaza Chicago, Illinois 60606 | 00103188 |
(a) As of the end of the period covered by this report, the Registrant has adopted a code of ethics (the “Code”) that applies to its principal executive officer and principal financial officer (the “Covered Officers”).
(b) No disclosures are required pursuant to this Item 2(b).
(c) During the period covered by the report, the Registrant did not make any amendment to a provision of the Code.
(d) During the period covered by the report, the Registrant did not grant any waivers, including implicit waivers, from the provisions of the Code.
(e) Not applicable.
(f) A copy of the Code is filed as Exhibit 14(a)(1) to this Form N-CSR.
| Item 3. | Audit Committee Financial Expert |
The Registrant’s Board of Trustees has determined that the Registrant has at least one “audit committee financial expert” (as defined in Item 3 of Form N-CSR) serving on its Audit Committee. Mr. Daniel N. Leib, the Registrant’s audit committee financial expert, is “independent” for purposes of Item 3 to Form N-CSR.
An “audit committee financial expert” is not an “expert” for any purpose, including for purposes of Section 11 of the Securities Act of 1933, as a result of being designated as an “audit committee financial expert.” Further, the designation of a person as an “audit committee financial expert” does not mean that the person has any greater duties, obligations, or liability than those imposed on the person without the “audit committee financial expert” designation. Similarly, the designation of a person as an “audit committee financial expert” does not affect the duties, obligations, or liability of any other member of the audit committee or Board of Trustees.
| Item 4. | Principal Accountant Fees and Services |
Audit Fees
For the fiscal years ended December 31, 2022 and 2023, Ernst & Young LLP, the Registrant’s principal accountant (“E&Y”), billed the Registrant $489,200 and $492,900, respectively, for professional services rendered for the audit of the Registrant’s annual financial statements or services that are normally provided in connection with statutory and regulatory filings.
Audit-Related Fees
For the fiscal years ended December 31, 2022 and 2023, E&Y billed the Registrant $0 and $0, respectively, for assurance and related services that are reasonably related to the performance of the audit of the Registrant’s financial statements and that are not reported above. For the fiscal years ended December 31, 2022 and 2023, E&Y provided no audit-related services to William Blair Investment Management, LLC, the Registrant’s investment adviser (“William Blair”), or any of its control affiliates that were for engagements directly related to the Registrant’s operations and financial reporting.
Tax Fees
For the fiscal years ended December 31, 2022 and 2023, E&Y billed the Registrant $194,140 and $325,408, respectively, for professional services rendered for tax compliance, tax advice and tax planning. Such services consisted of preparation of tax returns, year-end distribution review, qualifying dividend income analysis and review of year-end tax reporting. For the fiscal years ended December 31, 2022 and 2023, E&Y did not bill William Blair and its control affiliates for any services that were for engagements directly related to the Registrant’s operations and financial reporting.
All Other Fees
For the fiscal years ended December 31, 2022 and 2023, E&Y did not bill the Registrant for products and services other than the services reported above. For the fiscal year ended December 31, 2022 and 2023, E&Y provided no other services to William Blair or any of its control affiliates that were for engagements directly related to the Registrant’s operations and financial reporting.
Audit Committee Pre-Approval Policies and Procedures
Pursuant to the Registrant’s Audit Committee Charter (the “Charter”), the Audit Committee is responsible for pre-approving any engagement of the principal accountant to provide non-prohibited services to the Registrant, including the fees and other compensation to be paid to the principal accountant, to the extent required by Rule 2-01(c)(7) of Regulation S-X. Pursuant to the Charter, the Audit Committee is also responsible for pre-approving any engagement of the principal accountant, including the fees and other compensation to be paid to the principal accountant, to provide non-audit services to the Registrant’s investment adviser (or any entity controlling, controlled by, or under common control with the adviser that provides ongoing services to the Registrant), if the engagement relates directly to the operations and financial reporting of the Registrant, to the extent required by Rule 2-01(c)(7) of Regulation S-X. The Chair of the Audit Committee may grant the pre-approval referenced above for non-prohibited and non-audit services. All such delegated pre-approvals will be presented to the Audit Committee no later than the next Audit Committee meeting. None of the Audit-Related and Tax Services billed by E&Y for the fiscal years ended December 31, 2022 and 2023 discussed above were approved by the Audit Committee pursuant to a waiver of these Pre-Approval Policies and Procedures.
Non-Audit Fees
For the fiscal years ended December 31, 2022 and 2023, E&Y billed the Trust $194,140 and $325,408, respectively, in non-audit fees (tax services). For the same periods, E&Y billed the Adviser and its control affiliates $0 and $0, respectively, in non-audit fees.
Auditor Branch or Office Located in Foreign Jurisdiction
Not applicable to this Registrant.
Foreign Issuer
Not applicable to this Registrant.
| Item 5. | Audit Committee of Listed Registrants |
Not applicable to this Registrant, insofar as the Registrant is not a listed company.
| Item 6. | Schedule of Investments |
See Schedule of Investments in Item 1 with respect to Item 6(a).
Item 6(b) is not applicable to this filing.
| Item 7. | Disclosure of Proxy Voting Policies and Procedures for Closed-End Management Investment Companies |
Not applicable to this Registrant, insofar as the Registrant is not a closed-end management investment company.
| Item 8. | Portfolio Managers of Closed-End Management Investment Companies |
Not applicable to this Registrant, insofar as the Registrant is not a closed-end management investment company.
| Item 9. | Purchase of Equity Securities by Closed-End Management Investment Companies and Affiliated Purchasers |
Not applicable to this Registrant, insofar as the Registrant is not a closed-end management investment company.
| Item 10. | Submission of Matters to a Vote of Security Holders |
There have been no material changes to the procedures by which shareholders may recommend nominees to the Registrant’s Board of Trustees since the Registrant last provided disclosure in response to this item.
Controls and Procedures
(a) The Registrant’s principal executive and principal financial officers, or persons performing similar functions, have concluded that the Registrant’s Disclosure Controls and Procedures (as defined in Rule 30a-3(c) under the Investment Company Act of 1940, as amended (the “1940 Act”) (17 CFR 270.30a-3(c)) are effective, as of a date within 90 days of the filing date of this report that includes the disclosure required by this paragraph, based on their evaluation of these controls and procedures required by Rule 30a-3 (b) under the 1940 Act (17 CFR 270.30a-3(b) and Rules 13a-15(b) or 15d-15(b) under the Securities Exchange Act of 1934, as amended to date (17 CFR 240.13a-15(b) or 240.15d-15(b)).
(b) There were no changes in the Registrant’s internal control over financial reporting (as defined in Rule 30a-3(d) under the 1940 Act (17 CFR 270.30a-3(d)) that occurred during the period covered by this report that has materially affected, or is reasonably likely to materially affect, the Registrant’s internal control over financial reporting.
| Item 12. | Disclosure of Securities Lending Activities for Closed-End Management Investment Companies |
Not applicable to this Registrant, insofar as the Registrant is not a closed-end management investment company.
| Item 13. | Recovery of Erroneously Awarded Compensation |
(a) Not applicable.
(b) Not applicable.
14. (a) (1) Code of Ethics required by Item 2 is filed as an exhibit hereto.
14. (a) (2) (1)
Certification of Principal Executive Officer Required by Rule 30a-2(a) of the Investment Company Act of 1940 is filed as an exhibit hereto.
14. (a) (2) (2)
Certification of Principal Financial Officer Required by Rule 30a-2(a) of the Investment Company Act of 1940 is filed as an exhibit hereto.
14. (a) (3)
Not applicable to this Registrant.
14. (a) (4)
Not applicable to this filing.
14. (b)
Certifications of the Principal Executive Officer and Principal Financial Officer of the issuer as required by Rule 30a-2(b) of the Investment Company Act of 1940 are filed as exhibits hereto.
SIGNATURES
Pursuant to the requirements of the Securities Exchange Act of 1934 and the Investment Company Act of 1940, the Registrant has duly caused this report to be signed on its behalf by the undersigned, thereunto duly authorized.
| | | William Blair Funds |
| | |
| | | /s/ Stephanie G. Braming |
| By: | | Stephanie G. Braming |
| | | President (Principal Executive Officer) |
Date: February 23, 2024
Pursuant to the requirements of the Securities Exchange Act of 1934 and the Investment Company Act of 1940, this report has been signed below by the following persons on behalf of the Registrant and in the capacities and on the dates indicated.
| | | /s/ Stephanie G. Braming |
| By: | | Stephanie G. Braming |
| | | President (Principal Executive Officer) |
Date: February 23, 2024
| | | /s/ John M. Raczek |
| By: | | John M. Raczek |
| | | Treasurer (Principal Financial Officer) |
Date: February 23, 2024