UNITED STATES
SECURITIES AND EXCHANGE COMMISSION
Washington, D.C. 20549
Form N-CSR
CERTIFIED SHAREHOLDER REPORT OF REGISTERED
MANAGEMENT INVESTMENT COMPANIES
Investment Company Act File Number 811-5344
William Blair Funds
(Exact name of registrant as specified in charter)
| 150 North Riverside Plaza, Chicago, IL | | 60606 |
| (Address of principal executive offices) | | (Zip Code) |
Stephanie G. Braming, Principal Executive Officer
William Blair Funds
150 North Riverside Plaza, Chicago, IL 60606
(Name and address of agent for service)
Registrant’s telephone number, including area code: 312-236-1600
Date of fiscal year end: December 31
Date of reporting period: December 31, 2022
Item 1. December 31, 2022 Annual Reports transmitted to shareholders.
 | |
| | |
| | |
| | |
| | |
| | |
| | |
| | |
| | December 31, 2022 |
William Blair Funds
Annual Report | |
| | | | |
| | | | |
| | | | |
| | | | |
| | | | |
| | | | |
| | | | |
| | | | |
| | | | |
| | | | |
| | | | |
| | | | |
| December 31, 2022 | William Blair Funds | 1 |
The views expressed in the commentary for each Fund reflect those of the portfolio management team only through the end of the period of the report as stated on the cover. The portfolio management team’s views are subject to change at any time based on market and other conditions and should not be construed as a recommendation. Statements involving predictions, assessments, analyses, or outlook for individual securities, industries, market sectors, and/or markets involve risks and uncertainties, and there is no guarantee they will come to pass.
This report is submitted for the general information of the shareholders of William Blair Funds. It is not authorized for distribution to prospective Fund investors unless accompanied or preceded by the Fund’s prospectus. Please carefully consider a Fund’s investment objectives, risks, charges, and expenses before investing. This and other information is contained in the Fund’s prospectus, which you may obtain by calling 1-800-742-7272. Read it carefully before you invest or send money.
| 2 | Annual Report | December 31, 2022 |
U.S. Growth & Core Market Review and Outlook
U.S. equity indices were broadly positive during the fourth quarter. Together with negative returns in the three prior quarters, U.S. equities still ended the year in substantially negative territory as 2022 marked the worst year since 2008 for the S&P 500 Index.
During the first half of the year, the market was largely dominated by elevated inflation and monetary tightening by the U.S. Federal Reserve (Fed) which broadly pressured equity valuations. Valuation compression associated with higher interest rates was fairly indiscriminate, and on a relative basis, benefited the least expensive, and in some cases, lower quality equities most. In March, the Fed implemented the first increase of the target federal funds rate in this cycle. With record-high gasoline prices, elevated mortgage rates, lower asset prices and higher food costs, consumer sentiment weakened, as did other economic data points. At the same time, the labor market and corporate earnings remained resilient.
Mid-year, a brief equity market rally was fueled by optimism that inflation would moderate, requiring fewer rate increases by the Fed. This sentiment faded, along with stock prices, after the Fed reiterated its priority was to tame inflation, potentially at the expense of economic growth.
U.S. equity indices recovered somewhat in the fourth quarter as investors responded positively to moderating inflation. The Fed continued to act aggressively in the quarter and raised the target federal funds rate by 125 basis points, for a total of 425 basis points in 2022. After rising throughout the year, 10-year Treasury bond yields peaked in late October, offering a reprieve to pressured valuations. U.S. corporate earnings remained resilient, though forward estimates softened, and management commentary generally reflected considerable uncertainty looking ahead.
As we look forward to 2023, there are indications that higher quality investments should fare better in the coming year. Investors expect interest rates to continue to rise, albeit at a slower pace than in 2022, assuming inflation continues to moderate. We believe the majority of valuation pressure from rising interest rates should already be embedded in stocks. In contrast to 2022, we believe market performance in 2023 will likely be tied more closely to fundamentals than valuation differences.
Given the lagged impact, the effects of interest rate increases will likely have a more meaningful impact on the U.S. economy in 2023. We believe that a slowing economy and generally weaker demand relative to this past year may necessitate costs come into equilibrium with slower revenue growth. This implies risk to corporate earnings. Moreover, as an era of near-zero rates ends, capital sources for more speculative equities are likely to diminish, focusing more on near-term fundamentals.
Quality companies, which have the financial independence to continue to invest in their operations and the business model flexibility to adjust quickly in a dynamic environment, have in our view become increasingly attractive investment opportunities against this backdrop. Pricing flexibility, for example, will be critical if inflationary pressures from labor and materials persist and overall demand weakens. This scenario would likely cause pressure on margins and earnings disappointments for the average company. We believe companies with strong management teams, superior business models and solid financials would be in a better position to navigate such headwinds. In addition, higher quality investments did not materially outperform during the sell-off in 2022, resulting in compelling valuations for these businesses as we look ahead.
| December 31, 2022 | William Blair Funds | 3 |
U.S. Value Market Review and Outlook
The drivers of equity market performance in 2022 can be summed up in one word: inflation. Throughout the first quarter, the prices of key commodities grew at unprecedented rates. While these factors were already on an upward trajectory entering 2022, the Russian invasion of Ukraine on February 24th caused a surge in commodity prices. Interest rates followed a similarly volatile path as the U.S. Federal Reserve (Fed) took a hawkish posture to combat against the potential for inflation to become ingrained. For much of the second quarter tension built as it appeared that the Fed’s actions of consecutive interest rate hikes and increasing hawkish rhetoric were having limited success in containing upward pressure on prices. The debate among economists and investors quickly shifted to how aggressive the Fed was willing to be and how much collateral damage to the economy was acceptable to reduce inflation. At its June meeting, the Fed responded by raising rates an additional 75 basis points and promised additional monetary tightening. At the annual mid-August gathering of Fed officials in Jackson Hole, Wyoming, Fed Chair Jerome Powell communicated to financial markets that inflation remained a concern for the economy and that the Fed was likely to continue to aggressively raise interest rates in response. More importantly, Powell signaled that the Fed had effectively abandoned its previous cautious approach and desire to avoid economic collateral damage when he said, “reducing inflation is likely to require a sustained period of below-trend growth, some softening labor market conditions, and some pain to households and businesses.” Indeed, this commentary suggested that the Fed was not only less concerned with engineering a so-called soft-landing, but that it believed disruption was a requirement of its mission. Any plans for an imminent pause in rate hikes, or, as some participants believed, a pivot to easing became unlikely. By the end of the fourth quarter, unlike earlier in the year, the economic data and Fed commentary turned more encouraging.
In early November, the October Consumer Price Index (CPI) reading was 7.7% which, while still high, was lower than prior points and consensus expectations. During a speech at the Brookings Institution, Chair Powell noted several improving economic trends and offered a balanced tone, especially compared to his hawkish remarks in mid-August. In mid-December, CPI was reported as 7.1%, again below the prior period and expectations. While the market reacted positively to these events, the damage was already done for the year. For 2022, the S&P500 Index was down over 18%, the Nasdaq was down over 32%, the Russell Midcap® Value Index was down 12%, and the Russell Small Cap® Value Index was down 14.5%.
Like the past year, the future direction of the equity markets will largely be determined by anticipated Fed action. There is, however, a subtle distinction between then and now. In 2022, the main question asked by financial markets was: how high will the Fed take interest rates? While the answer is still unknown, the range of possible outcomes has narrowed considerably. Last year, anything between 4%-6% (or even higher) was considered possible, whereas today a terminal rate of 5% to 5.5% seems likely.
Given the tighter spread of possibilities, the debate is now less about what the ultimate rate is, but how long will it last. More specifically, will a stop in interest rate increases be followed in short order by an interest rate cut? We don’t think so. Barring some unexpected event, our base case is that the Fed will stop raising rates at 5.25% and will not cut rates in 2023. With a focus on high quality companies with strong balance sheets, we believe the portfolio is well positioned regardless of the ultimate macroeconomic backdrop.
Also key to this discussion is the impact that rising rates will have on company earnings in 2023. The view among most pundits is that earnings estimates are too high, and actual results will disappoint. We don’t disagree. However, we think that many of the holdings already discount earnings that are not only lower than current estimates, but also suggest too bearish a scenario. Ironically, we believe that when these companies report earnings that are below estimates, but above the scenario being priced, the stocks will go up. On this basis, we believe that the portfolios could offer meaningful downside protection and attractive upside potential.
| 4 | Annual Report | December 31, 2022 |
| | Growth Fund |
| | |
| | The Growth Fund seeks long-term capital appreciation. |
| | |
| | AN OVERVIEW FROM THE PORTFOLIO MANAGER |
| | |

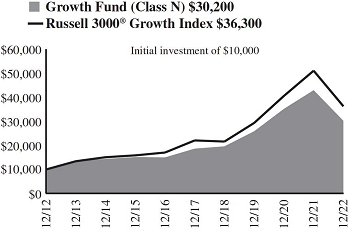
David C. Fording, CFA | The William Blair Growth Fund (Class N shares) (the “Fund”) posted a 29.65% decrease, net of fees, for the year ended December 31, 2022. By comparison, the Fund’s benchmark index, the Russell 3000® Growth Index (the “Index”), decreased 28.97%. The Fund’s relative performance was driven by stock-specific dynamics. Our top contributors for the period included UnitedHealth Group (Health Care), Mastercard (Information Technology), New Fortress (Energy), Performance Food Group (Consumer Staples) and Coca-Cola (Consumer Staples). UnitedHealth Group reported strong results across multiple segments against a backdrop of stability and strong current free cash flow, while shares of Mastercard benefited from better-than-expected revenue and earnings. Not owning Tesla (Consumer Discretionary) and Meta Platforms (Communication Services) also contributed to relative performance. As it relates to Tesla, while we share the market’s view that electric vehicle penetration is likely to accelerate from here, we believe the stock was embedding unrealistic expectations as to Tesla’s ultimate market share and margin profile, which began to negatively impact the stock’s valuation in 2022. Meta Platforms experienced slowing advertising revenue growth. Our top individual detractors included PayPal Holdings (Information Technology), Farfetch (Consumer Discretionary), Advanced Micro Devices (Information Technology) and Amazon (Consumer Discretionary). Shares of PayPal lagged due to concerns of slowing industry growth and potential market share losses. Stock selection in industrials, including our position in Kornit Digital, also detracted from relative returns. Macro-related headwinds and delayed equipment purchases from e-commerce customers weighed on shares of Kornit Digital, a manufacturer of digital printers for the apparel industry, as growth in the e-commerce market normalizes from pandemic highs. From a style perspective, our emphasis on longer duration growth companies was a headwind as companies with lower growth characteristics outperformed given investor focus on higher current free cash flow yields. Please refer to the U.S. Growth & Core Market Review and Outlook relating to the Fund on page 3. |
| December 31, 2022 | William Blair Funds | 5 |
Growth Fund
Performance Highlights (Unaudited)
| Average Annual Total Returns through 12/31/2022 |
| | | | | | | | | | | Since |
| | | 1 Year | | 3 Year | | 5 Year | | 10 Year | | Inception(a) |
| Class N | | | (29.65 | )% | | | 5.31 | % | | | 10.13 | % | | | 11.70 | % | | | — | % |
| Class I | | | (29.52 | ) | | | 5.60 | | | | 10.44 | | | | 12.03 | | | | — | |
| Class R6 | | | (29.44 | ) | | | 5.68 | | | | — | | | | — | | | | 7.57 | |
| Russell 3000® Growth Index | | | (28.97 | ) | | | 7.32 | | | | 10.45 | | | | 13.75 | | | | 9.47 | |
| S&P 500® Index | | | (18.11 | ) | | | 7.66 | | | | 9.42 | | | | 12.56 | | | | 9.56 | |
| (a) | Since inception is for the period from May 2, 2019 (Commencement of Operations) to December 31, 2022. |
Performance cited represents past performance. Past performance does not guarantee future results and current performance may be lower or higher than the data quoted. Results shown are average annual total returns, which assume reinvestment of dividends and capital gains. Investment returns and principal will fluctuate and you may have a gain or loss when you sell shares. For the most current month-end performance information, please call 1-800-742-7272, or visit our Web site at www.williamblairfunds.com. From time to time, the investment adviser may waive fees or reimburse expenses for the Fund. Without these waivers/reimbursements, performance would be lower. Class N shares are not subject to a sales load. Class I shares are not subject to a sales load or distribution (Rule 12b-1) fees. Class R6 shares are not subject to a sales load, distribution (Rule 12b-1) fees, or sub-transfer agent fees.
The performance highlights and graph presented above do not reflect the deduction of taxes that a shareholder would pay on fund distributions or the redemption of fund shares.
The Russell 3000® Growth Index consists of large, medium, and small capitalization companies with above average price-to-book ratios and forecasted growth rates. The index is weighted by market capitalization and large/medium/small companies make up approximately 80%/15%/5% of the index.
The S&P 500® Index indicates broad larger capitalization equity market performance.
This report identifies the Fund’s investments on December 31, 2022. These holdings are subject to change. Not all stocks in the Fund performed the same, nor is there any guarantee that these stocks will perform as well in the future. Market forecasts provided in this report may not necessarily come to pass.
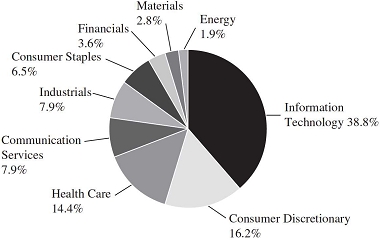
Sector Diversification (Unaudited)

The sector diversification shown is based on the total long-term securities.
| 6 | Annual Report | December 31, 2022 |
Growth Fund
Portfolio of Investments, December 31, 2022 (all dollar amounts in thousands)
| | | | | | | | |
| | | | | | | | |
| | Issuer | | Shares | | | Value | |
| | | | | | | | | | |
| | Common Stocks | | | | | | | | |
| | Information Technology—34.3% | | | | | | | | |
| * | Advanced Micro Devices, Inc. | | | 48,276 | | | $ | 3,127 | |
| * | Dynatrace, Inc. | | | 74,824 | | | | 2,866 | |
| | Fidelity National Information Services, Inc. | | | 38,666 | | | | 2,623 | |
| | Mastercard, Inc. | | | 26,728 | | | | 9,294 | |
| | Microsoft Corp. | | | 83,472 | | | | 20,018 | |
| * | MongoDB, Inc. | | | 5,638 | | | | 1,110 | |
| | National Instruments Corp. | | | 89,317 | | | | 3,296 | |
| * | Nice Ltd.—ADR | | | 13,253 | | | | 2,549 | |
| | NVIDIA Corp. | | | 24,292 | | | | 3,550 | |
| * | Palo Alto Networks, Inc. | | | 17,891 | | | | 2,496 | |
| * | PayPal Holdings, Inc. | | | 39,877 | | | | 2,840 | |
| * | Pure Storage, Inc. | | | 83,649 | | | | 2,238 | |
| | Texas Instruments, Inc. | | | 26,299 | | | | 4,345 | |
| * | Verra Mobility Corp. | | | 193,244 | | | | 2,673 | |
| * | Workday, Inc. | | | 11,246 | | | | 1,882 | |
| | | | | | | | | 64,907 | |
| | Health Care—16.1% | | | | | | | | |
| | Agilent Technologies, Inc. | | | 13,312 | | | | 1,992 | |
| * | HealthEquity, Inc. | | | 24,115 | | | | 1,486 | |
| * | Horizon Therapeutics PLC† | | | 33,855 | | | | 3,853 | |
| * | Intuitive Surgical, Inc. | | | 16,096 | | | | 4,271 | |
| * | Penumbra, Inc. | | | 6,198 | | | | 1,379 | |
| | Stryker Corp. | | | 9,673 | | | | 2,365 | |
| | UnitedHealth Group, Inc. | | | 14,493 | | | | 7,684 | |
| * | Veeva Systems, Inc. | | | 14,771 | | | | 2,384 | |
| | Zoetis, Inc. | | | 33,790 | | | | 4,952 | |
| | | | | | | | | 30,366 | |
| | Consumer Discretionary—12.2% | | | | | | | | |
| * | Amazon.com, Inc. | | | 115,675 | | | | 9,717 | |
| * | Bright Horizons Family Solutions, Inc. | | | 28,601 | | | | 1,805 | |
| * | Burlington Stores, Inc. | | | 12,840 | | | | 2,603 | |
| * | Etsy, Inc. | | | 12,485 | | | | 1,496 | |
| * | Farfetch Ltd.† | | | 109,181 | | | | 516 | |
| | NIKE, Inc. | | | 40,853 | | | | 4,780 | |
| * | Revolve Group, Inc. | | | 37,929 | | | | 844 | |
| * | Skyline Champion Corp. | | | 24,292 | | | | 1,251 | |
| | | | | | | | | 23,012 | |
| | Communication Services—10.0% | | | | | | | | |
| * | Alphabet, Inc. | | | 131,348 | | | | 11,589 | |
| * | Take-Two Interactive Software, Inc. | | | 18,831 | | | | 1,961 | |
| | Warner Music Group Corp. | | | 109,476 | | | | 3,834 | |
| * | ZipRecruiter, Inc. | | | 94,482 | | | | 1,551 | |
| | | | | | | | | 18,935 | |
| | Industrials—9.0% | | | | | | | | |
| * | ACV Auctions, Inc. | | | 145,993 | | | | 1,199 | |
| | Brink’s Co. | | | 46,252 | | | | 2,484 | |
| * | Chart Industries, Inc. | | | 16,706 | | | | 1,925 | |
| * | Copart, Inc. | | | 76,211 | | | | 4,641 | |
| * | CoStar Group, Inc. | | | 42,208 | | | | 3,262 | |
| * | Energy Recovery, Inc. | | | 86,837 | | | | 1,779 | |
| * | Kornit Digital Ltd.† | | | 45,506 | | | | 1,045 | |
| * | Trex Co., Inc. | | | 17,503 | | | | 741 | |
| | | | | | | | | 17,076 | |
| | Issuer | | Shares or
Principal
Amount | | | Value | |
| | | | | | | | | | |
| | Common Stocks—(continued) | | | | | | | | |
| | Consumer Staples—5.9% | | | | | | | | |
| | Coca-Cola Co. | | | 80,993 | | | $ | 5,152 | |
| | Estee Lauder Cos., Inc. | | | 10,242 | | | | 2,541 | |
| * | Performance Food Group Co. | | | 60,450 | | | | 3,530 | |
| | | | | | | | | 11,223 | |
| | Energy—4.8% | | | | | | | | |
| | Cameco Corp. | | | 192,388 | | | | 4,361 | |
| * | Green Plains, Inc. | | | 54,989 | | | | 1,677 | |
| | New Fortress Energy, Inc. | | | 69,275 | | | | 2,939 | |
| | | | | | | | | 8,977 | |
| | Financials—4.1% | | | | | | | | |
| | Aon PLC† | | | 8,471 | | | | 2,543 | |
| | Apollo Global Management, Inc. | | | 36,807 | | | | 2,348 | |
| | Ares Management Corp. | | | 32,557 | | | | 2,228 | |
| | Bridge Investment Group Holdings, Inc. | | | 54,605 | | | | 658 | |
| | | | | | | | | 7,777 | |
| | Real Estate—1.9% | | | | | | | | |
| | SBA Communications Corp. | | | 12,544 | | | | 3,516 | |
| | Materials—1.4% | | | | | | | | |
| | Crown Holdings, Inc. | | | 32,586 | | | | 2,678 | |
| | Total Common Stocks—99.7%
(cost $124,966) | | | | | | | 188,467 | |
| | | | | | | | | | |
| | Repurchase Agreement | | | | | | | | |
| | Fixed Income Clearing Corporation, 1.600% dated 12/30/22, due 01/03/23, repurchase price $787, collateralized by U.S. Treasury Note, 2.375%, due 03/31/29, valued at $802 | | | $787 | | | | 787 | |
| | Total Repurchase Agreement—0.4%
(cost $787) | | | | | | | 787 | |
| | Total Investments—100.1%
(cost $125,753) | | | | | | | 189,254 | |
| | Liabilities, plus cash and other assets—(0.1)% | | | | | | | (246 | ) |
| | Net assets—100.0% | | | | | | $ | 189,008 | |
ADR = American Depository Receipt
* = Non-income producing security
† = U.S. listed foreign security
See accompanying Notes to Financial Statements.
| December 31, 2022 | William Blair Funds | 7 |
| | Large Cap Growth Fund |
| | |
| | The Large Cap Growth Fund seeks long-term capital appreciation. |
| | |
| | AN OVERVIEW FROM THE PORTFOLIO MANAGERS |
| | |

James S. Golan, CFA 
David P. Ricci, CFA | The William Blair Large Cap Growth Fund (Class N shares) (the “Fund”) posted a 32.61% decrease, net of fees, for the year ended December 31, 2022. By comparison, the Fund’s benchmark index, the Russell 1000® Growth Index (the “Index”), decreased 29.14%. The Fund trailed the Index for the full year period driven by a combination of style factors and stock-specific dynamics. From a style perspective, our emphasis on longer duration growth companies was a headwind as companies with lower growth characteristics outperformed given investor focus on higher current free cash flow yields. From a stock-specific perspective, selection in Information Technology, including our positions in Unity Software, PayPal Holdings and Salesforce detracted from relative returns. Shares of Unity Software lagged as the company unexpectedly experienced data quality and engineering challenges in its advertising technology business. Other top detractors included Netflix (Communication Services) and Amazon (Consumer Discretionary). Netflix reported a decline in subscribers and announced related business initiatives in hope of re-igniting subscriber growth. Top contributors included UnitedHealth Group (Health Care), Mastercard (Information Technology), CoStar Group (Industrials), ABIOMED (Health Care) and Apollo Global Management (Financials). UnitedHealth Group reported strong results across multiple segments against a backdrop of stability and strong current free cash flow, while shares of Mastercard benefited from better-than-expected revenue and earnings. Our decision to not own Tesla (Consumer Discretionary) and Meta Platforms (Communication Services) also aided relative returns. As it relates to Tesla, while we share the market’s view that electric vehicle penetration is likely to accelerate from here, we believe the stock was embedding unrealistic expectations as to Tesla’s ultimate market share and margin profile, which began to negatively impact the stock’s valuation in 2022. Meta Platforms experienced slowing advertising revenue growth. Please refer to the U.S. Growth & Core Market Review and Outlook relating to the Fund on page 3. |
| 8 | Annual Report | December 31, 2022 |
Large Cap Growth Fund
Performance Highlights (Unaudited)
| Average Annual Total Returns through 12/31/2022 |
| | | | | | | | | | | Since |
| | | 1 Year | | 3 Year | | 5 Year | | 10 Year | | Inception(a) |
| Class N | | | (32.61 | )% | | | 5.55 | % | | | 10.92 | % | | | 13.81 | % | | | — | % |
| Class I | | | (32.46 | ) | | | 5.81 | | | | 11.19 | | | | 14.09 | | | | — | |
| Class R6 | | | (32.41 | ) | | | 5.87 | | | | — | | | | — | | | | 8.62 | |
| Russell 1000® Growth Index | | | (29.14 | ) | | | 7.79 | | | | 10.96 | | | | 14.10 | | | | 9.96 | |
| (a) | Since inception is for the period from May 2, 2019 (Commencement of Operations) to December 31, 2022. |
Performance cited represents past performance. Past performance does not guarantee future results and current performance may be lower or higher than the data quoted. Results shown are average annual total returns, which assume reinvestment of dividends and capital gains. Investment returns and principal will fluctuate and you may have a gain or loss when you sell shares. For the most current month-end performance information, please call 1-800-742-7272, or visit our Web site at www.williamblairfunds.com. From time to time, the investment adviser may waive fees or reimburse expenses for the Fund. Without these waivers/reimbursements, performance would be lower. Class N shares are not subject to a sales load. Class I shares are not subject to a sales load or distribution (Rule 12b-1) fees. Class R6 shares are not subject to a sales load, distribution (Rule 12b-1) fees, or sub-transfer agent fees.
The performance highlights and graph presented above do not reflect the deduction of taxes that a shareholder would pay on fund distributions or the redemption of fund shares.
The Russell 1000® Growth Index consists of large capitalization companies with above average price-to-book ratios and forecasted growth rates.
This report identifies the Fund’s investments on December 31, 2022. These holdings are subject to change. Not all stocks in the Fund performed the same, nor is there any guarantee that these stocks will perform as well in the future. Market forecasts provided in this report may not necessarily come to pass.
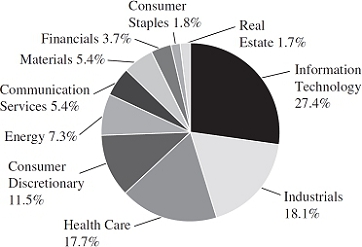
Sector Diversification (Unaudited)
The sector diversification shown is based on the total long-term securities.
| December 31, 2022 | William Blair Funds | 9 |
Large Cap Growth Fund
Portfolio of Investments, December 31, 2022 (all dollar amounts in thousands)
| | | | | | | | |
| | | | | | | | |
| | Issuer | | Shares | | | Value | |
| | | | | | | | | | |
| | Common Stocks | | | | | | | | |
| | Information Technology—38.2% | | | | | | | | |
| | Accenture PLC† | | | 136,510 | | | $ | 36,426 | |
| * | Adobe, Inc. | | | 60,660 | | | | 20,414 | |
| * | Advanced Micro Devices, Inc. | | | 160,788 | | | | 10,414 | |
| * | Guidewire Software, Inc. | | | 176,380 | | | | 11,034 | |
| | Intuit, Inc. | | | 80,820 | | | | 31,457 | |
| | Lam Research Corp. | | | 22,200 | | | | 9,331 | |
| | Mastercard, Inc. | | | 197,050 | | | | 68,520 | |
| | Microsoft Corp. | | | 582,840 | | | | 139,777 | |
| * | Palo Alto Networks, Inc. | | | 102,170 | | | | 14,257 | |
| * | PayPal Holdings, Inc. | | | 381,560 | | | | 27,175 | |
| * | Salesforce, Inc. | | | 151,300 | | | | 20,061 | |
| | Texas Instruments, Inc. | | | 89,120 | | | | 14,724 | |
| * | Unity Software, Inc. | | | 223,480 | | | | 6,389 | |
| | | | | | | | | 409,979 | |
| | Consumer Discretionary—16.1% | | | | | | | | |
| * | Amazon.com, Inc. | | | 711,100 | | | | 59,733 | |
| * | Chipotle Mexican Grill, Inc. | | | 12,370 | | | | 17,163 | |
| | Marriott International, Inc. | | | 138,930 | | | | 20,685 | |
| | NIKE, Inc. | | | 279,900 | | | | 32,751 | |
| * | O’Reilly Automotive, Inc. | | | 20,670 | | | | 17,446 | |
| | Starbucks Corp. | | | 245,500 | | | | 24,354 | |
| | | | | | | | | 172,132 | |
| | Health Care—14.2% | | | | | | | | |
| * | Intuitive Surgical, Inc. | | | 33,380 | | | | 8,857 | |
| | Stryker Corp. | | | 132,490 | | | | 32,393 | |
| | UnitedHealth Group, Inc. | | | 112,670 | | | | 59,735 | |
| * | Veeva Systems, Inc. | | | 111,650 | | | | 18,018 | |
| | Zoetis, Inc. | | | 230,590 | | | | 33,793 | |
| | | | | | | | | 152,796 | |
| | Communication Services—7.8% | | | | | | | | |
| * | Alphabet, Inc. | | | 755,660 | | | | 66,672 | |
| * | Live Nation Entertainment, Inc. | | | 249,742 | | | | 17,417 | |
| | | | | | | | | 84,089 | |
| | Industrials—7.8% | | | | | | | | |
| * | Copart, Inc. | | | 519,640 | | | | 31,641 | |
| * | CoStar Group, Inc. | | | 546,580 | | | | 42,239 | |
| | Equifax, Inc. | | | 49,470 | | | | 9,615 | |
| | | | | | | | | 83,495 | |
| | Consumer Staples—6.5% | | | | | | | | |
| | Costco Wholesale Corp. | | | 103,010 | | | | 47,024 | |
| | Estee Lauder Cos., Inc. | | | 90,310 | | | | 22,407 | |
| | | | | | | | | 69,431 | |
| | Financials—3.6% | | | | | | | | |
| | Apollo Global Management, Inc. | | | 595,550 | | | | 37,990 | |
| | Materials—2.8% | | | | | | | | |
| | Linde PLC† | | | 92,510 | | | | 30,175 | |
| | Energy—1.9% | | | | | | | | |
| | Pioneer Natural Resources Co. | | | 90,480 | | | | 20,665 | |
| | Total Common Stocks—98.9%
(cost $1,086,991) | | | | | | | 1,060,752 | |
| | | | | | | | |
| | Issuer | | Principal
Amount | | Value | |
| | | | | | | | | | |
| | Repurchase Agreement | | | | | | | | |
| | Fixed Income Clearing Corporation, 1.600% dated 12/30/22, due 01/03/23, repurchase price $9,812, collateralized by U.S. Treasury Note, 2.375%, due 03/31/29, valued at $10,007 | | | $9,811 | | | $ | 9,811 | |
| | Total Repurchase Agreement—0.9%
(cost $9,811) | | | | | | | 9,811 | |
| | Total Investments—99.8%
(cost $1,096,802) | | | | | | | 1,070,563 | |
| | Cash and other assets, less liabilities—0.2% | | | | | | | 2,457 | |
| | Net assets—100.0% | | | | | | $ | 1,073,020 | |
† = U.S. listed foreign security
* = Non-income producing security
See accompanying Notes to Financial Statements.
| 10 | Annual Report | December 31, 2022 |
| | Mid Cap Growth Fund |
| | |
| | The Mid Cap Growth Fund seeks long-term capital appreciation. |
| | |
| | AN OVERVIEW FROM THE PORTFOLIO MANAGERS |
| | |

Daniel Crowe, CFA 
James E. Jones, CFA | The William Blair Mid Cap Growth Fund (Class N shares) (the “Fund”) posted a 26.84% decrease, net of fees, for the year ended December 31, 2022. By comparison, the Fund’s benchmark index, the Russell Midcap® Growth Index (the “Index”), decreased 26.72%. Relative performance for the full-year period was driven by stock-specific dynamics as style factors were offsetting. Top contributors to performance included New Fortress Energy (Energy), BWX Technologies (Industrials), CoStar Group (Industrials), Axon Enterprise (Industrials) and ABIOMED (Health Care). New Fortress Energy develops, finances and constructs liquified natural gas assets and relative infrastructure. The company continued to progress its floating liquified natural gas business and benefited from a positive backdrop for new contract activity. BWX Technologies, the sole-source provider of propulsion systems for the U.S. Navy, reported solid earnings results, as well as continued progress in the medical isotopes business. Stock selection in Information Technology and Communication Services also added value as our holdings, in aggregate, outperformed the Index sector returns. Top detractors during the year included our positions in Clarivate (Industrials), MKS Instruments (Information Technology) and Align Technology (Health Care). Clarivate is a diversified information services company whose shares underperformed on subscription and transaction revenue that was below expectations and a cautious outlook given potential macroeconomic headwinds. Stock selection in Consumer Discretionary, including our positions in Farfetch and Bright Horizons Family Solutions, also dampened relative performance. Shares of Farfetch were pressured by macro-related issues, including the company’s exposure to consumers in Europe and China and difficult year-over-year comparisons. From a style perspective, our typical underweight to companies without earnings was a tailwind, while our higher growth bias was a headwind. Please refer to the U.S. Growth & Core Market Review and Outlook relating to the Fund on page 3. |
| December 31, 2022 | William Blair Funds | 11 |
Mid Cap Growth Fund
Performance Highlights (Unaudited)
| Average Annual Total Returns through 12/31/2022 |
| | | 1 Year | | 3 Year | | 5 Year | | 10 Year | | Since
Inception(a) |
| Class N | | | (26.84 | )% | | | 0.09 | % | | | 6.15 | % | | | 8.48 | % | | | — | % |
| Class I | | | (26.72 | ) | | | 0.34 | | | | 6.40 | | | | 8.74 | | | | — | |
| Class R6 | | | (26.68 | ) | | | 0.37 | | | | — | | | | — | | | | 2.72 | |
| Russell Midcap® Growth Index | | | (26.72 | ) | | | 3.85 | | | | 7.64 | | | | 11.41 | | | | 5.74 | |
| (a) | Since inception is for the period from May 2, 2019 (Commencement of Operations) to December 31, 2022. |
Performance cited represents past performance. Past performance does not guarantee future results and current performance may be lower or higher than the data quoted. Results shown are average annual total returns, which assume reinvestment of dividends and capital gains. Investment returns and principal will fluctuate and you may have a gain or loss when you sell shares. For the most current month-end performance information, please call 1-800-742-7272, or visit our Web site at www.williamblairfunds.com. Investing in medium capitalization companies involves special risks, including higher volatility and lower liquidity. Medium capitalization stocks are also more sensitive to purchase/sale transactions and changes in the issuer’s financial condition. From time to time, the investment adviser may waive fees or reimburse expenses for the Fund. Without these waivers/reimbursements, performance would be lower. Class N shares are not subject to a sales load. Class I shares are not subject to a sales load or distribution (Rule 12b-1) fees. Class R6 shares are not subject to a sales load, distribution (Rule 12b-1) fees, or sub-transfer agent fees.
The performance highlights and graph presented above do not reflect the deduction of taxes that a shareholder would pay on fund distributions or the redemption of fund shares.
The Russell Midcap® Growth Index is an index that is constructed to provide a comprehensive and unbiased barometer of the mid-cap growth market.
This report identifies the Fund’s investments on December 31, 2022. These holdings are subject to change. Not all stocks in the Fund performed the same, nor is there any guarantee that these stocks will perform as well in the future. Market forecasts provided in this report may not necessarily come to pass.
Sector Diversification (Unaudited)
The sector diversification shown is based on the total long-term securities.
| 12 | Annual Report | December 31, 2022 |
Mid Cap Growth Fund
Portfolio of Investments, December 31, 2022 (all dollar amounts in thousands)
| | | | | | | | |
| | | | | | | | |
| | Issuer | | Shares | | | Value | |
| | | | | | | | | | |
| | Common Stocks | | | | | | | | |
| | Information Technology—26.4% | | | | | | | | |
| * | Cadence Design Systems, Inc. | | | 6,915 | | | $ | 1,111 | |
| * | Coupa Software, Inc. | | | 5,183 | | | | 410 | |
| * | Dynatrace, Inc. | | | 21,010 | | | | 805 | |
| * | EPAM Systems, Inc. | | | 1,175 | | | | 385 | |
| * | Euronet Worldwide, Inc. | | | 9,275 | | | | 875 | |
| * | Guidewire Software, Inc. | | | 3,792 | | | | 237 | |
| | MKS Instruments, Inc. | | | 6,560 | | | | 556 | |
| * | MongoDB, Inc. | | | 2,565 | | | | 505 | |
| * | Nice Ltd.—ADR | | | 3,610 | | | | 694 | |
| * | Palo Alto Networks, Inc. | | | 3,915 | | | | 546 | |
| * | Pure Storage, Inc. | | | 28,910 | | | | 774 | |
| * | SolarEdge Technologies, Inc. | | | 2,085 | | | | 591 | |
| * | Teledyne Technologies, Inc. | | | 2,680 | | | | 1,072 | |
| | | | | | | | | 8,561 | |
| | Industrials—17.5% | | | | | | | | |
| * | Axon Enterprise, Inc. | | | 6,235 | | | | 1,035 | |
| * | Builders FirstSource, Inc. | | | 10,735 | | | | 696 | |
| | BWX Technologies, Inc. | | | 19,514 | | | | 1,133 | |
| * | Clarivate PLC† | | | 56,900 | | | | 475 | |
| * | Copart, Inc. | | | 18,889 | | | | 1,150 | |
| * | CoStar Group, Inc. | | | 15,210 | | | | 1,175 | |
| | | | | | | | | 5,664 | |
| | Health Care—17.0% | | | | | | | | |
| | Agilent Technologies, Inc. | | | 5,970 | | | | 894 | |
| * | Align Technology, Inc. | | | 1,995 | | | | 421 | |
| * | Charles River Laboratories International, Inc. | | | 2,300 | | | | 501 | |
| * | DexCom, Inc. | | | 8,315 | | | | 942 | |
| * | IDEXX Laboratories, Inc. | | | 1,305 | | | | 532 | |
| * | Mettler-Toledo International, Inc. | | | 515 | | | | 744 | |
| | STERIS PLC† | | | 2,025 | | | | 374 | |
| * | Veeva Systems, Inc. | | | 6,915 | | | | 1,116 | |
| | | | | | | | | 5,524 | |
| | Consumer Discretionary—11.1% | | | | | | | | |
| * | Aptiv PLC† | | | 5,145 | | | | 479 | |
| * | Bright Horizons Family Solutions, Inc. | | | 4,920 | | | | 310 | |
| * | Burlington Stores, Inc. | | | 4,130 | | | | 837 | |
| * | Chipotle Mexican Grill, Inc. | | | 667 | | | | 926 | |
| * | Etsy, Inc. | | | 4,229 | | | | 507 | |
| | Pool Corp. | | | 1,800 | | | | 544 | |
| | | | | | | | | 3,603 | |
| | Energy—7.0% | | | | | | | | |
| | Cameco Corp. | | | 24,170 | | | | 548 | |
| | Hess Corp. | | | 6,845 | | | | 971 | |
| | New Fortress Energy, Inc. | | | 17,648 | | | | 748 | |
| | | | | | | | | 2,267 | |
| | Communication Services—5.2% | | | | | | | | |
| * | Live Nation Entertainment, Inc. | | | 8,171 | | | | 570 | |
| * | Take-Two Interactive Software, Inc. | | | 3,295 | | | | 343 | |
| | Warner Music Group Corp. | | | 22,325 | | | | 782 | |
| | | | | | | | | 1,695 | |
| | Issuer | | Shares or
Principal
Amount | | | Value | |
| | | | | | | | | | |
| | Common Stocks—(continued) | | | | | | | | |
| | Materials—5.2% | | | | | | | | |
| | Crown Holdings, Inc. | | | 6,230 | | | $ | 512 | |
| | Vulcan Materials Co. | | | 6,675 | | | | 1,169 | |
| | | | | | | | | 1,681 | |
| | Financials—3.6% | | | | | | | | |
| | Ares Management Corp. | | | 5,585 | | | | 382 | |
| | PacWest Bancorp | | | 12,795 | | | | 294 | |
| | Western Alliance Bancorp | | | 8,000 | | | | 476 | |
| | | | | | | | | 1,152 | |
| | Consumer Staples—1.7% | | | | | | | | |
| * | Performance Food Group Co. | | | 9,635 | | | | 563 | |
| | Real Estate—1.6% | | | | | | | | |
| | SBA Communications Corp. | | | 1,840 | | | | 516 | |
| | Total Common Stocks—96.3%
(cost $30,698) | | | | | | | 31,226 | |
| | | | | | | | | | |
| | Rights | | | | | | | | |
| | Health Care—0.0% | | | | | | | | |
| * | Abiomed, Inc. CVR** | | | 1,508 | | | | — | |
| | Total Rights—0.0%
(cost $1) | | | | | | | — | |
| | | | | | | | | | |
| | Repurchase Agreement | | | | | | | | |
| | Fixed Income Clearing Corporation, 1.600% dated 12/30/22, due 01/03/23, repurchase price $1,191, collateralized by U.S. Treasury Bond, 2.500%, due 01/15/29, valued at $1,215 | | | $1,191 | | | | 1,191 | |
| | Total Repurchase Agreement—3.7%
(cost $1,191) | | | | | | | 1,191 | |
| | Total Investments—100.0%
(cost $31,890) | | | | | | | 32,417 | |
| | Liabilities, plus cash and other assets—(0.0)% | | | | | | | (13 | ) |
| | Net assets—100.0% | | | | | | $ | 32,404 | |
ADR = American Depository Receipt
CVR = Contingent Value Right
* = Non-income producing security
** = Fair valued pursuant to the Fund’s Valuation Procedures. This holding represents 0.00% of the Fund’s net assets at December 31, 2022.
† = U.S. listed foreign security
See accompanying Notes to Financial Statements.
| December 31, 2022 | William Blair Funds | 13 |
| | Mid Cap Value Fund |
| | |
| | The Mid Cap Value Fund seeks long-term capital appreciation. |
| | |
| | AN OVERVIEW FROM THE PORTFOLIO MANAGERS |
| | |

William Heaphy, CFA 
Matthew Fleming, CFA | The William Blair Mid Cap Value Fund (Class I shares) (the “Fund”) posted a 7.13% decrease, net of fees, for the period from inception on March 16, 2022 to December 31, 2022. By comparison, the Fund’s benchmark index, the Russell Midcap® Value Index (the “Index”), decreased 6.09%. The Fund’s relative underperformance during the period was driven by an underweight position to the Energy and Utilities sectors coupled with poor stock selection in the Materials and Communication Services sectors. The Fund’s Financials holdings were the largest contributor to relative performance in the since inception period ended December 31, 2022. The Fund’s insurance stocks were top contributors as they benefitted from increased industry prices after Hurricane Ian. Arch Capital, a top contributor, returned over 30% for the period on the heels of strong execution and its recent inclusion into the S&P 500. Also contributing to relative performance for the period was the strategy’s overweight to the Health Care sector, specifically the managed health care and distributors subsector where we continue to see long-term value. Further bolstering relative performance was the outperformance of the Fund’s Health Care holdings which trumped the 3.7% decline for Index constituents driven by top contributor AmerisourceBergen Corp for the period. On the negative side, the Fund’s Energy sector holdings struggled to pace with Index constituents which rose over 20% for the year. The Fund was significantly underweight to Energy shares in the first half of the year, which was a large drag on relative performance as oil and natural gas prices spiked. Our exposure to companies serving the offshore drilling market was the cause of this relative underperformance as the market favored companies benefitting from the increase in onshore shale drilling which is ramping up faster. Also detracting from relative performance for the period were the Fund’s Materials sector investments. An underweight position of the metals and mining subsectors was more than offset by the Fund’s investments in the diversified chemicals subsector, namely Huntsman Corp which detracted from relative performance. Crown Holdings, a packaging stock, also detracted from relative performance for the period. Longer-term we believe Crown Holdings is underrepresented in certain growing, high margin categories of the beverage industry and has the opportunity to increase market share, thereby improving specialty mix and expanding margins. Finally in Communication Services, media holding Warner Bros. Discovery, Inc. detracted from relative performance. The company struggled during the period, declining over 60%, as management suggested their original 2023 EBITDA outlook may be difficult to achieve given the challenging advertising market on the heels of a potential recession. Longer term however we remain confident that the company’s ongoing turnaround will be effective and rewarded in the market. Please refer to the U.S. Value Market Review and Outlook relating to the Fund on page 4. |
| 14 | Annual Report | December 31, 2022 |
Mid Cap Value Fund
Performance Highlights (Unaudited)
| Average Annual Total Returns through 12/31/2022 |
| | | Since
Inception(a) |
| Class I | | | (7.13 | )% |
| Class R6 | | | (7.01 | ) |
| Russell Midcap® Value Index | | | (6.09 | ) |
| (a) | Since inception is for the period from March 16, 2022 (Commencement of Operations) to December 31, 2022. |
Performance cited represents past performance. Past performance does not guarantee future results and current performance may be lower or higher than the data quoted. Results shown are average annual total returns, which assume reinvestment of dividends and capital gains. Investment returns and principal will fluctuate and you may have a gain or loss when you sell shares. For the most current month-end performance information, please call 1-800-742-7272, or visit our Web site at www.williamblairfunds.com. Investing in smaller and medium capitalization companies involves special risks, including higher volatility and lower liquidity. Smaller and medium capitalization stocks are also more sensitive to purchase/sale transactions and changes in the issuer’s financial condition. From time to time, the investment adviser may waive fees or reimburse expenses for the Fund. Without these waivers/reimbursements, performance would be lower. Class I shares are not subject to a sales load or distribution (Rule 12b-1) fees. Class R6 shares are not subject to a sales load, distribution (Rule 12b-1) fees, or sub-transfer agent fees.
The performance highlights and graph presented above do not reflect the deduction of taxes that a shareholder would pay on fund distributions or the redemption of fund shares.
The Russell Midcap® Value Index measures the performance of the mid-cap value segment of the U.S. equity universe. It includes those Russell Midcap companies with lower price-to-book ratios and lower forecasted growth values.
This report identifies the Fund’s investments on December 31, 2022. These holdings are subject to change. Not all stocks in the Fund performed the same, nor is there any guarantee that these stocks will perform as well in the future. Market forecasts provided in this report may not necessarily come to pass.
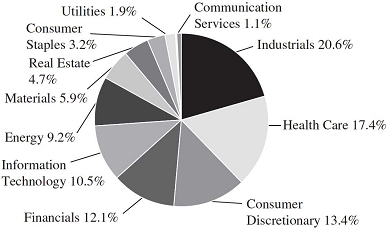
Sector Diversification (Unaudited)

The sector diversification shown is based on the total long-term securities.
| December 31, 2022 | William Blair Funds | 15 |
Mid Cap Value Fund
Portfolio of Investments, December 31, 2022 (all dollar amounts in thousands)
| | | | | | | | |
| | | | | | | | |
| | Issuer | | Shares | | | Value | |
| | | | | | | | |
| | Common Stocks | | | | | | | | |
| | Financials—17.9% | | | | | | | | |
| * | Arch Capital Group Ltd.† | | | 549 | | | $ | 35 | |
| | Comerica, Inc. | | | 389 | | | | 26 | |
| | East West Bancorp, Inc. | | | 383 | | | | 25 | |
| | Hartford Financial Services Group, Inc. | | | 412 | | | | 31 | |
| | Huntington Bancshares, Inc. | | | 1,576 | | | | 22 | |
| | Invesco Ltd.† | | | 1,686 | | | | 30 | |
| | KKR & Co., Inc. | | | 319 | | | | 15 | |
| | SLM Corp. | | | 1,577 | | | | 26 | |
| | Synovus Financial Corp. | | | 666 | | | | 25 | |
| | Willis Towers Watson PLC† | | | 137 | | | | 34 | |
| | | | | | | | | 269 | |
| | Industrials—17.8% | | | | | | | | |
| | Acuity Brands, Inc. | | | 156 | | | | 26 | |
| | AGCO Corp. | | | 255 | | | | 35 | |
| * | Alaska Air Group, Inc. | | | 612 | | | | 26 | |
| | Flowserve Corp. | | | 611 | | | | 19 | |
| | ITT, Inc. | | | 355 | | | | 29 | |
| | Knight-Swift Transportation Holdings, Inc. | | | 614 | | | | 32 | |
| | MSC Industrial Direct Co., Inc. | | | 336 | | | | 27 | |
| | Regal Rexnord Corp. | | | 91 | | | | 11 | |
| | Snap-on, Inc. | | | 140 | | | | 32 | |
| | Timken Co. | | | 436 | | | | 31 | |
| | | | | | | | | 268 | |
| | Information Technology—12.8% | | | | | | | | |
| * | Check Point Software Technologies Ltd.† | | | 218 | | | | 28 | |
| | Cognizant Technology Solutions Corp. | | | 371 | | | | 21 | |
| * | DXC Technology Co. | | | 908 | | | | 24 | |
| * | F5, Inc. | | | 182 | | | | 26 | |
| * | Flex Ltd.† | | | 1,202 | | | | 26 | |
| | Hewlett Packard Enterprise Co. | | | 1,182 | | | | 19 | |
| | Jabil, Inc. | | | 425 | | | | 29 | |
| | Skyworks Solutions, Inc. | | | 221 | | | | 20 | |
| | | | | | | | | 193 | |
| | Health Care—10.9% | | | | | | | | |
| | AmerisourceBergen Corp. | | | 132 | | | | 22 | |
| * | Centene Corp. | | | 290 | | | | 24 | |
| | Encompass Health Corp. | | | 423 | | | | 25 | |
| * | Henry Schein, Inc. | | | 372 | | | | 30 | |
| * | Hologic, Inc. | | | 271 | | | | 20 | |
| | Laboratory Corp. of America Holdings | | | 83 | | | | 20 | |
| | Viatris, Inc. | | | 2,094 | | | | 23 | |
| | | | | | | | | 164 | |
| | Consumer Discretionary—10.3% | | | | | | | | |
| | Brunswick Corp. | | | 298 | | | | 21 | |
| | LKQ Corp. | | | 598 | | | | 32 | |
| * | Mohawk Industries, Inc. | | | 198 | | | | 20 | |
| | Ralph Lauren Corp. | | | 270 | | | | 29 | |
| | Toll Brothers, Inc. | | | 581 | | | | 29 | |
| | Whirlpool Corp. | | | 174 | | | | 25 | |
| | | | | | | | | 156 | |
| | | | | | | | |
| | | | | | | | |
| | Issuer | | Shares | | | Value | |
| | |
| | Common Stocks—(continued) | | | | | | | | |
| | Materials—7.4% | | | | | | | | |
| | Crown Holdings, Inc. | | | 349 | | | $ | 29 | |
| | Huntsman Corp. | | | 1,024 | | | | 28 | |
| | PPG Industries, Inc. | | | 212 | | | | 27 | |
| | Sealed Air Corp. | | | 90 | | | | 4 | |
| | Westlake Corp. | | | 227 | | | | 23 | |
| | | | | | | | | 111 | |
| | Energy—6.1% | | | | | | | | |
| | APA Corp. | | | 628 | | | | 29 | |
| | Coterra Energy, Inc. | | | 872 | | | | 21 | |
| | Diamondback Energy, Inc. | | | 190 | | | | 26 | |
| | Phillips 66 | | | 149 | | | | 16 | |
| | | | | | | | | 92 | |
| | Consumer Staples—5.7% | | | | | | | | |
| | Ingredion, Inc. | | | 312 | | | | 31 | |
| | Molson Coors Beverage Co. | | | 612 | | | | 31 | |
| | Tyson Foods, Inc. | | | 379 | | | | 24 | |
| | | | | | | | | 86 | |
| | Real Estate—5.2% | | | | | | | | |
| | Camden Property Trust | | | 217 | | | | 24 | |
| | Highwoods Properties, Inc. | | | 971 | | | | 27 | |
| | Host Hotels & Resorts, Inc. | | | 1,737 | | | | 28 | |
| | | | | | | | | 79 | |
| | Utilities—4.0% | | | | | | | | |
| | Entergy Corp. | | | 284 | | | | 32 | |
| | PPL Corp. | | | 978 | | | | 29 | |
| | | | | | | | | 61 | |
| | Communication Services—0.9% | | | | | | | | |
| * | Warner Bros Discovery, Inc. | | | 1,396 | | | | 13 | |
| | Total Common Stocks—99.0%
(cost $1,597) | | | | | | | 1,492 | |
| | Total Investments—99.0%
(cost $1,597) | | | | | | | 1,492 | |
| | Cash and other assets, less liabilities—1.0% | | | | | | | 15 | |
| | Net assets—100.0% | | | | | | $ | 1,507 | |
* = Non-income producing security
† = U.S. listed foreign security
See accompanying Notes to Financial Statements.
| 16 | Annual Report | December 31, 2022 |
| | Small-Mid Cap Core Fund |
| | |
| | The Small-Mid Cap Core Fund seeks long-term capital appreciation. |
| | |
| | AN OVERVIEW FROM THE PORTFOLIO MANAGERS |
| | |

Daniel Crowe, CFA 
Ward D. Sexton, CFA | The William Blair Small-Mid Cap Core Fund (Class I shares) (the “Fund”) posted a 17.11% decrease, net of fees, for the year ended December 31, 2022. By comparison, the Fund’s benchmark index, the Russell 2500™ Index (the “Index”), decreased 18.37%. The Fund outperformed the Index in the full-year period, driven by a combination of style factors and stock-specific dynamics. From a style perspective, our typical underweight to companies without earnings was a tailwind. However, among companies with earnings, quality factors did not provide their typical down-market benefit. From a sector perspective, Health Care, including our position in Merit Medical, and Energy, including our positions in New Fortress, TechnipFMC and Whitecap Resources, were positive relative contributors. New Fortress Energy develops, finances and constructs liquified natural gas assets and relative infrastructure. The company continued to progress its floating liquified natural gas business and benefited from a positive backdrop for new contract activity. Shares of TechnipFMC, an equipment and service provider for offshore oil and gas projects, benefited from improved pricing and share gains against the backdrop of an accelerating offshore cycle. Our position in Axon Enterprise (Industrials) also contributed positively to relative returns. Our top individual detractors included Owens & Minor (Health Care), Kornit Digital (Industrials), Trex Company (Industrials) and Coupa Software (Information Technology). Owens & Minor, a manufacturer and distributor of disposable healthcare supplies, reported weakness in its Products & Healthcare Services segment. Kornit Digital, a manufacturer of innovative digital textile printers and inks, experienced macro-related headwinds that impacted orders. From a sector perspective, Financials and Consumer Discretionary detracted from relative returns. Within Financials, our position in Western Alliance Bancorp was a detractor from sector performance. Within Consumer Discretionary, our holdings in the sector in aggregate lagged the sector return in the Index. Please refer to the U.S. Growth & Core Market Review and Outlook relating to the Fund on page 3. |
| December 31, 2022 | William Blair Funds | 17 |
Small-Mid Cap Core Fund
Performance Highlights (Unaudited)
| Average Annual Total Returns through 12/31/2022 |
| | | 1 Year | | 3 Year | | Since
Inception(a) |
| Class I | | | (17.11 | )% | | | 8.18 | % | | | 9.74 | % |
| Class R6 | | | (17.10 | ) | | | 8.20 | | | | 9.77 | |
| Russell 2500TM Index | | | (18.37 | ) | | | 5.00 | | | | 7.27 | |
| (a) | Since inception is for the period from October 1, 2019 (Commencement of Operations) to December 31, 2022. |
Performance cited represents past performance. Past performance does not guarantee future results and current performance may be lower or higher than the data quoted. Results shown are average annual total returns, which assume reinvestment of dividends and capital gains. Investment returns and principal will fluctuate and you may have a gain or loss when you sell shares. For the most current month-end performance information, please call 1-800-742-7272, or visit our Web site at www.williamblairfunds.com. Investing in smaller and medium capitalization companies involves special risks, including higher volatility and lower liquidity. Smaller and medium capitalization stocks are also more sensitive to purchase/sale transactions and changes in the issuer’s financial condition. From time to time, the investment adviser may waive fees or reimburse expenses for the Fund. Without these waivers/reimbursements, performance would be lower. Class I shares are not subject to a sales load or distribution (Rule 12b-1) fees. Class R6 shares are not subject to a sales load, distribution (Rule 12b-1) fees, or sub-transfer agent fees.
The performance highlights and graph presented above do not reflect the deduction of taxes that a shareholder would pay on fund distributions or the redemption of fund shares.
The Russell 2500TMIndex measures the performance of those Russell 2500 companies with above average price-to-book ratios and forecasted growth rates.
This report identifies the Fund’s investments on December 31, 2022. These holdings are subject to change. Not all stocks in the Fund performed the same, nor is there any guarantee that these stocks will perform as well in the future. Market forecasts provided in this report may not necessarily come to pass.
Sector Diversification (Unaudited)
The sector diversification shown is based on the total long-term securities.
| 18 | Annual Report | December 31, 2022 |
Small-Mid Cap Core Fund
Portfolio of Investments, December 31, 2022 (all dollar amounts in thousands)
| | | | | | | | |
| | | | | | | | |
| | Issuer | | Shares | | | Value | |
| | |
| | Common Stocks | | | | | | | | |
| | Industrials—20.1% | | | | | | | | |
| * | ACV Auctions, Inc. | | | 126,113 | | | $ | 1,035 | |
| | AGCO Corp. | | | 8,560 | | | | 1,187 | |
| * | Axon Enterprise, Inc. | | | 20,139 | | | | 3,342 | |
| | Brink’s Co. | | | 33,826 | | | | 1,817 | |
| * | Builders FirstSource, Inc. | | | 43,599 | | | | 2,829 | |
| | BWX Technologies, Inc. | | | 60,235 | | | | 3,498 | |
| * | Casella Waste Systems, Inc. | | | 36,678 | | | | 2,909 | |
| * | Chart Industries, Inc. | | | 19,929 | | | | 2,296 | |
| | Douglas Dynamics, Inc. | | | 24,255 | | | | 877 | |
| * | Energy Recovery, Inc. | | | 73,864 | | | | 1,514 | |
| | Lincoln Electric Holdings, Inc. | | | 5,610 | | | | 811 | |
| * | Mercury Systems, Inc. | | | 47,566 | | | | 2,128 | |
| * | Shoals Technologies Group, Inc. | | | 36,467 | | | | 900 | |
| * | Trex Co., Inc. | | | 23,350 | | | | 988 | |
| * | WillScot Mobile Mini Holdings Corp. | | | 63,565 | | | | 2,871 | |
| | | | | | | | | 29,002 | |
| | Health Care—17.1% | | | | | | | | |
| * | Acadia Healthcare Co., Inc. | | | 31,725 | | | | 2,612 | |
| * | Allscripts Healthcare Solutions, Inc. | | | 64,070 | | | | 1,130 | |
| * | Azenta, Inc. | | | 19,179 | | | | 1,117 | |
| * | Certara, Inc. | | | 90,050 | | | | 1,447 | |
| | Chemed Corp. | | | 4,770 | | | | 2,435 | |
| | Encompass Health Corp. | | | 36,451 | | | | 2,180 | |
| * | Globus Medical, Inc. | | | 28,576 | | | | 2,122 | |
| * | Halozyme Therapeutics, Inc. | | | 33,580 | | | | 1,911 | |
| * | Horizon Therapeutics PLC† | | | 6,817 | | | | 776 | |
| * | Merit Medical Systems, Inc. | | | 41,752 | | | | 2,948 | |
| * | Owens & Minor, Inc. | | | 109,231 | | | | 2,133 | |
| * | Penumbra, Inc. | | | 9,176 | | | | 2,041 | |
| * | Repligen Corp. | | | 6,147 | | | | 1,041 | |
| | STERIS PLC† | | | 4,387 | | | | 810 | |
| | | | | | | | | 24,703 | |
| | Consumer Discretionary—13.2% | | | | | | | | |
| | ADT, Inc. | | | 114,496 | | | | 1,038 | |
| | Aramark | | | 25,485 | | | | 1,053 | |
| * | Boot Barn Holdings, Inc. | | | 11,446 | | | | 716 | |
| * | Bright Horizons Family Solutions, Inc. | | | 14,988 | | | | 946 | |
| * | Burlington Stores, Inc. | | | 9,835 | | | | 1,994 | |
| * | Fox Factory Holding Corp. | | | 12,080 | | | | 1,102 | |
| * | Grand Canyon Education, Inc. | | | 18,927 | | | | 2,000 | |
| * | Leslie’s, Inc. | | | 79,737 | | | | 974 | |
| * | National Vision Holdings, Inc. | | | 70,145 | | | | 2,719 | |
| | Pool Corp. | | | 5,258 | | | | 1,590 | |
| * | Revolve Group, Inc. | | | 34,133 | | | | 760 | |
| | Signet Jewelers Ltd.† | | | 16,880 | | | | 1,148 | |
| * | Skyline Champion Corp. | | | 28,537 | | | | 1,470 | |
| | Wyndham Hotels & Resorts, Inc. | | | 21,112 | | | | 1,505 | |
| | | | | | | | | 19,015 | |
| | Financials—11.9% | | | | | | | | |
| | Ares Management Corp. | | | 13,435 | | | | 919 | |
| | Carlyle Group, Inc. | | | 25,260 | | | | 754 | |
| | Columbia Banking System, Inc. | | | 59,058 | | | | 1,779 | |
| | East West Bancorp, Inc. | | | 34,070 | | | | 2,245 | |
| * | Goosehead Insurance, Inc. | | | 18,993 | | | | 652 | |
| | Hannon Armstrong Sustainable Infrastructure Capital, Inc. | | | 52,778 | | | | 1,530 | |
| | LPL Financial Holdings, Inc. | | | 8,541 | | | | 1,846 | |
| | PacWest Bancorp | | | 50,441 | | | | 1,158 | |
| | Virtu Financial, Inc. | | | 103,318 | | | | 2,109 | |
| | Western Alliance Bancorp | | | 38,814 | | | | 2,312 | |
| | Wintrust Financial Corp. | | | 21,932 | | | | 1,854 | |
| | | | | | | | | 17,158 | |
| | | | | | | | |
| | | | | | | | |
| | Issuer | | Shares | | | Value | |
| | |
| | Common Stocks—(continued) | | | | | | | | |
| | Information Technology—10.4% | | | | | | | | |
| * | Alarm.com Holdings, Inc. | | | 17,795 | | | $ | 881 | |
| * | Ambarella, Inc.† | | | 15,767 | | | | 1,297 | |
| | Cognex Corp. | | | 25,033 | | | | 1,179 | |
| * | Dynatrace, Inc. | | | 40,811 | | | | 1,563 | |
| | Entegris, Inc. | | | 14,923 | | | | 979 | |
| * | Euronet Worldwide, Inc. | | | 19,403 | | | | 1,831 | |
| | MKS Instruments, Inc. | | | 9,002 | | | | 763 | |
| * | Nice Ltd.—ADR | | | 6,771 | | | | 1,302 | |
| * | Pure Storage, Inc. | | | 26,908 | | | | 720 | |
| * | SolarEdge Technologies, Inc. | | | 5,567 | | | | 1,577 | |
| * | Verra Mobility Corp. | | | 163,593 | | | | 2,262 | |
| * | Wolfspeed, Inc. | | | 8,501 | | | | 587 | |
| | | | | | | | | 14,941 | |
| | Energy—9.1% | | | | | | | | |
| | Cameco Corp. | | | 129,750 | | | | 2,941 | |
| * | Denbury, Inc. | | | 17,006 | | | | 1,480 | |
| * | Green Plains, Inc. | | | 42,605 | | | | 1,299 | |
| | New Fortress Energy, Inc. | | | 33,580 | | | | 1,425 | |
| * | TechnipFMC PLC† | | | 244,264 | | | | 2,978 | |
| | Whitecap Resources, Inc. | | | 370,983 | | | | 2,949 | |
| | | | | | | | | 13,072 | |
| | Materials—5.7% | | | | | | | | |
| | Berry Global Group, Inc. | | | 18,819 | | | | 1,137 | |
| | CF Industries Holdings, Inc. | | | 18,072 | | | | 1,540 | |
| | Crown Holdings, Inc. | | | 31,296 | | | | 2,573 | |
| | Eagle Materials, Inc. | | | 10,462 | | | | 1,390 | |
| | Sylvamo Corp. | | | 34,162 | | | | 1,660 | |
| | | | | | | | | 8,300 | |
| | Real Estate—4.6% | | | | | | | | |
| | Americold Realty Trust, Inc. | | | 69,410 | | | | 1,965 | |
| | Equity LifeStyle Properties, Inc. | | | 30,890 | | | | 1,995 | |
| | Healthcare Realty Trust, Inc. | | | 108,237 | | | | 2,086 | |
| | Pebblebrook Hotel Trust | | | 49,835 | | | | 667 | |
| | | | | | | | | 6,713 | |
| | Consumer Staples—3.2% | | | | | | | | |
| | Inter Parfums, Inc. | | | 17,960 | | | | 1,734 | |
| * | Performance Food Group Co. | | | 29,685 | | | | 1,733 | |
| | Primo Water Corp. | | | 70,026 | | | | 1,088 | |
| | | | | | | | | 4,555 | |
| | Utilities—1.8% | | | | | | | | |
| | IDACORP, Inc. | | | 24,552 | | | | 2,648 | |
| | Communication Services—1.1% | | | | | | | | |
| * | Live Nation Entertainment, Inc. | | | 9,222 | | | | 643 | |
| * | ZipRecruiter, Inc. | | | 54,671 | | | | 891 | |
| | | | | | | | | 1,534 | |
| | Total Common Stocks—98.2%
(cost $147,499) | | | | | | | 141,641 | |
See accompanying Notes to Financial Statements.
| December 31, 2022 | William Blair Funds | 19 |
Small-Mid Cap Core Fund
Portfolio of Investments, December 31, 2022 (all dollar amounts in thousands)
| | | | | | | | |
| | | | | | | | |
| | Issuer | | Principal
Amount | | | Value | |
| | |
| | Repurchase Agreement | | | | | | | | |
| | Fixed Income Clearing Corporation, 1.600% dated 12/30/22, due 01/03/23, repurchase price $2,341, collateralized by U.S. Treasury Note, 2.375%, due 03/31/29, valued at $2,387 | | | $2,340 | | | $ | 2,340 | |
| | Total Repurchase Agreement—1.6%
(cost $2,340) | | | | | | | 2,340 | |
| | Total Investments—99.8%
(cost $149,839) | | | | | | | 143,981 | |
| | Cash and other assets, less liabilities—0.2% | | | | | | | 240 | |
| | Net assets—100.0% | | | | | | $ | 144,221 | |
ADR = American Depository Receipt
* = Non-income producing security
† = U.S. listed foreign security
See accompanying Notes to Financial Statements.
| 20 | Annual Report | December 31, 2022 |
| | Small-Mid Cap Growth Fund |
| | |
| | The Small-Mid Cap Growth Fund seeks long-term capital appreciation. |
| | |
| | AN OVERVIEW FROM THE PORTFOLIO MANAGERS |
| | |

Daniel Crowe, CFA 
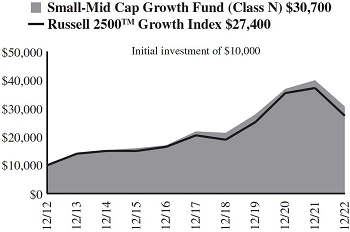
James E. Jones, CFA | The William Blair Small-Mid Cap Growth Fund (Class N shares) (the “Fund”) posted a 23.11% decrease, net of fees, for the year ended December 31, 2022. By comparison, the Fund’s benchmark index, the Russell 2500™ Growth Index (the “Index”), decreased 26.21%. The Fund outperformed the Index in the full-year period, driven by a combination of style factors and stock-specific dynamics. From a style perspective, our typical underweight to companies without earnings was a tailwind. However, while quality factors did not provide their typical down-market benefit during the market selloff in the first nine months of the year, this dynamic began to change in the fourth quarter as recession concerns shifted investor focus toward companies that can continue to grow earnings in a more difficult environment. From a sector perspective, Health Care, including our position in Acadia Healthcare, and Energy, including our position in Denbury, were positive relative contributors. Shares of behavioral health company Acadia Healthcare advanced during the year, driven by strong demand, diversification across services and geographies and effective execution. Other top individual contributors included BWX Technologies (Industrials), Axon Enterprise (Industrials) and Performance Food Group (Consumer Staples). BWX Technologies, the sole-source provider of propulsion systems for the U.S. Navy, reported solid earnings results, as well as continued progress in the medical isotopes business. Our top individual detractors included Trex Company (Industrials), Azenta (Health Care) and Cable One (Communication Services). Shares of Trex, the industry leader in composite residential decking, were pressured by lower-than-expected revenue in the second half of 2022 due to excess inventory and slowing demand. From a sector perspective, Consumer Discretionary, including our position in Revolve Group, and Information Technology, including our position in Coupa, detracted from relative returns. Elevated shipping rates and concerns around the health of the consumer weighed on shares of online fashion retailer Revolve Group. Please refer to the U.S. Growth & Core Market Review and Outlook relating to the Fund on page 3. |
| December 31, 2022 | William Blair Funds | 21 |
Small-Mid Cap Growth Fund
Performance Highlights (Unaudited)
| Average Annual Total Returns through 12/31/2022 |
| | | 1 Year | | 3 Year | | 5 Year | | 10 Year | | Since
Inception(a) |
| Class N | | | (23.11 | )% | | | 3.20 | % | | | 6.97 | % | | | 11.87 | % | | | — | % |
| Class I | | | (22.92 | ) | | | 3.46 | | | | 7.24 | | | | 12.16 | | | | — | |
| Class R6 | | | (22.84 | ) | | | 3.53 | | | | — | | | | — | | | | 5.11 | |
| Russell 2500TM Growth Index | | | (26.21 | ) | | | 2.88 | | | | 5.97 | | | | 10.62 | | | | 4.77 | |
| (a) | Since inception is for the period from May 2, 2019 (Commencement of Operations) to December 31, 2022. |
Performance cited represents past performance. Past performance does not guarantee future results and current performance may be lower or higher than the data quoted. Results shown are average annual total returns, which assume reinvestment of dividends and capital gains. Investment returns and principal will fluctuate and you may have a gain or loss when you sell shares. For the most current month-end performance information, please call 1-800-742-7272, or visit our Web site at www.williamblairfunds.com. Investing in smaller and medium capitalization companies involves special risks, including higher volatility and lower liquidity. Smaller and medium capitalization stocks are also more sensitive to purchase/sale transactions and changes in the issuer’s financial condition. From time to time, the investment adviser may waive fees or reimburse expenses for the Fund. Without these waivers/reimbursements, performance would be lower. Class N shares are not subject to a sales load. Class I shares are not subject to a sales load or distribution (Rule 12b-1) fees. Class R6 shares are not subject to a sales load, distribution (Rule 12b-1) fees, or sub-transfer agent fees.
The performance highlights and graph presented above do not reflect the deduction of taxes that a shareholder would pay on fund distributions or the redemption of fund shares.
The Russell 2500TM Growth Index measures the performance of those Russell 2500 companies with above average price-to-book ratios and forecasted growth rates.
This report identifies the Fund’s investments on December 31, 2022. These holdings are subject to change. Not all stocks in the Fund performed the same, nor is there any guarantee that these stocks will perform as well in the future. Market forecasts provided in this report may not necessarily come to pass.
Sector Diversification (Unaudited)

The sector diversification shown is based on the total long-term securities.
| 22 | Annual Report | December 31, 2022 |
Small-Mid Cap Growth Fund
Portfolio of Investments, December 31, 2022 (all dollar amounts in thousands)
| | | | | | | | |
| | | | | | | | |
| | Issuer | | Shares | | | Value | |
| | | | | | | | | | |
| | Common Stocks | | | | | | | | |
| | Health Care—22.6% | | | | | | | | |
| * | Acadia Healthcare Co., Inc. | | | 421,880 | | | $ | 34,729 | |
| * | Azenta, Inc. | | | 255,016 | | | | 14,847 | |
| * | Blueprint Medicines Corp. | | | 177,904 | | | | 7,794 | |
| * | Certara, Inc. | | | 928,274 | | | | 14,917 | |
| * | Charles River Laboratories International, Inc. | | | 114,137 | | | | 24,870 | |
| | Chemed Corp. | | | 91,284 | | | | 46,594 | |
| | Encompass Health Corp. | | | 714,100 | | | | 42,710 | |
| * | Globus Medical, Inc. | | | 314,395 | | | | 23,350 | |
| * | Halozyme Therapeutics, Inc. | | | 584,177 | | | | 33,240 | |
| * | HealthEquity, Inc. | | | 555,508 | | | | 34,242 | |
| * | Insmed, Inc. | | | 595,151 | | | | 11,891 | |
| * | Inspire Medical Systems, Inc. | | | 145,242 | | | | 36,584 | |
| * | Insulet Corp. | | | 62,446 | | | | 18,383 | |
| * | Merit Medical Systems, Inc. | | | 550,226 | | | | 38,857 | |
| * | Penumbra, Inc. | | | 193,759 | | | | 43,104 | |
| * | Repligen Corp. | | | 123,500 | | | | 20,910 | |
| * | Twist Bioscience Corp. | | | 335,373 | | | | 7,985 | |
| | | | | | | | | 455,007 | |
| | | | | | | | | | |
| | Information Technology—20.5% | | | | | | | | |
| * | Alarm.com Holdings, Inc. | | | 392,641 | | | | 19,428 | |
| * | Ambarella, Inc.† | | | 220,900 | | | | 18,165 | |
| | Cognex Corp. | | | 406,247 | | | | 19,138 | |
| * | Dynatrace, Inc. | | | 827,886 | | | | 31,708 | |
| | Entegris, Inc. | | | 290,476 | | | | 19,052 | |
| * | Euronet Worldwide, Inc. | | | 416,180 | | | | 39,279 | |
| | Genpact Ltd.† | | | 419,800 | | | | 19,445 | |
| * | Guidewire Software, Inc. | | | 295,655 | | | | 18,496 | |
| | MKS Instruments, Inc. | | | 158,865 | | | | 13,461 | |
| * | MongoDB, Inc. | | | 77,500 | | | | 15,255 | |
| | National Instruments Corp. | | | 788,051 | | | | 29,079 | |
| * | Nice Ltd.—ADR | | | 137,768 | | | | 26,493 | |
| * | Novanta, Inc.† | | | 188,754 | | | | 25,646 | |
| * | PagerDuty, Inc. | | | 885,320 | | | | 23,514 | |
| * | Pure Storage, Inc. | | | 727,448 | | | | 19,466 | |
| * | SolarEdge Technologies, Inc. | | | 121,541 | | | | 34,429 | |
| * | Varonis Systems, Inc. | | | 1,105,332 | | | | 26,462 | |
| * | Wolfspeed, Inc. | | | 186,413 | | | | 12,870 | |
| | | | | | | | | 411,386 | |
| | Industrials—19.8% | | | | | | | | |
| | Advanced Drainage Systems, Inc. | | | 250,400 | | | | 20,525 | |
| * | Axon Enterprise, Inc. | | | 298,748 | | | | 49,571 | |
| | Brink’s Co. | | | 654,916 | | | | 35,176 | |
| * | Builders FirstSource, Inc. | | | 740,215 | | | | 48,025 | |
| | BWX Technologies, Inc. | | | 1,007,852 | | | | 58,536 | |
| * | Casella Waste Systems, Inc. | | | 301,361 | | | | 23,901 | |
| * | Chart Industries, Inc. | | | 261,187 | | | | 30,097 | |
| | HEICO Corp. | | | 198,856 | | | | 23,833 | |
| | Lincoln Electric Holdings, Inc. | | | 116,235 | | | | 16,795 | |
| * | Mercury Systems, Inc. | | | 846,001 | | | | 37,850 | |
| * | Shoals Technologies Group, Inc. | | | 676,330 | | | | 16,685 | |
| * | Trex Co., Inc. | | | 524,821 | | | | 22,216 | |
| * | WillScot Mobile Mini Holdings Corp. | | | 341,300 | | | | 15,416 | |
| | | | | | | | | 398,626 | |
| | Consumer Discretionary—11.5% | | | | | | | | |
| * | Burlington Stores, Inc. | | | 121,061 | | | | 24,546 | |
| * | Fox Factory Holding Corp. | | | 264,706 | | | | 24,149 | |
| * | Leslie’s, Inc. | | | 1,859,474 | | | | 22,704 | |
| * | National Vision Holdings, Inc. | | | 1,032,962 | | | | 40,038 | |
| * | Planet Fitness, Inc. | | | 389,400 | | | | 30,685 | |
| | Pool Corp. | | | 105,500 | | | | 31,896 | |
| * | Revolve Group, Inc. | | | 803,692 | | | | 17,890 | |
| | Wyndham Hotels & Resorts, Inc. | | | 542,845 | | | | 38,710 | |
| | | | | | | | | 230,618 | |
| | Issuer | | Shares or
Principal
Amount | | | Value | |
| | | | | | | | | | |
| | Common Stocks—(continued) | | | | | | | | |
| | Energy—7.5% | | | | | | | | |
| | Cameco Corp. | | | 1,660,262 | | | $ | 37,638 | |
| * | Denbury, Inc. | | | 240,985 | | | | 20,971 | |
| | New Fortress Energy, Inc. | | | 574,512 | | | | 24,371 | |
| * | TechnipFMC PLC† | | | 3,153,900 | | | | 38,446 | |
| | Whitecap Resources, Inc. | | | 3,714,000 | | | | 29,526 | |
| | | | | | | | | 150,952 | |
| | Materials—4.9% | | | | | | | | |
| | CF Industries Holdings, Inc. | | | 271,431 | | | | 23,126 | |
| | Crown Holdings, Inc. | | | 485,787 | | | | 39,937 | |
| | Martin Marietta Materials, Inc. | | | 104,096 | | | | 35,181 | |
| | | | | | | | | 98,244 | |
| | Financials—4.6% | | | | | | | | |
| | Ares Management Corp. | | | 323,240 | | | | 22,123 | |
| | Carlyle Group, Inc. | | | 522,900 | | | | 15,603 | |
| | Virtu Financial, Inc. | | | 1,426,736 | | | | 29,120 | |
| | Western Alliance Bancorp | | | 431,582 | | | | 25,705 | |
| | | | | | | | | 92,551 | |
| | Consumer Staples—4.4% | | | | | | | | |
| * | Freshpet, Inc. | | | 258,600 | | | | 13,646 | |
| | Lancaster Colony Corp. | | | 155,000 | | | | 30,582 | |
| * | Performance Food Group Co. | | | 757,895 | | | | 44,253 | |
| | | | | | | | | 88,481 | |
| | Real Estate—0.9% | | | | | | | | |
| | FirstService Corp. | | | 153,968 | | | | 18,869 | |
| | Communication Services—0.8% | | | | | | | | |
| * | Live Nation Entertainment, Inc. | | | 237,212 | | | | 16,543 | |
| | Total Common Stocks—97.5%
(cost $1,861,347) | | | | | | | 1,961,277 | |
| | | | | | | | | | |
| | Rights | | | | | | | | |
| | Health Care—0.0% | | | | | | | | |
| * | Abiomed, Inc. CVR** | | | 80,133 | | | | — | |
| | Total Rights—0.0%
(cost $82) | | | | | | | — | |
| | | | | | | | | | |
| | Repurchase Agreement | | | | | | | | |
| | Fixed Income Clearing Corporation, 1.600% dated 12/30/22, due 01/03/23, repurchase price $50,730, collateralized by U.S. Treasury Note, 2.375%, due 03/31/29, valued at $51,736 | | | $50,722 | | | | 50,722 | |
| | Total Repurchase Agreement—2.5%
(cost $50,722) | | | | | | | 50,722 | |
| | Total Investments—100.0%
(cost $1,912,151) | | | | | | | 2,011,999 | |
| | Cash and other assets, less liabilities—0.0% | | | | | | | 326 | |
| | Net assets—100.0% | | | | | | $ | 2,012,325 | |
ADR = American Depository Receipt
CVR = Contingent Value Right
* = Non-income producing security
** = Fair valued pursuant to the Fund’s Valuation Procedures. This holding represents 0.00% of the Fund’s net assets at December 31, 2022.
† = U.S. listed foreign security
See accompanying Notes to Financial Statements.
| December 31, 2022 | William Blair Funds | 23 |
| | Small Cap Growth Fund |
| | |
| | The Small Cap Growth Fund seeks long-term capital appreciation. |
| | |
| | AN OVERVIEW FROM THE PORTFOLIO MANAGERS |
| | |

Ward D. Sexton, CFA 
Mark C. Thompson, CFA | The William Blair Small Cap Growth Fund (Class N shares) (the “Fund”) posted a 21.59% decrease, net of fees, for the year ended December 31, 2022. By comparison, the Fund’s benchmark index, the Russell 2000® Growth Index (the “Index”), decreased 26.36%. For the year, outperformance was broad-based and primarily the result of stock specific dynamics, with positive relative results across most sectors. Top contributors included TechnipFMC (Energy), BWX Technologies (Industrials), Acadia Healthcare (Health Care), Penumbra (Health Care) and Merit Medical (Health Care). Shares of TechnipFMC, an equipment and service provider for offshore oil and gas projects, benefited from improved pricing and share gains against the backdrop of an accelerating offshore cycle. BWX Technologies, the sole-source provider of propulsion systems for the U.S. Navy, reported solid earnings results, as well as continued progress in the medical isotopes business. From a style perspective, our typical valuation sensitivity was a modest tailwind as the most expensive stocks in the Index underperformed. Top detractors for the year were Kornit Digital (Industrials), Codexis (Health Care), The Beauty Health Co (Consumer Staples), Pulmonx (Health Care) and Owens & Minor (Health Care). Kornit Digital, a manufacturer of innovative digital textile printers and inks, lagged as macro-related headwinds impacted orders. Protein engineering company Codexis experienced demand weakness for pre-clinical projects in the area of drug discovery and formulation. Please refer to the U.S. Growth & Core Market Review and Outlook relating to the Fund on page 3. |
| | |
| 24 | Annual Report | December 31, 2022 |
Small Cap Growth Fund
Performance Highlights (Unaudited)
| Average Annual Total Returns through 12/31/2022 |
| | | 1 Year | | 3 Year | | 5 Year | | 10 Year | | Since
Inception(a) |
| Class N | | | (21.59 | )% | | | 6.99 | % | | | 7.94 | % | | | 12.70 | % | | | — | % |
| Class I | | | (21.39 | ) | | | 7.27 | | | | 8.21 | | | | 12.98 | | | | — | |
| Class R6 | | | (21.35 | ) | | | 7.34 | | | | — | | | | — | | | | 6.75 | |
| Russell 2000® Growth Index | | | (26.36 | ) | | | 0.65 | | | | 3.51 | | | | 9.20 | | | | 2.55 | |
| (a) | Since inception is for the period from May 2, 2019 (Commencement of Operations) to December 31, 2022. |
Performance cited represents past performance. Past performance does not guarantee future results and current performance may be lower or higher than the data quoted. Results shown are average annual total returns, which assume reinvestment of dividends and capital gains. Investment returns and principal will fluctuate and you may have a gain or loss when you sell shares. For the most current month-end performance information, please call 1-800-742-7272, or visit our Web site at www.williamblairfunds.com. Investing in smaller companies involves special risks, including higher volatility and lower liquidity. Smaller capitalization stocks are also more sensitive to purchase/sale transactions and changes in the issuer’s financial condition. From time to time, the investment adviser may waive fees or reimburse expenses for the Fund. Without these waivers/reimbursements, performance would be lower. Class N shares are not subject to a sales load. Class I shares are not subject to a sales load or distribution (Rule 12b-1) fees. Class R6 shares are not subject to a sales load, distribution (Rule 12b-1) fees, or sub-transfer agent fees.
The performance highlights and graph presented above do not reflect the deduction of taxes that a shareholder would pay on fund distributions or the redemption of fund shares.
The Russell 2000® Growth Index is an unmanaged composite of the smallest 2000 stocks of the Russell 3000® Growth Index.
This report identifies the Fund’s investments on December 31, 2022. These holdings are subject to change. Not all stocks in the Fund performed the same, nor is there any guarantee that these stocks will perform as well in the future. Market forecasts provided in this report may not necessarily come to pass.
Sector Diversification (Unaudited)

The sector diversification shown is based on the total long-term securities.
| December 31, 2022 | William Blair Funds | 25 |
Small Cap Growth Fund
Portfolio of Investments, December 31, 2022 (all dollar amounts in thousands)
| | | | | | | | |
| | | | | | | | |
| | Issuer | | Shares | | | Value | |
| | | | | | | | | | |
| | Common Stocks | | | | | | | | |
| | Health Care—22.4% | | | | | | | | |
| * | Acadia Healthcare Co., Inc. | | | 65,839 | | | $ | 5,420 | |
| * | Allscripts Healthcare Solutions, Inc. | | | 309,858 | | | | 5,466 | |
| * | Amicus Therapeutics, Inc. | | | 585,810 | | | | 7,153 | |
| * | Axogen, Inc. | | | 409,434 | | | | 4,086 | |
| * | Azenta, Inc. | | | 98,345 | | | | 5,726 | |
| * | Blueprint Medicines Corp. | | | 45,920 | | | | 2,012 | |
| * | Certara, Inc. | | | 305,993 | | | | 4,917 | |
| | Encompass Health Corp. | | | 141,650 | | | | 8,472 | |
| * | Globus Medical, Inc. | | | 123,040 | | | | 9,138 | |
| * | Halozyme Therapeutics, Inc. | | | 127,020 | | | | 7,227 | |
| * | HealthEquity, Inc. | | | 68,165 | | | | 4,202 | |
| * | Insmed, Inc. | | | 143,450 | | | | 2,866 | |
| * | Inspire Medical Systems, Inc. | | | 36,910 | | | | 9,297 | |
| * | Ligand Pharmaceuticals, Inc. | | | 39,120 | | | | 2,613 | |
| * | Merit Medical Systems, Inc. | | | 151,250 | | | | 10,681 | |
| * | OmniAb, Inc. | | | 699,159 | | | | 2,517 | |
| * | OmniAb, Inc. 12.50 Earnout (Acquired 11/02/22, Cost $0)**# | | | 23,037 | | | | — | |
| * | OmniAb, Inc. 15.00 Earnout (Acquired 11/02/22, Cost $0)**# | | | 23,037 | | | | — | |
| * | Owens & Minor, Inc. | | | 216,380 | | | | 4,226 | |
| * | Penumbra, Inc. | | | 34,590 | | | | 7,695 | |
| * | Treace Medical Concepts, Inc. | | | 203,170 | | | | 4,671 | |
| * | Twist Bioscience Corp. | | | 116,506 | | | | 2,774 | |
| * | Veracyte, Inc. | | | 155,450 | | | | 3,689 | |
| * | Vericel Corp. | | | 136,250 | | | | 3,589 | |
| | | | | | | | | 118,437 | |
| | Industrials—22.1% | | | | | | | | |
| * | ACV Auctions, Inc. | | | 459,160 | | | | 3,770 | |
| | Albany International Corp. | | | 108,035 | | | | 10,651 | |
| | Brink’s Co. | | | 195,216 | | | | 10,485 | |
| * | Builders FirstSource, Inc. | | | 72,330 | | | | 4,693 | |
| | BWX Technologies, Inc. | | | 209,867 | | | | 12,189 | |
| * | Casella Waste Systems, Inc. | | | 144,350 | | | | 11,448 | |
| * | Chart Industries, Inc. | | | 45,593 | | | | 5,254 | |
| | Douglas Dynamics, Inc. | | | 177,993 | | | | 6,436 | |
| * | Ducommun, Inc. | | | 154,642 | | | | 7,726 | |
| * | Energy Recovery, Inc. | | | 389,836 | | | | 7,988 | |
| * | Kornit Digital Ltd.† | | | 179,160 | | | | 4,115 | |
| | Lincoln Electric Holdings, Inc. | | | 52,820 | | | | 7,632 | |
| | Luxfer Holdings PLC† | | | 450,756 | | | | 6,184 | |
| * | Mercury Systems, Inc. | | | 170,036 | | | | 7,608 | |
| * | Montrose Environmental Group, Inc. | | | 181,298 | | | | 8,048 | |
| * | Stem, Inc. | | | 337,406 | | | | 3,016 | |
| | | | | | | | | 117,243 | |
| | Information Technology—17.0% | | | | | | | | |
| * | Alarm.com Holdings, Inc. | | | 101,740 | | | | 5,034 | |
| * | Ambarella, Inc.† | | | 38,360 | | | | 3,154 | |
| | American Software, Inc. | | | 283,900 | | | | 4,168 | |
| * | Euronet Worldwide, Inc. | | | 73,530 | | | | 6,940 | |
| * | JFrog Ltd.† | | | 165,360 | | | | 3,527 | |
| * | Novanta, Inc.† | | | 40,810 | | | | 5,545 | |
| * | PagerDuty, Inc. | | | 170,460 | | | | 4,527 | |
| | | | | | | | |
| | | | | | | | |
| | Issuer | | Shares | | | Value | |
| | | | | | | | | | |
| | Common Stocks—(continued) | | | | | | | | |
| | Information Technology—(continued) | | | | | | | | |
| * | PDF Solutions, Inc. | | | 234,207 | | | $ | 6,680 | |
| | Power Integrations, Inc. | | | 40,510 | | | | 2,905 | |
| * | PROS Holdings, Inc. | | | 199,570 | | | | 4,842 | |
| * | Pure Storage, Inc. | | | 192,336 | | | | 5,147 | |
| * | SiTime Corp. | | | 27,245 | | | | 2,769 | |
| * | Varonis Systems, Inc. | | | 236,090 | | | | 5,652 | |
| * | Verra Mobility Corp. | | | 748,619 | | | | 10,353 | |
| * | Vertex, Inc. | | | 370,573 | | | | 5,377 | |
| * | WNS Holdings Ltd.—ADR | | | 109,842 | | | | 8,786 | |
| * | Workiva, Inc. | | | 55,220 | | | | 4,637 | |
| | | | | | | | | 90,043 | |
| | Consumer Discretionary—11.9% | | | | | | | | |
| * | Boot Barn Holdings, Inc. | | | 73,704 | | | | 4,608 | |
| | Cheesecake Factory, Inc. | | | 217,580 | | | | 6,899 | |
| * | Fox Factory Holding Corp. | | | 44,120 | | | | 4,025 | |
| * | Golden Entertainment, Inc. | | | 115,240 | | | | 4,310 | |
| * | Grand Canyon Education, Inc. | | | 74,130 | | | | 7,833 | |
| * | National Vision Holdings, Inc. | | | 285,098 | | | | 11,050 | |
| * | Overstock.com, Inc. | | | 141,950 | | | | 2,748 | |
| * | Revolve Group, Inc. | | | 105,457 | | | | 2,348 | |
| | Signet Jewelers Ltd.† | | | 66,920 | | | | 4,551 | |
| * | Skyline Champion Corp. | | | 104,740 | | | | 5,395 | |
| | Wingstop, Inc. | | | 21,366 | | | | 2,940 | |
| | Winmark Corp. | | | 26,110 | | | | 6,158 | |
| | | | | | | | | 62,865 | |
| | Energy—8.6% | | | | | | | | |
| | Cameco Corp. | | | 342,720 | | | | 7,770 | |
| | ChampionX Corp. | | | 203,770 | | | | 5,907 | |
| * | Denbury, Inc. | | | 50,269 | | | | 4,374 | |
| * | Green Plains, Inc. | | | 194,142 | | | | 5,921 | |
| * | TechnipFMC PLC† | | | 1,141,600 | | | | 13,916 | |
| | Whitecap Resources, Inc. | | | 954,040 | | | | 7,585 | |
| | | | | | | | | 45,473 | |
| | Communication Services—3.9% | | | | | | | | |
| * | Gogo, Inc. | | | 341,220 | | | | 5,037 | |
| * | QuinStreet, Inc. | | | 277,025 | | | | 3,975 | |
| * | Ziff Davis, Inc. | | | 89,763 | | | | 7,100 | |
| * | ZipRecruiter, Inc. | | | 294,100 | | | | 4,829 | |
| | | | | | | | | 20,941 | |
| | Consumer Staples—3.9% | | | | | | | | |
| * | Beauty Health Co. | | | 313,640 | | | | 2,854 | |
| * | Performance Food Group Co. | | | 168,360 | | | | 9,831 | |
| * | Vita Coco Co., Inc. | | | 207,366 | | | | 2,866 | |
| * | Vital Farms, Inc. | | | 358,330 | | | | 5,346 | |
| | | | | | | | | 20,897 | |
| | Real Estate—2.4% | | | | | | | | |
| | Colliers International Group, Inc. | | | 54,708 | | | | 5,035 | |
| | FirstService Corp. | | | 62,877 | | | | 7,706 | |
| | | | | | | | | 12,741 | |
See accompanying Notes to Financial Statements.
| 26 | Annual Report | December 31, 2022 |
Small Cap Growth Fund
Portfolio of Investments, December 31, 2022 (all dollar amounts in thousands)
| | Issuer | | Shares or
Principal
Amount | | | Value | |
| | | | | | | | | | |
| | Common Stocks—(continued) | | | | | | | | |
| | Materials—2.4% | | | | | | | | |
| | Ardagh Metal Packaging SA† | | | 729,560 | | | $ | 3,509 | |
| * | Century Aluminum Co. | | | 243,090 | | | | 1,988 | |
| | Orion Engineered Carbons SA† | | | 391,397 | | | | 6,971 | |
| | | | | | | | | 12,468 | |
| | Financials—2.3% | | | | | | | | |
| * | Goosehead Insurance, Inc. | | | 68,520 | | | | 2,353 | |
| | PacWest Bancorp | | | 189,970 | | | | 4,360 | |
| | Wintrust Financial Corp. | | | 64,820 | | | | 5,478 | |
| | | | | | | | | 12,191 | |
| | Total Common Stocks—96.9%
(cost $474,693) | | | | | | | 513,299 | |
| | | | | | | | | | |
| | Repurchase Agreement | | | | | | | | |
| | Fixed Income Clearing Corporation, 1.600% dated 12/30/22, due 01/03/23, repurchase price $13,901, collateralized by U.S. Treasury Note, 2.375%, due 03/31/29, valued at $14,177 | | | $13,899 | | | | 13,899 | |
| | Total Repurchase Agreement—2.6%
(cost $13,899) | | | | | | | 13,899 | |
| | Total Investments—99.5%
(cost $488,592) | | | | | | | 527,198 | |
| | Cash and other assets, less liabilities—0.5% | | | | | | | 2,639 | |
| | Net assets—100.0% | | | | | | $ | 529,837 | |
ADR = American Depository Receipt
* = Non-income producing security
** = Fair valued pursuant to the Fund’s Valuation Procedures. These holdings represent 0.00% of the Fund’s net assets at December 31, 2022.
# = Investment in securities not registered under the Securities Act of 1933 (excluding securities acquired pursuant to Rule 144A and Regulation S). The value of such restricted securities represents 0.00% of the Fund’s net assets at December 31, 2022.
† = U.S. listed foreign security
See accompanying Notes to Financial Statements.
| December 31, 2022 | William Blair Funds | 27 |
| | Small Cap Value Fund |
| | |
| | The Small Cap Value Fund seeks long-term capital appreciation. |
| | |
| | AN OVERVIEW FROM THE PORTFOLIO MANAGERS |
| | |

William Heaphy, CFA 
Gary Merwitz | The William Blair Small Cap Value Fund (Class N shares) (the “Fund”) posted a 11.36% decrease, net of fees, for the year ended December 31, 2022. By comparison, the Fund’s benchmark index, the Russell 2000® Value Index (the “Index”), decreased 14.48%. The Fund’s relative outperformance during the period was driven by the combination of stock selection and style observations during the year given its quality biases compared to the Index. From a style perspective, the value indices witnessed a continued preference for higher quality stocks with cheaper valuations which provided our strategy with a tailwind for the year. Furthermore, within the Index, quality and value (as defined by the highest return on equity and the lowest price/earnings ratios, respectively) were the best performing attributes for the year. At the sector level, the Fund’s Health Care holdings were a major contributor to relative performance in 2022. A lack of exposure to the poorly performing biotechnology subsector was a major contributor to this result, but several of the Fund’s Health Care holdings posted significantly positive returns, including Health Care supplier Lantheus Holdings. The Fund was also positively impacted by a relative outperformance by the Fund’s holdings in the Information Technology sector. The Fund’s Information Technology holdings held up much better than the Index peers in a difficult market, only declining 9.9% versus a much steeper loss of 26.8% for the Index. The outperformance was broad based contributing to relative performance in the hardware, software, and semiconductor subsectors as many of the supply chain issues that hindered these companies’ results over the last 18 months appear to be easing. On the negative side, the Fund’s Energy sector holdings struggled to pace with Index constituents which rose over 60% for the year. The Fund was significantly underweight to Energy shares in the first half of the year, which was a large drag on relative performance as oil and natural gas prices spiked. Our exposure to companies serving the offshore drilling market was also a cause of this relative underperformance as the market favored companies benefitting from the increase in onshore shale drilling which is ramping up faster. The Fund’s underweight positions in the Utilities and Financials sectors were also a drag on relative performance for the year. The portfolio was negatively impacted by top detractor Argo Group International in the property and casualty subsector. Another disappointment in the year came from the Industrials sector, where the Fund’s holdings fell 15.1% compared to a 12.7% decline for Index constituents. The Fund was significantly overweight in the commercial and professional services subsector, which declined more than 17% in the year. These companies are more domestically oriented and tend to be less cyclical which in our view makes their weaker performance surprising. The Fund’s performance in 2022 was also hindered by Great Lakes Dredge and Dock which declined 62% after reporting a challenging result due to adverse weather conditions and multiple operational issues. Management will need to demonstrate better execution, but we believe the stock is undervalued and the long-term growth drivers, including infrastructure spending and port dredging and expansion demand, are still intact. Please refer to the U.S. Value Market Review and Outlook relating to the Fund on page 4. |
| 28 | Annual Report | December 31, 2022 |
Small Cap Value Fund
Performance Highlights (Unaudited)
| Average Annual Total Returns through 12/31/2022 |
| | | 1 Year | | 3 Year | | 5 Year | | 10 Year | | Since
Inception(a) |
| Class N | | | (11.36 | )% | | | — | % | | | — | % | | | — | % | | | (2.59 | )% |
| Class I | | | (11.12 | ) | | | 5.76 | | | | 5.13 | | | | 9.97 | | | | — | |
| Class R6 | | | (11.06 | ) | | | — | | | | — | | | | — | | | | (2.25 | ) |
| Russell 2000® Value Index | | | (14.48 | ) | | | 4.70 | | | | 4.13 | | | | 8.48 | | | | (5.69 | ) |
| (a) | Since inception is for the period from July 17, 2021 (Commencement of Operations) to December 31, 2022. |
Performance cited represents past performance. Past performance does not guarantee future results and current performance may be lower or higher than the data quoted. Results shown are average annual total returns, which assume reinvestment of dividends and capital gains. Investment returns and principal will fluctuate and you may have a gain or loss when you sell shares. For the most current month-end performance information, please call 1-800-742-7272, or visit our Web site at www.williamblairfunds.com. Investing in smaller companies involves special risks, including higher volatility and lower liquidity. Smaller capitalization stocks are also more sensitive to purchase/sale transactions and changes in the issuer’s financial condition. From time to time, the investment adviser may waive fees or reimburse expenses for the Fund. Without these waivers/reimbursements, performance would be lower. Class N shares are not subject to a sales load. Class I shares are not subject to a sales load or distribution (Rule 12b-1) fees. Class R6 shares are not subject to a sales load, distribution (Rule 12b-1) fees, or sub-transfer agent fees.
The performance highlights and graph presented above do not reflect the deduction of taxes that a shareholder would pay on fund distributions or the redemption of fund shares.
The Russell 2000® Value Index consists of small-capitalization companies with below average price-to-book ratios and forecasted growth rates.
This report identifies the Fund’s investments on December 31, 2022. These holdings are subject to change. Not all stocks in the Fund performed the same, nor is there any guarantee that these stocks will perform as well in the future. Market forecasts provided in this report may not necessarily come to pass.
Sector Diversification (Unaudited)

The sector diversification shown is based on the total long-term securities.
| December 31, 2022 | William Blair Funds | 29 |
Small Cap Value Fund
Portfolio of Investments, December 31, 2022 (all dollar amounts in thousands)
| | | | | | | | |
| | | | | | | | |
| | Issuer | | Shares | | | Value | |
| | | | | | | | |
| | Common Stocks | | | | | | | | |
| | Financials—22.1% | | | | | | | | |
| | Ameris Bancorp | | | 310,853 | | | $ | 14,654 | |
| | Argo Group International Holdings Ltd.† | | | 315,326 | | | | 8,151 | |
| | Atlantic Union Bankshares Corp. | | | 364,829 | | | | 12,820 | |
| | Banc of California, Inc. | | | 712,861 | | | | 11,356 | |
| | Berkshire Hills Bancorp, Inc. | | | 399,255 | | | | 11,938 | |
| | Brightsphere Investment Group, Inc. | | | 472,552 | | | | 9,725 | |
| | Compass Diversified Holdings | | | 569,459 | | | | 10,381 | |
| | ConnectOne Bancorp, Inc. | | | 410,459 | | | | 9,937 | |
| | Dime Community Bancshares, Inc. | | | 411,959 | | | | 13,113 | |
| | Eastern Bankshares, Inc. | | | 733,717 | | | | 12,657 | |
| | Enterprise Financial Services Corp. | | | 274,972 | | | | 13,463 | |
| | First Bancorp | | | 288,347 | | | | 12,353 | |
| | First Merchants Corp. | | | 325,013 | | | | 13,361 | |
| | Hancock Whitney Corp. | | | 61,563 | | | | 2,979 | |
| | MGIC Investment Corp. | | | 923,798 | | | | 12,009 | |
| | Old National Bancorp | | | 819,331 | | | | 14,732 | |
| | Pacific Premier Bancorp, Inc. | | | 330,933 | | | | 10,444 | |
| * | PRA Group, Inc. | | | 417,315 | | | | 14,097 | |
| | Seacoast Banking Corp. of Florida | | | 370,882 | | | | 11,568 | |
| | Simmons First National Corp. | | | 510,975 | | | | 11,027 | |
| * | Texas Capital Bancshares, Inc. | | | 248,707 | | | | 14,999 | |
| | Veritex Holdings, Inc. | | | 369,748 | | | | 10,382 | |
| | Washington Federal, Inc. | | | 368,182 | | | | 12,352 | |
| | | | | | | | | 268,498 | |
| | Industrials—19.4% | | | | | | | | |
| | ABM Industries, Inc. | | | 322,428 | | | | 14,322 | |
| * | Aerojet Rocketdyne Holdings, Inc. | | | 36,761 | | | | 2,056 | |
| | Albany International Corp. | | | 169,287 | | | | 16,690 | |
| | Armstrong World Industries, Inc. | | | 152,595 | | | | 10,467 | |
| | Astec Industries, Inc. | | | 118,345 | | | | 4,812 | |
| | Brady Corp. | | | 268,814 | | | | 12,661 | |
| * | CBIZ, Inc. | | | 321,881 | | | | 15,080 | |
| | Deluxe Corp. | | | 506,881 | | | | 8,607 | |
| | Federal Signal Corp. | | | 262,991 | | | | 12,221 | |
| | GrafTech International Ltd. | | | 1,204,699 | | | | 5,734 | |
| | Granite Construction, Inc. | | | 409,021 | | | | 14,344 | |
| * | Great Lakes Dredge & Dock Corp. | | | 960,633 | | | | 5,716 | |
| | Hillenbrand, Inc. | | | 295,520 | | | | 12,610 | |
| * | Hub Group, Inc. | | | 164,417 | | | | 13,070 | |
| * | KAR Auction Services, Inc. | | | 606,395 | | | | 7,913 | |
| | Marten Transport Ltd. | | | 592,821 | | | | 11,726 | |
| | MillerKnoll, Inc. | | | 440,985 | | | | 9,265 | |
| | Mueller Water Products, Inc. | | | 601,464 | | | | 6,472 | |
| * | PGT Innovations, Inc. | | | 560,301 | | | | 10,063 | |
| * | SP Plus Corp. | | | 302,233 | | | | 10,494 | |
| | Tennant Co. | | | 59,902 | | | | 3,688 | |
| | Terex Corp. | | | 374,084 | | | | 15,981 | |
| | Werner Enterprises, Inc. | | | 292,211 | | | | 11,764 | |
| | | | | | | | | 235,756 | |
| | | | | | | | |
| | | | | | | | |
| | Issuer | | Shares | | | Value | |
| | | | | | | | |
| | Common Stocks—(continued) | | | | | | | | |
| | Information Technology—13.9% | | | | | | | | |
| | Advanced Energy Industries, Inc. | | | 112,681 | | | $ | 9,666 | |
| | AudioCodes Ltd.† | | | 549,935 | | | | 9,838 | |
| | Belden, Inc. | | | 272,554 | | | | 19,597 | |
| * | Cognyte Software Ltd.† | | | 1,085,516 | | | | 3,376 | |
| * | Conduent, Inc. | | | 2,511,951 | | | | 10,173 | |
| | CSG Systems International, Inc. | | | 195,066 | | | | 11,158 | |
| * | Knowles Corp. | | | 881,512 | | | | 14,474 | |
| | Kulicke & Soffa Industries, Inc. | | | 279,701 | | | | 12,380 | |
| | Maximus, Inc. | | | 172,198 | | | | 12,627 | |
| | Methode Electronics, Inc. | | | 371,314 | | | | 16,475 | |
| * | NetScout Systems, Inc. | | | 441,612 | | | | 14,357 | |
| * | Plexus Corp. | | | 87,528 | | | | 9,009 | |
| | Progress Software Corp. | | | 316,217 | | | | 15,953 | |
| * | Verint Systems, Inc. | | | 268,039 | | | | 9,725 | |
| | | | | | | | | 168,808 | |
| | Consumer Discretionary—12.8% | | | | | | | | |
| * | Adient PLC† | | | 297,505 | | | | 10,321 | |
| | Bloomin’ Brands, Inc. | | | 621,292 | | | | 12,500 | |
| | Carter’s, Inc. | | | 178,665 | | | | 13,330 | |
| | Cracker Barrel Old Country Store, Inc. | | | 85,949 | | | | 8,143 | |
| | Designer Brands, Inc. | | | 734,996 | | | | 7,188 | |
| | El Pollo Loco Holdings, Inc. | | | 556,658 | | | | 5,544 | |
| | La-Z-Boy, Inc. | | | 477,317 | | | | 10,892 | |
| | Oxford Industries, Inc. | | | 93,686 | | | | 8,730 | |
| | Standard Motor Products, Inc. | | | 369,585 | | | | 12,862 | |
| | Steven Madden Ltd. | | | 414,200 | | | | 13,238 | |
| * | Taylor Morrison Home Corp. | | | 415,921 | | | | 12,623 | |
| * | Tri Pointe Homes, Inc. | | | 599,094 | | | | 11,137 | |
| * | Universal Electronics, Inc. | | | 209,244 | | | | 4,354 | |
| * | Urban Outfitters, Inc. | | | 600,532 | | | | 14,323 | |
| | Winnebago Industries, Inc. | | | 195,340 | | | | 10,295 | |
| | | | | | | | | 155,480 | |
| | Real Estate—7.4% | | | | | | | | |
| | Brandywine Realty Trust | | | 630,811 | | | | 3,880 | |
| | CareTrust REIT, Inc. | | | 503,105 | | | | 9,348 | |
| | Elme Communities | | | 652,709 | | | | 11,618 | |
| | Empire State Realty Trust, Inc. | | | 1,472,851 | | | | 9,927 | |
| | Four Corners Property Trust, Inc. | | | 434,333 | | | | 11,262 | |
| | Kite Realty Group Trust | | | 767,560 | | | | 16,157 | |
| | Pebblebrook Hotel Trust | | | 569,415 | | | | 7,624 | |
| | Sunstone Hotel Investors, Inc. | | | 945,087 | | | | 9,130 | |
| | UMH Properties, Inc. | | | 687,328 | | | | 11,066 | |
| | | | | | | | | 90,012 | |
| | Materials—6.1% | | | | | | | | |
| | Greif, Inc. | | | 179,362 | | | | 12,028 | |
| | Kaiser Aluminum Corp. | | | 167,011 | | | | 12,686 | |
| | Materion Corp. | | | 142,466 | | | | 12,467 | |
| | Minerals Technologies, Inc. | | | 192,261 | | | | 11,674 | |
| | Myers Industries, Inc. | | | 515,889 | | | | 11,469 | |
| | Orion Engineered Carbons SA† | | | 762,708 | | | | 13,584 | |
| | | | | | | | | 73,908 | |
See accompanying Notes to Financial Statements.
| 30 | Annual Report | December 31, 2022 |
Small Cap Value Fund
Portfolio of Investments, December 31, 2022 (all dollar amounts in thousands)
| | Issuer | | Shares or
Principal
Amount | | | Value | |
| | | | | | | | |
| | Common Stocks—(continued) | | | | | | | | |
| | Health Care—5.6% | | | | | | | | |
| * | ANI Pharmaceuticals, Inc. | | | 192,746 | | | $ | 7,754 | |
| * | Integer Holdings Corp. | | | 217,290 | | | | 14,876 | |
| * | Lantheus Holdings, Inc. | | | 216,951 | | | | 11,056 | |
| * | ModivCare, Inc. | | | 101,371 | | | | 9,096 | |
| * | NextGen Healthcare, Inc. | | | 562,533 | | | | 10,564 | |
| * | NuVasive, Inc. | | | 172,966 | | | | 7,133 | |
| * | Owens & Minor, Inc. | | | 347,987 | | | | 6,796 | |
| | | | | | | | | 67,275 | |
| | Energy—4.0% | | | | | | | | |
| * | Dril-Quip, Inc. | | | 448,423 | | | | 12,184 | |
| * | Earthstone Energy, Inc. | | | 639,589 | | | | 9,101 | |
| * | Expro Group Holdings NV† | | | 755,894 | | | | 13,704 | |
| | SM Energy Co. | | | 370,529 | | | | 12,906 | |
| | | | | | | | | 47,895 | |
| | Consumer Staples—3.7% | | | | | | | | |
| * | Central Garden & Pet Co. | | | 305,013 | | | | 10,919 | |
| | Edgewell Personal Care Co. | | | 239,496 | | | | 9,230 | |
| | Spectrum Brands Holdings, Inc. | | | 106,709 | | | | 6,501 | |
| * | Sprouts Farmers Market, Inc. | | | 199,777 | | | | 6,467 | |
| * | TreeHouse Foods, Inc. | | | 241,499 | | | | 11,925 | |
| | | | | | | | | 45,042 | |
| | Utilities—2.1% | | | | | | | | |
| | NorthWestern Corp. | | | 217,043 | | | | 12,879 | |
| | Spire, Inc. | | | 180,915 | | | | 12,458 | |
| | | | | | | | | 25,337 | |
| | Communication Services—0.9% | | | | | | | | |
| | John Wiley & Sons, Inc. | | | 283,838 | | | | 11,370 | |
| | Total Common Stocks—98.0%
(cost $1,182,940) | | | | | | | 1,189,381 | |
| | | | | | | | | | |
| | Repurchase Agreement | | | | | | | | |
| | Fixed Income Clearing Corporation, 1.600% dated 12/30/22, due 01/03/23, repurchase price $24,686, collateralized by U.S. Treasury Note, 2.375%, due 03/31/29, valued at $25,175 | | | $24,682 | | | | 24,682 | |
| | Total Repurchase Agreement—2.0%
(cost $24,682) | | | | | | | 24,682 | |
| | Total Investments—100.0%
(cost $1,207,622) | | | | | | | 1,214,063 | |
| | Cash and other assets, less liabilities—0.0% | | | | | | | 145 | |
| | Net assets—100.0% | | | | | | $ | 1,214,208 | |
REIT = Real Estate Investment Trust
† = U.S. listed foreign security
* = Non-income producing security
See accompanying Notes to Financial Statements.
| December 31, 2022 | William Blair Funds | 31 |
Global Markets Review and Outlook
Global equities advanced in the fourth quarter (the MSCI ACWI IMI returned +9.84% for the quarter and -18.40% for the year in USD terms), marking the end to the worst year for global equities in more than a decade. Growth equities underperformed value-oriented equities (the MSCI ACWI IMI Growth returned +5.67% for the fourth quarter and -28.24% year-to-date, while the MSCI ACWI IMI Value returned +13.98% for the fourth quarter and -8.07% year-to-date) as equity markets rallied behind a more dovish outlook for U.S. Federal Reserve (Fed) interest rate hikes and loosened COVID-19 restrictions in China. From a global sector perspective, energy was the only sector to outperform on a year-to-date period (+17.35% during the fourth quarter and +34.10% year-to-date as measured by the MSCI ACWI IMI), while consumer discretionary and communication services lagged (+0.84% during the fourth quarter and -30.99% year-to-date and +2.68% during the fourth quarter and -35.29% year-to-date, respectively, as measured by the MSCI ACWI IMI).
U.S. equities advanced during the fourth quarter (+7.08% for the quarter and -19.61% year-to-date as measured by the MSCI USA IMI) as investor optimism was bolstered by the prospect of cooling inflation and that policy tightening would slow. Hopes for a near-term peak in the Fed tightening cycle were fueled by some positive developments on the inflation front, including cooler Consumer Price Index (CPI) prints for both October and November. While the latest CPI print for November slowed to 0.1% month-on-month, inflation remains elevated at 7.1% year-on-year. Nevertheless, the final Fed rate hike of the year was 50 basis points, a pivot from the four straight 75-basis-point increases in 2022.
European equities outperformed global markets for the fourth quarter (+19.52% for the quarter and -16.71% year-to-date, as measured by the MSCI Europe IMI), capping off a difficult year, mainly from the fallout of Russia’s invasion of Ukraine and subsequent energy crisis. Within the U.K., equities advanced (+17.24% for the fourth quarter and -9.76% year-to-date, as measured by the MSCI United Kingdom IMI), following a turbulent September. On the political front, former Prime Minister Liz Truss stepped down and Rishi Sunak from the Conservative Party was appointed. Similarly, Europe ex-U.K. advanced (+20.28% for the fourth quarter and -18.85% year-to-date, as measured by the MSCI Europe ex-UK IMI), aided by a rally in the fourth quarter amid hopes that cooling inflation would sway central banks.
Emerging markets gained (+9.50% for the fourth quarter and -19.83% year-to-date, as measured by the MSCI EM IMI) broadly across countries. Chinese equities rebounded (+13.83% for the fourth quarter and -22.03% year-to-date) on news of the relaxation of the zero-COVID policies, which helped boost optimism for economic growth in 2023. Similarly, Latin America returns continued to advance (+5.45% for the fourth quarter and +7.26% year-to-date, as measured by the MSCI EM Latin America IMI), bolstered primarily by Argentina (+32.68 for the fourth quarter and +35.91% year-to-date, as measured by MSCI Argentina) and Mexico (+13.47% for the fourth quarter and flat for the year). Brazil, which outperformed for most of 2022, underperformed on a relative basis in the fourth quarter (+1.37% for the fourth quarter and +10.31% year-to-date, as measured by MSCI Brazil IMI) amid investor concerns about President Luiz Inácio Lula da Silva’s plans to ramp up fiscal spending. EMEA gained (+6.65% for the fourth quarter and -25.62% year-to-date, as measured by the MSCI EM EMEA IMI) despite weaker returns from Qatar and Saudi Arabia (-14.43% during the fourth quarter and -7.37% year-to-date, as measured by MSCI Qatar IMI, and -7.32% during the fourth quarter and -5.13% year-to-date, as measured by MSCI Saudi Arabia IMI), which were impacted by weaker energy prices.
Our outlook has two primary elements: first, the current cycle and the implications for markets in 2023. Second, we address the bigger issue, relating to the developing likelihood we have begun to shift into a different economic and market environment, marking a different era than we have seen in the decade-plus post the Global Financial Crisis (GFC).
We likely experienced peak rates of inflation during the fourth quarter of 2022 and thus as price increases abate, we may be finally nearing the end of the central bank tightening in the coming months. However, while perhaps peaking, inflation is likely to remain above the historically low levels experienced during the last decade. Tight labor markets and the slowing rate of globalization are probable key culprits.
Global central banks have been vigilant managing these inflationary forces, and even if we are at the tipping point of the current tightening cycle, it is quite possible that interest rates remain at levels above what we have been used to during the post-GFC era.
Regarding economic growth, there is great debate about whether a recession in the U.S. can be avoided, but the precision is not relevant. It is clear to us that we are and will be in a slowdown during the first part of 2023, and that will be felt even deeper in Europe.
Corporate earnings growth is projected to be slower in 2023 than 2022, and consensus estimates still appear too high in our estimation. The market started to acknowledge slower corporate earnings growth in the fourth quarter of last year, and we expect that will pick up in the first months of this year.
| 32 | Annual Report | December 31, 2022 |
Global Markets Review and Outlook
China is a different story, as growth should accelerate as it emerges from extended COVID-related lockdowns. However, we expect growth will be uneven, and not as strong as we have seen elsewhere given there has not been as much fiscal support to boost consumption in China.
Interestingly, pent-up travel demand from China is likely to contribute more to persistent inflation than is generally understood. We expect that close to 300 million of China’s population could be traveling abroad in the next several quarters, buoying demand for goods and services outside of China increasing inflation volatility—one of the reasons we believe inflation may prove to be stickier this year.
With that backdrop–lower but elevated rates of inflation, interest rates remaining above that seen in the last decade, and sluggish economic and corporate profit growth–it will remain a difficult equity market to navigate. While the big move in valuation occurred in the early parts of 2022, we still believe valuation will remain a powerful factor. In other words, we expect that market returns will be a function of earnings growth rather than valuation.
The nature of this market environment and the potential for shifts in where we might find future earnings growth in 2023 and beyond are discussed in the next section.
We postulate that the period post GFC was anomalous, and going forward we expect we may experience marginal shifts to the investing environment that would suggest an era dating back to prior decades rather than merely reverting back to the 2010s.
It has been well documented, but worth noting, that the unusual shock to the global economy and markets resulting from the GFC led to a decade of extremely accommodative monetary policies, lowering interest rates to historic levels. The period was also unusual in that the expansion was quite protracted, intermittently lasting for most of the decade. We witnessed the continuation of globalization and China’s ascension into the world’s second biggest economy, with still high (>6%) rates of growth as key drivers, as well as the continuation of innovation and productivity enabled by the digitalization of many areas of the industrial and consumer economy.
Thus, we experienced a long, albeit low growth, expansion accompanied by very modest inflation. This ultimately led to a period of strong returns for equities and risk assets, as “TINA”—there is no alternative—took hold in a low (zero) interest rate environment.
This ballooned during the pandemic, once it was clear to the markets that global central banks were going to do whatever was necessary to keep economic demand from plummeting. The bubble was pricked in 2022, as inflation and rates accelerated at an historic rate.
Beyond this year, there is no reason to believe that underlying real structural growth will be materially different than what we have seen in the prior decade. If anything, there may be slight risks to the downside. Inflation and interest rates have shifted upward, and we think the forces that caused this may be beyond just this current pandemic-influenced economic cycle. Unfortunately, we do not believe that these increases will revert to recent lows in the near future, as the move from quantitative easing to quantitative tightening is just underway.
Because it sets the stage for corporate performance, but also perhaps more importantly market leadership. We believe the environment has changed enough that market leadership will be broader in the coming years as compared to the pre-pandemic era.
We look to previous central bank tightening cycles for some perspective. Our analysis shows that following the peak of prior tightening cycles, inflation remained sticky, persisting up to two years, corporate earnings growth receded, and valuation remained a dominant factor. We believe this is likely to be the case for the intermediate-term investing period.
Despite this backdrop, we still believe companies that persistently out-earn their cost of capital, grow their asset bases with high returns on invested capital, and innovate to solve customer needs will be attractive investments. But as we experienced post the dot-com bubble, we believe the market needs to recalibrate expectations. We have experienced the first phase of this in 2022 but expect that it could take the next few years for this to fully materialize.
| December 31, 2022 | William Blair Funds | 33 |
Global Markets Review and Outlook
We think diversity of growth, industries, and business models at appropriate levels of valuation will make for optimal portfolio construction and investment returns. This is different than most of the 2010’s, where concentrated investment strategies optimized for maximization of expected growth, in a small number of industries, with in many cases similar business models outperformed massively. We have seen these before, the Nifty Fifty of the 1970’s and the tech bubble of the 1990s.
Each of these periods were symbolized by concentration of market leadership and a narrowness of what was favored—at the extreme expense of almost everything else. This really is not reflective of longer-term market environments characterized by much more breadth and diversity in both the real economy and the markets.
Looking forward, we believe there should be opportunities for growth equities from numerous sources. We believe that marginal changes to growth rates, in both directions, will likely drive investment performance. Companies with superior capital allocation strategies should prove to be attractive. We believe the delivery of cash flows will likely be favored over promise of growth, in other words, lower versus longer duration. In our view, quality, cash flows, and predictability will be favored. We believe “old economy cyclicals” that were left for dead (commodities, financials) may continue their resurrection.
As growth equity investors for now close to three decades, we welcome this shift back to “normal” as breadth and diversity of investment ideas have been a hallmark of our success.
| 34 | Annual Report | December 31, 2022 |
| | Global Leaders Fund |
| | |
| | The Global Leaders Fund seeks long-term capital appreciation. |
| | |
| | AN OVERVIEW FROM THE PORTFOLIO MANAGERS |
| | |

Kenneth J. McAtamney 
Hugo Scott-Gall | The William Blair Global Leaders Fund (Class N shares) (the “Fund”) posted a 29.49% decrease, net of fees, for the year ended December 31, 2022. By comparison, the Fund’s benchmark index, the MSCI All Country World IMI (net) (the “Index”), decreased 18.40%. Underperformance versus the Index was largely due to style headwinds amid strong outperformance of low-valuation stocks. The underperformance was highly correlated to the inflationary pressures and increase in interest rates, leading to significant multiple contraction for growth companies. Quality companies, which typically offer downside protection, did not help offset the underperformance amid the largely indiscriminate sell-off of high-growth, high-price-to-earnings (P/E) stocks. Stock selection was the primary driver of negative performance and was persistent across most sectors and regions due to the overarching style headwinds seen in 2022. Stock selection within Health Care, Information Technology, and Industrials was particularly negative, while Consumer Discretionary was positive. Within Health Care, Align Technology (Align) and Charles River Laboratories (Charles River) were the largest drivers of relative underperformance. Align designs, manufactures, and markets clear aligners and intraoral scanners for dentistry, as well as computer-aided design and manufacturing software for dental laboratories and dental practitioners. Align results have deteriorated meaningfully this year given the tough consumer environment and macroeconomic backdrop. Results have been negatively impacted by both volume and pricing. We exited the position late in the year as we believe there is risk of further downside to Align’s results and the stock price. Charles River is a leading contract research organization that has evolved to be the global leader in the early-stage portion of the research market holding a dominant market share lead. The stock underperformance mostly occurred in the first half of the year as full-year guidance was lowered and the stock P/E multiple declined from an all-time high to below its long-term average. Toward the end of the year, the company reported better results, and we continue to have confidence in Charles River’s competitive position. Partially offsetting this was positive stock selection from Novo Nordisk (Novo), a leader in diabetes and obesity care. Throughout the year the company delivered strong corporate results and consistently raised its forward guidance. Novo’s launch of Wegovy, an obesity drug, got off to an incredible start, and we see a long runway of growth for Novo’s obesity franchise given its pipeline progression and the large market opportunity. Selection in Information Technology was negative, largely driven by Atlassian and Salesforce. Atlassian designs and develops enterprise software for project management, collaboration, issue tracking, integration, deployment, and support services. Layoffs and the slower pace of hiring among customers are leading to slower growth at Atlassian and the business is more sensitive to economic conditions than we previously thought. Atlassian’s full year 2023 guidance was recently lowered. At the same time, Atlassian is a high-valuation, long-duration stock. We exited the position during the fourth quarter. While corporate performance in the most recent quarter for Salesforce was strong, forward-looking revenue came in lower than expected, and the company also announced the departure of its co-CEO, weighing on the stock price. Industrials stock selection also contributed to relative underperformance as Nihon M&A Center (Nihon) and Rational AG (Rational) underperformed. Nihon specializes in providing mergers and acquisitions intermediary services to small and midsize companies in Japan. Nihon recently experienced a revenue-recognition accounting issue and subsequent negative impact to near-term fundamentals as the company works to improve internal controls, corporate governance, and sales culture. We have yet to see a rebound in company fundamentals that would give us confidence in the near term, and we exited the position late in the year. Rational manufactures cooking appliances that combine convection and steam cooking into single appliances, |
| | |
| December 31, 2022 | William Blair Funds | 35 |
Global Leaders Fund
primarily for commercial use. While company results have been mostly strong, the stock has not performed well, largely due to its high valuation. The stock reached a peak forward P/E multiple of 81 times in 2021 and has come back down to 35 times in 2022 and is slightly below its long-term average as of the end of the period.
Selection within Consumer Discretionary was positive during the year, largely due to strong performance of Ulta Beauty (Ulta) and Compass Group. We believe Ulta is well positioned in the structurally attractive beauty category, benefiting from the continued channel shift away from department stores, strong user activation/engagement, and an expanding portfolio with newness and a higher mix of prestige brands and skincare products. Ulta has a resilient business model characterized by a balanced product offering with a wide breadth of appeal across categories, price points, brands, and services. We believe that its strong digital capabilities, coupled with an attractive in-store retail experience, have made Ulta’s business more defensible against the likes of Amazon. The stock performed well as the company had three consecutive quarters of beating earnings expectations and raising forward-looking guidance. Compass Group is the global leader in outsourced foodservice and other support services to private businesses, schools and colleges, hospitals, and in remote environments. It is benefiting from the ongoing global trend toward outsourcing foodservice and hospitality services. Share prices outperformed on stronger-than-anticipated organic growth across segments and regions as revenue exceeded 2019 levels.
Please refer to the Global Markets Review and Outlook relating to the Fund beginning on page 32.
| 36 | Annual Report | December 31, 2022 |
Global Leaders Fund
Performance Highlights (Unaudited)
Average Annual Total Returns through 12/31/2022
| | | 1 Year | | 3 Year | | 5 Year | | 10 Year |
| Class N | | | (29.49 | )% | | | 2.62 | % | | | 5.47 | % | | | 8.20 | % |
| Class I | | | (29.28 | ) | | | 2.88 | | | | 5.73 | | | | 8.49 | |
| Class R6 | | | (29.30 | ) | | | 2.92 | | | | 5.78 | | | | 8.56 | |
| MSCI ACW IMI (net) | | | (18.40 | ) | | | 3.89 | | | | 4.96 | | | | 7.94 | |
Performance cited represents past performance. Past performance does not guarantee future results and current performance may be lower or higher than the data quoted. Results shown are average annual total returns, which assume reinvestment of dividends and capital gains. Investment returns and principal will fluctuate and you may have a gain or loss when you sell shares. For the most current month-end performance information, please call 1-800-742-7272, or visit our Web site at www.williamblairfunds.com. Investing in smaller and medium capitalization companies involves special risks, including higher volatility and lower liquidity. Smaller and medium capitalization stocks are also more sensitive to purchase/sale transactions and changes in the issuer’s financial condition. International investing involves special risk considerations, including currency fluctuations, lower liquidity, economic and political risk. From time to time, the investment adviser may waive fees or reimburse expenses for the Fund. Without these waivers/reimbursements, performance would be lower. Class N shares are not subject to a sales load. Class I shares are not subject to a sales load or distribution (Rule 12b-1) fees. Class R6 shares are not subject to a sales load, distribution (Rule 12b-1) fees, or sub-transfer agent fees.
The performance highlights and graph presented above do not reflect the deduction of taxes that a shareholder would pay on fund distributions or the redemption of fund shares.
The Morgan Stanley Capital International (MSCI) All Country World (ACW) Investable Market Index (IMI) (net) is a free float-adjusted market capitalization weighted index that is designed to measure the equity market of developed and emerging markets. This index approximates the minimum possible dividend reinvestment by deducting for the highest possible withholding tax rates of those markets.
This report identifies the Fund’s investments on December 31, 2022. These holdings are subject to change. Not all stocks in the Fund performed the same, nor is there any guarantee that these stocks will perform as well in the future. Market forecasts provided in this report may not necessarily come to pass.
Sector Diversification (Unaudited)

The sector diversification shown is based on the total long-term securities.
| December 31, 2022 | William Blair Funds | 37 |
Global Leaders Fund
Portfolio of Investments, December 31, 2022 (all dollar amounts in thousands)
| | | | | | | | |
| | | | | | | | |
| | Issuer | | Shares | | | Value | |
| | | | | | | | | | |
| | Common Stocks | | | | | | | | |
| | | | | | | | | | |
| | Western Hemisphere—50.8% | | | | | | | | |
| | Canada—3.5% | | | | | | | | |
| | Canadian Pacific Railway Ltd. (Road & rail) | | | 24,562 | | | $ | 1,832 | |
| * | Lululemon Athletica, Inc. (Textiles, apparel & luxury goods) | | | 4,408 | | | | 1,412 | |
| | | | | | | | | 3,244 | |
| | United States—47.3% | | | | | | | | |
| * | Alphabet, Inc. (Interactive Media & Services) | | | 28,120 | | | | 2,481 | |
| * | Amazon.com, Inc. (Internet & direct marketing retail) | | | 21,731 | | | | 1,825 | |
| * | Autodesk, Inc. (Software) | | | 6,283 | | | | 1,174 | |
| | BlackRock, Inc. (Capital markets) | | | 2,033 | | | | 1,441 | |
| * | Charles River Laboratories International, Inc. (Life sciences tools & services) | | | 5,954 | | | | 1,297 | |
| * | CoStar Group, Inc. (Professional services) | | | 17,737 | | | | 1,371 | |
| * | Enphase Energy, Inc. (Semiconductors & semiconductor equipment) | | | 2,298 | | | | 609 | |
| | Estee Lauder Cos., Inc. (Personal products) | | | 5,250 | | | | 1,303 | |
| * | IDEXX Laboratories, Inc. (Health care equipment & supplies) | | | 2,803 | | | | 1,143 | |
| | Intercontinental Exchange, Inc. (Capital markets) | | | 13,118 | | | | 1,346 | |
| * | Intuitive Surgical, Inc. (Health care equipment & supplies) | | | 4,365 | | | | 1,158 | |
| | Mastercard, Inc. (IT services) | | | 9,149 | | | | 3,181 | |
| * | Meta Platforms, Inc. (Interactive Media & Services) | | | 8,872 | | | | 1,068 | |
| | Microsoft Corp. (Software) | | | 12,971 | | | | 3,111 | |
| | NextEra Energy, Inc. (Electric utilities) | | | 17,048 | | | | 1,425 | |
| | NIKE, Inc. (Textiles, apparel & luxury goods) | | | 12,564 | | | | 1,470 | |
| | Old Dominion Freight Line, Inc. (Road & rail) | | | 3,142 | | | | 892 | |
| * | PayPal Holdings, Inc. (IT services) | | | 12,209 | | | | 870 | |
| | Prologis, Inc. (Equity REIT) | | | 5,626 | | | | 634 | |
| | Roper Technologies, Inc. (Software) | | | 3,016 | | | | 1,303 | |
| * | Salesforce, Inc. (Software) | | | 12,357 | | | | 1,638 | |
| * | SVB Financial Group (Banks) | | | 1,984 | | | | 457 | |
| * | Synopsys, Inc. (Software) | | | 4,298 | | | | 1,372 | |
| | Thermo Fisher Scientific, Inc. (Life sciences tools & services) | | | 3,423 | | | | 1,885 | |
| * | Ulta Beauty, Inc. (Specialty retail) | | | 4,919 | | | | 2,307 | |
| | UnitedHealth Group, Inc. (Health care providers & services) | | | 4,289 | | | | 2,274 | |
| * | Veeva Systems, Inc. (Health care technology) | | | 2,664 | | | | 430 | |
| | Watsco, Inc. (Trading companies & distributors) | | | 4,194 | | | | 1,046 | |
| * | Workday, Inc. (Software) | | | 9,865 | | | | 1,651 | |
| | Zoetis, Inc. (Pharmaceuticals) | | | 7,827 | | | | 1,147 | |
| | | | | | | | | 43,309 | |
| | | | | | | | |
| | | | | | | | |
| | Issuer | | Shares | | | Value | |
| | | | | | | | | | |
| | Common Stocks—(continued) | | | | | | | | |
| | | | | | | | | | |
| | Europe—27.5% | | | | | | | | |
| | Denmark—4.6% | | | | | | | | |
| | DSV AS (Air freight & logistics) | | | 10,841 | | | $ | 1,711 | |
| | Novo Nordisk AS (Pharmaceuticals) | | | 18,708 | | | | 2,526 | |
| | | | | | | | | 4,237 | |
| | France—6.0% | | | | | | | | |
| | Airbus SE (Aerospace & defense) | | | 26,529 | | | | 3,153 | |
| | LVMH Moet Hennessy Louis Vuitton SE (Textiles, apparel & luxury goods) | | | 3,245 | | | | 2,362 | |
| | | | | | | | | 5,515 | |
| | Germany—4.1% | | | | | | | | |
| | Infineon Technologies AG (Semiconductors & semiconductor equipment) | | | 57,705 | | | | 1,756 | |
| | MTU Aero Engines AG (Aerospace & defense) | | | 9,204 | | | | 1,992 | |
| | | | | | | | | 3,748 | |
| | Ireland—1.0% | | | | | | | | |
| * | Ryanair Holdings PLC—ADR (Airlines) | | | 12,251 | | | | 916 | |
| | Netherlands—2.1% | | | | | | | | |
| * | Adyen NV (IT services) | | | 927 | | | | 1,279 | |
| | ASML Holding NV (Semiconductors & semiconductor equipment) | | | 1,189 | | | | 641 | |
| | | | | | | | | 1,920 | |
| | Sweden—5.8% | | | | | | | | |
| | Atlas Copco AB (Machinery) | | | 142,369 | | | | 1,680 | |
| | Evolution AB (Hotels, restaurants & leisure) | | | 10,703 | | | | 1,041 | |
| | Hexagon AB (Electronic equipment, instruments & components) | | | 173,145 | | | | 1,809 | |
| | Indutrade AB (Machinery) | | | 36,846 | | | | 745 | |
| | | | | | | | | 5,275 | |
| | Switzerland—3.9% | | | | | | | | |
| | Lonza Group AG (Life sciences tools & services) | | | 2,467 | | | | 1,209 | |
| | Partners Group Holding AG (Capital markets) | | | 1,252 | | | | 1,106 | |
| | Zurich Insurance Group AG (Insurance) | | | 2,633 | | | | 1,259 | |
| | | | | | | | | 3,574 | |
| | | | | | | | | | |
| | United Kingdom—7.9% | | | | | | | | |
| | Compass Group PLC (Hotels, restaurants & leisure) | | | 113,901 | | | | 2,640 | |
| | Experian PLC (Professional services) | | | 36,509 | | | | 1,242 | |
| | Halma PLC (Electronic equipment, instruments & components) | | | 26,759 | | | | 639 | |
| | Linde PLC (Chemicals)† | | | 4,021 | | | | 1,311 | |
| | Rentokil Initial PLC (Commercial services & supplies) | | | 223,088 | | | | 1,370 | |
| | | | | | | | | 7,202 | |
See accompanying Notes to Financial Statements.
| 38 | Annual Report | December 31, 2022 |
Global Leaders Fund
Portfolio of Investments, December 31, 2022 (all dollar amounts in thousands)
| | | | | | | | |
| | | | | | | | |
| | Issuer | | Shares | | | Value | |
| | | | | | | | | | |
| | Common Stocks—(continued) | | | | | | | | |
| | | | | | | | | | |
| | Emerging Asia—4.9% | | | | | | | | |
| | India—3.5% | | | | | | | | |
| | HDFC Bank Ltd.—ADR (Banks) | | | 24,772 | | | $ | 1,694 | |
| | Reliance Industries Ltd. (Oil, gas & consumable fuels) | | | 49,921 | | | | 1,537 | |
| | | | | | | | | 3,231 | |
| | Taiwan—1.4% | | | | | | | | |
| | Taiwan Semiconductor Manufacturing Co. Ltd.—ADR (Semiconductors & semiconductor equipment) | | | 17,071 | | | | 1,272 | |
| | | | | | | | | | |
| | Asia—3.4% | | | | | | | | |
| | Australia—1.6% | | | | | | | | |
| | Aristocrat Leisure Ltd. (Hotels, restaurants & leisure) | | | 16,537 | | | | 344 | |
| | CSL Ltd. (Biotechnology) | | | 5,642 | | | | 1,105 | |
| | | | | | | | | 1,449 | |
| | Hong Kong—1.8% | | | | | | | | |
| | AIA Group Ltd. (Insurance) | | | 148,800 | | | | 1,655 | |
| | | | | | | | | | |
| | Japan—2.5% | | | | | | | | |
| | Daikin Industries Ltd. (Building products) | | | 7,000 | | | | 1,078 | |
| | Keyence Corp. (Electronic equipment, instruments & components) | | | 3,000 | | | | 1,175 | |
| | | | | | | | | 2,253 | |
| | | | | | | | | | |
| | Emerging Latin America—1.6% | | | | | | | | |
| | Argentina—0.9% | | | | | | | | |
| * | Globant SA (IT services)† | | | 5,060 | | | | 851 | |
| | Brazil—0.7% | | | | | | | | |
| * | MercadoLibre, Inc. (Internet & direct marketing retail) | | | 703 | | | | 595 | |
| | Total Common Stocks—98.6%
(cost $63,991) | | | | | | | 90,246 | |
| | | | | | | | |
| | Issuer | | Principal
Amount | | | Value | |
| | | | | | | | | | |
| | Repurchase Agreement | | | | | | | | |
| | Fixed Income Clearing Corporation, 1.600% dated 12/30/22, due 01/03/23, repurchase price $1,406, collateralized by U.S. Treasury Note, 2.375%, due 03/31/29, valued at $1,434 | | | $1,406 | | | $ | 1,406 | |
| | Total Repurchase Agreement—1.5%
(cost $1,406) | | | | | | | 1,406 | |
| | Total Investments—100.1%
(cost $65,397) | | | | | | | 91,652 | |
| | Liabilities, plus cash and other assets—(0.1)% | | | | | | | (93 | ) |
| | Net assets—100.0% | | | | | | $ | 91,559 | |
ADR = American Depository Receipt
REIT = Real Estate Investment Trust
* = Non-income producing security
† = U.S. listed foreign security
At December 31, 2022, the Fund’s Portfolio of Investments includes the following industry categories (as a percentage of long-term investments):
| Information Technology | | | 27.0 | % |
| Industrials | | | 21.1 | % |
| Health Care | | | 15.7 | % |
| Consumer Discretionary | | | 15.5 | % |
| Financials | | | 9.9 | % |
| Communication Services | | | 3.9 | % |
| Energy | | | 1.7 | % |
| Utilities | | | 1.6 | % |
| Materials | | | 1.5 | % |
| Consumer Staples | | | 1.4 | % |
| Real Estate | | | 0.7 | % |
| Total | | | 100.0 | % |
At December 31, 2022, the Fund’s Portfolio of Investments includes the following currency categories (as a percentage of long-term investments):
| U.S. Dollar | | | 58.9 | % |
| Euro | | | 12.4 | % |
| British Pound Sterling | | | 6.5 | % |
| Swedish Krona | | | 5.9 | % |
| Danish Krone | | | 4.7 | % |
| Swiss Franc | | | 4.0 | % |
| Japanese Yen | | | 2.5 | % |
| Hong Kong Dollar | | | 1.8 | % |
| Indian Rupee | | | 1.7 | % |
| Australian Dollar | | | 1.6 | % |
| Total | | | 100.0 | % |
See accompanying Notes to Financial Statements.
| December 31, 2022 | William Blair Funds | 39 |
| | International Leaders Fund |
| | |
| | The International Leaders Fund seeks long-term capital appreciation. |
| | |
| | AN OVERVIEW FROM THE PORTFOLIO MANAGERS |
| | |

Simon Fennell 
Kenneth J. McAtamney 
Alaina Anderson, CFA | The William Blair International Leaders Fund (Class N shares) (the “Fund”) posted a 28.70% decrease, net of fees, for the year ended December 31, 2022. By comparison, the Fund’s benchmark index, the MSCI All Country World ex-U.S. IMI (net) (the “Index”), decreased 16.58%. Underperformance versus the Index was largely due to style headwinds amid strong outperformance of low-valuation stocks. The underperformance was highly correlated to the inflationary pressures and increase in interest rates, which has led to significant multiple contraction for growth companies. Quality companies, which typically offer downside protection, did not help offset the underperformance amid the largely indiscriminate sell-off of high-growth, high-price-to-earnings (P/E) stocks. From an attribution perspective, stock selection was the primary driver of negative performance and was persistent across most sectors and regions due to the overarching style headwinds seen in 2022. Selection within Industrials and Health Care were particularly negative. Within the Industrials sector, Kingspan and TOMRA Systems (TOMRA) were the largest sources of underperformance. Kingspan is a leading building materials company that has developed a differentiated technology in insulated panels. The primary advantage of its insulation products is energy efficiency, improved durability, reduced maintenance costs, and faster construction times. These “green” products also stand to benefit from existing and future legislation from nations looking to reduce their carbon footprint. While we believe it should continue to gain market share given the strong value proposition it offers customers, which is only increased by higher energy prices, the economic pressure and risk of a recession in Europe and margin pressure on input costs have reduced Kingspan’s earnings power in the near term and the position was exited in the period. TOMRA manufactures and sells sorting machines for food, recycling, and mining with focus on high-tech solutions. The company also designs, sells, and services reverse vending machines with a focus on North America, Europe, and Australia. While TOMRA’s superior hardware and software technology, scale, and strong balance sheet should allow the company to maintain its leadership position, cost inflation was a major headwind to margins and earnings as price increases are negotiated in existing contracts. Given the market environment and expected declines in earnings in the near term, the position was exited. Within the Health Care sector, Straumann was the largest detractor to performance. Straumann is the global leader in esthetic dentistry. The categories that the company participates in–implants, clear aligners, and digital dentistry–are growing well above global dental market rates. As a total solution provider, Straumann offers training, support, and a wide range of services to the dental industry all over the world. In addition, the company is investing in technology and expanding capacity to make clear aligners a second long-term growth pillar. Straumann was the best performing stock in our portfolio in 2021, and we trimmed the position earlier in 2022. Recent fundamental results have been strong, with revenue up 12% in the third quarter. Despite those results, P/E multiples have compressed significantly, from 58 times in 2021 to 32 times this year. Partially offsetting these effects was an underweight to Emerging Asia, an overweight to the U.K., and strong stock selection within Consumer Discretionary led by Compass Group. Compass Group is the global leader in outsourced foodservice and other support services to private businesses, schools and colleges, hospitals, and in remote environments. It is benefiting from the ongoing global trend toward outsourcing foodservice and hospitality services. Share prices outperformed on stronger-than-anticipated organic growth across segments and regions as revenue exceeded 2019 levels. Please refer to the Global Markets Review and Outlook relating to the Fund beginning on page 32. |
| | | |
| 40 | Annual Report | December 31, 2022 |
International Leaders Fund
Performance Highlights (Unaudited)
Average Annual Total Returns through 12/31/2022
| | | 1 Year | | 3 Year | | 5 Year | | 10 Year |
| Class N | | | (28.70 | )% | | | (0.29 | )% | | | 2.61 | % | | | 6.19 | % |
| Class I | | | (28.55 | ) | | | (0.07 | ) | | | 2.86 | | | | 6.45 | |
| Class R6 | | | (28.51 | ) | | | 0.00 | | | | 2.92 | | | | 6.55 | |
| MSCI ACW ex-U.S. IMI (net) | | | (16.58 | ) | | | 0.20 | | | | 0.85 | | | | 3.98 | |
Performance cited represents past performance. Past performance does not guarantee future results and current performance may be lower or higher than the data quoted. Results shown are average annual total returns, which assume reinvestment of dividends and capital gains. Investment returns and principal will fluctuate and you may have a gain or loss when you sell shares. For the most current month-end performance information, please call 1-800-742-7272, or visit our Web site at www.williamblairfunds.com. Investing in smaller and medium capitalization companies involves special risks, including higher volatility and lower liquidity. Smaller and medium capitalization stocks are also more sensitive to purchase/sale transactions and changes in the issuer’s financial condition. International investing involves special risk considerations, including currency fluctuations, lower liquidity, economic and political risk. From time to time the investment adviser may waive fees or reimburse expenses for the Fund. Without these waivers/reimbursements, performance would be lower. Class N shares are not subject to a sales load. Class I shares are not subject to a sales load or distribution (Rule 12b-1) fees. Class R6 shares are not subject to a sales load, distribution (Rule 12b-1) fees, or sub-transfer agent fees.
The performance highlights presented above do not reflect the deduction of taxes that a shareholder would pay on fund distributions or the redemption of fund shares.
The Morgan Stanley Capital International (MSCI) All Country World (ACW) ex-U.S. Investable Market Index (IMI) (net) is a free float-adjusted market capitalization weighted index that is designed to measure the equity market performance of developed and emerging markets, excluding the United States. This index approximates the minimum possible dividend reinvestment by deducting for the highest possible withholding tax rates of those markets.
This report identifies the Fund’s investments on December 31, 2022. These holdings are subject to change. Not all stocks in the Fund performed the same, nor is there any guarantee that these stocks will perform as well in the future. Market forecasts provided in this report may not necessarily come to pass.
Sector Diversification (Unaudited)

The sector diversification shown is based on the total long-term securities.
| December 31, 2022 | William Blair Funds | 41 |
International Leaders Fund
Portfolio of Investments, December 31, 2022 (all dollar amounts in thousands)
| | | | | | | | |
| | | | | | | | |
| | Issuer | | Shares | | | Value | |
| | | | | | | | |
| | Common Stocks | | | | | | | | |
| | | | | | | | | | |
| | Europe—46.3% | | | | | | | | |
| | Belgium—1.5% | | | | | | | | |
| | KBC Group NV (Banks) | | | 236,537 | | | $ | 15,212 | |
| | Denmark—4.9% | | | | | | | | |
| | Coloplast AS (Health care equipment & supplies) | | | 77,003 | | | | 9,001 | |
| | DSV AS (Air freight & logistics) | | | 86,358 | | | | 13,631 | |
| | Novo Nordisk AS (Pharmaceuticals) | | | 194,120 | | | | 26,211 | |
| | | | | | | | | 48,843 | |
| | Finland—1.4% | | | | | | | | |
| | Neste Oyj (Oil, gas & consumable fuels) | | | 301,746 | | | | 13,896 | |
| | France—13.1% | | | | | | | | |
| | Airbus SE (Aerospace & defense) | | | 158,887 | | | | 18,882 | |
| | Dassault Systemes SE (Software) | | | 191,451 | | | | 6,864 | |
| | L’Oreal SA (Personal products) | | | 36,221 | | | | 12,935 | |
| | LVMH Moet Hennessy Louis Vuitton SE (Textiles, apparel & luxury goods) | | | 38,113 | | | | 27,738 | |
| | Safran SA (Aerospace & defense) | | | 124,553 | | | | 15,589 | |
| | Sartorius Stedim Biotech (Life sciences tools & services) | | | 35,986 | | | | 11,653 | |
| | Teleperformance (Professional services) | | | 45,061 | | | | 10,742 | |
| | Vinci SA (Construction & engineering) | | | 272,626 | | | | 27,225 | |
| | | | | | | | | 131,628 | |
| | Germany—1.6% | | | | | | | | |
| | Infineon Technologies AG (Semiconductors & semiconductor equipment) | | | 515,542 | | | | 15,689 | |
| | Rational AG (Machinery) | | | 1,493 | | | | 887 | |
| | | | | | | | | 16,576 | |
| | Ireland—2.0% | | | | | | | | |
| * | ICON PLC (Life sciences tools & services)† | | | 104,715 | | | | 20,341 | |
| | Luxembourg—2.6% | | | | | | | | |
| | Tenaris SA (Energy equipment & services) | | | 1,475,556 | | | | 25,722 | |
| | Netherlands—3.3% | | | | | | | | |
| * | Adyen NV (IT services) | | | 10,188 | | | | 14,051 | |
| | ASML Holding NV (Semiconductors & semiconductor equipment) | | | 34,558 | | | | 18,637 | |
| | | | | | | | | 32,688 | |
| | Norway—1.5% | | | | | | | | |
| | Equinor ASA (Oil, gas & consumable fuels) | | | 416,871 | | | | 14,970 | |
| | TOMRA Systems ASA (Commercial services & supplies) | | | 25,819 | | | | 436 | |
| | | | | | | | | 15,406 | |
| | Spain—2.4% | | | | | | | | |
| * | Amadeus IT Group SA (IT services) | | | 459,433 | | | | 23,877 | |
| | | | | | | | |
| | | | | | | | |
| | Issuer | | Shares | | | Value | |
| | | | | | | | |
| | Common Stocks—(continued) | | | | | | | | |
| | | | | | | | | | |
| | Europe—(continued) | | | | | | | | |
| | Sweden—4.9% | | | | | | | | |
| | Atlas Copco AB (Machinery) | | | 1,149,376 | | | $ | 13,559 | |
| | Evolution AB (Hotels, restaurants & leisure) | | | 150,705 | | | | 14,665 | |
| | Hexagon AB (Electronic equipment, instruments & components) | | | 1,548,658 | | | | 16,177 | |
| | Indutrade AB (Machinery) | | | 241,333 | | | | 4,882 | |
| | | | | | | | | 49,283 | |
| | Switzerland—7.1% | | | | | | | | |
| | Lonza Group AG (Life sciences tools & services) | | | 30,412 | | | | 14,903 | |
| | Partners Group Holding AG (Capital markets) | | | 12,357 | | | | 10,916 | |
| | Sika AG (Chemicals) | | | 33,573 | | | | 8,050 | |
| | Straumann Holding AG (Health care equipment & supplies) | | | 100,630 | | | | 11,492 | |
| | Zurich Insurance Group AG (Insurance) | | | 53,564 | | | | 25,622 | |
| | | | | | | | | 70,983 | |
| | | | | | | | | | |
| | United Kingdom—19.8% | | | | | | | | |
| | Ashtead Group PLC (Trading companies & distributors) | | | 247,372 | | | | 14,116 | |
| | AstraZeneca PLC (Pharmaceuticals) | | | 219,907 | | | | 29,824 | |
| | Bunzl PLC (Trading companies & distributors) | | | 553,594 | | | | 18,465 | |
| | Compass Group PLC (Hotels, restaurants & leisure) | | | 1,248,066 | | | | 28,932 | |
| | Diageo PLC (Beverages) | | | 424,208 | | | | 18,719 | |
| | Experian PLC (Professional services) | | | 451,188 | | | | 15,344 | |
| | Halma PLC (Electronic equipment, instruments & components) | | | 385,463 | | | | 9,199 | |
| | Linde PLC (Chemicals)† | | | 53,733 | | | | 17,527 | |
| | London Stock Exchange Group PLC (Capital markets) | | | 188,065 | | | | 16,224 | |
| | Rentokil Initial PLC (Commercial services & supplies) | | | 2,623,197 | | | | 16,110 | |
| | Segro PLC (Equity REIT) | | | 755,423 | | | | 6,974 | |
| | Spirax-Sarco Engineering PLC (Machinery) | | | 55,688 | | | | 7,146 | |
| | | | | | | | | 198,580 | |
| | | | | | | | | | |
| | Emerging Asia—10.3% | | | | | | | | |
| | China—2.6% | | | | | | | | |
| | China Tourism Group Duty Free Corp. Ltd. (Specialty retail) | | | 334,597 | | | | 10,398 | |
| | Contemporary Amperex Technology Co. Ltd. (Electrical equipment) | | | 92,400 | | | | 5,229 | |
| | Shenzhen Inovance Technology Co. Ltd. (Machinery) | | | 1,028,969 | | | | 10,287 | |
| | | | | | | | | 25,914 | |
| | India—5.8% | | | | | | | | |
| | Housing Development Finance Corp. Ltd. (Diversified financial services) | | | 520,704 | | | | 16,629 | |
| | Infosys Ltd. (IT services) | | | 765,052 | | | | 13,951 | |
| | Reliance Industries Ltd. (Oil, gas & consumable fuels) | | | 918,817 | | | | 28,287 | |
| | | | | | | | | 58,867 | |
See accompanying Notes to Financial Statements.
| 42 | Annual Report | December 31, 2022 |
International Leaders Fund
Portfolio of Investments, December 31, 2022 (all dollar amounts in thousands)
| | | | | | | | |
| | | | | | | | |
| | Issuer | | Shares | | | Value | |
| | | | | | | | |
| | Common Stocks—(continued) | | | | | | | | |
| | | | | | | | | | |
| | Emerging Asia—(continued) | | | | | | | | |
| | Taiwan—1.9% | | | | | | | | |
| | Taiwan Semiconductor Manufacturing Co. Ltd. (Semiconductors & semiconductor equipment) | | | 1,301,000 | | | $ | 18,985 | |
| | | | | | | | | | |
| | Canada—9.9% | | | | | | | | |
| | Canadian Pacific Railway Ltd. (Road & rail) | | | 397,928 | | | | 29,681 | |
| | Dollarama, Inc. (Multiline retail) | | | 323,217 | | | | 18,904 | |
| | Intact Financial Corp. (Insurance) | | | 113,138 | | | | 16,286 | |
| * | Lululemon Athletica, Inc. (Textiles, apparel & luxury goods) | | | 49,141 | | | | 15,744 | |
| | Toronto-Dominion Bank (Banks) | | | 290,165 | | | | 18,788 | |
| | | | | | | | | 99,403 | |
| | | | | | | | | | |
| | Japan—5.5% | | | | | | | | |
| | Daikin Industries Ltd. (Building products) | | | 94,500 | | | | 14,545 | |
| | Hoya Corp. (Health care equipment & supplies) | | | 117,100 | | | | 11,336 | |
| | Keyence Corp. (Electronic equipment, instruments & components) | | | 48,500 | | | | 19,002 | |
| | Shin-Etsu Chemical Co. Ltd. (Chemicals) | | | 81,700 | | | | 10,101 | |
| | | | | | | | | 54,984 | |
| | | | | | | | | | |
| | Asia—4.0% | | | | | | | | |
| | Australia—2.1% | | | | | | | | |
| | Aristocrat Leisure Ltd. (Hotels, restaurants & leisure) | | | 328,480 | | | | 6,826 | |
| | CSL Ltd. (Biotechnology) | | | 73,285 | | | | 14,358 | |
| | | | | | | | | 21,184 | |
| | Hong Kong—1.9% | | | | | | | | |
| | AIA Group Ltd. (Insurance) | | | 1,469,800 | | | | 16,345 | |
| | Techtronic Industries Co. Ltd. (Machinery) | | | 256,500 | | | | 2,862 | |
| | | | | | | | | 19,207 | |
| | | | | | | | | | |
| | Emerging Latin America—2.0% | | | | | | | | |
| | Argentina—0.5% | | | | | | | | |
| * | Globant SA (IT services)† | | | 27,557 | | | | 4,634 | |
| | Brazil—1.5% | | | | | | | | |
| | B3 SA - Brasil Bolsa Balcao (Capital markets) | | | 2,865,000 | | | | 7,168 | |
| * | MercadoLibre, Inc. (Internet & direct marketing retail) | | | 9,844 | | | | 8,331 | |
| | | | | | | | | 15,499 | |
| | Total Common Stocks—97.8%
(cost $893,251) | | | | | | | 981,712 | |
| | | | | | | | |
| | | | Principal | | | | |
| | Issuer | | Amount | | | Value | |
| | | | | | | | |
| | Repurchase Agreement | | | | | | | | |
| | Fixed Income Clearing Corporation, 1.600% dated 12/30/22, due 01/03/23, repurchase price $7,610, collateralized by U.S. Treasury Note, 2.375%, due 03/31/29, valued at $7,760 | | | $7,608 | | | $ | 7,608 | |
| | Total Repurchase Agreement—0.7%
(cost $7,608) | | | | | | | 7,608 | |
| | Total Investments—98.5%
(cost $900,859) | | | | | | | 989,320 | |
| | Cash and other assets, less liabilities—1.5% | | | | | | | 14,901 | |
| | Net assets—100.0% | | | | | | $ | 1,004,221 | |
REIT = Real Estate Investment Trust
* = Non-income producing security
† = U.S. listed foreign security
At December 31, 2022, the Fund’s Portfolio of Investments includes the following industry categories (as a percentage of long-term investments):
| Industrials | | | 24.5 | % |
| Information Technology | | | 16.4 | % |
| Health Care | | | 15.2 | % |
| Financials | | | 14.6 | % |
| Consumer Discretionary | | | 13.4 | % |
| Energy | | | 8.4 | % |
| Materials | | | 3.6 | % |
| Consumer Staples | | | 3.2 | % |
| Real Estate | | | 0.7 | % |
| Total | | | 100.0 | % |
At December 31, 2022, the Fund’s Portfolio of Investments includes the following currency categories (as a percentage of long-term investments):
| Euro | | | 26.5 | % |
| British Pound Sterling | | | 18.4 | % |
| U.S. Dollar | | | 9.8 | % |
| Swiss Franc | | | 7.2 | % |
| Indian Rupee | | | 6.0 | % |
| Japanese Yen | | | 5.6 | % |
| Canadian Dollar | | | 5.5 | % |
| Swedish Krona | | | 5.0 | % |
| Danish Krone | | | 5.0 | % |
| Chinese Yuan Renminbi | | | 2.6 | % |
| Australian Dollar | | | 2.2 | % |
| Hong Kong Dollar | | | 2.0 | % |
| New Taiwan Dollar | | | 1.9 | % |
| Norwegian Krone | | | 1.6 | % |
| All Other Currencies | | | 0.7 | % |
| Total | | | 100.0 | % |
See accompanying Notes to Financial Statements.
| December 31, 2022 | William Blair Funds | 43 |
| | International Growth Fund |
| | |
| | The International Growth Fund seeks long-term capital appreciation. |
| | |
| | AN OVERVIEW FROM THE PORTFOLIO MANAGERS |
| | |

Simon Fennell 
Kenneth J. McAtamney 
Andrew Siepker, CFA | The William Blair International Growth Fund (Class N shares) (the “Fund”) posted a 28.51% decrease, net of fees, for the year ended December 31, 2022. By comparison, the Fund’s benchmark index, the MSCI All Country World ex-U.S. IMI (net) (the “Index”), decreased 16.58%. Underperformance versus the Index was largely due to style headwinds amid strong outperformance of low-valuation stocks. The underperformance was highly correlated to the inflationary pressures and increase in interest rates, which has led to significant multiple contraction for growth companies. Quality companies, which typically offer downside protection, did not help offset the underperformance amid the largely indiscriminate sell-off of high-growth, high-price-to-earnings (P/E) stocks. From an attribution perspective, stock selection was the primary driver of negative performance and was persistent across most sectors and regions due to the overarching style headwinds seen in 2022. Stock selection within Industrials and Information Technology was particularly negative. Within the Industrials sector, Kingspan and Ashtead Group (Ashtead) were the largest sources of underperformance. Kingspan is a leading building materials company that has developed a differentiated technology in insulated panels. The primary advantage of its insulation products is energy efficiency, improved durability, reduced maintenance costs, and faster construction times. These “green” products also stand to benefit from existing and future legislation from nations looking to reduce their carbon footprint. While the economic pressure and risk of a recession in Europe, as well as margin pressure on input costs have reduced Kingspan’s earnings power in the near term, we believe it should continue to gain market share given the strong value proposition it offers customers which is only increased by higher energy prices. Ashtead, which operates under the Sunbelt brand, rents a broad range of construction and industrial equipment from general tools to specialty equipment. The rental business is simple, with the rental provider offering customers homogenous products. While simplistic, Ashtead has the key benefit of scale in a largely fragmented market. We believe the benefits of scale are significant. Ashtead is able to buy equipment cheaper than the competition, it has a large and well-invested fleet to meet customer needs, and it has a wide-reaching and growing distribution network, ensuring that equipment is closer to the customer. These advantages have driven growth in cash flow, in turn driving further investment that has resulted in share gains and greater scale. Ashtead’s fundamental results over the year were above consensus with rental revenue up 26%. Despite these results, the stock is down year-to-date as the P/E multiple has contracted from 25 times at the beginning of the year to 14 times at the end of the year, below the company’s 10-year average. Within the Information Technology sector, Atlassian was the largest source of underperformance. Atlassian designs and develops enterprise software for project management, collaboration, issue tracking, integration, deployment, and support services. Layoffs and the slower pace of hiring among customers are leading to slower growth at Atlassian, and the business is more sensitive to economic conditions than we previously thought. Atlassian’s full year 2023 guidance was recently lowered. At the same time, Atlassian is a high-valuation, long-duration stock. We exited the position during the period. |
| | | |
| 44 | Annual Report | December 31, 2022 |
International Growth Fund
Partially offsetting these effects was an underweight to Emerging Asia, an overweight to the U.K., and strong stock selection within North America. Within Health Care, Novo Nordisk was a standout positive contributor. Novo Nordisk is the world leader in insulin and diabetes care and also sells other pharmaceuticals such as hormones and treatments for bleeding disorders. Novo’s competitive advantages as a large incumbent include a sizable and valuable commercial/marketing presence especially in diabetes, low-cost production particularly of insulins, and therapeutic area domain expertise that helps fuel innovation faster and at a higher level than its competitors. It performed well in 2022 on strong fundamentals including 30% growth in its obesity and diabetes franchises as it continued to increase forward guidance. We believe the obesity business will be a significant driver of future growth for the company.
Please refer to the Global Markets Review and Outlook relating to the Fund beginning on page 32.
| December 31, 2022 | William Blair Funds | 45 |
International Growth Fund
Performance Highlights (Unaudited)
Average Annual Total Returns through 12/31/2022
| | | | | | | 1 Year | | 3 Year | | 5 Year | | 10 Year | | Since
Inception(a) |
| Class N | | | | | | | (28.51 | )% | | | 0.75 | % | | | 1.78 | % | | | 4.60 | % | | | — | % |
| Class I | | | | | | | (28.33 | ) | | | 1.03 | | | | 2.08 | | | | 4.92 | | | | — | |
| Class R6 | | | | | | | (28.30 | ) | | | 1.11 | | | | — | | | | — | | | | 4.00 | |
| MSCI ACW ex-U.S. IMI (net) | | | | | | | (16.58 | ) | | | 0.20 | | | | 0.85 | | | | 3.98 | | | | 2.11 | |
| | |
| (a) | Since inception is for the period from May 2, 2019 (Commencement of Operations) to December 31, 2022. |
Performance cited represents past performance. Past performance does not guarantee future results and current performance may be lower or higher than the data quoted. Results shown are average annual total returns, which assume reinvestment of dividends and capital gains. Investment returns and principal will fluctuate and you may have a gain or loss when you sell shares. For the most current month-end performance information, please call 1-800-742-7272, or visit our Web site at www.williamblairfunds.com. Investing in smaller and medium capitalization companies involves special risks, including higher volatility and lower liquidity. Smaller and medium capitalization stocks are also more sensitive to purchase/sale transactions and changes in the issuer’s financial condition. International investing involves special risk considerations, including currency fluctuations, lower liquidity, economic and political risk. From time to time, the investment adviser may waive fees or reimburse expenses for the Fund. Without these waivers/reimbursements, performance would be lower. Class N shares are not subject to a sales load. Class I shares are not subject to a sales load or distribution (Rule 12b-1) fees. Class R6 shares are not subject to a sales load, distribution (Rule 12b-1) fees, or sub-transfer agent fees.
The performance highlights and graph presented above do not reflect the deduction of taxes that a shareholder would pay on fund distributions or the redemption of fund shares.
The Morgan Stanley Capital International (MSCI) All Country World (ACW) ex-U.S. Investable Market Index (IMI) (net) is a free float-adjusted market capitalization weighted index that is designed to measure the equity market performance of developed and emerging markets, excluding the United States. This index approximates the minimum possible dividend reinvestment by deducting for the highest possible withholding tax rates of those markets.
This report identifies the Fund’s investments on December 31, 2022. These holdings are subject to change. Not all stocks in the Fund performed the same, nor is there any guarantee that these stocks will perform as well in the future. Market forecasts provided in this report may not necessarily come to pass.
Sector Diversification (Unaudited)

The sector diversification shown is based on the total long-term securities.
| 46 | Annual Report | December 31, 2022 |
International Growth Fund
Portfolio of Investments, December 31, 2022 (all dollar amounts in thousands)
| | | | | | | | |
| | | | | | | | |
| | Issuer | | Shares | | | Value | |
| | | | | | | | | | |
| | Common Stocks | | | | | | | | |
| | | | | | | | | | |
| | Europe, Mid-East—43.2% | | | | | | | | |
| | Belgium—1.5% | | | | | | | | |
| | KBC Group NV (Banks) | | | 285,727 | | | $ | 18,376 | |
| | Warehouses De Pauw CVA (Equity REIT) | | | 87,468 | | | | 2,500 | |
| | | | | | | | | 20,876 | |
| | Denmark—4.7% | | | | | | | | |
| | Coloplast AS (Health care equipment & supplies) | | | 49,731 | | | | 5,813 | |
| | DSV AS (Air freight & logistics) | | | 119,506 | | | | 18,863 | |
| * | Genmab AS (Biotechnology) | | | 26,279 | | | | 11,126 | |
| | Novo Nordisk AS (Pharmaceuticals) | | | 202,169 | | | | 27,298 | |
| | Royal Unibrew AS (Beverages) | | | 49,692 | | | | 3,543 | |
| | | | | | | | | 66,643 | |
| | Finland—1.2% | | | | | | | | |
| | Metso Outotec Oyj (Machinery) | | | 327,293 | | | | 3,368 | |
| | Neste Oyj (Oil, gas & consumable fuels) | | | 299,909 | | | | 13,811 | |
| | | | | | | | | 17,179 | |
| | France—12.3% | | | | | | | | |
| | Airbus SE (Aerospace & defense) | | | 173,466 | | | | 20,615 | |
| | Capgemini SE (IT services) | | | 70,407 | | | | 11,754 | |
| | Dassault Systemes SE (Software) | | | 285,244 | | | | 10,227 | |
| | Hermes International (Textiles, apparel & luxury goods) | | | 8,097 | | | | 12,525 | |
| | L’Oreal SA (Personal products) | | | 36,228 | | | | 12,937 | |
| | LVMH Moet Hennessy Louis Vuitton SE (Textiles, apparel & luxury goods) | | | 26,961 | | | | 19,622 | |
| | Safran SA (Aerospace & defense) | | | 138,464 | | | | 17,330 | |
| | Sartorius Stedim Biotech (Life sciences tools & services) | | | 26,062 | | | | 8,439 | |
| * | SES-imagotag SA (Electronic equipment, instruments & components) | | | 17,063 | | | | 2,228 | |
| | Teleperformance (Professional services) | | | 51,068 | | | | 12,174 | |
| | Thales SA (Aerospace & defense) | | | 181,905 | | | | 23,230 | |
| | TotalEnergies SE (Oil, gas & consumable fuels) | | | 126,208 | | | | 7,924 | |
| | Vinci SA (Construction & engineering) | | | 180,291 | | | | 18,004 | |
| | | | | | | | | 177,009 | |
| | Germany—3.3% | | | | | | | | |
| | Carl Zeiss Meditec AG (Health care equipment & supplies) | | | 34,907 | | | | 4,405 | |
| * | CTS Eventim AG & Co. KGaA (Entertainment) | | | 100,055 | | | | 6,383 | |
| | Infineon Technologies AG (Semiconductors & semiconductor equipment) | | | 549,394 | | | | 16,720 | |
| | MTU Aero Engines AG (Aerospace & defense) | | | 83,583 | | | | 18,091 | |
| | Nemetschek SE (Software) | | | 42,073 | | | | 2,148 | |
| | | | | | | | | 47,747 | |
| | | | | | | | |
| | | | | | | | |
| | Issuer | | Shares | | | Value | |
| | | | | | | | |
| | Common Stocks—(continued) | | | | | | | | |
| | | | | | | | | | |
| | Europe, Mid-East—(continued) | | | | | | | | |
| | Ireland—1.8% | | | | | | | | |
| * | ICON PLC (Life sciences tools & services)† | | | 103,509 | | | $ | 20,107 | |
| | Kingspan Group PLC (Building products) | | | 112,777 | | | | 6,106 | |
| | | | | | | | | 26,213 | |
| | Israel—0.8% | | | | | | | | |
| * | Inmode Ltd. (Health care equipment & supplies)† | | | 87,559 | | | | 3,126 | |
| | Mizrahi Tefahot Bank Ltd. (Banks) | | | 94,220 | | | | 3,053 | |
| * | Nice Ltd.—ADR (Software) | | | 29,443 | | | | 5,662 | |
| | | | | | | | | 11,841 | |
| | Italy—1.3% | | | | | | | | |
| | Amplifon SpA (Health care providers & services) | | | 106,973 | | | | 3,186 | |
| | Brunello Cucinelli SpA (Textiles, apparel & luxury goods) | | | 62,893 | | | | 4,652 | |
| | FinecoBank Banca Fineco SpA (Banks) | | | 411,181 | | | | 6,831 | |
| | Moncler SpA (Textiles, apparel & luxury goods) | | | 76,705 | | | | 4,064 | |
| | | | | | | | | 18,733 | |
| | Luxembourg—0.8% | | | | | | | | |
| | Tenaris SA (Energy equipment & services) | | | 674,961 | | | | 11,766 | |
| | Netherlands—2.7% | | | | | | | | |
| * | Adyen NV (IT services) | | | 6,337 | | | | 8,740 | |
| | ASML Holding NV (Semiconductors & semiconductor equipment) | | | 31,935 | | | | 17,222 | |
| | BE Semiconductor Industries NV (Semiconductors & semiconductor equipment) | | | 55,979 | | | | 3,389 | |
| | Euronext NV (Capital markets) | | | 61,267 | | | | 4,536 | |
| | IMCD NV (Trading companies & distributors) | | | 33,491 | | | | 4,774 | |
| | | | | | | | | 38,661 | |
| | Norway—0.9% | | | | | | | | |
| * | AutoStore Holdings Ltd. (Machinery) | | | 1,626,178 | | | | 2,975 | |
| | Equinor ASA (Oil, gas & consumable fuels) | | | 206,657 | | | | 7,421 | |
| | Gjensidige Forsikring ASA (Insurance) | | | 156,167 | | | | 3,064 | |
| | | | | | | | | 13,460 | |
| | Spain—1.7% | | | | | | | | |
| * | Amadeus IT Group SA (IT services) | | | 337,053 | | | | 17,517 | |
| | EDP Renovaveis SA (Independent power & renewable electricity producers) | | | 302,974 | | | | 6,674 | |
| | | | | | | | | 24,191 | |
| | Sweden—3.7% | | | | | | | | |
| | Atlas Copco AB (Machinery) | | | 1,176,630 | | | | 13,881 | |
| | Beijer Ref AB (Trading companies & distributors) | | | 224,147 | | | | 3,160 | |
| | Evolution AB (Hotels, restaurants & leisure) | | | 71,949 | | | | 7,001 | |
See accompanying Notes to Financial Statements.
| December 31, 2022 | William Blair Funds | 47 |
International Growth Fund
Portfolio of Investments, December 31, 2022 (all dollar amounts in thousands)
| | | | | | | | |
| | | | | | | | |
| | Issuer | | Shares | | | Value | |
| | | | | | | | |
| | Common Stocks—(continued) | | | | | | | | |
| | | | | | | | | | |
| | Europe, Mid-East—(continued) | | | | | | | | |
| | Sweden—(continued) | | | | | | | | |
| | Hemnet Group AB (Interactive Media & Services) | | | 147,819 | | | $ | 1,779 | |
| | Hexagon AB (Electronic equipment, instruments & components) | | | 1,267,475 | | | | 13,240 | |
| | Indutrade AB (Machinery) | | | 214,256 | | | | 4,335 | |
| | Lifco AB (Industrial conglomerates) | | | 245,870 | | | | 4,103 | |
| | Sweco AB (Construction & engineering) | | | 187,616 | | | | 1,795 | |
| | Thule Group AB (Leisure products) | | | 83,544 | | | | 1,743 | |
| | Vitrolife AB (Biotechnology) | | | 72,760 | | | | 1,298 | |
| | | | | | | | | 52,335 | |
| | Switzerland—6.5% | | | | | | | | |
| | Belimo Holding AG (Building products) | | | 7,925 | | | | 3,771 | |
| | Galenica AG (Health care providers & services) | | | 52,687 | | | | 4,305 | |
| | Lonza Group AG (Life sciences tools & services) | | | 28,514 | | | | 13,972 | |
| | Partners Group Holding AG (Capital markets) | | | 12,030 | | | | 10,627 | |
| | Siegfried Holding AG (Life sciences tools & services) | | | 5,139 | | | | 3,410 | |
| | SIG Group AG (Containers & packaging) | | | 291,961 | | | | 6,378 | |
| | Sika AG (Chemicals) | | | 41,224 | | | | 9,884 | |
| | Straumann Holding AG (Health care equipment & supplies) | | | 64,248 | | | | 7,337 | |
| | Tecan Group AG (Life sciences tools & services) | | | 11,969 | | | | 5,338 | |
| | VAT Group AG (Machinery) | | | 14,820 | | | | 4,052 | |
| | Zurich Insurance Group AG (Insurance) | | | 49,267 | | | | 23,567 | |
| | | | | | | | | 92,641 | |
| | | | | | | | | | |
| | United Kingdom—16.2% | | | | | | | | |
| | 3i Group PLC (Capital markets) | | | 404,645 | | | | 6,563 | |
| * | Abcam PLC—ADR (Biotechnology) | | | 143,370 | | | | 2,231 | |
| | Ashtead Group PLC (Trading companies & distributors) | | | 196,137 | | | | 11,192 | |
| | AstraZeneca PLC (Pharmaceuticals) | | | 171,325 | | | | 23,235 | |
| | Beazley PLC (Insurance) | | | 442,058 | | | | 3,631 | |
| | Big Yellow Group PLC (Equity REIT) | | | 217,432 | | | | 3,015 | |
| | Bunzl PLC (Trading companies & distributors) | | | 199,980 | | | | 6,670 | |
| | Compass Group PLC (Hotels, restaurants & leisure) | | | 989,310 | | | | 22,934 | |
| | ConvaTec Group PLC (Health care equipment & supplies) | | | 2,703,170 | | | | 7,601 | |
| | Croda International PLC (Chemicals) | | | 72,088 | | | | 5,755 | |
| | CVS Group PLC (Health care providers & services) | | | 123,919 | | | | 2,900 | |
| | Diageo PLC (Beverages) | | | 388,585 | | | | 17,147 | |
| | Diploma PLC (Trading companies & distributors) | | | 108,610 | | | | 3,645 | |
| | Experian PLC (Professional services) | | | 439,438 | | | | 14,944 | |
| | Greggs PLC (Hotels, restaurants & leisure) | | | 137,891 | | | | 3,911 | |
| | | | | | | | |
| | | | | | | | |
| | Issuer | | Shares | | | Value | |
| | | | | | | | |
| | Common Stocks—(continued) | | | | | | | | |
| | | | | | | | | | |
| | United Kingdom—(continued) | | | | | | | | |
| | Halma PLC (Electronic equipment, instruments & components) | | | 418,691 | | | $ | 9,992 | |
| | Intermediate Capital Group PLC (Capital markets) | | | 313,126 | | | | 4,346 | |
| | Linde PLC (Chemicals)† | | | 55,981 | | | | 18,260 | |
| | London Stock Exchange Group PLC (Capital markets) | | | 190,456 | | | | 16,431 | |
| | Renishaw PLC (Electronic equipment, instruments & components) | | | 46,410 | | | | 2,058 | |
| | Rentokil Initial PLC (Commercial services & supplies) | | | 1,922,283 | | | | 11,806 | |
| | Rotork PLC (Machinery) | | | 1,775,434 | | | | 6,581 | |
| | Segro PLC (Equity REIT) | | | 379,623 | | | | 3,505 | |
| | Softcat PLC (IT services) | | | 158,423 | | | | 2,268 | |
| | Spectris PLC (Electronic equipment, instruments & components) | | | 77,598 | | | | 2,816 | |
| | Spirax-Sarco Engineering PLC (Machinery) | | | 51,159 | | | | 6,565 | |
| | SSE PLC (Electric utilities) | | | 355,440 | | | | 7,357 | |
| | Weir Group PLC (Machinery) | | | 215,753 | | | | 4,353 | |
| | | | | | | | | 231,712 | |
| | | | | | | | | | |
| | Emerging Asia—13.4% | | | | | | | | |
| | China—3.1% | | | | | | | | |
| | Airtac International Group (Machinery) | | | 110,713 | | | | 3,354 | |
| * | Alibaba Group Holding Ltd. (Internet & direct marketing retail) | | | 1,310,800 | | | | 14,484 | |
| | BYD Co. Ltd. (Automobiles) | | | 153,200 | | | | 5,663 | |
| | Contemporary Amperex Technology Co. Ltd. (Electrical equipment) | | | 68,000 | | | | 3,848 | |
| | Foshan Haitian Flavouring & Food Co. Ltd. (Food products) | | | 357,691 | | | | 4,096 | |
| | Proya Cosmetics Co. Ltd. (Personal products) | | | 187,878 | | | | 4,526 | |
| | Shenzhen Inovance Technology Co. Ltd. (Machinery) | | | 653,192 | | | | 6,530 | |
| | Silergy Corp. (Semiconductors & semiconductor equipment) | | | 106,000 | | | | 1,506 | |
| | | | | | | | | 44,007 | |
| | India—6.6% | | | | | | | | |
| | Apollo Hospitals Enterprise Ltd. (Health care providers & services) | | | 52,745 | | | | 2,854 | |
| | Britannia Industries Ltd. (Food products) | | | 55,349 | | | | 2,887 | |
| | Crompton Greaves Consumer Electricals Ltd. (Household durables) | | | 651,076 | | | | 2,652 | |
| | Havells India Ltd. (Electrical equipment) | | | 249,713 | | | | 3,326 | |
| | HDFC Bank Ltd. (Banks) | | | 965,373 | | | | 19,020 | |
| | Hindustan Unilever Ltd. (Personal products) | | | 295,477 | | | | 9,158 | |
| | Info Edge India Ltd. (Interactive Media & Services) | | | 53,593 | | | | 2,535 | |
| | Infosys Ltd. (IT services) | | | 605,269 | | | | 11,037 | |
| * | InterGlobe Aviation Ltd. (Airlines) | | | 239,568 | | | | 5,795 | |
See accompanying Notes to Financial Statements.
| 48 | Annual Report | December 31, 2022 |
International Growth Fund
Portfolio of Investments, December 31, 2022 (all dollar amounts in thousands)
| | | | | | | | |
| | | | | | | | |
| | Issuer | | Shares | | | Value | |
| | | | | | | | |
| | Common Stocks—(continued) | | | | | | | | |
| | | | | | | | | | |
| | Emerging Asia—(continued) | | | | | | | | |
| | India—(continued) | | | | | | | | |
| * | Max Healthcare Institute Ltd. (Health care providers & services) | | | 382,687 | | | $ | 2,036 | |
| | Petronet LNG Ltd. (Oil, gas & consumable fuels) | | | 1,244,649 | | | | 3,242 | |
| | Pidilite Industries Ltd. (Chemicals) | | | 121,266 | | | | 3,752 | |
| | Reliance Industries Ltd. (Oil, gas & consumable fuels) | | | 702,702 | | | | 21,634 | |
| | UPL Ltd. (Chemicals) | | | 348,752 | | | | 3,023 | |
| | Voltas Ltd. (Construction & engineering) | | | 269,427 | | | | 2,602 | |
| | | | | | | | | 95,553 | |
| | Indonesia—1.9% | | | | | | | | |
| | Bank Central Asia Tbk PT (Banks) | | | 34,325,500 | | | | 18,852 | |
| | Telkom Indonesia Persero Tbk PT (Diversified telecommunication services) | | | 32,729,900 | | | | 7,884 | |
| | | | | | | | | 26,736 | |
| | South Korea—0.4% | | | | | | | | |
| | Samsung SDI Co. Ltd. (Electronic equipment, instruments & components) | | | 13,197 | | | | 6,168 | |
| | Taiwan—1.4% | | | | | | | | |
| | Globalwafers Co. Ltd. (Semiconductors & semiconductor equipment) | | | 120,000 | | | | 1,669 | |
| | MediaTek, Inc. (Semiconductors & semiconductor equipment) | | | 253,000 | | | | 5,145 | |
| | Taiwan Semiconductor Manufacturing Co. Ltd.—ADR (Semiconductors & semiconductor equipment) | | | 183,058 | | | | 13,636 | |
| | | | | | | | | 20,450 | |
| | | | | | | | | | |
| | Canada—9.1% | | | | | | | | |
| | Canadian National Railway Co. (Road & rail) | | | 149,121 | | | | 17,714 | |
| | Canadian Pacific Railway Ltd. (Road & rail) | | | 247,070 | | | | 18,429 | |
| | CCL Industries, Inc. (Containers & packaging) | | | 113,948 | | | | 4,868 | |
| | Dollarama, Inc. (Multiline retail) | | | 277,301 | | | | 16,218 | |
| | Intact Financial Corp. (Insurance) | | | 127,064 | | | | 18,291 | |
| * | Kinaxis, Inc. (Software) | | | 36,049 | | | | 4,044 | |
| * | Lululemon Athletica, Inc. (Textiles, apparel & luxury goods) | | | 34,889 | | | | 11,178 | |
| | Metro, Inc. (Food & staples retailing) | | | 273,005 | | | | 15,116 | |
| | Parkland Corp. (Oil, gas & consumable fuels) | | | 161,903 | | | | 3,553 | |
| | Toromont Industries Ltd. (Trading companies & distributors) | | | 62,072 | | | | 4,479 | |
| | Toronto-Dominion Bank (Banks) | | | 267,974 | | | | 17,351 | |
| | | | | | | | | 131,241 | |
| | | | | | | | | | |
| | Japan—8.5% | | | | | | | | |
| | BayCurrent Consulting, Inc. (Professional services) | | | 94,700 | | | | 2,969 | |
| | Benefit One, Inc. (Professional services) | | | 146,800 | | | | 2,162 | |
| | | | | | | | |
| | | | | | | | |
| | Issuer | | Shares | | | Value | |
| | | | | | | | |
| | Common Stocks—(continued) | | | | | | | | |
| | | | | | | | | | |
| | Japan—(continued) | | | | | | | | |
| | Daikin Industries Ltd. (Building products) | | | 99,300 | | | $ | 15,284 | |
| | Disco Corp. (Semiconductors & semiconductor equipment) | | | 12,400 | | | | 3,567 | |
| | Food & Life Cos. Ltd. (Hotels, restaurants & leisure) | | | 111,500 | | | | 2,207 | |
| | GMO Payment Gateway, Inc. (IT services) | | | 37,700 | | | | 3,137 | |
| | Harmonic Drive Systems, Inc. (Machinery) | | | 62,200 | | | | 1,761 | |
| | Hoya Corp. (Health care equipment & supplies) | | | 103,400 | | | | 10,010 | |
| | Japan Elevator Service Holdings Co. Ltd. (Commercial services & supplies) | | | 156,900 | | | | 1,977 | |
| | Keyence Corp. (Electronic equipment, instruments & components) | | | 41,300 | | | | 16,182 | |
| | MonotaRO Co. Ltd. (Trading companies & distributors) | | | 349,700 | | | | 4,948 | |
| | Nihon M&A Center Holdings, Inc. (Professional services) | | | 323,800 | | | | 4,019 | |
| | Olympus Corp. (Health care equipment & supplies) | | | 609,000 | | | | 10,914 | |
| | Rakus Co. Ltd. (Software) | | | 165,800 | | | | 2,001 | |
| | SCSK Corp. (IT services) | | | 179,500 | | | | 2,737 | |
| * | SHIFT, Inc. (IT services) | | | 24,900 | | | | 4,428 | |
| | Shin-Etsu Chemical Co. Ltd. (Chemicals) | | | 58,700 | | | | 7,257 | |
| | SMS Co. Ltd. (Professional services) | | | 75,900 | | | | 1,940 | |
| | TechnoPro Holdings, Inc. (Professional services) | | | 194,500 | | | | 5,224 | |
| | TIS, Inc. (IT services) | | | 265,600 | | | | 7,043 | |
| | Tokio Marine Holdings, Inc. (Insurance) | | | 545,200 | | | | 11,746 | |
| | | | | | | | | 121,513 | |
| | | | | | | | | | |
| | Asia—5.2% | | | | | | | | |
| | Australia—2.1% | | | | | | | | |
| | Aristocrat Leisure Ltd. (Hotels, restaurants & leisure) | | | 110,000 | | | | 2,286 | |
| | CSL Ltd. (Biotechnology) | | | 89,000 | | | | 17,437 | |
| | Domino’s Pizza Enterprises Ltd. (Hotels, restaurants & leisure) | | | 58,834 | | | | 2,654 | |
| | Netwealth Group Ltd. (Capital markets) | | | 252,696 | | | | 2,082 | |
| | Pro Medicus Ltd. (Health care technology) | | | 83,345 | | | | 3,136 | |
| | Steadfast Group Ltd. (Insurance) | | | 839,014 | | | | 3,124 | |
| | | | | | | | | 30,719 | |
| | Hong Kong—1.7% | | | | | | | | |
| | AIA Group Ltd. (Insurance) | | | 1,812,200 | | | | 20,153 | |
| | Techtronic Industries Co. Ltd. (Machinery) | | | 400,500 | | | | 4,469 | |
| | | | | | | | | 24,622 | |
| | Singapore—1.4% | | | | | | | | |
| | DBS Group Holdings Ltd. (Banks) | | | 768,900 | | | | 19,472 | |
See accompanying Notes to Financial Statements.
| December 31, 2022 | William Blair Funds | 49 |
International Growth Fund
Portfolio of Investments, December 31, 2022 (all dollar amounts in thousands)
| | Issuer | | Shares or
Principal
Amount | | | Value | |
| | | | | | | | |
| | Common Stocks—(continued) | | | | | | | | |
| | | | | | | | | | |
| | Emerging Latin America—3.4% | | | | | | | | |
| | Argentina—0.3% | | | | | | | | |
| * | Globant SA (IT services)† | | | 23,719 | | | $ | 3,989 | |
| | Brazil—1.5% | | | | | | | | |
| | B3 SA - Brasil Bolsa Balcao (Capital markets) | | | 2,629,800 | | | | 6,580 | |
| * | Locaweb Servicos de Internet SA (IT services) | | | 1,264,893 | | | | 1,682 | |
| * | MercadoLibre, Inc. (Internet & direct marketing retail) | | | 6,443 | | | | 5,452 | |
| | Raia Drogasil SA (Food & staples retailing) | | | 589,800 | | | | 2,650 | |
| | Rumo SA (Road & rail) | | | 718,700 | | | | 2,533 | |
| | WEG SA (Electrical equipment) | | | 375,600 | | | | 2,739 | |
| | | | | | | | | 21,636 | |
| | Mexico—1.4% | | | | | | | | |
| | Grupo Aeroportuario del Sureste SAB de CV— ADR (Transportation infrastructure) | | | 26,476 | | | | 6,169 | |
| | Wal-Mart de Mexico SAB de CV (Food & staples retailing) | | | 3,834,600 | | | | 13,554 | |
| | | | | | | | | 19,723 | |
| | Peru—0.2% | | | | | | | | |
| | Credicorp Ltd. (Banks)† | | | 21,708 | | | | 2,945 | |
| | | | | | | | | | |
| | Emerging Mid-East, Africa—0.5% | | | | | | | | |
| | South Africa—0.2% | | | | | | | | |
| | Bid Corp. Ltd. (Food & staples retailing) | | | 183,914 | | | | 3,571 | |
| | United Arab Emirates—0.3% | | | | | | | | |
| | First Abu Dhabi Bank PJSC (Banks) | | | 915,997 | | | | 4,265 | |
| | Total Common Stocks—99.5%
(cost $1,186,643) | | | | | | | 1,427,617 | |
| | | | | | | | | | |
| | Repurchase Agreement | | | | | | | | |
| | Fixed Income Clearing Corporation, 1.600% dated 12/30/22, due 01/03/23, repurchase price $6,592, collateralized by U.S. Treasury Note, 2.375%, due 03/31/29, valued at $6,722 | | | $6,590 | | | | 6,590 | |
| | Total Repurchase Agreement—0.5%
(cost $6,590) | | | | | | | 6,590 | |
| | Total Investments—100.0%
(cost $1,193,233) | | | | | | | 1,434,207 | |
| | Cash and other assets, less liabilities—0.0% | | | | | | | 429 | |
| | Net assets—100.0% | | | | | | $ | 1,434,636 | |
ADR = American Depository Receipt
REIT = Real Estate Investment Trust
* = Non-income producing security
† = U.S. listed foreign security
At December 31, 2022, the Fund’s Portfolio of Investments includes the following industry categories (as a percentage of long-term investments):
| Industrials | | | 25.8 | % |
| Financials | | | 17.2 | % |
| Information Technology | | | 15.0 | % |
| Health Care | | | 14.1 | % |
| Consumer Discretionary | | | 9.8 | % |
| Consumer Staples | | | 6.2 | % |
| Energy | | | 4.9 | % |
| Materials | | | 4.1 | % |
| Communication Services | | | 1.3 | % |
| Utilities | | | 1.0 | % |
| Real Estate | | | 0.6 | % |
| Total | | | 100.0 | % |
At December 31, 2022, the Fund’s Portfolio of Investments includes the following currency categories (as a percentage of long-term investments):
| Euro | | | 25.4 | % |
| British Pound Sterling | | | 14.8 | % |
| Japanese Yen | | | 8.5 | % |
| U.S. Dollar | | | 7.8 | % |
| Canadian Dollar | | | 7.1 | % |
| Indian Rupee | | | 6.7 | % |
| Swiss Franc | | | 6.5 | % |
| Danish Krone | | | 4.7 | % |
| Swedish Krona | | | 3.7 | % |
| Hong Kong Dollar | | | 2.7 | % |
| Australian Dollar | | | 2.1 | % |
| Indonesian Rupiah | | | 1.9 | % |
| Chinese Yuan Renminbi | | | 1.7 | % |
| Singapore Dollar | | | 1.4 | % |
| Brazilian Real | | | 1.1 | % |
| All Other Currencies | | | 3.9 | % |
| Total | | | 100.0 | % |
See accompanying Notes to Financial Statements.
| 50 | Annual Report | December 31, 2022 |
| | Institutional International Growth Fund |
| | |
| | The Institutional International Growth Fund seeks long-term capital appreciation. |
| | |
| | AN OVERVIEW FROM THE PORTFOLIO MANAGERS |
| | |

Simon Fennell 
Kenneth J. McAtamney 
Andrew Siepker, CFA | The William Blair Institutional International Growth Fund (the “Fund”) posted a 28.28% decrease, net of fees, for the year ended December 31, 2022. By comparison, the Fund’s benchmark index, the MSCI All Country World ex-U.S. IMI (net) (the “Index”), decreased 16.58%. Underperformance versus the Index was largely due to style headwinds amid strong outperformance of low-valuation stocks. The underperformance was highly correlated to the inflationary pressures and increase in interest rates, which has led to significant multiple contraction for growth companies. Quality companies, which typically offer downside protection, did not help offset the underperformance amid the largely indiscriminate sell-off of high-growth, high-price-to-earnings (P/E) stocks. From an attribution perspective, stock selection was the primary driver of negative performance and was persistent across most sectors and regions due to the overarching style headwinds seen in 2022. Stock selection within Industrials and Information Technology was particularly negative. Within the Industrials sector, Kingspan and Ashtead Group (Ashtead) were the largest sources of underperformance. Kingspan is a leading building materials company that has developed a differentiated technology in insulated panels. The primary advantage of its insulation products is energy efficiency, improved durability, reduced maintenance costs, and faster construction times. These “green” products also stand to benefit from existing and future legislation from nations looking to reduce their carbon footprint. While the economic pressure and risk of a recession in Europe, as well as margin pressure on input costs have reduced Kingspan’s earnings power in the near term, we believe it should continue to gain market share given the strong value proposition it offers customers which is only increased by higher energy prices. Ashtead, which operates under the Sunbelt brand, rents a broad range of construction and industrial equipment from general tools to specialty equipment. The rental business is simple, with the rental provider offering customers homogenous products. While simplistic, Ashtead has the key benefit of scale in a largely fragmented market. We believe the benefits of scale are significant. Ashtead is able to buy equipment cheaper than the competition, it has a large and well-invested fleet to meet customer needs, and it has a wide-reaching and growing distribution network, ensuring that equipment is closer to the customer. These advantages have driven growth in cash flow, in turn driving further investment that has resulted in share gains and greater scale. Ashtead’s fundamental results over the year were above consensus with rental revenue up 26%. Despite these results, the stock is down year-to-date as the P/E multiple has contracted from 25 times at the beginning of the year to 14 times at the end of the year, below the company’s 10-year average. Within the Information Technology sector, Atlassian was the largest source of underperformance. Atlassian designs and develops enterprise software for project management, collaboration, issue tracking, integration, deployment, and support services. Layoffs and the slower pace of hiring among customers are leading to slower growth at Atlassian, and the business is more sensitive to economic conditions than we previously thought. Atlassian’s full year 2023 guidance was recently lowered. At the same time, Atlassian is a high-valuation, long-duration stock. We exited the position during the period. |
| | | |
| December 31, 2022 | William Blair Funds | 51 |
Institutional International Growth Fund
Partially offsetting these effects was an underweight to Emerging Asia, an overweight to the U.K., and strong stock selection within North America. Within Health Care, Novo Nordisk was a standout positive contributor. Novo Nordisk is the world leader in insulin and diabetes care and also sells other pharmaceuticals such as hormones and treatments for bleeding disorders. Novo’s competitive advantages as a large incumbent include a sizable and valuable commercial/marketing presence especially in diabetes, low-cost production particularly of insulins, and therapeutic area domain expertise that helps fuel innovation faster and at a higher level than its competitors. It performed well in 2022 on strong fundamentals including 30% growth in its obesity and diabetes franchises as it continued to increase forward guidance. We believe the obesity business will be a significant driver of future growth for the company.
Please refer to the Global Markets Review and Outlook relating to the Fund beginning on page 32.
| 52 | Annual Report | December 31, 2022 |
Institutional International Growth Fund
Performance Highlights (Unaudited)
Average Annual Total Returns through 12/31/2022
| | | 1 Year | | 3 Year | | 5 Year | | 10 Year |
| Institutional International Growth Fund | | | (28.28 | )% | | | 1.29 | % | | | 2.31 | % | | | 5.08 | % |
| MSCI ACW ex-U.S. IMI (net) | | | (16.58 | ) | | | 0.20 | | | | 0.85 | | | | 3.98 | |
Performance cited represents past performance. Past performance does not guarantee future results and current performance may be lower or higher than the data quoted. Results shown are average annual total returns, which assume reinvestment of dividends and capital gains. Investment returns and principal will fluctuate and you may have a gain or loss when you sell shares. For the most current month-end performance information, please call 1-800-742-7272, or visit our Web site at www.williamblairfunds.com. From time to time, the investment adviser may waive fees or reimburse expenses for the Fund. Without these waivers/reimbursements, performance would be lower. Investing in smaller and medium capitalization companies involves special risks, including higher volatility and lower liquidity. Smaller and medium capitalization stocks are also more sensitive to purchase/sale transactions and changes in the issuer’s financial condition. International investing involves special risk considerations, including currency fluctuations, lower liquidity, economic and political risk. Shares of the Fund are not subject to a sales load, distribution (Rule 12b-1) fees, or sub-transfer agent fees.
The performance highlights and graph presented above do not reflect the deduction of taxes that a shareholder would pay on fund distributions or the redemption of fund shares.
The Morgan Stanley Capital International (MSCI) All Country World (ACW) ex-U.S. Investable Market Index (IMI) (net) is a free float-adjusted market capitalization weighted index that is designed to measure the equity market performance of developed and emerging markets, excluding the United States. This index approximates the minimum possible dividend reinvestment by deducting for the highest possible withholding tax rates of those markets.
This report identifies the Fund’s investments on December 31, 2022. These holdings are subject to change. Not all stocks in the Fund performed the same, nor is there any guarantee that these stocks will perform as well in the future. Market forecasts provided in this report may not necessarily come to pass.
Sector Diversification (Unaudited)

The sector diversification shown is based on the total long-term securities.
| | | |
| December 31, 2022 | William Blair Funds | 53 |
Institutional International Growth Fund
Portfolio of Investments, December 31, 2022 (all dollar amounts in thousands)
| | | | | | | | |
| | | | | | | | |
| | Issuer | | Shares | | | Value | |
| | | | | | | | | | |
| | Common Stocks | | | | | | | | |
| | | | | | | | | | |
| | Europe, Mid-East—42.9% | | | | | | | | |
| | Belgium—1.5% | | | | | | | | |
| | KBC Group NV (Banks) | | | 179,770 | | | $ | 11,561 | |
| | Warehouses De Pauw CVA (Equity REIT) | | | 55,032 | | | | 1,573 | |
| | | | | | | | | 13,134 | |
| | Denmark—4.6% | | | | | | | | |
| | Coloplast AS (Health care equipment & supplies) | | | 31,289 | | | | 3,657 | |
| | DSV AS (Air freight & logistics) | | | 75,170 | | | | 11,865 | |
| * | Genmab AS (Biotechnology) | | | 16,534 | | | | 7,000 | |
| | Novo Nordisk AS (Pharmaceuticals) | | | 127,198 | | | | 17,175 | |
| | Royal Unibrew AS (Beverages) | | | 31,265 | | | | 2,229 | |
| | | | | | | | | 41,926 | |
| | Finland—1.2% | | | | | | | | |
| | Metso Outotec Oyj (Machinery) | | | 205,869 | | | | 2,118 | |
| | Neste Oyj (Oil, gas & consumable fuels) | | | 188,693 | | | | 8,690 | |
| | | | | | | | | 10,808 | |
| | France—12.3% | | | | | | | | |
| | Airbus SE (Aerospace & defense) | | | 109,139 | | | | 12,970 | |
| | Capgemini SE (IT services) | | | 44,298 | | | | 7,395 | |
| | Dassault Systemes SE (Software) | | | 179,466 | | | | 6,435 | |
| | Hermes International (Textiles, apparel & luxury goods) | | | 5,094 | | | | 7,879 | |
| | L’Oreal SA (Personal products) | | | 22,824 | | | | 8,150 | |
| | LVMH Moet Hennessy Louis Vuitton SE (Textiles, apparel & luxury goods) | | | 16,963 | | | | 12,346 | |
| | Safran SA (Aerospace & defense) | | | 87,117 | | | | 10,903 | |
| | Sartorius Stedim Biotech (Life sciences tools & services) | | | 16,398 | | | | 5,310 | |
| * | SES-imagotag SA (Electronic equipment, instruments & components) | | | 10,732 | | | | 1,402 | |
| | Teleperformance (Professional services) | | | 32,122 | | | | 7,657 | |
| | Thales SA (Aerospace & defense) | | | 114,448 | | | | 14,616 | |
| | TotalEnergies SE (Oil, gas & consumable fuels) | | | 79,510 | | | | 4,992 | |
| | Vinci SA (Construction & engineering) | | | 113,583 | | | | 11,343 | |
| | | | | | | | | 111,398 | |
| | Germany—3.3% | | | | | | | | |
| | Carl Zeiss Meditec AG (Health care equipment & supplies) | | | 21,962 | | | | 2,772 | |
| * | CTS Eventim AG & Co. KGaA (Entertainment) | | | 62,951 | | | | 4,016 | |
| | Infineon Technologies AG (Semiconductors & semiconductor equipment) | | | 345,572 | | | | 10,517 | |
| | MTU Aero Engines AG (Aerospace & defense) | | | 52,588 | | | | 11,382 | |
| | Nemetschek SE (Software) | | | 26,471 | | | | 1,351 | |
| | | | | | | | | 30,038 | |
| | Ireland—1.8% | | | | | | | | |
| * | ICON PLC (Life sciences tools & services)† | | | 65,125 | | | | 12,650 | |
| | Kingspan Group PLC (Building products) | | | 70,955 | | | | 3,842 | |
| | | | | | | | | 16,492 | |
| | | | | | | | |
| | | | | | | | |
| | Issuer | | Shares | | | Value | |
| | | | | | | | | | |
| | Common Stocks—(continued) | | | | | | | | |
| | | | | | | | | | |
| | Europe, Mid-East—(continued) | | | | | | | | |
| | Israel—0.8% | | | | | | | | |
| * | Inmode Ltd. (Health care equipment & supplies)† | | | 55,089 | | | $ | 1,967 | |
| | Mizrahi Tefahot Bank Ltd. (Banks) | | | 59,280 | | | | 1,921 | |
| * | Nice Ltd.—ADR (Software) | | | 18,520 | | | | 3,561 | |
| | | | | | | | | 7,449 | |
| | Italy—1.3% | | | | | | | | |
| | Amplifon SpA (Health care providers & services) | | | 67,304 | | | | 2,004 | |
| | Brunello Cucinelli SpA (Textiles, apparel & luxury goods) | | | 39,570 | | | | 2,927 | |
| | FinecoBank Banca Fineco SpA (Banks) | | | 258,702 | | | | 4,298 | |
| | Moncler SpA (Textiles, apparel & luxury goods) | | | 48,260 | | | | 2,557 | |
| | | | | | | | | 11,786 | |
| | Luxembourg—0.8% | | | | | | | | |
| | Tenaris SA (Energy equipment & services) | | | 424,663 | | | | 7,403 | |
| | Netherlands—2.7% | | | | | | | | |
| * | Adyen NV (IT services) | | | 3,987 | | | | 5,499 | |
| | ASML Holding NV (Semiconductors & semiconductor equipment) | | | 20,088 | | | | 10,833 | |
| | BE Semiconductor Industries NV (Semiconductors & semiconductor equipment) | | | 35,211 | | | | 2,132 | |
| | Euronext NV (Capital markets) | | | 38,547 | | | | 2,854 | |
| | IMCD NV (Trading companies & distributors) | | | 21,071 | | | | 3,003 | |
| | | | | | | | | 24,321 | |
| | Norway—0.9% | | | | | | | | |
| * | AutoStore Holdings Ltd. (Machinery) | | | 1,023,137 | | | | 1,872 | |
| | Equinor ASA (Oil, gas & consumable fuels) | | | 130,192 | | | | 4,675 | |
| | Gjensidige Forsikring ASA (Insurance) | | | 98,255 | | | | 1,928 | |
| | | | | | | | | 8,475 | |
| | Spain—1.7% | | | | | | | | |
| * | Amadeus IT Group SA (IT services) | | | 212,008 | | | | 11,018 | |
| | EDP Renovaveis SA (Independent power & renewable electricity producers) | | | 190,621 | | | | 4,200 | |
| | | | | | | | | 15,218 | |
| | Sweden—3.6% | | | | | | | | |
| | Atlas Copco AB (Machinery) | | | 740,108 | | | | 8,731 | |
| | Beijer Ref AB (Trading companies & distributors) | | | 141,026 | | | | 1,988 | |
| | Evolution AB (Hotels, restaurants & leisure) | | | 45,268 | | | | 4,405 | |
| | Hemnet Group AB (Interactive Media & Services) | | | 93,003 | | | | 1,119 | |
| | Hexagon AB (Electronic equipment, instruments & components) | | | 797,250 | | | | 8,328 | |
| | Indutrade AB (Machinery) | | | 134,802 | | | | 2,727 | |
| | Lifco AB (Industrial conglomerates) | | | 154,693 | | | | 2,582 | |
| | Sweco AB (Construction & engineering) | | | 118,041 | | | | 1,129 | |
See accompanying Notes to Financial Statements.
| 54 | Annual Report | December 31, 2022 |
Institutional International Growth Fund
Portfolio of Investments, December 31, 2022 (all dollar amounts in thousands)
| | | | | | | | |
| | | | | | | | |
| | Issuer | | Shares | | | Value | |
| | | | | | | | | | |
| | Common Stocks—(continued) | | | | | | | | |
| | | | | | | | | | |
| | Europe, Mid-East—(continued) | | | | | | | | |
| | Sweden—(continued) | | | | | | | | |
| | Thule Group AB (Leisure products) | | | 52,563 | | | $ | 1,097 | |
| | Vitrolife AB (Biotechnology) | | | 45,778 | | | | 817 | |
| | | | | | | | | 32,923 | |
| | Switzerland—6.4% | | | | | | | | |
| | Belimo Holding AG (Building products) | | | 4,986 | | | | 2,373 | |
| | Galenica AG (Health care providers & services) | | | 33,149 | | | | 2,708 | |
| | Lonza Group AG (Life sciences tools & services) | | | 17,940 | | | | 8,791 | |
| | Partners Group Holding AG (Capital markets) | | | 7,569 | | | | 6,686 | |
| * | Siegfried Holding AG (Life sciences tools & services) | | | 3,233 | | | | 2,145 | |
| * | SIG Group AG (Containers & packaging) | | | 183,692 | | | | 4,013 | |
| | Sika AG (Chemicals) | | | 25,930 | | | | 6,217 | |
| | Straumann Holding AG (Health care equipment & supplies) | | | 40,423 | | | | 4,617 | |
| | Tecan Group AG (Life sciences tools & services) | | | 7,530 | | | | 3,358 | |
| | VAT Group AG (Machinery) | | | 9,322 | | | | 2,549 | |
| | Zurich Insurance Group AG (Insurance) | | | 30,990 | | | | 14,824 | |
| | | | | | | | | 58,281 | |
| | | | | | | | | | |
| | United Kingdom—16.0% | | | | | | | | |
| | 3i Group PLC (Capital markets) | | | 254,589 | | | | 4,129 | |
| * | Abcam PLC—ADR (Biotechnology) | | | 90,125 | | | | 1,402 | |
| | Ashtead Group PLC (Trading companies & distributors) | | | 123,403 | | | | 7,042 | |
| | AstraZeneca PLC (Pharmaceuticals) | | | 107,792 | | | | 14,619 | |
| | Beazley PLC (Insurance) | | | 278,128 | | | | 2,285 | |
| | Big Yellow Group PLC (Equity REIT) | | | 136,801 | | | | 1,897 | |
| | Bunzl PLC (Trading companies & distributors) | | | 125,986 | | | | 4,202 | |
| | Compass Group PLC (Hotels, restaurants & leisure) | | | 622,441 | | | | 14,429 | |
| | ConvaTec Group PLC (Health care equipment & supplies) | | | 1,700,745 | | | | 4,782 | |
| | Croda International PLC (Chemicals) | | | 45,355 | | | | 3,621 | |
| | CVS Group PLC (Health care providers & services) | | | 77,965 | | | | 1,825 | |
| | Diageo PLC (Beverages) | | | 244,485 | | | | 10,788 | |
| | Diploma PLC (Trading companies & distributors) | | | 68,334 | | | | 2,293 | |
| | Experian PLC (Professional services) | | | 276,410 | | | | 9,400 | |
| | Greggs PLC (Hotels, restaurants & leisure) | | | 86,756 | | | | 2,461 | |
| | Halma PLC (Electronic equipment, instruments & components) | | | 263,432 | | | | 6,287 | |
| | Intermediate Capital Group PLC (Capital markets) | | | 197,008 | | | | 2,734 | |
| | Linde PLC (Chemicals)† | | | 35,268 | | | | 11,504 | |
| | London Stock Exchange Group PLC (Capital markets) | | | 119,828 | | | | 10,338 | |
| | Renishaw PLC (Electronic equipment, instruments & components) | | | 29,199 | | | | 1,295 | |
| | | | | | | | |
| | | | | | | | |
| | Issuer | | Shares | | | Value | |
| | | | | | | | | | |
| | Common Stocks—(continued) | | | | | | | | |
| | | | | | | | | | |
| | United Kingdom—(continued) | | | | | | | | |
| | Rentokil Initial PLC (Commercial services & supplies) | | | 1,209,437 | | | $ | 7,428 | |
| | Rotork PLC (Machinery) | | | 1,117,044 | | | | 4,140 | |
| | Segro PLC (Equity REIT) | | | 239,159 | | | | 2,208 | |
| | Softcat PLC (IT services) | | | 99,675 | | | | 1,427 | |
| | Spectris PLC (Electronic equipment, instruments & components) | | | 48,809 | | | | 1,771 | |
| | Spirax-Sarco Engineering PLC (Machinery) | | | 32,187 | | | | 4,130 | |
| | SSE PLC (Electric utilities) | | | 223,925 | | | | 4,635 | |
| | Weir Group PLC (Machinery) | | | 135,710 | | | | 2,738 | |
| | | | | | | | | 145,810 | |
| | | | | | | | | | |
| | Emerging Asia—13.4% | | | | | | | | |
| | China—3.1% | | | | | | | | |
| | Airtac International Group (Machinery) | | | 70,204 | | | | 2,127 | |
| * | Alibaba Group Holding Ltd. (Internet & direct marketing retail) | | | 825,800 | | | | 9,125 | |
| | BYD Co. Ltd. (Automobiles) | | | 96,500 | | | | 3,567 | |
| | Contemporary Amperex Technology Co. Ltd. (Electrical equipment) | | | 42,800 | | | | 2,422 | |
| | Foshan Haitian Flavouring & Food Co. Ltd. (Food products) | | | 225,063 | | | | 2,577 | |
| | Proya Cosmetics Co. Ltd. (Personal products) | | | 118,240 | | | | 2,849 | |
| | Shenzhen Inovance Technology Co. Ltd. (Machinery) | | | 410,900 | | | | 4,108 | |
| | Silergy Corp. (Semiconductors & semiconductor equipment) | | | 67,000 | | | | 951 | |
| | | | | | | | | 27,726 | |
| | India—6.6% | | | | | | | | |
| | Apollo Hospitals Enterprise Ltd. (Health care providers & services) | | | 33,185 | | | | 1,796 | |
| | Britannia Industries Ltd. (Food products) | | | 34,824 | | | | 1,817 | |
| | Crompton Greaves Consumer Electricals Ltd. (Household durables) | | | 409,635 | | | | 1,668 | |
| | Havells India Ltd. (Electrical equipment) | | | 157,111 | | | | 2,093 | |
| | HDFC Bank Ltd. (Banks) | | | 607,380 | | | | 11,967 | |
| | Hindustan Unilever Ltd. (Personal products) | | | 185,905 | | | | 5,762 | |
| | Info Edge India Ltd. (Interactive Media & Services) | | | 33,719 | | | | 1,595 | |
| | Infosys Ltd. (IT services) | | | 380,815 | | | | 6,944 | |
| * | InterGlobe Aviation Ltd. (Airlines) | | | 150,728 | | | | 3,646 | |
| * | Max Healthcare Institute Ltd. (Health care providers & services) | | | 240,774 | | | | 1,281 | |
| | Petronet LNG Ltd. (Oil, gas & consumable fuels) | | | 783,092 | | | | 2,040 | |
| | Pidilite Industries Ltd. (Chemicals) | | | 76,296 | | | | 2,360 | |
| | Reliance Industries Ltd. (Oil, gas & consumable fuels) | | | 442,697 | | | | 13,629 | |
| | UPL Ltd. (Chemicals) | | | 219,423 | | | | 1,902 | |
| | Voltas Ltd. (Construction & engineering) | | | 169,514 | | | | 1,637 | |
| | | | | | | | | 60,137 | |
See accompanying Notes to Financial Statements.
| | | |
| December 31, 2022 | William Blair Funds | 55 |
Institutional International Growth Fund
Portfolio of Investments, December 31, 2022 (all dollar amounts in thousands)
| | | | | | | | |
| | | | | | | | |
| | Issuer | | Shares | | | Value | |
| | | | | | | | | | |
| | Common Stocks—(continued) | | | | | | | | |
| | | | | | | | | | |
| | Emerging Asia—(continued) | | | | | | | | |
| | Indonesia—1.9% | | | | | | | | |
| | Bank Central Asia Tbk PT (Banks) | | | 21,596,430 | | | $ | 11,861 | |
| | Telkom Indonesia Persero Tbk PT (Diversified telecommunication services) | | | 20,592,600 | | | | 4,961 | |
| | | | | | | | | 16,822 | |
| | South Korea—0.4% | | | | | | | | |
| | Samsung SDI Co. Ltd. (Electronic equipment, instruments & components) | | | 8,303 | | | | 3,881 | |
| | Taiwan—1.4% | | | | | | | | |
| | Globalwafers Co. Ltd. (Semiconductors & semiconductor equipment) | | | 75,000 | | | | 1,043 | |
| | MediaTek, Inc. (Semiconductors & semiconductor equipment) | | | 159,000 | | | | 3,233 | |
| | Taiwan Semiconductor Manufacturing Co. Ltd.—ADR (Semiconductors & semiconductor equipment) | | | 115,144 | | | | 8,577 | |
| | | | | | | | | 12,853 | |
| | | | | | | | | | |
| | Canada—9.1% | | | | | | | | |
| | Canadian National Railway Co. (Road & rail) | | | 93,946 | | | | 11,160 | |
| | Canadian Pacific Railway Ltd. (Road & rail) | | | 155,448 | | | | 11,595 | |
| | CCL Industries, Inc. (Containers & packaging) | | | 71,692 | | | | 3,062 | |
| | Dollarama, Inc. (Multiline retail) | | | 174,469 | | | | 10,204 | |
| | Intact Financial Corp. (Insurance) | | | 79,924 | | | | 11,505 | |
| * | Kinaxis, Inc. (Software) | | | 22,681 | | | | 2,545 | |
| * | Lululemon Athletica, Inc. (Textiles, apparel & luxury goods) | | | 21,951 | | | | 7,033 | |
| | Metro, Inc. (Food & staples retailing) | | | 171,766 | | | | 9,510 | |
| | Parkland Corp. (Oil, gas & consumable fuels) | | | 101,864 | | | | 2,235 | |
| | Toromont Industries Ltd. (Trading companies & distributors) | | | 39,054 | | | | 2,818 | |
| | Toronto-Dominion Bank (Banks) | | | 168,558 | | | | 10,914 | |
| | | | | | | | | 82,581 | |
| | | | | | | | | | |
| | Japan—8.4% | | | | | | | | |
| | BayCurrent Consulting, Inc. (Professional services) | | | 59,600 | | | | 1,869 | |
| | Benefit One, Inc. (Professional services) | | | 92,400 | | | | 1,361 | |
| | Daikin Industries Ltd. (Building products) | | | 62,500 | | | | 9,620 | |
| | Disco Corp. (Semiconductors & semiconductor equipment) | | | 7,800 | | | | 2,244 | |
| | Food & Life Cos. Ltd. (Hotels, restaurants & leisure) | | | 70,100 | | | | 1,388 | |
| | GMO Payment Gateway, Inc. (IT services) | | | 23,700 | | | | 1,972 | |
| | Harmonic Drive Systems, Inc. (Machinery) | | | 39,100 | | | | 1,107 | |
| | Hoya Corp. (Health care equipment & supplies) | | | 65,000 | | | | 6,292 | |
| | Japan Elevator Service Holdings Co. Ltd. (Commercial services & supplies) | | | 98,700 | | | | 1,244 | |
| | Keyence Corp. (Electronic equipment, instruments & components) | | | 25,900 | | | | 10,148 | |
| | | | | | | | | | |
| | | | | | | | |
| | | | | | | | |
| | Issuer | | Shares | | | Value | |
| | | | | | | | | | |
| | Common Stocks—(continued) | | | | | | | | |
| | | | | | | | | | |
| | Japan—(continued) | | | | | | | | |
| | MonotaRO Co. Ltd. (Trading companies & distributors) | | | 220,000 | | | $ | 3,113 | |
| | Nihon M&A Center Holdings, Inc. (Professional services) | | | 203,700 | | | | 2,528 | |
| | Olympus Corp. (Health care equipment & supplies) | | | 383,700 | | | | 6,876 | |
| | Rakus Co. Ltd. (Software) | | | 104,300 | | | | 1,259 | |
| | SCSK Corp. (IT services) | | | 112,900 | | | | 1,721 | |
| * | SHIFT, Inc. (IT services) | | | 15,700 | | | | 2,792 | |
| | Shin-Etsu Chemical Co. Ltd. (Chemicals) | | | 37,000 | | | | 4,574 | |
| | SMS Co. Ltd. (Professional services) | | | 47,800 | | | | 1,222 | |
| | TechnoPro Holdings, Inc. (Professional services) | | | 122,400 | | | | 3,287 | |
| | TIS, Inc. (IT services) | | | 167,100 | | | | 4,431 | |
| | Tokio Marine Holdings, Inc. (Insurance) | | | 343,000 | | | | 7,390 | |
| | | | | | | | | 76,438 | |
| | | | | | | | | | |
| | Asia—5.2% | | | | | | | | |
| | Australia—2.1% | | | | | | | | |
| | Aristocrat Leisure Ltd. (Hotels, restaurants & leisure) | | | 66,870 | | | | 1,389 | |
| | CSL Ltd. (Biotechnology) | | | 55,996 | | | | 10,971 | |
| | Domino’s Pizza Enterprises Ltd. (Hotels, restaurants & leisure) | | | 37,017 | | | | 1,670 | |
| | Netwealth Group Ltd. (Capital markets) | | | 158,988 | | | | 1,310 | |
| | Pro Medicus Ltd. (Health care technology) | | | 52,438 | | | | 1,973 | |
| | Steadfast Group Ltd. (Insurance) | | | 527,987 | | | | 1,966 | |
| | | | | | | | | 19,279 | |
| | Hong Kong—1.7% | | | | | | | | |
| | AIA Group Ltd. (Insurance) | | | 1,140,263 | | | | 12,680 | |
| | Techtronic Industries Co. Ltd. (Machinery) | | | 244,500 | | | | 2,729 | |
| | | | | | | | | 15,409 | |
| | Singapore—1.4% | | | | | | | | |
| | DBS Group Holdings Ltd. (Banks) | | | 483,800 | | | | 12,252 | |
| | | | | | | | | | |
| | Emerging Latin America—3.3% | | | | | | | | |
| | Argentina—0.3% | | | | | | | | |
| * | Globant SA (IT services)† | | | 14,923 | | | | 2,509 | |
| | Brazil—1.5% | | | | | | | | |
| | B3 SA - Brasil Bolsa Balcao (Capital markets) | | | 1,654,600 | | | | 4,140 | |
| * | Locaweb Servicos de Internet SA (IT services) | | | 795,786 | | | | 1,058 | |
| * | MercadoLibre, Inc. (Internet & direct marketing retail) | | | 4,054 | | | | 3,431 | |
| | Raia Drogasil SA (Food & staples retailing) | | | 371,100 | | | | 1,667 | |
| | Rumo SA (Road & rail) | | | 452,200 | | | | 1,594 | |
| | WEG SA (Electrical equipment) | | | 232,700 | | | | 1,697 | |
| | | | | | | | | 13,587 | |
See accompanying Notes to Financial Statements.
| 56 | Annual Report | December 31, 2022 |
Institutional International Growth Fund
Portfolio of Investments, December 31, 2022 (all dollar amounts in thousands)
| | Issuer | | Shares or
Principal
Amount | | | Value | |
| | | | | | | | | | |
| | Common Stocks—(continued) | | | | | | | | |
| | | | | | | | | | |
| | Emerging Latin America—(continued) | | | | | | | | |
| | Mexico—1.3% | | | | | | | | |
| | Grupo Aeroportuario del Sureste SAB de CV—ADR (Transportation infrastructure) | | | 16,658 | | | $ | 3,881 | |
| | Wal-Mart de Mexico SAB de CV (Food & staples retailing) | | | 2,412,600 | | | | 8,528 | |
| | | | | | | | | 12,409 | |
| | Peru—0.2% | | | | | | | | |
| | Credicorp Ltd. (Banks)† | | | 13,658 | | | | 1,853 | |
| | | | | | | | | | |
| | Emerging Mid-East, Africa—0.5% | | | | | | | | |
| | South Africa—0.2% | | | | | | | | |
| | Bid Corp. Ltd. (Food & staples retailing) | | | 115,713 | | | | 2,246 | |
| | United Arab Emirates—0.3% | | | | | | | | |
| | First Abu Dhabi Bank PJSC (Banks) | | | 576,315 | | | | 2,684 | |
| | Total Common Stocks—98.8%
(cost $757,321) | | | | | | | 898,128 | |
| | | | | | | | | | |
| | Repurchase Agreement | | | | | | | | |
| | Fixed Income Clearing Corporation, 1.600% dated 12/30/22, due 01/03/23, repurchase price $7,787, collateralized by U.S. Treasury Note, 2.375%, due 03/31/29, valued at $7,941 | | $ | 7,786 | | | | 7,786 | |
| | Total Repurchase Agreement—0.9%
(cost $7,786) | | | | | | | 7,786 | |
| | Total Investments—99.7%
(cost $765,107) | | | | | | | 905,914 | |
| | Cash and other assets, less liabilities—0.3% | | | | | | | 2,818 | |
| | Net assets—100.0% | | | | | | $ | 908,732 | |
ADR = American Depository Receipt
REIT = Real Estate Investment Trust
* = Non-income producing security
† = U.S. listed foreign security
At December 31, 2022, the Fund’s Portfolio of Investments includes the following industry categories (as a percentage of long-term investments):
| Industrials | 25.8% |
| Financials | 17.2% |
| Information Technology | 15.0% |
| Health Care | 14.1% |
| Consumer Discretionary | 9.8% |
| Consumer Staples | 6.2% |
| Energy | 4.9% |
| Materials | 4.1% |
| Communication Services | 1.3% |
| Utilities | 1.0% |
| Real Estate | 0.6% |
| Total | 100.0% |
At December 31, 2022, the Fund’s Portfolio of Investments includes the following currency categories (as a percentage of long-term investments):
| Euro | 25.4% |
| British Pound Sterling | 14.8% |
| Japanese Yen | 8.5% |
| U.S. Dollar | 7.8% |
| Canadian Dollar | 7.1% |
| Indian Rupee | 6.7% |
| Swiss Franc | 6.5% |
| Danish Krone | 4.7% |
| Swedish Krona | 3.7% |
| Hong Kong Dollar | 2.7% |
| Australian Dollar | 2.1% |
| Indonesian Rupiah | 1.9% |
| Chinese Yuan Renminbi | 1.7% |
| Singapore Dollar | 1.4% |
| Brazilian Real | 1.1% |
| All Other Currencies | 3.9% |
| Total | 100.0% |
See accompanying Notes to Financial Statements.
| | | |
| December 31, 2022 | William Blair Funds | 57 |
| | International Small Cap Growth Fund |
| | |
| | The International Small Cap Growth Fund seeks long-term capital appreciation. |
| | |
| | AN OVERVIEW FROM THE PORTFOLIO MANAGERS |
| | |

Simon Fennell  D.J. Neiman, CFA | The William Blair International Small Cap Growth Fund (Class N shares) (the “Fund”) posted a 35.14% decrease, net of fees, for the year ended December 31, 2022. By comparison, the Fund’s benchmark index, the MSCI All Country World ex-U.S. Small Cap Index (net) (the “Index”), decreased 19.97%. The Fund underperformed the Index during the year-to-date period. Underperformance was primarily due to the continued rotation in the market towards low-valuation, low-quality, and low-growth companies, which was amplified in the non-U.S. small cap space in the first half of the year. Additionally, the underperformance was highly correlated to the inflationary pressures and increase in interest rates, which has led to significant multiple contraction for growth companies in particular. From an attribution perspective, weaker stock selection within Industrials and Consumer Discretionary drove underperformance. Industrials weakness was primarily due to Japanese professional services company, Benefit One. Benefit One is a provider of HR-related services, in the form of outsourced fringe benefits. A structural tightening of the Japanese labor market has increased the need for employers to attract hires using the types of services offered by Benefit One. We believe future regulatory changes may also drive increased demand. As the business has a fixed cost base and low variable costs, operating leverage is high, which has supported a rate of profit growth at the top end of the peer group. The share price declined on lower-than-consensus operating profit, primarily due to an increase in costs in the fringe benefits segment of the business. Consumer Discretionary was weak, primarily due to MIPS. MIPS (abbreviation for Multidirectional Impact Protection System) is the market leader in rotational motion protection technology used in helmets to reduce risk of brain injury caused from shearing and/or stretching of brain tissue caused by impact. The company works with helmet companies to improve their products’ safety by inserting the MIPS’ Low Friction Layer during the helmet companies’ manufacturing process and can go into new or existing models. The company’s business model is asset-light (effectively an intellectual property company). The growth opportunity is substantial, in our view, given only 5% penetration of a large addressable market. After a strong run in 2021, the share price declined amid the broad market rotation into lower-valuation companies. Partially offsetting underperformance was the benefit of an underweight allocation to the Real Estate sector and an overweight allocation to the Industrials sector. From a regional standpoint, the strategy benefited from an overweight allocation and positive stock selection within Latin America. Group Aeroportuario del Centro Norte (OMAB) within Mexico strengthened on solid second-quarter results and a positive outlook. OMAB is a quality airport operator that we believe has scope to grow traffic and profitability in excess of peers in the intermediate term. The Mexican airport subsector is an attractive space, in our view, characterized by regional monopolies and favorable returns. We believe OMAB has multiple avenues to enhance profitability relative to peers, including adding non-aeronautical sources of revenue and increasing international traffic through its airports. Please refer to the Global Markets Review and Outlook relating to the Fund beginning on page 32. |
| 58 | Annual Report | December 31, 2022 |
International Small Cap Growth Fund
Performance Highlights (Unaudited)
Average Annual Total Returns through 12/31/2022
| | | 1 Year | | 3 Year | | 5 Year | | 10 Year |
| Class N | | | (35.14 | )% | | | (2.56 | )% | | | (1.33 | )% | | | 4.06 | % |
| Class I | | | (34.99 | ) | | | (2.30 | ) | | | (1.07 | ) | | | 4.36 | |
| Class R6 | | | (34.94 | ) | | | (2.20 | ) | | | (0.97 | ) | | | 4.48 | |
| MSCI ACW ex-U.S. Small Cap Index (net) | | | (19.97 | ) | | | 1.07 | | | | 0.67 | | | | 5.24 | |
Performance cited represents past performance. Past performance does not guarantee future results and current performance may be lower or higher than the data quoted. Results shown are average annual total returns, which assume reinvestment of dividends and capital gains. Investment returns and principal will fluctuate and you may have a gain or loss when you sell shares. For the most current month-end performance information, please call 1-800-742-7272, or visit our Web site at www.williamblairfunds.com. From time to time, the investment adviser may waive fees or reimburse expenses for the Fund. Without these waivers/reimbursements, performance would be lower. Investing in smaller companies involves special risks, including higher volatility and lower liquidity. Smaller capitalization stocks are also more sensitive to purchase/sale transactions and changes in the issuer’s financial condition. International investing involves special risk considerations, including currency fluctuations, lower liquidity, economic and political risk. Class N shares are not subject to a sales load. Class I shares are not subject to a sales load or distribution (Rule 12b-1) fees. Class R6 shares are not subject to a sales load, distribution (Rule 12b-1) fees, or sub-transfer agent fees.
The performance highlights and graph presented above do not reflect the deduction of taxes that a shareholder would pay on fund distributions or the redemption of fund shares.
The Morgan Stanley Capital International (MSCI) All Country World (ACW) ex-U.S. Small Cap Index (net) is a free float-adjusted market capitalization weighted index that is designed to measure the equity market performance of small capitalization developed and emerging markets, excluding the United States. This index approximates the minimum possible dividend reinvestment by deducting for the highest possible withholding tax rates of those markets.
This report identifies the Fund’s investments on December 31, 2022. These holdings are subject to change. Not all stocks in the Fund performed the same, nor is there any guarantee that these stocks will perform as well in the future. Market forecasts provided in this report may not necessarily come to pass.
Sector Diversification (Unaudited)
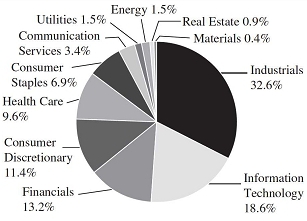
The sector diversification shown is based on the total long-term securities.
| December 31, 2022 | William Blair Funds | 59 |
International Small Cap Growth Fund
Portfolio of Investments, December 31, 2022 (all dollar amounts in thousands)
| | | | | | | | |
| | | | | | | | |
| | Issuer | | Shares | | | Value | |
| | | | | | | | |
| | Common Stocks | | | | | | | | |
| | | | | | | | | | |
| | Europe, Mid-East—33.7% | | | | | | | | |
| | Belgium—1.8% | | | | | | | | |
| | Melexis NV (Semiconductors & semiconductor equipment) | | | 38,008 | | | $ | 3,296 | |
| | Warehouses De Pauw CVA (Equity REIT) | | | 35,590 | | | | 1,017 | |
| | | | | | | | | 4,313 | |
| | Denmark—0.5% | | | | | | | | |
| | Royal Unibrew AS (Beverages) | | | 17,042 | | | | 1,215 | |
| | Finland—1.2% | | | | | | | | |
| * | Musti Group Oyj (Specialty retail) | | | 58,319 | | | | 975 | |
| | Valmet Oyj (Machinery) | | | 66,098 | | | | 1,780 | |
| | | | | | | | | 2,755 | |
| | France—0.9% | | | | | | | | |
| * | SES-imagotag SA (Electronic equipment, instruments & components) | | | 16,478 | | | | 2,152 | |
| | Germany—2.7% | | | | | | | | |
| * | CTS Eventim AG & Co. KGaA (Entertainment) | | | 63,617 | | | | 4,059 | |
| | Siltronic AG (Semiconductors & semiconductor equipment) | | | 29,708 | | | | 2,167 | |
| | | | | | | | | 6,226 | |
| | Israel—2.6% | | | | | | | | |
| | First International Bank Of Israel Ltd. (Banks) | | | 55,221 | | | | 2,184 | |
| * | Inmode Ltd. (Health care equipment & supplies)† | | | 101,399 | | | | 3,620 | |
| | Maytronics Ltd. (Household durables) | | | 40,390 | | | | 402 | |
| | | | | | | | | 6,206 | |
| | Italy—5.2% | | | | | | | | |
| | Amplifon SpA (Health care providers & services) | | | 31,137 | | | | 927 | |
| | Ariston Holding NV (Household durables) | | | 407,030 | | | | 4,192 | |
| | Azimut Holding SpA (Capital markets) | | | 42,976 | | | | 963 | |
| | Brembo SpA (Auto components) | | | 132,871 | | | | 1,486 | |
| | Brunello Cucinelli SpA (Textiles, apparel & luxury goods) | | | 36,114 | | | | 2,671 | |
| | Carel Industries SpA (Building products) | | | 80,508 | | | | 2,025 | |
| | | | | | | | | 12,264 | |
| | Netherlands—1.3% | | | | | | | | |
| | BE Semiconductor Industries NV (Semiconductors & semiconductor equipment) | | | 49,361 | | | | 2,988 | |
| | Norway—2.5% | | | | | | | | |
| * | AutoStore Holdings Ltd. (Machinery) | | | 979,248 | | | | 1,792 | |
| | Gjensidige Forsikring ASA (Insurance) | | | 141,219 | | | | 2,770 | |
| | TOMRA Systems ASA (Commercial services & supplies) | | | 77,546 | | | | 1,311 | |
| | | | | | | | | 5,873 | |
| | Spain—1.5% | | | | | | | | |
| | EDP Renovaveis SA (Independent power & renewable electricity producers) | | | 110,047 | | | | 2,424 | |
| | | | | | | | |
| | | | | | | | |
| | Issuer | | Shares | | | Value | |
| | | | | | | | |
| | Common Stocks—(continued) | | | | | | | | |
| | | | | | | | | | |
| | Europe, Mid-East—(continued) | | | | | | | | |
| | Spain—(continued) | | | | | | | | |
| * | Solaria Energia y Medio Ambiente SA (Independent power & renewable electricity producers) | | | 57,334 | | | $ | 1,051 | |
| | | | | | | | | 3,475 | |
| | Sweden—9.8% | | | | | | | | |
| | AddTech AB (Trading companies & distributors) | | | 125,920 | | | | 1,794 | |
| | Beijer Ref AB (Trading companies & distributors) | | | 156,289 | | | | 2,203 | |
| | Biotage AB (Life sciences tools & services) | | | 136,954 | | | | 2,435 | |
| | Bravida Holding AB (Commercial services & supplies) | | | 118,312 | | | | 1,263 | |
| | Bufab AB (Trading companies & distributors) | | | 64,942 | | | | 1,456 | |
| | Fortnox AB (Software) | | | 418,239 | | | | 1,895 | |
| | Hemnet Group AB (Interactive Media & Services) | | | 91,114 | | | | 1,097 | |
| | Lagercrantz Group AB (Electronic equipment, instruments & components) | | | 202,291 | | | | 2,003 | |
| | Lifco AB (Industrial conglomerates) | | | 130,487 | | | | 2,178 | |
| | MIPS AB (Leisure products) | | | 36,521 | | | | 1,505 | |
| | Nolato AB (Industrial conglomerates) | | | 200,419 | | | | 1,050 | |
| * | Sdiptech AB (Commercial services & supplies) | | | 66,324 | | | | 1,436 | |
| | Sweco AB (Construction & engineering) | | | 152,775 | | | | 1,462 | |
| | Vitrolife AB (Biotechnology) | | | 75,377 | | | | 1,345 | |
| | | | | | | | | 23,122 | |
| | Switzerland—3.7% | | | | | | | | |
| | Galenica AG (Health care providers & services) | | | 43,283 | | | | 3,536 | |
| | Kardex Holding AG (Machinery) | | | 18,687 | | | | 3,072 | |
| * | Siegfried Holding AG (Life sciences tools & services) | | | 2,998 | | | | 1,989 | |
| | | | | | | | | 8,597 | |
| | | | | | | | | | |
| | Emerging Asia—16.5% | | | | | | | | |
| | China—3.6% | | | | | | | | |
| | Chacha Food Co. Ltd. (Food products) | | | 461,600 | | | | 3,320 | |
| | Proya Cosmetics Co. Ltd. (Personal products) | | | 162,908 | | | | 3,925 | |
| | Sichuan Swellfun Co. Ltd. (Beverages) | | | 105,682 | | | | 1,283 | |
| | | | | | | | | 8,528 | |
| | India—7.9% | | | | | | | | |
| * | Aavas Financiers Ltd. (Thrifts & mortgage finance) | | | 81,401 | | | | 1,819 | |
| * | Affle India Ltd. (Media) | | | 56,856 | | | | 740 | |
| | AU Small Finance Bank Ltd. (Banks) | | | 563,043 | | | | 4,458 | |
| | Cholamandalam Investment & Finance Co. Ltd. (Consumer finance) | | | 136,594 | | | | 1,198 | |
| | Info Edge India Ltd. (Interactive Media & Services) | | | 40,773 | | | | 1,928 | |
See accompanying Notes to Financial Statements.
| 60 | Annual Report | December 31, 2022 |
International Small Cap Growth Fund
Portfolio of Investments, December 31, 2022 (all dollar amounts in thousands)
| | | | | | | | |
| | | | | | | | |
| | Issuer | | Shares | | | Value | |
| | | | | | | | | | |
| | Common Stocks—(continued) | | | | | | | | |
| | | | | | | | | | |
| | Emerging Asia—(continued) | | | | | | | | |
| | India—(continued) | | | | | | | | |
| * | Max Healthcare Institute Ltd. (Health care providers & services) | | | 205,617 | | | $ | 1,094 | |
| | Motherson Sumi Wiring India Ltd. (Auto components) | | | 2,921,279 | | | | 2,053 | |
| | Polycab India Ltd. (Electrical equipment) | | | 54,353 | | | | 1,691 | |
| | Tube Investments of India Ltd. (Auto components) | | | 42,169 | | | | 1,404 | |
| | UPL Ltd. (Chemicals) | | | 118,420 | | | | 1,027 | |
| | Varun Beverages Ltd. (Beverages) | | | 76,942 | | | | 1,231 | |
| | | | | | | | | 18,643 | |
| | Indonesia—1.3% | | | | | | | | |
| | Bank Negara Indonesia Persero Tbk PT (Banks) | | | 3,100,700 | | | | 1,837 | |
| * | Mitra Adiperkasa Tbk PT (Multiline retail) | | | 12,990,600 | | | | 1,206 | |
| | | | | | | | | 3,043 | |
| | Malaysia—0.6% | | | | | | | | |
| | MR DIY Group M Bhd (Specialty retail) | | | 2,969,400 | | | | 1,348 | |
| | South Korea—0.6% | | | | | | | | |
| * | Koh Young Technology, Inc. (Semiconductors & semiconductor equipment) | | | 145,023 | | | | 1,462 | |
| | Taiwan—2.5% | | | | | | | | |
| | ASPEED Technology, Inc. (Semiconductors & semiconductor equipment) | | | 30,600 | | | | 1,678 | |
| | Tripod Technology Corp. (Electronic equipment, instruments & components) | | | 307,000 | | | | 939 | |
| | Voltronic Power Technology Corp. (Electrical equipment) | | | 64,451 | | | | 3,240 | |
| | | | | | | | | 5,857 | |
| | | | | | | | | | |
| | Japan—15.6% | | | | | | | | |
| | AZ-COM MARUWA Holdings, Inc. (Air freight & logistics) | | | 51,100 | | | | 613 | |
| | BayCurrent Consulting, Inc. (Professional services) | | | 135,600 | | | | 4,252 | |
| | Benefit One, Inc. (Professional services) | | | 181,600 | | | | 2,675 | |
| | Food & Life Cos. Ltd. (Hotels, restaurants & leisure) | | | 83,100 | | | | 1,645 | |
| | Fukuoka Financial Group, Inc. (Banks) | | | 54,200 | | | | 1,241 | |
| | GMO Payment Gateway, Inc. (IT services) | | | 16,000 | | | | 1,331 | |
| | Japan Elevator Service Holdings Co. Ltd. (Commercial services & supplies) | | | 182,300 | | | | 2,298 | |
| | Meitec Corp. (Professional services) | | | 137,000 | | | | 2,501 | |
| | Nihon M&A Center Holdings, Inc. (Professional services) | | | 95,800 | | | | 1,189 | |
| | Prestige International, Inc. (Commercial services & supplies) | | | 60,200 | | | | 333 | |
| | Rakus Co. Ltd. (Software) | | | 86,600 | | | | 1,045 | |
| | SCSK Corp. (IT services) | | | 176,000 | | | | 2,684 | |
| * | SHIFT, Inc. (IT services) | | | 17,500 | | | | 3,112 | |
| | SIGMAXYZ Holdings, Inc. (Professional services) | | | 101,100 | | | | 996 | |
| | SMS Co. Ltd. (Professional services) | | | 159,400 | | | | 4,075 | |
| | | | | | | | |
| | | | | | | | |
| | Issuer | | Shares | | | Value | |
| | | | | | | | |
| | Common Stocks—(continued) | | | | | | | | |
| | | | | | | | | | |
| | Japan—(continued) | | | | | | | | |
| | TechnoPro Holdings, Inc. (Professional services) | | | 176,200 | | | $ | 4,733 | |
| | TIS, Inc. (IT services) | | | 69,400 | | | | 1,840 | |
| | | | | | | | | 36,563 | |
| | | | | | | | | | |
| | United Kingdom—12.3% | | | | | | | | |
| * | Abcam PLC—ADR (Biotechnology) | | | 115,996 | | | | 1,805 | |
| | Beazley PLC (Insurance) | | | 556,327 | | | | 4,570 | |
| | Burford Capital Ltd. (Diversified financial services) | | | 181,291 | | | | 1,462 | |
| | CVS Group PLC (Health care providers & services) | | | 60,769 | | | | 1,422 | |
| | Diploma PLC (Trading companies & distributors) | | | 114,327 | | | | 3,837 | |
| | Greggs PLC (Hotels, restaurants & leisure) | | | 67,700 | | | | 1,920 | |
| | IntegraFin Holdings PLC (Capital markets) | | | 270,277 | | | | 987 | |
| * | Kin & Carta PLC (IT services) | | | 433,373 | | | | 1,121 | |
| | Pets at Home Group PLC (Specialty retail) | | | 428,380 | | | | 1,469 | |
| | Renishaw PLC (Electronic equipment, instruments & components) | | | 64,309 | | | | 2,852 | |
| | Rotork PLC (Machinery) | | | 1,109,112 | | | | 4,111 | |
| | Safestore Holdings PLC (Equity REIT) | | | 94,291 | | | | 1,077 | |
| | Softcat PLC (IT services) | | | 161,148 | | | | 2,307 | |
| | | | | | | | | 28,940 | |
| | | | | | | | | | |
| | Emerging Latin America—5.7% | | | | | | | | |
| | Brazil—2.0% | | | | | | | | |
| | Arezzo Industria e Comercio SA (Textiles, apparel & luxury goods) | | | 65,200 | | | | 966 | |
| | Rumo SA (Road & rail) | | | 447,700 | | | | 1,578 | |
| | TOTVS SA (Software) | | | 411,700 | | | | 2,154 | |
| | | | | | | | | 4,698 | |
| | Mexico—3.7% | | | | | | | | |
| | Grupo Aeroportuario del Centro Norte SAB de CV (Transportation infrastructure) | | | 488,500 | | | | 3,756 | |
| | Grupo Aeroportuario del Sureste SAB de CV (Transportation infrastructure) | | | 120,525 | | | | 2,808 | |
| | Regional SAB de CV (Banks) | | | 289,000 | | | | 2,091 | |
| | | | | | | | | 8,655 | |
| | | | | | | | | | |
| | Asia—5.3% | | | | | | | | |
| | Australia—3.8% | | | | | | | | |
| | Domino’s Pizza Enterprises Ltd. (Hotels, restaurants & leisure) | | | 35,327 | | | | 1,593 | |
| | EBOS Group Ltd. (Health care providers & services) | | | 47,281 | | | | 1,318 | |
| | Johns Lyng Group Ltd. (Construction & engineering) | | | 179,502 | | | | 757 | |
| | Netwealth Group Ltd. (Capital markets) | | | 88,651 | | | | 730 | |
| | Pro Medicus Ltd. (Health care technology) | | | 65,514 | | | | 2,465 | |
| | Steadfast Group Ltd. (Insurance) | | | 574,243 | | | | 2,139 | |
| | | | | | | | | 9,002 | |
See accompanying Notes to Financial Statements.
| December 31, 2022 | William Blair Funds | 61 |
International Small Cap Growth Fund
Portfolio of Investments, December 31, 2022 (all dollar amounts in thousands)
| | Issuer | | Shares or Principal Amount | | | Value | |
| | | | | | | | |
| | Common Stocks—(continued) | | | | | | | | |
| | | | | | | | | | |
| | Asia—(continued) | | | | | | | | |
| | New Zealand—1.5% | | | | | | | | |
| | Mainfreight Ltd. (Air freight & logistics) | | | 79,417 | | | $ | 3,403 | |
| | | | | | | | | | |
| | Canada—5.2% | | | | | | | | |
| | EQB, Inc. (Thrifts & mortgage finance) | | | 42,597 | | | | 1,785 | |
| * | Kinaxis, Inc. (Software) | | | 28,186 | | | | 3,163 | |
| | North West Co., Inc. (Food & staples retailing) | | | 73,359 | | | | 1,927 | |
| | Parkland Corp. (Oil, gas & consumable fuels) | | | 156,783 | | | | 3,440 | |
| | Richelieu Hardware Ltd. (Trading companies & distributors) | | | 68,023 | | | | 1,819 | |
| | | | | | | | | 12,134 | |
| | | | | | | | | | |
| | Emerging Europe, Mid-East, Africa—3.4% | | | | | | | | |
| | Greece—0.6% | | | | | | | | |
| | JUMBO SA (Specialty retail) | | | 80,352 | | | | 1,374 | |
| | South Africa—1.8% | | | | | | | | |
| | Bidvest Group Ltd. (Industrial conglomerates) | | | 93,868 | | | | 1,185 | |
| | Clicks Group Ltd. (Food & staples retailing) | | | 189,322 | | | | 3,009 | |
| | | | | | | | | 4,194 | |
| | United Arab Emirates—1.0% | | | | | | | | |
| * | Network International Holdings PLC (IT services) | | | 673,004 | | | | 2,425 | |
| | Total Common Stocks—97.7%
(cost $234,272) | | | | | | | 229,455 | |
| | | | | | | | | | |
| | Repurchase Agreement | | | | | | | | |
| | Fixed Income Clearing Corporation, 1.600% dated 12/30/22, due 01/03/23, repurchase price $4,960, collateralized by U.S. Treasury Note, 2.375%, due 03/31/29, valued at $5,058 | | $ | 4,959 | | | | 4,959 | |
| | Total Repurchase Agreement—2.1%
(cost $4,959) | | | | | | | 4,959 | |
| | Total Investments—99.8%
(cost $239,231) | | | | | | | 234,414 | |
| | Cash and other assets, less liabilities—0.2% | | | | | | | 536 | |
| | Net assets—100.0% | | | | | | $ | 234,950 | |
ADR = American Depository Receipt
REIT = Real Estate Investment Trust
* = Non-income producing security
† = U.S. listed foreign security
At December 31, 2022, the Fund’s Portfolio of Investments includes the following industry categories (as a percentage of long-term investments):
| Industrials | | | 32.6 | % |
| Information Technology | | | 18.6 | % |
| Financials | | | 13.2 | % |
| Consumer Discretionary | | | 11.4 | % |
| Health Care | | | 9.6 | % |
| Consumer Staples | | | 6.9 | % |
| Communication Services | | | 3.4 | % |
| Utilities | | | 1.5 | % |
| Energy | | | 1.5 | % |
| Real Estate | | | 0.9 | % |
| Materials | | | 0.4 | % |
| Total | | | 100.0 | % |
At December 31, 2022, the Fund’s Portfolio of Investments includes the following currency categories (as a percentage of long-term investments):
| Japanese Yen | | | 15.9 | % |
| Euro | | | 15.5 | % |
| British Pound Sterling | | | 12.9 | % |
| Swedish Krona | | | 10.1 | % |
| Indian Rupee | | | 8.1 | % |
| Canadian Dollar | | | 5.3 | % |
| Mexican Peso | | | 3.8 | % |
| Swiss Franc | | | 3.7 | % |
| Chinese Yuan Renminbi | | | 3.7 | % |
| Australian Dollar | | | 3.3 | % |
| Norwegian Krone | | | 2.6 | % |
| New Taiwan Dollar | | | 2.6 | % |
| U.S. Dollar | | | 2.4 | % |
| New Zealand Dollar | | | 2.1 | % |
| Brazilian Real | | | 2.0 | % |
| South African Rand | | | 1.8 | % |
| Indonesian Rupiah | | | 1.3 | % |
| Israeli Shekel | | | 1.1 | % |
| All Other Currencies | | | 1.8 | % |
| Total | | | 100.0 | % |
See accompanying Notes to Financial Statements.
| 62 | Annual Report | December 31, 2022 |
| | Emerging Markets Leaders Fund |
| | |
| | The Emerging Markets Leaders Fund seeks long-term capital appreciation. |
| | |
| | AN OVERVIEW FROM THE PORTFOLIO MANAGERS |
| | |

Todd M. McClone, CFA 
Kenneth J. McAtamney 
Hugo Scott-Gall | The William Blair Emerging Markets Leaders Fund (Class N shares) (the “Fund”) posted a 26.11% decrease, net of fees, for the year ended December 31, 2022. By comparison, the Fund’s benchmark index, the MSCI Emerging Markets Index (net) (the “Index”), decreased 20.09%. Calendar-year underperformance versus the Index was largely driven by style headwinds amid strong performance of low-valuation stocks and underperformance of high-growth, high-quality and long-duration assets. From a sector perspective, the underperformance was driven by negative stock selection effect within Communication Services, Consumer Discretionary, and Information Technology. Within Communication Services, Yandex, a Russian internet platform, and SEA, a Southeast Asia gaming and e-commerce company, dragged down relative performance. Yandex fell sharply along with Russian equities mainly from the fallout of Russia’s invasion of Ukraine. We exited the position in February 2022. SEA was dragged down by the rising interest rates environment and weakening fundamentals, with slowing growth in the core gaming segment and continued investments in new markets. We exited the position in the third quarter. Within Consumer Discretionary, e-commerce names were notable detractors, in particular MercadoLibre, as growth deceleration post pandemic coupled with the stock’s high multiple and long duration hampered stock performance. Globant and Mediatek, within the IT services and semiconductor industries, respectively, weighed on the Information Technology sector’s relative performance. Mediatek’s underperformance was largely driven by weak semiconductor cycle and concerns about slower demand and 5G adoption increasing risk to 2022-2023 expectations. Partially offsetting these effects was positive stock selection within the Energy and Financials sectors, coupled with the overweight allocation to Consumer Staples and Industrials. Within Energy, Reliance Industries (Reliance) bolstered relative performance as the company delivered strong results, benefiting from robust retail trends amid India’s reopening, rising gas prices, and wireless tariff increases. We believe that Reliance’s transformation from an asset-heavy, cyclical energy business to more diversified, end-consumer businesses with large and expanding total addressable markets is underappreciated and will continue to drive strong growth and returns over the long term while the commodity business provides earnings support in the near term. Bank Central Asia and HDFC Bank bolstered results in the Financials sector. Bank Central Asia is the highest-quality bank in Indonesia and is one of the strongest banks globally thanks to its exceptional deposit franchise and efficient cost structure. The bank continued to deliver strong results amid accelerating loan growth and lower provisions and raised loan growth guidance. We believe the growth outlook remains well underpinned against a favorable economic backdrop in Indonesia, improving asset quality, and higher interest rates environment. HDFC Bank is, in our view, the highest-quality banking franchise in India. The bank has been a consistent compounder of book value per share driven by its high absolute and relative return on equity. Loan growth is accelerating and net interest margin appears poised to improve with increased share of higher margin loans. The bank continues to gain market share and we believe that its total addressable market remains substantial amid strong demographic trends, extremely low penetration and improving affordability and supportive government policy. Please refer to the Global Markets Review and Outlook relating to the Fund beginning on page 32. |
| December 31, 2022 | William Blair Funds | 63 |
Emerging Markets Leaders Fund
Performance Highlights (Unaudited)
| Average Annual Total Returns through 12/31/2022 |
| | | | | | | | | |
| | | 1 Year | | 3 Year | | 5 Year | | 10 Year |
| Class N | | | (26.11 | )% | | | (4.61 | )% | | | (1.79 | )% | | | 1.30 | % |
| Class I | | | (25.84 | ) | | | (4.35 | ) | | | (1.50 | ) | | | 1.58 | |
| Class R6 | | | (25.86 | ) | | | (4.33 | ) | | | (1.47 | ) | | | 1.64 | |
| MSCI Emerging Markets Index (net) | | | (20.09 | ) | | | (2.69 | ) | | | (1.40 | ) | | | 1.44 | |
Performance cited represents past performance. Past performance does not guarantee future results and current performance may be lower or higher than the data quoted. Results shown are average annual total returns, which assume reinvestment of dividends and capital gains. Investment returns and principal will fluctuate and you may have a gain or loss when you sell shares. For the most current month-end performance information, please call 1-800-742-7272, or visit our Web site at www.williamblairfunds.com. International investing involves special risk considerations, including currency fluctuations, lower liquidity, economic and political risk. These risks may be magnified when investing in emerging markets. From time to time, the investment adviser may waive fees or reimburse expenses for the Fund. Without these waivers/reimbursements, performance would be lower. Class N shares are not subject to a sales load. Class I shares are not subject to a sales load or distribution (Rule 12b-1) fees. Class R6 shares are not subject to a sales load, distribution (Rule 12b-1) fees, or sub-transfer agent fees.
The performance highlights and graph presented above do not reflect the deduction of taxes that a shareholder would pay on fund distributions or the redemption of fund shares.
The Morgan Stanley Capital International (MSCI) Emerging Markets Index (net) is a free float-adjusted market-capitalization-weighted index that is designed to measure equity market performance of emerging markets. This index approximates the minimum possible dividend reinvestment by deducting for the highest possible withholding tax rates of those markets.
This report identifies the Fund’s investments on December 31, 2022. These holdings are subject to change. Not all stocks in the Fund performed the same, nor is there any guarantee that these stocks will perform as well in the future. Market forecasts provided in this report may not necessarily come to pass.
Sector Diversification (Unaudited)

The sector diversification shown is based on the total long-term securities.
| 64 | Annual Report | December 31, 2022 |
Emerging Markets Leaders Fund
Portfolio of Investments, December 31, 2022 (all dollar amounts in thousands)
| | | | | | | | |
| | | | | | | | |
| | Issuer | | Shares | | | Value | |
| | | | | | | | | | |
| | Common Stocks | | | | | | | | |
| | | | | | | | | | |
| | Emerging Asia—71.4% | | | | | | | | |
| | China—29.6% | | | | | | | | |
| | Airtac International Group (Machinery) | | | 165,000 | | | $ | 4,998 | |
| * | Alibaba Group Holding Ltd. (Internet & direct marketing retail) | | | 1,204,428 | | | | 13,309 | |
| | China Merchants Bank Co. Ltd. (Banks) | | | 1,190,000 | | | | 6,655 | |
| | China Tourism Group Duty Free Corp. Ltd. (Specialty retail) | | | 321,056 | | | | 9,977 | |
| | Contemporary Amperex Technology Co. Ltd. (Electrical equipment) | | | 65,600 | | | | 3,713 | |
| | Foshan Haitian Flavouring & Food Co. Ltd. (Food products) | | | 519,301 | | | | 5,946 | |
| | JD.com, Inc. (Internet & direct marketing retail) | | | 129,254 | | | | 3,646 | |
| | Kweichow Moutai Co. Ltd. (Beverages) | | | 35,559 | | | | 8,834 | |
| | Midea Group Co. Ltd. (Household durables) | | | 783,900 | | | | 5,841 | |
| | Shenzhen Inovance Technology Co. Ltd. (Machinery) | | | 476,300 | | | | 4,762 | |
| | Silergy Corp. (Semiconductors & semiconductor equipment) | | | 103,000 | | | | 1,463 | |
| | Suzhou Maxwell Technologies Co. Ltd. (Electrical equipment) | | | 102,200 | | | | 6,055 | |
| | Tencent Holdings Ltd. (Interactive Media & Services) | | | 376,800 | | | | 16,123 | |
| | TravelSky Technology Ltd. (IT services) | | | 1,487,000 | | | | 3,143 | |
| | Wuxi Lead Intelligent Equipment Co. Ltd. (Machinery) | | | 715,269 | | | | 4,141 | |
| | Zhangzhou Pientzehuang Pharmaceutical Co. Ltd. (Pharmaceuticals) | | | 136,300 | | | | 5,656 | |
| | | | | | | | | 104,262 | |
| | India—23.7% | | | | | | | | |
| | Asian Paints Ltd. (Chemicals) | | | 76,662 | | | | 2,861 | |
| | Bajaj Finance Ltd. (Consumer finance) | | | 97,248 | | | | 7,731 | |
| | Britannia Industries Ltd. (Food products) | | | 84,921 | | | | 4,430 | |
| | Havells India Ltd. (Electrical equipment) | | | 192,718 | | | | 2,567 | |
| | HDFC Bank Ltd. (Banks) | | | 607,044 | | | | 11,960 | |
| | Housing Development Finance Corp. Ltd. (Diversified financial services) | | | 212,221 | | | | 6,777 | |
| | Infosys Ltd. (IT services) | | | 629,575 | | | | 11,481 | |
| * | InterGlobe Aviation Ltd. (Airlines) | | | 275,753 | | | | 6,670 | |
| | Motherson Sumi Wiring India Ltd. (Auto components) | | | 1,189,559 | | | | 836 | |
| | Reliance Industries Ltd. (Oil, gas & consumable fuels) | | | 697,192 | | | | 21,465 | |
| | UPL Ltd. (Chemicals) | | | 750,946 | | | | 6,510 | |
| | | | | | | | | 83,288 | |
| | Indonesia—5.9% | | | | | | | | |
| | Bank Central Asia Tbk PT (Banks) | | | 26,235,200 | | | | 14,409 | |
| | Bank Rakyat Indonesia Persero Tbk PT (Banks) | | | 20,601,200 | | | | 6,537 | |
| | | | | | | | | 20,946 | |
| | South Korea—1.9% | | | | | | | | |
| | Samsung Electronics Co. Ltd. (Technology hardware, storage & peripherals) | | | 78,693 | | | | 3,441 | |
| | | | | | | | |
| | | | | | | | |
| | Issuer | | Shares | | | Value | |
| | | | | | | | |
| | Common Stocks—(continued) | | | | | | |
| | | | | | | | |
| | Emerging Asia—(continued) | | | | | | |
| | South Korea—(continued) | | | | | | |
| | Samsung SDI Co. Ltd. (Electronic equipment, instruments & components) | | | 6,790 | | | $ | 3,174 | |
| | | | | | | | | 6,615 | |
| | Taiwan—8.5% | | | | | | | | |
| | ASPEED Technology, Inc. (Semiconductors & semiconductor equipment) | | | 33,000 | | | | 1,809 | |
| | E.Sun Financial Holding Co. Ltd. (Banks) | | | 4,859,449 | | | | 3,803 | |
| | eMemory Technology, Inc. (Semiconductors & semiconductor equipment) | | | 56,000 | | | | 2,432 | |
| | MediaTek, Inc. (Semiconductors & semiconductor equipment) | | | 126,000 | | | | 2,562 | |
| | Taiwan Semiconductor Manufacturing Co. Ltd.—ADR (Semiconductors & semiconductor equipment) | | | 257,544 | | | | 19,185 | |
| | | | | | | | | 29,791 | |
| | Thailand—1.8% | | | | | | | | |
| | Bangkok Dusit Medical Services PCL (Health care providers & services) | | | 7,746,500 | | | | 6,486 | |
| | | | | | | | | | |
| | Emerging Latin America—22.9% | | | | | | | | |
| | Argentina—1.9% | | | | | | | | |
| * | Globant SA (IT services)† | | | 39,115 | | | | 6,577 | |
| | Brazil—14.0% | | | | | | | | |
| | B3 SA - Brasil Bolsa Balcao (Capital markets) | | | 4,213,200 | | | | 10,542 | |
| | Banco BTG Pactual SA (Capital markets) | | | 938,500 | | | | 4,256 | |
| * | Locaweb Servicos de Internet SA (IT services) | | | 2,579,900 | | | | 3,430 | |
| * | MercadoLibre, Inc. (Internet & direct marketing retail) | | | 9,961 | | | | 8,429 | |
| | Raia Drogasil SA (Food & staples retailing) | | | 713,300 | | | | 3,205 | |
| | Rumo SA (Road & rail) | | | 1,216,900 | | | | 4,289 | |
| | TOTVS SA (Software) | | | 1,151,200 | | | | 6,022 | |
| | WEG SA (Electrical equipment) | | | 1,252,400 | | | | 9,135 | |
| | | | | | | | | 49,308 | |
| | Mexico—5.4% | | | | | | | | |
| | Grupo Aeroportuario del Pacifico SAB de CV (Transportation infrastructure) | | | 480,300 | | | | 6,887 | |
| | Wal-Mart de Mexico SAB de CV (Food & staples retailing) | | | 3,405,400 | | | | 12,037 | |
| | | | | | | | | 18,924 | |
| | Peru—1.6% | | | | | | | | |
| | Credicorp Ltd. (Banks)† | | | 42,017 | | | | 5,700 | |
| | | | | | | | | | |
| | Emerging Africa—3.9% | | | | | | | | |
| | South Africa—3.9% | | | | | | | | |
| | Capitec Bank Holdings Ltd. (Banks) | | | 77,540 | | | | 8,482 | |
| | Clicks Group Ltd. (Food & staples retailing) | | | 331,023 | | | | 5,262 | |
| | | | | | | | | 13,744 | |
See accompanying Notes to Financial Statements.
| December 31, 2022 | William Blair Funds | 65 |
Emerging Markets Leaders Fund
Portfolio of Investments, December 31, 2022 (all dollar amounts in thousands)
| | Issuer | | Shares or
Principal
Amount | | | Value | |
| | | | | | | | |
| | Common Stocks—(continued) | | | | | | |
| | | | | | | | |
| | Asia—1.0% | | | | | | |
| | Hong Kong—1.0% | | | | | | |
| | AIA Group Ltd. (Insurance) | | | 327,800 | | | $ | 3,645 | |
| | Total Common Stocks—99.2%
(cost $366,248) | | | | | | | 349,286 | |
| | | | | | | | | | |
| | Repurchase Agreement | | | | | | | | |
| | Fixed Income Clearing Corporation, 1.600% dated 12/30/22, due 01/03/23, repurchase price $3,487, collateralized by U.S. Treasury Note, 2.375%, due 03/31/29, valued at $3,556 | | $ | 3,486 | | | | 3,486 | |
| | Total Repurchase Agreement—1.0%
(cost $3,486) | | | | | | | 3,486 | |
| | Total Investments—100.2%
(cost $369,734) | | | | | | | 352,772 | |
| | Liabilities, plus cash and other assets—(0.2)% | | | | | | | (679 | ) |
| | Net assets—100.0% | | | | | | $ | 352,093 | |
ADR = American Depository Receipt
* = Non-income producing security
† = U.S. listed foreign security
At December 31, 2022, the Fund’s Portfolio of Investments includes the following industry categories (as a percentage of long-term investments):
| Financials | | | 26.0 | % |
| Information Technology | | | 18.5 | % |
| Industrials | | | 15.2 | % |
| Consumer Discretionary | | | 12.0 | % |
| Consumer Staples | | | 11.4 | % |
| Energy | | | 6.1 | % |
| Communication Services | | | 4.6 | % |
| Health Care | | | 3.5 | % |
| Materials | | | 2.7 | % |
| Total | | | 100.0 | % |
At December 31, 2022, the Fund’s Portfolio of Investments includes the following currency categories (as a percentage of long-term investments):
| Indian Rupee | | | 23.9 | % |
| Chinese Yuan Renminbi | | | 15.7 | % |
| Hong Kong Dollar | | | 13.3 | % |
| Brazilian Real | | | 11.7 | % |
| U.S. Dollar | | | 11.4 | % |
| Indonesian Rupiah | | | 6.0 | % |
| Mexican Peso | | | 5.4 | % |
| New Taiwan Dollar | | | 4.9 | % |
| South African Rand | | | 3.9 | % |
| South Korean Won | | | 1.9 | % |
| Thai Baht | | | 1.9 | % |
| Total | | | 100.0 | % |
See accompanying Notes to Financial Statements.
| 66 | Annual Report | December 31, 2022 |
| | Emerging Markets Growth Fund |
| | |
| | The Emerging Markets Growth Fund seeks long-term capital appreciation. |
| | |
| | AN OVERVIEW FROM THE PORTFOLIO MANAGERS |
| | |

Todd M. McClone, CFA 
Casey K. Preyss, CFA 
Vivian Lin Thurston, CFA | The William Blair Emerging Markets Growth Fund (Class N shares) (the “Fund”) posted a 33.33% decrease, net of fees, for the year ended December 31, 2022. By comparison, the Fund’s benchmark index, the MSCI Emerging Markets IMI (net) (the “Index”), decreased 19.83%. Calendar-year underperformance versus the Index was largely driven by style headwinds amid strong performance of low-valuation stocks and underperformance of high-growth, high-quality and long-duration assets. From a sector perspective, the underperformance was driven by negative stock selection effects within most sectors, particularly, Financials, Information Technology, and Consumer Discretionary. Within Financials, TCS Group and China Merchants Banks were notable detractors. TCS Group, the leading Russian digital financial services company, fell sharply in the wake of Russia’s invasion of Ukraine. China Merchants Bank is unique as a commercially driven, retail-oriented bank in the structurally growing Chinese market. The stock underperformance was largely driven by a weakening macroeconomic backdrop, property market issues, and government pressure to lower interest rates across the industry driving deceleration in loan demand, net interest margins and fees, as well as an increase in non-performing loans (NPLs). Information Technology was dragged down by semiconductor stocks, such as Silergy and Mediatek. Silergy is the market leader in China for analog semiconductors and, in our view, remains a beneficiary of structural growth in demand from automobile, cloud, and 5G end-markets, as well as a localization trend. Silergy’s stock price weakened amid a deteriorated demand backdrop. Mediatek’s underperformance was largely driven by a weak semiconductor cycle and concerns about slower demand and 5G adoption increasing risk to 2022-2023 expectations. Internet retailers, particularly MercadoLibre, were the most notable detractors to relative performance within Consumer Discretionary. While MercadoLibre’s fundamental performance remained solid, investor concerns about deteriorating macroeconomic conditions, the impact of higher interest rates, and fuel costs as well as increasing NPLs, coupled with the stock’s high price-to-earnings multiple, drove the stock’s underperformance in 2022. Partially offsetting these effects was positive stock selection within Energy, bolstered by Reliance Industries (Reliance), coupled with the overweighting to Consumer Staples. Reliance delivered strong results, benefiting from robust retail trends amid India’s reopening, rising gas prices, and wireless tariff increases. We believe that Reliance’s transformation from an asset-heavy, cyclical energy business to more diversified, end-consumer businesses with large and expanding total addressable markets is under-appreciated and will continue to drive strong growth and returns over the long term, while the commodity business provides earnings support in the near term. In addition, Varun Beverages, Bank Central Asia, and Bank Rakyat Indonesia Persero were key individual contributors to relative performance during the year. Please refer to the Global Markets Review and Outlook relating to the Fund beginning on page 32. |
| December 31, 2022 | William Blair Funds | 67 |
Emerging Markets Growth Fund
Performance Highlights (Unaudited)
Average Annual Total Returns through 12/31/2022
| | | 1 Year | | 3 Year | | 5 Year | | 10 Year |
| Class N | | | (33.33 | )% | | | (1.21 | )% | | | (0.68 | )% | | | 2.61 | % |
| Class I | | | (33.14 | ) | | | (0.96 | ) | | | (0.41 | ) | | | 2.87 | |
| Class R6 | | | (33.13 | ) | | | (0.87 | ) | | | (0.33 | ) | | | 2.98 | |
| MSCI Emerging Markets IMI (net) | | | (19.83 | ) | | | (1.82 | ) | | | (1.10 | ) | | | 1.64 | |
Performance cited represents past performance. Past performance does not guarantee future results and current performance may be lower or higher than the data quoted. Results shown are average annual total returns, which assume reinvestment of dividends and capital gains. Investment returns and principal will fluctuate and you may have a gain or loss when you sell shares. For the most current month-end performance information, please call 1-800-742-7272, or visit our Web site at www.williamblairfunds.com. From time to time, the investment adviser may waive fees or reimburse expenses for the Fund. Without these waivers/reimbursements, performance would be lower. International investing involves special risk considerations, including currency fluctuations, lower liquidity, economic and political risk. These risks may be magnified when investing in emerging markets. Class N shares are not subject to a sales load. Class I shares are not subject to a sales load or distribution (Rule 12b-1) fees. Class R6 shares are not subject to a sales load, distribution (Rule 12b-1) fees, or sub-transfer agent fees.
The performance highlights and graph presented above do not reflect the deduction of taxes that a shareholder would pay on fund distributions or the redemption of fund shares.
The Morgan Stanley Capital International (MSCI) Emerging Markets Investable Market Index (IMI) (net) is a free float-adjusted market capitalization weighted index that is designed to measure the equity market performance of emerging markets. This index approximates the minimum possible dividend reinvestment by deducting for the highest possible withholding tax rates of those markets.
This report identifies the Fund’s investments on December 31, 2022. These holdings are subject to change. Not all stocks in the Fund performed the same, nor is there any guarantee that these stocks will perform as well in the future. Market forecasts provided in this report may not necessarily come to pass.
Sector Diversification (Unaudited)

The sector diversification shown is based on the total long-term securities.
| 68 | Annual Report | December 31, 2022 |
Emerging Markets Growth Fund
Portfolio of Investments, December 31, 2022 (all dollar amounts in thousands)
| | | | | | | | |
| | | | | | | | |
| | Issuer | | Shares | | | Value | |
| | | | | | | | | | |
| | Common Stocks | | | | | | | | |
| | | | | | | | | | |
| | Emerging Asia—74.0% | | | | | | | | |
| | China—21.2% | | | | | | | | |
| | Airtac International Group (Machinery) | | | 68,852 | | | $ | 2,086 | |
| * | Alibaba Group Holding Ltd. (Internet & direct marketing retail) | | | 945,800 | | | | 10,451 | |
| | ANTA Sports Products Ltd. (Textiles, apparel & luxury goods) | | | 259,000 | | | | 3,394 | |
| | Bank of Chengdu Co. Ltd. (Banks) | | | 2,198,135 | | | | 4,838 | |
| | Bank of Ningbo Co. Ltd. (Banks) | | | 1,321,500 | | | | 6,169 | |
| | Chacha Food Co. Ltd. (Food products) | | | 331,872 | | | | 2,387 | |
| | China Tourism Group Duty Free Corp. Ltd. (Specialty retail) | | | 535,990 | | | | 16,656 | |
| | Contemporary Amperex Technology Co. Ltd. (Electrical equipment) | | | 62,300 | | | | 3,526 | |
| | Foshan Haitian Flavouring & Food Co. Ltd. (Food products) | | | 302,129 | | | | 3,459 | |
| | Huaneng Lancang River Hydropower, Inc. (Independent power & renewable electricity producers) | | | 3,825,909 | | | | 3,632 | |
| | JD.com, Inc. (Internet & direct marketing retail) | | | 432,621 | | | | 12,205 | |
| | Kweichow Moutai Co. Ltd. (Beverages) | | | 60,274 | | | | 14,974 | |
| | Li Ning Co. Ltd. (Textiles, apparel & luxury goods) | | | 927,500 | | | | 8,051 | |
| | NARI Technology Co. Ltd. (Electrical equipment) | | | 643,720 | | | | 2,259 | |
| | NetEase, Inc. (Entertainment) | | | 529,400 | | | | 7,766 | |
| | Proya Cosmetics Co. Ltd. (Personal products) | | | 203,420 | | | | 4,901 | |
| | Shenzhen Inovance Technology Co. Ltd. (Machinery) | | | 427,863 | | | | 4,278 | |
| | Suzhou Maxwell Technologies Co. Ltd. (Electrical equipment) | | | 53,807 | | | | 3,188 | |
| | Tencent Holdings Ltd. (Interactive Media & Services) | | | 244,360 | | | | 10,456 | |
| | Wuliangye Yibin Co. Ltd. (Beverages) | | | 329,999 | | | | 8,577 | |
| | Wuxi Lead Intelligent Equipment Co. Ltd. (Machinery) | | | 544,300 | | | | 3,151 | |
| | Zhangzhou Pientzehuang Pharmaceutical Co. Ltd. (Pharmaceuticals) | | | 56,500 | | | | 2,344 | |
| | Zhejiang Jingsheng Mechanical & Electrical Co. Ltd. (Semiconductors & semiconductor equipment) | | | 351,590 | | | | 3,215 | |
| | | | | | | | | 141,963 | |
| | India—24.2% | | | | | | | | |
| * | Aarti Pharmalabs Ltd. (Pharmaceuticals)** | | | 39,500 | | | | 189 | |
| | ABB India Ltd. (Electrical equipment) | | | 61,416 | | | | 1,987 | |
| | Adani Ports & Special Economic Zone Ltd. (Transportation infrastructure) | | | 187,388 | | | | 1,855 | |
| * | Affle India Ltd. (Media) | | | 56,338 | | | | 733 | |
| | APL Apollo Tubes Ltd. (Metals & mining) | | | 133,531 | | | | 1,759 | |
| | Apollo Hospitals Enterprise Ltd. (Health care providers & services) | | | 83,366 | | | | 4,510 | |
| | Asian Paints Ltd. (Chemicals) | | | 88,556 | | | | 3,304 | |
| | Astral Ltd. (Building products) | | | 72,595 | | | | 1,720 | |
| | Atul Ltd. (Chemicals) | | | 5,366 | | | | 537 | |
| | Bajaj Finance Ltd. (Consumer finance) | | | 122,852 | | | | 9,767 | |
| | | | | | | | |
| | | | | | | | |
| | Issuer | | Shares | | | Value | |
| | | | | | | | | | |
| | Common Stocks—(continued) | | | | | | | | |
| | | | | | | | | | |
| | Emerging Asia—(continued) | | | | | | | | |
| | India—(continued) | | | | | | | | |
| | Bharat Electronics Ltd. (Aerospace & defense) | | | 1,728,679 | | | $ | 2,092 | |
| | Britannia Industries Ltd. (Food products) | | | 46,219 | | | | 2,411 | |
| | Dabur India Ltd. (Personal products) | | | 290,623 | | | | 1,973 | |
| * | Devyani International Ltd. (Hotels, restaurants & leisure) | | | 402,808 | | | | 879 | |
| | Dixon Technologies India Ltd. (Household durables) | | | 32,272 | | | | 1,524 | |
| | Fine Organic Industries Ltd. (Chemicals) | | | 22,840 | | | | 1,582 | |
| | Gujarat Fluorochemicals Ltd. (Chemicals) | | | 41,016 | | | | 1,539 | |
| | Havells India Ltd. (Electrical equipment) | | | 91,954 | | | | 1,225 | |
| | HDFC Bank Ltd. (Banks) | | | 666,875 | | | | 13,139 | |
| | Hindustan Unilever Ltd. (Personal products) | | | 110,822 | | | | 3,435 | |
| | Housing Development Finance Corp. Ltd. (Diversified financial services) | | | 276,997 | | | | 8,846 | |
| | Infosys Ltd. (IT services) | | | 252,866 | | | | 4,611 | |
| | JK Cement Ltd. (Construction materials) | | | 36,227 | | | | 1,272 | |
| | Jubilant Foodworks Ltd. (Hotels, restaurants & leisure) | | | 52,716 | | | | 326 | |
| | Kajaria Ceramics Ltd. (Building products) | | | 128,097 | | | | 1,774 | |
| | KEI Industries Ltd. (Electrical equipment) | | | 134,669 | | | | 2,399 | |
| | KPIT Technologies Ltd. (Software) | | | 246,949 | | | | 2,096 | |
| * | Macrotech Developers Ltd. (Real estate management & development) | | | 139,169 | | | | 1,834 | |
| * | Max Healthcare Institute Ltd. (Health care providers & services) | | | 444,321 | | | | 2,364 | |
| | Motherson Sumi Wiring India Ltd. (Auto components) | | | 3,092,544 | | | | 2,174 | |
| | Nestle India Ltd. (Food products) | | | 9,046 | | | | 2,141 | |
| | Oberoi Realty Ltd. (Real estate management & development) | | | 137,047 | | | | 1,433 | |
| | Page Industries Ltd. (Textiles, apparel & luxury goods) | | | 3,372 | | | | 1,750 | |
| | PI Industries Ltd. (Chemicals) | | | 49,589 | | | | 2,055 | |
| | Pidilite Industries Ltd. (Chemicals) | | | 78,463 | | | | 2,427 | |
| | Polycab India Ltd. (Electrical equipment) | | | 56,927 | | | | 1,771 | |
| | Reliance Industries Ltd. (Oil, gas & consumable fuels) | | | 982,286 | | | | 30,242 | |
| | SRF Ltd. (Chemicals) | | | 78,862 | | | | 2,187 | |
| | Sun Pharmaceutical Industries Ltd. (Pharmaceuticals) | | | 402,670 | | | | 4,867 | |
| | Tata Consultancy Services Ltd. (IT services) | | | 139,017 | | | | 5,469 | |
| | Tata Consumer Products Ltd. (Food products) | | | 244,677 | | | | 2,283 | |
| | Titan Co. Ltd. (Textiles, apparel & luxury goods) | | | 153,528 | | | | 4,816 | |
| | Trent Ltd. (Specialty retail) | | | 190,732 | | | | 3,112 | |
| | Tube Investments of India Ltd. (Auto components) | | | 79,653 | | | | 2,653 | |
| | UNO Minda Ltd. (Auto components) | | | 507,608 | | | | 3,184 | |
| | UPL Ltd. (Chemicals) | | | 370,983 | | | | 3,216 | |
| | Varun Beverages Ltd. (Beverages) | | | 313,848 | | | | 5,021 | |
| | | | | | | | | 162,483 | |
See accompanying Notes to Financial Statements.
| December 31, 2022 | William Blair Funds | 69 |
Emerging Markets Growth Fund
Portfolio of Investments, December 31, 2022 (all dollar amounts in thousands)
| | | | | | | | |
| | | | | | | | |
| | Issuer | | Shares | | | Value | |
| | | | | | | | | | |
| | Common Stocks—(continued) | | | | | | | | |
| | | | | | | | | | |
| | Emerging Asia—(continued) | | | | | | | | |
| | Indonesia—6.1% | | | | | | | | |
| | Astra International Tbk PT (Automobiles) | | | 4,565,000 | | | $ | 1,671 | |
| | Bank Central Asia Tbk PT (Banks) | | | 43,149,495 | | | | 23,699 | |
| | Bank Rakyat Indonesia Persero Tbk PT (Banks) | | | 42,718,851 | | | | 13,556 | |
| | United Tractors Tbk PT (Oil, gas & consumable fuels) | | | 990,400 | | | | 1,659 | |
| | | | | | | | | 40,585 | |
| | Philippines—1.1% | | | | | | | | |
| | BDO Unibank, Inc. (Banks) | | | 1,849,974 | | | | 3,509 | |
| | International Container Terminal Services, Inc. (Transportation infrastructure) | | | 1,050,400 | | | | 3,770 | |
| | | | | | | | | 7,279 | |
| | South Korea—6.3% | | | | | | | | |
| * | JYP Entertainment Corp. (Entertainment) | | | 48,859 | | | | 2,620 | |
| | LEENO Industrial, Inc. (Semiconductors & semiconductor equipment) | | | 20,303 | | | | 2,497 | |
| * | Samsung Biologics Co. Ltd. (Life sciences tools & services) | | | 6,238 | | | | 4,050 | |
| | Samsung Electronics Co. Ltd. (Technology hardware, storage & peripherals) | | | 581,068 | | | | 25,412 | |
| | Samsung SDI Co. Ltd. (Electronic equipment, instruments & components) | | | 16,279 | | | | 7,608 | |
| | | | | | | | | 42,187 | |
| | Taiwan—11.8% | | | | | | | | |
| | Accton Technology Corp. (Communications equipment) | | | 201,000 | | | | 1,534 | |
| | Advantech Co. Ltd. (Technology hardware, storage & peripherals) | | | 208,766 | | | | 2,248 | |
| | ASPEED Technology, Inc. (Semiconductors & semiconductor equipment) | | | 28,300 | | | | 1,552 | |
| | Chailease Holding Co. Ltd. (Diversified financial services) | | | 632,190 | | | | 4,463 | |
| | Chroma ATE, Inc. (Electronic equipment, instruments & components) | | | 215,000 | | | | 1,266 | |
| | E.Sun Financial Holding Co. Ltd. (Banks) | | | 4,531,915 | | | | 3,546 | |
| | eMemory Technology, Inc. (Semiconductors & semiconductor equipment) | | | 42,000 | | | | 1,824 | |
| | Lotes Co. Ltd. (Electronic equipment, instruments & components) | | | 133,459 | | | | 3,587 | |
| | Sinbon Electronics Co. Ltd. (Electronic equipment, instruments & components) | | | 371,000 | | | | 3,319 | |
| | Taiwan Semiconductor Manufacturing Co. Ltd. (Semiconductors & semiconductor equipment) | | | 781,000 | | | | 11,397 | |
| | Taiwan Semiconductor Manufacturing Co. Ltd.—ADR (Semiconductors & semiconductor equipment) | | | 511,397 | | | | 38,094 | |
| | Voltronic Power Technology Corp. (Electrical equipment) | | | 100,586 | | | | 5,056 | |
| | Wiwynn Corp. (Technology hardware, storage & peripherals) | | | 46,000 | | | | 1,193 | |
| | | | | | | | | 79,079 | |
| | | | | | | | |
| | | | | | | | |
| | Issuer | | Shares | | | Value | |
| | | | | | | | | | |
| | Common Stocks—(continued) | | | | | | | | |
| | | | | | | | | | |
| | Emerging Asia—(continued) | | | | | | | | |
| | Thailand—3.3% | | | | | | | | |
| | Bangkok Dusit Medical Services PCL (Health care providers & services) | | | 8,793,200 | | | $ | 7,362 | |
| | Bumrungrad Hospital PCL (Health care providers & services) | | | 559,200 | | | | 3,423 | |
| | Central Pattana PCL (Real estate management & development) | | | 1,947,200 | | | | 3,991 | |
| | Central Retail Corp. PCL (Multiline retail) | | | 1,921,500 | | | | 2,566 | |
| | Kasikornbank PCL (Banks) | | | 406,900 | | | | 1,733 | |
| | PTT Exploration & Production PCL (Oil, gas & consumable fuels) | | | 643,200 | | | | 3,278 | |
| | | | | | | | | 22,353 | |
| | | | | | | | | | |
| | Emerging Latin America—12.3% | | | | | | | | |
| | Argentina—0.5% | | | | | | | | |
| * | Globant SA (IT services)† | | | 19,275 | | | | 3,241 | |
| | Brazil—8.2% | | | | | | | | |
| | B3 SA - Brasil Bolsa Balcao (Capital markets) | | | 2,255,700 | | | | 5,644 | |
| | Banco BTG Pactual SA (Capital markets) | | | 1,227,200 | | | | 5,565 | |
| | Hypera SA (Pharmaceuticals) | | | 669,900 | | | | 5,735 | |
| | Itau Unibanco Holding SA—ADR (Banks) | | | 1,540,865 | | | | 7,257 | |
| | Localiza Rent a Car SA (Road & rail) | | | 322,300 | | | | 3,248 | |
| * | MercadoLibre, Inc. (Internet & direct marketing retail) | | | 7,145 | | | | 6,046 | |
| | Multiplan Empreendimentos Imobiliarios SA (Real estate management & development) | | | 318,400 | | | | 1,321 | |
| | Patria Investments Ltd. (Capital markets)† | | | 120,042 | | | | 1,672 | |
| | Raia Drogasil SA (Food & staples retailing) | | | 781,200 | | | | 3,510 | |
| | Rumo SA (Road & rail) | | | 887,800 | | | | 3,129 | |
| | TOTVS SA (Software) | | | 830,900 | | | | 4,347 | |
| | Vinci Partners Investments Ltd. (Capital markets)† | | | 163,829 | | | | 1,481 | |
| | WEG SA (Electrical equipment) | | | 821,841 | | | | 5,994 | |
| | | | | | | | | 54,949 | |
| | Chile—0.4% | | | | | | | | |
| | Sociedad Quimica y Minera de Chile SA—ADR (Chemicals) | | | 31,073 | | | | 2,481 | |
| | Mexico—2.9% | | | | | | | | |
| | Arca Continental SAB de CV (Beverages) | | | 593,200 | | | | 4,811 | |
| | Wal-Mart de Mexico SAB de CV (Food & staples retailing) | | | 4,154,900 | | | | 14,687 | |
| | | | | | | | | 19,498 | |
| | Peru—0.3% | | | | | | | | |
| | Credicorp Ltd. (Banks)† | | | 17,827 | | | | 2,418 | |
| | | | | | | | | | |
| | Emerging Europe, Mid-East, Africa—9.3% | | |
| | Poland—0.8% | | | | | | | | |
| * | Dino Polska SA (Food & staples retailing) | | | 64,026 | | | | 5,484 | |
See accompanying Notes to Financial Statements.
| 70 | Annual Report | December 31, 2022 |
Emerging Markets Growth Fund
Portfolio of Investments, December 31, 2022 (all dollar amounts in thousands)
| | | | | | | | |
| | | | | | | | |
| | Issuer | | Shares | | | Value | |
| | | | | | | | | | |
| | Common Stocks—(continued) | | | | | | | | |
| | | | | | | | | | |
| | Emerging Europe, Mid-East, Africa—(continued) | | |
| | Qatar—0.8% | | | | | | | | |
| | Qatar Gas Transport Co. Ltd. (Oil, gas & consumable fuels) | | | 1,470,127 | | | $ | 1,478 | |
| | Qatar Islamic Bank SAQ (Banks) | | | 316,582 | | | | 1,613 | |
| | Qatar National Bank QPSC (Banks) | | | 478,781 | | | | 2,367 | |
| | | | | | | | | 5,458 | |
| | Saudi Arabia—2.4% | | | | | | | | |
| | Alinma Bank (Banks) | | | 340,177 | | | | 2,946 | |
| | Arabian Internet & Communications Services Co. (IT services) | | | 29,454 | | | | 1,903 | |
| | Bupa Arabia for Cooperative Insurance Co. (Insurance) | | | 42,332 | | | | 1,620 | |
| | Dallah Healthcare Co. (Health care providers & services) | | | 39,369 | | | | 1,551 | |
| | Dr Sulaiman Al Habib Medical Services Group Co. (Health care providers & services) | | | 47,126 | | | | 2,766 | |
| | Elm Co. (IT services) | | | 19,175 | | | | 1,694 | |
| | Nahdi Medical Co. (Food & staples retailing) | | | 37,501 | | | | 1,669 | |
| | Saudi Arabian Oil Co. (Oil, gas & consumable fuels) | | | 177,064 | | | | 1,512 | |
| | | | | | | | | 15,661 | |
| | South Africa—3.0% | | | | | | | | |
| | Bid Corp. Ltd. (Food & staples retailing) | | | 125,476 | | | | 2,436 | |
| | Bidvest Group Ltd. (Industrial conglomerates) | | | 301,145 | | | | 3,800 | |
| | Capitec Bank Holdings Ltd. (Banks) | | | 46,748 | | | | 5,113 | |
| | Clicks Group Ltd. (Food & staples retailing) | | | 255,228 | | | | 4,057 | |
| | Shoprite Holdings Ltd. (Food & staples retailing) | | | 368,847 | | | | 4,906 | |
| | | | | | | | | 20,312 | |
| | United Arab Emirates—2.3% | | | | | | | | |
| | Abu Dhabi National Oil Co. for Distribution PJSC (Specialty retail) | | | 1,421,375 | | | | 1,707 | |
| * | Americana Restaurants International PLC (Hotels, restaurants & leisure) | | | 2,412,322 | | | | 1,951 | |
| | Emaar Properties PJSC (Real estate management & development) | | | 2,860,190 | | | | 4,564 | |
| | First Abu Dhabi Bank PJSC (Banks) | | | 1,114,940 | | | | 5,191 | |
| * | Salik Co. PJSC (Transportation infrastructure) | | | 2,807,959 | | | | 1,896 | |
| | | | | | | | | 15,309 | |
| | | | | | | | | | |
| | Asia—2.6% | | | | | | | | |
| | Hong Kong—2.6% | | | | | | | | |
| | AIA Group Ltd. (Insurance) | | | 1,577,600 | | | | 17,544 | |
| | Total Common Stocks—98.2%
(cost $644,863) | | | | | | | 658,284 | |
| | Issuer | | Shares or
Principal
Amount | | | Value | |
| | | | | | | | | | |
| | Rights | | | | | | | | |
| | | | | | | | | | |
| | Emerging Latin America—0.0% | | | | | | | | |
| | Brazil—0.0% | | | | | | | | |
| * | Localiza Rent a Car SA, Expiring 1/31/23 (Road & rail) | | | 1,370 | | | $ | 3 | |
| | Total Rights—0.0%
(cost $0) | | | | | | | 3 | |
| | | | | | | | | | |
| | Repurchase Agreement | | | | | | | | |
| | Fixed Income Clearing Corporation, 1.600% dated 12/30/22, due 01/03/23, repurchase price $8,310, collateralized by U.S. Treasury Note, 2.375%, due 03/31/29, valued at $8,474 | | $ | 8,308 | | | | 8,308 | |
| | Total Repurchase Agreement—1.3%
(cost $8,308) | | | | | | | 8,308 | |
| | Total Investments—99.5%
(cost $653,171) | | | | | | | 666,595 | |
| | Cash and other assets, less liabilities—0.5% | | | | | | | 3,539 | |
| | Net assets—100.0% | | | | | | $ | 670,134 | |
ADR = American Depository Receipt
* = Non-income producing security
** = Fair valued pursuant to the Fund’s Valuation Procedures. This holding represents 0.03% of the Fund’s net assets at December 31, 2022.
† = U.S. listed foreign security
See accompanying Notes to Financial Statements.
| December 31, 2022 | William Blair Funds | 71 |
Emerging Markets Growth Fund
Portfolio of Investments, December 31, 2022
At December 31, 2022, the Fund’s Portfolio of Investments includes the following industry categories (as a percentage of long-term investments):
| Financials | | | 23.4 | % |
| Information Technology | | | 19.5 | % |
| Consumer Staples | | | 14.1 | % |
| Consumer Discretionary | | | 12.9 | % |
| Industrials | | | 9.1 | % |
| Health Care | | | 5.9 | % |
| Energy | | | 5.8 | % |
| Materials | | | 3.4 | % |
| Communication Services | | | 3.3 | % |
| Real Estate | | | 2.0 | % |
| Utilities | | | 0.6 | % |
| Total | | | 100.0 | % |
At December 31, 2022, the Fund’s Portfolio of Investments includes the following currency categories (as a percentage of long-term investments):
| Indian Rupee | | | 24.7 | % |
| Chinese Yuan Renminbi | | | 13.3 | % |
| Hong Kong Dollar | | | 10.6 | % |
| U.S. Dollar | | | 9.5 | % |
| New Taiwan Dollar | | | 6.5 | % |
| South Korean Won | | | 6.4 | % |
| Indonesian Rupiah | | | 6.2 | % |
| Brazilian Real | | | 5.8 | % |
| South African Rand | | | 5.5 | % |
| Thai Baht | | | 3.4 | % |
| Mexican Peso | | | 3.0 | % |
| UAE Dirham | | | 2.3 | % |
| Philippine Peso | | | 1.1 | % |
| All Other Currencies | | | 1.7 | % |
| Total | | | 100.0 | % |
See accompanying Notes to Financial Statements.
| 72 | Annual Report | December 31, 2022 |
| | Emerging Markets ex China Growth Fund |
| | |
| | The Emerging Markets ex China Growth Fund seeks long-term capital appreciation. |
| | |
| | AN OVERVIEW FROM THE PORTFOLIO MANAGERS |
| | |

Todd M. McClone, CFA 
Casey K. Preyss, CFA 
Vivian Lin Thurston, CFA | The William Blair Emerging Markets ex China Growth Fund (Class I shares) posted a 5.90% decrease, net of fees, for the period from inception on July 29, 2022 to December 31, 2022. By comparison, the Fund’s benchmark index, the MSCI Emerging Markets ex-China IMI (the “Index”), decreased 1.46%. Inception to date underperformance versus the Index was largely driven by style headwinds amid strong performance of low-valuation stocks and underperformance of high-growth, high-quality, and long-duration assets. From a sector perspective, allocation effect was negative due to an overweight to Information Technology and an underweight to Materials. Stock selection was negative mostly driven by Information Technology, Materials, and Financials. Information Technology was dragged down by Taiwan Semiconductor Manufacturing (TSMC). TSMC underperformed amid broad cyclical weakness. Despite near-term headwinds, we believe long-term growth remains well underpinned by TSMC’s monopolistic positioning at the leading edge alongside secular growth in high performance computing. Within Materials, Gujarat Fluorochemicals detracted from relative returns. Gujarat Fluorochemicals (GFL) is an Indian chemicals company with strong expertise in fluorine chemistry. The company is key supplier of fluoropolymers to Europe and the United States, and we believe it is well positioned to benefit from its first-mover advantage in new age products. Capitec, a retail bank with a digital focus in South Africa, was a notable detractor to performance within Financials. The stock fell after announcing first half of year results primarily due to a disappointing dividend announcement. During the fourth quarter, the stock rebounded and pared back some of those losses due to improved investor sentiment toward South Africa fueled by encouraging fiscal budget trends, expectations of more dovish moves by the U.S. Federal Reserve, as well as China reopening. Partially offsetting these effects was positive stock selection within Health Care, bolstered by Bangkok Dusit Medical and Bumrungrad, coupled with the overweighting in Consumer Staples and Financials and underweighting in Communication Services. Bangkok Dusit Medical is the largest private hospital group in Thailand. The company reported numbers that were ahead of expectations with international patient numbers approaching pre-COVID levels. We expect management to increase its full-year revenue and profitability guidance, as a result of numbers being a better than expected. Bumrungrad Hospital, which operates one of the largest and most sophisticated private hospitals in Asia, was a notable contributor to relative performance as international patients’ revenues accelerated amid normalizing travel dynamics post-COVID disruption. Please refer to the Global Markets Review and Outlook relating to the Fund beginning on page 32. |
| December 31, 2022 | William Blair Funds | 73 |
Emerging Markets ex China Growth Fund
Performance Highlights (Unaudited)
| Average Annual Total Returns through 12/31/2022 |
| | | Since
Inception(a) |
| Class I | | | (5.90 | )% |
| Class R6 | | | (5.80 | ) |
| MSCI Emerging Markets ex-China IMI (net) | | | (1.46 | ) |
| (a) | Since inception is for the period from July 29, 2022 (Commencement of Operations) to December 31, 2022. |
Performance cited represents past performance. Past performance does not guarantee future results and current performance may be lower or higher than the data quoted. Results shown are average annual total returns, which assume reinvestment of dividends and capital gains. Investment returns and principal will fluctuate and you may have a gain or loss when you sell shares. For the most current month-end performance information, please call 1-800-742-7272, or visit our Web site at www.williamblairfunds.com. From time to time, the investment adviser may waive fees or reimburse expenses for the Fund. Without these waivers/reimbursements, performance would be lower. International investing involves special risk considerations, including currency fluctuations, lower liquidity, economic and political risk. These risks may be magnified when investing in emerging markets. Class I shares are not subject to a sales load or distribution (Rule 12b-1) fees. Class R6 shares are not subject to a sales load, distribution (Rule 12b-1) fees, or sub-transfer agent fees.
The performance highlights and graph presented above do not reflect the deduction of taxes that a shareholder would pay on fund distributions or the redemption of fund shares.
The Morgan Stanley Capital International (MSCI) Emerging Markets ex-China IMI Index (net) is a free float-adjusted market capitalization index that is designed to measure equity market performance of emerging markets excluding China. This series approximates the minimum possible dividend reinvestment.
This report identifies the Fund’s investments on December 31, 2022. These holdings are subject to change. Not all stocks in the Fund performed the same, nor is there any guarantee that these stocks will perform as well in the future. Market forecasts provided in this report may not necessarily come to pass.
Sector Diversification (Unaudited)
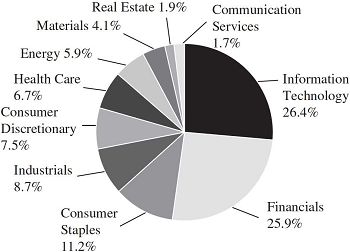
The sector diversification shown is based on the total long-term securities.
| 74 | Annual Report | December 31, 2022 |
Emerging Markets ex China Growth Fund
Portfolio of Investments, December 31, 2022 (all dollar amounts in thousands)
| | | | | | | | |
| | | | | | | | |
| | Issuer | | Shares | | | Value | |
| | | | | | | | | | |
| | Common Stocks | | | | | | | | |
| | | | | | | | | | |
| | Emerging Asia—70.0% | | | | | | | | |
| | India—30.8% | | | | | | | | |
| * | Aarti Pharmalabs Ltd. (Pharmaceuticals)** | | | 702 | | | $ | 3 | |
| | ABB India Ltd. (Electrical equipment) | | | 1,401 | | | | 45 | |
| | Adani Ports & Special Economic Zone Ltd. (Transportation infrastructure) | | | 4,953 | | | | 49 | |
| * | Affle India Ltd. (Media) | | | 2,192 | | | | 29 | |
| | APL Apollo Tubes Ltd. (Metals & mining) | | | 4,196 | | | | 55 | |
| | Apollo Hospitals Enterprise Ltd. (Health care providers & services) | | | 1,868 | | | | 101 | |
| | Asian Paints Ltd. (Chemicals) | | | 2,061 | | | | 77 | |
| | Astral Ltd. (Building products) | | | 1,418 | | | | 34 | |
| | Atul Ltd. (Chemicals) | | | 151 | | | | 15 | |
| | Bajaj Finance Ltd. (Consumer finance) | | | 3,131 | | | | 249 | |
| | Bharat Electronics Ltd. (Aerospace & defense) | | | 30,768 | | | | 37 | |
| | Britannia Industries Ltd. (Food products) | | | 979 | | | | 51 | |
| | Computer Age Management Services Ltd. (IT services) | | | 1,589 | | | | 43 | |
| | Crompton Greaves Consumer Electricals Ltd. (Household durables) | | | 9,605 | | | | 39 | |
| | Dabur India Ltd. (Personal products) | | | 6,439 | | | | 44 | |
| * | Devyani International Ltd. (Hotels, restaurants & leisure) | | | 12,191 | | | | 27 | |
| | Dixon Technologies India Ltd. (Household durables) | | | 888 | | | | 42 | |
| | Escorts Kubota Ltd. (Machinery) | | | 1,839 | | | | 47 | |
| | Fine Organic Industries Ltd. (Chemicals) | | | 592 | | | | 41 | |
| | Gujarat Fluorochemicals Ltd. (Chemicals) | | | 1,059 | | | | 40 | |
| | Havells India Ltd. (Electrical equipment) | | | 2,733 | | | | 36 | |
| | HDFC Bank Ltd. (Banks) | | | 16,625 | | | | 328 | |
| | Hindustan Unilever Ltd. (Personal products) | | | 2,978 | | | | 92 | |
| | Housing Development Finance Corp. Ltd. (Diversified financial services) | | | 6,941 | | | | 222 | |
| | Infosys Ltd. (IT services) | | | 6,377 | | | | 116 | |
| | Kajaria Ceramics Ltd. (Building products) | | | 2,790 | | | | 39 | |
| | KEI Industries Ltd. (Electrical equipment) | | | 4,048 | | | | 72 | |
| | KPIT Technologies Ltd. (Software) | | | 5,511 | | | | 47 | |
| * | Max Healthcare Institute Ltd. (Health care providers & services) | | | 10,106 | | | | 54 | |
| | Motherson Sumi Wiring India Ltd. (Auto components) | | | 75,771 | | | | 53 | |
| | Nestle India Ltd. (Food products) | | | 245 | | | | 58 | |
| | Oberoi Realty Ltd. (Real estate management & development) | | | 3,467 | | | | 36 | |
| | Page Industries Ltd. (Textiles, apparel & luxury goods) | | | 97 | | | | 50 | |
| | PI Industries Ltd. (Chemicals) | | | 1,253 | | | | 52 | |
| | Pidilite Industries Ltd. (Chemicals) | | | 2,101 | | | | 65 | |
| | Polycab India Ltd. (Electrical equipment) | | | 1,173 | | | | 36 | |
| | Reliance Industries Ltd. (Oil, gas & consumable fuels) | | | 21,232 | | | | 654 | |
| | SRF Ltd. (Chemicals) | | | 1,822 | | | | 51 | |
| | Sun Pharmaceutical Industries Ltd. (Pharmaceuticals) | | | 8,153 | | | | 99 | |
| | | | | | | | |
| | | | | | | | |
| | Issuer | | Shares | | | Value | |
| | | | | | | | | | |
| | Common Stocks—(continued) | | | | | | | | |
| | | | | | | | | | |
| | Emerging Asia—(continued) | | | | | | | | |
| | India—(continued) | | | | | | | | |
| | Tata Consultancy Services Ltd. (IT services) | | | 3,388 | | | $ | 133 | |
| | Tata Consumer Products Ltd. (Food products) | | | 6,252 | | | | 58 | |
| | Tata Elxsi Ltd. (Software) | | | 438 | | | | 33 | |
| | Titan Co. Ltd. (Textiles, apparel & luxury goods) | | | 3,587 | | | | 112 | |
| | Trent Ltd. (Specialty retail) | | | 5,067 | | | | 83 | |
| | Tube Investments of India Ltd. (Auto components) | | | 2,090 | | | | 70 | |
| | UNO Minda Ltd. (Auto components) | | | 13,249 | | | | 83 | |
| | UPL Ltd. (Chemicals) | | | 8,675 | | | | 75 | |
| | Varun Beverages Ltd. (Beverages) | | | 8,837 | | | | 141 | |
| | | | | | | | | 4,016 | |
| | Indonesia—7.0% | | | | | | | | |
| | Astra International Tbk PT (Automobiles) | | | 124,700 | | | | 46 | |
| | Bank Central Asia Tbk PT (Banks) | | | 972,500 | | | | 534 | |
| | Bank Rakyat Indonesia Persero Tbk PT (Banks) | | | 1,052,200 | | | | 334 | |
| | | | | | | | | 914 | |
| | Philippines—2.0% | | | | | | | | |
| | BDO Unibank, Inc. (Banks) | | | 53,978 | | | | 102 | |
| | International Container Terminal Services, Inc. (Transportation infrastructure) | | | 21,980 | | | | 79 | |
| | Wilcon Depot, Inc. (Specialty retail) | | | 137,200 | | | | 73 | |
| | | | | | | | | 254 | |
| | South Korea—9.0% | | | | | | | | |
| * | JYP Entertainment Corp. (Entertainment) | | | 2,016 | | | | 108 | |
| | Kakao Corp. (Interactive Media & Services) | | | 962 | | | | 40 | |
| | LEENO Industrial, Inc. (Semiconductors & semiconductor equipment) | | | 803 | | | | 99 | |
| | NAVER Corp. (Interactive Media & Services) | | | 290 | | | | 41 | |
| * | Samsung Biologics Co. Ltd. (Life sciences tools & services) | | | 154 | | | | 100 | |
| | Samsung Electronics Co. Ltd. (Technology hardware, storage & peripherals) | | | 14,616 | | | | 639 | |
| | Samsung SDI Co. Ltd. (Electronic equipment, instruments & components) | | | 325 | | | | 152 | |
| | | | | | | | | 1,179 | |
| | Taiwan—16.8% | | | | | | | | |
| | Accton Technology Corp. (Communications equipment) | | | 7,000 | | | | 53 | |
| | Chailease Holding Co. Ltd. (Diversified financial services) | | | 16,000 | | | | 113 | |
| | Chroma ATE, Inc. (Electronic equipment, instruments & components) | | | 11,000 | | | | 65 | |
| | E.Sun Financial Holding Co. Ltd. (Banks) | | | 109,000 | | | | 85 | |
| | eMemory Technology, Inc. (Semiconductors & semiconductor equipment) | | | 1,300 | | | | 56 | |
See accompanying Notes to Financial Statements.
| December 31, 2022 | William Blair Funds | 75 |
Emerging Markets ex China Growth Fund
Portfolio of Investments, December 31, 2022 (all dollar amounts in thousands)
| | | | | | | | |
| | | | | | | | |
| | Issuer | | Shares | | | Value | |
| | | | | | | | | | |
| | Common Stocks—(continued) | | | | | | | | |
| | | | | | | | | | |
| | Emerging Asia—(continued) | | | | | | | | |
| | Taiwan—(continued) | | | | | | | | |
| | Lotes Co. Ltd. (Electronic equipment, instruments & components) | | | 3,000 | | | $ | 81 | |
| | Sinbon Electronics Co. Ltd. (Electronic equipment, instruments & components) | | | 10,000 | | | | 90 | |
| | Taiwan Semiconductor Manufacturing Co. Ltd. (Semiconductors & semiconductor equipment) | | | 100,000 | | | | 1,459 | |
| | Voltronic Power Technology Corp. (Electrical equipment) | | | 2,700 | | | | 136 | |
| | Wiwynn Corp. (Technology hardware, storage & peripherals) | | | 2,000 | | | | 52 | |
| | | | | | | | | 2,190 | |
| | Thailand—4.4% | | | | | | | | |
| | Bangkok Dusit Medical Services PCL (Health care providers & services) | | | 212,900 | | | | 178 | |
| | Bumrungrad Hospital PCL (Health care providers & services) | | | 14,800 | | | | 91 | |
| | Central Pattana PCL (Real estate management & development) | | | 55,200 | | | | 113 | |
| | Central Retail Corp. PCL (Multiline retail) | | | 39,800 | | | | 53 | |
| | Kasikornbank PCL (Banks) | | | 17,100 | | | | 73 | |
| | PTT Exploration & Production PCL (Oil, gas & consumable fuels) | | | 13,100 | | | | 67 | |
| | | | | | | | | 575 | |
| | | | | | | | | | |
| | Emerging Latin America—17.2% | | | | | | | | |
| | Argentina—0.6% | | | | | | | | |
| * | Globant SA (IT services)† | | | 484 | | | | 81 | |
| | Brazil—10.3% | | | | | | | | |
| | Arezzo Industria e Comercio SA (Textiles, apparel & luxury goods) | | | 1,700 | | | | 25 | |
| | B3 SA - Brasil Bolsa Balcao (Capital markets) | | | 45,500 | | | | 114 | |
| | Banco BTG Pactual SA (Capital markets) | | | 25,600 | | | | 116 | |
| | Hypera SA (Pharmaceuticals) | | | 14,200 | | | | 122 | |
| | Itau Unibanco Holding SA—ADR (Banks) | | | 39,445 | | | | 186 | |
| | Localiza Rent a Car SA (Road & rail) | | | 6,800 | | | | 69 | |
| * | MercadoLibre, Inc. (Internet & direct marketing retail) | | | 188 | | | | 159 | |
| | Patria Investments Ltd. (Capital markets)† | | | 4,936 | | | | 69 | |
| | Raia Drogasil SA (Food & staples retailing) | | | 21,600 | | | | 97 | |
| | Rumo SA (Road & rail) | | | 24,500 | | | | 86 | |
| | TOTVS SA (Software) | | | 21,100 | | | | 110 | |
| | Vinci Partners Investments Ltd. (Capital markets)† | | | 5,762 | | | | 52 | |
| | WEG SA (Electrical equipment) | | | 18,200 | | | | 133 | |
| | | | | | | | | 1,338 | |
| | Chile—0.5% | | | | | | | | |
| | Sociedad Quimica y Minera de Chile SA—ADR (Chemicals) | | | 752 | | | | 60 | |
| | | | | | | | |
| | | | | | | | |
| | Issuer | | Shares | | | Value | |
| | | | | | | | | | |
| | Common Stocks—(continued) | | | | | | | | |
| | | | | | | | | | |
| | Emerging Latin America—(continued) | | | | | |
| | Mexico—5.0% | | | | | | | | |
| | Arca Continental SAB de CV (Beverages) | | | 8,000 | | | $ | 65 | |
| | Banco del Bajio SA (Banks) | | | 23,300 | | | | 73 | |
| | Grupo Aeroportuario del Sureste SAB de CV (Transportation infrastructure) | | | 3,300 | | | | 77 | |
| | Regional SAB de CV (Banks) | | | 9,100 | | | | 66 | |
| | Wal-Mart de Mexico SAB de CV (Food & staples retailing) | | | 105,900 | | | | 374 | |
| | | | | | | | | 655 | |
| | Peru—0.8% | | | | | | | | |
| | Credicorp Ltd. (Banks)† | | | 740 | | | | 100 | |
| | | | | | | | | | |
| | Emerging Europe, Mid-East, Africa—11.2% | | | | | |
| | Poland—1.1% | | | | | | | | |
| * | Dino Polska SA (Food & staples retailing) | | | 1,634 | | | | 140 | |
| | Qatar—1.1% | | | | | | | | |
| | Qatar Gas Transport Co. Ltd. (Oil, gas & consumable fuels) | | | 33,820 | | | | 34 | |
| | Qatar Islamic Bank SAQ (Banks) | | | 9,628 | | | | 49 | |
| | Qatar National Bank QPSC (Banks) | | | 12,822 | | | | 63 | |
| | | | | | | | | 146 | |
| | Saudi Arabia—2.9% | | | | | | | | |
| | Alinma Bank (Banks) | | | 8,540 | | | | 74 | |
| | Arabian Internet & Communications Services Co. (IT services) | | | 729 | | | | 47 | |
| | Bupa Arabia for Cooperative Insurance Co. (Insurance) | | | 982 | | | | 37 | |
| | Dallah Healthcare Co. (Health care providers & services) | | | 905 | | | | 36 | |
| | Dr Sulaiman Al Habib Medical Services Group Co. (Health care providers & services) | | | 1,207 | | | | 71 | |
| | Elm Co. (IT services) | | | 495 | | | | 44 | |
| | Nahdi Medical Co. (Food & staples retailing) | | | 962 | | | | 43 | |
| | Saudi Tadawul Group Holding Co. (Capital markets) | | | 655 | | | | 31 | |
| | | | | | | | | 383 | |
| | South Africa—3.9% | | | | | | | | |
| | Bidvest Group Ltd. (Industrial conglomerates) | | | 7,647 | | | | 96 | |
| | Capitec Bank Holdings Ltd. (Banks) | | | 1,270 | | | | 139 | |
| | Clicks Group Ltd. (Food & staples retailing) | | | 7,840 | | | | 125 | |
| | Shoprite Holdings Ltd. (Food & staples retailing) | | | 10,721 | | | | 143 | |
| | | | | | | | | 503 | |
| | United Arab Emirates—2.2% | | | | | | | | |
| | Abu Dhabi National Oil Co. for Distribution PJSC (Specialty retail) | | | 39,292 | | | | 47 | |
| | Emaar Properties PJSC (Real estate management & development) | | | 56,714 | | | | 91 | |
See accompanying Notes to Financial Statements.
| 76 | Annual Report | December 31, 2022 |
Emerging Markets ex China Growth Fund
Portfolio of Investments, December 31, 2022 (all dollar amounts in thousands)
| | Issuer | | Shares or
Principal
Amount | | | Value | |
| | | | | | | | | | |
| | Common Stocks—(continued) | | | | | | | | |
| | | | | | | | | | |
| | Emerging Europe, Mid-East, Africa—(continued) | | | | | |
| | United Arab Emirates—(continued) | | | | | | | | |
| | First Abu Dhabi Bank PJSC (Banks) | | | 22,222 | | | $ | 103 | |
| * | Salik Co. PJSC (Transportation infrastructure) | | | 63,552 | | | | 43 | |
| | | | | | | | | 284 | |
| | Total Common Stocks—98.4%
(cost $12,969) | | | | | | | 12,818 | |
| | | | | | | | | | |
| | Rights | | | | | | | | |
| | | | | | | | | | |
| | Emerging Latin America—0.0% | | | | | | | | |
| | Brazil—0.0% | | | | | | | | |
| * | Localiza Rent a Car SA, Expiring 1/31/23 (Road & rail) | | | 28 | | | | — | |
| | Total Rights—0.0%
(cost $0) | | | | | | | — | |
| | | | | | | | | | |
| | Repurchase Agreement | | | | | | | | |
| | Fixed Income Clearing Corporation, 1.600% dated 12/30/22, due 01/03/23, repurchase price $222, collateralized by U.S. Treasury Note, 2.375%, due 03/31/29, valued at $226 | | $ | 222 | | | | 222 | |
| | Total Repurchase Agreement—1.7%
(cost $222) | | | | | | | 222 | |
| | Total Investments—100.1%
(cost $13,191) | | | | | | | 13,040 | |
| | Liabilities, plus cash and other assets—(0.1)% | | | | | | | (7 | ) |
| | Net assets—100.0% | | | | | | $ | 13,033 | |
ADR = American Depository Receipt
* = Non-income producing security
** = Fair valued pursuant to the Fund’s Valuation Procedures. This holding represents 0.03% of the Fund’s net assets at December 31, 2022.
† = U.S. listed foreign security
At December 31, 2022, the Fund’s Portfolio of Investments includes the following industry categories (as a percentage of long-term investments):
| Information Technology | | | 26.4 | % |
| Financials | | | 25.9 | % |
| Consumer Staples | | | 11.2 | % |
| Industrials | | | 8.7 | % |
| Consumer Discretionary | | | 7.5 | % |
| Health Care | | | 6.7 | % |
| Energy | | | 5.9 | % |
| Materials | | | 4.1 | % |
| Real Estate | | | 1.9 | % |
| Communication Services | | | 1.7 | % |
| Total | | | 100.0 | % |
At December 31, 2022, the Fund’s Portfolio of Investments includes the following currency categories (as a percentage of long-term investments):
| Indian Rupee | | | 31.3 | % |
| New Taiwan Dollar | | | 17.1 | % |
| South Korean Won | | | 9.2 | % |
| Indonesian Rupiah | | | 7.1 | % |
| South African Rand | | | 6.9 | % |
| Brazilian Real | | | 6.8 | % |
| U.S. Dollar | | | 5.5 | % |
| Mexican Peso | | | 5.1 | % |
| Thai Baht | | | 4.5 | % |
| UAE Dirham | | | 2.2 | % |
| Philippine Peso | | | 2.0 | % |
| Qatari Rial | | | 1.2 | % |
| Polish Zloty | | | 1.1 | % |
| Total | | | 100.0 | % |
See accompanying Notes to Financial Statements.
| December 31, 2022 | William Blair Funds | 77 |
| | Emerging Markets Small Cap Growth Fund |
| | |
| | The Emerging Markets Small Cap Growth Fund seeks long-term capital appreciation. |
| | |
| | AN OVERVIEW FROM THE PORTFOLIO MANAGERS |
| | |

Todd M. McClone, CFA 
Casey K. Preyss, CFA 
D.J. Neiman, CFA | The William Blair Emerging Markets Small Cap Growth Fund (Class N shares) (the “Fund”) posted a 28.12% decrease, net of fees, for the year ended December 31, 2022. By comparison, the Fund’s benchmark index, the MSCI Emerging Markets Small Cap Index (net) (the “Index”), decreased 18.02%. Calendar year underperformance versus the Index was largely driven by style headwinds amid strong performance of low-valuation stocks and underperformance of high-growth, high-quality, and long-duration assets. From a sector perspective, the underperformance was driven by negative stock selection effects within most sectors, in particular, Consumer Discretionary, Information Technology, and Materials. Within Consumer Discretionary, Pet Center Comercio E Participacoes, the largest pet store chain in Brazil, was a notable detractor. While the company’s sales growth and market share gains remained strong, weaker margins on the back of inflationary pressure and unfavorable product and channel mix coupled with the stock high valuation weighed on the share price. Grupo Sbf (Centauro) also weighed on relative performance during the year, dragged down by weakness in the fourth quarter. Information Technology was dragged down by ASPEED Technology, a Taiwanese semiconductor company specializing in baseboard management controllers, and Dlocal, a payments service provider. ASPEED Technology’s decline was primarily driven by the decelerating semiconductor cycle and softer demand outlook, while Dlocal fell on the back of a short seller report. Hansol Chemical, a South Korean chemical company that supplies components and consumables to large tech hardware companies, hampered relative results in the Materials sector. The company delivered weaker-than-expected results against cost pressure from higher oil and liquid natural gas prices, the fall in NB-latex price, and overall weaker end-market demand. Partially offsetting these negative effects was the positive stock selection effect within Consumer Staples and Health Care, coupled with the overweighting allocation to Consumer Staples and underweighting allocation to Health Care. Within Consumer Staples, Varun Beverages and Proya Cosmetics (Proya) were the most significant contributors to relative performance. Varun Beverages’ outperformance was demand driven by very strong operating performance during the year, consistently exceeding consensus expectations amid strong demand recovery and price hikes coupled with distribution expansion and new product launches. Proya is a leading domestic Chinese beauty company focused on lower-tier cities. The company is a key beneficiary of the domestic substitution trend within China’s cosmetics and beauty industry. It continued to deliver strong sales momentum during the lockdowns due to its digital-first channel strategy, brand recognition, and new product ramp-up. In Health Care, Thailand-based Bumrungrad Hospital, which operates one of the largest and most sophisticated private hospitals in Asia, was a notable contributor to relative performance as international patients’ revenues accelerated amid normalizing travel dynamics post-COVID disruption. Please refer to the Global Markets Review and Outlook relating to the Fund beginning on page 32. |
| 78 | Annual Report | December 31, 2022 |
Emerging Markets Small Cap Growth Fund
Performance Highlights (Unaudited)
| Average Annual Total Returns through 12/31/2022 |
| | | | | | | | | |
| | | 1 Year | | 3 Year | | 5 Year | | 10 Year |
| Class N | | | (28.12 | )% | | | 3.09 | % | | | 0.15 | % | | | 5.24 | % |
| Class I | | | (27.93 | ) | | | 3.35 | | | | 0.41 | | | | 5.53 | |
| Class R6 | | | (27.91 | ) | | | 3.39 | | | | 0.47 | | | | 5.60 | |
MSCI Emerging Markets Small Cap
Index (net) | | | (18.02 | ) | | | 5.11 | | | | 1.06 | | | | 3.21 | |
Performance cited represents past performance. Past performance does not guarantee future results and current performance may be lower or higher than the data quoted. Results shown are average annual total returns, which assume reinvestment of dividends and capital gains. Investment returns and principal will fluctuate and you may have a gain or loss when you sell shares. For the most current month-end performance information, please call 1-800-742-7272, or visit our Web site at www.williamblairfunds.com. From time to time, the investment adviser may waive fees or reimburse expenses for the Fund. Without these waivers/reimbursements, performance would be lower. International investing involves special risk considerations, including currency fluctuations, lower liquidity, economic and political risk. These risks may be magnified when investing in emerging markets. Smaller capitalization stocks are also more sensitive to purchase/sale transactions and changes in the issuer’s financial condition. Class N shares are not subject to a sales load. Class I shares are not subject to a sales load or distribution (Rule 12b-1) fees. Class R6 shares are not subject to a sales load, distribution (Rule 12b-1) fees, or sub-transfer agent fees.
The performance highlights and graph presented above do not reflect the deduction of taxes that a shareholder would pay on fund distributions or the redemption of fund shares.
The Morgan Stanley Capital International (MSCI) Emerging Markets Small Cap Index (net) is a free float-adjusted market capitalization index that is designed to measure the equity market performance of emerging markets. This index approximates the minimum possible dividend reinvestment by deducting for the highest possible withholding tax rates of those markets.
This report identifies the Fund’s investments on December 31, 2022. These holdings are subject to change. Not all stocks in the Fund performed the same, nor is there any guarantee that these stocks will perform as well in the future. Market forecasts provided in this report may not necessarily come to pass.
Sector Diversification (Unaudited)

The sector diversification shown is based on the total long-term securities.
| December 31, 2022 | William Blair Funds | 79 |
Emerging Markets Small Cap Growth Fund
Portfolio of Investments, December 31, 2022 (all dollar amounts in thousands)
| | | | | | | | |
| | | | | | |
| | Issuer | | Shares | | | Value | |
| | | | | | | | | | |
| | Common Stocks | | | | | | | | |
| | | | | | | | | | |
| | Emerging Asia—65.8% | | | | | | | | |
| | China—14.2% | | | | | | | | |
| | Anhui Guangxin Agrochemical Co. Ltd. (Chemicals) | | | 510,073 | | | $ | 2,157 | |
| | Centre Testing International Group Co. Ltd. (Professional services) | | | 1,083,705 | | | | 3,476 | |
| | Estun Automation Co. Ltd. (Machinery) | | | 184,800 | | | | 576 | |
| | Huaneng Lancang River Hydropower, Inc. (Independent power & renewable electricity producers) | | | 5,513,812 | | | | 5,235 | |
| | Jiangsu Hengli Hydraulic Co. Ltd. (Machinery) | | | 108,900 | | | | 989 | |
| | Jiumaojiu International Holdings Ltd. (Hotels, restaurants & leisure) | | | 2,001,000 | | | | 5,345 | |
| | Juewei Food Co. Ltd. (Food products) | | | 607,500 | | | | 5,339 | |
| | Longshine Technology Group Co. Ltd. (Software) | | | 439,058 | | | | 1,388 | |
| | Proya Cosmetics Co. Ltd. (Personal products) | | | 309,749 | | | | 7,463 | |
| | Shanghai M&G Stationery, Inc. (Commercial services & supplies) | | | 622,447 | | | | 4,923 | |
| | Sichuan Swellfun Co. Ltd. (Beverages) | | | 272,891 | | | | 3,314 | |
| | Suzhou Maxwell Technologies Co. Ltd. (Electrical equipment) | | | 90,223 | | | | 5,345 | |
| | Yunnan Botanee Bio-Technology Group Co. Ltd. (Personal products) | | | 18,000 | | | | 387 | |
| | | | | | | | | 45,937 | |
| | India—28.0% | | | | | | | | |
| * | Aavas Financiers Ltd. (Thrifts & | | | | | | | | |
| | mortgage finance) | | | 43,743 | | | | 978 | |
| * | Affle India Ltd. (Media) | | | 147,454 | | | | 1,919 | |
| | APL Apollo Tubes Ltd. (Metals & mining) | | | 334,072 | | | | 4,402 | |
| | Astral Ltd. (Building products) | | | 72,193 | | | | 1,710 | |
| | Atul Ltd. (Chemicals) | | | 1,424 | | | | 142 | |
| | AU Small Finance Bank Ltd. (Banks) | | | 474,880 | | | | 3,759 | |
| | Carborundum Universal Ltd. (Chemicals) | | | 33,752 | | | | 359 | |
| | Central Depository Services India Ltd. (Capital markets) | | | 86,385 | | | | 1,164 | |
| | Century Plyboards India Ltd. (Paper & forest products) | | | 291,115 | | | | 1,830 | |
| | Cholamandalam Investment & Finance Co. Ltd. (Consumer finance) | | | 665,170 | | | | 5,833 | |
| | City Union Bank Ltd. (Banks) | | | 838,752 | | | | 1,817 | |
| | Dixon Technologies India Ltd. (Household durables) | | | 48,938 | | | | 2,311 | |
| | Fine Organic Industries Ltd. (Chemicals) | | | 45,358 | | | | 3,142 | |
| | GMM Pfaudler Ltd. (Machinery) | | | 65,601 | | | | 1,239 | |
| * | Godrej Properties Ltd. (Real estate management & development) | | | 49,231 | | | | 727 | |
| | Gujarat Fluorochemicals Ltd. (Chemicals) | | | 57,559 | | | | 2,160 | |
| | Havells India Ltd. (Electrical equipment) | | | 23,919 | | | | 319 | |
| | Kajaria Ceramics Ltd. (Building products) | | | 26,461 | | | | 367 | |
| | KEI Industries Ltd. (Electrical equipment) | | | 236,752 | | | | 4,218 | |
| * | Macrotech Developers Ltd. (Real estate management & development) | | | 406,553 | | | | 5,357 | |
| | | | | | |
| | | | | | |
| | Issuer | | Shares | | Value |
| | | | | | | | | | |
| | Common Stocks—(continued) | | | | | | | | |
| | | | | | | | | | |
| | Emerging Asia—(continued) | | | | | | | | |
| | India—(continued) | | | | | | | | |
| | *Max Healthcare Institute Ltd. (Health care providers & services) | | | 504,679 | | | $ | 2,685 | |
| | Motherson Sumi Wiring India Ltd. (Auto components) | | | 1,052,845 | | | | 740 | |
| | Navin Fluorine International Ltd. (Chemicals) | | | 25,335 | | | | 1,248 | |
| | Oberoi Realty Ltd. (Real estate management & development) | | | 272,057 | | | | 2,845 | |
| | Page Industries Ltd. (Textiles, apparel & luxury goods) | | | 585 | | | | 304 | |
| | PI Industries Ltd. (Chemicals) | | | 89,270 | | | | 3,699 | |
| | Pidilite Industries Ltd. (Chemicals) | | | 10,396 | | | | 322 | |
| | Polycab India Ltd. (Electrical equipment) | | | 107,611 | | | | 3,348 | |
| | Radico Khaitan Ltd. (Beverages) | | | 144,852 | | | | 1,775 | |
| | SRF Ltd. (Chemicals) | | | 11,707 | | | | 325 | |
| | Sumitomo Chemical India Ltd. (Chemicals) | | | 320,051 | | | | 1,899 | |
| | Sundram Fasteners Ltd. (Auto components) | | | 71,246 | | | | 840 | |
| | Trent Ltd. (Specialty retail) | | | 332,512 | | | | 5,426 | |
| | Tube Investments of India Ltd. (Auto components) | | | 186,080 | | | | 6,197 | |
| | UNO Minda Ltd. (Auto components) | | | 441,561 | | | | 2,770 | |
| | Varun Beverages Ltd. (Beverages) | | | 416,884 | | | | 6,669 | |
| | Vinati Organics Ltd. (Chemicals) | | | 130,778 | | | | 3,152 | |
| | VIP Industries Ltd. (Textiles, apparel & luxury goods) | | | 289,624 | | | | 2,346 | |
| | | | | | | | | 90,343 | |
| | Indonesia—4.7% | | | | | | | | |
| | Bank BTPN Syariah Tbk PT (Banks) | | | 19,688,000 | | | | 3,528 | |
| | Bank Negara Indonesia Persero Tbk PT (Banks) | | | 12,449,900 | | | | 7,378 | |
| * | PT Mitra Adiperkasa Tbk (Multiline retail) | | | 32,005,100 | | | | 2,971 | |
| | United Tractors Tbk PT (Oil, gas & consumable fuels) | | | 667,700 | | | | 1,118 | |
| | | | | | | | | 14,995 | |
| | Philippines—2.1% | | | | | | | | |
| | International Container Terminal Services, Inc. (Transportation infrastructure) | | | 274,150 | | | | 984 | |
| * | TDCX, Inc.—ADR (IT services) | | | 63,960 | | | | 792 | |
| | Wilcon Depot, Inc. (Specialty retail) | | | 9,369,700 | | | | 4,960 | |
| | | | | | | | | 6,736 | |
| | South Korea—3.9% | | | | | | | | |
| * | F&F Co. Ltd. (Textiles, apparel & luxury goods) | | | 45,953 | | | | 5,251 | |
| * | JYP Entertainment Corporation (Entertainment) | | | 24,926 | | | | 1,336 | |
| | LEENO Industrial, Inc. (Semiconductors & semiconductor equipment) | | | 48,537 | | | | 5,969 | |
| | | | | | | | | 12,556 | |
| | Taiwan—10.8% | | | | | | | | |
| | Airtac International Group (Machinery) | | | 69,158 | | | | 2,095 | |
| | ASMedia Technology, Inc. (Semiconductors & semiconductor equipment) | | | 50,000 | | | | 1,090 | |
See accompanying Notes to Financial Statements.
| 80 | Annual Report | December 31, 2022 |
Emerging Markets Small Cap Growth Fund
Portfolio of Investments, December 31, 2022 (all dollar amounts in thousands)
| | | | | | |
| | | | | | |
| | Issuer | | Shares | | | Value | |
| | | | | | | | | | |
| | Common Stocks—(continued) | | | | | | | | |
| | | | | | | | | | |
| | Emerging Asia—(continued) | | | | | | | | |
| | Taiwan—(continued) | | | | | | | | |
| | ASPEED Technology, Inc. (Semiconductors & semiconductor equipment) | | | 62,900 | | | $ | 3,448 | |
| | Elite Material Co. Ltd. (Electronic equipment, instruments & components) | | | 188,000 | | | | 1,046 | |
| | eMemory Technology, Inc. (Semiconductors & semiconductor equipment) | | | 61,000 | | | | 2,650 | |
| * | Globalwafers Co. Ltd. (Semiconductors & semiconductor equipment) | | | 177,000 | | | | 2,462 | |
| | Lotes Co. Ltd. (Electronic equipment, instruments & components) | | | 227,831 | | | | 6,123 | |
| | Nanya Technology Corp. (Semiconductors & semiconductor equipment) | | | 2,129,000 | | | | 3,547 | |
| | Parade Technologies Ltd. (Semiconductors & semiconductor equipment) | | | 103,000 | | | | 2,590 | |
| | Sinbon Electronics Co. Ltd. (Electronic equipment, instruments & components) | | | 564,000 | | | | 5,046 | |
| | Voltronic Power Technology Corp. (Electrical equipment) | | | 97,507 | | | | 4,901 | |
| | | | | | | | | 34,998 | |
| | Thailand—2.1% | | | | | | | | |
| | Bumrungrad Hospital PCL (Health care providers & services) | | | 799,200 | | | | 4,892 | |
| | Com7 PCL (Specialty retail) | | | 1,843,100 | | | | 1,809 | |
| | | | | | | | | 6,701 | |
| | | | | | | | | | |
| | Emerging Latin America—17.2% | | | | | | | | |
| | Brazil—8.7% | | | | | | | | |
| | Arezzo Industria e Comercio SA (Textiles, apparel & luxury goods) | | | 299,000 | | | | 4,431 | |
| * | CI&T, Inc. (IT services)† | | | 83,812 | | | | 545 | |
| | Cyrela Brazil Realty SA Empreendimentos e Participacoes (Household durables) | | | 658,500 | | | | 1,630 | |
| | Hypera SA (Pharmaceuticals) | | | 650,800 | | | | 5,572 | |
| * | Infracommerce CXAAS SA (IT services) | | | 90,100 | | | | 63 | |
| * | Locaweb Servicos de Internet SA (IT services) | | | 3,054,278 | | | | 4,061 | |
| | Multiplan Empreendimentos Imobiliarios SA (Real estate management & development) | | | 947,200 | | | | 3,929 | |
| | Pet Center Comercio e Participacoes SA (Specialty retail) | | | 249,606 | | | | 296 | |
| | TOTVS SA (Software) | | | 1,420,200 | | | | 7,430 | |
| | | | | | | | | 27,957 | |
| | Mexico—8.5% | | | | | | | | |
| | Banco del Bajio SA (Banks) | | | 1,820,400 | | | | 5,734 | |
| | Corp. Inmobiliaria Vesta SAB de CV (Real estate management & development) | | | 348,000 | | | | 825 | |
| | Grupo Aeroportuario del Centro Norte SAB de CV (Transportation infrastructure) | | | 787,899 | | | | 6,058 | |
| | Grupo Aeroportuario del Sureste SAB de CV (Transportation infrastructure) | | | 445,230 | | | | 10,373 | |
| | | | | | | |
| | | | | | |
| | Issuer | | Shares | | | Value |
| | | | | | | | | | |
| | Common Stocks—(continued) | | | | | | | | |
| | | | | | | | | | |
| | Emerging Latin America—(continued) | | | | | | | | |
| | Mexico—(continued) | | | | | | | | |
| | Grupo Comercial Chedraui SA de CV (Food & staples retailing) | | | 197,700 | | | $ | 842 | |
| | Regional SAB de CV (Banks) | | | 516,900 | | | | 3,740 | |
| | | | | | | | | 27,572 | |
| | | | | | | | | | |
| | Emerging Europe, Mid-East, Africa—16.2% | | | | | |
| | Greece—2.9% | | | | | | | | |
| | Motor Oil Hellas Corinth Refineries SA (Oil, gas & consumable fuels) | | | 149,063 | | | | 3,482 | |
| | Terna Energy SA (Independent power & renewable electricity producers) | | | 274,831 | | | | 5,995 | |
| | | | | | | | | 9,477 | |
| | Kazakhstan—1.4% | | | | | | | | |
| | Kaspi.KZ JSC—GDR (Consumer finance) | | | 61,651 | | | | 4,408 | |
| | Poland—2.5% | | | | | | | | |
| * | Dino Polska SA (Food & staples retailing) | | | 94,399 | | | | 8,086 | |
| | Qatar—0.6% | | | | | | | | |
| | Qatar Gas Transport Co. Ltd. (Oil, gas & consumable fuels) | | | 2,054,911 | | | | 2,066 | |
| | Romania—0.6% | | | | | | | | |
| | Banca Transilvania SA (Banks) | | | 405,313 | | | | 1,749 | |
| | Saudi Arabia—4.9% | | | | | | | | |
| | Arabian Internet & Communications Services Co. (IT services) | | | 51,156 | | | | 3,305 | |
| | Bupa Arabia for Cooperative Insurance Co. (Insurance) | | | 65,969 | | | | 2,524 | |
| | Dallah Healthcare Co. (Health care providers & services) | | | 69,283 | | | | 2,729 | |
| | Dr Sulaiman Al Habib Medical Services Group Co. (Health care providers & services) | | | 70,908 | | | | 4,163 | |
| | Nahdi Medical Co. (Food & staples retailing) | | | 69,070 | | | | 3,073 | |
| | | | | | | | | 15,794 | |
| | South Africa—0.1% | | | | | | | | |
| | Transaction Capital Ltd. (Consumer finance) | | | 171,107 | | | | 333 | |
| | United Arab Emirates—3.2% | | | | | | | | |
| | Abu Dhabi National Oil Co. for Distribution PJSC (Specialty retail) | | | 4,145,421 | | | | 4,978 | |
| * | Americana Restaurants International PLC (Hotels, restaurants & leisure) | | | 1,093,325 | | | | 884 | |
| * | Network International Holdings PLC (IT services) | | | 625,409 | | | | 2,253 | |
| * | Salik Co. PJSC (Transportation infrastructure) | | | 3,446,007 | | | | 2,327 | |
| | | | | | | | | 10,442 | |
| | Total Common Stocks—99.2%
(cost $310,900) | | | | | | | 320,150 | |
See accompanying Notes to Financial Statements.
| December 31, 2022 | William Blair Funds | 81 |
Emerging Markets Small Cap Growth Fund
Portfolio of Investments, December 31, 2022 (all dollar amounts in thousands)
| | | | | | | |
| | Issuer | | Principal
Amount | | | Value | |
| | | | | | | | | | |
| | Repurchase Agreement | | | | | | | | |
| | Fixed Income Clearing Corporation, 1.600% dated 12/30/22, due 01/03/23, repurchase price $3,088, collateralized by U.S. Treasury Note, 2.375%, due 03/31/29, valued at $3,149 | | $ | 3,088 | | | $ | 3,088 | |
| | Total Repurchase Agreement—1.0%
(cost $3,088) | | | | | | | 3,088 | |
| | Total Investments—100.2%
(cost $313,988) | | | | | | | 323,238 | |
| | Liabilities, plus cash and other assets—(0.2)% | | | | | | | (565 | ) |
| | Net assets—100.0% | | | | | | $ | 322,673 | |
ADR = American Depository Receipt
GDR = Global Depository Receipt
* = Non-income producing security
† = U.S. listed foreign security
At December 31, 2022, the Fund’s Portfolio of Investments includes the following industry categories (as a percentage of long-term investments):
| Information Technology | | | 16.8 | % |
| Consumer Discretionary | | | 16.7 | % |
| Industrials | | | 16.6 | % |
| Financials | | | 13.4 | % |
| Consumer Staples | | | 11.5 | % |
| Materials | | | 7.8 | % |
| Health Care | | | 6.3 | % |
| Real Estate | | | 4.3 | % |
| Utilities | | | 3.5 | % |
| Energy | | | 2.1 | % |
| Communication Services | | | 1.0 | % |
| Total | | | 100.0 | % |
At December 31, 2022, the Fund’s Portfolio of Investments includes the following currency categories (as a percentage of long-term investments):
| Indian Rupee | | | 28.2 | % |
| Chinese Yuan Renminbi | | | 12.7 | % |
| New Taiwan Dollar | | | 10.9 | % |
| Mexican Peso | | | 8.6 | % |
| Brazilian Real | | | 8.6 | % |
| South African Rand | | | 5.0 | % |
| Indonesian Rupiah | | | 4.7 | % |
| South Korean Won | | | 3.9 | % |
| Euro | | | 3.0 | % |
| UAE Dirham | | | 2.6 | % |
| Polish Zloty | | | 2.5 | % |
| Thai Baht | | | 2.1 | % |
| Philippine Peso | | | 1.8 | % |
| U.S. Dollar | | | 1.8 | % |
| Hong Kong Dollar | | | 1.7 | % |
| All Other Currencies | | | 1.9 | % |
| Total | | | 100.0 | % |
See accompanying Notes to Financial Statements.
| 82 | Annual Report | December 31, 2022 |
| | China Growth Fund |
| | |
| | The China Growth Fund seeks long-term capital appreciation. |
| | |
| | AN OVERVIEW FROM THE PORTFOLIO MANAGERS |
| | |

Vivian Lin Thurston, CFA 
Casey K. Preyss, CFA | The William Blair China Growth Fund (Class I shares) (the “Fund”) posted a 32.43% decrease, net of fees, for the year ended December 31, 2022. By comparison, the Fund’s benchmark index, the MSCI China All Shares Index (net) (the “Index”), decreased 23.61%. Underperformance versus the Index was primarily driven by style headwinds amid strong outperformance of low-valuation stocks. From a sector perspective, the portfolio’s lack of exposure to Energy and overweight in Information Technology were particularly detrimental. Style headwinds also drove negative stock selection across sectors, which was particularly acute in the Financials and Health Care sectors, and by the portfolio’s exposure to technology hardware, particularly semiconductor manufacturers Silergy and Will Semiconductor. Silergy is the market leader in China for analog semiconductors and, in our view, remains a beneficiary of structural growth in demand from automobile, cloud, and 5G end-markets, as well as a localization trend. Will Semiconductor produces image sensors for smartphones, automotive, and other uses. It is taking market share at the lower end of the technology spectrum as competitors on the leading edge reduce capacity. The stock price for the industry weakened against a deteriorated demand backdrop and rising costs. Within Financials, the omission of several large banks that outperformed the broad sector was the primary detractor, while Wuxi Biologics was the primary detractor in Health Care. Wuxi Biologics offers a full range of research and manufacturing services for biologic drugs that are designed to help clients improve research and development efficiency, shorten development timelines, and lower costs. Early in the year, the company was added to the U.S. Commerce Department’s Unverified List and was restricted from purchasing bioreactors and hollow fiber filters from U.S. suppliers because regulators were not able to verify appropriate (i.e., non-defense related) end-market use due to an inability to conduct an on-site inspection. Subsequently, the on-site inspection was completed, and the stock recovered as the import restrictions were removed in December, but it still remains below its peak valuations. Partially offsetting those effects was an underweight in Materials and an overweight in Consumer Staples, anchored by Proya Cosmetics (Proya). Proya is a leading domestic Chinese beauty company focused on lower-tier cities. The company is a key beneficiary of the domestic substitution trend within China’s cosmetics and beauty industry. It continued to deliver strong sales momentum during the lockdowns due to its digital-first channel strategy, brand recognition, and new product ramp-up. Please refer to the Global Markets Review and Outlook relating to the Fund beginning on page 32. |
| | | |
| December 31, 2022 | William Blair Funds | 83 |
China Growth Fund
Performance Highlights (Unaudited)
Average Annual Total Return 12/31/2022
| | | 1 Year | | Since
Inception(a) |
| Class I | | | (32.43 | )% | | | (27.69 | )% |
| Class R6 | | | (32.49 | ) | | | (27.73 | ) |
| MSCI China All Shares Index (net) | | | (23.61 | ) | | | (20.17 | ) |
| | |
| (a) | Since inception is for the period from August 27, 2021 (Commencement of Operations) to December 31, 2022. |
Performance cited represents past performance. Past performance does not guarantee future results and current performance may be lower or higher than the data quoted. Results shown are average annual total returns, which assume reinvestment of dividends and capital gains. Investment returns and principal will fluctuate and you may have a gain or loss when you sell shares. For the most current month-end performance information, please call 1-800-742-7272, or visit our Web site at www.williamblairfunds.com. From time to time, the investment adviser may waive fees or reimburse expenses for the Fund. Without these waivers/reimbursements, performance would be lower. International investing involves special risk considerations, including currency fluctuations, lower liquidity, economic and political risk. These risks may be magnified when investing in emerging markets. Smaller capitalization stocks are also more sensitive to purchase/sale transactions and changes in the issuer’s financial condition. Class I shares are not subject to a sales load or distribution (Rule 12b-1) fees. Class R6 shares are not subject to a sales load, distribution (Rule 12b-1) fees, or sub-transfer agent fees.
The performance highlights and graph presented above do not reflect the deduction of taxes that a shareholder would pay on fund distributions or the redemption of fund shares.
The MSCI China All Shares Index (net) captures large and mid-cap representation across China A-shares, B-shares, H-shares, Red-chips, P-chips, and foreign listings. The index aims to reflect the opportunity set of China share classes listed in Hong Kong, Shanghai, Shenzhen, and outside of China. The Index is unmanaged, does not incur fees or expenses, and cannot be invested in directly.
This report identifies the Fund’s investments on December 31, 2022. These holdings are subject to change. Not all stocks in the Fund performed the same, nor is there any guarantee that these stocks will perform as well in the future. Market forecasts provided in this report may not necessarily come to pass.
Sector Diversification (Unaudited)

The sector diversification shown is based on the total long-term securities.
| 84 | Annual Report | December 31, 2022 |
China Growth Fund
Portfolio of Investments, December 31, 2022 (all dollar amounts in thousands)
| | | | | | | | |
| | | | | | | | |
| | Issuer | | Shares | | | Value | |
| | | | | | | | |
| | Common Stocks | | | | | | | | |
| | | | | | | | | | |
| | Emerging Asia—95.5% | | | | | | | | |
| | China—95.5% | | | | | | | | |
| | Aier Eye Hospital Group Co. Ltd. (Health care providers & services) | | | 10,937 | | | $ | 49 | |
| | Airtac International Group (Machinery) | | | 1,000 | | | | 30 | |
| * | Alibaba Group Holding Ltd. (Internet & direct marketing retail) | | | 9,300 | | | | 103 | |
| | Bank of Chengdu Co. Ltd.(Banks) | | | 16,200 | | | | 36 | |
| | Bank of Ningbo Co. Ltd. (Banks) | | | 11,590 | | | | 54 | |
| | Beijing Kingsoft Office Software, Inc. (Software) | | | 968 | | | | 37 | |
| | China Merchants Bank Co. Ltd. (Banks) | | | 9,000 | | | | 50 | |
| | China Tourism Group Duty Free Corp. Ltd. (Specialty retail) | | | 3,400 | | | | 106 | |
| | Chongqing Zhifei Biological Products Co. Ltd. (Biotechnology) | | | 800 | | | | 10 | |
| | Contemporary Amperex Technology Co. Ltd. (Electrical equipment) | | | 900 | | | | 51 | |
| | East Money Information Co. Ltd. (Capital markets) | | | 16,120 | | | | 45 | |
| | Foshan Haitian Flavouring & Food Co. Ltd. (Food products) | | | 7,110 | | | | 81 | |
| | Guanghui Energy Co. Ltd. (Oil, gas & consumable fuels) | | | 7,800 | | | | 10 | |
| | Hangzhou Tigermed Consulting Co. Ltd. (Life sciences tools & services) | | | 1,417 | | | | 21 | |
| | Huaneng Lancang River Hydropower, Inc. (Independent power & renewable electricity producers) | | | 22,800 | | | | 22 | |
| | Inner Mongolia Yili Industrial Group Co. Ltd. (Food products) | | | 6,500 | | | | 29 | |
| | JD.com, Inc. (Internet & direct marketing retail) | | | 2,702 | | | | 76 | |
| | Jiangsu Hengli Hydraulic Co. Ltd. (Machinery) | | | 3,100 | | | | 28 | |
| | Juewei Food Co. Ltd. (Food products) | | | 2,300 | | | | 20 | |
| * | Kuaishou Technology (Interactive Media & Services) | | | 2,300 | | | | 21 | |
| | Kweichow Moutai Co. Ltd. (Beverages) | | | 400 | | | | 99 | |
| | Li Ning Co. Ltd. (Textiles, apparel & luxury goods) | | | 4,500 | | | | 39 | |
| * | LONGi Green Energy Technology Co. Ltd. (Semiconductors & semiconductor equipment) | | | 2,500 | | | | 15 | |
| | Maxscend Microelectronics Co. Ltd. (Electronic equipment, instruments & components) | | | 1,000 | | | | 17 | |
| * | Meituan (Internet & direct marketing retail) | | | 2,600 | | | | 58 | |
| | NAURA Technology Group Co. Ltd. (Semiconductors & semiconductor equipment) | | | 900 | | | | 29 | |
| | NetEase, Inc. (Entertainment) | | | 3,500 | | | | 51 | |
| | Proya Cosmetics Co. Ltd. (Personal products) | | | 1,820 | | | | 44 | |
| | SG Micro Corp. (Semiconductors & semiconductor equipment) | | | 1,250 | | | | 31 | |
| | | | | | | | |
| | | | | | | | |
| | Issuer | | Shares | | | Value | |
| | | | | | | | |
| | Common Stocks—(continued) | | | | | | | | |
| | | | | | | | | | |
| | Emerging Asia—(continued) | | | | | | | | |
| | China—(continued) | | | | | | | | |
| | Shanghai M&G Stationery, Inc. (Commercial services & supplies) | | | 2,300 | | | $ | 18 | |
| | Shenzhen Inovance Technology Co. Ltd. (Machinery) | | | 4,500 | | | | 45 | |
| | Shenzhen Mindray Bio-Medical Electronics Co. Ltd. (Health care equipment & supplies) | | | 400 | | | | 18 | |
| | Silergy Corp. (Semiconductors & semiconductor equipment) | | | 2,000 | | | | 28 | |
| | Suzhou Maxwell Technologies Co. Ltd. (Electrical equipment) | | | 420 | | | | 25 | |
| | Tencent Holdings Ltd. (Interactive Media & Services) | | | 4,100 | | | | 176 | |
| * | Topchoice Medical Corp. (Health care providers & services) | | | 1,000 | | | | 22 | |
| | Wuliangye Yibin Co. Ltd. (Beverages) | | | 1,900 | | | | 49 | |
| | WuXi AppTec Co. Ltd. (Life sciences tools & services) | | | 2,600 | | | | 28 | |
| * | Wuxi Biologics Cayman, Inc. (Life sciences tools & services) | | | 3,500 | | | | 27 | |
| | Wuxi Lead Intelligent Equipment Co. Ltd. (Machinery) | | | 2,800 | | | | 16 | |
| | Yonyou Network Technology Co. Ltd. (Software) | | | 6,200 | | | | 22 | |
| | Yunnan Botanee Bio-Technology Group Co. Ltd. (Personal products) | | | 900 | | | | 19 | |
| | Yunnan Energy New Material Co. Ltd. (Chemicals) | | | 1,000 | | | | 19 | |
| | Zhangzhou Pientzehuang Pharmaceutical Co. Ltd. (Pharmaceuticals) | | | 1,000 | | | | 42 | |
| | Zhejiang Jingsheng Mechanical & Electrical Co. Ltd. (Semiconductors & semiconductor equipment) | | | 2,400 | | | | 22 | |
| | Zhongsheng Group Holdings Ltd. (Specialty retail) | | | 4,000 | | | | 21 | |
| | | | | | | | | 1,859 | |
| | | | | | | | | | |
| | Asia—3.8% | | | | | | | | |
| | Hong Kong—3.8% | | | | | | | | |
| | AIA Group Ltd. (Insurance) | | | 4,800 | | | | 53 | |
| | Hong Kong Exchanges & Clearing Ltd. (Capital markets) | | | 500 | | | | 22 | |
| | | | | | | | | 75 | |
| | Total Common Stocks—99.3%
(cost $2,543) | | | | | | | 1,934 | |
| | Total Investments—99.3%
(cost $2,543) | | | | | | | 1,934 | |
| | Cash and other assets, less liabilities—0.7% | | | | | | | 13 | |
| | Net assets—100.0% | | | | | | $ | 1,947 | |
* = Non-income producing security
See accompanying Notes to Financial Statements.
| December 31, 2022 | William Blair Funds | 85 |
China Growth Fund
Portfolio of Investments, December 31, 2022
At December 31, 2022, the Fund’s Portfolio of Investments includes the following industry categories (as a percentage of long-term investments):
| Consumer Discretionary | | | 20.9 | % |
| Consumer Staples | | | 17.7 | % |
| Financials | | | 13.4 | % |
| Communication Services | | | 12.8 | % |
| Health Care | | | 11.2 | % |
| Industrials | | | 11.0 | % |
| Information Technology | | | 10.4 | % |
| Utilities | | | 1.1 | % |
| Materials | | | 1.0 | % |
| Energy | | | 0.5 | % |
| Total | | | 100.0 | % |
At December 31, 2022, the Fund’s Portfolio of Investments includes the following currency categories (as a percentage of long-term investments):
| Chinese Yuan Renminbi | | | 59.5 | % |
| Hong Kong Dollar | | | 37.5 | % |
| New Taiwan Dollar | | | 3.0 | % |
| Total | | | 100.0 | % |
See accompanying Notes to Financial Statements.
| 86 | Annual Report | December 31, 2022 |
Emerging Markets Debt Market Review and Outlook
In a year of strong headwinds, emerging market (EM) assets suffered one of the worst years of performance on record. This was especially true of dollar-denominated sovereign debt, which lagged corporate and local currency debt. The Russia-Ukraine conflict started the year off by creating significant uncertainties for global investors. Moreover, a negative combination of factors—including rising inflationary pressures, the continuation of global supply-chain disruptions, ongoing monetary policy normalization, higher global rates, and rising economic growth risks—all weighed on investor sentiment. This led to outflows from EM debt portfolios, widening EM debt credit spreads, higher EM local bond yields, and weaker EM currencies—all amid high levels of market volatility for much of the year. Market conditions finally improved in the fourth quarter as headwinds moderated and China’s reopening generated positive sentiment for global growth and supply chain strength. The reduction in inflationary pressure allowed investors to price in the end of the US Federal Reserve’s rate hiking cycle, which partially offset the prospect of a slowing global economy.
In this environment, the credit spread of the J.P. Morgan Emerging Markets Bond Index Global Diversified (EMBIGD) widened by 84 basis points (bps), to 452 bps, producing a negative total return of -17.78% for the full year.
While we believe high inflation and monetary-policy tightening have the potential to cloud the beginning of 2023, we expect market conditions to improve as we move through the year and inflationary pressures dissipate, particularly in the United States.
Therefore, we believe a combination of declining food and energy prices, improving global supply-chain dynamics, a still strong U.S. dollar, and softening economic conditions should drive inflation lower. Declining inflation, in turn, should allow for a less aggressive rate-hiking cycle, leading to lower U.S. Treasury yields and reduced risk of a sharp economic contraction.
Despite a better market environment in 2023, we believe global growth is likely to be lackluster. While there is the risk of a recession in the United States, we believe the U.S Federal Reserve should be able to engineer a soft landing. We believe economic conditions could be more challenging in Europe, however, as the continent faces an unprecedented energy crisis. In China, we believe economic conditions should improve after a very weak 2022, but COVID-related risks and uncertainty in the property sector could limit the potential for a stronger economic recovery in the near term.
While we anticipate softer economic conditions in EMs more broadly, we believe economic growth in these countries could come in around 3.6% in 2023 (approximately 2.5 percentage points higher than the International Monetary Fund’s projected growth for advanced economies) due to improved economic conditions in China and still-supportive commodity prices.
Resilient economic activity could continue to support fiscal dynamics across EMs, in our opinion. We believe the overall fiscal deficit in 2023 will be approximately –5.8% of EM gross domestic product (GDP), marginally lower than last year’s number. We believe basic balances (current account balances plus net foreign direct investments) should remain healthy at 1.3% of EM GDP, partly reflecting recent terms-of-trade gains enabled by higher commodity prices. Stable fiscal accounts should support debt dynamics in the next year, leading us to anticipate an overall total debt of 57% of GDP in 2023, marginally higher than in 2022.
It is important to note that central banks in EMs have been preemptively hiking interest rates such that real interest rates are now significantly higher than in advanced economies, providing significant support for local currencies and adding to the positive fundamental landscape.
Technical conditions should be more supportive in 2023, in our opinion. We saw record outflows from dedicated EM debt portfolios, high market volatility, and low liquidity, which resulted in limited new-debt issuance in 2022. Forced selling by passive funds and exchange-traded funds created significant dislocation in the marketplace, driving prices far below their fundamental values.
While we see market conditions gradually normalizing in 2023 and new debt issuance picking up in the first quarter of the year, we anticipate another year of limited net debt supply. Higher funding costs in primary markets should encourage issuers to tap into more affordable multilateral and bilateral financing. We also anticipate flows coming back to dedicated EM debt portfolios, attracted by appealing valuations. Reduced long-investor positioning and high investor cash levels should also add to a more constructive technical landscape.
In our opinion, EM debt appears attractively valued on both an absolute and relative basis, with spreads wider than their historical levels. EM sovereign high-yield spreads appear particularly compelling, especially relative to U.S. high-yield levels. In the distressed credit space, we believe current prices overestimate the probability of credit events and underestimate potential restructuring and recovery values. Despite softer economic conditions globally, overall EM credit fundamentals remain supportive—and while we see some pockets of weakness, especially among energy- and food-importing countries, overall we believe EM debt is well positioned to withstand a period of weaker global growth.
All things considered, we continue to believe that current valuations overcompensate investors for credit risk as well as volatility—so EM debt may offer attractive value to investors with a medium- to long-term horizon and a willingness to tolerate a period of higher volatility.
| December 31, 2022 | William Blair Funds | 87 |
| | Emerging Markets Debt Fund |
| | |
| | The Emerging Markets Debt Fund seeks to provide attractive risk-adjusted returns relative to the Fund’s benchmark. |
| | |
| | AN OVERVIEW FROM THE PORTFOLIO MANAGERS |
| | |

Marcelo Assalin, CFA 
Marco Ruijer, CFA | The William Blair Emerging Markets Debt Fund (Class I shares) (the “Fund”) posted a 16.93% decrease, net of fees, for the year ended December 31, 2022. By comparison, the Fund’s benchmark index, the JPMorgan EMBI Global Diversified (the “Index”), decreased 17.78%. Active performance was driven by security selection, especially within medium- and lower-risk countries, while allocation impacts detracted from relative performance. With respect to higher-risk countries, security selection drove outperformance, especially in Argentina, as did an underweight position in Russia and an overweight in Angola. Conversely, overweight positions in Ukraine, Zambia, and Ghana detracted from relative performance. In Russia, our underweight position generated positive alpha following the invasion of Ukraine that began in February. Bonds were marked down sharply as widescale financial and economic sanctions were placed on Russia, which are likely to severely weaken its domestic economy and could ultimately lead to a sovereign default. J.P. Morgan decided to remove all Russian bonds from the Index at the end of March, and we also sold the last of our U.S.-dollar-denominated Russian sovereign bonds during the month. In Argentina, performance was driven primarily by our underweight of sovereign bonds and overweight of higher-quality provincial bonds. In addition, our bond positions and sovereign credit default swap hedges performed well in an environment in which Argentine bonds slid. Although higher-risk countries underperformed during the year, Argentina was also plagued by domestic concerns as confidence in the government’s ability to manage its debt eroded. In Angola, bonds remained supported as markets viewed that fiscal policy remained prudent, which reduced concerns about short term financing. The depreciation of the kwanza towards the end of 2022 gave further comfort about the increased flexibility in the exchange rate regime, which is a tool that serves as a shock absorber for the economy. Our overweight position in Angola contributed to relative performance as the country’s bonds outperformed the broader market on a relative basis. In Ukraine, our overweight exposure detracted from performance as the country came under military attack from Russia. Despite Ukrainian officials’ commitment to servicing their external debt obligations the country had to restructure its debt and external creditors agreed to a freeze on debt payments. Given the extent of the military invasion and its deep impact on Ukraine’s economy, the size of our overweight relative to the Index has been significantly eroded. In Zambia, the broader backdrop and concerns about the pace of debt restructuring negotiations, particularly with bilateral creditors, weighed on investor sentiment and bond prices. Our overweight position in the country detracted from performance. In Ghana, our overweight positions in the country detracted from performance as bond prices fell against a challenging external backdrop, as well as the ebb and flow of the market’s confidence in the International Monetary Fund (IMF) negotiation progress after an October visit by IMF staff to Accra ended without reaching an agreement. In December bonds saw some support when an IMF staff level agreement was reached. The authorities announced a domestic bond exchange and the suspension of external debt servicing on inter alia Eurobonds in December. Security selection in medium-risk countries contributed to relative performance, especially in Dominican Republic, Colombia, Mongolia, and Uzbekistan where our overweight positions also contributed. Conversely, security selection and underweight positions in Brazil and Mexico, as well as an underweight in South Africa detracted from relative performance. |
| 88 | Annual Report | December 31, 2022 |
Emerging Markets Debt Fund
In the Dominican Republic, our overweight position drove positive relative performance, as well as security selection via the holding of a corporate airport issuer. We have been tactical in our risk positioning in the country as investor flows can impact valuations given the country’s favorable investor popularity and positioning.
We added to our overweight position in Colombia during the year as we believed the bonds were unfairly oversold. Expectations of radical policies from recently elected President Gustavo Petro led many market participants to believe that severe fiscal slippage was likely to occur. The budget which eventually passed was more moderate than originally expected, driving strength in bond prices, aiding our outperformance in the country.
In Uzbekistan and Mongolia overweight positions drove relative outperformance as the countries outperformed the broader market. In Mongolia, we reduced our positioning in the country’s sovereign debt after a slowdown of export activity into China due to Covid-related lockdowns.
In Brazil, underperformance was driven by security selection via the use of shorter-duration corporate debt, as well as our underweight position in the country’s sovereign debt, which outperformed the broader market.
In Mexico, underperformance was driven primarily by security selection, specifically an idiosyncratic issue with one of our corporate positions. Without this issue, the country was a relative outperformer for the year as it stands to benefit from higher oil prices and continued capital investment as companies re-shore to North America.
In South Africa we increased our positioning through the primary and secondary markets in the year but remained underweight to the country which outperformed on a relative basis. The rise in commodity prices delivered a positive terms-of-trade shock, which we believe assisted the performance of the external and fiscal sector. Our positioning was also focused on the long-end of the yield curve, which has been negatively impacted by a steepening of the curve.
In lower-risk countries, selection and our underweight positions in Kazakhstan and the United Arab Emirates (UAE) contributed to relative performance. Conversely, an underweight position in China, as well as security selection in Uruguay and Chile detracted from relative performance.
Kazakhstan’s bonds were negatively impacted by the country’s geographical proximity and economic ties to Russia, as well as its perceived political alignment with Russia. In addition, infrastructure damage forced the closure of one of Kazakhstan’s oil pipelines for about a month. Our large underweight position contributed to relative performance in the year. However, we partially closed the underweight position by buying bonds at what we believed were attractive valuations.
In Indonesia, security selection drove alpha, particularly in our holdings of quasi-sovereign debt, which we viewed as attractive and an overweight position in a credit in the oil and gas sector given its strong financial profile and leading position in Indonesia’s energy market. The issuer could benefit from the high-oil-price backdrop because—despite domestic price controls on retail fuels—the government reimburses the company via subsidies. We also complemented our positions in corporate issuers in the metals and mining and financials sectors.
Security selection in the UAE and Georgia contributed to relative outperformance as the bonds outperformed the broader market, especially in the long-end of the yield curve and corporate holdings in the UAE.
In China, relative underperformance was primarily due to our sizeable underweight against the Index via sovereigns and quasi-sovereigns, together with overweight positioning in corporate debt. China’s bond performance outperformed the broader market in the year.
In Chile our underperformance was driven primarily through our overweight in the telecommunications sector, which underperformed the sovereign.
Our underweight in Uruguay, largely driven by poor valuations, detracted from relative performance. Fundamentals in Uruguay remained strong, however, bonds compressed materially since the pandemic, offering limited potential spread tightening.
Please refer to the Emerging Markets Debt Review and Outlook relating to the Fund on page 87.
| December 31, 2022 | William Blair Funds | 89 |
Emerging Markets Debt Fund
Performance Highlights (Unaudited)
Average Annual Total Return 12/31/2022
| | | 1 Year | | Since
Inception(a) |
| Class I | | | (16.93 | )% | | | (11.69 | )% |
| Class R6 | | | (16.95 | ) | | | (11.66 | ) |
| JPMorgan EMBI Global Diversified | | | (17.78 | ) | | | (11.62 | ) |
| | |
| (a) | Since inception is for the period from May 25, 2021 (Commencement of Operations) to December 31, 2022. |
Performance cited represents past performance. Past performance does not guarantee future results and current performance may be lower or higher than the data quoted. Results shown are average annual total returns, which assume reinvestment of dividends and capital gains. Investment returns and principal will fluctuate and you may have a gain or loss when you sell shares. For the most current month-end performance information, please call 1-800-742-7272, or visit our Web site at www.williamblairfunds.com. From time to time, the investment adviser may waive fees or reimburse expenses for the Fund. Without these waivers/reimbursements, performance would be lower. Class I shares are not subject to a sales load or distribution (Rule 12b-1) fees. Class R6 shares are not subject to a sales load, distribution (Rule 12b-1) fees, or sub-transfer agent fees.
The performance highlights and graph presented above do not reflect the deduction of taxes that a shareholder would pay on fund distributions or the redemption of fund shares.
The JP Morgan Emerging Markets Bond Index (EMBI) Global Diversified tracks the total return of U.S.-dollar denominated debt instruments issued by sovereign and quasi-sovereign entities.
This report identifies the Fund’s investments on December 31, 2022. These holdings are subject to change. Not all investments in the Fund performed the same, nor is there any guarantee that these investments will perform as well in the future. Market forecasts provided in this report may not necessarily come to pass.
Sector Diversification (Unaudited)

The sector diversification shown is based on the total investments.
| 90 | Annual Report | December 31, 2022 |
Emerging Markets Debt Fund
Portfolio of Investments, December 31, 2022 (all dollar amounts in thousands)
| | | | | | | | |
| | | | Principal | | | | |
| | Issuer | | Amount | | | Value | |
| | | | | | | | |
| | Foreign Government Bonds—62.1% | | | | | | | | |
| | Angola—2.1% | | | | | | | | |
| | Angolan Government International Bond, 8.000%, due 11/26/29 | | $ | 300 | | | $ | 264 | |
| | Angolan Government International Bond, 8.750%, due 4/14/32(a) | | | 250 | | | | 216 | |
| | Angolan Government International Bond, 9.125%, due 11/26/49 | | | 400 | | | | 312 | |
| | Angolan Government International Bond, 9.375%, due 5/8/48 | | | 200 | | | | 157 | |
| | | | | | | | | 949 | |
| | Argentina—1.5% | | | | | | | | |
| | Argentine Government International Bond, 0.500%, due 7/9/30, (b) | | | 215 | | | | 58 | |
| | Argentine Government International Bond, 3.000%, due 1/9/38, (b) | | EUR | 320 | | | | 87 | |
| | Argentine Government International Bond, 3.500%, due 7/9/41, (b) | | $ | 955 | | | | 270 | |
| | Argentine Government International Bond, 3.875%, due 1/9/38, (b) | | | 930 | | | | 293 | |
| | | | | | | | | 708 | |
| | Azerbaijan—0.5% | | | | | | | | |
| | Azerbaijan International Bond, 3.500%, due 9/1/32 | | | 300 | | | | 249 | |
| | Bahrain—1.3% | | | | | | | | |
| | Bahrain Government International Bond, 5.250%, due 1/25/33 | | | 200 | | | | 170 | |
| | Bahrain Government International Bond, 6.250%, due 1/25/51 | | | 300 | | | | 235 | |
| | Bahrain Government International Bond, 7.000%, due 1/26/26 | | | 200 | | | | 204 | |
| | | | | | | | | 609 | |
| | Benin—0.3% | | | | | | | | |
| | Benin Government International Bond, 6.875%, due 1/19/52 | | EUR | 200 | | | | 155 | |
| | Bermuda—1.2% | | | | | | | | |
| | Bermuda Government International Bond, 3.375%, due 8/20/50 | | $ | 200 | | | | 140 | |
| | Bermuda Government International Bond, 5.000%, due 7/15/32(a) | | | 200 | | | | 199 | |
| | Bermuda Government International Bond, 5.000%, due 7/15/32 | | | 200 | | | | 198 | |
| | | | | | | | | 537 | |
| | Brazil—1.5% | | | | | | | | |
| | Brazil Letras do Tesouro Nacional, 0.000%, due 1/1/26 | | BRL | 900 | | | | 119 | |
| | Brazilian Government International Bond, 4.750%, due 1/14/50 | | $ | 280 | | | | 195 | |
| | Brazilian Government International Bond, 5.625%, due 2/21/47 | | | 200 | | | | 158 | |
| | Brazil Notas do Tesouro Nacional Serie F, 10.000%, due 1/1/25 | | BRL | 560 | | | | 101 | |
| | Brazil Notas do Tesouro Nacional Serie F, 10.000%, due 1/1/33 | | | 610 | | | | 99 | |
| | | | | | | | | 672 | |
| | Cameroon—0.4% | | | | | | | | |
| | Republic of Cameroon Government International Bond, 5.950%, due 7/7/32(a) | | EUR | 250 | | | | 197 | |
| | | | | | | | |
| | | | Principal | | | | |
| | Issuer | | Amount | | | Value | |
| | | | | | | | |
| | Foreign Government Bonds—(continued) | | | | | | | | |
| | Chile—0.5% | | | | | | | | |
| | Chile Government International Bond, 4.340%, due 3/7/42 | | $ | 250 | | | $ | 211 | |
| | Colombia—1.9% | | | | | | | | |
| | Colombia Government International Bond, 4.125%, due 2/22/42 | | | 300 | | | | 187 | |
| | Colombia Government International Bond, 4.125%, due 5/15/51 | | | 200 | | | | 120 | |
| | Colombia Government International Bond, 5.000%, due 6/15/45 | | | 650 | | | | 446 | |
| | Colombia Government International Bond, 6.125%, due 1/18/41 | | | 120 | | | | 96 | |
| | | | | | | | | 849 | |
| | Costa Rica—0.7% | | | | | | | | |
| | Costa Rica Government International Bond, 4.375%, due 4/30/25 | | | 340 | | | | 328 | |
| | Dominican Republic—2.8% | | | | | | | | |
| | Dominican Republic International Bond, 4.875%, due 9/23/32 | | | 290 | | | | 240 | |
| | Dominican Republic International Bond, 5.300%, due 1/21/41 | | | 200 | | | | 154 | |
| | Dominican Republic International Bond, 5.875%, due 1/30/60 | | | 400 | | | | 292 | |
| | Dominican Republic International Bond, 6.400%, due 6/5/49 | | | 320 | | | | 258 | |
| | Dominican Republic International Bond, 9.750%, due 6/5/26 | | DOP | 19,000 | | | | 321 | |
| | | | | | | | | 1,265 | |
| | Ecuador—2.1% | | | | | | | | |
| | Ecuador Government International Bond, 0.000%, due 7/31/30 | | $ | 410 | | | | 159 | |
| | Ecuador Government International Bond, 2.500%, due 7/31/35, (b) | | 890 | | | | 407 | |
| | Ecuador Government International Bond, 5.500%, due 7/31/30, (b) | | 630 | | | | 401 | |
| | | | | | | | | 967 | |
| | Egypt—3.0% | | | | | | | | |
| | Egypt Government International Bond, 4.750%, due 4/16/26 | | EUR | 200 | | | | 177 | |
| | Egypt Government International Bond, 6.375%, due 4/11/31 | | | 250 | | | | 184 | |
| | Egypt Government International Bond, 7.300%, due 9/30/33(a) | | $ | 250 | | | | 177 | |
| | Egypt Government International Bond, 7.500%, due 2/16/61 | | | 250 | | | | 152 | |
| | Egypt Government International Bond, 8.750%, due 9/30/51(a) | | | 250 | | | | 167 | |
| | Egypt Government International Bond, 8.875%, due 5/29/50 | | | 750 | | | | 500 | |
| | | | | | | | | 1,357 | |
| | El Salvador—0.9% | | | | | | | | |
| | El Salvador Government International Bond, 6.375%, due 1/18/27 | | | 225 | | | | 97 | |
| | El Salvador Government International Bond, 7.625%, due 2/1/41 | | | 440 | | | | 169 | |
| | El Salvador Government International Bond, 8.250%, due 4/10/32 | | | 110 | | | | 47 | |
| | El Salvador Government International Bond, 9.500%, due 7/15/52 | | | 225 | | | | 97 | |
| | | | | | | | | 410 | |
See accompanying Notes to Financial Statements.
| December 31, 2022 | William Blair Funds | 91 |
Emerging Markets Debt Fund
Portfolio of Investments, December 31, 2022 (all dollar amounts in thousands)
| | | | | | | | |
| | | | Principal | | | | |
| | Issuer | | Amount | | | Value | |
| | | | | | | | |
| | Foreign Government Bonds—(continued) | | | | | | | | |
| | Gabon—0.4% | | | | | | | | |
| | Gabon Government International Bond, 7.000%, due 11/24/31 | | $ | 250 | | | $ | 205 | |
| | Ghana—1.7% | | | | | | | | |
| | Ghana Government International Bond, 0.000%, due 4/7/25 (c) | | | 350 | | | | 111 | |
| | Ghana Government International Bond, 6.375%, due 2/11/27 (c) | | | 600 | | | | 225 | |
| | Ghana Government International Bond, 7.750%, due 4/7/29 (c) | | | 500 | | | | 181 | |
| | Ghana Government International Bond, 8.625%, due 4/7/34 (c) | | | 400 | | | | 142 | |
| | Ghana Government International Bond, 8.950%, due 3/26/51 (c) | | | 350 | | | | 121 | |
| | | | | | | | | 780 | |
| | Guatemala—0.4% | | | | | | | | |
| | Guatemala Government Bond, 3.700%, due 10/7/33 | | | 200 | | | | 164 | |
| | Hungary—0.5% | | | | | | | | |
| | Hungary Government International Bond, 3.125%, due 9/21/51 | | | 400 | | | | 238 | |
| | Indonesia—3.8% | | | | | | | | |
| | Indonesia Government International Bond, 3.400%, due 9/18/29 | | | 550 | | | | 506 | |
| | Indonesia Government International Bond, 3.750%, due 6/14/28 | | EUR | 300 | | | | 311 | |
| | Indonesia Government International Bond, 4.450%, due 4/15/70 | | $ | 250 | | | | 209 | |
| | Indonesia Government International Bond, 5.125%, due 1/15/45 | | | 500 | | | | 482 | |
| | Indonesia Government International Bond, 6.500%, due 6/15/25 | | IDR | 3,500,000 | | | | 225 | |
| | | | | | | | | 1,733 | |
| | Iraq—1.3% | | | | | | | | |
| | Iraq International Bond, 6.752%, due 3/9/23 | | $ | 600 | | | | 591 | |
| | Ivory Coast—1.0% | | | | | | | | |
| | Ivory Coast Government International Bond, 6.625%, due 3/22/48 | | EUR | 600 | | | | 452 | |
| | Kenya—1.0% | | | | | | | | |
| | Kenya Government International Bond, 8.250%, due 2/28/48 | | $ | 600 | | | | 466 | |
| | Lebanon—0.4% | | | | | | | | |
| | Lebanon Government International Bond, 5.800%, due 4/14/20(c) | | | 1,400 | | | | 79 | |
| | Lebanon Government International Bond, 6.850%, due 3/23/27(c) | | | 600 | | | | 34 | |
| | Lebanon Government International Bond, 7.150%, due 11/20/31(c) | | | 1,200 | | | | 68 | |
| | | | | | | | | 181 | |
| | Mexico—1.5% | | | | | | | | |
| | Mexico Government International Bond, 3.750%, due 4/19/71 | | | 400 | | | | 249 | |
| | Mexico Government International Bond, 4.875%, due 5/19/33 | | | 225 | | | | 208 | |
| | Mexico Government International Bond, 5.625%, due 3/19/14 | | GBP | 275 | | | | 248 | |
| | | | | | | | | 705 | |
| | | | | | | | |
| | | | Principal | | | | |
| | Issuer | | Amount | | | Value | |
| | | | | | | | |
| | Foreign Government Bonds—(continued) | | | | | | | | |
| | Mongolia—0.8% | | | | | | | | |
| | Mongolia Government International Bond, 4.450%, due 7/7/31 | | $ | 200 | | | $ | 154 | |
| | Mongolia Government International Bond, 5.625%, due 5/1/23 | | | 200 | | | | 194 | |
| | | | | | | | | 348 | |
| | Morocco—0.3% | | | | | | | | |
| | Morocco Government International Bond, 4.000%, due 12/15/50 | | | 200 | | | | 136 | |
| | Mozambique—0.7% | | | | | | | | |
| | Mozambique International Bond, 5.000%, due 9/15/31, (b) | | | 400 | | | | 303 | |
| | Nigeria—2.0% | | | | | | | | |
| | Nigeria Government International Bond, 6.500%, due 11/28/27 | | | 400 | | | | 322 | |
| | Nigeria Government International Bond, 7.696%, due 2/23/38 | | | 400 | | | | 270 | |
| | Nigeria Government International Bond, 8.250%, due 9/28/51(a) | | | 475 | | | | 316 | |
| | | | | | | | | 908 | |
| | Oman—1.2% | | | | | | | | |
| | Oman Government International Bond, 4.750%, due 6/15/26 | | | 200 | | | | 193 | |
| | Oman Government International Bond, 6.750%, due 1/17/48 | | | 400 | | | | 372 | |
| | | | | | | | | 565 | |
| | Pakistan—0.7% | | | | | | | | |
| | Pakistan Government International Bond, 8.875%, due 4/8/51 | | | 900 | | | | 308 | |
| | Panama—1.4% | | | | | | | | |
| | Panama Government International Bond, 4.500%, due 4/1/56 | | | 200 | | | | 147 | |
| | Panama Government International Bond, 4.500%, due 1/19/63 | | | 400 | | | | 282 | |
| | Panama Government International Bond, 6.400%, due 2/14/35 | | | 200 | | | | 203 | |
| | | | | | | | | 632 | |
| | Paraguay—1.0% | | | | | | | | |
| | Paraguay Government International Bond, 5.400%, due 3/30/50 | | | 350 | | | | 300 | |
| | Paraguay Government International Bond, 5.600%, due 3/13/48 | | | 200 | | | | 174 | |
| | | | | | | | | 474 | |
| | Peru—1.9% | | | | | | | | |
| | Peruvian Government International Bond, 2.783%, due 1/23/31 | | | 840 | | | | 695 | |
| | Peruvian Government International Bond, 3.600%, due 1/15/72 | | | 300 | | | | 195 | |
| | | | | | | | | 890 | |
| | Philippines—1.8% | | | | | | | | |
| | Philippine Government International Bond, 3.700%, due 2/2/42 | | | 500 | | | | 406 | |
| | Philippines Government International Bond, 5.609%, due 4/13/33 | | | 400 | | | | 422 | |
| | | | | | | | | 828 | |
See accompanying Notes to Financial Statements.
| 92 | Annual Report | December 31, 2022 |
Emerging Markets Debt Fund
Portfolio of Investments, December 31, 2022 (all dollar amounts in thousands)
| | | | | | | | |
| | | | Principal | | | | |
| | Issuer | | Amount | | | Value | |
| | | | | | | | |
| | Foreign Government Bonds—(continued) | | | | | | | | |
| | Qatar—2.9% | | | | | | | | |
| | Qatar Government International Bond, 3.400%, due 4/16/25 | | $ | 450 | | | $ | 435 | |
| | Qatar Government International Bond, 4.400%, due 4/16/50 | | | 1,000 | | | | 910 | |
| | | | | | | | | 1,345 | |
| | Romania—1.3% | | | | | | | | |
| | Romanian Government International Bond, 2.875%, due 4/13/42 | | EUR | 200 | | | | 119 | |
| | Romanian Government International Bond, 3.375%, due 1/28/50 | | | 780 | | | | 479 | |
| | | | | | | | | 598 | |
| | Saudi Arabia—2.1% | | | | | | | | |
| | Saudi Government International Bond, 2.250%, due 2/2/33 | | $ | 400 | | | | 323 | |
| | Saudi Government International Bond, 3.250%, due 11/17/51 | | | 200 | | | | 143 | |
| | Saudi Government International Bond, 3.450%, due 2/2/61 | | | 500 | | | | 356 | |
| | Saudi Government International Bond, 3.750%, due 1/21/55 | | | 200 | | | | 157 | |
| | | | | | | | | 979 | |
| | Senegal—0.3% | | | | | | | | |
| | Senegal Government International Bond, 5.375%, due 6/8/37 | | EUR | 200 | | | | 143 | |
| | Serbia—0.3% | | | | | | | | |
| | Serbia International Bond, 2.050%, due 9/23/36 | | | 200 | | | | 120 | |
| | South Africa—2.2% | | | | | | | | |
| | South Africa Government International Bond, 5.750%, due 9/30/49 | | $ | 800 | | | | 586 | |
| | South Africa Government International Bond, 7.300%, due 4/20/52 | | | 200 | | | | 171 | |
| | South Africa Government International Bond, 8.750%, due 2/28/48 | | ZAR | 5,400 | | | | 249 | |
| | | | | | | | | 1,006 | |
| | Sri Lanka—1.3% | | | | | | | | |
| | Sri Lanka Government International Bond, 5.750%, due 4/18/23(b)(c) | | $ | 400 | | | | 119 | |
| | Sri Lanka Government International Bond, 6.850%, due 11/3/25(b)(c) | | | 400 | | | | 120 | |
| | Sri Lanka Government International Bond, 7.850%, due 3/14/29(b)(c) | | | 1,200 | | | | 345 | |
| | | | | | | | | 584 | |
| | Tunisia—0.7% | | | | | | | | |
| | Runisia International Bond, 5.625%, due 2/17/24 | | EUR | 400 | | | | 336 | |
| | Turkey—2.2% | | | | | | | | |
| | Turkey Government International Bond, 4.375%, due 7/8/27 | | | 100 | | | | 100 | |
| | Turkey Government International Bond, 4.875%, due 10/9/26 | | $ | 200 | | | | 179 | |
| | Turkey Government International Bond, 4.875%, due 4/16/43 | | | 900 | | | | 583 | |
| | Turkey Government International Bond, 5.950%, due 1/15/31 | | | 200 | | | | 166 | |
| | | | | | | | | 1,028 | |
| | | | | | | | |
| | | | Principal | | | | |
| | Issuer | | Amount | | | Value | |
| | | | | | | | |
| | Foreign Government Bonds—(continued) | | | | | | | | |
| | Ukraine—0.9% | | | | | | | | |
| | Ukraine Government International Bond, 0.000%, due 8/1/41, (b) (c) | | $ | 280 | | | $ | 80 | |
| | Ukraine Government International Bond, 6.876%, due 5/21/31(b) (c) | | | 200 | | | | 38 | |
| | Ukraine Government International Bond, 7.253%, due 3/15/35(b) (c) | | | 1,500 | | | | 279 | |
| | | | | | | | | 397 | |
| | United Arab Emirates—1.3% | | | | | | | | |
| | Abu Dhabi Government International Bond, 2.700%, due 9/2/70 | | | 450 | | | | 277 | |
| | Dubai Government International Bond, 3.900%, due 9/9/50 | | | 450 | | | | 320 | |
| | | | | | | | | 597 | |
| | Uruguay—0.7% | | | | | | | | |
| | Uruguay Government International Bond, 4.975%, due 4/20/55 | | | 350 | | | | 337 | |
| | Vietnam—0.4% | | | | | | | | |
| | Vietnam Government International Bond, 4.800%, due 11/19/24 | | | 200 | | | | 195 | |
| | Zambia—1.0% | | | | | | | | |
| | Zambia Government International Bond, 8.500%, due 4/14/24(b) | | | 400 | | | | 180 | |
| | Zambia Government International Bond, 8.970%, due 7/30/27(b) | | | 600 | | | | 264 | |
| | | | | | | | | 444 | |
| | Total Foreign Government Bonds—62.1%
(cost $33,169) | | | | | | | 28,479 | |
| | | | | | | | | | |
| | Foreign Corporate Bonds—30.1% | | | | | | | | |
| | Brazil—1.2% | | | | | | | | |
| | Embraer Netherlands Finance BV, 5.050%, due 6/15/25 | | | 200 | | | | 194 | |
| | Fibria Overseas Finance Ltd., 4.000%, due 1/14/25 | | | 200 | | | | 194 | |
| | Petrorio Luxembourg Trading Sarl, 6.125%, due 6/9/26 | | | 200 | | | | 190 | |
| | | | | | | | | 578 | |
| | Chile—2.3% | | | | | | | | |
| | CAP SA, 3.900%, due 4/27/31 | | | 250 | | | | 195 | |
| | Celulosa Arauco y Constitucion SA, 4.250%, due 4/30/29 | | | 200 | | | | 187 | |
| | Empresa Nacional del Petroleo, 5.250%, due 11/6/29 | | | 450 | | | | 434 | |
| | Kenbourne Invest SA, 4.700%, due 1/22/28 | | | 200 | | | | 156 | |
| | VTR Finance NV, 6.375%, due 7/15/28 | | | 200 | | | | 73 | |
| | | | | | | | | 1,045 | |
See accompanying Notes to Financial Statements.
| December 31, 2022 | William Blair Funds | 93 |
Emerging Markets Debt Fund
Portfolio of Investments, December 31, 2022 (all dollar amounts in thousands)
| | | | | | | | |
| | | | Principal | | | | |
| | Issuer | | Amount | | | Value | |
| | | | | | | | |
| | Foreign Corporate Bonds—(continued) | | | | | | | | |
| | China—2.9% | | | | | | | | |
| | Bank of East Asia Ltd., 5 year CMT + 5.527%, 5.825%, due 10/21/25, (d) (e) | | $ | 250 | | | $ | 219 | |
| | China Evergrande Group, 9.500%, due 3/29/24(b) (c) | | | 300 | | | | 20 | |
| | China Hongqiao Group Ltd., 6.250%, due 6/8/24 | | | 200 | | | | 184 | |
| | Huarong Finance 2017 Co. Ltd., 4.250%, due 11/7/27 | | | 200 | | | | 169 | |
| | Lenovo Group Ltd., 5.875%, due 4/24/25 | | | 200 | | | | 196 | |
| | Sinochem Offshore Capital Co. Ltd., 2.375%, due 9/23/31 | | | 500 | | | | 379 | |
| | Sinochem Offshore Capital Co. Ltd., 3.375%, due 5/12/26 | | | 200 | | | | 170 | |
| | Yuzhou Group Holdings Co. Ltd., 7.850%, due 8/12/26(c) | | | 200 | | | | 18 | |
| | | | | | | | | 1,355 | |
| | Colombia—0.8% | | | | | | | | |
| | Canacol Energy Ltd., 5.750%, due 11/24/28(a) | | | 200 | | | | 176 | |
| | Gran Tierra Energy International Holdings Ltd., 6.250%, due 2/15/25 | | | 200 | | | | 174 | |
| | | | | | | | | 350 | |
| | Costa Rica—0.4% | | | | | | | | |
| | Instituto Costarricense de Electricidad, 6.375%, due 5/15/43 | | | 250 | | | | 196 | |
| | Dominican Republic—0.9% | | | | | | | | |
| | Aeropuertos Dominicanos Siglo XXI SA, 6.750%, due 3/30/29 | | | 200 | | | | 194 | |
| | Empresa Generadora de Electricidad Haina SA, 5.625%, due 11/8/28(a) | | | 250 | | | | 221 | |
| | | | | | | | | 415 | |
| | Georgia—0.4% | | | | | | | | |
| | Georgian Railway JSC, 4.000%, due 6/17/28 | | | 200 | | | | 174 | |
| | Ghana—0.3% | | | | | | | | |
| | Tullow Oil PLC, 7.000%, due 3/1/25 | | | 200 | | | | 121 | |
| | Guatemala—0.8% | | | | | | | | |
| | Energuate Trust, 5.875%, due 5/3/27 | | | 200 | | | | 189 | |
| | Investment Energy Resources Ltd., 6.250%, due 4/26/29(a) | | | 200 | | | | 187 | |
| | | | | | | | | 376 | |
| | India—1.1% | | | | | | | | |
| | Continuum Energy Levanter Pte. Ltd., 4.500%, due 2/9/27 | | | 194 | | | | 175 | |
| | Export-Import Bank of India, 3.875%, due 2/1/28 | | | 200 | | | | 185 | |
| | Export-Import Bank of India, 2.250%, due 1/13/31 | | | 200 | | | | 158 | |
| | | | | | | | | 518 | |
| | | | | | | | |
| | | | Principal | | | | |
| | Issuer | | Amount | | | Value | |
| | | | | | | | |
| | Foreign Corporate Bonds—(continued) | | | | | | | | |
| | Indonesia—3.1% | | | | | | | | |
| | Bank Negara Indonesia Persero Tbk PT, 3.750%, due 3/30/26 | | $ | 200 | | | $ | 182 | |
| | Medco Laurel Tree Pte. Ltd., 6.950%, due 11/12/28 | | | 200 | | | | 177 | |
| | Nickel Industries Ltd., 6.500%, due 4/1/24(a) | | | 200 | | | | 184 | |
| | Pertamina Persero PT, 2.300%, due 2/9/31 | | | 200 | | | | 161 | |
| | Pertamina Persero PT, 3.100%, due 8/27/30 | | | 400 | | | | 342 | |
| | Pertamina Persero PT, 6.000%, due 5/3/42 | | | 200 | | | | 189 | |
| | Perusahaan Penerbit SBSN Indonesia III, 4.700%, due 6/6/32(a) | | | 200 | | | | 197 | |
| | | | | | | | | 1,432 | |
| | Jamaica—0.4% | | | | | | | | |
| | Sagicor Financial Co. Ltd., 5.300%, due 5/13/28 | | | 200 | | | | 187 | |
| | Kazakhstan—1.3% | | | | | | | | |
| | KazMunayGas National Co. JSC, 3.500%, due 4/14/33 | | | 800 | | | | 589 | |
| | Kuwait—0.4% | | | | | | | | |
| | NBK Tier 1 Ltd., 6 year CMT + 2.875%, 3.625%, due 8/24/26, (d) (e) | | | 200 | | | | 174 | |
| | Malaysia—3.5% | | | | | | | | |
| | 1MDB Global Investments Ltd., 4.400%, due 3/9/23 | | | 1,200 | | | | 1,172 | |
| | Dua Capital Ltd., 2.780%, due 5/11/31 | | | 300 | | | | 238 | |
| | Petronas Capital Ltd., 4.550%, due 4/21/50 | | | 200 | | | | 177 | |
| | | | | | | | | 1,587 | |
| | Mexico—4.0% | | | | | | | | |
| | Banco Santander Mexico SA Institucion de Banca Multiple Grupo Financiero Santand, 5.375%, due 4/17/25 | | | 200 | | | | 198 | |
| | BBVA Bancomer SA, 5 year CMT + 2.650%, 5.125%, due 1/18/33, (e) | | | 200 | | | | 179 | |
| | Credito Real SAB de CV SOFOM ER, 5.000%, due 2/1/27(c) | | EUR | 200 | | | | 6 | |
| | Petroleos Mexicanos, 7.690%, due 1/23/50 | | $ | 250 | | | | 173 | |
| | Petroleos Mexicanos, 6.750%, due 9/21/47 | | | 1,248 | | | | 795 | |
| | Petroleos Mexicanos, 6.700%, due 2/16/32 | | | 330 | | | | 259 | |
| | Petroleos Mexicanos, 5.950%, due 1/28/31 | | | 300 | | | | 227 | |
| | | | | | | | | 1,837 | |
| | Mongolia—0.4% | | | | | | | | |
| | Development Bank of Mongolia LLC, 7.250%, due 10/23/23 | | | 200 | | | | 178 | |
See accompanying Notes to Financial Statements.
| 94 | Annual Report | December 31, 2022 |
Emerging Markets Debt Fund
Portfolio of Investments, December 31, 2022 (all dollar amounts in thousands)
| | | | | | | | |
| | | | Principal | | | | |
| | Issuer | | Amount | | | Value | |
| | | | | | | | |
| | Foreign Corporate Bonds—(continued) | | | | | | | | |
| | Nigeria—0.4% | | | | | | | | |
| | SEPLAT Energy PLC, 7.750%, due 4/1/26 | | $ | 250 | | | $ | 198 | |
| | Oman—0.4% | | | | | | | | |
| | Bank Muscat SAOG, 4.750%, due 3/17/26 | | | 200 | | | | 190 | |
| | Panama—0.4% | | | | | | | | |
| | Aeropuerto Internacional de Tocumen SA, 5.125%, due 8/11/61 | | | 250 | | | | 205 | |
| | Peru—1.3% | | | | | | | | |
| | Corp. Financiera de Desarrollo SA, 2.400%, due 9/28/27 | | | 420 | | | | 352 | |
| | Fondo MIVIVIENDA SA, 4.625%, due 4/12/27(a) | | | 250 | | | | 235 | |
| | | | | | | | | 587 | |
| | South Africa—0.4% | | | | | | | | |
| | Stillwater Mining Co., 4.000%, due 11/16/26 | | | 200 | | | | 176 | |
| | Supranational—0.4% | | | | | | | | |
| | African Export-Import Bank, 2.634%, due 5/17/26 | | | 200 | | | | 177 | |
| | Trinidad And Tobago—0.9% | | | | | | | | |
| | Heritage Petroleum Co. Ltd., 9.000%, due 8/12/29(a) | | | 200 | | | | 207 | |
| | Heritage Petroleum Co. Ltd., 9.000%, due 8/12/29 | | | 200 | | | | 208 | |
| | | | | | | | | 415 | |
| | United Arab Emirates—1.3% | | | | | | | | |
| | Aldar Sukuk Ltd., 4.750%, due 9/29/25 | | | 200 | | | | 196 | |
| | Finance Department Government of Sharjah, 4.000%, due 7/28/50 | | | 300 | | | | 196 | |
| | MAF Global Securities Ltd., 5 year CMT + 3.539%, 6.375%, due 3/20/26, (d) (e) | | | 200 | | | | 191 | |
| | | | | | | | | 583 | |
| | Uzbekistan—0.4% | | | | | | | | |
| | Ipoteka-Bank ATIB, 5.500%, due 11/19/25 | | | 200 | | | | 173 | |
| | Total Foreign Corporate Bonds—30.1%
(cost $15,464) | | | | | | | 13,816 | |
| | | | | | | | | | |
| | Foreign Municipal Bonds—1.2% | | | | | | | | |
| | Argentina—1.2% | | | | | | | | |
| | Provincia de Buenos Aires, 5.250%, due 9/1/37, (a) (b) | | | 50 | | | | 17 | |
| | Provincia de Buenos Aires, 4.500%, due 9/1/37, (a) (b) | | | 200 | | | | 56 | |
| | Provincia de Buenos Aires, 5.250%, due 9/1/37, (b) | | | 400 | | | | 138 | |
| | Provincia de Cordoba, 6.875%, due 12/10/25, (b) | | | 200 | | | | 160 | |
| | Provincia del Chubut Argentina, 7.750%, due 7/26/30, (b) | | | 219 | | | | 178 | |
| | | | | | | | | 549 | |
| | Total Foreign Municipal Bonds—1.2%
(cost $662) | | | | | | | 549 | |
| | | | | | | | |
| | | | Principal | | | | |
| | Issuer | | Amount | | | Value | |
| | | | | | | | |
| | Repurchase Agreement | | | | | | | | |
| | Fixed Income Clearing Corporation, 1.600% dated 12/30/22, due 01/03/23, repurchase price $482, collateralized by U.S. Treasury Note, 2.375%, due 03/31/29, valued at $491 | | $ | 482 | | | $ | 482 | |
| | Total Repurchase Agreement—1.1%
(cost $482) | | | | | | | 482 | |
| | | | | | | | | | |
| | U.S. Government—3.6% | | | | | | | | |
| | U.S. Treasury Bill, 3.521%, due 2/16/23 (f) | | | 456 | | | | 454 | |
| | U.S. Treasury Bill, 4.239%, due 3/9/23 (f) | | | 258 | | | | 256 | |
| | U.S. Treasury Bill, 4.450%, due 4/4/23 | | | 470 | | | | 465 | |
| | U.S. Treasury Bill, 4.600%, due 5/11/23 | | | 470 | | | | 462 | |
| | Total U.S. Government—3.6%
(cost $1,637) | | | | | | | 1,637 | |
| | Total Investments in Securities—98.1%
(cost $51,414) | | | | | | | 44,963 | |
| | Total Investments—98.1%
(cost $51,414) | | | | | | | 44,963 | |
| | Cash and other assets, less liabilities—1.9% | | | | | | | 863 | |
| | Net assets—100.0% | | | | | | $ | 45,826 | |
(a) Security exempt from registration under Rule 144A of the Securities Act of 1933. These securities may be resold in transactions exempt from registration, normally to qualified institutional buyers.
(b) Variable/Floating interest rate security. Certain variable/floating interest rate securities are not based on a published reference rate and spread but are determined by the issuer or agent and are based on current market conditions. These securities do not indicate a reference rate and spread in their description above. Rate presented is as of December 31, 2022.
(c) Security is currently in default and/or non-income producing.
(d) Security is perpetual in nature and has no stated maturity.
(e) Floating Rate Bond. Rate shown is as of December 31, 2022.
(f) Security, or portion of security, is segregated as collateral to cover initial margin requirements on centrally cleared swaps aggregating a total value of $545 (in thousands).
CMT = Constant Maturity Treasury
EURIBOR = Euro Interbank Offered Rate
SOFR = Secured Overnight Financing Rate
SONIA = Sterling Overnight Index Average
At December 31, 2022, the Fund’s Portfolio of Investments includes the following industry categories (as a percentage of long-term investments):
| Sovereign | | | 67.4 | % |
| Quasi-Sovereign | | | 16.9 | % |
| Corporate | | | | |
| Financials | | | 5.3 | % |
| Energy | | | 2.8 | % |
| Materials | | | 2.6 | % |
| Utilities | | | 1.8 | % |
| Industrials | | | 0.9 | % |
| Communication Services | | | 0.5 | % |
| Information Technology | | | 0.5 | % |
| Sub Sovereign | | | 1.3 | % |
| Total | | | 100.0 | % |
At December 31, 2022, the Fund’s Portfolio of Investments includes the following currency categories (as a percentage of long-term investments):
| U.S. Dollar | | | 90.1 | % |
| Euro | | | 6.7 | % |
| All Other Currencies | | | 3.2 | % |
| Total | | | 100.0 | % |
See accompanying Notes to Financial Statements.
| December 31, 2022 | William Blair Funds | 95 |
Emerging Markets Debt Fund
Portfolio of Investments, December 31, 2022 (all dollar amounts in thousands)
Forward Foreign Currency Contracts
| | | | | | | | | USD (Base) | | | | | | Net
Unrealized | |
| Settlement | | | | | | Local Currency | | Purchased | | | Current | | | Appreciation | |
| Date | | Deliver/Receive | | Counterparty | | (in thousands) | | or Sold | | | Value | | | (Depreciation) | |
| Sold | | | | | | | | | | | | | | | | | | | |
| 3/15/23 | | British Pound Sterling | | Citibank N.A. London | | 218 | | | $ 270 | | | | $ 263 | | | | $ | 7 | |
| 3/15/23 | | Euro | | Citibank N.A. London | | 3,080 | | | 3,301 | | | | 3,314 | | | | | (13 | ) |
| Total net unrealized appreciation (depreciation) on forward foreign currency contracts | | | | | | | | $ | (6 | ) |
Centrally Cleared Interest Rate Swaps
| | | | | | | | | | | | | | | | Upfront | | | | | | | |
| | | | | | | | | | | | | Notional | | | Payment | | | | | Unrealized | |
| Floating Rate | | Pay/Receive | | Fixed | | Payment | | Maturity | | Cleared | | Amount | | | Paid | | | | | Appreciation | |
| Reference | | Floating Rate | | Rate | | Frequency | | Date | | Exchange | | (in thousands) | | | (Received) | | | Value | | (Depreciation) | |
| 1-Day USD SOFR | | Receive | | 3.500% | | 1Y | | June 2047 | | LCH | | $ | 200 | | | $ | 2 | | | $ | (6 | ) | | $ | (8 | ) |
| 1-Day USD SOFR | | Receive | | 3.750% | | 1Y | | June 2032 | | LCH | | $ | 1,115 | | | | (8 | ) | | | (23 | ) | | | (15 | ) |
| 6 Month EURIBOR | | Receive | | 3.250% | | 1Y | | September 2032 | | LCH | | EUR | 128 | | | | — | | | | (1 | ) | | | (1 | ) |
| 6 Month EURIBOR | | Receive | | 3.000% | | 1Y | | September 2027 | | LCH | | EUR | 115 | | | | — | | | | 1 | | | | 1 | |
| 6 Month EURIBOR | | Receive | | 3.000% | | 1Y | | September 2029 | | LCH | | EUR | 556 | | | | 3 | | | | 5 | | | | 2 | |
| 6 Month EURIBOR | | Receive | | 3.250% | | 1Y | | September 2037 | | LCH | | EUR | 766 | | | | (2 | ) | | | (15 | ) | | | (13 | ) |
| 6 Month EURIBOR | | Receive | | 2.750% | | 1Y | | September 2047 | | LCH | | EUR | 367 | | | | 5 | | | | (4 | ) | | | (9 | ) |
| 1-Day GBP SONIA | | Receive | | 3.650% | | 1Y | | December 2037 | | LCH | | GBP | 240 | | | | — | | | | — | | | | — | |
| 1-Day USD SOFR | | Pay | | 4.000% | | 1Y | | June 2025 | | LCH | | $ | 2,080 | | | | 3 | | | | 2 | | | | (1 | ) |
| 1-Day USD SOFR | | Pay | | 3.750% | | 1Y | | June 2027 | | LCH | | $ | 2,494 | | | | (2 | ) | | | 8 | | | | 10 | |
| 1-Day USD SOFR | | Pay | | 3.750% | | 1Y | | June 2029 | | LCH | | $ | 1,038 | | | | (2 | ) | | | 11 | | | | 13 | |
| 1-Day USD SOFR | | Pay | | 3.500% | | 1Y | | June 2042 | | LCH | | $ | 46 | | | | — | | | | — | | | | — | |
| 1-Day USD SOFR | | Pay | | 3.000% | | 1Y | | June 2062 | | LCH | | $ | 6 | | | | — | | | | — | | | | — | |
| | | | | | | | | | | | | | | | | | | | | | | | | $ | (21 | ) |
See accompanying Notes to Financial Statements.
| 96 | Annual Report | December 31, 2022 |
Emerging Markets Debt Fund
Portfolio of Investments, December 31, 2022 (all dollar amounts in thousands)
Centrally Cleared Credit Default Swaps
| | | | | | | | | | | | | | | | Upfront | | | | | | | |
| | | | | | | | | | | | | Notional | | | Payment | | | | | Unrealized | |
| Reference | | Buy/Sell | | | | Payment | | Maturity | | Cleared | | Amount | | | Paid | | | | | Appreciation | |
| Entity | | Protection | | Fixed Rate | | Frequency | | Date | | Exchange | | (in thousands) | | | (Received) | | | Value | | (Depreciation) | |
| Kingdom of Saudi Arabia | | Buy | | 1.000% | | 3M | | June 2026 | | ICE | | $ | 400 | | | $ | (8 | ) | | $ | (7 | ) | | $ | 1 | |
| Argentine Republic | | Buy | | 5.000% | | 3M | | December 2023 | | ICE | | | 200 | | | | 31 | | | | 27 | | | | (4 | ) |
| Argentine Republic | | Buy | | 1.000% | | 3M | | December 2025 | | ICE | | | 500 | | | | 304 | | | | 335 | | | | 31 | |
| Argentine Republic | | Buy | | 5.000% | | 3M | | June 2026 | | ICE | | | 250 | | | | 143 | | | | 155 | | | | 12 | |
| Argentine Republic | | Buy | | 1.000% | | 3M | | June 2027 | | ICE | | | 250 | | | | 205 | | | | 178 | | | | (27 | ) |
| Republic of South Africa | | Buy | | 1.000% | | 3M | | December 2027 | | ICE | | | 250 | | | | 16 | | | | 16 | | | | — | |
| Argentine Republic | | Sell | | 5.000% | | 3M | | December 2031 | | ICE | | | 500 | | | | (293 | ) | | | (330 | ) | | | (37 | ) |
| Argentine Republic | | Sell | | 5.000% | | 3M | | June 2032 | | ICE | | | 100 | | | | (63 | ) | | | (66 | ) | | | (3 | ) |
| Argentine Republic | | Sell | | 5.000% | | 3M | | December 2024 | | ICE | | | 250 | | | | (103 | ) | | | (118 | ) | | | (15 | ) |
| Argentine Republic | | Sell | | 5.000% | | 3M | | June 2027 | | ICE | | | 250 | | | | (190 | ) | | | (160 | ) | | | 30 | |
| Federative Republic of Brazil | | Sell | | 1.000% | | 3M | | December 2032 | | ICE | | | 420 | | | | (82 | ) | | | (70 | ) | | | 12 | |
| Republic of Chile | | Sell | | 1.000% | | 3M | | December 2032 | | ICE | | | 270 | | | | (23 | ) | | | (14 | ) | | | 9 | |
| | | | | | | | | | | | | | | | | | | | | | | | | $ | 9 | |
| Total net unrealized appreciation (depreciation) on swaps | | | | | | | | | | | | | | | $ | (12 | ) |
See accompanying Notes to Financial Statements.
| December 31, 2022 | William Blair Funds | 97 |
Statements of Assets and Liabilities
As of December 31, 2022 (dollar amounts in thousands)
| | | Growth
Fund | | | Large Cap
Growth
Fund | | | Mid Cap
Growth
Fund | | | Mid Cap
Value
Fund | |
| Assets | | | | | | | | | | | | |
| Investments in securities, at cost | | $ | 125,753 | | | $ | 1,096,802 | | | $ | 31,890 | | | $ | 1,597 | |
| Investments in securities, at value | | $ | 189,254 | | | $ | 1,070,563 | | | $ | 32,417 | | | $ | 1,492 | |
| Cash | | | — | | | | — | | | | 3 | | | | — | |
| Receivable for securities sold | | | — | | | | — | | | | — | | | | 29 | |
| Receivable for fund shares sold | | | 108 | | | | 3,498 | | | | 148 | | | | — | |
| Receivable from Adviser | | | 1 | | | | 159 | | | | 14 | | | | 14 | |
| Dividend and interest receivable | | | 9 | | | | 138 | | | | 2 | | | | 3 | |
| Total assets | | | 189,372 | | | | 1,074,358 | | | | 32,584 | | | | 1,538 | |
| Liabilities | | | | | | | | | | | | | | | | |
| Payable for fund shares redeemed | | | 171 | | | | 507 | | | | 109 | | | | — | |
| Payable to custodian | | | — | | | | — | | | | — | | | | 1 | |
| Management fee payable | | | 125 | | | | 557 | | | | 26 | | | | 1 | |
| Distribution fee payable | | | 5 | | | | 28 | | | | 1 | | | | — | |
| Other payables and accrued expenses | | | 63 | | | | 246 | | | | 44 | | | | 29 | |
| Total liabilities | | | 364 | | | | 1,338 | | | | 180 | | | | 31 | |
| Net assets | | $ | 189,008 | | | $ | 1,073,020 | | | $ | 32,404 | | | $ | 1,507 | |
| Capital | | | | | | | | | | | | | | | | |
| Composition of net assets | | | | | | | | | | | | | | | | |
| Paid in capital | | $ | 122,234 | | | $ | 1,133,617 | | | $ | 32,714 | | | $ | 1,643 | |
| Total distributable earnings (loss) | | | 66,774 | | | | (60,597 | ) | | | (310 | ) | | | (136 | ) |
| Net assets | | $ | 189,008 | | | $ | 1,073,020 | | | $ | 32,404 | | | $ | 1,507 | |
| | | | | | | | | | | | | | | | | |
| Class N shares | | | | | | | | | | | | | | | | |
| Net assets | | $ | 23,829 | | | $ | 132,225 | | | $ | 3,273 | | | | — | |
| Shares outstanding | | | 2,998,648 | | | | 8,073,612 | | | | 510,011 | | | | — | |
| Net asset value per share | | $ | 7.95 | | | $ | 16.38 | | | $ | 6.42 | | | | — | |
| Class I shares | | | | | | | | | | | | | | | | |
| Net assets | | $ | 136,051 | | | $ | 702,441 | | | $ | 28,633 | | | $ | 76 | |
| Shares outstanding | | | 13,404,707 | | | | 40,047,342 | | | | 3,842,458 | | | | 8,190 | |
| Net asset value per share | | $ | 10.15 | | | $ | 17.54 | | | $ | 7.45 | | | $ | 9.19 | |
| Class R6 shares | | | | | | | | | | | | | | | | |
| Net assets | | $ | 29,128 | | | $ | 238,354 | | | $ | 498 | | | $ | 1,431 | |
| Shares outstanding | | | 2,858,750 | | | | 13,599,734 | | | | 66,642 | | | | 155,673 | |
| Net asset value per share | | $ | 10.19 | | | $ | 17.53 | | | $ | 7.47 | | | $ | 9.19 | |
See accompanying Notes to Financial Statements.
| 98 | Annual Report | December 31, 2022 |
Statements of Operations
For the Year Ended December 31, 2022 (all amounts in thousands)
| | | Growth
Fund | | | Large Cap
Growth
Fund | | | Mid Cap
Growth
Fund | | | Mid Cap
Value
Fund (a) | |
| Investment income | | | | | | | | | | | | | | | | | |
| Dividends | | $ | 1,559 | | | $ | 8,585 | | | $ | 140 | | | | $ | 26 | |
| Less foreign tax withheld | | | (3 | ) | | | — | | | | — | | | | | — | |
| Interest | | | 17 | | | | 87 | | | | 4 | | | | | — | |
| Total income | | | 1,573 | | | | 8,672 | | | | 144 | | | | | 26 | |
| Expenses | | | | | | | | | | | | | | | | | |
| Investment advisory fees | | | 1,864 | | | | 6,675 | | | | 343 | | | | | 8 | |
| Distribution fees | | | 70 | | | | 368 | | | | 10 | | | | | — | |
| Custodian fees | | | 66 | | | | 65 | | | | 59 | | | | | 49 | |
| Transfer agent fees | | | 78 | | | | 141 | | | | 6 | | | | | 4 | |
| Sub-transfer agent fees | | | | | | | | | | | | | | | | | |
| Class N | | | 34 | | | | 184 | | | | 5 | | | | | — | |
| Class I | | | 103 | | | | 946 | | | | 47 | | | | | — | |
| Professional fees | | | 52 | | | | 130 | | | | 28 | | | | | 30 | |
| Registration fees | | | 55 | | | | 130 | | | | 51 | | | | | 8 | |
| Shareholder reporting fees | | | 15 | | | | 75 | | | | 4 | | | | | — | |
| Trustee fees | | | 23 | | | | 72 | | | | 5 | | | | | — | |
| Other expenses | | | 15 | | | | 42 | | | | 7 | | | | | 1 | |
| Total expenses before expense limitation | | | 2,375 | | | | 8,828 | | | | 565 | | | | | 100 | |
| Expenses waived or reimbursed by the Adviser | | | | | | | | | | | | | | | | | |
| Class N | | | (12 | ) | | | (194 | ) | | | (19 | ) | | | | — | |
| Class I | | | — | | | | (1,013 | ) | | | (172 | ) | | | | (4 | ) |
| Class R6 | | | — | | | | (133 | ) | | | (2 | ) | | | | (88 | ) |
| Total expenses waived or reimbursed by the Adviser | | | (12 | ) | | | (1,340 | ) | | | (193 | ) | | | | (92 | ) |
| Net expenses | | | 2,363 | | | | 7,488 | | | | 372 | | | | | 8 | |
| Net investment income (loss) | | | (790 | ) | | | 1,184 | | | | (228 | ) | | | | 18 | |
| Realized and unrealized gain (loss) | | | | | | | | | | | | | | | | | |
| Net realized gain (loss) on transactions from: | | | | | | | | | | | | | | | | | |
| Investments in securities | | | 7,497 | | | | (30,976 | ) | | | 64 | | | | | (34 | ) |
| Total net realized gain (loss) | | | 7,497 | | | | (30,976 | ) | | | 64 | | | | | (34 | ) |
| Change in net unrealized appreciation (depreciation) of: | | | | | | | | | | | | | | | | | |
| Investments in securities | | | (104,075 | ) | | | (412,476 | ) | | | (13,691 | ) | | | | (105 | ) |
| Change in net unrealized appreciation (depreciation) | | | (104,075 | ) | | | (412,476 | ) | | | (13,691 | ) | | | | (105 | ) |
| Net increase (decrease) in net assets resulting from operations | | $ | (97,368 | ) | | $ | (442,268 | ) | | $ | (13,855 | ) | | | $ | (121 | ) |
| (a) | For the period from March 16, 2022 (Commencement of Operations) to December 31, 2022. |
See accompanying Notes to Financial Statements.
| December 31, 2022 | William Blair Funds | 99 |
Statements of Changes in Net Assets
For the Years Ended December 31, 2022 and 2021 (all amounts in thousands)
| | | Growth Fund | | | Large Cap
Growth Fund | | | Mid Cap
Growth Fund | | | Mid Cap
Value
Fund | |
| | | 2022 | | | 2021 | | | 2022 | | | 2021 | | | 2022 | | | 2021 | | | 2022 (a) | |
| Operations | | | | | | | | | | | | | | | | | | | | | | | | | | | | |
| Net investment income (loss) | | $ | (790 | ) | | $ | (1,243 | ) | | $ | 1,184 | | | $ | (863 | ) | | $ | (228 | ) | | $ | (523 | ) | | $ | 18 | |
| Net realized gain (loss) on investments, and other assets and liabilities | | | 7,497 | | | | 38,774 | | | | (30,976 | ) | | | 54,657 | | | | 64 | | | | 22,029 | | | | (34 | ) |
| Change in net unrealized appreciation (depreciation) on investments, and other assets and liabilities | | | (104,075 | ) | | | 27,119 | | | | (412,476 | ) | | | 154,591 | | | | (13,691 | ) | | | (13,963 | ) | | | (105 | ) |
| Net increase (decrease) in net assets resulting from operations | | | (97,368 | ) | | | 64,650 | | | | (442,268 | ) | | | 208,385 | | | | (13,855 | ) | | | 7,543 | | | | (121 | ) |
| Distributions to shareholders | | | | | | | | | | | | | | | | | | | | | | | | | | | | |
| Class N | | | (1,055 | ) | | | (4,767 | ) | | | (1,004 | ) | | | (8,639 | ) | | | (1,380 | ) | | | (243 | ) | | | — | |
| Class I | | | (4,820 | ) | | | (31,377 | ) | | | (5,758 | ) | | | (27,171 | ) | | | (9,255 | ) | | | (1,877 | ) | | | (1 | ) |
| Class R6 | | | (1,050 | ) | | | (1,576 | ) | | | (2,071 | ) | | | (9,649 | ) | | | (155 | ) | | | (27 | ) | | | (15 | ) |
| Total distributions | | | (6,925 | ) | | | (37,720 | ) | | | (8,833 | ) | | | (45,459 | ) | | | (10,790 | ) | | | (2,147 | ) | | | (16 | ) |
| Capital stock transactions | | | | | | | | | | | | | | | | | | | | | | | | | | | | |
| Proceeds from sale of shares | | | 36,716 | | | | 24,728 | | | | 808,663 | | | | 419,690 | | | | 4,970 | | | | 8,991 | | | | 1,661 | |
| Shares issued in reinvestment of income dividends and capital gain distributions | | | 6,664 | | | | 36,511 | | | | 8,463 | | | | 43,442 | | | | 10,679 | | | | 2,127 | | | | 16 | |
| Less cost of shares redeemed | | | (95,779 | ) | | | (39,720 | ) | | | (399,025 | ) | | | (232,907 | ) | | | (11,450 | ) | | | (47,634 | ) | | | (33 | ) |
| Net increase (decrease) in net assets resulting from capital share transactions | | | (52,399 | ) | | | 21,519 | | | | 418,101 | | | | 230,225 | | | | 4,199 | | | | (36,516 | ) | | | 1,644 | |
| Increase (decrease) in net assets | | | (156,692 | ) | | | 48,449 | | | | (33,000 | ) | | | 393,151 | | | | (20,446 | ) | | | (31,120 | ) | | | 1,507 | |
| Net assets | | | | | | | | | | | | | | | | | | | | | | | | | | | | |
| Beginning of period | | | 345,700 | | | | 297,251 | | | | 1,106,020 | | | | 712,869 | | | | 52,850 | | | | 83,970 | | | | — | |
| End of period | | $ | 189,008 | | | $ | 345,700 | | | $ | 1,073,020 | | | $ | 1,106,020 | | | $ | 32,404 | | | $ | 52,850 | | | $ | 1,507 | |
| (a) | For the period from March 16, 2022 (Commencement of Operations) to December 31, 2022. |
See accompanying Notes to Financial Statements.
| 100 | Annual Report | December 31, 2022 |
Statements of Assets and Liabilities
As of December 31, 2022 (dollar amounts in thousands)
| | | Small-Mid
Cap Core
Fund | | | Small-Mid
Cap Growth
Fund | | | Small Cap
Growth
Fund | | | Small Cap
Value
Fund | |
| Assets | | | | | | | | | | | | | | | | |
| Investments in securities, at cost | | $ | 149,839 | | | $ | 1,912,151 | | | $ | 488,592 | | | $ | 1,207,622 | |
| Investments in securities, at value | | $ | 143,981 | | | $ | 2,011,999 | | | $ | 527,198 | | | $ | 1,214,063 | |
| Receivable for securities sold | | | — | | | | — | | | | 1,355 | | | | — | |
| Receivable for fund shares sold | | | 539 | | | | 4,103 | | | | 2,816 | | | | 625 | |
| Receivable from Adviser | | | 33 | | | | 58 | | | | 6 | | | | 35 | |
| Dividend and interest receivable | | | 70 | | | | 316 | | | | 139 | | | | 1,438 | |
| Total assets | | | 144,623 | | | | 2,016,476 | | | | 531,514 | | | | 1,216,161 | |
| Liabilities | | | | | | | | | | | | | | | | |
| Payable for securities purchased | | | — | | | | — | | | | 132 | | | | 744 | |
| Payable for fund shares redeemed | | | 187 | | | | 1,895 | | | | 883 | | | | 107 | |
| Management fee payable | | | 112 | | | | 1,758 | | | | 502 | | | | 797 | |
| Distribution fee payable | | | — | | | | 24 | | | | 25 | | | | 1 | |
| Other payables and accrued expenses | | | 103 | | | | 474 | | | | 135 | | | | 304 | |
| Total liabilities | | | 402 | | | | 4,151 | | | | 1,677 | | | | 1,953 | |
| Net assets | | $ | 144,221 | | | $ | 2,012,325 | | | $ | 529,837 | | | $ | 1,214,208 | |
| Capital | | | | | | | | | | | | | | | | |
| Composition of net assets | | | | | | | | | | | | | | | | |
| Paid in capital | | $ | 161,044 | | | $ | 1,915,653 | | | $ | 517,990 | | | $ | 1,204,417 | |
| Total distributable earnings (loss) | | | (16,823 | ) | | | 96,672 | | | | 11,847 | | | | 9,791 | |
| Net assets | | $ | 144,221 | | | $ | 2,012,325 | | | $ | 529,837 | | | $ | 1,214,208 | |
| Class N shares | | | | | | | | | | | | | | | | |
| Net assets | | | — | | | $ | 110,241 | | | $ | 114,324 | | | $ | 2,648 | |
| Shares outstanding | | | — | | | | 4,600,607 | | | | 4,761,162 | | | | 95,407 | |
| Net asset value per share | | | — | | | $ | 23.96 | | | $ | 24.01 | | | $ | 27.76 | |
| Class I shares | | | | | | | | | | | | | | | | |
| Net assets | | $ | 87,540 | | | $ | 1,509,931 | | | $ | 303,016 | | | $ | 758,104 | |
| Shares outstanding | | | 6,477,145 | | | | 58,266,266 | | | | 10,636,971 | | | | 27,350,192 | |
| Net asset value per share | | $ | 13.52 | | | $ | 25.91 | | | $ | 28.49 | | | $ | 27.72 | |
| Class R6 shares | | | | | | | | | | | | | | | | |
| Net assets | | $ | 56,681 | | | $ | 392,153 | | | $ | 112,497 | | | $ | 453,456 | |
| Shares outstanding | | | 4,189,250 | | | | 15,090,580 | | | | 3,936,966 | | | | 16,364,021 | |
| Net asset value per share | | $ | 13.53 | | | $ | 25.99 | | | $ | 28.57 | | | $ | 27.71 | |
See accompanying Notes to Financial Statements.
| December 31, 2022 | William Blair Funds | 101 |
Statements of Operations
For the Year Ended December 31, 2022 (all amounts in thousands)
| | | Small-Mid
Cap Core
Fund | | | Small-Mid
Cap Growth
Fund | | | Small Cap Growth
Fund | | | Small Cap
Value
Fund | |
| Investment income | | | | | | | | | | | | | | | | |
| Dividends | | $ | 1,178 | | | $ | 11,007 | | | $ | 2,714 | | | $ | 21,863 | |
| Less foreign tax withheld | | | (18 | ) | | | (177 | ) | | | (112 | ) | | | (45 | ) |
| Interest | | | 19 | | | | 238 | | | | 58 | | | | 93 | |
| Total income | | | 1,179 | | | | 11,068 | | | | 2,660 | | | | 21,911 | |
| Expenses | | | | | | | | | | | | | | | | |
| Investment advisory fees | | | 1,191 | | | | 23,191 | | | | 6,191 | | | | 10,120 | |
| Distribution fees | | | — | | | | 397 | | | | 321 | | | | 7 | |
| Custodian fees | | | 74 | | | | 89 | | | | 80 | | | | 77 | |
| Transfer agent fees | | | 6 | | | | 226 | | | | 103 | | | | 52 | |
| Sub-transfer agent fees | | | | | | | | | | | | | | | | |
| Class N | | | — | | | | 212 | | | | 154 | | | | 2 | |
| Class I | | | 149 | | | | 2,264 | | | | 329 | | | | 1,256 | |
| Professional fees | | | 36 | | | | 230 | | | | 82 | | | | 257 | |
| Registration fees | | | 34 | | | | 76 | | | | 60 | | | | 48 | |
| Shareholder reporting fees | | | 1 | | | | 131 | | | | 53 | | | | 79 | |
| Trustee fees | | | 7 | | | | 220 | | | | 50 | | | | 126 | |
| Other expenses | | | 42 | | | | 89 | | | | 26 | | | | 113 | |
| Total expenses before expense limitation | | | 1,540 | | | | 27,125 | | | | 7,449 | | | | 12,137 | |
| Expenses waived or reimbursed by the Adviser | | | | | | | | | | | | | | | | |
| Class N | | | — | | | | (125 | ) | | | (64 | ) | | | — | |
| Class I | | | (247 | ) | | | (1,274 | ) | | | (103 | ) | | | (488 | ) |
| Class R6 | | | (58 | ) | | | — | | | | — | | | | — | |
| Total expenses waived or reimbursed by the Adviser | | | (305 | ) | | | (1,399 | ) | | | (167 | ) | | | (488 | ) |
| Net expenses | | | 1,235 | | | | 25,726 | | | | 7,282 | | | | 11,649 | |
| Net investment income (loss) | | | (56 | ) | | | (14,658 | ) | | | (4,622 | ) | | | 10,262 | |
| Realized and unrealized gain (loss) | | | | | | | | | | | | | | | | |
| Net realized gain (loss) on transactions from: | | | | | | | | | | | | | | | | |
| Investments in securities | | | (4,236 | ) | | | 8,098 | | | | (12,491 | ) | | | 53,563 | |
| Redemptions in-kind | | | — | | | | 3,930 | | | | — | | | | 201,191 | |
| Foreign currency transactions | | | — | | | | (1 | ) | | | (1 | ) | | | — | |
| Total net realized gain (loss) | | | (4,236 | ) | | | 12,027 | | | | (12,492 | ) | | | 254,754 | |
| Change in net unrealized appreciation (depreciation) of: | | | | | | | | | | | | | | | | |
| Investments in securities | | | (19,672 | ) | | | (679,120 | ) | | | (136,772 | ) | | | (425,307 | ) |
| Change in net unrealized appreciation (depreciation) | | | (19,672 | ) | | | (679,120 | ) | | | (136,772 | ) | | | (425,307 | ) |
| Net increase (decrease) in net assets resulting from operations | | $ | (23,964 | ) | | $ | (681,751 | ) | | $ | (153,886 | ) | | $ | (160,291 | ) |
See accompanying Notes to Financial Statements.
| 102 | Annual Report | December 31, 2022 |
Statements of Changes in Net Assets
For the Years Ended December 31, 2022 and 2021 (all amounts in thousands)
| | | | | | | | | | | | | | | | | | | | | Small Cap Value Fund | |
| | | Small-Mid
Cap Core Fund | | | Small-Mid
Cap Growth Fund | | | Small Cap
Growth Fund | | | | | | | | | Year Ended
October 31, | |
| | | 2022 | | | 2021 | | | 2022 | | | 2021 | | | 2022 | | | 2021 | | | 2022 | | | 2021 (a) | | | 2021 | |
| Operations | | | | | | | | | | | | | | | | | | | | | | | | | | | | | | | | | | | | |
| Net investment income (loss) | | $ | (56 | ) | | $ | (88 | ) | | $ | (14,658 | ) | | $ | (26,790 | ) | | $ | (4,622 | ) | | $ | (7,225 | ) | | $ | 10,262 | | | $ | 1,951 | | | $ | 9,948 | |
| Net realized gain (loss) on investments, and other assets and liabilities | | | (4,236 | ) | | | 6,597 | | | | 12,027 | | | | 732,573 | | | | (12,492 | ) | | | 132,217 | | | | 254,754 | | | | 61,233 | | | | 239,708 | |
| Change in net unrealized appreciation (depreciation) on investments, and other assets and liabilities | | | (19,672 | ) | | | 6,181 | | | | (679,120 | ) | | | (416,628 | ) | | | (136,772 | ) | | | (38,580 | ) | | | (425,307 | ) | | | 23,828 | | | | 449,268 | |
| Net increase (decrease) in net assets resulting from operations | | | (23,964 | ) | | | 12,690 | | | | (681,751 | ) | | | 289,155 | | | | (153,886 | ) | | | 86,412 | | | | (160,291 | ) | | | 87,012 | | | | 698,924 | |
| Distributions to shareholders | | | | | | | | | | | | | | | | | | | | | | | | | | | | | | | | | | | | |
| Class N | | | — | | | | — | | | | (3,897 | ) | | | (21,416 | ) | | | (4,693 | ) | | | (32,137 | ) | | | (187 | ) | | | (117 | ) | | | — | (b) |
| Class I | | | — | | | | — | | | | (49,427 | ) | | | (214,965 | ) | | | (10,353 | ) | | | (64,470 | ) | | | (54,725 | ) | | | (40,018 | ) | | | (184,473 | ) |
| Class R6 | | | — | | | | — | | | | (12,748 | ) | | | (27,879 | ) | | | (3,839 | ) | | | (18,771 | ) | | | (33,495 | ) | | | (38,470 | ) | | | — | (b) |
| Total distributions | | | — | | | | — | | | | (66,072 | ) | | | (264,260 | ) | | | (18,885 | ) | | | (115,378 | ) | | | (88,407 | ) | | | (78,605 | ) | | | (184,473 | ) |
| Capital stock transactions | | | | | | | | | | | | | | | | | | | | | | | | | | | | | | | | | | | | |
| Proceeds from sale of shares | | | 109,055 | | | | 56,055 | | | | 509,350 | | | | 760,395 | | | | 137,373 | | | | 138,428 | | | | 229,728 | | | | 156,798 | | | | 1,256,445 | |
| Shares issued in connection with reorganization - See Note 1(b) | | | — | | | | — | | | | — | | | | — | | | | — | | | | — | | | | — | | | | — | | | | 45,734 | |
| Shares issued in reinvestment of income dividends and capital gain distributions | | | — | | | | — | | | | 64,751 | | | | 258,615 | | | | 18,519 | | | | 113,063 | | | | 86,757 | | | | 77,431 | | | | 181,788 | |
| Less cost of shares redeemed | | | (33,650 | ) | | | (6,010 | ) | | | (862,015 | ) | | | (1,572,925 | ) | | | (163,362 | ) | | | (187,055 | ) | | | (922,977 | ) | | | (193,465 | ) | | | (1,159,600 | ) |
| Net increase (decrease) in net assets resulting from capital share transactions | | | 75,405 | | | | 50,045 | | | | (287,914 | ) | | | (553,915 | ) | | | (7,470 | ) | | | 64,436 | | | | (606,492 | ) | | | 40,764 | | | | 324,367 | |
| Increase (decrease) in net assets | | | 51,441 | | | | 62,735 | | | | (1,035,737 | ) | | | (529,020 | ) | | | (180,241 | ) | | | 35,470 | | | | (855,190 | ) | | | 49,171 | | | | 838,818 | |
| Net assets | | | | | | | | | | | | | | | | | | | | | | | | | | | | | | | | | | | | |
| Beginning of period | | | 92,780 | | | | 30,045 | | | | 3,048,062 | | | | 3,577,082 | | | | 710,078 | | | | 674,608 | | | | 2,069,398 | | | | 2,020,227 | | | | 1,181,409 | |
| End of period | | $ | 144,221 | | | $ | 92,780 | | | $ | 2,012,325 | | | $ | 3,048,062 | | | $ | 529,837 | | | $ | 710,078 | | | $ | 1,214,208 | | | $ | 2,069,398 | | | $ | 2,020,227 | |
| (a) | For the period from November 1, 2021 to December 31, 2021. |
| (b) | For the period from July 17, 2021 (Commencement of Operations) to October 31, 2021. |
See accompanying Notes to Financial Statements.
| December 31, 2022 | William Blair Funds | 103 |
Statements of Assets and Liabilities
As of December 31, 2022 (dollar amounts in thousands)
| | | | Global
Leaders
Fund | | | | International
Leaders
Fund | | | | International
Growth
Fund | | | | Institutional
International
Growth
Fund |
| Assets | | | | | | | | | | | |
| Investments in securities, at cost | | $ | 65,397 | | | $ | 900,859 | | | $ | 1,193,233 | | | $ | 765,107 |
| Investments in securities, at value | | $ | 91,652 | | | $ | 989,320 | | | $ | 1,434,207 | | | $ | 905,914 |
| Foreign currency, at value (cost $ — ; $316; $146; $67) | | | — | | | | 316 | | | | 146 | | | | 67 |
| Receivable for securities sold | | | 25 | | | | 1,159 | | | | 167 | | | | 102 |
| Receivable for fund shares sold | | | 7 | | | | 14,395 | | | | 1,556 | | | | 2,097 |
| Receivable from Adviser | | | 17 | | | | 102 | | | | 116 | | | | 62 |
| Dividend and interest receivable | | | 120 | | | | 1,481 | | | | 3,394 | | | | 1,826 |
| Total assets | | | 91,821 | | | | 1,006,773 | | | | 1,439,586 | | | | 910,068 |
| Liabilities | | | | | | | | | | | | | | | |
| Payable for fund shares redeemed | | | 127 | | | | 881 | | | | 2,680 | | | | 16 |
| Management fee payable | | | 68 | | | | 729 | | | | 1,199 | | | | 741 |
| Distribution fee payable | | | 2 | | | | 8 | | | | 67 | | | | — |
| Foreign capital gains tax liability | | | 12 | | | | 712 | | | | 621 | | | | 400 |
| Other payables and accrued expenses | | | 53 | | | | 222 | | | | 383 | | | | 179 |
| Total liabilities | | | 262 | | | | 2,552 | | | | 4,950 | | | | 1,336 |
| Net assets | | $ | 91,559 | | | $ | 1,004,221 | | | $ | 1,434,636 | | | $ | 908,732 |
| Capital | | | | | | | | | | | | | | | |
| Composition of net assets | | | | | | | | | | | | | | | |
| Paid in capital | | $ | 65,915 | | | $ | 990,383 | | | $ | 1,191,080 | | | $ | 786,184 |
| Total distributable earnings (loss) | | | 25,644 | | | | 13,838 | | | | 243,556 | | | | 122,548 |
| Net assets | | $ | 91,559 | | | $ | 1,004,221 | | | $ | 1,434,636 | | | $ | 908,732 |
| | | | | | | | | | | | | | | | |
| Class N shares | | | | | | | | | | | | | | | |
| Net assets | | $ | 8,317 | | | $ | 35,966 | | | $ | 301,485 | | | | — |
| Shares outstanding | | | 628,135 | | | | 2,081,966 | | | | 12,097,722 | | | | — |
| Net asset value per share | | $ | 13.24 | | | $ | 17.28 | | | $ | 24.92 | | | | — |
| Class I shares | | | | | | | | | | | | | | | |
| Net assets | | $ | 69,987 | | | $ | 369,171 | | | $ | 981,813 | | | | — |
| Shares outstanding | | | 5,243,438 | | | | 21,202,401 | | | | 38,144,159 | | | | — |
| Net asset value per share | | $ | 13.35 | | | $ | 17.41 | | | $ | 25.74 | | | | — |
| Institutional/Class R6 shares | | | | | | | | | | | | | | | |
| Net assets | | $ | 13,255 | | | $ | 599,084 | | | $ | 151,338 | | | $ | 908,732 |
| Shares outstanding | | | 992,675 | | | | 34,385,380 | | | | 5,874,605 | | | | 70,893,789 |
| Net asset value per share | | $ | 13.35 | | | $ | 17.42 | | | $ | 25.76 | | | $ | 12.82 |
See accompanying Notes to Financial Statements.
| 104 | Annual Report | December 31, 2022 |
Statements of Operations
For the Year Ended December 31, 2022 (all amounts in thousands)
| | | | Global
Leaders
Fund | | | | International
Leaders
Fund | | | | International
Growth
Fund | | | | Institutional
International
Growth
Fund | |
| Investment income | | | | | | | | | | | | |
| Dividends | | $ | 956 | | | $ | 16,139 | | | $ | 25,806 | | | $ | 15,668 | |
| Less foreign tax withheld | | | (62 | ) | | | (1,727 | ) | | | (2,898 | ) | | | (1,818 | ) |
| Other income | | | 4 | | | | 44 | | | | 6,543 | | | | 2,908 | |
| Total income | | | 898 | | | | 14,456 | | | | 29,451 | | | | 16,758 | |
| Expenses | | | | | | | | | | | | | | | | |
| Investment advisory fees | | | 900 | | | | 9,137 | | | | 15,493 | | | | 9,260 | |
| Distribution fees | | | 24 | | | | 96 | | | | 650 | | | | — | |
| Custodian fees | | | 85 | | | | 204 | | | | 305 | | | | 214 | |
| Transfer agent fees | | | 10 | | | | 68 | | | | 109 | | | | 36 | |
| Sub-transfer agent fees | | | | | | | | | | | | | | | | |
| Class N | | | 14 | | | | 36 | | | | 313 | | | | — | |
| Class I | | | 61 | | | | 517 | | | | 1,139 | | | | — | |
| Professional fees | | | 52 | | | | 173 | | | | 228 | | | | 162 | |
| Registration fees | | | 46 | | | | 90 | | | | 60 | | | | 27 | |
| Shareholder reporting fees | | | 5 | | | | 40 | | | | 109 | | | | 12 | |
| Trustee fees | | | 9 | | | | 88 | | | | 151 | | | | 88 | |
| Other expenses | | | 9 | | | | 44 | | | | 62 | | | | 37 | |
| Total expenses before expense limitation | | | 1,215 | | | | 10,493 | | | | 18,619 | | | | 9,836 | |
| Expenses waived or reimbursed by the Adviser | | | | | | | | | | | | | | | | |
| Class N | | | (30 | ) | | | (42 | ) | | | (234 | ) | | | — | |
| Class I | | | (200 | ) | | | (582 | ) | | | (749 | ) | | | — | |
| Institutional/Class R6 | | | (12 | ) | | | (409 | ) | | | (22 | ) | | | (301 | ) |
| Total expenses waived or reimbursed by the Adviser | | | (242 | ) | | | (1,033 | ) | | | (1,005 | ) | | | (301 | ) |
| Net expenses | | | 973 | | | | 9,460 | | | | 17,614 | | | | 9,535 | |
| Net investment income (loss) | | | (75 | ) | | | 4,996 | | | | 11,837 | | | | 7,223 | |
| Realized and unrealized gain (loss) | | | | | | | | | | | | | | | | |
| Net realized gain (loss) on transactions from: | | | | | | | | | | | | | | | | |
| Investments in securities (net of foreign capital gains tax paid $— ; $365; $242; $90) | | | 712 | | | | (67,866 | ) | | | 63,131 | | | | 45,340 | |
| Foreign currency transactions | | | (5 | ) | | | (821 | ) | | | (501 | ) | | | (371 | ) |
| Total net realized gain (loss) | | | 707 | | | | (68,687 | ) | | | 62,630 | | | | 44,969 | |
| Change in net unrealized appreciation (depreciation) of: | | | | | | | | | | | | | | | | |
| Investments in securities (net of foreign capital gains tax accrual $12; $(704); $(1,290); $(763)) | | | (42,393 | ) | | | (337,376 | ) | | | (671,726 | ) | | | (410,529 | ) |
| Foreign currency translations | | | (4 | ) | | | (30 | ) | | | (186 | ) | | | (61 | ) |
| Change in net unrealized appreciation (depreciation) | | | (42,397 | ) | | | (337,406 | ) | | | (671,912 | ) | | | (410,590 | ) |
| Net increase (decrease) in net assets resulting from operations | | $ | (41,765 | ) | | $ | (401,097 | ) | | $ | (597,445 | ) | | $ | (358,398 | ) |
See accompanying Notes to Financial Statements.
| December 31, 2022 | William Blair Funds | 105 |
Statements of Changes in Net Assets
For the Years Ended December 31, 2022 and 2021 (all amounts in thousands)
| | | Global
Leaders Fund | | | International
Leaders Fund | | | International
Growth Fund | | | Institutional
International
Growth Fund | |
| | | | 2022 | | | | 2021 | | | | 2022 | | | | 2021 | | | | 2022 | | | | 2021 | | | | 2022 | | | | 2021 | |
| Operations | | | | | | | | | | | | | | | | | | | | | | | | | | | | | | | | |
| Net investment income (loss) | | $ | (75 | ) | | $ | (460 | ) | | $ | 4,996 | | | $ | (2,629 | ) | | $ | 11,837 | | | $ | (9,181 | ) | | $ | 7,223 | | | $ | (2,879 | ) |
| Net realized gain (loss) on investments, and other assets and liabilities | | | 707 | | | | 9,127 | | | | (68,687 | ) | | | 39,090 | | | | 62,630 | | | | 332,710 | | | | 44,969 | | | | 172,547 | |
| Change in net unrealized appreciation (depreciation) on investments, and other assets and liabilities | | | (42,397 | ) | | | 12,186 | | | | (337,406 | ) | | | 79,811 | | | | (671,912 | ) | | | (124,200 | ) | | | (410,590 | ) | | | (51,592 | ) |
| Net increase (decrease) in net assets resulting from operations | | | (41,765 | ) | | | 20,853 | | | | (401,097 | ) | | | 116,272 | | | | (597,445 | ) | | | 199,329 | | | | (358,398 | ) | | | 118,076 | |
| Distributions to shareholders | | | | | | | | | | | | | | | | | | | | | | |
| Class N | | | (174 | ) | | | (737 | ) | | | (68 | ) | | | (1,210 | ) | | | (23,255 | ) | | | (31,606 | ) | | | — | | | | — | |
| Class I | | | (1,502 | ) | | | (6,705 | ) | | | (631 | ) | | | (16,237 | ) | | | (74,123 | ) | | | (181,589 | ) | | | — | | | | — | |
| Institutional/Class R6 | | | (296 | ) | | | (299 | ) | | | (1,130 | ) | | | (18,646 | ) | | | (11,497 | ) | | | (13,865 | ) | | | (56,236 | ) | | | (181,394 | ) |
| Total distributions | | | (1,972 | ) | | | (7,741 | ) | | | (1,829 | ) | | | (36,093 | ) | | | (108,875 | ) | | | (227,060 | ) | | | (56,236 | ) | | | (181,394 | ) |
| Capital stock transactions | | | | | | | | | | | | | | | | | | | | | | |
| Proceeds from sale of shares | | | 14,887 | | | | 13,948 | | | | 455,376 | | | | 383,722 | | | | 539,922 | | | | 199,696 | | | | 142,332 | | | | 48,760 | |
| Shares issued in reinvestment of income dividends and capital gain distributions | | | 1,954 | | | | 7,707 | | | | 1,814 | | | | 35,670 | | | | 104,297 | | | | 211,018 | | | | 56,157 | | | | 181,112 | |
| Less cost of shares redeemed | | | (25,327 | ) | | | (13,167 | ) | | | (356,773 | ) | | | (293,194 | ) | | | (626,160 | ) | | | (572,736 | ) | | | (156,966 | ) | | | (211,193 | ) |
| Net increase (decrease) in net assets resulting from capital share transactions | | | (8,486 | ) | | | 8,488 | | | | 100,417 | | | | 126,198 | | | | 18,059 | | | | (162,022 | ) | | | 41,523 | | | | 18,679 | |
| Increase (decrease) in net assets | | | (52,223 | ) | | | 21,600 | | | | (302,509 | ) | | | 206,377 | | | | (688,261 | ) | | | (189,753 | ) | | | (373,111 | ) | | | (44,639 | ) |
| Net assets | | | | | | | | | | | | | | | | | | | | | | | | | | | | | | | | |
| Beginning of period | | | 143,782 | | | | 122,182 | | | | 1,306,730 | | | | 1,100,353 | | | | 2,122,897 | | | | 2,312,650 | | | | 1,281,843 | | | | 1,326,482 | |
| End of period | | $ | 91,559 | | | $ | 143,782 | | | $ | 1,004,221 | | | $ | 1,306,730 | | | $ | 1,434,636 | | | $ | 2,122,897 | | | $ | 908,732 | | | $ | 1,281,843 | |
See accompanying Notes to Financial Statements.
| 106 | Annual Report | December 31, 2022 |
Statements of Assets and Liabilities
As of December 31, 2022 (dollar amounts in thousands)
| | | International
Small Cap
Growth
Fund | | | Emerging
Markets
Leaders
Fund | | | Emerging
Markets
Growth
Fund | | | Emerging
Markets
ex China
Growth Fund | |
| Assets | | | | | | | | | | | | |
| Investments in securities, at cost | | $ | 239,231 | | | $ | 369,734 | | | $ | 653,171 | | | $ | 13,191 | |
| Investments in securities, at value | | $ | 234,414 | | | $ | 352,772 | | | $ | 666,595 | | | $ | 13,040 | |
| Foreign currency, at value (cost $9; $2,830; $1,315; $12) | | | 9 | | | | 2,830 | | | | 1,314 | | | | 12 | |
| Receivable for securities sold | | | 42 | | | | 212 | | | | 2,789 | | | | — | |
| Receivable for fund shares sold | | | 707 | | | | 395 | | | | 2,215 | | | | — | |
| Receivable from Adviser | | | — | | | | 41 | | | | 122 | | | | 44 | |
| Dividend and interest receivable | | | 571 | | | | 376 | | | | 1,281 | | | | 21 | |
| Total assets | | | 235,743 | | | | 356,626 | | | | 674,316 | | | | 13,117 | |
| Liabilities | | | | | | | | | | | | | | | | |
| Payable for securities purchased | | | 23 | | | | 3,244 | | | | 91 | | | | 3 | |
| Payable for fund shares redeemed | | | 386 | | | | 41 | | | | 2,175 | | | | — | |
| Management fee payable | | | 204 | | | | 280 | | | | 532 | | | | 10 | |
| Distribution fee payable | | | — | | | | — | | | | 3 | | | | — | |
| Foreign capital gains tax liability | | | 75 | | | | 831 | | | | 1,037 | | | | 9 | |
| Other payables and accrued expenses | | | 105 | | | | 137 | | | | 344 | | | | 62 | |
| Total liabilities | | | 793 | | | | 4,533 | | | | 4,182 | | | | 84 | |
| Net assets | | $ | 234,950 | | | $ | 352,093 | | | $ | 670,134 | | | $ | 13,033 | |
| Capital | | | | | | | | | | | | | | | | |
| Composition of net assets | | | | | | | | | | | | | | | | |
| Paid in capital | | $ | 283,658 | | | $ | 450,192 | | | $ | 719,520 | | | $ | 13,987 | |
| Total distributable earnings (loss) | | | (48,708 | ) | | | (98,099 | ) | | | (49,386 | ) | | | (954 | ) |
| Net assets | | $ | 234,950 | | | $ | 352,093 | | | $ | 670,134 | | | $ | 13,033 | |
| Class N shares | | | | | | | | | | | | | | | | |
| Net assets | | $ | 1,638 | | | $ | 1,092 | | | $ | 14,664 | | | | — | |
| Shares outstanding | | | 152,577 | | | | 131,778 | | | | 1,416,346 | | | | — | |
| Net asset value per share | | $ | 10.74 | | | $ | 8.29 | | | $ | 10.35 | | | | — | |
| Class I shares | | | | | | | | | | | | | | | | |
| Net assets | | $ | 98,330 | | | $ | 29,682 | | | $ | 174,884 | | | $ | 9 | |
| Shares outstanding | | | 9,021,026 | | | | 3,568,216 | | | | 16,531,867 | | | | 1,001 | |
| Net asset value per share | | $ | 10.90 | | | $ | 8.32 | | | $ | 10.58 | | | $ | 9.41 | |
| Class R6 shares | | | | | | | | | | | | | | | | |
| Net assets | | $ | 134,982 | | | $ | 321,319 | | | $ | 480,586 | | | $ | 13,024 | |
| Shares outstanding | | | 12,304,489 | | | | 38,654,874 | | | | 44,875,537 | | | | 1,382,935 | |
| Net asset value per share | | $ | 10.97 | | | $ | 8.31 | | | $ | 10.71 | | | $ | 9.42 | |
See accompanying Notes to Financial Statements.
| December 31, 2022 | William Blair Funds | 107 |
Statements of Operations
For the Year Ended December 31, 2022 (all amounts in thousands)
| | | | International
Small Cap
Growth
Fund | | | | Emerging
Markets
Leaders
Fund | | | | Emerging
Markets
Growth
Fund | | | | Emerging
Markets ex
China Growth
Fund(a) | |
| Investment income | | | | | | | | | | | | | | | | |
| Dividends | | $ | 4,536 | | | $ | 7,329 | | | $ | 13,719 | | | $ | 102 | |
| Less foreign tax withheld | | | (532 | ) | | | (900 | ) | | | (1,838 | ) | | | (17 | ) |
| Other income | | | 26 | | | | 13 | | | | 34 | | | | 1 | |
| Total income | | | 4,030 | | | | 6,442 | | | | 11,915 | | | | 86 | |
| Expenses | | | | | | | | | | | | | | | | |
| Investment advisory fees | | | 2,660 | | | | 3,985 | | | | 7,694 | | | | 59 | |
| Distribution fees | | | 5 | | | | 3 | | | | 48 | | | | — | |
| Custodian fees | | | 152 | | | | 205 | | | | 509 | | | �� | 53 | |
| Transfer agent fees | | | 22 | | | | 24 | | | | 78 | | | | 4 | |
| Sub-transfer agent fees | | | | | | | | | | | | | | | | |
| Class N | | | 2 | | | | 1 | | | | 20 | | | | — | |
| Class I | | | 90 | | | | 32 | | | | 200 | | | | — | |
| Professional fees | | | 80 | | | | 104 | | | | 228 | | | | 54 | |
| Registration fees | | | 48 | | | | 49 | | | | 80 | | | | 2 | |
| Shareholder reporting fees | | | 22 | | | | 12 | | | | 31 | | | | 1 | |
| Trustee fees | | | 25 | | | | 28 | | | | 76 | | | | 1 | |
| Other expenses | | | 16 | | | | 17 | | | | 32 | | | | 1 | |
| Total expenses before expense limitation | | | 3,122 | | | | 4,460 | | | | 8,996 | | | | 175 | |
| Expenses waived or reimbursed by the Adviser | | | | | | | | | | | | | | | | |
| Class N | | | — | | | | (2 | ) | | | (26 | ) | | | — | |
| Class I | | | — | | | | (55 | ) | | | (231 | ) | | | — | |
| Class R6 | | | — | | | | (396 | ) | | | (443 | ) | | | (116 | ) |
| Total expenses waived or reimbursed by the Adviser | | | — | | | | (453 | ) | | | (700 | ) | | | (116 | ) |
| Net expenses | | | 3,122 | | | | 4,007 | | | | 8,296 | | | | 59 | |
| Net investment income (loss) | | | 908 | | | | 2,435 | | | | 3,619 | | | | 27 | |
| Realized and unrealized gain (loss) | | | | | | | | | | | | | | | | |
| Net realized gain (loss) on transactions from: | | | | | | | | | | | | | | | | |
| Investments in securities (net of foreign capital gains tax paid $1; $1,224; $1,183; $8) | | | (40,216 | ) | | | (73,532 | ) | | | (54,941 | ) | | | (775 | ) |
| Foreign currency transactions | | | (248 | ) | | | (320 | ) | | | (1,395 | ) | | | (52 | ) |
| Total net realized gain (loss) | | | (40,464 | ) | | | (73,852 | ) | | | (56,336 | ) | | | (827 | ) |
| Change in net unrealized appreciation (depreciation) of: | | | | | | | | | | | | | | | | |
| Investments in securities (net of foreign capital gains tax accrual $75; $(1,697); $(6,564); $9) | | | (93,756 | ) | | | (55,413 | ) | | | (283,070 | ) | | | (160 | ) |
| Foreign currency translations | | | (22 | ) | | | (11 | ) | | | (68 | ) | | | — | |
| Change in net unrealized appreciation (depreciation) | | | (93,778 | ) | | | (55,424 | ) | | | (283,138 | ) | | | (160 | ) |
| Net increase (decrease) in net assets resulting from operations | | $ | (133,334 | ) | | $ | (126,841 | ) | | $ | (335,855 | ) | | $ | (960 | ) |
| (a) | For the period from July 29, 2022 (Commencement of Operations) to December 31, 2022. |
See accompanying Notes to Financial Statements.
| 108 | Annual Report | December 31, 2022 |
Statements of Changes in Net Assets
For the Years Ended December 31, 2022 and 2021 (all amounts in thousands)
| | | International Small
Cap Growth Fund | | | Emerging Markets
Leaders Fund | | | Emerging Markets
Growth Fund | | | Emerging
Markets
ex China
Growth Fund | |
| | | | 2022 | | | | 2021 | | | | 2022 | | | | 2021 | | | | 2022 | | | | 2021 | | | | | | 2022(a) | |
| Operations | | | | | | | | | | | | | | | | | | | | | | | | | | | | | | |
| Net investment income (loss) | | $ | 908 | | | $ | (1,285 | ) | | $ | 2,435 | | | $ | (611 | ) | | $ | 3,619 | | | $ | (3,469 | ) | | | | $ | 27 | |
| Net realized gain (loss) on investments, and other assets and liabilities | | | (40,464 | ) | | | 50,965 | | | | (73,852 | ) | | | 30,340 | | | | (56,336 | ) | | | 192,407 | | | | | | (827 | ) |
| Change in net unrealized appreciation (depreciation) on investments, and other assets and liabilities | | | (93,778 | ) | | | (13,255 | ) | | | (55,424 | ) | | | (58,106 | ) | | | (283,138 | ) | | | (147,125 | ) | | | | | (160 | ) |
| Net increase (decrease) in net assets resulting from operations | | | (133,334 | ) | | | 36,425 | | | | (126,841 | ) | | | (28,377 | ) | | | (335,855 | ) | | | 41,813 | | | | | | (960 | ) |
| Distributions to shareholders | | | | | | | | | | | | | | | | | | | | | | | | | | | | | | |
| Class N | | | — | | | | (504 | ) | | | (9 | ) | | | (114 | ) | | | (24 | ) | | | (5,480 | ) | | | | | — | |
| Class I | | | (202 | ) | | | (20,759 | ) | | | (289 | ) | | | (3,247 | ) | | | (278 | ) | | | (30,440 | ) | | | | | — | |
| Class R6 | | | (406 | ) | | | (34,265 | ) | | | (3,110 | ) | | | (32,392 | ) | | | (716 | ) | | | (144,353 | ) | | | | | — | |
| Total distributions | | | (608 | ) | | | (55,528 | ) | | | (3,408 | ) | | | (35,753 | ) | | | (1,018 | ) | | | (180,273 | ) | | | | | — | |
| Capital stock transactions | | | | | | | | | | | | | | | | | | | | | | | | | | | | | | |
| Proceeds from sale of shares | | | 43,756 | | | | 65,065 | | | | 100,114 | | | | 407,452 | | | | 313,584 | | | | 303,585 | | | | | | 19,590 | |
| Shares issued in reinvestment of income dividends and capital gain distributions | | | 513 | | | | 49,466 | | | | 3,401 | | | | 35,512 | | | | 956 | | | | 167,335 | | | | | | — | |
| Less cost of shares redeemed | | | (58,888 | ) | | | (48,798 | ) | | | (94,858 | ) | | | (167,286 | ) | | | (349,371 | ) | | | (486,358 | ) | | | | | (5,597 | ) |
| Net increase (decrease) in net assets resulting from capital share transactions | | | (14,619 | ) | | | 65,733 | | | | 8,657 | | | | 275,678 | | | | (34,831 | ) | | | (15,438 | ) | | | | | 13,993 | |
| Increase (decrease) in net assets | | | (148,561 | ) | | | 46,630 | | | | (121,592 | ) | | | 211,548 | | | | (371,704 | ) | | | (153,898 | ) | | | | | 13,033 | |
| Net assets | | | | | | | | | | | | | | | | | | | | | | | | | | | | | | |
| Beginning of period | | | 383,511 | | | | 336,881 | | | | 473,685 | | | | 262,137 | | | | 1,041,838 | | | | 1,195,736 | | | | | | — | |
| End of period | | $ | 234,950 | | | $ | 383,511 | | | $ | 352,093 | | | $ | 473,685 | | | $ | 670,134 | | | $ | 1,041,838 | | | | | $ | 13,033 | |
| (a) | For the period from July 29, 2022 (Commencement of Operations) to December 31, 2022. |
See accompanying Notes to Financial Statements.
| December 31, 2022 | William Blair Funds | 109 |
Statements of Assets and Liabilities
As of December 31, 2022 (dollar amounts in thousands)
| | | Emerging
Markets
Small Cap
Growth Fund | | | China
Growth
Fund | | | Emerging
Markets
Debt
Fund | |
| Assets | | | | | | | | | |
| Investments in securities, at cost | | $ | 313,988 | | | $ | 2,543 | | | $ | 51,414 | |
| Investments in securities, at value | | $ | 323,238 | | | $ | 1,934 | | | $ | 44,963 | |
| Cash | | | — | | | | 33 | | | | 26 | |
| Foreign currency, at value (cost $1,237; $— ; $— ) | | | 1,237 | | | | — | | | | — | |
| Receivable for securities sold | | | 1,086 | | | | — | | | | — | |
| Receivable for fund shares sold | | | 1,335 | | | | — | | | | — | |
| Receivable for variation margin on centrally cleared swaps | | | — | | | | — | | | | 15 | |
| Receivable from Adviser | | | 31 | | | | 16 | | | | 33 | |
| Dividend and interest receivable | | | 367 | | | | 1 | | | | 882 | |
| Unrealized appreciation on forward foreign currency contracts | | | — | | | | — | | | | 7 | |
| Total assets | | | 327,294 | | | | 1,984 | | | | 45,926 | |
| Liabilities | | | | | | | | | | | | |
| Payable for securities purchased | | | 1,747 | | | | — | | | | — | |
| Payable for fund shares redeemed | | | 303 | | | | — | | | | 18 | |
| Unrealized depreciation on forward foreign currency contracts | | | — | | | | — | | | | 13 | |
| Management fee payable | | | 314 | | | | 2 | | | | 25 | |
| Distribution fee payable | | | 1 | | | | — | | | | — | |
| Foreign capital gains tax liability | | | 2,036 | | | | — | | | | — | |
| Other payables and accrued expenses | | | 220 | | | | 35 | | | | 44 | |
| Total liabilities | | | 4,621 | | | | 37 | | | | 100 | |
| Net assets | | $ | 322,673 | | | $ | 1,947 | | | $ | 45,826 | |
| | | | | | | | | | | | | |
| Capital | | | | | | | | | | | | |
| Composition of net assets | | | | | | | | | | | | |
| Paid in capital | | $ | 374,490 | | | $ | 4,541 | | | $ | 60,027 | |
| Total distributable earnings (loss) | | | (51,817 | ) | | | (2,594 | ) | | | (14,201 | ) |
| Net assets | | $ | 322,673 | | | $ | 1,947 | | | $ | 45,826 | |
| | | | | | | | | | | | | |
| Class N shares | | | | | | | | | | | | |
| Net assets | | $ | 3,069 | | | | — | | | | — | |
| Shares outstanding | | | 190,308 | | | | — | | | | — | |
| Net asset value per share | | $ | 16.13 | | | | — | | | | — | |
| Class I shares | | | | | | | | | | | | |
| Net assets | | $ | 108,401 | | | $ | 509 | | | $ | 923 | |
| Shares outstanding | | | 6,623,481 | | | | 78,641 | | | | 124,078 | |
| Net asset value per share | | $ | 16.37 | | | $ | 6.46 | | | $ | 7.44 | |
| Class R6 shares | | | | | | | | | | | | |
| Net assets | | $ | 211,203 | | | $ | 1,438 | | | $ | 44,903 | |
| Shares outstanding | | | 12,870,584 | | | | 222,830 | | | | 6,038,695 | |
| Net asset value per share | | $ | 16.41 | | | $ | 6.45 | | | $ | 7.44 | |
See accompanying Notes to Financial Statements.
| 110 | Annual Report | December 31, 2022 |
Statements of Operations
For the Year Ended December 31, 2022 (all amounts in thousands)
| | | Emerging
Markets
Small Cap
Growth Fund | | | China
Growth
Fund | | | Emerging
Markets
Debt
Fund | |
| Investment income | | | | | | | | | | | | |
| Dividends | | $ | 6,463 | | | $ | 53 | | | $ | — | |
| Less foreign tax withheld | | | (742 | ) | | | (2 | ) | | | — | |
| Interest | | | 12 | | | | — | | | | 3,082 | |
| Less foreign tax withheld | | | — | | | | — | | | | (1 | ) |
| Total income | | | 5,733 | | | | 51 | | | | 3,081 | |
| | | | | | | | | | | | | |
| Expenses | | | | | | | | | | | | |
| Investment advisory fees | | | 4,224 | | | | 36 | | | | 299 | |
| Distribution fees | | | 9 | | | | — | | | | — | |
| Custodian fees | | | 430 | | | | 87 | | | | 139 | |
| Transfer agent fees | | | 47 | | | | 1 | | | | 3 | |
| Sub-transfer agent fees | | | | | | | | | | | | |
| Class N | | | 5 | | | | — | | | | — | |
| Class I | | | 124 | | | | 1 | | | | 1 | |
| Professional fees | | | 190 | | | | 35 | | | | 65 | |
| Registration fees | | | 51 | | | | 36 | | | | 36 | |
| Shareholder reporting fees | | | 23 | | | | 1 | | | | 3 | |
| Trustee fees | | | 32 | | | | — | | | | 3 | |
| Other expenses | | | 23 | | | | 3 | | | | 7 | |
| Total expenses before expense limitation | | | 5,158 | | | | 200 | | | | 556 | |
| Expenses waived or reimbursed by the Adviser | | | | | | | | | | | | |
| Class N | | | (5 | ) | | | — | | | | — | |
| Class I | | | (135 | ) | | | (104 | ) | | | (6 | ) |
| Class R6 | | | (142 | ) | | | (58 | ) | | | (248 | ) |
| Total expenses waived or reimbursed by the Adviser | | | (282 | ) | | | (162 | ) | | | (254 | ) |
| Net expenses | | | 4,876 | | | | 38 | | | | 302 | |
| Net investment income (loss) | | | 857 | | | | 13 | | | | 2,779 | |
| Realized and unrealized gain (loss) | | | | | | | | | | | | |
| Net realized gain (loss) on transactions from: | | | | | | | | | | | | |
| Investments in securities (net of foreign capital gains tax paid $1,603; $— ; $— ) | | | (55,306 | ) | | | (1,949 | ) | | | (7,959 | ) |
| Swaps | | | — | | | | — | | | | 569 | |
| Forward foreign currency contracts | | | — | | | | — | | | | 142 | |
| Foreign currency transactions | | | (942 | ) | | | (8 | ) | | | 55 | |
| Total net realized gain (loss) | | | (56,248 | ) | | | (1,957 | ) | | | (7,193 | ) |
| Change in net unrealized appreciation (depreciation) of: | | | | | | | | | | | | |
| Investments in securities (net of foreign capital gains tax accrual $(3,645); $— ; $— ) | | | (81,075 | ) | | | (178 | ) | | | (4,447 | ) |
| Swaps | | | — | | | | — | | | | (90 | ) |
| Forward foreign currency contracts | | | — | | | | — | | | | 20 | |
| Foreign currency translations | | | (10 | ) | | | — | | | | 7 | |
| Change in net unrealized appreciation (depreciation) | | | (81,085 | ) | | | (178 | ) | | | (4,510 | ) |
| Net increase (decrease) in net assets resulting from operations | | $ | (136,476 | ) | | $ | (2,122 | ) | | $ | (8,924 | ) |
See accompanying Notes to Financial Statements.
| December 31, 2022 | William Blair Funds | 111 |
Statements of Changes in Net Assets
For the Years Ended December 31, 2022 and 2021 (all amounts in thousands)
| | | Emerging Markets
Small Cap
Growth Fund | | | China Growth Fund | | | Emerging Markets
Debt Fund | |
| | | 2022 | | | 2021 | | | 2022 | | | 2021(a) | | | 2022 | | | 2021(b) | |
| Operations | | | | | | | | | | | | | | | | | | | | | | | | |
| Net investment income (loss) | | $ | 857 | | | $ | (2,297 | ) | | $ | 13 | | | $ | (14 | ) | | $ | 2,779 | | | $ | 1,200 | |
| Net realized gain (loss) on investments, and other assets and liabilities | | | (56,248 | ) | | | 57,364 | | | | (1,957 | ) | | | (39 | ) | | | (7,193 | ) | | | (227 | ) |
| Change in net unrealized appreciation (depreciation) on investments, and other assets and liabilities | | | (81,085 | ) | | | (1,751 | ) | | | (178 | ) | | | (431 | ) | | | (4,510 | ) | | | (1,954 | ) |
| Net increase (decrease) in net assets resulting from operations | | | (136,476 | ) | | | 53,316 | | | | (2,122 | ) | | | (484 | ) | | | (8,924 | ) | | | (981 | ) |
| Distributions to shareholders | | | | | | | | | | | | | | | | | | | | | | | | |
| Class N | | | (145 | ) | | | (333 | ) | | | — | | | | — | | | | — | | | | — | |
| Class I | | | (5,030 | ) | | | (13,825 | ) | | | — | | | | — | | | | (75 | )(c) | | | (35 | ) |
| Class R6 | | | (9,975 | ) | | | (26,855 | ) | | | (1 | ) | | | — | | | | (3,077 | )(c) | | | (1,228 | ) |
| Total distributions | | | (15,150 | ) | | | (41,013 | ) | | | (1 | ) | | | — | | | | (3,152 | ) | | | (1,263 | ) |
| Capital stock transactions | | | | | | | | | | | | | | | | | | | | | | | | |
| Proceeds from sale of shares | | | 121,609 | | | | 242,540 | | | | 420 | | | | 7,722 | | | | 4,347 | | | | 52,600 | |
| Shares issued in reinvestment of income dividends and capital gain distributions | | | 14,983 | | | | 40,338 | | | | 1 | | | | — | | | | 3,151 | | | | 1,275 | |
| Less cost of shares redeemed | | | (162,701 | ) | | | (102,182 | ) | | | (3,576 | ) | | | (13 | ) | | | (1,090 | ) | | | (137 | ) |
| Net increase (decrease) in net assets resulting from capital share transactions | | | (26,109 | ) | | | 180,696 | | | | (3,155 | ) | | | 7,709 | | | | 6,408 | | | | 53,738 | |
| Increase (decrease) in net assets | | | (177,735 | ) | | | 192,999 | | | | (5,278 | ) | | | 7,225 | | | | (5,668 | ) | | | 51,494 | |
| Net assets | | | | | | | | | | | | | | | | | | | | | | | | |
| Beginning of period | | | 500,408 | | | | 307,409 | | | | 7,225 | | | | — | | | | 51,494 | | | | — | |
| End of period | | $ | 322,673 | | | $ | 500,408 | | | $ | 1,947 | | | $ | 7,225 | | | $ | 45,826 | | | $ | 51,494 | |
| (a) | For the period from August 27, 2021 (Commencement of Operations) to December 31, 2021. |
| (b) | For the period from May 25, 2021 (Commencement of Operations) to December 31, 2021. |
| (c) | Included in the distribution is a tax return of capital in the amount of $1 and $118 (in thousands) for Class I and Class R6, respectively. |
See accompanying Notes to Financial Statements.
| 112 | Annual Report | December 31, 2022 |
Notes to Financial Statements
(1) Organization
(a) Description of the Trust
William Blair Funds (the “Trust”) is a Delaware statutory trust registered under the Investment Company Act of 1940, as amended (the “1940 Act”), as an open-end management investment company. As of the date of this report, the Trust has the following nineteen funds (the “Funds”) available for sale, each with its own investment objective and policies. For each Fund, the number of shares authorized is unlimited.
| U.S. Equity Funds | | Global Equity Fund | | Emerging Markets Debt Fund |
Growth
Large Cap Growth
Mid Cap Growth
Mid Cap Value
Small-Mid Cap Core
Small-Mid Cap Growth
Small Cap Growth
Small Cap Value | | Global Leaders International Equity Funds
International Leaders
International Growth
Institutional International Growth
International Small Cap Growth
Emerging Markets Leaders
Emerging Markets Growth
Emerging Markets ex China Growth
Emerging Markets Small Cap Growth
China Growth | | Emerging Markets Debt |
William Blair Investment Management, LLC (the “Adviser”) serves as the Trust’s investment adviser. William Blair & Company, L.L.C. (“WBC” or the “Distributor”), an affiliate of the Adviser, serves as the Trust’s principal underwriter and distributor.
(b) Reorganization of Small Cap Value Fund
In connection with the Adviser’s acquisition of Investment Counselors of Maryland, LLC (“ICM”), the Board of Trustees of the Trust and the Board of Trustees of The Advisors’ Inner Circle Fund (“AIC”) approved a reorganization of the ICM Small Company Portfolio (“Predecessor Fund”), a series of AIC advised by ICM, into the Small Cap Value Fund (“SCV Fund”) (the “Reorganization”), pursuant to which the SCV Fund acquired all assets and assumed all liabilities of the Predecessor Fund in exchange for Class I shares of the SCV Fund. The tax-free reorganization occurred on July 16, 2021. The SCV Fund is the surviving entity for legal and tax purposes and has maintained a tax year end of December 31. The Predecessor Fund is the accounting survivor for financial reporting purposes. As a result, the statement of changes in net assets and Class I financial highlights for the periods prior to the merger date reflect the operations of the Predecessor Fund. The performance and accounting history for Class N and Class R6 shares of the reorganized SCV Fund began effective July 17, 2021.
The following is a summary of shares outstanding, net assets, net asset value per share and unrealized appreciation (depreciation) immediately before and after the tax-free reorganization (dollar amounts are in thousands):
| | | Before
Reorganization | | After
Reorganization |
| | | Small Cap
Value Fund | | ICM Small
Company Portfolio | | Small Cap
Value Fund |
| Class N | | | | | | | | | | | | |
| Shares outstanding | | | 317,775 | (a) | | | N/A | | | | 317,775 | |
| Net assets | | $ | 10,216 | | | | N/A | | | $ | 10,216 | |
| Net asset value | | $ | 32.15 | (a) | | | N/A | | | $ | 32.15 | |
| Class I / Institutional Class | | | | | | | | | | | | |
| Shares outstanding | | | 760,891 | (b) | | | 59,609,442 | | | | 60,370,333 | |
| Net assets | | $ | 24,461 | | | $ | 1,916,342 | | | $ | 1,940,803 | |
| Net asset value | | $ | 32.15 | (b) | | $ | 32.15 | | | $ | 32.15 | |
| | | |
| December 31, 2022 | William Blair Funds | 113 |
Notes to Financial Statements
| | | Before
Reorganization | | After
Reorganization |
| | | Small Cap
Value Fund | | ICM Small
Company Portfolio | | Small Cap
Value Fund |
| Class R6 | | | | | | | | | | | | |
| Shares outstanding | | | 343,951 | (c) | | | N/A | | | | 343,951 | |
| Net assets | | $ | 11,057 | | | | N/A | | | $ | 11,057 | |
| Net asset value | | $ | 32.15 | (c) | | | N/A | | | $ | 32.15 | |
| Total | | | | | | | | | | | | |
| Net assets | | $ | 45,734 | | | $ | 1,916,342 | | | $ | 1,962,076 | |
| Cost of long-term investments | | $ | 46,200 | | | $ | 1,499,746 | | | $ | 1,545,946 | |
| Unrealized appreciation (depreciation) | | $ | (834 | ) | | $ | 398,015 | | | $ | 397,181 | |
| (a) | Reflects a 0.454985-for-1 stock split which occurred immediately prior to the reorganization on July 16, 2021. |
| (b) | Reflects a 0.474218-for-1 stock split which occurred immediately prior to the reorganization on July 16, 2021. |
| (c) | Reflects a 0.473845-for-1 stock split which occurred immediately prior to the reorganization on July 16, 2021. |
Assuming the reorganization had been completed on November 1, 2020, the SCV Fund’s results of operations for the year ended October 31, 2021 would have been as follows (in thousands):
| Net investment income | | $ | 10,239 | |
| Net realized and unrealized gain (loss) on investments | | | 706,989 | |
| Net increase in net assets resulting from operations | | $ | 717,228 | |
Because the combined investment portfolios have been managed as a single portfolio since the reorganization was completed, it is not practical to separate the amounts of revenue and earnings to the SCV Fund that have been included in its Statement of Operations since the reorganization.
For financial reporting purposes, assets received and shares issued by the SCV Fund were recorded at fair value; however, the cost basis of the investments from the Predecessor Fund was carried forward to align ongoing reporting of the SCV Fund’s realized and unrealized gains and losses with amounts distributable to shareholders for tax purposes.
(c) Share Classes
Each Fund is comprised of Class N, Class I and Class R6 shares, except the Mid Cap Value, Small-Mid Cap Core, Emerging Markets ex China Growth, China Growth and Emerging Markets Debt Funds, which are comprised of Class I and Class R6 shares, and Institutional International Growth Fund, which does not offer multiple classes of shares.
Class N shares are available to the general public, either directly through the Trust’s distributor or through a select number of financial intermediaries. Class N shares are sold without any sales load and carry an annual 12b-1 distribution fee at a fixed rate (0.25% for all Funds as discussed in Note 4(b) – Transactions with Affiliates – Underwriting and Distribution Services Agreements) and a sub-transfer agent fee that is not a fixed rate and varies by Fund and class, as discussed below.
Class I shares are available to certain retirement and deferred compensation plans, clients of certain financial intermediaries, and asset-based fee advisory clients of William Blair. The minimum initial investment for a Class I account is $500,000, subject to certain exceptions. Class I shares do not carry any sales load or distribution fees and generally have lower ongoing expenses than Class N shares. Class I shares have a sub-transfer agent fee that is not a fixed rate and varies by Fund and class, as discussed below.
Class R6 shares are available to certain retirement and deferred compensation plans, clients of certain financial intermediaries, asset-based fee advisory clients of William Blair, and additional types of investors, provided that neither the investor nor the financial intermediary requires the Funds to make any type of servicing or administrative payment. The minimum initial investment for a Class R6 account is $1 million, subject to certain exceptions.
Shares of the Institutional International Growth Fund require a minimum initial investment of $5 million, subject to certain exceptions.
| 114 | Annual Report | December 31, 2022 |
Notes to Financial Statements
Class R6 shares and the Institutional International Growth Fund do not carry any sales load, distribution fees or sub-transfer agent fees. Class R6 shares of a Fund generally have lower ongoing expenses than the Fund’s Class N and Class I shares.
Sub-transfer agent fees: For Class N and Class I shares, the Funds may reimburse WBC for fees paid to intermediaries such as banks, broker-dealers, financial advisers or other financial institutions for sub-administration, sub-transfer agency and other services provided to investors whose shares of record are held in omnibus, other group accounts, retirement plans or accounts traded through registered securities clearing agents. These fees may vary based on, for example, the nature of services provided, but generally range up to 0.15% of the assets of the class serviced or maintained by the intermediary or up to $15 per sub-account maintained by the intermediary, depending on the method by which the intermediary charges for the services.
(d) Fund Objectives
The investment objectives of the Funds are as follows:
| U.S. Equity Funds | | Long-term capital appreciation. |
| Global Equity Fund | | Long-term capital appreciation. |
| International Equity Funds | | Long-term capital appreciation. |
| Emerging Markets Debt Fund | | Provide attractive risk-adjusted returns relative to the Fund’s benchmark. |
(2) Significant Accounting Policies
The following is a summary of the Trust’s significant accounting policies in effect during the periods covered by the financial statements, which are in accordance with U.S. generally accepted accounting principles (“US GAAP”), which includes the accounting and reporting guidelines under Accounting Standards Topic 946, Financial Services—Investment Companies.
(a) Investment income and transactions
Investment income, realized and unrealized gains and losses, and certain Fund level expenses and expense reductions, if any, are allocated based on the relative net assets of each class, except for certain class-specific expenses, which are charged directly to the appropriate class. Differences in class expenses may result in the payment of different per share dividends by class. All share classes of the Funds have equal rights with respect to voting, subject to class specific arrangements.
Dividend income and expenses are recorded on the ex-dividend date, except for those dividends from certain foreign securities that are recorded when the information is available.
Interest income is recorded on an accrual basis, adjusted for amortization of premium or accretion of discount. Variable rate bonds and floating rate notes earn interest at coupon rates that fluctuate at specific time intervals. The interest rates shown in the Portfolio of Investments for the Emerging Markets Debt Fund were the rates in effect on December 31, 2022. Put bonds may be redeemed at the discretion of the holder on specified dates prior to maturity.
Premiums and discounts are amortized and accreted, respectively, on a straight-line basis for short-term investments and on an effective interest method for long-term investments.
For the year ended December 31, 2022, the International Growth and Institutional International Growth Funds received tax reclaim payments from certain member countries of the European Union, including interest, of $6,383 and $2,800, respectively (in thousands), relating to amounts withheld on dividends received by the Funds during the fiscal years ended December 31, 2009 through 2014. The amounts withheld on dividends were not previously passed through to the Funds’ shareholders in the years the dividends were received by the Funds. The payments received are included within other income in the Statement of Operations.
The Funds do not isolate the portion of operations resulting from fluctuations in foreign currency exchange rates on investments from the fluctuations arising from changes in the value of securities held. Such currency fluctuations are included with the net realized and unrealized gain or loss from investments.
| | | |
| December 31, 2022 | William Blair Funds | 115 |
Notes to Financial Statements
Reported net realized foreign currency gains or losses arise from disposition of foreign currency, the difference in the foreign exchange rates between the trade and settlement dates on securities transactions, and the difference between the amounts of dividends, interest and foreign withholding taxes recorded on the ex-date or accrual date and the U.S. dollar equivalent of the amounts actually received or paid. Net unrealized foreign exchange gains and losses arise from changes (due to the changes in the exchange rate) in the value of foreign currency and other assets and liabilities denominated in foreign currencies held at period end.
For financial reporting purposes, security and shareholder transactions are recorded on trade date in accordance with US GAAP. Realized gains and losses from securities transactions are recognized on a specifically identified cost basis.
Awards from class action litigation may be recorded as a reduction of cost. If the Funds no longer own the applicable securities, the proceeds are recorded as realized gains.
(b) Share Valuation and Distributions to Shareholders
Shares are sold and redeemed on a continuous basis at net asset value. The net asset value per share is determined separately for each class by dividing the Fund’s net assets attributable to that class by the number of shares of the class outstanding as of the close of regular trading on the New York Stock Exchange (the “NYSE”), which is generally 4:00 p.m. Eastern time, on each day the NYSE is open.
Distributions from net investment income, if any, for all Equity Funds are declared and paid at least annually. Distributions from net investment income for Emerging Markets Debt Fund are declared daily and paid monthly. Capital gain distributions, if any, for all Funds, are declared and paid at least annually in December and/or January. Distributions payable to shareholders are recorded on the ex-dividend date.
For the period from November 1, 2020 to July 16, 2021, the Predecessor Fund distributed its net investment income quarterly, and distributed its net realized gains at least annually. In connection with the Reorganization, the Predecessor Fund also distributed all of its net realized gains on July 13, 2021. Effective July 17, 2021, the Small Cap Value Fund pays distributions in accordance with the aforementioned policy.
(c) Foreign Currency Translation
The Funds may invest in securities denominated in foreign currencies. As such, assets and liabilities denominated in foreign currencies are translated into U.S. dollar amounts at the current exchange rate on the date of valuation. The values of foreign investments, open forward foreign currency contracts, and cash denominated in foreign currencies are translated into U.S. dollars using a spot market rate of exchange as of the time of the determination of each Fund’s net asset value, typically 4:00 p.m. Eastern time on days when there is regular trading on the NYSE. Payables and receivables for securities transactions, dividends, interest income and tax reclaims are translated into U.S. dollars using a spot market rate of exchange as of 4:00 p.m. Eastern time. Settlement of purchases and sales and dividend and interest receipts are translated into U.S. dollars using a spot market rate of exchange as of 11:00 a.m. Eastern time.
(d) Income Taxes
Each Fund intends to comply with the provisions of Subchapter M of the Code, in order to qualify as regulated investment companies. Each Fund intends to make the requisite distributions of income and capital gains to its shareholders sufficient to relieve it from all, or substantially all, federal income and excise taxes. No provision for federal income and excise taxes has been made.
Certain Funds may be subject to foreign income taxes imposed on realized gains on securities of issuers from certain foreign countries. Such taxes, if applicable, are included within net realized gain (loss) on transactions from investments in securities in the Statement of Operations.
Management evaluates tax positions taken or expected to be taken in the course of preparing the Funds’ tax returns to determine whether it is “more likely than not” that each tax position would be sustained upon examination by a taxing authority based on the technical merits of the positions. Tax positions not deemed to meet the “more likely than not” threshold would be recorded as a tax benefit or expense in the current year. Management has evaluated all of the uncertain tax positions of the Funds and has determined that no liability is required to be recorded in the financial statements.
| 116 | Annual Report | December 31, 2022 |
Notes to Financial Statements
The statute of limitations on the Funds’ tax returns for the prior three years remains open and the returns are subject to examination.
Adjustments to the cost of investments for tax purposes may be due to the deferred loss associated with current and prior year wash sales, income recognition from investments in real estate investment trusts, and the Funds’ election to mark-to-market their investments in Passive Foreign Investment Companies (“PFICs”). The cost of investments, including derivatives, for federal income tax purposes and related gross unrealized appreciation (depreciation) and net unrealized appreciation/(depreciation) at December 31, 2022, were as follows (in thousands):
| Fund | | Cost of
Investments | | | Gross
Unrealized
Appreciation | | | Gross
Unrealized
Depreciation | | | Net
Unrealized
Appreciation/
(Depreciation) |
| Growth | | $ | 128,519 | | | $ | 73,675 | | | $ | 12,940 | | | $ | 60,735 | |
| Large Cap Growth | | | 1,113,030 | | | | 81,151 | | | | 123,618 | | | | (42,467 | ) |
| Mid Cap Growth | | | 32,606 | | | | 5,361 | | | | 5,550 | | | | (189 | ) |
| Mid Cap Value | | | 1,596 | | | | 64 | | | | 168 | | | | (104 | ) |
| Small-Mid Cap Core | | | 152,023 | | | | 11,971 | | | | 20,013 | | | | (8,042 | ) |
| Small-Mid Cap Growth | | | 1,946,524 | | | | 311,638 | | | | 246,163 | | | | 65,475 | |
| Small Cap Growth | | | 502,082 | | | | 102,273 | | | | 77,157 | | | | 25,116 | |
| Small Cap Value | | | 1,212,356 | | | | 144,242 | | | | 142,535 | | | | 1,707 | |
| Global Leaders | | | 65,884 | | | | 29,637 | | | | 3,869 | | | | 25,768 | |
| International Leaders | | | 914,240 | | | | 128,135 | | | | 53,055 | | | | 75,080 | |
| International Growth | | | 1,203,449 | | | | 295,403 | | | | 64,645 | | | | 230,758 | |
| Institutional International Growth | | | 778,698 | | | | 172,629 | | | | 45,413 | | | | 127,216 | |
| International Small Cap Growth | | | 242,078 | | | | 22,801 | | | | 30,465 | | | | (7,664 | ) |
| Emerging Markets Leaders | | | 385,251 | | | | 17,894 | | | | 50,373 | | | | (32,479 | ) |
| Emerging Markets Growth | | | 671,681 | | | | 58,905 | | | | 63,991 | | | | (5,086 | ) |
| Emerging Markets ex China Growth | | | 13,306 | | | | 471 | | | | 737 | | | | (266 | ) |
| Emerging Markets Small Cap Growth | | | 319,567 | | | | 29,355 | | | | 25,684 | | | | 3,671 | |
| China Growth | | | 2,598 | | | | 12 | | | | 676 | | | | (664 | ) |
| Emerging Markets Debt | | | 52,341 | | | | 570 | | | | 7,966 | | | | (7,396 | ) |
In addition, the Funds may periodically record reclassifications among certain capital accounts to reflect differences between financial reporting and income tax basis distributions. The reclassifications were reported in order to reflect the tax treatment for certain permanent differences that exist between income tax regulations and US GAAP. The reclassifications generally relate to the tax treatment of net operating losses, redemptions in-kind, and utilization of earnings and profits distributed to shareholders on redemption of shares. These reclassifications have no impact on the net asset values or the net assets of the Funds. Accordingly, at December 31, 2022, the following reclassifications were recorded (in thousands):
| Fund | | Paid in
Capital | | | Total
Distributable
Earnings
(Loss) |
| Growth | | $ | 2,906 | | | $ | (2,906 | ) |
| Large Cap Growth | | | 1,233 | | | | (1,233 | ) |
| Mid Cap Growth | | | 2,124 | | | | (2,124 | ) |
| Mid Cap Value | | | (1 | ) | | | 1 | |
| Small-Mid Cap Core | | | (235 | ) | | | 235 | |
| Small-Mid Cap Growth | | | 1,801 | | | | (1,801 | ) |
| Small Cap Growth | | | (2,741 | ) | | | 2,741 | |
| Small Cap Value | | | 234,645 | | | | (234,645 | ) |
| Global Leaders | | | 419 | | | | (419 | ) |
| International Leaders | | | 2 | | | | (2 | ) |
| International Growth | | | 47,771 | | | | (47,771 | ) |
| | | |
| December 31, 2022 | William Blair Funds | 117 |
Notes to Financial Statements
| Fund | | Paid in
Capital | | | Total
Distributable
Earnings
(Loss) |
| Institutional International Growth | | $ | 4,540 | | | $ | (4,540 | ) |
| International Small Cap Growth | | | (339 | ) | | | 339 | |
| Emerging Markets Leaders | | | (445 | ) | | | 445 | |
| Emerging Markets Growth | | | (909 | ) | | | 909 | |
| Emerging Markets ex China Growth | | | (6 | ) | | | 6 | |
| Emerging Markets Small Cap Growth | | | (1,255 | ) | | | 1,255 | |
| China Growth | | | — | | | | — | |
| Emerging Markets Debt | | | (119 | ) | | | 119 | |
The timing and characterization of certain income and capital gain distributions are determined annually in accordance with federal income tax regulations that may differ from US GAAP. As a result, net investment income or loss and net realized gain or loss for a reporting period may differ from the amount distributed during such period.
Distributions from net realized gains for book purposes may include short-term capital gains, which are included as ordinary income for tax purposes. The tax character of distributions paid during 2022 and 2021 was as follows (in thousands):
| | | Distributions Paid in 2022 | |
| | | Ordinary
Income | | | Long-Term
Capital Gains | |
| Fund | | Class N | | | Class I | | | Class R6 | | | Class N | | | Class I | | | Class R6 | |
| Growth | | $ | — | | | $ | — | | | $ | — | | | $ | 1,055 | | | $ | 4,820 | | | $ | 1,050 | |
| Large Cap Growth | | | — | | | | 801 | | | | 396 | | | | 1,004 | | | | 4,957 | | | | 1,675 | |
| Mid Cap Growth | | | 97 | | | | 652 | | | | 11 | | | | 1,283 | | | | 8,603 | | | | 144 | |
| Mid Cap Value | | | N/A | | | | 1 | | | | 15 | | | | N/A | | | | — | | | | — | |
| Small-Mid Cap Core | | | N/A | | | | — | | | | — | | | | N/A | | | | — | | | | — | |
| Small-Mid Cap Growth | | | — | | | | — | | | | — | | | | 3,897 | | | | 49,427 | | | | 12,748 | |
| Small Cap Growth | | | — | | | | — | | | | — | | | | 4,693 | | | | 10,353 | | | | 3,839 | |
| Small Cap Value | | | 27 | | | | 9,580 | | | | 6,246 | | | | 160 | | | | 45,145 | | | | 27,249 | |
| Global Leaders | | | — | | | | 51 | | | | 19 | | | | 174 | | | | 1,451 | | | | 277 | |
| International Leaders | | | — | | | | — | | | | — | | | | 68 | | | | 631 | | | | 1,130 | |
| International Growth | | | 196 | | | | 2,305 | | | | 457 | | | | 23,059 | | | | 71,818 | | | | 11,040 | |
| Institutional International Growth | | | N/A | | | | N/A | | | | 3,768 | | | | N/A | | | | N/A | | | | 52,468 | |
| International Small Cap Growth | | | — | | | | 202 | | | | 406 | | | | — | | | | — | | | | — | |
| Emerging Markets Leaders | | | — | | | | — | | | | — | | | | 9 | | | | 289 | | | | 3,110 | |
| Emerging Markets Growth | | | — | | | | — | | | | — | | | | 24 | | | | 278 | | | | 716 | |
| Emerging Markets ex China Growth | | | N/A | | | | — | | | | — | | | | N/A | | | | — | | | | — | |
| Emerging Markets Small Cap Growth | | | — | | | | — | | | | — | | | | 145 | | | | 5,030 | | | | 9,975 | |
| China Growth | | | N/A | | | | — | | | | 1 | | | | N/A | | | | — | | | | — | |
| Emerging Markets Debt (a) | | | N/A | | | | 75 | | | | 3,077 | | | | N/A | | | | — | | | | — | |
| | | Distributions Paid in 2021 | |
| | | Ordinary
Income | | | Long-Term
Capital Gains | |
| Fund | | Class N | | | Class I | | | Class R6 | | | Class N | | | Class I | | | Class R6 | |
| Growth | | $ | 910 | | | $ | 5,989 | | | $ | 301 | | | $ | 3,857 | | | $ | 25,388 | | | $ | 1,275 | |
| Large Cap Growth | | | 192 | | | | 602 | | | | 219 | | | | 8,447 | | | | 26,569 | | | | 9,430 | |
| Mid Cap Growth | | | 93 | | | | 714 | | | | 10 | | | | 150 | | | | 1,163 | | | | 17 | |
| Small-Mid Cap Core | | | N/A | | | | — | | | | — | | | | N/A | | | | — | | | | — | |
| Small-Mid Cap Growth | | | 4,167 | | | | 41,826 | | | | 5,424 | | | | 17,249 | | | | 173,139 | | | | 22,455 | |
| Small Cap Growth | | | 9,052 | | | | 18,160 | | | | 5,287 | | | | 23,085 | | | | 46,310 | | | | 13,484 | |
| Small Cap Value (b) | | | 17 | | | | 8,093 | | | | 8,154 | | | | 100 | | | | 31,925 | | | | 30,316 | |
| Global Leaders | | | 9 | | | | 83 | | | | 4 | | | | 728 | | | | 6,622 | | | | 295 | |
| International Leaders | | | 2 | | | | 1,050 | | | | 1,464 | | | | 1,208 | | | | 15,187 | | | | 17,182 | |
| 118 | Annual Report | December 31, 2022 |
Notes to Financial Statements
| | | Distributions Paid in 2021 | |
| | | Ordinary
Income | | | Long-Term
Capital Gains | |
| Fund | | Class N | | | Class I | | | Class R6 | | | Class N | | | Class I | | | Class R6 | |
| International Growth | | $ | 3,311 | | | $ | 19,023 | | | $ | 1,452 | | | $ | 28,295 | | | $ | 162,566 | | | $ | 12,413 | |
| Institutional International Growth | | | N/A | | | | N/A | | | | 19,074 | | | | N/A | | | | N/A | | | | 162,320 | |
| International Small Cap Growth | | | 46 | | | | 2,186 | | | | 3,804 | | | | 458 | | | | 18,573 | | | | 30,461 | |
| Emerging Markets Leaders | | | 1 | | | | 204 | | | | 2,279 | | | | 113 | | | | 3,043 | | | | 30,113 | |
| Emerging Markets Growth | | | 4 | | | | 21 | | | | 830 | | | | 5,476 | | | | 30,419 | | | | 143,523 | |
| Emerging Markets Small Cap Growth | | | — | | | | — | | | | — | | | | 333 | | | | 13,825 | | | | 26,855 | |
| China Growth | | | N/A | | | | — | | | | — | | | | N/A | | | | — | | | | — | |
| Emerging Markets Debt | | | N/A | | | | 35 | | | | 1,228 | | | | N/A | | | | — | | | | — | |
| (a) | Included in the distribution is a tax return of capital in the amount of $1 and $118 (in thousands) for Class I and Class R6, respectively. |
| (b) | For the period from November 1, 2021 to December 31, 2021. For the year ended October 31, 2021, the tax character of distributions paid for Class I was $76,786 and $107,687 (in thousands) of ordinary income and long-term capital gains, respectively. There was no distribution for Class N or Class R6. |
As of December 31, 2022, the components of distributable earnings on a tax basis were as follows (in thousands):
| Fund | | Undistributed
Ordinary
Income | | | Accumulated
Capital and
Other Losses | | | Undistributed
Long-Term
Capital Gains | | | Net Unrealized
Appreciation/
(Depreciation) | | Total | |
| Growth | | $ | — | | | $ | — | | | $ | 6,039 | | | $ | 60,735 | | | $ | 66,774 | |
| Large Cap Growth | | | — | | | | (18,130 | ) | | | — | | | | (42,467 | ) | | | (60,597 | ) |
| Mid Cap Growth | | | — | | | | (121 | ) | | | — | | | | (189 | ) | | | (310 | ) |
| Mid Cap Value | | | — | | | | (32 | ) | | | — | | | | (104 | ) | | | (136 | ) |
| Small-Mid Cap Core | | | — | | | | (8,781 | ) | | | — | | | | (8,042 | ) | | | (16,823 | ) |
| Small-Mid Cap Growth | | | — | | | | — | | | | 31,197 | | | | 65,475 | | | | 96,672 | |
| Small Cap Growth | | | — | | | | (13,269 | ) | | | — | | | | 25,116 | | | | 11,847 | |
| Small Cap Value | | | — | | | | — | | | | 8,084 | | | | 1,707 | | | | 9,791 | |
| Global Leaders | | | — | | | | (108 | ) | | | — | | | | 25,752 | | | | 25,644 | |
| International Leaders | | | 365 | | | | (60,877 | ) | | | — | | | | 74,350 | | | | 13,838 | |
| International Growth | | | 1,539 | | | | — | | | | 12,191 | | | | 229,826 | | | | 243,556 | |
| Institutional International Growth | | | — | | | | (4,200 | ) | | | — | | | | 126,748 | | | | 122,548 | |
| International Small Cap Growth | | | — | | | | (40,945 | ) | | | — | | | | (7,763 | ) | | | (48,708 | ) |
| Emerging Markets Leaders | | | — | | | | (64,787 | ) | | | — | | | | (33,312 | ) | | | (98,099 | ) |
| Emerging Markets Growth | | | — | | | | (43,241 | ) | | | — | | | | (6,145 | ) | | | (49,386 | ) |
| Emerging Markets ex China Growth | | | — | | | | (679 | ) | | | — | | | | (275 | ) | | | (954 | ) |
| Emerging Markets Small Cap Growth | | | — | | | | (53,450 | ) | | | — | | | | 1,633 | | | | (51,817 | ) |
| China Growth | | | — | | | | (1,930 | ) | | | — | | | | (664 | ) | | | (2,594 | ) |
| Emerging Markets Debt | | | — | | | | (6,810 | ) | | | — | | | | (7,391 | ) | | | (14,201 | ) |
As of December 31, 2022, the Funds may have unused capital loss carryforwards available for federal income tax purposes to be applied against future capital gains, if any. Under current law, the Funds may carry forward net capital losses indefinitely to use to offset capital gains realized in future years. The following table details the Funds’ available capital loss carryforwards as of December 31, 2022, and the capital loss carryforwards utilized by the Funds in 2022 (in thousands):
| | | Available Capital Loss Carryforwards | | Capital Loss
Carryforwards |
| Fund | | Short Term | | Long Term | | Total | | Utilized in 2022 |
| Large Cap Growth | | $ | 18,130 | | | $ | — | | | $ | 18,130 | | | $ | — | |
| Mid Cap Value | | | 32 | | | | — | | | | 32 | | | | — | |
| Small-Mid Cap Core | | | 8,781 | | | | — | | | | 8,781 | | | | — | |
| Small Cap Growth | | | 13,269 | | | | — | | | | 13,269 | | | | — | |
| International Leaders | | | 50,000 | | | | 10,877 | | | | 60,877 | | | | — | |
| International Small Cap Growth | | | 24,803 | | | | 16,045 | | | | 40,848 | | | | — | |
| Emerging Markets Leaders | | | 39,679 | | | | 25,022 | | | | 64,701 | | | | — | |
| Emerging Markets Growth | | | 43,241 | | | | — | | | | 43,241 | | | | — | |
| Emerging Markets ex China Growth | | | 679 | | | | — | | | | 679 | | | | — | |
| Emerging Markets Small Cap Growth | | | 53,252 | | | | — | | | | 53,252 | | | | — | |
| China Growth | | | 1,881 | | | | 49 | | | | 1,930 | | | | — | |
| Emerging Markets Debt | | | 5,818 | | | | 805 | | | | 6,623 | | | | — | |
| | | |
| December 31, 2022 | William Blair Funds | 119 |
Notes to Financial Statements
In order to meet certain excise tax distribution requirements, the Funds are required to measure and distribute annually, net capital gains realized during a twelve month period ending October 31 and net investment income earned during a twelve month period ending December 31. In connection with this, the Funds are permitted for tax purposes to defer into their next fiscal year qualified late year losses. Qualified late year capital losses are any short term or long term capital losses incurred between November 1 and the end of their fiscal year, December 31, 2022. Qualified late year ordinary losses are comprised of losses related to swaps, foreign currency and PFICs incurred between November 1 and the end of their fiscal year, December 31, 2022.
As of December 31, 2022, the following Funds deferred, on a tax basis, qualified late year losses of (in thousands):
| | | Qualified Late Year Losses | |
| Fund | | Ordinary
Income | | | Net
Capital | |
| Mid Cap Growth | | $ | — | | | $ | 121 | |
| Global Leaders | | | — | | | | 108 | |
| Institutional International Growth | | | — | | | | 4,200 | |
| International Small Cap Growth | | | 97 | | | | — | |
| Emerging Markets Leaders | | | 86 | | | | — | |
| Emerging Markets Small Cap Growth | | | 198 | | | | — | |
| Emerging Markets Debt | | | 187 | | | | — | |
(e) Repurchase Agreements
In a repurchase agreement, a Fund buys a security at one price and at the time of sale, the seller agrees to repurchase the security at a mutually agreed upon time and price (usually within seven days). The repurchase agreement thereby determines the yield during the purchaser’s holding period, while the seller’s obligation to repurchase is secured by the value of the underlying collateral. The Adviser monitors, on an ongoing basis, the value of the underlying collateral to ensure that the value always equals or exceeds the repurchase price plus accrued interest. Repurchase agreements may involve certain risks in the event of a default or insolvency of the other party to the agreement, including possible delays or restrictions upon a Fund’s ability to dispose of the underlying collateral. The risk to a Fund is limited to the ability of the seller to pay the agreed upon sum on the delivery date. In the event of default, a repurchase agreement provides that a Fund is entitled to sell the underlying collateral. The loss, if any, to a Fund will be the difference between the proceeds from the sale and the repurchase price. However, if bankruptcy proceedings are commenced with respect to the seller of the security, disposition of the collateral by the Fund may be delayed or limited. The Funds have master repurchase agreements which allow the Funds to offset amounts owed to a counterparty with amounts owed from the same counterparty, including any collateral, in the event the counterparty defaults. Each Fund’s outstanding repurchase agreements, if any, and related collateral, are shown on the Fund’s Portfolio of Investments. Although no definitive creditworthiness criteria are used, the Adviser reviews the creditworthiness of the banks and non-bank dealers with which a Fund enters into repurchase agreements to evaluate those risks. A Fund may, for tax purposes, deem repurchase agreements collateralized by U.S. Government securities to be investments in U.S. Government securities.
(f) Use of Estimates
The preparation of financial statements in conformity with US GAAP requires management to make estimates and assumptions that affect the amounts reported in the financial statements. Actual results may differ from those estimates.
(g) Indemnification
In the normal course of business, the Funds have entered into contracts in which the Funds agree to indemnify the other party or parties against various potential costs or liabilities. The Funds’ maximum exposure under these arrangements is unknown. No claim has been made for indemnification pursuant to any such agreement of the Funds.
| 120 | Annual Report | December 31, 2022 |
Notes to Financial Statements
(h) Redemption In-Kind
In accordance with the Trust’s prospectus, the Funds may distribute portfolio securities rather than cash as payment for a redemption of Fund shares (in-kind redemption). For financial reporting purposes, the Fund recognizes a gain or loss on the transfer of securities depending on the value of those securities on the date of redemption. Gains and losses realized on in-kind redemptions may not be recognized for tax purposes and are reclassified from accumulated net realized gain (loss), a component of distributable earnings (loss), to capital paid in excess of par value. During the year ended December 31, 2022, the Small-Mid Cap Growth and Small Cap Value Funds redeemed $19,912 and $579,643 (in thousands), respectively, of fund shares in-kind rather than with cash and recognized net realized gains of $3,930 and $201,191 (in thousands), respectively, on the securities distributed to shareholders.
(3) Valuation
(a) Investment Valuation
The value of U.S. equity securities, including exchange-traded funds, is determined by valuing securities traded on national securities markets or in the over-the-counter markets at the last sale price or, if applicable, the official closing price or, in the absence of a recent sale on the date of determination, at the mean between the last reported bid and ask prices.
The value of foreign equity securities is generally determined based upon the last sale price on the foreign exchange or market on which it is primarily traded and in the currency of that market as of the close of the appropriate exchange or, if there have been no sales during that day, at the mean between the last reported bid and ask prices. The Adviser has determined that the passage of time between when the foreign exchanges or markets close and when the Funds compute their net asset values could cause the value of foreign equity securities to no longer be representative or accurate and, as a result, may necessitate that such securities be fair valued. Accordingly, for foreign equity securities, the Funds may use an independent pricing service to fair value price the security as of the close of regular trading on the NYSE. As a result, a Fund’s value for a foreign security may be different from the last sale price (or the mean between the last reported bid and ask prices). As of December 31, 2022, fair valuation estimates for foreign equity securities were not obtained.
Fixed income securities are generally valued using evaluated prices provided by an independent pricing service. The evaluated prices are formed using various market inputs that the pricing service believes accurately represent the market value of a security at a particular point in time. The pricing service determines evaluated prices for fixed income securities using inputs including, but not limited to, recent transaction prices for such securities, dealer quotes, transaction prices for other securities with similar characteristics, collateral characteristics, credit quality, payment history, liquidity and market conditions.
Repurchase agreements are valued at cost, which approximates fair value.
Forward foreign currency contracts are valued on the basis of the value of the underlying currencies at the prevailing currency exchange rate as supplied by an independent pricing service.
Swaps that are centrally cleared through an exchange are valued at the most recent settlement price provided by the exchange on which they are cleared. Total return swaps on equities, equity baskets, indices and other financial instruments are valued by an independent pricing service, or if unavailable, based on the security’s or instrument’s underlying reference asset.
Securities, and other assets, for which a market quotation is not available or is deemed unreliable (e.g., securities affected by unusual or extraordinary events, such as natural disasters or securities affected by market or economic events, such as bankruptcy filings), or the value of which is affected by a significant valuation event, are valued at a fair value. Pursuant to Rule 2a-5 under the 1940 Act, the Board of Trustees has designated the Adviser as the valuation designee to perform fair value determinations for the Funds. The value of these fair valued securities may be different from the last sale price (or the mean between the last reported bid and ask prices), and there is no guarantee that a fair valued security will be sold at the price at which a Fund is carrying the security.
| | | |
| December 31, 2022 | William Blair Funds | 121 |
Notes to Financial Statements
(b) Fair Value Measurements
Fair value is defined as the price that a Fund would receive upon selling a security in an orderly transaction to an independent buyer in the principal or most advantageous market for the investment. Various inputs are used in determining the value of a Fund’s investments. A three-tier hierarchy of inputs is used to classify fair value measurements for disclosure purposes. The three-tier hierarchy of inputs is summarized in the three broad levels listed below:
| | • | Level 1—Quoted prices (unadjusted) in active markets for an identical security. |
| | | |
| | • | Level 2—Prices determined using other significant observable inputs. Observable inputs are inputs that other market participants would use in pricing a security. These may include quoted prices for similar securities, interest rates, prepayment speeds, credit risk, and others. In addition, other observable inputs such as foreign exchange rates, benchmark securities indices and foreign futures contracts may be utilized in the valuation of certain foreign securities when significant events occur between the last sale on the foreign securities exchange and the time at which the net asset value of the Fund is calculated. |
| | | |
| | • | Level 3—Prices determined using significant unobservable inputs. In situations where quoted prices or observable inputs are unavailable (for example, when there is little or no market activity for an investment), unobservable inputs may be used. Unobservable inputs reflect the Fund’s own assumptions about the factors market participants would use in pricing an investment, and are based on the best information available. |
The inputs or methodology used for valuing an investment are not necessarily an indication of the risk associated with investing in those securities.
A description of the valuation methodologies applied to the Funds’ major categories of assets and liabilities measured at fair value on a recurring basis is as follows:
Exchange-Traded Securities
Securities traded on a national securities exchange (or reported on the NASDAQ national market), including exchange-traded funds, are stated at the last reported sales price on the day of valuation. Other securities traded in the over-the-counter market and listed securities for which no sale was reported on that date are stated at the mean between the last reported bid and ask prices. To the extent these securities are actively traded and valuation adjustments are not applied, they are categorized as Level 1 of the fair value hierarchy. Securities traded on inactive markets or valued by reference to similar instruments are generally categorized as Level 2 of the fair value hierarchy.
Fixed Income Securities
Fixed income securities are generally valued using evaluated prices provided by an independent pricing service. The evaluated prices are formed using various market inputs that the pricing service believes accurately represent the fair value of a security at a particular point in time. The pricing service determines evaluated prices for fixed income securities using inputs including, but not limited to, recent transaction prices for such securities, dealer quotes, transaction prices for other securities with similar characteristics, collateral characteristics, credit quality, payment history, liquidity and market conditions. Securities that use similar valuation techniques and observable inputs as described above are categorized as Level 2 of the fair value hierarchy.
Repurchase Agreements
Repurchase agreements are valued at cost, which approximates fair value. Repurchase agreements are categorized as Level 2 of the fair value hierarchy.
Derivative Instruments
Forward foreign currency contracts and swaps are valued using pricing inputs observed from actively quoted markets and are categorized within Level 2 of the fair value hierarchy.
| 122 | Annual Report | December 31, 2022 |
Notes to Financial Statements
As of December 31, 2022, the value of investments in securities and other financial instruments, segregated by their hierarchical input levels used in determining fair value and by security class or other financial instruments, are shown below (in thousands).
| Investments in securities | | Growth | | | Large Cap
Growth | | | Mid Cap
Growth | | | Mid Cap
Value | |
| Level 1—Quoted prices | | | | | | | | | | | | | | | | |
| Common Stocks | | $ | 188,467 | | | $ | 1,060,752 | | | $ | 31,226 | | | $ | 1,492 | |
| Level 2—Other significant observable inputs | | | | | | | | | | | | | | | | |
| Repurchase Agreements | | | 787 | | | | 9,811 | | | | 1,191 | | | | — | |
| Level 3—Significant unobservable inputs | | | | | | | | | | | | | | | | |
| Rights | | | — | | | | — | | | | — | | | | — | |
| Total investments in securities | | $ | 189,254 | | | $ | 1,070,563 | | | $ | 32,417 | | | $ | 1,492 | |
| | | | | | | | | | | | | | | | | |
| Investments in securities | | | Small-Mid
Cap Core | | | | Small-Mid
Cap Growth | | | | Small Cap
Growth | | | | Small Cap
Value | |
| Level 1—Quoted prices | | | | | | | | | | | | | | | | |
| Common Stocks | | $ | 141,641 | | | $ | 1,961,277 | | | $ | 513,299 | | | $ | 1,189,381 | |
| Level 2—Other significant observable inputs | | | | | | | | | | | | | | | | |
| Repurchase Agreements | | | 2,340 | | | | 50,722 | | | | 13,899 | | | | 24,682 | |
| Level 3—Significant unobservable inputs | | | | | | | | | | | | | | | | |
| Rights | | | — | | | | — | | | | — | | | | — | |
| Total investments in securities | | $ | 143,981 | | | $ | 2,011,999 | | | $ | 527,198 | | | $ | 1,214,063 | |
| | | | | | | | | | | | | | | | | |
| Investments in securities | | | Global
Leaders | | | | International
Leaders | | | | International
Growth | | | | Institutional
International
Growth | |
| Level 1—Quoted prices | | | | | | | | | | | | | | | | |
| Common Stocks | | $ | 90,246 | | | $ | 981,712 | | | $ | 1,427,617 | | | $ | 898,128 | |
| Level 2—Other significant observable inputs | | | | | | | | | | | | | | | | |
| Repurchase Agreements | | | 1,406 | | | | 7,608 | | | | 6,590 | | | | 7,786 | |
| Level 3—Significant unobservable inputs | | | | | | | | | | | | | | | | |
| None | | | — | | | | — | | | | — | | | | — | |
| Total investments in securities | | $ | 91,652 | | | $ | 989,320 | | | $ | 1,434,207 | | | $ | 905,914 | |
| | | | | | | | | | | | | | | | | |
| Investments in securities | | | International
Small Cap
Growth | | | | Emerging
Markets
Leaders | | | | Emerging
Markets
Growth | | | | Emerging
Markets
ex China
Growth | |
| Level 1—Quoted prices | | | | | | | | | | | | | | | | |
| Common Stocks | | $ | 229,455 | | | $ | 342,800 | | | $ | 635,742 | | | $ | 12,240 | |
| Rights | | | — | | | | — | | | | 3 | | | | — | |
| Level 2—Other significant observable inputs | | | | | | | | | | | | | | | | |
| Common Stocks | | | — | | | | 6,486 | | | | 22,353 | | | | 575 | |
| Repurchase Agreements | | | 4,959 | | | | 3,486 | | | | 8,308 | | | | 222 | |
| Level 3—Significant unobservable inputs | | | | | | | | | | | | | | | | |
| Common Stocks | | | — | | | | — | | | | 189 | | | | 3 | |
| Total investments in securities | | $ | 234,414 | | | $ | 352,772 | | | $ | 666,595 | | | $ | 13,040 | |
| | | |
| December 31, 2022 | William Blair Funds | 123 |
Notes to Financial Statements
| Investments in securities | | Emerging
Markets
Small Cap
Growth | | | China
Growth | | | Emerging
Markets
Debt | |
| Assets | | | | | | | | | | | | |
| Level 1—Quoted prices | | | | | | | | | | | | |
| Common Stocks | | $ | 313,449 | | | $ | 1,934 | | | $ | — | |
| Level 2—Other significant observable inputs | | | | | | | | | | | | |
| Common Stocks | | | 6,701 | | | | — | | | | — | |
| Foreign Corporate Bonds | | | — | | | | — | | | | 13,816 | |
| Foreign Government Bonds | | | — | | | | — | | | | 28,479 | |
| Foreign Municipal Bonds | | | — | | | | — | | | | 549 | |
| Repurchase Agreements | | | 3,088 | | | | — | | | | 482 | |
| U.S. Government | | | — | | | | — | | | | 1,637 | |
| Level 3—Significant unobservable inputs | | | | | | | | | | | | |
| None | | | — | | | | — | | | | — | |
| Liabilities | | | | | | | | | | | | |
| Level 1—Quoted prices | | | | | | | | | | | | |
| None | | | — | | | | — | | | | — | |
| Level 2—Other significant observable inputs | | | | | | | | | | | | |
| None | | | — | | | | — | | | | — | |
| Level 3—Significant unobservable inputs | | | | | | | | | | | | |
| None | | | — | | | | — | | | | — | |
| Total investments in securities | | $ | 323,238 | | | $ | 1,934 | | | $ | 44,963 | |
| Other financial instruments | | | | | | | | | | | | |
| Assets | | | | | | | | | | | | |
| Level 1—Quoted prices | | | | | | | | | | | | |
| None | | $ | — | | | $ | — | | | $ | — | |
| Level 2—Other significant observable inputs | | | | | | | | | | | | |
| Forward Foreign Currency Contracts | | | — | | | | — | | | | 7 | |
| Swaps | | | — | | | | — | | | | 121 | |
| Level 3—Significant unobservable inputs | | | | | | | | | | | | |
| None | | | — | | | | — | | | | — | |
| Liabilities | | | | | | | | | | | | |
| Level 1—Quoted prices | | | | | | | | | | | | |
| None | | | — | | | | — | | | | — | |
| Level 2—Other significant observable inputs | | | | | | | | | | | | |
| Forward Foreign Currency Contracts | | | — | | | | — | | | | (13 | ) |
| Swaps | | | — | | | | — | | | | (133 | ) |
| Level 3—Significant unobservable inputs | | | | | | | | | | | | |
| None | | | — | | | | — | | | | — | |
| Total other financial instruments | | $ | — | | | $ | — | | | $ | (18 | ) |
See Portfolio of Investments for Sector Classification.
The fair value estimates for the Level 3 securities in the Mid Cap Growth, Small-Mid Cap Growth, Small Cap Growth, Emerging Markets Growth and Emerging Markets ex China Growth Funds were determined in good faith by the Adviser pursuant to the Valuation Procedures. There were various factors considered in reaching the fair value determination, including, but not limited to, the following: the type of security, the extent of public trading of the security, information obtained for the security, and analysis of the company’s performance and market trends that influence its performance. The Level 3 securities represented 0.00%, 0.00%, 0.00%, 0.03% and 0.03% as a percentage of net assets in the Mid Cap Growth, Small-Mid Cap Growth, Small Cap Growth, Emerging Markets Growth and Emerging Markets ex China Growth Funds, respectively.
| 124 | Annual Report | December 31, 2022 |
Notes to Financial Statements
(4) Transactions with Affiliates
(a) Management and Expense Limitation Agreements
Each Fund has a management agreement with the Adviser for investment management, clerical, bookkeeping and administrative services. Each Fund pays the Adviser an annual management fee, which is accrued daily and paid monthly, based on a specified percentage of the Fund’s average daily net assets. Each Fund’s annual management fee rate is as follows:
| U.S. Equity Funds | | | | |
| Growth | | | 0.75 | % |
| Large Cap Growth | | | 0.60 | % |
| Mid Cap Growth | | | 0.90 | % |
| Mid Cap Value | | | 0.70 | % |
| Small-Mid Cap Core | | | 0.90 | % |
| Small-Mid Cap Growth | | | 1.00 | % |
| Small Cap Growth | | | 1.10 | % |
| Small Cap Value | | | 0.75 | % |
| | | | | |
| Emerging Markets Debt Fund | | | | |
| Emerging Markets Debt | | | 0.65 | % |
| | | | | |
| Global Equity Fund | | | | |
| Global Leaders | | | 0.85 | % |
| International Equity Funds | | | |
| International Leaders | | | 0.85 | % |
| International Growth1: | | | | |
| First $3 billion | | | 0.94 | % |
| Next $2 billion | | | 0.90 | % |
| Next $5 billion | | | 0.85 | % |
| Next $5 billion | | | 0.825 | % |
| In excess of $15 billion | | | 0.80 | % |
| Institutional International Growth2: | | | | |
| First $1.875 billion | | | 0.94 | % |
| Next $625 million | | | 0.90 | % |
| Next $2.5 billion | | | 0.875 | % |
| Next $5 billion | | | 0.85 | % |
| Next $5 billion | | | 0.825 | % |
| In excess of $15 billion | | | 0.80 | % |
| International Small Cap Growth | | | 1.00 | % |
| Emerging Markets Leaders3 | | | 0.94 | % |
| Emerging Markets Growth4 | | | 0.94 | % |
| Emerging Markets ex China Growth | | | 0.94 | % |
| Emerging Markets Small Cap Growth | | | 1.10 | % |
| China Growth5 | | | 0.94 | % |
| 1 | Prior to May 1, 2022, the International Growth Fund paid a management fee at a rate of 1.10% of the first $250 million of the Fund’s average daily net assets; plus 1.00% of the next $2.25 billion of the Fund’s average daily net assets; plus 0.975% of the next $2.5 billion of the Fund’s average daily net assets; plus 0.95% of the next $5 billion of the Fund’s average daily net assets; plus 0.925% of the next $5 billion of the Fund’s average daily net assets; plus 0.90% of the Fund’s average daily net assets over $15 billion. Effective May 1, 2022, the management fee paid to the Adviser was reduced to 0.94% of the first $3 billion of the Fund’s average daily net assets; plus 0.90% of the next $2 billion of the Fund’s average daily net assets; plus 0.85% of the next $5 billion of the Fund’s average daily net assets; plus 0.825% of the next $5 billion of the Fund’s average daily net assets; plus 0.80% of the Fund’s average daily net assets over $15 billion. |
| 2 | Prior to May 1, 2022, the Institutional International Growth Fund paid a management fee at a rate of 1.00% of the first $500 million of the Fund’s average daily net assets; plus 0.95% of the next $500 million of the Fund’s average daily net assets; plus 0.90% of the next $1.5 billion of the Fund’s average daily net assets; plus 0.875% of the next $2.5 billion of the Fund’s average daily net assets; plus 0.85% of the next $5 billion of the Fund’s average daily net assets; plus 0.825% of the next $5 billion of the Fund’s average daily net assets; plus 0.80% of the Fund’s average daily net assets over $15 billion. Effective May 1, 2022, the management fee paid to the Adviser was reduced to 0.94% of the first $1.875 billion of the Fund’s average daily net assets; plus 0.90% of the next $625 million of the Fund’s average daily net assets; plus 0.875% of the next $2.5 billion of the Fund’s average daily net assets; plus 0.85% of the next $5 billion of the Fund’s average daily net assets; plus 0.825% of the next $5 billion of the Fund’s average daily net assets; plus 0.80% of the Fund’s average daily net assets over $15 billion. |
| 3 | Prior to May 1, 2022, the Emerging Markets Leaders Fund paid a management fee at a rate of 1.10% of the Fund’s average daily net assets. Effective May 1, 2022, the management fee paid to the Adviser was reduced to 0.94%. |
| 4 | Prior to May 1, 2022, the Emerging Markets Growth Fund paid a management fee at a rate of 1.10% of the Fund’s average daily net assets. Effective May 1, 2022, the management fee paid to the Adviser was reduced to 0.94%. |
| 5 | Prior to May 1, 2022, the China Growth Fund paid a management fee at a rate of 1.00% of the Fund’s average daily net assets. Effective May 1, 2022, the management fee paid to the Adviser was reduced to 0.94%. |
| December 31, 2022 | William Blair Funds | 125 |
Notes to Financial Statements
The Funds have also entered into an Amended and Restated Expense Limitation Agreement with the Adviser. Under the terms of the agreement, the Adviser will waive its management fee and/or reimburse a Fund for certain operating expenses, subject to certain excluded expenses, in excess of the agreed upon rate through April 30, 2023. Excluded expenses include interest expenses, taxes, brokerage commissions, acquired fund fees and expenses, dividend and interest expenses on short sales, other investment-related costs and extraordinary expenses, such as litigation and other expenses not incurred in the ordinary course of a Fund’s business. The amount the Adviser owes a Fund as of the reporting date is recorded as Receivable from Adviser in the Statements of Assets and Liabilities. The Adviser reimburses the Funds on a monthly basis. The Adviser will waive fees and/or reimburse expenses to the extent that the total operating expenses for the stated class of the Funds, subject to certain excluded expenses, exceed the following rates (as a percentage of average daily net assets):
| | | Class N | | Class I | | Institutional/Class R6 |
| Fund | | Effective
May 1, 2022
through
April 30,
2023 | | Effective
May 1, 2021
through
April 30,
2022 | | Effective
May 1, 2022
through
April 30,
2023 | | Effective
May 1, 2021
through
April 30,
2022 | | Effective
May 1, 2022
through
April 30,
2023 | | Effective
May 1, 2021
through
April 30,
2022 |
| Growth | | | 1.20 | % | | | 1.20 | % | | | 0.95 | % | | | 0.95 | % | | | 0.90 | % | | | 0.90 | % |
| Large Cap Growth | | | 0.90 | % | | | 0.90 | % | | | 0.65 | % | | | 0.65 | % | | | 0.60 | % | | | 0.60 | % |
| Mid Cap Growth | | | 1.20 | % | | | 1.20 | % | | | 0.95 | % | | | 0.95 | % | | | 0.90 | % | | | 0.90 | % |
| Mid Cap Value | | | N/A | | | | N/A | | | | 0.75 | %2 | | | 0.75 | %1 | | | 0.70 | %2 | | | 0.70 | %1 |
| Small-Mid Cap Core | | | N/A | | | | N/A | | | | 0.95 | % | | | 0.95 | % | | | 0.90 | % | | | 0.90 | % |
| Small-Mid Cap Growth | | | 1.35 | % | | | 1.35 | % | | | 1.10 | % | | | 1.10 | % | | | 1.05 | % | | | 1.05 | % |
| Small Cap Growth | | | 1.50 | % | | | 1.50 | % | | | 1.25 | % | | | 1.25 | % | | | 1.20 | % | | | 1.20 | % |
| Small Cap Value | | | 1.15 | % | | | 1.15 | %3 | | | 0.89 | % | | | 0.89 | % | | | 0.85 | % | | | 0.85 | %3 |
| Global Leaders | | | 1.15 | % | | | 1.15 | % | | | 0.90 | % | | | 0.90 | % | | | 0.85 | % | | | 0.85 | % |
| International Leaders | | | 1.15 | % | | | 1.15 | % | | | 0.90 | % | | | 0.90 | % | | | 0.85 | % | | | 0.85 | % |
| International Growth | | | 1.24 | % | | | 1.45 | % | | | 0.99 | % | | | 1.20 | % | | | 0.94 | % | | | 1.15 | % |
| Institutional International Growth | | | N/A | | | | N/A | | | | N/A | | | | N/A | | | | 0.94 | % | | | 1.05 | % |
| International Small Cap Growth | | | 1.55 | % | | | 1.55 | % | | | 1.30 | % | | | 1.30 | % | | | 1.25 | % | | | 1.25 | % |
| Emerging Markets Leaders | | | 1.24 | % | | | 1.40 | % | | | 0.99 | % | | | 1.15 | % | | | 0.94 | % | | | 1.10 | % |
| Emerging Markets Growth | | | 1.24 | % | | | 1.60 | % | | | 0.99 | % | | | 1.35 | % | | | 0.94 | % | | | 1.30 | % |
| Emerging Markets ex China Growth | | | N/A | | | | N/A | | | | 0.99 | %2,4 | | | N/A | | | | 0.94 | %2,4 | | | N/A | |
| Emerging Markets Small Cap Growth | | | 1.55 | % | | | 1.55 | % | | | 1.30 | % | | | 1.30 | % | | | 1.25 | % | | | 1.25 | % |
| China Growth | | | N/A | | | | N/A | | | | 0.99 | % | | | 1.05 | %5 | | | 0.94 | % | | | 1.00 | %5 |
| Emerging Markets Debt | | | N/A | | | | N/A | | | | 0.70 | % | | | 0.70 | %6 | | | 0.65 | % | | | 0.65 | %6 |
| 1 | Effective March 16, 2022 (Commencement of Operations). |
| 2 | Effective through April 30, 2024. |
| 3 | Effective July 17, 2021 (Commencement of Operations). |
| 4 | Effective July 29, 2022 (Commencement of Operations). |
| 5 | Effective August 27, 2021 (Commencement of Operations). |
| 6 | Effective May 25, 2021 (Commencement of Operations). |
The fee waivers and/or expense reimbursements received by each class are reported in the Statements of Operations.
The Adviser is entitled to recoupment of previously waived fees and reimbursed expenses for a period of three years subsequent to a fund’s commencement of operations to the extent that such recoupment does not cause the fund’s annual operating expenses (after the recoupment is taken into account) to exceed both (1) the expense limit in place when such amounts were waived or reimbursed and (2) the fund’s current expense limitation. The total amounts available for recoupment as of December 31, 2022 were as follows (in thousands):
| Fund | | Available for
Recoupment | | | Expiration of
Recoupment |
| Mid Cap Value | | | $ 92 | | | March 16, 2025 |
| Emerging Markets ex China Growth | | | 116 | | | July 29, 2025 |
| China Growth | | | 218 | | | August 27, 2024 |
| Emerging Markets Debt | | | 388 | | | May 25, 2024 |
| 126 | Annual Report | December 31, 2022 |
Notes to Financial Statements
(b) Underwriting and Distribution Services Agreements
Pursuant to separate Underwriting and Distribution Agreements, WBC is the principal underwriter and distributor for the continuous offering of shares of the Trust and acts as agent of the Trust in the sale of its shares. The Underwriting Agreement provides that the Distributor will use its best efforts to distribute the Trust’s shares. The Distributor is not compensated under the Underwriting Agreement.
Each Fund, except the Mid Cap Value, Small-Mid Cap Core, Emerging Markets ex China Growth, China Growth, Emerging Markets Debt and Institutional International Growth Funds, has a Distribution Agreement with WBC for distribution services to the Funds’ Class N shares. Each Fund pays WBC an annual fee, payable monthly, based on a specified percentage of its average daily net assets of Class N shares. The annual rate expressed as a percentage of average daily net assets for Class N is 0.25% for all Funds. Pursuant to the Distribution Agreement, WBC enters into related selling group agreements with various firms at various rates for sales of the Funds’ Class N shares.
(c) Administration Agreement
For the period from November 1, 2020 to July 16, 2021, the Predecessor Fund and the SEI Investments Distribution Co. were parties to a Distribution Agreement. SEI Investments Distribution Co. received no fees under the agreement. Effective July 17, 2021, the Small Cap Value Fund was subject to the aforementioned Underwriting and Distribution Agreements.
(5) Investment Transactions
Investment transactions, excluding short-term securities, for the year ended December 31, 2022, were as follows (in thousands):
| Fund | | Purchases | | | Sales | |
| Growth | | $ | 102,567 | | | $ | 156,985 | |
| Large Cap Growth | | | 719,796 | | | | 315,257 | |
| Mid Cap Growth | | | 11,813 | | | | 18,596 | |
| Mid Cap Value (a) | | | 1,933 | | | | 302 | |
| Small-Mid Cap Core | | | 138,798 | | | | 64,077 | |
| Small-Mid Cap Growth | | | 1,119,822 | | | | 1,459,331 | |
| Small Cap Growth | | | 251,986 | | | | 284,827 | |
| Small Cap Value | | | 347,511 | | | | 1,024,805 | |
| Global Leaders | | | 15,553 | | | | 23,780 | |
| International Leaders | | | 687,413 | | | | 586,562 | |
| International Growth | | | 786,413 | | | | 823,310 | |
| Institutional International Growth | | | 539,702 | | | | 529,550 | |
| International Small Cap Growth | | | 135,077 | | | | 148,959 | |
| Emerging Markets Leaders | | | 177,783 | | | | 167,315 | |
| Emerging Markets Growth | | | 698,867 | | | | 730,124 | |
| Emerging Markets ex China Growth (b) | | | 23,065 | | | | 9,327 | |
| Emerging Markets Small Cap Growth | | | 390,219 | | | | 432,624 | |
| China Growth | | | 1,403 | | | | 4,485 | |
| Emerging Markets Debt | | | 57,693 | | | | 50,448 | |
| (a) | For the period from March 16, 2022 (Commencement of Operations) to December 31, 2022. |
| (b) | For the period from July 29, 2022 (Commencement of Operations) to December 31, 2022. |
(6) Financial Derivative Instruments
Each Fund may use derivative instruments to maintain liquidity, to provide hedging, or in anticipation of changes in the composition of its portfolio holdings or as otherwise provided in each Fund’s prospectus. The derivative instruments held as of December 31, 2022, as disclosed in each Fund’s Portfolios of Investments, are representative of each Fund’s derivative instrument trading activity during the year ended December 31, 2022.
Derivative transactions carry counterparty risk as they are based on contracts between a Fund and the applicable counterparty. For exchange-traded or cleared derivative contracts, such counterparty risk is limited due to the role of the exchange or clearinghouse. OTC derivative contracts, however, are exposed to counterparty risk in the amount of unrealized gains, net of collateral held, for the duration of the contract.
| December 31, 2022 | William Blair Funds | 127 |
Notes to Financial Statements
The Emerging Markets Debt Fund is subject to certain netting arrangements through International Swaps and Derivatives Association, Inc. Master Agreements and Credit Support Annexes (“ISDAs”). The ISDAs maintain provisions for general obligations, representations, agreements, collateral and events of default or termination. The ISDAs cover certain OTC derivative securities entered into by the Emerging Markets Debt Fund with various counterparties and allow the Emerging Markets Debt Fund to close out and net its total exposure to a counterparty in the event of a default.
Forward Foreign Currency Contracts
The Global Equity, International Equity and Emerging Markets Debt Funds may enter into forward foreign currency contracts. When entering into a forward foreign currency contract, a Fund agrees to receive or deliver a fixed quantity of foreign currency for an agreed-upon price on an agreed future date. A Fund’s net equity therein, representing unrealized gain or loss on the contracts as measured by the difference between the forward foreign exchange rates at the dates of entry into the contracts and the forward rates at the reporting date, is included in the Statement of Assets and Liabilities as unrealized appreciation/depreciation on forward foreign currency contracts. Realized and unrealized gains and losses are included in the Statement of Operations. These instruments may involve market risk, credit risk, or both kinds of risks in excess of the amount recognized in the Statement of Assets and Liabilities. Risks arise from the possible inability of counterparties to meet the terms of their contracts and from the price movements in currencies.
Swap Contracts
Swap agreements may include total return, interest rate, securities index, commodity, security, currency exchange rate, credit default index, volatility and variance swaps. Cleared swaps are transacted through futures commission merchants that are members of central clearing houses with the clearing house serving as a central counterparty similar to transactions in futures contracts. In a standard “swap” transaction, two parties agree to exchange the returns (or differentials in rates of return) earned or realized on particular predetermined investments or instruments. The gross returns to be exchanged or “swapped” between the parties are calculated with respect to a “notional amount” (i.e., the change in the value of a particular dollar amount invested, for example, at a particular interest rate, in a particular foreign currency, or in a “basket” of securities representing a particular index). Swap agreements are subject to the risk that the counterparty to the swap will default on its obligation to pay a Fund and the risk that a Fund will not be able to meet its obligations to pay the counterparty to the swap. Swap agreements may also involve fees, commissions or other costs that may reduce a Fund’s gains from a swap agreement or may cause a Fund to lose money. To the extent permitted by its investment policies and restrictions, a Fund may invest in the following types of swaps:
Credit Default Swaps—A Fund may invest in credit default swaps as a means of “buying” credit protection (i.e., attempting to mitigate the risk of default or credit quality deterioration in some portion of a Fund’s holdings) or “selling” credit protection (i.e., attempting to gain exposure to an underlying issuer’s credit quality characteristics without directly investing in that issuer). A credit default swap is a contract between a buyer and a seller of protection against a pre-defined credit event (e.g., a ratings downgrade or default) on an underlying reference obligation, which may be a single debt instrument or baskets or indices of securities. Under current regulatory requirements, a Fund may be a buyer or seller of a credit default swap. As a seller of protection on credit default swap agreements, a Fund will generally receive from the buyer of protection a fixed rate of income throughout the term of the swap provided that there is no credit event. A Fund adds leverage to its portfolio because the Fund is subject to investment exposure on the notional amount of the swap. The maximum potential amount of future payments that a Fund as a seller of protection could be required to make under a credit default swap agreement equals the notional amount of the agreement. Notional amounts of each individual credit default swap agreement outstanding as of the period end for which a Fund is the seller of protection are disclosed in the Fund’s Portfolio of Investments. These potential amounts would be partially offset by any recovery values of the respective referenced obligations, upfront payments received upon entering into the agreement, or net amounts received from the settlement of buy protection credit default swap agreements entered into by the same Fund for the same referenced entity or entities. For credit default swap contracts on credit indices, the quoted market prices and resulting values serve as an indicator of the payment performance risk. Increasing market values, in absolute terms when compared to the notional amount of the swap, typically represent deterioration of the referenced entities’ credit soundness and a greater likelihood or risk of default or other credit event occurring as defined under the terms of the swap.
Interest Rate Swap—A Fund may invest in interest rate swaps to gain or mitigate exposure to changes in interest rates. Interest rate swap agreements involve a commitment between parties to pay either a fixed interest rate or a floating interest rate based on a notional amount of principal. The parties make payments at predetermined intervals throughout the life of the swap. As a payer, a Fund would make the fixed payment and receive the floating payment. As a receiver, a Fund would make the floating payment and receive the fixed payment.
| 128 | Annual Report | December 31, 2022 |
Notes to Financial Statements
Total Return Swap—A Fund may invest in total return swaps to gain or mitigate exposure to an underlying security, or securities. Total return swap agreements may involve commitments to pay interest in exchange for the return on the underlying security, or securities. At maturity, a net cash flow is exchanged between the parties based on the total return of the underlying security, or securities, less a financing rate. As a receiver in the transaction, a Fund would receive a payment for a positive return and would make a payment for a negative return. As a payer in the transaction, a Fund would make a payment for a positive return and would receive a payment for a negative return.
The following table presents the value of financial derivative instruments, by Fund and primary risk exposure, as of December 31, 2022, and their respective location in the Statements of Assets and Liabilities (in thousands):
| | | Assets | | Liabilities |
Fund and
Primary Risk Exposure | | Statements of Assets
and Liabilities | | Value | | Statements of Assets
and Liabilities | | Value |
| Emerging Markets Debt | | | | | | | | | | | | |
| Credit | | Receivable for variation margin on centrally cleared swaps(1) | | | $95 | | Payable for variation margin on centrally cleared swaps(1) | | | $86 |
| Currency | | Unrealized appreciation on forward foreign currency contracts | | | 7 | | Unrealized depreciation on forward foreign currency contracts) | | | 13 |
| Interest rate | | Receivable for variation margin on centrally cleared swaps(1) | | | 26 | | Payable for variation margin on centrally cleared swaps(1) | | | 47 |
| (1) | The table above includes cumulative appreciation/(depreciation) on centrally cleared swaps as reported in the applicable Fund’s Portfolio of Investments. Receivable/payable for variation margin on centrally cleared swaps as reported in the applicable Fund’s Statement of Assets and Liabilities represents the current day’s variation margin. |
The following table indicates the effect of derivatives, by Fund and primary risk exposure, in the Statements of Operations for the year ended December 31, 2022 (in thousands):
| | | Net Realized Gain (Loss) | | | Change in Net Unrealized
Appreciation (Depreciation) |
Fund and
Primary Risk Exposure | | Statements of Operations | | Value | | | Statements of Operations | | Value |
| Emerging Markets Debt | | | | | | | | | | | | |
| Credit | | Swaps | | | $267 | | | Swaps | | | $ (2 | ) |
| Currency | | Forward foreign currency contracts | | | 142 | | | Forward foreign currency contracts | | | 20 | |
| Interest rate | | Swaps | | | 302 | | | Swaps | | | (88 | ) |
The following table is a summary by counterparty of the derivative instruments and collateral pledged/(received) included in the Fund’s Statement of Assets and Liabilities at December 31, 2022 (in thousands):
| | | Financial Derivative Assets | | Financial Derivative Liabilities | | | | | | |
| Counterparty | | Forward
Foreign
Currency
Contracts | | Total | | Forward
Foreign
Currency
Contracts | | Total | | Net
Market
Value | | Collateral
Pledged
(Received) | | Net
Exposure |
| Emerging Markets Debt | | | | | | | | | | | | | | | | | | | | | | | | | | | | |
| Citibank N.A. | | | $7 | | | | $7 | | | | $(13 | ) | | | $(13 | ) | | | $(6 | ) | | | $— | | | | $(6 | ) |
| | | | $7 | | | | $7 | | | | $(13 | ) | | | $(13 | ) | | | | | | | | | | | | |
The net exposure represents the amount due from/(due to) the counterparty in the event of default. Any net exposure is generally due to changes in market value of the underlying derivative instruments on the last day of the period as timing of collateral movement occurs the following day.
| December 31, 2022 | William Blair Funds | 129 |
Notes to Financial Statements
(7) Fund Share Transactions
The following tables summarize the activity in capital shares of each Fund for the year ended December 31, 2022 (in thousands):
| | | Class N |
| | | Dollars | | | Shares |
| Fund | | Sales | | | Reinvest | | | Redemptions | | | Total | | | Sales | | | Reinvest | | | Redemptions | | | Total |
| Growth | | $ | 3,300 | | | $ | 1,034 | | | $ | 5,457 | | | $ | (1,123 | ) | | | 306 | | | | 128 | | | | 551 | | | | (117 | ) |
| Large Cap Growth | | | 66,244 | | | | 986 | | | | 69,880 | | | | (2,650 | ) | | | 3,478 | | | | 59 | | | | 3,754 | | | | (217 | ) |
| Mid Cap Growth | | | 733 | | | | 1,284 | | | | 1,411 | | | | 606 | | | | 73 | | | | 197 | | | | 172 | | | | 98 | |
| Small-Mid Cap Growth | | | 16,581 | | | | 3,843 | | | | 88,421 | | | | (67,997 | ) | | | 628 | | | | 158 | | | | 3,380 | | | | (2,594 | ) |
| Small Cap Growth | | | 27,063 | | | | 4,597 | | | | 53,914 | | | | (22,254 | ) | | | 973 | | | | 190 | | | | 2,036 | | | | (873 | ) |
| Small Cap Value | | | 438 | | | | 182 | | | | 729 | | | | (109 | ) | | | 13 | | | | 7 | | | | 24 | | | | (4 | ) |
| Global Leaders | | | 224 | | | | 165 | | | | 1,635 | | | | (1,246 | ) | | | 14 | | | | 12 | | | | 113 | | | | (87 | ) |
| International Leaders | | | 18,462 | | | | 68 | | | | 15,537 | | | | 2,993 | | | | 960 | | | | 4 | | | | 827 | | | | 137 | |
| International Growth | | | 156,713 | | | | 22,957 | | | | 61,189 | | | | 118,481 | | | | 5,684 | | | | 905 | | | | 2,302 | | | | 4,287 | |
| International Small Cap Growth | | | 29 | | | | — | | | | 761 | | | | (732 | ) | | | 3 | | | | — | | | | 64 | | | | (61 | ) |
| Emerging Markets Leaders | | | 3,090 | | | | 9 | | | | 3,673 | | | | (574 | ) | | | 317 | | | | 1 | | | | 371 | | | | (53 | ) |
| Emerging Markets Growth | | | 10,620 | | | | 20 | | | | 15,860 | | | | (5,220 | ) | | | 873 | | | | 2 | | | | 1,296 | | | | (421 | ) |
| Emerging Markets Small Cap Growth | | | 584 | | | | 145 | | | | 521 | | | | 208 | | | | 27 | | | | 9 | | | | 27 | | | | 9 | |
| | | Class I |
| | | Dollars | | | Shares |
| Fund | | Sales | | | Reinvest | | | Redemptions | | | Total | | | Sales | | | Reinvest | | | Redemptions | | | Total |
| Growth | | $ | 11,551 | | | $ | 4,580 | | | $ | 86,472 | | | $ | (70,341 | ) | | | 938 | | | | 443 | | | | 7,693 | | | | (6,312 | ) |
| Large Cap Growth | | | 606,323 | | | | 5,568 | | | | 281,678 | | | | 330,213 | | | | 28,937 | | | | 313 | | | | 14,763 | | | | 14,487 | |
| Mid Cap Growth | | | 4,227 | | | | 9,240 | | | | 10,032 | | | | 3,435 | | | | 392 | | | | 1,221 | | | | 953 | | | | 660 | |
| Mid Cap Value(a) | | | 108 | | | | 1 | | | | 32 | | | | 77 | | | | 11 | | | | — | | | | 3 | | | | 8 | |
| Small-Mid Cap Core | | | 71,963 | | | | — | | | | 27,550 | | | | 44,413 | | | | 4,695 | | | | — | | | | 1,985 | | | | 2,710 | |
| Small-Mid Cap Growth | | | 280,513 | | | | 48,171 | | | | 693,533 | | | | (364,849 | ) | | | 9,846 | | | | 1,832 | | | | 25,066 | | | | (13,388 | ) |
| Small Cap Growth | | | 79,330 | | | | 10,263 | | | | 90,795 | | | | (1,202 | ) | | | 2,593 | | | | 357 | | | | 3,045 | | | | (95 | ) |
| Small Cap Value | | | 109,607 | | | | 53,312 | | | | 295,065 | | | | (132,146 | ) | | | 3,575 | | | | 1,928 | | | | 9,693 | | | | (4,190 | ) |
| Global Leaders | | | 4,757 | | | | 1,493 | | | | 22,285 | | | | (16,035 | ) | | | 315 | | | | 110 | | | | 1,638 | | | | (1,213 | ) |
| International Leaders | | | 230,076 | | | | 617 | | | | 286,493 | | | | (55,800 | ) | | | 12,574 | | | | 35 | | | | 15,639 | | | | (3,030 | ) |
| International Growth | | | 293,273 | | | | 71,737 | | | | 528,810 | | | | (163,800 | ) | | | 10,345 | | | | 2,738 | | | | 18,956 | | | | (5,873 | ) |
| International Small Cap Growth | | | 40,252 | | | | 182 | | | | 30,096 | | | | 10,338 | | | | 3,553 | | | | 16 | | | | 2,676 | | | | 893 | |
| Emerging Markets Leaders | | | 26,985 | | | | 283 | | | | 27,281 | | | | (13 | ) | | | 2,914 | | | | 34 | | | | 3,152 | | | | (204 | ) |
| Emerging Markets Growth | | | 190,957 | | | | 269 | | | | 130,228 | | | | 60,998 | | | | 15,421 | | | | 25 | | | | 10,961 | | | | 4,485 | |
| Emerging Markets ex China Growth (b) | | | 10 | | | | — | | | | — | | | | 10 | | | | 1 | | | | — | | | | — | | | | 1 | |
| Emerging Markets Small Cap Growth | | | 44,207 | | | | 4,873 | | | | 59,722 | | | | (10,642 | ) | | | 2,315 | | | | 292 | | | | 3,214 | | | | (607 | ) |
| China Growth | | | 12 | | | | — | | | | 3,449 | | | | (3,437 | ) | | | 2 | | | | — | | | | 503 | | | | (501 | ) |
| Emerging Markets Debt | | | 415 | | | | 74 | | | | 708 | | | | (219 | ) | | | 49 | | | | 9 | | | | 89 | | | | (31 | ) |
| (a) | For the period from March 16, 2022 (Commencement of Operations) to December 31, 2022. |
| (b) | For the period from July 29, 2022 (Commencement of Operations) to December 31, 2022. |
| 130 | Annual Report | December 31, 2022 |
Notes to Financial Statements
| | | Institutional/Class R6 |
| | | Dollars | | | Shares |
| Fund | | Sales | | | Reinvest | | | Redemptions | | | Total | | | Sales | | | Reinvest | | | Redemptions | | | Total |
| Growth | | $ | 21,865 | | | $ | 1,050 | | | $ | 3,850 | | | $ | 19,065 | | | | 2,107 | | | | 101 | | | | 352 | | | | 1,856 | |
| Large Cap Growth | | | 136,096 | | | | 1,909 | | | | 47,467 | | | | 90,538 | | | | 6,978 | | | | 107 | | | | 2,430 | | | | 4,655 | |
| Mid Cap Growth | | | 10 | | | | 155 | | | | 7 | | | | 158 | | | | 2 | | | | 20 | | | | 1 | | | | 21 | |
| Mid Cap Value (a) | | | 1,553 | | | | 15 | | | | 1 | | | | 1,567 | | | | 154 | | | | 2 | | | | — | | | | 156 | |
| Small-Mid Cap Core | | | 37,092 | | | | — | | | | 6,100 | | | | 30,992 | | | | 2,713 | | | | — | | | | 445 | | | | 2,268 | |
| Small-Mid Cap Growth | | | 212,256 | | | | 12,737 | | | | 80,061 | | | | 144,932 | | | | 8,130 | | | | 483 | | | | 2,950 | | | | 5,663 | |
| Small Cap Growth | | | 30,980 | | | | 3,659 | | | | 18,653 | | | | 15,986 | | | | 1,018 | | | | 127 | | | | 604 | | | | 541 | |
| Small Cap Value | | | 119,683 | | | | 33,263 | | | | 627,183 | | | | (474,237 | ) | | | 3,861 | | | | 1,203 | | | | 18,688 | | | | (13,624 | ) |
| Global Leaders | | | 9,906 | | | | 296 | | | | 1,407 | | | | 8,795 | | | | 782 | | | | 22 | | | | 100 | | | | 704 | |
| International Leaders | | | 206,838 | | | | 1,129 | | | | 54,743 | | | | 153,224 | | | | 9,990 | | | | 63 | | | | 3,031 | | | | 7,022 | |
| International Growth | | | 89,936 | | | | 9,603 | | | | 36,161 | | | | 63,378 | | | | 3,526 | | | | 366 | | | | 1,288 | | | | 2,604 | |
| Institutional International Growth | | | 142,332 | | | | 56,157 | | | | 156,966 | | | | 41,523 | | | | 10,211 | | | | 4,307 | | | | 10,970 | | | | 3,548 | |
| International Small Cap Growth | | | 3,475 | | | | 331 | | | | 28,031 | | | | (24,225 | ) | | | 295 | | | | 30 | | | | 2,414 | | | | (2,089 | ) |
| Emerging Markets Leaders | | | 70,039 | | | | 3,109 | | | | 63,904 | | | | 9,244 | | | | 7,781 | | | | 374 | | | | 7,384 | | | | 771 | |
| Emerging Markets Growth | | | 112,007 | | | | 667 | | | | 203,283 | | | | (90,609 | ) | | | 9,621 | | | | 62 | | | | 16,080 | | | | (6,397 | ) |
| Emerging Markets ex China Growth (b) | | | 19,580 | | | | — | | | | 5,597 | | | | 13,983 | | | | 1,970 | | | | — | | | | 587 | | | | 1,383 | |
| Emerging Markets Small Cap Growth | | | 76,818 | | | | 9,965 | | | | 102,458 | | | | (15,675 | ) | | | 4,023 | | | | 595 | | | | 5,344 | | | | (726 | ) |
| China Growth | | | 408 | | | | 1 | | | | 127 | | | | 282 | | | | 64 | | | | — | | | | 18 | | | | 46 | |
| Emerging Markets Debt | | | 3,932 | | | | 3,077 | | | | 382 | | | | 6,627 | | | | 473 | | | | 398 | | | | 49 | | | | 822 | |
| | | Net Change in Net Assets Relating to Fund Share Activity |
| | | Dollars | | | Shares |
| Fund | | Sales | | | Reinvest | | | Redemptions | | | Total | | | Sales | | | Reinvest | | | Redemptions | | | Total |
| Growth | | $ | 36,716 | | | $ | 6,664 | | | $ | 95,779 | | | $ | (52,399 | ) | | | 3,351 | | | | 672 | | | | 8,596 | | | | (4,573 | ) |
| Large Cap Growth | | | 808,663 | | | | 8,463 | | | | 399,025 | | | | 418,101 | | | | 39,393 | | | | 479 | | | | 20,947 | | | | 18,925 | |
| Mid Cap Growth | | | 4,970 | | | | 10,679 | | | | 11,450 | | | | 4,199 | | | | 467 | | | | 1,438 | | | | 1,126 | | | | 779 | |
| Mid Cap Value (a) | | | 1,661 | | | | 16 | | | | 33 | | | | 1,644 | | | | 165 | | | | 2 | | | | 3 | | | | 164 | |
| Small-Mid Cap Core | | | 109,055 | | | | — | | | | 33,650 | | | | 75,405 | | | | 7,408 | | | | — | | | | 2,430 | | | | 4,978 | |
| Small-Mid Cap Growth | | | 509,350 | | | | 64,751 | | | | 862,015 | | | | (287,914 | ) | | | 18,604 | | | | 2,473 | | | | 31,396 | | | | (10,319 | ) |
| Small Cap Growth | | | 137,373 | | | | 18,519 | | | | 163,362 | | | | (7,470 | ) | | | 4,584 | | | | 674 | | | | 5,685 | | | | (427 | ) |
| Small Cap Value | | | 229,728 | | | | 86,757 | | | | 922,977 | | | | (606,492 | ) | | | 7,449 | | | | 3,138 | | | | 28,405 | | | | (17,818 | ) |
| Global Leaders | | | 14,887 | | | | 1,954 | | | | 25,327 | | | | (8,486 | ) | | | 1,111 | | | | 144 | | | | 1,851 | | | | (596 | ) |
| International Leaders | | | 455,376 | | | | 1,814 | | | | 356,773 | | | | 100,417 | | | | 23,524 | | | | 102 | | | | 19,497 | | | | 4,129 | |
| International Growth | | | 539,922 | | | | 104,297 | | | | 626,160 | | | | 18,059 | | | | 19,555 | | | | 4,009 | | | | 22,546 | | | | 1,018 | |
| Institutional International Growth | | | 142,332 | | | | 56,157 | | | | 156,966 | | | | 41,523 | | | | 10,211 | | | | 4,307 | | | | 10,970 | | | | 3,548 | |
| International Small Cap Growth | | | 43,756 | | | | 513 | | | | 58,888 | | | | (14,619 | ) | | | 3,851 | | | | 46 | | | | 5,154 | | | | (1,257 | ) |
| Emerging Markets Leaders | | | 100,114 | | | | 3,401 | | | | 94,858 | | | | 8,657 | | | | 11,012 | | | | 409 | | | | 10,907 | | | | 514 | |
| Emerging Markets Growth | | | 313,584 | | | | 956 | | | | 349,371 | | | | (34,831 | ) | | | 25,915 | | | | 89 | | | | 28,337 | | | | (2,333 | ) |
| Emerging Markets ex China Growth (b) | | | 19,590 | | | | — | | | | 5,597 | | | | 13,993 | | | | 1,971 | | | | — | | | | 587 | | | | 1,384 | |
| Emerging Markets Small Cap Growth | | | 121,609 | | | | 14,983 | | | | 162,701 | | | | (26,109 | ) | | | 6,365 | | | | 896 | | | | 8,585 | | | | (1,324 | ) |
| China Growth | | | 420 | | | | 1 | | | | 3,576 | | | | (3,155 | ) | | | 66 | | | | — | | | | 521 | | | | (455 | ) |
| Emerging Markets Debt | | | 4,347 | | | | 3,151 | | | | 1,090 | | | | 6,408 | | | | 522 | | | | 407 | | | | 138 | | | | 791 | |
| (a) | For the period from March 16, 2022 (Commencement of Operations) to December 31, 2022. |
| (b) | For the period from July 29, 2022 (Commencement of Operations) to December 31, 2022. |
| December 31, 2022 | William Blair Funds | 131 |
Notes to Financial Statements
The following tables summarize the activity in capital shares of each Fund for the year ended December 31, 2021 (in thousands):
| | | Class N |
| | | Dollars | | | Shares |
| Fund | | Sales | | | Reinvest | | | Redemptions | | | Total | | | Sales | | | Reinvest | | | Redemptions | | | Total |
| Growth | | $ | 3,638 | | | $ | 4,724 | | | $ | 9,192 | | | $ | (830 | ) | | | 280 | | | | 412 | | | | 758 | | | | (66 | ) |
| Large Cap Growth | | | 65,433 | | | | 8,488 | | | | 41,026 | | | | 32,895 | | | | 2,867 | | | | 356 | | | | 1,830 | | | | 1,393 | |
| Mid Cap Growth | | | 267 | | | | 225 | | | | 1,283 | | | | (791 | ) | | | 20 | | | | 18 | | | | 97 | | | | (59 | ) |
| Small-Mid Cap Growth | | | 36,098 | | | | 21,174 | | | | 142,815 | | | | (85,543 | ) | | | 1,030 | | | | 694 | | | | 4,074 | | | | (2,350 | ) |
| Small Cap Growth | | | 31,616 | | | | 31,635 | | | | 54,012 | | | | 9,239 | | | | 821 | | | | 1,043 | | | | 1,468 | | | | 396 | |
| Small Cap Value (a) | | | 198 | | | | 114 | | | | 6,875 | | | | (6,563 | ) | | | 5 | | | | 4 | | | | 203 | | | | (194 | ) |
| Global Leaders | | | 815 | | | | 709 | | | | 870 | | | | 654 | | | | 41 | | | | 38 | | | | 45 | | | | 34 | |
| International Leaders | | | 36,810 | | | | 1,209 | | | | 11,899 | | | | 26,120 | | | | 1,526 | | | | 51 | | | | 495 | | | | 1,082 | |
| International Growth | | | 18,167 | | | | 30,895 | | | | 37,544 | | | | 11,518 | | | | 440 | | | | 847 | | | | 933 | | | | 354 | |
| International Small Cap Growth | | | 502 | | | | 443 | | | | 332 | | | | 613 | | | | 27 | | | | 28 | | | | 19 | | | | 36 | |
| Emerging Markets Leaders | | | 6,412 | | | | 95 | | | | 5,943 | | | | 564 | | | | 494 | | | | 9 | | | | 454 | | | | 49 | |
| Emerging Markets Growth | | | 33,625 | | | | 4,793 | | | | 22,748 | | | | 15,670 | | | | 1,723 | | | | 313 | | | | 1,209 | | | | 827 | |
| Emerging Markets Small Cap Growth | | | 247 | | | | 333 | | | | 516 | | | | 64 | | | | 10 | | | | 15 | | | | 22 | | | | 3 | |
| | | Class I |
| | | Dollars | | | Shares |
| Fund | | Sales | | | Reinvest | | | Redemptions | | | Total | | | Sales | | | Reinvest | | | Redemptions | | | Total |
| Growth | | $ | 19,229 | | | $ | 30,211 | | | $ | 28,892 | | | $ | 20,548 | | | | 1,245 | | | | 2,088 | | | | 1,918 | | | | 1,415 | |
| Large Cap Growth | | | 277,571 | | | | 25,384 | | | | 122,960 | | | | 179,995 | | | | 11,137 | | | | 996 | | | | 5,236 | | | | 6,897 | |
| Mid Cap Growth | | | 8,724 | | | | 1,875 | | | | 46,351 | | | | (35,752 | ) | | | 592 | | | | 134 | | | | 3,013 | | | | (2,287 | ) |
| Small-Mid Cap Core | | | 34,907 | | | | — | | | | 5,431 | | | | 29,476 | | | | 2,343 | | | | — | | | | 359 | | | | 1,984 | |
| Small-Mid Cap Growth | | | 487,031 | | | | 209,644 | | | | 1,385,928 | | | | (689,253 | ) | | | 13,062 | | | | 6,384 | | | | 37,145 | | | | (17,699 | ) |
| Small Cap Growth | | | 84,017 | | | | 63,719 | | | | 121,526 | | | | 26,210 | | | | 1,948 | | | | 1,786 | | | | 2,923 | | | | 811 | |
| Small Cap Value (a) | | | 23,757 | | | | 39,018 | | | | 155,752 | | | | (92,977 | ) | | | 709 | | | | 1,209 | | | | 4,486 | | | | (2,568 | ) |
| Global Leaders | | | 11,174 | | | | 6,699 | | | | 12,223 | | | | 5,650 | | | | 580 | | | | 358 | | | | 629 | | | | 309 | |
| International Leaders | | | 277,059 | | | | 16,022 | | | | 125,675 | | | | 167,406 | | | | 11,454 | | | | 677 | | | | 5,165 | | | | 6,966 | |
| International Growth | | | 114,128 | | | | 173,395 | | | | 481,271 | | | | (193,748 | ) | | | 2,731 | | | | 4,615 | | | | 11,607 | | | | (4,261 | ) |
| International Small Cap Growth | | | 20,954 | | | | 18,099 | | | | 42,075 | | | | (3,022 | ) | | | 1,120 | | | | 1,121 | | | | 2,340 | | | | (99 | ) |
| Emerging Markets Leaders | | | 73,454 | | | | 3,030 | | | | 90,773 | | | | (14,289 | ) | | | 5,753 | | | | 274 | | | | 6,949 | | | | (922 | ) |
| Emerging Markets Growth | | | 167,716 | | | | 29,260 | | | | 91,992 | | | | 104,984 | | | | 8,926 | | | | 1,876 | | | | 4,848 | | | | 5,954 | |
| Emerging Markets Small Cap Growth | | | 38,960 | | | | 13,160 | | | | 39,950 | | | | 12,170 | | | | 1,569 | | | | 569 | | | | 1,663 | | | | 475 | |
| China Growth (b) | | | 5,955 | | | | — | | | | 13 | | | | 5,942 | | | | 581 | | | | — | | | | 1 | | | | 580 | |
| Emerging Markets Debt (c) | | | 1,531 | | | | 35 | | | | 26 | | | | 1,540 | | | | 154 | | | | 4 | | | | 3 | | | | 155 | |
| (a) | The Small Cap Value Fund figures reflect the fiscal period from November 1, 2021 to December 31, 2021. |
| (b) | For the period from August 27, 2021 (Commencement of Operations) to December 31, 2021. |
| (c) | For the period from May 25, 2021 (Commencement of Operations) to December 31, 2021. |
| 132 | Annual Report | December 31, 2022 |
Notes to Financial Statements
| | | Institutional/Class R6 |
| | | Dollars | | | Shares |
| Fund | | Sales | | | Reinvest | | | Redemptions | | | Total | | | Sales | | | Reinvest | | | Redemptions | | | Total |
| Growth | | $ | 1,861 | | | $ | 1,576 | | | $ | 1,636 | | | $ | 1,801 | | | | 122 | | | | 109 | | | | 109 | | | | 122 | |
| Large Cap Growth | | | 76,686 | | | | 9,570 | | | | 68,921 | | | | 17,335 | | | | 3,270 | | | | 376 | | | | 3,039 | | | | 607 | |
| Mid Cap Growth | | | — | | | | 27 | | | | — | | | | 27 | | | | — | | | | 2 | | | | — | | | | 2 | |
| Small-Mid Cap Core | | | 21,148 | | | | — | | | | 579 | | | | 20,569 | | | | 1,409 | | | | — | | | | 38 | | | | 1,371 | |
| Small-Mid Cap Growth | | | 237,266 | | | | 27,797 | | | | 44,182 | | | | 220,881 | | | | 6,258 | | | | 845 | | | | 1,178 | | | | 5,925 | |
| Small Cap Growth | | | 22,795 | | | | 17,709 | | | | 11,517 | | | | 28,987 | | | | 538 | | | | 495 | | | | 263 | | | | 770 | |
| Small Cap Value (a) | | | 132,843 | | | | 38,299 | | | | 30,838 | | | | 140,304 | | | | 3,809 | | | | 1,187 | | | | 877 | | | | 4,119 | |
| Global Leaders | | | 1,959 | | | | 299 | | | | 74 | | | | 2,184 | | | | 108 | | | | 16 | | | | 4 | | | | 120 | |
| International Leaders | | | 69,853 | | | | 18,439 | | | | 155,620 | | | | (67,328 | ) | | | 2,934 | | | | 779 | | | | 6,494 | | | | (2,781 | ) |
| International Growth | | | 67,401 | | | | 6,728 | | | | 53,921 | | | | 20,208 | | | | 1,592 | | | | 179 | | | | 1,254 | | | | 517 | |
| Institutional International Growth | | | 48,760 | | | | 181,112 | | | | 211,193 | | | | 18,679 | | | | 2,286 | | | | 9,812 | | | | 9,861 | | | | 2,237 | |
| International Small Cap Growth | | | 43,609 | | | | 30,924 | | | | 6,391 | | | | 68,142 | | | | 2,217 | | | | 1,903 | | | | 343 | | | | 3,777 | |
| Emerging Markets Leaders | | | 327,586 | | | | 32,387 | | | | 70,570 | | | | 289,403 | | | | 25,256 | | | | 2,931 | | | | 5,236 | | | | 22,951 | |
| Emerging Markets Growth | | | 102,244 | | | | 133,282 | | | | 371,618 | | | | (136,092 | ) | | | 5,116 | | | | 8,447 | | | | 18,743 | | | | (5,180 | ) |
| Emerging Markets Small Cap Growth | | | 203,333 | | | | 26,845 | | | | 61,716 | | | | 168,462 | | | | 8,175 | | | | 1,159 | | | | 2,519 | | | | 6,815 | |
| China Growth (b) | | | 1,767 | | | | — | | | | — | | | | 1,767 | | | | 177 | | | | — | | | | — | | | | 177 | |
| Emerging Markets Debt (c) | | | 51,069 | | | | 1,240 | | | | 111 | | | | 52,198 | | | | 5,101 | | | | 127 | | | | 11 | | | | 5,217 | |
| | | Net Change in Net Assets Relating to Fund Share Activity |
| | | Dollars | | | Shares |
| Fund | | Sales | | | Reinvest | | | Redemptions | | | Total | | | Sales | | | Reinvest | | | Redemptions | | | Total |
| Growth | | $ | 24,728 | | | $ | 36,511 | | | $ | 39,720 | | | $ | 21,519 | | | | 1,647 | | | | 2,609 | | | | 2,785 | | | | 1,471 | |
| Large Cap Growth | | | 419,690 | | | | 43,442 | | | | 232,907 | | | | 230,225 | | | | 17,274 | | | | 1,728 | | | | 10,105 | | | | 8,897 | |
| Mid Cap Growth | | | 8,991 | | | | 2,127 | | | | 47,634 | | | | (36,516 | ) | | | 612 | | | | 154 | | | | 3,110 | | | | (2,344 | ) |
| Small-Mid Cap Core | | | 56,055 | | | | — | | | | 6,010 | | | | 50,045 | | | | 3,752 | | | | — | | | | 397 | | | | 3,355 | |
| Small-Mid Cap Growth | | | 760,395 | | | | 258,615 | | | | 1,572,925 | | | | (553,915 | ) | | | 20,350 | | | | 7,923 | | | | 42,397 | | | | (14,124 | ) |
| Small Cap Growth | | | 138,428 | | | | 113,063 | | | | 187,055 | | | | 64,436 | | | | 3,307 | | | | 3,324 | | | | 4,654 | | | | 1,977 | |
| Small Cap Value (a) | | | 156,798 | | | | 77,431 | | | | 193,465 | | | | 40,764 | | | | 4,523 | | | | 2,400 | | | | 5,566 | | | | 1,357 | |
| Global Leaders | | | 13,948 | | | | 7,707 | | | | 13,167 | | | | 8,488 | | | | 729 | | | | 412 | | | | 678 | | | | 463 | |
| International Leaders | | | 383,722 | | | | 35,670 | | | | 293,194 | | | | 126,198 | | | | 15,914 | | | | 1,507 | | | | 12,154 | | | | 5,267 | |
| International Growth | | | 199,696 | | | | 211,018 | | | | 572,736 | | | | (162,022 | ) | | | 4,763 | | | | 5,641 | | | | 13,794 | | | | (3,390 | ) |
| Institutional International Growth | | | 48,760 | | | | 181,112 | | | | 211,193 | | | | 18,679 | | | | 2,286 | | | | 9,812 | | | | 9,861 | | | | 2,237 | |
| International Small Cap Growth | | | 65,065 | | | | 49,466 | | | | 48,798 | | | | 65,733 | | | | 3,364 | | | | 3,052 | | | | 2,702 | | | | 3,714 | |
| Emerging Markets Leaders | | | 407,452 | | | | 35,512 | | | | 167,286 | | | | 275,678 | | | | 31,503 | | | | 3,214 | | | | 12,639 | | | | 22,078 | |
| Emerging Markets Growth | | | 303,585 | | | | 167,335 | | | | 486,358 | | | | (15,438 | ) | | | 15,765 | | | | 10,636 | | | | 24,800 | | | | 1,601 | |
| Emerging Markets Small Cap Growth | | | 242,540 | | | | 40,338 | | | | 102,182 | | | | 180,696 | | | | 9,754 | | | | 1,743 | | | | 4,204 | | | | 7,293 | |
| China Growth (b) | | | 7,722 | | | | — | | | | 13 | | | | 7,709 | | | | 758 | | | | — | | | | 1 | | | | 757 | |
| Emerging Markets Debt (c) | | | 52,600 | | | | 1,275 | | | | 137 | | | | 53,738 | | | | 5,255 | | | | 131 | | | | 14 | | | | 5,372 | |
| (a) | The Small Cap Value Fund figures reflect the fiscal period from November 1, 2021 to December 31, 2021. |
| (b) | For the period from August 27, 2021 (Commencement of Operations) to December 31, 2021. |
| (c) | For the period from May 25, 2021 (Commencement of Operations) to December 31, 2021. |
| December 31, 2022 | William Blair Funds | 133 |
Notes to Financial Statements
The following tables summarize the activity in capital shares of the Small Cap Value Fund for the year ended October 31, 2021 (dollar amounts in thousands):
| | | 2021 | |
| | | Dollars | | | Shares | |
| | | Sales | | | Issued in
Reorga-
nization | | | Reinvest | | | Redemptions | | | Total | | | Sales | | | Issued in
Reorga-
nization | | | Reinvest | | | Redemptions | | | Total | |
| Class N (a) | | $ | 715 | | | $ | 10,216 | | | $ | — | | | $ | 1,521 | | | $ | 9,410 | | | | 21,895 | | | | 317,775 | | | | — | | | | 46,864 | | | | 292,806 | |
| Class I | | | 398,983 | | | | 24,461 | | | | 181,788 | | | | 1,146,946 | | | | (541,714 | ) | | | 12,568,399 | | | | 760,891 | | | | 5,519,000 | | | | 34,394,651 | | | | (15,546,361 | ) |
| Class R6 (a) | | | 856,747 | | | | 11,057 | | | | — | | | | 11,133 | | | | 856,671 | | | | 25,855,620 | | | | 343,951 | | | | — | | | | 330,341 | | | | 25,869,230 | |
| | | $ | 1,256,445 | | | $ | 45,734 | | | $ | 181,788 | | | $ | 1,159,600 | | | $ | 324,367 | | | | | | | | | | | | | | | | | | | | | |
| (a) | For the period from July 17, 2021 (Commencement of Operations) to October 31, 2021. |
(8) Subsequent Events
The Funds have evaluated subsequent events through the date of issuance of the Funds’ financial statements and have determined there are no other impacts to the Funds’ financial statements.
| 134 | Annual Report | December 31, 2022 |
Financial Highlights — For a share outstanding throughout each period
Growth Fund
| | | Class N | |
| | | | | | | | | | | | | |
| | | Years Ended December 31, | |
| | | 2022 | | | 2021 | | | 2020 | | | 2019 | | | 2018 | |
| Net asset value, beginning of year | | $ | 11.81 | | | $ | 11.15 | | | $ | 9.45 | | | $ | 7.91 | | | $ | 10.27 | |
| Income (loss) from investment operations: | | | | | | | | | | | | | | | | | | | | |
| Net investment income (loss) | | | (0.05 | ) | | | (0.08 | ) | | | (0.05 | ) | | | (0.03 | ) | | | (0.04 | ) |
| Net realized and unrealized gain (loss) on investments | | | (3.44 | ) | | | 2.49 | | | | 3.43 | | | | 2.54 | | | | 0.75 | |
| Total from investment operations | | | (3.49 | ) | | | 2.41 | | | | 3.38 | | | | 2.51 | | | | 0.71 | |
| Less distributions from: | | | | | | | | | | | | | | | | | | | | |
| Net investment income | | | — | | | | — | | | | — | | | | — | | | | — | |
| Net realized gain | | | 0.37 | | | | 1.75 | | | | 1.68 | | | | 0.97 | | | | 3.07 | |
| Total distributions | | | 0.37 | | | | 1.75 | | | | 1.68 | | | | 0.97 | | | | 3.07 | |
| Net asset value, end of year | | $ | 7.95 | | | $ | 11.81 | | | $ | 11.15 | | | $ | 9.45 | | | $ | 7.91 | |
| Total return (%) | | | (29.65 | ) | | | 22.09 | | | | 35.97 | | | | 31.97 | | | | 5.10 | |
| Ratios to average daily net assets (%): | | | | | | | | | | | | | | | | | | | | |
| Expenses, before waivers and reimbursements | | | 1.24 | | | | 1.21 | | | | 1.26 | | | | 1.24 | | | | 1.22 | |
| Expenses, net of waivers and reimbursements | | | 1.20 | | | | 1.20 | | | | 1.20 | | | | 1.20 | | | | 1.20 | |
| Net investment income (loss), before waivers and reimbursements | | | (0.60 | ) | | | (0.67 | ) | | | (0.55 | ) | | | (0.35 | ) | | | (0.36 | ) |
| Net investment income (loss), net of waivers and reimbursements | | | (0.56 | ) | | | (0.66 | ) | | | (0.49 | ) | | | (0.31 | ) | | | (0.34 | ) |
| Class N net assets at the end of the year (in thousands) | | $ | 23,829 | | | $ | 36,807 | | | $ | 35,494 | | | $ | 32,710 | | | $ | 38,370 | |
| Portfolio turnover rate (%) | | | 41 | | | | 30 | | | | 46 | | | | 39 | | | | 46 | |
| | | | | | | | | | | | | | | | | | | | | |
| | | | | | | | | | | | | | | | | | Class I | |
| | | | | | | | | | | | | | | | | | | |
| | | | | | | | | | | | Years Ended December 31, | |
| | | 2022 | | | 2021 | | | 2020 | | | 2019 | | | 2018 | |
| Net asset value, beginning of year | | $ | 14.91 | | | $ | 13.64 | | | $ | 11.25 | | | $ | 9.25 | | | $ | 11.51 | |
| Income (loss) from investment operations: | | | | | | | | | | | | | | | | | | | | |
| Net investment income (loss) | | | (0.04 | ) | | | (0.05 | ) | | | (0.03 | ) | | | (0.00 | )^ | | | (0.01 | ) |
| Net realized and unrealized gain (loss) on investments | | | (4.35 | ) | | | 3.07 | | | | 4.10 | | | | 2.97 | | | | 0.82 | |
| Total from investment operations | | | (4.39 | ) | | | 3.02 | | | | 4.07 | | | | 2.97 | | | | 0.81 | |
| Less distributions from: | | | | | | | | | | | | | | | | | | | | |
| Net investment income | | | — | | | | — | | | | — | | | | — | | | | 0.00 | ^ |
| Net realized gain | | | 0.37 | | | | 1.75 | | | | 1.68 | | | | 0.97 | | | | 3.07 | |
| Total distributions | | | 0.37 | | | | 1.75 | | | | 1.68 | | | | 0.97 | | | | 3.07 | |
| Net asset value, end of year | | $ | 10.15 | | | $ | 14.91 | | | $ | 13.64 | | | $ | 11.25 | | | $ | 9.25 | |
| Total return (%) | | | (29.52 | ) | | | 22.54 | | | | 36.35 | | | | 32.32 | | | | 5.42 | |
| Ratios to average daily net assets (%): | | | | | | | | | | | | | | | | | | | | |
| Expenses | | | 0.92 | | | | 0.89 | | | | 0.93 | | | | 0.92 | | | | 0.91 | |
| Net investment income (loss) | | | (0.29 | ) | | | (0.35 | ) | | | (0.23 | ) | | | (0.03 | ) | | | (0.06 | ) |
| Class I net assets at the end of the year (in thousands) | | $ | 136,051 | | | $ | 293,900 | | | $ | 249,716 | | | $ | 220,660 | | | $ | 187,306 | |
| Portfolio turnover rate (%) | | | 41 | | | | 30 | | | | 46 | | | | 39 | | | | 46 | |
| ^ | Amount is less than $0.005 per share. |
Note: Net investment income (loss) per share is based on the average shares outstanding during the year.
Performance cited represents past performance. Past performance does not guarantee future results and current performance may be lower or higher than the data quoted. Results shown are annual returns, which assume reinvestment of dividends and capital gains. Investment returns and principal will fluctuate and you may have a gain or loss when you sell shares. For the most current month-end performance information, please call 1-800-742-7272 or visit our Web site atwww.williamblairfunds.com.
| December 31, 2022 | William Blair Funds | 135 |
Financial Highlights — For a share outstanding throughout each period
Growth Fund
| | | Class R6 | |
| | | | |
| | | Years Ended December 31, | |
| | | | 2022 | | | | 2021 | | | | 2020 | | | | 2019(a) | |
| Net asset value, beginning of year | | $ | 14.95 | | | $ | 13.67 | | | $ | 11.26 | | | $ | 11.06 | |
| Income (loss) from investment operations: | | | | | | | | | | | | | | | | |
| Net investment income (loss) | | | (0.02 | ) | | | (0.04 | ) | | | (0.03 | ) | | | (0.00 | )^ |
| Net realized and unrealized gain (loss) on investments | | | (4.37 | ) | | | 3.07 | | | | 4.12 | | | | 1.17 | |
| Total from investment operations | | | (4.39 | ) | | | 3.03 | | | | 4.09 | | | | 1.17 | |
| Less distributions from: | | | | | | | | | | | | | | | | |
| Net investment income | | | — | | | | — | | | | — | | | | — | |
| Net realized gain | | | 0.37 | | | | 1.75 | | | | 1.68 | | | | 0.97 | |
| Total distributions | | | 0.37 | | | | 1.75 | | | | 1.68 | | | | 0.97 | |
| Net asset value, end of year | | $ | 10.19 | | | $ | 14.95 | | | $ | 13.67 | | | $ | 11.26 | |
| Total return (%)* | | | (29.44 | ) | | | 22.55 | | | | 36.50 | | | | 10.75 | |
| Ratios to average daily net assets (%)**: | | | | | | | | | | | | | | | | |
| Expenses | | | 0.87 | | | | 0.84 | | | | 0.87 | | | | 0.88 | |
| Net investment income (loss) | | | (0.18 | ) | | | (0.29 | ) | | | (0.23 | ) | | | (0.06 | ) |
| Class R6 net assets at the end of the year (in thousands) | | $ | 29,128 | | | $ | 14,993 | | | $ | 12,041 | | | $ | 217 | |
| Portfolio turnover rate (%)* | | | 41 | | | | 30 | | | | 46 | | | | 39 | |
| (a) | For the period from May 2, 2019 (Commencement of Operations) to December 31, 2019. |
| * | Rates are not annualized for periods less than a year. |
| ** | Rates are annualized for periods less than a year. |
| ^ | Amount is less than $0.005 per share. |
Note: Net investment income (loss) per share is based on the average shares outstanding during the year.
Performance cited represents past performance. Past performance does not guarantee future results and current performance may be lower or higher than the data quoted. Results shown are annual returns, which assume reinvestment of dividends and capital gains. Investment returns and principal will fluctuate and you may have a gain or loss when you sell shares. For the most current month-end performance information, please call 1-800-742-7272 or visit our Web site atwww.williamblairfunds.com.
| 136 | Annual Report | December 31, 2022 |
Financial Highlights — For a share outstanding throughout each period
Large Cap Growth Fund
| | | Class N | |
| | | | | | | | | Years Ended December 31, | |
| | | 2022 | | | 2021 | | | 2020 | | | 2019 | | | 2018 | |
| Net asset value, beginning of year | | $ | 24.49 | | | $ | 20.03 | | | $ | 15.27 | | | $ | 11.99 | | | $ | 13.35 | |
| Income (loss) from investment operations: | | | | | | | | | | | | | | | | | | | | |
| Net investment income (loss) | | | (0.03 | ) | | | (0.07 | ) | | | 0.01 | | | | 0.00 | ^ | | | (0.02 | ) |
| Net realized and unrealized gain (loss) on investments | | | (7.96 | ) | | | 5.65 | | | | 5.52 | | | | 4.29 | | | | 0.81 | |
| Total from investment operations | | | (7.99 | ) | | | 5.58 | | | | 5.53 | | | | 4.29 | | | | 0.79 | |
| Less distributions from: | | | | | | | | | | | | | | | | | | | | |
| Net investment income | | | — | | | | — | | | | 0.00 | ^ | | | 0.01 | | | | — | |
| Net realized gain | | | 0.12 | | | | 1.12 | | | | 0.77 | | | | 1.00 | | | | 2.15 | |
| Total distributions | | | 0.12 | | | | 1.12 | | | | 0.77 | | | | 1.01 | | | | 2.15 | |
| Net asset value, end of year | | $ | 16.38 | | | $ | 24.49 | | | $ | 20.03 | | | $ | 15.27 | | | $ | 11.99 | |
| Total return (%) | | | (32.61 | ) | | | 28.03 | | | | 36.30 | | | | 36.00 | | | | 4.96 | |
| Ratios to average daily net assets (%): | | | | | | | | | | | | | | | | | | | | |
| Expenses, before waivers and reimbursements | | | 1.03 | | | | 1.05 | | | | 1.09 | | | | 1.12 | | | | 1.21 | |
| Expenses, net of waivers and reimbursements | | | 0.90 | | | | 0.90 | | | | 0.90 | | | | 0.95 | | | | 1.05 | |
| Net investment income (loss), before waivers and reimbursements | | | (0.28 | ) | | | (0.46 | ) | | | (0.15 | ) | | | (0.14 | ) | | | (0.33 | ) |
| Net investment income (loss), net of waivers and reimbursements | | | (0.15 | ) | | | (0.31 | ) | | | 0.04 | | | | 0.03 | | | | (0.17 | ) |
| Class N net assets at the end of the year (in thousands) | | $ | 132,225 | | | $ | 203,014 | | | $ | 138,152 | | | $ | 65,314 | | | $ | 41,361 | |
| Portfolio turnover rate (%) | | | 29 | | | | 26 | | | | 35 | | | | 37 | | | | 47 | |
| | | | | | | | | | | | | | | | | | | | | |
| | | | Class I | |
| | | | Years Ended December 31, | |
| | | 2022 | | | 2021 | | | 2020 | | | 2019 | | | 2018 | |
| Net asset value, beginning of year | | $ | 26.18 | | | $ | 21.29 | | | $ | 16.19 | | | $ | 12.66 | | | $ | 13.97 | |
| Income (loss) from investment operations: | | | | | | | | | | | | | | | | | | | | |
| Net investment income (loss) | | | 0.03 | | | | (0.02 | ) | | | 0.06 | | | | 0.04 | | | | 0.01 | |
| Net realized and unrealized gain (loss) on investments | | | (8.53 | ) | | | 6.03 | | | | 5.85 | | | | 4.54 | | | | 0.85 | |
| Total from investment operations | | | (8.50 | ) | | | 6.01 | | | | 5.91 | | | | 4.58 | | | | 0.86 | |
| Less distributions from: | | | | | | | | | | | | | | | | | | | | |
| Net investment income | | | 0.02 | | | | — | | | | 0.04 | | | | 0.05 | | | | 0.02 | |
| Net realized gain | | | 0.12 | | | | 1.12 | | | | 0.77 | | | | 1.00 | | | | 2.15 | |
| Total distributions | | | 0.14 | | | | 1.12 | | | | 0.81 | | | | 1.05 | | | | 2.17 | |
| Net asset value, end of year | | $ | 17.54 | | | $ | 26.18 | | | $ | 21.29 | | | $ | 16.19 | | | $ | 12.66 | |
| Total return (%) | | | (32.46 | ) | | | 28.39 | | | | 36.59 | | | | 36.35 | | | | 5.21 | |
| Ratios to average daily net assets (%): | | | | | | | | | | | | | | | | | | | | |
| Expenses, before waivers and reimbursements | | | 0.79 | | | | 0.75 | | | | 0.80 | | | | 0.81 | | | | 0.90 | |
| Expenses, net of waivers and reimbursements | | | 0.65 | | | | 0.65 | | | | 0.65 | | | | 0.70 | | | | 0.80 | |
| Net investment income (loss), before waivers and reimbursements | | | (0.01 | ) | | | (0.17 | ) | | | 0.16 | | | | 0.16 | | | | (0.01 | ) |
| Net investment income (loss), net of waivers and reimbursements | | | 0.13 | | | | (0.07 | ) | | | 0.31 | | | | 0.27 | | | | 0.09 | |
| Class I net assets at the end of the year (in thousands) | | $ | 702,441 | | | $ | 669,060 | | | $ | 397,370 | | | $ | 236,930 | | | $ | 137,599 | |
| Portfolio turnover rate (%) | | | 29 | | | | 26 | | | | 35 | | | | 37 | | | | 47 | |
| ^ | Amount is less than $0.005 per share. |
Note: Net investment income (loss) per share is based on the average shares outstanding during the year.
Performance cited represents past performance. Past performance does not guarantee future results and current performance may be lower or higher than the data quoted. Results shown are annual returns, which assume reinvestment of dividends and capital gains. Investment returns and principal will fluctuate and you may have a gain or loss when you sell shares. For the most current month-end performance information, please call 1-800-742-7272 or visit our Web site atwww.williamblairfunds.com.
| December 31, 2022 | William Blair Funds | 137 |
Financial Highlights — For a share outstanding throughout each period
Large Cap Growth Fund
| | | Class R6 | |
| | | Years Ended December 31, | |
| | | 2022 | | | 2021 | | | 2020 | | | 2019(a) | |
| Net asset value, beginning of year | | $ | 26.16 | | | $ | 21.27 | | | $ | 16.17 | | | $ | 15.12 | |
| Income (loss) from investment operations: | | | | | | | | | | | | | | | | |
| Net investment income (loss) | | | 0.04 | | | | (0.00 | )^ | | | 0.01 | | | | 0.04 | |
| Net realized and unrealized gain (loss) on investments | | | (8.52 | ) | | | 6.01 | | | | 5.91 | | | | 2.07 | |
| Total from investment operations | | | (8.48 | ) | | | 6.01 | | | | 5.92 | | | | 2.11 | |
| Less distributions from: | | | | | | | | | | | | | | | | |
| Net investment income | | | 0.03 | | | | 0.00 | ^ | | | 0.05 | | | | 0.06 | |
| Net realized gain | | | 0.12 | | | | 1.12 | | | | 0.77 | | | | 1.00 | |
| Total distributions | | | 0.15 | | | | 1.12 | | | | 0.82 | | | | 1.06 | |
| Net asset value, end of year | | $ | 17.53 | | | $ | 26.16 | | | $ | 21.27 | | | $ | 16.17 | |
| Total return (%)* | | | (32.41 | ) | | | 28.42 | | | | 36.70 | | | | 14.13 | |
| Ratios to average daily net assets (%)**: | | | | | | | | | | | | | | | | |
| Expenses, before waivers and reimbursements | | | 0.66 | | | | 0.67 | | | | 0.70 | | | | 0.71 | |
| Expenses, net of waivers and reimbursements | | | 0.60 | | | | 0.60 | | | | 0.60 | | | | 0.60 | |
| Net investment income (loss), before waivers and reimbursements | | | 0.13 | | | | (0.08 | ) | | | (0.03 | ) | | | 0.22 | |
| Net investment income (loss), net of waivers and reimbursements | | | 0.19 | | | | (0.01 | ) | | | 0.07 | | | | 0.33 | |
| Class R6 net assets at the end of the year (in thousands) | | $ | 238,354 | | | $ | 233,946 | | | $ | 177,347 | | | $ | 1,590 | |
| Portfolio turnover rate (%)* | | | 29 | | | | 26 | | | | 35 | | | | 37 | |
| (a) | For the period from May 2, 2019 (Commencement of Operations) to December 31, 2019. |
| * | Rates are not annualized for periods less than a year. |
| ** | Rates are annualized for periods less than a year. |
| ^ | Amount is less than $0.005 per share. |
Note: Net investment income (loss) per share is based on the average shares outstanding during the year.
Performance cited represents past performance. Past performance does not guarantee future results and current performance may be lower or higher than the data quoted. Results shown are annual returns, which assume reinvestment of dividends and capital gains. Investment returns and principal will fluctuate and you may have a gain or loss when you sell shares. For the most current month-end performance information, please call 1-800-742-7272 or visit our Web site atwww.williamblairfunds.com.
| 138 | Annual Report | December 31, 2022 |
Financial Highlights — For a share outstanding throughout each period
Mid Cap Growth Fund
| | | Class N | |
| | | Years Ended December 31, | |
| | | 2022 | | | 2021 | | | 2020 | | | 2019 | | | 2018 | |
| Net asset value, beginning of year | | $ | 13.29 | | | $ | 12.89 | | | $ | 10.99 | | | $ | 8.87 | | | $ | 10.92 | |
| Income (loss) from investment operations: | | | | | | | | | | | | | | | | | | | | |
| Net investment income (loss) | | | (0.08 | ) | | | (0.12 | ) | | | (0.08 | ) | | | (0.05 | ) | | | (0.06 | ) |
| Net realized and unrealized gain (loss) on investments | | | (3.44 | ) | | | 1.13 | | | | 3.01 | | | | 3.22 | | | | 0.03 | |
| Total from investment operations | | | (3.52 | ) | | | 1.01 | | | | 2.93 | | | | 3.17 | | | | (0.03 | ) |
| Less distributions from: | | | | | | | | | | | | | | | | | | | | |
| Net investment income | | | — | | | | — | | | | — | | | | — | | | | — | |
| Net realized gain | | | 3.35 | | | | 0.61 | | | | 1.03 | | | | 1.05 | | | | 2.02 | |
| Total distributions | | | 3.35 | | | | 0.61 | | | | 1.03 | | | | 1.05 | | | | 2.02 | |
| Net asset value, end of year | | $ | 6.42 | | | $ | 13.29 | | | $ | 12.89 | | | $ | 10.99 | | | $ | 8.87 | |
| Total return (%) | | | (26.84 | ) | | | 8.10 | | | | 26.80 | | | | 36.02 | | | | (1.20 | ) |
| Ratios to average daily net assets (%): | | | | | | | | | | | | | | | | | | | | |
| Expenses, before waivers and reimbursements | | | 1.69 | | | | 1.48 | | | | 1.54 | | | | 1.51 | | | | 1.57 | |
| Expenses, net of waivers and reimbursements | | | 1.20 | | | | 1.20 | | | | 1.20 | | | | 1.20 | | | | 1.23 | |
| Net investment income (loss), before waivers and reimbursements | | | (1.31 | ) | | | (1.14 | ) | | | (1.06 | ) | | | (0.79 | ) | | | (0.85 | ) |
| Net investment income (loss), net of waivers and reimbursements | | | (0.82 | ) | | | (0.86 | ) | | | (0.72 | ) | | | (0.48 | ) | | | (0.51 | ) |
| Class N net assets at the end of the year (in thousands) | | $ | 3,273 | | | $ | 5,480 | | | $ | 6,074 | | | $ | 5,465 | | | $ | 4,944 | |
| Portfolio turnover rate (%) | | | 31 | | | | 47 | | | | 45 | | | | 43 | | | | 58 | |
| | | | | | | | | | | | | | | | | | | | | |
| | | | Class I | |
| | | | Years Ended December 31, | |
| | | 2022 | | | 2021 | | | 2020 | | | 2019 | | | 2018 | |
| Net asset value, beginning of year | | $ | 14.67 | | | $ | 14.13 | | | $ | 11.93 | | | $ | 9.55 | | | $ | 11.57 | |
| Income (loss) from investment operations: | | | | | | | | | | | | | | | | | | | | |
| Net investment income (loss) | | | (0.06 | ) | | | (0.09 | ) | | | (0.06 | ) | | | (0.03 | ) | | | (0.03 | ) |
| Net realized and unrealized gain (loss) on investments | | | (3.81 | ) | | | 1.24 | | | | 3.29 | | | | 3.46 | | | | 0.03 | |
| Total from investment operations | | | (3.87 | ) | | | 1.15 | | | | 3.23 | | | | 3.43 | | | | — | |
| Less distributions from: | | | | | | | | | | | | | | | | | | | | |
| Net investment income | | | — | | | | — | | | | — | | | | — | | | | — | |
| Net realized gain | | | 3.35 | | | | 0.61 | | | | 1.03 | | | | 1.05 | | | | 2.02 | |
| Total distributions | | | 3.35 | | | | 0.61 | | | | 1.03 | | | | 1.05 | | | | 2.02 | |
| Net asset value, end of year | | $ | 7.45 | | | $ | 14.67 | | | $ | 14.13 | | | $ | 11.93 | | | $ | 9.55 | |
| Total return (%) | | | (26.72 | ) | | | 8.38 | | | | 27.21 | | | | 36.17 | | | | (0.86 | ) |
| Ratios to average daily net assets (%): | | | | | | | | | | | | | | | | | | | | |
| Expenses, before waivers and reimbursements | | | 1.46 | | | | 1.24 | | | | 1.29 | | | | 1.28 | | | | 1.31 | |
| Expenses, net of waivers and reimbursements | | | 0.95 | | | | 0.95 | | | | 0.95 | | | | 0.95 | | | | 0.98 | |
| Net investment income (loss), before waivers and reimbursements | | | (1.08 | ) | | | (0.91 | ) | | | (0.80 | ) | | | (0.56 | ) | | | (0.58 | ) |
| Net investment income (loss), net of waivers and reimbursements | | | (0.57 | ) | | | (0.62 | ) | | | (0.46 | ) | | | (0.23 | ) | | | (0.25 | ) |
| Class I net assets at the end of the year (in thousands) | | $ | 28,633 | | | $ | 46,694 | | | $ | 77,273 | | | $ | 67,936 | | | $ | 51,173 | |
| Portfolio turnover rate (%) | | | 31 | | | | 47 | | | | 45 | | | | 43 | | | | 58 | |
Note: Net investment income (loss) per share is based on the average shares outstanding during the year.
Performance cited represents past performance. Past performance does not guarantee future results and current performance may be lower or higher than the data quoted. Results shown are annual returns, which assume reinvestment of dividends and capital gains. Investment returns and principal will fluctuate and you may have a gain or loss when you sell shares. For the most current month-end performance information, please call 1-800-742-7272 or visit our Web site atwww.williamblairfunds.com.
| December 31, 2022 | William Blair Funds | 139 |
Financial Highlights — For a share outstanding throughout each period
Mid Cap Growth Fund
| | | Class R6 | |
| | | Years Ended December 31, | |
| | | | 2022 | | | | 2021 | | | | 2020 | | | | 2019(a) | |
| Net asset value, beginning of year | | $ | 14.69 | | | $ | 14.14 | | | $ | 11.94 | | | $ | 11.93 | |
| Income (loss) from investment operations: | | | | | | | | | | | | | | | | |
| Net investment income (loss) | | | (0.06 | ) | | | (0.08 | ) | | | (0.06 | ) | | | (0.01 | ) |
| Net realized and unrealized gain (loss) on investments | | | (3.81 | ) | | | 1.24 | | | | 3.29 | | | | 1.07 | |
| Total from investment operations | | | (3.87 | ) | | | 1.16 | | | | 3.23 | | | | 1.06 | |
| Less distributions from: | | | | | | | | | | | | | | | | |
| Net investment income | | | — | | | | — | | | | — | | | | — | |
| Net realized gain | | | 3.35 | | | | 0.61 | | | | 1.03 | | | | 1.05 | |
| Total distributions | | | 3.35 | | | | 0.61 | | | | 1.03 | | | | 1.05 | |
| Net asset value, end of year | | $ | 7.47 | | | $ | 14.69 | | | $ | 14.14 | | | $ | 11.94 | |
| Total return (%)* | | | (26.68 | ) | | | 8.44 | | | | 27.18 | | | | 9.10 | |
| Ratios to average daily net assets (%)**: | | | | | | | | | | | | | | | | |
| Expenses, before waivers and reimbursements | | | 1.32 | | | | 1.11 | | | | 1.16 | | | | 1.14 | |
| Expenses, net of waivers and reimbursements | | | 0.90 | | | | 0.90 | | | | 0.90 | | | | 0.90 | |
| Net investment income (loss), before waivers and reimbursements | | | (0.94 | ) | | | (0.78 | ) | | | (0.70 | ) | | | (0.41 | ) |
| Net investment income (loss), net of waivers and reimbursements | | | (0.52 | ) | | | (0.57 | ) | | | (0.44 | ) | | | (0.17 | ) |
| Class R6 net assets at the end of the year (in thousands) | | $ | 498 | | | $ | 676 | | | $ | 623 | | | $ | 145 | |
| Portfolio turnover rate (%)* | | | 31 | | | | 47 | | | | 45 | | | | 43 | |
| (a) | For the period from May 2, 2019 (Commencement of Operations) to December 31, 2019. |
| * | Rates are not annualized for periods less than a year. |
| ** | Rates are annualized for periods less than a year. |
Note: Net investment income (loss) per share is based on the average shares outstanding during the year.
Performance cited represents past performance. Past performance does not guarantee future results and current performance may be lower or higher than the data quoted. Results shown are annual returns, which assume reinvestment of dividends and capital gains. Investment returns and principal will fluctuate and you may have a gain or loss when you sell shares. For the most current month-end performance information, please call 1-800-742-7272 or visit our Web site at www.williamblairfunds.com.
| 140 | Annual Report | December 31, 2022 |
Financial Highlights — For a share outstanding throughout each period
Mid Cap Value Fund
| | | Class I | |
| | | Period Ended
December 31, | |
| | | | 2022(a) | |
| Net asset value, beginning of year | | | $ | 10.00 | |
| Income (loss) from investment operations: | | | | | |
| Net investment income (loss) | | | | 0.12 | |
| Net realized and unrealized gain (loss) on investments | | | | (0.83 | ) |
| Total from investment operations | | | | (0.71 | ) |
| Less distributions from: | | | | | |
| Net investment income | | | | 0.10 | |
| Net realized gain | | | | — | |
| Total distributions | | | | 0.10 | |
| Net asset value, end of year | | | $ | 9.19 | |
| Total return (%)* | | | | (7.13 | ) |
| Ratios to average daily net assets (%)**: | | | | | |
| Expenses, before waivers and reimbursements | | | | 8.52 | |
| Expenses, net of waivers and reimbursements | | | | 0.75 | |
| Net investment income (loss), before waivers and reimbursements | | | | (6.14 | ) |
| Net investment income (loss), net of waivers and reimbursements | | | | 1.63 | |
| Class I net assets at the end of the year (in thousands) | | | $ | 76 | |
| Portfolio turnover rate (%)* | | | | 21 | |
| | | | | | |
| | | Class R6 | |
| | | Period Ended
December 31, | |
| | | | 2022(a) | |
| Net asset value, beginning of year | | | $ | 10.00 | |
| Income (loss) from investment operations: | | | | | |
| Net investment income (loss) | | | | 0.11 | |
| Net realized and unrealized gain (loss) on investments | | | | (0.82 | ) |
| Total from investment operations | | | | (0.71 | ) |
| Less distributions from: | | | | | |
| Net investment income | | | | 0.10 | |
| Net realized gain | | | | — | |
| Total distributions | | | | 0.10 | |
| Net asset value, end of year | | | $ | 9.19 | |
| Total return (%)* | | | | (7.01 | ) |
| Ratios to average daily net assets (%)**: | | | | | |
| Expenses, before waivers and reimbursements | | | | 8.52 | |
| Expenses, net of waivers and reimbursements | | | | 0.70 | |
| Net investment income (loss), before waivers and reimbursements | | | | (6.35 | ) |
| Net investment income (loss), net of waivers and reimbursements | | | | 1.47 | |
| Class R6 net assets at the end of the year (in thousands) | | | $ | 1,431 | |
| Portfolio turnover rate (%)* | | | | 21 | |
| (a) | For the period from March 16, 2022 (Commencement of Operations) to December 31, 2022. |
| * | Rates are not annualized for periods less than a year. |
| ** | Rates are annualized for periods less than a year. |
Note: Net investment income (loss) per share is based on the average shares outstanding during the year.
Performance cited represents past performance. Past performance does not guarantee future results and current performance may be lower or higher than the data quoted. Results shown are annual returns, which assume reinvestment of dividends and capital gains. Investment returns and principal will fluctuate and you may have a gain or loss when you sell shares. For the most current month-end performance information, please call 1-800-742-7272 or visit our Web site at www.williamblairfunds.com.
| December 31, 2022 | William Blair Funds | 141 |
Financial Highlights — For a share outstanding throughout each period
Small-Mid Cap Core Fund
| | | Class I | |
| | | Years Ended December 31, | |
| | | 2022 | | | 2021 | | | 2020 | | | 2019(a) | |
| Net asset value, beginning of year | | $ | 16.31 | | | $ | 12.88 | | | $ | 10.68 | | | $ | 10.00 | |
| Income (loss) from investment operations: | | | | | | | | | | | | | | | | |
| Net investment income (loss) | | | (0.01 | ) | | | (0.03 | ) | | | 0.00 | ^ | | | 0.02 | |
| Net realized and unrealized gain (loss) on investments | | | (2.78 | ) | | | 3.46 | | | | 2.20 | | | | 0.67 | |
| Total from investment operations | | | (2.79 | ) | | | 3.43 | | | | 2.20 | | | | 0.69 | |
| Less distributions from: | | | | | | | | | | | | | | | | |
| Net investment income | | | — | | | | — | | | | — | | | | 0.01 | |
| Net realized gain | | | — | | | | — | | | | — | | | | — | |
| Total distributions | | | — | | | | — | | | | — | | | | 0.01 | |
| Net asset value, end of year | | $ | 13.52 | | | $ | 16.31 | | | $ | 12.88 | | | $ | 10.68 | |
| Total return (%)* | | | (17.11 | ) | | | 26.63 | | | | 20.60 | | | | 6.87 | |
| Ratios to average daily net assets (%)**: | | | | | | | | | | | | | | | | |
| Expenses, before waivers and reimbursements | | | 1.21 | | | | 1.25 | | | | 1.22 | | | | 3.92 | |
| Expenses, net of waivers and reimbursements | | | 0.95 | | | | 0.95 | | | | 0.95 | | | | 0.95 | |
| Net investment income (loss), before waivers and reimbursements | | | (0.32 | ) | | | (0.47 | ) | | | (0.27 | ) | | | (2.23 | ) |
| Net investment income (loss), net of waivers and reimbursements | | | (0.06 | ) | | | (0.17 | ) | | | 0.00 | | | | 0.74 | |
| Class I net assets at the end of the year (in thousands) | | $ | 87,540 | | | $ | 61,433 | | | $ | 22,958 | | | $ | 1,655 | |
| Portfolio turnover rate (%)* | | | 50 | | | | 45 | | | | 244 | | | | 12 | |
| | | | | | | | | | | | | | | | | |
| | | Class R6 | |
| | | Years Ended December 31, | |
| | | 2022 | | | 2021 | | | 2020 | | | 2019(a) | |
| Net asset value, beginning of year | | $ | 16.32 | | | $ | 12.88 | | | $ | 10.68 | | | $ | 10.00 | |
| Income (loss) from investment operations: | | | | | | | | | | | | | | | | |
| Net investment income (loss) | | | 0.00 | ^ | | | (0.02 | ) | | | 0.01 | | | | 0.01 | |
| Net realized and unrealized gain (loss) on investments | | | (2.79 | ) | | | 3.46 | | | | 2.19 | | | | 0.68 | |
| Total from investment operations | | | (2.79 | ) | | | 3.44 | | | | 2.20 | | | | 0.69 | |
| Less distributions from: | | | | | | | | | | | | | | | | |
| Net investment income | | | — | | | | — | | | | 0.00 | ^ | | | 0.01 | |
| Net realized gain | | | — | | | | — | | | | — | | | | — | |
| Total distributions | | | — | | | | — | | | | 0.00 | ^ | | | 0.01 | |
| Net asset value, end of year | | $ | 13.53 | | | $ | 16.32 | | | $ | 12.88 | | | $ | 10.68 | |
| Total return (%)* | | | (17.10 | ) | | | 26.71 | | | | 20.60 | | | | 6.88 | |
| Ratios to average daily net assets (%)**: | | | | | | | | | | | | | | | | |
| Expenses, before waivers and reimbursements | | | 1.05 | | | | 1.16 | | | | 1.07 | | | | 3.92 | |
| Expenses, net of waivers and reimbursements | | | 0.90 | | | | 0.90 | | | | 0.90 | | | | 0.90 | |
| Net investment income (loss), before waivers and reimbursements | | | (0.14 | ) | | | (0.37 | ) | | | (0.11 | ) | | | (2.71 | ) |
| Net investment income (loss), net of waivers and reimbursements | | | 0.01 | | | | (0.11 | ) | | | 0.06 | | | | 0.31 | |
| Class R6 net assets at the end of the year (in thousands) | | $ | 56,681 | | | $ | 31,347 | | | $ | 7,087 | | | $ | 4,933 | |
| Portfolio turnover rate (%)* | | | 50 | | | | 45 | | | | 244 | | | | 12 | |
| (a) | For the period from October 1, 2019 (Commencement of Operations) to December 31, 2019. |
| * | Rates are not annualized for periods less than a year. |
| ** | Rates are annualized for periods less than a year. |
| ^ | Amount is less than $0.005 per share. |
Note: Net investment income (loss) per share is based on the average shares outstanding during the year.
Performance cited represents past performance. Past performance does not guarantee future results and current performance may be lower or higher than the data quoted. Results shown are annual returns, which assume reinvestment of dividends and capital gains. Investment returns and principal will fluctuate and you may have a gain or loss when you sell shares. For the most current month-end performance information, please call 1-800-742-7272 or visit our Web site at www.williamblairfunds.com.
| 142 | Annual Report | December 31, 2022 |
Financial Highlights — For a share outstanding throughout each period
Small-Mid Cap Growth Fund
| | | Class N | |
| | | Years Ended December 31, | |
| | | 2022 | | | 2021 | | | 2020 | | | 2019 | | | 2018 | |
| Net asset value, beginning of year | | $ | 32.27 | | | $ | 32.96 | | | $ | 25.41 | | | $ | 20.97 | | | $ | 23.36 | |
| Income (loss) from investment operations: | | | | | | | | | | | | | | | | | | | | |
| Net investment income (loss) | | | (0.23 | ) | | | (0.36 | ) | | | (0.24 | ) | | | (0.20 | ) | | | (0.18 | ) |
| Net realized and unrealized gain (loss) on investments | | | (7.22 | ) | | | 2.90 | | | | 8.37 | | | | 6.56 | | | | (0.25 | ) |
| Total from investment operations | | | (7.45 | ) | | | 2.54 | | | | 8.13 | | | | 6.36 | | | | (0.43 | ) |
| Less distributions from: | | | | | | | | | | | | | | | | | | | | |
| Net investment income | | | — | | | | — | | | | — | | | | — | | | | — | |
| Net realized gain | | | 0.86 | | | | 3.23 | | | | 0.58 | | | | 1.92 | | | | 1.96 | |
| Total distributions | | | 0.86 | | | | 3.23 | | | | 0.58 | | | | 1.92 | | | | 1.96 | |
| Net asset value, end of year | | $ | 23.96 | | | $ | 32.27 | | | $ | 32.96 | | | $ | 25.41 | | | $ | 20.97 | |
| Total return (%) | | | (23.11 | ) | | | 8.27 | | | | 32.04 | | | | 30.41 | | | | (2.29 | ) |
| Ratios to average daily net assets (%): | | | | | | | | | | | | | | | | | | | | |
| Expenses, before waivers and reimbursements | | | 1.43 | | | | 1.43 | | | | 1.45 | | | | 1.43 | | | | 1.44 | |
| Expenses, net of waivers and reimbursements | | | 1.35 | | | | 1.35 | | | | 1.35 | | | | 1.35 | | | | 1.35 | |
| Net investment income (loss), before waivers and reimbursements | | | (0.96 | ) | | | (1.10 | ) | | | (1.01 | ) | | | (0.88 | ) | | | (0.81 | ) |
| Net investment income (loss), net of waivers and reimbursements | | | (0.88 | ) | | | (1.02 | ) | | | (0.91 | ) | | | (0.80 | ) | | | (0.72 | ) |
| Class N net assets at the end of the year (in thousands) | | $ | 110,241 | | | $ | 232,166 | | | $ | 314,572 | | | $ | 334,017 | | | $ | 424,865 | |
| Portfolio turnover rate (%) | | | 49 | | | | 38 | | | | 55 | | | | 56 | | | | 46 | |
| | | | | | | | | | | | | | | | | | | | | |
| | | Class I | |
| | | Years Ended December 31, | |
| | | 2022 | | | 2021 | | | 2020 | | | 2019 | | | 2018 | |
| Net asset value, beginning of year | | $ | 34.72 | | | $ | 35.13 | | | $ | 26.99 | | | $ | 22.12 | | | $ | 24.48 | |
| Income (loss) from investment operations: | | | | | | | | | | | | | | | | | | | | |
| Net investment income (loss) | | | (0.18 | ) | | | (0.29 | ) | | | (0.19 | ) | | | (0.14 | ) | | | (0.12 | ) |
| Net realized and unrealized gain (loss) on investments | | | (7.77 | ) | | | 3.11 | | | | 8.91 | | | | 6.93 | | | | (0.28 | ) |
| Total from investment operations | | | (7.95 | ) | | | 2.82 | | | | 8.72 | | | | 6.79 | | | | (0.40 | ) |
| Less distributions from: | | | | | | | | | | | | | | | | | | | | |
| Net investment income | | | — | | | | — | | | | — | | | | — | | | | — | |
| Net realized gain | | | 0.86 | | | | 3.23 | | | | 0.58 | | | | 1.92 | | | | 1.96 | |
| Total distributions | | | 0.86 | | | | 3.23 | | | | 0.58 | | | | 1.92 | | | | 1.96 | |
| Net asset value, end of year | | $ | 25.91 | | | $ | 34.72 | | | $ | 35.13 | | | $ | 26.99 | | | $ | 22.12 | |
| Total return (%) | | | (22.92 | ) | | | 8.56 | | | | 32.35 | | | | 30.77 | | | | (2.06 | ) |
| Ratios to average daily net assets (%): | | | | | | | | | | | | | | | | | | | | |
| Expenses, before waivers and reimbursements | | | 1.17 | | | | 1.16 | | | | 1.17 | | | | 1.16 | | | | 1.16 | |
| Expenses, net of waivers and reimbursements | | | 1.10 | | | | 1.10 | | | | 1.10 | | | | 1.10 | | | | 1.10 | |
| Net investment income (loss), before waivers and reimbursements | | | (0.70 | ) | | | (0.83 | ) | | | (0.73 | ) | | | (0.59 | ) | | | (0.53 | ) |
| Net investment income (loss), net of waivers and reimbursements | | | (0.63 | ) | | | (0.77 | ) | | | (0.66 | ) | | | (0.53 | ) | | | (0.47 | ) |
| Class I net assets at the end of the year (in thousands) | | $ | 1,509,931 | | | $ | 2,487,862 | | | $ | 3,139,290 | | | $ | 2,531,823 | | | $ | 1,979,105 | |
| Portfolio turnover rate (%) | | | 49 | | | | 38 | | | | 55 | | | | 56 | | | | 46 | |
Note: Net investment income (loss) per share is based on the average shares outstanding during the year.
Performance cited represents past performance. Past performance does not guarantee future results and current performance may be lower or higher than the data quoted. Results shown are annual returns, which assume reinvestment of dividends and capital gains. Investment returns and principal will fluctuate and you may have a gain or loss when you sell shares. For the most current month-end performance information, please call 1-800-742-7272 or visit our Web site at www.williamblairfunds.com.
| December 31, 2022 | William Blair Funds | 143 |
Financial Highlights — For a share outstanding throughout each period
Small-Mid Cap Growth Fund
| | | Class R6 | |
| | | Years Ended December 31, | |
| | | | 2022 | | | | 2021 | | | | 2020 | | | | 2019(a) | |
| Net asset value, beginning of year | | $ | 34.79 | | | $ | 35.18 | | | $ | 27.01 | | | $ | 26.76 | |
| Income (loss) from investment operations: | | | | | | | | | | | | | | | | |
| Net investment income (loss) | | | (0.15 | ) | | | (0.26 | ) | | | (0.17 | ) | | | (0.09 | ) |
| Net realized and unrealized gain (loss) on investments | | | (7.79 | ) | | | 3.10 | | | | 8.92 | | | | 2.26 | |
| Total from investment operations | | | (7.94 | ) | | | 2.84 | | | | 8.75 | | | | 2.17 | |
| Less distributions from: | | | | | | | | | | | | | | | | |
| Net investment income | | | — | | | | — | | | | — | | | | — | |
| Net realized gain | | | 0.86 | | | | 3.23 | | | | 0.58 | | | | 1.92 | |
| Total distributions | | | 0.86 | | | | 3.23 | | | | 0.58 | | | | 1.92 | |
| Net asset value, end of year | | $ | 25.99 | | | $ | 34.79 | | | $ | 35.18 | | | $ | 27.01 | |
| Total return (%)* | | | (22.84 | ) | | | 8.60 | | | | 32.44 | | | | 8.17 | |
| Ratios to average daily net assets (%)**: | | | | | | | | | | | | | | | | |
| Expenses | | | 1.05 | | | | 1.03 | | | | 1.05 | | | | 1.05 | |
| Net investment income (loss) | | | (0.55 | ) | | | (0.69 | ) | | | (0.61 | ) | | | (0.46 | ) |
| Class R6 net assets at the end of the year (in thousands) | | $ | 392,153 | | | $ | 328,034 | | | $ | 123,220 | | | $ | 39,974 | |
| Portfolio turnover rate (%)* | | | 49 | | | | 38 | | | | 55 | | | | 56 | |
| (a) | For the period from May 2, 2019 (Commencement of Operations) to December 31, 2019. |
| * | Rates are not annualized for periods less than a year. |
| ** | Rates are annualized for periods less than a year. |
Note: Net investment income (loss) per share is based on the average shares outstanding during the year.
Performance cited represents past performance. Past performance does not guarantee future results and current performance may be lower or higher than the data quoted. Results shown are annual returns, which assume reinvestment of dividends and capital gains. Investment returns and principal will fluctuate and you may have a gain or loss when you sell shares. For the most current month-end performance information, please call 1-800-742-7272 or visit our Web site at www.williamblairfunds.com.
| 144 | Annual Report | December 31, 2022 |
Financial Highlights — For a share outstanding throughout each period
Small Cap Growth Fund
| | | Class N | |
| | | Years Ended December 31, | |
| | | 2022 | | | 2021 | | | 2020 | | | 2019 | | | 2018 | |
| Net asset value, beginning of year | | $ | 31.90 | | | $ | 34.49 | | | $ | 27.75 | | | $ | 23.23 | | | $ | 26.87 | |
| Income (loss) from investment operations: | | | | | | | | | | | | | | | | | | | | |
| Net investment income (loss) | | | (0.27 | ) | | | (0.45 | ) | | | (0.29 | ) | | | (0.24 | ) | | | (0.27 | ) |
| Net realized and unrealized gain (loss) on investments | | | (6.61 | ) | | | 4.56 | | | | 10.86 | | | | 5.40 | | | | (0.10 | ) |
| Total from investment operations | | | (6.88 | ) | | | 4.11 | | | | 10.57 | | | | 5.16 | | | | (0.37 | ) |
| Less distributions from: | | | | | | | | | | | | | | | | | | | | |
| Net investment income | | | — | | | | — | | | | — | | | | — | | | | — | |
| Net realized gain | | | 1.01 | | | | 6.70 | | | | 3.83 | | | | 0.64 | | | | 3.27 | |
| Total distributions | | | 1.01 | | | | 6.70 | | | | 3.83 | | | | 0.64 | | | | 3.27 | |
| Net asset value, end of year | | $ | 24.01 | | | $ | 31.90 | | | $ | 34.49 | | | $ | 27.75 | | | $ | 23.23 | |
| Total return (%) | | | (21.59 | ) | | | 12.91 | | | | 38.32 | | | | 22.26 | | | | (2.14 | ) |
| Ratios to average daily net assets (%): | | | | | | | | | | | | | | | | | | | | |
| Expenses, before waivers and reimbursements | | | 1.55 | | | | 1.56 | | | | 1.58 | | | | 1.54 | | | | 1.55 | |
| Expenses, net of waivers and reimbursements | | | 1.50 | | | | 1.50 | | | | 1.50 | | | | 1.50 | | | | 1.50 | |
| Net investment income (loss), before waivers and reimbursements | | | (1.08 | ) | | | (1.24 | ) | | | (1.10 | ) | | | (0.92 | ) | | | (0.94 | ) |
| Net investment income (loss), net of waivers and reimbursements | | | (1.03 | ) | | | (1.18 | ) | | | (1.02 | ) | | | (0.88 | ) | | | (0.89 | ) |
| Class N net assets at the end of the year (in thousands) | | $ | 114,324 | | | $ | 179,739 | | | $ | 180,635 | | | $ | 180,706 | | | $ | 169,074 | |
| Portfolio turnover rate (%) | | | 45 | | | | 49 | | | | 71 | | | | 51 | | | | 74 | |
| | | | | | | | | | | | | | | | | | | | | |
| | | Class I | |
| | | | Years Ended December 31, | |
| | | | 2022 | | | | 2021 | | | | 2020 | | | | 2019 | | | | 2018 | |
| Net asset value, beginning of year | | $ | 37.52 | | | $ | 39.36 | | | $ | 31.19 | | | $ | 25.99 | | | $ | 29.61 | |
| Income (loss) from investment operations: | | | | | | | | | | | | | | | | | | | | |
| Net investment income (loss) | | | (0.24 | ) | | | (0.41 | ) | | | (0.24 | ) | | | (0.19 | ) | | | (0.21 | ) |
| Net realized and unrealized gain (loss) on investments | | | (7.78 | ) | | | 5.27 | | | | 12.24 | | | | 6.03 | | | | (0.14 | ) |
| Total from investment operations | | | (8.02 | ) | | | 4.86 | | | | 12.00 | | | | 5.84 | | | | (0.35 | ) |
| Less distributions from: | | | | | | | | | | | | | | | | | | | | |
| Net investment income | | | — | | | | — | | | | — | | | | — | | | | — | |
| Net realized gain | | | 1.01 | | | | 6.70 | | | | 3.83 | | | | 0.64 | | | | 3.27 | |
| Total distributions | | | 1.01 | | | | 6.70 | | | | 3.83 | | | | 0.64 | | | | 3.27 | |
| Net asset value, end of year | | $ | 28.49 | | | $ | 37.52 | | | $ | 39.36 | | | $ | 31.19 | | | $ | 25.99 | |
| Total return (%) | | | (21.39 | ) | | | 13.22 | | | | 38.68 | | | | 22.51 | | | | (1.88 | ) |
| Ratios to average daily net assets (%): | | | | | | | | | | | | | | | | | | | | |
| Expenses, before waivers and reimbursements | | | 1.28 | | | | 1.25 | | | | 1.30 | | | | 1.27 | | | | 1.25 | |
| Expenses, net of waivers and reimbursements | | | 1.25 | | | | 1.25 | | | | 1.25 | | | | 1.25 | | | | 1.25 | |
| Net investment income (loss), before waivers and reimbursements | | | (0.81 | ) | | | (0.93 | ) | | | (0.82 | ) | | | (0.65 | ) | | | (0.65 | ) |
| Net investment income (loss), net of waivers and reimbursements | | | (0.78 | ) | | | (0.93 | ) | | | (0.77 | ) | | | (0.63 | ) | | | (0.65 | ) |
| Class I net assets at the end of the year (in thousands) | | $ | 303,016 | | | $ | 402,629 | | | $ | 390,511 | | | $ | 423,881 | | | $ | 410,233 | |
| Portfolio turnover rate (%) | | | 45 | | | | 49 | | | | 71 | | | | 51 | | | | 74 | |
Note: Net investment income (loss) per share is based on the average shares outstanding during the year.
Performance cited represents past performance. Past performance does not guarantee future results and current performance may be lower or higher than the data quoted. Results shown are annual returns, which assume reinvestment of dividends and capital gains. Investment returns and principal will fluctuate and you may have a gain or loss when you sell shares. For the most current month-end performance information, please call 1-800-742-7272 or visit our Web site at www.williamblairfunds.com.
| December 31, 2022 | William Blair Funds | 145 |
Financial Highlights — For a share outstanding throughout each period
Small Cap Growth Fund
| | | Class R6 | |
| | | Years Ended December 31, | |
| | | 2022 | | | 2021 | | | 2020 | | | 2019(a) | |
| Net asset value, beginning of year | | $ | 37.60 | | | $ | 39.40 | | | $ | 31.20 | | | $ | 31.00 | |
| Income (loss) from investment operations: | | | | | | | | | | | | | | | | |
| Net investment income (loss) | | | (0.21 | ) | | | (0.37 | ) | | | (0.23 | ) | | | (0.11 | ) |
| Net realized and unrealized gain (loss) on investments | | | (7.81 | ) | | | 5.27 | | | | 12.26 | | | | 0.95 | |
| Total from investment operations | | | (8.02 | ) | | | 4.90 | | | | 12.03 | | | | 0.84 | |
| Less distributions from: | | | | | | | | | | | | | | | | |
| Net investment income | | | — | | | | — | | | | — | | | | — | |
| Net realized gain | | | 1.01 | | | | 6.70 | | | | 3.83 | | | | 0.64 | |
| Total distributions | | | 1.01 | | | | 6.70 | | | | 3.83 | | | | 0.64 | |
| Net asset value, end of year | | $ | 28.57 | | | $ | 37.60 | | | $ | 39.40 | | | $ | 31.20 | |
| Total return (%)* | | | (21.35 | ) | | | 13.31 | | | | 38.76 | | | | 2.75 | |
| Ratios to average daily net assets (%)**: | | | | | | | | | | | | | | | | |
| Expenses | | | 1.18 | | | | 1.16 | | | | 1.19 | | | | 1.18 | |
| Net investment income (loss) | | | (0.70 | ) | | | (0.84 | ) | | | (0.71 | ) | | | (0.51 | ) |
| Class R6 net assets at the end of the year (in thousands) | | $ | 112,497 | | | $ | 127,710 | | | $ | 103,462 | | | $ | 69,950 | |
| Portfolio turnover rate (%)* | | | 45 | | | | 49 | | | | 71 | | | | 51 | |
| (a) | For the period from May 2, 2019 (Commencement of Operations) to December 31, 2019. |
| * | Rates are not annualized for periods less than a year. |
| ** | Rates are annualized for periods less than a year. |
Note: Net investment income (loss) per share is based on the average shares outstanding during the year.
Performance cited represents past performance. Past performance does not guarantee future results and current performance may be lower or higher than the data quoted. Results shown are annual returns, which assume reinvestment of dividends and capital gains. Investment returns and principal will fluctuate and you may have a gain or loss when you sell shares. For the most current month-end performance information, please call 1-800-742-7272 or visit our Web site at www.williamblairfunds.com.
| 146 | Annual Report | December 31, 2022 |
Financial Highlights — For a share outstanding throughout each period
Small Cap Value Fund
| | Class N | |
| | Year Ended
December 31, | | | Period Ended
December 31, | | | Period Ended
October 31, | |
| | | 2022 | | | | 2021(b) | | | | 2021(a) | |
| Net asset value, beginning of year | | $ | 33.63 | | | | $ | 33.49 | | | | $ | 32.15 | |
| Income (loss) from investment operations: | | | | | | | | | | | | | | |
| Net investment income (loss) | | | 0.15 | | | | | 0.00 | ^ | | | | 0.05 | |
| Net realized and unrealized gain (loss) on investments | | | (3.98 | ) | | | | 1.37 | | | | | 1.29 | |
| Total from investment operations | | | (3.83 | ) | | | | 1.37 | | | | | 1.34 | |
| Less distributions from: | | | | | | | | | | | | | | |
| Net investment income | | | 0.12 | | | | | — | | | | | — | |
| Net realized gain | | | 1.92 | | | | | 1.23 | | | | | — | |
| Total distributions | | | 2.04 | | | | | 1.23 | | | | | — | |
| Net asset value, end of year | | $ | 27.76 | | | | $ | 33.63 | | | | $ | 33.49 | |
| Total return (%)* | | | (11.36 | ) | | | | 4.24 | | | | | 4.17 | |
| Ratios to average daily net assets (%)**: | | | | | | | | | | | | | | |
| Expenses, before waivers and reimbursements | | | 1.15 | | | | | 1.26 | | | | | 1.17 | |
| Expenses, net of waivers and reimbursements | | | 1.15 | | | | | 1.15 | | | | | 1.15 | |
| Net investment income (loss), before waivers and reimbursements | | | 0.48 | | | | | (0.05 | ) | | | | 0.51 | |
| Net investment income (loss), net of waivers and reimbursements | | | 0.48 | | | | | 0.06 | | | | | 0.53 | |
| Class N net assets at the end of the year (in thousands) | | $ | 2,648 | | | | $ | 3,313 | | | | $ | 9,805 | |
| Portfolio turnover rate (%)* | | | 25 | | | | | 7 | | | | | 35 | |
| | | | | | | | | | | | | | | |
| | | Class I | |
| | | Year Ended
December 31, | | | Period Ended
December 31, | | | | | | | | | | | | Year Ended
October 31, | |
| | | | 2022 | | | | 2021(b) | | | 2021 | | | 2020 | | | 2019 | | | | 2018 | |
| Net asset value, beginning of year | | | $ | 33.58 | | | | $ | 33.52 | | | $ | 23.79 | �� | | $ | 28.84 | | | $ | 31.53 | | | | $ | 35.04 | |
| Income (loss) from investment operations: | | | | | | | | | | | | | | | | | | | | | | | | | | | |
| Net investment income (loss) | | | | 0.22 | | | | | 0.03 | | | | 0.18 | | | | 0.09 | | | | 0.18 | | | | | 0.06 | |
| Net realized and unrealized gain (loss) on investments | | | | (3.96 | ) | | | | 1.35 | | | | 12.91 | | | | (3.89 | ) | | | 1.59 | | | | | (1.00 | ) |
| Total from investment operations | | | | (3.74 | ) | | | | 1.38 | | | | 13.09 | | | | (3.80 | ) | | | 1.77 | | | | | (0.94 | ) |
| Less distributions from: | | | | | | | | | | | | | | | | | | | | | | | | | | | |
| Net investment income | | | | 0.20 | | | | | 0.09 | | | | 0.11 | | | | 0.07 | | | | 0.15 | | | | | 0.09 | |
| Net realized gain | | | | 1.92 | | | | | 1.23 | | | | 3.25 | | | | 1.18 | | | | 4.31 | | | | | 2.48 | |
| Total distributions | | | | 2.12 | | | | | 1.32 | | | | 3.36 | | | | 1.25 | | | | 4.46 | | | | | 2.57 | |
| Net asset value, end of year | | | $ | 27.72 | | | | $ | 33.58 | | | $ | 33.52 | | | $ | 23.79 | | | $ | 28.84 | | | | $ | 31.53 | |
| Total return (%)* | | | | (11.12 | ) | | | | 4.31 | | | | 55.32 | | | | (13.91 | ) | | | 8.60 | | | | | (3.06 | ) |
| Ratios to average daily net assets (%)**: | | | | | | | | | | | | | | | | | | | | | | | | | | | |
| Expenses, before waivers and reimbursements | | | | 0.94 | | | | | 0.82 | | | | 0.86 | | | | 0.89 | | | | 0.93 | | | | | 0.93 | |
| Expenses, net of waivers and reimbursements | | | | 0.89 | | | | | 0.82 | | | | 0.86 | | | | 0.89 | | | | 0.93 | | | | | 0.93 | |
| Net investment income (loss), before waivers and reimbursements | | | | 0.67 | | | | | 0.55 | | | | 0.52 | | | | 0.37 | | | | 0.63 | | | | | 0.16 | |
| Net investment income (loss), net of waivers and reimbursements | | | | 0.72 | | | | | 0.55 | | | | 0.52 | | | | 0.37 | | | | 0.63 | | | | | 0.16 | |
| Class I net assets at the end of the year (in thousands) | | | $ | 758,104 | | | | $ | 1,059,157 | | | $ | 1,143,150 | | | $ | 1,181,409 | | | $ | 908,831 | | | | $ | 738,558 | |
| Portfolio turnover rate (%)* | | | | 25 | | | | | 7 | | | | 35 | | | | 27 | | | | 31 | | | | | 31 | |
| (a) | For the period from July 17, 2021 (Commencement of Operations) to October 31, 2021. |
| (b) | For the period from November 1, 2021 to December 31, 2021. |
| * | Rates are not annualized for periods less than a year. |
| ** | Rates are annualized for periods less than a year. |
| ^ | Amount is less than $0.005 per share. |
Note: Net investment income (loss) per share is based on the average shares outstanding during the year.
Performance cited represents past performance. Past performance does not guarantee future results and current performance may be lower or higher than the data quoted. Results shown are annual returns, which assume reinvestment of dividends and capital gains. Investment returns and principal will fluctuate and you may have a gain or loss when you sell shares. For the most current month-end performance information, please call 1-800-742-7272 or visit our Web site at www.williamblairfunds.com.
| December 31, 2022 | William Blair Funds | 147 |
Financial Highlights — For a share outstanding throughout each period
Small Cap Value Fund
| | Class R6 | |
| | Year Ended
December 31, | | | Period Ended
December 31, | | | Period Ended
October 31, | |
| | | | 2022 | | | | | 2021(b) | | | | | 2021(a) | |
| Net asset value, beginning of year | | $ | 33.58 | | | | $ | 33.53 | | | | $ | 32.15 | |
| Income (loss) from investment operations: | | | | | | | | | | | | | | |
| Net investment income (loss) | | | 0.26 | | | | | 0.03 | | | | | 0.06 | |
| Net realized and unrealized gain (loss) on investments | | | (3.98 | ) | | | | 1.35 | | | | | 1.32 | |
| Total from investment operations | | | (3.72 | ) | | | | 1.38 | | | | | 1.38 | |
| Less distributions from: | | | | | | | | | | | | | | |
| Net investment income | | | 0.23 | | | | | 0.10 | | | | | — | |
| Net realized gain | | | 1.92 | | | | | 1.23 | | | | | — | |
| Total distributions | | | 2.15 | | | | | 1.33 | | | | | — | |
| Net asset value, end of year | | $ | 27.71 | | | | $ | 33.58 | | | | $ | 33.53 | |
| Total return (%)* | | | (11.06 | ) | | | | 4.33 | | | | | 4.26 | |
| Ratios to average daily net assets (%)**: | | | | | | | | | | | | | | |
| Expenses | | | 0.81 | | | | | 0.78 | | | | | 0.78 | |
| Net investment income (loss) | | | 0.85 | | | | | 0.59 | | | | | 0.64 | |
| Class R6 net assets at the end of the year (in thousands) | | $ | 453,456 | | | | $ | 1,006,928 | | | | $ | 867,272 | |
| Portfolio turnover rate (%)* | | | 25 | | | | | 7 | | | | | 35 | |
| (a) | For the period from July 17, 2021 (Commencement of Operations) to October 31, 2021. |
| (b) | For the period from November 1, 2021 to December 31, 2021. |
| * | Rates are not annualized for periods less than a year. |
| ** | Rates are annualized for periods less than a year. |
Note: Net investment income (loss) per share is based on the average shares outstanding during the year.
Performance cited represents past performance. Past performance does not guarantee future results and current performance may be lower or higher than the data quoted. Results shown are annual returns, which assume reinvestment of dividends and capital gains. Investment returns and principal will fluctuate and you may have a gain or loss when you sell shares. For the most current month-end performance information, please call 1-800-742-7272 or visit our Web site at www.williamblairfunds.com.
| 148 | Annual Report | December 31, 2022 |
Financial Highlights — For a share outstanding throughout each period
Global Leaders Fund
| | | Class N | |
| | | Years Ended December 31, | |
| | | 2022 | | | 2021 | | | 2020 | | | 2019 | | | 2018 | |
| Net asset value, beginning of year | | $ | 19.17 | | | $ | 17.41 | | | $ | 14.92 | | | $ | 11.47 | | | $ | 14.53 | |
| Income (loss) from investment operations: | | | | | | | | | | | | | | | | | | | | |
| Net investment income (loss) | | | (0.04 | ) | | | (0.11 | ) | | | (0.06 | ) | | | 0.01 | | | | 0.02 | |
| Net realized and unrealized gain (loss) on investments | | | (5.61 | ) | | | 2.96 | | | | 4.74 | | | | 3.61 | | | | (1.12 | ) |
| Total from investment operations | | | (5.65 | ) | | | 2.85 | | | | 4.68 | | | | 3.62 | | | | (1.10 | ) |
| Less distributions from: | | | | | | | | | | | | | | | | | | | | |
| Net investment income | | | — | | | | — | | | | — | | | | 0.03 | | | | — | |
| Net realized gain | | | 0.28 | | | | 1.09 | | | | 2.19 | | | | 0.14 | | | | 1.96 | |
| Total distributions | | | 0.28 | | | | 1.09 | | | | 2.19 | | | | 0.17 | | | | 1.96 | |
| Net asset value, end of year | | $ | 13.24 | | | $ | 19.17 | | | $ | 17.41 | | | $ | 14.92 | | | $ | 11.47 | |
| Total return (%) | | | (29.49 | ) | | | 16.55 | | | | 31.50 | | | | 31.57 | | | | (8.23 | ) |
| Ratios to average daily net assets (%): | | | | | | | | | | | | | | | | | | | | |
| Expenses, before waivers and reimbursements | | | 1.45 | | | | 1.38 | | | | 1.45 | | | | 1.39 | | | | 1.47 | |
| Expenses, net of waivers and reimbursements | | | 1.15 | | | | 1.15 | | | | 1.15 | | | | 1.20 | | | | 1.33 | |
| Net investment income (loss), before waivers and reimbursements | | | (0.60 | ) | | | (0.79 | ) | | | (0.67 | ) | | | (0.10 | ) | | | (0.01 | ) |
| Net investment income (loss), net of waivers and reimbursements | | | (0.30 | ) | | | (0.56 | ) | | | (0.37 | ) | | | 0.09 | | | | 0.13 | |
| Class N net assets at the end of the year (in thousands) | | $ | 8,317 | | | $ | 13,709 | | | $ | 11,861 | | | $ | 8,910 | | | $ | 7,225 | |
| Portfolio turnover rate (%) | | | 15 | | | | 18 | | | | 27 | | | | 27 | | | | 49 | |
| | | | | | | | | | | | | | | | | | | | | |
| | | Class I | |
| | | Years Ended December 31, | |
| | | | 2022 | | | | 2021 | | | | 2020 | | | | 2019 | | | | 2018 | |
| Net asset value, beginning of year | | $ | 19.28 | | | $ | 17.47 | | | $ | 14.93 | | | $ | 11.47 | | | $ | 14.56 | |
| Income (loss) from investment operations: | | | | | | | | | | | | | | | | | | | | |
| Net investment income (loss) | | | (0.01 | ) | | | (0.06 | ) | | | (0.01 | ) | | | 0.05 | | | | 0.06 | |
| Net realized and unrealized gain (loss) on investments | | | (5.63 | ) | | | 2.96 | | | | 4.74 | | | | 3.61 | | | | (1.13 | ) |
| Total from investment operations | | | (5.64 | ) | | | 2.90 | | | | 4.73 | | | | 3.66 | | | | (1.07 | ) |
| Less distributions from: | | | | | | | | | | | | | | | | | | | | |
| Net investment income | | | 0.01 | | | | — | | | | 0.00 | ^ | | | 0.06 | | | | 0.06 | |
| Net realized gain | | | 0.28 | | | | 1.09 | | | | 2.19 | | | | 0.14 | | | | 1.96 | |
| Total distributions | | | 0.29 | | | | 1.09 | | | | 2.19 | | | | 0.20 | | | | 2.02 | |
| Net asset value, end of year | | $ | 13.35 | | | $ | 19.28 | | | $ | 17.47 | | | $ | 14.93 | | | $ | 11.47 | |
| Total return (%) | | | (29.28 | ) | | | 16.78 | | | | 31.86 | | | | 31.96 | | | | (8.06 | ) |
| Ratios to average daily net assets (%): | | | | | | | | | | | | | | | | | | | | |
| Expenses, before waivers and reimbursements | | | 1.12 | | | | 1.07 | | | | 1.12 | | | | 1.07 | | | | 1.15 | |
| Expenses, net of waivers and reimbursements | | | 0.90 | | | | 0.90 | | | | 0.90 | | | | 0.95 | | | | 1.07 | |
| Net investment income (loss), before waivers and reimbursements | | | (0.27 | ) | | | (0.49 | ) | | | (0.31 | ) | | | 0.22 | | | | 0.31 | |
| Net investment income (loss), net of waivers and reimbursements | | | (0.05 | ) | | | (0.32 | ) | | | (0.09 | ) | | | 0.34 | | | | 0.39 | |
| Class I net assets at the end of the year (in thousands) | | $ | 69,987 | | | $ | 124,488 | | | $ | 107,375 | | | $ | 114,666 | | | $ | 83,790 | |
| Portfolio turnover rate (%) | | | 15 | | | | 18 | | | | 27 | | | | 27 | | | | 49 | |
| ^ | Amount is less than $0.005 per share. |
Note: Net investment income (loss) per share is based on the average shares outstanding during the year.
Performance cited represents past performance. Past performance does not guarantee future results and current performance may be lower or higher than the data quoted. Results shown are annual returns, which assume reinvestment of dividends and capital gains. Investment returns and principal will fluctuate and you may have a gain or loss when you sell shares. For the most current month-end performance information, please call 1-800-742-7272 or visit our Web site at www.williamblairfunds.com.
| December 31, 2022 | William Blair Funds | 149 |
Financial Highlights — For a share outstanding throughout each period
Global Leaders Fund
| | | Class R6 | |
| | | Years Ended December 31, | |
| | | 2022 | | | 2021 | | | 2020 | | | 2019 | | | 2018 | |
| Net asset value, beginning of year | | $ | 19.30 | | | $ | 17.47 | | | $ | 14.93 | | | $ | 11.47 | | | $ | 14.56 | |
| Income (loss) from investment operations: | | | | | | | | | | | | | | | | | | | | |
| Net investment income (loss) | | | (0.01 | ) | | | (0.05 | ) | | | 0.02 | | | | 0.06 | | | | 0.07 | |
| Net realized and unrealized gain (loss) on investments | | | (5.64 | ) | | | 2.97 | | | | 4.72 | | | | 3.61 | | | | (1.13 | ) |
| Total from investment operations | | | (5.65 | ) | | | 2.92 | | | | 4.74 | | | | 3.67 | | | | (1.06 | ) |
| Less distributions from: | | | | | | | | | | | | | | | | | | | | |
| Net investment income | | | 0.02 | | | | — | | | | 0.01 | | | | 0.07 | | | | 0.07 | |
| Net realized gain | | | 0.28 | | | | 1.09 | | | | 2.19 | | | | 0.14 | | | | 1.96 | |
| Total distributions | | | 0.30 | | | | 1.09 | | | | 2.20 | | | | 0.21 | | | | 2.03 | |
| Net asset value, end of year | | $ | 13.35 | | | $ | 19.30 | | | $ | 17.47 | | | $ | 14.93 | | | $ | 11.47 | |
| Total return (%) | | | (29.30 | ) | | | 16.90 | | | | 31.91 | | | | 32.02 | | | | (7.99 | ) |
| Ratios to average daily net assets (%): | | | | | | | | | | | | | | | | | | | | |
| Expenses, before waivers and reimbursements | | | 1.05 | | | | 0.99 | | | | 1.06 | | | | 1.01 | | | | 1.08 | |
| Expenses, net of waivers and reimbursements | | | 0.85 | | | | 0.85 | | | | 0.85 | | | | 0.90 | | | | 1.00 | |
| Net investment income (loss), before waivers and reimbursements | | | (0.30 | ) | | | (0.40 | ) | | | (0.10 | ) | | | 0.32 | | | | 0.39 | |
| Net investment income (loss), net of waivers and reimbursements | | | (0.10 | ) | | | (0.26 | ) | | | 0.11 | | | | 0.43 | | | | 0.47 | |
| Class R6 net assets at the end of the year (in thousands) | | $ | 13,255 | | | $ | 5,585 | | | $ | 2,946 | | | $ | 48,133 | | | $ | 79,685 | |
| Portfolio turnover rate (%) | | | 15 | | | | 18 | | | | 27 | | | | 27 | | | | 49 | |
Note: Net investment income (loss) per share is based on the average shares outstanding during the year.
Performance cited represents past performance. Past performance does not guarantee future results and current performance may be lower or higher than the data quoted. Results shown are annual returns, which assume reinvestment of dividends and capital gains. Investment returns and principal will fluctuate and you may have a gain or loss when you sell shares. For the most current month-end performance information, please call 1-800-742-7272 or visit our Web site at www.williamblairfunds.com.
| 150 | Annual Report | December 31, 2022 |
Financial Highlights — For a share outstanding throughout each period
International Leaders Fund
| | | Class N | |
| | | Years Ended December 31, | |
| | | 2022 | | | 2021 | | | 2020 | | | 2019 | | | 2018 | |
| Net asset value, beginning of year | | $ | 24.28 | | | $ | 22.69 | | | $ | 18.08 | | | $ | 13.80 | | | $ | 16.37 | |
| Income (loss) from investment operations: | | | | | | | | | | | | | | | | | | | | |
| Net investment income (loss) | | | 0.04 | | | | (0.12 | ) | | | (0.04 | ) | | | 0.09 | | | | 0.13 | |
| Net realized and unrealized gain (loss) on investments | | | (7.01 | ) | | | 2.35 | | | | 4.82 | | | | 4.25 | | | | (2.19 | ) |
| Total from investment operations | | | (6.97 | ) | | | 2.23 | | | | 4.78 | | | | 4.34 | | | | (2.06 | ) |
| Less distributions from: | | | | | | | | | | | | | | | | | | | | |
| Net investment income | | | — | | | | 0.00 | ^ | | | — | | | | 0.06 | | | | 0.06 | |
| Net realized gain | | | 0.03 | | | | 0.64 | | | | 0.17 | | | | — | | | | 0.45 | |
| Total distributions | | | 0.03 | | | | 0.64 | | | | 0.17 | | | | 0.06 | | | | 0.51 | |
| Net asset value, end of year | | $ | 17.28 | | | $ | 24.28 | | | $ | 22.69 | | | $ | 18.08 | | | $ | 13.80 | |
| Total return (%) | | | (28.70 | ) | | | 9.93 | | | | 26.45 | | | | 31.46 | | | | (12.70 | ) |
| Ratios to average daily net assets (%): | | | | | | | | | | | | | | | | | | | | |
| Expenses, before waivers and reimbursements | | | 1.26 | | | | 1.30 | | | | 1.31 | | | | 1.32 | | | | 1.39 | |
| Expenses, net of waivers and reimbursements | | | 1.15 | | | | 1.15 | | | | 1.15 | | | | 1.18 | | | | 1.28 | |
| Net investment income (loss), before waivers and reimbursements | | | 0.09 | | | | (0.65 | ) | | | (0.39 | ) | | | 0.44 | | | | 0.70 | |
| Net investment income (loss), net of waivers and reimbursements | | | 0.20 | | | | (0.50 | ) | | | (0.23 | ) | | | 0.58 | | | | 0.81 | |
| Class N net assets at the end of the year (in thousands) | | $ | 35,966 | | | $ | 47,234 | | | $ | 19,586 | | | $ | 11,163 | | | $ | 8,715 | |
| Portfolio turnover rate (%) | | | 55 | | | | 18 | | | | 34 | | | | 20 | | | | 33 | |
| | | | | | | | | | | | | | | | | | | | | |
| | | Class I | |
| | | Years Ended December 31, | |
| | | 2022 | | | | 2021 | | | | 2020 | | | | 2019 | | | | 2018 | |
| Net asset value, beginning of year | | $ | 24.41 | | | $ | 22.80 | | | $ | 18.13 | | | $ | 13.84 | | | $ | 16.44 | |
| Income (loss) from investment operations: | | | | | | | | | | | | | | | | | | | | |
| Net investment income (loss) | | | 0.08 | | | | (0.06 | ) | | | (0.00 | )^ | | | 0.12 | | | | 0.17 | |
| Net realized and unrealized gain (loss) on investments | | | (7.05 | ) | | | 2.36 | | | | 4.85 | | | | 4.27 | | | | (2.19 | ) |
| Total from investment operations | | | (6.97 | ) | | | 2.30 | | | | 4.85 | | | | 4.39 | | | | (2.02 | ) |
| Less distributions from: | | | | | | | | | | | | | | | | | | | | |
| Net investment income | | | — | | | | 0.05 | | | | 0.01 | | | | 0.10 | | | | 0.13 | |
| Net realized gain | | | 0.03 | | | | 0.64 | | | | 0.17 | | | | — | | | | 0.45 | |
| Total distributions | | | 0.03 | | | | 0.69 | | | | 0.18 | | | | 0.10 | | | | 0.58 | |
| Net asset value, end of year | | $ | 17.41 | | | $ | 24.41 | | | $ | 22.80 | | | $ | 18.13 | | | $ | 13.84 | |
| Total return (%) | | | (28.55 | ) | | | 10.17 | | | | 26.77 | | | | 31.76 | | | | (12.45 | ) |
| Ratios to average daily net assets (%): | | | | | | | | | | | | | | | | | | | | |
| Expenses, before waivers and reimbursements | | | 1.04 | | | | 0.99 | | | | 1.01 | | | | 1.01 | | | | 1.07 | |
| Expenses, net of waivers and reimbursements | | | 0.90 | | | | 0.90 | | | | 0.90 | | | | 0.93 | | | | 1.03 | |
| Net investment income (loss), before waivers and reimbursements | | | 0.28 | | | | (0.33 | ) | | | (0.11 | ) | | | 0.64 | | | | 1.02 | |
| Net investment income (loss), net of waivers and reimbursements | | | 0.42 | | | | (0.24 | ) | | | (0.00 | ) | | | 0.72 | | | | 1.06 | |
| Class I net assets at the end of the year (in thousands) | | $ | 369,171 | | | $ | 591,500 | | | $ | 393,596 | | | $ | 181,617 | | | $ | 76,382 | |
| Portfolio turnover rate (%) | | | 55 | | | | 18 | | | | 34 | | | | 20 | | | | 33 | |
| ^ | Amount is less than $0.005 per share. |
Note: Net investment income (loss) per share is based on the average shares outstanding during the year.
Performance cited represents past performance. Past performance does not guarantee future results and current performance may be lower or higher than the data quoted. Results shown are annual returns, which assume reinvestment of dividends and capital gains. Investment returns and principal will fluctuate and you may have a gain or loss when you sell shares. For the most current month-end performance information, please call 1-800-742-7272 or visit our Web site at www.williamblairfunds.com.
| December 31, 2022 | William Blair Funds | 151 |
Financial Highlights — For a share outstanding throughout each period
International Leaders Fund
| | | Class R6 | |
| | | Years Ended December 31, | |
| | | 2022 | | | 2021 | | | 2020 | | | 2019 | | | 2018 | |
| Net asset value, beginning of year | | $ | 24.41 | | | $ | 22.80 | | | $ | 18.12 | | | $ | 13.83 | | | $ | 16.43 | |
| Income (loss) from investment operations: | | | | | | | | | | | | | | | | | | | | |
| Net investment income (loss) | | | 0.09 | | | | (0.04 | ) | | | 0.02 | | | | 0.14 | | | | 0.18 | |
| Net realized and unrealized gain (loss) on investments | | | (7.05 | ) | | | 2.35 | | | | 4.85 | | | | 4.26 | | | | (2.19 | ) |
| Total from investment operations | | | (6.96 | ) | | | 2.31 | | | | 4.87 | | | | 4.40 | | | | (2.01 | ) |
| Less distributions from: | | | | | | | | | | | | | | | | | | | | |
| Net investment income | | | — | | | | 0.06 | | | | 0.02 | | | | 0.11 | | | | 0.14 | |
| Net realized gain | | | 0.03 | | | | 0.64 | | | | 0.17 | | | | — | | | | 0.45 | |
| Total distributions | | | 0.03 | | | | 0.70 | | | | 0.19 | | | | 0.11 | | | | 0.59 | |
| Net asset value, end of year | | $ | 17.42 | | | $ | 24.41 | | | $ | 22.80 | | | $ | 18.12 | | | $ | 13.83 | |
| Total return (%) | | | (28.51 | ) | | | 10.22 | | | | 26.88 | | | | 31.83 | | | | (12.38 | ) |
| Ratios to average daily net assets (%): | | | | | | | | | | | | | | | | | | | | |
| Expenses, before waivers and reimbursements | | | 0.92 | | | | 0.91 | | | | 0.92 | | | | 0.93 | | | | 0.99 | |
| Expenses, net of waivers and reimbursements | | | 0.85 | | | | 0.85 | | | | 0.85 | | | | 0.88 | | | | 0.95 | |
| Net investment income (loss), before waivers and reimbursements | | | 0.44 | | | | (0.24 | ) | | | 0.03 | | | | 0.80 | | | | 1.07 | |
| Net investment income (loss), net of waivers and reimbursements | | | 0.51 | | | | (0.18 | ) | | | 0.10 | | | | 0.85 | | | | 1.11 | |
| Class R6 net assets at the end of the year (in thousands) | | $ | 599,084 | | | $ | 667,996 | | | $ | 687,171 | | | $ | 461,124 | | | $ | 324,902 | |
| Portfolio turnover rate (%) | | | 55 | | | | 18 | | | | 34 | | | | 20 | | | | 33 | |
Note: Net investment income (loss) per share is based on the average shares outstanding during the year.
Performance cited represents past performance. Past performance does not guarantee future results and current performance may be lower or higher than the data quoted. Results shown are annual returns, which assume reinvestment of dividends and capital gains. Investment returns and principal will fluctuate and you may have a gain or loss when you sell shares. For the most current month-end performance information, please call 1-800-742-7272 or visit our Web site at www.williamblairfunds.com.
| 152 | Annual Report | December 31, 2022 |
Financial Highlights — For a share outstanding throughout each period
International Growth Fund
| | | Class N | |
| | | Years Ended December 31, | |
| | | 2022 | | | 2021 | | | 2020 | | | 2019 | | | 2018 | |
| Net asset value, beginning of year | | $ | 37.57 | | | $ | 38.75 | | | $ | 29.68 | | | $ | 23.04 | | | $ | 30.41 | |
| Income (loss) from investment operations: | | | | | | | | | | | | | | | | | | | | |
| Net investment income (loss) | | | 0.11 | | | | (0.28 | ) | | | (0.16 | ) | | | 0.09 | | | | 0.16 | |
| Net realized and unrealized gain (loss) on investments | | | (10.78 | ) | | | 3.51 | | | | 9.55 | | | | 6.87 | | | | (5.56 | ) |
| Total from investment operations | | | (10.67 | ) | | | 3.23 | | | | 9.39 | | | | 6.96 | | | | (5.40 | ) |
| Less distributions from: | | | | | | | | | | | | | | | | | | | | |
| Net investment income | | | 0.02 | | | | — | | | | 0.06 | | | | 0.32 | | | | 0.12 | |
| Net realized gain | | | 1.96 | | | | 4.41 | | | | 0.26 | | | | — | | | | 1.85 | |
| Total distributions | | | 1.98 | | | | 4.41 | | | | 0.32 | | | | 0.32 | | | | 1.97 | |
| Net asset value, end of year | | $ | 24.92 | | | $ | 37.57 | | | $ | 38.75 | | | $ | 29.68 | | | $ | 23.04 | |
| Total return (%) | | | (28.51 | ) | | | 8.68 | | | | 31.64 | | | | 30.24 | | | | (18.00 | ) |
| Ratios to average daily net assets (%): | | | | | | | | | | | | | | | | | | | | |
| Expenses, before waivers and reimbursements | | | 1.40 | | | | 1.46 | | | | 1.47 | | | | 1.45 | | | | 1.46 | |
| Expenses, net of waivers and reimbursements | | | 1.31 | | | | 1.45 | | | | 1.45 | | | | 1.45 | | | | 1.45 | |
| Net investment income (loss), before waivers and reimbursements | | | 0.30 | | | | (0.68 | ) | | | (0.56 | ) | | | 0.34 | | | | 0.54 | |
| Net investment income (loss), net of waivers and reimbursements | | | 0.39 | | | | (0.67 | ) | | | (0.54 | ) | | | 0.34 | | | | 0.55 | |
| Class N net assets at the end of the year (in thousands) | | $ | 301,485 | | | $ | 293,481 | | | $ | 288,976 | | | $ | 494,788 | | | $ | 456,533 | |
| Portfolio turnover rate (%) | | | 50 | | | | 19 | | | | 27 | | | | 34 | | | | 78 | |
| | | | | | | | | | | | | | | | | | | | | |
| | | Class I | |
| | | Years Ended December 31, | |
| | | | 2022 | | | | 2021 | | | | 2020 | | | | 2019 | | | | 2018 | |
| Net asset value, beginning of year | | $ | 38.68 | | | $ | 39.65 | | | $ | 30.38 | | | $ | 23.56 | | | $ | 31.13 | |
| Income (loss) from investment operations: | | | | | | | | | | | | | | | | | | | | |
| Net investment income (loss) | | | 0.24 | | | | (0.15 | ) | | | (0.08 | ) | | | 0.18 | | | | 0.26 | |
| Net realized and unrealized gain (loss) on investments | | | (11.16 | ) | | | 3.59 | | | | 9.79 | | | | 7.03 | | | | (5.70 | ) |
| Total from investment operations | | | (10.92 | ) | | | 3.44 | | | | 9.71 | | | | 7.21 | | | | (5.44 | ) |
| Less distributions from: | | | | | | | | | | | | | | | | | | | | |
| Net investment income | | | 0.06 | | | | — | | | | 0.18 | | | | 0.39 | | | | 0.28 | |
| Net realized gain | | | 1.96 | | | | 4.41 | | | | 0.26 | | | | — | | | | 1.85 | |
| Total distributions | | | 2.02 | | | | 4.41 | | | | 0.44 | | | | 0.39 | | | | 2.13 | |
| Net asset value, end of year | | $ | 25.74 | | | $ | 38.68 | | | $ | 39.65 | | | $ | 30.38 | | | $ | 23.56 | |
| Total return (%) | | | (28.33 | ) | | | 9.01 | | | | 31.99 | | | | 30.66 | | | | (17.73 | ) |
| Ratios to average daily net assets (%): | | | | | | | | | | | | | | | | | | | | |
| Expenses, before waivers and reimbursements | | | 1.12 | | | | 1.14 | | | | 1.16 | | | | 1.14 | | | | 1.13 | |
| Expenses, net of waivers and reimbursements | | | 1.06 | | | | 1.14 | | | | 1.16 | | | | 1.14 | | | | 1.13 | |
| Net investment income (loss), before waivers and reimbursements | | | 0.76 | | | | (0.36 | ) | | | (0.24 | ) | | | 0.65 | | | | 0.86 | |
| Net investment income (loss), net of waivers and reimbursements | | | 0.82 | | | | (0.36 | ) | | | (0.24 | ) | | | 0.65 | | | | 0.86 | |
| Class I net assets at the end of the year (in thousands) | | $ | 981,813 | | | $ | 1,702,775 | | | $ | 1,914,460 | | | $ | 1,552,355 | | | $ | 1,646,811 | |
| Portfolio turnover rate (%) | | | 50 | | | | 19 | | | | 27 | | | | 34 | | | | 78 | |
Note: Net investment income (loss) per share is based on the average shares outstanding during the year.
Performance cited represents past performance. Past performance does not guarantee future results and current performance may be lower or higher than the data quoted. Results shown are annual returns, which assume reinvestment of dividends and capital gains. Investment returns and principal will fluctuate and you may have a gain or loss when you sell shares. For the most current month-end performance information, please call 1-800-742-7272 or visit our Web site at www.williamblairfunds.com.
| December 31, 2022 | William Blair Funds | 153 |
Financial Highlights — For a share outstanding throughout each period
International Growth Fund
| | | Class R6 | |
| | | Years Ended December 31, | |
| | | 2022 | | | 2021 | | | 2020 | | | 2019(a) | |
| Net asset value, beginning of year | | $ | 38.72 | | | $ | 39.66 | | | $ | 30.37 | | | $ | 27.56 | |
| Income (loss) from investment operations: | | | | | | | | | | | | | | | | |
| Net investment income (loss) | | | 0.21 | | | | (0.11 | ) | | | (0.07 | ) | | | (0.05 | ) |
| Net realized and unrealized gain (loss) on investments | | | (11.13 | ) | | | 3.58 | | | | 9.83 | | | | 3.27 | |
| Total from investment operations | | | (10.92 | ) | | | 3.47 | | | | 9.76 | | | | 3.22 | |
| Less distributions from: | | | | | | | | | | | | | | | | |
| Net investment income | | | 0.08 | | | | — | | | | 0.21 | | | | 0.41 | |
| Net realized gain | | | 1.96 | | | | 4.41 | | | | 0.26 | | | | — | |
| Total distributions | | | 2.04 | | | | 4.41 | | | | 0.47 | | | | 0.41 | |
| Net asset value, end of year | | $ | 25.76 | | | $ | 38.72 | | | $ | 39.66 | | | $ | 30.37 | |
| Total return (%)* | | | (28.30 | ) | | | 9.09 | | | | 32.16 | | | | 11.71 | |
| Ratios to average daily net assets (%)**: | | | | | | | | | | | | | | | | |
| Expenses, before waivers and reimbursements | | | 1.03 | | | | 1.06 | | | | 1.07 | | | | 1.06 | |
| Expenses, net of waivers and reimbursements | | | 1.01 | | | | 1.06 | | | | 1.07 | | | | 1.06 | |
| Net investment income (loss), before waivers and reimbursements | | | 0.69 | | | | (0.25 | ) | | | (0.23 | ) | | | (0.26 | ) |
| Net investment income (loss), net of waivers and reimbursements | | | 0.71 | | | | (0.25 | ) | | | (0.23 | ) | | | (0.26 | ) |
| Class R6 net assets at the end of the year (in thousands) | | $ | 151,338 | | | $ | 126,641 | | | $ | 109,214 | | | $ | 61,916 | |
| Portfolio turnover rate (%)* | | | 50 | | | | 19 | | | | 27 | | | | 34 | |
| (a) | For the period from May 2, 2019 (Commencement of Operations) to December 31, 2019. |
| * | Rates are not annualized for periods less than a year. |
| ** | Rates are annualized for periods less than a year. |
Note: Net investment income (loss) per share is based on the average shares outstanding during the year.
Performance cited represents past performance. Past performance does not guarantee future results and current performance may be lower or higher than the data quoted. Results shown are annual returns, which assume reinvestment of dividends and capital gains. Investment returns and principal will fluctuate and you may have a gain or loss when you sell shares. For the most current month-end performance information, please call 1-800-742-7272 or visit our Web site at www.williamblairfunds.com.
| 154 | Annual Report | December 31, 2022 |
Financial Highlights — For a share outstanding throughout each period
Institutional International Growth Fund
| | | Institutional | |
| | | Years Ended December 31, | |
| | | 2022 | | | 2021 | | | 2020 | | | 2019 | | | 2018 | |
| Net asset value, beginning of year | | $ | 19.03 | | | $ | 20.37 | | | $ | 17.35 | | | $ | 13.40 | | | $ | 18.08 | |
| Income (loss) from investment operations: | | | | | | | | | | | | | | | | | | | | |
| Net investment income (loss) | | | 0.11 | | | | (0.05 | ) | | | (0.01 | ) | | | 0.12 | | | | 0.18 | |
| Net realized and unrealized gain (loss) on investments | | | (5.47 | ) | | | 1.86 | | | | 5.60 | | | | 4.00 | | | | (3.29 | ) |
| Total from investment operations | | | (5.36 | ) | | | 1.81 | | | | 5.59 | | | | 4.12 | | | | (3.11 | ) |
| Less distributions from: | | | | | | | | | | | | | | | | | | | | |
| Net investment income | | | 0.06 | | | | — | | | | 0.02 | | | | 0.17 | | | | 0.17 | |
| Net realized gain | | | 0.79 | | | | 3.15 | | | | 2.55 | | | | — | | | | 1.40 | |
| Total distributions | | | 0.85 | | | | 3.15 | | | | 2.57 | | | | 0.17 | | | | 1.57 | |
| Net asset value, end of year | | $ | 12.82 | | | $ | 19.03 | | | $ | 20.37 | | | $ | 17.35 | | | $ | 13.40 | |
| Total return (%) | | | (28.28 | ) | | | 9.39 | | | | 32.47 | | | | 30.75 | | | | (17.50 | ) |
| Ratios to average daily net assets (%): | | | | | | | | | | | | | | | | | | | | |
| Expenses, before waivers and reimbursements | | | 1.01 | | | | 1.01 | | | | 1.00 | | | | 0.99 | | | | 0.97 | |
| Expenses, net of waivers and reimbursements | | | 0.98 | | | | 1.01 | | | | 1.00 | | | | 0.99 | | | | 0.97 | |
| Net investment income (loss), before waivers and reimbursements | | | 0.71 | | | | (0.22 | ) | | | (0.04 | ) | | | 0.77 | | | | 1.01 | |
| Net investment income (loss), net of waivers and reimbursements | | | 0.74 | | | | (0.22 | ) | | | (0.04 | ) | | | 0.77 | | | | 1.01 | |
| Net assets at the end of the year (in thousands) | | $ | 908,732 | | | $ | 1,281,843 | | | $ | 1,326,482 | | | $ | 1,892,911 | | | $ | 1,784,435 | |
| Portfolio turnover rate (%) | | | 55 | | | | 19 | | | | 31 | | | | 35 | | | | 82 | |
Note: Net investment income (loss) per share is based on the average shares outstanding during the year.
Performance cited represents past performance. Past performance does not guarantee future results and current performance may be lower or higher than the data quoted. Results shown are annual returns, which assume reinvestment of dividends and capital gains. Investment returns and principal will fluctuate and you may have a gain or loss when you sell shares. For the most current month-end performance information, please call 1-800-742-7272 or visit our Web site at www.williamblairfunds.com.
| December 31, 2022 | William Blair Funds | 155 |
Financial Highlights — For a share outstanding throughout each period
International Small Cap Growth Fund
| | | Class N | |
| | | Years Ended December 31, | |
| | | 2022 | | | 2021 | | | 2020 | | | 2019 | | | 2018 | |
| Net asset value, beginning of year | | $ | 16.56 | | | $ | 17.45 | | | $ | 13.85 | | | $ | 10.36 | | | $ | 15.49 | |
| Income (loss) from investment operations: | | | | | | | | | | | | | | | | | | | | |
| Net investment income (loss) | | | 0.00 | ^ | | | (0.12 | ) | | | (0.05 | ) | | | 0.05 | | | | 0.04 | |
| Net realized and unrealized gain (loss) on investments | | | (5.82 | ) | | | 1.91 | | | | 4.01 | | | | 3.45 | | | | (3.78 | ) |
| Total from investment operations | | | (5.82 | ) | | | 1.79 | | | | 3.96 | | | | 3.50 | | | | (3.74 | ) |
| Less distributions from: | | | | | | | | | | | | | | | | | | | | |
| Net investment income | | | — | | | | — | | | | — | | | | 0.01 | | | | 0.08 | |
| Net realized gain | | | — | | | | 2.68 | | | | 0.36 | | | | — | | | | 1.31 | |
| Total distributions | | | — | | | | 2.68 | | | | 0.36 | | | | 0.01 | | | | 1.39 | |
| Net asset value, end of year | | $ | 10.74 | | | $ | 16.56 | | | $ | 17.45 | | | $ | 13.85 | | | $ | 10.36 | |
| Total return (%) | | | (35.14 | ) | | | 10.87 | | | | 28.68 | | | | 33.81 | | | | (24.48 | ) |
| Ratios to average daily net assets (%): | | | | | | | | | | | | | | | | | | | | |
| Expenses | | | 1.49 | | | | 1.46 | | | | 1.52 | | | | 1.48 | | | | 1.48 | |
| Net investment income (loss) | | | 0.04 | | | | (0.67 | ) | | | (0.36 | ) | | | 0.45 | | | | 0.29 | |
| Class N net assets at the end of the year (in thousands) | | $ | 1,638 | | | $ | 3,540 | | | $ | 3,101 | | | $ | 3,650 | | | $ | 3,440 | |
| Portfolio turnover rate (%) | | | 51 | | | | 52 | | | | 63 | | | | 38 | | | | 88 | |
| | | | | | | | | | | | | | | | | | | | | |
| | | Class I | |
| | | Years Ended December 31, | |
| | | | 2022 | | | | 2021 | | | | 2020 | | | | 2019 | | | | 2018 | |
| Net asset value, beginning of year | | $ | 16.80 | | | $ | 17.66 | | | $ | 13.98 | | | $ | 10.45 | | | $ | 15.65 | |
| Income (loss) from investment operations: | | | | | | | | | | | | | | | | | | | | |
| Net investment income (loss) | | | 0.03 | | | | (0.07 | ) | | | (0.01 | ) | | | 0.09 | | | | 0.09 | |
| Net realized and unrealized gain (loss) on investments | | | (5.91 | ) | | | 1.93 | | | | 4.06 | | | | 3.48 | | | | (3.84 | ) |
| Total from investment operations | | | (5.88 | ) | | | 1.86 | | | | 4.05 | | | | 3.57 | | | | (3.75 | ) |
| Less distributions from: | | | | | | | | | | | | | | | | | | | | |
| Net investment income | | | 0.02 | | | | 0.04 | | | | 0.01 | | | | 0.04 | | | | 0.14 | |
| Net realized gain | | | — | | | | 2.68 | | | | 0.36 | | | | — | | | | 1.31 | |
| Total distributions | | | 0.02 | | | | 2.72 | | | | 0.37 | | | | 0.04 | | | | 1.45 | |
| Net asset value, end of year | | $ | 10.90 | | | $ | 16.80 | | | $ | 17.66 | | | $ | 13.98 | | | $ | 10.45 | |
| Total return (%) | | | (34.99 | ) | | | 11.17 | | | | 29.04 | | | | 34.22 | | | | (24.29 | ) |
| Ratios to average daily net assets (%): | | | | | | | | | | | | | | | | | | | | |
| Expenses | | | 1.23 | | | | 1.19 | | | | 1.25 | | | | 1.21 | | | | 1.18 | |
| Net investment income (loss) | | | 0.28 | | | | (0.40 | ) | | | (0.05 | ) | | | 0.75 | | | | 0.60 | |
| Class I net assets at the end of the year (in thousands) | | $ | 98,330 | | | $ | 136,573 | | | $ | 145,283 | | | $ | 142,951 | | | $ | 165,451 | |
| Portfolio turnover rate (%) | | | 51 | | | | 52 | | | | 63 | | | | 38 | | | | 88 | |
| ^ | Amount is less than $0.005 per share. |
Note: Net investment income (loss) per share is based on the average shares outstanding during the year.
Performance cited represents past performance. Past performance does not guarantee future results and current performance may be lower or higher than the data quoted. Results shown are annual returns, which assume reinvestment of dividends and capital gains. Investment returns and principal will fluctuate and you may have a gain or loss when you sell shares. For the most current month-end performance information, please call 1-800-742-7272 or visit our Web site at www.williamblairfunds.com.
| 156 | Annual Report | December 31, 2022 |
Financial Highlights — For a share outstanding throughout each period
International Small Cap Growth Fund
| | | Class R6 | |
| | | Years Ended December 31, | |
| | | 2022 | | | 2021 | | | 2020 | | | 2019 | | | 2018 | |
| Net asset value, beginning of year | | $ | 16.91 | | | $ | 17.76 | | | $ | 14.05 | | | $ | 10.50 | | | $ | 15.73 | |
| Income (loss) from investment operations: | | | | | | | | | | | | | | | | | | | | |
| Net investment income (loss) | | | 0.05 | | | | (0.06 | ) | | | 0.00 | ^ | | | 0.11 | | | | 0.10 | |
| Net realized and unrealized gain (loss) on investments | | | (5.96 | ) | | | 1.95 | | | | 4.09 | | | | 3.49 | | | | (3.85 | ) |
| Total from investment operations | | | (5.91 | ) | | | 1.89 | | | | 4.09 | | | | 3.60 | | | | (3.75 | ) |
| Less distributions from: | | | | | | | | | | | | | | | | | | | | |
| Net investment income | | | 0.03 | | | | 0.06 | | | | 0.02 | | | | 0.05 | | | | 0.17 | |
| Net realized gain | | | — | | | | 2.68 | | | | 0.36 | | | | — | | | | 1.31 | |
| Total distributions | | | 0.03 | | | | 2.74 | | | | 0.38 | | | | 0.05 | | | | 1.48 | |
| Net asset value, end of year | | $ | 10.97 | | | $ | 16.91 | | | $ | 17.76 | | | $ | 14.05 | | | $ | 10.50 | |
| Total return (%) | | | (34.94 | ) | | | 11.27 | | | | 29.23 | | | | 34.32 | | | | (24.19 | ) |
| Ratios to average daily net assets (%): | | | | | | | | | | | | | | | | | | | | |
| Expenses | | | 1.14 | | | | 1.10 | | | | 1.14 | | | | 1.12 | | | | 1.08 | |
| Net investment income (loss) | | | 0.38 | | | | (0.31 | ) | | | 0.02 | | | | 0.86 | | | | 0.67 | |
| Class R6 net assets at the end of the year (in thousands) | | $ | 134,982 | | | $ | 243,398 | | | $ | 188,497 | | | $ | 162,465 | | | $ | 171,833 | |
| Portfolio turnover rate (%) | | | 51 | | | | 52 | | | | 63 | | | | 38 | | | | 88 | |
| ^ | Amount is less than $0.005 per share. |
Note: Net investment income (loss) per share is based on the average shares outstanding during the year.
Performance cited represents past performance. Past performance does not guarantee future results and current performance may be lower or higher than the data quoted. Results shown are annual returns, which assume reinvestment of dividends and capital gains. Investment returns and principal will fluctuate and you may have a gain or loss when you sell shares. For the most current month-end performance information, please call 1-800-742-7272 or visit our Web site at www.williamblairfunds.com.
| December 31, 2022 | William Blair Funds | 157 |
Financial Highlights — For a share outstanding throughout each period
Emerging Markets Leaders Fund
| | | Class N | |
| | | Years Ended December 31, | |
| | | 2022 | | | 2021 | | | 2020 | | | 2019 | | | 2018 | |
| Net asset value, beginning of year | | $ | 11.33 | | | $ | 13.26 | | | $ | 10.51 | | | $ | 8.26 | | | $ | 11.06 | |
| Income (loss) from investment operations: | | | | | | | | | | | | | | | | | | | | |
| Net investment income (loss) | | | 0.02 | | | | (0.06 | ) | | | (0.02 | ) | | | 0.03 | | | | 0.03 | |
| Net realized and unrealized gain (loss) on investments | | | (2.98 | ) | | | (0.98 | ) | | | 2.88 | | | | 2.28 | | | | (1.97 | ) |
| Total from investment operations | | | (2.96 | ) | | | (1.04 | ) | | | 2.86 | | | | 2.31 | | | | (1.94 | ) |
| Less distributions from: | | | | | | | | | | | | | | | | | | | | |
| Net investment income | | | — | | | | 0.01 | | | | — | | | | 0.04 | | | | 0.07 | |
| Net realized gain | | | 0.08 | | | | 0.88 | | | | 0.11 | | | | 0.02 | | | | 0.79 | |
| Total distributions | | | 0.08 | | | | 0.89 | | | | 0.11 | | | | 0.06 | | | | 0.86 | |
| Net asset value, end of year | | $ | 8.29 | | | $ | 11.33 | | | $ | 13.26 | | | $ | 10.51 | | | $ | 8.26 | |
| Total return (%) | | | (26.11 | ) | | | (7.69 | ) | | | 27.23 | | | | 27.98 | | | | (17.73 | ) |
| Ratios to average daily net assets (%): | | | | | | | | | | | | | | | | | | | | |
| Expenses, before waivers and reimbursements | | | 1.48 | | | | 1.56 | | | | 1.63 | | | | 1.62 | | | | 1.60 | |
| Expenses, net of waivers and reimbursements | | | 1.29 | | | | 1.40 | | | | 1.40 | | | | 1.45 | | | | 1.58 | |
| Net investment income (loss), before waivers and reimbursements | | | 0.05 | | | | (0.64 | ) | | | (0.45 | ) | | | 0.17 | | | | 0.27 | |
| Net investment income (loss), net of waivers and reimbursements | | | 0.24 | | | | (0.48 | ) | | | (0.22 | ) | | | 0.34 | | | | 0.29 | |
| Class N net assets at the end of the year (in thousands) | | $ | 1,092 | | | $ | 2,096 | | | $ | 1,803 | | | $ | 1,856 | | | $ | 2,239 | |
| Portfolio turnover rate (%) | | | 42 | | | | 40 | | | | 47 | | | | 33 | | | | 52 | |
| | | | | | | | | | | | | | | | | | | | | |
| | | Class I | |
| | | Years Ended December 31, | |
| | | 2022 | | | 2021 | | | 2020 | | | 2019 | | | 2018 | |
| Net asset value, beginning of year | | $ | 11.33 | | | $ | 13.28 | | | $ | 10.52 | | | $ | 8.27 | | | $ | 11.09 | |
| Income (loss) from investment operations: | | | | | | | | | | | | | | | | | | | | |
| Net investment income (loss) | | | 0.06 | | | | (0.04 | ) | | | (0.00 | )^ | | | 0.06 | | | | 0.06 | |
| Net realized and unrealized gain (loss) on investments | | | (2.99 | ) | | | (0.98 | ) | | | 2.89 | | | | 2.29 | | | | (1.97 | ) |
| Total from investment operations | | | (2.93 | ) | | | (1.02 | ) | | | 2.89 | | | | 2.35 | | | | (1.91 | ) |
| Less distributions from: | | | | | | | | | | | | | | | | | | | | |
| Net investment income | | | — | | | | 0.05 | | | | 0.02 | | | | 0.08 | | | | 0.12 | |
| Net realized gain | | | 0.08 | | | | 0.88 | | | | 0.11 | | | | 0.02 | | | | 0.79 | |
| Total distributions | | | 0.08 | | | | 0.93 | | | | 0.13 | | | | 0.10 | | | | 0.91 | |
| Net asset value, end of year | | $ | 8.32 | | | $ | 11.33 | | | $ | 13.28 | | | $ | 10.52 | | | $ | 8.27 | |
| Total return (%) | | | (25.84 | ) | | | (7.48 | ) | | | 27.52 | | | | 28.36 | | | | (17.45 | ) |
| Ratios to average daily net assets (%): | | | | | | | | | | | | | | | | | | | | |
| Expenses, before waivers and reimbursements | | | 1.19 | | | | 1.28 | | | | 1.33 | | | | 1.29 | | | | 1.27 | |
| Expenses, net of waivers and reimbursements | | | 1.05 | | | | 1.15 | | | | 1.15 | | | | 1.20 | | | | 1.27 | |
| Net investment income (loss), before waivers and reimbursements | | | 0.46 | | | | (0.40 | ) | | | (0.21 | ) | | | 0.53 | | | | 0.58 | |
| Net investment income (loss), net of waivers and reimbursements | | | 0.60 | | | | (0.27 | ) | | | (0.03 | ) | | | 0.62 | | | | 0.58 | |
| Class I net assets at the end of the year (in thousands) | | $ | 29,682 | | | $ | 42,750 | | | $ | 62,319 | | | $ | 45,090 | | | $ | 34,786 | |
| Portfolio turnover rate (%) | | | 42 | | | | 40 | | | | 47 | | | | 33 | | | | 52 | |
| ^ | Amount is less than $0.005 per share. |
Note: Net investment income (loss) per share is based on the average shares outstanding during the year.
Performance cited represents past performance. Past performance does not guarantee future results and current performance may be lower or higher than the data quoted. Results shown are annual returns, which assume reinvestment of dividends and capital gains. Investment returns and principal will fluctuate and you may have a gain or loss when you sell shares. For the most current month-end performance information, please call 1-800-742-7272 or visit our Web site at www.williamblairfunds.com.
| 158 | Annual Report | December 31, 2022 |
Financial Highlights — For a share outstanding throughout each period
Emerging Markets Leaders Fund
| | | Class R6 | |
| | | Years Ended December 31, | |
| | | 2022 | | | 2021 | | | 2020 | | | 2019 | | | 2018 | |
| Net asset value, beginning of year | | $ | 11.32 | | | $ | 13.26 | | | $ | 10.51 | | | $ | 8.26 | | | $ | 11.09 | |
| Income (loss) from investment operations: | | | | | | | | | | | | | | | | | | | | |
| Net investment income (loss) | | | 0.06 | | | | (0.02 | ) | | | 0.00 | ^ | | | 0.06 | | | | 0.07 | |
| Net realized and unrealized gain (loss) on investments | | | (2.99 | ) | | | (0.98 | ) | | | 2.89 | | | | 2.29 | | | | (1.98 | ) |
| Total from investment operations | | | (2.93 | ) | | | (1.00 | ) | | | 2.89 | | | | 2.35 | | | | (1.91 | ) |
| Less distributions from: | | | | | | | | | | | | | | | | | | | | |
| Net investment income | | | — | | | | 0.06 | | | | 0.03 | | | | 0.08 | | | | 0.13 | |
| Net realized gain | | | 0.08 | | | | 0.88 | | | | 0.11 | | | | 0.02 | | | | 0.79 | |
| Total distributions | | | 0.08 | | | | 0.94 | | | | 0.14 | | | | 0.10 | | | | 0.92 | |
| Net asset value, end of year | | $ | 8.31 | | | $ | 11.32 | | | $ | 13.26 | | | $ | 10.51 | | | $ | 8.26 | |
| Total return (%) | | | (25.86 | ) | | | (7.35 | ) | | | 27.50 | | | | 28.45 | | | | (17.46 | ) |
| Ratios to average daily net assets (%): | | | | | | | | | | | | | | | | | | | | |
| Expenses, before waivers and reimbursements | | | 1.11 | | | | 1.20 | | | | 1.26 | | | | 1.23 | | | | 1.20 | |
| Expenses, net of waivers and reimbursements | | | 1.00 | | | | 1.10 | | | | 1.10 | | | | 1.15 | | | | 1.20 | |
| Net investment income (loss), before waivers and reimbursements | | | 0.50 | | | | (0.26 | ) | | | (0.11 | ) | | | 0.57 | | | | 0.71 | |
| Net investment income (loss), net of waivers and reimbursements | | | 0.61 | | | | (0.16 | ) | | | 0.05 | | | | 0.65 | | | | 0.71 | |
| Class R6 net assets at the end of the year (in thousands) | | $ | 321,319 | | | $ | 428,839 | | | $ | 198,015 | | | $ | 191,337 | | | $ | 161,889 | |
| Portfolio turnover rate (%) | | | 42 | | | | 40 | | | | 47 | | | | 33 | | | | 52 | |
| ^ | Amount is less than $0.005 per share. |
Note: Net investment income (loss) per share is based on the average shares outstanding during the year.
Performance cited represents past performance. Past performance does not guarantee future results and current performance may be lower or higher than the data quoted. Results shown are annual returns, which assume reinvestment of dividends and capital gains. Investment returns and principal will fluctuate and you may have a gain or loss when you sell shares. For the most current month-end performance information, please call 1-800-742-7272 or visit our Web site at www.williamblairfunds.com.
| December 31, 2022 | William Blair Funds | 159 |
Financial Highlights — For a share outstanding throughout each period
Emerging Markets Growth Fund
| | | Class N | |
| | | Years Ended December 31, | |
| | | 2022 | | | 2021 | | | 2020 | | | 2019 | | | 2018 | |
| Net asset value, beginning of year | | $ | 15.55 | | | $ | 18.42 | | | $ | 13.67 | | | $ | 11.14 | | | $ | 16.20 | |
| Income (loss) from investment operations: | | | | | | | | | | | | | | | | | | | | |
| Net investment income (loss) | | | 0.02 | | | | (0.13 | ) | | | (0.09 | ) | | | 0.11 | | | | 0.01 | |
| Net realized and unrealized gain (loss) on investments | | | (5.20 | ) | | | 0.62 | | | | 5.60 | | | | 2.98 | | | | (3.49 | ) |
| Total from investment operations | | | (5.18 | ) | | | 0.49 | | | | 5.51 | | | | 3.09 | | | | (3.48 | ) |
| Less distributions from: | | | | | | | | | | | | | | | | | | | | |
| Net investment income | | | — | | | | — | | | | — | | | | 0.16 | | | | 0.11 | |
| Net realized gain | | | 0.02 | | | | 3.36 | | | | 0.76 | | | | 0.40 | | | | 1.47 | |
| Total distributions | | | 0.02 | | | | 3.36 | | | | 0.76 | | | | 0.56 | | | | 1.58 | |
| Net asset value, end of year | | $ | 10.35 | | | $ | 15.55 | | | $ | 18.42 | | | $ | 13.67 | | | $ | 11.14 | |
| Total return (%) | | | (33.33 | ) | | | 2.97 | | | | 40.43 | | | | 27.89 | | | | (21.61 | ) |
| Ratios to average daily net assets (%): | | | | | | | | | | | | | | | | | | | | |
| Expenses, before waivers and reimbursements | | | 1.50 | | | | 1.55 | | | | 1.55 | | | | 1.51 | | | | 1.52 | |
| Expenses, net of waivers and reimbursements | | | 1.36 | | | | 1.55 | | | | 1.55 | | | | 1.51 | | | | 1.52 | |
| Net investment income (loss), before waivers and reimbursements | | | 0.07 | | | | (0.65 | ) | | | (0.60 | ) | | | 0.84 | | | | 0.09 | |
| Net investment income (loss), net of waivers and reimbursements | | | 0.21 | | | | (0.65 | ) | | | (0.60 | ) | | | 0.84 | | | | 0.09 | |
| Class N net assets at the end of the year (in thousands) | | $ | 14,664 | | | $ | 28,565 | | | $ | 18,606 | | | $ | 7,804 | | | $ | 7,103 | |
| Portfolio turnover rate (%) | | | 92 | | | | 52 | | | | 77 | | | | 79 | | | | 113 | |
| | | | | | | | | | | | | | | | | | | | | |
| | | Class I | |
| | | Years Ended December 31, | |
| | | | 2022 | | | | 2021 | | | | 2020 | | | | 2019 | | | | 2018 | |
| Net asset value, beginning of year | | $ | 15.85 | | | $ | 18.66 | | | $ | 13.82 | | | $ | 11.25 | | | $ | 16.36 | |
| Income (loss) from investment operations: | | | | | | | | | | | | | | | | | | | | |
| Net investment income (loss) | | | 0.05 | | | | (0.07 | ) | | | (0.05 | ) | | | 0.14 | | | | 0.05 | |
| Net realized and unrealized gain (loss) on investments | | | (5.30 | ) | | | 0.62 | | | | 5.66 | | | | 3.02 | | | | (3.52 | ) |
| Total from investment operations | | | (5.25 | ) | | | 0.55 | | | | 5.61 | | | | 3.16 | | | | (3.47 | ) |
| Less distributions from: | | | | | | | | | | | | | | | | | | | | |
| Net investment income | | | — | | | | — | | | | 0.01 | | | | 0.19 | | | | 0.17 | |
| Net realized gain | | | 0.02 | | | | 3.36 | | | | 0.76 | | | | 0.40 | | | | 1.47 | |
| Total distributions | | | 0.02 | | | | 3.36 | | | | 0.77 | | | | 0.59 | | | | 1.64 | |
| Net asset value, end of year | | $ | 10.58 | | | $ | 15.85 | | | $ | 18.66 | | | $ | 13.82 | | | $ | 11.25 | |
| Total return (%) | | | (33.14 | ) | | | 3.25 | | | | 40.72 | | | | 28.29 | | | | (21.37 | ) |
| Ratios to average daily net assets (%): | | | | | | | | | | | | | | | | | | | | |
| Expenses, before waivers and reimbursements | | | 1.24 | | | | 1.27 | | | | 1.30 | | | | 1.26 | | | | 1.27 | |
| Expenses, net of waivers and reimbursements | | | 1.11 | | | | 1.27 | | | | 1.30 | | | | 1.26 | | | | 1.27 | |
| Net investment income (loss), before waivers and reimbursements | | | 0.32 | | | | (0.37 | ) | | | (0.33 | ) | | | 1.06 | | | | 0.34 | |
| Net investment income (loss), net of waivers and reimbursements | | | 0.45 | | | | (0.37 | ) | | | (0.33 | ) | | | 1.06 | | | | 0.34 | |
| Class I net assets at the end of the year (in thousands) | | $ | 174,884 | | | $ | 190,985 | | | $ | 113,697 | | | $ | 73,496 | | | $ | 79,427 | |
| Portfolio turnover rate (%) | | | 92 | | | | 52 | | | | 77 | | | | 79 | | | | 113 | |
Note: Net investment income (loss) per share is based on the average shares outstanding during the year.
Performance cited represents past performance. Past performance does not guarantee future results and current performance may be lower or higher than the data quoted. Results shown are annual returns, which assume reinvestment of dividends and capital gains. Investment returns and principal will fluctuate and you may have a gain or loss when you sell shares. For the most current month-end performance information, please call 1-800-742-7272 or visit our Web site at www.williamblairfunds.com.
| 160 | Annual Report | December 31, 2022 |
Financial Highlights — For a share outstanding throughout each period
Emerging Markets Growth Fund
| | | Class R6 | |
| | | Years Ended December 31, | |
| | | | 2022 | | | | 2021 | | | | 2020 | | | | 2019 | | | | 2018 | |
| Net asset value, beginning of year | | $ | 16.04 | | | $ | 18.84 | | | $ | 13.94 | | | $ | 11.35 | | | $ | 16.49 | |
| Income (loss) from investment operations: | | | | | | | | | | | | | | | | | | | | |
| Net investment income (loss) | | | 0.06 | | | | (0.05 | ) | | | (0.03 | ) | | | 0.15 | | | | 0.07 | |
| Net realized and unrealized gain (loss) on investments | | | (5.37 | ) | | | 0.63 | | | | 5.71 | | | | 3.04 | | | | (3.56 | ) |
| Total from investment operations | | | (5.31 | ) | | | 0.58 | | | | 5.68 | | | | 3.19 | | | | (3.49 | ) |
| Less distributions from: | | | | | | | | | | | | | | | | | | | | |
| Net investment income | | | — | | | | 0.02 | | | | 0.02 | | | | 0.20 | | | | 0.18 | |
| Net realized gain | | | 0.02 | | | | 3.36 | | | | 0.76 | | | | 0.40 | | | | 1.47 | |
| Total distributions | | | 0.02 | | | | 3.38 | | | | 0.78 | | | | 0.60 | | | | 1.65 | |
| Net asset value, end of year | | $ | 10.71 | | | $ | 16.04 | | | $ | 18.84 | | | $ | 13.94 | | | $ | 11.35 | |
| Total return (%) | | | (33.13 | ) | | | 3.37 | | | | 40.90 | | | | 28.28 | | | | (21.29 | ) |
| Ratios to average daily net assets (%): | | | | | | | | | | | | | | | | | | | | |
| Expenses, before waivers and reimbursements | | | 1.14 | | | | 1.17 | | | | 1.20 | | | | 1.19 | | | | 1.19 | |
| Expenses, net of waivers and reimbursements | | | 1.06 | | | | 1.17 | | | | 1.20 | | | | 1.19 | | | | 1.19 | |
| Net investment income (loss), before waivers and reimbursements | | | 0.41 | | | | (0.27 | ) | | | (0.22 | ) | | | 1.17 | | | | 0.46 | |
| Net investment income (loss), net of waivers and reimbursements | | | 0.49 | | | | (0.27 | ) | | | (0.22 | ) | | | 1.17 | | | | 0.46 | |
| Class R6 net assets at the end of the year (in thousands) | | $ | 480,586 | | | $ | 822,288 | | | $ | 1,063,433 | | | $ | 708,892 | | | $ | 654,441 | |
| Portfolio turnover rate (%) | | | 92 | | | | 52 | | | | 77 | | | | 79 | | | | 113 | |
Note: Net investment income (loss) per share is based on the average shares outstanding during the year.
Performance cited represents past performance. Past performance does not guarantee future results and current performance may be lower or higher than the data quoted. Results shown are annual returns, which assume reinvestment of dividends and capital gains. Investment returns and principal will fluctuate and you may have a gain or loss when you sell shares. For the most current month-end performance information, please call 1-800-742-7272 or visit our Web site at www.williamblairfunds.com.
| December 31, 2022 | William Blair Funds | 161 |
Financial Highlights — For a share outstanding throughout each period
Emerging Markets ex China Growth Fund
| | | Class I | |
| | | Period Ended
December 31, | |
| | | | 2022(a) | |
| Net asset value, beginning of year | | | $ | 10.00 | |
| Income (loss) from investment operations: | | | | | |
| Net investment income (loss) | | | | 0.02 | |
| Net realized and unrealized gain (loss) on investments | | | | (0.61 | ) |
| Total from investment operations | | | | (0.59 | ) |
| Less distributions from: | | | | | |
| Net investment income | | | | — | |
| Net realized gain | | | | — | |
| Total distributions | | | | — | |
| Net asset value, end of year | | | $ | 9.41 | |
| Total return (%)* | | | | (5.90 | ) |
| Ratios to average daily net assets (%)**: | | | | | |
| Expenses, before waivers and reimbursements | | | | 2.77 | |
| Expenses, net of waivers and reimbursements | | | | 0.99 | |
| Net investment income (loss), before waivers and reimbursements | | | | (1.40 | ) |
| Net investment income (loss), net of waivers and reimbursements | | | | 0.38 | |
| Class I net assets at end of year (in thousands) | | | $ | 9 | |
| Portfolio turnover rate (%)* | | | | 64 | |
| | | | | | |
| | | Class R6 | |
| | | Period Ended
December 31, | |
| | | | 2022(a) | |
| Net asset value, beginning of year | | | $ | 10.00 | |
| Income (loss) from investment operations: | | | | | |
| Net investment income (loss) | | | | 0.02 | |
| Net realized and unrealized gain (loss) on investments | | | | (0.60 | ) |
| Total from investment operations | | | | (0.58 | ) |
| Less distributions from: | | | | | |
| Net investment income | | | | — | |
| Net realized gain | | | | — | |
| Total distributions | | | | — | |
| Net asset value, end of year | | | $ | 9.42 | |
| Total return (%)* | | | | (5.80 | ) |
| Ratios to average daily net assets (%)**: | | | | | |
| Expenses, before waivers and reimbursements | | | | 2.78 | |
| Expenses, net of waivers and reimbursements | | | | 0.94 | |
| Net investment income (loss), before waivers and reimbursements | | | | (1.42 | ) |
| Net investment income (loss), net of waivers and reimbursements | | | | 0.42 | |
| Class R6 net assets at end of year (in thousands) | | | $ | 13,024 | |
| Portfolio turnover rate (%)* | | | | 64 | |
| (a) | For the period from July 29, 2022 (Commencement of Operations) to December 31, 2022. |
| * | Rates are not annualized for periods less than a year. |
| ** | Rates are annualized for periods less than a year. |
Note: Net investment income (loss) per share is based on the average shares outstanding during the year.
Performance cited represents past performance. Past performance does not guarantee future results and current performance may be lower or higher than the data quoted. Results shown are annual returns, which assume reinvestment of dividends and capital gains. Investment returns and principal will fluctuate and you may have a gain or loss when you sell shares. For the most current month-end performance information, please call 1-800-742-7272 or visit our Web site at www.williamblairfunds.com.
| 162 | Annual Report | December 31, 2022 |
Financial Highlights — For a share outstanding throughout each period
Emerging Markets Small Cap Growth Fund
| | | Class N | |
| | | Years Ended December 31, | |
| | | | 2022 | | | | 2021 | | | | 2020 | | | | 2019 | | | | 2018 | |
| Net asset value, beginning of year | | $ | 23.52 | | | $ | 22.22 | | | $ | 16.80 | | | $ | 13.96 | | | $ | 18.66 | |
| Income (loss) from investment operations: | | | | | | | | | | | | | | | | | | | | |
| Net investment income (loss) | | | (0.01 | ) | | | (0.20 | ) | | | (0.06 | ) | | | 0.00 | ^ | | | (0.02 | ) |
| Net realized and unrealized gain (loss) on investments | | | (6.59 | ) | | | 3.53 | | | | 5.48 | | | | 2.84 | | | | (4.38 | ) |
| Total from investment operations | | | (6.60 | ) | | | 3.33 | | | | 5.42 | | | | 2.84 | | | | (4.40 | ) |
| Less distributions from: | | | | | | | | | | | | | | | | | | | | |
| Net investment income | | | — | | | | — | | | | — | | | | — | | | | — | |
| Net realized gain | | | 0.79 | | | | 2.03 | | | | — | | | | — | | | | 0.30 | |
| Total distributions | | | 0.79 | | | | 2.03 | | | | — | | | | — | | | | 0.30 | |
| Net asset value, end of year | | $ | 16.13 | | | $ | 23.52 | | | $ | 22.22 | | | $ | 16.80 | | | $ | 13.96 | |
| Total return (%) | | | (28.12 | ) | | | 15.23 | | | | 32.26 | | | | 20.34 | | | | (23.57 | ) |
| Ratios to average daily net assets (%): | | | | | | | | | | | | | | | | | | | | |
| Expenses, before waivers and reimbursements | | | 1.69 | | | | 1.60 | | | | 1.77 | | | | 1.71 | | | | 1.70 | |
| Expenses, net of waivers and reimbursements | | | 1.55 | | | | 1.55 | | | | 1.55 | | | | 1.55 | | | | 1.58 | |
| Net investment income (loss), before waivers and reimbursements | | | (0.18 | ) | | | (0.88 | ) | | | (0.58 | ) | | | (0.14 | ) | | | (0.22 | ) |
| Net investment income (loss), net of waivers and reimbursements | | | (0.04 | ) | | | (0.83 | ) | | | (0.36 | ) | | | 0.02 | | | | (0.10 | ) |
| Class N net assets at the end of the year (in thousands) | | $ | 3,069 | | | $ | 4,262 | | | $ | 3,947 | | | $ | 4,025 | | | $ | 8,977 | |
| Portfolio turnover rate (%) | | | 101 | | | | 76 | | | | 119 | | | | 142 | | | | 187 | |
| | | Class I | |
| | | Years Ended December 31, | |
| | | | 2022 | | | | 2021 | | | | 2020 | | | | 2019 | | | | 2018 | |
| Net asset value, beginning of year | | $ | 23.79 | | | $ | 22.40 | | | $ | 16.90 | | | $ | 14.03 | | | $ | 18.73 | |
| Income (loss) from investment operations: | | | | | | | | | | | | | | | | | | | | |
| Net investment income (loss) | | | 0.04 | | | | (0.14 | ) | | | (0.02 | ) | | | 0.04 | | | | 0.03 | |
| Net realized and unrealized gain (loss) on investments | | | (6.67 | ) | | | 3.56 | | | | 5.53 | | | | 2.86 | | | | (4.41 | ) |
| Total from investment operations | | | (6.63 | ) | | | 3.42 | | | | 5.51 | | | | 2.90 | | | | (4.38 | ) |
| Less distributions from: | | | | | | | | | | | | | | | | | | | | |
| Net investment income | | | — | | | | — | | | | 0.01 | | | | 0.03 | | | | 0.02 | |
| Net realized gain | | | 0.79 | | | | 2.03 | | | | — | | | | — | | | | 0.30 | |
| Total distributions | | | 0.79 | | | | 2.03 | | | | 0.01 | | | | 0.03 | | | | 0.32 | |
| Net asset value, end of year | | $ | 16.37 | | | $ | 23.79 | | | $ | 22.40 | | | $ | 16.90 | | | $ | 14.03 | |
| Total return (%) | | | (27.93 | ) | | | 15.51 | | | | 32.60 | | | | 20.58 | | | | (23.31 | ) |
| Ratios to average daily net assets (%): | | | | | | | | | | | | | | | | | | | | |
| Expenses, before waivers and reimbursements | | | 1.40 | | | | 1.31 | | | | 1.45 | | | | 1.40 | | | | 1.38 | |
| Expenses, net of waivers and reimbursements | | | 1.30 | | | | 1.30 | | | | 1.30 | | | | 1.30 | | | | 1.33 | |
| Net investment income (loss), before waivers and reimbursements | | | 0.11 | | | | (0.59 | ) | | | (0.25 | ) | | | 0.18 | | | | 0.13 | |
| Net investment income (loss), net of waivers and reimbursements | | | 0.21 | | | | (0.58 | ) | | | (0.10 | ) | | | 0.28 | | | | 0.18 | |
| Class I net assets at the end of the year (in thousands) | | $ | 108,401 | | | $ | 171,994 | | | $ | 151,302 | | | $ | 142,885 | | | $ | 169,770 | |
| Portfolio turnover rate (%) | | | 101 | | | | 76 | | | | 119 | | | | 142 | | | | 187 | |
| ^ | Amount is less than $0.005 per share. |
Note: Net investment income (loss) per share is based on the average shares outstanding during the year.
Performance cited represents past performance. Past performance does not guarantee future results and current performance may be lower or higher than the data quoted. Results shown are annual returns, which assume reinvestment of dividends and capital gains. Investment returns and principal will fluctuate and you may have a gain or loss when you sell shares. For the most current month-end performance information, please call 1-800-742-7272 or visit our Web site at www.williamblairfunds.com.
| December 31, 2022 | William Blair Funds | 163 |
Financial Highlights — For a share outstanding throughout each period
Emerging Markets Small Cap Growth Fund
| | | Class R6 | |
| | | Years Ended December 31, | |
| | | | 2022 | | | | 2021 | | | | 2020 | | | | 2019 | | | | 2018 | |
| Net asset value, beginning of year | | $ | 23.84 | | | $ | 22.44 | | | $ | 16.93 | | | $ | 14.06 | | | $ | 18.76 | |
| Income (loss) from investment operations: | | | | | | | | | | | | | | | | | | | | |
| Net investment income (loss) | | | 0.05 | | | | (0.12 | ) | | | (0.00 | )^ | | | 0.05 | | | | 0.05 | |
| Net realized and unrealized gain (loss) on investments | | | (6.69 | ) | | | 3.56 | | | | 5.53 | | | | 2.86 | | | | (4.41 | ) |
| Total from investment operations | | | (6.64 | ) | | | 3.44 | | | | 5.53 | | | | 2.91 | | | | (4.36 | ) |
| Less distributions from: | | | | | | | | | | | | | | | | | | | | |
| Net investment income | | | — | | | | 0.01 | | | | 0.02 | | | | 0.04 | | | | 0.04 | |
| Net realized gain | | | 0.79 | | | | 2.03 | | | | — | | | | — | | | | 0.30 | |
| Total distributions | | | 0.79 | | | | 2.04 | | | | 0.02 | | | | 0.04 | | | | 0.34 | |
| Net asset value, end of year | | $ | 16.41 | | | $ | 23.84 | | | $ | 22.44 | | | $ | 16.93 | | | $ | 14.06 | |
| Total return (%) | | | (27.91 | ) | | | 15.58 | | | | 32.66 | | | | 20.69 | | | | (23.24 | ) |
| Ratios to average daily net assets (%): | | | | | | | | | | | | | | | | | | | | |
| Expenses, before waivers and reimbursements | | | 1.31 | | | | 1.23 | | | | 1.36 | | | | 1.33 | | | | 1.30 | |
| Expenses, net of waivers and reimbursements | | | 1.25 | | | | 1.23 | | | | 1.25 | | | | 1.25 | | | | 1.25 | |
| Net investment income (loss), before waivers and reimbursements | | | 0.18 | | | | (0.49 | ) | | | (0.14 | ) | | | 0.27 | | | | 0.22 | |
| Net investment income (loss), net of waivers and reimbursements | | | 0.24 | | | | (0.49 | ) | | | (0.03 | ) | | | 0.35 | | | | 0.27 | |
| Class R6 net assets at the end of the year (in thousands) | | $ | 211,203 | | | $ | 324,152 | | | $ | 152,160 | | | $ | 130,711 | | | $ | 98,188 | |
| Portfolio turnover rate (%) | | | 101 | | | | 76 | | | | 119 | | | | 142 | | | | 187 | |
| ^ | Amount is less than $0.005 per share. |
Note: Net investment income (loss) per share is based on the average shares outstanding during the year.
Performance cited represents past performance. Past performance does not guarantee future results and current performance may be lower or higher than the data quoted. Results shown are annual returns, which assume reinvestment of dividends and capital gains. Investment returns and principal will fluctuate and you may have a gain or loss when you sell shares. For the most current month-end performance information, please call 1-800-742-7272 or visit our Web site at www.williamblairfunds.com.
| 164 | Annual Report | December 31, 2022 |
Financial Highlights — For a share outstanding throughout each period
China Growth Fund
| | | Class I | |
| | | Years Ended December 31, | |
| | | | 2022 | | | | 2021(a) | |
| Net asset value, beginning of year | | | $ | 9.54 | | | | $ | 10.00 | |
| Income (loss) from investment operations: | | | | | | | | | | |
| Net investment income (loss) | | | | 0.03 | | | | | (0.04 | ) |
| Net realized and unrealized gain (loss) on investments | | | | (3.11 | ) | | | | (0.42 | ) |
| Total from investment operations | | | | (3.08 | ) | | | | (0.46 | ) |
| Less distributions from: | | | | | | | | | | |
| Net investment income | | | | — | | | | | — | |
| Net realized gain | | | | — | | | | | — | |
| Total distributions | | | | — | | | | | — | |
| Net asset value, end of year | | | $ | 6.46 | | | | $ | 9.54 | |
| Total return (%)* | | | | (32.43 | ) | | | | (4.40 | ) |
| Ratios to average daily net assets (%)**: | | | | | | | | | | |
| Expenses, before waivers and reimbursements | | | | 5.31 | | | | | 4.74 | |
| Expenses, net of waivers and reimbursements | | | | 1.01 | | | | | 1.05 | |
| Net investment income (loss), before waivers and reimbursements | | | | (3.90 | ) | | | | (4.69 | ) |
| Net investment income (loss), net of waivers and reimbursements | | | | 0.40 | | | | | (1.00 | ) |
| Class I net assets at the end of the year (in thousands) | | | $ | 509 | | | | $ | 5,538 | |
| Portfolio turnover rate (%)* | | | | 36 | | | | | 4 | |
| | | | | | | | | | | |
| | | Class R6 | |
| | | Years Ended December 31, | |
| | | | 2022 | | | | 2021(a) | |
| Net asset value, beginning of year | | | $ | 9.54 | | | | $ | 10.00 | |
| Income (loss) from investment operations: | | | | | | | | | | |
| Net investment income (loss) | | | | 0.02 | | | | | (0.03 | ) |
| Net realized and unrealized gain (loss) on investments | | | | (3.11 | ) | | | | (0.43 | ) |
| Total from investment operations | | | | (3.09 | ) | | | | (0.46 | ) |
| Less distributions from: | | | | | | | | | | |
| Net investment income | | | | — | | | | | — | |
| Net realized gain | | | | — | | | | | — | |
| Total distributions | | | | — | | | | | — | |
| Net asset value, end of year | | | $ | 6.45 | | | | $ | 9.54 | |
| Total return (%)* | | | | (32.49 | ) | | | | (4.40 | ) |
| Ratios to average daily net assets (%)**: | | | | | | | | | | |
| Expenses, before waivers and reimbursements | | | | 5.27 | | | | | 4.72 | |
| Expenses, net of waivers and reimbursements | | | | 0.96 | | | | | 1.00 | |
| Net investment income (loss), before waivers and reimbursements | | | | (4.01 | ) | | | | (4.61 | ) |
| Net investment income (loss), net of waivers and reimbursements | | | | 0.30 | | | | | (0.89 | ) |
| Class R6 net assets at the end of the year (in thousands) | | | $ | 1,438 | | | | $ | 1,687 | |
| Portfolio turnover rate (%)* | | | | 36 | | | | | 4 | |
| (a) | For the period from August 27, 2021 (Commencement of Operations) to December 31, 2021. |
| * | Rates are not annualized for periods less than a year. |
| ** | Rates are annualized for periods less than a year. |
Note: Net investment income (loss) per share is based on the average shares outstanding during the year.
Performance cited represents past performance. Past performance does not guarantee future results and current performance may be lower or higher than the data quoted. Results shown are annual returns, which assume reinvestment of dividends and capital gains. Investment returns and principal will fluctuate and you may have a gain or loss when you sell shares. For the most current month-end performance information, please call 1-800-742-7272 or visit our Web site at www.williamblairfunds.com.
| December 31, 2022 | William Blair Funds | 165 |
Financial Highlights — For a share outstanding throughout each period
Emerging Markets Debt Fund
| | | Class I | |
| | | Years Ended December 31, | |
| | | | 2022 | | | 2021(a) | |
| Net asset value, beginning of year | | | $ | 9.59 | | | $ | 10.00 | |
| Income (loss) from investment operations: | | | | | | | | | |
| Net investment income (loss) | | | | 0.48 | | | | 0.27 | |
| Net realized and unrealized gain (loss) on investments | | | | (2.10 | ) | | | (0.40 | ) |
| Total from investment operations | | | | (1.62 | ) | | | (0.13 | ) |
| Less distributions from: | | | | | | | | | |
| Net investment income | | | | 0.51 | | | | 0.28 | |
| Net realized gain | | | | — | | | | — | |
| Return of Capital | | | | 0.02 | | | | — | |
| Total distributions | | | | 0.53 | | | | 0.28 | |
| Net asset value, end of year | | | $ | 7.44 | | | $ | 9.59 | |
| Total return (%)* | | | | (16.93 | ) | | | (1.39 | ) |
| Ratios to average daily net assets (%)**: | | | | | | | | | |
| Expenses, before waivers and reimbursements | | | | 1.28 | | | | 1.24 | |
| Expenses, net of waivers and reimbursements | | | | 0.70 | | | | 0.70 | |
| Net investment income (loss), before waivers and reimbursements | | | | 5.39 | | | | 4.02 | |
| Net investment income (loss), net of waivers and reimbursements | | | | 5.97 | | | | 4.56 | |
| Class I net assets at the end of the year (in thousands) | | | $ | 923 | | | $ | 1,484 | |
| Portfolio turnover rate (%)* | | | | 118 | | | | 72 | |
| | | | | | | | | | |
| | | Class R6 | |
| | | Years Ended December 31, | |
| | | | 2022 | | | 2021 (a) | |
| Net asset value, beginning of year | | | $ | 9.59 | | | $ | 10.00 | |
| Income (loss) from investment operations: | | | | | | | | | |
| Net investment income (loss) | | | | 0.48 | | | | 0.28 | |
| Net realized and unrealized gain (loss) on investments | | | | (2.09 | ) | | | (0.41 | ) |
| Total from investment operations | | | | (1.61 | ) | | | (0.13 | ) |
| Less distributions from: | | | | | | | | | |
| Net investment income | | | | 0.52 | | | | 0.28 | |
| Net realized gain | | | | — | | | | — | |
| Return of Capital | | | | 0.02 | | | | — | |
| Total distributions | | | | 0.54 | | | | 0.28 | |
| Net asset value, end of year | | | $ | 7.44 | | | $ | 9.59 | |
| Total return (%)* | | | | (16.95 | ) | | | (1.32 | ) |
| Ratios to average daily net assets (%)**: | | | | | | | | | |
| Expenses, before waivers and reimbursements | | | | 1.20 | | | | 1.17 | |
| Expenses, net of waivers and reimbursements | | | | 0.65 | | | | 0.65 | |
| Net investment income (loss), before waivers and reimbursements | | | | 5.50 | | | | 4.10 | |
| Net investment income (loss), net of waivers and reimbursements | | | | 6.05 | | | | 4.62 | |
| Class R6 net assets at the end of the year (in thousands) | | | $ | 44,903 | | | $ | 50,010 | |
| Portfolio turnover rate (%)* | | | | 118 | | | | 72 | |
| (a) | For the period from May 25, 2021 (Commencement of Operations) to December 31, 2021. |
| * | Rates are not annualized for periods less than a year. |
| ** | Rates are annualized for periods less than a year. |
Note: Net investment income (loss) per share is based on the average shares outstanding during the year.
Performance cited represents past performance. Past performance does not guarantee future results and current performance may be lower or higher than the data quoted. Results shown are annual returns, which assume reinvestment of dividends and capital gains. Investment returns and principal will fluctuate and you may have a gain or loss when you sell shares. For the most current month-end performance information, please call 1-800-742-7272 or visit our Web site at www.williamblairfunds.com.
| 166 | Annual Report | December 31, 2022 |
REPORT OF INDEPENDENT REGISTERED PUBLIC ACCOUNTING FIRM
To the Shareholders and the Board of Trustees of William Blair Funds
Opinion on the Financial Statements
We have audited the accompanying statements of assets and liabilities of William Blair Funds (the “Trust”) (comprising Growth Fund, Large Cap Growth Fund, Mid Cap Growth Fund, Mid Cap Value Fund, Small-Mid Cap Core Fund, Small-Mid Cap Growth Fund, Small Cap Growth Fund, Small Cap Value Fund, Global Leaders Fund, International Leaders Fund, International Growth Fund, Institutional International Growth Fund, International Small Cap Growth Fund, Emerging Markets Leaders Fund, Emerging Markets Growth Fund, Emerging Markets ex China Growth Fund, Emerging Markets Small Cap Growth Fund, China Growth Fund, and Emerging Markets Debt Fund (collectively referred to as the “Funds”)), including the portfolios of investments, as of December 31, 2022, and the related statements of operations and changes in net assets, and the financial highlights for each of the periods indicated in the table below and the related notes (collectively referred to as the “financial statements”). In our opinion, the financial statements present fairly, in all material respects, the financial position of each of the Funds comprising William Blair Funds at December 31, 2022, the results of their operations, changes in net assets and financial highlights for each of the periods indicated in the table below, in conformity with U.S. generally accepted accounting principles.
| Funds comprising the William Blair Funds | Statements
of operations | Statements
of changes
in net assets | Financial
highlights |
Growth Fund Large Cap Growth Fund Mid Cap Growth Fund Small-Mid Cap Growth Fund Small Cap Growth Fund Global Leaders Fund International Leaders Fund International Growth Fund Institutional International Growth Fund International Small Cap Growth Fund Emerging Markets Leaders Fund Emerging Markets Growth Fund Emerging Markets Small Cap Growth Fund | For the year ended December 31, 2022 | For each of the two years in the period ended December 31, 2022 | For each of the five years in the period ended December 31, 2022 |
| Small-Mid Cap Core Fund | For the year ended December 31, 2022 | For each of the two years in the period ended December 31, 2022 | For each of the three years in the period ended December 31, 2022 and the period from October 1, 2019 (commencement of operations) through December 31, 2019 |
| Emerging Markets Debt Fund | For the year ended December 31, 2022 | For the year ended December 31, 2022 and the period from May 25, 2021 (commencement of operations) through December 31, 2021 |
| China Growth Fund | For the year ended December 31, 2022 | For the year ended December 31, 2022 and the period from August 27, 2021 (commencement of operations) through December 31, 2021 |
| Small Cap Value Fund | For the year ended December 31, 2022 | For year ended December 31, 2022, the period from November 1, 2021 through December 31, 2021 and the year ended October 31, 2021 |
| Mid Cap Value Fund | For the period from March 16, 2022 (commencement of operations) through December 31, 2022 |
| Emerging Markets ex China Growth Fund | For the period from July 29, 2022 (commencement of operations) through December 31, 2022 |
The financial highlights for each of the three years in the period ended October 31, 2020 for the Small Cap Value Fund were audited by other auditors whose report dated December 21, 2020, expressed an unqualified opinion on the financial statements and financial highlights.
| December 31, 2022 | William Blair Funds | 167 |
Basis for Opinion
These financial statements are the responsibility of the Trust’s management. Our responsibility is to express an opinion on each of the Funds’ financial statements based on our audits. We are a public accounting firm registered with the Public Company Accounting Oversight Board (United States) (“PCAOB”) and are required to be independent with respect to the Trust in accordance with the U.S. federal securities laws and the applicable rules and regulations of the Securities and Exchange Commission and the PCAOB.
We conducted our audits in accordance with the standards of the PCAOB. Those standards require that we plan and perform the audit to obtain reasonable assurance about whether the financial statements are free of material misstatement, whether due to error or fraud. The Trust is not required to have, nor were we engaged to perform, an audit of the Trust’s internal control over financial reporting. As part of our audits, we are required to obtain an understanding of internal control over financial reporting but not for the purpose of expressing an opinion on the effectiveness of the Trust’s internal control over financial reporting. Accordingly, we express no such opinion.
Our audits included performing procedures to assess the risks of material misstatement of the financial statements, whether due to error or fraud, and performing procedures that respond to those risks. Such procedures included examining, on a test basis, evidence regarding the amounts and disclosures in the financial statements. Our procedures included confirmation of securities owned as of December 31, 2022, by correspondence with the custodian and brokers, when replies were not received from brokers, we performed other auditing procedures. Our audits also included evaluating the accounting principles used and significant estimates made by management, as well as evaluating the overall presentation of the financial statements. We believe that our audits provide a reasonable basis for our opinion.

We have served as the auditor of one or more William Blair investment companies since 1989.
Chicago, Illinois
February 24, 2023
| 168 | Annual Report | December 31, 2022 |
APPROVAL OF THE MANAGEMENT AGREEMENT FOR THE WILLIAM BLAIR EMERGING
MARKETS EX CHINA GROWTH FUND
On November 30, 2021, the Board of Trustees (the “Board”) of William Blair Funds (the “Trust”), including the Trustees who are not interested persons of the Trust as defined by the Investment Company Act of 1940, as amended (the “Independent Trustees”), approved the management agreement between the Trust, on behalf of the William Blair Emerging Markets ex China Growth Fund (the “Fund”), and William Blair Investment Management, LLC (the “Adviser”). The Independent Trustees reviewed materials provided by the Adviser and Broadridge for the approval of the management agreement and were assisted by independent legal counsel in making their determination. The Board determined that, given the totality of the information provided with respect to the management agreement, the Board had received sufficient information to consider the approval of the management agreement. The Board considered the following factors in making its determination, but did not identify any single factor or group of factors as all important or controlling and considered all factors together.
Nature, Quality and Extent of Services. In evaluating the nature, quality and extent of the services expected to be provided by the Adviser to the Fund, the Board noted that the Adviser is a quality firm with a reputation for integrity and honesty that employs high quality people. The Board considered that the Adviser also manages other series of the Trust and that the Board is familiar with the background and experience of the Fund’s portfolio managers. The Board considered the extensive information it receives from the Adviser in connection with the annual contract renewal process including financial information regarding the Adviser. The Board considered the previous experience of the Fund’s portfolio management team members with investing in emerging markets. The Board also considered the Adviser’s experience in managing new funds and investing in the proposed Fund’s respective asset class and that the Adviser serves as investment adviser to the other series of the Trust. Based upon all relevant factors, the Board concluded that the nature, quality and extent of the services to be provided by the Adviser to the Fund were expected to be satisfactory.
Fees and Expenses. The Board reviewed the proposed advisory fee for the Fund and reviewed information comparing the Fund’s advisory fee to a peer group and a peer universe of institutional funds provided by Broadridge. The Broadridge peer group for the Fund consisted of the Fund and 17 other (no-load) institutional emerging markets funds with no Rule 12b-1 fees, as classified by Broadridge. The Broadridge peer universe for the Fund consisted of the Fund, the Fund’s Broadridge peer group and all other institutional emerging markets funds, excluding outliers.
In considering the information, the Board noted that the proposed advisory fee for the Fund was above the median and the average contractual management fee of the peer group. The Board also considered that the Adviser had proposed to limit total operating expenses, including waiving advisory fees for each share class of the Fund, until April 30, 2024. On the basis of the information provided, the Board concluded that the proposed advisory fee for the Fund was reasonable in light of the nature, quality and extent of services expected to be provided by the Adviser.
Profitability. With respect to the estimated profitability of the Management Agreement to the Adviser with respect to the Fund, the Board considered the Fund’s proposed advisory fee, that the Fund was newly organized, the Adviser’s agreement to limit total expenses until April 30, 2024 for Class I and Class R6 shares. The Board also considered that the Adviser will be incurring all expenses related to the organization of the Fund.
Economies of Scale. The Board considered the extent to which economies of scale would be realized as the Fund grows and whether fee levels reflect these economies of scale for the benefit of investors. In considering whether fee levels reflect economies of scale for the benefit of Fund investors, the Board reviewed the Fund’s advisory fee compared to peer funds and the Fund’s estimated expense ratios giving effect to the Adviser’s agreement to limit total expenses until April 30, 2024, and concluded that the advisory fee for the Fund was reasonable.
Other Benefits to the Adviser. The Board considered benefits to be derived by the Adviser from its relationship with the Trust based on information provided during the annual contract renewal process, including receipt of research from brokerage firms, for Class I shares, reimbursement of some intermediary fees in the nature of sub-transfer agency fees and favorable media coverage. The Board concluded that, after taking into account these benefits, the proposed advisory fee for the Fund was reasonable.
Conclusion. Based upon the information considered and the conclusions reached, the Board determined that the terms of the Management Agreement are fair and reasonable and that the approval of the Management Agreement is in the best interests of the Fund.
| December 31, 2022 | William Blair Funds | 169 |
Trustees and Officers (Unaudited).† The trustees and officers of the William Blair Funds, their year of birth, their principal occupations during the last five years, their affiliations, if any, with William Blair, and other significant affiliations are set forth below. The address of each officer and trustee is 150 North Riverside Plaza, Chicago, Illinois 60606.
| Name and Year of Birth | | Position(s)
Held with
Trust | | Term of
Office(1) and
Length of
Time
Served | | Principal
Occupation(s)
During Past 5 Years | | Number of
Portfolios
in Trust
Complex
Overseen
by Trustee* | | Other Directorships
Held by Trustee
During Past 5 Years** |
| Interested Trustees | | |
Stephanie G. Braming, CFA,
1970(2) | | Chairman of the Board and President, previously Senior Vice President | | Chairman of the Board and President since 2018, and Senior Vice President 2014 to 2018 | | Global Head of Investment Management since 2017, portfolio manager (2014 to 2017) and Partner, William Blair | | 19 | | Chairman, William Blair SICAV |
Cissie Citardi,
1975(2) | | Trustee | | Since 2021 | | General Counsel (since 2021), Deputy General Counsel (May 2020 to December 2020) and Partner, William Blair; formerly, General Counsel, PineBridge Investments (2016-2020) | | 19 | | Director, William Blair SICAV |
| Non-Interested Trustees | | |
Vann A. Avedisian,
1964 | | Trustee | | Since 2012 | | Co-founder and Partner, Newbond Holdings (real estate operations) (since 2021); formerly, Principal, Highgate Holdings (hotel investments) (2009-2021); co-founder and Managing Director, Oxford Capital Partners Inc. (1994 to 2006) | | 19 | | Potbelly Sandwich Works (2001 to 2015 and since 2021)(3) |
Kathleen T. Barr,
1955 | | Trustee | | Since 2013 | | Retired; Chair Emeritus, Independent Directors Council (since 2022); formerly, Chairman of the Governing Council, Independent Directors Council (2020 to 2022); formerly, President, Productive Capital Management, Inc. (registered investment adviser to public entities) and Owner, KT Barr Consulting, LLC (mutual fund and investment management consulting) (2010 to 2013); prior thereto, Chief Administrative Officer, Senior Vice President and Senior Managing Director of Allegiant Asset Management Company (merged with PNC Capital Advisors, LLC in 2009) (2004 to 2010) | | 19 | | Muzinich BDC, Inc. (since 2019); Board of Governors, Investment Company Institute (since 2019); Professionally Managed Portfolios (since 2018) |
| † | William Blair Investment Management, LLC and William Blair & Company, L.L.C. are collectively referred to in this section as “William Blair”, each of which is a wholly owned subsidiary of WBC Holdings, L.P., which is wholly owned by certain William Blair employees (employee owners are referred to as ‘partners’). |
| | |
| * | The number shown does not include two additional series of the Trust that are in existence, but not currently offered to the public. |
| | |
| ** | Includes directorships of public companies and other registered investment companies held during the past five years. |
| 170 | Annual Report | December 31, 2022 |
| Name and Year of Birth | | Position(s)
Held with
Trust | | Term of
Office(1) and
Length of
Time
Served | | Principal
Occupation(s)
During Past 5 Years | | Number of
Portfolios
in Trust
Complex
Overseen
by Trustee* | | Other Directorships
Held by Trustee
During Past 5 Years** |
Daniel N. Leib,
1966(4) | | Trustee | | Since 2016 | | Chief Executive Officer, Donnelley Financial Solutions, Inc. (since 2016); formerly, Executive Vice President and Chief Financial Officer (2011 to 2016) and Group Chief Financial Officer (2009 to 2011), R.R. Donnelley & Sons Company | | 19 | | Donnelley Financial Solutions, Inc. (since 2016) |
Dorri C. McWhorter,
1973 | | Trustee | | Since 2019 | | President and Chief Executive Officer, YMCA of Metropolitan Chicago (since 2021); formerly, Chief Executive Officer, YWCA Metropolitan Chicago (2013 to 2021); Partner, Crowe LLP (2008 to 2013)(5) | | 19 | | Highland Funds (since 2022); Skyway Concession Company, LLC (since 2018); Illinois CPA Society (since 2017); Lifeway Foods, Inc. (since 2020); Green Thumb Industries (2022); LanzaTech Global (since 2023) |
| Thomas J. Skelly, | | Trustee | | Since 2007 | | Advisory Board Member for | | 19 | | Mutual Trust Financial Group |
| 1951 | | | | | | various U.S. companies (since 2005); formerly, Managing Partner of various divisions at Accenture (1994 to 2004) | | | | (provider of insurance and investment products) |
Steven R. Zenz,
1954 | | Trustee | | Since 2018 | | Consultant, Steven R. Zenz Consulting LLC (merger and acquisition transactions and SEC reporting and filings) (since 2011); formerly, Partner, KPMG LLP (1987 to 2010)(6) | | 19 | | Engine Media Holdings, Inc. (media group supporting esports, news streaming and gaming) (2020 to 2021); Frankly Inc. (technology products/services for media industry) (2016 to 2020); Insignia Systems, Inc. (in-store advertising services for consumer packaged goods manufacturers) (2013 to 2019) |
| (1) | Each Trustee serves until the election and qualification of a successor, or until death, resignation or retirement, or removal as provided in the Trust’s Declaration of Trust. Retirement for Independent Trustees occurs no later than at the conclusion of the calendar year that occurs after the earlier of (a) the Independent Trustee’s 75th birthday or (b) the 17th anniversary of the date that the Independent Trustee became a member of the Board of Trustees. |
| (2) | Ms. Braming and Ms. Citardi are interested persons of the Trust because they are partners of William Blair, and with respect to Ms. Braming also due to her position as an officer of the Trust. |
| (3) | On February 9, 2021, Potbelly Corporation (“Potbelly”) entered into a securities purchase agreement with accredited purchasers, pursuant to which Potbelly agreed to issue and sell to the purchasers in a private placement an aggregate of (i) 3,249,668 shares of Potbelly’s common stock, par value $0.01 per share and (ii) warrants to purchase an aggregate of 1,299,861 shares of common stock, for an aggregate purchase price of $15.9 million (the “Offering”). The Offering closed on February 12, 2021. WBC acted as the sole placement agent for the Offering and received fees from Potbelly of approximately $1,025,000. |
| (4) | The Trust and William Blair use Donnelley Financial Solutions, Inc. (“DFS’’) for financial printing and other services. DFS is a public company. The Trust and William Blair in the aggregate paid DFS approximately $214,000 and $252,000 in 2020 and 2021, respectively, for the services provided. DFS’s revenue was approximately $895 million in 2020 and $993 million in 2021. Mr. Leib, as the Chief Executive Officer of DFS, is not directly involved in any of the services provided to the Trust or William Blair and his compensation is not materially affected by the fees DFS receives from the Trust and William Blair. |
| (5) | As a former partner of the audit firm Crowe LLP (formerly, Crowe Horwath LLP), Ms. McWhorter received distributions of her capital in the firm over time and those distributions were completed in March 2021. The Trust and William Blair made no payments to Crowe LLP over the past three years. |
| (6) | The Trust engages KPMG to provide foreign tax services in Taiwan. KPMG does not provide audit or audit-related services to the Trust. Mr. Zenz is a former partner of KPMG and receives pension/retirement funds from KPMG. |
| December 31, 2022 | William Blair Funds | 171 |
| Name and Year of Birth | | Position(s) Held
with Trust | | Term of Office
and Length of
Time Served(1) | | Principal Occupation(s)
During Past 5 Years |
| | | | | | | |
| Officers | | | | | | |
| | | | | | | |
Alaina Anderson, CFA,
1975 | | Senior Vice President | | Since 2021 | | Partner, William Blair |
| | | | | | | |
Marcelo Assalin, CFA,
1973 | | Senior Vice President | | Since 2020 | | Partner, William Blair (since 2022); formerly, Associate, William Blair (2020-2021); NN Investment Partners (formerly, ING Investment Management) (2013-2020) |
| | | | | | | |
Daniel Crowe, CFA,
1972 | | Senior Vice President | | Since 2016 | | Partner, William Blair |
| | | | | | | |
Robert J. Duwa, CFA,
1967 | | Senior Vice President | | Since 2019 | | Partner, William Blair |
| | | | | | | |
Simon Fennell,
1969 | | Senior Vice President | | Since 2013 | | Partner, William Blair |
| | | | | | | |
David C. Fording, CFA,
1967 | | Senior Vice President | | Since 2006 | | Partner, William Blair |
| | | | | | | |
James S. Golan, CFA,
1961 | | Senior Vice President | | Since 2005 | | Partner, William Blair |
| | | | | | | |
William V. Heaphy, CFA,
1967 | | Senior Vice President | | Since 2021 | | Associate, William Blair (since 2021); formerly, Principal, Investment Counselors of Maryland, LLC (1994-2021) |
| | | | | | | |
James E. Jones, CFA,
1977 | | Senior Vice President | | Since 2019 | | Partner, William Blair |
| | | | | | | |
Kenneth J. McAtamney,
1966 | | Senior Vice President | | Since 2008 | | Partner, William Blair |
| | | | | | | |
Todd M. McClone, CFA,
1968 | | Senior Vice President | | Since 2005 | | Partner, William Blair |
| | | | | | | |
D.J. Neiman, CFA,
1975 | | Senior Vice President | | Since 2021 | | Partner, William Blair |
| | | | | | | |
Casey K. Preyss, CFA,
1976 | | Senior Vice President | | Since 2015 | | Partner, William Blair |
| | | | | | | |
David P. Ricci, CFA,
1958 | | Senior Vice President | | Since 2006 | | Partner, William Blair |
| | | | | | | |
Lisa D. Rusch,
1970 | | Senior Vice President Vice President | | Since 2020
2018-2020 | | Partner, William Blair (since 2020); formerly, Associate, William Blair |
| | | | | | | |
Hugo Scott-Gall,
1971 | | Senior Vice President | | Since 2021 | | Partner, William Blair (since 2018); formerly, Managing Director, Goldman Sachs International (1998-2018) |
| | | | | | | |
Ward D. Sexton, CFA,
1974 | | Senior Vice President | | Since 2016 | | Partner, William Blair |
| | | | | | | |
Andrew Siepker, CFA,
1981 | | Senior Vice President | | Since 2022 | | Partner, William Blair (since 2019); formerly, Associate, William Blair |
| 172 | Annual Report | December 31, 2022 |
| Name and Year of Birth | | Position(s) Held
with Trust | | Term of Office
and Length of
Time Served(1) | | Principal Occupation(s)
During Past 5 Years |
| | | | | | | |
Mark C. Thompson, CFA,
1976 | | Senior Vice President | | Since 2020 | | Partner, William Blair |
| | | | | | | |
Vivian Lin Thurston, CFA,
1972 | | Senior Vice President | | Since 2021 | | Partner, William Blair |
| | | | | | | |
Dan Zelazny,
1971 | | Senior Vice President | | Since 2019 | | Associate, William Blair (since 2019); formerly, Managing Director, AQR Capital Management (2011-2019) |
| | | | | | | |
Matthew Fleming, CFA,
1973 | | Vice President | | Since 2022 | | Associate, William Blair (since 2021); formerly, Investment Counselors of Maryland, LLC (2008-2021) |
| | | | | | | |
Gary J. Merwitz,
1970 | | Vice President | | Since 2021 | | Associate, William Blair (since 2021); formerly, Principal, Investment Counselors of Maryland, LLC (2004-2021) |
| | | | | | | |
Marco Ruijer, CFA,
1975 | | Vice President | | Since 2020 | | Associate, William Blair (since 2020); formerly, NN Investment Partners (formerly, ING Investment Management) (2013-2020) |
| | | | | | | |
John M. Raczek,
1970 | | Treasurer
Assistant Treasurer | | Since 2019
2010-2019 | | Associate, William Blair |
| | | | | | | |
Andrew T. Pfau,
1970 | | Secretary | | Since 2009 | | Associate, William Blair |
| | | | | | | |
David M. Cihak,
1982 | | Assistant Treasurer | | Since 2019 | | Associate, William Blair |
| | | | | | | |
Walter R. Randall, Jr.,
1960 | | Chief Compliance Officer and Assistant Secretary | | Since 2009 | | Associate, William Blair |
| (1) | The Trust’s Officers, except the Chief Compliance Officer, are elected annually by the Board of Trustees. The Trust’s Chief Compliance Officer is designated by the Board of Trustees and may only be removed by action of the Board of Trustees, including a majority of Independent Trustees. Length of Time Served for all Officers indicates the year the individual became an Officer of the Trust. |
The Statement of Additional Information for the William Blair Funds includes additional information about the trustees and is available without charge by calling 1-800-635-2886 (in Massachusetts 1-800-635-2840) or by writing the Fund.
| December 31, 2022 | William Blair Funds | 173 |
(Unaudited)
Proxy Voting
A description of the policies and procedures that the Funds use to determine how to vote proxies relating to portfolio securities and information regarding how the Funds voted proxies relating to portfolio securities for the most recent 12-month period ended June 30 are available without charge, upon request, by calling 1-800-635-2886 (in Massachusetts 1-800-635-2840), at www.williamblairfunds.com and on the SEC’s website at http://www.sec.gov.
Quarterly Portfolio Schedules
Each Fund files its complete schedule of portfolio holdings with the SEC for the first and third fiscal quarters of each fiscal year (quarters ended March 31 and September 30) on Form N-PORT. The Funds’ Forms N-PORT are available on the SEC’s website at http://www.sec.gov.
Additional Federal Income Tax Information: (unaudited)
Under Section 852(b)(3)(C) of the Code, the Funds hereby designate the following amounts as capital gain dividends for the fiscal year ended December 31, 2022 (in thousands):
| Fund | | Capital Gain Dividend |
| Growth | | $ | 10,688 | |
| Large Cap Growth | | | 8,894 | |
| Mid Cap Growth | | | 12,401 | |
| Small-Mid Cap Growth | | | 80,594 | |
| Small Cap Growth | | | 20,795 | |
| Small Cap Value | | | 106,344 | |
| Global Leaders | | | 2,469 | |
| International Leaders | | | 1,829 | |
| International Growth | | | 153,692 | |
| Institutional International Growth | | | 57,898 | |
| Emerging Markets Leaders | | | 3,408 | |
| Emerging Markets Growth | | | 1,018 | |
| Emerging Markets Small Cap Growth | | | 16,730 | |
| 174 | Annual Report | December 31, 2022 |
Useful Information About Your Report (Unaudited)
Please refer to this information when reviewing the Expense Example for each Fund.
Expense Example
As a shareholder of a Fund, you incur two types of costs: (1) transaction costs and (2) ongoing costs, including management fees, distribution (12b-1) fees (for Class N shares, as applicable), and other Fund expenses. The example is intended to help you understand your ongoing costs (in dollars) of investing in the Fund and to compare these costs with the ongoing costs of investing in other mutual funds. To do so, compare the Fund’s 5% hypothetical example with the 5% hypothetical examples that appear in the shareholder reports of other funds. The example is based on an investment of $1,000 invested at the beginning of the period and held for the entire six-month period from July 1, 2022 to December 31, 2022.
Actual Expenses
In each example, the first line for each share class in the table provides information about the actual account values and actual expenses. These expenses reflect the effect of any expense cap applicable to the share class during the period. Without this expense cap, the costs shown in the table would have been higher. You may use the information in this line, together with the amount you invested, to estimate the expenses that you paid over the period. Simply divide your account value by $1,000 (example, an $8,600 account value divided by $1,000 = 8.6), then multiply the result by the number in the first line under the heading entitled “Expenses Paid During the Period” to estimate the expenses you paid on your account during the period.
Hypothetical Example for Comparison Purposes
In each example, the second line for each share class in the table provides information about hypothetical account values and hypothetical expenses based on the Fund’s actual expense ratio and an assumed rate of return of 5% per year before expenses. This is not the Fund’s actual return. The hypothetical account values and expenses may not be used to estimate your actual ending account balance or the expenses you paid for the period. You may use this information to compare the ongoing costs of investing in the Fund to the costs of investing in other funds. To do so, compare this 5% hypothetical example with the 5% hypothetical examples that appear in the shareholder reports of other funds.
Please note that the expenses shown in both examples are meant to highlight your ongoing costs only and do not reflect any transactional costs or account type fees, such as IRA administration fees. These fees are discussed in the prospectus. Therefore, the second line of each share class in the table is useful in comparing ongoing costs only and will not help you determine the relative costs of owning different funds. In addition, if these transactional costs or account fees were included, your costs would have been higher.
| December 31, 2022 | William Blair Funds | 175 |
Fund Expenses (Unaudited)
| Expense Example | | Beginning Account Value 7/1/2022 | | Ending Account Value 12/31/2022 | | Expenses Paid During the Period (a) | | Annualized Expense Ratio |
| Growth Fund | | | | | | | | | | |
| Class N-actual return | | $1,000.00 | | $984.46 | | | $6.00 | | 1.20 | % |
| Class N-hypothetical 5% return | | $1,000.00 | | $1,043.95 | | | $6.18 | | 1.20 | |
| Class I-actual return | | $1,000.00 | | $984.89 | | | $4.60 | | 0.92 | |
| Class I-hypothetical 5% return | | $1,000.00 | | $1,045.36 | | | $4.74 | | 0.92 | |
| Class R6-actual return | | $1,000.00 | | $984.95 | | | $4.35 | | 0.87 | |
| Class R6-hypothetical 5% return | | $1,000.00 | | $1,045.61 | | | $4.49 | | 0.87 | |
| Large Cap Growth Fund | | | | | | | | | | |
| Class N-actual return | | $1,000.00 | | $988.18 | | | $4.51 | | 0.90 | |
| Class N-hypothetical 5% return | | $1,000.00 | | $1,045.46 | | | $4.64 | | 0.90 | |
| Class I-actual return | | $1,000.00 | | $989.50 | | | $3.26 | | 0.65 | |
| Class I-hypothetical 5% return | | $1,000.00 | | $1,046.72 | | | $3.35 | | 0.65 | |
| Class R6-actual return | | $1,000.00 | | $990.02 | | | $3.01 | | 0.60 | |
| Class R6-hypothetical 5% return | | $1,000.00 | | $1,046.98 | | | $3.10 | | 0.60 | |
| Mid Cap Growth Fund | | | | | | | | | | |
| Class N-actual return | | $1,000.00 | | $1,076.69 | | | $6.28 | | 1.20 | |
| Class N-hypothetical 5% return | | $1,000.00 | | $1,043.95 | | | $6.18 | | 1.20 | |
| Class I-actual return | | $1,000.00 | | $1,077.24 | | | $4.97 | | 0.95 | |
| Class I-hypothetical 5% return | | $1,000.00 | | $1,045.21 | | | $4.90 | | 0.95 | |
| Class R6-actual return | | $1,000.00 | | $1,077.10 | | | $4.71 | | 0.90 | |
| Class R6-hypothetical 5% return | | $1,000.00 | | $1,045.46 | | | $4.64 | | 0.90 | |
| Mid Cap Value Fund | | | | | | | | | | |
| Class I-actual return | | $1,000.00 | | $1,062.58 | | | $3.90 | | 0.75 | |
| Class I-hypothetical 5% return | | $1,000.00 | | $1,046.22 | | | $3.87 | | 0.75 | |
| Class R6-actual return | | $1,000.00 | | $1,064.01 | | | $3.64 | | 0.70 | |
| Class R6-hypothetical 5% return | | $1,000.00 | | $1,046.47 | | | $3.61 | | 0.70 | |
| Small-Mid Cap Core Fund | | | | | | | | | | |
| Class I-actual return | | $1,000.00 | | $1,059.56 | | | $4.93 | | 0.95 | |
| Class I-hypothetical 5% return | | $1,000.00 | | $1,045.21 | | | $4.90 | | 0.95 | |
| Class R6-actual return | | $1,000.00 | | $1,059.51 | | | $4.67 | | 0.90 | |
| Class R6-hypothetical 5% return | | $1,000.00 | | $1,045.46 | | | $4.64 | | 0.90 | |
| Small-Mid Cap Growth Fund | | | | | | | | | | |
| Class N-actual return | | $1,000.00 | | $1,076.92 | | | $7.07 | | 1.35 | |
| Class N-hypothetical 5% return | | $1,000.00 | | $1,043.19 | | | $6.95 | | 1.35 | |
| Class I-actual return | | $1,000.00 | | $1,078.25 | | | $5.76 | | 1.10 | |
| Class I-hypothetical 5% return | | $1,000.00 | | $1,044.45 | | | $5.67 | | 1.10 | |
| Class R6-actual return | | $1,000.00 | | $1,078.88 | | | $5.50 | | 1.05 | |
| Class R6-hypothetical 5% return | | $1,000.00 | | $1,044.71 | | | $5.41 | | 1.05 | |
| Small Cap Growth Fund | | | | | | | | | | |
| Class N-actual return | | $1,000.00 | | $1,088.46 | | | $7.90 | | 1.50 | |
| Class N-hypothetical 5% return | | $1,000.00 | | $1,042.44 | | | $7.72 | | 1.50 | |
| Class I-actual return | | $1,000.00 | | $1,089.91 | | | $6.58 | | 1.25 | |
| Class I-hypothetical 5% return | | $1,000.00 | | $1,043.70 | | | $6.44 | | 1.25 | |
| Class R6-actual return | | $1,000.00 | | $1,090.05 | | | $6.22 | | 1.18 | |
| Class R6-hypothetical 5% return | | $1,000.00 | | $1,044.05 | | | $6.08 | | 1.18 | |
| Small Cap Value Fund | | | | | | | | | | |
| Class N-actual return | | $1,000.00 | | $1,047.45 | | | $5.93 | | 1.15 | |
| Class N-hypothetical 5% return | | $1,000.00 | | $1,044.20 | | | $5.93 | | 1.15 | |
| Class I-actual return | | $1,000.00 | | $1,048.69 | | | $4.60 | | 0.89 | |
| Class I-hypothetical 5% return | | $1,000.00 | | $1,045.51 | | | $4.59 | | 0.89 | |
| Class R6-actual return | | $1,000.00 | | $1,048.68 | | | $4.18 | | 0.81 | |
| Class R6-hypothetical 5% return | | $1,000.00 | | $1,045.92 | | | $4.18 | | 0.81 | |
| Global Leaders Fund | | | | | | | | | | |
| Class N-actual return | | $1,000.00 | | $1,021.66 | | | $5.86 | | 1.15 | |
| Class N-hypothetical 5% return | | $1,000.00 | | $1,044.20 | | | $5.93 | | 1.15 | |
| Class I-actual return | | $1,000.00 | | $1,022.93 | | | $4.59 | | 0.90 | |
| Class I-hypothetical 5% return | | $1,000.00 | | $1,045.46 | | | $4.64 | | 0.90 | |
| Class R6-actual return | | $1,000.00 | | $1,022.05 | | | $4.33 | | 0.85 | |
| Class R6-hypothetical 5% return | | $1,000.00 | | $1,045.72 | | | $4.38 | | 0.85 | |
| 176 | Annual Report | December 31, 2022 |
Fund Expenses (Unaudited)
| Expense Example | | Beginning Account Value 7/1/2022 | | Ending
Account Value 12/31/2022 | | Expenses Paid During the Period (a) | | Annualized Expense Ratio |
| International Leaders Fund | | | | | | | | | | |
| Class N-actual return | | $1,000.00 | | $1,036.01 | | | $5.90 | | 1.15 | % |
| Class N-hypothetical 5% return | | $1,000.00 | | $1,044.20 | | | $5.93 | | 1.15 | |
| Class I-actual return | | $1,000.00 | | $1,036.97 | | | $4.62 | | 0.90 | |
| Class I-hypothetical 5% return | | $1,000.00 | | $1,045.46 | | | $4.64 | | 0.90 | |
| Class R6-actual return | | $1,000.00 | | $1,037.56 | | | $4.37 | | 0.85 | |
| Class R6-hypothetical 5% return | | $1,000.00 | | $1,045.72 | | | $4.38 | | 0.85 | |
| International Growth Fund | | | | | | | | | | |
| Class N-actual return | | $1,000.00 | | $1,031.41 | | | $6.35 | | 1.24 | |
| Class N-hypothetical 5% return | | $1,000.00 | | $1,043.75 | | | $6.39 | | 1.24 | |
| Class I-actual return | | $1,000.00 | | $1,032.54 | | | $5.07 | | 0.99 | |
| Class I-hypothetical 5% return | | $1,000.00 | | $1,045.01 | | | $5.10 | | 0.99 | |
| Class R6-actual return | | $1,000.00 | | $1,032.80 | | | $4.82 | | 0.94 | |
| Class R6-hypothetical 5% return | | $1,000.00 | | $1,045.26 | | | $4.85 | | 0.94 | |
| Institutional International Growth Fund | | | | | | | | | | |
| Institutional Class-actual return | | $1,000.00 | | $1,033.94 | | | $4.82 | | 0.94 | |
| Institutional Class-hypothetical 5% return | | $1,000.00 | | $1,045.26 | | | $4.85 | | 0.94 | |
| International Small Cap Growth Fund | | | | | | | | | | |
| Class N-actual return | | $1,000.00 | | $1,062.31 | | | $7.75 | | 1.49 | |
| Class N-hypothetical 5% return | | $1,000.00 | | $1,042.49 | | | $7.67 | | 1.49 | |
| Class I-actual return | | $1,000.00 | | $1,063.48 | | | $6.40 | | 1.23 | |
| Class I-hypothetical 5% return | | $1,000.00 | | $1,043.80 | | | $6.34 | | 1.23 | |
| Class R6-actual return | | $1,000.00 | | $1,063.02 | | | $5.93 | | 1.14 | |
| Class R6-hypothetical 5% return | | $1,000.00 | | $1,044.25 | | | $5.87 | | 1.14 | |
| Emerging Markets Leaders Fund | | | | | | | | | | |
| Class N-actual return | | $1,000.00 | | $965.66 | | | $6.14 | | 1.24 | |
| Class N-hypothetical 5% return | | $1,000.00 | | $1,043.75 | | | $6.39 | | 1.24 | |
| Class I-actual return | | $1,000.00 | | $966.90 | | | $4.91 | | 0.99 | |
| Class I-hypothetical 5% return | | $1,000.00 | | $1,045.01 | | | $5.10 | | 0.99 | |
| Class R6-actual return | | $1,000.00 | | $965.73 | | | $4.66 | | 0.94 | |
| Class R6-hypothetical 5% return | | $1,000.00 | | $1,045.26 | | | $4.85 | | 0.94 | |
| Emerging Markets Growth Fund | | | | | | | | | | |
| Class N-actual return | | $1,000.00 | | $926.41 | | | $6.02 | | 1.24 | |
| Class N-hypothetical 5% return | | $1,000.00 | | $1,043.75 | | | $6.39 | | 1.24 | |
| Class I-actual return | | $1,000.00 | | $927.90 | | | $4.81 | | 0.99 | |
| Class I-hypothetical 5% return | | $1,000.00 | | $1,045.01 | | | $5.10 | | 0.99 | |
| Class R6-actual return | | $1,000.00 | | $927.90 | | | $4.57 | | 0.94 | |
| Class R6-hypothetical 5% return | | $1,000.00 | | $1,045.26 | | | $4.85 | | 0.94 | |
| Emerging Markets ex China Growth Fund | | | | | | | | | | |
| Class I-actual return (b) | | $1,000.00 | | $941.00 | | | $4.11 | | 0.99 | |
| Class I-hypothetical 5% return (6 month period) | | $1,000.00 | | $1,045.77 | | | $4.33 | | 0.99 | |
| Class R6-actual return (b) | | $1,000.00 | | $942.00 | | | $3.90 | | 0.94 | |
| Class R6-hypothetical 5% return (6 month period) | | $1,000.00 | | $1,045.98 | | | $4.11 | | 0.94 | |
| Emerging Markets Small Cap Growth Fund | | | | | | | | | | |
| Class N-actual return | | $1,000.00 | | $985.78 | | | $7.76 | | 1.55 | |
| Class N-hypothetical 5% return | | $1,000.00 | | $1,042.19 | | | $7.98 | | 1.55 | |
| Class I-actual return | | $1,000.00 | | $987.10 | | | $6.51 | | 1.30 | |
| Class I-hypothetical 5% return | | $1,000.00 | | $1,043.45 | | | $6.70 | | 1.30 | |
| Class R6-actual return | | $1,000.00 | | $987.13 | | | $6.26 | | 1.25 | |
| Class R6-hypothetical 5% return | | $1,000.00 | | $1,043.70 | | | $6.44 | | 1.25 | |
| China Growth Fund | | | | | | | | | | |
| Class I-actual return | | $1,000.00 | | $831.40 | | | $4.57 | | 0.99 | |
| Class I-hypothetical 5% return | | $1,000.00 | | $1,045.01 | | | $5.10 | | 0.99 | |
| Class R6-actual return | | $1,000.00 | | $830.67 | | | $4.34 | | 0.94 | |
| Class R6-hypothetical 5% return | | $1,000.00 | | $1,045.26 | | | $4.85 | | 0.94 | |
| December 31, 2022 | William Blair Funds | 177 |
Fund Expenses (Unaudited)
| Expense Example | | Beginning
Account Value
7/1/2022 | | Ending
Account Value
12/31/2022 | | Expenses Paid
During
the Period (a) | | Annualized
Expense Ratio |
| Emerging Markets Debt Fund | | | | | | | | | | |
| Class I-actual return | | $1,000.00 | | $1,046.78 | | | $3.61 | | 0.70 | % |
| Class I-hypothetical 5% return | | $1,000.00 | | $1,046.47 | | | $3.61 | | 0.70 | |
| Class R6-actual return | | $1,000.00 | | $1,046.29 | | | $3.35 | | 0.65 | |
| Class R6-hypothetical 5% return | | $1,000.00 | | $1,046.72 | | | $3.35 | | 0.65 | |
| (a) | Expenses are equal to the annualized expense ratio, multiplied by the average account value over the period, multiplied by the number of days in the period, 184 and divided by 365 (to reflect the one-half year period). |
| (b) | For the period July 29, 2022 (Commencement of Operations) to December 31, 2022. |
| 178 | Annual Report | December 31, 2022 |
BOARD OF TRUSTEES (as of February 24, 2023)
Vann A. Avedisian
Co-founder and Partner, Newbond Holdings
Kathleen T. Barr
Retired Senior Managing Director, PNC Capital Advisors, LLC
Stephanie G. Braming, CFA, Chairman and President
Partner, William Blair
Cissie Citardi
Partner, William Blair
Daniel N. Leib
Chief Executive Officer, Donnelley Financial Solutions, Inc.
Dorri C. McWhorter
President and Chief Executive Officer, YMCA of Metropolitan Chicago
Thomas J. Skelly
Retired Managing Partner, Accenture
Steven R. Zenz
Retired Partner, KPMG LLP
Officers
Alaina Anderson, CFA, Senior Vice President
Marcelo Assalin, CFA, Senior Vice President
Daniel Crowe, CFA, Senior Vice President
Robert J. Duwa, CFA, Senior Vice President
Simon Fennell, Senior Vice President
David C. Fording, CFA, Senior Vice President
James S. Golan, CFA, Senior Vice President
William V. Heaphy, CFA, Senior Vice President
James E. Jones, CFA, Senior Vice President
Kenneth J. McAtamney, Senior Vice President
Todd M. McClone, CFA, Senior Vice President
D.J. Neiman, CFA, Senior Vice President
Casey K. Preyss, CFA, Senior Vice President
David P. Ricci, CFA, Senior Vice President
Lisa D. Rusch, Senior Vice President
Hugo Scott-Gall, Senior Vice President
Ward D. Sexton, CFA, Senior Vice President
Andrew Siepker, CFA, Senior Vice President
Mark C. Thompson, CFA, Senior Vice President
Vivian Lin Thurston, CFA, Senior Vice President
Dan Zelazny, Senior Vice President
Matthew Fleming, CFA, Vice President
Gary J. Merwitz, Vice President
Marco Ruijer, CFA, Vice President
John M. Raczek, Treasurer
Andrew T. Pfau, Secretary
David M. Cihak, Assistant Treasurer
Walter R. Randall, Jr., Chief Compliance Officer and Assistant Secretary
Investment Adviser
William Blair Investment Management, LLC
Distributor
William Blair & Company, L.L.C.
Independent Registered Public Accounting Firm
Ernst & Young LLP
Transfer Agent
SS&C GIDS, Inc.
For customer assistance, call 1-800-635-2886
P.O. Box 219137
Kansas City, Missouri 64121-9137
| December 31, 2022 | William Blair Funds | 179 |
| | | | | | |
| | William Blair Funds | | |
| | | | | | |
| | U.S. EQUITY | | GLOBAL EQUITY | | EMERGING MARKETS DEBT |
| | Growth Fund | | Global Leaders Fund | | Emerging Markets Debt Fund |
| | Large Cap Growth Fund | | | | |
| | Mid Cap Growth Fund | | INTERNATIONAL EQUITY | | |
| | Mid Cap Value Fund | | International Leaders Fund | | |
| | Small-Mid Cap Core Fund | | International Growth Fund | | |
| | Small-Mid Cap Growth Fund | | Institutional International Growth Fund | | |
| | Small Cap Growth Fund | | International Small Cap Growth Fund | | |
| | Small Cap Value Fund | | Emerging Markets Leaders Fund | | |
| | | | Emerging Markets Growth Fund | | |
| | | | Emerging Markets ex China Growth Fund | | |
| | | | Emerging Markets Small Cap Growth Fund | | |
| | | | China Growth Fund | | |
| | | © | William Blair & Company, L.L.C., distributor | |
 | +1 800 742 7272 williamblairfunds.com | | 150 North Riverside Plaza Chicago, Illinois 60606 | 00103188 |
(a) As of the end of the period covered by this report, the Registrant has adopted a code of ethics (the “Code”) that applies to its principal executive officer and principal financial officer (the “Covered Officers”).
(b) No disclosures are required pursuant to this Item 2(b).
(c) During the period covered by the report, the Registrant did not make any amendment to a provision of the Code.
(d) During the period covered by the report, the Registrant did not grant any waivers, including implicit waivers, from the provisions of the Code.
(e) Not applicable.
(f) A copy of the Code is filed as Exhibit 13(a)(1) to this Form N-CSR.
| Item 3. | Audit Committee Financial Expert |
The Registrant’s Board of Trustees has determined that the Registrant has at least one “audit committee financial expert” (as defined in Item 3 of Form N-CSR) serving on its Audit Committee. Mr. Daniel N. Leib, the Registrant’s audit committee financial expert, is “independent” for purposes of Item 3 to Form N-CSR.
An “audit committee financial expert” is not an “expert” for any purpose, including for purposes of Section 11 of the Securities Act of 1933, as a result of being designated as an “audit committee financial expert.” Further, the designation of a person as an “audit committee financial expert” does not mean that the person has any greater duties, obligations, or liability than those imposed on the person without the “audit committee financial expert” designation. Similarly, the designation of a person as an “audit committee financial expert” does not affect the duties, obligations, or liability of any other member of the audit committee or Board of Trustees.
| Item 4. | Principal Accountant Fees and Services |
Audit Fees
For the fiscal years ended December 31, 2021 and 2022, Ernst & Young LLP, the Registrant’s principal accountant (“E&Y”), billed the Registrant $587,100 and $489,200, respectively, for professional services rendered for the audit of the Registrant’s annual financial statements or services that are normally provided in connection with statutory and regulatory filings.
Audit-Related Fees
For the fiscal years ended December 31, 2021 and 2022, E&Y billed the Registrant $0 and $0, respectively, for assurance and related services that are reasonably related to the performance of the audit of the Registrant’s financial statements and that are not reported above. For the fiscal years ended December 31, 2021 and 2022, E&Y provided no audit-related services to William Blair Investment Management, LLC, the Registrant’s investment adviser (“William Blair”), or any of its control affiliates that were for engagements directly related to the Registrant’s operations and financial reporting.
Tax Fees
For the fiscal years ended December 31, 2021 and 2022, E&Y billed the Registrant $158,125 and $194,140, respectively, for professional services rendered for tax compliance, tax advice and tax planning. Such services consisted of preparation of tax returns, year-end distribution review, qualifying dividend income analysis and review of year-end tax reporting. For the fiscal years ended December 31, 2021 and 2022, E&Y did not bill William Blair and its control affiliates for any services that were for engagements directly related to the Registrant’s operations and financial reporting.
All Other Fees
For the fiscal years ended December 31, 2021 and 2022, E&Y did not bill the Registrant for products and services other than the services reported above. For the fiscal year ended December 31, 2021 and 2022, E&Y provided no other services to William Blair or any of its control affiliates that were for engagements directly related to the Registrant’s operations and financial reporting.
Audit Committee Pre-Approval Policies and Procedures
Pursuant to the Registrant’s Audit Committee Charter (the “Charter”), the Audit Committee is responsible for pre-approving any engagement of the principal accountant to provide non-prohibited services to the Registrant, including the fees and other compensation to be paid to the principal accountant, to the extent required by Rule 2-01(c)(7) of Regulation S-X. Pursuant to the Charter, the Audit Committee is also responsible for pre-approving any engagement of the principal accountant, including the fees and other compensation to be paid to the principal accountant, to provide non-audit services to the Registrant’s investment adviser (or any entity controlling, controlled by, or under common control with the adviser that provides ongoing services to the Registrant), if the engagement relates directly to the operations and financial reporting of the Registrant, to the extent required by Rule 2-01(c)(7) of Regulation S-X. The Chair of the Audit Committee may grant the pre-approval referenced above for non-prohibited and non-audit services. All such delegated pre-approvals will be presented to the Audit Committee no later than the next Audit Committee meeting. None of the Audit-Related and Tax Services billed by E&Y for the fiscal years ended December 31, 2021 and 2022 discussed above were approved by the Audit Committee pursuant to a waiver of these Pre-Approval Policies and Procedures.
Non-Audit Fees
For the fiscal years ended December 31, 2021 and 2022, E&Y billed the Trust $158,125 and $194,140, respectively, in non-audit fees (tax services). For the same periods, E&Y billed the Adviser and its control affiliates $0 and $0, respectively, in non-audit fees.
| Item 5. | Audit Committee of Listed Registrants |
Not applicable to this Registrant, insofar as the Registrant is not a listed company.
| Item 6. | Schedule of Investments |
See Schedule of Investments in Item 1.
| Item 7. | Disclosure of Proxy Voting Policies and Procedures for Closed-End Management Investment Companies |
Not applicable to this Registrant, insofar as the Registrant is not a closed-end management investment company.
| Item 8. | Portfolio Managers of Closed-End Management Investment Companies |
Not applicable to this Registrant, insofar as the Registrant is not a closed-end management investment company.
| Item 9. | Purchase of Equity Securities by Closed-End Management Investment Companies and Affiliated Purchasers |
Not applicable to this Registrant, insofar as the Registrant is not a closed-end management investment company.
| Item 10. | Submission of Matters to a Vote of Security Holders |
There have been no material changes to the procedures by which shareholders may recommend nominees to the Registrant’s Board of Trustees since the Registrant last provided disclosure in response to this item.
Controls and Procedures
(a) The Registrant’s principal executive and principal financial officers, or persons performing similar functions, have concluded that the Registrant’s Disclosure Controls and Procedures (as defined in Rule 30a-3(c) under the Investment Company Act of 1940, as amended (the “1940 Act”) (17 CFR 270.30a-3(c)) are effective, as of a date within 90 days of the filing date of this report that includes the disclosure required by this paragraph, based on their evaluation of these controls and procedures required by Rule 30a-3 (b) under the 1940 Act (17 CFR 270.30a-3(b) and Rules 13a-15(b) or 15d-15(b) under the Securities Exchange Act of 1934, as amended to date (17 CFR 240.13a-15(b) or 240.15d-15(b)).
(b) There were no changes in the Registrant’s internal control over financial reporting (as defined in Rule 30a-3(d) under the 1940 Act (17 CFR 270.30a-3(d)) that occurred during the period covered by this report that has materially affected, or is reasonably likely to materially affect, the Registrant’s internal control over financial reporting.
| Item 12. | Disclosure of Securities Lending Activities for Closed-End Management Investment Companies |
Not applicable to this Registrant, insofar as the Registrant is not a closed-end management investment company.
13. (a) (1)
Code of Ethics required by Item 2 is filed as an exhibit hereto.
13. (a) (2) (1)
Certification of Principal Executive Officer Required by Rule 30a-2(a) of the Investment Company Act of 1940 is filed as an exhibit hereto.
13. (a) (2) (2)
Certification of Principal Financial Officer Required by Rule 30a-2(a) of the Investment Company Act of 1940 is filed as an exhibit hereto.
13. (a) (3)
Not applicable to this Registrant.
13. (a) (4)
Not applicable to this filing.
13. (b)
Certifications of the Principal Executive Officer and Principal Financial Officer of the issuer as required by Rule 30a-2(b) of the Investment Company Act of 1940 are filed as exhibits hereto.
SIGNATURES
Pursuant to the requirements of the Securities Exchange Act of 1934 and the Investment Company Act of 1940, the Registrant has duly caused this report to be signed on its behalf by the undersigned, thereunto duly authorized.
| | | William Blair Funds |
| | |
| | | /s/ Stephanie G. Braming |
| By: | | Stephanie G. Braming |
| | | President (Principal Executive Officer) |
Date: February 24, 2023
Pursuant to the requirements of the Securities Exchange Act of 1934 and the Investment Company Act of 1940, this report has been signed below by the following persons on behalf of the Registrant and in the capacities and on the dates indicated.
| | | /s/ Stephanie G. Braming |
| By: | | Stephanie G. Braming |
| | | President (Principal Executive Officer) |
Date: February 24, 2023
| | | /s/ John M. Raczek |
| By: | | John M. Raczek |
| | | Treasurer (Principal Financial Officer) |
Date: February 24, 2023