UNITED STATES
SECURITIES AND EXCHANGE COMMISSION
Washington, D.C. 20549
Form N-CSR
CERTIFIED SHAREHOLDER REPORT OF REGISTERED
MANAGEMENT INVESTMENT COMPANIES
Investment Company Act File Number 811-5344
William Blair Funds
(Exact name of registrant as specified in charter)
| 150 North Riverside Plaza, Chicago, IL | | 60606 |
| (Address of principal executive offices) | | (Zip Code) |
Stephanie G. Braming, Principal Executive Officer
William Blair Funds
150 North Riverside Plaza, Chicago, IL 60606
(Name and address of agent for service)
Registrant’s telephone number, including area code: 312-236-1600
Date of fiscal year end: December 31
Date of reporting period: December 31, 2020
Item 1. December 31, 2020 Annual Reports transmitted to shareholders.
 | |
| | |
| | |
| | |
| | |
| | |
| | |
| | |
| | December 31, 2020 |
William Blair Funds
Annual Report | |
| | | | |
| | | | |
| | | | |
| | | | |
| | | | |
| | | | |
| | | | |
| | | | |
| | | | |
| | | | |
| | | | |
| | | | |
| December 31, 2020 | William Blair Funds | 1 |
The views expressed in the commentary for each Fund reflect those of the portfolio management team only through the end of the period of the report as stated on the cover. The portfolio management team’s views are subject to change at any time based on market and other conditions and should not be construed as a recommendation. Statements involving predictions, assessments, analyses, or outlook for individual securities, industries, market sectors, and/or markets involve risks and uncertainties, and there is no guarantee they will come to pass.
This report is submitted for the general information of the shareholders of William Blair Funds. It is not authorized for distribution to prospective Fund investors unless accompanied or preceded by the Fund’s prospectus. Please carefully consider a Fund’s investment objectives, risks, charges, and expenses before investing. This and other information is contained in the Fund’s prospectus, which you may obtain by calling 1-800-742-7272. Read it carefully before you invest or send money.
| 2 | Annual Report | December 31, 2020 |
U.S. Growth Market Review and Outlook
In a volatile yet robust year for U.S. equities, COVID-19 was the dominant force affecting the economy and stock market during 2020.
During the first quarter, equities declined rapidly due to stay-at-home directives, which effectively shut down many segments of the economy. After bottoming in late March, equity returns rebounded rapidly during the second quarter. This was predominately the result of massive amounts of fiscal and monetary stimulus, coupled with improving COVID-19 trends and apparent progress toward re-opening the economy.
Continued economic improvement, including positive trends in employment and increases in consumer spending, coupled with incremental progress towards the development of a vaccine, supported the market rise into the third quarter. Within the market, there was a pronounced bifurcation between the performance of “COVID-19 beneficiaries” and those disrupted by COVID-19, as select companies across different sectors saw a strengthening of demand for their products (e.g., e-commerce), while others saw a complete collapse in demand (e.g., travel-related), though this divergence began to narrow somewhat late in the third quarter.
Gains for U.S. equities accelerated in the fourth quarter, most notably as the market digested U.S. election results and several announcements of highly efficacious COVID-19 vaccine candidates. From a political standpoint, while the Democratic Party claimed the presidency, it did not achieve overwhelming congressional victories. We believe this effectively removed the most extreme agenda items from either party as likely outcomes and suggested a more centrist approach from President Elect Biden. On the vaccine front, strong clinical trial results, FDA approvals and the commencement of vaccinations gave investors some visibility in terms of a path to return to more normal lifestyles and economic activity. These developments, together with resilient corporate earnings, overshadowed the recent surge in virus cases and hospitalizations, which could lead to further limitations on business activity.
With significant COVID-19-related business disruption throughout 2020, the Federal Reserve (Fed) committed to keep the Federal Funds rate low for an extended period. This support, coupled with lower 10-year U.S. Treasury yields and a focus on longer-term corporate profit potential, drove valuation multiple expansion and resulted in several U.S. equity indices ending the year at all-time highs.
Looking past the current surge in COVID-19 cases, we believe that there is a sense of optimism around U.S. economic potential when a sufficiently large portion of the population is vaccinated. COVID-19 has had materially negative impacts on many households while others have experienced little-to-no financial hardship. Acknowledging that dispersion, in aggregate the U.S. personal savings rate is up dramatically and mortgage rates are near historic lows. When combined with the recently passed stimulus measures, we believe that there is likely pent-up demand to be unlocked as the economy re-opens.
Tempering that optimism is the potential for slower than expected vaccine distribution and the prospect of inflation. While the unemployment rate in the U.S. has fallen since earlier in the year, we believe that there remains slack in the employment market, which could mitigate the potential inflationary impact of continued Fed asset purchases and possible additional fiscal stimulus.
As equity investors, we must also weigh what expectations are embedded in stock prices. We believe it matters what you pay for an asset and have long focused on investing in stocks of quality companies where we believe the future risk/reward potential is skewed in our favor. While having this sensitivity to valuation has generally not benefited relative returns in 2020, we believe our portfolio is well-positioned for an eventual normalization of more extreme (relative to history) valuations in certain segments of the market. Furthermore, we believe that better visibility for a return to a more normal economic environment (relative to history) creates a supportive backdrop for the attractively valued stocks of durable businesses in which we invest.
| December 31, 2020 | William Blair Funds | 3 |
U.S. Value Market Review and Outlook
This past year has been an interesting year to say the least and has presented everyone with a variety of challenges as COVID-19 was the dominant force affecting both the economy and equities in a volatile year overall. Even in the face of such adversity, domestic equity benchmark returns were robust in the fourth quarter, finishing the year in positive territory.
The abrupt halt of economic activity due to COVID-19-related stay-at-home directives contributed to the dramatic decline in U.S. equities in the first quarter. Essentially shutting down a large percentage of the economy resulted in a spike in the unemployment rate to almost 15% and a precipitous decline in GDP. Extraordinary and aggressive stimulus measures, improving virus-related case trends, apparent progress toward economic re-opening, and vaccine development optimism triggered a risk-on rally off its mid-March lows with robust equity market returns in the second quarter. Market returns continued higher, supported by progress towards the development of a vaccine, solid corporate earnings, and continued positive trends in economic data, highlighted by a drop in the unemployment rate to 8.4%. Political brinksmanship and dampened prospects for further fiscal stimulus ahead of the U.S. Presidential election muted these positive market returns.
U.S. equity returns reaccelerated in the fourth quarter with some benchmarks delivering their best monthly returns ever in November. The robust returns in the quarter were driven by positive vaccine developments, resilient corporate earnings, positive economic trends, U.S. election results, continued central bank support, and the anticipation of additional fiscal stimulus measures. All of these overshadowed the recent surge in virus cases nationally and the potential for restrictions being reinstated. On the vaccine front, multiple companies published better than expected efficacy data for their vaccines. The increased optimism around the vaccines and the potential for a faster “return to normal” led investors to favor value and cyclical stocks periodically during the quarter.
Investors appear to be looking through the recent surge in COVID-19 cases and the potential for renewed restrictions as the widespread vaccination process begins. This vaccine-related optimism is somewhat offset by the potential for slower than expected vaccine distribution.
The pandemic has impacted us all in a variety of ways, some more than others, and while it appears that a return to more normal times is on the horizon, we are constantly evaluating what this new normal will look like, potential changes in consumer behavior, and the impact this may have on future business activity. Although Joe Biden won the U.S. Presidential election, the political landscape remains relatively balanced, which, in our view, is generally preferred and should allow for a continued favorable tax environment for businesses.
We continue to maintain our higher quality portfolio positioning due to concerns about corporate debt levels and continued market volatility as a result of potential economic implications associated with recent virus trends. We believe that companies in which we invest will be able to endure and emerge from this crisis stronger and with increased market share, regardless of the trajectory of the broader economic recovery. Said differently, while the portfolio is defensively positioned and has been impacted by the initial market response to recent vaccine news, we believe we will participate in a variety of different market environments. We remain steadfast in our foundational belief that long-term value creation and stock performance is driven by superior capital stewardship, as characterized by strong cash flows and improving or sustainable return on invested capital.
| 4 | Annual Report | December 31, 2020 |
| | Growth Fund |
| | |
| | The Growth Fund seeks long-term capital appreciation. |
| | |
| | AN OVERVIEW FROM THE PORTFOLIO MANAGER |
| | |

David C. Fording | The William Blair Growth Fund (Class N shares) posted a 35.97% increase, net of fees, for the year ended December 31, 2020. By comparison, the Fund’s benchmark index, the Russell 3000® Growth Index (the “Index”), increased 38.26%. While posting strong absolute performance during 2020, the Fund trailed the return of the Index, primarily driven by stock specific dynamics. The largest source of underperformance as compared to our benchmark came from not owning Apple (Information Technology) and Tesla (Consumer Discretionary) as both stocks have benefited from significant valuation multiple expansion during the year. In the case of Apple, given the maturity of the high-end smart phone, tablet and PC markets, and the recent revaluation of its services business, we believe the long-term growth and return prospects for our other Information Technology holdings are more attractive. As it relates to Tesla, while we share the market’s view that electric vehicle penetration is likely to accelerate, resulting in better forward growth than was expected a year ago, we believe the stock is embedding unrealistic expectations as to Tesla’s ultimate market share and margin profile. Within the portfolio, stock selection in Information Technology, including our positions in Fidelity National Information Services and Sabre, detracted from relative performance. Other notable laggards included Coca-Cola (Consumer Staples), BWX Technologies (Industrials) and Laureate Education (Consumer Discretionary). Beverage company Coca-Cola faced revenue headwinds that resulted from COVID-19-related store and restaurant closures, as roughly 40% of its beverages are consumed “away from home.” Outside of Information Technology, and the impact of not owning Apple or Tesla, stock selection was generally favorable across the portfolio and most notably in Health Care and Industrials. Top individual stock contributors for the year-to-date period included Horizon Therapeutics (Health Care), Amazon.com (Consumer Discretionary), Etsy (Consumer Discretionary), Advanced Micro Devices (Information Technology) and Rush Street Interactive (Consumer Discretionary). Horizon Therapeutics was a standout as sales of Tepezza, a recently launched drug that treats Thyroid Eye Disease, handily exceeded expectations for much of the year. Amazon benefited from COVID-19 related tailwinds in its retail business, including increased consumer demand and the rapid shift to e-commerce, and in its cloud computing business AWS, including accelerating migration to, and use of, cloud-based services. Please refer to the U.S. Growth Market Review and Outlook relating to the Fund on page 3. |
| | |
| December 31, 2020 | William Blair Funds | 5 |
Growth Fund
Performance Highlights (Unaudited)
| Average Annual Total Returns through 12/31/2020 |
| | | 1 Year | | 3 Year | | 5 Year | | 10 Year | | Since
Inception(a) |
| Class N | | | 35.97 | % | | | 23.55 | % | | | 18.35 | % | | | 14.85 | % | | | — | |
| Class I | | | 36.35 | | | | 23.90 | | | | 18.68 | | | | 15.20 | | | | — | |
| Class R6 | | | 36.50 | | | | — | | | | — | | | | — | | | | 28.10 | % |
| Russell 3000® Growth Index | | | 38.26 | | | | 22.50 | | | | 20.67 | | | | 16.93 | | | | 30.46 | |
| S&P 500® Index | | | 18.40 | | | | 14.18 | | | | 15.22 | | | | 13.88 | | | | 18.42 | |
| | |
| (a) | Since inception is for the period from May 2, 2019 (Commencement of Operations) to December 31, 2020. |
Performance cited represents past performance. Past performance does not guarantee future results and current performance may be lower or higher than the data quoted. Results shown are average annual total returns, which assume reinvestment of dividends and capital gains. Investment returns and principal will fluctuate and you may have a gain or loss when you sell shares. For the most current month-end performance information, please call 1-800-742-7272, or visit our Web site at www.williamblairfunds.com. From time to time, the investment adviser may waive fees or reimburse expenses for the Fund. Without these waivers/reimbursements, performance would be lower. Class N shares are not subject to a sales load. Class I shares are not subject to a sales load or distribution (Rule 12b-1) fees. Class R6 shares are not subject to a sales load, distribution (Rule 12b-1) fees, or sub-transfer agent fees.
The performance highlights and graph presented above do not reflect the deduction of taxes that a shareholder would pay on fund distributions or the redemption of fund shares.
The Russell 3000® Growth Index consists of large, medium, and small capitalization companies with above average price-to-book ratios and forecasted growth rates. The index is weighted by market capitalization and large/medium/small companies make up approximately 80%/15%/5% of the index.
The S&P 500® Index indicates broad larger capitalization equity market performance.
This report identifies the Fund’s investments on December 31, 2020. These holdings are subject to change. Not all stocks in the Fund performed the same, nor is there any guarantee that these stocks will perform as well in the future. Market forecasts provided in this report may not necessarily come to pass.
Sector Diversification (Unaudited)

The sector diversification shown is based on the total long-term securities.
| 6 | Annual Report | December 31, 2020 |
Growth Fund
Portfolio of Investments, December 31, 2020 (all dollar amounts in thousands)
| | | | | | | | |
| | | | | | | | |
| | Issuer | | Shares | | | Value | |
| | | | | | | | | | |
| | Common Stocks | | | | | | | | |
| | Information Technology—39.4% | | | | | | | | |
| * | Adobe, Inc. | | | 16,741 | | | $ | 8,373 | |
| * | Advanced Micro Devices, Inc. | | | 79,224 | | | | 7,266 | |
| * | Alarm.com Holdings, Inc. | | | 14,748 | | | | 1,526 | |
| * | Arista Networks, Inc. | | | 19,221 | | | | 5,585 | |
| | Brooks Automation, Inc. | | | 31,750 | | | | 2,154 | |
| | Fidelity National Information Services, Inc. | | | 45,548 | | | | 6,443 | |
| * | GoDaddy, Inc. | | | 45,089 | | | | 3,740 | |
| * | Grid Dynamics Holdings, Inc. | | | 189,874 | | | | 2,392 | |
| | Mastercard, Inc. | | | 33,313 | | | | 11,891 | |
| | Microsoft Corporation | | | 124,037 | | | | 27,588 | |
| * | MongoDB, Inc. | | | 7,863 | | | | 2,823 | |
| | National Instruments Corporation | | | 89,588 | | | | 3,937 | |
| * | Nice, Ltd.—ADR | | | 15,247 | | | | 4,323 | |
| * | PayPal Holdings, Inc. | | | 48,279 | | | | 11,307 | |
| * | Pure Storage, Inc. | | | 194,620 | | | | 4,400 | |
| | Texas Instruments, Inc. | | | 41,261 | | | | 6,772 | |
| * | Verra Mobility Corporation | | | 180,072 | | | | 2,417 | |
| * | Workday, Inc. | | | 17,925 | | | | 4,295 | |
| | | | | | | | | 117,232 | |
| | Consumer Discretionary—16.3% | | | | | | | | |
| | Advance Auto Parts, Inc. | | | 22,434 | | | | 3,534 | |
| * | Amazon.com, Inc. | | | 7,130 | | | | 23,222 | |
| * | Bright Horizons Family Solutions, Inc. | | | 16,516 | | | | 2,857 | |
| * | Burlington Stores, Inc. | | | 10,597 | | | | 2,772 | |
| * | Etsy, Inc. | | | 11,242 | | | | 2,000 | |
| * | Grand Canyon Education, Inc. | | | 28,573 | | | | 2,661 | |
| * | Revolve Group, Inc. | | | 85,763 | | | | 2,673 | |
| * | Rush Street Interactive, Inc. | | | 172,625 | | | | 3,737 | |
| * | Skyline Champion Corporation | | | 60,933 | | | | 1,885 | |
| * | Ulta Beauty, Inc. | | | 11,161 | | | | 3,205 | |
| | | | | | | | | 48,546 | |
| | Health Care—14.7% | | | | | | | | |
| | Abbott Laboratories | | | 36,808 | | | | 4,030 | |
| | Agilent Technologies, Inc. | | | 39,119 | | | | 4,635 | |
| * | Certara, Inc. | | | 75,190 | | | | 2,536 | |
| * | Horizon Therapeutics plc† | | | 70,845 | | | | 5,182 | |
| * | Ligand Pharmaceuticals, Inc. | | | 16,685 | | | | 1,659 | |
| * | Penumbra, Inc. | | | 14,317 | | | | 2,506 | |
| | STERIS plc† | | | 15,417 | | | | 2,922 | |
| | Stryker Corporation | | | 26,380 | | | | 6,464 | |
| | UnitedHealth Group, Inc. | | | 25,732 | | | | 9,024 | |
| * | Veracyte, Inc. | | | 28,550 | | | | 1,397 | |
| | Zoetis, Inc. | | | 20,715 | | | | 3,428 | |
| | | | | | | | | 43,783 | |
| | Communication Services—10.1% | | | | | | | | |
| | Activision Blizzard, Inc. | | | 57,946 | | | | 5,380 | |
| * | Alphabet, Inc. Class “A” | | | 11,135 | | | | 19,516 | |
| * | Live Nation Entertainment, Inc. | | | 37,456 | | | | 2,752 | |
| * | Take-Two Interactive Software, Inc. | | | 11,104 | | | | 2,307 | |
| | | | | | | | | 29,955 | |
| | Industrials—8.4% | | | | | | | | |
| | BWX Technologies, Inc. | | | 73,867 | | | | 4,453 | |
| * | Copart, Inc. | | | 45,235 | | | | 5,756 | |
| * | CoStar Group, Inc. | | | 4,786 | | | | 4,424 | |
| | Issuer | | Shares or
Principal
Amount | | | Value | |
| | | | | | | | | | |
| | Common Stocks—(continued) | | | | | | | | |
| | Industrials—(continued) | | | | | | | | |
| | Fortive Corporation | | | 54,019 | | | $ | 3,826 | |
| | The Brink’s Co. | | | 62,740 | | | | 4,517 | |
| * | Trex Co., Inc. | | | 22,829 | | | | 1,911 | |
| | | | | | | | | 24,887 | |
| | Consumer Staples—4.7% | | | | | | | | |
| * | BJ’s Wholesale Club Holdings, Inc. | | | 95,388 | | | | 3,556 | |
| | The Coca-Cola Co. | | | 117,763 | | | | 6,458 | |
| | The Estee Lauder Cos., Inc. | | | 15,388 | | | | 4,096 | |
| | | | | | | | | 14,110 | |
| | Financials—2.4% | | | | | | | | |
| | Aon plc† | | | 19,109 | | | | 4,037 | |
| | Ares Management Corporation | | | 64,456 | | | | 3,033 | |
| | | | | | | | | 7,070 | |
| | Materials—1.5% | | | | | | | | |
| | Ball Corporation | | | 47,320 | | | | 4,409 | |
| | Energy—1.2% | | | | | | | | |
| | Cameco Corporation† | | | 255,023 | | | | 3,417 | |
| | Real Estate—1.1% | | | | | | | | |
| | SBA Communications Corporation | | | 11,161 | | | | 3,149 | |
| | Total Common Stocks—99.8%
(cost $156,101) | | | | | | | 296,558 | |
| | | | | | | | | | |
| | Repurchase Agreement | | | | | | | | |
| | Fixed Income Clearing Corporation, 0.000% dated 12/31/20, due 1/4/21, repurchase price $1,067, collateralized by U.S. Treasury Note, 0.500%, due 6/30/27, valued at $1,088 | | | $1,067 | | | | 1,067 | |
| | Total Repurchase Agreement—0.3%
(cost $1,067) | | | | | | | 1,067 | |
| | Total Investments—100.1%
(cost $157,168) | | | | | | | 297,625 | |
| | Liabilities, plus cash and other assets—(0.1)% | | | | | | | (374 | ) |
| | Net assets—100.0% | | | | | | $ | 297,251 | |
ADR = American Depository Receipt
* = Non-income producing security
† = U.S. listed foreign security
See accompanying Notes to Financial Statements.
| December 31, 2020 | William Blair Funds | 7 |
| | Large Cap Growth Fund |
| | |
| | The Large Cap Growth Fund seeks long-term capital appreciation. |
| | |
| | AN OVERVIEW FROM THE PORTFOLIO MANAGERS |
| | |

James S. Golan 
David P. Ricci | The William Blair Large Cap Growth Fund (Class N shares) posted a 36.30% increase, net of fees, for the year ended December 31, 2020. By comparison, the Fund’s benchmark index, the Russell 1000® Growth Index (the “Index”), increased 38.49%. While posting strong absolute performance during 2020, the Fund trailed the return of the Index, primarily driven by stock specific dynamics. The largest source of underperformance as compared to our benchmark came from not owning Apple (Information Technology) and Tesla (Consumer Discretionary) as both stocks have benefited from significant valuation multiple expansion during the year. In the case of Apple, given the maturity of the high-end smart phone, tablet and PC markets, and the recent revaluation of its services business, we believe the long-term growth and return prospects for our other Information Technology holdings are more attractive. As it relates to Tesla, while we share the market’s view that electric vehicle penetration is likely to accelerate, resulting in better forward growth than was expected a year ago, we believe the stock is embedding unrealistic expectations as to Tesla’s ultimate market share and margin profile. Within the portfolio a number of our top detractors could be characterized as companies that experienced COVID-19-related business headwinds, including Coca-Cola (Consumer Staples), Fortive Corp. (Industrials) and Live Nation Entertainment (Communication Services). Beverage company Coca-Cola faced revenue headwinds that resulted from COVID-19-related store and restaurant closures, as roughly 40% of its beverages are consumed “away from home.” Other laggards were Fidelity National Information Services (Information Technology) and Apollo Global Management (Financials). Conversely, top individual stock contributors for the year included PayPal Holdings (Information Technology), Advanced Micro Devices (Information Technology), Amazon.com (Consumer Discretionary), Veeva Systems (Health Care) and Lam Research (Information Technology). Digital payments company PayPal had record levels of new client additions and transactions as it continued to benefit from the rapid transition to e-commerce and digital payments. Advanced Micro Devices outperformed on strong demand for its chipsets and market share gains. Please refer to the U.S. Growth Market Review and Outlook relating to the Fund on page 3. |
| | |
| 8 | Annual Report | December 31, 2020 |
Large Cap Growth Fund
Performance Highlights (Unaudited)
| Average Annual Total Returns through 12/31/2020 |
| | | 1 Year | | 3 Year | | 5 Year | | 10 Year | | Since
Inception(a) |
| Class N | | | 36.30 | % | | | 24.84 | % | | | 21.03 | % | | | 17.02 | % | | | — | |
| Class I | | | 36.59 | | | | 25.14 | | | | 21.34 | | | | 17.31 | | | | — | |
| Class R6 | | | 36.70 | | | | — | | | | — | | | | — | | | | 30.55 | % |
| Russell 1000® Growth Index | | | 38.49 | | | | 22.99 | | | | 21.00 | | | | 17.21 | | | | 30.85 | |
| | |
| (a) | Since inception is for the period from May 2, 2019 (Commencement of Operations) to December 31, 2020. |
Performance cited represents past performance. Past performance does not guarantee future results and current performance may be lower or higher than the data quoted. Results shown are average annual total returns, which assume reinvestment of dividends and capital gains. Investment returns and principal will fluctuate and you may have a gain or loss when you sell shares. For the most current month-end performance information, please call 1-800-742-7272, or visit our Web site at www.williamblairfunds.com. From time to time, the investment adviser may waive fees or reimburse expenses for the Fund. Without these waivers/reimbursements, performance would be lower. Class N shares are not subject to a sales load. Class I shares are not subject to a sales load or distribution (Rule 12b-1) fees. Class R6 shares are not subject to a sales load, distribution (Rule 12b-1) fees, or sub-transfer agent fees.
The performance highlights and graph presented above do not reflect the deduction of taxes that a shareholder would pay on fund distributions or the redemption of fund shares.
The Russell 1000® Growth Index consists of large capitalization companies with above average price-to-book ratios and forecasted growth rates.
This report identifies the Fund’s investments on December 31, 2020. These holdings are subject to change. Not all stocks in the Fund performed the same, nor is there any guarantee that these stocks will perform as well in the future. Market forecasts provided in this report may not necessarily come to pass.
Sector Diversification (Unaudited)

The sector diversification shown is based on the total long-term securities.
| December 31, 2020 | William Blair Funds | 9 |
Large Cap Growth Fund
Portfolio of Investments, December 31, 2020 (all dollar amounts in thousands)
| | | | | | | | |
| | | | | | | | |
| | Issuer | | Shares | | | Value | |
| | | | | | | | | | |
| | Common Stocks | | | | | | | | |
| | Information Technology—42.0% | | | | | | | | |
| | Accenture plc† | | | 88,620 | | | $ | 23,148 | |
| * | Adobe, Inc. | | | 46,290 | | | | 23,150 | |
| * | Advanced Micro Devices, Inc. | | | 234,928 | | | | 21,545 | |
| | Fidelity National Information Services, Inc. | | | 88,400 | | | | 12,505 | |
| * | Guidewire Software, Inc. | | | 61,950 | | | | 7,975 | |
| | Intuit, Inc. | | | 50,630 | | | | 19,232 | |
| | Lam Research Corporation | | | 40,710 | | | | 19,226 | |
| | Mastercard, Inc. | | | 86,710 | | | | 30,950 | |
| | Microsoft Corporation | | | 318,910 | | | | 70,932 | |
| * | PayPal Holdings, Inc. | | | 146,160 | | | | 34,231 | |
| * | salesforce.com, Inc. | | | 63,640 | | | | 14,162 | |
| | Texas Instruments, Inc. | | | 137,270 | | | | 22,530 | |
| | | | | | | | | 299,586 | |
| | Consumer Discretionary—17.0% | | | | | | | | |
| * | Amazon.com, Inc. | | | 20,065 | | | | 65,350 | |
| | Marriott International, Inc. | | | 66,350 | | | | 8,753 | |
| | NIKE, Inc. | | | 191,720 | | | | 27,123 | |
| | Starbucks Corporation | | | 185,910 | | | | 19,889 | |
| | | | | | | | | 121,115 | |
| | Health Care—13.5% | | | | | | | | |
| | Abbott Laboratories | | | 141,820 | | | | 15,528 | |
| * | ABIOMED, Inc. | | | 33,658 | | | | 10,912 | |
| * | Illumina, Inc. | | | 28,440 | | | | 10,523 | |
| | Stryker Corporation | | | 76,050 | | | | 18,635 | |
| | UnitedHealth Group, Inc. | | | 73,480 | | | | 25,768 | |
| | Zoetis, Inc. | | | 91,410 | | | | 15,128 | |
| | | | | | | | | 96,494 | |
| | Communication Services—11.5% | | | | | | | | |
| | Activision Blizzard, Inc. | | | 190,320 | | | | 17,671 | |
| * | Alphabet, Inc. Class “A” | | | 21,820 | | | | 38,243 | |
| * | Alphabet, Inc. Class “C” | | | 5,950 | | | | 10,424 | |
| * | Live Nation Entertainment, Inc. | | | 209,200 | | | | 15,372 | |
| | | | | | | | | 81,710 | |
| | Industrials—6.6% | | | | | | | | |
| * | Copart, Inc. | | | 156,150 | | | | 19,870 | |
| | Equifax, Inc. | | | 77,160 | | | | 14,879 | |
| | Fortive Corporation | | | 169,300 | | | | 11,990 | |
| | | | | | | | | 46,739 | |
| | Consumer Staples—4.9% | | | | | | | | |
| | Costco Wholesale Corporation | | | 51,810 | | | | 19,521 | |
| | The Estee Lauder Cos., Inc. | | | 58,790 | | | | 15,649 | |
| | | | | | | | | 35,170 | |
| | Financials—2.0% | | | | | | | | |
| | Apollo Global Management, Inc. | | | 288,640 | | | | 14,138 | |
| | Materials—1.6% | | | | | | | | |
| | Linde plc† | | | 42,770 | | | | 11,270 | |
| | Total Common Stocks—99.1%
(cost $474,576) | | | | | | | 706,222 | |
| | | | | | | | |
| | Issuer | | Principal
Amount | | | Value | |
| | | | | | | | |
| | Repurchase Agreement | | | | | | | | |
| | Fixed Income Clearing Corporation, 0.000% dated 12/31/20, due 1/4/21, repurchase price $5,155, collateralized by U.S. Treasury Note, 0.500%, due 6/30/27, valued at $5,258 | | | $5,155 | | | $ | 5,155 | |
| | Total Repurchase Agreement—0.7%
(cost $5,155) | | | | | | | 5,155 | |
| | Total Investments—99.8%
(cost $479,731) | | | | | | | 711,377 | |
| | Cash and other assets, less liabilities—0.2% | | | | | | | 1,492 | |
| | Net assets—100.0% | | | | | | $ | 712,869 | |
† = U.S. listed foreign security
* = Non-income producing security
See accompanying Notes to Financial Statements.
| 10 | Annual Report | December 31, 2020 |
| | Mid Cap Growth Fund |
| | |
| | The Mid Cap Growth Fund seeks long-term capital appreciation. |
| | |
| | AN OVERVIEW FROM THE PORTFOLIO MANAGERS |
| | |

Daniel Crowe 
James E. Jones | The William Blair Mid Cap Growth Fund (Class N shares) posted a 26.80% increase, net of fees, for the year ended December 31, 2020. By comparison, the Fund’s benchmark index, the Russell Midcap® Growth Index (the “Index”), increased 35.59%. Despite outperforming during the downturn earlier in the year, the Fund lagged the Index in the full-year period due to a combination of style headwinds and stock-specific factors. From a style perspective, our typical lower beta profile and bias toward companies with more consistent business models were headwinds during the period as the most volatile and highest beta quintiles of the benchmark were the best performers. From a sector perspective, Information Technology was the primary source of the Fund’s underperformance for the year. This was a result of some stock-specific factors and the Fund’s valuation discipline, as the most expensive stocks in the sector (e.g., Software) dramatically outperformed. Given our underweight to certain parts of the market where valuations are at what we believe to be extreme levels, relative to history, most notably in Information Technology, we believe that any normalization in valuations could prove to be beneficial to the Fund’s relative performance in the future. From a stock-specific standpoint, WEX (Information Technology) and BWX Technologies (Industrials) were among the top detractors during the period. COVID-19 related headwinds, including a decline in fuel prices and a broad slowdown in travel, weighed on shares of WEX, a leading provider of payment solutions to the global fuel card market and online travel agents. BWX Technologies, the sole-source provider of propulsion systems for the U.S. Navy, experienced weakness due to concerns surrounding the extended timeline of the rollout of its medical radioisotope product as well as uncertainty around future government military spending under a Democratic U.S. Presidential administration. Stock selection in Consumer Discretionary, including our positions in Ross Stores, Advance Auto Parts and Wayfair, also detracted from relative returns. Conversely, stock selection in Industrials contributed positively to relative returns. Top individual contributors included Horizon Therapeutics (Health Care), Align Technology (Health Care), MongoDB (Information Technology), Take-Two Interactive Software (Communication Services) and EPAM Systems (Information Technology). We believe that medical device company Align Technology reported very strong earnings results, with case volumes, revenues and operating margins all significantly exceeding expectations. Horizon Therapeutics benefitted from continued robust growth of the company’s recently launched drug Tepezza, a drug that treats Thyroid Eye Disease. Please refer to the U.S. Growth Market Review and Outlook relating to the Fund on page 3. |
| December 31, 2020 | William Blair Funds | 11 |
Mid Cap Growth Fund
Performance Highlights (Unaudited)
| |
| Average Annual Total Returns through 12/31/2020 |
| | | 1 Year | | 3 Year | | 5 Year | | 10 Year | | Since
Inception(a) |
| Class N | | | 26.80 | % | | | 19.44 | % | | | 15.60 | % | | | 12.39 | % | | | — | |
| Class I | | | 27.21 | | | | 19.75 | | | | 15.90 | | | | 12.68 | | | | — | |
| Class R6 | | | 27.18 | | | | — | | | | — | | | | — | | | | 21.69 | % |
| Russell Midcap® | | | | | | | | | | | | | | | | | | | | |
| Growth Index | | | 35.59 | | | | 20.50 | | | | 18.66 | | | | 15.04 | | | | 26.74 | |
| (a) | Since inception is for the period from May 2, 2019 (Commencement of Operations) to December 31, 2020. |
Performance cited represents past performance. Past performance does not guarantee future results and current performance may be lower or higher than the data quoted. Results shown are average annual total returns, which assume reinvestment of dividends and capital gains. Investment returns and principal will fluctuate and you may have a gain or loss when you sell shares. For the most current month-end performance information, please call 1-800-742-7272, or visit our Web site at www.williamblairfunds.com. Investing in medium capitalization companies involves special risks, including higher volatility and lower liquidity. Medium capitalization stocks are also more sensitive to purchase/sale transactions and changes in the issuer’s financial condition. From time to time, the investment adviser may waive fees or reimburse expenses for the Fund. Without these waivers/reimbursements, performance would be lower. Class N shares are not subject to a sales load. Class I shares are not subject to a sales load or distribution (Rule 12b-1) fees. Class R6 shares are not subject to a sales load, distribution (Rule 12b-1) fees, or sub-transfer agent fees.
The performance highlights and graph presented above do not reflect the deduction of taxes that a shareholder would pay on fund distributions or the redemption of fund shares.
The Russell Midcap® Growth Index is an index that is constructed to provide a comprehensive and unbiased barometer of the mid-cap growth market.
This report identifies the Fund’s investments on December 31, 2020. These holdings are subject to change. Not all stocks in the Fund performed the same, nor is there any guarantee that these stocks will perform as well in the future. Market forecasts provided in this report may not necessarily come to pass.
Sector Diversification (Unaudited)

The sector diversification shown is based on the total long-term securities.
| 12 | Annual Report | December 31, 2020 |
Mid Cap Growth Fund
Portfolio of Investments, December 31, 2020 (all dollar amounts in thousands)
| | | | | | | | |
| | | | | | | | |
| | Issuer | | Shares | | | Value | |
| | | | | | | | |
| | Common Stocks | | | | | | | | |
| | Information Technology—29.4% | | | | | | | | |
| * | Arista Networks, Inc. | | | 7,365 | | | $ | 2,140 | |
| * | Aspen Technology, Inc. | | | 6,560 | | | | 854 | |
| | Booz Allen Hamilton Holding Corporation | | | 16,779 | | | | 1,463 | |
| * | Cadence Design Systems, Inc. | | | 18,935 | | | | 2,583 | |
| * | Coupa Software, Inc. | | | 3,585 | | | | 1,215 | |
| | Dolby Laboratories, Inc. | | | 11,790 | | | | 1,145 | |
| * | EPAM Systems, Inc. | | | 2,990 | | | | 1,072 | |
| * | Euronet Worldwide, Inc. | | | 11,410 | | | | 1,654 | |
| * | GoDaddy, Inc. | | | 17,920 | | | | 1,486 | |
| * | Guidewire Software, Inc. | | | 6,982 | | | | 899 | |
| | Microchip Technology, Inc. | | | 11,250 | | | | 1,554 | |
| * | MongoDB, Inc. | | | 4,945 | | | | 1,775 | |
| * | Nice, Ltd.—ADR | | | 4,905 | | | | 1,391 | |
| * | Pure Storage, Inc. | | | 71,285 | | | | 1,612 | |
| * | RingCentral, Inc. | | | 4,845 | | | | 1,836 | |
| * | SolarEdge Technologies, Inc. | | | 2,695 | | | | 860 | |
| * | Zendesk, Inc. | | | 7,965 | | | | 1,140 | |
| | | | | | | | | 24,679 | |
| | Health Care—23.1% | | | | | | | | |
| * | 10X Genomics, Inc. | | | 5,860 | | | | 830 | |
| * | ABIOMED, Inc. | | | 3,723 | | | | 1,207 | |
| | Agilent Technologies, Inc. | | | 20,630 | | | | 2,444 | |
| * | Align Technology, Inc. | | | 4,275 | | | | 2,285 | |
| | Bio-Techne Corporation | | | 2,762 | | | | 877 | |
| * | Centene Corporation | | | 12,180 | | | | 731 | |
| | Encompass Health Corporation | | | 19,078 | | | | 1,578 | |
| * | Exact Sciences Corporation | | | 12,125 | | | | 1,606 | |
| * | Horizon Therapeutics plc† | | | 28,520 | | | | 2,086 | |
| * | Insulet Corporation | | | 6,335 | | | | 1,619 | |
| * | Mettler-Toledo International, Inc. | | | 950 | | | | 1,083 | |
| | STERIS plc† | | | 6,515 | | | | 1,235 | |
| | Teleflex, Inc. | | | 4,510 | | | | 1,856 | |
| | | | | | | | | 19,437 | |
| | Industrials—14.5% | | | | | | | | |
| | BWX Technologies, Inc. | | | 35,969 | | | | 2,168 | |
| * | Clarivate plc† | | | 33,590 | | | | 998 | |
| * | Copart, Inc. | | | 22,192 | | | | 2,824 | |
| * | CoStar Group, Inc. | | | 2,999 | | | | 2,772 | |
| | Equifax, Inc. | | | 4,575 | | | | 882 | |
| | Fortive Corporation | | | 10,530 | | | | 746 | |
| | Rockwell Automation, Inc. | | | 4,050 | | | | 1,016 | |
| * | Teledyne Technologies, Inc. | | | 1,915 | | | | 750 | |
| | | | | | | | | 12,156 | |
| | Consumer Discretionary—10.0% | | | | | | | | |
| | Advance Auto Parts, Inc. | | | 8,098 | | | | 1,275 | |
| | Aptiv plc† | | | 9,485 | | | | 1,236 | |
| * | Bright Horizons Family Solutions, Inc. | | | 5,165 | | | | 893 | |
| * | Burlington Stores, Inc. | | | 3,830 | | | | 1,002 | |
| | Domino’s Pizza, Inc. | | | 2,438 | | | | 935 | |
| * | Floor & Decor Holdings, Inc. | | | 12,445 | | | | 1,156 | |
| | Service Corporation International | | | 17,850 | | | | 876 | |
| * | Ulta Beauty, Inc. | | | 3,475 | | | | 998 | |
| | | | | | | | | 8,371 | |
| | Issuer | | Shares or
Principal
Amount | | | Value | |
| | | | | | | | |
| | Common Stocks—(continued) | | | | | | | | |
| | Communication Services—6.2% | | | | | | | | |
| | Cable One, Inc. | | | 310 | | | $ | 690 | |
| * | Live Nation Entertainment, Inc. | | | 12,984 | | | | 954 | |
| * | Take-Two Interactive Software, Inc. | | | 11,760 | | | | 2,444 | |
| * | Zillow Group, Inc. | | | 8,680 | | | | 1,127 | |
| | | | | | | | | 5,215 | |
| | Materials—5.2% | | | | | | | | |
| | Ball Corporation | | | 14,935 | | | | 1,391 | |
| | FMC Corporation | | | 8,605 | | | | 989 | |
| | Vulcan Materials Co. | | | 13,450 | | | | 1,995 | |
| | | | | | | | | 4,375 | |
| | Financials—3.5% | | | | | | | | |
| | Arthur J Gallagher & Co. | | | 15,150 | | | | 1,874 | |
| | East West Bancorp, Inc. | | | 21,165 | | | | 1,074 | |
| | | | | | | | | 2,948 | |
| | Consumer Staples—2.3% | | | | | | | | |
| * | BJ’s Wholesale Club Holdings, Inc. | | | 24,554 | | | | 916 | |
| | Conagra Brands, Inc. | | | 27,995 | | | | 1,015 | |
| | | | | | | | | 1,931 | |
| | Real Estate—1.4% | | | | | | | | |
| | SBA Communications Corporation | | | 4,140 | | | | 1,168 | |
| | Energy—1.1% | | | | | | | | |
| | New Fortress Energy, Inc. | | | 16,703 | | | | 895 | |
| | Total Common Stocks—96.7%
(cost $52,994) | | | | | | | 81,175 | |
| | | | | | | | | | |
| | Repurchase Agreement | | | | | | |
| | Fixed Income Clearing Corporation, 0.000% dated 12/31/20, due 1/4/21, repurchase price $2,803, collateralized by U.S. Treasury Note, 0.500%, due 6/30/27, valued at $2,859 | | | $2,803 | | | | 2,803 | |
| | Total Repurchase Agreement—3.3%
(cost $2,803) | | | | | | | 2,803 | |
| | Total Investments—100.0%
(cost $55,797) | | | | | | | 83,978 | |
| | Liabilities, plus cash and other assets—(0.0)% | | | | | | | (8 | ) |
| | Net assets—100.0% | | | | | | $ | 83,970 | |
ADR = American Depository Receipt
* = Non-income producing security
† = U.S. listed foreign security
See accompanying Notes to Financial Statements.
| December 31, 2020 | William Blair Funds | 13 |
| | Small-Mid Cap Core Fund |
| | |
| | The Small-Mid Cap Core Fund seeks long-term capital appreciation. |
| | |
| | AN OVERVIEW FROM THE PORTFOLIO MANAGERS |
| | |

Daniel Crowe 
Ward D. Sexton | The William Blair Small-Mid Cap Core Fund (Class I shares) posted a 20.60% increase, net of fees, for the year ended December 31, 2020. By comparison, the Fund’s benchmark index, the Russell 2500™ Index (the “Index”), increased 19.99%. As a result of adding value during the downturn earlier in the year, the Fund outperformed its benchmark in the full-year period, primarily driven by stock-specific factors. Stock selection in Financials, including our position in Virtu Financial, was a standout contributor during the period. The top individual contributors were Horizon Therapeutics (Health Care), SolarEdge Technologies (Information Technology), NICE (Information Technology) and BJ’s Wholesale Clubs (Consumer Staples). Horizon Therapeutics benefitted from continued robust growth of the company’s recently launched drug Tepezza, a drug that treats Thyroid Eye Disease. Solar inverter manufacturer SolarEdge Technologies experienced strong demand and continued to expand into the large and growing international markets. Conversely, from a style perspective, our biases toward companies with high returns on invested capital and more consistent business models were headwinds during the period as the lowest return on invested capital and most volatile quintiles of the benchmark were the best performers. From a sector perspective, Information Technology was the largest detractor for the year. This was a result of some stock-specific factors and the Fund’s valuation discipline, as the most expensive stocks in the sector (e.g., Software) dramatically outperformed. Given our underweight to certain parts of the market where valuations are at extreme levels, relative to history, most notably in Information Technology, any normalization in valuations could prove to be beneficial to the Fund’s relative performance in the future. Stock selection in Health Care, including our typical underweight to Biotechnology, also detracted from relative returns. Our top individual detractors included Brink’s Co (Industrials), Douglas Emmett (Real Estate), Hanger (Health Care), BWX Technologies (Industrials) and Blue Bird Corp (Industrials). COVID-19 related closures weighed on cash management services provider Brink’s Company, most notably as it relates to revenues derived from retail locations that were either temporarily closed or operating on a limited basis. Real estate investment trust Douglas Emmett experienced weakness driven by write-offs resulting from COVID-19 related office closures. Please refer to the U.S. Growth Market Review and Outlook relating to the Fund on page 3. |
| 14 | Annual Report | December 31, 2020 |
Small-Mid Cap Core Fund
Performance Highlights (Unaudited)
| Average Annual Total Returns through 12/31/2020 |
| | | 1 Year | | Since
Inception(a) |
| Class I | | | 20.60 | % | | | 22.46 | % |
| Class R6 | | | 20.60 | | | | 22.47 | |
| Russell 2500TM Index | | | 19.99 | | | | 23.53 | |
| (a) | Since inception is for the period from October 1, 2019 (Commencement of Operations) to December 31, 2020. |
Performance cited represents past performance. Past performance does not guarantee future results and current performance may be lower or higher than the data quoted. Results shown are average annual total returns, which assume reinvestment of dividends and capital gains. Investment returns and principal will fluctuate and you may have a gain or loss when you sell shares. For the most current month-end performance information, please call 1-800-742-7272, or visit our Web site at www.williamblairfunds.com. Investing in smaller and medium capitalization companies involves special risks, including higher volatility and lower liquidity. Smaller and medium capitalization stocks are also more sensitive to purchase/sale transactions and changes in the issuer’s financial condition. From time to time, the investment adviser may waive fees or reimburse expenses for the Fund. Without these waivers/reimbursements, performance would be lower. Class I shares are not subject to a sales load or distribution (Rule 12b-1) fees. Class R6 shares are not subject to a sales load, distribution (Rule 12b-1) fees, or sub-transfer agent fees.
The performance highlights and graph presented above do not reflect the deduction of taxes that a shareholder would pay on fund distributions or the redemption of fund shares.
The Russell 2500TMIndex measures the performance of those Russell 2500 companies with above average price-to-book ratios and forecasted growth rates.
This report identifies the Fund’s investments on December 31, 2020. These holdings are subject to change. Not all stocks in the Fund performed the same, nor is there any guarantee that these stocks will perform as well in the future. Market forecasts provided in this report may not necessarily come to pass.
Sector Diversification (Unaudited)
The sector diversification shown is based on the total long-term securities.
| December 31, 2020 | William Blair Funds | 15 |
Small-Mid Cap Core Fund
Portfolio of Investments, December 31, 2020 (all dollar amounts in thousands)
| | | | | | | | |
| | | | | | | | |
| | Issuer | | Shares | | | Value | |
| | | | | | | | |
| | Common Stocks | | | | | | | | |
| | Health Care—16.3% | | | | | | | | |
| * | Codexis, Inc. | | | 18,669 | | | $ | 408 | |
| | Encompass Health Corporation | | | 4,686 | | | | 388 | |
| * | Hanger, Inc. | | | 16,779 | | | | 369 | |
| * | HealthEquity, Inc. | | | 3,849 | | | | 268 | |
| * | Horizon Therapeutics plc† | | | 5,855 | | | | 428 | |
| * | LHC Group, Inc. | | | 1,935 | | | | 413 | |
| * | Ligand Pharmaceuticals, Inc. | | | 1,762 | | | | 175 | |
| * | Mednax, Inc. | | | 23,308 | | | | 572 | |
| * | Merit Medical Systems, Inc. | | | 10,249 | | | | 569 | |
| | Owens & Minor, Inc. | | | 10,271 | | | | 278 | |
| * | Penumbra, Inc. | | | 1,303 | | | | 228 | |
| | STERIS plc† | | | 1,658 | | | | 314 | |
| * | Tabula Rasa HealthCare, Inc. | | | 5,612 | | | | 240 | |
| * | Veracyte, Inc. | | | 4,852 | | | | 237 | |
| | | | | | | | | 4,887 | |
| | Financials—15.6% | | | | | | | | |
| | Ares Management Corporation | | | 7,647 | | | | 360 | |
| | Columbia Banking System, Inc. | | | 8,227 | | | | 295 | |
| | East West Bancorp, Inc. | | | 9,518 | | | | 483 | |
| * | Encore Capital Group, Inc. | | | 6,664 | | | | 259 | |
| | FirstCash, Inc. | | | 4,449 | | | | 312 | |
| | Glacier Bancorp, Inc. | | | 7,648 | | | | 352 | |
| | Hannon Armstrong Sustainable Infrastructure Capital, Inc. | | | 4,104 | | | | 260 | |
| | LPL Financial Holdings, Inc. | | | 2,925 | | | | 305 | |
| | Prog Holdings, Inc. | | | 4,240 | | | | 228 | |
| * | Star Peak Energy Transition Corporation | | | 13,328 | | | | 273 | |
| | Virtu Financial, Inc. | | | 14,133 | | | | 356 | |
| | Voya Financial, Inc. | | | 4,637 | | | | 273 | |
| | Western Alliance Bancorp | | | 9,703 | | | | 582 | |
| | Wintrust Financial Corporation | | | 5,730 | | | | 350 | |
| | | | | | | | | 4,688 | |
| | Industrials—15.5% | | | | | | | | |
| * | Axon Enterprise, Inc. | | | 2,271 | | | | 278 | |
| * | Builders FirstSource, Inc. | | | 13,052 | | | | 533 | |
| | BWX Technologies, Inc. | | | 9,617 | | | | 580 | |
| * | Casella Waste Systems, Inc. | | | 3,018 | | | | 187 | |
| | Douglas Dynamics, Inc. | | | 5,386 | | | | 230 | |
| * | Generac Holdings, Inc. | | | 1,219 | | | | 277 | |
| * | IAA, Inc. | | | 3,755 | | | | 244 | |
| | Lincoln Electric Holdings, Inc. | | | 3,153 | | | | 367 | |
| | Luxfer Holdings plc† | | | 10,707 | | | | 176 | |
| | Owens Corning | | | 5,127 | | | | 388 | |
| * | Teledyne Technologies, Inc. | | | 418 | | | | 164 | |
| | The Brink’s Co. | | | 9,381 | | | | 676 | |
| * | Trex Co., Inc. | | | 3,898 | | | | 326 | |
| * | WillScot Mobile Mini Holdings Corporation | | | 10,074 | | | | 233 | |
| | | | | | | | | 4,659 | |
| | Information Technology—15.4% | | | | | | | | |
| * | Alarm.com Holdings, Inc. | | | 3,952 | | | | 409 | |
| | Booz Allen Hamilton Holding Corporation | | | 2,379 | | | | 207 | |
| | Brooks Automation, Inc. | | | 4,752 | | | | 322 | |
| | CMC Materials, Inc. | | | 1,483 | | | | 224 | |
| * | Cree, Inc. | | | 2,857 | | | | 302 | |
| | Dolby Laboratories, Inc. | | | 3,620 | | | | 352 | |
| | Entegris, Inc. | | | 2,276 | | | | 219 | |
| * | Euronet Worldwide, Inc. | | | 2,816 | | | | 408 | |
| * | j2 Global, Inc. | | | 2,956 | | | | 289 | |
| * | Knowles Corporation | | | 9,438 | | | | 174 | |
| | | | | | | | |
| | | | | | | | |
| | Issuer | | Shares | | | Value | |
| | | | | | | | |
| | Common Stocks—(continued) | | | | | | | | |
| | Information Technology—(continued) | | | | | | | | |
| * | Nice, Ltd.—ADR | | | 1,772 | | | $ | 502 | |
| * | Pure Storage, Inc. | | | 15,788 | | | | 357 | |
| * | SolarEdge Technologies, Inc. | | | 1,162 | | | | 371 | |
| * | Verra Mobility Corporation | | | 23,071 | | | | 310 | |
| * | Vertex, Inc. | | | 4,840 | | | | 169 | |
| | | | | | | | | 4,615 | |
| | Consumer Discretionary—9.5% | | | | | | | | |
| | Advance Auto Parts, Inc. | | | 2,032 | | | | 320 | |
| * | Boot Barn Holdings, Inc. | | | 10,252 | | | | 445 | |
| * | Burlington Stores, Inc. | | | 1,286 | | | | 336 | |
| * | Grand Canyon Education, Inc. | | | 5,594 | | | | 521 | |
| * | National Vision Holdings, Inc. | | | 6,742 | | | | 305 | |
| | Service Corporation International | | | 6,537 | | | | 321 | |
| * | Skyline Champion Corporation | | | 10,303 | | | | 319 | |
| * | Terminix Global Holdings, Inc. | | | 5,537 | | | | 282 | |
| | | | | | | | | 2,849 | |
| | Real Estate—7.0% | | | | | | | | |
| | Americold Realty Trust | | | 8,207 | | | | 306 | |
| | CoreSite Realty Corporation | | | 1,560 | | | | 195 | |
| | Douglas Emmett, Inc. | | | 8,383 | | | | 245 | |
| | Equity LifeStyle Properties, Inc. | | | 7,255 | | | | 460 | |
| | Healthcare Realty Trust, Inc. | | | 8,910 | | | | 264 | |
| | Jones Lang LaSalle, Inc. | | | 1,541 | | | | 229 | |
| | Sunstone Hotel Investors, Inc. | | | 35,054 | | | | 397 | |
| | | | | | | | | 2,096 | |
| | Materials—6.4% | | | | | | | | |
| | Avery Dennison Corporation | | | 1,943 | | | | 301 | |
| * | Crown Holdings, Inc. | | | 4,616 | | | | 463 | |
| | Eagle Materials, Inc. | | | 3,211 | | | | 325 | |
| | FMC Corporation | | | 1,702 | | | | 196 | |
| | Martin Marietta Materials, Inc. | | | 1,007 | | | | 286 | |
| | Orion Engineered Carbons S.A.† | | | 20,715 | | | | 355 | |
| | | | | | | | | 1,926 | |
| | Consumer Staples—4.5% | | | | | | | | |
| * | BJ’s Wholesale Club Holdings, Inc. | | | 6,973 | | | | 260 | |
| | Inter Parfums, Inc. | | | 4,517 | | | | 273 | |
| * | Performance Food Group Co. | | | 4,143 | | | | 197 | |
| | Primo Water Corporation† | | | 15,550 | | | | 244 | |
| | Spectrum Brands Holdings, Inc. | | | 4,593 | | | | 363 | |
| | | | | | | | | 1,337 | |
| | Energy—3.7% | | | | | | | | |
| | Cameco Corporation† | | | 33,988 | | | | 455 | |
| * | ChampionX Corporation | | | 9,864 | | | | 151 | |
| | New Fortress Energy, Inc. | | | 4,003 | | | | 215 | |
| | Parsley Energy, Inc. | | | 21,515 | | | | 305 | |
| | | | | | | | | 1,126 | |
| | Communication Services—2.7% | | | | | | | | |
| | Cable One, Inc. | | | 137 | | | | 305 | |
| * | Live Nation Entertainment, Inc. | | | 3,455 | | | | 254 | |
| * | Zynga, Inc. | | | 26,189 | | | | 259 | |
| | | | | | | | | 818 | |
| | Utilities—1.3% | | | | | | | | |
| | IDACORP, Inc. | | | 4,194 | | | | 403 | |
| | Total Common Stocks—97.9%
(cost $21,771) | | | | | | | 29,404 | |
See accompanying Notes to Financial Statements.
| 16 | Annual Report | December 31, 2020 |
Small-Mid Cap Core Fund
Portfolio of Investments, December 31, 2020 (all dollar amounts in thousands)
| | | | | | | | |
| | Issuer | | Principal
Amount | | | Value | |
| | | | | | | | |
| | Repurchase Agreement | | | | | | | | |
| | Fixed Income Clearing Corporation, 0.000% dated 12/31/20, due 1/4/21, repurchase price $747, collateralized by U.S. Treasury Note, 0.500%, due 6/30/27, valued at $762 | | | $747 | | | $ | 747 | |
| | Total Repurchase Agreement—2.5%
(cost $747) | | | | | | | 747 | |
| | Total Investments—100.4%
(cost $22,518) | | | | | | | 30,151 | |
| | Liabilities, plus cash and other assets—(0.4)% | | | | | | | (106 | ) |
| | Net assets—100.0% | | | | | | $ | 30,045 | |
ADR = American Depository Receipt
* = Non-income producing security
† = U.S. listed foreign security
See accompanying Notes to Financial Statements.
| December 31, 2020 | William Blair Funds | 17 |
| | Small-Mid Cap Growth Fund |
| | |
| | The Small-Mid Cap Growth Fund seeks long-term capital appreciation. |
| | |
| | AN OVERVIEW FROM THE PORTFOLIO MANAGERS |
| | |

Daniel Crowe  James E. Jones | The William Blair Small-Mid Cap Growth Fund (Class N shares) posted a 32.04% increase, net of fees, for the year ended December 31, 2020. By comparison, the Fund’s benchmark index, the Russell 2500™ Growth Index (the “Index”), increased 40.47%. Despite outperforming during the downturn earlier in the year, the Fund trailed the Index in the full-year period. Relative performance was driven by a combination of style headwinds and stock-specific factors. From a style perspective, our biases toward companies with high returns on invested capital and more consistent business models, as well as our typical lower beta profile, were headwinds during the period as the lowest returns on invested capital, most volatile and highest beta quintiles of the benchmark were the best performers. Partly offsetting this headwind was our typical larger market cap profile relative to the Index as the largest stocks in our universe outperformed. From a sector perspective, Information Technology was the primary source of the Fund’s underperformance for the year. This was a result of some stock-specific factors and the Fund’s valuation discipline, as the most expensive stocks in the sector (e.g., Software) dramatically outperformed. Given our underweight to certain parts of the market where we believe that valuations are at extreme levels, most notably in Information Technology, we believe any normalization in valuations could prove to be beneficial to the Fund’s relative performance in the future. Top individual stock detractors included BWX Technologies (Industrials), Grand Canyon Education (Consumer Discretionary), Brink’s Co (Industrials), Martin Marietta (Materials) and Live Nation Entertainment (Communication Services). BWX Technologies, the sole-source provider of propulsion systems for the U.S. Navy, experienced weakness due to concerns surrounding the extended timeline of the rollout of its medical radioisotope product as well as uncertainty around future government military spending under a Democratic U.S. Presidential administration. Online education services provider Grand Canyon lagged as the U.S. Presidential election and the company’s pending non-profit status with the Department of Education weighed on the stock. Conversely, stock selection in Industrials, including our position in Trex Co, contributed positively to relative returns. Top individual contributors included Etsy (Consumer Discretionary), Horizon Therapeutics (Health Care), SolarEdge Technologies (Information Technology) and iRhythm Technologies (Health Care). E-commerce marketplace Etsy added new buyers to its platform amid COVID-19 retail disruption, which we believe could sustainably increase longer-term sales potential for the company. Horizon Therapeutics benefitted from continued robust growth of the company’s recently launched drug Tepezza, a drug that treats Thyroid Eye Disease. Please refer to the U.S. Growth Market Review and Outlook relating to the Fund on page 3. |
| 18 | Annual Report | December 31, 2020 |
Small-Mid Cap Growth Fund
Performance Highlights (Unaudited)
| Average Annual Total Returns through 12/31/2020 |
| | | 1 Year | | 3 Year | | 5 Year | | 10 Year | | Since
Inception(a) |
| Class N | | | 32.04 | % | | | 18.94 | % | | | 18.15 | % | | | 15.23 | % | | | — | |
| Class I | | | 32.35 | | | | 19.24 | | | | 18.45 | | | | 15.51 | | | | — | |
| Class R6 | | | 32.44 | | | | — | | | | — | | | | — | | | | 24.05 | % |
| Russell 2500TM Growth Index | | | 40.47 | | | | 19.91 | | | | 18.68 | | | | 15.00 | | | | 29.02 | |
| (a) | Since inception is for the period from May 2, 2019 (Commencement of Operations) to December 31, 2020. |
Performance cited represents past performance. Past performance does not guarantee future results and current performance may be lower or higher than the data quoted. Results shown are average annual total returns, which assume reinvestment of dividends and capital gains. Investment returns and principal will fluctuate and you may have a gain or loss when you sell shares. For the most current month-end performance information, please call 1-800-742-7272, or visit our Web site at www.williamblairfunds.com. Investing in smaller and medium capitalization companies involves special risks, including higher volatility and lower liquidity. Smaller and medium capitalization stocks are also more sensitive to purchase/sale transactions and changes in the issuer’s financial condition. From time to time, the investment adviser may waive fees or reimburse expenses for the Fund. Without these waivers/reimbursements, performance would be lower. Class N shares are not subject to a sales load. Class I shares are not subject to a sales load or distribution (Rule 12b-1) fees. Class R6 shares are not subject to a sales load, distribution (Rule 12b-1) fees, or sub-transfer agent fees.
The performance highlights and graph presented above do not reflect the deduction of taxes that a shareholder would pay on fund distributions or the redemption of fund shares.
The Russell 2500TM Growth Index measures the performance of those Russell 2500 companies with above average price-to-book ratios and forecasted growth rates.
This report identifies the Fund’s investments on December 31, 2020. These holdings are subject to change. Not all stocks in the Fund performed the same, nor is there any guarantee that these stocks will perform as well in the future. Market forecasts provided in this report may not necessarily come to pass.
Sector Diversification (Unaudited)

The sector diversification shown is based on the total long-term securities.
| December 31, 2020 | William Blair Funds | 19 |
Small-Mid Cap Growth Fund
Portfolio of Investments, December 31, 2020 (all dollar amounts in thousands)
| | | | | | | | |
| | | | | | | | |
| | Issuer | | Shares | | | Value | |
| | | | | | | | |
| | Common Stocks | | | | | | | | |
| | Information Technology—27.4% | | | | | | | | |
| * | Alarm.com Holdings, Inc. | | | 594,031 | | | $ | 61,453 | |
| * | Aspen Technology, Inc. | | | 365,246 | | | | 47,573 | |
| * | Avalara, Inc. | | | 324,048 | | | | 53,432 | |
| | Booz Allen Hamilton Holding Corporation | | | 296,877 | | | | 25,882 | |
| | Brooks Automation, Inc. | | | 785,020 | | | | 53,264 | |
| * | Cree, Inc. | | | 383,869 | | | | 40,652 | |
| | Entegris, Inc. | | | 362,640 | | | | 34,850 | |
| * | Euronet Worldwide, Inc. | | | 390,003 | | | | 56,519 | |
| * | GoDaddy, Inc. | | | 551,874 | | | | 45,778 | |
| * | Guidewire Software, Inc. | | | 227,970 | | | | 29,347 | |
| * | j2 Global, Inc. | | | 381,876 | | | | 37,305 | |
| * | LiveRamp Holdings, Inc. | | | 623,095 | | | | 45,604 | |
| | MAXIMUS, Inc. | | | 267,652 | | | | 19,589 | |
| * | MongoDB, Inc. | | | 123,314 | | | | 44,275 | |
| | National Instruments Corporation | | | 851,937 | | | | 37,434 | |
| * | Nice, Ltd.—ADR | | | 278,216 | | | | 78,885 | |
| * | Novanta, Inc.† | | | 223,976 | | | | 26,478 | |
| * | Proofpoint, Inc. | | | 235,834 | | | | 32,170 | |
| * | Pure Storage, Inc. | | | 2,998,259 | | | | 67,791 | |
| * | SolarEdge Technologies, Inc. | | | 188,013 | | | | 59,999 | |
| * | Varonis Systems, Inc. | | | 270,412 | | | | 44,242 | |
| * | Zendesk, Inc. | | | 252,400 | | | | 36,123 | |
| | | | | | | | | 978,645 | |
| | Health Care—26.3% | | | | | | | | |
| * | 10X Genomics, Inc. | | | 303,655 | | | | 42,998 | |
| * | ABIOMED, Inc. | | | 101,688 | | | | 32,967 | |
| * | Acadia Healthcare Co., Inc. | | | 556,514 | | | | 27,970 | |
| * | Amedisys, Inc. | | | 188,792 | | | | 55,378 | |
| | Bio-Techne Corporation | | | 174,883 | | | | 55,534 | |
| * | Blueprint Medicines Corporation | | | 220,000 | | | | 24,673 | |
| | Encompass Health Corporation | | | 951,833 | | | | 78,707 | |
| * | Halozyme Therapeutics, Inc. | | | 1,382,903 | | | | 59,064 | |
| * | HealthEquity, Inc. | | | 799,091 | | | | 55,705 | |
| * | Horizon Therapeutics plc† | | | 1,125,488 | | | | 82,330 | |
| * | Insmed, Inc. | | | 726,438 | | | | 24,183 | |
| * | Inspire Medical Systems, Inc. | | | 132,900 | | | | 24,997 | |
| * | Insulet Corporation | | | 206,256 | | | | 52,725 | |
| * | Ligand Pharmaceuticals, Inc. | | | 392,440 | | | | 39,028 | |
| * | Masimo Corporation | | | 110,590 | | | | 29,680 | |
| * | Merit Medical Systems, Inc. | | | 604,458 | | | | 33,554 | |
| * | Penumbra, Inc. | | | 293,275 | | | | 51,323 | |
| | STERIS plc† | | | 255,885 | | | | 48,500 | |
| | Teleflex, Inc. | | | 109,577 | | | | 45,099 | |
| * | Twist Bioscience Corporation | | | 145,687 | | | | 20,584 | |
| * | Veracyte, Inc. | | | 1,116,120 | | | | 54,623 | |
| | | | | | | | | 939,622 | |
| | Industrials—16.5% | | | | | | | | |
| * | Axon Enterprise, Inc. | | | 431,771 | | | | 52,905 | |
| * | Builders FirstSource, Inc. | | | 1,128,954 | | | | 46,072 | |
| | BWX Technologies, Inc. | | | 1,453,595 | | | | 87,623 | |
| * | Generac Holdings, Inc. | | | 196,076 | | | | 44,590 | |
| | HEICO Corporation | | | 238,343 | | | | 27,900 | |
| | Lincoln Electric Holdings, Inc. | | | 232,608 | | | | 27,041 | |
| * | Mercury Systems, Inc. | | | 754,895 | | | | 66,476 | |
| | Ritchie Bros Auctioneers, Inc.† | | | 893,677 | | | | 62,155 | |
| * | Teledyne Technologies, Inc. | | | 103,344 | | | | 40,509 | |
| | The Brink’s Co. | | | 1,017,753 | | | | 73,278 | |
| * | Trex Co., Inc. | | | 739,954 | | | | 61,949 | |
| | | | | | | | | 590,498 | |
| | Issuer | | Shares or
Principal
Amount | | | Value | |
| | | | | | | | |
| | Common Stocks—(continued) | | | | | | | | |
| | Consumer Discretionary—12.1% | | | | | | | | |
| | Advance Auto Parts, Inc. | | | 265,616 | | | $ | 41,837 | |
| * | Bright Horizons Family Solutions, Inc. | | | 280,971 | | | | 48,605 | |
| * | Burlington Stores, Inc. | | | 120,525 | | | | 31,523 | |
| * | Etsy, Inc. | | | 493,939 | | | | 87,877 | |
| * | Grand Canyon Education, Inc. | | | 863,402 | | | | 80,391 | |
| * | Helen of Troy, Ltd.† | | | 228,708 | | | | 50,817 | |
| * | National Vision Holdings, Inc. | | | 779,816 | | | | 35,318 | |
| * | Terminix Global Holdings, Inc. | | | 653,795 | | | | 33,350 | |
| * | Ulta Beauty, Inc. | | | 84,494 | | | | 24,263 | |
| | | | | | | | | 433,981 | |
| | Materials—4.3% | | | | | | | | |
| * | Crown Holdings, Inc. | | | 730,716 | | | | 73,218 | |
| | Martin Marietta Materials, Inc. | | | 281,833 | | | | 80,032 | |
| | | | | | | | | 153,250 | |
| | Financials—4.2% | | | | | | | | |
| | Ares Management Corporation | | | 806,512 | | | | 37,946 | |
| | FirstCash, Inc. | | | 421,043 | | | | 29,490 | |
| | *Star Peak Energy Transition Corporation | | | 977,639 | | | | 20,003 | |
| | Virtu Financial, Inc. | | | 1,399,607 | | | | 35,228 | |
| | Western Alliance Bancorp | | | 450,800 | | | | 27,026 | |
| | | | | | | | | 149,693 | |
| | Communication Services—3.9% | | | | | | | | |
| | Cable One, Inc. | | | 25,080 | | | | 55,871 | |
| * | Live Nation Entertainment, Inc. | | | 522,452 | | | | 38,390 | |
| * | Zynga, Inc. | | | 4,660,235 | | | | 45,996 | |
| | | | | | | | | 140,257 | |
| | Energy—1.9% | | | | | | | | |
| | Cameco Corporation† | | | 2,865,567 | | | | 38,399 | |
| | New Fortress Energy, Inc. | | | 555,048 | | | | 29,745 | |
| | | | | | | | | 68,144 | |
| | Consumer Staples—1.4% | | | | | | | | |
| * | BJ’s Wholesale Club Holdings, Inc. | | | 1,397,012 | | | | 52,081 | |
| | Real Estate—1.1% | | | | | | | | |
| | FirstService Corporation† | | | 283,101 | | | | 38,717 | |
| | Total Common Stocks—99.1%
(cost $2,349,292) | | | | | | | 3,544,888 | |
| | | | | | | | | | |
| | Repurchase Agreement | | | | | | | | |
| | Fixed Income Clearing Corporation, 0.000% dated 12/31/20, due 1/4/21, repurchase price $29,355, collateralized by U.S. Treasury Note, 0.500%, due 6/30/27, valued at $29,942 | | | $29,355 | | | | 29,355 | |
| | Total Repurchase Agreement—0.8%
(cost $29,355) | | | | | | | 29,355 | |
| | Total Investments—99.9%
(cost $2,378,647) | | | | | | | 3,574,243 | |
| | Cash and other assets, less liabilities—0.1% | | | | | | | 2,839 | |
| | Net assets—100.0% | | | | | | $ | 3,577,082 | |
ADR = American Depository Receipt
* = Non-income producing security
† = U.S. listed foreign security
See accompanying Notes to Financial Statements.
| 20 | Annual Report | December 31, 2020 |
| | Small-Mid Cap Value Fund |
| | |
| | The Small-Mid Cap Value Fund seeks long-term capital appreciation. |
| | |
| | AN OVERVIEW FROM THE PORTFOLIO MANAGERS |
| | |

Mark T. Leslie 
David S. Mitchell | The William Blair Small-Mid Cap Value Fund (Class N shares) posted a 5.09% decrease, net of fees, for year ended December 31, 2020. By comparison, the Fund’s benchmark index, the Russell 2500™ Value Index (the “Index”), increased 4.88%. The Fund trailed the Index in 2020 due to the combination of stock selection and style headwinds during the period given its larger market cap and higher quality biases. We believe that 2020 was a unique year from a style perspective. Stocks were highly correlated with little differentiation between larger and smaller caps or between higher and lower quality stocks during the market sell-off in the first quarter. In contrast, as the market rebounded dramatically and finished the year over 80% higher off its mid-March low, there was significant dispersion across the size and quality quintiles as smaller caps and lower quality stocks dramatically outperformed. At the sector level, Consumer Discretionary was the largest detractor during the period due to stock selection within Specialty Retail, Diversified Consumer Services and Distributors. Within Energy, stock selection within Consumable Fuels and Equipment & Services, impacted by the drop in oil prices during the year, drove relative returns within the sector. The relative returns within Industrials was the result of stock selection within Building Products, Aerospace & Defense, Machinery, and Construction & Engineering. The relative outperformance within Financials was largely due to a lack of exposure to Mortgage real estate investment trusts. Looking specifically at stock selection, the strategy’s largest detractors during the period were EPR Properties (Real Estate), Parsley Energy (Energy), and Patterson-UIT Energy (Energy). Offsetting these detractors were our investments in Dunkin’ Brands (Consumer Staples), Cadence Design Systems (Information Technology), TopBuild (Consumer Discretionary). Please refer to the U.S. Value Market Review and Outlook relating to the Fund on page 4. |
| December 31, 2020 | William Blair Funds | 21 |
Small-Mid Cap Value Fund
Performance Highlights (Unaudited)
Average Annual Total Returns through 12/31/2020
| | | 1 Year | | 3 Year | | 5 Year | | Since
Inception |
| Class N(a) | | | (5.09 | )% | | | (0.45 | )% | | | 5.47 | % | | | 8.60 | % |
| Class I(a) | | | (4.53 | ) | | | (0.08 | ) | | | 5.81 | | | | 8.93 | |
| Russell 2500TM Value Index(a) | | | 4.88 | | | | 4.34 | | | | 9.43 | | | | 11.28 | |
| Class R6(b) | | | (4.77 | ) | | | — | | | | — | | | | (0.64 | ) |
| Russell 2500TM Value Index(b) | | | 4.88 | | | | — | | | | — | | | | 6.79 | |
| (a) | Since inception is for the period from December 15, 2011 (Commencement of Operations) to December 31, 2020. |
| (b) | Since inception is for the period from May 2, 2019 (Commencement of Operations) to December 31, 2020. |
Performance cited represents past performance. Past performance does not guarantee future results and current performance may be lower or higher than the data quoted. Results shown are average annual total returns, which assume reinvestment of dividends and capital gains. Investment returns and principal will fluctuate and you may have a gain or loss when you sell shares. For the most current month-end performance information, please call 1-800-742-7272, or visit our Web site at www.williamblairfunds.com. Investing in smaller and medium capitalization companies involves special risks, including higher volatility and lower liquidity. Smaller and medium capitalization stocks are also more sensitive to purchase/sale transactions and changes in the issuer’s financial condition. From time to time, the investment adviser may waive fees or reimburse expenses for the Fund. Without these waivers/reimbursements, performance would be lower. Class N shares are not subject to a sales load. Class I shares are not subject to a sales load or distribution (Rule 12b-1) fees. Class R6 shares are not subject to a sales load, distribution (Rule 12b-1) fees, or sub-transfer agent fees.
The performance highlights and graph presented above do not reflect the deduction of taxes that a shareholder would pay on fund distributions or the redemption of fund shares.
The Russell 2500TM Value Index consists of small to mid-capitalization companies with below average price-to-book ratios and forecasted growth rates.
This report identifies the Fund’s investments on December 31, 2020. These holdings are subject to change. Not all stocks in the Fund performed the same, nor is there any guarantee that these stocks will perform as well in the future. Market forecasts provided in this report may not necessarily come to pass.
Sector Diversification (Unaudited)

The sector diversification shown is based on the total long-term securities.
| 22 | Annual Report | December 31, 2020 |
Small-Mid Cap Value Fund
Portfolio of Investments, December 31, 2020 (all dollar amounts in thousands)
| | | | | | | | |
| | | | | | | | |
| | Issuer | | Shares | | | Value | |
| | | | | | | | |
| | Common Stocks | | | | | | | | |
| | Financials—20.3% | | | | | | | | |
| | American Financial Group, Inc. | | | 193 | | | $ | 17 | |
| | CNO Financial Group, Inc. | | | 687 | | | | 15 | |
| | East West Bancorp, Inc. | | | 368 | | | | 19 | |
| | First American Financial Corporation | | | 324 | | | | 17 | |
| | FNB Corporation | | | 1,422 | | | | 14 | |
| | Hancock Whitney Corporation | | | 463 | | | | 16 | |
| | Home BancShares, Inc. | | | 792 | | | | 15 | |
| | National Bank Holdings Corporation | | | 398 | | | | 13 | |
| | PacWest Bancorp | | | 718 | | | | 18 | |
| | Radian Group, Inc. | | | 751 | | | | 15 | |
| | Selective Insurance Group, Inc. | | | 308 | | | | 21 | |
| * | SVB Financial Group | | | 64 | | | | 25 | |
| | The Hanover Insurance Group, Inc. | | | 166 | | | | 19 | |
| | Umpqua Holdings Corporation | | | 1,286 | | | | 19 | |
| | Voya Financial, Inc. | | | 392 | | | | 23 | |
| | Western Alliance Bancorp | | | 419 | | | | 25 | |
| | | | | | | | | 291 | |
| | Industrials—17.5% | | | | | | | | |
| | Brady Corporation | | | 475 | | | | 25 | |
| * | Chart Industries, Inc. | | | 209 | | | | 25 | |
| | Curtiss-Wright Corporation | | | 196 | | | | 23 | |
| | Fortune Brands Home & Security, Inc. | | | 291 | | | | 25 | |
| * | FTI Consulting, Inc. | | | 181 | | | | 20 | |
| | Kansas City Southern | | | 152 | | | | 31 | |
| | Rexnord Corporation | | | 541 | | | | 21 | |
| | Simpson Manufacturing Co., Inc. | | | 204 | | | | 19 | |
| | The Toro Co. | | | 339 | | | | 32 | |
| | Westinghouse Air Brake Technologies Corporation | | | 417 | | | | 31 | |
| | | | | | | | | 252 | |
| | Consumer Discretionary—12.8% | | | | | | | | |
| | Churchill Downs, Inc. | | | 109 | | | | 21 | |
| * | Deckers Outdoor Corporation | | | 84 | | | | 24 | |
| * | Helen of Troy, Ltd.† | | | 118 | | | | 26 | |
| * | LKQ Corporation | | | 582 | | | | 21 | |
| | Murphy USA, Inc. | | | 141 | | | | 19 | |
| | PulteGroup, Inc. | | | 561 | | | | 24 | |
| | Service Corporation International | | | 415 | | | | 20 | |
| * | TopBuild Corporation | | | 155 | | | | 29 | |
| | | | | | | | | 184 | |
| | Real Estate—11.1% | | | | | | | | |
| | American Assets Trust, Inc. | | | 577 | | | | 17 | |
| | American Campus Communities, Inc. | | | 347 | | | | 15 | |
| | Americold Realty Trust | | | 553 | | | | 21 | |
| | CoreSite Realty Corporation | | | 93 | | | | 12 | |
| | Equity LifeStyle Properties, Inc. | | | 407 | | | | 26 | |
| | Healthcare Realty Trust, Inc. | | | 729 | | | | 21 | |
| | Highwoods Properties, Inc. | | | 343 | | | | 13 | |
| | Life Storage, Inc. | | | 154 | | | | 18 | |
| | Terreno Realty Corporation | | | 278 | | | | 16 | |
| | | | | | | | | 159 | |
| | | | | | | | |
| | | | | | | | |
| | Issuer | | Shares | | | Value | |
| | | | | | | | |
| | Common Stocks—(continued) | | | | | | | | |
| | Health Care—7.3% | | | | | | | | |
| * | Bio-Rad Laboratories, Inc. | | | 26 | | | $ | 15 | |
| | CONMED Corporation | | | 139 | | | | 16 | |
| | Encompass Health Corporation | | | 275 | | | | 23 | |
| * | Hologic, Inc. | | | 310 | | | | 23 | |
| | PerkinElmer, Inc. | | | 199 | | | | 28 | |
| | | | | | | | | 105 | |
| | Information Technology—7.3% | | | | | | | | |
| * | Arista Networks, Inc. | | | 69 | | | | 20 | |
| | Booz Allen Hamilton Holding Corporation | | | 198 | | | | 17 | |
| * | Cadence Design Systems, Inc. | | | 165 | | | | 22 | |
| * | Ciena Corporation | | | 469 | | | | 25 | |
| | MAXIMUS, Inc. | | | 271 | | | | 20 | |
| | | | | | | | | 104 | |
| | Materials—6.5% | | | | | | | | |
| | Avient Corporation | | | 475 | | | | 19 | |
| | FMC Corporation | | | 247 | | | | 29 | |
| | Sensient Technologies Corporation | | | 194 | | | | 14 | |
| | Silgan Holdings, Inc. | | | 328 | | | | 12 | |
| | Steel Dynamics, Inc. | | | 519 | | | | 19 | |
| | | | | | | | | 93 | |
| | Utilities—3.6% | | | | | | | | |
| | Alliant Energy Corporation | | | 312 | | | | 16 | |
| | Atmos Energy Corporation | | | 178 | | | | 17 | |
| | IDACORP, Inc. | | | 194 | | | | 19 | |
| | | | | | | | | 52 | |
| | Consumer Staples—3.5% | | | | | | | | |
| * | BJ’s Wholesale Club Holdings, Inc. | | | 303 | | | | 11 | |
| | Casey’s General Stores, Inc. | | | 53 | | | | 10 | |
| | J&J Snack Foods Corporation | | | 93 | | | | 14 | |
| | Lamb Weston Holdings, Inc. | | | 192 | | | | 15 | |
| | | | | | | | | 50 | |
| | Energy—3.4% | | | | | | | | |
| * | CNX Resources Corporation | | | 1,256 | | | | 14 | |
| | Diamondback Energy, Inc. | | | 329 | | | | 16 | |
| | Helmerich & Payne, Inc. | | | 381 | | | | 9 | |
| | Valero Energy Corporation | | | 183 | | | | 10 | |
| | | | | | | | | 49 | |
| | Communication Services—3.3% | | | | | | | | |
| | The Interpublic Group of Cos., Inc. | | | 1,222 | | | | 29 | |
| * | Zynga, Inc. | | | 1,971 | | | | 19 | |
| | | | | | | | | 48 | |
| | Total Common Stocks—96.6%
(cost $985) | | | | | | | 1,387 | |
See accompanying Notes to Financial Statements.
| December 31, 2020 | William Blair Funds | 23 |
Small-Mid Cap Value Fund
Portfolio of Investments, December 31, 2020 (all dollar amounts in thousands)
| | | | | | | | |
| | Issuer | | Principal
Amount | | | Value | |
| | | | | | | | |
| | Repurchase Agreement | | | | | | | | |
| | Fixed Income Clearing Corporation, 0.000% dated 12/31/20, due 1/4/21, repurchase price $107, collateralized by U.S. Treasury Note, 0.500%, due 6/30/27, valued at $109 | | | $107 | | | $ | 107 | |
| | Total Repurchase Agreement—7.4%
(cost $107) | | | | | | | 107 | |
| | Total Investments—104.0%
(cost $1,092) | | | | | | | 1,494 | |
| | Liabilities, plus cash and other assets—(4.0)% | | | | | | | (57 | ) |
| | Net assets—100.0% | | | | | | $ | 1,437 | |
* = Non-income producing security
† = U.S. listed foreign security
See accompanying Notes to Financial Statements.
| 24 | Annual Report | December 31, 2020 |
| | Small Cap Growth Fund |
| | |
| | The Small Cap Growth Fund seeks long-term capital appreciation. |
| | |
| | AN OVERVIEW FROM THE PORTFOLIO MANAGERS |
| | |

Ward D. Sexton 
Mark C. Thompson | The William Blair Small Cap Growth Fund (Class N shares) posted a 38.32% increase, net of fees, for the year ended December 31, 2020. By comparison, the Fund’s benchmark index, the Russell 2000® Growth Index (the “Index”), increased 34.63%. Outperformance for the year was the result of strong stock selection, which more than offset a headwind to our investment style. The portfolio benefited from stock selection across several sectors, most notably in Health Care. Top contributors in the sector included our positions in Twist Bioscience, Horizon Therapeutics and Simulations Plus. Through its innovation and execution amid the pandemic, synthetic biology company Twist Bioscience has attracted new customers, which we believe creates a sustainable benefit for the business into the future. Other top contributors were SiTime Corp (Information Technology) and Etsy (Consumer Discretionary). Semiconductor company SiTime reported numerous design wins during the year, which drove stock performance. Stock selection in Industrials, including our positions in Brink’s Co, BWX Technologies and Douglas Dynamics, detracted from relative performance. Despite improving fundamentals and stock performance late in the year, cash management services provider Brink’s Company suffered from COVID-19 related closures, most notably from retail customers. Other notable laggards included Health Care holdings Hanger and Aerie Pharmaceuticals. Hanger is a provider of orthotic and prosthetic services that experienced a transitory demand reduction as individuals delayed office visits amid the pandemic. From a style perspective, the most expensive segments of our benchmark outperformed. Because of our valuation sensitivity, our typical underweight to the most expensive stocks in the benchmark was a headwind. Please refer to the U.S. Growth Market Review and Outlook relating to the Fund on page 3. |
| December 31, 2020 | William Blair Funds | 25 |
Small Cap Growth Fund
Performance Highlights (Unaudited)
| Average Annual Total Returns through 12/31/2020 |
| | | 1 Year | | 3 Year | | 5 Year | | 10 Year | | Since
Inception(a) |
| Class N | | | 38.32 | % | | | 18.28 | % | | | 20.04 | % | | | 14.36 | % | | | — | |
| Class I | | | 38.68 | | | | 18.57 | | | | 20.34 | | | | 14.63 | | | | — | |
| Class R6 | | | 38.76 | | | | — | | | | — | | | | — | | | | 23.69 | % |
| Russell 2000® Growth Index | | | 34.63 | | | | 16.20 | | | | 16.36 | | | | 13.48 | | | | 24.81 | |
| (a) | Since inception is for the period from May 2, 2019 (Commencement of Operations) to December 31, 2020. |
Performance cited represents past performance. Past performance does not guarantee future results and current performance may be lower or higher than the data quoted. Results shown are average annual total returns, which assume reinvestment of dividends and capital gains. Investment returns and principal will fluctuate and you may have a gain or loss when you sell shares. For the most current month-end performance information, please call 1-800-742-7272, or visit our Web site at www.williamblairfunds.com. Investing in smaller companies involves special risks, including higher volatility and lower liquidity. Smaller capitalization stocks are also more sensitive to purchase/sale transactions and changes in the issuer’s financial condition. From time to time, the investment adviser may waive fees or reimburse expenses for the Fund. Without these waivers/reimbursements, performance would be lower. Class N shares are not subject to a sales load. Class I shares are not subject to a sales load or distribution (Rule 12b-1) fees. Class R6 shares are not subject to a sales load, distribution (Rule 12b-1) fees, or sub-transfer agent fees.
The performance highlights and graph presented above do not reflect the deduction of taxes that a shareholder would pay on fund distributions or the redemption of fund shares.
The Russell 2000® Growth Index is an unmanaged composite of the smallest 2000 stocks of the Russell 3000® Growth Index.
This report identifies the Fund’s investments on December 31, 2020. These holdings are subject to change. Not all stocks in the Fund performed the same, nor is there any guarantee that these stocks will perform as well in the future. Market forecasts provided in this report may not necessarily come to pass.
Sector Diversification (Unaudited)

The sector diversification shown is based on the total long-term securities.
| 26 | Annual Report | December 31, 2020 |
Small Cap Growth Fund
Portfolio of Investments, December 31, 2020 (all dollar amounts in thousands)
| | | | | | | | |
| | | | | | | | |
| | Issuer | | | Shares | | Value | |
| | | | | | | | | | | |
| | Common Stocks | | | | | | | | |
| | Health Care—26.1% | | | | | | | | |
| * | Acadia Healthcare Co., Inc. | | | 145,199 | | | $ | 7,298 | |
| * | Aerie Pharmaceuticals, Inc. | | | 444,841 | | | | 6,010 | |
| * | Amicus Therapeutics, Inc. | | | 315,280 | | | | 7,280 | |
| * | AxoGen, Inc. | | | 397,690 | | | | 7,119 | |
| * | Blueprint Medicines Corporation | | | 31,390 | | | | 3,520 | |
| * | CareDx, Inc. | | | 123,197 | | | | 8,926 | |
| * | Codexis, Inc. | | | 385,298 | | | | 8,411 | |
| * | CryoLife, Inc. | | | 258,442 | | | | 6,102 | |
| | Encompass Health Corporation | | | 75,781 | | | | 6,266 | |
| * | GenMark Diagnostics, Inc. | | | 431,634 | | | | 6,302 | |
| * | Halozyme Therapeutics, Inc. | | | 250,510 | | | | 10,699 | |
| * | Hanger, Inc. | | | 412,230 | | | | 9,065 | |
| * | Harmony Biosciences Holdings, Inc. | | | 45,007 | | | | 1,627 | |
| * | Health Catalyst, Inc. | | | 221,958 | | | | 9,662 | |
| * | HealthEquity, Inc. | | | 94,655 | | | | 6,598 | |
| * | Insmed, Inc. | | | 240,170 | | | | 7,995 | |
| * | LHC Group, Inc. | | | 37,223 | | | | 7,940 | |
| * | Ligand Pharmaceuticals, Inc. | | | 108,058 | | | | 10,746 | |
| * | Merit Medical Systems, Inc. | | | 167,090 | | | | 9,275 | |
| * | Penumbra, Inc. | | | 25,148 | | | | 4,401 | |
| | Simulations Plus, Inc. | | | 62,200 | | | | 4,474 | |
| * | Tabula Rasa HealthCare, Inc. | | | 151,106 | | | | 6,473 | |
| * | Twist Bioscience Corporation | | | 50,306 | | | | 7,108 | |
| | US Physical Therapy, Inc. | | | 50,807 | | | | 6,110 | |
| * | Veracyte, Inc. | | | 141,320 | | | | 6,916 | |
| | | | | | | | | 176,323 | |
| | Information Technology—23.7% | | | | | | | | |
| * | Agilysys, Inc. | | | 86,772 | | | | 3,330 | |
| * | Alarm.com Holdings, Inc. | | | 90,950 | | | | 9,409 | |
| | American Software, Inc. | | | 258,320 | | | | 4,435 | |
| | Brooks Automation, Inc. | | | 133,245 | | | | 9,041 | |
| | CMC Materials, Inc. | | | 37,050 | | | | 5,606 | |
| | Computer Services, Inc. | | | 105,369 | | | | 6,259 | |
| * | Euronet Worldwide, Inc. | | | 56,960 | | | | 8,255 | |
| * | Grid Dynamics Holdings, Inc. | | | 930,729 | | | | 11,727 | |
| * | j2 Global, Inc. | | | 80,933 | | | | 7,906 | |
| * | Knowles Corporation | | | 276,970 | | | | 5,105 | |
| | Littelfuse, Inc. | | | 26,863 | | | | 6,841 | |
| * | LivePerson, Inc. | | | 102,647 | | | | 6,388 | |
| * | LiveRamp Holdings, Inc. | | | 147,430 | | | | 10,790 | |
| * | Novanta, Inc.† | | | 36,790 | | | | 4,349 | |
| * | PAR Technology Corporation | | | 62,750 | | | | 3,940 | |
| * | PDF Solutions, Inc. | | | 206,932 | | | | 4,470 | |
| * | PROS Holdings, Inc. | | | 46,761 | | | | 2,374 | |
| * | Pure Storage, Inc. | | | 501,496 | | | | 11,339 | |
| * | SiTime Corporation | | | 38,765 | | | | 4,339 | |
| * | Upland Software, Inc. | | | 164,140 | | | | 7,532 | |
| * | Varonis Systems, Inc. | | | 44,080 | | | | 7,212 | |
| * | Verra Mobility Corporation | | | 539,699 | | | | 7,243 | |
| * | Vertex, Inc. | | | 82,477 | | | | 2,874 | |
| * | WNS Holdings, Ltd.—ADR | | | 131,052 | | | | 9,442 | |
| | | | | | | | | 160,206 | |
| | | | | | |
| | | | | | |
| | Issuer | | | Shares | | Value | |
| | | | | | | | | | |
| | Common Stocks—(continued) | | | | | | | | |
| | Industrials—20.6% | | | | | | | | |
| | Albany International Corporation | | | 97,785 | | | $ | 7,179 | |
| * | Builders FirstSource, Inc. | | | 130,800 | | | | 5,338 | |
| | BWX Technologies, Inc. | | | 223,539 | | | | 13,475 | |
| * | Casella Waste Systems, Inc. | | | 178,930 | | | | 11,085 | |
| | Douglas Dynamics, Inc. | | | 162,323 | | | | 6,943 | |
| * | Ducommun, Inc. | | | 255,499 | | | | 13,720 | |
| * | Energy Recovery, Inc. | | | 279,256 | | | | 3,809 | |
| | ESCO Technologies, Inc. | | | 51,156 | | | | 5,280 | |
| * | Forrester Research, Inc. | | | 142,843 | | | | 5,985 | |
| * | IAA, Inc. | | | 96,520 | | | | 6,272 | |
| | Lincoln Electric Holdings, Inc. | | | 48,390 | | | | 5,625 | |
| | Luxfer Holdings plc† | | | 403,685 | | | | 6,628 | |
| * | Mercury Systems, Inc. | | | 90,376 | | | | 7,959 | |
| * | Montrose Environmental Group, Inc. | | | 220,166 | | | | 6,816 | |
| * | PAE, Inc. | | | 950,968 | | | | 8,730 | |
| | Ritchie Bros Auctioneers, Inc.† | | | 136,845 | | | | 9,518 | |
| | The Brink’s Co. | | | 199,216 | | | | 14,344 | |
| | | | | | | | | 138,706 | |
| | Consumer Discretionary—10.5% | | | | | | | | |
| * | Boot Barn Holdings, Inc. | | | 243,094 | | | | 10,541 | |
| * | Grand Canyon Education, Inc. | | | 104,742 | | | | 9,753 | |
| * | Laureate Education, Inc. | | | 349,672 | | | | 5,091 | |
| | Lithia Motors, Inc. | | | 29,239 | | | | 8,557 | |
| * | National Vision Holdings, Inc. | | | 152,218 | | | | 6,894 | |
| * | Revolve Group, Inc. | | | 285,464 | | | | 8,898 | |
| * | Rush Street Interactive, Inc. | | | 443,050 | | | | 9,592 | |
| * | Skyline Champion Corporation | | | 209,680 | | | | 6,487 | |
| | Winmark Corporation | | | 26,970 | | | | 5,011 | |
| | | | | | | | | 70,824 | |
| | Financials—8.1% | | | | | | | | |
| * | Encore Capital Group, Inc. | | | 196,723 | | | | 7,662 | |
| | FirstCash, Inc. | | | 143,778 | | | | 10,070 | |
| | Home BancShares, Inc. | | | 314,518 | | | | 6,127 | |
| | LPL Financial Holdings, Inc. | | | 58,470 | | | | 6,094 | |
| * | Open Lending Corporation | | | 164,137 | | | | 5,738 | |
| | Prog Holdings, Inc. | | | 172,937 | | | | 9,316 | |
| * | South Mountain Merger Corporation | | | 198,309 | | | | 3,199 | |
| * | Star Peak Energy Transition Corporation | | | 303,809 | | | | 6,216 | |
| | | | | | | | | 54,422 | |
| | Communication Services—2.7% | | | | | | | | |
| * | Porch Group, Inc. | | | 415,958 | | | | 5,936 | |
| * | QuinStreet, Inc. | | | 559,665 | | | | 11,999 | |
| | | | | | | | | 17,935 | |
| | Consumer Staples—2.4% | | | | | | | | |
| * | BJ’s Wholesale Club Holdings, Inc. | | | 157,510 | | | | 5,872 | |
| * | Darling Ingredients, Inc. | | | 182,820 | | | | 10,545 | |
| | | | | | | | | 16,417 | |
| | Real Estate—1.8% | | | | | | | | |
| | Colliers International Group, Inc.† | | | 65,098 | | | | 5,802 | |
| | FirstService Corporation† | | | 48,767 | | | | 6,670 | |
| | | | | | | | | 12,472 | |
See accompanying Notes to Financial Statements.
| December 31, 2020 | William Blair Funds | 27 |
Small Cap Growth Fund
Portfolio of Investments, December 31, 2020 (all dollar amounts in thousands)
| | | | Shares or | | | | |
| | | | Principal | | | | |
| | Issuer | | Amount | | | Value | |
| | | | | | | | |
| | Common Stocks—(continued) | | | | | | |
| | Energy—1.3% | | | | | | |
| | Cameco Corporation† | | | 653,740 | | | $ | 8,760 | |
| | Materials—1.3% | | | | | | | | |
| | Orion Engineered Carbons S.A.† | | | 496,777 | | | | 8,515 | |
| | Total Common Stocks—98.5%
(cost $450,622) | | | | | | | 664,580 | |
| | |
| | Repurchase Agreement | | | | | | | | |
| | Fixed Income Clearing Corporation, 0.000% dated 12/31/20, due 1/4/21, repurchase price $10,756, collateralized by U.S. Treasury Note, 0.500%, due 6/30/27, valued at $10,972 | | | $10,756 | | | | 10,756 | |
| | Total Repurchase Agreement—1.6%
(cost $10,756) | | | | | | | 10,756 | |
| | Total Investments—100.1%
(cost $461,378) | | | | | | | 675,336 | |
| | Liabilities, plus cash and other assets—(0.1)% | | | | | | | (728 | ) |
| | Net assets—100.0% | | | | | | $ | 674,608 | |
ADR = American Depository Receipt
* = Non-income producing security
† = U.S. listed foreign security
See accompanying Notes to Financial Statements.
| 28 | Annual Report | December 31, 2020 |
| | Small Cap Value Fund |
| | |
| | The Small Cap Value Fund seeks long-term capital appreciation. |
| | |
| | AN OVERVIEW FROM THE PORTFOLIO MANAGERS |
| | |

Mark T. Leslie 
David S. Mitchell | The William Blair Small Cap Value Fund (Class N shares) posted a 5.76% decrease, net of fees, for the year ended December 31, 2020. By comparison, the Fund’s benchmark index, the Russell 2000® Value Index (the “Index”), increased 4.63%. The Fund’s relative performance was impacted by the combination of stock selection and style headwinds during the year given its larger market cap and higher quality biases. We believe that 2020 was a unique year from a style perspective. Stocks were highly correlated with little differentiation between larger and smaller caps or between higher and lower quality stocks during the market sell-off in the first quarter of 2020. In contrast, as the market rebounded dramatically and finished the year over 85% higher off its mid-March low, there was significant dispersion across the size and quality quintiles as smaller caps and lower quality stocks dramatically outperformed. At the sector level, Consumer Discretionary was the largest detractor during the period due to a lack of exposure to Internet & Direct Marketing Retail and Leisure Products and stock selection within Hotels, Restaurants & Leisure, Specialty Retail, and Auto Components. Within Energy, stock selection within Consumable Fuels and Equipment & Services, impacted by the drop in oil prices during the year, drove relative returns within the sector. The relative returns within Real Estate was primarily driven by stock selection within Specialized real estate investment trusts (“REITs”). The relative outperformance within Financials was due to a lack of exposure to Mortgage REITs and stock selection within Banks. Communication Services was another contributor to relative returns during the period mainly due to an underweight to Media stocks. Looking specifically at stock selection, the strategy’s largest detractors during the period were EPR Properties (Real Estate), Pebblebrook Hotel Trust (Real Estate), and Helix Energy Solutions (Energy). Offsetting these detractors were our investments in Inphi (Information Technology), Darling Ingredients (Consumer Staples), and Dunkin’ Brands (Consumer Discretionary). Please refer to the U.S. Value Market Review and Outlook relating to the Fund on page 4. |
| December 31, 2020 | William Blair Funds | 29 |
Small Cap Value Fund
Performance Highlights (Unaudited)
| Average Annual Total Returns through 12/31/2020 |
| | | 1 Year | | 3 Year | | 5 Year | | 10 Year | | Since
Inception(a) |
| Class N | | | (5.76 | )% | | | (1.65 | )% | | | 5.25 | % | | | 6.34 | % | | | — | |
| Class I | | | (5.57 | ) | | | (1.41 | ) | | | 5.50 | | | | 6.61 | | | | — | |
| Class R6 | | | (5.55 | ) | | | — | | | | — | | | | — | | | | (1.81 | )% |
| Russell 2000® Value Index | | | 4.63 | | | | 3.72 | | | | 9.65 | | | | 8.66 | | | | 6.52 | |
| (a) | Since inception is for the period from May 2, 2019 (Commencement of Operations) to December 31, 2020. |
Performance cited represents past performance. Past performance does not guarantee future results and current performance may be lower or higher than the data quoted. Results shown are average annual total returns, which assume reinvestment of dividends and capital gains. Investment returns and principal will fluctuate and you may have a gain or loss when you sell shares. For the most current month-end performance information, please call 1-800-742-7272, or visit our Web site at www.williamblairfunds.com. Investing in smaller companies involves special risks, including higher volatility and lower liquidity. Smaller capitalization stocks are also more sensitive to purchase/sale transactions and changes in the issuer’s financial condition. From time to time, the investment adviser may waive fees or reimburse expenses for the Fund. Without these waivers/reimbursements, performance would be lower. Class N shares are not subject to a sales load. Class I shares are not subject to a sales load or distribution (Rule 12b-1) fees. Class R6 shares are not subject to a sales load, distribution (Rule 12b-1) fees, or sub-transfer agent fees.
The performance highlights and graph presented above do not reflect the deduction of taxes that a shareholder would pay on fund distributions or the redemption of fund shares.
The Russell 2000® Value Index consists of small-capitalization companies with below average price-to-book ratios and forecasted growth rates.
This report identifies the Fund’s investments on December 31, 2020. These holdings are subject to change. Not all stocks in the Fund performed the same, nor is there any guarantee that these stocks will perform as well in the future. Market forecasts provided in this report may not necessarily come to pass.
Sector Diversification (Unaudited)

The sector diversification shown is based on the total long-term securities.
| 30 | Annual Report | December 31, 2020 |
Small Cap Value Fund
Portfolio of Investments, December 31, 2020 (all dollar amounts in thousands)
| | | | | | | | |
| | | | | | | | |
| | Issuer | | Shares | | | Value | |
| | |
| | Common Stocks | | | | | | | | |
| | Financials—27.4% | | | | | | | | |
| | Banc of California, Inc. | | | 27,198 | | | $ | 400 | |
| | Banner Corporation | | | 12,874 | | | | 600 | |
| | Boston Private Financial Holdings, Inc. | | | 79,032 | | | | 668 | |
| | Cadence BanCorp | | | 39,091 | | | | 642 | |
| | CNO Financial Group, Inc. | | | 38,339 | | | | 852 | |
| | First American Financial Corporation | | | 10,706 | | | | 553 | |
| | FNB Corporation | | | 68,394 | | | | 650 | |
| | Glacier Bancorp, Inc. | | | 17,834 | | | | 821 | |
| | Hancock Whitney Corporation | | | 30,289 | | | | 1,030 | |
| | Home BancShares, Inc. | | | 46,402 | | | | 904 | |
| | Horace Mann Educators Corporation | | | 16,636 | | | | 699 | |
| | National Bank Holdings Corporation | | | 19,625 | | | | 643 | |
| | OceanFirst Financial Corporation | | | 28,319 | | | | 528 | |
| | PacWest Bancorp | | | 24,869 | | | | 632 | |
| | Radian Group, Inc. | | | 47,639 | | | | 965 | |
| | Renasant Corporation | | | 19,137 | | | | 644 | |
| | Sandy Spring Bancorp, Inc. | | | 19,862 | | | | 639 | |
| * | Seacoast Banking Corporation of Florida | | | 28,427 | | | | 837 | |
| | Selective Insurance Group, Inc. | | | 15,590 | | | | 1,044 | |
| | The Hanover Insurance Group, Inc. | | | 6,850 | | | | 801 | |
| | Umpqua Holdings Corporation | | | 47,901 | | | | 725 | |
| | Western Alliance Bancorp | | | 19,253 | | | | 1,154 | |
| | | | | | | | | 16,431 | |
| | Industrials—17.1% | | | | | | | | |
| | Alamo Group, Inc. | | | 2,040 | | | | 282 | |
| | Brady Corporation | | | 25,684 | | | | 1,357 | |
| * | Chart Industries, Inc. | | | 7,285 | | | | 858 | |
| | Curtiss-Wright Corporation | | | 9,203 | | | | 1,071 | |
| | ESCO Technologies, Inc. | | | 5,875 | | | | 606 | |
| | Federal Signal Corporation | | | 12,656 | | | | 420 | |
| * | FTI Consulting, Inc. | | | 6,705 | | | | 749 | |
| * | Gibraltar Industries, Inc. | | | 14,420 | | | | 1,037 | |
| | Rexnord Corporation | | | 15,330 | | | | 605 | |
| * | Saia, Inc. | | | 3,334 | | | | 603 | |
| | Simpson Manufacturing Co., Inc. | | | 7,007 | | | | 655 | |
| | UniFirst Corporation | | | 4,295 | | | | 909 | |
| | Watts Water Technologies, Inc. | | | 8,869 | | | | 1,079 | |
| | | | | | | | | 10,231 | |
| | Consumer Discretionary—11.6% | | | | | | | | |
| | Carter’s, Inc. | | | 8,007 | | | | 753 | |
| * | Cavco Industries, Inc. | | | 2,187 | | | | 384 | |
| | Churchill Downs, Inc. | | | 3,345 | | | | 652 | |
| * | Deckers Outdoor Corporation | | | 3,591 | | | | 1,030 | |
| * | Helen of Troy, Ltd.† | | | 4,357 | | | | 968 | |
| | KB Home | | | 13,930 | | | | 467 | |
| * | Monarch Casino & Resort, Inc. | | | 13,068 | | | | 800 | |
| | Murphy USA, Inc. | | | 6,390 | | | | 836 | |
| * | TopBuild Corporation | | | 5,651 | | | | 1,040 | |
| | | | | | | | | 6,930 | |
| | Real Estate—8.5% | | | | | | | | |
| | Agree Realty Corporation | | | 11,198 | | | | 746 | |
| | American Assets Trust, Inc. | | | 21,499 | | | | 621 | |
| | Americold Realty Trust | | | 10,368 | | | | 387 | |
| | CoreSite Realty Corporation | | | 3,426 | | | | 429 | |
| | Healthcare Realty Trust, Inc. | | | 27,121 | | | | 803 | |
| | Highwoods Properties, Inc. | | | 17,575 | | | | 696 | |
| | | | | | | | |
| | | | | | | | |
| | Issuer | | Shares | | | Value | |
| | |
| | Common Stocks—(continued) | | | | | | | | |
| | Real Estate—(continued) | | | | | | | | |
| | Life Storage, Inc. | | | 5,808 | | | $ | 693 | |
| | Terreno Realty Corporation | | | 11,930 | | | | 698 | |
| | | | | | | | | 5,073 | |
| | Health Care—6.6% | | | | | | | | |
| | CONMED Corporation | | | 11,447 | | | | 1,282 | |
| | Encompass Health Corporation | | | 14,443 | | | | 1,195 | |
| * | Integer Holdings Corporation | | | 10,976 | | | | 891 | |
| * | Magellan Health, Inc. | | | 7,089 | | | | 587 | |
| | | | | | | | | 3,955 | |
| | Information Technology—5.9% | | | | | | | | |
| * | j2 Global, Inc. | | | 6,451 | | | | 630 | |
| * | LiveRamp Holdings, Inc. | | | 10,487 | | | | 768 | |
| | MAXIMUS, Inc. | | | 8,694 | | | | 636 | |
| | Perspecta, Inc. | | | 18,211 | | | | 439 | |
| * | Semtech Corporation | | | 4,090 | | | | 295 | |
| * | Viavi Solutions, Inc. | | | 51,779 | | | | 775 | |
| | | | | | | | | 3,543 | |
| | Materials—5.7% | | | | | | | | |
| | Avient Corporation | | | 18,472 | | | | 744 | |
| | Carpenter Technology Corporation | | | 17,560 | | | | 511 | |
| | Minerals Technologies, Inc. | | | 11,495 | | | | 714 | |
| | Sensient Technologies Corporation | | | 9,087 | | | | 671 | |
| | Silgan Holdings, Inc. | | | 20,172 | | | | 748 | |
| | | | | | | | | 3,388 | |
| | Utilities—4.7% | | | | | | | | |
| | Black Hills Corporation | | | 11,737 | | | | 721 | |
| | Chesapeake Utilities Corporation | | | 5,625 | | | | 609 | |
| | IDACORP, Inc. | | | 6,893 | | | | 662 | |
| | ONE Gas, Inc. | | | 10,869 | | | | 834 | |
| | | | | | | | | 2,826 | |
| | Consumer Staples—4.7% | | | | | | | | |
| * | BJ’s Wholesale Club Holdings, Inc. | | | 11,113 | | | | 414 | |
| | Casey’s General Stores, Inc. | | | 2,722 | | | | 486 | |
| * | Darling Ingredients, Inc. | | | 21,901 | | | | 1,263 | |
| | J&J Snack Foods Corporation | | | 4,218 | | | | 656 | |
| | | | | | | | | 2,819 | |
| | Energy—4.2% | | | | | | | | |
| | Archrock, Inc. | | | 54,148 | | | | 469 | |
| | Brigham Minerals, Inc. | | | 35,819 | | | | 394 | |
| | Cactus, Inc. | | | 10,622 | | | | 277 | |
| * | CNX Resources Corporation | | | 48,087 | | | | 519 | |
| | HollyFrontier Corporation | | | 11,709 | | | | 303 | |
| * | PDC Energy, Inc. | | | 27,387 | | | | 562 | |
| | | | | | | | | 2,524 | |
| | Communication Services—2.1% | | | | | | | | |
| | John Wiley & Sons, Inc. | | | 6,570 | | | | 300 | |
| | Nexstar Media Group, Inc. | | | 3,485 | | | | 381 | |
| * | QuinStreet, Inc. | | | 16,463 | | | | 353 | |
| | The Interpublic Group of Cos., Inc. | | | 10,346 | | | | 243 | |
| | | | | | | | | 1,277 | |
| | Total Common Stocks—98.5%
(cost $43,146) | | | | | | | 58,997 | |
See accompanying Notes to Financial Statements.
| December 31, 2020 | William Blair Funds | 31 |
Small Cap Value Fund
Portfolio of Investments, December 31, 2020 (all dollar amounts in thousands)
| | | | | | | | |
| | | | Principal | | | | |
| | Issuer | | Amount | | | Value | |
| | |
| | Repurchase Agreement | | | | | | | | |
| | Fixed Income Clearing Corporation, 0.000% dated 12/31/20, due 1/4/21, repurchase price $1,066, collateralized by U.S. Treasury Note, 0.500%, due 6/30/27, valued at $1,087 | | | $1,066 | | | $ | 1,066 | |
| | Total Repurchase Agreement—1.8%
(cost $1,066) | | | | | | | 1,066 | |
| | Total Investments—100.3%
(cost $44,212) | | | | | | | 60,063 | |
| | Liabilities, plus cash and other assets—(0.3)% | | | | | | | (162 | ) |
| | Net assets—100.0% | | | | | | $ | 59,901 | |
* = Non-income producing security
† = U.S. listed foreign security
See accompanying Notes to Financial Statements.
| 32 | Annual Report | December 31, 2020 |
Global Markets Review and Outlook
Global equities surged in the fourth quarter on promising news of multiple vaccines having high rates of effectiveness against the coronavirus (the MSCI ACWI IMI advanced +15.70% for the quarter and +16.25% for the year). The prospect of a return to normality drove a sharp style rotation out of defensive technology names in favor of value-oriented stocks which had underperformed for most of the year.
US equities advanced (+14.56% for the quarter and +20.46% for the year, as measured by the MSCI US IMI) on the vaccine news which overshadowed the presidential election results and transition of power to President-elect Joe Biden. Investor sentiment was further bolstered in the final days of December as Congress passed a $900 billion relief package which included direct payments to qualified individuals and an expanded loan program for small businesses.
European equities gained (+16.40% for the quarter and +6.46% for the year as measured by the MSCI Europe IMI) despite a resurgence in new coronavirus cases and newly imposed lockdown measures. The long-awaited trade agreement between the UK and the European Union was settled in late December signaling the UK’s official transition period out of the EU. UK equities gained +18.60% in US dollar terms during the fourth quarter (as measured by the MSCI UK IMI), bolstered by a stronger British Pound, which advanced nearly 6% against the dollar. Despite the fourth quarter rally, UK equities ended the year down 8.97% in dollar terms (-11.78% in British Pound terms).
Emerging markets (+19.95% for the quarter and +18.39% for the year, as measured by the MSCI EM IMI) outpaced developed markets primarily due to strength within Latin America and South Korea. China underperformed on a relative basis (+11.38% for the quarter and +29.42% for the year) as tension between China and the US weighed on investor sentiment.
While reviewing the prior year and forming an outlook for the market, it is impossible not to take greater stock of the world events and think more broadly about lessons learned during this time, which has been unlike any other we have experienced in our lifetimes.
As we consider these lessons, it is informative to draw comparisons to what we believe are critical factors for companies and their stocks, and our own experience as investors and businesspeople.
First, in our view, there is no substitute for world-class culture. This means organizations that attract great talent and provide an environment where individuals can flourish. Great management teams lead and empower people to help achieve success for their clients.
During the pandemic we saw increased differentiation among those companies who are innovative, forward looking and agile, who have adapted to overcome multiple challenges in order to stay relevant to their customers. It’s too simple to point to the alleged “COVID-19 beneficiaries” who saw a boon to their business due to forced changes in consumption and business practices. In our view, it is more about those companies that have invested in leading data-driven, digital support to their businesses in order to pivot or take advantage of the demand disruption. These companies form the core of each of our investment strategies.
What we are seeing from what we view to be the best companies is their preparedness and their ability to navigate through the crisis in terms of protecting client relationships, managing resources effectively, and executing around their strategy. As in all crises, we expect the best will not only survive but emerge stronger, with improved competitive positioning and more enduring growth prospects. This is where we are continuing to focus.
This relates to our own experience working on your behalf this past year. Our team demonstrated great resilience, commitment, and adaptability. Once again we saw that outstanding people and a committed team culture can overcome a lot of obstacles. The collaborative, engaged nature of our investment process has prepared us remarkably well for this more decentralized, virtual form of work and connectedness. We believe that the content of our research has never been richer and that the engagement and the commitment of the team have never been stronger. Our long-term growth research projects this year were not just a triage for the current crisis, but an opportunity for deeper, reflective work on its longer-term growth implications. This has provided cohesion and consistency to our process.
We believe the second lesson is the importance of growth. Growth is a critical business imperative as it applies to people, products, and ideas. We are attracted to growth companies because we feel that they will add the most value to the future global economy and generate Sustainable Value Creation in the form of cash flows that are underappreciated today. These are three very specific and important words: create, meaning that companies are in control of their destiny; value, referring to positive economic outcomes; and sustainable, referencing durability over a long period of time. This is of particular importance because
| December 31, 2020 | William Blair Funds | 33 |
Global Markets Review and Outlook (continued)
in recent years the shares of companies classified as having higher long-term growth have substantially outperformed those of companies classified as value investments.
This stock market recovery has been unique in that it has been driven by the same types of companies that have led the market for several years: highly innovative “digital winners”, those with high and persistent investment for future growth, and companies that have been able to scale at an unprecedented pace. This has fueled the performance of “Growth versus Value” and the ensuing debate around future equity investing style performance.
While these market leaders (Growth stocks) may have high current multiples (i.e., not equating to Value classification), we believe that their earnings power has proven to be undervalued. In our view, the market is still trying to reconcile the digital transformation of business models and the resulting scalability at higher than expected profit levels. Or, put differently, the durability of that growth and profit profile is underappreciated in our view. We believe that the style performance differential therefore reflects a realization that the corporate performance gap is widening.
As a firm and as a team, we often reflect on the fact that we should run our own business and hold ourselves accountable to the same sustainable value creation standards as our portfolio companies. Our firm is 85 years old and our team is 25 years old. Growth is an imperative to a successful long-term franchise, including our own. That means people and people development. Hiring bright minds with diverse perspectives and giving them an opportunity to grow and flourish. They demand growth. It means challenging our investment philosophy and process with new ideas and evolving (growing) our investment skills and tools so that we are as relevant today as we were 10 and 25 years ago. It also means innovating and creating new investment products that meet our clients’ current and future needs. This in turn creates an energized, positive environment that allows us to maximize the contribution of all of our teammates in order to generate long-term returns for our clients.
This leads to the next lesson, which is our belief that “ESG” and sustainable business practices are here to stay. Society at large and (more recently) the investment community appear to have woken up to the fact that long- term thinking is the foundation of business success and investment returns. Building durable, sustainable, enduring businesses and societies is the goal, and the stock market is increasingly recognizing these factors as being important organizational values. We have long seen the obvious connection between long-term corporate value creation and “ESG” practices. The best companies that we referred to previously are increasingly focused on their business activity’s impact on all stakeholders.
As for the market outlook, we expect the economic recovery in 2021 to be extremely robust and surprise to the upside. In our view, consumer spending is likely to grow smartly across developed markets, as pent up demand and high aggregate savings rates work in tandem. Indeed, retail sales volumes already have surpassed their prior peak. At the same time, industrial production, which enables the consumption of these goods, remains some 7-10% below pre-COVID-19 recession levels. So, even in the absence of further fiscal support—already approved in Europe and quite likely in the US—we believe that major developed market economies may be firing on all cylinders by the spring.
In short, we believe that high aggregate personal savings rates and strong acceleration in consumer spending, especially on services, together with still-depressed levels of industrial production suggest that economic growth in 2021 is likely to be the strongest in many decades and exceed current forecasts. In our view, corporate profit growth is therefore likely to be underestimated as well.
If economic growth is to trend higher this year, then so is inflation in our view. For now, an inflation “spike” beyond a 3% annual rate in 2021—if that can even be considered a spike—looks likely to be transitory. Even if growth surprises to the upside and developed markets grow at well above current consensus forecasts, we believe that major economies (excluding China) are unlikely to regain their pre-crisis trajectory of output until 2022 at the earliest.
Thus, we believe we will see corporate profit growth ahead of general expectations, with a broadening out to include many of the industries that were left behind in the second half of 2020. At the same time, we expect rising interest rates will prove to be manageable, creating a positive backdrop for equities.
The aforementioned performance gap between growth and value stocks may even have a chance of moderating this year, as the broadening of growth may support the performance of stocks in value-oriented industries that stand to benefit from increased economic activity. We still believe the long-term investment potential of creators of long-term value (growth stocks) will prove to be superior to that of companies or industries in competitive decline.
| 34 | Annual Report | December 31, 2020 |
| | Global Leaders Fund |
| | |
| | The Global Leaders Fund seeks long-term capital appreciation. |
| | |
| | AN OVERVIEW FROM THE PORTFOLIO MANAGERS |
| | |

Andrew G. Flynn 
Kenneth J. McAtamney | The William Blair Global Leaders Fund (Class N shares) posted a 31.50% increase, net of fees, for the year ended December 31, 2020. By comparison, the Fund’s benchmark index, the MSCI All Country World IMI (net) (the “Index”), increased 16.25%. Outperformance versus the Index was driven by a combination of allocation and stock selection effects. An underweight allocation to Energy and an overweight allocation to Consumer Discretionary, coupled with above average stock selection within the Health Care sector, were the largest drivers of relative performance. Within the Health Care sector, Lonza and IDEXX Laboratories propelled relative performance. Lonza is a leader in custom manufacturing of biopharmaceuticals and specialty ingredients. Business trends remain strong, particularly in its pharma biotech segment amid the COVID-19 pandemic. Lonza offers highly visible growth, and given the strong market demand for outsourced biopharma production and related services, we remain confident it can deliver on growth in the future. IDEXX is the world leader in veterinary diagnostic testing, with three primary business segments: companion animals, livestock and poultry, and water. The company’s growth is tied to the animal health market which has attractive structural growth characteristics. Moreover, IDEXX is a compelling growth compounder that we believe should continue to deliver double-digit top and bottom-line growth for the foreseeable future. Partially offsetting these effects was negative stock selection within the Consumer Discretionary sector and an overweight allocation to the Asia Ex-Japan region. Within Consumer Discretionary, Compass Group weighed on relative returns. Compass is the global leader in outsourced foodservice and other support services to private businesses, schools and colleges, hospitals, and in remote environments. It is benefiting from the ongoing trend toward outsourcing foodservice and hospitality services globally. Given the COVID-19 pandemic, the narrative around contract caterers is fairly negative due to work from home dynamics, social distancing, and a challenging macro backdrop. However, as volumes recover and people gain comfort that the business model remains intact, we expect the stock will reflect the long-term earnings power of the business. Current estimates do not account for an acceleration of market share gains as business shifts away from competitors with weaker offerings, the demand for outsourcing increases due to health and safety concerns, or any upside from M&A, which we anticipate the company will take an active role in. Unowned Tesla also hindered relative results as the stock was up over 700% in 2020, well above our view of intrinsic value. Please refer to the Global Markets Review and Outlook relating to the Fund beginning on page 33. |
| December 31, 2020 | William Blair Funds | 35 |
Global Leaders Fund
Performance Highlights (Unaudited)
| Average Annual Total Returns through 12/31/2020 |
| | | 1 Year | | 3 Year | | 5 Year | | 10 Year | | Since
Inception |
| Class N | | | 31.50 | % | | | 16.66 | % | | | 15.80 | % | | | 11.72 | % | | | — | |
| Class I | | | 31.86 | | | | 16.96 | | | | 16.12 | | | | 12.02 | | | | — | |
| MSCI ACW IMI (net) | | | 16.25 | | | | 9.72 | | | | 12.15 | | | | 9.09 | | | | — | |
| Class R6(a) | | | 31.91 | | | | 17.01 | | | | 16.18 | | | | — | | | | 13.38 | % |
| MSCI ACW IMI (net)(a) | | | 16.25 | | | | 9.72 | | | | 12.15 | | | | — | | | | 10.42 | |
| (a) | Since inception is for the period from December 19, 2012 (Commencement of Operations) to December 31, 2020. |
Performance cited represents past performance. Past performance does not guarantee future results and current performance may be lower or higher than the data quoted. Results shown are average annual total returns, which assume reinvestment of dividends and capital gains. Investment returns and principal will fluctuate and you may have a gain or loss when you sell shares. For the most current month-end performance information, please call 1-800-742-7272, or visit our Web site at www.williamblairfunds.com. Investing in smaller and medium capitalization companies involves special risks, including higher volatility and lower liquidity. Smaller and medium capitalization stocks are also more sensitive to purchase/sale transactions and changes in the issuer’s financial condition. International investing involves special risk considerations, including currency fluctuations, lower liquidity, economic and political risk. From time to time, the investment adviser may waive fees or reimburse expenses for the Fund. Without these waivers/reimbursements, performance would be lower. Class N shares are not subject to a sales load. Class I shares are not subject to a sales load or distribution (Rule 12b-1) fees. Class R6 shares are not subject to a sales load, distribution (Rule 12b-1) fees, or sub-transfer agent fees.
The performance highlights and graph presented above do not reflect the deduction of taxes that a shareholder would pay on fund distributions or the redemption of fund shares.
The Morgan Stanley Capital International (MSCI) All Country World (ACW) Investable Market Index (IMI) (net) is a free float-adjusted market capitalization weighted index that is designed to measure the equity market of developed and emerging markets. This index approximates the minimum possible dividend reinvestment by deducting for the highest possible withholding tax rates of those markets.
This report identifies the Fund’s investments on December 31, 2020. These holdings are subject to change. Not all stocks in the Fund performed the same, nor is there any guarantee that these stocks will perform as well in the future. Market forecasts provided in this report may not necessarily come to pass.
Sector Diversification (Unaudited)
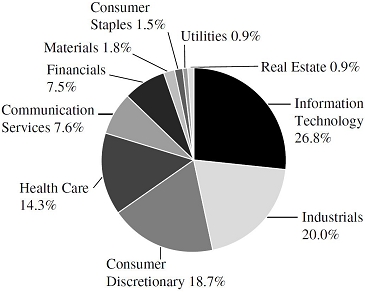
The sector diversification shown is based on the total long-term securities.
| 36 | Annual Report | December 31, 2020 |
Global Leaders Fund
Portfolio of Investments, December 31, 2020 (all dollar amounts in thousands)
| | | | | | | | |
| | | | | | | | |
| | Issuer | | Shares | | | Value | |
| | | | | | | | |
| | Common Stocks | | | | | | |
| | | | | | | | |
| | Western Hemisphere—48.2% | | | | | | |
| | Canada—1.4% | | | | | | | | |
| * | Lululemon Athletica, Inc. (Textiles, apparel & luxury goods) | | | 4,883 | | | $ | 1,700 | |
| | United States—46.8% | | | | | | | | |
| * | Adobe, Inc. (Software) | | | 3,623 | | | | 1,812 | |
| * | Alphabet, Inc. Class “A” (Interactive Media & Services) | | | 2,056 | | | | 3,603 | |
| * | Amazon.com, Inc. (Internet & direct marketing retail) | | | 1,325 | | | | 4,315 | |
| | BlackRock, Inc. (Capital markets) | | | 2,574 | | | | 1,857 | |
| * | Charles River Laboratories International, Inc. (Life sciences tools & services) | | | 4,784 | | | | 1,195 | |
| * | CoStar Group, Inc. (Professional services) | | | 1,463 | | | | 1,352 | |
| | Ecolab, Inc. (Chemicals) | | | 5,366 | | | | 1,161 | |
| * | Edwards Lifesciences Corporation (Health care equipment & supplies) | | | 14,973 | | | | 1,366 | |
| * | Facebook, Inc. Class “A” (Interactive Media & Services) | | | 10,449 | | | | 2,854 | |
| | Fidelity National Information Services, Inc. (IT services) | | | 11,833 | | | | 1,674 | |
| * | IDEXX Laboratories, Inc. (Health care equipment & supplies) | | | 3,625 | | | | 1,812 | |
| | Intercontinental Exchange, Inc. (Capital markets) | | | 14,533 | | | | 1,676 | |
| * | Intuitive Surgical, Inc. (Health care equipment & supplies) | | | 1,612 | | | | 1,319 | |
| | Lockheed Martin Corporation (Aerospace & defense) | | | 3,294 | | | | 1,169 | |
| | Mastercard, Inc. Class “A” (IT services) | | | 7,859 | | | | 2,805 | |
| | Microsoft Corporation (Software) | | | 10,395 | | | | 2,312 | |
| | NextEra Energy, Inc. (Electric utilities) | | | 14,361 | | | | 1,108 | |
| | NIKE, Inc. Class “B” (Textiles, apparel & luxury goods) | | | 13,919 | | | | 1,969 | |
| * | PayPal Holdings, Inc. (IT services) | | | 10,365 | | | | 2,428 | |
| | Prologis, Inc. (Equity REIT) | | | 10,858 | | | | 1,082 | |
| | Roper Technologies, Inc. (Industrial conglomerates) | | | 3,877 | | | | 1,671 | |
| * | salesforce.com, Inc. (Software) | | | 14,082 | | | | 3,134 | |
| | The Estee Lauder Cos., Inc. Class “A” (Personal products) | | | 6,924 | | | | 1,843 | |
| | Thermo Fisher Scientific, Inc. (Life sciences tools & services) | | | 3,793 | | | | 1,767 | |
| * | Ulta Beauty, Inc. (Specialty retail) | | | 5,497 | | | | 1,579 | |
| | Union Pacific Corporation (Road & rail) | | | 8,355 | | | | 1,740 | |
| | UnitedHealth Group, Inc. (Health care providers & services) | | | 6,230 | | | | 2,185 | |
| * | Veeva Systems, Inc. Class “A” (Health care technology) | | | 2,951 | | | | 803 | |
| * | Workday, Inc. Class “A” (Software) | | | 8,360 | | | | 2,003 | |
| | Zoetis, Inc. (Pharmaceuticals) | | | 9,690 | | | | 1,604 | |
| | | | | | | | | 57,198 | |
| | | | | | | | |
| | | | | | | | |
| | Issuer | | Shares | | | Value | |
| | | | | | | | |
| | Common Stocks—(continued) | | | | | | |
| | | | | | | | |
| | Europe—23.9% | | | | | | |
| | Denmark—3.6% | | | | | | |
| * | Chr Hansen Holding A/S (Chemicals) | | | 10,097 | | | $ | 1,038 | |
| | DSV PANALPINA A/S (Air freight & logistics) | | | 11,140 | | | | 1,865 | |
| | Novo Nordisk A/S Class “B” (Pharmaceuticals) | | | 20,725 | | | | 1,452 | |
| | | | | | | | | 4,355 | |
| | France—3.7% | | | | | | | | |
| * | Airbus SE (Aerospace & defense) | | | 20,438 | | | | 2,242 | |
| | LVMH Moet Hennessy Louis Vuitton SE (Textiles, apparel & luxury goods) | | | 3,618 | | | | 2,258 | |
| | | | | | | | | 4,500 | |
| | Germany—4.6% | | | | | | | | |
| | Infineon Technologies AG (Semiconductors & semiconductor equipment) | | | 80,513 | | | | 3,087 | |
| | MTU Aero Engines AG (Aerospace & defense) | | | 6,642 | | | | 1,732 | |
| | Rational AG (Machinery) | | | 869 | | | | 808 | |
| | | | | | | | | 5,627 | |
| | Ireland—2.6% | | | | | | | | |
| | Allegion plc (Building products)† | | | 7,497 | | | | 872 | |
| | Aptiv plc (Auto components)† | | | 17,918 | | | | 2,335 | |
| | | | | | | | | 3,207 | |
| | Netherlands—1.2% | | | | | | | | |
| * | Adyen N.V. (IT services) | | | 650 | | | | 1,513 | |
| | Sweden—5.1% | | | | | | | | |
| | Atlas Copco AB Class “A” (Machinery) | | | 39,429 | | | | 2,018 | |
| | Evolution Gaming Group AB (Hotels, restaurants & leisure) | | | 7,020 | | | | 712 | |
| | Hexagon AB Class “B” (Electronic equipment, instruments & components) | | | 28,602 | | | | 2,607 | |
| * | Indutrade AB (Trading companies & distributors) | | | 41,640 | | | | 892 | |
| | | | | | | | | 6,229 | |
| | Switzerland—3.1% | | | | | | | | |
| | Lonza Group AG (Life sciences tools & services) | | | 2,733 | | | | 1,756 | |
| | Partners Group Holding AG (Capital markets) | | | 1,668 | | | | 1,959 | |
| | | | | | | | | 3,715 | |
| | | | | | | | | | |
| | Emerging Asia—9.1% | | | | | | | | |
| | China—5.1% | | | | | | | | |
| * | Alibaba Group Holding, Ltd. (Internet & direct marketing retail) | | | 88,944 | | | | 2,669 | |
| | Shenzhou International Group Holdings, Ltd. (Textiles, apparel & luxury goods) | | | 48,300 | | | | 947 | |
| | Tencent Holdings, Ltd. (Interactive Media & Services) | | | 36,800 | | | | 2,677 | |
| | | | | | | | | 6,293 | |
See accompanying Notes to Financial Statements.
| December 31, 2020 | William Blair Funds | 37 |
Global Leaders Fund
Portfolio of Investments, December 31, 2020 (all dollar amounts in thousands)
| | | | | | | | |
| | | | | | | | |
| | Issuer | | Shares | | | Value | |
| | | | | | | | |
| | Common Stocks—(continued) | | | | | | | | |
| | | | | | | | | | |
| | Emerging Asia—(continued) | | | | | | | | |
| | India—1.2% | | | | | | | | |
| * | HDFC Bank, Ltd.—ADR (Banks) | | | 20,827 | | | $ | 1,505 | |
| | Taiwan—2.8% | | | | | | | | |
| | Taiwan Semiconductor Manufacturing Co., Ltd.—ADR (Semiconductors & semiconductor equipment) | | | 31,039 | | | | 3,384 | |
| | | | | | | | | | |
| | Japan—6.7% | | | | | | | | |
| | Daikin Industries, Ltd. (Building products) | | | 9,400 | | | | 2,087 | |
| | Keyence Corporation (Electronic equipment, instruments & components) | | | 4,200 | | | | 2,359 | |
| | Nihon M&A Center, Inc. (Professional services) | | | 34,800 | | | | 2,325 | |
| | SMC Corporation (Machinery) | | | 2,400 | | | | 1,463 | |
| | | | | | | | | 8,234 | |
| | | | | | | | | | |
| | Asia—5.2% | | | | | | | | |
| | Australia—3.1% | | | | | | | | |
| | Aristocrat Leisure, Ltd. (Hotels, restaurants & leisure) | | | 52,657 | | | | 1,258 | |
| * | Atlassian Corporation plc Class “A” (Software)† | | | 4,846 | | | | 1,133 | |
| | CSL, Ltd. (Biotechnology) | | | 6,250 | | | | 1,365 | |
| | | | | | | | | 3,756 | |
| | Hong Kong—1.6% | | | | | | | | |
| | AIA Group, Ltd. (Insurance) | | | 164,800 | | | | 2,020 | |
| | New Zealand—0.5% | | | | | | | | |
| | Fisher & Paykel Healthcare Corp., Ltd. (Health care equipment & supplies) | | | 23,501 | | | | 557 | |
| | | | | | | | | | |
| | United Kingdom—3.1% | | | | | | | | |
| | Compass Group plc (Hotels, restaurants & leisure) | | | 78,923 | | | | 1,471 | |
| | Experian plc (Professional services) | | | 26,747 | | | | 1,016 | |
| | Halma plc (Electronic equipment, instruments & components) | | | 15,243 | | | | 510 | |
| * | Rentokil Initial plc (Commercial services & supplies) | | | 113,161 | | | | 789 | |
| | | | | | | | | 3,786 | |
| | | | | | | | | | |
| | Emerging Latin America—2.0% | | | | | | | | |
| | Argentina—2.0% | | | | | | | | |
| * | Globant S.A. (IT services)† | | | 5,605 | | | | 1,220 | |
| * | MercadoLibre, Inc. (Internet & direct marketing retail) | | | 729 | | | | 1,221 | |
| | | | | | | | | 2,441 | |
| | Total Common Stocks—98.2%
(cost $63,577) | | | | | | | 120,020 | |
| | | | | | | | |
| | Issuer | | Principal
Amount | | | Value | |
| | | | | | | | |
| | Repurchase Agreement | | | | | | | | |
| | Fixed Income Clearing Corporation, 0.000% dated 12/31/20, due 1/4/21, repurchase price $2,070, collateralized by U.S. Treasury Note, 0.500%, due 6/30/27, valued at $2,111 | | | $2,070 | | | $ | 2,070 | |
| | Total Repurchase Agreement—1.7%
(cost $2,070) | | | | | | | 2,070 | |
| | Total Investments—99.9%
(cost $65,647) | | | | | | | 122,090 | |
| | Cash and other assets, less liabilities—0.1% | | | | | | | 92 | |
| | Net assets—100.0% | | | | | | $ | 122,182 | |
ADR = American Depository Receipt
REIT = Real Estate Investment Trust
* = Non-income producing security
† = U.S. listed foreign security
At December 31, 2020, the Fund’s Portfolio of Investments includes the following industry categories (as a percentage of long-term investments):
| Information Technology | | | 26.8 | % |
| Industrials | | | 20.0 | % |
| Consumer Discretionary | | | 18.7 | % |
| Health Care | | | 14.3 | % |
| Communication Services | | | 7.6 | % |
| Financials | | | 7.5 | % |
| Materials | | | 1.8 | % |
| Consumer Staples | | | 1.5 | % |
| Utilities | | | 0.9 | % |
| Real Estate | | | 0.9 | % |
| Total | | | 100.0 | % |
At December 31, 2020, the Fund’s Portfolio of Investments includes the following currency categories (as a percentage of long-term investments):
| U.S. Dollar | | | 58.8 | % |
| Euro | | | 9.7 | % |
| Hong Kong Dollar | | | 6.9 | % |
| Japanese Yen | | | 6.9 | % |
| Swedish Krona | | | 5.2 | % |
| Danish Krone | | | 3.6 | % |
| British Pound Sterling | | | 3.1 | % |
| Swiss Franc | | | 3.1 | % |
| Australian Dollar | | | 2.2 | % |
| All Other Currencies | | | 0.5 | % |
| Total | | | 100.0 | % |
See accompanying Notes to Financial Statements.
| 38 | Annual Report | December 31, 2020 |
| | International Leaders Fund |
| | |
| | The International Leaders Fund seeks long-term capital appreciation. |
| | |
| | AN OVERVIEW FROM THE PORTFOLIO MANAGERS |
| | |

Simon Fennell 
Kenneth J. McAtamney | The William Blair International Leaders Fund (Class N shares) posted a 26.45% increase, net of fees, for the year ended December 31, 2020. By comparison, the Fund’s benchmark index, the MSCI All Country World ex-U.S. IMI (net) (the “Index”), increased 11.12%. Outperformance versus the Index was primarily driven by positive stock selection across most sectors. The Financials, Energy and Health Care sectors were the most notable sources of relative return. Within Financials, Partners Group propelled relative results as the company’s share price rebounded off the COVID-19-induced lows earlier in the year. The company’s most recent financial results highlighted better than expected first half results with performance fees, EBIT and net profit all ahead of consensus. The company’s strong structural growth outlook is supported by increasing allocations to private markets given low interest rates and low growth. It continues to be a key beneficiary of this environment given its global scale in distribution, investment performance and breadth of private market investment solutions and management. The company continues to see solid demand for its range of private market programs and mandates. Neste, within the Energy sector, was an additional source of outperformance. Neste is the world’s largest producer of renewable diesel and jet fuel refined from waste and residues. It offers a superior product compared to petroleum diesel as it not only helps meet renewable/carbon reduction targets, but also burns cleaner in internal combustion engines, resulting in lower emissions and engine maintenance costs. Within Health Care, Lonza Group was the strongest contributor to relative results. Lonza is a leader in custom manufacturing of biopharmaceuticals and specialty ingredients. Business trends remain strong, particularly in its pharma biotech segment amid the COVID-19 pandemic. Lonza offers highly visible growth, and given the strong market demand for outsourced biopharma production and related services, we remain confident it can deliver on growth in the future. Partially offsetting these effects were the underweight allocation to the Materials sector and an overweight allocation to the Developed Europe region, coupled with below average stock selection within the Information Technology sector. Within Information Technology, Temenos was the largest detractor to relative performance. Temenos is a leading software provider to the financial services industry. We believe its offering is superior to its competitors, but the key difference today vs. the past is its brand recognition. Upgrading to Temenos software is synonymous with upgrading your core technology in the right way, and this change in mindset by customers is changing its ability to sign new deals at attractive prices. At the same time, management has delivered more consistent execution. While the company continues to win new clients, some contracts were delayed. We believe this should be a positive tailwind to the company once the economy approaches normalcy (relative to history). Despite the lumpiness quarter-to-quarter, the structural drivers of digital transformation, regulation, cost pressures and the move to open banking are likely to accelerate post-crisis. Please refer to the Global Markets Review and Outlook relating to the Fund beginning on page 33. |
| December 31, 2020 | William Blair Funds | 39 |
International Leaders Fund
Performance Highlights (Unaudited)
| Average Annual Total Returns through 12/31/2020 |
| | | 1 Year | | 3 Year | | 5 Year | | Since
Inception |
| Class N(a) | | | 26.45 | % | | | 13.22 | % | | | 13.67 | % | | | 11.64 | % |
| Class I(a) | | | 26.77 | | | | 13.51 | | | | 13.97 | | | | 11.92 | |
| MSCI ACW Ex-U.S. IMI (net)(a) | | | 11.12 | | | | 4.83 | | | | 8.98 | | | | 7.09 | |
| Class R6(b) | | | 26.88 | | | | 13.59 | | | | 14.06 | | | | 12.03 | |
| MSCI ACW Ex-U.S. IMI (net)(b) | | | 11.12 | | | | 4.83 | | | | 8.98 | | | | 6.79 | |
| (a) | Since inception is for the period from August 16, 2012 (Commencement of Operations) to December 31, 2020. |
| (b) | Since inception is for the period from November 2, 2012 (Commencement of Operations) to December 31, 2020. |
Performance cited represents past performance. Past performance does not guarantee future results and current performance may be lower or higher than the data quoted. Results shown are average annual total returns, which assume reinvestment of dividends and capital gains. Investment returns and principal will fluctuate and you may have a gain or loss when you sell shares. For the most current month-end performance information, please call 1-800-742-7272, or visit our Web site at www.williamblairfunds.com. Investing in smaller and medium capitalization companies involves special risks, including higher volatility and lower liquidity. Smaller and medium capitalization stocks are also more sensitive to purchase/sale transactions and changes in the issuer’s financial condition. International investing involves special risk considerations, including currency fluctuations, lower liquidity, economic and political risk. From time to time the investment adviser may waive fees or reimburse expenses for the Fund. Without these waivers/reimbursements, performance would be lower. Class N shares are not subject to a sales load. Class I shares are not subject to a sales load or distribution (Rule 12b-1) fees. Class R6 shares are not subject to a sales load, distribution (Rule 12b-1) fees, or sub-transfer agent fees.
The performance highlights presented above do not reflect the deduction of taxes that a shareholder would pay on fund distributions or the redemption of fund shares.
The Morgan Stanley Capital International (MSCI) All Country World (ACW) Ex-U.S. Investable Market Index (IMI) (net) is a free float-adjusted market capitalization weighted index that is designed to measure the equity market performance of developed and emerging markets, excluding the United States. This index approximates the minimum possible dividend reinvestment by deducting for the highest possible withholding tax rates of those markets.
This report identifies the Fund’s investments on December 31, 2020. These holdings are subject to change. Not all stocks in the Fund performed the same, nor is there any guarantee that these stocks will perform as well in the future. Market forecasts provided in this report may not necessarily come to pass.
Sector Diversification (Unaudited)
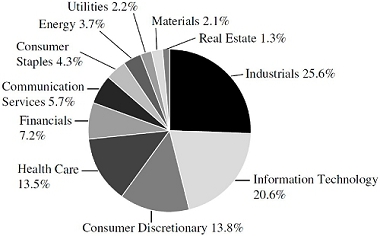
The sector diversification shown is based on the total long-term securities.
| 40 | Annual Report | December 31, 2020 |
International Leaders Fund
Portfolio of Investments, December 31, 2020 (all dollar amounts in thousands)
| | | | | | | | |
| | | | | | | | |
| | Issuer | | Shares | | | Value | |
| | | | | | | | |
| | Common Stocks | | | | | | | | |
| | | | | | | | | | |
| | Europe—45.5% | | | | | | | | |
| | Denmark—6.7% | | | | | | | | |
| * | Chr Hansen Holding A/S (Chemicals) | | | 41,337 | | | $ | 4,250 | |
| | Coloplast A/S Class “B” (Health care equipment & supplies) | | | 102,436 | | | | 15,630 | |
| | DSV PANALPINA A/S (Air freight & logistics) | | | 73,365 | | | | 12,283 | |
| | Novo Nordisk A/S Class “B” (Pharmaceuticals) | | | 245,934 | | | | 17,223 | |
| | Orsted A/S (Electric utilities) | | | 117,571 | | | | 23,997 | |
| | | | | | | | | 73,383 | |
| | Finland—2.0% | | | | | | | | |
| | Neste Oyj (Oil, gas & consumable fuels) | | | 304,017 | | | | 21,972 | |
| | France—10.3% | | | | | | | | |
| * | Airbus SE (Aerospace & defense) | | | 174,624 | | | | 19,153 | |
| | L’Oreal S.A. (Personal products) | | | 42,714 | | | | 16,218 | |
| | LVMH Moet Hennessy Louis Vuitton SE (Textiles, apparel & luxury goods) | | | 56,206 | | | | 35,081 | |
| * | Safran S.A. (Aerospace & defense) | | | 160,532 | | | | 22,739 | |
| | Sartorius Stedim Biotech (Life sciences tools & services) | | | 26,958 | | | | 9,590 | |
| | Teleperformance (Professional services) | | | 31,543 | | | | 10,454 | |
| | | | | | | | | 113,235 | |
| | Germany—4.7% | | | | | | | | |
| | Infineon Technologies AG (Semiconductors & semiconductor equipment) | | | 763,560 | | | | 29,281 | |
| | Rational AG (Machinery) | | | 16,120 | | | | 14,996 | |
| * | TeamViewer AG (Software) | | | 150,574 | | | | 8,063 | |
| | | | | | | | | 52,340 | |
| | Ireland—1.4% | | | | | | | | |
| * | Kingspan Group plc (Building products) | | | 216,125 | | | | 15,155 | |
| | Netherlands—4.1% | | | | | | | | |
| * | Adyen N.V. (IT services) | | | 12,335 | | | | 28,707 | |
| | ASML Holding N.V. (Semiconductors & semiconductor equipment) | | | 34,668 | | | | 16,837 | |
| | | | | | | | | 45,544 | |
| | Norway—1.0% | | | | | | | | |
| | TOMRA Systems ASA (Commercial services & supplies) | | | 215,681 | | | | 10,630 | |
| | Spain—1.3% | | | | | | | | |
| | Amadeus IT Group S.A. (IT services) | | | 191,728 | | | | 13,951 | |
| | Sweden—5.6% | | | | | | | | |
| | Atlas Copco AB Class “A” (Machinery) | | | 398,302 | | | | 20,386 | |
| | Hexagon AB Class “B” (Electronic equipment, instruments & components) | | | 314,710 | | | | 28,680 | |
| | Nibe Industrier AB Class “B” (Building products) | | | 369,814 | | | | 12,122 | |
| | | | | | | | | 61,188 | |
| | | | | | | | |
| | | | | | | | |
| | Issuer | | Shares | | | Value | |
| | | | | | | | |
| | Common Stocks—(continued) | | | | | | | | |
| | | | | | | | | | |
| | Europe—(continued) | | | | | | | | |
| | Switzerland—8.4% | | | | | | | | |
| | Lonza Group AG (Life sciences tools & services) | | | 37,660 | | | $ | 24,196 | |
| | Partners Group Holding AG (Capital markets) | | | 15,534 | | | | 18,248 | |
| | Sika AG (Chemicals) | | | 67,518 | | | | 18,441 | |
| | Straumann Holding AG (Health care equipment & supplies) | | | 16,603 | | | | 19,345 | |
| | Temenos AG (Software) | | | 91,384 | | | | 12,764 | |
| | | | | | | | | 92,994 | |
| | | | | | | | | | |
| | Emerging Asia—19.2% | | | | | | | | |
| | China—11.5% | | | | | | | | |
| * | Alibaba Group Holding, Ltd. (Internet & direct marketing retail) | | | 943,856 | | | | 28,319 | |
| | Foshan Haitian Flavouring & Food Co., Ltd. Class “A” (Food products) | | | 425,287 | | | | 13,041 | |
| | Kweichow Moutai Co., Ltd. Class “A” (Beverages) | | | 57,100 | | | | 17,445 | |
| | NetEase, Inc. (Entertainment) | | | 952,175 | | | | 18,129 | |
| * | TAL Education Group—ADR (Diversified consumer services) | | | 280,563 | | | | 20,063 | |
| | Tencent Holdings, Ltd. (Interactive Media & Services) | | | 413,100 | | | | 30,053 | |
| | | | | | | | | 127,050 | |
| | India—3.5% | | | | | | | | |
| | Housing Development Finance Corporation, Ltd. (Thrifts & mortgage finance) | | | 566,668 | | | | 19,776 | |
| | Reliance Industries, Ltd. (Oil, gas & consumable fuels) | | | 697,432 | | | | 18,396 | |
| | | | | | | | | 38,172 | |
| | Taiwan—3.0% | | | | | | | | |
| | Taiwan Semiconductor Manufacturing Co., Ltd. (Semiconductors & semiconductor equipment) | | | 1,762,000 | | | | 33,236 | |
| | Thailand—1.2% | | | | | | | | |
| * | Sea, Ltd.—ADR (Entertainment) | | | 66,703 | | | | 13,277 | |
| | | | | | | | | | |
| | United Kingdom—11.4% | | | | | | | | |
| | Ashtead Group plc (Trading companies & distributors) | | | 451,408 | | | | 21,223 | |
| | Compass Group plc (Hotels, restaurants & leisure) | | | 659,984 | | | | 12,302 | |
| | Experian plc (Professional services) | | | 503,600 | | | | 19,124 | |
| | Halma plc (Electronic equipment, instruments & components) | | | 306,876 | | | | 10,277 | |
| | London Stock Exchange Group plc (Capital markets) | | | 153,031 | | | | 18,851 | |
| * | Rentokil Initial plc (Commercial services & supplies) | | | 1,627,203 | | | | 11,340 | |
| | Segro plc (Equity REIT) | | | 1,096,708 | | | | 14,212 | |
| | Spirax-Sarco Engineering plc (Machinery) | | | 73,925 | | | | 11,418 | |
| * | Trainline plc (Internet & direct marketing retail) | | | 1,124,179 | | | | 7,133 | |
| | | | | | | | | 125,880 | |
See accompanying Notes to Financial Statements.
| December 31, 2020 | William Blair Funds | 41 |
International Leaders Fund
Portfolio of Investments, December 31, 2020 (all dollar amounts in thousands)
| | Issuer | | Shares or
Principal
Amount | | |
Value | |
| | | | | | | | |
| | Common Stocks—(continued) | | | | | | | | |
| | | | | | | | | | |
| | Japan—10.8% | | | | | | | | |
| | Asahi Intecc Co., Ltd. (Health care equipment & supplies) | | | 224,900 | | | $ | 8,200 | |
| | Daikin Industries, Ltd. (Building products) | | | 97,700 | | | | 21,687 | |
| | Hoya Corporation (Health care equipment & supplies) | | | 144,600 | | | | 19,984 | |
| | Keyence Corporation (Electronic equipment, instruments & components) | | | 55,400 | | | | 31,119 | |
| | M3, Inc. (Health care technology) | | | 66,100 | | | | 6,237 | |
| | Nihon M&A Center, Inc. (Professional services) | | | 186,900 | | | | 12,490 | |
| | SMC Corporation (Machinery) | | | 31,100 | | | | 18,960 | |
| | | | | | | | | 118,677 | |
| | | | | | | | | | |
| | Asia—6.1% | | | | | | | | |
| | Australia—3.4% | | | | | | | | |
| | Aristocrat Leisure, Ltd. (Hotels, restaurants & leisure) | | | 447,326 | | | | 10,691 | |
| * | Atlassian Corporation plc Class “A” (Software)† | | | 40,885 | | | | 9,562 | |
| | CSL, Ltd. (Biotechnology) | | | 75,006 | | | | 16,375 | |
| | | | | | | | | 36,628 | |
| | Hong Kong—1.9% | | | | | | | | |
| | AIA Group, Ltd. (Insurance) | | | 1,718,400 | | | | 21,057 | |
| | New Zealand—0.8% | | | | | | | | |
| | Fisher & Paykel Healthcare Corp., Ltd. (Health care equipment & supplies) | | | 379,176 | | | | 8,995 | |
| | | | | | | | | | |
| | Canada—3.0% | | | | | | | | |
| | Canadian National Railway Co. (Road & rail) | | | 187,111 | | | | 20,571 | |
| * | Lululemon Athletica, Inc. (Textiles, apparel & luxury goods) | | | 37,557 | | | | 13,071 | |
| | | | | | | | | 33,642 | |
| | | | | | | | | | |
| | Emerging Latin America—2.0% | | | | | | | | |
| | Argentina—2.0% | | | | | | | | |
| * | MercadoLibre, Inc. (Internet & direct marketing retail) | | | 12,929 | | | | 21,659 | |
| | Total Common Stocks—98.0%
(cost $732,420) | | | | | | | 1,078,665 | |
| | | | | | | | | | |
| | Repurchase Agreement | | | | | | | | |
| | Fixed Income Clearing Corporation, 0.000% dated 12/31/20, due 1/4/21, repurchase price $27,934, collateralized by U.S. Treasury Note, 0.500%, due 6/30/27, valued at $28,493 | | | $27,934 | | | | 27,934 | |
| | Total Repurchase Agreement—2.6%
(cost $27,934) | | | | | | | 27,934 | |
| | Total Investments—100.6%
(cost $760,354) | | | | | | | 1,106,599 | |
| | Liabilities, plus cash and other assets—(0.6)% | | | | | | | (6,246 | ) |
| | | | | | | | | |
| | | | | | | | | |
| | | | | | | | | |
| | | | | | | | | |
| Net assets—100.0% | | | | | | $ | 1,100,353 | |
ADR = American Depository Receipt
REIT = Real Estate Investment Trust
* = Non-income producing security
† = U.S. listed foreign security
At December 31, 2020, the Fund’s Portfolio of Investments includes the following industry categories (as a percentage of long-term investments):
| Industrials | | | 25.6% | |
| Information Technology | | | 20.6% | |
| Consumer Discretionary | | | 13.8% | |
| Health Care | | | 13.5% | |
| Financials | | | 7.2% | |
| Communication Services | | | 5.7% | |
| Consumer Staples | | | 4.3% | |
| Energy | | | 3.7% | |
| Utilities | | | 2.2% | |
| Materials | | | 2.1% | |
| Real Estate | | | 1.3% | |
| Total | | | 100.0% | |
| | | | | |
| At December 31, 2020, the Fund’s Portfolio of Investments includes the following currency categories (as a percentage of long-term investments): |
| | | | | |
| Euro | | | 24.3% | |
| British Pound Sterling | | | 11.7% | |
| Japanese Yen | | | 11.0% | |
| Hong Kong Dollar | | | 9.1% | |
| Swiss Franc | | | 8.6% | |
| U.S. Dollar | | | 7.2% | |
| Danish Krone | | | 6.8% | |
| Swedish Krona | | | 5.7% | |
| Indian Rupee | | | 3.5% | |
| New Taiwan Dollar | | | 3.1% | |
| Chinese Yuan Renminbi | | | 2.8% | |
| Australian Dollar | | | 2.5% | |
| Canadian Dollar | | | 1.9% | |
| All Other Currencies | | | 1.8% | |
| Total | | | 100.0% | |
See accompanying Notes to Financial Statements.
| 42 | Annual Report | December 31, 2020 |
| | International Growth Fund |
| | |
| | The International Growth Fund seeks long-term capital appreciation. |
| | |
| | AN OVERVIEW FROM THE PORTFOLIO MANAGERS |
| | |

Simon Fennell 
Kenneth J. McAtamney | The William Blair International Growth Fund (Class N shares) posted a 31.64% increase, net of fees, for the year ended December 31, 2020. By comparison, the Fund’s benchmark index, the MSCI All Country World ex-U.S. IMI (net) (the “Index”), increased 11.12%. Outperformance versus the Index was primarily driven by positive stock selection across all sectors. The Health Care, Communication Services and Industrials sectors were the most notable contributors to relative return. Within Health Care, Lonza contributed to relative results as the company posted positive financial results throughout the year. Lonza is a leader in custom manufacturing of biopharmaceuticals and specialty ingredients. Business trends remain strong, particularly in its pharma biotech segment amid the COVID-19 pandemic. Lonza offers highly visible growth, and given the strong market demand for outsourced biopharma production and related services, we remain confident it can deliver on growth in the future. Sea Ltd, a South East Asian mobile gaming and e-commerce company within Communication Services, was an additional source of outperformance. Sea primarily operates in seven South East Asian markets, including Indonesia, Malaysia, the Philippines, Singapore, Thailand, Taiwan and Vietnam. More recently, it has expanded its gaming operations to include India, Russia and Latin America. The company is the market leader in both gaming revenues and e-commerce, and current game success coupled with a robust pipeline are driving higher revenue growth and profitability expectations, and e-commerce operating metrics continue to be strong. Within the Industrials, DSV Panalpina propelled relative performance. DSV is a leading logistics company within Industrials. Following a path of steady organic growth and regular M&A, DSV is now one of the largest air and sea freight forwarders in the world. Its asset light business model allows it to generate high levels of return on invested capital with minimal ongoing capex needs that in turn powers market share gains and rising free cash flow. The stock made new highs in the fourth quarter after its share price completely recovered from its significant first quarter decline driven by the global COVID-19 pandemic, but failed to keep pace with the overall market. Partially offsetting these effects was the underweight allocation to the Materials sector coupled with negative effects from owning travel-related companies such as Airbus, Safran and Amadeus during the COVID-19 pandemic. We added to these positions post their sell-off to take advantage of attractive valuations and to prepare the portfolio for what we believe will be the inevitable recovery once economies begin to fully reopen. We believe that recent performance of these securities has begun to reflect increasing confidence of a strong economic snap back in 2021. Please refer to the Global Markets Review and Outlook relating to the Fund beginning on page 33. |
| December 31, 2020 | William Blair Funds | 43 |
International Growth Fund
Performance Highlights (Unaudited)
| Average Annual Total Returns through 12/31/2020 |
| | | 1 Year | | 3 Year | | 5 Year | | 10 Year | | Since
Inception(a) |
| Class N | | | 31.64 | % | | | 12.03 | % | | | 12.01 | % | | | 7.87 | % | | | — | |
| Class I | | | 31.99 | | | | 12.37 | | | | 12.36 | | | | 8.20 | | | | — | |
| Class R6 | | | 32.16 | | | | — | | | | — | | | | — | | | | 26.31 | % |
| MSCI ACW Ex-U.S. IMI (net) | | | 11.12 | | | | 4.83 | | | | 8.98 | | | | 5.06 | | | | 11.11 | |
| (a) | Since inception is for the period from May 2, 2019 (Commencement of Operations) to December 31, 2020. |
Performance cited represents past performance. Past performance does not guarantee future results and current performance may be lower or higher than the data quoted. Results shown are average annual total returns, which assume reinvestment of dividends and capital gains. Investment returns and principal will fluctuate and you may have a gain or loss when you sell shares. For the most current month-end performance information, please call 1-800-742-7272, or visit our Web site at www.williamblairfunds.com. Investing in smaller and medium capitalization companies involves special risks, including higher volatility and lower liquidity. Smaller and medium capitalization stocks are also more sensitive to purchase/sale transactions and changes in the issuer’s financial condition. International investing involves special risk considerations, including currency fluctuations, lower liquidity, economic and political risk. From time to time, the investment adviser may waive fees or reimburse expenses for the Fund. Without these waivers/reimbursements, performance would be lower. Class N shares are not subject to a sales load. Class I shares are not subject to a sales load or distribution (Rule 12b-1) fees. Class R6 shares are not subject to a sales load, distribution (Rule 12b-1) fees, or sub-transfer agent fees.
The performance highlights and graph presented above do not reflect the deduction of taxes that a shareholder would pay on fund distributions or the redemption of fund shares.
The Morgan Stanley Capital International (MSCI) All Country World (ACW) Ex-U.S. Investable Market Index (IMI) (net) is a free float-adjusted market capitalization weighted index that is designed to measure the equity market performance of developed and emerging markets, excluding the United States. This index approximates the minimum possible dividend reinvestment by deducting for the highest possible withholding tax rates of those markets.
This report identifies the Fund’s investments on December 31, 2020. These holdings are subject to change. Not all stocks in the Fund performed the same, nor is there any guarantee that these stocks will perform as well in the future. Market forecasts provided in this report may not necessarily come to pass.
Sector Diversification (Unaudited)
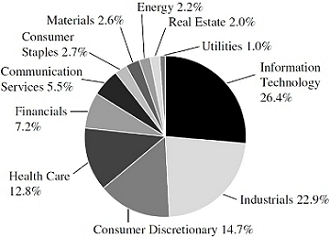
The sector diversification shown is based on the total long-term securities.
| 44 | Annual Report | December 31, 2020 |
International Growth Fund
Portfolio of Investments, December 31, 2020 (all dollar amounts in thousands)
| | | | | | | | |
| | | | | | | | |
| | Issuer | | Shares | | | Value | |
| | | | | | | | |
| | Common Stocks | | | | | | | | |
| | | | | | | | | | |
| | Europe, Mid-East—42.1% | | | | | | | | |
| | Belgium—0.3% | | | | | | | | |
| | Melexis N.V. (Semiconductors & semiconductor equipment) | | | 29,106 | | | $ | 2,841 | |
| | Warehouses De Pauw CVA (Equity REIT) | | | 128,219 | | | | 4,427 | |
| | | | | | | | | 7,268 | |
| | Denmark—4.9% | | | | | | | | |
| * | Chr Hansen Holding A/S (Chemicals) | | | 72,101 | | | | 7,413 | |
| | Coloplast A/S Class “B” (Health care equipment & supplies) | | | 62,812 | | | | 9,584 | |
| | DSV PANALPINA A/S (Air freight & logistics) | | | 210,734 | | | | 35,282 | |
| * | Genmab A/S (Biotechnology) | | | 39,667 | | | | 16,036 | |
| * | Netcompany Group A/S (Software) | | | 55,048 | | | | 5,625 | |
| | Novo Nordisk A/S Class “B” (Pharmaceuticals) | | | 223,304 | | | | 15,638 | |
| | Orsted A/S (Electric utilities) | | | 90,688 | | | | 18,510 | |
| | Royal Unibrew A/S (Beverages) | | | 41,715 | | | | 4,838 | |
| | | | | | | | | 112,926 | |
| | Finland—1.2% | | | | | | | | |
| | Neste Oyj (Oil, gas & consumable fuels) | | | 378,776 | | | | 27,375 | |
| | France—8.7% | | | | | | | | |
| * | Airbus SE (Aerospace & defense) | | | 281,209 | | | | 30,843 | |
| | Dassault Systemes SE (Software) | | | 82,940 | | | | 16,835 | |
| | Hermes International (Textiles, apparel & luxury goods) | | | 8,668 | | | | 9,314 | |
| | Kering S.A. (Textiles, apparel & luxury goods) | | | 22,296 | | | | 16,190 | |
| | L’Oreal S.A. (Personal products) | | | 58,013 | | | | 22,027 | |
| | LVMH Moet Hennessy Louis Vuitton SE (Textiles, apparel & luxury goods) | | | 53,390 | | | | 33,323 | |
| * | Orpea SA (Health care providers & services) | | | 37,526 | | | | 4,931 | |
| * | Safran S.A. (Aerospace & defense) | | | 203,239 | | | | 28,789 | |
| | Sartorius Stedim Biotech (Life sciences tools & services) | | | 24,300 | | | | 8,645 | |
| | Teleperformance (Professional services) | | | 50,979 | | | | 16,896 | |
| * | Worldline S.A. (IT services) | | | 146,849 | | | | 14,190 | |
| | | | | | | | | 201,983 | |
| | Germany—5.9% | | | | | | | | |
| | Carl Zeiss Meditec AG (Health care equipment & supplies) | | | 40,003 | | | | 5,322 | |
| | CompuGroup Medical SE & Co. KgaA (Health care technology) | | | 62,568 | | | | 6,008 | |
| * | HelloFresh SE (Internet & direct marketing retail) | | | 88,752 | | | | 6,852 | |
| * | Hypoport SE (Diversified financial services) | | | 2,343 | | | | 1,474 | |
| | Infineon Technologies AG (Semiconductors & semiconductor equipment) | | | 872,282 | | | | 33,450 | |
| | KION Group AG (Machinery) | | | 91,355 | | | | 7,942 | |
| | MTU Aero Engines AG (Aerospace & defense) | | | 111,587 | | | | 29,091 | |
| | Nemetschek SE (Software) | | | 53,137 | | | | 3,921 | |
| * | Puma SE (Textiles, apparel & luxury goods) | | | 159,182 | | | | 17,945 | |
| | | | | | | | |
| | | | | | | | |
| | Issuer | | Shares | | | Value | |
| | | | | | | | |
| | Common Stocks—(continued) | | | | | | | | |
| | | | | | | | | | |
| | Europe, Mid-East—(continued) | | | | | | | | |
| | Germany—(continued) | | | | | | | | |
| * | TeamViewer AG (Software) | | | 172,101 | | | $ | 9,215 | |
| | Vonovia SE (Real estate management & development) | | | 199,873 | | | | 14,592 | |
| | | | | | | | | 135,812 | |
| | Ireland—1.2% | | | | | | | | |
| * | ICON plc (Life sciences tools & services)† | | | 70,008 | | | | 13,650 | |
| * | Kingspan Group plc (Building products) | | | 190,332 | | | | 13,347 | |
| | | | | | | | | 26,997 | |
| | Israel—0.6% | | | | | | | | |
| * | CyberArk Software, Ltd. (Software)† | | | 37,222 | | | | 6,015 | |
| * | Wix.com, Ltd. (IT services)† | | | 34,919 | | | | 8,728 | |
| | | | | | | | | 14,743 | |
| | Italy—0.6% | | | | | | | | |
| * | Amplifon SpA (Health care providers & services) | | | 135,106 | | | | 5,618 | |
| * | Brunello Cucinelli SpA (Textiles, apparel & luxury goods) | | | 79,436 | | | | 3,464 | |
| * | Moncler SpA (Textiles, apparel & luxury goods) | | | 72,398 | | | | 4,435 | |
| | | | | | | | | 13,517 | |
| | Luxembourg—0.4% | | | | | | | | |
| * | Eurofins Scientific SE (Life sciences tools & services) | | | 105,137 | | | | 8,815 | |
| | Netherlands—4.0% | | | | | | | | |
| * | Adyen N.V. (IT services) | | | 13,518 | | | | 31,460 | |
| | ASML Holding N.V. (Semiconductors & semiconductor equipment) | | | 93,592 | | | | 45,454 | |
| | BE Semiconductor Industries N.V. (Semiconductors & semiconductor equipment) | | | 81,812 | | | | 4,955 | |
| | Euronext N.V. (Capital markets) | | | 42,232 | | | | 4,651 | |
| | IMCD N.V. (Trading companies & distributors) | | | 42,297 | | | | 5,387 | |
| | | | | | | | | 91,907 | |
| | Norway—0.4% | | | | | | | | |
| | TOMRA Systems ASA (Commercial services & supplies) | | | 190,913 | | | | 9,409 | |
| | Spain—1.2% | | | | | | | | |
| | Amadeus IT Group S.A. (IT services) | | | 328,243 | | | | 23,883 | |
| * | Solaria Energia y Medio Ambiente S.A. (Independent power & renewable electricity producers) | | | 149,935 | | | | 4,330 | |
| | | | | | | | | 28,213 | |
| | Sweden—5.7% | | | | | | | | |
| | AddTech AB Class “B” (Trading companies & distributors) | | | 238,184 | | | | 3,155 | |
| | Atlas Copco AB Class “A” (Machinery) | | | 700,714 | | | | 35,864 | |
| | Beijer Ref AB (Trading companies & distributors) | | | 117,021 | | | | 5,354 | |
| | Evolution Gaming Group AB (Hotels, restaurants & leisure) | | | 168,546 | | | | 17,101 | |
See accompanying Notes to Financial Statements.
| December 31, 2020 | William Blair Funds | 45 |
International Growth Fund
Portfolio of Investments, December 31, 2020 (all dollar amounts in thousands)
| | | | | | | | |
| | | | | | | | |
| | Issuer | | Shares | | | Value | |
| | | | | | | | |
| | Common Stocks—(continued) | | | | | | | | |
| | | | | | | | | | |
| | Europe, Mid-East—(continued) | | | | | | | | |
| | Sweden—(continued) | | | | | | | | |
| | Hexagon AB Class “B” (Electronic equipment, instruments & components) | | | 341,790 | | | $ | 31,148 | |
| * | Indutrade AB (Trading companies & distributors) | | | 383,709 | | | | 8,217 | |
| | Investment AB Latour Class “B” (Industrial conglomerates) | | | 233,738 | | | | 5,673 | |
| | Lifco AB Class “B” (Industrial conglomerates) | | | 59,342 | | | | 5,691 | |
| | Nibe Industrier AB Class “B” (Building products) | | | 234,157 | | | | 7,676 | |
| * | Nolato AB Class “B” (Industrial conglomerates) | | | 52,486 | | | | 5,308 | |
| | Sweco AB Class “B” (Construction & engineering) | | | 236,954 | | | | 4,349 | |
| * | Vitrolife AB (Biotechnology) | | | 97,275 | | | | 2,551 | |
| | | | | | | | | 132,087 | |
| | Switzerland—7.0% | | | | | | | | |
| | Belimo Holding AG (Building products) | | | 500 | | | | 4,338 | |
| | Logitech International S.A. (Technology hardware, storage & peripherals) | | | 127,373 | | | | 12,362 | |
| | Lonza Group AG (Life sciences tools & services) | | | 43,822 | | | | 28,155 | |
| | Partners Group Holding AG (Capital markets) | | | 14,029 | | | | 16,480 | |
| * | SIG Combibloc Group AG (Containers & packaging) | | | 297,531 | | | | 6,903 | |
| | Sika AG (Chemicals) | | | 108,753 | | | | 29,703 | |
| * | Softwareone Holding AG (Electronic equipment, instruments & components) . | | | 147,059 | | | | 4,352 | |
| | STMicroelectronics N.V. (Semiconductors & semiconductor equipment) | | | 512,294 | | | | 19,120 | |
| | Straumann Holding AG (Health care equipment & supplies) | | | 13,629 | | | | 15,880 | |
| | Tecan Group AG (Life sciences tools & services) | | | 13,663 | | | | 6,695 | |
| | Temenos AG (Software) | | | 65,332 | | | | 9,125 | |
| | VAT Group AG (Machinery) | | | 25,188 | | | | 6,282 | |
| * | Zur Rose Group AG (Food & staples retailing) | | | 10,101 | | | | 3,229 | |
| | | | | | | | | 162,624 | |
| | | | | | | | | | |
| | Emerging Asia—25.6% | | | | | | | | |
| | China—16.0% | | | | | | | | |
| | A-Living Smart City Services Co., Ltd. Class “H” (Commercial services & supplies) | | | 688,500 | | | | 3,055 | |
| | Aier Eye Hospital Group Co., Ltd. Class “A” (Health care providers & services) | | | 967,516 | | | | 11,079 | |
| | AK Medical Holdings, Ltd. (Health care equipment & supplies) | | | 802,000 | | | | 1,393 | |
| * | Alibaba Group Holding, Ltd. (Internet & direct marketing retail) | | | 1,362,884 | | | | 40,891 | |
| | Centre Testing International Group Co., Ltd. Class “A” (Professional services) | | | 2,159,100 | | | | 9,036 | |
| | | | | | | | |
| | | | | | | | |
| | Issuer | | Shares | | | Value | |
| | | | | | | | |
| | Common Stocks—(continued) | | | | | | | | |
| | | | | | | | | | |
| | Emerging Asia—(continued) | | | | | | | | |
| | China—(continued) | | | | | | | | |
| | Chacha Food Co., Ltd. Class “A” (Food products) | | | 446,842 | | | $ | 3,679 | |
| | Country Garden Services Holdings Co., Ltd. (Commercial services & supplies) | | | 1,612,000 | | | | 10,906 | |
| | Foshan Haitian Flavouring & Food Co., Ltd. Class “A” (Food products) | | | 316,259 | | | | 9,698 | |
| | Hangzhou Tigermed Consulting Co., Ltd. Class “A” (Life sciences tools & services) | | | 470,870 | | | | 11,636 | |
| * | JD.com, Inc. Class “A” (Internet & direct marketing retail) | | | 414,300 | | | | 18,277 | |
| | Kweichow Moutai Co., Ltd. Class “A” (Beverages) | | | 50,253 | | | | 15,353 | |
| | Li Ning Co., Ltd. (Textiles, apparel & luxury goods) | | | 3,342,000 | | | | 22,977 | |
| * | Meituan Class “B” (Internet & direct marketing retail) | | | 463,700 | | | | 17,621 | |
| | NAURA Technology Group Co., Ltd. Class “A” (Semiconductors & semiconductor equipment) | | | 170,413 | | | | 4,710 | |
| | NetEase, Inc. (Entertainment) | | | 922,025 | | | | 17,555 | |
| | Offcn Education Technology Co., Ltd. Class “A” (Diversified consumer services) | | | 907,421 | | | | 4,874 | |
| | Ping An Insurance Group Co. of China, Ltd. Class “H” (Insurance) | | | 1,933,000 | | | | 23,687 | |
| | Shenzhen Mindray Bio-Medical Electronics Co., Ltd. Class “A” (Health care equipment & supplies) | | | 95,150 | | | | 6,198 | |
| | Shenzhou International Group Holdings, Ltd. (Textiles, apparel & luxury goods) | | | 434,000 | | | | 8,509 | |
| | Silergy Corporation (Semiconductors & semiconductor equipment) | | | 142,000 | | | | 12,180 | |
| * | TAL Education Group—ADR (Diversified consumer services) | | | 289,891 | | | | 20,730 | |
| | Tencent Holdings, Ltd. (Interactive Media & Services) | | | 688,200 | | | | 50,067 | |
| * | Tencent Music Entertainment Group—ADR (Entertainment) | | | 237,657 | | | | 4,573 | |
| * | Topchoice Medical Corporation Class “A” (Health care providers & services) | | | 195,739 | | | | 8,276 | |
| * | Venus MedTech Hangzhou, Inc. Class “H” (Health care equipment & supplies) | | | 277,000 | | | | 2,825 | |
| | Will Semiconductor Co., Ltd. Class “A” (Semiconductors & semiconductor equipment) | | | 79,177 | | | | 2,798 | |
| | WuXi AppTec Co., Ltd. Class “A” (Life sciences tools & services) | | | 278,714 | | | | 5,742 | |
| * | Wuxi Biologics Cayman, Inc. (Life sciences tools & services) | | | 1,658,000 | | | | 21,986 | |
| | | | | | | | | 370,311 | |
| | India—2.0% | | | | | | | | |
| * | HDFC Bank, Ltd. (Banks) | | | 766,791 | | | | 15,095 | |
| | Ipca Laboratories, Ltd. (Pharmaceuticals) | | | 114,663 | | | | 3,445 | |
| | Pidilite Industries, Ltd. (Chemicals) | | | 153,159 | | | | 3,698 | |
See accompanying Notes to Financial Statements.
| 46 | Annual Report | December 31, 2020 |
International Growth Fund
Portfolio of Investments, December 31, 2020 (all dollar amounts in thousands)
| | | | | | | | |
| | | | | | | | |
| | Issuer | | Shares | | | Value | |
| | | | | | | | |
| | Common Stocks—(continued) | | | | | | | | |
| | | | | | | | | | |
| | Emerging Asia—(continued) | | | | | | | | |
| | India—(continued) | | | | | | | | |
| | Reliance Industries, Ltd. (Oil, gas & consumable fuels) | | | 885,369 | | | $ | 23,473 | |
| | | | | | | | | 45,711 | |
| | Indonesia—0.9% | | | | | | | | |
| | Bank Central Asia Tbk PT (Banks) | | | 8,442,600 | | | | 20,340 | |
| | South Korea—1.2% | | | | | | | | |
| | Kakao Corporation (Interactive Media & Services) | | | 35,163 | | | | 12,608 | |
| | Samsung SDI Co., Ltd. (Electronic equipment, instruments & components) | | | 28,978 | | | | 16,752 | |
| | | | | | | | | 29,360 | |
| | Taiwan—4.1% | | | | | | | | |
| | Airtac International Group (Machinery) | | | 135,000 | | | | 4,324 | |
| | Globalwafers Co., Ltd. (Semiconductors & semiconductor equipment) | | | 249,000 | | | | 6,274 | |
| | MediaTek, Inc. (Semiconductors & semiconductor equipment) | | | 1,123,000 | | | | 29,856 | |
| | Taiwan Semiconductor Manufacturing Co., Ltd.—ADR (Semiconductors & semiconductor equipment) | | | 497,573 | | | | 54,255 | |
| | | | | | | | | 94,709 | |
| | Thailand—1.4% | | | | | | | | |
| | Airports of Thailand PCL (Transportation infrastructure) | | | 1,355,900 | | | | 2,817 | |
| | Carabao Group PCL Class “F” (Beverages) | | | 764,500 | | | | 2,922 | |
| * | Sea, Ltd.—ADR (Entertainment) | | | 135,069 | | | | 26,886 | |
| | | | | | | | | 32,625 | |
| | | | | | | | | | |
| | Japan—12.5% | | | | | | | | |
| | Asahi Intecc Co., Ltd. (Health care equipment & supplies) | | | 273,100 | | | | 9,958 | |
| * | BASE, Inc. (IT services) | | | 50,800 | | | | 4,802 | |
| | Benefit One, Inc. (Professional services) | | | 184,900 | | | | 5,462 | |
| * | Bengo4.com, Inc. (Interactive Media & Services) | | | 32,100 | | | | 3,184 | |
| | Daikin Industries, Ltd. (Building products) | | | 118,600 | | | | 26,326 | |
| | Disco Corporation (Semiconductors & semiconductor equipment) | | | 42,000 | | | | 14,135 | |
| | GMO Payment Gateway, Inc. (IT services) | | | 47,300 | | | | 6,340 | |
| | Harmonic Drive Systems, Inc. (Machinery) | | | 78,500 | | | | 7,010 | |
| | Hoya Corporation (Health care equipment & supplies) | | | 130,500 | | | | 18,035 | |
| | Keyence Corporation (Electronic equipment, instruments & components) | | | 80,000 | | | | 44,937 | |
| | M3, Inc. (Health care technology) | | | 146,000 | | | | 13,776 | |
| | MISUMI Group, Inc. (Machinery) | | | 201,300 | | | | 6,599 | |
| | MonotaRO Co., Ltd. (Trading companies & distributors) | | | 179,800 | | | | 9,142 | |
| | Nihon M&A Center, Inc. (Professional services) | | | 204,600 | | | | 13,672 | |
| | Nomura Research Institute, Ltd. (IT services) | | | 355,000 | | | | 12,704 | |
| | | | | | | | |
| | | | | | | | |
| | Issuer | | Shares | | | Value | |
| | | | | | | | |
| | Common Stocks—(continued) | | | | | | | | |
| | | | | | | | | | |
| | Japan—(continued) | | | | | | | | |
| | Olympus Corporation (Health care equipment & supplies) | | | 487,200 | | | $ | 10,647 | |
| | Omron Corporation (Electronic equipment, instruments & components) | | | 278,600 | | | | 24,823 | |
| | Rakus Co., Ltd. (Software) | | | 209,500 | | | | 4,853 | |
| * | SHIFT, Inc. (IT services) | | | 31,400 | | | | 4,352 | |
| | SMC Corporation (Machinery) | | | 49,000 | | | | 29,873 | |
| | Sushiro Global Holdings, Ltd. (Hotels, restaurants & leisure) | | | 140,900 | | | | 5,390 | |
| | TechnoPro Holdings, Inc. (Professional services) | | | 68,800 | | | | 5,697 | |
| | TIS, Inc. (IT services) | | | 335,400 | | | | 6,867 | |
| | | | | | | | | 288,584 | |
| | | | | | | | | | |
| | United Kingdom—9.7% | | | | | | | | |
| | 3i Group plc (Capital markets) | | | 511,054 | | | | 8,093 | |
| | Abcam plc (Biotechnology) | | | 130,155 | | | | 2,759 | |
| | Ashtead Group plc (Trading companies & distributors) | | | 431,291 | | | | 20,277 | |
| | Avast plc (Software) | | | 874,529 | | | | 6,428 | |
| | AVEVA Group plc (Software) | | | 177,850 | | | | 7,788 | |
| | Big Yellow Group plc (Equity REIT) | | | 274,616 | | | | 4,120 | |
| * | boohoo Group plc (Internet & direct marketing retail) | | | 927,267 | | | | 4,349 | |
| | Compass Group plc (Hotels, restaurants & leisure) | | | 1,038,500 | | | | 19,357 | |
| | Croda International plc (Chemicals) | | | 138,859 | | | | 12,525 | |
| | Diploma plc (Trading companies & distributors) | | | 137,177 | | | | 4,112 | |
| | Experian plc (Professional services) | | | 513,617 | | | | 19,505 | |
| | Halma plc (Electronic equipment, instruments & components) | | | 496,070 | | | | 16,613 | |
| | Intermediate Capital Group plc (Capital markets) | | | 395,470 | | | | 9,334 | |
| | Intertek Group plc (Professional services) . | | | 118,957 | | | | 9,188 | |
| | London Stock Exchange Group plc (Capital markets) | | | 169,962 | | | | 20,937 | |
| * | Renishaw plc (Electronic equipment, instruments & components) | | | 58,615 | | | | 4,617 | |
| * | Rentokil Initial plc (Commercial services & supplies) | | | 1,971,235 | | | | 13,737 | |
| | Rotork plc (Machinery) | | | 1,391,713 | | | | 6,052 | |
| | Segro plc (Equity REIT) | | | 1,001,196 | | | | 12,974 | |
| | Softcat plc (IT services) | | | 200,087 | | | | 3,759 | |
| | Spirax-Sarco Engineering plc (Machinery) . | | | 89,617 | | | | 13,842 | |
| * | Trainline plc (Internet & direct marketing retail) | | | 698,810 | | | | 4,434 | |
| | | | | | | | | 224,800 | |
| | | | | | | | | | |
| | Asia—3.7% | | | | | | | | |
| | Australia—2.2% | | | | | | | | |
| | Aristocrat Leisure, Ltd. (Hotels, restaurants & leisure) | | | 531,095 | | | | 12,693 | |
See accompanying Notes to Financial Statements.
| December 31, 2020 | William Blair Funds | 47 |
International Growth Fund
Portfolio of Investments, December 31, 2020 (all dollar amounts in thousands)
| | | | | | | | |
| | | | | | | | |
| | Issuer | | Shares | | | Value | |
| | | | | | | | |
| | Common Stocks—(continued) | | | | | | | | |
| | | | | | | | | | |
| | Asia—(continued) | | | | | | | | |
| | Australia—(continued) | | | | | | | | |
| * | Atlassian Corporation plc Class “A” (Software)† | | | 61,976 | | | $ | 14,494 | |
| | CSL, Ltd. (Biotechnology) | | | 60,937 | | | | 13,304 | |
| | Goodman Group (Equity REIT) | | | 629,330 | | | | 9,175 | |
| | | | | | | | | 49,666 | |
| | Hong Kong—1.5% | | | | | | | | |
| | AIA Group, Ltd. (Insurance) | | | 2,882,800 | | | | 35,326 | |
| | | | | | | | | | |
| | Canada—2.6% | | | | | | | | |
| | Canadian National Railway Co. (Road & rail) | | | 265,879 | | | | 29,230 | |
| | Enghouse Systems, Ltd. (Software) | | | 63,911 | | | | 3,096 | |
| * | Kinaxis, Inc. (Software) | | | 33,260 | | | | 4,712 | |
| * | Lululemon Athletica, Inc. (Textiles, apparel & luxury goods) | | | 53,588 | | | | 18,650 | |
| | Toromont Industries, Ltd. (Trading companies & distributors) | | | 48,393 | | | | 3,391 | |
| | | | | | | | | 59,079 | |
| | | | | | | | | | |
| | Emerging Latin America—2.4% | | | | | | | | |
| | Argentina—1.0% | | | | | | | | |
| * | Globant S.A. (IT services)† | | | 29,956 | | | | 6,519 | |
| * | MercadoLibre, Inc. (Internet & direct marketing retail) | | | 9,625 | | | | 16,124 | |
| | | | | | | | | 22,643 | |
| | Brazil—1.3% | | | | | | | | |
| | B3 S.A. - Brasil Bolsa Balcao (Capital markets) | | | 832,500 | | | | 9,934 | |
| | Locaweb Servicos de Internet S.A. (IT services) | | | 352,100 | | | | 5,455 | |
| | Magazine Luiza S.A. (Multiline retail) | | | 1,853,100 | | | | 8,901 | |
| | Notre Dame Intermedica Participacoes S.A. (Health care providers & services) | | | 354,000 | | | | 5,339 | |
| | | | | | | | | 29,629 | |
| | Mexico—0.1% | | | | | | | | |
| * | Grupo Aeroportuario del Sureste S.A.B. de C.V.—ADR (Transportation infrastructure) | | | 24,821 | | | | 4,094 | |
| | | | | | | | | | |
| | Emerging Europe—0.8% | | | | | | | | |
| | Poland—0.3% | | | | | | | | |
| * | Allegro.eu S.A. (Internet & direct marketing retail) | | | 281,256 | | | | 6,377 | |
| | Russia—0.5% | | | | | | | | |
| * | Yandex N.V. Class “A” (Interactive Media & Services)† | | | 176,114 | | | | 12,254 | |
| | Total Common Stocks—99.4%
(cost $1,262,683) | | | | | | | 2,299,184 | |
| | | | | | | | | | |
| | | | | | | | |
| | | | Principal | | | | |
| | Issuer | | Amount | | | Value | |
| | | | | |
| | Repurchase Agreement | | | | | | | | |
| | Fixed Income Clearing Corporation, 0.000% dated 12/31/20, due 1/4/21, repurchase price $11,737, collateralized by U.S. Treasury Note, 0.500%, due 6/30/27, valued at $11,972 | | | $11,737 | | | $ | 11,737 | |
| | Total Repurchase Agreement—0.5%
(cost $11,737) | | | | | | | 11,737 | |
| | Total Investments—99.9%
(cost $1,274,420) | | | | | | | 2,310,921 | |
| | Cash and other assets, less liabilities—0.1% | | | | | | | 1,729 | |
| | Net assets—100.0% | | | | | | $ | 2,312,650 | |
ADR = American Depository Receipt
REIT = Real Estate Investment Trust
* = Non-income producing security
† = U.S. listed foreign security
At December 31, 2020, the Fund’s Portfolio of Investments includes the following industry categories (as a percentage of long-term investments):
| Information Technology | | | 26.4% | |
| Industrials | | | 22.9% | |
| Consumer Discretionary | | | 14.7% | |
| Health Care | | | 12.8% | |
| Financials | | | 7.2% | |
| Communication Services | | | 5.5% | |
| Consumer Staples | | | 2.7% | |
| Materials | | | 2.6% | |
| Energy | | | 2.2% | |
| Real Estate | | | 2.0% | |
| Utilities | | | 1.0% | |
| Total | | | 100.0% | |
At December 31, 2020, the Fund’s Portfolio of Investments includes the following currency categories (as a percentage of long-term investments):
| Euro | | | 23.8% | |
| Japanese Yen | | | 12.6% | |
| Hong Kong Dollar | | | 12.0% | |
| British Pound Sterling | | | 9.8% | |
| U.S. Dollar | | | 9.0% | |
| Swiss Franc | | | 6.2% | |
| Swedish Krona | | | 5.7% | |
| Danish Krone | | | 4.9% | |
| Chinese Yuan Renminbi | | | 4.0% | |
| New Taiwan Dollar | | | 2.3% | |
| Indian Rupee | | | 2.0% | |
| Canadian Dollar | | | 1.8% | |
| Australian Dollar | | | 1.5% | |
| Brazilian Real | | | 1.3% | |
| South Korean Won | | | 1.3% | |
| All Other Currencies | | | 1.8% | |
| Total | | | 100.0% | |
See accompanying Notes to Financial Statements.
| 48 | Annual Report | December 31, 2020 |
| | Institutional International Growth Fund |
| | |
| | The Institutional International Growth Fund seeks long-term capital appreciation. |
| | |
| | AN OVERVIEW FROM THE PORTFOLIO MANAGERS |
| | |

Simon Fennell 
Kenneth J. McAtamney | The William Blair Institutional International Growth Fund posted a 32.47% increase, net of fees, for the year ended December 31, 2020. By comparison, the Fund’s benchmark index, the MSCI All Country World ex-U.S. IMI (net) (the “Index”), increased 11.12%. Outperformance versus the Index was primarily driven by positive stock selection across all sectors. The Health Care, Communication Services and Industrials sectors were the most notable contributors to relative return. Within Health Care, Lonza contributed to relative results as the company posted positive financial results throughout the year. Lonza is a leader in custom manufacturing of biopharmaceuticals and specialty ingredients. Business trends remain strong, particularly in its pharma biotech segment amid the COVID-19 pandemic. Lonza offers highly visible growth, and given the strong market demand for outsourced biopharma production and related services, we remain confident it can deliver on growth in the future. Sea Ltd, a South East Asian mobile gaming and e-commerce company within Communication Services, was an additional source of outperformance. Sea primarily operates in seven South East Asian markets, including Indonesia, Malaysia, the Philippines, Singapore, Thailand, Taiwan and Vietnam. More recently, it has expanded its gaming operations to include India, Russia and Latin America. The company is the market leader in both gaming revenues and e-commerce, and current game success coupled with a robust pipeline are driving higher revenue growth and profitability expectations, and e-commerce operating metrics continue to be strong. Within the Industrials, DSV Panalpina propelled relative performance. DSV is a leading logistics company within Industrials. Following a path of steady organic growth and regular M&A, DSV is now one of the largest air and sea freight forwarders in the world. Its asset light business model allows it to generate high levels of return on invested capital with minimal ongoing capex needs that in turn powers market share gains and rising free cash flow. The stock made new highs in the fourth quarter after its share price completely recovered from its significant first quarter decline driven by the global COVID-19 pandemic, but failed to keep pace with the overall market. Partially offsetting these effects was the underweight allocation to the Materials sector coupled with negative effects from owning travel-related companies such as Airbus, Safran and Amadeus during the COVID-19 pandemic. We added to these positions post their sell-off to take advantage of attractive valuations and to prepare the portfolio for what we believe will be the inevitable recovery once economies begin to fully reopen. Recent performance of these securities has begun to reflect increasing confidence of a strong economic snap back in 2021. Please refer to the Global Markets Review and Outlook relating to the Fund beginning on page 33. |
| December 31, 2020 | William Blair Funds | 49 |
Institutional International Growth Fund
Performance Highlights (Unaudited)
| |
| Average Annual Total Returns through 12/31/2020 |
| | | | | | | | | |
| | | 1 Year | | 3 Year | | 5 Year | | 10 Year |
| Institutional | | | | | | | | | | | | | | | | |
| International Growth Fund | | | 32.47 | % | | | 12.63 | % | | | 12.56 | % | | | 8.41 | % |
| MSCI ACW Ex-U.S. IMI (net) | | | 11.12 | | | | 4.83 | | | | 8.98 | | | | 5.06 | |
Performance cited represents past performance. Past performance does not guarantee future results and current performance may be lower or higher than the data quoted. Results shown are average annual total returns, which assume reinvestment of dividends and capital gains. Investment returns and principal will fluctuate and you may have a gain or loss when you sell shares. For the most current month-end performance information, please call 1-800-742-7272, or visit our Web site at www.williamblairfunds.com. From time to time, the investment adviser may waive fees or reimburse expenses for the Fund. Without these waivers/reimbursements, performance would be lower. Investing in smaller and medium capitalization companies involves special risks, including higher volatility and lower liquidity. Smaller and medium capitalization stocks are also more sensitive to purchase/sale transactions and changes in the issuer’s financial condition. International investing involves special risk considerations, including currency fluctuations, lower liquidity, economic and political risk. Shares of the Fund are not subject to a sales load, distribution (Rule 12b-1) fees, or sub-transfer agent fees.
The performance highlights and graph presented above do not reflect the deduction of taxes that a shareholder would pay on fund distributions or the redemption of fund shares.
The Morgan Stanley Capital International (MSCI) All Country World (ACW) Ex-U.S. Investable Market Index (IMI) (net) is a free float-adjusted market capitalization weighted index that is designed to measure the equity market performance of developed and emerging markets, excluding the United States. This index approximates the minimum possible dividend reinvestment by deducting for the highest possible withholding tax rates of those markets.
This report identifies the Fund’s investments on December 31, 2020. These holdings are subject to change. Not all stocks in the Fund performed the same, nor is there any guarantee that these stocks will perform as well in the future. Market forecasts provided in this report may not necessarily come to pass.
Sector Diversification (Unaudited)

The sector diversification shown is based on the total long-term securities.
| 50 | Annual Report | December 31, 2020 |
Institutional International Growth Fund
Portfolio of Investments, December 31, 2020 (all dollar amounts in thousands)
| | | | | | | | |
| | | | | | | | |
| | Issuer | | Shares | | | Value | |
| | | | | | | | |
| | Common Stocks | | | | | | | | |
| | | | | | | | | | |
| | Europe, Mid-East—42.0% | | | | | | | | |
| | Belgium—0.3% | | | | | | | | |
| | Melexis N.V. (Semiconductors & semiconductor equipment) | | | 16,633 | | | $ | 1,623 | |
| | Warehouses De Pauw CVA (Equity REIT) | | | 73,272 | | | | 2,530 | |
| | | | | | | | | 4,153 | |
| | Denmark—4.9% | | | | | | | | |
| * | Chr Hansen Holding A/S (Chemicals) | | | 41,373 | | | | 4,254 | |
| | Coloplast A/S Class “B” (Health care equipment & supplies) | | | 36,042 | | | | 5,499 | |
| | DSV PANALPINA A/S (Air freight & logistics) | | | 120,922 | | | | 20,245 | |
| * | Genmab A/S (Biotechnology) | | | 22,761 | | | | 9,202 | |
| * | Netcompany Group A/S (Software) | | | 31,587 | | | | 3,228 | |
| | Novo Nordisk A/S Class “B” (Pharmaceuticals) | | | 128,135 | | | | 8,973 | |
| | Orsted A/S (Electric utilities) | | | 52,038 | | | | 10,621 | |
| | Royal Unibrew A/S (Beverages) | | | 23,937 | | | | 2,776 | |
| | | | | | | | | 64,798 | |
| | Finland—1.2% | | | | | | | | |
| | Neste Oyj (Oil, gas & consumable fuels) | | | 217,347 | | | | 15,708 | |
| | France—8.7% | | | | | | | | |
| * | Airbus SE (Aerospace & defense) | | | 160,701 | | | | 17,626 | |
| | Dassault Systemes SE (Software) | | | 47,397 | | | | 9,621 | |
| | Hermes International (Textiles, apparel & luxury goods) | | | 4,954 | | | | 5,323 | |
| | Kering S.A. (Textiles, apparel & luxury goods) | | | 12,741 | | | | 9,252 | |
| | L’Oreal S.A. (Personal products) | | | 33,152 | | | | 12,587 | |
| | LVMH Moet Hennessy Louis Vuitton SE (Textiles, apparel & luxury goods) | | | 30,510 | | | | 19,043 | |
| * | Orpea SA (Health care providers & services) | | | 21,444 | | | | 2,817 | |
| * | Safran S.A. (Aerospace & defense) | | | 116,144 | | | | 16,452 | |
| | Sartorius Stedim Biotech (Life sciences tools & services) | | | 13,887 | | | | 4,940 | |
| | Teleperformance (Professional services) | | | 29,133 | | | | 9,656 | |
| * | Worldline S.A. (IT services) | | | 83,919 | | | | 8,109 | |
| | | | | | | | | 115,426 | |
| | Germany—5.9% | | | | | | | | |
| | Carl Zeiss Meditec AG (Health care equipment & supplies) | | | 22,954 | | | | 3,054 | |
| | CompuGroup Medical SE & Co. KgaA (Health care technology) | | | 35,902 | | | | 3,447 | |
| * | HelloFresh SE (Internet & direct marketing retail) | | | 50,927 | | | | 3,932 | |
| * | Hypoport SE (Diversified financial services) | | | 1,363 | | | | 857 | |
| | Infineon Technologies AG (Semiconductors & semiconductor equipment) | | | 500,527 | | | | 19,194 | |
| | KION Group AG (Machinery) | | | 52,421 | | | | 4,557 | |
| | MTU Aero Engines AG (Aerospace & defense) | | | 64,030 | | | | 16,693 | |
| | Nemetschek SE (Software) | | | 30,491 | | | | 2,250 | |
| | | | | | | | |
| | | | | | | | |
| | Issuer | | Shares | | | Value | |
| | | | | | | | |
| | Common Stocks—(continued) | | | | | | | | |
| | | | | | | | | | |
| | Europe, Mid-East—(continued) | | | | | | | | |
| | Germany—(continued) | | | | | | | | |
| * | Puma SE (Textiles, apparel & luxury goods) | | | 91,340 | | | $ | 10,297 | |
| * | TeamViewer AG (Software) | | | 98,754 | | | | 5,288 | |
| | Vonovia SE (Real estate management & development) | | | 114,690 | | | | 8,373 | |
| | | | | | | | | 77,942 | |
| | Ireland—1.2% | | | | | | | | |
| * | ICON plc (Life sciences tools & services)† | | | 40,007 | | | | 7,801 | |
| * | Kingspan Group plc (Building products) | | | 108,767 | | | | 7,627 | |
| | | | | | | | | 15,428 | |
| | Israel—0.6% | | | | | | | | |
| * | CyberArk Software, Ltd. (Software)† | | | 21,271 | | | | 3,437 | |
| * | Wix.com, Ltd. (IT services)† | | | 19,955 | | | | 4,988 | |
| | | | | | | | | 8,425 | |
| | Italy—0.6% | | | | | | | | |
| * | Amplifon SpA (Health care providers & services) | | | 77,526 | | | | 3,224 | |
| * | Brunello Cucinelli SpA (Textiles, apparel & luxury goods) | | | 45,581 | | | | 1,988 | |
| * | Moncler SpA (Textiles, apparel & luxury goods) | | | 41,543 | | | | 2,545 | |
| | | | | | | | | 7,757 | |
| | Luxembourg—0.4% | | | | | | | | |
| * | Eurofins Scientific SE (Life sciences tools & services) | | | 60,082 | | | | 5,038 | |
| | Netherlands—3.9% | | | | | | | | |
| * | Adyen N.V. (IT services) | | | 7,725 | | | | 17,978 | |
| | ASML Holding N.V. (Semiconductors & semiconductor equipment) | | | 53,484 | | | | 25,975 | |
| | BE Semiconductor Industries N.V. (Semiconductors & semiconductor equipment) | | | 46,752 | | | | 2,832 | |
| | Euronext N.V. (Capital markets) | | | 24,134 | | | | 2,658 | |
| | IMCD N.V. (Trading companies & distributors) | | | 24,171 | | | | 3,078 | |
| | | | | | | | | 52,521 | |
| | Norway—0.4% | | | | | | | | |
| | TOMRA Systems ASA (Commercial services & supplies) | | | 109,549 | | | | 5,399 | |
| | Spain—1.2% | | | | | | | | |
| | Amadeus IT Group S.A. (IT services) | | | 187,578 | | | | 13,648 | |
| * | Solaria Energia y Medio Ambiente S.A. (Independent power & renewable electricity producers) | | | 85,682 | | | | 2,475 | |
| | | | | | | | | 16,123 | |
| | Sweden—5.7% | | | | | | | | |
| | AddTech AB Class “B” (Trading companies & distributors) | | | 136,673 | | | | 1,811 | |
| | Atlas Copco AB Class “A” (Machinery) | | | 402,078 | | | | 20,579 | |
| | Beijer Ref AB (Trading companies & distributors) | | | 67,148 | | | | 3,072 | |
See accompanying Notes to Financial Statements.
| December 31, 2020 | William Blair Funds | 51 |
Institutional International Growth Fund
Portfolio of Investments, December 31, 2020 (all dollar amounts in thousands)
| | | | | | | | |
| | | | | | | | |
| | Issuer | | Shares | | | Value | |
| | | | | | | | |
| | Common Stocks—(continued) | | | | | | | | |
| | | | | | | | | | |
| | Europe, Mid-East—(continued) | | | | | | | | |
| | Sweden—(continued) | | | | | | | | |
| | Evolution Gaming Group AB (Hotels, restaurants & leisure) | | | 96,714 | | | $ | 9,813 | |
| | Hexagon AB Class “B” (Electronic equipment, instruments & components) | | | 196,124 | | | | 17,873 | |
| * | Indutrade AB (Trading companies & distributors) | | | 218,457 | | | | 4,679 | |
| | Investment AB Latour Class “B” (Industrial conglomerates) | | | 134,122 | | | | 3,255 | |
| | Lifco AB Class “B” (Industrial conglomerates) | | | 34,051 | | | | 3,265 | |
| | Nibe Industrier AB Class “B” (Building products) | | | 134,363 | | | | 4,404 | |
| * | Nolato AB Class “B” (Industrial conglomerates) | | | 30,117 | | | | 3,046 | |
| | Sweco AB Class “B” (Construction & engineering) | | | 135,967 | | | | 2,495 | |
| * | Vitrolife AB (Biotechnology) | | | 55,818 | | | | 1,464 | |
| | | | | | | | | 75,756 | |
| | Switzerland—7.0% | | | | | | | | |
| | Belimo Holding AG (Building products) | | | 287 | | | | 2,490 | |
| | Logitech International S.A. (Technology hardware, storage & peripherals) | | | 73,088 | | | | 7,093 | |
| | Lonza Group AG (Life sciences tools & services) | | | 25,146 | | | | 16,156 | |
| | Partners Group Holding AG (Capital markets) | | | 8,050 | | | | 9,457 | |
| * | SIG Combibloc Group AG (Containers & packaging) | | | 170,727 | | | | 3,961 | |
| | Sika AG (Chemicals) | | | 62,404 | | | | 17,044 | |
| * | Softwareone Holding AG (Electronic equipment, instruments & components) | | | 84,384 | | | | 2,497 | |
| | STMicroelectronics N.V. (Semiconductors & semiconductor equipment) | | | 293,961 | | | | 10,971 | |
| | Straumann Holding AG (Health care equipment & supplies) | | | 7,821 | | | | 9,112 | |
| | Tecan Group AG (Life sciences tools & services) | | | 7,840 | | | | 3,842 | |
| | Temenos AG (Software) | | | 37,488 | | | | 5,236 | |
| | VAT Group AG (Machinery) | | | 14,453 | | | | 3,605 | |
| * | Zur Rose Group AG (Food & staples retailing) | | | 5,796 | | | | 1,853 | |
| | | | | | | | | 93,317 | |
| | | | | | | | | | |
| | Emerging Asia—25.6% | | | | | | | | |
| | China—15.9% | | | | | | | | |
| | A-Living Smart City Services Co., Ltd. Class “H” (Commercial services & supplies) | | | 393,500 | | | | 1,746 | |
| | Aier Eye Hospital Group Co., Ltd. Class “A” (Health care providers & services) | | | 552,930 | | | | 6,332 | |
| | AK Medical Holdings, Ltd. (Health care equipment & supplies) | | | 458,000 | | | | 795 | |
| * | Alibaba Group Holding, Ltd. (Internet & direct marketing retail) | | | 778,900 | | | | 23,370 | |
| | | | | | | | |
| | | | | | | | |
| | Issuer | | Shares | | | Value | |
| | | | | | | | |
| | Common Stocks—(continued) | | | | | | | | |
| | | | | | | | | | |
| | Emerging Asia—(continued) | | | | | | | | |
| | China—(continued) | | | | | | | | |
| | Centre Testing International Group Co., Ltd. Class “A” (Professional services) | | | 1,233,900 | | | $ | 5,164 | |
| | Chacha Food Co., Ltd. Class “A” (Food products) | | | 255,300 | | | | 2,102 | |
| | Country Garden Services Holdings Co., Ltd. (Commercial services & supplies) | | | 921,000 | | | | 6,231 | |
| | Foshan Haitian Flavouring & Food Co., Ltd. Class “A” (Food products) | | | 180,740 | | | | 5,542 | |
| | Hangzhou Tigermed Consulting Co., Ltd. Class “A” (Life sciences tools & services) | | | 269,100 | | | | 6,650 | |
| * | JD.com, Inc. Class “A” (Internet & direct marketing retail) | | | 236,750 | | | | 10,444 | |
| | Kweichow Moutai Co., Ltd. Class “A” (Beverages) | | | 28,717 | | | | 8,773 | |
| | Li Ning Co., Ltd. (Textiles, apparel & luxury goods) | | | 1,910,000 | | | | 13,132 | |
| * | Meituan Class “B” (Internet & direct marketing retail) | | | 265,000 | | | | 10,070 | |
| | NAURA Technology Group Co., Ltd. Class “A” (Semiconductors & semiconductor equipment) | | | 97,400 | | | | 2,692 | |
| | NetEase, Inc. (Entertainment) | | | 526,900 | | | | 10,032 | |
| | Offcn Education Technology Co., Ltd. Class “A” (Diversified consumer services) | | | 518,600 | | | | 2,786 | |
| | Ping An Insurance Group Co. of China, Ltd. Class “H” (Insurance) | | | 1,104,500 | | | | 13,535 | |
| | Shenzhen Mindray Bio-Medical Electronics Co., Ltd. Class “A” (Health care equipment & supplies) | | | 54,400 | | | | 3,544 | |
| | Shenzhou International Group Holdings, Ltd. (Textiles, apparel & luxury goods) | | | 248,400 | | | | 4,870 | |
| | Silergy Corporation (Semiconductors & semiconductor equipment) | | | 81,000 | | | | 6,947 | |
| * | TAL Education Group—ADR (Diversified consumer services) | | | 165,662 | | | | 11,847 | |
| | Tencent Holdings, Ltd. (Interactive Media & Services) | | | 393,300 | | | | 28,613 | |
| * | Tencent Music Entertainment Group—ADR (Entertainment) | | | 135,812 | | | | 2,613 | |
| * | Topchoice Medical Corporation Class “A” (Health care providers & services) | | | 111,800 | | | | 4,727 | |
| * | Venus MedTech Hangzhou, Inc. Class “H” (Health care equipment & supplies) | | | 158,500 | | | | 1,616 | |
| | Will Semiconductor Co., Ltd. Shanghai Class “A” (Semiconductors & semiconductor equipment) | | | 45,270 | | | | 1,600 | |
| | WuXi AppTec Co., Ltd. Class “A” (Life sciences tools & services) | | | 159,264 | | | | 3,281 | |
| * | Wuxi Biologics Cayman, Inc. (Life sciences tools & services) | | | 947,500 | | | | 12,564 | |
| | | | | | | | | 211,618 | |
See accompanying Notes to Financial Statements.
| 52 | Annual Report | December 31, 2020 |
Institutional International Growth Fund
Portfolio of Investments, December 31, 2020 (all dollar amounts in thousands)
| | | | | | | | |
| | | | | | | | |
| | Issuer | | Shares | | | Value | |
| | | | | | | | |
| | Common Stocks—(continued) | | | | | | | | |
| | | | | | | | | | |
| | Emerging Asia—(continued) | | | | | | | | |
| | India—2.0% | | | | | | | | |
| * | HDFC Bank, Ltd. (Banks) | | | 438,192 | | | $ | 8,627 | |
| | Ipca Laboratories, Ltd. (Pharmaceuticals) | | | 65,526 | | | | 1,968 | |
| | Pidilite Industries, Ltd. (Chemicals) | | | 87,525 | | | | 2,113 | |
| | Reliance Industries, Ltd. (Oil, gas & consumable fuels) | | | 505,955 | | | | 13,414 | |
| | | | | | | | | 26,122 | |
| | Indonesia—0.9% | | | | | | | | |
| | Bank Central Asia Tbk PT (Banks) | | | 4,844,406 | | | | 11,672 | |
| | South Korea—1.3% | | | | | | | | |
| * | Kakao Corporation (Interactive Media & Services) | | | 20,177 | | | | 7,234 | |
| * | Samsung SDI Co., Ltd. (Electronic equipment, instruments & components) | | | 16,628 | | | | 9,613 | |
| | | | | | | | | 16,847 | |
| | Taiwan—4.1% | | | | | | | | |
| | Airtac International Group (Machinery) | | | 77,000 | | | | 2,467 | |
| | Globalwafers Co., Ltd. (Semiconductors & semiconductor equipment) | | | 142,000 | | | | 3,578 | |
| | MediaTek, Inc. (Semiconductors & semiconductor equipment) | | | 641,000 | | | | 17,041 | |
| | Taiwan Semiconductor Manufacturing Co., Ltd.—ADR (Semiconductors & semiconductor equipment) | | | 284,344 | | | | 31,005 | |
| | | | | | | | | 54,091 | |
| | Thailand—1.4% | | | | | | | | |
| | Airports of Thailand PCL (Transportation infrastructure) | | | 778,100 | | | | 1,617 | |
| | Carabao Group PCL Class “F” (Beverages) | | | 438,700 | | | | 1,676 | |
| * | Sea, Ltd.—ADR (Entertainment) | | | 77,187 | | | | 15,364 | |
| | | | | | | | | 18,657 | |
| | | | | | | | | | |
| | Japan—12.5% | | | | | | | | |
| | Asahi Intecc Co., Ltd. (Health care equipment & supplies) | | | 156,700 | | | | 5,714 | |
| * | BASE, Inc. (IT services) | | | 29,200 | | | | 2,760 | |
| | Benefit One, Inc. (Professional services) | | | 106,100 | | | | 3,134 | |
| * | Bengo4.com, Inc. (Interactive Media & Services) | | | 18,400 | | | | 1,825 | |
| | Daikin Industries, Ltd. (Building products) | | | 68,000 | | | | 15,094 | |
| | Disco Corporation (Semiconductors & semiconductor equipment) | | | 24,100 | | | | 8,111 | |
| | GMO Payment Gateway, Inc. (IT services) | | | 27,100 | | | | 3,632 | |
| | Harmonic Drive Systems, Inc. (Machinery) | | | 45,000 | | | | 4,018 | |
| | Hoya Corporation (Health care equipment & supplies) | | | 74,900 | | | | 10,351 | |
| | Keyence Corporation (Electronic equipment, instruments & components) | | | 45,900 | | | | 25,783 | |
| | M3, Inc. (Health care technology) | | | 84,800 | | | | 8,002 | |
| | MISUMI Group, Inc. (Machinery) | | | 115,500 | | | | 3,786 | |
| | MonotaRO Co., Ltd. (Trading companies & distributors) | | | 103,200 | | | | 5,247 | |
| | | | | | | | |
| | | | | | | | |
| | Issuer | | Shares | | | Value | |
| | | | | | | | |
| | Common Stocks—(continued) | | | | | | | | |
| | | | | | | | | | |
| | Japan—(continued) | | | | | | | | |
| | Nihon M&A Center, Inc. (Professional services) | | | 117,400 | | | $ | 7,845 | |
| | Nomura Research Institute, Ltd. (IT services) | | | 203,700 | | | | 7,290 | |
| | Olympus Corporation (Health care equipment & supplies) | | | 279,600 | | | | 6,110 | |
| | Omron Corporation (Electronic equipment, instruments & components) | | | 159,900 | | | | 14,247 | |
| | Rakus Co., Ltd. (Software) | | | 120,200 | | | | 2,785 | |
| * | SHIFT, Inc. (IT services) | | | 18,000 | | | | 2,495 | |
| | SMC Corporation (Machinery) | | | 28,100 | | | | 17,131 | |
| | Sushiro Global Holdings, Ltd. (Hotels, restaurants & leisure) | | | 80,900 | | | | 3,095 | |
| | TechnoPro Holdings, Inc. (Professional services) | | | 39,500 | | | | 3,271 | |
| | TIS, Inc. (IT services) | | | 192,500 | | | | 3,941 | |
| | | | | | | | | 165,667 | |
| | | | | | | | | | |
| | United Kingdom—9.7% | | | | | | | | |
| | 3i Group plc (Capital markets) | | | 292,048 | | | | 4,625 | |
| | Abcam plc (Biotechnology) | | | 74,379 | | | | 1,577 | |
| | Ashtead Group plc (Trading companies & distributors) | | | 246,467 | | | | 11,588 | |
| | Avast plc (Software) | | | 499,761 | | | | 3,673 | |
| | AVEVA Group plc (Software) | | | 101,635 | | | | 4,450 | |
| | Big Yellow Group plc (Equity REIT) | | | 156,933 | | | | 2,354 | |
| * | boohoo Group plc (Internet & direct marketing retail) | | | 529,898 | | | | 2,486 | |
| | Compass Group plc (Hotels, restaurants & leisure) | | | 593,463 | | | | 11,062 | |
| | Croda International plc (Chemicals) | | | 79,353 | | | | 7,158 | |
| | Diploma plc (Trading companies & distributors) | | | 78,392 | | | | 2,350 | |
| | Experian plc (Professional services) | | | 293,513 | | | | 11,146 | |
| | Halma plc (Electronic equipment, instruments & components) | | | 283,485 | | | | 9,494 | |
| | Intermediate Capital Group plc (Capital markets) | | | 225,996 | | | | 5,334 | |
| | Intertek Group plc (Professional services) | | | 67,979 | | | | 5,250 | |
| | London Stock Exchange Group plc (Capital markets) | | | 97,127 | | | | 11,965 | |
| * | Renishaw plc (Electronic equipment, instruments & components) | | | 33,496 | | | | 2,638 | |
| * | Rentokil Initial plc (Commercial services & supplies) | | | 1,126,487 | | | | 7,850 | |
| | Rotork plc (Machinery) | | | 795,312 | | | | 3,459 | |
| | Segro plc (Equity REIT) | | | 572,146 | | | | 7,414 | |
| | Softcat plc (IT services) | | | 114,342 | | | | 2,148 | |
| | Spirax-Sarco Engineering plc (Machinery) | | | 51,213 | | | | 7,910 | |
| * | Trainline plc (Internet & direct marketing retail) | | | 405,147 | | | | 2,571 | |
| | | | | | | | | 128,502 | |
See accompanying Notes to Financial Statements.
| December 31, 2020 | William Blair Funds | 53 |
Institutional International Growth Fund
Portfolio of Investments, December 31, 2020 (all dollar amounts in thousands)
| | | | | | | | |
| | | | | | | | |
| | Issuer | | Shares | | | Value | |
| | | | | | | | |
| | Common Stocks—(continued) | | | | | | | | |
| | | | | | | | | | |
| | Asia—3.7% | | | | | | | | |
| | Australia—2.2% | | | | | | | | |
| | Aristocrat Leisure, Ltd. (Hotels, restaurants & leisure) | | | 303,501 | | | $ | 7,254 | |
| * | Atlassian Corporation plc Class “A” (Software)† | | | 35,417 | | | | 8,283 | |
| | CSL, Ltd. (Biotechnology) | | | 34,823 | | | | 7,602 | |
| | Goodman Group (Equity REIT) | | | 359,639 | | | | 5,243 | |
| | | | | | | | | 28,382 | |
| | Hong Kong—1.5% | | | | | | | | |
| | AIA Group, Ltd. (Insurance) | | | 1,647,463 | | | | 20,188 | |
| | | | | | | | | | |
| | Canada—2.5% | | | | | | | | |
| | Canadian National Railway Co. (Road & rail) | | | 151,940 | | | | 16,704 | |
| | Enghouse Systems, Ltd. (Software) | | | 36,523 | | | | 1,769 | |
| * | Kinaxis, Inc. (Software) | | | 19,007 | | | | 2,693 | |
| * | Lululemon Athletica, Inc. (Textiles, apparel & luxury goods) | | | 30,623 | | | | 10,658 | |
| | Toromont Industries, Ltd. (Trading companies & distributors) | | | 27,655 | | | | 1,938 | |
| | | | | | | | | 33,762 | |
| | | | | | | | | | |
| | Emerging Latin America—2.4% | | | | | | | | |
| | Argentina—0.9% | | | | | | | | |
| * | Globant S.A. (IT services)† | | | 17,119 | | | | 3,725 | |
| * | MercadoLibre, Inc. (Internet & direct marketing retail) | | | 5,501 | | | | 9,216 | |
| | | | | | | | | 12,941 | |
| | Brazil—1.3% | | | | | | | | |
| | B3 S.A. - Brasil Bolsa Balcao (Capital markets) | | | 477,700 | | | | 5,700 | |
| | Locaweb Servicos de Internet S.A. (IT services) | | | 202,100 | | | | 3,131 | |
| | Magazine Luiza S.A. (Multiline retail) | | | 1,063,300 | | | | 5,108 | |
| | Notre Dame Intermedica Participacoes S.A. (Health care providers & services) | | | 203,100 | | | | 3,063 | |
| | | | | | | | | 17,002 | |
| | Mexico—0.2% | | | | | | | | |
| * | Grupo Aeroportuario del Sureste S.A.B. de C.V.—ADR (Transportation infrastructure) | | | 14,184 | | | | 2,339 | |
| | | | | | | | | | |
| | Emerging Europe —0.8% | | | | | | | | |
| | Poland—0.3% | | | | | | | | |
| * | Allegro.eu S.A. (Internet & direct marketing retail) | | | 161,311 | | | | 3,657 | |
| | Russia—0.5% | | | | | | | | |
| * | Yandex N.V. Class “A” (Interactive Media & Services)† | | | 100,642 | | | | 7,003 | |
| | Total Common Stocks—99.2%
(cost $713,438) | | | | | | | 1,316,241 | |
| | | | | | | | | |
| | | | | | | | | |
| | Issuer | | | | | | Value | |
| | | | | | | | | | |
| | Total Investments—99.2%
(cost $713,438) | | | | | | $ | 1,316,241 | |
| | Cash and other assets, less liabilities—0.8% | | | | | | | 10,241 | |
| | Net assets—100.0% | | | | | | $ | 1,326,482 | |
ADR = American Depository Receipt
REIT = Real Estate Investment Trust
* = Non-income producing security
† = U.S. listed foreign security
At December 31, 2020, the Fund’s Portfolio of Investments includes the following industry categories (as a percentage of long-term investments):
| Information Technology | | | 26.4 | % |
| Industrials | | | 22.9 | % |
| Consumer Discretionary | | | 14.7 | % |
| Health Care | | | 12.8 | % |
| Financials | | | 7.2 | % |
| Communication Services | | | 5.5 | % |
| Consumer Staples | | | 2.7 | % |
| Materials | | | 2.6 | % |
| Energy | | | 2.2 | % |
| Real Estate | | | 2.0 | % |
| Utilities | | | 1.0 | % |
| Total | | | 100.0 | % |
At December 31, 2020, the Fund’s Portfolio of Investments includes the following currency categories (as a percentage of long-term investments):
| Euro | | | 23.8 | % |
| Japanese Yen | | | 12.6 | % |
| Hong Kong Dollar | | | 11.9 | % |
| British Pound Sterling | | | 9.8 | % |
| U.S. Dollar | | | 9.0 | % |
| Swiss Franc | | | 6.3 | % |
| Swedish Krona | | | 5.8 | % |
| Danish Krone | | | 4.9 | % |
| Chinese Yuan Renminbi | | | 4.0 | % |
| New Taiwan Dollar | | | 2.3 | % |
| Indian Rupee | | | 2.0 | % |
| Canadian Dollar | | | 1.7 | % |
| Australian Dollar | | | 1.5 | % |
| Brazilian Real | | | 1.3 | % |
| South Korean Won | | | 1.3 | % |
| All Other Currencies | | | 1.8 | % |
| Total | | | 100.0 | % |
See accompanying Notes to Financial Statements.
| 54 | Annual Report | December 31, 2020 |
| | International Small Cap Growth Fund |
| | |
| | The International Small Cap Growth Fund seeks long-term capital appreciation. |
| | |
| | AN OVERVIEW FROM THE PORTFOLIO MANAGERS |
| | |
 Simon Fennell  Andrew G. Flynn | The William Blair International Small Cap Growth Fund (Class N shares) posted a 28.68% increase, net of fees, for the year ended December 31, 2020. By comparison, the Fund’s benchmark index, the MSCI All Country World ex-U.S. Small Cap Index (net) (the “Index”), increased 14.24%. Calendar year outperformance was driven primarily by strong selection within the Industrials sector, combined with the overweight and positive stock selection within Information Technology. Within Industrials, Nihon M&A Center and Indutrade were the top contributors to performance. Nihon M&A Center is a high-quality Japanese growth company that provides advisory services to small- and mid-sized enterprises facing succession-oriented challenges. It is led by an entrepreneurial management team that has built an attractive network of national relationships aimed at identifying buyers and sellers and sourcing transactions. Share price performance was driven by record high revenue growth in the first half of the year, as the company continued to benefit from structural tailwinds and its strong network, less volatile average deal size, and diverse industry exposure. Indutrade is a leader in the Northern European market for industrial component distribution. The company is differentiated by its high proportion of proprietary products (38% of sales), a range of product offerings from high-quality suppliers, and a technically-savvy sales team, all of which help to reinforce close relationships with customers. Indutrade experienced a relatively limited impact on its business from the pandemic, bolstered by its healthy balance sheet and diversified end markets. Partially offsetting these positive effects were Healthcare stock selection and the underweight to Materials. Within Healthcare, China-based AK Medical Holdings was the largest performance detractor. AK Medical is the leading domestic orthopedic joints manufacturer in China. The company’s key competitive advantages are its product quality, first-mover advantage and R&D capabilities. China’s orthopedics market is growing 15%-20% per year, supported by an aging population, increased patient awareness, rising incomes and favorable government policy. The share price weakened in the second half of the year following strong first half performance, reflecting profit taking and investor concerns about price cuts associated with Chinese bulk purchases of high-value medical goods. Please refer to the Global Markets Review and Outlook relating to the Fund on beginning page 33. |
| December 31, 2020 | William Blair Funds | 55 |
International Small Cap Growth Fund
Performance Highlights (Unaudited)
| Average Annual Total Returns through 12/31/2020 |
| | | | | | | | | |
| | 1 Year | | 3 Year | | 5 Year | | 10 Year |
| Class N | | | 28.68 | % | | | 9.15 | % | | | 10.39 | % | | | 8.19 | % |
| Class I | | | 29.04 | | | | 9.45 | | | | 10.71 | | | | 8.51 | |
| Class R6 | | | 29.23 | | | | 9.58 | | | | 10.81 | | | | 8.67 | |
| MSCI ACW Ex-U.S. Small Cap Index (net) | | | 14.24 | | | | 4.59 | | | | 9.37 | | | | 5.95 | |
Performance cited represents past performance. Past performance does not guarantee future results and current performance may be lower or higher than the data quoted. Results shown are average annual total returns, which assume reinvestment of dividends and capital gains. Investment returns and principal will fluctuate and you may have a gain or loss when you sell shares. For the most current month-end performance information, please call 1-800-742-7272, or visit our Web site at www.williamblairfunds.com. From time to time, the investment adviser may waive fees or reimburse expenses for the Fund. Without these waivers/reimbursements, performance would be lower. Investing in smaller companies involves special risks, including higher volatility and lower liquidity. Smaller capitalization stocks are also more sensitive to purchase/sale transactions and changes in the issuer’s financial condition. International investing involves special risk considerations, including currency fluctuations, lower liquidity, economic and political risk. Class N shares are not subject to a sales load. Class I shares are not subject to a sales load or distribution (Rule 12b-1) fees. Class R6 shares are not subject to a sales load, distribution (Rule 12b-1) fees, or sub-transfer agent fees.
The performance highlights and graph presented above do not reflect the deduction of taxes that a shareholder would pay on fund distributions or the redemption of fund shares.
The Morgan Stanley Capital International (MSCI) All Country World (ACW) Ex-U.S. Small Cap Index (net) is a free float-adjusted market capitalization weighted index that is designed to measure the equity market performance of small capitalization developed and emerging markets, excluding the United States. This index approximates the minimum possible dividend reinvestment by deducting for the highest possible withholding tax rates of those markets.
This report identifies the Fund’s investments on December 31, 2020. These holdings are subject to change. Not all stocks in the Fund performed the same, nor is there any guarantee that these stocks will perform as well in the future. Market forecasts provided in this report may not necessarily come to pass.
Sector Diversification (Unaudited)

The sector diversification shown is based on the total long-term securities.
| 56 | Annual Report | December 31, 2020 |
International Small Cap Growth Fund
Portfolio of Investments, December 31, 2020 (all dollar amounts in thousands)
| | | | | | | | | | |
| | | | | | | | |
| | Issuer | | Shares | | | Value | |
| | | | | | | | | | |
| | Common Stocks | | | | | | | | |
| | | | | | | | | | |
| | Europe, Mid-East—43.5% | | | | | | | | |
| | Belgium—1.7% | | | | | | | | |
| | Melexis N.V. (Semiconductors & semiconductor equipment) | | | 33,342 | | | $ | 3,254 | |
| | Warehouses De Pauw CVA (Equity REIT) | | | 76,778 | | | | 2,651 | |
| | | | | | | | | 5,905 | |
| | Denmark—4.1% | | | | | | | | |
| * | Netcompany Group A/S (Software) | | | 67,824 | | | | 6,930 | |
| | Royal Unibrew A/S (Beverages) | | | 35,597 | | | | 4,129 | |
| | SimCorp A/S (Software) | | | 18,609 | | | | 2,766 | |
| | | | | | | | | 13,825 | |
| | Germany—4.4% | | | | | | | | |
| | Carl Zeiss Meditec AG (Health care equipment & supplies) | | | 37,014 | | | | 4,924 | |
| | CompuGroup Medical SE & Co. KgaA (Health care technology) | | | 25,679 | | | | 2,466 | |
| * | Hypoport SE (Diversified financial services) | | | 1,779 | | | | 1,119 | |
| | Siltronic AG (Semiconductors & semiconductor equipment) | | | 40,370 | | | | 6,318 | |
| | | | | | | | | 14,827 | |
| | Israel—2.0% | | | | | | | | |
| * | CyberArk Software, Ltd. (Software)† | | | 27,936 | | | | 4,514 | |
| | Strauss Group, Ltd. (Food products) | | | 72,658 | | | | 2,179 | |
| | | | | | | | | 6,693 | |
| | Italy—2.1% | | | | | | | | |
| * | Amplifon SpA (Health care providers & services) | | | 126,644 | | | | 5,266 | |
| * | Brunello Cucinelli SpA (Textiles, apparel & luxury goods) | | | 38,012 | | | | 1,658 | |
| | | | | | | | | 6,924 | |
| | Netherlands—1.8% | | | | | | | | |
| | BE Semiconductor Industries N.V. (Semiconductors & semiconductor equipment) | | | 83,846 | | | | 5,079 | |
| | IMCD N.V. (Trading companies & distributors) | | | 6,920 | | | | 881 | |
| | | | | | | | | 5,960 | |
| | Norway—1.3% | | | | | | | | |
| | TOMRA Systems ASA (Commercial services & supplies) | | | 89,069 | | | | 4,390 | |
| | Spain—3.0% | | | | | | | | |
| | EDP Renovaveis S.A. (Independent power & renewable electricity producers) | | | 212,847 | | | | 5,928 | |
| * | Solaria Energia y Medio Ambiente S.A. (Independent power & renewable electricity producers) | | | 144,933 | | | | 4,186 | |
| | | | | | | | | 10,114 | |
| | Sweden��14.1% | | | | | | | | |
| | AddTech AB Class “B” (Trading companies & distributors) | | | 240,407 | | | | 3,185 | |
| | Arjo AB Class “B” (Health care equipment & supplies) | | | 444,542 | | | | 3,396 | |
| | | | | | | | | | |
| | | | | | | | |
| | Issuer | | Shares | | | Value | |
| | | | | | | | | | |
| | Common Stocks—(continued) | | | | | | | | |
| | | | | | | | | | |
| | Europe, Mid-East—(continued) | | | | | | | | |
| | Sweden—(continued) | | | | | | | | |
| | Beijer Ref AB (Trading companies & distributors) | | | 135,604 | | | $ | 6,204 | |
| | BioGaia AB Class “B” (Biotechnology) | | | 24,266 | | | | 1,584 | |
| * | Biotage AB (Life sciences tools & services) | | | 115,063 | | | | 1,944 | |
| * | Indutrade AB (Trading companies & distributors) | | | 322,947 | | | | 6,916 | |
| | Investment AB Latour Class “B” (Industrial conglomerates) | | | 201,118 | | | | 4,882 | |
| | Lifco AB Class “B” (Industrial conglomerates) | | | 58,253 | | | | 5,586 | |
| | MIPS AB (Leisure products) | | | 82,268 | | | | 5,149 | |
| * | Nolato AB Class “B” (Industrial conglomerates) | | | 37,631 | | | | 3,805 | |
| | Sweco AB Class “B” (Construction & engineering) | | | 144,338 | | | | 2,649 | |
| * | Vitrolife AB (Biotechnology) | | | 79,126 | | | | 2,075 | |
| | | | | | | | | 47,375 | |
| | Switzerland—9.0% | | | | | | | | |
| | Belimo Holding AG (Building products) | | | 353 | | | | 3,062 | |
| | Galenica AG (Health care providers & services) | | | 22,516 | | | | 1,501 | |
| | Kardex Holding AG (Machinery) | | | 15,337 | | | | 3,354 | |
| * | Siegfried Holding AG (Life sciences tools & services) | | | 4,485 | | | | 3,300 | |
| * | SIG Combibloc Group AG (Containers & packaging) | | | 34,475 | | | | 800 | |
| * | Softwareone Holding AG (Electronic equipment, instruments & components) | | | 146,136 | | | | 4,325 | |
| | Tecan Group AG (Life sciences tools & services) | | | 6,680 | | | | 3,273 | |
| | VAT Group AG (Machinery) | | | 28,604 | | | | 7,134 | |
| * | Zur Rose Group AG (Food & staples retailing) | | | 11,392 | | | | 3,642 | |
| | | | | | | | | 30,391 | |
| | | | | | | | | | |
| | United Kingdom—15.3% | | | | | | | | |
| | Abcam plc (Biotechnology) | | | 81,246 | | | | 1,722 | |
| | Avast plc (Software) | | | 379,302 | | | | 2,788 | |
| | AVEVA Group plc (Software) | | | 132,704 | | | | 5,811 | |
| | Beazley plc (Insurance) | | | 528,385 | | | | 2,634 | |
| | Big Yellow Group plc (Equity REIT) | | | 207,638 | | | | 3,115 | |
| * | boohoo Group plc (Internet & direct marketing retail) | | | 857,089 | | | | 4,020 | |
| | Burford Capital, Ltd. (Diversified financial services) | | | 76,111 | | | | 740 | |
| | Diploma plc (Trading companies & distributors) | | | 186,786 | | | | 5,599 | |
| | Hill & Smith Holdings plc (Metals & mining) | | | 86,350 | | | | 1,665 | |
| | Intermediate Capital Group plc (Capital markets) | | | 265,888 | | | | 6,276 | |
| * | Renishaw plc (Electronic equipment, instruments & components) | | | 58,431 | | | | 4,602 | |
| | Rotork plc (Machinery) | | | 679,368 | | | | 2,954 | |
See accompanying Notes to Financial Statements.
| December 31, 2020 | William Blair Funds | 57 |
International Small Cap Growth Fund
Portfolio of Investments, December 31, 2020 (all dollar amounts in thousands)
| | | | | | | | | | |
| | | | | | | | |
| | Issuer | | Shares | | | Value | |
| | | | | | | | | | |
| | Common Stocks—(continued) | | | | | | | | |
| | | | | | | | | | |
| | United Kingdom—(continued) | | | | | | | | |
| | Safestore Holdings plc (Equity REIT) | | | 341,549 | | | $ | 3,643 | |
| | Softcat plc (IT services) | | | 147,453 | | | | 2,771 | |
| * | Trainline plc (Internet & direct marketing retail) | | | 515,750 | | | | 3,273 | |
| | | | | | | | | 51,613 | |
| | | | | | | | | | |
| | Emerging Asia—15.0% | | | | | | | | |
| | Cambodia—1.1% | | | | | | | | |
| | NagaCorp, Ltd. (Hotels, restaurants & leisure) | | | 2,786,000 | | | | 3,651 | |
| | China—4.2% | | | | | | | | |
| | A-Living Smart City Services Co., Ltd. Class “H” (Commercial services & supplies) | | | 466,500 | | | | 2,070 | |
| | AK Medical Holdings, Ltd. (Health care equipment & supplies) | | | 1,168,000 | | | | 2,028 | |
| | Centre Testing International Group Co., Ltd. Class “A” (Professional services) | | | 502,790 | | | | 2,104 | |
| | Chacha Food Co., Ltd. Class “A” (Food products) | | | 220,800 | | | | 1,818 | |
| | Silergy Corporation (Semiconductors & semiconductor equipment) | | | 41,000 | | | | 3,517 | |
| * | Venus MedTech Hangzhou, Inc. Class “H” (Health care equipment & supplies) | | | 268,500 | | | | 2,738 | |
| | | | | | | | | 14,275 | |
| | India—4.6% | | | | | | | | |
| * | AU Small Finance Bank, Ltd. (Banks) | | | 217,475 | | | | 2,534 | |
| | Info Edge India, Ltd. (Interactive Media & Services) | | | 43,049 | | | | 2,822 | |
| | Ipca Laboratories, Ltd. (Pharmaceuticals) | | | 141,424 | | | | 4,248 | |
| | Motherson Sumi Systems, Ltd. (Auto components) | | | 2,636,444 | | | | 5,954 | |
| | | | | | | | | 15,558 | |
| | South Korea—0.6% | | | | | | | | |
| * | Koh Young Technology, Inc. (Semiconductors & semiconductor equipment) | | | 21,363 | | | | 2,065 | |
| | Taiwan—4.5% | | | | | | | | |
| | ASPEED Technology, Inc. (Semiconductors & semiconductor equipment) | | | 35,000 | | | | 2,136 | |
| | Feng TAY Enterprise Co., Ltd. (Textiles, apparel & luxury goods) | | | 481,680 | | | | 3,420 | |
| | Globalwafers Co., Ltd. (Semiconductors & semiconductor equipment) | | | 262,000 | | | | 6,602 | |
| | Voltronic Power Technology Corporation (Electrical equipment) | | | 70,451 | | | | 2,808 | |
| | | | | | | | | 14,966 | |
| | | | | | | | | | |
| | Japan—13.8% | | | | | | | | |
| * | BASE, Inc. (IT services) | | | 37,500 | | | | 3,545 | |
| | Benefit One, Inc. (Professional services) | | | 179,400 | | | | 5,299 | |
| * | Bengo4.com, Inc. (Interactive Media & Services) | | | 14,600 | | | | 1,448 | |
| | GMO Payment Gateway, Inc. (IT services) | | | 31,600 | | | | 4,236 | |
| | | | | | | | | | |
| | | | | | | | |
| | Issuer | | Shares | | | Value | |
| | | | | | | | | | |
| | Common Stocks—(continued) | | | | | | | | |
| | | | | | | | | | |
| | Japan—(continued) | | | | | | | | |
| | Harmonic Drive Systems, Inc. (Machinery) | | | 57,400 | | | $ | 5,125 | |
| | JINS Holdings, Inc. (Specialty retail) | | | 46,300 | | | | 3,040 | |
| | MonotaRO Co., Ltd. (Trading companies & distributors) | | | 4,300 | | | | 219 | |
| | Nihon Unisys, Ltd. (IT services) | | | 123,700 | | | | 4,840 | |
| | Rakus Co., Ltd. (Software) | | | 114,300 | | | | 2,648 | |
| * | SHIFT, Inc. (IT services) | | | 19,200 | | | | 2,661 | |
| | SMS Co., Ltd. (Professional services) | | | 70,200 | | | | 2,685 | |
| | Sushiro Global Holdings, Ltd. (Hotels, restaurants & leisure) | | | 106,800 | | | | 4,086 | |
| | TechnoPro Holdings, Inc. (Professional services) | | | 55,600 | | | | 4,604 | |
| | TIS, Inc. (IT services) | | | 93,400 | | | | 1,912 | |
| | | | | | | | | 46,348 | |
| | | | | | | | | | |
| | Canada—4.6% | | | | | | | | |
| | Enghouse Systems, Ltd. (Software) | | | 67,853 | | | | 3,286 | |
| * | Kinaxis, Inc. (Software) | | | 29,545 | | | | 4,186 | |
| | Parkland Corporation (Oil, gas & consumable fuels) | | | 109,726 | | | | 3,482 | |
| | Toromont Industries, Ltd. (Trading companies & distributors) | | | 66,508 | | | | 4,660 | |
| | | | | | | | | 15,614 | |
| | | | | | | | | | |
| | Emerging Latin America—2.3% | | | | | | | | |
| | Brazil—1.0% | | | | | | | | |
| | Arezzo Industria e Comercio S.A. (Textiles, apparel & luxury goods) | | | 203,900 | | | | 2,676 | |
| | Pet Center Comercio e Participacoes S.A. (Specialty retail) | | | 223,500 | | | | 822 | |
| | | | | | | | | 3,498 | |
| | Mexico—1.3% | | | | | | | | |
| * | Grupo Aeroportuario del Centro Norte S.A.B. de C.V. (Transportation infrastructure) | | | 669,800 | | | | 4,321 | |
| | | | | | | | | | |
| | Asia—2.3% | | | | | | | | |
| | Australia—1.4% | | | | | | | | |
| * | Nanosonics, Ltd. (Health care equipment & supplies) | | | 399,283 | | | | 2,472 | |
| | Pro Medicus, Ltd. (Health care technology) | | | 89,717 | | | | 2,363 | |
| | | | | | | | | 4,835 | |
| | New Zealand—0.9% | | | | | | | | |
| | Ryman Healthcare, Ltd. (Health care providers & services) | | | 259,479 | | | | 2,836 | |
| | | | | | | | | | |
| | Emerging Mid-East, Africa—1.6% | | | | | | | | |
| | South Africa—0.7% | | | | | | | | |
| | Clicks Group, Ltd. (Food & staples retailing) | | | 149,994 | | | | 2,579 | |
| | United Arab Emirates—0.9% | | | | | | | | |
| * | Network International Holdings plc (IT services) | | | 654,645 | | | | 2,924 | |
| | Total Common Stocks—98.4%
(cost $229,419) | | | | | | | 331,487 | |
See accompanying Notes to Financial Statements.
| 58 | Annual Report | December 31, 2020 |
International Small Cap Growth Fund
Portfolio of Investments, December 31, 2020 (all dollar amounts in thousands)
| | | | | | | | | | |
| | Issuer | | Principal
Amount | | | Value | |
| | | | | | | | | | |
| | Repurchase Agreement | | | | | | | | |
| | Fixed Income Clearing Corporation, 0.000% dated 12/31/20, due 1/4/21, repurchase price $2,805, collateralized by U.S. Treasury Note, 0.500%, due 6/30/27, valued at $2,861 | | | $2,805 | | | $ | 2,805 | |
| | Total Repurchase Agreement—0.8%
(cost $2,805) | | | | | | | 2,805 | |
| | Total Investments—99.2%
(cost $232,224) | | | | | | | 334,292 | |
| | Cash and other assets, less liabilities—0.8% | | | | | | | 2,589 | |
| | Net assets—100.0% | | | | | | $ | 336,881 | |
REIT = Real Estate Investment Trust
* = Non-income producing security
† = U.S. listed foreign security
At December 31, 2020, the Fund’s Portfolio of Investments includes the following industry categories (as a percentage of long-term investments):
| Industrials | | | 28.5 | % |
| Information Technology | | | 28.3 | % |
| Health Care | | | 14.5 | % |
| Consumer Discretionary | | | 11.4 | % |
| Consumer Staples | | | 4.3 | % |
| Financials | | | 4.0 | % |
| Utilities | | | 3.1 | % |
| Real Estate | | | 2.8 | % |
| Communication Services | | | 1.3 | % |
| Energy | | | 1.1 | % |
| Materials | | | 0.7 | % |
| Total | | | 100.0 | % |
At December 31, 2020, the Fund’s Portfolio of Investments includes the following currency categories (as a percentage of long-term investments):
| British Pound Sterling | | | 16.4 | % |
| Swedish Krona | | | 14.3 | % |
| Japanese Yen | | | 14.0 | % |
| Euro | | | 13.2 | % |
| Swiss Franc | | | 9.2 | % |
| New Taiwan Dollar | | | 5.6 | % |
| Canadian Dollar | | | 4.7 | % |
| Indian Rupee | | | 4.7 | % |
| Danish Krone | | | 4.2 | % |
| Hong Kong Dollar | | | 3.2 | % |
| Australian Dollar | | | 1.4 | % |
| U.S. Dollar | | | 1.4 | % |
| Norwegian Krone | | | 1.3 | % |
| Mexican Peso | | | 1.3 | % |
| Chinese Yuan Renminbi | | | 1.2 | % |
| Brazilian Real | | | 1.0 | % |
| All Other Currencies | | | 2.9 | % |
| Total | | | 100.0 | % |
See accompanying Notes to Financial Statements.
| December 31, 2020 | William Blair Funds | 59 |
| | Emerging Markets Leaders Fund |
| | |
| | The Emerging Markets Leaders Fund seeks long-term capital appreciation. |
| | |
| | AN OVERVIEW FROM THE PORTFOLIO MANAGERS |
| | |

Todd M. McClone 
John C. Murphy | The William Blair Emerging Markets Leaders Fund (Class N shares) posted a 27.23% increase, net of fees, for the year ended December 31, 2020. By comparison, the Fund’s benchmark index, the MSCI Emerging Markets Index (net) (the “Index”) increased 18.31%. Calendar year outperformance versus the Index was primarily driven by positive stock selection across most sectors. Stock selection within the Communication Services and Consumer Discretionary sectors was particularly strong, bolstered by Yandex and NetEase within the former, and China Tourism Group Duty Free and MercadoLibre within the latter. Yandex, the Russian search and internet platform, continues to execute well on its growth strategy, which is predicated on the sustained growth in its portal business allowing the company to fund early stage and new growth areas like food delivery, ride-hailing, autonomous driving and entertainment. NetEase, the leading developer of self-developed PC and mobile games in China, outperformed amid increased online customer engagement in gaming and rapid growth in its online education business. China Tourism Group Duty Free rallied amid easing travel restrictions and policy support. MercadoLibre’s strong share price performance was underpinned by accelerating online sales, with the pandemic serving as a catalyst for faster e-commerce adoption, as well as the company’s best-in-class services ecosystem (wallet, merchant services, managed fulfillment, etc.). Partially offsetting these effects was negative stock selection within the Industrials and Financials sectors. Within Industrials, Rumo SA, the largest independent railroad logistics operator in Latin America, hurt relative performance. Rumo underperformance was driven by lower corn exports and increased trucking competition in the near term. Rumo’s investment thesis remains predicated on accelerating agricultural exports, increasing market share gains from trucking and network expansion projects. Within the Financials sector, IRB Brasil Resseguros, the dominant reinsurance company in Brazil, weighed on performance as the stock fell amid a short seller report and corporate governance issues, which led us to exit the position. Please refer to the Global Markets Review and Outlook relating to the Fund beginning on page 33. |
| 60 | Annual Report | December 31, 2020 |
Emerging Markets Leaders Fund
Performance Highlights (Unaudited)
| Average Annual Total Returns through 12/31/2020 |
| | | | 1 Year | | | 3 Year | | | 5 Year | | | 10 Year |
| Class N | | | 27.23 | % | | | 10.24 | % | | | 13.99 | % | | | 4.91 | % |
| Class I | | | 27.52 | | | | 10.55 | | | | 14.31 | | | | 5.19 | |
| Class R6 | | | 27.50 | | | | 10.57 | | | | 14.35 | | | | 5.28 | |
| MSCI Emerging Markets Index (net) | | | 18.31 | | | | 6.17 | | | | 12.81 | | | | 3.63 | |
Performance cited represents past performance. Past performance does not guarantee future results and current performance may be lower or higher than the data quoted. Results shown are average annual total returns, which assume reinvestment of dividends and capital gains. Investment returns and principal will fluctuate and you may have a gain or loss when you sell shares. For the most current month-end performance information, please call 1-800-742-7272, or visit our Web site at www.williamblairfunds.com. International investing involves special risk considerations, including currency fluctuations, lower liquidity, economic and political risk. These risks may be magnified when investing in emerging markets. From time to time, the investment adviser may waive fees or reimburse expenses for the Fund. Without these waivers/reimbursements, performance would be lower. Class N shares are not subject to a sales load. Class I shares are not subject to a sales load or distribution (Rule 12b-1) fees. Class R6 shares are not subject to a sales load, distribution (Rule 12b-1) fees, or sub-transfer agent fees.
The performance highlights and graph presented above do not reflect the deduction of taxes that a shareholder would pay on fund distributions or the redemption of fund shares.
The Morgan Stanley Capital International (MSCI) Emerging Markets Index (net) is a free float-adjusted market-capitalization-weighted index that is designed to measure equity market performance of emerging markets. This index approximates the minimum possible dividend reinvestment by deducting for the highest possible withholding tax rates of those markets.
This report identifies the Fund’s investments on December 31, 2020. These holdings are subject to change. Not all stocks in the Fund performed the same, nor is there any guarantee that these stocks will perform as well in the future. Market forecasts provided in this report may not necessarily come to pass.
Sector Diversification (Unaudited)

The sector diversification shown is based on the total long-term securities.
| December 31, 2020 | William Blair Funds | 61 |
Emerging Markets Leaders Fund
Portfolio of Investments, December 31, 2020 (all dollar amounts in thousands)
| | | | | | | | | | |
| | | | | | | | |
| | Issuer | | Shares | | | Value | |
| | | | | | | | | | |
| | Common Stocks | | | | | | | | |
| | | | | | | | | | |
| | Emerging Asia—77.3% | | | | | | | | |
| | China—37.8% | | | | | | | | |
| * | Alibaba Group Holding, Ltd. (Internet & direct marketing retail) | | | 650,328 | | | $ | 19,512 | |
| | China Tourism Group Duty Free Corporation, Ltd. Class “A” (Specialty retail) | | | 164,156 | | | | 7,090 | |
| | Foshan Haitian Flavouring & Food Co., Ltd. Class “A” (Food products) | | | 96,800 | | | | 2,968 | |
| | Jiangsu Hengrui Medicine Co., Ltd. Class “A” (Pharmaceuticals) | | | 137,870 | | | | 2,350 | |
| | Kweichow Moutai Co., Ltd. Class “A” (Beverages) | | | 15,659 | | | | 4,784 | |
| | Midea Group Co., Ltd. Class “A” (Household durables) | | | 439,400 | | | | 6,614 | |
| | NetEase, Inc. (Entertainment) | | | 438,950 | | | | 8,357 | |
| | Ping An Insurance Group Co. of China, Ltd. Class “H” (Insurance) | | | 749,500 | | | | 9,185 | |
| | Shenzhou International Group Holdings, Ltd. (Textiles, apparel & luxury goods) | | | 142,200 | | | | 2,788 | |
| * | TAL Education Group—ADR (Diversified consumer services) | | | 46,702 | | | | 3,340 | |
| | Tencent Holdings, Ltd. (Interactive Media & Services) | | | 260,100 | | | | 18,923 | |
| * | Tencent Music Entertainment Group—ADR (Entertainment) | | | 316,236 | | | | 6,084 | |
| | Travelsky Technology, Ltd. Class “H” (IT services) | | | 1,447,000 | | | | 3,490 | |
| | Zhangzhou Pientzehuang Pharmaceutical Co., Ltd. Class “A” (Pharmaceuticals) | | | 87,300 | | | | 3,571 | |
| | | | | | | | | 99,056 | |
| | India—17.0% | | | | | | | | |
| | Asian Paints, Ltd. (Chemicals) | | | 74,384 | | | | 2,810 | |
| | Bajaj Finance, Ltd. (Consumer finance) | | | 34,195 | | | | 2,475 | |
| | Britannia Industries, Ltd. (Food products) . | | | 47,820 | | | | 2,338 | |
| * | HDFC Bank, Ltd. (Banks) | | | 322,404 | | | | 6,347 | |
| | Housing Development Finance Corporation, Ltd. (Thrifts & mortgage finance) | | | 112,711 | | | | 3,934 | |
| | Infosys, Ltd. (IT services) | | | 334,369 | | | | 5,736 | |
| | Maruti Suzuki India, Ltd. (Automobiles) | | | 20,479 | | | | 2,145 | |
| | Motherson Sumi Systems, Ltd. (Auto components) | | | 2,111,059 | | | | 4,767 | |
| | Reliance Industries, Ltd. (Oil, gas & consumable fuels) | | | 364,695 | | | | 9,660 | |
| | UPL, Ltd. (Chemicals) | | | 687,746 | | | | 4,393 | |
| | | | | | | | | 44,605 | |
| | Indonesia—1.8% | | | | | | | | |
| | PT Bank Central Asia Tbk (Banks) | | | 1,919,400 | | | | 4,624 | |
| | South Korea—6.5% | | | | | | | | |
| | Douzone Bizon Co., Ltd. (Software) | | | 31,870 | | | | 3,051 | |
| * | Kakao Corporation (Interactive Media & Services) | | | 7,306 | | | | 2,620 | |
| * | LG Household & Health Care, Ltd. (Personal products) | | | 4,029 | | | | 6,009 | |
| * | NAVER Corporation (Interactive Media & Services) | | | 19,629 | | | | 5,285 | |
| | | | | | | | | 16,965 | |
| | | | | | | | | | |
| | | | | | | | |
| | Issuer | | Shares | | | Value | |
| | | | | | | | | | |
| | Common Stocks—(continued) | | | | | | | | |
| | | | | | | | | | |
| | Emerging Asia—(continued) | | | | | | | | |
| | Taiwan—12.7% | | | | | | | | |
| | E.Sun Financial Holding Co., Ltd. (Banks) | | | 2,703,301 | | | $ | 2,458 | |
| | MediaTek, Inc. (Semiconductors & semiconductor equipment) | | | 260,000 | | | | 6,912 | |
| | Taiwan Semiconductor Manufacturing Co., Ltd.—ADR (Semiconductors & semiconductor equipment) | | | 189,567 | | | | 20,670 | |
| | Uni-President Enterprises Corporation (Food products) | | | 1,321,000 | | | | 3,174 | |
| | | | | | | | | 33,214 | |
| | Thailand—1.5% | | | | | | | | |
| * | Sea, Ltd.—ADR (Entertainment) | | | 20,261 | | | | 4,033 | |
| | | | | | | | | | |
| | Emerging Latin America—14.8% | | | | | | | | |
| | Argentina—4.3% | | | | | | | | |
| * | Globant S.A. (Software)† | | | 20,432 | | | | 4,446 | |
| * | MercadoLibre, Inc. (Internet & direct marketing retail) | | | 4,051 | | | | 6,787 | |
| | | | | | | | | 11,233 | |
| | Brazil—5.5% | | | | | | | | |
| | B3 S.A. - Brasil Bolsa Balcao (Capital markets) | | | 417,400 | | | | 4,981 | |
| | Odontoprev S.A. (Health care providers & services) | | | 221,853 | | | | 621 | |
| | Raia Drogasil S.A. (Food & staples retailing) | | | 378,900 | | | | 1,827 | |
| * | Rumo S.A. (Road & rail) | | | 1,097,200 | | | | 4,064 | |
| | TOTVS S.A. (Software) | | | 531,200 | | | | 2,937 | |
| | | | | | | | | 14,430 | |
| | Mexico—3.1% | | | | | | | | |
| * | Grupo Aeroportuario del Pacifico S.A.B. de C.V. Class “B” (Transportation infrastructure) | | | 426,600 | | | | 4,759 | |
| | Wal-Mart de Mexico S.A.B. de C.V. (Food & staples retailing) | | | 1,154,200 | | | | 3,242 | |
| | | | | | | | | 8,001 | |
| | Peru—1.9% | | | | | | | | |
| | Credicorp, Ltd. (Banks)† | | | 30,644 | | | | 5,026 | |
| | | | | | | | | | |
| | Emerging Europe, Mid-East, Africa—7.5% | | | | | | | | |
| | Poland—1.2% | | | | | | | | |
| * | Allegro.eu S.A. (Internet & direct marketing retail) | | | 140,378 | | | | 3,183 | |
| | Russia—2.2% | | | | | | | | |
| * | Yandex N.V. Class “A” (Interactive Media & Services)† | | | 84,659 | | | | 5,891 | |
| | South Africa—3.6% | | | | | | | | |
| | Bid Corporation, Ltd. (Food & staples retailing) | | | 102,062 | | | | 1,827 | |
| * | Capitec Bank Holdings, Ltd. (Banks) | | | 46,453 | | | | 4,528 | |
| | Clicks Group, Ltd. (Food & staples retailing) | | | 175,806 | | | | 3,023 | |
| | | | | | | | | 9,378 | |
See accompanying Notes to Financial Statements.
| 62 | Annual Report | December 31, 2020 |
Emerging Markets Leaders Fund
Portfolio of Investments, December 31, 2020 (all dollar amounts in thousands)
| | Issuer | | Shares or
Principal
Amount | | | Value | |
| | | | | | | | | | |
| | Common Stocks—(continued) | | | | | | | | |
| | | | | | | | | | |
| | Emerging Europe, Mid-East, Africa—(continued) | | | | | | | | |
| | United Arab Emirates—0.5% | | | | | | | | |
| * | Network International Holdings plc (IT services) | | | 291,443 | | | $ | 1,302 | |
| | Total Common Stocks—99.6%
(cost $163,738) | | | | | | | 260,941 | |
| | | | | | | | | | |
| | Repurchase Agreement | | | | | | | | |
| | Fixed Income Clearing Corporation, 0.000% dated 12/31/20, due 1/4/21, repurchase price $2,667, collateralized by U.S. Treasury Note, 0.500%, due 6/30/27, valued at $2,721 | | | $2,667 | | | | 2,667 | |
| | Total Repurchase Agreement—1.0%
(cost $2,667) | | | | | | | 2,667 | |
| | Total Investments—100.6%
(cost $166,405) | | | | | | | 263,608 | |
| | Liabilities, plus cash and other assets—(0.6)% | | | | | | | (1,471 | ) |
| | Net assets—100.0% | | | | | | $ | 262,137 | |
ADR = American Depository Receipt
* = Non-income producing security
† = U.S. listed foreign security
At December 31, 2020, the Fund’s Portfolio of Investments includes the following industry categories (as a percentage of long-term investments):
| Consumer Discretionary | | | 21.5 | % |
| Communication Services | | | 19.6 | % |
| Information Technology | | | 18.6 | % |
| Financials | | | 16.7 | % |
| Consumer Staples | | | 11.2 | % |
| Energy | | | 3.7 | % |
| Industrials | | | 3.4 | % |
| Materials | | | 2.8 | % |
| Health Care | | | 2.5 | % |
| Total | | | 100.0 | % |
At December 31, 2020, the Fund’s Portfolio of Investments includes the following currency categories (as a percentage of long-term investments):
| Hong Kong Dollar | | | 23.8 | % |
| U.S. Dollar | | | 21.6 | % |
| Indian Rupee | | | 17.1 | % |
| Chinese Yuan Renminbi | | | 10.5 | % |
| South Korean Won | | | 6.5 | % |
| Brazilian Real | | | 5.5 | % |
| New Taiwan Dollar | | | 4.8 | % |
| South African Rand | | | 3.6 | % |
| Mexican Peso | | | 3.1 | % |
| Indonesian Rupiah | | | 1.8 | % |
| Polish Zloty | | | 1.2 | % |
| All Other Currencies | | | 0.5 | % |
| Total | | | 100.0 | % |
See accompanying Notes to Financial Statements.
| December 31, 2020 | William Blair Funds | 63 |
| | Emerging Markets Growth Fund |
| | |
| | The Emerging Markets Growth Fund seeks long-term capital appreciation. |
| | |
| | AN OVERVIEW FROM THE PORTFOLIO MANAGERS |
| | |

Todd M. McClone 
Casey K. Preyss | The William Blair Emerging Markets Growth Fund (Class N shares) posted a 40.43% increase, net of fees, for the year ended December 31, 2020. By comparison, the Fund’s benchmark index, the MSCI Emerging Markets IMI (net) (the “Index”), increased 18.39%. Calendar year outperformance versus the Index was primarily driven by positive stock selection across most sectors. The Communication Services, Health Care and Consumer Staples sectors were the most notable sources of relative return. Within Communication Services, Sea Ltd, the leading online game publisher and e-commerce platform in Southeast Asia, enhanced relative performance as the company delivered significant growth in gaming and acceleration of e-commerce penetration and market share gains. Top Glove Corp Bhd, the world’s largest rubber glove manufacturer, within Health Care was an additional source of outperformance in the first part of the year. The company’s stock price accelerated on the back of the COVID-19-induced strong volume growth, higher ASP and production efficiency. Within Consumer Staples, Wuliangye Yibin Co Ltd, the second-largest premium baijiu player in China, helped relative returns. The company continued to deliver on the investment thesis which is predicated on management’s reform efforts, including increasing the focus on high-end products, improving brand support and channel management infrastructure. Partially offsetting these effects were the overweight allocation to Brazil and underweight allocation to the Communication Services sector in the first part of the year, coupled with below average stock selection within the Financials sector. Indian financials, especially Bajaj Finance, weighed on relative results due to investor concerns about increased funding costs and deteriorating asset quality as a result of the economic disruption in India. Brazilian financials also detracted from relative performance. Banco BTG Pactual, a leading investment bank and wealth manager in Brazil and Latin America, weakened due to deteriorated business sentiment amid COVID-19’s disruption of the economic recovery. Please refer to the Global Markets Review and Outlook relating to the Fund beginning on page 33. |
| | | |
| 64 | Annual Report | December 31, 2020 |
Emerging Markets Growth Fund
Performance Highlights (Unaudited)
| Average Annual Total Returns through 12/31/2020 |
| | | | | | | | | |
| | | 1 Year | | 3 Year | | 5 Year | | 10 Year |
| Class N | | | 40.43 | % | | | 12.08 | % | | | 16.24 | % | | | 6.52 | % |
| Class I | | | 40.72 | | | | 12.39 | | | | 16.54 | | | | 6.80 | |
| Class R6 | | | 40.90 | | | | 12.47 | | | | 16.62 | | | | 6.95 | |
| MSCI Emerging Markets IMI (net) | | | 18.39 | | | | 5.77 | | | | 12.22 | | | | 3.47 | |
Performance cited represents past performance. Past performance does not guarantee future results and current performance may be lower or higher than the data quoted. Results shown are average annual total returns, which assume reinvestment of dividends and capital gains. Investment returns and principal will fluctuate and you may have a gain or loss when you sell shares. For the most current month-end performance information, please call 1-800-742-7272, or visit our Web site at www.williamblairfunds.com. From time to time, the investment adviser may waive fees or reimburse expenses for the Fund. Without these waivers/reimbursements, performance would be lower. International investing involves special risk considerations, including currency fluctuations, lower liquidity, economic and political risk. These risks may be magnified when investing in emerging markets. Class N shares are not subject to a sales load. Class I shares are not subject to a sales load or distribution (Rule 12b-1) fees. Class R6 shares are not subject to a sales load, distribution (Rule 12b-1) fees, or sub-transfer agent fees.
The performance highlights and graph presented above do not reflect the deduction of taxes that a shareholder would pay on fund distributions or the redemption of fund shares.
The Morgan Stanley Capital International (MSCI) Emerging Markets Investable Market Index (IMI) (net) is a free float-adjusted market capitalization weighted index that is designed to measure the equity market performance of emerging markets. This index approximates the minimum possible dividend reinvestment by deducting for the highest possible withholding tax rates of those markets.
This report identifies the Fund’s investments on December 31, 2020. These holdings are subject to change. Not all stocks in the Fund performed the same, nor is there any guarantee that these stocks will perform as well in the future. Market forecasts provided in this report may not necessarily come to pass.
Sector Diversification (Unaudited)
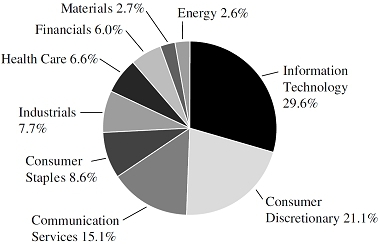
The sector diversification shown is based on the total long-term securities.
| December 31, 2020 | William Blair Funds | 65 |
Emerging Markets Growth Fund
Portfolio of Investments, December 31, 2020 (all dollar amounts in thousands)
| | | | | | | | |
| | | | | | | | |
| | Issuer | | Shares | | | Value | |
| | | | | | | | | | |
| | Common Stocks | | | | | | | | |
| | | | | | | | | | |
| | Emerging Asia—84.4% | | | | | | | | |
| | China—38.4% | | | | | | | | |
| | A-Living Smart City Services Co., Ltd. Class “H” (Commercial services & supplies) | | | 285,250 | | | $ | 1,266 | |
| | Aier Eye Hospital Group Co., Ltd. Class “A” (Health care providers & services) | | | 353,209 | | | | 4,045 | |
| * | Alibaba Group Holding, Ltd. (Internet & direct marketing retail) | | | 2,136,832 | | | | 64,112 | |
| * | Alibaba Health Information Technology, Ltd. (Health care technology) | | | 1,430,000 | | | | 4,224 | |
| | Autobio Diagnostics Co., Ltd. Class “A” (Health care equipment & supplies) | | | 100,300 | | | | 2,227 | |
| | Beijing Oriental Yuhong Waterproof Technology Co., Ltd. Class “A” (Construction materials) | | | 595,250 | | | | 3,532 | |
| | Centre Testing International Group Co., Ltd. Class “A” (Professional services) | | | 1,429,900 | | | | 5,984 | |
| | Chacha Food Co., Ltd. Class “A” (Food products) | | | 386,697 | | | | 3,184 | |
| | Changzhou Xingyu Automotive Lighting Systems Co., Ltd. Class “A” (Auto components) | | | 102,800 | | | | 3,152 | |
| | China Education Group Holdings, Ltd. (Diversified consumer services) | | | 1,315,000 | | | | 2,534 | |
| | China Meidong Auto Holdings, Ltd. (Specialty retail) | | | 1,132,000 | | | | 4,600 | |
| | China Merchants Bank Co., Ltd. Class “H” (Banks) | | | 895,500 | | | | 5,660 | |
| | China Tourism Group Duty Free Corporation, Ltd. Class “A” (Specialty retail) | | | 179,858 | | | | 7,768 | |
| | Chongqing Zhifei Biological Products Co., Ltd. Class “A” (Biotechnology) | | | 142,400 | | | | 3,221 | |
| | Contemporary Amperex Technology Co., Ltd. Class “A” (Electrical equipment) | | | 96,800 | | | | 5,197 | |
| | Country Garden Services Holdings Co., Ltd. (Commercial services & supplies) | | | 959,000 | | | | 6,488 | |
| | Foshan Haitian Flavouring & Food Co., Ltd. Class “A” (Food products) | | | 325,281 | | | | 9,975 | |
| | Guangdong Haid Group Co., Ltd. Class “A” (Food products) | | | 288,233 | | | | 2,887 | |
| | Hangzhou Tigermed Consulting Co., Ltd. Class “A” (Life sciences tools & services) | | | 224,266 | | | | 5,542 | |
| | Hundsun Technologies, Inc. Class “A” (Software) | | | 269,581 | | | | 4,324 | |
| | Jafron Biomedical Co., Ltd. Class “A” (Health care equipment & supplies) | | | 225,621 | | | | 2,340 | |
| * | JD.com, Inc. Class “A” (Internet & direct marketing retail) | | | 446,750 | | | | 19,708 | |
| | Jiangsu Hengli Hydraulic Co., Ltd. Class “A” (Machinery) | | | 920,865 | | | | 15,911 | |
| | Jiangsu Hengrui Medicine Co., Ltd. Class “A” (Pharmaceuticals) | | | 339,151 | | | | 5,780 | |
| * | Jiumaojiu International Holdings, Ltd. (Hotels, restaurants & leisure) | | | 1,037,000 | | | | 3,157 | |
| * | Kingdee International Software Group Co., Ltd. (Software) | | | 1,448,000 | | | | 5,902 | |
| | | | | | | | |
| | | | | | | | |
| | Issuer | | Shares | | | Value | |
| | | | | | | | | | |
| | Common Stocks—(continued) | | | | | | | | |
| | | | | | | | | | |
| | Emerging Asia—(continued) | | | | | | | | |
| | China—(continued) | | | | | | | | |
| | Kweichow Moutai Co., Ltd. Class “A” (Beverages) | | | 32,542 | | | $ | 9,942 | |
| | Li Ning Co., Ltd. (Textiles, apparel & luxury goods) | | | 1,170,500 | | | | 8,047 | |
| | Luxshare Precision Industry Co., Ltd. Class “A” (Electronic equipment, instruments & components) | | | 1,032,540 | | | | 8,861 | |
| * | Meituan Class “B” (Internet & direct marketing retail) | | | 582,300 | | | | 22,128 | |
| | Midea Group Co., Ltd. Class “A” (Household durables) | | | 586,033 | | | | 8,821 | |
| | NetEase, Inc. (Entertainment) | | | 787,100 | | | | 14,986 | |
| | Offcn Education Technology Co., Ltd. Class “A” (Diversified consumer services) | | | 1,126,090 | | | | 6,049 | |
| * | Ping An Healthcare and Technology Co., Ltd. (Health care technology) | | | 99,200 | | | | 1,203 | |
| | SG Micro Corporation Class “A” (Semiconductors & semiconductor equipment) | | | 77,200 | | | | 3,114 | |
| | Shanghai M&G Stationery, Inc. Class “A” (Commercial services & supplies) | | | 277,877 | | | | 3,763 | |
| | Shenzhen Inovance Technology Co., Ltd. Class “A” (Machinery) | | | 456,143 | | | | 6,508 | |
| | Shenzhen Mindray Bio-Medical Electronics Co., Ltd. Class “A” (Health care equipment & supplies) | | | 112,768 | | | | 7,346 | |
| | Sichuan Teway Food Group Co., Ltd. Class “A” (Food products) | | | 306,200 | | | | 3,851 | |
| | Silergy Corporation (Semiconductors & semiconductor equipment) | | | 143,000 | | | | 12,265 | |
| | Tencent Holdings, Ltd. (Interactive Media & Services) | | | 952,260 | | | | 69,278 | |
| * | Topchoice Medical Corporation Class “A” (Health care providers & services) | | | 108,700 | | | | 4,596 | |
| | Topsports International Holdings, Ltd. (Specialty retail) | | | 1,987,000 | | | | 2,973 | |
| * | Weimob, Inc. (Software) | | | 2,065,000 | | | | 3,713 | |
| | Wuliangye Yibin Co., Ltd. Class “A” (Beverages) | | | 303,394 | | | | 13,539 | |
| | WuXi AppTec Co., Ltd. Class “H” (Life sciences tools & services) | | | 378,400 | | | | 7,409 | |
| * | Wuxi Biologics Cayman, Inc. (Life sciences tools & services) | | | 1,146,000 | | | | 15,196 | |
| | Yifeng Pharmacy Chain Co., Ltd. Class “A” (Food & staples retailing) | | | 199,660 | | | | 2,754 | |
| * | Yihai International Holding, Ltd. (Food products) | | | 291,000 | | | | 4,317 | |
| | Zhangzhou Pientzehuang Pharmaceutical Co., Ltd. Class “A” (Pharmaceuticals) | | | 152,729 | | | | 6,247 | |
| | Zhongsheng Group Holdings, Ltd. (Specialty retail) | | | 1,371,500 | | | | 9,774 | |
| | | | | | | | | 459,400 | |
See accompanying Notes to Financial Statements.
| 66 | Annual Report | December 31, 2020 |
Emerging Markets Growth Fund
Portfolio of Investments, December 31, 2020 (all dollar amounts in thousands)
| | | | | | | | |
| | | | | | | | |
| | Issuer | | Shares | | | Value | |
| | | | | | | | | | |
| | Common Stocks—(continued) | | | | | | | | |
| | | | | | | | | | |
| | Emerging Asia—(continued) | | | | | | | | |
| | India—11.8% | | | | | | | | |
| | Amber Enterprises India, Ltd. (Household durables) | | | 41,567 | | | $ | 1,339 | |
| | Asian Paints, Ltd. (Chemicals) | | | 177,631 | | | | 6,711 | |
| | Crompton Greaves Consumer Electricals, Ltd. (Household durables) | | | 690,961 | | | | 3,593 | |
| | Dabur India, Ltd. (Personal products) | | | 761,278 | | | | 5,553 | |
| | Divi’s Laboratories, Ltd. (Life sciences tools & services) | | | 106,361 | | | | 5,587 | |
| | Dixon Technologies India, Ltd. (Household durables) | | | 9,613 | | | | 1,767 | |
| | Dr. Lal PathLabs, Ltd. (Health care providers & services) | | | 71,313 | | | | 2,247 | |
| | Escorts, Ltd. (Machinery) | | | 160,789 | | | | 2,793 | |
| | Havells India, Ltd. (Electrical equipment) | | | 303,006 | | | | 3,801 | |
| * | HDFC Bank, Ltd. (Banks) | | | 947,523 | | | | 18,654 | |
| * | HDFC Life Insurance Co., Ltd. (Insurance) | | | 287,610 | | | | 2,661 | |
| | Hindustan Unilever, Ltd. (Household products) | | | 155,453 | | | | 5,093 | |
| | Housing Development Finance Corporation, Ltd. (Thrifts & mortgage finance) | | | 286,214 | | | | 9,988 | |
| | Info Edge India, Ltd. (Interactive Media & Services) | | | 87,263 | | | | 5,719 | |
| | Nestle India, Ltd. (Food products) | | | 21,835 | | | | 5,492 | |
| | PI Industries, Ltd. (Chemicals) | | | 109,902 | | | | 3,300 | |
| | Pidilite Industries, Ltd. (Chemicals) | | | 226,973 | | | | 5,480 | |
| | Reliance Industries, Ltd. (Oil, gas & consumable fuels) | | | 1,173,118 | | | | 30,934 | |
| | SRF, Ltd. (Chemicals) | | | 57,662 | | | | 4,386 | |
| | Tata Consultancy Services, Ltd. (IT services) | | | 223,876 | | | | 8,778 | |
| | Tata Consumer Products, Ltd. (Food products) | | | 476,303 | | | | 3,849 | |
| | Varun Beverages, Ltd. (Beverages) | | | 229,595 | | | | 2,859 | |
| | | | | | | | | 140,584 | |
| | Indonesia—0.9% | | | | | | | | |
| | Bank Central Asia Tbk PT (Banks) | | | 4,392,299 | | | | 10,582 | |
| | South Korea—12.9% | | | | | | | | |
| * | Hansol Chemical Co., Ltd. (Chemicals) | | | 24,633 | | | | 4,456 | |
| * | JYP Entertainment Corporation (Entertainment) | | | 64,988 | | | | 2,297 | |
| | s Kakao Corporation (Interactive Media & Services) | | | 62,266 | | | | 22,326 | |
| | LEENO Industrial, Inc. (Semiconductors & semiconductor equipment) | | | 33,162 | | | | 4,121 | |
| * | LG Household & Health Care, Ltd. (Personal products) | | | 6,354 | | | | 9,476 | |
| * | NAVER Corporation (Interactive Media & Services) | | | 62,531 | | | | 16,837 | |
| * | NCSoft Corporation (Entertainment) | | | 7,493 | | | | 6,422 | |
| * | NHN KCP Corporation (IT services) | | | 59,752 | | | | 3,768 | |
| * | NICE Information Service Co., Ltd. (Professional services) | | | 139,926 | | | | 3,195 | |
| | Samsung Electronics Co., Ltd. (Technology hardware, storage & peripherals) | | | 794,079 | | | | 59,211 | |
| | | | | | | | |
| | | | | | | | |
| | Issuer | | Shares | | | Value | |
| | | | | | | | | | |
| | Common Stocks—(continued) | | | | | | | | |
| | | | | ’ | | | | | |
| | Emerging Asia—(continued) | | | | | | | | |
| | South Korea—(continued) | | | | | | | | |
| * | Samsung SDI Co., Ltd. (Electronic equipment, instruments & components) | | | 11,732 | | | $ | 6,782 | |
| * | SK Hynix, Inc. (Semiconductors & semiconductor equipment) | | | 111,677 | | | | 12,182 | |
| * | WONIK IPS Co., Ltd. (Semiconductors & semiconductor equipment) | | | 72,836 | | | | 2,967 | |
| | | | | | | | | 154,040 | |
| | Taiwan—18.6% | | | | | | | | |
| | Accton Technology Corporation (Communications equipment) | | | 381,000 | | | | 4,285 | |
| | Advantech Co., Ltd. (Technology hardware, storage & peripherals) | | | 368,766 | | | | 4,594 | |
| | Airtac International Group (Machinery) | | | 428,000 | | | | 13,709 | |
| | ASMedia Technology, Inc. (Semiconductors & semiconductor equipment) | | | 132,000 | | | | 7,376 | |
| | ASPEED Technology, Inc. (Semiconductors & semiconductor equipment) | | | 118,000 | | | | 7,202 | |
| | Chailease Holding Co., Ltd. (Diversified financial services) | | | 683,000 | | | | 4,084 | |
| | E.Sun Financial Holding Co., Ltd. (Banks) | | | 4,464,313 | | | | 4,060 | |
| | Elite Material Co., Ltd. (Electronic equipment, instruments & components) | | | 513,000 | | | | 2,866 | |
| | Hiwin Technologies Corporation (Machinery) | | | 211,000 | | | | 2,887 | |
| | Lotes Co., Ltd. (Electronic equipment, instruments & components) | | | 220,000 | | | | 3,715 | |
| | MediaTek, Inc. (Semiconductors & semiconductor equipment) | | | 896,000 | | | | 23,821 | |
| | momo.com, Inc. (Internet & direct marketing retail) | | | 158,000 | | | | 3,582 | |
| | Parade Technologies, Ltd. (Semiconductors & semiconductor equipment) | | | 147,000 | | | | 5,807 | |
| | Poya International Co., Ltd. (Multiline retail) | | | 103,000 | | �� | | 2,111 | |
| | Realtek Semiconductor Corporation (Semiconductors & semiconductor equipment) | | | 394,000 | | | | 5,476 | |
| | Sinbon Electronics Co., Ltd. (Electronic equipment, instruments & components) | | | 573,000 | | | | 4,405 | |
| | Taiwan Semiconductor Manufacturing Co., Ltd. (Semiconductors & semiconductor equipment) | | | 1,711,000 | | | | 32,274 | |
| | Taiwan Semiconductor Manufacturing Co., Ltd.—ADR (Semiconductors & semiconductor equipment) | | | 702,552 | | | | 76,606 | |
| | Voltronic Power Technology Corporation (Electrical equipment) | | | 125,586 | | | | 5,006 | |
| | Win Semiconductors Corporation (Semiconductors & semiconductor equipment) | | | 417,000 | | | | 5,135 | |
| | Wiwynn Corporation (Technology hardware, storage & peripherals) | | | 135,000 | | | | 3,382 | |
| | | | | | | | | 222,383 | |
See accompanying Notes to Financial Statements.
| December 31, 2020 | William Blair Funds | 67 |
Emerging Markets Growth Fund
Portfolio of Investments, December 31, 2020 (all dollar amounts in thousands)
| | | | | | | | |
| | | | | | | | |
| | Issuer | | Shares | | | Value | |
| | | | | | | | | | |
| | Common Stocks—(continued) | | | | | | | | |
| | | | | | | | | | |
| | Emerging Asia—(continued) | | | | | | | | |
| | Thailand—1.5% | | | | | | | | |
| * | Sea, Ltd.—ADR (Entertainment) | | | 92,406 | | | $ | 18,393 | |
| | Vietnam—0.3% | | | | | | | | |
| | Hoa Phat Group JSC (Metals & mining) | | | 2,117,260 | | | | 3,802 | |
| | | | | | | | | | |
| | Emerging Latin America—8.3% | | | | | | | | |
| | Argentina—2.9% | | | | | | | | |
| * | Globant S.A. (IT services)† | | | 30,702 | | | | 6,681 | |
| * | MercadoLibre, Inc. (Internet & direct marketing retail) | | | 16,812 | | | | 28,164 | |
| | | | | | | | | 34,845 | |
| | Brazil—5.0% | | | | | | | | |
| | B3 S.A. - Brasil Bolsa Balcao (Capital markets) | | | 790,900 | | | | 9,438 | |
| | Localiza Rent a Car S.A. (Road & rail) | | | 458,000 | | | | 6,080 | |
| | Locaweb Servicos de Internet S.A. (IT services) | | | 299,200 | | | | 4,635 | |
| | Magazine Luiza S.A. (Multiline retail) | | | 3,093,900 | | | | 14,861 | |
| * | StoneCo, Ltd. Class “A” (IT services)† | | | 148,691 | | | | 12,478 | |
| | TOTVS S.A. (Software) | | | 763,800 | | | | 4,223 | |
| | WEG S.A. (Electrical equipment) | | | 529,020 | | | | 7,714 | |
| | | | | | | | | 59,429 | |
| | Mexico—0.4% | | | | | | | | |
| | Wal-Mart de Mexico S.A.B. de C.V. (Food & staples retailing) | | | 1,545,200 | | | | 4,341 | |
| | | | | | | | | | |
| | Emerging Europe, Africa—5.9% | | | | | | | | |
| | Kenya—0.2% | | | | | | | | |
| | Safaricom plc (Wireless telecommunication services) | | | 9,304,554 | | | | 2,910 | |
| | Poland—1.9% | | | | | | | | |
| * | Allegro.eu S.A. (Internet & direct marketing retail) | | | 561,958 | | | | 12,741 | |
| * | Dino Polska S.A. (Food & staples retailing) | | | 123,035 | | | | 9,532 | |
| | | | | | | | | 22,273 | |
| | Russia—2.0% | | | | | | | | |
| | TCS Group Holding plc—GDR (Banks) | | | 156,224 | | | | 5,140 | |
| * | Yandex N.V. Class “A” (Interactive Media & Services)† | | | 269,412 | | | | 18,745 | |
| | | | | | | | | 23,885 | |
| | South Africa—1.8% | | | | | | | | |
| | Clicks Group, Ltd. (Food & staples retailing) | | | 240,548 | | | | 4,136 | |
| | Naspers, Ltd. Class “N” (Internet & direct marketing retail) | | | 83,816 | | | | 17,221 | |
| | | | | | | | | 21,357 | |
| | Total Common Stocks—98.6%
(cost $732,722) | | | | | | | 1,178,224 | |
| | | | | | | | |
| | | | Principal | | | | |
| | Issuer | | Amount | | | Value | |
| | | | | | | | | | |
| | Repurchase Agreement | | | | | | | | |
| | Fixed Income Clearing Corporation, 0.000% dated 12/31/20, due 1/4/21, repurchase price $15,886, collateralized by U.S. Treasury Note, 0.500%, due 6/30/27, valued at $16,204 | | | $15,886 | | | $ | 15,886 | |
| | Total Repurchase Agreement—1.3%
(cost $15,886) | | | | | | | 15,886 | |
| | Total Investments—99.9%
(cost $748,608) | | | | | | | 1,194,110 | |
| | Cash and other assets, less liabilities—0.1% | | | | | | | 1,626 | |
| | Net assets—100.0% | | | | | | $ | 1,195,736 | |
ADR = American Depository Receipt
GDR = Global Depository Receipt
* = Non-income producing security
† = U.S. listed foreign security
At December 31, 2020, the Fund’s Portfolio of Investments includes the following industry categories (as a percentage of long-term investments):
| Information Technology | | | 29.6 | % |
| Consumer Discretionary | | | 21.1 | % |
| Communication Services | | | 15.1 | % |
| Consumer Staples | | | 8.6 | % |
| Industrials | | | 7.7 | % |
| Health Care | | | 6.6 | % |
| Financials | | | 6.0 | % |
| Materials | | | 2.7 | % |
| Energy | | | 2.6 | % |
| Total | | | 100.0 | % |
At December 31, 2020, the Fund’s Portfolio of Investments includes the following currency categories (as a percentage of long-term investments):
| Hong Kong Dollar | | | 23.5 | % |
| Chinese Yuan Renminbi | | | 14.5 | % |
| U.S. Dollar | | | 14.1 | % |
| New Taiwan Dollar | | | 13.4 | % |
| South Korean Won | | | 13.1 | % |
| Indian Rupee | | | 11.9 | % |
| Brazilian Real | | | 4.0 | % |
| Polish Zloty | | | 1.9 | % |
| South African Rand | | | 1.8 | % |
| All Other Currencies | | | 1.8 | % |
| Total | | | 100.0 | % |
See accompanying Notes to Financial Statements.
| 68 | Annual Report | December 31, 2020 |
| | Emerging Markets Small Cap Growth Fund |
| | |
| | The Emerging Markets Small Cap Growth Fund seeks long-term capital appreciation. |
| | |
| | AN OVERVIEW FROM THE PORTFOLIO MANAGERS |
| | |

Todd M. McClone 
Casey K. Preyss | The William Blair Emerging Markets Small Cap Growth Fund (Class N shares) posted a 32.26% increase, net of fees, for the year ended December 31, 2020. By comparison, the Fund’s benchmark index, the MSCI Emerging Markets Small Cap Index (net) (the “Index”), increased 19.29%. Calendar year outperformance versus the Index was primarily driven by positive stock selection across most sectors. Stock selection within the Industrials sector was particularly positive, with Jiangsu Hengli Hydraulic Co, Country Garden Services Holding and Airtac International Group adding to relative returns. Jiangsu Hengli Hydraulic and Airtac’s stock performance accelerated in the second half of the year amid strong operating performance coupled with improved investor sentiment, reflecting the robust industry backdrop. The property management company Country Garden Services Holding boosted performance in the first half of the year. The company posted robust growth in the gross floor area under management and increased revenue from value-added services, benefiting from heightened demand for extra services and local government subsidies on the back of the COVID-19 outbreak. Consumer Staples also aided returns, bolstered by the strong performance of Dino Polska. The leading Polish proximity supermarket chain’s investment thesis is predicated on its ability to deliver strong growth and investment returns on the back of competitive pricing, strong cost control, vertical integration and an efficient logistics network. Partially offsetting these effects was negative stock selection within the Financials and Real Estate sectors. Within Financials, Bank BTPN Syariah Tbk PT (BTPS) and AU Small Finance Bank Ltd hindered relative performance. BTPS is a highly-profitable Shariah bank in Indonesia with a leading position in the ultra-micro segment. AU Small Finance Bank Ltd is a unique Indian bank specializing in small ticket retail loans on income-generating products targeting the unserved and underserved customer segments. Both stocks were hit in the first quarter by investor concerns over the banks’ unsecure credit business coupled with deteriorated growth and credit quality outlooks. Within the Real Estate sector, China Overseas Property Holding detracted from performance amid disappointing growth despite the stability and a strong backing from third-party development companies. We exited the position due to a weaker fundamental outlook. Please refer to the Global Markets Review and Outlook relating to the Fund beginning on page 33. |
| | |
| December 31, 2020 | William Blair Funds | 69 |
Emerging Markets Small Cap Growth Fund
Performance Highlights (Unaudited)
| Average Annual Total Returns through 12/31/2020 |
| | | 1 Year | | 3 Year | | 5 Year | | Since
Inception |
| Class N(a) | | | 32.26 | % | | | 6.75 | % | | | 10.04 | % | | | 11.08 | % |
| Class I(a) | | | 32.60 | | | | 7.03 | | | | 10.34 | | | | 11.39 | |
| MSCI Emerging Markets Small Cap Index (net)(a) | | | 19.29 | | | | 2.69 | | | | 8.19 | | | | 5.34 | |
| Class R6(b) | | | 32.66 | | | | 7.11 | | | | 10.41 | | | | 9.70 | |
| MSCI Emerging Markets Small Cap Index (net)(b) | | | 19.29 | | | | 2.69 | | | | 8.19 | | | | 4.54 | |
| | | | | | | | | | | | | | | | | |
| (a) | Since inception is for the period from October 24, 2011 (Commencement of Operations) to December 31, 2020. |
| (b) | Since inception is for the period from December 20, 2012 (Commencement of Operations) to December 31, 2020. |
Performance cited represents past performance. Past performance does not guarantee future results and current performance may be lower or higher than the data quoted. Results shown are average annual total returns, which assume reinvestment of dividends and capital gains. Investment returns and principal will fluctuate and you may have a gain or loss when you sell shares. For the most current month-end performance information, please call 1-800-742-7272, or visit our Web site at www.williamblairfunds.com. From time to time, the investment adviser may waive fees or reimburse expenses for the Fund. Without these waivers/reimbursements, performance would be lower. International investing involves special risk considerations, including currency fluctuations, lower liquidity, economic and political risk. These risks may be magnified when investing in emerging markets. Smaller capitalization stocks are also more sensitive to purchase/sale transactions and changes in the issuer’s financial condition. Class N shares are not subject to a sales load. Class I shares are not subject to a sales load or distribution (Rule 12b-1) fees. Class R6 shares are not subject to a sales load, distribution (Rule 12b-1) fees, or sub-transfer agent fees.
The performance highlights and graph presented above do not reflect the deduction of taxes that a shareholder would pay on fund distributions or the redemption of fund shares.
The Morgan Stanley Capital International (MSCI) Emerging Markets Small Cap Index (net) is a free float-adjusted market capitalization index that is designed to measure the equity market performance of emerging markets. This index approximates the minimum possible dividend reinvestment by deducting for the highest possible withholding tax rates of those markets.
This report identifies the Fund’s investments on December 31, 2020. These holdings are subject to change. Not all stocks in the Fund performed the same, nor is there any guarantee that these stocks will perform as well in the future. Market forecasts provided in this report may not necessarily come to pass.
Sector Diversification (Unaudited)

The sector diversification shown is based on the total long-term securities.
| 70 | Annual Report | December 31, 2020 |
Emerging Markets Small Cap Growth Fund
Portfolio of Investments, December 31, 2020 (all dollar amounts in thousands)
| | | | | | | | |
| | | | | | | | |
| | Issuer | | Shares | | | Value | |
| | | | | | | | |
| | Common Stocks | | | | | | | | |
| | | | | | | | | | |
| | Emerging Asia—79.3% | | | | | | | | |
| | Cambodia—0.5% | | | | | | | | |
| | NagaCorp, Ltd. (Hotels, restaurants & leisure) | | | 1,234,000 | | | $ | 1,617 | |
| | China—16.8% | | | | | | | | |
| | A-Living Smart City Services Co., Ltd. Class “H” (Commercial services & supplies) | | | 102,500 | | | | 455 | |
| | Autobio Diagnostics Co., Ltd. Class “A” (Health care equipment & supplies) | | | 31,700 | | | | 704 | |
| | By-health Co., Ltd. Class “A” (Personal products) | | | 371,400 | | | | 1,371 | |
| | Centre Testing International Group Co., Ltd. Class “A” (Professional services) | | | 1,521,605 | | | | 6,368 | |
| | Chacha Food Co., Ltd. Class “A” (Food products) | | | 157,473 | | | | 1,297 | |
| | Changzhou Xingyu Automotive Lighting Systems Co., Ltd. Class “A” (Auto components) | | | 111,447 | | | | 3,417 | |
| | China Lesso Group Holdings, Ltd. (Building products) | | | 549,000 | | | | 860 | |
| | China Meidong Auto Holdings, Ltd. (Specialty retail) | | | 846,000 | | | | 3,437 | |
| | Ever Sunshine Lifestyle Services Group, Ltd. (Commercial services & supplies) | | | 1,292,000 | | | | 2,836 | |
| | Hefei Meiya Optoelectronic Technology, Inc. Class “A” (Machinery) | | | 35,695 | | | | 242 | |
| | Jiangsu Hengli Hydraulic Co., Ltd. Class “A” (Machinery) | | | 413,613 | | | | 7,147 | |
| | Jiangsu Hengshun Vinegar Industry Co., Ltd. Class “A” (Food products) | | | 320,600 | | | | 1,085 | |
| * | Jiumaojiu International Holdings, Ltd. (Hotels, restaurants & leisure) | | | 869,000 | | | | 2,645 | |
| * | Kingsoft Cloud Holdings, Ltd.—ADR (IT services) | | | 77,498 | | | | 3,375 | |
| | Ovctek China, Inc. Class “A” (Health care equipment & supplies) | | | 139,377 | | | | 1,746 | |
| | Proya Cosmetics Co., Ltd. Class “A” (Personal products) | | | 31,124 | | | | 847 | |
| | Shanghai M&G Stationery, Inc. Class “A” (Commercial services & supplies) | | | 125,319 | | | | 1,697 | |
| | Sichuan Teway Food Group Co., Ltd. Class “A” (Food products) | | | 232,100 | | | | 2,919 | |
| | Silergy Corporation (Semiconductors & semiconductor equipment) | | | 37,000 | | | | 3,173 | |
| | Topsports International Holdings, Ltd. (Specialty retail) | | | 493,000 | | | | 738 | |
| * | Weimob, Inc. (Software) | | | 1,585,000 | | | | 2,850 | |
| | Zhejiang Dingli Machinery Co., Ltd. Class “A” (Machinery) | | | 147,971 | | | | 2,290 | |
| | | | | | | | | 51,499 | |
| | India—33.6% | | | | | | | | |
| | Aarti Industries, Ltd. (Chemicals) | | | 159,937 | | | | 2,699 | |
| | Amber Enterprises India, Ltd. (Household durables) | | | 72,163 | | | | 2,324 | |
| | Apollo Hospitals Enterprise, Ltd. (Health care providers & services) | | | 39,444 | | | | 1,299 | |
| | | | | | | | |
| | | | | | | | |
| | Issuer | | Shares | | | Value | |
| | | | | |
| | Common Stocks—(continued) | | | | | | |
| | | | | |
| | Emerging Asia—(continued) | | | | | | | | |
| | India—(continued) | | | | | | | | |
| | Astral Poly Technik, Ltd. (Building products) | | | 232,956 | | | $ | 5,420 | |
| | Atul, Ltd. (Chemicals) | | | 47,791 | | | | 4,202 | |
| * | AU Small Finance Bank Ltd. (Banks) | | | 416,870 | | | | 4,858 | |
| | Balkrishna Industries, Ltd. (Auto components) | | | 223,662 | | | | 5,048 | |
| * | Bandhan Bank, Ltd. (Banks) | | | 265,975 | | | | 1,463 | |
| | Berger Paints India, Ltd. (Chemicals) | | | 410,721 | | | | 4,261 | |
| * | Biocon, Ltd. (Biotechnology) | | | 163,638 | | | | 1,041 | |
| | Cholamandalam Investment and Finance Co., Ltd. (Consumer finance) | | | 394,274 | | | | 2,088 | |
| | City Union Bank, Ltd. (Banks) | | | 519,378 | | | | 1,284 | |
| | Coforge, Ltd. (IT services) | | | 57,898 | | | | 2,140 | |
| | Computer Age Management Services, Ltd. (IT services) | | | 66,112 | | | | 1,645 | |
| | Crompton Greaves Consumer Electricals, Ltd. (Household durables) | | | 850,437 | | | | 4,423 | |
| | Dixon Technologies India, Ltd. (Household durables) | | | 7,221 | | | | 1,327 | |
| | Dr. Lal PathLabs, Ltd. (Health care providers & services) | | | 54,617 | | | | 1,721 | |
| | Endurance Technologies, Ltd. (Auto components) | | | 7,529 | | | | 138 | |
| | Escorts, Ltd. (Machinery) | | | 247,296 | | | | 4,296 | |
| * | Godrej Properties, Ltd. (Real estate management & development) | | | 195,350 | | | | 3,823 | |
| | Havells India, Ltd. (Electrical equipment) | | | 122,692 | | | | 1,539 | |
| | HDFC Asset Management Co., Ltd. (Capital markets) | | | 45,232 | | | | 1,810 | |
| | Info Edge India, Ltd. (Interactive Media & Services) | | | 14,402 | | | | 944 | |
| | Ipca Laboratories, Ltd. (Pharmaceuticals) | | | 113,837 | | | | 3,420 | |
| | Kansai Nerolac Paints, Ltd. (Chemicals) | | | 152,707 | | | | 1,265 | |
| | KEC International, Ltd. (Construction & engineering) | | | 195,085 | | | | 969 | |
| | Larsen & Toubro Infotech Ltd. (IT services) | | | 63,851 | | | | 3,196 | |
| * | Metropolis Healthcare, Ltd. (Health care providers & services) | | | 53,032 | | | | 1,422 | |
| | Motherson Sumi Systems, Ltd. (Auto components) | | | 872,129 | | | | 1,969 | |
| | Navin Fluorine International, Ltd. (Chemicals) | | | 83,186 | | | | 2,981 | |
| * | Oberoi Realty, Ltd. (Real estate management & development) | | | 185,054 | | | | 1,467 | |
| | PI Industries, Ltd. (Chemicals) | | | 164,504 | | | | 4,940 | |
| | Pidilite Industries, Ltd. (Chemicals) | | | 68,162 | | | | 1,646 | |
| | RBL Bank, Ltd. (Banks) | | | 364,037 | | | | 1,149 | |
| * | Relaxo Footwears, Ltd. (Textiles, apparel & luxury goods) | | | 226,942 | | | | 2,508 | |
| | SRF, Ltd. (Chemicals) | | | 67,655 | | | | 5,146 | |
| | Tata Consumer Products, Ltd. (Food products) | | | 168,835 | | | | 1,365 | |
| | Tata Elxsi, Ltd. (Software) | | | 153,279 | | | | 3,868 | |
| | Torrent Pharmaceuticals, Ltd. (Pharmaceuticals) | | | 22,216 | | | | 851 | |
| | | | | | | | | | |
See accompanying Notes to Financial Statements.
| December 31, 2020 | William Blair Funds | 71 |
Emerging Markets Small Cap Growth Fund
Portfolio of Investments, December 31, 2020 (all dollar amounts in thousands)
| | | | | | | | |
| | | | | | | | |
| | Issuer | | Shares | | | Value | |
| | | | | | | | | | |
| | Common Stocks—(continued) | | | | | | | | |
| | | | | | | | | | |
| | Emerging Asia—(continued) | | | | | | | | |
| | India—(continued) | | | | | | | | |
| | Trent, Ltd. (Multiline retail) | | | 219,637 | | | $ | 2,062 | |
| | Varun Beverages, Ltd. (Beverages) | | | 258,628 | | | | 3,221 | |
| | | | | | | | | 103,238 | |
| | Indonesia—1.2% | | | | | | | | |
| | PT Bank Tabungan Pensiunan Nasional Syariah Tbk (Banks) | | | 13,752,300 | | | | 3,671 | |
| | Malaysia—0.5% | | | | | | | | |
| | Inari Amertron Bhd (Electronic equipment, instruments & components) | | | 2,096,300 | | | | 1,438 | |
| | Philippines—0.6% | | | | | | | | |
| | Wilcon Depot, Inc. (Specialty retail) | | | 5,472,600 | | | | 1,926 | |
| | South Korea—6.8% | | | | | | | | |
| | Douzone Bizon Co., Ltd. (Software) | | | 47,623 | | | | 4,559 | |
| * | Hansol Chemical Co., Ltd. (Chemicals) | | | 13,027 | | | | 2,356 | |
| * | JYP Entertainment Corporation (Entertainment) | | | 35,608 | | | | 1,259 | |
| | LEENO Industrial, Inc. (Semiconductors & semiconductor equipment) | | | 32,482 | | | | 4,037 | |
| * | NHN KCP Corporation (IT services) | | | 73,881 | | | | 4,659 | |
| * | NICE Information Service Co., Ltd. (Professional services) | | | 136,603 | | | | 3,119 | |
| * | WONIK IPS Co., Ltd. (Semiconductors & semiconductor equipment) | | | 24,486 | | | | 997 | |
| | | | | | | | | 20,986 | |
| | Taiwan—15.8% | | | | | | | | |
| | Accton Technology Corporation (Communications equipment) | | | 164,000 | | | | 1,844 | |
| | Airtac International Group (Machinery) | | | 327,000 | | | | 10,474 | |
| | ASMedia Technology, Inc. (Semiconductors & semiconductor equipment) | | | 33,000 | | | | 1,844 | |
| | ASPEED Technology, Inc. (Semiconductors & semiconductor equipment) | | | 87,000 | | | | 5,310 | |
| | Bizlink Holding, Inc. (Electrical equipment) | | | 69,000 | | | | 598 | |
| | Elite Material Co., Ltd. (Electronic equipment, instruments & components) | | | 244,000 | | | | 1,363 | |
| | Hiwin Technologies Corporation (Machinery) | | | 173,106 | | | | 2,369 | |
| | Lotes Co., Ltd. (Electronic equipment, instruments & components) | | | 266,000 | | | | 4,492 | |
| | momo.com, Inc. (Internet & direct marketing retail) | | | 28,000 | | | | 635 | |
| | Parade Technologies, Ltd. (Semiconductors & semiconductor equipment) | | | 79,000 | | | | 3,121 | |
| | Poya International Co., Ltd. (Multiline retail) | | | 99,000 | | | | 2,030 | |
| | RichWave Technology Corporation (Semiconductors & semiconductor equipment) | | | 225,000 | | | | 3,159 | |
| | Sinbon Electronics Co., Ltd. (Electronic equipment, instruments & components) . | | | 792,000 | | | | 6,088 | |
| | Sporton International, Inc. (Professional services) | | | 186,000 | | | | 1,774 | |
| | | | | | | | |
| | | | | | | | |
| | Issuer | | Shares | | | Value | |
| | | | | | | | |
| | Common Stocks—(continued) | | | | | | | | |
| | | | | | | | | | |
| | Emerging Asia—(continued) | | | | | | | | |
| | Taiwan — (continued) | | | | | | | | |
| | Voltronic Power Technology Corporation (Electrical equipment) | | | 83,507 | | | $ | 3,329 | |
| | | | | | | | | 48,430 | |
| | Thailand—1.6% | | | | | | | | |
| | Carabao Group PCL Class “F” (Beverages) | | | 631,800 | | | | 2,414 | |
| | Com7 PCL Class “F” (Specialty retail) | | | 1,995,600 | | | | 2,598 | |
| | | | | | | | | 5,012 | |
| | Vietnam—1.9% | | | | | | | | |
| | Hoa Phat Group JSC (Metals & mining) | | | 3,236,126 | | | | 5,811 | |
| | | | | | | | | | |
| | Emerging Latin America—11.3% | | | | | | | | |
| | Brazil—9.5% | | | | | | | | |
| * | B2W Cia Digital (Internet & direct marketing retail) | | | 20,700 | | | | 301 | |
| | Banco BTG Pactual S.A. (Capital markets) | | | 90,900 | | | | 1,645 | |
| | Construtora Tenda S.A. (Household durables) | | | 199,600 | | | | 1,160 | |
| | Cyrela Brazil Realty S.A. Empreendimentos e Participacoes (Household durables) | | | 605,700 | | | | 3,438 | |
| | Ez Tec Empreendimentos e Participacoes S.A. (Household durables) | | | 321,000 | | | | 2,651 | |
| * | Grupo SBF S.A. (Specialty retail) | | | 208,392 | | | | 1,192 | |
| | Hapvida Participacoes e Investimentos S.A. (Health care providers & services) | | | 707,100 | | | | 2,077 | |
| | Locaweb Servicos de Internet S.A. (IT services) | | | 410,500 | | | | 6,360 | |
| | Pet Center Comercio e Participacoes S.A. (Specialty retail) | | | 871,300 | | | | 3,204 | |
| | Tegma Gestao Logistica S.A. (Road & rail) | | | 616,200 | | | | 3,200 | |
| | TOTVS S.A. (Software) | | | 721,200 | | | | 3,988 | |
| | | | | | | | | 29,216 | |
| | Mexico—1.8% | | | | | | | | |
| * | Grupo Aeroportuario del Centro Norte S.A.B. de C.V. (Transportation infrastructure) | | | 646,000 | | | | 4,167 | |
| * | Grupo Aeroportuario del Sureste S.A.B. de C.V. (Transportation infrastructure) | | | 72,440 | | | | 1,201 | |
| | | | | | | | | 5,368 | |
| | | | | | | | | | |
| | Emerging Europe, Mid-East, Africa—6.8% | | | | | |
| | Greece—1.6% | | | | | | | | |
| | JUMBO S.A. (Specialty retail) | | | 67,425 | | | | 1,171 | |
| | Terna Energy S.A. (Independent power & renewable electricity producers) | | | 226,187 | | | | 3,647 | |
| | | | | | | | | 4,818 | |
| | Kenya—0.5% | | | | | | | | |
| | Safaricom plc (Wireless telecommunication services) | | | 5,205,900 | | | | 1,628 | |
| | Poland—2.3% | | | | | | | | |
| * | Dino Polska S.A. (Food & staples retailing) | | | 91,968 | | | | 7,125 | |
See accompanying Notes to Financial Statements.
| 72 | Annual Report | December 31, 2020 |
Emerging Markets Small Cap Growth Fund
Portfolio of Investments, December 31, 2020 (all dollar amounts in thousands)
| | | | Shares or | | | | |
| | | | Principal | | | | |
| | Issuer | | Amount | | | Value | |
| | | | | | | | | | |
| | Common Stocks—(continued) | | | | | | | | |
| | | | | | | | | | |
| | Emerging Europe, Mid-East, Africa—(continued) | | |
| | Russia—1.1% | | | | | | | | |
| | HeadHunter Group plc—ADR (Professional services) | | | 36,380 | | | $ | 1,101 | |
| | TCS Group Holding plc—GDR (Banks) | | | 68,252 | | | | 2,245 | |
| | | | | | | | | 3,346 | |
| | South Africa—1.0% | | | | | | | | |
| | Clicks Group, Ltd. (Food & staples retailing) | | | 49,836 | | | | 857 | |
| | Transaction Capital, Ltd. (Consumer finance) | | | 1,305,145 | | | | 2,210 | |
| | | | | | | | | 3,067 | |
| | United Arab Emirates—0.3% | | | | | | | | |
| | Abu Dhabi National Oil Co. for Distribution PJSC (Specialty retail) | | | 1,050,508 | | | | 1,072 | |
| | Total Common Stocks—97.4%
(cost $209,841) | | | | | | | 299,268 | |
| | | | | | | | | | |
| | Preferred Stock | | | | | | | | |
| | Brazil—1.4% | | | | | | | | |
| | Randon S.A. Implementos e Participacoes (Machinery) | | | 1,400,850 | | | | 4,337 | |
| | Total Preferred Stock—1.4%
(cost $3,197) | | | | | | | 4,337 | |
| | | | | | | | | | |
| | Repurchase Agreement | | | | | | | | |
| | Fixed Income Clearing Corporation, 0.000% dated 12/31/20, due 1/4/21, repurchase price $3,667, collateralized by U.S. Treasury Note, 0.500%, due 6/30/27, valued at $3,741 | | | $3,667 | | | | 3,667 | |
| | Total Repurchase Agreement—1.2%
(cost $3,667) | | | | | | | 3,667 | |
| | Total Investments—100.0%
(cost $216,705) | | | | | | | 307,272 | |
| | Cash and other assets, less liabilities—0.0% | | | | | | | 137 | |
| | Net assets—100.0% | | | | | | $ | 307,409 | |
ADR = American Depository Receipt
GDR = Global Depository Receipt
* = Non-income producing security
At December 31, 2020, the Fund’s Portfolio of Investments includes the following industry categories (as a percentage of long-term investments):
| Information Technology | | | 24.2 | % |
| Industrials | | | 23.0 | % |
| Consumer Discretionary | | | 17.5 | % |
| Materials | | | 11.6 | % |
| Consumer Staples | | | 7.4 | % |
| Financials | | | 7.4 | % |
| Health Care | | | 4.7 | % |
| Real Estate | | | 1.7 | % |
| Communication Services | | | 1.3 | % |
| Utilities | | | 1.2 | % |
| Total | | | 100.0 | % |
At December 31, 2020, the Fund’s Portfolio of Investments includes the following currency categories (as a percentage of long-term investments):
| Indian Rupee | | | 34.0 | % |
| New Taiwan Dollar | | | 17.0 | % |
| Brazilian Real | | | 11.1 | % |
| Chinese Yuan Renminbi | | | 10.3 | % |
| South Korean Won | | | 6.9 | % |
| Hong Kong Dollar | | | 5.1 | % |
| Polish Zloty | | | 2.3 | % |
| U.S. Dollar | | | 2.2 | % |
| Vietnamese Dong | | | 1.9 | % |
| Mexican Peso | | | 1.8 | % |
| Thai Baht | | | 1.7 | % |
| Euro | | | 1.6 | % |
| Indonesian Rupiah | | | 1.1 | % |
| South African Rand | | | 1.0 | % |
| All Other Currencies | | | 2.0 | % |
| Total | | | 100.0 | % |
See accompanying Notes to Financial Statements.
| December 31, 2020 | William Blair Funds | 73 |
Fixed Income Market Review and Outlook
The Bloomberg Barclays U.S. Aggregate Index earned a robust 7.51% rate of return for the year ended December 31, 2020. The market benefitted by the quick response of policy makers in providing monetary and fiscal stimulus in the early days of the COVID-19 pandemic.
While the year started with an extreme (relative to history) rally in U.S. Treasuries, spread sectors led the market during the remainder of the year as investors yearned for yield and policy makers continued to support market liquidity. The spread sector rally that started at the end of March continued through 2020 and was enough to offset the impact of interest rates which started increasing from the lows during the last five months of the year.
The Corporate Bond sector led the broad market with a return of 9.89% as measured by the Bloomberg Barclays Corporate Bond Index. Strong demand for corporates was met with record new issuance. For the full year, new corporate bond issuance was approximately $2.1 trillion, more than 40% higher than the previous record (2017 = $1.47 trillion).
U.S. Treasury Inflation-Protected Securities (TIPS) performed well as the economic rebound resulted in increasing inflation expectations. During the year, TIPS earned a 10.99% return as measured by the Bloomberg Barclays U.S. Treasury Inflation Protected Securities (TIPS) Index, compared with 8.00% for the nominal Treasury Index as measured by the Bloomberg Barclays U.S. Treasury Index. At year end, the breakeven rate for inflation expectations was close to the Federal Reserve’s lower band of their target inflation range of 2.00-2.50%.
We believe that the Federal Open Market Committee (FOMC) will be patient in moving away from the Zero Lower Bound as FOMC Chairman Powell continues to reiterate no plans to raise rates. With market expectations for inflation increasing we continue to see TIPS as an attractive alternative to fixed-rate Treasuries to mitigate the effects of rising rates.
We believe that spread sectors remain attractive to Treasuries over the intermediate-to-long term.
Within corporate bonds, we believe that security selection will be critical as certain industries and business models are more adapted to successfully navigating the post-pandemic environment than others. Additionally overall valuations are back to pre-pandemic levels.
Overall liquidity for corporate issuers continues to be relatively strong as it appears that most were able to prefund financing needs with low all-in yields during 2020. Going forward we expect issuance to be less than the record levels seen in 2020. Risks remain in corporates as debt levels are high. We believe that as we emerge from the pandemic, companies will look to utilize excess cash on their balance sheets.
We believe that higher-coupon segments (30-year mortgage-backed securities (MBS) coupon rates of 5.0% and above) of the U.S. Government Agency MBS market offer compelling value. These segments of the MBS market offer a defensive duration profile with relatively stable cash flows. Prepayment protection is critical in this interest rate environment.
| 74 | Annual Report | December 31, 2020 |
| | Bond Fund |
| | |
| | The Bond Fund seeks to outperform the Bloomberg Barclays U.S. Aggregate Index by maximizing total return through a combination of income and capital appreciation. |
| | |
| | AN OVERVIEW FROM THE PORTFOLIO MANAGERS |
| | |

Paul J. Sularz 
Ruta Ziverte | The William Blair Bond Fund (Class N shares) returned 7.63%, net of fees, for the year ended December 31, 2020. By comparison, the Fund’s benchmark, the Bloomberg Barclays U.S. Aggregate Index (the “Index”), returned 7.51%. The first quarter of the year was dominated by the market’s reaction to the early days of the COVID-19 pandemic. In early March the bond market experienced an extreme flight (relative to history) to quality with U.S. Treasuries outperforming all other sectors. By the end of the first quarter, however, the Federal Reserve (Fed) stepped in to support market liquidity with numerous programs that continued through year end. Because of the flight to quality in the first quarter, the Fund underperformed due to its significant underweight to U.S. Treasuries. In the second half of the year we increased our treasury exposure within the Fund, but continued to be underweight. Additionally, we maintained exposure to Treasury Inflation Protected Securities (TIPS) which benefitted from the economic rebound and increasing inflation expectations in the second half of the year. After the first quarter, risk premiums in the spread sectors rebounded for most of the year as investors sought out incremental yield. The Fund’s performance benefitted from our security selection strategies within spread sectors which offset the negative impact of our underweight to U.S. Treasuries in March. Within mortgage-backed securities, we emphasize securities with higher-than-market coupons and pools with seasoned, low-loan balance mortgages. These securities historically have tended to have more stable, predictable cash flows than the current coupon mortgages that are in the index. Our strategy in corporate bonds involved shifting away from cyclical sectors and favoring work-from-home beneficiaries such as technology, telecom, and consumer staples. This proved beneficial as the pandemic lasted longer than some initially anticipated. Performance was augmented by increasing our overall corporate bond exposure and by select holdings in below investment grade and USD-denominated emerging market corporate bonds. With the Fed holding overnight rates at the zero lower bound, we were able to add incremental value with our active cash management strategy in the commercial paper market. Please refer to the Fixed Income Market Review and Outlook relating to the Fund on page 74. |
| December 31, 2020 | William Blair Funds | 75 |
Bond Fund
Performance Highlights (Unaudited)
| Average Annual Total Returns through 12/31/2020 |
| | | | | | | | | | | | | |
| | | 1 Year | | 3 Year | | 5 Year | | 10 Year |
| Class N | | | 7.63 | % | | | 5.27 | % | | | 4.81 | % | | | 4.29 | % |
| Class I | | | 7.73 | | | | 5.39 | | | | 4.97 | | | | 4.47 | |
| Class R6 | | | 7.79 | | | | 5.48 | | | | 5.06 | | | | 4.58 | |
| Bloomberg Barclays U.S. Aggregate Index | | | 7.51 | | | | 5.34 | | | | 4.44 | | | | 3.84 | |
Performance cited represents past performance. Past performance does not guarantee future results and current performance may be lower or higher than the data quoted. Results shown are average annual total returns, which assume reinvestment of dividends and capital gains. Investment returns and principal will fluctuate and you may have a gain or loss when you sell shares. For the most current month-end performance information, please call 1-800-742-7272, or visit our Web site at www.williamblairfunds.com. From time to time, the investment adviser may waive fees or reimburse expenses for the Fund. Without these waivers/reimbursements, performance would be lower. Class N shares are not subject to a sales load. Class I shares are not subject to a sales load or distribution (Rule 12b-1) fees. Class R6 shares are not subject to a sales load, distribution (Rule 12b-1) fees, or sub-transfer agent fees.
The performance highlights and graph presented above do not reflect the deduction of taxes that a shareholder would pay on fund distributions or the redemption of fund shares.
The Bloomberg Barclays U.S. Aggregate Index indicates broad intermediate government/corporate bond market performance.
This report identifies the Fund’s investments on December 31, 2020. These holdings are subject to change. Not all investments in the Fund performed the same, nor is there any guarantee that these investments will perform as well in the future. Market forecasts provided in this report may not necessarily come to pass.
Sector Diversification (Unaudited)

The sector diversification shown is based on the total investments.
| 76 | Annual Report | December 31, 2020 |
Bond Fund
Portfolio of Investments, December 31, 2020 (all dollar amounts in thousands)
| | Issuer | |
Principal
Amount | | | Value | |
| | | | | | | | |
| | U.S. Government and U.S. Government Agency—58.9% |
| | U.S. Treasury Inflation Indexed Notes/Bonds—4.5% |
| | U.S. Treasury Inflation Indexed Bond,
3.875%, due 4/15/29 | | | $9,899 | | | $ | 14,273 | |
| | U.S. Treasury—10.0% | | | | | | | | |
| | U.S. Treasury Bill, 0.107%, due 4/22/21 | | | 1,500 | | | | 1,500 | |
| | U.S. Treasury Bill, 0.108%, due 7/15/21(a) | | | 1,000 | | | | 1,000 | |
| | U.S. Treasury Bill, 0.123%, due 10/7/21 | | | 3,000 | | | | 2,998 | |
| | U.S. Treasury Note, 0.395%, due 10/31/21 | | | 7,500 | | | | 7,516 | |
| | U.S. Treasury Note, 1.125%, due 2/28/27 | | | 2,250 | | | | 2,334 | |
| | U.S. Treasury Strip Principal, 0.000%, due 8/15/27 | | | 4,750 | | | | 4,581 | |
| | U.S. Treasury Note, 0.625%, due 5/15/30 | | | 2,100 | | | | 2,053 | |
| | U.S. Treasury Note, 0.625%, due 8/15/30 | | | 4,300 | | | | 4,193 | |
| | U.S. Treasury Bond, 1.125%, due 5/15/40 | | | 2,000 | | | | 1,900 | |
| | U.S. Treasury Bond, 2.375%, due 11/15/49 | | | 2,267 | | | | 2,664 | |
| | U.S. Treasury Note, 1.250%, due 5/15/50 | | | 1,500 | | | | 1,361 | |
| | Total U.S. Treasury | | | | | | | 32,100 | |
| | | | | | | | | | |
| | Federal Home Loan Mortgage Corp. (FHLMC)—10.6% |
| | #J02986, 6.500%, due 7/1/21 | | | 1 | | | | 1 | |
| | #G30255, 7.000%, due 7/1/21 | | | — | | | | — | (b) |
| | #G02210, 7.000%, due 12/1/28 | | | 28 | | | | 31 | |
| | #G02183, 6.500%, due 3/1/30 | | | 3 | | | | 4 | |
| | #G01400, 7.000%, due 4/1/32 | | | 333 | | | | 390 | |
| | #G01728, 7.500%, due 7/1/32 | | | 55 | | | | 66 | |
| | #C01385, 6.500%, due 8/1/32 | | | 42 | | | | 48 | |
| | #ZT1221, 5.500%, due 1/1/33 | | | 469 | | | | 546 | |
| | #C01623, 5.500%, due 9/1/33 | | | 48 | | | | 56 | |
| | #A15039, 5.500%, due 10/1/33 | | | 2 | | | | 2 | |
| | #A17603, 5.500%, due 1/1/34 | | | 1,206 | | | | 1,416 | |
| | #G01843, 6.000%, due 6/1/35 | | | 10 | | | | 12 | |
| | #A62858, 6.500%, due 7/1/37 | | | 56 | | | | 64 | |
| | #G03170, 6.500%, due 8/1/37 | | | 102 | | | | 118 | |
| | #A78138, 5.500%, due 6/1/38 | | | 140 | | | | 163 | |
| | #G04466, 5.500%, due 7/1/38 | | | 8,775 | | | | 10,392 | |
| | #G60366, 6.000%, due 10/1/39 | | | 8,420 | | | | 9,923 | |
| | #G61450, 6.000%, due 4/1/40 | | | 8,898 | | | | 10,708 | |
| | #C03665, 9.000%, due 4/1/41 | | | 172 | | | | 212 | |
| | Total FHLMC Mortgage Obligations | | | | | | | 34,152 | |
| | | | | | | | | | |
| | Federal National Mortgage Association (FNMA)—33.8% |
| | #900725, 6.000%, due 8/1/21 | | | 2 | | | | 2 | |
| | #893325, 7.000%, due 9/1/21 | | | 1 | | | | 1 | |
| | #735104, 7.000%, due 5/1/22 | | | — | | | | — | (b) |
| | #255956, 5.500%, due 10/1/25 | | | 5 | | | | 6 | |
| | #AL2853, 4.500%, due 6/1/26 | | | 2,047 | | | | 2,174 | |
| | Issuer | |
Principal
Amount | | | Value | |
| | | | | | | | |
| | U.S. Government and U.S. Government Agency—(continued) |
| | Federal National Mortgage Association (FNMA)—(continued) |
| | #252925, 7.500%, due 12/1/29 | | $ | 1 | | | $ | 1 | |
| | #AD0729, 7.500%, due 12/1/30 | | | 2,280 | | | | 2,672 | |
| | #535977, 6.500%, due 4/1/31 | | | 4 | | | | 4 | |
| | #253907, 7.000%, due 7/1/31 | | | 1 | | | | 1 | |
| | #587849, 6.500%, due 11/1/31 | | | 4 | | | | 4 | |
| | #545437, 7.000%, due 2/1/32 | | | 25 | | | | 29 | |
| | #545759, 6.500%, due 7/1/32 | | | 212 | | | | 248 | |
| | #545869, 6.500%, due 7/1/32 | | | 717 | | | | 835 | |
| | #670385, 6.500%, due 9/1/32 | | | 319 | | | | 377 | |
| | #254548, 5.500%, due 12/1/32 | | | 20 | | | | 24 | |
| | #AD0725, 7.000%, due 12/1/32 | | | 1,076 | | | | 1,273 | |
| | #555340, 5.500%, due 4/1/33 | | | 163 | | | | 191 | |
| | #741850, 5.500%, due 9/1/33 | | | 243 | | | | 284 | |
| | #555800, 5.500%, due 10/1/33 | | | 23 | | | | 27 | |
| | #CA2754, 4.500%, due 11/1/33 | | | 619 | | | | 688 | |
| | #AL3455, 5.500%, due 11/1/33 | | | 3,506 | | | | 4,115 | |
| | #756153, 5.500%, due 11/1/33 | | | 246 | | | | 287 | |
| | #AL3401, 5.500%, due 2/1/34 | | | 687 | | | | 805 | |
| | #763798, 5.500%, due 3/1/34 | | | 45 | | | | 52 | |
| | #725228, 6.000%, due 3/1/34 | | | 2,258 | | | | 2,703 | |
| | #725611, 5.500%, due 6/1/34 | | | 51 | | | | 60 | |
| | #745563, 5.500%, due 8/1/34 | | | 301 | | | | 352 | |
| | #AL6413, 8.000%, due 8/1/34 | | | 288 | | | | 330 | |
| | #794474, 6.000%, due 10/1/34 | | | 26 | | | | 32 | |
| | #745092, 6.500%, due 7/1/35 | | | 168 | | | | 196 | |
| | #357944, 6.000%, due 9/1/35 | | | 7 | | | | 8 | |
| | #AL6412, 7.500%, due 9/1/35 | | | 471 | | | | 540 | |
| | #AD0979, 7.500%, due 10/1/35 | | | 33 | | | | 39 | |
| | #CA8368, 2.000%, due 12/1/35 | | | 5,000 | | | | 5,276 | |
| | #888305, 7.000%, due 3/1/36 | | | 5 | | | | 6 | |
| | #895637, 6.500%, due 5/1/36 | | | 32 | | | | 38 | |
| | #831540, 6.000%, due 6/1/36 | | | 13 | | | | 15 | |
| | #893318, 6.500%, due 8/1/36 | | | 7 | | | | 8 | |
| | #902974, 6.000%, due 12/1/36 | | | 93 | | | | 110 | |
| | #831926, 6.000%, due 12/1/36 | | | 370 | | | | 441 | |
| | #AB0265, 6.000%, due 2/1/37 | | | 6,957 | | | | 8,351 | |
| | #938440, 6.000%, due 7/1/37 | | | 54 | | | | 64 | |
| | #948689, 6.000%, due 8/1/37 | | | 65 | | | | 75 | |
| | #AL6411, 7.000%, due 12/1/37 | | | 1,140 | | | | 1,304 | |
| | #AL0904, 5.500%, due 1/1/38 | | | 62 | | | | 73 | |
| | #986856, 6.500%, due 9/1/38 | | | 67 | | | | 79 | |
| | #FM1735, 6.500%, due 10/1/38 | | | 4,020 | | | | 4,872 | |
| | #995076, 6.000%, due 11/1/38 | | | 3,139 | | | | 3,801 | |
| | #991911, 7.000%, due 11/1/38 | | | 72 | | | | 83 | |
| | #FM2467, 6.000%, due 1/1/39 | | | 3,865 | | | | 4,598 | |
| | #AD0752, 7.000%, due 1/1/39 | | | 339 | | | | 428 | |
| | #AC1619, 5.500%, due 8/1/39 | | | 167 | | | | 192 | |
| | #FM1736, 6.500%, due 10/1/39 | | | 6,551 | | | | 7,863 | |
| | #BM5204, 6.500%, due 6/1/40 | | | 4,073 | | | | 5,033 | |
| | #AD7137, 5.500%, due 7/1/40 | | | 2,352 | | | | 2,771 | |
| | #BM1689, 5.500%, due 8/1/40 | | | 1,937 | | | | 2,267 | |
| | #AL5815, 5.500%, due 4/1/41 | | | 2,311 | | | | 2,720 | |
| | #BM3525, 6.000%, due 4/1/41 | | | 8,382 | | | | 10,085 | |
| | #AL9226, 5.500%, due 12/1/41 | | | 9,899 | | | | 11,697 | |
| | #AL9225, 6.000%, due 1/1/42 | | | 4,396 | | | | 5,286 | |
| | #BM5121, 5.500%, due 12/1/48 | | | 10,289 | | | | 12,411 | |
| | Total FNMA Mortgage Obligations | | | | | | | 108,307 | |
See accompanying Notes to Financial Statements.
| December 31, 2020 | William Blair Funds | 77 |
Bond Fund
Portfolio of Investments, December 31, 2020 (all dollar amounts in thousands)
| | Issuer | |
Principal
Amount | | | Value | |
| | | | | | | | |
| | Asset-Backed Securities—1.3% | | | | | | | | |
| | Tesla Auto Lease Trust—144A, 2019-A, Tranche E,
5.480%, 5/22/23 | | $ | 1,000 | | | $ | 1,057 | |
| | GM Financial Automobile Leasing Trust, 2020-1, Tranche D,
2.280%, 6/20/24 | | | 3,050 | | | | 3,106 | |
| | Total Asset-Backed Securities | | | | | | | 4,163 | |
| | | | | | | | | | |
| | Corporate Obligations—37.9% | | | | | | | | |
| | Fresenius Medical Care US Finance II, Inc.—144A,
5.875%, due 1/31/22 | | | 1,000 | | | | 1,054 | |
| | Jones Lang LaSalle, Inc.,
4.400%, due 11/15/22 | | | 2,500 | | | | 2,650 | |
| | Toll Brothers Finance Corporation,
4.375%, due 4/15/23 | | | 2,750 | | | | 2,925 | |
| | CNH Industrial Capital LLC,
1.950%, due 7/2/23 | | | 2,500 | | | | 2,575 | |
| | Wells Fargo & Co.,
4.480%, due 1/16/24 | | | 1,500 | | | | 1,670 | |
| | Lennar Corporation,
4.500%, due 4/30/24 | | | 2,450 | | | | 2,712 | |
| | Banco Inbursa S.A. Institucion de Banca Multiple—144A,
4.125%, due 6/6/24 | | | 2,000 | | | | 2,151 | |
| | Grupo Bimbo S.A.B. de C.V.—144A,
3.875%, due 6/27/24 | | | 2,000 | | | | 2,191 | |
| | JPMorgan Chase & Co., SOFR + 3.125%,
4.600%, due 2/1/25, VRN | | | 3,000 | | | | 3,101 | |
| | Ford Motor Co.,
9.000%, due 4/22/25 | | | 700 | | | | 859 | |
| | American Tower Corporation,
4.000%, due 6/1/25 | | | 2,500 | | | | 2,825 | |
| | Simon Property Group L.P.,
3.300%, due 1/15/26 | | | 2,750 | | | | 3,022 | |
| | Republic Services, Inc.,
2.900%, due 7/1/26 | | | 2,500 | | | | 2,764 | |
| | Xylem, Inc.,
3.250%, due 11/1/26 | | | 2,225 | | | | 2,505 | |
| | Fibria Overseas Finance, Ltd.,
5.500%, due 1/17/27 | | | 2,000 | | | | 2,279 | |
| | Gilead Sciences, Inc.,
1.200%, due 10/1/27 | | | 1,600 | | | | 1,614 | |
| | Motorola Solutions, Inc.,
4.600%, due 2/23/28 | | | 2,750 | | | | 3,320 | |
| | TreeHouse Foods, Inc.,
4.000%, due 9/1/28 | | | 1,400 | | | | 1,451 | |
| | Roper Technologies, Inc.,
4.200%, due 9/15/28 | | | 2,500 | | | | 2,985 | |
| | The Kroger Co.,
8.000%, due 9/15/29 | | | 2,000 | | | | 2,900 | |
| | United Rentals North America, Inc.,
5.250%, due 1/15/30 | | | 1,250 | | | | 1,390 | |
| | Omnicom Group, Inc.,
2.450%, due 4/30/30 | | | 2,800 | | | | 2,977 | |
| | Issuer | |
Principal
Amount | | | Value | |
| | | | | | | | |
| | Corporate Obligations—(continued) | | | | | |
| | Abbott Laboratories,
1.400%, due 6/30/30 | | $ | 2,000 | | | $ | 2,032 | |
| | Intuit, Inc.,
1.650%, due 7/15/30 | | | 1,200 | | | | 1,234 | |
| | FLIR Systems, Inc.,
2.500%, due 8/1/30 | | | 2,500 | | | | 2,627 | |
| | Alphabet, Inc.,
1.100%, due 8/15/30 | | | 2,620 | | | | 2,587 | |
| | Johnson Controls International plc,
1.750%, due 9/15/30 | | | 2,100 | | | | 2,137 | |
| | Fresenius Medical Care U.S. Finance III, Inc.—144A,
2.375%, due 2/16/31 | | | 1,800 | | | | 1,832 | |
| | Costco Wholesale Corporation,
1.750%, due 4/20/32 | | | 2,500 | | | | 2,602 | |
| | Owens Corning,
7.000%, due 12/1/36 | | | 2,250 | | | | 3,215 | |
| | Yum! Brands, Inc.,
6.875%, due 11/15/37 | | | 1,250 | | | | 1,612 | |
| | ConocoPhillips,
6.500%, due 2/1/39 | | | 2,000 | | | | 3,097 | |
| | Citigroup, Inc.,
5.875%, due 1/30/42 | | | 2,000 | | | | 3,046 | |
| | Bank of America Corporation,
5.875%, due 2/7/42 | | | 2,000 | | | | 3,047 | |
| | Orbia Advance Corp S.A.B. de C.V. —144A,
5.875%, due 9/17/44 | | | 2,250 | | | | 2,795 | |
| | AbbVie, Inc.,
4.700%, due 5/14/45 | | | 2,250 | | | | 2,948 | |
| | ERP Operating L.P.,
4.500%, due 6/1/45 | | | 2,500 | | | | 3,312 | |
| | Apple, Inc.,
4.650%, due 2/23/46 | | | 2,250 | | | | 3,204 | |
| | PepsiCo, Inc.,
4.450%, due 4/14/46 | | | 2,250 | | | | 3,147 | |
| | Activision Blizzard, Inc.,
2.500%, due 9/15/50 | | | 2,600 | | | | 2,547 | |
| | Microsoft Corporation,
4.750%, due 11/3/55 | | | 2,000 | | | | 3,049 | |
| | AT&T, Inc.,
5.700%, due 3/1/57 | | | 2,000 | | | | 2,799 | |
| | Comcast Corporation,
4.950%, due 10/15/58 | | | 2,000 | | | | 3,043 | |
| | Altria Group, Inc.,
6.200%, due 2/14/59 | | | 2,250 | | | | 3,170 | |
| | Amazon.com, Inc.,
2.700%, due 6/3/60 | | | 2,500 | | | | 2,683 | |
| | Verizon Communications, Inc.,
3.000%, due 11/20/60 | | | 3,000 | | | | 3,037 | |
| | Corning, Inc.,
5.850%, due 11/15/68 | | | 2,150 | | | | 3,175 | |
| | Petrobras Global Finance BV,
6.850%, due 6/5/15 | | | 1,250 | | | | 1,553 | |
| | Total Corporate Obligations | | | | | | | 121,450 | |
| | Total Long-Term Investments—98.1%
(cost $291,611) | | | | | | | 314,445 | |
See accompanying Notes to Financial Statements.
| 78 | Annual Report | December 31, 2020 |
Bond Fund
Portfolio of Investments, December 31, 2020 (all dollar amounts in thousands)
| | Issuer | |
Principal
Amount | | | Value | |
| | | | | | | | |
| | Repurchase Agreement | | | | | | | | |
| | Fixed Income Clearing Corporation, 0.000% dated 12/31/20, due 1/4/21, repurchase price $4,615, collateralized by U.S. Treasury Note, 0.500%, due 6/30/27, valued at $4,707 | | | $4,615 | | | $ | 4,615 | |
| | Total Repurchase Agreement—1.4%
(cost $4,615) | | | | | | | 4,615 | |
| | Total Investments—99.5%
(cost $296,226) | | | | | | | 319,060 | |
| | | | | | | | | | |
| | Securities Sold, Not Yet Purchased | | | | | | | | |
| | | | | | | | | | |
| | U.S. Government Agency—(3.3)% | | | | | | | | |
| | Federal National Mortgage Association (FNMA)—(3.3)% |
| | TBA, 4.000%, due 1/1/51 | | | (10,000 | ) | | | (10,680 | ) |
| | Total Securities Sold, Not Yet Purchased—(3.3)%
(proceeds $10,680) | | | | | | | (10,680 | ) |
| | Cash and other assets, less liabilities—3.8% | | | | | | | 12,340 | |
| | Net assets—100.0% | | | | | | $ | 320,720 | |
The obligations of certain U.S. Government-sponsored securities are neither issued nor guaranteed by the U.S. Treasury.
144A = Security exempt from registration under Rule 144A of the Securities Act of 1933. These securities may be resold in transactions exempt from registration, normally to qualified institutional buyers.
SOFR = Secured Overnight Financing Rate
TBA = To Be Announced—TBAs are mortgage-backed securities traded under delayed delivery commitments, settling after December 31, 2020. The term TBA comes from the fact that the specific mortgage-backed security that will be delivered to fulfill a TBA trade is not designated at the time the trade is made.
VRN = Variable Rate Note
(a) Security, or a portion of security, is segregated as collateral for the centrally cleared credit default swaps, aggregating a total of $870.
(b) Amount is less than the minimum amount disclosed.
Centrally Cleared Credit Default Swaps
Reference
Entity | | Buy/Sell
Protection | | Fixed Deal
Pay Rate | | Payment
Frequency | | Maturity
Date | | Cleared
Exchange | | Notional
Amount
(in thousands) | | Upfront
Payment
Paid
(Received) | | Value | | Unrealized
Appreciation
(Depreciation) |
| CDX.NA.HY- 34 | | Buy | | 5.000 | % | | 3M | | June 2025 | | ICE | | | $9,200 | | | | | $(221 | ) | | | $ | (867 | ) | | | $ | (646 | ) |
| CDX.NA.HY- 35 | | Buy | | 5.000 | % | | 3M | | December 2025 | | ICE | | | 5,000 | | | | | (241 | ) | | | | (473 | ) | | | | (232 | ) |
| Total net unrealized appreciation (depreciation) on swaps | | | | | | | | | | | | | | | | | | | $ | (878 | ) |
See accompanying Notes to Financial Statements.
| December 31, 2020 | William Blair Funds | 79 |
| | Income Fund |
| | |
| | The Income Fund seeks a high level of current income with relative stability of principal. |
| | |
| | AN OVERVIEW FROM THE PORTFOLIO MANAGER |
| | |

Ruta Ziverte | The William Blair Income Fund (Class N shares) returned 4.34%, net of fees, for the year ended December 31, 2020. By comparison, the Fund’s benchmark, the Bloomberg Barclays Intermediate Government/Credit Bond Index (the “Index”), returned 6.43%. Because of the flight to quality in the first quarter, the Fund underperformed due to its significant underweight to U.S. Treasuries. In the second half of the year we increased our treasury exposure within the Fund, but continued to be underweight. The Fund’s emphasis of shorter-maturity corporates as well as its structural underweight to BBB-rated names detracted from performance as corporate spreads rallied during most of the year, with BBB-rated and longer-maturity corporates leading the sector. Our emphasis of mortgage-backed securities, in which we focus on securities with higher-than-market coupons and pools with seasoned, low-loan balance mortgages benefitted the Fund’s return and helped to offset some of the Fund’s underperformance. These securities historically have tended to have more stable, predictable cash flows than the current coupon mortgages that are in the index. Exposure to Treasury Inflation Protected Securities (TIPS) which comprised slightly less than half of our treasury exposure at year end was beneficial as TIPS outperformed with inflation expectations increasing in the second half of the year. Please refer to the Fixed Income Market Review and Outlook relating to the Fund on page 74. |
| 80 | Annual Report | December 31, 2020 |
Income Fund
Performance Highlights (Unaudited)
| Average Annual Total Returns through 12/31/2020 |
| | | 1 Year | | 3 Year | | 5 Year | | 10 Year | | Since
Inception(a) |
| Class N | | | 4.34 | % | | | 3.09 | % | | | 2.63 | % | | | 2.60 | % | | | — | |
| Class I | | | 4.39 | | | | 3.27 | | | | 2.85 | | | | 2.83 | | | | — | |
| Class R6 | | | 4.44 | | | | — | | | | — | | | | — | | | | 4.58 | % |
| Bloomberg Barclays Intermediate Government/Credit Bond Index | | | 6.43 | | | | 4.67 | | | | 3.64 | | | | 3.11 | | | | 6.41 | |
| (a) | Since inception is for the period from May 2, 2019 (Commencement of Operations) to December 31, 2020. |
Performance cited represents past performance. Past performance does not guarantee future results and current performance may be lower or higher than the data quoted. Results shown are average annual total returns, which assume reinvestment of dividends and capital gains. Investment returns and principal will fluctuate and you may have a gain or loss when you sell shares. For the most current month-end performance information, please call 1-800-742-7272, or visit our Web site at www.williamblairfunds.com. From time to time, the investment adviser may waive fees or reimburse expenses for the Fund. Without these waivers/reimbursements, performance would be lower. Class N shares are not subject to a sales load. Class I shares are not subject to a sales load or distribution (Rule 12b-1) fees. Class R6 shares are not subject to a sales load, distribution (Rule 12b-1) fees, or sub-transfer agent fees.
The performance highlights and graph presented above do not reflect the deduction of taxes that a shareholder would pay on fund distributions or the redemption of fund shares.
The Bloomberg Barclays Intermediate Government/Credit Bond Index indicates broad intermediate government/corporate bond market performance.
This report identifies the Fund’s investments on December 31, 2020. These holdings are subject to change. Not all investments in the Fund performed the same, nor is there any guarantee that these investments will perform as well in the future. Market forecasts provided in this report may not necessarily come to pass.
Sector Diversification (Unaudited)
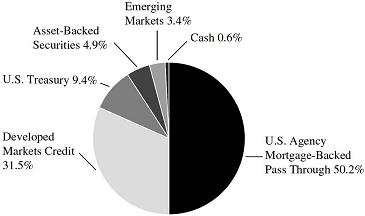
The sector diversification shown is based on the total investments.
| December 31, 2020 | William Blair Funds | 81 |
Income Fund
Portfolio of Investments, December 31, 2020 (all dollar amounts in thousands)
| | | | | | | | |
| | Issuer | | Principal
Amount | | | Value | |
| | | | | | | | |
| | U.S. Government and U.S. Government Agency—59.5% | | |
| | U.S. Treasury Inflation Indexed Notes/Bonds—2.5% | | | | | | | | |
| | U.S. Treasury Inflation Indexed Bond, 3.875%, due 4/15/29 | | $ | 1,188 | | | $ | 1,713 | |
| | U.S. Treasury—6.9% | | | | | | | | |
| | U.S. Treasury Note, 0.315%, due 7/31/21 | | | 175 | | | | 175 | |
| | U.S. Treasury Note, 0.395%, due 10/31/21 | | | 1,000 | | | | 1,002 | |
| | U.S. Treasury Note, 2.500%, due 2/15/22(a) | | | 470 | | | | 483 | |
| | U.S. Treasury Note, 0.250%, due 7/31/25 | | | 1,000 | | | | 997 | |
| | U.S. Treasury Note, 1.125%, due 2/28/27 | | | 600 | | | | 622 | |
| | U.S. Treasury Note, 0.625%, due 8/15/30 | | | 700 | | | | 683 | |
| | U.S. Treasury Strip Principal, 0.000%, due 8/15/27 | | | 775 | | | | 747 | |
| | Total U.S. Treasury Obligations | | | | | | | 4,709 | |
| | Federal Home Loan Mortgage Corp. (FHLMC)—6.4% | | | | | | | | |
| | #E02490, 6.000%, due 4/1/23 | | | 13 | | | | 14 | |
| #J13022, 4.000%, due 9/1/25 | | | 159 | | | | 169 | |
| | #G14150, 4.500%, due 4/1/26 | | | 49 | | | | 53 | |
| | #J16051, 4.500%, due 7/1/26 | | | 376 | | | | 410 | |
| | #G15030, 4.000%, due 3/1/29 | | | 273 | | | | 299 | |
| | #A17603, 5.500%, due 1/1/34 | | | 349 | | | | 410 | |
| | #G01705, 5.500%, due 6/1/34 | | | 635 | | | | 747 | |
| | #A45790, 7.500%, due 5/1/35 | | | 62 | | | | 71 | |
| | #G04126, 6.000%, due 6/1/37 | | | 147 | | | | 176 | |
| | #G04564, 6.000%, due 12/1/37 | | | 113 | | | | 134 | |
| | #G05566, 5.500%, due 12/1/38 | | | 83 | | | | 97 | |
| | #G05875, 5.500%, due 2/1/40 | | | 59 | | | | 69 | |
| | #G61450, 6.000%, due 4/1/40 | | | 1,334 | | | | 1,605 | |
| | #C03665, 9.000%, due 4/1/41 | | | 83 | | | | 103 | |
| | Total FHLMC Mortgage Obligations | | | | | | | 4,357 | |
| | Federal National Mortgage Association (FNMA)—43.7% | | | | | | | | |
| | #735574, 8.000%, due 3/1/22 | | | 1 | | | | 1 | |
| | FNR G93-19 SH, 1M USD LIBOR + 56.169%, 11.234%, due 4/25/23, VRN | | | 6 | | | | 7 | |
| | #982885, 5.000%, due 5/1/23 | | | 78 | | | | 82 | |
| | #933985, 5.500%, due 8/1/23 | | | 42 | | | | 44 | |
| | #255956, 5.500%, due 10/1/25 | | | 16 | | | | 18 | |
| | #AH0971, 4.000%, due 12/1/25 | | | 180 | | | | 191 | |
| | #AL2853, 4.500%, due 6/1/26 | | | 265 | | | | 281 | |
| | #AJ6954, 4.000%, due 11/1/26 | | | 84 | | | | 90 | |
| | #256639, 5.000%, due 2/1/27 | | | 4 | | | | 4 | |
| | #AL9730, 4.500%, due 2/1/27 | | | 551 | | | | 592 | |
| | #806458, 8.000%, due 6/1/28 | | | 57 | | | | 64 | |
| | #AL9857, 4.000%, due 2/1/29 | | | 3,377 | | | | 3,594 | |
| | #880155, 8.500%, due 7/1/29 | | | 89 | | | | 102 | |
| | #797846, 7.000%, due 3/1/32 | | | 12 | | | | 12 | |
| | #745519, 8.500%, due 5/1/32 | | | 39 | | | | 43 | |
| | #654674, 6.500%, due 9/1/32 | | | 26 | | | | 30 | |
| | #AD0725, 7.000%, due 12/1/32 | | | 459 | | | | 543 | |
| | | | | | | | |
| | Issuer | | Principal
Amount | | | Value | |
| | | | | | | | |
| | U.S. Government and U.S. Government Agency—(continued) | |
| | Federal National Mortgage Association (FNMA)—(continued) | | | | | |
| | #254693, 5.500%, due 4/1/33 | | $ | 4 | | | $ | 4 | |
| | #555531, 5.500%, due 6/1/33 | | | 33 | | | | 39 | |
| | #711736, 5.500%, due 6/1/33 | | | 53 | | | | 62 | |
| | #555591, 5.500%, due 7/1/33 | | | 6 | | | | 6 | |
| | #CA2754, 4.500%, due 11/1/33 | | | 339 | | | | 376 | |
| | #AL3455, 5.500%, due 11/1/33 | | | 1,030 | | | | 1,209 | |
| | #725424, 5.500%, due 4/1/34 | | | 36 | | | | 41 | |
| | #AL6413, 8.000%, due 8/1/34 | | | 140 | | | | 161 | |
| | #CA5931, 4.000%, due 5/1/35 | | | 4,195 | | | | 4,684 | |
| | #AL6412, 7.500%, due 9/1/35 | | | 353 | | | | 405 | |
| | #888884, 5.500%, due 12/1/35 | | | 83 | | | | 97 | |
| | #CA8368, 2.000%, due 12/1/35 | | | 1,000 | | | | 1,055 | |
| | #928658, 6.500%, due 9/1/37 | | | 13 | | | | 14 | |
| | #889371, 6.000%, due 1/1/38 | | | 1,538 | | | | 1,828 | |
| | #FM1735, 6.500%, due 10/1/38 | | | 1,137 | | | | 1,378 | |
| | #991911, 7.000%, due 11/1/38 | | | 46 | | | | 53 | |
| | #995076, 6.000%, due 11/1/38 | | | 419 | | | | 507 | |
| | #FM2467, 6.000%, due 1/1/39 | | | 429 | | | | 511 | |
| | #FM1736, 6.500%, due 10/1/39 | | | 1,084 | | | | 1,301 | |
| | #BM5204, 6.500%, due 6/1/40 | | | 119 | | | | 147 | |
| | #BM1689, 5.500%, due 8/1/40 | | | 262 | | | | 306 | |
| | #AL5815, 5.500%, due 4/1/41 | | | 330 | | | | 389 | |
| | #BM3525, 6.000%, due 4/1/41 | | | 744 | | | | 895 | |
| | #AL9226, 5.500%, due 12/1/41 | | | 3,129 | | | | 3,697 | |
| | #BM1328, 6.000%, due 1/1/42 | | | 1,284 | | | | 1,535 | |
| | #AL9225, 6.000%, due 1/1/42 | | | 1,209 | | | | 1,454 | |
| | #BM5121, 5.500%, due 12/1/48 | | | 1,692 | | | | 2,041 | |
| | Total FNMA Mortgage Obligations | | | | | | | 29,893 | |
| | | | | | | | | | |
| | Asset-Backed Securities—4.9% | | | | | | | | |
| | Verizon Owner Trust 2018-1—144A, 2018-1A, Tranche A1A,
2.820%, 9/20/22 | | | 117 | | | | 118 | |
| | GMF Floorplan Owner Revolving Trust—144A, 2018-2, Tranche A2, 1M USD LIBOR + 0.380%,
0.539%, 3/15/23, VRN | | | 1,000 | | | | 1,001 | |
| | Citibank Credit Card Issuance Trust, 2016-A3, Tranche A3, 1M LIBOR + 0.490%,
0.643%, 12/7/23, VRN | | | 800 | | | | 803 | |
| | GM Financial Automobile Leasing Trust, 2020-1, Tranche C,
2.040%, 12/20/23 | | | 950 | | | | 967 | |
| | Verizon Owner Trust, 2020-A, Tranche C,
2.060%, 7/22/24 | | | 425 | | | | 439 | |
| | Total Asset-Backed Securities | | | | | | | 3,328 | |
See accompanying Notes to Financial Statements.
| 82 | Annual Report | December 31, 2020 |
Income Fund
Portfolio of Investments, December 31, 2020 (all dollar amounts in thousands)
| | | | | | | | |
| | Issuer | | Principal
Amount | | | Value | |
| | | | | | | | |
| | Corporate Obligations—34.7% | | | | | | | | |
| | HSBC Holdings plc, 3M USD LIBOR + 2.240%, 2.466%, due 3/8/21, VRN | | | $500 | | | | $502 | |
| | Banco Santander Mexico S.A. Institucion de Banca Multiple Grupo Financiero Santand—144A,
4.125%, due 11/9/22 | | | 475 | | | | 501 | |
| | Canadian Imperial Bank of Commerce, SOFR + 0.800%, 0.889%, due 3/17/23, VRN | | | 750 | | | | 756 | |
| | Toll Brothers Finance Corporation,
4.375%, due 4/15/23 | | | 500 | | | | 532 | |
| | CNH Industrial Capital LLC,
1.950%, due 7/2/23 | | | 350 | | | | 360 | |
| | Shell International Finance BV,
0.375%, due 9/15/23 | | | 500 | | | | 501 | |
| | GlaxoSmithKline Capital plc,
0.534%, due 10/1/23 | | | 300 | | | | 301 | |
| | Ally Financial, Inc.,
1.450%, due 10/2/23 | | | 525 | | | | 536 | |
| | Royal Bank of Canada, SOFR + 0.450%,
0.535%, due 10/26/23, VRN | | | 350 | | | | 351 | |
| | KeyBank NA, SOFR + 0.340%,
0.430%, due 1/3/24, VRN | | | 700 | | | | 700 | |
| | Wells Fargo & Co.,
4.480%, due 1/16/24 | | | 650 | | | | 724 | |
| | The Goldman Sachs Group, Inc.,
4.000%, due 3/3/24 | | | 550 | | | | 608 | |
| | Mitsubishi UFJ Financial Group, Inc.,
3.407%, due 3/7/24 | | | 550 | | | | 597 | |
| | Citigroup, Inc., SOFR + 1.667%,
1.678%, due 5/15/24, VRN | | | 500 | | | | 515 | |
| | Grupo Bimbo S.A.B. de C.V.—144A,
3.875%, due 6/27/24 | | | 500 | | | | 548 | |
| | JPMorgan Chase & Co.,
3.875%, due 9/10/24 | | | 625 | | | | 700 | |
| | United Parcel Service, Inc.,
3.900%, due 4/1/25 | | | 500 | | | | 565 | |
| | The Hershey Co.,
0.900%, due 6/1/25 | | | 525 | | | | 533 | |
| | American Honda Finance Corporation,
1.200%, due 7/8/25 | | | 450 | | | | 461 | |
| | Intuit, Inc.,
0.950%, due 7/15/25 | | | 450 | | | | 456 | |
| | Skandinaviska Enskilda Banken AB—144A,
0.850%, due 9/2/25 | | | 500 | | | | 501 | |
| | Bank of America Corporation, SOFR + 0.910%,
0.981%, due 9/25/25, VRN | | | 700 | | | | 708 | |
| | Comcast Corporation,
3.950%, due 10/15/25 | | | 600 | | | | 690 | |
| | Morgan Stanley, SOFR + 0.745%,
0.864%, due 10/21/25, VRN | | | 550 | | | | 555 | |
| | | | | | | | |
| | Issuer | | Principal
Amount | | | Value | |
| | | | | | | | |
| | Corporate Obligations—(continued) | | | | | | | | |
| | Capital One Financial Corporation,
4.200%, due 10/29/25 | | | $500 | | | | $571 | |
| | Intercontinental Exchange, Inc.,
3.750%, due 12/1/25 | | | 450 | | | | 511 | |
| | Simon Property Group L.P.,
3.300%, due 1/15/26 | | | 550 | | | | 604 | |
| | Tencent Holdings Ltd.—144A,
1.810%, due 1/26/26 | | | 700 | | | | 716 | |
| | AT&T, Inc.,
4.125%, due 2/17/26 | | | 600 | | | | 695 | |
| | Merck & Co., Inc.,
0.750%, due 2/24/26 | | | 700 | | | | 708 | |
| | ConocoPhillips Co.,
4.950%, due 3/15/26 | | | 600 | | | | 721 | |
| | Brookfield Finance, Inc.,
4.250%, due 6/2/26 | | | 550 | | | | 643 | |
| | Fibria Overseas Finance, Ltd.,
5.500%, due 1/17/27 | | | 500 | | | | 570 | |
| | Costco Wholesale Corporation,
1.375%, due 6/20/27 | | | 500 | | | | 516 | |
| | Gilead Sciences, Inc.,
1.200%, due 10/1/27 | | | 400 | | | | 403 | |
| | Abbott Laboratories,
1.150%, due 1/30/28 | | | 700 | | | | 711 | |
| | Motorola Solutions, Inc.,
4.600%, due 2/23/28 | | | 600 | | | | 724 | |
| | Roper Technologies, Inc.,
4.200%, due 9/15/28 | | | 375 | | | | 448 | |
| | The Kroger Co.,
8.000%, due 9/15/29 | | | 450 | | | | 653 | |
| | Omnicom Group, Inc.,
2.450%, due 4/30/30 | | | 500 | | | | 532 | |
| | Amazon.com, Inc.,
1.500%, due 6/3/30 | | | 450 | | | | 458 | |
| | Johnson Controls International plc,
1.750%, due 9/15/30 | | | 350 | | | | 356 | |
| | Total Corporate Obligations | | | | | | | 23,741 | |
| | Total Investments—99.1%
(cost $65,727) | | | | | | | 67,741 | |
| | | | | | | | | | |
| | Securities Sold, Not Yet Purchased | | | | | | | | |
| | | | | | | | | | |
| | U.S. Government Agency—(3.1)% | | | | | | | | |
| | Federal National Mortgage Association (FNMA)—(3.1)% | | | | | | | | |
| | TBA, 4.000%, due 1/1/51 | | | (2,000 | ) | | | (2,136 | ) |
| | Total Securities Sold, Not Yet Purchased—(3.1)%
(proceeds $2,136) | | | | | | | (2,136 | ) |
| | Cash and other assets, less liabilities—4.0% | | | | | | | 2,717 | |
| | Net assets—100.0% | | | | | | $ | 68,322 | |
See accompanying Notes to Financial Statements.
| December 31, 2020 | William Blair Funds | 83 |
Income Fund
Portfolio of Investments, December 31, 2020 (all dollar amounts in thousands)
The obligations of certain U.S. Government-sponsored securities are neither issued nor guaranteed by the U.S. Treasury.
144A = Security exempt from registration under Rule 144A of the Securities Act of 1933. These securities may be resold in transactions exempt from registration, normally to qualified institutional buyers.
SOFR = Secured Overnight Financing Rate
TBA = To Be Announced — TBAs are mortgage-backed securities traded under delayed delivery commitments, settling after December 31, 2020. The term TBA comes from the fact that the specific mortgage-backed security that will be delivered to fulfill a TBA trade is not designated at the time the trade is made.
VRN = Variable Rate Note
(a) Security, or a portion of security, is segregated as collateral for the centrally cleared credit default swaps, aggregating a total of $359.
| Centrally Cleared Credit Default Swap |
| | | | | | | | | | | | | | | | | | | | | | | |
Reference
Entity | | Buy/Sell
Protection | | Fixed Deal
Pay Rate | | | Payment
Frequency | | Maturity
Date | | Cleared
Exchange | | Notional
Amount
(in thousands) | | Upfront
Payment
Paid
(Received) | | | Value | | | Unrealized
Appreciation
(Depreciation) | |
| CDX.NA.HY-34 | | Buy | | 5.000% | | | 3M | | June 2025 | | ICE | | | | $4,600 | | | | $(110) | | | | | $(434) | | | | $ | (324) | |
See accompanying Notes to Financial Statements.
| 84 | Annual Report | December 31, 2020 |
| | Low Duration Fund |
| | |
| | The Low Duration Fund seeks to maximize total return. Total return includes both income and capital appreciation. |
| | |
| | AN OVERVIEW FROM THE PORTFOLIO MANAGERS |
| | |

Kathleen M. Lynch 
Paul J. Sularz | The William Blair Low Duration Fund (Class N shares) returned 2.56%, net of fees, for the year ended December 31, 2020. By comparison, the Fund’s benchmark, the ICE BofAML 1-Year US Treasury Note Index (the “Index”), returned 1.82%. The Fund’s mortgage-backed securities drove overall performance with relatively high levels of monthly income and stable cash flows. We focused on investment in agency mortgage-backed securities with higher-than-market coupons and pools with seasoned, low-loan balance mortgages. Our holdings in the asset-backed securities (ABS) sector augmented the Fund’s return throughout the year. We tend to favor high quality and liquid ABS backed by credit card and auto loan receivables. Corporate bond exposure was a mix of fixed- and floating-rate securities which also added incremental income to the Fund’s return. Please refer to the Fixed Income Market Review and Outlook relating to the Fund on page 74. |
| December 31, 2020 | William Blair Funds | 85 |
Low Duration Fund
Performance Highlights (Unaudited)
| Average Annual Total Returns through 12/31/2020 |
| | | | | | | | | |
| | | 1 Year | | 3 Year | | 5 Year | | 10 Year |
| Class N | | | 2.56 | % | | | 2.28 | % | | | 1.77 | % | | | 1.39 | % |
| Class I | | | 2.72 | | | | 2.45 | | | | 1.93 | | | | 1.56 | |
| Class R6 | | | 2.65 | | | | 2.49 | | | | 1.97 | | | | 1.64 | |
| ICE BofAML 1-Year US Treasury Note Index | | | 1.82 | | | | 2.20 | | | | 1.58 | | | | 0.93 | |
Performance cited represents past performance. Past performance does not guarantee future results and current performance may be lower or higher than the data quoted. Results shown are average annual total returns, which assume reinvestment of dividends and capital gains. Investment returns and principal will fluctuate and you may have a gain or loss when you sell shares. For the most current month-end performance information, please call 1-800-742-7272, or visit our Web site at www.williamblairfunds.com. From time to time, the investment adviser may waive fees or reimburse expenses for the Fund. Without these waivers/reimbursements, performance would be lower. Class N shares are not subject to a sales load. Class I shares are not subject to a sales load or distribution (Rule 12b-1) fees. Class R6 shares are not subject to a sales load, distribution (Rule 12b-1) fees, or sub-transfer agent fees.
The performance highlights and graph presented above do not reflect the deduction of taxes that a shareholder would pay on fund distributions or the redemption of fund shares.
The ICE BofAML 1-Year US Treasury Note Index is comprised of a single U.S. Treasury Note issue purchased at the beginning of the month and held for a full month. Each month the index is rebalanced and the issue selected is the outstanding U.S. Treasury Note that matures closest to, but not beyond one year from the rebalancing date.
This report identifies the Fund’s investments on December 31, 2020. These holdings are subject to change. Not all investments in the Fund performed the same, nor is there any guarantee that these investments will perform as well in the future. Market forecasts provided in this report may not necessarily come to pass.
Sector Diversification (Unaudited)

The sector diversification shown is based on the total investments.
| 86 | Annual Report | December 31, 2020 |
Low Duration Fund
Portfolio of Investments, December 31, 2020 (all dollar amounts in thousands)
| | | | | | | | |
| | Issuer | | Principal
Amount | | | Value | |
| | | | | | | | |
| | U.S. Government and U.S. Government Agency—61.3% | | |
| | U.S. Treasury—14.0% | | | | | | | | |
| | U.S. Treasury Note, 0.395%, due 10/31/21 | | $ | 5,000 | | | $ | 5,011 | |
| | U.S. Treasury Note, 0.249%, due 1/31/22 | | | 5,000 | | | | 5,005 | |
| | U.S. Treasury Note, 2.500%, due 1/15/22 | | | 4,000 | | | | 4,098 | |
| | U.S. Treasury Note, 0.209%, due 4/30/22 | | | 5,000 | | | | 5,004 | |
| | U.S. Treasury Strip Principal, 0.000%, due 8/15/21 | | | 3,000 | | | | 2,998 | |
| | Total U.S. Treasury Obligations | | | | | | | 22,116 | |
| | Federal Home Loan Mortgage Corp. (FHLMC)—11.0% |
| | #E02322, 5.500%, due 5/1/22 | | | 3 | | | | 3 | |
| | #G12725, 6.000%, due 6/1/22 | | | 17 | | | | 17 | |
| | #G13225, 5.000%, due 6/1/23 | | | 369 | | | | 388 | |
| | #J08450, 5.500%, due 7/1/23 | | | 6 | | | | 6 | |
| | #J08703, 5.500%, due 9/1/23 | | | 4 | | | | 4 | |
| | #C00351, 8.000%, due 7/1/24 | | | 16 | | | | 17 | |
| | #J11208, 5.000%, due 11/1/24 | | | 17 | | | | 18 | |
| | #G00363, 8.000%, due 6/1/25 | | | 29 | | | | 31 | |
| | #C80329, 8.000%, due 8/1/25 | | | 6 | | | | 6 | |
| | #G14643, 4.000%, due 8/1/26 | | | 74 | | | | 79 | |
| | #G14550, 4.500%, due 9/1/26 | | | 476 | | | | 504 | |
| | #G15360, 4.500%, due 11/1/26 | | | 170 | | | | 181 | |
| | #G14402, 4.000%, due 2/1/27 | | | 121 | | | | 129 | |
| | #G04821, 8.500%, due 7/1/31 | | | 1,131 | | | | 1,367 | |
| | #G02454, 6.500%, due 7/1/32 | | | 519 | | | | 583 | |
| | #ZT1221, 5.500%, due 1/1/33 | | | 466 | | | | 542 | |
| | #A81372, 6.000%, due 8/1/38 | | | 126 | | | | 146 | |
| | #G04687, 6.000%, due 9/1/38 | | | 38 | | | | 45 | |
| | #G04745, 6.000%, due 9/1/38 | | | 126 | | | | 145 | |
| | #G06085, 6.500%, due 9/1/38 | | | 36 | | | | 41 | |
| | #G60681, 7.000%, due 2/1/39 | | | 4,703 | | | | 5,910 | |
| | #G07480, 6.000%, due 5/1/39 | | | 600 | | | | 712 | |
| | #G60680, 6.500%, due 9/1/39 | | | 573 | | | | 687 | |
| | #G07058, 6.000%, due 9/1/39 | | | 588 | | | | 718 | |
| | #G61450, 6.000%, due 4/1/40 | | | 4,001 | | | | 4,815 | |
| | #G61050, 5.500%, due 3/1/41 | | | 284 | | | | 336 | |
| | Total FHLMC Mortgage Obligations | | | | | | | 17,430 | |
| | Federal National Mortgage Association (FNMA)—36.3% |
| | #879607, 5.500%, due 4/1/21 | | | 1 | | | | — | (a) |
| | #831497, 6.000%, due 4/1/21 | | | 4 | | | | 4 | |
| | #831525, 5.500%, due 6/1/21 | | | 1 | | | | 1 | |
| | #880993, 6.000%, due 1/1/22 | | | 1 | | | | 1 | |
| | #888982, 6.000%, due 12/1/22 | | | 20 | | | | 21 | |
| | #972934, 5.500%, due 2/1/23 | | | 26 | | | | 27 | |
| | #889670, 5.500%, due 6/1/23 | | | 5 | | | | 5 | |
| | #AE0011, 5.500%, due 9/1/23 | | | 3 | | | | 4 | |
| | #995253, 5.500%, due 12/1/23 | | | 225 | | | | 230 | |
| | #995395, 6.000%, due 12/1/23 | | | 11 | | | | 11 | |
| | #190988, 9.000%, due 6/1/24 | | | 2 | | | | 2 | |
| | #AL8529, 6.000%, due 11/1/24 | | | 2,341 | | | | 2,439 | |
| | #AL2853, 4.500%, due 6/1/26 | | | 839 | | | | 891 | |
| | | | | | | | |
| | Issuer | | Principal
Amount | | | Value | |
| | | | | | | | |
| | U.S. Government and U.S. Government Agency—(continued) |
| | Federal National Mortgage Association (FNMA)—(continued) | | | | | | | | |
| | #AI4748, 4.000%, due 7/1/26 | | $ | 172 | | | $ | 183 | |
| | #AL9730, 4.500%, due 2/1/27 | | | 1,378 | | | | 1,479 | |
| | #BM3382, 5.000%, due 3/1/27 | | | 902 | | | | 947 | |
| | #AL3388, 4.000%, due 9/1/27 | | | 290 | | | | 309 | |
| | #AL9870, 6.500%, due 2/1/28 | | | 730 | | | | 819 | |
| | #AL4502, 4.000%, due 11/1/28 | | | 360 | | | | 395 | |
| | #AL9857, 4.000%, due 2/1/29 | | | 3,450 | | | | 3,672 | |
| | #323933, 7.000%, due 9/1/29 | | | 219 | | | | 259 | |
| | #555933, 7.000%, due 6/1/32 | | | 293 | | | | 339 | |
| | #555866, 7.500%, due 3/1/33 | | | 168 | | | | 199 | |
| | #745409, 7.000%, due 4/1/33 | | | 420 | | | | 485 | |
| | #CA2408, 4.000%, due 10/1/33 | | | 165 | | | | 183 | |
| | #CA2754, 4.500%, due 11/1/33 | | | 102 | | | | 113 | |
| | #725228, 6.000%, due 3/1/34 | | | 724 | | | | 866 | |
| | #AL6413, 8.000%, due 8/1/34 | | | 163 | | | | 187 | |
| | #AD0720, 5.500%, due 12/1/34 | | | 203 | | | | 237 | |
| | #CA5298, 4.000%, due 2/1/35 | | | 4,386 | | | | 4,898 | |
| | #AL6412, 7.500%, due 9/1/35 | | | 588 | | | | 675 | |
| | #CA8368, 2.000%, due 12/1/35 | | | 1,500 | | | | 1,583 | |
| | #886762, 7.000%, due 9/1/36 | | | 178 | | | | 217 | |
| | #888530, 7.500%, due 8/1/37 | | | 1,501 | | | | 1,899 | |
| | #AD0731, 7.500%, due 8/1/37 | | | 4,073 | | | | 4,984 | |
| | #AL6411, 7.000%, due 12/1/37 | | | 1,140 | | | | 1,304 | |
| | #889219, 6.000%, due 3/1/38 | | | 1,069 | | | | 1,313 | |
| | #FM1735, 6.500%, due 10/1/38 | | | 2,031 | | | | 2,461 | |
| | #995076, 6.000%, due 11/1/38 | | | 1,910 | | | | 2,313 | |
| | #AD0100, 7.000%, due 12/1/38 | | | 416 | | | | 502 | |
| | #FM2467, 6.000%, due 1/1/39 | | | 1,718 | | | | 2,044 | |
| | #FM1736, 6.500%, due 10/1/39 | | | 2,617 | | | | 3,141 | |
| | #BM5204, 6.500%, due 6/1/40 | | | 2,308 | | | | 2,852 | |
| | #AL0515, 6.000%, due 7/1/40 | | | 495 | | | | 606 | |
| | #BM3525, 6.000%, due 4/1/41 | | | 2,380 | | | | 2,864 | |
| | #AL9226, 5.500%, due 12/1/41 | | | 2,195 | | | | 2,593 | |
| | #AL9225, 6.000%, due 1/1/42 | | | 1,978 | | | | 2,379 | |
| | #BM1328, 6.000%, due 1/1/42 | | | 1,235 | | | | 1,476 | |
| | #AL6276, 5.500%, due 10/1/43 | | | 160 | | | | 187 | |
| | #BM5121, 5.500%, due 12/1/48 | | | 1,116 | | | | 1,346 | |
| | #CA5837, 6.000%, due 7/1/49 | | | 1,358 | | | | 1,633 | |
| | Total FNMA Mortgage Obligations | | | | | | | 57,578 | |
| | | | | | | | | | |
| | Asset-Backed Securities—10.4% | | | | | | | | |
| | Tesla Auto Lease Trust
2018-B—144A, 2018-B, Tranche A, 3.710%, 8/20/21 | | | 355 | | | | 357 | |
| | Honda Auto Receivables Owner Trust, 2019-3, Tranche A2,
1.900%, 4/15/22 | | | 397 | | | | 398 | |
| | Ford Credit Auto Lease Trust 2019-B, 2019-B, Tranche A4,
2.270%, 11/15/22 | | | 329 | | | | 335 | |
| | Toyota Auto Receivables 2020-B Owner Trust, 2020-B, Tranche A2,
1.380%, 12/15/22 | | | 1,027 | | | | 1,032 | |
See accompanying Notes to Financial Statements.
| December 31, 2020 | William Blair Funds | 87 |
Low Duration Fund
Portfolio of Investments, December 31, 2020 (all dollar amounts in thousands)
| | | | | | | | |
| | Issuer | | Principal
Amount | | | Value | |
| | | | | | | | |
| | Asset-Backed Securities—(continued) |
| | Tesla Auto Lease Trust—144A, 2019-A, Tranche C,
2.680%, 1/20/23 | | $ | 675 | | | $ | 695 | |
| | Mercedes-Benz Auto Lease Trust 2020-B, 2020-B, Tranche A2,
0.310%, 2/15/23 | | | 500 | | | | 500 | |
| | GM Financial Automobile Leasing Trust, 2019-2, Tranche C,
3.120%, 3/20/23 | | | 425 | | | | 434 | |
| | Verizon Owner Trust 2018-A, 2018-A, Tranche A1A,
3.230%, 4/20/23 | | | 781 | | | | 791 | |
| | Kubota Credit Owner Trust—144A, 2020-2A, Tranche A2,
0.410%, 6/15/23 | | | 1,500 | | | | 1,502 | |
| | BA Credit Card Trust, 2018-A1, Tranche A1,
2.700%, 7/17/23 | | | 450 | | | | 451 | |
| | BA Credit Card Trust, 2018-A2, Tranche A2,
3.000%, 9/15/23 | | | 1,000 | | | | 1,008 | |
| | GM Financial Consumer Automobile Receivables Trust, 2018-4, Tranche A3,
3.210%, 10/16/23 | | | 568 | | | | 579 | |
| | Nissan Auto Lease Trust 2020-B, 2020-B, Tranche A3,
0.430%, 10/16/23 | | | 550 | | | | 551 | |
| | Citibank Credit Card Issuance Trust, 2016-A3, Tranche A3, 1M LIBOR + 0.490%,
0.643%, 12/7/23, VRN | | | 1,150 | | | | 1,155 | |
| | Discover Card Execution Note Trust, 2019-A2, Tranche A, 1M USD LIBOR + 0.270%,
0.429%, 12/15/23, VRN | | | 647 | | | | 649 | |
| | GM Financial Automobile Leasing Trust, 2020-1, Tranche C,
2.040%, 12/20/23 | | | 1,400 | | | | 1,425 | |
| | Verizon Owner Trust 2019-C, 2019-C, Tranche C,
2.160%, 4/22/24 | | | 60 | | | | 62 | |
| | Canadian Pacer Auto Receivables Trust—144A, 2020-1A, Tranche A3,
1.830%, 7/19/24 | | | 500 | | | | 509 | |
| | Verizon Owner Trust, 2020-A, Tranche C,
2.060%, 7/22/24 | | | 1,250 | | | | 1,290 | |
| | Nissan Auto Receivables 2020-A Owner Trust, 2020-A, Tranche A3,
1.380%, 12/16/24 | | | 1,126 | | | | 1,147 | |
| | CNH Equipment Trust 2020-A, 2020-A, Tranche A3,
1.160%, 6/16/25 | | | 300 | | | | 305 | |
| | Canadian Pacer Auto Receivables Trust—144A, 2020-1A, Tranche B,
2.000%, 7/21/25 | | | 500 | | | | 510 | |
| | | | | | | | |
| | Issuer | | Principal
Amount | | | Value | |
| | | | | | | | |
| | Asset-Backed Securities—(continued) |
| | CarMax Auto Owner Trust, 2020-1, Tranche C,
2.340%, 11/17/25 | | $ | 600 | | | $ | 622 | |
| | Navient Private Education Refi Loan Trust 2020-F—144A, 2020-FA, Tranche A,
1.220%, 7/15/69 | | | 225 | | | | 228 | |
| | Total Asset-Backed Securities | | | | | | | 16,535 | |
| | | | | | | | | | |
| | Corporate Obligations—27.2% | | | | | | | | |
| | Apple, Inc.,
3M USD LIBOR + 1.130%,
1.343%, due 2/23/21, VRN | | | 550 | | | | 551 | |
| | Philip Morris International, Inc.,
1.875%, due 2/25/21 | | | 119 | | | | 119 | |
| | JPMorgan Chase & Co.,
3M USD LIBOR + 1.480%,
1.705%, due 3/1/21, VRN | | | 1,500 | | | | 1,502 | |
| | Wells Fargo & Co.,
3M USD LIBOR + 1.340%,
1.571%, due 3/4/21, VRN | | | 2,000 | | | | 2,004 | |
| | HSBC Holdings plc,
3M USD LIBOR + 2.240%,
2.466%, due 3/8/21, VRN | | | 2,000 | | | | 2,007 | |
| | The Toronto-Dominion Bank,
3M USD LIBOR + 0.270%,
0.499%, due 3/17/21, VRN | | | 2,150 | | | | 2,151 | |
| | Citigroup, Inc.,
3M USD LIBOR + 1.380%,
1.620%, due 3/30/21, VRN | | | 1,500 | | | | 1,505 | |
| | Bank of America Corporation,
3M USD LIBOR + 1.420%,
1.638%, due 4/19/21, VRN | | | 1,200 | | | | 1,205 | |
| | The Goldman Sachs Group, Inc.,
3M USD LIBOR + 1.360%,
1.575%, due 4/23/21, VRN | | | 1,150 | | | | 1,153 | |
| | American Express Credit Corporation,
2.250%, due 5/5/21 | | | 1,500 | | | | 1,508 | |
| | Chevron Corporation,
3M USD LIBOR + 0.950%,
1.171%, due 5/16/21, VRN | | | 500 | | | | 502 | |
| | American Express Co.,
3M USD LIBOR + 0.525%,
0.747%, due 5/17/21, VRN | | | 1,225 | | | | 1,227 | |
| | Citibank NA,
3.400%, due 7/23/21 | | | 525 | | | | 533 | |
| | The Goldman Sachs Group, Inc.,
5.250%, due 7/27/21 | | | 1,000 | | | | 1,028 | |
| | Gilead Sciences, Inc.,
3M USD LIBOR + 0.150%,
0.379%, due 9/17/21, VRN | | | 1,000 | | | | 1,001 | |
| | Credit Suisse AG,
3.000%, due 10/29/21 | | | 1,000 | | | | 1,022 | |
| | Bristol-Myers Squibb Co.,
2.600%, due 5/16/22 | | | 1,000 | | | | 1,032 | |
| | Toyota Motor Credit Corporation,
1.150%, due 5/26/22 | | | 2,225 | | | | 2,254 | |
| | AT&T, Inc.,
3.000%, due 6/30/22 | | | 1,500 | | | | 1,553 | |
See accompanying Notes to Financial Statements.
| 88 | Annual Report | December 31, 2020 |
Low Duration Fund
Portfolio of Investments, December 31, 2020 (all dollar amounts in thousands)
| | | | | | | | |
| | Issuer | | Principal
Amount | | | Value | |
| | | | | | | | |
| | Corporate Obligations—(continued) | | | |
| | John Deere Capital Corporation,
0.550%, due 7/5/22 | | | $1,200 | | | $ | 1,206 | |
| | Mitsubishi UFJ Financial Group, Inc.,
2.623%, due 7/18/22 | | | 2,000 | | | | 2,067 | |
| | Philip Morris International, Inc.,
2.375%, due 8/17/22 | | | 1,500 | | | | 1,548 | |
| | Toyota Motor Credit Corporation,
SOFR + 0.340%,
0.425%, due 10/14/22, VRN | | | 200 | | | | 200 | |
| | Morgan Stanley,
SOFR + 0.700%,
0.785%, due 1/20/23, VRN | | | 400 | | | | 402 | |
| | Capital One Bank USA NA,
SOFR + 0.616%,
2.014%, due 1/27/23, VRN | | | 1,400 | | | | 1,424 | |
| | Morgan Stanley,
3.750%, due 2/25/23 | | | 2,003 | | | | 2,148 | |
| | Caterpillar Financial Services Corporation,
2.625%, due 3/1/23 | | | 1,579 | | | | 1,657 | |
| | Bank of Montreal,
SOFR + 0.680%,
0.768%, due 3/10/23, VRN | | | 1,250 | | | | 1,261 | |
| | Canadian Imperial Bank of Commerce,
SOFR + 0.800%,
0.889%, due 3/17/23, VRN | | | 1,000 | | | | 1,009 | |
| | Intuit, Inc.,
0.650%, due 7/15/23 | | | 1,300 | | | | 1,312 | |
| | GlaxoSmithKline Capital plc,
0.534%, due 10/1/23 | | | 1,000 | | | | 1,005 | |
| | Royal Bank of Canada,
SOFR + 0.450%,
0.535%, due 10/26/23, VRN | | | 1,500 | | | | 1,505 | |
| | KeyBank NA,
SOFR + 0.340%,
0.430%, due 1/3/24, VRN | | | 2,500 | | | | 2,501 | |
| | Total Corporate Obligations | | | | | | | 43,102 | |
| | Total Long-Term Investments—98.9%
(cost $155,547) | | | | | | | 156,761 | |
| | | | | | | | | | |
| | Repurchase Agreement | | | | | | | | |
| | Fixed Income Clearing Corporation, 0.000% dated 12/31/20, due 1/4/21, repurchase price $880, collateralized by U.S. Treasury Note,
0.500%, due 6/30/27, valued at $898 | | | 880 | | | | 880 | |
| | Total Repurchase Agreement—0.6%
(cost $880) | | | | | | | 880 | |
| | Total Investments—99.5%
(cost $156,427) | | | | | | | 157,641 | |
| | | | | | | | |
| | Issuer | | Principal
Amount | | | Value | |
| | | | | | | | |
| | Securities Sold, Not Yet Purchased U.S. Government Agency—(3.3)% |
| | Federal National Mortgage Association (FNMA)—(3.3)% | | | | | | | | |
| | TBA, 4.000%, due 1/1/51 | | $ | (5,000 | ) | | $ | (5,340 | ) |
| | Total Securities Sold, Not Yet Purchased—(3.3)%
(proceeds $5,340) | | | | | | | (5,340 | ) |
| | Cash and other assets, less liabilities—3.8% | | | | | | | 6,079 | |
| | Net assets—100.0% | | | | | | $ | 158,380 | |
The obligations of certain U.S. Government-sponsored securities are neither issued nor guaranteed by the U.S. Treasury.
144A = Security exempt from registration under Rule 144A of the Securities Act of 1933. These securities may be resold in transactions exempt from registration, normally to qualified institutional buyers.
SOFR = Secured Overnight Financing Rate
TBA = To Be Announced—TBAs are mortgage-backed securities traded under delayed delivery commitments, settling after December 31, 2020. The term TBA comes from the fact that the specific mortgage-backed security that will be delivered to fulfill a TBA trade is not designated at the time the trade is made.
VRN = Variable Rate Note
| (a) | Amount is less than the minimum amount disclosed. |
See accompanying Notes to Financial Statements.
| December 31, 2020 | William Blair Funds | 89 |
| | Macro Allocation Fund |
| | |
| | The Macro Allocation Fund seeks to maximize long-term risk-adjusted total return. |
| | |
| | AN OVERVIEW FROM THE PORTFOLIO MANAGERS |

Thomas Clarke 
Brian D. Singer | The William Blair Macro Allocation Fund (Class N shares) posted a 3.49% decrease, net of fees, for the year ended December 31, 2020. By comparison, the Fund’s benchmark index, the ICE BofAML US 3-Month Treasury Bill Index (the “Index”), increased 0.67%. The Fund had negative performance from both the market segment (i.e., equity and fixed income) and the currency segment. The largest detractors within the Fund’s market-oriented exposures included long exposures to U.K., Greece, Brazil, Spain, and India equities. Contributors within the market segment included long exposure to U.S. Treasuries, as well as to U.S. and Vietnam equities. Within the Fund’s currency segment, the largest detractors were short exposures to the Swiss franc, Australian dollar, and Chinese yuan. Contributing positive performance within currencies were long exposures to the South African rand, Turkish lira, and Swedish krona. We believe that calendar year 2020 was an unprecedented year for macro investing and navigating its challenges involved dynamic shifts in our portfolio exposures that were more sizable than in any prior year since inception. At the start of the fourth quarter of 2020, however, we concluded that the prevailing medium-term valuation opportunities across the macro space mostly required patience—and that there were reasons for optimism in respect of these opportunities being rewarded. We therefore did not make significant navigational alterations to our strategy during that quarter. We eliminated two Macro Themes that were integrated into our investment process and had previously contributed to a higher risk assessment and valuation headwinds; these Themes dealt with global protectionism and Chinese growth. In addition, we believe that the macro influence of European populism (which we retain as a Theme) is no longer a significant headwind to valuation opportunities. With fewer headwinds, there may be a less obstructed path for price to gravitate toward value, which we believe justifies retaining positions—or even increasing them—as we have done. As of year-end, we have an aggregate equity exposure that is close to the anticipated long-term average level in our strategies, and this aligns with fundamental opportunities to a greater extent than earlier in the year. The Fund is net long of equities, with long exposures primarily within the U.S., U.K., and emerging markets. The Fund is also slightly net long of fixed income securities, mostly in U.S. and China government bonds. Within currencies, as of the end of the period, the Fund maintained long exposure to emerging currencies such as the Turkish lira, Mexican peso, and Brazilian real, with the largest short exposures in the U.S. dollar and New Zealand dollar. |
| 90 | Annual Report | December 31, 2020 |
Macro Allocation Fund
Performance Highlights (Unaudited)
| Average Annual Total Returns through 12/31/2020 |
| | | | | | | | | | | | Since |
| | | 1 Year | | 3 Year | | 5 Year | | Inception |
| Class N(a) | | | (3.49 | )% | | | (0.32 | )% | | | 1.20 | % | | | 3.39 | % |
| Class I(a) | | | (3.15 | ) | | | (0.08 | ) | | | 1.48 | | | | 3.66 | |
| ICE BofAML US 3-Month Treasury Bill Index(a) | | | 0.67 | | | | 1.61 | | | | 1.20 | | | | 0.69 | |
| Class R6(b) | | | (3.13 | ) | | | 0.02 | | | | 1.58 | | | | 0.91 | |
| ICE BofAML US 3-Month Treasury Bill Index(b) | | | 0.67 | | | | 1.61 | | | | 1.20 | | | | 0.85 | |
| (a) | Since inception is for the period from November 29, 2011 (Commencement of Operations) to December 31, 2020. |
| (b) | Since inception is for the period from October 21, 2013 (Commencement of Operations) to December 31, 2020. |
Performance cited represents past performance. Past performance does not guarantee future results and current performance may be lower or higher than the data quoted. Results shown are average annual total returns, which assume reinvestment of dividends and capital gains. Investment returns and principal will fluctuate and you may have a gain or loss when you sell shares. For the most current month-end performance information, please call 1-800-742-7272, or visit our Web site at www.williamblairfunds.com. The Fund involves a high level of risk and may not be appropriate for everyone. You could lose money by investing in the Fund. There can be no assurance that the Fund’s investment objective will be achieved or that the Fund’s investment strategies will be successful. The Fund is not a complete investment program. From time to time, the investment adviser may waive fees or reimburse expenses for the Fund. Without these waivers/reimbursements, performance would be lower. Class N shares are not subject to a sales load. Class I shares are not subject to a sales load or distribution (Rule 12b-1) fees. Class R6 shares are not subject to a sales load, distribution (Rule 12b-1) fees, or sub-transfer agent fees.
The performance highlights and graph presented above do not reflect the deduction of taxes that a shareholder would pay on fund distributions or the redemption of fund shares.
The ICE BofAML US 3-Month Treasury Bill Index measures total return on cash, including price and interest income, based on short-term government Treasury Bills of about 90-day maturity. The Index is unmanaged, does not incur fees or expenses, and cannot be invested in directly.
This report identifies the Fund’s investments on December 31, 2020. These holdings are subject to change. Not all investments in the Fund performed the same, nor is there any guarantee that these investments will perform as well in the future. Market forecasts provided in this report may not necessarily come to pass.
Portfolio Allocation (Unaudited)
The table below provides the allocation of the Fund’s holdings as a percent of net assets as of December 31, 2020.
| | | % of net |
| Category | | assets |
| Equity Exchange-Traded Funds | | | 61.6 | |
| Fixed Income Exchange-Traded Funds | | | 9.3 | |
| Common Stocks | | | 3.4 | |
| Foreign Government Bonds | | | 5.4 | |
| Preferred Stocks | | | 0.4 | |
| Repurchase Agreement | | | 3.9 | |
| U.S. Government | | | 16.2 | |
| Liabilities, plus cash and other assets | | | (0.2 | ) |
| Total | | | 100.0 | % |
| December 31, 2020 | William Blair Funds | 91 |
Macro Allocation Fund
Portfolio of Investments, December 31, 2020 (all dollar amounts in thousands)
| | | | | | | | |
| | | | | | | | |
| | Issuer | | Shares | | | Value | |
| | | | | | | | | | |
| | Exchange-Traded Funds—70.9% | | | | | | | | |
| | Equity Exchange-Traded Funds—61.6% | | | | | | | | |
| | iShares MSCI Brazil ETF | | | 17,400 | | | $ | 645 | |
| | iShares MSCI Chile ETF | | | 82,000 | | | | 2,477 | |
| | iShares MSCI China ETF | | | 45,300 | | | | 3,668 | |
| | SPDR S&P 500 ETF Trust | | | 542,300 | | | | 202,755 | |
| | Utilities Select Sector SPDR Fund | | | 14,100 | | | | 884 | |
| | Vietnam Enterprise Investments, Ltd. Class “C” | | | 1,015,765 | | | | 7,571 | |
| | Total Equity Exchange-Traded Funds | | | | | | | 218,000 | |
| | Fixed Income Exchange-Traded Funds—9.3% | | | | | | | | |
| | iShares iBoxx $ Investment Grade Corporate Bond ETF | | | 82,100 | | | | 11,340 | |
| | iShares MBS ETF | | | 159,600 | | | | 17,577 | |
| | SPDR Bloomberg Barclays High Yield Bond ETF | | | 35,100 | | | | 3,824 | |
| | Total Fixed Income Exchange-Traded Funds | | | | | | | 32,741 | |
| | Total Exchange-Traded Funds—70.9%
(cost $196,114) | | | | | | | 250,741 | |
| | | | | | | | | | |
| | Common Stocks—3.4% | | | | | | | | |
| | | | | | | | | | |
| | Emerging Asia—1.4% | | | | | | | | |
| | Philippines—1.4% | | | | | | | | |
| | Aboitiz Equity Ventures, Inc. (Industrial conglomerates) | | | 185,163 | | | | 182 | |
| | Aboitiz Power Corporation (Independent power & renewable electricity producers) | | | 132,126 | | | | 73 | |
| | Ayala Corporation (Industrial conglomerates) | | | 24,300 | | | | 419 | |
| | Ayala Land, Inc. (Real estate management & development) | | | 666,910 | | | | 568 | |
| | Bank of the Philippine Islands (Banks) | | | 73,549 | | | | 125 | |
| | BDO Unibank, Inc. (Banks) | | | 165,123 | | | | 367 | |
| | Globe Telecom, Inc. (Wireless telecommunication services) | | | 3,163 | | | | 134 | |
| | GT Capital Holdings, Inc. (Diversified financial services) | | | 7,975 | | | | 97 | |
| | International Container Terminal Services, Inc. (Transportation infrastructure) | | | 88,154 | | | | 227 | |
| | JG Summit Holdings, Inc. (Industrial conglomerates) | | | 260,594 | | | | 389 | |
| | Jollibee Foods Corporation (Hotels, restaurants & leisure) | | | 35,005 | | | | 142 | |
| | Manila Electric Co. (Electric utilities) | | | 19,247 | | | | 117 | |
| | Megaworld Corporation (Real estate management & development) | | | 1,002,038 | | | | 85 | |
| | Metro Pacific Investments Corporation (Diversified financial services) | | | 1,146,973 | | | | 102 | |
| | Metropolitan Bank & Trust Co. (Banks) | | | 152,967 | | | | 156 | |
| | PLDT, Inc. (Wireless telecommunication services) | | | 8,056 | | | | 225 | |
| | Puregold Price Club, Inc. (Food & staples retailing) | | | 107,530 | | | | 92 | |
| | Robinsons Land Corporation (Real estate management & development) | | | 169,669 | | | | 75 | |
| | SM Investments Corporation (Industrial conglomerates) | | | 20,851 | | | | 455 | |
| | | | Shares or | | | | |
| | | | Principal | | | | |
| | Issuer | | Amount | | | Value | |
| | | | | | | | |
| | Common Stocks—(continued) | | | | | | | | |
| | | | | | | | | | |
| | Emerging Asia—(continued) | | | | | | | | |
| | Philippines—(continued) | | | | | | | | |
| | SM Prime Holdings, Inc. (Real estate management & development) | | | 824,474 | | | $ | 661 | |
| | Universal Robina Corporation (Food products) | | | 78,434 | | | | 249 | |
| | | | | | | | | 4,940 | |
| | | | | | | | | | |
| | Emerging Latin America—2.0% | | | | | | | | |
| | Chile—2.0% | | | | | | | | |
| | Aguas Andinas S.A. Class “A” (Water utilities) | | | 571,244 | | | | 184 | |
| | Banco de Chile (Banks) | | | 8,648,503 | | | | 883 | |
| | Banco de Credito e Inversiones S.A. (Banks) | | | 10,111 | | | | 397 | |
| | Banco Santander Chile (Banks) | | | 12,392,049 | | | | 595 | |
| | Cencosud S.A. (Food & staples retailing) | | | 313,755 | | | | 559 | |
| | Cencosud Shopping S.A. | | | 102,518 | | | | 164 | |
| | Cia Cervecerias Unidas S.A. (Beverages) | | | 32,976 | | | | 244 | |
| | Colbun S.A. (Independent power & renewable electricity producers) | | | 1,677,888 | | | | 296 | |
| | Empresas CMPC S.A. (Paper & forest products) | | | 225,122 | | | | 592 | |
| | Empresas COPEC S.A. (Oil, gas & consumable fuels) | | | 73,462 | | | | 745 | |
| | Enel Americas S.A. (Electric utilities) | | | 6,760,566 | | | | 1,104 | |
| | Enel Chile S.A. (Electric utilities) | | | 5,867,452 | | | | 456 | |
| | ENTEL Chile S.A. (Wireless telecommunication services) | | | 31,161 | | | | 193 | |
| | Falabella S.A. (Multiline retail) | | | 158,200 | | | | 586 | |
| | | | | | | | | 6,998 | |
| | Total Common Stocks—3.4%
(cost $10,144) | | | | | | | 11,938 | |
| | | | | | | | | | |
| | Foreign Government Bonds—5.4% | | | | | | |
| | Malaysia—3.9% | | | | | | | | |
| | Malaysia Government Bond, 4.160%, due 7/15/21 | | MYR | 54,850 | | | | 13,798 | |
| | South Africa—1.5% | | | | | | | | |
| | Republic of South Africa Government Bond, 8.000%, due 1/31/30 | | ZAR | 83,895 | | | | 5,443 | |
| | Total Foreign Government Bonds—5.4%
(cost $17,961) | | | | | | | 19,241 | |
| | | | | | | | | | |
| | Preferred Stocks—0.4% | | | | | | | | |
| | | | | | | | | | |
| | Emerging Latin America —0.4% | | | | | | | | |
| | Chile—0.4% | | | | | | | | |
| | Embotelladora Andina S.A. | | | 79,237 | | | | 204 | |
| | Sociedad Quimica y Minera de Chile S.A. | | | 21,441 | | | | 1,044 | |
| | | | | | | | | 1,248 | |
| | Total Preferred Stocks—0.4%
(cost $936) | | | | | | | 1,248 | |
See accompanying Notes to Financial Statements.
| 92 | Annual Report | December 31, 2020 |
Macro Allocation Fund
Portfolio of Investments, December 31, 2020 (all dollar amounts in thousands)
| | | | | | | | |
| | | | Principal | | | | |
| | Issuer | | Amount | | | Value | |
| | | | | | | | |
| | Repurchase Agreement—3.9% | | | | | | | | |
| | Fixed Income Clearing Corporation, 0.000% dated 12/31/20, due 1/4/21, repurchase price $13,901, collateralized by U.S. Treasury Note, 0.500%, due 6/30/27, valued at $14,179 | | | $13,901 | | | $ | 13,901 | |
| | Total Repurchase Agreement—3.9%
(cost $13,901) | | | | | | | 13,901 | |
| | | | | | | | | | |
| | U.S. Government—16.2% | | | | | | | | |
| | U.S. Treasury Bill, 1.248%, due 1/28/21 | | | 2,500 | | | | 2,500 | |
| | U.S. Treasury Bill, 1.255%, due 2/25/21 (a) | | | 2,500 | | | | 2,500 | |
| | U.S. Treasury Bill, 0.211%, due 3/25/21 (a) | | | 2,500 | | | | 2,500 | |
| | U.S. Treasury Bill, 0.161%, due 4/22/21 (a)(b) | | | 7,500 | | | | 7,498 | |
| | U.S. Treasury Bill, 0.156%, due 5/20/21 (a) | | | 7,500 | | | | 7,498 | |
| | U.S. Treasury Bill, 0.192%, due 6/17/21 (a) | | | 7,500 | | | | 7,498 | |
| | U.S. Treasury Bill, 0.154%, due 7/15/21 (a)(b) | | | 7,500 | | | | 7,497 | |
| | U.S. Treasury Bill, 0.141%, due 8/12/21 (a)(b) | | | 5,000 | | | | 4,998 | |
| | U.S. Treasury Bill, 0.137%, due 9/9/21 | | | 5,000 | | | | 4,997 | |
| | U.S. Treasury Bill, 0.132%, due 10/7/21 | | | 2,500 | | | | 2,498 | |
| | U.S. Treasury Bill, 0.119%, due 11/4/21 | | | 2,500 | | | | 2,498 | |
| | U.S. Treasury Bill, 0.109%, due 12/2/21 | | | 2,500 | | | | 2,498 | |
| | U.S. Treasury Bill, 0.109%, due 12/30/21 | | | 2,500 | | | | 2,498 | |
| | Total U.S. Government—16.2%
(cost $57,451) | | | | | | | 57,478 | |
| | Total Investments in Securities—100.2%
(cost $296,507) | | | | | | | 354,547 | |
| | Liabilities, plus cash and other assets—(0.2)% | | | | | | | (832 | ) |
| | Net assets—100.0% | | | | | | $ | 353,715 | |
(a) Security, or portion of security, is segregated as collateral for centrally cleared swaps and to cover initial margin requirements on open futures contracts aggregating a total value of $23,424 (in thousands).
(b) Security, or portion of security, is pledged as collateral for OTC swap contracts aggregating a total value of $1,146 (in thousands).
See accompanying Notes to Financial Statements.
| December 31, 2020 | William Blair Funds | 93 |
Macro Allocation Fund
Portfolio of Investments, December 31, 2020 (all dollar amounts in thousands)
Forward Foreign Currency Contracts
| | | | | | | | | USD (Base) | | | | | Net Unrealized | |
| Settlement | | | | | | Local Currency | | Purchased | | Current | | | Appreciation | |
| Date | | Deliver/Receive | | Counterparty | | (in thousands) | | or Sold | | Value | | | (Depreciation) | |
| Purchased | | | | | | | | | | | | | | | | | | | |
| 1/13/21 | | New Turkish Lira | | Citibank N.A. London | | 382,754 | | $ | 48,354 | | | $ | 51,359 | | | | $ | 3,005 | |
| 1/20/21 | | Australian Dollar | | Citibank N.A. London | | 17,277 | | | 13,044 | | | | 13,322 | | | | | 278 | |
| 1/20/21 | | Brazilian Real | | Citibank N.A. London | | 157,098 | | | 30,529 | | | | 30,244 | | | | | (285 | ) |
| 1/20/21 | | British Pound Sterling | | Citibank N.A. London | | 11,622 | | | 15,574 | | | | 15,896 | | | | | 322 | |
| 1/20/21 | | Canadian Dollar | | Citibank N.A. London | | 465 | | | 363 | | | | 365 | | | | | 2 | |
| 1/20/21 | | Chilean Peso | | Citibank N.A. London | | 300,746 | | | 422 | | | | 423 | | | | | 1 | |
| 1/20/21 | | Chinese Yuan Renminbi | | Citibank N.A. London | | 7,599 | | | 1,164 | | | | 1,168 | | | | | 4 | |
| 1/20/21 | | Colombian Peso | | Citibank N.A. London | | 77,168,911 | | | 22,243 | | | | 22,594 | | | | | 351 | |
| 1/20/21 | | Czech Koruna | | Citibank N.A. London | | 13,238 | | | 617 | | | | 616 | | | | | (1 | ) |
| 1/20/21 | | Euro | | Citibank N.A. London | | 678 | | | 831 | | | | 829 | | | | | (2 | ) |
| 1/20/21 | | Hong Kong Dollar | | Citibank N.A. London | | 7,016 | | | 905 | | | | 905 | | | | | — | |
| 1/20/21 | | Indian Rupee | | Citibank N.A. London | | 696,177 | | | 9,412 | | | | 9,518 | | | | | 106 | |
| 1/20/21 | | Indonesian Rupiah | | Citibank N.A. London | | 8,208,119 | | | 580 | | | | 589 | | | | | 9 | |
| 1/20/21 | | Israeli Shekel | | Citibank N.A. London | | 3,470 | | | 1,079 | | | | 1,080 | | | | | 1 | |
| 1/20/21 | | Japanese Yen | | Citibank N.A. London | | 2,283,732 | | | 21,931 | | | | 22,122 | | | | | 191 | |
| 1/20/21 | | Mexican Peso | | Citibank N.A. London | | 608,817 | | | 30,529 | | | | 30,541 | | | | | 12 | |
| 1/20/21 | | New Zealand Dollar | | Citibank N.A. London | | 2,033 | | | 1,456 | | | | 1,463 | | | | | 7 | |
| 1/20/21 | | Philippine Peso | | Citibank N.A. London | | 1,008,365 | | | 20,907 | | | | 20,978 | | | | | 71 | |
| 1/20/21 | | Russian Ruble | | Citibank N.A. London | | 1,974,466 | | | 26,768 | | | | 26,671 | | | | | (97 | ) |
| 1/20/21 | | Singapore Dollar | | Citibank N.A. London | | 47,322 | | | 35,397 | | | | 35,807 | | | | | 410 | |
| 1/20/21 | | South African Rand | | Citibank N.A. London | | 118,050 | | | 7,873 | | | | 8,015 | | | | | 142 | |
| 1/20/21 | | Swedish Krona | | Citibank N.A. London | | 74,518 | | | 8,797 | | | | 9,059 | | | | | 262 | |
| 1/20/21 | | Swiss Franc | | Citibank N.A. London | | 951 | | | 1,076 | | | | 1,075 | | | | | (1 | ) |
| 1/20/21 | | Taiwan Dollar | | Citibank N.A. London | | 30,713 | | | 1,099 | | | | 1,095 | | | | | (4 | ) |
| 1/20/21 | | Thai Baht | | Citibank N.A. London | | 22,644 | | | 755 | | | | 756 | | | | | 1 | |
| | | | | | | | | | | | | | | | | | $ | 4,785 | |
| Sold | | | | | | | | | | | | | | | | | | | |
| 1/13/21 | | New Turkish Lira | | Citibank N.A. London | | 30,474 | | | 4,118 | | | | 4,089 | | | | | 29 | |
| 1/20/21 | | Australian Dollar | | Citibank N.A. London | | 54,353 | | | 40,617 | | | | 41,911 | | | | | (1,294 | ) |
| 1/20/21 | | Brazilian Real | | Citibank N.A. London | | 4,985 | | | 960 | | | | 960 | | | | | — | |
| 1/20/21 | | British Pound Sterling | | Citibank N.A. London | | 388 | | | 524 | | | | 531 | | | | | (7 | ) |
| 1/20/21 | | Canadian Dollar | | Citibank N.A. London | | 13,407 | | | 10,478 | | | | 10,533 | | | | | (55 | ) |
| 1/20/21 | | Chilean Peso | | Citibank N.A. London | | 8,404,054 | | | 11,336 | | | | 11,827 | | | | | (491 | ) |
| 1/20/21 | | Chinese Yuan Renminbi | | Citibank N.A. London | | 174,598 | | | 26,710 | | | | 26,823 | | | | | (113 | ) |
| 1/20/21 | | Colombian Peso | | Citibank N.A. London | | 2,662,242 | | | 765 | | | | 779 | | | | | (14 | ) |
| 1/20/21 | | Czech Koruna | | Citibank N.A. London | | 384,421 | | | 17,715 | | | | 17,900 | | | | | (185 | ) |
| 1/20/21 | | Euro | | Citibank N.A. London | | 19,491 | | | 23,589 | | | | 23,821 | | | | | (232 | ) |
| 1/20/21 | | Hong Kong Dollar | | Citibank N.A. London | | 140,514 | | | 18,125 | | | | 18,126 | | | | | (1 | ) |
| 1/20/21 | | Indonesian Rupiah | | Citibank N.A. London | | 222,528,449 | | | 15,732 | | | | 15,978 | | | | | (246 | ) |
| 1/20/21 | | Israeli Shekel | | Citibank N.A. London | | 100,723 | | | 31,000 | | | | 31,352 | | | | | (352 | ) |
| 1/20/21 | | Japanese Yen | | Citibank N.A. London | | 78,806 | | | 761 | | | | 763 | | | | | (2 | ) |
| 1/20/21 | | Mexican Peso | | Citibank N.A. London | | 21,658 | | | 1,086 | | | | 1,086 | | | | | — | |
| 1/20/21 | | New Zealand Dollar | | Citibank N.A. London | | 62,025 | | | 43,812 | | | | 44,632 | | | | | (820 | ) |
| 1/20/21 | | Philippine Peso | | Citibank N.A. London | | 35,229 | | | 733 | | | | 733 | | | | | — | |
| 1/20/21 | | Russian Ruble | | Citibank N.A. London | | 66,002 | | | 893 | | | | 892 | | | | | 1 | |
| 1/20/21 | | Singapore Dollar | | Citibank N.A. London | | 1,619 | | | 1,219 | | | | 1,225 | | | | | (6 | ) |
| 1/20/21 | | South Korean Won | | Citibank N.A. London | | 8,572,512 | | | 7,886 | | | | 7,879 | | | | | 7 | |
| 1/20/21 | | Swiss Franc | | Citibank N.A. London | | 27,517 | | | 30,975 | | | | 31,096 | | | | | (121 | ) |
| 1/20/21 | | Thai Baht | | Citibank N.A. London | | 658,827 | | | 21,919 | | | | 21,990 | | | | | (71 | ) |
| | | | | | | | | | | | | | | | | | $ | (3,973 | ) |
| Total net unrealized appreciation (depreciation) on forward foreign currency contracts | | | | | | | $ | 812 | |
See accompanying Notes to Financial Statements.
| 94 | Annual Report | December 31, 2020 |
Macro Allocation Fund
Portfolio of Investments, December 31, 2020 (all dollar amounts in thousands)
Futures Contracts
| | | | | | | | | | Notional Value | | Notional | | | Notional | | Net Unrealized |
| Number of | | | | | | | | (Local, | | Amount | | | Value | | Appreciation |
| Contracts | | Description | | Expiration Date | | Local Currency | | in Thousands) | | (USD) | | | (USD) | | (Depreciation) |
| Long | | | | | | | | | | | | | | | | | | | | | | |
| 79 | | | CAC 40 Index | | January 2021 | | Euro | | 4,378 | | $ | 5,341 | | | $ | 5,349 | | | | $ | 8 | |
| 77 | | | IBEX 35 Index | | January 2021 | | Euro | | 6,214 | | | 7,672 | | | | 7,592 | | | | | (80 | ) |
| 21 | | | FTSE Taiwan Index | | January 2021 | | U.S. Dollar | | 1,072 | | | 1,045 | | | | 1,072 | | | | | 27 | |
| 431 | | | MSCI Singapore ETS Index | | January 2021 | | Singapore Dollar | | 13,934 | | | 10,575 | | | | 10,543 | | | | | (32 | ) |
| 22 | | | KOSPI 200 Index | | March 2021 | | South Korean Won | | 2,140,325 | | | 1,850 | | | | 1,970 | | | | | 120 | |
| 3 | | | NIKKEI 225 Index | | March 2021 | | Japanese Yen | | 41,235 | | | 387 | | | | 399 | | | | | 12 | |
| 87 | | | SPI 200 Index | | March 2021 | | Australian Dollar | | 14,218 | | | 11,062 | | | | 10,961 | | | | | (101 | ) |
| 13 | | | DAX Index | | March 2021 | | Euro | | 4,467 | | | 5,262 | | | | 5,458 | | | | | 196 | |
| 354 | | | FTSE 100 Index | | March 2021 | | British Pound Sterling | | 22,727 | | | 31,508 | | | | 31,079 | | | | | (429 | ) |
| 26 | | | FTSE MIB Index | | March 2021 | | Euro | | 2,877 | | | 3,437 | | | | 3,514 | | | | | 77 | |
| 2 | | | MSCI China Index | | March 2021 | | U.S. Dollar | | 118 | | | 117 | | | | 118 | | | | | 1 | |
| 437 | | | MSCI Indonesia Index | | March 2021 | | U.S. Dollar | | 7,071 | | | 7,063 | | | | 7,071 | | | | | 8 | |
| 27 | | | MSCI Philippines Index | | March 2021 | | U.S. Dollar | | 678 | | | 683 | | | | 678 | | | | | (5 | ) |
| 489 | | | MSCI World Energy Index | | March 2021 | | U.S. Dollar | | 10,802 | | | 11,255 | | | | 10,802 | | | | | (453 | ) |
| | | | | | | | | | | | | | | | | | | | | $ | (651 | ) |
| Short | | | | | | | | | | | | | | | | | | | | | | |
| 6 | | | Amsterdam Index | | January 2021 | | Euro | | 749 | | $ | 903 | | | $ | 916 | | | | $ | (13 | ) |
| 27 | | | OMXS 30 Index | | January 2021 | | Swedish Krona | | 5,071 | | | 622 | | | | 616 | | | | | 6 | |
| 58 | | | FTSE 40 Index | | March 2021 | | South African Rand | | 31,681 | | | 2,165 | | | | 2,156 | | | | | 9 | |
| 1 | | | S&P TSE 60 Index | | March 2021 | | Canadian Dollar | | 206 | | | 164 | | | | 162 | | | | | 2 | |
| 421 | | | EURO STOXX 50 Index | | March 2021 | | Euro | | 14,946 | | | 18,038 | | | | 18,258 | | | | | (220 | ) |
| 115 | | | MSCI Emerging Markets Index | | March 2021 | | U.S. Dollar | | 7,407 | | | 7,190 | | | | 7,407 | | | | | (217 | ) |
| 170 | | | MSCI Mexico Index | | March 2021 | | U.S. Dollar | | 4,078 | | | 3,889 | | | | 4,078 | | | | | (189 | ) |
| 41 | | | SWISS Markets Index March 2021 | | | | Swiss Franc | | 4,364 | | | 4,743 | | | | 4,930 | | | | | (187 | ) |
| 921 | | | S&P 500 E Mini Index March 2021 | | | | U.S. Dollar | | 172,632 | | | 168,268 | | | | 172,632 | | | | | (4,364 | ) |
| 21 | | | S&P E Mini Com Ser Index | | March 2021 | | U.S. Dollar | | 1,855 | | | 1,840 | | | | 1,855 | | | | | (15 | ) |
| 13 | | | XAK Technology | | March 2021 | | U.S. Dollar | | 1,704 | | | 1,622 | | | | 1,704 | | | | | (82 | ) |
| 22 | | | XAY Cons Discret | | March 2021 | | U.S. Dollar | | 3,575 | | | 3,474 | | | | 3,575 | | | | | (101 | ) |
| 51 | | | 10YR Can Bond | | March 2021 | | Canadian Dollar | | 7,604 | | | 5,957 | | | | 5,974 | | | | | (17 | ) |
| | | | | | | | | | | | | | | | | | | | | $ | (5,388 | ) |
| Total net unrealized appreciation (depreciation) on futures contracts | | | | | | | | | | $ | (6,039 | ) |
See accompanying Notes to Financial Statements.
| December 31, 2020 | William Blair Funds | 95 |
Macro Allocation Fund
Portfolio of Investments, December 31, 2020 (all dollar amounts in thousands)
Centrally Cleared Interest Rate Swap
Floating
Rate
Reference | | Pay/Receive
Floating
Rate | | Fixed Rate | | Pay/Receive
Payment
Frequency | | Maturity
Date | | Cleared
Exchange | | Notional
Amount
(in thousands) | | | Upfront
Payment
Paid
(Received) | | Value | | Unrealized
Appreciation
(Depreciation) | |
| China 1-Week Repo Rate | | Pay | | 2.800% | | 3M | | December 2025 | | LCH | | CNY 180,090 | | | $1 | | $194 | | | $ | 193 | |
Total Return Swaps
Reference
Entity | | Pay/Receive
Floating/
Fixed Rate | | Floating/
Fixed Rates | | Maturity
Dates | | Counterparty | | Notional
Amount (in
thousands) | | Market
Value | | Unrealized
Appreciation
(Depreciation) | |
| 10YR T-Note Future | | Pay | | 0 bp | | Mar 2021 | | Credit Suisse International | | $30,198 | | $41 | | | | $ | 41 | |
| 5YR T-Note Future | | Pay | | 0 bp | | Mar 2021 | | Credit Suisse International | | 13,093 | | 28 | | | | | 28 | |
| CSI 500 Net Total Return Index | | Pay | | (1,305) bp | | Sep 2021 | | Credit Suisse International | | 9,055 | | 340 | | | | | 340 | |
| Euro-Bund Future | | Receive | | 0 bp | | Mar 2021 | | Credit Suisse International | | EUR 1,419 | | (2 | ) | | | | (2 | ) |
| RTS Index Future | | Pay | | 0 bp | | Mar 2021 | | Credit Suisse International | | $4,128 | | (71 | ) | | | | (71 | ) |
| | | | | | | | | | | | | | | | | $ | 336 | |
Centrally Cleared Credit Default Swap
| | | | | | | | | | | | | | | | Upfront | | | | | | |
| | | | | | | | | | | | | Notional | | | Payment | | | | Unrealized | |
| Reference | | Buy/Sell | | Fixed Deal | | Payment | | Maturity | | Cleared | | Amount | | | Paid | | | | Appreciation | |
| Entity | | Protection | | Pay Rate | | Frequency | | Date | | Exchange | | (in thousands) | | | (Received) | | Value | | (Depreciation) | |
iTRAXX
Europe S34 | | Sell | | 1.000% | | 3M | | December 2025 | | ICE | | EUR 6,167 | | | $155 | | $198 | | | $ | 43 | |
| Total net unrealized appreciation (depreciation) on swaps | | | | | | | | | | $ | 572 | |
See accompanying Notes to Financial Statements.
| 96 | Annual Report | December 31, 2020 |
Statements of Assets and Liabilities
As of December 31, 2020 (dollar amounts in thousands)
| | | Growth
Fund | | | Large Cap
Growth
Fund | | | Mid Cap
Growth Fund | | | Small-Mid
Cap Core
Fund | |
| Assets | | | | | | | | | | | | |
| Investments in securities, at cost | | $ | 157,168 | | | $ | 479,731 | | | $ | 55,797 | | | $ | 22,518 | |
| Investments in securities, at value | | $ | 297,625 | | | $ | 711,377 | | | $ | 83,978 | | | $ | 30,151 | |
| Receivable for fund shares sold | | | 107 | | | | 1,939 | | | | 95 | | | | — | |
| Receivable from Adviser | | | 1 | | | | 160 | | | | 21 | | | | 30 | |
| Dividend and interest receivable | | | 22 | | | | 101 | | | | 11 | | | | 15 | |
| Total assets | | | 297,755 | | | | 713,577 | | | | 84,105 | | | | 30,196 | |
| Liabilities | | | | | | | | | | | | | | | | |
| Payable for fund shares redeemed | | | 208 | | | | 167 | | | | 2 | | | | 41 | |
| Management fee payable | | | 186 | | | | 351 | | | | 62 | | | | 22 | |
| Distribution fee payable | | | 7 | | | | 29 | | | | 1 | | | | — | |
| Other payables and accrued expenses | | | 103 | | | | 161 | | | | 70 | | | | 88 | |
| Total liabilities | | | 504 | | | | 708 | | | | 135 | | | | 151 | |
| Net assets | | $ | 297,251 | | | $ | 712,869 | | | $ | 83,970 | | | $ | 30,045 | |
| Capital | | | | | | | | | | | | | | | | |
| Composition of net assets | | | | | | | | | | | | | | | | |
| Paid in capital | | $ | 147,602 | | | $ | 478,108 | | | $ | 54,356 | | | $ | 35,956 | |
| Total distributable earnings (loss) | | | 149,649 | | | | 234,761 | | | | 29,614 | | | | (5,911 | ) |
| Net assets | | $ | 297,251 | | | $ | 712,869 | | | $ | 83,970 | | | $ | 30,045 | |
| | | | | | | | | | | | | | | | | |
| Class N shares | | | | | | | | | | | | | | | | |
| Net assets | | $ | 35,494 | | | $ | 138,152 | | | $ | 6,074 | | | | — | |
| Shares outstanding | | | 3,182,417 | | | | 6,898,011 | | | | 471,133 | | | | — | |
| Net asset value per share | | $ | 11.15 | | | $ | 20.03 | | | $ | 12.89 | | | | — | |
| Class I shares | | | | | | | | | | | | | | | | |
| Net assets | | $ | 249,716 | | | $ | 397,370 | | | $ | 77,273 | | | $ | 22,958 | |
| Shares outstanding | | | 18,302,003 | | | | 18,662,917 | | | | 5,469,001 | | | | 1,782,845 | |
| Net asset value per share | | $ | 13.64 | | | $ | 21.29 | | | $ | 14.13 | | | $ | 12.88 | |
| Class R6 shares | | | | | | | | | | | | | | | | |
| Net assets | | $ | 12,041 | | | $ | 177,347 | | | $ | 623 | | | $ | 7,087 | |
| Shares outstanding | | | 880,517 | | | | 8,338,144 | | | | 44,075 | | | | 550,189 | |
| Net asset value per share | | $ | 13.67 | | | $ | 21.27 | | | $ | 14.14 | | | $ | 12.88 | |
See accompanying Notes to Financial Statements.
| December 31, 2020 | William Blair Funds | 97 |
Statements of Operations
For the Year Ended December 31, 2020 (all amounts in thousands)
| | | Growth
Fund | | | Large Cap
Growth
Fund | | | Mid Cap
Growth
Fund | | | Small-Mid
Cap Core
Fund | |
| Investment income | | | | | | | | | | | | | | | | |
| Dividends | | $ | 1,784 | | | $ | 4,835 | | | $ | 349 | | | $ | 1,336 | |
| Less foreign tax withheld | | | (2 | ) | | | — | | | | (1 | ) | | | (9 | ) |
| Interest | | | 1 | | | | 1 | | | | — | | | | 1 | |
| Total income | | | 1,783 | | | | 4,836 | | | | 348 | | | | 1,328 | |
| Expenses | | | | | | | | | | | | | | | | |
| Investment advisory fees | | | 1,901 | | | | 3,082 | | | | 642 | | | | 1,255 | |
| Distribution fees | | | 79 | | | | 289 | | | | 13 | | | | — | |
| Custodian fees | | | 86 | | | | 92 | | | | 85 | | | | 112 | |
| Transfer agent fees | | | 63 | | | | 91 | | | | 12 | | | | 10 | |
| Sub-transfer agent fees | | | | | | | | | | | | | | | | |
| Class N | | | 45 | | | | 168 | | | | 6 | | | | — | |
| Class I | | | 124 | | | | 384 | | | | 83 | | | | 202 | |
| Professional fees | | | 49 | | | | 115 | | | | 33 | | | | 41 | |
| Registration fees | | | 65 | | | | 67 | | | | 42 | | | | 41 | |
| Shareholder reporting fees | | | 18 | | | | 89 | | | | 3 | | | | 2 | |
| Trustee fees | | | 19 | | | | 33 | | | | 5 | | | | 11 | |
| Other expenses | | | 15 | | | | 22 | | | | 11 | | | | 14 | |
| Total expenses before expense limitation | | | 2,464 | | | | 4,432 | | | | 935 | | | | 1,688 | |
| Expenses waived or reimbursed by the Adviser | | | | | | | | | | | | | | | | |
| Class N | | | (21 | ) | | | (224 | ) | | | (17 | ) | | | — | |
| Class I | | | — | | | | (567 | ) | | | (227 | ) | | | (357 | ) |
| Class R6 | | | — | | | | (23 | ) | | | (1 | ) | | | (9 | ) |
| Total expenses waived or reimbursed by the Adviser | | | (21 | ) | | | (814 | ) | | | (245 | ) | | | (366 | ) |
| Net expenses | | | 2,443 | | | | 3,618 | | | | 690 | | | | 1,322 | |
| Net investment income (loss) | | | (660 | ) | | | 1,218 | | | | (342 | ) | | | 6 | |
| Realized and unrealized gain (loss) | | | | | | | | | | | | | | | | |
| Net realized gain (loss) on transactions from: | | | | | | | | | | | | | | | | |
| Investments in securities | | | 42,176 | | | | 34,530 | | | | 6,414 | | | | (13,038 | ) |
| Futures contracts | | | — | | | | — | | | | — | | | | (640 | ) |
| Total net realized gain (loss) | | | 42,176 | | | | 34,530 | | | | 6,414 | | | | (13,678 | ) |
| Change in net unrealized appreciation (depreciation) of: | | | | | | | | | | | | | | | | |
| Investments in securities | | | 40,608 | | | | 144,802 | | | | 12,060 | | | | 7,247 | |
| Change in net unrealized appreciation (depreciation) | | | 40,608 | | | | 144,802 | | | | 12,060 | | | | 7,247 | |
| Net increase (decrease) in net assets resulting from operations | | $ | 82,124 | | | $ | 180,550 | | | $ | 18,132 | | | $ | (6,425 | ) |
See accompanying Notes to Financial Statements.
| 98 | Annual Report | December 31, 2020 |
Statements of Changes in Net Assets
For the Years Ended December 31, 2020 and 2019 (all amounts in thousands)
| | | Growth Fund | | | Large Cap
Growth Fund | | | Mid Cap
Growth Fund | | | Small-Mid Cap
Core Fund | |
| | | 2020 | | | 2019 | | | 2020 | | | 2019 | | | 2020 | | | 2019 | | | 2020 | | | 2019 (a) | |
| Operations | | | | | | | | | | | | | | | | | | | | | | | | |
| Net investment income (loss) | | $ | (660 | ) | | $ | (175 | ) | | $ | 1,218 | | | $ | 475 | | | $ | (342 | ) | | $ | (171 | ) | | $ | 6 | | | $ | 4 | |
| Net realized gain (loss) on investments, and other assets and liabilities | | | 42,176 | | | | 24,088 | | | | 34,530 | | | | 17,324 | | | | 6,414 | | | | 7,108 | | | | (13,678 | ) | | | (16 | ) |
| Change in net unrealized appreciation (depreciation) on investments, and other assets and liabilities | | | 40,608 | | | | 45,368 | | | | 144,802 | | | | 49,902 | | | | 12,060 | | | | 13,055 | | | | 7,247 | | | | 386 | |
| Net increase (decrease) in net assets resulting from operations | | | 82,124 | | | | 69,281 | | | | 180,550 | | | | 67,701 | | | | 18,132 | | | | 19,992 | | | | (6,425 | ) | | | 374 | |
| Distributions to shareholders from | | | | | | | | | | | | | | | | | | | | | | | | | | |
| Class N | | | (4,769 | ) | | | (3,190 | ) | | | (5,187 | ) | | | (3,981 | ) | | | (466 | ) | | | (480 | ) | | | — | | | | — | |
| Class I | | | (27,747 | ) | | | (17,880 | ) | | | (14,681 | ) | | | (12,030 | ) | | | (5,249 | ) | | | (5,507 | ) | | | — | | | | (1 | ) |
| Class R6 | | | (1,332 | ) | | | (17 | ) | | | (6,012 | ) | | | (97 | ) | | | (42 | ) | | | (12 | ) | | | — | | | | (3 | ) |
| Total distributions | | | (33,848 | ) | | | (21,087 | ) | | | (25,880 | ) | | | (16,108 | ) | | | (5,757 | ) | | | (5,999 | ) | | | — | | | | (4 | ) |
| Capital stock transactions | | | | | | | | | | | | | | | | | | | | | | | | | | | | | |
| Proceeds from sale of shares | | | 28,188 | | | | 21,672 | | | | 494,318 | | | | 122,974 | | | | 11,489 | | | | 10,314 | | | | 266,207 | | | | 6,238 | |
| Shares issued in reinvestment of income dividends and capital gain distributions | | | 32,736 | | | | 20,274 | | | | 22,621 | | | | 13,134 | | | | 5,537 | | | | 5,817 | | | | — | | | | 4 | |
| Less cost of shares redeemed | | | (65,536 | ) | | | (62,229 | ) | | | (262,574 | ) | | | (62,827 | ) | | | (18,977 | ) | | | (12,695 | ) | | | (236,325 | ) | | | (24 | ) |
| Net increase (decrease) in net assets resulting from capital share transactions | | | (4,612 | ) | | | (20,283 | ) | | | 254,365 | | | | 73,281 | | | | (1,951 | ) | | | 3,436 | | | | 29,882 | | | | 6,218 | |
| Increase (decrease) in net assets | | | 43,664 | | | | 27,911 | | | | 409,035 | | | | 124,874 | | | | 10,424 | | | | 17,429 | | | | 23,457 | | | | 6,588 | |
| Net assets | | | | | | | | | | | | | | | | | | | | | | | | | | | | | | | | |
| Beginning of period | | | 253,587 | | | | 225,676 | | | | 303,834 | | | | 178,960 | | | | 73,546 | | | | 56,117 | | | | 6,588 | | | | — | |
| End of period | | $ | 297,251 | | | $ | 253,587 | | | $ | 712,869 | | | $ | 303,834 | | | $ | 83,970 | | | $ | 73,546 | | | $ | 30,045 | | | $ | 6,588 | |
| (a) | For the period from October 1, 2019 (Commencement of Operations) to December 31, 2019. |
See accompanying Notes to Financial Statements.
| December 31, 2020 | William Blair Funds | 99 |
Statements of Assets and Liabilities
As of December 31, 2020 (dollar amounts in thousands)
| | | Small-Mid
Cap Growth
Fund | | | Small-Mid
Cap Value
Fund | | | Small Cap
Growth
Fund | | | Small Cap
Value
Fund | |
| Assets | | | | | | | | | | | | |
| Investments in securities, at cost | | $ | 2,378,647 | | | $ | 1,092 | | | $ | 461,378 | | | $ | 44,212 | |
| Investments in securities, at value | | $ | 3,574,243 | | | $ | 1,494 | | | $ | 675,336 | | | $ | 60,063 | |
| Receivable for securities sold | | | — | | | | — | | | | 551 | | | | 16 | |
| Receivable for fund shares sold | | | 9,646 | | | | — | | | | 605 | | | | 49 | |
| Receivable from Adviser | | | 179 | | | | 7 | | | | 2 | | | | 15 | |
| Dividend and interest receivable | | | 498 | | | | 1 | | | | 97 | | | | 45 | |
| Total assets | | | 3,584,566 | | | | 1,502 | | | | 676,591 | | | | 60,188 | |
| Liabilities | | | | | | | | | | | | | | | | |
| Payable for securities purchased | | | 1,048 | | | | — | | | | 818 | | | | 172 | |
| Payable for fund shares redeemed | | | 2,792 | | | | 2 | | | | 339 | | | | 6 | |
| Management fee payable | | | 2,971 | | | | 1 | | | | 620 | | | | 48 | |
| Distribution fee payable | | | 67 | | | | — | | | | 38 | | | | 2 | |
| Other payables and accrued expenses | | | 606 | | | | 62 | | | | 168 | | | | 59 | |
| Total liabilities | | | 7,484 | | | | 65 | | | | 1,983 | | | | 287 | |
| Net assets | | $ | 3,577,082 | | | $ | 1,437 | | | $ | 674,608 | | | $ | 59,901 | |
| Capital | | | | | | | | | | | | | | | | |
| Composition of net assets | | | | | | | | | | | | | | | | |
| Paid in capital | | $ | 2,308,087 | | | $ | 4,206 | | | $ | 450,191 | | | $ | 58,426 | |
| Total distributable earnings (loss) | | | 1,268,995 | | | | (2,769 | ) | | | 224,417 | | | | 1,475 | |
| Net assets | | $ | 3,577,082 | | | $ | 1,437 | | | $ | 674,608 | | | $ | 59,901 | |
| | | | | | | | | | | | | | | | | |
| Class N shares | | | | | | | | | | | | | | | | |
| Net assets | | $ | 314,572 | | | $ | 77 | | | $ | 180,635 | | | $ | 7,402 | |
| Shares outstanding | | | 9,545,077 | | | | 7,359 | | | | 5,237,598 | | | | 567,624 | |
| Net asset value per share | | $ | 32.96 | | | $ | 10.43 | | | $ | 34.49 | | | $ | 13.04 | |
| Class I shares | | | | | | | | | | | | | | | | |
| Net assets | | $ | 3,139,290 | | | $ | 1,067 | | | $ | 390,511 | | | $ | 42,311 | |
| Shares outstanding | | | 89,353,269 | | | | 103,075 | | | | 9,921,262 | | | | 3,117,896 | |
| Net asset value per share | | $ | 35.13 | | | $ | 10.35 | | | $ | 39.36 | | | $ | 13.57 | |
| Class R6 shares | | | | | | | | | | | | | | | | |
| Net assets | | $ | 123,220 | | | $ | 293 | | | $ | 103,462 | | | $ | 10,188 | |
| Shares outstanding | | | 3,502,759 | | | | 28,425 | | | | 2,625,845 | | | | 751,392 | |
| Net asset value per share | | $ | 35.18 | | | $ | 10.31 | | | $ | 39.40 | | | $ | 13.56 | |
See accompanying Notes to Financial Statements.
| 100 | Annual Report | December 31, 2020 |
Statements of Operations
For the Year Ended December 31, 2020 (all amounts in thousands)
| | | Small-Mid
Cap Growth
Fund | | | Small-Mid
Cap Value
Fund | | | Small Cap
Growth
Fund | | | Small Cap
Value
Fund | |
| Investment income | | | | | | | | | | | | | | | | |
| Dividends | | $ | 13,035 | | | $ | 62 | | | $ | 2,731 | | | $ | 1,900 | |
| Less foreign tax withheld | | | (171 | ) | | | — | | | | (47 | ) | | | — | |
| Interest | | | 18 | | | | — | | | | 3 | | | | 1 | |
| Total income | | | 12,882 | | | | 62 | | | | 2,687 | | | | 1,901 | |
| Expenses | | | | | | | | | | | | | | | | |
| Investment advisory fees | | | 29,523 | | | | 26 | | | | 6,171 | | | | 964 | |
| Distribution fees | | | 724 | | | | — | | | | 381 | | | | 20 | |
| Custodian fees | | | 102 | | | | 109 | | | | 111 | | | | 102 | |
| Transfer agent fees | | | 361 | | | | 1 | | | | 102 | | | | 32 | |
| Sub-transfer agent fees | | | | | | | | | | | | | | | | |
| Class N | | | 440 | | | | — | | | | 219 | | | | 13 | |
| Class I | | | 3,053 | | | | 2 | | | | 372 | | | | 150 | |
| Professional fees | | | 302 | | | | 30 | | | | 81 | | | | 47 | |
| Registration fees | | | 86 | | | | 48 | | | | 63 | | | | 80 | |
| Shareholder reporting fees | | | 228 | | | | 2 | | | | 67 | | | | 11 | |
| Trustee fees | | | 223 | | | | — | | | | 55 | | | | 20 | |
| Other expenses | | | 92 | | | | 9 | | | | 12 | | | | — | |
| Total expenses before expense limitation | | | 35,134 | | | | 227 | | | | 7,634 | | | | 1,439 | |
| Expenses waived or reimbursed by the Adviser | | | | | | | | | | | | | | | | |
| Class N | | | (288 | ) | | | (10 | ) | | | (124 | ) | | | (30 | ) |
| Class I | | | (1,688 | ) | | | (174 | ) | | | (159 | ) | | | (334 | ) |
| Class R6 | | | — | | | | (15 | ) | | | — | | | | (12 | ) |
| Total expenses waived or reimbursed by the Adviser | | | (1,976 | ) | | | (199 | ) | | | (283 | ) | | | (376 | ) |
| Net expenses | | | 33,158 | | | | 28 | | | | 7,351 | | | | 1,063 | |
| Net investment income (loss) | | | (20,276 | ) | | | 34 | | | | (4,664 | ) | | | 838 | |
| Realized and unrealized gain (loss) | | | | | | | | | | | | | | | | |
| Net realized gain (loss) on transactions from: | | | | | | | | | | | | | | | | |
| Investments in securities | | | 135,859 | | | | (3,109 | ) | | | 88,363 | | | | (12,303 | ) |
| Redemptions in-kind | | | 36,409 | | | | — | | | | — | | | | 7,459 | |
| Foreign currency transactions | | | 3 | | | | — | | | | 1 | | | | — | |
| Total net realized gain (loss) | | | 172,271 | | | | (3,109 | ) | | | 88,364 | | | | (4,844 | ) |
| Change in net unrealized appreciation (depreciation) of: | | | | | | | | | | | | | | | | |
| Investments in securities | | | 703,070 | | | | (26 | ) | | | 88,533 | | | | (26,660 | ) |
| Change in net unrealized appreciation (depreciation) | | | 703,070 | | | | (26 | ) | | | 88,533 | | | | (26,660 | ) |
| Net increase (decrease) in net assets resulting from operations | | $ | 855,065 | | | $ | (3,101 | ) | | $ | 172,233 | | | $ | (30,666 | ) |
See accompanying Notes to Financial Statements.
| December 31, 2020 | William Blair Funds | 101 |
Statements of Changes in Net Assets
For the Years Ended December 31, 2020 and 2019 (all amounts in thousands)
| | | Small-Mid
Cap Growth Fund | | | Small-Mid
Cap Value Fund | | | Small Cap
Growth Fund | | | Small Cap
Value Fund | |
| | | 2020 | | | 2019 | | | 2020 | | | 2019 | | | 2020 | | | 2019 | | | 2020 | | | 2019 | |
| Operations | | | | | | | | | | | | | | | | | | | | | | | | | | | | | | | | |
| Net investment income (loss) | | $ | (20,276 | ) | | $ | (15,808 | ) | | $ | 34 | | | $ | 40 | | | $ | (4,664 | ) | | $ | (4,727 | ) | | $ | 838 | | | $ | 3,710 | |
| Net realized gain (loss) on investments, and other assets and liabilities | | | 172,271 | | | | 293,543 | | | | (3,109 | ) | | | 109 | | | | 88,364 | | | | 10,576 | | | | (4,844 | ) | | | 73,420 | |
| Change in net unrealized appreciation (depreciation) on investments, and other assets and liabilities | | | 703,070 | | | | 439,745 | | | | (26 | ) | | | 446 | | | | 88,533 | | | | 125,876 | | | | (26,660 | ) | | | 15,381 | |
| Net increase (decrease) in net assets resulting from operations | | | 855,065 | | | | 717,480 | | | | (3,101 | ) | | | 595 | | | | 172,233 | | | | 131,725 | | | | (30,666 | ) | | | 92,511 | |
| Distributions to shareholders from | | | | | | | | | | | | | | | | | | | | | | | | | | | | | |
| Class N | | | (5,612 | ) | | | (24,075 | ) | | | (1 | ) | | | (6 | ) | | | (18,482 | ) | | | (4,188 | ) | | | (2,130 | ) | | | (498 | ) |
| Class I | | | (51,667 | ) | | | (172,835 | ) | | | (27 | ) | | | (131 | ) | | | (35,006 | ) | | | (8,605 | ) | | | (26,640 | ) | | | (14,700 | ) |
| Class R6 | | | (1,737 | ) | | | (2,668 | ) | | | (8 | ) | | | (3 | ) | | | (9,448 | ) | | | (1,345 | ) | | | (202 | ) | | | (16 | ) |
| Total distributions | | | (59,016 | ) | | | (199,578 | ) | | | (36 | ) | | | (140 | ) | | | (62,936 | ) | | | (14,138 | ) | | | (28,972 | ) | | | (15,214 | ) |
| Capital stock transactions | | | | | | | | | | | | | | | | | | | | | | | | | | | | | |
| Proceeds from sale of shares | | | 829,348 | | | | 835,740 | | | | 3,271 | | | | 7,068 | | | | 113,709 | | | | 265,349 | | | | 22,998 | | | | 49,983 | |
| Shares issued in reinvestment of income dividends and capital gain distributions | | | 58,002 | | | | 193,454 | | | | 37 | | | | 139 | | | | 62,018 | | | | 14,035 | | | | 27,878 | | | | 14,998 | |
| Less cost of shares redeemed | | | (1,012,131) | | | | (1,045,252) | | | | (6,262 | ) | | | (1,813 | ) | | | (280,953 | ) | | | (305,741 | ) | | | (106,615 | ) | | | (458,515 | ) |
| Net increase (decrease) in net assets resulting from capital share transactions | | | (124,781 | ) | | | (16,058 | ) | | | (2,954 | ) | | | 5,394 | | | | (105,226 | ) | | | (26,357 | ) | | | (55,739 | ) | | | (393,534 | ) |
| Increase (decrease) in net assets | | | 671,268 | | | | 501,844 | | | | (6,091 | ) | | | 5,849 | | | | 4,071 | | | | 91,230 | | | | (115,377 | ) | | | (316,237 | ) |
| Net assets | | | | | | | | | | | | | | | | | | | | | | | | | | | | | | | | |
| Beginning of period | | | 2,905,814 | | | | 2,403,970 | | | | 7,528 | | | | 1,679 | | | | 670,537 | | | | 579,307 | | | | 175,278 | | | | 491,515 | |
| End of period | | $ | 3,577,082 | | | $ | 2,905,814 | | | $ | 1,437 | | | $ | 7,528 | | | $ | 674,608 | | | $ | 670,537 | | | $ | 59,901 | | | $ | 175,278 | |
See accompanying Notes to Financial Statements.
| 102 | Annual Report | December 31, 2020 |
Statements of Assets and Liabilities
As of December 31, 2020 (dollar amounts in thousands)
| | | Global
Leaders
Fund | | | International
Leaders
Fund | | | International
Growth
Fund | | | Institutional
International
Growth
Fund | |
| Assets | | | | | | | | | | | | | | | | | | | |
| Investments in securities, at cost | | $ | 65,647 | | | | $ | 760,354 | | | | $ | 1,274,420 | | | | $ | 713,438 | |
| Investments in securities, at value | | $ | 122,090 | | | | $ | 1,106,599 | | | | $ | 2,310,921 | | | | $ | 1,316,241 | |
| Foreign currency, at value (cost $— ; $703; $74; $43) | | | — | | | | | 703 | | | | | 74 | | | | | 42 | |
| Receivable for securities sold | | | — | | | | | — | | | | | — | | | | | 10,374 | |
| Receivable for fund shares sold | | | 152 | | | | | 17,378 | | | | | 1,260 | | | | | 142 | |
| Receivable from Adviser | | | 18 | | | | | 70 | | | | | — | | | | | — | |
| Dividend and interest receivable | | | 109 | | | | | 751 | | | | | 4,649 | | | | | 2,730 | |
| Total assets | | | 122,369 | | | | | 1,125,501 | | | | | 2,316,904 | | | | | 1,329,529 | |
| Liabilities | | | | | | | | | | | | | | | | | | | |
| Payable for securities purchased | | | — | | | | | 8,015 | | | | | 32 | | | | | 15 | |
| Payable for fund shares redeemed | | | — | | | | | 15,217 | | | | | 1,112 | | | | | 371 | |
| Payable to custodian | | | — | | | | | — | | | | | — | | | | | 843 | |
| Management fee payable | | | 87 | | | | | 760 | | | | | 1,940 | | | | | 1,063 | |
| Distribution fee payable | | | 2 | | | | | 4 | | | | | 59 | | | | | — | |
| Foreign capital gains tax liability | | | — | | | | | 962 | | | | | 443 | | | | | 426 | |
| Other payables and accrued expenses | | | 98 | | | | | 190 | | | | | 668 | | | | | 329 | |
| Total liabilities | | | 187 | | | | | 25,148 | | | | | 4,254 | | | | | 3,047 | |
| Net assets | | $ | 122,182 | | | | $ | 1,100,353 | | | | $ | 2,312,650 | | | | $ | 1,326,482 | |
| Capital | | | | | | | | | | | | | | | | | | | |
| Composition of net assets | | | | | | | | | | | | | | | | | | | |
| Paid in capital | | $ | 65,060 | | | | $ | 757,814 | | | | $ | 1,246,702 | | | | $ | 703,037 | |
| Total distributable earnings (loss) | | | 57,122 | | | | | 342,539 | | | | | 1,065,948 | | | | | 623,445 | |
| Net assets | | $ | 122,182 | | | | $ | 1,100,353 | | | | $ | 2,312,650 | | | | $ | 1,326,482 | |
| |
| Class N shares | | | | | | | | | | | | | | | | | | | |
| Net assets | | $ | 11,861 | | | | $ | 19,586 | | | | $ | 288,976 | | | | | — | |
| Shares outstanding | | | 681,176 | | | | | 863,136 | | | | | 7,456,585 | | | | | — | |
| Net asset value per share | | $ | 17.41 | | | | $ | 22.69 | | | | $ | 38.75 | | | | | — | |
| Class I shares | | | | | | | | | | | | | | | | | | | |
| Net assets | | $ | 107,375 | | | | $ | 393,596 | | | | $ | 1,914,460 | | | | | — | |
| Shares outstanding | | | 6,146,661 | | | | | 17,266,278 | | | | | 48,278,055 | | | | | — | |
| Net asset value per share | | $ | 17.47 | | | | $ | 22.80 | | | | $ | 39.65 | | | | | — | |
| Institutional/Class R6 shares | | | | | | | | | | | | | | | | | | | |
| Net assets | | $ | 2,946 | | | | $ | 687,171 | | | | $ | 109,214 | | | | $ | 1,326,482 | |
| Shares outstanding | | | 168,576 | | | | | 30,143,712 | | | | | 2,754,058 | | | | | 65,108,589 | |
| Net asset value per share | | $ | 17.47 | | | | $ | 22.80 | | | | $ | 39.66 | | | | $ | 20.37 | |
See accompanying Notes to Financial Statements.
| December 31, 2020 | William Blair Funds | 103 |
Statements of Operations
For the Year Ended December 31, 2020 (all amounts in thousands)
| | | Global
Leaders
Fund | | | International
Leaders
Fund | | | International
Growth
Fund | | | Institutional
International
Growth
Fund | |
| Investment income | | | | | | | | | | | | | | | | | | | |
| Dividends | | $ | 1,138 | | | | $ | 7,804 | | | | $ | 19,961 | | | | $ | 16,772 | |
| Less foreign tax withheld | | | (70 | ) | | | | (892 | ) | | | | (1,984 | ) | | | | (1,632 | ) |
| Interest | | | 1 | | | | | 3 | | | | | 4 | | | | | 10 | |
| Total income | | | 1,069 | | | | | 6,915 | | | | | 17,981 | | | | | 15,150 | |
| Expenses | | | | | | | | | | | | | | | | | | | |
| Investment advisory fees | | | 1,091 | | | | | 6,317 | | | | | 19,982 | | | | | 14,820 | |
| Distribution fees | | | 24 | | | | | 29 | | | | | 751 | | | | | — | |
| Custodian fees | | | 111 | | | | | 167 | | | | | 402 | | | | | 375 | |
| Transfer agent fees | | | 9 | | | | | 56 | | | | | 138 | | | | | 57 | |
| Sub-transfer agent fees | | | | | | | | | | | | | | | | | | | |
| Class N | | | 13 | | | | | 16 | | | | | 443 | | | | | — | |
| Class I | | | 69 | | | | | 200 | | | | | 1,410 | | | | | — | |
| Professional fees | | | 51 | | | | | 113 | | | | | 247 | | | | | 226 | |
| Registration fees | | | 62 | | | | | 61 | | | | | 78 | | | | | 28 | |
| Shareholder reporting fees | | | 6 | | | | | 23 | | | | | 97 | | | | | 16 | |
| Trustee fees | | | 13 | | | | | 49 | | | | | 154 | | | | | 135 | |
| Other expenses | | | 13 | | | | | 33 | | | | | 46 | | | | | 46 | |
| Total expenses before expense limitation | | | 1,462 | | | | | 7,064 | | | | | 23,748 | | | | | 15,703 | |
| Expenses waived or reimbursed by the Adviser | | | | | | | | | | | | | | | | | | | |
| Class N | | | (28 | ) | | | | (18 | ) | | | | (55 | ) | | | | — | |
| Class I | | | (227 | ) | | | | (239 | ) | | | | — | | | | | — | |
| Institutional/Class R6 | | | (37 | ) | | | | (341 | ) | | | | — | | | | | — | |
| Total expenses waived or reimbursed by the Adviser | | | (292 | ) | | | | (598 | ) | | | | (55 | ) | | | | — | |
| Net expenses | | | 1,170 | | | | | 6,466 | | | | | 23,693 | | | | | 15,703 | |
| Net investment income (loss) | | | (101 | ) | | | | 449 | | | | | (5,712 | ) | | | | (553 | ) |
| Realized and unrealized gain (loss) | | | | | | | | | | | | | | | | | | | |
| Net realized gain (loss) on transactions from: | | | | | | | | | | | | | | | | | | | |
| Investments in securities (net of foreign capital gains tax paid $—; $4; $2; $121) | | | 16,304 | | | | | 9,168 | | | | | 75,319 | | | | | 251,393 | |
| Redemptions in-kind | | | 7,974 | | | | | — | | | | | — | | | | | 7,699 | |
| Foreign currency transactions | | | (19 | ) | | | | (256 | ) | | | | (409 | ) | | | | (316 | ) |
| Total net realized gain (loss) | | | 24,259 | | | | | 8,912 | | | | | 74,910 | | | | | 258,776 | |
| Change in net unrealized appreciation (depreciation) of: | | | | | | | | | | | | | | | | | | | |
| Investments in securities (net of foreign capital gains tax accrual $—; $725; $443; $417) | | | 7,598 | | | | | 192,651 | | | | | 491,988 | | | | | 131,212 | |
| Foreign currency translations | | | 7 | | | | | (1,408 | ) | | | | (699 | ) | | | | (666 | ) |
| Change in net unrealized appreciation (depreciation) | | | 7,605 | | | | | 191,243 | | | | | 491,289 | | | | | 130,546 | |
| Net increase (decrease) in net assets resulting from operations | | $ | 31,763 | | | | $ | 200,604 | | | | $ | 560,487 | | | | $ | 388,769 | |
See accompanying Notes to Financial Statements.
| 104 | Annual Report | December 31, 2020 |
Statements of Changes in Net Assets
For the Years Ended December 31, 2020 and 2019 (all amounts in thousands)
| | | Global
Leaders Fund | | | International
Leaders Fund | | | International
Growth Fund | | | Institutional
International
Growth Fund | |
| | | 2020 | | | 2019 | | | 2020 | | | 2019 | | | 2020 | | | 2019 | | | 2020 | | | 2019 | |
| Operations | | | | | | | | | | | | | | | | | | | | | | | | | | | | | | | | |
| Net investment income (loss) | | $ | (101 | ) | | $ | 690 | | | $ | 449 | | | $ | 4,360 | | | $ | (5,712 | ) | | $ | 12,129 | | | $ | (553 | ) | | $ | 14,030 | |
| Net realized gain (loss) on investments, and other assets and liabilities | | | 24,259 | | | | 21,561 | | | | 8,912 | | | | 138 | | | | 74,910 | | | | 31,125 | | | | 258,776 | | | | 4,333 | |
| Change in net unrealized appreciation (depreciation) on investments, and other assets and liabilities | | | 7,605 | | | | 27,856 | | | | 191,243 | | | | 139,075 | | | | 491,289 | | | | 530,581 | | | | 130,546 | | | | 472,155 | |
| Net increase (decrease) in net assets resulting from operations | | | 31,763 | | | | 50,107 | | | | 200,604 | | | | 143,573 | | | | 560,487 | | | | 573,835 | | | | 388,769 | | | | 490,518 | |
| Distributions to shareholders from | | | | | | | | | | | | | | | | | | | | | | | | | | | | | | | | |
| Class N | | | (1,323 | ) | | | (99 | ) | | | (140 | ) | | | (37 | ) | | | (2,350 | ) | | | (5,328 | ) | | | — | | | | — | |
| Class I | | | (12,213 | ) | | | (1,500 | ) | | | (2,856 | ) | | | (981 | ) | | | (21,253 | ) | | | (19,998 | ) | | | — | | | | — | |
| Institutional/Class R6 | | | (323 | ) | | | (656 | ) | | | (5,774 | ) | | | (2,772 | ) | | | (1,273 | ) | | | (819 | ) | | | (151,353 | ) | | | (17,917 | ) |
| Total distributions | | | (13,859 | ) | | | (2,255 | ) | | | (8,770 | ) | | | (3,790 | ) | | | (24,876 | ) | | | (26,145 | ) | | | (151,353 | ) | | | (17,917 | ) |
| Capital stock transactions | | | | | | | | | | | | | | | | | | | | | | | | | | | | | | | | |
| Proceeds from sale of shares | | | 17,101 | | | | 16,564 | | | | 390,602 | | | | 150,318 | | | | 345,376 | | | | 290,402 | | | | 148,064 | | | | 192,878 | |
| Shares issued in reinvestment of income dividends and capital gain distributions | | | 13,852 | | | | 2,241 | | | | 8,654 | | | | 3,249 | | | | 23,253 | | | | 24,177 | | | | 150,369 | | | | 17,852 | |
| Less cost of shares redeemed | | | (98,384 | ) | | | (65,648 | ) | | | (144,641 | ) | | | (49,445 | ) | | | (700,649 | ) | | | (856,554) | | | | (1,102,278 | ) | | | (574,855 | ) |
| Net increase (decrease) in net assets resulting from capital share transactions | | | (67,431 | ) | | | (46,843 | ) | | | 254,615 | | | | 104,122 | | | | (332,020 | ) | | | (541,975 | ) | | | (803,845 | ) | | | (364,125 | ) |
| Increase (decrease) in net assets | | | (49,527 | ) | | | 1,009 | | | | 446,449 | | | | 243,905 | | | | 203,591 | | | | 5,715 | | | | (566,429 | ) | | | 108,476 | |
| Net assets | | | | | | | | | | | | | | | | | | | | | | | | | | | | | | | | |
| Beginning of period | | | 171,709 | | | | 170,700 | | | | 653,904 | | | | 409,999 | | | | 2,109,059 | | | | 2,103,344 | | | | 1,892,911 | | | | 1,784,435 | |
| End of period | | $ | 122,182 | | | $ | 171,709 | | | $ | 1,100,353 | | | $ | 653,904 | | | $ | 2,312,650 | | | $ | 2,109,059 | | | $ | 1,326,482 | | | $ | 1,892,911 | |
See accompanying Notes to Financial Statements.
| December 31, 2020 | William Blair Funds | 105 |
Statements of Assets and Liabilities
As of December 31, 2020 (dollar amounts in thousands)
| | | International
Small Cap
Growth
Fund | | | Emerging
Markets
Leaders
Fund | | | Emerging
Markets
Growth
Fund | | | Emerging
Markets
Small Cap
Growth Fund | |
| Assets | | | | | | | | | | | | | | | | | | |
| Investments in securities, at cost | | | $ | 232,224 | | | $ | 166,405 | | | $ | 748,608 | | | | $ | 216,705 | |
| Investments in securities, at value | | | $ | 334,292 | | | $ | 263,608 | | | $ | 1,194,110 | | | | $ | 307,272 | |
| Foreign currency, at value (cost $917; $135; $861; $1,101) | | | | 939 | | | | 135 | | | | 862 | | | | | 1,101 | |
| Receivable for securities sold | | | | 3,674 | | | | — | | | | — | | | | | 625 | |
| Receivable for fund shares sold | | | | 190 | | | | 335 | | | | 4,651 | | | | | 572 | |
| Receivable from Adviser | | | | — | | | | 26 | | | | — | | | | | 1 | |
| Dividend and interest receivable | | | | 1,134 | | | | 109 | | | | 1,065 | | | | | 333 | |
| Total assets | | | | 340,229 | | | | 264,213 | | | | 1,200,688 | | | | | 309,904 | |
| Liabilities | | | | | | | | | | | | | | | | | | |
| Payable for securities purchased | | | | 2,342 | | | | — | | | | 29 | | | | | 1,178 | |
| Payable for fund shares redeemed | | | | 92 | | | | 177 | | | | 526 | | | | | 54 | |
| Payable to custodian | | | | 448 | | | | — | | | | 30 | | | | | 89 | |
| Management fee payable | | | | 275 | | | | 258 | | | | 1,049 | | | | | 279 | |
| Distribution fee payable | | | | 1 | | | | — | | | | 3 | | | | | 1 | |
| Foreign capital gains tax liability | | | | — | | | | 1,468 | | | | 2,890 | | | | | 522 | |
| Other payables and accrued expenses | | | | 190 | | | | 173 | | | | 425 | | | | | 372 | |
| Total liabilities | | | | 3,348 | | | | 2,076 | | | | 4,952 | | | | | 2,495 | |
| Net assets | | | $ | 336,881 | | | $ | 262,137 | | | $ | 1,195,736 | | | | $ | 307,409 | |
| Capital | | | | | | | | | | | | | | | | | | |
| Composition of net assets | | | | | | | | | | | | | | | | | | |
| Paid in capital | | | $ | 229,280 | | | $ | 161,390 | | | $ | 730,191 | | | | $ | 219,444 | |
| Total distributable earnings (loss) | | | | 107,601 | | | | 100,747 | | | | 465,545 | | | | | 87,965 | |
| Net assets | | | $ | 336,881 | | | $ | 262,137 | | | $ | 1,195,736 | | | | $ | 307,409 | |
| |
| Class N shares | | | | | | | | | | | | | | | | | | |
| Net assets | | | $ | 3,101 | | | $ | 1,803 | | | $ | 18,606 | | | | $ | 3,947 | |
| Shares outstanding | | | | 177,765 | | | | 136,058 | | | | 1,010,121 | | | | | 177,645 | |
| Net asset value per share | | | $ | 17.45 | | | $ | 13.26 | | | $ | 18.42 | | | | $ | 22.22 | |
| Class I shares | | | | | | | | | | | | | | | | | | |
| Net assets | | | $ | 145,283 | | | $ | 62,319 | | | $ | 113,697 | | | | $ | 151,302 | |
| Shares outstanding | | | | 8,227,492 | | | | 4,694,399 | | | | 6,092,968 | | | | | 6,754,897 | |
| Net asset value per share | | | $ | 17.66 | | | $ | 13.28 | | | $ | 18.66 | | | | $ | 22.40 | |
| Class R6 shares | | | | | | | | | | | | | | | | | | |
| Net assets | | | $ | 188,497 | | | $ | 198,015 | | | $ | 1,063,433 | | | | $ | 152,160 | |
| Shares outstanding | | | | 10,615,857 | | | | 14,932,846 | | | | 56,453,349 | | | | | 6,782,061 | |
| Net asset value per share | | | $ | 17.76 | | | $ | 13.26 | | | $ | 18.84 | | | | $ | 22.44 | |
See accompanying Notes to Financial Statements.
| 106 | Annual Report | December 31, 2020 |
Statements of Operations
For the Year Ended December 31, 2020 (all amounts in thousands)
| | | International
Small Cap
Growth
Fund | | | Emerging
Markets
Leaders
Fund | | | Emerging
Markets
Growth
Fund | | | Emerging
Markets
Small Cap
Growth
Fund | |
| Investment income | | | | | | | | | | | | | | | | | | | | |
| Dividends | | | $ | 3,651 | | | | $ | 3,042 | | | | $ | 9,938 | | | | $ | 3,658 | |
| Less foreign tax withheld | | | | (413 | ) | | | | (411 | ) | | | | (1,399 | ) | | | | (410 | ) |
| Interest | | | | 7 | | | | | 2 | | | | | 56 | | | | | 6 | |
| Total income | | | | 3,245 | | | | | 2,633 | | | | | 8,595 | | | | | 3,254 | |
| Expenses | | | | | | | | | | | | | | | | | | | | |
| Investment advisory fees | | | | 2,747 | | | | | 2,528 | | | | | 9,681 | | | | | 2,963 | |
| Distribution fees | | | | 7 | | | | | 4 | | | | | 23 | | | | | 9 | |
| Custodian fees | | | | 168 | | | | | 178 | | | | | 481 | | | | | 375 | |
| Transfer agent fees | | | | 19 | | | | | 13 | | | | | 40 | | | | | 62 | |
| Sub-transfer agent fees | | | | | | | | | | | | | | | | | | | | |
| Class N | | | | 3 | | | | | 2 | | | | | 9 | | | | | 6 | |
| Class I | | | | 139 | | | | | 36 | | | | | 82 | | | | | 124 | |
| Professional fees | | | | 84 | | | | | 81 | | | | | 181 | | | | | 144 | |
| Registration fees | | | | 56 | | | | | 50 | | | | | 57 | | | | | 46 | |
| Shareholder reporting fees | | | | 32 | | | | | 13 | | | | | 7 | | | | | 26 | |
| Trustee fees | | | | 24 | | | | | 18 | | | | | 61 | | | | | 21 | |
| Other expenses | | | | 12 | | | | | 15 | | | | | 30 | | | | | 15 | |
| Total expenses before expense limitation | | | | 3,291 | | | | | 2,938 | | | | | 10,652 | | | | | 3,791 | |
| Expenses waived or reimbursed by the Adviser | | | | | | | | | | | | | | | | | | | | |
| Class N | | | | — | | | | | (4 | ) | | | | — | | | | | (8 | ) |
| Class I | | | | — | | | | | (89 | ) | | | | — | | | | | (195 | ) |
| Class R6 | | | | — | | | | | (287 | ) | | | | — | | | | | (146 | ) |
| Total expenses waived or reimbursed by the Adviser | | | | — | | | | | (380 | ) | | | | — | | | | | (349 | ) |
| Net expenses | | | | 3,291 | | | | | 2,558 | | | | | 10,652 | | | | | 3,442 | |
| Net investment income (loss) | | | | (46 | ) | | | | 75 | | | | | (2,057 | ) | | | | (188 | ) |
| Realized and unrealized gain (loss) | | | | | | | | | | | | | | | | | | | | |
| Net realized gain (loss) on transactions from: | | | | | | | | | | | | | | | | | | | | |
| Investments in securities (net of foreign capital gains tax paid $—; $1; $257; $—) | | | 32,909 | | | | | 8,069 | | | | | 75,991 | | | | | 46,960 | |
| Foreign currency transactions | | | | (90 | ) | | | | (66 | ) | | | | (1,344 | ) | | | | (448 | ) |
| Total net realized gain (loss) | | | | 32,819 | | | | | 8,003 | | | | | 74,647 | | | | | 46,512 | |
| Change in net unrealized appreciation (depreciation) of: | | | | | | | | | | | | | | | | | | | | |
| Investments in securities (net of foreign capital gains tax accrual $—; $584; $924; $522) | | | | 41,543 | | | | | 50,279 | | | | | 267,470 | | | | | 30,611 | |
| Foreign currency translations | | | | 58 | | | | | (1,174 | ) | | | | (1,799 | ) | | | | (1,040 | ) |
| Change in net unrealized appreciation (depreciation) | | | | 41,601 | | | | | 49,105 | | | | | 265,671 | | | | | 29,571 | |
| Net increase (decrease) in net assets resulting from operations | | | $ | 74,374 | | | | $ | 57,183 | | | | $ | 338,261 | | | | $ | 75,895 | |
See accompanying Notes to Financial Statements.
| December 31, 2020 | William Blair Funds | 107 |
Statements of Changes in Net Assets
For the Years Ended December 31, 2020 and 2019 (all amounts in thousands)
| | | International
Small Cap
Growth Fund | | | Emerging Markets
Leaders Fund | | | Emerging Markets
Growth Fund | | | Emerging Markets
Small Cap
Growth Fund | |
| | | 2020 | | | 2019 | | | 2020 | | | 2019 | | | 2020 | | | 2019 | | | 2020 | | | 2019 | |
| Operations | | | | | | | | | | | | | | | | | | | | | | | | | | | | | | | | |
| Net investment income (loss) | | $ | (46 | ) | | $ | 2,537 | | | $ | 75 | | | $ | 1,416 | | | $ | (2,057 | ) | | $ | 9,209 | | | $ | (188 | ) | | $ | 848 | |
| Net realized gain (loss) on investments, and other assets and liabilities | | | 32,819 | | | | (185 | ) | | | 8,003 | | | | 5,825 | | | | 74,647 | | | | 42,250 | | | | 46,512 | | | | (596 | ) |
| Change in net unrealized appreciation (depreciation) on investments, and other assets and liabilities | | | 41,601 | | | | 92,376 | | | | 49,105 | | | | 48,207 | | | | 265,671 | | | | 143,459 | | | | 29,571 | | | | 51,198 | |
| Net increase (decrease) in net assets resulting from operations | | | 74,374 | | | | 94,728 | | | | 57,183 | | | | 55,448 | | | | 338,261 | | | | 194,918 | | | | 75,895 | | | | 51,450 | |
| Distributions to shareholders from | | | | | | | | | | | | | | | | | | | | | | | | | | | | | | | | |
| Class N | | | (63 | ) | | | (3 | ) | | | (15 | ) | | | (11 | ) | | | (531 | ) | | | (311 | ) | | | — | | | | — | |
| Class I | | | (3,008 | ) | | | (460 | ) | | | (621 | ) | | | (393 | ) | | | (4,443 | ) | | | (3,046 | ) | | | (65 | ) | | | (236 | ) |
| Class R6 | | | (4,066 | ) | | | (597 | ) | | | (2,293 | ) | | | (1,820 | ) | | | (42,354 | ) | | | (28,573 | ) | | | (129 | ) | | | (286 | ) |
| Total distributions | | | (7,137 | ) | | | (1,060 | ) | | | (2,929 | ) | | | (2,224 | ) | | | (47,328 | ) | | | (31,930 | ) | | | (194 | ) | | | (522 | ) |
| Capital stock transactions | | | | | | | | | | | | | | | | | | | | | | | | | | | | | | | | |
| Proceeds from sale of shares | | | 42,647 | | | | 45,917 | | | | 61,028 | | | | 38,679 | | | | 318,162 | | | | 171,633 | | | | 71,699 | | | | 60,868 | |
| Shares issued in reinvestment of income dividends and capital gain distributions | | | 6,416 | | | | 969 | | | | 2,899 | | | | 2,206 | | | | 44,146 | | | | 26,669 | | | | 191 | | | | 465 | |
| Less cost of shares redeemed | | | (88,485 | ) | | | (172,212 | ) | | | (94,327 | ) | | | (54,740 | ) | | | (247,697 | ) | | | (312,069 | ) | | | (117,803 | ) | | | (111,575 | ) |
| Net increase (decrease) in net assets resulting from capital share transactions | | | (39,422 | ) | | | (125,326 | ) | | | (30,400 | ) | | | (13,855 | ) | | | 114,611 | | | | (113,767 | ) | | | (45,913 | ) | | | (50,242 | ) |
| Increase (decrease) in net assets | | | 27,815 | | | | (31,658 | ) | | | 23,854 | | | | 39,369 | | | | 405,544 | | | | 49,221 | | | | 29,788 | | | | 686 | |
| Net assets | | | | | | | | | | | | | | | | | | | | | | | | | | | | | | | | |
| Beginning of period | | | 309,066 | | | | 340,724 | | | | 238,283 | | | | 198,914 | | | | 790,192 | | | | 740,971 | | | | 277,621 | | | | 276,935 | |
| End of period | | $ | 336,881 | | | $ | 309,066 | | | $ | 262,137 | | | $ | 238,283 | | | $ | 1,195,736 | | | $ | 790,192 | | | $ | 307,409 | | | $ | 277,621 | |
See accompanying Notes to Financial Statements.
| 108 | Annual Report | December 31, 2020 |
Statements of Assets and Liabilities
As of December 31, 2020 (dollar amounts in thousands)
| | | Bond
Fund | | | Income
Fund | | | Low
Duration
Fund | | | Macro
Allocation
Fund | |
| Assets | | | | | | | | |
| Investments in securities, at cost | | $ | 296,226 | | | $ | 65,727 | | | $ | 156,427 | | | $ | 296,507 | |
| Investments in securities, at value | | $ | 319,060 | | | $ | 67,741 | | | $ | 157,641 | | | $ | 354,547 | |
| Cash | | | — | | | | — | | | | — | | | | 4 | |
| Foreign currency, at value (cost $—; $—; $—; $2) | | | — | | | | — | | | | — | | | | 2 | |
| Receivable for securities sold | | | 10,680 | | | | 2,656 | | | | 5,340 | | | | 325 | |
| Receivable for fund shares sold | | | 465 | | | | 84 | | | | 11,407 | | | | 269 | |
| Receivable for variation margin on centrally cleared swaps | | | — | | | | — | | | | — | | | | 7 | |
| Receivable from Adviser | | | 42 | | | | 2 | | | | 37 | | | | — | |
| Dividend and interest receivable | | | 1,814 | | | | 312 | | | | 547 | | | | 1,384 | |
| Unrealized appreciation on swap contracts | | | — | | | | — | | | | — | | | | 409 | |
| Unrealized appreciation on forward foreign currency contracts | | | — | | | | — | | | | — | | | | 5,212 | |
| Total assets | | | 332,061 | | | | 70,795 | | | | 174,972 | | | | 362,159 | |
| Liabilities | | | | | | | | | | | | | | | | |
| Security sold, not yet purchased, at value (proceeds $10,680; $2,136; $5,340; $—) | | | 10,680 | | | | 2,136 | | | | 5,340 | | | | — | |
| Payable for futures variation margin | | | — | | | | — | | | | — | | | | 1,948 | |
| Payable for variation margin on centrally cleared swaps | | | 19 | | | | 6 | | | | — | | | | — | |
| Payable for securities purchased | | | — | | | | — | | | | 10,920 | | | | — | |
| Payable for fund shares redeemed | | | 391 | | | | 89 | | | | 205 | | | | 551 | |
| Payable to custodian | | | — | | | | 149 | | | | — | | | | — | |
| Cash received as collateral, due to broker | | | — | | | | — | | | | — | | | | 1,020 | |
| Unrealized depreciation on swap contracts | | | — | | | | — | | | | — | | | | 73 | |
| Unrealized depreciation on forward foreign currency contracts | | | — | | | | — | | | | — | | | | 4,400 | |
| Management fee payable | | | 81 | | | | 19 | | | | 39 | | | | 251 | |
| Distribution fee payable | | | 5 | | | | 3 | | | | 2 | | | | 2 | |
| Distributions payable to shareholders | | | 46 | | | | — | | | | 3 | | | | — | |
| Other payables and accrued expenses | | | 119 | | | | 71 | | | | 83 | | | | 199 | |
| Total liabilities | | | 11,341 | | | | 2,473 | | | | 16,592 | | | | 8,444 | |
| Net assets | | $ | 320,720 | | | $ | 68,322 | | | $ | 158,380 | | | $ | 353,715 | |
| Capital | | | | | | | | | | | | | | | | |
| Composition of net assets | | | | | | | | | | | | | | | | |
| Paid in capital | | $ | 318,549 | | | $ | 73,462 | | | $ | 186,938 | | | $ | 535,084 | |
| Total distributable earnings (loss) | | | 2,171 | | | | (5,140 | ) | | | (28,558 | ) | | | (181,369 | ) |
| Net assets | | $ | 320,720 | | | $ | 68,322 | | | $ | 158,380 | | | $ | 353,715 | |
| | | | | | | | | | | | | | | | | |
| Class N shares | | | | | | | | | | | | | | | | |
| Net assets | | $ | 39,522 | | | $ | 22,610 | | | $ | 13,736 | | | $ | 7,674 | |
| Shares outstanding | | | 3,650,466 | | | | 2,597,222 | | | | 1,588,592 | | | | 701,924 | |
| Net asset value per share | | $ | 10.83 | | | $ | 8.71 | | | $ | 8.65 | | | $ | 10.93 | |
| Class I shares | | | | | | | | | | | | | | | | |
| Net assets | | $ | 232,716 | | | $ | 45,641 | | | $ | 104,093 | | | $ | 171,153 | |
| Shares outstanding | | | 21,723,983 | | | | 5,278,731 | | | | 12,048,229 | | | | 15,779,964 | |
| Net asset value per share | | $ | 10.71 | | | $ | 8.65 | | | $ | 8.64 | | | $ | 10.85 | |
| Class R6 shares | | | | | | | | | | | | | | | | |
| Net assets | | $ | 48,482 | | | $ | 71 | | | $ | 40,551 | | | $ | 174,888 | |
| Shares outstanding | | | 4,528,032 | | | | 8,168 | | | | 4,692,094 | | | | 16,117,670 | |
| Net asset value per share | | $ | 10.71 | | | $ | 8.65 | | | $ | 8.64 | | | $ | 10.85 | |
See accompanying Notes to Financial Statements.
| December 31, 2020 | William Blair Funds | 109 |
Statements of Operations
For the Year Ended December 31, 2020 (all amounts in thousands)
| | | Bond
Fund | | | Income
Fund | | | Low
Duration
Fund | | | Macro
Allocation
Fund | |
| Investment income | | | | | | | | | | | | | | | | |
| Dividends | | $ | — | | | $ | — | | | $ | — | | | $ | 6,156 | |
| Less foreign tax withheld | | | — | | | | — | | | | — | | | | (15 | ) |
| Interest | | | 8,262 | | | | 1,275 | | | | 1,774 | | | | 2,511 | |
| Total income | | | 8,262 | | | | 1,275 | | | | 1,774 | | | | 8,652 | |
| Expenses | | | | | | | | | | | | | | | | |
| Investment advisory fees | | | 870 | | | | 210 | | | | 329 | | | | 4,269 | |
| Distribution fees | | | 48 | | | | 32 | | | | 11 | | | | 23 | |
| Custodian fees | | | 137 | | | | 98 | | | | 104 | | | | 159 | |
| Transfer agent fees | | | 74 | | | | 10 | | | | 12 | | | | 202 | |
| Sub-transfer agent fees | | | | | | | | | | | | | | | | |
| Class N | | | 56 | | | | 31 | | | | 11 | | | | 16 | |
| Class I | | | 181 | | | | 18 | | | | 36 | | | | 252 | |
| Professional fees | | | 161 | | | | 43 | | | | 71 | | | | 103 | |
| Registration fees | | | 56 | | | | 49 | | | | 54 | | | | 59 | |
| Shareholder reporting fees | | | 15 | | | | 7 | | | | 4 | | | | 23 | |
| Trustee fees | | | 23 | | | | 5 | | | | 7 | | | | 77 | |
| Other expenses | | | 11 | | | | 10 | | | | 10 | | | | 110 | |
| Total expenses before expense limitation | | | 1,632 | | | | 513 | | | | 649 | | | | 5,293 | |
| Expenses waived or reimbursed by the Adviser | | | | | | | | | | | | | | | | |
| Class N | | | (60 | ) | | | (37 | ) | | | (21 | ) | | | (9 | ) |
| Class I | | | (209 | ) | | | (30 | ) | | | (126 | ) | | | (58 | ) |
| Class R6 | | | (29 | ) | | | — | | | | (71 | ) | | | — | |
| Total expenses waived or reimbursed by the Adviser | | | (298 | ) | | | (67 | ) | | | (218 | ) | | | (67 | ) |
| Net expenses | | | 1,334 | | | | 446 | | | | 431 | | | | 5,226 | |
| Net investment income (loss) | | | 6,928 | | | | 829 | | | | 1,343 | | | | 3,426 | |
| Realized and unrealized gain (loss) | | | | | | | | | | | | | | | | |
| Net realized gain (loss) on transactions from: | | | | | | | | | | | | | | | | |
| Investments in securities | | | 3,454 | | | | 187 | | | | (353 | ) | | | 20,575 | |
| Options | | | — | | | | — | | | | — | | | | (6,041 | ) |
| Futures contracts | | | — | | | | — | | | | — | | | | (34,740 | ) |
| Swaps | | | 370 | | | | (26 | ) | | | (56 | ) | | | 3,449 | |
| Forward foreign currency contracts | | | — | | | | — | | | | — | | | | (12,975 | ) |
| Foreign currency transactions | | | — | | | | — | | | | — | | | | (1,282 | ) |
| Total net realized gain (loss) | | | 3,824 | | | | 161 | | | | (409 | ) | | | (31,014 | ) |
| Change in net unrealized appreciation (depreciation) of: | | | | | | | | | | | | | | | | |
| Investments in securities | | | 10,135 | | | | 1,605 | | | | 1,479 | | | | (9,386 | ) |
| Futures contracts | | | — | | | | — | | | | — | | | | (1,059 | ) |
| Swaps | | | (252 | ) | | | (324 | ) | | | — | | | | (439 | ) |
| Forward foreign currency contracts | | | — | | | | — | | | | — | | | | 3,624 | |
| Foreign currency translations | | | — | | | | — | | | | — | | | | 55 | |
| Change in net unrealized appreciation (depreciation) | | | 9,883 | | | | 1,281 | | | | 1,479 | | | | (7,205 | ) |
| Net increase (decrease) in net assets resulting from operations | | $ | 20,635 | | | $ | 2,271 | | | $ | 2,413 | | | $ | (34,793 | ) |
See accompanying Notes to Financial Statements.
| 110 | Annual Report | December 31, 2020 |
Statements of Changes in Net Assets
For the Years Ended December 31, 2020 and 2019 (all amounts in thousands)
| | | Bond Fund | | | Income Fund | | | Low Duration
Fund | | | Macro Allocation
Fund | |
| | | 2020 | | | 2019 | | | 2020 | | | 2019 | | | 2020 | | | 2019 | | | 2020 | | | 2019 | |
| Operations | | | | | | | | | | | | | | | | | | | | | | | | | | | | | | | | |
| Net investment income (loss) | | $ | 6,928 | | | $ | 11,304 | | | $ | 829 | | | $ | 1,286 | | | $ | 1,343 | | | $ | 2,273 | | | $ | 3,426 | | | $ | 10,006 | |
| Net realized gain (loss) on investments, and other assets and liabilities | | | 3,824 | | | | 5,641 | | | | 161 | | | | 98 | | | | (409 | ) | | | (575 | ) | | | (31,014 | ) | | | (33,187 | ) |
| Change in net unrealized appreciation (depreciation) on investments, and other assets and liabilities | | | 9,883 | | | | 25,603 | | | | 1,281 | | | | 2,291 | | | | 1,479 | | | | 1,875 | | | | (7,205 | ) | | | 58,793 | |
| Net increase (decrease) in net assets resulting from operations | | | 20,635 | | | | 42,548 | | | | 2,271 | | | | 3,675 | | | | 2,413 | | | | 3,573 | | | | (34,793 | ) | | | 35,612 | |
| Distributions to shareholders from | | | | | | | | | | | | | | | | | | | | | | | | | | | | | | | | |
| Class N | | | (1,089 | ) | | | (2,191 | ) | | | (546 | ) | | | (699 | ) | | | (189 | ) | | | (60 | ) | | | (79 | ) | | | (503 | ) |
| Class I | | | (7,496 | ) | | | (10,482 | ) | | | (1,009 | ) | | | (1,385 | ) | | | (1,833 | ) | | | (1,999 | ) | | | (2,289 | ) | | | (15,861 | ) |
| Class R6 | | | (1,641 | ) | | | (2,442 | ) | | | (2 | ) | | | (1 | ) | | | (1,168 | ) | | | (1,674 | ) | | | (2,567 | ) | | | (16,522 | ) |
| Total distributions | | | (10,226 | ) | | | (15,115 | ) | | | (1,557 | ) | | | (2,085 | ) | | | (3,190 | ) | | | (3,733 | ) | | | (4,935 | ) | | | (32,886 | ) |
| Capital stock transactions | | | | | | | | | | | | | | | | | | | | | | | | | | | | | | | | |
| Proceeds from sale of shares | | | 95,911 | | | | 80,419 | | | | 33,540 | | | | 17,977 | | | | 166,102 | | | | 14,009 | | | | 75,968 | | | | 222,795 | |
| Shares issued in reinvestment of income dividends and capital gain distributions | | | 8,711 | | | | 13,243 | | | | 1,470 | | | | 1,968 | | | | 2,649 | | | | 2,946 | | | | 4,686 | | | | 27,731 | |
| Less cost of shares redeemed | | | (76,446 | ) | | | (261,506 | ) | | | (18,745 | ) | | | (27,407 | ) | | | (86,109 | ) | | | (45,646 | ) | | | (438,011 | ) | | | (424,270 | ) |
| Net increase (decrease) in net assets resulting from capital share transactions | | | 28,176 | | | | (167,844 | ) | | | 16,265 | | | | (7,462 | ) | | | 82,642 | | | | (28,691 | ) | | | (357,357 | ) | | | (173,744 | ) |
| Increase (decrease) in net assets | | | 38,585 | | | | (140,411 | ) | | | 16,979 | | | | (5,872 | ) | | | 81,865 | | | | (28,851 | ) | | | (397,085 | ) | | | (171,018 | ) |
| Net assets | | | | | | | | | | | | | | | | | | | | | | | | | | | | | | | | |
| Beginning of period | | | 282,135 | | | | 422,546 | | | | 51,343 | | | | 57,215 | | | | 76,515 | | | | 105,366 | | | | 750,800 | | | | 921,818 | |
| End of period | | $ | 320,720 | | | $ | 282,135 | | | $ | 68,322 | | | $ | 51,343 | | | $ | 158,380 | | | $ | 76,515 | | | $ | 353,715 | | | $ | 750,800 | |
See accompanying Notes to Financial Statements.
| December 31, 2020 | William Blair Funds | 111 |
Notes to Financial Statements
(1) Organization
(a) Description of the Trust
William Blair Funds (the “Trust”) is a Delaware statutory trust registered under the Investment Company Act of 1940, as amended (the “1940 Act”), as an open-end management investment company. As of the date of this report, the Trust has the following twenty funds (the “Funds”) available for sale, each with its own investment objective and policies. For each Fund, the number of shares authorized is unlimited.
| U.S. Equity Funds | | Global Equity Fund | | Fixed Income Funds |
| Growth | | Global Leaders | | Bond |
| Large Cap Growth | | | | Income |
| Mid Cap Growth | | International Equity Funds | | Low Duration |
| Small-Mid Cap Core | | International Leaders | | |
| Small-Mid Cap Growth | | International Growth | | Multi-Asset and Alternative Fund |
| Small-Mid Cap Value | | Institutional International Growth | | Macro Allocation |
| Small Cap Growth | | International Small Cap Growth | | |
| Small Cap Value | | Emerging Markets Leaders | | |
| | | Emerging Markets Growth | | |
| | | Emerging Markets Small Cap Growth | | |
William Blair Investment Management, LLC (the “Adviser”) serves as the Trust’s investment adviser. William Blair & Company, L.L.C. (“WBC” or the “Distributor”), an affiliate of the Adviser, serves as the Trust’s principal underwriter and distributor.
(b) Share Classes
Each Fund is comprised of Class N, Class I and Class R6 shares, except Small-Mid Cap Core Fund, which is comprised of Class I and Class R6 shares, and Institutional International Growth Fund, which does not offer multiple classes of shares.
Class N shares are available to the general public, either directly through the Trust’s distributor or through a select number of financial intermediaries. Class N shares are sold without any sales load and carry an annual 12b-1 distribution fee at a fixed rate (0.25% for the U.S. Equity, Global Equity, International Equity and Multi-Asset and Alternative Funds and 0.15% for the Fixed Income Funds as discussed in Note 4(b) – Transactions with Affiliates – Underwriting Distribution Services and Shareholder Administration Agreements) and a sub-transfer agent fee that is not a fixed rate and varies by Fund and class, as discussed below.
Class I shares are available to certain retirement and deferred compensation plans, clients of certain financial intermediaries, and asset-based fee advisory clients of William Blair. The minimum initial investment for a Class I account is $500,000, subject to certain exceptions. Class I shares do not carry any sales load or distribution fees and generally have lower ongoing expenses than Class N shares. Class I shares have a sub-transfer agent fee that is not a fixed rate and varies by Fund and class, as discussed below.
Class R6 shares are available to certain retirement and deferred compensation plans, clients of certain financial intermediaries, asset-based fee advisory clients of William Blair, and additional types of investors, provided that neither the investor nor the financial intermediary requires the Funds to make any type of servicing or administrative payment. The minimum initial investment for a Class R6 account is $1 million, subject to certain exceptions.
Shares of the Institutional International Growth Fund require a minimum initial investment of $5 million, subject to certain exceptions.
Class R6 shares and the Institutional International Growth Fund do not carry any sales load, distribution fees or sub-transfer agents fees. Class R6 shares of a Fund generally have lower ongoing expenses than the Fund’s Class N and Class I shares.
Sub-transfer agent fees: For Class N and Class I shares, the Funds may reimburse WBC for fees paid to intermediaries such as banks, broker-dealers, financial advisers or other financial institutions for sub-administration, sub-transfer agency and other services provided to investors whose shares of record are held in omnibus, other group accounts, retirement plans or accounts
| 112 | Annual Report | December 31, 2020 |
Notes to Financial Statements
traded through registered securities clearing agents. These fees may vary based on, for example, the nature of services provided, but generally range up to 0.15% of the assets of the class serviced or maintained by the intermediary or up to $15 per sub-account maintained by the intermediary, depending on the method by which the intermediary charges for the services.
(c) Fund Objectives
The investment objectives of the Funds are as follows:
| U.S. Equity Funds | Long-term capital appreciation. |
| Global Equity Fund | Long-term capital appreciation. |
| International Equity Funds | Long-term capital appreciation. |
| Bond Fund | Outperform the Bloomberg Barclays U.S. Aggregate Index by maximizing total return through a combination of income and capital appreciation. |
| Income Fund | High level of current income with relative stability of principal. |
| Low Duration Fund | Maximize total return. Total return includes both income and capital appreciation. |
| Macro Allocation Fund | Maximize long-term risk-adjusted total return. |
(2) Significant Accounting Policies
The following is a summary of the Trust’s significant accounting policies in effect during the periods covered by the financial statements, which are in accordance with U.S. generally accepted accounting principles (“US GAAP”), which includes the accounting and reporting guidelines under Accounting Standards Topic 946, Financial Services—Investment Companies.
(a) Investment income and transactions
Investment income, realized and unrealized gains and losses, and certain Fund level expenses and expense reductions, if any, are allocated based on the relative net assets of each class, except for certain class-specific expenses, which are charged directly to the appropriate class. Differences in class expenses may result in the payment of different per share dividends by class. All share classes of the Funds have equal rights with respect to voting, subject to class specific arrangements.
Dividend income and expenses are recorded on the ex-dividend date, except for those dividends from certain foreign securities that are recorded when the information is available.
Interest income is recorded on an accrual basis, adjusted for amortization of premium or accretion of discount. Variable rate bonds and floating rate notes earn interest at coupon rates that fluctuate at specific time intervals. The interest rates shown in the Portfolio of Investments for the Bond, Income, Low Duration and Macro Allocation Funds were the rates in effect on December 31, 2020. Put bonds may be redeemed at the discretion of the holder on specified dates prior to maturity.
Premiums and discounts are amortized and accreted, respectively, on a straight-line basis for short-term investments and on an effective interest method for long-term investments.
Paydown gains and losses on mortgage-backed and asset-backed securities are treated as an adjustment to interest income. For the year ended December 31, 2020, the Bond, Income and Low Duration Funds recognized a reduction of interest income and a corresponding increase in net realized gain of $3,674, $821 and $1,844, respectively (in thousands). This reclassification had no effect on the net increase (decrease) in net assets resulting from operations, net asset value or the net assets of the Funds.
The Funds do not isolate the portion of operations resulting from fluctuations in foreign currency exchange rates on investments from the fluctuations arising from changes in the value of securities held. Such currency fluctuations are included with the net realized and unrealized gain or loss from investments.
Reported net realized foreign currency gains or losses arise from disposition of foreign currency, the difference in the foreign exchange rates between the trade and settlement dates on securities transactions, and the difference between the amounts of dividends, interest and foreign withholding taxes recorded on the ex-date or accrual date and the U.S. dollar equivalent of the amounts actually received or paid. Net unrealized foreign exchange gains and losses arise from changes (due to the changes in the exchange rate) in the value of foreign currency and other assets and liabilities denominated in foreign currencies held at period end.
| December 31, 2020 | William Blair Funds | 113 |
Notes to Financial Statements
For financial reporting purposes, security and shareholder transactions are recorded on trade date in accordance with US GAAP. Realized gains and losses from securities transactions are recognized on a specifically identified cost basis.
Awards from class action litigation may be recorded as a reduction of cost. If the Funds no longer own the applicable securities, the proceeds are recorded as realized gains.
(b) Share Valuation and Distributions to Shareholders
Shares are sold and redeemed on a continuous basis at net asset value. The net asset value per share is determined separately for each class by dividing the Fund’s net assets attributable to that class by the number of shares of the class outstanding as of the close of regular trading on the New York Stock Exchange (the “NYSE”), which is generally 4:00 p.m. Eastern time, on each day the NYSE is open.
Distributions from net investment income, if any, for all Equity and Multi-Asset and Alternative Funds are declared and paid at least annually. Distributions from net investment income for the Fixed Income Funds are declared daily and paid monthly. Capital gain distributions, if any, for all Funds, are declared and paid at least annually in December and/or January. The Small Cap Value Fund paid an additional distribution from capital gains in March 2020. Distributions payable to shareholders are recorded on the ex-dividend date.
(c) Foreign Currency Translation
The Funds may invest in securities denominated in foreign currencies. As such, assets and liabilities denominated in foreign currencies are translated into U.S. dollar amounts at the current exchange rate on the date of valuation. The values of foreign investments, open forward foreign currency contracts, and cash denominated in foreign currencies are translated into U.S. dollars using a spot market rate of exchange as of the time of the determination of each Fund’s net asset value, typically 4:00 p.m. Eastern time on days when there is regular trading on the NYSE. Payables and receivables for securities transactions, dividends, interest income and tax reclaims are translated into U.S. dollars using a spot market rate of exchange as of 4:00 p.m. Eastern time. Settlement of purchases and sales and dividend and interest receipts are translated into U.S. dollars using a spot market rate of exchange as of 11:00 a.m. Eastern time.
(d) Income Taxes
Each Fund intends to comply with the provisions of Subchapter M of the Internal Revenue Code of 1986, as amended (the “Code”), in order to qualify as regulated investment companies. Each Fund intends to make the requisite distributions of income and capital gains to its shareholders sufficient to relieve it from all, or substantially all, federal income and excise taxes. No provision for federal income and excise taxes has been made.
Certain Funds may be subject to foreign income taxes imposed on realized gains on securities of issuers from certain foreign countries. Such taxes, if applicable, are included within net realized gain (loss) on transactions from investments in securities in the Statement of Operations.
Management evaluates tax positions taken or expected to be taken in the course of preparing the Funds’ tax returns to determine whether it is “more likely than not” that each tax position would be sustained upon examination by a taxing authority based on the technical merits of the positions. Tax positions not deemed to meet the “more likely than not” threshold would be recorded as a tax benefit or expense in the current year. Management has evaluated all of the uncertain tax positions of the Funds and has determined that no liability is required to be recorded in the financial statements.
The statute of limitations on the Funds’ tax returns for the prior three years remains open and the returns are subject to examination.
| 114 | Annual Report | December 31, 2020 |
Notes to Financial Statements
Adjustments to the cost of investments for tax purposes may be due to the deferred loss associated with current and prior year wash sales, income recognition from investments in real estate investment trusts, and the Funds’ election to mark-to-market their investments in Passive Foreign Investment Companies (“PFICs”). The cost of investments, including derivatives, for federal income tax purposes and related gross unrealized appreciation (depreciation) and net unrealized appreciation/(depreciation) at December 31, 2020, were as follows (in thousands):
| Fund | | Cost of
Investments | | | Gross
Unrealized
Appreciation | | Gross
Unrealized
Depreciation | | Net
Unrealized
Appreciation/
(Depreciation) |
| Growth | | $ | 157,894 | | | $ | 139,968 | | | $ | 237 | | | $ | 139,731 | |
| Large Cap Growth | | | 481,768 | | | | 229,770 | | | | 161 | | | | 229,609 | |
| Mid Cap Growth | | | 56,009 | | | | 28,191 | | | | 222 | | | | 27,969 | |
| Small-Mid Cap Core | | | 23,256 | | | | 7,272 | | | | 377 | | | | 6,895 | |
| Small-Mid Cap Growth | | | 2,394,499 | | | | 1,189,614 | | | | 9,870 | | | | 1,179,744 | |
| Small-Mid Cap Value | | | 1,363 | | | | 131 | | | | — | | | | 131 | |
| Small Cap Growth | | | 475,136 | | | | 202,690 | | | | 2,490 | | | | 200,200 | |
| Small Cap Value | | | 45,529 | | | | 15,604 | | | | 1,070 | | | | 14,534 | |
| Global Leaders | | | 66,339 | | | | 55,822 | | | | 71 | | | | 55,751 | |
| International Leaders | | | 764,825 | | | | 342,316 | | | | 542 | | | | 341,774 | |
| International Growth | | | 1,291,027 | | | | 1,022,326 | | | | 2,432 | | | | 1,019,894 | |
| Institutional International Growth | | | 728,004 | | | | 589,548 | | | | 1,301 | | | | 588,247 | |
| International Small Cap Growth | | | 236,063 | | | | 101,563 | | | | 3,332 | | | | 98,231 | |
| Emerging Markets Leaders | | | 170,276 | | | | 94,410 | | | | 1,078 | | | | 93,332 | |
| Emerging Markets Growth | | | 758,881 | | | | 436,334 | | | | 1,105 | | | | 435,229 | |
| Emerging Markets Small Cap Growth | | | 219,231 | | | | 88,793 | | | | 748 | | | | 88,045 | |
| Bond | | | 296,276 | | | | 23,477 | | | | 715 | | | | 22,762 | |
| Income | | | 65,736 | | | | 2,387 | | | | 390 | | | | 1,997 | |
| Low Duration | | | 156,427 | | | | 1,554 | | | | 340 | | | | 1,214 | |
| Macro Allocation | | | 300,007 | | | | 61,299 | | | | 6,046 | | | | 55,253 | |
In addition, the Funds may periodically record reclassifications among certain capital accounts to reflect differences between financial reporting and income tax basis distributions. The reclassifications were reported in order to reflect the tax treatment for certain permanent differences that exist between income tax regulations and US GAAP. The reclassifications generally relate to the tax treatment of net operating losses, redemptions in-kind, and utilization of earnings and profits distributed to shareholders on redemption of shares. These reclassifications have no impact on the net asset values or the net assets of the Funds. Accordingly, at December 31, 2020, the following reclassifications were recorded (in thousands):
| December 31, 2020 | William Blair Funds | 115 |
Notes to Financial Statements
| Fund | | Paid in
Capital | | | Total
Distributable
Earnings
(Loss) |
| Growth | | $ | 4,621 | | | $ | (4,621 | ) |
| Large Cap Growth | | | 8,484 | | | | (8,484 | ) |
| Mid Cap Growth | | | 914 | | | | (914 | ) |
| Small-Mid Cap Core | | | (144 | ) | | | 144 | |
| Small-Mid Cap Growth | | | 37,133 | | | | (37,133 | ) |
| Small-Mid Cap Value | | | 9 | | | | (9 | ) |
| Small Cap Growth | | | 5,048 | | | | (5,048 | ) |
| Small Cap Value | | | 6,656 | | | | (6,656 | ) |
| Global Leaders | | | 9,296 | | | | (9,296 | ) |
| International Leaders | | | 159 | | | | (159 | ) |
| International Growth | | | (2,606 | ) | | | 2,606 | |
| Institutional International Growth | | | 38,628 | | | | (38,628 | ) |
| International Small Cap Growth | | | 207 | | | | (207 | ) |
| Emerging Markets Leaders | | | (5 | ) | | | 5 | |
| Emerging Markets Growth | | | 2,826 | | | | (2,826 | ) |
| Emerging Markets Small Cap Growth | | | (534 | ) | | | 534 | |
| Bond | | | (38 | ) | | | 38 | |
| Income | | | (83 | ) | | | 83 | |
| Low Duration | | | (5 | ) | | | 5 | |
| Macro Allocation | | | (7,986 | ) | | | 7,986 | |
The timing and characterization of certain income and capital gain distributions are determined annually in accordance with federal income tax regulations that may differ from US GAAP. As a result, net investment income or loss and net realized gain or loss for a reporting period may differ from the amount distributed during such period.
Distributions from net realized gains for book purposes may include short-term capital gains, which are included as ordinary income for tax purposes. The tax character of distributions paid during 2020 and 2019 was as follows (in thousands):
| | | Distributions Paid in 2020 | |
| | | Ordinary
Income | | | Long-Term
Capital Gains | |
| Fund | | Class N | | | Class I | | | Institutional/
Class R6 | | | Class N | | | Class I | | | Institutional/
Class R6 | |
| Growth | | $ | 15 | | | $ | 89 | | | $ | 4 | | | $ | 4,754 | | | $ | 27,658 | | | $ | 1,328 | |
| Large Cap Growth | | | 258 | | | | 1,349 | | | | 612 | | | | 4,929 | | | | 13,332 | | | | 5,400 | |
| Mid Cap Growth | | | 86 | | | | 967 | | | | 8 | | | | 380 | | | | 4,282 | | | | 34 | |
| Small-Mid Cap Core | | | N/A | | | | — | | | | — | | | | N/A | | | | — | | | | — | |
| Small-Mid Cap Growth | | | — | | | | — | | | | — | | | | 5,612 | | | | 51,667 | | | | 1,737 | |
| Small-Mid Cap Value | | | 1 | | | | 21 | | | | 6 | | | | — | | | | 6 | | | | 2 | |
| Small Cap Growth | | | 4,713 | | | | 8,926 | | | | 2,409 | | | | 13,769 | | | | 26,080 | | | | 7,039 | |
| Small Cap Value | | | 30 | | | | 273 | | | | 70 | | | | 2,100 | | | | 26,367 | | | | 132 | |
| Global Leaders | | | — | | | | 25 | | | | 2 | | | | 1,323 | | | | 12,188 | | | | 321 | |
| International Leaders | | | — | | | | 178 | | | | 558 | | | | 140 | | | | 2,678 | | | | 5,216 | |
| International Growth | | | 431 | | | | 8,798 | | | | 572 | | | | 1,919 | | | | 12,455 | | | | 701 | |
| Institutional International Growth | | | N/A | | | | N/A | | | | 962 | | | | N/A | | | | N/A | | | | 150,391 | |
| International Small Cap Growth | | | — | | | | 55 | | | | 253 | | | | 63 | | | | 2,953 | | | | 3,813 | |
| Emerging Markets Leaders | | | — | | | | 105 | | | | 456 | | | | 15 | | | | 516 | | | | 1,837 | |
| Emerging Markets Growth | | | — | | | | 61 | | | | 1,303 | | | | 531 | | | | 4,382 | | | | 41,051 | |
| Emerging Markets Small Cap Growth | | | — | | | | 65 | | | | 129 | | | | — | | | | — | | | | — | |
| Bond | | | 1,089 | | | | 7,496 | | | | 1,641 | | | | — | | | | — | | | | — | |
| Income | | | 546 | | | | 1,009 | | | | 2 | | | | — | | | | — | | | | — | |
| Low Duration | | | 189 | | | | 1,833 | | | | 1,168 | | | | — | | | | — | | | | — | |
| Macro Allocation | | | 79 | | | | 2,289 | | | | 2,567 | | | | — | | | | — | | | | — | |
| 116 | Annual Report | December 31, 2020 |
Notes to Financial Statements
| | | Distributions Paid in 2019 | |
| | | Ordinary
Income | | | Long-Term
Capital Gains | |
| Fund | | Class N | | | Class I | | | Institutional/
Class R6 | | | Class N | | | Class I | | | Institutional/
Class R6 | |
| Growth | | $ | 133 | | | $ | 742 | | | $ | 1 | | | $ | 3,057 | | | $ | 17,138 | | | $ | 16 | |
| Large Cap Growth | | | 44 | | | | 512 | | | | 6 | | | | 3,937 | | | | 11,518 | | | | 91 | |
| Mid Cap Growth | | | 4 | | | | 46 | | | | — | | | | 476 | | | | 5,461 | | | | 12 | |
| Small-Mid Cap Core | | | N/A | | | | 1 | | | | 3 | | | | N/A | | | | — | | | | — | |
| Small-Mid Cap Growth | | | — | | | | — | | | | — | | | | 24,075 | | | | 172,835 | | | | 2,668 | |
| Small-Mid Cap Value | | | 1 | | | | 34 | | | | 1 | | | | 5 | | | | 97 | | | | 2 | |
| Small Cap Growth | | | — | | | | — | | | | — | | | | 4,188 | | | | 8,605 | | | | 1,345 | |
| Small Cap Value | | | 79 | | | | 3,251 | | | | 4 | | | | 419 | | | | 11,449 | | | | 12 | |
| Global Leaders | | | 17 | | | | 470 | | | | 220 | | | | 82 | | | | 1,030 | | | | 436 | |
| International Leaders | | | 37 | | | | 981 | | | | 2,772 | | | | — | | | | — | | | | — | |
| International Growth | | | 5,328 | | | | 19,998 | | | | 819 | | | | — | | | | — | | | | — | |
| Institutional International Growth | | | N/A | | | | N/A | | | | 17,917 | | | | N/A | | | | N/A | | | | — | |
| International Small Cap Growth | | | 3 | | | | 460 | | | | 597 | | | | — | | | | — | | | | — | |
| Emerging Markets Leaders | | | 8 | | | | 323 | | | | 1,511 | | | | 3 | | | | 70 | | | | 309 | |
| Emerging Markets Growth | | | 89 | | | | 994 | | | | 9,560 | | | | 222 | | | | 2,052 | | | | 19,013 | |
| Emerging Markets Small Cap Growth | | | — | | | | 236 | | | | 286 | | | | — | | | | — | | | | — | |
| Bond | | | 2,191 | | | | 10,482 | | | | 2,442 | | | | — | | | | — | | | | — | |
| Income | | | 699 | | | | 1,385 | | | | 1 | | | | — | | | | — | | | | — | |
| Low Duration | | | 60 | | | | 1,999 | | | | 1,674 | | | | — | | | | — | | | | — | |
| Macro Allocation | | | 503 | | | | 15,861 | | | | 16,522 | | | | — | | | | — | | | | — | |
As of December 31, 2020, the components of distributable earnings on a tax basis were as follows (in thousands):
| Fund | | Undistributed
Ordinary
Income | | Accumulated
Capital and
Other Losses | | Undistributed
Long-Term
Capital Gains | | Net Unrealized
Appreciation/
(Depreciation) | | Total | |
| Growth | | $ | 3,387 | | | $ | — | | | $ | 6,531 | | | $ | 139,731 | | | $ | 149,649 | |
| Large Cap Growth | | | 6 | | | | — | | | | 5,146 | | | | 229,609 | | | | 234,761 | |
| Mid Cap Growth | | | 535 | | | | — | | | | 1,110 | | | | 27,969 | | | | 29,614 | |
| Small-Mid Cap Core | | | — | | | | (12,806 | ) | | | — | | | | 6,895 | | | | (5,911 | ) |
| Small-Mid Cap Growth | | | — | | | | — | | | | 89,251 | | | | 1,179,744 | | | | 1,268,995 | |
| Small-Mid Cap Value | | | — | | | | (2,900 | ) | | | — | | | | 131 | | | | (2,769 | ) |
| Small Cap Growth | | | 13,733 | | | | — | | | | 10,484 | | | | 200,200 | | | | 224,417 | |
| Small Cap Value | | | 309 | | | | (13,368 | ) | | | — | | | | 14,534 | | | | 1,475 | |
| Global Leaders | | | — | | | | — | | | | 1,364 | | | | 55,758 | | | | 57,122 | |
| International Leaders | | | 194 | | | | — | | | | 1,490 | | | | 340,855 | | | | 342,539 | |
| International Growth | | | — | | | | — | | | | 46,402 | | | | 1,019,546 | | | | 1,065,948 | |
| Institutional International Growth | | | — | | | | — | | | | 35,490 | | | | 587,955 | | | | 623,445 | |
| International Small Cap Growth | | | 1,093 | | | | — | | | | 8,230 | | | | 98,278 | | | | 107,601 | |
| Emerging Markets Leaders | | | 306 | | | | — | | | | 8,577 | | | | 91,864 | | | | 100,747 | |
| Emerging Markets Growth | | | 855 | | | | — | | | | 32,335 | | | | 432,355 | | | | 465,545 | |
| Emerging Markets Small Cap Growth | | | — | | | | (102 | ) | | | 543 | | | | 87,524 | | | | 87,965 | |
| Bond | | | — | | | | (20,545 | ) | | | — | | | | 22,762 | | | | 2,217 | |
| Income | | | — | | | | (7,137 | ) | | | — | | | | 1,997 | | | | (5,140 | ) |
| Low Duration | | | 14 | | | | (29,783 | ) | | | — | | | | 1,214 | | | | (28,555 | ) |
| Macro Allocation | | | — | | | | (236,646 | ) | | | — | | | | 55,277 | | | | (181,369 | ) |
As of December 31, 2020, the Funds may have unused capital loss carryforwards available for federal income tax purposes to be applied against future capital gains, if any. Under current law, the Funds may carry forward net capital losses indefinitely to use to offset capital gains realized in future years. The following table details the Funds’ available capital loss carryforwards as of December 31, 2020, and the capital loss carryforwards utilized by the Funds in 2020:
| December 31, 2020 | William Blair Funds | 117 |
Notes to Financial Statements
| | | Available Capital Loss Carryforwards | | Capital Loss
Carryforwards |
| Fund | | Short Term | | Long Term | | Total | | Utilized in 2020 |
| Small-Mid Cap Core | | $ | 12,755 | | | $ | 51 | | | $ | 12,806 | | | $ | — | |
| Small-Mid Cap Value | | | 2,627 | | | | 273 | | | | 2,900 | | | | — | |
| Small Cap Value | | | 13,368 | | | | — | | | | 13,368 | | | | — | |
| International Growth | | | — | | | | — | | | | — | | | | 8,604 | |
| Institutional International Growth | | | — | | | | — | | | | — | | | | 33,252 | |
| International Small Cap Growth | | | — | | | | — | | | | — | | | | 15,355 | |
| Emerging Markets Small Cap Growth | | | — | | | | — | | | | — | | | | 46,476 | |
| Bond | | | 9,761 | | | | 10,043 | | | | 19,804 | | | | 523 | |
| Income | | | 2,596 | | | | 4,313 | | | | 6,909 | | | | — | |
| Low Duration | | | 13,806 | | | | 15,977 | | | | 29,783 | | | | — | |
| Macro Allocation | | | 224,668 | | | | 11,978 | | | | 236,646 | | | | — | |
In order to meet certain excise tax distribution requirements, the Funds are required to measure and distribute annually, net capital gains realized during a twelve month period ending October 31 and net investment income earned during a twelve month period ending December 31. In connection with this, the Funds are permitted for tax purposes to defer into their next fiscal year qualified late year losses. Qualified late year capital losses are any short term or long term capital losses incurred between November 1 and the end of their fiscal year, December 31, 2020. Qualified late year ordinary losses are comprised of losses related to swaps, foreign currency and PFICs incurred between November 1 and the end of their fiscal year, December 31, 2020.
As of December 31, 2020, the following Funds deferred, on a tax basis, qualified late year losses of (in thousands):
| | | Qualified Late Year Losses | |
| Fund | | Ordinary
Income | | | Net
Capital | |
| Emerging Markets Small Cap Growth | | $ | 102 | | | $ | — | |
| Bond | | | 741 | | | | — | |
| Income | | | 228 | | | | — | |
(e) Repurchase Agreements
In a repurchase agreement, a Fund buys a security at one price and at the time of sale, the seller agrees to repurchase the security at a mutually agreed upon time and price (usually within seven days). The repurchase agreement thereby determines the yield during the purchaser’s holding period, while the seller’s obligation to repurchase is secured by the value of the underlying collateral. The Adviser monitors, on an ongoing basis, the value of the underlying collateral to ensure that the value always equals or exceeds the repurchase price plus accrued interest. Repurchase agreements may involve certain risks in the event of a default or insolvency of the other party to the agreement, including possible delays or restrictions upon a Fund’s ability to dispose of the underlying collateral. The risk to a Fund is limited to the ability of the seller to pay the agreed upon sum on the delivery date. In the event of default, a repurchase agreement provides that a Fund is entitled to sell the underlying collateral. The loss, if any, to a Fund will be the difference between the proceeds from the sale and the repurchase price. However, if bankruptcy proceedings are commenced with respect to the seller of the security, disposition of the collateral by the Fund may be delayed or limited. The Funds have master repurchase agreements which allow the Funds to offset amounts owed to a counterparty with amounts owed from the same counterparty, including any collateral, in the event the counterparty defaults. Each Fund’s outstanding repurchase agreements, if any, and related collateral, are shown on the Fund’s Portfolio of Investments. Although no definitive creditworthiness criteria are used, the Adviser reviews the creditworthiness of the banks and non-bank dealers with which a Fund enters into repurchase agreements to evaluate those risks. A Fund may, for tax purposes, deem repurchase agreements collateralized by U.S. Government securities to be investments in U.S. Government securities.
(f) TBA Securities
The Fixed Income Funds may invest in mortgage pass-through securities eligible to be sold in the “to-be announced” market (“TBAs”). TBAs provide for the forward or delayed delivery of the underlying instrument with settlement in up to 180 days. The term TBA comes from the fact that the specific mortgage-backed security that will be delivered to fulfill a TBA trade is not designated at the time the trade is made, but rather is generally announced 48 hours before the settlement date. A Fund generally has the ability to close out a TBA obligation on or before the settlement date, rather than take delivery of the security. When a Fund sells TBAs, it incurs risks similar to those incurred in short sales. For example, when a Fund sells TBAs without owning
| 118 | Annual Report | December 31, 2020 |
Notes to Financial Statements
or having the right to obtain the deliverable securities it incurs a risk of loss because it could have to purchase the securities at a price that is higher than the price at which it sold the securities.
(g) Securities Sold, Not Yet Purchased
A Fund may sell a security it does not own (known as selling a security short) in anticipation of a decline in the fair value of that security. When a Fund sells a security short, it must borrow the security sold short and deliver it to the broker through which it made the short sale. A gain, limited to the price at which the fund sold the security short, or a loss, unlimited in size, will be recognized upon the termination of the short sale. A Fund is also subject to the risk that it may be unable to acquire a security to terminate a short position except at a price substantially in excess of the price at which it sold the security short.
(h) Use of Estimates
The preparation of financial statements in conformity with US GAAP requires management to make estimates and assumptions that affect the amounts reported in the financial statements. Actual results may differ from those estimates.
(i) Indemnification
In the normal course of business, the Funds have entered into contracts in which the Funds agree to indemnify the other party or parties against various potential costs or liabilities. The Funds’ maximum exposure under these arrangements is unknown. No claim has been made for indemnification pursuant to any such agreement of the Funds.
(j) Redemption In-Kind
In accordance with the Trust’s prospectus, the Funds may distribute portfolio securities rather than cash as payment for a redemption of Fund shares (in-kind redemption). For financial reporting purposes, the Fund recognizes a gain or loss on the transfer of securities depending on the value of those securities on the date of redemption. Gains and losses realized on in-kind redemptions may not be recognized for tax purposes and are reclassified from accumulated net realized gain (loss) to capital paid in excess of par value. During the year ended December 31, 2020, the Small-Mid Cap Growth, Small Cap Value, Global Leaders and Institutional International Growth Funds redeemed $109,894, $37,335, $19,073 and $37,257 (in thousands), respectively, of Fund shares in-kind rather than with cash and recognized net realized gains of $36,409, $7,459, $7,974 and $7,699 (in thousands), respectively, on the securities distributed to shareholders.
(3) Valuation
(a) Investment Valuation
The value of U.S. equity securities, including exchange-traded funds, is determined by valuing securities traded on national securities markets or in the over-the-counter markets at the last sale price or, if applicable, the official closing price or, in the absence of a recent sale on the date of determination, at the mean between the last reported bid and ask prices.
The value of foreign equity securities is generally determined based upon the last sale price on the foreign exchange or market on which it is primarily traded and in the currency of that market as of the close of the appropriate exchange or, if there have been no sales during that day, at the mean between the last reported bid and ask prices. The Board of Trustees has determined that the passage of time between when the foreign exchanges or markets close and when the Funds compute their net asset values could cause the value of foreign equity securities to no longer be representative or accurate and, as a result, may necessitate that such securities be fair valued. Accordingly, for foreign equity securities, the Funds may use an independent pricing service to fair value price the security as of the close of regular trading on the NYSE. As a result, a Fund’s value for a foreign security may be different from the last sale price (or the mean between the last reported bid and ask prices). As of December 31, 2020, fair valuation estimates for foreign equity securities were not obtained.
Fixed income securities are generally valued using evaluated prices provided by an independent pricing service. The evaluated prices are formed using various market inputs that the pricing service believes accurately represent the market value of a security at a particular point in time. The pricing service determines evaluated prices for fixed income securities using inputs including, but not limited to, recent transaction prices for such securities, dealer quotes, transaction prices for other securities with similar characteristics, collateral characteristics, credit quality, payment history, liquidity and market conditions.
Repurchase agreements are valued at cost, which approximates fair value.
Option contracts on securities, currencies and other financial instruments traded on one or more exchanges are valued at their most recent sale price on the exchange on which they are traded most extensively. Option contracts on foreign indices are valued at the settlement price. If there were no sales that day or if no settlement price is available, such option contracts are valued at
| December 31, 2020 | William Blair Funds | 119 |
Notes to Financial Statements
the mean between the last reported bid and ask prices. Option contracts traded in the Over-the-Counter (“OTC”) market shall be valued by an independent pricing service. Futures contracts are valued at the most recent settlement price on the exchange on which they are traded most extensively, or if no settlement price is available, at the last sale price as of the close of the exchange. Forward foreign currency contracts are valued on the basis of the value of the underlying currencies at the prevailing currency exchange rate as supplied by an independent pricing service.
Swaps that are centrally cleared through an exchange are valued at the most recent settlement price provided by the exchange on which they are cleared. Total return swaps on equities, equity baskets, indices and other financial instruments are valued by an independent pricing service, or if unavailable, based on the security’s or instrument’s underlying reference asset. All other swap contracts are valued by an independent pricing service. Depending on the product and the terms of the transaction, the independent pricing service may use a series of techniques, including simulation pricing models. The pricing models use inputs that are observed from actively quoted markets such as issuer details, indices, spreads, interest rates, yield curves, dividends and exchange rates.
Securities, and other assets, for which a market price is not available or is deemed unreliable (e.g., securities affected by unusual or extraordinary events, such as natural disasters or securities affected by market or economic events, such as bankruptcy filings), or the value of which is affected by a significant valuation event, are valued at a fair value as determined in good faith by, or under the direction of, the Board of Trustees and in accordance with the Valuation Procedures approved by the Board of Trustees. The value of these fair valued securities may be different from the last sale price (or the mean between the last reported bid and ask prices), and there is no guarantee that a fair valued security will be sold at the price at which a Fund is carrying the security.
(b) Fair Value Measurements
Fair value is defined as the price that a Fund would receive upon selling a security in an orderly transaction to an independent buyer in the principal or most advantageous market for the investment. Various inputs are used in determining the value of a Fund’s investments. A three-tier hierarchy of inputs is used to classify fair value measurements for disclosure purposes. The three-tier hierarchy of inputs is summarized in the three broad levels listed below:
| | • | Level 1—Quoted prices (unadjusted) in active markets for an identical security. |
| | | |
| | • | Level 2—Prices determined using other significant observable inputs. Observable inputs are inputs that other market participants would use in pricing a security. These may include quoted prices for similar securities, interest rates, prepayment speeds, credit risk, and others. In addition, other observable inputs such as foreign exchange rates, benchmark securities indices and foreign futures contracts may be utilized in the valuation of certain foreign securities when significant events occur between the last sale on the foreign securities exchange and the time at which the net asset value of the Fund is calculated. |
| | | |
| | • | Level 3—Prices determined using significant unobservable inputs. In situations where quoted prices or observable inputs are unavailable (for example, when there is little or no market activity for an investment), unobservable inputs may be used. Unobservable inputs reflect the Fund’s own assumptions about the factors market participants would use in pricing an investment, and are based on the best information available. |
The inputs or methodology used for valuing an investment are not necessarily an indication of the risk associated with investing in those securities.
A description of the valuation methodologies applied to the Funds’ major categories of assets and liabilities measured at fair value on a recurring basis is as follows:
Exchange-Traded Securities
Securities traded on a national securities exchange (or reported on the NASDAQ national market), including exchange-traded funds, are stated at the last reported sales price on the day of valuation. Other securities traded in the over-the-counter market and listed securities for which no sale was reported on that date are stated at the mean between the last reported bid and ask prices. To the extent these securities are actively traded and valuation adjustments are not applied, they are categorized as Level 1 of the fair value hierarchy. Securities traded on inactive markets or valued by reference to similar instruments are generally categorized as Level 2 of the fair value hierarchy.
Fixed Income Securities
Fixed income securities including corporate, convertible and municipal bonds and notes, U.S. government agency obligations, U.S. treasury obligations, sovereign issues, bank loans, convertible preferred securities, asset-backed securities, non-U.S. bonds and commercial paper are generally valued using evaluated prices provided by an independent pricing service. The evaluated
| 120 | Annual Report | December 31, 2020 |
Notes to Financial Statements
prices are formed using various market inputs that the pricing service believes accurately represent the fair value of a security at a particular point in time. The pricing service determines evaluated prices for fixed income securities using inputs including, but not limited to, recent transaction prices for such securities, dealer quotes, transaction prices for other securities with similar characteristics, collateral characteristics, credit quality, payment history, liquidity and market conditions. Securities that use similar valuation techniques and observable inputs as described above are categorized as Level 2 of the fair value hierarchy.
Repurchase Agreements
Repurchase agreements are valued at cost, which approximates fair value. Repurchase agreements are categorized as Level 2 of the fair value hierarchy.
Derivative Instruments
Listed derivatives, such as certain options and futures contracts, that are actively traded are valued based on quoted prices from the exchange on which they are traded most extensively and are categorized as Level 1 of the fair value hierarchy. OTC derivative contracts include forward foreign currency contracts, swap and certain option contracts related to interest rates, foreign currencies, the credit standing of reference entities, equity prices, or commodity prices. Depending on the product and the terms of the transaction, the fair value of OTC derivative products can be modeled by independent pricing services taking into account the counterparties’ creditworthiness and using a series of techniques, including simulation models. Many pricing models do not entail material subjectivity because the methodologies employed do not necessitate significant judgments and the pricing inputs are observed from actively quoted markets, as is the case of forward foreign currency contracts and interest rate swaps. A substantial majority of OTC derivative products valued by a Fund using pricing models fall into this category and are categorized as Level 2 of the fair value hierarchy.
| December 31, 2020 | William Blair Funds | 121 |
Notes to Financial Statements
As of December 31, 2020, the value of investments in securities and other financial instruments, segregated by their hierarchical input levels used in determining fair value and by security class or other financial instruments, are shown below (in thousands).
| Investments in securities | | Growth | | Large Cap
Growth | | Mid Cap
Growth | | Small-Mid
Cap Core | |
| Level 1—Quoted prices | | | | | | | | | | | | | | | | | |
| Common Stocks | | | $ | 296,558 | | | $ | 706,222 | | | $ | 81,175 | | | $ | 29,404 | |
| Level 2—Other significant observable inputs | | | | | | | | | | | | | | | | | |
| Repurchase Agreements | | | | 1,067 | | | | 5,155 | | | | 2,803 | | | | 747 | |
| Level 3—Significant unobservable inputs | | | | | | | | | | | | | | | | | |
| None | | | | — | | | | — | | | | — | | | | — | |
| Total investments in securities | | | $ | 297,625 | | | $ | 711,377 | | | $ | 83,978 | | | $ | 30,151 | |
| | | | | | | | | | | | | | | | | | |
| Investments in securities | | Small-Mid
Cap Growth | | Small-Mid
Cap Value | | Small Cap
Growth | | Small Cap
Value | |
| Level 1—Quoted prices | | | | | | | | | | | | | | | | | |
| Common Stocks | | | $ | 3,544,888 | | | $ | 1,387 | | | $ | 664,580 | | | $ | 58,997 | |
| Level 2—Other significant observable inputs | | | | | | | | | | | | | | | | | |
| Repurchase Agreements | | | | 29,355 | | | | 107 | | | | 10,756 | | | | 1,066 | |
| Level 3—Significant unobservable inputs | | | | | | | | | | | | | | | | | |
| None | | | | — | | | | — | | | | — | | | | — | |
| Total investments in securities | | | $ | 3,574,243 | | | $ | 1,494 | | | $ | 675,336 | | | $ | 60,063 | |
| | | | | | | | | | | | | | | | | | |
| Investments in securities | | Global
Leaders | | International
Leaders | | International
Growth | | Institutional
International
Growth | |
| Level 1—Quoted prices | | | | | | | | | | | | | | | | | |
| Common Stocks | | | $ | 120,020 | | | $ | 1,078,665 | | | $ | 2,293,445 | | | $ | 1,312,948 | |
| Level 2—Other significant observable inputs | | | | | | | | | | | | | | | | | |
| Common Stocks | | | | — | | | | — | | | | 5,739 | | | | 3,293 | |
| Repurchase Agreements | | | | 2,070 | | | | 27,934 | | | | 11,737 | | | | — | |
| Level 3—Significant unobservable inputs | | | | | | | | | | | | | | | | | |
| None | | | | — | | | | — | | | | — | | | | — | |
| Total investments in securities | | | $ | 122,090 | | | $ | 1,106,599 | | | $ | 2,310,921 | | | $ | 1,316,241 | |
| | | | | | | | | | | | | | | | | | |
| Investments in securities | | International
Small Cap
Growth | | Emerging
Markets
Leaders | | Emerging
Markets
Growth | | Emerging
Markets
Small Cap
Growth | |
| Level 1—Quoted prices | | | | | | | | | | | | | | | | | |
| Common Stocks | | | $ | 331,487 | | | $ | 260,941 | | | $ | 1,178,224 | | | $ | 294,256 | |
| Preferred Stocks | | | | — | | | | — | | | | — | | | | 4,337 | |
| Level 2—Other significant observable inputs | | | | | | | | | | | | | | | | | |
| Common Stocks | | | | — | | | | — | | | | — | | | | 5,012 | |
| Repurchase Agreements | | | | 2,805 | | | | 2,667 | | | | 15,886 | | | | 3,667 | |
| Level 3—Significant unobservable inputs | | | | | | | | | | | | | | | | | |
| None | | | | — | | | | — | | | | — | | | | — | |
| Total investments in securities | | | $ | 334,292 | | | $ | 263,608 | | | $ | 1,194,110 | | | $ | 307,272 | |
| 122 | Annual Report | December 31, 2020 |
Notes to Financial Statements
| Investments in securities | | Bond | | | Income | | | Low
Duration | | | Macro
Allocation | |
| Level 1—Quoted prices | | | | | | | | | | | | | | | | |
| Exchange-Traded Funds | | $ | — | | | $ | — | | | $ | — | | | $ | 250,741 | |
| Common Stocks | | | — | | | | — | | | | — | | | | 11,938 | |
| Preferred Stocks | | | — | | | | — | | | | — | | | | 1,248 | |
| Level 2—Other significant observable inputs | | | | | | | | | | | | | | | | |
| Asset-Backed Securities | | | 4,163 | | | | 3,328 | | | | 16,535 | | | | — | |
| Corporate Obligations | | | 121,450 | | | | 23,741 | | | | 43,102 | | | | — | |
| Foreign Government Bonds | | | — | | | | — | | | | — | | | | 19,241 | |
| Repurchase Agreements | | | 4,615 | | | | — | | | | 880 | | | | 13,901 | |
| U.S. Government and U.S. Government Agency | | | 188,832 | | | | 40,672 | | | | 97,124 | | | | 57,478 | |
| Level 3—Significant unobservable inputs | | | | | | | | | | | | | | | | |
| None | | | — | | | | — | | | | — | | | | — | |
| Total investments in securities | | $ | 319,060 | | | $ | 67,741 | | | $ | 157,641 | | | $ | 354,547 | |
| Other financial instruments | | | | | | | | | | | | | | | | |
| Assets | | | | | | | | | | | | | | | | |
| Level 1—Quoted prices | | | | | | | | | | | | | | | | |
| Futures Contracts | | $ | — | | | $ | — | | | $ | — | | | $ | 466 | |
| Level 2—Other significant observable inputs | | | | | | | | | | | | | | | | |
| Forward Foreign Currency Contracts | | | — | | | | — | | | | — | | | | 5,212 | |
| Swaps | | | — | | | | — | | | | — | | | | 645 | |
| Level 3—Significant unobservable inputs | | | | | | | | | | | | | | | | |
| None | | | — | | | | — | | | | — | | | | — | |
| Liabilities | | | | | | | | | | | | | | | | |
| Level 1—Quoted prices | | | | | | | | | | | | | | | | |
| Futures Contracts | | | — | | | | — | | | | — | | | | (6,505 | ) |
| Level 2—Other significant observable inputs | | | | | | | | | | | | | | | | |
| Forward Foreign Currency Contracts | | | — | | | | — | | | | — | | | | (4,400 | ) |
| Swaps | | | (878 | ) | | | (324 | ) | | | — | | | | (73 | ) |
| U.S. Government Agency | | | (10,680 | ) | | | (2,136 | ) | | | (5,340 | ) | | | — | |
| Level 3—Significant unobservable inputs | | | | | | | | | | | | | | | | |
| None | | | — | | | | — | | | | — | | | | — | |
| Total other financial instruments | | $ | (11,558 | ) | | $ | (2,460 | ) | | $ | (5,340 | ) | | $ | (4,655 | ) |
See Portfolio of Investments for Sector Classification.
| December 31, 2020 | William Blair Funds | 123 |
Notes to Financial Statements
(4) Transactions with Affiliates
(a) Management and Expense Limitation Agreements
Each Fund has a management agreement with the Adviser for investment management, clerical, bookkeeping and administrative services. Each Fund pays the Adviser an annual management fee, which is accrued daily and paid monthly, based on a specified percentage of the Fund’s average daily net assets. Each Fund’s annual management fee rate is as follows:
| U.S. Equity Funds | | | |
| Growth | | | 0.75 | % |
| Large Cap Growth | | | 0.60 | % |
| Mid Cap Growth | | | 0.90 | % |
| Small-Mid Cap Core | | | 0.90 | % |
| Small-Mid Cap Growth | | | 1.00 | % |
| Small-Mid Cap Value2 | | | 0.85 | % |
| Small Cap Growth | | | 1.10 | % |
| Small Cap Value3 | | | 0.95 | % |
| | | | | |
| Fixed Income Funds | | | | |
| Bond | | | 0.30 | % |
| Income1: | | | | |
| First $250 million | | | 0.25 | % |
| In excess of $250 million | | | 0.20 | % |
| Low Duration | | | 0.30 | % |
| | | | | |
| Multi-Asset and Alternative Fund | | | | |
| Macro Allocation | | | 0.80 | % |
| | | | | |
| Global Equity Fund | | | | |
| Global Leaders | | | 0.85 | % |
| International Equity Funds | | | | |
| International Leaders | | | 0.85 | % |
| International Growth: | | | | |
| First $250 million | | | 1.10 | % |
| Next $2.25 billion | | | 1.00 | % |
| Next $2.5 billion | | | 0.975 | % |
| Next $5 billion | | | 0.95 | % |
| Next $5 billion | | | 0.925 | % |
| In excess of $15 billion | | | 0.90 | % |
| Institutional International Growth: | | | | |
| First $500 million | | | 1.00 | % |
| Next $500 million | | | 0.95 | % |
| Next $1.5 billion | | | 0.90 | % |
| Next $2.5 billion | | | 0.875 | % |
| Next $5 billion | | | 0.85 | % |
| Next $5 billion | | | 0.825 | % |
| In excess of $15 billion | | | 0.80 | % |
| International Small Cap Growth | | | 1.00 | % |
| Emerging Markets Leaders | | | 1.10 | % |
| Emerging Markets Growth | | | 1.10 | % |
| Emerging Markets Small Cap Growth | | | 1.10 | % |
| 1 | Management fee also includes a charge of 5% of gross income. |
| 2 | Prior to May 1, 2020, the Small-Mid Cap Value Fund paid a management fee at a rate of 0.95% of the Fund’s average daily net assets. Effective May 1, 2020, the management fee paid to the Adviser was reduced to 0.85%. |
| 3 | Prior to May 1, 2020, the Small Cap Value Fund paid a management fee at a rate of 1.10% of the Fund’s average daily net assets. Effective May 1, 2020, the management fee paid to the Adviser was reduced to 0.95%. |
| 124 | Annual Report | December 31, 2020 |
Notes to Financial Statements
The Funds have also entered into an Amended and Restated Expense Limitation Agreement with the Adviser. Under the terms of the agreement, the Adviser will waive its management fee and/or reimburse a Fund for certain operating expenses, subject to certain excluded expenses, in excess of the agreed upon rate through April 30, 2021. The amount the Adviser owes a Fund as of the reporting date is recorded as Receivable from Adviser in the Statements of Assets and Liabilities. The Adviser reimburses the Funds on a monthly basis. The Adviser will waive fees and/or reimburse expenses to the extent that the total operating expenses for the stated class of the Funds, subject to certain excluded expenses, exceed the following rates (as a percentage of average daily net assets):
| | | Class N | | Class I | | Institutional/Class R6 |
| Fund | | Effective
May 1, 2020
through
April 30,
2021 | | Effective
May 1, 2019
through
April 30,
2020 | | Effective
May 1, 2020
through
April 30,
2021 | | Effective
May 1, 2019
through
April 30,
2020 | | Effective
May 1, 2020
through
April 30,
2021 | | Effective
May 1, 2019
through
April 30,
2020 |
| Growth | | | 1.20 | % | | | 1.20 | % | | | 0.95 | % | | | 0.95 | % | | | 0.90 | % | | | 0.90 | % |
| Large Cap Growth | | | 0.90 | % | | | 0.90 | % | | | 0.65 | % | | | 0.65 | % | | | 0.60 | % | | | 0.60 | % |
| Mid Cap Growth | | | 1.20 | % | | | 1.20 | % | | | 0.95 | % | | | 0.95 | % | | | 0.90 | % | | | 0.90 | % |
| Small-Mid Cap Core | | | N/A | | | | N/A | | | | 0.95 | % | | | 0.95 | %1 | | | 0.90 | % | | | 0.90 | %1 |
| Small-Mid Cap Growth | | | 1.35 | % | | | 1.35 | % | | | 1.10 | % | | | 1.10 | % | | | 1.05 | % | | | 1.05 | % |
| Small-Mid Cap Value | | | 1.15 | % | | | 1.25 | % | | | 0.90 | % | | | 1.00 | % | | | 0.85 | % | | | 0.95 | % |
| Small Cap Growth | | | 1.50 | % | | | 1.50 | % | | | 1.25 | % | | | 1.25 | % | | | 1.20 | % | | | 1.20 | % |
| Small Cap Value | | | 1.25 | % | | | 1.50 | % | | | 1.00 | % | | | 1.25 | % | | | 0.95 | % | | | 1.20 | % |
| Global Leaders | | | 1.15 | % | | | 1.15 | % | | | 0.90 | % | | | 0.90 | % | | | 0.85 | % | | | 0.85 | % |
| International Leaders | | | 1.15 | % | | | 1.15 | % | | | 0.90 | % | | | 0.90 | % | | | 0.85 | % | | | 0.85 | % |
| International Growth | | | 1.45 | % | | | 1.45 | % | | | 1.20 | % | | | 1.20 | % | | | 1.15 | % | | | 1.15 | % |
| Institutional International Growth | | | N/A | | | | N/A | | | | N/A | | | | N/A | | | | 1.05 | % | | | 1.05 | % |
| International Small Cap Growth | | | 1.55 | % | | | 1.55 | % | | | 1.30 | % | | | 1.30 | % | | | 1.25 | % | | | 1.25 | % |
| Emerging Markets Leaders | | | 1.40 | % | | | 1.40 | % | | | 1.15 | % | | | 1.15 | % | | | 1.10 | % | | | 1.10 | % |
| Emerging Markets Growth | | | 1.60 | % | | | 1.60 | % | | | 1.35 | % | | | 1.35 | % | | | 1.30 | % | | | 1.30 | % |
| Emerging Markets Small Cap Growth | | | 1.55 | % | | | 1.55 | % | | | 1.30 | % | | | 1.30 | % | | | 1.25 | % | | | 1.25 | % |
| Bond | | | 0.60 | % | | | 0.60 | % | | | 0.45 | % | | | 0.45 | % | | | 0.40 | % | | | 0.40 | % |
| Income | | | 0.85 | % | | | 0.85 | % | | | 0.70 | % | | | 0.70 | % | | | 0.65 | % | | | 0.65 | % |
| Low Duration | | | 0.55 | % | | | 0.55 | % | | | 0.40 | % | | | 0.40 | % | | | 0.35 | % | | | 0.35 | % |
| Macro Allocation | | | 1.25 | % | | | 1.25 | % | | | 1.00 | % | | | 1.00 | % | | | 0.95 | % | | | 0.95 | % |
| 1 | Effective October 1, 2019 (Commencement of Operations). |
The fee waivers and/or expense reimbursements received by each class are reported in the Statements of Operations.
With respect to the Small-Mid Cap Core Fund, the Adviser is entitled to recoupment of previously waived fees and reimbursed expenses for a period of three years subsequent to October 1, 2019 (Commencement of Operations) to the extent that such recoupment does not cause the fund’s annual operating expenses (after the recoupment is taken into account) to exceed both (1) the expense limit in place when such amounts were waived or reimbursed and (2) the fund’s current expense limitation. The total amount available for recoupment as of December 31, 2020 is $407 (in thousands).
(b) Underwriting and Distribution Services Agreements
Pursuant to separate Underwriting and Distribution Agreements, WBC is the principal underwriter and distributor for the continuous offering of shares of the Trust and acts as agent of the Trust in the sale of its shares. The Underwriting Agreement provides that the Distributor will use its best efforts to distribute the Trust’s shares. The Distributor is not compensated under the Underwriting Agreement.
Each Fund, except the Small-Mid Cap Core and Institutional International Growth Funds, has a Distribution Agreement with WBC for distribution services to the Funds’ Class N shares. Each Fund pays WBC an annual fee, payable monthly, based on a specified percentage of its average daily net assets of Class N shares. The annual rate expressed as a percentage of average daily net assets for Class N is 0.25% for all Funds except the Bond, Income and Low Duration Funds, which is 0.15%. Pursuant to
| December 31, 2020 | William Blair Funds | 125 |
Notes to Financial Statements
the Distribution Agreement, WBC enters into related selling group agreements with various firms at various rates for sales of the Funds’ Class N shares.
(5) Investment Transactions
Investment transactions, excluding U.S. government securities and short-term securities, for the year ended December 31, 2020, were as follows (in thousands):
| Fund | | Purchases | | | Sales | |
| Growth | | $ | 116,745 | | | $ | 155,562 | |
| Large Cap Growth | | | 401,176 | | | | 176,225 | |
| Mid Cap Growth | | | 31,545 | | | | 40,611 | |
| Small-Mid Cap Core | | | 324,633 | | | | 295,925 | |
| Small-Mid Cap Growth | | | 1,600,068 | | | | 1,691,732 | |
| Small-Mid Cap Value | | | 7,100 | | | | 9,975 | |
| Small Cap Growth | | | 391,189 | | | | 560,740 | |
| Small Cap Value | | | 61,588 | | | | 102,136 | |
| Global Leaders | | | 34,793 | | | | 97,095 | |
| International Leaders | | | 492,663 | | | | 247,422 | |
| International Growth | | | 536,264 | | | | 889,405 | |
| Institutional International Growth | | | 479,595 | | | | 1,381,725 | |
| International Small Cap Growth | | | 171,661 | | | | 221,305 | |
| Emerging Markets Leaders | | | 106,152 | | | | 136,668 | |
| Emerging Markets Growth | | | 724,514 | | | | 668,389 | |
| Emerging Markets Small Cap Growth | | | 317,810 | | | | 365,681 | |
| Bond | | | 231,469 | | | | 202,890 | |
| Income | | | 46,420 | | | | 31,168 | |
| Low Duration | | | 129,498 | | | | 71,539 | |
| Macro Allocation | | | 112,601 | | | | 378,164 | |
Investment transactions in U.S. government securities, excluding short-term securities, for the year ended December 31, 2020, were as follows (in thousands):
| Fund | | Purchases | | | Sales | |
| Bond | | $ | 30,788 | | | $ | 6,465 | |
| Income | | | 7,177 | | | | 2,725 | |
| Low Duration | | | 25,340 | | | | 3,210 | |
| Macro Allocation | | | — | | | | — | |
(6) Financial Derivative Instruments
Each Fund may use derivative instruments to maintain liquidity, to provide hedging, or in anticipation of changes in the composition of its portfolio holdings or as otherwise provided in each Fund’s prospectus. Macro Allocation Fund may also use derivative instruments to obtain investment exposures. The derivative instruments held as of December 31, 2020, as disclosed in each Fund’s Portfolios of Investments, are representative of each Fund’s derivative instrument trading activity during the year ended December 31, 2020.
Derivative transactions carry counterparty risk as they are based on contracts between a Fund and the applicable counterparty. For exchange-traded or cleared derivative contracts, such counterparty risk is limited due to the role of the exchange or clearinghouse. OTC derivative contracts, however, are exposed to counterparty risk in the amount of unrealized gains, net of collateral held, for the duration of the contract.
Macro Allocation Fund is subject to certain netting arrangements through International Swaps and Derivatives Association, Inc. Master Agreements and Credit Support Annexes (“ISDAs”). The ISDAs maintain provisions for general obligations, representations, agreements, collateral and events of default or termination. The ISDAs cover certain OTC derivative securities entered into by Macro Allocation Fund with various counterparties and allow Macro Allocation Fund to close out and net its total exposure to a counterparty in the event of a default.
| 126 | Annual Report | December 31, 2020 |
Notes to Financial Statements
Futures Contracts
A futures contract provides for the future sale by one party and purchase by another party of a specified amount of a specific financial instrument for a specified price at a designated date, time and place. An index futures contract is an agreement pursuant to which the parties agree to take or make delivery of an amount of cash equal to the difference between the value of the index at the close of the last trading day of the contract and the price at which the index futures contract was originally written. A futures contract can be closed out prior to delivery by entering into an offsetting transaction in a matching futures contract. Although the value of an index might be a function of the value of certain specified securities, no physical delivery of those securities is made. If the offsetting purchase price is less than the original sale price, a Fund realizes a gain; if it is more, a Fund realizes a loss. Conversely, if the offsetting sale price is more than the original purchase price, a Fund realizes a gain; if it is less, a Fund realizes a loss. The transaction costs must also be included in these calculations. There can be no assurance, however, that a Fund will be able to enter into an offsetting transaction with respect to a particular futures contract at a particular time. If a Fund is not able to enter into an offsetting transaction, a Fund will continue to be required to maintain the margin deposits on the futures contract.
Upon entering into a futures contract, a Fund is required to pledge to the broker an amount of cash, U.S. government securities, or other liquid assets equal to a certain percentage of the contract amount (“initial margin deposit”). Futures contracts are marked to market daily and an appropriate payable or receivable for the change in value (“variation margin”) is recorded by a Fund and a cash payment is either made to or received from the broker each day. Gains or losses on futures contracts are recognized but not considered realized until the contracts expire or are closed and are included in the Statement of Operations.
Options
The purchase or sale of an option by a Fund involves the payment or receipt of a premium by the investor and the corresponding right or obligation, as the case may be, either to purchase or sell the underlying security, commodity, or other instrument for a specific price at a certain time or during a certain period. Purchasing options involves the risk that the underlying instrument will not change price in the manner expected, so the investor loses its premium. Writing options involves potentially greater risk because the investor is exposed to the extent of the actual price movement in the underlying security rather than only the amount of the premium paid (which could result in a potentially unlimited loss). OTC options also involve counterparty credit risk. Purchased options are shown as an asset in the Statement of Assets and Liabilities and are included in Investments in securities. Premiums received for written options are shown as a liability in the Statement of Assets and Liabilities. Realized gains and losses on the sale, expiration or assignment of an option are disclosed in the Statement of Operations.
Forward Foreign Currency Contracts
The Global Equity, International Equity and Multi-Asset and Alternative Funds may enter into forward foreign currency contracts. When entering into a forward foreign currency contract, a Fund agrees to receive or deliver a fixed quantity of foreign currency for an agreed-upon price on an agreed future date. A Fund’s net equity therein, representing unrealized gain or loss on the contracts as measured by the difference between the forward foreign exchange rates at the dates of entry into the contracts and the forward rates at the reporting date, is included in the Statement of Assets and Liabilities as unrealized appreciation/depreciation on forward foreign currency contracts. Realized and unrealized gains and losses are included in the Statement of Operations. These instruments may involve market risk, credit risk, or both kinds of risks in excess of the amount recognized in the Statement of Assets and Liabilities. Risks arise from the possible inability of counterparties to meet the terms of their contracts and from the price movements in currencies.
Swap Contracts
Swap agreements may include total return, interest rate, securities index, commodity, security, currency exchange rate, credit default index, volatility and variance swaps. Cleared swaps are transacted through futures commission merchants that are members of central clearing houses with the clearing house serving as a central counterparty similar to transactions in futures contracts. In a standard “swap” transaction, two parties agree to exchange the returns (or differentials in rates of return) earned or realized on particular predetermined investments or instruments. The gross returns to be exchanged or “swapped” between the parties are calculated with respect to a “notional amount” (i.e., the change in the value of a particular dollar amount invested, for example, at a particular interest rate, in a particular foreign currency, or in a “basket” of securities representing a particular index). Swap agreements are subject to the risk that the counterparty to the swap will default on its obligation to pay a Fund and the risk that a Fund will not be able to meet its obligations to pay the counterparty to the swap. Swap agreements may also
| December 31, 2020 | William Blair Funds | 127 |
Notes to Financial Statements
involve fees, commissions or other costs that may reduce a Fund’s gains from a swap agreement or may cause a Fund to lose money. To the extent permitted by its investment policies and restrictions, a Fund may invest in the following types of swaps:
Credit Default Swaps—A Fund may invest in credit default swaps as a means of “buying” credit protection (i.e., attempting to mitigate the risk of default or credit quality deterioration in some portion of a Fund’s holdings) or “selling” credit protection (i.e., attempting to gain exposure to an underlying issuer’s credit quality characteristics without directly investing in that issuer). A credit default swap is a contract between a buyer and a seller of protection against a pre-defined credit event (e.g., a ratings downgrade or default) on an underlying reference obligation, which may be a single debt instrument or baskets or indices of securities. Under current regulatory requirements, a Fund may be a buyer or seller of a credit default swap. As a seller of protection on credit default swap agreements, a Fund will generally receive from the buyer of protection a fixed rate of income throughout the term of the swap provided that there is no credit event. A Fund adds leverage to its portfolio because the Fund is subject to investment exposure on the notional amount of the swap. The maximum potential amount of future payments that a Fund as a seller of protection could be required to make under a credit default swap agreement equals the notional amount of the agreement. Notional amounts of each individual credit default swap agreement outstanding as of the period end for which a Fund is the seller of protection are disclosed in the Fund’s Portfolio of Investments. These potential amounts would be partially offset by any recovery values of the respective referenced obligations, upfront payments received upon entering into the agreement, or net amounts received from the settlement of buy protection credit default swap agreements entered into by the same Fund for the same referenced entity or entities. For credit default swap contracts on credit indices, the quoted market prices and resulting values serve as an indicator of the payment performance risk. Increasing market values, in absolute terms when compared to the notional amount of the swap, typically represent deterioration of the referenced entities’ credit soundness and a greater likelihood or risk of default or other credit event occurring as defined under the terms of the swap.
Interest Rate Swap—A Fund may invest in interest rate swaps to gain or mitigate exposure to changes in interest rates. Interest rate swap agreements involve a commitment between parties to pay either a fixed interest rate or a floating interest rate based on a notional amount of principal. The parties make payments at predetermined intervals throughout the life of the swap. As a payer, a Fund would make the fixed payment and receive the floating payment. As a receiver, a Fund would make the floating payment and receive the fixed payment.
Total Return Swap—A Fund may invest in total return swaps to gain or mitigate exposure to an underlying security, or securities. Total return swap agreements may involve commitments to pay interest in exchange for the return on the underlying security, or securities. At maturity, a net cash flow is exchanged between the parties based on the total return of the underlying security, or securities, less a financing rate. As a receiver in the transaction, a Fund would receive a payment for a positive return and would make a payment for a negative return. As a payer in the transaction, a Fund would make a payment for a positive return and would receive a payment for a negative return.
Variance Swap—A Fund may invest in variance swaps in order to gain or mitigate its exposure to an underlying reference entity such as a broad based index. A variance swap is an agreement between two parties to exchange cash flows based on the measured variance of a reference entity. The payer agrees to exchange the fixed rate, which is the variance strike price of the reference entity, to the receiver for the floating rate, which is the realized variance price of the reference entity. At the time the trade is originated, the agreed upon variance strike price is generally set so that the fair value of the swap is near zero. At maturity, a net cash flow is exchanged between the parties based on the difference between the final realized variance price of the swap and the variance strike price multiplied by the notional, or vega amount. As a receiver of the floating rate, a Fund would receive a payment if the final realized variance price is greater than the variance strike price and would make a payment if the final realized variance price is less than the variance strike price. As a payer of the floating rate, a Fund would receive a payment if the final realized variance price is less than the variance strike price and would make a payment if the final realized variance price is greater than the variance strike price.
| 128 | Annual Report | December 31, 2020 |
Notes to Financial Statements
The following table presents the value of financial derivative instruments, by Fund and primary risk exposure, as of December 31, 2020, and their respective location in the Statements of Assets and Liabilities (in thousands):
| | | Assets | | | Liabilities | |
Fund and
Primary Risk Exposure | | Statements of Assets
and Liabilities | | Value | | | Statements of Assets
and Liabilities | | Value | |
| Bond | | | | | | | | | | | | |
| Credit | | Receivable for variation margin on centrally cleared swaps(1) | | $ | — | | | Payable for variation margin on centrally cleared swaps(1) | | $ | 878 | |
| Income | | | | | | | | | | | | |
| Credit | | Receivable for variation margin on centrally cleared swaps(1) | | | — | | | Payable for variation margin on centrally cleared swaps(1) | | | 324 | |
| Macro Allocation | | | | | | | | | | | | |
| Credit | | Receivable for variation margin on centrally cleared swaps(1) | | | 43 | | | Payable for variation margin on centrally cleared swaps(1) | | | — | |
| Currency | | Unrealized appreciation on forward foreign currency contracts | | | 5,212 | | | Unrealized depreciation on forward foreign currency contracts | | | 4,400 | |
| Equity | | Receivable for futures variation margin(1) | | | 466 | | | Payable for futures variation margin(1) | | | 6,488 | |
| Equity | | Unrealized appreciation on swap contracts | | | 340 | | | Unrealized depreciation on swap contracts | | | 71 | |
| Interest rate | | Unrealized appreciation on swap contracts | | | 69 | | | Unrealized depreciation on swap contracts | | | 2 | |
| Interest rate | | Receivable for futures variation margin(1) | | | — | | | Payable for futures variation margin(1) | | | 17 | |
| Interest rate | | Receivable for variation margin on centrally cleared swaps(1) | | | 193 | | | Payable for variation margin on centrally cleared swaps(1) | | | — | |
| (1) | The table above includes cumulative appreciation/(depreciation) on futures contracts and centrally cleared swaps as reported in the applicable Fund’s Portfolio of Investments. Receivable/payable for variation margin on futures contracts and centrally cleared swaps as reported in the applicable Fund’s Statement of Assets and Liabilities represents the current day’s variation margin. |
| December 31, 2020 | William Blair Funds | 129 |
Notes to Financial Statements
The following table indicates the effect of derivatives, by Fund and primary risk exposure, in the Statements of Operations for the year ended December 31, 2020 (in thousands):
| | | Net Realized Gain (Loss) | | | Change in Net Unrealized
Appreciation (Depreciation) | |
Fund and
Primary Risk Exposure | | Statements of Operations | | Value | | | Statements of Operations | | Value | |
| Small-Mid Cap Core | | | | | | | | | | | | |
| Equity | | Futures contracts | | $ | (640 | ) | | Futures contracts | | $ | — | |
| Bond | | | | | | | | | | | | |
| Credit | | Swaps | | | 370 | | | Swaps | | | (252 | ) |
| Income | | | | | | | | | | | | |
| Credit | | Swaps | | | (26 | ) | | Swaps | | | (324 | ) |
| Low Duration | | | | | | | | | | | | |
| Credit | | Swaps | | | (56 | ) | | Swaps | | | — | |
| Macro Allocation | | | | | | | | | | | | |
| Credit | | Swaps | | | 37 | | | Swaps | | | (67 | ) |
| Currency | | Forward foreign currency contracts | | | (12,975 | ) | | Forward foreign currency contracts | | | 3,624 | |
| Equity | | Futures contracts | | | (35,796 | ) | | Futures contracts | | | (1,834 | ) |
| Equity | | Options | | | (6,041 | ) | | Options | | | — | |
| Equity | | Swaps | | | 631 | | | Swaps | | | (712 | ) |
| Interest rate | | Futures contracts | | | 1,056 | | | Futures contracts | | | 775 | |
| Interest rate | | Swaps | | | 2,781 | | | Swaps | | | 340 | |
The following table is a summary by counterparty of the derivative instruments and collateral pledged/(received) included in the Macro Allocation Fund’s Statement of Assets and Liabilities at December 31, 2020 (in thousands):
| | | Financial Derivative Assets | | Financial Derivative Liabilities | | | | | | |
| Counterparty | Forward
Foreign
Currency
Contracts | | Swaps | | Total | | Forward
Foreign
Currency
Contracts | | Swaps | | Total | | Net
Market
Value | | Collateral
Pledged
(Received) | | Net
Exposure |
| Citibank N.A. | | | $5,212 | | | $ | — | | | $ | 5,212 | | | $ | (4,400 | ) | | | $ — | | | $ | (4,400 | ) | | $ | 812 | | | | $(812 | ) | | | $ — | |
| Credit Suisse | | | — | | | | 409 | | | | 409 | | | | — | | | | (73 | ) | | | (73 | ) | | | 336 | | | | — | | | | 336 | |
| | | | $5,212 | | | $ | 409 | | | $ | 5,621 | | | $ | (4,400 | ) | | | $ (73 | ) | | $ | (4,473 | ) | | | | | | | | | | | | |
The net exposure represents the amount due from/(due to) the counterparty in the event of default. Any net exposure is generally due to changes in market value of the underlying derivative instruments on the last day of the period as timing of collateral movement occurs the following day. For Citibank N.A., the table does not include additional collateral received in the amount of $208 (in thousands). For Credit Suisse, the table does not include collateral pledged in the amount of $1,146 (in thousands) that is necessary to cover initial margin requirements on OTC swap contracts.
| 130 | Annual Report | December 31, 2020 |
Notes to Financial Statements
(7) Fund Share Transactions
The following tables summarize the activity in capital shares of each Fund for the year ended December 31, 2020 (in thousands):
| | | Class N | |
| | | Dollars | | | Shares | |
| Fund | | Sales | | | Reinvest | | | Redemptions | | | Total | | | Sales | | | Reinvest | | | Redemptions | | | Total | |
| Growth | | $ | 2,054 | | | | $ 4,719 | | | | $ 9,133 | | | $ | (2,360 | ) | | | 199 | | | | 428 | | | | 907 | | | | (280 | ) |
| Large Cap Growth | | | 103,916 | | | | 5,098 | | | | 72,994 | | | | 36,020 | | | | 6,564 | | | | 257 | | | | 4,199 | | | | 2,622 | |
| Mid Cap Growth | | | 580 | | | | 436 | | | | 1,290 | | | | (274 | ) | | | 58 | | | | 34 | | | | 118 | | | | (26 | ) |
| Small-Mid Cap Growth | | | 52,389 | | | | 5,571 | | | | 146,798 | | | | (88,838 | ) | | | 2,096 | | | | 172 | | | | 5,868 | | | | (3,600 | ) |
| Small-Mid Cap Value | | | 34 | | | | 2 | | | | 222 | | | | (186 | ) | | | 5 | | | | — | | | | 26 | | | | (21 | ) |
| Small Cap Growth | | | 33,285 | | | | 18,183 | | | | 79,823 | | | | (28,355 | ) | | | 1,253 | | | | 536 | | | | 3,063 | | | | (1,274 | ) |
| Small Cap Value | | | 1,442 | | | | 2,112 | | | | 5,248 | | | | (1,694 | ) | | | 132 | | | | 176 | | | | 465 | | | | (157 | ) |
| Global Leaders | | | 1,294 | | | | 1,318 | | | | 1,082 | | | | 1,530 | | | | 79 | | | | 76 | | | | 71 | | | | 84 | |
| International Leaders | | | 13,189 | | | | 140 | | | | 7,585 | | | | 5,744 | | | | 660 | | | | 6 | | | | 420 | | | | 246 | |
| International Growth | | | 35,689 | | | | 2,302 | | | | 270,854 | | | | (232,863 | ) | | | 1,431 | | | | 60 | | | | 10,703 | | | | (9,212 | ) |
| International Small Cap Growth | | | 156 | | | | 57 | | | | 1,156 | | | | (943 | ) | | | 12 | | | | 3 | | | | 101 | | | | (86 | ) |
| Emerging Markets Leaders | | | 4,442 | | | | 16 | | | | 4,880 | | | | (422 | ) | | | 432 | | | | 1 | | | | 474 | | | | (41 | ) |
| Emerging Markets Growth | | | 11,134 | | | | 382 | | | | 3,715 | | | | 7,801 | | | | 677 | | | | 21 | | | | 259 | | | | 439 | |
| Emerging Markets Small Cap Growth | | | 97 | | | | — | | | | 1,036 | | | | (939 | ) | | | 5 | | | | — | | | | 67 | | | | (62 | ) |
| Bond | | | 17,987 | | | | 1,085 | | | | 12,752 | | | | 6,320 | | | | 1,685 | | | | 102 | | | | 1,228 | | | | 559 | |
| Income | | | 9,681 | | | | 538 | | | | 7,582 | | | | 2,637 | | | | 1,117 | | | | 62 | | | | 875 | | | | 304 | |
| Low Duration | | | 21,451 | | | | 185 | | | | 9,322 | | | | 12,314 | | | | 2,468 | | | | 21 | | | | 1,074 | | | | 1,415 | |
| Macro Allocation | | | 1,054 | | | | 78 | | | | 6,566 | | | | (5,434 | ) | | | 97 | | | | 7 | | | | 602 | | | | (498 | ) |
| | | | | | | | | | | | | | | | | | | | | | | | | | | | | | | | | |
| | | Class I | |
| | | Dollars | | | Shares | |
| Fund | | Sales | | | Reinvest | | | Redemptions | | | Total | | | Sales | | | Reinvest | | | Redemptions | | | Total | |
| Growth | | $ | 14,750 | | | | $26,685 | | | | $ 54,977 | | | $ | (13,542 | ) | | | 1,235 | | | | 1,980 | | | | 4,530 | | | | (1,315 | ) |
| Large Cap Growth | | | 219,016 | | | | 11,860 | | | | 185,086 | | | | 45,790 | | | | 12,682 | | | | 563 | | | | 9,216 | | | | 4,029 | |
| Mid Cap Growth | | | 10,548 | | | | 5,059 | | | | 17,687 | | | | (2,080 | ) | | | 885 | | | | 363 | | | | 1,472 | | | | (224 | ) |
| Small-Mid Cap Core | | | 265,306 | | | | — | | | | 236,282 | | | | 29,024 | | | | 24,899 | | | | — | | | | 23,271 | | | | 1,628 | |
| Small-Mid Cap Growth | | | 704,716 | | | | 50,709 | | | | 850,114 | | | | (94,689 | ) | | | 25,299 | | | | 1,466 | | | | 31,213 | | | | (4,448 | ) |
| Small-Mid Cap Value | | | 3,110 | | | | 27 | | | | 6,035 | | | | (2,898 | ) | | | 300 | | | | 3 | | | | 833 | | | | (530 | ) |
| Small Cap Growth | | | 53,293 | | | | 34,928 | | | | 185,988 | | | | (97,767 | ) | | | 1,750 | | | | 902 | | | | 6,319 | | | | (3,667 | ) |
| Small Cap Value | | | 13,215 | | | | 25,566 | | | | 100,768 | | | | (61,987 | ) | | | 1,144 | | | | 2,043 | | | | 9,063 | | | | (5,876 | ) |
| Global Leaders | | | 12,040 | | | | 12,211 | | | | 46,586 | | | | (22,335 | ) | | | 853 | | | | 705 | | | | 3,092 | | | | (1,534 | ) |
| International Leaders | | | 216,096 | | | | 2,810 | | | | 68,924 | | | | 149,982 | | | | 10,917 | | | | 125 | | | | 3,796 | | | | 7,246 | |
| International Growth | | | 272,612 | | | | 19,944 | | | | 417,516 | | | | (124,960 | ) | | | 10,406 | | | | 512 | | | | 13,740 | | | | (2,822 | ) |
| International Small Cap Growth | | | 23,282 | | | | 2,718 | | | | 51,685 | | | | (25,685 | ) | | | 1,680 | | | | 158 | | | | 3,837 | | | | (1,999 | ) |
| Emerging Markets Leaders | | | 15,739 | | | | 590 | | | | 10,915 | | | | 5,414 | | | | 1,480 | | | | 45 | | | | 1,115 | | | | 410 | |
| Emerging Markets Growth | | | 28,566 | | | | 4,194 | | | | 18,435 | | | | 14,325 | | | | 1,793 | | | | 230 | | | | 1,249 | | | | 774 | |
| Emerging Markets Small Cap Growth | | | 17,451 | | | | 62 | | | | 44,837 | | | | (27,324 | ) | | | 1,057 | | | | 3 | | | | 2,759 | | | | (1,699 | ) |
| Bond | | | 71,936 | | | | 5,973 | | | | 59,078 | | | | 18,831 | | | | 6,799 | | | | 567 | | | | 5,669 | | | | 1,697 | |
| Income | | | 23,843 | | | | 930 | | | | 11,163 | | | | 13,610 | | | | 2,754 | | | | 108 | | | | 1,297 | | | | 1,565 | |
| Low Duration | | | 111,572 | | | | 1,820 | | | | 46,902 | | | | 66,490 | | | | 12,854 | | | | 210 | | | | 5,414 | | | | 7,650 | |
| Macro Allocation | | | 46,704 | | | | 2,087 | | | | 218,856 | | | | (170,065 | ) | | | 4,300 | | | | 192 | | | | 20,335 | | | | (15,843 | ) |
| December 31, 2020 | William Blair Funds | 131 |
Notes to Financial Statements
| | | Institutional/Class R6 | |
| | | Dollars | | | Shares | |
| Fund | | Sales | | | Reinvest | | | Redemptions | | | Total | | | Sales | | | Reinvest | | | Redemptions | | | Total | |
| Growth | | $ | 11,384 | | | | $ 1,332 | | | | $ 1,426 | | | $ | 11,290 | | | | 868 | | | | 99 | | | | 105 | | | | 862 | |
| Large Cap Growth | | | 171,386 | | | | 5,663 | | | | 4,494 | | | | 172,555 | | | | 8,196 | | | | 269 | | | | 225 | | | | 8,240 | |
| Mid Cap Growth | | | 361 | | | | 42 | | | | — | | | | 403 | | | | 29 | | | | 3 | | | | — | | | | 32 | |
| Small-Mid Cap Core | | | 901 | | | | — | | | | 43 | | | | 858 | | | | 93 | | | | — | | | | 5 | | | | 88 | |
| Small-Mid Cap Growth | | | 72,243 | | | | 1,722 | | | | 15,219 | | | | 58,746 | | | | 2,470 | | | | 50 | | | | 497 | | | | 2,023 | |
| Small-Mid Cap Value | | | 127 | | | | 8 | | | | 5 | | | | 130 | | | | 12 | | | | 1 | | | | — | | | | 13 | |
| Small Cap Growth | | | 27,131 | | | | 8,907 | | | | 15,142 | | | | 20,896 | | | | 748 | | | | 230 | | | | 466 | | | | 512 | |
| Small Cap Value | | | 8,341 | | | | 200 | | | | 599 | | | | 7,942 | | | | 758 | | | | 16 | | | | 51 | | | | 723 | |
| Global Leaders | | | 3,767 | | | | 323 | | | | 50,716 | | | | (46,626 | ) | | | 263 | | | | 19 | | | | 3,336 | | | | (3,054 | ) |
| International Leaders | | | 161,317 | | | | 5,704 | | | | 68,132 | | | | 98,889 | | | | 8,186 | | | | 253 | | | | 3,738 | | | | 4,701 | |
| International Growth | | | 37,075 | | | | 1,007 | | | | 12,279 | | | | 25,803 | | | | 1,104 | | | | 26 | | | | 414 | | | | 716 | |
| Institutional International Growth | | | 148,064 | | | | 150,369 | | | | 1,102,278 | | | | (803,845 | ) | | | 8,792 | | | | 7,511 | | | | 60,324 | | | | (44,021 | ) |
| International Small Cap Growth | | | 19,209 | | | | 3,641 | | | | 35,644 | | | | (12,794 | ) | | | 1,297 | | | | 210 | | | | 2,453 | | | | (946 | ) |
| Emerging Markets Leaders | | | 40,847 | | | | 2,293 | | | | 78,532 | | | | (35,392 | ) | | | 3,598 | | | | 175 | | | | 7,041 | | | | (3,268 | ) |
| Emerging Markets Growth | | | 278,462 | | | | 39,570 | | | | 225,547 | | | | 92,485 | | | | 18,092 | | | | 2,152 | | | | 14,653 | | | | 5,591 | |
| Emerging Markets Small Cap Growth | | | 54,151 | | | | 129 | | | | 71,930 | | | | (17,650 | ) | | | 3,232 | | | | 6 | | | | 4,178 | | | | (940 | ) |
| Bond | | | 5,988 | | | | 1,653 | | | | 4,616 | | | | 3,025 | | | | 568 | | | | 157 | | | | 437 | | | | 288 | |
| Income | | | 16 | | | | 2 | | | | — | | | | 18 | | | | 2 | | | | — | | | | — | | | | 2 | |
| Low Duration | | | 33,079 | | | | 644 | | | | 29,885 | | | | 3,838 | | | | 3,815 | | | | 74 | | | | 3,442 | | | | 447 | |
| Macro Allocation | | | 28,210 | | | | 2,521 | | | | 212,589 | | | | (181,858 | ) | | | 2,528 | | | | 232 | | | | 19,934 | | | | (17,174 | ) |
| | | | | | | | | | | | | | | | | | | | | | | | | | | | | | | | | |
| | | Net Change in Net Assets Relating to Fund Share Activity | |
| | | Dollars | | | Shares | |
| Fund | | Sales | | | Reinvest | | | Redemptions | | | Total | | | Sales | | | Reinvest | | | Redemptions | | | Total | |
| Growth | | $ | 28,188 | | | | $ 32,736 | | | | $ 65,536 | | | $ | (4,612 | ) | | | 2,302 | | | | 2,507 | | | | 5,542 | | | | (733 | ) |
| Large Cap Growth | | | 494,318 | | | | 22,621 | | | | 262,574 | | | | 254,365 | | | | 27,442 | | | | 1,089 | | | | 13,640 | | | | 14,891 | |
| Mid Cap Growth | | | 11,489 | | | | 5,537 | | | | 18,977 | | | | (1,951 | ) | | | 972 | | | | 400 | | | | 1,590 | | | | (218 | ) |
| Small-Mid Cap Core | | | 266,207 | | | | — | | | | 236,325 | | | | 29,882 | | | | 24,992 | | | | — | | | | 23,276 | | | | 1,716 | |
| Small-Mid Cap Growth | | | 829,348 | | | | 58,002 | | | | 1,012,131 | | | | (124,781 | ) | | | 29,865 | | | | 1,688 | | | | 37,578 | | | | (6,025 | ) |
| Small-Mid Cap Value | | | 3,271 | | | | 37 | | | | 6,262 | | | | (2,954 | ) | | | 317 | | | | 4 | | | | 859 | | | | (538 | ) |
| Small Cap Growth | | | 113,709 | | | | 62,018 | | | | 280,953 | | | | (105,226 | ) | | | 3,751 | | | | 1,668 | | | | 9,848 | | | | (4,429 | ) |
| Small Cap Value | | | 22,998 | | | | 27,878 | | | | 106,615 | | | | (55,739 | ) | | | 2,034 | | | | 2,235 | | | | 9,579 | | | | (5,310 | ) |
| Global Leaders | | | 17,101 | | | | 13,852 | | | | 98,384 | | | | (67,431 | ) | | | 1,195 | | | | 800 | | | | 6,499 | | | | (4,504 | ) |
| International Leaders | | | 390,602 | | | | 8,654 | | | | 144,641 | | | | 254,615 | | | | 19,763 | | | | 384 | | | | 7,954 | | | | 12,193 | |
| International Growth | | | 345,376 | | | | 23,253 | | | | 700,649 | | | | (332,020 | ) | | | 12,941 | | | | 598 | | | | 24,857 | | | | (11,318 | ) |
| Institutional International Growth | | | 148,064 | | | | 150,369 | | | | 1,102,278 | | | | (803,845 | ) | | | 8,792 | | | | 7,511 | | | | 60,324 | | | | (44,021 | ) |
| International Small Cap Growth | | | 42,647 | | | | 6,416 | | | | 88,485 | | | | (39,422 | ) | | | 2,989 | | | | 371 | | | | 6,391 | | | | (3,031 | ) |
| Emerging Markets Leaders | | | 61,028 | | | | 2,899 | | | | 94,327 | | | | (30,400 | ) | | | 5,510 | | | | 221 | | | | 8,630 | | | | (2,899 | ) |
| Emerging Markets Growth | | | 318,162 | | | | 44,146 | | | | 247,697 | | | | 114,611 | | | | 20,562 | | | | 2,403 | | | | 16,161 | | | | 6,804 | |
| Emerging Markets Small Cap Growth | | | 71,699 | | | | 191 | | | | 117,803 | | | | (45,913 | ) | | | 4,294 | | | | 9 | | | | 7,004 | | | | (2,701 | ) |
| Bond | | | 95,911 | | | | 8,711 | | | | 76,446 | | | | 28,176 | | | | 9,052 | | | | 826 | | | | 7,334 | | | | 2,544 | |
| Income | | | 33,540 | | | | 1,470 | | | | 18,745 | | | | 16,265 | | | | 3,873 | | | | 170 | | | | 2,172 | | | | 1,871 | |
| Low Duration | | | 166,102 | | | | 2,649 | | | | 86,109 | | | | 82,642 | | | | 19,137 | | | | 305 | | | | 9,930 | | | | 9,512 | |
| Macro Allocation | | | 75,968 | | | | 4,686 | | | | 438,011 | | | | (357,357 | ) | | | 6,925 | | | | 431 | | | | 40,871 | | | | (33,515 | ) |
| 132 | Annual Report | December 31, 2020 |
Notes to Financial Statements
The following tables summarize the activity in capital shares of each Fund for the year ended December 31, 2019 (in thousands):
| | | Class N | |
| | | Dollars | | | Shares | |
| Fund | | Sales | | | Reinvest | | | Redemptions | | | Total | | | Sales | | | Reinvest | | | Redemptions | | | Total | |
| Growth | | $ | 4,699 | | | | $ 3,142 | | | | $ 21,051 | | | $ | (13,210 | ) | | | 512 | | | | 339 | | | | 2,242 | | | | (1,391 | ) |
| Large Cap Growth | | | 33,843 | | | | 3,913 | | | | 25,920 | | | | 11,836 | | | | 2,320 | | | | 263 | | | | 1,756 | | | | 827 | |
| Mid Cap Growth | | | 476 | | | | 431 | | | | 1,578 | | | | (671 | ) | | | 43 | | | | 40 | | | | 143 | | | | (60 | ) |
| Small-Mid Cap Growth | | | 74,019 | | | | 23,898 | | | | 268,742 | | | | (170,825 | ) | | | 2,970 | | | | 946 | | | | 11,034 | | | | (7,118 | ) |
| Small-Mid Cap Value | | | 102 | | | | 6 | | | | 76 | | | | 32 | | | | 10 | | | | — | | | | 7 | | | | 3 | |
| Small Cap Growth | | | 57,125 | | | | 4,113 | | | | 83,288 | | | | (22,050 | ) | | | 2,151 | | | | 150 | | | | 3,066 | | | | (765 | ) |
| Small Cap Value | | | 2,377 | | | | 495 | | | | 9,131 | | | | (6,259 | ) | | | 138 | | | | 29 | | | | 531 | | | | (364 | ) |
| Global Leaders | | | 953 | | | | 98 | | | | 1,463 | | | | (412 | ) | | | 72 | | | | 7 | | | | 112 | | | | (33 | ) |
| International Leaders | | | 2,342 | | | | 37 | | | | 2,610 | | | | (231 | ) | | | 145 | | | | 2 | | | | 161 | | | | (14 | ) |
| International Growth | | | 44,662 | | | | 5,263 | | | | 133,868 | | | | (83,943 | ) | | | 1,723 | | | | 183 | | | | 5,050 | | | | (3,144 | ) |
| International Small Cap Growth | | | 76 | | | | 3 | | | | 908 | | | | (829 | ) | | | 7 | | | | — | | | | 75 | | | | (68 | ) |
| Emerging Markets Leaders | | | 3,645 | | | | 11 | | | | 4,555 | | | | (899 | ) | | | 388 | | | | 1 | | | | 483 | | | | (94 | ) |
| Emerging Markets Growth | | | 1,739 | | | | 300 | | | | 2,909 | | | | (870 | ) | | | 142 | | | | 23 | | | | 231 | | | | (66 | ) |
| Emerging Markets Small Cap Growth | | | 561 | | | | — | | | | 6,536 | | | | (5,975 | ) | | | 37 | | | | — | | | | 440 | | | | (403 | ) |
| Bond | | | 13,853 | | | | 2,166 | | | | 58,587 | | | | (42,568 | ) | | | 1,355 | | | | 212 | | | | 5,682 | | | | (4,115 | ) |
| Income | | | 2,090 | | | | 686 | | | | 6,085 | | | | (3,309 | ) | | | 245 | | | | 80 | | | | 714 | | | | (389 | ) |
| Low Duration | | | 613 | | | | 53 | | | | 809 | | | | (143 | ) | | | 70 | | | | 6 | | | | 93 | | | | (17 | ) |
| Macro Allocation | | | 6,932 | | | | 489 | | | | 37,706 | | | | (30,285 | ) | | | 607 | | | | 43 | | | | 3,261 | | | | (2,611 | ) |
| | | | | | | | | | | | | | | | | | | | | | | | | | | | | | | | | |
| | | Class I | |
| | | Dollars | | | Shares | |
| Fund | | Sales | | | Reinvest | | | Redemptions | | | Total | | | Sales | | | Reinvest | | | Redemptions | | | Total | |
| Growth | | $ | 16,720 | | | | $ 17,115 | | | | $ 41,128 | | | $ | (7,293 | ) | | | 1,519 | | | | 1,552 | | | | 3,712 | | | | (641 | ) |
| Large Cap Growth | | | 87,517 | | | | 9,125 | | | | 36,804 | | | | 59,838 | | | | 5,611 | | | | 578 | | | | 2,424 | | | | 3,765 | |
| Mid Cap Growth | | | 9,653 | | | | 5,374 | | | | 11,067 | | | | 3,960 | | | | 818 | | | | 460 | | | | 945 | | | | 333 | |
| Small-Mid Cap Core (a) | | | 1,600 | | | | 1 | | | | 1 | | | | 1,600 | | | | 155 | | | | — | | | | — | | | | 155 | |
| Small-Mid Cap Growth | | | 722,356 | | | | 166,901 | | | | 775,495 | | | | 113,762 | | | | 27,182 | | | | 6,225 | | | | 29,057 | | | | 4,350 | |
| Small-Mid Cap Value | | | 6,397 | | | | 130 | | | | 1,342 | | | | 5,185 | | | | 589 | | | | 12 | | | | 125 | | | | 476 | |
| Small Cap Growth | | | 137,860 | | | | 8,577 | | | | 216,223 | | | | (69,786 | ) | | | 4,617 | | | | 278 | | | | 7,091 | | | | (2,196 | ) |
| Small Cap Value | | | 47,012 | | | | 14,487 | | | | 449,289 | | | | (387,790 | ) | | | 2,655 | | | | 811 | | | | 25,120 | | | | (21,654 | ) |
| Global Leaders | | | 13,378 | | | | 1,486 | | | | 9,732 | | | | 5,132 | | | | 983 | | | | 102 | | | | 710 | | | | 375 | |
| International Leaders | | | 93,939 | | | | 938 | | | | 21,157 | | | | 73,720 | | | | 5,758 | | | | 53 | | | | 1,312 | | | | 4,499 | |
| International Growth | | | 187,914 | | | | 18,095 | | | | 720,429 | | | | (514,420 | ) | | | 7,104 | | | | 614 | | | | 26,516 | | | | (18,798 | ) |
| International Small Cap Growth | | | 37,548 | | | | 370 | | | | 104,497 | | | | (66,579 | ) | | | 3,181 | | | | 27 | | | | 8,815 | | | | (5,607 | ) |
| Emerging Markets Leaders | | | 11,138 | | | | 376 | | | | 10,689 | | | | 825 | | | | 1,144 | | | | 37 | | | | 1,102 | | | | 79 | |
| Emerging Markets Growth | | | 6,749 | | | | 2,839 | | | | 31,465 | | | | (21,877 | ) | | | 529 | | | | 211 | | | | 2,480 | | | | (1,740 | ) |
| Emerging Markets Small Cap Growth | | | 34,235 | | | | 217 | | | | 89,550 | | | | (55,098 | ) | | | 2,330 | | | | 13 | | | | 5,987 | | | | (3,644 | ) |
| Bond | | | 63,530 | | | | 8,645 | | | | 165,844 | | | | (93,669 | ) | | | 6,285 | | | | 855 | | | | 16,289 | | | | (9,149 | ) |
| Income | | | 15,837 | | | | 1,281 | | | | 21,322 | | | | (4,204 | ) | | | 1,889 | | | | 151 | | | | 2,517 | | | | (477 | ) |
| Low Duration | | | 5,864 | | | | 1,972 | | | | 25,726 | | | | (17,890 | ) | | | 673 | | | | 226 | | | | 2,953 | | | | (2,054 | ) |
| Macro Allocation | | | 95,661 | | | | 13,901 | | | | 238,819 | | | | (129,257 | ) | | | 8,287 | | | | 1,233 | | | | 20,648 | | | | (11,128 | ) |
| December 31, 2020 | William Blair Funds | 133 |
Notes to Financial Statements
| | | Institutional/Class R6 | |
| | | Dollars | | | Shares | |
| Fund | | Sales | | | Reinvest | | | Redemptions | | | Total | | | Sales | | | Reinvest | | | Redemptions | | | Total | |
| Growth (b) | | $ | 253 | | | | $ 17 | | | | $ 50 | | | $ | 220 | | | | 21 | | | | 2 | | | | 4 | | | | 19 | |
| Large Cap Growth (b) | | | 1,614 | | | | 96 | | | | 103 | | | | 1,607 | | | | 98 | | | | 6 | | | | 6 | | | | 98 | |
| Mid Cap Growth (b) | | | 185 | | | | 12 | | | | 50 | | | | 147 | | | | 15 | | | | 1 | | | | 4 | | | | 12 | |
| Small-Mid Cap Core (a) | | | 4,638 | | | | 3 | | | | 23 | | | | 4,618 | | | | 464 | | | | — | | | | 2 | | | | 462 | |
| Small-Mid Cap Growth (b) | | | 39,365 | | | | 2,655 | | | | 1,015 | | | | 41,005 | | | | 1,417 | | | | 99 | | | | 36 | | | | 1,480 | |
| Small-Mid Cap Value (b) | | | 569 | | | | 3 | | | | 395 | | | | 177 | | | | 52 | | | | — | | | | 37 | | | | 15 | |
| Small Cap Growth (b) | | | 70,364 | | | | 1,345 | | | | 6,230 | | | | 65,479 | | | | 2,272 | | | | 44 | | | | 202 | | | | 2,114 | |
| Small Cap Value (b) | | | 594 | | | | 16 | | | | 95 | | | | 515 | | | | 32 | | | | 1 | | | | 5 | | | | 28 | |
| Global Leaders | | | 2,233 | | | | 657 | | | | 54,453 | | | | (51,563 | ) | | | 167 | | | | 45 | | | | 3,935 | | | | (3,723 | ) |
| International Leaders | | | 54,037 | | | | 2,274 | | | | 25,678 | | | | 30,633 | | | | 3,363 | | | | 129 | | | | 1,540 | | | | 1,952 | |
| International Growth (b) | | | 57,826 | | | | 819 | | | | 2,257 | | | | 56,388 | | | | 2,087 | | | | 28 | | | | 77 | | | | 2,038 | |
| Institutional International Growth | | | 192,878 | | | | 17,852 | | | | 574,855 | | | | (364,125 | ) | | | 12,482 | | | | 1,060 | | | | 37,590 | | | | (24,048 | ) |
| International Small Cap Growth | | | 8,293 | | | | 596 | | | | 66,807 | | | | (57,918 | ) | | | 690 | | | | 44 | | | | 5,534 | | | | (4,800 | ) |
| Emerging Markets Leaders | | | 23,896 | | | | 1,819 | | | | 39,496 | | | | (13,781 | ) | | | 2,519 | | | | 179 | | | | 4,094 | | | | (1,396 | ) |
| Emerging Markets Growth | | | 163,145 | | | | 23,530 | | | | 277,695 | | | | (91,020 | ) | | | 12,739 | | | | 1,737 | | | | 21,289 | | | | (6,813 | ) |
| Emerging Markets Small Cap Growth | | | 26,072 | | | | 248 | | | | 15,489 | | | | 10,831 | | | | 1,756 | | | | 15 | | | | 1,035 | | | | 736 | |
| Bond | | | 3,036 | | | | 2,432 | | | | 37,075 | | | | (31,607 | ) | | | 304 | | | | 241 | | | | 3,654 | | | | (3,109 | ) |
| Income (b) | | | 50 | | | | 1 | | | | — | | | | 51 | | | | 6 | | | | — | | | | — | | | | 6 | |
| Low Duration | | | 7,532 | | | | 921 | | | | 19,111 | | | | (10,658 | ) | | | 863 | | | | 106 | | | | 2,191 | | | | (1,222 | ) |
| Macro Allocation | | | 120,202 | | | | 13,341 | | | | 147,745 | | | | (14,202 | ) | | | 10,415 | | | | 1,183 | | | | 12,734 | | | | (1,136 | ) |
| | | | | | | | | | | | | | | | | | | | | | | | | | | | | | | | | |
| | | Net Change in Net Assets Relating to Fund Share Activity | |
| | | Dollars | | | Shares | |
| Fund | | Sales | | | Reinvest | | | Redemptions | | | Total | | | Sales | | | Reinvest | | | Redemptions | | | Total | |
| Growth | | $ | 21,672 | | | | $ 20,274 | | | | $ 62,229 | | | $ | (20,283 | ) | | | 2,052 | | | | 1,893 | | | | 5,958 | | | | (2,013 | ) |
| Large Cap Growth | | | 122,974 | | | | 13,134 | | | | 62,827 | | | | 73,281 | | | | 8,029 | | | | 847 | | | | 4,186 | | | | 4,690 | |
| Mid Cap Growth | | | 10,314 | | | | 5,817 | | | | 12,695 | | | | 3,436 | | | | 876 | | | | 501 | | | | 1,092 | | | | 285 | |
| Small-Mid Cap Core (a) | | | 6,238 | | | | 4 | | | | 24 | | | | 6,218 | | | | 619 | | | | — | | | | 2 | | | | 617 | |
| Small-Mid Cap Growth | | | 835,740 | | | | 193,454 | | | | 1,045,252 | | | | (16,058 | ) | | | 31,569 | | | | 7,270 | | | | 40,127 | | | | (1,288 | ) |
| Small-Mid Cap Value | | | 7,068 | | | | 139 | | | | 1,813 | | | | 5,394 | | | | 651 | | | | 12 | | | | 169 | | | | 494 | |
| Small Cap Growth | | | 265,349 | | | | 14,035 | | | | 305,741 | | | | (26,357 | ) | | | 9,040 | | | | 472 | | | | 10,359 | | | | (847 | ) |
| Small Cap Value | | | 49,983 | | | | 14,998 | | | | 458,515 | | | | (393,534 | ) | | | 2,825 | | | | 841 | | | | 25,656 | | | | (21,990 | ) |
| Global Leaders | | | 16,564 | | | | 2,241 | | | | 65,648 | | | | (46,843 | ) | | | 1,222 | | | | 154 | | | | 4,757 | | | | (3,381 | ) |
| International Leaders | | | 150,318 | | | | 3,249 | | | | 49,445 | | | | 104,122 | | | | 9,266 | | | | 184 | | | | 3,013 | | | | 6,437 | |
| International Growth | | | 290,402 | | | | 24,177 | | | | 856,554 | | | | (541,975 | ) | | | 10,914 | | | | 825 | | | | 31,643 | | | | (19,904 | ) |
| Institutional International Growth | | | 192,878 | | | | 17,852 | | | | 574,855 | | | | (364,125 | ) | | | 12,482 | | | | 1,060 | | | | 37,590 | | | | (24,048 | ) |
| International Small Cap Growth | | | 45,917 | | | | 969 | | | | 172,212 | | | | (125,326 | ) | | | 3,878 | | | | 71 | | | | 14,424 | | | | (10,475 | ) |
| Emerging Markets Leaders | | | 38,679 | | | | 2,206 | | | | 54,740 | | | | (13,855 | ) | | | 4,051 | | | | 217 | | | | 5,679 | | | | (1,411 | ) |
| Emerging Markets Growth | | | 171,633 | | | | 26,669 | | | | 312,069 | | | | (113,767 | ) | | | 13,410 | | | | 1,971 | | | | 24,000 | | | | (8,619 | ) |
| Emerging Markets Small Cap Growth | | | 60,868 | | | | 465 | | | | 111,575 | | | | (50,242 | ) | | | 4,123 | | | | 28 | | | | 7,462 | | | | (3,311 | ) |
| Bond | | | 80,419 | | | | 13,243 | | | | 261,506 | | | | (167,844 | ) | | | 7,944 | | | | 1,308 | | | | 25,625 | | | | (16,373 | ) |
| Income | | | 17,977 | | | | 1,968 | | | | 27,407 | | | | (7,462 | ) | | | 2,140 | | | | 231 | | | | 3,231 | | | | (860 | ) |
| Low Duration | | | 14,009 | | | | 2,946 | | | | 45,646 | | | | (28,691 | ) | | | 1,606 | | | | 338 | | | | 5,237 | | | | (3,293 | ) |
| Macro Allocation | | | 222,795 | | | | 27,731 | | | | 424,270 | | | | (173,744 | ) | | | 19,309 | | | | 2,459 | | | | 36,643 | | | | (14,875 | ) |
| (a) | For the period from October 1, 2019 (Commencement of Operations) to December 31, 2019. |
| (b) | For the period from May 2, 2019 (Commencement of Operations) to December 31, 2019. |
| 134 | Annual Report | December 31, 2020 |
Notes to Financial Statements
(8) Subsequent Events
On February 23, 2021, upon the recommendation of the Adviser, the Funds’ Board of Trustees determined that it was in the best interest of Small-Mid Cap Value Fund to redeem all shares of Small-Mid Cap Value Fund outstanding on or before April 15, 2021, and then to terminate Small-Mid Cap Value Fund.
The Funds have evaluated subsequent events through the date of issuance of the Funds’ financial statements and have determined there are no other impacts to the Funds’ financial statements.
| December 31, 2020 | William Blair Funds | 135 |
Financial Highlights — For a share outstanding throughout each period
Growth Fund
| | | Class N | |
| | | Years Ended December 31, | |
| | | 2020 | | | 2019 | | | 2018 | | | 2017 | | | 2016 | |
| Net asset value, beginning of year | | $ | 9.45 | | | $ | 7.91 | | | $ | 10.27 | | | $ | 11.41 | | | $ | 12.52 | |
| Income (loss) from investment operations: | | | | | | | | | | | | | | | | | | | | |
| Net investment income (loss) | | | (0.05 | ) | | | (0.03 | ) | | | (0.04 | ) | | | (0.02 | ) | | | (0.02 | ) |
| Net realized and unrealized gain (loss) on investments | | | 3.43 | | | | 2.54 | | | | 0.75 | | | | 2.78 | | | | (0.08 | ) |
| Total from investment operations | | | 3.38 | | | | 2.51 | | | | 0.71 | | | | 2.76 | | | | (0.10 | ) |
| Less distributions from: | | | | | | | | | | | | | | | | | | | | |
| Net investment income | | | — | | | | — | | | | — | | | | — | | | | — | |
| Net realized gain | | | 1.68 | | | | 0.97 | | | | 3.07 | | | | 3.90 | | | | 1.01 | |
| Total distributions | | | 1.68 | | | | 0.97 | | | | 3.07 | | | | 3.90 | | | | 1.01 | |
| Net asset value, end of year | | $ | 11.15 | | | $ | 9.45 | | | $ | 7.91 | | | $ | 10.27 | | | $ | 11.41 | |
| Total return (%) | | | 35.97 | | | | 31.97 | | | | 5.10 | | | | 24.35 | | | | (0.98 | ) |
| Ratios to average daily net assets (%): | | | | | | | | | | | | | | | | | | | | |
| Expenses, before waivers and reimbursements | | | 1.26 | | | | 1.24 | | | | 1.22 | | | | 1.20 | | | | 1.21 | |
| Expenses, net of waivers and reimbursements | | | 1.20 | | | | 1.20 | | | | 1.20 | | | | 1.20 | | | | 1.21 | |
| Net investment income (loss), before waivers and reimbursements | | | (0.55 | ) | | | (0.35 | ) | | | (0.36 | ) | | | (0.14 | ) | | | (0.15 | ) |
| Net investment income (loss), net of waivers and reimbursements | | | (0.49 | ) | | | (0.31 | ) | | | (0.34 | ) | | | (0.14 | ) | | | (0.15 | ) |
| Class N net assets at the end of the year (in thousands) | | $ | 35,494 | | | $ | 32,710 | | | $ | 38,370 | | | $ | 34,886 | | | $ | 62,936 | |
| Portfolio turnover rate (%) | | | 46 | | | | 39 | | | | 46 | | | | 38 | | | | 79 | |
| | | | | | | | | | | | | | | | | | | | | |
| | | Class I | |
| | | Years Ended December 31, | |
| | | | 2020 | | | | 2019 | | | | 2018 | | | | 2017 | | | | 2016 | |
| Net asset value, beginning of year | | $ | 11.25 | | | $ | 9.25 | | | $ | 11.51 | | | $ | 12.39 | | | $ | 13.50 | |
| Income (loss) from investment operations: | | | | | | | | | | | | | | | | | | | | |
| Net investment income (loss) | | | (0.03 | ) | | | (0.00 | )^ | | | (0.01 | ) | | | 0.02 | | | | 0.03 | |
| Net realized and unrealized gain (loss) on investments | | | 4.10 | | | | 2.97 | | | | 0.82 | | | | 3.02 | | | | (0.10 | ) |
| Total from investment operations | | | 4.07 | | | | 2.97 | | | | 0.81 | | | | 3.04 | | | | (0.07 | ) |
| Less distributions from: | | | | | | | | | | | | | | | | | | | | |
| Net investment income | | | — | | | | — | | | | 0.00 | ^ | | | 0.02 | | | | 0.03 | |
| Net realized gain | | | 1.68 | | | | 0.97 | | | | 3.07 | | | | 3.90 | | | | 1.01 | |
| Total distributions | | | 1.68 | | | | 0.97 | | | | 3.07 | | | | 3.92 | | | | 1.04 | |
| Net asset value, end of year | | $ | 13.64 | | | $ | 11.25 | | | $ | 9.25 | | | $ | 11.51 | | | $ | 12.39 | |
| Total return (%) | | | 36.35 | | | | 32.32 | | | | 5.42 | | | | 24.64 | | | | (0.69 | ) |
| Ratios to average daily net assets (%): | | | | | | | | | | | | | | | | | | | | |
| Expenses | | | 0.93 | | | | 0.92 | | | | 0.91 | | | | 0.92 | | | | 0.90 | |
| Net investment income (loss) | | | (0.23 | ) | | | (0.03 | ) | | | (0.06 | ) | | | 0.12 | | | | 0.20 | |
| Class I net assets at the end of the year (in thousands) | | $ | 249,716 | | | $ | 220,660 | | | $ | 187,306 | | | $ | 318,848 | | | $ | 514,870 | |
| Portfolio turnover rate (%) | | | 46 | | | | 39 | | | | 46 | | | | 38 | | | | 79 | |
| ^ | Amount is less than $0.005 per share. |
Note: Net investment income (loss) per share is based on the average shares outstanding during the year.
Performance cited represents past performance. Past performance does not guarantee future results and current performance may be lower or higher than the data quoted. Results shown are annual returns, which assume reinvestment of dividends and capital gains. Investment returns and principal will fluctuate and you may have a gain or loss when you sell shares. For the most current month-end performance information, please call 1-800-742-7272 or visit our Web site at www.williamblairfunds.com.
| 136 | Annual Report | December 31, 2020 |
Financial Highlights — For a share outstanding throughout each period
Growth Fund
| | | Class R6 | |
| | | Years Ended December 31, | |
| | | | 2020 | | | | 2019(a) | |
| Net asset value, beginning of year | | | $ | 11.26 | | | | $ | 11.06 | |
| Income (loss) from investment operations: | | | | | | | | | | |
| Net investment income (loss) | | | | (0.03 | ) | | | | (0.00 | )^ |
| Net realized and unrealized gain (loss) on investments | | | | 4.12 | | | | | 1.17 | |
| Total from investment operations | | | | 4.09 | | | | | 1.17 | |
| Less distributions from: | | | | | | | | | | |
| Net investment income | | | | — | | | | | — | |
| Net realized gain | | | | 1.68 | | | | | 0.97 | |
| Total distributions | | | | 1.68 | | | | | 0.97 | |
| Net asset value, end of year | | | $ | 13.67 | | | | $ | 11.26 | |
| Total return (%)* | | | | 36.50 | | | | | 10.75 | |
| Ratios to average daily net assets (%)**: | | | | | | | | | | |
| Expenses | | | | 0.87 | | | | | 0.88 | |
| Net investment income (loss) | | | | (0.23 | ) | | | | (0.06 | ) |
| Class R6 net assets at the end of the year (in thousands) | | | $ | 12,041 | | | | $ | 217 | |
| Portfolio turnover rate (%)* | | | | 46 | | | | | 39 | |
| (a) | For the period from May 2, 2019 (Commencement of Operations) to December 31, 2019. |
| * | Rates are not annualized for periods less than a year. |
| ** | Rates are annualized for periods less than a year. |
| ^ | Amount is less than $0.005 per share. |
Note: Net investment income (loss) per share is based on the average shares outstanding during the year.
Performance cited represents past performance. Past performance does not guarantee future results and current performance may be lower or higher than the data quoted. Results shown are annual returns, which assume reinvestment of dividends and capital gains. Investment returns and principal will fluctuate and you may have a gain or loss when you sell shares. For the most current month-end performance information, please call 1-800-742-7272 or visit our Web site at www.williamblairfunds.com.
| December 31, 2020 | William Blair Funds | 137 |
Financial Highlights — For a share outstanding throughout each period
Large Cap Growth Fund
| | | Class N | |
| | | Years Ended December 31, | |
| | | 2020 | | | 2019 | | | 2018 | | | 2017 | | | 2016 | |
| Net asset value, beginning of year | | $ | 15.27 | | | $ | 11.99 | | | $ | 13.35 | | | $ | 10.26 | | | $ | 10.15 | |
| Income (loss) from investment operations: | | | | | | | | | | | | | | | | | | | | |
| Net investment income (loss) | | | 0.01 | | | | 0.00^ | | | | (0.02 | ) | | | (0.02 | ) | | | 0.02 | |
| Net realized and unrealized gain (loss) on investments | | | 5.52 | | | | 4.29 | | | | 0.81 | | | | 3.19 | | | | 0.18 | |
| Total from investment operations | | | 5.53 | | | | 4.29 | | | | 0.79 | | | | 3.17 | | | | 0.20 | |
| Less distributions from: | | | | | | | | | | | | | | | | | | | | |
| Net investment income | | | 0.00 | ^ | | | 0.01 | | | | — | | | | — | | | | 0.01 | |
| Net realized gain | | | 0.77 | | | | 1.00 | | | | 2.15 | | | | 0.08 | | | | 0.08 | |
| Total distributions | | | 0.77 | | | | 1.01 | | | | 2.15 | | | | 0.08 | | | | 0.09 | |
| Net asset value, end of year | | $ | 20.03 | | | $ | 15.27 | | | $ | 11.99 | | | $ | 13.35 | | | $ | 10.26 | |
| Total return (%) | | | 36.30 | | | | 36.00 | | | | 4.96 | | | | 30.88 | | | | 1.97 | |
| Ratios to average daily net assets (%): | | | | | | | | | | | | | | | | | | | | |
| Expenses, before waivers and reimbursements | | | 1.09 | | | | 1.12 | | | | 1.21 | | | | 1.19 | | | | 1.23 | |
| Expenses, net of waivers and reimbursements | | | 0.90 | | | | 0.95 | | | | 1.05 | | | | 1.05 | | | | 1.05 | |
| Net investment income (loss), before waivers and reimbursements | | | (0.15 | ) | | | (0.14 | ) | | | (0.33 | ) | | | (0.27 | ) | | | (0.01 | ) |
| Net investment income (loss), net of waivers and reimbursements | | | 0.04 | | | | 0.03 | | | | (0.17 | ) | | | (0.13 | ) | | | 0.17 | |
| Class N net assets at the end of the year (in thousands) | | $ | 138,152 | | | $ | 65,314 | | | $ | 41,361 | | | $ | 25,604 | | | $ | 11,860 | |
| Portfolio turnover rate (%) | | | 35 | | | | 37 | | | | 47 | | | | 29 | | | | 44 | |
| | | | | | | | | | | | | | | | | | | | | |
| | | Class I | |
| | | Years Ended December 31, | |
| | | | 2020 | | | | 2019 | | | | 2018 | | | | 2017 | | | | 2016 | |
| Net asset value, beginning of year | | $ | 16.19 | | | $ | 12.66 | | | $ | 13.97 | | | $ | 10.70 | | | $ | 10.58 | |
| Income (loss) from investment operations: | | | | | | | | | | | | | | | | | | | | |
| Net investment income (loss) | | | 0.06 | | | | 0.04 | | | | 0.01 | | | | 0.02 | | | | 0.04 | |
| Net realized and unrealized gain (loss) on investments | | | 5.85 | | | | 4.54 | | | | 0.85 | | | | 3.33 | | | | 0.19 | |
| Total from investment operations | | | 5.91 | | | | 4.58 | | | | 0.86 | | | | 3.35 | | | | 0.23 | |
| Less distributions from: | | | | | | | | | | | | | | | | | | | | |
| Net investment income | | | 0.04 | | | | 0.05 | | | | 0.02 | | | | — | | | | 0.03 | |
| Net realized gain | | | 0.77 | | | | 1.00 | | | | 2.15 | | | | 0.08 | | | | 0.08 | |
| Total distributions | | | 0.81 | | | | 1.05 | | | | 2.17 | | | | 0.08 | | | | 0.11 | |
| Net asset value, end of year | | $ | 21.29 | | | $ | 16.19 | | | $ | 12.66 | | | $ | 13.97 | | | $ | 10.70 | |
| Total return (%) | | | 36.59 | | | | 36.35 | | | | 5.21 | | | | 31.29 | | | | 2.22 | |
| Ratios to average daily net assets (%): | | | | | | | | | | | | | | | | | | | | |
| Expenses, before waivers and reimbursements | | | 0.80 | | | | 0.81 | | | | 0.90 | | | | 0.90 | | | | 0.91 | |
| Expenses, net of waivers and reimbursements | | | 0.65 | | | | 0.70 | | | | 0.80 | | | | 0.80 | | | | 0.80 | |
| Net investment income (loss), before waivers and reimbursements | | | 0.16 | | | | 0.16 | | | | (0.01 | ) | | | 0.03 | | | | 0.30 | |
| Net investment income (loss), net of waivers and reimbursements | | | 0.31 | | | | 0.27 | | | | 0.09 | | | | 0.13 | | | | 0.41 | |
| Class I net assets at the end of the year (in thousands) | | $ | 397,370 | | | $ | 236,930 | | | $ | 137,599 | | | $ | 177,959 | | | $ | 110,475 | |
| Portfolio turnover rate (%) | | | 35 | | | | 37 | | | | 47 | | | | 29 | | | | 44 | |
| ^ | Amount is less than $0.005 per share. |
Note: Net investment income (loss) per share is based on the average shares outstanding during the year.
Performance cited represents past performance. Past performance does not guarantee future results and current performance may be lower or higher than the data quoted. Results shown are annual returns, which assume reinvestment of dividends and capital gains. Investment returns and principal will fluctuate and you may have a gain or loss when you sell shares. For the most current month-end performance information, please call 1-800-742-7272 or visit our Web site at www.williamblairfunds.com.
| 138 | Annual Report | December 31, 2020 |
Financial Highlights — For a share outstanding throughout each period
Large Cap Growth Fund
| | | Class R6 | |
| | | Years Ended December 31, | |
| | | | 2020 | | | | 2019(a) | |
| Net asset value, beginning of year | | | $ | 16.17 | | | | $ | 15.12 | |
| Income (loss) from investment operations: | | | | | | | | | | |
| Net investment income (loss) | | | | 0.01 | | | | | 0.04 | |
| Net realized and unrealized gain (loss) on investments | | | | 5.91 | | | | | 2.07 | |
| Total from investment operations | | | | 5.92 | | | | | 2.11 | |
| Less distributions from: | | | | | | | | | | |
| Net investment income | | | | 0.05 | | | | | 0.06 | |
| Net realized gain | | | | 0.77 | | | | | 1.00 | |
| Total distributions | | | | 0.82 | | | | | 1.06 | |
| Net asset value, end of year | | | $ | 21.27 | | | | $ | 16.17 | |
| Total return (%)* | | | | 36.70 | | | | | 14.13 | |
| Ratios to average daily net assets (%)**: | | | | | | | | | | |
| Expenses, before waivers and reimbursements | | | | 0.70 | | | | | 0.71 | |
| Expenses, net of waivers and reimbursements | | | | 0.60 | | | | | 0.60 | |
| Net investment income (loss), before waivers and reimbursements | | | | (0.03 | ) | | | | 0.22 | |
| Net investment income (loss), net of waivers and reimbursements | | | | 0.07 | | | | | 0.33 | |
| Class R6 net assets at the end of the year (in thousands) | | | $ | 177,347 | | | | $ | 1,590 | |
| Portfolio turnover rate (%)* | | | | 35 | | | | | 37 | |
| (a) | For the period from May 2, 2019 (Commencement of Operations) to December 31, 2019. |
| * | Rates are not annualized for periods less than a year. |
| ** | Rates are annualized for periods less than a year. |
Note: Net investment income (loss) per share is based on the average shares outstanding during the year.
Performance cited represents past performance. Past performance does not guarantee future results and current performance may be lower or higher than the data quoted. Results shown are annual returns, which assume reinvestment of dividends and capital gains. Investment returns and principal will fluctuate and you may have a gain or loss when you sell shares. For the most current month-end performance information, please call 1-800-742-7272 or visit our Web site at www.williamblairfunds.com.
| December 31, 2020 | William Blair Funds | 139 |
Financial Highlights — For a share outstanding throughout each period
Mid Cap Growth Fund
| | | Class N | |
| | | Years Ended December 31, | |
| | | 2020 | | | 2019 | | | 2018 | | | 2017 | | | 2016 | |
| Net asset value, beginning of year | | $ | 10.99 | | | $ | 8.87 | | | $ | 10.92 | | | $ | 10.69 | | | $ | 11.28 | |
| Income (loss) from investment operations: | | | | | | | | | | | | | | | | | | | | |
| Net investment income (loss) | | | (0.08 | ) | | | (0.05 | ) | | | (0.06 | ) | | | (0.08 | ) | | | (0.06 | ) |
| Net realized and unrealized gain (loss) on investments | | | 3.01 | | | | 3.22 | | | | 0.03 | | | | 2.29 | | | | 0.09 | |
| Total from investment operations | | | 2.93 | | | | 3.17 | | | | (0.03 | ) | | | 2.21 | | | | 0.03 | |
| Less distributions from: | | | | | | | | | | | | | | | | | | | | |
| Net investment income | | | — | | | | — | | | | — | | | | — | | | | — | |
| Net realized gain | | | 1.03 | | | | 1.05 | | | | 2.02 | | | | 1.98 | | | | 0.62 | |
| Total distributions | | | 1.03 | | | | 1.05 | | | | 2.02 | | | | 1.98 | | | | 0.62 | |
| Net asset value, end of year | | $ | 12.89 | | | $ | 10.99 | | | $ | 8.87 | | | $ | 10.92 | | | $ | 10.69 | |
| Total return (%) | | | 26.80 | | | | 36.02 | | | | (1.20 | ) | | | 20.88 | | | | 0.23 | |
| Ratios to average daily net assets (%): | | | | | | | | | | | | | | | | | | | | |
| Expenses, before waivers and reimbursements | | | 1.54 | | | | 1.51 | | | | 1.57 | | | | 1.49 | | | | 1.45 | |
| Expenses, net of waivers and reimbursements | | | 1.20 | | | | 1.20 | | | | 1.23 | | | | 1.30 | | | | 1.30 | |
| Net investment income (loss), before waivers and reimbursements | | | (1.06 | ) | | | (0.79 | ) | | | (0.85 | ) | | | (0.84 | ) | | | (0.68 | ) |
| Net investment income (loss), net of waivers and reimbursements | | | (0.72 | ) | | | (0.48 | ) | | | (0.51 | ) | | | (0.65 | ) | | | (0.53 | ) |
| Class N net assets at the end of the year (in thousands) | | $ | 6,074 | | | $ | 5,465 | | | $ | 4,944 | | | $ | 6,166 | | | $ | 16,234 | |
| Portfolio turnover rate (%) | | | 45 | | | | 43 | | | | 58 | | | | 59 | | | | 60 | |
| | | Class I | |
| | | Years Ended December 31, | |
| | | | 2020 | | | | 2019 | | | | 2018 | | | | 2017 | | | | 2016 | |
| Net asset value, beginning of year | | $ | 11.93 | | | $ | 9.55 | | | $ | 11.57 | | | $ | 11.20 | | | $ | 11.76 | |
| Income (loss) from investment operations: | | | | | | | | | | | | | | | | | | | | |
| Net investment income (loss) | | | (0.06 | ) | | | (0.03 | ) | | | (0.03 | ) | | | (0.05 | ) | | | (0.03 | ) |
| Net realized and unrealized gain (loss) on investments | | | 3.29 | | | | 3.46 | | | | 0.03 | | | | 2.40 | | | | 0.09 | |
| Total from investment operations | | | 3.23 | | | | 3.43 | | | | — | | | | 2.35 | | | | 0.06 | |
| Less distributions from: | | | | | | | | | | | | | | | | | | | | |
| Net investment income | | | — | | | | — | | | | — | | | | — | | | | — | |
| Net realized gain | | | 1.03 | | | | 1.05 | | | | 2.02 | | | | 1.98 | | | | 0.62 | |
| Total distributions | | | 1.03 | | | | 1.05 | | | | 2.02 | | | | 1.98 | | | | 0.62 | |
| Net asset value, end of year | | $ | 14.13 | | | $ | 11.93 | | | $ | 9.55 | | | $ | 11.57 | | | $ | 11.20 | |
| Total return (%) | | | 27.21 | | | | 36.17 | | | | (0.86 | ) | | | 21.18 | | | | 0.48 | |
| Ratios to average daily net assets (%): | | | | | | | | | | | | | | | | | | | | |
| Expenses, before waivers and reimbursements | | | 1.29 | | | | 1.28 | | | | 1.31 | | | | 1.23 | | | | 1.18 | |
| Expenses, net of waivers and reimbursements | | | 0.95 | | | | 0.95 | | | | 0.98 | | | | 1.05 | | | | 1.05 | |
| Net investment income (loss), before waivers and reimbursements | | | (0.80 | ) | | | (0.56 | ) | | | (0.58 | ) | | | (0.58 | ) | | | (0.39 | ) |
| Net investment income (loss), net of waivers and reimbursements | | | (0.46 | ) | | | (0.23 | ) | | | (0.25 | ) | | | (0.40 | ) | | | (0.26 | ) |
| Class I net assets at the end of the year (in thousands) | | $ | 77,273 | | | $ | 67,936 | | | $ | 51,173 | | | $ | 71,369 | | | $ | 119,424 | |
| Portfolio turnover rate (%) | | | 45 | | | | 43 | | | | 58 | | | | 59 | | | | 60 | |
Note: Net investment income (loss) per share is based on the average shares outstanding during the year.
Performance cited represents past performance. Past performance does not guarantee future results and current performance may be lower or higher than the data quoted. Results shown are annual returns, which assume reinvestment of dividends and capital gains. Investment returns and principal will fluctuate and you may have a gain or loss when you sell shares. For the most current month-end performance information, please call 1-800-742-7272 or visit our Web site at www.williamblairfunds.com.
| 140 | Annual Report | December 31, 2020 |
Financial Highlights — For a share outstanding throughout each period
Mid Cap Growth Fund
| | | Class R6 | |
| | | Years Ended December 31, | |
| | | | 2020 | | | | 2019(a) | |
| Net asset value, beginning of year | | | $ | 11.94 | | | | $ | 11.93 | |
| Income (loss) from investment operations: | | | | | | | | | | |
| Net investment income (loss) | | | | (0.06 | ) | | | | (0.01 | ) |
| Net realized and unrealized gain (loss) on investments | | | | 3.29 | | | | | 1.07 | |
| Total from investment operations | | | | 3.23 | | | | | 1.06 | |
| Less distributions from: | | | | | | | | | | |
| Net investment income | | | | — | | | | | — | |
| Net realized gain | | | | 1.03 | | | | | 1.05 | |
| Total distributions | | | | 1.03 | | | | | 1.05 | |
| Net asset value, end of year | | | $ | 14.14 | | | | $ | 11.94 | |
| Total return (%)* | | | | 27.18 | | | | | 9.10 | |
| Ratios to average daily net assets (%)**: | | | | | | | | | | |
| Expenses, before waivers and reimbursements | | | | 1.16 | | | | | 1.14 | |
| Expenses, net of waivers and reimbursements | | | | 0.90 | | | | | 0.90 | |
| Net investment income (loss), before waivers and reimbursements | | | | (0.70 | ) | | | | (0.41 | ) |
| Net investment income (loss), net of waivers and reimbursements | | | | (0.44 | ) | | | | (0.17 | ) |
| Class R6 net assets at the end of the year (in thousands) | | | $ | 623 | | | | $ | 145 | |
| Portfolio turnover rate (%)* | | | | 45 | | | | | 43 | |
| (a) | For the period from May 2, 2019 (Commencement of Operations) to December 31, 2019. |
| * | Rates are not annualized for periods less than a year. |
| ** | Rates are annualized for periods less than a year. |
Note: Net investment income (loss) per share is based on the average shares outstanding during the year.
Performance cited represents past performance. Past performance does not guarantee future results and current performance may be lower or higher than the data quoted. Results shown are annual returns, which assume reinvestment of dividends and capital gains. Investment returns and principal will fluctuate and you may have a gain or loss when you sell shares. For the most current month-end performance information, please call 1-800-742-7272 or visit our Web site at www.williamblairfunds.com.
| December 31, 2020 | William Blair Funds | 141 |
Financial Highlights — For a share outstanding throughout each period
Small-Mid Cap Core Fund
| | | Class I | |
| | | Years Ended December 31, | |
| | | | 2020 | | | | 2019(a) | |
| Net asset value, beginning of year | | | $ | 10.68 | | | | $ | 10.00 | |
| Income (loss) from investment operations: | | | | | | | | | | |
| Net investment income (loss) | | | | 0.00 | ^ | | | | 0.02 | |
| Net realized and unrealized gain (loss) on investments | | | | 2.20 | | | | | 0.67 | |
| Total from investment operations | | | | 2.20 | | | | | 0.69 | |
| Less distributions from: | | | | | | | | | | |
| Net investment income | | | | — | | | | | 0.01 | |
| Net realized gain | | | | — | | | | | — | |
| Total distributions | | | | — | | | | | 0.01 | |
| Net asset value, end of year | | | $ | 12.88 | | | | $ | 10.68 | |
| Total return (%)* | | | | 20.60 | | | | | 6.87 | |
| Ratios to average daily net assets (%)**: | | | | | | | | | | |
| Expenses, before waivers and reimbursements | | | | 1.22 | | | | | 3.92 | |
| Expenses, net of waivers and reimbursements | | | | 0.95 | | | | | 0.95 | |
| Net investment income (loss), before waivers and reimbursements | | | | (0.27 | ) | | | | (2.23 | ) |
| Net investment income (loss), net of waivers and reimbursements | | | | 0.00 | | | | | 0.74 | |
| Class N net assets at the end of the year (in thousands) | | | $ | 22,958 | | | | $ | 1,655 | |
| Portfolio turnover rate (%)* | | | | 244 | | | | | 12 | |
| | | | | | | | | | | |
| | | Class R6 | |
| | | Years Ended December 31, | |
| | | | 2020 | | | | 2019(a) | |
| Net asset value, beginning of year | | | $ | 10.68 | | | | $ | 10.00 | |
| Income (loss) from investment operations: | | | | | | | | | | |
| Net investment income (loss) | | | | 0.01 | | | | | 0.01 | |
| Net realized and unrealized gain (loss) on investments | | | | 2.19 | | | | | 0.68 | |
| Total from investment operations | | | | 2.20 | | | | | 0.69 | |
| Less distributions from: | | | | | | | | | | |
| Net investment income | | | | 0.00 | ^ | | | | 0.01 | |
| Net realized gain | | | | — | | | | | — | |
| Total distributions | | | | 0.00 | ^ | | | | 0.01 | |
| Net asset value, end of year | | | $ | 12.88 | | | | $ | 10.68 | |
| Total return (%)* | | | | 20.60 | | | | | 6.88 | |
| Ratios to average daily net assets (%)**: | | | | | | | | | | |
| Expenses, before waivers and reimbursements | | | | 1.07 | | | | | 3.92 | |
| Expenses, net of waivers and reimbursements | | | | 0.90 | | | | | 0.90 | |
| Net investment income (loss), before waivers and reimbursements | | | | (0.11 | ) | | | | (2.71 | ) |
| Net investment income (loss), net of waivers and reimbursements | | | | 0.06 | | | | | 0.31 | |
| Class I net assets at the end of the year (in thousands) | | | $ | 7,087 | | | | $ | 4,933 | |
| Portfolio turnover rate (%)* | | | | 244 | | | | | 12 | |
| (a) | For the period from October 1, 2019 (Commencement of Operations) to December 31, 2019. |
| * | Rates are not annualized for periods less than a year. |
| ** | Rates are annualized for periods less than a year. |
| ^ | Amount is less than $0.005 per share. |
Note: Net investment income (loss) per share is based on the average shares outstanding during the year.
Performance cited represents past performance. Past performance does not guarantee future results and current performance may be lower or higher than the data quoted. Results shown are annual returns, which assume reinvestment of dividends and capital gains. Investment returns and principal will fluctuate and you may have a gain or loss when you sell shares. For the most current month-end performance information, please call 1-800-742-7272 or visit our Web site at www.williamblairfunds.com.
| 142 | Annual Report | December 31, 2020 |
Financial Highlights — For a share outstanding throughout each period
Small-Mid Cap Growth Fund
| | | Class N | |
| | | Years Ended December 31, | |
| | | 2020 | | | 2019 | | | 2018 | | | 2017 | | | 2016 | |
| Net asset value, beginning of year | | $ | 25.41 | | | $ | 20.97 | | | $ | 23.36 | | | $ | 19.20 | | | $ | 18.53 | |
| Income (loss) from investment operations: | | | | | | | | | | | | | | | | | | | | |
| Net investment income (loss) | | | (0.24 | ) | | | (0.20 | ) | | | (0.18 | ) | | | (0.16 | ) | | | (0.09 | ) |
| Net realized and unrealized gain (loss) on investments | | | 8.37 | | | | 6.56 | | | | (0.25 | ) | | | 5.62 | | | | 1.29 | |
| Total from investment operations | | | 8.13 | | | | 6.36 | | | | (0.43 | ) | | | 5.46 | | | | 1.20 | |
| Less distributions from: | | | | | | | | | | | | | | | | | | | | |
| Net investment income | | | — | | | | — | | | | — | | | | — | | | | — | |
| Net realized gain | | | 0.58 | | | | 1.92 | | | | 1.96 | | | | 1.30 | | | | 0.53 | |
| Total distributions | | | 0.58 | | | | 1.92 | | | | 1.96 | | | | 1.30 | | | | 0.53 | |
| Net asset value, end of year | | $ | 32.96 | | | $ | 25.41 | | | $ | 20.97 | | | $ | 23.36 | | | $ | 19.20 | |
| Total return (%) | | | 32.04 | | | | 30.41 | | | | (2.29 | ) | | | 28.57 | | | | 6.45 | |
| Ratios to average daily net assets (%): | | | | | | | | | | | | | | | | | | | | |
| Expenses, before waivers and reimbursements | | | 1.45 | | | | 1.43 | | | | 1.44 | | | | 1.43 | | | | 1.43 | |
| Expenses, net of waivers and reimbursements | | | 1.35 | | | | 1.35 | | | | 1.35 | | | | 1.35 | | | | 1.35 | |
| Net investment income (loss), before waivers and reimbursements | | | (1.01 | ) | | | (0.88 | ) | | | (0.81 | ) | | | (0.82 | ) | | | (0.59 | ) |
| Net investment income (loss), net of waivers and reimbursements | | | (0.91 | ) | | | (0.80 | ) | | | (0.72 | ) | | | (0.74 | ) | | | (0.51 | ) |
| Class N net assets at the end of the year (in thousands) | | $ | 314,572 | | | $ | 334,017 | | | $ | 424,865 | | | $ | 228,828 | | | $ | 171,638 | |
| Portfolio turnover rate (%) | | | 55 | | | | 56 | | | | 46 | | | | 64 | | | | 66 | |
| | | | | | | | | | | | | | | | | | | | | |
| | | Class I | |
| | | Years Ended December 31, | |
| | | 2020 | | | 2019 | | | 2018 | | | 2017 | | | 2016 | |
| Net asset value, beginning of year | | $ | 26.99 | | | $ | 22.12 | | | $ | 24.48 | | | $ | 20.02 | | | $ | 19.25 | |
| Income (loss) from investment operations: | | | | | | | | | | | | | | | | | | | | |
| Net investment income (loss) | | | (0.19 | ) | | | (0.14 | ) | | | (0.12 | ) | | | (0.11 | ) | | | (0.05 | ) |
| Net realized and unrealized gain (loss) on investments | | | 8.91 | | | | 6.93 | | | | (0.28 | ) | | | 5.87 | | | | 1.35 | |
| Total from investment operations | | | 8.72 | | | | 6.79 | | | | (0.40 | ) | | | 5.76 | | | | 1.30 | |
| Less distributions from: | | | | | | | | | | | | | | | | | | | | |
| Net investment income | | | — | | | | — | | | | — | | | | — | | | | — | |
| Net realized gain | | | 0.58 | | | | 1.92 | | | | 1.96 | | | | 1.30 | | | | 0.53 | |
| Total distributions | | | 0.58 | | | | 1.92 | | | | 1.96 | | | | 1.30 | | | | 0.53 | |
| Net asset value, end of year | | $ | 35.13 | | | $ | 26.99 | | | $ | 22.12 | | | $ | 24.48 | | | $ | 20.02 | |
| Total return (%) | | | 32.35 | | | | 30.77 | | | | (2.06 | ) | | | 28.90 | | | | 6.72 | |
| Ratios to average daily net assets (%): | | | | | | | | | | | | | | | | | | | | |
| Expenses, before waivers and reimbursements | | | 1.17 | | | | 1.16 | | | | 1.16 | | | | 1.16 | | | | 1.16 | |
| Expenses, net of waivers and reimbursements | | | 1.10 | | | | 1.10 | | | | 1.10 | | | | 1.10 | | | | 1.10 | |
| Net investment income (loss), before waivers and reimbursements | | | (0.73 | ) | | | (0.59 | ) | | | (0.53 | ) | | | (0.55 | ) | | | (0.34 | ) |
| Net investment income (loss), net of waivers and reimbursements | | | (0.66 | ) | | | (0.53 | ) | | | (0.47 | ) | | | (0.49 | ) | | | (0.28 | ) |
| Class I net assets at the end of the year (in thousands) | | $ | 3,139,290 | | | $ | 2,531,823 | | | $ | 1,979,105 | | | $ | 1,576,180 | | | $ | 1,090,939 | |
| Portfolio turnover rate (%) | | | 55 | | | | 56 | | | | 46 | | | | 64 | | | | 66 | |
Note: Net investment income (loss) per share is based on the average shares outstanding during the year.
Performance cited represents past performance. Past performance does not guarantee future results and current performance may be lower or higher than the data quoted. Results shown are annual returns, which assume reinvestment of dividends and capital gains. Investment returns and principal will fluctuate and you may have a gain or loss when you sell shares. For the most current month-end performance information, please call 1-800-742-7272 or visit our Web site at www.williamblairfunds.com.
| December 31, 2020 | William Blair Funds | 143 |
Financial Highlights — For a share outstanding throughout each period
Small-Mid Cap Growth Fund
| | | Class R6 | |
| | | Years Ended December 31, | |
| | | | 2020 | | | | 2019(a) | |
| Net asset value, beginning of year | | | $ | 27.01 | | | | $ | 26.76 | |
| Income (loss) from investment operations: | | | | | | | | | | |
| Net investment income (loss) | | | | (0.17 | ) | | | | (0.09 | ) |
| Net realized and unrealized gain (loss) on investments | | | | 8.92 | | | | | 2.26 | |
| Total from investment operations | | | | 8.75 | | | | | 2.17 | |
| Less distributions from: | | | | | | | | | | |
| Net investment income | | | | — | | | | | — | |
| Net realized gain | | | | 0.58 | | | | | 1.92 | |
| Total distributions | | | | 0.58 | | | | | 1.92 | |
| Net asset value, end of year | | | $ | 35.18 | | | | $ | 27.01 | |
| Total return (%)* | | | | 32.44 | | | | | 8.17 | |
| Ratios to average daily net assets (%)**: | | | | | | | | | | |
| Expenses | | | | 1.05 | | | | | 1.05 | |
| Net investment income (loss) | | | | (0.61 | ) | | | | (0.46 | ) |
| Class R6 net assets at the end of the year (in thousands) | | | $ | 123,220 | | | | $ | 39,974 | |
| Portfolio turnover rate (%)* | | | | 55 | | | | | 56 | |
| (a) | For the period from May 2, 2019 (Commencement of Operations) to December 31, 2019. |
| * | Rates are not annualized for periods less than a year. |
| ** | Rates are annualized for periods less than a year. |
Note: Net investment income (loss) per share is based on the average shares outstanding during the year.
Performance cited represents past performance. Past performance does not guarantee future results and current performance may be lower or higher than the data quoted. Results shown are annual returns, which assume reinvestment of dividends and capital gains. Investment returns and principal will fluctuate and you may have a gain or loss when you sell shares. For the most current month-end performance information, please call 1-800-742-7272 or visit our Web site at www.williamblairfunds.com.
| 144 | Annual Report | December 31, 2020 |
Financial Highlights — For a share outstanding throughout each period
Small-Mid Cap Value Fund
| | | Class N | |
| | | Years Ended December 31, | |
| | | 2020 | | | 2019 | | | 2018 | | | 2017 | | | 2016 | |
| Net asset value, beginning of year | | $ | 11.22 | | | $ | 9.31 | | | $ | 14.31 | | | $ | 14.53 | | | $ | 12.54 | |
| Income (loss) from investment operations: | | | | | | | | | | | | | | | | | | | | |
| Net investment income (loss) | | | 0.09 | | | | 0.10 | | | | 0.09 | | | | 0.04 | | | | 0.04 | |
| Net realized and unrealized gain (loss) on investments | | | (0.66 | ) | | | 2.00 | | | | (2.08 | ) | | | 1.33 | | | | 2.55 | |
| Total from investment operations | | | (0.57 | ) | | | 2.10 | | | | (1.99 | ) | | | 1.37 | | | | 2.59 | |
| Less distributions from: | | | | | | | | | | | | | | | | | | | | |
| Net investment income | | | 0.16 | | | | 0.03 | | | | 0.03 | | | | 0.02 | | | | 0.01 | |
| Net realized gain | | | 0.06 | | | | 0.16 | | | | 2.98 | | | | 1.57 | | | | 0.59 | |
| Total distributions | | | 0.22 | | | | 0.19 | | | | 3.01 | | | | 1.59 | | | | 0.60 | |
| Net asset value, end of year | | $ | 10.43 | | | $ | 11.22 | | | $ | 9.31 | | | $ | 14.31 | | | $ | 14.53 | |
| Total return (%) | | | (5.09 | ) | | | 22.77 | | | | (15.32 | ) | | | 9.59 | | | | 20.69 | |
| Ratios to average daily net assets (%): | | | | | | | | | | | | | | | | | | | | |
| Expenses, before waivers and reimbursements | | | 7.94 | | | | 6.76 | | | | 6.88 | | | | 4.83 | | | | 4.15 | |
| Expenses, net of waivers and reimbursements | | | 1.18 | | | | 1.25 | | | | 1.28 | | | | 1.35 | | | | 1.35 | |
| Net investment income (loss), before waivers and reimbursements | | | (5.84 | ) | | | (4.59 | ) | | | (4.97 | ) | | | (3.21 | ) | | | (2.51 | ) |
| Net investment income (loss), net of waivers and reimbursements | | | 0.92 | | | | 0.92 | | | | 0.63 | | | | 0.27 | | | | 0.29 | |
| Class N net assets at the end of the year (in thousands) | | $ | 77 | | | $ | 315 | | | $ | 234 | | | $ | 284 | | | $ | 267 | |
| Portfolio turnover rate (%) | | | 225 | | | | 107 | | | | 104 | | | | 70 | | | | 45 | |
| | | | | | | | | | | | | | | | | | | | | |
| | | Class I | |
| | | Years Ended December 31, | |
| | | 2020 | | | 2019 | | | 2018 | | | 2017 | | | 2016 | |
| Net asset value, beginning of year | | $ | 11.13 | | | $ | 9.23 | | | $ | 14.24 | | | $ | 14.47 | | | $ | 12.54 | |
| Income (loss) from investment operations: | | | | | | | | | | | | | | | | | | | | |
| Net investment income (loss) | | | 0.11 | | | | 0.14 | | | | 0.11 | | | | 0.07 | | | | 0.08 | |
| Net realized and unrealized gain (loss) on investments | | | (0.62 | ) | | | 1.98 | | | | (2.06 | ) | | | 1.33 | | | | 2.55 | |
| Total from investment operations | | | (0.51 | ) | | | 2.12 | | | | (1.95 | ) | | | 1.40 | | | | 2.63 | |
| Less distributions from: | | | | | | | | | | | | | | | | | | | | |
| Net investment income | | | 0.21 | | | | 0.06 | | | | 0.08 | | | | 0.06 | | | | 0.11 | |
| Net realized gain | | | 0.06 | | | | 0.16 | | | | 2.98 | | | | 1.57 | | | | 0.59 | |
| Total distributions | | | 0.27 | | | | 0.22 | | | | 3.06 | | | | 1.63 | | | | 0.70 | |
| Net asset value, end of year | | $ | 10.35 | | | $ | 11.13 | | | $ | 9.23 | | | $ | 14.24 | | | $ | 14.47 | |
| Total return (%) | | | (4.53 | ) | | | 23.00 | | | | (15.03 | ) | | | 9.84 | | | | 21.00 | |
| Ratios to average daily net assets (%): | | | | | | | | | | | | | | | | | | | | |
| Expenses, before waivers and reimbursements | | | 7.62 | | | | 6.45 | | | | 6.54 | | | | 4.55 | | | | 3.92 | |
| Expenses, net of waivers and reimbursements | | | 0.93 | | | | 1.00 | | | | 1.03 | | | | 1.10 | | | | 1.10 | |
| Net investment income (loss), before waivers and reimbursements | | | (5.55 | ) | | | (4.13 | ) | | | (4.69 | ) | | | (2.94 | ) | | | (2.20 | ) |
| Net investment income (loss), net of waivers and reimbursements | | | 1.14 | | | | 1.32 | | | | 0.82 | | | | 0.51 | | | | 0.62 | |
| Class I net assets at the end of the year (in thousands) | | $ | 1,067 | | | $ | 7,042 | | | $ | 1,445 | | | $ | 3,359 | | | $ | 3,186 | |
| Portfolio turnover rate (%) | | | 225 | | | | 107 | | | | 104 | | | | 70 | | | | 45 | |
Note: Net investment income (loss) per share is based on the average shares outstanding during the year.
Performance cited represents past performance. Past performance does not guarantee future results and current performance may be lower or higher than the data quoted. Results shown are annual returns, which assume reinvestment of dividends and capital gains. Investment returns and principal will fluctuate and you may have a gain or loss when you sell shares. For the most current month-end performance information, please call 1-800-742-7272 or visit our Web site at www.williamblairfunds.com.
| December 31, 2020 | William Blair Funds | 145 |
Financial Highlights — For a share outstanding throughout each period
Small-Mid Cap Value Fund
| | | Class R6 | |
| | | Years Ended December 31, | |
| | | | 2020 | | | | 2019(a) | |
| Net asset value, beginning of year | | | $ | 11.13 | | | | $ | 10.93 | |
| Income (loss) from investment operations: | | | | | | | | | | |
| Net investment income (loss) | | | | 0.10 | | | | | 0.11 | |
| Net realized and unrealized gain (loss) on investments | | | | (0.63 | ) | | | | 0.31 | |
| Total from investment operations | | | | (0.53 | ) | | | | 0.42 | |
| Less distributions from: | | | | | | | | | | |
| Net investment income | | | | 0.23 | | | | | 0.06 | |
| Net realized gain | | | | 0.06 | | | | | 0.16 | |
| Total distributions | | | | 0.29 | | | | | 0.22 | |
| Net asset value, end of year | | | $ | 10.31 | | | | $ | 11.13 | |
| Total Return (%)* | | | | (4.77 | ) | | | | 3.89 | |
| Ratios to average daily net assets (%)**: | | | | | | | | | | |
| Expenses, before waivers and reimbursements | | | | 7.54 | | | | | 4.85 | |
| Expenses, net of waivers and reimbursements | | | | 0.88 | | | | | 0.95 | |
| Net investment income (loss), before waivers and reimbursements | | | | (5.57 | ) | | | | (2.41 | ) |
| Net investment income (loss), net of waivers and reimbursements | | | | 1.09 | | | | | 1.49 | |
| Class R6 net assets at the end of the year (in thousands) | | | $ | 293 | | | | $ | 171 | |
| Portfolio turnover rate (%)* | | | | 225 | | | | | 107 | |
| (a) | For the period from May 2, 2019 (Commencement of Operations) to December 31, 2019. |
| * | Rates are not annualized for periods less than a year. |
| ** | Rates are annualized for periods less than a year. |
Note: Net investment income (loss) per share is based on the average shares outstanding during the year.
Performance cited represents past performance. Past performance does not guarantee future results and current performance may be lower or higher than the data quoted. Results shown are annual returns, which assume reinvestment of dividends and capital gains. Investment returns and principal will fluctuate and you may have a gain or loss when you sell shares. For the most current month-end performance information, please call 1-800-742-7272 or visit our Web site at www.williamblairfunds.com.
| 146 | Annual Report | December 31, 2020 |
Financial Highlights — For a share outstanding throughout each period
Small Cap Growth Fund
| | Class N | |
| | | Years Ended December 31, | |
| | | 2020 | | | 2019 | | | 2018 | | | 2017 | | | 2016 | |
| Net asset value, beginning of year | | $ | 27.75 | | | $ | 23.23 | | | $ | 26.87 | | | $ | 25.24 | | | $ | 22.47 | |
| Income (loss) from investment operations: | | | | | | | | | | | | | | | | | | | | |
| Net investment income (loss) | | | (0.29 | ) | | | (0.24 | ) | | | (0.27 | ) | | | (0.25 | ) | | | (0.18 | ) |
| Net realized and unrealized gain (loss) on investments | | | 10.86 | | | | 5.40 | | | | (0.10 | ) | | | 6.88 | | | | 4.43 | |
| Total from investment operations | | | 10.57 | | | | 5.16 | | | | (0.37 | ) | | | 6.63 | | | | 4.25 | |
| Less distributions from: | | | | | | | | | | | | | | | | | | | | |
| Net investment income | | | — | | | | — | | | | — | | | | — | | | | — | |
| Net realized gain | | | 3.83 | | | | 0.64 | | | | 3.27 | | | | 5.00 | | | | 1.48 | |
| Total distributions | | | 3.83 | | | | 0.64 | | | | 3.27 | | | | 5.00 | | | | 1.48 | |
| Net asset value, end of year | | $ | 34.49 | | | $ | 27.75 | | | $ | 23.23 | | | $ | 26.87 | | | $ | 25.24 | |
| Total return (%) | | | 38.32 | | | | 22.26 | | | | (2.14 | ) | | | 26.70 | | | | 18.89 | |
| Ratios to average daily net assets (%): | | | | | | | | | | | | | | | | | | | | |
| Expenses, before waivers and reimbursements | | | 1.58 | | | | 1.54 | | | | 1.55 | | | | 1.54 | | | | 1.55 | |
| Expenses, net of waivers and reimbursements | | | 1.50 | | | | 1.50 | | | | 1.50 | | | | 1.50 | | | | 1.50 | |
| Net investment income (loss), before waivers and reimbursements | | | (1.10 | ) | | | (0.92 | ) | | | (0.94 | ) | | | (0.93 | ) | | | (0.84 | ) |
| Net investment income (loss), net of waivers and reimbursements | | | (1.02 | ) | | | (0.88 | ) | | | (0.89 | ) | | | (0.89 | ) | | | (0.79 | ) |
| Class N net assets at the end of the year (in thousands) | | $ | 180,635 | | | $ | 180,706 | | | $ | 169,074 | | | $ | 146,291 | | | $ | 117,068 | |
| Portfolio turnover rate (%) | | | 71 | | | | 51 | | | | 74 | | | | 81 | | | | 90 | |
| | | | | | | | | | | | | | | | | | | | | |
| | Class I | |
| | | Years Ended December 31, | |
| | | 2020 | | | 2019 | | | 2018 | | | 2017 | | | 2016 | |
| Net asset value, beginning of year | | $ | 31.19 | | | $ | 25.99 | | | $ | 29.61 | | | $ | 27.34 | | | $ | 24.17 | |
| Income (loss) from investment operations: | | | | | | | | | | | | | | | | | | | | |
| Net investment income (loss) | | | (0.24 | ) | | | (0.19 | ) | | | (0.21 | ) | | | (0.20 | ) | | | (0.13 | ) |
| Net realized and unrealized gain (loss) on investments | | | 12.24 | | | | 6.03 | | | | (0.14 | ) | | | 7.47 | | | | 4.78 | |
| Total from investment operations | | | 12.00 | | | | 5.84 | | | | (0.35 | ) | | | 7.27 | | | | 4.65 | |
| Less distributions from: | | | | | | | | | | | | | | | | | | | | |
| Net investment income | | | — | | | | — | | | | — | | | | — | | | | — | |
| Net realized gain | | | 3.83 | | | | 0.64 | | | | 3.27 | | | | 5.00 | | | | 1.48 | |
| Total distributions | | | 3.83 | | | | 0.64 | | | | 3.27 | | | | 5.00 | | | | 1.48 | |
| Net asset value, end of year | | $ | 39.36 | | | $ | 31.19 | | | $ | 25.99 | | | $ | 29.61 | | | $ | 27.34 | |
| Total return (%) | | | 38.68 | | | | 22.51 | | | | (1.88 | ) | | | 26.99 | | | | 19.22 | |
| Ratios to average daily net assets (%) | | | | | | | | | | | | | | | | | | | | |
| Expenses, before waivers and reimbursements | | | 1.30 | | | | 1.27 | | | | 1.25 | | | | 1.25 | | | | 1.27 | |
| Expenses, net of waivers and reimbursements | | | 1.25 | | | | 1.25 | | | | 1.25 | | | | 1.25 | | | | 1.25 | |
| Net investment income (loss), before waivers and reimbursements | | | (0.82 | ) | | | (0.65 | ) | | | (0.65 | ) | | | (0.64 | ) | | | (0.56 | ) |
| Net investment income (loss), net of waivers and reimbursements | | | (0.77 | ) | | | (0.63 | ) | | | (0.65 | ) | | | (0.64 | ) | | | (0.54 | ) |
| Class I net assets at the end of the year (in thousands) | | $ | 390,511 | | | $ | 423,881 | | | $ | 410,233 | | | $ | 343,119 | | | $ | 271,830 | |
| Portfolio turnover rate (%) | | | 71 | | | | 51 | | | | 74 | | | | 81 | | | | 90 | |
Note: Net investment income (loss) per share is based on the average shares outstanding during the year.
Performance cited represents past performance. Past performance does not guarantee future results and current performance may be lower or higher than the data quoted. Results shown are annual returns, which assume reinvestment of dividends and capital gains. Investment returns and principal will fluctuate and you may have a gain or loss when you sell shares. For the most current month-end performance information, please call 1-800-742-7272 or visit our Web site at www.williamblairfunds.com.
| December 31, 2020 | William Blair Funds | 147 |
Financial Highlights — For a share outstanding throughout each period
Small Cap Growth Fund
| | | Class R6 | |
| | | Years Ended December 31, | |
| | | | 2020 | | | | 2019(a) | |
| Net asset value, beginning of year | | | $ | 31.20 | | | | $ | 31.00 | |
| Income (loss) from investment operations: | | | | | | | | | | |
| Net investment income (loss) | | | | (0.23 | ) | | | | (0.11 | ) |
| Net realized and unrealized gain (loss) on investments | | | | 12.26 | | | | | 0.95 | |
| Total from investment operations | | | | 12.03 | | | | | 0.84 | |
| Less distributions from: | | | | | | | | | | |
| Net investment income | | | | — | | | | | — | |
| Net realized gain | | | | 3.83 | | | | | 0.64 | |
| Total distributions | | | | 3.83 | | | | | 0.64 | |
| Net asset value, end of year | | | $ | 39.40 | | | | $ | 31.20 | |
| Total Return (%)* | | | | 38.76 | | | | | 2.75 | |
| Ratios to average daily net assets (%)**: | | | | | | | | | | |
| Expenses | | | | 1.19 | | | | | 1.18 | |
| Net investment income (loss) | | | | (0.71 | ) | | | | (0.51 | ) |
| Class R6 net assets at the end of the year (in thousands) | | | $ | 103,462 | | | | $ | 65,950 | |
| Portfolio turnover rate (%)* | | | | 71 | | | | | 51 | |
| (a) | For the period from May 2, 2019 (Commencement of Operations) to December 31, 2019. |
| * | Rates are not annualized for periods less than a year. |
| ** | Rates are annualized for periods less than a year. |
Note: Net investment income (loss) per share is based on the average shares outstanding during the year.
Performance cited represents past performance. Past performance does not guarantee future results and current performance may be lower or higher than the data quoted. Results shown are annual returns, which assume reinvestment of dividends and capital gains. Investment returns and principal will fluctuate and you may have a gain or loss when you sell shares. For the most current month-end performance information, please call 1-800-742-7272 or visit our Web site at www.williamblairfunds.com.
| 148 | Annual Report | December 31, 2020 |
Financial Highlights — For a share outstanding throughout each period
Small Cap Value Fund
| | | Class N | |
| | | Years Ended December 31, | |
| | | 2020 | | | 2019 | | | 2018 | | | 2017 | | | 2016 | |
| Net asset value, beginning of year | | $ | 17.47 | | | $ | 15.04 | | | $ | 20.15 | | | $ | 20.18 | | | $ | 16.68 | |
| Income (loss) from investment operations: | | | | | | | | | | | | | | | | | | | | |
| Net investment income (loss) | | | 0.08 | | | | 0.09 | | | | 0.03 | | | | 0.01 | | | | 0.04 | |
| Net realized and unrealized gain (loss) on investments | | | (1.38 | ) | | | 2.92 | | | | (3.12 | ) | | | 1.50 | | | | 4.34 | |
| Total from investment operations | | | (1.30 | ) | | | 3.01 | | | | (3.09 | ) | | | 1.51 | | | | 4.38 | |
| Less distributions from: | | | | | | | | | | | | | | | | | | | | |
| Net investment income | | | 0.05 | | | | 0.09 | | | | — | | | | — | | | | 0.04 | |
| Net realized gain | | | 3.08 | | | | 0.49 | | | | 2.02 | | | | 1.54 | | | | 0.84 | |
| Total distributions | | | 3.13 | | | | 0.58 | | | | 2.02 | | | | 1.54 | | | | 0.88 | |
| Net asset value, end of year | | $ | 13.04 | | | $ | 17.47 | | | $ | 15.04 | | | $ | 20.15 | | | $ | 20.18 | |
| Total return (%) | | | (5.76 | ) | | | 20.09 | | | | (15.93 | ) | | | 7.57 | | | | 26.19 | |
| Ratios to average daily net assets (%): | | | | | | | | | | | | | | | | | | | | |
| Expenses, before waivers and reimbursements | | | 1.71 | | | | 1.55 | | | | 1.56 | | | | 1.55 | | | | 1.53 | |
| Expenses, net of waivers and reimbursements | | | 1.33 | | | | 1.50 | | | | 1.50 | | | | 1.50 | | | | 1.50 | |
| Net investment income (loss), before waivers and reimbursements | | | 0.26 | | | | 0.49 | | | | 0.08 | | | | (0.01 | ) | | | 0.19 | |
| Net investment income (loss), net of waivers and reimbursements | | | 0.64 | | | | 0.54 | | | | 0.14 | | | | 0.04 | | | | 0.22 | |
| Class N net assets at the end of the year (in thousands) | | $ | 7,402 | | | $ | 12,672 | | | $ | 16,381 | | | $ | 29,271 | | | $ | 33,359 | |
| Portfolio turnover rate (%) | | | 64 | | | | 116 | | | | 56 | | | | 38 | | | | 33 | |
| | | | | | | | | | | | | | | | | | | | | |
| | | Class I | |
| | | Years Ended December 31, | |
| | | | 2020 | | | | 2019 | | | | 2018 | | | | 2017 | | | | 2016 | |
| Net asset value, beginning of year | | $ | 18.02 | | | $ | 15.50 | | | $ | 20.70 | | | $ | 20.68 | | | $ | 17.08 | |
| Income (loss) from investment operations: | | | | | | | | | | | | | | | | | | | | |
| Net investment income (loss) | | | 0.11 | | | | 0.14 | | | | 0.08 | | | | 0.06 | | | | 0.09 | |
| Net realized and unrealized gain (loss) on investments | | | (1.40 | ) | | | 3.01 | | | | (3.21 | ) | | | 1.54 | | | | 4.44 | |
| Total from investment operations | | | (1.29 | ) | | | 3.15 | | | | (3.13 | ) | | | 1.60 | | | | 4.53 | |
| Less distributions from: | | | | | | | | | | | | | | | | | | | | |
| Net investment income | | | 0.08 | | | | 0.14 | | | | 0.05 | | | | 0.04 | | | | 0.09 | |
| Net realized gain | | | 3.08 | | | | 0.49 | | | | 2.02 | | | | 1.54 | | | | 0.84 | |
| Total distributions | | | 3.16 | | | | 0.63 | | | | 2.07 | | | | 1.58 | | | | 0.93 | |
| Net asset value, end of year | | $ | 13.57 | | | $ | 18.02 | | | $ | 15.50 | | | $ | 20.70 | | | $ | 20.68 | |
| Total return (%) | | | (5.57 | ) | | | 20.45 | | | | (15.74 | ) | | | 7.85 | | | | 26.46 | |
| Ratios to average daily net assets (%): | | | | | | | | | | | | | | | | | | | | |
| Expenses, before waivers and reimbursements | | | 1.48 | | | | 1.31 | | | | 1.30 | | | | 1.29 | | | | 1.29 | |
| Expenses, net of waivers and reimbursements | | | 1.08 | | | | 1.25 | | | | 1.25 | | | | 1.25 | | | | 1.25 | |
| Net investment income (loss), before waivers and reimbursements | | | 0.48 | | | | 0.74 | | | | 0.36 | | | | 0.25 | | | | 0.43 | |
| Net investment income (loss), net of waivers and reimbursements | | | 0.88 | | | | 0.80 | | | | 0.41 | | | | 0.29 | | | | 0.47 | |
| Class I net assets at the end of the year (in thousands) | | $ | 42,311 | | | $ | 162,093 | | | $ | 475,134 | | | $ | 644,749 | | | $ | 675,272 | |
| Portfolio turnover rate (%) | | | 64 | | | | 116 | | | | 56 | | | | 38 | | | | 33 | |
Note: Net investment income (loss) per share is based on the average shares outstanding during the year.
Performance cited represents past performance. Past performance does not guarantee future results and current performance may be lower or higher than the data quoted. Results shown are annual returns, which assume reinvestment of dividends and capital gains. Investment returns and principal will fluctuate and you may have a gain or loss when you sell shares. For the most current month-end performance information, please call 1-800-742-7272 or visit our Web site at www.williamblairfunds.com.
| December 31, 2020 | William Blair Funds | 149 |
Financial Highlights — For a share outstanding throughout each period
Small Cap Value Fund
| | Class R6 | |
| | Years Ended December 31, | |
| | | 2020 | | | 2019(a) | |
| Net asset value, beginning of year | | $ | 18.03 | | | $ | 18.19 | |
| Income (loss) from investment operations: | | | | | | | | |
| Net investment income (loss) | | | 0.12 | | | | 0.16 | |
| Net realized and unrealized gain (loss) on investments | | | (1.41 | ) | | | 0.32 | |
| Total from investment operations | | | (1.29 | ) | | | 0.48 | |
| Less distributions from: | | | | | | | | |
| Net investment income | | | 0.10 | | | | 0.15 | |
| Net realized gain | | | 3.08 | | | | 0.49 | |
| Total distributions | | | 3.18 | | | | 0.64 | |
| Net asset value, end of year | | $ | 13.56 | | | $ | 18.03 | |
| Total Return (%)* | | | (5.55 | ) | | | 2.69 | |
| Ratios to average daily net assets (%)**: | | | | | | | | |
| Expenses, before waivers and reimbursements | | | 1.30 | | | | 1.17 | |
| Expenses, net of waivers and reimbursements | | | 1.03 | | | | 1.17 | |
| Net investment income (loss), before waivers and reimbursements | | | 0.75 | | | | 1.28 | |
| Net investment income (loss), net of waivers and reimbursements | | | 1.02 | | | | 1.28 | |
| Class R6 net assets at the end of the year (in thousands) | | $ | 10,188 | | | $ | 513 | |
| Portfolio turnover rate (%)* | | | 64 | | | | 116 | |
| (a) | For the period from May 2, 2019 (Commencement of Operations) to December 31, 2019. |
| * | Rates are not annualized for periods less than a year. |
| ** | Rates are annualized for periods less than a year. |
Note: Net investment income (loss) per share is based on the average shares outstanding during the year.
Performance cited represents past performance. Past performance does not guarantee future results and current performance may be lower or higher than the data quoted. Results shown are annual returns, which assume reinvestment of dividends and capital gains. Investment returns and principal will fluctuate and you may have a gain or loss when you sell shares. For the most current month-end performance information, please call 1-800-742-7272 or visit our Web site at www.williamblairfunds.com.
| 150 | Annual Report | December 31, 2020 |
Financial Highlights — For a share outstanding throughout each period
Global Leaders Fund
| | | Class N | |
| | | Years Ended December 31, | |
| | | 2020 | | | 2019 | | | 2018 | | | 2017 | | | 2016 | |
| Net asset value, beginning of year | | $ | 14.92 | | | $ | 11.47 | | | $ | 14.53 | | | $ | 11.60 | | | $ | 11.58 | |
| Income (loss) from investment operations: | | | | | | | | | | | | | | | | | | | | |
| Net investment income (loss) | | | (0.06 | ) | | | 0.01 | | | | 0.02 | | | | 0.05 | | | | 0.03 | |
| Net realized and unrealized gain (loss) on investments | | | 4.74 | | | | 3.61 | | | | (1.12 | ) | | | 3.46 | | | | 0.04 | |
| Total from investment operations | | | 4.68 | | | | 3.62 | | | | (1.10 | ) | | | 3.51 | | | | 0.07 | |
| Less distributions from: | | | | | | | | | | | | | | | | | | | | |
| Net investment income | | | — | | | | 0.03 | | | | — | | | | 0.10 | | | | — | |
| Net realized gain | | | 2.19 | | | | 0.14 | | | | 1.96 | | | | 0.48 | | | | 0.05 | |
| Total distributions | | | 2.19 | | | | 0.17 | | | | 1.96 | | | | 0.58 | | | | 0.05 | |
| Net asset value, end of year | | $ | 17.41 | | | $ | 14.92 | | | $ | 11.47 | | | $ | 14.53 | | | $ | 11.60 | |
| Total return (%) | | | 31.50 | | | | 31.57 | | | | (8.23 | ) | | | 30.31 | | | | 0.62 | |
| Ratios to average daily net assets (%): | | | | | | | | | | | | | | | | | | | | |
| Expenses, before waivers and reimbursements | | | 1.45 | | | | 1.39 | | | | 1.47 | | | | 1.63 | | | | 1.62 | |
| Expenses, net of waivers and reimbursements | | | 1.15 | | | | 1.20 | | | | 1.33 | | | | 1.37 | | | | 1.36 | |
| Net investment income (loss), before waivers and reimbursements | | | (0.67 | ) | | | (0.10 | ) | | | (0.01 | ) | | | 0.09 | | | | (0.03 | ) |
| Net investment income (loss), net of waivers and reimbursements | | | (0.37 | ) | | | 0.09 | | | | 0.13 | | | | 0.35 | | | | 0.23 | |
| Class N net assets at the end of the year (in thousands) | | $ | 11,861 | | | $ | 8,910 | | | $ | 7,225 | | | $ | 7,761 | | | $ | 5,760 | |
| Portfolio turnover rate (%) | | | 27 | | | | 27 | | | | 49 | | | | 41 | | | | 75 | |
| | | | | | | | | | | | | | | | | | | | | |
| | | Class I | |
| | | Years Ended December 31, | |
| | | | 2020 | | | | 2019 | | | | 2018 | | | | 2017 | | | | 2016 | |
| Net asset value, beginning of year | | $ | 14.93 | | | $ | 11.47 | | | $ | 14.56 | | | $ | 11.62 | | | $ | 11.59 | |
| Income (loss) from investment operations: | | | | | | | | | | | | | | | | | | | | |
| Net investment income (loss) | | | (0.01 | ) | | | 0.05 | | | | 0.06 | | | | 0.09 | | | | 0.06 | |
| Net realized and unrealized gain (loss) on investments | | | 4.74 | | | | 3.61 | | | | (1.13 | ) | | | 3.47 | | | | 0.05 | |
| Total from investment operations | | | 4.73 | | | | 3.66 | | | | (1.07 | ) | | | 3.56 | | | | 0.11 | |
| Less distributions from: | | | | | | | | | | | | | | | | | | | | |
| Net investment income | | | 0.00 | ^ | | | 0.06 | | | | 0.06 | | | | 0.14 | | | | 0.03 | |
| Net realized gain | | | 2.19 | | | | 0.14 | | | | 1.96 | | | | 0.48 | | | | 0.05 | |
| Total distributions | | | 2.19 | | | | 0.20 | | | | 2.02 | | | | 0.62 | | | | 0.08 | |
| Net asset value, end of year | | $ | 17.47 | | | $ | 14.93 | | | $ | 11.47 | | | $ | 14.56 | | | $ | 11.62 | |
| Total return (%) | | | 31.86 | | | | 31.96 | | | | (8.06 | ) | | | 30.69 | | | | 0.98 | |
| Ratios to average daily net assets (%): | | | | | | | | | | | | | | | | | | | | |
| Expenses, before waivers and reimbursements | | | 1.12 | | | | 1.07 | | | | 1.15 | | | | 1.33 | | | | 1.31 | |
| Expenses, net of waivers and reimbursements | | | 0.90 | | | | 0.95 | | | | 1.07 | | | | 1.07 | | | | 1.05 | |
| Net investment income (loss), before waivers and reimbursements | | | (0.31 | ) | | | 0.22 | | | | 0.31 | | | | 0.39 | | | | 0.28 | |
| Net investment income (loss), net of waivers and reimbursements | | | (0.09 | ) | | | 0.34 | | | | 0.39 | | | | 0.65 | | | | 0.54 | |
| Class I net assets at the end of the year (in thousands) | | $ | 107,375 | | | $ | 114,666 | | | $ | 83,790 | | | $ | 60,067 | | | $ | 45,772 | |
| Portfolio turnover rate (%) | | | 27 | | | | 27 | | | | 49 | | | | 41 | | | | 75 | |
| ^ | Amount is less than $0.005 per share. |
Note: Net investment income (loss) per share is based on the average shares outstanding during the year.
Performance cited represents past performance. Past performance does not guarantee future results and current performance may be lower or higher than the data quoted. Results shown are annual returns, which assume reinvestment of dividends and capital gains. Investment returns and principal will fluctuate and you may have a gain or loss when you sell shares. For the most current month-end performance information, please call 1-800-742-7272 or visit our Web site at www.williamblairfunds.com.
| December 31, 2020 | William Blair Funds | 151 |
Financial Highlights — For a share outstanding throughout each period
Global Leaders Fund
| | | Class R6 | |
| | | Years Ended December 31, | |
| | | 2020 | | | 2019 | | | 2018 | | | 2017 | | | 2016 | |
| Net asset value, beginning of year | | $ | 14.93 | | | $ | 11.47 | | | $ | 14.56 | | | $ | 11.62 | | | $ | 11.59 | |
| Income (loss) from investment operations: | | | | | | | | | | | | | | | | | | | | |
| Net investment income (loss) | | | 0.02 | | | | 0.06 | | | | 0.07 | | | | 0.10 | | | | 0.07 | |
| Net realized and unrealized gain (loss) on investments | | | 4.72 | | | | 3.61 | | | | (1.13 | ) | | | 3.47 | | | | 0.05 | |
| Total from investment operations | | | 4.74 | | | | 3.67 | | | | (1.06 | ) | | | 3.57 | | | | 0.12 | |
| Less distributions from: | | | | | | | | | | | | | | | | | | | | |
| Net investment income | | | 0.01 | | | | 0.07 | | | | 0.07 | | | | 0.15 | | | | 0.04 | |
| Net realized gain | | | 2.19 | | | | 0.14 | | | | 1.96 | | | | 0.48 | | | | 0.05 | |
| Total distributions | | | 2.20 | | | | 0.21 | | | | 2.03 | | | | 0.63 | | | | 0.09 | |
| Net asset value, end of year | | $ | 17.47 | | | $ | 14.93 | | | $ | 11.47 | | | $ | 14.56 | | | $ | 11.62 | |
| Total return (%) | | | 31.91 | | | | 32.02 | | | | (7.99 | ) | | | 30.78 | | | | 1.03 | |
| Ratios to average daily net assets (%): | | | | | | | | | | | | | | | | | | | | |
| Expenses, before waivers and reimbursements | | | 1.06 | | | | 1.01 | | | | 1.08 | | | | 1.10 | | | | 1.11 | |
| Expenses, net of waivers and reimbursements | | | 0.85 | | | | 0.90 | | | | 1.00 | | | | 1.00 | | | | 1.00 | |
| Net investment income (loss), before waivers and reimbursements | | | (0.10 | ) | | | 0.32 | | | | 0.39 | | | | 0.65 | | | | 0.48 | |
| Net investment income (loss), net of waivers and reimbursements | | | 0.11 | | | | 0.43 | | | | 0.47 | | | | 0.75 | | | | 0.59 | |
| Class R6 net assets at the end of the year (in thousands) | | $ | 2,946 | | | $ | 48,133 | | | $ | 79,685 | | | $ | 143,521 | | | $ | 125,199 | |
| Portfolio turnover rate (%) | | | 27 | | | | 27 | | | | 49 | | | | 41 | | | | 75 | |
Note: Net investment income (loss) per share is based on the average shares outstanding during the year.
Performance cited represents past performance. Past performance does not guarantee future results and current performance may be lower or higher than the data quoted. Results shown are annual returns, which assume reinvestment of dividends and capital gains. Investment returns and principal will fluctuate and you may have a gain or loss when you sell shares. For the most current month-end performance information, please call 1-800-742-7272 or visit our Web site at www.williamblairfunds.com.
| 152 | Annual Report | December 31, 2020 |
Financial Highlights — For a share outstanding throughout each period
International Leaders Fund
| | | Class N | |
| | | Years Ended December 31, | |
| | | 2020 | | | 2019 | | | 2018 | | | 2017 | | | 2016 | |
| Net asset value, beginning of year | | $ | 18.08 | | | $ | 13.80 | | | $ | 16.37 | | | $ | 12.88 | | | $ | 12.89 | |
| Income (loss) from investment operations: | | | | | | | | | | | | | | | | | | | | |
| Net investment income (loss) | | | (0.04 | ) | | | 0.09 | | | | 0.13 | | | | 0.11 | | | | 0.03 | |
| Net realized and unrealized gain (loss) on investments | | | 4.82 | | | | 4.25 | | | | (2.19 | ) | | | 3.70 | | | | 0.08 | |
| Total from investment operations | | | 4.78 | | | | 4.34 | | | | (2.06 | ) | | | 3.81 | | | | 0.11 | |
| Less distributions from: | | | | | | | | | | | | | | | | | | | | |
| Net investment income | | | — | | | | 0.06 | | | | 0.06 | | | | 0.20 | | | | 0.12 | |
| Net realized gain | | | 0.17 | | | | — | | | | 0.45 | | | | 0.12 | | | | — | |
| Total distributions | | | 0.17 | | | | 0.06 | | | | 0.51 | | | | 0.32 | | | | 0.12 | |
| Net asset value, end of year | | $ | 22.69 | | | $ | 18.08 | | | $ | 13.80 | | | $ | 16.37 | | | $ | 12.88 | |
| Total return (%) | | | 26.45 | | | | 31.46 | | | | (12.70 | ) | | | 29.65 | | | | 0.88 | |
| Ratios to average daily net assets (%): | | | | | | | | | | | | | | | | | | | | |
| Expenses, before waivers and reimbursements | | | 1.31 | | | | 1.32 | | | | 1.39 | | | | 1.59 | | | | 1.56 | |
| Expenses, net of waivers and reimbursements | | | 1.15 | | | | 1.18 | | | | 1.28 | | | | 1.35 | | | | 1.30 | |
| Net investment income (loss), before waivers and reimbursements | | | (0.39 | ) | | | 0.44 | | | | 0.70 | | | | 0.48 | | | | (0.02 | ) |
| Net investment income (loss), net of waivers and reimbursements | | | (0.23 | ) | | | 0.58 | | | | 0.81 | | | | 0.72 | | | | 0.24 | |
| Class N net assets at the end of the year (in thousands) | | $ | 19,586 | | | $ | 11,163 | | | $ | 8,715 | | | $ | 9,651 | | | $ | 2,922 | |
| Portfolio turnover rate (%) | | | 34 | | | | 20 | | | | 33 | | | | 41 | | | | 59 | |
| | | | | | | | | | | | | | | | | | | | | |
| | | Class I | |
| | | Years Ended December 31, | |
| | | | 2020 | | | | 2019 | | | | 2018 | | | | 2017 | | | | 2016 | |
| Net asset value, beginning of year | | $ | 18.13 | | | $ | 13.84 | | | $ | 16.44 | | | $ | 12.92 | | | $ | 12.91 | |
| Income (loss) from investment operations: | | | | | | | | | | | | | | | | | | | | |
| Net investment income (loss) | | | (0.00) | ^ | | | 0.12 | | | | 0.17 | | | | 0.16 | | | | 0.10 | |
| Net realized and unrealized gain (loss) on investments | | | 4.85 | | | | 4.27 | | | | (2.19 | ) | | | 3.71 | | | | 0.04 | |
| Total from investment operations | | | 4.85 | | | | 4.39 | | | | (2.02 | ) | | | 3.87 | | | | 0.14 | |
| Less distributions from: | | | | | | | | | | | | | | | | | | | | |
| Net investment income | | | 0.01 | | | | 0.10 | | | | 0.13 | | | | 0.23 | | | | 0.13 | |
| Net realized gain | | | 0.17 | | | | — | | | | 0.45 | | | | 0.12 | | | | — | |
| Total distributions | | | 0.18 | | | | 0.10 | | | | 0.58 | | | | 0.35 | | | | 0.13 | |
| Net asset value, end of year | | $ | 22.80 | | | $ | 18.13 | | | $ | 13.84 | | | $ | 16.44 | | | $ | 12.92 | |
| Total return (%) | | | 26.77 | | | | 31.76 | | | | (12.45 | ) | | | 30.05 | | | | 1.10 | |
| Ratios to average daily net assets (%): | | | | | | | | | | | | | | | | | | | | |
| Expenses, before waivers and reimbursements | | | 1.01 | | | | 1.01 | | | | 1.07 | | | | 1.28 | | | | 1.30 | |
| Expenses, net of waivers and reimbursements | | | 0.90 | | | | 0.93 | | | | 1.03 | | | | 1.05 | | | | 1.04 | |
| Net investment income (loss), before waivers and reimbursements | | | (0.11 | ) | | | 0.64 | | | | 1.02 | | | | 0.86 | | | | 0.48 | |
| Net investment income (loss), net of waivers and reimbursements | | | (0.00 | ) | | | 0.72 | | | | 1.06 | | | | 1.09 | | | | 0.74 | |
| Class I net assets at the end of the year (in thousands) | | $ | 393,596 | | | $ | 181,617 | | | $ | 76,382 | | | $ | 60,279 | | | $ | 30,944 | |
| Portfolio turnover rate (%) | | | 34 | | | | 20 | | | | 33 | | | | 41 | | | | 59 | |
| ^ | Amount is less than $0.005 per share. |
Note: Net investment income (loss) per share is based on the average shares outstanding during the year.
Performance cited represents past performance. Past performance does not guarantee future results and current performance may be lower or higher than the data quoted. Results shown are annual returns, which assume reinvestment of dividends and capital gains. Investment returns and principal will fluctuate and you may have a gain or loss when you sell shares. For the most current month-end performance information, please call 1-800-742-7272 or visit our Web site at www.williamblairfunds.com.
| December 31, 2020 | William Blair Funds | 153 |
Financial Highlights — For a share outstanding throughout each period
International Leaders Fund
| | | Class R6 | |
| | | Years Ended December 31, | |
| | | 2020 | | | 2019 | | | 2018 | | | 2017 | | | 2016 | |
| Net asset value, beginning of year | | $ | 18.12 | | | $ | 13.83 | | | $ | 16.43 | | | $ | 12.92 | | | $ | 12.90 | |
| Income (loss) from investment operations: | | | | | | | | | | | | | | | | | | | | |
| Net investment income (loss) | | | 0.02 | | | | 0.14 | | | | 0.18 | | | | 0.18 | | | | 0.12 | |
| Net realized and unrealized gain (loss) on investments | | | 4.85 | | | | 4.26 | | | | (2.19 | ) | | | 3.70 | | | | 0.04 | |
| Total from investment operations | | | 4.87 | | | | 4.40 | | | | (2.01 | ) | | | 3.88 | | | | 0.16 | |
| Less distributions from: | | | | | | | | | | | | | | | | | | | | |
| Net investment income | | | 0.02 | | | | 0.11 | | | | 0.14 | | | | 0.25 | | | | 0.14 | |
| Net realized gain | | | 0.17 | | | | — | | | | 0.45 | | | | 0.12 | | | | — | |
| Total distributions | | | 0.19 | | | | 0.11 | | | | 0.59 | | | | 0.37 | | | | 0.14 | |
| Net asset value, end of year | | $ | 22.80 | | | $ | 18.12 | | | $ | 13.83 | | | $ | 16.43 | | | $ | 12.92 | |
| Total return (%) | | | 26.88 | | | | 31.83 | | | | (12.38 | ) | | | 30.08 | | | | 1.25 | |
| Ratios to average daily net assets (%): | | | | | | | | | | | | | | | | | | | | |
| Expenses, before waivers and reimbursements | | | 0.92 | | | | 0.93 | | | | 0.99 | | | | 1.03 | | | | 1.06 | |
| Expenses, net of waivers and reimbursements | | | 0.85 | | | | 0.88 | | | | 0.95 | | | | 0.95 | | | | 0.95 | |
| Net investment income (loss), before waivers and reimbursements | | | 0.03 | | | | 0.80 | | | | 1.07 | | | | 1.10 | | | | 0.81 | |
| Net investment income (loss), net of waivers and reimbursements | | | 0.10 | | | | 0.85 | | | | 1.11 | | | | 1.18 | | | | 0.92 | |
| Class R6 net assets at the end of the year (in thousands) | | $ | 687,171 | | | $ | 461,124 | | | $ | 324,902 | | | $ | 308,898 | | | $ | 221,356 | |
| Portfolio turnover rate (%) | | | 34 | | | | 20 | | | | 33 | | | | 41 | | | | 59 | |
Note: Net investment income (loss) per share is based on the average shares outstanding during the year.
Performance cited represents past performance. Past performance does not guarantee future results and current performance may be lower or higher than the data quoted. Results shown are annual returns, which assume reinvestment of dividends and capital gains. Investment returns and principal will fluctuate and you may have a gain or loss when you sell shares. For the most current month-end performance information, please call 1-800-742-7272 or visit our Web site at www.williamblairfunds.com.
| 154 | Annual Report | December 31, 2020 |
Financial Highlights — For a share outstanding throughout each period
International Growth Fund
| | | Class N | |
| | | Years Ended December 31, | |
| | | 2020 | | | 2019 | | | 2018 | | | 2017 | | | 2016 | |
| Net asset value, beginning of year | | $ | 29.68 | | | $ | 23.04 | | | $ | 30.41 | | | $ | 23.86 | | | $ | 24.94 | |
| Income (loss) from investment operations: | | | | | | | | | | | | | | | | | | | | |
| Net investment income (loss) | | | (0.16 | ) | | | 0.09 | | | | 0.16 | | | | 0.21 | | | | 0.20 | |
| Net realized and unrealized gain (loss) on investments | | | 9.55 | | | | 6.87 | | | | (5.56 | ) | | | 6.73 | | | | (0.92 | ) |
| Total from investment operations | | | 9.39 | | | | 6.96 | | | | (5.40 | ) | | | 6.94 | | | | (0.72 | ) |
| Less distributions from: | | | | | | | | | | | | | | | | | | | | |
| Net investment income | | | 0.06 | | | | 0.32 | | | | 0.12 | | | | 0.39 | | | | 0.36 | |
| Net realized gain | | | 0.26 | | | | — | | | | 1.85 | | | | — | | | | — | |
| Total distributions | | | 0.32 | | | | 0.32 | | | | 1.97 | | | | 0.39 | | | | 0.36 | |
| Net asset value, end of year | | $ | 38.75 | | | $ | 29.68 | | | $ | 23.04 | | | $ | 30.41 | | | $ | 23.86 | |
| Total return (%) | | | 31.64 | | | | 30.24 | | | | (18.00 | ) | | | 29.11 | | | | (2.88 | ) |
| Ratios to average daily net assets (%): | | | | | | | | | | | | | | | | | | | | |
| Expenses, before waivers and reimbursements | | | 1.47 | | | | 1.45 | | | | 1.46 | | | | 1.47 | | | | 1.43 | |
| Expenses, net of waivers and reimbursements | | | 1.45 | | | | 1.45 | | | | 1.45 | | | | 1.45 | | | | 1.43 | |
| Net investment income (loss), before waivers and reimbursements | | | (0.56 | ) | | | 0.34 | | | | 0.54 | | | | 0.76 | | | | 0.84 | |
| Net investment income (loss), net of waivers and reimbursements | | | (0.54 | ) | | | 0.34 | | | | 0.55 | | | | 0.78 | | | | 0.84 | |
| Class N net assets at the end of the year (in thousands) | | $ | 288,976 | | | $ | 494,788 | | | $ | 456,533 | | | $ | 763,740 | | | $ | 729,544 | |
| Portfolio turnover rate (%) | | | 27 | | | | 34 | | | | 78 | | | | 82 | | | | 101 | |
| | | | | | | | | | | | | | | | | | | | | |
| | | Class I | |
| | | Years Ended December 31, | |
| | | 2020 | | | 2019 | | | 2018 | | | 2017 | | | 2016 | |
| Net asset value, beginning of year | | $ | 30.38 | | | $ | 23.56 | | | $ | 31.13 | | | $ | 24.42 | | | $ | 25.51 | |
| Income (loss) from investment operations: | | | | | | | | | | | | | | | | | | | | |
| Net investment income (loss) | | | (0.08 | ) | | | 0.18 | | | | 0.26 | | | | 0.30 | | | | 0.29 | |
| Net realized and unrealized gain (loss) on investments | | | 9.79 | | | | 7.03 | | | | (5.70 | ) | | | 6.89 | | | | (0.94 | ) |
| Total from investment operations | | | 9.71 | | | | 7.21 | | | | (5.44 | ) | | | 7.19 | | | | (0.65 | ) |
| Less distributions from: | | | | | | | | | | | | | | | | | | | | |
| Net investment income | | | 0.18 | | | | 0.39 | | | | 0.28 | | | | 0.48 | | | | 0.44 | |
| Net realized gain | | | 0.26 | | | | — | | | | 1.85 | | | | — | | | | — | |
| Total distributions | | | 0.44 | | | | 0.39 | | | | 2.13 | | | | 0.48 | | | | 0.44 | |
| Net asset value, end of year | | $ | 39.65 | | | $ | 30.38 | | | $ | 23.56 | | | $ | 31.13 | | | $ | 24.42 | |
| Total return (%) | | | 31.99 | | | | 30.66 | | | | (17.73 | ) | | | 29.49 | | | | (2.54 | ) |
| Ratios to average daily net assets (%): | | | | | | | | | | | | | | | | | | | | |
| Expenses | | | 1.16 | | | | 1.14 | | | | 1.13 | | | | 1.14 | | | | 1.13 | |
| Net investment income (loss) | | | (0.24 | ) | | | 0.65 | | | | 0.86 | | | | 1.08 | | | | 1.16 | |
| Class I net assets at the end of the year (in thousands) | | $ | 1,914,460 | | | $ | 1,552,355 | | | $ | 1,646,811 | | | $ | 2,375,326 | | | $ | 2,251,701 | |
| Portfolio turnover rate (%) | | | 27 | | | | 34 | | | | 78 | | | | 82 | | | | 101 | |
Note: Net investment income (loss) per share is based on the average shares outstanding during the year.
Performance cited represents past performance. Past performance does not guarantee future results and current performance may be lower or higher than the data quoted. Results shown are annual returns, which assume reinvestment of dividends and capital gains. Investment returns and principal will fluctuate and you may have a gain or loss when you sell shares. For the most current month-end performance information, please call 1-800-742-7272 or visit our Web site at www.williamblairfunds.com.
| December 31, 2020 | William Blair Funds | 155 |
Financial Highlights — For a share outstanding throughout each period
International Growth Fund
| | | Class R6 | |
| | | Years Ended December 31, | |
| | | | 2020 | | | | 2019(a) | |
| Net asset value, beginning of year | | | $ | 30.37 | | | | $ | 27.56 | |
| Income (loss) from investment operations: | | | | | | | | | | |
| Net investment income (loss) | | | | (0.07 | ) | | | | (0.05 | ) |
| Net realized and unrealized gain (loss) on investments | | | | 9.83 | | | | | 3.27 | |
| Total from investment operations | | | | 9.76 | | | | | 3.22 | |
| Less distributions from: | | | | | | | | | | |
| Net investment income | | | | 0.21 | | | | | 0.41 | |
| Net realized gain | | | | 0.26 | | | | | — | |
| Total distributions | | | | 0.47 | | | | | 0.41 | |
| Net asset value, end of year | | | $ | 39.66 | | | | $ | 30.37 | |
| Total Return (%)* | | | | 32.16 | | | | | 11.71 | |
| Ratios to average daily net assets (%)**: | | | | | | | | | | |
| Expenses | | | | 1.07 | | | | | 1.06 | |
| Net investment income (loss) | | | | (0.23 | ) | | | | (0.26 | ) |
| Class R6 net assets at end of year (in thousands) | | | $ | 109,214 | | | | $ | 61,916 | |
| Portfolio turnover rate (%)* | | | | 27 | | | | | 34 | |
| (a) | For the period from May 2, 2019 (Commencement of Operations) to December 31, 2019. |
| * | Rates are not annualized for periods less than a year. |
| ** | Rates are annualized for periods less than a year. |
Note: Net investment income (loss) per share is based on the average shares outstanding during the year.
Performance cited represents past performance. Past performance does not guarantee future results and current performance may be lower or higher than the data quoted. Results shown are annual returns, which assume reinvestment of dividends and capital gains. Investment returns and principal will fluctuate and you may have a gain or loss when you sell shares. For the most current month-end performance information, please call 1-800-742-7272 or visit our Web site at www.williamblairfunds.com.
| 156 | Annual Report | December 31, 2020 |
Financial Highlights — For a share outstanding throughout each period
Institutional International Growth Fund
| | | Institutional | |
| | | Years Ended December 31, | |
| | | 2020 | | | 2019 | | | 2018 | | | 2017 | | | 2016 | |
| Net asset value, beginning of year | | $ | 17.35 | | | $ | 13.40 | | | $ | 18.08 | | | $ | 14.55 | | | $ | 15.08 | |
| Income (loss) from investment operations: | | | | | | | | | | | | | | | | | | | | |
| Net investment income (loss) | | | (0.01 | ) | | | 0.12 | | | | 0.18 | | | | 0.21 | | | | 0.18 | |
| Net realized and unrealized gain (loss) on investments | | | 5.60 | | | | 4.00 | | | | (3.29 | ) | | | 4.07 | | | | (0.54 | ) |
| Total from investment operations | | | 5.59 | | | | 4.12 | | | | (3.11 | ) | | | 4.28 | | | | (0.36 | ) |
| Less distributions from: | | | | | | | | | | | | | | | | | | | | |
| Net investment income | | | 0.02 | | | | 0.17 | | | | 0.17 | | | | 0.44 | | | | 0.17 | |
| Net realized gain | | | 2.55 | | | | — | | | | 1.40 | | | | 0.31 | | | | — | |
| Total distributions | | | 2.57 | | | | 0.17 | | | | 1.57 | | | | 0.75 | | | | 0.17 | |
| Net asset value, end of year | | $ | 20.37 | | | $ | 17.35 | | | $ | 13.40 | | | $ | 18.08 | | | $ | 14.55 | |
| Total return (%) | | | 32.47 | | | | 30.75 | | | | (17.50 | ) | | | 29.53 | | | | (2.40 | ) |
| Ratios to average daily net assets (%): | | | | | | | | | | | | | | | | | | | | |
| Expenses | | | 1.00 | | | | 0.99 | | | | 0.97 | | | | 0.97 | | | | 0.98 | |
| Net investment income (loss) | | | (0.04 | ) | | | 0.77 | | | | 1.01 | | | | 1.22 | | | | 1.25 | |
| Net assets at the end of the year (in thousands) | | $ | 1,326,482 | | | $ | 1,892,911 | | | $ | 1,784,435 | | | $ | 2,330,299 | | | $ | 2,093,971 | |
| Portfolio turnover rate (%) | | | 31 | | | | 35 | | | | 82 | | | | 84 | | | | 105 | |
Note: Net investment income (loss) per share is based on the average shares outstanding during the year.
Performance cited represents past performance. Past performance does not guarantee future results and current performance may be lower or higher than the data quoted. Results shown are annual returns, which assume reinvestment of dividends and capital gains. Investment returns and principal will fluctuate and you may have a gain or loss when you sell shares. For the most current month-end performance information, please call 1-800-742-7272 or visit our Web site at www.williamblairfunds.com.
| December 31, 2020 | William Blair Funds | 157 |
Financial Highlights — For a share outstanding throughout each period
International Small Cap Growth Fund
| | | Class N | |
| | | Years Ended December 31, | |
| | | 2020 | | | 2019 | | | 2018 | | | 2017 | | | 2016 | |
| Net asset value, beginning of year | | $ | 13.85 | | | $ | 10.36 | | | $ | 15.49 | | | $ | 12.87 | | | $ | 13.50 | |
| Income (loss) from investment operations: | | | | | | | | | | | | | | | | | | | | |
| Net investment income (loss) | | | (0.05 | ) | | | 0.05 | | | | 0.04 | | | | 0.12 | | | | 0.10 | |
| Net realized and unrealized gain (loss) on investments | | | 4.01 | | | | 3.45 | | | | (3.78 | ) | | | 3.98 | | | | (0.72 | ) |
| Total from investment operations | | | 3.96 | | | | 3.50 | | | | (3.74 | ) | | | 4.10 | | | | (0.62 | ) |
| Less distributions from: | | | | | | | | | | | | | | | | | | | | |
| Net investment income | | | — | | | | 0.01 | | | | 0.08 | | | | 0.32 | | | | 0.01 | |
| Net realized gain | | | 0.36 | | | | — | | | | 1.31 | | | | 1.16 | | | | 0.00 | ^ |
| Total distributions | | | 0.36 | | | | 0.01 | | | | 1.39 | | | | 1.48 | | | | 0.01 | |
| Net asset value, end of year | | $ | 17.45 | | | $ | 13.85 | | | $ | 10.36 | | | $ | 15.49 | | | $ | 12.87 | |
| Total return (%) | | | 28.68 | | | | 33.81 | | | | (24.48 | ) | | | 32.17 | | | | (4.60 | ) |
| Ratios to average daily net assets (%): | | | | | | | | | | | | | | | | | | | | |
| Expenses, before waivers and reimbursements | | | 1.52 | | | | 1.48 | | | | 1.48 | | | | 1.62 | | | | 1.59 | |
| Expenses, net of waivers and reimbursements | | | 1.52 | | | | 1.48 | | | | 1.48 | | | | 1.47 | | | | 1.44 | |
| Net investment income (loss), before waivers and reimbursements | | | (0.36 | ) | | | 0.45 | | | | 0.29 | | | | 0.70 | | | | 0.62 | |
| Net investment income (loss), net of waivers and reimbursements | | | (0.36 | ) | | | 0.45 | | | | 0.29 | | | | 0.85 | | | | 0.77 | |
| Class N net assets at the end of the year (in thousands) | | $ | 3,101 | | | $ | 3,650 | | | $ | 3,440 | | | $ | 6,275 | | | $ | 10,361 | |
| Portfolio turnover rate (%) | | | 63 | | | | 38 | | | | 88 | | | | 64 | | | | 73 | |
| | | | | | | | | | | | | | | | | | | | | |
| | | Class I | |
| | | Years Ended December 31, | |
| | | 2020 | | | 2019 | | | 2018 | | | 2017 | | | 2016 | |
| Net asset value, beginning of year | | $ | 13.98 | | | $ | 10.45 | | | $ | 15.65 | | | $ | 13.00 | | | $ | 13.65 | |
| Income (loss) from investment operations: | | | | | | | | | | | | | | | | | | | | |
| Net investment income (loss) | | | (0.01 | ) | | | 0.09 | | | | 0.09 | | | | 0.14 | | | | 0.14 | |
| Net realized and unrealized gain (loss) on investments | | | 4.06 | | | | 3.48 | | | | (3.84 | ) | | | 4.07 | | | | (0.75 | ) |
| Total from investment operations | | | 4.05 | | | | 3.57 | | | | (3.75 | ) | | | 4.21 | | | | (0.61 | ) |
| Less distributions from: | | | | | | | | | | | | | | | | | | | | |
| Net investment income | | | 0.01 | | | | 0.04 | | | | 0.14 | | | | 0.40 | | | | 0.04 | |
| Net realized gain | | | 0.36 | | | | — | | | | 1.31 | | | | 1.16 | | | | 0.00 | ^ |
| Total distributions | | | 0.37 | | | | 0.04 | | | | 1.45 | | | | 1.56 | | | | 0.04 | |
| Net asset value, end of year | | $ | 17.66 | | | $ | 13.98 | | | $ | 10.45 | | | $ | 15.65 | | | $ | 13.00 | |
| Total return (%) | | | 29.04 | | | | 34.22 | | | | (24.29 | ) | | | 32.70 | | | | (4.41 | ) |
| Ratios to average daily net assets (%): | | | | | | | | | | | | | | | | | | | | |
| Expenses, before waivers and reimbursements | | | 1.25 | | | | 1.21 | | | | 1.18 | | | | 1.31 | | | | 1.30 | |
| Expenses, net of waivers and reimbursements | | | 1.25 | | | | 1.21 | | | | 1.18 | | | | 1.16 | | | | 1.15 | |
| Net investment income (loss), before waivers and reimbursements | | | (0.05 | ) | | | 0.75 | | | | 0.60 | | | | 0.77 | | | | 0.91 | |
| Net investment income (loss), net of waivers and reimbursements | | | (0.05 | ) | | | 0.75 | | | | 0.60 | | | | 0.92 | | | | 1.06 | |
| Class I net assets at the end of the year (in thousands) | | $ | 145,283 | | | $ | 142,951 | | | $ | 165,451 | | | $ | 338,920 | | | $ | 306,526 | |
| Portfolio turnover rate (%) | | | 63 | | | | 38 | | | | 88 | | | | 64 | | | | 73 | |
| ^ | Amount is less than $0.005 per share. |
Note: Net investment income (loss) per share is based on the average shares outstanding during the year.
Performance cited represents past performance. Past performance does not guarantee future results and current performance may be lower or higher than the data quoted. Results shown are annual returns, which assume reinvestment of dividends and capital gains. Investment returns and principal will fluctuate and you may have a gain or loss when you sell shares. For the most current month-end performance information, please call 1-800-742-7272 or visit our Web site at www.williamblairfunds.com.
| 158 | Annual Report | December 31, 2020 |
Financial Highlights — For a share outstanding throughout each period
International Small Cap Growth Fund
| | | Class R6 | |
| | | Years Ended December 31, | |
| | | 2020 | | | 2019 | | | 2018 | | | 2017 | | | 2016 | |
| Net asset value, beginning of year | | $ | 14.05 | | | $ | 10.50 | | | $ | 15.73 | | | $ | 13.07 | | | $ | 13.72 | |
| Income (loss) from investment operations: | | | | | | | | | | | | | | | | | | | | |
| Net investment income (loss) | | | 0.00 | ^ | | | 0.11 | | | | 0.10 | | | | 0.15 | | | | 0.15 | |
| Net realized and unrealized gain (loss) on investments | | | 4.09 | | | | 3.49 | | | | (3.85 | ) | | | 4.08 | | | | (0.74 | ) |
| Total from investment operations | | | 4.09 | | | | 3.60 | | | | (3.75 | ) | | | 4.23 | | | | (0.59 | ) |
| Less distributions from: | | | | | | | | | | | | | | | | | | | | |
| Net investment income | | | 0.02 | | | | 0.05 | | | | 0.17 | | | | 0.41 | | | | 0.06 | |
| Net realized gain | | | 0.36 | | | | — | | | | 1.31 | | | | 1.16 | | | | 0.00 | ^ |
| Total distributions | | | 0.38 | | | | 0.05 | | | | 1.48 | | | | 1.57 | | | | 0.06 | |
| Net asset value, end of year | | $ | 17.76 | | | $ | 14.05 | | | $ | 10.50 | | | $ | 15.73 | | | $ | 13.07 | |
| Total return (%) | | | 29.23 | | | | 34.32 | | | | (24.19 | ) | | | 32.70 | | | | (4.31 | ) |
| Ratios to average daily net assets (%): | | | | | | | | | | | | | | | | | | | | |
| Expenses | | | 1.14 | | | | 1.12 | | | | 1.08 | | | | 1.08 | | | | 1.07 | |
| Net investment income (loss) | | | 0.02 | | | | 0.86 | | | | 0.67 | | | | 0.99 | | | | 1.13 | |
| Class R6 net assets at the end of the year (in thousands) | | $ | 188,497 | | | $ | 162,465 | | | $ | 171,833 | | | $ | 256,558 | | | $ | 199,746 | |
| Portfolio turnover rate (%) | | | 63 | | | | 38 | | | | 88 | | | | 64 | | | | 73 | |
| ^ | Amount is less than $0.005 per share. |
Note: Net investment income (loss) per share is based on the average shares outstanding during the year.
Performance cited represents past performance. Past performance does not guarantee future results and current performance may be lower or higher than the data quoted. Results shown are annual returns, which assume reinvestment of dividends and capital gains. Investment returns and principal will fluctuate and you may have a gain or loss when you sell shares. For the most current month-end performance information, please call 1-800-742-7272 or visit our Web site at www.williamblairfunds.com.
| December 31, 2020 | William Blair Funds | 159 |
Financial Highlights — For a share outstanding throughout each period
Emerging Markets Leaders Fund
| | | Class N | |
| | | Years Ended December 31, | |
| | | 2020 | | | 2019 | | | 2018 | | | 2017 | | | 2016 | |
| Net asset value, beginning of year | | $ | 10.51 | | | $ | 8.26 | | | $ | 11.06 | | | $ | 7.84 | | | $ | 7.73 | |
| Income (loss) from investment operations: | | | | | | | | | | | | | | | | | | | | |
| Net investment income (loss) | | | (0.02 | ) | | | 0.03 | | | | 0.03 | | | | 0.01 | | | | 0.02 | |
| Net realized and unrealized gain (loss) on investments | | | 2.88 | | | | 2.28 | | | | (1.97 | ) | | | 3.26 | | | | 0.09 | |
| Total from investment operations | | | 2.86 | | | | 2.31 | | | | (1.94 | ) | | | 3.27 | | | | 0.11 | |
| Less distributions from: | | | | | | | | | | | | | | | | | | | | |
| Net investment income | | | — | | | | 0.04 | | | | 0.07 | | | | 0.05 | | | | — | |
| Net realized gain | | | 0.11 | | | | 0.02 | | | | 0.79 | | | | — | | | | — | |
| Total distributions | | | 0.11 | | | | 0.06 | | | | 0.86 | | | | 0.05 | | | | — | |
| Net asset value, end of year | | $ | 13.26 | | | $ | 10.51 | | | $ | 8.26 | | | $ | 11.06 | | | $ | 7.84 | |
| Total return (%) | | | 27.23 | | | | 27.98 | | | | (17.73 | ) | | | 41.68 | | | | 1.42 | |
| Ratios to average daily net assets (%): | | | | | | | | | | | | | | | | | | | | |
| Expenses, before waivers and reimbursements | | | 1.63 | | | | 1.62 | | | | 1.60 | | | | 1.62 | | | | 1.81 | |
| Expenses, net of waivers and reimbursements | | | 1.40 | | | | 1.45 | | | | 1.58 | | | | 1.47 | | | | 1.57 | |
| Net investment income (loss), before waivers and reimbursements | | | (0.45 | ) | | | 0.17 | | | | 0.27 | | | | (0.01 | ) | | | 0.05 | |
| Net investment income (loss), net of waivers and reimbursements | | | (0.22 | ) | | | 0.34 | | | | 0.29 | | | | 0.14 | | | | 0.29 | |
| Class N net assets at the end of the year (in thousands) | | $ | 1,803 | | | $ | 1,856 | | | $ | 2,239 | | | $ | 2,766 | | | $ | 2,479 | |
| Portfolio turnover rate (%) | | | 47 | | | | 33 | | | | 52 | | | | 59 | | | | 135 | |
| | | | | | | | | | | | | | | | | | | | | |
| | | Class I | |
| | | Years Ended December 31, | |
| | | 2020 | | | 2019 | | | 2018 | | | 2017 | | | 2016 | |
| Net asset value, beginning of year | | $ | 10.52 | | | $ | 8.27 | | | $ | 11.09 | | | $ | 7.87 | | | $ | 7.74 | |
| Income (loss) from investment operations: | | | | | | | | | | | | | | | | | | | | |
| Net investment income (loss) | | | (0.00 | )^ | | | 0.06 | | | | 0.06 | | | | 0.02 | | | | 0.04 | |
| Net realized and unrealized gain (loss) on investments | | | 2.89 | | | | 2.29 | | | | (1.97 | ) | | | 3.27 | | | | 0.10 | |
| Total from investment operations | | | 2.89 | | | | 2.35 | | | | (1.91 | ) | | | 3.29 | | | | 0.14 | |
| Less distributions from: | | | | | | | | | | | | | | | | | | | | |
| Net investment income | | | 0.02 | | | | 0.08 | | | | 0.12 | | | | 0.07 | | | | 0.01 | |
| Net realized gain | | | 0.11 | | | | 0.02 | | | | 0.79 | | | | — | | | | — | |
| Total distributions | | | 0.13 | | | | 0.10 | | | | 0.91 | | | | 0.07 | | | | 0.01 | |
| Net asset value, end of year | | $ | 13.28 | | | $ | 10.52 | | | $ | 8.27 | | | $ | 11.09 | | | $ | 7.87 | |
| Total return (%) | | | 27.52 | | | | 28.36 | | | | (17.45 | ) | | | 41.89 | | | | 1.82 | |
| Ratios to average daily net assets (%): | | | | | | | | | | | | | | | | | | | | |
| Expenses, before waivers and reimbursements | | | 1.33 | | | | 1.29 | | | | 1.27 | | | | 1.40 | | | | 1.54 | |
| Expenses, net of waivers and reimbursements | | | 1.15 | | | | 1.20 | | | | 1.27 | | | | 1.25 | | | | 1.30 | |
| Net investment income (loss), before waivers and reimbursements | | | (0.21 | ) | | | 0.53 | | | | 0.58 | | | | 0.09 | | | | 0.28 | |
| Net investment income (loss), net of waivers and reimbursements | | | (0.03 | ) | | | 0.62 | | | | 0.58 | | | | 0.24 | | | | 0.52 | |
| Class I net assets at the end of the year (in thousands) | | $ | 62,319 | | | $ | 45,090 | | | $ | 34,786 | | | $ | 47,666 | | | $ | 30,346 | |
| Portfolio turnover rate (%) | | | 47 | | | | 33 | | | | 52 | | | | 59 | | | | 135 | |
| ^ | Amount is less than $0.005 per share. |
Note: Net investment income (loss) per share is based on the average shares outstanding during the year.
Performance cited represents past performance. Past performance does not guarantee future results and current performance may be lower or higher than the data quoted. Results shown are annual returns, which assume reinvestment of dividends and capital gains. Investment returns and principal will fluctuate and you may have a gain or loss when you sell shares. For the most current month-end performance information, please call 1-800-742-7272 or visit our Web site at www.williamblairfunds.com.
| 160 | Annual Report | December 31, 2020 |
Financial Highlights — For a share outstanding throughout each period
Emerging Markets Leaders Fund
| | | Class R6 | |
| | | Years Ended December 31, | |
| | | 2020 | | | 2019 | | | 2018 | | | 2017 | | | 2016 | |
| Net asset value, beginning of year | | $ | 10.51 | | | $ | 8.26 | | | $ | 11.09 | | | $ | 7.86 | | | $ | 7.74 | |
| Income (loss) from investment operations: | | | | | | | | | | | | | | | | | | | | |
| Net investment income (loss) | | | 0.00 | ^ | | | 0.06 | | | | 0.07 | | | | 0.03 | | | | 0.03 | |
| Net realized and unrealized gain (loss) on investments | | | 2.89 | | | | 2.29 | | | | (1.98 | ) | | | 3.28 | | | | 0.10 | |
| Total from investment operations | | | 2.89 | | | | 2.35 | | | | (1.91 | ) | | | 3.31 | | | | 0.13 | |
| Less distributions from: | | | | | | | | | | | | | | | | | | | | |
| Net investment income | | | 0.03 | | | | 0.08 | | | | 0.13 | | | | 0.08 | | | | 0.01 | |
| Net realized gain | | | 0.11 | | | | 0.02 | | | | 0.79 | | | | — | | | | — | |
| Total distributions | | | 0.14 | | | | 0.10 | | | | 0.92 | | | | 0.08 | | | | 0.01 | |
| Net asset value, end of year | | $ | 13.26 | | | $ | 10.51 | | | $ | 8.26 | | | $ | 11.09 | | | $ | 7.86 | |
| Total return (%) | | | 27.50 | | | | 28.45 | | | | (17.46 | ) | | | 42.15 | | | | 1.74 | |
| Ratios to average daily net assets (%): | | | | | | | | | | | | | | | | | | | | |
| Expenses, before waivers and reimbursements | | | 1.26 | | | | 1.23 | | | | 1.20 | | | | 1.19 | | | | 1.34 | |
| Expenses, net of waivers and reimbursements | | | 1.10 | | | | 1.15 | | | | 1.20 | | | | 1.19 | | | | 1.25 | |
| Net investment income (loss), before waivers and reimbursements | | | (0.11 | ) | | | 0.57 | | | | 0.71 | | | | 0.33 | | | | 0.30 | |
| Net investment income (loss), net of waivers and reimbursements | | | 0.05 | | | | 0.65 | | | | 0.71 | | | | 0.33 | | | | 0.39 | |
| Class R6 net assets at the end of the year (in thousands) | | $ | 198,015 | | | $ | 191,337 | | | $ | 161,889 | | | $ | 427,480 | | | $ | 272,678 | |
| Portfolio turnover rate (%) | | | 47 | | | | 33 | | | | 52 | | | | 59 | | | | 135 | |
| ^ | Amount is less than $0.005 per share. |
Note: Net investment income (loss) per share is based on the average shares outstanding during the year.
Performance cited represents past performance. Past performance does not guarantee future results and current performance may be lower or higher than the data quoted. Results shown are annual returns, which assume reinvestment of dividends and capital gains. Investment returns and principal will fluctuate and you may have a gain or loss when you sell shares. For the most current month-end performance information, please call 1-800-742-7272 or visit our Web site at www.williamblairfunds.com.
| December 31, 2020 | William Blair Funds | 161 |
Financial Highlights — For a share outstanding throughout each period
Emerging Markets Growth Fund
| | | Class N | |
| | | Years Ended December 31, | |
| | | 2020 | | | 2019 | | | 2018 | | | 2017 | | | 2016 | |
| Net asset value, beginning of year | | $ | 13.67 | | | $ | 11.14 | | | $ | 16.20 | | | $ | 10.99 | | | $ | 10.85 | |
| Income (loss) from investment operations: | | | | | | | | | | | | | | | | | | | | |
| Net investment income (loss) | | | (0.09 | ) | | | 0.11 | | | | 0.01 | | | | (0.02 | ) | | | 0.03 | |
| Net realized and unrealized gain (loss) on investments | | | 5.60 | | | | 2.98 | | | | (3.49 | ) | | | 5.35 | | | | 0.13 | |
| Total from investment operations | | | 5.51 | | | | 3.09 | | | | (3.48 | ) | | | 5.33 | | | | 0.16 | |
| Less distributions from: | | | | | | | | | | | | | | | | | | | | |
| Net investment income | | | — | | | | 0.16 | | | | 0.11 | | | | 0.12 | | | | 0.02 | |
| Net realized gain | | | 0.76 | | | | 0.40 | | | | 1.47 | | | | — | | | | — | |
| Total distributions | | | 0.76 | | | | 0.56 | | | | 1.58 | | | | 0.12 | | | | 0.02 | |
| Net asset value, end of year | | $ | 18.42 | | | $ | 13.67 | | | $ | 11.14 | | | $ | 16.20 | | | $ | 10.99 | |
| Total return (%) | | | 40.43 | | | | 27.89 | | | | (21.61 | ) | | | 48.53 | | | | 1.49 | |
| Ratios to average daily net assets (%): | | | | | | | | | | | | | | | | | | | | |
| Expenses, before waivers and reimbursements | | | 1.55 | | | | 1.51 | | | | 1.52 | | | | 1.65 | | | | 1.65 | |
| Expenses, net of waivers and reimbursements | | | 1.55 | | | | 1.51 | | | | 1.52 | | | | 1.50 | | | | 1.50 | |
| Net investment income (loss), before waivers and reimbursements | | | (0.60 | ) | | | 0.84 | | | | 0.09 | | | | (0.29 | ) | | | 0.13 | |
| Net investment income (loss), net of waivers and reimbursements | | | (0.60 | ) | | | 0.84 | | | | 0.09 | | | | (0.14 | ) | | | 0.28 | |
| Class N net assets at the end of the year (in thousands) | | $ | 18,606 | | | $ | 7,804 | | | $ | 7,103 | | | $ | 10,479 | | | $ | 8,488 | |
| Portfolio turnover rate (%) | | | 77 | | | | 79 | | | | 113 | | | | 91 | | | | 105 | |
| | | | | | | | | | | | | | | | | | | | | |
| | | Class I | |
| | | Years Ended December 31, | |
| | | | 2020 | | | | 2019 | | | | 2018 | | | | 2017 | | | | 2016 | |
| Net asset value, beginning of year | | $ | 13.82 | | | $ | 11.25 | | | $ | 16.36 | | | $ | 11.10 | | | $ | 10.96 | |
| Income (loss) from investment operations: | | | | | | | | | | | | | | | | | | | | |
| Net investment income (loss) | | | (0.05 | ) | | | 0.14 | | | | 0.05 | | | | 0.01 | | | | 0.06 | |
| Net realized and unrealized gain (loss) on investments | | | 5.66 | | | | 3.02 | | | | (3.52 | ) | | | 5.40 | | | | 0.13 | |
| Total from investment operations | | | 5.61 | | | | 3.16 | | | | (3.47 | ) | | | 5.41 | | | | 0.19 | |
| Less distributions from: | | | | | | | | | | | | | | | | | | | | |
| Net investment income | | | 0.01 | | | | 0.19 | | | | 0.17 | | | | 0.15 | | | | 0.05 | |
| Net realized gain | | | 0.76 | | | | 0.40 | | | | 1.47 | | | | — | | | | — | |
| Total distributions | | | 0.77 | | | | 0.59 | | | | 1.64 | | | | 0.15 | | | | 0.05 | |
| Net asset value, end of year | | $ | 18.66 | | | $ | 13.82 | | | $ | 11.25 | | | $ | 16.36 | | | $ | 11.10 | |
| Total return (%) | | | 40.72 | | | | 28.29 | | | | (21.37 | ) | | | 48.83 | | | | 1.73 | |
| Ratios to average daily net assets (%): | | | | | | | | | | | | | | | | | | | | |
| Expenses, before waivers and reimbursements | | | 1.30 | | | | 1.26 | | | | 1.27 | | | | 1.42 | | | | 1.41 | |
| Expenses, net of waivers and reimbursements | | | 1.30 | | | | 1.26 | | | | 1.27 | | | | 1.27 | | | | 1.26 | |
| Net investment income (loss), before waivers and reimbursements | | | (0.33 | ) | | | 1.06 | | | | 0.34 | | | | (0.07 | ) | | | 0.38 | |
| Net investment income (loss), net of waivers and reimbursements | | | (0.33 | ) | | | 1.06 | | | | 0.34 | | | | 0.08 | | | | 0.53 | |
| Class I net assets at the end of the year (in thousands) | | $ | 113,697 | | | $ | 73,496 | | | $ | 79,427 | | | $ | 129,481 | | | $ | 93,668 | |
| Portfolio turnover rate (%) | | | 77 | | | | 79 | | | | 113 | | | | 91 | | | | 105 | |
Note: Net investment income (loss) per share is based on the average shares outstanding during the year.
Performance cited represents past performance. Past performance does not guarantee future results and current performance may be lower or higher than the data quoted. Results shown are annual returns, which assume reinvestment of dividends and capital gains. Investment returns and principal will fluctuate and you may have a gain or loss when you sell shares. For the most current month-end performance information, please call 1-800-742-7272 or visit our Web site at www.williamblairfunds.com.
| 162 | Annual Report | December 31, 2020 |
Financial Highlights — For a share outstanding throughout each period
Emerging Markets Growth Fund
| | | Class R6 | |
| | | Years Ended December 31, | |
| | | 2020 | | | 2019 | | | 2018 | | | 2017 | | | 2016 | |
| Net asset value, beginning of year | | $ | 13.94 | | | $ | 11.35 | | | $ | 16.49 | | | $ | 11.18 | | | $ | 11.05 | |
| Income (loss) from investment operations: | | | | | | | | | | | | | | | | | | | | |
| Net investment income (loss) | | | (0.03 | ) | | | 0.15 | | | | 0.07 | | | | 0.02 | | | | 0.07 | |
| Net realized and unrealized gain (loss) on investments | | | 5.71 | | | | 3.04 | | | | (3.56 | ) | | | 5.46 | | | | 0.12 | |
| Total from investment operations | | | 5.68 | | | | 3.19 | | | | (3.49 | ) | | | 5.48 | | | | 0.19 | |
| Less distributions from: | | | | | | | | | | | | | | | | | | | | |
| Net investment income | | | 0.02 | | | | 0.20 | | | | 0.18 | | | | 0.17 | | | | 0.06 | |
| Net realized gain | | | 0.76 | | | | 0.40 | | | | 1.47 | | | | — | | | | — | |
| Total distributions | | | 0.78 | | | | 0.60 | | | | 1.65 | | | | 0.17 | | | | 0.06 | |
| Net asset value, end of year | | $ | 18.84 | | | $ | 13.94 | | | $ | 11.35 | | | $ | 16.49 | | | | $11.18 | |
| Total return (%) | | | 40.90 | | | | 28.28 | | | | (21.29 | ) | | | 49.06 | | | | 1.71 | |
| Ratios to average daily net assets (%): | | | | | | | | | | | | | | | | | | | | |
| Expenses | | | 1.20 | | | | 1.19 | | | | 1.19 | | | | 1.17 | | | | 1.19 | |
| Net investment income (loss) | | | (0.22 | ) | | | 1.17 | | | | 0.46 | | | | 0.17 | | | | 0.60 | |
| Class R6 net assets at the end of the year (in thousands) | | $ | 1,063,433 | | | $ | 708,892 | | | $ | 654,441 | | | $ | 1,178,853 | | | $ | 831,587 | |
| Portfolio turnover rate (%) | | | 77 | | | | 79 | | | | 113 | | | | 91 | | | | 105 | |
Note: Net investment income (loss) per share is based on the average shares outstanding during the year.
Performance cited represents past performance. Past performance does not guarantee future results and current performance may be lower or higher than the data quoted. Results shown are annual returns, which assume reinvestment of dividends and capital gains. Investment returns and principal will fluctuate and you may have a gain or loss when you sell shares. For the most current month-end performance information, please call 1-800-742-7272 or visit our Web site at www.williamblairfunds.com.
| December 31, 2020 | William Blair Funds | 163 |
Financial Highlights — For a share outstanding throughout each period
Emerging Markets Small Cap Growth Fund
| | | Class N | |
| | | Years Ended December 31, | |
| | | 2020 | | | 2019 | | | 2018 | | | 2017 | | | 2016 | |
| Net asset value, beginning of year | | $ | 16.80 | | | $ | 13.96 | | | $ | 18.66 | | | $ | 13.73 | | | $ | 14.84 | |
| Income (loss) from investment operations: | | | | | | | | | | | | | | | | | | | | |
| Net investment income (loss) | | | (0.06 | ) | | | 0.00 | ^ | | | (0.02 | ) | | | 0.01 | | | | 0.09 | |
| Net realized and unrealized gain (loss) on investments | | | 5.48 | | | | 2.84 | | | | (4.38 | ) | | | 5.46 | | | | (0.88 | ) |
| Total from investment operations | | | 5.42 | | | | 2.84 | | | | (4.40 | ) | | | 5.47 | | | | (0.79 | ) |
| Less distributions from: | | | | | | | | | | | | | | | | | | | | |
| Net investment income | | | — | | | | — | | | | — | | | | 0.50 | | | | 0.32 | |
| Net realized gain | | | — | | | | — | | | | 0.30 | | | | 0.04 | | | | — | |
| Total distributions | | | — | | | | — | | | | 0.30 | | | | 0.54 | | | | 0.32 | |
| Net asset value, end of year | | $ | 22.22 | | | $ | 16.80 | | | $ | 13.96 | | | $ | 18.66 | | | $ | 13.73 | |
| Total return (%) | | | 32.26 | | | | 20.34 | | | | (23.57 | ) | | | 40.09 | | | | (5.33 | ) |
| Ratios to average daily net assets (%): | | | | | | | | | | | | | | | | | | | | |
| Expenses, before waivers and reimbursements | | | 1.77 | | | | 1.71 | | | | 1.70 | | | | 1.83 | | | | 1.82 | |
| Expenses, net of waivers and reimbursements | | | 1.55 | | | | 1.55 | | | | 1.58 | | | | 1.64 | | | | 1.61 | |
| Net investment income (loss), before waivers and reimbursements | | | (0.58 | ) | | | (0.14 | ) | | | (0.22 | ) | | | (0.11 | ) | | | 0.41 | |
| Net investment income (loss), net of waivers and reimbursements | | | (0.36 | ) | | | 0.02 | | | | (0.10 | ) | | | 0.08 | | | | 0.62 | |
| Class N net assets at the end of the year (in thousands) | | $ | 3,947 | | | $ | 4,025 | | | $ | 8,977 | | | $ | 15,082 | | | $ | 9,263 | |
| Portfolio turnover rate (%) | | | 119 | | | | 142 | | | | 187 | | | | 183 | | | | 157 | |
| | | | | | | | | | | | | | | | | | | | | |
| | | Class I | |
| | | Years Ended December 31, | |
| | | | 2020 | | | | 2019 | | | | 2018 | | | | 2017 | | | | 2016 | |
| Net asset value, beginning of year | | $ | 16.90 | | | $ | 14.03 | | | $ | 18.73 | | | $ | 13.77 | | | $ | 14.90 | |
| Income (loss) from investment operations: | | | | | | | | | | | | | | | | | | | | |
| Net investment income (loss) | | | (0.02 | ) | | | 0.04 | | | | 0.03 | | | | 0.08 | | | | 0.13 | |
| Net realized and unrealized gain (loss) on investments | | | 5.53 | | | | 2.86 | | | | (4.41 | ) | | | 5.47 | | | | (0.89 | ) |
| Total from investment operations | | | 5.51 | | | | 2.90 | | | | (4.38 | ) | | | 5.55 | | | | (0.76 | ) |
| Less distributions from: | | | | | | | | | | | | | | | | | | | | |
| Net investment income | | | 0.01 | | | | 0.03 | | | | 0.02 | | | | 0.55 | | | | 0.37 | |
| Net realized gain | | | — | | | | — | | | | 0.30 | | | | 0.04 | | | | — | |
| Total distributions | | | 0.01 | | | | 0.03 | | | | 0.32 | | | | 0.59 | | | | 0.37 | |
| Net asset value, end of year | | $ | 22.40 | | | $ | 16.90 | | | $ | 14.03 | | | $ | 18.73 | | | $ | 13.77 | |
| Total return (%) | | | 32.60 | | | | 20.58 | | | | (23.31 | ) | | | 40.53 | | | | (5.11 | ) |
| Ratios to average daily net assets (%): | | | | | | | | | | | | | | | | | | | | |
| Expenses, before waivers and reimbursements | | | 1.45 | | | | 1.40 | | | | 1.38 | | | | 1.50 | | | | 1.51 | |
| Expenses, net of waivers and reimbursements | | | 1.30 | | | | 1.30 | | | | 1.33 | | | | 1.31 | | | | 1.30 | |
| Net investment income (loss), before waivers and reimbursements | | | (0.25 | ) | | | 0.18 | | | | 0.13 | | | | 0.30 | | | | 0.66 | |
| Net investment income (loss), net of waivers and reimbursements | | | (0.10 | ) | | | 0.28 | | | | 0.18 | | | | 0.49 | | | | 0.87 | |
| Class I net assets at the end of the year (in thousands) | | $ | 151,302 | | | $ | 142,885 | | | $ | 169,770 | | | $ | 282,620 | | | $ | 147,949 | |
| Portfolio turnover rate (%) | | | 119 | | | | 142 | | | | 187 | | | | 183 | | | | 157 | |
| ^ | Amount is less than $0.005 per share. |
Note: Net investment income (loss) per share is based on the average shares outstanding during the year.
Performance cited represents past performance. Past performance does not guarantee future results and current performance may be lower or higher than the data quoted. Results shown are annual returns, which assume reinvestment of dividends and capital gains. Investment returns and principal will fluctuate and you may have a gain or loss when you sell shares. For the most current month-end performance information, please call 1-800-742-7272 or visit our Web site at www.williamblairfunds.com.
| 164 | Annual Report | December 31, 2020 |
Financial Highlights — For a share outstanding throughout each period
Emerging Markets Small Cap Growth Fund
| | | Class R6 | |
| | | Years Ended December 31, | |
| | | 2020 | | | 2019 | | | 2018 | | | 2017 | | | 2016 | |
| Net asset value, beginning of year | | $ | 16.93 | | | $ | 14.06 | | | $ | 18.76 | | | $ | 13.79 | | | $ | 14.92 | |
| Income (loss) from investment operations: | | | | | | | | | | | | | | | | | | | | |
| Net investment income (loss) | | | (0.00 | )^ | | | 0.05 | | | | 0.05 | | | | 0.10 | | | | 0.14 | |
| Net realized and unrealized gain (loss) on investments | | | 5.53 | | | | 2.86 | | | | (4.41 | ) | | | 5.47 | | | | (0.89 | ) |
| Total from investment operations | | | 5.53 | | | | 2.91 | | | | (4.36 | ) | | | 5.57 | | | | (0.75 | ) |
| Less distributions from: | | | | | | | | | | | | | | | | | | | | |
| Net investment income | | | 0.02 | | | | 0.04 | | | | 0.04 | | | | 0.56 | | | | 0.38 | |
| Net realized gain | | | — | | | | — | | | | 0.30 | | | | 0.04 | | | | — | |
| Total distributions | | | 0.02 | | | | 0.04 | | | | 0.34 | | | | 0.60 | | | | 0.38 | |
| Net asset value, end of year | | $ | 22.44 | | | $ | 16.93 | | | $ | 14.06 | | | $ | 18.76 | | | $ | 13.79 | |
| Total return (%) | | | 32.66 | | | | 20.69 | | | | (23.24 | ) | | | 40.62 | | | | (5.05 | ) |
| Ratios to average daily net assets (%): | | | | | | | | | | | | | | | | | | | | |
| Expenses, before waivers and reimbursements | | | 1.36 | | | | 1.33 | | | | 1.30 | | | | 1.29 | | | | 1.31 | |
| Expenses, net of waivers and reimbursements | | | 1.25 | | | | 1.25 | | | | 1.25 | | | | 1.25 | | | | 1.25 | |
| Net investment income (loss), before waivers and reimbursements | | | (0.14 | ) | | | 0.27 | | | | 0.22 | | | | 0.53 | | | | 0.88 | |
| Net investment income (loss), net of waivers and reimbursements | | | (0.03 | ) | | | 0.35 | | | | 0.27 | | | | 0.57 | | | | 0.94 | |
| Class R6 net assets at the end of the year (in thousands) | | $ | 152,160 | | | $ | 130,711 | | | $ | 98,188 | | | $ | 166,927 | | | $ | 125,650 | |
| Portfolio turnover rate (%) | | | 119 | | | | 142 | | | | 187 | | | | 183 | | | | 157 | |
| ^ | Amount is less than $0.005 per share. |
Note: Net investment income (loss) per share is based on the average shares outstanding during the year.
Performance cited represents past performance. Past performance does not guarantee future results and current performance may be lower or higher than the data quoted. Results shown are annual returns, which assume reinvestment of dividends and capital gains. Investment returns and principal will fluctuate and you may have a gain or loss when you sell shares. For the most current month-end performance information, please call 1-800-742-7272 or visit our Web site at www.williamblairfunds.com.
| December 31, 2020 | William Blair Funds | 165 |
Financial Highlights — For a share outstanding throughout each period
Bond Fund
| | | Class N | |
| | | Years Ended December 31, | |
| | | 2020 | | | 2019 | | | 2018 | | | 2017 | | | 2016 | |
| Net asset value, beginning of year | | $ | 10.41 | | | $ | 9.75 | | | $ | 10.41 | | | $ | 10.41 | | | $ | 10.34 | |
| Income (loss) from investment operations: | | | | | | | | | | | | | | | | | | | | |
| Net investment income (loss) | | | 0.24 | | | | 0.30 | | | | 0.31 | | | | 0.27 | | | | 0.27 | |
| Net realized and unrealized gain (loss) on investments | | | 0.54 | | | | 0.77 | | | | (0.56 | ) | | | 0.12 | | | | 0.18 | |
| Total from investment operations | | | 0.78 | | | | 1.07 | | | | (0.25 | ) | | | 0.39 | | | | 0.45 | |
| Less distributions from: | | | | | | | | | | | | | | | | | | | | |
| Net investment income | | | 0.36 | | | | 0.41 | | | | 0.41 | | | | 0.39 | | | | 0.38 | |
| Net realized gain | | | — | | | | — | | | | — | | | | — | | | | — | |
| Total distributions | | | 0.36 | | | | 0.41 | | | | 0.41 | | | | 0.39 | | | | 0.38 | |
| Net asset value, end of year | | $ | 10.83 | | | $ | 10.41 | | | $ | 9.75 | | | $ | 10.41 | | | $ | 10.41 | |
| Total return (%) | | | 7.63 | | | | 11.09 | | | | (2.42 | ) | | | 3.83 | | | | 4.40 | |
| Ratios to average daily net assets (%): | | | | | | | | | | | | | | | | | | | | |
| Expenses, before waivers and reimbursements | | | 0.79 | | | | 0.69 | | | | 0.69 | | | | 0.82 | | | | 0.82 | |
| Expenses, net of waivers and reimbursements | | | 0.60 | | | | 0.60 | | | | 0.62 | | | | 0.65 | | | | 0.65 | |
| Net investment income (loss), before waivers and reimbursements | | | 2.04 | | | | 2.90 | | | | 3.01 | | | | 2.40 | | | | 2.43 | |
| Net investment income (loss), net of waivers and reimbursements | | | 2.23 | | | | 2.99 | | | | 3.08 | | | | 2.57 | | | | 2.60 | |
| Class N net assets at the end of the year (in thousands) | | $ | 39,522 | | | $ | 32,176 | | | $ | 70,253 | | | $ | 83,662 | | | $ | 125,866 | |
| Portfolio turnover rate (%) | | | 71 | | | | 58 | | | | 40 | | | | 17 | | | | 17 | |
| | | | | | | | | | | | | | | | | | | | | |
| | | Class I | |
| | | Years Ended December 31, | |
| | | | 2020 | | | | 2019 | | | | 2018 | | | | 2017 | | | | 2016 | |
| Net asset value, beginning of year | | $ | 10.30 | | | $ | 9.65 | | | $ | 10.31 | | | $ | 10.30 | | | $ | 10.24 | |
| Income (loss) from investment operations: | | | | | | | | | | | | | | | | | | | | |
| Net investment income (loss) | | | 0.25 | | | | 0.31 | | | | 0.32 | | | | 0.29 | | | | 0.30 | |
| Net realized and unrealized gain (loss) on investments | | | 0.54 | | | | 0.76 | | | | (0.56 | ) | | | 0.13 | | | | 0.16 | |
| Total from investment operations | | | 0.79 | | | | 1.07 | | | | (0.24 | ) | | | 0.42 | | | | 0.46 | |
| Less distributions from: | | | | | | | | | | | | | | | | | | | | |
| Net investment income | | | 0.38 | | | | 0.42 | | | | 0.42 | | | | 0.41 | | | | 0.40 | |
| Net realized gain | | | — | | | | — | | | | — | | | | — | | | | — | |
| Total distributions | | | 0.38 | | | | 0.42 | | | | 0.42 | | | | 0.41 | | | | 0.40 | |
| Net asset value, end of year | | $ | 10.71 | | | $ | 10.30 | | | $ | 9.65 | | | $ | 10.31 | | | $ | 10.30 | |
| Total return (%) | | | 7.73 | | | | 11.22 | | | | (2.31 | ) | | | 4.16 | | | | 4.55 | |
| Ratios to average daily net assets (%): | | | | | | | | | | | | | | | | | | | | |
| Expenses, before waivers and reimbursements | | | 0.55 | | | | 0.47 | | | | 0.46 | | | | 0.60 | | | | 0.58 | |
| Expenses, net of waivers and reimbursements | | | 0.45 | | | | 0.45 | | | | 0.46 | | | | 0.43 | | | | 0.41 | |
| Net investment income (loss), before waivers and reimbursements | | | 2.29 | | | | 3.10 | | | | 3.24 | | | | 2.62 | | | | 2.66 | |
| Net investment income (loss), net of waivers and reimbursements | | | 2.39 | | | | 3.12 | | | | 3.24 | | | | 2.79 | | | | 2.83 | |
| Class I net assets at the end of the year (in thousands) | | $ | 232,716 | | | $ | 206,304 | | | $ | 281,442 | | | $ | 384,464 | | | $ | 322,174 | |
| Portfolio turnover rate (%) | | | 71 | | | | 58 | | | | 40 | | | | 17 | | | | 17 | |
Note: Net investment income (loss) per share is based on the average shares outstanding during the year.
Performance cited represents past performance. Past performance does not guarantee future results and current performance may be lower or higher than the data quoted. Results shown are annual returns, which assume reinvestment of dividends and capital gains. Investment returns and principal will fluctuate and you may have a gain or loss when you sell shares. For the most current month-end performance information, please call 1-800-742-7272 or visit our Web site at www.williamblairfunds.com.
| 166 | Annual Report | December 31, 2020 |
Financial Highlights — For a share outstanding throughout each period
Bond Fund
| | | Class R6 | |
| | | Years Ended December 31, | |
| | | 2020 | | | 2019 | | | 2018 | | | 2017 | | | 2016 | |
| Net asset value, beginning of year | | $ | 10.30 | | | $ | 9.64 | | | $ | 10.30 | | | $ | 10.29 | | | $ | 10.23 | |
| Income (loss) from investment operations: | | | | | | | | | | | | | | | | | | | | |
| Net investment income (loss) | | | 0.26 | | | | 0.32 | | | | 0.33 | | | | 0.30 | | | | 0.30 | |
| Net realized and unrealized gain (loss) on investments | | | 0.53 | | | | 0.76 | | | | (0.56 | ) | | | 0.13 | | | | 0.17 | |
| Total from investment operations | | | 0.79 | | | | 1.08 | | | | (0.23 | ) | | | 0.43 | | | | 0.47 | |
| Less distributions from: | | | | | | | | | | | | | | | | | | | | |
| Net investment income | | | 0.38 | | | | 0.42 | | | | 0.43 | | | | 0.42 | | | | 0.41 | |
| Net realized gain | | | — | | | | — | | | | — | | | | — | | | | — | |
| Total distributions | | | 0.38 | | | | 0.42 | | | | 0.43 | | | | 0.42 | | | | 0.41 | |
| Net asset value, end of year | | $ | 10.71 | | | $ | 10.30 | | | $ | 9.64 | | | $ | 10.30 | | | $ | 10.29 | |
| Total return (%) | | | 7.79 | | | | 11.39 | | | | (2.26 | ) | | | 4.24 | | | | 4.61 | |
| Ratios to average daily net assets (%): | | | | | | | | | | | | | | | | | | | | |
| Expenses, before waivers and reimbursements | | | 0.46 | | | | 0.41 | | | | 0.38 | | | | 0.37 | | | | 0.37 | |
| Expenses, net of waivers and reimbursements | | | 0.40 | | | | 0.40 | | | | 0.38 | | | | 0.35 | | | | 0.35 | |
| Net investment income (loss), before waivers and reimbursements | | | 2.39 | | | | 3.17 | | | | 3.32 | | | | 2.85 | | | | 2.88 | |
| Net investment income (loss), net of waivers and reimbursements | | | 2.45 | | | | 3.18 | | | | 3.32 | | | | 2.87 | | | | 2.90 | |
| Class R6 net assets at the end of the year (in thousands) | | $ | 48,482 | | | $ | 43,655 | | | $ | 70,851 | | | $ | 91,629 | | | $ | 95,216 | |
| Portfolio turnover rate (%) | | | 71 | | | | 58 | | | | 40 | | | | 17 | | | | 17 | |
Note: Net investment income (loss) per share is based on the average shares outstanding during the year.
Performance cited represents past performance. Past performance does not guarantee future results and current performance may be lower or higher than the data quoted. Results shown are annual returns, which assume reinvestment of dividends and capital gains. Investment returns and principal will fluctuate and you may have a gain or loss when you sell shares. For the most current month-end performance information, please call 1-800-742-7272 or visit our Web site at www.williamblairfunds.com.
| December 31, 2020 | William Blair Funds | 167 |
Financial Highlights — For a share outstanding throughout each period
Income Fund
| | | Class N | |
| | | Years Ended December 31, | |
| | | 2020 | | | 2019 | | | 2018 | | | 2017 | | | 2016 | |
| Net asset value, beginning of year | | $ | 8.57 | | | $ | 8.36 | | | $ | 8.72 | | | $ | 8.86 | | | $ | 8.90 | |
| Income (loss) from investment operations: | | | | | | | | | | | | | | | | | | | | |
| Net investment income (loss) | | | 0.12 | | | | 0.17 | | | | 0.17 | | | | 0.16 | | | | 0.16 | |
| Net realized and unrealized gain (loss) on investments | | | 0.25 | | | | 0.32 | | | | (0.25 | ) | | | (0.03 | ) | | | 0.06 | |
| Total from investment operations | | | 0.37 | | | | 0.49 | | | | (0.08 | ) | | | 0.13 | | | | 0.22 | |
| Less distributions from: | | | | | | | | | | | | | | | | | | | | |
| Net investment income | | | 0.23 | | | | 0.28 | | | | 0.28 | | | | 0.27 | | | | 0.26 | |
| Net realized gain | | | — | | | | — | | | | — | | | | — | | | | — | |
| Total distributions | | | 0.23 | | | | 0.28 | | | | 0.28 | | | | 0.27 | | | | 0.26 | |
| Net asset value, end of year | | $ | 8.71 | | | $ | 8.57 | | | $ | 8.36 | | | $ | 8.72 | | | $ | 8.86 | |
| Total return (%) | | | 4.34 | | | | 5.92 | | | | (0.86 | ) | | | 1.46 | | | | 2.44 | |
| Ratios to average daily net assets (%): | | | | | | | | | | | | | | | | | | | | |
| Expenses, before waivers and reimbursements | | | 1.03 | | | | 0.98 | | | | 0.91 | | | | 0.88 | | | | 0.79 | |
| Expenses, net of waivers and reimbursements | | | 0.85 | | | | 0.85 | | | | 0.85 | | | | 0.85 | | | | 0.79 | |
| Net investment income (loss), before waivers and reimbursements | | | 1.16 | | | | 1.85 | | | | 1.96 | | | | 1.77 | | | | 1.80 | |
| Net investment income (loss), net of waivers and reimbursements | | | 1.34 | | | | 1.98 | | | | 2.02 | | | | 1.80 | | | | 1.80 | |
| Class N net assets at the end of the year (in thousands) | | $ | 22,610 | | | $ | 19,662 | | | $ | 22,422 | | | $ | 39,625 | | | $ | 52,710 | |
| Portfolio turnover rate (%) | | | 57 | | | | 114 | | | | 97 | | | | 37 | | | | 22 | |
| | | | | | | | | | | | | | | | | | | | | |
| | | Class I | |
| | | Years Ended December 31, | |
| | | | 2020 | | | | 2019 | | | | 2018 | | | | 2017 | | | | 2016 | |
| Net asset value, beginning of year | | $ | 8.52 | | | $ | 8.30 | | | $ | 8.66 | | | $ | 8.80 | | | $ | 8.83 | |
| Income (loss) from investment operations: | | | | | | | | | | | | | | | | | | | | |
| Net investment income (loss) | | | 0.12 | | | | 0.18 | | | | 0.19 | | | | 0.18 | | | | 0.18 | |
| Net realized and unrealized gain (loss) on investments | | | 0.25 | | | | 0.33 | | | | (0.25 | ) | | | (0.03 | ) | | | 0.06 | |
| Total from investment operations | | | 0.37 | | | | 0.51 | | | | (0.06 | ) | | | 0.15 | | | | 0.24 | |
| Less distributions from: | | | | | | | | | | | | | | | | | | | | |
| Net investment income | | | 0.24 | | | | 0.29 | | | | 0.30 | | | | 0.29 | | | | 0.27 | |
| Net realized gain | | | — | | | | — | | | | — | | | | — | | | | — | |
| Total distributions | | | 0.24 | | | | 0.29 | | | | 0.30 | | | | 0.29 | | | | 0.27 | |
| Net asset value, end of year | | $ | 8.65 | | | $ | 8.52 | | | $ | 8.30 | | | $ | 8.66 | | | $ | 8.80 | |
| Total return (%) | | | 4.39 | | | | 6.24 | | | | (0.69 | ) | | | 1.68 | | | | 2.78 | |
| Ratios to average daily net assets (%): | | | | | | | | | | | | | | | | | | | | |
| Expenses, before waivers and reimbursements | | | 0.78 | | | | 0.74 | | | | 0.65 | | | | 0.62 | | | | 0.57 | |
| Expenses, net of waivers and reimbursements | | | 0.70 | | | | 0.70 | | | | 0.65 | | | | 0.62 | | | | 0.57 | |
| Net investment income (loss), before waivers and reimbursements | | | 1.35 | | | | 2.10 | | | | 2.22 | | | | 2.03 | | | | 2.05 | |
| Net investment income (loss), net of waivers and reimbursements | | | 1.43 | | | | 2.14 | | | | 2.22 | | | | 2.03 | | | | 2.05 | |
| Class I net assets at the end of the year (in thousands) | | $ | 45,641 | | | $ | 31,629 | | | $ | 34,793 | | | $ | 51,153 | | | $ | 58,160 | |
| Portfolio turnover rate (%) | | | 57 | | | | 114 | | | | 97 | | | | 37 | | | | 22 | |
Note: Net investment income (loss) per share is based on the average shares outstanding during the year.
Performance cited represents past performance. Past performance does not guarantee future results and current performance may be lower or higher than the data quoted. Results shown are annual returns, which assume reinvestment of dividends and capital gains. Investment returns and principal will fluctuate and you may have a gain or loss when you sell shares. For the most current month-end performance information, please call 1-800-742-7272 or visit our Web site at www.williamblairfunds.com.
| 168 | Annual Report | December 31, 2020 |
Financial Highlights — For a share outstanding throughout each period
Income Fund
| | | Class R6 | |
| | | Years Ended December 31, | |
| | | | 2020 | | | 2019(a) | |
| Net asset value, beginning of year | | | $ | 8.52 | | | $ | 8.45 | |
| Income (loss) from investment operations: | | | | | | | | | |
| Net investment income (loss) | | | | 0.13 | | | | 0.09 | |
| Net realized and unrealized gain (loss) on investments | | | | 0.24 | | | | 0.18 | |
| Total from investment operations | | | | 0.37 | | | | 0.27 | |
| Less distributions from: | | | | | | | | | |
| Net investment income | | | | 0.24 | | | | 0.20 | |
| Net realized gain | | | | — | | | | — | |
| Total distributions | | | | 0.24 | | | | 0.20 | |
| Net asset value, end of year | | | $ | 8.65 | | | $ | 8.52 | |
| Total Return (%)* | | | | 4.44 | | | | 3.18 | |
| Ratios to average daily net assets (%)**: | | | | | | | | | |
| Expenses, before of waivers and reimbursements | | | | 0.73 | | | | 0.71 | |
| Expenses, net waivers and reimbursements | | | | 0.65 | | | | 0.65 | |
| Net investment income (loss), before of waivers and reimbursements | | | | 1.47 | | | | 1.46 | |
| Net investment income (loss), net waivers and reimbursements | | | | 1.55 | | | | 1.52 | |
| Class R6 net assets at end of year (in thousands) | | | $ | 71 | | | $ | 52 | |
| Portfolio turnover rate (%)* | | | | 57 | | | | 114 | |
| (a) | For the period from May 2, 2019 (Commencement of Operations) to December 31, 2019. |
| * | Rates are not annualized for periods less than a year. |
| ** | Rates are annualized for periods less than a year. |
Note: Net investment income (loss) per share is based on the average shares outstanding during the year.
Performance cited represents past performance. Past performance does not guarantee future results and current performance may be lower or higher than the data quoted. Results shown are annual returns, which assume reinvestment of dividends and capital gains. Investment returns and principal will fluctuate and you may have a gain or loss when you sell shares. For the most current month-end performance information, please call 1-800-742-7272 or visit our Web site at www.williamblairfunds.com.
| December 31, 2020 | William Blair Funds | 169 |
Financial Highlights — For a share outstanding throughout each period
Low Duration Fund
| | | Class N | |
| | | Years Ended December 31, | |
| | | 2020 | | | 2019 | | | 2018 | | | 2017 | | | 2016 | |
| Net asset value, beginning of year | | $ | 8.68 | | | $ | 8.70 | | | $ | 8.92 | | | $ | 9.07 | | | $ | 9.16 | |
| Income (loss) from investment operations: | | | | | | | | | | | | | | | | | | | | |
| Net investment income (loss) | | | 0.08 | | | | 0.19 | | | | 0.17 | | | | 0.11 | | | | 0.09 | |
| Net realized and unrealized gain (loss) on investments | | | 0.14 | | | | 0.11 | | | | (0.10 | ) | | | (0.04 | ) | | | 0.02 | |
| Total from investment operations | | | 0.22 | | | | 0.30 | | | | 0.07 | | | | 0.07 | | | | 0.11 | |
| Less distributions from: | | | | | | | | | | | | | | | | | | | | |
| Net investment income | | | 0.25 | | | | 0.32 | | | | 0.29 | | | | 0.22 | | | | 0.20 | |
| Net realized gain | | | — | | | | — | | | | — | | | | — | | | | — | |
| Total distributions | | | 0.25 | | | | 0.32 | | | | 0.29 | | | | 0.22 | | | | 0.20 | |
| Net asset value, end of year | | $ | 8.65 | | | $ | 8.68 | | | $ | 8.70 | | | $ | 8.92 | | | $ | 9.07 | |
| Total return (%) | | | 2.56 | | | | 3.48 | | | | 0.80 | | | | 0.84 | | | | 1.16 | |
| Ratios to average daily net assets (%): | | | | | | | | | | | | | | | | | | | | |
| Expenses, before waivers and reimbursements | | | 0.84 | | | | 0.75 | | | | 0.72 | | | | 0.79 | | | | 0.83 | |
| Expenses, net of waivers and reimbursements | | | 0.55 | | | | 0.55 | | | | 0.58 | | | | 0.61 | | | | 0.68 | |
| Net investment income (loss), before waivers and reimbursements | | | 0.60 | | | | 1.96 | | | | 1.83 | | | | 1.04 | | | | 0.83 | |
| Net investment income (loss), net of waivers and reimbursements | | | 0.89 | | | | 2.16 | | | | 1.97 | | | | 1.22 | | | | 0.98 | |
| Class N net assets at the end of the year (in thousands) | | $ | 13,736 | | | $ | 1,513 | | | $ | 1,661 | | | $ | 1,979 | | | $ | 7,237 | |
| Portfolio turnover rate (%) | | | 72 | | | | 183 | | | | 122 | | | | 109 | | | | 81 | |
| | | | | | | | | | | | | | | | | | | | | |
| | | Class I | |
| | | Years Ended December 31, | |
| | | | 2020 | | | | 2019 | | | | 2018 | | | | 2017 | | | | 2016 | |
| Net asset value, beginning of year | | $ | 8.67 | | | $ | 8.70 | | | $ | 8.91 | | | $ | 9.07 | | | $ | 9.16 | |
| Income (loss) from investment operations: | | | | | | | | | | | | | | | | | | | | |
| Net investment income (loss) | | | 0.10 | | | | 0.20 | | | | 0.19 | | | | 0.13 | | | | 0.11 | |
| Net realized and unrealized gain (loss) on investments | | | 0.13 | | | | 0.10 | | | | (0.09 | ) | | | (0.05 | ) | | | 0.02 | |
| Total from investment operations | | | 0.23 | | | | 0.30 | | | | 0.10 | | | | 0.08 | | | | 0.13 | |
| Less distributions from: | | | | | | | | | | | | | | | | | | | | |
| Net investment income | | | 0.26 | | | | 0.33 | | | | 0.31 | | | | 0.24 | | | | 0.22 | |
| Net realized gain | | | — | | | | — | | | | — | | | | — | | | | — | |
| Total distributions | | | 0.26 | | | | 0.33 | | | | 0.31 | | | | 0.24 | | | | 0.22 | |
| Net asset value, end of year | | $ | 8.64 | | | $ | 8.67 | | | $ | 8.70 | | | $ | 8.91 | | | $ | 9.07 | |
| Total return (%) | | | 2.72 | | | | 3.52 | | | | 1.12 | | | | 0.91 | | | | 1.40 | |
| Ratios to average daily net assets (%): | | | | | | | | | | | | | | | | | | | | |
| Expenses, before waivers and reimbursements | | | 0.60 | | | | 0.53 | | | | 0.46 | | | | 0.59 | | | | 0.59 | |
| Expenses, net of waivers and reimbursements | | | 0.40 | | | | 0.40 | | | | 0.39 | | | | 0.41 | | | | 0.44 | |
| Net investment income (loss), before waivers and reimbursements | | | 0.98 | | | | 2.19 | | | | 2.05 | | | | 1.27 | | | | 1.05 | |
| Net investment income (loss), net of waivers and reimbursements | | | 1.18 | | | | 2.32 | | | | 2.12 | | | | 1.45 | | | | 1.20 | |
| Class I net assets at the end of the year (in thousands) | | $ | 104,093 | | | $ | 38,156 | | | $ | 56,120 | | | $ | 131,186 | | | $ | 219,714 | |
| Portfolio turnover rate (%) | | | 72 | | | | 183 | | | | 122 | | | | 109 | | | | 81 | |
Note: Net investment income (loss) per share is based on the average shares outstanding during the year.
Performance cited represents past performance. Past performance does not guarantee future results and current performance may be lower or higher than the data quoted. Results shown are annual returns, which assume reinvestment of dividends and capital gains. Investment returns and principal will fluctuate and you may have a gain or loss when you sell shares. For the most current month-end performance information, please call 1-800-742-7272 or visit our Web site at www.williamblairfunds.com.
| 170 | Annual Report | December 31, 2020 |
Financial Highlights — For a share outstanding throughout each period
Low Duration Fund
| | | Class R6 | |
| | | Years Ended December 31, | |
| | | 2020 | | | 2019 | | | 2018 | | | 2017 | | | 2016 | |
| Net asset value, beginning of year | | $ | 8.68 | | | $ | 8.70 | | | $ | 8.91 | | | $ | 9.07 | | | $ | 9.16 | |
| Income (loss) from investment operations: | | | | | | | | | | | | | | | | | | | | |
| Net investment income (loss) | | | 0.12 | | | | 0.21 | | | | 0.19 | | | | 0.14 | | | | 0.11 | |
| Net realized and unrealized gain (loss) on investments | | | 0.11 | | | | 0.11 | | | | (0.09 | ) | | | (0.05 | ) | | | 0.02 | |
| Total from investment operations | | | 0.23 | | | | 0.32 | | | | 0.10 | | | | 0.09 | | | | 0.13 | |
| Less distributions from: | | | | | | | | | | | | | | | | | | | | |
| Net investment income | | | 0.27 | | | | 0.34 | | | | 0.31 | | | | 0.25 | | | | 0.22 | |
| Net realized gain | | | — | | | | — | | | | — | | | | — | | | | — | |
| Total distributions | | | 0.27 | | | | 0.34 | | | | 0.31 | | | | 0.25 | | | | 0.22 | |
| Net asset value, end of year | | $ | 8.64 | | | $ | 8.68 | | | $ | 8.70 | | | $ | 8.91 | | | $ | 9.07 | |
| Total return (%) | | | 2.65 | | | | 3.69 | | | | 1.15 | | | | 0.96 | | | | 1.43 | |
| Ratios to average daily net assets (%): | | | | | | | | | | | | | | | | | | | | |
| Expenses, before waivers and reimbursements | | | 0.53 | | | | 0.50 | | | | 0.42 | | | | 0.40 | | | | 0.40 | |
| Expenses, net of waivers and reimbursements | | | 0.35 | | | | 0.35 | | | | 0.35 | | | | 0.37 | | | | 0.40 | |
| Net investment income (loss), before waivers and reimbursements | | | 1.19 | | | | 2.22 | | | | 2.10 | | | | 1.48 | | | | 1.25 | |
| Net investment income (loss), net of waivers and reimbursements | | | 1.37 | | | | 2.37 | | | | 2.17 | | | | 1.51 | | | | 1.25 | |
| Class R6 net assets at the end of the year (in thousands) | | $ | 40,551 | | | $ | 36,846 | | | $ | 47,585 | | | $ | 99,912 | | | $ | 53,122 | |
| Portfolio turnover rate (%) | | | 72 | | | | 183 | | | | 122 | | | | 109 | | | | 81 | |
Note: Net investment income (loss) per share is based on the average shares outstanding during the year.
Performance cited represents past performance. Past performance does not guarantee future results and current performance may be lower or higher than the data quoted. Results shown are annual returns, which assume reinvestment of dividends and capital gains. Investment returns and principal will fluctuate and you may have a gain or loss when you sell shares. For the most current month-end performance information, please call 1-800-742-7272 or visit our Web site at www.williamblairfunds.com.
| December 31, 2020 | William Blair Funds | 171 |
Financial Highlights — For a share outstanding throughout each period
Macro Allocation Fund
| | | Class N | |
| | | Years Ended December 31, | |
| | | 2020 | | | 2019 | | | 2018 | | | 2017 | | | 2016 | |
| Net asset value, beginning of year | | $ | 11.44 | | | $ | 11.41 | | | $ | 11.84 | | | $ | 11.34 | | | $ | 11.32 | |
| Income (loss) from investment operations: | | | | | | | | | | | | | | | | | | | | |
| Net investment income (loss) | | | 0.04 | | | | 0.08 | | | | 0.08 | | | | 0.06 | | | | 0.04 | |
| Net realized and unrealized gain (loss) on investments | | | (0.44 | ) | | | 0.37 | | | | (0.24 | ) | | | 0.51 | | | | 0.19 | |
| Total from investment operations | | | (0.40 | ) | | | 0.45 | | | | (0.16 | ) | | | 0.57 | | | | 0.23 | |
| Less distributions from: | | | | | | | | | | | | | | | | | | | | |
| Net investment income | | | 0.11 | | | | 0.42 | | | | 0.27 | | | | 0.07 | | | | 0.21 | |
| Net realized gain | | | — | | | | — | | | | — | | | | — | | | | — | |
| Total distributions | | | 0.11 | | | | 0.42 | | | | 0.27 | | | | 0.07 | | | | 0.21 | |
| Net asset value, end of year | | $ | 10.93 | | | $ | 11.44 | | | $ | 11.41 | | | $ | 11.84 | | | $ | 11.34 | |
| Total return (%) | | | (3.49 | ) | | | 3.97 | | | | (1.30 | ) | | | 5.06 | | | | 2.01 | |
| Ratios to average daily net assets (%): | | | | | | | | | | | | | | | | | | | | |
| Expenses, before waivers and reimbursements | | | 1.36 | | | | 1.22 | | | | 1.30 | | | | 1.52 | | | | 1.38 | |
| Expenses, net of waivers and reimbursements | | | 1.26 | | | | 1.22 | | | | 1.30 | | | | 1.37 | | | | 1.23 | |
| Expenses (excluding interest or short dividend expense), net of waivers and reimbursements | | | 1.25 | | | | 1.21 | | | | 1.28 | | | | 1.31 | | | | 1.23 | |
| Net investment income (loss), before waivers and reimbursements | | | 0.26 | | | | 0.70 | | | | 0.66 | | | | 0.35 | | | | 0.17 | |
| Net investment income (loss), net of waivers and reimbursements | | | 0.36 | | | | 0.70 | | | | 0.66 | | | | 0.50 | | | | 0.32 | |
| Class N net assets at the end of the year (in thousands) | | $ | 7,674 | | | $ | 13,717 | | | $ | 43,463 | | | $ | 41,483 | | | $ | 61,376 | |
| Portfolio turnover rate (%) | | | 29 | | | | 31 | | | | 36 | | | | 43 | | | | 50 | |
| | | | | | | | | | | | | | | | | | | | | |
| | | Class I | |
| | | Years Ended December 31, | |
| | | | 2020 | | | | 2019 | | | | 2018 | | | | 2017 | | | | 2016 | |
| Net asset value, beginning of year | | $ | 11.35 | | | $ | 11.38 | | | $ | 11.88 | | | $ | 11.38 | | | $ | 11.38 | |
| Income (loss) from investment operations: | | | | | | | | | | | | | | | | | | | | |
| Net investment income (loss) | | | 0.06 | | | | 0.13 | | | | 0.11 | | | | 0.11 | | | | 0.08 | |
| Net realized and unrealized gain (loss) on investments | | | (0.42 | ) | | | 0.34 | | | | (0.24 | ) | | | 0.51 | | | | 0.18 | |
| Total from investment operations | | | (0.36 | ) | | | 0.47 | | | | (0.13 | ) | | | 0.62 | | | | 0.26 | |
| Less distributions from: | | | | | | | | | | | | | | | | | | | | |
| Net investment income | | | 0.14 | | | | 0.50 | | | | 0.37 | | | | 0.12 | | | | 0.26 | |
| Net realized gain | | | — | | | | — | | | | — | | | | — | | | | — | |
| Total distributions | | | 0.14 | | | | 0.50 | | | | 0.37 | | | | 0.12 | | | | 0.26 | |
| Net asset value, end of year | | $ | 10.85 | | | $ | 11.35 | | | $ | 11.38 | | | $ | 11.88 | | | $ | 11.38 | |
| Total return (%) | | | (3.15 | ) | | | 4.14 | | | | (1.08 | ) | | | 5.50 | | | | 2.26 | |
| Ratios to average daily net assets (%): | | | | | | | | | | | | | | | | | | | | |
| Expenses, before waivers and reimbursements | | | 1.04 | | | | 0.97 | | | | 0.99 | | | | 1.17 | | | | 1.12 | |
| Expenses, net of waivers and reimbursements | | | 1.01 | | | | 0.97 | | | | 0.99 | | | | 1.02 | | | | 0.97 | |
| Expenses (excluding interest or short dividend expense), net of waivers and reimbursements | | | 1.00 | | | | 0.96 | | | | 0.97 | | | | 0.96 | | | | 0.97 | |
| Net investment income (loss), before waivers and reimbursements | | | 0.56 | | | | 1.09 | | | | 0.95 | | | | 0.75 | | | | 0.52 | |
| Net investment income (loss), net of waivers and reimbursements | | | 0.59 | | | | 1.09 | | | | 0.95 | | | | 0.90 | | | | 0.67 | |
| Class I net assets at the end of the year (in thousands) | | $ | 171,153 | | | $ | 358,935 | | | $ | 486,543 | | | $ | 780,075 | | | $ | 937,244 | |
| Portfolio turnover rate (%) | | | 29 | | | | 31 | | | | 36 | | | | 43 | | | | 50 | |
Note: Net investment income (loss) per share is based on the average shares outstanding during the year.
Performance cited represents past performance. Past performance does not guarantee future results and current performance may be lower or higher than the data quoted. Results shown are annual returns, which assume reinvestment of dividends and capital gains. Investment returns and principal will fluctuate and you may have a gain or loss when you sell shares. For the most current month-end performance information, please call 1-800-742-7272 or visit our Web site at www.williamblairfunds.com.
| 172 | Annual Report | December 31, 2020 |
Financial Highlights — For a share outstanding throughout each period
Macro Allocation Fund
| | | Class R6 | |
| | | Years Ended December 31, | |
| | | 2020 | | | 2019 | | | 2018 | | | 2017 | | | 2016 | |
| Net asset value, beginning of year | | $ | 11.36 | | | $ | 11.38 | | | $ | 11.89 | | | $ | 11.40 | | | $ | 11.39 | |
| Income (loss) from investment operations: | | | | | | | | | | | | | | | | | | | | |
| Net investment income (loss) | | | 0.08 | | | | 0.14 | | | | 0.13 | | | | 0.12 | | | | 0.09 | |
| Net realized and unrealized gain (loss) on investments | | | (0.44 | ) | | | 0.34 | | | | (0.24 | ) | | | 0.51 | | | | 0.19 | |
| Total from investment operations | | | (0.36 | ) | | | 0.48 | | | | (0.11 | ) | | | 0.63 | | | | 0.28 | |
| Less distributions from: | | | | | | | | | | | | | | | | | | | | |
| Net investment income | | | 0.15 | | | | 0.50 | | | | 0.40 | | | | 0.14 | | | | 0.27 | |
| Net realized gain | | | — | | | | — | | | | — | | | | — | | | | — | |
| Total distributions | | | 0.15 | | | | 0.50 | | | | 0.40 | | | | 0.14 | | | | 0.27 | |
| Net asset value, end of year | | $ | 10.85 | | | $ | 11.36 | | | $ | 11.38 | | | $ | 11.89 | | | $ | 11.40 | |
| Total return (%) | | | (3.13 | ) | | | 4.29 | | | | (0.94 | ) | | | 5.51 | | | | 2.44 | |
| Ratios to average daily net assets (%): | | | | | | | | | | | | | | | | | | | | |
| Expenses, before waivers and reimbursements | | | 0.93 | | | | 0.89 | | | | 0.91 | | | | 0.92 | | | | 0.89 | |
| Expenses, net of waivers and reimbursements | | | 0.93 | | | | 0.89 | | | | 0.91 | | | | 0.92 | | | | 0.89 | |
| Expenses (excluding interest or short dividend expense), net of waivers and reimbursements | | | 0.92 | | | | 0.88 | | | | 0.89 | | | | 0.86 | | | | 0.89 | |
| Net investment income (loss), before waivers and reimbursements | | | 0.70 | | | | 1.23 | | | | 1.10 | | | | 1.04 | | | | 0.81 | |
| Net investment income (loss), net of waivers and reimbursements | | | 0.70 | | | | 1.23 | | | | 1.10 | | | | 1.04 | | | | 0.81 | |
| Class R6 net assets at the end of the year (in thousands) | | $ | 174,888 | | | $ | 378,148 | | | $ | 391,812 | | | $ | 487,082 | | | $ | 582,298 | |
| Portfolio turnover rate (%) | | | 29 | | | | 31 | | | | 36 | | | | 43 | | | | 50 | |
Note: Net investment income (loss) per share is based on the average shares outstanding during the year.
Performance cited represents past performance. Past performance does not guarantee future results and current performance may be lower or higher than the data quoted. Results shown are annual returns, which assume reinvestment of dividends and capital gains. Investment returns and principal will fluctuate and you may have a gain or loss when you sell shares. For the most current month-end performance information, please call 1-800-742-7272 or visit our Web site at www.williamblairfunds.com.
| December 31, 2020 | William Blair Funds | 173 |
REPORT OF INDEPENDENT REGISTERED PUBLIC ACCOUNTING FIRM
To the Shareholders and the Board of Trustees of William Blair Funds
Opinion on the Financial Statements
We have audited the accompanying statements of assets and liabilities of the William Blair Funds (the “Trust”) (comprising the Growth Fund, Large Cap Growth Fund, Mid Cap Growth Fund, Small-Mid Cap Core Fund, Small-Mid Cap Growth Fund, Small-Mid Cap Value Fund, Small Cap Growth Fund, Small Cap Value Fund, Global Leaders Fund, International Leaders Fund, International Growth Fund, Institutional International Growth Fund, International Small Cap Growth Fund, Emerging Markets Leaders Fund, Emerging Markets Growth Fund, Emerging Markets Small Cap Growth Fund, Bond Fund, Income Fund, Low Duration Fund, and Macro Allocation Fund (collectively referred to as the “Funds”)), including the portfolios of investments, as of December 31, 2020, and the related statements of operations and changes in net assets, and the financial highlights for each of the periods indicated in the table below and the related notes (collectively referred to as the “financial statements”). In our opinion, the financial statements present fairly, in all material respects, the financial position of each of the Funds comprising the William Blair Funds at December 31, 2020, and the results of their operations, changes in net assets, and financial highlights for each of the periods indicated in the table below, in conformity with U.S. generally accepted accounting principles.
| Funds comprising William Blair Funds | Statements
of operations | Statements
of changes
in net assets | Financial
highlights |
Growth Fund
Large Cap Growth Fund
Mid Cap Growth Fund
Small-Mid Cap Growth Fund
Small-Mid Cap Value Fund
Small Cap Growth Fund
Small Cap Value Fund
Global Leaders Fund
International Leaders Fund
International Growth Fund
Institutional International Growth Fund
International Small Cap Growth Fund
Emerging Markets Leaders Fund
Emerging Markets Growth Fund
Emerging Markets Small Cap Growth Fund
Bond Fund
Income Fund
Low Duration Fund
Macro Allocation Fund | For the year ended December 31, 2020 | For each of the two years in the period ended December 31, 2020 | For each of the five years in the period ended December 31, 2020 |
| Small-Mid Cap Core Fund | For the year ended December 31, 2020 | For the year ended December 31, 2020 and the period from October 1, 2019 (commencement of operations) to December 31, 2019 |
| 174 | Annual Report | December 31, 2020 |
Basis for Opinion
These financial statements are the responsibility of the Trust’s management. Our responsibility is to express an opinion on each of the Funds’ financial statements based on our audits. We are a public accounting firm registered with the Public Company Accounting Oversight Board (United States) (“PCAOB”) and are required to be independent with respect to the Trust in accordance with the U.S. federal securities laws and the applicable rules and regulations of the Securities and Exchange Commission and the PCAOB.
We conducted our audits in accordance with the standards of the PCAOB. Those standards require that we plan and perform the audit to obtain reasonable assurance about whether the financial statements are free of material misstatement, whether due to error or fraud. The Trust is not required to have, nor were we engaged to perform, an audit of the Trust’s internal control over financial reporting. As part of our audits we are required to obtain an understanding of internal control over financial reporting but not for the purpose of expressing an opinion on the effectiveness of the Trust’s internal control over financial reporting. Accordingly, we express no such opinion.
Our audits included performing procedures to assess the risks of material misstatement of the financial statements, whether due to error or fraud, and performing procedures that respond to those risks. Such procedures included examining, on a test basis, evidence regarding the amounts and disclosures in the financial statements. Our procedures included confirmation of securities owned as of December 31, 2020, by correspondence with the custodian and brokers or by other appropriate auditing procedures where replies from brokers were not received. Our audits also included evaluating the accounting principles used and significant estimates made by management, as well as evaluating the overall presentation of the financial statements. We believe that our audits provide a reasonable basis for our opinion.

We have served as the auditor of one or more William Blair investment companies since 1989.
Chicago, Illinois
February 26, 2021
| December 31, 2020 | William Blair Funds | 175 |
Trustees and Officers (Unaudited).† The trustees and officers of the William Blair Funds, their year of birth, their principal occupations during the last five years, their affiliations, if any, with William Blair, and other significant affiliations are set forth below. The address of each officer and trustee is 150 North Riverside Plaza, Chicago, Illinois 60606.
| Name and Year of Birth | | Position(s)
Held with
Trust | | Term of
Office(1) and
Length of
Time
Served | | Principal
Occupation(s)
During Past 5 Years | | Number of
Portfolios
in Trust
Complex
Overseen
by Trustee* | | Other Directorships
Held by Trustee
During Past 5 Years** |
| Interested Trustees |
Stephanie G. Braming,
1970(2) | | Chairman of the Board and President, previously Senior Vice President | | Chairman of the Board and President since 2018, and Senior Vice President 2014 to 2018 | | Global Head of Investment Management since 2017, portfolio manager (2014 to 2017) and Partner, William Blair | | 20 | | Chairman, William Blair SICAV |
Arthur J. Simon,
1954(2) | | Trustee | | Since 2018 | | General Counsel and Partner, William Blair | | 20 | | Director, William Blair SICAV |
| Non-Interested Trustees |
Vann A. Avedisian,
1964(3) | | Trustee | | Since 2012 | | Principal, Highgate Holdings (hotel investments) (since 2009); formerly, co-founder and Managing Director, Oxford Capital Partners Inc. (1994 to 2006) | | 20 | | None |
Kathleen T. Barr,
1955 | | Trustee | | Since 2013 | | Retired; Chairman of the Governing Council, Independent Directors Council (since 2020); formerly, President, Productive Capital Management, Inc. (registered investment adviser to public entities) and Owner, KT Barr Consulting, LLC (mutual fund and investment management consulting) (2010 to 2013); prior thereto, Chief Administrative Officer, Senior Vice President and Senior Managing Director of Allegiant Asset Management Company (merged with PNC Capital Advisors, LLC in 2009) (2004 to 2010); Chief Administrative Officer, Chief Compliance Officer and Senior Vice President of PNC Funds and PNC Advantage Funds (f/k/a Allegiant Funds) (2003 to 2010) | | 20 | | Muzinich BDC, Inc. (since 2019); Board of Governors, Investment Company Institute (since 2019); Professionally Managed Portfolios (since 2018); Council Member, Independent Directors Council; AmericaFirst Quantitative Funds (5 portfolios) (2012 to 2016) |
| † | William Blair Investment Management, LLC and William Blair & Company, L.L.C. are collectively referred to in this section as “William Blair”, each of which is a wholly owned subsidiary of WBC Holdings, L.P., which is wholly owned by certain William Blair employees (employee owners are referred to as ‘partners’). |
| | |
| * | The number shown does not include three additional series of the Trust that are in existence, but not currently offered to the public. |
| | |
| ** | Includes directorships of public companies and other registered investment companies held during the past five years. |
| 176 | Annual Report | December 31, 2020 |
| Name and Year of Birth | | Position(s)
Held with
Trust | | Term of
Office(1) and
Length of
Time
Served | | Principal
Occupation(s)
During Past 5 Years | | Number of
Portfolios
in Trust
Complex
Overseen
by Trustee* | | Other Directorships
Held by Trustee
During Past 5 Years** |
Daniel N. Leib,
1966(3) | | Trustee | | Since 2016 | | Chief Executive Officer, Donnelley Financial Solutions, Inc. (since 2016); formerly, Executive Vice President and Chief Financial Officer (2011 to 2016) and Group Chief Financial Officer (2009 to 2011), R.R. Donnelley & Sons Company | | 20 | | Donnelley Financial Solutions, Inc. (since 2016) |
Dorri C. McWhorter,
1973 | | Trustee | | Since 2019 | | Chief Executive Officer, YWCA Metropolitan Chicago (since 2013); formerly Partner, Crowe LLP (2008 to 2013)(4) | | 20 | | Skyway Concession Company, LLC (since 2018); Illinois CPA Society (since 2017); Lifeway Foods, Inc. (since 2020); American Institute of Certified Public Accountants (2013 to 2016); Chicago Finance Exchange (2009 to 2017) |
Thomas J. Skelly,
1951 | | Trustee | | Since 2007 | | Advisory Board Member for various U.S. companies (since 2005); formerly, Managing Partner of various divisions at Accenture (1994 to 2004) | | 20 | | Mutual Trust Financial Group (provider of insurance and investment products) |
Steven R. Zenz,
1954 | | Trustee | | Since 2018 | | Consultant, Steven R. Zenz Consulting LLC (merger and acquisition transactions and SEC reporting and filings) (since 2011); formerly, Partner, KPMG LLP (1987 to 2010)(5) | | 20 | | Engine Media Holdings, Inc. (media group supporting esports, news streaming and gaming) (2020 to 2021); Frankly Inc. (technology products/services for media industry) (2016 to its 2020 acquisition by Engine Media Holdings); Insignia Systems, Inc. (in-store advertising services for consumer packaged goods manufacturers) (2013 to 2019) |
| (1) | Each Trustee serves until the election and qualification of a successor, or until death, resignation or retirement, or removal as provided in the Trust’s Declaration of Trust. Retirement for Independent Trustees occurs no later than at the conclusion of the calendar year that occurs after the earlier of (a) the Independent Trustee’s 75th birthday or (b) the 17th anniversary of the date that the Independent Trustee became a member of the Board of Trustees. |
| (2) | Ms. Braming and Mr. Simon are interested persons of the Trust because they are partners of William Blair, and with respect to Ms. Braming also due to her position as an officer of the Trust. |
| (3) | The Trust and William Blair use Donnelley Financial Solutions, Inc. (“DFS’’) for financial printing and other services. DFS is a public company. The Trust and William Blair in the aggregate paid DFS approximately $122,000 and $188,000 in 2018 and 2019, respectively, for the services provided. DFS’s revenue was approximately $1 billion in 2018 and approximately $900 million in 2019. Mr. Leib, as the Chief Executive Officer of DFS, is not directly involved in any of the services provided to the Trust or William Blair and his compensation is not materially affected by the fees DFS receives from the Trust and William Blair. |
| (4) | As a former partner of the audit firm Crowe LLP (formerly, Crowe Horwath LLP), Ms. McWhorter receives distributions of her capital in the firm over time and those distributions are expected to be completed in March 2021. The Trust and William Blair made no payments to Crowe LLP over the past three years. |
| (5) | The Trust engages KPMG to provide foreign tax services in Taiwan. KPMG does not provide audit or audit-related services to the Trust. Mr. Zenz is a former partner of KPMG and receives pension/retirement funds from KPMG. |
| December 31, 2020 | William Blair Funds | 177 |
| Name and Year of Birth | | Position(s) Held
with Trust | | Term of Office
and Length of
Time Served(1) | | Principal Occupation(s)
During Past 5 Years |
| | | | | | | |
| Officers | | | | | | |
| | | | | | | |
Marcelo Assalin,
1973 | | Senior Vice President | | Since 2020 | | Associate, William Blair (since 2020); formerly, NN Investment Partners (2013- 2020) |
Thomas Clarke,
1968 | | Senior Vice President | | Since 2011 | | Partner, William Blair |
Daniel Crowe,
1972 | | Senior Vice President | | Since 2016 | | Partner, William Blair |
Robert J. Duwa,
1967 | | Senior Vice President | | Since 2019 | | Partner, William Blair |
Simon Fennell,
1969 | | Senior Vice President | | Since 2013 | | Partner, William Blair |
Andrew G. Flynn,
1961 | | Senior Vice President | | Since 2013 | | Partner, William Blair |
David C. Fording,
1967 | | Senior Vice President | | Since 2006 | | Partner, William Blair |
James S. Golan,
1961 | | Senior Vice President | | Since 2005 | | Partner, William Blair |
James E. Jones,
1977 | | Senior Vice President | | Since 2019 | | Partner, William Blair |
Mark T. Leslie,
1967 | | Senior Vice President | | Since 2005 | | Partner, William Blair |
Stephen Livingston,
1981 | | Senior Vice President | | Since 2021 | | Partner, William Blair (since 2017); formerly, Associate, William Blair |
Kenneth J. McAtamney,
1966 | | Senior Vice President | | Since 2008 | | Partner, William Blair |
Todd M. McClone,
1968 | | Senior Vice President | | Since 2005 | | Partner, William Blair |
David S. Mitchell,
1960 | | Senior Vice President | | Since 2003 | | Partner, William Blair |
John C. Murphy,
1969 | | Senior Vice President | | Since 2014 | | Partner, William Blair |
Casey K. Preyss,
1976 | | Senior Vice President | | Since 2015 | | Partner, William Blair |
David P. Ricci,
1958 | | Senior Vice President | | Since 2006 | | Partner, William Blair |
Lisa D. Rusch,
1970 | | Senior Vice President Vice President | | Since 2020 2018-2020 | | Partner, William Blair (since 2020); formerly, Associate, William Blair |
Ward D. Sexton,
1974 | | Senior Vice President | | Since 2016 | | Partner, William Blair |
Brian D. Singer,
1960 | | Senior Vice President | | Since 2011 | | Partner, William Blair |
| 178 | Annual Report | December 31, 2020 |
| Name and Year of Birth | | Position(s) Held
with Trust | | Term of Office
and Length of
Time Served(1) | | Principal Occupation(s)
During Past 5 Years |
| | | | | | | |
Mark C. Thompson,
1976 | | Senior Vice President | | Since 2020 | | Partner, William Blair |
| | | | | | | |
Dan Zelazny,
1971 | | Senior Vice President | | Since 2019 | | Associate, William Blair (since 2019); formerly, Managing Director, AQR Capital Management (2011-2019) |
| | | | | | | |
Ruta Ziverte,
1973 | | Senior Vice President | | Since 2020 | | Partner, William Blair (since 2021); formerly, Associate, William Blair (2019-2021), Oppenheimer Funds (2015-2019) |
| | | | | | | |
Kathleen M. Lynch,
1971 | | Vice President | | Since 2020 | | Associate, William Blair |
| | | | | | | |
Marco Ruijer,
1975 | | Vice President | | Since 2020 | | Associate, William Blair (since 2020); formerly, NN Investment Partners (2013-2020) |
| | | | | | | |
Paul J. Sularz,
1971 | | Vice President | | Since 2009 | | Associate, William Blair |
| | | | | | | |
John M. Raczek,
1970 | | Treasurer Assistant Treasurer | | Since 2019 2010-2019 | | Associate, William Blair |
| | | | | | | |
Andrew T. Pfau,
1970 | | Secretary | | Since 2009 | | Associate, William Blair |
| | | | | | | |
David M. Cihak,
1982 | | Assistant Treasurer | | Since 2019 | | Associate, William Blair |
| | | | | | | |
Walter R. Randall,
Jr., 1960 | | Chief Compliance Officer and Assistant Secretary | | Since 2009 | | Associate, William Blair |
| | | | | | | |
Robert J. Toner,
1967 | | Assistant Secretary | | Since 2016 | | Associate, William Blair |
| (1) | The Trust’s officers, except the Chief Compliance Officer, are elected annually by the Board of Trustees. The Trust’s Chief Compliance Officer is designated by the Board of Trustees and may only be removed by action of the Board of Trustees, including a majority of independent trustees. Length of Time Served for all officers indicates the year the individual became an officer of the Trust. |
The Statement of Additional Information for the William Blair Funds includes additional information about the trustees and is available without charge by calling 1-800-635-2886 (in Massachusetts 1-800-635-2840) or by writing the Fund.
| December 31, 2020 | William Blair Funds | 179 |
(Unaudited)
Proxy Voting
A description of the policies and procedures that the Funds use to determine how to vote proxies relating to portfolio securities and information regarding how the Funds voted proxies relating to portfolio securities for the most recent 12-month period ended June 30 are available without charge, upon request, by calling 1-800-635-2886 (in Massachusetts 1-800-635-2840), at www.williamblairfunds.com and on the SEC’s website at http://www.sec.gov.
Quarterly Portfolio Schedules
Each Fund files its complete schedule of portfolio holdings with the SEC for the first and third fiscal quarters of each fiscal year (quarters ended March 31 and September 30) on Form N-PORT. The Funds’ Forms N-PORT are available on the SEC’s website at http://www.sec.gov.
Shareholder Meeting Results
A Special Meeting of Shareholders (the “Meeting”) of the William Blair Large Cap Growth Fund (the “Fund”) was held virtually on November 12, 2020 via a live webcast. At the Meeting, shareholders voted to approve a change in the Fund’s classification under the Investment Company Act of 1940, as amended, from a “diversified” fund to a “non-diversified” fund.
| Number of Votes: |
| For | | Against | | Withheld | | Abstentions |
| 16,894,074.686 | | 149,259.787 | | N/A | | 109,666.363 |
Additional Federal Income Tax Information: (unaudited)
Under Section 852(b)(3)(C) of the Code, the Funds hereby designate the following amounts as capital gain dividends for the fiscal year ended December 31, 2020 (in thousands):
| Fund | | Capital Gain Dividend |
| Growth | | | $ | 38,359 | |
| Large Cap Growth | | | | 32,144 | |
| Mid Cap Growth | | | | 5,611 | |
| Small-Mid Cap Growth | | | | 64,284 | |
| Small-Mid Cap Value | | | | 9 | |
| Small Cap Growth | | | | 51,936 | |
| Small Cap Value | | | | 28,599 | |
| Global Leaders | | | | 15,321 | |
| International Leaders | | | | 8,192 | |
| International Growth. | | | | 17,392 | |
| Institutional International Growth | | | | 183,461 | |
| International Small Cap Growth | | | | 7,037 | |
| Emerging Markets Leaders. | | | | 2,367 | |
| Emerging Markets Growth | | | | 48,790 | |
| 180 | Annual Report | December 31, 2020 |
Useful Information About Your Report (Unaudited)
Please refer to this information when reviewing the Expense Example for each Fund.
Expense Example
As a shareholder of a Fund, you incur two types of costs: (1) transaction costs and (2) ongoing costs, including management fees, distribution (12b-1) fees (for Class N shares, as applicable), and other Fund expenses. The example is intended to help you understand your ongoing costs (in dollars) of investing in the Fund and to compare these costs with the ongoing costs of investing in other mutual funds. To do so, compare the Fund’s 5% hypothetical example with the 5% hypothetical examples that appear in the shareholder reports of other funds. The example is based on an investment of $1,000 invested at the beginning of the period and held for the entire six-month period from July 1, 2020 to December 31, 2020.
Actual Expenses
In each example, the first line for each share class in the table provides information about the actual account values and actual expenses. These expenses reflect the effect of any expense cap applicable to the share class during the period. Without this expense cap, the costs shown in the table would have been higher. You may use the information in this line, together with the amount you invested, to estimate the expenses that you paid over the period. Simply divide your account value by $1,000 (example, an $8,600 account value divided by $1,000 = 8.6), then multiply the result by the number in the first line under the heading entitled “Expenses Paid During the Period” to estimate the expenses you paid on your account during the period.
Hypothetical Example for Comparison Purposes
In each example, the second line for each share class in the table provides information about hypothetical account values and hypothetical expenses based on the Fund’s actual expense ratio and an assumed rate of return of 5% per year before expenses. This is not the Fund’s actual return. The hypothetical account values and expenses may not be used to estimate your actual ending account balance or the expenses you paid for the period. You may use this information to compare the ongoing costs of investing in the Fund to the costs of investing in other funds. To do so, compare this 5% hypothetical example with the 5% hypothetical examples that appear in the shareholder reports of other funds.
Please note that the expenses shown in both examples are meant to highlight your ongoing costs only and do not reflect any transactional costs or account type fees, such as IRA administration fees. These fees are discussed in the prospectus. Therefore, the second line of each share class in the table is useful in comparing ongoing costs only and will not help you determine the relative costs of owning different funds. In addition, if these transactional costs or account fees were included, your costs would have been higher.
| December 31, 2020 | William Blair Funds | 181 |
Fund Expenses (Unaudited)
| Expense Example | | Beginning
Account Value
7/1/2020 | | Ending
Account Value
12/31/2020 | | Expenses Paid
During
the Period (a) | | Annualized
Expense Ratio |
| Growth Fund | | | | | | | | | | | | | | | | |
| Class N-actual return | | $ | 1,000.00 | | | $ | 1,249.96 | | | $ | 6.79 | | | | 1.20 | % |
| Class N-hypothetical 5% return | | $ | 1,000.00 | | | $ | 1,043.97 | | | $ | 6.17 | | | | 1.20 | |
| Class I-actual return | | $ | 1,000.00 | | | $ | 1,251.20 | | | $ | 5.26 | | | | 0.93 | |
| Class I-hypothetical 5% return | | $ | 1,000.00 | | | $ | 1,045.32 | | | $ | 4.78 | | | | 0.93 | |
| Class R6-actual return | | $ | 1,000.00 | | | $ | 1,251.60 | | | $ | 4.92 | | | | 0.87 | |
| Class R6-hypothetical 5% return | | $ | 1,000.00 | | | $ | 1,045.63 | | | $ | 4.47 | | | | 0.87 | |
| Large Cap Growth Fund | | | | | | | | | | | | | | | | |
| Class N-actual return | | $ | 1,000.00 | | | $ | 1,229.37 | | | $ | 5.04 | | | | 0.90 | |
| Class N-hypothetical 5% return | | $ | 1,000.00 | | | $ | 1,045.48 | | | $ | 4.63 | | | | 0.90 | |
| Class I-actual return | | $ | 1,000.00 | | | $ | 1,230.61 | | | $ | 3.64 | | | | 0.65 | |
| Class I-hypothetical 5% return | | $ | 1,000.00 | | | $ | 1,046.73 | | | $ | 3.34 | | | | 0.65 | |
| Class R6-actual return | | $ | 1,000.00 | | | $ | 1,231.44 | | | $ | 3.37 | | | | 0.60 | |
| Class R6-hypothetical 5% return | | $ | 1,000.00 | | | $ | 1,046.98 | | | $ | 3.09 | | | | 0.60 | |
| Mid Cap Growth Fund | | | | | | | | | | | | | | | | |
| Class N-actual return | | $ | 1,000.00 | | | $ | 1,277.29 | | | $ | 6.87 | | | | 1.20 | |
| Class N-hypothetical 5% return | | $ | 1,000.00 | | | $ | 1,043.97 | | | $ | 6.17 | | | | 1.20 | |
| Class I-actual return | | $ | 1,000.00 | | | $ | 1,278.48 | | | $ | 5.44 | | | | 0.95 | |
| Class I-hypothetical 5% return | | $ | 1,000.00 | | | $ | 1,045.22 | | | $ | 4.88 | | | | 0.95 | |
| Class R6-actual return | | $ | 1,000.00 | | | $ | 1,279.32 | | | $ | 5.16 | | | | 0.90 | |
| Class R6-hypothetical 5% return | | $ | 1,000.00 | | | $ | 1,045.48 | | | $ | 4.63 | | | | 0.90 | |
| Small-Mid Cap Core Fund | | | | | | | | | | | | | | | | |
| Class I-actual return | | $ | 1,000.00 | | | $ | 1,351.52 | | | $ | 5.62 | | | | 0.95 | |
| Class I-hypothetical 5% return | | $ | 1,000.00 | | | $ | 1,045.22 | | | $ | 4.88 | | | | 0.95 | |
| Class R6-actual return | | $ | 1,000.00 | | | $ | 1,351.55 | | | $ | 5.32 | | | | 0.90 | |
| Class R6-hypothetical 5% return | | $ | 1,000.00 | | | $ | 1,045.48 | | | $ | 4.63 | | | | 0.90 | |
| Small-Mid Cap Growth Fund | | | | | | | | | | | | | | | | |
| Class N-actual return | | $ | 1,000.00 | | | $ | 1,304.02 | | | $ | 7.82 | | | | 1.35 | |
| Class N-hypothetical 5% return | | $ | 1,000.00 | | | $ | 1,043.21 | | | $ | 6.93 | | | | 1.35 | |
| Class I-actual return | | $ | 1,000.00 | | | $ | 1,305.17 | | | $ | 6.37 | | | | 1.10 | |
| Class I-hypothetical 5% return | | $ | 1,000.00 | | | $ | 1,044.47 | | | $ | 5.65 | | | | 1.10 | |
| Class R6-actual return | | $ | 1,000.00 | | | $ | 1,306.04 | | | $ | 6.09 | | | | 1.05 | |
| Class R6-hypothetical 5% return | | $ | 1,000.00 | | | $ | 1,044.72 | | | $ | 5.40 | | | | 1.05 | |
| Small-Mid Cap Value Fund | | | | | | | | | | | | | | | | |
| Class N-actual return | | $ | 1,000.00 | | | $ | 1,255.79 | | | $ | 6.52 | | | | 1.15 | |
| Class N-hypothetical 5% return | | $ | 1,000.00 | | | $ | 1,044.22 | | | $ | 5.91 | | | | 1.15 | |
| Class I-actual return | | $ | 1,000.00 | | | $ | 1,258.93 | | | $ | 5.11 | | | | 0.90 | |
| Class I-hypothetical 5% return | | $ | 1,000.00 | | | $ | 1,045.48 | | | $ | 4.63 | | | | 0.90 | |
| Class R6-actual return | | $ | 1,000.00 | | | $ | 1,258.79 | | | $ | 4.83 | | | | 0.85 | |
| Class R6-hypothetical 5% return | | $ | 1,000.00 | | | $ | 1,045.73 | | | $ | 4.37 | | | | 0.85 | |
| Small Cap Growth Fund | | | | | | | | | | | | | | | | |
| Class N-actual return | | $ | 1,000.00 | | | $ | 1,423.20 | | | $ | 9.14 | | | | 1.50 | |
| Class N-hypothetical 5% return | | $ | 1,000.00 | | | $ | 1,042.46 | | | $ | 7.70 | | | | 1.50 | |
| Class I-actual return | | $ | 1,000.00 | | | $ | 1,425.17 | | | $ | 7.62 | | | | 1.25 | |
| Class I-hypothetical 5% return | | $ | 1,000.00 | | | $ | 1,043.72 | | | $ | 6.42 | | | | 1.25 | |
| Class R6-actual return | | $ | 1,000.00 | | | $ | 1,425.55 | | | $ | 7.26 | | | | 1.19 | |
| Class R6-hypothetical 5% return | | $ | 1,000.00 | | | $ | 1,044.02 | | | $ | 6.11 | | | | 1.19 | |
| Small Cap Value Fund | | | | | | | | | | | | | | | | |
| Class N-actual return | | $ | 1,000.00 | | | $ | 1,297.66 | | | $ | 7.22 | | | | 1.25 | |
| Class N-hypothetical 5% return | | $ | 1,000.00 | | | $ | 1,043.72 | | | $ | 6.42 | | | | 1.25 | |
| Class I-actual return | | $ | 1,000.00 | | | $ | 1,299.05 | | | $ | 5.78 | | | | 1.00 | |
| Class I-hypothetical 5% return | | $ | 1,000.00 | | | $ | 1,044.97 | | | $ | 5.14 | | | | 1.00 | |
| Class R6-actual return | | $ | 1,000.00 | | | $ | 1,299.35 | | | $ | 5.49 | | | | 0.95 | |
| Class R6-hypothetical 5% return | | $ | 1,000.00 | | | $ | 1,045.22 | | | $ | 4.88 | | | | 0.95 | |
| 182 | Annual Report | December 31, 2020 |
Fund Expenses (Unaudited)
| Expense Example | | Beginning
Account Value
7/1/2020 | | Ending
Account Value
12/31/2020 | | Expenses Paid
During
the Period (a) | | Annualized
Expense Ratio |
| Global Leaders Fund | | | | | | | | | | | | | | | | |
| Class N-actual return | | $ | 1,000.00 | | | $ | 1,275.71 | | | $ | 6.58 | | | | 1.15 | % |
| Class N-hypothetical 5% return | | $ | 1,000.00 | | | $ | 1,044.22 | | | $ | 5.91 | | | | 1.15 | |
| Class I-actual return | | $ | 1,000.00 | | | $ | 1,277.48 | | | $ | 5.15 | | | | 0.90 | |
| Class I-hypothetical 5% return | | $ | 1,000.00 | | | $ | 1,045.48 | | | $ | 4.63 | | | | 0.90 | |
| Class R6-actual return | | $ | 1,000.00 | | | $ | 1,277.16 | | | $ | 4.87 | | | | 0.85 | |
| Class R6-hypothetical 5% return | | $ | 1,000.00 | | | $ | 1,045.73 | | | $ | 4.37 | | | | 0.85 | |
| International Leaders Fund | | | | | | | | | | | | | | | | |
| Class N-actual return | | $ | 1,000.00 | | | $ | 1,272.97 | | | $ | 6.57 | | | | 1.15 | |
| Class N-hypothetical 5% return | | $ | 1,000.00 | | | $ | 1,044.22 | | | $ | 5.91 | | | | 1.15 | |
| Class I-actual return | | $ | 1,000.00 | | | $ | 1,275.48 | | | $ | 5.15 | | | | 0.90 | |
| Class I-hypothetical 5% return | | $ | 1,000.00 | | | $ | 1,045.48 | | | $ | 4.63 | | | | 0.90 | |
| Class R6-actual return | | $ | 1,000.00 | | | $ | 1,275.16 | | | $ | 4.86 | | | | 0.85 | |
| Class R6-hypothetical 5% return | | $ | 1,000.00 | | | $ | 1,045.73 | | | $ | 4.37 | | | | 0.85 | |
| International Growth Fund | | | | | | | | | | | | | | | | |
| Class N-actual return | | $ | 1,000.00 | | | $ | 1,305.44 | | | $ | 8.40 | | | | 1.45 | |
| Class N-hypothetical 5% return | | $ | 1,000.00 | | | $ | 1,042.71 | | | $ | 7.45 | | | | 1.45 | |
| Class I-actual return | | $ | 1,000.00 | | | $ | 1,307.42 | | | $ | 6.73 | | | | 1.16 | |
| Class I-hypothetical 5% return | | $ | 1,000.00 | | | $ | 1,044.17 | | | $ | 5.96 | | | | 1.16 | |
| Class R6-actual return | | $ | 1,000.00 | | | $ | 1,308.27 | | | $ | 6.21 | | | | 1.07 | |
| Class R6-hypothetical 5% return | | $ | 1,000.00 | | | $ | 1,044.62 | | | $ | 5.50 | | | | 1.07 | |
| Institutional International Growth Fund | | | | | | | | | | | | | | | | |
| Institutional Class-actual return | | $ | 1,000.00 | | | $ | 1,308.13 | | | $ | 5.80 | | | | 1.00 | |
| Institutional Class-hypothetical 5% return | | $ | 1,000.00 | | | $ | 1,044.97 | | | $ | 5.14 | | | | 1.00 | |
| International Small Cap Growth Fund | | | | | | | | | | | | | | | | |
| Class N-actual return | | $ | 1,000.00 | | | $ | 1,317.22 | | | $ | 8.85 | | | | 1.52 | |
| Class N-hypothetical 5% return | | $ | 1,000.00 | | | $ | 1,042.36 | | | $ | 7.80 | | | | 1.52 | |
| Class I-actual return | | $ | 1,000.00 | | | $ | 1,319.61 | | | $ | 7.29 | | | | 1.25 | |
| Class I-hypothetical 5% return | | $ | 1,000.00 | | | $ | 1,043.72 | | | $ | 6.42 | | | | 1.25 | |
| Class R6-actual return | | $ | 1,000.00 | | | $ | 1,320.49 | | | $ | 6.65 | | | | 1.14 | |
| Class R6-hypothetical 5% return | | $ | 1,000.00 | | | $ | 1,044.27 | | | $ | 5.86 | | | | 1.14 | |
| Emerging Markets Leaders Fund | | | | | | | | | | | | | | | | |
| Class N-actual return | | $ | 1,000.00 | | | $ | 1,317.46 | | | $ | 8.16 | | | | 1.40 | |
| Class N-hypothetical 5% return | | $ | 1,000.00 | | | $ | 1,042.96 | | | $ | 7.19 | | | | 1.40 | |
| Class I-actual return | | $ | 1,000.00 | | | $ | 1,317.77 | | | $ | 6.70 | | | | 1.15 | |
| Class I-hypothetical 5% return | | $ | 1,000.00 | | | $ | 1,044.22 | | | $ | 5.91 | | | | 1.15 | |
| Class R6-actual return | | $ | 1,000.00 | | | $ | 1,317.61 | | | $ | 6.41 | | | | 1.10 | |
| Class R6-hypothetical 5% return | | $ | 1,000.00 | | | $ | 1,044.47 | | | $ | 5.65 | | | | 1.10 | |
| Emerging Markets Growth Fund | | | | | | | | | | | | | | | | |
| Class N-actual return | | $ | 1,000.00 | | | $ | 1,350.00 | | | $ | 9.16 | | | | 1.55 | |
| Class N-hypothetical 5% return | | $ | 1,000.00 | | | $ | 1,042.21 | | | $ | 7.96 | | | | 1.55 | |
| Class I-actual return | | $ | 1,000.00 | | | $ | 1,351.46 | | | $ | 7.68 | | | | 1.30 | |
| Class I-hypothetical 5% return | | $ | 1,000.00 | | | $ | 1,043.46 | | | $ | 6.68 | | | | 1.30 | |
| Class R6-actual return | | $ | 1,000.00 | | | $ | 1,352.73 | | | $ | 7.10 | | | | 1.20 | |
| Class R6-hypothetical 5% return | | $ | 1,000.00 | | | $ | 1,043.97 | | | $ | 6.17 | | | | 1.20 | |
| Emerging Markets Small Cap Growth Fund | | | | | | | | | | | | | | | | |
| Class N-actual return | | $ | 1,000.00 | | | $ | 1,297.90 | | | $ | 8.95 | | | | 1.55 | |
| Class N-hypothetical 5% return | | $ | 1,000.00 | | | $ | 1,042.21 | | | $ | 7.96 | | | | 1.55 | |
| Class I-actual return | | $ | 1,000.00 | | | $ | 1,299.88 | | | $ | 7.52 | | | | 1.30 | |
| Class I-hypothetical 5% return | | $ | 1,000.00 | | | $ | 1,043.46 | | | $ | 6.68 | | | | 1.30 | |
| Class R6-actual return | | $ | 1,000.00 | | | $ | 1,300.50 | | | $ | 7.23 | | | | 1.25 | |
| Class R6-hypothetical 5% return | | $ | 1,000.00 | | | $ | 1,043.72 | | | $ | 6.42 | | | | 1.25 | |
| Bond Fund | | | | | | | | | | | | | | | | |
| Class N-actual return | | $ | 1,000.00 | | | $ | 1,030.95 | | | $ | 3.06 | | | | 0.60 | |
| Class N-hypothetical 5% return | | $ | 1,000.00 | | | $ | 1,046.98 | | | $ | 3.09 | | | | 0.60 | |
| Class I-actual return | | $ | 1,000.00 | | | $ | 1,030.92 | | | $ | 2.30 | | | | 0.45 | |
| Class I-hypothetical 5% return | | $ | 1,000.00 | | | $ | 1,047.74 | | | $ | 2.32 | | | | 0.45 | |
| Class R6-actual return | | $ | 1,000.00 | | | $ | 1,031.17 | | | $ | 2.04 | | | | 0.40 | |
| Class R6-hypothetical 5% return | | $ | 1,000.00 | | | $ | 1,047.99 | | | $ | 2.06 | | | | 0.40 | |
| December 31, 2020 | William Blair Funds | 183 |
Fund Expenses (Unaudited)
| Expense Example | | Beginning
Account Value
7/1/2020 | | Ending
Account Value
12/31/2020 | | Expenses Paid
During
the Period (a) | | Annualized
Expense Ratio |
| Income Fund | | | | | | | | | | | | | | | | |
| Class N-actual return | | $ | 1,000.00 | | | $ | 1,009.32 | | | $ | 4.29 | | | | 0.85 | % |
| Class N-hypothetical 5% return | | $ | 1,000.00 | | | $ | 1,045.73 | | | $ | 4.37 | | | | 0.85 | |
| Class I-actual return | | $ | 1,000.00 | | | $ | 1,010.05 | | | $ | 3.54 | | | | 0.70 | |
| Class I-hypothetical 5% return | | $ | 1,000.00 | | | $ | 1,046.48 | | | $ | 3.60 | | | | 0.70 | |
| Class R6-actual return | | $ | 1,000.00 | | | $ | 1,010.31 | | | $ | 3.28 | | | | 0.65 | |
| Class R6-hypothetical 5% return | | $ | 1,000.00 | | | $ | 1,046.73 | | | $ | 3.34 | | | | 0.65 | |
| Low Duration Fund | | | | | | | | | | | | | | | | |
| Class N-actual return | | $ | 1,000.00 | | | $ | 1,004.54 | | | $ | 2.77 | | | | 0.55 | |
| Class N-hypothetical 5% return | | $ | 1,000.00 | | | $ | 1,047.23 | | | $ | 2.83 | | | | 0.55 | |
| Class I-actual return | | $ | 1,000.00 | | | $ | 1,005.31 | | | $ | 2.02 | | | | 0.40 | |
| Class I-hypothetical 5% return | | $ | 1,000.00 | | | $ | 1,047.99 | | | $ | 2.06 | | | | 0.40 | |
| Class R6-actual return | | $ | 1,000.00 | | | $ | 1,005.56 | | | $ | 1.76 | | | | 0.35 | |
| Class R6-hypothetical 5% return | | $ | 1,000.00 | | | $ | 1,048.24 | | | $ | 1.80 | | | | 0.35 | |
| Macro Allocation Fund | | | | | | | | | | | | | | | | |
| Class N-actual return | | $ | 1,000.00 | | | $ | 1,032.84 | | | $ | 6.44 | | | | 1.26 | |
| Class N-hypothetical 5% return | | $ | 1,000.00 | | | $ | 1,043.67 | | | $ | 6.47 | | | | 1.26 | |
| Class I-actual return | | $ | 1,000.00 | | | $ | 1,034.11 | | | $ | 5.16 | | | | 1.01 | |
| Class I-hypothetical 5% return | | $ | 1,000.00 | | | $ | 1,044.92 | | | $ | 5.19 | | | | 1.01 | |
| Class R6-actual return | | $ | 1,000.00 | | | $ | 1,034.28 | | | $ | 4.76 | | | | 0.93 | |
| Class R6-hypothetical 5% return | | $ | 1,000.00 | | | $ | 1,045.32 | | | $ | 4.78 | | | | 0.93 | |
| (a) | Expenses are equal to the annualized expense ratio, multiplied by the average account value over the period, multiplied by the number of days in the period, 184 and divided by 366 (to reflect the one-half year period). |
| 184 | Annual Report | December 31, 2020 |
| | BOARD OF TRUSTEES (as of February 26, 2021) |
| | Vann A. Avedisian
Principal, Highgate Holdings
Kathleen T. Barr
Retired Senior Managing Director, PNC Capital Advisors, LLC
Stephanie G. Braming, Chairman and President
Partner, William Blair
Daniel N. Leib
Chief Executive Officer, Donnelley Financial Solutions, Inc.
Dorri C. McWhorter
Chief Executive Officer, YWCA Metropolitan Chicago
Arthur J. Simon
Partner, William Blair
Thomas J. Skelly
Retired Managing Partner, Accenture
Steven R. Zenz
Retired Partner, KPMG LLP |
| | Officers |
| | Marcelo Assalin, Senior Vice President
Thomas Clarke, Senior Vice President
Daniel Crowe, Senior Vice President
Robert J. Duwa, Senior Vice President
Simon Fennell, Senior Vice President
Andrew G. Flynn, Senior Vice President
David C. Fording, Senior Vice President
James S. Golan, Senior Vice President
James E. Jones, Senior Vice President
Mark T. Leslie, Senior Vice President
Stephen Livingston, Senior Vice President
Kenneth J. McAtamney, Senior Vice President
Todd M. McClone, Senior Vice President
David S. Mitchell, Senior Vice President
John C. Murphy, Senior Vice President
Casey K. Preyss, Senior Vice President
David P. Ricci, Senior Vice President
Lisa D. Rusch, Senior Vice President
Ward D. Sexton, Senior Vice President
Brian D. Singer, Senior Vice President
Mark C. Thompson, Senior Vice President
Dan Zelazny, Senior Vice President
Ruta Ziverte, Senior Vice President
Kathleen M. Lynch, Vice President
Marco Ruijer, Vice President
Paul J. Sularz, Vice President
John M. Raczek, Treasurer
Andrew T. Pfau, Secretary
David M. Cihak, Assistant Treasurer
Walter R. Randall, Jr., Chief Compliance Officer and Assistant Secretary
Robert J. Toner, Assistant Secretary
Investment Adviser
William Blair Investment Management, LLC
Distributor
William Blair & Company, L.L.C.
Independent Registered Public Accounting Firm
Ernst & Young LLP
Transfer Agent
DST Asset Manager Solutions, Inc.
For customer assistance, call 1-800-635-2886
P.O. Box 219137
Kansas City, Missouri 64121-9137 |
| December 31, 2020 | William Blair Funds | 185 |
| | | | | | |
| | William Blair Funds | | |
| | | | | | |
| | U.S. EQUITY | | GLOBAL EQUITY | | FIXED INCOME |
| | Growth Fund | | Global Leaders Fund | | Bond Fund |
| | Large Cap Growth Fund | | | | Income Fund |
| | Mid Cap Growth Fund | | INTERNATIONAL EQUITY | | Low Duration Fund |
| | Small-Mid Cap Core Fund | | International Leaders Fund | | |
| | Small-Mid Cap Growth Fund | | International Growth Fund | | MULTI-ASSET AND |
| | Small-Mid Cap Value Fund | | Institutional International Growth Fund | | ALTERNATIVE |
| | Small Cap Growth Fund | | International Small Cap Growth Fund | | Macro Allocation Fund |
| | Small Cap Value Fund | | Emerging Markets Leaders Fund | | |
| | | | Emerging Markets Growth Fund | | |
| | | | Emerging Markets Small Cap Growth Fund | | |
 | | © | William Blair & Company, L.L.C., distributor | |
| +1 800 742 7272 | | 150 North Riverside Plaza | |
| williamblairfunds.com | | Chicago, Illinois 60606 | 00103188 |
(a) As of the end of the period covered by this report, the Registrant has adopted a code of ethics (the “Code”) that applies to its principal executive officer and principal financial officer (the “Covered Officers”).
(b) No disclosures are required pursuant to this Item 2(b).
(c) During the period covered by the report, the Registrant did not make any amendment to a provision of the Code.
(d) During the period covered by the report, the Registrant did not grant any waivers, including implicit waivers, from the provisions of the Code.
(e) Not applicable.
(f) A copy of the Code is filed as Exhibit 13(a)(1) to this Form N-CSR.
| Item 3. | Audit Committee Financial Expert |
The Registrant’s Board of Trustees has determined that the Registrant has at least one “audit committee financial expert” (as defined in Item 3 of Form N-CSR) serving on its Audit Committee. Mr. Daniel N. Leib, the Registrant’s audit committee financial expert, is “independent” for purposes of Item 3 to Form N-CSR.
An “audit committee financial expert” is not an “expert” for any purpose, including for purposes of Section 11 of the Securities Act of 1933, as a result of being designated as an “audit committee financial expert.” Further, the designation of a person as an “audit committee financial expert” does not mean that the person has any greater duties, obligations, or liability than those imposed on the person without the “audit committee financial expert” designation. Similarly, the designation of a person as an “audit committee financial expert” does not affect the duties, obligations, or liability of any other member of the audit committee or Board of Trustees.
| Item 4. | Principal Accountant Fees and Services |
Audit Fees
For the fiscal years ended December 31, 2019 and 2020, Ernst & Young LLP, the Registrant’s principal accountant (“E&Y”), billed the Registrant $621,400 and $508,300, respectively, for professional services rendered for the audit of the Registrant’s annual financial statements or services that are normally provided in connection with statutory and regulatory filings.
Audit-Related Fees
For the fiscal years ended December 31, 2019 and 2020, E&Y billed the Registrant $0 and $0, respectively, for assurance and related services that are reasonably related to the performance of the audit of the Registrant’s financial statements and that are not reported above. For the fiscal years ended December 31, 2019 and 2020, E&Y provided no audit-related services to William Blair Investment Management, LLC, the Registrant’s investment adviser (“William Blair”), or any of its control affiliates that were for engagements directly related to the Registrant’s operations and financial reporting.
Tax Fees
For the fiscal years ended December 31, 2019 and 2020, E&Y billed the Registrant $249,928 and $341,754, respectively, for professional services rendered for tax compliance, tax advice and tax planning. Such services consisted of preparation of tax returns, year-end distribution review, qualifying dividend income analysis and review of year-end tax reporting. For the fiscal years ended December 31, 2019 and 2020, E&Y did not bill William Blair and its control affiliates for any services that were for engagements directly related to the Registrant’s operations and financial reporting.
All Other Fees
For the fiscal years ended December 31, 2019 and 2020, E&Y did not bill the Registrant for products and services other than the services reported above. For the fiscal year ended December 31, 2019 and 2020, E&Y provided no other services to William Blair or any of its control affiliates that were for engagements directly related to the Registrant’s operations and financial reporting.
Audit Committee Pre-Approval Policies and Procedures
Pursuant to the Registrant’s Audit Committee Charter (the “Charter”), the Audit Committee is responsible for pre-approving any engagement of the principal accountant to provide non-prohibited services to the Registrant, including the fees and other compensation to be paid to the principal accountant, to the extent required by Rule 2-01(c)(7) of Regulation S-X. Pursuant to the Charter, the Audit Committee is also responsible for pre-approving any engagement of the principal accountant, including the fees and other compensation to be paid to the principal accountant, to provide non-audit services to the Registrant’s investment adviser (or any entity controlling, controlled by, or under common control with the adviser that provides ongoing services to the Registrant), if the engagement relates directly to the operations and financial reporting of the Registrant, to the extent required by Rule 2-01(c)(7) of Regulation S-X. The Chair of the Audit Committee may grant the pre-approval referenced above for non-prohibited and non-audit services. All such delegated pre-approvals will be presented to the Audit Committee no later than the next Audit Committee meeting. None of the Audit-Related and Tax Services billed by E&Y for the fiscal years ended December 31, 2019 and 2020 discussed above were approved by the Audit Committee pursuant to a waiver of these Pre-Approval Policies and Procedures.
Non-Audit Fees
For the fiscal years ended December 31, 2019 and 2020, E&Y billed the Trust $249,928 and $341,754, respectively, in non-audit fees (tax services). For the same periods, E&Y billed the Adviser and its control affiliates $0 and $0, respectively, in non-audit fees.
| Item 5. | Audit Committee of Listed Registrants |
Not applicable to this Registrant, insofar as the Registrant is not a listed company.
| Item 6. | Schedule of Investments |
See Schedule of Investments in Item 1.
| Item 7. | Disclosure of Proxy Voting Policies and Procedures for Closed-End Management Investment Companies |
Not applicable to this Registrant, insofar as the Registrant is not a closed-end management investment company.
| Item 8. | Portfolio Managers of Closed-End Management Investment Companies |
Not applicable to this Registrant, insofar as the Registrant is not a closed-end management investment company.
| Item 9. | Purchase of Equity Securities by Closed-End Management Investment Companies and Affiliated Purchasers |
Not applicable to this Registrant, insofar as the Registrant is not a closed-end management investment company.
| Item 10. | Submission of Matters to a Vote of Security Holders |
There have been no material changes to the procedures by which shareholders may recommend nominees to the Registrant’s Board of Trustees since the Registrant last provided disclosure in response to this item.
Controls and Procedures
(a) The Registrant’s principal executive and principal financial officers, or persons performing similar functions, have concluded that the Registrant’s Disclosure Controls and Procedures (as defined in Rule 30a-3(c) under the Investment Company Act of 1940, as amended (the “1940 Act”) (17 CFR 270.30a-3(c)) are effective, as of a date within 90 days of the filing date of this report that includes the disclosure required by this paragraph, based on their evaluation of these controls and procedures required by Rule 30a-3 (b) under the 1940 Act (17 CFR 270.30a-3(b) and Rules 13a-15(b) or 15d-15(b) under the Securities Exchange Act of 1934, as amended to date (17 CFR 240.13a-15(b) or 240.15d-15(b)).
(b) There were no changes in the Registrant’s internal control over financial reporting (as defined in Rule 30a-3(d) under the 1940 Act (17 CFR 270.30a-3(d)) that occurred during the period covered by this report that has materially affected, or is reasonably likely to materially affect, the Registrant’s internal control over financial reporting.
| Item 12. | Disclosure of Securities Lending Activities for Closed-End Management Investment Companies |
Not applicable to this Registrant, insofar as the Registrant is not a closed-end management investment company.
13. (a) (1) Code of Ethics
13. (a) (2) (1)
Certification of Principal Executive Officer Required by Rule 30a-2(a) of the Investment Company Act of 1940 is filed as an exhibit hereto.
13. (a) (2) (2)
Certification of Principal Financial Officer Required by Rule 30a-2(a) of the Investment Company Act of 1940 is filed as an exhibit hereto.
13. (a) (3)
Not applicable to this Registrant.
13. (a) (4)
Not applicable to this filing.
13. (b)
Certifications of the Principal Executive Officer and Principal Financial Officer of the issuer as required by Rule 30a-2(b) of the Investment Company Act of 1940 are filed as exhibits hereto.
SIGNATURES
Pursuant to the requirements of the Securities Exchange Act of 1934 and the Investment Company Act of 1940, the Registrant has duly caused this report to be signed on its behalf by the undersigned, thereunto duly authorized.
| | | William Blair Funds |
| | |
| | | /s/ Stephanie G. Braming |
| By: | | Stephanie G. Braming |
| | | President (Principal Executive Officer) |
Date: March 1, 2021
Pursuant to the requirements of the Securities Exchange Act of 1934 and the Investment Company Act of 1940, this report has been signed below by the following persons on behalf of the Registrant and in the capacities and on the dates indicated.
| | | /s/ Stephanie G. Braming |
| By: | | Stephanie G. Braming |
| | | President (Principal Executive Officer) |
Date: March 1, 2021
| | | /s/ John M. Raczek |
| By: | | John M. Raczek |
| | | Treasurer (Principal Financial Officer) |
Date: March 1, 2021