UNITED STATES
SECURITIES AND EXCHANGE COMMISSION
Washington, D.C. 20549
Form N-CSR
CERTIFIED SHAREHOLDER REPORT OF REGISTERED
MANAGEMENT INVESTMENT COMPANIES
Investment Company Act File Number 811-5344
William Blair Funds
(Exact name of registrant as specified in charter)
| 150 North Riverside Plaza, Chicago, IL | | 60606 |
| (Address of principal executive offices) | | (Zip Code) |
Stephanie G. Braming, Principal Executive Officer
William Blair Funds
150 North Riverside Plaza, Chicago, IL 60606
(Name and address of agent for service)
Registrant’s telephone number, including area code: 312-236-1600
Date of fiscal year end: December 31
Date of reporting period: December 31, 2019
Item 1. December 31, 2019 Annual Reports transmitted to shareholders.
 | |
| | |
| | |
| | |
| | |
| | |
| | |
| | |
| | December 31, 2019 |
William Blair Funds
Annual Report | |
| | IMPORTANT NOTE: Beginning on January 1, 2021, as permitted by regulations adopted by the Securities and Exchange Commission, paper copies of the William Blair Funds’ (the “Funds”) annual and semi-annual shareholder reports will no longer be sent by mail, unless you specifically request paper copies of the shareholder reports from the Funds or from your financial intermediary, such as a broker-dealer or bank. Instead, shareholder reports will be available on the Funds’ website (https://www.williamblairfunds.com/investor_services/prospectus_reports_forms.fs), and you will be notified by mail each time a report is posted and provided with a website link to access the report. If you already elected to receive shareholder reports electronically, you will not be affected by this change and you need not take any action. You may elect to receive shareholder reports and other communications from the Funds electronically by notifying your financial intermediary or, if you are a direct investor, by calling 1-800-635-2886. You may elect to receive all future shareholder reports in paper free of charge. You can inform your financial intermediary that you wish to continue receiving paper copies of your shareholder reports, or if you are a direct investor, by calling 1-800-635-2886. Your election to receive reports in paper will apply to all Funds you hold directly or through your financial intermediary, as applicable. | | |
| | | | |
| | | | |
| | | |
| December 31, 2019 | William Blair Funds | 1 |
The views expressed in the commentary for each Fund reflect those of the portfolio management team only through the end of the period of the report as stated on the cover. The portfolio management team’s views are subject to change at any time based on market and other conditions and should not be construed as a recommendation. Statements involving predictions, assessments, analyses, or outlook for individual securities, industries, market sectors, and/or markets involve risks and uncertainties, and there is no guarantee they will come to pass.
This report is submitted for the general information of the shareholders of William Blair Funds. It is not authorized for distribution to prospective Fund investors unless accompanied or preceded by the Fund’s prospectus. Please carefully consider a Fund’s investment objectives, risks, charges, and expenses before investing. This and other information is contained in the Fund’s prospectus, which you may obtain by calling 1-800-742-7272. Read it carefully before you invest or send money.
| 2 | Annual Report | December 31, 2019 |
U.S. Growth Market Review and Outlook
The U.S. equity market posted strong gains in 2019, supported by monetary easing from U.S. and global central banks. In contrast to the dramatic market decline during the fourth quarter of 2018, the first few months of 2019 brought a sharp rebound, driven by a reversal in U.S. Federal Reserve (the “Fed”) policy. The Fed communicated an increased willingness to cut interest rates if warranted by economic conditions, after raising the target Fed Funds rate by 1.0% over the course of 2018.
Following the initial 2019 market rebound, equities ground modestly higher through September. This period was characterized by mixed U.S. economic data. The consumer segment of the economy remained solid, helped by a healthy labor market, while domestic manufacturing activity declined. In addition, the Fed announced two target rate decreases of 25 basis points each, joining other central banks that had already begun monetary easing. Further, the yield curve inverted (3 month/10 year maturities), which some view as a leading indicator of a potential recession. Investor concern that the U.S. economy could be slowing resulted in a preference for companies with more sustainable growth models, while increased trade policy uncertainty contributed to market volatility. Correspondingly, following improvements in trade negotiations and select economic data in September, there was a pronounced rotation toward more cyclical and speculative areas of the market as we moved into the fourth quarter.
Robust fourth quarter returns were driven by a combination of continued monetary easing, reduced fears of a U.S. economic recession and a de-escalation of trade tensions with China. The Fed cut the target Fed Funds rate by another 25 basis points, reversing almost all of 2018’s increases, and started to expand its balance sheet. Recession fears dissipated alongside U.S. manufacturing data that showed early signs of stabilization, a resilient labor market and a healthy housing market. This was also reflected in the 3 month/10 year treasury spread, which steepened back into positive territory. Finally, the expected phase one trade deal between the U.S. and China, which avoided a December tariff increase, further paved the way for equities to move higher.
While we do not anticipate a continuation of the magnitude of positive returns we saw in 2019, we have a fairly balanced view as we look to the coming year. With the global economy showing signs of stabilization, we could see moderate improvements in economic growth given a continuation of global central bank stimulus and improving trade relations. Additionally, inventory levels are lean in many segments of the economy. Conversely, rising geopolitical tensions, a deterioration in trade negotiations between the U.S. and China or potential negative impacts associated with UK’s planned withdrawal from the European Union all have the potential to derail economic improvements.
These economic and monetary policy considerations, together with the 2020 U.S. presidential election, are likely to result in continued stock market volatility. The 2019 market rally was largely driven by rising prices rather than rising earnings, reducing the opportunity for further multiple expansion broadly. Relative to history, broad market valuations are high on an absolute basis. However, when considering the low interest rate environment coupled with lower credit spreads, broad market valuations do not appear extended. Given expectations for forward earnings growth have come down in the past year, corporate earnings growth has the potential to reaccelerate from a lower base. Our focus continues to be on identifying durable business franchises whose stock prices do not fully reflect our view of long term value creation potential.
| December 31, 2019 | William Blair Funds | 3 |
U.S. Value Market Review and Outlook
U.S. equity benchmarks progressed higher in the fourth quarter and ended the year posting robust returns, with all indices up in excess of twenty percent for the year. Strong returns in the first half of the year were due to solid corporate earnings, a dovish pivot by the U.S. Federal Reserve (the “Fed”), and optimism regarding trade relations between the U.S. and China.
Intensified recessionary fears in late summer, amid worries that a global slowdown would impact the U.S. economy, contributed to a market downdraft and to the decision by the Fed to lower rates for the first time in over a decade. Although the Fed lowered rates twice during the third quarter, it failed to deliver on dovish investor expectations and classified its lowering of rates as a “mid cycle” adjustment rather than a sustained rate cutting cycle, resulting in uncertainty regarding future monetary policy decisions. A deterioration in trade negotiations and the potential for new tariffs also contributed to the decreased market performance during the period.
Initial market declines to begin the fourth quarter stemmed from weaker than expected economic data in the U.S. and globally. These initial declines quickly reversed due to dovish comments by the Fed signaling natural balance sheet expansion, a steeper yield curve, a tentative truce in the U.S.-China trade war and the announcement of a Phase One deal, and generally easy financial conditions. Better than feared corporate earnings and the apparent stabilization in economic data, along with no disruption on the trade front, seemed to encourage investors to shift into a risk-on mode and add cyclical exposure given increased confidence in the economic environment.
For the first time in history, the U.S. economy started and ended a decade without going into a recession. While the current economic expansion is one of the longest on record, it has also been one of the more moderate, fueled by Fed policy decisions and an apparent commitment to extending the current economic cycle as long as possible. While we are encouraged by the strong labor market, stable economic data, and a seemingly more positive trade environment, we remain cognizant of the numerous geopolitical and economic risks that could impact the trajectory of future market returns. These risks include the upcoming U.S. presidential election, the constantly changing U.S.-China trade situation, U.S. presidential impeachment proceedings, and slowing global and U.S. growth.
While Phase One of a trade deal has been reached between the U.S. and China, it has yet to be signed and many believe any progress towards a Phase Two deal would be extremely challenging and take considerable time. The ever-evolving trade landscape has impacted global supply chains and is likely contributing to muted global growth. Generally speaking, trade uncertainty presents a risk for both corporate earnings growth and capital spending, both of which are necessary for improved global growth.
Our concerns regarding corporate debt levels continue as the more highly levered companies may come under pressure as more of their cash flow is necessary to service rising debt levels, resulting in increased market volatility. We believe the economy’s late cycle nature argues investors should invest in self-funding, high return on invested capital companies. We continue to focus on companies with increasingly stronger balance sheets given our concern about corporate debt levels and expectations for increased market volatility. As always, our focus remains on identifying quality companies at discount prices and corporate transformation opportunities. We continue to find opportunities across sectors and believe the portfolio is well-suited to withstand a variety of market scenarios and add value over the long-term.
| 4 | Annual Report | December 31, 2019 |
| | Growth Fund |
| | |
| | The Growth Fund seeks long-term capital appreciation. |
| | |
| | AN OVERVIEW FROM THE PORTFOLIO MANAGER |
| | |

David C. Fording | The William Blair Growth Fund (Class N shares) posted a 31.97% increase, net of fees, for the twelve months ended December 31, 2019. By comparison, the Fund’s benchmark index, the Russell 3000®Growth Index (the “Index”), increased 35.85%. Underperformance for the full year period was concentrated in the fourth quarter and was driven by stock specific dynamics as style factors were largely offsetting. From a style perspective, our higher valuation exposure, driven by the Fund’s quality growth bias, was a tailwind for the first eight months of the year, as stocks with higher valuations generally outperformed during the period. However, following the market rotation in September 2019, this exposure became a headwind, offsetting the benefit from earlier in the year. From a stock-specific standpoint, not owning Apple was the largest detractor from relative returns over the full year period. While Apple shareholders have benefited from share buybacks and valuation multiple expansion, the high-end smart phone market (a significant source of revenue for the company) has largely matured, in our view limiting the company’s ability to materially grow revenues and operating profits over the longer term. Within the portfolio, notable underperformers included Healthcare Services Group (Industrials), ABIOMED (Health Care), Virtu Financial (Financials) and Cameco Corporation (Energy). Healthcare Services Group, which provides housekeeping, laundry, linen, facility maintenance and food services to long-term care facilities, underperformed as revenues lagged due to contract exits as certain customers were unable to comply with the company’s more stringent payment terms. Medical technology company ABIOMED underperformed as confusion surrounding a Dear Doctor letter that the FDA released earlier in the year continued to weigh on business results, despite company efforts to improve physician education and training. Stock selection in Consumer Discretionary, including our position in Grand Canyon Education, also detracted from returns. Conversely positive selection in Industrials was a standout, including positions in Copart, CoStar Group and BWX Technologies. Copart, an online auction platform for salvage vehicles, outperformed as a growing buyer base drove higher average selling prices and Copart raised buyer fees on select vehicles. Other notable outperformers included Information Technology holdings Worldpay and Mastercard. Shares of merchant acquirer Worldpay advanced on strong execution and the announcement that Worldpay had agreed to be acquired. Please refer to the U.S. Growth Market Review and Outlook relating to the Fund on page 3. |
| December 31, 2019 | William Blair Funds | 5 |
Growth Fund
Performance Highlights (Unaudited)
Average Annual Total Return through 12/31/2019
| | | 1 Year | | 3 Year | | 5 Year | | 10 Year | | Since
Inception(a) |
| Class N | | | 31.97 | % | | | 19.92 | % | | | 12.46 | % | | | 12.85 | % | | | — | |
| Class I | | | 32.32 | | | | 20.25 | | | | 12.78 | | | | 13.19 | | | | — | |
| Class R6 | | | — | | | | — | | | | — | | | | — | | | | 10.75 | |
| Russell 3000® Growth Index | | | 35.85 | | | | 19.89 | | | | 14.23 | | | | 15.05 | | | | 12.79 | |
| S&P 500®Index | | | 31.49 | | | | 15.27 | | | | 11.70 | | | | 13.56 | | | | 12.03 | |
| (a) | Since inception is for the period from May 2, 2019 (Commencement of Operations) to December 31, 2019. |
Performance cited represents past performance. Past performance does not guarantee future results and current performance may be lower or higher than the data quoted. Results shown are average annual returns, which assume reinvestment of dividends and capital gains. Investment returns and principal will fluctuate and you may have a gain or loss when you sell shares. For the most current month-end performance information, please call 1-800-742-7272, or visit our Web site atwww.williamblairfunds.com. From time to time, the investment adviser may waive fees or reimburse expenses for the Fund. Without these waivers/reimbursements, performance would be lower. Class N shares are not subject to a sales load. Class I shares are not subject to a sales load or distribution (Rule 12b-1) fees. Class R6 shares are not subject to a sales load, distribution (Rule 12b-1) fees, or sub-transfer agent fees.
The performance highlights and graph presented above do not reflect the deduction of taxes that a shareholder would pay on fund distributions or the redemption of fund shares.
The Russell 3000®Growth Index consists of large, medium, and small capitalization companies with above average price-to-book ratios and forecasted growth rates. The index is weighted by market capitalization and large/medium/small companies make up approximately 80%/15%/5% of the index.
The S&P 500®Index indicates broad larger capitalization equity market performance.
This report identifies the Fund’s investments on December 31, 2019. These holdings are subject to change. Not all stocks in the Fund performed the same, nor is there any guarantee that these stocks will perform as well in the future. Market forecasts provided in this report may not necessarily come to pass.
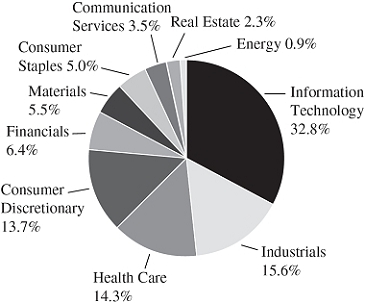
Sector Diversification (Unaudited)

The sector diversification shown is based on the total long-term securities.
| 6 | Annual Report | December 31, 2019 |
Growth Fund
Portfolio of Investments, December 31, 2019(all dollar amounts in thousands)
| | | | | | | | |
| | | | | | | | |
| | Issuer | | Shares | | | Value | |
| | | | | | | | | | |
| | Common Stocks | | | | | | | | |
| | Information Technology—36.0% | | | | | | | | |
| * | Adobe, Inc. | | | 17,307 | | | $ | 5,708 | |
| * | Advanced Micro Devices, Inc. | | | 108,541 | | | | 4,978 | |
| * | Arista Networks, Inc. | | | 15,206 | | | | 3,093 | |
| | Booz Allen Hamilton Holding Corporation | | | 34,310 | | | | 2,440 | |
| | Dolby Laboratories, Inc. | | | 66,208 | | | | 4,555 | |
| | Fidelity National Information Services, Inc. | | | 38,362 | | | | 5,336 | |
| | Genpact, Ltd.† | | | 80,987 | | | | 3,415 | |
| * | Guidewire Software, Inc. | | | 18,358 | | | | 2,015 | |
| * | Knowles Corporation | | | 67,883 | | | | 1,436 | |
| | Mastercard, Inc. Class “A” | | | 34,484 | | | | 10,297 | |
| | Microchip Technology, Inc. | | | 32,710 | | | | 3,425 | |
| | Microsoft Corporation | | | 144,535 | | | | 22,793 | |
| | National Instruments Corporation | | | 64,557 | | | | 2,733 | |
| | Perspecta, Inc. | | | 116,357 | | | | 3,077 | |
| * | Pure Storage, Inc. | | | 233,464 | | | | 3,995 | |
| * | Rogers Corporation | | | 9,064 | | | | 1,131 | |
| | Sabre Corporation | | | 155,012 | | | | 3,478 | |
| | Texas Instruments, Inc. | | | 42,858 | | | | 5,498 | |
| * | Verra Mobility Corporation | | | 132,581 | | | | 1,855 | |
| | | | | | | | | 91,258 | |
| | Health Care—14.5% | | | | | | | | |
| | Abbott Laboratories | | | 59,969 | | | | 5,209 | |
| | Agilent Technologies, Inc. | | | 46,274 | | | | 3,948 | |
| * | Codexis, Inc. | | | 65,220 | | | | 1,043 | |
| * | Horizon Therapeutics plc† | | | 108,564 | | | | 3,930 | |
| * | Portola Pharmaceuticals, Inc. | | | 93,927 | | | | 2,243 | |
| | Stryker Corporation | | | 16,716 | | | | 3,509 | |
| | Teleflex, Inc. | | | 8,572 | | | | 3,227 | |
| | UnitedHealth Group, Inc. | | | 30,050 | | | | 8,834 | |
| | Zoetis, Inc. | | | 35,896 | | | | 4,751 | |
| | | | | | | | | 36,694 | |
| | Industrials—12.3% | | | | | | | | |
| | BWX Technologies, Inc. | | | 104,958 | | | | 6,516 | |
| * | Copart, Inc. | | | 58,852 | | | | 5,352 | |
| * | CoStar Group, Inc. | | | 6,266 | | | | 3,749 | |
| | Fortive Corporation | | | 50,773 | | | | 3,879 | |
| | Luxfer Holdings plc† | | | 110,413 | | | | 2,044 | |
| | Raytheon Co. | | | 24,303 | | | | 5,340 | |
| | The Brink’s Co. | | | 28,572 | | | | 2,591 | |
| * | Trex Co., Inc. | | | 18,752 | | | | 1,685 | |
| | | | | | | | | 31,156 | |
| | Consumer Discretionary—11.9% | | | | | | | | |
| | Advance Auto Parts, Inc. | | | 23,712 | | | | 3,798 | |
| * | Amazon.com, Inc. | | | 8,309 | | | | 15,354 | |
| * | Burlington Stores, Inc. | | | 17,275 | | | | 3,939 | |
| * | Grand Canyon Education, Inc. | | | 30,060 | | | | 2,879 | |
| * | Laureate Education, Inc. | | | 133,478 | | | | 2,351 | |
| * | Ulta Salon Cosmetics & Fragrance, Inc. | | | 7,061 | | | | 1,787 | |
| | | | | | | | | 30,108 | |
| | Issuer | | Shares or
Principal
Amount | | | Value | |
| | | | | | | | | | |
| | Common Stocks—(continued) | | | | | | | | |
| | Communication Services—10.5% | | | | | | | | |
| | Activision Blizzard, Inc. | | | 60,494 | | | $ | 3,595 | |
| * | Alphabet, Inc. Class “A” | | | 13,370 | | | | 17,908 | |
| * | Live Nation Entertainment, Inc. | | | 35,896 | | | | 2,566 | |
| * | Take-Two Interactive Software, Inc. | | | 20,624 | | | | 2,525 | |
| | | | | | | | | 26,594 | |
| | Consumer Staples—7.0% | | | | | | | | |
| * | BJ’s Wholesale Club Holdings, Inc. | | | 125,783 | | | | 2,860 | |
| | Costco Wholesale Corporation | | | 14,877 | | | | 4,373 | |
| | The Coca-Cola Co. | | | 136,654 | | | | 7,564 | |
| | The Estee Lauder Cos., Inc. Class “A” | | | 14,943 | | | | 3,086 | |
| | | | | | | | | 17,883 | |
| | Financials—3.9% | | | | | | | | |
| * | Encore Capital Group, Inc. | | | 50,477 | | | | 1,785 | |
| | Intercontinental Exchange, Inc. | | | 62,432 | | | | 5,778 | |
| | Virtu Financial, Inc. | | | 149,803 | | | | 2,395 | |
| | | | | | | | | 9,958 | |
| | Materials—3.2% | | | | | | | | |
| | Ball Corporation | | | 71,759 | | | | 4,641 | |
| | Linde plc† | | | 15,961 | | | | 3,397 | |
| | | | | | | | | 8,038 | |
| | Energy—0.5% | | | | | | | | |
| | Cameco Corporation† | | | 150,171 | | | | 1,336 | |
| | Total Common Stocks—99.8%
(cost $153,176) | | | | | | | 253,025 | |
| | | | | | | | | | |
| | Repurchase Agreement | | | | | | | | |
| | Fixed Income Clearing Corporation, 0.120% dated 12/31/19, due 1/2/20, repurchase price $875, collateralized by U.S. Treasury Bond, 2.500%, due 5/15/46 valued at $894 | | | $875 | | | | 875 | |
| | Total Repurchase Agreement—0.3%
(cost $875) | | | | | | | 875 | |
| | Total Investments—100.1%
(cost $154,051) | | | | | | | 253,900 | |
| | Liabilities, plus cash and other assets—(0.1)% | | | | | | | (313 | ) |
| | Net assets—100.0% | | | | | | $ | 253,587 | |
* = Non-income producing security
† = U.S. listed foreign security
See accompanying Notes to Financial Statements.
| December 31, 2019 | William Blair Funds | 7 |
| | Large Cap Growth Fund |
| | |
| | The Large Cap Growth Fund seeks long-term capital appreciation. |
| | |
| | AN OVERVIEW FROM THE PORTFOLIO MANAGERS |
| | |

James S. Golan 
David P. Ricci | The William Blair Large Cap Growth Fund (Class N shares) posted a 36.00% increase, net of fees, for the twelve months ended December 31, 2019. By comparison, the Fund’s benchmark index, the Russell 1000®Growth Index (the “Index”), increased 36.39%. Relative performance for the year was primarily the result of stock specific dynamics as style factors were largely offsetting. From a style perspective, our higher valuation exposure, driven by the Fund’s quality growth bias, was a tailwind for the first eight months of the year, as stocks with higher valuations generally outperformed during the period. However, following the market rotation in September 2019, this exposure became a headwind, offsetting the benefit from earlier in the period. From a stock-specific standpoint, not owning Apple was the largest detractor from relative returns over the full year period. While Apple shareholders have benefited from share buybacks and valuation multiple expansion, the high-end smart phone market (a significant source of revenue for the company) has largely matured, in our view limiting the company’s ability to materially grow revenues and operating profits over the longer term. Within the portfolio, notable underperformers included ABIOMED (Health Care) and McDonald’s Corporation (Consumer Discretionary). Medical technology company ABIOMED underperformed as confusion surrounding a Dear Doctor letter that the FDA released weighed on business results, despite company efforts to improve physician education and training. McDonald’s underperformed on disappointing traffic trends. Other laggards included UnitedHealth Group (Health Care), Fortive (Industrials) and Abbott Laboratories (Health Care). Conversely, strong selection in Industrials was additive to performance. The top contributor from the sector was Copart, an online auction platform for salvage vehicles, which outperformed as a growing buyer base drove higher average selling prices and Copart raised buyer fees on select vehicles. Other notable outperformers included Zoetis (Health Care), Advanced Micro Devices (Information Technology), Lam Research (Information Technology) and Estee Lauder (Consumer Staples). Shares of Zoetis, the market leader in animal health therapeutics and vaccines, advanced on broad-based fundamental strength as both its livestock and companion animal segments grew faster than anticipated. Please refer to the U.S. Growth Market Review and Outlook relating to the Fund on page 3. |
| 8 | Annual Report | December 31, 2019 |
Large Cap Growth Fund
Performance Highlights (Unaudited)
Average Annual Total Return through 12/31/2019
| | | 1 Year | | 3 Year | | 5 Year | | 10 Year | | Since
Inception(a) |
| Class N | | | 36.00 | % | | | 23.16 | % | | | 15.32 | % | | | 15.14 | % | | | — | |
| Class I | | | 36.35 | | | | 23.50 | | | | 15.61 | | | | 15.41 | | | | — | |
| Class R6 | | | — | | | | — | | | | — | | | | — | | | | 14.13 | % |
| Russell 1000® Growth Index | | | 36.39 | | | | 20.49 | | | | 14.63 | | | | 15.22 | | | | 13.18 | |
| (a) | Since inception is for the period from May 2, 2019 (Commencement of Operations) to December 31, 2019. |
Performance cited represents past performance. Past performance does not guarantee future results and current performance may be lower or higher than the data quoted. Results shown are average annual total returns, which assume reinvestment of dividends and capital gains. Investment returns and principal will fluctuate and you may have a gain or loss when you sell shares. For the most current month-end performance information, please call 1-800-742-7272, or visit our Web site atwww.williamblairfunds.com. From time to time, the investment adviser may waive fees or reimburse expenses for the Fund. Without these waivers/reimbursements, performance would be lower. Class N shares are not subject to a sales load. Class I shares are not subject to a sales load or distribution (Rule 12b-1) fees. Class R6 shares are not subject to a sales load, distribution (Rule 12b-1) fees, or sub-transfer agent fees.
The performance highlights and graph presented above do not reflect the deduction of taxes that a shareholder would pay on fund distributions or the redemption of fund shares.
The Russell 1000®Growth Index consists of large capitalization companies with above average price-to-book ratios and forecasted growth rates.
This report identifies the Fund’s investments on December 31, 2019. These holdings are subject to change. Not all stocks in the Fund performed the same, nor is there any guarantee that these stocks will perform as well in the future. Market forecasts provided in this report may not necessarily come to pass.
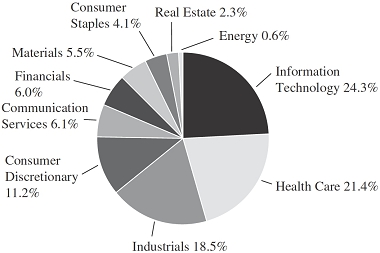
Sector Diversification (Unaudited)

The sector diversification shown is based on the total long-term securities.
| December 31, 2019 | William Blair Funds | 9 |
Large Cap Growth Fund
Portfolio of Investments, December 31, 2019(all dollar amounts in thousands)
| | | | | | | | |
| | | | | | | | |
| | Issuer | | Shares | | | Value | |
| | | | | | | | |
| | Common Stocks | | | | | | | | |
| | Information Technology—36.4% | | | | | | | | |
| | Accenture plc† | | | 49,150 | | | $ | 10,350 | |
| * | Adobe, Inc. | | | 24,980 | | | | 8,239 | |
| * | Advanced Micro Devices, Inc. | | | 196,328 | | | | 9,004 | |
| | Fidelity National Information Services, Inc. | | | 42,190 | | | | 5,868 | |
| * | Guidewire Software, Inc. | | | 53,720 | | | | 5,897 | |
| | Intuit, Inc. | | | 18,510 | | | | 4,848 | |
| | Lam Research Corporation | | | 23,770 | | | | 6,950 | |
| | Mastercard, Inc. | | | 33,710 | | | | 10,065 | |
| | Microsoft Corporation | | | 181,470 | | | | 28,618 | |
| * | PayPal Holdings, Inc. | | | 97,790 | | | | 10,578 | |
| | Texas Instruments, Inc. | | | 80,210 | | | | 10,290 | |
| | | | | | | | | 110,707 | |
| | Health Care—14.6% | | | | | | | | |
| | Abbott Laboratories | | | 101,660 | | | | 8,830 | |
| | Stryker Corporation | | | 35,420 | | | | 7,436 | |
| | UnitedHealth Group, Inc. | | | 50,690 | | | | 14,902 | |
| * | Veeva Systems, Inc. Class “A” | | | 35,680 | | | | 5,019 | |
| | Zoetis, Inc. | | | 60,340 | | | | 7,986 | |
| | | | | | | | | 44,173 | |
| | Communication Services—12.6% | | | | | | | | |
| | Activision Blizzard, Inc. | | | 148,820 | | | | 8,843 | |
| * | Alphabet, Inc. Class “A” | | | 12,290 | | | | 16,461 | |
| * | Alphabet, Inc. Class “C” | | | 4,916 | | | | 6,573 | |
| * | Live Nation Entertainment, Inc. | | | 87,550 | | | | 6,257 | |
| | | | | | | | | 38,134 | |
| | Consumer Discretionary—11.0% | | | | | | | | |
| * | Amazon.com, Inc. | | | 12,170 | | | | 22,488 | |
| | Starbucks Corporation | | | 124,130 | | | | 10,914 | |
| | | | | | | | | 33,402 | |
| | Industrials—9.1% | | | | | | | | |
| * | Copart, Inc. | | | 77,060 | | | | 7,008 | |
| | Equifax, Inc. | | | 40,250 | | | | 5,640 | |
| | Fortive Corporation | | | 116,240 | | | | 8,879 | |
| | Raytheon Co. | | | 28,250 | | | | 6,208 | |
| | | | | | | | | 27,735 | |
| | Consumer Staples—7.2% | | | | | | | | |
| | Costco Wholesale Corporation | | | 16,740 | | | | 4,920 | |
| | The Coca-Cola Co. | | | 181,760 | | | | 10,061 | |
| | The Estee Lauder Cos., Inc. Class “A” | | | 33,480 | | | | 6,915 | |
| | | | | | | | | 21,896 | |
| | Financials—6.1% | | | | | | | | |
| | Aon plc† | | | 29,490 | | | | 6,142 | |
| | Apollo Global Management, Inc. | | | 138,360 | | | | 6,601 | |
| | Intercontinental Exchange, Inc. | | | 62,430 | | | | 5,778 | |
| | | | | | | | | 18,521 | |
| | Materials—2.4% | | | | | | | | |
| | Linde plc† | | | 34,760 | | | | 7,399 | |
| | Total Common Stocks—99.4%
(cost $215,123) | | | | | | | 301,967 | |
| | | | | | | | |
| | Issuer | | Principal Amount | | | Value | |
| | | | | | | | |
| | Repurchase Agreement | | | | | | | | |
| | Fixed Income Clearing Corporation, 0.120% dated 12/31/19, due 1/2/20, repurchase price $2,985, collateralized by U.S. Treasury Bond, 2.500%, due 5/15/46 valued at $3,048 | | $ | 2,985 | | | $ | 2,985 | |
| | Total Repurchase Agreement—1.0%
(cost $2,985) | | | | | | | 2,985 | |
| | Total Investments—100.4%
(cost $218,108) | | | | | | | 304,952 | |
| | Liabilities, plus cash and other assets—(0.4)% | | | | | | | (1,118 | ) |
| | Net assets—100.0% | | | | | | $ | 303,834 | |
† = U.S. listed foreign security
* = Non-income producing security
See accompanying Notes to Financial Statements.
| 10 | Annual Report | December 31, 2019 |
| | Mid Cap Growth Fund |
| | |
| | The Mid Cap Growth Fund seeks long-term capital appreciation. |
| | |
| | AN OVERVIEW FROM THE PORTFOLIO MANAGERS |
| | |

Daniel Crowe 
James E. Jones 
Robert C. Lanphier, IV | The William Blair Mid Cap Growth Fund (Class N shares) posted a 36.02% increase, net of fees, for the twelve months ended December 31, 2019. By comparison, the Fund’s benchmark index, the Russell Midcap®Growth Index (the “Index”), increased 35.47%. The Fund generally lagged during the strongest periods of benchmark returns while adding value in periods of more moderate to negative benchmark performance. The Fund outperformed the benchmark for the full-year period, largely driven by strong stock specific factors. Selection in Industrials was a standout, including our positions in Copart, CoStar Group and BWX Technologies. Copart, an online auction platform for salvage vehicles, outperformed as a growing buyer base drove higher average selling prices and Copart raised buyer fees on select vehicles. Other notable contributors included Worldpay (Information Technology) and Burlington Coat Factory (Consumer Discretionary). Shares of merchant acquirer Worldpay advanced on strong execution and the announcement that Worldpay had agreed to be acquired by Fidelity National Information Services. Conversely, our top detractors for the period included ABIOMED (Health Care), GoDaddy (Information Technology), Sabre Corp (Information Technology) and DexCom (Health Care). Medical technology company ABIOMED underperformed as unfavorable data with respect to the use of Impella in certain settings was presented at an American Health Association meeting, adding to the confusion caused earlier in the year after a Dear Doctor letter was released by the FDA. GoDaddy, a leading provider of domain names, underperformed as lower-than-expected gross margins and the announcement of the CEO’s departure due to health reasons weighed on shares. Additionally, stock selection in Financials, including our position in East West Bancorp, was a detractor from relative returns. Please refer to the U.S. Growth Market Review and Outlook relating to the Fund on page 3. |
| December 31, 2019 | William Blair Funds | 11 |
Mid Cap Growth Fund
Performance Highlights (Unaudited)
| Average Annual Total Return through 12/31/2019 |
| | | 1 Year | | 3 Year | | 5 Year | | 10 Year | | Since
Inception(a) |
| Class N | | | 36.02 | % | | | 17.55 | % | | | 10.20 | % | | | 12.14 | % | | | — | |
| Class I | | | 36.17 | | | | 17.83 | | | | 10.45 | | | | 12.42 | | | | — | |
| Class R6 | | | — | | | | — | | | | — | | | | — | | | | 9.10 | % |
| Russell Midcap® Growth Index | | | 35.47 | | | | 17.36 | | | | 11.60 | | | | 14.24 | | | | 9.58 | |
| (a) | Since inception is for the period from May 2, 2019 (Commencement of Operations) to December 31, 2019. |
Performance cited represents past performance. Past performance does not guarantee future results and current performance may be lower or higher than the data quoted. Results shown are average annual total returns, which assume reinvestment of dividends and capital gains. Investment returns and principal will fluctuate and you may have a gain or loss when you sell shares. For the most current month-end performance information, please call 1-800-742-7272, or visit our Web site atwww.williamblairfunds.com. Investing in medium capitalization companies involves special risks, including higher volatility and lower liquidity. Medium capitalization stocks are also more sensitive to purchase/sale transactions and changes in the issuer’s financial condition. From time to time, the investment adviser may waive fees or reimburse expenses for the Fund. Without these waivers/reimbursements, performance would be lower. Class N shares are not subject to a sales load. Class I shares are not subject to a sales load or distribution (Rule 12b-1) fees. Class R6 shares are not subject to a sales load, distribution (Rule 12b-1) fees, or sub-transfer agent fees.
The performance highlights and graph presented above do not reflect the deduction of taxes that a shareholder would pay on fund distributions or the redemption of fund shares.
The Russell Midcap®Growth Index is an index that is constructed to provide a comprehensive and unbiased barometer of the mid-cap growth market.
This report identifies the Fund’s investments on December 31, 2019. These holdings are subject to change. Not all stocks in the Fund performed the same, nor is there any guarantee that these stocks will perform as well in the future. Market forecasts provided in this report may not necessarily come to pass.
Sector Diversification (Unaudited)
The sector diversification shown is based on the total long-term securities.
| 12 | Annual Report | December 31, 2019 |
Mid Cap Growth Fund
Portfolio of Investments, December 31, 2019(all dollar amounts in thousands)
| | | | | | | | |
| | | | | | | | |
| | Issuer | | Shares | | | Value | |
| | | | | | | | | | |
| | Common Stocks | | | | | | | | |
| | Information Technology—32.0% | | | | | | | | |
| * | Advanced Micro Devices, Inc. | | | 59,980 | | | $ | 2,751 | |
| * | Arista Networks, Inc. | | | 7,460 | | | | 1,517 | |
| * | Autodesk, Inc. | | | 6,405 | | | | 1,175 | |
| | Booz Allen Hamilton Holding Corporation | | | 19,134 | | | | 1,361 | |
| | Dolby Laboratories, Inc. | | | 20,045 | | | | 1,379 | |
| * | EPAM Systems, Inc. | | | 5,910 | | | | 1,254 | |
| * | Euronet Worldwide, Inc. | | | 8,040 | | | | 1,267 | |
| | Global Payments, Inc. | | | 11,180 | | | | 2,041 | |
| * | GoDaddy, Inc. | | | 20,330 | | | | 1,381 | |
| * | Guidewire Software, Inc. | | | 6,843 | | | | 751 | |
| | j2 Global, Inc. | | | 10,218 | | | | 957 | |
| | MAXIMUS, Inc. | | | 11,790 | | | | 877 | |
| | Microchip Technology, Inc. | | | 21,225 | | | | 2,223 | |
| * | Pure Storage, Inc. | | | 80,875 | | | | 1,384 | |
| | Sabre Corporation | | | 63,188 | | | | 1,418 | |
| * | WEX, Inc. | | | 8,545 | | | | 1,790 | |
| | | | | | | | | 23,526 | |
| | Industrials—15.2% | | | | | | | | |
| | BWX Technologies, Inc. | | | 39,174 | | | | 2,432 | |
| * | Copart, Inc. | | | 28,130 | | | | 2,558 | |
| * | CoStar Group, Inc. | | | 3,734 | | | | 2,234 | |
| | Equifax, Inc. | | | 5,190 | | | | 727 | |
| | Fortive Corporation | | | 12,920 | | | | 987 | |
| * | The Middleby Corporation | | | 6,221 | | | | 681 | |
| | Verisk Analytics, Inc. | | | 3,505 | | | | 524 | |
| | Waste Connections, Inc.† | | | 11,615 | | | | 1,055 | |
| | | | | | | | | 11,198 | |
| | Health Care—14.0% | | | | | | | | |
| * | ABIOMED, Inc. | | | 3,600 | | | | 614 | |
| | Agilent Technologies, Inc. | | | 20,370 | | | | 1,738 | |
| * | Centene Corporation | | | 21,801 | | | | 1,371 | |
| | Encompass Health Corporation | | | 21,760 | | | | 1,507 | |
| * | Horizon Therapeutics plc† | | | 24,100 | | | | 872 | |
| * | Insulet Corporation | | | 4,735 | | | | 811 | |
| * | Mettler-Toledo International, Inc. | | | 895 | | | | 710 | |
| | Teleflex, Inc. | | | 4,840 | | | | 1,822 | |
| * | Veeva Systems, Inc. Class “A” | | | 5,986 | | | | 842 | |
| | | | | | | | | 10,287 | |
| | Consumer Discretionary—13.3% | | | | | | | | |
| | Advance Auto Parts, Inc. | | | 10,538 | | | | 1,688 | |
| | Aptiv plc† | | | 10,815 | | | | 1,027 | |
| * | Burlington Stores, Inc. | | | 6,370 | | | | 1,452 | |
| * | CarMax, Inc. | | | 6,395 | | | | 561 | |
| | Ross Stores, Inc. | | | 11,425 | | | | 1,330 | |
| | Service Corporation International | | | 20,350 | | | | 937 | |
| * | Ulta Salon Cosmetics & Fragrance, Inc. | | | 3,315 | | | | 839 | |
| | Vail Resorts, Inc. | | | 6,055 | | | | 1,452 | |
| * | Wayfair, Inc. | | | 5,680 | | | | 513 | |
| | | | | | | | | 9,799 | |
| | Issuer | | Shares or
Principal
Amount | | | Value | |
| | | | | | | | | | |
| | Common Stocks—(continued) | | | | | | | | |
| | Financials—6.3% | | | | | | | | |
| | Arthur J Gallagher & Co. | | | 17,275 | | | $ | 1,645 | |
| | Cboe Global Markets, Inc. | | | 11,470 | | | | 1,377 | |
| | Signature Bank | | | 4,995 | | | | 682 | |
| * | SVB Financial Group | | | 3,650 | | | | 916 | |
| | | | | | | | | 4,620 | |
| | Materials—5.3% | | | | | | | | |
| | Ball Corporation | | | 32,560 | | | | 2,106 | |
| | Vulcan Materials Co. | | | 12,755 | | | | 1,836 | |
| | | | | | | | | 3,942 | |
| | Consumer Staples—4.9% | | | | | | | | |
| * | BJ’s Wholesale Club Holdings, Inc. | | | 30,095 | | | | 684 | |
| | Conagra Brands, Inc. | | | 31,920 | | | | 1,093 | |
| | Lamb Weston Holdings, Inc. | | | 20,990 | | | | 1,806 | |
| | | | | | | | | 3,583 | |
| | Communication Services—3.5% | | | | | | | | |
| * | Live Nation Entertainment, Inc. | | | 15,930 | | | | 1,138 | |
| * | Take-Two Interactive Software, Inc. | | | 11,490 | | | | 1,407 | |
| | | | | | | | | 2,545 | |
| | Real Estate—2.2% | | | | | | | | |
| | SBA Communications Corporation | | | 6,775 | | | | 1,633 | |
| | Energy—0.9% | | | | | | | | |
| | Parsley Energy, Inc. | | | 34,295 | | | | 649 | |
| | Total Common Stocks—97.6%
(cost $55,661) | | | | | | | 71,782 | |
| | | | | | | | | | |
| | Repurchase Agreement | | | | | | | | |
| | Fixed Income Clearing Corporation, 0.120% dated 12/31/19, due 1/2/20, repurchase price $1,682, collateralized by U.S. Treasury Bond, 2.500%, due 5/15/46 valued at $1,720 | | $ | 1,682 | | | | 1,682 | |
| | Total Repurchase Agreement—2.3%
(cost $1,682) | | | | | | | 1,682 | |
| | Total Investments—99.9%
(cost $57,343) | | | | | | | 73,464 | |
| | Cash and other assets, less liabilities—0.1% | | | | | | | 82 | |
| | Net assets—100.0% | | | | | | $ | 73,546 | |
* = Non-income producing security
† = U.S. listed foreign security
See accompanying Notes to Financial Statements.
| December 31, 2019 | William Blair Funds | 13 |
| | Small-Mid Cap Core Fund |
| | |
| | The Small-Mid Cap Core Fund seeks long-term capital appreciation. |
| | |
| | AN OVERVIEW FROM THE PORTFOLIO MANAGERS |
| | |

Daniel Crowe 
Robert C. Lanphier, IV 
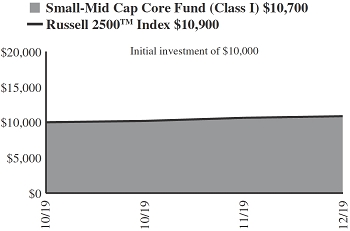
Ward D. Sexton | The William Blair Small-Mid Cap Core Fund (Class I shares) posted a 6.87% increase, net of fees, since the inception of the Fund on October 1, 2019 through December 31, 2019. By comparison, the Fund’s benchmark index, the Russell 2500TMIndex (the “Index”), increased 8.54%. Since the Fund’s inception on October 1, 2019, the Fund underperformed its benchmark due to a combination of stock selection and style headwinds. From a style perspective, the companies within the lowest quintile of return on invested capital along with the most volatile, highest beta equities outperformed the benchmark, creating an unfavorable style environment for the Fund given our high-quality investment philosophy. These dynamics persisted across many industries. Notably, our typical underweight to speculative Biotechnology, which consists of companies without approved products, created a headwind during the quarter. From a stock perspective, selection in Information Technology dampened relative returns as in aggregate, our holdings lagged the sector return of the Index. Our top detractors included BJ’s Wholesale Club (Consumer Staples) and CoreSite Realty (Real Estate). BJ’s Wholesale Club, the third largest wholesale club retailer, reported weakness in its general merchandise business due to transitory headwinds. CoreSite Realty Corporation, a real estate investment trust, reported results that were broadly in-line with expectations; however, elevated customer churn and supply constraints weighed on shares. Other notable laggards included Advance Auto Parts (Consumer Discretionary), Centennial Resource Development (Energy) and IDACORP (Utilities). Conversely, stock selection was strongest in Financials, including our positions in Western Alliance Bancorp and SVB Financial. Regional bank Western Alliance benefited from accelerating loan and deposit growth and strong credit quality. Other notable contributors included Horizon Therapeutics (Health Care), Hanger (Health Care) and Boot Barn (Consumer Discretionary). Shares of Horizon Therapeutics, a specialty biopharmaceutical company, advanced on strong business results and optimism around the launch of Teprotumumab, a drug used to treat thyroid eye disease. Please refer to the U.S. Growth Market Review and Outlook relating to the Fund on page 3. |
| 14 | Annual Report | December 31, 2019 |
Small-Mid Cap Core Fund
Performance Highlights (Unaudited)
| Average Annual Total Return through 12/31/2019 |
| | | Since
Inception(a) |
| Class I | | | 6.87 | % |
| Class R6 | | | 6.88 | |
| Russell 2500TMIndex | | | 8.54 | |
| | |
| (a) | Since inception is for the period from October 1, 2019 (Commencement of Operations) to December 31, 2019. |
Performance cited represents past performance. Past performance does not guarantee future results and current performance may be lower or higher than the data quoted. Results shown are average annual total returns, which assume reinvestment of dividends and capital gains. Investment returns and principal will fluctuate and you may have a gain or loss when you sell shares. For the most current month-end performance information, please call 1-800-742-7272, or visit our Web site atwww.williamblairfunds.com. Investing in smaller and medium capitalization companies involves special risks, including higher volatility and lower liquidity. Smaller and medium capitalization stocks are also more sensitive to purchase/sale transactions and changes in the issuer’s financial condition. From time to time, the investment adviser may waive fees or reimburse expenses for the Fund. Without these waivers/reimbursements, performance would be lower. Class I shares are not subject to a sales load or distribution (Rule 12b-1) fees. Class R6 shares are not subject to a sales load, distribution (Rule 12b-1) fees, or sub-transfer agent fees.
The performance highlights and graph presented above do not reflect the deduction of taxes that a shareholder would pay on fund distributions or the redemption of fund shares.
The Russell 2500TMIndex measures the performance of those Russell 2500 companies with above average price-to-book ratios and forecasted growth rates.
This report identifies the Fund’s investments on December 31, 2019. These holdings are subject to change. Not all stocks in the Fund performed the same, nor is there any guarantee that these stocks will perform as well in the future. Market forecasts provided in this report may not necessarily come to pass.
Sector Diversification (Unaudited)

The sector diversification shown is based on the total long-term securities.
| December 31, 2019 | William Blair Funds | 15 |
Small-Mid Cap Core Fund
Portfolio of Investments, December 31, 2019(all dollar amounts in thousands)
| | | | | | | | |
| | | | | | | | |
| | Issuer | | Shares | | | Value | |
| | | | | | | | | | |
| | Common Stocks | | | | | | | | |
| | Information Technology—16.9% | | | | | | | | |
| | Booz Allen Hamilton Holding Corporation | | | 678 | | | $ | 48 | |
| | Dolby Laboratories, Inc. | | | 1,265 | | | | 87 | |
| | Entegris, Inc. | | | 667 | | | | 33 | |
| * | Euronet Worldwide, Inc. | | | 568 | | | | 89 | |
| | Genpact, Ltd.† | | | 1,602 | | | | 68 | |
| | j2 Global, Inc. | | | 1,044 | | | | 98 | |
| * | Knowles Corporation | | | 3,603 | | | | 76 | |
| | MAXIMUS, Inc. | | | 672 | | | | 50 | |
| * | Nice, Ltd.—ADR | | | 720 | | | | 112 | |
| | Perspecta, Inc. | | | 3,436 | | | | 91 | |
| * | Pure Storage, Inc. | | | 4,503 | | | | 77 | |
| * | Rogers Corporation | | | 394 | | | | 49 | |
| | Sabre Corporation | | | 3,778 | | | | 85 | |
| * | Verra Mobility Corporation | | | 6,215 | | | | 87 | |
| * | WEX, Inc. | | | 296 | | | | 62 | |
| | | | | | | | | 1,112 | |
| | Industrials—16.8% | | | | | | | | |
| | Armstrong World Industries, Inc. | | | 553 | | | | 52 | |
| * | Blue Bird Corporation | | | 3,147 | | | | 72 | |
| | BWX Technologies, Inc. | | | 2,507 | | | | 156 | |
| * | Colfax Corporation | | | 1,372 | | | | 50 | |
| | Douglas Dynamics, Inc. | | | 1,221 | | | | 67 | |
| * | Generac Holdings, Inc. | | | 501 | | | | 50 | |
| | Healthcare Services Group, Inc. | | | 2,653 | | | | 64 | |
| | John Bean Technologies Corporation | | | 674 | | | | 76 | |
| | Luxfer Holdings plc† | | | 3,054 | | | | 57 | |
| | Nordson Corporation | | | 424 | | | | 69 | |
| * | Teledyne Technologies, Inc. | | | 119 | | | | 41 | |
| | Tennant Co. | | | 874 | | | | 68 | |
| | The Brink’s Co. | | | 1,758 | | | | 159 | |
| | The Toro Co. | | | 636 | | | | 51 | |
| * | Trex Co., Inc. | | | 798 | | | | 72 | |
| | | | | | | | | 1,104 | |
| | Financials—13.7% | | | | | | | | |
| | Ares Management Corporation | | | 1,445 | | | | 52 | |
| | Arthur J Gallagher & Co. | | | 699 | | | | 67 | |
| | Cboe Global Markets, Inc. | | | 590 | | | | 71 | |
| * | Encore Capital Group, Inc. | | | 1,813 | | | | 64 | |
| | FirstCash, Inc. | | | 702 | | | | 57 | |
| | Signature Bank | | | 623 | | | | 85 | |
| * | SVB Financial Group | | | 559 | | | | 140 | |
| | Virtu Financial, Inc. | | | 4,650 | | | | 74 | |
| | Western Alliance Bancorp | | | 3,250 | | | | 185 | |
| | Wintrust Financial Corporation | | | 1,482 | | | | 105 | |
| | | | | | | | | 900 | |
| | Health Care—13.6% | | | | | | | | |
| * | Codexis, Inc. | | | 3,999 | | | | 64 | |
| | Encompass Health Corporation | | | 1,367 | | | | 95 | |
| * | Hanger, Inc. | | | 3,172 | | | | 87 | |
| * | Horizon Therapeutics plc† | | | 3,837 | | | | 139 | |
| * | LHC Group, Inc. | | | 607 | | | | 84 | |
| * | Mednax, Inc. | | | 2,336 | | | | 65 | |
| * | Merit Medical Systems, Inc. | | | 3,228 | | | | 101 | |
| * | Portola Pharmaceuticals, Inc. | | | 2,143 | | | | 51 | |
| | STERIS plc† | | | 454 | | | | 69 | |
| * | Tabula Rasa HealthCare, Inc. | | | 1,127 | | | | 55 | |
| | Teleflex, Inc. | | | 178 | | | | 67 | |
| * | Veracyte, Inc. | | | 721 | | | | 20 | |
| | | | | | | | | 897 | |
| | | | | | | | |
| | | | | | | | |
| | Issuer | | Shares | | | Value | |
| | | | | | | | | | |
| | Common Stocks—(continued) | | | | | | | | |
| | Real Estate—9.5% | | | | | | | | |
| | Americold Realty Trust | | | 1,955 | | | $ | 69 | |
| | CoreSite Realty Corporation | | | 778 | | | | 87 | |
| | Douglas Emmett, Inc. | | | 1,945 | | | | 85 | |
| | Healthcare Realty Trust, Inc. | | | 2,541 | | | | 85 | |
| | Jones Lang LaSalle, Inc. | | | 361 | | | | 63 | |
| | Outfront Media, Inc. | | | 1,644 | | | | 44 | |
| | Rexford Industrial Realty, Inc. | | | 1,226 | | | | 56 | |
| | VICI Properties, Inc. | | | 5,282 | | | | 135 | |
| | | | | | | | | 624 | |
| | Consumer Discretionary—8.3% | | | | | | | | |
| | Advance Auto Parts, Inc. | | | 675 | | | | 108 | |
| * | Boot Barn Holdings, Inc. | | | 1,530 | | | | 68 | |
| * | Burlington Stores, Inc. | | | 367 | | | | 84 | |
| * | CarMax, Inc. | | | 824 | | | | 72 | |
| | Dine Brands Global, Inc. | | | 520 | | | | 44 | |
| * | Grand Canyon Education, Inc. | | | 1,001 | | | | 96 | |
| | Service Corporation International | | | 894 | | | | 41 | |
| | Vail Resorts, Inc. | | | 138 | | | | 33 | |
| | | | | | | | | 546 | |
| | Materials—6.1% | | | | | | | | |
| * | Crown Holdings, Inc. | | | 1,723 | | | | 125 | |
| | Eagle Materials, Inc. | | | 366 | | | | 33 | |
| | FMC Corporation | | | 809 | | | | 81 | |
| * | Ingevity Corporation | | | 714 | | | | 62 | |
| | Orion Engineered Carbons S.A.† | | | 5,086 | | | | 98 | |
| | | | | | | | | 399 | |
| | Consumer Staples—5.1% | | | | | | | | |
| * | BJ’s Wholesale Club Holdings, Inc. | | | 3,598 | | | | 82 | |
| | Cott Corporation† | | | 4,430 | | | | 61 | |
| | Lamb Weston Holdings, Inc. | | | 1,293 | | | | 111 | |
| | Spectrum Brands Holdings, Inc. | | | 1,310 | | | | 84 | |
| | | | | | | | | 338 | |
| | Communication Services—4.5% | | | | | | | | |
| | Cable One, Inc. | | | 47 | | | | 70 | |
| * | Live Nation Entertainment, Inc. | | | 523 | | | | 37 | |
| * | Take–Two Interactive Software, Inc. | | | 603 | | | | 74 | |
| | World Wrestling Entertainment, Inc. | | | 1,011 | | | | 66 | |
| * | Zynga, Inc. | | | 8,336 | | | | 51 | |
| | | | | | | | | 298 | |
| | Energy—2.6% | | | | | | | | |
| | Cameco Corporation† | | | 6,911 | | | | 61 | |
| * | Oceaneering International, Inc. | | | 1,119 | | | | 17 | |
| | Parsley Energy, Inc. | | | 3,764 | | | | 71 | |
| * | Talos Energy, Inc. | | | 834 | | | | 25 | |
| | | | | | | | | 174 | |
| | Utilities—1.4% | | | | | | | | |
| | IDACORP, Inc. | | | 887 | | | | 95 | |
| | Total Common Stocks—98.5%
(cost $6,101) | | | | | | | 6,487 | |
| | Total Investments—98.5%
(cost $6,101) | | | | | | | 6,487 | |
| | Cash and other assets, less liabilities—1.5% | | | | | | | 101 | |
| | Net assets—100.0% | | | | | | $ | 6,588 | |
ADR = American Depository Receipt
* = Non-income producing security
† = U.S. listed foreign security
See accompanying Notes to Financial Statements.
| 16 | Annual Report | December 31, 2019 |
| | Small-Mid Cap Growth Fund |
| | |
| | The Small-Mid Cap Growth Fund seeks long-term capital appreciation. |
| | |
| | AN OVERVIEW FROM THE PORTFOLIO MANAGERS |
| | |

Daniel Crowe 
James E. Jones 
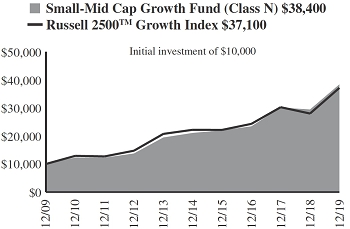
Robert C. Lanphier, IV | The William Blair Small-Mid Cap Growth Fund (Class N shares) posted a 30.41% increase, net of fees, for the twelve months ended December 31, 2019. By comparison, the Fund’s benchmark index, the Russell 2500TMGrowth Index (the “Index”), increased 32.65%. The Fund generally lagged during the strongest periods of benchmark returns while adding value in periods of more moderate to negative benchmark performance. In aggregate, the Fund modestly trailed the benchmark for the year. From a style perspective, our typical larger market cap bias provided a tailwind for much of the year as the larger cap stocks within our small-mid universe outperformed the smaller cap stocks. However, this style benefit was offset by fourth quarter market dynamics; specifically, companies within the lowest quintile of return on invested capital along with the most volatile, highest beta equities outperformed the benchmark. From a stock perspective, stock selection in Information Technology, including our underweight to Semiconductors, and Consumer Discretionary, including our positions in Adtalem Global Education and Grand Canyon Education dampened relative returns. Adtalem Global Education, a postsecondary education company, underperformed during the period due to previously lowered earnings expectations and the eventual sale of its Brazil programs, lackluster enrollment in its medical and healthcare programs, as well as investor concerns related to the presidential election and its potential effects on the for-profit education industry. Given the increased uncertainty and lowered confidence in the company’s execution ability, we liquidated our position during the fourth quarter. Other notable laggards during the period included Healthcare Services Group (Industrials), Inogen (Health Care) and Virtu Financial (Financials). Healthcare Services Group, which provides housekeeping, laundry, linen, facility maintenance and food services to long-term care facilities, underperformed during the period as revenues lagged due to contract exits as certain customers were unable to comply with the company’s more stringent payment terms. Conversely, selection in Industrials was a standout, helped by positions in CoStar Group, Copart and BWX Technologies. Shares of CoStar Group, a real estate information services company, advanced on business trends that were consistent with our thesis including strong growth in its commercial real estate business and continued share gains in its apartment rental advertising business. After strong relative performance during our holding period, we liquidated our position in the company during the third quarter as the market capitalization became too large relative to our SMID cap mandate. Outperformance from Health Care holdings Insulet and Horizon Therapeutics also contributed to relative returns. Insulet outperformed during the period as its tubeless insulin pump’s favorable form factor and the simplicity of use enabled by its Dash Personal Diabetes Manager were key growth drivers, validating the company’s differentiated business model. Stock selection in Materials and Communication Services also added value. Please refer to the U.S. Growth Market Review and Outlook relating to the Fund on page 3. |
| | | |
| December 31, 2019 | William Blair Funds | 17 |
Small-Mid Cap Growth Fund
Performance Highlights (Unaudited)
Average Annual Total Return through 12/31/2019
| | | 1 Year | | 3 Year | | 5 Year | | 10 Year | | Since
Inception(a) |
| Class N | | | 30.41 | % | | | 17.89 | % | | | 12.75 | % | | | 14.39 | % | | | — | |
| Class I | | | 30.77 | | | | 18.19 | | | | 13.04 | | | | 14.67 | | | | — | |
| Class R6 | | | — | | | | — | | | | — | | | | — | | | | 8.17 | % |
| Russell 2500TM Growth Index | | | 32.65 | | | | 15.17 | | | | 10.84 | | | | 14.01 | | | | 8.99 | |
| (a) | Since inception is for the period from May 2, 2019 (Commencement of Operations) to December 31, 2019. |
Performance cited represents past performance. Past performance does not guarantee future results and current performance may be lower or higher than the data quoted. Results shown are average annual total returns, which assume reinvestment of dividends and capital gains. Investment returns and principal will fluctuate and you may have a gain or loss when you sell shares. For the most current month-end performance information, please call 1-800-742-7272, or visit our Web site atwww.williamblairfunds.com. Investing in smaller and medium capitalization companies involves special risks, including higher volatility and lower liquidity. Smaller and medium capitalization stocks are also more sensitive to purchase/sale transactions and changes in the issuer’s financial condition. From time to time, the investment adviser may waive fees or reimburse expenses for the Fund. Without these waivers/reimbursements, performance would be lower. Class N shares are not subject to a sales load. Class I shares are not subject to a sales load or distribution (Rule 12b-1) fees. Class R6 shares are not subject to a sales load, distribution (Rule 12b-1) fees, or sub-transfer agent fees.
The performance highlights and graph presented above do not reflect the deduction of taxes that a shareholder would pay on fund distributions or the redemption of fund shares.
The Russell 2500TMGrowth Index measures the performance of those Russell 2500 companies with above average price-to-book ratios and forecasted growth rates.
This report identifies the Fund’s investments on December 31, 2019. These holdings are subject to change. Not all stocks in the Fund performed the same, nor is there any guarantee that these stocks will perform as well in the future. Market forecasts provided in this report may not necessarily come to pass.
Sector Diversification (Unaudited)
The sector diversification shown is based on the total long-term securities.
| 18 | Annual Report | December 31, 2019 |
Small-Mid Cap Growth Fund
Portfolio of Investments, December 31, 2019(all dollar amounts in thousands)
| | | | | | | | |
| | | | | | | | |
| | Issuer | | Shares | | | Value | |
| | | | | | | | | | |
| | Common Stocks | | | | | | | | |
| | Information Technology—24.0% | | | | | | | | |
| * | Anaplan, Inc. | | | 414,200 | | | $ | 21,704 | |
| * | Aspen Technology, Inc. | | | 397,425 | | | | 48,061 | |
| * | Avalara, Inc. | | | 477,762 | | | | 34,996 | |
| | Booz Allen Hamilton Holding Corporation | | | 607,597 | | | | 43,218 | |
| | Entegris, Inc. | | | 290,019 | | | | 14,527 | |
| * | Euronet Worldwide, Inc. | | | 461,255 | | | | 72,675 | |
| * | GoDaddy, Inc. | | | 648,923 | | | | 44,075 | |
| * | Guidewire Software, Inc. | | | 276,548 | | | | 30,357 | |
| | j2 Global, Inc. | | | 469,671 | | | | 44,013 | |
| | National Instruments Corporation | | | 594,307 | | | | 25,163 | |
| * | Nice, Ltd.—ADR | | | 326,057 | | | | 50,588 | |
| * | Novanta, Inc.† | | | 243,868 | | | | 21,568 | |
| | Perspecta, Inc. | | | 823,300 | | | | 21,768 | |
| * | Proofpoint, Inc. | | | 257,400 | | | | 29,544 | |
| * | Pure Storage, Inc. | | | 3,262,458 | | | | 55,821 | |
| * | Qualys, Inc. | | | 76,419 | | | | 6,371 | |
| * | Rogers Corporation | | | 190,753 | | | | 23,793 | |
| | Sabre Corporation | | | 2,067,088 | | | | 46,385 | |
| * | Varonis Systems, Inc. | | | 294,800 | | | | 22,909 | |
| * | WEX, Inc. | | | 194,736 | | | | 40,789 | |
| | | | | | | | | 698,325 | |
| | Health Care—21.1% | | | | | | | | |
| * | ABIOMED, Inc. | | | 157,892 | | | | 26,935 | |
| * | Amedisys, Inc. | | | 240,118 | | | | 40,081 | |
| | Encompass Health Corporation | | | 1,063,259 | | | | 73,652 | |
| * | Glaukos Corporation | | | 458,378 | | | | 24,968 | |
| * | Halozyme Therapeutics, Inc. | | | 1,505,047 | | | | 26,685 | |
| * | Horizon Therapeutics plc† | | | 1,905,940 | | | | 68,995 | |
| * | Inspire Medical Systems, Inc. | | | 258,638 | | | | 19,194 | |
| * | Insulet Corporation | | | 405,095 | | | | 69,352 | |
| * | iRhythm Technologies, Inc. | | | 327,900 | | | | 22,327 | |
| * | Ligand Pharmaceuticals, Inc. | | | 315,212 | | | | 32,873 | |
| * | Penumbra, Inc. | | | 300,426 | | | | 49,351 | |
| * | Portola Pharmaceuticals, Inc. | | | 1,604,653 | | | | 38,319 | |
| | STERIS plc† | | | 277,498 | | | | 42,296 | |
| | Teleflex, Inc. | | | 156,451 | | | | 58,894 | |
| * | Veracyte, Inc. | | | 724,223 | | | | 20,220 | |
| | | | | | | | | 614,142 | |
| | Industrials—18.3% | | | | | | | | |
| | BWX Technologies, Inc. | | | 1,568,128 | | | | 97,349 | |
| * | Copart, Inc. | | | 326,105 | | | | 29,656 | |
| * | Generac Holdings, Inc. | | | 230,600 | | | | 23,196 | |
| | Healthcare Services Group, Inc. | | | 1,296,427 | | | | 31,529 | |
| | HEICO Corporation | | | 365,034 | | | | 32,682 | |
| | Ritchie Bros Auctioneers, Inc.† | | | 795,862 | | | | 34,182 | |
| * | SiteOne Landscape Supply, Inc. | | | 319,497 | | | | 28,962 | |
| * | Teledyne Technologies, Inc. | | | 206,478 | | | | 71,553 | |
| | The Brink’s Co. | | | 461,795 | | | | 41,876 | |
| | TransUnion | | | 676,779 | | | | 57,939 | |
| * | Trex Co., Inc. | | | 913,752 | | | | 82,128 | |
| | | | | | | | | 531,052 | |
| | Consumer Discretionary—11.0% | | | | | | | | |
| | Advance Auto Parts, Inc. | | | 181,390 | | | | 29,051 | |
| * | Burlington Stores, Inc. | | | 349,686 | | | | 79,739 | |
| * | Etsy, Inc. | | | 506,800 | | | | 22,451 | |
| * | Grand Canyon Education, Inc. | | | 662,501 | | | | 63,461 | |
| * | Ollie’s Bargain Outlet Holdings, Inc. | | | 433,800 | | | | 28,331 | |
| | Issuer | | Shares or
Principal
Amount | | | Value | |
| | | | | | | | | | |
| | Common Stocks—(continued) | | | | | | | | |
| | Consumer Discretionary—(continued) | | | | | | | | |
| * | Planet Fitness, Inc. | | | 398,900 | | | $ | 29,790 | |
| | Vail Resorts, Inc. | | | 193,728 | | | | 46,462 | |
| * | Wayfair, Inc. | | | 232,185 | | | | 20,983 | |
| | | | | | | | | 320,268 | |
| | Communication Services—6.0% | | | | | | | | |
| | Cable One, Inc. | | | 27,847 | | | | 41,450 | |
| * | Live Nation Entertainment, Inc. | | | 883,722 | | | | 63,160 | |
| | World Wrestling Entertainment, Inc. | | | 508,500 | | | | 32,986 | |
| * | Zynga, Inc. | | | 5,926,300 | | | | 36,269 | |
| | | | | | | | | 173,865 | |
| | Financials—5.9% | | | | | | | | |
| | Ares Management Corporation | | | 664,384 | | | | 23,712 | |
| | Cboe Global Markets, Inc. | | | 248,703 | | | | 29,844 | |
| * | Encore Capital Group, Inc. | | | 693,113 | | | | 24,508 | |
| | FirstCash, Inc. | | | 458,127 | | | | 36,939 | |
| | Signature Bank | | | 208,837 | | | | 28,529 | |
| | Virtu Financial, Inc. | | | 1,720,171 | | | | 27,506 | |
| | | | | | | | | 171,038 | |
| | Materials—5.5% | | | | | | | | |
| * | Axalta Coating Systems, Ltd.† | | | 799,674 | | | | 24,310 | |
| * | Crown Holdings, Inc. | | | 794,881 | | | | 57,661 | |
| | Martin Marietta Materials, Inc. | | | 275,945 | | | | 77,165 | |
| | | | | | | | | 159,136 | |
| | Consumer Staples—4.0% | | | | | | | | |
| * | BJ’s Wholesale Club Holdings, Inc. | | | 2,096,379 | | | | 47,672 | |
| | Lamb Weston Holdings, Inc. | | | 813,838 | | | | 70,014 | |
| | | | | | | | | 117,686 | |
| | Real Estate—2.3% | | | | | | | | |
| | FirstService Corporation† | | | 307,960 | | | | 28,653 | |
| | Jones Lang LaSalle, Inc. | | | 217,579 | | | | 37,878 | |
| | | | | | | | | 66,531 | |
| | Energy—0.6% | | | | | | | | |
| | Parsley Energy, Inc. | | | 868,652 | | | | 16,426 | |
| | Total Common Stocks—98.7%
(cost $2,375,943) | | | | | | | 2,868,469 | |
| | | | | | | | | | |
| | Repurchase Agreement | | | | | | | | |
| | Fixed Income Clearing Corporation, 0.120% dated 12/31/19, due 1/2/20, repurchase price $51,376, collateralized by U.S. Treasury Bond, 2.500%, due 5/15/46 valued at $52,405 | | | $51,376 | | | | 51,376 | |
| | Total Repurchase Agreement—1.8%
(cost $51,376) | | | | | | | 51,376 | |
| | Total Investments—100.5%
(cost $2,427,319) | | | | | | | 2,919,845 | |
| | Liabilities, plus cash and other assets—(0.5)% | | | | | | | (14,031 | ) |
| | Net assets—100.0% | | | | | | $ | 2,905,814 | |
ADR = American Depository Receipt
* = Non-income producing security
† = U.S. listed foreign security
See accompanying Notes to Financial Statements.
| December 31, 2019 | William Blair Funds | 19 |
| | Small-Mid Cap Value Fund |
| | |
| | The Small-Mid Cap Value Fund seeks long-term capital appreciation. |
| | |
| | AN OVERVIEW FROM THE PORTFOLIO MANAGERS |
| | |

Chad M. Kilmer 
Mark T. Leslie 
David S. Mitchell | The William Blair Small-Mid Cap Value Fund (Class N shares) posted a 22.77% increase, net of fees, for the twelve months ended December 31, 2019. By comparison, the Fund’s benchmark index, the Russell 2500TMValue Index (the “Index”), increased 23.56%. The Fund narrowly trailed its Index in 2019 due to stock selection. At the sector level, Consumer Discretionary was the largest detractor during the period. Stock selection within Hotels, Restaurants & Leisure and Diversified Consumer Services were the main drivers of the relative underperformance within the sector. Within Real Estate, stock selection within Diversified REITs, Office REITs and Hotel & Resort REITs contributed to the relative performance within the sector during the period. Within Information Technology, the best performing sector of the market and almost 20% better than the next closest sector, a lack of exposure to Semiconductors & Semiconductor Equipment was the main driver of the relative underperformance for the year. The most significant contributor to relative performance for the year was Industrials due to strong stock selection within Road & Rail. Within Materials, stock selection within Chemicals drove the relative outperformance within the sector. The relative outperformance within Health Care was the result of strong stock selection within Equipment & Supplies and a lack of exposure to Biotechnology stocks. Looking specifically at stock selection, the strategy’s largest detractors during the period were Range Resources (Energy), Foot Locker (Consumer Discretionary) and Whiting Petroleum (Energy). Offsetting these detractors were our investments in TopBuild (Consumer Discretionary), Kansas City Southern (Industrials) and Booz Allen Hamilton (Information Technology). Please refer to the U.S. Value Market Review and Outlook relating to the Fund on page 4. |
| | | |
| 20 | Annual Report | December 31, 2019 |
Small-Mid Cap Value Fund
Performance Highlights (Unaudited)
Average Annual Total Return through 12/31/2019
| | | 1 Year | | 3 Year | | 5 Year | | Since
Inception |
| Class N(a) | | | 22.77 | % | | | 4.44 | % | | | 5.90 | % | | | 10.44 | % |
| Class I(a) | | | 23.00 | | | | 4.70 | | | | 6.17 | | | | 10.73 | |
| Russell 2500TMValue Index(a) | | | 23.56 | | | | 6.12 | | | | 7.18 | | | | 12.11 | |
| Class R6(b) | | | — | | | | — | | | | — | | | | 3.89 | |
| Russell 2500TMValue Index(b) | | | — | | | | — | | | | — | | | | 6.42 | |
| | |
| (a) | Since inception is for the period from December 15, 2011 (Commencement of Operations) to December 31, 2019. |
| (b) | Since inception is for the period from May 2, 2019 (Commencement of Operations) to December 31, 2019. |
Performance cited represents past performance. Past performance does not guarantee future results and current performance may be lower or higher than the data quoted. Results shown are average annual total returns, which assume reinvestment of dividends and capital gains. Investment returns and principal will fluctuate and you may have a gain or loss when you sell shares. For the most current month-end performance information, please call 1-800-742-7272, or visit our Web site atwww.williamblairfunds.com. Investing in smaller and medium capitalization companies involves special risks, including higher volatility and lower liquidity. Smaller and medium capitalization stocks are also more sensitive to purchase/sale transactions and changes in the issuer’s financial condition. From time to time, the investment adviser may waive fees or reimburse expenses for the Fund. Without these waivers/reimbursements, performance would be lower. Class N shares are not subject to a sales load. Class I shares are not subject to a sales load or distribution (Rule 12b-1) fees. Class R6 shares are not subject to a sales load, distribution (Rule 12b-1) fees, or sub-transfer agent fees.
The performance highlights and graph presented above do not reflect the deduction of taxes that a shareholder would pay on fund distributions or the redemption of fund shares.
The Russell 2500TMValue Index consists of small to mid-capitalization companies with below average price-to-book ratios and forecasted growth rates.
This report identifies the Fund’s investments on December 31, 2019. These holdings are subject to change. Not all stocks in the Fund performed the same, nor is there any guarantee that these stocks will perform as well in the future. Market forecasts provided in this report may not necessarily come to pass.
Sector Diversification (Unaudited)

The sector diversification shown is based on the total long-term securities.
| December 31, 2019 | William Blair Funds | 21 |
Small-Mid Cap Value Fund
Portfolio of Investments, December 31, 2019(all dollar amounts in thousands)
| | | | | | | | |
| | | | | | | | |
| | Issuer | | Shares | | | Value | |
| | | | | | | | | | |
| | Common Stocks | | | | | | | | |
| | Financials—22.3% | | | | | | | | |
| | American Financial Group, Inc. | | | 773 | | | $ | 85 | |
| | CNO Financial Group, Inc. | | | 3,591 | | | | 65 | |
| | East West Bancorp, Inc. | | | 1,638 | | | | 80 | |
| | First American Financial Corporation | | | 1,411 | | | | 82 | |
| | FNB Corporation | | | 6,619 | | | | 84 | |
| | Hancock Whitney Corporation | | | 1,726 | | | | 76 | |
| | Hanover Insurance Group, Inc. | | | 729 | | | | 100 | |
| | Home BancShares, Inc. | | | 4,137 | | | | 81 | |
| | Iberiabank Corporation | | | 1,172 | | | | 88 | |
| | National Bank Holdings Corporation | | | 2,073 | | | | 73 | |
| | PacWest Bancorp | | | 3,140 | | | | 120 | |
| | Radian Group, Inc. | | | 3,943 | | | | 99 | |
| | Selective Insurance Group, Inc. | | | 1,347 | | | | 88 | |
| | Sterling Bancorp | | | 4,395 | | | | 93 | |
| * | SVB Financial Group | | | 335 | | | | 84 | |
| | Umpqua Holdings Corporation | | | 4,762 | | | | 84 | |
| | Voya Financial, Inc. | | | 2,054 | | | | 125 | |
| | Western Alliance Bancorp | | | 1,625 | | | | 92 | |
| | WSFS Financial Corporation | | | 1,726 | | | | 76 | |
| | | | | | | | | 1,675 | |
| | Real Estate—14.6% | | | | | | | | |
| | Acadia Realty Trust | | | 3,929 | | | | 102 | |
| | American Assets Trust, Inc. | | | 2,323 | | | | 107 | |
| | American Campus Communities, Inc. | | | 3,034 | | | | 143 | |
| | Americold Realty Trust | | | 3,161 | | | | 111 | |
| | Douglas Emmett, Inc. | | | 2,448 | | | | 107 | |
| | EPR Properties | | | 1,423 | | | | 101 | |
| | Equity LifeStyle Properties, Inc. | | | 1,681 | | | | 118 | |
| | Healthcare Realty Trust, Inc. | | | 3,671 | | | | 122 | |
| | Pebblebrook Hotel Trust | | | 2,993 | | | | 80 | |
| | Terreno Realty Corporation | | | 2,008 | | | | 109 | |
| | | | | | | | | 1,100 | |
| | Industrials—13.3% | | | | | | | | |
| | Brady Corporation | | | 2,386 | | | | 137 | |
| | Curtiss-Wright Corporation | | | 933 | | | | 131 | |
| | EMCOR Group, Inc. | | | 1,193 | | | | 103 | |
| * | FTI Consulting, Inc. | | | 800 | | | | 89 | |
| | Herman Miller, Inc. | | | 2,191 | | | | 91 | |
| | Kansas City Southern | | | 855 | | | | 131 | |
| | Owens Corning | | | 1,814 | | | | 118 | |
| | UniFirst Corporation | | | 425 | | | | 86 | |
| | Westinghouse Air Brake Technologies Corporation | | | 1,494 | | | | 116 | |
| | | | | | | | | 1,002 | |
| | Consumer Discretionary—10.6% | | | | | | | | |
| | Carter’s, Inc. | | | 1,084 | | | | 119 | |
| | Dana, Inc. | | | 4,327 | | | | 79 | |
| | Dunkin’ Brands Group, Inc. | | | 1,514 | | | | 114 | |
| * | LKQ Corporation | | | 4,239 | | | | 151 | |
| | Newell Brands, Inc. | | | 5,912 | | | | 114 | |
| | PulteGroup, Inc. | | | 3,202 | | | | 124 | |
| | Wolverine World Wide, Inc. | | | 2,858 | | | | 96 | |
| | | | | | | | | 797 | |
| | | | | | | | |
| | | | | | | | |
| | Issuer | | Shares | | | Value | |
| | | | | | | | | | |
| | Common Stocks—(continued) | | | | | | | | |
| | Information Technology—8.6% | | | | | | | | |
| | Avnet, Inc. | | | 2,484 | | | $ | 105 | |
| | Belden, Inc. | | | 2,066 | | | | 114 | |
| | Booz Allen Hamilton Holding Corporation | | | 1,553 | | | | 110 | |
| * | Ciena Corporation | | | 1,856 | | | | 79 | |
| | j2 Global, Inc. | | | 1,331 | | | | 125 | |
| | MAXIMUS, Inc. | | | 1,553 | | | | 116 | |
| | | | | | | | | 649 | |
| | Materials—6.5% | | | | | | | | |
| | Carpenter Technology Corporation | | | 1,835 | | | | 91 | |
| | FMC Corporation | | | 917 | | | | 91 | |
| | Minerals Technologies, Inc. | | | 1,140 | | | | 66 | |
| | PolyOne Corporation | | | 2,484 | | | | 91 | |
| | Sensient Technologies Corporation | | | 1,022 | | | | 68 | |
| | Steel Dynamics, Inc. | | | 2,409 | | | | 82 | |
| | | | | | | | | 489 | |
| | Utilities—5.9% | | | | | | | | |
| | Alliant Energy Corporation | | | 2,837 | | | | 155 | |
| | Atmos Energy Corporation | | | 1,418 | | | | 159 | |
| | IDACORP, Inc. | | | 1,246 | | | | 133 | |
| | | | | | | | | 447 | |
| | Health Care—5.4% | | | | | | | | |
| | CONMED Corporation | | | 719 | | | | 80 | |
| | Encompass Health Corporation | | | 1,448 | | | | 100 | |
| * | Hologic, Inc. | | | 2,160 | | | | 113 | |
| | PerkinElmer, Inc. | | | 1,138 | | | | 111 | |
| | | | | | | | | 404 | |
| | Energy—5.2% | | | | | | | | |
| | Murphy Oil Corporation | | | 2,744 | | | | 74 | |
| | Patterson-UTI Energy, Inc. | | | 7,876 | | | | 83 | |
| | Targa Resources Corporation | | | 2,871 | | | | 117 | |
| | TechnipFMC plc† | | | 1,321 | | | | 28 | |
| * | WPX Energy, Inc. | | | 6,610 | | | | 91 | |
| | | | | | | | | 393 | |
| | Consumer Staples—3.7% | | | | | | | | |
| | J&J Snack Foods Corporation | | | 575 | | | | 106 | |
| | Lamb Weston Holdings, Inc. | | | 2,002 | | | | 172 | |
| | | | | | | | | 278 | |
| | Communication Services—2.3% | | | | | | | | |
| | Cinemark Holdings, Inc. | | | 2,211 | | | | 75 | |
| | The Interpublic Group of Cos., Inc. | | | 4,234 | | | | 98 | |
| | | | | | | | | 173 | |
| | Total Common Stocks—98.4%
(cost $6,979) | | | | | | | 7,407 | |
See accompanying Notes to Financial Statements.
| 22 | Annual Report | December 31, 2019 |
Small-Mid Cap Value Fund
Portfolio of Investments, December 31, 2019(all dollar amounts in thousands)
| | | | | | | | |
| | Issuer | | Principal
Amount | | | Value | |
| | | | | | | | | | |
| | Repurchase Agreement | | | | | | | | |
| | Fixed Income Clearing Corporation, 0.120% dated 12/31/19, due 1/2/20, repurchase price $341, collateralized by U.S. Treasury Bond, 2.500%, due 5/15/46 valued at $351 | | | $341 | | | $ | 341 | |
| | Total Repurchase Agreement—4.5%
(cost $341) | | | | | | | 341 | |
| | Total Investments—102.9%
(cost $7,320) | | | | | | | 7,748 | |
| | Liabilities, plus cash and other assets—(2.9)% | | | | | | | (220 | ) |
| | Net assets—100.0% | | | | | | $ | 7,528 | |
* = Non-income producing security
† = U.S. listed foreign security
See accompanying Notes to Financial Statements.
| December 31, 2019 | William Blair Funds | 23 |
| | Small Cap Growth Fund |
| | |
| | The Small Cap Growth Fund seeks long-term capital appreciation. |
| | |
| | AN OVERVIEW FROM THE PORTFOLIO MANAGERS |
| | |

Michael P. Balkin 
Ward D. Sexton | The William Blair Small Cap Growth Fund (Class N shares) posted a 22.26% increase, net of fees, for the twelve months ended December 31, 2019. By comparison, the Fund’s benchmark index, the Russell 2000®Growth Index (the “Index”), increased 28.48%. Underperformance for the full year period was concentrated in the fourth quarter and was driven by stock specific dynamics as well as a style headwind. From a style perspective, our typical underweight to the Biotechnology industry was a headwind. This was most pronounced in the fourth quarter. Biotechnology, which represents nearly 14% of the Index, substantially outperformed. Our typical underweight to the industry, driven by our high quality investment approach, and the speculative nature of the best-performing biotechnology stocks, were headwinds. From a stock specific standpoint, 2U (Information Technology) and Virtu Financial (Financials) were top individual detractors. 2U, which partners with not-for-profit universities to deliver online graduate courses, underperformed as a slowdown in enrollment in two of its larger programs and increased competition in the online education market negatively impacted the company’s financial results. Virtu Financial, a leading electronic market maker and liquidity provider, underperformed during the period as the combination of lower market volatility and a drop in retail participation during the period weighed on shares. Other notable underperforming holdings included ORBCOMM (Communication Services), Healthcare Services Group (Industrials) and At Home Group (Consumer Discretionary). Top contributors in 2019 were Boot Barn (Consumer Discretionary) and Agilysys (Information Technology). Shares of Boot Barn, a western work wear retailer, advanced on strong business fundamentals and an increasing appreciation for the company’s opportunity in private label, where they have high quality brands and higher margins. Hospitality-focused software company Agilysys outperformed as the company’s product reinvigoration appeared to be resonating with customers. Other strong performers included Horizon Therapeutics (Health Care), Cable One (Communication Services) and Lithia Motors (Consumer Discretionary). Please refer to the U.S. Growth Market Review and Outlook relating to the Fund on page 3. |
| 24 | Annual Report | December 31, 2019 |
Small Cap Growth Fund
Performance Highlights (Unaudited)
Average Annual Total Return through 12/31/2019
| | | | | | | | | | | Since |
| | | 1 Year | | 3 Year | | 5 Year | | 10 Year | | Inception(a) |
| Class N | | | 22.26 | % | | | 14.87 | % | | | 11.48 | % | | | 12.38 | % | | | — | |
| Class I | | | 22.51 | | | | 15.14 | | | | 11.76 | | | | 12.66 | | | | — | |
| Class R6 | | | — | | | | — | | | | — | | | | — | | | | 2.75 | % |
| Russell 2000® Growth Index | | | 28.48 | | | | 12.49 | | | | 9.34 | | | | 13.01 | | | | 7.57 | |
| (a) | Since inception is for the period from May 2, 2019 (Commencement of Operations) to December 31, 2019. |
Performance cited represents past performance. Past performance does not guarantee future results and current performance may be lower or higher than the data quoted. Results shown are average annual total returns, which assume reinvestment of dividends and capital gains. Investment returns and principal will fluctuate and you may have a gain or loss when you sell shares. For the most current month-end performance information, please call 1-800-742-7272, or visit our Web site atwww.williamblairfunds.com. Investing in smaller companies involves special risks, including higher volatility and lower liquidity. Smaller capitalization stocks are also more sensitive to purchase/sale transactions and changes in the issuer’s financial condition. From time to time, the investment adviser may waive fees or reimburse expenses for the Fund. Without these waivers/reimbursements, performance would be lower. Class N shares are not subject to a sales load. Class I shares are not subject to a sales load or distribution (Rule 12b-1) fees. Class R6 shares are not subject to a sales load, distribution (Rule 12b-1) fees, or sub-transfer agent fees.
The performance highlights and graph presented above do not reflect the deduction of taxes that a shareholder would pay on fund distributions or the redemption of fund shares.
The Russell 2000®Growth Index is an unmanaged composite of the smallest 2000 stocks of the Russell 3000®Growth Index.
This report identifies the Fund’s investments on December 31, 2019. These holdings are subject to change. Not all stocks in the Fund performed the same, nor is there any guarantee that these stocks will perform as well in the future. Market forecasts provided in this report may not necessarily come to pass.
Sector Diversification (Unaudited)
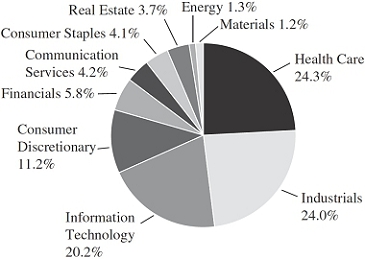
The sector diversification shown is based on the total long-term securities.
| December 31, 2019 | William Blair Funds | 25 |
Small Cap Growth Fund
Portfolio of Investments, December 31, 2019(all dollar amounts in thousands)
| | | | | | | | | | |
| | | | | | | | | | |
| | Issuer | | Shares | | | Value | |
| | | | | | | | | | |
| | Common Stocks | | | | | | | | |
| | Health Care—23.9% | | | | | | | | |
| * | Amedisys, Inc. | | | 68,550 | | | $ | 11,442 | |
| * | AxoGen, Inc. | | | 378,930 | | | | 6,779 | |
| * | CareDx, Inc. | | | 147,880 | | | | 3,190 | |
| * | Codexis, Inc. | | | 528,211 | | | | 8,446 | |
| * | CryoLife, Inc. | | | 291,422 | | | | 7,895 | |
| | Encompass Health Corporation | | | 171,407 | | | | 11,873 | |
| * | Glaukos Corporation | | | 103,523 | | | | 5,639 | |
| * | Halozyme Therapeutics, Inc. | | | 274,890 | | | | 4,874 | |
| * | Hanger, Inc. | | | 464,430 | | | | 12,823 | |
| * | Horizon Therapeutics plc† | | | 359,292 | | | | 13,006 | |
| * | Inspire Medical Systems, Inc. | | | 89,430 | | | | 6,637 | |
| * | LHC Group, Inc. | | | 77,245 | | | | 10,641 | |
| * | Ligand Pharmaceuticals, Inc. | | | 94,859 | | | | 9,893 | |
| * | Merit Medical Systems, Inc. | | | 278,200 | | | | 8,686 | |
| * | Penumbra, Inc. | | | 36,083 | | | | 5,927 | |
| * | Portola Pharmaceuticals, Inc. | | | 358,050 | | | | 8,550 | |
| | Simulations Plus, Inc. | | | 204,880 | | | | 5,956 | |
| * | Tabula Rasa HealthCare, Inc. | | | 190,000 | | | | 9,249 | |
| * | Veracyte, Inc. | | | 303,080 | | | | 8,462 | |
| | | | | | | | | 159,968 | |
| | Industrials—23.5% | | | | | | | | |
| | Albany International Corporation | | | 76,205 | | | | 5,786 | |
| | Armstrong World Industries, Inc. | | | 70,293 | | | | 6,605 | |
| * | Blue Bird Corporation | | | 377,980 | | | | 8,663 | |
| | BWX Technologies, Inc. | | | 267,579 | | | | 16,611 | |
| * | Casella Waste Systems, Inc. | | | 222,000 | | | | 10,219 | |
| | Douglas Dynamics, Inc. | | | 191,377 | | | | 10,526 | |
| * | Ducommun, Inc. | | | 114,786 | | | | 5,800 | |
| | ESCO Technologies, Inc. | | | 57,766 | | | | 5,343 | |
| | Forrester Research, Inc. | | | 82,584 | | | | 3,444 | |
| | Healthcare Services Group, Inc. | | | 271,167 | | | | 6,595 | |
| | John Bean Technologies Corporation | | | 80,730 | | | | 9,095 | |
| | Luxfer Holdings plc† | | | 473,855 | | | | 8,771 | |
| * | Mercury Systems, Inc. | | | 108,426 | | | | 7,493 | |
| | Ritchie Bros Auctioneers, Inc.† | | | 287,415 | | | | 12,345 | |
| * | SiteOne Landscape Supply, Inc. | | | 82,468 | | | | 7,476 | |
| | The Brink’s Co. | | | 167,020 | | | | 15,145 | |
| * | Trex Co., Inc. | | | 106,130 | | | | 9,539 | |
| * | Willdan Group, Inc. | | | 257,388 | | | | 8,180 | |
| | | | | | | | | 157,636 | |
| | Information Technology—19.8% | | | | | | | | |
| * | Agilysys, Inc. | | | 409,382 | | | | 10,402 | |
| * | Avalara, Inc. | | | 91,968 | | | | 6,737 | |
| | Computer Services, Inc. | | | 30,874 | | | | 1,374 | |
| * | Euronet Worldwide, Inc. | | | 77,600 | | | | 12,227 | |
| | j2 Global, Inc. | | | 143,992 | | | | 13,494 | |
| * | Knowles Corporation | | | 325,000 | | | | 6,874 | |
| | Littelfuse, Inc. | | | 42,453 | | | | 8,121 | |
| * | LivePerson, Inc. | | | 131,877 | | | | 4,879 | |
| * | MaxLinear, Inc. | | | 252,019 | | | | 5,348 | |
| * | MobileIron, Inc. | | | 657,022 | | | | 3,193 | |
| * | Novanta, Inc.† | | | 41,060 | | | | 3,631 | |
| | Perspecta, Inc. | | | 313,170 | | | | 8,280 | |
| * | Pure Storage, Inc. | | | 507,296 | | | | 8,680 | |
| * | Qualys, Inc. | | | 41,060 | | | | 3,423 | |
| | | | | | | | | | |
| | | | | | | | | | |
| | Issuer | | Shares | | | Value | |
| | | | | | | | | | |
| | Common Stocks—(continued) | | | | | | | | |
| | Information Technology—(continued) | | | | | | | | |
| * | Repay Holdings Corporation | | | 342,157 | | | $ | 5,013 | |
| * | Rogers Corporation | | | 36,257 | | | | 4,522 | |
| * | Varonis Systems, Inc. | | | 117,580 | | | | 9,137 | |
| * | Verra Mobility Corporation | | | 504,090 | | | | 7,052 | |
| * | WNS Holdings, Ltd.—ADR | | | 154,152 | | | | 10,197 | |
| | | | | | | | | 132,584 | |
| | Consumer Discretionary—11.0% | | | | | | | | |
| * | Boot Barn Holdings, Inc. | | | 262,535 | | | | 11,691 | |
| | Dine Brands Global, Inc. | | | 91,170 | | | | 7,615 | |
| * | Etsy, Inc. | | | 115,532 | | | | 5,118 | |
| * | Grand Canyon Education, Inc. | | | 100,913 | | | | 9,666 | |
| * | Laureate Education, Inc. | | | 610,603 | | | | 10,753 | |
| | Lithia Motors, Inc. | | | 56,019 | | | | 8,235 | |
| * | Ollie’s Bargain Outlet Holdings, Inc. | | | 107,170 | | | | 6,999 | |
| * | OneSpaWorld Holdings, Ltd.† | | | 541,080 | | | | 9,112 | |
| * | The Habit Restaurants, Inc. | | | 422,180 | | | | 4,403 | |
| | | | | | | | | 73,592 | |
| | Financials—5.7% | | | | | | | | |
| * | Encore Capital Group, Inc. | | | 204,988 | | | | 7,248 | |
| | FirstCash, Inc. | | | 113,958 | | | | 9,189 | |
| | Glacier Bancorp, Inc. | | | 161,455 | | | | 7,425 | |
| | Home BancShares, Inc. | | | 386,244 | | | | 7,594 | |
| | Virtu Financial, Inc. | | | 425,416 | | | | 6,802 | |
| | | | | | | | | 38,258 | |
| | Communication Services—4.1% | | | | | | | | |
| | Cable One, Inc. | | | 9,400 | | | | 13,992 | |
| * | ORBCOMM, Inc. | | | 968,905 | | | | 4,079 | |
| * | QuinStreet, Inc. | | | 638,160 | | | | 9,770 | |
| | | | | | | | | 27,841 | |
| | Consumer Staples—4.0% | | | | | | | | |
| * | BJ’s Wholesale Club Holdings, Inc. | | | 279,070 | | | | 6,346 | |
| | Calavo Growers, Inc. | | | 83,511 | | | | 7,565 | |
| * | Darling Ingredients, Inc. | | | 348,550 | | | | 9,787 | |
| * | Primo Water Corporation | | | 301,611 | | | | 3,386 | |
| | | | | | | | | 27,084 | |
| | Real Estate—3.6% | | | | | | | | |
| | Colliers International Group, Inc.† | | | 102,924 | | | | 8,025 | |
| | CoreSite Realty Corporation | | | 64,374 | | | | 7,217 | |
| | FirstService Corporation† | | | 94,817 | | | | 8,822 | |
| | | | | | | | | 24,064 | |
| | Energy—1.3% | | | | | | | | |
| | Cameco Corporation† | | | 601,980 | | | | 5,358 | |
| | Parsley Energy, Inc. | | | 169,460 | | | | 3,204 | |
| | | | | | | | | 8,562 | |
| | Materials—1.1% | | | | | | | | |
| | Orion Engineered Carbons S.A.† | | | 396,682 | | | | 7,656 | |
| | Total Common Stocks—98.0%
(cost $531,820) | | | | | | | 657,245 | |
See accompanying Notes to Financial Statements.
| 26 | Annual Report | December 31, 2019 |
Small Cap Growth Fund
Portfolio of Investments, December 31, 2019(all dollar amounts in thousands)
| | | | | | | | | | |
| | | | Principal | | | | | |
| | Issuer | | Amount | | | Value | |
| | | | | | | | |
| | Repurchase Agreement | | | | | | |
| | Fixed Income Clearing Corporation, 0.120% dated 12/31/19, due 1/2/20, repurchase price $15,920, collateralized by U.S. Treasury Bond, 2.500%, due 5/15/46 valued at $16,241 | | $ | 15,920 | | | $ | 15,920 | |
| | Total Repurchase Agreement—2.4%
(cost $15,920) | | | | | | | 15,920 | |
| | Total Investments—100.4%
(cost $547,740) | | | | | | | 673,165 | |
| | Liabilities, plus cash and other assets—(0.4)% | | | | | | | (2,628 | ) |
| | Net assets—100.0% | | | | | | $ | 670,537 | |
ADR = American Depository Receipt
* = Non-income producing security
† = U.S. listed foreign security
See accompanying Notes to Financial Statements.
| December 31, 2019 | William Blair Funds | 27 |
| | Small Cap Value Fund |
| | |
| | The Small Cap Value Fund seeks long-term capital appreciation. |
| | |
| | AN OVERVIEW FROM THE PORTFOLIO MANAGERS |
| | |

Chad M. Kilmer 
Mark T. Leslie 
David S. Mitchell | The William Blair Small Cap Value Fund (Class N shares) posted a 20.09% increase, net of fees, for the twelve months ended December 31, 2019. By comparison, the Fund’s benchmark index, the Russell 2000®Value Index (the “Index”), increased 22.39%. Although the Fund benefitted from a slight tailwind given its larger market cap bias, stock selection was the main driver of the relative underperformance during the year. At the sector level, Real Estate was the largest detractor during the period. Stock selection within Diversified REITs, Hotel REITs and Retail REITs was the main driver of the relative underperformance within Real Estate. Within Information Technology, the best performing sector of the market and over 20% better than the next closest sector, stock selection within Distributors and a lack of exposure to Semiconductor Equipment were the primary determinants of relative performance within the sector. Stock selection within Oil & Gas Equipment & Services and Media contributed to the relative underperformance within Energy and Communication Services, respectively, during the year. The most significant contributor to relative performance for the year was Industrials due to stock selection within Building Products and Machinery. Within Health Care, strong stock selection within Health Care Equipment & Supplies contributed to the relative outperformance within the sector during the period. Stock selection within Property & Casualty and Life & Health Insurance contributed to the relative outperformance within Financials. Looking specifically at stock selection, the Fund’s largest detractors during the period were McDermott International (Energy), Meredith Corp. (Communication Services) and Callon Petroleum (Energy). Offsetting these detractors were investments in CONMED (Health Care), Inphi (Information Technology) and TopBuild (Consumer Discretionary). Please refer to the U.S. Value Market Review and Outlook relating to the Fund on page 4. |
| 28 | Annual Report | December 31, 2019 |
Small Cap Value Fund
Performance Highlights (Unaudited)
| Average Annual Total Return through 12/31/2019 |
| | | | | | | | | | | Since |
| | | 1 Year | | 3 Year | | 5 Year | | 10 Year | | Inception(a) |
| Class N | | | 20.09 | % | | | 2.79 | % | | | 5.25 | % | | | 9.89 | % | | | — | |
| Class I | | | 20.45 | | | | 3.06 | | | | 5.53 | | | | 10.17 | | | | — | |
| Class R6 | | | — | | | | — | | | | — | | | | — | | | | 2.69 | % |
| Russell 2000® Value Index | | | 22.39 | | | | 4.77 | | | | 6.99 | | | | 10.56 | | | | 6.21 | |
| (a) | Since inception is for the period from May 2, 2019 (Commencement of Operations) to December 31, 2019. |
Performance cited represents past performance. Past performance does not guarantee future results and current performance may be lower or higher than the data quoted. Results shown are average annual total returns, which assume reinvestment of dividends and capital gains. Investment returns and principal will fluctuate and you may have a gain or loss when you sell shares. For the most current month-end performance information, please call 1-800-742-7272, or visit our Web site atwww.williamblairfunds.com. Investing in smaller companies involves special risks, including higher volatility and lower liquidity. Smaller capitalization stocks are also more sensitive to purchase/sale transactions and changes in the issuer’s financial condition. From time to time, the investment adviser may waive fees or reimburse expenses for the Fund. Without these waivers/reimbursements, performance would be lower. Class N shares are not subject to a sales load. Class I shares are not subject to a sales load or distribution (Rule 12b-1) fees. Class R6 shares are not subject to a sales load, distribution (Rule 12b-1) fees, or sub-transfer agent fees.
The performance highlights and graph presented above do not reflect the deduction of taxes that a shareholder would pay on fund distributions or the redemption of fund shares.
The Russell 2000®Value Index consists of small-capitalization companies with below average price-to-book ratios and forecasted growth rates.
This report identifies the Fund’s investments on December 31, 2019. These holdings are subject to change. Not all stocks in the Fund performed the same, nor is there any guarantee that these stocks will perform as well in the future. Market forecasts provided in this report may not necessarily come to pass.
Sector Diversification (Unaudited)

The sector diversification shown is based on the total long-term securities.
| December 31, 2019 | William Blair Funds | 29 |
Small Cap Value Fund
Portfolio of Investments, December 31, 2019(all dollar amounts in thousands)
| | | | | | | | | | |
| | | | | | | | | | |
| | Issuer | | Shares | | | Value | |
| | | | | | | | | | |
| | Common Stocks | | | | | | | | |
| | Financials—26.4% | | | | | | | | |
| | Banc of California, Inc. | | | 91,417 | | | $ | 1,571 | |
| | Banner Corporation | | | 36,010 | | | | 2,038 | |
| | Boston Private Financial Holdings, Inc. | | | 150,718 | | | | 1,813 | |
| | CNO Financial Group, Inc. | | | 92,434 | | | | 1,676 | |
| | FNB Corporation | | | 164,533 | | | | 2,090 | |
| | Glacier Bancorp, Inc. | | | 30,664 | | | | 1,410 | |
| | Hancock Whitney Corporation | | | 61,577 | | | | 2,702 | |
| | Hanover Insurance Group, Inc. | | | 16,461 | | | | 2,250 | |
| | Home BancShares, Inc. | | | 128,298 | | | | 2,522 | |
| | Horace Mann Educators Corporation | | | 31,735 | | | | 1,386 | |
| | Iberiabank Corporation | | | 30,245 | | | | 2,263 | |
| | National Bank Holdings Corporation | | | 54,579 | | | | 1,922 | |
| | OceanFirst Financial Corporation | | | 77,757 | | | | 1,986 | |
| | PacWest Bancorp | | | 51,654 | | | | 1,977 | |
| | Radian Group, Inc. | | | 106,853 | | | | 2,688 | |
| | Renasant Corporation | | | 53,027 | | | | 1,878 | |
| | Sandy Spring Bancorp, Inc. | | | 47,012 | | | | 1,781 | |
| | *Seacoast Banking Corporation of Florida | | | 74,400 | | | | 2,274 | |
| | Selective Insurance Group, Inc. | | | 33,570 | | | | 2,188 | |
| | Sterling Bancorp | | | 101,675 | | | | 2,143 | |
| | Umpqua Holdings Corporation | | | 91,082 | | | | 1,612 | |
| | Western Alliance Bancorp | | | 39,380 | | | | 2,245 | |
| | WSFS Financial Corporation | | | 41,912 | | | | 1,844 | |
| | | | | | | | | 46,259 | |
| | Industrials—12.3% | | | | | | | | |
| | Brady Corporation | | | 70,149 | | | | 4,017 | |
| | Curtiss-Wright Corporation | | | 29,015 | | | | 4,088 | |
| | EMCOR Group, Inc. | | | 28,610 | | | | 2,469 | |
| * | FTI Consulting, Inc. | | | 25,310 | | | | 2,801 | |
| | Herman Miller, Inc. | | | 49,980 | | | | 2,082 | |
| | UniFirst Corporation | | | 12,740 | | | | 2,573 | |
| | Watts Water Technologies, Inc. | | | 35,218 | | | | 3,513 | |
| | | | | | | | | 21,543 | |
| | Real Estate—11.0% | | | | | | | | |
| | Acadia Realty Trust | | | 84,303 | | | | 2,186 | |
| | Agree Realty Corporation | | | 18,527 | | | | 1,300 | |
| | American Assets Trust, Inc. | | | 46,866 | | | | 2,151 | |
| | Americold Realty Trust | | | 70,760 | | | | 2,481 | |
| | EPR Properties | | | 26,880 | | | | 1,899 | |
| | Healthcare Realty Trust, Inc. | | | 86,266 | | | | 2,879 | |
| | Highwoods Properties, Inc. | | | 45,159 | | | | 2,209 | |
| | Pebblebrook Hotel Trust | | | 80,526 | | | | 2,159 | |
| | Terreno Realty Corporation | | | 37,024 | | | | 2,004 | |
| | | | | | | | | 19,268 | |
| | Consumer Discretionary—10.0% | | | | | | | | |
| | Boyd Gaming Corporation | | | 75,895 | | | | 2,272 | |
| | Carter’s, Inc. | | | 32,871 | | | | 3,594 | |
| | Cracker Barrel Old Country Store, Inc. | | | 10,540 | | | | 1,620 | |
| | Dana, Inc. | | | 102,622 | | | | 1,868 | |
| | Foot Locker, Inc. | | | 49,685 | | | | 1,937 | |
| | MDC Holdings, Inc. | | | 61,630 | | | | 2,352 | |
| * | Murphy USA, Inc. | | | 17,585 | | | | 2,058 | |
| | Wolverine World Wide, Inc. | | | 56,351 | | | | 1,901 | |
| | | | | | | | | 17,602 | |
| | | | | | | | |
| | | | | | | | |
| | Issuer | | Shares | | | Value | |
| | | | | | | | | | |
| | Common Stocks—(continued) | | | | | | | | |
| | Information Technology—8.6% | | | | | | | | |
| | Avnet, Inc. | | | 43,901 | | | $ | 1,863 | |
| | Belden, Inc. | | | 39,886 | | | | 2,194 | |
| * | Inphi Corporation | | | 18,858 | | | | 1,396 | |
| | j2 Global, Inc. | | | 25,412 | | | | 2,381 | |
| * | LiveRamp Holdings, Inc. | | | 31,994 | | | | 1,538 | |
| | MAXIMUS, Inc. | | | 23,437 | | | | 1,744 | |
| * | Semtech Corporation | | | 31,036 | | | | 1,642 | |
| * | Viavi Solutions, Inc. | | | 153,627 | | | | 2,304 | |
| | | | | | | | | 15,062 | |
| | Utilities—6.1% | | | | | | | | |
| | Black Hills Corporation | | | 30,277 | | | | 2,378 | |
| | IDACORP, Inc. | | | 17,068 | | | | 1,823 | |
| | ONE Gas, Inc. | | | 24,335 | | | | 2,277 | |
| | PNM Resources, Inc. | | | 44,680 | | | | 2,265 | |
| | South Jersey Industries, Inc. | | | 61,123 | | | | 2,016 | |
| | | | | | | | | 10,759 | |
| | Health Care—5.9% | | | | | | | | |
| | CONMED Corporation | | | 31,801 | | | | 3,556 | |
| | Encompass Health Corporation | | | 40,204 | | | | 2,785 | |
| * | Integer Holdings Corporation | | | 30,309 | | | | 2,438 | |
| * | Magellan Health, Inc. | | | 19,411 | | | | 1,519 | |
| | | | | | | | | 10,298 | |
| | Energy—5.8% | | | | | | | | |
| | Archrock, Inc. | | | 170,437 | | | | 1,711 | |
| | Brigham Minerals, Inc. | | | 53,665 | | | | 1,151 | |
| * | Callon Petroleum Co. | | | 344,462 | | | | 1,664 | |
| * | Helix Energy Solutions Group, Inc. | | | 195,275 | | | | 1,880 | |
| * | Newpark Resources, Inc. | | | 172,325 | | | | 1,080 | |
| * | PDC Energy, Inc. | | | 59,528 | | | | 1,558 | |
| | Solaris Oilfield Infrastructure, Inc. | | | 85,968 | | | | 1,204 | |
| | | | | | | | | 10,248 | |
| | Materials—4.8% | | | | | | | | |
| | Carpenter Technology Corporation | | | 37,199 | | | | 1,852 | |
| | Minerals Technologies, Inc. | | | 28,639 | | | | 1,650 | |
| | PolyOne Corporation | | | 40,264 | | | | 1,481 | |
| | Sensient Technologies Corporation | | | 24,267 | | | | 1,604 | |
| | Silgan Holdings, Inc. | | | 56,047 | | | | 1,742 | |
| | | | | | | | | 8,329 | |
| | Consumer Staples—3.1% | | | | | | | | |
| * | Darling Ingredients, Inc. | | | 97,581 | | | | 2,740 | |
| | J&J Snack Foods Corporation | | | 14,775 | | | | 2,723 | |
| | | | | | | | | 5,463 | |
| | Communication Services—1.6% | | | | | | | | |
| | Cinemark Holdings, Inc. | | | 41,573 | | | | 1,407 | |
| * | IMAX Corporation† | | | 63,820 | | | | 1,304 | |
| | | | | | | | | 2,711 | |
| | Total Common Stocks—95.6%
(cost $125,031) | | | | | | | 167,542 | |
See accompanying Notes to Financial Statements.
| 30 | Annual Report | December 31, 2019 |
Small Cap Value Fund
Portfolio of Investments, December 31, 2019(all dollar amounts in thousands)
| | | | | | | | |
| | | | Principal | | | | |
| | Issuer | | Amount | | | Value | |
| | | | | | | | |
| | Repurchase Agreement | | | | | | |
| | Fixed Income Clearing Corporation, 0.120% dated 12/31/19, due 1/2/20, repurchase price $21,593, collateralized by U.S. Treasury Bond, 2.500%, due 5/15/46 valued at $22,026 | | $ | 21,593 | | | $ | 21,593 | |
| | Total Repurchase Agreement—12.3%
(cost $21,593) | | | | | | | 21,593 | |
| | Total Investments—107.9%
(cost $146,624) | | | | | | | 189,135 | |
| | Liabilities, plus cash and other assets—(7.9)% | | | | | | | (13,857 | ) |
| | Net assets—100.0% | | | | | | $ | 175,278 | |
* = Non-income producing security
† = U.S. listed foreign security
See accompanying Notes to Financial Statements.
| December 31, 2019 | William Blair Funds | 31 |
Global Markets Review and Outlook
Despite ongoing concerns around geopolitical tensions and signals of decelerating global growth, global equities delivered robust returns in 2019 as the MSCI All Country World Index (ACWI) Investable Market Index (“IMI”) advanced 26.35% in US dollar terms; the best calendar year return over the past decade. After a difficult end to 2018, equity markets around the world rebounded strongly in 2019 as investor sentiment was bolstered by a more dovish tone out of major central banks and improved, albeit volatile, trade negotiations between the U.S. and China.
The market rally in the first four months of the year came to a halt in May as tariff negotiations quickly soured between the U.S. and China. Global equities traded flat from May through September despite a handful of volatile swings in the market as geopolitical developments dominated economic headlines, coupled with ongoing concerns surrounding a continued slowdown in global growth. Equity markets advanced 9.05% in the fourth quarter as growth concerns moderated and progress towards a potential trade deal helped alleviate volatility.
U.S. equities outperformed major market regions for the second consecutive year, advancing 30.39% (as measured by the MSCI USA IMI). The continued trend of U.S. equity dominance was mostly attributable to strength within the Information Technology sector, which gained 48.30%, bolstered by mega-cap companies such as Apple (+86.16%) and Microsoft (+55.26%). Apple and the technology hardware industry benefited from excitement surrounding the applications of fifth generation (5G) wireless technology, coupled with a de-escalation in tariffs on certain Apple products which bolstered investor sentiment.
European and U.K. equities advanced 24.44% (as measured by the MSCI Europe IMI in US dollar terms) in 2019 despite a significant slowdown in industrial production in Germany and political uncertainty for most of the year surrounding the terms of Brexit. Within Germany, manufacturing growth declined meaningfully and purchasing manager surveys continued to point to deceleration in the pace of industrial orders growth. The European Central Bank remained supportive by announcing quantitative easing measures by cutting its bank deposit rate to -0.5%-the lowest on record. After nearly four years of political uncertainty, a landslide victory for the Conservative Party in the U.K. solidified the country’s departure from the European Union. The decisive victory drove British Pound Sterling strength and equity performance in the fourth quarter (the MSCI UK IMI advanced 11.38% in US dollar terms, 3.61% in local terms).
Returns across emerging markets were mixed for calendar year 2019, with notable strength in Russia (+50.13%), Taiwan (+35.18%) and Brazil (+29.27%) offset by significant weakness in countries like Argentina (-18.04%) and Chile (-17.36%) (as measured by the MSCI Emerging Markets IMI in US dollar terms). Robust returns in Russian equities were mostly attributable to the rebound in crude oil prices and increased investor confidence after the U.S. government lifted sanctions on a number of financial companies early in the year. Outperformance in Taiwan was primarily due to the cyclical recovery of the semiconductor industry and stronger earnings expectations heading into 2020. In contrast, currency headwinds weighed on Argentina and Chile in 2019 due to political volatility within each country.
From a global sector perspective, Information Technology outperformed by a wide margin in 2019. Other growth-oriented sectors such as Consumer Discretionary and Industrials also outperformed. Conversely, defensive sectors such as Energy, Materials and Utilities lagged.
Throughout 2019 we commented at length about the market’s conflicting signals and indecisiveness with respect to the outlook for economic growth and corporate performance. Were we headed toward a major global recession, or was the uncertainty around U.S. and China trade relations causing an artificial slowdown in corporate activity?
Beginning in early 2019, our analysis indicated the market was overly pessimistic about the growth outlook, and thus we increased our positioning to more economically-sensitive areas of the market across all of our strategies throughout the year. This included areas such as semiconductors, capital goods and factory automation equipment. Some of our favorite stocks in these industries were not merely pricing in a slowdown, but a recession not seen since the global financial crisis of 2008.
We remained resolute in our positioning, and that in turn created good balance in our portfolios, helping to drive positive performance across our investment platform. In recent months there has been mounting evidence that a recession will in fact be avoided, including the bottoming of manufacturing and industrial activity, and accelerating sequential semiconductor sales. Further bolstering the outlook have been positive sentiment developments related to the likely conclusion of a Phase 1 U.S.-China trade deal, in addition to coordinated central bank money supply expansion.
We expect the economy to continue on this pace of positive, albeit restrained, growth. As expectations of more economic stability take hold, safe havens or crowded (and expensive) defensive trades will likely give way to more attractively valued cyclical
| 32 | Annual Report | December 31, 2019 |
Global Markets Review and Outlook (continued)
industries and companies, as well as broader market participation. We started to see this play out during the fourth quarter, where valuation as a factor was the dominant force driving investment returns, reversing course from the previous nine months.
The accelerating economic backdrop also bodes well for global emerging market (GEM) performance. The GEMs stock markets lagged developed markets (DMs) in 2019, but we believe this is likely to reverse in 2020. A number of developments suggest a more favorable outcome for GEMs: improving industrial activity in key markets like China and Brazil, collapsing corporate profit growth differentials between the major DMs and GEMs and the global cyclical recovery. The trade deal and tariff clarity should act as additional catalysts.
We believe Brazil will continue to be an attractive market driven by pro-growth government reforms. Private consumption will be the main driver for growth as we continue to see the benefits of a downward trajectory in benchmark interest rates-making car loans, mortgages and other consumer goods far more accessible. While economic recovery remains timid and uneven, we expect consumer activity and credit expansion to drive earnings growth. We also expect dramatically lower rates to continue to drive a rotation of domestic portfolios out of fixed income and into equities.
From a sector perspective, technology remains an obvious focus for us. The demand picture appears unassailable given the convergence of tech with seemingly everything: consumer models, healthcare, finance, autos and other industrial applications. Technology as a source of corporate innovation and an enabler of superior execution are related themes that we expect will persist. As we have previously written, 5G telecommunications are likely to accelerate a pace of change that could be more transformational than 4G mobility was.
While we do have concerns about mounting regulatory pressures, especially in consumer-facing internet models, the growth and return profiles of many of our leading technology holdings are only becoming more resolute, and we do not believe that valuations of these companies are inconsistent with that expected corporate performance.
In many cases these advantages are found not just within the technology sector itself, but thoughtful strategic data and technology integration increasingly are the source of differentiated competitive advantages for many of our holdings across multiple industries. To that end, we have been increasing our research staffing to the tech sector, including newer associate analysts, in order to broaden and strengthen our resident expertise. This will increasingly be the foundation for our ability to analyze companies in the future “tech of everything” world.
| December 31, 2019 | William Blair Funds | 33 |
| | Global Leaders Fund |
| | |
| | The Global Leaders Fund seeks long-term capital appreciation. |
| | |
| | AN OVERVIEW FROM THE PORTFOLIO MANAGERS |
| | |

Andrew G. Flynn 
Kenneth J. McAtamney | The William Blair Global Leaders Fund (Class N shares) posted a 31.57% increase, net of fees, for the twelve months ended December 31, 2019. By comparison, the Fund’s benchmark index, the MSCI All Country World IMI (net) (the “Index”), increased 26.35%. Calendar year outperformance versus the Index was primarily driven by positive stock selection across most sectors. The Financials and Industrials sectors were the most significant contributors to relative return. Within Financials, Brookfield Asset Management and Partners Group were the largest sources of outperformance. Brookfield Asset Management is a unique investment management company with a clearly defined business strategy focused on hard assets such as real estate, infrastructure and power. These alternative investments are in demand by investors seeking stable, long-term cash flows to meet duration risk. Brookfield continues to be well-positioned to benefit from strong demand for alternative assets given its strong brand and investment performance, global platform and distribution, and ability to conduct large transactions. Partners Group, one of the largest private equity investors in the world, should continue to benefit from increased allocations to private markets, and stands out for its global platform (sourcing, distribution and client-base), its breadth of private market investment solutions, investment performance and cash flow generation. Atlas Copco, a well-managed, consistently profitable provider of compressors, vacuum solutions and air treatment systems with a compelling growth outlook within Industrials, was an additional source of outperformance. Partially offsetting these effects was negative stock selection within the Information Technology and Materials sectors. Within Information Technology, Capgemini detracted from relative returns. Capgemini, a global IT service provider, is making incremental changes to its breadth of offerings. It is improving its go-to-market strategy and efficiency of product delivery, allowing for consistent improvements in profitability and share gains in a fragmented marketplace. Additionally, it is structurally well-positioned to benefit from a relatively nascent adoption of recurring outsourcing business in European markets that are slowly overcoming cultural resistance. Despite the modest quarter-over-quarter improvement, management reduced fiscal year revenue guidance to the lower end of its original target, implying that near term results will slow, citing softening in the UK and banking globally. In our view, the fundamental improvement shown in recent years is not reflected in the valuation gap to peers, and we added to the position during the year. Christian Hansen, within the Materials sector, also weighed on relative results due to soft economic growth within China. Christian Hansen is the established leader in dairy market cultures and enzymes and has a growing presence selling microbial products (strains) into human, animal and plant health markets. Growth uncertainty in China may linger for a while, but we believe the company is still poised to deliver on long-term growth expectations. Its leadership in technology, manufacturing and distribution creates multiple barriers to entry, supporting its high return profile. Targeted end-markets are underpenetrated, relatively uncorrelated, and have high switching costs, which reduces the risk profile of its growth. Please refer to the Global Markets Review and Outlook relating to the Fund beginning on page 32. |
| 34 | Annual Report | December 31, 2019 |
Global Leaders Fund
Performance Highlights (Unaudited)
| Average Annual Total Return through 12/31/2019 |
| | | 1 Year | | 3 Year | | 5 Year | | 10 Year | | Since
Inception |
| Class N | | | 31.57 | % | | | 16.31 | % | | | 10.16 | % | | | 10.75 | % | | | — | |
| Class I | | | 31.96 | | | | 16.61 | | | | 10.48 | | | | 11.04 | | | | — | |
| MSCI ACW IMI (net) | | | 26.35 | | | | 12.09 | | | | 8.34 | | | | 8.91 | | | | — | |
| Class R6(a) | | | 32.02 | | | | 16.68 | | | | 10.54 | | | | — | | | | 10.96 | % |
| MSCI ACW IMI (net)(a) | | | 26.35 | | | | 12.09 | | | | 8.34 | | | | — | | | | 9.62 | |
| | |
| (a) | Since inception is for the period from December 19, 2012 (Commencement of Operations) to December 31, 2019. |
Performance cited represents past performance. Past performance does not guarantee future results and current performance may be lower or higher than the data quoted. Results shown are average annual total returns, which assume reinvestment of dividends and capital gains. Investment returns and principal will fluctuate and you may have a gain or loss when you sell shares. For the most current month-end performance information, please call 1-800-742-7272, or visit our Web site atwww.williamblairfunds.com. Investing in smaller and medium capitalization companies involves special risks, including higher volatility and lower liquidity. Smaller and medium capitalization stocks are also more sensitive to purchase/sale transactions and changes in the issuer’s financial condition. International investing involves special risk considerations, including currency fluctuations, lower liquidity, economic and political risk. From time to time, the investment adviser may waive fees or reimburse expenses for the Fund. Without these waivers/reimbursements, performance would be lower. Class N shares are not subject to a sales load. Class I shares are not subject to a sales load or distribution (Rule 12b-1) fees. Class R6 shares are not subject to a sales load, distribution (Rule 12b-1) fees, or sub-transfer agent fees.
The performance highlights and graph presented above do not reflect the deduction of taxes that a shareholder would pay on fund distributions or the redemption of fund shares.
The Morgan Stanley Capital International (MSCI) All Country World (ACW) Investable Market Index (IMI) (net) is a free float-adjusted market capitalization weighted index that is designed to measure the equity market of developed and emerging markets. This index approximates the minimum possible dividend reinvestment by deducting for the highest possible withholding tax rates of those markets.
This report identifies the Fund’s investments on December 31, 2019. These holdings are subject to change. Not all stocks in the Fund performed the same, nor is there any guarantee that these stocks will perform as well in the future. Market forecasts provided in this report may not necessarily come to pass.
Sector Diversification (Unaudited)

The sector diversification shown is based on the total long-term securities.
| | | |
| December 31, 2019 | William Blair Funds | 35 |
Global Leaders Fund
Portfolio of Investments, December 31, 2019(all dollar amounts in thousands)
| | | | | | | | |
| | | | | | | | |
| | Issuer | | Shares | | | Value | |
| | | | | | |
| | Common Stocks | | | | |
| | | | | | |
| | Western Hemisphere—48.9% | | | | |
| | Canada—1.8% | | | | |
| | Brookfield Asset Management, Inc. Class “A” (Capital markets)† | | | 52,270 | | | $ | 3,021 | |
| | United States—47.1% | | | | | | | | |
| * | Adobe, Inc. (Software) | | | 9,863 | | | | 3,253 | |
| * | Alphabet, Inc. Class “A” (Interactive Media & Services) | | | 3,726 | | | | 4,991 | |
| * | Amazon.com, Inc. (Internet & direct marketing retail) | | | 2,444 | | | | 4,516 | |
| | BlackRock, Inc. (Capital markets) | | | 5,886 | | | | 2,959 | |
| * | CoStar Group, Inc. (Professional services) | | | 2,758 | | | | 1,650 | |
| * | Edwards Lifesciences Corporation (Health care equipment & supplies) | | | 10,897 | | | | 2,542 | |
| * | Facebook, Inc. Class “A” (Interactive Media & Services) | | | 17,291 | | | | 3,549 | |
| | Fidelity National Information Services, Inc. (IT services) | | | 22,303 | | | | 3,102 | |
| * | Guidewire Software, Inc. (Software) | | | 10,651 | | | | 1,169 | |
| * | IDEXX Laboratories, Inc. (Health care equipment & supplies) | | | 5,410 | | | | 1,413 | |
| * | Illumina, Inc. (Life sciences tools & services) | | | 3,245 | | | | 1,076 | |
| | Intercontinental Exchange, Inc. (Capital markets) | | | 31,265 | | | | 2,894 | |
| * | Intuitive Surgical, Inc. (Health care equipment & supplies) | | | 3,038 | | | | 1,796 | |
| | JPMorgan Chase & Co. (Banks) | | | 24,785 | | | | 3,455 | |
| | Lockheed Martin Corporation (Aerospace & defense) | | | 6,208 | | | | 2,417 | |
| | Mastercard, Inc. Class “A” (IT services) | | | 14,058 | | | | 4,198 | |
| | NextEra Energy, Inc. (Electric utilities) | | | 11,105 | | | | 2,689 | |
| * | PayPal Holdings, Inc. (IT services) | | | 23,816 | | | | 2,576 | |
| | Prologis, Inc. (Equity REIT) | | | 20,465 | | | | 1,824 | |
| | Roper Technologies, Inc. (Industrial conglomerates) | | | 8,079 | | | | 2,862 | |
| * | salesforce.com, Inc. (Software) | | | 23,056 | | | | 3,750 | |
| | Southwest Airlines Co. (Airlines) | | | 15,423 | | | | 833 | |
| | The Estee Lauder Cos., Inc. Class “A” (Personal products) | | | 13,051 | | | | 2,696 | |
| | Thermo Fisher Scientific, Inc. (Life sciences tools & services) | | | 9,357 | | | | 3,040 | |
| * | Ulta Salon Cosmetics & Fragrance, Inc. (Specialty retail) | | | 8,843 | | | | 2,238 | |
| | Union Pacific Corporation (Road & rail) | | | 18,806 | | | | 3,400 | |
| | UnitedHealth Group, Inc. (Health care providers & services) | | | 15,132 | | | | 4,448 | |
| | Vail Resorts, Inc. (Hotels, restaurants & leisure) | | | 8,397 | | | | 2,014 | |
| * | Veeva Systems, Inc. Class “A” (Health care technology) | | | 5,562 | | | | 782 | |
| | Zoetis, Inc. (Pharmaceuticals) | | | 21,062 | | | | 2,788 | |
| | | | | | | | | 80,920 | |
| | | | | | | | |
| | | | | | | | |
| | Issuer | | Shares | | | Value | |
| | | | | | | | | | |
| | Common Stocks—(continued) | | | | | | | | |
| | | | | | | | | | |
| | Europe—20.5% | | | | | | | | |
| | Denmark—3.9% | | | | | | | | |
| | Chr Hansen Holding A/S (Chemicals) | | | 19,032 | | | $ | 1,512 | |
| | DSV PANALPINA A/S (Air freight & logistics) | | | 20,998 | | | | 2,420 | |
| | Novo Nordisk A/S Class “B” (Pharmaceuticals) | | | 47,613 | | | | 2,764 | |
| | | | | | | | | 6,696 | |
| | France—3.2% | | | | | | | | |
| | Capgemini SE (IT services) | | | 18,693 | | | | 2,283 | |
| | LVMH Moet Hennessy Louis Vuitton SE (Textiles, apparel & luxury goods) | | | 6,819 | | | | 3,168 | |
| | | | | | | | | 5,451 | |
| | Germany—3.0% | | | | | | | | |
| | Infineon Technologies AG (Semiconductors & semiconductor equipment) | | | 120,505 | | | | 2,745 | |
| | MTU Aero Engines AG (Aerospace & defense) | | | 8,616 | | | | 2,461 | |
| | | | | | | | | 5,206 | |
| | Ireland—2.1% | | | | | | | | |
| | Allegion plc (Building products)† | | | 14,131 | | | | 1,760 | |
| | Aptiv plc (Auto components)† | | | 20,263 | | | | 1,924 | |
| | | | | | | | | 3,684 | |
| | Netherlands—1.1% | | | | | | | | |
| | Royal Dutch Shell plc Class “A” (Oil, gas & consumable fuels) | | | 64,749 | | | | 1,900 | |
| | Sweden—4.0% | | | | | | | | |
| | Atlas Copco AB Class “A” (Machinery) | | | 74,317 | | | | 2,964 | |
| | Hexagon AB Class “B” (Electronic equipment, instruments & components) | | | 53,909 | | | | 3,022 | |
| | Indutrade AB (Trading companies & distributors) | | | 25,645 | | | | 918 | |
| | | | | | | | | 6,904 | |
| | Switzerland—3.2% | | | | | | | | |
| * | Lonza Group AG (Life sciences tools & services) | | | 7,054 | | | | 2,575 | |
| | Partners Group Holding AG (Capital markets) | | | 3,103 | | | | 2,845 | |
| | | | | | | | | 5,420 | |
| | | | | | | | | | |
| | Emerging Asia—10.6% | | | | | | | | |
| | China—6.0% | | | | | | | | |
| * | Alibaba Group Holding, Ltd.—ADR (Internet & direct marketing retail) | | | 21,011 | | | | 4,457 | |
| | Huazhu Group, Ltd.—ADR (Hotels, restaurants & leisure) | | | 27,144 | | | | 1,088 | |
| | Shenzhou International Group Holdings, Ltd. (Textiles, apparel & luxury goods) | | | 90,600 | | | | 1,324 | |
| | Tencent Holdings, Ltd. (Interactive Media & Services) | | | 69,900 | | | | 3,369 | |
| | | | | | | | | 10,238 | |
See accompanying Notes to Financial Statements.
| 36 | Annual Report | December 31, 2019 |
Global Leaders Fund
Portfolio of Investments, December 31 2019(all dollar amounts in thousands)
| | | | | | | | |
| | | | | | | | |
| | Issuer | | Shares | | | Value | |
| | | | | | | | |
| | Common Stocks—(continued) | | | | | | |
| | | | | | | | |
| | Emerging Asia—(continued) | | | | | | |
| | India—1.4% | | | | | | |
| | HDFC Bank, Ltd.—ADR (Banks) | | | 39,254 | | | $ | 2,487 | |
| | Taiwan—3.2% | | | | | | | | |
| | Taiwan Semiconductor Manufacturing Co., Ltd.—ADR (Semiconductors & semiconductor equipment) | | | 94,918 | | | | 5,515 | |
| | | | | | | | | | |
| | Asia—7.9% | | | | | | | | |
| | Australia—4.7% | | | | | | | | |
| | Aristocrat Leisure, Ltd. (Hotels, restaurants & leisure) | | | 72,531 | | | | 1,713 | |
| | CSL, Ltd. (Biotechnology) | | | 19,434 | | | | 3,761 | |
| | Macquarie Group, Ltd. (Capital markets) | | | 26,712 | | | | 2,584 | |
| | | | | | | | | 8,058 | |
| | Hong Kong—3.2% | | | | | | | | |
| | AIA Group, Ltd. (Insurance) | | | 310,600 | | | | 3,261 | |
| | Galaxy Entertainment Group, Ltd. (Hotels, restaurants & leisure) | | | 309,000 | | | | 2,276 | |
| | | | | | | | | 5,537 | |
| | | | | | | | | | |
| | Japan—7.1% | | | | | | | | |
| | Daikin Industries, Ltd. (Building products) | | | 20,700 | | | | 2,944 | |
| | Keyence Corporation (Electronic equipment, instruments & components) | | | 9,600 | | | | 3,401 | |
| | MISUMI Group, Inc. (Machinery) | | | 25,800 | | | | 646 | |
| | Nihon M&A Center, Inc. (Professional services) | | | 55,700 | | | | 1,930 | |
| | SMC Corporation (Machinery) | | | 4,500 | | | | 2,083 | |
| | ZOZO Inc. (Internet & direct marketing retail) | | | 61,400 | | | | 1,179 | |
| | | | | | | | | 12,183 | |
| | | | | | | | | | |
| | United Kingdom—2.9% | | | | | | | | |
| | Compass Group plc (Hotels, restaurants & leisure) | | | 111,041 | | | | 2,780 | |
| | Fevertree Drinks plc (Beverages) | | | 24,945 | | | | 692 | |
| | Victrex plc (Chemicals) | | | 47,718 | | | | 1,576 | |
| | | | | | | | | 5,048 | |
| | | | | | | | | | |
| | Emerging Latin America—0.7% | | | | | | | | |
| | Argentina—0.7% | | | | | | | | |
| * | Globant S.A. (Software)† | | | 10,565 | | | | 1,120 | |
| | Total Common Stocks—98.6%
(cost $120,543) | | | | | | | 169,388 | |
| | | | | | | | |
| | Issuer | | Principal
Amount | | | Value | |
| | | | | | | | |
| | Repurchase Agreement | | | | | | |
| | Fixed Income Clearing Corporation, 0.120% dated 12/31/19, due 1/2/20, repurchase price $2,367, collateralized by U.S. Treasury Bond, 2.500%, due 5/15/46 valued at $2,418 | | $ | 2,367 | | | $ | 2,367 | |
| | Total Repurchase Agreement—1.4%
(cost $2,367) | | | | | | | 2,367 | |
| | Total Investments—100.0%
(cost $122,910) | | | | | | | 171,755 | |
| | Liabilities, plus cash and other assets—0.0% | | | | | | | (46 | ) |
| | Net assets—100.0% | | | | | | $ | 171,709 | |
ADR = American Depository Receipt
REIT = Real Estate Investment Trust
† = U.S. listed foreign security
* = Non-income producing security
For securities primarily traded on exchanges or markets that close before the close of regular trading on the New York Stock Exchange, the Fund may use an independent pricing service to fair value price the securities pursuant to Valuation Procedures approved by the Board of Trustees.
At December 31, 2019, the Fund’s Portfolio of Investments includes the following industry categories (as a percentage of long-term investments):
| Information Technology | | | 21.4 | % |
| Industrials | | | 17.3 | % |
| Consumer Discretionary | | | 16.9 | % |
| Health Care | | | 15.9 | % |
| Financials | | | 13.9 | % |
| Communication Services | | | 7.0 | % |
| Consumer Staples | | | 2.0 | % |
| Materials | | | 1.8 | % |
| Utilities | | | 1.6 | % |
| Energy | | | 1.1 | % |
| Real Estate | | | 1.1 | % |
| Total | | | 100.0 | % |
At December 31, 2019, the Fund’s Portfolio of Investments includes the following currency categories (as a percentage of long-term investments):
| U.S. Dollar | | | 60.4 | % |
| Euro | | | 7.4 | % |
| Japanese Yen | | | 7.2 | % |
| Hong Kong Dollar | | | 6.0 | % |
| Australian Dollar | | | 4.8 | % |
| Swedish Krona | | | 4.1 | % |
| Danish Krone | | | 3.9 | % |
| Swiss Franc | | | 3.2 | % |
| British Pound Sterling | | | 3.0 | % |
| Total | | | 100.0 | % |
See accompanying Notes to Financial Statements.
| December 31, 2019 | William Blair Funds | 37 |
| | International Leaders Fund |
| | |
| | The International Leaders Fund seeks long-term capital appreciation. |
| | |
| | AN OVERVIEW FROM THE PORTFOLIO MANAGERS |
| | |

Simon Fennell 
Kenneth J. McAtamney | The William Blair International Leaders Fund (Class N shares) posted a 31.46% increase, net of fees, for the twelve months ended December 31, 2019. By comparison, the Fund’s benchmark index, the MSCI All Country World ex-U.S. IMI (net) (the “Index”), increased 21.63%. Calendar year outperformance versus the Index was primarily driven by positive stock selection across most sectors. The Financials and Industrials sectors were the most significant contributors to relative return. Within Financials, London Stock Exchange (LSE) and Brookfield Asset Management propelled relative performance. LSE’s share price appreciated on the back of strong operating results and the announcement of the Refinitiv acquisition during the summer. The acquisition is a transformational deal that accelerates the strategy to be a leading global financial market infrastructure provider. It will increase recurring revenue streams, strengthen its data offering and bolster its trading platforms by adding currency and fixed income asset classes. The deal also strengthens LSE’s regional diversification by increasing the importance of North America and Emerging Markets. Brookfield Asset Management is a unique investment management company, with a clearly defined business strategy that is focused on hard assets such as real estate, infrastructure and power. These alternative investments are in demand by investors seeking stable, long-term cash flows to meet duration risk. It is expanding asset management operations and fee-income streams. Brookfield continues to be well-positioned to benefit from strong demand for alternative assets given its strong brand, favorable investment performance, global sourcing, wide distribution and ability to conduct large transactions. Atlas Copco, a well-managed, consistently profitable provider of compressors, vacuum solutions and air treatment systems with a compelling growth outlook within Industrials, was an additional source of outperformance. Partially offsetting these effects was negative stock selection within the Information Technology sector. Within Information Technology, Check Point Software Technologies detracted from relative returns as its more defensive but slower growth profile failed to keep pace with the market. Check Point sells network security appliances and software solutions to enhance the appliances’ capabilities. Enterprise security has strong future growth prospects and Check Point is a well-positioned security platform with high returns, a durable install base and an ability to cross-sell. We believe this should result in low single-digit revenue growth, with share buybacks enabling mid-to-high-single-digit EPS growth. Please refer to the Global Markets Review and Outlook relating to the Fund beginning on page 32. |
| | | |
| 38 | Annual Report | December 31, 2019 |
International Leaders Fund
Performance Highlights (Unaudited)
Average Annual Total Return through 12/31/2019
| | | 1 Year | | 3 Year | | 5 Year | | Since
Inception |
| Class N(a) | | | 31.46 | % | | | 14.16 | % | | | 9.74 | % | | | 9.77 | % |
| Class I(a) | | | 31.76 | | | | 14.48 | | | | 10.00 | | | | 10.04 | |
| MSCI ACW Ex-U.S. IMI (net)(a) | | | 21.63 | | | | 9.84 | | | | 5.71 | | | | 6.56 | |
| Class R6(b) | | | 31.83 | | | | 14.53 | | | | 10.10 | | | | 10.10 | |
| MSCI ACW Ex-U.S. IMI (net)(b) | | | 21.63 | | | | 9.84 | | | | 5.71 | | | | 6.20 | |
| | |
| (a) | Since inception is for the period from August 16, 2012 (Commencement of Operations) to December 31, 2019. |
| (b) | Since inception is for the period from November 2, 2012 (Commencement of Operations) to December 31, 2019. |
Performance cited represents past performance. Past performance does not guarantee future results and current performance may be lower or higher than the data quoted. Results shown are average annual returns, which assume reinvestment of dividends and capital gains. Investment returns and principal will fluctuate and you may have a gain or loss when you sell shares. For the most current month-end performance information, please call 1-800-742-7272, or visit our Web site atwww.williamblairfunds.com. Investing in smaller and medium capitalization companies involves special risks, including higher volatility and lower liquidity. Smaller and medium capitalization stocks are also more sensitive to purchase/sale transactions and changes in the issuer’s financial condition. International investing involves special risk considerations, including currency fluctuations, lower liquidity, economic and political risk. From time to time the investment adviser may waive fees or reimburse expenses for the Fund. Without these waivers/reimbursements, performance would be lower. Class N shares are not subject to a sales load. Class I shares are not subject to a sales load or distribution (Rule 12b-1) fees. Class R6 shares are not subject to a sales load, distribution (Rule 12b-1) fees, or sub-transfer agent fees.
The performance highlights presented above do not reflect the deduction of taxes that a shareholder would pay on fund distributions or the redemption of fund shares.
The Morgan Stanley Capital International (MSCI) All Country World (ACW) Ex-U.S. Investable Market Index (IMI) (net) is a free float-adjusted market capitalization weighted index that is designed to measure the equity market performance of developed and emerging markets, excluding the United States. This index approximates the minimum possible dividend reinvestment by deducting for the highest possible withholding tax rates of those markets.
This report identifies the Fund’s investments on December 31, 2019. These holdings are subject to change. Not all stocks in the Fund performed the same, nor is there any guarantee that these stocks will perform as well in the future. Market forecasts provided in this report may not necessarily come to pass.
Sector Diversification (Unaudited)

The sector diversification shown is based on the total long-term securities.
| December 31, 2019 | William Blair Funds | 39 |
International Leaders Fund
Portfolio of Investments, December 31, 2019(all dollar amounts in thousands)
| | | | | | | | |
| | | | | | | | |
| | Issuer | | Shares | | | Value | |
| | | | | | | | | | |
| | Common Stocks | | | | | | | | |
| | | | | | | | | | |
| | Europe, Mid-East—41.8% | | | | | | | | |
| | Denmark—6.3% | | | | | | | | |
| | Coloplast A/S Class “B” (Health care equipment & supplies) | | | 91,476 | | | $ | 11,348 | |
| | DSV PANALPINA A/S (Air freight & logistics) | | | 48,316 | | | | 5,569 | |
| | Novo Nordisk A/S Class “B” (Pharmaceuticals) | | | 216,442 | | | | 12,562 | |
| | Orsted A/S (Electric utilities) | | | 113,787 | | | | 11,768 | |
| | | | | | | | | 41,247 | |
| | Finland—0.4% | | | | | | | | |
| | Neste Oyj (Oil, gas & consumable fuels) | | | 79,883 | | | | 2,779 | |
| | France—9.0% | | | | | | | | |
| | Airbus SE (Aerospace & defense) | | | 103,067 | | | | 15,085 | |
| | Capgemini SE (IT services) | | | 90,225 | | | | 11,021 | |
| | LVMH Moet Hennessy Louis Vuitton SE (Textiles, apparel & luxury goods) | | | 37,399 | | | | 17,376 | |
| | Safran S.A. (Aerospace & defense) | | | 97,594 | | | | 15,069 | |
| | | | | | | | | 58,551 | |
| | Germany—4.6% | | | | | | | | |
| | Infineon Technologies AG (Semiconductors & semiconductor equipment) | | | 462,827 | | | | 10,544 | |
| | Rational AG (Machinery) | | | 9,590 | | | | 7,713 | |
| | SAP SE (Software) | | | 86,492 | | | | 11,673 | |
| | | | | | | | | 29,930 | |
| | Ireland—1.8% | | | | | | | | |
| | Kingspan Group plc (Building products) | | | 195,476 | | | | 11,939 | |
| | Israel—1.4% | | | | | | | | |
| * | Check Point Software Technologies, Ltd. (Software)† | | | 81,508 | | | | 9,044 | |
| | Italy—0.5% | | | | | | | | |
| | Ferrari N.V. (Automobiles) | | | 21,062 | | | | 3,494 | |
| | Luxembourg—0.6% | | | | | | | | |
| | Tenaris S.A. (Energy equipment & services) | | | 345,475 | | | | 3,894 | |
| | Netherlands—3.0% | | | | | | | | |
| * | Adyen N.V. (IT services) | | | 9,422 | | | | 7,726 | |
| | Koninklijke Philips N.V. (Health care equipment & supplies) | | | 246,379 | | | | 12,027 | |
| | | | | | | | | 19,753 | |
| | Spain—3.3% | | | | | | | | |
| | ACS Actividades de Construccion y Servicios S.A. (Construction & engineering) | | | 236,908 | | | | 9,474 | |
| | Amadeus IT Group S.A. (IT services) | | | 146,488 | | | | 11,962 | |
| | | | | | | | | 21,436 | |
| | Sweden—3.8% | | | | | | | | |
| | Atlas Copco AB Class “A” (Machinery) | | | 343,553 | | | | 13,704 | |
| | Hexagon AB Class “B” (Electronic equipment, instruments & components) | | | 196,767 | | | | 11,029 | |
| | | | | | | | | 24,733 | |
| | | | | | | | |
| | | | | | | | |
| | Issuer | | Shares | | | Value | |
| | | | | | | | | | |
| | Common Stocks—(continued) | | | | | | | | |
| | | | | | | | | | |
| | Europe, Mid-East—(continued) | | | | | | | | |
| | Switzerland—7.1% | | | | | | | | |
| * | Lonza Group AG (Life sciences tools & services) | | | 40,362 | | | $ | 14,730 | |
| | Partners Group Holding AG (Capital markets) | | | 12,870 | | | | 11,801 | |
| | Sika AG (Chemicals) | | | 51,586 | | | | 9,693 | |
| * | Temenos AG (Software) | | | 64,366 | | | | 10,189 | |
| | | | | | | | | 46,413 | |
| | | | | | | | | | |
| | Emerging Asia—14.7% | | | | | | | | |
| | China—9.1% | | | | | | | | |
| * | Alibaba Group Holding, Ltd.—ADR (Internet & direct marketing retail) | | | 95,246 | | | | 20,202 | |
| | China Merchants Bank Co., Ltd. Class “H” (Banks) | | | 2,450,500 | | | | 12,595 | |
| | NetEase, Inc.—ADR (Entertainment) | | | 33,911 | | | | 10,399 | |
| * | TAL Education Group—ADR (Diversified consumer services) | | | 44,924 | | | | 2,165 | |
| | Tencent Holdings, Ltd. (Interactive Media & Services) | | | 300,000 | | | | 14,460 | |
| | | | | | | | | 59,821 | |
| | India—2.5% | | | | | | | | |
| | Housing Development Finance Corporation, Ltd. (Thrifts & mortgage finance) | | | 302,401 | | | | 10,223 | |
| | Reliance Industries, Ltd. (Oil, gas & consumable fuels) | | | 282,628 | | | | 6,003 | |
| | | | | | | | | 16,226 | |
| | Taiwan—3.1% | | | | | | | | |
| | Taiwan Semiconductor Manufacturing Co., Ltd. (Semiconductors & semiconductor equipment) | | | 1,846,000 | | | | 20,383 | |
| | | | | | | | | | |
| | United Kingdom—12.2% | | | | | | | | |
| | Abcam plc (Biotechnology) | | | 146,009 | | | | 2,615 | |
| | Compass Group plc (Hotels, restaurants & leisure) | | | 419,108 | | | | 10,492 | |
| | Diageo plc (Beverages) | | | 249,150 | | | | 10,563 | |
| | Experian plc (Professional services) | | | 419,018 | | | | 14,164 | |
| | London Stock Exchange Group plc (Capital markets) | | | 125,566 | | | | 12,890 | |
| | RELX plc (Professional services) | | | 486,814 | | | | 12,287 | |
| | Segro plc (Equity REIT) | | | 930,576 | | | | 11,059 | |
| | St James’s Place plc (Capital markets) | | | 357,957 | | | | 5,522 | |
| | | | | | | | | 79,592 | |
| | | | | | | | | | |
| | Japan—10.5% | | | | | | | | |
| | Asahi Intecc Co., Ltd. (Health care equipment & supplies) | | | 117,200 | | | | 3,452 | |
| | Daikin Industries, Ltd. (Building products) | | | 74,500 | | | | 10,593 | |
| | Hoya Corporation (Health care equipment & supplies) | | | 110,500 | | | | 10,627 | |
| | Keyence Corporation (Electronic equipment, instruments & components) | | | 48,500 | | | | 17,181 | |
See accompanying Notes to Financial Statements.
| 40 | Annual Report | December 31, 2019 |
International Leaders Fund
Portfolio of Investments, December 31 2019(all dollar amounts in thousands)
| | Issuer | | Shares or
Principal
Amount | | | Value | |
| | | | | | | | | | |
| | Common Stocks—(continued) | | | | | | | | |
| | | | | | | | | | |
| | Japan—(continued) | | | | | | | | |
| | Nitori Holdings Co., Ltd. (Specialty retail) | | | 35,500 | | | $ | 5,628 | |
| | Shiseido Co., Ltd. (Personal products) | | | 143,100 | | | | 10,249 | |
| | SMC Corporation (Machinery) | | | 23,800 | | | | 11,016 | |
| | | | | | | | | 68,746 | |
| | | | | | | | | | |
| | Asia—9.4% | | | | | | | | |
| | Australia—5.2% | | | | | | | | |
| | Aristocrat Leisure, Ltd. (Hotels, restaurants & leisure) | | | 299,532 | | | | 7,077 | |
| | CSL, Ltd. (Biotechnology) | | | 71,095 | | | | 13,758 | |
| | Macquarie Group, Ltd. (Capital markets) | | | 134,929 | | | | 13,053 | |
| | | | | | | | | 33,888 | |
| | Hong Kong—4.2% | | | | | | | | |
| | AIA Group, Ltd. (Insurance) | | | 1,822,800 | | | | 19,135 | |
| | Galaxy Entertainment Group, Ltd. (Hotels, restaurants & leisure) | | | 1,146,000 | | | | 8,441 | |
| | | | | | | | | 27,576 | |
| | | | | | | | | | |
| | Canada—8.1% | | | | | | | | |
| | Brookfield Asset Management, Inc. Class “A” (Capital markets)† | | | 262,709 | | | | 15,185 | |
| | Canadian National Railway Co. (Road & rail) | | | 165,604 | | | | 14,981 | |
| | Dollarama, Inc. (Multiline retail) | | | 199,839 | | | | 6,868 | |
| * | Lululemon Athletica, Inc. (Textiles, apparel & luxury goods) | | | 14,471 | | | | 3,353 | |
| | The Toronto-Dominion Bank (Banks) | | | 222,665 | | | | 12,488 | |
| | | | | | | | | 52,875 | |
| | Total Common Stocks-96.7%
(cost $478,001) | | | | | | | 632,320 | |
| | | | | | | | | | |
| | Repurchase Agreement | | | | | | | | |
| | Fixed Income Clearing Corporation, 0.120% dated 12/31/19, due 1/2/20, repurchase price $24,861, collateralized by U.S. Treasury Bond, 2.500%, due 5/15/46 valued at $25,363 | | | $24,861 | | | | 24,861 | |
| | Total Repurchase Agreement—3.8%
(cost $24,861) | | | | | | | 24,861 | |
| | Total Investments—100.5%
(cost $502,862) | | | | | | | 657,181 | |
| | Liabilities, plus cash and other assets—(0.5)% | | | | | | | (3,277 | ) |
| | Net assets—100.0% | | | | | | $ | 653,904 | |
ADR = American Depository Receipt
REIT = Real Estate Investment Trust
* = Non-income producing security
† = U.S. listed foreign security
For securities primarily traded on exchanges or markets that close before the close of regular trading on the New York Stock Exchange, the Fund may use an independent pricing service to fair value price the securities pursuant to Valuation Procedures approved by the Board of Trustees.
At December 31, 2019, the Fund’s Portfolio of Investments includes the following industry categories (as a percentage of long-term investments):
| Industrials | | | 22.4 | % |
| Information Technology | | | 19.1 | % |
| Financials | | | 17.9 | % |
| Consumer Discretionary | | | 13.5 | % |
| Health Care | | | 12.8 | % |
| Communication Services | | | 3.9 | % |
| Consumer Staples | | | 3.3 | % |
| Energy | | | 2.0 | % |
| Utilities | | | 1.9 | % |
| Real Estate | | | 1.7 | % |
| Materials | | | 1.5 | % |
| Total | | | 100.0 | % |
At December 31, 2019, the Fund’s Portfolio of Investments includes the following currency categories (as a percentage of long-term investments):
| Euro | | | 24.0 | % |
| British Pound Sterling | | | 12.6 | % |
| Japanese Yen | | | 10.9 | % |
| U.S. Dollar | | | 9.6 | % |
| Hong Kong Dollar | | | 8.6 | % |
| Swiss Franc | | | 7.3 | % |
| Danish Krone | | | 6.5 | % |
| Canadian Dollar | | | 5.4 | % |
| Australian Dollar | | | 5.4 | % |
| Swedish Krona | | | 3.9 | % |
| New Taiwan Dollar | | | 3.2 | % |
| Indian Rupee | | | 2.6 | % |
| Total | | | 100.0 | % |
See accompanying Notes to Financial Statements.
| December 31, 2019 | William Blair Funds | 41 |
| | International Growth Fund |
| | |
| | The International Growth Fund seeks long-term capital appreciation. |
| | |
| | AN OVERVIEW FROM THE PORTFOLIO MANAGERS |
| | |

Simon Fennell 
Kenneth J. McAtamney | The William Blair International Growth Fund (Class N shares) posted a 30.24% increase, net of fees, for the twelve months ended December 31, 2019. By comparison, the Fund’s benchmark index, the MSCI All Country World ex-U.S. IMI (net) (the “Index”), increased 21.63%. Calendar year outperformance versus the Index was primarily driven by positive stock selection across most sectors. The Industrials, Financials and Consumer Discretionary sectors were the most significant sources of relative return. Within Industrials, Airbus and MTU Aero Engines helped relative returns. Airbus’s transition to the next generation of aircrafts (which pressured earnings and cash flows at the company over the last several years) has largely concluded, leaving the company in a favorable position where investment is moderating and profitability is poised to improve. Civil passenger traffic growing at more than two times GDP, strong airline load factors and replacement demand have resulted in backlogs that are well diversified by airline and geography. MTU is one of the world’s largest manufacturers of aircraft engine modules with an installed base of 22,000 aircraft, which is approximately 34% of the global non-military aircraft fleet. Its profit growth in 2019 was driven by its spare parts activity, which generates most of its earnings. As secular growth in air traffic increases, demand for spare parts and maintenance, repair and operations services (MRO) will naturally follow. London Stock Exchange (LSE), within Financials, was an additional source of outperformance. LSE’s share price appreciated on the back of strong operating results and the announcement of the Refinitiv acquisition during the summer. The acquisition is a transformational deal that accelerates the strategy to be a leading global financial market infrastructure provider. The strategic rationale includes increasing recurring revenue streams, strengthening its data offering and bolstering its trading platforms by adding currency and fixed income asset classes. The deal also strengthens LSE’s regional diversification by increasing the importance of North America and Emerging Markets. Within the Consumer Discretionary sector, Li Ning boosted relative results. Li Ning sells footwear, apparel, equipment and accessories for professional and leisure purposes, primarily under the LI-NING brand. The company is in its fifth year of a major turnaround with growth from here most likely driven by margin expansion. Margins are low but trending up with good visibility due to cost controls, including a step down in endorsement expenses. Overall, the spending environment is supportive and Li Ning is making significant strides in strengthening its execution capabilities in e-commerce and new product development. Partially offsetting these effects was below average stock selection within the Information Technology sector. Hampering relative results within Information Technology was the integrated payment service provider Wirecard, and Digital Arts, an enterprise security software company based in Japan. Wirecard was sold from the portfolio in Q1 after concerns were raised regarding its internal controls and quality of recent acquisitions. Digital Arts weighed on returns due to recent quarterly results that failed to meet consensus expectations. We believe the company remains well positioned in the Japanese enterprise security software space, which continues to lag global standards for security. Recent new product launches, project wins and higher pricing trends are all supportive of structurally higher adoption of security software in Japan, and we maintained the position throughout the year. Please refer to the Global Markets Review and Outlook relating to the Fund beginning on page 32. |
| | | |
| 42 | Annual Report | December 31, 2019 |
International Growth Fund
Performance Highlights (Unaudited)
Average Annual Total Return through 12/31/2019
| | | 1 Year | | 3 Year | | 5 Year | | 10 Year | | Since
Inception(a) |
| Class N | | | 30.24 | % | | | 11.31 | % | | | 5.96 | % | | | 6.89 | % | | | — | |
| Class I | | | 30.66 | | | | 11.65 | | | | 6.28 | | | | 7.21 | | | | — | |
| Class R6 | | | — | | | | — | | | | — | | | | — | | | | 11.71 | % |
| MSCI ACW Ex-U.S. IMI (net) | | | 21.63 | | | | 9.84 | | | | 5.71 | | | | 5.21 | | | | 7.32 | |
| | |
| (a) | Since inception is for the period from May 2, 2019 (Commencement of Operations) to December 31, 2019. |
Performance cited represents past performance. Past performance does not guarantee future results and current performance may be lower or higher than the data quoted. Results shown are average annual total returns, which assume reinvestment of dividends and capital gains. Investment returns and principal will fluctuate and you may have a gain or loss when you sell shares. For the most current month-end performance information, please call 1-800-742-7272, or visit our Web site atwww.williamblairfunds.com. Investing in smaller and medium capitalization companies involves special risks, including higher volatility and lower liquidity. Smaller and medium capitalization stocks are also more sensitive to purchase/sale transactions and changes in the issuer’s financial condition. International investing involves special risk considerations, including currency fluctuations, lower liquidity, economic and political risk. From time to time, the investment adviser may waive fees or reimburse expenses for the Fund. Without these waivers/reimbursements, performance would be lower. Class N shares are not subject to a sales load. Class I shares are not subject to a sales load or distribution (Rule 12b-1) fees. Class R6 shares are not subject to a sales load, distribution (Rule 12b-1) fees, or sub-transfer agent fees.
The performance highlights and graph presented above do not reflect the deduction of taxes that a shareholder would pay on fund distributions or the redemption of fund shares.
The Morgan Stanley Capital International (MSCI) All Country World (ACW) Ex-U.S. Investable Market Index (IMI) (net) is a free float-adjusted market capitalization weighted index that is designed to measure the equity market performance of developed and emerging markets, excluding the United States. This index approximates the minimum possible dividend reinvestment by deducting for the highest possible withholding tax rates of those markets.
This report identifies the Fund’s investments on December 31, 2019. These holdings are subject to change. Not all stocks in the Fund performed the same, nor is there any guarantee that these stocks will perform as well in the future. Market forecasts provided in this report may not necessarily come to pass.
Sector Diversification (Unaudited)
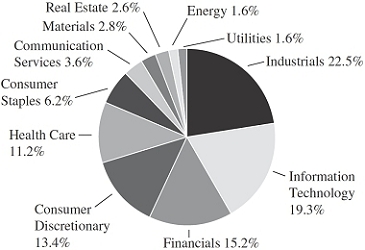
The sector diversification shown is based on the total long-term securities.
| December 31, 2019 | William Blair Funds | 43 |
International Growth Fund
Portfolio of Investments, December 31, 2019(all dollar amounts in thousands)
| | | | | | | | |
| | Issuer | | Shares | | | Value | |
| | | | | | | | | | |
| | Common Stocks | | | | | | | | |
| | | | | | | | | | |
| | Europe, Mid-East—40.4% | | | | | | | | |
| | Belgium—0.3% | | | | | | | | |
| | Melexis N.V. (Semiconductors & semiconductor equipment) | | | 35,299 | | | $ | 2,655 | |
| | Warehouses De Pauw CVA (Equity REIT) | | | 22,215 | | | | 4,042 | |
| | | | | | | | | 6,697 | |
| | Denmark—4.8% | | | | | | | | |
| | Chr Hansen Holding A/S (Chemicals) | | | 88,154 | | | | 7,005 | |
| | Coloplast A/S Class “B” (Health care equipment & supplies) | | | 111,136 | | | | 13,786 | |
| | DSV PANALPINA A/S (Air freight & logistics) | | | 182,977 | | | | 21,089 | |
| * | Genmab A/S (Biotechnology) | | | 55,048 | | | | 12,242 | |
| | Novo Nordisk A/S Class “B” (Pharmaceuticals) | | | 351,566 | | | | 20,405 | |
| | Orsted A/S (Electric utilities) | | | 175,467 | | | | 18,147 | |
| | Royal Unibrew A/S (Beverages) | | | 51,003 | | | | 4,670 | |
| | Tryg A/S (Insurance) | | | 96,762 | | | | 2,869 | |
| | | | | | | | | 100,213 | |
| | Faroe Islands—0.2% | | | | | | | | |
| | Bakkafrost P/F (Food products) | | | 46,851 | | | | 3,469 | |
| | Finland—0.8% | | | | | | | | |
| | Neste Oyj (Oil, gas & consumable fuels) | | | 463,101 | | | | 16,114 | |
| | France—10.0% | | | | | | | | |
| | Airbus SE (Aerospace & defense) | | | 248,952 | | | | 36,436 | |
| | Alten S.A. (IT services) | | | 29,914 | | | | 3,775 | |
| | Capgemini SE (IT services) | | | 162,312 | | | | 19,827 | |
| | Dassault Systemes SE (Software) | | | 100,590 | | | | 16,535 | |
| | Hermes International (Textiles, apparel & luxury goods) | | | 10,511 | | | | 7,854 | |
| | Ipsen S.A. (Pharmaceuticals) | | | 31,921 | | | | 2,829 | |
| | Kering S.A. (Textiles, apparel & luxury goods) | | | 31,376 | | | | 20,596 | |
| | L’Oreal S.A. (Personal products) | | | 69,103 | | | | 20,463 | |
| | LVMH Moet Hennessy Louis Vuitton SE (Textiles, apparel & luxury goods) | | | 64,755 | | | | 30,086 | |
| | Orpea (Health care providers & services) | | | 45,510 | | | | 5,835 | |
| | Rubis SCA (Gas utilities) | | | 62,803 | | | | 3,857 | |
| | Safran S.A. (Aerospace & defense) | | | 167,224 | | | | 25,820 | |
| | Teleperformance (Professional services) | | | 44,951 | | | | 10,962 | |
| * | Worldline S.A. (IT services) | | | 72,817 | | | | 5,158 | |
| | | | | | | | | 210,033 | |
| | Germany—4.4% | | | | | | | | |
| | Carl Zeiss Meditec AG (Health care equipment & supplies) | | | 48,907 | | | | 6,237 | |
| | GRENKE AG (Diversified financial services) | | | 35,749 | | | | 3,699 | |
| | KION Group AG (Machinery) | | | 52,897 | | | | 3,653 | |
| | MTU Aero Engines AG (Aerospace & defense) | | | 83,823 | | | | 23,938 | |
| | Puma SE (Textiles, apparel & luxury goods) | | | 88,743 | | | | 6,804 | |
| * | QIAGEN N.V. (Life sciences tools & services)† | | | 127,325 | | | | 4,304 | |
| | SAP SE (Software) | | | 159,139 | | | | 21,478 | |
| | | | | | | | |
| | Issuer | | Shares | | | Value | |
| | | | | | | | | | |
| | Common Stocks—(continued) | | | | | | | | |
| | | | | | | | | | |
| | Europe, Mid-East—(continued) | | | | | | | | |
| | Germany—(continued) | | | | | | | | |
| * | TeamViewer AG (Software) | | | 171,878 | | | $ | 6,146 | |
| | Vonovia SE (Real estate management & development) | | | 314,508 | | | | 16,934 | |
| | | | | | | | | 93,193 | |
| | Ireland—1.7% | | | | | | | | |
| * | ICON plc (Life sciences tools & services)† | | | 72,988 | | | | 12,571 | |
| | Kerry Group plc Class “A” (Food products) | | | 97,283 | | | | 12,124 | |
| | Kingspan Group plc (Building products) | | | 196,318 | | | | 11,990 | |
| | | | | | | | | 36,685 | |
| | Israel—1.0% | | | | | | | | |
| * | Check Point Software Technologies, Ltd. (Software)† | | | 119,956 | | | | 13,310 | |
| * | CyberArk Software, Ltd. (Software)† | | | 22,256 | | | | 2,595 | |
| * | Wix.com, Ltd. (IT services)† | | | 42,351 | | | | 5,183 | |
| | | | | | | | | 21,088 | |
| | Italy—1.8% | | | | | | | | |
| | Amplifon SpA (Health care providers & services) | | | 165,183 | | | | 4,751 | |
| | Banca Generali SpA (Capital markets) | | | 147,550 | | | | 4,793 | |
| | Enel SpA (Electric utilities) | | | 1,385,781 | | | | 10,993 | |
| | Ferrari N.V. (Automobiles) | | | 63,198 | | | | 10,484 | |
| | Moncler SpA (Textiles, apparel & luxury goods) | | | 88,513 | | | | 3,978 | |
| | Technogym SpA (Leisure products) | | | 243,652 | | | | 3,168 | |
| | | | | | | | | 38,167 | |
| | Luxembourg—0.2% | | | | | | | | |
| | Tenaris S.A. (Energy equipment & services) | | | 392,605 | | | | 4,426 | |
| | Netherlands—4.3% | | | | | | | | |
| * | Adyen N.V. (IT services) | | | 13,772 | | | | 11,292 | |
| | ASML Holding N.V. (Semiconductors & semiconductor equipment) | | | 131,137 | | | | 38,789 | |
| * | Basic-Fit N.V. (Hotels, restaurants & leisure) | | | 66,782 | | | | 2,536 | |
| | Euronext N.V. (Capital markets) | | | 51,222 | | | | 4,174 | |
| | Koninklijke Philips N.V. (Health care equipment & supplies) | | | 363,034 | | | | 17,722 | |
| | Wolters Kluwer N.V. (Professional services) | | | 213,782 | | | | 15,592 | |
| | | | | | | | | 90,105 | |
| | Spain—1.7% | | | | | | | | |
| | ACS Actividades de Construccion y Servicios S.A. (Construction & engineering) | | | 278,161 | | | | 11,123 | |
| | Amadeus IT Group S.A. (IT services) | | | 313,332 | | | | 25,587 | |
| | | | | | | | | 36,710 | |
| | Sweden—4.1% | | | | | | | | |
| | AAK AB (Food products) | | | 147,339 | | | | 2,800 | |
| | Atlas Copco AB Class “A” (Machinery) | | | 856,710 | | | | 34,172 | |
| | Evolution Gaming Group AB (Hotels, restaurants & leisure) | | | 206,067 | | | | 6,204 | |
| | Fabege AB (Real estate management & development) | | | 265,119 | | | | 4,407 | |
See accompanying Notes to Financial Statements.
| 44 | Annual Report | December 31, 2019 |
International Growth Fund
Portfolio of Investments, December 31, 2019(all dollar amounts in thousands)
| | | | | | | | |
| | Issuer | | Shares | | | Value | |
| | | | | | | | | | |
| | Common Stocks—(continued) | | | | | | | | |
| | | | | | | | | | |
| | Europe, Mid-East—(continued) | | | | | | | | |
| | Sweden—(continued) | | | | | | | | |
| | Hexagon AB Class “B” (Electronic | | | | | | | | |
| | equipment, instruments & components) | | | 365,339 | | | $ | 20,478 | |
| | Indutrade AB (Trading companies & distributors) | | | 122,384 | | | | 4,380 | |
| | Lifco AB Class “B” (Industrial conglomerates) | | | 72,556 | | | | 4,431 | |
| | Nibe Industrier AB Class “B” (Building products) | | | 225,133 | | | | 3,903 | |
| | Nolato AB Class “B” (Industrial conglomerates) | | | 64,168 | | | | 3,768 | |
| | Vitrolife AB (Biotechnology) | | | 118,930 | | | | 2,508 | |
| | | | | | | | | 87,051 | |
| | Switzerland—5.1% | | | | | | | | |
| | Belimo Holding AG (Building products) | | | 426 | | | | 3,209 | |
| | Logitech International S.A. (Technology hardware, storage & peripherals) | | | 155,728 | | | | 7,374 | |
| * | Lonza Group AG (Life sciences tools & services) | | | 87,675 | | | | 31,997 | |
| | Partners Group Holding AG (Capital markets) | | | 20,414 | | | | 18,718 | |
| | Sika AG (Chemicals) | | | 132,965 | | | | 24,984 | |
| | Tecan Group AG (Life sciences tools & services) | | | 11,666 | | | | 3,279 | |
| * | Temenos AG (Software) | | | 79,875 | | | | 12,644 | |
| * | VAT Group AG (Machinery) | | | 30,793 | | | | 5,204 | |
| | | | | | | | | 107,409 | |
| | | | | | | | | | |
| | Emerging Asia—17.3% | | | | | | | | |
| | China—10.2% | | | | | | | | |
| | Aier Eye Hospital Group Co., Ltd. Class “A” (Health care providers & services) | | | 900,628 | | | | 5,115 | |
| * | Alibaba Group Holding, Ltd.—ADR (Internet & direct marketing retail) | | | 212,317 | | | | 45,032 | |
| | Centre Testing International Group Co., Ltd. Class “A” (Professional services) | | | 2,612,000 | | | | 5,591 | |
| * | China Mengniu Dairy Co., Ltd. (Food products) | | | 1,673,000 | | | | 6,763 | |
| | China Merchants Bank Co., Ltd. Class “H” (Banks) | | | 4,280,500 | | | | 22,000 | |
| | Country Garden Services Holdings Co., Ltd. (Commercial services & supplies) | | | 1,499,000 | | | | 5,050 | |
| | Huazhu Group, Ltd.—ADR (Hotels, restaurants & leisure) | | | 111,893 | | | | 4,484 | |
| | Kweichow Moutai Co., Ltd. Class “A” (Beverages) | | | 61,453 | | | | 10,437 | |
| | Li Ning Co., Ltd. (Textiles, apparel & luxury goods) | | | 3,406,000 | | | | 10,206 | |
| | NetEase, Inc.—ADR (Entertainment) | | | 52,133 | | | | 15,986 | |
| | Ping An Insurance Group Co. of China, Ltd. Class “H” (Insurance) | | | 2,343,000 | | | | 27,693 | |
| | Shenzhou International Group Holdings, Ltd. (Textiles, apparel & luxury goods) | | | 529,000 | | | | 7,732 | |
| * | TAL Education Group—ADR (Diversified consumer services) | | | 75,632 | | | | 3,645 | |
| | | | | | | | |
| | Issuer | | Shares | | | Value | |
| | | | | | | | | | |
| | Common Stocks—(continued) | | | | | | | | |
| | | | | | | | | | |
| | Emerging Asia—(continued) | | | | | | | | |
| | China—(continued) | | | | | | | | |
| | Tencent Holdings, Ltd. (Interactive Media & Services) | | | 873,200 | | | $ | 42,090 | |
| * | Tencent Music Entertainment Group—ADR (Entertainment) | | | 190,536 | | | | 2,237 | |
| | Vitasoy International Holdings, Ltd. (Food products) | | | 538,000 | | | | 1,950 | |
| | | | | | | | | 216,011 | |
| | India—1.9% | | | | | | | | |
| | HDFC Bank, Ltd. (Banks) | | | 555,870 | | | | 9,933 | |
| | Hexaware Technologies, Ltd. (IT services) | | | 482,354 | | | | 2,262 | |
| | Hindustan Unilever, Ltd. (Household products) | | | 102,823 | | | | 2,766 | |
| | Maruti Suzuki India, Ltd. (Automobiles) | | | 59,325 | | | | 6,126 | |
| | Pidilite Industries, Ltd. (Chemicals) | | | 183,813 | | | | 3,572 | |
| | Reliance Industries, Ltd. (Oil, gas & consumable fuels) | | | 485,139 | | | | 10,304 | |
| | Titan Co., Ltd. (Textiles, apparel & luxury goods) | | | 261,787 | | | | 4,364 | |
| | | | | | | | | 39,327 | |
| | Indonesia—1.2% | | | | | | | | |
| | PT Bank Central Asia Tbk (Banks) | | | 10,214,200 | | | | 24,593 | |
| | South Korea—0.5% | | | | | | | | |
| * | Kakao Corporation (Interactive Media & Services) | | | 34,714 | | | | 4,608 | |
| * | Samsung SDI Co., Ltd. (Electronic equipment, instruments & components) | | | 35,059 | | | | 7,154 | |
| | | | | | | | | 11,762 | |
| | Taiwan—3.1% | | | | | | | | |
| | Eclat Textile Co., Ltd. (Textiles, apparel & luxury goods) | | | 236,000 | | | | 3,173 | |
| | Globalwafers Co., Ltd. (Semiconductors & semiconductor equipment) | | | 301,000 | | | | 3,841 | |
| | MediaTek, Inc. (Semiconductors & semiconductor equipment) | | | 948,000 | | | | 14,025 | |
| | Taiwan Semiconductor Manufacturing Co., Ltd.—ADR (Semiconductors & semiconductor equipment) | | | 753,704 | | | | 43,790 | |
| | | | | | | | | 64,829 | |
| | Thailand—0.4% | | | | | | | | |
| | Airports of Thailand PCL (Transportation infrastructure) | | | 1,658,000 | | | | 4,110 | |
| | Tisco Financial Group PCL (Banks) | | | 1,290,400 | | | | 4,276 | |
| | | | | | | | | 8,386 | |
| | | | | | | | | | |
| | United Kingdom—13.6% | | | | | | | | |
| | 3i Group plc (Capital markets) | | | 619,826 | | | | 9,015 | |
| | Abcam plc (Biotechnology) | | | 157,858 | | | | 2,827 | |
| | Avast plc (Software) | | | 1,060,660 | | | | 6,362 | |
| | AVEVA Group plc (Software) | | | 121,334 | | | | 7,483 | |
| | Beazley plc (Insurance) | | | 626,322 | | | | 4,613 | |
| | Big Yellow Group plc (Equity REIT) | | | 305,292 | | | | 4,853 | |
| | Burford Capital, Ltd. (Capital markets) | | | 114,455 | | | | 1,079 | |
See accompanying Notes to Financial Statements.
| December 31, 2019 | William Blair Funds | 45 |
International Growth Fund
Portfolio of Investments, December 31, 2019(all dollar amounts in thousands)
| | | | | | | | |
| | Issuer | | Shares | | | Value | |
| | | | | | | | | | |
| | Common Stocks—(continued) | | | | | | | | |
| | | | | | | | | | |
| | United Kingdom—(continued) | | | | | | | | |
| | Compass Group plc (Hotels, restaurants & leisure) | | | 1,032,694 | | | $ | 25,853 | |
| | Croda International plc (Chemicals) | | | 126,286 | | | | 8,565 | |
| | Diageo plc (Beverages) | | | 568,418 | | | | 24,097 | |
| | Experian plc (Professional services) | | | 730,916 | | | | 24,708 | |
| | Fevertree Drinks plc (Beverages) | | | 112,554 | | | | 3,120 | |
| | Greggs plc (Hotels, restaurants & leisure) | | | 280,715 | | | | 8,545 | |
| | Halma plc (Electronic equipment, instruments & components) | | | 418,167 | | | | 11,721 | |
| | Hiscox, Ltd. (Insurance) | | | 379,150 | | | | 7,152 | |
| | Intermediate Capital Group plc (Capital markets) | | | 352,490 | | | | 7,517 | |
| | Intertek Group plc (Professional services) | | | 82,987 | | | | 6,433 | |
| | London Stock Exchange Group plc (Capital markets) | | | 206,136 | | | | 21,161 | |
| | Melrose Industries plc (Electrical equipment) | | | 3,188,478 | | | | 10,141 | |
| | RELX plc (Professional services) | | | 649,363 | | | | 16,390 | |
| | Renishaw plc (Electronic equipment, instruments & components) | | | 71,092 | | | | 3,548 | |
| | Rentokil Initial plc (Commercial services & supplies) | | | 2,000,119 | | | | 12,002 | |
| | Rotork plc (Machinery) | | | 1,125,209 | | | | 4,993 | |
| | Segro plc (Equity REIT) | | | 1,214,288 | | | | 14,431 | |
| | Softcat plc (IT services) | | | 242,672 | | | | 3,703 | |
| | Spirax-Sarco Engineering plc (Machinery) | | | 73,791 | | | | 8,689 | |
| | SSP Group plc (Hotels, restaurants & leisure) | | | 447,303 | | | | 3,851 | |
| | St James’s Place plc (Capital markets) | | | 639,106 | | | | 9,858 | |
| | The UNITE Group plc (Equity REIT) | | | 197,029 | | | | 3,288 | |
| | Victrex plc (Chemicals) | | | 168,413 | | | | 5,564 | |
| | WH Smith plc (Specialty retail) | | | 163,969 | | | | 5,647 | |
| | | | | | | | | 287,209 | |
| | | | | | | | | | |
| | Japan—12.7% | | | | | | | | |
| | Asahi Intecc Co., Ltd. (Health care equipment & supplies) | | | 334,200 | | | | 9,842 | |
| | Benefit One, Inc. (Professional services) | | | 226,100 | | | | 4,705 | |
| | Daikin Industries, Ltd. (Building products) | | | 144,900 | | | | 20,604 | |
| | Digital Arts, Inc. (Software) | | | 37,600 | | | | 1,931 | |
| | en-japan, Inc. (Professional services) | | | 62,800 | | | | 2,760 | |
| | GMO Payment Gateway, Inc. (IT services) | | | 57,800 | | | | 3,979 | |
| | Harmonic Drive Systems, Inc. (Machinery) | | | 95,900 | | | | 4,651 | |
| | Hoya Corporation (Health care equipment & supplies) | | | 268,700 | | | | 25,842 | |
| | Keyence Corporation (Electronic equipment, instruments & components) | | | 98,000 | | | | 34,716 | |
| | Meitec Corporation (Professional services) | | | 51,100 | | | | 2,892 | |
| | MISUMI Group, Inc. (Machinery) | | | 245,900 | | | | 6,160 | |
| | MonotaRO Co., Ltd. (Trading companies & distributors) | | | 155,000 | | | | 4,170 | |
| | Nihon M&A Center, Inc. (Professional services) | | | 183,800 | | | | 6,369 | |
| | Nitori Holdings Co., Ltd. (Specialty retail) | | | 25,000 | | | | 3,963 | |
| | Nitto Denko Corporation (Chemicals) | | | 139,700 | | | | 7,946 | |
| | | | | | | | |
| | Issuer | | Shares | | | Value | |
| | | | | | | | | | |
| | Common Stocks—(continued) | | | | | | | | |
| | | | | | | | | | |
| | Japan—(continued) | | | | | | | | |
| | Nomura Research Institute, Ltd. (IT services) | | | 434,000 | | | $ | 9,339 | |
| | NS Solutions Corporation (IT services) | | | 88,300 | | | | 2,926 | |
| | Omron Corporation (Electronic equipment, instruments & components) | | | 220,300 | | | | 13,017 | |
| | Persol Holdings Co., Ltd. (Professional services) | | | 212,400 | | | | 4,009 | |
| | Shimadzu Corporation (Electronic equipment, instruments & components) | | | 240,900 | | | | 7,627 | |
| | Shiseido Co., Ltd. (Personal products) | | | 262,400 | | | | 18,793 | |
| | SMC Corporation (Machinery) | | | 59,800 | | | | 27,678 | |
| | Sushiro Global Holdings, Ltd. (Hotels, restaurants & leisure) | | | 42,800 | | | | 3,691 | |
| | TechnoPro Holdings, Inc. (Professional services) | | | 84,200 | | | | 5,928 | |
| | Terumo Corporation (Health care equipment & supplies) | | | 539,100 | | | | 19,276 | |
| | TIS, Inc. (IT services) | | | 135,800 | | | | 8,036 | |
| | UT Group Co., Ltd. (Professional services) | | | 122,500 | | | | 3,709 | |
| | Zenkoku Hosho Co., Ltd. (Diversified financial services) | | | 84,300 | | | | 3,608 | |
| | | | | | | | | 268,167 | |
| | | | | | | | | | |
| | Canada—5.8% | | | | | | | | |
| | Alimentation Couche-Tard, Inc. Class “B” (Food & staples retailing) | | | 478,670 | | | | 15,191 | |
| | Brookfield Asset Management, Inc. Class “A” (Capital markets)† | | | 488,995 | | | | 28,264 | |
| | Canadian National Railway Co. (Road & rail) | | | 246,599 | | | | 22,308 | |
| | Canadian Pacific Railway, Ltd. (Road & rail)† | | | 68,404 | | | | 17,439 | |
| * | Lululemon Athletica, Inc. (Textiles, apparel & luxury goods) | | | 64,996 | | | | 15,058 | |
| | Parkland Fuel Corporation (Oil, gas & consumable fuels) | | | 83,232 | | | | 3,058 | |
| | The Toronto-Dominion Bank (Banks) | | | 313,759 | | | | 17,597 | |
| | Toromont Industries, Ltd. (Trading companies & distributors) | | | 58,694 | | | | 3,191 | |
| | | | | | | | | 122,106 | |
| | | | | | | | | | |
| | Asia—5.1% | | | | | | | | |
| | Australia—2.7% | | | | | | | | |
| | Aristocrat Leisure, Ltd. (Hotels, restaurants & leisure) | | | 374,089 | | | | 8,839 | |
| | CSL, Ltd. (Biotechnology) | | | 122,527 | | | | 23,711 | |
| | Goodman Group (Equity REIT) | | | 763,278 | | | | 7,161 | |
| | Macquarie Group, Ltd. (Capital markets) | | | 177,366 | | | | 17,158 | |
| | | | | | | | | 56,869 | |
| | Hong Kong—2.3% | | | | | | | | |
| | AIA Group, Ltd. (Insurance) | | | 3,496,600 | | | | 36,706 | |
| | Galaxy Entertainment Group, Ltd. (Hotels, restaurants & leisure) | | | 1,473,000 | | | | 10,850 | |
| | | | | | | | | 47,556 | |
See accompanying Notes to Financial Statements.
| 46 | Annual Report | December 31, 2019 |
International Growth Fund
Portfolio of Investments, December 31, 2019(all dollar amounts in thousands)
| | | | | | | | |
| | | | | | | | |
| | Issuer | | Shares | | | Value | |
| | | | | | | | | | |
| | Common Stocks—(continued) | | | | | | | | |
| | | | | | | | | | |
| | Asia—(continued) | | | | | | | | |
| | New Zealand—0.1% | | | | | | | | |
| | Auckland International Airport, Ltd. (Transportation infrastructure) | | | 455,967 | | | $ | 2,686 | |
| | | | | | | | | | |
| | Emerging Latin America—2.9% | | | | | | | | |
| | Argentina—0.2% | | | | | | | | |
| * | Globant S.A. (Software)† | | | 36,331 | | | | 3,853 | |
| | Brazil—1.9% | | | | | | | | |
| | B3 S.A.-Brasil Bolsa Balcao (Capital markets) | | | 810,500 | | | | 8,658 | |
| | CVC Brasil Operadora e Agencia de Viagens S.A. (Hotels, restaurants & leisure) | | | 235,100 | | | | 2,560 | |
| | IRB Brasil Resseguros S.A. (Insurance) | | | 628,300 | | | | 6,083 | |
| | Localiza Rent a Car S.A. (Road & rail) | | | 415,695 | | | | 4,899 | |
| | Lojas Renner S.A. (Multiline retail) | | | 325,400 | | | | 4,545 | |
| | Magazine Luiza S.A. (Multiline retail) | | | 560,500 | | | | 6,646 | |
| | Notre Dame Intermedica Participacoes S.A. (Health care providers & services) | | | 428,300 | | | | 7,267 | |
| | | | | | | | | 40,658 | |
| | Mexico—0.2% | | | | | | | | |
| | Grupo Aeroportuario del Sureste S.A.B. de C.V.—ADR (Transportation infrastructure) | | | 22,154 | | | | 4,152 | |
| | Peru—0.6% | | | | | | | | |
| | Credicorp, Ltd. (Banks)† | | | 55,164 | | | | 11,757 | |
| | | | | | |
| | Emerging Europe, Mid-East, Africa—1.0% | | | | |
| | Russia—0.4% | | | | | | | | |
| * | Yandex N.V. Class “A” (Interactive Media & Services)† | | | 213,599 | | | | 9,289 | |
| | South Africa—0.4% | | | | | | | | |
| | Bid Corporation, Ltd. (Food & staples retailing) | | | 141,553 | | | | 3,337 | |
| | Bidvest Group, Ltd. (Industrial conglomerates) | | | 141,553 | | | | 2,070 | |
| | Mr. Price Group, Ltd. (Specialty retail) | | | 190,081 | | | | 2,477 | |
| | | | | | | | | 7,884 | |
| | United Arab Emirates—0.2% | | | | | | | | |
| | First Abu Dhabi Bank PJSC (Banks) | | | 1,119,495 | | | | 4,620 | |
| | Total Common Stocks—98.8%
(cost $1,538,118) | | | | | | | 2,083,074 | |
| | | | | | | | |
| | Issuer | | Principal
Amount | | | Value | |
| | | | | | | | | | |
| | Repurchase Agreement | | | | | | | | |
| | Fixed Income Clearing Corporation, 0.120% dated 12/31/19, due 1/2/20, repurchase price $18,733, collateralized by U.S. Treasury Bond, 2.500%, due 5/15/46 valued at $19,108 | | | $18,733 | | | $ | 18,733 | |
| | Total Repurchase Agreement—0.9%
(cost $18,733) | | | | | | | 18,733 | |
| | Total Investments—99.7%
(cost $1,556,851) | | | | | | | 2,101,807 | |
| | Cash and other assets, less liabilities—0.3% | | | | | | | 7,252 | |
| | Net assets—100.0% | | | | | | $ | 2,109,059 | |
ADR = American Depository Receipt
REIT = Real Estate Investment Trust
* = Non-income producing security
† = U.S. listed foreign security
For securities primarily traded on exchanges or markets that close before the close of regular trading on the New York Stock Exchange, the Fund may use an independent pricing service to fair value price the securities pursuant to Valuation Procedures approved by the Board of Trustees.
At December 31, 2019, the Fund’s Portfolio of Investments includes the following industry categories (as a percentage of long-term investments):
| Industrials | | | 22.5 | % |
| Information Technology | | | 19.3 | % |
| Financials | | | 15.2 | % |
| Consumer Discretionary | | | 13.4 | % |
| Health Care | | | 11.2 | % |
| Consumer Staples | | | 6.2 | % |
| Communication Services | | | 3.6 | % |
| Materials | | | 2.8 | % |
| Real Estate | | | 2.6 | % |
| Energy | | | 1.6 | % |
| Utilities | | | 1.6 | % |
| Total | | | 100.0 | % |
At December 31, 2019, the Fund’s Portfolio of Investments includes the following currency categories (as a percentage of long-term investments):
| Euro | | | 24.7 | % |
| British Pound Sterling | | | 13.8 | % |
| Japanese Yen | | | 12.9 | % |
| U.S. Dollar | | | 11.7 | % |
| Hong Kong Dollar | | | 8.2 | % |
| Swiss Franc | | | 5.2 | % |
| Danish Krone | | | 4.8 | % |
| Swedish Krona | | | 4.2 | % |
| Canadian Dollar | | | 2.9 | % |
| Australian Dollar | | | 2.7 | % |
| Brazilian Real | | | 1.9 | % |
| Indian Rupee | | | 1.9 | % |
| Indonesian Rupiah | | | 1.2 | % |
| Yuan Renminbi | | | 1.0 | % |
| New Taiwan Dollar | | | 1.0 | % |
| All Other Currencies | | | 1.9 | % |
| Total | | | 100.0 | % |
See accompanying Notes to Financial Statements.
| December 31, 2019 | William Blair Funds | 47 |
| | Institutional International Growth Fund |
| | |
| | The Institutional International Growth Fund seeks long-term capital appreciation. |
| | |
| | AN OVERVIEW FROM THE PORTFOLIO MANAGERS |
| | |

Simon Fennell 
Kenneth J. McAtamney | The William Blair Institutional International Growth Fund posted a 30.75% increase, net of fees, for the twelve months ended December 31, 2019. By comparison, the Fund’s benchmark index, the MSCI All Country World ex-U.S. IMI (net) (the “Index”), increased 21.63%. Calendar year outperformance versus the Index was primarily driven by positive stock selection across most sectors. The Industrials, Financials and Consumer Discretionary sectors were the most significant sources of relative return. Within Industrials, Airbus and MTU Aero Engines helped relative returns. Airbus’s transition to the next generation of aircrafts (which pressured earnings and cash flows at the company over the last several years) has largely concluded, leaving the company in a favorable position where investment is moderating and profitability is poised to improve. Civil passenger traffic growing at more than two times GDP, strong airline load factors and replacement demand have resulted in backlogs that are well diversified by airline and geography. MTU is one of the world’s largest manufacturers of aircraft engine modules with an installed base of 22,000 aircraft, which is approximately 34% of the global non-military aircraft fleet. Its profit growth in 2019 was driven by its spare parts activity, which generates most of its earnings. As secular growth in air traffic increases, demand for spare parts and maintenance, repair and operations services (MRO) will naturally follow. London Stock Exchange (LSE), within Financials, was an additional source of outperformance. LSE’s share price appreciated on the back of strong operating results and the announcement of the Refinitiv acquisition during the summer. The acquisition is a transformational deal that accelerates the strategy to be a leading global financial market infrastructure provider. The strategic rationale includes increasing recurring revenue streams, strengthening its data offering and bolstering its trading platforms by adding currency and fixed income asset classes. The deal also strengthens LSE’s regional diversification by increasing the importance of North America and Emerging Markets. Within the Consumer Discretionary sector, Li Ning boosted relative results. Li Ning sells footwear, apparel, equipment and accessories for professional and leisure purposes, primarily under the LI-NING brand. The company is in its fifth year of a major turnaround with growth from here most likely driven by margin expansion. Margins are low but trending up with good visibility due to cost controls, including a step down in endorsement expenses. Overall, the spending environment is supportive and Li Ning is making significant strides in strengthening its execution capabilities in e-commerce and new product development. Partially offsetting these effects was below average stock selection within the Information Technology sector. Hampering relative results within Information Technology was the integrated payment service provider Wirecard, and Digital Arts, an enterprise security software company based in Japan. Wirecard was sold from the portfolio in Q1 after concerns were raised regarding its internal controls and quality of recent acquisitions. Digital Arts weighed on returns due to recent quarterly results that failed to meet consensus expectations. We believe the company remains well positioned in the Japanese enterprise security software space, which continues to lag global standards for security. Recent new product launches, project wins and higher pricing trends are all supportive of structurally higher adoption of security software in Japan, and we maintained the position throughout the year. Please refer to the Global Markets Review and Outlook relating to the Fund beginning on page 32. |
| 48 | Annual Report | December 31, 2019 |
Institutional International Growth Fund
Performance Highlights (Unaudited)
| Average Annual Total Return through 12/31/2019 |
| | | 1 Year | | 3 Year | | 5 Year | | 10 Year |
| Institutional | | | | | | | | | | | | | | | | |
| International Growth Fund | | | 30.75 | % | | | 11.79 | % | | | 6.42 | % | | | 7.35 | % |
| MSCI ACW Ex-U.S. IMI (net) | | | 21.63 | | | | 9.84 | | | | 5.71 | | | | 5.21 | |
Performance cited represents past performance. Past performance does not guarantee future results and current performance may be lower or higher than the data quoted. Results shown are average annual returns, which assume reinvestment of dividends and capital gains. Investment returns and principal will fluctuate and you may have a gain or loss when you sell shares. For the most current month-end performance information, please call 1-800-742-7272, or visit our Web site atwww.williamblairfunds.com. From time to time, the investment adviser may waive fees or reimburse expenses for the Fund. Without these waivers/reimbursements, performance would be lower. Investing in smaller and medium capitalization companies involves special risks, including higher volatility and lower liquidity. Smaller and medium capitalization stocks are also more sensitive to purchase/sale transactions and changes in the issuer’s financial condition. International investing involves special risk considerations, including currency fluctuations, lower liquidity, economic and political risk. Shares of the Fund are not subject to a sales load, distribution (Rule 12b-1) fees, or sub-transfer agent fees.
The performance highlights and graph presented above do not reflect the deduction of taxes that a shareholder would pay on fund distributions or the redemption of fund shares.
The Morgan Stanley Capital International (MSCI) All Country World (ACW) Ex-U.S. Investable Market Index (IMI) (net) is a free float-adjusted market capitalization weighted index that is designed to measure the equity market performance of developed and emerging markets, excluding the United States. This index approximates the minimum possible dividend reinvestment by deducting for the highest possible withholding tax rates of those markets.
This report identifies the Fund’s investments on December 31, 2019. These holdings are subject to change. Not all stocks in the Fund performed the same, nor is there any guarantee that these stocks will perform as well in the future. Market forecasts provided in this report may not necessarily come to pass.
Sector Diversification (Unaudited)

The sector diversification shown is based on the total long-term securities.
| December 31, 2019 | William Blair Funds | 49 |
Institutional International Growth Fund
Portfolio of Investments, December 31, 2019(all dollar amounts in thousands)
| | | | | | | | |
| | Issuer | | Shares | | | Value | |
| | | | | | | | |
| | Common Stocks | | | | | | | | |
| | | | | | | | | | |
| | Europe, Mid-East—40.1% | | | | | | | | |
| | Belgium—0.3% | | | | | | | | |
| | Melexis N.V. (Semiconductors & semiconductor equipment) | | | 31,632 | | | $ | 2,379 | |
| | Warehouses De Pauw CVA (Equity REIT) | | | 19,907 | | | | 3,622 | |
| | | | | | | | | 6,001 | |
| | Denmark—4.7% | | | | | | | | |
| | Chr Hansen Holding A/S (Chemicals) | | | 78,362 | | | | 6,227 | |
| | Coloplast A/S Class “B” (Health care equipment & supplies) | | | 98,791 | | | | 12,255 | |
| | DSV PANALPINA A/S (Air freight & logistics) | | | 162,653 | | | | 18,746 | |
| * | Genmab A/S (Biotechnology) | | | 48,934 | | | | 10,882 | |
| | Novo Nordisk A/S Class “B” (Pharmaceuticals) | | | 312,516 | | | | 18,138 | |
| | Orsted A/S (Electric utilities) | | | 155,977 | | | | 16,132 | |
| | Royal Unibrew A/S (Beverages) | | | 45,338 | | | | 4,152 | |
| | Tryg A/S (Insurance) | | | 86,014 | | | | 2,550 | |
| | | | | | | | | 89,082 | |
| | Faroe Islands—0.2% | | | | | | | | |
| | Bakkafrost P/F (Food products) | | | 41,647 | | | | 3,083 | |
| | Finland—0.8% | | | | | | | | |
| | Neste Oyj (Oil, gas & consumable fuels) | | | 411,663 | | | | 14,324 | |
| | France—9.9% | | | | | | | | |
| | Airbus SE (Aerospace & defense) | | | 223,085 | | | | 32,650 | |
| | Alten S.A. (IT services) | | | 26,806 | | | | 3,383 | |
| | Capgemini SE (IT services) | | | 145,447 | | | | 17,767 | |
| | Dassault Systemes SE (Software) | | | 90,139 | | | | 14,817 | |
| | Hermes International (Textiles, apparel & luxury goods) | | | 9,419 | | | | 7,039 | |
| | Ipsen S.A. (Pharmaceuticals) | | | 28,604 | | | | 2,535 | |
| | Kering S.A. (Textiles, apparel & luxury goods) | | | 28,116 | | | | 18,456 | |
| | L’Oreal S.A. (Personal products) | | | 61,923 | | | | 18,337 | |
| | LVMH Moet Hennessy Louis Vuitton SE (Textiles, apparel & luxury goods) | | | 58,027 | | | | 26,960 | |
| | Orpea (Health care providers & services) | | | 40,781 | | | | 5,228 | |
| | Rubis SCA (Gas utilities) | | | 56,278 | | | | 3,456 | |
| | Safran S.A. (Aerospace & defense) | | | 149,849 | | | | 23,137 | |
| | Teleperformance (Professional services) | | | 40,281 | | | | 9,823 | |
| * | Worldline S.A. (IT services) | | | 65,251 | | | | 4,622 | |
| | | | | | | | | 188,210 | |
| | Germany—4.4% | | | | | | | | |
| | Carl Zeiss Meditec AG (Health care equipment & supplies) | | | 43,474 | | | | 5,544 | |
| | GRENKE AG (Diversified financial services) | | | 31,778 | | | | 3,288 | |
| | KION Group AG (Machinery) | | | 47,022 | | | | 3,247 | |
| | MTU Aero Engines AG (Aerospace & defense) | | | 74,512 | | | | 21,279 | |
| | Puma SE (Textiles, apparel & luxury goods) . | | | 78,886 | | | | 6,048 | |
| * | QIAGEN N.V. (Life sciences tools & services)† | | | 113,183 | | | | 3,826 | |
| | SAP SE (Software) | | | 141,463 | | | | 19,092 | |
| | | | | | | | | | |
| | Issuer | | Shares | | | Value | |
| | | | | | | | |
| | Common Stocks—(continued) | | | | | | | | |
| | | | | | | | | | |
| | Europe, Mid-East—(continued) | | | | | | | | |
| | Germany—(continued) | | | | | | | | |
| * | TeamViewer AG (Software) | | | 152,787 | | | $ | 5,464 | |
| | Vonovia SE (Real estate management & development) | | | 279,574 | | | | 15,053 | |
| | | | | | | | | 82,841 | |
| | Ireland—1.7% | | | | | | | | |
| * | ICON plc (Life sciences tools & services)† | | | 65,404 | | | | 11,264 | |
| | Kerry Group plc Class “A” (Food products) | | | 87,175 | | | | 10,864 | |
| | Kingspan Group plc (Building products) | | | 175,920 | | | | 10,745 | |
| | | | | | | | | 32,873 | |
| | Israel—1.0% | | | | | | | | |
| * | Check Point Software Technologies, Ltd. (Software)† | | | 107,492 | | | | 11,927 | |
| * | CyberArk Software, Ltd. (Software)† | | | 19,943 | | | | 2,325 | |
| * | Wix.com, Ltd. (IT services)† | | | 37,950 | | | | 4,645 | |
| | | | | | | | | 18,897 | |
| | Italy—1.8% | | | | | | | | |
| | Amplifon SpA (Health care providers & services) | | | 146,836 | | | | 4,223 | |
| | Banca Generali SpA (Capital markets) | | | 131,161 | | | | 4,261 | |
| | Enel SpA (Electric utilities) | | | 1,231,857 | | | | 9,772 | |
| | Ferrari N.V. (Automobiles) | | | 56,178 | | | | 9,320 | |
| | Moncler SpA (Textiles, apparel & luxury goods) | | | 78,682 | | | | 3,536 | |
| | Technogym SpA (Leisure products) | | | 216,589 | | | | 2,816 | |
| | | | | | | | | 33,928 | |
| | Luxembourg—0.2% | | | | | | | | |
| | Tenaris S.A. (Energy equipment & services) | | | 348,996 | | | | 3,934 | |
| | Netherlands—4.3% | | | | | | | | |
| * | Adyen N.V. (IT services) | | | 12,341 | | | | 10,119 | |
| | ASML Holding N.V. (Semiconductors & semiconductor equipment) | | | 117,511 | | | | 34,759 | |
| * | Basic-Fit N.V. (Hotels, restaurants & leisure) | | | 59,382 | | | | 2,255 | |
| | Euronext N.V. (Capital markets) | | | 45,900 | | | | 3,740 | |
| | Koninklijke Philips N.V. (Health care equipment & supplies) | | | 325,314 | | | | 15,881 | |
| | Wolters Kluwer N.V. (Professional services) | | | 191,570 | | | | 13,972 | |
| | | | | | | | | 80,726 | |
| | Spain—1.7% | | | | | | | | |
| | ACS Actividades de Construccion y Servicios S.A. (Construction & engineering) | | | 249,259 | | | | 9,968 | |
| | Amadeus IT Group S.A. (IT services) | | | 280,776 | | | | 22,928 | |
| | | | | | | | | 32,896 | |
| | Sweden—4.1% | | | | | | | | |
| | AAK AB (Food products) | | | 130,973 | | | | 2,489 | |
| | Atlas Copco AB Class “A” (Machinery) | | | 761,552 | | | | 30,376 | |
| | Evolution Gaming Group AB (Hotels, restaurants & leisure) | | | 183,178 | | | | 5,515 | |
| | Fabege AB (Real estate management & development) | | | 235,671 | | | | 3,918 | |
| | Hexagon AB Class “B” (Electronic equipment, instruments & components) | | | 324,759 | | | | 18,203 | |
See accompanying Notes to Financial Statements.
| 50 | Annual Report | December 31, 2019 |
Institutional International Growth Fund
Portfolio of Investments, December 31, 2019(all dollar amounts in thousands)
| | | | | | | | |
| | Issuer | | Shares | | | Value | |
| | | | | | | | |
| | Common Stocks—(continued) | | | | | | | | |
| | | | | | | | | | |
| | Europe, Mid-East—(continued) | | | | | | | | |
| | Sweden—(continued) | | | | | | | | |
| | Indutrade AB (Trading companies & distributors) | | | 108,791 | | | $ | 3,893 | |
| | Lifco AB Class “B” (Industrial conglomerates) | | | 64,497 | | | | 3,939 | |
| | Nibe Industrier AB Class “B” (Building products) | | | 200,126 | | | | 3,470 | |
| | Nolato AB Class “B” (Industrial conglomerates) | | | 57,041 | | | | 3,350 | |
| | Vitrolife AB (Biotechnology) | | | 105,720 | | | | 2,229 | |
| | | | | | | | | 77,382 | |
| | Switzerland—5.0% | | | | | | | | |
| | Belimo Holding AG (Building products) | | | 379 | | | | 2,855 | |
| | Logitech International S.A. (Technology hardware, storage & peripherals) | | | 138,431 | | | | 6,555 | |
| * | Lonza Group AG (Life sciences tools & services) | | | 77,937 | | | | 28,443 | |
| | Partners Group Holding AG (Capital markets) | | | 18,146 | | | | 16,639 | |
| | Sika AG (Chemicals) | | | 118,196 | | | | 22,209 | |
| | Tecan Group AG (Life sciences tools & services) | | | 10,370 | | | | 2,914 | |
| * | Temenos AG (Software) | | | 71,003 | | | | 11,240 | |
| * | VAT Group AG (Machinery) | | | 27,373 | | | | 4,626 | |
| | | | | | | | | 95,481 | |
| | | | | | | | | | |
| | Emerging Asia—17.3% | | | | | | | | |
| | China—10.2% | | | | | | | | |
| | Aier Eye Hospital Group Co., Ltd. Class “A” (Health care providers & services) | | | 807,100 | | | | 4,584 | |
| * | Alibaba Group Holding, Ltd.—ADR (Internet & direct marketing retail) | | | 190,257 | | | | 40,353 | |
| | Centre Testing International Group Co., Ltd. Class “A” (Professional services) | | | 2,340,600 | | | | 5,010 | |
| * | China Mengniu Dairy Co., Ltd. (Food products) | | | 1,499,000 | | | | 6,060 | |
| | China Merchants Bank Co., Ltd. Class “H” (Banks) | | | 3,836,000 | | | | 19,716 | |
| | Country Garden Services Holdings Co., Ltd. (Commercial services & supplies) | | | 1,343,000 | | | | 4,524 | |
| | Huazhu Group, Ltd.—ADR (Hotels, restaurants & leisure) | | | 100,268 | | | | 4,018 | |
| | Kweichow Moutai Co., Ltd. Class “A” (Beverages) | | | 55,017 | | | | 9,344 | |
| | Li Ning Co., Ltd. (Textiles, apparel & luxury goods) | | | 3,052,000 | | | | 9,145 | |
| | NetEase, Inc.—ADR (Entertainment) | | | 46,716 | | | | 14,325 | |
| | Ping An Insurance Group Co. of China, Ltd. Class “H” (Insurance) | | | 2,099,500 | | | | 24,815 | |
| | Shenzhou International Group Holdings, Ltd. (Textiles, apparel & luxury goods) | | | 473,900 | | | | 6,927 | |
| * | TAL Education Group—ADR (Diversified consumer services) | | | 67,558 | | | | 3,256 | |
| | Tencent Holdings, Ltd. (Interactive Media & Services) | | | 782,500 | | | | 37,718 | |
| | | | | | | | |
| | Issuer | | Shares | | | Value | |
| | | | | | | | |
| | Common Stocks—(continued) | | | | | | | | |
| | | | | | | | | | |
| | Emerging Asia—(continued) | | | | | | | | |
| | China—(continued) | | | | | | | | |
| * | Tencent Music Entertainment Group—ADR (Entertainment) | | | 170,739 | | | $ | 2,004 | |
| | Vitasoy International Holdings, Ltd. (Food products) | | | 482,000 | | | | 1,747 | |
| | | | | | | | | 193,546 | |
| | India—1.9% | | | | | | | | |
| | HDFC Bank, Ltd. (Banks) | | | 498,114 | | | | 8,901 | |
| | Hexaware Technologies, Ltd. (IT services) | | | 432,236 | | | | 2,027 | |
| | Hindustan Unilever, Ltd. (Household products) | | | 91,402 | | | | 2,459 | |
| | Maruti Suzuki India, Ltd. (Automobiles) | | | 53,161 | | | | 5,489 | |
| | Pidilite Industries, Ltd. (Chemicals) | | | 164,714 | | | | 3,201 | |
| | Reliance Industries, Ltd. (Oil, gas & consumable fuels) | | | 432,038 | | | | 9,176 | |
| | Titan Co., Ltd. (Textiles, apparel & luxury goods) | | | 234,587 | | | | 3,911 | |
| | | | | | | | | 35,164 | |
| | Indonesia—1.2% | | | | | | | | |
| | PT Bank Central Asia Tbk (Banks) | | | 9,079,706 | | | | 21,861 | |
| | South Korea—0.5% | | | | | | | | |
| * | Kakao Corporation (Interactive Media & Services) | | | 30,859 | | | | 4,096 | |
| * | Samsung SDI Co., Ltd. (Electronic equipment, instruments & components) | | | 31,164 | | | | 6,360 | |
| | | | | | | | | 10,456 | |
| | Taiwan—3.1% | | | | | | | | |
| | Eclat Textile Co., Ltd. (Textiles, apparel & luxury goods) | | | 211,000 | | | | 2,837 | |
| | Globalwafers Co., Ltd. (Semiconductors & semiconductor equipment) | | | 269,000 | | | | 3,432 | |
| | MediaTek, Inc. (Semiconductors & semiconductor equipment) | | | 849,000 | | | | 12,561 | |
| | Taiwan Semiconductor Manufacturing Co., Ltd.—ADR (Semiconductors & semiconductor equipment) | | | 675,393 | | | | 39,240 | |
| | | | | | | | | 58,070 | |
| | Thailand—0.4% | | | | | | | | |
| | Airports of Thailand PCL (Transportation infrastructure) | | | 1,473,900 | | | | 3,654 | |
| | Tisco Financial Group PCL (Banks) | | | 1,147,000 | | | | 3,800 | |
| | | | | | | | | 7,454 | |
| | | | | | | | | | |
| | United Kingdom—13.6% | | | | | | | | |
| | 3i Group plc (Capital markets) | | | 555,425 | | | | 8,078 | |
| | Abcam plc (Biotechnology) | | | 141,456 | | | | 2,533 | |
| | Avast plc (Software) | | | 950,455 | | | | 5,701 | |
| | AVEVA Group plc (Software) | | | 108,727 | | | | 6,706 | |
| | Beazley plc (Insurance) | | | 561,246 | | | | 4,133 | |
| | Big Yellow Group plc (Equity REIT) | | | 273,571 | | | | 4,348 | |
| | Burford Capital, Ltd. (Capital markets) | | | 102,563 | | | | 967 | |
| | Compass Group plc (Hotels, restaurants & leisure) | | | 925,395 | | | | 23,167 | |
| | Croda International plc (Chemicals) | | | 113,164 | | | | 7,675 | |
See accompanying Notes to Financial Statements.
| December 31, 2019 | William Blair Funds | 51 |
Institutional International Growth Fund
Portfolio of Investments, December 31, 2019(all dollar amounts in thousands)
| | | | | | | | |
| | Issuer | | Shares | | | Value | |
| | | | | | | | |
| | Common Stocks—(continued) | | | | | | | | |
| | | | | | | | | | |
| | United Kingdom—(continued) | | | | | | | | |
| | Diageo plc (Beverages) | | | 509,359 | | | $ | 21,594 | |
| | Experian plc (Professional services) | | | 654,972 | | | | 22,140 | |
| | Fevertree Drinks plc (Beverages) | | | 100,859 | | | | 2,796 | |
| | Greggs plc (Hotels, restaurants & leisure) | | | 251,548 | | | | 7,657 | |
| | Halma plc (Electronic equipment, instruments & components) | | | 374,718 | | | | 10,503 | |
| | Hiscox, Ltd. (Insurance) | | | 339,755 | | | | 6,409 | |
| | Intermediate Capital Group plc (Capital markets) | | | 315,865 | | | | 6,736 | |
| | Intertek Group plc (Professional services) | | | 74,364 | | | | 5,764 | |
| | London Stock Exchange Group plc (Capital markets) | | | 184,718 | | | | 18,962 | |
| | Melrose Industries plc (Electrical equipment) | | | 2,857,190 | | | | 9,087 | |
| | RELX plc (Professional services) | | | 581,893 | | | | 14,687 | |
| | Renishaw plc (Electronic equipment, instruments & components) | | | 63,705 | | | | 3,180 | |
| | Rentokil Initial plc (Commercial services & supplies) | | | 1,792,303 | | | | 10,755 | |
| | Rotork plc (Machinery) | | | 1,008,298 | | | | 4,474 | |
| | Segro plc (Equity REIT) | | | 1,088,121 | | | | 12,932 | |
| | Softcat plc (IT services) | | | 217,458 | | | | 3,318 | |
| | Spirax-Sarco Engineering plc (Machinery) | | | 66,124 | | | | 7,787 | |
| | SSP Group plc (Hotels, restaurants & leisure) | | | 400,827 | | | | 3,451 | |
| | St James’s Place plc (Capital markets) | | | 572,702 | | | | 8,834 | |
| | The UNITE Group plc (Equity REIT) | | | 176,557 | | | | 2,947 | |
| | Victrex plc (Chemicals) | | | 150,915 | | | | 4,986 | |
| | WH Smith plc (Specialty retail) | | | 146,932 | | | | 5,060 | |
| | | | | | | | | 257,367 | |
| | | | | | | | | | |
| | Japan—12.6% | | | | | | | | |
| | Asahi Intecc Co., Ltd. (Health care equipment & supplies) | | | 297,100 | | | | 8,750 | |
| | Benefit One, Inc. (Professional services) | | | 201,000 | | | | 4,183 | |
| | Daikin Industries, Ltd. (Building products) | | | 128,800 | | | | 18,315 | |
| | Digital Arts, Inc. (Software) | | | 33,400 | | | | 1,715 | |
| | en-japan, Inc. (Professional services) | | | 55,900 | | | | 2,457 | |
| | GMO Payment Gateway, Inc. (IT services) | | | 51,400 | | | | 3,539 | |
| | Harmonic Drive Systems, Inc. (Machinery) | | | 85,300 | | | | 4,137 | |
| | Hoya Corporation (Health care equipment & supplies) | | | 238,900 | | | | 22,976 | |
| | Keyence Corporation (Electronic equipment, instruments & components) | | | 87,100 | | | | 30,854 | |
| | Meitec Corporation (Professional services) | | | 45,400 | | | | 2,570 | |
| | MISUMI Group, Inc. (Machinery) | | | 218,600 | | | | 5,476 | |
| | MonotaRO Co., Ltd. (Trading companies & distributors) | | | 137,800 | | | | 3,707 | |
| | Nihon M&A Center, Inc. (Professional services) | | | 163,400 | | | | 5,662 | |
| | Nitori Holdings Co., Ltd. (Specialty retail) | | | 22,500 | | | | 3,567 | |
| | Nitto Denko Corporation (Chemicals) | | | 124,200 | | | | 7,064 | |
| | Nomura Research Institute, Ltd. (IT services) | | | 385,800 | | | | 8,302 | |
| | NS Solutions Corporation (IT services) | | | 78,500 | | | | 2,601 | |
| | | | | | | | |
| | Issuer | | Shares | | | Value | |
| | | | | | | | |
| | Common Stocks—(continued) | | | | | | | | |
| | | | | | | | | | |
| | Japan—(continued) | | | | | | | | |
| | Omron Corporation (Electronic equipment, instruments & components) | | | 195,800 | | | $ | 11,569 | |
| | Persol Holdings Co., Ltd. (Professional services) | | | 188,800 | | | | 3,564 | |
| | Shimadzu Corporation (Electronic equipment, instruments & components) | | | 214,100 | | | | 6,778 | |
| | Shiseido Co., Ltd. (Personal products) | | | 233,200 | | | | 16,702 | |
| | SMC Corporation (Machinery) | | | 53,200 | | | | 24,623 | |
| | Sushiro Global Holdings, Ltd. (Hotels, restaurants & leisure) | | | 38,100 | | | | 3,286 | |
| | TechnoPro Holdings, Inc. (Professional services) | | | 74,800 | | | | 5,266 | |
| | Terumo Corporation (Health care equipment & supplies) | | | 480,500 | | | | 17,180 | |
| | TIS, Inc. (IT services) | | | 120,700 | | | | 7,143 | |
| | UT Group Co., Ltd. (Professional services) | | | 108,900 | | | | 3,297 | |
| | Zenkoku Hosho Co., Ltd. (Diversified financial services) | | | 75,000 | | | | 3,210 | |
| | | | | | | | | 238,493 | |
| | | | | | | | | | |
| | Canada—5.8% | | | | | | | | |
| | Alimentation Couche-Tard, Inc. Class “B” (Food & staples retailing) | | | 428,935 | | | | 13,613 | |
| | Brookfield Asset Management, Inc. Class “A” (Capital markets)† | | | 438,188 | | | | 25,327 | |
| | Canadian National Railway Co. (Road & rail) | | | 220,977 | | | | 19,990 | |
| | Canadian Pacific Railway, Ltd. (Road & rail)† | | | 61,297 | | | | 15,628 | |
| * | Lululemon Athletica, Inc. (Textiles, apparel & luxury goods) | | | 58,243 | | | | 13,493 | |
| | Parkland Fuel Corporation (Oil, gas & consumable fuels) | | | 74,584 | | | | 2,740 | |
| | The Toronto-Dominion Bank (Banks) | | | 281,158 | | | | 15,769 | |
| | Toromont Industries, Ltd. (Trading companies & distributors) | | | 52,596 | | | | 2,859 | |
| | | | | | | | | 109,419 | |
| | | | | | | | | | |
| | Asia—5.1% | | | | | | | | |
| | Australia—2.7% | | | | | | | | |
| | Aristocrat Leisure, Ltd. (Hotels, restaurants & leisure) | | | 335,220 | | | | 7,921 | |
| | CSL, Ltd. (Biotechnology) | | | 109,796 | | | | 21,247 | |
| | Goodman Group (Equity REIT) | | | 683,972 | | | | 6,417 | |
| | Macquarie Group, Ltd. (Capital markets) | | | 158,938 | | | | 15,375 | |
| | | | | | | | | 50,960 | |
| | Hong Kong—2.3% | | | | | | | | |
| | AIA Group, Ltd. (Insurance) | | | 3,133,263 | | | | 32,892 | |
| | Galaxy Entertainment Group, Ltd. (Hotels, restaurants & leisure) | | | 1,320,000 | | | | 9,723 | |
| | | | | | | | | 42,615 | |
See accompanying Notes to Financial Statements.
| 52 | Annual Report | December 31, 2019 |
Institutional International Growth Fund
Portfolio of Investments, December 31, 2019(all dollar amounts in thousands)
| | | | | |
| | | | | |
| | Issuer | | Shares | | | Value | |
| | | | | |
| | Common Stocks—(continued) | | | | | | | | |
| | | | | | | | | | |
| | Asia—(continued) | | | | | | | | |
| | New Zealand—0.1% | | | | | | | | |
| | Auckland International Airport, Ltd. (Transportation infrastructure) | | | 408,591 | | | $ | 2,407 | |
| | | | | | | | | | |
| | Emerging Latin America—2.8% | | | | | | | | |
| | Argentina—0.2% | | | | | | | | |
| * | Globant S.A. (Software)† | | | 32,556 | | | | 3,453 | |
| | Brazil—1.9% | | | | | | | | |
| | B3 S.A.—Brasil Bolsa Balcao (Capital markets) | | | 720,500 | | | | 7,696 | |
| | CVC Brasil Operadora e Agencia de Viagens S.A. (Hotels, restaurants & leisure) | | | 209,000 | | | | 2,276 | |
| | IRB Brasil Resseguros S.A. (Insurance) | | | 558,600 | | | | 5,409 | |
| | Localiza Rent a Car S.A. (Road & rail) | | | 369,495 | | | | 4,355 | |
| | Lojas Renner S.A. (Multiline retail) | | | 289,260 | | | | 4,040 | |
| | Magazine Luiza S.A. (Multiline retail) | | | 498,200 | | | | 5,907 | |
| | Notre Dame Intermedica Participacoes S.A. (Health care providers & services) | | | 380,700 | | | | 6,459 | |
| | | | | | | | | 36,142 | |
| | Mexico—0.2% | | | | | | | | |
| | Grupo Aeroportuario del Sureste S.A.B. de C.V.—ADR (Transportation infrastructure) | | | 19,852 | | | | 3,720 | |
| | | | | | | | | | |
| | Peru—0.5% | | | | | | | | |
| | Credicorp, Ltd. (Banks)† | | | 49,432 | | | | 10,535 | |
| | | | | | | | | | |
| | Emerging Europe, Mid-East, Africa—1.0% | | | | | | | | |
| | Russia—0.4% | | | | | | | | |
| * | Yandex N.V. Class “A” (Interactive Media & Services)† | | | 191,405 | | | | 8,324 | |
| | South Africa—0.4% | | | | | | | | |
| | Bid Corporation, Ltd. (Food & staples retailing) | | | 126,846 | | | | 2,991 | |
| | Bidvest Group, Ltd. (Industrial conglomerates) | | | 126,846 | | | | 1,855 | |
| | Mr. Price Group, Ltd. (Specialty retail) | | | 170,331 | | | | 2,219 | |
| | | | | | | | | 7,065 | |
| | United Arab Emirates—0.2% | | | | | | | | |
| | First Abu Dhabi Bank PJSC (Banks) | | | 1,003,177 | | | | 4,140 | |
| | Total Common Stocks—98.3%
(cost $1,388,841) | | | | | | | 1,860,849 | |
| | | | | | | | |
| | | | Principal | | | | |
| | Issuer | | Amount | | | Value | |
| | | | | | | | |
| | Repurchase Agreement | | | | | | | | |
| | Fixed Income Clearing Corporation, 0.120% dated 12/31/19, due 1/2/20, repurchase price $22,389, collateralized by U.S. Treasury Bond, 2.500%, due 5/15/46 valued at $22,837 | | $ | 22,389 | | | $ | 22,389 | |
| | Total Repurchase Agreement—1.2%
(cost $22,389) | | | | | | | 22,389 | |
| | Total Investments—99.5%
(cost $1,411,230) | | | | | | | 1,883,238 | |
| | Cash and other assets, less liabilities—0.5% | | | | | | | 9,673 | |
| | Net assets—100.0% | | | | | | $ | 1,892,911 | |
ADR = American Depository Receipt
REIT = Real Estate Investment Trust
* = Non-income producing security
† = U.S. listed foreign security
For securities primarily traded on exchanges or markets that close before the close of regular trading on the New York Stock Exchange, the Fund may use an independent pricing service to fair value price the securities pursuant to Valuation Procedures approved by the Board of Trustees.
At December 31, 2019, the Fund’s Portfolio of Investments includes the following industry categories (as a percentage of long-term investments):
| Industrials | | | 22.5 | % |
| Information Technology | | | 19.3 | % |
| Financials | | | 15.3 | % |
| Consumer Discretionary | | | 13.4 | % |
| Health Care | | | 11.1 | % |
| Consumer Staples | | | 6.2 | % |
| Communication Services | | | 3.6 | % |
| Materials | | | 2.8 | % |
| Real Estate | | | 2.6 | % |
| Energy | | | 1.6 | % |
| Utilities | | | 1.6 | % |
| Total | | | 100.0 | % |
At December 31, 2019, the Fund’s Portfolio of Investments includes the following currency categories (as a percentage of long-term investments):
| Euro | | | 24.8 | % |
| British Pound Sterling | | | 13.8 | % |
| Japanese Yen | | | 12.8 | % |
| U.S. Dollar | | | 11.7 | % |
| Hong Kong Dollar | | | 8.2 | % |
| Swiss Franc | | | 5.1 | % |
| Danish Krone | | | 4.8 | % |
| Swedish Krona | | | 4.2 | % |
| Canadian Dollar | | | 3.0 | % |
| Australian Dollar | | | 2.7 | % |
| Brazilian Real | | | 1.9 | % |
| Indian Rupee | | | 1.9 | % |
| Indonesian Rupiah | | | 1.2 | % |
| Yuan Renminbi | | | 1.0 | % |
| New Taiwan Dollar | | | 1.0 | % |
| All Other Currencies | | | 1.9 | % |
| Total | | | 100.0 | % |
See accompanying Notes to Financial Statements.
| December 31, 2019 | William Blair Funds | 53 |
| | International Small Cap Growth Fund |
| | |
| | The International Small Cap Growth Fund seeks long-term capital appreciation. |
| | |
| | AN OVERVIEW FROM THE PORTFOLIO MANAGERS |
| | |

Simon Fennell 
Andrew G. Flynn | The William Blair International Small Cap Growth Fund (Class N shares) posted a 33.81% increase, net of fees, for the twelve months ended December 31, 2019. By comparison, the Fund’s benchmark index, the MSCI All Country World ex-U.S. Small Cap Index (net) (the “Index”), increased 22.42%. Calendar year outperformance was driven by positive stock selection across most sectors-most notably Industrials and Consumer Discretionary. Within Industrials, Japan-based Nihon M&A Center was a key contributor to 2019 performance. Nihon M&A Center is a high-quality company that provides advisory services to small and midsize enterprises facing succession-oriented challenges. It is led by an entrepreneurial management team that has built an attractive network of national relationships aimed at identifying buyers and sellers and sourcing transactions. The share price benefited from strong earnings results on increased deal activity. UK-based Diploma PLC also bolstered Industrials sector performance. A globally diverse distributor of essential technical products across a range of industries, Diploma’s product portfolio is geared toward aftermarket, services and replacement demand. The company’s close customer relationships, strong market position and replacement-driven demand have resulted in high and stable cash flow generation. We believe the combination of organic growth and value-accretive M&A should continue to produce earnings growth going forward. Within the Consumer Discretionary sector, Chinese sportswear company Li Ning was the leading contributor. Li Ning sells footwear, apparel, equipment and accessories for professional and leisure purposes, primarily under the LI-NING brand. The company is in the fourth year of a major turnaround with growth from here most likely driven by margin expansion. Margins are low but trending up with good visibility due to cost controls, including a step down in endorsement expenses in 2018. Overall, the spending environment is supportive and Li Ning is making significant strides in strengthening its execution capabilities in e-commerce and new product development target women and children customers. Partially offsetting these positive effects were the underweighting to Real Estate and overweightings to Consumer Discretionary and Financials. Weak stock selection within the Utilities sector also detracted, as France-based Rubis SCA’s share price underperformed. Rubis operates energy distribution and storage businesses, which generate solid returns and cash flows with low volatility. Rubis’s business model is focused on maintaining leading market share in niche markets. The environmentally-sensitive nature of the transport and distribution of energy products creates high barriers to entry, as new competitors are deterred from building capacity due to lengthy and complicated permitting processes. The management team has been able to grow the company organically, as well as by redeploying cash for value-accretive acquisitions. Underpinned by a 4% dividend yield, we believe the valuation is attractive relative to peers, leaving room for further upward share price re-rating. Please refer to the Global Markets Review and Outlook relating to the Fund beginning on page 32. |
| 54 | Annual Report | December 31, 2019 |
International Small Cap Growth Fund
Performance Highlights (Unaudited)
| Average Annual Total Return through 12/31/2019 |
| | | 1 Year | | 3 Year | | 5 Year | | 10 Year |
| Class N | | | 33.81 | % | | | 10.13 | % | | | 6.92 | % | | | 7.95 | % |
| Class I | | | 34.22 | | | | 10.48 | | | | 7.23 | | | | 8.28 | |
| Class R6 | | | 34.32 | | | | 10.56 | | | | 7.31 | | | | 8.43 | |
| MSCI ACW Ex-U.S. Small Cap Index (net) | | | 22.42 | | | | 9.65 | | | | 7.04 | | | | 6.92 | |
Performance cited represents past performance. Past performance does not guarantee future results and current performance may be lower or higher than the data quoted. Results shown are average annual returns, which assume reinvestment of dividends and capital gains. Investment returns and principal will fluctuate and you may have a gain or loss when you sell shares. For the most current month-end performance information, please call 1-800-742-7272, or visit our Web site atwww.williamblairfunds.com. From time to time, the investment adviser may waive fees or reimburse expenses for the Fund. Without these waivers/reimbursements, performance would be lower. Investing in smaller companies involves special risks, including higher volatility and lower liquidity. Smaller capitalization stocks are also more sensitive to purchase/sale transactions and changes in the issuer’s financial condition. International investing involves special risk considerations, including currency fluctuations, lower liquidity, economic and political risk. Class N shares are not subject to a sales load. Class I shares are not subject to a sales load or distribution (Rule 12b-1) fees. Class R6 shares are not subject to a sales load, distribution (Rule 12b-1) fees, or sub-transfer agent fees.
The performance highlights and graph presented above do not reflect the deduction of taxes that a shareholder would pay on fund distributions or the redemption of fund shares.
The Morgan Stanley Capital International (MSCI) All Country World (ACW) Ex-U.S. Small Cap Index (net) is a free float-adjusted market capitalization weighted index that is designed to measure the equity market performance of small capitalization developed and emerging markets, excluding the United States. This index approximates the minimum possible dividend reinvestment by deducting for the highest possible withholding tax rates of those markets.
This report identifies the Fund’s investments on December 31, 2019. These holdings are subject to change. Not all stocks in the Fund performed the same, nor is there any guarantee that these stocks will perform as well in the future. Market forecasts provided in this report may not necessarily come to pass.
Sector Diversification (Unaudited)

The sector diversification shown is based on the total long-term securities.
| December 31, 2019 | William Blair Funds | 55 |
International Small Cap Growth Fund
Portfolio of Investments, December 31, 2019(all dollar amounts in thousands)
| | | | | | | | | | |
| | Issuer | | Shares | | | Value | |
| | | | | | | | |
| | Common Stocks | | | | | | | | |
| | | | | | | | | | |
| | Europe, Mid-East—39.1% | | | | | | | | |
| | Belgium—2.3% | | | | | | | | |
| | Melexis N.V. (Semiconductors & semiconductor equipment) | | | 39,432 | | | $ | 2,966 | |
| | Warehouses De Pauw CVA (Equity REIT) | | | 22,179 | | | | 4,035 | |
| | | | | | | | | 7,001 | |
| | Denmark—3.0% | | | | | | | | |
| * | Netcompany Group A/S (Software) | | | 79,855 | | | | 3,800 | |
| | Royal Unibrew A/S (Beverages) | | | 41,911 | | | | 3,837 | |
| | Tryg A/S (Insurance) | | | 60,507 | | | | 1,794 | |
| | | | | | | | | 9,431 | |
| | Faroe Islands—1.3% | | | | | | | | |
| | Bakkafrost P/F (Food products) | | | 55,238 | | | | 4,090 | |
| | | | | | | | | | |
| | France—5.1% | | | | | | | | |
| | Alten S.A. (IT services) | | | 33,362 | | | | 4,210 | |
| | Ipsen S.A. (Pharmaceuticals) | | | 21,584 | | | | 1,913 | |
| | Nexity S.A. (Real estate management & development) | | | 57,937 | | | | 2,910 | |
| | Rubis SCA (Gas utilities) | | | 47,888 | | | | 2,941 | |
| * | Worldline S.A. (IT services) | | | 52,890 | | | | 3,746 | |
| | | | | | | | | 15,720 | |
| | Germany—3.5% | | | | | | | | |
| | Carl Zeiss Meditec AG (Health care equipment & supplies) | | | 34,701 | | | | 4,426 | |
| | CTS Eventim AG & Co. KGaA (Entertainment) | | | 28,975 | | | | 1,822 | |
| | GRENKE AG (Diversified financial services) | | | 12,613 | | | | 1,305 | |
| | Norma Group SE (Machinery) | | | 39,447 | | | | 1,681 | |
| * | TeamViewer AG (Software) | | | 43,655 | | | | 1,561 | |
| | | | | | | | | 10,795 | |
| | Israel—2.7% | | | | | | | | |
| * | CyberArk Software, Ltd. (Software)† | | | 24,048 | | | | 2,804 | |
| | Elbit Systems, Ltd. (Aerospace & defense) | | | 13,855 | | | | 2,157 | |
| | Mizrahi Tefahot Bank, Ltd. (Banks) | | | 77,864 | | | | 2,074 | |
| * | Wix.com, Ltd. (IT services)† | | | 11,539 | | | | 1,412 | |
| | | | | | | | | 8,447 | |
| | Italy—1.9% | | | | | | | | |
| | Amplifon SpA (Health care providers & services) | | | 114,626 | | | | 3,297 | |
| | Brunello Cucinelli SpA (Textiles, apparel & luxury goods) | | | 44,755 | | | | 1,584 | |
| | Technogym SpA (Leisure products) | | | 68,196 | | | | 887 | |
| | | | | | | | | 5,768 | |
| | Jersey—0.8% | | | | | | | | |
| | Sanne Group plc (Capital markets) | | | 264,675 | | | | 2,374 | |
| | Netherlands—2.6% | | | | | | | | |
| * | Basic-Fit N.V. (Hotels, restaurants & leisure) | | | 56,372 | | | | 2,140 | |
| | Euronext N.V. (Capital markets) | | | 54,265 | | | | 4,422 | |
| | IMCD N.V. (Trading companies & distributors) | | | 17,472 | | | | 1,525 | |
| | | | | | | | | 8,087 | |
| | | | | | | | | | |
| | Issuer | | Shares | | | Value | |
| | | | | | | | |
| | Common Stocks—(continued) | | | | | | | | |
| | | | | | | | | | |
| | Europe, Mid-East—(continued) | | | | | | | | |
| | Spain—0.5% | | | | | | | | |
| | EDP Renovaveis S.A. (Independent power & renewable electricity producers) | | | 125,718 | | | $ | 1,481 | |
| | Sweden—10.2% | | | | | | | | |
| | AAK AB (Food products) | | | 69,554 | | | | 1,322 | |
| | AddTech AB Class “B” (Trading companies & distributors) | | | 46,811 | | | | 1,514 | |
| | Beijer Ref AB (Trading companies & distributors) | | | 95,946 | | | | 2,815 | |
| | Biotage AB (Life sciences tools & services) | | | 61,339 | | | | 812 | |
| | Evolution Gaming Group AB (Hotels, restaurants & leisure) | | | 215,739 | | | | 6,495 | |
| | Indutrade AB (Trading companies & distributors) | | | 170,800 | | | | 6,113 | |
| | Lifco AB Class “B” (Industrial conglomerates) | | | 42,343 | | | | 2,586 | |
| | MIPS AB (Leisure products) | | | 58,581 | | | | 1,241 | |
| | Nibe Industrier AB Class “B” (Building products) | | | 145,629 | | | | 2,525 | |
| | Nolato AB Class “B” (Industrial conglomerates) | | | 36,138 | | | | 2,122 | |
| | Thule Group AB (Leisure products) | | | 93,928 | | | | 2,166 | |
| | Vitrolife AB (Biotechnology) | | | 93,162 | | | | 1,964 | |
| | | | | | | | | 31,675 | |
| | Switzerland—5.2% | | | | | | | | |
| | Belimo Holding AG (Building products) | | | 159 | | | | 1,198 | |
| * | Galenica AG (Health care providers & services) | | | 45,844 | | | | 2,835 | |
| | Kardex AG (Machinery) | | | 14,737 | | | | 2,482 | |
| * | Siegfried Holding AG (Life sciences tools & services) | | | 4,289 | | | | 2,078 | |
| | Tecan Group AG (Life sciences tools & services) | | | 13,557 | | | | 3,810 | |
| * | VAT Group AG (Machinery) | | | 21,391 | | | | 3,615 | |
| | | | | | | | | 16,018 | |
| | | | | | | | | | |
| | United Kingdom—18.5% | | | | | | | | |
| | Abcam plc (Biotechnology) | | | 166,477 | | | | 2,981 | |
| | Avast plc (Software) | | | 781,112 | | | | 4,685 | |
| | AVEVA Group plc (Software) | | | 75,386 | | | | 4,649 | |
| | Beazley plc (Insurance) | | | 670,606 | | | | 4,939 | |
| | Big Yellow Group plc (Equity REIT) | | | 150,356 | | | | 2,390 | |
| | Burford Capital, Ltd. (Capital markets) | | | 90,014 | | | | 849 | |
| | Diploma plc (Trading companies & distributors) | | | 198,688 | | | | 5,327 | |
| | Electrocomponents plc (Electronic equipment, instruments & components) | | | 385,554 | | | | 3,460 | |
| | Fevertree Drinks plc (Beverages) | | | 93,048 | | | | 2,580 | |
| | Hill & Smith Holdings plc (Metals & mining) | | | 102,124 | | | | 1,993 | |
| | Intermediate Capital Group plc (Capital markets) | | | 142,303 | | | | 3,035 | |
See accompanying Notes to Financial Statements.
| 56 | Annual Report | December 31, 2019 |
International Small Cap Growth Fund
Portfolio of Investments, December 31, 2019(all dollar amounts in thousands)
| | | | | | | | | | |
| | Issuer | | Shares | | | Value | |
| | | | | | | | |
| | Common Stocks—(continued) | | | | | | | | |
| | | | | | | | | | |
| | United Kingdom—(continued) | | | | | | | | |
| | Renishaw plc (Electronic equipment, instruments & components) | | | 34,775 | | | $ | 1,736 | |
| | Rotork plc (Machinery) | | | 543,807 | | | | 2,413 | |
| | Safestore Holdings plc (Equity REIT) | | | 157,838 | | | | 1,685 | |
| | Scapa Group plc (Chemicals) | | | 256,430 | | | | 829 | |
| | Softcat plc (IT services) | | | 174,386 | | | | 2,661 | |
| | SSP Group plc (Hotels, restaurants & leisure) | | | 207,148 | | | | 1,783 | |
| | The UNITE Group plc (Equity REIT) | | | 301,746 | | | | 5,036 | |
| | Victrex plc (Chemicals) | | | 62,157 | | | | 2,053 | |
| | Workspace Group plc (Equity REIT) | | | 142,963 | | | | 2,250 | |
| | | | | | | | | 57,334 | |
| | | | | | | | | | |
| | Japan—15.9% | | | | | | | | |
| | Asahi Intecc Co., Ltd. (Health care equipment & supplies) | | | 138,000 | | | | 4,064 | |
| | Benefit One, Inc. (Professional services) | | | 126,800 | | | | 2,639 | |
| | Digital Arts, Inc. (Software) | | | 22,400 | | | | 1,150 | |
| | GMO Payment Gateway, Inc. (IT services) | | | 29,300 | | | | 2,017 | |
| | Harmonic Drive Systems, Inc. (Machinery) | | | 80,400 | | | | 3,900 | |
| | Matsumotokiyoshi Holdings Co., Ltd. (Food & staples retailing) | | | 75,900 | | | | 2,958 | |
| | MonotaRO Co., Ltd. (Trading companies & distributors) | | | 59,900 | | | | 1,611 | |
| | Nihon M&A Center, Inc. (Professional services) | | | 164,700 | | | | 5,707 | |
| | Nihon Unisys, Ltd. (IT services) | | | 145,700 | | | | 4,593 | |
| | NS Solutions Corporation (IT services) | | | 78,900 | | | | 2,614 | |
| | PALTAC Corporation (Distributors) | | | 49,500 | | | | 2,387 | |
| | Park24 Co., Ltd. (Commercial services & supplies) | | | 73,800 | | | | 1,813 | |
| | SMS Co., Ltd. (Professional services) | | | 57,600 | | | | 1,604 | |
| | Sushiro Global Holdings, Ltd. (Hotels, restaurants & leisure) | | | 31,400 | | | | 2,708 | |
| | TechnoPro Holdings, Inc. (Professional services) | | | 42,200 | | | | 2,971 | |
| | TIS, Inc. (IT services) | | | 83,500 | | | | 4,941 | |
| | Tokyo Century Corporation (Diversified financial services) | | | 28,300 | | | | 1,524 | |
| | | | | | | | | 49,201 | |
| | | | | | | | | | |
| | Emerging Asia—9.9% | | | | | | | | |
| | Cambodia—0.9% | | | | | | | | |
| | NagaCorp, Ltd. (Hotels, restaurants & leisure) | | | 1,664,000 | | | | 2,904 | |
| | China—2.8% | | | | | | | | |
| | Huazhu Group, Ltd.—ADR (Hotels, restaurants & leisure) | | | 83,311 | | | | 3,338 | |
| | Li Ning Co., Ltd. (Textiles, apparel & luxury goods) | | | 546,500 | | | | 1,638 | |
| | Silergy Corporation (Semiconductors & semiconductor equipment) | | | 78,000 | | | | 2,472 | |
| | Travelsky Technology, Ltd. Class “H” (IT services) | | | 486,000 | | | | 1,186 | |
| | | | | | | | | 8,634 | |
| | | | | | | | | | |
| | Issuer | | Shares | | | Value | |
| | | | | | | | |
| | Common Stocks—(continued) | | | | | | | | |
| | | | | | | | | | |
| | Emerging Asia—(continued) | | | | | | | | |
| | India—1.5% | | | | | | | | |
| | Crompton Greaves Consumer Electricals, Ltd. (Household durables) | | | 78,345 | | | $ | 263 | |
| | Motherson Sumi Systems, Ltd. (Auto components) | | | 771,186 | | | | 1,584 | |
| | PVR, Ltd. (Entertainment) | | | 69,168 | | | | 1,836 | |
| | RBL Bank, Ltd. (Banks) | | | 176,819 | | | | 854 | |
| | | | | | | | | 4,537 | |
| | South Korea—0.3% | | | | | | | | |
| | Koh Young Technology, Inc. (Semiconductors & semiconductor equipment) | | | 11,524 | | | | 1,051 | |
| | Taiwan—3.5% | | | | | | | | |
| | ASPEED Technology, Inc. (Semiconductors & semiconductor equipment) | | | 26,000 | | | | 832 | |
| | Chailease Holding Co., Ltd. (Diversified financial services) | | | 327,736 | | | | 1,509 | |
| | Eclat Textile Co., Ltd. (Textiles, apparel & luxury goods) | | | 188,000 | | | | 2,527 | |
| | Feng TAY Enterprise Co., Ltd. (Textiles, apparel & luxury goods) | | | 253,400 | | | | 1,648 | |
| | Globalwafers Co., Ltd. (Semiconductors & semiconductor equipment) | | | 251,000 | | | | 3,203 | |
| | Voltronic Power Technology Corporation (Electrical equipment) | | | 44,000 | | | | 1,050 | |
| | | | | | | | | 10,769 | |
| | Thailand—0.9% | | | | | | | | |
| | Tisco Financial Group PCL (Banks) | | | 802,700 | | | | 2,660 | |
| | | | | | | | | | |
| | Emerging Latin America—5.3% | | | | | | | | |
| | Argentina—1.6% | | | | | | | | |
| | *Globant S.A. (Software)† | | | 45,470 | | | | 4,822 | |
| | Brazil—1.8% | | | | | | | | |
| | CVC Brasil Operadora e Agencia de Viagens S.A. (Hotels, restaurants & leisure) | | | 214,000 | | | | 2,330 | |
| | IRB Brasil Resseguros S.A. (Insurance) | | | 160,100 | | | | 1,550 | |
| | Sul America S.A. (Insurance) | | | 119,800 | | | | 1,785 | |
| | | | | | | | | 5,665 | |
| | Mexico—1.9% | | | | | | | | |
| | Grupo Aeroportuario del Centro Norte S.A.B. de C.V. (Transportation infrastructure) | | | 385,100 | | | | 2,883 | |
| | Grupo Aeroportuario del Sureste S.A.B. de C.V.—ADR (Transportation infrastructure) | | | 16,288 | | | | 3,052 | |
| | | | | | | | | 5,935 | |
| | | | | | | | | | |
| | Asia—3.9% | | | | | | | | |
| | Australia—1.3% | | | | | | | | |
| | Corporate Travel Management, Ltd. (Hotels, restaurants & leisure) | | | 102,389 | | | | 1,473 | |
| | Orora, Ltd. (Containers & packaging) | | | 1,193,954 | | | | 2,664 | |
| | | | | | | | | 4,137 | |
See accompanying Notes to Financial Statements.
| December 31, 2019 | William Blair Funds | 57 |
International Small Cap Growth Fund
Portfolio of Investments, December 31, 2019(all dollar amounts in thousands)
| | | | Shares or | | | | |
| | | | Principal | | | | |
| | Issuer | | Amount | | | Value | |
| | | | | | | | |
| | Common Stocks—(continued) | | | | | | | | |
| | | | | | | | | | |
| | Asia—(continued) | | | | | | | | |
| | Hong Kong—0.6% | | | | | | | | |
| | MGM China Holdings, Ltd. (Hotels, restaurants & leisure) | | | 1,041,600 | | | $ | 1,700 | |
| | New Zealand—2.0% | | | | | | | | |
| | Ryman Healthcare, Ltd. (Health care providers & services) | | | 306,875 | | | | 3,374 | |
| | Spark New Zealand, Ltd. (Diversified telecommunication services) | | | 925,582 | | | | 2,698 | |
| | | | | | | | | 6,072 | |
| | | | | | | | | | |
| | Canada—3.8% | | | | | | | | |
| | Enghouse Systems, Ltd. (Software) | | | 48,091 | | | | 1,784 | |
| * | Kinaxis, Inc. (Software) | | | 33,289 | | | | 2,564 | |
| | Parkland Fuel Corporation (Oil, gas & consumable fuels) | | | 104,822 | | | | 3,851 | |
| | Toromont Industries, Ltd. (Trading companies & distributors) | | | 64,244 | | | | 3,493 | |
| | | | | | | | | 11,692 | |
| | | | | | | | | | |
| | Emerging Europe, Mid-East, Africa—2.2% | | | | | | | | |
| | South Africa—1.7% | | | | | | | | |
| | Bidvest Group, Ltd. (Industrial conglomerates) | | | 143,638 | | | | 2,100 | |
| | Clicks Group, Ltd. (Food & staples retailing) | | | 177,392 | | | | 3,250 | |
| | | | | | | | | 5,350 | |
| | United Arab Emirates—0.5% | | | | | | | | |
| * | Network International Holdings plc (IT services) | | | 183,166 | | | | 1,555 | |
| | Total Common Stocks—98.6%
(cost $244,380) | | | | | | | 304,905 | |
| | | | | | | | | | |
| | Repurchase Agreement | | | | | | | | |
| | Fixed Income Clearing Corporation, 0.120% dated 12/31/19, due 1/2/20, repurchase price $2,344, collateralized by U.S. Treasury Bond, 2.500%, due 5/15/46 valued at $2,392 | | $ | 2,344 | | | | 2,344 | |
| | Total Repurchase Agreement—0.8%
(cost $2,344) | | | | | | | 2,344 | |
| | Total Investments—99.4%
(cost $246,724) | | | | | | | 307,249 | |
| | Cash and other assets, less liabilities—0.6% | | | | | | | 1,817 | |
| | Net assets—100.0% | | | | | | $ | 309,066 | |
ADR = American Depository Receipt
REIT = Real Estate Investment Trust
* = Non-income producing security
† = U.S. listed foreign security
For securities primarily traded on exchanges or markets that close before the close of regular trading on the New York Stock Exchange, the Fund may use an independent pricing service to fair value price the securities pursuant to Valuation Procedures approved by the Board of Trustees.
At December 31, 2019, the Fund’s Portfolio of Investments includes the following industry categories (as a percentage of long-term investments):
| Information Technology | | | 23.6 | % |
| Industrials | | | 23.3 | % |
| Consumer Discretionary | | | 13.4 | % |
| Health Care | | | 10.3 | % |
| Financials | | | 10.1 | % |
| Real Estate | | | 6.0 | % |
| Consumer Staples | | | 5.9 | % |
| Materials | | | 2.5 | % |
| Communication Services | | | 2.1 | % |
| Utilities | | | 1.5 | % |
| Energy | | | 1.3 | % |
| Total | | | 100.0 | % |
At December 31, 2019, the Fund’s Portfolio of Investments includes the following currency categories (as a percentage of long-term investments):
| British Pound Sterling | | | 20.1 | % |
| Japanese Yen | | | 16.1 | % |
| Euro | | | 16.0 | % |
| Swedish Krona | | | 10.4 | % |
| Swiss Franc | | | 5.2 | % |
| U.S. Dollar | | | 5.1 | % |
| New Taiwan Dollar | | | 4.3 | % |
| Canadian Dollar | | | 3.8 | % |
| Danish Krone | | | 3.1 | % |
| Hong Kong Dollar | | | 2.4 | % |
| New Zealand Dollar | | | 2.0 | % |
| Brazilian Real | | | 1.9 | % |
| South African Rand | | | 1.8 | % |
| Indian Rupee | | | 1.5 | % |
| Israeli Shekel | | | 1.4 | % |
| Australian Dollar | | | 1.4 | % |
| Norwegian Krone | | | 1.3 | % |
| All Other Currencies | | | 2.2 | % |
| Total | | | 100.0 | % |
See accompanying Notes to Financial Statements.
| 58 | Annual Report | December 31, 2019 |
| | Emerging Markets Leaders Fund |
| | |
| | The Emerging Markets Leaders Fund seeks long-term capital appreciation. |
| | |
| | AN OVERVIEW FROM THE PORTFOLIO MANAGERS |
| | |
 Todd M. McClone 
John C. Murphy | The William Blair Emerging Markets Leaders Fund (Class N shares) posted a 27.98% increase, net of fees, for the twelve months ended December 31, 2019. By comparison, the Fund’s benchmark index, the MSCI Emerging Markets Index (net) (the “Index”), increased 18.42%. Calendar year outperformance versus the Index was primarily driven by positive stock selection across most sectors, especially Financials, Consumer Staples and Industrials. Within Financials, Bajaj Finance, the Indian consumer lending company, continued to outperform as the company’s strong execution and higher quality drove stronger growth and returns, standing out against competitors in a challenging backdrop. Kweichow Moutai, the China A-Share leading liquor company in China, within Consumer Staples, was an additional source of outperformance. Moutai continues to benefit from strong structural growth amid increasing per capita consumption and premiumization. The share price was also lifted by the company’s restructuring of its distribution to increase direct sales, boosting bottom line growth. Within Industrials, WEG supported relative returns, especially after the strong rally in the fourth quarter. Partially offsetting these effects were the underweight allocation to the Information Technology sector, overweight allocation to Consumer Staples and below average stock selection within the Energy sector. Within Energy, Reliance Industries underperformed during the abbreviated holding period from early December through year end. The company is the Indian private conglomerate that has transformed itself from an asset-heavy, cyclical energy company into a more diversified, consumer-oriented business with significant scale and expanding market opportunity. Samsung Electronics and Tencent Music Entertainment were notable detractors from relative performance. Samsung Electronics weighed on relative performance, as the stock strengthened after we liquidated the position. Despite the recent improvement in memory pricing, we believe the fundamental long term outlook remains challenging and capital returns uncertain. Moreover, the strong profits from memory may be at risk due to China’s effort to ramp up its own memory capability. Tencent Music Entertainment, the largest Chinese online music entertainment platform within Communication Services was also a drag due to increased competition and margin pressure as the company continues to invest in content. Tencent Music Entertainment has over 800 million monthly active users and 90% market share by revenue. The attractive user growth and under-monetized opportunity underpins the emerging growth, high return investment thesis. During the fourth quarter, Consumer Discretionary exposure was increased through the purchase of Midea Group. Midea is the second-largest Chinese home appliance company with favorable exposure to both air conditioning and small appliances. We believe strong operating momentum should continue given management’s ability to segment the market, drive innovation and consistently improve manufacturing efficiencies. Exposure to Consumer Staples also declined as a result of the sale of Ambev, the dominant brewer in Brazil. We sold the company amid continued weak operating results and increased competitive pressures. From a geographic perspective, notable adjustments were increases to China via the purchase of Midea and additions to our Tencent and Travelsky positions, offset by decreases to Thailand and Taiwan through trims of Airports of Thailand and Taiwan Semiconductor Manufacturing. Please refer to the Global Markets Review and Outlook relating to the Fund beginning on page 32. |
| December 31, 2019 | William Blair Funds | 59 |
Emerging Markets Leaders Fund
Performance Highlights (Unaudited)
| Average Annual Total Return through 12/31/2019 |
| | | 1 Year | | 3 Year | | 5 Year | | 10 Year | | Since
Inception |
| Class N(a) | | | 27.98 | % | | | 14.26 | % | | | 5.27 | % | | | — | | | | 4.31 | % |
| MSCI Emerging Markets Index (net)(a) | | | 18.42 | | | | 11.57 | | | | 5.61 | | | | — | | | | 3.54 | |
| Class I | | | 28.36 | | | | 14.56 | | | | 5.56 | | | | 4.87 | % | | | — | |
| Class R6 | | | 28.45 | | | | 14.65 | | | | 5.63 | | | | 4.97 | | | | — | |
| MSCI Emerging Markets Index (net) | | | 18.42 | | | | 11.57 | | | | 5.61 | | | | 3.68 | | | | — | |
| | |
| (a) | Since inception is for the period from May 3, 2010 (Commencement of Operations) to December 31, 2019. |
Performance cited represents past performance. Past performance does not guarantee future results and current performance may be lower or higher than the data quoted. Results shown are average annual total returns, which assume reinvestment of dividends and capital gains. Investment returns and principal will fluctuate and you may have a gain or loss when you sell shares. For the most current month-end performance information, please call 1-800-742-7272, or visit our Web site atwww.williamblairfunds.com. International investing involves special risk considerations, including currency fluctuations, lower liquidity, economic and political risk. These risks may be magnified when investing in emerging markets. From time to time, the investment adviser may waive fees or reimburse expenses for the Fund. Without these waivers/reimbursements, performance would be lower. Class N shares are not subject to a sales load. Class I shares are not subject to a sales load or distribution (Rule 12b-1) fees. Class R6 shares are not subject to a sales load, distribution (Rule 12b-1) fees, or sub-transfer agent fees.
The performance highlights and graph presented above do not reflect the deduction of taxes that a shareholder would pay on fund distributions or the redemption of fund shares.
The Morgan Stanley Capital International (MSCI) Emerging Markets Index (net) is a free float-adjusted market-capitalization-weighted index that is designed to measure equity market performance of emerging markets. This index approximates the minimum possible dividend reinvestment by deducting for the highest possible withholding tax rates of those markets.
This report identifies the Fund’s investments on December 31, 2019. These holdings are subject to change. Not all stocks in the Fund performed the same, nor is there any guarantee that these stocks will perform as well in the future. Market forecasts provided in this report may not necessarily come to pass.
Sector Diversification (Unaudited)

The sector diversification shown is based on the total long-term securities.
| 60 | Annual Report | December 31, 2019 |
Emerging Markets Leaders Fund
Portfolio of Investments, December 31, 2019(all dollar amounts in thousands)
| | | | | | | | |
| | Issuer | | Shares | | | Value | |
| | | | | | | | |
| | Common Stocks | | | | | | |
| | | | | | | | |
| | Emerging Asia—77.0% | | | | | | |
| | Australia—0.9% | | | | | | |
| | Oil Search, Ltd. (Oil, gas & consumable fuels) | | | 393,690 | | | $ | 2,003 | |
| | China—37.2% | | | | | | | | |
| * | Alibaba Group Holding, Ltd.—ADR (Internet & direct marketing retail) | | | 79,139 | | | | 16,785 | |
| | China International Travel Service Corporation, Ltd. Class “A” (Hotels, restaurants & leisure) | | | 303,756 | | | | 3,879 | |
| | CNOOC, Ltd. (Oil, gas & consumable fuels) | | | 2,005,000 | | | | 3,335 | |
| | Haier Electronics Group Co., Ltd. (Household durables) | | | 1,136,000 | | | | 3,550 | |
| | Huazhu Group, Ltd.—ADR (Hotels, restaurants & leisure) | | | 136,720 | | | | 5,478 | |
| | Jiangsu Hengrui Medicine Co., Ltd. Class “A” (Pharmaceuticals) | | | 165,792 | | | | 2,083 | |
| | Kweichow Moutai Co., Ltd. Class “A” (Beverages) | | | 21,059 | | | | 3,577 | |
| | Midea Group Co., Ltd. Class “A” (Household durables) | | | 421,200 | | | | 3,522 | |
| | NetEase, Inc.—ADR (Entertainment) | | | 17,936 | | | | 5,500 | |
| | Ping An Insurance Group Co. of China, Ltd. Class “H” (Insurance) | | | 745,500 | | | | 8,811 | |
| | Shenzhou International Group Holdings, Ltd. (Textiles, apparel & luxury goods) | | | 296,200 | | | | 4,330 | |
| * | TAL Education Group—ADR (Diversified consumer services) | | | 64,197 | | | | 3,094 | |
| | Tencent Holdings, Ltd. (Interactive Media & Services) | | | 338,100 | | | | 16,297 | |
| * | Tencent Music Entertainment Group—ADR (Entertainment) | | | 285,382 | | | | 3,350 | |
| | Travelsky Technology, Ltd. Class “H” (IT services) | | | 1,092,000 | | | | 2,666 | |
| | Zhangzhou Pientzehuang Pharmaceutical Co., Ltd. Class “A” (Pharmaceuticals) | | | 149,800 | | | | 2,363 | |
| | | | | | | | | 88,620 | |
| | India—18.8% | | | | | | | | |
| | Asian Paints, Ltd. (Chemicals) | | | 96,211 | | | | 2,413 | |
| | Bajaj Finance, Ltd. (Consumer finance) | | | 61,344 | | | | 3,631 | |
| | Britannia Industries, Ltd. (Food products) | | | 57,033 | | | | 2,426 | |
| | HDFC Bank, Ltd. (Banks) | | | 268,939 | | | | 4,806 | |
| | HDFC Bank, Ltd.—ADR (Banks) | | | 5,315 | | | | 337 | |
| | HDFC Life Insurance Co. Ltd. (Insurance) | | | 321,825 | | | | 2,807 | |
| | Housing Development Finance Corporation, Ltd. (Thrifts & mortgage finance) | | | 129,805 | | | | 4,388 | |
| | IndusInd Bank, Ltd. (Banks) | | | 136,781 | | | | 2,897 | |
| | Infosys, Ltd. (IT services) | | | 386,651 | | | | 3,965 | |
| | Maruti Suzuki India, Ltd. (Automobiles) | | | 17,142 | | | | 1,770 | |
| | Motherson Sumi Systems, Ltd. (Auto components) | | | 1,368,178 | | | | 2,810 | |
| | MRF, Ltd. (Auto components) | | | 3,087 | | | | 2,863 | |
| | Petronet LNG, Ltd. (Oil, gas & consumable fuels) | | | 649,465 | | | | 2,439 | |
| | Reliance Industries, Ltd. (Oil, gas & consumable fuels) | | | 183,207 | | | | 3,891 | |
| | UPL, Ltd. (Chemicals) | | | 402,899 | | | | 3,296 | |
| | | | | | | | | 44,739 | |
| | | | | | | | |
| | Issuer | | Shares | | | Value | |
| | | | | | | | |
| | Common Stocks—(continued) | | | | | | |
| | | | | | | | |
| | Emerging Asia—(continued) | | | | | | |
| | Indonesia—5.1% | | | | | | |
| | PT Bank Rakyat Indonesia Persero Tbk (Banks) | | | 17,674,600 | | | $ | 5,602 | |
| | PT Telekomunikasi Indonesia Persero Tbk (Diversified telecommunication services) | | | 15,634,700 | | | | 4,471 | |
| | PT Unilever Indonesia Tbk (Household products) | | | 711,500 | | | | 2,152 | |
| | | | | | | | | 12,225 | |
| | South Korea—2.7% | | | | | | | | |
| | Douzone Bizon Co., Ltd. (Software) | | | 29,297 | | | | 2,052 | |
| | LG Household & Health Care, Ltd. (Personal products) | | | 3,987 | | | | 4,347 | |
| | | | | | | | | 6,399 | |
| | Taiwan—9.9% | | | | | | | | |
| | E.Sun Financial Holding Co., Ltd. (Banks) | | | 2,897,648 | | | | 2,697 | |
| | Taiwan Semiconductor Manufacturing Co., Ltd.—ADR (Semiconductors & semiconductor equipment) | | | 278,017 | | | | 16,153 | |
| | Uni-President Enterprises Corporation (Food products) | | | 1,938,000 | | | | 4,797 | |
| | | | | | | | | 23,647 | |
| | Thailand—2.4% | | | | | | | | |
| | Airports of Thailand PCL (Transportation infrastructure) | | | 1,082,100 | | | | 2,682 | |
| | CP ALL PCL (Food & staples retailing) | | | 1,273,100 | | | | 3,071 | |
| | | | | | | | | 5,753 | |
| | | | | | | | | | |
| | Emerging Latin America—13.3% | | | | | | | | |
| | Brazil—8.4% | | | | | | | | |
| | B3 S.A. - Brasil Bolsa Balcao (Capital markets) | | | 369,700 | | | | 3,949 | |
| | IRB Brasil Resseguros S.A. (Insurance) | | | 560,000 | | | | 5,422 | |
| | Odontoprev S.A. (Health care providers & services) | | | 455,953 | | | | 1,912 | |
| | Raia Drogasil S.A. (Food & staples retailing) | | | 114,000 | | | | 3,164 | |
| * | Rumo S.A. (Road & rail) | | | 280,500 | | | | 1,820 | |
| | WEG S.A. (Electrical equipment) | | | 433,200 | | | | 3,733 | |
| | | | | | | | | 20,000 | |
| | Mexico—3.4% | | | | | | | | |
| | Grupo Aeroportuario del Pacifico S.A.B. de C.V. Class “B” (Transportation infrastructure) | | | 298,000 | | | | 3,542 | |
| | Grupo Financiero Banorte S.A.B. de C.V. Class “O” (Banks) | | | 448,600 | | | | 2,504 | |
| | Wal-Mart de Mexico S.A.B. de C.V. (Food & staples retailing) | | | 691,300 | | | | 1,985 | |
| | | | | | | | | 8,031 | |
| | Peru—1.5% | | | | | | | | |
| | Credicorp, Ltd. (Banks)† | | | 17,166 | | | | 3,659 | |
See accompanying Notes to Financial Statements.
| December 31, 2019 | William Blair Funds | 61 |
Emerging Markets Leaders Fund
Portfolio of Investments, December 31, 2019(all dollar amounts in thousands)
| | | | | | | | |
| | | | | | | | |
| | Issuer | | Shares | | | Value | |
| | | | | | | | |
| | Emerging Europe, Mid-East, Africa—7.8% | | | | | | |
| | Russia—1.6% | | | | | | |
| * | Yandex N.V. Class “A” (Interactive Media & Services)† | | | 88,064 | | | $ | 3,830 | |
| | South Africa—6.2% | | | | | | | | |
| | Bid Corporation, Ltd. (Food & staples retailing) | | | 86,149 | | | | 2,031 | |
| | Bidvest Group, Ltd. (Industrial conglomerates) | | | 237,341 | | | | 3,470 | |
| | Capitec Bank Holdings, Ltd. (Banks) | | | 38,186 | | | | 3,943 | |
| | Clicks Group, Ltd. (Food & staples retailing) | | | 156,753 | | | | 2,872 | |
| | FirstRand, Ltd. (Diversified financial services) | | | 549,773 | | | | 2,465 | |
| | | | | | | | | 14,781 | |
| | Total Common Stocks—98.1%
(cost $186,179) | | | | | | | 233,687 | |
| | Total Investments—98.1%
(cost $186,179) | | | | | | | 233,687 | |
| | Cash and other assets, less liabilities—1.9% | | | | | | | 4,596 | |
| | Net assets—100.0% | | | | | | $ | 238,283 | �� |
ADR = American Depository Receipt
* = Non-income producing security
† = U.S. listed foreign security
For securities primarily traded on exchanges or markets that close before the close of regular trading on the New York Stock Exchange, the Fund may use an independent pricing service to fair value price the securities pursuant to Valuation Procedures approved by the Board of Trustees.
At December 31, 2019, the Fund’s Portfolio of Investments includes the following industry categories (as a percentage of long-term investments):
| Financials | | | 24.8 | % |
| Consumer Discretionary | | | 20.7 | % |
| Communication Services | | | 14.3 | % |
| Consumer Staples | | | 13.0 | % |
| Information Technology | | | 10.6 | % |
| Industrials | | | 6.5 | % |
| Energy | | | 5.0 | % |
| Health Care | | | 2.7 | % |
| Materials | | | 2.4 | % |
| Total | | | 100.0 | % |
At December 31, 2019, the Fund’s Portfolio of Investments includes the following currency categories (as a percentage of long-term investments):
| U.S. Dollar | | | 24.9 | % |
| Indian Rupee | | | 19.0 | % |
| Hong Kong Dollar | | | 16.7 | % |
| Brazilian Real | | | 8.6 | % |
| Yuan Renminbi | | | 6.6 | % |
| South African Rand | | | 6.3 | % |
| Indonesian Rupiah | | | 5.2 | % |
| Mexican Peso | | | 3.4 | % |
| New Taiwan Dollar | | | 3.2 | % |
| South Korean Won | | | 2.7 | % |
| Thai Baht | | | 2.5 | % |
| All Other Currencies | | | 0.9 | % |
| Total | | | 100.0 | % |
See accompanying Notes to Financial Statements.
| 62 | Annual Report | December 31, 2019 |
| | Emerging Markets Growth Fund |
| | |
| | The Emerging Markets Growth Fund seeks long-term capital appreciation. |
| | |
| | AN OVERVIEW FROM THE PORTFOLIO MANAGERS |
| | |

Todd M. McClone 
Casey K. Preyss | The William Blair Emerging Markets Growth Fund (Class N shares) posted a 27.89% increase, net of fees, for the twelve months ended December 31, 2019. By comparison, the Fund’s benchmark index, the MSCI Emerging Markets IMI (net) (the “Index”), increased 17.64%. Calendar year outperformance versus the Index was primarily driven by positive stock selection across most sectors. Stock selection within the Financials sector was particularly beneficial, aided by Bajaj Finance and China Merchants Bank. Bajaj Finance, the Indian consumer lending company, continued to outperform as the company’s strong execution and higher quality drove stronger growth and returns, standing out against competitors in a challenging backdrop. Shares of China Merchants Bank, the leading private retail bank in China, climbed amid an improved macro backdrop and solid fundamental results. The bank’s growth and profitability continue to stand out relative to large peers. Brazilian capital goods company WEG also bolstered results in Industrials, amid strong operating trends and improved growth outlook. Partially offsetting these effects were the underweight allocation to Russia, coupled with below average stock selection within the Information Technology and Real Estate sectors. Within Information Technology, Samsung Electronics and Pagseguro Digital hindered performance. The underweight position in Samsung Electronics hurt as the stock rallied on improving memory pricing and new handset launches. Pagseguro weighed due to weak operating performance in the fourth quarter. Multiplan Empreendimentos Imobiliarios, a premier mall operator in Brazil, weighed on relative returns within the Real Estate sector as the company posted slower operating momentum and higher than expected financial expenses in the first quarter. We sold the position as a result. Please refer to the Global Markets Review and Outlook relating to the Fund beginning on page 32. |
| December 31, 2019 | William Blair Funds | 63 |
Emerging Markets Growth Fund
Performance Highlights (Unaudited)
| Average Annual Total Return through 12/31/2019 |
| | | 1 Year | | 3 Year | | 5 Year | | 10 Year |
| Class N | | | 27.89 | % | | | 14.19 | % | | | 5.13 | % | | | 5.16 | % |
| Class I | | | 28.29 | | | | 14.51 | | | | 5.40 | | | | 5.44 | |
| Class R6 | | | 28.28 | | | | 14.60 | | | | 5.49 | | | | 5.58 | |
| MSCI Emerging Markets IMI (net) | | | 17.64 | | | | 11.00 | | | | 5.30 | | | | 3.60 | |
Performance cited represents past performance. Past performance does not guarantee future results and current performance may be lower or higher than the data quoted. Results shown are average annual returns, which assume reinvestment of dividends and capital gains. Investment returns and principal will fluctuate and you may have a gain or loss when you sell shares. For the most current month-end performance information, please call 1-800-742-7272, or visit our Web site atwww.williamblairfunds.com. From time to time, the investment adviser may waive fees or reimburse expenses for the Fund. Without these waivers/reimbursements, performance would be lower. International investing involves special risk considerations, including currency fluctuations, lower liquidity, economic and political risk. These risks may be magnified when investing in emerging markets. Class N shares are not subject to a sales load. Class I shares are not subject to a sales load or distribution (Rule 12b-1) fees. Class R6 shares are not subject to a sales load, distribution (Rule 12b-1) fees, or sub-transfer agent fees.
The performance highlights and graph presented above do not reflect the deduction of taxes that a shareholder would pay on fund distributions or the redemption of fund shares.
The Morgan Stanley Capital International (MSCI) Emerging Markets Investable Market Index (IMI) (net) is a free float-adjusted market capitalization weighted index that is designed to measure the equity market performance of emerging markets. This index approximates the minimum possible dividend reinvestment by deducting for the highest possible withholding tax rates of those markets.
This report identifies the Fund’s investments on December 31, 2019. These holdings are subject to change. Not all stocks in the Fund performed the same, nor is there any guarantee that these stocks will perform as well in the future. Market forecasts provided in this report may not necessarily come to pass.
Sector Diversification (Unaudited)

The sector diversification shown is based on the total long-term securities.
| 64 | Annual Report | December 31, 2019 |
Emerging Markets Growth Fund
Portfolio of Investments, December 31, 2019(all dollar amounts in thousands)
| | | | | | | | |
| | | | | | | | |
| | Issuer | | Shares | | | Value | |
| | | | | | | | | | |
| | Common Stocks | | | | | | | | |
| | | | | | | | | | |
| | Emerging Asia—74.4% | | | | | | | | |
| | China—30.9% | | | | | | | | |
| | A-Living Services Co. Ltd. Class “H” (Commercial services & supplies) | | | 832,500 | | | $ | 2,874 | |
| | Aier Eye Hospital Group Co., Ltd. Class “A” (Health care providers & services) | | | 587,420 | | | | 3,336 | |
| * | Alibaba Group Holding, Ltd.—ADR (Internet & direct marketing retail) | | | 262,550 | | | | 55,687 | |
| | ANTA Sports Products, Ltd. (Textiles, apparel & luxury goods) | | | 779,000 | | | | 6,973 | |
| | Bank of Ningbo Co., Ltd. Class “A” (Banks) | | | 967,000 | | | | 3,908 | |
| | Centre Testing International Group Co., Ltd. Class “A” (Professional services) | | | 1,771,600 | | | | 3,792 | |
| | Chacha Food Co., Ltd. Class “A” (Food products) | | | 390,367 | | | | 1,904 | |
| | China International Travel Service Corporation, Ltd. Class “A” (Hotels, restaurants & leisure) | | | 305,640 | | | | 3,903 | |
| * | China Mengniu Dairy Co., Ltd. (Food products) | | | 987,000 | | | | 3,990 | |
| | China Merchants Bank Co., Ltd. Class “H” (Banks) | | | 2,232,500 | | | | 11,474 | |
| | Country Garden Services Holdings Co., Ltd. (Commercial services & supplies) | | | 1,477,000 | | | | 4,976 | |
| | Foshan Haitian Flavouring & Food Co., Ltd. Class “A” (Food products) | | | 456,654 | | | | 7,048 | |
| | Hangzhou Tigermed Consulting Co., Ltd. Class “A” (Life sciences tools & services) | | | 367,866 | | | | 3,335 | |
| | Jiangsu Hengrui Medicine Co., Ltd. Class “A” (Pharmaceuticals) | | | 315,600 | | | | 3,965 | |
| | Juewei Food Co., Ltd. Class “A” (Food products) | | | 294,700 | | | | 1,965 | |
| | Kweichow Moutai Co., Ltd. Class “A” (Beverages) | | | 45,342 | | | | 7,701 | |
| | Li Ning Co., Ltd. (Textiles, apparel & luxury goods) | | | 1,693,000 | | | | 5,073 | |
| | Luxshare Precision Industry Co., Ltd. Class “A” (Electronic equipment, instruments & components) | | | 893,700 | | | | 4,683 | |
| | Midea Group Co., Ltd. Class “A” (Household durables) | | | 447,693 | | | | 3,744 | |
| * | New Oriental Education & Technology Group, Inc.—ADR (Diversified consumer services) | | | 48,000 | | | | 5,820 | |
| | Offcn Education Technology Co., Ltd. Class “A” (Diversified consumer services) | | | 964,700 | | | | 2,476 | |
| * | Ping An Healthcare and Technology Co. Ltd. (Health care technology) | | | 338,600 | | | | 2,470 | |
| | Ping An Insurance Group Co. of China, Ltd. Class “H” (Insurance) | | | 1,614,300 | | | | 19,080 | |
| | Shanghai International Airport Co., Ltd. Class “A” (Transportation infrastructure) | | | 243,865 | | | | 2,757 | |
| | Shanghai M&G Stationery, Inc. Class “A” (Commercial services & supplies) | | | 263,500 | | | | 1,844 | |
| | | | | | | | |
| | | | | | | | |
| | Issuer | | Shares | | | Value | |
| | | | | | | | | | |
| | Common Stocks—(continued) | | | | | | | | |
| | | | | | | | | | |
| | Emerging Asia—(continued) | | | | | | | | |
| | China—(continued) | | | | | | | | |
| | Shennan Circuits Co., Ltd. Class “A” (Electronic equipment, instruments & components) | | | 102,403 | | | $ | 2,089 | |
| | Shenzhen Mindray Bio-Medical Electronics Co., Ltd. Class “A” (Health care equipment & supplies) | | | 137,800 | | | | 3,598 | |
| | Shenzhou International Group Holdings, Ltd. (Textiles, apparel & luxury goods) | | | 412,000 | | | | 6,022 | |
| | Silergy Corporation (Semiconductors & semiconductor equipment) | | | 128,000 | | | | 4,056 | |
| | Sunny Optical Technology Group Co., Ltd. (Electronic equipment, instruments & components) | | | 348,800 | | | | 6,038 | |
| | Tencent Holdings, Ltd. (Interactive Media & Services) | | | 368,060 | | | | 17,741 | |
| * | Topchoice Medical Investment Corporation Class “A”(Health care providers & services) | | | 169,200 | | | | 2,490 | |
| | Topsports International Holdings Ltd. (Specialty retail) | | | 2,885,000 | | | | 3,488 | |
| | Wuliangye Yibin Co., Ltd. Class “A” (Beverages) | | | 441,994 | | | | 8,440 | |
| | WuXi AppTec Co. Ltd. Class “A” (Life sciences tools & services) | | | 330,400 | | | | 4,098 | |
| * | Wuxi Biologics Cayman, Inc. (Life sciences tools & services) | | | 321,000 | | | | 4,064 | |
| * | Yihai International Holding, Ltd. (Food products) | | | 527,000 | | | | 3,091 | |
| | Zhejiang Supor Co., Ltd. Class “A” (Household durables) | | | 352,882 | | | | 3,890 | |
| | | | | | | | | 243,883 | |
| | India—13.5% | | | | | | | | |
| | Asian Paints, Ltd. (Chemicals) | | | 179,541 | | | | 4,503 | |
| | Bajaj Finance, Ltd. (Consumer finance) | | | 250,280 | | | | 14,814 | |
| | Bandhan Bank, Ltd. (Banks) | | | 176,380 | | | | 1,260 | |
| | HDFC Asset Management Co., Ltd. (Capital markets) | | | 108,212 | | | | 4,836 | |
| | HDFC Bank, Ltd. (Banks) | | | 1,158,453 | | | | 20,701 | |
| | HDFC Life Insurance Co. Ltd. (Insurance) | | | 527,550 | | | | 4,601 | |
| | Hindustan Unilever, Ltd. (Household products) | | | 211,844 | | | | 5,699 | |
| | Housing Development Finance Corporation, Ltd. (Thrifts & mortgage finance) | | | 372,972 | | | | 12,609 | |
| | Indraprastha Gas, Ltd. (Gas utilities) | | | 625,135 | | | | 3,753 | |
| | Info Edge India, Ltd. (Interactive Media & Services) | | | 76,154 | | | | 2,710 | |
| | Nestle India, Ltd. (Food products) | | | 20,705 | | | | 4,285 | |
| | Pidilite Industries, Ltd. (Chemicals) | | | 120,711 | | | | 2,345 | |
| | Reliance Industries, Ltd. (Oil, gas & consumable fuels) | | | 941,421 | | | | 19,995 | |
| | Tata Consultancy Services, Ltd. (IT services) | | | 163,791 | | | | 4,968 | |
| | | | | | | | | 107,079 | |
See accompanying Notes to Financial Statements.
| December 31, 2019 | William Blair Funds | 65 |
Emerging Markets Growth Fund
Portfolio of Investments, December 31, 2019(all dollar amounts in thousands)
| | | | | | | | |
| | | | | | | | |
| | Issuer | | Shares | | | Value | |
| | | | | | | | | | |
| | Common Stocks—(continued) | | | | | | | | |
| | | | | | | | | | |
| | Emerging Asia—(continued) | | | | | | | | |
| | | | | | | | | | |
| | Indonesia—2.6% | | | | | | | | |
| | PT Bank Central Asia Tbk (Banks) | | | 6,733,900 | | | $ | 16,213 | |
| | PT Bank Rakyat Indonesia Persero Tbk (Banks) | | | 13,435,605 | | | | 4,259 | |
| | | | | | | | | 20,472 | |
| | Philippines—0.4% | | | | | | | | |
| | Ayala Land, Inc. (Real estate management & development) | | | 3,688,400 | | | | 3,314 | |
| | South Korea—7.5% | | | | | | | | |
| * | Kakao Corporation (Interactive Media & Services) | | | 57,460 | | | | 7,627 | |
| | LG Household & Health Care, Ltd. (Personal products) | | | 6,045 | | | | 6,592 | |
| | Macquarie Korea Infrastructure Fund (Capital markets) | | | 260,033 | | | | 2,608 | |
| | RFHIC Corporation (Semiconductors & semiconductor equipment) | | | 39,032 | | | | 1,244 | |
| | Samsung Electronics Co., Ltd. (Technology hardware, storage & peripherals) | | | 854,498 | | | | 41,230 | |
| | | | | | | | | 59,301 | |
| | Taiwan—17.5% | | | | | | | | |
| | Accton Technology Corporation (Communications equipment) | | | 465,000 | | | | 2,606 | |
| | Advantech Co., Ltd. (Technology hardware, storage & peripherals) | | | 264,000 | | | | 2,660 | |
| | ASMedia Technology, Inc. (Semiconductors & semiconductor equipment) | | | 101,000 | | | | 2,214 | |
| | ASPEED Technology, Inc. (Semiconductors & semiconductor equipment) | | | 98,000 | | | | 3,135 | |
| | Bizlink Holding, Inc. (Electrical equipment) | | | 319,000 | | | | 2,400 | |
| | Chailease Holding Co., Ltd. (Diversified financial services) | | | 1,227,071 | | | | 5,649 | |
| | E.Sun Financial Holding Co., Ltd. (Banks) | | | 10,008,007 | | | | 9,315 | |
| | Elite Material Co., Ltd. (Electronic equipment, instruments & components) | | | 634,000 | | | | 2,897 | |
| | Giant Manufacturing Co., Ltd. (Leisure products) | | | 258,000 | | | | 1,833 | |
| | ITEQ Corporation (Electronic equipment, instruments & components) | | | 653,000 | | | | 2,777 | |
| | King Yuan Electronics Co., Ltd. (Semiconductors & semiconductor equipment) | | | 2,026,000 | | | | 2,538 | |
| | Lotes Co., Ltd. (Electronic equipment, instruments & components) | | | 179,000 | | | | 1,926 | |
| | MediaTek, Inc. (Semiconductors & semiconductor equipment) | | | 1,163,000 | | | | 17,206 | |
| | Parade Technologies, Ltd. (Semiconductors & semiconductor equipment) | | | 126,000 | | | | 2,585 | |
| | Powertech Technology, Inc. (Semiconductors & semiconductor equipment) | | | 864,000 | | | | 2,876 | |
| | RichWave Technology Corporation (Semiconductors & semiconductor equipment) | | | 229,000 | | | | 1,299 | |
| | | | | | | | |
| | | | | | | | |
| | Issuer | | Shares | | | Value | |
| | | | | | | | | | |
| | Common Stocks—(continued) | | | | | | | | |
| | | | | | | | | | |
| | Emerging Asia—(continued) | | | | | | | | |
| | | | | | | | | | |
| | Taiwan—(continued) | | | | | | | | |
| | Sinbon Electronics Co., Ltd. (Electronic equipment, instruments & components) | | | 435,000 | | | $ | 1,799 | |
| | Taiwan Semiconductor Manufacturing Co., Ltd. (Semiconductors & semiconductor equipment) | | | 1,623,000 | | | | 17,921 | |
| | Taiwan Semiconductor Manufacturing Co., Ltd.—ADR (Semiconductors & semiconductor equipment) | | | 666,236 | | | | 38,708 | |
| | Taiwan Union Technology Corporation (Electronic equipment, instruments & components) | | | 584,000 | | | | 2,883 | |
| | Tripod Technology Corporation (Electronic equipment, instruments & components) | | | 713,000 | | | | 2,985 | |
| | Voltronic Power Technology Corporation (Electrical equipment) | | | 112,700 | | | | 2,688 | |
| | Win Semiconductors Corporation (Semiconductors & semiconductor equipment) | | | 716,000 | | | | 7,022 | |
| | | | | | | | | 137,922 | |
| | Thailand—1.8% | | | | | | | | |
| | Airports of Thailand PCL (Transportation infrastructure) | | | 922,800 | | | | 2,288 | |
| | CP ALL PCL (Food & staples retailing) | | | 1,567,700 | | | | 3,781 | |
| | Home Product Center PCL (Specialty retail) | | | 5,113,600 | | | | 2,732 | |
| | Muangthai Capital PCL (Consumer finance) | | | 1,024,400 | | | | 2,180 | |
| * | Sea, Ltd.—ADR (Entertainment) | | | 89,290 | | | | 3,591 | |
| | | | | | | | | 14,572 | |
| | Vietnam—0.2% | | | | | | | | |
| * | Vingroup JSC (Real estate management & development) | | | 329,388 | | | | 1,635 | |
| | | | | | | | | | |
| | Emerging Latin America—16.5% | | | | | | | | |
| | Argentina—1.6% | | | | | | | | |
| * | Globant S.A. (Software)† | | | 29,115 | | | | 3,088 | |
| * | MercadoLibre, Inc. (Internet & direct marketing retail) | | | 16,188 | | | | 9,258 | |
| | | | | | | | | 12,346 | |
| | Brazil—13.3% | | | | | | | | |
| * | Azul S.A.—ADR (Airlines) | | | 41,763 | | | | 1,788 | |
| | B3 S.A. – Brasil Bolsa Balcao (Capital markets) | | | 1,578,600 | | | | 16,862 | |
| | Banco BTG Pactual S.A. (Capital markets) | | | 436,300 | | | | 8,257 | |
| | Cyrela Brazil Realty S.A. Empreendimentos e Participacoes (Household durables) | | | 594,100 | | | | 4,385 | |
| | Hapvida Participacoes e Investimentos S.A. (Health care providers & services) | | | 272,800 | | | | 4,333 | |
| | IRB Brasil Resseguros S.A. (Insurance) | | | 978,000 | | | | 9,470 | |
| | Localiza Rent a Car S.A. (Road & rail) | | | 485,121 | | | | 5,717 | |
| | Lojas Renner S.A. (Multiline retail) | | | 631,880 | | | | 8,826 | |
| | Magazine Luiza S.A. (Multiline retail) | | | 791,800 | | | | 9,389 | |
See accompanying Notes to Financial Statements.
| 66 | Annual Report | December 31, 2019 |
Emerging Markets Growth Fund
Portfolio of Investments, December 31, 2019(all dollar amounts in thousands)
| | | | | | | | |
| | | | | | | | |
| | Issuer | | Shares | | | Value | |
| | | | | | | | | | |
| | Common Stocks—(continued) | | | | | | | | |
| | | | | | | | | | |
| | Emerging Latin America—(continued) | | | | | | | | |
| | Brazil—(continued) | | | | | | | | |
| | Notre Dame Intermedica Participacoes S.A. (Health care providers & services) | | | 291,500 | | | $ | 4,946 | |
| * | Pagseguro Digital, Ltd. Class “A” (IT services)† | | | 101,722 | | | | 3,475 | |
| * | Rumo S.A. (Road & rail) | | | 457,400 | | | | 2,968 | |
| * | StoneCo, Ltd. Class “A” (IT services)† | | | 110,258 | | | | 4,398 | |
| | Sul America S.A. (Insurance) | | | 290,800 | | | | 4,332 | |
| | TOTVS S.A. (Software) | | | 259,300 | | | | 4,161 | |
| | WEG S.A. (Electrical equipment) | | | 793,320 | | | | 6,835 | |
| * | XP, Inc. Class “A” (Capital markets)† | | | 122,206 | | | | 4,707 | |
| | | | | | | | | 104,849 | |
| | Colombia—0.3% | | | | | | | | |
| | Bancolombia S.A.—ADR (Banks) | | | 51,763 | | | | 2,836 | |
| | Mexico—0.8% | | | | | | | | |
| | Grupo Aeroportuario del Centro Norte S.A.B. de C.V. (Transportation infrastructure) | | | 271,800 | | | | 2,035 | |
| | Wal-Mart de Mexico S.A.B. de C.V. (Food & staples retailing) | | | 1,465,200 | | | | 4,206 | |
| | | | | | | | | 6,241 | |
| | Peru—0.5% | | | | | | | | |
| | Credicorp, Ltd. (Banks)† | | | 9,135 | | | | 1,947 | |
| * | Intercorp Financial Services, Inc. (Banks)† | | | 44,592 | | | | 1,842 | |
| | | | | | | | | 3,789 | |
| | | | | | | | | | |
| | Emerging Europe, Mid-East, Africa—6.7% | | | | | | | | |
| | Czech Republic—0.3% | | | | | | | | |
| | Moneta Money Bank A.S. (Banks) | | | 730,963 | | | | 2,741 | |
| | Greece—0.3% | | | | | | | | |
| | JUMBO S.A. (Specialty retail) | | | 117,460 | | | | 2,444 | |
| | Hungary—1.1% | | | | | | | | |
| | OTP Bank Nyrt (Banks) | | | 171,047 | | | | 8,945 | |
| | Kenya—0.3% | | | | | | | | |
| | Safaricom plc (Wireless telecommunication services) | | | 6,783,854 | | | | 2,115 | |
| | Poland—0.9% | | | | | | | | |
| | CD Projekt S.A. (Entertainment) | | | 55,745 | | | | 4,107 | |
| * | Dino Polska S.A. (Food & staples retailing) | | | 70,023 | | | | 2,657 | |
| | | | | | | | | 6,764 | |
| | Romania—0.3% | | | | | | | | |
| | Banca Transilvania S.A. (Banks) | | | 3,982,325 | | | | 2,421 | |
| | Russia—0.3% | | | | | | | | |
| | TCS Group Holding plc—GDR (Banks) | | | 98,747 | | | | 2,123 | |
| | South Africa—2.1% | | | | | | | | |
| | Capitec Bank Holdings, Ltd. (Banks) | | | 38,979 | | | | 4,025 | |
| | Clicks Group, Ltd. (Food & staples retailing) | | | 223,854 | | | | 4,101 | |
| | Naspers, Ltd. (Internet & direct marketing retail) | | | 51,426 | | | | 8,411 | |
| | | | | | | | | 16,537 | |
| | Issuer | | Shares or
Principal
Amount | | | Value | |
| | | | | | | | | | |
| | Common Stocks—(continued) | | | | | | | | |
| | | | | | | | | | |
| | Emerging Europe, Mid-East, Africa—(continued) | | | | | | | | |
| | United Arab Emirates—1.1% | | | | | | | | |
| | Aramex PJSC (Air freight & logistics) | | | 1,281,269 | | | $ | 1,245 | |
| | First Abu Dhabi Bank PJSC (Banks) | | | 875,094 | | | | 3,612 | |
| * | Network International Holdings plc (IT services) | | | 460,696 | | | | 3,912 | |
| | | | | | | | | 8,769 | |
| | Total Common Stocks—97.6%
(cost $592,476) | | | | | | | 771,098 | |
| | | | | | | | | | |
| | Preferred Stock | | | | | | | | |
| | Brazil—1.0% | | | | | | | | |
| | Itau Unibanco Holding S.A. (Banks) | | | 888,290 | | | | 8,192 | |
| | Total Preferred Stock—1.0%
(cost $7,858) | | | | | | | 8,192 | |
| | | | | | | | | | |
| | Repurchase Agreement | | | | | | | | |
| | Fixed Income Clearing Corporation, 0.120% dated 12/31/19, due 1/2/20, repurchase price $12,845, collateralized by U.S. Treasury Bond, 2.500%, due 5/15/46 valued at $13,105 | | $ | 12,845 | | | | 12,845 | |
| | Total Repurchase Agreement—1.6%
(cost $12,845) | | | | | | | 12,845 | |
| | Total Investments—100.2%
(cost $613,179) | | | | | | | 792,135 | |
| | Liabilities, plus cash | | | | | | | | |
| | and other assets—(0.2)% | | | | | | | (1,943 | ) |
| | Net assets—100.0% | | | | | | $ | 790,192 | |
ADR = American Depository Receipt
GDR = Global Depository Receipt
* = Non-income producing security
† = U.S. listed foreign security
For securities primarily traded on exchanges or markets that close before the close of regular trading on the New York Stock Exchange, the Fund may use an independent pricing service to fair value price the securities pursuant to Valuation Procedures approved by the Board of Trustees.
See accompanying Notes to Financial Statements.
| December 31, 2019 | William Blair Funds | 67 |
Emerging Markets Growth Fund
Portfolio of Investments, December 31, 2019
At December 31, 2019, the Fund’s Portfolio of Investments includes the following industry categories (as a percentage of long-term investments):
| Financials | | | 27.6 | % |
| Information Technology | | | 25.6 | % |
| Consumer Discretionary | | | 18.5 | % |
| Consumer Staples | | | 8.4 | % |
| Industrials | | | 5.7 | % |
| Communication Services | | | 4.9 | % |
| Health Care | | | 4.7 | % |
| Energy | | | 2.6 | % |
| Materials | | | 0.9 | % |
| Real Estate | | | 0.6 | % |
| Utilities | | | 0.5 | % |
| Total | | | 100.0 | % |
At December 31, 2019, the Fund’s Portfolio of Investments includes the following currency categories (as a percentage of long-term investments):
| U.S. Dollar | | | 17.9 | % |
| Indian Rupee | | | 13.7 | % |
| New Taiwan Dollar | | | 13.3 | % |
| Hong Kong Dollar | | | 13.0 | % |
| Brazilian Real | | | 12.7 | % |
| Yuan Renminbi | | | 9.9 | % |
| South Korean Won | | | 7.6 | % |
| Indonesian Rupiah | | | 2.6 | % |
| South African Rand | | | 2.1 | % |
| Thai Baht | | | 1.4 | % |
| Hungarian Forint | | | 1.1 | % |
| All Other Currencies | | | 4.7 | % |
| Total | | | 100.0 | % |
See accompanying Notes to Financial Statements.
| 68 | Annual Report | December 31, 2019 |
| | Emerging Markets Small Cap Growth Fund |
| | |
| | The Emerging Markets Small Cap Growth Fund seeks long-term capital appreciation. |
| | |
| | AN OVERVIEW FROM THE PORTFOLIO MANAGERS |
| | |

Todd M. McClone 
Casey K. Preyss | The William Blair Emerging Markets Small Cap Growth Fund (Class N shares) posted a 20.34% increase, net of fees, for the twelve months ended December 31, 2019. By comparison, the Fund’s benchmark index, the MSCI Emerging Markets Small Cap Index (net) (the “Index”), increased 11.50%. Calendar year outperformance versus the Index was primarily driven by positive stock selection across most sectors. The Industrials and Consumer Discretionary sectors were the most notable sources of relative return. Within Industrials, A-Living Services and Centre Testing International, the Chinese leading testing, inspection and certification company in a highly fragmented market, bolstered relative returns during the period. Strong stock performance for both companies was underpinned by accelerating fundamental trends, in line with our investment thesis. Li Ning Co, a Chinese sportswear company within Consumer Discretionary was an additional source of outperformance. The stock price was propelled by Li Ning’s continued strong same-store-sales growth, accelerating ecommerce sales growth and improved margins on the back of its better brand image and increased premium segment sales. Partially offsetting these positive effects was the underweight allocation to Taiwan, coupled with below average stock selection within the Information Technology and Utilities sectors. Within Information Technology, Cafe24, the leading provider of web-based ecommerce solutions in Korea, was a drag amid lackluster results that significantly lagged market expectations and increased competitive pressures; we exited the position as a result. Accton Technology, the leader in white-box switches, also detracted from relative results. However, we believe the investment thesis is intact as the company is well positioned to benefit from a secular shift toward unbundled hardware/software networking solutions in datacenters, as well as favorable network capex and product mix trends. Mahanagar Gas within the Utilities sector was also negative. The stock performance was hampered by weaker 4QFY19 operating results coupled with regulatory headwinds. Please refer to the Global Markets Review and Outlook relating to the Fund beginning on page 32. |
| December 31, 2019 | William Blair Funds | 69 |
Emerging Markets Small Cap Growth Fund
Performance Highlights (Unaudited)
| Average Annual Total Return through 12/31/2019 |
| | | 1 Year | | 3 Year | | 5 Year | | Since
Inception |
| Class N(a) | | | 20.34 | % | | | 8.82 | % | | | 2.69 | % | | | 8.74 | % |
| Class I(a) | | | 20.58 | | | | 9.13 | | | | 2.99 | | | | 9.05 | |
| MSCI Emerging Markets Small Cap Index (net)(a) | | | 11.50 | | | | 6.70 | | | | 2.97 | | | | 3.76 | |
| Class R6(b) | | | 20.69 | | | | 9.21 | | | | 3.07 | | | | 6.77 | |
| MSCI Emerging Markets Small Cap Index (net)(b) | | | 11.50 | | | | 6.70 | | | | 2.97 | | | | 2.60 | |
| (a) | Since inception is for the period from October 24, 2011 (Commencement of Operations) to December 31, 2019. |
| (b) | Since inception is for the period from December 20, 2012 (Commencement of Operations) to December 31, 2019. |
Performance cited represents past performance. Past performance does not guarantee future results and current performance may be lower or higher than the data quoted. Results shown are average annual returns, which assume reinvestment of dividends and capital gains. Investment returns and principal will fluctuate and you may have a gain or loss when you sell shares. For the most current month-end performance information, please call 1-800-742-7272, or visit our Web site atwww.williamblairfunds.com. From time to time, the investment adviser may waive fees or reimburse expenses for the Fund. Without these waivers/reimbursements, performance would be lower. International investing involves special risk considerations, including currency fluctuations, lower liquidity, economic and political risk. These risks may be magnified when investing in emerging markets. Smaller capitalization stocks are also more sensitive to purchase/sale transactions and changes in the issuer’s financial condition. Class N shares are not subject to a sales load. Class I shares are not subject to a sales load or distribution (Rule 12b-1) fees. Class R6 shares are not subject to a sales load, distribution (Rule 12b-1) fees, or sub-transfer agent fees.
The performance highlights and graph presented above do not reflect the deduction of taxes that a shareholder would pay on fund distributions or the redemption of fund shares.
The Morgan Stanley Capital International (MSCI) Emerging Markets Small Cap Index (net) is a free float-adjusted market capitalization index that is designed to measure the equity market performance of emerging markets. This index approximates the minimum possible dividend reinvestment by deducting for the highest possible withholding tax rates of those markets.
This report identifies the Fund’s investments on December 31, 2019. These holdings are subject to change. Not all stocks in the Fund performed the same, nor is there any guarantee that these stocks will perform as well in the future. Market forecasts provided in this report may not necessarily come to pass.
Sector Diversification (Unaudited)
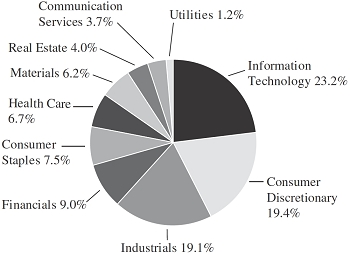
The sector diversification shown is based on the total long-term securities.
| 70 | Annual Report | December 31, 2019 |
Emerging Markets Small Cap Growth Fund
Portfolio of Investments, December 31, 2019(all dollar amounts in thousands)
| | | | | | | | |
| | | | | | | | |
| | Issuer | | Shares | | | Value | |
| | | | | |
| | Common Stocks | | | | | | |
| | | | | |
| | Emerging Asia—72.5% | | | | | | | | |
| | Cambodia—1.2% | | | | | | | | |
| | NagaCorp, Ltd. (Hotels, restaurants & leisure) | | | 2,008,000 | | | $ | 3,504 | |
| | China—19.0% | | | | | | | | |
| | A-Living Services Co. Ltd. Class “H” (Commercial services & supplies) | | | 1,456,250 | | | | 5,027 | |
| | Anhui Gujing Distillery Co., Ltd. Class “A” (Beverages) | | | 34,600 | | | | 675 | |
| | Centre Testing International Group Co., Ltd. Class “A” (Professional services) | | | 2,277,305 | | | | 4,875 | |
| | Chacha Food Co., Ltd. Class “A” (Food products) | | | 344,798 | | | | 1,682 | |
| | Changzhou Xingyu Automotive Lighting Systems Co., Ltd. Class “A” (Auto components) | | | 110,747 | | | | 1,510 | |
| | Chengdu Hongqi Chain Co., Ltd. Class “A” (Food & staples retailing) | | | 1,221,480 | | | | 1,324 | |
| * | China East Education Holdings, Ltd. (Diversified consumer services) | | | 750,500 | | | | 1,572 | |
| | CIFI Holdings Group Co., Ltd. (Real estate management & development) | | | 1,970,000 | | | | 1,666 | |
| | Country Garden Services Holdings Co., Ltd. (Commercial services & supplies) | | | 1,378,000 | | | | 4,642 | |
| | Ever Sunshine Lifestyle Services Group, Ltd. (Commercial services & supplies) | | | 1,686,000 | | | | 1,142 | |
| | Greentown Service Group Co., Ltd. (Commercial services & supplies) | | | 1,642,000 | | | | 1,793 | |
| * | GSX Techedu, Inc.—ADR (Diversified consumer services) | | | 146,312 | | | | 3,198 | |
| | Hangzhou Tigermed Consulting Co., Ltd. Class “A” (Life sciences tools & services) | | | 236,800 | | | | 2,147 | |
| | Hefei Meiya Optoelectronic Technology, Inc. Class “A” (Machinery) | | | 270,595 | | | | 1,519 | |
| | Jiajiayue Group Co., Ltd. Class “A” (Food & staples retailing) | | | 358,252 | | | | 1,252 | |
| | Jiangsu Hengli Hydraulic Co., Ltd. Class “A” (Machinery) | | | 296,666 | | | | 2,119 | |
| | Jinxin Fertility Group, Ltd. (Health care providers & services) | | | 152,000 | | | | 203 | |
| | Juewei Food Co., Ltd. Class “A” (Food products) | | | 237,135 | | | | 1,581 | |
| * | KWG Group Holdings, Ltd. (Real estate management & development) | | | 730,000 | | | | 1,023 | |
| | Offcn Education Technology Co., Ltd. Class “A” (Diversified consumer services) | | | 488,000 | | | | 1,253 | |
| | Shanghai M&G Stationery, Inc. Class “A” (Commercial services & supplies) | | | 307,475 | | | | 2,151 | |
| | Silergy Corporation (Semiconductors & semiconductor equipment) | | | 68,000 | | | | 2,155 | |
| * | Topchoice Medical Corporation Class “A” (Health care providers & services) | | | 142,700 | | | | 2,100 | |
| | Topsports International Holdings Ltd. (Specialty retail) | | | 997,000 | | | | 1,205 | |
| | | | | | | | |
| | | | | | | | |
| | Issuer | | Shares | | | Value | |
| | | | | | | | | | |
| | Common Stocks—(continued) | | | | | | | | |
| | | | | | | | | | |
| | Emerging Asia—(continued) | | | | | | | | |
| | China—(continued) | | | | | | | | |
| * | Yihai International Holding, Ltd. (Food products) | | | 165,000 | | | $ | 968 | |
| | Zhejiang Dingli Machinery Co., Ltd. Class “A” (Machinery) | | | 217,894 | | | | 2,237 | |
| | Zhejiang Supor Co., Ltd. Class “A” (Household durables) | | | 148,108 | | | | 1,633 | |
| | | | | | | | | 52,652 | |
| | India—19.6% | | | | | | | | |
| | Aarti Industries, Ltd. (Chemicals) | | | 249,342 | | | | 2,917 | |
| | Apollo Hospitals Enterprise, Ltd. (Health care providers & services) | | | 107,364 | | | | 2,164 | |
| * | Arti Surfactants, Ltd. (Chemicals)** | | | 13,896 | | | | 2 | |
| | Astral Poly Technik, Ltd. (Building products) | | | 220,224 | | | | 3,638 | |
| | Bandhan Bank Ltd. (Banks) | | | 254,451 | | | | 1,817 | |
| | Bata India, Ltd. (Textiles, apparel & luxury goods) | | | 33,609 | | | | 824 | |
| | Berger Paints India, Ltd. (Chemicals) | | | 411,459 | | | | 2,974 | |
| | City Union Bank, Ltd. (Banks) | | | 635,687 | | | | 2,091 | |
| | Colgate-Palmolive India, Ltd. (Personal products) | | | 64,609 | | | | 1,319 | |
| | Dr. Lal PathLabs, Ltd. (Health care providers & services) | | | 106,476 | | | | 2,230 | |
| * | Godrej Properties, Ltd. (Real estate management & development) | | | 88,001 | | | | 1,216 | |
| | HDFC Asset Management Co. Ltd. (Capital markets) | | | 83,532 | | | | 3,733 | |
| | Indraprastha Gas, Ltd. (Gas utilities) | | | 531,723 | | | | 3,192 | |
| | Info Edge India, Ltd. (Interactive Media & Services) | | | 65,728 | | | | 2,339 | |
| | Ipca Laboratories, Ltd. (Pharmaceuticals) | | | 187,746 | | | | 2,996 | |
| | KEI Industries, Ltd. (Electrical equipment) | | | 127,696 | | | | 818 | |
| | Motherson Sumi Systems, Ltd. (Auto components) | | | 1,505,396 | | | | 3,092 | |
| | NIIT Technologies, Ltd. (IT services) | | | 102,049 | | | | 2,269 | |
| | PI Industries, Ltd. (Chemicals) | | | 113,324 | | | | 2,294 | |
| | Pidilite Industries, Ltd. (Chemicals) | | | 165,799 | | | | 3,222 | |
| | PVR, Ltd. (Entertainment) | | | 55,412 | | | | 1,471 | |
| | SRF, Ltd. (Chemicals) | | | 59,729 | | | | 2,870 | |
| | The Phoenix Mills, Ltd. (Real estate management & development) | | | 116,717 | | | | 1,354 | |
| | Titan Co., Ltd. (Textiles, apparel & luxury goods) | | | 40,702 | | | | 679 | |
| | Varun Beverages, Ltd. (Beverages) | | | 312,901 | | | | 3,069 | |
| | | | | | | | | 54,590 | |
| | Indonesia—2.1% | | | | | | | | |
| | PT Ace Hardware Indonesia Tbk (Specialty retail) | | | 10,878,800 | | | | 1,171 | |
| * | PT Bank Tabungan Pensiunan Nasional Syariah Tbk (Banks) | | | 7,570,700 | | | | 2,318 | |
| | PT Indofood CBP Sukses Makmur Tbk (Food products) | | | 2,886,400 | | | | 2,318 | |
| | | | | | | | | 5,807 | |
See accompanying Notes to Financial Statements.
| December 31, 2019 | William Blair Funds | 71 |
Emerging Markets Small Cap Growth Fund
Portfolio of Investments, December 31, 2019(all dollar amounts in thousands)
| | | | | | | | |
| | | | | | | | |
| | Issuer | | Shares | | | Value | |
| | | | | | | | | | |
| | Common Stocks—(continued) | | | | | | | | |
| | | | | | | | | | |
| | Emerging Asia—(continued) | | | | | | | | |
| | Malaysia—0.5% | | | | | | | | |
| | Inari Amertron Bhd (Electronic equipment, instruments & components) | | | 3,171,400 | | | $ | 1,318 | |
| | Pakistan—0.4% | | | | | | | | |
| | Lucky Cement, Ltd. (Construction materials) | | | 431,250 | | | | 1,187 | |
| | Philippines—2.4% | | | | | | | | |
| | Bloomberry Resorts Corporation (Hotels, restaurants & leisure) | | | 1,966,600 | | | | 439 | |
| | International Container Terminal Services, Inc. (Transportation infrastructure) | | | 556,090 | | | | 1,412 | |
| | Security Bank Corporation (Banks) | | | 753,460 | | | | 2,901 | |
| | Wilcon Depot, Inc. (Specialty retail) | | | 5,264,400 | | | | 1,871 | |
| | | | | | | | | 6,623 | |
| | South Korea—6.5% | | | | | | | | |
| | AfreecaTV Co., Ltd. (Interactive Media & Services) | | | 21,727 | | | | 1,294 | |
| * | CJ Logistics Corporation (Road & rail) | | | 6,610 | | | | 886 | |
| | Douzone Bizon Co., Ltd. (Software) | | | 72,758 | | | | 5,096 | |
| | F&F Co., Ltd. (Textiles, apparel & luxury goods) | | | 14,792 | | | | 1,433 | |
| | Fila Korea, Ltd. (Textiles, apparel & luxury goods) | | | 25,595 | | | | 1,173 | |
| | JYP Entertainment Corporation (Entertainment) | | | 122,738 | | | | 2,563 | |
| | Koh Young Technology, Inc. (Semiconductors & semiconductor equipment) | | | 51,243 | | | | 4,675 | |
| | RFHIC Corporation (Semiconductors & semiconductor equipment) | | | 29,435 | | | | 938 | |
| | | | | | | | | 18,058 | |
| | Taiwan—18.3% | | | | | | | | |
| | Accton Technology Corporation (Communications equipment) | | | 361,000 | | | | 2,023 | |
| | Airtac International Group (Machinery) | | | 257,000 | | | | 3,999 | |
| | ASPEED Technology, Inc. (Semiconductors & semiconductor equipment) | | | 91,000 | | | | 2,911 | |
| | Bizlink Holding, Inc. (Electrical equipment) | | | 298,000 | | | | 2,242 | |
| | Elite Material Co., Ltd. (Electronic equipment, instruments & components) | | | 482,000 | | | | 2,203 | |
| | Giant Manufacturing Co., Ltd. (Leisure products) | | | 98,000 | | | | 696 | |
| | Globalwafers Co., Ltd. (Semiconductors & semiconductor equipment) | | | 310,000 | | | | 3,955 | |
| | ITEQ Corporation (Electronic equipment, instruments & components) | | | 536,000 | | | | 2,280 | |
| | King Yuan Electronics Co., Ltd. (Semiconductors & semiconductor equipment) | | | 2,302,000 | | | | 2,883 | |
| | Lotes Co., Ltd. (Electronic equipment, instruments & components) | | | 157,000 | | | | 1,689 | |
| | | | | | | | |
| | | | | | | | |
| | Issuer | | Shares | | | Value | |
| | | | | | | | | | |
| | Common Stocks—(continued) | | | | | | | | |
| | | | | | | | | | |
| | Emerging Asia—(continued) | | | | | | | | |
| | Taiwan—(continued) | | | | | | | | |
| | Nanya Technology Corporation (Semiconductors & semiconductor equipment) | | | 1,084,000 | | | $ | 3,016 | |
| | Parade Technologies, Ltd. (Semiconductors & semiconductor equipment) | | | 212,000 | | | | 4,349 | |
| | Powertech Technology, Inc. (Semiconductors & semiconductor equipment) | | | 504,000 | | | | 1,678 | |
| | Poya International Co., Ltd. (Multiline retail) | | | 66,000 | | | | 928 | |
| | RichWave Technology Corporation (Semiconductors & semiconductor equipment) | | | 182,000 | | | | 1,032 | |
| | Sinbon Electronics Co., Ltd. (Electronic equipment, instruments & components) | | | 854,000 | | | | 3,533 | |
| | Sporton International, Inc. (Professional services) | | | 186,000 | | | | 1,322 | |
| | Taiwan Union Technology Corporation (Electronic equipment, instruments & components) | | | 572,000 | | | | 2,824 | |
| | Tripod Technology Corporation (Electronic equipment, instruments & components) | | | 787,000 | | | | 3,295 | |
| | Voltronic Power Technology Corporation (Electrical equipment) | | | 98,100 | | | | 2,340 | |
| | Win Semiconductors Corporation (Semiconductors & semiconductor equipment) | | | 158,000 | | | | 1,550 | |
| | | | | | | | | 50,748 | |
| | Thailand—2.5% | | | | | | | | |
| | Com7 PCL Class “F” (Specialty retail) | | | 1,527,300 | | | | 1,351 | |
| | Muangthai Capital PCL (Consumer finance) | | | 544,000 | | | | 1,158 | |
| | Tisco Financial Group PCL (Banks) | | | 861,700 | | | | 2,855 | |
| | TOA Paint Thailand PCL (Chemicals) | | | 1,163,400 | | | | 1,525 | |
| | | | | | | | | 6,889 | |
| | | | | | | | | | |
| | Emerging Latin America—18.3% | | | | | | | | |
| | Argentina—0.9% | | | | | | | | |
| * | Globant S.A. (Software)† | | | 23,115 | | | | 2,451 | |
| | Brazil—16.9% | | | | | | | | |
| * | Arco Platform, Ltd. Class “A” (Diversified consumer services)† | | | 41,024 | | | | 1,813 | |
| | Arezzo Industria e Comercio S.A. (Textiles, apparel & luxury goods) | | | 57,700 | | | | 918 | |
| * | BR Properties S.A. (Real estate management & development) | | | 861,400 | | | | 3,101 | |
| | Construtora Tenda S.A. (Household durables) | | | 102,900 | | | | 772 | |
| | Cyrela Brazil Realty SA Empreendimentos e Participacoes (Household durables) | | | 680,900 | | | | 5,026 | |
| | EcoRodovias Infraestrutura e Logistica S.A. (Transportation infrastructure) | | | 280,200 | | | | 1,135 | |
| | Ez Tec Empreendimentos e Participacoes S.A. (Household durables) | | | 266,800 | | | | 3,442 | |
See accompanying Notes to Financial Statements.
| 72 | Annual Report | December 31, 2019 |
Emerging Markets Small Cap Growth Fund
Portfolio of Investments, December 31, 2019(all dollar amounts in thousands)
| | | | | | | | |
| | | | | | | | |
| | Issuer | | Shares | | | Value | |
| | | | | | | | | | |
| | Common Stocks—(continued) | | | | | | | | |
| | | | | | | | | | |
| | Emerging Latin America—(continued) | | | | | | | | |
| | Brazil—(continued) | | | | | | | | |
| * | Grupo SBF S.A. (Specialty retail) | | | 361,900 | | | $ | 3,165 | |
| | Hapvida Participacoes e Investimentos S.A. (Health care providers & services) | | | 154,900 | | | | 2,461 | |
| | Iguatemi Empresa de Shopping Centers S.A. (Real estate management & development) | | | 46,800 | | | | 615 | |
| | IRB Brasil Resseguros S.A. (Insurance) | | | 233,800 | | | | 2,264 | |
| | Localiza Rent a Car S.A. (Road & rail) | | | 200,229 | | | | 2,360 | |
| | Magazine Luiza S.A. (Multiline retail) | | | 413,300 | | | | 4,901 | |
| | Multiplan Empreendimentos Imobiliarios S.A. (Real estate management & development) | | | 241,300 | | | | 1,986 | |
| | Notre Dame Intermedica Participacoes S.A. (Health care providers & services) | | | 238,500 | | | | 4,046 | |
| | Sul America S.A. (Insurance) | | | 79,900 | | | | 1,190 | |
| | Tegma Gestao Logistica S.A. (Road & rail) | | | 355,700 | | | | 3,329 | |
| | TOTVS S.A. (Software) | | | 279,800 | | | | 4,490 | |
| | | | | | | | | 47,014 | |
| | Peru—0.5% | | | | | | | | |
| * | Intercorp Financial Services, Inc. (Banks)† | | | 29,274 | | | | 1,209 | |
| | | | | | | | | | |
| | Emerging Europe, Mid-East, Africa—6.1% | | | | | | | | |
| | Greece—1.3% | | | | | | | | |
| | JUMBO S.A. (Specialty retail) | | | 88,373 | | | | 1,839 | |
| | OPAP S.A. (Hotels, restaurants & leisure) | | | 142,713 | | | | 1,855 | |
| | | | | | | | | 3,694 | |
| | Kenya—0.5% | | | | | | | | |
| | Safaricom plc (Wireless telecommunication services) | | | 4,977,800 | | | | 1,552 | |
| | Poland—1.7% | | | | | | | | |
| | CD Projekt S.A. (Entertainment) | | | 13,476 | | | | 993 | |
| * | Dino Polska S.A. (Food & staples retailing) | | | 96,887 | | | | 3,677 | |
| | | | | | | | | 4,670 | |
| | South Africa—2.1% | | | | | | | | |
| | Capitec Bank Holdings, Ltd. (Banks) | | | 30,503 | | | | 3,150 | |
| | Clicks Group, Ltd. (Food & staples retailing) | | | 143,962 | | | | 2,637 | |
| | | | | | | | | 5,787 | |
| | United Arab Emirates—0.5% | | | | | | | | |
| * | Network International Holdings plc (IT services) | | | 155,105 | | | | 1,317 | |
| | Total Common Stocks—96.9%
(cost $210,002) | | | | | | | 269,070 | |
| | Issuer | | Shares or
Principal
Amount | | | Value | |
| | | | | | | | | | |
| | Preferred Stocks | | | | | | | | |
| | Brazil—1.9% | | | | | | | | |
| * | Alpargatas S.A. (Textiles, apparel & luxury goods) | | | 231,200 | | | $ | 1,908 | |
| | Randon S.A. Implementos e Participacoes (Machinery) | | | 1,035,450 | | | | 3,449 | |
| | | | | | | | | 5,357 | |
| | Total Preferred Stocks—1.9%
(cost $3,947) | | | | | | | 5,357 | |
| | | | | | | | | | |
| | Repurchase Agreement | | | | | | | | |
| | Fixed Income Clearing Corporation, 0.120% dated 12/31/19, due 1/2/20, repurchase price $3,610, collateralized by U.S. Treasury Bond, 2.500%, due 5/15/46 valued at $3,683 | | $ | 3,610 | | | | 3,610 | |
| | Total Repurchase Agreement—1.3%
(cost $3,610) | | | | | | | 3,610 | |
| | Total Investments—100.1%
(cost $217,559) | | | | | | | 278,037 | |
| | Liabilities, plus cash and other assets—(0.1)% | | | | | | | (416 | ) |
| | Net assets—100.0% | | | | | | $ | 277,621 | |
ADR = American Depository Receipt
* = Non-income producing security
** = Fair valued pursuant to Valuation Procedures approved by the Board of Trustees. This holding represents 0.00% of the Fund’s net assets at December 31, 2019.
† = U.S. listed foreign security
For securities primarily traded on exchanges or markets that close before the close of regular trading on the New York Stock Exchange, the Fund may use an independent pricing service to fair value price the securities pursuant to Valuation Procedures approved by the Board of Trustees.
See accompanying Notes to Financial Statements.
| December 31, 2019 | William Blair Funds | 73 |
Emerging Markets Small Cap Growth Fund
Portfolio of Investments, December 31, 2019
At December 31, 2019, the Fund’s Portfolio of Investments includes the following industry categories (as a percentage of long-term investments):
| | | | | |
| Information Technology | | | 23.2 | % |
| Consumer Discretionary | | | 19.4 | % |
| Industrials | | | 19.1 | % |
| Financials | | | 9.0 | % |
| Consumer Staples | | | 7.5 | % |
| Health Care | | | 6.7 | % |
| Materials | | | 6.2 | % |
| Real Estate | | | 4.0 | % |
| Communication Services | | | 3.7 | % |
| Utilities | | | 1.2 | % |
| Total | | | 100.0 | % |
| | | | | |
| At December 31, 2019, the Fund’s Portfolio of Investments includes the following currency categories (as a percentage of long-term investments): |
| | | | | |
| Indian Rupee | | | 19.9 | % |
| New Taiwan Dollar | | | 19.3 | % |
| Brazilian Real | | | 18.4 | % |
| Yuan Renminbi | | | 10.2 | % |
| Hong Kong Dollar | | | 8.3 | % |
| South Korean Won | | | 6.6 | % |
| U.S. Dollar | | | 3.2 | % |
| Thai Baht | | | 2.5 | % |
| Philippine Peso | | | 2.4 | % |
| Indonesian Rupiah | | | 2.1 | % |
| South African Rand | | | 2.1 | % |
| Polish Zloty | | | 1.7 | % |
| Euro | | | 1.3 | % |
| All Other Currencies | | | 2.0 | % |
| Total | | | 100.0 | % |
See accompanying Notes to Financial Statements.
| 74 | Annual Report | December 31, 2019 |
Fixed Income Market Review and Outlook
The Bloomberg Barclays U.S. Aggregate Index (the “Index”) returned +8.72% during 2019 as interest rates declined and risk spreads compressed. All major segments of the Index experienced gains during the year.
The Federal Open Market Committee (FOMC) changed its course during 2019 and cut rates three times after having raised rates as recently as December 2018, citing global uncertainties and muted inflationary pressures. Interest rates of all tenors declined due to both the expectations for and actual cuts to the federal funds rate. At the end of 2019, the market predicted a steadier year for the FOMC’s federal funds rate policy; Eurodollar futures markets predicted no change to the target range during 2020.
The FOMC influenced the markets in other ways, as well. The market for repurchase agreements (repos) experienced a surge in borrowing costs in September as the combination of scheduled corporate tax obligations and Treasury coupon payments created a shortage of U.S. dollars in the market. The market remained concerned about high borrowing costs in the repo market due to dealer banks’ unwillingness to provide capital out of concerns of incurring Global Systemically Important Bank (GSIB) surcharges. The FOMC took two actions to ensure adequate systemic liquidity: it directed purchases of Treasury bills of $60 billion per month at least into the second quarter of 2020, and it supported overnight and term repo operations through January of 2020. These events reduced repo market rates and Treasury bill rates during the fourth quarter of 2019.
U.S. Treasury Inflation-Protected Securities (TIPS) performed in-line with fixed-rate Treasuries after controlling for differences in maturity during 2019. Market-implied breakeven inflation rates remained at levels below the FOMC’s stated objective of 2.0%-2.5% per year.
Agency mortgage-backed securities outperformed Treasuries after controlling for the effects of duration. The best-performing segments of the market were higher-coupon 30-year pools (coupons of 5.5% and higher). Many lower-coupon pools experienced higher prepayment activity in light of the decline in interest rates during the year.
Corporate bonds of all tenors, credit qualities and sectors outperformed similar-maturity Treasury instruments during the year. BBB-rated bonds outperformed corporate bonds rated above A3/A-. Long maturity corporate bonds outperformed short maturity corporate bonds. BB- and B-rated high yield corporate bonds outperformed investment-grade corporate bonds. The average risk spread of the Bloomberg Barclays U.S. Corporate Index at the end of the quarter was near its lowest levels since the Global Financial Crisis.
We believe that the FOMC will be measured in its decisions to change the target range of the federal funds rate in 2020. The U.S. economy is growing, albeit at a low rate. Inflationary pressures are benign, and inflation projections are below the FOMC’s longer-term objective of 2.0%-2.5%. We believe that the FOMC will react appropriately to shocks and will be cautious to prevent a deterioration to inflationary pressures.
We believe that selective opportunities exist in the spread sectors relative to fixed-rate Treasuries. The shape of the yield curve normalized after the FOMC cut rates during 2019, and we believe the curve will continue to steepen as the FOMC supports the front end of the curve by purchasing $60 billion of Treasury bills per month while longer-term rates remain range-bound.
We believe that U.S. TIPS are an attractive alternative to fixed-rate Treasuries to mitigate the effects of unexpected inflationary pressures. U.S. TIPS have market-implied breakeven inflation rates that are below the FOMC’s stated longer-term target range of 2.0%-2.5%.
We believe that opportunities exist in higher-coupon segments of the agency mortgage-backed securities (MBS) market. We believe that higher-coupon segments (30-year MBS coupon rates of 5.5% and above) of the agency MBS market offer attractive spreads and a defensive duration profile. Prepayment protection is critical in this lower interest rate regime. We mitigate this risk by focusing on specified pools comprised of borrowers that do not have the economic incentive to refinance their loans: low-loan balance pools. We find other segments of the MBS market unappealing. 30-year pools with coupons of 3.5% and below offer little risk premium due to ongoing sponsorship from the FOMC. 30-year pools with coupons of 4.0%-5.0% may experience increased refinance activity due to the recent decline in interest rates.
We believe that there are selective opportunities in the corporate bond market, although the market carries risks. Global trade tensions and the U.S. election cycle could drive volatility in corporate bonds over the near-term. Valuations are tight; credit risk spreads compressed during 2019 to levels that are low compared to both long- and near-term history. On a positive note, the new issue market remains open and robust; companies have access to capital in the debt markets. We believe there are idiosyncratic opportunities that can generate attractive income in a low-but-stable interest rate regime. We find these opportunities in longer-maturity investment-grade bonds, BBB-rated bonds and some higher-quality high yield corporate bonds (primarily BB-rated), subject to fund guidelines.
| December 31, 2019 | William Blair Funds | 75 |
| | Bond Fund |
| | |
| | The Bond Fund seeks to outperform the Bloomberg Barclays U.S. Aggregate Index by maximizing total return through a combination of income and capital appreciation. |
| | |
| | AN OVERVIEW FROM THE PORTFOLIO MANAGERS |
| | |

Paul J. Sularz 
Christopher T. Vincent | The William Blair Bond Fund (Class N shares) returned 11.09%, net of fees, for the twelve months ended December 31, 2019. By comparison, the Fund’s benchmark index, the Bloomberg Barclays U.S. Aggregate Index (the “Index”), returned 8.72%. The Fund experienced favorable security selection results from its investment-grade corporate bond holdings. The Fund held an overweight allocation to longer maturity segments of the corporate bond market, and the Fund experienced contributions from positions in bonds issued by AT&T and Brookfield Asset Management. Sector positioning also contributed to performance, as the Fund was underweight to fixed-rate Treasuries in favor of corporate bonds. Selection of higher-coupon agency mortgage-backed securities (MBS) also impacted results favorably, as low loan balance specified pools experienced stable and manageable prepayment experiences despite the declining interest rate environment. The Fund’s selection of high yield corporate bonds was also additive to performance. There were some factors that detracted from results during the year. Credit risk hedging in the Fund detracted from results as the credit market rallied throughout the year. A position in bonds issued by Chemours detracted modestly from performance. Finally, an allocation to U.S. TIPS had a small, negative impact on returns during the year. Please refer to the Fixed Income Market Review and Outlook relating to the Fund on page 75. |
| 76 | Annual Report | December 31, 2019 |
Bond Fund
Performance Highlights (Unaudited)
| Average Annual Total Return through 12/31/2019 |
| | | 1 Year | | 3 Year | | 5 Year | | 10 Year |
| Class N | | | 11.09 | % | | | 4.02 | % | | | 3.23 | % | | | 4.31 | % |
| Class I | | | 11.22 | | | | 4.21 | | | | 3.41 | | | | 4.48 | |
| Class R6 | | | 11.39 | | | | 4.31 | | | | 3.50 | | | | 4.61 | |
| Bloomberg Barclays U.S. Aggregate Index | | | 8.72 | | | | 4.03 | | | | 3.05 | | | | 3.75 | |
Performance cited represents past performance. Past performance does not guarantee future results and current performance may be lower or higher than the data quoted. Results shown are average annual total returns, which assume reinvestment of dividends and capital gains. Investment returns and principal will fluctuate and you may have a gain or loss when you sell shares. For the most current month-end performance information, please call 1-800-742-7272, or visit our Web site atwww.williamblairfunds.com. From time to time, the investment adviser may waive fees or reimburse expenses for the Fund. Without these waivers/reimbursements, performance would be lower. Class N shares are not subject to a sales load. Class I shares are not subject to a sales load or distribution (Rule 12b-1) fees. Class R6 shares are not subject to a sales load, distribution (Rule 12b-1) fees, or sub-transfer agent fees.
The performance highlights and graph presented above do not reflect the deduction of taxes that a shareholder would pay on fund distributions or the redemption of fund shares.
The Bloomberg Barclays U.S. Aggregate Index indicates broad intermediate government/corporate bond market performance.
This report identifies the Fund’s investments on December 31, 2019. These holdings are subject to change. Not all investments in the Fund performed the same, nor is there any guarantee that these investments will perform as well in the future. Market forecasts provided in this report may not necessarily come to pass.
Sector Diversification (Unaudited)

The sector diversification shown is based on the total investments.
| December 31, 2019 | William Blair Funds | 77 |
Bond Fund
Portfolio of Investments, December 31, 2019(all dollar amounts in thousands)
| | Issuer | |
Principal
Amount | | | Value | |
| | | | | | | | |
| | U.S. Government and U.S. Government Agency—56.4% |
| | U.S. Treasury Inflation Indexed Notes/Bonds—5.1% |
| | U.S. Treasury Inflation Indexed Bond,
3.875%, due 4/15/29 | | $ | 10,879 | | | $ | 14,520 | |
| | U.S. Treasury—0.4% | | | | | | | | |
| | U.S. Treasury Bill, 1.559%, due 10/8/20(a) | | | 1,000 | | | | 988 | |
| | Federal Home Loan Mortgage Corp. (FHLMC)—14.9% |
| | #J02986, 6.500%, due 7/1/21 | | | 3 | | | | 4 | |
| | #G12720, 5.500%, due 6/1/22 | | | 9 | | | | 9 | |
| | #G14150, 4.500%, due 4/1/26 | | | 729 | | | | 783 | |
| | #J16051, 4.500%, due 7/1/26 | | | 431 | | | | 464 | |
| | #G02210, 7.000%, due 12/1/28 | | | 38 | | | | 43 | |
| | #G02183, 6.500%, due 3/1/30 | | | 5 | | | | 6 | |
| | #G01400, 7.000%, due 4/1/32 | | | 392 | | | | 456 | |
| | #G01728, 7.500%, due 7/1/32 | | | 67 | | | | 81 | |
| | #C01385, 6.500%, due 8/1/32 | | | 52 | | | | 58 | |
| | #C01623, 5.500%, due 9/1/33 | | | 60 | | | | 67 | |
| | #A15039, 5.500%, due 10/1/33 | | | 2 | | | | 2 | |
| | #A17603, 5.500%, due 1/1/34 | | | 1,394 | | | | 1,570 | |
| | #G01843, 6.000%, due 6/1/35 | | | 12 | | | | 14 | |
| | #G03711, 6.000%, due 6/1/37 | | | 390 | | | | 450 | |
| | #A62858, 6.500%, due 7/1/37 | | | 69 | | | | 78 | |
| | #G03170, 6.500%, due 8/1/37 | | | 122 | | | | 140 | |
| | #G04053, 5.500%, due 3/1/38 | | | 496 | | | | 557 | |
| | #A78138, 5.500%, due 6/1/38 | | | 187 | | | | 212 | |
| | #G04466, 5.500%, due 7/1/38 | | | 10,365 | | | | 11,753 | |
| | #G60366, 6.000%, due 10/1/39 | | | 10,344 | | | | 11,874 | |
| | #G05875, 5.500%, due 2/1/40 | | | 384 | | | | 432 | |
| | #G61450, 6.000%, due 4/1/40 | | | 10,458 | | | | 12,087 | |
| | #G61050, 5.500%, due 3/1/41 | | | 388 | | | | 439 | |
| | #C03665, 9.000%, due 4/1/41 | | | 296 | | | | 348 | |
| | Total FHLMC Mortgage Obligations | | | | | | | 41,927 | |
| | Federal National Mortgage Association (FNMA)—36.0% |
| | #900725, 6.000%, due 8/1/21 | | | 6 | | | | 6 | |
| | #893325, 7.000%, due 9/1/21 | | | 2 | | | | 2 | |
| | #AC5410, 4.500%, due 10/1/24 | | | 152 | | | | 160 | |
| | #AC9560, 5.000%, due 1/1/25 | | | 615 | | | | 643 | |
| | #255956, 5.500%, due 10/1/25 | | | 7 | | | | 8 | |
| | #AL2853, 4.500%, due 6/1/26 | | | 3,206 | | | | 3,426 | |
| | #AL9730, 4.500%, due 2/1/27 | | | 1,009 | | | | 1,083 | |
| | #AL2134, 4.000%, due 7/1/27 | | | 159 | | | | 168 | |
| | #AL9857, 4.000%, due 2/1/29 | | | 1,609 | | | | 1,683 | |
| | #AS1902, 4.000%, due 3/1/29 | | | 484 | | | | 514 | |
| | #252925, 7.500%, due 12/1/29 | | | 1 | | | | 1 | |
| | #AD0729, 7.500%, due 12/1/30 | | | 2,833 | | | | 3,254 | |
| | #535977, 6.500%, due 4/1/31 | | | 5 | | | | 5 | |
| | #253907, 7.000%, due 7/1/31 | | | 1 | | | | 1 | |
| | #587849, 6.500%, due 11/1/31 | | | 5 | | | | 5 | |
| | #545437, 7.000%, due 2/1/32 | | | 31 | | | | 35 | |
| | #545759, 6.500%, due 7/1/32 | | | 260 | | | | 292 | |
| | #545869, 6.500%, due 7/1/32 | | | 849 | | | | 969 | |
| | #670385, 6.500%, due 9/1/32 | | | 389 | | | | 446 | |
| | #254548, 5.500%, due 12/1/32 | | | 25 | | | | 28 | |
| | Issuer | | NRSRO
Rating
(unaudited) | | Principal
Amount | | | Value | |
| | | | | | | | | | |
| | U.S. Government and U.S. Government Agency—(continued) |
| | Federal National Mortgage Association (FNMA)—(continued) |
| | #AD0725, 7.000%, due 12/1/32 | | | | $ | 1,291 | | | $ | 1,493 | |
| | #741850, 5.500%, due 9/1/33 | | | | | 306 | | | | 344 | |
| | #555800, 5.500%, due 10/1/33 | | | | | 29 | | | | 32 | |
| | #CA2754, 4.500%, due 11/1/33 | | | | | 776 | | | | 842 | |
| | #756153, 5.500%, due 11/1/33 | | | | | 318 | | | | 357 | |
| | #AL3455, 5.500%, due 11/1/33 | | | | | 4,101 | | | | 4,617 | |
| | #AL3401, 5.500%, due 2/1/34 | | | | | 818 | | | | 922 | |
| | #763798, 5.500%, due 3/1/34 | | | | | 54 | | | | 61 | |
| | #725611, 5.500%, due 6/1/34 | | | | | 64 | | | | 72 | |
| | #745563, 5.500%, due 8/1/34 | | | | | 382 | | | | 430 | |
| | #AL6413, 8.000%, due 8/1/34 | | | | | 404 | | | | 457 | |
| | #794474, 6.000%, due 10/1/34 | | | | | 32 | | | | 37 | |
| | #745092, 6.500%, due 7/1/35 | | | | | 204 | | | | 231 | |
| | #357944, 6.000%, due 9/1/35 | | | | | 8 | | | | 9 | |
| | #AL6412, 7.500%, due 9/1/35 | | | | | 636 | | | | 720 | |
| | #AD0979, 7.500%, due 10/1/35 | | | | | 41 | | | | 48 | |
| | #888305, 7.000%, due 3/1/36 | | | | | 6 | | | | 8 | |
| | #895637, 6.500%, due 5/1/36 | | | | | 38 | | | | 44 | |
| | #831540, 6.000%, due 6/1/36 | | | | | 15 | | | | 17 | |
| | #893318, 6.500%, due 8/1/36 | | | | | 7 | | | | 8 | |
| | #831926, 6.000%, due 12/1/36 | | | | | 415 | | | | 476 | |
| | #902974, 6.000%, due 12/1/36 | | | | | 109 | | | | 125 | |
| | #AB0265, 6.000%, due 2/1/37 | | | | | 8,506 | | | | 9,819 | |
| | #938440, 6.000%, due 7/1/37 | | | | | 62 | | | | 72 | |
| | #948689, 6.000%, due 8/1/37 | | | | | 103 | | | | 118 | |
| | #AL6411, 7.000%, due 12/1/37 | | | | | 1,506 | | | | 1,688 | |
| | #AL0904, 5.500%, due 1/1/38 | | | | | 77 | | | | 86 | |
| | #986856, 6.500%, due 9/1/38 | | | | | 93 | | | | 110 | |
| | #FM1735, 6.500%, due 10/1/38 | | | | | 4,796 | | | | 5,684 | |
| | #991911, 7.000%, due 11/1/38 | | | | | 102 | | | | 116 | |
| | #AD0752, 7.000%, due 1/1/39 | | | | | 423 | | | | 516 | |
| | #AC1619, 5.500%, due 8/1/39 | | | | | 274 | | | | 308 | |
| | #FM1736, 6.500%, due 10/1/39 | | | | | 7,786 | | | | 9,061 | |
| | #AD7137, 5.500%, due 7/1/40 | | | | | 2,936 | | | | 3,346 | |
| | #BM1689, 5.500%, due 8/1/40 | | | | | 2,391 | | | | 2,693 | |
| | #AI1201, 5.500%, due 4/1/41 | | | | | 3,588 | | | | 4,088 | |
| | #AL5815, 5.500%, due 4/1/41 | | | | | 2,918 | | | | 3,324 | |
| | #BM3525, 6.000%, due 4/1/41 | | | | | 10,259 | | | | 11,770 | |
| | #AL9226, 5.500%, due 12/1/41 | | | | | 12,098 | | | | 13,689 | |
| | #AL9225, 6.000%, due 1/1/42 | | | | | 5,366 | | | | 6,159 | |
| | #BM5121, 5.500%, due 12/1/48 | | | | | 4,375 | | | | 4,973 | |
| | Total Federal National Mortgage Association | | | | | | | | | 101,699 | |
| | | | | | | | | | | | |
| | Asset-Backed Securities—1.9% |
| | Tesla Auto Lease Trust—144A, 2018-A, Tranche D,
3.300%, 5/20/20 | | Aaa | | | 1,525 | | | | 1,526 | |
| | Centre Point Funding LLC—144A, 2012-2A, Tranche 1,
2.610%, 8/20/21 | | A1 | | | 320 | | | | 320 | |
| | Tesla Auto Lease Trust—144A, 2019-A, Tranche E,
5.480%, 5/22/23 | | Ba3 | | | 1,000 | | | | 1,005 | |
| | Oxford Finance Funding LLC—144A, 2019-1A, Tranche B,
5.438%, 2/15/27 | | BBB | | | 1,180 | | | | 1,202 | |
See accompanying Notes to Financial Statements.
| 78 | Annual Report | December 31, 2019 |
Bond Fund
Portfolio of Investments, December 31, 2019(all dollar amounts in thousands)
| | Issuer | | NRSRO
Rating
(unaudited) | | Principal
Amount | | | Value | |
| | | | | | | | | | | | |
| | Asset-Backed Securities—(continued) |
| | SLM Private Education Loan Trust—144A, 2011-A, Tranche A3,
1M USD LIBOR + 2.500%,
4.240%, 1/15/43, VRN | | AAA | | $ | 1,422 | | | $ | 1,425 | |
| | Total Asset-Backed Securities | | | | | | | | | 5,478 | |
| | |
| | Corporate Obligations—38.3% |
| | John Deere Capital Corporation, 3M USD LIBOR + 0.180%,
2.223%, due 1/7/20, VRN | | A | | | 2,000 | | | | 2,000 | |
| | Caterpillar Financial Services Corporation,
2.100%, due 1/10/20 | | A | | | 1,057 | | | | 1,057 | |
| | Fresenius Medical Care US Finance II, Inc.—144A,
5.875%, due 1/31/22 | | BBB | | | 2,000 | | | | 2,141 | |
| | Masco Corporation,
5.950%, due 3/15/22 | | BBB | | | 2,750 | | | | 2,956 | |
| | Jones Lang LaSalle, Inc.,
4.400%, due 11/15/22 | | BBB+ | | | 2,500 | | | | 2,612 | |
| | Toll Brothers Finance Corporation,
4.375%, due 4/15/23 | | BBB- | | | 2,750 | | | | 2,882 | |
| | Itau Unibanco Holding S.A.—144A,
5.125%, due 5/13/23 | | Ba3 | | | 1,400 | | | | 1,478 | |
| | Wells Fargo & Co.,
4.480%, due 1/16/24 | | A | | | 1,500 | | | | 1,621 | |
| | Lennar Corporation,
4.500%, due 4/30/24 | | BBB- | | | 2,450 | | | | 2,596 | |
| | Banco Inbursa S.A. Institucion de Banca Multiple—144A,
4.125%, due 6/6/24 | | BBB+ | | | 2,000 | | | | 2,076 | |
| | Grupo Bimbo S.A.B. de C.V.—144A,
3.875%, due 6/27/24 | | BBB | | | 2,000 | | | | 2,091 | |
| | Centene Corporation,
4.750%, due 1/15/25 | | BBB- | | | 1,750 | | | | 1,821 | |
| | Booz Allen Hamilton, Inc.—144A,
5.125%, due 5/1/25 | | B+ | | | 1,400 | | | | 1,443 | |
| | DaVita, Inc.,
5.000%, due 5/1/25 | | Ba3 | | | 1,400 | | | | 1,443 | |
| | Simon Property Group L.P.,
3.300%, due 1/15/26 | | A | | | 2,750 | | | | 2,897 | |
| | Penske Automotive Group, Inc.,
5.500%, due 5/15/26 | | Ba3 | | | 1,500 | | | | 1,574 | |
| | Xylem, Inc.,
3.250%, due 11/1/26 | | BBB | | | 2,225 | | | | 2,306 | |
| | Netflix, Inc.,
4.375%, due 11/15/26 | | BB- | | | 1,400 | | | | 1,438 | |
| | Fibria Overseas Finance, Ltd.,
5.500%, due 1/17/27 | | BBB- | | | 2,000 | | | | 2,193 | |
| | Hess Corporation,
4.300%, due 4/1/27 | | BBB- | | | 2,750 | | | | 2,935 | |
| | Sirius XM Radio, Inc.—144A,
5.000%, due 8/1/27 | | BB | | | 1,400 | | | | 1,480 | |
| | Lear Corporation,
3.800%, due 9/15/27 | | Baa2 | | | 2,750 | | | | 2,780 | |
| | Motorola Solutions, Inc.,
4.600%, due 2/23/28 | | BBB- | | | 2,750 | | | | 2,985 | |
| | Issuer | | NRSRO
Rating
(unaudited) | | Principal
Amount | | | Value | |
| | | | | | | | | | | | |
| | Corporate Obligations—(continued) |
| | The Kroger Co.,
8.000%, due 9/15/29 | | Baa1 | | $ | 2,250 | | | $ | 3,096 | |
| | United Rentals North America, Inc.,
5.250%, due 1/15/30 | | BB- | | | 1,500 | | | | 1,617 | |
| | Owens Corning,
7.000%, due 12/1/36 | | BBB | | | 2,250 | | | | 2,807 | |
| | Yum! Brands, Inc.,
6.875%, due 11/15/37 | | B+ | | | 1,250 | | | | 1,454 | |
| | ConocoPhillips,
6.500%, due 2/1/39 | | A | | | 2,000 | | | | 2,919 | |
| | Citigroup, Inc.,
5.875%, due 1/30/42 | | A | | | 2,000 | | | | 2,820 | |
| | Bank of America Corporation,
5.875%, due 2/7/42 | | A+ | | | 2,000 | | | | 2,846 | |
| | Cox Communications, Inc.—144A,
4.700%, due 12/15/42 | | BBB+ | | | 2,500 | | | | 2,716 | |
| | JPMorgan Chase & Co.,
4.850%, due 2/1/44 | | AA- | | | 2,250 | | | | 2,881 | |
| | Orbia Advance Corp S.A.B. de C.V.—144A,
5.875%, due 9/17/44 | | BBB | | | 2,250 | | | | 2,379 | |
| | AbbVie, Inc.,
4.700%, due 5/14/45 | | A- | | | 2,750 | | | | 3,078 | |
| | ERP Operating L.P.,
4.500%, due 6/1/45 | | A | | | 2,500 | | | | 2,984 | |
| | Apple, Inc.,
4.650%, due 2/23/46 | | AA+ | | | 2,250 | | | | 2,827 | |
| | PepsiCo, Inc.,
4.450%, due 4/14/46 | | A+ | | | 2,250 | | | | 2,768 | |
| | Brookfield Finance, Inc.,
4.700%, due 9/20/47 | | A- | | | 2,750 | | | | 3,168 | |
| | Union Pacific Corporation,
4.300%, due 3/1/49 | | A- | | | 2,500 | | | | 2,893 | |
| | Microsoft Corporation,
4.750%, due 11/3/55 | | AAA | | | 2,250 | | | | 3,010 | |
| | AT&T, Inc.,
5.700%, due 3/1/57 | | A- | | | 2,250 | | | | 2,910 | |
| | Comcast Corporation,
4.950%, due 10/15/58 | | A- | | | 2,250 | | | | 2,936 | |
| | Altria Group, Inc.,
6.200%, due 2/14/59 | | A3 | | | 2,250 | | | | 2,685 | |
| | Corning, Inc.,
5.850%, due 11/15/68 | | BBB+ | | | 2,400 | | | | 2,869 | |
| | Petrobras Global Finance BV,
6.850%, due 6/5/15 | | Ba2 | | | 1,250 | | | | 1,433 | |
| | Total Corporate Obligations | | | | | | | | | 107,901 | |
| | Total Long-Term Investments—96.6%
(cost $259,774) | | | | | | | | | 272,513 | |
See accompanying Notes to Financial Statements.
| December 31, 2019 | William Blair Funds | 79 |
Bond Fund
Portfolio of Investments, December 31, 2019(all dollar amounts in thousands)
| | Issuer | | Principal
Amount | | | Value | |
| | | | | | | | | | |
| | Repurchase Agreements |
| | Fixed Income Clearing Corporation, 0.120% dated 12/31/19, due 1/2/20, repurchase price $5,170, collateralized by U.S. Treasury Bond, 2.500%, due 5/15/46 valued at $5,274 | | $ | 5,170 | | | $ | 5,170 | |
| | Total Repurchase Agreement—1.8%
(cost $5,170) | | | | | | | 5,170 | |
| | | | | | | | | | |
| | Commercial Paper | | | | | | | | |
| | Anheuser-Busch InBev S.A.,
1.979%, due 1/6/20† | | | 1,000 | | | | 1,000 | |
| | The Western Union Co.,
2.100%, due 1/3/20 | | | 2,000 | | | | 2,000 | |
| | Total Commercial Paper—1.1%
(cost $3,000) | | | | | | | 3,000 | |
| | Total Investments—99.5%
(cost $267,944) | | | | | | | 280,683 | |
| | Issuer | | Principal
Amount | | | Value | |
| | | | | | | | | | |
| | Securities Sold, Not Yet Purchased |
| | | | | | | | | | |
| | U.S. Government Agency—(5.4)% |
| | Federal National Mortgage Association (FNMA)—(5.4)% |
| | TBA, 3.000%, due 1/14/50 | | $ | (15,000 | ) | | $ | (15,214 | ) |
| | Total Securities Sold, Not Yet Purchased—(5.4)%
(proceeds $15,174) | | | | | | | (15,214 | ) |
| | Cash and other assets, less liabilities—5.9% | | | | | | | 16,666 | |
| | Net assets—100.0% | | | | | | $ | 282,135 | |
The obligations of certain U.S. Government-sponsored securities are neither issued nor guaranteed by the U.S. Treasury.
144A = Security exempt from registration under Rule 144A of the Securities Act of 1933. These securities may be resold in transactions exempt from registration, normally to qualified institutional buyers.
NRSRO = Nationally Recognized Statistical Rating Organization—The credit quality ratings of the securities in the Fund reflect the highest category rating by any of Fitch Ratings, Moody’s Investors Service Inc., or Standard & Poor’s, a division of the McGraw-Hill Companies, Inc.
TBA = To Be Announced—TBAs are mortgage-backed securities traded under delayed delivery commitments, settling after December 31, 2019. The term TBA comes from the fact that the specific mortgage-backed security that will be delivered to fulfill a TBA trade is not designated at the time the trade is made.
VRN = Variable Rate Note
† = U.S. listed foreign security
(a) Security, or a portion of security, is segregated as collateral for the centrally cleared credit default swaps, aggregating a total of $682 (in thousands).
Centrally Cleared Credit Default Swaps
| Reference Entity | | Buy/Sell
Protection | | Fixed Deal
Pay Rate | | Payment
Frequency | | Maturity
Date | | Cleared
Exchange | | Notional
Amount
(in thousands) | | Upfront
Payment
Paid
(Received) | | | Value | | | Unrealized
Appreciation
(Depreciation) | |
| CDX.NA.HY-33 | | Buy | | 5.000 | % | | 3M | | December 2024 | | ICE | | | $ | 9,900 | | | $ | (591 | ) | | | $ | (972 | ) | | | $ | (381 | ) |
| CDX.EM-32 | | Buy | | 1.000 | % | | 3M | | December 2024 | | ICE | | | | 5,000 | | | | 275 | | | | | 166 | | | | | (109 | ) |
| CDX.NA.IG-33 | | Buy | | 1.000 | % | | 3M | | December 2029 | | ICE | | | | 10,000 | | | | 46 | | | | | (90 | ) | | | | (136 | ) |
| Total net unrealized appreciation (depreciation) on swaps | | | | | | | | | | | | | | | | | | $ | (626 | ) |
See accompanying Notes to Financial Statements.
| 80 | Annual Report | December 31, 2019 |
| | Income Fund |
| | |
| | The Income Fund seeks a high level of current income with relative stability of principal. |
| | |
| | AN OVERVIEW FROM THE PORTFOLIO MANAGER |
| | |

Christopher T. Vincent | The William Blair Income Fund (Class N shares) returned 5.92%, net of fees, for the twelve months ended December 31, 2019. By comparison, the Fund’s benchmark index, the Bloomberg Barclays Intermediate Government/Credit Bond Index (the “Index”), returned 6.80%. The Fund’s interest rate positioning detracted from results. The Fund is designed to have less duration than the Index, as the Index’s composition has become dominated by fixed-rate U.S. Treasuries. This hindered results during a period of declining interest rates. In addition, the Fund was underweight to corporate bonds, and in particular BBB-rated corporate bonds, and these themes hindered results as corporate bonds outperformed and BBB-rated corporate bonds had notably strong returns. There were some factors that contributed to returns. Sector positioning contributed to performance, as the Fund was underweight to fixed-rate Treasuries in favor of high-coupon MBS. The Fund also experienced favorable selection of investment-grade corporate bonds, with particular contributions coming from bonds issued by Kroger, Brookfield and Toll Brothers. Please refer to the Fixed Income Market Review and Outlook relating to the Fund on page 75. |
| December 31, 2019 | William Blair Funds | 81 |
Income Fund
Performance Highlights (Unaudited)
| Average Annual Total Return through 12/31/2019 |
| | | | | | | | | | | Since |
| | | 1 Year | | 3 Year | | 5 Year | | 10 Year | | Inception(a) |
| Class N | | | 5.92 | % | | | 2.13 | % | | | 1.84 | % | | | 2.77 | % | | | — | |
| Class I | | | 6.24 | | | | 2.37 | | | | 2.10 | | | | 3.01 | | | | — | |
| Class R6 | | | — | | | | — | | | | — | | | | — | | | | 3.18 | % |
| Bloomberg Barclays Intermediate Government/ Credit Bond Index | | | 6.80 | | | | 3.24 | | | | 2.57 | | | | 3.05 | | | | 4.24 | |
| (a) | Since inception is for the period from May 2, 2019 (Commencement of Operations) to December 31, 2019. |
Performance cited represents past performance. Past performance does not guarantee future results and current performance may be lower or higher than the data quoted. Results shown are average annual total returns, which assume reinvestment of dividends and capital gains. Investment returns and principal will fluctuate and you may have a gain or loss when you sell shares. For the most current month-end performance information, please call 1-800-742-7272, or visit our Web site atwww.williamblairfunds.com. From time to time, the investment adviser may waive fees or reimburse expenses for the Fund. Without these waivers/reimbursements, performance would be lower. Class N shares are not subject to a sales load. Class I shares are not subject to a sales load or distribution (Rule 12b-1) fees. Class R6 shares are not subject to a sales load, distribution (Rule 12b-1) fees, or sub-transfer agent fees.
The performance highlights and graph presented above do not reflect the deduction of taxes that a shareholder would pay on fund distributions or the redemption of fund shares.
The Bloomberg Barclays Intermediate Government/Credit Bond Index indicates broad intermediate government/corporate bond market performance.
This report identifies the Fund’s investments on December 31, 2019. These holdings are subject to change. Not all investments in the Fund performed the same, nor is there any guarantee that these investments will perform as well in the future. Market forecasts provided in this report may not necessarily come to pass.
Sector Diversification (Unaudited)
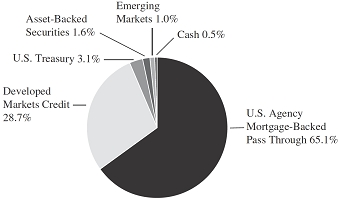
The sector diversification shown is based on the total investments.
| 82 | Annual Report | December 31, 2019 |
Income Fund
Portfolio of Investments, December 31, 2019(all dollar amounts in thousands)
| | | | | | | |
| | | | Principal | | | |
| | Issuer | | Amount | | | Value | |
| | | | | | |
| | U.S. Government and U.S. Government Agency—68.1% |
| | U.S. Treasury Inflation Indexed Notes/Bonds—3.0% |
| | U.S. Treasury Inflation Indexed Bond,
3.875%, due 4/15/29 | | $ | 1,174 | | | $ | 1,567 | |
| | Federal Home Loan Mortgage Corp.
(FHLMC)—9.8% | | | | | | | | |
| | #E02490, 6.000%, due 4/1/23 | | | 26 | | | | 27 | |
| | #J13022, 4.000%, due 9/1/25 | | | 240 | | | | 251 | |
| | #G14150, 4.500%, due 4/1/26 | | | 69 | | | | 74 | |
| | #J16051, 4.500%, due 7/1/26 | | | 520 | | | | 559 | |
| | #G15030, 4.000%, due 3/1/29 | | | 164 | | | | 175 | |
| | #A17603, 5.500%, due 1/1/34 | | | 404 | | | | 454 | |
| | #G01705, 5.500%, due 6/1/34 | | | 754 | | | | 836 | |
| | #A45790, 7.500%, due 5/1/35 | | | 82 | | | | 92 | |
| | #G04126, 6.000%, due 6/1/37 | | | 188 | | | | 217 | |
| | #G04564, 6.000%, due 12/1/37 | | | 144 | | | | 165 | |
| | #G05566, 5.500%, due 12/1/38 | | | 102 | | | | 114 | |
| | #G05875, 5.500%, due 2/1/40 | | | 77 | | | | 86 | |
| | #G61450, 6.000%, due 4/1/40 | | | 1,568 | | | | 1,812 | |
| | #C03665, 9.000%, due 4/1/41 | | | 144 | | | | 169 | |
| | Total FHLMC Mortgage Obligations | | | | | | | 5,031 | |
| | Federal National Mortgage Association
(FNMA)—55.3% | | | | | | | | |
| | #735574, 8.000%, due 3/1/22 | | | 15 | | | | 15 | |
| | FNR G93-19 SH, 1M USD
LIBOR + 56.169%, 11.234%, due 4/25/23, VRN | | | 11 | | | | 12 | |
| | #982885, 5.000%, due 5/1/23 | | | 134 | | | | 141 | |
| | #933985, 5.500%, due 8/1/23 | | | 64 | | | | 66 | |
| | #255956, 5.500%, due 10/1/25 | | | 22 | | | | 24 | |
| | #AH0971, 4.000%, due 12/1/25 | | | 257 | | | | 268 | |
| | #AL2853, 4.500%, due 6/1/26 | | | 415 | | | | 443 | |
| | #AJ6954, 4.000%, due 11/1/26 | | | 111 | | | | 117 | |
| | #AL9730, 4.500%, due 2/1/27 | | | 807 | | | | 867 | |
| | #256639, 5.000%, due 2/1/27 | | | 5 | | | | 5 | |
| | #806458, 8.000%, due 6/1/28 | | | 67 | | | | 74 | |
| | #AL9857, 4.000%, due 2/1/29 | | | 4,882 | | | | 5,106 | |
| | #880155, 8.500%, due 7/1/29 | | | 137 | | | | 156 | |
| | #797846, 7.000%, due 3/1/32 | | | 30 | | | | 31 | |
| | #745519, 8.500%, due 5/1/32 | | | 47 | | | | 52 | |
| | #654674, 6.500%, due 9/1/32 | | | 33 | | | | 37 | |
| | #AD0725, 7.000%, due 12/1/32 | | | 551 | | | | 637 | |
| | #254693, 5.500%, due 4/1/33 | | | 4 | | | | 5 | |
| | #555531, 5.500%, due 6/1/33 | | | 42 | | | | 47 | |
| | #711736, 5.500%, due 6/1/33 | | | 60 | | | | 67 | |
| | #555591, 5.500%, due 7/1/33 | | | 7 | | | | 8 | |
| | #CA2754, 4.500%, due 11/1/33 | | | 424 | | | | 460 | |
| | #AL3455, 5.500%, due 11/1/33 | | | 1,204 | | | | 1,356 | |
| | #725424, 5.500%, due 4/1/34 | | | 45 | | | | 50 | |
| | #AL6413, 8.000%, due 8/1/34 | | | 197 | | | | 223 | |
| | #AL6412, 7.500%, due 9/1/35 | | | 477 | | | | 540 | |
| | #888884, 5.500%, due 12/1/35 | | | 100 | | | | 112 | |
| | #928658, 6.500%, due 9/1/37 | | | 16 | | | | 18 | |
| | #889371, 6.000%, due 1/1/38 | | | 1,887 | | | | 2,178 | |
| | #FM1735, 6.500%, due 10/1/38 | | | 1,357 | | | | 1,608 | |
| | #991911, 7.000%, due 11/1/38 | | | 65 | | | | 74 | |
| | #FM1736, 6.500%, due 10/1/39 | | | 1,288 | | | | 1,499 | |
| | | | NRSRO | | | | | | |
| | | | Rating | | Principal | | | | |
| | Issuer | | (unaudited) | | Amount | | | Value | |
| | | | | | | | | | | | |
| | U.S. Government and U.S. Government Agency—(continued) |
| | Federal National Mortgage Association (FNMA)—(continued) |
| | #BM1689, 5.500%, due 8/1/40 | | | | $ | 323 | | | $ | 364 | |
| | #AL5815, 5.500%, due 4/1/41 | | | | | 417 | | | | 475 | |
| | #BM3525, 6.000%, due 4/1/41 | | | | | 910 | | | | 1,045 | |
| | #AL9226, 5.500%, due 12/1/41 | | | | | 3,823 | | | | 4,326 | |
| | #BM1328, 6.000%, due 1/1/42 | | | | | 1,542 | | | | 1,779 | |
| | #AL9225, 6.000%, due 1/1/42 | | | | | 1,476 | | | | 1,694 | |
| | #BM5121, 5.500%, due 12/1/48 | | | | | 2,122 | | | | 2,412 | |
| | Total Federal National Mortgage Association (FNMA) | | | | | | | | | 28,391 | |
| | | | | | | | | | | | |
| | Asset-Backed Securities—1.6% | | | | | | | | | | |
| | Tesla Auto Lease Trust—144A, 2018-A, Tranche C,
2.970%, 4/20/20 | | Aaa | | | 150 | | | | 150 | |
| | Oxford Finance Funding LLC—144A, 2019-1A, Tranche A2,
4.459%, 2/15/27 | | A | | | 500 | | | | 508 | |
| | SLM Private Education Loan Trust—144A, 2011-A, Tranche A3,
1M USD LIBOR + 2.500%,
4.240%, 1/15/43, VRN | | AAA | | | 142 | | | | 142 | |
| | Total Asset-Backed Securities | | | | | | | | | 800 | |
| | | | | | | | | | | | |
| | Corporate Obligations—29.6% | | | | | | | | | | |
| | HSBC Holdings plc,
3M USD LIBOR + 2.240%,
4.125%, due 3/8/21, VRN | | A+ | | | 500 | | | | 511 | |
| | Chevron Corporation,
3M USD LIBOR + 0.950%,
2.854%, due 5/16/21, VRN | | AA | | | 500 | | | | 506 | |
| | The Boeing Co.,
2.300%, due 8/1/21 | | A | | | 550 | | | | 553 | |
| | Apple, Inc.,
1.550%, due 8/4/21 | | AA+ | | | 550 | | | | 548 | |
| | FedEx Corporation,
3.400%, due 1/14/22 | | BBB | | | 500 | | | | 514 | |
| | Jones Lang LaSalle, Inc.,
4.400%, due 11/15/22 | | BBB+ | | | 500 | | | | 522 | |
| | Toll Brothers Finance Corporation,
4.375%, due 4/15/23 | | BBB- | | | 500 | | | | 524 | |
| | Ryder System, Inc.,
3.750%, due 6/9/23 | | A- | | | 550 | | | | 575 | |
| | Wells Fargo & Co.,
4.480%, due 1/16/24 | | A | | | 550 | | | | 594 | |
| | The Goldman Sachs Group, Inc.,
4.000%, due 3/3/24 | | A | | | 550 | | | | 586 | |
| | Bank of America Corporation,
3M USD LIBOR + 0.780%,
3.550%, due 3/5/24, VRN | | A+ | | | 650 | | | | 675 | |
| | Mitsubishi UFJ Financial Group, Inc.,
3.407%, due 3/7/24 | | A1 | | | 550 | | | | 574 | |
| | Grupo Bimbo S.A.B. de C.V.—144A,
3.875%, due 6/27/24 | | BBB | | | 500 | | | | 523 | |
| | AbbVie, Inc.,
3.600%, due 5/14/25 | | A- | | | 550 | | | | 582 | |
See accompanying Notes to Financial Statements.
| December 31, 2019 | William Blair Funds | 83 |
Income Fund
Portfolio of Investments, December 31, 2019(all dollar amounts in thousands)
| | | | NRSRO | | | | | | |
| | | | Rating | | Principal | | | | |
| | Issuer | | (unaudited) | | Amount | | | Value | |
| | | | | | | | | | | | |
| | Corporate Obligations—(continued) | | | | | | | | | | |
| | ERP Operating L.P.,
3.375%, due 6/1/25 | | A | | $ | 550 | | | $ | 579 | |
| | Comcast Corporation,
3.950%, due 10/15/25 | | A- | | | 500 | | | | 546 | |
| | Capital One Financial Corporation,
4.200%, due 10/29/25 | | Baa1 | | | 500 | | | | 540 | |
| | Intercontinental Exchange, Inc.,
3.750%, due 12/1/25 | | A | | | 550 | | | | 593 | |
| | Simon Property Group L.P.,
3.300%, due 1/15/26 | | A | | | 550 | | | | 579 | |
| | AT&T, Inc.,
4.125%, due 2/17/26 | | A- | | | 550 | | | | 597 | |
| | ConocoPhillips Co.,
4.950%, due 3/15/26 | | A | | | 500 | | | | 576 | |
| | Brookfield Finance, Inc.,
4.250%, due 6/2/26 | | A- | | | 550 | | | | 598 | |
| | Motorola Solutions, Inc.,
4.600%, due 2/23/28 | | BBB- | | | 500 | | | | 543 | |
| | Roper Technologies, Inc.,
4.200%, due 9/15/28 | | BBB+ | | | 500 | | | | 548 | |
| | Quest Diagnostics, Inc.,
4.200%, due 6/30/29 | | BBB+ | | | 500 | | | | 553 | |
| | United Parcel Service, Inc.,
2.500%, due 9/1/29 | | A | | | 620 | | | | 619 | |
| | The Kroger Co.,
8.000%, due 9/15/29 | | Baa1 | | | 400 | | | | 551 | |
| | Total Corporate Obligations | | | | | | | | | 15,209 | |
| | Total Long-Term Investments—99.3%
(cost $50,577) | | | | | | | | | 50,998 | |
| | | | | | | | | | | | |
| | Repurchase Agreement | | | | | | | | | | |
| | Fixed Income Clearing Corporation, 0.120% dated 12/31/19, due 1/2/20, repurchase price $154, collateralized by U.S. Treasury Bond, 2.500%, due 5/15/46 valued at $160 | | | | | 154 | | | | 154 | |
| | Total Repurchase Agreement—0.3%
(cost $154) | | | | | | | | | 154 | |
| | Total Investments—99.6%
(cost $50,731) | | | | | | | | | 51,152 | |
| | | | | | | | |
| | | | Principal | | | | |
| | Issuer | | Amount | | | Value | |
| | | | | | | | |
| | Securities Sold , Not Yet Purchased | | | | | | |
| | | | | | | | |
| | U.S. Government Agency—(9.8)% | | | | | | |
| | Federal National Mortgage Association
(FNMA)—(9.8)% | | | | | | |
| | TBA, 2.500%, due 1/16/35 | | $ | (5,000 | ) | | $ | (5,046 | ) |
| | Total Securities Sold, Not Yet Purchased—(9.8)%
(proceeds $5,034) | | | | | | | (5,046 | ) |
| | Cash and other assets, less liabilities—10.2% | | | | | | | 5,237 | |
| | Net assets—100.0% | | | | | | $ | 51,343 | |
The obligations of certain U.S. Government-sponsored securities are neither issued nor guaranteed by the U.S. Treasury.
144A = Security exempt from registration under Rule 144A of the Securities Act of 1933. These securities may be resold in transactions exempt from registration, normally to qualified institutional buyers.
NRSRO = Nationally Recognized Statistical Rating Organization—The credit quality ratings of the securities in the Fund reflect the highest category rating by any of Fitch Ratings, Moody’s Investors Service Inc., or Standard & Poor’s, a division of the McGraw-Hill Companies, Inc.
TBA = To Be Announced—TBAs are mortgage-backed securities traded under delayed delivery commitments, settling after December 31, 2019. The term TBA comes from the fact that the specific mortgage-backed security that will be delivered to fulfill a TBA trade is not designated at the time the trade is made.
VRN = Variable Rate Note
See accompanying Notes to Financial Statements.
| 84 | Annual Report | December 31, 2019 |
| | Low Duration Fund |
| | |
| | The Low Duration Fund seeks to maximize total return. Total return includes both income and capital appreciation. |
| | |
| | AN OVERVIEW FROM THE PORTFOLIO MANAGERS |
| | |
 Paul J. Sularz 
Christopher T. Vincent | The William Blair Low Duration Fund (Class N shares) returned 3.48%, net of fees, for the twelve months ended December 31, 2019. By comparison, the Fund’s benchmark index, the ICE BofAML 1-Year US Treasury Note Index (the “Index”), returned 2.93%. The Fund’s holdings of higher-coupon agency mortgage-backed securities (MBS) contributed to performance. The Fund held low loan balance specified pools experienced stable and manageable prepayment experiences despite the declining interest rate environment. The Fund’s positioning within corporate bonds also contributed to performance during the year, as the Fund’s exposure shifted out of floating-rate instruments into fixed-rate instruments as the Fed’s policy changed during the year. There were some factors that detracted from performance during the year. The Fund hedged some of its interest rate risk using mortgage to-be announced (TBA) contracts, and these hedges hindered results as interest rates fell. Please refer to the Fixed Income Market Review and Outlook relating to the Fund on page 75. |
| December 31, 2019 | William Blair Funds | 85 |
Low Duration Fund
Performance Highlights (Unaudited)
| Average Annual Total Return through 12/31/2019 |
| | | 1 Year | | 3 Year | | 5 Year | | 10 Year |
| Class N | | | 3.48 | % | | | 1.70 | % | | | 1.25 | % | | | 1.32 | % |
| Class I | | | 3.52 | | | | 1.84 | | | | 1.44 | | | | 1.48 | |
| Class R6 | | | 3.69 | | | | 1.93 | | | | 1.49 | | | | 1.59 | |
| ICE BofAML 1-Year US Treasury Note Index | | | 2.93 | | | | 1.78 | | | | 1.25 | | | | 0.81 | |
Performance cited represents past performance. Past performance does not guarantee future results and current performance may be lower or higher than the data quoted. Results shown are average annual total returns, which assume reinvestment of dividends and capital gains. Investment returns and principal will fluctuate and you may have a gain or loss when you sell shares. For the most current month-end performance information, please call 1-800-742-7272, or visit our Web site atwww.williamblairfunds.com. From time to time, the investment adviser may waive fees or reimburse expenses for the Fund. Without these waivers/reimbursements, performance would be lower. Class N shares are not subject to a sales load. Class I shares are not subject to a sales load or distribution (Rule 12b-1) fees. Class R6 shares are not subject to a sales load, distribution (Rule 12b-1) fees, or sub-transfer agent fees.
The performance highlights and graph presented above do not reflect the deduction of taxes that a shareholder would pay on fund distributions or the redemption of fund shares.
The ICE BofAML 1-Year US Treasury Note Index is comprised of a single U.S. Treasury Note issue purchased at the beginning of the month and held for a full month. Each month the index is rebalanced and the issue selected is the outstanding U.S. Treasury Note that matures closest to, but not beyond one year from the rebalancing date.
This report identifies the Fund’s investments on December 31, 2019. These holdings are subject to change. Not all investments in the Fund performed the same, nor is there any guarantee that these investments will perform as well in the future. Market forecasts provided in this report may not necessarily come to pass.
Sector Diversification (Unaudited)

The sector diversification shown is based on the total investments.
| 86 | Annual Report | December 31, 2019 |
Low Duration Fund
Portfolio of Investments, December 31, 2019(all dollar amounts in thousands)
| | | | | | | | |
| | Issuer | | Principal
Amount | | | Value | |
| | | | | | | | | | |
| | U.S. Government Agency—61.6% | | | | | | | | |
| | Federal Home Loan Mortgage Corp. (FHLMC)—13.0% | | |
| | #B19222, 4.500%, due 4/1/20 | | $ | 2 | | | $ | 2 | |
| | #G11836, 5.500%, due 12/1/20 | | | 1 | | | | 1 | |
| | #E02322, 5.500%, due 5/1/22 | | | 8 | | | | 8 | |
| | #G12725, 6.000%, due 6/1/22 | | | 36 | | | | 37 | |
| | #J08450, 5.500%, due 7/1/23 | | | 13 | | | | 13 | |
| | #J08703, 5.500%, due 9/1/23 | | | 17 | | | | 17 | |
| | #C00351, 8.000%, due 7/1/24 | | | 23 | | | | 25 | |
| | #J11208, 5.000%, due 11/1/24 | | | 31 | | | | 33 | |
| | #G00363, 8.000%, due 6/1/25 | | | 37 | | | | 40 | |
| | #C80329, 8.000%, due 8/1/25 | | | 7 | | | | 8 | |
| | #G14402, 4.000%, due 2/1/27 | | | 170 | | | | 178 | |
| | #G04821, 8.500%, due 7/1/31 | | | 1,387 | | | | 1,668 | |
| | #G04641, 6.000%, due 6/1/38 | | | 1,045 | | | | 1,197 | |
| | #A81372, 6.000%, due 8/1/38 | | | 143 | | | | 158 | |
| | #G04687, 6.000%, due 9/1/38 | | | 45 | | | | 52 | |
| | #G04745, 6.000%, due 9/1/38 | | | 174 | | | | 200 | |
| | #G06085, 6.500%, due 9/1/38 | | | 43 | | | | 49 | |
| | #G60680, 6.500%, due 9/1/39 | | | 701 | | | | 829 | |
| | #G61450, 6.000%, due 4/1/40 | | | 4,703 | | | | 5,435 | |
| | Total FHLMC Mortgage Obligations | | | | | | | 9,950 | |
| | Federal National Mortgage Association
(FNMA)—48.6% | | | | | | | | |
| | #357865, 5.000%, due 7/1/20 | | | 4 | | | | 5 | |
| | #879607, 5.500%, due 4/1/21 | | | 5 | | | | 5 | |
| | #831497, 6.000%, due 4/1/21 | | | 26 | | | | 26 | |
| | #831525, 5.500%, due 6/1/21 | | | 8 | | | | 8 | |
| | #880993, 6.000%, due 1/1/22 | | | 2 | | | | 2 | |
| | #888982, 6.000%, due 12/1/22 | | | 45 | | | | 46 | |
| | #972934, 5.500%, due 2/1/23 | | | 54 | | | | 56 | |
| | #889670, 5.500%, due 6/1/23 | | | 11 | | | | 12 | |
| | #AE0011, 5.500%, due 9/1/23 | | | 11 | | | | 11 | |
| | #995395, 6.000%, due 12/1/23 | | | 31 | | | | 32 | |
| | #190988, 9.000%, due 6/1/24 | | | 4 | | | | 4 | |
| | #AL8529, 6.000%, due 11/1/24 | | | 4,735 | | | | 4,926 | |
| | #AL2853, 4.500%, due 6/1/26 | | | 1,315 | | | | 1,405 | |
| | #AL9730, 4.500%, due 2/1/27 | | | 1,211 | | | | 1,300 | |
| | #AL9857, 4.000%, due 2/1/29 | | | 4,137 | | | | 4,327 | |
| | #555933, 7.000%, due 6/1/32 | | | 370 | | | | 420 | |
| | #CA2754, 4.500%, due 11/1/33 | | | 127 | | | | 138 | |
| | #AL6413, 8.000%, due 8/1/34 | | | 229 | | | | 259 | |
| | #AL6412, 7.500%, due 9/1/35 | | | 795 | | | | 900 | |
| | #886762, 7.000%, due 9/1/36 | | | 199 | | | | 236 | |
| | #888530, 7.500%, due 8/1/37 | | | 1,509 | | | | 1,825 | |
| | #AL6411, 7.000%, due 12/1/37 | | | 1,506 | | | | 1,688 | |
| | #FM1735, 6.500%, due 10/1/38 | | | 2,423 | | | | 2,871 | |
| | #AD0100, 7.000%, due 12/1/38 | | | 516 | | | | 615 | |
| | #FM1736, 6.500%, due 10/1/39 | | | 3,111 | | | | 3,620 | |
| | #BM3525, 6.000%, due 4/1/41 | | | 2,913 | | | | 3,342 | |
| | #AL9226, 5.500%, due 12/1/41 | | | 2,682 | | | | 3,035 | |
| | #AL9225, 6.000%, due 1/1/42 | | | 2,415 | | | | 2,771 | |
| | #BM1328, 6.000%, due 1/1/42 | | | 1,482 | | | | 1,711 | |
| | #BM5121, 5.500%, due 12/1/48 | | | 1,400 | | | | 1,591 | |
| | Total FNMA Mortgage Obligations | | | | | | | 37,187 | |
| | Issuer | | NRSRO
Rating
(unaudited) | | Principal
Amount | | | Value | |
| | | | | | | | | | | | |
| | Asset-Backed Securities—10.6% | | | | | | | | |
| | GM Financial Consumer Automobile Receivables Trust, 2018-3, Tranche A2B, 1M USD LIBOR + 0.110%, 1.850%, 7/16/21, VRN | | AAA | | $ | 459 | | | $ | 459 | |
| | PFS Financing Corporation—144A, 2018-A, Tranche A, 1M USD LIBOR + 0.400%, 2.140%, 2/17/22, VRN | | AAA | | | 1,500 | | | | 1,499 | |
| | Chase Issuance Trust, 2015-A4, Tranche A4, 1.840%, 4/15/22 | | AAA | | | 1,000 | | | | 1,000 | |
| | Honda Auto Receivables Owner Trust, 2019-3, Tranche A2, 1.900%, 4/15/22 | | AAA | | | 500 | | | | 500 | |
| | Mercedes-Benz Master Owner Trust—144A, 2017-BA, Tranche A, 1M LIBOR + 0.420%, 2.160%, 5/16/22, VRN | | Aaa | | | 1,280 | | | | 1,281 | |
| | American Express Credit Account Master Trust, 2017-3, Tranche A, 1.770%, 11/15/22 | | AAA | | | 1,000 | | | | 1,000 | |
| | Tesla Auto Lease Trust—144A, 2019-A, Tranche C, 2.680%, 1/20/23 | | A2 | | | 675 | | | | 673 | |
| | Oxford Finance Funding LLC—144A, 2019-1A, Tranche A2, 4.459%, 2/15/27 | | A | | | 1,000 | | | | 1,015 | |
| | SLM Private Education Loan Trust—144A, 2011-A, Tranche A3, 1M USD LIBOR + 2.500%, 4.240%, 1/15/43, VRN | | AAA | | | 668 | | | | 670 | |
| | Total Asset-Backed Securities | | | | | | | | | 8,097 | |
| | | | | | | | | | | | |
| | Corporate Obligations—25.5% | | | | | | | | |
| | National Australia Bank Ltd.—144A,
3M USD LIBOR + 0.510%,
2.409%, due 5/22/20, VRN | | AA- | | | 1,500 | | | | 1,503 | |
| | Apple, Inc.,
3M USD LIBOR + 1.130%,
3.040%, due 2/23/21, VRN | | AA+ | | | 550 | | | | 557 | |
| | JPMorgan Chase & Co.,
3M USD LIBOR + 1.480%,
3.387%, due 3/1/21, VRN | | AA- | | | 1,500 | | | | 1,520 | |
| | Wells Fargo & Co.,
3M USD LIBOR + 1.340%,
3.240%, due 3/4/21, VRN | | A+ | | | 1,500 | | | | 1,519 | |
| | HSBC Holdings plc,
3M USD LIBOR + 2.240%,
4.125%, due 3/8/21, VRN | | A+ | | | 1,500 | | | | 1,533 | |
| | Bank of America Corporation,
3M USD LIBOR + 1.420%,
3.386%, due 4/19/21, VRN | | A+ | | | 1,000 | | | | 1,016 | |
| | The Goldman Sachs Group, Inc.,
3M USD LIBOR + 1.360%,
3.300%, due 4/23/21, VRN | | A | | | 1,000 | | | | 1,013 | |
See accompanying Notes to Financial Statements.
| December 31, 2019 | William Blair Funds | 87 |
Low Duration Fund
Portfolio of Investments, December 31, 2019(all dollar amounts in thousands)
| | Issuer | | NRSRO
Rating
(unaudited) | | Principal
Amount | | | Value | |
| | | | | | | | | | | | |
| | Corporate Obligations—(continued) | | | | | | | | | | |
| | The Boeing Co.,
2.300%, due 8/1/21 | | A | | $ | 1,500 | | | $ | 1,509 | |
| | Barclays plc,
3M USD LIBOR + 2.110%,
4.011%, due 8/10/21, VRN | | A | | | 1,500 | | | | 1,536 | |
| | Verizon Communications, Inc.,
3.125%, due 3/16/22 | | A- | | | 1,000 | | | | 1,027 | |
| | Bristol-Myers Squibb Co.—144A,
2.600%, due 5/16/22 | | A+ | | | 1,000 | | | | 1,017 | |
| | Ryder System, Inc.,
2.875%, due 6/1/22 | | A- | | | 1,500 | | | | 1,523 | |
| | AT&T, Inc.,
3.000%, due 6/30/22 | | A- | | | 1,500 | | | | 1,533 | |
| | Mitsubishi UFJ Financial Group, Inc.,
2.623%, due 7/18/22 | | A1 | | | 1,150 | | | | 1,166 | |
| | Lloyds Bank plc, 2.250%, due 8/14/22 | | Aa3 | | | 1,500 | | | | 1,509 | |
| | Total Corporate Obligations | | | | | | | | | 19,481 | |
| | Total Long-Term Investments—97.7%
(cost $74,943) | | | | | | | | | 74,715 | |
| | | | | | | | | | | | |
| | Repurchase Agreement | | | | | | | | | | |
| | Fixed Income Clearing Corporation, 0.120% dated 12/31/19, due 1/2/20, repurchase price $1,688, collateralized by U.S. Treasury Bond, 2.500%, due 5/15/46 valued at $1,725 | | | | | 1,688 | | | | 1,688 | |
| | Total Repurchase Agreement—2.2%
(cost $1,688) | | | | | | | | | 1,688 | |
| | Total Investments—99.9%
(cost $76,631) | | | | | | | | | 76,403 | |
| | | | | | | | |
| | Issuer | | Principal
Amount | | | Value | |
| | | | | | | | | | |
| | Securities Sold , Not Yet Purchased | | | | | | | | |
| | | | | | | | | | |
| | U.S. Government Agency | | | | | | | | |
| | Federal National Mortgage Association
(FNMA)—(19.8)% | | | | | | | | |
| | TBA, 2.500%, due 1/16/35 | | | $(15,000 | ) | | $ | (15,138 | ) |
| | Total Securities Sold, Not Yet Purchased—(19.8)%
(proceeds $15,101) | | | | | | | (15,138 | ) |
| | Cash and other assets, less liabilities—19.9% | | | | | | | 15,250 | |
| | Net assets—100.0% | | | | | | $ | 76,515 | |
The obligations of certain U.S. Government-sponsored securities are neither issued nor guaranteed by the U.S. Treasury.
144A = Security exempt from registration under Rule 144A of the Securities Act of 1933. These securities may be resold in transactions exempt from registration, normally to qualified institutional buyers.
NRSRO = Nationally Recognized Statistical Rating Organization—The credit quality ratings of the securities in the Fund reflect the highest category rating by any of Fitch Ratings, Moody’s Investors Service Inc., or Standard & Poor’s, a division of the McGraw-Hill Companies, Inc.
TBA = To Be Announced—TBAs are mortgage-backed securities traded under delayed delivery commitments, settling after December 31, 2019. The term TBA comes from the fact that the specific mortgage-backed security that will be delivered to fulfill a TBA trade is not designated at the time the trade is made.
VRN = Variable Rate Note
See accompanying Notes to Financial Statements.
| 88 | Annual Report | December 31, 2019 |
| | Macro Allocation Fund |
| | |
| | AN OVERVIEW FROM THE PORTFOLIO MANAGERS |
| | |

Thomas Clarke 
Brian D. Singer | The William Blair Macro Allocation Fund (Class N shares) posted a 3.97% increase, net of fees, for the twelve months ended December 31, 2019. By comparison, the Fund’s benchmark index, the ICE BofAML US 3-Month Treasury Bill Index (the “Index”), increased 2.28%. The Fund had positive performance from both the market segment (i.e., equity and fixed income) and the currency segment. The largest contributors within the Fund’s market-oriented exposures included long exposures to Greece, Brazil, France, Spain and United States equities. Detractors within the market segment included short exposures to European government bonds, as well as to Canada and Netherlands equities. Within the Fund’s currency segment, the largest contributors to performance were long exposures to the Mexican peso, Philippines peso and Russian ruble, and short exposure to the Euro. Detracting from performance within currencies were short exposures to the Thai baht and Indonesian rupiah, and long exposure to the Swedish krona. Following another year of equity market buoyancy, we only see marginal medium-term upside opportunities across equities in general, and we are not inclined to chase prices higher via materially long exposures. As part of our navigation of the central bank-influenced environment, we have recently made modest increases to our overall equity exposure in portfolios and finished the year with a larger total equity position than we began. However, our overall beta and risk postures are still slightly below expected long-term central tendencies. Two major geopolitical risks-the trade dispute between the U.S. and China and a “no-deal” Brexit-have subsided but not yet altogether disappeared. The Fund’s market segment is moderately long of equities, with long exposures within emerging markets, developed European markets and the U.S. The market segment is also slightly long of fixed income securities, mostly in U.S. government bonds. Within currencies, the Fund’s strategy remains long of emerging market currencies such as the Philippine peso, Mexican peso and Indian rupee, and the largest short exposures are in the Thai baht, Euro and New Zealand dollar. |
| December 31, 2019 | William Blair Funds | 89 |
Macro Allocation Fund
Performance Highlights (Unaudited)
| Average Annual Total Return through 12/31/2019 |
| | | | | | | | | | | | Since |
| | | 1 Year | | 3 Year | | 5 Year | | Inception |
| Class N(a) | | | 3.97 | % | | | 2.54 | % | | | 0.62 | % | | | 4.27 | % |
| Class I(a) | | | 4.14 | | | | 2.81 | | | | 0.88 | | | | 4.53 | |
| ICE BofAML US 3-Month Treasury Bill Index(a) | | | 2.28 | | | | 1.67 | | | | 1.07 | | | | 0.69 | |
| Class R6(b) | | | 4.29 | | | | 2.91 | | | | 0.99 | | | | 1.58 | |
| ICE BofAML US 3-Month Treasury Bill Index(b) | | | 2.28 | | | | 1.67 | | | | 1.07 | | | | 0.87 | |
| (a) | Since inception is for the period from November 29, 2011 (Commencement of Operations) to December 31, 2019. |
| (b) | Since inception is for the period from October 21, 2013 (Commencement of Operations) to December 31, 2019. |
Performance cited represents past performance. Past performance does not guarantee future results and current performance may be lower or higher than the data quoted. Results shown are average annual total returns, which assume reinvestment of dividends and capital gains. Investment returns and principal will fluctuate and you may have a gain or loss when you sell shares. For the most current month-end performance information, please call 1-800-742-7272, or visit our Web site atwww.williamblairfunds.com. The Fund involves a high level of risk and may not be appropriate for everyone. You could lose money by investing in the Fund. There can be no assurance that the Fund’s investment objective will be achieved or that the Fund’s investment strategies will be successful. The Fund is not a complete investment program. From time to time, the investment adviser may waive fees or reimburse expenses for the Fund. Without these waivers/reimbursements, performance would be lower. Class N shares are not subject to a sales load. Class I shares are not subject to a sales load or distribution (Rule 12b-1) fees. Class R6 shares are not subject to a sales load, distribution (Rule 12b-1) fees, or sub-transfer agent fees.
The performance highlights and graph presented above do not reflect the deduction of taxes that a shareholder would pay on fund distributions or the redemption of fund shares.
The ICE BofAML US 3-Month Treasury Bill Index measures total return on cash, including price and interest income, based on short-term government Treasury Bills of about 90-day maturity. The Index is unmanaged, does not incur fees or expenses, and cannot be invested in directly.
This report identifies the Fund’s investments on December 31, 2019. These holdings are subject to change. Not all investments in the Fund performed the same, nor is there any guarantee that these investments will perform as well in the future. Market forecasts provided in this report may not necessarily come to pass.
Portfolio Allocation (Unaudited)
The table below provides the allocation of the Fund’s holdings as a percent of net assets as of December 31, 2019.
| | | % of net |
| Category | | assets |
| Equity Exchange-Traded Funds | | | 64.8 | % |
| Fixed Income Exchange-Traded Funds | | | 4.2 | |
| Foreign Government Bond | | | 2.3 | |
| Repurchase Agreement | | | 3.5 | |
| U.S. Government | | | 26.1 | |
| Liabilities, Plus Cash and Other Assets | | | (0.9 | ) |
| Net Assets | | | 100.0 | % |
| 90 | Annual Report | December 31, 2019 |
Macro Allocation Fund
Portfolio of Investments, December 31, 2019(all dollar amounts in thousands)
| | | | Shares or | | | | |
| | | | Principal | | | | |
| | Issuer | | Amount | | | Value | |
| | | | | | | | |
| | Exchange-Traded Funds—69.0% | | | | | | | | |
| | Equity Exchange-Traded Funds—64.8% | | | | | | | | |
| | Consumer Staples Select Sector SPDR Fund | | | 184,900 | | | $ | 11,645 | |
| | Dragon Capital-Vietnam Enterprise Investments, Ltd. Class “C” | | | 2,464,700 | | | | 15,491 | |
| | Global X MSCI Greece ETF | | | 2,114,400 | | | | 21,419 | |
| | iShares Core MSCI Emerging Markets ETF | | | 567,400 | | | | 30,503 | |
| | iShares MSCI Brazil ETF | | | 322,900 | | | | 15,322 | |
| | iShares MSCI Chile ETF | | | 225,500 | | | | 7,516 | |
| | iShares MSCI India ETF | | | 434,900 | | | | 15,287 | |
| | iShares MSCI Malaysia ETF | | | 257,500 | | | | 7,341 | |
| | SPDR S&P 500 ETF Trust | | | 1,113,300 | | | | 358,327 | |
| | Utilities Select Sector SPDR Fund | | | 28,800 | | | | 1,861 | |
| | VanEck Vectors Russia ETF | | | 73,500 | | | | 1,835 | |
| | Total Equity Exchange-Traded Funds | | | | | | | 486,547 | |
| | Fixed Income Exchange-Traded Funds—4.2% | | | | | | | | |
| | iShares iBoxx $ Investment Grade Corporate Bond ETF | | | 176,800 | | | | 22,623 | |
| | SPDR Bloomberg Barclays High Yield Bond ETF | | | 79,400 | | | | 8,698 | |
| | Total Fixed Income Exchange-Traded Funds | | | | | | | 31,321 | |
| | Total Exchange-Traded Funds—69.0%
(cost $450,902) | | | | | | | 517,868 | |
| | | | | | | | | | |
| | Foreign Government Bond—2.3% | | | | | | | | |
| | Malaysia—2.3% | | | | | | | | |
| | Malaysia Government Bond, 4.160%, due 7/15/21 | | MYR | 70,881 | | | | 17,631 | |
| | Total Foreign Government Bonds—2.3%
(cost $17,451) | | | | | | | 17,631 | |
| | | | | | | | | | |
| | Repurchase Agreement—3.5% | | | | | | | | |
| | Fixed Income Clearing Corporation, 0.120% dated 12/31/19, due 1/2/20, repurchase price $25,979, collateralized by U.S. Treasury Bond, 2.500%, due 5/15/46 valued at $26,500 | | | 25,979 | | | | 25,979 | |
| | Total Repurchase Agreement—3.5%
(cost $25,979) | | | | | | | 25,979 | |
| | | | | | | | |
| | | | Principal | | | | |
| | Issuer | | Amount | | | Value | |
| | | | | | | | |
| | U.S. Government—26.1% | | | | | | | | |
| | U.S. Treasury Bill, 1.812%, due 1/30/20(a) | | | 2,500 | | | $ | 2,497 | |
| | U.S. Treasury Bill, 2.344%, due 2/27/20(a)(b) | | | 17,500 | | | | 17,459 | |
| | U.S. Treasury Bill, 2.240%, due 3/26/20(a) | | | 17,500 | | | | 17,439 | |
| | U.S. Treasury Bill, 2.278%, due 4/23/20(a) | | | 17,500 | | | | 17,417 | |
| | U.S. Treasury Bill, 2.235%, due 5/21/20(a) | | | 17,500 | | | | 17,396 | |
| | U.S. Treasury Bill, 1.998%, due 6/18/20(a) | | | 17,500 | | | | 17,375 | |
| | U.S. Treasury Bill, 1.902%, due 7/16/20(a) | | | 17,500 | | | | 17,354 | |
| | U.S. Treasury Bill, 1.771%, due 8/13/20 | | | 17,500 | | | | 17,334 | |
| | U.S. Treasury Bill, 1.775%, due 9/10/20 | | | 17,500 | | | | 17,314 | |
| | U.S. Treasury Bill, 1.564%, due 10/8/20 | | | 17,500 | | | | 17,295 | |
| | U.S. Treasury Bill, 1.577%, due 11/5/20 | | | 17,500 | | | | 17,275 | |
| | U.S. Treasury Bill, 1.561%, due 12/3/20 | | | 15,000 | | | | 14,793 | |
| | U.S. Treasury Bill, 1.544%, due 12/31/20 | | | 5,000 | | | | 4,923 | |
| | Total U.S. Government—26.1%
(cost $195,591) | | | | | | | 195,871 | |
| | Total Investments in Securities—100.9%
(cost $689,923) | | | | | | | 757,349 | |
| | Liabilities, plus cash and other assets—(0.9)% | | | | | | | (6,549 | ) |
| | Net assets—100.0% | | | | | | $ | 750,800 | |
(a) Security, or portion of security, is segregated as collateral for centrally cleared swaps and to cover initial margin requirements on open futures contracts aggregating a total value of $30,480 (in thousands).
(b) Security, or portion of security, is pledged as collateral for OTC swap contracts aggregating a total value of $1,220 (in thousands).
If a fund’s portfolio holdings represent ownership of 5% or more of the voting securities of a company, the company is deemed to be an affiliate as defined in the Investment Company Act of 1940. The Fund had the following transactions during the year ended December 31, 2019 with companies deemed affiliated during the year or at December 31, 2019.
| | | Share Activity | | | | | Year Ended December 31, 2019 |
| | | | | | | | | | | | | | | | | | | | | | | | Change in net |
| | | | | | | | | | | | | | | | | | | | | | | | unrealized |
| | | Balance | | | | | | | | Balance | | Value | | Dividend | | Net realized | | appreciation |
| Security Name | | 12/31/2018 | | Purchases | | Sales | | 12/31/2019 | | 12/31/2019 | | Income | | gain (loss) | | (depreciation) |
| Global X MSCI Greece ETF | | | 2,434,000 | | | | 963,200 | | | | 1,282,800 | | | | 2,114,400 | | | | $21,419 | | | | $514 | | | | $939 | | | | $7,013 | |
| | | | | | | | | | | | | | | | | | | | $21,419 | | | | $514 | | | | $939 | | | | $7,013 | |
See accompanying Notes to Financial Statements.
| December 31, 2019 | William Blair Funds | 91 |
Macro Allocation Fund
Portfolio of Investments, December 31, 2019(all dollar amounts in thousands)
Forward Foreign Currency Contracts
| | | | | | | | | USD (Base) | | | | | | Net Unrealized | |
| Settlement | | | | | | Local Currency | | Purchased | | | Current | | | Appreciation | |
| Date | | Deliver/Receive | | Counterparty | | (in thousands) | | or Sold | | | Value | | | (Depreciation) | |
| Purchased | | | | | | | | | | | | | | | | | | | |
| 1/15/20 | | New Turkish Lira | | Citibank N.A. London | | 136,632 | | $ | 23,387 | | | $ | 22,890 | | | | $ | (497 | ) |
| 3/18/20 | | Australian Dollar | | Citibank N.A. London | | 3,414 | | | 2,389 | | | | 2,400 | | | | | 11 | |
| 3/18/20 | | Brazilian Real | | Citibank N.A. London | | 4,405 | | | 1,084 | | | | 1,092 | | | | | 8 | |
| 3/18/20 | | British Pound Sterling | | Citibank N.A. London | | 36,799 | | | 48,649 | | | | 48,844 | | | | | 195 | |
| 3/18/20 | | Chinese Yuan Renminbi | | Citibank N.A. London | | 7,235 | | | 1,032 | | | | 1,037 | | | | | 5 | |
| 3/18/20 | | Colombian Peso | | Citibank N.A. London | | 131,043,649 | | | 38,518 | | | | 39,723 | | | | | 1,205 | |
| 3/18/20 | | Czech Koruna | | Citibank N.A. London | | 39,287 | | | 1,722 | | | | 1,733 | | | | | 11 | |
| 3/18/20 | | Euro | | Citibank N.A. London | | 3,909 | | | 4,387 | | | | 4,405 | | | | | 18 | |
| 3/18/20 | | Hong Kong Dollar | | Citibank N.A. London | | 13,832 | | | 1,775 | | | | 1,774 | | | | | (1 | ) |
| 3/18/20 | | Hungarian Forint | | Citibank N.A. London | | 232,507 | | | 788 | | | | 791 | | | | | 3 | |
| 3/18/20 | | Indian Rupee | | Citibank N.A. London | | 2,494,470 | | | 34,883 | | | | 34,754 | | | | | (129 | ) |
| 3/18/20 | | Indonesian Rupiah | | Citibank N.A. London | | 22,062,014 | | | 1,571 | | | | 1,585 | | | | | 14 | |
| 3/18/20 | | Israeli Shekel | | Citibank N.A. London | | 6,761 | | | 1,965 | | | | 1,966 | | | | | 1 | |
| 3/18/20 | | Japanese Yen | | Citibank N.A. London | | 4,988,275 | | | 46,179 | | | | 46,091 | | | | | (88 | ) |
| 3/18/20 | | Mexican Peso | | Citibank N.A. London | | 1,443,195 | | | 74,291 | | | | 75,485 | | | | | 1,194 | |
| 3/18/20 | | New Zealand Dollar | | Citibank N.A. London | | 4,917 | | | 3,304 | | | | 3,314 | | | | | 10 | |
| 3/18/20 | | Norwegian Krone | | Citibank N.A. London | | 433,830 | | | 47,445 | | | | 49,426 | | | | | 1,981 | |
| 3/18/20 | | Philippine Peso | | Citibank N.A. London | | 3,988,722 | | | 78,312 | | | | 78,488 | | | | | 176 | |
| 3/18/20 | | Polish Zloty | | Citibank N.A. London | | 30,076 | | | 7,788 | | | | 7,929 | | | | | 141 | |
| 3/18/20 | | Russian Ruble | | Citibank N.A. London | | 1,865,282 | | | 29,028 | | | | 29,805 | | | | | 777 | |
| 3/18/20 | | Singapore Dollar | | Citibank N.A. London | | 89,149 | | | 65,685 | | | | 66,332 | | | | | 647 | |
| 3/18/20 | | South African Rand | | Citibank N.A. London | | 206,675 | | | 13,817 | | | | 14,611 | | | | | 794 | |
| 3/18/20 | | South Korean Won | | Citibank N.A. London | | 1,880,204 | | | 1,624 | | | | 1,630 | | | | | 6 | |
| 3/18/20 | | Swedish Krona | | Citibank N.A. London | | 610,317 | | | 64,970 | | | | 65,396 | | | | | 426 | |
| 3/18/20 | | Swiss Franc | | Citibank N.A. London | | 3,030 | | | 3,124 | | | | 3,147 | | | | | 23 | |
| 3/18/20 | | Taiwan Dollar | | Citibank N.A. London | | 64,350 | | | 2,161 | | | | 2,164 | | | | | 3 | |
| 3/18/20 | | Thai Baht | | Citibank N.A. London | | 78,289 | | | 2,599 | | | | 2,618 | | | | | 19 | |
| | | | | | | | | | | | | | | | | | $ | 6,953 | |
| Sold | | | | | | | | | | | | | | | | | | | |
| 1/15/20 | | New Turkish Lira | | Citibank N.A. London | | 6,680 | | $ | 1,117 | | | $ | 1,119 | | | | $ | (2 | ) |
| 3/18/20 | | Australian Dollar | | Citibank N.A. London | | 68,131 | | | 46,749 | | | | 47,900 | | | | | (1,151 | ) |
| 3/18/20 | | Brazilian Real | | Citibank N.A. London | | 43,594 | | | 10,535 | | | | 10,804 | | | | | (269 | ) |
| 3/18/20 | | British Pound Sterling | | Citibank N.A. London | | 1,881 | | | 2,468 | | | | 2,497 | | | | | (29 | ) |
| 3/18/20 | | Chinese Yuan Renminbi | | Citibank N.A. London | | 158,969 | | | 22,526 | | | | 22,797 | | | | | (271 | ) |
| 3/18/20 | | Colombian Peso | | Citibank N.A. London | | 6,374,993 | | | 1,928 | | | | 1,933 | | | | | (5 | ) |
| 3/18/20 | | Czech Koruna | | Citibank N.A. London | | 467,470 | | | 20,365 | | | | 20,625 | | | | | (260 | ) |
| 3/18/20 | | Euro | | Citibank N.A. London | | 84,354 | | | 94,158 | | | | 95,064 | | | | | (906 | ) |
| 3/18/20 | | Hong Kong Dollar | | Citibank N.A. London | | 199,188 | | | 25,465 | | | | 25,547 | | | | | (82 | ) |
| 3/18/20 | | Hungarian Forint | | Citibank N.A. London | | 4,599,789 | | | 15,515 | | | | 15,648 | | | | | (133 | ) |
| 3/18/20 | | Indonesian Rupiah | | Citibank N.A. London | | 556,819,724 | | | 39,344 | | | | 40,006 | | | | | (662 | ) |
| 3/18/20 | | Israeli Shekel | | Citibank N.A. London | | 191,113 | | | 55,242 | | | | 55,567 | | | | | (325 | ) |
| 3/18/20 | | Japanese Yen | | Citibank N.A. London | | 252,853 | | | 2,316 | | | | 2,336 | | | | | (20 | ) |
| 3/18/20 | | Mexican Peso | | Citibank N.A. London | | 63,383 | | | 3,324 | | | | 3,315 | | | | | 9 | |
| 3/18/20 | | New Zealand Dollar | | Citibank N.A. London | | 107,816 | | | 70,793 | | | | 72,657 | | | | | (1,864 | ) |
| 3/18/20 | | Norwegian Krone | | Citibank N.A. London | | 21,518 | | | 2,440 | | | | 2,452 | | | | | (12 | ) |
| 3/18/20 | | Philippine Peso | | Citibank N.A. London | | 177,674 | | | 3,486 | | | | 3,496 | | | | | (10 | ) |
| 3/18/20 | | Russian Ruble | | Citibank N.A. London | | 86,314 | | | 1,377 | | | | 1,379 | | | | | (2 | ) |
| 3/18/20 | | Singapore Dollar | | Citibank N.A. London | | 3,197 | | | 2,366 | | | | 2,379 | | | | | (13 | ) |
| 3/18/20 | | South Korean Won | | Citibank N.A. London | | 32,720,060 | | | 27,466 | | | | 28,363 | | | | | (897 | ) |
| 3/18/20 | | Swedish Krona | | Citibank N.A. London | | 30,864 | | | 3,314 | | | | 3,307 | | | | | 7 | |
| 3/18/20 | | Swiss Franc | | Citibank N.A. London | | 62,056 | | | 63,390 | | | | 64,448 | | | | | (1,058 | ) |
| 3/18/20 | | Taiwan Dollar | | Citibank N.A. London | | 1,167,702 | | | 38,637 | | | | 39,262 | | | | | (625 | ) |
| 3/18/20 | | Thai Baht | | Citibank N.A. London | | 3,168,810 | | | 104,793 | | | | 105,978 | | | | | (1,185 | ) |
| | | | | | | | | | | | | | | | | | $ | (9,765 | ) |
| Total net unrealized appreciation (depreciation) on forward foreign currency contracts | | | | $ | (2,812 | ) |
See accompanying Notes to Financial Statements.
| 92 | Annual Report | December 31, 2019 |
Macro Allocation Fund
Portfolio of Investments, December 31, 2019(all dollar amounts in thousands)
Futures Contracts
| | | | | | | | | | Notional Value | | Notional | | | Notional | | Net Unrealized |
| Number of | | | | | | | | (Local, | | Amount | | | Value | | Appreciation |
| Contracts | | Description | | Expiration Date | | Local Currency | | in Thousands | | (USD) | | | (USD) | | (Depreciation) |
| Long | | | | | | | | | | | | | | | | | | | | | | |
| 161 | | | CAC 40 Index | | January 2020 | | Euro | | 9,612 | | $ | 10,774 | | | $ | 10,782 | | | | $ | 8 | |
| 288 | | | IBEX 35 Index | | January 2020 | | Euro | | 27,442 | | | 30,816 | | | | 30,781 | | | | | (35 | ) |
| 65 | | | HSCEI Index | | January 2020 | | Hong Kong Dollar | | 36,436 | | | 4,608 | | | | 4,676 | | | | | 68 | |
| 565 | | | MSCI Singapore ETS Index | | January 2020 | | Singapore Dollar | | 20,990 | | | 15,617 | | | | 15,606 | | | | | (11 | ) |
| 3,350 | | | BIST 30 Index | | February 2020 | | Turkish Lira | | 47,336 | | | 7,907 | | | | 7,957 | | | | | 50 | |
| 285 | | | KOSPI 200 Index | | March 2020 | | South Korean Won | | 21,033,000 | | | 16,960 | | | | 18,188 | | | | | 1,228 | |
| 9 | | | NIKKEI 225 Index | | March 2020 | | Japanese Yen | | 105,188 | | | 970 | | | | 968 | | | | | (2 | ) |
| 71 | | | SPI 200 Index | | March 2020 | | Australian Dollar | | 11,720 | | | 8,457 | | | | 8,225 | | | | | (232 | ) |
| 31 | | | DAX Index | | March 2020 | | Euro | | 10,266 | | | 11,643 | | | | 11,515 | | | | | (128 | ) |
| 589 | | | FTSE 100 Index | | March 2020 | | British Pound Sterling | | 44,169 | | | 57,164 | | | | 58,506 | | | | | 1,342 | |
| 195 | | | Ultra U.S. Treasury Bond | | March 2020 | | U.S. Dollar | | 35,423 | | | 36,424 | | | | 35,423 | | | | | (1,001 | ) |
| | | | | | | | | | | | | | | | | | | | | $ | 1,287 | |
| Short | | | | | | | | | | | | | | | | | | | | | | |
| 90 | | | Amsterdam Index | | January 2020 | | Euro | | 10,883 | | $ | 12,284 | | | $ | 12,208 | | | | $ | 76 | |
| 78 | | | OMXS 30 Index | | January 2020 | | Swedish Krona | | 13,792 | | | 1,479 | | | | 1,472 | | | | | 7 | |
| 236 | | | MSCI Taiwan Index | | January 2020 | | U.S. Dollar | | 10,847 | | | 10,915 | | | | 10,847 | | | | | 68 | |
| 527 | | | FTSE 40 Index | | March 2020 | | South African Rand | | 270,667 | | | 19,628 | | | | 19,325 | | | | | 303 | |
| 109 | | | 10YR Can Bond | | March 2020 | | Canadian Dollar | | 14,985 | | | 11,749 | | | | 11,540 | | | | | 209 | |
| 444 | | | EURO STOXX 50 Index | | March 2020 | | Euro | | 16,557 | | | 18,665 | | | | 18,572 | | | | | 93 | |
| 943 | | | MSCI Mexico Index | | March 2020 | | U.S. Dollar | | 22,835 | | | 22,927 | | | | 22,835 | | | | | 92 | |
| 1,889 | | | S&P 500 E Mini Index | | March 2020 | | U.S. Dollar | | 305,177 | | | 298,711 | | | | 305,177 | | | | | (6,466 | ) |
| 53 | | | S&P E Mini Com Ser Index | | March 2020 | | U.S. Dollar | | 3,733 | | | 3,661 | | | | 3,733 | | | | | (72 | ) |
| 102 | | | XAK Technology | | March 2020 | | U.S. Dollar | | 9,423 | | | 9,115 | | | | 9,423 | | | | | (308 | ) |
| 102 | | | XAY Cons Discret | | March 2020 | | U.S. Dollar | | 12,936 | | | 12,667 | | | | 12,936 | | | | | (269 | ) |
| | | | | | | | | | | | | | | | | | | | | $ | (6,267 | ) |
| Total net unrealized appreciation (depreciation) on futures contracts | | | | $ | (4,980 | ) |
| | | | | | | | | | | | | | | | | | | | | | | |
| Total Return Swaps | | | | | | | | | | | | | | | | | |
| | | | | | | | | | | | Notional | | | | | | | Unrealized |
| Reference | | | Pay/Receive | | | | Maturity | | | | Amount (in | | | Market | | Appreciation |
| Entity | | | Floating Rate | | Floating Rate | | Date | | Counterparty | | thousands) | | | Value | | (Depreciation) |
| Euro-Bund Future | | | Receive | | 0 bp | | Mar 2020 | | Credit Suisse International | | EUR | 3,791 | | | $ | 45 | | | | $ | 45 | |
| 10YR T-Note Future | | | Pay | | 0 bp | | Mar 2020 | | Credit Suisse International | | $ | 25,773 | | | | (217 | ) | | | | (217 | ) |
| 5YR T-Note Future | | | Receive | | 0 bp | | Mar 2020 | | Credit Suisse International | | $ | 6,667 | | | | 25 | | | | | 25 | |
| Swiss Market Index (Total Return) | | | Receive | | 3 Month LIBOR plus 91 bp | | Mar 2020 | | Goldman Sachs International | | CHF | 10,568 | | | | 64 | | | | | 64 | |
| MSCI Emerging Markets Indonesia Net Total Return USD | | | Pay | | 3 Month LIBOR minus 5 bp | | Jun 2020 | | Citibank N.A. | | $ | 6,392 | | | | 984 | | | | | 984 | |
| | | | | | | | | | | | | | | | | | | | | $ | 901 | |
Centrally Cleared Credit Default Swap
| | | | | | | | | | | | | | | | Upfront | | | | | | |
| | | | | | | | | | | | | Notional | | | Payment | | | | Unrealized | |
| Reference | | Buy/Sell | | Fixed Deal | | Payment | | Maturity | | Cleared | | Amount | | | Paid | | | | Appreciation | |
| Entity | | Protection | | Pay Rate | | Frequency | | Date | | Exchange | | (in thousands) | | | (Received) | | Value | | (Depreciation) | |
| iTRAXX Europe S32 | | Sell | | 1.000% | | 3M | | December 2024 | | ICE | | $15,262 | | | $371 | | $481 | | | $ | 110 | |
| Total net unrealized appreciation (depreciation) on swaps | | | $ | 1,011 | |
See accompanying Notes to Financial Statements.
| December 31, 2019 | William Blair Funds | 93 |
Statements of Assets and Liabilities
As of December 31, 2019(dollar amounts in thousands)
| | | Growth
Fund | | | Large Cap
Growth
Fund | | | Mid Cap
Growth
Fund | | | Small-Mid
Cap Core
Fund | |
| Assets | | | | | | | | | | | | | | | | |
| Investments in securities, at cost | | $ | 154,051 | | | $ | 218,108 | | | $ | 57,343 | | | $ | 6,101 | |
| Investments in securities, at value | | $ | 253,900 | | | $ | 304,952 | | | $ | 73,464 | | | $ | 6,487 | |
| Cash | | | — | | | | — | | | | — | | | | 100 | |
| Receivable for securities sold | | | — | | | | — | | | | — | | | | 62 | |
| Receivable for fund shares sold | | | 40 | | | �� | 1,475 | | | | 175 | | | | — | |
| Receivable from Adviser | | | 1 | | | | 22 | | | | 21 | | | | 14 | |
| Dividend and interest receivable | | | 27 | | | | 44 | | | | 21 | | | | 6 | |
| Total assets | | | 253,968 | | | | 306,493 | | | | 73,681 | | | | 6,669 | |
| Liabilities | | | | | | | | | | | | | | | | |
| Payable for investment securities purchased | | | — | | | | 2,340 | | | | — | | | | 40 | |
| Payable for fund shares redeemed | | | 113 | | | | 71 | | | | 4 | | | | — | |
| Management fee payable | | | 162 | | | | 143 | | | | 55 | | | | 5 | |
| Distribution fee payable | | | 7 | | | | 13 | | | | 1 | | | | — | |
| Other payables and accrued expenses | | | 99 | | | | 92 | | | | 75 | | | | 36 | |
| Total liabilities | | | 381 | | | | 2,659 | | | | 135 | | | | 81 | |
| Net assets | | $ | 253,587 | | | $ | 303,834 | | | $ | 73,546 | | | $ | 6,588 | |
| Capital | | | | | | | | | | | | | | | | |
| Composition of net assets | | | | | | | | | | | | | | | | |
| Paid in capital | | $ | 147,593 | | | $ | 215,259 | | | $ | 55,393 | | | $ | 6,218 | |
| Total distributable earnings (loss) | | | 105,994 | | | | 88,575 | | | | 18,153 | | | | 370 | |
| Net assets | | $ | 253,587 | | | $ | 303,834 | | | $ | 73,546 | | | $ | 6,588 | |
| | | | | | | | | | | | | | | | | |
| Class N shares | | | | | | | | | | | | | | | | |
| Net assets | | $ | 32,710 | | | $ | 65,314 | | | $ | 5,465 | | | | — | |
| Shares outstanding | | | 3,462,332 | | | | 4,276,389 | | | | 497,391 | | | | — | |
| Net asset value per share. | | $ | 9.45 | | | $ | 15.27 | | | $ | 10.99 | | | | — | |
| Class I shares | | | | | | | | | | | | | | | | |
| Net assets | | $ | 220,660 | | | $ | 236,930 | | | $ | 67,936 | | | $ | 1,655 | |
| Shares outstanding | | | 19,617,008 | | | | 14,633,871 | | | | 5,693,136 | | | | 155,028 | |
| Net asset value per share. | | $ | 11.25 | | | $ | 16.19 | | | $ | 11.93 | | | $ | 10.68 | |
| Class R6 shares | | | | | | | | | | | | | | | | |
| Net assets | | $ | 217 | | | $ | 1,590 | | | $ | 145 | | | $ | 4,933 | |
| Shares outstanding | | | 19,282 | | | | 98,275 | | | | 12,109 | | | | 461,941 | |
| Net asset value per share. | | $ | 11.26 | | | $ | 16.17 | | | $ | 11.94 | | | $ | 10.68 | |
See accompanying Notes to Financial Statements.
| 94 | Annual Report | December 31, 2019 |
Statements of Operations
For the Year Ended December 31, 2019(all amounts in thousands)
| | | Growth
Fund | | | Large Cap
Growth
Fund | | | Mid Cap
Growth
Fund | | | Small-Mid
Cap Core
Fund (a) | |
| Investment income | | | | | | | | | | | | | | | | |
| Dividends | | $ | 2,256 | | | $ | 2,192 | | | $ | 481 | | | $ | 17 | |
| Less foreign tax withheld | | | (1 | ) | | | — | | | | (1 | ) | | | — | |
| Interest | | | 8 | | | | 8 | | | | 5 | | | | — | |
| Total income | | | 2,263 | | | | 2,200 | | | | 485 | | | | 17 | |
| Expenses | | | | | | | | | | | | | | | | |
| Investment advisory fees | | | 1,901 | | | | 1,426 | | | | 619 | | | | 12 | |
| Distribution fees | | | 97 | | | | 139 | | | | 14 | | | | — | |
| Custodian fees | | | 78 | | | | 42 | | | | 38 | | | | 9 | |
| Transfer agent fees | | | 59 | | | | 40 | | | | 14 | | | | 1 | |
| Sub-transfer agent fees | | | | | | | | | | | | | | | | |
| Class N | | | 46 | | | | 77 | | | | 6 | | | | — | |
| Class I | | | 97 | | | | 126 | | | | 79 | | | | — | |
| Professional fees | | | 48 | | | | 44 | | | | 38 | | | | 25 | |
| Registration fees | | | 65 | | | | 57 | | | | 52 | | | | 7 | |
| Shareholder reporting fees | | | 21 | | | | 22 | | | | 2 | | | | — | |
| Trustee fees | | | 23 | | | | 17 | | | | 5 | | | | — | |
| Other expenses | | | 20 | | | | 19 | | | | 10 | | | | — | |
| Total expenses before expense limitation | | | 2,455 | | | | 2,009 | | | | 877 | | | | 54 | |
| Expenses waived or reimbursed by the Adviser | | | (17 | ) | | | (284 | ) | | | (221 | ) | | | (41 | ) |
| Net expenses | | | 2,438 | | | | 1,725 | | | | 656 | | | | 13 | |
| Net investment income (loss) | | | (175 | ) | | | 475 | | | | (171 | ) | | | 4 | |
| Realized and unrealized gain (loss) | | | | | | | | | | | | | | | | |
| Net realized gain (loss) on transactions from: | | | | | | | | | | | | | | | | |
| Investments in securities | | | 24,088 | | | | 17,324 | | | | 7,108 | | | | (16 | ) |
| Total net realized gain (loss) | | | 24,088 | | | | 17,324 | | | | 7,108 | | | | (16 | ) |
| Change in net unrealized appreciation (depreciation) of: | | | | | | | | | | | | | | | | |
| Investments in securities | | | 45,368 | | | | 49,902 | | | | 13,055 | | | | 386 | |
| Change in net unrealized appreciation (depreciation) | | | 45,368 | | | | 49,902 | | | | 13,055 | | | | 386 | |
| Net increase (decrease) in net assets resulting from operations | | $ | 69,281 | | | $ | 67,701 | | | $ | 19,992 | | | $ | 374 | |
| (a) | For the period from October 1, 2019 (Commencement of Operations) to December 31, 2019. |
See accompanying Notes to Financial Statements.
| December 31, 2019 | William Blair Funds | 95 |
Statements of Changes in Net Assets
For the Years Ended December 31, 2019 and 2018(all amounts in thousands)
| | | Growth Fund | | | Large Cap
Growth Fund | | | Mid Cap
Growth Fund | | | Small-Mid
Cap Core
Fund (a) | |
| | | 2019 | | | 2018 | | | 2019 | | | 2018 | | | 2019 | | | 2018 | | | 2019 | |
| Operations | | | | | | | | | | | | | | | | | | | | | | | | | | | | |
| Net investment income (loss) | | $ | (175 | ) | | $ | (311 | ) | | $ | 475 | | | $ | 86 | | | $ | (171 | ) | | $ | (180 | ) | | $ | 4 | |
| Net realized gain (loss) on investments, and other assets and liabilities | | | 24,088 | | | | 81,637 | | | | 17,324 | | | | 32,604 | | | | 7,108 | | | | 13,079 | | | | (16 | ) |
| Change in net unrealized appreciation (depreciation) on investments, and other assets and liabilities | | | 45,368 | | | | (49,663 | ) | | | 49,902 | | | | (17,587 | ) | | | 13,055 | | | | (12,543 | ) | | | 386 | |
| Net increase (decrease) in net assets resulting from operations | | | 69,281 | | | | 31,663 | | | | 67,701 | | | | 15,103 | | | | 19,992 | | | | 356 | | | | 374 | |
| Distributions to shareholders from | | | | | | | | | | | | | | | | | | | | | | | | | | | | |
| Class N | | | (3,190 | ) | | | (12,048 | ) | | | (3,981 | ) | | | (6,522 | ) | | | (480 | ) | | | (982 | ) | | | — | |
| Class I | | | (17,880 | ) | | | (51,103 | ) | | | (12,030 | ) | | | (20,739 | ) | | | (5,507 | ) | | | (9,097 | ) | | | (1 | ) |
| Class R6 | | | (17 | ) | | | — | | | | (97 | ) | | | — | | | | (12 | ) | | | — | | | | (3 | ) |
| Total distributions | | | (21,087 | ) | | | (63,151 | ) | | | (16,108 | ) | | | (27,261 | ) | | | (5,999 | ) | | | (10,079 | ) | | | (4 | ) |
| Capital stock transactions | | | | | | | | | | | | | | | | | | | | | | | | | | | | |
| Proceeds from sale of shares | | | 21,672 | | | | 42,834 | | | | 122,974 | | | | 60,009 | | | | 10,314 | | | | 10,781 | | | | 6,238 | |
| Shares issued in reinvestment of income dividends and capital gain distributions | | | 20,274 | | | | 60,277 | | | | 13,134 | | | | 23,837 | | | | 5,817 | | | | 9,695 | | | | 4 | |
| Less cost of shares redeemed | | | (62,229 | ) | | | (199,681 | ) | | | (62,827 | ) | | | (96,291 | ) | | | (12,695 | ) | | | (32,171 | ) | | | (24 | ) |
| Net increase (decrease) in net assets resulting from capital share transactions | | | (20,283 | ) | | | (96,570 | ) | | | 73,281 | | | | (12,445 | ) | | | 3,436 | | | | (11,695 | ) | | | 6,218 | |
| Increase (decrease) in net assets | | | 27,911 | | | | (128,058 | ) | | | 124,874 | | | | (24,603 | ) | | | 17,429 | | | | (21,418 | ) | | | 6,588 | |
| Net assets | | | | | | | | | | | | | | | | | | | | | | | | | | | | |
| Beginning of period | | | 225,676 | | | | 353,734 | | | | 178,960 | | | | 203,563 | | | | 56,117 | | | | 77,535 | | | | — | |
| End of period | | $ | 253,587 | | | $ | 225,676 | | | $ | 303,834 | | | $ | 178,960 | | | $ | 73,546 | | | $ | 56,117 | | | $ | 6,588 | |
| (a) | For the period from October 1, 2019 (Commencement of Operations) to December 31, 2019. |
See accompanying Notes to Financial Statements.
| 96 | Annual Report | December 31, 2019 |
Statements of Assets and Liabilities
As of December 31, 2019(dollar amounts in thousands)
| | | Small-Mid
Cap Growth
Fund | | | Small-Mid
Cap Value
Fund | | | Small Cap
Growth
Fund | | | Small Cap
Value
Fund | |
| Assets | | | | | | | | | | | | | | | | |
| Investments in securities, at cost | | $ | 2,427,319 | | | $ | 7,320 | | | $ | 547,740 | | | $ | 146,624 | |
| Investments in securities, at value | | $ | 2,919,845 | | | $ | 7,748 | | | $ | 673,165 | | | $ | 189,135 | |
| Cash | | | — | | | | — | | | | — | | | | 4 | |
| Receivable for securities sold | | | 2,601 | | | | — | | | | 231 | | | | 256,386 | |
| Receivable for fund shares sold | | | 12,205 | | | | 2 | | | | 871 | | | | 271 | |
| Receivable from Adviser | | | 141 | | | | 17 | | | | 5 | | | | 12 | |
| Dividend and interest receivable | | | 747 | | | | 10 | | | | 244 | | | | 730 | |
| Total assets | | | 2,935,539 | | | | 7,777 | | | | 674,516 | | | | 446,538 | |
| Liabilities | | | | | | | | | | | | | | | | |
| Payable for investment securities purchased | | | — | | | | 178 | | | | 947 | | | | — | |
| Payable for fund shares redeemed | | | 26,429 | �� | | | — | | | | 2,191 | | | | 270,708 | |
| Management fee payable | | | 2,496 | | | | 6 | | | | 628 | | | | 415 | |
| Distribution fee payable | | | 72 | | | | — | | | | 39 | | | | 3 | |
| Other payables and accrued expenses | | | 728 | | | | 65 | | | | 174 | | | | 134 | |
| Total liabilities | | | 29,725 | | | | 249 | | | | 3,979 | | | | 271,260 | |
| Net assets | | $ | 2,905,814 | | | $ | 7,528 | | | $ | 670,537 | | | $ | 175,278 | |
| Capital | | | | | | | | | | | | | | | | |
| Composition of net assets | | | | | | | | | | | | | | | | |
| Paid in capital | | $ | 2,395,735 | | | $ | 7,151 | | | $ | 550,369 | | | $ | 107,509 | |
| Total distributable earnings (loss) | | | 510,079 | | | | 377 | | | | 120,168 | | | | 67,769 | |
| Net assets | | $ | 2,905,814 | | | $ | 7,528 | | | $ | 670,537 | | | $ | 175,278 | |
| | | | | | | | | | | | | | | | | |
| Class N shares | | | | | | | | | | | | | | | | |
| Net assets | | $ | 334,017 | | | $ | 315 | | | $ | 180,706 | | | $ | 12,672 | |
| Shares outstanding | | | 13,144,862 | | | | 28,067 | | | | 6,512,199 | | | | 725,165 | |
| Net asset value per share | | $ | 25.41 | | | $ | 11.22 | | | $ | 27.75 | | | $ | 17.47 | |
| Class I shares | | | | | | | | | | | | | | | | |
| Net assets | | $ | 2,531,823 | | | $ | 7,042 | | | $ | 423,881 | | | $ | 162,093 | |
| Shares outstanding | | | 93,801,425 | | | | 632,652 | | | | 13,588,170 | | | | 8,993,897 | |
| Net asset value per share | | $ | 26.99 | | | $ | 11.13 | | | $ | 31.19 | | | $ | 18.02 | |
| Class R6 shares | | | | | | | | | | | | | | | | |
| Net assets | | $ | 39,974 | | | $ | 171 | | | $ | 65,950 | | | $ | 513 | |
| Shares outstanding | | | 1,479,991 | | | | 15,322 | | | | 2,113,608 | | | | 28,446 | |
| Net asset value per share | | $ | 27.01 | | | $ | 11.13 | | | $ | 31.20 | | | $ | 18.03 | |
See accompanying Notes to Financial Statements.
| December 31, 2019 | William Blair Funds | 97 |
Statements of Operations
For the Year Ended December 31, 2019(all amounts in thousands)
| | | Small-Mid
Cap Growth
Fund | | | Small-Mid
Cap Value
Fund | | | Small Cap
Growth
Fund | | | Small Cap
Value
Fund | |
| Investment income | | | | | | | | | | | | | | | | |
| Dividends | | $ | 15,642 | | | $ | 69 | | | $ | 4,303 | | | $ | 9,575 | |
| Less foreign tax withheld | | | (123 | ) | | | — | | | | (89 | ) | | | — | |
| Interest | | | 292 | | | | — | | | | 69 | | | | 47 | |
| Total income | | | 15,811 | | | | 69 | | | | 4,283 | | | | 9,622 | |
| Expenses | | | | | | | | | | | | | | | | |
| Investment advisory fees | | | 27,928 | | | | 29 | | | | 7,523 | | | | 5,168 | |
| Distribution fees | | | 905 | | | | 1 | | | | 482 | | | | 40 | |
| Custodian fees | | | 63 | | | | 61 | | | | 46 | | | | 53 | |
| Transfer agent fees | | | 308 | | | | 3 | | | | 110 | | | | 51 | |
| Sub-transfer agent fees | | | | | | | | | | | | | | | | |
| Class N | | | 458 | | | | — | | | | 233 | | | | 21 | |
| Class I | | | 2,653 | | | | 2 | | | | 424 | | | | 611 | |
| Professional fees | | | 210 | | | | 36 | | | | 82 | | | | 65 | |
| Registration fees | | | 188 | | | | 53 | | | | 75 | | | | 56 | |
| Shareholder reporting fees | | | 249 | | | | 1 | | | | 91 | | | | 20 | |
| Trustee fees | | | 194 | | | | — | | | | 49 | | | | 45 | |
| Other expenses | | | 190 | | | | 4 | | | | 53 | | | | 40 | |
| Total expenses before expense limitation | | | 33,346 | | | | 190 | | | | 9,168 | | | | 6,170 | |
| Expenses waived or reimbursed by the Adviser | | | (1,727 | ) | | | (161 | ) | | | (158 | ) | | | (258 | ) |
| Net expenses | | | 31,619 | | | | 29 | | | | 9,010 | | | | 5,912 | |
| Net investment income (loss) | | | (15,808 | ) | | | 40 | | | | (4,727 | ) | | | 3,710 | |
| Realized and unrealized gain (loss) | | | | | | | | | | | | | | | | |
| Net realized gain (loss) on transactions from: | | | | | | | | | | | | | | | | |
| Investments in securities | | | 246,469 | | | | 109 | | | | 10,576 | | | | 73,420 | |
| Redemptions in-kind | | | 47,074 | | | | — | | | | — | | | | — | |
| Total net realized gain (loss) | | | 293,543 | | | | 109 | | | | 10,576 | | | | 73,420 | |
| Change in net unrealized appreciation (depreciation) of: | | | | | | | | | | | | | | | | |
| Investments in securities | | | 439,745 | | | | 446 | | | | 125,876 | | | | 15,381 | |
| Change in net unrealized appreciation (depreciation) | | | 439,745 | | | | 446 | | | | 125,876 | | | | 15,381 | |
| Net increase (decrease) in net assets resulting from operations | | $ | 717,480 | | | $ | 595 | | | $ | 131,725 | | | $ | 92,511 | |
See accompanying Notes to Financial Statements.
| 98 | Annual Report | December 31, 2019 |
Statements of Changes in Net Assets
For the Years Ended December 31, 2019 and 2018(all amounts in thousands)
| | | Small-Mid
Cap Growth Fund | | | Small-Mid
Cap Value Fund | | | Small Cap
Growth Fund | | | Small Cap
Value Fund | |
| | | 2019 | | | 2018 | | | 2019 | | | 2018 | | | 2019 | | | 2018 | | | 2019 | | | 2018 | |
| Operations | | | | | | | | | | | | | | | | | | | | | | | | | | | | | | | | |
| Net investment income (loss) | | $ | (15,808 | ) | | $ | (12,353 | ) | | $ | 40 | | | $ | 18 | | | $ | (4,727 | ) | | $ | (4,419 | ) | | $ | 3,710 | | | $ | 2,500 | |
| Net realized gain (loss) on investments, and other assets and liabilities | | | 293,543 | | | | 188,474 | | | | 109 | | | | 479 | | | | 10,576 | | | | 81,093 | | | | 73,420 | | | | 61,842 | |
| Change in net unrealized appreciation (depreciation) on investments, and other assets and liabilities | | | 439,745 | | | | (287,618 | ) | | | 446 | | | | (852 | ) | | | 125,876 | | | | (111,007 | ) | | | 15,381 | | | | (157,546 | ) |
| Net increase (decrease) in net assets resulting from operations | | | 717,480 | | | | (111,497 | ) | | | 595 | | | | (355 | ) | | | 131,725 | | | | (34,333 | ) | | | 92,511 | | | | (93,204 | ) |
| Distributions to shareholders from | | | | | | | | | | | | | | | | | | | | | | | | | | | | | | | | |
| Class N | | | (24,075 | ) | | | (37,426 | ) | | | (6 | ) | | | (59 | ) | | | (4,188 | ) | | | (23,655 | ) | | | (498 | ) | | | (2,248 | ) |
| Class I | | | (172,835 | ) | | | (160,129 | ) | | | (131 | ) | | | (381 | ) | | | (8,605 | ) | | | (47,224 | ) | | | (14,700 | ) | | | (57,005 | ) |
| Class R6 | | | (2,668 | ) | | | — | | | | (3 | ) | | | — | | | | (1,345 | ) | | | — | | | | (16 | ) | | | — | |
| Total distributions | | | (199,578 | ) | | | (197,555 | ) | | | (140 | ) | | | (440 | ) | | | (14,138 | ) | | | (70,879 | ) | | | (15,214 | ) | | | (59,253 | ) |
| Capital stock transactions | | | | | | | | | | | | | | | | | | | | | | | | | | | | | | | | |
| Proceeds from sale of shares | | | 835,740 | | | | 1,291,881 | | | | 7,068 | | | | 488 | | | | 265,349 | | | | 326,138 | | | | 49,983 | | | | 71,840 | |
| Shares issued in reinvestment of income dividends and capital gain distributions | | | 193,454 | | | | 193,965 | | | | 139 | | | | 439 | | | | 14,035 | | | | 70,242 | | | | 14,998 | | | | 58,395 | |
| Less cost of shares redeemed | | | (1,045,252 | ) | | | (577,832 | ) | | | (1,813 | ) | | | (2,096 | ) | | | (305,741 | ) | | | (201,271 | ) | | | (458,515 | ) | | | (160,283 | ) |
| Net increase (decrease) in net assets resulting from capital share transactions | | | (16,058 | ) | | | 908,014 | | | | 5,394 | | | | (1,169 | ) | | | (26,357 | ) | | | 195,109 | | | | (393,534 | ) | | | (30,048 | ) |
| Increase (decrease) in net assets | | | 501,844 | | | | 598,962 | | | | 5,849 | | | | (1,964 | ) | | | 91,230 | | | | 89,897 | | | | (316,237 | ) | | | (182,505 | ) |
| Net assets | | | | | | | | | | | | | | | | | | | | | | | | | | | | | | | | |
| Beginning of period | | | 2,403,970 | | | | 1,805,008 | | | | 1,679 | | | | 3,643 | | | | 579,307 | | | | 489,410 | | | | 491,515 | | | | 674,020 | |
| End of period | | $ | 2,905,814 | | | $ | 2,403,970 | | | $ | 7,528 | | | $ | 1,679 | | | $ | 670,537 | | | $ | 579,307 | | | $ | 175,278 | | | $ | 491,515 | |
See accompanying Notes to Financial Statements.
| December 31, 2019 | William Blair Funds | 99 |
Statements of Assets and Liabilities
As of December 31, 2019(dollar amounts in thousands)
| | | Global
Leaders
Fund | | | International
Leaders
Fund | | | International
Growth
Fund | | | Institutional
International
Growth
Fund | |
| Assets | | | | | | | | | | | | | | | | |
| Investments in securities, at cost | | $ | 122,910 | | | $ | 502,862 | | | $ | 1,556,851 | | | $ | 1,411,230 | |
| Investments in securities, at value | | $ | 171,755 | | | $ | 657,181 | | | $ | 2,101,807 | | | $ | 1,883,238 | |
| Foreign currency, at value (cost $—; $1,364; $3,136; $2,826) | | | — | | | | 1,364 | | | | 3,136 | | | | 2,826 | |
| Receivable for securities sold | | | — | | | | 380 | | | | 16,617 | | | | 5,844 | |
| Receivable for fund shares sold | | | 10 | | | | 355 | | | | 612 | | | | 1,871 | |
| Receivable from Adviser | | | 23 | | | | 32 | | | | — | | | | — | |
| Dividend and interest receivable | | | 147 | | | | 608 | | | | 4,959 | | | | 2,929 | |
| Total assets | | | 171,935 | | | | 659,920 | | | | 2,127,131 | | | | 1,896,708 | |
| Liabilities | | | | | | | | | | | | | | | | |
| Payable for investment securities purchased | | | — | | | | 5,022 | | | | 2,137 | | | | 1,895 | |
| Payable for fund shares redeemed | | | 1 | | | | 104 | | | | 13,333 | | | | 9 | |
| Management fee payable | | | 122 | | | | 461 | | | | 1,816 | | | | 1,487 | |
| Distribution fee payable | | | 2 | | | | 2 | | | | 104 | | | | — | |
| Foreign capital gains tax liability | | | — | | | | 237 | | | | — | | | | 9 | |
| Other payables and accrued expenses | | | 101 | | | | 190 | | | | 682 | | | | 397 | |
| Total liabilities | | | 226 | | | | 6,016 | | | | 18,072 | | | | 3,797 | |
| Net assets | | $ | 171,709 | | | $ | 653,904 | | | $ | 2,109,059 | | | $ | 1,892,911 | |
| Capital | | | | | | | | | | | | | | | | |
| Composition of net assets | | | | | | | | | | | | | | | | |
| Paid in capital | | $ | 123,195 | | | $ | 503,040 | | | $ | 1,581,328 | | | $ | 1,468,254 | |
| Total distributable earnings (loss) | | | 48,514 | | | | 150,864 | | | | 527,731 | | | | 424,657 | |
| Net assets | | $ | 171,709 | | | $ | 653,904 | | | $ | 2,109,059 | | | $ | 1,892,911 | |
| | | | | | | | | | | | | | | | | |
| Class N shares | | | | | | | | | | | | | | | | |
| Net assets | | $ | 8,910 | | | $ | 11,163 | | | $ | 494,788 | | | | — | |
| Shares outstanding | | | 597,182 | | | | 617,351 | | | | 16,668,833 | | | | — | |
| Net asset value per share | | $ | 14.92 | | | $ | 18.08 | | | $ | 29.68 | | | | — | |
| Class I shares | | | | | | | | | | | | | | | | |
| Net assets | | $ | 114,666 | | | $ | 181,617 | | | $ | 1,552,355 | | | | — | |
| Shares outstanding | | | 7,681,325 | | | | 10,019,587 | | | | 51,100,476 | | | | — | |
| Net asset value per share | | $ | 14.93 | | | $ | 18.13 | | | $ | 30.38 | | | | — | |
| Institutional/Class R6 shares | | | | | | | | | | | | | | | | |
| Net assets | | $ | 48,133 | | | $ | 461,124 | | | $ | 61,916 | | | $ | 1,892,911 | |
| Shares outstanding | | | 3,223,119 | | | | 25,443,103 | | | | 2,038,430 | | | | 109,129,991 | |
| Net asset value per share | | $ | 14.93 | | | $ | 18.12 | | | $ | 30.37 | | | $ | 17.35 | |
See accompanying Notes to Financial Statements.
| 100 | Annual Report | December 31, 2019 |
Statements of Operations
For the Year Ended December 31, 2019(all amounts in thousands)
| | | Global
Leaders
Fund | | | International
Leaders
Fund | | | International
Growth
Fund | | | Institutional
International
Growth
Fund | |
| Investment income | | | | | | | | | | | | | | | | |
| Dividends | | $ | 2,597 | | | $ | 9,973 | | | $ | 41,172 | | | $ | 34,942 | |
| Less foreign tax withheld | | | (149 | ) | | | (867 | ) | | | (3,536 | ) | | | (3,068 | ) |
| Interest | | | 13 | | | | 59 | | | | 63 | | | | 85 | |
| Total income | | | 2,461 | | | | 9,165 | | | | 37,699 | | | | 31,959 | |
| Expenses | | | | | | | | | | | | | | | | |
| Investment advisory fees | | | 1,666 | | | | 4,622 | | | | 21,323 | | | | 17,129 | |
| Distribution fees | | | 21 | | | | 25 | | | | 1,221 | | | | — | |
| Custodian fees | | | 64 | | | | 92 | | | | 288 | | | | 208 | |
| Transfer agent fees | | | 12 | | | | 35 | | | | 175 | | | | 80 | |
| Sub-transfer agent fees | | | | | | | | | | | | | | | | |
| Class N | | | 11 | | | | 13 | | | | 657 | | | | — | |
| Class I | | | 73 | | | | 94 | | | | 1,175 | | | | — | |
| Professional fees | | | 57 | | | | 86 | | | | 205 | | | | 186 | |
| Registration fees | | | 51 | | | | 65 | | | | 70 | | | | 29 | |
| Shareholder reporting fees | | | 4 | | | | 17 | | | | 121 | | | | 17 | |
| Trustee fees | | | 15 | | | | 35 | | | | 201 | | | | 158 | |
| Other expenses | | | 20 | | | | 40 | | | | 153 | | | | 122 | |
| Total expenses before expense limitation | | | 1,994 | | | | 5,124 | | | | 25,589 | | | | 17,929 | |
| Expenses waived or reimbursed by the Adviser | | | (223 | ) | | | (319 | ) | | | (19 | ) | | | — | |
| Net expenses | | | 1,771 | | | | 4,805 | | | | 25,570 | | | | 17,929 | |
| Net investment income (loss) | | | 690 | | | | 4,360 | | | | 12,129 | | | | 14,030 | |
| Realized and unrealized gain (loss) | | | | | | | | | | | | | | | | |
| Net realized gain (loss) on transactions from: | | | | | | | | | | | | | | | | |
| Investments in securities, net of foreign taxes, if applicable | | | 3,070 | | | | 201 | | | | 32,271 | | | | (2,087 | ) |
| Redemptions in-kind | | | 18,498 | | | | — | | | | — | | | | 7,027 | |
| Foreign currency transactions | | | (7 | ) | | | (63 | ) | | | (1,146 | ) | | | (607 | ) |
| Total net realized gain (loss) | | | 21,561 | | | | 138 | | | | 31,125 | | | | 4,333 | |
| Change in net unrealized appreciation (depreciation) of: | | | | | | | | | | | | | | | | |
| Investments in securities | | | 27,856 | | | | 139,292 | | | | 530,599 | | | | 472,155 | |
| Foreign currency translations | | | — | | | | (217 | ) | | | (18 | ) | | | — | |
| Change in net unrealized appreciation (depreciation) | | | 27,856 | | | | 139,075 | | | | 530,581 | | | | 472,155 | |
| Net increase (decrease) in net assets resulting from operations | | $ | 50,107 | | | $ | 143,573 | | | $ | 573,835 | | | $ | 490,518 | |
See accompanying Notes to Financial Statements.
| December 31, 2019 | William Blair Funds | 101 |
Statements of Changes in Net Assets
For the Years Ended December 31, 2019 and 2018(all amounts in thousands)
| | | Global
Leaders Fund | | | International
Leaders Fund | | | International
Growth Fund | | | Institutional
International
Growth Fund | |
| | | 2019 | | | 2018 | | | 2019 | | | 2018 | | | 2019 | | | 2018 | | | 2019 | | | 2018 | |
| Operations | | | | | | | | | | | | | | | | | | | | | | | | | | | | | | | | |
| Net investment income (loss) | | $ | 690 | | | $ | 813 | | | $ | 4,360 | | | $ | 4,623 | | | $ | 12,129 | | | $ | 22,467 | | | $ | 14,030 | | | $ | 21,963 | |
| Net realized gain (loss) on investments, and other assets and liabilities | | | 21,561 | | | | 28,281 | | | | 138 | | | | 6,745 | | | | 31,125 | | | | 132,672 | | | | 4,333 | | | | 98,966 | |
| Change in net unrealized appreciation (depreciation) on investments, and other assets and liabilities | | | 27,856 | | | | (39,539 | ) | | | 139,075 | | | | (70,725 | ) | | | 530,581 | | | | (661,540 | ) | | | 472,155 | | | | (496,584 | ) |
| Net increase (decrease) in net assets resulting from operations | | | 50,107 | | | | (10,445 | ) | | | 143,573 | | | | (59,357 | ) | | | 573,835 | | | | (506,401 | ) | | | 490,518 | | | | (375,655 | ) |
| Distributions to shareholders from | | | | | | | | | | | | | | | | | | | | | | | | | | | | | | | | |
| Class N | | | (99 | ) | | | (1,089 | ) | | | (37 | ) | | | (312 | ) | | | (5,328 | ) | | | (39,208 | ) | | | — | | | | — | |
| Class I | | | (1,500 | ) | | | (13,017 | ) | | | (981 | ) | | | (3,051 | ) | | | (19,998 | ) | | | (145,771 | ) | | | — | | | | — | |
| Institutional/Class R6 | | | (656 | ) | | | (12,002 | ) | | | (2,772 | ) | | | (13,274 | ) | | | (819 | ) | | | — | | | | (17,917 | ) | | | (186,678 | ) |
| Total distributions | | | (2,255 | ) | | | (26,108 | ) | | | (3,790 | ) | | | (16,637 | ) | | | (26,145 | ) | | | (184,979 | ) | | | (17,917 | ) | | | (186,678 | ) |
| Capital stock transactions | | | | | | | | | | | | | | | | | | | | | | | | | | | | | | | | |
| Proceeds from sale of shares | | | 16,564 | | | | 46,840 | | | | 150,318 | | | | 153,690 | | | | 290,402 | | | | 309,595 | | | | 192,878 | | | | 268,610 | |
| Shares issued in reinvestment of income dividends and capital gain distributions | | | 2,241 | | | | 25,924 | | | | 3,249 | | | | 15,804 | | | | 24,177 | | | | 172,803 | | | | 17,852 | | | | 180,253 | |
| Less cost of shares redeemed | | | (65,648 | ) | | | (76,860 | ) | | | (49,445 | ) | | | (62,329 | ) | | | (856,554 | ) | | | (826,740 | ) | | | (574,855 | ) | | | (432,394 | ) |
| Net increase (decrease) in net assets resulting from capital share transactions | | | (46,843 | ) | | | (4,096 | ) | | | 104,122 | | | | 107,165 | | | | (541,975 | ) | | | (344,342 | ) | | | (364,125 | ) | | | 16,469 | |
| Increase (decrease) in net assets | | | 1,009 | | | | (40,649 | ) | | | 243,905 | | | | 31,171 | | | | 5,715 | | | | (1,035,722 | ) | | | 108,476 | | | | (545,864 | ) |
| Net assets | | | | | | | | | | | | | | | | | | | | | | | | | | | | | | | | |
| Beginning of period | | | 170,700 | | | | 211,349 | | | | 409,999 | | | | 378,828 | | | | 2,103,344 | | | | 3,139,066 | | | | 1,784,435 | | | | 2,330,299 | |
| End of period | | $ | 171,709 | | | $ | 170,700 | | | $ | 653,904 | | | $ | 409,999 | | | $ | 2,109,059 | | | $ | 2,103,344 | | | $ | 1,892,911 | | | $ | 1,784,435 | |
See accompanying Notes to Financial Statements.
| 102 | Annual Report | December 31, 2019 |
Statements of Assets and Liabilities
As of December 31, 2019(dollar amounts in thousands)
| | | | International
Small Cap
Growth
Fund | | | | Emerging
Markets
Leaders
Fund | | | Emerging
Markets
Growth
Fund | | | Emerging
Markets
Small Cap
Growth Fund | |
| Assets | | | | | | | | | | | | | | |
| Investments in securities, at cost | | | $ | 246,724 | | | | $ | 186,179 | | | $ | 613,179 | | | $ | 217,559 | |
| Investments in securities, at value | | | $ | 307,249 | | | | $ | 233,687 | | | $ | 792,135 | | | $ | 278,037 | |
| Foreign currency, at value (cost $392; $229; $375; $—) | | | | 392 | | | | | 231 | | | | 375 | | | | — | |
| Receivable for securities sold | | | | 2,084 | | | | | 5,766 | | | | — | | | | 1,110 | |
| Receivable for fund shares sold | | | | 75 | | | | | 337 | | | | 60 | | | | 278 | |
| Receivable from Adviser | | | | — | | | | | 22 | | | | — | | | | 5 | |
| Dividend and interest receivable | | | | 980 | | | | | 208 | | | | 1,888 | | | | 231 | |
| Total assets | | | | 310,780 | | | | | 240,251 | | | | 794,458 | | | | 279,661 | |
| Liabilities | | | | | | | | | | | | | | | | | | |
| Payable for investment securities purchased | | | | 391 | | | | | 62 | | | | — | | | | 1,268 | |
| Payable for fund shares redeemed | | | | 705 | | | | | 55 | | | | 1,123 | | | | 66 | |
| Payable to custodian | | | | 178 | | | | | 549 | | | | — | | | | — | |
| Management fee payable | | | | 260 | | | | | 223 | | | | 710 | | | | 252 | |
| Distribution fee payable | | | | 1 | | | | | — | | | | 2 | | | | 1 | |
| Foreign capital gains tax liability | | | | — | | | | | 884 | | | | 1,966 | | | | — | |
| Other payables and accrued expenses | | | | 179 | | | | | 195 | | | | 465 | | | | 453 | |
| Total liabilities | | | | 1,714 | | | | | 1,968 | | | | 4,266 | | | | 2,040 | |
| Net assets | | | $ | 309,066 | | | | $ | 238,283 | | | $ | 790,192 | | | $ | 277,621 | |
| Capital | | | | | | | | | | | | | | | | | | |
| Composition of net assets | | | | | | | | | | | | | | | | | | |
| Paid in capital | | | $ | 268,495 | | | | $ | 191,795 | | | $ | 612,754 | | | $ | 265,891 | |
| Total distributable earnings (loss) | | | | 40,571 | | | | | 46,488 | | | | 177,438 | | | | 11,730 | |
| Net assets | | | $ | 309,066 | | | | $ | 238,283 | | | $ | 790,192 | | | $ | 277,621 | |
| Class N shares | | | | | | | | | | | | | | | | | | |
| Net assets | | | $ | 3,650 | | | | $ | 1,856 | | | $ | 7,804 | | | $ | 4,025 | |
| Shares outstanding | | | | 263,611 | | | | | 176,557 | | | | 570,978 | | | | 239,643 | |
| Net asset value per share | | | $ | 13.85 | | | | $ | 10.51 | | | $ | 13.67 | | | $ | 16.80 | |
| Class I shares | | | | | | | | | | | | | | | | | | |
| Net assets | | | $ | 142,951 | | | | $ | 45,090 | | | $ | 73,496 | | | $ | 142,885 | |
| Shares outstanding | | | | 10,226,413 | | | | | 4,284,185 | | | | 5,319,310 | | | | 8,454,413 | |
| Net asset value per share | | | $ | 13.98 | | | | $ | 10.52 | | | $ | 13.82 | | | $ | 16.90 | |
| Class R6 shares | | | | | | | | | | | | | | | | | | |
| Net assets | | | $ | 162,465 | | | | $ | 191,337 | | | $ | 708,892 | | | $ | 130,711 | |
| Shares outstanding | | | | 11,561,702 | | | | | 18,200,963 | | | | 50,861,660 | | | | 7,721,921 | |
| Net asset value per share | | | $ | 14.05 | | | | $ | 10.51 | | | $ | 13.94 | | | $ | 16.93 | |
See accompanying Notes to Financial Statements.
| December 31, 2019 | William Blair Funds | 103 |
Statements of Operations
For the Year Ended December 31, 2019(all amounts in thousands)
| | | International
Small Cap
Growth
Fund | | | Emerging
Markets
Leaders
Fund | | | Emerging
Markets
Growth
Fund | | | Emerging
Markets
Small Cap
Growth
Fund | |
| Investment income | | | | | | | | | | | | | | | | |
| Dividends | | | $ | 6,846 | | | | $ | 4,377 | | | | $ | 20,179 | | | | $ | 4,910 | |
| Less foreign tax withheld | | | | (639 | ) | | | | (438 | ) | | | | (1,495 | ) | | | | (504 | ) |
| Interest | | | | 33 | | | | | 39 | | | | | 35 | | | | | 43 | |
| Total income | | | | 6,240 | | | | | 3,978 | | | | | 18,719 | | | | | 4,449 | |
| Expenses | | | | | | | | | | | | | | | | | | | | |
| Investment advisory fees | | | | 3,166 | | | | | 2,430 | | | | | 8,750 | | | | | 3,085 | |
| Distribution fees | | | | 9 | | | | | 6 | | | | | 19 | | | | | 14 | |
| Custodian fees | | | | 120 | | | | | 94 | | | | | 314 | | | | | 244 | |
| Transfer agent fees | | | | 25 | | | | | 12 | | | | | 39 | | | | | 56 | |
| Sub-transfer agent fees | | | | | | | | | | | | | | | | | | | | |
| Class N | | | | 4 | | | | | 3 | | | | | 6 | | | | | 7 | |
| Class I | | | | 135 | | | | | 25 | | | | | 55 | | | | | 108 | |
| Professional fees | | | | 86 | | | | | 78 | | | | | 139 | | | | | 206 | |
| Registration fees | | | | 51 | | | | | 52 | | | | | 53 | | | | | 64 | |
| Shareholder reporting fees | | | | 36 | | | | | 11 | | | | | 8 | | | | | 25 | |
| Trustee fees | | | | 37 | | | | | 26 | | | | | 75 | | | | | 30 | |
| Other expenses | | | | 34 | | | | | 20 | | | | | 52 | | | | | 28 | |
| Total expenses before expense limitation | | | | 3,703 | | | | | 2,757 | | | | | 9,510 | | | | | 3,867 | |
| Expenses waived or reimbursed by the Adviser | | | | — | | | | | (195 | ) | | | | — | | | | | (266 | ) |
| Net expenses | | | | 3,703 | | | | | 2,562 | | | | | 9,510 | | | | | 3,601 | |
| Net investment income (loss) | | | | 2,537 | | | | | 1,416 | | | | | 9,209 | | | | | 848 | |
| Realized and unrealized gain (loss) | | | | | | | | | | | | | | | | | | | | |
| Net realized gain (loss) on transactions from: | | | | | | | | | | | | | | | | | | | | |
| Investments in securities, net of foreign taxes, if applicable | | | | (102 | ) | | | | 5,968 | | | | | 43,274 | | | | | (9 | ) |
| Foreign currency transactions | | | | (83 | ) | | | | (143 | ) | | | | (1,024 | ) | | | | (587 | ) |
| Total net realized gain (loss) | | | | (185 | ) | | | | 5,825 | | | | | 42,250 | | | | | (596 | ) |
| Change in net unrealized appreciation (depreciation) of: | | | | | | | | | | | | | | | | | | | | |
| Investments in securities | | | | 92,370 | | | | | 49,052 | | | | | 145,461 | | | | | 51,180 | |
| Foreign currency translations | | | | 6 | | | | | (845 | ) | | | | (2,002 | ) | | | | 18 | |
| Change in net unrealized appreciation (depreciation) | | | | 92,376 | | | | | 48,207 | | | | | 143,459 | | | | | 51,198 | |
| Net increase (decrease) in net assets resulting from operations | | | $ | 94,728 | | | | $ | 55,448 | | | | $ | 194,918 | | | | $ | 51,450 | |
See accompanying Notes to Financial Statements.
| 104 | Annual Report | December 31, 2019 |
Statements of Changes in Net Assets
For the Years Ended December 31, 2019 and 2018(all amounts in thousands)
| | | International
Small Cap
Growth Fund | | | | Emerging Markets
Leaders Fund | | | Emerging Markets
Growth Fund | | | Emerging Markets
Small Cap
Growth Fund | |
| | | 2019 | | | 2018 | | | | 2019 | | | | 2018 | | | 2019 | | | 2018 | | | 2019 | | | 2018 | |
| Operations | | | | | | | | | | | | | | | | | | | | | | | | | | | | | | | | | | |
| Net investment income (loss) | | $ | 2,537 | | | $ | 3,491 | | | | $ | 1,416 | | | | $ | 2,757 | | | $ | 9,209 | | | $ | 4,704 | | | $ | 848 | | | $ | 931 | |
| Net realized gain (loss) on investments, and other assets and liabilities | | | (185 | ) | | | 16,217 | | | | | 5,825 | | | | | 38,309 | | | | 42,250 | | | | 136,983 | | | | (596 | ) | | | (40,803 | ) |
| Change in net unrealized appreciation (depreciation) on investments, and other assets and liabilities | | | 92,376 | | | | (159,626 | ) | | | | 48,207 | | | | | (116,117 | ) | | | 143,459 | | | | (369,221 | ) | | | 51,198 | | | | (81,984 | ) |
| Net increase (decrease) in net assets resulting from operations | | | 94,728 | | | | (139,918 | ) | | | | 55,448 | | | | | (75,051 | ) | | | 194,918 | | | | (227,534 | ) | | | 51,450 | | | | (121,856 | ) |
| Distributions to shareholders from | | | | | | | | | | | | | | | | | | | | | | | | | | | | | | | | | | |
| Class N | | | (3 | ) | | | (462 | ) | | | | (11 | ) | | | | (179 | ) | | | (311 | ) | | | (966 | ) | | | — | | | | (201 | ) |
| Class I | | | (460 | ) | | | (25,473 | ) | | | | (393 | ) | | | | (3,674 | ) | | | (3,046 | ) | | | (11,141 | ) | | | (236 | ) | | | (4,413 | ) |
| Class R6 | | | (597 | ) | | | (21,100 | ) | | | | (1,820 | ) | | | | (16,113 | ) | | | (28,573 | ) | | | (81,475 | ) | | | (286 | ) | | | (2,353 | ) |
| Total distributions | | | (1,060 | ) | | | (47,035 | ) | | | | (2,224 | ) | | | | (19,966 | ) | | | (31,930 | ) | | | (93,582 | ) | | | (522 | ) | | | (6,967 | ) |
| Capital stock transactions | | | | | | | | | | | | | | | | | | | | | | | | | | | | | | | | | | |
| Proceeds from sale of shares | | | 45,917 | | | | 95,395 | | | | | 38,679 | | | | | 45,869 | | | | 171,633 | | | | 228,271 | | | | 60,868 | | | | 157,577 | |
| Shares issued in reinvestment of income dividends and capital gain distributions | | | 969 | | | | 40,939 | | | | | 2,206 | | | | | 19,766 | | | | 26,669 | | | | 81,112 | | | | 465 | | | | 6,516 | |
| Less cost of shares redeemed | | | (172,212 | ) | | | (210,410 | ) | | | | (54,740 | ) | | | | (249,616 | ) | | | (312,069 | ) | | | (566,109 | ) | | | (111,575 | ) | | | (222,964 | ) |
| Net increase (decrease) in net assets resulting from capital share transactions | | | (125,326 | ) | | | (74,076 | ) | | | | (13,855 | ) | | | | (183,981 | ) | | | (113,767 | ) | | | (256,726 | ) | | | (50,242 | ) | | | (58,871 | ) |
| Increase (decrease) in net assets | | | (31,658 | ) | | | (261,029 | ) | | | | 39,369 | | | | | (278,998 | ) | | | 49,221 | | | | (577,842 | ) | | | 686 | | | | (187,694 | ) |
| Net assets | | | | | | | | | | | | | | | | | | | | | | | | | | | | | | | | | | |
| Beginning of period | | | 340,724 | | | | 601,753 | | | | | 198,914 | | | | | 477,912 | | | | 740,971 | | | | 1,318,813 | | | | 276,935 | | | | 464,629 | |
| End of period | | $ | 309,066 | | | $ | 340,724 | | | | $ | 238,283 | | | | $ | 198,914 | | | $ | 790,192 | | | $ | 740,971 | | | $ | 277,621 | | | $ | 276,935 | |
See accompanying Notes to Financial Statements.
| December 31, 2019 | William Blair Funds | 105 |
Statements of Assets and Liabilities
As of December 31, 2019(dollar amounts in thousands)
| | Bond
Fund | | | Income
Fund | | | Low
Duration
Fund | | | Macro
Allocation
Fund | |
| Assets | | | | | | | | | | | | | | | |
| Investments in securities, at cost | | $ | 267,944 | | | | $ | 50,731 | | | | $ | 76,631 | | | | $ | 672,287 | |
| Investments in affiliated companies, at cost | | | — | | | | | — | | | | | — | | | | | 17,636 | |
| Investments in securities, at value | | $ | 280,683 | | | | $ | 51,152 | | | | $ | 76,403 | | | | $ | 735,930 | |
| Investments in affiliated company, at value | | | — | | | | | — | | | | | — | | | | | 21,419 | |
| Cash pledged as collateral, due from broker | | | — | | | | | — | | | | | — | | | | | 1,350 | |
| Receivable for securities sold | | | 15,174 | | | | | 5,034 | | | | | 15,101 | | | | | 129 | |
| Receivable for fund shares sold | | | 269 | | | | | 75 | | | | | 51 | | | | | 709 | |
| Receivable for variation margin on centrally cleared swaps | | | 9 | | | | | — | | | | | — | | | | | — | |
| Receivable from Adviser | | | 1 | | | | | 9 | | | | | 17 | | | | | — | |
| Dividend and interest receivable | | | 1,971 | | | | | 283 | | | | | 322 | | | | | 2,579 | |
| Unrealized appreciation on swap contracts | | | — | | | | | — | | | | | — | | | | | 1,118 | |
| Unrealized appreciation on forward foreign currency contracts | | | — | | | | | — | | | | | — | | | | | 7,684 | |
| Total assets | | | 298,107 | | | | | 56,553 | | | | | 91,894 | | | | | 770,918 | |
| Liabilities | | | | | | | | | | | | | | | | | | | |
| Security sold, not yet purchased (proceeds $15,174; $5,034; $15,101; $—) | | | 15,214 | | | | | 5,046 | | | | | 15,138 | | | | | — | |
| Payable for futures variation margin | | | — | | | | | — | | | | | — | | | | | 1,423 | |
| Payable for variation margin on centrally cleared swaps | | | — | | | | | — | | | | | — | | | | | 5 | |
| Payable for investment securities purchased | | | — | | | | | — | | | | | — | | | | | 4,923 | |
| Payable for fund shares redeemed | | | 430 | | | | | 59 | | | | | 87 | | | | | 2,312 | |
| Unrealized depreciation on swap contracts | | | — | | | | | — | | | | | — | | | | | 217 | |
| Unrealized depreciation on forward foreign currency contracts | | | — | | | | | — | | | | | — | | | | | 10,496 | |
| Management fee payable | | | 77 | | | | | 18 | | | | | 21 | | | | | 521 | |
| Distribution fee payable | | | 4 | | | | | 3 | | | | | — | | | | | 3 | |
| Distributions payable to shareholders | | | 137 | | | | | 10 | | | | | 62 | | | | | — | |
| Other payables and accrued expenses | | | 110 | | | | | 74 | | | | | 71 | | | | | 218 | |
| Total liabilities | | | 15,972 | | | | | 5,210 | | | | | 15,379 | | | | | 20,118 | |
| Net assets | | $ | 282,135 | | | | $ | 51,343 | | | | $ | 76,515 | | | | $ | 750,800 | |
| Capital | | | | | | | | | | | | | | | | | | | |
| Composition of net assets | | | | | | | | | | | | | | | | | | | |
| Paid in capital | | $ | 290,411 | | | | $ | 57,280 | | | | $ | 104,301 | | | | $ | 900,427 | |
| Total distributable earnings (loss) | | | (8,276 | ) | | | | (5,937 | ) | | | | (27,786 | ) | | | | (149,627 | ) |
| Net assets | | $ | 282,135 | | | | $ | 51,343 | | | | $ | 76,515 | | | | $ | 750,800 | |
| | | | | | | | | | | | | | | | | | | | |
| Class N shares | | | | | | | | | | | | | | | | | | | |
| Net assets | | $ | 32,176 | | | | $ | 19,662 | | | | $ | 1,513 | | | | $ | 13,717 | |
| Shares outstanding | | | 3,090,571 | | | | | 2,293,255 | | | | | 174,236 | | | | | 1,199,603 | |
| Net asset value per share | | $ | 10.41 | | | | $ | 8.57 | | | | $ | 8.68 | | | | $ | 11.44 | |
| Class I shares | | | | | | | | | | | | | | | | | | | |
| Net assets | | $ | 206,304 | | | | $ | 31,629 | | | | $ | 38,156 | | | | $ | 358,935 | |
| Shares outstanding | | | 20,027,187 | | | | | 3,714,333 | | | | | 4,398,497 | | | | | 31,622,604 | |
| Net asset value per share | | $ | 10.30 | | | | $ | 8.52 | | | | $ | 8.67 | | | | $ | 11.35 | |
| Class R6 shares | | | | | | | | | | | | | | | | | | | |
| Net assets | | $ | 43,655 | | | | $ | 52 | | | | $ | 36,846 | | | | $ | 378,148 | |
| Shares outstanding | | | 4,239,915 | | | | | 6,055 | | | | | 4,245,246 | | | | | 33,292,162 | |
| Net asset value per share | | $ | 10.30 | | | | $ | 8.52 | | | | $ | 8.68 | | | | $ | 11.36 | |
See accompanying Notes to Financial Statements.
| 106 | Annual Report | December 31, 2019 |
Statements of Operations
For the Year Ended December 31, 2019(all amounts in thousands)
| | | Bond
Fund | | | Income
Fund | | | Low
Duration
Fund | | | Macro
Allocation
Fund | |
| Investment income | | | | | | | | | | | | | | | | | | | |
| Dividends | | $ | — | | | | $ | — | | | | $ | — | | | | $ | 12,298 | (1) |
| Interest | | | 12,995 | | | | | 1,748 | | | | | 2,641 | | | | | 5,972 | |
| Total income | | | 12,995 | | | | | 1,748 | | | | | 2,641 | | | | | 18,270 | |
| Expenses | | | | | | | | | | | | | | | | | | | |
| Investment advisory fees | | | 1,093 | | | | | 244 | | | | | 293 | | | | | 6,999 | |
| Distribution fees | | | 81 | | | | | 32 | | | | | 2 | | | | | 80 | |
| Custodian fees | | | 83 | | | | | 57 | | | | | 65 | | | | | 105 | |
| Transfer agent fees | | | 65 | | | | | 11 | | | | | 6 | | | | | 234 | |
| Sub-transfer agent fees | | | | | | | | | | | | | | | | | | | |
| Class N | | | 71 | | | | | 29 | | | | | 2 | | | | | 25 | |
| Class I | | | 166 | | | | | 18 | | | | | 16 | | | | | 342 | |
| Professional fees | | | 71 | | | | | 40 | | | | | 42 | | | | | 109 | |
| Registration fees | | | 65 | | | | | 51 | | | | | 56 | | | | | 62 | |
| Shareholder reporting fees | | | 33 | | | | | 7 | | | | | 2 | | | | | 41 | |
| Trustee fees | | | 37 | | | | | 5 | | | | | 11 | | | | | 83 | |
| Other expenses | | | 37 | | | | | 10 | | | | | 15 | | | | | 184 | |
| Total expenses before expense limitation | | | 1,802 | | | | | 504 | | | | | 510 | | | | | 8,264 | |
| Expenses waived or reimbursed by the Adviser | | | (111 | ) | | | | (42 | ) | | | | (142 | ) | | | | — | |
| Net expenses | | | 1,691 | | | | | 462 | | | | | 368 | | | | | 8,264 | |
| Net investment income (loss) | | | 11,304 | | | | | 1,286 | | | | | 2,273 | | | | | 10,006 | |
| Realized and unrealized gain (loss) | | | | | | | | | | | | | | | | | | | |
| Net realized gain (loss) on transactions from: | | | | | | | | | | | | | | | | | | | |
| Investments in securities | | | 6,015 | | | | | 98 | | | | | (575 | ) | | | | 49,026 | (2) |
| Options | | | — | | | | | — | | | | | — | | | | | (3,270 | ) |
| Futures contracts | | | — | | | | | — | | | | | — | | | | | (94,762 | ) |
| Swaps | | | (374 | ) | | | | — | | | | | — | | | | | (4,370 | ) |
| Forward foreign currency contracts | | | — | | | | | — | | | | | — | | | | | 20,190 | |
| Foreign currency transactions | | | — | | | | | — | | | | | — | | | | | (1 | ) |
| Total net realized gain (loss) | | | 5,641 | | | | | 98 | | | | | (575 | ) | | | | (33,187 | ) |
| Change in net unrealized appreciation (depreciation) of: | | | | | | | | | | | | | | | | | | | |
| Investments in securities | | | 26,505 | | | | | 2,291 | | | | | 1,875 | | | | | 76,794 | (3) |
| Options | | | — | | | | | — | | | | | — | | | | | 921 | |
| Futures contracts | | | — | | | | | — | | | | | — | | | | | (13,133 | ) |
| Swaps | | | (902 | ) | | | | — | | | | | — | | | | | 2,225 | |
| Forward foreign currency contracts | | | — | | | | | — | | | | | — | | | | | (8,007 | ) |
| Foreign currency translations | | | — | | | | | — | | | | | — | | | | | (7 | ) |
| Change in net unrealized appreciation (depreciation) | | | 25,603 | | | | | 2,291 | | | | | 1,875 | | | | | 58,793 | |
| Net increase (decrease) in net assets resulting from operations | | $ | 42,548 | | | | $ | 3,675 | | | | $ | 3,573 | | | | $ | 35,612 | |
| (1) | Includes $514 from a company deemed affiliated during the year. |
| (2) | Includes $939 from a company deemed affiliated during the year. |
| (3) | Includes $7,013 from a company deemed affiliated during the year. |
See accompanying Notes to Financial Statements.
| December 31, 2019 | William Blair Funds | 107 |
Statements of Changes in Net Assets
For the Years Ended December 31, 2019 and 2018(all amounts in thousands)
| | | Bond Fund | | | Income Fund | | | Low Duration
Fund | | | Macro Allocation
Fund | |
| | | 2019 | | | 2018 | | | 2019 | | | 2018 | | | 2019 | | | 2018 | | | 2019 | | | 2018 | |
| Operations | | | | | | | | | | | | | | | | | | | | | | | | | | | | | | | | |
| Net investment income (loss) | | $ | 11,304 | | | $ | 16,661 | | | $ | 1,286 | | | $ | 1,481 | | | $ | 2,273 | | | $ | 3,651 | | | $ | 10,006 | | | $ | 11,691 | |
| Net realized gain (loss) on investments, and other assets and liabilities | | | 5,641 | | | | (4,154 | ) | | | 98 | | | | (654 | ) | | | (575 | ) | | | (1,308 | ) | | | (33,187 | ) | | | 78,431 | |
| Change in net unrealized appreciation (depreciation) on investments, and other assets and liabilities | | | 25,603 | | | | (25,201 | ) | | | 2,291 | | | | (1,488 | ) | | | 1,875 | | | | (410 | ) | | | 58,793 | | | | (109,906 | ) |
| Net increase (decrease) in net assets resulting from operations | | | 42,548 | | | | (12,694 | ) | | | 3,675 | | | | (661 | ) | | | 3,573 | | | | 1,933 | | | | 35,612 | | | | (19,784 | ) |
| Distributions to shareholders from | | | | | | | | | | | | | | | | | | | | | | | | | | | | | | | | |
| Class N | | | (2,191 | ) | | | (3,412 | ) | | | (699 | ) | | | (993 | ) | | | (60 | ) | | | (62 | ) | | | (503 | ) | | | (675 | ) |
| Class I | | | (10,482 | ) | | | (14,892 | ) | | | (1,385 | ) | | | (1,404 | ) | | | (1,999 | ) | | | (2,632 | ) | | | (15,861 | ) | | | (15,790 | ) |
| Class R6 | | | (2,442 | ) | | | (3,657 | ) | | | (1 | ) | | | — | | | | (1,674 | ) | | | (3,226 | ) | | | (16,522 | ) | | | (13,220 | ) |
| Total distributions | | | (15,115 | ) | | | (21,961 | ) | | | (2,085 | ) | | | (2,397 | ) | | | (3,733 | ) | | | (5,920 | ) | | | (32,886 | ) | | | (29,685 | ) |
| Capital stock transactions | | | | | | | | | | | | | | | | | | | | | | | | | | | | | | | | |
| Proceeds from sale of shares | | | 80,419 | | | | 117,343 | | | | 17,977 | | | | 10,624 | | | | 14,009 | | | | 16,290 | | | | 222,795 | | | | 301,576 | |
| Shares issued in reinvestment of income dividends and capital gain distributions | | | 13,243 | | | | 20,114 | | | | 1,968 | | | | 2,283 | | | | 2,946 | | | | 5,084 | | | | 27,731 | | | | 25,916 | |
| Less cost of shares redeemed | | | (261,506 | ) | | | (240,011 | ) | | | (27,407 | ) | | | (43,412 | ) | | | (45,646 | ) | | | (145,098 | ) | | | (424,270 | ) | | | (664,845 | ) |
| Net increase (decrease) in net assets resulting from capital share transactions | | | (167,844 | ) | | | (102,554 | ) | | | (7,462 | ) | | | (30,505 | ) | | | (28,691 | ) | | | (123,724 | ) | | | (173,744 | ) | | | (337,353 | ) |
| Increase (decrease) in net assets | | | (140,411 | ) | | | (137,209 | ) | | | (5,872 | ) | | | (33,563 | ) | | | (28,851 | ) | | | (127,711 | ) | | | (171,018 | ) | | | (386,822 | ) |
| Net assets | | | | | | | | | | | | | | | | | | | | | | | | | | | | | | | | |
| Beginning of period | | | 422,546 | | | | 559,755 | | | | 57,215 | | | | 90,778 | | | | 105,366 | | | | 233,077 | | | | 921,818 | | | | 1,308,640 | |
| End of period | | $ | 282,135 | | | $ | 422,546 | | | $ | 51,343 | | | $ | 57,215 | | | $ | 76,515 | | | $ | 105,366 | | | $ | 750,800 | | | $ | 921,818 | |
See accompanying Notes to Financial Statements.
| 108 | Annual Report | December 31, 2019 |
Notes to Financial Statements
(1) Organization
(a) Description of the Trust
William Blair Funds (the “Trust”) is a Delaware statutory trust registered under the Investment Company Act of 1940, as amended (the “1940 Act”), as an open-end management investment company. The Trust currently has the following twenty funds (the “Funds”) available for sale, each with its own investment objective and policies. For each Fund, the number of shares authorized is unlimited.
| U.S. Equity Funds | | Global Equity Fund | | Fixed Income Funds |
| Growth | | Global Leaders | | Bond |
| Large Cap Growth | | | | Income |
| Mid Cap Growth | | International Equity Funds | | Low Duration |
| Small-Mid Cap Core | | International Leaders | | |
| Small-Mid Cap Growth | | International Growth | | Multi-Asset and Alternative Fund |
| Small-Mid Cap Value | | Institutional International Growth | | Macro Allocation |
| Small Cap Growth | | International Small Cap Growth | | |
| Small Cap Value | | Emerging Markets Leaders | | |
| | | Emerging Markets Growth | | |
| | | Emerging Markets Small Cap Growth | | |
William Blair Investment Management, LLC (the “Adviser”) serves as the Trust’s investment adviser. William Blair & Company, L.L.C. (“WBC” or the “Distributor”), an affiliate of the Adviser, serves as the Trust’s principal underwriter and distributor.
(b) Share Classes
Each Fund is comprised of Class N, Class I and Class R6 shares, except Small-Mid Cap Core Fund, which is comprised of Class I and Class R6 shares, and Institutional International Growth Fund, which does not offer multiple classes of shares.
Effective May 1, 2019, Institutional Class shares of Global Leaders, International Leaders, International Small Cap Growth, Emerging Markets Leaders, Emerging Markets Growth, Emerging Markets Small Cap Growth, Bond, Low Duration and Macro Allocation Funds were redesignated as Class R6 shares. On that same date, the Growth, Large Cap Growth, Mid Cap Growth, Small-Mid Cap Growth, Small-Mid Cap Value, Small Cap Growth, Small Cap Value, International Growth and Income Funds began offering Class R6 shares.
Class Nshares are available to the general public, either directly through the Trust’s distributor or through a select number of financial intermediaries. Class N shares are sold without any sales load and carry an annual 12b-1 distribution fee at a fixed rate (0.25% for the U.S. Equity, Global Equity, International Equity and Multi-Asset and Alternative Funds and 0.15% for the Fixed Income Funds as discussed inNote 4(b) – Transactions with Affiliates – Underwriting Distribution Services and Shareholder Administration Agreements) and a sub-transfer agent fee that is not a fixed rate and varies by Fund and class, as discussed below.
Class Ishares are available to certain retirement and deferred compensation plans, clients of certain financial intermediaries, and asset-based fee advisory clients of William Blair. The minimum initial investment for a Class I account is $500,000, subject to certain exceptions. Class I shares do not carry any sales load or distribution fees and generally have lower ongoing expenses than Class N shares. Class I shares have a sub-transfer agent fee that is not a fixed rate and varies by Fund and class, as discussed below.
Class R6shares are available to certain retirement and deferred compensation plans, clients of certain financial intermediaries, asset-based fee advisory clients of William Blair, and additional types of investors, provided that neither the investor nor the financial intermediary requires the Funds to make any type of servicing or administrative payment. The minimum initial investment for a Class R6 account is $1 million, subject to certain exceptions.
Shares of the Institutional International Growth Fund require a minimum initial investment of $5 million, subject to certain exceptions.
| December 31, 2019 | William Blair Funds | 109 |
Notes to Financial Statements
Class R6 shares and the Institutional International Growth Fund do not carry any sales load, distribution fees or sub-transfer agents fees. Class R6 shares of a Fund generally have lower ongoing expenses than the Fund’s Class N and Class I shares.
Sub-transfer agent fees:For Class N and Class I shares, the Funds may reimburse WBC for fees paid to intermediaries such as banks, broker-dealers, financial advisers or other financial institutions for sub-administration, sub-transfer agency and other services provided to investors whose shares of record are held in omnibus, other group accounts, retirement plans or accounts traded through registered securities clearing agents. These fees may vary based on, for example, the nature of services provided, but generally range up to 0.15% of the assets of the class serviced or maintained by the intermediary or up to $15 per sub-account maintained by the intermediary, depending on the method by which the intermediary charges for the services.
(c) Fund Objectives
The investment objectives of the Funds are as follows:
| U.S. Equity Funds | Long-term capital appreciation. |
| Global Equity Fund | Long-term capital appreciation. |
| International Equity Funds | Long-term capital appreciation. |
| Bond Fund | Outperform the Bloomberg Barclays U.S. Aggregate Index by maximizing total return through a combination of income and capital appreciation. |
| Income Fund | High level of current income with relative stability of principal. |
| Low Duration Fund | Maximize total return. Total return includes both income and capital appreciation. |
| Macro Allocation Fund | Maximize long-term risk-adjusted total return. |
(2) Significant Accounting Policies
The following is a summary of the Trust’s significant accounting policies in effect during the periods covered by the financial statements, which are in accordance with U.S. generally accepted accounting principles (“US GAAP”), which includes the accounting and reporting guidelines under Accounting Standards Topic 946,Financial Services—Investment Companies.
(a) Investment income and transactions
Investment income, realized and unrealized gains and losses, and certain Fund level expenses and expense reductions, if any, are allocated based on the relative net assets of each class, except for certain class-specific expenses, which are charged directly to the appropriate class. Differences in class expenses may result in the payment of different per share dividends by class. All share classes of the Funds have equal rights with respect to voting, subject to class specific arrangements.
Dividend income and expenses are recorded on the ex-dividend date, except for those dividends from certain foreign securities that are recorded when the information is available.
Interest income is recorded on an accrual basis, adjusted for amortization of premium or accretion of discount. Variable rate bonds and floating rate notes earn interest at coupon rates that fluctuate at specific time intervals. The interest rates shown in the Portfolio of Investments for the Bond, Income, Low Duration and Macro Allocation Funds were the rates in effect on December 31, 2019. Put bonds may be redeemed at the discretion of the holder on specified dates prior to maturity.
Premiums and discounts are amortized and accreted, respectively, on a straight-line basis for short-term investments and on an effective interest method for long-term investments.
Paydown gains and losses on mortgage-backed and asset-backed securities are treated as an adjustment to interest income. For the year ended December 31, 2019, the Bond, Income and Low Duration Funds recognized a reduction of interest income and a corresponding increase in net realized gain of $3,993, $800 and $1,463, respectively (in thousands). This reclassification had no effect on the net increase (decrease) in net assets resulting from operations, net asset value or the net assets of the Funds.
The Funds do not isolate the portion of operations resulting from fluctuations in foreign currency exchange rates on investments from the fluctuations arising from changes in the value of securities held. Such currency fluctuations are included with the net realized and unrealized gain or loss from investments.
| 110 | Annual Report | December 31, 2019 |
Notes to Financial Statements
Reported net realized foreign currency gains or losses arise from disposition of foreign currency, the difference in the foreign exchange rates between the trade and settlement dates on securities transactions, and the difference between the amounts of dividends, interest and foreign withholding taxes recorded on the ex-date or accrual date and the U.S. dollar equivalent of the amounts actually received or paid. Net unrealized foreign exchange gains and losses arise from changes (due to the changes in the exchange rate) in the value of foreign currency and other assets and liabilities denominated in foreign currencies held at period end.
For financial reporting purposes, security and shareholder transactions are recorded on trade date in accordance with US GAAP. Realized gains and losses from securities transactions are recognized on a specifically identified cost basis.
Awards from class action litigation may be recorded as a reduction of cost. If the Funds no longer own the applicable securities, the proceeds are recorded as realized gains.
(b) Share Valuation and Distributions to Shareholders
Shares are sold and redeemed on a continuous basis at net asset value. The net asset value per share is determined separately for each class by dividing the Fund’s net assets attributable to that class by the number of shares of the class outstanding as of the close of regular trading on the New York Stock Exchange (the “NYSE”), which is generally 4:00 p.m. Eastern time, on each day the NYSE is open.
Distributions from net investment income, if any, for all Equity and Multi-Asset and Alternative Funds are declared and paid at least annually. Distributions from net investment income for the Fixed Income Funds are declared daily and paid monthly. Capital gain distributions, if any, for all Funds, are declared and paid at least annually in December and/or January. Distributions payable to shareholders are recorded on the ex-dividend date.
(c) Foreign Currency Translation
The Funds may invest in securities denominated in foreign currencies. As such, assets and liabilities denominated in foreign currencies are translated into U.S. dollar amounts at the current exchange rate on the date of valuation. The values of foreign investments, open forward foreign currency contracts, and cash denominated in foreign currencies are translated into U.S. dollars using a spot market rate of exchange as of the time of the determination of each Fund’s net asset value, typically 4:00 p.m. Eastern time on days when there is regular trading on the NYSE. Payables and receivables for securities transactions, dividends, interest income and tax reclaims are translated into U.S. dollars using a spot market rate of exchange as of 4:00 p.m. Eastern time. Settlement of purchases and sales and dividend and interest receipts are translated into U.S. dollars using a spot market rate of exchange as of 11:00 a.m. Eastern time.
(d) Income Taxes
Each Fund intends to comply with the provisions of Subchapter M of the Internal Revenue Code of 1986, as amended (the “Code”), in order to qualify as regulated investment companies. Each Fund intends to make the requisite distributions of income and capital gains to its shareholders sufficient to relieve it from all, or substantially all, federal income and excise taxes. No provision for federal income and excise taxes has been made.
Certain Funds may be subject to foreign income taxes imposed on realized gains on securities of issuers from certain foreign countries. Such taxes, if applicable, are included within net realized gain (loss) on transactions from investments in securities in the Statement of Operations.
Management evaluates tax positions taken or expected to be taken in the course of preparing the Funds’ tax returns to determine whether it is “more likely than not” that each tax position would be sustained upon examination by a taxing authority based on the technical merits of the positions. Tax positions not deemed to meet the “more likely than not” threshold would be recorded as a tax benefit or expense in the current year. Management has evaluated all of the uncertain tax positions of the Funds and has determined that no liability is required to be recorded in the financial statements.
The statute of limitations on the Funds’ tax returns for the prior three years remains open and the returns are subject to examination.
Adjustments to the cost of investments for tax purposes may be due to the deferred loss associated with current and prior year wash sales, income recognition from investments in real estate investment trusts and partnerships, and the Funds’ election to
| December 31, 2019 | William Blair Funds | 111 |
Notes to Financial Statements
mark-to-market their investments in Passive Foreign Investment Companies (“PFICs”). The cost of investments, including derivatives, for federal income tax purposes and related gross unrealized appreciation (depreciation) and net unrealized appreciation/(depreciation) at December 31, 2019, were as follows (in thousands):
| Fund | | Cost of
Investments | | Gross
Unrealized
Appreciation | | Gross
Unrealized
Depreciation | | Net
Unrealized
Appreciation/
(Depreciation) |
| Growth | | $ | 154,927 | | | $ | 101,048 | | | $ | 2,075 | | | $ | 98,973 | |
| Large Cap Growth | | | 218,779 | | | | 86,265 | | | | 92 | | | | 86,173 | |
| Mid Cap Growth | | | 57,567 | | | | 16,980 | | | | 1,083 | | | | 15,897 | |
| Small-Mid Cap Core | | | 6,103 | | | | 441 | | | | 57 | | | | 384 | |
| Small-Mid Cap Growth | | | 2,440,421 | | | | 576,421 | | | | 96,997 | | | | 479,424 | |
| Small-Mid Cap Value | | | 7,380 | | | | 416 | | | | 48 | | | | 368 | |
| Small Cap Growth | | | 552,397 | | | | 148,721 | | | | 27,953 | | | | 120,768 | |
| Small Cap Value | | | 149,963 | | | | 40,860 | | | | 1,688 | | | | 39,172 | |
| Global Leaders | | | 123,268 | | | | 49,375 | | | | 888 | | | | 48,487 | |
| International Leaders | | | 506,889 | | | | 153,688 | | | | 3,396 | | | | 150,292 | |
| International Growth | | | 1,575,189 | | | | 543,999 | | | | 17,381 | | | | 526,618 | |
| Institutional International Growth | | | 1,426,267 | | | | 472,528 | | | | 15,557 | | | | 456,971 | |
| International Small Cap Growth | | | 251,621 | | | | 63,747 | | | | 8,119 | | | | 55,628 | |
| Emerging Markets Leaders | | | 189,250 | | | | 47,141 | | | | 2,704 | | | | 44,437 | |
| Emerging Markets Growth | | | 624,047 | | | | 172,752 | | | | 4,664 | | | | 168,088 | |
| Emerging Markets Small Cap Growth | | | 220,026 | | | | 60,233 | | | | 2,222 | | | | 58,011 | |
| Bond | | | 268,014 | | | | 13,869 | | | | 1,249 | | | | 12,620 | |
| Income | | | 50,739 | | | | 805 | | | | 404 | | | | 401 | |
| Low Duration | | | 76,630 | | | | 396 | | | | 660 | | | | (264 | ) |
| Macro Allocation | | | 691,787 | | | | 75,011 | | | | 8,556 | | | | 66,455 | |
In addition, the Funds may periodically record reclassifications among certain capital accounts to reflect differences between financial reporting and income tax basis distributions. The reclassifications were reported in order to reflect the tax treatment for certain permanent differences that exist between income tax regulations and US GAAP. The reclassifications generally relate to the tax treatment of net operating losses, redemptions in-kind, and utilization of earnings and profits distributed to shareholders on redemption of shares. These reclassifications have no impact on the net asset values or the net assets of the Funds. Accordingly, at December 31, 2019 (the Funds’ most recent fiscal year end), the following reclassifications were recorded (in thousands):
| 112 | Annual Report | December 31, 2019 |
Notes to Financial Statements
| Fund | | Paid in
Capital | | Total
Distributable
Earnings
(Loss) |
| Growth | | | $3,519 | | | | $(3,519 | ) |
| Large Cap Growth | | | 2,474 | | | | (2,474 | ) |
| Mid Cap Growth | | | 932 | | | | (932 | ) |
| Small-Mid Cap Core | | | — | | | | — | |
| Small-Mid Cap Growth | | | 62,542 | | | | (62,542 | ) |
| Small-Mid Cap Value | | | 1 | | | | (1 | ) |
| Small Cap Growth | | | (3,586 | ) | | | 3,586 | |
| Small Cap Value | | | 35,454 | | | | (35,454 | ) |
| Global Leaders | | | 19,326 | | | | (19,326 | ) |
| International Leaders | | | — | | | | — | |
| International Growth | | | — | | | | — | |
| Institutional International Growth | | | 5,561 | | | | (5,561 | ) |
| International Small Cap Growth | | | — | | | | — | |
| Emerging Markets Leaders | | | — | | | | — | |
| Emerging Markets Growth | | | 2,722 | | | | (2,722 | ) |
| Emerging Markets Small Cap Growth | | | — | | | | — | |
| Bond | | | (48 | ) | | | 48 | |
| Income | | | — | | | | — | |
| Low Duration | | | — | | | | — | |
| Macro Allocation | | | (9 | ) | | | 9 | |
The timing and characterization of certain income and capital gain distributions are determined annually in accordance with federal income tax regulations that may differ from US GAAP. As a result, net investment income or loss and net realized gain or loss for a reporting period may differ from the amount distributed during such period.
Distributions from net realized gains for book purposes may include short-term capital gains, which are included as ordinary income for tax purposes. The tax character of distributions paid during 2019 and 2018 was as follows (in thousands):
| | | Distributions Paid in 2019 | |
| | | Ordinary
Income | | | Long-Term
Capital Gains | |
| Fund | | Class N | | | Class I | | | Institutional/
Class R6 | | | Class N | | | Class I | | | Institutional/
Class R6 | |
| Growth | | $ | 133 | | | $ | 742 | | | $ | 1 | | | $ | 3,057 | | | $ | 17,138 | | | $ | 16 | |
| Large Cap Growth | | | 44 | | | | 512 | | | | 6 | | | | 3,937 | | | | 11,518 | | | | 91 | |
| Mid Cap Growth | | | 4 | | | | 46 | | | | — | | | | 476 | | | | 5,461 | | | | 12 | |
| Small-Mid Cap Core | | | N/A | | | | 1 | | | | 3 | | | | N/A | | | | — | | | | — | |
| Small-Mid Cap Growth | | | — | | | | — | | | | — | | | | 24,075 | | | | 172,835 | | | | 2,668 | |
| Small-Mid Cap Value | | | 1 | | | | 34 | | | | 1 | | | | 5 | | | | 97 | | | | 2 | |
| Small Cap Growth | | | — | | | | — | | | | — | | | | 4,188 | | | | 8,605 | | | | 1,345 | |
| Small Cap Value | | | 79 | | | | 3,251 | | | | 4 | | | | 419 | | | | 11,449 | | | | 12 | |
| Global Leaders | | | 17 | | | | 470 | | | | 220 | | | | 82 | | | | 1,030 | | | | 436 | |
| International Leaders | | | 37 | | | | 981 | | | | 2,772 | | | | — | | | | — | | | | — | |
| International Growth | | | 5,328 | | | | 19,998 | | | | 819 | | | | — | | | | — | | | | — | |
| Institutional International Growth | | | N/A | | | | N/A | | | | 17,917 | | | | N/A | | | | N/A | | | | — | |
| International Small Cap Growth | | | 3 | | | | 460 | | | | 597 | | | | — | | | | — | | | | — | |
| Emerging Markets Leaders | | | 8 | | | | 323 | | | | 1,511 | | | | 3 | | | | 70 | | | | 309 | |
| Emerging Markets Growth | | | 89 | | | | 994 | | | | 9,560 | | | | 222 | | | | 2,052 | | | | 19,013 | |
| Emerging Markets Small Cap Growth | | | — | | | | 236 | | | | 286 | | | | — | | | | — | | | | — | |
| Bond | | | 2,191 | | | | 10,482 | | | | 2,442 | | | | — | | | | — | | | | — | |
| Income | | | 699 | | | | 1,385 | | | | 1 | | | | — | | | | — | | | | — | |
| Low Duration | | | 60 | | | | 1,999 | | | | 1,674 | | | | — | | | | — | | | | — | |
| Macro Allocation | | | 503 | | | | 15,861 | | | | 16,522 | | | | — | | | | — | | | | — | |
| December 31, 2019 | William Blair Funds | 113 |
Notes to Financial Statements
| | | Distributions Paid in 2018 | |
| | | Ordinary
Income | | Long-Term
Capital Gains | |
| Fund | | Class N | | | Class I | | | Institutional/
Class R6 | | | Class N | | | Class I | | | Institutional/
Class R6 | |
| Growth | | $ | 815 | | | $ | 3,461 | | | | N/A | | | $ | 11,233 | | | $ | 47,642 | | | | N/A | |
| Large Cap Growth | | | 503 | | | | 1,744 | | | | N/A | | | | 6,019 | | | | 18,995 | | | | N/A | |
| Mid Cap Growth | | | — | | | | — | | | | N/A | | | | 982 | | | | 9,097 | | | | N/A | |
| Small-Mid Cap Growth | | | 576 | | | | 2,467 | | | | N/A | | | | 36,850 | | | | 157,662 | | | | N/A | |
| Small-Mid Cap Value | | | 11 | | | | 75 | | | | N/A | | | | 47 | | | | 307 | | | | N/A | |
| Small Cap Growth | | | 2,543 | | | | 5,077 | | | | N/A | | | | 21,112 | | | | 42,147 | | | | N/A | |
| Small Cap Value | | | — | | | | 1,274 | | | | N/A | | | | 2,248 | | | | 55,731 | | | | N/A | |
| Global Leaders | | | 107 | | | | 1,617 | | | $ | 1,539 | | | | 982 | | | | 11,400 | | | $ | 10,463 | |
| International Leaders | | | 37 | | | | 672 | | | | 3,148 | | | | 275 | | | | 2,379 | | | | 10,126 | |
| International Growth | | | 2,365 | | | | 19,058 | | | | N/A | | | | 36,843 | | | | 126,713 | | | | N/A | |
| Institutional International Growth | | | N/A | | | | N/A | | | | 20,298 | | | | N/A | | | | N/A | | | | 166,380 | |
| International Small Cap Growth | | | 61 | | | | 4,260 | | | | 3,872 | | | | 402 | | | | 21,212 | | | | 17,228 | |
| Emerging Markets Leaders | | | 15 | | | | 477 | | | | 2,228 | | | | 164 | | | | 3,197 | | | | 13,885 | |
| Emerging Markets Growth | | | 69 | | | | 1,152 | | | | 9,103 | | | | 897 | | | | 9,989 | | | | 72,372 | |
| Emerging Markets Small Cap Growth | | | — | | | | 303 | | | | 257 | | | | 201 | | | | 4,110 | | | | 2,096 | |
| Bond | | | 3,412 | | | | 14,892 | | | | 3,657 | | | | — | | | | — | | | | — | |
| Income | | | 993 | | | | 1,404 | | | | N/A | | | | — | | | | — | | | | N/A | |
| Low Duration | | | 62 | | | | 2,632 | | | | 3,226 | | | | — | | | | — | | | | — | |
| Macro Allocation | | | 675 | | | | 15,790 | | | | 13,220 | | | | — | | | | — | | | | — | |
As of December 31, 2019, the components of distributable earnings on a tax basis were as follows (in thousands):
| Fund | | Undistributed
Ordinary
Income | | Accumulated
Capital and
Other Losses | | Undistributed
Long-Term
Capital Gains | | Net Unrealized
Appreciation/
(Depreciation) | | Total | |
| Growth | | $ | — | | | | — | | | $ | 7,021 | | | $ | 98,973 | | | $ | 105,994 | |
| Large Cap Growth | | | — | | | | — | | | | 2,402 | | | | 86,173 | | | | 88,575 | |
| Mid Cap Growth | | | 628 | | | | — | | | | 1,628 | | | | 15,897 | | | | 18,153 | |
| Small-Mid Cap Core | | | — | | | | (14 | ) | | | — | | | | 384 | | | | 370 | |
| Small-Mid Cap Growth | | | — | | | | — | | | | 30,655 | | | | 479,424 | | | | 510,079 | |
| Small-Mid Cap Value | | | 2 | | | | — | | | | 7 | | | | 368 | | | | 377 | |
| Small Cap Growth | | | — | | | | (600 | ) | | | — | | | | 120,768 | | | | 120,168 | |
| Small Cap Value | | | 185 | | | | — | | | | 28,412 | | | | 39,172 | | | | 67,769 | |
| Global Leaders | | | 26 | | | | — | | | | — | | | | 48,488 | | | | 48,514 | |
| International Leaders | | | 736 | | | | — | | | | 73 | | | | 150,055 | | | | 150,864 | |
| International Growth | | | 9,800 | | | | (8,604 | ) | | | — | | | | 526,535 | | | | 527,731 | |
| Institutional International Growth | | | 962 | | | | (33,252 | ) | | | — | | | | 456,947 | | | | 424,657 | |
| International Small Cap Growth | | | 306 | | | | (15,355 | ) | | | — | | | | 55,620 | | | | 40,571 | |
| Emerging Markets Leaders | | | 561 | | | | — | | | | 2,366 | | | | 43,561 | | | | 46,488 | |
| Emerging Markets Growth | | | 801 | | | | — | | | | 10,549 | | | | 166,088 | | | | 177,438 | |
| Emerging Markets Small Cap Growth | | | 195 | | | | (46,476 | ) | | | — | | | | 58,011 | | | | 11,730 | |
| Bond | | | — | | | | (20,759 | ) | | | — | | | | 12,620 | | | | (8,139 | ) |
| Income | | | 21 | | | | (6,349 | ) | | | — | | | | 401 | | | | (5,927 | ) |
| Low Duration | | | 70 | | | | (27,530 | ) | | | — | | | | (264 | ) | | | (27,724 | ) |
| Macro Allocation | | | 4,958 | | | | (221,040 | ) | | | — | | | | 66,455 | | | | (149,627 | ) |
| 114 | Annual Report | December 31, 2019 |
Notes to Financial Statements
As of December 31, 2019, the Funds may have unused capital loss carryforwards available for federal income tax purposes to be applied against future capital gains, if any. Under current law, the Funds may carry forward net capital losses indefinitely to use to offset capital gains realized in future years. The following table details the Funds’ available capital loss carryforwards as of December 31, 2019, and the capital loss carryforwards utilized by the Funds in 2019:
| | | | | Capital Loss |
| | | Available Capital Loss Carryforwards | | Carryforwards |
| Fund | | Short Term | | Long Term | | Total | | Utilized in 2019 |
| Small-Mid Cap Core | | $ | 14 | | | $ | — | | | $ | 14 | | | $ | — | |
| International Growth | | | 8,604 | | | | — | | | | 8,604 | | | | — | |
| Institutional International Growth | | | 33,252 | | | | — | | | | 33,252 | | | | — | |
| International Small Cap Growth | | | 15,355 | | | | — | | | | 15,355 | | | | — | |
| Emerging Markets Small Cap Growth | | | 46,476 | | | | — | | | | 46,476 | | | | — | |
| Bond | | | 10,477 | | | | 9,850 | | | | 20,327 | | | | 1,720 | |
| Income | | | 2,323 | | | | 4,026 | | | | 6,349 | | | | — | |
| Low Duration | | | 12,502 | | | | 15,028 | | | | 27,530 | | | | — | |
| Macro Allocation | | | 195,996 | | | | 25,044 | | | | 221,040 | | | | — | |
In order to meet certain excise tax distribution requirements, the Funds are required to measure and distribute annually, net capital gains realized during a twelve month period ending October 31 and net investment income earned during a twelve month period ending December 31. In connection with this, the Funds are permitted for tax purposes to defer into their next fiscal year qualified late year losses. Qualified late year capital losses are any short term or long term capital losses incurred between November 1 and the end of their fiscal year, December 31, 2019. Qualified late year ordinary losses are comprised of losses related to swaps, foreign currency and PFICs incurred between November 1 and the end of their fiscal year, December 31, 2019.
As of December 31, 2019, the following Funds deferred, on a tax basis, qualified late year losses of (in thousands):
| | | Qualified Late Year Losses |
| Fund | | Ordinary
Income | | Net
Capital |
| Small Cap Growth | | $ | — | | | $ | 600 | |
| Bond | | | 432 | | | | — | |
(e) Repurchase Agreements
In a repurchase agreement, a Fund buys a security at one price and at the time of sale, the seller agrees to repurchase the security at a mutually agreed upon time and price (usually within seven days). The repurchase agreement thereby determines the yield during the purchaser’s holding period, while the seller’s obligation to repurchase is secured by the value of the underlying collateral. The Adviser monitors, on an ongoing basis, the value of the underlying collateral to ensure that the value always equals or exceeds the repurchase price plus accrued interest. Repurchase agreements may involve certain risks in the event of a default or insolvency of the other party to the agreement, including possible delays or restrictions upon a Fund’s ability to dispose of the underlying collateral. The risk to a Fund is limited to the ability of the seller to pay the agreed upon sum on the delivery date. In the event of default, a repurchase agreement provides that a Fund is entitled to sell the underlying collateral. The loss, if any, to a Fund will be the difference between the proceeds from the sale and the repurchase price. However, if bankruptcy proceedings are commenced with respect to the seller of the security, disposition of the collateral by the Fund may be delayed or limited. The Funds have master repurchase agreements which allow the Funds to offset amounts owed to a counterparty with amounts owed from the same counterparty, including any collateral, in the event the counterparty defaults. As of December 31, 2019, each Fund’s outstanding repurchase agreements, if any, and related collateral, are shown on the Fund’s Portfolio of Investments. Although no definitive creditworthiness criteria are used, the Adviser reviews the creditworthiness of the banks and non-bank dealers with which a Fund enters into repurchase agreements to evaluate those risks. A Fund may, for tax purposes, deem repurchase agreements collateralized by U.S. Government securities to be investments in U.S. Government securities.
(f) TBA Securities
The Fixed Income Funds may invest in mortgage pass-through securities eligible to be sold in the “to-be announced” market (“TBAs”). TBAs provide for the forward or delayed delivery of the underlying instrument with settlement in up to 180 days. The term TBA comes from the fact that the specific mortgage-backed security that will be delivered to fulfill a TBA trade is not designated at the time the trade is made, but rather is generally announced 48 hours before the settlement date. A Fund generally has the ability to close out a TBA obligation on or before the settlement date, rather than take delivery of the security. When a
| December 31, 2019 | William Blair Funds | 115 |
Notes to Financial Statements
Fund sells TBAs, it incurs risks similar to those incurred in short sales. For example, when a Fund sells TBAs without owning or having the right to obtain the deliverable securities it incurs a risk of loss because it could have to purchase the securities at a price that is higher than the price at which it sold the securities.
(g) Securities Sold, Not Yet Purchased
A Fund may sell a security it does not own (known as selling a security short) in anticipation of a decline in the fair value of that security. When a Fund sells a security short, it must borrow the security sold short and deliver it to the broker through which it made the short sale. A gain, limited to the price at which the fund sold the security short, or a loss, unlimited in size, will be recognized upon the termination of the short sale. A Fund is also subject to the risk that it may be unable to acquire a security to terminate a short position except at a price substantially in excess of the price at which it sold the security short.
(h) Use of Estimates
The preparation of financial statements in conformity with US GAAP requires management to make estimates and assumptions that affect the amounts reported in the financial statements. Actual results may differ from those estimates.
(i) Indemnification
In the normal course of business, the Funds have entered into contracts in which the Funds agree to indemnify the other party or parties against various potential costs or liabilities. The Funds’ maximum exposure under these arrangements is unknown. No claim has been made for indemnification pursuant to any such agreement of the Funds.
(j) Redemption In-Kind
In accordance with the Trust’s prospectus, the Funds may distribute portfolio securities rather than cash as payment for a redemption of Fund shares (in-kind redemption). For financial reporting purposes, the Fund recognizes a gain or loss on the transfer of securities depending on the value of those securities on the date of redemption. Gains and losses realized on in-kind redemptions may not be recognized for tax purposes and are reclassified from accumulated net realized gain (loss) to capital paid in excess of par value. During the year ended December 31, 2019, the Small-Mid Cap Growth, Global Leaders and Institutional International Growth Funds redeemed $142,438, $50, 890 and $50,390 (in thousands), respectively, of Fund shares in-kind rather than with cash and recognized net realized gains of $47,074, $18,498 and $7,027 (in thousands), respectively, on the securities distributed to shareholders.
(k) Recent Accounting Pronouncements
In March 2017, the Financial Accounting Standards Board (the “FASB”) issued Accounting Standards Update 2017-08 –Receivables – Nonrefundable Fees and Other Costs (Subtopic 310-20): Premium Amortization on Purchased Callable Debt Securities (“ASU 2017-08”). ASU 2017-08 changes the amortization of premium on certain debt securities with explicit noncontingent call features that are callable at fixed prices on preset dates by reducing the amortization period from maturity date to the earliest date a bond could be called. For the year ended December 31, 2019, the Funds have adopted ASU 2017-08, which did not have a material impact on the financial statements, and had no effect on the net increase (decrease) in net assets resulting from operations, net asset value or the net assets of the Funds.
(3) Valuation
(a) Investment Valuation
The value of U.S. equity securities, including exchange-traded funds, is determined by valuing securities traded on national securities markets or in the over-the-counter markets at the last sale price or, if applicable, the official closing price or, in the absence of a recent sale on the date of determination, at the mean between the last reported bid and ask prices.
The value of foreign equity securities is generally determined based upon the last sale price on the foreign exchange or market on which it is primarily traded and in the currency of that market as of the close of the appropriate exchange or, if there have been no sales during that day, at the mean between the last reported bid and ask prices. The Board of Trustees has determined that the passage of time between when the foreign exchanges or markets close and when the Funds compute their net asset values could cause the value of foreign equity securities to no longer be representative or accurate and, as a result, may necessitate that such securities be fair valued. Accordingly, for foreign equity securities, the Funds may use an independent pricing service to fair value price the security as of the close of regular trading on the NYSE. As a result, a Fund’s value for a foreign security
| 116 | Annual Report | December 31, 2019 |
Notes to Financial Statements
may be different from the last sale price (or the mean between the last reported bid and ask prices). As of December 31, 2019, fair valuation estimates for foreign equity securities were not obtained.
Fixed income securities are generally valued using evaluated prices provided by an independent pricing service. The evaluated prices are formed using various market inputs that the pricing service believes accurately represent the market value of a security at a particular point in time. The pricing service determines evaluated prices for fixed income securities using inputs including, but not limited to, recent transaction prices for such securities, dealer quotes, transaction prices for other securities with similar characteristics, collateral characteristics, credit quality, payment history, liquidity and market conditions.
Repurchase agreements are valued at cost, which approximates fair value.
Option contracts on securities, currencies and other financial instruments traded on one or more exchanges are valued at their most recent sale price on the exchange on which they are traded most extensively. Option contracts on foreign indices are valued at the settlement price. If there were no sales that day or if no settlement price is available, such option contracts are valued at the mean between the last reported bid and ask prices. Option contracts traded in the Over-the-Counter (“OTC”) market shall be valued by an independent pricing service. Futures contracts are valued at the most recent settlement price on the exchange on which they are traded most extensively, or if no settlement price is available, at the last sale price as of the close of the exchange. Forward foreign currency contracts are valued on the basis of the value of the underlying currencies at the prevailing currency exchange rate as supplied by an independent pricing service.
Swaps that are centrally cleared through an exchange are valued at the most recent settlement price provided by the exchange on which they are cleared. Total return swaps on equities, equity baskets, indices and other financial instruments are valued by an independent pricing service, or if unavailable, based on the security’s or instrument’s underlying reference asset. All other swap contracts are valued by an independent pricing service. Depending on the product and the terms of the transaction, the independent pricing service may use a series of techniques, including simulation pricing models. The pricing models use inputs that are observed from actively quoted markets such as issuer details, indices, spreads, interest rates, yield curves, dividends and exchange rates.
Securities, and other assets, for which a market price is not available or is deemed unreliable (e.g., securities affected by unusual or extraordinary events, such as natural disasters or securities affected by market or economic events, such as bankruptcy filings), or the value of which is affected by a significant valuation event, are valued at a fair value as determined in good faith by, or under the direction of, the Board of Trustees and in accordance with the Valuation Procedures approved by the Board of Trustees. The value of these fair valued securities may be different from the last sale price (or the mean between the last reported bid and ask prices), and there is no guarantee that a fair valued security will be sold at the price at which a Fund is carrying the security.
(b) Fair Value Measurements
Fair value is defined as the price that a Fund would receive upon selling a security in an orderly transaction to an independent buyer in the principal or most advantageous market for the investment. Various inputs are used in determining the value of a Fund’s investments. A three-tier hierarchy of inputs is used to classify fair value measurements for disclosure purposes. The three-tier hierarchy of inputs is summarized in the three broad levels listed below:
| | • | Level 1—Quoted prices (unadjusted) in active markets for an identical security. |
| | | |
| | • | Level 2—Prices determined using other significant observable inputs. Observable inputs are inputs that other market participants would use in pricing a security. These may include quoted prices for similar securities, interest rates, prepayment speeds, credit risk, and others. In addition, other observable inputs such as foreign exchange rates, benchmark securities indices and foreign futures contracts may be utilized in the valuation of certain foreign securities when significant events occur between the last sale on the foreign securities exchange and the time at which the net asset value of the Fund is calculated. |
| | | |
| | • | Level 3—Prices determined using significant unobservable inputs. In situations where quoted prices or observable inputs are unavailable (for example, when there is little or no market activity for an investment), unobservable inputs may be used. Unobservable inputs reflect the Fund’s own assumptions about the factors market participants would use in pricing an investment, and are based on the best information available. |
The inputs or methodology used for valuing an investment are not necessarily an indication of the risk associated with investing in those securities.
A description of the valuation methodologies applied to the Funds’ major categories of assets and liabilities measured at fair value on a recurring basis is as follows:
| December 31, 2019 | William Blair Funds | 117 |
Notes to Financial Statements
Exchange-Traded Securities
Securities traded on a national securities exchange (or reported on the NASDAQ national market), including exchange-traded funds, are stated at the last reported sales price on the day of valuation. Other securities traded in the over-the-counter market and listed securities for which no sale was reported on that date are stated at the mean between the last reported bid and ask prices. To the extent these securities are actively traded and valuation adjustments are not applied, they are categorized as Level 1 of the fair value hierarchy. Securities traded on inactive markets or valued by reference to similar instruments are generally categorized as Level 2 of the fair value hierarchy.
Fixed Income Securities
Fixed income securities including corporate, convertible and municipal bonds and notes, U.S. government agency obligations, U.S. treasury obligations, sovereign issues, bank loans, convertible preferred securities, asset-backed securities, non-U.S. bonds and commercial paper are generally valued using evaluated prices provided by an independent pricing service. The evaluated prices are formed using various market inputs that the pricing service believes accurately represent the fair value of a security at a particular point in time. The pricing service determines evaluated prices for fixed income securities using inputs including, but not limited to, recent transaction prices for such securities, dealer quotes, transaction prices for other securities with similar characteristics, collateral characteristics, credit quality, payment history, liquidity and market conditions. Securities that use similar valuation techniques and observable inputs as described above are categorized as Level 2 of the fair value hierarchy.
Repurchase Agreements
Repurchase agreements are valued at cost, which approximates fair value. Repurchase agreements are categorized as Level 2 of the fair value hierarchy.
Derivative Instruments
Listed derivatives, such as certain options and futures contracts, that are actively traded are valued based on quoted prices from the exchange on which they are traded most extensively and are categorized as Level 1 of the fair value hierarchy. OTC derivative contracts include forward foreign currency contracts, swap and certain option contracts related to interest rates, foreign currencies, the credit standing of reference entities, equity prices, or commodity prices. Depending on the product and the terms of the transaction, the fair value of OTC derivative products can be modeled by independent pricing services taking into account the counterparties’ creditworthiness and using a series of techniques, including simulation models. Many pricing models do not entail material subjectivity because the methodologies employed do not necessitate significant judgments and the pricing inputs are observed from actively quoted markets, as is the case of forward foreign currency contracts and interest rate swaps. A substantial majority of OTC derivative products valued by a Fund using pricing models fall into this category and are categorized as Level 2 of the fair value hierarchy.
| 118 | Annual Report | December 31, 2019 |
Notes to Financial Statements
As of December 31, 2019, the value of securities and other assets, segregated by their hierarchical input levels used in determining fair value and by security class or other financial instruments, are shown below (in thousands).
| Investments in securities | | Growth | | Large Cap
Growth | | Mid Cap
Growth | | Small-Mid
Cap Core | |
| Level 1—Quoted prices | | | | | | | | | | | | | | | | | |
| Common Stocks | | | $ | 253,025 | | | $ | 301,967 | | | $ | 71,782 | | | $ | 6,487 | |
| Level 2—Other significant observable inputs | | | | | | | | | | | | | | | | | |
| Repurchase Agreements | | | | 875 | | | | 2,985 | | | | 1,682 | | | | — | |
| Level 3—Significant unobservable inputs | | | | | | | | | | | | | | | | | |
| None | | | | — | | | | — | | | | — | | | | — | |
| Total investments in securities | | | $ | 253,900 | | | $ | 304,952 | | | $ | 73,464 | | | $ | 6,487 | |
| | | | | | | | | | | | | | | | | | |
| Investments in securities | | Small-Mid
Cap Growth | | Small-Mid
Cap Value | | Small Cap
Growth | | Small Cap
Value | |
| Level 1—Quoted prices | | | | | | | | | | | | | | | | | |
| Common Stocks | | | $ | 2,868,469 | | | $ | 7,407 | | | $ | 657,245 | | | $ | 167,542 | |
| Level 2—Other significant observable inputs | | | | | | | | | | | | | | | | | |
| Repurchase Agreements | | | | 51,376 | | | | 341 | | | | 15,920 | | | | 21,593 | |
| Level 3—Significant unobservable inputs | | | | | | | | | | | | | | | | | |
| None | | | | — | | | | — | | | | — | | | | — | |
| Total investments in securities | | | $ | 2,919,845 | | | $ | 7,748 | | | $ | 673,165 | | | $ | 189,135 | |
| | | | | | | | | | | | | | | | | | |
| Investments in securities | | Global
Leaders | | International
Leaders | | International
Growth | | Institutional
International
Growth | |
| Level 1—Quoted prices | | | | | | | | | | | | | | | | | |
| Common Stocks | | | $ | 169,388 | | | $ | 632,320 | | | $ | 2,074,688 | | | $ | 1,853,395 | |
| Level 2—Other significant observable inputs | | | | | | | | | | | | | | | | | |
| Common Stocks | | | | — | | | | — | | | | 8,386 | | | | 7,454 | |
| Repurchase Agreements | | | | 2,367 | | | | 24,861 | | | | 18,733 | | | | 22,389 | |
| Level 3—Significant unobservable inputs | | | | | | | | | | | | | | | | | |
| None | | | | — | | | | — | | | | — | | | | — | |
| Total investments in securities | | | $ | 171,755 | | | $ | 657,181 | | | $ | 2,101,807 | | | $ | 1,883,238 | |
| | | | | | | | | | | | | | | | | | |
| Investments in securities | | International
Small Cap
Growth | | Emerging
Markets
Leaders | | Emerging
Markets
Growth | | Emerging
Markets
Small Cap
Growth | |
| Level 1—Quoted prices | | | | | | | | | | | | | | | | | |
| Common Stocks | | | $ | 302,245 | | | $ | 227,934 | | | $ | 760,117 | | | $ | 262,179 | |
| Preferred Stocks | | | | — | | | | — | | | | 8,192 | | | | 5,357 | |
| Level 2—Other significant observable inputs | | | | | | | | | | | | | | | | | |
| Common Stocks | | | | 2,660 | | | | 5,753 | | | | 10,981 | | | | 6,889 | |
| Repurchase Agreements | | | | 2,344 | | | | — | | | | 12,845 | | | | 3,610 | |
| Level 3—Significant unobservable inputs | | | | | | | | | | | | | | | | | |
| Common Stocks | | | | — | | | | — | | | | — | | | | 2 | |
| Total investments in securities | | | $ | 307,249 | | | $ | 233,687 | | | $ | 792,135 | | | $ | 278,037 | |
| December 31, 2019 | William Blair Funds | 119 |
Notes to Financial Statements
| Investments in securities | | Bond | | | Income | | | Low
Duration | | | Macro
Allocation | |
| Assets | | | | | | | | | | | | | | | | |
| Level 1—Quoted Prices | | | | | | | | | | | | | | | | |
| Exchange-Traded Funds | | $ | — | | | $ | — | | | $ | — | | | $ | 517,868 | |
| Level 2—Other significant observable inputs | | | | | | | | | | | | | | | | |
| Asset-Backed Securities | | | 5,478 | | | | 800 | | | | 8,097 | | | | — | |
| Commercial Paper | | | 3,000 | | | | — | | | | — | | | | — | |
| Corporate Obligations | | | 107,901 | | | | 15,209 | | | | 19,481 | | | | — | |
| Foreign Government Bond | | | — | | | | — | | | | — | | | | 17,631 | |
| Repurchase Agreements | | | 5,170 | | | | 154 | | | | 1,688 | | | | 25,979 | |
| U.S. Government and U.S. Government Agency | | | 159,134 | | | | 34,989 | | | | 47,137 | | | | 195,871 | |
| Level 3—Significant unobservable inputs | | | | | | | | | | | | | | | | |
| None | | | — | | | | — | | | | — | | | | — | |
| Liabilities | | | | | | | | | | | | | | | | |
| Level 1—Quoted Prices | | | | | | | | | | | | | | | | |
| None | | | — | | | | — | | | | — | | | | — | |
| Level 2—Other significant observable inputs | | | | | | | | | | | | | | | | |
| None | | | — | | | | — | | | | — | | | | — | |
| Level 3—Significant unobservable inputs | | | | | | | | | | | | | | | | |
| None | | | — | | | | — | | | | — | | | | — | |
| Total investments in securities | | $ | 280,683 | | | $ | 51,152 | | | $ | 76,403 | | | $ | 757,349 | |
| Other financial instruments | | | | | | | | | | | | | | | | |
| Assets | | | | | | | | | | | | | | | | |
| Level 1—Quoted Prices | | | | | | | | | | | | | | | | |
| Futures Contracts | | $ | — | | | $ | — | | | $ | — | | | $ | 3,544 | |
| Level 2—Other significant observable inputs | | | | | | | | | | | | | | | | |
| Forward Foreign Currency Contracts | | | — | | | | — | | | | — | | | | 7,684 | |
| Swaps | | | — | | | | — | | | | — | | | | 1,228 | |
| Level 3—Significant unobservable inputs | | | | | | | | | | | | | | | | |
| None | | | — | | | | — | | | | — | | | | — | |
| Liabilities | | | | | | | | | | | | | | | | |
| Level 1—Quoted Prices | | | | | | | | | | | | | | | | |
| Futures Contracts | | | — | | | | — | | | | — | | | | (8,524 | ) |
| Level 2—Other significant observable inputs | | | | | | | | | | | | | | | | |
| Forward Foreign Currency Contracts | | | — | | | | — | | | | — | | | | (10,496 | ) |
| Swaps | | | (626 | ) | | | — | | | | — | | | | (217 | ) |
| U.S. Government Agency | | | (15,214 | ) | | | (5,046 | ) | | | (15,138 | ) | | | — | |
| Level 3—Significant unobservable inputs | | | | | | | | | | | | | | | | |
| None | | | — | | | | — | | | | — | | | | — | |
| Total Other Financial Instruments | | $ | (15,840 | ) | | $ | (5,046 | ) | | $ | (15,138 | ) | | $ | (6,781 | ) |
Level 1 Common Stocks are exchange-traded securities with a quoted price. See Portfolio of Investments for Sector Classification.
The fair value estimate for the Level 3 security in the Emerging Markets Small Cap Growth Fund was determined in good faith by the Pricing Committee, pursuant to the Valuation Procedures approved by the Board of Trustees. There were various factors considered in reaching the fair value determination, including, but not limited to, the following: the type of security, the extent of public trading of the security, information obtained for the security, and analysis of the company’s performance and market trends that influence its performance. The Level 3 security represented 0.00% as a percentage of net assets in the Emerging Markets Small Cap Growth Fund. The change in net unrealized gain (loss) related to this security held at December 31, 2019 is included within change in net unrealized appreciation (depreciation) of investments in securities in the Statement of Operations.
| 120 | Annual Report | December 31, 2019 |
Notes to Financial Statements
(4) Transactions with Affiliates
(a) Management and Expense Limitation Agreements
Each Fund has a management agreement with the Adviser for investment management, clerical, bookkeeping and administrative services. Each Fund pays the Adviser an annual management fee, which is accrued daily and paid monthly, based on a specified percentage of the Fund’s average daily net assets. Each Fund’s annual management fee rate is as follows:
| U.S. Equity Funds | | |
| Growth | | | 0.75 | % |
| Large Cap Growth2 | | | 0.60 | % |
| Mid Cap Growth3 | | | 0.90 | % |
| Small-Mid Cap Core | | | 0.90 | % |
| Small-Mid Cap Growth | | | 1.00 | % |
| Small-Mid Cap Value4 | | | 0.95 | % |
| Small Cap Growth | | | 1.10 | % |
| Small Cap Value | | | 1.10 | % |
| | | | | |
| Fixed Income Funds | | | | |
| Bond | | | 0.30 | % |
| Income1: | | | | |
| First $250 million | | | 0.25 | % |
| In excess of $250 million | | | 0.20 | % |
| Low Duration | | | 0.30 | % |
| | | | | |
| Multi-Asset and Alternative Fund | | | | |
| Macro Allocation | | | 0.80 | % |
| | | | | |
| Global Equity Fund | | | | |
| Global Leaders5 | | | 0.85 | % |
| International Equity Funds | | |
| International Leaders6 | | | 0.85 | % |
| International Growth: | | | | |
| First $250 million | | | 1.10 | % |
| Next $2.25 billion | | | 1.00 | % |
| Next $2.5 billion | | | 0.975 | % |
| Next $5 billion | | | 0.95 | % |
| Next $5 billion | | | 0.925 | % |
| In excess of $15 billion | | | 0.90 | % |
| Institutional International Growth: | | | | |
| First $500 million | | | 1.00 | % |
| Next $500 million | | | 0.95 | % |
| Next $1.5 billion | | | 0.90 | % |
| Next $2.5 billion | | | 0.875 | % |
| Next $5 billion | | | 0.85 | % |
| Next $5 billion | | | 0.825 | % |
| In excess of $15 billion | | | 0.80 | % |
| International Small Cap Growth | | | 1.00 | % |
| Emerging Markets Leaders | | | 1.10 | % |
| Emerging Markets Growth | | | 1.10 | % |
| Emerging Markets Small Cap Growth | | | 1.10 | % |
| 1 | Management fee also includes a charge of 5% of gross income. |
| 2 | Prior to May 1, 2019, the Large Cap Growth Fund paid a management fee at a rate of 0.70% of the Fund’s average daily net assets. Effective May 1, 2019,the management fee paid to the Adviser was reduced to 0.60%. |
| 3 | Prior to May 1, 2019, the Mid Cap Growth Fund paid a management fee at a rate of 0.95% of the Fund’s average daily net assets. Effective May 1, 2019,the management fee paid to the Adviser was reduced to 0.90%. |
| 4 | Prior to May 1, 2019, the Small-Mid Cap Value Fund paid a management fee at a rate of 1.00% of the Fund’s average daily net assets. Effective May 1,2019, the management fee paid to the Adviser was reduced to 0.95%. |
| 5 | Prior to May 1, 2019, the Global Leaders Fund paid a management fee at a rate of 0.95% of the Fund’s average daily net assets. Effective May 1, 2019, themanagement fee paid to the Adviser was reduced to 0.85%. |
| 6 | Prior to May 1, 2019, the International Leaders Fund paid a management fee at a rate of 0.90% of the Fund’s average daily net assets. Effective May 1,2019, the management fee paid to the Adviser was reduced to 0.85%. |
| December 31, 2019 | William Blair Funds | 121 |
Notes to Financial Statements
The Funds have also entered into an Amended and Restated Expense Limitation Agreement with the Adviser. Under the terms of the agreement, the Adviser will waive its management fee and/or reimburse a Fund for certain operating expenses, subject to certain excluded expenses, in excess of the agreed upon rate through April 30, 2020. The amount the Adviser owes a Fund as of the reporting date is recorded as Receivable from Adviser in the Statements of Assets and Liabilities. The Adviser reimburses the Funds on a monthly basis. The Adviser will waive fees and/or reimburse expenses to the extent that the total operating expenses for the stated class of the Funds, subject to certain excluded expenses, exceed the following rates (as a percentage of average daily net assets):
| | | Class N | | Class I | | Institutional/Class R6 |
| Fund | | Effective
May 1, 2019
through
April 30,
2020 | | Effective
May 1, 2018
through
April 30,
2019 | | Effective
May 1, 2019
through
April 30,
2020 | | Effective
May 1, 2018
through
April 30,
2019 | | Effective
May 1, 2019
through
April 30,
2020 | | Effective
May 1, 2018
through
April 30,
2019 |
| Growth | | | 1.20 | % | | | 1.20 | % | | | 0.95 | % | | | 0.95 | % | | | 0.90 | % | | | N/A | |
| Large Cap Growth | | | 0.90 | % | | | 1.05 | % | | | 0.65 | % | | | 0.80 | % | | | 0.60 | % | | | N/A | |
| Mid Cap Growth | | | 1.20 | % | | | 1.20 | % | | | 0.95 | % | | | 0.95 | % | | | 0.90 | % | | | N/A | |
| Small-Mid Cap Core | | | N/A | | | | N/A | | | | 0.95 | %1 | | | N/A | | | | 0.90 | %1 | | | N/A | |
| Small-Mid Cap Growth | | | 1.35 | % | | | 1.35 | % | | | 1.10 | % | | | 1.10 | % | | | 1.05 | % | | | N/A | |
| Small-Mid Cap Value | | | 1.25 | % | | | 1.25 | % | | | 1.00 | % | | | 1.00 | % | | | 0.95 | % | | | N/A | |
| Small Cap Growth | | | 1.50 | % | | | 1.50 | % | | | 1.25 | % | | | 1.25 | % | | | 1.20 | % | | | N/A | |
| Small Cap Value | | | 1.50 | % | | | 1.50 | % | | | 1.25 | % | | | 1.25 | % | | | 1.20 | % | | | N/A | |
| Global Leaders | | | 1.15 | % | | | 1.30 | % | | | 0.90 | % | | | 1.05 | % | | | 0.85 | % | | | 1.00 | % |
| International Leaders | | | 1.15 | % | | | 1.25 | % | | | 0.90 | % | | | 1.00 | % | | | 0.85 | % | | | 0.95 | % |
| International Growth | | | 1.45 | % | | | 1.45 | % | | | 1.20 | % | | | 1.20 | % | | | 1.15 | % | | | N/A | |
| Institutional International Growth | | | N/A | | | | N/A | | | | N/A | | | | N/A | | | | 1.05 | % | | | 1.05 | % |
| International Small Cap Growth | | | 1.55 | % | | | 1.55 | % | | | 1.30 | % | | | 1.30 | % | | | 1.25 | % | | | 1.25 | % |
| Emerging Markets Leaders | | | 1.40 | % | | | 1.55 | % | | | 1.15 | % | | | 1.30 | % | | | 1.10 | % | | | 1.25 | % |
| Emerging Markets Growth | | | 1.60 | % | | | 1.60 | % | | | 1.35 | % | | | 1.35 | % | | | 1.30 | % | | | 1.30 | % |
| Emerging Markets Small Cap Growth | | | 1.55 | % | | | 1.55 | % | | | 1.30 | % | | | 1.30 | % | | | 1.25 | % | | | 1.25 | % |
| Bond | | | 0.60 | % | | | 0.60 | % | | | 0.45 | % | | | 0.45 | % | | | 0.40 | % | | | 0.40 | % |
| Income | | | 0.85 | % | | | 0.85 | % | | | 0.70 | % | | | 0.70 | % | | | 0.65 | % | | | N/A | |
| Low Duration | | | 0.55 | % | | | 0.55 | % | | | 0.40 | % | | | 0.40 | % | | | 0.35 | % | | | 0.35 | % |
| Macro Allocation | | | 1.25 | % | | | 1.25 | % | | | 1.00 | % | | | 1.00 | % | | | 0.95 | % | | | 0.95 | % |
| 1 | Effective October 1, 2019 through April 30, 2021. |
| 122 | Annual Report | December 31, 2019 |
Notes to Financial Statements
For the year ended December 31, 2019, the fee waivers and/or expense reimbursements received by each Fund were as follows (in thousands):
| Fund | | Class N
Waiver | | | Class I
Waiver | | | Institutional/Class R6
Waiver | | | Total
Waiver | |
| Growth | | | $17 | | | | $— | | | | $— | | | | $17 | |
| Large Cap Growth | | | 96 | | | | 188 | | | | — | | | | 284 | |
| Mid Cap Growth | | | 18 | | | | 203 | | | | — | | | | 221 | |
| Small-Mid Cap Core (a) | | | N/A | | | | 6 | | | | 35 | | | | 41 | |
| Small-Mid Cap Growth | | | 277 | | | | 1,450 | | | | — | | | | 1,727 | |
| Small-Mid Cap Value | | | 14 | | | | 145 | | | | 2 | | | | 161 | |
| Small Cap Growth | | | 85 | | | | 73 | | | | — | | | | 158 | |
| Small Cap Value | | | 8 | | | | 250 | | | | — | | | | 258 | |
| Global Leaders | | | 15 | | | | 124 | | | | 84 | | | | 223 | |
| International Leaders | | | 14 | | | | 90 | | | | 215 | | | | 319 | |
| International Growth | | | 19 | | | | — | | | | — | | | | 19 | |
| Institutional International Growth | | | N/A | | | | N/A | | | | — | | | | — | |
| International Small Cap Growth | | | — | | | | — | | | | — | | | | — | |
| Emerging Markets Leaders | | | 4 | | | | 39 | | | | 152 | | | | 195 | |
| Emerging Markets Growth | | | — | | | | — | | | | — | | | | — | |
| Emerging Markets Small Cap Growth | | | 9 | | | | 164 | | | | 93 | | | | 266 | |
| Bond | | | 47 | | | | 59 | | | | 5 | | | | 111 | |
| Income | | | 27 | | | | 15 | | | | — | | | | 42 | |
| Low Duration | | | 3 | | | | 72 | | | | 67 | | | | 142 | |
| Macro Allocation | | | — | | | | — | | | | — | | | | — | |
| (a) | For the period from October 1, 2019 (Commencement of Operations) to December 31, 2019. |
(b) Underwriting, Distribution Services, and Shareholder Administration Agreements
Pursuant to separate Underwriting and Distribution Agreements, WBC is the principal underwriter and distributor for the continuous offering of shares of the Trust and acts as agent of the Trust in the sale of its shares. The Underwriting Agreement provides that the Distributor will use its best efforts to distribute the Trust’s shares. The Distributor is not compensated under the Underwriting Agreement.
Each Fund, except the Small-Mid Cap Core and Institutional International Growth Funds, has a Distribution Agreement with WBC for distribution services to the Funds’ Class N shares. Each Fund pays WBC an annual fee, payable monthly, based on a specified percentage of its average daily net assets of Class N shares. The annual rate expressed as a percentage of average daily net assets for Class N is 0.25% for all Funds except the Bond, Income and Low Duration Funds, which is 0.15%. Pursuant to the Distribution Agreement, WBC enters into related selling group agreements with various firms at various rates for sales of the Funds’ Class N shares.
The Global Leaders, International Leaders, International Small Cap Growth, Emerging Markets Leaders, Emerging Markets Growth, Emerging Markets Small Cap Growth, Bond, Low Duration and Macro Allocation Funds have a Shareholder Administration Agreement with WBC to provide shareholder administration services to Class N and Class I shares. Class N and Class I shares of the Funds previously agreed to pay an annual fee, payable monthly, of 0.15% of average daily net assets attributable to each class, respectively, all of which had been waived by WBC since January 2015. Effective January 1, 2018, the fee was reduced to 0.00%. WBC has provided, and continues to provide, shareholder administration services pursuant to the Shareholder Administration Agreements.
| December 31, 2019 | William Blair Funds | 123 |
Notes to Financial Statements
(5) Investment Transactions
Investment transactions, excluding U.S. government securities and short-term securities, for the year ended December 31, 2019, were as follows (in thousands):
| Fund | | Purchases | | | Sales | |
| Growth | | $ | 97,609 | | | $ | 138,784 | |
| Large Cap Growth | | | 140,842 | | | | 83,449 | |
| Mid Cap Growth | | | 28,603 | | | | 31,970 | |
| Small-Mid Cap Core (a) | | | 6,781 | | | | 664 | |
| Small-Mid Cap Growth | | | 1,503,251 | | | | 1,678,267 | |
| Small-Mid Cap Value | | | 8,408 | | | | 3,216 | |
| Small Cap Growth | | | 336,270 | | | | 391,143 | |
| Small Cap Value | | | 509,487 | | | | 904,758 | |
| Global Leaders | | | 49,287 | | | | 96,346 | |
| International Leaders | | | 196,631 | | | | 101,332 | |
| International Growth | | | 718,856 | | | | 1,291,068 | |
| Institutional International Growth | | | 631,649 | | | | 1,004,750 | |
| International Small Cap Growth | | | 117,991 | | | | 239,349 | |
| Emerging Markets Leaders | | | 71,029 | | | | 85,371 | |
| Emerging Markets Growth | | | 616,650 | | | | 756,907 | |
| Emerging Markets Small Cap Growth | | | 393,420 | | | | 448,317 | |
| Bond | | | 211,836 | | | | 352,778 | |
| Income | | | 72,860 | | | | 71,695 | |
| Low Duration | | | 198,459 | | | | 207,287 | |
| Macro Allocation | | | 182,159 | | | | 362,936 | |
| (a) | For the period from October 1, 2019 (Commencement of Operations) to December 31, 2019. |
Investment transactions in U.S. government securities, excluding short-term securities, for the year ended December 31, 2019, were as follows (in thousands):
| Fund | | Purchases | | | Sales | |
| Bond | | $ | 2,925 | | | $ | 16,689 | |
| Income | | | — | | | | 295 | |
| Low Duration | | | — | | | | — | |
| Macro Allocation | | | — | | | | — | |
| 124 | Annual Report | December 31, 2019 |
Notes to Financial Statements
(6) Financial Derivative Instruments
Each Fund may use derivative instruments to maintain liquidity, to provide hedging, or in anticipation of changes in the composition of its portfolio holdings or as otherwise provided in each Fund’s prospectus. Macro Allocation Fund may also use derivative instruments to obtain investment exposures. The derivative instruments held as of December 31, 2019, as disclosed in each Fund’s Portfolios of Investments, are representative of each Fund’s derivative instrument trading activity during the year ended December 31, 2019.
Derivative transactions carry counterparty risk as they are based on contracts between a Fund and the applicable counterparty. For exchange-traded or cleared derivative contracts, such counterparty risk is limited due to the role of the exchange or clearinghouse. OTC derivative contracts, however, are exposed to counterparty risk in the amount of unrealized gains, net of collateral held, for the duration of the contract.
Macro Allocation Fund is subject to certain netting arrangements through International Swaps and Derivatives Association, Inc. Master Agreements and Credit Support Annexes (“ISDAs”). The ISDAs maintain provisions for general obligations, representations, agreements, collateral and events of default or termination. The ISDAs cover certain OTC derivative securities entered into by Macro Allocation Fund with various counterparties and allow Macro Allocation Fund to close out and net its total exposure to a counterparty in the event of a default.
Futures Contracts
A futures contract provides for the future sale by one party and purchase by another party of a specified amount of a specific financial instrument for a specified price at a designated date, time and place. An index futures contract is an agreement pursuant to which the parties agree to take or make delivery of an amount of cash equal to the difference between the value of the index at the close of the last trading day of the contract and the price at which the index futures contract was originally written. A futures contract can be closed out prior to delivery by entering into an offsetting transaction in a matching futures contract. Although the value of an index might be a function of the value of certain specified securities, no physical delivery of those securities is made. If the offsetting purchase price is less than the original sale price, a Fund realizes a gain; if it is more, a Fund realizes a loss. Conversely, if the offsetting sale price is more than the original purchase price, a Fund realizes a gain; if it is less, a Fund realizes a loss. The transaction costs must also be included in these calculations. There can be no assurance, however, that a Fund will be able to enter into an offsetting transaction with respect to a particular futures contract at a particular time. If a Fund is not able to enter into an offsetting transaction, a Fund will continue to be required to maintain the margin deposits on the futures contract.
Upon entering into a futures contract, a Fund is required to pledge to the broker an amount of cash, U.S. government securities, or other liquid assets equal to a certain percentage of the contract amount (“initial margin deposit”). Futures contracts are marked to market daily and an appropriate payable or receivable for the change in value (“variation margin”) is recorded by a Fund and a cash payment is either made to or received from the broker each day. Gains or losses on futures contracts are recognized but not considered realized until the contracts expire or are closed and are included in the Statement of Operations.
Options
The purchase or sale of an option by a Fund involves the payment or receipt of a premium by the investor and the corresponding right or obligation, as the case may be, either to purchase or sell the underlying security, commodity, or other instrument for a specific price at a certain time or during a certain period. Purchasing options involves the risk that the underlying instrument will not change price in the manner expected, so the investor loses its premium. Writing options involves potentially greater risk because the investor is exposed to the extent of the actual price movement in the underlying security rather than only the amount of the premium paid (which could result in a potentially unlimited loss). OTC options also involve counterparty credit risk. Purchased options are shown as an asset in the Statement of Assets and Liabilities and are included in Investments in securities. Premiums received for written options are shown as a liability in the Statement of Assets and Liabilities. Realized gains and losses on the sale, expiration or assignment of an option are disclosed in the Statement of Operations.
Forward Foreign Currency Contracts
The Global Equity, International Equity and Multi-Asset and Alternative Funds may enter into forward foreign currency contracts. When entering into a forward foreign currency contract, a Fund agrees to receive or deliver a fixed quantity of foreign currency for an agreed-upon price on an agreed future date. A Fund’s net equity therein, representing unrealized gain or loss on the contracts as measured by the difference between the forward foreign exchange rates at the dates of entry into the contracts and
| December 31, 2019 | William Blair Funds | 125 |
Notes to Financial Statements
the forward rates at the reporting date, is included in the Statement of Assets and Liabilities as unrealized appreciation/depreciation on forward foreign currency contracts. Realized and unrealized gains and losses are included in the Statement of Operations. These instruments may involve market risk, credit risk, or both kinds of risks in excess of the amount recognized in the Statement of Assets and Liabilities. Risks arise from the possible inability of counterparties to meet the terms of their contracts and from the price movements in currencies.
Swap Contracts
Swap agreements may include total return, interest rate, securities index, commodity, security, currency exchange rate, credit default index, volatility and variance swaps. Cleared swaps are transacted through futures commission merchants that are members of central clearing houses with the clearing house serving as a central counterparty similar to transactions in futures contracts. In a standard “swap” transaction, two parties agree to exchange the returns (or differentials in rates of return) earned or realized on particular predetermined investments or instruments. The gross returns to be exchanged or “swapped” between the parties are calculated with respect to a “notional amount” (i.e., the change in the value of a particular dollar amount invested, for example, at a particular interest rate, in a particular foreign currency, or in a “basket” of securities representing a particular index). Swap agreements are subject to the risk that the counterparty to the swap will default on its obligation to pay a Fund and the risk that a Fund will not be able to meet its obligations to pay the counterparty to the swap. Swap agreements may also involve fees, commissions or other costs that may reduce a Fund’s gains from a swap agreement or may cause a Fund to lose money. To the extent permitted by its investment policies and restrictions, a Fund may invest in the following types of swaps:
Credit Default Swaps—A Fund may invest in credit default swaps as a means of “buying” credit protection (i.e., attempting to mitigate the risk of default or credit quality deterioration in some portion of a Fund’s holdings) or “selling” credit protection (i.e., attempting to gain exposure to an underlying issuer’s credit quality characteristics without directly investing in that issuer). A credit default swap is a contract between a buyer and a seller of protection against a pre-defined credit event (e.g., a ratings downgrade or default) on an underlying reference obligation, which may be a single debt instrument or baskets or indices of securities. A Fund may be a buyer or seller of a credit default swap. As a seller of protection on credit default swap agreements, a Fund will generally receive from the buyer of protection a fixed rate of income throughout the term of the swap provided that there is no credit event. A Fund adds leverage to its portfolio because the Fund is subject to investment exposure on the notional amount of the swap. The maximum potential amount of future payments that a Fund as a seller of protection could be required to make under a credit default swap agreement equals the notional amount of the agreement. Notional amounts of each individual credit default swap agreement outstanding as of the period end for which a Fund is the seller of protection are disclosed in the Fund’s Portfolio of Investments. These potential amounts would be partially offset by any recovery values of the respective referenced obligations, upfront payments received upon entering into the agreement, or net amounts received from the settlement of buy protection credit default swap agreements entered into by the same Fund for the same referenced entity or entities. For credit default swap contracts on credit indices, the quoted market prices and resulting values serve as an indicator of the payment performance risk. Increasing market values, in absolute terms when compared to the notional amount of the swap, typically represent deterioration of the referenced entities’ credit soundness and a greater likelihood or risk of default or other credit event occurring as defined under the terms of the swap.
Interest Rate Swap—A Fund may invest in interest rate swaps to gain or mitigate exposure to changes in interest rates. Interest rate swap agreements involve a commitment between parties to pay either a fixed interest rate or a floating interest rate based on a notional amount of principal. The parties make payments at predetermined intervals throughout the life of the swap. As a payer, a Fund would make the fixed payment and receive the floating payment. As a receiver, a Fund would make the floating payment and receive the fixed payment.
Total Return Swap—A Fund may invest in total return swaps to gain or mitigate exposure to an underlying security, or securities. Total return swap agreements may involve commitments to pay interest in exchange for the return on the underlying security, or securities. At maturity, a net cash flow is exchanged between the parties based on the total return of the underlying security, or securities, less a financing rate. As a receiver in the transaction, a Fund would receive a payment for a positive return and would make a payment for a negative return. As a payer in the transaction, a Fund would make a payment for a positive return and would receive a payment for a negative return.
Variance Swap—A Fund may invest in variance swaps in order to gain or mitigate its exposure to an underlying reference entity such as a broad based index. A variance swap is an agreement between two parties to exchange cash flows based on the measured variance of a reference entity. The payer agrees to exchange the fixed rate, which is the variance strike price of the reference
| 126 | Annual Report | December 31, 2019 |
Notes to Financial Statements
entity, to the receiver for the floating rate, which is the realized variance price of the reference entity. At the time the trade is originated, the agreed upon variance strike price is generally set so that the fair value of the swap is near zero. At maturity, a net cash flow is exchanged between the parties based on the difference between the final realized variance price of the swap and the variance strike price multiplied by the notional, or vega amount. As a receiver of the floating rate, a Fund would receive a payment if the final realized variance price is greater than the variance strike price and would make a payment if the final realized variance price is less than the variance strike price. As a payer of the floating rate, a Fund would receive a payment if the final realized variance price is less than the variance strike price and would make a payment if the final realized variance price is greater than the variance strike price.
The following table presents the value of financial derivative instruments, by Fund and primary risk exposure, as of December 31, 2019, and their respective location in the Statements of Assets and Liabilities (in thousands):
| | | Assets | | | Liabilities | |
Fund and
Primary Risk Exposure | | Statements of Assets
and Liabilities | | Value | | | Statements of Assets
and Liabilities | | Value | |
| Bond | | | | | | | | | | | | |
| Credit | | Receivable for variation margin on centrally cleared swaps(1) | | $ | — | | | Payable for variation margin on centrally cleared swaps(1) | | $ | 626 | |
| Macro Allocation | | | | | | | | | | | | |
| Credit | | Receivable for variation margin on centrally cleared swaps(1) | | | 110 | | | Payable for variation margin on centrally cleared swaps(1) | | | — | |
| Currency | | Unrealized appreciation on forward currency contracts | | | 7,684 | | | Unrealized depreciation on forward currency contracts | | | 10,496 | |
| Equity | | Receivable for variation margin on futures(1) | | | 3,335 | | | Payable for variation margin on futures(1) | | | 7,523 | |
| Equity | | Unrealized appreciation on swap contracts | | | 1,048 | | | Unrealized depreciation on swap contracts | | | — | |
| Interest rate | | Unrealized appreciation on swap contracts | | | 70 | | | Unrealized depreciation on swap contracts | | | 217 | |
| Interest rate | | Receivable for variation margin on futures(1) | | | 209 | | | Payable for variation margin on futures(1) | | | 1,001 | |
| (1) | The table above includes cumulative appreciation/(depreciation) on futures contracts and centrally cleared swaps as reported in the applicable Fund’s Portfolio of Investments. Receivable/payable for variation margin on futures contracts and centrally cleared swaps as reported in the applicable Fund’s Statement of Assets and Liabilities represents the current day’s variation margin. |
| December 31, 2019 | William Blair Funds | 127 |
Notes to Financial Statements
The following table indicates the effect of derivatives, by Fund and primary risk exposure, in the Statements of Operations for the year ended December 31, 2019 (in thousands):
| | | Realized Gain (Loss) | | | Change in Net Unrealized
Appreciation (Depreciation) | |
Fund and
Primary Risk Exposure | | Statements of Operations | | Value | | | Statements of Operations | | Value | |
| Bond | | | | | | | | | | | | |
| Credit | | Swaps | | $ | (374 | ) | | Swaps | | $ | (902 | ) |
| Macro Allocation | | | | | | | | | | | | |
| Credit | | Swaps | | | 409 | | | Swaps | | | 228 | |
| Currency | | Forward foreign currency contracts | | | 20,190 | | | Forward foreign currency contracts | | | (8,007 | ) |
| Currency | | Options | | | (1,844 | ) | | Options | | | 1,484 | |
| Equity | | Futures contracts | | | (90,672 | ) | | Futures contracts | | | (12,783 | ) |
| Equity | | Options | | | (566 | ) | | Options | | | (154 | ) |
| Equity | | Swaps | | | 1,914 | | | Swaps | | | 1,207 | |
| Interest rate | | Futures contracts | | | (4,090 | ) | | Futures contracts | | | (350 | ) |
| Interest rate | | Options | | | (860 | ) | | Options | | | (409 | ) |
| Interest rate | | Swaps | | | (6,693 | ) | | Swaps | | | 790 | |
The following table is a summary by counterparty of the derivative instruments and collateral pledged/(received) included in the Macro Allocation Fund’s Statement of Assets and Liabilities at December 31, 2019 (in thousands):
| | | Financial Derivative Assets | | Financial Derivative Liabilities | | | | | | |
| Counterparty | | Forward
Foreign
Currency
Contracts | | Swaps | | Total | | Forward
Foreign
Currency
Contracts | | Swaps | | Total | | Net
Market
Value | | Collateral
Pledged
(Received) | | Net
Exposure |
| Citibank N.A. | | $ | 7,684 | | | $ | 984 | | | $ | 8,668 | | | $ | (10,496 | ) | | $ | — | | | $ | (10,496 | ) | | $ | (1,828 | ) | | $ | 1,350 | | | $ | (478 | ) |
| Credit Suisse | | | — | | | | 70 | | | | 70 | | | | — | | | | (217 | ) | | | (217 | ) | | | (147 | ) | | | 147 | | | | — | |
| Goldman Sachs | | | — | | | | 64 | | | | 64 | | | | — | | | | — | | | | — | | | | 64 | | | | — | | | | 64 | |
| | | $ | 7,684 | | | $ | 1,118 | | | $ | 8,802 | | | $ | (10,496 | ) | | $ | (217 | ) | | $ | (10,713 | ) | | | | | | | | | | | | |
The net exposure represents the amount due from/(due to) the counterparty in the event of default. Any net exposure is generally due to changes in market value of the underlying derivative instruments on the last day of the period as timing of collateral movement occurs the following day. For Credit Suisse, the table does not include collateral pledged in the amount of $1,073 (in thousands) that is necessary to cover initial margin requirements on OTC swap contracts.
| 128 | Annual Report | December 31, 2019 |
Notes to Financial Statements
(7) Fund Share Transactions
The following tables summarize the activity in capital shares of each Fund for the year ended December 31, 2019 (in thousands):
| | | Class N | |
| | | Dollars | | | Shares | |
| Fund | | Sales | | | Reinvest | | | Redemptions | | | Total | | | Sales | | | Reinvest | | | Redemptions | | | Total | |
| Growth | | $ | 4,699 | | | $ | 3,142 | | | $ | 21,051 | | | $ | (13,210 | ) | | | 512 | | | | 339 | | | | 2,242 | | | | (1,391 | ) |
| Large Cap Growth | | | 33,843 | | | | 3,913 | | | | 25,920 | | | | 11,836 | | | | 2,320 | | | | 263 | | | | 1,756 | | | | 827 | |
| Mid Cap Growth | | | 476 | | | | 431 | | | | 1,578 | | | | (671 | ) | | | 43 | | | | 40 | | | | 143 | | | | (60 | ) |
| Small-Mid Cap Growth | | | 74,019 | | | | 23,898 | | | | 268,742 | | | | (170,825 | ) | | | 2,970 | | | | 946 | | | | 11,034 | | | | (7,118 | ) |
| Small-Mid Cap Value | | | 102 | | | | 6 | | | | 76 | | | | 32 | | | | 10 | | | | — | | | | 7 | | | | 3 | |
| Small Cap Growth | | | 57,125 | | | | 4,113 | | | | 83,288 | | | | (22,050 | ) | | | 2,151 | | | | 150 | | | | 3,066 | | | | (765 | ) |
| Small Cap Value | | | 2,377 | | | | 495 | | | | 9,131 | | | | (6,259 | ) | | | 138 | | | | 29 | | | | 531 | | | | (364 | ) |
| Global Leaders | | | 953 | | | | 98 | | | | 1,463 | | | | (412 | ) | | | 72 | | | | 7 | | | | 112 | | | | (33 | ) |
| International Leaders | | | 2,342 | | | | 37 | | | | 2,610 | | | | (231 | ) | | | 145 | | | | 2 | | | | 161 | | | | (14 | ) |
| International Growth | | | 44,662 | | | | 5,263 | | | | 133,868 | | | | (83,943 | ) | | | 1,723 | | | | 183 | | | | 5,050 | | | | (3,144 | ) |
| International Small Cap Growth | | | 76 | | | | 3 | | | | 908 | | | | (829 | ) | | | 7 | | | | — | | | | 75 | | | | (68 | ) |
| Emerging Markets Leaders | | | 3,645 | | | | 11 | | | | 4,555 | | | | (899 | ) | | | 388 | | | | 1 | | | | 483 | | | | (94 | ) |
| Emerging Markets Growth | | | 1,739 | | | | 300 | | | | 2,909 | | | | (870 | ) | | | 142 | | | | 23 | | | | 231 | | | | (66 | ) |
| Emerging Markets Small Cap Growth | | | 561 | | | | — | | | | 6,536 | | | | (5,975 | ) | | | 37 | | | | — | | | | 440 | | | | (403 | ) |
| Bond | | | 13,853 | | | | 2,166 | | | | 58,587 | | | | (42,568 | ) | | | 1,355 | | | | 212 | | | | 5,682 | | | | (4,115 | ) |
| Income | | | 2,090 | | | | 686 | | | | 6,085 | | | | (3,309 | ) | | | 245 | | | | 80 | | | | 714 | | | | (389 | ) |
| Low Duration | | | 613 | | | | 53 | | | | 809 | | | | (143 | ) | | | 70 | | | | 6 | | | | 93 | | | | (17 | ) |
| Macro Allocation | | | 6,932 | | | | 489 | | | | 37,706 | | | | (30,285 | ) | | | 607 | | | | 43 | | | | 3,261 | | | | (2,611 | ) |
| | | Class I | |
| | | Dollars | | | Shares | |
| Fund | | Sales | | | Reinvest | | | Redemptions | | | Total | | | Sales | | | Reinvest | | | Redemption | | | Total | |
| Growth | | $ | 16,720 | | | $ | 17,115 | | | $ | 41,128 | | | $ | (7,293 | ) | | | 1,519 | | | | 1,552 | | | | 3,712 | | | | (641 | ) |
| Large Cap Growth | | | 87,517 | | | | 9,125 | | | | 36,804 | | | | 59,838 | | | | 5,611 | | | | 578 | | | | 2,424 | | | | 3,765 | |
| Mid Cap Growth | | | 9,653 | | | | 5,374 | | | | 11,067 | | | | 3,960 | | | | 818 | | | | 460 | | | | 945 | | | | 333 | |
| Small-Mid Cap Core (a) | | | 1,600 | | | | 1 | | | | 1 | | | | 1,600 | | | | 155 | | | | — | | | | — | | | | 155 | |
| Small-Mid Cap Growth | | | 722,356 | | | | 166,901 | | | | 775,495 | | | | 113,762 | | | | 27,182 | | | | 6,225 | | | | 29,057 | | | | 4,350 | |
| Small-Mid Cap Value | | | 6,397 | | | | 130 | | | | 1,342 | | | | 5,185 | | | | 589 | | | | 12 | | | | 125 | | | | 476 | |
| Small Cap Growth | | | 137,860 | | | | 8,577 | | | | 216,223 | | | | (69,786 | ) | | | 4,617 | | | | 278 | | | | 7,091 | | | | (2,196 | ) |
| Small Cap Value | | | 47,012 | | | | 14,487 | | | | 449,289 | | | | (387,790 | ) | | | 2,655 | | | | 811 | | | | 25,120 | | | | (21,654 | ) |
| Global Leaders | | | 13,378 | | | | 1,486 | | | | 9,732 | | | | 5,132 | | | | 983 | | | | 102 | | | | 710 | | | | 375 | |
| International Leaders | | | 93,939 | | | | 938 | | | | 21,157 | | | | 73,720 | | | | 5,758 | | | | 53 | | | | 1,312 | | | | 4,499 | |
| International Growth | | | 187,914 | | | | 18,095 | | | | 720,429 | | | | (514,420 | ) | | | 7,104 | | | | 614 | | | | 26,516 | | | | (18,798 | ) |
| International Small Cap Growth | | | 37,548 | | | | 370 | | | | 104,497 | | | | (66,579 | ) | | | 3,181 | | | | 27 | | | | 8,815 | | | | (5,607 | ) |
| Emerging Markets Leaders | | | 11,138 | | | | 376 | | | | 10,689 | | | | 825 | | | | 1,144 | | | | 37 | | | | 1,102 | | | | 79 | |
| Emerging Markets Growth | | | 6,749 | | | | 2,839 | | | | 31,465 | | | | (21,877 | ) | | | 529 | | | | 211 | | | | 2,480 | | | | (1,740 | ) |
| Emerging Markets Small Cap Growth | | | 34,235 | | | | 217 | | | | 89,550 | | | | (55,098 | ) | | | 2,330 | | | | 13 | | | | 5,987 | | | | (3,644 | ) |
| Bond | | | 63,530 | | | | 8,645 | | | | 165,844 | | | | (93,669 | ) | | | 6,285 | | | | 855 | | | | 16,289 | | | | (9,149 | ) |
| Income | | | 15,837 | | | | 1,281 | | | | 21,322 | | | | (4,204 | ) | | | 1,889 | | | | 151 | | | | 2,517 | | | | (477 | ) |
| Low Duration | | | 5,864 | | | | 1,972 | | | | 25,726 | | | | (17,890 | ) | | | 673 | | | | 226 | | | | 2,953 | | | | (2,054 | ) |
| Macro Allocation | | | 95,661 | | | | 13,901 | | | | 238,819 | | | | (129,257 | ) | | | 8,287 | | | | 1,233 | | | | 20,648 | | | | (11,128 | ) |
| December 31, 2019 | William Blair Funds | 129 |
Notes to Financial Statements
| | | Institutional/Class R6 | |
| | | Dollars | | | Shares | |
| Fund | | Sales | | | Reinvest | | | Redemptions | | | Total | | | Sales | | | Reinvest | | | Redemptions | | | Total | |
| Growth (b) | | $ | 253 | | | $ | 17 | | | $ | 50 | | | $ | 220 | | | | 21 | | | | 2 | | | | 4 | | | | 19 | |
| Large Cap Growth (b) | | | 1,614 | | | | 96 | | | | 103 | | | | 1,607 | | | | 98 | | | | 6 | | | | 6 | | | | 98 | |
| Mid Cap Growth (b) | | | 185 | | | | 12 | | | | 50 | | | | 147 | | | | 15 | | | | 1 | | | | 4 | | | | 12 | |
| Small-Mid Cap Core (a) | | | 4,638 | | | | 3 | | | | 23 | | | | 4,618 | | | | 464 | | | | — | | | | 2 | | | | 462 | |
| Small-Mid Cap Growth (b) | | | 39,365 | | | | 2,655 | | | | 1,015 | | | | 41,005 | | | | 1,417 | | | | 99 | | | | 36 | | | | 1,480 | |
| Small-Mid Cap Value (b) | | | 569 | | | | 3 | | | | 395 | | | | 177 | | | | 52 | | | | — | | | | 37 | | | | 15 | |
| Small Cap Growth (b) | | | 70,364 | | | | 1,345 | | | | 6,230 | | | | 65,479 | | | | 2,272 | | | | 44 | | | | 202 | | | | 2,114 | |
| Small Cap Value (b) | | | 594 | | | | 16 | | | | 95 | | | | 515 | | | | 32 | | | | 1 | | | | 5 | | | | 28 | |
| Global Leaders | | | 2,233 | | | | 657 | | | | 54,453 | | | | (51,563 | ) | | | 167 | | | | 45 | | | | 3,935 | | | | (3,723 | ) |
| International Leaders | | | 54,037 | | | | 2,274 | | | | 25,678 | | | | 30,633 | | | | 3,363 | | | | 129 | | | | 1,540 | | | | 1,952 | |
| International Growth (b) | | | 57,826 | | | | 819 | | | | 2,257 | | | | 56,388 | | | | 2,087 | | | | 28 | | | | 77 | | | | 2,038 | |
| Institutional International Growth | | | 192,878 | | | | 17,852 | | | | 574,855 | | | | (364,125 | ) | | | 12,482 | | | | 1,060 | | | | 37,590 | | | | (24,048 | ) |
| International Small Cap Growth | | | 8,293 | | | | 596 | | | | 66,807 | | | | (57,918 | ) | | | 690 | | | | 44 | | | | 5,534 | | | | (4,800 | ) |
| Emerging Markets Leaders | | | 23,896 | | | | 1,819 | | | | 39,496 | | | | (13,781 | ) | | | 2,519 | | | | 179 | | | | 4,094 | | | | (1,396 | ) |
| Emerging Markets Growth | | | 163,145 | | | | 23,530 | | | | 277,695 | | | | (91,020 | ) | | | 12,739 | | | | 1,737 | | | | 21,289 | | | | (6,813 | ) |
| Emerging Markets Small Cap Growth | | | 26,072 | | | | 248 | | | | 15,489 | | | | 10,831 | | | | 1,756 | | | | 15 | | | | 1,035 | | | | 736 | |
| Bond | | | 3,036 | | | | 2,432 | | | | 37,075 | | | | (31,607 | ) | | | 304 | | | | 241 | | | | 3,654 | | | | (3,109 | ) |
| Income (b) | | | 50 | | | | 1 | | | | — | | | | 51 | | | | 6 | | | | — | | | | — | | | | 6 | |
| Low Duration | | | 7,532 | | | | 921 | | | | 19,111 | | | | (10,658 | ) | | | 863 | | | | 106 | | | | 2,191 | | | | (1,222 | ) |
| Macro Allocation | | | 120,202 | | | | 13,341 | | | | 147,745 | | | | (14,202 | ) | | | 10,415 | | | | 1,183 | | | | 12,734 | | | | (1,136 | ) |
| | | Net Change in Net Assets Relating to Fund Share Activity | |
| | | Dollars | | | Shares | |
| Fund | | Sales | | | Reinvest | | | Redemptions | | | Total | | | Sales | | | Reinvest | | | Redemptions | | | Total | |
| Growth | | $ | 21,672 | | | $ | 20,274 | | | $ | 62,229 | | | $ | (20,283 | ) | | | 2,052 | | | | 1,893 | | | | 5,958 | | | | (2,013 | ) |
| Large Cap Growth | | | 122,974 | | | | 13,134 | | | | 62,827 | | | | 73,281 | | | | 8,029 | | | | 847 | | | | 4,186 | | | | 4,690 | |
| Mid Cap Growth | | | 10,314 | | | | 5,817 | | | | 12,695 | | | | 3,436 | | | | 876 | | | | 501 | | | | 1,092 | | | | 285 | |
| Small-Mid Cap Core (a) | | | 6,238 | | | | 4 | | | | 24 | | | | 6,218 | | | | 619 | | | | — | | | | 2 | | | | 617 | |
| Small-Mid Cap Growth | | | 835,740 | | | | 193,454 | | | | 1,045,252 | | | | (16,058 | ) | | | 31,569 | | | | 7,270 | | | | 40,127 | | | | (1,288 | ) |
| Small-Mid Cap Value | | | 7,068 | | | | 139 | | | | 1,813 | | | | 5,394 | | | | 651 | | | | 12 | | | | 169 | | | | 494 | |
| Small Cap Growth | | | 265,349 | | | | 14,035 | | | | 305,741 | | | | (26,357 | ) | | | 9,040 | | | | 472 | | | | 10,359 | | | | (847 | ) |
| Small Cap Value | | | 49,983 | | | | 14,998 | | | | 458,515 | | | | (393,534 | ) | | | 2,825 | | | | 841 | | | | 25,656 | | | | (21,990 | ) |
| Global Leaders | | | 16,564 | | | | 2,241 | | | | 65,648 | | | | (46,843 | ) | | | 1,222 | | | | 154 | | | | 4,757 | | | | (3,381 | ) |
| International Leaders | | | 150,318 | | | | 3,249 | | | | 49,445 | | | | 104,122 | | | | 9,266 | | | | 184 | | | | 3,013 | | | | 6,437 | |
| International Growth | | | 290,402 | | | | 24,177 | | | | 856,554 | | | | (541,975 | ) | | | 10,914 | | | | 825 | | | | 31,643 | | | | (19,904 | ) |
| Institutional International Growth | | | 192,878 | | | | 17,852 | | | | 574,855 | | | | (364,125 | ) | | | 12,482 | | | | 1,060 | | | | 37,590 | | | | (24,048 | ) |
| International Small Cap Growth | | | 45,917 | | | | 969 | | | | 172,212 | | | | (125,326 | ) | | | 3,878 | | | | 71 | | | | 14,424 | | | | (10,475 | ) |
| Emerging Markets Leaders | | | 38,679 | | | | 2,206 | | | | 54,740 | | | | (13,855 | ) | | | 4,051 | | | | 217 | | | | 5,679 | | | | (1,411 | ) |
| Emerging Markets Growth | | | 171,633 | | | | 26,669 | | | | 312,069 | | | | (113,767 | ) | | | 13,410 | | | | 1,971 | | | | 24,000 | | | | (8,619 | ) |
| Emerging Markets Small Cap Growth | | | 60,868 | | | | 465 | | | | 111,575 | | | | (50,242 | ) | | | 4,123 | | | | 28 | | | | 7,462 | | | | (3,311 | ) |
| Bond | | | 80,419 | | | | 13,243 | | | | 261,506 | | | | (167,844 | ) | | | 7,944 | | | | 1,308 | | | | 25,625 | | | | (16,373 | ) |
| Income | | | 17,977 | | | | 1,968 | | | | 27,407 | | | | (7,462 | ) | | | 2,140 | | | | 231 | | | | 3,231 | | | | (860 | ) |
| Low Duration | | | 14,009 | | | | 2,946 | | | | 45,646 | | | | (28,691 | ) | | | 1,606 | | | | 338 | | | | 5,237 | | | | (3,293 | ) |
| Macro Allocation | | | 222,795 | | | | 27,731 | | | | 424,270 | | | | (173,744 | ) | | | 19,309 | | | | 2,459 | | | | 36,643 | | | | (14,875 | ) |
| (a) | For the period from October 1, 2019 (Commencement of Operations) to December 31, 2019. |
| (b) | For the period from May 2, 2019 (Commencement of Operations) to December 31, 2019. |
| 130 | Annual Report | December 31, 2019 |
Notes to Financial Statements
The following tables summarize the activity in capital shares of each Fund for the year ended December 31, 2018 (in thousands):
| | | Class N | |
| | | Dollars | | | Shares | |
| Fund | | Sales | | | Reinvest | | | Redemptions | | | Total | | | Sales | | | Reinvest | | | Redemptions | | | Total | |
| Growth | | $ | 23,472 | | | $ | 11,875 | | | $ | 21,376 | | | $ | 13,971 | | | | 2,069 | | | | 1,409 | | | | 2,022 | | | | 1,456 | |
| Large Cap Growth | | | 29,850 | | | | 6,475 | | | | 14,335 | | | | 21,990 | | | | 2,017 | | | | 509 | | | | 994 | | | | 1,532 | |
| Mid Cap Growth | | | 708 | | | | 913 | | | | 1,816 | | | | (195 | ) | | | 60 | | | | 98 | | | | 165 | | | | (7 | ) |
| Small-Mid Cap Growth | | | 380,723 | | | | 37,279 | | | | 163,129 | | | | 254,873 | | | | 15,220 | | | | 1,679 | | | | 6,431 | | | | 10,468 | |
| Small-Mid Cap Value | | | 113 | | | | 58 | | | | 122 | | | | 49 | | | | 7 | | | | 6 | | | | 8 | | | | 5 | |
| Small Cap Growth | | | 123,547 | | | | 23,316 | | | | 86,965 | | | | 59,898 | | | | 4,080 | | | | 939 | | | | 3,187 | | | | 1,832 | |
| Small Cap Value | | | 5,677 | | | | 2,217 | | | | 14,925 | | | | (7,031 | ) | | | 281 | | | | 138 | | | | 782 | | | | (363 | ) |
| Global Leaders | | | 1,661 | | | | 1,030 | | | | 1,425 | | | | 1,266 | | | | 109 | | | | 85 | | | | 98 | | | | 96 | |
| International Leaders | | | 3,308 | | | | 312 | | | | 2,911 | | | | 709 | | | | 200 | | | | 22 | | | | 181 | | | | 41 | |
| International Growth | | | 108,982 | | | | 38,814 | | | | 295,580 | | | | (147,784 | ) | | | 3,862 | | | | 1,621 | | | | 10,783 | | | | (5,300 | ) |
| International Small Cap Growth | | | 239 | | | | 429 | | | | 1,644 | | | | (976 | ) | | | 17 | | | | 40 | | | | 130 | | | | (73 | ) |
| Emerging Markets Leaders | | | 4,063 | | | | 179 | | | | 4,196 | | | | 46 | | | | 410 | | | | 21 | | | | 410 | | | | 21 | |
| Emerging Markets Growth | | | 1,881 | | | | 889 | | | | 2,909 | | | | (139 | ) | | | 116 | | | | 79 | | | | 205 | | | | (10 | ) |
| Emerging Markets Small Cap Growth | | | 3,416 | | | | 201 | | | | 6,551 | | | | (2,934 | ) | | | 198 | | | | 14 | | | | 377 | | | | (165 | ) |
| Bond | | | 23,108 | | | | 3,396 | | | | 34,380 | | | | (7,876 | ) | | | 2,284 | | | | 340 | | | | 3,453 | | | | (829 | ) |
| Income | | | 2,428 | | | | 983 | | | | 19,283 | | | | (15,872 | ) | | | 286 | | | | 116 | | | | 2,264 | | | | (1,862 | ) |
| Low Duration | | | 1,165 | | | | 56 | | | | 1,495 | | | | (274 | ) | | | 132 | | | | 6 | | | | 169 | | | | (31 | ) |
| Macro Allocation | | | 22,540 | | | | 666 | | | | 19,962 | | | | 3,244 | | | | 1,959 | | | | 59 | | | | 1,710 | | | | 308 | |
| | | Class I | |
| | | Dollars | | | Shares | |
| Fund | | Sales | | | Reinvest | | | Redemptions | | | Total | | | Sales | | | Reinvest | | | Redemptions | | | Total | |
| Growth | | $ | 19,362 | | | $ | 48,402 | | | $ | 178,305 | | | $ | (110,541 | ) | | | 1,521 | | | | 4,909 | | | | 13,868 | | | | (7,438 | ) |
| Large Cap Growth | | | 30,159 | | | | 17,362 | | | | 81,956 | | | | (34,435 | ) | | | 1,958 | | | | 1,293 | | | | 5,120 | | | | (1,869 | ) |
| Mid Cap Growth | | | 10,073 | | | | 8,782 | | | | 30,355 | | | | (11,500 | ) | | | 806 | | | | 873 | | | | 2,485 | | | | (806 | ) |
| Small-Mid Cap Growth | | | 911,158 | | | | 156,686 | | | | 414,703 | | | | 653,141 | | | | 34,323 | | | | 6,690 | | | | 15,937 | | | | 25,076 | |
| Small-Mid Cap Value | | | 375 | | | | 381 | | | | 1,974 | | | | (1,218 | ) | | | 27 | | | | 39 | | | | 145 | | | | (79 | ) |
| Small Cap Growth | | | 202,591 | | | | 46,926 | | | | 114,306 | | | | 135,211 | | | | 6,183 | | | | 1,690 | | | | 3,677 | | | | 4,196 | |
| Small Cap Value | | | 66,163 | | | | 56,178 | | | | 145,358 | | | | (23,017 | ) | | | 3,311 | | | | 3,405 | | | | 7,213 | | | | (497 | ) |
| Global Leaders | | | 41,290 | | | | 12,892 | | | | 9,995 | | | | 44,187 | | | | 2,836 | | | | 1,066 | | | | 722 | | | | 3,180 | |
| International Leaders | | | 56,269 | | | | 2,896 | | | | 28,827 | | | | 30,338 | | | | 3,554 | | | | 202 | | | | 1,902 | | | | 1,854 | |
| International Growth | | | 200,613 | | | | 133,989 | | | | 531,160 | | | | (196,558 | ) | | | 6,692 | | | | 5,473 | | | | 18,564 | | | | (6,399 | ) |
| International Small Cap Growth | | | 82,715 | | | | 19,411 | | | | 169,747 | | | | (67,621 | ) | | | 5,533 | | | | 1,796 | | | | 13,158 | | | | (5,829 | ) |
| Emerging Markets Leaders | | | 9,820 | | | | 3,475 | | | | 14,210 | | | | (915 | ) | | | 917 | | | | 412 | | | | 1,420 | | | | (91 | ) |
| Emerging Markets Growth | | | 26,970 | | | | 10,009 | | | | 49,600 | | | | (12,621 | ) | | | 1,675 | | | | 876 | | | | 3,405 | | | | (854 | ) |
| Emerging Markets Small Cap Growth | | | 101,685 | | | | 4,171 | | | | 141,110 | | | | (35,254 | ) | | | 5,901 | | | | 296 | | | | 9,187 | | | | (2,990 | ) |
| Bond | | | 89,791 | | | | 13,105 | | | | 182,485 | | | | (79,589 | ) | | | 9,041 | | | | 1,324 | | | | 18,497 | | | | (8,132 | ) |
| Income | | | 8,196 | | | | 1,300 | | | | 24,129 | | | | (14,633 | ) | | | 976 | | | | 154 | | | | 2,848 | | | | (1,718 | ) |
| Low Duration | | | 9,060 | | | | 2,567 | | | | 84,883 | | | | (73,256 | ) | | | 1,029 | | | | 291 | | | | 9,591 | | | | (8,271 | ) |
| Macro Allocation | | | 204,410 | | | | 14,124 | | | | 483,628 | | | | (265,094 | ) | | | 17,377 | | | | 1,250 | | | | 41,548 | | | | (22,921 | ) |
| December 31, 2019 | William Blair Funds | 131 |
Notes to Financial Statements
| | | Institutional/Class R6 | |
| | | Dollars | | | Shares | |
| Fund | | Sales | | | Reinvest | | | Redemptions | | | Total | | | Sales | | | Reinvest | | | Redemptions | | | Total | |
| Global Leaders | | $ | 3,889 | | | $ | 12,002 | | | $ | 65,440 | | | $ | (49,549 | ) | | | 268 | | | | 993 | | | | 4,170 | | | | (2,909 | ) |
| International Leaders | | | 94,113 | | | | 12,596 | | | | 30,591 | | | | 76,118 | | | | 5,729 | | | | 881 | | | | 1,917 | | | | 4,693 | |
| Institutional International Growth | | | 268,610 | | | | 180,253 | | | | 432,394 | | | | 16,469 | | | | 15,659 | | | | 12,959 | | | | 24,320 | | | | 4,298 | |
| International Small Cap Growth | | | 12,441 | | | | 21,099 | | | | 39,019 | | | | (5,479 | ) | | | 833 | | | | 1,941 | | | | 2,717 | | | | 57 | |
| Emerging Markets Leaders | | | 31,986 | | | | 16,112 | | | | 231,210 | | | | (183,112 | ) | | | 2,961 | | | | 1,911 | | | | 23,818 | | | | (18,946 | ) |
| Emerging Markets Growth | | | 199,420 | | | | 70,214 | | | | 513,600 | | | | (243,966 | ) | | | 14,257 | | | | 6,095 | | | | 34,162 | | | | (13,810 | ) |
| Emerging Markets Small Cap Growth | | | 52,476 | | | | 2,144 | | | | 75,303 | | | | (20,683 | ) | | | 2,989 | | | | 152 | | | | 5,051 | | | | (1,910 | ) |
| Bond | | | 4,444 | | | | 3,613 | | | | 23,146 | | | | (15,089 | ) | | | 448 | | | | 366 | | | | 2,364 | | | | (1,550 | ) |
| Low Duration | | | 6,065 | | | | 2,461 | | | | 58,720 | | | | (50,194 | ) | | | 687 | | | | 279 | | | | 6,709 | | | | (5,743 | ) |
| Macro Allocation | | | 74,626 | | | | 11,126 | | | | 161,255 | | | | (75,503 | ) | | | 6,351 | | | | 985 | | | | 13,863 | | | | (6,527 | ) |
| | | Net Change in Net Assets Relating to Fund Share Activity | |
| | | Dollars | | | Shares | |
| Fund | | Sales | | | Reinvest | | | Redemptions | | | Total | | | Sales | | | Reinvest | | | Redemptions | | | Total | |
| Growth | | $ | 42,834 | | | $ | 60,277 | | | $ | 199,681 | | | $ | (96,570 | ) | | | 3,590 | | | | 6,318 | | | | 15,890 | | | | (5,982 | ) |
| Large Cap Growth | | | 60,009 | | | | 23,837 | | | | 96,291 | | | | (12,445 | ) | | | 3,975 | | | | 1,802 | | | | 6,114 | | | | (337 | ) |
| Mid Cap Growth | | | 10,781 | | | | 9,695 | | | | 32,171 | | | | (11,695 | ) | | | 866 | | | | 971 | | | | 2,650 | | | | (813 | ) |
| Small-Mid Cap Growth | | | 1,291,881 | | | | 193,965 | | | | 577,832 | | | | 908,014 | | | | 49,543 | | | | 8,369 | | | | 22,368 | | | | 35,544 | |
| Small-Mid Cap Value | | | 488 | | | | 439 | | | | 2,096 | | | | (1,169 | ) | | | 34 | | | | 45 | | | | 153 | | | | (74 | ) |
| Small Cap Growth | | | 326,138 | | | | 70,242 | | | | 201,271 | | | | 195,109 | | | | 10,263 | | | | 2,629 | | | | 6,864 | | | | 6,028 | |
| Small Cap Value | | | 71,840 | | | | 58,395 | | | | 160,283 | | | | (30,048 | ) | | | 3,592 | | | | 3,543 | | | | 7,995 | | | | (860 | ) |
| Global Leaders | | | 46,840 | | | | 25,924 | | | | 76,860 | | | | (4,096 | ) | | | 3,213 | | | | 2,144 | | | | 4,990 | | | | 367 | |
| International Leaders | | | 153,690 | | | | 15,804 | | | | 62,329 | | | | 107,165 | | | | 9,483 | | | | 1,105 | | | | 4,000 | | | | 6,588 | |
| International Growth | | | 309,595 | | | | 172,803 | | | | 826,740 | | | | (344,342 | ) | | | 10,554 | | | | 7,094 | | | | 29,347 | | | | (11,699 | ) |
| Institutional International Growth | | | 268,610 | | | | 180,253 | | | | 432,394 | | | | 16,469 | | | | 15,659 | | | | 12,959 | | | | 24,320 | | | | 4,298 | |
| International Small Cap Growth | | | 95,395 | | | | 40,939 | | | | 210,410 | | | | (74,076 | ) | | | 6,383 | | | | 3,777 | | | | 16,005 | | | | (5,845 | ) |
| Emerging Markets Leaders | | | 45,869 | | | | 19,766 | | | | 249,616 | | | | (183,981 | ) | | | 4,288 | | | | 2,344 | | | | 25,648 | | | | (19,016 | ) |
| Emerging Markets Growth | | | 228,271 | | | | 81,112 | | | | 566,109 | | | | (256,726 | ) | | | 16,048 | | | | 7,050 | | | | 37,772 | | | | (14,674 | ) |
| Emerging Markets Small Cap Growth | | | 157,577 | | | | 6,516 | | | | 222,964 | | | | (58,871 | ) | | | 9,088 | | | | 462 | | | | 14,615 | | | | (5,065 | ) |
| Bond | | | 117,343 | | | | 20,114 | | | | 240,011 | | | | (102,554 | ) | | | 11,773 | | | | 2,030 | | | | 24,314 | | | | (10,511 | ) |
| Income | | | 10,624 | | | | 2,283 | | | | 43,412 | | | | (30,505 | ) | | | 1,262 | | | | 270 | | | | 5,112 | | | | (3,580 | ) |
| Low Duration | | | 16,290 | | | | 5,084 | | | | 145,098 | | | | (123,724 | ) | | | 1,848 | | | | 576 | | | | 16,469 | | | | (14,045 | ) |
| Macro Allocation | | | 301,576 | | | | 25,916 | | | | 664,845 | | | | (337,353 | ) | | | 25,687 | | | | 2,294 | | | | 57,121 | | | | (29,140 | ) |
(8) Subsequent Events
The Funds have evaluated subsequent events through the date of issuance of the Funds’ financial statements and have determined there is no impact to the Funds’ financial statements.
| 132 | Annual Report | December 31, 2019 |
Financial Highlights— For a share outstanding throughout each period
Growth Fund
| | | Class N | |
| | | Years Ended December 31, | |
| | | 2019 | | | 2018 | | | 2017 | | | 2016 | | | 2015 | |
| Net asset value, beginning of year | | $ | 7.91 | | | $ | 10.27 | | | $ | 11.41 | | | $ | 12.52 | | | $ | 13.55 | |
| Income (loss) from investment operations: | | | | | | | | | | | | | | | | | | | | |
| Net investment income (loss) | | | (0.03 | ) | | | (0.04 | ) | | | (0.02 | ) | | | (0.02 | ) | | | (0.04 | ) |
| Net realized and unrealized gain (loss) on investments | | | 2.54 | | | | 0.75 | | | | 2.78 | | | | (0.08 | ) | | | 0.75 | |
| Total from investment operations | | | 2.51 | | | | 0.71 | | | | 2.76 | | | | (0.10 | ) | | | 0.71 | |
| Less distributions from: | | | | | | | | | | | | | | | | | | | | |
| Net investment income | | | — | | | | — | | | | — | | | | — | | | | — | |
| Net realized gain | | | 0.97 | | | | 3.07 | | | | 3.90 | | | | 1.01 | | | | 1.74 | |
| Total distributions | | | 0.97 | | | | 3.07 | | | | 3.90 | | | | 1.01 | | | | 1.74 | |
| Net asset value, end of year | | $ | 9.45 | | | $ | 7.91 | | | $ | 10.27 | | | $ | 11.41 | | | $ | 12.52 | |
| Total return (%) | | | 31.97 | | | | 5.10 | | | | 24.35 | | | | (0.98 | ) | | | 5.31 | |
| Ratios to average daily net assets (%): | | | | | | | | | | | | | | | | | | | | |
| Expenses, before waivers and reimbursements | | | 1.24 | | | | 1.22 | | | | 1.20 | | | | 1.21 | | | | 1.19 | |
| Expenses, net of waivers and reimbursements | | | 1.20 | | | | 1.20 | | | | 1.20 | | | | 1.21 | | | | 1.19 | |
| Net investment income (loss), before waivers and reimbursements | | | (0.35 | ) | | | (0.36 | ) | | | (0.14 | ) | | | (0.15 | ) | | | (0.29 | ) |
| Net investment income (loss), net of waivers and reimbursements | | | (0.31 | ) | | | (0.34 | ) | | | (0.14 | ) | | | (0.15 | ) | | | (0.29 | ) |
| Class N net assets at the end of the year (in thousands) | | $ | 32,710 | | | $ | 38,370 | | | $ | 34,886 | | | $ | 62,936 | | | $ | 149,754 | |
| Portfolio turnover rate (%) | | | 39 | | | | 46 | | | | 38 | | | | 79 | | | | 78 | |
| | | | | | | | | | | | | | | | | | | | | |
| | | Class I | |
| | | Years Ended December 31, | |
| | | | 2019 | | | | 2018 | | | | 2017 | | | | 2016 | | | | 2015 | |
| Net asset value, beginning of year | | $ | 9.25 | | | $ | 11.51 | | | $ | 12.39 | | | $ | 13.50 | | | $ | 14.43 | |
| Income (loss) from investment operations: | | | | | | | | | | | | | | | | | | | | |
| Net investment income (loss) | | | (0.00 | )^ | | | (0.01 | ) | | | 0.02 | | | | 0.03 | | | | 0.01 | |
| Net realized and unrealized gain (loss) on investments | | | 2.97 | | | | 0.82 | | | | 3.02 | | | | (0.10 | ) | | | 0.80 | |
| Total from investment operations | | | 2.97 | | | | 0.81 | | | | 3.04 | | | | (0.07 | ) | | | 0.81 | |
| Less distributions from: | | | | | | | | | | | | | | | | | | | | |
| Net investment income | | | — | | | | 0.00 | ^ | | | 0.02 | | | | 0.03 | | | | — | |
| Net realized gain | | | 0.97 | | | | 3.07 | | | | 3.90 | | | | 1.01 | | | | 1.74 | |
| Total distributions | | | 0.97 | | | | 3.07 | | | | 3.92 | | | | 1.04 | | | | 1.74 | |
| Net asset value, end of year | | $ | 11.25 | | | $ | 9.25 | | | $ | 11.51 | | | $ | 12.39 | | | $ | 13.50 | |
| Total return (%) | | | 32.32 | | | | 5.42 | | | | 24.64 | | | | (0.69 | ) | | | 5.69 | |
| Ratios to average daily net assets (%): | | | | | | | | | | | | | | | | | | | | |
| Expenses | | | 0.92 | | | | 0.91 | | | | 0.92 | | | | 0.90 | | | | 0.89 | |
| Net investment income (loss) | | | (0.03 | ) | | | (0.06 | ) | | | 0.12 | | | | 0.20 | | | | 0.06 | |
| Class I net assets at the end of the year (in thousands) | | $ | 220,660 | | | $ | 187,306 | | | $ | 318,848 | | | $ | 514,870 | | | $ | 696,744 | |
| Portfolio turnover rate (%) | | | 39 | | | | 46 | | | | 38 | | | | 79 | | | | 78 | |
| ^ | Amount is less than $0.005 per share. |
Note: Net investment income (loss) per share is based on the average shares outstanding during the year.
Performance cited represents past performance. Past performance does not guarantee future results and current performance may be lower or higher than the data quoted. Results shown are annual returns, which assume reinvestment of dividends and capital gains. Investment returns and principal will fluctuate and you may have a gain or loss when you sell shares. For the most current month-end performance information, please call 1-800-742-7272 or visit our Web site atwww.williamblairfunds.com.
| December 31, 2019 | William Blair Funds | 133 |
Financial Highlights— For a share outstanding throughout each period
Growth Fund
| | | Class R6 | |
| | | Period Ended
December 31, | |
| | | 2019(a) | |
| Net asset value, beginning of year | | | $ | 11.06 | |
| Income (loss) from investment operations: | | | | | |
| Net investment income (loss) | | | | (0.00 | )^ |
| Net realized and unrealized gain (loss) on investments | | | | 1.17 | |
| Total from investment operations | | | | 1.17 | |
| Less distributions from: | | | | | |
| Net investment income | | | | — | |
| Net realized gain | | | | 0.97 | |
| Total distributions | | | | 0.97 | |
| Net asset value, end of year | | | $ | 11.26 | |
| Total return (%)* | | | | 10.75 | |
| Ratios to average daily net assets (%)**: | | | | | |
| Expenses | | | | 0.88 | |
| Net investment income (loss) | | | | (0.06 | ) |
| Class R6 net assets at the end of the year (in thousands) | | | $ | 217 | |
| Portfolio turnover rate (%)* | | | | 39 | |
| (a) | For the period from May 2, 2019 (Commencement of Operations) to December 31, 2019. |
| * | Rates are not annualized for periods less than a year. |
| ** | Rates are annualized for periods less than a year. |
| ^ | Amount is less than $0.005 per share. |
Note: Net investment income (loss) per share is based on the average shares outstanding during the year.
Performance cited represents past performance. Past performance does not guarantee future results and current performance may be lower or higher than the data quoted. Results shown are annual returns, which assume reinvestment of dividends and capital gains. Investment returns and principal will fluctuate and you may have a gain or loss when you sell shares. For the most current month-end performance information, please call 1-800-742-7272 or visit our Web site atwww.williamblairfunds.com.
| 134 | Annual Report | December 31, 2019 |
Financial Highlights— For a share outstanding throughout each period
Large Cap Growth Fund
| | | Class N | |
| | | Years Ended December 31, | |
| | | 2019 | | | 2018 | | | 2017 | | | 2016 | | | 2015 | |
| Net asset value, beginning of year | | $ | 11.99 | | | $ | 13.35 | | | $ | 10.26 | | | $ | 10.15 | | | $ | 10.46 | |
| Income (loss) from investment operations: | | | | | | | | | | | | | | | | | | | | |
| Net investment income (loss) | | | 0.00 | ^ | | | (0.02 | ) | | | (0.02 | ) | | | 0.02 | | | | (0.02 | ) |
| Net realized and unrealized gain (loss) on investments | | | 4.29 | | | | 0.81 | | | | 3.19 | | | | 0.18 | | | | 0.75 | |
| Total from investment operations | | | 4.29 | | | | 0.79 | | | | 3.17 | | | | 0.20 | | | | 0.73 | |
| Less distributions from: | | | | | | | | | | | | | | | | | | | | |
| Net investment income | | | 0.01 | | | | — | | | | — | | | | 0.01 | | | | — | |
| Net realized gain | | | 1.00 | | | | 2.15 | | | | 0.08 | | | | 0.08 | | | | 1.04 | |
| Total distributions | | | 1.01 | | | | 2.15 | | | | 0.08 | | | | 0.09 | | | | 1.04 | |
| Net asset value, end of year | | $ | 15.27 | | | $ | 11.99 | | | $ | 13.35 | | | $ | 10.26 | | | $ | 10.15 | |
| Total return (%) | | | 36.00 | | | | 4.96 | | | | 30.88 | | | | 1.97 | | | | 7.04 | |
| Ratios to average daily net assets (%): | | | | | | | | | | | | | | | | | | | | |
| Expenses, before waivers and reimbursements | | | 1.12 | | | | 1.21 | | | | 1.19 | | | | 1.23 | | | | 1.28 | |
| Expenses, net of waivers and reimbursements | | | 0.95 | | | | 1.05 | | | | 1.05 | | | | 1.05 | | | | 1.07 | |
| Net investment income (loss), before waivers and reimbursements | | | (0.14 | ) | | | (0.33 | ) | | | (0.27 | ) | | | (0.01 | ) | | | (0.43 | ) |
| Net investment income (loss), net of waivers and reimbursements | | | 0.03 | | | | (0.17 | ) | | | (0.13 | ) | | | 0.17 | | | | (0.22 | ) |
| Class N net assets at the end of the year (in thousands) | | $ | 65,314 | | | $ | 41,361 | | | $ | 25,604 | | | $ | 11,860 | | | $ | 10,443 | |
| Portfolio turnover rate (%) | | | 37 | | | | 47 | | | | 29 | | | | 44 | | | | 38 | |
| | | | | | | | | | | | | | | | | | | | | |
| | | Class I | |
| | | Years Ended December 31, | |
| | | | 2019 | | | | 2018 | | | | 2017 | | | | 2016 | | | | 2015 | |
| Net asset value, beginning of year | | $ | 12.66 | | | $ | 13.97 | | | $ | 10.70 | | | $ | 10.58 | | | $ | 10.84 | |
| Income (loss) from investment operations: | | | | | | | | | | | | | | | | | | | | |
| Net investment income (loss) | | | 0.04 | | | | 0.01 | | | | 0.02 | | | | 0.04 | | | | (0.00 | )^ |
| Net realized and unrealized gain (loss) on investments | | | 4.54 | | | | 0.85 | | | | 3.33 | | | | 0.19 | | | | 0.78 | |
| Total from investment operations | | | 4.58 | | | | 0.86 | | | | 3.35 | | | | 0.23 | | | | 0.78 | |
| Less distributions from: | | | | | | | | | | | | | | | | | | | | |
| Net investment income | | | 0.05 | | | | 0.02 | | | | — | | | | 0.03 | | | | — | |
| Net realized gain | | | 1.00 | | | | 2.15 | | | | 0.08 | | | | 0.08 | | | | 1.04 | |
| Total distributions | | | 1.05 | | | | 2.17 | | | | 0.08 | | | | 0.11 | | | | 1.04 | |
| Net asset value, end of year | | $ | 16.19 | | | $ | 12.66 | | | $ | 13.97 | | | $ | 10.70 | | | $ | 10.58 | |
| Total return (%) | | | 36.35 | | | | 5.21 | | | | 31.29 | | | | 2.22 | | | | 7.26 | |
| Ratios to average daily net assets (%): | | | | | | | | | | | | | | | | | | | | |
| Expenses, before waivers and reimbursements | | | 0.81 | | | | 0.90 | | | | 0.90 | | | | 0.91 | | | | 0.95 | |
| Expenses, net of waivers and reimbursements | | | 0.70 | | | | 0.80 | | | | 0.80 | | | | 0.80 | | | | 0.82 | |
| Net investment income (loss), before waivers and reimbursements | | | 0.16 | | | | (0.01 | ) | | | 0.03 | | | | 0.30 | | | | (0.10 | ) |
| Net investment income (loss), net of waivers and reimbursements | | | 0.27 | | | | 0.09 | | | | 0.13 | | | | 0.41 | | | | 0.03 | |
| Class I net assets at the end of the year (in thousands) | | $ | 236,930 | | | $ | 137,599 | | | $ | 177,959 | | | $ | 110,475 | | | $ | 59,038 | |
| Portfolio turnover rate (%) | | | 37 | | | | 47 | | | | 29 | | | | 44 | | | | 38 | |
| ^ | Amount is less than $0.005 per share. |
Note: Net investment income (loss) per share is based on the average shares outstanding during the year.
Performance cited represents past performance. Past performance does not guarantee future results and current performance may be lower or higher than the data quoted. Results shown are annual returns, which assume reinvestment of dividends and capital gains. Investment returns and principal will fluctuate and you may have a gain or loss when you sell shares. For the most current month-end performance information, please call 1-800-742-7272 or visit our Web site atwww.williamblairfunds.com.
| December 31, 2019 | William Blair Funds | 135 |
Financial Highlights— For a share outstanding throughout each period
Large Cap Growth Fund
| | | Class R6 | |
| | | Period Ended
December 31, | |
| | | 2019(a) | |
| Net asset value, beginning of year | | | $ | 15.12 | |
| Income (loss) from investment operations: | | | | | |
| Net investment income (loss) | | | | 0.04 | |
| Net realized and unrealized gain (loss) on investments | | | | 2.07 | |
| Total from investment operations | | | | 2.11 | |
| Less distributions from: | | | | | |
| Net investment income | | | | 0.06 | |
| Net realized gain | | | | 1.00 | |
| Total distributions | | | | 1.06 | |
| Net asset value, end of year | | | $ | 16.17 | |
| Total return (%)* | | | | 14.13 | |
| Ratios to average daily net assets (%)**: | | | | | |
| Expenses, before waivers and reimbursements | | | | 0.71 | |
| Expenses, net of waivers and reimbursements | | | | 0.60 | |
| Net investment income (loss), before waivers and reimbursements | | | | 0.22 | |
| Net investment income (loss), net of waivers and reimbursements | | | | 0.33 | |
| Class R6 net assets at the end of the year (in thousands) | | | $ | 1,590 | |
| Portfolio turnover rate (%)* | | | | 37 | |
| (a) | For the period from May 2, 2019 (Commencement of Operations) to December 31, 2019. |
| * | Rates are not annualized for periods less than a year. |
| ** | Rates are annualized for periods less than a year. |
Note: Net investment income (loss) per share is based on the average shares outstanding during the year.
Performance cited represents past performance. Past performance does not guarantee future results and current performance may be lower or higher than the data quoted. Results shown are annual returns, which assume reinvestment of dividends and capital gains. Investment returns and principal will fluctuate and you may have a gain or loss when you sell shares. For the most current month-end performance information, please call 1-800-742-7272 or visit our Web site atwww.williamblairfunds.com.
| 136 | Annual Report | December 31, 2019 |
Financial Highlights— For a share outstanding throughout each period
Mid Cap Growth Fund
| | | Class N | |
| | | Years Ended December 31, | |
| | | 2019 | | | 2018 | | | 2017 | | | 2016 | | | 2015 | |
| Net asset value, beginning of year | | $ | 8.87 | | | $ | 10.92 | | | $ | 10.69 | | | $ | 11.28 | | | $ | 14.20 | |
| Income (loss) from investment operations: | | | | | | | | | | | | | | | | | | | | |
| Net investment income (loss) | | | (0.05 | ) | | | (0.06 | ) | | | (0.08 | ) | | | (0.06 | ) | | | (0.09 | ) |
| Net realized and unrealized gain (loss) on investments | | | 3.22 | | | | 0.03 | | | | 2.29 | | | | 0.09 | | | | 0.04 | |
| Total from investment operations | | | 3.17 | | | | (0.03 | ) | | | 2.21 | | | | 0.03 | | | | (0.05 | ) |
| Less distributions from: | | | | | | | | | | | | | | | | | | | | |
| Net investment income | | | — | | | | — | | | | — | | | | — | | | | — | |
| Net realized gain | | | 1.05 | | | | 2.02 | | | | 1.98 | | | | 0.62 | | | | 2.87 | |
| Total distributions | | | 1.05 | | | | 2.02 | | | | 1.98 | | | | 0.62 | | | | 2.87 | |
| Net asset value, end of year | | $ | 10.99 | | | $ | 8.87 | | | $ | 10.92 | | | $ | 10.69 | | | $ | 11.28 | |
| Total return (%) | | | 36.02 | | | | (1.20 | ) | | | 20.88 | | | | 0.23 | | | | (0.20 | ) |
| Ratios to average daily net assets (%): | | | | | | | | | | | | | | | | | | | | |
| Expenses, before waivers and reimbursements | | | 1.51 | | | | 1.57 | | | | 1.49 | | | | 1.45 | | | | 1.43 | |
| Expenses, net of waivers and reimbursements | | | 1.20 | | | | 1.23 | | | | 1.30 | | | | 1.30 | | | | 1.32 | |
| Net investment income (loss), before waivers and reimbursements | | | (0.79 | ) | | | (0.85 | ) | | | (0.84 | ) | | | (0.68 | ) | | | (0.76 | ) |
| Net investment income (loss), net of waivers and reimbursements | | | (0.48 | ) | | | (0.51 | ) | | | (0.65 | ) | | | (0.53 | ) | | | (0.65 | ) |
| Class N net assets at the end of the year (in thousands) | | $ | 5,465 | | | $ | 4,944 | | | $ | 6,166 | | | $ | 16,234 | | | $ | 25,105 | |
| Portfolio turnover rate (%) | | | 43 | | | | 58 | | | | 59 | | | | 60 | | | | 65 | |
| | | | | | | | | | | | | | | | | | | | | |
| | | Class I | |
| | | Years Ended December 31, | |
| | | | 2019 | | | | 2018 | | | | 2017 | | | | 2016 | | | | 2015 | |
| Net asset value, beginning of year | | $ | 9.55 | | | $ | 11.57 | | | $ | 11.20 | | | $ | 11.76 | | | $ | 14.65 | |
| Income (loss) from investment operations: | | | | | | | | | | | | | | | | | | | | |
| Net investment income (loss) | | | (0.03 | ) | | | (0.03 | ) | | | (0.05 | ) | | | (0.03 | ) | | | (0.06 | ) |
| Net realized and unrealized gain (loss) on investments | | | 3.46 | | | | 0.03 | | | | 2.40 | | | | 0.09 | | | | 0.04 | |
| Total from investment operations | | | 3.43 | | | | — | | | | 2.35 | | | | 0.06 | | | | (0.02 | ) |
| Less distributions from: | | | | | | | | | | | | | | | | | | | | |
| Net investment income | | | — | | | | — | | | | — | | | | — | | | | — | |
| Net realized gain | | | 1.05 | | | | 2.02 | | | | 1.98 | | | | 0.62 | | | | 2.87 | |
| Total distributions | | | 1.05 | | | | 2.02 | | | | 1.98 | | | | 0.62 | | | | 2.87 | |
| Net asset value, end of year | | $ | 11.93 | | | $ | 9.55 | | | $ | 11.57 | | | $ | 11.20 | | | $ | 11.76 | |
| Total return (%) | | | 36.17 | | | | (0.86 | ) | | | 21.18 | | | | 0.48 | | | | 0.00 | |
| Ratios to average daily net assets (%): | | | | | | | | | | | | | | | | | | | | |
| Expenses, before waivers and reimbursements | | | 1.28 | | | | 1.31 | | | | 1.23 | | | | 1.18 | | | | 1.14 | |
| Expenses, net of waivers and reimbursements | | | 0.95 | | | | 0.98 | | | | 1.05 | | | | 1.05 | | | | 1.07 | |
| Net investment income (loss), before waivers and reimbursements | | | (0.56 | ) | | | (0.58 | ) | | | (0.58 | ) | | | (0.39 | ) | | | (0.48 | ) |
| Net investment income (loss), net of waivers and reimbursements | | | (0.23 | ) | | | (0.25 | ) | | | (0.40 | ) | | | (0.26 | ) | | | (0.41 | ) |
| Class I net assets at the end of the year (in thousands) | | $ | 67,936 | | | $ | 51,173 | | | $ | 71,369 | | | $ | 119,424 | | | $ | 174,617 | |
| Portfolio turnover rate (%) | | | 43 | | | | 58 | | | | 59 | | | | 60 | | | | 65 | |
Note: Net investment income (loss) per share is based on the average shares outstanding during the year.
Performance cited represents past performance. Past performance does not guarantee future results and current performance may be lower or higher than the data quoted. Results shown are annual returns, which assume reinvestment of dividends and capital gains. Investment returns and principal will fluctuate and you may have a gain or loss when you sell shares. For the most current month-end performance information, please call 1-800-742-7272 or visit our Web site atwww.williamblairfunds.com.
| December 31, 2019 | William Blair Funds | 137 |
Financial Highlights— For a share outstanding throughout each period
Mid Cap Growth Fund
| | | Class R6 | |
| | | Period Ended
December 31, | |
| | | 2019(a) | |
| Net asset value, beginning of year | | | $ | 11.93 | |
| Income (loss) from investment operations: | | | | | |
| Net investment income (loss) | | | | (0.01 | ) |
| Net realized and unrealized gain (loss) on investments | | | | 1.07 | |
| Total from investment operations | | | | 1.06 | |
| Less distributions from: | | | | | |
| Net investment income | | | | — | |
| Net realized gain | | | | 1.05 | |
| Total distributions | | | | 1.05 | |
| Net asset value, end of year | | | $ | 11.94 | |
| Total return (%)* | | | | 9.10 | |
| Ratios to average daily net assets (%)**: | | | | | |
| Expenses, before waivers and reimbursements | | | | 1.14 | |
| Expenses, net of waivers and reimbursements | | | | 0.90 | |
| Net investment income (loss), before waivers and reimbursements | | | | (0.41 | ) |
| Net investment income (loss), net of waivers and reimbursements | | | | (0.17 | ) |
| Class R6 net assets at the end of the year (in thousands) | | | $ | 145 | |
| Portfolio turnover rate (%)* | | | | 43 | |
| (a) | For the period from May 2, 2019 (Commencement of Operations) to December 31, 2019. |
| * | Rates are not annualized for periods less than a year. |
| ** | Rates are annualized for periods less than a year. |
Note: Net investment income (loss) per share is based on the average shares outstanding during the year.
Performance cited represents past performance. Past performance does not guarantee future results and current performance may be lower or higher than the data quoted. Results shown are annual returns, which assume reinvestment of dividends and capital gains. Investment returns and principal will fluctuate and you may have a gain or loss when you sell shares. For the most current month-end performance information, please call 1-800-742-7272 or visit our Web site atwww.williamblairfunds.com.
| 138 | Annual Report | December 31, 2019 |
Financial Highlights— For a share outstanding throughout each period
Small-Mid Cap Core Fund
| | | Class I | |
| | | Period Ended
December 31, | |
| | | 2019(a) | |
| Net asset value, beginning of year | | | $ | 10.00 | |
| Income (loss) from investment operations: | | | | | |
| Net investment income (loss) | | | | 0.02 | |
| Net realized and unrealized gain (loss) on investments | | | | 0.67 | |
| Total from investment operations | | | | 0.69 | |
| Less distributions from: | | | | | |
| Net investment income | | | | 0.01 | |
| Net realized gain | | | | — | |
| Total distributions | | | | 0.01 | |
| Net asset value, end of year | | | $ | 10.68 | |
| Total return (%)* | | | | 6.87 | |
| Ratios to average daily net assets (%)**: | | | | | |
| Expenses, before waivers and reimbursements | | | | 3.92 | |
| Expenses, net of waivers and reimbursements | | | | 0.95 | |
| Net investment income (loss), before waivers and reimbursements | | | | (2.23 | ) |
| Net investment income (loss), net of waivers and reimbursements | | | | 0.74 | |
| Class N net assets at the end of the year (in thousands) | | | $ | 1,655 | |
| Portfolio turnover rate (%)* | | | | 12 | |
| | | | | | |
| | | Class R6 | |
| | | Period Ended
December 31, | |
| | | 2019(a) | |
| Net asset value, beginning of year | | | $ | 10.00 | |
| Income (loss) from investment operations: | | | | | |
| Net investment income (loss) | | | | 0.01 | |
| Net realized and unrealized gain (loss) on investments | | | | 0.68 | |
| Total from investment operations | | | | 0.69 | |
| Less distributions from: | | | | | |
| Net investment income | | | | 0.01 | |
| Net realized gain | | | | — | |
| Total distributions | | | | 0.01 | |
| Net asset value, end of year | | | $ | 10.68 | |
| Total return (%)* | | | | 6.88 | |
| Ratios to average daily net assets (%)**: | | | | | |
| Expenses, before waivers and reimbursements | | | | 3.92 | |
| Expenses, net of waivers and reimbursements | | | | 0.90 | |
| Net investment income (loss), before waivers and reimbursements | | | | (2.71 | ) |
| Net investment income (loss), net of waivers and reimbursements | | | | 0.31 | |
| Class I net assets at the end of the year (in thousands) | | | $ | 4,933 | |
| Portfolio turnover rate (%)* | | | | 12 | |
| (a) | For the period from October 1, 2019 (commencement of operations) to December 31, 2019. |
| * | Rates are not annualized for periods less than a year. |
| ** | Rates are annualized for periods less than a year. |
Note: Net investment income (loss) per share is based on the average shares outstanding during the year.
Performance cited represents past performance. Past performance does not guarantee future results and current performance may be lower or higher than the data quoted. Results shown are annual returns, which assume reinvestment of dividends and capital gains. Investment returns and principal will fluctuate and you may have a gain or loss when you sell shares. For the most current month-end performance information, please call 1-800-742-7272 or visit our Web site atwww.williamblairfunds.com.
| December 31, 2019 | William Blair Funds | 139 |
Financial Highlights— For a share outstanding throughout each period
Small-Mid Cap Growth Fund
| | | Class N | |
| | | Years Ended December 31, | |
| | | 2019 | | | 2018 | | | 2017 | | | 2016 | | | 2015 | |
| Net asset value, beginning of year | | $ | 20.97 | | | $ | 23.36 | | | $ | 19.20 | | | $ | 18.53 | | | $ | 18.72 | |
| Income (loss) from investment operations: | | | | | | | | | | | | | | | | | | | | |
| Net investment income (loss) | | | (0.20 | ) | | | (0.18 | ) | | | (0.16 | ) | | | (0.09 | ) | | | (0.10 | ) |
| Net realized and unrealized gain (loss) on investments | | | 6.56 | | | | (0.25 | ) | | | 5.62 | | | | 1.29 | | | | 0.93 | |
| Total from investment operations | | | 6.36 | | | | (0.43 | ) | | | 5.46 | | | | 1.20 | | | | 0.83 | |
| Less distributions from: | | | | | | | | | | | | | | | | | | | | |
| Net investment income | | | — | | | | — | | | | — | | | | — | | | | — | |
| Net realized gain | | | 1.92 | | | | 1.96 | | | | 1.30 | | | | 0.53 | | | | 1.02 | |
| Total distributions | | | 1.92 | | | | 1.96 | | | | 1.30 | | | | 0.53 | | | | 1.02 | |
| Net asset value, end of year | | $ | 25.41 | | | $ | 20.97 | | | $ | 23.36 | | | $ | 19.20 | | | $ | 18.53 | |
| Total return (%) | | | 30.41 | | | | (2.29 | ) | | | 28.57 | | | | 6.45 | | | | 4.47 | |
| Ratios to average daily net assets (%): | | | | | | | | | | | | | | | | | | | | |
| Expenses, before waivers and reimbursements | | | 1.43 | | | | 1.44 | | | | 1.43 | | | | 1.43 | | | | 1.42 | |
| Expenses, net of waivers and reimbursements | | | 1.35 | | | | 1.35 | | | | 1.35 | | | | 1.35 | | | | 1.35 | |
| Net investment income (loss), before waivers and reimbursements | | | (0.88 | ) | | | (0.81 | ) | | | (0.82 | ) | | | (0.59 | ) | | | (0.58 | ) |
| Net investment income (loss), net of waivers and reimbursements | | | (0.80 | ) | | | (0.72 | ) | | | (0.74 | ) | | | (0.51 | ) | | | (0.51 | ) |
| Class N net assets at the end of the year (in thousands) | | $ | 334,017 | | | $ | 424,865 | | | $ | 228,828 | | | $ | 171,638 | | | $ | 169,595 | |
| Portfolio turnover rate (%) | | | 56 | | | | 46 | | | | 64 | | | | 66 | | | | 44 | |
| | | | | | | | | | | | | | | | | | | | | |
| | | Class I | |
| | | Years Ended December 31, | |
| | | | 2019 | | | | 2018 | | | | 2017 | | | | 2016 | | | | 2015 | |
| Net asset value, beginning of year | | $ | 22.12 | | | $ | 24.48 | | | $ | 20.02 | | | $ | 19.25 | | | $ | 19.36 | |
| Income (loss) from investment operations: | | | | | | | | | | | | | | | | | | | | |
| Net investment income (loss) | | | (0.14 | ) | | | (0.12 | ) | | | (0.11 | ) | | | (0.05 | ) | | | (0.06 | ) |
| Net realized and unrealized gain (loss) on investments | | | 6.93 | | | | (0.28 | ) | | | 5.87 | | | | 1.35 | | | | 0.97 | |
| Total from investment operations | | | 6.79 | | | | (0.40 | ) | | | 5.76 | | | | 1.30 | | | | 0.91 | |
| Less distributions from: | | | | | | | | | | | | | | | | | | | | |
| Net investment income | | | — | | | | — | | | | — | | | | — | | | | — | |
| Net realized gain | | | 1.92 | | | | 1.96 | | | | 1.30 | | | | 0.53 | | | | 1.02 | |
| Total distributions | | | 1.92 | | | | 1.96 | | | | 1.30 | | | | 0.53 | | | | 1.02 | |
| Net asset value, end of year | | $ | 26.99 | | | $ | 22.12 | | | $ | 24.48 | | | $ | 20.02 | | | $ | 19.25 | |
| Total return (%) | | | 30.77 | | | | (2.06 | ) | | | 28.90 | | | | 6.72 | | | | 4.74 | |
| Ratios to average daily net assets (%): | | | | | | | | | | | | | | | | | | | | |
| Expenses, before waivers and reimbursements | | | 1.16 | | | | 1.16 | | | | 1.16 | | | | 1.16 | | | | 1.15 | |
| Expenses, net of waivers and reimbursements | | | 1.10 | | | | 1.10 | | | | 1.10 | | | | 1.10 | | | | 1.10 | |
| Net investment income (loss), before waivers and reimbursements | | | (0.59 | ) | | | (0.53 | ) | | | (0.55 | ) | | | (0.34 | ) | | | (0.33 | ) |
| Net investment income (loss), net of waivers and reimbursements | | | (0.53 | ) | | | (0.47 | ) | | | (0.49 | ) | | | (0.28 | ) | | | (0.28 | ) |
| Class I net assets at the end of the year (in thousands) | | $ | 2,531,823 | | | $ | 1,979,105 | | | $ | 1,576,180 | | | $ | 1,090,939 | | | $ | 1,019,544 | |
| Portfolio turnover rate (%) | | | 56 | | | | 46 | | | | 64 | | | | 66 | | | | 44 | |
Note: Net investment income (loss) per share is based on the average shares outstanding during the year.
Performance cited represents past performance. Past performance does not guarantee future results and current performance may be lower or higher than the data quoted. Results shown are annual returns, which assume reinvestment of dividends and capital gains. Investment returns and principal will fluctuate and you may have a gain or loss when you sell shares. For the most current month-end performance information, please call 1-800-742-7272 or visit our Web site atwww.williamblairfunds.com.
| 140 | Annual Report | December 31, 2019 |
Financial Highlights— For a share outstanding throughout each period
Small-Mid Cap Growth Fund
| | | Class R6 | |
| | | Period Ended
December 31, | |
| | | 2019(a) | |
| Net asset value, beginning of year | | | $ | 26.76 | |
| Income (loss) from investment operations: | | | | | |
| Net investment income (loss) | | | | (0.09 | ) |
| Net realized and unrealized gain (loss) on investments | | | | 2.26 | |
| Total from investment operations | | | | 2.17 | |
| Less distributions from: | | | | | |
| Net investment income | | | | — | |
| Net realized gain | | | | 1.92 | |
| Total distributions | | | | 1.92 | |
| Net asset value, end of year | | | $ | 27.01 | |
| Total return (%)* | | | | 8.17 | |
| Ratios to average daily net assets (%)**: | | | | | |
| Expenses | | | | 1.05 | |
| Net investment income (loss) | | | | (0.46 | ) |
| Class R6 net assets at the end of the year (in thousands) | | | $ | 39,974 | |
| Portfolio turnover rate (%)* | | | | 56 | |
| (a) | For the period from May 2, 2019 (Commencement of Operations) to December 31, 2019. |
| * | Rates are not annualized for periods less than a year. |
| ** | Rates are annualized for periods less than a year. |
Note: Net investment income (loss) per share is based on the average shares outstanding during the year.
Performance cited represents past performance. Past performance does not guarantee future results and current performance may be lower or higher than the data quoted. Results shown are annual returns, which assume reinvestment of dividends and capital gains. Investment returns and principal will fluctuate and you may have a gain or loss when you sell shares. For the most current month-end performance information, please call 1-800-742-7272 or visit our Web site atwww.williamblairfunds.com.
| December 31, 2019 | William Blair Funds | 141 |
Financial Highlights— For a share outstanding throughout each period
Small-Mid Cap Value Fund
| | | Class N | |
| | | Years Ended December 31, | |
| | | 2019 | | | 2018 | | | 2017 | | | 2016 | | | 2015 | |
| Net asset value, beginning of year | | $ | 9.31 | | | $ | 14.31 | | | $ | 14.53 | | | $ | 12.54 | | | $ | 13.63 | |
| Income (loss) from investment operations: | | | | | | | | | | | | | | | | | | | | |
| Net investment income (loss) | | | 0.10 | | | | 0.09 | | | | 0.04 | | | | 0.04 | | | | 0.04 | |
| Net realized and unrealized gain (loss) on investments | | | 2.00 | | | | (2.08 | ) | | | 1.33 | | | | 2.55 | | | | (0.47 | ) |
| Total from investment operations | | | 2.10 | | | | (1.99 | ) | | | 1.37 | | | | 2.59 | | | | (0.43 | ) |
| Less distributions from: | | | | | | | | | | | | | | | | | | | | |
| Net investment income | | | 0.03 | | | | 0.03 | | | | 0.02 | | | | 0.01 | | | | 0.01 | |
| Net realized gain | | | 0.16 | | | | 2.98 | | | | 1.57 | | | | 0.59 | | | | 0.65 | |
| Total distributions | | | 0.19 | | | | 3.01 | | | | 1.59 | | | | 0.60 | | | | 0.66 | |
| Net asset value, end of year | | $ | 11.22 | | | $ | 9.31 | | | $ | 14.31 | | | $ | 14.53 | | | $ | 12.54 | |
| Total return (%) | | | 22.77 | | | | (15.32 | ) | | | 9.59 | | | | 20.69 | | | | (3.13 | ) |
| Ratios to average daily net assets (%): | | | | | | | | | | | | | | | | | | | | |
| Expenses, before waivers and reimbursements | | | 6.76 | | | | 6.88 | | | | 4.83 | | | | 4.15 | | | | 3.93 | |
| Expenses, net of waivers and reimbursements | | | 1.25 | | | | 1.28 | | | | 1.35 | | | | 1.35 | | | | 1.37 | |
| Net investment income (loss), before waivers and reimbursements | | | (4.59 | ) | | | (4.97 | ) | | | (3.21 | ) | | | (2.51 | ) | | | (2.29 | ) |
| Net investment income (loss), net of waivers and reimbursements | | | 0.92 | | | | 0.63 | | | | 0.27 | | | | 0.29 | | | | 0.27 | |
| Class N net assets at the end of the year (in thousands) | | $ | 315 | | | $ | 234 | | | $ | 284 | | | $ | 267 | | | $ | 855 | |
| Portfolio turnover rate (%) | | | 107 | | | | 104 | | | | 70 | | | | 45 | | | | 35 | |
| | | | | | | | | | | | | | | | | | | | | |
| | | Class I | |
| | | Years Ended December 31, | |
| | | | 2019 | | | | 2018 | | | | 2017 | | | | 2016 | | | | 2015 | |
| Net asset value, beginning of year | | $ | 9.23 | | | $ | 14.24 | | | $ | 14.47 | | | $ | 12.54 | | | $ | 13.63 | |
| Income (loss) from investment operations: | | | | | | | | | | | | | | | | | | | | |
| Net investment income (loss) | | | 0.14 | | | | 0.11 | | | | 0.07 | | | | 0.08 | | | | 0.07 | |
| Net realized and unrealized gain (loss) on investments | | | 1.98 | | | | (2.06 | ) | | | 1.33 | | | | 2.55 | | | | (0.47 | ) |
| Total from investment operations | | | 2.12 | | | | (1.95 | ) | | | 1.40 | | | | 2.63 | | | | (0.40 | ) |
| Less distributions from: | | | | | | | | | | | | | | | | | | | | |
| Net investment income | | | 0.06 | | | | 0.08 | | | | 0.06 | | | | 0.11 | | | | 0.04 | |
| Net realized gain | | | 0.16 | | | | 2.98 | | | | 1.57 | | | | 0.59 | | | | 0.65 | |
| Total distributions | | | 0.22 | | | | 3.06 | | | | 1.63 | | | | 0.70 | | | | 0.69 | |
| Net asset value, end of year | | $ | 11.13 | | | $ | 9.23 | | | $ | 14.24 | | | $ | 14.47 | | | $ | 12.54 | |
| Total return (%) | | | 23.00 | | | | (15.03 | ) | | �� | 9.84 | | | | 21.00 | | | | (2.86 | ) |
| Ratios to average daily net assets (%): | | | | | | | | | | | | | | | | | | | | |
| Expenses, before waivers and reimbursements | | | 6.45 | | | | 6.54 | | | | 4.55 | | | | 3.92 | | | | 3.72 | |
| Expenses, net of waivers and reimbursements | | | 1.00 | | | | 1.03 | | | | 1.10 | | | | 1.10 | | | | 1.12 | |
| Net investment income (loss), before waivers and reimbursements | | | (4.13 | ) | | | (4.69 | ) | | | (2.94 | ) | | | (2.20 | ) | | | (2.08 | ) |
| Net investment income (loss), net of waivers and reimbursements | | | 1.32 | | | | 0.82 | | | | 0.51 | | | | 0.62 | | | | 0.52 | |
| Class I net assets at the end of the year (in thousands) | | $ | 7,042 | | | $ | 1,445 | | | $ | 3,359 | | | $ | 3,186 | | | $ | 3,220 | |
| Portfolio turnover rate (%) | | | 107 | | | | 104 | | | | 70 | | | | 45 | | | | 35 | |
Note: Net investment income (loss) per share is based on the average shares outstanding during the year.
Performance cited represents past performance. Past performance does not guarantee future results and current performance may be lower or higher than the data quoted. Results shown are annual returns, which assume reinvestment of dividends and capital gains. Investment returns and principal will fluctuate and you may have a gain or loss when you sell shares. For the most current month-end performance information, please call 1-800-742-7272 or visit our Web site atwww.williamblairfunds.com.
| 142 | Annual Report | December 31, 2019 |
Financial Highlights— For a share outstanding throughout each period
Small-Mid Cap Value Fund
| | | Class R6 | |
| | | Period Ended
December 31, | |
| | | 2019(a) | |
| Net asset value, beginning of year | | | $ | 10.93 | |
| Income (loss) from investment operations: | | | | | |
| Net investment income (loss) | | | | 0.11 | |
| Net realized and unrealized gain (loss) on investments | | | | 0.31 | |
| Total from investment operations | | | | 0.42 | |
| Less distributions from: | | | | | |
| Net investment income | | | | 0.06 | |
| Net realized gain | | | | 0.16 | |
| Total distributions | | | | 0.22 | |
| Net asset value, end of year | | | $ | 11.13 | |
| Total Return (%)* | | | | 3.89 | |
| Ratios to average daily net assets (%)**: | | | | | |
| Expenses, before waivers and reimbursements | | | | 4.85 | |
| Expenses, net of waivers and reimbursements | | | | 0.95 | |
| Net investment income (loss), before waivers and reimbursements | | | | (2.41 | ) |
| Net investment income (loss), net of waivers and reimbursements | | | | 1.49 | |
| Class R6 net assets at the end of the year (in thousands) | | | $ | 171 | |
| Portfolio turnover rate (%)* | | | | 107 | |
| (a) | For the period from May 2, 2019 (Commencement of Operations) to December 31, 2019. |
| * | Rates are not annualized for periods less than a year. |
| ** | Rates are annualized for periods less than a year. |
Note: Net investment income (loss) per share is based on the average shares outstanding during the year.
Performance cited represents past performance. Past performance does not guarantee future results and current performance may be lower or higher than the data quoted. Results shown are annual returns, which assume reinvestment of dividends and capital gains. Investment returns and principal will fluctuate and you may have a gain or loss when you sell shares. For the most current month-end performance information, please call 1-800-742-7272 or visit our Web site atwww.williamblairfunds.com.
| December 31, 2019 | William Blair Funds | 143 |
Financial Highlights— For a share outstanding throughout each period
Small Cap Growth Fund
| | | Class N | |
| | | Years Ended December 31, | |
| | | 2019 | | | 2018 | | | 2017 | | | 2016 | | | 2015 | |
| Net asset value, beginning of year | | $ | 23.23 | | | $ | 26.87 | | | $ | 25.24 | | | $ | 22.47 | | | $ | 25.61 | |
| Income (loss) from investment operations: | | | | | | | | | | | | | | | | | | | | |
| Net investment income (loss) | | | (0.24 | ) | | | (0.27 | ) | | | (0.25 | ) | | | (0.18 | ) | | | (0.22 | ) |
| Net realized and unrealized gain (loss) on investments | | | 5.40 | | | | (0.10 | ) | | | 6.88 | | | | 4.43 | | | | (0.93 | ) |
| Total from investment operations | | | 5.16 | | | | (0.37 | ) | | | 6.63 | | | | 4.25 | | | | (1.15 | ) |
| Less distributions from: | | | | | | | | | | | | | | | | | | | | |
| Net investment income | | | — | | | | — | | | | — | | | | — | | | | — | |
| Net realized gain | | | 0.64 | | | | 3.27 | | | | 5.00 | | | | 1.48 | | | | 1.99 | |
| Total distributions | | | 0.64 | | | | 3.27 | | | | 5.00 | | | | 1.48 | | | | 1.99 | |
| Net asset value, end of year | | $ | 27.75 | | | $ | 23.23 | | | $ | 26.87 | | | $ | 25.24 | | | $ | 22.47 | |
| Total return (%) | | | 22.26 | | | | (2.14 | ) | | | 26.70 | | | | 18.89 | | | | (4.44 | ) |
| Ratios to average daily net assets (%): | | | | | | | | | | | | | | | | | | | | |
| Expenses, before waivers and reimbursements | | | 1.54 | | | | 1.55 | | | | 1.54 | | | | 1.55 | | | | 1.59 | |
| Expenses, net of waivers and reimbursements | | | 1.50 | | | | 1.50 | | | | 1.50 | | | | 1.50 | | | | 1.50 | |
| Net investment income (loss), before waivers and reimbursements | | | (0.92 | ) | | | (0.94 | ) | | | (0.93 | ) | | | (0.84 | ) | | | (0.94 | ) |
| Net investment income (loss), net of waivers and reimbursements | | | (0.88 | ) | | | (0.89 | ) | | | (0.89 | ) | | | (0.79 | ) | | | (0.85 | ) |
| Class N net assets at the end of the year (in thousands) | | $ | 180,706 | | | $ | 169,074 | | | $ | 146,291 | | | $ | 117,068 | | | $ | 111,944 | |
| Portfolio turnover rate (%) | | | 51 | | | | 74 | | | | 81 | | | | 90 | | | | 91 | |
| | | | | | | | | | | | | | | | | | | | | |
| | | Class I | |
| | | Years Ended December 31, | |
| | | | 2019 | | | | 2018 | | | | 2017 | | | | 2016 | | | | 2015 | |
| Net asset value, beginning of year | | $ | 25.99 | | | $ | 29.61 | | | $ | 27.34 | | | $ | 24.17 | | | $ | 27.32 | |
| Income (loss) from investment operations: | | | | | | | | | | | | | | | | | | | | |
| Net investment income (loss) | | | (0.19 | ) | | | (0.21 | ) | | | (0.20 | ) | | | (0.13 | ) | | | (0.17 | ) |
| Net realized and unrealized gain (loss) on investments | | | 6.03 | | | | (0.14 | ) | | | 7.47 | | | | 4.78 | | | | (0.99 | ) |
| Total from investment operations | | | 5.84 | | | | (0.35 | ) | | | 7.27 | | | | 4.65 | | | | (1.16 | ) |
| Less distributions from: | | | | | | | | | | | | | | | | | | | | |
| Net investment income | | | — | | | | — | | | | — | | | | — | | | | — | |
| Net realized gain | | | 0.64 | | | | 3.27 | | | | 5.00 | | | | 1.48 | | | | 1.99 | |
| Total distributions | | | 0.64 | | | | 3.27 | | | | 5.00 | | | | 1.48 | | | | 1.99 | |
| Net asset value, end of year | | $ | 31.19 | | | $ | 25.99 | | | $ | 29.61 | | | $ | 27.34 | | | $ | 24.17 | |
| Total return (%) | | | 22.51 | | | | (1.88 | ) | | | 26.99 | | | | 19.22 | | | | (4.20 | ) |
| Ratios to average daily net assets (%): | | | | | | | | | | | | | | | | | | | | |
| Expenses, before waivers and reimbursements | | | 1.27 | | | | 1.25 | | | | 1.25 | | | | 1.27 | | | | 1.30 | |
| Expenses, net of waivers and reimbursements | | | 1.25 | | | | 1.25 | | | | 1.25 | | | | 1.25 | | | | 1.25 | |
| Net investment income (loss), before waivers and reimbursements | | | (0.65 | ) | | | (0.65 | ) | | | (0.64 | ) | | | (0.56 | ) | | | (0.66 | ) |
| Net investment income (loss), net of waivers and reimbursements | | | (0.63 | ) | | | (0.65 | ) | | | (0.64 | ) | | | (0.54 | ) | | | (0.61 | ) |
| Class I net assets at the end of the year (in thousands) | | $ | 423,881 | | | $ | 410,233 | | | $ | 343,119 | | | $ | 271,830 | | | $ | 261,269 | |
| Portfolio turnover rate (%) | | | 51 | | | | 74 | | | | 81 | | | | 90 | | | | 91 | |
Note: Net investment income (loss) per share is based on the average shares outstanding during the year.
Performance cited represents past performance. Past performance does not guarantee future results and current performance may be lower or higher than the data quoted. Results shown are annual returns, which assume reinvestment of dividends and capital gains. Investment returns and principal will fluctuate and you may have a gain or loss when you sell shares. For the most current month-end performance information, please call 1-800-742-7272 or visit our Web site atwww.williamblairfunds.com.
| 144 | Annual Report | December 31, 2019 |
Financial Highlights— For a share outstanding throughout each period
Small Cap Growth Fund
| | | Class R6 | |
| | | Period Ended
December 31, | |
| | | 2019(a) | |
| Net asset value, beginning of year | | | $ | 31.00 | |
| Income (loss) from investment operations: | | | | | |
| Net investment income (loss) | | | | (0.11 | ) |
| Net realized and unrealized gain (loss) on investments | | | | 0.95 | |
| Total from investment operations | | | | 0.84 | |
| Less distributions from: | | | | | |
| Net investment income | | | | — | |
| Net realized gain | | | | 0.64 | |
| Total distributions | | | | 0.64 | |
| Net asset value, end of year | | | $ | 31.20 | |
| Total Return (%)* | | | | 2.75 | |
| Ratios to average daily net assets (%)**: | | | | | |
| Expenses | | | | 1.18 | |
| Net investment income (loss) | | | | (0.51 | ) |
| Class R6 net assets at the end of the year (in thousands) | | | $ | 65,950 | |
| Portfolio turnover rate (%)* | | | | 51 | |
| (a) | For the period from May 2, 2019 (Commencement of Operations) to December 31, 2019. |
| * | Rates are not annualized for periods less than a year. |
| ** | Rates are annualized for periods less than a year. |
Note: Net investment income (loss) per share is based on the average shares outstanding during the year.
Performance cited represents past performance. Past performance does not guarantee future results and current performance may be lower or higher than the data quoted. Results shown are annual returns, which assume reinvestment of dividends and capital gains. Investment returns and principal will fluctuate and you may have a gain or loss when you sell shares. For the most current month-end performance information, please call 1-800-742-7272 or visit our Web site atwww.williamblairfunds.com.
| December 31, 2019 | William Blair Funds | 145 |
Financial Highlights— For a share outstanding throughout each period
Small Cap Value Fund
| | | Class N | |
| | | Years Ended December 31, | |
| | | 2019 | | | 2018 | | | 2017 | | | 2016 | | | 2015 | |
| Net asset value, beginning of year | | $ | 15.04 | | | $ | 20.15 | | | $ | 20.18 | | | $ | 16.68 | | | $ | 17.76 | |
| Income (loss) from investment operations: | | | | | | | | | | | | | | | | | | | | |
| Net investment income (loss) | | | 0.09 | | | | 0.03 | | | | 0.01 | | | | 0.04 | | | | 0.02 | |
| Net realized and unrealized gain (loss) on investments | | | 2.92 | | | | (3.12 | ) | | | 1.50 | | | | 4.34 | | | | (1.05 | ) |
| Total from investment operations | | | 3.01 | | | | (3.09 | ) | | | 1.51 | | | | 4.38 | | | | (1.03 | ) |
| Less distributions from: | | | | | | | | | | | | | | | | | | | | |
| Net investment income | | | 0.09 | | | | — | | | | — | | | | 0.04 | | | | — | |
| Net realized gain | | | 0.49 | | | | 2.02 | | | | 1.54 | | | | 0.84 | | | | 0.05 | |
| Total distributions | | | 0.58 | | | | 2.02 | | | | 1.54 | | | | 0.88 | | | | 0.05 | |
| Net asset value, end of year | | $ | 17.47 | | | $ | 15.04 | | | $ | 20.15 | | | $ | 20.18 | | | $ | 16.68 | |
| Total return (%) | | | 20.09 | | | | (15.93 | ) | | | 7.57 | | | | 26.19 | | | | (5.77 | ) |
| Ratios to average daily net assets (%): | | | | | | | | | | | | | | | | | | | | |
| Expenses, before waivers and reimbursements | | | 1.55 | | | | 1.56 | | | | 1.55 | | | | 1.53 | | | | 1.54 | |
| Expenses, net of waivers and reimbursements | | | 1.50 | | | | 1.50 | | | | 1.50 | | | | 1.50 | | | | 1.50 | |
| Net investment income (loss), before waivers and reimbursements | | | 0.49 | | | | 0.08 | | | | (0.01 | ) | | | 0.19 | | | | 0.10 | |
| Net investment income (loss), net of waivers and reimbursements | | | 0.54 | | | | 0.14 | | | | 0.04 | | | | 0.22 | | | | 0.14 | |
| Class N net assets at the end of the year (in thousands) | | $ | 12,672 | | | $ | 16,381 | | | $ | 29,271 | | | $ | 33,359 | | | $ | 33,351 | |
| Portfolio turnover rate (%) | | | 116 | | | | 56 | | | | 38 | | | | 33 | | | | 30 | |
| | | | | | | | | | | | | | | | | | | | | |
| | | Class I | |
| | | Years Ended December 31, | |
| | | | 2019 | | | | 2018 | | | | 2017 | | | | 2016 | | | | 2015 | |
| Net asset value, beginning of year | | $ | 15.50 | | | $ | 20.70 | | | $ | 20.68 | | | $ | 17.08 | | | $ | 18.17 | |
| Income (loss) from investment operations: | | | | | | | | | | | | | | | | | | | | |
| Net investment income (loss) | | | 0.14 | | | | 0.08 | | | | 0.06 | | | | 0.09 | | | | 0.08 | |
| Net realized and unrealized gain (loss) on investments | | | 3.01 | | | | (3.21 | ) | | | 1.54 | | | | 4.44 | | | | (1.08 | ) |
| Total from investment operations | | | 3.15 | | | | (3.13 | ) | | | 1.60 | | | | 4.53 | | | | (1.00 | ) |
| Less distributions from: | | | | | | | | | | | | | | | | | | | | |
| Net investment income | | | 0.14 | | | | 0.05 | | | | 0.04 | | | | 0.09 | | | | 0.04 | |
| Net realized gain | | | 0.49 | | | | 2.02 | | | | 1.54 | | | | 0.84 | | | | 0.05 | |
| Total distributions | | | 0.63 | | | | 2.07 | | | | 1.58 | | | | 0.93 | | | | 0.09 | |
| Net asset value, end of year | | $ | 18.02 | | | $ | 15.50 | | | $ | 20.70 | | | $ | 20.68 | | | $ | 17.08 | |
| Total return (%) | | | 20.45 | | | | (15.74 | ) | | | 7.85 | | | | 26.46 | | | | (5.47 | ) |
| Ratios to average daily net assets (%): | | | | | | | | | | | | | | | | | | | | |
| Expenses, before waivers and reimbursements | | | 1.31 | | | | 1.30 | | | | 1.29 | | | | 1.29 | | | | 1.24 | |
| Expenses, net of waivers and reimbursements | | | 1.25 | | | | 1.25 | | | | 1.25 | | | | 1.25 | | | | 1.24 | |
| Net investment income (loss), before waivers and reimbursements | | | 0.74 | | | | 0.36 | | | | 0.25 | | | | 0.43 | | | | 0.43 | |
| Net investment income (loss), net of waivers and reimbursements | | | 0.80 | | | | 0.41 | | | | 0.29 | | | | 0.47 | | | | 0.43 | |
| Class I net assets at the end of the year (in thousands) | | $ | 162,093 | | | $ | 475,134 | | | $ | 644,749 | | | $ | 675,272 | | | $ | 579,010 | |
| Portfolio turnover rate (%) | | | 116 | | | | 56 | | | | 38 | | | | 33 | | | | 30 | |
Note: Net investment income (loss) per share is based on the average shares outstanding during the year.
Performance cited represents past performance. Past performance does not guarantee future results and current performance may be lower or higher than the data quoted. Results shown are annual returns, which assume reinvestment of dividends and capital gains. Investment returns and principal will fluctuate and you may have a gain or loss when you sell shares. For the most current month-end performance information, please call 1-800-742-7272 or visit our Web site atwww.williamblairfunds.com.
| 146 | Annual Report | December 31, 2019 |
Financial Highlights— For a share outstanding throughout each period
Small Cap Value Fund
| | | Class R6 | |
| | | Period Ended
December 31, | |
| | | 2019(a) | |
| Net asset value, beginning of year | | | $ | 18.19 | |
| Income (loss) from investment operations: | | | | | |
| Net investment income (loss) | | | | 0.16 | |
| Net realized and unrealized gain (loss) on investments | | | | 0.32 | |
| Total from investment operations | | | | 0.48 | |
| Less distributions from: | | | | | |
| Net investment income | | | | 0.15 | |
| Net realized gain | | | | 0.49 | |
| Total distributions | | | | 0.64 | |
| Net asset value, end of year | | | $ | 18.03 | |
| Total Return (%)* | | | | 2.69 | |
| Ratios to average daily net assets (%)**: | | | | | |
| Expenses | | | | 1.17 | |
| Net investment income (loss) | | | | 1.28 | |
| Class R6 net assets at the end of the year (in thousands) | | | $ | 513 | |
| Portfolio turnover rate (%)* | | | | 116 | |
| (a) | For the period from May 2, 2019 (Commencement of Operations) to December 31, 2019. |
| * | Rates are not annualized for periods less than a year. |
| ** | Rates are annualized for periods less than a year. |
Note: Net investment income (loss) per share is based on the average shares outstanding during the year.
Performance cited represents past performance. Past performance does not guarantee future results and current performance may be lower or higher than the data quoted. Results shown are annual returns, which assume reinvestment of dividends and capital gains. Investment returns and principal will fluctuate and you may have a gain or loss when you sell shares. For the most current month-end performance information, please call 1-800-742-7272 or visit our Web site atwww.williamblairfunds.com.
| December 31, 2019 | William Blair Funds | 147 |
Financial Highlights— For a share outstanding throughout each period
Global Leaders Fund
| | | Class N | |
| | | Years Ended December 31, | |
| | | 2019 | | | 2018 | | | 2017 | | | 2016 | | | 2015 | |
| Net asset value, beginning of year | | $ | 11.47 | | | $ | 14.53 | | | $ | 11.60 | | | $ | 11.58 | | | $ | 11.84 | |
| Income (loss) from investment operations: | | | | | | | | | | | | | | | | | | | | |
| Net investment income (loss) | | | 0.01 | | | | 0.02 | | | | 0.05 | | | | 0.03 | | | | 0.02 | |
| Net realized and unrealized gain (loss) on investments | | | 3.61 | | | | (1.12 | ) | | | 3.46 | | | | 0.04 | | | | 0.27 | |
| Total from investment operations | | | 3.62 | | | | (1.10 | ) | | | 3.51 | | | | 0.07 | | | | 0.29 | |
| Less distributions from: | | | | | | | | | | | | | | | | | | | | |
| Net investment income | | | 0.03 | | | | — | | | | 0.10 | | | | — | | | | 0.01 | |
| Net realized gain | | | 0.14 | | | | 1.96 | | | | 0.48 | | | | 0.05 | | | | 0.54 | |
| Total distributions | | | 0.17 | | | | 1.96 | | | | 0.58 | | | | 0.05 | | | | 0.55 | |
| Net asset value, end of year | | $ | 14.92 | | | $ | 11.47 | | | $ | 14.53 | | | $ | 11.60 | | | $ | 11.58 | |
| Total return (%) | | | 31.57 | | | | (8.23 | ) | | | 30.31 | | | | 0.62 | | | | 2.49 | |
| Ratios to average daily net assets (%): | | | | | | | | | | | | | | | | | | | | |
| Expenses, before waivers and reimbursements | | | 1.39 | | | | 1.47 | | | | 1.63 | | | | 1.62 | | | | 1.61 | |
| Expenses, net of waivers and reimbursements | | | 1.20 | | | | 1.33 | | | | 1.37 | | | | 1.36 | | | | 1.39 | |
| Net investment income (loss), before waivers and reimbursements | | | (0.10 | ) | | | (0.01 | ) | | | 0.09 | | | | (0.03 | ) | | | (0.10 | ) |
| Net investment income (loss), net of waivers and reimbursements | | | 0.09 | | | | 0.13 | | | | 0.35 | | | | 0.23 | | | | 0.12 | |
| Class N net assets at the end of the year (in thousands) | | $ | 8,910 | | | $ | 7,225 | | | $ | 7,761 | | | $ | 5,760 | | | $ | 5,588 | |
| Portfolio turnover rate (%) | | | 27 | | | | 49 | | | | 41 | | | | 75 | | | | 55 | |
| | | | | | | | | | | | | | | | | | | | | |
| | | | Class I | |
| | | Years Ended December 31, | |
| | | | 2019 | | | | 2018 | | | | 2017 | | | | 2016 | | | | 2015 | |
| Net asset value, beginning of year | | $ | 11.47 | | | $ | 14.56 | | | $ | 11.62 | | | $ | 11.59 | | | $ | 11.85 | |
| Income (loss) from investment operations: | | | | | | | | | | | | | | | | | | | | |
| Net investment income (loss) | | | 0.05 | | | | 0.06 | | | | 0.09 | | | | 0.06 | | | | 0.06 | |
| Net realized and unrealized gain (loss) on investments | | | 3.61 | | | | (1.13 | ) | | | 3.47 | | | | 0.05 | | | | 0.26 | |
| Total from investment operations | | | 3.66 | | | | (1.07 | ) | | | 3.56 | | | | 0.11 | | | | 0.32 | |
| Less distributions from: | | | | | | | | | | | | | | | | | | | | |
| Net investment income | | | 0.06 | | | | 0.06 | | | | 0.14 | | | | 0.03 | | | | 0.04 | |
| Net realized gain | | | 0.14 | | | | 1.96 | | | | 0.48 | | | | 0.05 | | | | 0.54 | |
| Total distributions | | | 0.20 | | | | 2.02 | | | | 0.62 | | | | 0.08 | | | | 0.58 | |
| Net asset value, end of year | | $ | 14.93 | | | $ | 11.47 | | | $ | 14.56 | | | $ | 11.62 | | | $ | 11.59 | |
| Total return (%) | | | 31.96 | | | | (8.06 | ) | | | 30.69 | | | | 0.98 | | | | 2.77 | |
| Ratios to average daily net assets (%): | | | | | | | | | | | | | | | | | | | | |
| Expenses, before waivers and reimbursements | | | 1.07 | | | | 1.15 | | | | 1.33 | | | | 1.31 | | | | 1.32 | |
| Expenses, net of waivers and reimbursements | | | 0.95 | | | | 1.07 | | | | 1.07 | | | | 1.05 | | | | 1.10 | |
| Net investment income (loss), before waivers and reimbursements | | | 0.22 | | | | 0.31 | | | | 0.39 | | | | 0.28 | | | | 0.23 | |
| Net investment income (loss), net of waivers and reimbursements | | | 0.34 | | | | 0.39 | | | | 0.65 | | | | 0.54 | | | | 0.45 | |
| Class I net assets at the end of the year (in thousands) | | $ | 114,666 | | | $ | 83,790 | | | $ | 60,067 | | | $ | 45,772 | | | $ | 45,853 | |
| Portfolio turnover rate (%) | | | 27 | | | | 49 | | | | 41 | | | | 75 | | | | 55 | |
Note: Net investment income (loss) per share is based on the average shares outstanding during the year.
Performance cited represents past performance. Past performance does not guarantee future results and current performance may be lower or higher than the data quoted. Results shown are annual returns, which assume reinvestment of dividends and capital gains. Investment returns and principal will fluctuate and you may have a gain or loss when you sell shares. For the most current month-end performance information, please call 1-800-742-7272 or visit our Web site atwww.williamblairfunds.com.
| 148 | Annual Report | December 31, 2019 |
Financial Highlights— For a share outstanding throughout each period
Global Leaders Fund
| | | Class R6 | |
| | | Years Ended December 31, | |
| | | 2019 | | | 2018 | | | 2017 | | | 2016 | | | 2015 | |
| Net asset value, beginning of year | | $ | 11.47 | | | $ | 14.56 | | | $ | 11.62 | | | $ | 11.59 | | | $ | 11.85 | |
| Income (loss) from investment operations: | | | | | | | | | | | | | | | | | | | | |
| Net investment income (loss) | | | 0.06 | | | | 0.07 | | | | 0.10 | | | | 0.07 | | | | 0.06 | |
| Net realized and unrealized gain (loss) on investments | | | 3.61 | | | | (1.13 | ) | | | 3.47 | | | | 0.05 | | | | 0.27 | |
| Total from investment operations | | | 3.67 | | | | (1.06 | ) | | | 3.57 | | | | 0.12 | | | | 0.33 | |
| Less distributions from: | | | | | | | | | | | | | | | | | | | | |
| Net investment income | | | 0.07 | | | | 0.07 | | | | 0.15 | | | | 0.04 | | | | 0.05 | |
| Net realized gain | | | 0.14 | | | | 1.96 | | | | 0.48 | | | | 0.05 | | | | 0.54 | |
| Total distributions | | | 0.21 | | | | 2.03 | | | | 0.63 | | | | 0.09 | | | | 0.59 | |
| Net asset value, end of year | | $ | 14.93 | | | $ | 11.47 | | | $ | 14.56 | | | $ | 11.62 | | | $ | 11.59 | |
| Total return (%) | | | 32.02 | | | | (7.99 | ) | | | 30.78 | | | | 1.03 | | | | 2.85 | |
| Ratios to average daily net assets (%): | | | | | | | | | | | | | | | | | | | | |
| Expenses, before waivers and reimbursements | | | 1.01 | | | | 1.08 | | | | 1.10 | | | | 1.11 | | | | 1.11 | |
| Expenses, net of waivers and reimbursements | | | 0.90 | | | | 1.00 | | | | 1.00 | | | | 1.00 | | | | 1.03 | |
| Net investment income (loss), before waivers and reimbursements | | | 0.32 | | | | 0.39 | | | | 0.65 | | | | 0.48 | | | | 0.39 | |
| Net investment income (loss), net of waivers and reimbursements | | | 0.43 | | | | 0.47 | | | | 0.75 | | | | 0.59 | | | | 0.47 | |
| Class R6 net assets at the end of the year (in thousands) | | $ | 48,133 | | | $ | 79,685 | | | $ | 143,521 | | | $ | 125,199 | | | $ | 137,527 | |
| Portfolio turnover rate (%) | | | 27 | | | | 49 | | | | 41 | | | | 75 | | | | 55 | |
Note: Net investment income (loss) per share is based on the average shares outstanding during the year.
Performance cited represents past performance. Past performance does not guarantee future results and current performance may be lower or higher than the data quoted. Results shown are annual returns, which assume reinvestment of dividends and capital gains. Investment returns and principal will fluctuate and you may have a gain or loss when you sell shares. For the most current month-end performance information, please call 1-800-742-7272 or visit our Web site atwww.williamblairfunds.com.
| December 31, 2019 | William Blair Funds | 149 |
Financial Highlights— For a share outstanding throughout each period
International Leaders Fund
| | | Class N | |
| | | Years Ended December 31, | |
| | | 2019 | | | 2018 | | | 2017 | | | 2016 | | | 2015 | |
| Net asset value, beginning of year | | $ | 13.80 | | | $ | 16.37 | | | $ | 12.88 | | | $ | 12.89 | | | $ | 12.25 | |
| Income (loss) from investment operations: | | | | | | | | | | | | | | | | | | | | |
| Net investment income (loss) | | | 0.09 | | | | 0.13 | | | | 0.11 | | | | 0.03 | | | | 0.07 | |
| Net realized and unrealized gain (loss) on investments | | | 4.25 | | | | (2.19 | ) | | | 3.70 | | | | 0.08 | | | | 0.66 | |
| Total from investment operations | | | 4.34 | | | | (2.06 | ) | | | 3.81 | | | | 0.11 | | | | 0.73 | |
| Less distributions from: | | | | | | | | | | | | | | | | | | | | |
| Net investment income | | | 0.06 | | | | 0.06 | | | | 0.20 | | | | 0.12 | | | | 0.02 | |
| Net realized gain | | | — | | | | 0.45 | | | | 0.12 | | | | — | | | | 0.07 | |
| Total distributions | | | 0.06 | | | | 0.51 | | | | 0.32 | | | | 0.12 | | | | 0.09 | |
| Net asset value, end of year | | $ | 18.08 | | | $ | 13.80 | | | $ | 16.37 | | | $ | 12.88 | | | $ | 12.89 | |
| Total return (%) | | | 31.46 | | | | (12.70 | ) | | | 29.65 | | | | 0.88 | | | | 6.01 | |
| Ratios to average daily net assets (%): | | | | | | | | | | | | | | | | | | | | |
| Expenses, before waivers and reimbursements | | | 1.32 | | | | 1.39 | | | | 1.59 | | | | 1.56 | | | | 1.56 | |
| Expenses, net of waivers and reimbursements | | | 1.18 | | | | 1.28 | | | | 1.35 | | | | 1.30 | | | | 1.24 | |
| Net investment income (loss), before waivers and reimbursements | | | 0.44 | | | | 0.70 | | | | 0.48 | | | | (0.02 | ) | | | 0.19 | |
| Net investment income (loss), net of waivers and reimbursements | | | 0.58 | | | | 0.81 | | | | 0.72 | | | | 0.24 | | | | 0.51 | |
| Class N net assets at the end of the year (in thousands) | | $ | 11,163 | | | $ | 8,715 | | | $ | 9,651 | | | $ | 2,922 | | | $ | 377 | |
| Portfolio turnover rate (%) | | | 20 | | | | 33 | | | | 41 | | | | 59 | | | | 29 | |
| | | | | | | | | | | | | | | | | | | | | |
| | | Class I | |
| | | Years Ended December 31, | |
| | | | 2019 | | | | 2018 | | | | 2017 | | | | 2016 | | | | 2015 | |
| Net asset value, beginning of year | | $ | 13.84 | | | $ | 16.44 | | | $ | 12.92 | | | $ | 12.91 | | | $ | 12.25 | |
| Income (loss) from investment operations: | | | | | | | | | | | | | | | | | | | | |
| Net investment income (loss) | | | 0.12 | | | | 0.17 | | | | 0.16 | | | | 0.10 | | | | 0.10 | |
| Net realized and unrealized gain (loss) on investments | | | 4.27 | | | | (2.19 | ) | | | 3.71 | | | | 0.04 | | | | 0.65 | |
| Total from investment operations | | | 4.39 | | | | (2.02 | ) | | | 3.87 | | | | 0.14 | | | | 0.75 | |
| Less distributions from: | | | | | | | | | | | | | | | | | | | | |
| Net investment income | | | 0.10 | | | | 0.13 | | | | 0.23 | | | | 0.13 | | | | 0.02 | |
| Net realized gain | | | — | | | | 0.45 | | | | 0.12 | | | | — | | | | 0.07 | |
| Total distributions | | | 0.10 | | | | 0.58 | | | | 0.35 | | | | 0.13 | | | | 0.09 | |
| Net asset value, end of year | | $ | 18.13 | | | $ | 13.84 | | | $ | 16.44 | | | $ | 12.92 | | | $ | 12.91 | |
| Total return (%) | | | 31.76 | | | | (12.45 | ) | | | 30.05 | | | | 1.10 | | | | 6.18 | |
| Ratios to average daily net assets (%): | | | | | | | | | | | | | | | | | | | | |
| Expenses, before waivers and reimbursements | | | 1.01 | | | | 1.07 | | | | 1.28 | | | | 1.30 | | | | 1.46 | |
| Expenses, net of waivers and reimbursements | | | 0.93 | | | | 1.03 | | | | 1.05 | | | | 1.04 | | | | 1.13 | |
| Net investment income (loss), before waivers and reimbursements | | | 0.64 | | | | 1.02 | | | | 0.86 | | | | 0.48 | | | | 0.42 | |
| Net investment income (loss), net of waivers and reimbursements | | | 0.72 | | | | 1.06 | | | | 1.09 | | | | 0.74 | | | | 0.75 | |
| Class I net assets at the end of the year (in thousands) | | $ | 181,617 | | | $ | 76,382 | | | $ | 60,279 | | | $ | 30,944 | | | $ | 13,474 | |
| Portfolio turnover rate (%) | | | 20 | | | | 33 | | | | 41 | | | | 59 | | | | 29 | |
Note: Net investment income (loss) per share is based on the average shares outstanding during the year.
Performance cited represents past performance. Past performance does not guarantee future results and current performance may be lower or higher than the data quoted. Results shown are annual returns, which assume reinvestment of dividends and capital gains. Investment returns and principal will fluctuate and you may have a gain or loss when you sell shares. For the most current month-end performance information, please call 1-800-742-7272 or visit our Web site atwww.williamblairfunds.com.
| 150 | Annual Report | December 31, 2019 |
Financial Highlights— For a share outstanding throughout each period
International Leaders Fund
| | | Class R6 | |
| | | Years Ended December 31, | |
| | | 2019 | | | 2018 | | | 2017 | | | 2016 | | | 2015 | |
| Net asset value, beginning of year | | $ | 13.83 | | | $ | 16.43 | | | $ | 12.92 | | | $ | 12.90 | | | $ | 12.24 | |
| Income (loss) from investment operations: | | | | | | | | | | | | | | | | | | | | |
| Net investment income (loss) | | | 0.14 | | | | 0.18 | | | | 0.18 | | | | 0.12 | | | | 0.11 | |
| Net realized and unrealized gain (loss) on investments | | | 4.26 | | | | (2.19 | ) | | | 3.70 | | | | 0.04 | | | | 0.66 | |
| Total from investment operations | | | 4.40 | | | | (2.01 | ) | | | 3.88 | | | | 0.16 | | | | 0.77 | |
| Less distributions from: | | | | | | | | | | | | | | | | | | | | |
| Net investment income | | | 0.11 | | | | 0.14 | | | | 0.25 | | | | 0.14 | | | | 0.04 | |
| Net realized gain | | | — | | | | 0.45 | | | | 0.12 | | | | — | | | | 0.07 | |
| Total distributions | | | 0.11 | | | | 0.59 | | | | 0.37 | | | | 0.14 | | | | 0.11 | |
| Net asset value, end of year | | $ | 18.12 | | | $ | 13.83 | | | $ | 16.43 | | | $ | 12.92 | | | $ | 12.90 | |
| Total return (%) | | | 31.83 | | | | (12.38 | ) | | | 30.08 | | | | 1.25 | | | | 6.33 | |
| Ratios to average daily net assets (%): | | | | | | | | | | | | | | | | | | | | |
| Expenses, before waivers and reimbursements | | | 0.93 | | | | 0.99 | | | | 1.03 | | | | 1.06 | | | | 1.15 | |
| Expenses, net of waivers and reimbursements | | | 0.88 | | | | 0.95 | | | | 0.95 | | | | 0.95 | | | | 0.98 | |
| Net investment income (loss), before waivers and reimbursements | | | 0.80 | | | | 1.07 | | | | 1.10 | | | | 0.81 | | | | 0.71 | |
| Net investment income (loss), net of waivers and reimbursements | | | 0.85 | | | | 1.11 | | | | 1.18 | | | | 0.92 | | | | 0.88 | |
| Class R6 net assets at the end of the year (in thousands) | | $ | 461,124 | | | $ | 324,902 | | | $ | 308,898 | | | $ | 221,356 | | | $ | 102,227 | |
| Portfolio turnover rate (%) | | | 20 | | | | 33 | | | | 41 | | | | 59 | | | | 29 | |
Note: Net investment income (loss) per share is based on the average shares outstanding during the year.
Performance cited represents past performance. Past performance does not guarantee future results and current performance may be lower or higher than the data quoted. Results shown are annual returns, which assume reinvestment of dividends and capital gains. Investment returns and principal will fluctuate and you may have a gain or loss when you sell shares. For the most current month-end performance information, please call 1-800-742-7272 or visit our Web site atwww.williamblairfunds.com.
| December 31, 2019 | William Blair Funds | 151 |
Financial Highlights— For a share outstanding throughout each period
International Growth Fund
| | | Class N | |
| | | Years Ended December 31, | |
| | | 2019 | | | 2018 | | | 2017 | | | 2016 | | | 2015 | |
| Net asset value, beginning of year | | $ | 23.04 | | | $ | 30.41 | | | $ | 23.86 | | | $ | 24.94 | | | $ | 25.24 | |
| Income (loss) from investment operations: | | | | | | | | | | | | | | | | | | | | |
| Net investment income (loss) | | | 0.09 | | | | 0.16 | | | | 0.21 | | | | 0.20 | | | | 0.18 | |
| Net realized and unrealized gain (loss) on investments | | | 6.87 | | | | (5.56 | ) | | | 6.73 | | | | (0.92 | ) | | | (0.25 | ) |
| Total from investment operations | | | 6.96 | | | | (5.40 | ) | | | 6.94 | | | | (0.72 | ) | | | (0.07 | ) |
| Less distributions from: | | | | | | | | | | | | | | | | | | | | |
| Net investment income | | | 0.32 | | | | 0.12 | | | | 0.39 | | | | 0.36 | | | | 0.23 | |
| Net realized gain | | | — | | | | 1.85 | | | | — | | | | — | | | | — | |
| Total distributions | | | 0.32 | | | | 1.97 | | | | 0.39 | | | | 0.36 | | | | 0.23 | |
| Net asset value, end of year | | $ | 29.68 | | | $ | 23.04 | | | $ | 30.41 | | | $ | 23.86 | | | $ | 24.94 | |
| Total return (%) | | | 30.24 | | | | (18.00 | ) | | | 29.11 | | | | (2.88 | ) | | | (0.27 | ) |
| Ratios to average daily net assets (%): | | | | | | | | | | | | | | | | | | | | |
| Expenses, before waivers and reimbursements | | | 1.45 | | | | 1.46 | | | | 1.47 | | | | 1.43 | | | | 1.42 | |
| Expenses, net of waivers and reimbursements | | | 1.45 | | | | 1.45 | | | | 1.45 | | | | 1.43 | | | | 1.42 | |
| Net investment income (loss), before waivers and reimbursements | | | 0.34 | | | | 0.54 | | | | 0.76 | | | | 0.84 | | | | 0.71 | |
| Net investment income (loss), net of waivers and reimbursements | | | 0.34 | | | | 0.55 | | | | 0.78 | | | | 0.84 | | | | 0.71 | |
| Class N net assets at the end of the year (in thousands) | | $ | 494,788 | | | $ | 456,533 | | | $ | 763,740 | | | $ | 729,544 | | | $ | 1,023,588 | |
| Portfolio turnover rate (%) | | | 34 | | | | 78 | | | | 82 | | | | 101 | | | | 70 | |
| | | | | | | | | | | | | | | | | | | | | |
| | | Class I | |
| | | Years Ended December 31, | |
| | | 2019 | | | 2018 | | | 2017 | | | 2016 | | | 2015 | |
| Net asset value, beginning of year | | $ | 23.56 | | | $ | 31.13 | | | $ | 24.42 | | | $ | 25.51 | | | $ | 25.82 | |
| Income (loss) from investment operations: | | | | | | | | | | | | | | | | | | | | |
| Net investment income (loss) | | | 0.18 | | | | 0.26 | | | | 0.30 | | | | 0.29 | | | | 0.27 | |
| Net realized and unrealized gain (loss) on investments | | | 7.03 | | | | (5.70 | ) | | | 6.89 | | | | (0.94 | ) | | | (0.28 | ) |
| Total from investment operations | | | 7.21 | | | | (5.44 | ) | | | 7.19 | | | | (0.65 | ) | | | (0.01 | ) |
| Less distributions from: | | | | | | | | | | | | | | | | | | | | |
| Net investment income | | | 0.39 | | | | 0.28 | | | | 0.48 | | | | 0.44 | | | | 0.30 | |
| Net realized gain | | | — | | | | 1.85 | | | | — | | | | — | | | | — | |
| Total distributions | | | 0.39 | | | | 2.13 | | | | 0.48 | | | | 0.44 | | | | 0.30 | |
| Net asset value, end of year | | $ | 30.38 | | | $ | 23.56 | | | $ | 31.13 | | | $ | 24.42 | | | $ | 25.51 | |
| Total return (%) | | | 30.66 | | | | (17.73 | ) | | | 29.49 | | | | (2.54 | ) | | | (0.03 | ) |
| Ratios to average daily net assets (%): | | | | | | | | | | | | | | | | | | | | |
| Expenses | | | 1.14 | | | | 1.13 | | | | 1.14 | | | | 1.13 | | | | 1.14 | |
| Net investment income (loss) | | | 0.65 | | | | 0.86 | | | | 1.08 | | | | 1.16 | | | | 1.02 | |
| Class I net assets at the end of the year (in thousands) | | $ | 1,552,355 | | | $ | 1,646,811 | | | $ | 2,375,326 | | | $ | 2,251,701 | | | $ | 2,655,156 | |
| Portfolio turnover rate (%) | | | 34 | | | | 78 | | | | 82 | | | | 101 | | | | 70 | |
Note: Net investment income (loss) per share is based on the average shares outstanding during the year.
Performance cited represents past performance. Past performance does not guarantee future results and current performance may be lower or higher than the data quoted. Results shown are annual returns, which assume reinvestment of dividends and capital gains. Investment returns and principal will fluctuate and you may have a gain or loss when you sell shares. For the most current month-end performance information, please call 1-800-742-7272 or visit our Web site atwww.williamblairfunds.com.
| 152 | Annual Report | December 31, 2019 |
Financial Highlights— For a share outstanding throughout each period
International Growth Fund
| | | Class R6 | |
| | | Period Ended
December 31, | |
| | | 2019(a) | |
| Net asset value, beginning of year | | | $ | 27.56 | |
| Income (loss) from investment operations: | | | | | |
| Net investment income (loss) | | | | (0.05 | ) |
| Net realized and unrealized gain (loss) on investments | | | | 3.27 | |
| Total from investment operations | | | | 3.22 | |
| Less distributions from: | | | | | |
| Net investment income | | | | 0.41 | |
| Net realized gain | | | | — | |
| Total distributions | | | | 0.41 | |
| Net asset value, end of year | | | $ | 30.37 | |
| Total Return (%)* | | | | 11.71 | |
| Ratios to average daily net assets (%)**: | | | | | |
| Expenses | | | | 1.06 | |
| Net investment income (loss) | | | | (0.26 | ) |
| Class R6 net assets at end of year (in thousands) | | | $ | 61,916 | |
| Portfolio turnover rate (%)* | | | | 34 | |
| (a) | For the period from May 2, 2019 (Commencement of Operations) to December 31, 2019. |
| * | Rates are not annualized for periods less than a year. |
| ** | Rates are annualized for periods less than a year. |
Note: Net investment income (loss) per share is based on the average shares outstanding during the year.
Performance cited represents past performance. Past performance does not guarantee future results and current performance may be lower or higher than the data quoted. Results shown are annual returns, which assume reinvestment of dividends and capital gains. Investment returns and principal will fluctuate and you may have a gain or loss when you sell shares. For the most current month-end performance information, please call 1-800-742-7272 or visit our Web site atwww.williamblairfunds.com.
| December 31, 2019 | William Blair Funds | 153 |
Financial Highlights— For a share outstanding throughout each period
Institutional International Growth Fund
| | | Institutional | |
| | | Years Ended December 31, | |
| | | 2019 | | | 2018 | | | 2017 | | | 2016 | | | 2015 | |
| Net asset value, beginning of year | | $ | 13.40 | | | $ | 18.08 | | | $ | 14.55 | | | $ | 15.08 | | | $ | 15.26 | |
| Income (loss) from investment operations: | | | | | | | | | | | | | | | | | | | | |
| Net investment income (loss) | | | 0.12 | | | | 0.18 | | | | 0.21 | | | | 0.18 | | | | 0.19 | |
| Net realized and unrealized gain (loss) on investments | | | 4.00 | | | | (3.29 | ) | | | 4.07 | | | | (0.54 | ) | | | (0.18 | ) |
| Total from investment operations | | | 4.12 | | | | (3.11 | ) | | | 4.28 | | | | (0.36 | ) | | | 0.01 | |
| Less distributions from: | | | | | | | | | | | | | | | | | | | | |
| Net investment income | | | 0.17 | | | | 0.17 | | | | 0.44 | | | | 0.17 | | | | 0.09 | |
| Net realized gain | | | — | | | | 1.40 | | | | 0.31 | | | | — | | | | 0.10 | |
| Total distributions | | | 0.17 | | | | 1.57 | | | | 0.75 | | | | 0.17 | | | | 0.19 | |
| Net asset value, end of year | | $ | 17.35 | | | $ | 13.40 | | | $ | 18.08 | | | $ | 14.55 | | | $ | 15.08 | |
| Total return (%) | | | 30.75 | | | | (17.50 | ) | | | 29.53 | | | | (2.40 | ) | | | 0.09 | |
| Ratios to average daily net assets (%): | | | | | | | | | | | | | | | | | | | | |
| Expenses | | | 0.99 | | | | 0.97 | | | | 0.97 | | | | 0.98 | | | | 0.96 | |
| Net investment income (loss), | | | 0.77 | | | | 1.01 | | | | 1.22 | | | | 1.25 | | | | 1.18 | |
| Net assets at the end of the year (in thousands) | | $ | 1,892,911 | | | $ | 1,784,435 | | | $ | 2,330,299 | | | $ | 2,093,971 | | | $ | 2,335,632 | |
| Portfolio turnover rate (%) | | | 35 | | | | 82 | | | | 84 | | | | 105 | | | | 70 | |
Note: Net investment income (loss) per share is based on the average shares outstanding during the year.
Performance cited represents past performance. Past performance does not guarantee future results and current performance may be lower or higher than the data quoted. Results shown are annual returns, which assume reinvestment of dividends and capital gains. Investment returns and principal will fluctuate and you may have a gain or loss when you sell shares. For the most current month-end performance information, please call 1-800-742-7272 or visit our Web site atwww.williamblairfunds.com.
| 154 | Annual Report | December 31, 2019 |
Financial Highlights— For a share outstanding throughout each period
International Small Cap Growth Fund
| | | Class N | |
| | | Years Ended December 31, | |
| | | 2019 | | | 2018 | | | 2017 | | | 2016 | | | 2015 | |
| Net asset value, beginning of year | | $ | 10.36 | | | $ | 15.49 | | | $ | 12.87 | | | $ | 13.50 | | | $ | 12.56 | |
| Income (loss) from investment operations: | | | | | | | | | | | | | | | | | | | | |
| Net investment income (loss) | | | 0.05 | | | | 0.04 | | | | 0.12 | | | | 0.10 | | | | 0.05 | |
| Net realized and unrealized gain (loss) on investments | | | 3.45 | | | | (3.78 | ) | | | 3.98 | | | | (0.72 | ) | | | 1.16 | |
| Total from investment operations | | | 3.50 | | | | (3.74 | ) | | | 4.10 | | | | (0.62 | ) | | | 1.21 | |
| Less distributions from: | | | | | | | | | | | | | | | | | | | | |
| Net investment income | | | 0.01 | | | | 0.08 | | | | 0.32 | | | | 0.01 | | | | 0.24 | |
| Net realized gain | | | — | | | | 1.31 | | | | 1.16 | | | | 0.00^ | | | | 0.03 | |
| Total distributions | | | 0.01 | | | | 1.39 | | | | 1.48 | | | | 0.01 | | | | 0.27 | |
| Net asset value, end of year | | $ | 13.85 | | | $ | 10.36 | | | $ | 15.49 | | | $ | 12.87 | | | $ | 13.50 | |
| Total return (%) | | | 33.81 | | | | (24.48 | ) | | | 32.17 | | | | (4.60 | ) | | | 9.67 | |
| Ratios to average daily net assets (%): | | | | | | | | | | | | | | | | | | | | |
| Expenses, before waivers and reimbursements | | | 1.48 | | | | 1.48 | | | | 1.62 | | | | 1.59 | | | | 1.62 | |
| Expenses, net of waivers and reimbursements | | | 1.48 | | | | 1.48 | | | | 1.47 | | | | 1.44 | | | | 1.47 | |
| Net investment income (loss), before waivers and reimbursements | | | 0.45 | | | | 0.29 | | | | 0.70 | | | | 0.62 | | | | 0.19 | |
| Net investment income (loss), net of waivers and reimbursements | | | 0.45 | | | | 0.29 | | | | 0.85 | | | | 0.77 | | | | 0.34 | |
| Class N net assets at the end of the year (in thousands) | | $ | 3,650 | | | $ | 3,440 | | | $ | 6,275 | | | $ | 10,361 | | | $ | 11,350 | |
| Portfolio turnover rate (%) | | | 38 | | | | 88 | | | | 64 | | | | 73 | | | | 90 | |
| | | | | | | | | | | | | | | | | | | | | |
| | | Class I | |
| | | Years Ended December 31, | |
| | | | 2019 | | | | 2018 | | | | 2017 | | | | 2016 | | | | 2015 | |
| Net asset value, beginning of year | | $ | 10.45 | | | $ | 15.65 | | | $ | 13.00 | | | $ | 13.65 | | | $ | 12.70 | |
| Income (loss) from investment operations: | | | | | | | | | | | | | | | | | | | | |
| Net investment income (loss) | | | 0.09 | | | | 0.09 | | | | 0.14 | | | | 0.14 | | | | 0.09 | |
| Net realized and unrealized gain (loss) on investments | | | 3.48 | | | | (3.84 | ) | | | 4.07 | | | | (0.75 | ) | | | 1.18 | |
| Total from investment operations | | | 3.57 | | | | (3.75 | ) | | | 4.21 | | | | (0.61 | ) | | | 1.27 | |
| Less distributions from: | | | | | | | | | | | | | | | | | | | | |
| Net investment income | | | 0.04 | | | | 0.14 | | | | 0.40 | | | | 0.04 | | | | 0.29 | |
| Net realized gain | | | — | | | | 1.31 | | | | 1.16 | | | | 0.00^ | | | | 0.03 | |
| Total distributions | | | 0.04 | | | | 1.45 | | | | 1.56 | | | | 0.04 | | | | 0.32 | |
| Net asset value, end of year | | $ | 13.98 | | | $ | 10.45 | | | $ | 15.65 | | | $ | 13.00 | | | $ | 13.65 | |
| Total return (%) | | | 34.22 | | | | (24.29 | ) | | | 32.70 | | | | (4.41 | ) | | | 10.00 | |
| Ratios to average daily net assets (%): | | | | | | | | | | | | | | | | | | | | |
| Expenses, before waivers and reimbursements | | | 1.21 | | | | 1.18 | | | | 1.31 | | | | 1.30 | | | | 1.31 | |
| Expenses, net of waivers and reimbursements | | | 1.21 | | | | 1.18 | | | | 1.16 | | | | 1.15 | | | | 1.16 | |
| Net investment income (loss), before waivers and reimbursements | | | 0.75 | | | | 0.60 | | | | 0.77 | | | | 0.91 | | | | 0.51 | |
| Net investment income (loss), net of waivers and reimbursements | | | 0.75 | | | | 0.60 | | | | 0.92 | | | | 1.06 | | | | 0.66 | |
| Class I net assets at the end of the year (in thousands) | | $ | 142,951 | | | $ | 165,451 | | | $ | 338,920 | | | $ | 306,526 | | | $ | 342,232 | |
| Portfolio turnover rate (%) | | | 38 | | | | 88 | | | | 64 | | | | 73 | | | | 90 | |
| ^ | Amount is less than $0.005 per share. |
Note: Net investment income (loss) per share is based on the average shares outstanding during the year.
Performance cited represents past performance. Past performance does not guarantee future results and current performance may be lower or higher than the data quoted. Results shown are annual returns, which assume reinvestment of dividends and capital gains. Investment returns and principal will fluctuate and you may have a gain or loss when you sell shares. For the most current month-end performance information, please call 1-800-742-7272 or visit our Web site atwww.williamblairfunds.com.
| December 31, 2019 | William Blair Funds | 155 |
Financial Highlights— For a share outstanding throughout each period
International Small Cap Growth Fund
| | | Class R6 | |
| | | Years Ended December 31, | |
| | | 2019 | | | 2018 | | | 2017 | | | 2016 | | | 2015 | |
| Net asset value, beginning of year | | $ | 10.50 | | | $ | 15.73 | | | $ | 13.07 | | | $ | 13.72 | | | $ | 12.77 | |
| Income (loss) from investment operations: | | | | | | | | | | | | | | | | | | | | |
| Net investment income (loss) | | | 0.11 | | | | 0.10 | | | | 0.15 | | | | 0.15 | | | | 0.10 | |
| Net realized and unrealized gain (loss) on investments | | | 3.49 | | | | (3.85 | ) | | | 4.08 | | | | (0.74 | ) | | | 1.18 | |
| Total from investment operations | | | 3.60 | | | | (3.75 | ) | | | 4.23 | | | | (0.59 | ) | | | 1.28 | |
| Less distributions from: | | | | | | | | | | | | | | | | | | | | |
| Net investment income | | | 0.05 | | | | 0.17 | | | | 0.41 | | | | 0.06 | | | | 0.30 | |
| Net realized gain | | | — | | | | 1.31 | | | | 1.16 | | | | 0.00 | ^ | | | 0.03 | |
| Total distributions | | | 0.05 | | | | 1.48 | | | | 1.57 | | | | 0.06 | | | | 0.33 | |
| Net asset value, end of year | | $ | 14.05 | | | $ | 10.50 | | | $ | 15.73 | | | $ | 13.07 | | | $ | 13.72 | |
| Total return (%) | | | 34.32 | | | | (24.19 | ) | | | 32.70 | | | | (4.31 | ) | | | 10.03 | |
| Ratios to average daily net assets (%): | | | | | | | | | | | | | | | | | | | | |
| Expenses | | | 1.12 | | | | 1.08 | | | | 1.08 | | | | 1.07 | | | | 1.08 | |
| Net investment income (loss) | | | 0.86 | | | | 0.67 | | | | 0.99 | | | | 1.13 | | | | 0.76 | |
| Class R6 net assets at the end of the year (in thousands) | | $ | 162,465 | | | $ | 171,833 | | | $ | 256,558 | | | $ | 199,746 | | | $ | 221,018 | |
| Portfolio turnover rate (%) | | | 38 | | | | 88 | | | | 64 | | | | 73 | | | | 90 | |
| ^ | Amount is less than $0.005 per share. |
Note: Net investment income (loss) per share is based on the average shares outstanding during the year.
Performance cited represents past performance. Past performance does not guarantee future results and current performance may be lower or higher than the data quoted. Results shown are annual returns, which assume reinvestment of dividends and capital gains. Investment returns and principal will fluctuate and you may have a gain or loss when you sell shares. For the most current month-end performance information, please call 1-800-742-7272 or visit our Web site atwww.williamblairfunds.com.
| 156 | Annual Report | December 31, 2019 |
Financial Highlights— For a share outstanding throughout each period
Emerging Markets Leaders Fund
| | | Class N | |
| | | Years Ended December 31, | |
| | | 2019 | | | 2018 | | | 2017 | | | 2016 | | | 2015 | |
| Net asset value, beginning of year | | $ | 8.26 | | | $ | 11.06 | | | $ | 7.84 | | | $ | 7.73 | | | $ | 9.06 | |
| Income (loss) from investment operations: | | | | | | | | | | | | | | | | | | | | |
| Net investment income (loss) | | | 0.03 | | | | 0.03 | | | | 0.01 | | | | 0.02 | | | | 0.02 | |
| Net realized and unrealized gain (loss) on investments | | | 2.28 | | | | (1.97 | ) | | | 3.26 | | | | 0.09 | | | | (1.34 | ) |
| Total from investment operations | | | 2.31 | | | | (1.94 | ) | | | 3.27 | | | | 0.11 | | | | (1.32 | ) |
| Less distributions from: | | | | | | | | | | | | | | | | | | | | |
| Net investment income | | | 0.04 | | | | 0.07 | | | | 0.05 | | | | — | | | | — | |
| Net realized gain | | | 0.02 | | | | 0.79 | | | | — | | | | — | | | | 0.01 | |
| Total distributions | | | 0.06 | | | | 0.86 | | | | 0.05 | | | | — | | | | 0.01 | |
| Net asset value, end of year | | $ | 10.51 | | | $ | 8.26 | | | $ | 11.06 | | | $ | 7.84 | | | $ | 7.73 | |
| Total return (%) | | | 27.98 | | | | (17.73 | ) | | | 41.68 | | | | 1.42 | | | | (14.56 | ) |
| Ratios to average daily net assets (%): | | | | | | | | | | | | | | | | | | | | |
| Expenses, before waivers and reimbursements | | | 1.62 | | | | 1.60 | | | | 1.62 | | | | 1.81 | | | | 1.89 | |
| Expenses, net of waivers and reimbursements | | | 1.45 | | | | 1.58 | | | | 1.47 | | | | 1.57 | | | | 1.64 | |
| Net investment income (loss), before waivers and reimbursements | | | 0.17 | | | | 0.27 | | | | (0.01 | ) | | | 0.05 | | | | (0.07 | ) |
| Net investment income (loss), net of waivers and reimbursements | | | 0.34 | | | | 0.29 | | | | 0.14 | | | | 0.29 | | | | 0.18 | |
| Class N net assets at the end of the year (in thousands) | | $ | 1,856 | | | $ | 2,239 | | | $ | 2,766 | | | $ | 2,479 | | | $ | 1,599 | |
| Portfolio turnover rate (%) | | | 33 | | | | 52 | | | | 59 | | | | 135 | | | | 110 | |
| | | | | | | | | | | | | | | | | | | | | |
| | | Class I | |
| | | Years Ended December 31, | |
| | | 2019 | | | 2018 | | | 2017 | | | 2016 | | | 2015 | |
| Net asset value, beginning of year | | $ | 8.27 | | | $ | 11.09 | | | $ | 7.87 | | | $ | 7.74 | | | $ | 9.08 | |
| Income (loss) from investment operations: | | | | | | | | | | | | | | | | | | | | |
| Net investment income (loss) | | | 0.06 | | | | 0.06 | | | | 0.02 | | | | 0.04 | | | | 0.05 | |
| Net realized and unrealized gain (loss) on investments | | | 2.29 | | | | (1.97 | ) | | | 3.27 | | | | 0.10 | | | | (1.36 | ) |
| Total from investment operations | | | 2.35 | | | | (1.91 | ) | | | 3.29 | | | | 0.14 | | | | (1.31 | ) |
| Less distributions from: | | | | | | | | | | | | | | | | | | | | |
| Net investment income | | | 0.08 | | | | 0.12 | | | | 0.07 | | | | 0.01 | | | | 0.02 | |
| Net realized gain | | | 0.02 | | | | 0.79 | | | | — | | | | — | | | | 0.01 | |
| Total distributions | | | 0.10 | | | | 0.91 | | | | 0.07 | | | | 0.01 | | | | 0.03 | |
| Net asset value, end of year | | $ | 10.52 | | | $ | 8.27 | | | $ | 11.09 | | | $ | 7.87 | | | $ | 7.74 | |
| Total return (%) | | | 28.36 | | | | (17.45 | ) | | | 41.89 | | | | 1.82 | | | | (14.37 | ) |
| Ratios to average daily net assets (%): | | | | | | | | | | | | | | | | | | | | |
| Expenses, before waivers and reimbursements | | | 1.29 | | | | 1.27 | | | | 1.40 | | | | 1.54 | | | | 1.54 | |
| Expenses, net of waivers and reimbursements | | | 1.20 | | | | 1.27 | | | | 1.25 | | | | 1.30 | | | | 1.29 | |
| Net investment income (loss), before waivers and reimbursements | | | 0.53 | | | | 0.58 | | | | 0.09 | | | | 0.28 | | | | 0.28 | |
| Net investment income (loss), net of waivers and reimbursements | | | 0.62 | | | | 0.58 | | | | 0.24 | | | | 0.52 | | | | 0.53 | |
| Class I net assets at the end of the year (in thousands) | | $ | 45,090 | | | $ | 34,786 | | | $ | 47,666 | | | $ | 30,346 | | | $ | 32,862 | |
| Portfolio turnover rate (%) | | | 33 | | | | 52 | | | | 59 | | | | 135 | | | | 110 | |
Note: Net investment income (loss) per share is based on the average shares outstanding during the year.
Performance cited represents past performance. Past performance does not guarantee future results and current performance may be lower or higher than the data quoted. Results shown are annual returns, which assume reinvestment of dividends and capital gains. Investment returns and principal will fluctuate and you may have a gain or loss when you sell shares. For the most current month-end performance information, please call 1-800-742-7272 or visit our Web site atwww.williamblairfunds.com.
| December 31, 2019 | William Blair Funds | 157 |
Financial Highlights— For a share outstanding throughout each period
Emerging Markets Leaders Fund
| | | Class R6 | |
| | | Years Ended December 31, | |
| | | 2019 | | | 2018 | | | 2017 | | | 2016 | | | 2015 | |
| Net asset value, beginning of year | | $ | 8.26 | | | $ | 11.09 | | | $ | 7.86 | | | $ | 7.74 | | | $ | 9.07 | |
| Income (loss) from investment operations: | | | | | | | | | | | | | | | | | | | | |
| Net investment income (loss) | | | 0.06 | | | | 0.07 | | | | 0.03 | | | | 0.03 | | | | 0.04 | |
| Net realized and unrealized gain (loss) on investments | | | 2.29 | | | | (1.98 | ) | | | 3.28 | | | | 0.10 | | | | (1.33 | ) |
| Total from investment operations | | | 2.35 | | | | (1.91 | ) | | | 3.31 | | | | 0.13 | | | | (1.29 | ) |
| Less distributions from: | | | | | | | | | | | | | | | | | | | | |
| Net investment income | | | 0.08 | | | | 0.13 | | | | 0.08 | | | | 0.01 | | | | 0.03 | |
| Net realized gain | | | 0.02 | | | | 0.79 | | | | — | | | | — | | | | 0.01 | |
| Total distributions | | | 0.10 | | | | 0.92 | | | | 0.08 | | | | 0.01 | | | | 0.04 | |
| Net asset value, end of year | | $ | 10.51 | | | $ | 8.26 | | | $ | 11.09 | | | $ | 7.86 | | | $ | 7.74 | |
| Total return (%) | | | 28.45 | | | | (17.46 | ) | | | 42.15 | | | | 1.74 | | | | (14.24 | ) |
| Ratios to average daily net assets (%): | | | | | | | | | | | | | | | | | | | | |
| Expenses, before waivers and reimbursements | | | 1.23 | | | | 1.20 | | | | 1.19 | | | | 1.34 | | | | 1.35 | |
| Expenses, net of waivers and reimbursements | | | 1.15 | | | | 1.20 | | | | 1.19 | | | | 1.25 | | | | 1.25 | |
| Net investment income (loss), before waivers and reimbursements | | | 0.57 | | | | 0.71 | | | | 0.33 | | | | 0.30 | | | | 0.39 | |
| Net investment income (loss), net of waivers and reimbursements | | | 0.65 | | | | 0.71 | | | | 0.33 | | | | 0.39 | | | | 0.49 | |
| Class R6 net assets at the end of the year (in thousands) | | $ | 191,337 | | | $ | 161,889 | | | $ | 427,480 | | | $ | 272,678 | | | $ | 93,217 | |
| Portfolio turnover rate (%) | | | 33 | | | | 52 | | | | 59 | | | | 135 | | | | 110 | |
Note: Net investment income (loss) per share is based on the average shares outstanding during the year.
Performance cited represents past performance. Past performance does not guarantee future results and current performance may be lower or higher than the data quoted. Results shown are annual returns, which assume reinvestment of dividends and capital gains. Investment returns and principal will fluctuate and you may have a gain or loss when you sell shares. For the most current month-end performance information, please call 1-800-742-7272 or visit our Web site atwww.williamblairfunds.com.
| 158 | Annual Report | December 31, 2019 |
Financial Highlights— For a share outstanding throughout each period
Emerging Markets Growth Fund
| | | Class N | |
| | | Years Ended December 31, | |
| | | 2019 | | | 2018 | | | 2017 | | | 2016 | | | 2015 | |
| Net asset value, beginning of year | | $ | 11.14 | | | $ | 16.20 | | | $ | 10.99 | | | $ | 10.85 | | | $ | 12.91 | |
| Income (loss) from investment operations: | | | | | | | | | | | | | | | | | | | | |
| Net investment income (loss) | | | 0.11 | | | | 0.01 | | | | (0.02 | ) | | | 0.03 | | | | 0.04 | |
| Net realized and unrealized gain (loss) on investments | | | 2.98 | | | | (3.49 | ) | | | 5.35 | | | | 0.13 | | | | (1.98 | ) |
| Total from investment operations | | | 3.09 | | | | (3.48 | ) | | | 5.33 | | | | 0.16 | | | | (1.94 | ) |
| Less distributions from: | | | | | | | | | | | | | | | | | | | | |
| Net investment income | | | 0.16 | | | | 0.11 | | | | 0.12 | | | | 0.02 | | | | — | |
| Net realized gain | | | 0.40 | | | | 1.47 | | | | — | | | | — | | | | 0.12 | |
| Total distributions | | | 0.56 | | | | 1.58 | | | | 0.12 | | | | 0.02 | | | | 0.12 | |
| Net asset value, end of year | | $ | 13.67 | | | $ | 11.14 | | | $ | 16.20 | | | $ | 10.99 | | | $ | 10.85 | |
| Total return (%) | | | 27.89 | | | | (21.61 | ) | | | 48.53 | | | | 1.49 | | | | (15.03 | ) |
| Ratios to average daily net assets (%): | | | | | | | | | | | | | | | | | | | | |
| Expenses, before waivers and reimbursements | | | 1.51 | | | | 1.52 | | | | 1.65 | | | | 1.65 | | | | 1.65 | |
| Expenses, net of waivers and reimbursements | | | 1.51 | | | | 1.52 | | | | 1.50 | | | | 1.50 | | | | 1.50 | |
| Net investment income (loss), before waivers and reimbursements | | | 0.84 | | | | 0.09 | | | | (0.29 | ) | | | 0.13 | | | | 0.18 | |
| Net investment income (loss), net of waivers and reimbursements | | | 0.84 | | | | 0.09 | | | | (0.14 | ) | | | 0.28 | | | | 0.33 | |
| Class N net assets at the end of the year (in thousands) | | $ | 7,804 | | | $ | 7,103 | | | $ | 10,479 | | | $ | 8,488 | | | $ | 9,367 | |
| Portfolio turnover rate (%) | | | 79 | | | | 113 | | | | 91 | | | | 105 | | | | 121 | |
| | | | | | | | | | | | | | | | | | | | | |
| | | Class I | |
| | | Years Ended December 31, | |
| | | 2019 | | | 2018 | | | 2017 | | | 2016 | | | 2015 | |
| Net asset value, beginning of year | | $ | 11.25 | | | $ | 16.36 | | | $ | 11.10 | | | $ | 10.96 | | | $ | 13.01 | |
| Income (loss) from investment operations: | | | | | | | | | | | | | | | | | | | | |
| Net investment income (loss) | | | 0.14 | | | | 0.05 | | | | 0.01 | | | | 0.06 | | | | 0.07 | |
| Net realized and unrealized gain (loss) on investments | | | 3.02 | | | | (3.52 | ) | | | 5.40 | | | | 0.13 | | | | (2.00 | ) |
| Total from investment operations | | | 3.16 | | | | (3.47 | ) | | | 5.41 | | | | 0.19 | | | | (1.93 | ) |
| Less distributions from: | | | | | | | | | | | | | | | | | | | | |
| Net investment income | | | 0.19 | | | | 0.17 | | | | 0.15 | | | | 0.05 | | | | — | |
| Net realized gain | | | 0.40 | | | | 1.47 | | | | — | | | | — | | | | 0.12 | |
| Total distributions | | | 0.59 | | | | 1.64 | | | | 0.15 | | | | 0.05 | | | | 0.12 | |
| Net asset value, end of year | | $ | 13.82 | | | $ | 11.25 | | | $ | 16.36 | | | $ | 11.10 | | | $ | 10.96 | |
| Total return (%) | | | 28.29 | | | | (21.37 | ) | | | 48.83 | | | | 1.73 | | | | (14.83 | ) |
| Ratios to average daily net assets (%): | | | | | | | | | | | | | | | | | | | | |
| Expenses, before waivers and reimbursements | | | 1.26 | | | | 1.27 | | | | 1.42 | | | | 1.41 | | | | 1.40 | |
| Expenses, net of waivers and reimbursements | | | 1.26 | | | | 1.27 | | | | 1.27 | | | | 1.26 | | | | 1.25 | |
| Net investment income (loss), before waivers and reimbursements | | | 1.06 | | | | 0.34 | | | | (0.07 | ) | | | 0.38 | | | | 0.43 | |
| Net investment income (loss), net of waivers and reimbursements | | | 1.06 | | | | 0.34 | | | | 0.08 | | | | 0.53 | | | | 0.58 | |
| Class I net assets at the end of the year (in thousands) | | $ | 73,496 | | | $ | 79,427 | | | $ | 129,481 | | | $ | 93,668 | | | $ | 130,491 | |
| Portfolio turnover rate (%) | | | 79 | | | | 113 | | | | 91 | | | | 105 | | | | 121 | |
Note: Net investment income (loss) per share is based on the average shares outstanding during the year.
Performance cited represents past performance. Past performance does not guarantee future results and current performance may be lower or higher than the data quoted. Results shown are annual returns, which assume reinvestment of dividends and capital gains. Investment returns and principal will fluctuate and you may have a gain or loss when you sell shares. For the most current month-end performance information, please call 1-800-742-7272 or visit our Web site atwww.williamblairfunds.com.
| December 31, 2019 | William Blair Funds | 159 |
Financial Highlights— For a share outstanding throughout each period
Emerging Markets Growth Fund
| | | Class R6 | |
| | | Years Ended December 31, | |
| | | 2019 | | | 2018 | | | 2017 | | | 2016 | | | 2015 | |
| Net asset value, beginning of year | | $ | 11.35 | | | $ | 16.49 | | | $ | 11.18 | | | $ | 11.05 | | | $ | 13.09 | |
| Income (loss) from investment operations: | | | | | | | | | | | | | | | | | | | | |
| Net investment income (loss) | | | 0.15 | | | | 0.07 | | | | 0.02 | | | | 0.07 | | | | 0.08 | |
| Net realized and unrealized gain (loss) on investments | | | 3.04 | | | | (3.56 | ) | | | 5.46 | | | | 0.12 | | | | (2.00 | ) |
| Total from investment operations | | | 3.19 | | | | (3.49 | ) | | | 5.48 | | | | 0.19 | | | | (1.92 | ) |
| Less distributions from: | | | | | | | | | | | | | | | | | | | | |
| Net investment income | | | 0.20 | | | | 0.18 | | | | 0.17 | | | | 0.06 | | | | — | |
| Net realized gain | | | 0.40 | | | | 1.47 | | | | — | | | | — | | | | 0.12 | |
| Total distributions | | | 0.60 | | | | 1.65 | | | | 0.17 | | | | 0.06 | | | | 0.12 | |
| Net asset value, end of year | | $ | 13.94 | | | $ | 11.35 | | | $ | 16.49 | | | $ | 11.18 | | | $ | 11.05 | |
| Total return (%) | | | 28.28 | | | | (21.29 | ) | | | 49.06 | | | | 1.71 | | | | (14.67 | ) |
| Ratios to average daily net assets (%): | | | | | | | | | | | | | | | | | | | | |
| Expenses | | | 1.19 | | | | 1.19 | | | | 1.17 | | | | 1.19 | | | | 1.17 | |
| Net investment income (loss) | | | 1.17 | | | | 0.46 | | | | 0.17 | | | | 0.60 | | | | 0.61 | |
| Class R6 net assets at the end of the year (in thousands) | | $ | 708,892 | | | $ | 654,441 | | | $ | 1,178,853 | | | $ | 831,587 | | | $ | 739,253 | |
| Portfolio turnover rate (%) | | | 79 | | | | 113 | | | | 91 | | | | 105 | | | | 121 | |
Note: Net investment income (loss) per share is based on the average shares outstanding during the year.
Performance cited represents past performance. Past performance does not guarantee future results and current performance may be lower or higher than the data quoted. Results shown are annual returns, which assume reinvestment of dividends and capital gains. Investment returns and principal will fluctuate and you may have a gain or loss when you sell shares. For the most current month-end performance information, please call 1-800-742-7272 or visit our Web site atwww.williamblairfunds.com.
| 160 | Annual Report | December 31, 2019 |
Financial Highlights— For a share outstanding throughout each period
Emerging Markets Small Cap Growth Fund
| | | Class N | |
| | | Years Ended December 31, | |
| | | 2019 | | | 2018 | | | 2017 | | | 2016 | | | 2015 | |
| Net asset value, beginning of year | | $ | 13.96 | | | $ | 18.66 | | | $ | 13.73 | | | $ | 14.84 | | | $ | 16.52 | |
| Income (loss) from investment operations: | | | | | | | | | | | | | | | | | | | | |
| Net investment income (loss) | | | 0.00 | ^ | | | (0.02 | ) | | | 0.01 | | | | 0.09 | | | | (0.01 | ) |
| Net realized and unrealized gain (loss) on investments | | | 2.84 | | | | (4.38 | ) | | | 5.46 | | | | (0.88 | ) | | | (1.05 | ) |
| Total from investment operations | | | 2.84 | | | | (4.40 | ) | | | 5.47 | | | | (0.79 | ) | | | (1.06 | ) |
| Less distributions from: | | | | | | | | | | | | | | | | | | | | |
| Net investment income | | | — | | | | — | | | | 0.50 | | | | 0.32 | | | | — | |
| Net realized gain | | | — | | | | 0.30 | | | | 0.04 | | | | — | | | | 0.62 | |
| Total distributions | | | — | | | | 0.30 | | | | 0.54 | | | | 0.32 | | | | 0.62 | |
| Net asset value, end of year | | $ | 16.80 | | | $ | 13.96 | | | $ | 18.66 | | | $ | 13.73 | | | $ | 14.84 | |
| Total return (%) | | | 20.34 | | | | (23.57 | ) | | | 40.09 | | | | (5.33 | ) | | | (6.40 | ) |
| Ratios to average daily net assets (%): | | | | | | | | | | | | | | | | | | | | |
| Expenses, before waivers and reimbursements | | | 1.71 | | | | 1.70 | | | | 1.83 | | | | 1.82 | | | | 1.94 | |
| Expenses, net of waivers and reimbursements | | | 1.55 | | | | 1.58 | | | | 1.64 | | | | 1.61 | | | | 1.65 | |
| Net investment income (loss), before waivers and reimbursements | | | (0.14 | ) | | | (0.22 | ) | | | (0.11 | ) | | | 0.41 | | | | (0.35 | ) |
| Net investment income (loss), net of waivers and reimbursements | | | 0.02 | | | | (0.10 | ) | | | 0.08 | | | | 0.62 | | | | (0.06 | ) |
| Class N net assets at the end of the year (in thousands) | | $ | 4,025 | | | $ | 8,977 | | | $ | 15,082 | | | $ | 9,263 | | | $ | 11,306 | |
| Portfolio turnover rate (%) | | | 142 | | | | 187 | | | | 183 | | | | 157 | | | | 167 | |
| | | | | | | | | | | | | | | | | | | | | |
| | | Class I | |
| | | Years Ended December 31, | |
| | | 2019 | | | 2018 | | | 2017 | | | 2016 | | | 2015 | |
| Net asset value, beginning of year | | $ | 14.03 | | | $ | 18.73 | | | $ | 13.77 | | | $ | 14.90 | | | $ | 16.52 | |
| Income (loss) from investment operations: | | | | | | | | | | | | | | | | | | | | |
| Net investment income (loss) | | | 0.04 | | | | 0.03 | | | | 0.08 | | | | 0.13 | | | | 0.05 | |
| Net realized and unrealized gain (loss) on investments | | | 2.86 | | | | (4.41 | ) | | | 5.47 | | | | (0.89 | ) | | | (1.05 | ) |
| Total from investment operations | | | 2.90 | | | | (4.38 | ) | | | 5.55 | | | | (0.76 | ) | | | (1.00 | ) |
| Less distributions from: | | | | | | | | | | | | | | | | | | | | |
| Net investment income | | | 0.03 | | | | 0.02 | | | | 0.55 | | | | 0.37 | | | | — | |
| Net realized gain | | | — | | | | 0.30 | | | | 0.04 | | | | — | | | | 0.62 | |
| Total distributions | | | 0.03 | | | | 0.32 | | | | 0.59 | | | | 0.37 | | | | 0.62 | |
| Net asset value, end of year | | $ | 16.90 | | | $ | 14.03 | | | $ | 18.73 | | | $ | 13.77 | | | $ | 14.90 | |
| Total return (%) | | | 20.58 | | | | (23.31 | ) | | | 40.53 | | | | (5.11 | ) | | | (6.03 | ) |
| Ratios to average daily net assets (%): | | | | | | | | | | | | | | | | | | | | |
| Expenses, before waivers and reimbursements | | | 1.40 | | | | 1.38 | | | | 1.50 | | | | 1.51 | | | | 1.52 | |
| Expenses, net of waivers and reimbursements | | | 1.30 | | | | 1.33 | | | | 1.31 | | | | 1.30 | | | | 1.31 | |
| Net investment income (loss), before waivers and reimbursements | | | 0.18 | | | | 0.13 | | | | 0.30 | | | | 0.66 | | | | 0.09 | |
| Net investment income (loss), net of waivers and reimbursements | | | 0.28 | | | | 0.18 | | | | 0.49 | | | | 0.87 | | | | 0.30 | |
| Class I net assets at the end of the year (in thousands) | | $ | 142,885 | | | $ | 169,770 | | | $ | 282,620 | | | $ | 147,949 | | | $ | 162,375 | |
| Portfolio turnover rate (%) | | | 142 | | | | 187 | | | | 183 | | | | 157 | | | | 167 | |
| ^ | Amount is less than $0.005 per share. |
Note: Net investment income (loss) per share is based on the average shares outstanding during the year.
Performance cited represents past performance. Past performance does not guarantee future results and current performance may be lower or higher than the data quoted. Results shown are annual returns, which assume reinvestment of dividends and capital gains. Investment returns and principal will fluctuate and you may have a gain or loss when you sell shares. For the most current month-end performance information, please call 1-800-742-7272 or visit our Web site atwww.williamblairfunds.com.
| December 31, 2019 | William Blair Funds | 161 |
Financial Highlights— For a share outstanding throughout each period
Emerging Markets Small Cap Growth Fund
| | | Class R6 | |
| | | Years Ended December 31, | |
| | | 2019 | | | 2018 | | | 2017 | | | 2016 | | | 2015 | |
| Net asset value, beginning of year | | $ | 14.06 | | | $ | 18.76 | | | $ | 13.79 | | | $ | 14.92 | | | $ | 16.53 | |
| Income (loss) from investment operations: | | | | | | | | | | | | | | | | | | | | |
| Net investment income (loss) | | | 0.05 | | | | 0.05 | | | | 0.10 | | | | 0.14 | | | | 0.06 | |
| Net realized and unrealized gain (loss) on investments | | | 2.86 | | | | (4.41 | ) | | | 5.47 | | | | (0.89 | ) | | | (1.05 | ) |
| Total from investment operations | | | 2.91 | | | | (4.36 | ) | | | 5.57 | | | | (0.75 | ) | | | (0.99 | ) |
| Less distributions from: | | | | | | | | | | | | | | | | | | | | |
| Net investment income | | | 0.04 | | | | 0.04 | | | | 0.56 | | | | 0.38 | | | | 0.00 | ^ |
| Net realized gain | | | — | | | | 0.30 | | | | 0.04 | | | | — | | | | 0.62 | |
| Total distributions | | | 0.04 | | | | 0.34 | | | | 0.60 | | | | 0.38 | | | | 0.62 | |
| Net asset value, end of year | | $ | 16.93 | | | $ | 14.06 | | | $ | 18.76 | | | $ | 13.79 | | | $ | 14.92 | |
| Total return (%) | | | 20.69 | | | | (23.24 | ) | | | 40.62 | | | | (5.05 | ) | | | (5.97 | ) |
| Ratios to average daily net assets (%): | | | | | | | | | | | | | | | | | | | | |
| Expenses, before waivers and reimbursements | | | 1.33 | | | | 1.30 | | | | 1.29 | | | | 1.31 | | | | 1.31 | |
| Expenses, net of waivers and reimbursements | | | 1.25 | | | | 1.25 | | | | 1.25 | | | | 1.25 | | | | 1.25 | |
| Net investment income (loss), before waivers and reimbursements | | | 0.27 | | | | 0.22 | | | | 0.53 | | | | 0.88 | | | | 0.28 | |
| Net investment income (loss), net of waivers and reimbursements | | | 0.35 | | | | 0.27 | | | | 0.57 | | | | 0.94 | | | | 0.34 | |
| Class R6 net assets at the end of the year (in thousands) | | $ | 130,711 | | | $ | 98,188 | | | $ | 166,927 | | | $ | 125,650 | | | $ | 123,160 | |
| Portfolio turnover rate (%) | | | 142 | | | | 187 | | | | 183 | | | | 157 | | | | 167 | |
| ^ | Amount is less than $0.005 per share. |
Note: Net investment income (loss) per share is based on the average shares outstanding during the year.
Performance cited represents past performance. Past performance does not guarantee future results and current performance may be lower or higher than the data quoted. Results shown are annual returns, which assume reinvestment of dividends and capital gains. Investment returns and principal will fluctuate and you may have a gain or loss when you sell shares. For the most current month-end performance information, please call 1-800-742-7272 or visit our Web site atwww.williamblairfunds.com.
| 162 | Annual Report | December 31, 2019 |
Financial Highlights— For a share outstanding throughout each period
Bond Fund
| | | Class N | |
| | | Years Ended December 31, | |
| | | 2019 | | | 2018 | | | 2017 | | | 2016 | | | 2015 | |
| Net asset value, beginning of year | | $ | 9.75 | | | $ | 10.41 | | | $ | 10.41 | | | $ | 10.34 | | | $ | 10.74 | |
| Income (loss) from investment operations: | | | | | | | | | | | | | | | | | | | | |
| Net investment income (loss) | | | 0.30 | | | | 0.31 | | | | 0.27 | | | | 0.27 | | | | 0.27 | |
| Net realized and unrealized gain (loss) on investments | | | 0.77 | | | | (0.56 | ) | | | 0.12 | | | | 0.18 | | | | (0.29 | ) |
| Total from investment operations | | | 1.07 | | | | (0.25 | ) | | | 0.39 | | | | 0.45 | | | | (0.02 | ) |
| Less distributions from: | | | | | | | | | | | | | | | | | | | | |
| Net investment income | | | 0.41 | | | | 0.41 | | | | 0.39 | | | | 0.38 | | | | 0.38 | |
| Net realized gain | | | — | | | | — | | | | — | | | | — | | | | — | |
| Total distributions | | | 0.41 | | | | 0.41 | | �� | | 0.39 | | | | 0.38 | | | | 0.38 | |
| Net asset value, end of year | | $ | 10.41 | | | $ | 9.75 | | | $ | 10.41 | | | $ | 10.41 | | | $ | 10.34 | |
| Total return (%) | | | 11.09 | | | | (2.42 | ) | | | 3.83 | | | | 4.40 | | | | (0.23 | ) |
| Ratios to average daily net assets (%): | | | | | | | | | | | | | | | | | | | | |
| Expenses, before waivers and reimbursements | | | 0.69 | | | | 0.69 | | | | 0.82 | | | | 0.82 | | | | 0.79 | |
| Expenses, net of waivers and reimbursements | | | 0.60 | | | | 0.62 | | | | 0.65 | | | | 0.65 | | | | 0.61 | |
| Net investment income (loss), before waivers and reimbursements | | | 2.90 | | | | 3.01 | | | | 2.40 | | | | 2.43 | | | | 2.42 | |
| Net investment income (loss), net of waivers and reimbursements | | | 2.99 | | | | 3.08 | | | | 2.57 | | | | 2.60 | | | | 2.60 | |
| Class N net assets at the end of the year (in thousands) | | $ | 32,176 | | | $ | 70,253 | | | $ | 83,662 | | | $ | 125,866 | | | $ | 139,303 | |
| Portfolio turnover rate (%) | | | 58 | | | | 40 | | | | 17 | | | | 17 | | | | 32 | |
| | | | | | | | | | | | | | | | | | | | | |
| | | Class I | |
| | | Years Ended December 31, | |
| | | | 2019 | | | | 2018 | | | | 2017 | | | | 2016 | | | | 2015 | |
| Net asset value, beginning of year | | $ | 9.65 | | | $ | 10.31 | | | $ | 10.30 | | | $ | 10.24 | | | $ | 10.64 | |
| Income (loss) from investment operations: | | | | | | | | | | | | | | | | | | | | |
| Net investment income (loss) | | | 0.31 | | | | 0.32 | | | | 0.29 | | | | 0.30 | | | | 0.31 | |
| Net realized and unrealized gain (loss) on investments | | | 0.76 | | | | (0.56 | ) | | | 0.13 | | | | 0.16 | | | | (0.31 | ) |
| Total from investment operations | | | 1.07 | | | | (0.24 | ) | | | 0.42 | | | | 0.46 | | | | — | |
| Less distributions from: | | | | | | | | | | | | | | | | | | | | |
| Net investment income | | | 0.42 | | | | 0.42 | | | | 0.41 | | | | 0.40 | | | | 0.40 | |
| Net realized gain | | | — | | | | — | | | | — | | | | — | | | | — | |
| Total distributions | | | 0.42 | | | | 0.42 | | | | 0.41 | | | | 0.40 | | | | 0.40 | |
| Net asset value, end of year | | $ | 10.30 | | | $ | 9.65 | | | $ | 10.31 | | | $ | 10.30 | | | $ | 10.24 | |
| Total return (%) | | | 11.22 | | | | (2.31 | ) | | | 4.16 | | | | 4.55 | | | | (0.05 | ) |
| Ratios to average daily net assets (%): | | | | | | | | | | | | | | | | | | | | |
| Expenses, before waivers and reimbursements | | | 0.47 | | | | 0.46 | | | | 0.60 | | | | 0.58 | | | | 0.59 | |
| Expenses, net of waivers and reimbursements | | | 0.45 | | | | 0.46 | | | | 0.43 | | | | 0.41 | | | | 0.41 | |
| Net investment income (loss), before waivers and reimbursements | | | 3.10 | | | | 3.24 | | | | 2.62 | | | | 2.66 | | | | 2.75 | |
| Net investment income (loss), net of waivers and reimbursements | | | 3.12 | | | | 3.24 | | | | 2.79 | | | | 2.83 | | | | 2.93 | |
| Class I net assets at the end of the year (in thousands) | | $ | 206,304 | | | $ | 281,442 | | | $ | 384,464 | | | $ | 322,174 | | | $ | 237,587 | |
| Portfolio turnover rate (%) | | | 58 | | | | 40 | | | | 17 | | | | 17 | | | | 32 | |
Note: Net investment income (loss) per share is based on the average shares outstanding during the year.
Performance cited represents past performance. Past performance does not guarantee future results and current performance may be lower or higher than the data quoted. Results shown are annual returns, which assume reinvestment of dividends and capital gains. Investment returns and principal will fluctuate and you may have a gain or loss when you sell shares. For the most current month-end performance information, please call 1-800-742-7272 or visit our Web site atwww.williamblairfunds.com.
| December 31, 2019 | William Blair Funds | 163 |
Financial Highlights— For a share outstanding throughout each period
Bond Fund
| | | Class R6 | |
| | | Years Ended December 31, | |
| | | 2019 | | | 2018 | | | 2017 | | | 2016 | | | 2015 | |
| Net asset value, beginning of year | | $ | 9.64 | | | $ | 10.30 | | | $ | 10.29 | | | $ | 10.23 | | | $ | 10.63 | |
| Income (loss) from investment operations: | | | | | | | | | | | | | | | | | | | | |
| Net investment income (loss) | | | 0.32 | | | | 0.33 | | | | 0.30 | | | | 0.30 | | | | 0.32 | |
| Net realized and unrealized gain (loss) on investments | | | 0.76 | | | | (0.56 | ) | | | 0.13 | | | | 0.17 | | | | (0.31 | ) |
| Total from investment operations | | | 1.08 | | | | (0.23 | ) | | | 0.43 | | | | 0.47 | | | | 0.01 | |
| Less distributions from: | | | | | | | | | | | | | | | | | | | | |
| Net investment income | | | 0.42 | | | | 0.43 | | | | 0.42 | | | | 0.41 | | | | 0.41 | |
| Net realized gain | | | — | | | | — | | | | — | | | | — | | | | — | |
| Total distributions | | | 0.42 | | | | 0.43 | | | | 0.42 | | | | 0.41 | | | | 0.41 | |
| Net asset value, end of year | | $ | 10.30 | | | $ | 9.64 | | | $ | 10.30 | | | $ | 10.29 | | | $ | 10.23 | |
| Total return (%) | | | 11.39 | | | | (2.26 | ) | | | 4.24 | | | | 4.61 | | | | 0.01 | |
| Ratios to average daily net assets (%): | | | | | | | | | | | | | | | | | | | | |
| Expenses, before waivers and reimbursements | | | 0.41 | | | | 0.38 | | | | 0.37 | | | | 0.37 | | | | 0.38 | |
| Expenses, net of waivers and reimbursements | | | 0.40 | | | | 0.38 | | | | 0.35 | | | | 0.35 | | | | 0.35 | |
| Net investment income (loss), before waivers and reimbursements | | | 3.17 | | | | 3.32 | | | | 2.85 | | | | 2.88 | | | | 2.98 | |
| Net investment income (loss), net of waivers and reimbursements | | | 3.18 | | | | 3.32 | | | | 2.87 | | | | 2.90 | | | | 3.01 | |
| Class R6 net assets at the end of the year (in thousands) | | $ | 43,655 | | | $ | 70,851 | | | $ | 91,629 | | | $ | 95,216 | | | $ | 103,904 | |
| Portfolio turnover rate (%) | | | 58 | | | | 40 | | | | 17 | | | | 17 | | | | 32 | |
Note: Net investment income (loss) per share is based on the average shares outstanding during the year.
Performance cited represents past performance. Past performance does not guarantee future results and current performance may be lower or higher than the data quoted. Results shown are annual returns, which assume reinvestment of dividends and capital gains. Investment returns and principal will fluctuate and you may have a gain or loss when you sell shares. For the most current month-end performance information, please call 1-800-742-7272 or visit our Web site atwww.williamblairfunds.com.
| 164 | Annual Report | December 31, 2019 |
Financial Highlights— For a share outstanding throughout each period
Income Fund
| | | Class N | |
| | | Years Ended December 31, | |
| | | 2019 | | | 2018 | | | 2017 | | | 2016 | | | 2015 | |
| Net asset value, beginning of year | | $ | 8.36 | | | $ | 8.72 | | | $ | 8.86 | | | $ | 8.90 | | | $ | 9.12 | |
| Income (loss) from investment operations: | | | | | | | | | | | | | | | | | | | | |
| Net investment income (loss) | | | 0.17 | | | | 0.17 | | | | 0.16 | | | | 0.16 | | | | 0.15 | |
| Net realized and unrealized gain (loss) on investments | | | 0.32 | | | | (0.25 | ) | | | (0.03 | ) | | | 0.06 | | | | (0.11 | ) |
| Total from investment operations | | | 0.49 | | | | (0.08 | ) | | | 0.13 | | | | 0.22 | | | | 0.04 | |
| Less distributions from: | | | | | | | | | | | | | | | | | | | | |
| Net investment income | | | 0.28 | | | | 0.28 | | | | 0.27 | | | | 0.26 | | | | 0.26 | |
| Net realized gain | | | — | | | | — | | | | — | | | | — | | | | — | |
| Total distributions | | | 0.28 | | | | 0.28 | | | | 0.27 | | | | 0.26 | | | | 0.26 | |
| Net asset value, end of year | | $ | 8.57 | | | $ | 8.36 | | | $ | 8.72 | | | $ | 8.86 | | | $ | 8.90 | |
| Total return (%) | | | 5.92 | | | | (0.86 | ) | | | 1.46 | | | | 2.44 | | | | 0.39 | |
| Ratios to average daily net assets (%): | | | | | | | | | | | | | | | | | | | | |
| Expenses, before waivers and reimbursements | | | 0.98 | | | | 0.91 | | | | 0.88 | | | | 0.79 | | | | 0.81 | |
| Expenses, net of waivers and reimbursements | | | 0.85 | | | | 0.85 | | | | 0.85 | | | | 0.79 | | | | 0.81 | |
| Net investment income (loss), before waivers and reimbursements | | | 1.85 | | | | 1.96 | | | | 1.77 | | | | 1.80 | | | | 1.71 | |
| Net investment income (loss), net of waivers and reimbursements | | | 1.98 | | | | 2.02 | | | | 1.80 | | | | 1.80 | | | | 1.71 | |
| Class N net assets at the end of the year (in thousands) | | $ | 19,662 | | | $ | 22,422 | | | $ | 39,625 | | | $ | 52,710 | | | $ | 32,942 | |
| Portfolio turnover rate (%) | | | 114 | | | | 97 | | | | 37 | | | | 22 | | | | 21 | |
| | | | | | | | | | | | | | | | | | | | | |
| | | Class I | |
| | | Years Ended December 31, | |
| | | 2019 | | | 2018 | | | 2017 | | | 2016 | | | 2015 | |
| Net asset value, beginning of year | | $ | 8.30 | | | $ | 8.66 | | | $ | 8.80 | | | $ | 8.83 | | | $ | 9.05 | |
| Income (loss) from investment operations: | | | | | | | | | | | | | | | | | | | | |
| Net investment income (loss) | | | 0.18 | | | | 0.19 | | | | 0.18 | | | | 0.18 | | | | 0.18 | |
| Net realized and unrealized gain (loss) on investments | | | 0.33 | | | | (0.25 | ) | | | (0.03 | ) | | | 0.06 | | | | (0.12 | ) |
| Total from investment operations | | | 0.51 | | | | (0.06 | ) | | | 0.15 | | | | 0.24 | | | | 0.06 | |
| Less distributions from: | | | | | | | | | | | | | | | | | | | | |
| Net investment income | | | 0.29 | | | | 0.30 | | | | 0.29 | | | | 0.27 | | | | 0.28 | |
| Net realized gain | | | — | | | | — | | | | — | | | | — | | | | — | |
| Total distributions | | | 0.29 | | | | 0.30 | | | | 0.29 | | | | 0.27 | | | | 0.28 | |
| Net asset value, end of year | | $ | 8.52 | | | $ | 8.30 | | | $ | 8.66 | | | $ | 8.80 | | | $ | 8.83 | |
| Total return (%) | | | 6.24 | | | | (0.69 | ) | | | 1.68 | | | | 2.78 | | | | 0.63 | |
| Ratios to average daily net assets (%): | | | | | | | | | | | | | | | | | | | | |
| Expenses, before waivers and reimbursements | | | 0.74 | | | | 0.65 | | | | 0.62 | | | | 0.57 | | | | 0.55 | |
| Expenses, net of waivers and reimbursements | | | 0.70 | | | | 0.65 | | | | 0.62 | | | | 0.57 | | | | 0.55 | |
| Net investment income (loss), before waivers and reimbursements | | | 2.10 | | | | 2.22 | | | | 2.03 | | | | 2.05 | | | | 1.97 | |
| Net investment income (loss), net of waivers and reimbursements | | | 2.14 | | | | 2.22 | | | | 2.03 | | | | 2.05 | | | | 1.97 | |
| Class I net assets at the end of the year (in thousands) | | $ | 31,629 | | | $ | 34,793 | | | $ | 51,153 | | | $ | 58,160 | | | $ | 62,722 | |
| Portfolio turnover rate (%) | | | 114 | | | | 97 | | | | 37 | | | | 22 | | | | 21 | |
Note: Net investment income (loss) per share is based on the average shares outstanding during the year.
Performance cited represents past performance. Past performance does not guarantee future results and current performance may be lower or higher than the data quoted. Results shown are annual returns, which assume reinvestment of dividends and capital gains. Investment returns and principal will fluctuate and you may have a gain or loss when you sell shares. For the most current month-end performance information, please call 1-800-742-7272 or visit our Web site atwww.williamblairfunds.com.
| December 31, 2019 | William Blair Funds | 165 |
Financial Highlights— For a share outstanding throughout each period
Income Fund
| | | Class R6 | |
| | | Period Ended | |
| | | December 31, | |
| | | 2019(a) | |
| Net asset value, beginning of year | | | $ | 8.45 | |
| Income (loss) from investment operations: | | | | | |
| Net investment income (loss) | | | | 0.09 | |
| Net realized and unrealized gain (loss) on investments | | | | 0.18 | |
| Total from investment operations | | | | 0.27 | |
| Less distributions from: | | | | | |
| Net investment income | | | | 0.20 | |
| Net realized gain | | | | — | |
| Total distributions | | | | 0.20 | |
| Net asset value, end of year | | | $ | 8.52 | |
| Total Return (%)* | | | | 3.18 | |
| Ratios to average daily net assets (%)**: | | | | | |
| Expenses, before of waivers and reimbursements | | | | 0.71 | |
| Expenses, net waivers and reimbursements | | | | 0.65 | |
| Net investment income (loss), before of waivers and reimbursements | | | | 1.46 | |
| Net investment income (loss), net waivers and reimbursements | | | | 1.52 | |
| Class R6 net assets at end of year (in thousands) | | | $ | 52 | |
| Portfolio turnover rate (%)* | | | | 114 | |
| * | Rates are not annualized for periods less than a year. |
| ** | Rates are annualized for periods less than a year. |
| (a) | For the period from May 2, 2019 (Commencement of Operations) to December 31, 2019. |
Note: Net investment income (loss) per share is based on the average shares outstanding during the year.
Performance cited represents past performance. Past performance does not guarantee future results and current performance may be lower or higher than the data quoted. Results shown are annual returns, which assume reinvestment of dividends and capital gains. Investment returns and principal will fluctuate and you may have a gain or loss when you sell shares. For the most current month-end performance information, please call 1-800-742-7272 or visit our Web site atwww.williamblairfunds.com.
| 166 | Annual Report | December 31, 2019 |
Financial Highlights— For a share outstanding throughout each period
Low Duration Fund
| | | Class N | |
| | | Years Ended December 31, | |
| | | 2019 | | | 2018 | | | 2017 | | | 2016 | | | 2015 | |
| Net asset value, beginning of year | | $ | 8.70 | | | $ | 8.92 | | | $ | 9.07 | | | $ | 9.16 | | | $ | 9.38 | |
| Income (loss) from investment operations: | | | | | | | | | | | | | | | | | | | | |
| Net investment income (loss) | | | 0.19 | | | | 0.17 | | | | 0.11 | | | | 0.09 | | | | 0.07 | |
| Net realized and unrealized gain (loss) on investments | | | 0.11 | | | | (0.10 | ) | | | (0.04 | ) | | | 0.02 | | | | (0.07 | ) |
| Total from investment operations | | | 0.30 | | | | 0.07 | | | | 0.07 | | | | 0.11 | | | | — | |
| Less distributions from: | | | | | | | | | | | | | | | | | | | | |
| Net investment income | | | 0.32 | | | | 0.29 | | | | 0.22 | | | | 0.20 | | | | 0.22 | |
| Net realized gain | | | — | | | | — | | | | — | | | | — | | | | — | |
| Total distributions | | | 0.32 | | | | 0.29 | | | | 0.22 | | | | 0.20 | | | | 0.22 | |
| Net asset value, end of year | | $ | 8.68 | | | $ | 8.70 | | | $ | 8.92 | | | $ | 9.07 | | | $ | 9.16 | |
| Total return (%) | | | 3.48 | | | | 0.80 | | | | 0.84 | | | | 1.16 | | | | 0.01 | |
| Ratios to average daily net assets (%): | | | | | | | | | | | | | | | | | | | | |
| Expenses, before waivers and reimbursements | | | 0.75 | | | | 0.72 | | | | 0.79 | | | | 0.83 | | | | 0.77 | |
| Expenses, net of waivers and reimbursements | | | 0.55 | | | | 0.58 | | | | 0.61 | | | | 0.68 | | | | 0.60 | |
| Net investment income (loss), before waivers and reimbursements | | | 1.96 | | | | 1.83 | | | | 1.04 | | | | 0.83 | | | | 0.54 | |
| Net investment income (loss), net of waivers and reimbursements | | | 2.16 | | | | 1.97 | | | | 1.22 | | | | 0.98 | | | | 0.71 | |
| Class N net assets at the end of the year (in thousands) | | $ | 1,513 | | | $ | 1,661 | | | $ | 1,979 | | | $ | 7,237 | | | $ | 2,712 | |
| Portfolio turnover rate (%) | | | 183 | | | | 122 | | | | 109 | | | | 81 | | | | 106 | |
| | | | | | | | | | | | | | | | | | | | | |
| | | Class I | |
| | | Years Ended December 31, | |
| | | 2019 | | | 2018 | | | 2017 | | | 2016 | | | 2015 | |
| Net asset value, beginning of year | | $ | 8.70 | | | $ | 8.91 | | | $ | 9.07 | | | $ | 9.16 | | | $ | 9.37 | |
| Income (loss) from investment operations: | | | | | | | | | | | | | | | | | | | | |
| Net investment income (loss) | | | 0.20 | | | | 0.19 | | | | 0.13 | | | | 0.11 | | | | 0.08 | |
| Net realized and unrealized gain (loss) on investments | | | 0.10 | | | | (0.09 | ) | | | (0.05 | ) | | | 0.02 | | | | (0.05 | ) |
| Total from investment operations | | | 0.30 | | | | 0.10 | | | | 0.08 | | | | 0.13 | | | | 0.03 | |
| Less distributions from: | | | | | | | | | | | | | | | | | | | | |
| Net investment income | | | 0.33 | | | | 0.31 | | | | 0.24 | | | | 0.22 | | | | 0.24 | |
| Net realized gain | | | — | | | | — | | | | — | | | | — | | | | — | |
| Total distributions | | | 0.33 | | | | 0.31 | | | | 0.24 | | | | 0.22 | | | | 0.24 | |
| Net asset value, end of year | | $ | 8.67 | | | $ | 8.70 | | | $ | 8.91 | | | $ | 9.07 | | | $ | 9.16 | |
| Total return (%) | | | 3.52 | | | | 1.12 | | | | 0.91 | | | | 1.40 | | | | 0.30 | |
| Ratios to average daily net assets (%): | | | | | | | | | | | | | | | | | | | | |
| Expenses, before waivers and reimbursements | | | 0.53 | | | | 0.46 | | | | 0.59 | | | | 0.59 | | | | 0.59 | |
| Expenses, net of waivers and reimbursements | | | 0.40 | | | | 0.39 | | | | 0.41 | | | | 0.44 | | | | 0.42 | |
| Net investment income (loss), before waivers and reimbursements | | | 2.19 | | | | 2.05 | | | | 1.27 | | | | 1.05 | | | | 0.70 | |
| Net investment income (loss), net of waivers and reimbursements | | | 2.32 | | | | 2.12 | | | | 1.45 | | | | 1.20 | | | | 0.87 | |
| Class I net assets at the end of the year (in thousands) | | $ | 38,156 | | | $ | 56,120 | | | $ | 131,186 | | | $ | 219,714 | | | $ | 107,137 | |
| Portfolio turnover rate (%) | | | 183 | | | | 122 | | | | 109 | | | | 81 | | | | 106 | |
Note: Net investment income (loss) per share is based on the average shares outstanding during the year.
Performance cited represents past performance. Past performance does not guarantee future results and current performance may be lower or higher than the data quoted. Results shown are annual returns, which assume reinvestment of dividends and capital gains. Investment returns and principal will fluctuate and you may have a gain or loss when you sell shares. For the most current month-end performance information, please call 1-800-742-7272 or visit our Web site atwww.williamblairfunds.com.
| December 31, 2019 | William Blair Funds | 167 |
Financial Highlights— For a share outstanding throughout each period
Low Duration Fund
| | | Class R6 | |
| | | Years Ended December 31, | |
| | | 2019 | | | 2018 | | | 2017 | | | 2016 | | | 2015 | |
| Net asset value, beginning of year | | $ | 8.70 | | | $ | 8.91 | | | $ | 9.07 | | | $ | 9.16 | | | $ | 9.38 | |
| Income (loss) from investment operations: | | | | | | | | | | | | | | | | | | | | |
| Net investment income (loss) | | | 0.21 | | | | 0.19 | | | | 0.14 | | | | 0.11 | | | | 0.09 | |
| Net realized and unrealized gain (loss) on investments | | | 0.11 | | | | (0.09 | ) | | | (0.05 | ) | | | 0.02 | | | | (0.07 | ) |
| Total from investment operations | | | 0.32 | | | | 0.10 | | | | 0.09 | | | | 0.13 | | | | 0.02 | |
| Less distributions from: | | | | | | | | | | | | | | | | | | | | |
| Net investment income | | | 0.34 | | | | 0.31 | | | | 0.25 | | | | 0.22 | | | | 0.24 | |
| Net realized gain | | | — | | | | — | | | | — | | | | — | | | | — | |
| Total distributions | | | 0.34 | | | | 0.31 | | | | 0.25 | | | | 0.22 | | | | 0.24 | |
| Net asset value, end of year | | $ | 8.68 | | | $ | 8.70 | | | $ | 8.91 | | | $ | 9.07 | | | $ | 9.16 | |
| Total return (%) | | | 3.69 | | | | 1.15 | | | | 0.96 | | | | 1.43 | | | | 0.22 | |
| Ratios to average daily net assets (%): | | | | | | | | | | | | | | | | | | | | |
| Expenses, before waivers and reimbursements | | | 0.50 | | | | 0.42 | | | | 0.40 | | | | 0.40 | | | | 0.42 | |
| Expenses, net of waivers and reimbursements | | | 0.35 | | | | 0.35 | | | | 0.37 | | | | 0.40 | | | | 0.40 | |
| Net investment income (loss), before waivers and reimbursements | | | 2.22 | | | | 2.10 | | | | 1.48 | | | | 1.25 | | | | 0.92 | |
| Net investment income (loss), net of waivers and reimbursements | | | 2.37 | | | | 2.17 | | | | 1.51 | | | | 1.25 | | | | 0.94 | |
| Class R6 net assets at the end of the year (in thousands) | | $ | 36,846 | | | $ | 47,585 | | | $ | 99,912 | | | $ | 53,122 | | | $ | 21,863 | |
| Portfolio turnover rate (%) | | | 183 | | | | 122 | | | | 109 | | | | 81 | | | | 106 | |
Note: Net investment income (loss) per share is based on the average shares outstanding during the year.
Performance cited represents past performance. Past performance does not guarantee future results and current performance may be lower or higher than the data quoted. Results shown are annual returns, which assume reinvestment of dividends and capital gains. Investment returns and principal will fluctuate and you may have a gain or loss when you sell shares. For the most current month-end performance information, please call 1-800-742-7272 or visit our Web site atwww.williamblairfunds.com.
| 168 | Annual Report | December 31, 2019 |
Financial Highlights— For a share outstanding throughout each period
Macro Allocation Fund
| | | Class N | |
| | | Years Ended December 31, | |
| | | 2019 | | | 2018 | | | 2017 | | | 2016 | | | 2015 | |
| Net asset value, beginning of year | | $ | 11.41 | | | $ | 11.84 | | | $ | 11.34 | | | $ | 11.32 | | | $ | 12.14 | |
| Income (loss) from investment operations: | | | | | | | | | | | | | | | | | | | | |
| Net investment income (loss) | | | 0.08 | | | | 0.08 | | | | 0.06 | | | | 0.04 | | | | 0.04 | |
| Net realized and unrealized gain (loss) on investments | | | 0.37 | | | | (0.24 | ) | | | 0.51 | | | | 0.19 | | | | (0.80 | ) |
| Total from investment operations | | | 0.45 | | | | (0.16 | ) | | | 0.57 | | | | 0.23 | | | | (0.76 | ) |
| Less distributions from: | | | | | | | | | | | | | | | | | | | | |
| Net investment income | | | 0.42 | | | | 0.27 | | | | 0.07 | | | | 0.21 | | | | 0.06 | |
| Net realized gain | | | — | | | | — | | | | — | | | | — | | | | — | |
| Total distributions | | | 0.42 | | | | 0.27 | | | | 0.07 | | | | 0.21 | | | | 0.06 | |
| Net asset value, end of year | | $ | 11.44 | | | $ | 11.41 | | | $ | 11.84 | | | $ | 11.34 | | | $ | 11.32 | |
| Total return (%) | | | 3.97 | | | | (1.30 | ) | | | 5.06 | | | | 2.01 | | | | (6.24 | ) |
| Ratios to average daily net assets (%): | | | | | | | | | | | | | | | | | | | | |
| Expenses, before waivers and reimbursements | | | 1.22 | | | | 1.30 | | | | 1.52 | | | | 1.38 | | | | 1.42 | |
| Expenses, net of waivers and reimbursements | | | 1.22 | | | | 1.30 | | | | 1.37 | | | | 1.23 | | | | 1.27 | |
| Expenses (excluding interest or short dividend expense), net of waivers and reimbursements | | | 1.21 | | | | 1.28 | | | | 1.31 | | | | 1.23 | | | | 1.27 | |
| Net investment income (loss), before waivers and reimbursements | | | 0.70 | | | | 0.66 | | | | 0.35 | | | | 0.17 | | | | 0.17 | |
| Net investment income (loss), net of waivers and reimbursements | | | 0.70 | | | | 0.66 | | | | 0.50 | | | | 0.32 | | | | 0.32 | |
| Class N net assets at the end of the year (in thousands) | | $ | 13,717 | | | $ | 43,463 | | | $ | 41,483 | | | $ | 61,376 | | | $ | 150,606 | |
| Portfolio turnover rate (%) | | | 31 | | | | 36 | | | | 43 | | | | 50 | | | | 34 | |
| | | | | | | | | | | | | | | | | | | | | |
| | | Class I | |
| | | Years Ended December 31, | |
| | | 2019 | | | 2018 | | | 2017 | | | 2016 | | | 2015 | |
| Net asset value, beginning of year | | $ | 11.38 | | | $ | 11.88 | | | $ | 11.38 | | | $ | 11.38 | | | $ | 12.22 | |
| Income (loss) from investment operations: | | | | | | | | | | | | | | | | | | | | |
| Net investment income (loss) | | | 0.13 | | | | 0.11 | | | | 0.11 | | | | 0.08 | | | | 0.09 | |
| Net realized and unrealized gain (loss) on investments | | | 0.34 | | | | (0.24 | ) | | | 0.51 | | | | 0.18 | | | | (0.82 | ) |
| Total from investment operations | | | 0.47 | | | | (0.13 | ) | | | 0.62 | | | | 0.26 | | | | (0.73 | ) |
| Less distributions from: | | | | | | | | | | | | | | | | | | | | |
| Net investment income | | | 0.50 | | | | 0.37 | | | | 0.12 | | | | 0.26 | | | | 0.11 | |
| Net realized gain | | | — | | | | — | | | | — | | | | — | | | | — | |
| Total distributions | | | 0.50 | | | | 0.37 | | | | 0.12 | | | | 0.26 | | | | 0.11 | |
| Net asset value, end of year | | $ | 11.35 | | | $ | 11.38 | | | $ | 11.88 | | | $ | 11.38 | | | $ | 11.38 | |
| Total return (%) | | | 4.14 | | | | (1.08 | ) | | | 5.50 | | | | 2.26 | | | | (6.00 | ) |
| Ratios to average daily net assets (%): | | | | | | | | | | | | | | | | | | | | |
| Expenses, before waivers and reimbursements | | | 0.97 | | | | 0.99 | | | | 1.17 | | | | 1.12 | | | | 1.14 | |
| Expenses, net of waivers and reimbursements | | | 0.97 | | | | 0.99 | | | | 1.02 | | | | 0.97 | | | | 0.99 | |
| Expenses (excluding interest or short dividend expense), net of waivers and reimbursements | | | 0.96 | | | | 0.97 | | | | 0.96 | | | | 0.97 | | | | 0.98 | |
| Net investment income (loss), before waivers and reimbursements | | | 1.09 | | | | 0.95 | | | | 0.75 | | | | 0.52 | | | | 0.58 | |
| Net investment income (loss), net of waivers and reimbursements | | | 1.09 | | | | 0.95 | | | | 0.90 | | | | 0.67 | | | | 0.73 | |
| Class I net assets at the end of the year (in thousands) | | $ | 358,935 | | | $ | 486,543 | | | $ | 780,075 | | | $ | 937,244 | | | $ | 1,155,051 | |
| Portfolio turnover rate (%) | | | 31 | | | | 36 | | | | 43 | | | | 50 | | | | 34 | |
Note: Net investment income (loss) per share is based on the average shares outstanding during the year.
Performance cited represents past performance. Past performance does not guarantee future results and current performance may be lower or higher than the data quoted. Results shown are annual returns, which assume reinvestment of dividends and capital gains. Investment returns and principal will fluctuate and you may have a gain or loss when you sell shares. For the most current month-end performance information, please call 1-800-742-7272 or visit our Web site atwww.williamblairfunds.com.
| December 31, 2019 | William Blair Funds | 169 |
Financial Highlights— For a share outstanding throughout each period
Macro Allocation Fund
| | | Class R6 | |
| | | Years Ended December 31, | |
| | | 2019 | | | 2018 | | | 2017 | | | 2016 | | | 2015 | |
| Net asset value, beginning of year | | $ | 11.38 | | | $ | 11.89 | | | $ | 11.40 | | | $ | 11.39 | | | $ | 12.23 | |
| Income (loss) from investment operations: | | | | | | | | | | | | | | | | | | | | |
| Net investment income (loss) | | | 0.14 | | | | 0.13 | | | | 0.12 | | | | 0.09 | | | | 0.12 | |
| Net realized and unrealized gain (loss) on investments | | | 0.34 | | | | (0.24 | ) | | | 0.51 | | | | 0.19 | | | | (0.84 | ) |
| Total from investment operations | | | 0.48 | | | | (0.11 | ) | | | 0.63 | | | | 0.28 | | | | (0.72 | ) |
| Less distributions from: | | | | | | | | | | | | | | | | | | | | |
| Net investment income | | | 0.50 | | | | 0.40 | | | | 0.14 | | | | 0.27 | | | | 0.12 | |
| Net realized gain | | | — | | | | — | | | | — | | | | — | | | | — | |
| Total distributions | | | 0.50 | | | | 0.40 | | | | 0.14 | | | | 0.27 | | | | 0.12 | |
| Net asset value, end of year | | $ | 11.36 | | | $ | 11.38 | | | $ | 11.89 | | | $ | 11.40 | | | $ | 11.39 | |
| Total return (%) | | | 4.29 | | | | (0.94 | ) | | | 5.51 | | | | 2.44 | | | | (5.92 | ) |
| Ratios to average daily net assets (%): | | | | | | | | | | | | | | | | | | | | |
| Expenses, before waivers and reimbursements | | | 0.89 | | | | 0.91 | | | | 0.92 | | | | 0.89 | | | | 0.90 | |
| Expenses, net of waivers and reimbursements | | | 0.89 | | | | 0.91 | | | | 0.92 | | | | 0.89 | | | | 0.90 | |
| Expenses (excluding interest or short dividend expense), net of waivers and reimbursements | | | 0.88 | | | | 0.89 | | | | 0.86 | | | | 0.89 | | | | 0.90 | |
| Net investment income (loss), before waivers and reimbursements | | | 1.23 | | | | 1.10 | | | | 1.04 | | | | 0.81 | | | | 0.95 | |
| Net investment income (loss), net of waivers and reimbursements | | | 1.23 | | | | 1.10 | | | | 1.04 | | | | 0.81 | | | | 0.95 | |
| Class R6 net assets at the end of the year (in thousands) | | $ | 378,148 | | | $ | 391,812 | | | $ | 487,082 | | | $ | 582,298 | | | $ | 426,230 | |
| Portfolio turnover rate (%) | | | 31 | | | | 36 | | | | 43 | | | | 50 | | | | 34 | |
Note: Net investment income (loss) per share is based on the average shares outstanding during the year.
Performance cited represents past performance. Past performance does not guarantee future results and current performance may be lower or higher than the data quoted. Results shown are annual returns, which assume reinvestment of dividends and capital gains. Investment returns and principal will fluctuate and you may have a gain or loss when you sell shares. For the most current month-end performance information, please call 1-800-742-7272 or visit our Web site atwww.williamblairfunds.com.
| 170 | Annual Report | December 31, 2019 |
REPORT OF INDEPENDENT REGISTERED PUBLIC ACCOUNTING FIRM
To the Shareholders and the Board of Trustees of William Blair Funds
Opinion on the Financial Statements
We have audited the accompanying statements of assets and liabilities of the William Blair Funds (the “Trust”) (comprising the Growth Fund, Large Cap Growth Fund, Mid Cap Growth Fund, Small-Mid Cap Core Fund, Small-Mid Cap Growth Fund, Small-Mid Cap Value Fund, Small Cap Growth Fund, Small Cap Value Fund, Global Leaders Fund, International Leaders Fund, International Growth Fund, Institutional International Growth Fund, International Small Cap Growth Fund, Emerging Markets Leaders Fund, Emerging Markets Growth Fund, Emerging Markets Small Cap Growth Fund, Bond Fund, Income Fund, Low Duration Fund, and Macro Allocation Fund (collectively referred to as the “Funds”)), including the portfolios of investments, as of December 31, 2019, and the related statements of operations and changes in net assets, and the financial highlights for each of the periods indicated in the table below and the related notes (collectively referred to as the “financial statements”). In our opinion, the financial statements present fairly, in all material respects, the financial position of each of the Funds comprising the William Blair Funds at December 31, 2019, and the results of their operations, changes in net assets, and financial highlights for each of the periods indicated in the table below, in conformity with U.S. generally accepted accounting principles.
| William Blair Funds | Statements
of operations | Statements
of changes
in net assets | Financial
highlights |
Growth Fund Large Cap Growth Fund Mid Cap Growth Fund Small-Mid Cap Growth Fund Small-Mid Cap Value Fund Small Cap Growth Fund Small Cap Value Fund Global Leaders Fund International Leaders Fund International Growth Fund Institutional International Growth Fund International Small Cap Growth Fund Emerging Markets Leaders Fund Emerging Markets Growth Fund Emerging Markets Small Cap Growth Fund Bond Fund Income Fund Low Duration Fund Macro Allocation Fund | For the year ended December 31, 2019 | For each of the two years in the period ended December 31, 2019 | For each of the five years in the period ended December 31, 2019 |
| Small-Mid Cap Core Fund | For the period from October 1, 2019 to December 31, 2019 |
| December 31, 2019 | William Blair Funds | 171 |
Basis for Opinion
These financial statements are the responsibility of the Trust’s management. Our responsibility is to express an opinion on each of the Funds’ financial statements based on our audits. We are a public accounting firm registered with the Public Company Accounting Oversight Board (United States) (“PCAOB”) and are required to be independent with respect to the Trust in accordance with the U.S. federal securities laws and the applicable rules and regulations of the Securities and Exchange Commission and the PCAOB.
We conducted our audits in accordance with the standards of the PCAOB. Those standards require that we plan and perform the audit to obtain reasonable assurance about whether the financial statements are free of material misstatement, whether due to error or fraud. The Trust is not required to have, nor were we engaged to perform, an audit of the Trust’s internal control over financial reporting. As part of our audits we are required to obtain an understanding of internal control over financial reporting but not for the purpose of expressing an opinion on the effectiveness of the Trust’s internal control over financial reporting. Accordingly, we express no such opinion.
Our audits included performing procedures to assess the risks of material misstatement of the financial statements, whether due to error or fraud, and performing procedures that respond to those risks. Such procedures included examining, on a test basis, evidence regarding the amounts and disclosures in the financial statements. Our procedures included confirmation of securities owned as of December 31, 2019, by correspondence with the custodian and brokers or by other appropriate auditing procedures where replies from brokers were not received. Our audits also included evaluating the accounting principles used and significant estimates made by management, as well as evaluating the overall presentation of the financial statements. We believe that our audits provide a reasonable basis for our opinion.

We have served as the auditor of one or more William Blair investment companies since 1989.
Chicago, Illinois
February 26, 2020
| 172 | Annual Report | December 31, 2019 |
Approval of the Management Agreement for the William Blair Small-Mid Cap Core Fund
On July 31, 2019, the Board of Trustees (the “Board”) of William Blair Funds (the “Trust”), including the Trustees who are not interested persons of the Trust as defined by the Investment Company Act of 1940, as amended (the “Independent Trustees”), approved the Management Agreement between the Trust, on behalf of the William Blair Small-Mid Cap Core Fund (the “Fund”), and William Blair Investment Management, LLC (the “Adviser”). The Independent Trustees met independently of Trust management and the interested Trustees of the Trust to consider the approval of the Management Agreement. The Independent Trustees reviewed materials provided by the Adviser and Broadridge for the approval of the Management Agreement and were assisted by independent legal counsel in making their determination. The Board determined that, given the totality of the information provided with respect to the Management Agreement, the Board had received sufficient information to consider the approval of the Management Agreement. The Board considered the following factors in making its determination, but did not identify any single factor or group of factors as all important or controlling and considered all factors together.
Nature, Quality and Extent of Services.In evaluating the nature, quality and extent of services expected to be provided by the Adviser to the Fund, the Board noted that the Adviser is a quality firm with a reputation for integrity and honesty that employs high quality people. The Board considered biographical information about the Fund’s portfolio managers and financial information regarding the Adviser. The Board considered the proposed portfolio management team members’ experience in managing other series of the Trust. The Board also considered the Adviser’s experience in managing new funds. Based upon all relevant factors, the Board concluded that the nature, quality and extent of the services to be provided by the Adviser to the Fund were expected to be satisfactory.
Fees and Expenses.The Board reviewed the proposed advisory fee for the Fund and reviewed information comparing the advisory fee to a peer group and a peer universe of institutional funds provided by Broadridge. The Broadridge peer group consisted of the Fund and twelve other no-load institutional mid-cap core funds with no Rule 12b-1 fees, as classified by Broadridge. The Broadridge peer universe consisted of the Fund, the Fund’s Broadridge peer group and all other retail and institutional mid-cap blend funds, excluding outliers. In considering the information, the Board noted that the proposed advisory fee for the Fund was above the median contractual management fee of the peer group. The Board also considered that the Adviser had proposed to limit total operating expenses, including waiving advisory fees for each share class of the Fund until April 30, 2021. On the basis of the information provided, the Board concluded that the proposed advisory fee was reasonable in light of the nature, quality and extent of services expected to be provided by the Adviser.
Profitability.With respect to the estimated profitability of the Management Agreement to the Adviser, the Board considered the proposed advisory fee, that the Fund was newly organized, the amount of assets under management that the Adviser initially expected in the Fund and the Adviser’s agreement to limit total expenses until April 30, 2021. The Board considered that the Adviser will be incurring all expenses related to the organization of the Fund. The Board concluded that the expected profits to be realized by the Adviser were not expected to be unreasonable.
Economies of Scale.The Board considered the extent to which economies of scale would be realized as the Fund grows and whether fee levels reflect these economies of scale for the benefit of investors. In considering whether fee levels reflect economies of scale for the benefit of Fund investors, the Board reviewed the Fund’s advisory fee compared to peer funds and the Fund’s estimated expense ratios giving effect to the Adviser’s agreement to limit total expenses until April 30, 2021, and concluded that the advisory fee was reasonable. The Board noted the Adviser’s statements to the effect that the resources required for the Adviser’s fundamental investment process typically increase as a Fund increases in size. The Board also considered that the asset capacity of the Fund’s investment strategy was constrained by the Adviser and that opportunities for economies of scale would be limited.
Other Benefits to the Adviser.The Board considered benefits to be derived by the Adviser from its relationship with the Fund. The Board concluded that, after taking into account these benefits, the proposed advisory fee was reasonable.
Conclusion.Based upon all of the information considered and the conclusions reached, the Board determined that the terms of the Management Agreement are fair and reasonable and that the approval of the Management Agreement is in the best interests of the Fund.
| December 31, 2019 | William Blair Funds | 173 |
Trustees and Officers (Unaudited).† The trustees and officers of the William Blair Funds (the “Trust”), their year of birth, their principal occupations during the last five years, their affiliations, if any, with William Blair, and their other significant affiliations are set forth below. The address of each officer and trustee is 150 North Riverside Plaza, Chicago, Illinois 60606.
| Name and Year of Birth | | Position(s)
Held with
Trust | | Term of
Office(1)and
Length of
Time
Served | | Principal
Occupation(s)
During Past 5 Years | | Number of
Portfolios
in Trust
Complex
Overseen
by Trustee* | | Other Directorships
Held by Trustee
During Past 5 Years |
| Interested Trustees | | | | | | | | | | |
| Stephanie G. Braming, 1970(2) | | Chairman of the Board and President, previously Senior Vice President | | Chairman of the Board and President since 2018, and Senior Vice President 2014-2018 | | Global Head of Investment Management since 2017, portfolio manager (2014–2017) and Partner, William Blair | | 20 | | Chairman, William Blair SICAV |
Arthur J. Simon,
1954(2) | | Trustee | | Since 2018 | | General Counsel and Partner, Willaim Blair | | 20 | | Director, William Blair SICAV |
| Non-Interested Trustees | | | | | | | | |
Vann A. Avedisian,
1964(3) | | Trustee | | Since 2012 | | Principal, Highgate Holdings (hotel investments) (since 2009); formerly, co-founder and Managing Director, Oxford Capital Partners Inc. (1994 to 2006) | | 20 | | Potbelly Corporation (2001 to 2015) |
Kathleen T. Barr,
1955 | | Trustee | | Since 2013 | | Retired; Vice Chairman, Independent Directors Council (since 2019); formerly, President, Productive Capital Management, Inc. (registered investment adviser to public entities) and Owner, KT Barr Consulting, LLC (mutual fund and investment management consulting) (2010 to 2013); prior thereto, Chief Administrative Officer, Senior Vice President and Senior Managing Director of Allegiant Asset Management Company (merged with PNC Capital Advisors, LLC in 2009) (2004 to 2010); Chief Administrative Officer, Chief Compliance Officer and Senior Vice President of PNC Funds and PNC Advantage Funds (f/k/a Allegiant Funds) (2003 to 2010) | | 20 | | Muzinich BDC, Inc. (since 2019); Board of Governors, Investment Company Institute (since 2019); Professionally Managed Portfolios (since 2018); Council Member, Independent Directors Council; AmericaFirst Quantitative Funds (5 portfolios) (2012 to 2016) |
| † | William Blair Investment Management, LLC and William Blair & Company, L.L.C. are collectively referred to in this section as “William Blair”, each of which is a wholly owned subsidiary of WBC Holdings, L.P., which is wholly owned by certain William Blair employees (employee owners are referred to as ‘partners’). |
| | |
| * | The number shown does not include two additional series of the Trust that are in existence, but not offered to the public. |
| 174 | Annual Report | December 31, 2019 |
| Name and Year of Birth | | Position(s)
Held with
Trust | | Term of
Office(1) and
Length of
Time
Served | | Principal
Occupation(s)
During Past 5 Years | | Number of
Portfolios
in Trust
Complex
Overseen
by Trustee* | | Other Directorships
Held by Trustee
During Past 5 Years |
Daniel N. Leib,
1966(4) | | Trustee | | Since 2016 | | Chief Executive Officer, Donnelley Financial Solutions, Inc. (since 2016); formerly, Executive Vice President and Chief Financial Officer, (2011 to 2016) and Group Chief Financial Officer (2009 to 2011), R.R. Donnelley & Sons Company | | 20 | | Donnelley Financial Solutions, Inc. (since 2016) |
| Dorri C. McWhorter, 1973 | | Trustee | | Since 2019 | | Chief Executive Officer, YWCA Metropolitan Chicago (since 2013); formerly Partner, Crowe LLP (2008-2013)(5) | | 20 | | Skyway Concession Company, LLC (since 2018); Illinois CPA Society (since 2017); American Institute of Certified Public Accountants (2013-2016); Chicago Finance Exchange (2009-2017) |
Thomas J. Skelly,
1951 | | Trustee | | Since 2007 | | Advisory Board Member for various U.S. companies (since 2005); formerly, Managing Partner of various divisions at Accenture (1994-2004) | | 20 | | Mutual Trust Financial Group (provider of insurance and investment products) |
Steven R. Zenz,
1954 | | Trustee | | Since 2018 | | Consultant, Steven R. Zenz Consulting LLC (merger and acquisition transactions and SEC reporting and filings) (since 2011); formerly, Partner, KPMG LLP (1987-2010)(6) | | 20 | | Frankly Inc. (technology products and services for media industry) (since 2016); Insignia Systems, Inc. (in-store advertising services for consumer packaged goods manufacturers) (2013-2019) |
| (1) | Each Trustee serves until the election and qualification of a successor, or until death, resignation or retirement, or removal as provided in the Trust’s Declaration of Trust. |
| (2) | Ms. Braming and Mr. Simon are interested persons of the Trust because they are partners of William Blair, and with respect to Ms. Braming also due to her position as an officer of the Trust. |
| (3) | Mr. Avedisian served as a member of the Board of Directors of Potbelly Corporation (“Potbelly”) from 2001 to 2015. In October 2013, Potbelly completed an underwritten initial public offering of its common stock (the “Offering”). William Blair served as a member of the underwriting syndicate. At the time of the Offering, Mr. Avedisian, through entities he owns or controls, indirectly beneficially owned 1,607,448 shares of Potbelly common stock and warrants to purchase 241,704 shares of common stock representing approximately 8.9% of the shares before the Offering. Mr. Avedisian disclaimed beneficial ownership of the shares except to the extent of his pecuniary interest therein. Potbelly sold 8,474,869 shares and certain stockholders, including two entities affiliated with William Blair, sold 150,131 shares in the Offering at a price to the public of $14.00 per share. Neither Mr. Avedisian nor the entities he owns or controls was a selling stockholder in the Offering. A portion of the net proceeds received by Potbelly from the Offering was used to pay a previously declared cash dividend, in an aggregate amount of approximately $49.9 million, on Potbelly common and preferred shares outstanding immediately prior to the closing of the Offering, which included the outstanding shares indirectly beneficially owned by Mr. Avedisian, William Blair and two entities affiliated with William Blair. |
| (4) | The Funds and William Blair use Donnelley Financial Solutions, Inc. (“DFS’’) for financial printing and other services. DFS is a public company. The Funds and William Blair in the aggregate paid DFS approximately $172,000 and $122,000 in 2017 and 2018, respectively, for the services provided. DFS’s revenue was approximately $1 billion in each of 2017 and 2018. Mr. Leib, as the Chief Executive Officer of DFS, is not directly involved in any of the services provided to the Funds or William Blair and his compensation is not materially affected by the fees DFS receives from the Funds and William Blair. |
| (5) | As a former partner of the audit firm Crowe LLP (formerly, Crowe Horwath LLP), Ms. McWhorter receives distributions of her capital in the firm over time and those distributions are expected to be completed in March 2021. The Funds and William Blair made no payments to Crowe LLP over the past three years. |
| (6) | The Funds engage KPMG to provide foreign tax services in Taiwan. KPMG does not provide audit or audit-related services to the Funds. Mr. Zenz is a former partner of KPMG and receives pension/retirement funds from KPMG. |
| December 31, 2019 | William Blair Funds | 175 |
| Name and Year of Birth | | Position(s) Held
with Trust | | | Term of Office
and Length of
Time Served(1) | | | Principal Occupation(s)
During Past 5 Years |
| | | | | | | |
| Officers | | | | | | |
| | | | | | | |
Michael P. Balkin,
1959 | | Senior Vice President | | Since 2008 | | Partner, William Blair |
| | | | | | | |
Thomas Clarke,
1968 | | Senior Vice President | | Since 2011 | | Partner, William Blair |
| | | | | | | |
Daniel Crowe,
1972 | | Senior Vice President | | Since 2016 | | Partner, William Blair (since 2015); formerly, Associate, William Blair |
| | | | | | | |
Robert J. Duwa,
1967 | | Senior Vice President | | Since 2019 | | Partner, William Blair |
| | | | | | | |
Simon Fennell,
1969 | | Senior Vice President | | Since 2013 | | Partner, William Blair |
| | | | | | | |
Andrew G. Flynn,
1961 | | Senior Vice President | | Since 2013 | | Partner, William Blair |
| | | | | | | |
David C. Fording,
1967 | | Senior Vice President | | Since 2006 | | Partner, William Blair |
| | | | | | | |
James S. Golan,
1961 | | Senior Vice President | | Since 2005 | | Partner, William Blair |
| | | | | | | |
James E. Jones,
1977 | | Senior Vice President | | Since 2019 | | Partner, William Blair (since 2015); formerly, Associate, William Blair |
| | | | | | | |
Chad M. Kilmer,
1975 | | Senior Vice President | | Since 2006 | | Partner, William Blair |
| | | | | | | |
Robert C. Lanphier IV,
1956 | | Senior Vice President | | Since 2003 | | Partner, William Blair |
| | | | | | | |
Mark T. Leslie,
1967 | | Senior Vice President | | Since 2005 | | Partner, William Blair |
| | | | | | | |
Kenneth J. McAtamney,
1966 | | Senior Vice President | | Since 2008 | | Partner, William Blair |
| | | | | | | |
Todd M. McClone,
1968 | | Senior Vice President | | Since 2005 | | Partner, William Blair |
| | | | | | | |
David S. Mitchell,
1960 | | Senior Vice President | | Since 2003 | | Partner, William Blair |
| | | | | | | |
John C. Murphy,
1969 | | Senior Vice President | | Since 2014 | | Partner, William Blair |
| | | | | | | |
Casey K. Preyss,
1976 | | Senior Vice President | | Since 2015 | | Partner, William Blair |
| | | | | | | |
David P. Ricci,
1958 | | Senior Vice President | | Since 2006 | | Partner, William Blair |
| | | | | | | |
Lisa D. Rusch,
1970 | | Senior Vice President Vice President | | Since 2020
2018-2020 | | Partner, William Blair (since 2020); formerly, Associate, William Blair |
| | | | | | | |
Ward D. Sexton,
1974 | | Senior Vice President | | Since 2016 | | Partner, William Blair |
| | | | | | | |
Brian D. Singer,
1960 | | Senior Vice President | | Since 2011 | | Partner, William Blair |
| 176 | Annual Report | December 31, 2019 |
| Name and Year of Birth | | Position(s) Held
with Trust | | | Term of Office
and Length of
Time Served(1) | | | Principal Occupation(s)
During Past 5 Years |
| | | | | | | |
Christopher T. Vincent,
1956 | | Senior Vice President | | Since 2002 | | Partner, William Blair |
| | | | | | | |
Dan Zelazny,
1971 | | Senior Vice President | | Since 2019 | | Associate, William Blair (since 2019); formerly Managing Director, AQR Capital Management (2011-2019) |
| | | | | | | |
Paul J. Sularz,
1967 | | Vice President | | Since 2009 | | Associate, William Blair (2006-2012 and since 2014); Partner, William Blair (2012-2014) |
| | | | | | | |
John M. Raczek,
1970 | | Treasurer Assistant Treasurer | | Since 2019
2010-2019 | | Associate, William Blair |
| | | | | | | |
Andrew T. Pfau,
1970 | | Secretary | | Since 2009 | | Associate, William Blair |
| | | | | | | |
David M. Cihak,
1982 | | Assistant Treasurer | | Since 2019 | | Associate, William Blair |
| | | | | | | |
Walter R. Randall, Jr.,
1960 | | Chief Compliance Officer and Assistant Secretary | | Since 2009 | | Associate, William Blair |
| | | | | | | |
Robert J. Toner,
1967 | | Assistant Secretary | | Since 2016 | | Associate, William Blair (since 2015); formerly, Managing Director and Counsel, Wellington Management & Company LLP (2007-2015) |
| (1) | The Trust’s officers, except the Chief Compliance Officer, are elected annually by the Board of Trustees. The Trust’s Chief Compliance Officer is designated by the Board of Trustees and may only be removed by action of the Board of Trustees, including a majority of independent trustees. Length of Time Served for all officers indicates the year the individual became an officer of the Trust. |
The Statement of Additional Information for the William Blair Funds includes additional information about the trustees and is available without charge by calling 1-800-635-2886 (in Massachusetts 1-800-635-2840) or by writing the Fund.
| December 31, 2019 | William Blair Funds | 177 |
(Unaudited)
Proxy Voting
A description of the policies and procedures that the Funds use to determine how to vote proxies relating to portfolio securities and information regarding how the Funds voted proxies relating to portfolio securities for the most recent 12-month period ended June 30 are available without charge, upon request, by calling 1-800-635-2886 (in Massachusetts 1-800-635-2840), atwww.williamblairfunds.com and on the SEC’s website athttp://www.sec.gov.
Quarterly Portfolio Schedules
Each Fund files its complete schedule of portfolio holdings with the SEC for the first and third fiscal quarters of each fiscal year (quarters ended March 31 and September 30) on Form N-PORT. The Funds’ Forms N-PORT are available on the SEC’s website athttp://www.sec.gov.
Additional Federal Income Tax Information: (unaudited)
Under Section 852(b)(3)(C) of the Code, the Funds hereby designate the following amounts as capital gain dividends for the fiscal year ended December 31, 2019 (in thousands):
| Fund | | Capital Gain Dividend |
| Growth | | | $ | 23,906 | |
| Large Cap Growth | | | | 18,020 | |
| Mid Cap Growth | | | | 6,879 | |
| Small-Mid Cap Growth | | | | 231,889 | |
| Small-Mid Cap Value | | | | 105 | |
| Small Cap Growth | | | | 15,356 | |
| Small Cap Value | | | | 47,335 | |
| Global Leaders | | | | 2,859 | |
| Emerging Markets Leaders | | | | 382 | |
| Emerging Markets Growth | | | | 24,009 | |
| 178 | Annual Report | December 31, 2019 |
Useful Information About Your Report (Unaudited)
Please refer to this information when reviewing the Expense Example for each Fund.
Expense Example
As a shareholder of a Fund, you incur two types of costs: (1) transaction costs and (2) ongoing costs, including management fees, distribution (12b-1) fees (for Class N shares, as applicable), and other Fund expenses. The example is intended to help you understand your ongoing costs (in dollars) of investing in the Fund and to compare these costs with the ongoing costs of investing in other mutual funds. To do so, compare the Fund’s 5% hypothetical example with the 5% hypothetical examples that appear in the shareholder reports of other funds. The example is based on an investment of $1,000 invested at the beginning of the period and held for the entire six-month period from July 1, 2019 to December 31, 2019.
Actual Expenses
In each example, the first line for each share class in the table provides information about theactualaccount values andactualexpenses. These expenses reflect the effect of any expense cap applicable to the share class during the period. Without this expense cap, the costs shown in the table would have been higher. You may use the information in this line, together with the amount you invested, to estimate the expenses that you paid over the period. Simply divide your account value by $1,000 (example, an $8,600 account value divided by $1,000 = 8.6), then multiply the result by the number in the first line under the heading entitled “Expenses Paid During the Period” to estimate the expenses you paid on your account during the period.
Hypothetical Example for Comparison Purposes
In each example, the second line for each share class in the table provides information abouthypotheticalaccount values andhypotheticalexpenses based on the Fund’s actual expense ratio and an assumed rate of return of 5% per year before expenses. This is not the Fund’s actual return. The hypothetical account values and expenses may not be used to estimate your actual ending account balance or the expenses you paid for the period. You may use this information to compare the ongoing costs of investing in the Fund to the costs of investing in other funds. To do so, compare this 5% hypothetical example with the 5% hypothetical examples that appear in the shareholder reports of other funds.
Please note that the expenses shown in both examples are meant to highlight your ongoing costs only and do not reflect any transactional costs or account type fees, such as IRA administration fees. These fees are discussed in the prospectus. Therefore, the second line of each share class in the table is useful in comparing ongoing costs only and will not help you determine the relative costs of owning different funds. In addition, if these transactional costs or account fees were included, your costs would have been higher.
| December 31, 2019 | William Blair Funds | 179 |
Fund Expenses (Unaudited)
| Expense Example | | Beginning
Account Value
7/1/2019 | | Ending
Account Value
12/31/2019 | | Expenses Paid
During
the Period (a) | | Annualized
Expense Ratio |
| Growth Fund | | | | | | | | | | | | | | | | |
| Class N-actual return | | $ | 1,000.00 | | | $ | 1,078.41 | | | $ | 6.29 | | | | 1.20 | % |
| Class N-hypothetical 5% return | | $ | 1,000.00 | | | $ | 1,043.95 | | | $ | 6.18 | | | | 1.20 | |
| Class I-actual return | | $ | 1,000.00 | | | $ | 1,079.32 | | | $ | 4.82 | | | | 0.92 | |
| Class I-hypothetical 5% return | | $ | 1,000.00 | | | $ | 1,045.36 | | | $ | 4.74 | | | | 0.92 | |
| Class R6-actual return | | $ | 1,000.00 | | | $ | 1,080.12 | | | $ | 4.61 | | | | 0.88 | |
| Class R6-hypothetical 5% return | | $ | 1,000.00 | | | $ | 1,045.56 | | | $ | 4.54 | | | | 0.88 | |
| Large Cap Growth Fund | | | | | | | | | | | | | | | | |
| Class N-actual return | | $ | 1,000.00 | | | $ | 1,095.87 | | | $ | 4.75 | | | | 0.90 | |
| Class N-hypothetical 5% return | | $ | 1,000.00 | | | $ | 1,045.46 | | | $ | 4.64 | | | | 0.90 | |
| Class I-actual return | | $ | 1,000.00 | | | $ | 1,097.41 | | | $ | 3.44 | | | | 0.65 | |
| Class I-hypothetical 5% return | | $ | 1,000.00 | | | $ | 1,046.72 | | | $ | 3.35 | | | | 0.65 | |
| Class R6-actual return | | $ | 1,000.00 | | | $ | 1,097.08 | | | $ | 3.17 | | | | 0.60 | |
| Class R6-hypothetical 5% return | | $ | 1,000.00 | | | $ | 1,046.98 | | | $ | 3.10 | | | | 0.60 | |
| Mid Cap Growth Fund | | | | | | | | | | | | | | | | |
| Class N-actual return | | $ | 1,000.00 | | | $ | 1,067.67 | | | $ | 6.25 | | | | 1.20 | |
| Class N-hypothetical 5% return | | $ | 1,000.00 | | | $ | 1,043.95 | | | $ | 6.18 | | | | 1.20 | |
| Class I-actual return | | $ | 1,000.00 | | | $ | 1,068.58 | | | $ | 4.95 | | | | 0.95 | |
| Class I-hypothetical 5% return | | $ | 1,000.00 | | | $ | 1,045.21 | | | $ | 4.90 | | | | 0.95 | |
| Class R6-actual return | | $ | 1,000.00 | | | $ | 1,069.48 | | | $ | 4.69 | | | | 0.90 | |
| Class R6-hypothetical 5% return | | $ | 1,000.00 | | | $ | 1,045.46 | | | $ | 4.64 | | | | 0.90 | |
| Small-Mid Cap Core Fund | | | | | | | | | | | | | | | | |
| Class I-actual return (b) | | $ | 1,000.00 | | | $ | 1,068.77 | | | $ | 2.48 | | | | 0.95 | |
| Class I-hypothetical 5% return (6 month period) | | $ | 1,000.00 | | | $ | 1,045.21 | | | $ | 4.90 | | | | 0.95 | |
| Class R6-actual return (b) | | $ | 1,000.00 | | | $ | 1,068.66 | | | $ | 2.35 | | | | 0.90 | |
| Class R6-hypothetical 5% return (6 month period) | | $ | 1,000.00 | | | $ | 1,045.46 | | | $ | 4.64 | | | | 0.90 | |
| Small-Mid Cap Growth Fund | | | | | | | | | | | | | | | | |
| Class N-actual return | | $ | 1,000.00 | | | $ | 1,049.35 | | | $ | 6.97 | | | | 1.35 | |
| Class N-hypothetical 5% return | | $ | 1,000.00 | | | $ | 1,043.19 | | | $ | 6.95 | | | | 1.35 | |
| Class I-actual return | | $ | 1,000.00 | | | $ | 1,050.74 | | | $ | 5.69 | | | | 1.10 | |
| Class I-hypothetical 5% return | | $ | 1,000.00 | | | $ | 1,044.45 | | | $ | 5.67 | | | | 1.10 | |
| Class R6-actual return | | $ | 1,000.00 | | | $ | 1,051.08 | | | $ | 5.43 | | | | 1.05 | |
| Class R6-hypothetical 5% return | | $ | 1,000.00 | | | $ | 1,044.71 | | | $ | 5.41 | | | | 1.05 | |
| Small-Mid Cap Value Fund | | | | | | | | | | | | | | | | |
| Class N-actual return | | $ | 1,000.00 | | | $ | 1,052.32 | | | $ | 6.47 | | | | 1.25 | |
| Class N-hypothetical 5% return | | $ | 1,000.00 | | | $ | 1,043.70 | | | $ | 6.44 | | | | 1.25 | |
| Class I-actual return | | $ | 1,000.00 | | | $ | 1,053.14 | | | $ | 5.18 | | | | 1.00 | |
| Class I-hypothetical 5% return | | $ | 1,000.00 | | | $ | 1,044.96 | | | $ | 5.15 | | | | 1.00 | |
| Class R6-actual return | | $ | 1,000.00 | | | $ | 1,052.36 | | | $ | 4.91 | | | | 0.95 | |
| Class R6-hypothetical 5% return | | $ | 1,000.00 | | | $ | 1,045.21 | | | $ | 4.90 | | | | 0.95 | |
| Small Cap Growth Fund | | | | | | | | | | | | | | | | |
| Class N-actual return | | $ | 1,000.00 | | | $ | 1,027.54 | | | $ | 7.67 | | | | 1.50 | |
| Class N-hypothetical 5% return | | $ | 1,000.00 | | | $ | 1,042.44 | | | $ | 7.72 | | | | 1.50 | |
| Class I-actual return | | $ | 1,000.00 | | | $ | 1,028.46 | | | $ | 6.39 | | | | 1.25 | |
| Class I-hypothetical 5% return | | $ | 1,000.00 | | | $ | 1,043.70 | | | $ | 6.44 | | | | 1.25 | |
| Class R6-actual return | | $ | 1,000.00 | | | $ | 1,028.78 | | | $ | 6.03 | | | | 1.18 | |
| Class R6-hypothetical 5% return | | $ | 1,000.00 | | | $ | 1,044.05 | | | $ | 6.08 | | | | 1.18 | |
| Small Cap Value Fund | | | | | | | | | | | | | | | | |
| Class N-actual return | | $ | 1,000.00 | | | $ | 1,033.25 | | | $ | 7.69 | | | | 1.50 | |
| Class N-hypothetical 5% return | | $ | 1,000.00 | | | $ | 1,042.44 | | | $ | 7.72 | | | | 1.50 | |
| Class I-actual return | | $ | 1,000.00 | | | $ | 1,034.87 | | | $ | 6.41 | | | | 1.25 | |
| Class I-hypothetical 5% return | | $ | 1,000.00 | | | $ | 1,043.70 | | | $ | 6.44 | | | | 1.25 | |
| Class R6-actual return | | $ | 1,000.00 | | | $ | 1,034.85 | | | $ | 6.00 | | | | 1.17 | |
| Class R6-hypothetical 5% return | | $ | 1,000.00 | | | $ | 1,044.10 | | | $ | 6.03 | | | | 1.17 | |
| 180 | Annual Report | December 31, 2019 |
Fund Expenses (Unaudited)
| Expense Example | | Beginning
Account Value
7/1/2019 | | Ending
Account Value
12/31/2019 | | Expenses Paid
During
the Period (a) | | Annualized
Expense Ratio |
| Global Leaders Fund | | | | | | | | | | | | | | | | |
| Class N-actual return | | $ | 1,000.00 | | | $ | 1,090.36 | | | $ | 6.06 | | | | 1.15 | % |
| Class N-hypothetical 5% return | | $ | 1,000.00 | | | $ | 1,044.20 | | | $ | 5.93 | | | | 1.15 | |
| Class I-actual return | | $ | 1,000.00 | | | $ | 1,091.26 | | | $ | 4.74 | | | | 0.90 | |
| Class I-hypothetical 5% return | | $ | 1,000.00 | | | $ | 1,045.46 | | | $ | 4.64 | | | | 0.90 | |
| Class R6-actual return | | $ | 1,000.00 | | | $ | 1,091.76 | | | $ | 4.48 | | | | 0.85 | |
| Class R6-hypothetical 5% return | | $ | 1,000.00 | | | $ | 1,045.72 | | | $ | 4.38 | | | | 0.85 | |
| International Leaders Fund | | | | | | | | | | | | | | | | |
| Class N-actual return | | $ | 1,000.00 | | | $ | 1,090.25 | | | $ | 6.06 | | | | 1.15 | |
| Class N-hypothetical 5% return | | $ | 1,000.00 | | | $ | 1,044.20 | | | $ | 5.93 | | | | 1.15 | |
| Class I-actual return | | $ | 1,000.00 | | | $ | 1,091.92 | | | $ | 4.75 | | | | 0.90 | |
| Class I-hypothetical 5% return | | $ | 1,000.00 | | | $ | 1,045.46 | | | $ | 4.64 | | | | 0.90 | |
| Class R6-actual return | | $ | 1,000.00 | | | $ | 1,091.71 | | | $ | 4.48 | | | | 0.85 | |
| Class R6-hypothetical 5% return | | $ | 1,000.00 | | | $ | 1,045.72 | | | $ | 4.38 | | | | 0.85 | |
| International Growth Fund | | | | | | | | | | | | | | | | |
| Class N-actual return | | $ | 1,000.00 | | | $ | 1,092.00 | | | $ | 7.65 | | | | 1.45 | |
| Class N-hypothetical 5% return | | $ | 1,000.00 | | | $ | 1,042.69 | | | $ | 7.47 | | | | 1.45 | |
| Class I-actual return | | $ | 1,000.00 | | | $ | 1,093.90 | | | $ | 6.02 | | | | 1.14 | |
| Class I-hypothetical 5% return | | $ | 1,000.00 | | | $ | 1,044.25 | | | $ | 5.87 | | | | 1.14 | |
| Class R6-actual return | | $ | 1,000.00 | | | $ | 1,094.12 | | | $ | 5.60 | | | | 1.06 | |
| Class R6-hypothetical 5% return | | $ | 1,000.00 | | | $ | 1,044.66 | | | $ | 5.46 | | | | 1.06 | |
| Institutional International Growth Fund | | | | | | | | | | | | | | | | |
| Institutional Class-actual return | | $ | 1,000.00 | | | $ | 1,095.01 | | | $ | 5.23 | | | | 0.99 | |
| Institutional Class-hypothetical 5% return | | $ | 1,000.00 | | | $ | 1,045.01 | | | $ | 5.10 | | | | 0.99 | |
| International Small Cap Growth Fund | | | | | | | | | | | | | | | | |
| Class N-actual return | | $ | 1,000.00 | | | $ | 1,127.05 | | | $ | 7.93 | | | | 1.48 | |
| Class N-hypothetical 5% return | | $ | 1,000.00 | | | $ | 1,042.54 | | | $ | 7.62 | | | | 1.48 | |
| Class I-actual return | | $ | 1,000.00 | | | $ | 1,128.37 | | | $ | 6.49 | | | | 1.21 | |
| Class I-hypothetical 5% return | | $ | 1,000.00 | | | $ | 1,043.90 | | | $ | 6.23 | | | | 1.21 | |
| Class R6-actual return | | $ | 1,000.00 | | | $ | 1,129.16 | | | $ | 6.01 | | | | 1.12 | |
| Class R6-hypothetical 5% return | | $ | 1,000.00 | | | $ | 1,044.35 | | | $ | 5.77 | | | | 1.12 | |
| Emerging Markets Leaders Fund | | | | | | | | | | | | | | | | |
| Class N-actual return | | $ | 1,000.00 | | | $ | 1,096.62 | | | $ | 7.40 | | | | 1.40 | |
| Class N-hypothetical 5% return | | $ | 1,000.00 | | | $ | 1,042.94 | | | $ | 7.21 | | | | 1.40 | |
| Class I-actual return | | $ | 1,000.00 | | | $ | 1,097.76 | | | $ | 6.08 | | | | 1.15 | |
| Class I-hypothetical 5% return | | $ | 1,000.00 | | | $ | 1,044.20 | | | $ | 5.93 | | | | 1.15 | |
| Class R6-actual return | | $ | 1,000.00 | | | $ | 1,098.37 | | | $ | 5.82 | | | | 1.10 | |
| Class R6-hypothetical 5% return | | $ | 1,000.00 | | | $ | 1,044.45 | | | $ | 5.67 | | | | 1.10 | |
| Emerging Markets Growth Fund | | | | | | | | | | | | | | | | |
| Class N-actual return | | $ | 1,000.00 | | | $ | 1,104.44 | | | $ | 8.01 | | | | 1.51 | |
| Class N-hypothetical 5% return | | $ | 1,000.00 | | | $ | 1,042.39 | | | $ | 7.77 | | | | 1.51 | |
| Class I-actual return | | $ | 1,000.00 | | | $ | 1,106.80 | | | $ | 6.69 | | | | 1.26 | |
| Class I-hypothetical 5% return | | $ | 1,000.00 | | | $ | 1,043.65 | | | $ | 6.49 | | | | 1.26 | |
| Class R6-actual return | | $ | 1,000.00 | | | $ | 1,106.40 | | | $ | 6.32 | | | | 1.19 | |
| Class R6-hypothetical 5% return | | $ | 1,000.00 | | | $ | 1,044.00 | | | $ | 6.13 | | | | 1.19 | |
| Emerging Markets Small Cap Growth Fund | | | | | | | | | | | | | | | | |
| Class N-actual return | | $ | 1,000.00 | | | $ | 1,105.26 | | | $ | 8.22 | | | | 1.55 | |
| Class N-hypothetical 5% return | | $ | 1,000.00 | | | $ | 1,042.19 | | | $ | 7.98 | | | | 1.55 | |
| Class I-actual return | | $ | 1,000.00 | | | $ | 1,106.45 | | | $ | 6.90 | | | | 1.30 | |
| Class I-hypothetical 5% return | | $ | 1,000.00 | | | $ | 1,043.45 | | | $ | 6.70 | | | | 1.30 | |
| Class R6-actual return | | $ | 1,000.00 | | | $ | 1,106.88 | | | $ | 6.64 | | | | 1.25 | |
| Class R6-hypothetical 5% return | | $ | 1,000.00 | | | $ | 1,043.70 | | | $ | 6.44 | | | | 1.25 | |
| Bond Fund | | | | | | | | | | | | | | | | |
| Class N-actual return | | $ | 1,000.00 | | | $ | 1,028.17 | | | $ | 3.07 | | | | 0.60 | |
| Class N-hypothetical 5% return | | $ | 1,000.00 | | | $ | 1,046.98 | | | $ | 3.10 | | | | 0.60 | |
| Class I-actual return | | $ | 1,000.00 | | | $ | 1,029.04 | | | $ | 2.30 | | | | 0.45 | |
| Class I-hypothetical 5% return | | $ | 1,000.00 | | | $ | 1,047.73 | | | $ | 2.32 | | | | 0.45 | |
| Class R6-actual return | | $ | 1,000.00 | | | $ | 1,030.31 | | | $ | 2.05 | | | | 0.40 | |
| Class R6-hypothetical 5% return | | $ | 1,000.00 | | | $ | 1,047.98 | | | $ | 2.06 | | | | 0.40 | |
| December 31, 2019 | William Blair Funds | 181 |
Fund Expenses (Unaudited)
| Expense Example | | Beginning
Account Value
7/1/2019 | | Ending
Account Value
12/31/2019 | | Expenses Paid
During
the Period (a) | | Annualized
Expense Ratio |
| Income Fund | | | | | | | | | | | | | | | | |
| Class N-actual return | | $ | 1,000.00 | | | $ | 1,015.20 | | | $ | 4.32 | | | | 0.85 | % |
| Class N-hypothetical 5% return | | $ | 1,000.00 | | | $ | 1,045.72 | | | $ | 4.38 | | | | 0.85 | |
| Class I-actual return | | $ | 1,000.00 | | | $ | 1,015.96 | | | $ | 3.56 | | | | 0.70 | |
| Class I-hypothetical 5% return | | $ | 1,000.00 | | | $ | 1,046.47 | | | $ | 3.61 | | | | 0.70 | |
| Class R6-actual return | | $ | 1,000.00 | | | $ | 1,016.22 | | | $ | 3.30 | | | | 0.65 | |
| Class R6-hypothetical 5% return | | $ | 1,000.00 | | | $ | 1,046.72 | | | $ | 3.35 | | | | 0.65 | |
| Low Duration Fund | | | | | | | | | | | | | | | | |
| Class N-actual return | | $ | 1,000.00 | | | $ | 1,009.95 | | | $ | 2.79 | | | | 0.55 | |
| Class N-hypothetical 5% return | | $ | 1,000.00 | | | $ | 1,047.23 | | | $ | 2.84 | | | | 0.55 | |
| Class I-actual return | | $ | 1,000.00 | | | $ | 1,009.56 | | | $ | 2.03 | | | | 0.40 | |
| Class I-hypothetical 5% return | | $ | 1,000.00 | | | $ | 1,047.98 | | | $ | 2.06 | | | | 0.40 | |
| Class R6-actual return | | $ | 1,000.00 | | | $ | 1,010.98 | | | $ | 1.77 | | | | 0.35 | |
| Class R6-hypothetical 5% return | | $ | 1,000.00 | | | $ | 1,048.24 | | | $ | 1.81 | | | | 0.35 | |
| Macro Allocation Fund | | | | | | | | | | | | | | | | |
| Class N-actual return | | $ | 1,000.00 | | | $ | 1,014.76 | | | $ | 6.20 | | | | 1.22 | |
| Class N-hypothetical 5% return | | $ | 1,000.00 | | | $ | 1,043.85 | | | $ | 6.28 | | | | 1.22 | |
| Class I-actual return | | $ | 1,000.00 | | | $ | 1,014.63 | | | $ | 4.93 | | | | 0.97 | |
| Class I-hypothetical 5% return | | $ | 1,000.00 | | | $ | 1,045.11 | | | $ | 5.00 | | | | 0.97 | |
| Class R6-actual return | | $ | 1,000.00 | | | $ | 1,016.09 | | | $ | 4.52 | | | | 0.89 | |
| Class R6-hypothetical 5% return | | $ | 1,000.00 | | | $ | 1,045.51 | | | $ | 4.59 | | | | 0.89 | |
| (a) | Expenses are equal to the annualized expense ratio, multiplied by the average account value over the period, multiplied by the number of days in the period, 184 and divided by 365 (to reflect the one-half year period). |
| (b) | For the period October 1, 2019 (Commencement of Operations) to December 31, 2019. |
| 182 | Annual Report | December 31, 2019 |
| | BOARD OF TRUSTEES(as of February 26, 2020) |
| | Vann A. Avedisian Principal, Highgate Holdings Kathleen T. Barr Retired Senior Managing Director, PNC Capital Advisors, LLC Stephanie G. Braming, Chairman and President Partner, William Blair Daniel N. Leib Chief Executive Officer, Donnelley Financial Solutions, Inc. Dorri C. McWhorter Chief Executive Officer, YWCA Metropolitan Chicago Arthur J. Simon Partner, William Blair Thomas J. Skelly Retired Managing Partner, Accenture Steven R. Zenz Retired Partner, KPMG LLP |
| | Officers |
| | Michael P. Balkin,Senior Vice President Thomas Clarke,Senior Vice President Daniel Crowe,Senior Vice President Robert J. Duwa,Senior Vice President Simon Fennell,Senior Vice President Andrew G. Flynn,Senior Vice President David C. Fording,Senior Vice President James S. Golan,Senior Vice President James E. Jones,Senior Vice President Chad M. Kilmer,Senior Vice President Robert C. Lanphier, IV,Senior Vice President Mark T. Leslie,Senior Vice President Kenneth J. McAtamney,Senior Vice President Todd M. McClone,Senior Vice President David S. Mitchell,Senior Vice President John C. Murphy,Senior Vice President Casey K. Preyss,Senior Vice President David P. Ricci,Senior Vice President Lisa D. Rusch,Senior Vice President Ward D. Sexton,Senior Vice President Brian D. Singer,Senior Vice President Christopher T. Vincent,Senior Vice President Dan Zelazny,Senior Vice President Paul J. Sularz,Vice President John M. Raczek,Treasurer Andrew T. Pfau,Secretary David M. Cihak,Assistant Treasurer Walter R. Randall, Jr.,Chief Compliance Officer and Assistant Secretary Robert J. Toner,Assistant Secretary Investment Adviser William Blair Investment Management, LLC Distributor William Blair & Company, L.L.C. Independent Registered Public Accounting Firm Ernst & Young LLP Transfer Agent DST Asset Manager Solutions, Inc. (formerly known as Boston Financial Data Services, Inc.) For customer assistance, call 1-800-635-2886 P.O. Box 219137 Kansas City, Missouri 64121-9137 |
| December 31, 2019 | William Blair Funds | 183 |
| | | | | | |
| | William Blair Funds | | |
| | | | | | |
| | U.S. EQUITY | | GLOBAL EQUITY | | FIXED INCOME |
| | Growth Fund | | Global Leaders Fund | | Bond Fund |
| | Large Cap Growth Fund | | | | Income Fund |
| | Mid Cap Growth Fund | | INTERNATIONAL EQUITY | | Low Duration Fund |
| | Small-Mid Cap Core Fund | | International Leaders Fund | | |
| | Small-Mid Cap Growth Fund | | International Growth Fund | | MULTI-ASSET AND |
| | Small-Mid Cap Value Fund | | Institutional International Growth Fund | | ALTERNATIVE |
| | Small Cap Growth Fund | | International Small Cap Growth Fund | | Macro Allocation Fund |
| | Small Cap Value Fund | | Emerging Markets Leaders Fund | | |
| | | | Emerging Markets Growth Fund | | |
| | | | Emerging Markets Small Cap Growth Fund | | |
 | | © | William Blair & Company, L.L.C., distributor | |
| +1 800 742 7272 | | 150 North Riverside Plaza | |
| williamblairfunds.com | | Chicago, Illinois 60606 | 00103188 |
(a) Registrant has adopted a code of ethics (the “Code”) that applies to its principal executive officer and principal financial officer (the “Covered Officers”).
(b) No disclosures are required pursuant to this Item 2(b).
(c) During the period covered by the report, registrant did not make any amendment to a provision of the Code.
(d) During the period covered by the report, registrant did not grant any waivers, including implicit waivers, from the provisions of the Code.
(e) Not applicable.
(f) A copy of the Code is filed as Exhibit 13(a)(1) to this Form N-CSR.
| Item 3. | Audit Committee Financial Expert |
The Registrant’s Board of Trustees has determined that the Registrant has at least one “audit committee financial expert” (as defined in Item 3 of Form N-CSR) serving on its Audit Committee. Mr. Daniel N. Leib, the Registrant’s audit committee financial expert, is “independent” for purposes of Item 3 to Form N-CSR.
An “audit committee financial expert” is not an “expert” for any purpose, including for purposes of Section 11 of the Securities Act of 1933, as a result of being designated as an “audit committee financial expert.” Further, the designation of a person as an “audit committee financial expert” does not mean that the person has any greater duties, obligations, or liability than those imposed on the person without the “audit committee financial expert” designation. Similarly, the designation of a person as an “audit committee financial expert” does not affect the duties, obligations, or liability of any other member of the audit committee or Board of Trustees.
| Item 4. | Principal Accountant Fees and Services |
Audit Fees
For the fiscal years ended December 31, 2018 and 2019, Ernst & Young LLP, the Registrant’s principal accountant (“E&Y”), billed the Registrant $663,600 and $621,400, respectively, for professional services rendered for the audit of the Registrant’s annual financial statements or services that are normally provided in connection with statutory and regulatory filings.
Audit-Related Fees
For the fiscal years ended December 31, 2018 and 2019, E&Y billed the Registrant $0 and $0, respectively, for assurance and related services that are reasonably related to the performance of the audit of the Registrant’s financial statements and that are not reported above. For the fiscal years ended December 31, 2018 and 2019, E&Y provided no audit-related services to William Blair Investment Management, LLC, the Registrant’s investment adviser (“William Blair”), or any of its control affiliates that were for engagements directly related to the Registrant’s operations and financial reporting.
Tax Fees
For the fiscal years ended December 31, 2018 and 2019, E&Y billed the Registrant $210,190 and $249,928, respectively, for professional services rendered for tax compliance, tax advice and tax planning. Such services consisted of preparation of tax returns, year-end distribution review, qualifying dividend income analysis and review of year-end tax reporting. For the fiscal years ended December 31, 2018 and 2019, E&Y did not bill William Blair and its control affiliates for any services that were for engagements directly related to the Registrant’s operations and financial reporting.
All Other Fees
For the fiscal years ended December 31, 2018 and 2019, E&Y did not bill the Registrant for products and services other than the services reported above. For the fiscal year ended December 31, 2018 and 2019, E&Y provided no other services to William Blair or any of its control affiliates that were for engagements directly related to the Registrant’s operations and financial reporting.
Audit Committee Pre-Approval Policies and Procedures
Pursuant to the Registrant’s Audit Committee Charter (the “Charter”), the Audit Committee is responsible for pre-approving any engagement of the principal accountant to provide non-prohibited services to the Registrant, including the fees and other compensation to be paid to the principal accountant, to the extent required by Rule 2-01(c)(7) of Regulation S-X. Pursuant to the Charter, the Audit Committee is also responsible for pre-approving any engagement of the principal accountant, including the fees and other compensation to be paid to the principal accountant, to provide non-audit services to the Registrant’s investment advisor (or any entity controlling, controlled by, or under common control with the adviser that provides ongoing services to the Registrant), if the engagement relates directly to the operations and financial reporting of the Registrant, to the extent required by Rule 2-01(c)(7) of Regulation S-X. The Chair of the Audit Committee may grant the pre-approval referenced above for non-prohibited and non-audit services. All such delegated pre-approvals will be presented to the Audit Committee no later than the next Audit Committee meeting. None of the Audit-Related and Tax Services billed by E&Y for the fiscal years ended December 31, 2018 and 2019 discussed above were approved by the Audit Committee pursuant to a waiver of these Pre-Approval Policies and Procedures.
Non-Audit Fees
For the fiscal years ended December 31, 2018 and 2019, E&Y billed the Trust $210,190 and $249,928, respectively, in non-audit fees (tax services). For the same periods, E&Y billed the Adviser and its control affiliates $0 and $0, respectively, in non-audit fees.
| Item 5. | Audit Committee of Listed Registrants |
Not Applicable to this Registrant, insofar as the Registrant is not a listed company.
| Item 6. | Schedule of Investments |
See Schedule of Investments in Item 1.
| Item 7. | Disclosure of Proxy Voting Policies and Procedures for Closed-End Management Investment Companies |
Not applicable to this Registrant, insofar as the Registrant is not a closed-end management investment company.
| Item 8. | Portfolio Managers of Closed-End Management Investment Companies |
Not applicable to this Registrant, insofar as the Registrant is not a closed-end management investment company.
| Item 9. | Purchase of Equity Securities by Closed-End Management Investment Companies and Affiliated Purchasers |
Not applicable to this Registrant, insofar as the Registrant is not a closed-end management investment company.
| Item 10. | Submission of Matters to a Vote of Security Holders |
There have been no material changes to the procedures by which shareholders may recommend nominees to the Registrant’s Board of Trustees since the Registrant last provided disclosure in response to this item.
Controls and Procedures
(a) The Registrant’s principal executive and principal financial officers, or persons performing similar functions, have concluded that the Registrant’s Disclosure Controls and Procedures (as defined in Rule 30a-3(c) under the Investment Company Act of 1940, as amended (the “1940 Act”) (17 CFR 270.30a-3(c)) are effective, as of a date within 90 days of the filing date of this report that includes the disclosure required by this paragraph, based on their evaluation of these controls and procedures required by Rule 30a-3 (b) under the 1940 Act (17 CFR 270.30a-3(b) and Rules 13a-15(b) or 15d-15(b) under the Securities Exchange Act of 1934, as amended to date (17 CFR 240.13a-15(b) or 240.15d-15(b)).
(b) There were no changes in the Registrant’s internal control over financial reporting (as defined in Rule 30a-3(d) under the 1940 Act (17 CFR 270.30a-3(d)) that occurred during the period covered by this report that has materially affected, or is reasonably likely to materially affect, the Registrant’s internal control over financial reporting.
| Item 12. | Disclosure of Securities Lending Activities for Closed-End Management Investment Companies |
Not applicable to this Registrant, insofar as the Registrant is not a closed-end management investment company.
13. (a) (1) Code of Ethics
13. (a) (2) (1)
Certification of Principal Executive Officer Required by Rule 30a-2(a) of the Investment Company Act of 1940 is filed as an exhibit hereto.
13. (a) (2) (2)
Certification of Principal Financial Officer Required by Rule 30a-2(a) of the Investment Company Act of 1940 is filed as an exhibit hereto.
13. (a) (3)
Not applicable to this Registrant.
13. (a) (4)
Not applicable to this filing.
13. (b)
Certifications of the Principal Executive Officer and Principal Financial Officer of the issuer as required by Rule 30a-2(b) of the Investment Company Act of 1940 are filed as exhibits hereto.
SIGNATURES
Pursuant to the requirements of the Securities Exchange Act of 1934 and the Investment Company Act of 1940, the Registrant has duly caused this report to be signed on its behalf by the undersigned, thereunto duly authorized.
| | | William Blair Funds |
| | |
| | | /s/ Stephanie G. Braming |
| By: | | Stephanie G. Braming |
| | | President (Principal Executive Officer) |
Date: February 27, 2020
Pursuant to the requirements of the Securities Exchange Act of 1934 and the Investment Company Act of 1940, this report has been signed below by the following persons on behalf of the Registrant and in the capacities and on the dates indicated.
| | | /s/ Stephanie G. Braming |
| By: | | Stephanie G. Braming |
| | | President (Principal Executive Officer) |
Date: February 27, 2020
| | | /s/ John M. Raczek |
| By: | | John M. Raczek |
| | | Treasurer (Principal Financial Officer) |
Date: February 27, 2020