UNITED STATES
SECURITIES AND EXCHANGE COMMISSION
Washington, D.C. 20549
Form N-CSR
CERTIFIED SHAREHOLDER REPORT OF REGISTERED
MANAGEMENT INVESTMENT COMPANIES
Investment Company Act File Number 811-5344
William Blair Funds
(Exact name of registrant as specified in charter)
| 222 West Adams Street, Chicago, IL | | 60606 |
| (Address of principal executive offices) | | (Zip Code) |
Michelle R. Seitz
William Blair Funds
222 West Adams Street, Chicago, IL 60606
(Name and address of agent for service)
Registrant’s telephone number, including area code: 312-236-1600
Date of fiscal year end: December 31
Date of reporting period: December 31, 2016
Form N-CSR is to be used by management investment companies to file reports with the Commission not later than 10 days after the transmission to stockholders of any report that is required to be transmitted to stockholders under Rule 30e-1 under the Investment Company Act of 1940 (17 CFR 270.30e-1). The Commission may use the information provided on Form N-CSR in its regulatory, disclosure review, inspection, and policymaking roles.
A registrant is required to disclose the information specified by Form N-CSR, and the Commission will make this information public. A Registrant is not required to respond to the collection of information contained in Form N-CSR unless the form displays a currently valid Office of Management and Budget (“OMB”) control number. Please direct comments concerning the accuracy of the information collection burden estimates and any suggestions for reducing the burden to Secretary, Securities and Exchange Commission, 100 F Street, NE, Washington, DC 20549. The OMB has reviewed this collection of information under the clearance requirements of 44 U.S.C. (ss) 3507.
| Item 1. | February 24, 2017 Annual Reports transmitted to shareholders. |
 | |
| | |
| | |
| | |
| | |
| | December 31, 2016 |
William Blair Funds Annual Report | |
Table of Contents
| December 31, 2016 | William Blair Funds | 1 |
The views expressed in the commentary for each Fund reflect those of the portfolio management team only through the end of the period of the report as stated on the cover. The portfolio management team’s views are subject to change at any time based on market and other conditions and should not be construed as a recommendation. Statements involving predictions, assessments, analyses, or outlook for individual securities, industries, market sectors, and/or markets involve risks and uncertainties, and there is no guarantee they will come to pass.
This report is submitted for the general information of the shareholders of William Blair Funds. It is not authorized for distribution to prospective investors unless accompanied or preceded by a prospectus of William Blair Funds. Please carefully consider the Funds’ investment objectives, risks, charges, and expenses before investing. This and other information is contained in the Funds’ prospectus, which you may obtain by calling 1-800-742-7272. Read it carefully before you invest or send money.
| 2 | Annual Report | December 31, 2016 |
Performance as of December 31, 2016—Class N Shares (Unaudited)
| | | | | | | | | 10 yr | | | | Overall |
| | | | | | | | | (or since | | Inception | | Morningstar |
| | | 1 yr | | 3 yr | | 5 yr | | inception) | | Date | | Rating |
| | | | | | | | | | | | | | | | | |
| Growth Fund | | | | | | | | | | | | | | | | |
| Class N | | (0.98 | ) | | 3.59 | | | 11.66 | | | 6.65 | | | 3/20/1946 | | *** |
| Morningstar Large Growth | | 3.23 | | | 5.70 | | | 12.94 | | | 6.91 | | | | | Among 1,315 |
| Russell 3000® Growth Index | | 7.39 | | | 8.27 | | | 14.44 | | | 8.28 | | | | | Large Growth Funds |
| S&P 500® Index | | 11.96 | | | 8.87 | | | 14.66 | | | 6.95 | | | | | |
| | | | | | | | | | | | | | | | | |
| Large Cap Growth Fund | | | | | | | | | | | | | | | | |
| Class N | | 1.97 | | | 7.65 | | | 14.44 | | | 6.98 | | | 12/27/1999 | | **** |
| Morningstar Large Growth | | 3.23 | | | 5.70 | | | 12.94 | | | 6.91 | | | | | Among 1,315 |
| Russell 1000® Growth Index | | 7.08 | | | 8.55 | | | 14.50 | | | 8.33 | | | | | Large Growth Funds |
| | | | | | | | | | | | | | | | | |
| Mid Cap Growth Fund | | | | | | | | | | | | | | | | |
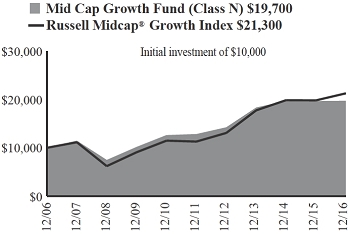
| Class N | | 0.23 | | | 2.46 | | | 8.97 | | | 7.02 | | | 2/1/2006 | | *** |
| Morningstar Mid-Cap Growth | | 6.03 | | | 4.03 | | | 11.79 | | | 6.79 | | | | | Among 588 |
| Russell Midcap® Growth Index | | 7.33 | | | 6.23 | | | 13.51 | | | 7.83 | | | | | Mid-Cap Growth Funds |
| | | | | | | | | | | | | | | | | |
| Mid Cap Value Fund | | | | | | | | | | | | | | | | |
| Class N | | 14.49 | | | 7.49 | | | 13.14 | | | 10.96 | | | 5/3/2010 | | *** |
| Morningstar Mid-Cap Blend | | 14.14 | | | 5.89 | | | 13.32 | | | — | | | | | Among 371 |
| Russell Midcap® Value Index | | 20.00 | | | 9.45 | | | 15.70 | | | 12.48 | | | | | Mid-Cap Blend Funds |
| | | | | | | | | | | | | | | | | |
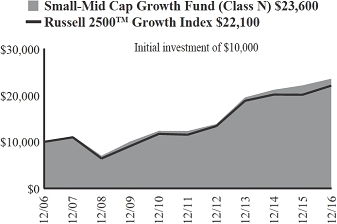
| Small-Mid Cap Growth Fund | | | | | | | | | | | | | | | | |
| Class N | | 6.45 | | | 6.41 | | | 13.85 | | | 8.94 | | | 12/29/2003 | | **** |
| Morningstar Mid-Cap Growth | | 6.03 | | | 4.03 | | | 11.79 | | | 6.79 | | | | | Among 588 |
| Russell 2500TM Growth Index | | 9.73 | | | 5.45 | | | 13.88 | | | 8.24 | | | | | Mid-Cap Growth Funds |
| | | | | | | | | | | | | | | | | |
| Small-Mid Cap Value Fund | | | | | | | | | | | | | | | | |
| Class N | | 20.69 | | | 6.96 | | | 13.30 | | | 14.16 | | | 12/15/2011 | | *** |
| Morningstar Small Blend | | 20.78 | | | 5.89 | | | 13.52 | | | — | | | | | Among 626 |
| Russell 2500® Value Index | | 25.20 | | | 8.22 | | | 15.04 | | | 15.82 | | | | | Small Blend Funds |
| | | | | | | | | | | | | | | | | |
| Small Cap Growth Fund | | | | | | | | | | | | | | | | |
| Class N | | 18.89 | | | 5.25 | | | 16.04 | | | 6.45 | | | 12/27/1999 | | *** |
| Morningstar Small Growth | | 11.20 | | | 3.55 | | | 12.33 | | | 7.08 | | | | | Among 599 |
| Russell 2000® Growth Index | | 11.32 | | | 5.05 | | | 13.74 | | | 7.76 | | | | | Small Growth Funds |
| | | | | | | | | | | | | | | | | |
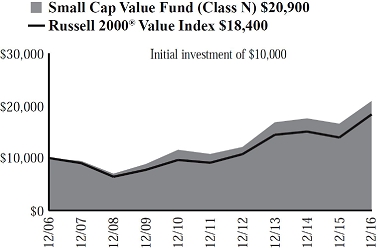
| Small Cap Value Fund | | | | | | | | | | | | | | | | |
| Class N | | 26.19 | | | 7.50 | | | 14.19 | | | 7.66 | | | 12/23/1996 | | **** |
| Morningstar Small Blend | | 20.78 | | | 5.89 | | | 13.52 | | | 6.79 | | | | | Among 626 |
| Russell 2000® Value Index | | 31.74 | | | 8.31 | | | 15.07 | | | 6.26 | | | | | Small Blend Funds |
| December 31, 2016 | William Blair Funds | 3 |
Performance as of December 31, 2016—Class N Shares (Unaudited)—continued
| | | | | | | | | 10 yr | | | | Overall |
| | | | | | | | | (or since | | Inception | | Morningstar |
| | | 1 yr | | 3 yr | | 5 yr | | inception) | | Date | | Rating |
| | | | | | | | | | | | | | | | | |
| Global Leaders Fund | | | | | | | | | | | | | | | | |
| Class N | | 0.62 | | | 2.28 | | | 8.68 | | | 2.34 | | | 10/15/2007 | | *** |
| Morningstar World Stock | | 5.54 | | | 2.10 | | | 9.24 | | | — | | | | | Among 848 |
| MSCI ACW IMI (net) | | 8.36 | | | 3.25 | | | 9.61 | | | 2.47 | | | | | World Stock Funds |
| | | | | | | | | | | | | | | | | |
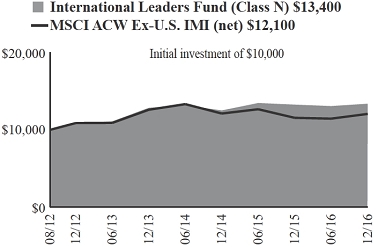
| International Leaders Fund | | | | | | | | | | | | | | | | |
| Class N | | 0.88 | | | 1.35 | | | — | | | 6.86 | | | 8/16/2012 | | ***** |
| Morningstar Foreign Large Growth | | (2.14 | ) | | (1.83 | ) | | — | | | — | | | | | Among 312 |
| MSCI ACW Ex-U.S. IMI (net) | | 4.41 | | | (1.44 | ) | | — | | | 4.37 | | | | | Foreign Large Growth Funds |
| | | | | | | | | | | | | | | | | |
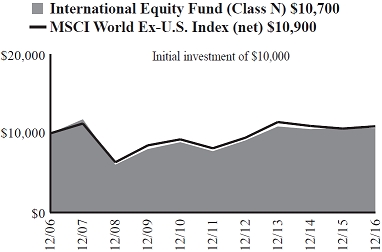
| International Equity Fund | | | | | | | | | | | | | | | | |
| Class N | | (0.27 | ) | | (0.62 | ) | | 6.63 | | | 0.64 | | | 5/24/2004 | | *** |
| Morningstar Foreign Large Growth | | (2.14 | ) | | (1.83 | ) | | 6.15 | | | 1.43 | | | | | Among 312 |
| MSCI World Ex-U.S. Index (net) | | 2.75 | | | (1.59 | ) | | 6.07 | | | 0.86 | | | | | Foreign Large Growth Funds |
| | | | | | | | | | | | | | | | | |
| International Growth Fund | | | | | | | | | | | | | | | | |
| Class N | | (2.88 | ) | | (2.12 | ) | | 6.58 | | | 1.24 | | | 10/1/1992 | | *** |
| Morningstar Foreign Large Growth | | (2.14 | ) | | (1.83 | ) | | 6.15 | | | 1.43 | | | | | Among 312 |
| MSCI ACW Ex-U.S. IMI (net) | | 4.41 | | | (1.44 | ) | | 5.35 | | | 1.22 | | | | | Foreign Large Growth Funds |
| | | | | | | | | | | | | | | | | |
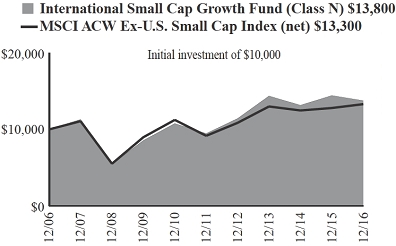
| International Small Cap Growth Fund | | | | | | | | | | | | | | | | |
| Class N | | (4.60 | ) | | (1.42 | ) | | 7.79 | | | 3.25 | | | 11/1/2005 | | *** |
| Morningstar Foreign Small/Mid Growth | | (2.98 | ) | | (0.63 | ) | | 8.87 | | | 3.12 | | | | | Among 107 |
| MSCI ACW Ex-U.S. | | | | | | | | | | | | | | | | Foreign Small/Mid Growth Funds |
| Small Cap Index (net) | | 3.91 | | | 0.76 | | | 7.74 | | | 2.90 | | | | | |
| | | | | | | | | | | | | | | | | |
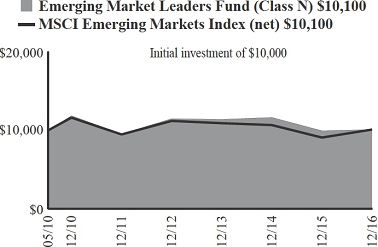
| Emerging Markets Leaders Fund | | | | | | | | | | | | | | | | |
| Class N | | 1.42 | | | (3.98 | ) | | 1.13 | | | 0.12 | | | 5/3/2010 | | *** |
| Morningstar Diversified Emerging | | | | | | | | | | | | | | | | Among 606 |
| Markets | | 8.47 | | | (3.18 | ) | | 1.61 | | | — | | | | | Diversified Emerging Markets Funds |
| MSCI Emerging Markets Index (net) | | 11.19 | | | (2.55 | ) | | 1.28 | | | 0.12 | | | | | |
| | | | | | | | | | | | | | | | | |
| Emerging Markets Growth Fund | | | | | | | | | | | | | | | | |
| Class N | | 1.49 | | | (3.75 | ) | | 1.69 | | | 0.18 | | | 6/6/2005 | | *** |
| Morningstar Diversified Emerging | | | | | | | | | | | | | | | | Among 606 |
| Markets | | 8.47 | | | (3.18 | ) | | 1.61 | | | 1.32 | | | | | Diversified Emerging Markets Funds |
| MSCI Emerging Markets IMI (net) | | 9.90 | | | (2.40 | ) | | 1.54 | | | 2.07 | | | | | |
| | | | | | | | | | | | | | | | | |
| Emerging Markets Small Cap Growth Fund | | | | | | | | | | | | | | | | |
| Class N | | (5.33 | ) | | 0.46 | | | 9.64 | | | 8.70 | | | 10/24/2011 | | ***** |
| Morningstar Diversified Emerging | | | | | | | | | | | | | | | | Among 606 |
| Markets | | 8.47 | | | (3.18 | ) | | 1.61 | | | — | | | | | Diversified Emerging Markets Funds |
| MSCI Emerging Markets Small Cap Index (net) | | 2.28 | | | (1.27 | ) | | 3.51 | | | 2.09 | | | | | |
| 4 | Annual Report | December 31, 2016 |
Performance as of December 31, 2016—Class N Shares (Unaudited)—continued
| | | | | | | | | 10 yr | | | | Overall |
| | | | | | | | | (or since | | Inception | | Morningstar |
| | | 1 yr | | 3 yr | | 5 yr | | inception) | | Date | | Rating |
| | | | | | | | | | | | | | | | | |
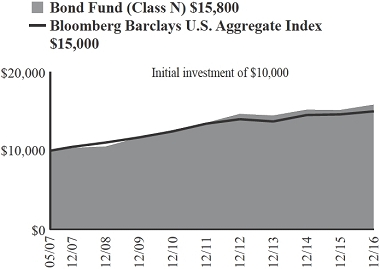
| Bond Fund | | | | | | | | | | | | | | | | |
| Class N | | 4.40 | | | 3.06 | | | 3.18 | | | 4.86 | | | 5/1/2007 | | **** |
| Morningstar Intermediate-Term Bond | | 3.23 | | | 2.73 | | | 2.61 | | | — | | | | | Among 869 |
| Bloomberg Barclays U.S. Aggregate Bond Index | | 2.65 | | | 3.03 | | | 2.23 | | | 4.28 | | | | | Intermediate-Term Bond Funds |
| | | | | | | | | | | | | | | | | |
| Income Fund | | | | | | | | | | | | | | | | |
| Class N | | 2.44 | | | 1.96 | | | 2.03 | | | 2.94 | | | 10/1/1990 | | **** |
| Morningstar Short-Term Bond | | 2.08 | | | 1.06 | | | 1.46 | | | 2.55 | | | | | Among 445 |
| Bloomberg Barclays Intermediate | | | | | | | | | | | | | | | | Short-Term Bond Funds |
| Government/Credit Bond Index | | 2.08 | | | 2.09 | | | 1.85 | | | 3.84 | | | | | |
| | | | | | | | | | | | | | | | | |
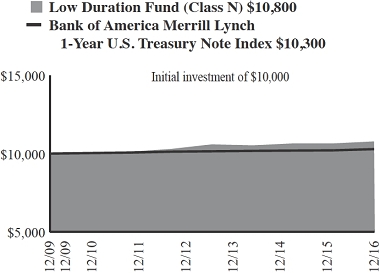
| Low Duration Fund | | | | | | | | | | | | | | | | |
| Class N | | 1.16 | | | 0.79 | | | 0.90 | | | 1.06 | | | 12/1/2009 | | *** |
| Morningstar Ultrashort Bond | | 1.41 | | | 0.67 | | | 0.95 | | | — | | | | | Among 128 |
| Bank of America Merrill Lynch | | | | | | | | | | | | | | | | Ultrashort Bond Funds |
| 1-Year U.S. Treasury Note Index | | 0.76 | | | 0.36 | | | 0.32 | | | 0.40 | | | | | |
| | | | | | | | | | | | | | | | | |
| Macro Allocation Fund | | | | | | | | | | | | | | | | |
| Class N | | 2.01 | | | (0.64 | ) | | 4.85 | | | 5.30 | | | 11/29/2011 | | *** |
| Morningstar Multialternative | | 1.38 | | | 0.61 | | | 3.14 | | | — | | | | | Among 239 |
| Bank of America Merrill Lynch | | | | | | | | | | | | | | | | Multialternative Funds |
| 3-Month U.S. Treasury Bill Index | | 0.33 | | | 0.14 | | | 0.12 | | | 0.12 | | | | | |
| Long-Term Comparative Index | | 3.68 | | | 2.36 | | | 3.84 | | | 3.85 | | | | | |
Performance cited represents past performance. Past performance does not guarantee future results and current performance may be lower or higher than the data quoted. Results shown are average annual total returns, which assume reinvestment of dividends and capital gains. Investment returns and principal will fluctuate and you may have a gain or a loss when you sell shares. For the most current month-end performance information, please call 1-800-742-7272, or visit our Web site at www.williamblairfunds.com. From time to time, the investment adviser may waive fees or reimburse expenses for the Fund. Without these waivers, performance would be lower. Investing in smaller companies involves special risks, including higher volatility and lower liquidity. International and emerging markets investing involves special risk considerations, including currency fluctuations, lower liquidity, economic and political risk. As interest rates rise, bond prices will typically fall and bond funds may become more volatile. Class N shares are available to the general public without a sales load.
Morningstar RatingsTM are as of 12/31/2016 and are subject to change every month. The ratings are based on a risk-adjusted return measure that accounts for variation in a fund’s monthly performance, placing more emphasis on downward variations and rewarding consistent performance. The top 10% of funds in each Category receive 5 stars, the next 22.5% receive 4 stars, the middle 35% receive 3 stars, the next 22.5% receive 2 stars, and the bottom 10% receive 1 star. The Overall Morningstar Rating for a fund is derived from a weighted-average of the performance figures associated with its three-, five- and ten-year (if applicable) Morningstar Rating metrics. The 3/5/10 year Morningstar ratings were as follows: Growth Fund **/**/*** and Large Cap Growth Fund ****/****/***, out of 1,315/1,154/809 large growth funds; Mid Cap Growth Fund ***/**/*** and Small-Mid Cap Growth Fund ****/****/**** out of 588/504/368 mid-cap growth funds; Mid Cap Value Fund ***/***/NA, out of 371/332/NA mid-cap blend funds; Small Cap Growth Fund ***/*****/**, out of 599/531/389 small growth funds; Small-Mid Cap Value Fund ***/*** /NA and Small Cap Value Fund ***/***/**** out of 626/534/360 small blend funds; Global Leaders Fund ***/***/NA out of 848/669/NA world stock funds; International Equity Fund ****/***/**, International Growth Fund ***/***/**, and International Leaders Fund *****/NA/NA out of 312/260/182 foreign large growth funds; International Small Cap Growth Fund ***/***/*** out of 107/97/55 foreign small/mid growth funds; Emerging Markets Leaders Fund ***/***/NA, Emerging Markets Growth Fund ***/***/**, and Emerging Markets Small Cap Growth *****/*****/NA out of 606/425/173 diversified emerging markets funds; Bond Fund ****/****/NA out of 869/759/NA intermediate-term bond funds; Income Fund ****/****/*** out of 445/357/252 short-term bond funds; Low Duration Fund ****/***/NA out of 128/91/NA ultrashort bond funds; and Macro Allocation Fund **/****/NA out of 239/141/NA multialternative funds.
Please carefully consider the Funds’ investment objectives, risks, charges, and expenses before investing. This and other information is contained in the Funds’ prospectus, which you may obtain by calling 1-800-742-7272. Read it carefully before you invest or send money.
| December 31, 2016 | William Blair Funds | 5 |
U.S. Growth Market Review and Outlook
The strength of U.S. equity market returns in 2016 masked some sharp but short-lived downdrafts during the year. This dynamic resulted in a style environment where both more defensive and more cyclical areas of the market exhibited leadership at different times over the course of the year.
In the first six weeks of 2016, the market declined precipitously, driven by concern that the U.S. could be headed into a recession given weakness in the manufacturing segment of the economy, falling oil prices and persistent headwinds from global economic growth challenges. In this environment, equity investors gravitated toward the perceived safety of high dividend yielding stocks (a dominant factor in the performance of larger cap indices during this period) and away from more speculative areas of the market such as biotechnology (a dominant factor in the performance of smaller-cap indices during this period). The mid-February market reversal, wherein leadership shifted to more cyclical companies, was spurred by further easing of monetary policy by foreign central banks and improving macroeconomic data points globally. From that point forward, with only a brief pause following the results of the Brexit vote, generally positive U.S. economic data carried the market higher.
While fourth quarter returns were positive overall, the market softened somewhat in October, likely due to anxiety ahead of the U.S. presidential election as a solid third quarter earnings season indicated health among U.S. corporations. The surprise election of Donald Trump, whose proposed policies of lower taxes, increased fiscal spending and looser regulations are generally perceived as reflationary and pro-U.S. growth, provided a tailwind for more economically sensitive areas of the market. At the same time, U.S. economic data surpassed expectations. U.S. retail sales, housing starts, unemployment claims and wages were all among positively trending data points. Accordingly, 10 year Treasury yields moved higher as investor confidence rose. With a backdrop of continued low unemployment, rising wages and inflation moving higher, the Federal Reserve, in what had become a widely anticipated move, raised the federal funds rate by 25 basis points in December.
The new administration will take office with the U.S. economy moving into the latter half of its eighth year of expansion and the Fed poised to enact further interest rate increases. In terms of Republican initiatives, lower regulatory burden, higher fiscal spending and lower taxes are generally considered to be favorable for economic growth. However, it remains to be seen how quickly the new administration’s proposed policies can be implemented. While more restrictive monetary policy in the U.S. could hinder economic growth, the Fed has thus far exhibited a cautious pace of rate increases relative to a more normalized cycle and global central bank policies remain stimulative. Conversely, Trump’s proposed policies reinforce already rising inflation, increasing the potential that the Fed could move too slowly in raising rates. Additional risks in the U.S. include potential geo-political missteps and trade ramifications from protectionist policies.
Absolute valuations moved up with the market during the year. For instance, the S&P 500 Index forward price-to-earnings multiple expand from 16.2 to 17.5 times earnings over the course of 2016. However, as of December 31, 2016, growth style indices were trading at only modest premiums to historical median levels. At the same time, relative to value indices, growth style indices were trading considerably below historical median premiums. Given this backdrop, our general view is that opportunity remains for U.S. growth equities. Further, the prospect of lower corporate taxes, repatriation of overseas cash, reduced regulations, and fiscal stimulus could lead to positive earnings revisions. Conversely, potentially offsetting factors include continued strength in the U.S. dollar and wage inflation.
As always, we believe broad investor focus on near-term events creates opportunities for investors such as ourselves who analyze companies over a long-term time horizon in an effort to achieve excess returns. We remain focused on identifying companies with durable growth drivers, independent of policy outcomes, whose stocks present compelling risk/reward opportunities.
| 6 | Annual Report | December 31, 2016 |
U.S. Value Market Review and Outlook
The domestic equity markets delivered positive returns in 2016, though there was a significant dispersion of returns between growth and value style indices. Following several years of outperformance by growth stock indices, value indices considerably outperformed during the year.
Investors experienced one of the worst starts to a new year on record for the domestic equity markets as investor sentiment during the first six weeks of 2016 seemed hysterically negative and recessionary fears ran rampant. Concerns over slowing U.S. and global growth, further weakening of commodities, strengthening of the U.S. dollar, and renewed fears of a slowdown in China pushed most equity markets into correction territory. The mid-February reversal was spurred by better domestic economic data helping to alleviate investor angst of an impending recession. Also, dovish comments by the Federal Reserve helped spark a risk-on rally from mid-February through the end of the third quarter, with a slight pause following the results of the Brexit vote. This rally was led by smaller, lower quality, and less expensive stocks.
The hard-charging domestic equity markets paused briefly in October after posting robust returns since the mid-February lows as U.S. economic expansion continued to progress, albeit at a slow and uneven pace. Similar to what transpired at the end of the second quarter following the surprising Brexit vote, market volatility spiked in early November heading into the U.S. presidential election. Better economic data and generally perceived reflationary and pro-growth policy initiatives, including increased fiscal spending, tax reform, and deregulation, helped push volatility back to near-historic lows and ultimately ignited a post-election rally that propelled the equity markets higher in the fourth quarter. The post-election rally was primarily driven by smaller cap stocks that are expected to be beneficiaries of the pro-growth initiatives of the newly elected president. The decision by OPEC ministers to cut oil production more than anticipated helped drive oil prices higher, further fueling the strong market returns during the fourth quarter.
With all of the post-election rhetoric focused on the protectionist, pro-growth initiatives of President-elect Trump and an improved U.S. economic outlook, domestic interest rates rose along with the U.S. dollar. With the backdrop of continued low unemployment, rising wages, and inflation appearing to perk up, the Federal Reserve raised the federal funds rate by 25 basis points in December.
The improvement in domestic economic data continues to support the view that U.S. economic expansion is progressing. With Donald Trump taking office early in 2017, the prospects for lower taxes, repatriation of overseas cash, increased fiscal spending, deregulation, and higher interest rates could lead to positive earnings revisions, further extending this market cycle. Some potential offsetting factors to these policy initiatives include continued strength of the U.S. dollar and wage inflation. Investor optimism is high for Trump’s pro-growth initiatives; however, there is the possibility for investor disappointment resulting from the gap between what is anticipated and actual policy results, which could lead to increased market volatility. Volatility continues to be at or near historic lows and we continue to anticipate higher volatility going forward given the uncertainty created by Brexit, concerns over a slowdown in China, policies and priorities of the newly elected U.S. president, and geopolitical tensions. There is a strong correlation between volatility and the performance of high quality companies, and higher volatility should benefit our strategy given our higher quality bias within the Funds.
While the Federal Reserve was able to squeeze in only one interest rate increase late in the year, we continue to believe that the Fed will be prudent with future rate increases and that the trajectory of interest rates will be lower than they would during a more normalized cycle. The beneficiaries of the universally accommodative monetary policy and ample liquidity during the current bull market have been the more highly leveraged companies. However, if interest rates rise faster than expected and lending standards continue to tighten, companies with conservative balance sheets and sufficient cash cushions, or those generating ample free cash flow should fare better than companies reliant on the capital markets to grow. This could provide a tailwind for our strategy as these higher quality companies with better balance sheets and solid cash flows should outperform under this scenario.
While we are cognizant of these macroeconomic variables, we are persistently seeking to identify attractive risk reward opportunities based on individual company fundamentals. From our bottom up perspective, we remain constructive on corporate earnings, albeit against a backdrop of lower revenue growth and increasing margin pressure from higher wages. As always, our focus remains on identifying quality companies at discount prices and corporate transformation opportunities, and we continue to find good ideas across all sectors. Given our investment approach, we believe the Funds are well-suited to withstand a variety of market scenarios and add value over the long-term.
| December 31, 2016 | William Blair Funds | 7 |
| | Growth Fund |
| | |
| | The Growth Fund seeks long-term capital appreciation. |
| | |
| | AN OVERVIEW FROM THE PORTFOLIO MANAGERS |
| | |

David C. Fording 
John F. Jostrand | The William Blair Growth Fund (Class N shares) posted a 0.98% decrease, net of fees, for the twelve months ended December 31, 2016. By comparison, the Fund’s benchmark index, the Russell 3000® Growth Index (the “Index”), increased 7.39%. Underperformance for 2016 versus the Index was due to a combination of style and stock-specific factors. From a style perspective, there were headwinds early in the year when investor preference for high dividend-yielding stocks dominated the market. While the preference for dividend yield was most pronounced at the beginning of the year, relative performance of high dividend-yielding stocks did not subside for the remainder of 2016 and high dividend-yielding stocks materially outperformed low dividend-yielding stocks in 2016. More economically-sensitive areas of the market also outperformed for the year, particularly in the third quarter and following the U.S. presidential election. The Fund tends to be significantly underweight high dividend- yielding and more economically-sensitive companies, preferring sustainable growth companies with substantial reinvestment opportunities that enable superior, durable long-term growth. From a stock-specific perspective, the largest detractor from the Fund’s relative performance was healthcare technology solutions provider Cerner after the company reported financial results below consensus expectations late in the year amid lower IT spending by hospitals, the company’s primary customers. Grocery retailer Kroger was a top detractor from relative performance for the year. The company experienced deflationary pressures on items such as milk, eggs and meat which negatively affected company earnings for much of 2016. However, fears of further deflation eased following the U.S. presidential election, and the stock was able to recover. Other top detractors from the Fund’s relative performance were Red Hat (Information Technology), BorgWarner (Consumer Discretionary) and Mead Johnson Nutrition (Consumer Staples). Top contributors for the year were rail operator Union Pacific and semiconductor manufacturer Texas Instruments. Union Pacific outperformed the Index mostly in the second half of 2016 due to improving trends in its underlying business. The stock performed particularly well following the election as investors gravitated to companies that would benefit the most from an improvement in the U.S. economy. Other top contributors to relative performance were Akamai Technologies (Information Technology), Vantiv (Information Technology) and NeuStar (Information Technology). Please refer to the U.S. Growth Market Review and Outlook relating to the Fund on page 6. |
| 8 | Annual Report | December 31, 2016 |
Growth Fund
Performance Highlights (Unaudited)
| Average Annual Total Return at 12/31/2016 |
| | | 1 Year | | 3 Year | | 5 Year | | 10 Year |
| | | | | | | | | | | | | |
| Class N | | | (0.98 | )% | | | 3.59 | % | | | 11.66 | % | | | 6.65 | % |
| Class I | | | (0.69 | ) | | | 3.93 | | | | 12.02 | | | | 7.01 | |
| Russell 3000® Growth Index | | | 7.39 | | | | 8.27 | | | | 14.44 | | | | 8.28 | |
| S&P 500® Index | | | 11.96 | | | | 8.87 | | | | 14.66 | | | | 6.95 | |
Performance cited represents past performance. Past performance does not guarantee future results and current performance may be lower or higher than the data quoted. Results shown are average annual returns, which assume reinvestment of dividends and capital gains. Investment returns and principal will fluctuate and you may have a gain or loss when you sell shares. For the most current month-end performance information, please call 1-800-742-7272, or visit our Web site at www.williamblairfunds.com. Class N shares are available to the general public without a sales load. Class I shares are available to certain institutional investors and advisory clients of William Blair Investment Management, LLC and William Blair & Company, L.L.C., without a sales load or distribution (12b-1) or service fees.
The performance highlights and graph presented above do not reflect the deduction of taxes that a shareholder would pay on fund distributions or the redemption of fund shares.
The Russell 3000® Growth Index consists of large, medium, and small capitalization companies with above average price-to-book ratios and forecasted growth rates. The index is weighted by market capitalization and large/medium/small companies make up approximately 80%/15%/5% of the index.
The S&P 500® Index indicates broad larger capitalization equity market performance.
This report identifies the Fund’s investments on December 31, 2016. These holdings are subject to change. Not all stocks in the Fund performed the same, nor is there any guarantee that these stocks will perform as well in the future. Market forecasts provided in this report may not necessarily come to pass.
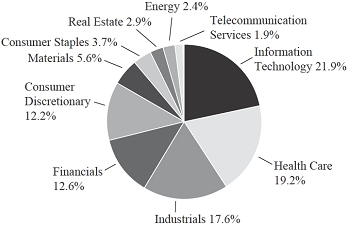
Sector Diversification (Unaudited)

The sector diversification shown is based on the total long-term securities.
| December 31, 2016 | William Blair Funds | 9 |
Growth Fund
Portfolio of Investments, December 31, 2016 (all dollar amounts in thousands)
| | Issuer | |
Shares | | | Value | |
| | | | | | | | |
| | Common Stocks | | | | | | | | |
| | Information Technology—35.1% | | | | | | | | |
| * | Adobe Systems, Inc. | | | 81,300 | | | $ | 8,370 | |
| * | Akamai Technologies, Inc. | | | 174,487 | | | | 11,635 | |
| * | Alphabet, Inc. Class “A” | | | 51,680 | | | | 40,954 | |
| | Booz Allen Hamilton Holding Corporation | | | 129,522 | | | | 4,672 | |
| * | CoStar Group, Inc. | | | 28,357 | | | | 5,345 | |
| | CSRA, Inc. | | | 275,807 | | | | 8,782 | |
| * | Facebook, Inc. | | | 155,700 | | | | 17,913 | |
| * | Guidewire Software, Inc. | | | 78,800 | | | | 3,887 | |
| | j2 Global, Inc. | | | 89,300 | | | | 7,305 | |
| | Mastercard, Inc. | | | 198,600 | | | | 20,505 | |
| | Microsoft Corporation | | | 563,600 | | | | 35,022 | |
| * | Red Hat, Inc. | | | 186,706 | | | | 13,013 | |
| | Texas Instruments, Inc. | | | 197,200 | | | | 14,390 | |
| * | Vantiv, Inc. | | | 188,039 | | | | 11,211 | |
| | | | | | | | | 203,004 | |
| | Health Care—17.8% | | | | | | | | |
| * | Align Technology, Inc. | | | 39,900 | | | | 3,836 | |
| * | Allergan plc† | | | 35,700 | | | | 7,497 | |
| * | Biogen, Inc. | | | 39,800 | | | | 11,286 | |
| * | BioMarin Pharmaceutical, Inc. | | | 57,600 | | | | 4,772 | |
| | Bristol-Myers Squibb Co. | | | 260,100 | | | | 15,200 | |
| * | Cerner Corporation | | | 261,800 | | | | 12,401 | |
| | Danaher Corporation | | | 152,900 | | | | 11,902 | |
| * | Edwards Lifesciences Corporation | | | 75,553 | | | | 7,079 | |
| * | Mednax, Inc. | | | 157,830 | | | | 10,521 | |
| | Shire plc—ADR | | | 34,000 | | | | 5,793 | |
| | Zoetis, Inc. | | | 233,600 | | | | 12,505 | |
| | | | | | | | | 102,792 | |
| | Consumer Discretionary—16.2% | | | | | | | | |
| * | Amazon.com, Inc. | | | 32,100 | | | | 24,071 | |
| | Dollar General Corporation | | | 184,200 | | | | 13,644 | |
| | Hanesbrands, Inc. | | | 268,079 | | | | 5,782 | |
| | Lowe’s Cos., Inc. | | | 248,700 | | | | 17,688 | |
| | Newell Brands, Inc. | | | 198,600 | | | | 8,867 | |
| | Starbucks Corporation | | | 215,200 | | | | 11,948 | |
| * | Steven Madden, Ltd. | | | 80,901 | | | | 2,892 | |
| | Vail Resorts, Inc. | | | 13,695 | | | | 2,209 | |
| | VF Corporation | | | 122,100 | | | | 6,514 | |
| | | | | | | | | 93,615 | |
| | Industrials—11.1% | | | | | | | | |
| | BWX Technologies, Inc. | | | 116,500 | | | | 4,625 | |
| | Fastenal Co. | | | 185,800 | | | | 8,729 | |
| | Raytheon Co. | | | 72,400 | | | | 10,281 | |
| | The Dun & Bradstreet Corporation | | | 76,200 | | | | 9,244 | |
| | TransDigm Group, Inc. | | | 35,580 | | | | 8,858 | |
| | Union Pacific Corporation | | | 146,400 | | | | 15,179 | |
| * | Verisk Analytics, Inc. | | | 90,020 | | | | 7,307 | |
| | | | | | | | | 64,223 | |
| | Issuer | | Shares or
Principal
Amount | | | Value | |
| | | | | | | | |
| | Common Stocks—(continued) | | | | | | | | |
| | Consumer Staples—9.2% | | | | | | | | |
| | Costco Wholesale Corporation | | | 102,800 | | | $ | 16,460 | |
| * | Herbalife, Ltd.† | | | 69,200 | | | | 3,331 | |
| | Mead Johnson Nutrition Co. | | | 139,300 | | | | 9,857 | |
| * | Sprouts Farmers Market, Inc. | | | 192,600 | | | | 3,644 | |
| | The Kroger Co. | | | 425,300 | | | | 14,677 | |
| | Tyson Foods, Inc. | | | 85,300 | | | | 5,261 | |
| | | | | | | | | 53,230 | |
| | Financials—7.2% | | | | | | | | |
| * | Affiliated Managers Group, Inc. | | | 31,200 | | | | 4,533 | |
| | Intercontinental Exchange, Inc. | | | 318,900 | | | | 17,992 | |
| * | Signature Bank | | | 47,600 | | | | 7,150 | |
| | Willis Towers Watson plc† | | | 94,800 | | | | 11,592 | |
| | | | | | | | | 41,267 | |
| | Energy—1.5% | | | | | | | | |
| | Schlumberger, Ltd.† | | | 104,600 | | | | 8,781 | |
| | Materials—1.4% | | | | | | | | |
| | PPG Industries, Inc. | | | 82,828 | | | | 7,849 | |
| | Total Common Stocks—99.5%
(cost $475,512) | | | | | | | 574,761 | |
| | | | | | | | | | |
| | Repurchase Agreement | | | | | | | | |
| | Fixed Income Clearing Corporation, 0.030% dated 12/30/16, due 1/3/17, repurchase price $4,823, collateralized by U.S. Treasury Bond, 3.375%, due 5/15/44 | | $ | 4,823 | | | | 4,823 | |
| | Total Repurchase Agreement—0.8%
(cost $4,823) | | | | | | | 4,823 | |
| | Total Investments—100.3%
(cost $480,335) | | | | | | | 579,584 | |
| | Liabilities, plus cash and other assets—(0.3)% | | | | | | | (1,778 | ) |
| | Net assets—100.0% | | | | | | $ | 577,806 | |
ADR = American Depository Receipt
* = Non-income producing securities
† = U.S. listed foreign security
See accompanying Notes to Financial Statements.
| 10 | Annual Report | December 31, 2016 |
| | Large Cap Growth Fund |
| | |
| | The Large Cap Growth Fund seeks long-term capital appreciation. |
| | |
| | AN OVERVIEW FROM THE PORTFOLIO MANAGERS |
| | |

James S. Golan

David P. Ricci
| The William Blair Large Cap Growth Fund (Class N shares) posted a 1.97% increase, net of fees, for the twelve months ended December 31, 2016. By comparison, the Fund’s benchmark index, the Russell 1000® Growth Index (the “Index”), increased 7.08%. Underperformance for 2016 versus the Index was primarily due to style headwinds. Headwinds were most pronounced early in the year when investor preference for high dividend-yielding stocks dominated the market. While this preference was concentrated mainly in January and February, relative performance of high dividend-yielding stocks did not subside for the remainder of 2016 and high dividend-yielding stocks materially outperformed low dividend-yielding stocks in 2016. Cheaper and more cyclical areas of the market also outperformed for the year, particularly following the U.S. presidential election. The Fund tends to be significantly underweight high dividend-yielding, low valuation and low growth companies, preferring companies with substantial reinvestment opportunities that enable superior, durable long-term growth. From a stock-specific perspective, the largest detractor from the Fund’s relative performance was grocery retailer Kroger. The company experienced deflationary pressures on items such as milk, eggs and meat which negatively affected company earnings for much of 2016. However, as stated above, fears of further deflation eased following the U.S. presidential election, and the stock was able to recover. Healthcare technology solutions provider Cerner was also a top detractor from the Fund’s relative performance for the year after reporting financial results below consensus expectations late in the year amid lower IT spending by hospitals, the company’s primary customers. Other top detractors were Apple (Information Technology), Red Hat (Information Technology) and Chipotle Mexican Grill (Consumer Discretionary). Top contributors to the Fund’s performance were rail operator Union Pacific and semiconductor manufacturer Texas Instruments. Union Pacific outperformed the Index mostly in the second half of 2016 due to improving trends in its underlying business. The stock performed particularly well following the election as investors gravitated to companies that would benefit the most from an improvement in the U.S. economy. Texas Instruments outperformed the Index for the year after several consecutive quarters in which it reported earnings that beat consensus expectations, primarily driven by continued improvement in operating margins. The Fund’s positions in IDEXX Laboratories and UnitedHealth Group were the primary drivers of positive stock selection effect in the Heath Care sector, and the Fund’s position in Schlumberger (Energy) was also a top contributor to the Fund’s performance. Please refer to the U.S. Growth Market Review and Outlook relating to the Fund on page 6. |
| December 31, 2016 | William Blair Funds | 11 |
Large Cap Growth Fund
Performance Highlights (Unaudited)
| Average Annual Total Return at 12/31/2016 | | | | | | |
| | | | 1 Year | | | 3 Year | | | 5 Year | | | 10 Year |
| Class N | | | 1.97 | % | | | 7.65 | % | | | 14.44 | % | | | 6.98 | % |
| Class I | | | 2.22 | | | | 7.92 | | | | 14.75 | | | | 7.23 | |
| Russell 1000® Growth Index | | | 7.08 | | | | 8.55 | | | | 14.50 | | | | 8.33 | |
Performance cited represents past performance. Past performance does not guarantee future results and current performance may be lower or higher than the data quoted. Results shown are average annual total returns, which assume reinvestment of dividends and capital gains. Investment returns and principal will fluctuate and you may have a gain or loss when you sell shares. For the most current month-end performance information, please call 1-800-742-7272, or visit our Web site at www.williamblairfunds.com. From time to time, the investment adviser may waive fees or reimburse expenses for the Fund. Without these waivers/reimbursements, performance would be lower. Class N shares are available to the general public without a sales load. Class I shares are available to certain institutional investors and advisory clients of William Blair Investment Management, LLC and William Blair & Company, L.L.C., without a sales load or distribution (12b-1) or service fees.
The performance highlights and graph presented above do not reflect the deduction of taxes that a shareholder would pay on fund distributions or the redemption of fund shares.
The Russell 1000® Growth Index consists of large capitalization companies with above average price-to-book ratios and forecasted growth rates.
This report identifies the Fund’s investments on December 31, 2016. These holdings are subject to change. Not all stocks in the Fund performed the same, nor is there any guarantee that these stocks will perform as well in the future. Market forecasts provided in this report may not necessarily come to pass.
Sector Diversification (Unaudited)

The sector diversification shown is based on the total long-term securities.
| 12 | Annual Report | December 31, 2016 |
Large Cap Growth Fund
Portfolio of Investments, December 31, 2016 (all dollar amounts in thousands)
| | | | | | | | |
| | | | | | | | |
| | Issuer | | Shares | | | Value | |
| | |
| | Common Stocks | | | | | | | | |
| | | | | | | | | | |
| | Information Technology—32.5% | | | | | | | | |
| | Accenture plc† | | | 21,770 | | | $ | 2,550 | |
| * | Adobe Systems, Inc. | | | 34,320 | | | | 3,533 | |
| * | Alphabet, Inc. Class “A” | | | 6,940 | | | | 5,500 | |
| * | Alphabet, Inc. Class “C” | | | 4,466 | | | | 3,447 | |
| * | Facebook, Inc. | | | 38,560 | | | | 4,436 | |
| | Mastercard, Inc. | | | 48,710 | | | | 5,029 | |
| | Microsoft Corporation | | | 123,330 | | | | 7,664 | |
| * | Red Hat, Inc. | | | 44,780 | | | | 3,121 | |
| | Texas Instruments, Inc. | | | 61,430 | | | | 4,483 | |
| | | | | | | | | 39,763 | |
| | Health Care—19.0% | | | | | | | | |
| * | Biogen, Inc. | | | 14,100 | | | | 3,998 | |
| | Bristol-Myers Squibb Co. | | | 54,270 | | | | 3,172 | |
| * | Cerner Corporation | | | 49,200 | | | | 2,331 | |
| | Danaher Corporation | | | 32,850 | | | | 2,557 | |
| * | IDEXX Laboratories, Inc. | | | 11,521 | | | | 1,351 | |
| | UnitedHealth Group, Inc. | | | 33,860 | | | | 5,419 | |
| | Zoetis, Inc. | | | 83,390 | | | | 4,464 | |
| | | | | | | | | 23,292 | |
| | Consumer Discretionary—17.9% | | | | | | | | |
| * | Amazon.com, Inc. | | | 8,550 | | | | 6,411 | |
| * | Chipotle Mexican Grill, Inc. | | | 5,500 | | | | 2,075 | |
| * | O’Reilly Automotive, Inc. | | | 12,560 | | | | 3,497 | |
| | Starbucks Corporation | | | 81,470 | | | | 4,523 | |
| | The Home Depot, Inc. | | | 40,390 | | | | 5,416 | |
| | | | | | | | | 21,922 | |
| | Industrials—10.9% | | | | | | | | |
| | Fortive Corporation | | | 36,250 | | | | 1,944 | |
| | TransDigm Group, Inc. | | | 11,780 | | | | 2,933 | |
| | Union Pacific Corporation | | | 56,260 | | | | 5,833 | |
| * | Verisk Analytics, Inc. | | | 31,860 | | | | 2,586 | |
| | | | | | | | | 13,296 | |
| | Consumer Staples—9.6% | | | | | | | | |
| | Mead Johnson Nutrition Co. | | | 42,060 | | | | 2,976 | |
| * | Monster Beverage Corporation | | | 50,750 | | | | 2,250 | |
| | The Estee Lauder Cos., Inc. | | | 19,850 | | | | 1,518 | |
| | The Kroger Co. | | | 144,000 | | | | 4,970 | |
| | | | | | | | | 11,714 | |
| | Financials—3.6% | | | | | | | | |
| * | Affiliated Managers Group, Inc. | | | 17,860 | | | | 2,595 | |
| | Intercontinental Exchange, Inc. | | | 31,120 | | | | 1,756 | |
| | | | | | | | | 4,351 | |
| | Telecommunication Services—2.1% | | | | | | | | |
| * | SBA Communications Corporation | | | 24,530 | | | | 2,533 | |
| | Materials—1.8% | | | | | | | | |
| | PPG Industries, Inc. | | | 23,380 | | | | 2,215 | |
| | Issuer | | Shares or
Principal
Amount | | | Value | |
| | | | | | | | | | |
| | Common Stocks—(continued) | | | | | | | | |
| | | | | | | | | | |
| | Energy—1.5% | | | | | | | | |
| | Schlumberger, Ltd.† | | | 22,560 | | | $ | 1,894 | |
| | Total Common Stocks—98.9%
(cost $106,780) | | | | | | | 120,980 | |
| | |
| | Repurchase Agreement | | | | | | | | |
| | Fixed Income Clearing Corporation, 0.030% dated 12/30/16, due 1/3/17, repurchase price $1,176, collateralized by U.S. Treasury Bond, 3.375%, due 5/15/44 | | $ | 1,176 | | | | 1,176 | |
| | Total Repurchase Agreement—1.0%
(cost $1,176) | | | | | | | 1,176 | |
| | Total Investments—99.9%
(cost $107,956) | | | | | | | 122,156 | |
| | Cash and other assets, less liabilities—0.1% | | | | | | | 179 | |
| | Net assets—100.0% | | | | | | $ | 122,335 | |
† = U.S. listed foreign security
* = Non-income producing securities
See accompanying Notes to Financial Statements.
| December 31, 2016 | William Blair Funds | 13 |
| | Mid Cap Growth Fund |
| | |
| | The Mid Cap Growth Fund seeks long-term capital appreciation. |
| | |
| | AN OVERVIEW FROM THE PORTFOLIO MANAGERS |
| | |

Daniel Crowe

Robert C. Lanphier, IV

David P. Ricci
| The William Blair Mid Cap Growth Fund (Class N shares) posted a 0.23% increase, net of fees, for the twelve months ended December 31, 2016. By comparison, the Fund’s benchmark index, the Russell Midcap® Growth Index (the “Index”), increased 7.33%. Underperformance for 2016 versus the Index was due to a combination of style and stock-specific factors. From a style perspective, there were headwinds early in the year when investor preference for high dividend-yielding stocks dominated the market. While the preference for dividend yield was most pronounced at the beginning of the year, relative performance of high dividend-yielding stocks did not subside for the remainder of 2016 and high dividend-yielding stocks materially outperformed low dividend-yielding stocks in 2016. More economically-sensitive areas of the market also outperformed for the year, particularly in the third quarter and following the U.S. presidential election. The Fund tends to be significantly underweight high dividend yielding and more economically-sensitive companies, preferring sustainable growth companies with substantial reinvestment opportunities that enable superior, durable long-term growth. From a stock-specific perspective, the largest detractor from the Fund’s relative performance was apparel company Hanesbrands. The stock underperformed the Index for the year as issues related to inventory restocking and soft organic growth were exacerbated by concerns late in the year regarding risks related to international manufacturing. Drugmaker Perrigo was also a top detractor for the year. CEO turnover and weakness in its European consumer healthcare business were the primary causes for the stock lagging in 2016. Other top detractors from relative performance were Cerner (Health Care), Mead Johnson Nutrition (Consumer Staples) and Red Hat (Information Technology). Top contributors to relative performance for the year were trucking company Old Dominion Freight Line and aggregates producer Vulcan Materials. Old Dominion Freight Line outperformed the Index mainly due to better-than-expected earnings in the latter half of the year. Also, the stock outperformed the index as investors gravitated towards more economically-sensitive stocks. Vulcan Materials outperformed the Index after reporting strong volumes and pricing mid-year and amid investor optimism late in 2016 that infrastructure spending in the U.S will likely rise in the short to intermediate term. Other top contributors to the Fund’s relative performance were Akamai Technologies (Information Technology), Vantiv (Information Technology) and Align Technology (Health Care). Please refer to the U.S. Growth Market Review and Outlook relating to the Fund on page 6. |
| 14 | Annual Report | December 31, 2016 |
Mid Cap Growth Fund
Performance Highlights (Unaudited)
| Average Annual Total Return at 12/31/2016 |
| | | 1 Year | | 3 Year | | 5 Year | | 10 Year |
| Class N | | | 0.23 | % | | | 2.46 | % | | | 8.97 | % | | | 7.02 | % |
| Class I | | | 0.48 | | | | 2.72 | | | | 9.25 | | | | 7.30 | |
| Russell Midcap® Growth Index | | | 7.33 | | | | 6.23 | | | | 13.51 | | | | 7.83 | |
Performance cited represents past performance. Past performance does not guarantee future results and current performance may be lower or higher than the data quoted. Results shown are average annual total returns, which assume reinvestment of dividends and capital gains. Investment returns and principal will fluctuate and you may have a gain or loss when you sell shares. For the most current month-end performance information, please call 1-800-742-7272, or visit our Web site at www.williamblairfunds.com. Investing in medium capitalization companies involves special risks, including higher volatility and lower liquidity. Medium capitalization stocks are also more sensitive to purchase/sale transactions and changes in the issuer’s financial condition. From time to time, the investment adviser may waive fees or reimburse expenses for the Fund. Without these waivers/reimbursements, performance would be lower. Class N shares are available to the general public without a sales load. Class I shares are available to certain institutional investors and advisory clients of William Blair Investment Management, LLC and William Blair & Company, L.L.C., without a sales load or distribution (12b-1) or service fees.
The performance highlights and graph presented above do not reflect the deduction of taxes that a shareholder would pay on fund distributions or the redemption of fund shares.
The Russell Midcap® Growth Index is an index that is constructed to provide a comprehensive and unbiased barometer of the mid-cap growth market.
This report identifies the Fund’s investments on December 31, 2016. These holdings are subject to change. Not all stocks in the Fund performed the same, nor is there any guarantee that these stocks will perform as well in the future. Market forecasts provided in this report may not necessarily come to pass.
Sector Diversification (Unaudited)

The sector diversification shown is based on the total long-term secuities.
| December 31, 2016 | William Blair Funds | 15 |
Mid Cap Growth Fund
Portfolio of Investments, December 31, 2016 (all dollar amounts in thousands)
| | | | | | | | |
| | | | | | | | |
| | Issuer | | Shares | | | Value | |
| | |
| | Common Stocks | | | | | | | | |
| | | | | | | | | | |
| | Information Technology—25.0% | | | | | | | | |
| * | Akamai Technologies, Inc. | | | 53,979 | | | $ | 3,599 | |
| * | Arista Networks, Inc. | | | 10,700 | | | | 1,035 | |
| | Booz Allen Hamilton Holding Corporation | | | 69,300 | | | | 2,500 | |
| * | Check Point Software Technologies, Ltd.† | | | 29,900 | | | | 2,525 | |
| * | CoStar Group, Inc. | | | 21,092 | | | | 3,976 | |
| | CSRA, Inc. | | | 109,400 | | | | 3,483 | |
| * | Genpact, Ltd.† | | | 99,952 | | | | 2,433 | |
| * | Guidewire Software, Inc. | | | 43,020 | | | | 2,122 | |
| * | IPG Photonics Corporation | | | 12,200 | | | | 1,204 | |
| | MAXIMUS, Inc. | | | 42,211 | | | | 2,355 | |
| * | Red Hat, Inc. | | | 64,430 | | | | 4,491 | |
| * | Vantiv, Inc. | | | 70,824 | | | | 4,223 | |
| | | | | | | | | 33,946 | |
| | Consumer Discretionary—20.1% | | | | | | | | |
| | BorgWarner, Inc. | | | 43,743 | | | | 1,725 | |
| | Dollar General Corporation | | | 29,865 | | | | 2,212 | |
| | Hanesbrands, Inc. | | | 137,500 | | | | 2,966 | |
| | Newell Brands, Inc. | | | 83,200 | | | | 3,715 | |
| * | O’Reilly Automotive, Inc. | | | 12,684 | | | | 3,531 | |
| * | Panera Bread Co. | | | 6,382 | | | | 1,309 | |
| | Ross Stores, Inc. | | | 59,500 | | | | 3,903 | |
| | Six Flags Entertainment Corporation | | | 55,380 | | | | 3,321 | |
| | Tractor Supply Co. | | | 48,900 | | | | 3,707 | |
| | Vail Resorts, Inc. | | | 5,411 | | | | 873 | |
| | | | | | | | | 27,262 | |
| | Health Care—17.1% | | | | | | | | |
| * | ABIOMED, Inc. | | | 9,700 | | | | 1,093 | |
| * | Align Technology, Inc. | | | 14,680 | | | | 1,411 | |
| * | BioMarin Pharmaceutical, Inc. | | | 25,531 | | | | 2,115 | |
| * | Centene Corporation | | | 50,700 | | | | 2,865 | |
| * | Cerner Corporation | | | 35,300 | | | | 1,672 | |
| | DENTSPLY SIRONA, Inc. | | | 25,559 | | | | 1,475 | |
| | HealthSouth Corporation | | | 34,000 | | | | 1,402 | |
| * | Mednax, Inc. | | | 51,760 | | | | 3,450 | |
| * | Mettler-Toledo International, Inc. | | | 4,775 | | | | 1,999 | |
| | Perrigo Co. plc† | | | 14,500 | | | | 1,207 | |
| * | Veeva Systems, Inc. | | | 32,500 | | | | 1,323 | |
| | Zoetis, Inc. | | | 58,300 | | | | 3,121 | |
| | | | | | | | | 23,133 | |
| | Industrials—14.7% | | | | | | | | |
| * | Copart, Inc. | | | 62,700 | | | | 3,474 | |
| | Equifax, Inc. | | | 10,400 | | | | 1,230 | |
| * | Old Dominion Freight Line, Inc. | | | 34,686 | | | | 2,976 | |
| | The Dun & Bradstreet Corporation | | | 13,800 | | | | 1,674 | |
| * | The Middleby Corporation | | | 17,470 | | | | 2,250 | |
| | TransDigm Group, Inc. | | | 9,175 | | | | 2,284 | |
| * | Verisk Analytics, Inc. | | | 46,280 | | | | 3,757 | |
| | Wabtec Corporation | | | 27,500 | | | | 2,283 | |
| | | | | | | | | 19,928 | |
| | Issuer | | Shares or
Principal
Amount | | | Value | |
| | |
| | Common Stocks—(continued) | | | | | | | | |
| | | | | | | | | | |
| | Financials—8.6% | | | | | | | | |
| * | Affiliated Managers Group, Inc. | | | 8,955 | | | $ | 1,301 | |
| | East West Bancorp, Inc. | | | 26,900 | | | | 1,367 | |
| | Intercontinental Exchange, Inc. | | | 26,875 | | | | 1,516 | |
| | Nasdaq, Inc. | | | 25,500 | | | | 1,712 | |
| * | Signature Bank | | | 26,456 | | | | 3,974 | |
| | Willis Towers Watson plc† | | | 14,190 | | | | 1,735 | |
| | | | | | | | | 11,605 | |
| | Materials—5.7% | | | | | | | | |
| * | Axalta Coating Systems, Ltd.† | | | 59,500 | | | | 1,619 | |
| | Ball Corporation | | | 47,200 | | | | 3,543 | |
| | Vulcan Materials Co. | | | 20,800 | | | | 2,603 | |
| | | | | | | | | 7,765 | |
| | Consumer Staples—4.9% | | | | | | | | |
| * | Herbalife, Ltd.† | | | 17,700 | | | | 852 | |
| | Mead Johnson Nutrition Co. | | | 38,200 | | | | 2,703 | |
| | Tyson Foods, Inc. | | | 49,900 | | | | 3,078 | |
| | | | | | | | | 6,633 | |
| | Telecommunication Services—1.8% | | | | | | | | |
| * | SBA Communications Corporation | | | 23,850 | | | | 2,463 | |
| | Energy—0.9% | | | | | | | | |
| * | Concho Resources, Inc. | | | 9,520 | | | | 1,262 | |
| | Total Common Stocks—98.8%
(cost $118,887) | | | | | | | 133,997 | |
| | |
| | Repurchase Agreement | | | | | | | | |
| | Fixed Income Clearing Corporation, 0.030% dated 12/30/16, due 1/3/17, repurchase price $352, collateralized by U.S. Treasury Bond, 3.375%, due 5/15/44 | | $ | 352 | | | | 352 | |
| | Total Repurchase Agreement—0.2%
(cost $352) | | | | | | | 352 | |
| | Total Investments—99.0%
(cost $119,239) | | | | | | | 134,349 | |
| | Cash and other assets, less liabilities—1.0% | | | | | | | 1,309 | |
| | Net assets—100.0% | | | | | | $ | 135,658 | |
* = Non-income producing securities
† = U.S. listed foreign security
See accompanying Notes to Financial Statements.
| 16 | Annual Report | December 31, 2016 |
| | Mid Cap Value Fund |
| | |
| | The Mid Cap Value Fund seeks long-term capital appreciation. |
| | |
| | AN OVERVIEW FROM THE PORTFOLIO MANAGERS |
| | |

Chad M. Kilmer

Mark T. Leslie

David S. Mitchell
| The William Blair Mid Cap Value Fund (Class N shares) posted a 14.49% increase, net of fees, for the twelve months ended December 31, 2016. By comparison, the Fund’s benchmark index, the Russell Midcap® Value Index (the “Index”), increased 20.00%. The Fund’s underperformance relative to the Index was driven by a combination of style factors and stock selection. The risk-on rally that began in mid-February continued on through the end of the year, led by smaller cap stocks and companies with slower growth. As such, our relative value style, which typically has a higher growth profile than the Index and an underweight to deep value stocks, was a headwind for the Fund. In addition, the worst performing stocks over the twelve months heading into the back half of 2016 rallied and the Fund’s lack of exposure to this segment was a headwind. At the sector level, Consumer Discretionary was the most significant detractor from the Fund’s relative performance due to stock selection within Specialized Consumer Services, Homebuilding, and Housewares & Specialties. Within the Real Estate sector, stock selection in Real Estate Services and Retail REITs contributed to the Fund’s underperformance. In general, REITs underperformed the rest of the market for the year due to the move up in interest rates during the back half of the year. The Industrials sector also detracted from the Fund’s relative performance during the year, mainly driven by the Fund’s lack of exposure to Airline stocks, which benefitted from better economic data and travel estimates given the pickup in business confidence. Broadly speaking, our higher quality bias and lack of exposure to the more cyclically exposed companies contributed to the Fund’s relative underperformance within Industrials as well. Financials was the most significant sector contributor to the Fund’s relative performance for the year due to stock selection within Property & Casualty Insurance. The Fund’s lack of exposure to Biotech and Pharmaceutical stocks contributed to the Fund’s outperformance within the Health Care sector during the period. With our focus on free cash flow and return on invested capital, most companies in these industries fail to meet our criteria. Looking specifically at stock selection, the Fund’s largest detractors from relative performance were Jones Lang LaSalle (Real Estate), Kroger (Consumer Staples), and H&R Block (Consumer Discretionary). Offsetting these detractors were our investments in Steel Dynamics (Materials), Patterson-UTI Energy (Energy), and Belden (Information Technology), which contributed to the Fund’s relative performance. Please refer to the U.S. Value Market Review and Outlook relating to the Fund on page 7. |
| December 31, 2016 | William Blair Funds | 17 |
Mid Cap Value Fund
Performance Highlights (Unaudited)
| Average Annual Total Return at 12/31/2016 |
| | | 1 Year | | 3 Year | | 5 Year | | Since
Inception(a) |
| Class N | | | 14.49 | % | | | 7.49 | % | | | 13.14 | % | | | 10.96 | % |
| Class I | | | 14.75 | | | | 7.78 | | | | 13.43 | | | | 11.24 | |
| Russell Midcap® Value Index | | | 20.00 | | | | 9.45 | | | | 15.70 | | | | 12.48 | |
| (a) | For the period from May 3, 2010 (Commencement of Operations) to December 31, 2016. |
Performance cited represents past performance. Past performance does not guarantee future results and current performance may be lower or higher than the data quoted. Results shown are average annual total returns, which assume reinvestment of dividends and capital gains. Investment returns and principal will fluctuate and you may have a gain or loss when you sell shares. For the most current month-end performance information, please call 1-800-742-7272, or visit our Web site at www.williamblairfunds.com. Investing in medium capitalization companies involves special risks, including higher volatility and lower liquidity. Medium capitalization stocks are also more sensitive to purchase/sale transactions and changes in the issuer’s financial condition. From time to time, the investment adviser may waive fees or reimburse expenses for the Fund. Without these waivers/reimbursements, performance would be lower. Class N shares are available to the general public without a sales load. Class I shares are available to certain institutional investors and advisory clients of William Blair Investment Management, LLC and William Blair & Company, L.L.C., without a sales load or distribution (12b-1) or service fees.
The performance highlights and graph presented above do not reflect the deduction of taxes that a shareholder would pay on fund distributions or the redemption of fund shares.
The Russell Midcap® Value Index consists of mid-capitalization companies with below average price-to-book ratios and forecasted growth rates.
This report identifies the Fund’s investments on December 31, 2016. These holdings are subject to change. Not all stocks in the Fund performed the same, nor is there any guarantee that these stocks will perform as well in the future. Market forecasts provided in this report may not necessarily come to pass.
Sector Diversification (Unaudited)

The sector diversification shown is based on the total long-term securities.
| 18 | Annual Report | December 31, 2016 |
Mid Cap Value Fund
Portfolio of Investments, December 31, 2016 (all dollar amounts in thousands)
| | | | | | | | |
| | | | | | | | |
| | Issuer | | Shares | | | Value | |
| | |
| | Common Stocks | | | | | | | | |
| | |
| | Financials—20.9% | | | | | | | | |
| | Allied World Assurance Co. Holdings, Ltd.† | | | 813 | | | $ | 44 | |
| | Ameriprise Financial, Inc. | | | 231 | | | | 26 | |
| * | Arch Capital Group, Ltd.† | | | 458 | | | | 39 | |
| | Assured Guaranty, Ltd.† | | | 920 | | | | 35 | |
| * | E*TRADE Financial Corporation | | | 1,149 | | | | 40 | |
| | East West Bancorp, Inc. | | | 1,037 | | | | 53 | |
| | FNF Group | | | 798 | | | | 27 | |
| | Hanover Insurance Group, Inc. | | | 438 | | | | 40 | |
| | Hartford Financial Services Group, Inc. | | | 885 | | | | 42 | |
| | Northern Trust Corporation | | | 609 | | | | 54 | |
| | PacWest Bancorp | | | 853 | | | | 46 | |
| | Principal Financial Group, Inc. | | | 684 | | | | 40 | |
| * | Signature Bank | | | 162 | | | | 24 | |
| | SunTrust Banks, Inc. | | | 695 | | | | 38 | |
| * | SVB Financial Group | | | 231 | | | | 40 | |
| | Zions Bancorporation | | | 988 | | | | 42 | |
| | | | | | | | | 630 | |
| | Real Estate—13.6% | | | | | | | | |
| | American Campus Communities, Inc. | | | 920 | | | | 46 | |
| | Boston Properties, Inc. | | | 208 | | | | 26 | |
| | DDR Corporation | | | 1,942 | | | | 30 | |
| | Douglas Emmett, Inc. | | | 585 | | | | 21 | |
| * | Equity Commonwealth | | | 699 | | | | 21 | |
| | Equity Residential | | | 436 | | | | 28 | |
| | Essex Property Trust, Inc. | | | 184 | | | | 43 | |
| | General Growth Properties, Inc. | | | 1,393 | | | | 35 | |
| | National Retail Properties, Inc. | | | 664 | | | | 29 | |
| | Pebblebrook Hotel Trust | | | 477 | | | | 14 | |
| | Prologis, Inc. | | | 642 | | | | 34 | |
| | SL Green Realty Corporation | | | 202 | | | | 22 | |
| | Taubman Centers, Inc. | | | 371 | | | | 27 | |
| | Ventas, Inc. | | | 514 | | | | 32 | |
| | | | | | | | | 408 | |
| | Industrials—11.8% | | | | | | | | |
| | Carlisle Cos., Inc. | | | 307 | | | | 34 | |
| | Fortune Brands Home & Security, Inc. | | | 550 | | | | 29 | |
| | Hubbell, Inc. | | | 270 | | | | 32 | |
| | Ingersoll-Rand plc† | | | 498 | | | | 37 | |
| | Johnson Controls International plc† | | | 1,122 | | | | 46 | |
| | Kansas City Southern | | | 447 | | | | 38 | |
| | Manpowergroup, Inc. | | | 250 | | | | 22 | |
| | Parker Hannifin Corporation | | | 327 | | | | 46 | |
| * | United Continental Holdings, Inc. | | | 508 | | | | 37 | |
| | Wabtec Corporation | | | 407 | | | | 34 | |
| | | | | | | | | 355 | |
| | Energy—10.5% | | | | | | | | |
| | Baker Hughes, Inc. | | | 720 | | | | 47 | |
| | Cimarex Energy Co. | | | 254 | | | | 34 | |
| * | Gulfport Energy Corporation | | | 1,160 | | | | 25 | |
| | Hess Corporation | | | 644 | | | | 40 | |
| | Noble Energy, Inc. | | | 1,091 | | | | 41 | |
| | | | | | | | |
| | | | | | | | |
| | Issuer | | Shares | | | Value | |
| | |
| | Common Stocks—(continued) | | | | | | | | |
| | | | | | | | | | |
| | Energy—(continued) | | | | | | | | |
| | Patterson-UTI Energy, Inc. | | | 1,174 | | | $ | 32 | |
| | Pioneer Natural Resources Co. | | | 243 | | | | 44 | |
| | Range Resources Corporation | | | 681 | | | | 23 | |
| * | Rice Energy, Inc. | | | 930 | | | | 20 | |
| * | Whiting Petroleum Corporation | | | 813 | | | | 10 | |
| | | | | | | | | 316 | |
| | Utilities—9.9% | | | | | | | | |
| | American Water Works Co., Inc. | | | 545 | | | | 39 | |
| | Atmos Energy Corporation | | | 517 | | | | 38 | |
| | CMS Energy Corporation | | | 939 | | | | 39 | |
| | Eversource Energy | | | 817 | | | | 45 | |
| | Pinnacle West Capital Corporation | | | 523 | | | | 41 | |
| | WEC Energy Group, Inc. | | | 819 | | | | 48 | |
| | Xcel Energy, Inc. | | | 1,167 | | | | 48 | |
| | | | | | | | | 298 | |
| | Information Technology—8.6% | | | | | | | | |
| * | Akamai Technologies, Inc. | | | 565 | | | | 38 | |
| | Belden, Inc. | | | 540 | | | | 40 | |
| * | Cadence Design Systems, Inc. | | | 1,753 | | | | 44 | |
| * | CommScope Holding Co., Inc. | | | 898 | | | | 34 | |
| * | Genpact, Ltd.† | | | 792 | | | | 19 | |
| | Juniper Networks, Inc. | | | 915 | | | | 26 | |
| * | NXP Semiconductors N.V.† | | | 210 | | | | 21 | |
| | TE Connectivity, Ltd.† | | | 536 | | | | 37 | |
| | | | | | | | | 259 | |
| | Consumer Discretionary—8.4% | | | | | | | | |
| | Darden Restaurants, Inc. | | | 517 | | | | 37 | |
| | Dick’s Sporting Goods, Inc. | | | 616 | | | | 33 | |
| | Leggett & Platt, Inc. | | | 737 | | | | 36 | |
| * | MGM Resorts International | | | 1,233 | | | | 35 | |
| | Newell Brands, Inc. | | | 849 | | | | 38 | |
| | Vail Resorts, Inc. | | | 258 | | | | 42 | |
| | VF Corporation | | | 594 | | | | 32 | |
| | | | | | | | | 253 | |
| | Materials—6.6% | | | | | | | | |
| | Carpenter Technology Corporation | | | 1,069 | | | | 39 | |
| | Eastman Chemical Co. | | | 623 | | | | 47 | |
| | FMC Corporation | | | 783 | | | | 44 | |
| | Steel Dynamics, Inc. | | | 1,916 | | | | 68 | |
| | | | | | | | | 198 | |
| | Health Care—5.6% | | | | | | | | |
| | CIGNA Corporation | | | 173 | | | | 23 | |
| * | Hologic, Inc. | | | 875 | | | | 35 | |
| * | Mednax, Inc. | | | 493 | | | | 33 | |
| * | Mettler-Toledo International, Inc. | | | 101 | | | | 43 | |
| | Zimmer Biomet Holdings, Inc. | | | 351 | | | | 36 | |
| | | | | | | | | 170 | |
| | Consumer Staples—4.0% | | | | | | | | |
| | Conagra Brands, Inc. | | | 758 | | | | 30 | |
| | Ingredion, Inc. | | | 336 | | | | 42 | |
| * | Lamb Weston Holdings, Inc. | | | 252 | | | | 10 | |
| | The Kroger Co. | | | 1,103 | | | | 38 | |
| | | | | | | | | 120 | |
See accompanying Notes to Financial Statements.
| December 31, 2016 | William Blair Funds | 19 |
Mid Cap Value Fund
Portfolio of Investments, December 31, 2016 (all dollar amounts in thousands)
| | | | |
| Issuer | | Value | |
| | | | |
Total Common Stocks—99.9%
(cost $2,385) | | $ | 3,007 | |
Total Investments—99.9%
(cost $2,385) | | | 3,007 | |
| Cash and other assets, less liabilities—0.1% | | | 2 | |
| Net assets—100.0% | | $ | 3,009 | |
† = U.S. listed foreign security
* = Non-income producing securities
See accompanying Notes to Financial Statements.
| 20 | Annual Report | December 31, 2016 |
| | Small-Mid Cap Growth Fund |
| | |
| | The Small-Mid Cap Growth Fund seeks long-term capital appreciation. |
| | |
| | AN OVERVIEW FROM THE PORTFOLIO MANAGERS |
| | |

Karl W. Brewer 
Daniel Crowe  Robert C. Lanphier, IV | The William Blair Small-Mid Cap Growth Fund (Class N shares) posted a 6.45% increase, net of fees, for the twelve months ended December 31, 2016. By comparison, the Fund’s benchmark index, the Russell 2500TM Growth Index (the “Index”), increased 9.73%. Underperformance for 2016 versus the Index was mostly due to individual stock dynamics as style factors were largely offsetting. From a style perspective, the Fund’s typical larger market cap profile relative to the Index was a headwind to performance as the smaller end of the Fund’s capitalization range outperformed. Further, more economically-sensitive areas of the market outperformed for the year. This dynamic was a headwind to the Fund’s investment style as the Fund’s emphasis on companies with durable growth drivers typically results in a portfolio with less cyclicality than the Index. The impact of these style headwinds was most pronounced in the third quarter, during which the Fund underperformed by more than it did for the year as a whole. Mostly offsetting the aforementioned headwinds was a benefit from the Fund’s typical underweight to Biotechnology and Pharmaceuticals, which underperformed in 2016 following several years of strong returns. From a stock-specific perspective, Information Technology was an area of weakness for the year, including the Fund’s positions in Guidewire Software and Cvent. Given the stock’s higher valuation multiple and several sources of near-term business uncertainty, Guidewire Software underperformed. Other notable detractors from relative performance included Jones Lang LaSalle (Real Estate), Centene (Health Care) and Tractor Supply Company (Consumer Discretionary). Shares of Jones Lang LaSalle declined as investors began to fear a peak in earnings associated with extended strength in the commercial real estate market. Conversely, stock selection within the Health Care sector contributed positively to the Fund’s relative returns. IDEXX Laboratories and Align Technology were among the top Health Care sector contributors. Shares of IDEXX Laboratories advanced following the company’s successful transition to a direct selling model and an acceleration in organic growth. Other strong performing holdings included Old Dominion Freight Line (Industrials), Nu Skin Enterprises (Consumer Staples) and Diamondback Energy (Energy). Old Dominion Freight Line outperformed the Index due to better-than-expected earnings in the latter half of the year and as investors gravitated towards more economically-sensitive stocks. Please refer to the U.S. Growth Market Review and Outlook relating to the Fund on page 6. |
| December 31, 2016 | William Blair Funds | 21 |
Small-Mid Cap Growth Fund
Performance Highlights (Unaudited)
| Average Annual Total Return at 12/31/2016 |
| | | | | | | | | |
| | | 1 Year | | 3 Year | | 5 Year | | 10 Year |
| Class N | | | 6.45 | % | | | 6.41 | % | | | 13.85 | % | | | 8.94 | % |
| Class I | | | 6.72 | | | | 6.68 | | | | 14.12 | | | | 9.22 | |
| Russell 2500TM Growth Index | | | 9.73 | | | | 5.45 | | | | 13.88 | | | | 8.24 | |
Performance cited represents past performance. Past performance does not guarantee future results and current performance may be lower or higher than the data quoted. Results shown are average annual total returns, which assume reinvestment of dividends and capital gains. Investment returns and principal will fluctuate and you may have a gain or loss when you sell shares. For the most current month-end performance information, please call 1-800-742-7272, or visit our Web site at www.williamblairfunds.com. Investing in smaller and medium capitalization companies involves special risks, including higher volatility and lower liquidity. Smaller and medium capitalization stocks are also more sensitive to purchase/sale transactions and changes in the issuer’s financial condition. From time to time, the investment adviser may waive fees or reimburse expenses for the Fund. Without these waivers/reimbursements, performance would be lower. Class N shares are available to the general public without a sales load. Class I shares are available to certain institutional investors and advisory clients of William Blair Investment Management, LLC and William Blair & Company, L.L.C., without a sales load or distribution (12b-1) or service fees.
The performance highlights and graph presented above do not reflect the deduction of taxes that a shareholder would pay on fund distributions or the redemption of fund shares.
The Russell 2500TM Growth Index measures the performance of those Russell 2500 companies with above average price-to-book ratios and forecasted growth rates.
This report identifies the Fund’s investments on December 31, 2016. These holdings are subject to change. Not all stocks in the Fund performed the same, nor is there any guarantee that these stocks will perform as well in the future. Market forecasts provided in this report may not necessarily come to pass.
Sector Diversification (Unaudited)
The sector diversification shown is based on the total long-term securities.
| 22 | Annual Report | December 31, 2016 |
Small-Mid Cap Growth Fund
Portfolio of Investments, December 31, 2016 (all dollar amounts in thousands)
| | | | | | | | |
| | | | | | | | |
| | Issuer | | Shares | | | Value | |
| | | | | | | | | | |
| | Common Stocks | | | | | | | | |
| | | | | | | | | | |
| | Information Technology—21.2% | | | | | | | | |
| * | 2U, Inc. | | | 494,745 | | | $ | 14,916 | |
| * | Akamai Technologies, Inc. | | | 301,730 | | | | 20,119 | |
| * | Arista Networks, Inc. | | | 143,590 | | | | 13,895 | |
| | Booz Allen Hamilton Holding Corporation | | | 767,248 | | | | 27,675 | |
| * | CoStar Group, Inc. | | | 165,440 | | | | 31,184 | |
| | CSRA, Inc. | | | 680,540 | | | | 21,668 | |
| * | Guidewire Software, Inc. | | | 469,264 | | | | 23,149 | |
| | j2 Global, Inc. | | | 361,315 | | | | 29,556 | |
| | MAXIMUS, Inc. | | | 485,750 | | | | 27,100 | |
| * | Pandora Media, Inc. | | | 632,333 | | | | 8,246 | |
| * | Take-Two Interactive Software, Inc. | | | 321,990 | | | | 15,871 | |
| * | Vantiv, Inc. | | | 387,720 | | | | 23,116 | |
| * | WNS Holdings, Ltd.—ADR | | | 412,280 | | | | 11,358 | |
| | | | | | | | | 267,853 | |
| | Health Care—18.6% | | | | | | | | |
| * | ABIOMED, Inc. | | | 149,118 | | | | 16,803 | |
| * | Akorn, Inc. | | | 812,296 | | | | 17,733 | |
| * | Align Technology, Inc. | | | 137,883 | | | | 13,255 | |
| * | Amedisys, Inc. | | | 293,344 | | | | 12,505 | |
| * | Cambrex Corporation | | | 401,270 | | | | 21,649 | |
| * | Centene Corporation | | | 361,340 | | | | 20,419 | |
| * | Exact Sciences Corporation | | | 1,154,070 | | | | 15,418 | |
| * | Glaukos Corporation | | | 381,550 | | | | 13,087 | |
| | HealthSouth Corporation | | | 378,664 | | | | 15,616 | |
| * | IDEXX Laboratories, Inc. | | | 104,502 | | | | 12,255 | |
| * | Ligand Pharmaceuticals, Inc. | | | 236,229 | | | | 24,003 | |
| * | Mettler-Toledo International, Inc. | | | 62,930 | | | | 26,340 | |
| * | Repligen Corporation | | | 101,935 | | | | 3,142 | |
| * | Veeva Systems, Inc. | | | 540,600 | | | | 22,002 | |
| | | | | | | | | 234,227 | |
| | Industrials—17.0% | | | | | | | | |
| | BWX Technologies, Inc. | | | 566,930 | | | | 22,507 | |
| * | Copart, Inc. | | | 430,360 | | | | 23,846 | |
| | HEICO Corporation | | | 226,630 | | | | 15,388 | |
| | Hexcel Corporation | | | 357,650 | | | | 18,398 | |
| * | Old Dominion Freight Line, Inc. | | | 422,101 | | | | 36,212 | |
| * | SiteOne Landscape Supply, Inc. | | | 279,190 | | | | 9,696 | |
| | The Dun & Bradstreet Corporation | | | 112,670 | | | | 13,669 | |
| * | The Middleby Corporation | | | 167,662 | | | | 21,597 | |
| | The Toro Co. | | | 292,556 | | | | 16,369 | |
| | TransDigm Group, Inc. | | | 86,015 | | | | 21,414 | |
| | Wabtec Corporation | | | 188,140 | | | | 15,619 | |
| | | | | | | | | 214,715 | |
| | Financials—12.2% | | | | | | | | |
| * | Affiliated Managers Group, Inc. | | | 155,431 | | | | 22,584 | |
| | Bank of the Ozarks, Inc. | | | 470,750 | | | | 24,757 | |
| | CBOE Holdings, Inc. | | | 174,110 | | | | 12,865 | |
| * | Encore Capital Group, Inc. | | | 399,491 | | | | 11,445 | |
| | FactSet Research Systems, Inc. | | | 94,854 | | | | 15,502 | |
| | FirstCash, Inc. | | | 304,323 | | | | 14,303 | |
| | Iberiabank Corporation | | | 108,890 | | | | 9,120 | |
| | OM Asset Management plc† | | | 641,858 | | | | 9,307 | |
| * | Signature Bank | | | 178,370 | | | | 26,791 | |
| | Virtu Financial, Inc. | | | 420,212 | | | | 6,702 | |
| | | | | | | | | 153,376 | |
| | Issuer | | Shares/
Principal
Amount | | | Value | |
| | | | | | | | | | |
| | Common Stocks—(continued) | | | | | | | | |
| | | | | | | | | | |
| | Consumer Discretionary—11.8% | | | | | | | | |
| | Cable One, Inc. | | | 12,230 | | | $ | 7,604 | |
| | DeVry Education Group, Inc. | | | 503,570 | | | | 15,711 | |
| * | IMAX Corporation† | | | 513,643 | | | | 16,129 | |
| | Six Flags Entertainment Corporation | | | 564,246 | | | | 33,832 | |
| | Tractor Supply Co. | | | 447,690 | | | | 33,939 | |
| * | Ulta Salon Cosmetics & Fragrance, Inc. | | | 75,530 | | | | 19,256 | |
| * | Universal Electronics, Inc. | | | 238,486 | | | | 15,394 | |
| | Vail Resorts, Inc. | | | 45,993 | | | | 7,419 | |
| | | | | | | | | 149,284 | |
| | Materials—5.4% | | | | | | | | |
| * | Axalta Coating Systems, Ltd.† | | | 541,150 | | | | 14,719 | |
| | Ball Corporation | | | 244,030 | | | | 18,319 | |
| | Celanese Corporation | | | 239,850 | | | | 18,886 | |
| | Martin Marietta Materials, Inc. | | | 75,040 | | | | 16,624 | |
| | | | | | | | | 68,548 | |
| | Consumer Staples—3.6% | | | | | | | | |
| * | Blue Buffalo Pet Products, Inc. | | | 484,780 | | | | 11,654 | |
| * | Herbalife, Ltd.† | | | 210,230 | | | | 10,121 | |
| | Nu Skin Enterprises, Inc. | | | 133,234 | | | | 6,366 | |
| | WD-40 Co. | | | 145,520 | | | | 17,011 | |
| | | | | | | | | 45,152 | |
| | Real Estate—2.8% | | | | | | | | |
| | Colliers International Group, Inc.† | | | 221,794 | | | | 8,151 | |
| | FirstService Corporation† | | | 329,662 | | | | 15,652 | |
| | Jones Lang LaSalle, Inc. | | | 112,591 | | | | 11,376 | |
| | | | | | | | | 35,179 | |
| | Energy—2.3% | | | | | | | | |
| * | Carrizo Oil & Gas, Inc. | | | 254,360 | | | | 9,500 | |
| * | Diamondback Energy, Inc. | | | 194,790 | | | | 19,686 | |
| | | | | | | | | 29,186 | |
| | Telecommunication Services—1.8% | | | | | | | | |
| * | SBA Communications Corporation | | | 222,920 | | | | 23,019 | |
| | Total Common Stocks—96.7%
(cost $1,060,058) | | | | | | | 1,220,539 | |
| | Repurchase Agreement | | | | | | | | |
| | | | | | | | | | |
| | Fixed Income Clearing Corporation, 0.030% dated 12/30/16, due 1/3/17, repurchase price $50,017, collateralized by U.S. Treasury Note, 2.750%, due 2/15/24 | | $ | 50,017 | | | | 50,017 | |
| | Total Repurchase Agreement—3.9%
(cost $50,017) | | | | | | | 50,017 | |
| | Total Investments—100.6%
(cost $1,110,075) | | | | | | | 1,270,556 | |
| | Liabilities, plus cash and other assets—(0.6)% | | | | | | | (7,979 | ) |
| | Net assets—100.0% | | | | | | $ | 1,262,577 | |
ADR = American Depository Receipt
* = Non-income producing securities
† = U.S. listed foreign security
See accompanying Notes to Financial Statements.
| December 31, 2016 | William Blair Funds | 23 |
| | Small-Mid Cap Value Fund |
| | |
| | The Small-Mid Cap Value Fund seeks long-term capital appreciation. |
| | |
| | AN OVERVIEW FROM THE PORTFOLIO MANAGERS |
| | |

Chad M. Kilmer 
Mark T. Leslie 
David S. Mitchell | The William Blair Small-Mid Cap Value Fund (Class N shares) posted a 20.69% increase, net of fees, for the twelve months ended December 31, 2016. By comparison, the Fund’s benchmark index, the Russell 2500™ Value Index (the “Index”), increased 25.20%. The Fund’s underperformance relative to the Index was driven by a combination of style factors and stock selection. The risk-on rally that began in mid-February continued on through the end of the year, led by smaller cap, lower quality and higher beta stocks. As such, our relative value style, lower beta exposure, and underweight to the smallest market cap stocks in the universe, relative to the Index, were headwinds for the Fund. In addition, the worst performing stocks over the twelve months heading into the back half of 2016 rallied and the Fund’s lack of exposure to this segment was a headwind. At the sector level, Real Estate, specifically REITs, was the largest detractor from the Fund’s relative performance due to stock selection as REITs in general were pressured by the move up in interest rates during the back half of the year. Within REITs, an overweight to and stock selection within Retail REITs was the main driver of underperformance. While the Industrials sector represented a significant detractor from the Fund’s relative performance due to stock selection throughout most industries within the sector, our stock selection in the Aerospace & Defense industry was one of the largest contributors to relative performance in 2016. Broadly speaking, our higher quality bias and lack of exposure to the more cyclically exposed companies contributed to the Fund’s relative underperformance within Industrials as well. While the Fund’s cash position is a residual of our investment process, the robust market return for the year created a notable cash drag on relative performance. Information Technology was the most significant sector contributor to relative performance during the year due to strong stock selection within Semiconductors, where the Fund benefitted from the acquisition of portfolio holding Intersil earlier in the year. The Consumer Discretionary sector was another notable contributor to the Fund’s relative performance, mainly due to stock selection within Media and Hotels, Restaurants & Leisure. Looking specifically at stock selection, the Fund’s largest detractors from relative performance were Jones Lang LaSalle (Real Estate), Gulfport (Energy), and Integer (Health Care). Offsetting these detractors were investments in Inphi (Information Technology), Intersil (Information Technology), and Children’s Place (Consumer Discretionary), which contributed to the Fund’s relative performance. Please refer to the U.S. Value Market Review and Outlook relating to the Fund on page 7. |
| 24 | Annual Report | December 31, 2016 |
Small-Mid Cap Value Fund
Performance Highlights (Unaudited)
| Average Annual Total Return at 12/31/2016 |
| | | | | | | | | |
| | | 1 Year | | 3 Year | | 5 Year | | Since
Inception(a) |
| Class N | | | 20.69 | % | | | 6.96 | % | | | 13.30 | % | | | 14.16 | % |
| Class I | | | 21.00 | | | | 7.25 | | | | 13.61 | | | | 14.47 | |
| Russell 2500TM Value Index | | | 25.20 | | | | 8.22 | | | | 15.04 | | | | 15.82 | |
| (a) | For the period from December 15, 2011 (Commencement of Operations) to December 31, 2016. |
Performance cited represents past performance. Past performance does not guarantee future results and current performance may be lower or higher than the data quoted. Results shown are average annual total returns, which assume reinvestment of dividends and capital gains. Investment returns and principal will fluctuate and you may have a gain or loss when you sell shares. For the most current month-end performance information, please call 1-800-742-7272, or visit our Web site at www.williamblairfunds.com. Investing in smaller and medium capitalization companies involves special risks, including higher volatility and lower liquidity. Smaller and medium capitalization stocks are also more sensitive to purchase/sale transactions and changes in the issuer’s financial condition. From time to time, the investment adviser may waive fees or reimburse expenses for the Fund. Without these waivers/reimbursements, performance would be lower. Class N shares are available to the general public without a sales load. Class I shares are available to certain institutional investors and advisory clients of William Blair Investment Management, LLC and William Blair & Company, L.L.C., without a sales load or distribution (12b-1) or service fees.
The performance highlights and graph presented above do not reflect the deduction of taxes that a shareholder would pay on fund distributions or the redemption of fund shares.
Russell 2500TM Value Index consists of mid-capitalization companies with below average price-to-book ratios and forecasted growth rates.
This report identifies the Fund’s investments on December 31, 2016. These holdings are subject to change. Not all stocks in the Fund performed the same, nor is there any guarantee that these stocks will perform as well in the future. Market forecasts provided in this report may not necessarily come to pass.
Sector Diversification (Unaudited)
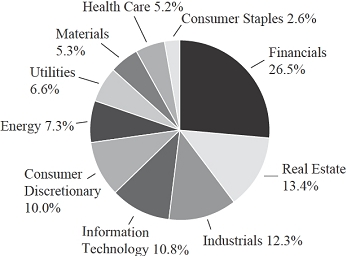
The sector diversification shown is based on the total long-term securities.
| December 31, 2016 | William Blair Funds | 25 |
Small-Mid Cap Value Fund
Portfolio of Investments, December 31, 2016 (all dollar amounts in thousands)
| | | | | | | | |
| | | | | | | | |
| | Issuer | | Shares | | | Value | |
| | | | | | | | | | |
| | Common Stocks | | | | | | | | |
| | | | | | | | | | |
| | Financials—28.0% | | | | | | | | |
| | Allied World Assurance Co. Holdings, Ltd.† | | | 816 | | | $ | 44 | |
| * | Arch Capital Group, Ltd.† | | | 530 | | | | 46 | |
| | Assured Guaranty, Ltd.† | | | 977 | | | | 37 | |
| | Bank of the Ozarks, Inc. | | | 836 | | | | 44 | |
| | Banner Corporation | | | 371 | | | | 21 | |
| | Boston Private Financial Holdings, Inc. | | | 902 | | | | 15 | |
| | CNO Financial Group, Inc. | | | 1,314 | | | | 25 | |
| | CVB Financial Corporation | | | 710 | | | | 16 | |
| * | E*TRADE Financial Corporation | | | 1,257 | | | | 44 | |
| | East West Bancorp, Inc. | | | 1,013 | | | | 52 | |
| | First American Financial Corporation | | | 769 | | | | 28 | |
| | Glacier Bancorp, Inc. | | | 1,050 | | | | 38 | |
| | Hanover Insurance Group, Inc. | | | 420 | | | | 38 | |
| | Home BancShares, Inc. | | | 1,011 | | | | 28 | |
| | Iberiabank Corporation | | | 410 | | | | 34 | |
| | Mid-America Apartment Communities, Inc. | | | 372 | | | | 36 | |
| | PacWest Bancorp | | | 832 | | | | 45 | |
| | Prosperity Bancshares, Inc. | | | 501 | | | | 36 | |
| | Radian Group, Inc. | | | 2,360 | | | | 42 | |
| | Renasant Corporation | | | 588 | | | | 25 | |
| | Selective Insurance Group, Inc. | | | 836 | | | | 36 | |
| * | Signature Bank | | | 182 | | | | 27 | |
| * | SVB Financial Group | | | 185 | | | | 32 | |
| | Tanger Factory Outlet Centers, Inc. | | | 935 | | | | 33 | |
| | Umpqua Holdings Corporation | | | 1,360 | | | | 26 | |
| * | Western Alliance Bancorp | | | 611 | | | | 30 | |
| | WSFS Financial Corporation | | | 880 | | | | 41 | |
| | Zions Bancorporation | | | 1,071 | | | | 46 | |
| | | | | | | | | 965 | |
| | Industrials—12.1% | | | | | | | | |
| | Brady Corporation | | | 681 | | | | 26 | |
| | Carlisle Cos., Inc. | | | 306 | | | | 34 | |
| | CIRCOR International, Inc. | | | 314 | | | | 20 | |
| | Curtiss-Wright Corporation | | | 265 | | | | 26 | |
| | EMCOR Group, Inc. | | | 509 | | | | 36 | |
| | Fortune Brands Home & Security, Inc. | | | 389 | | | | 21 | |
| * | FTI Consulting, Inc. | | | 572 | | | | 26 | |
| | Hubbell, Inc. | | | 225 | | | | 26 | |
| | Interface, Inc. | | | 1,681 | | | | 31 | |
| * | Lydall, Inc. | | | 379 | | | | 23 | |
| | Manpowergroup, Inc. | | | 286 | | | | 25 | |
| | Matson, Inc. | | | 594 | | | | 21 | |
| | Simpson Manufacturing Co., Inc. | | | 434 | | | | 19 | |
| | Standex International Corporation | | | 329 | | | | 29 | |
| | Valmont Industries, Inc. | | | 177 | | | | 25 | |
| | Wabtec Corporation | | | 348 | | | | 29 | |
| | | | | | | | | 417 | |
| | Real Estate—11.1% | | | | | | | | |
| | Acadia Realty Trust | | | 1,143 | | | | 37 | |
| | American Assets Trust, Inc. | | | 863 | | | | 37 | |
| | American Campus Communities, Inc. | | | 629 | | | | 31 | |
| | Care Capital Properties, Inc. | | | 819 | | | | 21 | |
| | | | | | | | |
| | | | | | | | |
| | Issuer | | Shares | | | Value | |
| | | | | | | | | | |
| | Common Stocks—(continued) | | | | | | | | |
| | | | | | | | | | |
| | Real Estate—(continued) | | | | | | | | |
| | DDR Corporation | | | 2,205 | | | $ | 34 | |
| | Douglas Emmett, Inc. | | | 1,061 | | | | 39 | |
| | Education Realty Trust, Inc. | | | 628 | | | | 27 | |
| * | EPR Properties | | | 313 | | | | 22 | |
| | Equity Commonwealth | | | 804 | | | | 24 | |
| | Highwoods Properties, Inc. | | | 474 | | | | 24 | |
| | National Retail Properties, Inc. | | | 569 | | | | 25 | |
| | Pebblebrook Hotel Trust | | | 531 | | | | 16 | |
| | Taubman Centers, Inc. | | | 399 | | | | 30 | |
| | Terreno Realty Corporation | | | 633 | | | | 18 | |
| | | | | | | | | 385 | |
| | Information Technology—10.6% | | | | | | | | |
| * | Acxiom Corporation | | | 1,744 | | | | 47 | |
| | ADTRAN, Inc. | | | 851 | | | | 19 | |
| | Belden, Inc. | | | 520 | | | | 39 | |
| | Booz Allen Hamilton Holding Corporation | | | 1,007 | | | | 36 | |
| * | Cadence Design Systems, Inc. | | | 1,815 | | | | 46 | |
| * | CommScope Holding Co., Inc. | | | 756 | | | | 28 | |
| | CSRA, Inc. | | | 1,231 | | | | 39 | |
| * | Genpact, Ltd.† | | | 1,008 | | | | 25 | |
| * | Inphi Corporation | | | 980 | | | | 44 | |
| | j2 Global, Inc. | | | 532 | | | | 43 | |
| | | | | | | | | 366 | |
| | Consumer Discretionary—9.8% | | | | | | | | |
| | American Eagle Outfitters, Inc. | | | 1,059 | | | | 16 | |
| * | Cavco Industries, Inc. | | | 183 | | | | 18 | |
| | Children’s Place, Inc. | | | 344 | | | | 35 | |
| | Churchill Downs, Inc. | | | 158 | | | | 24 | |
| | Columbia Sportswear Co. | | | 294 | | | | 17 | |
| | Dana, Inc. | | | 1,336 | | | | 25 | |
| | Darden Restaurants, Inc. | | | 312 | | | | 23 | |
| * | Dave & Buster’s Entertainment, Inc. | | | 561 | | | | 32 | |
| | Dick’s Sporting Goods, Inc. | | | 380 | | | | 20 | |
| | Ethan Allen Interiors, Inc. | | | 472 | | | | 17 | |
| * | Genesco, Inc. | | | 282 | | | | 17 | |
| | Leggett & Platt, Inc. | | | 486 | | | | 24 | |
| | Meredith Corporation | | | 476 | | | | 28 | |
| | Vail Resorts, Inc. | | | 134 | | | | 22 | |
| | Wolverine World Wide, Inc. | | | 942 | | | | 21 | |
| | | | | | | | | 339 | |
| | Energy—7.2% | | | | | | | | |
| * | Exterran Corporation | | | 722 | | | | 17 | |
| * | Gulfport Energy Corporation | | | 1,375 | | | | 30 | |
| * | Helix Energy Solutions Group, Inc. | | | 1,948 | | | | 17 | |
| * | Parsley Energy, Inc. | | | 1,357 | | | | 48 | |
| | Patterson-UTI Energy, Inc. | | | 717 | | | | 19 | |
| * | PDC Energy, Inc. | | | 613 | | | | 45 | |
| | Range Resources Corporation | | | 619 | | | | 21 | |
| * | Rice Energy, Inc. | | | 1,567 | | | | 33 | |
| * | Whiting Petroleum Corporation | | | 1,552 | | | | 19 | |
| | | | | | | | | 249 | |
See accompanying Notes to Financial Statements.
| 26 | Annual Report | December 31, 2016 |
Small-Mid Cap Value Fund
Portfolio of Investments, December 31, 2016 (all dollar amounts in thousands)
| | | | | | | | |
| | | | | | | | |
| | Issuer | | Shares | | | Value | |
| | | | | | | | | | |
| | Common Stocks—(continued) | | | | | | | | |
| | | | | | | | | | |
| | Utilities—6.5% | | | | | | | | |
| | Atmos Energy Corporation | | | 515 | | | $ | 38 | |
| | IDACORP, Inc. | | | 413 | | | | 33 | |
| | Pinnacle West Capital Corporation | | | 488 | | | | 38 | |
| | PNM Resources, Inc. | | | 768 | | | | 26 | |
| | Portland General Electric Co. | | | 619 | | | | 27 | |
| | Southwest Gas Corporation | | | 372 | | | | 29 | |
| | Spire, Inc. | | | 499 | | | | 32 | |
| | | | | | | | | 223 | |
| | Materials—5.2% | | | | | | | | |
| | Carpenter Technology Corporation | | | 460 | | | | 17 | |
| | FMC Corporation | | | 361 | | | | 20 | |
| | Minerals Technologies, Inc. | | | 439 | | | | 34 | |
| | PolyOne Corporation | | | 907 | | | | 29 | |
| | Sensient Technologies Corporation | | | 354 | | | | 28 | |
| | Silgan Holdings, Inc. | | | 309 | | | | 16 | |
| | Steel Dynamics, Inc. | | | 1,046 | | | | 37 | |
| | | | | | | | | 181 | |
| | Health Care—5.2% | | | | | | | | |
| | Analogic Corporation | | | 201 | | | | 17 | |
| | CONMED Corporation | | | 359 | | | | 16 | |
| | HealthSouth Corporation | | | 661 | | | | 27 | |
| * | Hologic, Inc. | | | 454 | | | | 18 | |
| * | Integer Holdings Corporation | | | 372 | | | | 11 | |
| * | Magellan Health, Inc. | | | 247 | | | | 19 | |
| * | Mednax, Inc. | | | 460 | | | | 31 | |
| * | Mettler-Toledo International, Inc. | | | 94 | | | | 39 | |
| | | | | | | | | 178 | |
| | Consumer Staples—2.5% | | | | | | | | |
| * | Darling Ingredients, Inc. | | | 910 | | | | 12 | |
| | Ingredion, Inc. | | | 394 | | | | 49 | |
| | J&J Snack Foods Corporation | | | 202 | | | | 27 | |
| | | | | | | | | 88 | |
| | Total Common Stocks—98.2%
(cost $2,527) | | | | | | | 3,391 | |
| | Total Investments—98.2%
(cost $2,527) | | | | | | | 3,391 | |
| | Cash and other assets, less liabilities—1.8% | | | | | | | 62 | |
| | Net assets—100.0% | | | | | | $ | 3,453 | |
† = U.S. listed foreign security
* = Non-income producing securities
See accompanying Notes to Financial Statements.
| December 31, 2016 | William Blair Funds | 27 |
| | Small Cap Growth Fund |
| | |
| | The Small Cap Growth Fund seeks long-term capital appreciation. |
| | |
| | AN OVERVIEW FROM THE PORTFOLIO MANAGERS |
| | |

Michael P. Balkin

Karl W. Brewer

Ward D. Sexton
| The William Blair Small Cap Growth Fund (Class N shares) posted an 18.89% increase, net of fees, for the twelve months ended December 31, 2016. By comparison, the Fund’s benchmark index, the Russell 2000® Growth Index (the “Index”), increased 11.32%. Significant outperformance in 2016 versus the Index was the result of both strong stock selection and style tailwinds for the Fund. From a style perspective, the Fund’s typical smaller market capitalization profile, relative to the Index, was a modest benefit while the Fund’s underweight allocations to Biotechnology and Pharmaceuticals provided a more significant tailwind as those industries underperformed in 2016. What had been a headwind to performance in prior years became a substantial tailwind in 2016 given the magnitude of our Biotechnology and Pharmaceuticals underweight, which has historically been driven by the relatively limited number of companies in those industries that satisfy our quality growth mandate. On a stock specific basis, selection was positive across several sectors, most notably in Health Care where ExamWorks, which was acquired in 2016, was the top contributor to the Fund’s relative performance. Other standout performers included Hudson Technologies (Industrials), Stillwater Mining Company (Materials), MaxLinear (Information Technology) and Xactly (Information Technology). Hudson Technologies outperformed after winning a large contract for new business and on optimism for continued strength in business fundamentals. Conversely, top detractors from relative performance during the year were Akorn (Health Care), Hortonworks (Information Technology), Virtu Financial (Financials), Air Methods Corporation (Health Care) and Guidewire Software (Information Technology). Akorn underperformed in part on investor concerns related to the restatement of the company’s financials while Hortonworks underperformed after announcing a dilutive secondary offering. Please refer to the U.S. Growth Market Review and Outlook relating to the Fund on page 6. |
| 28 | Annual Report | December 31, 2016 |
Small Cap Growth Fund
Performance Highlights (Unaudited)
| Average Annual Total Return at 12/31/2016 | | | | | | |
| | | | | | | | | | | | | |
| | | 1 Year | | 3 Year | | 5 Year | | 10 Year |
| Class N | | | 18.89 | % | | | 5.25 | % | | | 16.04 | % | | | 6.45 | % |
| Class I | | | 19.22 | | | | 5.52 | | | | 16.33 | | | | 6.74 | |
| Russell 2000® Growth Index | | | 11.32 | | | | 5.05 | | | | 13.74 | | | | 7.76 | |
Performance cited represents past performance. Past performance does not guarantee future results and current performance may be lower or higher than the data quoted. Results shown are average annual total returns, which assume reinvestment of dividends and capital gains. Investment returns and principal will fluctuate and you may have a gain or loss when you sell shares. For the most current month-end performance information, please call 1-800-742-7272, or visit our Web site at www.williamblairfunds.com. Investing in smaller companies involves special risks, including higher volatility and lower liquidity. Smaller capitalization stocks are also more sensitive to purchase/sale transactions and changes in the issuer’s financial condition. From time to time, the investment adviser may waive fees or reimburse expenses for the Fund. Without these waivers/reimbursements, performance would be lower. Class N shares are available to the general public without a sales load. Class I shares are available to certain institutional investors and advisory clients of William Blair Investment Management, LLC and William Blair & Company, L.L.C., without a sales load or distribution (12b-1) or service fees.
The performance highlights and graph presented above do not reflect the deduction of taxes that a shareholder would pay on fund distributions or the redemption of fund shares.
The Russell 2000® Growth Index is an unmanaged composite of the smallest 2000 stocks of the Russell 3000® Growth Index. This report identifies the Fund’s investments on December 31, 2016. These holdings are subject to change. Not all stocks in the Fund performed the same, nor is there any guarantee that these stocks will perform as well in the future. Market forecasts provided in this report may not necessarily come to pass.
Sector Diversification (Unaudited)
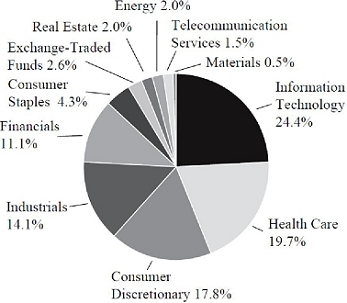
The sector diversification shown is based on the total long-term securities.
| December 31, 2016 | William Blair Funds | 29 |
Small Cap Growth Fund
Portfolio of Investments, December 31, 2016 (all dollar amounts in thousands)
| | | | | | | | |
| | | | | | | | |
| | Issuer | | Shares | | | Value | |
| | |
| | Common Stocks | | | | | | | | |
| | | | | | | | | | |
| | Information Technology—23.5% | | | | | | | | |
| * | 2U, Inc. | | | 147,580 | | | $ | 4,450 | |
| * | Acxiom Corporation | | | 138,290 | | | | 3,706 | |
| * | Callidus Software, Inc. | | | 244,517 | | | | 4,108 | |
| * | CardConnect Corporation | | | 404,920 | | | | 5,143 | |
| | CSRA, Inc. | | | 181,600 | | | | 5,782 | |
| * | Envestnet, Inc. | | | 101,230 | | | | 3,568 | |
| * | Guidewire Software, Inc. | | | 92,686 | | | | 4,572 | |
| * | Inphi Corporation | | | 106,370 | | | | 4,746 | |
| | j2 Global, Inc. | | | 139,031 | | | | 11,373 | |
| | MAXIMUS, Inc. | | | 71,650 | | | | 3,997 | |
| * | MaxLinear, Inc. | | | 220,661 | | | | 4,810 | |
| * | OSI Systems, Inc. | | | 69,300 | | | | 5,275 | |
| * | Pandora Media, Inc. | | | 358,340 | | | | 4,673 | |
| * | Planet Payment, Inc. | | | 451,815 | | | | 1,843 | |
| * | Q2 Holdings, Inc. | | | 89,090 | | | | 2,570 | |
| * | RealPage, Inc. | | | 164,890 | | | | 4,947 | |
| * | Take-Two Interactive Software, Inc. | | | 94,240 | | | | 4,645 | |
| * | USA Technologies, Inc. | | | 980,102 | | | | 4,215 | |
| * | WNS Holdings, Ltd.—ADR | | | 201,994 | | | | 5,565 | |
| * | Xactly Corporation | | | 129,190 | | | | 1,421 | |
| | | | | | | | | 91,409 | |
| | Health Care—18.9% | | | | | | | | |
| * | Accelerate Diagnostics, Inc. | | | 116,780 | | | | 2,423 | |
| * | Air Methods Corporation | | | 153,046 | | | | 4,875 | |
| * | Akorn, Inc. | | | 229,880 | | | | 5,018 | |
| * | Amedisys, Inc. | | | 87,105 | | | | 3,713 | |
| * | AtriCure, Inc. | | | 238,043 | | | | 4,659 | |
| * | Cambrex Corporation | | | 129,595 | | | | 6,992 | |
| * | Entellus Medical, Inc. | | | 18,947 | | | | 359 | |
| * | Exact Sciences Corporation | | | 313,964 | | | | 4,195 | |
| * | Glaukos Corporation | | | 110,376 | | | | 3,786 | |
| | HealthSouth Corporation | | | 86,685 | | | | 3,575 | |
| | LeMaitre Vascular, Inc. | | | 152,735 | | | | 3,870 | |
| * | LHC Group, Inc. | | | 97,460 | | | | 4,454 | |
| * | Ligand Pharmaceuticals, Inc. | | | 69,210 | | | | 7,032 | |
| * | NeoGenomics, Inc. | | | 419,891 | | | | 3,598 | |
| * | NxStage Medical, Inc. | | | 221,716 | | | | 5,811 | |
| * | Repligen Corporation | | | 113,470 | | | | 3,497 | |
| * | Veeva Systems, Inc. | | | 137,410 | | | | 5,593 | |
| | | | | | | | | 73,450 | |
| | Consumer Discretionary—17.1% | | | | | | | | |
| * | Bridgepoint Education, Inc. | | | 178,940 | | | | 1,813 | |
| | Cable One, Inc. | | | 8,200 | | | | 5,098 | |
| | Collectors Universe, Inc. | | | 134,122 | | | | 2,847 | |
| | DeVry Education Group, Inc. | | | 115,410 | | | | 3,601 | |
| * | Gentherm, Inc. | | | 164,730 | | | | 5,576 | |
| | Golden Entertainment, Inc. | | | 369,428 | | | | 4,474 | |
| * | Grand Canyon Education, Inc. | | | 63,600 | | | | 3,717 | |
| * | IMAX Corporation† | | | 179,447 | | | | 5,635 | |
| | Lithia Motors, Inc. | | | 43,160 | | | | 4,179 | |
| | Nutrisystem, Inc. | | | 137,310 | | | | 4,758 | |
| | Six Flags Entertainment Corporation | | | 152,342 | | | | 9,134 | |
| * | Steven Madden, Ltd. | | | 119,390 | | | | 4,268 | |
| * | U.S. Auto Parts Network, Inc. | | | 1,256,773 | | | | 4,424 | |
| * | Universal Electronics, Inc. | | | 106,499 | | | | 6,875 | |
| | | | | | | | | 66,399 | |
| | | | | | | | |
| | | | | | | | |
| | Issuer | | Shares | | | Value | |
| | |
| | Common Stocks—(continued) | | | | | | | | |
| | | | | | | | | | |
| | Industrials—13.5% | | | | | | | | |
| | Albany International Corporation | | | 46,270 | | | $ | 2,142 | |
| | BWX Technologies, Inc. | | | 127,780 | | | | 5,073 | |
| | ESCO Technologies, Inc. | | | 125,290 | | | | 7,098 | |
| * | GP Strategies Corporation | | | 120,667 | | | | 3,451 | |
| | HEICO Corporation | | | 109,150 | | | | 7,411 | |
| * | Hudson Technologies, Inc. | | | 478,316 | | | | 3,832 | |
| * | ICF International, Inc. | | | 69,041 | | | | 3,811 | |
| | John Bean Technologies Corporation | | | 62,155 | | | | 5,342 | |
| * | Mercury Systems, Inc. | | | 190,545 | | | | 5,758 | |
| | Ritchie Bros. Auctioneers, Inc.† | | | 73,880 | | | | 2,512 | |
| * | SiteOne Landscape Supply, Inc. | | | 82,600 | | | | 2,869 | |
| | The Dun & Bradstreet Corporation | | | 25,930 | | | | 3,146 | |
| | | | | | | | | 52,445 | |
| | Financials—10.7% | | | | | | | | |
| | A-Mark Precious Metals, Inc. | | | 25,384 | | | | 495 | |
| | B. Riley Financial, Inc. | | | 199,504 | | | | 3,681 | |
| * | BofI Holding, Inc. | | | 116,560 | | | | 3,328 | |
| * | Cowen Group, Inc. | | | 233,086 | | | | 3,613 | |
| * | Encore Capital Group, Inc. | | | 134,726 | | | | 3,860 | |
| | FirstCash, Inc. | | | 154,566 | | | | 7,264 | |
| | Iberiabank Corporation | | | 40,490 | | | | 3,391 | |
| | Meta Financial Group, Inc. | | | 58,000 | | | | 5,968 | |
| | Pacific Continental Corporation | | | 173,000 | | | | 3,780 | |
| | Virtu Financial, Inc. | | | 386,952 | | | | 6,172 | |
| | | | | | | | | 41,552 | |
| | Consumer Staples—4.1% | | | | | | | | |
| | MGP Ingredients, Inc. | | | 79,900 | | | | 3,994 | |
| | Nu Skin Enterprises, Inc. | | | 101,655 | | | | 4,857 | |
| * | USANA Health Sciences, Inc. | | | 56,520 | | | | 3,459 | |
| | WD-40 Co. | | | 30,431 | | | | 3,557 | |
| | | | | | | | | 15,867 | |
| | Real Estate—1.9% | | | | | | | | |
| | Colliers International Group, Inc.† | | | 74,653 | | | | 2,743 | |
| | FirstService Corporation† | | | 101,929 | | | | 4,840 | |
| | | | | | | | | 7,583 | |
| | Energy—1.9% | | | | | | | | |
| * | Callon Petroleum Co. | | | 173,330 | | | | 2,664 | |
| * | Carrizo Oil & Gas, Inc. | | | 76,093 | | | | 2,842 | |
| * | Gulfport Energy Corporation | | | 86,387 | | | | 1,870 | |
| | | | | | | | | 7,376 | |
| | Telecommunication Services—1.4% | | | | | | | | |
| * | ORBCOMM, Inc. | | | 659,002 | | | | 5,450 | |
| | Materials—0.4% | | | | | | | | |
| * | Codexis, Inc. | | | 385,210 | | | | 1,772 | |
| | Total Common Stocks—93.4%
(cost $291,689) | | | | | | | 363,303 | |
| | |
| | Exchange-Traded Fund | | | | | | | | |
| | iShares Russell 2000 Growth Index Fund | | | 62,260 | | | | 9,584 | |
| | Total Exchange-Traded Fund—2.5%
(cost $7,935) | | | | | | | 9,584 | |
See accompanying Notes to Financial Statements.
| 30 | Annual Report | December 31, 2016 |
Small Cap Growth Fund
Portfolio of Investments, December 31, 2016 (all dollar amounts in thousands)
| | | | | | | | |
| | | | Principal | | | |
| | Issuer | | Amount | | | Value | |
| | | | | | | | | | |
| | Repurchase Agreement | | | | | | | | |
| | Fixed Income Clearing Corporation, 0.030% dated 12/30/16, due 1/3/17, repurchase price $16,760, collateralized by U.S. Treasury Bond, 3.375%, due 5/15/44 | | $ | 16,760 | | | $ | 16,760 | |
| | Total Repurchase Agreement—4.3%
(cost $16,760) | | | | | | | 16,760 | |
| | Total Investments—100.2%
(cost $316,384) | | | | | | | 389,647 | |
| | Liabilities, plus cash and other assets—(0.2)% | | | | | | | (749 | ) |
| | Net assets—100.0% | | | | | | $ | 388,898 | |
ADR = American Depository Receipt
* = Non-income producing securities
† = U.S. listed foreign security
If a fund’s portfolio holdings represent ownership of 5% or more of the voting securities of a company, the company is deemed to be an affiliate as defined in the Investment Company Act of 1940. The Fund had the following transactions during the year ended December 31, 2016 with companies deemed affiliated during the year or at December 31, 2016.
| | | Share Activity | | Year Ended December 31, 2016 |
| Security Name | | Balance
12/31/2015 | | Purchases | | Sales | | Balance
12/31/2016 | | Value | | Dividend
Income | | Net realized
gain (loss) | | Change in net
unrealized
appreciation
(depreciation) |
| Hudson Technologies, Inc. | | | 1,681,784 | | | | 173,110 | | | | 1,376,578 | | | | 478,316 | | | | $ | 3,832 | | | | $ | — | | | | $ | 3,587 | | | | $ | 2,483 | |
| | | | | | | | | | | | | | | | | | | | $ | 3,832 | | | | $ | — | | | | $ | 3,587 | | | | $ | 2,483 | |
See accompanying Notes to Financial Statements.
| December 31, 2016 | William Blair Funds | 31 |
| | Small Cap Value Fund |
| | |
| | The Small Cap Value Fund seeks long-term capital appreciation. |
| | |
| | AN OVERVIEW FROM THE PORTFOLIO MANAGERS |
| | |
 Chad M. Kilmer 
Mark T. Leslie 
David S. Mitchell | The William Blair Small Cap Value Fund (Class N shares) posted a 26.19% increase, net of fees, for the twelve months ended December 31, 2016. By comparison, the Fund’s benchmark index, the Russell 2000® Value Index (the “Index”), increased 31.74%. The Fund’s underperformance relative to the Index was driven by a combination of style factors and stock selection. The risk-on rally that began in mid-February continued on through the end of the year, led by smaller cap, lower quality and higher beta stocks. As such, our larger market cap, higher quality biases and lower beta exposure were headwinds for the Fund. In addition, the worst performing stocks over the twelve months heading into the back half of 2016 rallied and the Fund’s lack of exposure to this segment was a headwind. At the sector level, Materials was the largest detractor from the Fund’s relative performance primarily due to a lack of exposure to Silver. An underweight to Steel, and stock selection within Steel, also detracted from relative performance. The Real Estate sector, specifically REITs, was another detractor from performance due to stock selection as REITs in general were pressured by the move up in interest rates during the back half of the year. While the Fund’s cash position is a residual of our investment process, the robust market return for the year created a notable cash drag on relative performance. Consumer Discretionary was the most significant sector contributor to the Fund’s relative performance during the year due to positive stock selection throughout the sector. The Energy sector was another notable contributor to relative performance, mainly due to stock selection within Oil, Gas & Consumable Fuels. Looking specifically at stock selection, the Fund’s largest detractors from relative performance were Integer (Health Care), Matson (Industrials), and TETRA Technologies (Energy). Offsetting these detractors were our investments in G&K Services (Industrials), Inphi (Information Technology), and Krispy Kreme Doughnuts (Consumer Discretionary), which contributed to the Fund’s relative performance. Please refer to the U.S. Value Market Review and Outlook relating to the Fund on page 7. |
| 32 | Annual Report | December 31, 2016 |
Small Cap Value Fund
Performance Highlights (Unaudited)
| Average Annual Total Return at 12/31/2016 | | | | | | |
| | | | | | | | | | | | | |
| | | 1 Year | | 3 Year | | 5 Year | | 10 Year |
| Class N | | | 26.19 | % | | | 7.50 | % | | | 14.19 | % | | | 7.66 | % |
| Class I | | | 26.46 | | | | 7.78 | | | | 14.48 | | | | 7.91 | |
| Russell 2000® Value Index | | | 31.74 | | | | 8.31 | | | | 15.07 | | | | 6.26 | |
Performance cited represents past performance. Past performance does not guarantee future results and current performance may be lower or higher than the data quoted. Results shown are average annual total returns, which assume reinvestment of dividends and capital gains. Investment returns and principal will fluctuate and you may have a gain or loss when you sell shares. For the most current month-end performance information, please call 1-800-742-7272, or visit our Web site at www.williamblairfunds.com. Investing in smaller companies involves special risks, including higher volatility and lower liquidity. Smaller capitalization stocks are also more sensitive to purchase/sale transactions and changes in the issuer’s financial condition. From time to time, the investment adviser may waive fees or reimburse expenses for the Fund. Without these waivers/reimbursements, performance would be lower. Class N shares are available to the general public without a sales load. Class I shares are available to certain institutional investors and advisory clients of William Blair Investment Management, LLC and William Blair & Company, L.L.C., without a sales load or distribution (12b-1) or service fees.
The performance highlights and graph presented above do not reflect the deduction of taxes that a shareholder would pay on fund distributions or the redemption of fund shares.
The Russell 2000® Value Index consists of small-capitalization companies with below average price-to-book ratios and forecasted growth rates.
This report identifies the Fund’s investments on December 31, 2016. These holdings are subject to change. Not all stocks in the Fund performed the same, nor is there any guarantee that these stocks will perform as well in the future. Market forecasts provided in this report may not necessarily come to pass.
Sector Diversification (Unaudited)

The sector diversification shown is based on the total long-term securities.
| December 31, 2016 | William Blair Funds | 33 |
Small Cap Value Fund
Portfolio of Investments, December 31, 2016 (all dollar amounts in thousands)
| | | | | | | | |
| | | | | | | | |
| | Issuer | | Shares | | | Value | |
| | |
| | Common Stocks | | | | | | | | |
| | | | | | | | | | |
| | Financials—30.6% | | | | | | | | |
| | Bank of the Ozarks, Inc. | | | 198,445 | | | $ | 10,436 | |
| | Banner Corporation | | | 145,360 | | | | 8,113 | |
| | Berkshire Hills Bancorp, Inc. | | | 231,342 | | | | 8,525 | |
| | Boston Private Financial Holdings, Inc. | | | 405,363 | | | | 6,709 | |
| | CNO Financial Group, Inc. | | | 367,366 | | | | 7,035 | |
| | CoBiz Financial, Inc. | | | 517,441 | | | | 8,740 | |
| | CVB Financial Corporation | | | 273,355 | | | | 6,268 | |
| | First American Financial Corporation | | | 178,147 | | | | 6,525 | |
| | Glacier Bancorp, Inc. | | | 284,319 | | | | 10,301 | |
| | Hancock Holding Co. | | | 224,720 | | | | 9,685 | |
| | Hanover Insurance Group, Inc. | | | 90,428 | | | | 8,230 | |
| | Home BancShares, Inc. | | | 301,578 | | | | 8,375 | |
| | Iberiabank Corporation | | | 132,661 | | | | 11,110 | |
| | National Bank Holdings Corporation | | | 198,012 | | | | 6,315 | |
| | PacWest Bancorp | | | 178,341 | | | | 9,709 | |
| | Prosperity Bancshares, Inc. | | | 134,940 | | | | 9,686 | |
| | Radian Group, Inc. | | | 633,231 | | | | 11,385 | |
| | Renasant Corporation | | | 207,782 | | | | 8,773 | |
| * | Safeguard Scientifics, Inc. | | | 179,553 | | | | 2,415 | |
| | Selective Insurance Group, Inc. | | | 206,588 | | | | 8,894 | |
| | Sterling Bancorp | | | 228,085 | | | | 5,337 | |
| | Tanger Factory Outlet Centers, Inc. | | | 184,770 | | | | 6,611 | |
| | Umpqua Holdings Corporation | | | 442,818 | | | | 8,316 | |
| * | Western Alliance Bancorp | | | 220,919 | | | | 10,761 | |
| | WSFS Financial Corporation | | | 214,624 | | | | 9,948 | |
| | Yadkin Financial Corporation | | | 250,774 | | | | 8,591 | |
| | | | | | | | | 216,793 | |
| | Industrials—12.5% | | | | | | | | |
| | Brady Corporation | | | 181,405 | | | | 6,812 | |
| | CIRCOR International, Inc. | | | 113,230 | | | | 7,346 | |
| | Curtiss-Wright Corporation | | | 74,232 | | | | 7,302 | |
| | EMCOR Group, Inc. | | | 136,330 | | | | 9,647 | |
| * | FTI Consulting, Inc. | | | 157,085 | | | | 7,081 | |
| | Interface, Inc. | | | 435,132 | | | | 8,072 | |
| | Kadant, Inc. | | | 108,212 | | | | 6,623 | |
| * | Lydall, Inc. | | | 110,450 | | | | 6,831 | |
| | Matson, Inc. | | | 151,983 | | | | 5,379 | |
| * | Northwest Pipe Co. | | | 230,862 | | | | 3,975 | |
| | Simpson Manufacturing Co., Inc. | | | 113,335 | | | | 4,958 | |
| | Standex International Corporation | | | 85,564 | | | | 7,517 | |
| | Valmont Industries, Inc. | | | 48,090 | | | | 6,776 | |
| | | | | | | | | 88,319 | |
| | Information Technology—11.2% | | | | | | | | |
| * | Acxiom Corporation | | | 382,977 | | | | 10,264 | |
| | ADTRAN, Inc. | | | 248,492 | | | | 5,554 | |
| | Belden, Inc. | | | 116,267 | | | | 8,693 | |
| | Booz Allen Hamilton Holding Corporation | | | 230,386 | | | | 8,310 | |
| * | CommScope Holding Co., Inc. | | | 209,194 | | | | 7,782 | |
| | CSRA, Inc. | | | 279,760 | | | | 8,908 | |
| * | Inphi Corporation | | | 192,954 | | | | 8,610 | |
| | Intersil Corporation | | | 241,220 | | | | 5,379 | |
| * | Intralinks Holdings, Inc. | | | 465,549 | | | | 6,294 | |
| | j2 Global, Inc. | | | 115,727 | | | | 9,466 | |
| | | | | | | | | 79,260 | |
| | | | | | | | |
| | | | | | | | |
| | Issuer | | Shares | | | Value | |
| | |
| | Common Stocks—(continued) | | | | | | | | |
| | | | | | | | | | |
| | Consumer Discretionary—10.1% | | | | | | | | |
| | American Eagle Outfitters, Inc. | | | 235,250 | | | $ | 3,569 | |
| * | Cavco Industries, Inc. | | | 54,280 | | | | 5,420 | |
| | Children’s Place, Inc. | | | 82,397 | | | | 8,318 | |
| | Churchill Downs, Inc. | | | 41,685 | | | | 6,271 | |
| | Columbia Sportswear Co. | | | 75,450 | | | | 4,399 | |
| | Dana, Inc. | | | 421,103 | | | | 7,992 | |
| * | Dave & Buster’s Entertainment, Inc. | | | 126,040 | | | | 7,096 | |
| | Ethan Allen Interiors, Inc. | | | 151,526 | | | | 5,584 | |
| * | Genesco, Inc. | | | 88,043 | | | | 5,467 | |
| | Meredith Corporation | | | 120,612 | | | | 7,134 | |
| | Vail Resorts, Inc. | | | 26,271 | | | | 4,238 | |
| | Wolverine World Wide, Inc. | | | 276,609 | | | | 6,072 | |
| | | | | | | | | 71,560 | |
| | Real Estate—8.5% | | | | | | | | |
| | Acadia Realty Trust | | | 250,121 | | | | 8,174 | |
| | American Assets Trust, Inc. | | | 191,607 | | | | 8,254 | |
| | American Campus Communities, Inc. | | | 139,176 | | | | 6,927 | |
| | Care Capital Properties, Inc. | | | 157,631 | | | | 3,941 | |
| | Education Realty Trust, Inc. | | | 195,909 | | | | 8,287 | |
| | EPR Properties | | | 71,974 | | | | 5,166 | |
| * | Equity Commonwealth | | | 158,931 | | | | 4,806 | |
| | Highwoods Properties, Inc. | | | 120,717 | | | | 6,158 | |
| | Pebblebrook Hotel Trust | | | 168,377 | | | | 5,009 | |
| | Terreno Realty Corporation | | | 127,665 | | | | 3,637 | |
| | | | | | | | | 60,359 | |
| | Utilities—6.1% | | | | | | | | |
| | Chesapeake Utilities Corporation | | | 91,080 | | | | 6,098 | |
| | IDACORP, Inc. | | | 99,877 | | | | 8,045 | |
| | PNM Resources, Inc. | | | 205,396 | | | | 7,045 | |
| | Portland General Electric Co. | | | 173,153 | | | | 7,503 | |
| | Southwest Gas Corporation | | | 96,835 | | | | 7,419 | |
| | Spire, Inc. | | | 111,818 | | | | 7,218 | |
| | | | | | | | | 43,328 | |
| | Energy—5.3% | | | | | | | | |
| | Archrock, Inc. | | | 464,418 | | | | 6,130 | |
| * | Exterran Corporation | | | 146,775 | | | | 3,508 | |
| * | Helix Energy Solutions Group, Inc. | | | 471,040 | | | | 4,154 | |
| * | PDC Energy, Inc. | | | 114,423 | | | | 8,305 | |
| * | Rice Energy, Inc. | | | 318,300 | | | | 6,796 | |
| * | RSP Permian, Inc. | | | 199,750 | | | | 8,913 | |
| | | | | | | | | 37,806 | |
| | Health Care—4.6% | | | | | | | | |
| | Analogic Corporation | | | 60,795 | | | | 5,043 | |
| | CONMED Corporation | | | 164,900 | | | | 7,284 | |
| | HealthSouth Corporation | | | 184,445 | | | | 7,606 | |
| * | Integer Holdings Corporation | | | 194,974 | | | | 5,742 | |
| * | Magellan Health, Inc. | | | 90,538 | | | | 6,813 | |
| | | | | | | | | 32,488 | |
See accompanying Notes to Financial Statements.
| 34 | Annual Report | December 31, 2016 |
Small Cap Value Fund
Portfolio of Investments, December 31, 2016 (all dollar amounts in thousands)
| | | | Shares or | | | | |
| | | | Principal | | | | |
| | Issuer | | Amount | | | Value | |
| | | | | | | | | | |
| | Common Stocks—(continued) | | | | | | | | |
| | | | | | | | | | |
| | Materials—4.4% | | | | | | | | |
| | Carpenter Technology Corporation | | | 131,685 | | | $ | 4,763 | |
| | Minerals Technologies, Inc. | | | 103,676 | | | | 8,009 | |
| | PolyOne Corporation | | | 168,917 | | | | 5,412 | |
| | Sensient Technologies Corporation | | | 97,488 | | | | 7,661 | |
| | Silgan Holdings, Inc. | | | 107,083 | | | | 5,480 | |
| | | | | | | | | 31,325 | |
| | Consumer Staples—3.4% | | | | | | | | |
| | *Darling Ingredients, Inc. | | | 448,135 | | | | 5,785 | |
| | J&J Snack Foods Corporation | | | 68,174 | | | | 9,096 | |
| | SpartanNash Co. | | | 233,273 | | | | 9,224 | |
| | | | | | | | | 24,105 | |
| | Total Common Stocks—96.7%
(cost $503,160) | | | | | | | 685,343 | |
| | |
| | Repurchase Agreement | | | | | | | | |
| | Fixed Income Clearing Corporation, 0.030% dated 12/30/16, due 1/3/17, repurchase price $20,650, collateralized by U.S. Treasury Bond, 3.375%, due 5/15/44 | | $ | 20,650 | | | | 20,650 | |
| | Total Repurchase Agreement—2.9%
(cost $20,650) | | | | | | | 20,650 | |
| | Total Investments—99.6%
(cost $523,810) | | | | | | | 705,993 | |
| | Cash and other assets, less liabilities—0.4% | | | | | | | 2,638 | |
| | Net assets—100.0% | | | | | | $ | 708,631 | |
* = Non-income producing securities
See accompanying Notes to Financial Statements.
| December 31, 2016 | William Blair Funds | 35 |
Global Markets Review and Outlook
Global equities overcame repeated slumps in 2016 amid an environment of heightened political risk and fragile growth. Stock markets around the world sustained a swift and painful correction to start the year, driven by concerns about global growth and the plummeting oil price. China’s economic slowdown and ongoing rebalancing also weighed on sentiment, compounded by worries about the weaker renminbi and opaque government policy measures. These fears quickly abated, and markets rallied strongly off their February lows into mid-year, when the U.K. referendum on European Union membership came into focus.
Although Brexit-induced losses in late June were quickly recovered on expectations of prolonged central bank stimulus measures, the environment for equities remained tenuous heading into the second half of 2016, with uncertainty about the longer-term Brexit ramifications for U.K. and European economic activity. In addition to the surprise referendum outcome and its implications for growth, investors were confronted with renewed worries about systemic risk in the European banking system as Deutsche Bank’s share price retreated on news that the U.S. Department of Justice was seeking $14 billion to settle a mortgage-abuse case. Expectations that these concerns would give the Federal Open Market Committee more reason to delay interest rate normalization, or convince the European Central Bank to expand its stimulus measures, contributed to a risk-on environment during the third quarter, broadly propelling equities higher.
In what was perhaps the defining moment of 2016, Donald Trump’s election victory shifted the market’s focus from monetary policy to fiscal expansion, igniting a strong rally in reflationary assets through the end of the year. U.S. equities, the dollar and commodities were among the primary beneficiaries of expected infrastructure spending increases and tax cuts under the new administration, while rising inflation and interest rate expectations led to a sharp repricing of sovereign bond yields.
Emerging Markets equities outperformed Developed Markets in 2016, benefiting from reasonable valuations versus Developed Markets, stabilizing fund flows and currencies, moderating political risk, and the rebound in commodity prices. Despite stumbling in the fourth quarter on Trump-related worries about a stronger dollar, higher U.S. interest rates and protectionism, the MSCI Emerging Markets Index (net) gained 9.90% in USD terms for the year. Consistent with the market’s preference for low valuation stocks, previously out-of-favor countries and sectors rallied significantly during the year. Brazilian and Russian equities outperformed in this environment, gaining 66.10% and 56.95%, respectively, in USD terms, driven largely by currency appreciation. From a sector perspective within Emerging Markets, Energy and Materials gained 35.41% and 29.65%, respectively, leading other sectors by a wide margin.
The broadening global growth and inflationary backdrop contributed to the substantial outperformance of value-oriented stocks across regions, sectors, and market capitalizations in 2016. This trend accelerated after the U.S. Presidential election, to the detriment of not only growth-oriented companies, but those with higher quality attributes including balance sheet strength and low earnings volatility.
At our recent Global Market Outlook presentation to clients, we noted that financial markets have been correctly reacting to the global economic environment. Inflation has returned to pre-crisis levels in the U.S., while real growth has stabilized for the world economy overall – albeit at relatively low levels. This stabilization is remarkable because it comes on the back of two and a half years of a sharp and protracted deceleration in growth. Combined with sequentially rising inflation, this stabilization means nominal growth for the world as a whole is gradually increasing.
Now that inflation is becoming more apparent, we believe that re-pricing in the bond market has only just begun. Higher inflation also matters for equity returns. At a minimum, higher inflation implies higher interest rates, which influences the discount rate for future cash flows. In practical terms, we have already seen a sharp rotation toward “value” stocks, including cyclical sectors such as Industrials and Financials which had underperformed for several years before 2016, making them relatively “cheap” or “value-like”.
Valuation sensitivity has increased across geographies and sectors. Looking at the traditional discounted cash flow framework, the three main elements are suddenly working against investors with long-life assets: the terminal multiple is probably coming down; the cost of capital seems to be heading up; and free cash flows are under pressure from taxes and protectionism. In this environment, we have been adding to high-quality companies with a focus on lower valuations. Our preference remains for high-quality growth, but we believe the available opportunity set has expanded, and some of those companies are in cheaper areas of the market.
Despite near-term uncertainty surrounding how a Trump administration and Republican majority may actually govern, we expect a continuation of the recent reflationary market environment in 2017. From a global portfolio strategy perspective, we continue to expect higher nominal growth and have generally positioned toward companies with rising earnings prospects that we believe are not fairly reflected in valuations. In addition to the Industrials, Energy and Materials sectors, we continue to be constructive on Financials, supported by higher rates and steeper yield curves – which we believe are likely to persist.
Specific to Emerging Markets, several factors are supportive of our 2017 outlook. Valuations remain attractive, with Emerging Markets equities overall trading at a 25% discount to Developed Markets (based on forward P/E multiples), about one standard deviation below their long-term average. After stagnating over the last few years, Emerging Market corporate earnings are forecast to increase at a low double-digit pace this year. From an external balance perspective (the difference between exports of goods and services and imports of goods and services), Emerging Markets currencies have already depreciated and current account deficits have moderated.
Key risk factors for Emerging Markets that bear close monitoring are a strengthening U.S. dollar and acceleration in U.S. interest rate hikes, in addition to protectionist measures that impede global trade. China’s capital outflows and currency management policy, as well as the lingering effects of India’s demonetization on local economic activity, will also be important risk considerations for Emerging Markets investors in 2017.
| 36 | Annual Report | December 31, 2016 |
| | Global Leaders Fund |
| | |
| | The Global Leaders Fund seeks long-term capital appreciation. |
| | |
| | AN OVERVIEW FROM THE PORTFOLIO MANAGERS |
| | |

Andrew G. Flynn 
Kenneth J. McAtamney | The William Blair Global Leaders Fund (Class N shares) posted a 0.62% increase, net of fees, for the twelve months ended December 31, 2016. By comparison, the Fund’s benchmark index, the MSCI All Country World IMI Index (net) (the “Index”), increased 8.36%. Adverse style effects broadly detracted from the Fund’s calendar year 2016 performance versus the Index. The Fund’s overweight to higher growth, higher valuation companies with relatively strong earnings trends was detrimental amid an environment of low valuation market leadership. From a sector attribution perspective relative to the Index, stock selection in Materials, Real Estate, Healthcare and Industrials were significant detractors from the Fund’s relative performance for the year. These effects were mitigated by positive stock selection in Energy and the Fund’s underweight position to Consumer Staples. Within Materials, the Fund’s performance was hampered by a lack of exposure to Metals & Mining stocks, which rallied strongly on global growth recovery prospects and the market’s rotation into value orientated stocks. Chemicals holdings also detracted from the Fund’s relative performance in the Materials sector. Within the Real Estate sector, property developer China Overseas Land & Investment’s share price was hampered by concerns about policy tightening measures in Shanghai and other mainland cities. U.S.-based commercial real estate company Jones Lang LaSalle also detracted from relative performance, as weaker investment sales, elevated expenses and currency effects weighed on financial results. Within the Health Care sector, U.S. managed care provider Centene’s share price weakened amid policy uncertainty following the Republican party sweep in November. Partially offsetting these effects were positive contributions to the Fund’s performance from Oil & Gas holdings, including Canadian oil sands producer Suncor Energy, which reported solid financial results driven by higher production and operational improvements. U.S.-based shale driller EOG Resources also contributed to the Fund’s relative performance, bolstered by better than expected crude oil production results, as well as production growth guidance. From a geographic attribution perspective, the primary detractor from relative performance in 2016 was U.S. stock selection, as the Fund’s U.S. Financials, Information Technology and Real Estate holdings lagged. In contrast, stock selection in Japan was positive, supported by the outperformance of the Japanese Industrials, Information Technology and Financials sectors, relative to the Index. Please refer to the Global Markets Review and Outlook relating to the Fund on page 36. |
| December 31, 2016 | William Blair Funds | 37 |
Global Leaders Fund
Performance Highlights (Unaudited)
Average Annual Total Return at 12/31/2016
| | | | | | | | | | | | Since |
| | | 1 Year | | 3 Year | | 5 Year | | Inception |
| Class N(a) | | | 0.62 | % | | | 2.28 | % | | | 8.68 | % | | | 2.34 | % |
| Class I(a) | | | 0.98 | | | | 2.60 | | | | 8.99 | | | | 2.63 | |
| MSCI ACW IMI (net)(a) | | | 8.36 | | | | 3.25 | | | | 9.61 | | | | 2.47 | |
| Institutional Class(b) | | | 1.03 | | | | 2.70 | | | | — | | | | 6.90 | |
| MSCI ACW IMI (net)(b) | | | 8.36 | | | | 3.25 | | | | — | | | | 7.82 | |
| (a) | Since inception is for the period from October 15, 2007 (Commencement of Operations) to December 31, 2016. |
| (b) | Since inception is for the period from December 19, 2012 (Commencement of Operations) to December 31, 2016. |
Performance cited represents past performance. Past performance does not guarantee future results and current performance may be lower or higher than the data quoted. Results shown are average annual total returns, which assume reinvestment of dividends and capital gains. Investment returns and principal will fluctuate and you may have a gain or loss when you sell shares. For the most current month-end performance information, please call 1-800-742-7272, or visit our Web site at www.williamblairfunds.com. Investing in smaller and medium capitalization companies involves special risks, including higher volatility and lower liquidity. Smaller and medium capitalization stocks are also more sensitive to purchase/sale transactions and changes in the issuer’s financial condition. International investing involves special risk considerations, including currency fluctuations, lower liquidity, economic and political risk. From time to time, the investment adviser may waive fees or reimburse expenses for the Fund. Without these waivers/reimbursements, performance would be lower. Class N shares are available to the general public without a sales load. Class I shares are available to certain institutional investors and advisory clients of William Blair Investment Management, LLC and William Blair & Company, L.L.C., without a sales load or distribution fees (12b-1). Institutional Class shares are available to institutional investors without a sales load or distribution (12b-1) or service fees.
The performance highlights and graph presented above do not reflect the deduction of taxes that a shareholder would pay on fund distributions or the redemption of fund shares.
The Morgan Stanley Capital International (MSCI) All Country World (ACW) Investable Market Index (IMI) (net) is a free float-adjusted market capitalization weighted index that is designed to measure the equity market of developed and emerging markets. This series approximates the minimum possible dividend reinvestment.
This report identifies the Fund’s investments on December 31, 2016. These holdings are subject to change. Not all stocks in the Fund performed the same, nor is there any guarantee that these stocks will perform as well in the future. Market forecasts provided in this report may not necessarily come to pass.
Sector Diversification (Unaudited)
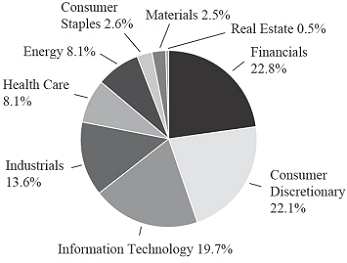
The sector diversification shown is based on the total long-term securities.
| 38 | Annual Report | December 31, 2016 |
Global Leaders Fund
Portfolio of Investments, December 31, 2016 (all dollar amounts in thousands)
| | | | | | | | |
| | | | | | | | |
| | Issuer | | Shares | | | Value | |
| | | | | | | | | | |
| | Common Stocks | | | | | | | | |
| | | | | | | | | | |
| | Western Hemisphere—59.0% | | | | | | | | |
| | Canada—5.0% | | | | | | | | |
| | Alimentation Couche Tard, Inc. Class “B” (Food & staples retailing) | | | 38,740 | | | $ | 1,757 | |
| | Brookfield Asset Management, Inc. Class “A” (Capital markets)† | | | 66,686 | | | | 2,201 | |
| | Intact Financial Corporation (Insurance) | | | 25,190 | | | | 1,803 | |
| | Suncor Energy, Inc. (Oil, gas & consumable fuels) | | | 96,264 | | | | 3,148 | |
| | | | | | | | | 8,909 | |
| | United States—54.0% | | | | | | | | |
| * | Adobe Systems, Inc. (Software) | | | 19,595 | | | | 2,017 | |
| * | Affiliated Managers Group, Inc. (Capital markets) | | | 11,638 | | | | 1,691 | |
| * | Akamai Technologies, Inc. (Internet software & services) | | | 43,237 | | | | 2,883 | |
| * | Align Technology, Inc. (Health care equipment & supplies) | | | 12,873 | | | | 1,238 | |
| * | Alphabet, Inc. Class “A” (Internet software & services) | | | 5,306 | | | | 4,205 | |
| * | Amazon.com, Inc. (Internet & direct marketing retail) | | | 6,008 | | | | 4,505 | |
| * | ANSYS, Inc. (Software) | | | 9,768 | | | | 904 | |
| | Apogee Enterprises, Inc. (Building products) | | | 33,124 | | | | 1,774 | |
| | BlackRock, Inc. (Capital markets) | | | 11,264 | | | | 4,286 | |
| * | Boston Scientific Corporation (Health care equipment & supplies) | | | 104,698 | | | | 2,265 | |
| | Brunswick Corporation (Leisure products) | | | 25,007 | | | | 1,364 | |
| | Costco Wholesale Corporation (Food & staples retailing) | | | 11,618 | | | | 1,860 | |
| | Danaher Corporation (Health care equipment & supplies) | | | 26,390 | | | | 2,054 | |
| * | Edwards Lifesciences Corporation (Health care equipment & supplies) | | | 23,526 | | | | 2,204 | |
| | EOG Resources, Inc. (Oil, gas & consumable fuels) | | | 18,357 | | | | 1,856 | |
| | Equifax, Inc. (Professional services) | | | 17,024 | | | | 2,013 | |
| * | Facebook, Inc. (Internet software & services) | | | 21,758 | | | | 2,503 | |
| | Fifth Third Bancorp (Banks) | | | 100,775 | | | | 2,718 | |
| | Hess Corporation (Oil, gas & consumable fuels) | | | 34,518 | | | | 2,150 | |
| | Honeywell International, Inc. (Industrial conglomerates) | | | 19,328 | | | | 2,239 | |
| | Intercontinental Exchange, Inc. (Capital markets) | | | 51,352 | | | | 2,897 | |
| | JPMorgan Chase & Co. (Banks) | | | 49,616 | | | | 4,281 | |
| | Mastercard, Inc. Class “A” (IT services) | | | 27,006 | | | | 2,788 | |
| | NIKE, Inc. Class “B” (Textiles, apparel & luxury goods) | | | 60,381 | | | | 3,069 | |
| | *O’Reilly Automotive, Inc. (Specialty retail) | | | 6,344 | | | | 1,766 | |
| | Pioneer Natural Resources Co. (Oil, gas & consumable fuels) | | | 7,456 | | | | 1,343 | |
| | PPG Industries, Inc. (Chemicals) | | | 18,685 | | | | 1,771 | |
| | Raytheon Co. (Aerospace & defense) | | | 24,924 | | | | 3,539 | |
| | | | | | | | |
| | | | | | | | |
| | Issuer | | Shares | | | Value | |
| | | | | | | | | | |
| | Common Stocks—(continued) | | | | | | | | |
| | | | | | | | | | |
| | Western Hemisphere—(continued) | | | | | | | | |
| | United States—(continued) | | | | | | | | |
| * | Red Hat, Inc. (Software) | | | 23,713 | | | $ | 1,653 | |
| * | salesforce.com, Inc. (Software) | | | 14,407 | | | | 986 | |
| | Schlumberger, Ltd. (Energy equipment & services)† | | | 33,036 | | | | 2,773 | |
| | Simon Property Group, Inc. (Equity real estate investment trusts (REITs)) | | | 4,811 | | | | 855 | |
| | The Goldman Sachs Group, Inc. (Capital markets) | | | 14,692 | | | | 3,518 | |
| | The Home Depot, Inc. (Specialty retail) | | | 28,274 | | | | 3,791 | |
| | Thermo Fisher Scientific, Inc. (Life sciences tools & services) | | | 17,748 | | | | 2,504 | |
| * | Ulta Salon Cosmetics & Fragrance, Inc. (Specialty retail) | | | 7,534 | | | | 1,921 | |
| | Vail Resorts, Inc. (Hotels, restaurants & leisure) | | | 14,610 | | | | 2,357 | |
| * | Vantiv, Inc. Class “A” (IT services) | | | 41,824 | | | | 2,494 | |
| * | VCA, Inc. (Health care providers & services) | | | 34,058 | | | | 2,338 | |
| | Watsco, Inc. (Trading companies & distributors) | | | 13,961 | | | | 2,068 | |
| | | | | | | | | 95,441 | |
| | | | | | | | | | |
| | Europe—13.3% | | | | | | | | |
| | France—4.3% | | | | | | | | |
| | BNP Paribas S.A. (Banks) | | | 53,369 | | | | 3,402 | |
| | Valeo S.A. (Auto components) | | | 71,351 | | | | 4,101 | |
| | | | | | | | | 7,503 | |
| | Germany—1.1% | | | | | | | | |
| | Siemens AG (Industrial conglomerates) | | | 14,980 | | | | 1,842 | |
| | Ireland—1.1% | | | | | | | | |
| | Paddy Power Betfair PLC (Hotels, restaurants & leisure) | | | 18,835 | | | | 2,012 | |
| | Netherlands—2.7% | | | | | | | | |
| | Koninklijke Philips N.V. (Industrial conglomerates) | | | 59,613 | | | | 1,820 | |
| | Royal Dutch Shell plc Class “A” (Oil, gas & consumable fuels) | | | 109,606 | | | | 2,998 | |
| | | | | | | | | 4,818 | |
| | Spain—1.0% | | | | | | | | |
| | Industria de Diseno Textil S.A. (Specialty retail) | | | 50,763 | | | | 1,733 | |
| | Sweden—1.9% | | | | | | | | |
| | Assa Abloy AB Class “B” (Building products) | | | 90,157 | | | | 1,673 | |
| | SKF AB Class “B” (Machinery) | | | 93,050 | | | | 1,712 | |
| | | | | | | | | 3,385 | |
| | Switzerland—1.2% | | | | | | | | |
| | Partners Group Holding AG (Capital markets) | | | 4,563 | | | | 2,139 | |
See accompanying Notes to Financial Statements.
| December 31, 2016 | William Blair Funds | 39 |
Global Leaders Fund
Portfolio of Investments, December 31, 2016 (all dollar amounts in thousands)
| | | | | | | | |
| | | | | | | | |
| | Issuer | | Shares | | | Value | |
| | | | | | | | | | |
| | Common Stocks—(continued) | | | | | | | | |
| | | | | | | | | | |
| | Japan—7.8% | | | | | | | | |
| | Daikin Industries, Ltd. (Building products) | | | 33,500 | | | $ | 3,077 | |
| | FANUC Corporation (Machinery) | | | 12,800 | | | | 2,170 | |
| | Fuji Heavy Industries, Ltd. (Automobiles) . | | | 79,300 | | | | 3,238 | |
| | Keyence Corporation (Electronic equipment, instruments & components) | | | 3,300 | | | | 2,264 | |
| | ORIX Corporation (Diversified financial services) | | | 198,300 | | | | 3,095 | |
| | | | | | | | | 13,844 | |
| | | | | | | | | | |
| | Emerging Asia—7.3% | | | | | | | | |
| | China—3.5% | | | | | | | | |
| * | Alibaba Group Holding, Ltd.—ADR (Internet software & services) | | | 27,970 | | | | 2,456 | |
| | Tencent Holdings, Ltd. (Internet software & services) | | | 85,000 | | | | 2,080 | |
| * | Yum China Holdings, Inc. (Hotels, restaurants & leisure) | | | 63,521 | | | | 1,659 | |
| | | | | | | | | 6,195 | |
| | India—1.5% | | | | | | | | |
| | HDFC Bank, Ltd.—ADR (Banks) | | | 43,512 | | | | 2,640 | |
| | Taiwan—2.3% | | | | | | | | |
| | Taiwan Semiconductor Manufacturing Co., Ltd.—ADR (Semiconductors & semiconductor equipment) | | | 142,725 | | | | 4,103 | |
| | | | | | | | | | |
| | Asia—6.6% | | | | | | | | |
| | Australia—2.4% | | | | | | | | |
| | CSL, Ltd. (Biotechnology) | | | 22,967 | | | | 1,664 | |
| | Macquarie Group, Ltd. (Capital markets) | | | 41,017 | | | | 2,579 | |
| | | | | | | | | 4,243 | |
| | Hong Kong—2.4% | | | | | | | | |
| | AIA Group, Ltd. (Insurance) | | | 441,600 | | | | 2,491 | |
| | Sands China, Ltd. (Hotels, restaurants & leisure) | | | 383,600 | | | | 1,667 | |
| | | | | | | | | 4,158 | |
| | Singapore—1.8% | | | | | | | | |
| | Broadcom, Ltd. (Semiconductors & semiconductor equipment)† | | | 18,038 | | | | 3,189 | |
| | | | | | | | | | |
| | United Kingdom—4.7% | | | | | | | | |
| | Compass Group plc (Hotels, restaurants & leisure) | | | 157,096 | | | | 2,906 | |
| | Rio Tinto plc (Metals & mining) | | | 68,576 | | | | 2,669 | |
| | WPP plc (Media) | | | 120,617 | | | | 2,700 | |
| | | | | | | | | 8,275 | |
| | | | Shares or | | | | |
| | | | Principal | | | | |
| | Issuer | | Amount | | | Value | |
| | | | | | | | | | |
| | Common Stocks—(continued) | | | | | | | | |
| | | | | | | | | | |
| | Emerging Europe, Mid-East, Africa—0.5% | | | | | | | | |
| | South Africa—0.5% | | | | | | | | |
| | Bid Corporation, Ltd. (Food & staples retailing) | | | 48,946 | | | $ | 873 | |
| | Total Common Stocks—99.2%
(cost $155,496) | | | | | | | 175,302 | |
| | | | | | | | | | |
| | Repurchase Agreement | | | | | | | | |
| | Fixed Income Clearing Corporation, 0.030% dated 12/30/16, due 1/3/17, repurchase price $1,481, collateralized by U.S. Treasury Bond, 3.000%, due 5/15/45 | | $ | 1,481 | | | | 1,481 | |
| | Total Repurchase Agreement—0.8%
(cost $1,481) | | | | | | | 1,481 | |
| | Total Investments—100.0%
(cost $156,977) | | | | | | | 176,783 | |
| | Liabilities, plus cash and other assets—0.0% | | | | | | | (52 | ) |
| | Net assets—100.0% | | | | | | $ | 176,731 | |
ADR = American Depository Receipt
† = U.S. listed foreign security
* = Non-income producing securities
For securities primarily traded on exchanges or markets that close before the close of regular trading on the New York Stock Exchange, the Fund may use an independent pricing service to fair value price the securities pursuant to Valuation Procedures approved by the Board of Trustees.
At December 31, 2016, the Fund’s Portfolio of Investments includes the following industry categories (as a percentage of long-term investments):
| Financials | | | 22.8 | % |
| Consumer Discretionary | | | 22.1 | % |
| Information Technology | | | 19.7 | % |
| Industrials | | | 13.6 | % |
| Energy | | | 8.1 | % |
| Health Care | | | 8.1 | % |
| Consumer Staples | | | 2.6 | % |
| Materials | | | 2.5 | % |
| Real Estate | | | 0.5 | % |
| Total | | | 100.0 | % |
At December 31, 2016, the Fund’s Portfolio of Investments includes the following currency categories (as a percentage of long-term investments):
| U.S. Dollar | | | 63.7 | % |
| Euro | | | 10.2 | % |
| Japanese Yen | | | 7.9 | % |
| British Pound Sterling | | | 4.7 | % |
| Canadian Dollar | | | 3.8 | % |
| Hong Kong Dollar | | | 3.6 | % |
| Australian Dollar | | | 2.4 | % |
| Swedish Krona | | | 2.0 | % |
| Swiss Franc | | | 1.2 | % |
| All Other Currencies | | | 0.5 | % |
| Total | | | 100.0 | % |
See accompanying Notes to Financial Statements.
| 40 | Annual Report | December 31, 2016 |
| | International Leaders Fund |
| | |
| | The International Leaders Fund seeks long-term capital appreciation. |
| | |

Simon Fennell 
Kenneth J. McAtamney | AN OVERVIEW FROM THE PORTFOLIO MANAGERS The William Blair International Leaders Fund (Class N shares) posted a 0.88% increase, net of fees, for the twelve months ended December 31, 2016. By comparison, the Fund’s benchmark index, the MSCI All Country World ex-U.S. IMI Index (net) (the “Index”), increased 4.41%. Adverse style effects broadly detracted from the Fund’s calendar year 2016 performance versus the Index. The Fund’s overweight to higher growth, higher valuation companies with relatively strong earnings trends was detrimental amid an environment of low valuation market leadership. From a sector attribution perspective, stock selection in Financials, Materials, Real Estate and Consumer Staples were significant detractors from the Fund’s performance relative to the Index for the year. These effects were mitigated by positive stock selection in Healthcare and Consumer Discretionary, the Fund’s underweight position in Consumer Staples and overweight in Information Technology. Financials stock selection detracted from the Fund’s relative performance partially due to holdings in Intesa Sanpaolo (Italy) and Sumitomo Mitsui Financial Group (Japan), which declined on concerns about profitability amid the low interest rate environment. Within the Materials sector, the Fund’s performance was hampered by a lack of exposure to Metals & Mining stocks, which rallied strongly on global growth recovery prospects and the market’s rotation into value orientated stocks. Automobile catalyst chemical maker Johnson Matthey (U.K.) also detracted from the Fund’s performance, as the shares were hit by general Brexit-related concerns and the impact of weaker platinum prices on its metals refining business. Within the Real Estate sector, property developer China Overseas Land & Investment’s share price was weighed down by concerns about policy tightening measures in Shanghai and other mainland cities. Finally, within Consumer Staples, Wal-Mart de Mexico’s shares came under pressure in the second half of 2016 amid decelerating top line growth and general concerns about the impact of Donald Trump’s policies on the Mexican economy. Mitigating these negative effects were positive stock selection effects in the Healthcare sector, as Swiss biotechnology company Actelion benefited from positive sales trends in its pulmonary arterial hypertension (PAH) drugs Uptravi and Opsumit, in addition to news that the company was in merger talks with French pharmaceutical company Sanofi after Johnson & Johnson dropped its own takeover offer for Actelion. Regarding stock selection within the Consumer Discretionary sector, Japanese home furnishings retailer Nitori’s share price was supported by positive sales trends on a combination of new store openings, same-store sales growth and online sales growth. From a geographic attribution perspective, stock selection was weakest in Canada and Latin America for the year, partially mitigated by good stock selection in Japan and Emerging Asia. Please refer to the Global Markets Review and Outlook relating to the Fund on page 36. |
| December 31, 2016 | William Blair Funds | 41 |
International Leaders Fund
Performance Highlights (Unaudited)
Average Annual Total Return at 12/31/2016
| | | | | | | | | Since |
| | | 1 Year | | 3 Year | | Inception |
| Class N(a) | | | 0.88 | % | | | 1.35 | % | | | 6.86 | % |
| Class I(a) | | | 1.10 | | | | 1.55 | | | | 7.10 | |
| MSCI ACW Ex-U.S. IMI (net)(a) | | | 4.41 | | | | (1.44 | ) | | | 4.37 | |
| Institutional Class(b) | | | 1.25 | | | | 1.68 | | | | 7.02 | |
| MSCI ACW Ex-U.S. IMI (net)(b) | | | 4.41 | | | | (1.44 | ) | | | 3.65 | |
| (a) | Since inception is for the period from August 16, 2012 (Commencement of Operations) to December 31, 2016. |
| (b) | Since inception is for the period from November 2, 2012 (Commencement of Operations) to December 31, 2016. |
Performance cited represents past performance. Past performance does not guarantee future results and current performance may be lower or higher than the data quoted. Results shown are average annual returns, which assume reinvestment of dividends and capital gains. Investment returns and principal will fluctuate and you may have a gain or loss when you sell shares. For the most current month-end performance information, please call 1-800-742-7272, or visit our Web site at www.williamblairfunds.com. Investing in smaller and medium capitalization companies involves special risks, including higher volatility and lower liquidity. Smaller and medium capitalization stocks are also more sensitive to purchase/sale transactions and changes in the issuer’s financial condition. International investing involves special risk considerations, including currency fluctuations, lower liquidity, economic and political risk. From time to time the investment adviser may waive fees or reimburse expenses for the Fund. Without these waivers/reimbursements, performance would be lower. Class N shares are available to the general public without a sales load. Class I shares are available to certain institutional investors and advisory clients of William Blair Investment Management, LLC and William Blair & Company, L.L.C., without a sales load or distribution (12b-1) fees. Institutional Class shares are available to institutional investors without a sales load or distribution (12b-1) or service fees.
The performance highlights presented above do not reflect the deduction of taxes that a shareholder would pay on fund distributions or the redemption of fund shares.
The Morgan Stanley Capital International (MSCI) All Country World (ACW) Ex-U.S. Investable Market Index (IMI) (net) is a free float-adjusted market capitalization weighted index that is designed to measure the equity market performance of developed and emerging markets, excluding the United States. This series approximates the minimum possible dividend reinvestment.
This report identifies the Fund’s investments on December 31, 2016. These holdings are subject to change. Not all stocks in the Fund performed the same, nor is there any guarantee that these stocks will perform as well in the future. Market forecasts provided in this report may not necessarily come to pass.
Sector Diversification (Unaudited)
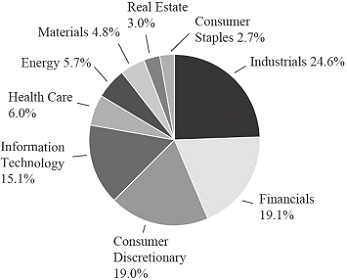
The sector diversification shown is based on the total long-term securities.
| 42 | Annual Report | December 31, 2016 |
International Leaders Fund
Portfolio of Investments, December 31, 2016 (all dollar amounts in thousands)
| | | | | | | | |
| | | | | | | | |
| | Issuer | | Shares | | | Value | |
| | | | | | | | | | |
| | Common Stocks | | | | | | | | |
| | | | | | | | | | |
| | Europe—34.5% | | | | | | | | |
| | Finland—2.7% | | | | | | | | |
| | Kone Oyj Class ‘‘B’’ (Machinery) | | | 67,249 | | | $ | 3,013 | |
| | Sampo Oyj Class ‘‘A’’ (Insurance) | | | 87,360 | | | | 3,917 | |
| | | | | | | | | 6,930 | |
| | France—8.0% | | | | | | | | |
| | Arkema S.A. (Chemicals) | | | 39,238 | | | | 3,839 | |
| | BNP Paribas S.A. (Banks) | | | 82,911 | | | | 5,284 | |
| | Total S.A. (Oil, gas & consumable fuels) | | | 83,586 | | | | 4,287 | |
| | Valeo S.A. (Auto components) | | | 101,187 | | | | 5,817 | |
| | Vinci S.A. (Construction & engineering) | | | 17,549 | | | | 1,195 | |
| | | | | | | | | 20,422 | |
| | Germany—2.7% | | | | | | | | |
| | Rational AG (Machinery) | | | 3,279 | | | | 1,463 | |
| | Siemens AG (Industrial conglomerates) | | | 44,056 | | | | 5,417 | |
| | | | | | | | | 6,880 | |
| | Ireland—4.2% | | | | | | | | |
| | Kingspan Group plc (Building products) | | | 137,053 | | | | 3,722 | |
| | Paddy Power Betfair PLC (Hotels, restaurants & leisure) | | | 24,134 | | | | 2,579 | |
| * | Ryanair Holdings plc—ADR (Airlines) | | | 53,902 | | | | 4,488 | |
| | | | | | | | | 10,789 | |
| | Italy—1.9% | | | | | | | | |
| | Luxottica Group SpA (Textiles, apparel & luxury goods) | | | 88,174 | | | | 4,743 | |
| | Netherlands—3.6% | | | | | | | | |
| | Koninklijke Philips N.V. (Industrial conglomerates) | | | 125,667 | | | | 3,836 | |
| | Royal Dutch Shell plc Class “A” (Oil, gas & consumable fuels) | | | 192,895 | | | | 5,276 | |
| | | | | | | | | 9,112 | |
| | Spain—2.9% | | | | | | | | |
| | Amadeus IT Group S.A. (IT services) | | | 69,111 | | | | 3,141 | |
| | Industria de Diseno Textil S.A. (Specialty retail) | | | 127,162 | | | | 4,341 | |
| | | | | | | | | 7,482 | |
| | Sweden—2.5% | | | | | | | | |
| | Atlas Copco AB Class “A” (Machinery) | | | 107,293 | | | | 3,268 | |
| | Hexagon AB Class “B” (Electronic equipment, instruments & components) | | | 84,916 | | | | 3,034 | |
| | | | | | | | | 6,302 | |
| | Switzerland—6.0% | | | | | | | | |
| * | Actelion, Ltd. (Biotechnology) | | | 25,040 | | | | 5,422 | |
| | Geberit AG (Building products) | | | 9,671 | | | | 3,877 | |
| * | Lonza Group AG (Life sciences tools & services) | | | 16,072 | | | | 2,782 | |
| | Partners Group Holding AG (Capital markets) | | | 7,041 | | | | 3,300 | |
| | | | | | | | | 15,381 | |
| | | | | | | | |
| | | | | | | | |
| | Issuer | | Shares | | | Value | |
| | | | | | | | | | |
| | Common Stocks—(continued) | | | | | | | | |
| | | | | | | | | | |
| | Japan—17.4% | | | | | | | | |
| | Daikin Industries, Ltd. (Building products) | | | 54,800 | | | $ | 5,033 | |
| | Daito Trust Construction Co., Ltd. (Real estate management & development) | | | 20,100 | | | | 3,023 | |
| | FANUC Corporation (Machinery) | | | 26,500 | | | | 4,493 | |
| | Fuji Heavy Industries, Ltd. (Automobiles) | | | 118,959 | | | | 4,857 | |
| | Hoya Corporation (Health care equipment & supplies) | | | 62,000 | | | | 2,605 | |
| | Keyence Corporation (Electronic equipment, instruments & components) | | | 6,500 | | | | 4,460 | |
| | Makita Corporation (Machinery) | | | 53,100 | | | | 3,557 | |
| | Mitsubishi UFJ Financial Group, Inc. (Banks) | | | 708,300 | | | | 4,365 | |
| | Nippon Prologis REIT, Inc. (Equity real estate investment trusts (REITs)) | | | 1,258 | | | | 2,572 | |
| | Nitori Holdings Co., Ltd. (Specialty retail) | | | 31,500 | | | | 3,601 | |
| | ORIX Corporation (Diversified financial services) | | | 297,200 | | | | 4,638 | |
| | Park24 Co., Ltd. (Commercial services & supplies) | | | 42,200 | | | | 1,145 | |
| | | | | | | | | 44,349 | |
| | | | | | | | | | |
| | United Kingdom—16.3% | | | | | | | | |
| | BAE Systems plc (Aerospace & defense) | | | 510,278 | | | | 3,720 | |
| | Compass Group plc (Hotels, restaurants & leisure) | | | 300,517 | | | | 5,559 | |
| | Experian plc (Professional services) | | | 250,034 | | | | 4,850 | |
| | IG Group Holdings plc (Capital markets) | | | 245,413 | | | | 1,494 | |
| | Johnson Matthey plc (Chemicals) | | | 95,333 | | | | 3,739 | |
| | Micro Focus International plc (Software) | | | 88,152 | | | | 2,367 | |
| | RELX plc (Professional services) | | | 222,367 | | | | 3,971 | |
| | Rio Tinto plc (Metals & mining) | | | 114,710 | | | | 4,465 | |
| | St James’s Place plc (Insurance) | | | 213,614 | | | | 2,669 | |
| | Wolseley plc (Trading companies & distributors) | | | 73,322 | | | | 4,484 | |
| | WPP plc (Media) | | | 194,718 | | | | 4,358 | |
| | | | | | | | | 41,676 | |
| | | | | | | | | | |
| | Emerging Asia—12.7% | | | | | | | | |
| | China—6.2% | | | | | | | | |
| * | Alibaba Group Holding, Ltd.—ADR (Internet software & services) | | | 56,361 | | | | 4,949 | |
| | China Overseas Land & Investment, Ltd. (Real estate management & development) | | | 678,000 | | | | 1,797 | |
| | NetEase, Inc.—ADR (Internet software & services) | | | 16,948 | | | | 3,650 | |
| | Tencent Holdings, Ltd. (Internet software & services) | | | 128,500 | | | | 3,143 | |
| * | Yum China Holdings, Inc. (Hotels, restaurants & leisure) | | | 90,811 | | | | 2,372 | |
| | | | | | | | | 15,911 | |
See accompanying Notes to Financial Statements.
| December 31, 2016 | William Blair Funds | 43 |
International Leaders Fund
Portfolio of Investments, December 31, 2016 (all dollar amounts in thousands)
| | | | | | | | |
| | | | | | | | |
| | Issuer | | Shares | | | Value | |
| | | | | | | | | | |
| | Common Stocks—(continued) | | | | | | | | |
| | | | | | | | | | |
| | Emerging Asia—(continued) | | | | | | | | |
| | India—4.0% | | | | | | | | |
| | Hero MotoCorp, Ltd. (Automobiles) | | | 84,954 | | | $ | 3,795 | |
| | Housing Development Finance Corporation, Ltd. (Thrifts & mortgage finance) | | | 157,854 | | | | 2,934 | |
| | Tata Motors, Ltd.—ADR (Automobiles) | | | 104,007 | | | | 3,577 | |
| | | | | | | | | 10,306 | |
| | Taiwan—2.5% | | | | | | | | |
| | Taiwan Semiconductor Manufacturing Co., Ltd. (Semiconductors & semiconductor equipment) | | | 1,106,000 | | | | 6,229 | |
| | | | | | | | | | |
| | Western Hemisphere—10.4% | | | | | | | | |
| | Canada—8.8% | | | | | | | | |
| | Alimentation Couche Tard, Inc. Class “B” (Food & staples retailing) | | | 77,761 | | | | 3,526 | |
| | Brookfield Asset Management, Inc. Class “A” (Capital markets)† | | | 161,684 | | | | 5,337 | |
| | Constellation Software, Inc. (Software) | | | 9,062 | | | | 4,118 | |
| | Suncor Energy, Inc. (Oil, gas & consumable fuels) | | | 139,556 | | | | 4,563 | |
| | The Toronto-Dominion Bank (Banks) | | | 98,054 | | | | 4,836 | |
| | | | | | | | | 22,380 | |
| | United States—1.6% | | | | | | | | |
| | Shire plc (Biotechnology) | | | 71,935 | | | | 4,153 | |
| | | | | | | | | | |
| | Asia—4.3% | | | | | | | | |
| | Australia—1.7% | | | | | | | | |
| | Macquarie Group, Ltd. (Capital markets) | | | 67,965 | | | | 4,273 | |
| | Hong Kong—2.6% | | | | | | | | |
| | AIA Group, Ltd. (Insurance) | | | 848,600 | | | | 4,788 | |
| | Sands China, Ltd. (Hotels, restaurants & leisure) | | | 440,800 | | | | 1,915 | |
| | | | | | | | | 6,703 | |
| | | | | | | | | | |
| | Emerging Latin America—1.4% | | | | | | | | |
| | Brazil—1.0% | | | | | | | | |
| | Cielo S.A. (IT services) | | | 293,100 | | | | 2,512 | |
| | Mexico—0.4% | | | | | | | | |
| | Wal-Mart de Mexico S.A.B. de C.V. (Food & staples retailing) | | | 579,900 | | | | 1,038 | |
| | | | | | | | | | |
| | Emerging Europe, Mid-East, Africa—0.9% | | | | | | | | |
| | South Africa—0.9% | | | | | | | | |
| | Bid Corporation, Ltd. (Food & staples retailing) | | | 124,599 | | | | 2,224 | |
| | Total Common Stocks—97.9%
(cost $236,896) | | | | | | | 249,795 | |
| | | | | | | | |
| | | | Principal | | | | |
| | Issuer | | Amount | | | Value | |
| | |
| | Repurchase Agreement | | | | | | | | |
| | Fixed Income Clearing Corporation, 0.030% dated 12/30/16, due 1/3/17, repurchase price $2,645, collateralized by U.S. Treasury Bond, 3.375%, due 5/15/44 | | $ | 2,644 | | | $ | 2,644 | |
| | Total Repurchase Agreement—1.0%
(cost $2,644) | | | | | | | 2,644 | |
| | Total Investments—98.9%
(cost $239,540) | | | | | | | 252,439 | |
| | Cash and other assets, less liabilities—1.1% | | | | | | | 2,783 | |
| | Net assets—100.0% | | | | | | $ | 255,222 | |
ADR = American Depository Receipt
* = Non-income producing securities
† = U.S. listed foreign security
For securities primarily traded on exchanges or markets that close before the close of regular trading on the New York Stock Exchange, the Fund may use an independent pricing service to fair value price the securities pursuant to Valuation Procedures approved by the Board of Trustees.
At December 31, 2016, the Fund’s Portfolio of Investments includes the following industry categories (as a percentage of long-term investments):
| Industrials | | | 24.6 | % |
| Financials | | | 19.1 | % |
| Consumer Discretionary | | | 19.0 | % |
| Information Technology | | | 15.1 | % |
| Health Care | | | 6.0 | % |
| Energy | | | 5.7 | % |
| Materials | | | 4.8 | % |
| Real Estate | | | 3.0 | % |
| Consumer Staples | | | 2.7 | % |
| Total | | | 100.0 | % |
At December 31, 2016, the Fund’s Portfolio of Investments includes the following currency categories (as a percentage of long-term investments):
| Euro | | | 24.8 | % |
| British Pound Sterling | | | 18.3 | % |
| Japanese Yen | | | 17.7 | % |
| U.S. Dollar | | | 9.8 | % |
| Canadian Dollar | | | 6.8 | % |
| Swiss Franc | | | 6.2 | % |
| Hong Kong Dollar | | | 4.7 | % |
| Indian Rupee | | | 2.7 | % |
| Swedish Krona | | | 2.5 | % |
| New Taiwan Dollar | | | 2.5 | % |
| Australian Dollar | | | 1.7 | % |
| Brazilian Real | | | 1.0 | % |
| All Other Currencies | | | 1.3 | % |
| Total | | | 100.0 | % |
See accompanying Notes to Financial Statements.
| 44 | Annual Report | December 31, 2016 |
| | International Equity Fund |
| | |
| | The International Equity Fund seeks long-term capital appreciation. |
| | |
| | AN OVERVIEW FROM THE PORTFOLIO MANAGERS |
| | |

David Merjan 
John C. Murphy | The William Blair International Equity Fund (Class N shares) posted a 0.27% decrease, net of fees, for the twelve months ended December 31, 2016. By comparison, the Fund’s benchmark index, the MSCI World ex-U.S. Index (net) (the “Index”), increased 2.75%. Adverse style effects broadly detracted from the Fund’s calendar year 2016 performance versus the Index. The Fund’s overweight to higher growth, higher valuation companies with relatively strong earnings trends was detrimental amid an environment of low valuation market leadership. From a sector attribution perspective, stock selection in Industrials, Financials and Consumer Staples were significant detractors from the Fund’s performance relative to the Index for the year. These effects were mitigated by positive stock selection in Energy and Real Estate, along with the Fund’s overweight position and stock selection in Information Technology. Within the Industrials sector, U.K. holdings were the primary detractor from the Fund’s relative performance during the year. British home improvement retailer Travis Perkins’s share price was hurt by Brexit concerns mid-year, followed by sluggish sales in the company’s plumbing and heating division during the third quarter. Within Financials, Japanese Commercial Bank Mitsubishi UFJ Financial Group detracted from the Fund’s performance during the first half of the year, amid concerns about the impact of the Bank of Japan’s (BOJ’s) negative interest rate policy on earnings. Stock selection within Consumer Staples, specifically the Fund’s position in Belgium-based brewing giant Anheuser-Busch Inbev which reported disappointing third quarter earnings results mainly due to its Brazil business, detracted from performance. Within Brazil, Anheuser-Busch Inbev attributed its difficulties to several factors including the continued challenging consumer environment, negative currency hedging impact, delayed price increases and higher marketing expenses. Offsetting these detractors were positive contributions to the Fund’s relative performance from North American Oil & Gas producers Enerplus and Canadian Natural Resources, which were supported by rising commodity prices and improving production growth outlooks. Specific to Enerplus, the prospect of a potential sale of the company’s Marcellus shale assets was viewed favorably, with expectations that the sale proceeds would be used for debt reduction or an earnings-accretive acquisition. Among the Fund’s Real Estate holdings, Japan-based REIT Nippon Prologis’s share price was bolstered by the BOJ’s negative interest rate policy, which was expected to support margins by ensuring a favorable spread between financing costs and rental yields. The company also reported better-than-expected financial results for the first half of 2016, benefiting from high occupancy levels and positive rental growth for its logistics facilities. From a geographic attribution perspective, the primary detractors from the Fund’s relative performance in 2016 were stock selection within Japan and an overweighting in the U.K. These effects were partially mitigated by positive stock selection in Canada, along with the Fund’s Emerging Markets exposure. Please refer to the Global Markets Review and Outlook relating to the Fund on page 36. |
| December 31, 2016 | William Blair Funds | 45 |
International Equity Fund
Performance Highlights (Unaudited)
| Average Annual Total Return at 12/31/2016 |
| | | | 1 Year | | | 3 Year | | | 5 Year | | | 10 Year | |
| Class N | | | (0.27 | )% | | | (0.62 | )% | | | 6.63 | % | | | 0.64 | % | |
| Class I | | | (0.02 | ) | | | (0.36 | ) | | | 6.91 | | | | 0.89 | | |
| MSCI World Ex-U.S. Index (net) | | | 2.75 | | | | (1.59 | ) | | | 6.07 | | | | 0.86 | | |
Performance cited represents past performance. Past performance does not guarantee future results and current performance may be lower or higher than the data quoted. Results shown are average annual returns, which assume reinvestment of dividends and capital gains. Investment returns and principal will fluctuate and you may have a gain or loss when you sell shares. For the most current month-end performance information, please call 1-800-742-7272, or visit our Web site at www.williamblairfunds.com. Investing in smaller and medium capitalization companies involves special risks, including higher volatility and lower liquidity. Smaller and medium capitalization stocks are also more sensitive to purchase/sale transactions and changes in the issuer’s financial condition. International investing involves special risk considerations, including currency fluctuations, lower liquidity, economic and political risk. From time to time the investment adviser may waive fees or reimburse expenses for the Fund. Without these waivers/reimbursements, performance would be lower. Class N shares are available to the general public without a sales load. Class I shares are available to certain institutional investors and advisory clients of William Blair Investment Management, LLC and William Blair & Company, L.L.C., without a sales load or distribution (12b-1) or service fees.
The performance highlights and graph presented above do not reflect the deduction of taxes that a shareholder would pay on fund distributions or the redemption of fund shares.
The Morgan Stanley Capital International (MSCI) World Ex-U.S. Index (net) is a free float-adjusted market capitalization weighted index that is designed to measure the equity market performance of developed markets, excluding the United States. This series approximates the minimum possible dividend reinvestment.
This report identifies the Fund’s investments on December 31, 2016. These holdings are subject to change. Not all stocks in the Fund performed the same, nor is there any guarantee that these stocks will perform as well in the future. Market forecasts provided in this report may not necessarily come to pass.
Sector Diversification (Unaudited)
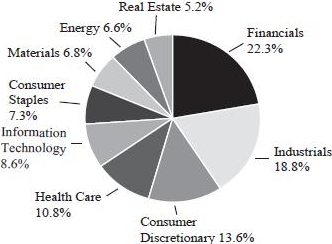
The sector diversification shown is based on the total long-term securities.
| 46 | Annual Report | December 31, 2016 |
International Equity Fund
Portfolio of Investments, December 31, 2016 (all dollar amounts in thousands)
| | | | | | | | |
| | | | | | | | |
| | Issuer | | Shares | | | Value | |
| | |
| | Common Stocks | | | | | | |
| | |
| | Europe—34.0% | | | | | | | | |
| | Belgium—2.8% | | | | | | | | |
| | Anheuser-Busch InBev N.V. (Beverages) | | | 10,272 | | | $ | 1,087 | |
| | UCB S.A. (Pharmaceuticals) | | | 20,601 | | | | 1,321 | |
| | | | | | | | | 2,408 | |
| | Finland—1.1% | | | | | | | | |
| | Kone Oyj Class “B” (Machinery) | | | 20,706 | | | | 928 | |
| | France—8.6% | | | | | | | | |
| | AXA S.A. (Insurance) | | | 54,376 | | | | 1,373 | |
| | BNP Paribas S.A. (Banks) | | | 20,351 | | | | 1,297 | |
| | Thales S.A. (Aerospace & defense) | | | 16,088 | | | | 1,560 | |
| | Total S.A. (Oil, gas & consumable fuels) | | | 31,221 | | | | 1,601 | |
| | Valeo S.A. (Auto components) | | | 28,877 | | | | 1,660 | |
| | | | | | | | | 7,491 | |
| | Germany—7.7% | | | | | | | | |
| | Fresenius Medical Care AG & Co. KGaA (Health care providers & services) | | | 18,342 | | | | 1,553 | |
| | Fresenius SE & Co. KGaA (Health care providers & services) | | | 19,476 | | | | 1,523 | |
| | Infineon Technologies AG (Semiconductors & semiconductor equipment) | | | 49,655 | | | | 863 | |
| | MTU Aero Engines AG (Aerospace & defense) | | | 12,496 | | | | 1,444 | |
| | Siemens AG (Industrial conglomerates) | | | 10,818 | | | | 1,330 | |
| | | | | | | | | 6,713 | |
| | Ireland—2.3% | | | | | | | | |
| | Accenture plc Class “A” (IT services)† | | | 7,105 | | | | 832 | |
| * | Ryanair Holdings plc-ADR (Airlines) | | | 13,990 | | | | 1,165 | |
| | | | | | | | | 1,997 | |
| | Italy—2.7% | | | | | | | | |
| | Intesa Sanpaolo SpA (Banks) | | | 359,754 | | | | 919 | |
| | Luxottica Group SpA (Textiles, apparel & luxury goods) | | | 27,029 | | | | 1,454 | |
| | | | | | | | | 2,373 | |
| | Netherlands—1.9% | | | | | | | | |
| * | NXP Semiconductors N.V. (Semiconductors & semiconductor equipment)† | | | 3,800 | | | | 372 | |
| | Royal Dutch Shell plc Class “A” (Oil, gas & consumable fuels) | | | 48,324 | | | | 1,322 | |
| | | | | | | | | 1,694 | |
| | Sweden—5.0% | | | | | | | | |
| | Assa Abloy AB Class “B” (Building products) | | | 50,837 | | | | 944 | |
| | Atlas Copco AB Class “A” (Machinery) | | | 31,224 | | | | 951 | |
| | Boliden AB (Metals & mining) | | | 31,215 | | | | 815 | |
| | Swedbank AB Class “A” (Banks) | | | 68,871 | | | | 1,665 | |
| | | | | | | | | 4,375 | |
| | Switzerland—1.9% | | | | | | | | |
| | Novartis AG (Pharmaceuticals) | | | 12,006 | | | | 874 | |
| | Straumann Holding AG (Health care equipment & supplies) | | | 2,067 | | | | 807 | |
| | | | | | | | | 1,681 | |
| | | | | | | | |
| | | | | | | | |
| | Issuer | | Shares | | | Value | |
| | |
| | Common Stocks—(continued) |
| | |
| | United Kingdom—24.8% | | | | | | | | |
| | Babcock International Group plc (Commercial services & supplies) | | | 71,054 | | | $ | 835 | |
| | BAE Systems plc (Aerospace & defense) | | | 159,855 | | | | 1,165 | |
| | Compass Group plc (Hotels, restaurants & leisure) | | | 109,945 | | | | 2,034 | |
| | Diageo plc (Beverages) | | | 57,893 | | | | 1,505 | |
| | Experian plc (Professional services) | | | 72,836 | | | | 1,413 | |
| | GlaxoSmithKline plc (Pharmaceuticals) | | | 107,983 | | | | 2,079 | |
| | ITV plc (Media) | | | 493,796 | | | | 1,256 | |
| | Johnson Matthey plc (Chemicals) | | | 24,119 | | | | 946 | |
| | Prudential plc (Insurance) | | | 80,228 | | | | 1,609 | |
| | Reckitt Benckiser Group plc (Household products) | | | 17,235 | | | | 1,463 | |
| | RELX plc (Professional services) | | | 89,875 | | | | 1,605 | |
| | Rio Tinto plc (Metals & mining) | | | 29,518 | | | | 1,149 | |
| | Schroders plc (Capital markets) | | | 30,110 | | | | 1,112 | |
| | UBM plc (Media) | | | 68,018 | | | | 613 | |
| | Unilever N.V. (Personal products) | | | 38,003 | | | | 1,565 | |
| | WPP plc (Media) | | | 57,964 | | | | 1,297 | |
| | | | | | | | | 21,646 | |
| | |
| | Japan—18.7% | | | | | | | | |
| | Daikin Industries, Ltd. (Building products) | | | 15,818 | | | | 1,453 | |
| | Daito Trust Construction Co., Ltd. (Real estate management & development) | | | 5,900 | | | | 887 | |
| | Denso Corporation (Auto components) | | | 23,100 | | | | 1,001 | |
| | Fuji Heavy Industries, Ltd. (Automobiles) | | | 41,672 | | | | 1,701 | |
| | GLP J-Reit (Equity real estate investment trusts (REITs)) | | | 1,047 | | | | 1,206 | |
| | Hoya Corporation (Health care equipment & supplies) | | | 26,700 | | | | 1,122 | |
| | Japan Exchange Group, Inc. (Capital markets) | | | 72,600 | | | | 1,037 | |
| | Keyence Corporation (Electronic equipment, instruments & components) | | | 1,905 | | | | 1,307 | |
| | Mitsui Fudosan Co., Ltd. (Real estate management & development) | | | 41,000 | | | | 949 | |
| | Nihon M&A Center, Inc. (Capital markets) | | | 15,840 | | | | 441 | |
| | Nippon Prologis REIT, Inc. (Equity real estate investment trusts (REITs)) | | | 386 | | | | 789 | |
| | Nitori Holdings Co., Ltd. (Specialty retail) | | | 6,000 | | | | 686 | |
| | ORIX Corporation (Diversified financial services) | | | 105,929 | | | | 1,653 | |
| | SCSK Corporation (IT services) | | | 28,563 | | | | 1,000 | |
| | Suruga Bank, Ltd. (Banks) | | | 51,200 | | | | 1,143 | |
| | | | | | | | | 16,375 | |
| | |
| | Canada—9.4% | | | | | | | | |
| | Canadian Apartment Properties REIT (Equity real estate investment trusts (REITs)) | | | 27,464 | | | | 642 | |
| | Canadian National Railway Co. (Road & rail)† | | | 20,044 | | | | 1,351 | |
| | Canadian Natural Resources, Ltd. (Oil, gas & consumable fuels) | | | 45,437 | | | | 1,448 | |
See accompanying Notes to Financial Statements.
| December 31, 2016 | William Blair Funds | 47 |
International Equity Fund
Portfolio of Investments, December 31, 2016 (all dollar amounts in thousands)
| | | | | | | | |
| | | | | | | | |
| | Issuer | | Shares | | | Value | |
| | |
| | Common Stocks—(continued) | | | | | | |
| | |
| | Canada—(continued) | | | | | | | | |
| | Enerplus Corporation (Oil, gas & consumable fuels) | | | 99,794 | | | $ | 947 | |
| * | Lundin Mining Corporation (Metals & mining) | | | 217,057 | | | | 1,034 | |
| | Peyto Exploration & Development Corporation (Oil, gas & consumable fuels) | | | 14,107 | | | | 349 | |
| | Silver Wheaton Corporation (Metals & mining)† | | | 30,339 | | | | 586 | |
| | The Toronto-Dominion Bank (Banks)† | | | 36,941 | | | | 1,823 | |
| | | | | | | | | 8,180 | |
| | |
| | Emerging Asia—5.3% | | | | | | | | |
| | India—1.2% | | | | | | | | |
| | HDFC Bank, Ltd.—ADR (Banks) | | | 16,999 | | | | 1,031 | |
| | Taiwan—3.4% | | | | | | | | |
| | Largan Precision Co., Ltd. (Electronic equipment, instruments & components) | | | 7,000 | | | | 823 | |
| | Novatek Microelectronics Corporation (Semiconductors & semiconductor equipment) | | | 172,000 | | | | 569 | |
| | Taiwan Semiconductor Manufacturing Co., Ltd.—ADR (Semiconductors & semiconductor equipment) | | | 56,458 | | | | 1,623 | |
| | | | | | | | | 3,015 | |
| | Thailand—0.7% | | | | | | | | |
| | CP ALL PCL (Food & staples retailing) | | | 350,200 | | | | 611 | |
| | |
| | Asia—4.3% | | | | | | | | |
| | Australia—2.7% | | | | | | | | |
| | BHP Billiton, Ltd.—ADR (Metals & mining) | | | 36,530 | | | | 1,307 | |
| | Macquarie Group, Ltd. (Capital markets) | | | 16,086 | | | | 1,011 | |
| | | | | | | | | 2,318 | |
| | Hong Kong—1.6% | | | | | | | | |
| | AIA Group, Ltd. (Insurance) | | | 250,586 | | | | 1,414 | |
| | |
| | Emerging Latin America—1.8% | | | | | | | | |
| | Mexico—1.1% | | | | | | | | |
| | Grupo Financiero Santander Mexico S.A.B. de C.V. Class “B” (Banks) | | | 696,100 | | | | 1,001 | |
| | Peru—0.7% | | | | | | | | |
| | Credicorp, Ltd. (Banks)† | | | 3,886 | | | | 613 | |
| | Total Common Stocks—98.3%
(cost $78,887) | | | | | | | 85,864 | |
| | | | | | | | |
| | | | Principal | | | | |
| | Issuer | | Amount | | | Value | |
| | |
| | Repurchase Agreement | | | | | | | | |
| | Fixed Income Clearing Corporation, 0.030% dated 12/30/16, due 1/3/17, repurchase price $1,380, collateralized by U.S. Treasury Bond, 3.375%, due 5/15/44 | | $ | 1,380 | | | $ | 1,380 | |
| | Total Repurchase Agreement—1.6%
(cost $1,380) | | | | | | | 1,380 | |
| | Total Investments—99.9%
(cost $80,267) | | | | | | | 87,244 | |
| | Cash and other assets, less liabilities—0.1% | | | | | | | 93 | |
| | Net assets—100.0% | | | | | | $ | 87,337 | |
ADR = American Depository Receipt
† = U.S. listed foreign security
* = Non-income producing securities
For securities primarily traded on exchanges or markets that close before the close of regular trading on the New York Stock Exchange, the Fund may use an independent pricing service to fair value price the securities pursuant to Valuation Procedures approved by the Board of Trustees.
At December 31, 2016, the Fund’s Portfolio of Investments includes the following industry categories (as a percentage of long-term investments):
| Financials | | | 22.3 | % |
| Industrials | | | 18.8 | % |
| Consumer Discretionary | | | 13.6 | % |
| Health Care | | | 10.8 | % |
| Information Technology | | | 8.6 | % |
| Consumer Staples | | | 7.3 | % |
| Materials | | | 6.8 | % |
| Energy | | | 6.6 | % |
| Real Estate | | | 5.2 | % |
| Total | | | 100.0 | % |
At December 31, 2016, the Fund’s Portfolio of Investments includes the following currency categories (as a percentage of long-term investments):
| Euro | | | 26.5 | % |
| British Pound Sterling | | | 23.4 | % |
| Japanese Yen | | | 19.1 | % |
| U.S. Dollar | | | 12.5 | % |
| Canadian Dollar | | | 5.1 | % |
| Swedish Krona | | | 5.1 | % |
| Swiss Franc | | | 2.0 | % |
| Hong Kong Dollar | | | 1.6 | % |
| New Taiwan Dollar | | | 1.6 | % |
| Australian Dollar | | | 1.2 | % |
| Mexican Peso | | | 1.2 | % |
| All Other Currencies | | | 0.7 | % |
| Total | | | 100.0 | % |
See accompanying Notes to Financial Statements.
| 48 | Annual Report | December 31, 2016 |
| | Institutional International Equity Fund |
| | |
| | The Institutional International Equity Fund seeks long-term capital appreciation. |
| | |
| | AN OVERVIEW FROM THE PORTFOLIO MANAGERS |
| | |

David Merjan 
John C. Murphy | The William Blair Institutional International Equity Fund posted a 0.27% decrease, net of fees, for the twelve months ended December 31, 2016. By comparison, the Fund’s benchmark index, the MSCI World ex-U.S. Index (net) (the “Index”), increased 2.75%. Adverse style effects broadly detracted from the Fund’s calendar year 2016 performance versus the Index. The Fund’s overweight to higher growth, higher valuation companies with relatively strong earnings trends was detrimental amid an environment of low valuation market leadership. From a sector attribution perspective, stock selection in Industrials, Financials and Consumer Staples were significant detractors from the Fund’s performance relative to the Index for the year. These effects were mitigated by positive stock selection in Energy and Real Estate, along with the Fund’s overweight position and stock selection in Information Technology. Within the Industrials sector, U.K. holdings were the primary detractor from the Fund’s relative performance during the year. British home improvement retailer Travis Perkins’s share price was hurt by Brexit concerns mid-year, followed by a soft sales forecast for the third quarter due to sluggish sales in the company’s plumbing and heating division. Within Financials, Japanese Commercial Bank Mitsubishi UFJ Financial Group detracted from the Fund’s performance during the first half of the year, amid concerns about the impact of the Bank of Japan’s (BOJ’s) negative interest rate policy on earnings. Stock selection within Consumer Staples, specifically the Fund’s position in Belgium-based brewing giant Anheuser-Busch Inbev which reported disappointing third quarter earnings results mainly due to its Brazil business, detracted from performance. Within Brazil, Anheuser-Busch Inbev attributed its difficulties to several factors including the continued challenging consumer environment, negative currency hedging impact, delayed price increases and higher marketing expenses. Offsetting these detractors were positive contributions to the Fund’s relative performance from North American Oil & Gas producers Enerplus and Canadian Natural Resources, which were supported by rising commodity prices and improving production growth outlooks. Specific to Enerplus, the prospect of a potential sale of the company’s Marcellus shale assets was viewed favorably, with expectations that the sale proceeds would be used for debt reduction or an earnings-accretive acquisition. Among the Fund’s Real Estate holdings, Japan-based REIT Nippon Prologis’s share price was bolstered by the BOJ’s negative interest rate policy, which was expected to support margins by ensuring a favorable spread between financing costs and rental yields. The company also reported better-than-expected financial results for the First half of 2016, benefiting from high occupancy levels and positive rental growth for its logistics facilities. From a geographic attribution perspective, the primary detractors from the Fund’s relative performance in 2016 were stock selection within Japan and an overweighting in the U.K. These effects were partially mitigated by positive stock selection in Canada, along with the Fund’s Emerging Markets exposure. Please refer to the Global Markets Review and Outlook relating to the Fund on page 36. |
| December 31, 2016 | William Blair Funds | 49 |
Institutional International Equity Fund
Performance Highlights (Unaudited)
| Average Annual Total Return at 12/31/2016 | | | | | | | |
| | | | 1 Year | | | 3 Year | | | 5 Year | | | 10 Year | |
| Institutional Class | | | (0.27 | )% | | | (0.64 | )% | | | 6.80 | % | | | 0.77 | % | |
| MSCI World Ex-U.S. Index (net) | | | 2.75 | | | | (1.59 | ) | | | 6.07 | | | | 0.86 | | |
Performance cited represents past performance. Past performance does not guarantee future results and current performance may be lower or higher than the data quoted. Results shown are average annual returns, which assume reinvestment of dividends and capital gains. Investment returns and principal will fluctuate and you may have a gain or loss when you sell shares. For the most current month end performance information, please call 1-800-742-7272, or visit our Web site at www.williamblairfunds.com. Investing in smaller and medium capitalization companies involves special risks, including higher volatility and lower liquidity. Smaller and medium capitalization stocks are also more sensitive to purchase/sale transactions and changes in the issuer’s financial condition. International investing involves special risk considerations, including currency fluctuations, lower liquidity, economic and political risk. From time to time, the investment adviser may waive fees or reimburse expenses for the Fund. Without these waivers/reimbursements, performance would be lower. Shares of the Fund are available without a sales load or distribution (12b-1) or service fees.
The performance highlights and graph presented above do not reflect the deduction of taxes that a shareholder would pay on fund distributions or the redemption of fund shares.
The Morgan Stanley Capital International (MSCI) World Ex-U.S. Index (net) is a free float-adjusted market capitalization weighted index that is designed to measure the equity market performance of developed markets, excluding the United States. This series approximates the minimum possible dividend reinvestment.
This report identifies the Fund’s investments on December 31, 2016. These holdings are subject to change. Not all stocks in the Fund performed the same, nor is there any guarantee that these stocks will perform as well in the future. Market forecasts provided in this report may not necessarily come to pass.
Sector Diversification (Unaudited)
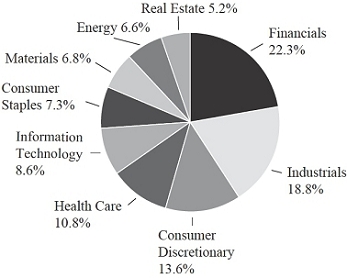
The sector diversification shown is based on the total long-term securities.
| 50 | Annual Report | December 31, 2016 |
Institutional International Equity Fund
Portfolio of Investments, December 31, 2016 (all dollar amounts in thousands)
| | | | | | | | |
| | | | | | | | |
| | Issuer | | Shares | | | Value | |
| | |
| | Common Stocks | | | | | | |
| | |
| | Europe—34.2% | | | | | | | | |
| | Belgium—2.8% | | | | | | | | |
| | Anheuser-Busch InBev S.A. (Beverages) | | | 1,956 | | | $ | 207 | |
| | UCB S.A. (Pharmaceuticals) | | | 3,928 | | | | 252 | |
| | | | | | | | | 459 | |
| | Finland—1.1% | | | | | | | | |
| | Kone Oyj Class ‘‘B’’ (Machinery) | | | 3,950 | | | | 177 | |
| | France—8.6% | | | | | | | | |
| | AXA S.A. (Insurance) | | | 10,373 | | | | 262 | |
| | BNP Paribas S.A. (Banks) | | | 3,883 | | | | 247 | |
| | Thales S.A. (Aerospace & defense) | | | 3,069 | | | | 298 | |
| | Total S.A. (Oil, gas & consumable fuels) | | | 5,956 | | | | 305 | |
| | Valeo S.A. (Auto components) | | | 5,509 | | | | 317 | |
| | | | | | | | | 1,429 | |
| | Germany—7.7% | | | | | | | | |
| | Fresenius Medical Care AG & Co. KGaA (Health care providers & services) | | | 3,495 | | | | 296 | |
| | Fresenius SE & Co. KGaA (Health care providers & services) | | | 3,711 | | | | 290 | |
| | Infineon Technologies AG (Semiconductors & semiconductor equipment) | | | 9,473 | | | | 164 | |
| | MTU Aero Engines AG (Aerospace & defense) | | | 2,377 | | | | 275 | |
| | Siemens AG (Industrial conglomerates) | | | 2,064 | | | | 254 | |
| | | | | | | | | 1,279 | |
| | Ireland—2.3% | | | | | | | | |
| | Accenture plc Class “A” (IT services)† | | | 1,352 | | | | 159 | |
| | *Ryanair Holdings plc—ADR (Airlines) | | | 2,669 | | | | 222 | |
| | | | | | | | | 381 | |
| | Italy—2.7% | | | | | | | | |
| | Intesa Sanpaolo SpA (Banks) | | | 68,546 | | | | 175 | |
| | Luxottica Group SpA (Textiles, apparel & luxury goods) | | | 5,149 | | | | 277 | |
| | | | | | | | | 452 | |
| | Netherlands—2.0% | | | | | | | | |
| * | NXP Semiconductors N.V. (Semiconductors & semiconductor equipment)† | | | 872 | | | | 86 | |
| | Royal Dutch Shell plc Class “A” (Oil, gas & consumable fuels) | | | 9,215 | | | | 252 | |
| | | | | | | | | 338 | |
| | Sweden—5.1% | | | | | | | | |
| | Assa Abloy AB Class “B” (Building products) | | | 9,698 | | | | 180 | |
| | Atlas Copco AB Class “A” (Machinery) | | | 5,956 | | | | 181 | |
| | Boliden AB (Metals & mining) | | | 5,952 | | | | 155 | |
| | Swedbank AB Class “A” (Banks) | | | 13,138 | | | | 318 | |
| | | | | | | | | 834 | |
| | Switzerland—1.9% | | | | | | | | |
| | Novartis AG (Pharmaceuticals) | | | 2,284 | | | | 166 | |
| | Straumann Holding AG (Health care equipment & supplies) | | | 394 | | | | 154 | |
| | | | | | | | | 320 | |
| | | | | | | | |
| | | | | | | | |
| | Issuer | | Shares | | | Value | |
| | |
| | Common Stocks—(continued) | | | | | | |
| | |
| | United Kingdom—24.9% | | | | | | | | |
| | Babcock International Group plc (Commercial services & supplies) | | | 13,556 | | | $ | 159 | |
| | BAE Systems plc (Aerospace & defense) | | | 30,412 | | | | 222 | |
| | Compass Group plc (Hotels, restaurants & leisure) | | | 20,973 | | | | 388 | |
| | Diageo plc (Beverages) | | | 11,040 | | | | 287 | |
| | Experian plc (Professional services) | | | 13,894 | | | | 270 | |
| | GlaxoSmithKline plc (Pharmaceuticals) | | | 20,591 | | | | 396 | |
| | ITV plc (Media) | | | 94,197 | | | | 240 | |
| | Johnson Matthey plc (Chemicals) | | | 4,595 | | | | 180 | |
| | Prudential plc (Insurance) | | | 15,304 | | | | 307 | |
| | Reckitt Benckiser Group plc (Household products) | | | 3,288 | | | | 279 | |
| | RELX plc (Professional services) | | | 17,145 | | | | 306 | |
| | Rio Tinto plc (Metals & mining) | | | 5,631 | | | | 219 | |
| | Schroders plc (Capital markets) | | | 5,744 | | | | 212 | |
| | UBM plc (Media) | | | 12,975 | | | | 117 | |
| | Unilever N.V. (Personal products) | | | 7,247 | | | | 298 | |
| | WPP plc (Media) | | | 11,057 | | | | 248 | |
| | | | | | | | | 4,128 | |
| | |
| | Japan—19.0% | | | | | | | | |
| | Daikin Industries, Ltd. (Building products) | | | 3,006 | | | | 276 | |
| | Daito Trust Construction Co., Ltd. (Real estate management & development) | | | 1,100 | | | | 166 | |
| | Denso Corporation (Auto components) | | | 4,400 | | | | 191 | |
| | Fuji Heavy Industries, Ltd. (Automobiles) | | | 7,900 | | | | 323 | |
| | GLP J-Reit (Equity real estate investment trusts (REITs)) | | | 199 | | | | 229 | |
| | Hoya Corporation (Health care equipment & supplies) | | | 5,100 | | | | 214 | |
| | Japan Exchange Group, Inc. (Capital markets) | | | 13,800 | | | | 197 | |
| | Keyence Corporation (Electronic equipment, instruments & components) | | | 400 | | | | 275 | |
| | Mitsui Fudosan Co., Ltd. (Real estate management & development) | | | 8,000 | | | | 185 | |
| | Nihon M&A Center, Inc. (Capital markets) | | | 3,000 | | | | 83 | |
| | Nippon Prologis REIT, Inc. (Equity real estate investment trusts (REITs)) | | | 74 | | | | 151 | |
| | Nitori Holdings Co., Ltd. (Specialty retail) | | | 1,100 | | | | 126 | |
| | ORIX Corporation (Diversified financial services) | | | 20,212 | | | | 315 | |
| | SCSK Corporation (IT services) | | | 5,483 | | | | 192 | |
| | Suruga Bank, Ltd. (Banks) | | | 9,800 | | | | 219 | |
| | | | | | | | | 3,142 | |
| | |
| | Canada—9.4% | | | | | | | | |
| | Canadian Apartment Properties REIT (Equity real estate investment trusts (REITs)) | | | 5,240 | | | | 122 | |
| | Canadian National Railway Co. (Road & rail)† | | | 3,824 | | | | 258 | |
| | Canadian Natural Resources, Ltd. (Oil, gas & consumable fuels) | | | 8,654 | | | | 276 | |
See accompanying Notes to Financial Statements.
| December 31, 2016 | William Blair Funds | 51 |
Institutional International Equity Fund
Portfolio of Investments, December 31, 2016 (all dollar amounts in thousands)
| | | | | | | | |
| | | | | | | | |
| | Issuer | | Shares | | | Value | |
| | |
| | Common Stocks—(continued) | | | | | | |
| | |
| | Canada—(continued) | | | | | | | | |
| | Enerplus Corporation (Oil, gas & consumable fuels) | | | 19,006 | | | $ | 180 | |
| * | Lundin Mining Corporation (Metals & mining) | | | 41,408 | | | | 197 | |
| | Peyto Exploration & Development Corporation (Oil, gas & consumable fuels) | | | 2,691 | | | | 67 | |
| | Silver Wheaton Corporation (Metals & mining)† | | | 5,787 | | | | 112 | |
| | The Toronto-Dominion Bank (Banks)† | | | 7,047 | | | | 348 | |
| | | | | | | | | 1,560 | |
| | |
| | Emerging Asia—5.1% | | | | | | | | |
| | India—1.2% | | | | | | | | |
| | HDFC Bank, Ltd.—ADR (Banks) | | | 3,243 | | | | 197 | |
| | Taiwan—3.2% | | | | | | | | |
| | Largan Precision Co., Ltd. (Electronic equipment, instruments & components) | | | 1,000 | | | | 117 | |
| | Novatek Microelectronics Corporation (Semiconductors & semiconductor equipment) | | | 33,000 | | | | 109 | |
| | Taiwan Semiconductor Manufacturing Co., Ltd.—ADR (Semiconductors & semiconductor equipment) | | | 10,770 | | | | 310 | |
| | | | | | | | | 536 | |
| | Thailand—0.7% | | | | | | | | |
| | CP ALL PCL (Food & staples retailing) | | | 66,600 | | | | 116 | |
| | |
| | Asia—4.3% | | | | | | | | |
| | Australia—2.7% | | | | | | | | |
| | BHP Billiton, Ltd.—ADR (Metals & mining) | | | 6,966 | | | | 249 | |
| | Macquarie Group, Ltd. (Capital markets) | | | 3,068 | | | | 193 | |
| | | | | | | | | 442 | |
| | Hong Kong—1.6% | | | | | | | | |
| | AIA Group, Ltd. (Insurance) | | | 47,871 | | | | 270 | |
| | |
| | Emerging Latin America—1.9% | | | | | | | | |
| | Mexico—1.2% | | | | | | | | |
| | Grupo Financiero Santander Mexico S.A.B. de C.V. Class “B” (Banks) | | | 132,300 | | | | 190 | |
| | Peru—0.7% | | | | | | | | |
| | Credicorp, Ltd. (Banks)† | | | 741 | | | | 117 | |
| | Total Common Stocks—98.8%
(cost $15,038) | | | | | | | 16,367 | |
| | | | | | | | |
| | | | Principal | | | | |
| | Issuer | | Amount | | | Value | |
| | |
| | Repurchase Agreement | | | | | | | | |
| | Fixed Income Clearing Corporation, 0.030% dated 12/30/16, due 1/3/17, repurchase price $206, collateralized by U.S. Treasury Bond, 3.000%, due 5/15/45 | | $ | 206 | | | $ | 206 | |
| | Total Repurchase Agreement—1.2%
(cost $206) | | | | | | | 206 | |
| | Total Investments—100.0%
(cost $15,244) | | | | | | | 16,573 | |
| | Liabilities, plus cash and other assets—0.0% | | | | | | | (8 | ) |
| | Net assets—100.0% | | | | | | $ | 16,565 | |
ADR = American Depository Receipt
† = U.S. listed foreign security
* = Non-income producing securities
For securities primarily traded on exchanges or markets that close before the close of regular trading on the New York Stock Exchange, the Fund may use an independent pricing service to fair value price the securities pursuant to Valuation Procedures approved by the Board of Trustees.
At December 31, 2016, the Fund’s Portfolio of Investments includes the following industry categories (as a percentage of long-term investments):
| Financials | | | 22.3 | % |
| Industrials | | | 18.8 | % |
| Consumer Discretionary | | | 13.6 | % |
| Health Care | | | 10.8 | % |
| Information Technology | | | 8.6 | % |
| Consumer Staples | | | 7.3 | % |
| Materials | | | 6.8 | % |
| Energy | | | 6.6 | % |
| Real Estate | | | 5.2 | % |
| Total | | | 100.0 | % |
At December 31, 2016, the Fund’s Portfolio of Investments includes the following currency categories (as a percentage of long-term investments):
| Euro | | | 26.5 | % |
| British Pound Sterling | | | 23.4 | % |
| Japanese Yen | | | 19.2 | % |
| U.S. Dollar | | | 12.6 | % |
| Canadian Dollar | | | 5.1 | % |
| Swedish Krona | | | 5.1 | % |
| Swiss Franc | | | 2.0 | % |
| Hong Kong Dollar | | | 1.6 | % |
| New Taiwan Dollar | | | 1.4 | % |
| Australian Dollar | | | 1.2 | % |
| Mexican Peso | | | 1.2 | % |
| All Other Currencies | | | 0.7 | % |
| Total | | | 100.0 | % |
See accompanying Notes to Financial Statements.
| 52 | Annual Report | December 31, 2016 |
| | International Growth Fund |
| | |
| | The International Growth Fund seeks long-term capital appreciation. |
| | |
| | AN OVERVIEW FROM THE PORTFOLIO MANAGERS |
| | |

Stephanie G. Braming 
Simon Fennell 
Jeffrey A. Urbina | The William Blair International Growth Fund (Class N shares) posted a 2.88% decrease, net of fees, for the twelve months ended December 31, 2016. By comparison, the Fund’s benchmark index, the MSCI All Country World ex-U.S. IMI Index (net) (the “Index”), increased 4.41%. Adverse style effects broadly detracted from the Fund’s calendar year 2016 performance versus the Index. The Fund’s overweight to higher growth, higher valuation companies with relatively strong earnings trends was detrimental amid an environment of low valuation market leadership. From a sector attribution perspective, stock selection in Financials, Materials and Real Estate were significant detractors from the Fund’s performance relative to the Index for the year. These effects were mitigated by positive stock selection in Healthcare, along with an overweight position in Information Technology and underweight positions in Real Estate and Utilities. Within Financials, stock selection in Banks and Insurance detracted from the Fund’s relative performance. Within Materials, the Fund’s performance was hampered by a lack of exposure to Metals & Mining stocks, which rallied strongly on global growth recovery prospects and the market’s rotation into value orientated stocks. Chemicals holdings also detracted from the Fund’s relative performance in the Materials sector. Within the Real Estate sector, U.K. REIT Derwent London, which owns, develops and refurbishes properties in central London, was negatively impacted by concerns of slowing demand for London office space due to Brexit. Property developer China Overseas Land & Investment’s share price was hampered by concerns about lending policy tightening measures in Shanghai and other mainland cities, despite the company’s strong revenue and operating profit growth trends. Within the Healthcare sector, Swiss biotechnology company Actelion benefited from positive sales trends in its pulmonary arterial hypertension (PAH) drugs Uptravi and Opsumit, in addition to news that the company was in merger talks with French pharmaceutical company Sanofi after Johnson & Johnson dropped its own takeover offer for Actelion. From a geographic attribution perspective, the primary detractors from the Fund’s relative performance in 2016 were stock selection within Japan, notably within Japanese Consumer Discretionary stocks, and the U.K., as the Fund’s U.K. Financials holdings lagged. Please refer to the Global Markets Review and Outlook relating to the Fund on page 36. |
| | |
| December 31, 2016 | William Blair Funds | 53 |
International Growth Fund
Performance Highlights (Unaudited)
| Average Annual Total Return at 12/31/2016 |
| | | 1 Year | | 3 Year | | 5 Year | | 10 Year |
| Class N | | | (2.88 | )% | | | (2.12 | )% | | | 6.58 | % | | | 1.24 | % |
| Class I | | | (2.54 | ) | | | (1.82 | ) | | | 6.89 | | | | 1.55 | |
| MSCI ACW Ex-U.S. IMI (net) | | | 4.41 | | | | (1.44 | ) | | | 5.35 | | | | 1.22 | |
Performance cited represents past performance. Past performance does not guarantee future results and current performance may be lower or higher than the data quoted. Results shown are average annual total returns, which assume reinvestment of dividends and capital gains. Investment returns and principal will fluctuate and you may have a gain or loss when you sell shares. For the most current month-end performance information, please call 1-800-742-7272, or visit our Web site at www.williamblairfunds.com. Investing in smaller and medium capitalization companies involves special risks, including higher volatility and lower liquidity. Smaller and medium capitalization stocks are also more sensitive to purchase/sale transactions and changes in the issuer’s financial condition. International investing involves special risk considerations, including currency fluctuations, lower liquidity, economic and political risk. From time to time, the investment adviser may waive fees or reimburse expenses for the Fund. Without these waivers/reimbursements, performance would be lower. Class N shares are available to the general public without a sales load. Class I shares are available to certain institutional investors and advisory clients of William Blair Investment Management, LLC and William Blair & Company, L.L.C., without a sales load or distribution (12b-1) or service fees.
The performance highlights and graph presented above do not reflect the deduction of taxes that a shareholder would pay on fund distributions or the redemption of fund shares.
The Morgan Stanley Capital International (MSCI) All Country World (ACW) Ex-U.S. Investable Market Index (IMI) (net) is a free float-adjusted market capitalization weighted index that is designed to measure the equity market performance of developed and emerging markets, excluding the United States. This series approximates the minimum possible dividend reinvestment.
This report identifies the Fund’s investments on December 31, 2016. These holdings are subject to change. Not all stocks in the Fund performed the same, nor is there any guarantee that these stocks will perform as well in the future. Market forecasts provided in this report may not necessarily come to pass.
Sector Diversification (Unaudited)
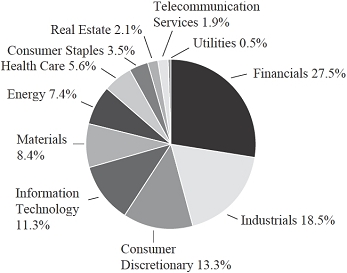
The sector diversification shown is based on the total long-term securities.
| 54 | Annual Report | December 31, 2016 |
International Growth Fund
Portfolio of Investments, December 31, 2016 (all dollar amounts in thousands)
| | | | | | | | |
| | | | | | | | |
| | Issuer | | Shares | | | Value | |
| | | | | | | | | | |
| | Common Stocks | | | | | | | | |
| | | | | | | | | | |
| | Europe, Mid-East—38.1% | | | | | | | | |
| | Austria—0.1% | | | | | | | | |
| | Lenzing AG (Chemicals) | | | 16,503 | | | $ | 1,998 | |
| | Belgium—1.5% | | | | | | | | |
| | Bekaert S.A. (Metals & mining) | | | 106,246 | | | | 4,304 | |
| | Colruyt S.A. (Food & staples retailing) | | | 124,927 | | | | 6,181 | |
| | KBC Groep N.V. (Banks) | | | 566,366 | | | | 35,074 | |
| | | | | | | | | 45,559 | |
| | Denmark—1.0% | | | | | | | | |
| | DSV A/S (Road & rail) | | | 258,268 | | | | 11,490 | |
| | Pandora A/S (Textiles, apparel & luxury goods) | | | 137,977 | | | | 18,052 | |
| | | | | | | | | 29,542 | |
| | Finland—0.9% | | | | | | | | |
| | Huhtamaki Oyj (Containers & packaging) | | | 118,902 | | | | 4,416 | |
| | Kone Oyj Class “B” (Machinery) | | | 529,428 | | | | 23,724 | |
| | | | | | | | | 28,140 | |
| | France—15.5% | | | | | | | | |
| | Arkema S.A. (Chemicals) | | | 194,046 | | | | 18,984 | |
| | Atos SE (IT services) | | | 216,696 | | | | 22,868 | |
| | AXA S.A. (Insurance) | | | 2,166,884 | | | | 54,709 | |
| | bioMerieux (Health care equipment & supplies) | | | 33,334 | | | | 4,979 | |
| | BNP Paribas S.A. (Banks) | | | 879,916 | | | | 56,084 | |
| | Christian Dior SE (Textiles, apparel & luxury goods) | | | 76,030 | | | | 15,947 | |
| | Cie Generale des Etablissements Michelin (Auto components) | | | 212,318 | | | | 23,624 | |
| | Cie Plastic Omnium S.A. (Auto components) | | | 229,705 | | | | 7,334 | |
| | Hermes International (Textiles, apparel & luxury goods) | | | 26,015 | | | | 10,680 | |
| | Ipsen S.A. (Pharmaceuticals) | | | 72,994 | | | | 5,279 | |
| * | Nexity S.A. (Real estate management & development) | | | 84,547 | | | | 3,957 | |
| | Rubis SCA (Gas utilities) | | | 58,394 | | | | 4,815 | |
| | Schneider Electric SE (Electrical equipment) | | | 655,382 | | | | 45,608 | |
| | SEB S.A. (Household durables) | | | 31,505 | | | | 4,270 | |
| | Sodexo S.A. (Hotels, restaurants & leisure) | | | 133,041 | | | | 15,293 | |
| | Technicolor S.A. (Media) | | | 568,568 | | | | 3,076 | |
| | Technip S.A. (Energy equipment & services) | | | 168,663 | | | | 12,039 | |
| | Thales S.A. (Aerospace & defense) | | | 382,241 | | | | 37,070 | |
| | Total S.A. (Oil, gas & consumable fuels) | | | 929,944 | | | | 47,692 | |
| | Valeo S.A. (Auto components) | | | 454,468 | | | | 26,125 | |
| | Vinci S.A. (Construction & engineering) | | | 595,463 | | | | 40,555 | |
| | | | | | | | | 460,988 | |
| | Germany—2.4% | | | | | | | | |
| | Bechtle AG (IT services) | | | 41,122 | | | | 4,278 | |
| | Deutsche Telekom AG (Diversified telecommunication services) | | | 1,458,514 | | | | 25,110 | |
| | Evonik Industries AG (Chemicals) | | | 266,911 | | | | 7,974 | |
| | | | | | | | |
| | | | | | | | |
| | Issuer | | Shares | | | Value | |
| | | | | | | | | | |
| | Common Stocks—(continued) | | | | | | | | |
| | | | | | | | | | |
| | Europe, Mid-East—(continued) | | | | | | | | |
| | Germany—(continued) | | | | | | | | |
| | KION Group AG (Machinery) | | | 88,332 | | | $ | 4,915 | |
| | MTU Aero Engines AG (Aerospace & defense) | | | 103,082 | | | | 11,914 | |
| | TUI AG (Hotels, restaurants & leisure) | | | 864,944 | | | | 12,123 | |
| | Wirecard AG (IT services) | | | 124,129 | | | | 5,343 | |
| | | | | | | | | 71,657 | |
| | Ireland—1.9% | | | | | | | | |
| | CRH plc (Construction materials) | | | 902,898 | | | | 31,322 | |
| | Greencore Group plc (Food products) | | | 2,396,660 | | | | 7,281 | |
| * | ICON plc (Life sciences tools & services)† | | | 141,079 | | | | 10,609 | |
| | Kingspan Group plc (Building products) | | | 249,883 | | | | 6,786 | |
| | | | | | | | | 55,998 | |
| | Israel—0.8% | | | | | | | | |
| * | Check Point Software Technologies, Ltd. (Software)† | | | 281,098 | | | | 23,742 | |
| | Italy—1.8% | | | | | | | | |
| | Azimut Holding SpA (Capital markets) | | | 298,574 | | | | 4,985 | |
| | Banca Generali SpA (Capital markets) | | | 384,667 | | | | 9,175 | |
| | Brembo SpA (Auto components) | | | 74,365 | | | | 4,501 | |
| | Interpump Group SpA (Machinery) | | | 414,442 | | | | 6,784 | |
| | Intesa Sanpaolo SpA (Banks) | | | 9,026,140 | | | | 23,050 | |
| | Recordati SpA (Pharmaceuticals) | | | 168,109 | | | | 4,764 | |
| | | | | | | | | 53,259 | |
| | Luxembourg—0.2% | | | | | | | | |
| | Eurofins Scientific SE (Life sciences tools & services) | | | 14,023 | | | | 5,978 | |
| | Netherlands—2.2% | | | | | | | | |
| | Randstad Holding N.V. (Professional services) | | | 168,369 | | | | 9,133 | |
| | Royal Dutch Shell plc Class “A” (Oil, gas & consumable fuels) | | | 2,048,076 | | | | 56,021 | |
| | | | | | | | | 65,154 | |
| | Norway—0.2% | | | | | | | | |
| | Gjensidige Forsikring ASA (Insurance) | | | 458,825 | | | | 7,279 | |
| | Portugal—0.2% | | | | | | | | |
| | Jeronimo Martins SGPS S.A. (Food & staples retailing) | | | 338,425 | | | | 5,251 | |
| | Spain—2.8% | | | | | | | | |
| | Aena S.A. (Transportation infrastructure) | | | 108,115 | | | | 14,755 | |
| | Amadeus IT Group S.A. (IT services) | | | 479,673 | | | | 21,798 | |
| | Bankinter S.A. (Banks) | | | 2,399,491 | | | | 18,590 | |
| | Industria de Diseno Textil S.A. (Specialty retail) | | | 692,716 | | | | 23,647 | |
| | Prosegur Cia de Seguridad S.A. (Commercial services & supplies) | | | 650,374 | | | | 4,067 | |
| | | | | | | | | 82,857 | |
See accompanying Notes to Financial Statements.
| December 31, 2016 | William Blair Funds | 55 |
International Growth Fund
Portfolio of Investments, December 31, 2016 (all dollar amounts in thousands)
| | | | | | | | |
| | | | | | | | |
| | Issuer | | Shares | | | Value | |
| | | | | | | | | | |
| | Common Stocks—(continued) | | | | | | | | |
| | | | | | | | | | |
| | Europe, Mid-East—(continued) | | | | | | | | |
| | Sweden—3.5% | | | | | | | | |
| | BillerudKorsnas AB (Containers & packaging) | | | 250,953 | | | $ | 4,214 | |
| | Boliden AB (Metals & mining) | | | 412,198 | | | | 10,763 | |
| | Fabege AB (Real estate management & development) | | | 266,464 | | | | 4,355 | |
| | Hexpol AB (Chemicals) | | | 480,537 | | | | 4,449 | |
| | Hufvudstaden AB Class “A” (Real estate management & development) | | | 278,171 | | | | 4,394 | |
| | Husqvarna AB Class “B” (Household durables) | | | 547,392 | | | | 4,257 | |
| | Intrum Justitia AB (Commercial services & supplies) | | | 206,088 | | | | 6,954 | |
| | SKF AB Class “B” (Machinery) | | | 987,230 | | | | 18,161 | |
| | Swedbank AB Class “A” (Banks) | | | 2,008,285 | | | | 48,562 | |
| | | | | | | | | 106,109 | |
| | Switzerland—3.1% | | | | | | | | |
| * | Actelion, Ltd. (Biotechnology) | | | 131,238 | | | | 28,418 | |
| | Adecco Group AG (Professional services) | | | 141,349 | | | | 9,251 | |
| * | Cembra Money Bank AG (Consumer finance) | | | 62,432 | | | | 4,549 | |
| * | dormakaba Holding AG (Building products) | | | 6,185 | | | | 4,598 | |
| | Logitech International S.A. (Technology hardware, storage & peripherals) | | | 179,957 | | | | 4,489 | |
| * | Lonza Group AG (Life sciences tools & services) | | | 97,466 | | | | 16,874 | |
| * | Luxoft Holding, Inc. (IT services)† | | | 65,262 | | | | 3,668 | |
| | Partners Group Holding AG (Capital markets) | | | 44,732 | | | | 20,965 | |
| | | | | | | | | 92,812 | |
| | | | | | | | | | |
| | Japan—19.5% | | | | | | | | |
| | Ain Holdings, Inc. (Food & staples retailing) | | | 3,400 | | | | 225 | |
| | Alps Electric Co., Ltd. (Electronic equipment, instruments & components) | | | 368,100 | | | | 8,901 | |
| | Asahi Intecc Co., Ltd. (Health care equipment & supplies) | | | 89,200 | | | | 3,614 | |
| | Asahi Kasei Corporation (Chemicals) | | | 2,535,000 | | | | 22,113 | |
| | Daifuku Co., Ltd. (Machinery) | | | 292,326 | | | | 6,235 | |
| | Daikin Industries, Ltd. (Building products) | | | 471,700 | | | | 43,326 | |
| | Daito Trust Construction Co., Ltd. (Real estate management & development) | | | 51,600 | | | | 7,761 | |
| | Daiwa House Industry Co., Ltd. (Real estate management & development) | | | 515,500 | | | | 14,097 | |
| | FANUC Corporation (Machinery) | | | 209,100 | | | | 35,451 | |
| | Fuji Electric Co., Ltd. (Electrical equipment) | | | 1,014,000 | | | | 5,258 | |
| | Fuji Heavy Industries, Ltd. (Automobiles) | | | 1,184,500 | | | | 48,363 | |
| | Fujitsu General, Ltd. (Household durables) | | | 200,000 | | | | 4,234 | |
| | Haseko Corporation (Household durables) | | | 581,000 | | | | 5,911 | |
| | Hitachi Chemical Co., Ltd. (Chemicals) | | | 147,000 | | | | 3,676 | |
| | ITOCHU Corporation (Trading companies & distributors) | | | 869,000 | | | | 11,540 | |
| | | | | | | | |
| | | | | | | | |
| | Issuer | | Shares | | | Value | |
| | | | | | | | | | |
| | Common Stocks—(continued) | | | | | | | | |
| | | | | | | | | | |
| | Japan—(continued) | | | | | | | | |
| | Keyence Corporation (Electronic equipment, instruments & components) | | | 37,200 | | | $ | 25,527 | |
| * | LINE Corporation—ADR (Software) | | | 114,200 | | | | 3,884 | |
| | Lion Corporation (Household products) | | | 291,000 | | | | 4,780 | |
| | M3, Inc. (Health care technology) | | | 175,300 | | | | 4,417 | |
| | MISUMI Group, Inc. (Trading companies & distributors) | | | 223,500 | | | | 3,679 | |
| | Mitsubishi Electric Corporation (Electrical equipment) | | | 1,678,000 | | | | 23,395 | |
| | Mitsubishi UFJ Financial Group, Inc. (Banks) | | | 6,545,600 | | | | 40,335 | |
| | Mitsui Mining & Smelting Co., Ltd. (Metals & mining) | | | 975,649 | | | | 2,471 | |
| | Nichias Corporation (Building products) | | | 368,000 | | | | 3,552 | |
| | Nihon M&A Center, Inc. (Capital markets) | | | 138,400 | | | | 3,849 | |
| | Nippon Prologis REIT, Inc. (Equity real estate investment trusts (REITs)) | | | 2,172 | | | | 4,440 | |
| | Nissan Chemical Industries, Ltd. (Chemicals) | | | 230,700 | | | | 7,708 | |
| | Nitori Holdings Co., Ltd. (Specialty retail) | | | 129,300 | | | | 14,780 | |
| | Oracle Corporation Japan (Software) | | | 72,600 | | | | 3,659 | |
| | ORIX Corporation (Diversified financial services) | | | 2,733,300 | | | | 42,657 | |
| | Park24 Co., Ltd. (Commercial services & supplies) | | | 249,500 | | | | 6,767 | |
| | Pola Orbis Holdings, Inc. (Personal products) | | | 87,600 | | | | 7,233 | |
| | SCSK Corporation (IT services) | | | 163,700 | | | | 5,729 | |
| | Shimamura Co., Ltd. (Specialty retail) | | | 36,000 | | | | 4,494 | |
| | Shionogi & Co., Ltd. (Pharmaceuticals) | | | 489,300 | | | | 23,440 | |
| | SoftBank Group Corporation (Wireless telecommunication services) | | | 368,400 | | | | 24,476 | |
| | Sumitomo Mitsui Financial Group, Inc. (Banks) | | | 953,800 | | | | 36,397 | |
| | Taisei Corporation (Construction & engineering) | | | 1,615,000 | | | | 11,303 | |
| | Temp Holdings Co., Ltd. (Professional services) | | | 308,600 | | | | 4,787 | |
| | TIS, Inc. (IT services) | | | 197,800 | | | | 4,231 | |
| | Tokio Marine Holdings, Inc. (Insurance) | | | 717,100 | | | | 29,426 | |
| | Tsuruha Holdings, Inc. (Food & staples retailing) | | | 87,300 | | | | 8,291 | |
| | Zenkoku Hosho Co., Ltd. (Diversified financial services) | | | 125,200 | | | | 4,022 | |
| | | | | | | | | 580,434 | |
| | | | | | | | | | |
| | United Kingdom—14.7% | | | | | | | | |
| | 3i Group plc (Capital markets) | | | 1,336,773 | | | | 11,598 | |
| | Babcock International Group plc (Commercial services & supplies) | | | 532,571 | | | | 6,255 | |
| | BAE Systems plc (Aerospace & defense) | | | 2,968,041 | | | | 21,636 | |
| | Bellway plc (Household durables) | | | 245,506 | | | | 7,491 | |
| | Berendsen plc (Commercial services & supplies) | | | 292,548 | | | | 3,139 | |
| | BHP Billiton plc (Metals & mining) | | | 2,211,621 | | | | 35,610 | |
See accompanying Notes to Financial Statements.
| 56 | Annual Report | December 31, 2016 |
International Growth Fund
Portfolio of Investments, December 31, 2016 (all dollar amounts in thousands)
| | | | | | | | |
| | | | | | | | |
| | Issuer | | Shares | | | Value | |
| | | | | | | | | | |
| | Common Stocks—(continued) | | | | | | | | |
| | | | | | | | | | |
| | United Kingdom—(continued) | | | | | | | | |
| | British American Tobacco plc (Tobacco) | | | 427,799 | | | $ | 24,365 | |
| | Bunzl plc (Trading companies & distributors) | | | 510,753 | | | | 13,275 | |
| | Cineworld Group plc (Media) | | | 559,315 | | | | 3,895 | |
| | Close Brothers Group plc (Capital markets) | | | 202,618 | | | | 3,608 | |
| | Compass Group plc (Hotels, restaurants & leisure) | | | 1,690,273 | | | | 31,267 | |
| | Domino’s Pizza Group plc (Hotels, restaurants & leisure) | | | 981,549 | | | | 4,365 | |
| | GlaxoSmithKline plc (Pharmaceuticals) | | | 1,249,659 | | | | 24,056 | |
| | Halma plc (Electronic equipment, instruments & components) | | | 381,453 | | | | 4,219 | |
| | Hiscox, Ltd. (Insurance) | | | 613,309 | | | | 7,687 | |
| | Informa plc (Media) | | | 2,099,312 | | | | 17,593 | |
| | Intermediate Capital Group plc (Capital markets) | | | 613,099 | | | | 5,289 | |
| | Intertek Group plc (Professional services) | | | 170,115 | | | | 7,298 | |
| | John Wood Group plc (Energy equipment & services) | | | 441,497 | | | | 4,766 | |
| | Johnson Matthey plc (Chemicals) | | | 391,116 | | | | 15,338 | |
| | Jupiter Fund Management plc (Capital markets) | | | 709,691 | | | | 3,880 | |
| | Micro Focus International plc (Software) | | | 370,904 | | | | 9,960 | |
| | Moneysupermarket.com Group plc (Internet software & services) | | | 918,324 | | | | 3,328 | |
| | Playtech plc (Software) | | | 529,829 | | | | 5,394 | |
| | Provident Financial plc (Consumer finance) | | | 165,977 | | | | 5,828 | |
| | Renishaw plc (Electronic equipment, instruments & components) | | | 130,246 | | | | 4,058 | |
| | Rio Tinto, Ltd. (Metals & mining) | | | 1,260,186 | | | | 54,474 | |
| | Spirax-Sarco Engineering plc (Machinery) | | | 148,601 | | | | 7,662 | |
| * | Subsea 7 S.A. (Energy equipment & services) | | | 401,827 | | | | 5,086 | |
| | The Sage Group plc (Software) | | | 1,502,603 | | | | 12,129 | |
| | UBM plc (Media) | | | 917,382 | | | | 8,270 | |
| | Unilever plc (Personal products) | | | 113,638 | | | | 4,611 | |
| | Victrex plc (Chemicals) | | | 208,886 | | | | 4,971 | |
| | WH Smith plc (Specialty retail) | | | 287,380 | | | | 5,518 | |
| | Wolseley plc (Trading companies & distributors) | | | 429,743 | | | | 26,280 | |
| | WPP plc (Media) | | | 1,109,115 | | | | 24,822 | |
| | | | | | | | | 439,021 | |
| | | | | | | | | | |
| | Emerging Asia—10.4% | | | | | | | | |
| | China—3.5% | | | | | | | | |
| | Anhui Conch Cement Co., Ltd. Class “H” (Construction materials) | | | 3,064,500 | | | | 8,339 | |
| | China Overseas Land & Investment, Ltd. (Real estate management & development) | | | 6,518,000 | | | | 17,273 | |
| | ENN Energy Holdings, Ltd. (Gas utilities) | | | 1,578,000 | | | | 6,491 | |
| | Industrial and Commercial Bank of China, Ltd. Class “H” (Banks) | | | 50,844,000 | | | | 30,489 | |
| | PICC Property & Casualty Co., Ltd. Class “H” (Insurance) | | | 6,718,000 | | | | 10,465 | |
| | | | | | | | |
| | | | | | | | |
| | Issuer | | Shares | | | Value | |
| | | | | | | | | | |
| | Common Stocks—(continued) | | | | | | | | |
| | | | | | | | | | |
| | Emerging Asia—(continued) | | | | | | | | |
| | China—(continued) | | | | | | | | |
| | Ping An Insurance Group Co. of China, Ltd. Class “H” (Insurance) | | | 5,936,500 | | | $ | 29,704 | |
| * | Xinyi Solar Holdings, Ltd. (Semiconductors & semiconductor equipment) | | | 10,204,000 | | | | 3,316 | |
| | | | | | | | | 106,077 | |
| | India—2.6% | | | | | | | | |
| | Bharat Petroleum Corporation, Ltd. (Oil, gas & consumable fuels) | | | 715,157 | | | | 6,680 | |
| | Britannia Industries, Ltd. (Food products) | | | 94,461 | | | | 4,012 | |
| | Eicher Motors, Ltd. (Machinery) | | | 15,041 | | | | 4,826 | |
| | HCL Technologies, Ltd. (IT services) | | | 659,054 | | | | 8,013 | |
| | HDFC Bank, Ltd. (Banks) | | | 790,298 | | | | 14,007 | |
| | IndusInd Bank, Ltd. (Banks) | | | 464,860 | | | | 7,582 | |
| | Maruti Suzuki India, Ltd. (Automobiles) | | | 126,727 | | | | 9,925 | |
| | Motherson Sumi Systems, Ltd. (Auto components) | | | 930,128 | | | | 4,457 | |
| | UPL, Ltd. (Chemicals) | | | 525,349 | | | | 5,007 | |
| | Voltas, Ltd. (Construction & engineering) | | | 794,643 | | | | 3,817 | |
| | Yes Bank, Ltd. (Banks) | | | 511,044 | | | | 8,697 | |
| | | | | | | | | 77,023 | |
| | Indonesia—0.5% | | | | | | | | |
| | PT Bank Central Asia Tbk (Banks) | | | 13,634,600 | | | | 15,686 | |
| | South Korea—2.8% | | | | | | | | |
| | Samsung Electronics Co., Ltd. (Technology hardware, storage & peripherals) | | | 32,539 | | | | 48,547 | |
| * | SK Hynix, Inc. (Semiconductors & semiconductor equipment) | | | 912,680 | | | | 33,778 | |
| | | | | | | | | 82,325 | |
| | Taiwan—1.0% | | | | | | | | |
| | Taiwan Semiconductor Manufacturing Co., Ltd.—ADR (Semiconductors & semiconductor equipment) | | | 1,023,819 | | | | 29,435 | |
| | | | | | | | | | |
| | Western Hemisphere—8.0% | | | | | | | | |
| | | | | | | | | | |
| | Canada—7.1% | | | | | | | | |
| | Alimentation Couche Tard, Inc. Class “B” (Food & staples retailing) | | | 224,641 | | | | 10,186 | |
| | Brookfield Asset Management, Inc. Class “A” (Capital markets)† | | | 163,146 | | | | 5,385 | |
| | Canadian National Railway Co. (Road & rail) | | | 376,385 | | | | 25,331 | |
| | Canadian Natural Resources, Ltd. (Oil, gas & consumable fuels) | | | 1,016,851 | | | | 32,407 | |
| * | CGI Group, Inc. Class “A” (IT services) | | | 399,974 | | | | 19,197 | |
| | Constellation Software, Inc. (Software) | | | 24,820 | | | | 11,279 | |
| | Dollarama, Inc. (Multiline retail) | | | 234,770 | | | | 17,202 | |
| | Finning International, Inc. (Trading companies & distributors) | | | 215,990 | | | | 4,229 | |
| | Intact Financial Corporation (Insurance) | | | 135,429 | | | | 9,693 | |
| | Suncor Energy, Inc. (Oil, gas & consumable fuels) | | | 741,900 | | | | 24,257 | |
| | The Toronto-Dominion Bank (Banks) | | | 1,048,391 | | | | 51,707 | |
| | | | | | | | | 210,873 | |
See accompanying Notes to Financial Statements.
| December 31, 2016 | William Blair Funds | 57 |
International Growth Fund
Portfolio of Investments, December 31, 2016 (all dollar amounts in thousands)
| | | | | | | | |
| | | | | | | | |
| | Issuer | | Shares | | | Value | |
| | | | | | | | | | |
| | Common Stocks—(continued) | | | | | | | | |
| | | | | | | | | | |
| | Western Hemisphere—(continued) | | | | | | | | |
| | United States—0.9% | | | | | | | | |
| | Shire plc (Biotechnology) | | | 484,550 | | | $ | 27,971 | |
| | | | | | | | | | |
| | Asia—3.3% | | | | | | | | |
| | Australia—2.2% | | | | | | | | |
| | Domino’s Pizza Enterprises, Ltd. (Hotels, restaurants & leisure) | | | 88,823 | | | | 4,166 | |
| | Downer EDI, Ltd. (Commercial services & supplies) | | | 1,050,836 | | | | 4,618 | |
| | JB Hi-Fi, Ltd. (Specialty retail) | | | 292,648 | | | | 5,922 | |
| | Macquarie Group, Ltd. (Capital markets) | | | 755,756 | | | | 47,515 | |
| | Vicinity Centres (Equity real estate investment trusts (REITs)) | | | 1,902,671 | | | | 4,105 | |
| | | | | | | | | 66,326 | |
| | Hong Kong—0.9% | | | | | | | | |
| | AIA Group, Ltd. (Insurance) | | | 4,620,200 | | | | 26,067 | |
| * | China High Precision Automation Group, Ltd. (Electronic equipment, instruments & components)**§ | | | 6,597,000 | | | | — | |
| | | | | | | | | 26,067 | |
| | New Zealand—0.2% | | | | | | | | |
| | Spark New Zealand, Ltd. (Diversified telecommunication services) | | | 2,088,923 | | | | 4,948 | |
| | | | | | | | | | |
| | Emerging Europe, Mid-East, Africa—1.8% | | | | | |
| | Hungary—0.2% | | | | | | | | |
| | MOL Hungarian Oil & Gas plc (Oil, gas & consumable fuels) | | | 70,810 | | | | 4,974 | |
| | South Africa—0.9% | | | | | | | | |
| | Bid Corporation, Ltd. (Food & staples retailing) | | | 286,848 | | | | 5,120 | |
| | Bidvest Group, Ltd. (Industrial conglomerates) | | | 286,848 | | | | 3,786 | |
| | RMB Holdings, Ltd. (Diversified financial services) | | | 985,828 | | | | 4,766 | |
| | Sanlam, Ltd. (Insurance) | | | 1,524,969 | | | | 6,984 | |
| | The Spar Group, Ltd. (Food & staples retailing) | | | 460,800 | | | | 6,663 | |
| | | | | | | | | 27,319 | |
| | Turkey—0.3% | | | | | | | | |
| | Turkiye Garanti Bankasi A.S. (Banks) | | | 4,133,437 | | | | 8,930 | |
| | United Arab Emirates—0.4% | | | | | | | | |
| | Dubai Islamic Bank PJSC (Banks) | | | 7,302,445 | | | | 11,074 | |
| | | | | | | | | | |
| | Emerging Latin America—1.3% | | | | | | | | |
| | Brazil—0.6% | | | | | | | | |
| | BB Seguridade Participacoes S.A. (Insurance) | | | 1,684,100 | | | | 14,643 | |
| | Engie Brasil Energia S.A. (Independent power & renewable electricity producers) | | | 366,900 | | | | 3,946 | |
| | | | | | | | | 18,589 | |
| | | | Shares or | | | | |
| | | | Principal | | | | |
| | Issuer | | Amount | | | Value | |
| | | | | | | | | | |
| | Common Stocks—(continued) | | | | | | | | |
| | | | | | | | | | |
| | Emerging Latin America—(continued) | | | | |
| | Mexico—0.3% | | | | | | | | |
| | Arca Continental S.A.B. de C.V. (Beverages) | | | 1,497,175 | | | $ | 7,789 | |
| | Peru—0.4% | | | | | | | | |
| | Credicorp, Ltd. (Banks)† | | | 84,043 | | | | 13,267 | |
| | Total Common Stocks—97.1%
(cost $2,690,422) | | | | | | | 2,894,451 | |
| | | | | | | | | | |
| | Preferred Stocks | | | | | | | | |
| | Brazil—1.3% | | | | | | | | |
| | Itau Unibanco Holding S.A. (Banks) | | | 1,443,040 | | | | 15,008 | |
| * | Petroleo Brasileiro S.A. (Oil, gas & consumable fuels) | | | 5,064,800 | | | | 23,140 | |
| | | | | | | | | 38,148 | |
| | Germany—0.1% | | | | | | | | |
| | Sartorius AG (Health care equipment & supplies) | | | 58,300 | | | | 4,327 | |
| | Total Preferred Stocks—1.4%
(cost $43,939) | | | | | | | 42,475 | |
| | | | | | | | | | |
| | Affiliated Fund | | | | | | | | |
| | China—0.0% | | | | | | | | |
| | William Blair China A-Share Fund, LLC§ | | | 10,158 | | | | 164 | |
| | Total Affiliated Fund—0.0%
(cost $102) | | | | | | | 164 | |
| | | | | | | | | | |
| | Repurchase Agreement | | | | | | | | |
| | Fixed Income Clearing Corporation, 0.030% dated 12/30/16, due 1/3/17, repurchase price $47,301, collateralized by U.S. Treasury Bond, 3.375%, due 5/15/44 | | $ | 47,300 | | | | 47,300 | |
| | Total Repurchase Agreement—1.6%
(cost $47,300) | | | | | | | 47,300 | |
| | Total Investments—100.1%
(cost $2,781,763) | | | | | | | 2,984,390 | |
| | Liabilities, plus cash and other assets—(0.1)% | | | | | | | (3,145 | ) |
| | Net assets—100.0% | | | | | | $ | 2,981,245 | |
ADR = American Depository Receipt
* = Non-income producing securities
† = U.S. listed foreign security
** = Fair valued pursuant to Valuation Procedures approved by the Board of Trustees. This holding represents 0.00% of the Fund’s net assets at December 31, 2016.
§ = Deemed illiquid pursuant to Liquidity Procedures approved by the Board of Trustees. These holdings represent 0.01% of the Fund’s net assets at December 31, 2016.
See accompanying Notes to Financial Statements.
| 58 | Annual Report | December 31, 2016 |
International Growth Fund
Portfolio of Investments, December 31, 2016 (all dollar amounts in thousands)
For securities primarily traded on exchanges or markets that close before the close of regular trading on the New York Stock Exchange, the Fund may use an independent pricing service to fair value price the securities pursuant to Valuation Procedures approved by the Board of Trustees.
At December 31, 2016, the Fund’s Portfolio of Investments includes the following industry categories (as a percentage of long-term investments):
| Financials | | | 27.5 | % |
| Industrials | | | 18.5 | % |
| Consumer Discretionary | | | 13.3 | % |
| Information Technology | | | 11.3 | % |
| Materials | | | 8.4 | % |
| Energy | | | 7.4 | % |
| Health Care | | | 5.6 | % |
| Consumer Staples | | | 3.5 | % |
| Real Estate | | | 2.1 | % |
| Telecommunication Services | | | 1.9 | % |
| Utilities | | | 0.5 | % |
| Total | | | 100.0 | % |
At December 31, 2016, the Fund’s Portfolio of Investments includes the following currency categories (as a percentage of long-term investments):
| Euro | | | 29.4 | % |
| Japanese Yen | | | 19.6 | % |
| British Pound Sterling | | | 14.1 | % |
| Canadian Dollar | | | 7.0 | % |
| Hong Kong Dollar | | | 4.5 | % |
| Australian Dollar | | | 4.1 | % |
| Swedish Krona | | | 3.6 | % |
| U.S. Dollar | | | 3.1 | % |
| Swiss Franc | | | 3.1 | % |
| South Korean Won | | | 2.8 | % |
| Indian Rupee | | | 2.6 | % |
| Brazilian Real | | | 1.9 | % |
| Danish Krone | | | 1.0 | % |
| All Other Currencies | | | 3.2 | % |
| Total | | | 100.0 | % |
As of December 31, 2016, the Fund invested in William Blair China A-Share Fund, LLC, an affiliated fund. There are no unfunded commitments to the affiliated fund. The Fund is subject to repatriation and other redemption restrictions imposed on the William Blair China A-Share Fund, LLC by the Chinese government.
| | | Share Activity | | Year Ended December 31, 2016 |
| Security Name | | Balance
12/31/2015 | | Purchases | | Sales | | Balance
12/31/2016 | | Value | | Dividend
Income | | Net realized
gain (loss) | | Change in net
unrealized
appreciation
(depreciation) |
| William Blair China A-Share Fund, LLC | | 223,614 | | — | | 213,456 | | 10,158 | | $164 | | $— | | $1,574 | | $(1,630) |
See accompanying Notes to Financial Statements.
| December 31, 2016 | William Blair Funds | 59 |
| | Institutional International Growth Fund |
| | |
| | The Institutional International Growth Fund seeks long-term capital appreciation. |
| | |
| | AN OVERVIEW FROM THE PORTFOLIO MANAGERS |
| | |

Stephanie G. Braming 
Simon Fennell 
Jeffrey A. Urbina | The William Blair Institutional International Growth Fund posted a 2.40% decrease, net of fees, for the twelve months ended December 31, 2016. By comparison, the Fund’s benchmark index, the MSCI All Country World ex-U.S. IMI Index (net) (the “Index”), increased 4.41%. Adverse style effects broadly detracted from the Fund’s calendar year 2016 performance versus the Index. The Fund’s overweight to higher growth, higher valuation companies with relatively strong earnings trends was detrimental amid an environment of low valuation market leadership. From a sector attribution perspective, stock selection in Financials, Materials and Real Estate were significant detractors from the Fund’s performance relative to the Index for the year. These effects were mitigated by positive stock selection in Healthcare, along with an overweight position in Information Technology and underweight positions in Real Estate and Utilities. Within Financials, stock selection in Banks and Insurance detracted from the Fund’s relative performance. Within Materials, the Fund’s performance was hampered by a lack of exposure to Metals & Mining stocks, which rallied strongly on global growth recovery prospects and the market’s rotation into value orientated stocks. Chemicals holdings also detracted from the Fund’s relative performance in the Materials sector. Within the Real Estate sector, U.K. REIT Derwent London, which owns, develops and refurbishes properties in central London, was negatively impacted by concerns of slowing demand for London office space due to Brexit. Property developer China Overseas Land & Investment’s share price was hampered by concerns about policy tightening measures in Shanghai and other mainland cities, despite the company’s strong revenue and operating profit growth trends. Within the Healthcare sector, Swiss biotechnology company Actelion benefited from positive sales trends in its pulmonary arterial hypertension (PAH) drugs Uptravi and Opsumit, in addition to news that the company was in merger talks with French pharmaceutical company Sanofi after Johnson & Johnson dropped its own takeover offer for Actelion. From a geographic attribution perspective, the primary detractors from the Fund’s relative performance in 2016 were stock selection within Japan, notably within Japanese Consumer Discretionary stocks, and the U.K., as the Fund’s U.K. Financials holdings lagged. Please refer to the Global Markets Review and Outlook relating to the Fund on page 36. |
| | |
| 60 | Annual Report | December 31, 2016 |
Institutional International Growth Fund
Performance Highlights (Unaudited)
| Average Annual Total Return at 12/31/2016 |
| | | 1 Year | | 3 Year | | 5 Year | | 10 Year |
| Institutional Class | | | (2.40 | )% | | | (1.66 | )% | | | 7.01 | % | | | 1.69 | % |
| MSCI ACW Ex-U.S. IMI (net) | | | 4.41 | | | | (1.44 | ) | | | 5.35 | | | | 1.22 | |
Performance cited represents past performance. Past performance does not guarantee future results and current performance may be lower or higher than the data quoted. Results shown are average annual returns, which assume reinvestment of dividends and capital gains. Investment returns and principal will fluctuate and you may have a gain or loss when you sell shares. For the most current month-end performance information, please call 1-800-742-7272, or visit our Web site at www.williamblairfunds.com. Investing in smaller and medium capitalization companies involves special risks, including higher volatility and lower liquidity. Smaller and medium capitalization stocks are also more sensitive to purchase/sale transactions and changes in the issuer’s financial condition. International investing involves special risk considerations, including currency fluctuations, lower liquidity, economic and political risk. Shares of the Fund are available without a sales load or distribution (12b-1) or service fees.
The performance highlights and graph presented above do not reflect the deduction of taxes that a shareholder would pay on fund distributions or the redemption of fund shares.
The Morgan Stanley Capital International (MSCI) All Country World (ACW) Ex-U.S. Investable Market Index (IMI) (net) is a free float-adjusted market capitalization weighted index that is designed to measure the equity market performance of developed and emerging markets, excluding the United States. This series approximates the minimum possible dividend reinvestment.
This report identifies the Fund’s investments on December 31, 2016. These holdings are subject to change. Not all stocks in the Fund performed the same, nor is there any guarantee that these stocks will perform as well in the future. Market forecasts provided in this report may not necessarily come to pass.
Sector Diversification (Unaudited)
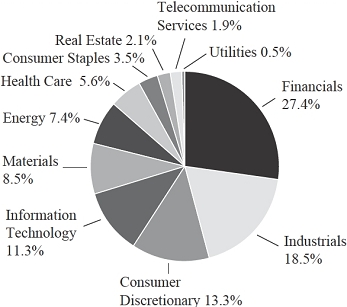
The sector diversification shown is based on the total long-term securities.
| December 31, 2016 | William Blair Funds | 61 |
Institutional International Growth Fund
Portfolio of Investments, December 31, 2016 (all dollar amounts in thousands)
| | | | | | | | |
| | | | | | | | |
| | Issuer | | Shares | | | Value | |
| | | | | | | | | | |
| | Common Stocks | | | | | | | | |
| | | | | | | | | | |
| | Europe, Mid-East—38.4% | | | | | | | | |
| | Austria—0.1% | | | | | | | | |
| | Lenzing AG (Chemicals) | | | 11,389 | | | $ | 1,379 | |
| | Belgium—1.5% | | | | | | | | |
| | Bekaert S.A. (Metals & mining) | | | 73,546 | | | | 2,979 | |
| | Colruyt S.A. (Food & staples retailing) | | | 86,477 | | | | 4,279 | |
| | KBC Groep N.V. (Banks) | | | 391,971 | | | | 24,274 | |
| | | | | | | | | 31,532 | |
| | Denmark—1.0% | | | | | | | | |
| | DSV A/S (Road & rail) | | | 178,774 | | | | 7,953 | |
| | Pandora A/S (Textiles, apparel & luxury goods) | | | 95,511 | | | | 12,496 | |
| | | | | | | | | 20,449 | |
| | Finland—0.9% | | | | | | | | |
| | Huhtamaki Oyj (Containers & packaging) | | | 82,306 | | | | 3,057 | |
| | Kone Oyj Class “B” (Machinery) | | | 366,480 | | | | 16,422 | |
| | | | | | | | | 19,479 | |
| | France—15.2% | | | | | | | | |
| | Arkema S.A. (Chemicals) | | | 134,322 | | | | 13,141 | |
| | Atos SE (IT services) | | | 150,001 | | | | 15,829 | |
| | AXA S.A. (Insurance) | | | 1,499,960 | | | | 37,871 | |
| | bioMerieux (Health care equipment & supplies) | | | 23,074 | | | | 3,447 | |
| | BNP Paribas S.A. (Banks) | | | 609,095 | | | | 38,822 | |
| | Christian Dior SE (Textiles, apparel & luxury goods) | | | 52,497 | | | | 11,011 | |
| | Cie Generale des Etablissements Michelin (Auto components) | | | 146,961 | | | | 16,352 | |
| | Cie Plastic Omnium S.A. (Auto components) | | | 159,007 | | | | 5,077 | |
| | Hermes International (Textiles, apparel & luxury goods) | | | 18,008 | | | | 7,393 | |
| | Ipsen S.A. (Pharmaceuticals) | | | 50,528 | | | | 3,654 | |
| * | Nexity S.A. (Real estate management & development) | | | 58,525 | | | | 2,739 | |
| | Rubis SCA (Gas utilities) | | | 40,422 | | | | 3,333 | |
| | Schneider Electric SE (Electrical equipment) | | | 453,668 | | | | 31,571 | |
| | SEB S.A. (Household durables) | | | 21,813 | | | | 2,956 | |
| | Sodexo S.A. (Hotels, restaurants & leisure) | | | 92,094 | | | | 10,586 | |
| | Technicolor S.A. (Media) | | | 393,574 | | | | 2,129 | |
| | Technip S.A. (Energy equipment & services) | | | 116,752 | | | | 8,334 | |
| | Thales S.A. (Aerospace & defense) | | | 264,595 | | | | 25,661 | |
| | Total S.A. (Oil, gas & consumable fuels) | | | 643,725 | | | | 33,013 | |
| | Valeo S.A. (Auto components) | | | 314,592 | | | | 18,084 | |
| | Vinci S.A. (Construction & engineering) | | | 412,191 | | | | 28,073 | |
| | | | | | | | | 319,076 | |
| | Germany—2.4% | | | | | | | | |
| | Bechtle AG (IT services) | | | 28,465 | | | | 2,961 | |
| | Deutsche Telekom AG (Diversified telecommunication services) | | | 1,009,612 | | | | 17,382 | |
| | Evonik Industries AG (Chemicals) | | | 184,761 | | | | 5,520 | |
| | KION Group AG (Machinery) | | | 61,145 | | | | 3,402 | |
| | | | | | | | |
| | | | | | | | |
| | Issuer | | Shares | | | Value | |
| | | | | | | | | | |
| | Common Stocks—(continued) | | | | | | | | |
| | | | | | | | | | |
| | Europe, Mid-East—(continued) | | | | | | | | |
| | Germany—(continued) | | | | | | | | |
| | MTU Aero Engines AG (Aerospace & defense) | | | 71,355 | | | $ | 8,247 | |
| | TUI AG (Hotels, restaurants & leisure) | | | 598,732 | | | | 8,392 | |
| | Wirecard AG (IT services) | | | 85,925 | | | | 3,698 | |
| | | | | | | | | 49,602 | |
| | Ireland—2.8% | | | | | | | | |
| | CRH plc (Construction materials) | | | 625,004 | | | | 21,681 | |
| | Greencore Group plc (Food products) | | | 1,647,714 | | | | 5,006 | |
| * | ICON plc (Life sciences tools & services)† | | | 97,658 | | | | 7,344 | |
| | Kingspan Group plc (Building products) | | | 172,974 | | | | 4,698 | |
| | Shire plc (Biotechnology) | | | 335,415 | | | | 19,362 | |
| | | | | | | | | 58,091 | |
| | Israel—0.8% | | | | | | | | |
| * | Check Point Software Technologies, Ltd. (Software)† | | | 194,581 | | | | 16,434 | |
| | Italy—1.7% | | | | | | | | |
| | Azimut Holding SpA (Capital markets) | | | 206,679 | | | | 3,450 | |
| | Banca Generali SpA (Capital markets) | | | 266,274 | | | | 6,351 | |
| | Brembo SpA (Auto components) | | | 51,477 | | | | 3,116 | |
| | Interpump Group SpA (Machinery) | | | 286,885 | | | | 4,696 | |
| | Intesa Sanpaolo SpA (Banks) | | | 6,219,512 | | | | 15,883 | |
| | Recordati SpA (Pharmaceuticals) | | | 116,368 | | | | 3,298 | |
| | | | | | | | | 36,794 | |
| | Luxembourg—0.2% | | | | | | | | |
| | Eurofins Scientific SE (Life sciences tools & services) | | | 9,707 | | | | 4,138 | |
| | Netherlands—2.1% | | | | | | | | |
| | Randstad Holding N.V. (Professional services) | | | 116,548 | | | | 6,322 | |
| | Royal Dutch Shell plc Class “A” (Oil, gas & consumable fuels) | | | 1,417,719 | | | | 38,779 | |
| | | | | | | | | 45,101 | |
| | Norway—0.2% | | | | | | | | |
| | Gjensidige Forsikring ASA (Insurance) | | | 317,686 | | | | 5,040 | |
| | Portugal—0.2% | | | | | | | | |
| | Jeronimo Martins SGPS S.A. (Food & staples retailing) | | | 234,343 | | | | 3,636 | |
| | Spain—2.7% | | | | | | | | |
| | Aena S.A. (Transportation infrastructure) | | | 74,839 | | | | 10,214 | |
| | Amadeus IT Group S.A. (IT services) | | | 332,039 | | | | 15,089 | |
| | Bankinter S.A. (Banks) | | | 1,660,975 | | | | 12,868 | |
| | Industria de Diseno Textil S.A. (Specialty retail) | | | 479,512 | | | | 16,369 | |
| | Prosegur Cia de Seguridad S.A. (Commercial services & supplies) | | | 450,201 | | | | 2,815 | |
| | | | | | | | | 57,355 | |
| | Sweden—3.5% | | | | | | | | |
| | BillerudKorsnas AB (Containers & packaging) | | | 173,715 | | | | 2,917 | |
| | Boliden AB (Metals & mining) | | | 285,331 | | | | 7,451 | |
See accompanying Notes to Financial Statements.
| 62 | Annual Report | December 31, 2016 |
Institutional International Growth Fund
Portfolio of Investments, December 31, 2016 (all dollar amounts in thousands)
| | | | | | | | |
| | | | | | | | |
| | Issuer | | Shares | | | Value | |
| | | | | | | | | | |
| | Common Stocks—(continued) | | | | | | | | |
| | | | | | | | | | |
| | Europe, Mid-East—(continued) | | | | | | | | |
| | Sweden—(continued) | | | | | | | | |
| | Fabege AB (Real estate management & | | | | | | | | |
| | development) | | | 184,451 | | | $ | 3,015 | |
| | Hexpol AB (Chemicals) | | | 332,637 | | | | 3,080 | |
| | Hufvudstaden AB Class “A” (Real estate management & development) | | | 192,555 | | | | 3,041 | |
| | Husqvarna AB Class “B” (Household durables) | | | 378,916 | | | | 2,947 | |
| | Intrum Justitia AB (Commercial services & supplies) | | | 142,658 | | | | 4,813 | |
| | SKF AB Class “B” (Machinery) | | | 683,380 | | | | 12,572 | |
| | Swedbank AB Class “A” (Banks) | | | 1,390,174 | | | | 33,615 | |
| | | | | | | | | 73,451 | |
| | Switzerland—3.1% | | | | | | | | |
| * | Actelion, Ltd. (Biotechnology) | | | 90,845 | | | | 19,672 | |
| | Adecco Group AG (Professional services) | | | 97,844 | | | | 6,404 | |
| * | Cembra Money Bank AG (Consumer finance) | | | 43,217 | | | | 3,149 | |
| * | dormakaba Holding AG (Building products) | | | 4,282 | | | | 3,183 | |
| | Logitech International S.A. (Technology hardware, storage & peripherals) | | | 124,570 | | | | 3,107 | |
| * | Lonza Group AG (Life sciences tools & services) | | | 67,468 | | | | 11,681 | |
| * | Luxoft Holding, Inc. (IT services)† | | | 45,176 | | | | 2,539 | |
| | Partners Group Holding AG (Capital markets) | | | 30,955 | | | | 14,508 | |
| | | | | | | | | 64,243 | |
| | | | | | | | | | |
| | Japan—19.2% | | | | | | | | |
| | Ain Holdings, Inc. (Food & staples retailing) | | | 2,300 | | | | 152 | |
| | Alps Electric Co., Ltd. (Electronic equipment, instruments & components) | | | 254,800 | | | | 6,161 | |
| | Asahi Intecc Co., Ltd. (Health care equipment & supplies) | | | 61,800 | | | | 2,504 | |
| | Asahi Kasei Corporation (Chemicals) | | | 1,755,000 | | | | 15,309 | |
| | Daifuku Co., Ltd. (Machinery) | | | 202,400 | | | | 4,317 | |
| | Daikin Industries, Ltd. (Building products) | | | 326,500 | | | | 29,989 | |
| | Daito Trust Construction Co., Ltd. (Real estate management & development) | | | 35,800 | | | | 5,385 | |
| | Daiwa House Industry Co., Ltd. (Real estate management & development) | | | 356,900 | | | | 9,760 | |
| | FANUC Corporation (Machinery) | | | 144,700 | | | | 24,532 | |
| | Fuji Electric Co., Ltd. (Electrical equipment) | | | 702,000 | | | | 3,640 | |
| | Fuji Heavy Industries, Ltd. (Automobiles) | | | 819,900 | | | | 33,476 | |
| | Fujitsu General, Ltd. (Household durables) | | | 139,000 | | | | 2,942 | |
| | Haseko Corporation (Household durables) . | | | 402,200 | | | | 4,092 | |
| | Hitachi Chemical Co., Ltd. (Chemicals) | | | 102,200 | | | | 2,556 | |
| | ITOCHU Corporation (Trading companies & distributors) | | | 601,500 | | | | 7,987 | |
| | Keyence Corporation (Electronic equipment, instruments & components) | | | 25,800 | | | | 17,704 | |
| * | LINE Corporation—ADR (Software) | | | 79,052 | | | | 2,689 | |
| | Lion Corporation (Household products) | | | 202,000 | | | | 3,318 | |
| | | | | | | | |
| | | | | | | | |
| | Issuer | | Shares | | | Value | |
| | | | | | | | | | |
| | Common Stocks—(continued) | | | | | | | | |
| | | | | | | | | | |
| | Japan—(continued) | | | | | | | | |
| | M3, Inc. (Health care technology) | | | 121,300 | | | $ | 3,056 | |
| | MISUMI Group, Inc. (Trading companies & distributors) | | | 154,700 | | | | 2,547 | |
| | Mitsubishi Electric Corporation (Electrical equipment) | | | 1,163,600 | | | | 16,223 | |
| | Mitsubishi UFJ Financial Group, Inc. (Banks) | | | 4,531,000 | | | | 27,921 | |
| | Mitsui Mining & Smelting Co., Ltd. (Metals & mining) | | | 675,250 | | | | 1,710 | |
| | Nichias Corporation (Building products) | | | 257,000 | | | | 2,480 | |
| | Nihon M&A Center, Inc. (Capital markets) | | | 95,800 | | | | 2,664 | |
| | Nippon Prologis REIT, Inc. (Equity real estate investment trusts (REITs)) | | | 1,504 | | | | 3,074 | |
| | Nissan Chemical Industries, Ltd. (Chemicals) | | | 159,700 | | | | 5,336 | |
| | Nitori Holdings Co., Ltd. (Specialty retail) . | | | 89,500 | | | | 10,231 | |
| | Oracle Corporation Japan (Software) | | | 50,300 | | | | 2,535 | |
| | ORIX Corporation (Diversified financial services) | | | 1,892,100 | | | | 29,529 | |
| | Park24 Co., Ltd. (Commercial services & supplies) | | | 172,700 | | | | 4,684 | |
| | Pola Orbis Holdings, Inc. (Personal products) | | | 60,700 | | | | 5,012 | |
| | SCSK Corporation (IT services) | | | 113,300 | | | | 3,965 | |
| | Shimamura Co., Ltd. (Specialty retail) | | | 24,900 | | | | 3,108 | |
| | Shionogi & Co., Ltd. (Pharmaceuticals) | | | 338,700 | | | | 16,226 | |
| | SoftBank Group Corporation (Wireless telecommunication services) | | | 255,000 | | | | 16,942 | |
| | Sumitomo Mitsui Financial Group, Inc. (Banks) | | | 660,200 | | | | 25,194 | |
| | Taisei Corporation (Construction & engineering) | | | 1,118,000 | | | | 7,825 | |
| | Temp Holdings Co., Ltd. (Professional services) | | | 213,600 | | | | 3,313 | |
| | TIS, Inc. (IT services) | | | 136,900 | | | | 2,928 | |
| | Tokio Marine Holdings, Inc. (Insurance) | | | 496,400 | | | | 20,370 | |
| | Tsuruha Holdings, Inc. (Food & staples retailing) | | | 60,500 | | | | 5,746 | |
| | Zenkoku Hosho Co., Ltd. (Diversified financial services) | | | 86,700 | | | | 2,786 | |
| | | | | | | | | 401,918 | |
| | | | | | | | | | |
| | United Kingdom—14.5% | | | | | | | | |
| | 3i Group plc (Capital markets) | | | 925,341 | | | | 8,028 | |
| | Babcock International Group plc (Commercial services & supplies) | | | 368,656 | | | | 4,330 | |
| | BAE Systems plc (Aerospace & defense) | | | 2,054,536 | | | | 14,977 | |
| | Bellway plc (Household durables) | | | 169,659 | | | | 5,177 | |
| | Berendsen plc (Commercial services & supplies) | | | 202,507 | | | | 2,172 | |
| | BHP Billiton plc (Metals & mining) | | | 1,531,463 | | | | 24,658 | |
| | British American Tobacco plc (Tobacco) | | | 296,131 | | | | 16,866 | |
| | Bunzl plc (Trading companies & distributors) | | | 353,553 | | | | 9,189 | |
| | Cineworld Group plc (Media) | | | 387,169 | | | | 2,696 | |
| | Close Brothers Group plc (Capital markets) | | | 139,824 | | | | 2,490 | |
See accompanying Notes to Financial Statements.
| December 31, 2016 | William Blair Funds | 63 |
Institutional International Growth Fund
Portfolio of Investments, December 31, 2016 (all dollar amounts in thousands)
| | | | | | | | |
| | | | | | | | |
| | Issuer | | Shares | | | Value | |
| | | | | | | | | | |
| | Common Stocks—(continued) | | | | | | | | |
| | | | | | | | | | |
| | United Kingdom—(continued) | | | | | | | | |
| | Compass Group plc (Hotels, restaurants & leisure) | | | 1,171,734 | | | $ | 21,675 | |
| | Croda International plc (Chemicals) | | | 1,600 | | | | 63 | |
| | Domino’s Pizza Group plc (Hotels, restaurants & leisure) | | | 679,447 | | | | 3,021 | |
| | GlaxoSmithKline plc (Pharmaceuticals) | | | 865,709 | | | | 16,665 | |
| | Halma plc (Electronic equipment, instruments & components) | | | 264,049 | | | | 2,921 | |
| | Hiscox, Ltd. (Insurance) | | | 424,544 | | | | 5,321 | |
| | Informa plc (Media) | | | 1,453,185 | | | | 12,178 | |
| | Intermediate Capital Group plc (Capital markets) | | | 424,399 | | | | 3,661 | |
| | Intertek Group plc (Professional services) | | | 117,757 | | | | 5,052 | |
| | John Wood Group plc (Energy equipment & services) | | | 305,613 | | | | 3,299 | |
| | Johnson Matthey plc (Chemicals) | | | 270,738 | | | | 10,617 | |
| | Jupiter Fund Management plc (Capital markets) | | | 491,262 | | | | 2,686 | |
| | Micro Focus International plc (Software) | | | 256,747 | | | | 6,895 | |
| | Moneysupermarket.com Group plc (Internet software & services) | | | 635,682 | | | | 2,304 | |
| | Playtech plc (Software) | | | 366,758 | | | | 3,733 | |
| | Provident Financial plc (Consumer finance) | | | 114,918 | | | | 4,035 | |
| | Renishaw plc (Electronic equipment, instruments & components) | | | 90,159 | | | | 2,809 | |
| | Rio Tinto, Ltd. (Metals & mining) | | | 872,628 | | | | 37,721 | |
| | Spirax-Sarco Engineering plc (Machinery) . | | | 102,865 | | | | 5,304 | |
| * | Subsea 7 S.A. (Energy equipment & services) | | | 278,153 | | | | 3,521 | |
| | The Sage Group plc (Software) | | | 1,040,131 | | | | 8,396 | |
| | UBM plc (Media) | | | 635,030 | | | | 5,725 | |
| | Unilever plc (Personal products) | | | 78,808 | | | | 3,198 | |
| | Victrex plc (Chemicals) | | | 144,595 | | | | 3,441 | |
| | WH Smith plc (Specialty retail) | | | 198,930 | | | | 3,820 | |
| | Wolseley plc (Trading companies & distributors) | | | 297,476 | | | | 18,191 | |
| | WPP plc (Media) | | | 767,751 | | | | 17,183 | |
| | | | | | | | | 304,018 | |
| | | | | | | | | | |
| | Emerging Asia—10.3% | | | | | | | | |
| | China—3.5% | | | | | | | | |
| | Anhui Conch Cement Co., Ltd. Class “H” (Construction materials) | | | 2,121,500 | | | | 5,772 | |
| | China Overseas Land & Investment, Ltd. (Real estate management & development) | | | 4,512,000 | | | | 11,957 | |
| | ENN Energy Holdings, Ltd. (Gas utilities) . | | | 1,092,000 | | | | 4,492 | |
| | Industrial and Commercial Bank of China, Ltd. Class “H” (Banks) | | | 35,195,000 | | | | 21,105 | |
| | PICC Property & Casualty Co., Ltd. Class “H” (Insurance) | | | 4,650,000 | | | | 7,244 | |
| | Ping An Insurance Group Co. of China, Ltd. Class “H” (Insurance) | | | 4,109,500 | | | | 20,562 | |
| * | Xinyi Solar Holdings, Ltd. (Semiconductors & semiconductor equipment) | | | 7,064,000 | | | | 2,296 | |
| | | | | | | | | 73,428 | |
| | | | | | | | |
| | | | | | | | |
| | Issuer | | Shares | | | Value | |
| | | | | | | | | | |
| | Common Stocks—(continued) | | | | | | | | |
| | | | | | | | | | |
| | Emerging Asia—(continued) | | | | | | | | |
| | India—2.6% | | | | | | | | |
| | Bharat Petroleum Corporation, Ltd. (Oil, gas & consumable fuels) | | | 495,046 | | | $ | 4,624 | |
| | Britannia Industries, Ltd. (Food products) | | | 65,388 | | | | 2,778 | |
| | Eicher Motors, Ltd. (Machinery) | | | 10,411 | | | | 3,340 | |
| | HCL Technologies, Ltd. (IT services) | | | 456,210 | | | | 5,547 | |
| | HDFC Bank, Ltd. (Banks) | | | 547,060 | | | | 9,696 | |
| | IndusInd Bank, Ltd. (Banks) | | | 321,611 | | | | 5,246 | |
| | Maruti Suzuki India, Ltd. (Automobiles) | | | 87,723 | | | | 6,870 | |
| | Motherson Sumi Systems, Ltd. (Auto components) | | | 643,853 | | | | 3,085 | |
| | UPL, Ltd. (Chemicals) | | | 363,657 | | | | 3,466 | |
| | Voltas, Ltd. (Construction & engineering) | | | 550,067 | | | | 2,642 | |
| | Yes Bank, Ltd. (Banks) | | | 353,755 | | | | 6,020 | |
| | | | | | | | | 53,314 | |
| | Indonesia—0.5% | | | | | | | | |
| | PT Bank Central Asia Tbk (Banks) | | | 9,438,200 | | | | 10,859 | |
| | South Korea—2.7% | | | | | | | | |
| | Samsung Electronics Co., Ltd. (Technology hardware, storage & peripherals) | | | 22,543 | | | | 33,634 | |
| * | SK Hynix, Inc. (Semiconductors & semiconductor equipment) | | | 631,770 | | | | 23,381 | |
| | | | | | | | | 57,015 | |
| | Taiwan—1.0% | | | | | | | | |
| | Taiwan Semiconductor Manufacturing Co., Ltd.—ADR (Semiconductors & semiconductor equipment) | | | 708,708 | | | | 20,375 | |
| | | | | | | | | | |
| | Canada—7.0% | | | | | | | | |
| | Alimentation Couche Tard, Inc. Class “B” (Food & staples retailing) | | | 155,501 | | | | 7,051 | |
| | Brookfield Asset Management, Inc. Class “A” (Capital markets)† | | | 112,185 | | | | 3,703 | |
| | Canadian National Railway Co. (Road & rail) | | | 260,541 | | | | 17,534 | |
| | Canadian Natural Resources, Ltd. (Oil, gas & consumable fuels) | | | 703,884 | | | | 22,433 | |
| * | CGI Group, Inc. Class “A” (IT services) | | | 276,870 | | | | 13,288 | |
| | Constellation Software, Inc. (Software) | | | 17,181 | | | | 7,807 | |
| | Dollarama, Inc. (Multiline retail) | | | 162,513 | | | | 11,908 | |
| | Finning International, Inc. (Trading companies & distributors) | | | 149,661 | | | | 2,930 | |
| | Intact Financial Corporation (Insurance) | | | 93,747 | | | | 6,710 | |
| | Suncor Energy, Inc. (Oil, gas & consumable fuels) | | | 513,500 | | | | 16,790 | |
| | The Toronto-Dominion Bank (Banks) | | | 725,717 | | | | 35,793 | |
| | | | | | | | | 145,947 | |
| | | | | | | | | | |
| | Asia—3.2% | | | | | | | | |
| | Australia—2.2% | | | | | | | | |
| | Domino’s Pizza Enterprises, Ltd. (Hotels, restaurants & leisure) | | | 61,485 | | | | 2,884 | |
| | Downer EDI, Ltd. (Commercial services & supplies) | | | 727,409 | | | | 3,197 | |
See accompanying Notes to Financial Statements.
| 64 | Annual Report | December 31, 2016 |
Institutional International Growth Fund
Portfolio of Investments, December 31, 2016 (all dollar amounts in thousands)
| | | | | | | | |
| | | | | | | | |
| | Issuer | | Shares | | | Value | |
| | | | | | | | | | |
| | Common Stocks—(continued | | | | | | | | |
| | | | | | | | | | |
| | Asia—(continued) | | | | | | | | |
| | JB Hi-Fi, Ltd. (Specialty retail) | | | 202,577 | | | $ | 4,099 | |
| | Macquarie Group, Ltd. (Capital markets) | | | 523,149 | | | | 32,890 | |
| | Vicinity Centres (Equity real estate investment trusts (REITs)) | | | 1,317,066 | | | | 2,842 | |
| | | | | | | | | 45,912 | |
| | Hong Kong—0.8% | | | | | | | | |
| | AIA Group, Ltd. (Insurance) | | | 3,198,263 | | | | 18,044 | |
| * | China High Precision Automation Group, Ltd. (Electronic equipment, instruments & components)**§ | | | 3,373,000 | | | | — | |
| | | | | | | | | 18,044 | |
| | New Zealand—0.2% | | | | | | | | |
| | Spark New Zealand, Ltd. (Diversified telecommunication services) | | | 1,445,993 | | | | 3,426 | |
| | | | | | | | | | |
| | Emerging Europe, Mid-East, Africa—1.8% | | | | | | | | |
| | Hungary—0.2% | | | | | | | | |
| | MOL Hungarian Oil & Gas plc (Oil, gas & consumable fuels) | | | 49,078 | | | | 3,447 | |
| | South Africa—0.9% | | | | | | | | |
| | Bid Corporation, Ltd. (Food & staples retailing) | | | 198,562 | | | | 3,544 | |
| | Bidvest Group, Ltd. (Industrial conglomerates) | | | 198,562 | | | | 2,620 | |
| | RMB Holdings, Ltd. (Diversified financial services) | | | 682,409 | | | | 3,299 | |
| | Sanlam, Ltd. (Insurance) | | | 1,055,613 | | | | 4,835 | |
| | The Spar Group, Ltd. (Food & staples retailing) | | | 319,000 | | | | 4,613 | |
| | | | | | | | | 18,911 | |
| | Turkey—0.3% | | | | | | | | |
| | Turkiye Garanti Bankasi A.S. (Banks) | | | 2,861,246 | | | | 6,182 | |
| | United Arab Emirates—0.4% | | | | | | | | |
| | Dubai Islamic Bank PJSC (Banks) | | | 5,054,896 | | | | 7,666 | |
| | | | | | | | | | |
| | Emerging Latin America—1.3% | | | | | | | | |
| | Brazil—0.6% | | | | | | | | |
| | BB Seguridade Participacoes S.A. (Insurance) | | | 1,165,700 | | | | 10,136 | |
| | Engie Brasil Energia S.A. (Independent power & renewable electricity producers) | | | 253,900 | | | | 2,730 | |
| | | | | | | | | 12,866 | |
| | Mexico—0.3% | | | | | | | | |
| | Arca Continental S.A.B. de C.V. (Beverages) | | | 1,036,374 | | | | 5,392 | |
| | Peru—0.4% | | | | | | | | |
| | Credicorp, Ltd. (Banks)† | | | 58,177 | | | | 9,184 | |
| | Total Common Stocks—95.7%
(cost $1,875,101) | | | | | | | 2,003,704 | |
| | | | Shares or | | | | |
| | | | Principal | | | | |
| | Issuer | | Amount | | | | Value | |
| | | | | | | | | | |
| | Preferred Stocks | | | | | | | | |
| | | | | | | | | | |
| | Brazil—1.3% | | | | | | | | |
| | Itau Unibanco Holding S.A. (Banks) | | | 998,900 | | | $ | 10,389 | |
| * | Petroleo Brasileiro S.A. (Oil, gas & consumable fuels) | | | 3,491,800 | | | | 15,953 | |
| | | | | | | | | 26,342 | |
| | Germany—0.1% | | | | | | | | |
| | Sartorius AG (Health care equipment & supplies) | | | 40,357 | | | | 2,995 | |
| | Total Preferred Stocks—1.4%
(cost $30,369) | | | | | | | 29,337 | |
| | | | | | | | | | |
| | Affiliated Fund | | | | | | | | |
| | China—0.0% | | | | | | | | |
| | William Blair China A-Share Fund, LLC§ | | | 6,312 | | | | 102 | |
| | Total Affiliated Fund—0.0%
(cost $63) | | | | | | | 102 | |
| | | | | | | | | | |
| | Repurchase Agreement | | | | | | | | |
| | Fixed Income Clearing Corporation, 0.030% dated 12/30/16, due 1/3/17, repurchase price $48,624, collateralized by U.S. Treasury Bond, 3.000%, due 5/15/45 | | $ | 48,624 | | | | 48,624 | |
| | Total Repurchase Agreement—2.3%
(cost $48,624) | | | | | | | 48,624 | |
| | Total Investments—99.4%
(cost $1,954,157) | | | | | | | 2,081,767 | |
| | Cash and other assets, less liabilities—0.6% | | | | | | | 12,204 | |
| | Net assets—100.0% | | | | | | $ | 2,093,971 | |
ADR = American Depository Receipt
* = Non-income producing securities
† = U.S. listed foreign security
** = Fair valued pursuant to Valuation Procedures approved by the Board of Trustees. This holding represents 0.00% of the Fund’s net assets at December 31, 2016.
§ = Deemed illiquid pursuant to Liquidity Procedures approved by the Board of Trustees. These holdings represent 0.00% of the Fund’s net assets at December 31, 2016.
For securities primarily traded on exchanges or markets that close before the close of regular trading on the New York Stock Exchange, the Fund may use an independent pricing service to fair value price the securities pursuant to Valuation Procedures approved by the Board of Trustees.
See accompanying Notes to Financial Statements.
| December 31, 2016 | William Blair Funds | 65 |
Institutional International Growth Fund
Portfolio of Investments, December 31, 2016 (all dollar amounts in thousands)
At December 31, 2016, the Fund’s Portfolio of Investments includes the following industry categories (as a percentage of long-term investments):
| Financials | | | 27.4 | % |
| Industrials | | | 18.5 | % |
| Consumer Discretionary | | | 13.3 | % |
| Information Technology | | | 11.3 | % |
| Materials | | | 8.5 | % |
| Energy | | | 7.4 | % |
| Health Care | | | 5.6 | % |
| Consumer Staples | | | 3.5 | % |
| Real Estate | | | 2.1 | % |
| Telecommunication Services | | | 1.9 | % |
| Utilities | | | 0.5 | % |
| Total | | | 100.0 | % |
At December 31, 2016, the Fund’s Portfolio of Investments includes the following currency categories (as a percentage of long-term investments):
| Euro | | | 29.4 | % |
| Japanese Yen | | | 19.7 | % |
| British Pound Sterling | | | 14.1 | % |
| Canadian Dollar | | | 7.0 | % |
| Hong Kong Dollar | | | 4.5 | % |
| Australian Dollar | | | 4.1 | % |
| Swedish Krona | | | 3.6 | % |
| U.S. Dollar | | | 3.1 | % |
| Swiss Franc | | | 3.0 | % |
| South Korean Won | | | 2.8 | % |
| Indian Rupee | | | 2.6 | % |
| Brazilian Real | | | 1.9 | % |
| Danish Krone | | | 1.0 | % |
| All Other Currencies | | | 3.2 | % |
| Total | | | 100.0 | % |
As of December 31, 2016, the Fund invested in William Blair China A-Share Fund, LLC, an affiliated fund. There are no unfunded commitments to the affiliated fund. The Fund is subject to repatriation and other redemption restrictions imposed on the William Blair China A-Share Fund, LLC by the Chinese government.
| | | Share Activity | | Year Ended December 31, 2016 |
| Security Name | | Balance
12/31/2015 | | Purchases | | Sales | | Balance
12/31/2016 | | Value | | Dividend
Income | | Net realized
gain (loss) | | Change in net
unrealized
appreciation
(depreciation) |
| William Blair China A-Share Fund, LLC | | 138,952 | | — | | 132,640 | | 6,312 | | $ 102 | | $— | | $978 | | $(1,012) |
See accompanying Notes to Financial Statements.
| 66 | Annual Report | December 31, 2016 |
| | International Small Cap Growth Fund |
| | |
| | The International Small Cap Growth Fund seeks long-term capital appreciation. |
| | |
| | AN OVERVIEW FROM THE PORTFOLIO MANAGERS |
| | |

Stephanie G. Braming 
Andrew G. Flynn | The William Blair International Small Cap Growth Fund (Class N shares) posted a 4.60% decrease, net of fees, for the twelve months ended December 31, 2016. By comparison, the Fund’s benchmark index, the MSCI All Country World ex-U.S. Small Cap Index (net) (the “Index”), increased 3.91%. Adverse style effects broadly detracted from the Fund’s calendar year 2016 performance versus the Index. The Fund’s overweight to higher growth, higher valuation companies with relatively strong earnings trends was detrimental amid an environment of low valuation market leadership. From a sector attribution perspective, stock selection in Real Estate and Information Technology (IT) were the largest detractors from the Fund’s performance relative to the Index for the year. The Fund’s Real Estate stock selection was adversely impacted by holdings in U.K. Real Estate Investment Trusts, including Workspace Group and Big Yellow Group, both of which suffered from uncertainty surrounding Britain’s referendum on European Union membership and Brexit’s potentially detrimental impact on U.K. real estate activity. Within the IT sector, exposure to Electronic Equipment, Internet Software and Semiconductor companies weighed on the Fund’s relative performance. U.K.-based price comparison website Moneysupermarket.com was a primary detractor within the Internet Software industry, hampered by earnings downgrades following the Brexit vote and the announced departure of its CEO. Helping to offset these negative effects was the Fund’s positive stock selection in the Energy and Healthcare sectors, combined with its underweightings in Real Estate and IT. Within Energy, oil services company Canadian Energy Services was the primary contributor to the Fund’s performance, benefiting from analyst upgrades on an improving outlook for drilling activity. Within Healthcare, positive stock selection was supported by Japanese medical information services company M3, which benefited from strength in its medical portal division and improving profitability overseas. From a geographic attribution perspective, stock selection in Japan was the primary detractor from the Fund’s relative performance in 2016, mostly within the IT, Consumer Discretionary and Consumer Staples sectors. These negative effects were mitigated by favorable stock selection in Emerging Asia, as the Fund’s holdings in China and India outperformed. Please refer to the Global Markets Review and Outlook relating to the Fund on page 36. |
| December 31, 2016 | William Blair Funds | 67 |
International Small Cap Growth Fund
Performance Highlights (Unaudited)
| Average Annual Total Return at 12/31/2016 |
| | | 1 Year | | 3 Year | | 5 Year | | 10 Year |
| Class N | | | (4.60 | )% | | | (1.42 | )% | | | 7.79 | % | | | 3.25 | % |
| Class I | | | (4.41 | ) | | | (1.14 | ) | | | 8.09 | | | | 3.57 | |
| Institutional Class | | | (4.31 | ) | | | (1.02 | ) | | | 8.28 | | | | 3.75 | |
| MSCI ACW Ex-U.S. Small Cap Index (net) | | | 3.91 | | | | 0.76 | | | | 7.74 | | | | 2.90 | |
Performance cited represents past performance. Past performance does not guarantee future results and current performance may be lower or higher than the data quoted. Results shown are average annual returns, which assume reinvestment of dividends and capital gains. Investment returns and principal will fluctuate and you may have a gain or loss when you sell shares. For the most current month-end performance information, please call 1-800-742-7272, or visit our Web site at www.williamblairfunds.com. From time to time, the investment adviser may waive fees or reimburse expenses for the Fund. Without these waivers/reimbursements, performance would be lower. Smaller capitalization stocks are also more sensitive to purchase/sale transactions and changes in the issuer’s financial condition. International investing involves special risk considerations, including currency fluctuations, lower liquidity, economic and political risk. Class N shares are available to the general public without a sales load. Class I shares are available to certain institutional investors and advisory clients of William Blair Investment Management, LLC and William Blair & Company, L.L.C., without a sales load or distribution (12b-1) fees. Institutional Class shares are available to institutional investors without a sales load or distribution (12b-1) or service fees.
The performance highlights and graph presented above do not reflect the deduction of taxes that a shareholder would pay on fund distributions or the redemption of fund shares.
The Morgan Stanley Capital International (MSCI) All Country World (ACW) Ex-U.S. Small Cap Index (net) is a free float-adjusted market capitalization weighted index that is designed to measure the equity market performance of small capitalization developed and emerging markets, excluding the United States. This series approximates the minimum possible dividend reinvestment.
This report identifies the Fund’s investments on December 31, 2016. These holdings are subject to change. Not all stocks in the Fund performed the same, nor is there any guarantee that these stocks will perform as well in the future. Market forecasts provided in this report may not necessarily come to pass.
Sector Diversification (Unaudited)

The sector diversification shown is based on the total long-term securities.
| 68 | Annual Report | December 31, 2016 |
International Small Cap Growth Fund
Portfolio of Investments, December 31, 2016 (all dollar amounts in thousands)
| | | | | | | | | | |
| | | | | | | | | | |
| | Issuer | | Shares | | | Value | |
| | | | | | | | | | |
| | Common Stocks | | | | | | | | |
| | | | | | | | | | |
| | Europe, Mid-East—33.0% | | | | | | | | |
| | Austria—0.4% | | | | | | | | |
| | Schoeller-Bleckmann Oilfield Equipment AG (Energy equipment & services) | | | 24,469 | | | $ | 1,971 | |
| | Denmark—0.7% | | | | | | | | |
| | Royal Unibrew A/S (Beverages) | | | 97,682 | | | | 3,770 | |
| | Finland—1.3% | | | | | | | | |
| | Huhtamaki Oyj (Containers & packaging) | | | 89,831 | | | | 3,336 | |
| | Tieto Oyj (IT services) | | | 115,629 | | | | 3,155 | |
| | | | | | | | | 6,491 | |
| | France—7.0% | | | | | | | | |
| | Alten S.A. (IT services) | | | 74,621 | | | | 5,241 | |
| | Ipsen S.A. (Pharmaceuticals) | | | 93,805 | | | | 6,784 | |
| | Metropole Television S.A. (Media) | | | 220,148 | | | | 4,095 | |
| * | Nexity S.A. (Real estate management & development) | | | 84,404 | | | | 3,950 | |
| | Rubis SCA (Gas utilities) | | | 64,368 | | | | 5,307 | |
| | Sartorius Stedim Biotech (Health care equipment & supplies) | | | 37,999 | | | | 2,399 | |
| | SEB S.A. (Household durables) | | | 19,226 | | | | 2,605 | |
| | Teleperformance (Professional services) | | | 57,884 | | | | 5,807 | |
| | | | | | | | | 36,188 | |
| | Germany—3.0% | | | | | | | | |
| | AURELIUS Equity Opportunities SE & Co KGaA (Capital markets) | | | 115,042 | | | | 6,736 | |
| | KION Group AG (Machinery) | | | 96,335 | | | | 5,360 | |
| | Norma Group SE (Machinery) | | | 80,495 | | | | 3,436 | |
| | | | | | | | | 15,532 | |
| | Ireland—2.6% | | | | | | | | |
| | Greencore Group plc (Food products) | | | 1,075,954 | | | | 3,269 | |
| * | ICON plc (Life sciences tools & services)† | | | 62,644 | | | | 4,711 | |
| | Kingspan Group plc (Building products) | | | 192,843 | | | | 5,237 | |
| | | | | | | | | 13,217 | |
| | Israel—2.0% | | | | | | | | |
| | Elbit Systems, Ltd. (Aerospace & defense) | | | 59,128 | | | | 5,986 | |
| | Mizrahi Tefahot Bank, Ltd. (Banks) | | | 141,815 | | | | 2,075 | |
| * | Orbotech, Ltd. (Electronic equipment, instruments & components)† | | | 75,041 | | | | 2,507 | |
| | | | | | | | | 10,568 | |
| | Italy—4.9% | | | | | | | | |
| | Banca IFIS SpA (Diversified financial services) | | | 123,332 | | | | 3,376 | |
| | Brembo SpA (Auto components) | | | 74,894 | | | | 4,533 | |
| | Cerved Information Solutions SpA (Diversified financial services) | | | 669,116 | | | | 5,557 | |
| | DiaSorin SpA (Health care equipment & supplies) | | | 50,949 | | | | 3,017 | |
| | Industria Macchine Automatiche SpA (Machinery) | | | 84,414 | | | | 5,118 | |
| | Recordati SpA (Pharmaceuticals) | | | 138,652 | | | | 3,929 | |
| | | | | | | | | 25,530 | |
| | | | | | | | |
| | | | | | |
| | Issuer | | Shares | | | Value | |
| | | | | | | | | | |
| | Common Stocks—(continued) | | | | | | | | |
| | | | | | | | | | |
| | Europe, Mid-East—(continued) | | | | | | | | |
| | Luxembourg—0.3% | | | | | | | | |
| * | Stabilus S.A. (Machinery) | | | 31,824 | | | $ | 1,710 | |
| | Spain—1.5% | | | | | | | | |
| | Atresmedia Corporation de Medios de Comunicaion S.A. (Media) | | | 226,980 | | | | 2,482 | |
| | Cia de Distribucion Integral Logista Holdings S.A. (Air freight & logistics) | | | 223,917 | | | | 5,186 | |
| | | | | | | | | 7,668 | |
| | Sweden—7.3% | | | | | | | | |
| | Bilia AB Class “A” (Specialty retail) | | | 107,193 | | | | 2,465 | |
| | BillerudKorsnas AB (Containers & packaging) | | | 236,109 | | | | 3,965 | |
| | Boliden AB (Metals & mining) | | | 258,564 | | | | 6,752 | |
| | Granges AB (Metals & mining) | | | 338,261 | | | | 3,193 | |
| | Indutrade AB (Trading companies & distributors) | | | 213,758 | | | | 4,294 | |
| | Intrum Justitia AB (Commercial services & supplies) | | | 201,340 | | | | 6,793 | |
| | Loomis AB Class “B” (Commercial services & supplies) | | | 105,407 | | | | 3,137 | |
| * | NetEnt AB (Internet software & services) | | | 605,167 | | | | 4,670 | |
| | Thule Group AB (Leisure products) | | | 163,888 | | | | 2,563 | |
| | | | | | | | | 37,832 | |
| | Switzerland—2.0% | | | | | | | | |
| * | Cembra Money Bank AG (Consumer finance) | | | 59,239 | | | | 4,317 | |
| * | dormakaba Holding AG (Building products) | | | 1,325 | | | | 985 | |
| * | Luxoft Holding, Inc. (IT services)† | | | 37,873 | | | | 2,128 | |
| | Straumann Holding AG (Health care equipment & supplies) | | | 7,133 | | | | 2,784 | |
| | | | | | | | | 10,214 | |
| | | | | | | | | | |
| | Japan—19.1% | | | | | | | | |
| | BML, Inc. (Health care providers & services) | | | 102,200 | | | | 2,436 | |
| | Daifuku Co., Ltd. (Machinery) | | | 174,100 | | | | 3,714 | |
| | Daiichikosho Co., Ltd. (Media) | | | 69,600 | | | | 2,751 | |
| | Dowa Holdings Co., Ltd. (Metals & mining) | | | 468,000 | | | | 3,580 | |
| | Fuji Electric Co., Ltd. (Electrical equipment) | | | 490,000 | | | | 2,541 | |
| | GLP J-Reit (Equity real estate investment trusts (REITs)) | | | 4,342 | | | | 5,000 | |
| | Haseko Corporation (Household durables) | | | 294,600 | | | | 2,997 | |
| | Hitachi Chemical Co., Ltd. (Chemicals) | | | 167,900 | | | | 4,199 | |
| | Hoshizaki Corp. (Machinery) | | | 30,400 | | | | 2,406 | |
| | Kose Corporation (Personal products) | | | 35,600 | | | | 2,958 | |
| | Meitec Corporation (Professional services) | | | 110,300 | | | | 4,223 | |
| | MISUMI Group, Inc. (Trading companies & distributors) | | | 198,800 | | | | 3,273 | |
| | Nihon M&A Center, Inc. (Capital markets) | | | 133,100 | | | | 3,701 | |
| | Nissan Chemical Industries, Ltd. (Chemicals) | | | 181,700 | | | | 6,071 | |
See accompanying Notes to Financial Statements.
| December 31, 2016 | William Blair Funds | 69 |
International Small Cap Growth Fund
Portfolio of Investments, December 31, 2016 (all dollar amounts in thousands)
| | | | | | | |
| | | | | | | |
| | Issuer | | Shares | | | Value | |
| | | | | | | | | | |
| | Common Stocks—(continued) | | | | | | | | |
| | | | | | | | | | |
| | Japan—(continued) | | | | | | | | |
| | NS Solutions Corporation (IT services) | | | 182,800 | | | $ | 3,291 | |
| | Okamoto Industries, Inc. (Chemicals) | | | 133,000 | | | | 1,227 | |
| | Oracle Corporation Japan (Software) | | | 63,400 | | | | 3,195 | |
| | Park24 Co., Ltd. (Commercial services & supplies) | | | 111,600 | | | | 3,027 | |
| | Pola Orbis Holdings, Inc. (Personal products) | | | 46,000 | | | | 3,798 | |
| | Relo Group, Inc. (Real estate management & development) | | | 26,700 | | | | 3,806 | |
| | Shimamura Co., Ltd. (Specialty retail) | | | 20,800 | | | | 2,596 | |
| | Start Today Co., Ltd. (Internet & direct marketing retail) | | | 182,800 | | | | 3,158 | |
| | Suruga Bank, Ltd. (Banks) | | | 322,700 | | | | 7,204 | |
| | Temp Holdings Co., Ltd. (Professional services) | | | 262,100 | | | | 4,066 | |
| | TIS, Inc. (IT services) | | | 141,800 | | | | 3,033 | |
| | Tokyo Century Corporation (Diversified financial services) | | | 88,500 | | | | 3,029 | |
| | Tsuruha Holdings, Inc. (Food & staples retailing) | | | 44,700 | | | | 4,245 | |
| | Zenkoku Hosho Co., Ltd. (Diversified financial services) | | | 98,700 | | | | 3,171 | |
| | | | | | | | | 98,696 | |
| | | | | | | | | | |
| | United Kingdom—14.0% | | | | | | | | |
| | Abcam plc (Biotechnology) | | | 261,722 | | | | 2,474 | |
| | Beazley plc (Insurance) | | | 1,212,534 | | | | 5,791 | |
| | Berendsen plc (Commercial services & supplies) | | | 365,258 | | | | 3,918 | |
| | Big Yellow Group plc (Equity real estate investment trusts (REITs)) | | | 280,859 | | | | 2,373 | |
| | Domino’s Pizza Group plc (Hotels, restaurants & leisure) | | | 624,755 | | | | 2,778 | |
| | Elementis plc (Chemicals) | | | 925,572 | | | | 3,164 | |
| | Halma plc (Electronic equipment, instruments & components) | | | 286,559 | | | | 3,170 | |
| | Hays plc (Professional services) | | | 1,219,867 | | | | 2,243 | |
| | IG Group Holdings plc (Capital markets) | | | 315,619 | | | | 1,922 | |
| | Inchcape plc (Distributors) | | | 442,082 | | | | 3,825 | |
| | Intermediate Capital Group plc (Capital markets) | | | 436,632 | | | | 3,767 | |
| | John Wood Group plc (Energy equipment & services) | | | 250,307 | | | | 2,702 | |
| | Jupiter Fund Management plc (Capital markets) | | | 664,405 | | | | 3,632 | |
| | Micro Focus International plc (Software) | | | 231,558 | | | | 6,218 | |
| | Playtech plc (Software) | | | 305,647 | | | | 3,111 | |
| | Rentokil Initial plc (Commercial services & supplies) | | | 1,926,440 | | | | 5,275 | |
| | Spirax-Sarco Engineering plc (Machinery) | | | 50,537 | | | | 2,606 | |
| | SSP Group plc (Hotels, restaurants & leisure) | | | 1,049,741 | | | | 5,009 | |
| | Ted Baker plc (Textiles, apparel & luxury goods) | | | 83,765 | | | | 2,905 | |
| | Ultra Electronics Holdings plc (Aerospace & defense) | | | 223,429 | | | | 5,345 | |
| | | | | | | | | 72,228 | |
| | | | | | | | |
| | | | | | | | |
| | Issuer | | Shares | | | Value | |
| | | | | | | | | | |
| | Common Stocks—(continued) | | | | | | | | |
| | | | | | | | | | |
| | Emerging Asia—11.0% | | | | | | | | |
| | China—2.6% | | | | | | | | |
| | Beijing Capital International Airport Co., Ltd. Class “H” (Transportation infrastructure) | | | 2,486,000 | | | $ | 2,513 | |
| * | China Lodging Group, Ltd.—ADR (Hotels, restaurants & leisure) | | | 85,033 | | | | 4,408 | |
| | Hollysys Automation Technologies, Ltd. (Electronic equipment, instruments & components)† | | | 180,041 | | | | 3,298 | |
| | Huaneng Renewables Corporation, Ltd. Class “H” (Independent power & renewable electricity producers) | | | 10,024,000 | | | | 3,258 | |
| | | | | | | | | 13,477 | |
| | India—3.2% | | | | | | | | |
| | Indiabulls Housing Finance, Ltd. (Thrifts & mortgage finance) | | | 444,366 | | | | 4,249 | |
| | Motherson Sumi Systems, Ltd. (Auto components) | | | 565,599 | | | | 2,710 | |
| | UPL, Ltd. (Chemicals) | | | 396,135 | | | | 3,775 | |
| | Yes Bank, Ltd. (Banks) | | | 334,808 | | | | 5,698 | |
| | | | | | | | | 16,432 | |
| | Indonesia—0.5% | | | | | | | | |
| | PT Bank Negara Indonesia Persero Tbk (Banks) | | | 7,046,500 | | | | 2,890 | |
| | South Korea—1.1% | | | | | | | | |
| * | BGF retail Co., Ltd. (Food & staples retailing) | | | 11,351 | | | | 769 | |
| * | Kangwon Land, Inc. (Hotels, restaurants & leisure) | | | 93,320 | | | | 2,762 | |
| * | S-1 Corporation (Commercial services & supplies) | | | 28,948 | | | | 2,102 | |
| | | | | | | | | 5,633 | |
| | Taiwan—3.6% | | | | | | | | |
| | Advantech Co., Ltd. (Technology hardware, storage & peripherals) | | | 304,000 | | | | 2,401 | |
| | E.Sun Financial Holding Co., Ltd. (Banks) | | | 6,833,345 | | | | 3,891 | |
| | Novatek Microelectronics Corporation (Semiconductors & semiconductor equipment) | | | 472,000 | | | | 1,560 | |
| | PChome Online, Inc. (Internet software & services) | | | 283,000 | | | | 2,485 | |
| | Powertech Technology, Inc. (Semiconductors & semiconductor equipment) | | | 1,163,000 | | | | 3,139 | |
| | Silicon Motion Technology Corporation— ADR (Semiconductors & semiconductor equipment) | | | 71,262 | | | | 3,027 | |
| | Tripod Technology Corporation (Electronic equipment, instruments & components) | | | 902,000 | | | | 2,037 | |
| | | | | | | | | 18,540 | |
See accompanying Notes to Financial Statements.
| 70 | Annual Report | December 31, 2016 |
International Small Cap Growth Fund
Portfolio of Investments, December 31, 2016 (all dollar amounts in thousands)
| | | | | | | | |
| | | | | | | | |
| | Issuer | | Shares | | | Value | |
| | | | | | | | | | |
| | Common Stocks—(continued) | | | | | | | | |
| | | | | | | | | | |
| | Asia—7.7% | | | | | | | | |
| | Australia—6.1% | | | | | | | | |
| | Challenger, Ltd. (Diversified financial services) | | | 651,734 | | | $ | 5,286 | |
| | DuluxGroup, Ltd. (Chemicals) | | | 1,147,633 | | | | 5,168 | |
| | JB Hi-Fi, Ltd. (Specialty retail) | | | 273,918 | | | | 5,543 | |
| | Magellan Financial Group, Ltd. (Capital markets) | | | 221,763 | | | | 3,804 | |
| | Orora, Ltd. (Containers & packaging) | | | 2,985,594 | | | | 6,442 | |
| | The Star Entertainment Group, Ltd. (Hotels, restaurants & leisure) | | | 1,347,105 | | | | 5,026 | |
| | | | | | | | | 31,269 | |
| | Hong Kong—0.8% | | | | | | | | |
| | Man Wah Holdings, Ltd. (Household durables) | | | 6,121,200 | | | | 4,144 | |
| | New Zealand—0.1% | | | | | | | | |
| | Ryman Healthcare, Ltd. (Health care providers & services) | | | 108,855 | | | | 614 | |
| | Singapore—0.7% | | | | | | | | |
| | SATS, Ltd. (Transportation infrastructure) | | | 1,140,000 | | | | 3,818 | |
| | | | | | | | | | |
| | Canada—5.0% | | | | | | | | |
| | Canadian Energy Services & Technology Corporation (Energy equipment & services) | | | 785,457 | | | | 4,481 | |
| | Finning International, Inc. (Trading companies & distributors) | | | 222,388 | | | | 4,354 | |
| | Linamar Corporation (Auto components) | | | 67,394 | | | | 2,896 | |
| | Peyto Exploration & Development Corporation (Oil, gas & consumable fuels) | | | 136,882 | | | | 3,386 | |
| * | Raging River Exploration, Inc. (Oil, gas & consumable fuels) | | | 669,202 | | | | 5,263 | |
| | Whitecap Resources, Inc. (Oil, gas & consumable fuels) | | | 584,532 | | | | 5,294 | |
| | | | | | | | | 25,674 | |
| | | | | | | | | | |
| | Emerging Europe, Mid-East, Africa—4.4% | | | | | | | | |
| | Czech Republic—0.7% | | | | | | | | |
| * | Moneta Money Bank A.S. (Banks) | | | 1,178,012 | | | | 3,800 | |
| | Hungary—0.7% | | | | | | | | |
| | Richter Gedeon Nyrt (Pharmaceuticals) | | | 182,157 | | | | 3,850 | |
| | South Africa—2.1% | | | | | | | | |
| | AVI, Ltd. (Food products) | | | 675,883 | | | | 4,496 | |
| | Bidvest Group, Ltd. (Industrial conglomerates) | | | 264,240 | | | | 3,487 | |
| | RMB Holdings, Ltd. (Diversified financial services) | | | 582,424 | | | | 2,816 | |
| | | | | | | | | 10,799 | |
| | Issuer | | | Shares or
Principal
Amount | | | | Value | |
| | | | | | | | | | |
| | Common Stocks—(continued) | | | | | | | | |
| | | | | | | | | | |
| | Emerging Europe, Mid-East, Africa—(continued) | | | | | | | | |
| | Turkey—0.9% | | | | | | | | |
| | Arcelik A.S. (Household durables) | | | 395,600 | | | $ | 2,378 | |
| | Turkiye Sinai Kalkinma Bankasi A.S. (Banks) | | | 5,246,711 | | | | 2,098 | |
| | | | | | | | | 4,476 | |
| | | | | | | | | | |
| | Emerging Latin America—4.2% | | | | | | | | |
| | Brazil—1.8% | | | | | | | | |
| | CVC Brasil Operadora e Agencia de Viagens S.A. (Hotels, restaurants & leisure) | | | 375,100 | | | | 2,731 | |
| | EDP - Energias do Brasil S.A. (Electric utilities) | | | 884,100 | | | | 3,640 | |
| | Localiza Rent a Car S.A. (Road & rail) | | | 269,500 | | | | 2,834 | |
| | | | | | | | | 9,205 | |
| | Mexico—2.4% | | | | | | | | |
| | Gentera S.A.B. de C.V. (Consumer finance) | | | 3,609,700 | | | | 5,806 | |
| | Grupo Aeroportuario del Centro Norte S.A.B. de C.V. (Transportation infrastructure) | | | 564,100 | | | | 2,428 | |
| | Grupo Aeroportuario del Sureste S.A.B. de C.V.—ADR (Transportation infrastructure) | | | 26,058 | | | | 3,749 | |
| | Promotora y Operadora de Infraestructura S.A.B. de C.V. (Transportation infrastructure) | | | 52,800 | | | | 441 | |
| | | | | | | | | 12,424 | |
| | Total Common Stocks—98.4%
(cost $476,252) | | | | | | | 508,660 | |
| | | | | | | | | | |
| | Repurchase Agreement | | | | | | | | |
| | Fixed Income Clearing Corporation, 0.030% dated 12/30/16, due 1/3/17, repurchase price $8,208, collateralized by U.S. Treasury Bond, 3.000%, due 5/15/45 | | $ | 8,207 | | | | 8,207 | |
| | Total Repurchase Agreement—1.6%
(cost $8,207) | | | | | | | 8,207 | |
| | Total Investments—100.0%
(cost $484,459) | | | | | | | 516,867 | |
| | Liabilities, plus cash and other assets—0.0% | | | | | | | (234 | ) |
| | Net assets—100.0% | | | | | | $ | 516,633 | |
ADR = American Depository Receipt
* = Non-income producing securities
† = U.S. listed foreign security
For securities primarily traded on exchanges or markets that close before the close of regular trading on the New York Stock Exchange, the Fund may use an independent pricing service to fair value price the securities pursuant to Valuation Procedures approved by the Board of Trustees.
See accompanying Notes to Financial Statements.
| December 31, 2016 | William Blair Funds | 71 |
International Small Cap Growth Fund
Portfolio of Investments, December 31, 2016 (all dollar amounts in thousands)
At December 31, 2016, the Fund’s Portfolio of Investments includes the following industry categories (as a percentage of long-term investments):
| Industrials | | | 23.9 | % |
| Financials | | | 18.6 | % |
| Consumer Discretionary | | | 15.2 | % |
| Information Technology | | | 11.3 | % |
| Materials | | | 10.0 | % |
| Health Care | | | 6.5 | % |
| Consumer Staples | | | 4.6 | % |
| Energy | | | 4.5 | % |
| Real Estate | | | 3.0 | % |
| Utilities | | | 2.4 | % |
| Total | | | 100.0 | % |
At December 31, 2016, the Fund’s Portfolio of Investments includes the following currency categories (as a percentage of long-term investments):
| Euro | | | 19.7 | % |
| Japanese Yen | | | 19.4 | % |
| British Pound Sterling | | | 14.8 | % |
| Swedish Krona | | | 7.4 | % |
| Australian Dollar | | | 6.1 | % |
| Canadian Dollar | | | 5.1 | % |
| U.S. Dollar | | | 4.7 | % |
| Indian Rupee | | | 3.2 | % |
| New Taiwan Dollar | | | 3.1 | % |
| South African Rand | | | 2.1 | % |
| Hong Kong Dollar | | | 2.0 | % |
| Brazilian Real | | | 1.8 | % |
| Mexican Peso | | | 1.7 | % |
| Swiss Franc | | | 1.6 | % |
| Israeli Shekel | | | 1.6 | % |
| South Korean Won | | | 1.1 | % |
| All Other Currencies | | | 4.6 | % |
| Total | | | 100.0 | % |
See accompanying Notes to Financial Statements.
| 72 | Annual Report | December 31, 2016 |
| | Emerging Markets Leaders Fund |
| | |
| | The Emerging Markets Leaders Fund seeks long-term capital appreciation. |
| | |
| | AN OVERVIEW FROM THE PORTFOLIO MANAGERS |
| | |

Todd M. McClone 
John C. Murphy 
Jeffrey A. Urbina | The William Blair Emerging Markets Leaders Fund (Class N shares) posted a 1.42% increase, net of fees, for the twelve months ended December 31, 2016. By comparison, the Fund’s benchmark index, the MSCI Emerging Markets Index (net) (the “Index”), increased 11.19%. Adverse style effects broadly detracted from the Fund’s calendar year 2016 performance versus the Index. The Fund’s overweight to higher growth, higher valuation companies with relatively strong earnings trends was detrimental amid an environment of significant low valuation market leadership. From a sector attribution perspective stock selection in Financials and Materials, an underweight to Energy, and an overweight to Consumer Staples were the primary detractors from the Fund’s performance relative to the Index for the year. Within Financials, the Fund’s Bank holdings did not keep pace with the Index, hampered partially by the position in Turkiye Garanti Bankasi, which stumbled on broader macroeconomic and political risk in Turkey. Mexican bank exposure, including Grupo Financiero Inbursa which was sold from the Fund in the second quarter due to slowing loan growth, and Grupo Financiero Banorte which weakened along with Mexican banks following Donald Trump’s election victory, also detracted from the Fund’s relative performance as a result of concerns about corporate credit quality and a potential increase in non-performing loans. Within Materials, the Fund’s lack of exposure to Metals & Mining stocks was a significant detractor from relative performance during the year. These effects more than offset the positive contributions from the Fund’s stock selection in the Industrials sector and its underweight positions in Healthcare, Telecommunication Services and Materials. From a geographic attribution perspective, stock selection within Russia and Brazil were the largest detractors from the Fund’s relative performance in 2016, driven by a lack of exposure to strong performing Index holdings in the Metals & Mining and Oil & Gas industries. These effects offset positive contributions from the Fund’s stock selection in Malaysia, the Philippines and Taiwan, along with its underweight to China and overweights to Thailand and Peru. Please refer to the Global Markets Review and Outlook relating to the Fund on page 36. |
| December 31, 2016 | William Blair Funds | 73 |
Emerging Markets Leaders Fund
Performance Highlights (Unaudited)
| Average Annual Total Return at 12/31/2016 |
| | | 1 Year | | 3 Year | | 5 Year | | | Since
Inception |
| Class N(b) | | | 1.42 | % | | | (3.98 | )% | | | 1.13 | % | | | 0.12 | % |
| MSCI Emerging Markets Index – (net)(b) | | | 11.19 | | | | (2.55 | ) | | | 1.28 | | | | 0.12 | |
| Class I(a) | | | 1.82 | | | | (3.64 | ) | | | 1.42 | | | | (1.01 | ) |
| Institutional Class(a) | | | 1.74 | | | | (3.60 | ) | | | 1.53 | | | | (0.90 | ) |
| MSCI Emerging Markets Index (net)(a) | | | 11.19 | | | | (2.55 | ) | | | 1.28 | | | | (0.41 | ) |
| (a) | Since inception is for the period from March 26, 2008 (Commencement of Operations) to December 31, 2016. |
| (b) | Since inception is for the period from May 3, 2010 (Commencement of Operations) to December 31, 2016. |
Performance cited represents past performance. Past performance does not guarantee future results and current performance may be lower or higher than the data quoted. Results shown are average annual total returns, which assume reinvestment of dividends and capital gains. Investment returns and principal will fluctuate and you may have a gain or loss when you sell shares. For the most current month-end performance information, please call 1-800-742-7272, or visit our Web site at www.williamblairfunds.com. International investing involves special risk considerations, including currency fluctuations, lower liquidity, economic and political risk. These risks may be magnified when investing in emerging markets. From time to time, the investment adviser may waive fees or reimburse expenses for the Fund. Without these waivers/reimbursements, performance would be lower. Class N shares are available to the general public without a sales load. Class I shares are available to certain institutional investors and advisory clients of William Blair Investment Management, LLC and William Blair & Company, L.L.C., without a sales load or distribution (12b-1) fees. Institutional Class shares are available to institutional investors without a sales load or distribution (12b-1) or service fees.
The performance highlights and graph presented above do not reflect the deduction of taxes that a shareholder would pay on fund distributions or the redemption of fund shares.
The Morgan Stanley Capital International (MSCI) Emerging Markets Index (net) is a free float-adjusted market-capitalization-weighted index that is designed to measure equity market performance of emerging markets. This series approximates the minimum possible dividend reinvestment.
This report identifies the Fund’s investments on December 31, 2016. These holdings are subject to change. Not all stocks in the Fund performed the same, nor is there any guarantee that these stocks will perform as well in the future. Market forecasts provided in this report may not necessarily come to pass.
Sector Diversification (Unaudited)
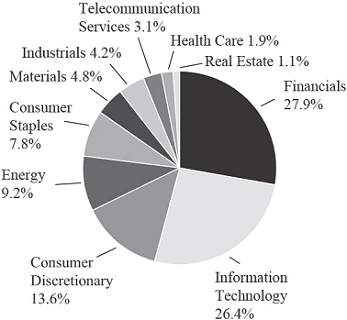
The sector diversification shown is based on the total long-term securities.
| 74 | Annual Report | December 31, 2016 |
Emerging Markets Leaders Fund
Portfolio of Investments, December 31, 2016 (all dollar amounts in thousands)
| | Issuer | |
Shares | | | Value | |
| | | | | | | | | | |
| | Common Stocks | | | | | | | | |
| | | | | | | | | | |
| | Emerging Asia—65.7% | | | | | | | | |
| | China—21.0% | | | | | | | | |
| * | Alibaba Group Holding, Ltd.—ADR (Internet software & services) | | | 101,933 | | | $ | 8,951 | |
| | Anhui Conch Cement Co., Ltd. Class “H” (Construction materials) | | | 1,761,500 | | | | 4,793 | |
| * | Baidu, Inc.—ADR (Internet software & services) | | | 18,809 | | | | 3,092 | |
| | China Mobile, Ltd. (Wireless telecommunication services) | | | 293,000 | | | | 3,106 | |
| | CNOOC, Ltd. (Oil, gas & consumable fuels) | | | 6,358,000 | | | | 7,953 | |
| | Industrial and Commercial Bank of China, Ltd. Class “H” (Banks) | | | 13,814,000 | | | | 8,284 | |
| | NetEase, Inc.—ADR (Internet software & services) | | | 13,053 | | | | 2,811 | |
| * | New Oriental Education & Technology Group, Inc.—ADR (Diversified consumer services) | | | 35,616 | | | | 1,499 | |
| | Ping An Insurance Group Co. of China, Ltd. Class “H” (Insurance) | | | 1,460,000 | | | | 7,305 | |
| | Sinopharm Group Co., Ltd. Class “H” (Health care providers & services) | | | 345,200 | | | | 1,422 | |
| | *TAL Education Group—ADR (Diversified consumer services) | | | 23,985 | | | | 1,682 | |
| | Tencent Holdings, Ltd. (Internet software & services) | | | 424,500 | | | | 10,385 | |
| * | Yum China Holdings, Inc. (Hotels, restaurants & leisure) | | | 109,251 | | | | 2,854 | |
| | | | | | | | | 64,137 | |
| | India—12.5% | | | | | | | | |
| | Asian Paints, Ltd. (Chemicals) | | | 149,360 | | | | 1,960 | |
| | Bharat Petroleum Corporation, Ltd. (Oil, gas & consumable fuels) | | | 420,200 | | | | 3,925 | |
| | HDFC Bank, Ltd. (Banks) | | | 177,687 | | | | 3,149 | |
| | HDFC Bank, Ltd.—ADR (Banks) | | | 66,481 | | | | 4,034 | |
| | Hero MotoCorp, Ltd. (Automobiles) | | | 129,600 | | | | 5,790 | |
| | Housing Development Finance Corporation, Ltd. (Thrifts & mortgage finance) | | | 322,475 | | | | 5,993 | |
| | IndusInd Bank, Ltd. (Banks) | | | 230,806 | | | | 3,765 | |
| | Maruti Suzuki India, Ltd. (Automobiles) | | | 50,522 | | | | 3,957 | |
| | Tata Motors, Ltd. (Automobiles) | | | 474,860 | | | | 3,288 | |
| | Vedanta, Ltd. (Metals & mining) | | | 689,583 | | | | 2,198 | |
| | | | | | | | | 38,059 | |
| | Indonesia—6.4% | | | | | | | | |
| | PT Astra International Tbk (Automobiles) | | | 8,140,800 | | | | 5,000 | |
| | PT Bank Rakyat Indonesia Persero Tbk (Banks) | | | 4,467,600 | | | | 3,872 | |
| | PT Kalbe Farma Tbk (Pharmaceuticals) | | | 18,044,100 | | | | 2,029 | |
| | PT Telekomunikasi Indonesia Persero Tbk (Diversified telecommunication services) | | | 20,191,600 | | | | 5,965 | |
| | PT Unilever Indonesia Tbk (Household products) | | | 955,500 | | | | 2,752 | |
| | | | | | | | | 19,618 | |
| | Issuer | |
Shares | | | Value | |
| | |
| | Common Stocks—(continued) | | | | | | |
| | |
| | Emerging Asia—(continued) | | | | | | | | |
| | Malaysia—1.4% | | | | | | | | |
| | Public Bank Bhd (Banks) | | | 984,400 | | | $ | 4,327 | |
| | Philippines—0.6% | | | | | | | | |
| | SM Prime Holdings, Inc. (Real estate management & development) | | | 3,194,500 | | | | 1,822 | |
| | South Korea—11.7% | | | | | | | | |
| * | Amorepacific Corporation (Personal products) | | | 4,947 | | | | 1,317 | |
| * | Hankook Tire Co., Ltd. (Auto components) | | | 81,670 | | | | 3,922 | |
| * | NAVER Corporation (Internet software & services) | | | 7,550 | | | | 4,844 | |
| | Samsung Electronics Co., Ltd. (Technology hardware, storage & peripherals) | | | 10,330 | | | | 15,412 | |
| * | Shinhan Financial Group Co., Ltd. (Banks) | | | 136,644 | | | | 5,119 | |
| * | SK Hynix, Inc. (Semiconductors & semiconductor equipment) | | | 141,250 | | | | 5,228 | |
| | | | | | | | | 35,842 | |
| | Taiwan—8.7% | | | | | | | | |
| | Fubon Financial Holding Co., Ltd. (Diversified financial services) | | | 2,747,000 | | | | 4,347 | |
| | Largan Precision Co., Ltd. (Electronic equipment, instruments & components) | | | 44,000 | | | | 5,174 | |
| | Taiwan Semiconductor Manufacturing Co., Ltd.—ADR (Semiconductors & semiconductor equipment) | | | 540,138 | | | | 15,529 | |
| | Uni-President Enterprises Corporation (Food products) | | | 871,000 | | | | 1,443 | |
| | | | | | | | | 26,493 | |
| | Thailand—3.4% | | | | | | | | |
| | Airports of Thailand PCL (Transportation infrastructure) | | | 411,200 | | | | 4,570 | |
| | Bangkok Dusit Medical Services PCL Class “F” (Health care providers & services) | | | 3,315,000 | | | | 2,138 | |
| | CP ALL PCL (Food & staples retailing) | | | 2,101,400 | | | | 3,668 | |
| | | | | | | | | 10,376 | |
| | |
| | Emerging Latin America—12.3% | | | | | | | | |
| | Argentina—1.0% | | | | | | | | |
| | MercadoLibre, Inc. (Internet software & services) | | | 19,594 | | | | 3,059 | |
| | Brazil—5.6% | | | | | | | | |
| | BB Seguridade Participacoes S.A. (Insurance) | | | 195,400 | | | | 1,699 | |
| | BM&F BOVESPA S.A. (Capital markets) | | | 494,600 | | | | 2,507 | |
| | Kroton Educacional S.A. (Diversified consumer services) | | | 920,400 | | | | 3,770 | |
| | Raia Drogasil S.A. (Food & staples retailing) | | | 202,900 | | | | 3,815 | |
| | Ultrapar Participacoes S.A. (Oil, gas & consumable fuels) | | | 153,400 | | | | 3,226 | |
| | Vale S.A.—ADR (Metals & mining) | | | 253,232 | | | | 1,930 | |
| | | | | | | | | 16,947 | |
See accompanying Notes to Financial Statements.
| December 31, 2016 | William Blair Funds | 75 |
Emerging Markets Leaders Fund
Portfolio of Investments, December 31, 2016 (all dollar amounts in thousands)
| | | | | | | | |
| | | | | | | | |
| | Issuer | | Shares | | | Value | |
| | |
| | Common Stocks—(continued) | | | | | | |
| | |
| | Emerging Latin America—continued) | | | | | | | | |
| | Mexico—3.7% | | | | | | | | |
| * | Cemex S.A.B. de C.V.—ADR (Construction materials) | | | 422,457 | | | $ | 3,392 | |
| | Fomento Economico Mexicano S.A.B. de C.V.—ADR (Beverages) | | | 30,037 | | | | 2,289 | |
| | Grupo Financiero Banorte S.A.B. de C.V. Class “O” (Banks) | | | 1,033,000 | | | | 5,088 | |
| | Wal-Mart de Mexico S.A.B. de C.V. (Food & staples retailing) | | | 330,200 | | | | 591 | |
| | | | | | | | | 11,360 | |
| | Peru—2.0% | | | | | | | | |
| | Credicorp, Ltd. (Banks)† | | | 38,914 | | | | 6,143 | |
| | |
| | Emerging Europe, Mid-East, Africa—12.1% | | | | | | | | |
| | Hungary—1.1% | | | | | | | | |
| | OTP Bank plc (Banks) | | | 122,351 | | | | 3,498 | |
| | Russia—2.3% | | | | | | | | |
| | Magnit PJSC—GDR (Food & staples retailing) | | | 76,425 | | | | 3,374 | |
| * | Yandex N.V. Class “A” (Internet software & services)† | | | 177,486 | | | | 3,573 | |
| | | | | | | | | 6,947 | |
| | South Africa—7.0% | | | | | | | | |
| | Bid Corporation, Ltd. (Food & staples retailing) | | | 219,645 | | | | 3,921 | |
| | Bidvest Group, Ltd. (Industrial conglomerates) | | | 306,181 | | | | 4,041 | |
| | FirstRand, Ltd. (Diversified financial services) | | | 1,251,083 | | | | 4,843 | |
| | Naspers, Ltd. (Media) | | | 58,381 | | | | 8,562 | |
| | | | | | | | | 21,367 | |
| | Turkey—1.2% | | | | | | | | |
| | KOC Holding A.S. (Industrial conglomerates) | | | 994,486 | | | | 3,891 | |
| | United Arab Emirates—0.5% | | | | | | | | |
| | Emaar Properties PJSC (Real estate management & development) | | | 766,287 | | | | 1,488 | |
| | Total Common Stocks—90.1%
(cost $269,841) | | | | | | | 275,374 | |
| | |
| | Preferred Stocks | | | | | | | | |
| | Brazil—6.8% | | | | | | | | |
| | Itau Unibanco Holding S.A. (Banks) | | | 829,150 | | | | 8,624 | |
| * | Petroleo Brasileiro S.A. (Oil, gas & consumable fuels) | | | 2,666,000 | | | | 12,180 | |
| | | | | | | | | 20,804 | |
| | Total Preferred Stocks—6.8%
(cost $20,349) | | | | | | | 20,804 | |
| | | | | | | | |
| | | | Principal | | | | |
| | Issuer | | Amount | | | Value | |
| | |
| | Repurchase Agreement | | | | | | | | |
| | Fixed Income Clearing Corporation, 0.030% dated 12/30/16, due 1/3/17, repurchase price $9,400, collateralized by U.S. Treasury Bond, 3.000%, due 5/15/45 | | $ | 9,399 | | | $ | 9,399 | |
| | Total Repurchase Agreement—3.1%
(cost $9,399) | | | | | | | 9,399 | |
| | Total Investments—100.0%
(cost $299,589) | | | | | | | 305,577 | |
| | Liabilities, plus cash and other assets—0.0% | | | | | | | (74 | ) |
| | Net assets—100.0% | | | | | | $ | 305,503 | |
ADR = American Depository Receipt
GDR = Global Depository Receipt
* = Non-income producing securities
† = U.S. listed foreign security
For securities primarily traded on exchanges or markets that close before the close of regular trading on the New York Stock Exchange, the Fund may use an independent pricing service to fair value price the securities pursuant to Valuation Procedures approved by the Board of Trustees.
At December 31, 2016, the Fund’s Portfolio of Investments includes the following industry categories (as a percentage of long-term investments):
| Financials | | | 27.9 | % |
| Information Technology | | | 26.4 | % |
| Consumer Discretionary | | | 13.6 | % |
| Energy | | | 9.2 | % |
| Consumer Staples | | | 7.8 | % |
| Materials | | | 4.8 | % |
| Industrials | | | 4.2 | % |
| Telecommunication Services | | | 3.1 | % |
| Health Care | | | 1.9 | % |
| Real Estate | | | 1.1 | % |
| Total | | | 100.0 | % |
See accompanying Notes to Financial Statements.
| 76 | Annual Report | December 31, 2016 |
Emerging Markets Leaders Fund
Portfolio of Investments, December 31, 2016 (all dollar amounts in thousands)
At December 31, 2016, the Fund’s Portfolio of Investments includes the following currency categories (as a percentage of long-term investments):
| U.S. Dollar | | | 21.7 | % |
| Hong Kong Dollar | | | 14.6 | % |
| South Korean Won | | | 12.1 | % |
| Brazilian Real | | | 12.1 | % |
| Indian Rupee | | | 11.5 | % |
| South African Rand | | | 7.2 | % |
| Indonesian Rupiah | | | 6.6 | % |
| New Taiwan Dollar | | | 3.7 | % |
| Thai Baht | | | 3.5 | % |
| Mexican Peso | | | 1.9 | % |
| Malaysian Ringgit | | | 1.5 | % |
| Turkish Lira | | | 1.3 | % |
| Hungarian Forint | | | 1.2 | % |
| All Other Currencies | | | 1.1 | % |
| Total | | | 100.0 | % |
See accompanying Notes to Financial Statements.
| December 31, 2016 | William Blair Funds | 77 |
| | Emerging Markets Growth Fund |
| | |
| | The Emerging Markets Growth Fund seeks long-term capital appreciation. |
| | |
| | AN OVERVIEW FROM THE PORTFOLIO MANAGERS |
| | |

Todd M. McClone 
Casey K. Preyss 
Jeffrey A. Urbina | The William Blair Emerging Markets Growth Fund (Class N shares) posted a 1.49% increase, net of fees, for the twelve months ended December 31, 2016. By comparison, the Fund’s benchmark index, the MSCI Emerging Markets IMI Index (net) (the “Index”), increased 9.90%. Adverse style effects broadly detracted from the Fund’s calendar year 2016 performance versus the Index. The Fund’s overweight to higher growth, higher valuation companies with relatively strong earnings trends was detrimental amid an environment of significant low valuation market leadership. From a sector attribution perspective, stock selection in Financials and Materials, an underweight to Energy, and an overweight to Consumer Staples were the primary detractors from the Fund’s performance relative to the Index for the year. Within Financials, the Fund’s Bank holdings did not keep pace with the Index, hampered partially by the position in Turkiye Garanti Bankasi which stumbled on broader macroeconomic and political risk in Turkey. Mexican bank exposure, including Grupo Financiero Inbursa which was sold from the Fund in the third quarter due to slowing loan growth, and Grupo Financiero Santander Mexico which weakened along with Mexican banks following Donald Trump’s election victory, also detracted from the Fund’s relative performance as a result of concerns about corporate credit quality and a potential increase in non-performing loans. Within Materials, the lack of exposure to Metals & Mining stocks was a significant detractor from the Fund’s performance during the year. These effects more than offset the positive contributions from the Fund’s stock selection in the Consumer Discretionary, Industrials, Telecommunication Services and Utilities sectors. India’s Tata Motors was a notable contributor within the Consumer Discretionary sector, bolstered by accelerating volume growth within its Jaguar division. Within Industrials, South African conglomerate Bidvest Group benefited from investors’ favorable reaction to the spin-off of the company’s food business. From a geographic attribution perspective, stock selection within Russia and Brazil were the largest detractors from the Fund’s relative performance in 2016, driven by a lack of exposure to strong performing Index holdings in the Metals & Mining and Oil & Gas Industries. These effects offset positive contributions from the Fund’s stock selection in India and Malaysia, along with underweights to China and Korea. Please refer to the Global Markets Review and Outlook relating to the Fund on page 36. |
| 78 | Annual Report | December 31, 2016 |
Emerging Markets Growth Fund
Performance Highlights (Unaudited)
| Average Annual Total Return at 12/31/2016 |
| | | 1 Year | | 3 Year | | 5 Year | | 10 Year |
| Class N | | | 1.49 | % | | | (3.75) | % | | | 1.69 | % | | | 0.18 | % |
| Class I | | | 1.73 | | | | (3.52 | ) | | | 1.95 | | | | 0.44 | |
| Institutional Class | | | 1.71 | | | | (3.40 | ) | | | 2.10 | | | | 0.59 | |
| MSCI Emerging Markets IMI (net) | | | 9.90 | | | | (2.40 | ) | | | 1.54 | | | | 2.07 | |
Performance cited represents past performance. Past performance does not guarantee future results and current performance may be lower or higher than the data quoted. Results shown are average annual returns, which assume reinvestment of dividends and capital gains. Investment returns and principal will fluctuate and you may have a gain or loss when you sell shares. For the most current month-end performance information, please call 1-800-742-7272, or visit our Web site at www.williamblairfunds.com. From time to time, the investment adviser may waive fees or reimburse expenses for the Fund. Without these waivers/reimbursements, performance would be lower. International investing involves special risk considerations, including currency fluctuations, lower liquidity, economic and political risk. These risks may be magnified when investing in emerging markets. Class N shares are available to the general public without a sales load. Class I shares are available to certain institutional investors and advisory clients of William Blair Investment Management, LLC and William Blair & Company, L.L.C., without a sales load or distribution (12b-1) fees. Institutional Class shares are available to institutional investors without a sales load or distribution (12b-1) or service fees.
The performance highlights and graph presented above do not reflect the deduction of taxes that a shareholder would pay on fund distributions or the redemption of fund shares.
The Morgan Stanley Capital International (MSCI) Emerging Markets Investable Market Index (IMI) (net) is a free float-adjusted market capitalization weighted index that is designed to measure the equity market performance of emerging markets. This series approximates the minimum possible dividend reinvestment.
This report identifies the Fund’s investments on December 31, 2016. These holdings are subject to change. Not all stocks in the Fund performed the same, nor is there any guarantee that these stocks will perform as well in the future. Market forecasts provided in this report may not necessarily come to pass.
Sector Diversification (Unaudited)

The sector diversification shown is based on the total long-term securities.
| December 31, 2016 | William Blair Funds | 79 |
Emerging Markets Growth Fund
Portfolio of Investments, December 31, 2016 (all dollar amounts in thousands)
| | | | | | | | |
| | | | | | | | |
| | Issuer | | Shares | | | Value | |
| | | | | | | | |
| | Common Stocks | | | | | | | | |
| | | | | | | | | | |
| | Emerging Asia—69.0% | | | | | | | | |
| | China—18.5% | | | | | | | | |
| * | Alibaba Group Holding, Ltd.—ADR (Internet software & services) | | | 372,851 | | | $ | 32,740 | |
| * | Baidu, Inc.—ADR (Internet software & services) | | | 60,183 | | | | 9,895 | |
| | CNOOC, Ltd. (Oil, gas & consumable fuels) | | | 17,399,000 | | | | 21,764 | |
| | CSPC Pharmaceutical Group, Ltd. (Pharmaceuticals) | | | 3,448,000 | | | | 3,682 | |
| * | Ctrip.com International, Ltd.—ADR (Internet & direct marketing retail) | | | 219,818 | | | | 8,793 | |
| | Geely Automobile Holdings, Ltd. (Automobiles) | | | 4,535,000 | | | | 4,334 | |
| | Huaneng Renewables Corporation, Ltd. Class “H” (Independent power & renewable electricity producers) | | | 8,985,932 | | | | 2,920 | |
| | NetEase, Inc.—ADR (Internet software & services) | | | 60,365 | | | | 12,999 | |
| * | New Oriental Education & Technology Group, Inc.—ADR (Diversified consumer services) | | | 98,181 | | | | 4,133 | |
| | Ping An Insurance Group Co. of China, Ltd. Class “H” (Insurance) | | | 1,973,500 | | | | 9,874 | |
| | Sinopharm Group Co., Ltd. Class “H” (Health care providers & services) | | | 898,200 | | | | 3,701 | |
| | Sunny Optical Technology Group Co., Ltd. (Electronic equipment, instruments & components) | | | 930,000 | | | | 4,072 | |
| * | TAL Education Group—ADR (Diversified consumer services) | | | 62,996 | | | | 4,419 | |
| | Tencent Holdings, Ltd. (Internet software & services) | | | 1,762,660 | | | | 43,120 | |
| | Travelsky Technology, Ltd. Class “H” (IT services) | | | 1,384,000 | | | | 2,909 | |
| | Weichai Power Co., Ltd. Class “H” (Machinery) | | | 2,405,000 | | | | 3,703 | |
| | | | | | | | | 173,058 | |
| | India—16.6% | | | | | | | | |
| | Asian Paints, Ltd. (Chemicals) | | | 404,678 | | | | 5,310 | |
| | Bajaj Finance, Ltd. (Consumer finance) | | | 317,273 | | | | 3,944 | |
| * | Bharat Financial Inclusion, Ltd. (Consumer finance) | | | 387,301 | | | | 3,362 | |
| | Bharat Petroleum Corporation, Ltd. (Oil, gas & consumable fuels) | | | 461,164 | | | | 4,308 | |
| | Bosch, Ltd. (Auto components) | | | 9,437 | | | | 2,948 | |
| | Britannia Industries, Ltd. (Food products) | | | 53,038 | | | | 2,253 | |
| | Eicher Motors, Ltd. (Machinery) | | | 13,067 | | | | 4,192 | |
| | Godrej Consumer Products, Ltd. (Personal products) | | | 126,083 | | | | 2,813 | |
| | Havells India, Ltd. (Electrical equipment) | | | 435,870 | | | | 2,191 | |
| | HDFC Bank, Ltd. (Banks) | | | 1,323,171 | | | | 23,451 | |
| | Hero MotoCorp, Ltd. (Automobiles) | | | 130,325 | | | | 5,823 | |
| | Hindustan Unilever, Ltd. (Household products) | | | 352,707 | | | | 4,291 | |
| | | | | | | | |
| | | | | | | | |
| | Issuer | | Shares | | | Value | |
| | | | | | | | |
| | Common Stocks—(continued) | | | | | | | | |
| | | | | | | | | | |
| | Emerging Asia—(continued) | | | | | | | | |
| | India—(continued) | | | | | | | | |
| | Housing Development Finance Corporation, Ltd. (Thrifts & mortgage finance) | | | 783,268 | | | $ | 14,557 | |
| | Indraprastha Gas, Ltd. (Gas utilities) | | | 289,279 | | | | 3,892 | |
| | IndusInd Bank, Ltd. (Banks) | | | 842,771 | | | | 13,746 | |
| | ITC, Ltd. (Tobacco) | | | 1,444,740 | | | | 5,126 | |
| | Maruti Suzuki India, Ltd. (Automobiles) | | | 154,077 | | | | 12,067 | |
| | Max Financial Services, Ltd. (Insurance) | | | 610,998 | | | | 4,986 | |
| | Motherson Sumi Systems, Ltd. (Auto components) | | | 764,916 | | | | 3,665 | |
| | Petronet LNG, Ltd. (Oil, gas & consumable fuels) | | | 538,905 | | | | 2,912 | |
| | Pidilite Industries, Ltd. (Chemicals) | | | 240,121 | | | | 2,082 | |
| | Shree Cement, Ltd. (Construction materials) | | | 14,337 | | | | 3,105 | |
| | Tata Motors, Ltd. (Automobiles) | | | 866,454 | | | | 5,999 | |
| | UPL, Ltd. (Chemicals) | | | 381,131 | | | | 3,632 | |
| | Yes Bank, Ltd. (Banks) | | | 659,385 | | | | 11,221 | |
| | Zee Entertainment Enterprises, Ltd. (Media) | | | 487,660 | | | | 3,255 | |
| | | | | | | | | 155,131 | |
| | Indonesia—5.2% | | | | | | | | |
| | PT Astra International Tbk (Automobiles) | | | 13,570,200 | | | | 8,335 | |
| | PT Bank Rakyat Indonesia Persero Tbk (Banks) | | | 14,552,421 | | | | 12,611 | |
| | PT Gudang Garam Tbk (Tobacco) | | | 823,500 | | | | 3,906 | |
| | PT Indofood CBP Sukses Makmur Tbk (Food products) | | | 3,761,200 | | | | 2,394 | |
| | PT Kalbe Farma Tbk (Pharmaceuticals) | | | 27,156,215 | | | | 3,054 | |
| | PT Matahari Department Store Tbk (Multiline retail) | | | 3,602,500 | | | | 4,044 | |
| | PT Telekomunikasi Indonesia Persero Tbk (Diversified telecommunication services) | | | 30,851,600 | | | | 9,114 | |
| | PT Unilever Indonesia Tbk (Household products) | | | 1,463,200 | | | | 4,214 | |
| | PT United Tractors Tbk (Oil, gas & consumable fuels) | | | 670,800 | | | | 1,058 | |
| | | | | | | | | 48,730 | |
| | Malaysia—1.2% | | | | | | | | |
| | Public Bank Bhd (Banks) | | | 2,586,100 | | | | 11,368 | |
| | | | | | | | | | |
| | Papua New Guinea—0.4% | | | | | | | | |
| | Oil Search, Ltd. (Oil, gas & consumable fuels) | | | 627,467 | | | | 3,247 | |
| | | | | | | | | | |
| | Philippines—3.1% | | | | | | | | |
| | Ayala Land, Inc. (Real estate management & development) | | | 6,912,200 | | | | 4,449 | |
| | BDO Unibank, Inc. (Banks) | | | 2,221,870 | | | | 5,010 | |
| | GT Capital Holdings, Inc. (Diversified financial services) | | | 92,635 | | | | 2,367 | |
| | International Container Terminal Services, Inc. (Transportation infrastructure) | | | 643,530 | | | | 932 | |
| | Jollibee Foods Corporation (Hotels, restaurants & leisure) | | | 644,780 | | | | 2,516 | |
See accompanying Notes to Financial Statements.
| 80 | Annual Report | December 31, 2016 |
Emerging Markets Growth Fund
Portfolio of Investments, December 31, 2016 (all dollar amounts in thousands)
| | | | | | | | |
| | | | | | | | |
| | Issuer | | Shares | | | Value | |
| | | | | | | | |
| | Common Stocks—(continued) | | | | | | | | |
| | | | | | | | | | |
| | Emerging Asia—(continued) | | | | | | | | |
| | Philippines—(continued) | | | | | | | | |
| | Metro Pacific Investments Corporation (Diversified financial services) | | | 18,904,400 | | | $ | 2,533 | |
| | Robinsons Retail Holdings, Inc. (Food & staples retailing) | | | 1,558,100 | | | | 2,327 | |
| | Security Bank Corporation (Banks) | | | 541,170 | | | | 2,068 | |
| | SM Investments Corporation (Industrial conglomerates) | | | 337,605 | | | | 4,448 | |
| | Universal Robina Corporation (Food products) | | | 630,600 | | | | 2,074 | |
| | | | | | | | | 28,724 | |
| | South Korea—10.5% | | | | | | | | |
| * | Amorepacific Corporation (Personal products) | | | 13,358 | | | | 3,556 | |
| | Halla Visteon Climate Control Corporation (Auto components) | | | 255,261 | | | | 2,177 | |
| | Hana Financial Group, Inc. (Banks) | | | 343,780 | | | | 8,895 | |
| * | Hankook Tire Co., Ltd. (Auto components) | | | 92,955 | | | | 4,464 | |
| * | Hanssem Co., Ltd. (Household durables) | | | 14,570 | | | | 2,401 | |
| * | KT&G Corporation (Tobacco) | | | 46,752 | | | | 3,909 | |
| * | LG Household & Health Care, Ltd.(Personal products) | | | 8,806 | | | | 6,248 | |
| * | Mando Corporation (Auto components) | | | 12,008 | | | | 2,331 | |
| * | NAVER Corporation (Internet software & services) | | | 18,527 | | | | 11,888 | |
| * | Samsung Biologics Co., Ltd. (Life sciences tools & services) | | | 30,375 | | | | 3,797 | |
| | Samsung Electronics Co., Ltd. (Technology hardware, storage & peripherals) | | | 25,389 | | | | 37,880 | |
| * | Samsung Fire & Marine Insurance Co., Ltd. (Insurance) | | | 18,641 | | | | 4,144 | |
| * | Shinhan Financial Group Co., Ltd. (Banks) | | | 173,999 | | | | 6,519 | |
| | | | | | | | | 98,209 | |
| | Taiwan—9.0% | | | | | | | | |
| | Advantech Co., Ltd. (Technology hardware, storage & peripherals) | | | 329,145 | | | | 2,599 | |
| | China Life Insurance Co., Ltd. (Insurance) | | | 3,085,000 | | | | 3,068 | |
| | E.Sun Financial Holding Co., Ltd. (Banks) | | | 9,787,860 | | | | 5,573 | |
| | Ennoconn Corporation (Technology hardware, storage & peripherals) | | | 204,000 | | | | 2,608 | |
| | Fubon Financial Holding Co., Ltd. (Diversified financial services) | | | 4,197,000 | | | | 6,641 | |
| | Largan Precision Co., Ltd. (Electronic equipment, instruments & components) | | | 68,000 | | | | 7,997 | |
| | Nien Made Enterprise Co., Ltd. (Household durables) | | | 204,000 | | | | 2,105 | |
| | President Chain Store Corporation (Food & staples retailing) | | | 635,000 | | | | 4,551 | |
| | Taiwan Semiconductor Manufacturing Co., Ltd. (Semiconductors & semiconductor equipment) | | | 2,972,000 | | | | 16,737 | |
| | Taiwan Semiconductor Manufacturing Co., Ltd.—ADR (Semiconductors & semiconductor equipment) | | | 942,857 | | | | 27,107 | |
| | | | | | | | |
| | | | | | | | |
| | Issuer | | Shares | | | Value | |
| | | | | | | | |
| | Common Stocks—(continued) | | | | | | | | |
| | | | | | | | | | |
| | Emerging Asia—(continued) | | | | | | | | |
| | Taiwan—(continued) | | | | | | | | |
| | Uni-President Enterprises Corporation (Food products) | | | 2,677,000 | | | $ | 4,435 | |
| | | | | | | | | 83,421 | |
| | Thailand—4.5% | | | | | | | | |
| | Airports of Thailand PCL (Transportation infrastructure) | | | 592,100 | | | | 6,581 | |
| | Bangkok Dusit Medical Services PCL Class “F” (Health care providers & services) | | | 6,739,700 | | | | 4,348 | |
| | Central Pattana PCL (Real estate management & development) | | | 5,458,000 | | | | 8,649 | |
| | CP ALL PCL (Food & staples retailing) | | | 6,599,100 | | | | 11,517 | |
| | Home Product Center PCL (Specialty retail) | | | 12,293,000 | | | | 3,501 | |
| | Minor International PCL (Hotels, restaurants & leisure) | | | 2,992,200 | | | | 2,987 | |
| | Thai Beverage PCL (Beverages) | | | 7,640,500 | | | | 4,485 | |
| | | | | | | | | 42,068 | |
| | Emerging Latin America—13.4% | | | | | | | | |
| | Argentina—1.0% | | | | | | | | |
| | Banco Macro S.A.—ADR (Banks) | | | 46,822 | | | | 3,013 | |
| | MercadoLibre, Inc. (Internet software & services)† | | | 43,306 | | | | 6,762 | |
| | | | | | | | | 9,775 | |
| | Brazil—6.4% | | | | | | | | |
| | AMBEV S.A.—ADR (Beverages) | | | 794,633 | | | | 3,902 | |
| | BB Seguridade Participacoes S.A. (Insurance) | | | 757,100 | | | | 6,583 | |
| | BM&F BOVESPA S.A. (Capital markets) | | | 1,331,200 | | | | 6,749 | |
| | Cielo S.A. (IT services) | | | 700,320 | | | | 6,001 | |
| | Engie Brasil Energia S.A. (Independent power & renewable electricity producers) | | | 301,900 | | | | 3,247 | |
| | Kroton Educacional S.A. (Diversified consumer services) | | | 1,509,600 | | | | 6,183 | |
| | Localiza Rent a Car S.A. (Road & rail) | | | 379,700 | | | | 3,992 | |
| | Lojas Renner S.A. (Multiline retail) | | | 757,100 | | | | 5,390 | |
| | Raia Drogasil S.A. (Food & staples retailing) | | | 361,400 | | | | 6,794 | |
| | Ultrapar Participacoes S.A. (Oil, gas & consumable fuels) | | | 292,000 | | | | 6,141 | |
| | WEG S.A. (Machinery) | | | 958,400 | | | | 4,564 | |
| | | | | | | | | 59,546 | |
| | Chile—1.4% | | | | | | | | |
| | Banco Santander Chile—ADR (Banks) | | | 336,532 | | | | 7,360 | |
| | S.A.C.I. Falabella (Multiline retail) | | | 696,997 | | | | 5,535 | |
| | | | | | | | | 12,895 | |
| | Mexico—3.4% | | | | | | | | |
| | Fomento Economico Mexicano S.A.B. de C.V.—ADR (Beverages) | | | 83,073 | | | | 6,331 | |
See accompanying Notes to Financial Statements.
| December 31, 2016 | William Blair Funds | 81 |
Emerging Markets Growth Fund
Portfolio of Investments, December 31 2016 (all dollar amounts in thousands)
| | | | | | | | |
| | | | | | | | |
| | Issuer | | Shares | | | Value | |
| | | | | | | | |
| | Common Stocks—(continued) | | | | | | | | |
| | | | | | | | | | |
| | Emerging Latin America—(continued) | | | | | | | | |
| | Mexico—(continued) | | | | | | | | |
| | Grupo Aeroportuario del Pacifico S.A.B. de C.V. Class “B” (Transportation infrastructure) | | | 466,600 | | | $ | 3,835 | |
| | Grupo Aeroportuario del Sureste S.A.B. de C.V.—ADR (Transportation infrastructure) | | | 25,952 | | | | 3,734 | |
| | Grupo Bimbo S.A.B. de C.V. Class “A” (Food products) | | | 1,063,200 | | | | 2,404 | |
| | Grupo Financiero Santander Mexico S.A.B. de C.V. Class “B” (Banks) | | | 1,968,700 | | | | 2,831 | |
| | Grupo Mexico S.A.B. de C.V. Class “B” (Metals & mining) | | | 1,312,900 | | | | 3,565 | |
| | Infraestructura Energetica Nova S.A.B. de C.V. (Gas utilities) | | | 644,300 | | | | 2,807 | |
| | Promotora y Operadora de Infraestructura S.A.B. de C.V. (Transportation infrastructure) | | | 69,700 | | | | 582 | |
| | Wal-Mart de Mexico S.A.B. de C.V. (Food & staples retailing) | | | 3,518,400 | | | | 6,297 | |
| | | | | | | | | 32,386 | |
| | Peru—1.2% | | | | | | | | |
| | Credicorp, Ltd. (Banks)† | | | 70,074 | | | | 11,062 | |
| | |
| | Emerging Europe, Mid-East, Africa—12.0% | | | | | | | | |
| | Hungary—1.2% | | | | | | | | |
| | OTP Bank plc (Banks) | | | 297,877 | | | | 8,517 | |
| | Richter Gedeon Nyrt (Pharmaceuticals) | | | 105,758 | | | | 2,236 | |
| | | | | | | | | 10,753 | |
| | Qatar—0.4% | | | | | | | | |
| | Qatar National Bank S.A.Q. (Banks) | | | 91,926 | | | | 4,112 | |
| | Russia—1.7% | | | | | | | | |
| | Magnit PJSC—GDR (Food & staples retailing) | | | 124,110 | | | | 5,480 | |
| * | X5 Retail Group N.V.—GDR (Food & staples retailing) | | | 118,380 | | | | 3,841 | |
| * | Yandex N.V. Class “A” (Internet software & services)† | | | 305,431 | | | | 6,148 | |
| | | | | | | | | 15,469 | |
| | South Africa—6.8% | | | | | | | | |
| | Aspen Pharmacare Holdings, Ltd. (Pharmaceuticals) | | | 154,553 | | | | 3,191 | |
| | Bid Corporation, Ltd. (Food & staples retailing) | | | 372,080 | | | | 6,642 | |
| | Bidvest Group, Ltd. (Industrial conglomerates) | | | 298,104 | | | | 3,934 | |
| | Capitec Bank Holdings, Ltd. (Banks) | | | 107,504 | | | | 5,440 | |
| | FirstRand, Ltd. (Diversified financial services) | | | 2,987,729 | | | | 11,567 | |
| | Naspers, Ltd. (Media) | | | 171,635 | | | | 25,171 | |
| | Steinhoff International Holdings N.V. (Household durables) | | | 1,374,190 | | | | 7,132 | |
| | | | | | | | | 63,077 | |
| | | | Shares or | | | | |
| | | | Principal | | | | |
| | Issuer | | Amount | | | Value | |
| | | | | | | | |
| | Common Stocks—(continued) | | | | | | | | |
| | | | | | | | | | |
| | Emerging Europe, Mid-East, Africa—(continued) | | | | | | | | |
| | Turkey—0.6% | | | | | | | | |
| | Arcelik A.S. (Household durables) | | | 457,262 | | | $ | 2,749 | |
| | Tofas Turk Otomobil Fabrikasi A.S. (Automobiles) | | | 475,364 | | | | 3,321 | |
| | | | | | | | | 6,070 | |
| | United Arab Emirates—1.3% | | | | | | | | |
| | Emaar Malls PJSC (Real estate management & development) | | | 2,987,396 | | | | 2,131 | |
| | Emaar Properties PJSC (Real estate management & development) | | | 3,392,474 | | | | 6,586 | |
| | First Gulf Bank PJSC (Banks) | | | 1,113,700 | | | | 3,896 | |
| | | | | | | | | 12,613 | |
| | Total Common Stocks—94.4%
(cost $829,154) | | | | | | | 881,714 | |
| | | | | | | | | | |
| | Preferred Stocks | | | | | | | | |
| | Brazil—4.4% | | | | | | | | |
| | Itau Unibanco Holding S.A. (Banks) | | | 1,524,660 | | | | 15,857 | |
| | *Petroleo Brasileiro S.A. (Oil, gas & consumable fuels) | | | 5,482,600 | | | | 25,049 | |
| | | | | | | | | 40,906 | |
| | Total Preferred Stocks—4.4%
(cost $41,374) | | | | | | | 40,906 | |
| | | | | | | | | | |
| | Affiliated Fund | | | | | | | | |
| | Emerging Asia—0.0% | | | | | | | | |
| | China—0.0% | | | | | | | | |
| | William Blair China A-Share Fund, LLC§ | | | 12,462 | | | | 201 | |
| | Total Affiliated Fund—0.0%
(cost $125) | | | | | | | 201 | |
| | | | | | | | | | |
| | Repurchase Agreement | | | | | | | | |
| | Fixed Income Clearing Corporation, 0.030% dated 12/30/16, due 1/3/17, repurchase price $3,898, collateralized by U.S. Treasury Bond, 3.000%, due 5/15/45 | | $ | 3,898 | | | | 3,898 | |
| | Total Repurchase Agreement—0.4%
(cost $3,898) | | | | | | | 3,898 | |
| | Total Investments—99.2%
(cost $874,551) | | | | | | | 926,719 | |
| | Cash and other assets, less liabilities—0.8% | | | | | | | 7,024 | |
| | Net assets—100.0% | | | | | | $ | 933,743 | |
See accompanying Notes to Financial Statements.
| 82 | Annual Report | December 31, 2016 |
Emerging Markets Growth Fund
Portfolio of Investments, December 31, 2016 (all dollar amounts in thousands)
ADR = American Depository Receipt
GDR = Global Depository Receipt
* = Non-income producing securities
† = U.S. listed foreign security
§ = Deemed illiquid pursuant to Liquidity Procedures approved by the Board of Trustees. This holding represents 0.02% of the Fund’s net assets at December 31, 2016.
For securities primarily traded on exchanges or markets that close before the close of regular trading on the New York Stock Exchange, the Fund may use an independent pricing service to fair value price the securities pursuant to Valuation Procedures approved by the Board of Trustees.
At December 31, 2016, the Fund’s Portfolio of Investments includes the following industry categories (as a percentage of long-term investments):
| Financials | | | 26.3 | % |
| Information Technology | | | 25.1 | % |
| Consumer Discretionary | | | 15.8 | % |
| Consumer Staples | | | 11.9 | % |
| Energy | | | 7.0 | % |
| Industrials | | | 4.6 | % |
| Health Care | | | 2.6 | % |
| Real Estate | | | 2.4 | % |
| Materials | | | 1.9 | % |
| Utilities | | | 1.4 | % |
| Telecommunication Services | | | 1.0 | % |
| Total | | | 100.0 | % |
At December 31, 2016, the Fund’s Portfolio of Investments includes the following currency categories (as a percentage of long-term investments):
| U.S. Dollar | | | 17.1 | % |
| Indian Rupee | | | 16.8 | % |
| Hong Kong Dollar | | | 10.9 | % |
| South Korean Won | | | 10.6 | % |
| Brazilian Real | | | 10.5 | % |
| South African Rand | | | 6.8 | % |
| New Taiwan Dollar | | | 6.1 | % |
| Indonesian Rupiah | | | 5.3 | % |
| Thai Baht | | | 4.1 | % |
| Philippine Peso | | | 3.1 | % |
| Mexican Peso | | | 2.4 | % |
| UAE Dirham | | | 1.4 | % |
| Malaysian Ringgit | | | 1.2 | % |
| Hungarian Forint | | | 1.2 | % |
| All Other Currencies | | | 2.5 | % |
| Total | | | 100.0 | % |
As of December 31, 2016, the Fund invested in William Blair China A-Share Fund, LLC, an affiliated fund. There are no unfunded commitments to the affiliated fund. The Fund is subject to repatriation and other redemption restrictions imposed on the William Blair China A-Share Fund, LLC by the Chinese government.
| | | Share Activity | | Year Ended December 31, 2016 |
| Security Name | | Balance
12/31/2015 | | Purchases | | Sales | | Balance
12/31/2016 | | Value | | Dividend
Income | | Net realized
gain (loss) | | Change in net
unrealized
appreciation
(depreciation) |
| William Blair China A-Share Fund, LLC | | 274,339 | | — | | 261,877 | | 12,462 | | $201 | | $— | | $1,931 | | $(2,000) |
See accompanying Notes to Financial Statements.
| December 31, 2016 | William Blair Funds | 83 |
| | Emerging Markets Small Cap Growth Fund |
| | |
| | The Emerging Markets Small Cap Growth Fund seeks long-term capital appreciation. |
| | |
| | AN OVERVIEW FROM THE PORTFOLIO MANAGERS |
| | |

Todd M. McClone 
Casey K. Preyss | The William Blair Emerging Markets Small Cap Growth Fund (Class N shares) posted a 5.33% decrease, net of fees, for the twelve months ended December 31, 2016. By comparison, the Fund’s benchmark index, the MSCI Emerging Markets Small Cap Index (net) (the “Index”), increased 2.28%. Adverse style effects broadly detracted from the Fund’s calendar year 2016 performance versus the Index. The Fund’s overweight to higher growth, higher valuation companies with relatively strong earnings trends was detrimental amid an environment of significant low valuation market leadership. From a sector attribution perspective, stock selection in Industrials, Materials, Real Estate and Utilities were the primary detractors from the Fund’s performance relative to the Index for the year. Within the Industrials sector, the Fund’s Airline holdings underperformed, including Mexican low-cost carrier Controladora Vuela Compania de Aviacion (“Volaris”), which declined significantly in November on concerns about President-elect Trump’s policies potentially hurting future travel demand. Panamanian airline Copa Holdings also detracted from the Fund’s performance due to share price weakness in the first half of 2016 amid poor operating conditions and a tough macroeconomic backdrop, and lingering concerns about the company’s impending write down of its Venezuelan cash balance. Within the Materials sector, the Fund’s lack of Metals & Mining exposure detracted from relative performance. In addition, stock selection in Chemicals detracted from performance, as Berger Paints India’s share price pulled back in November due to worries about a slowdown in consumer spending related to the Indian government’s abrupt removal of high denomination currency notes from circulation. From a geographic attribution perspective, stock selection in Korea, Taiwan and China were the primary detractors from the Fund’s relative performance in 2016, although partially mitigated by underweight positions in each country. These negative stock selection effects offset positive contributions from stock selection in India, Turkey, and the United Arab Emirates, in addition to the positive contributions from the Fund’s exposure to Pakistan and overweight in Brazil. Please refer to the Global Markets Review and Outlook relating to the Fund on page 36. |
| 84 | Annual Report | December 31, 2016 |
| Emerging Markets Small Cap Growth Fund |
| |
| Performance Highlights (Unaudited) |
| Average Annual Total Return at 12/31/2016 |
| | | | | | | | | | | | |
| | | | | | | | | | | | Since |
| | | 1 Year | | 3 Year | | 5 Year | | Inception |
| Class N(a) | | | (5.33 | )% | | | 0.46 | % | | | 9.64 | % | | | 8.70 | % |
| Class I(a) | | | (5.11 | ) | | | 0.76 | | | | 9.95 | | | | 9.00 | |
| MSCI Emerging Markets Small Cap Index (net)(a) | | | 2.28 | | | | (1.27 | ) | | | 3.51 | | | | 2.09 | |
| Institutional Class(b) | | | (5.05 | ) | | | 0.84 | | | | — | | | | 5.00 | |
| MSCI Emerging Markets Small Cap Index (net)(b) | | | 2.28 | | | | (1.27 | ) | | | — | | | | (0.34 | ) |
| (a) | Since inception is for the period from October 24, 2011 (Commencement of Operations) to December 31, 2016. |
| (b) | Since inception is for the period from December 20, 2012 (Commencement of Operations) to December 31, 2016 |
Performance cited represents past performance. Past performance does not guarantee future results and current performance may be lower or higher than the data quoted. Results shown are average annual returns, which assume reinvestment of dividends and capital gains. Investment returns and principal will fluctuate and you may have a gain or loss when you sell shares. For the most current month-end performance information, please call 1-800-742-7272, or visit our Web site at www.williamblairfunds.com. From time to time, the investment adviser may waive fees or reimburse expenses for the Fund. Without these waivers/reimbursements, performance would be lower. International investing involves special risk considerations, including currency fluctuations, lower liquidity, economic and political risk. These risks may be magnified when investing in emerging markets. Smaller capitalization stocks are also more sensitive to purchase/sale transactions and changes in the issuer’s financial condition. Class N shares are available to the general public without a sales load. Class I shares are available to certain institutional investors and advisory clients of William Blair Investment Management, LLC and William Blair & Company, L.L.C., without a sales load or distribution (12b-1) fees. Institutional Class shares are available to institutional investors without a sales load or distribution (12b-1) or service fees.
The performance highlights and graph presented above do not reflect the deduction of taxes that a shareholder would pay on fund distributions or the redemption of fund shares.
The Morgan Stanley Capital International (MSCI) Emerging Markets Small Cap Index (net) is a free float-adjusted market capitalization weighted index that is designed to measure the equity market performance of emerging markets. This series approximates the minimum possible dividend reinvestment.
This report identifies the Fund’s investments on December 31, 2016. These holdings are subject to change. Not all stocks in the Fund performed the same, nor is there any guarantee that these stocks will perform as well in the future. Market forecasts provided in this report may not necessarily come to pass.
Sector Diversification (Unaudited)
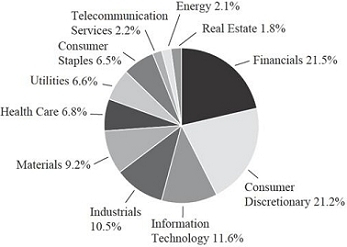
The sector diversification shown is based on the total long-term securities.
| December 31, 2016 | William Blair Funds | 85 |
| Emerging Markets Small Cap Growth Fund |
| |
Portfolio of Investments, December 31, 2016 (all dollar amounts in thousands)
| | | | | | | | |
| | | | | | | | |
| | Issuer | | Shares | | | Value | |
| | | | | | | | | | |
| | Common Stocks | | | | | | | | |
| | | | | | | | | | |
| | Emerging Asia—71.1% | | | | | | | | |
| | China—15.0% | | | | | | | | |
| | Beijing Capital International Airport Co., Ltd. Class “H” (Transportation infrastructure) | | | 1,272,000 | | | $ | 1,286 | |
| * | China Lodging Group, Ltd.—ADR (Hotels, restaurants & leisure) | | | 96,402 | | | | 4,998 | |
| | China Oilfield Services, Ltd. Class “H” (Energy equipment & services) | | | 1,896,000 | | | | 1,760 | |
| | Fuyao Glass Industry Group Co. Ltd. Class “H” (Auto components) | | | 1,612,400 | | | | 5,001 | |
| | Haitian International Holdings, Ltd. (Machinery) | | | 1,054,000 | | | | 2,069 | |
| | Huadian Fuxin Energy Corporation, Ltd. Class “H” (Independent power & renewable electricity producers) | | | 2,040,000 | | | | 453 | |
| | Huaneng Renewables Corporation, Ltd. Class “H” (Independent power & renewable electricity producers) | | | 4,212,000 | | | | 1,369 | |
| | Lonking Holdings, Ltd. (Machinery) | | | 6,041,000 | | | | 1,285 | |
| * | Microport Scientific Corporation (Health care equipment & supplies) | | | 397,486 | | | | 299 | |
| | Minth Group, Ltd. (Auto components) | | | 918,000 | | | | 2,859 | |
| | Shenzhou International Group Holdings, Ltd. (Textiles, apparel & luxury goods) | | | 520,000 | | | | 3,289 | |
| | Silergy Corporation (Semiconductors & semiconductor equipment) | | | 97,000 | | | | 1,366 | |
| | Sinotruk Hong Kong, Ltd. (Machinery) | | | 1,961,000 | | | | 1,398 | |
| | Sunny Optical Technology Group Co., Ltd. (Electronic equipment, instruments & components) | | | 498,000 | | | | 2,180 | |
| * | TAL Education Group—ADR (Diversified consumer services) | | | 38,983 | | | | 2,735 | |
| | Tarena International, Inc.—ADR (Diversified consumer services) | | | 240,108 | | | | 3,599 | |
| | Tongda Group Holdings, Ltd. (Electronic equipment, instruments & components) | | | 8,080,000 | | | | 2,084 | |
| | Travelsky Technology, Ltd. Class “H” (IT services) | | | 977,000 | | | | 2,054 | |
| | Weichai Power Co., Ltd. Class “H” (Machinery) | | | 1,614,000 | | | | 2,485 | |
| | | | | | | | | 42,569 | |
| | India—23.2% | | | | | | | | |
| | AIA Engineering, Ltd. (Machinery) | | | 84,899 | | | | 1,615 | |
| | Ajanta Pharma, Ltd. (Pharmaceuticals) | | | 81,472 | | | | 2,131 | |
| | Amara Raja Batteries, Ltd. (Electrical equipment) | | | 107,961 | | | | 1,384 | |
| | Bajaj Finance, Ltd. (Consumer finance) | | | 344,154 | | | | 4,278 | |
| | Berger Paints India, Ltd. (Chemicals) | | | 328,296 | | | | 1,020 | |
| | Can Fin Homes, Ltd. (Thrifts & mortgage finance) | | | 61,919 | | | | 1,444 | |
| | Cholamandalam Investment and Finance Co., Ltd. (Consumer finance) | | | 159,975 | | | | 2,225 | |
| | City Union Bank, Ltd. (Banks) | | | 928,958 | | | | 1,767 | |
| * | Crompton Greaves Consumer Electricals, Ltd. (Household durables) | | | 385,707 | | | | 826 | |
| | | | | | | | |
| | | | | | | | |
| | Issuer | | Shares | | | Value | |
| | | | | | | | | | |
| | Common Stocks—(continued) | | | | | | | | |
| | | | | | | | | | |
| | Emerging Asia—(continued) | | | | | | | | |
| | India—(continued) | | | | | | | | |
| | Dr. Lal PathLabs, Ltd. (Health care providers & services) | | | 91,129 | | | $ | 1,426 | |
| | Eicher Motors, Ltd. (Machinery) | | | 8,725 | | | | 2,799 | |
| | Finolex Industries, Ltd. (Chemicals) | | | 200,083 | | | | 1,291 | |
| | Godrej Consumer Products, Ltd. (Personal products) | | | 92,260 | | | | 2,058 | |
| | Gruh Finance, Ltd. (Thrifts & mortgage finance) | | | 714,154 | | | | 3,393 | |
| | Havells India, Ltd. (Electrical equipment) | | | 397,360 | | | | 1,998 | |
| | Indiabulls Housing Finance, Ltd. (Thrifts & mortgage finance) | | | 172,976 | | | | 1,654 | |
| | Indraprastha Gas, Ltd. (Gas utilities) | | | 269,608 | | | | 3,628 | |
| | Kajaria Ceramics, Ltd. (Building products) | | | 214,281 | | | | 1,467 | |
| | LIC Housing Finance, Ltd. (Thrifts & mortgage finance) | | | 199,033 | | | | 1,633 | |
| | Mahanagar Gas, Ltd. (Gas utilities) | | | 269,767 | | | | 3,116 | |
| | Max Financial Services, Ltd. (Insurance) | | | 154,185 | | | | 1,258 | |
| | Motherson Sumi Systems, Ltd. (Auto components) | | | 194,859 | | | | 934 | |
| | Petronet LNG, Ltd. (Oil, gas & consumable fuels) | | | 365,355 | | | | 1,974 | |
| | PI Industries, Ltd. (Chemicals) | | | 104,441 | | | | 1,277 | |
| | Pidilite Industries, Ltd. (Chemicals) | | | 128,700 | | | | 1,116 | |
| | Repco Home Finance, Ltd. (Consumer finance) | | | 98,065 | | | | 808 | |
| * | SKS Microfinance, Ltd. (Consumer finance) | | | 398,268 | | | | 3,457 | |
| | Supreme Industries, Ltd. (Chemicals) | | | 106,662 | | | | 1,422 | |
| | Syngene International Ltd. (Life sciences tools & services) | | | 236,400 | | | | 1,949 | |
| | UPL, Ltd. (Chemicals) | | | 264,135 | | | | 2,517 | |
| | Vakrangee, Ltd. (IT services) | | | 605,155 | | | | 2,444 | |
| | Vedanta, Ltd. (Metals & mining) | | | 1,224,927 | | | | 3,904 | |
| | Voltas, Ltd. (Construction & engineering) | | | 276,193 | | | | 1,327 | |
| | | | | | | | | 65,540 | |
| | Indonesia—3.8% | | | | | | | | |
| | PT Ace Hardware Indonesia Tbk (Specialty retail) | | | 3,148,200 | | | | 195 | |
| | PT Bank Tabungan Negara Persero Tbk (Banks) | | | 27,472,100 | | | | 3,548 | |
| | PT Ciputra Development Tbk (Real estate management & development) | | | 7,168,000 | | | | 710 | |
| | PT Indofood CBP Sukses Makmur Tbk (Food products) | | | 2,694,300 | | | | 1,715 | |
| | PT Mitra Keluarga Karyasehat Tbk (Health care providers & services) | | | 5,471,900 | | | | 1,044 | |
| | PT Pakuwon Jati Tbk (Real estate management & development) | | | 52,163,000 | | | | 2,188 | |
| | PT Summarecon Agung Tbk (Real estate management & development) | | | 562,300 | | | | 55 | |
| | PT Waskita Karya Persero Tbk (Construction & engineering) | | | 6,358,400 | | | | 1,204 | |
| | | | | | | | | 10,659 | |
See accompanying Notes to Financial Statements.
| 86 | Annual Report | December 31, 2016 |
| Emerging Markets Small Cap Growth Fund |
Portfolio of Investments, December 31, 2016 (all dollar amounts in thousands)
| | | | | | | | |
| | | | | | | | | | |
| | Issuer | | Shares | | | Value | |
| | | | | | | | | | |
| | Common Stocks—(continued) | | | | | | | | |
| | | | | | | | | | |
| | Emerging Asia—(continued) | | | | | | | | |
| | Malaysia—0.2% | | | | | | | | |
| | My EG Services Bhd (IT services) | | | 2,104,800 | | | $ | 709 | |
| | Pakistan—4.4% | | | | | | | | |
| | D.G. Khan Cement Co., Ltd. (Construction materials) | | | 949,000 | | | | 2,015 | |
| | Honda Atlas Cars Pakistan, Ltd. (Automobiles) | | | 16,000 | | | | 103 | |
| | Lucky Cement, Ltd. (Construction materials) | | | 423,000 | | | | 3,501 | |
| | Maple Leaf Cement Factory, Ltd. (Construction materials) | | | 1,768,121 | | | | 2,153 | |
| | Pakistan Oilfields, Ltd. (Oil, gas & consumable fuels) | | | 194,500 | | | | 997 | |
| | United Bank, Ltd. (Banks) | | | 1,611,500 | | | | 3,682 | |
| | | | | | | | | 12,451 | |
| | Philippines—2.7% | | | | | | | | |
| | D&L Industries, Inc. (Chemicals) | | | 6,895,800 | | | | 1,581 | |
| | GT Capital Holdings, Inc. (Diversified financial services) | | | 30,650 | | | | 783 | |
| | Jollibee Foods Corporation (Hotels, restaurants & leisure) | | | 182,530 | | | | 712 | |
| | Manila Water Co., Inc. (Water utilities) | | | 949,300 | | | | 554 | |
| | Metro Pacific Investments Corporation (Diversified financial services) | | | 7,076,000 | | | | 948 | |
| | Security Bank Corporation (Banks) | | | 802,070 | | | | 3,066 | |
| | | | | | | | | 7,644 | |
| | South Korea—4.6% | | | | | | | | |
| * | Advanced Process Systems Corporation (Semiconductors & semiconductor equipment) | | | 60,844 | | | | 1,504 | |
| * | BGF retail Co., Ltd. (Food & staples retailing) | | | 977 | | | | 66 | |
| | Halla Climate Control Corporation (Auto components) | | | 96,358 | | | | 822 | |
| * | Hanssem Co., Ltd. (Household durables) | | | 25,710 | | | | 4,236 | |
| * | Interojo Co., Ltd. (Health care equipment & supplies) | | | 30,340 | | | | 954 | |
| * | Mando Corporation (Auto components) | | | 11,419 | | | | 2,217 | |
| * | Samsung Biologics Co., Ltd. (Life sciences tools & services) | | | 8,120 | | | | 1,015 | |
| * | Vieworks Co., Ltd. (Health care equipment & supplies) | | | 43,782 | | | | 2,168 | |
| | | | | | | | | 12,982 | |
| | Taiwan—10.7% | | | | | | | | |
| | Advantech Co., Ltd. (Technology hardware, storage & peripherals) | | | 163,000 | | | | 1,287 | |
| | Airtac International Group (Machinery) | | | 195,000 | | | | 1,555 | |
| | ASPEED Technology, Inc. (Semiconductors & semiconductor equipment) | | | 105,000 | | | | 1,541 | |
| | China Life Insurance Co., Ltd. (Insurance) | | | 1,979,000 | | | | 1,968 | |
| | Chunghwa Precision Test Tech Co., Ltd. (Electronic equipment, instruments & components) | | | 42,000 | | | | 1,551 | |
| | | | | | | | |
| | | | | | | | | | |
| | Issuer | | Shares | | | Value | |
| | | | | | | | | | |
| | Common Stocks—(continued) | | | | | | | | |
| | | | | | | | | | |
| | Emerging Asia—(continued) | | | | | | | | |
| | Taiwan—(continued) | | | | | | | | |
| | Ennoconn Corporation (Technology hardware, storage & peripherals) | | | 201,000 | | | $ | 2,570 | |
| | Grape King Bio, Ltd. (Personal products) | | | 172,000 | | | | 998 | |
| | Kung Long Batteries Industrial Co., Ltd. (Electrical equipment) | | | 254,000 | | | | 1,241 | |
| | Nien Made Enterprise Co., Ltd. (Household durables) | | | 179,000 | | | | 1,847 | |
| | Posiflex Technology, Inc. (Electronic equipment, instruments & components) | | | 269,749 | | | | 1,481 | |
| | Powertech Technology, Inc. (Semiconductors & semiconductor equipment) | | | 938,000 | | | | 2,532 | |
| | Poya Co., Ltd. (Multiline retail) | | | 110,651 | | | | 1,282 | |
| | Silicon Motion Technology Corporation— ADR (Semiconductors & semiconductor equipment) | | | 42,758 | | | | 1,816 | |
| | Sinbon Electronics Co., Ltd. (Electronic equipment, instruments & components) | | | 597,274 | | | | 1,301 | |
| | Taiwan Paiho, Ltd. (Textiles, apparel & luxury goods) | | | 570,000 | | | | 1,687 | |
| | Tong Yang Industry Co., Ltd. (Auto components) | | | 568,000 | | | | 1,119 | |
| | Tripod Technology Corporation (Electronic equipment, instruments & components) | | | 700,000 | | | | 1,581 | |
| | Voltronic Power Technology Corporation (Electrical equipment) | | | 82,109 | | | | 1,135 | |
| | Win Semiconductors Corporation (Semiconductors & semiconductor equipment) | | | 459,000 | | | | 1,295 | |
| | Wistron NeWeb Corporation (Communications equipment) | | | 181,000 | | | | 485 | |
| | | | | | | | | 30,272 | |
| | Thailand—6.1% | | | | | | | | |
| | Bangkok Chain Hospital PCL (Health care providers & services) | | | 5,939,100 | | | | 2,455 | |
| | Beauty Community PCL (Specialty retail) | | | 4,770,100 | | | | 1,558 | |
| | Carabao Group PCL Class “F” (Beverages) | | | 1,459,200 | | | | 3,107 | |
| | Central Plaza Hotel PCL (Hotels, restaurants & leisure) | | | 1,250,900 | | | | 1,388 | |
| | Home Product Center PCL (Specialty retail) | | | 3,916,100 | | | | 1,115 | |
| | KCE Electronics PCL (Electronic equipment, instruments & components) | | | 684,800 | | | | 2,333 | |
| | Kiatnakin Bank PCL (Banks) | | | 1,195,600 | | | | 1,970 | |
| | Minor International PCL (Hotels, restaurants & leisure) | | | 1,573,201 | | | | 1,571 | |
| | Tisco Financial Group PCL (Banks) | | | 1,022,200 | | | | 1,720 | |
| | | | | | | | | 17,217 | |
| | Vietnam—0.4% | | | | | | | | |
| | Vietnam Dairy Products JSC (Food products) | | | 183,360 | | | | 1,011 | |
See accompanying Notes to Financial Statements.
| December 31, 2016 | William Blair Funds | 87 |
| Emerging Markets Small Cap Growth Fund |
Portfolio of Investments, December 31, 2016 (all dollar amounts in thousands)
| | | | | | | | |
| | | | | | | | | | |
| | Issuer | | Shares | | | Value | |
| | | | | | | | |
| | Common Stocks—(continued) | | | | | | | | |
| | | | | | | | | | |
| | Emerging Europe, Mid-East, Africa—15.6% | | | | | | | | |
| | Czech Republic—0.9% | | | | | | | | |
| * | Moneta Money Bank A.S. (Banks) | | | 773,264 | | | $ | 2,494 | |
| | Egypt—0.5% | | | | | | | | |
| * | Global Telecom Holding S.A.E.—GDR (Wireless telecommunication services) | | | 692,450 | | | | 1,288 | |
| | Georgia—0.7% | | | | | | | | |
| | BGEO Group plc (Banks) | | | 57,673 | | | | 2,121 | |
| | Greece—0.6% | | | | | | | | |
| | JUMBO S.A. (Specialty retail) | | | 47,470 | | | | 753 | |
| | OPAP S.A. (Hotels, restaurants & leisure) | | | 110,978 | | | | 981 | |
| | | | | | | | | 1,734 | |
| | Hungary—1.6% | | | | | | | | |
| | Magyar Telekom Telecommunications plc (Diversified telecommunication services) | | | 768,784 | | | | 1,303 | |
| | MOL Hungarian Oil & Gas plc (Oil, gas & consumable fuels) | | | 18,041 | | | | 1,267 | |
| | Richter Gedeon Nyrt (Pharmaceuticals) | | | 92,457 | | | | 1,955 | |
| | | | | | | | | 4,525 | |
| | Kenya—1.3% | | | | | | | | |
| | Safaricom, Ltd. (Wireless telecommunication services) | | | 20,336,400 | | | | 3,800 | |
| | Poland—1.1% | | | | | | | | |
| | KRUK S.A. (Consumer finance) | | | 53,529 | | | | 3,032 | |
| | Romania—1.0% | | | | | | | | |
| | Banca Transilvania S.A. (Banks) | | | 5,268,834 | | | | 2,914 | |
| | Russia—0.6% | | | | | | | | |
| | TCS Group Holding plc—GDR (Banks) | | | 167,655 | | | | 1,769 | |
| | South Africa—5.0% | | | | | | | | |
| | AVI, Ltd. (Food products) | | | 432,777 | | | | 2,879 | |
| | Capitec Bank Holdings, Ltd. (Banks) | | | 77,566 | | | | 3,925 | |
| | Cashbuild, Ltd. (Specialty retail) | | | 54,120 | | | | 1,356 | |
| | Clicks Group, Ltd. (Food & staples retailing) | | | 230,262 | | | | 1,936 | |
| * | Dis-Chem Pharmacies, Ltd. (Food & staples retailing) | | | 1,059,181 | | | | 1,728 | |
| | Famous Brands, Ltd. (Hotels, restaurants & leisure) | | | 126,386 | | | | 1,440 | |
| | PSG Group, Ltd. (Diversified financial services) | | | 53,350 | | | | 849 | |
| | | | | | | | | 14,113 | |
| | Turkey—0.9% | | | | | | | | |
| | Arcelik A.S. (Household durables) | | | 126,778 | | | | 762 | |
| | Tofas Turk Otomobil Fabrikasi A.S. (Automobiles) | | | 261,772 | | | | 1,829 | |
| | | | | | | | | 2,591 | |
| | United Arab Emirates—1.4% | | | | | | | | |
| | NMC Health plc (Health care providers & services) | | | 208,078 | | | | 3,959 | |
| | | | | | | | |
| | | | | | | | | | |
| | Issuer | | Shares | | | Value | |
| | | | | | | | |
| | Common Stocks—(continued) | | | | | | | | |
| | | | | | | | | | |
| | Emerging Latin America—12.5% | | | | | | | | |
| | Argentina—1.4% | | | | | | | | |
| | Banco Macro S.A.—ADR (Banks) | | | 21,784 | | | $ | 1,402 | |
| * | Pampa Energia S.A.—ADR (Electric utilities) | | | 72,304 | | | | 2,517 | |
| | | | | | | | | 3,919 | |
| | Brazil—6.5% | | | | | | | | |
| | Cia de Saneamento Basico do Estado de Sao Paulo (Water utilities) | | | 165,300 | | | | 1,462 | |
| | CVC Brasil Operadora e Agencia de Viagens S.A. (Hotels, restaurants & leisure) | | | 450,000 | | | | 3,277 | |
| | EcoRodovias Infraestrutura e Logistica S.A. (Transportation infrastructure) | | | 1,249,000 | | | | 3,162 | |
| | EDP - Energias do Brasil S.A. (Electric utilities) | | | 461,000 | | | | 1,898 | |
| | Linx S.A. (Software) | | | 185,400 | | | | 988 | |
| | Lojas Renner S.A. (Multiline retail) | | | 193,700 | | | | 1,379 | |
| | MRV Engenharia e Participacoes S.A. (Household durables) | | | 400,300 | | | | 1,346 | |
| | Raia Drogasil S.A. (Food & staples retailing) | | | 165,600 | | | | 3,113 | |
| | Ser Educacional S.A. (Diversified consumer services) | | | 331,700 | | | | 1,903 | |
| | | | | | | | | 18,528 | |
| | Chile—1.4% | | | | | | | | |
| | Aguas Andinas S.A. Class “A” (Water utilities) | | | 3,089,565 | | | | 1,614 | |
| | Parque Arauco S.A. (Real estate management & development) | | | 1,019,337 | | | | 2,283 | |
| | | | | | | | | 3,897 | |
| | Mexico—3.2% | | | | | | | | |
| | Alsea S.A.B. de C.V. (Hotels, restaurants & leisure) | | | 395,000 | | | | 1,128 | |
| | Banregio Grupo Financiero S.A.B. de C.V. (Banks) | | | 526,524 | | | | 2,934 | |
| | Grupo Aeroportuario del Centro Norte S.A.B. de C.V. (Transportation infrastructure) | | | 274,609 | | | | 1,182 | |
| | Grupo Aeroportuario del Pacifico S.A.B. de C.V. Class “B” (Transportation infrastructure) | | | 171,900 | | | | 1,413 | |
| | Infraestructura Energetica Nova S.A.B. de C.V. (Gas utilities) | | | 530,100 | | | | 2,309 | |
| | | | | | | | | 8,966 | |
| | Total Common Stocks—99.2%
(cost $266,225) | | | | | | | 280,704 | |
| | |
| | Preferred Stocks | | | | | | | | |
| | Brazil—1.5% | | | | | | | | |
| | Bradespar S.A. (Metals & mining) | | | 432,000 | | | | 1,971 | |
| * | Metalurgica Gerdau S.A. (Metals & mining) | | | 1,614,800 | | | | 2,381 | |
| | | | | | | | | 4,352 | |
| | Total Preferred Stocks—1.5%
(cost $4,792) | | | | | | | 4,352 | |
See accompanying Notes to Financial Statements.
| 88 | Annual Report | December 31, 2016 |
| Emerging Markets Small Cap Growth Fund |
Portfolio of Investments, December 31, 2016 (all dollar amounts in thousands)
| | | | | | | | |
| | Issuer | | Principal
Amount | | | Value | |
| | | | | | | | | | |
| | Repurchase Agreement | | | | | | | | |
| | Fixed Income Clearing Corporation, 0.030% dated 12/30/16, due 1/3/17, repurchase price $161, collateralized by U.S. Treasury Bond, 3.000%, due 5/15/45 | | $ | 161 | | | $ | 161 | |
| | Total Repurchase Agreement—0.1%
(cost $161) | | | | | | | 161 | |
| | Total Investments—100.8%
(cost $271,178) | | | | | | | 285,217 | |
| | Liabilities, plus cash and other assets—(0.8)% | | | | | | | (2,355 | ) |
| | Net assets—100.0% | | | | | | $ | 282,862 | |
ADR = American Depository Receipt
GDR = Global Depository Receipt
* = Non-income producing securities
For securities primarily traded on exchanges or markets that close before the close of regular trading on the New York Stock Exchange, the Fund may use an independent pricing service to fair value price the securities pursuant to Valuation Procedures approved by the Board of Trustees.
| At December 31, 2016, the Fund’s Portfolio of Investments includes the following industry categories (as a percentage of long-term investments): |
| |
| Financials | | | 21.5 | % |
| Consumer Discretionary | | | 21.2 | % |
| Information Technology | | | 11.6 | % |
| Industrials | | | 10.5 | % |
| Materials | | | 9.2 | % |
| Health Care | | | 6.8 | % |
| Utilities | | | 6.6 | % |
| Consumer Staples | | | 6.5 | % |
| Telecommunication Services | | | 2.2 | % |
| Energy | | | 2.1 | % |
| Real Estate | | | 1.8 | % |
| Total | | | 100.0 | % |
| | | | | |
| At December 31, 2016, the Fund’s Portfolio of Investments includes the following currency categories (as a percentage of long-term investments): |
| |
| Indian Rupee | | | 23.0 | % |
| Hong Kong Dollar | | | 10.5 | % |
| New Taiwan Dollar | | | 10.5 | % |
| Brazilian Real | | | 8.0 | % |
| U.S. Dollar | | | 7.1 | % |
| Thai Baht | | | 6.0 | % |
| South African Rand | | | 4.9 | % |
| South Korean Won | | | 4.6 | % |
| Pakistan Rupee | | | 4.4 | % |
| Indonesian Rupiah | | | 3.7 | % |
| Mexican Peso | | | 3.1 | % |
| Philippine Peso | | | 2.7 | % |
| British Pound Sterling | | | 2.1 | % |
| Hungarian Forint | | | 1.6 | % |
| Chilean Peso | | | 1.4 | % |
| Kenyan Shilling | | | 1.3 | % |
| Polish Zloty | | | 1.1 | % |
| Romanian Leu | | | 1.0 | % |
| All Other Currencies | | | 3.0 | % |
| Total | | | 100.0 | % |
See accompanying Notes to Financial Statements.
| December 31, 2016 | William Blair Funds | 89 |
| Fixed Income Market Review and Outlook |
The Bloomberg Barclays U.S. Aggregate Index (the “Index”) gained 2.65% during 2016, and interest rates rose in small magnitude across the yield curve. This perhaps-unspectacular headline masks the volatility experienced during the year. During the first six months of the year, interest rates plummeted to levels near historical lows and the Index gained 5.31%. During the last six months of the year, interest rates rose, the fourth quarter was the worst-performing calendar quarter for the Index in over 30 years, and the Index declined 2.53%.
The Federal Reserve did, in fact, raise the federal funds rate, although not at the pace predicted at the beginning of 2016. In January 2016, the Eurodollar futures market predicted four interest rate hikes during the calendar year. The Federal Open Market Committee (“FOMC”) did increase the target range of the federal funds rate once during the year by 0.25%, to a range of 0.50% -0.75%, at its December meeting. The FOMC cited strengthening labor market conditions that were supported by both the decline in the unemployment rate and an increase in wage inflation. However, the FOMC also stated that monetary policy remains accommodative to allow some further strengthening in labor market conditions, and that future increases in the federal funds rate are expected to be gradual. At the end of 2016, interest rates in the eurodollar futures market predicted three FOMC interest rate hikes during calendar year 2017.
The FOMC also stated that it will continue its practice of reinvesting principal payments from its holdings of Treasuries, agency debt, and agency mortgage-backed securities (“MBS”). These purchases influence longer-term interest rates and MBS risk spreads. While the FOMC is striking a hawkish tone on the direction of short-term rates, these purchases provide stable or downward pressure on longer-term interest rates. Meanwhile, the risk spreads of lower-coupon MBS that the FOMC is purchasing are lower than those of other MBS coupons that are being determined by more-traditional market forces.
Fixed-rate Treasuries underperformed the other major segments of the Index during the year. U.S. Treasury Inflation-Protected Securities (“TIPS”) outperformed fixed-rate Treasuries as market-implied inflation expectations rose. The MBS Index underperformed Treasuries after controlling for the effects of duration, but higher-coupon segments of the MBS market outperformed comparable-duration Treasuries. Corporate securities outperformed Treasuries on a duration-adjusted basis. High yield corporate bonds generated a robust gain of 17.13% during the year.
We believe that the FOMC will raise the federal funds rate gradually in 2017. The U.S. economy is growing; forecasters predict a real GDP growth rate of approximately 2.0% during 2016 and 2017. In addition, the U.S. labor market is adding jobs at a robust pace. Wage inflation increased throughout 2016, and estimates peg wage growth at 3.5% – 4.0% year-over-year, a level above the 2.5% upper bound of the FOMC’s target inflation range. Macroeconomic theory predicts that a robust labor market creates wage inflation, which in turn spurs broader inflation. We believe that the FOMC will raise the federal funds rate if market conditions remain normal and wage inflation takes hold.
TIPS have market-implied breakeven inflation rates slightly below the FOMC’s stated target range of 2.0% – 2.5%, and they are also below recent wage inflation estimates. We believe TIPS are an attractive alternative to fixed-rate Treasuries for mitigating the effects of rising rates driven by accelerating inflationary pressures.
We believe that spread sectors are poised to lead the market over the longer term. Corporate risk premiums are at levels above their longer-term averages, and risk premiums of higher-coupon segments of the agency MBS market remain attractive. In addition, we believe Treasuries are likely to struggle as the FOMC embarks on a tightening cycle.
We believe that higher-coupon segments (coupon rates of 5.0% and above for 30-year) of the agency MBS market offer compelling value. These segments of the agency MBS market offer attractive spreads and a defensive duration profile. The key risk of these securities is that the underlying borrowers are in-the-money to refinance their loan. We believe this risk can be mitigated by focusing on pools comprised of borrowers that do not have the economic incentive to refinance their loans (e.g., low-loan balance pools).
We believe that the corporate bond market remains attractive. Although fundamentals have deteriorated lately, risk spreads remain at attractive levels on a historical basis. We observed an increase in leverage among industrial companies over the past year as companies secured financing at low nominal yields in the robust new issue market for corporate bonds. We remain concerned about company-specific risks, including shareholder-friendly activities such as leveraged finance mergers and acquisitions, large share repurchases, and special dividends. Importantly, we do not believe the market will enter a period of excessive leveraged buyout activity.
| 90 | Annual Report | December 31, 2016 |
| | Bond Fund |
| | The Bond Fund seeks to outperform the Bloomberg Barclays U.S. Aggregate Index by maximizing total return through a combination of income and capital appreciation. |
| | |
| | AN OVERVIEW FROM THE PORTFOLIO MANAGERS |
| | |

Paul J. Sularz 
Christopher T. Vincent | The William Blair Bond Fund (Class N shares) posted a 4.40% return, net of fees, for the year ended December 31, 2016. By comparison, the Fund’s benchmark, the Bloomberg Barclays U.S. Aggregate Index (the “Index”), returned 2.65%. Multiple factors contributed to the Fund’s outperformance relative to the Index. Security selection among the Fund’s corporate bond holdings contributed to the Fund’s outperformance, specifically positions in bonds issued by ConocoPhillips, YUM! Brands, Petrobras, and Mexichem. Sector allocation also contributed to relative performance, as the Fund was underweight to fixed-rate Treasuries and overweight corporate bonds. The Fund experienced positive security selection results from its agency mortgage-backed securities holdings. Finally, the Fund held a position in U.S. Treasury Inflation-Protected Securities that was additive to performance. Detracting from the Fund’s relative performance in 2016 were exposures to bonds issued by Embraer and Credit Suisse. Please refer to the Fixed Income Market Review and Outlook relating to the Fund on page 90 for additional information. |
| December 31, 2016 | William Blair Funds | 91 |
Bond Fund
Performance Highlights (Unaudited)
| Average Annual Total Return at 12/31/2016 | |
| | | | 1 Year | | | 3 Year | | | 5 Year | | | Since
Inception (a) |
| Class N | | | 4.40 | % | | | 3.06 | % | | | 3.18 | % | | | 4.86 | % |
| Class I | | | 4.55 | | | | 3.26 | | | | 3.36 | | | | 5.03 | |
| Institutional Class | | | 4.61 | | | | 3.36 | | | | 3.46 | | | | 5.16 | |
| Bloomberg Barclays U.S. Aggregate Index | | | 2.65 | | | | 3.03 | | | | 2.23 | | | | 4.28 | |
| (a) | For the period from May 1, 2007 (Commencement of Operations) to December 31, 2016. |
Performance cited represents past performance. Past performance does not guarantee future results and current performance may be lower or higher than the data quoted. Results shown are average annual total returns, which assume reinvestment of dividends and capital gains. Investment returns and principal will fluctuate and you may have a gain or loss when you sell shares. For the most current month-end performance information, please call 1-800-742-7272, or visit our Web site at www.williamblairfunds.com. From time to time, the investment adviser may waive fees or reimburse expenses for the Fund. Without these waivers/reimbursements, performance would be lower. Class N shares are available to the general public without a sales load. Class I shares are available to certain institutional investors and advisory clients of William Blair Investment Management, LLC and William Blair & Company, L.L.C., without a sales load or distribution (12b-1) fees. Institutional Class shares are available to institutional investors without a sales load or distribution (12b-1) or service fees.
The performance highlights and graph presented above do not reflect the deduction of taxes that a shareholder would pay on fund distributions or the redemption of fund shares.
The Bloomberg Barclays U.S. Aggregate Index indicates broad intermediate government/corporate bond market performance.
This report identifies the Fund’s investments on December 31, 2016. These holdings are subject to change. Not all investments in the Fund performed the same, nor is there any guarantee that these investments will perform as well in the future. Market forecasts provided in this report may not necessarily come to pass.
Sector Diversification (Unaudited)
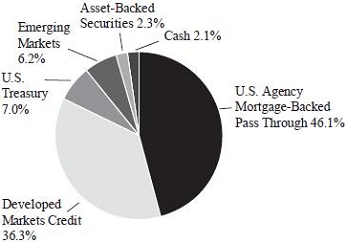
The sector diversification shown is based on the total investments.
| 92 | Annual Report | December 31, 2016 |
Bond Fund
Portfolio of Investments, December 31, 2016 (all dollar amounts in thousands)
| | | | | | | |
| | | Principal | | | | |
| Issuer | | Amount | | | Value | |
| | | | | | | |
| U.S. Government and U.S. Government Agency—52.7% |
| |
| U.S. Treasury Inflation Indexed Notes/Bonds—6.1% | |
U.S. Treasury Inflation Indexed Note,
1.875%, due 7/15/19 (a) | | $ | 4,959 | | | $ | 5,282 | |
U.S. Treasury Inflation Indexed Bond,
3.875%, due 4/15/29 | | | 20,456 | | | | 27,999 | |
| Total U.S. Treasury Inflation Indexed Notes/Bonds | | | | | | | 33,281 | |
| U.S. Treasury—0.7% | | | | | | | | |
U.S. Treasury Strip Principal,
0.000%, due 5/15/20 | | | 3,981 | | | | 3,772 | |
| Federal Home Loan Mortgage Corp. (FHLMC)—13.4% | | | |
| #E90398, 7.000%, due 5/1/17 | | | 2 | | | | 2 | |
| #G90027, 6.000%, due 11/17/17 | | | 1 | | | | 1 | |
| #G30093, 7.000%, due 12/1/17 | | | 1 | | | | 1 | |
| #O20005, 6.500%, due 1/1/18 | | | 1 | | | | 1 | |
| #E96940, 4.500%, due 6/1/18 | | | 11 | | | | 11 | |
| #B13747, 5.000%, due 4/1/19 | | | 143 | | | | 147 | |
| #G30254, 6.500%, due 5/1/19 | | | 3 | | | | 3 | |
| #G11697, 5.500%, due 4/1/20 | | | 257 | | | | 267 | |
| #G12113, 5.500%, due 5/1/21 | | | 241 | | | | 253 | |
| #J02986, 6.500%, due 7/1/21 | | | 13 | | | | 14 | |
| #G30255, 7.000%, due 7/1/21 | | | 2 | | | | 2 | |
| #G30243, 6.000%, due 12/1/21 | | | 3 | | | | 4 | |
| #G12720, 5.500%, due 6/1/22 | | | 33 | | | | 35 | |
| #D95621, 6.500%, due 7/1/22 | | | 24 | | | | 26 | |
| #G14150, 4.500%, due 4/1/26 | | | 1,786 | | | | 1,907 | |
| #J16051, 4.500%, due 7/1/26 | | | 780 | | | | 835 | |
| #G02210, 7.000%, due 12/1/28 | | | 72 | | | | 82 | |
| #G02183, 6.500%, due 3/1/30 | | | 19 | | | | 22 | |
| #G01728, 7.500%, due 7/1/32 | | | 113 | | | | 134 | |
| #C01385, 6.500%, due 8/1/32 | | | 91 | | | | 105 | |
| #G01551, 6.000%, due 4/1/33 | | | 1,965 | | | | 2,287 | |
| #C01623, 5.500%, due 9/1/33 | | | 111 | | | | 125 | |
| #A15039, 5.500%, due 10/1/33 | | | 2 | | | | 2 | |
| #A17603, 5.500%, due 1/1/34 | | | 2,030 | | | | 2,330 | |
| #G01705, 5.500%, due 6/1/34 | | | 814 | | | | 935 | |
| #G01843, 6.000%, due 6/1/35 | | | 21 | | | | 24 | |
| #G02141, 6.000%, due 3/1/36 | | | 607 | | | | 707 | |
| #G02883, 6.000%, due 4/1/37 | | | 1,926 | | | | 2,207 | |
| #A62179, 6.000%, due 6/1/37 | | | 251 | | | | 292 | |
| #G03711, 6.000%, due 6/1/37 | | | 779 | | | | 898 | |
| #G04126, 6.000%, due 6/1/37 | | | 2,182 | | | | 2,534 | |
| #A63539, 6.000%, due 7/1/37 | | | 339 | | | | 395 | |
| #A62858, 6.500%, due 7/1/37 | | | 121 | | | | 139 | |
| #G03170, 6.500%, due 8/1/37 | | | 263 | | | | 306 | |
| #A66843, 6.500%, due 10/1/37 | | | 862 | | | | 980 | |
| #G07837, 6.500%, due 2/1/38 | | | 2,848 | | | | 3,232 | |
| #G04053, 5.500%, due 3/1/38 | | | 539 | | | | 608 | |
| #A78138, 5.500%, due 6/1/38 | | | 335 | | | | 382 | |
| #G04466, 5.500%, due 7/1/38 | | | 16,022 | | | | 18,389 | |
| #G04544, 6.000%, due 8/1/38 | | | 669 | | | | 768 | |
| #A81799, 6.500%, due 9/1/38 | | | 456 | | | | 515 | |
| #G05723, 6.500%, due 11/1/38 | | | 1,504 | | | | 1,700 | |
| #G05124, 6.000%, due 12/1/38 | | | 1,450 | | | | 1,673 | |
| #A86143, 5.000%, due 5/1/39 | | | 49 | | | | 53 | |
| #G05810, 5.000%, due 2/1/40 | | | 14,478 | | | | 16,119 | |
| | | | | | | |
| | | Principal | | | | |
| Issuer | | Amount | | | Value | |
| | | | | | | |
| U.S. Government and U.S. Government Agency—(continued) |
| |
| Federal Home Loan Mortgage Corp. (FHLMC)—(continued) | |
| #G05875, 5.500%, due 2/1/40 | | $ | 699 | | | $ | 795 | |
| #G07300, 6.000%, due 4/1/40 | | | 6,339 | | | | 7,404 | |
| #G06017, 5.500%, due 6/1/40 | | | 170 | | | | 193 | |
| #C03665, 9.000%, due 4/1/41 | | | 742 | | | | 905 | |
| #G06583, 5.000%, due 6/1/41 | | | 1,866 | | | | 2,085 | |
| Total FHLMC Mortgage Obligations | | | | | | | 72,834 | |
| Federal National Mortgage Association (FNMA)—32.5% | | |
| #683100, 5.500%, due 2/1/18 | | | 29 | | | | 30 | |
| #689612, 5.000%, due 5/1/18 | | | 19 | | | | 19 | |
| #695910, 5.000%, due 5/1/18 | | | 49 | | | | 50 | |
| #697593, 5.000%, due 5/1/18 | | | 44 | | | | 45 | |
| #704049, 5.500%, due 5/1/18 | | | 102 | | | | 103 | |
| #735357, 5.500%, due 5/1/18 | | | 123 | | | | 125 | |
| #735003, 5.500%, due 7/1/18 | | | 119 | | | | 121 | |
| #251960, 6.000%, due 9/1/18 | | | 1 | | | | 1 | |
| #745498, 7.000%, due 11/1/18 | | | 23 | | | | 23 | |
| #770395, 5.000%, due 4/1/19 | | | 2 | | | | 2 | |
| #788424, 5.500%, due 9/1/19 | | | 9 | | | | 10 | |
| #835563, 7.000%, due 10/1/20 | | | 11 | | | | 12 | |
| #900725, 6.000%, due 8/1/21 | | | 31 | | | | 33 | |
| #888555, 5.500%, due 9/1/21 | | | 3,065 | | | | 3,227 | |
| #893325, 7.000%, due 9/1/21 | | | 9 | | | | 10 | |
| #735104, 7.000%, due 5/1/22 | | | 1 | | | | 1 | |
| #949589, 5.500%, due 8/1/22 | | | 2,309 | | | | 2,476 | |
| #949592, 6.000%, due 8/1/22 | | | 3,625 | | | | 3,909 | |
| #AA2924, 4.500%, due 4/1/24 | | | 221 | | | | 235 | |
| #931299, 4.500%, due 6/1/24 | | | 517 | | | | 553 | |
| #AC1848, 4.500%, due 9/1/24 | | | 320 | | | | 342 | |
| #AC5410, 4.500%, due 10/1/24 | | | 256 | | | | 273 | |
| #932095, 4.000%, due 11/1/24 | | | 1,213 | | | | 1,294 | |
| #932100, 4.500%, due 11/1/24 | | | 213 | | | | 227 | |
| #AL8529, 6.000%, due 11/1/24 | | | 5,833 | | | | 6,339 | |
| #AC9560, 5.000%, due 1/1/25 | | | 1,586 | | | | 1,694 | |
| #AD8164, 4.000%, due 8/1/25 | | | 546 | | | | 583 | |
| #AB1459, 4.000%, due 9/1/25 | | | 238 | | | | 254 | |
| #255956, 5.500%, due 10/1/25 | | | 17 | | | | 19 | |
| #AH2671, 4.000%, due 1/1/26 | | | 933 | | | | 995 | |
| #AI4872, 4.500%, due 6/1/26 | | | 353 | | | | 378 | |
| #AL2851, 4.000%, due 8/1/26 | | | 1,670 | | | | 1,785 | |
| #AI9811, 4.500%, due 8/1/26 | | | 287 | | | | 307 | |
| #AJ3203, 4.000%, due 10/1/26 | | | 100 | | | | 108 | |
| #AJ7724, 4.000%, due 12/1/26 | | | 724 | | | | 774 | |
| #AK7384, 4.000%, due 3/1/27 | | | 882 | | | | 945 | |
| #AB4818, 4.000%, due 4/1/27 | | | 594 | | | | 637 | |
| #AL2590, 4.000%, due 7/1/27 | | | 3,718 | | | | 3,974 | |
| #AV6413, 4.000%, due 2/1/29 | | | 2,816 | | | | 2,967 | |
| #252925, 7.500%, due 12/1/29 | | | 1 | | | | 1 | |
| #535977, 6.500%, due 4/1/31 | | | 8 | | | | 9 | |
| #253907, 7.000%, due 7/1/31 | | | 1 | | | | 2 | |
| #545339, 6.500%, due 11/1/31 | | | 45 | | | | 53 | |
| #587849, 6.500%, due 11/1/31 | | | 11 | | | | 12 | |
| #618547, 6.500%, due 11/1/31 | | | 4,997 | | | | 5,846 | |
| #545437, 7.000%, due 2/1/32 | | | 52 | | | | 61 | |
| #545759, 6.500%, due 7/1/32 | | | 472 | | | | 548 | |
See accompanying Notes to Financial Statements.
| December 31, 2016 | William Blair Funds | 93 |
Bond Fund
Portfolio of Investments, December 31, 2016 (all dollar amounts in thousands)
| | | | | | | | |
| | | Principal | | | | | |
| Issuer | | Amount | | | Value | |
| | | | | | | |
| U.S. Government and U.S. Government Agency—(continued) |
| |
| Federal National Mortgage Association (FNMA)—(continued) | |
| #545869, 6.500%, due 7/1/32 | | $ | 1,462 | | | $ | 1,667 | |
| #670385, 6.500%, due 9/1/32 | | | 730 | | | | 829 | |
| #254548, 5.500%, due 12/1/32 | | | 48 | | | | 53 | |
| #677290, 6.000%, due 1/1/33 | | | 2,091 | | | | 2,434 | |
| #684601, 6.000%, due 3/1/33 | | | 533 | | | | 620 | |
| #703391, 5.000%, due 5/1/33 | | | 166 | | | | 184 | |
| #708993, 5.000%, due 6/1/33 | | | 29 | | | | 32 | |
| #730131, 5.000%, due 8/1/33 | | | 56 | | | | 62 | |
| #741850, 5.500%, due 9/1/33 | | | 543 | | | | 616 | |
| #739243, 6.000%, due 9/1/33 | | | 671 | | | | 781 | |
| #739331, 6.000%, due 9/1/33 | | | 354 | | | | 412 | |
| #555800, 5.500%, due 10/1/33 | | | 53 | | | | 60 | |
| #756153, 5.500%, due 11/1/33 | | | 568 | | | | 645 | |
| #AL3455, 5.500%, due 11/1/33 | | | 6,703 | | | | 7,718 | |
| #763798, 5.500%, due 3/1/34 | | | 86 | | | | 97 | |
| #725611, 5.500%, due 6/1/34 | | | 116 | | | | 130 | |
| #787816, 6.000%, due 7/1/34 | | | 331 | | | | 386 | |
| #745563, 5.500%, due 8/1/34 | | | 651 | | | | 740 | |
| #794474, 6.000%, due 10/1/34 | | | 45 | | | | 52 | |
| #745092, 6.500%, due 7/1/35 | | | 367 | | | | 428 | |
| #357944, 6.000%, due 9/1/35 | | | 22 | | | | 25 | |
| #843487, 6.000%, due 10/1/35 | | | 107 | | | | 125 | |
| #AD0979, 7.500%, due 10/1/35 | | | 82 | | | | 99 | |
| #745349, 6.500%, due 2/1/36 | | | 319 | | | | 361 | |
| #888305, 7.000%, due 3/1/36 | | | 11 | | | | 13 | |
| #895637, 6.500%, due 5/1/36 | | | 87 | | | | 102 | |
| #831540, 6.000%, due 6/1/36 | | | 29 | | | | 34 | |
| #745802, 6.000%, due 7/1/36 | | | 166 | | | | 195 | |
| #886220, 6.000%, due 7/1/36 | | | 297 | | | | 342 | |
| #AL3449, 6.000%, due 7/1/36 | | | 1,652 | | | | 1,934 | |
| #893318, 6.500%, due 8/1/36 | | | 24 | | | | 27 | |
| #310037, 6.500%, due 10/1/36 | | | 198 | | | | 224 | |
| #831926, 6.000%, due 12/1/36 | | | 10 | | | | 12 | |
| #902974, 6.000%, due 12/1/36 | | | 238 | | | | 273 | |
| #995757, 6.000%, due 2/1/37 | | | 2,484 | | | | 2,900 | |
| #AB0265, 6.000%, due 2/1/37 | | | 15,234 | | | | 17,699 | |
| #938440, 6.000%, due 7/1/37 | | | 90 | | | | 103 | |
| #928561, 6.000%, due 8/1/37 | | | 219 | | | | 254 | |
| #948689, 6.000%, due 8/1/37 | | | 199 | | | | 228 | |
| #888703, 6.500%, due 8/1/37 | | | 4,455 | | | | 5,238 | |
| #888967, 6.000%, due 12/1/37 | | | 762 | | | | 893 | |
| #AL0904, 5.500%, due 1/1/38 | | | 55 | | | | 63 | |
| #889371, 6.000%, due 1/1/38 | | | 3,597 | | | | 4,203 | |
| #962058, 6.500%, due 3/1/38 | | | 1,459 | | | | 1,727 | |
| #934006, 6.500%, due 9/1/38 | | | 394 | | | | 446 | |
| #986856, 6.500%, due 9/1/38 | | | 208 | | | | 236 | |
| #991911, 7.000%, due 11/1/38 | | | 247 | | | | 281 | |
| #AL3775, 5.000%, due 1/1/39 | | | 1,889 | | | | 2,103 | |
| #AD0752, 7.000%, due 1/1/39 | | | 884 | | | | 1,052 | |
| #AA7611, 5.000%, due 5/1/39 | | | 930 | | | | 1,034 | |
| #AA8443, 5.000%, due 6/1/39 | | | 226 | | | | 251 | |
| #931492, 6.000%, due 7/1/39 | | | 196 | | | | 228 | |
| #AA6898, 6.000%, due 7/1/39 | | | 652 | | | | 752 | |
| #931801, 5.000%, due 8/1/39 | | | 763 | | | | 842 | |
| #AC1619, 5.500%, due 8/1/39 | | | 502 | | | | 569 | |
| #AD0315, 6.500%, due 8/1/39 | | | 2,880 | | | | 3,260 | |
| #932279, 5.000%, due 12/1/39 | | | 91 | | | | 100 | |
| | | NRSRO | | | | |
| | | Rating | | Principal | | |
| Issuer | | (unaudited) | | Amount | | | | Value | |
| | | | | | | | | | |
| U.S. Government and U.S. Government Agency—(continued) |
| |
| Federal National Mortgage Association (FNMA)—(continued) | |
| #AC9569, 5.000%, due 2/1/40 | | | | $ | 1,622 | | | $ | 1,806 | |
| #932638, 5.000%, due 3/1/40 | | | | | 167 | | | | 185 | |
| #932751, 5.000%, due 4/1/40 | | | | | 3,998 | | | | 4,454 | |
| #AE0082, 5.000%, due 5/1/40 | | | | | 467 | | | | 516 | |
| #AB1146, 5.000%, due 6/1/40 | | | | | 95 | | | | 106 | |
| #AD7137, 5.500%, due 7/1/40 | | | | | 4,621 | | | | 5,318 | |
| #AH0955, 5.000%, due 12/1/40 | | | | | 4,967 | | | | 5,515 | |
| #AH5585, 5.000%, due 2/1/41 | | | | | 182 | | | | 203 | |
| #AL0028, 5.000%, due 2/1/41 | | | | | 2,392 | | | | 2,648 | |
| #AL5815, 5.500%, due 4/1/41 | | | | | 3,713 | | | | 4,278 | |
| #AI6071, 5.000%, due 6/1/41 | | | | | 1,869 | | | | 2,089 | |
| #AI4222, 5.000%, due 7/1/41 | | | | | 135 | | | | 151 | |
| #AL0672, 5.000%, due 7/1/41 | | | | | 3,031 | | | | 3,381 | |
| #AL0913, 6.000%, due 7/1/41 | | | | | 2,122 | | | | 2,429 | |
| #AL9226, 5.500%, due 12/1/41 | | | | | 19,492 | | | | 22,420 | |
| #AL9225, 6.000%, due 1/1/42 | | | | | 9,640 | | | | 11,264 | |
| #AK2733, 5.000%, due 2/1/42 | | | | | 2,072 | | | | 2,316 | |
Total FNMA Mortgage
Obligations | | | | | | | | | 176,665 | |
| | | | | | | | | | | |
| Asset-Backed Securities—2.3% |
GE Capital Credit Card Master Note
Trust, 2012-6, Tranche B, 1.830%, 8/17/20 | | AA+ | | | 3,000 | | | | 3,009 | |
American Express Credit Account
Master Trust, 2008-2, Tranche A,
1.964%, 9/15/20, VRN | | AAA | | | 4,800 | | | | 4,860 | |
Centre Point Funding LLC—144A,
2012-2A, Tranche 1,
2.610%, 8/20/21 | | Baa2 | | | 2,396 | | | | 2,363 | |
SLM Private Education Loan Trust—
144A, 2011-A, Tranche A3,
3.204%, 1/15/43, VRN | | AAA | | | 2,000 | | | | 2,074 | |
| Total Asset-Backed Securities | | | | | | | | | 12,306 | |
| | | | | | | | | | | |
| Corporate Obligations—42.0% |
Toll Brothers Finance Corporation,
8.910%, due 10/15/17 | | BBB- | | | 1,050 | | | | 1,106 | |
Morgan Stanley,
6.625%, due 4/1/18 | | A | | | 3,400 | | | | 3,597 | |
Glencore Funding LLC—144A,
2.240%, due 1/15/19, VRN | | BBB- | | | 1,500 | | | | 1,511 | |
Petrobras Global Finance BV,
3.020%, due 1/15/19, VRN | | BB | | | 4,000 | | | | 3,938 | |
Baidu, Inc.,
2.750%, due 6/9/19 | | A | | | 4,000 | | | | 4,061 | |
Roper Industries, Inc.,
6.250%, due 9/1/19 | | BBB | | | 2,195 | | | | 2,416 | |
Republic Services, Inc.,
5.500%, due 9/15/19 | | BBB+ | | | 1,725 | | | | 1,878 | |
Boston Properties L.P.,
5.875%, due 10/15/19 | | A- | | | 4,000 | | | | 4,364 | |
Toll Brothers Finance Corporation,
6.750%, due 11/1/19 | | BBB- | | | 500 | | | | 549 | |
Ford Motor Credit Co. LLC,
8.125%, due 1/15/20 | | BBB | | | 4,000 | | | | 4,616 | |
See accompanying Notes to Financial Statements.
| 94 | Annual Report | December 31, 2016 |
Bond Fund
Portfolio of Investments, December 31, 2016 (all dollar amounts in thousands)
| | | NRSRO | | | | | | |
| | | Rating | | Principal | | | |
| Issuer | | (unaudited) | | Amount | | | Value | |
| | | | | | | | | | | |
| Corporate Obligations—(continued) |
Georgia-Pacific LLC—144A,
5.400%, due 11/1/20 | | A+ | | $ | 4,000 | | | $ | 4,401 | |
UBS Group AG,
6.875%, due 3/22/21, VRN | | BB+ | | | 2,000 | | | | 2,040 | |
JBS USA LUX SA / JBS USA Finance, Inc.—144A,
7.250%, due 6/1/21 | | BB+ | | | 3,000 | | | | 3,120 | |
Capital One Financial Corporation,
4.750%, due 7/15/21 | | A- | | | 3,375 | | | | 3,654 | |
O’Reilly Automotive, Inc.,
4.625%, due 9/15/21 | | BBB+ | | | 2,855 | | | | 3,067 | |
Fresenius Medical Care US Finance II, Inc.—144A,
5.875%, due 1/31/22 | | BB+ | | | 2,760 | | | | 3,036 | |
Ball Corporation,
5.000%, due 3/15/22 | | BB+ | | | 2,500 | | | | 2,628 | |
Masco Corporation,
5.950%, due 3/15/22 | | BBB | | | 4,050 | | | | 4,485 | |
Discover Financial Services,
5.200%, due 4/27/22 | | BBB+ | | | 3,000 | | | | 3,236 | |
Triumph Group, Inc.,
5.250%, due 6/1/22 | | B1 | | | 2,000 | | | | 1,875 | |
Penske Automotive Group, Inc.,
5.750%, due 10/1/22 | | B+ | | | 2,000 | | | | 2,070 | |
American Axle & Manufacturing, Inc.,
6.625%, due 10/15/22 | | BB | | | 3,000 | | | | 3,109 | |
Jones Lang LaSalle, Inc.,
4.400%, due 11/15/22 | | BBB+ | | | 4,218 | | | | 4,355 | |
Jaguar Land Rover Automotive plc—144A,
5.625%, due 2/1/23 | | BB+ | | | 3,225 | | | | 3,374 | |
Wyndham Worldwide Corporation,
3.900%, due 3/1/23 | | BBB- | | | 3,500 | | | | 3,498 | |
MGM Resorts International,
6.000%, due 3/15/23 | | BB- | | | 3,000 | | | | 3,248 | |
Avis Budget Car Rental LLC,
5.500%, due 4/1/23 | | BB- | | | 800 | | | | 789 | |
Toll Brothers Finance Corporation,
4.375%, due 4/15/23 | | BBB- | | | 3,375 | | | | 3,379 | |
Itau Unibanco Holding S.A.—144A,
5.125%, due 5/13/23 | | Ba3 | | | 2,500 | | | | 2,481 | |
Wells Fargo & Co.,
4.480%, due 1/16/24 | | A+ | | | 5,000 | | | | 5,268 | |
Fibria Overseas Finance, Ltd.,
5.250%, due 5/12/24 | | BBB- | | | 4,000 | | | | 4,030 | |
BRF S.A.—144A,
4.750%, due 5/22/24 | | BBB | | | 2,500 | | | | 2,441 | |
Banco Inbursa S.A. Institucion de Banca Multiple—144A,
4.125%, due 6/6/24 | | BBB+ | | | 2,500 | | | | 2,463 | |
Grupo Bimbo S.A.B. de C.V.—144A,
3.875%, due 6/27/24 | | BBB | | | 2,500 | | | | 2,495 | |
Synchrony Financial,
4.250%, due 8/15/24 | | BBB- | | | 5,000 | | | | 5,098 | |
SBA Communications Corporation—144A,
4.875%, due 9/1/24 | | B+ | | | 3,000 | | | | 2,970 | |
| | | NRSRO | | | | |
| | | Rating | | Principal | | |
| Issuer | | (unaudited) | | Amount | | | Value | |
| | | | | | | | | | | |
| Corporate Obligations—(continued) | | | |
HSBC Holdings plc,
6.375%, due 9/17/24, VRN | | BBB | | $ | 3,500 | | | $ | 3,452 | |
BNP Paribas S.A.,
4.250%, due 10/15/24 | | A | | | 4,000 | | | | 4,015 | |
CBS Radio, Inc.—144A,
7.250%, due 11/1/24 | | B- | | | 2,000 | | | | 2,105 | |
Owens Corning,
4.200%, due 12/1/24 | | BBB | | | 3,200 | | | | 3,284 | |
Cemex S.A.B. de C.V.—144A,
5.700%, due 1/11/25 | | BB- | | | 3,000 | | | | 3,030 | |
USG Corp.—144A,
5.500%, due 3/1/25 | | BB+ | | | 3,000 | | | | 3,094 | |
Simon Property Group L.P.,
3.300%, due 1/15/26 | | A | | | 4,500 | | | | 4,483 | |
Brookfield Finance, Inc.,
4.250%, due 6/2/26 | | A- | | | 4,775 | | | | 4,739 | |
Post Holdings, Inc.—144A,
5.000%, due 8/15/26 | | B | | | 3,000 | | | | 2,880 | |
United Rentals North America, Inc.,
5.875%, due 9/15/26 | | BB- | | | 2,500 | | | | 2,584 | |
Xylem, Inc.,
3.250%, due 11/1/26 | | BBB | | | 1,950 | | | | 1,897 | |
The Kroger Co.,
8.000%, due 9/15/29 | | Baa1 | | | 3,323 | | | | 4,505 | |
Yum! Brands, Inc.,
6.875%, due 11/15/37 | | B+ | | | 2,200 | | | | 2,156 | |
JPMorgan Chase & Co.,
6.400%, due 5/15/38 | | A+ | | | 3,500 | | | | 4,544 | |
ConocoPhillips,
6.500%, due 2/1/39 | | A- | | | 4,125 | | | | 5,239 | |
Petroleos Mexicanos,
6.500%, due 6/2/41 | | BBB+ | | | 2,500 | | | | 2,354 | |
Express Scripts Holding Co.,
6.125%, due 11/15/41 | | BBB+ | | | 4,700 | | | | 5,377 | |
Citigroup, Inc.,
5.875%, due 1/30/42 | | A | | | 4,000 | | | | 4,756 | |
Bank of America Corporation,
5.875%, due 2/7/42 | | A | | | 4,000 | | | | 4,852 | |
Mexichem S.A.B. de C.V.—144A,
5.875%, due 9/17/44 | | BBB | | | 3,500 | | | | 3,137 | |
Northrop Grumman Corporation,
3.850%, due 4/15/45 | | BBB+ | | | 4,500 | | | | 4,287 | |
ERP Operating L.P.,
4.500%, due 6/1/45 | | A- | | | 4,500 | | | | 4,537 | |
The Goldman Sachs Group, Inc.,
4.750%, due 10/21/45 | | A | | | 3,500 | | | | 3,709 | |
Anheuser-Busch InBev Finance, Inc.,
4.900%, due 2/1/46 | | A- | | | 5,000 | | | | 5,426 | |
Apple, Inc.,
4.650%, due 2/23/46 | | AA+ | | | 5,000 | | | | 5,412 | |
Exxon Mobil Corporation,
4.114%, due 3/1/46 | | Aaa | | | 2,275 | | | | 2,336 | |
PepsiCo, Inc.,
4.450%, due 4/14/46 | | A1 | | | 4,500 | | | | 4,805 | |
AT&T, Inc.,
4.750%, due 5/15/46 | | A- | | | 5,000 | | | | 4,755 | |
Verizon Communications, Inc.,
4.125%, due 8/15/46 | | A- | | | 5,000 | | | | 4,544 | |
See accompanying Notes to Financial Statements.
| December 31, 2016 | William Blair Funds | 95 |
Bond Fund
Portfolio of Investments, December 31, 2016 (all dollar amounts in thousands)
| | NRSRO | | | | | | |
| | Rating | | Principal | | | | |
| Issuer | (unaudited) | | Amount | | | Value | |
| | | | | | | | |
| Corporate Obligations—(continued) |
Microsoft Corporation,
4.750%, due 11/3/55 | AAA | | $ | 4,950 | | | $ | 5,399 | |
| Total Corporate Obligations | | | | | | | | 228,339 | |
Total Long-Term Investments—97.0%
(cost $520,864) | | | | | | | 527,197 | |
| | | | | | | | | | |
| Repurchase Agreements |
Fixed Income Clearing Corporation,
0.030% dated 12/30/16, due 1/3/17,
repurchase price $4,667,
collateralized by U.S. Treasury
Bond, 3.125%, due 2/15/43 | | | | 4,667 | | | $ | 4,667 | |
Total Repurchase Agreement—0.9%
(cost $4,667) | | | | | | | 4,667 | |
| | | | | | | | | | |
| U.S. Government and U.S. Government Agency |
U.S. Treasury Bill, 0.479%,
due 6/22/17 | | | | 500 | | | | 499 | |
Total U.S. Government and U.S. Government Agency—0.1%
(cost $499) | | | | | | | | 499 | |
| | | | | | | |
| | | Principal | | | | |
| Issuer | | Amount | | | Value | |
| | | | | | | | | |
| Commercial Paper | | | | | | | | |
Johnson Controls, 0.010%,
due 1/3/17 | | $ | 5,000 | | | $ | 5,000 | |
Total Commercial Paper—0.9%
(cost $5,000) | | | | | | | 5,000 | |
Total Investments—98.9%
(cost $531,030) | | | | | | | 537,363 | |
| Cash and other assets, less liabilities—1.1% | | | | | | | 5,893 | |
| Net assets—100.0% | | | | | | $ | 543,256 | |
144A = Security exempt from registration under Rule 144A of the Securities Act of 1933. These securities may be resold in transactions exempt from registration, normally to qualified institutional buyers.
NRSRO = Nationally Recognized Statistical Rating Organization—The credit quality ratings of the securities in the Fund reflect the highest category rating by any of Fitch Ratings, Moody’s Investors Service Inc., or Standard & Poor’s, a division of the McGraw-Hill Companies, Inc.
The obligations of certain U.S. Government-sponsored securities are neither issued nor guaranteed by the U.S. Treasury.
VRN = Variable Rate Note
(a) Security, or a portion of security, is segregated as collateral for the centrally cleared credit default swap, aggregating a total of $149.
Centrally Cleared Credit Default Swap
| | | | | | | | | | | | | | | Unrealized | |
| | | Buy/Sell | | Fixed Deal | | Maturity | | | | Notional | | | Appreciation | |
| Reference Entity | | Protection | | Pay Rate | | Date | | Cleared Exchange | | Amount | | | (Depreciation) | |
| CDX.IG-26 | | Buy | | | 1.000 | % | | June 2021 | | CME | | | $25,000 | | | | $(165 | ) |
See accompanying Notes to Financial Statements.
| 96 | Annual Report | December 31, 2016 |
| | Income Fund |
| | |
| | The Income Fund seeks a high level of current income with relative stability of principal. |
| | |
| | AN OVERVIEW FROM THE PORTFOLIO MANAGER |
| | |

Christopher T. Vincent | The William Blair Income Fund (Class N shares) returned 2.44%, net of fees, for the year ended December 31, 2016. By comparison, the Fund’s benchmark, the Bloomberg Barclays Intermediate Government/Credit Bond Index (the “Index”), returned 2.08%. Multiple factors contributed to the Fund’s outperformance relative to the Index. The Fund’s positions in agency mortgage-backed securities contributed to relative performance, as those positions performed well relative to comparable-duration securities in the Index. Security selection among the Fund’s corporate bond holdings contributed to the Fund’s outperformance, specifically positions in bonds issued by ConocoPhillips, Masco, JP Morgan, Synchrony Financial, BRF SA, and Fibria Cellulose. Finally, an allocation to U.S. Treasury Inflation-Protected Securities was additive to performance. Factors that detracted from the Fund’s relative performance in 2016 included an underweight to corporate bonds and BBB-rated securities, relative to the Index, both of which performed well during the year. In addition, the Fund held positions in bonds issued by Seagate Technology and Embraer that detracted from relative performance. Please refer to the Fixed Income Market Review and Outlook relating to the Fund on page 90 for additional information. |
| December 31, 2016 | William Blair Funds | 97 |
Income Fund
Performance Highlights (Unaudited)
| Average Annual Total Return at 12/31/2016 |
| | | 1 Year | | 3 Year | | 5 Year | | 10 Year |
| Class N | | | 2.44 | % | | | 1.96 | % | | | 2.03 | % | | | 2.94 | % |
| Class I | | | 2.78 | | | | 2.20 | | | | 2.27 | | | | 3.17 | |
| Bloomberg Barclays Intermediate Government/Credit Bond Index | | | 2.08 | | | | 2.09 | | | | 1.85 | | | | 3.84 | |
Performance cited represents past performance. Past performance does not guarantee future results and current performance may be lower or higher than the data quoted. Results shown are average annual total returns, which assume reinvestment of dividends and capital gains. Investment returns and principal will fluctuate and you may have a gain or loss when you sell shares. For the most current month-end performance information, please call 1-800-742-7272, or visit our Web site at www.williamblairfunds.com. From time to time, the investment adviser may waive fees or reimburse expenses for the Fund. Without these waivers/reimbursements, performance would be lower. Class N shares are available to the general public without a sales load. Class I shares are available to certain institutional investors and advisory clients of William Blair Investment Management, LLC and William Blair & Company, L.L.C., without a sales load or distribution (12b-1) or service fees.
The performance highlights and graph presented above do not reflect the deduction of taxes that a shareholder would pay on fund distributions or the redemption of fund shares.
The Bloomberg Barclays Intermediate Government/Credit Bond Index indicates broad intermediate government/corporate bond market performance.
This report identifies the Fund’s investments on December 31, 2016. These holdings are subject to change. Not all investments in the Fund performed the same, nor is there any guarantee that these investments will perform as well in the future. Market forecasts provided in this report may not necessarily come to pass.
Sector Diversification (Unaudited)

The sector diversification shown is based on the total investments.
| 98 | Annual Report | December 31, 2016 |
Income Fund
Portfolio of Investments, December 31, 2016 (all dollar amounts in thousands)
| | | | | | | | | |
| Issuer | | Principal
Amount | | | Value | |
| | | | | | | | | |
| U.S. Government and U.S. Government Agency—55.5% | | | |
| | | | |
| U.S. Treasury Inflation Indexed Notes/Bonds—5.3% | | | |
U.S. Treasury Inflation Indexed Note,
1.875%, due 7/15/19 | | $ | 2,264 | | | $ | 2,412 | |
U.S. Treasury Inflation Indexed Note,
1.125%, due 1/15/21 | | | 3,315 | | | | 3,480 | |
| Total U.S. Treasury Inflation Indexed Notes/Bonds | | | | | | | 5,892 | |
| U.S. Treasury—0.9% | | | | | | | | |
U.S. Treasury Strip Principal,
0.000%, due 5/15/20 | | | 1,000 | | | | 948 | |
| Federal Home Loan Mortgage Corp. (FHLMC)—7.4% | | | |
| #E90398, 7.000%, due 5/1/17 | | | 14 | | | | 14 | |
| #E97112, 4.000%, due 5/1/18 | | | 15 | | | | 15 | |
| #D95621, 6.500%, due 7/1/22 | | | 623 | | | | 677 | |
| #J13022, 4.000%, due 9/1/25 | | | 394 | | | | 418 | |
| #J16051, 4.500%, due 7/1/26 | | | 895 | | | | 957 | |
| #A17603, 5.500%, due 1/1/34 | | | 711 | | | | 816 | |
| #A45790, 7.500%, due 5/1/35 | | | 133 | | | | 150 | |
| #G02141, 6.000%, due 3/1/36 | | | 304 | | | | 354 | |
| #G03201, 6.500%, due 6/1/37 | | | 180 | | | | 211 | |
| #A66843, 6.500%, due 10/1/37 | | | 275 | | | | 313 | |
| #A81799, 6.500%, due 9/1/38 | | | 255 | | | | 289 | |
| #G06964, 5.500%, due 11/1/38 | | | 1,058 | | | | 1,216 | |
| #G05875, 5.500%, due 2/1/40 | | | 140 | | | | 159 | |
| #G07300, 6.000%, due 4/1/40 | | | 504 | | | | 588 | |
| #C03665, 9.000%, due 4/1/41 | | | 360 | | | | 439 | |
| #G06583, 5.000%, due 6/1/41 | | | 1,469 | | | | 1,641 | |
| Total FHLMC Mortgage Obligations | | | | | | | 8,257 | |
| Federal National Mortgage Association (FNMA)—41.9% | | | |
| #643217, 6.500%, due 6/1/17 | | | 11 | | | | 11 | |
| #679247, 7.000%, due 8/1/17 | | | 13 | | | | 13 | |
| #695910, 5.000%, due 5/1/18 | | | 51 | | | | 52 | |
| #740847, 6.000%, due 10/1/18 | | | 42 | | | | 43 | |
| #323501, 6.500%, due 1/1/19 | | | 13 | | | | 15 | |
| #751313, 5.000%, due 3/1/19 | | | 77 | | | | 79 | |
| #852864, 7.000%, due 7/1/20 | | | 281 | | | | 294 | |
| #458147, 10.000%, due 8/15/20 | | | 20 | | | | 21 | |
| #835563, 7.000%, due 10/1/20 | | | 120 | | | | 127 | |
| #831430, 5.500%, due 3/1/21 | | | 187 | | | | 197 | |
| #888555, 5.500%, due 9/1/21 | | | 1,226 | | | | 1,291 | |
| #735574, 8.000%, due 3/1/22 | | | 101 | | | | 107 | |
| #679253, 6.000%, due 10/1/22 | | | 317 | | | | 360 | |
| FNR G93-19 SH, 11.234%,due 4/25/23, VRN | | | 11 | | | | 14 | |
| #982878, 4.500%, due 5/1/23 | | | 174 | | | | 186 | |
| #AC5124, 4.000%, due 11/1/24 | | | 616 | | | | 658 | |
| #932095, 4.000%, due 11/1/24 | | | 3,431 | | | | 3,660 | |
| #932100, 4.500%, due 11/1/24 | | | 814 | | | | 870 | |
| #AL8529, 6.000%, due 11/1/24 | | | 7,471 | | | | 8,120 | |
| #AC6257, 4.000%, due 12/1/24 | | | 696 | | | | 742 | |
| #AC0596, 4.000%, due 12/1/24 | | | 185 | | | | 196 | |
| #AD4073, 4.000%, due 5/1/25 | | | 89 | | | | 95 | |
| #935995, 4.000%, due 6/1/25 | | | 86 | | | | 90 | |
| #AD4677, 4.000%, due 6/1/25 | | | 561 | | | | 598 | |
| #AE1176, 4.000%, due 8/1/25 | | | 273 | | | | 293 | |
| Issuer | | NRSRO
Rating
(unaudited) | | Principal
Amount | | | Value | |
| | | | | | | | | | | |
| U.S. Government and U.S. Government Agency—(continued) | |
| | |
| Federal National Mortgage Association (FNMA)—(continued) | |
| #255956, 5.500%, due 10/1/25 | | | | $ | 51 | | | $ | 56 | |
| #AL2851, 4.000%, due 8/1/26 | | | | | 2,088 | | | | 2,231 | |
| #AI9811, 4.500%, due 8/1/26 | | | | | 403 | | | | 431 | |
| #AJ3203, 4.000%, due 10/1/26 | | | | | 1,005 | | | | 1,076 | |
| #AJ7724, 4.000%, due 12/1/26 | | | | | 772 | | | | 826 | |
| #256639, 5.000%, due 2/1/27 | | | | | 10 | | | | 11 | |
| #AB4818, 4.000%, due 4/1/27 | | | | | 1,838 | | | | 1,969 | |
| #AL2590, 4.000%, due 7/1/27 | | | | | 1,317 | | | | 1,408 | |
| #806458, 8.000%, due 6/1/28 | | | | | 108 | | | | 121 | |
| #880155, 8.500%, due 7/1/29 | | | | | 208 | | | | 239 | |
| #797846, 7.000%, due 3/1/32 | | | | | 82 | | | | 87 | |
| #745519, 8.500%, due 5/1/32 | | | | | 59 | | | | 66 | |
| #654674, 6.500%, due 9/1/32 | | | | | 61 | | | | 69 | |
| #733897, 6.500%, due 12/1/32 | | | | | 232 | | | | 260 | |
| #254693, 5.500%, due 4/1/33 | | | | | 8 | | | | 9 | |
| #555531, 5.500%, due 6/1/33 | | | | | 77 | | | | 87 | |
| #711736, 5.500%, due 6/1/33 | | | | | 99 | | | | 113 | |
| #555591, 5.500%, due 7/1/33 | | | | | 13 | | | | 14 | |
| #AL3455, 5.500%, due 11/1/33 | | | | | 1,969 | | | | 2,267 | |
| #776964, 5.000%, due 4/1/34 | | | | | 349 | | | | 388 | |
| #725424, 5.500%, due 4/1/34 | | | | | 80 | | | | 90 | |
| #888884, 5.500%, due 12/1/35 | | | | | 174 | | | | 197 | |
| #886220, 6.000%, due 7/1/36 | | | | | 211 | | | | 244 | |
| #AL3449, 6.000%, due 7/1/36 | | | | | 944 | | | | 1,105 | |
| #888703, 6.500%, due 8/1/37 | | | | | 941 | | | | 1,106 | |
| #928658, 6.500%, due 9/1/37 | | | | | 31 | | | | 35 | |
| #962058, 6.500%, due 3/1/38 | | | | | 505 | | | | 597 | |
| #991911, 7.000%, due 11/1/38 | | | | | 158 | | | | 180 | |
| #AD0315, 6.500%, due 8/1/39 | | | | | 304 | | | | 344 | |
| #AC3237, 5.000%, due 10/1/39 | | | | | 139 | | | | 154 | |
| #AC9569, 5.000%, due 2/1/40 | | | | | 216 | | | | 241 | |
| #AL0028, 5.000%, due 2/1/41 | | | | | 1,021 | | | | 1,130 | |
| #AL5815, 5.500%, due 4/1/41 | | | | | 701 | | | | 807 | |
| #AL9226, 5.500%, due 12/1/41 | | | | | 6,335 | | | | 7,286 | |
| #AL9225, 6.000%, due 1/1/42 | | | | | 2,651 | | | | 3,098 | |
| Total FNMA Mortgage Obligations | | | | | | | | | 46,474 | |
| | | | | | | | | | | |
| Asset-Backed Securities—9.8% | | | | | | | | |
Mercedes Benz Auto Lease Trust, 2016-A, Tranche A2B,
1.264%, 7/16/18, VRN | | Aaa | | | 813 | | | | 814 | |
Ford Credit Auto Owner Trust, 2016-A, Tranche A2B,
1.104%, 12/15/18, VRN | | AAA | | | 1,669 | | | | 1,670 | |
Harley-Davidson Motorcycle Trust, 2015-2, Tranche A2B,
0.954%, 1/15/19, VRN | | AAA | | | 295 | | | | 295 | |
Capital One Multi-Asset Execution Trust, 2007-A1, Tranche A1,
0.754%, 11/15/19, VRN | | AAA | | | 1,700 | | | | 1,700 | |
Citibank Credit Card Issuance Trust, 2008-A2, Tranche A2,
1.905%, 1/23/20, VRN | | AAA | | | 1,225 | | | | 1,238 | |
GE Capital Credit Card Master Note Trust, 2012-6, Tranche B,
1.830%, 8/17/20 | | AA+ | | | 1,705 | | | | 1,710 | |
See accompanying Notes to Financial Statements.
| December 31, 2016 | William Blair Funds | 99 |
Income Fund
Portfolio of Investments, December 31, 2016 (all dollar amounts in thousands)
| Issuer | | NRSRO
Rating
(unaudited) | | Principal
Amount | | | Value | |
| | | | | | | | | | | |
| Asset-Backed Securities—(continued) | | | | | | |
American Express Credit Account Master Trust, 2008-2, Tranche A,
1.964%, 9/15/20, VRN | | AAA | | $ | 1,000 | | | $ | 1,013 | |
Capital One Multi-Asset Execution Trust, 2016-A1, Tranche A1,
1.154%, 2/15/22, VRN | | AAA | | | 1,850 | | | | 1,858 | |
SLM Private Education Loan Trust—144A, 2011-A, Tranche A3,
3.204%, 1/15/43, VRN | | AAA | | | 500 | | | | 518 | |
| Total Asset-Backed Securities | | | | | | | | | 10,816 | |
| | | | | | | | | | | |
| Corporate Obligations—33.2% | | | | | | | | |
Macquarie Group Ltd.—144A,
4.875%, due 8/10/17 | | A3 | | | 1,000 | | | | 1,018 | |
| Morgan Stanley, 6.625%, due 4/1/18 | | A | | | 1,000 | | | | 1,058 | |
Bank of America Corporation,
6.875%, due 11/15/18 | | A | | | 1,000 | | | | 1,088 | |
| Baidu, Inc., 2.750%, due 6/9/19 | | A | | | 750 | | | | 761 | |
JPMorgan Chase & Co.,
5.000%, due 7/1/19, VRN | | BBB- | | | 1,000 | | | | 999 | |
PNC Bank NA,
1.450%, due 7/29/19 | | A+ | | | 1,000 | | | | 987 | |
Burlington Northern Santa Fe LLC,
4.700%, due 10/1/19 | | A | | | 1,000 | | | | 1,076 | |
Boston Properties L.P.,
5.875%, due 10/15/19 | | A- | | | 1,000 | | | | 1,091 | |
Petroleos Mexicanos,
6.000%, due 3/5/20 | | BBB+ | | | 1,000 | | | | 1,057 | |
PepsiCo, Inc.,
2.150%, due 10/14/20 | | A1 | | | 1,000 | | | | 1,002 | |
Georgia-Pacific LLC—144A,
5.400%, due 11/1/20 | | A+ | | | 1,000 | | | | 1,100 | |
Mitsubishi UFJ Financial Group, Inc.,
2.950%, due 3/1/21 | | A1 | | | 1,000 | | | | 1,007 | |
Capital One Financial Corporation,
4.750%, due 7/15/21 | | A- | | | 1,000 | | | | 1,083 | |
Apple, Inc.,
1.550%, due 8/4/21 | | AA+ | | | 1,000 | | | | 967 | |
General Electric Capital Corporation,
4.650%, due 10/17/21 | | AA- | | | 1,000 | | | | 1,098 | |
Verizon Communications, Inc.,
3.500%, due 11/1/21 | | A- | | | 1,000 | | | | 1,033 | |
Ryder System, Inc.,
3.450%, due 11/15/21 | | A- | | | 900 | | | | 923 | |
Gilead Sciences, Inc.,
4.400%, due 12/1/21 | | A | | | 1,000 | | | | 1,077 | |
Masco Corporation,
5.950%, due 3/15/22 | | BBB | | | 1,000 | | | | 1,107 | |
Bancolombia S.A.,
5.125%, due 9/11/22 | | BBB- | | | 750 | | | | 766 | |
Jones Lang LaSalle, Inc.,
4.400%, due 11/15/22 | | BBB+ | | | 750 | | | | 774 | |
Anheuser-Busch InBev Finance, Inc.,
3.300%, due 2/1/23 | | A- | | | 1,000 | | | | 1,019 | |
Wyndham Worldwide Corporation,
3.900%, due 3/1/23 | | BBB- | | | 750 | | | | 750 | |
Toll Brothers Finance Corporation,
4.375%, due 4/15/23 | | BBB- | | | 500 | | | | 501 | |
| Issuer | | NRSRO
Rating
(unaudited) | | Principal
Amount | | | Value | |
| | | | | | | | | | | |
| Corporate Obligations—(continued) | | | | | | | | |
Wells Fargo & Co.,
4.480%, due 1/16/24 | | A+ | | $ | 1,000 | | | $ | 1,054 | |
The Goldman Sachs Group, Inc.,
4.000%, due 3/3/24 | | A | | | 1,000 | | | | 1,039 | |
Fibria Overseas Finance, Ltd.,
5.250%, due 5/12/24 | | BBB- | | | 1,000 | | | | 1,008 | |
BRF S.A.—144A,
4.750%, due 5/22/24 | | BBB | | | 750 | | | | 732 | |
Grupo Bimbo S.A.B. de C.V.—144A,
3.875%, due 6/27/24 | | BBB | | | 1,000 | | | | 998 | |
Synchrony Financial,
4.250%, due 8/15/24 | | BBB- | | | 1,000 | | | | 1,020 | |
BNP Paribas S.A.,
4.250%, due 10/15/24 | | A | | | 750 | | | | 753 | |
ERP Operating L.P.,
3.375%, due 6/1/25 | | A- | | | 1,000 | | | | 995 | |
Intercontinental Exchange, Inc.,
3.750%, due 12/1/25 | | A | | | 1,000 | | | | 1,026 | |
Simon Property Group L.P.,
3.300%, due 1/15/26 | | A | | | 1,000 | | | | 996 | |
ConocoPhillips Co.,
4.950%, due 3/15/26 | | A- | | | 900 | | | | 995 | |
Brookfield Finance, Inc.,
4.250%, due 6/2/26 | | A- | | | 750 | | | | 744 | |
Xylem, Inc.,
3.250%, due 11/1/26 | | BBB | | | 1,000 | | | | 973 | |
Crown Castle Towers LLC—144A,
6.113%, due 1/15/40 | | A2 | | | 1,000 | | | | 1,084 | |
| Total Corporate Obligations | | | | | | | | | 36,759 | |
Total Long-Term Investments—98.5%
(cost $109,149) | | | | | | | | | 109,146 | |
| | | | | | | | | | | |
| Repurchase Agreement | | | | | | | | | | |
| Fixed Income Clearing Corporation, 0.030% dated 12/30/16, due 1/3/17, repurchase price $279, collateralized by U.S. Treasury Bond, 3.375%,due 5/15/44 | | | | | 279 | | | | 279 | |
Total Repurchase Agreement—0.2%
(cost $279) | | | | | | | | | 279 | |
Total Investments—98.7%
(cost $109,428) | | | | | | | | | 109,425 | |
| Cash and other assets, less liabilities—1.3% | | | | | | | | | 1,445 | |
| Net assets—100.0% | | | | | | | | $ | 110,870 | |
144A = Security exempt from registration under Rule 144A of the Securities Act of 1933. These securities may be resold in transactions exempt from registration, normally to qualified institutional buyers.
NRSRO = Nationally Recognized Statistical Rating Organization—The credit quality ratings of the securities in the Fund reflect the highest category rating by any of Fitch Ratings, Moody’s Investors Service Inc., or Standard & Poor’s, a division of the McGraw-Hill Companies, Inc.
The obligations of certain U.S. Government-sponsored securities are neither issued nor guaranteed by the U.S. Treasury.
VRN = Variable Rate Note
See accompanying Notes to Financial Statements.
| 100 | Annual Report | December 31, 2016 |
| | Low Duration Fund |
| | |
| | The Low Duration Fund seeks to maximize total return. Total return includes both income and capital appreciation. |
| | |
| | AN OVERVIEW FROM THE PORTFOLIO MANAGERS |
| | |

Paul J. Sularz 
Christopher T. Vincent | The William Blair Low Duration Fund (Class N shares) returned 1.16%, net of fees, for the year ended December 31, 2016. By comparison, the Fund’s benchmark, the Bank of America Merrill Lynch 1-Year U.S. Treasury Note Index (the “Index”), returned 0.76%. Multiple factors contributed to the Fund’s outperformance relative to the Index. The Fund is designed to assume slightly more interest rate risk than the risk-free rate, and the Fund’s interest rate exposures contributed to relative performance as shorter-term interest rates generated positive returns during the year. Fund holdings in agency mortgage-backed securities were a contributing source of performance. Finally, allocations to floating-rate asset-backed and investment-grade corporate securities had a positive impact on performance. Factors that detracted from the Fund’s relative performance in 2016 included interest rate risk hedging and residual cash. Please refer to the Fixed Income Market Review and Outlook relating to the Fund on page 90 for additional information. |
| December 31, 2016 | William Blair Funds | 101 |
Low Duration Fund
Performance Highlights (Unaudited)
| Average Annual Total Return at 12/31/2016 |
| | | 1 Year | | 3 Year | | 5 Year | | Since
Inception (a) |
| Class N | | | 1.16 | % | | | 0.79 | % | | | 0.90 | % | | | 1.06 | % |
| Class I | | | 1.40 | | | | 0.98 | | | | 1.08 | | | | 1.22 | |
| Institutional Class | | | 1.43 | | | | 1.02 | | | | 1.17 | | | | 1.34 | |
| Bank of America Merrill Lynch 1-Year U.S. Treasury Note Index | | | 0.76 | | | | 0.36 | | | | 0.32 | | | | 0.40 | |
| (a) | For the period from December 1, 2009 (Commencement of Operations) to December 31, 2016. |
Performance cited represents past performance. Past performance does not guarantee future results and current performance may be lower or higher than the data quoted. Results shown are average annual total returns, which assume reinvestment of dividends and capital gains. Investment returns and principal will fluctuate and you may have a gain or loss when you sell shares. For the most current month-end performance information, please call 1-800-742-7272, or visit our Web site at www.williamblairfunds.com. From time to time, the investment adviser may waive fees or reimburse expenses for the Fund. Without these waivers/reimbursements, performance would be lower. Class N shares are available to the general public without a sales load. Class I shares are available to certain institutional investors and advisory clients of William Blair Investment Management, LLC and William Blair & Company, L.L.C., without a sales load or distribution (12b-1) fees. Institutional Class shares are available to institutional investors without a sales load or distribution (12b-1) or service fees.
The performance highlights and graph presented above do not reflect the deduction of taxes that a shareholder would pay on fund distributions or the redemption of fund shares.
The Bank of America Merrill Lynch 1-Year U.S. Treasury Note Index is comprised of a single U.S. Treasury Note issue purchased at the beginning of the month and held for a full month. Each month the index is rebalanced and the issue selected is the outstanding U.S. Treasury Note that matures closest to, but not beyond one year from the rebalancing date.
This report identifies the Fund’s investments on December 31, 2016. These holdings are subject to change. Not all investments in the Fund performed the same, nor is there any guarantee that these investments will perform as well in the future. Market forecasts provided in this report may not necessarily come to pass.
Sector Diversification (Unaudited)
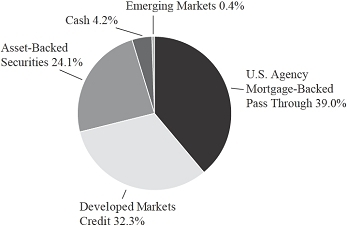
The sector diversification shown is based on the total investments.
| 102 | Annual Report | December 31, 2016 |
Low Duration Fund
Portfolio of Investments, December 31, 2016 (all dollar amounts in thousands)
| | | | | | | |
| Issuer | | Principal
Amount | | | Value | |
| | | | | | | | | |
| U.S. Government Agency—44.3% | | | | | | | | |
| | | | | | | | | |
| Federal Home Loan Mortgage Corp. (FHLMC)—14.6% | | | | | | | | |
| #E95760, 4.500%, due 4/1/18 | | $ | 3 | | | $ | 3 | |
| #E99582, 5.000%, due 9/1/18 | | | 5 | | | | 5 | |
| #E99684, 5.000%, due 10/1/18 | | | 127 | | | | 131 | |
| #B11362, 5.500%, due 12/1/18 | | | 13 | | | | 13 | |
| #B11849, 5.500%, due 1/1/19 | | | 32 | | | | 32 | |
| #B13870, 4.500%, due 5/1/19 | | | 28 | | | | 29 | |
| #G11604, 5.000%, due 7/1/19 | | | 33 | | | | 34 | |
| #G11596, 5.500%, due 8/1/19 | | | 28 | | | | 29 | |
| #G11605, 5.500%, due 9/1/19 | | | 17 | | | | 17 | |
| #B17294, 5.000%, due 11/1/19 | | | 80 | | | | 82 | |
| #B19222, 4.500%, due 4/1/20 | | | 73 | | | | 75 | |
| #G11697, 5.500%, due 4/1/20 | | | 72 | | | | 75 | |
| #J02537, 5.000%, due 9/1/20 | | | 33 | | | | 35 | |
| #G11836, 5.500%, due 12/1/20 | | | 11 | | | | 12 | |
| #G12113, 5.500%, due 5/1/21 | | | 86 | | | | 90 | |
| #G12395, 6.000%, due 10/1/21 | | | 371 | | | | 395 | |
| #E02322, 5.500%, due 5/1/22 | | | 23 | | | | 25 | |
| #G12725, 6.000%, due 6/1/22 | | | 149 | | | | 161 | |
| #G13124, 6.000%, due 12/1/22 | | | 124 | | | | 135 | |
| #J06871, 5.500%, due 1/1/23 | | | 74 | | | | 78 | |
| #J08450, 5.500%, due 7/1/23 | | | 37 | | | | 39 | |
| #J08703, 5.500%, due 9/1/23 | | | 67 | | | | 72 | |
| #E02614, 4.000%, due 4/1/24 | | | 2,303 | | | | 2,434 | |
| #J10351, 4.000%, due 7/1/24 | | | 123 | | | | 130 | |
| #C00351, 8.000%, due 7/1/24 | | | 46 | | | | 51 | |
| #J10600, 4.000%, due 8/1/24 | | | 8 | | | | 9 | |
| #G13695, 4.000%, due 9/1/24 | | | 570 | | | | 606 | |
| #J11208, 5.000%, due 11/1/24 | | | 80 | | | | 85 | |
| #G00363, 8.000%, due 6/1/25 | | | 79 | | | | 88 | |
| #J12853, 4.000%, due 8/1/25 | | | 158 | | | | 168 | |
| #C80329, 8.000%, due 8/1/25 | | | 17 | | | | 19 | |
| #J13022, 4.000%, due 9/1/25 | | | 158 | | | | 167 | |
| #J14491, 4.000%, due 2/1/26 | | | 2,992 | | | | 3,186 | |
| #J16051, 4.500%, due 7/1/26 | | | 2,018 | | | | 2,159 | |
| #G30348, 6.000%, due 7/1/27 | | | 1,049 | | | | 1,205 | |
| #G07290, 6.000%, due 6/1/34 | | | 2,118 | | | | 2,420 | |
| #G07837, 6.500%, due 2/1/38 | | | 1,545 | | | | 1,753 | |
| #G04424, 6.000%, due 6/1/38 | | | 663 | | | | 762 | |
| #G04778, 6.000%, due 7/1/38 | | | 90 | | | | 105 | |
| #A81372, 6.000%, due 8/1/38 | | | 246 | | | | 281 | |
| #G04544, 6.000%, due 8/1/38 | | | 335 | | | | 384 | |
| #G04687, 6.000%, due 9/1/38 | | | 94 | | | | 109 | |
| #G04745, 6.000%, due 9/1/38 | | | 290 | | | | 337 | |
| #A81799, 6.500%, due 9/1/38 | | | 240 | | | | 271 | |
| #G06085, 6.500%, due 9/1/38 | | | 101 | | | | 114 | |
| #G06964, 5.500%, due 11/1/38 | | | 3,157 | | | | 3,627 | |
| #G05723, 6.500%, due 11/1/38 | | | 1,367 | | | | 1,545 | |
| #G05124, 6.000%, due 12/1/38 | | | 4,639 | | | | 5,355 | |
| #G07480, 6.000%, due 5/1/39 | | | 3,138 | | | | 3,603 | |
| #G07300, 6.000%, due 4/1/40 | | | 5,185 | | | | 6,055 | |
| #G06017, 5.500%, due 6/1/40 | | | 1,113 | | | | 1,261 | |
| #4122, Tranche FP, 1.104%, due 10/15/42, VRN | | | 886 | | | | 882 | |
| Total FHLMC Mortgage Obligations | | | | | | | 40,738 | |
| Federal National Mortgage Association (FNMA)—29.7% | | | | | | | | |
| #672953, 5.000%, due 12/1/17 | | | 3 | | | | 3 | |
| #695838, 5.500%, due 4/1/18 | | | 9 | | | | 9 | |
| #697593, 5.000%, due 5/1/18 | | | 29 | | | | 30 | |
| #656573, 5.000%, due 6/1/18 | | | 20 | | | | 20 | |
| | | | | | | |
| Issuer | | Principal
Amount | | | Value | |
| | | | | | | | | |
| U.S. Government Agency—(continued) | | | | | |
| | | | | | |
| Federal National Mortgage Association (FNMA)—(continued) | | | | | | | |
| #709848, 5.000%, due 6/1/18 | | $ | 19 | | | $ | 19 | |
| #705741, 5.000%, due 6/1/18 | | | 18 | | | | 19 | |
| #728715, 5.000%, due 7/1/18 | | | 38 | | | | 39 | |
| #711991, 5.000%, due 8/1/18 | | | 24 | | | | 24 | |
| #257378, 5.000%, due 9/1/18 | | | 6 | | | | 6 | |
| #743183, 5.000%, due 10/1/18 | | | 11 | | | | 11 | |
| #749596, 5.000%, due 11/1/18 | | | 47 | | | | 48 | |
| #753866, 6.000%, due 12/1/18 | | | 55 | | | | 57 | |
| #761246, 5.000%, due 1/1/19 | | | 64 | | | | 65 | |
| #766059, 5.500%, due 2/1/19 | | | 57 | | | | 59 | |
| #766276, 5.000%, due 3/1/19 | | | 146 | | | | 150 | |
| #751313, 5.000%, due 3/1/19 | | | 34 | | | | 35 | |
| #779363, 5.000%, due 6/1/19 | | | 17 | | | | 17 | |
| #785259, 5.000%, due 8/1/19 | | | 68 | | | | 70 | |
| #788424, 5.500%, due 9/1/19 | | | 38 | | | | 39 | |
| #761489, 5.500%, due 9/1/19 | | | 42 | | | | 44 | |
| #725953, 5.000%, due 10/1/19 | | | 22 | | | | 23 | |
| #AL5831, 5.000%, due 1/1/20 | | | 2,023 | | | | 2,075 | |
| #745877, 5.000%, due 1/1/20 | | | 62 | | | | 64 | |
| #357865, 5.000%, due 7/1/20 | | | 53 | | | | 54 | |
| #888105, 5.000%, due 8/1/20 | | | 2 | | | | 3 | |
| #357978, 5.000%, due 9/1/20 | | | 512 | | | | 535 | |
| #844026, 6.000%, due 11/1/20 | | | 252 | | | | 264 | |
| #745735, 5.000%, due 3/1/21 | | | 208 | | | | 218 | |
| #879607, 5.500%, due 4/1/21 | | | 37 | | | | 39 | |
| #831497, 6.000%, due 4/1/21 | | | 122 | | | | 128 | |
| #831525, 5.500%, due 6/1/21 | | | 45 | | | | 47 | |
| #888555, 5.500%, due 9/1/21 | | | 1,542 | | | | 1,623 | |
| #880993, 6.000%, due 1/1/22 | | | 8 | | | | 9 | |
| #888982, 6.000%, due 12/1/22 | | | 142 | | | | 153 | |
| #972934, 5.500%, due 2/1/23 | | | 147 | | | | 158 | |
| #982878, 4.500%, due 5/1/23 | | | 158 | | | | 168 | |
| #889670, 5.500%, due 6/1/23 | | | 45 | | | | 47 | |
| #555734, 5.000%, due 7/1/23 | | | 345 | | | | 376 | |
| #AE0011, 5.500%, due 9/1/23 | | | 58 | | | | 62 | |
| #747339, 5.500%, due 10/1/23 | | | 178 | | | | 198 | |
| #995395, 6.000%, due 12/1/23 | | | 129 | | | | 140 | |
| #934808, 4.500%, due 3/1/24 | | | 90 | | | | 94 | |
| #AA4519, 4.500%, due 3/1/24 | | | 569 | | | | 607 | |
| #AA5028, 4.500%, due 4/1/24 | | | 155 | | | | 165 | |
| #AA5999, 4.500%, due 5/1/24 | | | 906 | | | | 968 | |
| #190988, 9.000%, due 6/1/24 | | | 37 | | | | 40 | |
| #AC1848, 4.500%, due 9/1/24 | | | 341 | | | | 364 | |
| #AC6600, 4.500%, due 11/1/24 | | | 35 | | | | 37 | |
| #AL8529, 6.000%, due 11/1/24 | | | 27,164 | | | | 29,523 | |
| #935795, 4.500%, due 12/1/24 | | | 604 | | | | 644 | |
| #AL3422, 5.000%, due 1/1/25 | | | 600 | | | | 645 | |
| #AL3889, 4.000%, due 5/1/25 | | | 250 | | | | 267 | |
| #AE1176, 4.000%, due 8/1/25 | | | 512 | | | | 548 | |
| #AI4872, 4.500%, due 6/1/26 | | | 53 | | | | 57 | |
| #AI4856, 4.500%, due 6/1/26 | | | 1,290 | | | | 1,380 | |
| #AL2851, 4.000%, due 8/1/26 | | | 2,004 | | | | 2,142 | |
| #AK7384, 4.000%, due 3/1/27 | | | 375 | | | | 402 | |
| #AL2590, 4.000%, due 7/1/27 | | | 2,195 | | | | 2,347 | |
| #555933, 7.000%, due 6/1/32 | | | 645 | | | | 745 | |
| #759336, 6.000%, due 1/1/34 | | | 1,444 | | | | 1,686 | |
| #AL3449, 6.000%, due 7/1/36 | | | 1,511 | | | | 1,768 | |
| #886762, 7.000%, due 9/1/36 | | | 354 | | | | 423 | |
| #831926, 6.000%, due 12/1/36 | | | 678 | | | | 783 | |
| #928574, 6.000%, due 7/1/37 | | | 120 | | | | 136 | |
| #948637, 6.500%, due 8/1/37 | | | 426 | | | | 482 | |
See accompanying Notes to Financial Statements.
| December 31, 2016 | William Blair Funds | 103 |
Low Duration Fund
Portfolio of Investments, December 31, 2016 (all dollar amounts in thousands)
| Issuer | | NRSRO
Rating
(unaudited) | | Principal
Amount | | | Value | |
| | | | | | | | | | | |
| U.S. Government Agency—(continued) | | | | | | |
| | | | | | | |
| Federal National Mortgage Association (FNMA)—(continued) | |
| #888703, 6.500%, due 8/1/37 | | | | $ | 3,515 | | | $ | 4,133 | |
| #889371, 6.000%, due 1/1/38 | | | | | 822 | | | | 961 | |
| #965534, 6.000%, due 1/1/38 | | | | | 43 | | | | 49 | |
| #975649, 6.000%, due 7/1/38 | | | | | 130 | | | | 150 | |
| #995712, 6.000%, due 8/1/38 | | | | | 1,908 | | | | 2,234 | |
| #AD0100, 7.000%, due 12/1/38 | | | | | 940 | | | | 1,114 | |
| #AD0315, 6.500%, due 8/1/39 | | | | | 660 | | | | 748 | |
| #AC3270, 5.500%, due 9/1/39 | | | | | 1,624 | | | | 1,868 | |
| #AL5815, 5.500%, due 4/1/41 | | | | | 3,503 | | | | 4,035 | |
| #AL9226, 5.500%, due 12/1/41 | | | | | 6,822 | | | | 7,847 | |
| #AL9225, 6.000%, due 1/1/42 | | | | | 5,784 | | | | 6,759 | |
| Total FNMA Mortgage Obligations | | | | | | | | | 83,299 | |
| | | | | | | | | | | |
| Asset-Backed Securities—24.1% | | | | | | | | | | |
Volvo Financial Equipment LLC—144A, 2015-1A, Tranche A2,
0.950%, 11/15/17 | | Aaa | | | 61 | | | | 61 | |
John Deere Owner Trust, 2015-A, Tranche A2B,
0.974%, 2/15/18, VRN | | Aaa | | | 93 | | | | 93 | |
Mercedes-Benz Auto Receivables Trust, 2015-1, Tranche A2B,
0.974%, 6/15/18, VRN | | AAA | | | 537 | | | | 537 | |
Mercedes Benz Auto Lease Trust, 2016-A, Tranche A2B,
1.264%, 7/16/18, VRN | | Aaa | | | 2,277 | | | | 2,279 | |
Nissan Auto Lease Trust, 2016-A, Tranche A2B,
1.084%, 8/15/18, VRN | | Aaa | | | 2,939 | | | | 2,943 | |
Ford Credit Auto Lease Trust, 2016-A, Tranche A2B,
1.244%, 11/15/18, VRN | | AAA | | | 535 | | | | 536 | |
Ford Credit Auto Owner Trust, 2016-A, Tranche A2B,
1.104%, 12/15/18, VRN | | AAA | | | 2,520 | | | | 2,522 | |
Nissan Auto Lease Trust, 2016-B, Tranche A2B,
0.984%, 12/17/18, VRN | | Aaa | | | 2,150 | | | | 2,152 | |
Harley-Davidson Motorcycle Trust, 2015-2, Tranche A2B,
0.954%, 1/15/19, VRN | | AAA | | | 295 | | | | 295 | |
Ford Credit Floorplan Master Owner Trust A, 2014-1, Tranche A2,
1.104%, 2/15/19, VRN | | AAA | | | 2,750 | | | | 2,751 | |
Nissan Auto Receivables 2016-A Owner Trust, 2016-A, Tranche A2B,
1.054%, 2/15/19, VRN | | Aaa | | | 3,188 | | | | 3,192 | |
Ford Credit Auto Owner Trust, 2016-B, Tranche A2B,
1.014%, 3/15/19, VRN | | AAA | | | 4,370 | | | | 4,372 | |
Nissan Auto Receivables Owner Trust, 2016-B, Tranche A2B,
1.004%, 4/15/19, VRN | | Aaa | | | 3,000 | | | | 3,002 | |
Discover Card Master Trust, 2012-A4, Tranche A,
0.370%, 11/15/19, VRN | | AAA | | | 2,000 | | | | 2,002 | |
Toyota Auto Receivables 2016-D Owner Trust, 2016-D, Tranche A2B,
0.834%, 5/15/19, VRN | | AAA | | | 2,025 | | | | 2,025 | |
| Issuer | | NRSRO
Rating
(unaudited) | | Principal
Amount | | | Value | |
| | | | | | | | | | | |
| Asset-Backed Securities—(continued) | | | | | | |
American Express Issuance Trust II, 2013-2, Tranche A,
1.134%, 8/15/19, VRN | | AAA | | $ | 1,993 | | | $ | 2,001 | |
Capital One Multi-Asset Execution Trust, 2007-A1, Tranche A1,
0.754%, 11/15/19, VRN | | AAA | | | 2,000 | | | | 2,000 | |
Bank of America Credit Card Trust, 2007-A11, Tranche A11,
0.774%, 12/15/19, VRN | | AAA | | | 915 | | | | 915 | |
Capital One Multi-Asset Execution Trust, 2007-A2, Tranche A2,
0.784%, 12/16/19, VRN | | AAA | | | 1,815 | | | | 1,815 | |
Citibank Credit Card Issuance Trust, 2008-A2, Tranche A2,
1.905%, 1/23/20, VRN | | AAA | | | 2,980 | | | | 3,011 | |
Mercedes-Benz Master Owner Trust—144A, 2015-BA, Tranche A,
1.084%, 4/15/20, VRN | | Aaa | | | 1,500 | | | | 1,500 | |
Mercedes-Benz Master Owner Trust—144A, 2016-AA, Tranche A,
1.284%, 5/15/20, VRN | | Aaa | | | 1,405 | | | | 1,410 | |
Citibank Credit Card Issuance Trust, 2013-A2, Tranche A2,
1.036%, 5/26/20, VRN | | AAA | | | 2,820 | | | | 2,824 | |
BMW Floorplan Master Owner Trust—144A, 2015-1A, Tranche A,
1.204%, 7/15/20, VRN | | AAA | | | 2,575 | | | | 2,576 | |
Chase Issuance Trust, 2013-A6, Tranche A6,
1.124%, 7/15/20, VRN | | AAA | | | 2,000 | | | | 2,007 | |
Discover Card Execution Note Trust, 2015-A1, Tranche A1,
1.054%, 8/17/20, VRN | | AAA | | | 3,000 | | | | 3,005 | |
American Express Credit Account Master Trust, 2008-2, Tranche A,
1.964%, 9/15/20, VRN | | AAA | | | 2,200 | | | | 2,228 | |
Chase Issuance Trust, 2016-A1, Tranche A,
1.114%, 5/17/21, VRN | | AAA | | | 2,000 | | | | 2,007 | |
Bank of America Credit Card Trust, 2014-A1, Tranche A,
1.084%, 6/15/21, VRN | | AAA | | | 1,000 | | | | 1,003 | |
MBNA Credit Card Master Note Trust, 2004-A3, Tranche A3,
0.964%, 8/16/21, VRN | | AAA | | | 3,000 | | | | 2,999 | |
Capital One Multi-Asset Execution Trust, 2014-A3, Tranche A3,
1.084%, 1/18/22, VRN | | AAA | | | 1,110 | | | | 1,111 | |
Capital One Multi-Asset Execution Trust, 2016-A1, Tranche A1,
1.154%, 2/15/22, VRN | | AAA | | | 2,750 | | | | 2,763 | |
SLM Student Loan Trust, 2008-4, Tranche A4,
2.532%, 7/25/22, VRN | | AAA | | | 976 | | | | 982 | |
Sierra Timeshare 2012-2 Receivables Funding LLC—144A, 2012-2A, Tranche A,
2.380%, 3/20/29 | | A+ | | | 216 | | | | 216 | |
SLM Private Education Loan Trust—144A, 2011-A, Tranche A3,
3.204%, 1/15/43, VRN | | AAA | | | 2,250 | | | | 2,333 | |
| Total Asset-Backed Securities | | | | | | | | | 67,468 | |
See accompanying Notes to Financial Statements.
| 104 | Annual Report | December 31, 2016 |
Low Duration Fund
Portfolio of Investments, December 31, 2016 (all dollar amounts in thousands)
| Issuer | | NRSRO
Rating
(unaudited) | | Principal
Amount | | | Value | |
| | | | | | | | | | | |
| Corporate Obligations—32.7% | | | | | | | |
Bank of America NA,
1.372%, due 2/14/17, VRN | | A+ | | $ | 2,600 | | | $ | 2,601 | |
JPMorgan Chase & Co.,
1.426%, due 2/15/17, VRN | | A+ | | | 3,000 | | | | 3,002 | |
Barclays Bank plc,
1.486%, due 2/17/17, VRN | | A1 | | | 1,620 | | | | 1,621 | |
Citigroup, Inc.,
1.493%, due 3/10/17, VRN | | A | | | 3,000 | | | | 3,002 | |
Mizuho Bank Ltd.—144A,
1.310%, due 4/16/17, VRN | | A1 | | | 1,000 | | | | 1,001 | |
Tencent Holdings Ltd.—144A,
2.000%, due 5/2/17 | | A+ | | | 1,200 | | | | 1,201 | |
Branch Banking & Trust Co.,
1.220%, due 5/23/17, VRN | | A2 | | | 3,000 | | | | 3,000 | |
American Express Credit Corporation,
1.212%, due 6/5/17, VRN | | A2 | | | 750 | | | | 751 | |
Standard Chartered plc—144A,
1.291%, due 9/8/17, VRN | | A1 | | | 2,000 | | | | 1,998 | |
Royal Bank of Canada,
1.138%, due 10/13/17, VRN | | AA | | | 1,925 | | | | 1,925 | |
Chevron Corporation,
1.247%, due 11/9/17, VRN | | Aa2 | | | 3,000 | | | | 3,007 | |
Canadian National Railway Co.,
1.072%, due 11/14/17, VRN | | A | | | 700 | | | | 701 | |
General Electric Capital Corporation,
1.448%, due 12/7/17, VRN | | AA- | | | 500 | | | | 499 | |
International Business Machines Corporation,
1.071%, due 2/6/18, VRN | | AA- | | | 3,150 | | | | 3,154 | |
Exxon Mobil Corporation,
1.537%, due 2/28/18, VRN | | Aaa | | | 3,000 | | | | 3,019 | |
The Bank of Tokyo-Mitsubishi UFJ, Ltd.—144A,
1.492%, due 3/5/18, VRN | | A+ | | | 1,400 | | | | 1,399 | |
Bank of Montreal,
1.476%, due 4/9/18, VRN | | Aa3 | | | 2,580 | | | | 2,590 | |
NBCUniversal Enterprise, Inc.—144A,
1.565%, due 4/15/18, VRN | | A- | | | 3,075 | | | | 3,094 | |
Wells Fargo & Co.,
1.512%, due 4/23/18, VRN | | AA- | | | 3,000 | | | | 3,012 | |
Morgan Stanley,
2.162%, due 4/25/18, VRN | | A | | | 4,000 | | | | 4,043 | |
The Goldman Sachs Group, Inc.,
2.087%, due 4/30/18, VRN | | A | | | 3,084 | | | | 3,111 | |
Merck & Co., Inc.,
1.269%, due 5/18/18, VRN | | AA | | | 3,175 | | | | 3,188 | |
KeyBank NA,
1.451%, due 6/1/18, VRN | | A- | | | 5,200 | | | | 5,208 | |
PNC Bank NA,
1.351%, due 6/1/18, VRN | | A+ | | | 1,035 | | | | 1,037 | |
Pfizer, Inc.,
1.263%, due 6/15/18, VRN | | AA | | | 3,275 | | | | 3,284 | |
Sumitomo Mitsui Banking Corporation,
1.548%, due 10/19/18, VRN | | A1 | | | 1,000 | | | | 1,004 | |
PNC Bank NA,
1.351%, due 12/7/18, VRN | | A+ | | | 3,000 | | | | 3,002 | |
Toyota Motor Credit Corporation,
1.731%, due 2/19/19, VRN | | AA- | | | 1,000 | | | | 1,012 | |
American Honda Finance Corporation,
1.741%, due 2/22/19, VRN | | A+ | | | 1,616 | | | | 1,632 | |
Apple, Inc.,
1.740%, due 2/22/19, VRN | | AA+ | | | 2,243 | | | | 2,275 | |
| Issuer | | NRSRO
Rating
(unaudited) | | Principal
Amount | | | Value | |
| | | | | | | | | | | |
| Corporate Obligations—(continued) | | | | | | |
PepsiCo, Inc.,
1.506%, due 2/22/19, VRN | | A1 | | $ | 1,000 | | | $ | 1,008 | |
Johnson & Johnson,
1.201%, due 3/1/19, VRN | | AAA | | | 2,785 | | | | 2,796 | |
Westpac Banking Corporation,
1.612%, due 5/13/19, VRN | | Aa2 | | | 1,000 | | | | 1,004 | |
Bank of Montreal,
1.532%, due 7/18/19, VRN | | Aa3 | | | 1,000 | | | | 1,003 | |
Apple, Inc.,
1.016%, due 8/2/19, VRN | | AA+ | | | 1,737 | | | | 1,736 | |
American Express Credit Corporation,
1.396%, due 8/15/19, VRN | | A2 | | | 1,000 | | | | 1,002 | |
Shell International Finance BV,
1.303%, due 9/12/19, VRN | | Aa2 | | | 3,263 | | | | 3,265 | |
PepsiCo, Inc.,
1.268%, due 10/4/19, VRN | | A1 | | | 2,000 | | | | 2,003 | |
Mondelez International Holdings Netherlands BV—144A,
1.500%, due 10/28/19, VRN | | A3 | | | 4,000 | | | | 4,010 | |
American Express Credit Corporation,
1.457%, due 10/30/19, VRN | | A2 | | | 250 | | | | 251 | |
Daimler Finance North America LLC—144A,
1.515%, due 10/30/19, VRN | | A | | | 1,000 | | | | 1,003 | |
United Technologies Corporation,
1.236%, due 11/1/19, VRN | | A- | | | 1,150 | | | | 1,153 | |
The Goldman Sachs Group, Inc.,
1.757%, due 12/13/19, VRN | | A | | | 2,000 | | | | 2,001 | |
| Total Corporate Obligations | | | | | | | | | 91,608 | |
Total Long-Term Investments—101.1%
(cost $283,937) | | | | | | | | | 283,113 | |
Total Investments—101.1%
(cost $283,937) | | | | | | | | | 283,113 | |
| | | | | | | | | | | |
| Securities Sold Short, Not Yet Purchased |
| |
| U.S. Government Agency—(5.4)% |
| |
| Federal National Mortgage Association (FNMA)—(5.4)% | |
| TBA, 2.500%, due 1/23/32 | | | | $ | (15,000 | ) | | | (15,025 | ) |
Total Securities Sold Short, Not Yet Purchased—(5.4)%
(proceeds $15,033) | | | | (15,025 | ) |
| Cash and other assets, less liabilities—4.3% | | | | | | | | | 11,985 | |
| Net assets—100.0% | | | | | | | | $ | 280,073 | |
144A = Security exempt from registration under Rule 144A of the Securities Act of 1933. These securities may be resold in transactions exempt from registration, normally to qualified institutional buyers.
NRSRO = Nationally Recognized Statistical Rating Organization—The credit quality ratings of the securities in the Fund reflect the highest category rating by any of Fitch Ratings, Moody’s Investors Service Inc., or Standard & Poor’s, a division of the McGraw-Hill Companies, Inc.
The obligations of certain U.S. Government-sponsored securities are neither issued nor guaranteed by the U.S. Treasury.
TBA = To Be Announced—TBAs are mortgage-backed securities traded under delayed delivery commitments, settling after December 31, 2016. The term TBA comes from the fact that the specific mortgage-backed security that will be delivered to fulfill a TBA trade is not designated at the time the trade is made.
VRN = Variable Rate Note
See accompanying Notes to Financial Statements.
| December 31, 2016 | William Blair Funds | 105 |
| | Macro Allocation Fund AN OVERVIEW FROM THE PORTFOLIO MANAGERS |
| | |

Thomas Clarke 
Brian D. Singer | The William Blair Macro Allocation Fund (Class N shares) posted a 2.01% increase, net of fees, for the twelve months ended December 31, 2016. By comparison, the Fund’s benchmark index, the Bank of America Merrill Lynch 3-Month U.S. Treasury Bill Index and the Long-Term Comparative Index (40% Bloomberg Barclays U.S. Aggregate Index, 30% MSCI All Country World Index (net) and 30% Bank of America Merrill Lynch 3-Month U.S. Treasury Bill Index), increased 0.33% and 3.68%, respectively. The Fund had flat performance from its market strategy (i.e., equity and fixed income) and positive performance from its currency strategy. Detractors from the Fund’s market-oriented exposures included positioning within U.S. equities, which mostly resulted from the Fund’s preference for large cap equities over small cap equities, and short exposure to Japanese equities. Long exposure to European equities contributed to the Fund’s gains, particularly a preference for European financial sector equities in the second half of the year. The Fund also benefitted from long exposure to U.S. credit. Within currency, long exposures to emerging currencies were beneficial to the Fund’s performance, with strong performance coming from exposures to the Russian ruble, Brazilian real, and Indonesian rupiah. This was partially offset by a negative contribution from long exposure to the Mexican peso and Malaysian ringgit. 2016 was a year filled with geopolitical uncertainty and a year in which thematic influences (such as Populism) remained quite intense. Areas of geopolitical focus that warranted navigation included the UK as it wrestled with the Brexit vote and the second Spanish election, both taking place in late June. Additional areas of focus were the U.S. presidential election and the Italian referendum, both of which took place late in the year. We feel compelled to remain relatively cautious in the domain of systematic (or beta-like) market risk, and to maintain lower risk exposures to attractive emerging markets currencies than would otherwise be the case due to our assessment that the forward-looking risk environment still remains somewhat elevated in general. However, we have begun to increase risk in the Fund’s portfolio in some places where shorter-term macro-thematic and geopolitical headwinds have abated. The Fund’s market strategy remains moderately long in equities with exposures to Europe, U.K., and emerging markets, while also moving to a slightly long exposure in the U.S. The market strategy is also slightly short in fixed income securities, with long exposure to emerging markets debt offset by short exposure to European government bonds. Within currencies, the Fund’s strategy remains long in emerging currencies and short in developed currencies, which is in line with fundamental valuation. The Fund’s long currency positions include the Colombian peso, Mexican peso, and Philippine peso, and the largest short positions are in the Swiss franc, New Zealand dollar, and Canadian dollar. |
| 106 | Annual Report | December 31, 2016 |
Macro Allocation Fund
Performance Highlights (Unaudited)
| Average Annual Total Return at 12/31/2016 |
| | | 1 Year | | 3 Year | | 5 Year | | Since
Inception |
| Class N(a) | | | 2.01 | % | | | (0.64 | )% | | | 4.85 | % | | | 5.30 | % |
| Class I(a) | | | 2.26 | | | | (0.39 | ) | | | 5.11 | | | | 5.56 | |
| BofA Merrill Lynch 3-Month U.S. Treasury Bill Index(a) | | | 0.33 | | | | 0.14 | | | | 0.12 | | | | 0.12 | |
| Long-Term Comparative Index(a) | | | 3.68 | | | | 2.36 | | | | 3.84 | | | | 3.85 | |
| Institutional Class(b) | | | 2.44 | | | | (0.26 | ) | | | — | | | | 0.35 | |
| BofA Merrill Lynch 3-Month U.S. Treasury Bill Index(b) | | | 0.33 | | | | 0.14 | | | | — | | | | 0.43 | |
| Long-Term Comparative Index(b) | | | 3.68 | | | | 2.36 | | | | — | | | | 2.45 | |
| (a) | For the period from November 29, 2011 (Commencement of Operations) to December 31, 2016. |
| (b) | For the period from October 21, 2013 (Commencement of Operations) to December 31, 2016. |
Performance cited represents past performance. Past performance does not guarantee future results and current performance may be lower or higher than the data quoted. Results shown are average annual total returns, which assume reinvestment of dividends and capital gains. Investment returns and principal will fluctuate and you may have a gain or loss when you sell shares. For the most current month-end performance information, please call 1-800-742-7272, or visit our Web site at www.williamblairfunds.com. The Fund involves a high level of risk and may not be appropriate for everyone. You could lose money by investing in the Fund. There can be no assurance that the Fund’s investment objective will be achieved or that the Fund’s investment strategies will be successful. The Fund is not a complete investment program. From time to time, the investment adviser may waive fees or reimburse expenses for the Fund. Without these waivers/reimbursements, performance would be lower. Class N shares are available to the general public without a sales load. Class I shares are available to certain institutional investors and advisory clients of William Blair Investment Management, LLC and William Blair & Company, L.L.C., without a sales load or distribution fee (12b-1 fee). Institutional Class shares are available to institutional investors without a sales load or distribution (12b-1) or service fees.
The performance highlights and graph presented above do not reflect the deduction of taxes that a shareholder would pay on fund distributions or the redemption of fund shares.
The Bank of America (“BofA”) Merrill Lynch 3-Month U.S. Treasury Bill Index measures total return on cash, including price and interest income, based on short-term government Treasury Bills of about 90-day maturity. The Index is unmanaged, does not incur fees or expenses, and cannot be invested in directly.
The Long-Term Comparative Index return is comprised of the following indices: 40% Bloomberg Barclays Capital U.S. Aggregate Index, 30% Morgan Stanley Capital International (MSCI) All Country World Index (net), and 30% BofA Merrill Lynch 3-month U.S. Treasury Bill Index.
This report identifies the Fund’s investments on December 31, 2016. These holdings are subject to change. Not all investments in the Fund performed the same, nor is there any guarantee that these investments will perform as well in the future. Market forecasts provided in this report may not necessarily come to pass.
Portfolio Allocation (Unaudited)
The table below provides the allocation of the Fund’s holdings as a percent of net assets as of December 31, 2016.
| Category | | % |
| Equity Exchange-Traded Funds | | 49.2 | % |
| Fixed Income Exchange-Traded Funds | | 10.9 | % |
| U.S. Government | | 8.6 | % |
| Foreign Government Bond | | 2.3 | % |
| Purchased Options | | 0.1 | % |
| Repurchase Agreements | | 26.2 | % |
| Written Option | | (0.1 | )% |
| Cash and Other Assets, Less Liabilities | | 2.8 | % |
| Net Assets | | 100.0 | % |
| December 31, 2016 | William Blair Funds | 107 |
Macro Allocation Fund
Portfolio of Investments, December 31, 2016 (all dollar amounts in thousands)
| Issuer | | Shares or
Principal
Amount | | | Value | |
| | | | | | | | | |
| Exchange-Traded Funds—60.1% | | | | | | | | |
| | | | | | | | | |
| Equity Exchange-Traded Funds—49.2% | | | | | | | | |
| Consumer Staples Select Sector SPDR Fund | | | 312,000 | | | $ | 16,134 | |
| Financial Select Sector SPDR Fund | | | 343,000 | | | | 7,975 | |
| Global X MSCI Greece ETF | | | 2,126,000 | | | | 16,562 | |
| iShares Global Energy ETF | | | 486,000 | | | | 16,913 | |
| iShares MSCI Chile Capped ETF | | | 434,800 | | | | 16,270 | |
| iShares MSCI Frontier 100 ETF | | | 983,000 | | | | 24,428 | |
| iShares MSCI Japan ETF | | | 504,000 | | | | 24,625 | |
| iShares MSCI Switzerland Capped ETF(a) | | | 345,000 | | | | 10,164 | |
| iShares Russell 1000 Growth ETF | | | 466,000 | | | | 48,883 | |
| iShares Russell 1000 Value ETF | | | 1,734,000 | | | | 194,260 | |
| SPDR S&P 500 ETF Trust | | | 1,576,000 | | | | 352,283 | |
| Utilities Select Sector SPDR Fund | | | 650,000 | | | | 31,570 | |
| VanEck Vectors Russia ETF | | | 809,000 | | | | 17,167 | |
| Total Equity Exchange-Traded Funds | | | | | | | 777,234 | |
| Fixed Income Exchange-Traded Funds—10.9% | | | | | | | | |
| iShares iBoxx $ Investment Grade Corporate Bond ETF | | | 660,000 | | | | 77,339 | |
| iShares JP Morgan USD Emerging Markets Bond ETF(a) | | | 294,000 | | | | 32,405 | |
| SPDR Barclays High Yield Bond ETF | | | 1,417,000 | | | | 51,649 | |
| WisdomTree Emerging Markets Local Debt Fund ETF | | | 326,500 | | | | 11,679 | |
| Total Fixed Income Exchange-Traded Funds . | | | | | | | 173,072 | |
Total Exchange-Traded Funds—60.1%
(cost $906,266) | | | | | | | 950,306 | |
| | | | | | | | | |
| Foreign Government Bond—2.3% | | | | | | | | |
| | | | | | | | | |
| Malaysia | | | | | | | | |
Malaysia Government Bond,
3.580%, due 9/28/18 | | $ | 161,563 | | | | 35,980 | |
Total Foreign Government Bonds—2.3%
(cost $36,703) | | | | | | | 35,980 | |
| | | | | | | | | |
| Repurchase Agreement—26.2% | | | | | | | | |
| Fixed Income Clearing Corporation, 0.030% dated 12/30/16, due 1/3/17, repurchase price $413,730, collateralized by U.S. Treasury Bonds, 3.000%-3.375%, due 5/15/44-5/15/45 | | | 413,728 | | | | 413,728 | |
Total Repurchase Agreement—26.2%
(cost $413,728) | | | | | | | 413,728 | |
| | | | | | | | | |
| U.S. Government—8.6% | | | | | | | | |
U.S. Treasury Bill,
0.463%, due 1/5/17 | | | 35,000 | | | | 34,999 | |
U.S. Treasury Bill,
0.527%, due 2/2/17(b) | | | 10,000 | | | | 9,997 | |
U.S. Treasury Bill,
0.659%, due 3/2/17(b) | | | 10,000 | | | | 9,992 | |
| Issuer | | Principal
Amount/
Contracts | | | Value | |
| | | | | | | | | |
| U.S. Government—(continued) | | | | | | | | |
U.S. Treasury Bill,
0.610%, due 3/30/17(a)(b) | | $ | 10,000 | | | $ | 9,988 | |
U.S. Treasury Bill,
0.592%, due 4/27/17(a)(b) | | | 10,000 | | | | 9,983 | |
U.S. Treasury Bill,
0.672%, due 5/25/17(b) | | | 8,000 | | | | 7,981 | |
U.S. Treasury Bill,
0.560%, due 6/22/17(b) | | | 8,000 | | | | 7,977 | |
U.S. Treasury Bill,
0.552%, due 7/20/17(a)(b) | | | 8,000 | | | | 7,972 | |
U.S. Treasury Bill,
0.580%, due 8/17/17(b) | | | 8,000 | | | | 7,966 | |
U.S. Treasury Bill,
0.614%, due 9/14/17(b) | | | 7,000 | | | | 6,966 | |
U.S. Treasury Bill,
0.684%, due 10/12/17(b) | | | 8,000 | | | | 7,953 | |
U.S. Treasury Bill,
0.681%, due 11/9/17(b) | | | 8,000 | | | | 7,945 | |
U.S. Treasury Bill,
0.833%, due 12/7/17(b) | | | 7,000 | | | | 6,946 | |
Total U.S. Government—8.6%
(cost $136,679) | | | | | | | 136,665 | |
| | | | | | | | | |
| Purchased Options—0.1% | | | | | | | | |
| S&P 500 Index, February 2017, Strike $2,180, Put | | | 358 | | | | 861 | |
| S&P 500 Index, February 2017, Strike $2,315, Call | | | 358 | | | | 268 | |
| S&P 500 Index, January 2017, Strike $2,180, Put | | | 380 | | | | 374 | |
Total Purchased Options—0.1%
(cost $2,759) | | | | | | | 1,503 | |
Total Investments in Securities—97.3%
(cost $1,496,135) | | | | | | | 1,538,182 | |
| | | | | | | | | |
| Written Options—(0.1)% | | | | | | | | |
| S&P 500 Index, January 2017, Strike $2,240, Call | | | (380 | ) | | | (900 | ) |
Total Written Options—(0.1)%
(premiums received $513) | | | | | | | (900 | ) |
| Cash and other assets, less Liabilities—2.8% | | | | | | | 43,636 | |
| Net assets—100.0% | | | | | | $ | 1,580,918 | |
(a) Security, or portion of security, is pledged as collateral for OTC swap contracts and a listed written option aggregating a total value of $8,694 (in thousands).
(b) Security, or portion of security, is segregated as collateral for centrally cleared swaps and to cover initial margin requirements on open futures contracts aggregating a total value of $87,253 (in thousands).
See accompanying Notes to Financial Statements.
| 108 | Annual Report | December 31, 2016 |
Macro Allocation Fund
Portfolio of Investments, December 31, 2016 (all dollar amounts in thousands)
If a fund’s portfolio holdings represent ownership of 5% or more of the voting securities of a company, the company is deemed to be an affiliate as defined in the Investment Company Act of 1940. The Fund had the following transactions during the year ended December 31, 2016 with companies deemed affiliated during the year or at December 31, 2016.
| | | | Share Activity | | Year Ended December 31, 2016 |
| | Security Name | | Balance
12/31/2015 | | Purchases | | Sales | | Balance
12/31/2016 | | Value | | Dividend
Income | | Net realized
gain (loss) | | Change in net
unrealized
appreciation
(depreciation) |
| π | Global X MSCI Greece ETF | | | 1,987,000 | | | | 855,000 | | | | 716,000 | | | | 2,126,000 | | | | $ | 16,562 | | | | $ | 337 | | | | $ | (1,545 | ) | | | $ | 1,978 | |
| | iShares MSCI Frontier 100 ETF | | | — | | | | 1,068,000 | | | | 85,000 | | | | 983,000 | | | | | 24,428 | | | | | 27 | | | | | (4 | ) | | | | (109 | ) |
| π | WisdomTree Emerging Markets Local Debt Fund ETF | | | 415,000 | | | | — | | | | 88,500 | | | | 326,500 | | | | | 11,679 | | | | | 673 | | | | | (945 | ) | | | | 1,683 | |
| | | | | | | | | | | | | | | | | | | | | $ | 52,669 | | | | $ | 1,037 | | | | $ | (2,494 | ) | | | $ | 3,552 | |
π = Affiliated company at December 31, 2016. The Fund’s total value in companies deemed to be affiliated at December 31, 2016 was $28,241.
Forward Foreign Currency Contracts
Settlement
Date | | Deliver/Receive | | Counterparty | | Local Currency
(in thousands) | | Current Value | | Net Unrealized
Appreciation
(Depreciation) |
| Purchased | | | | | | | | | | | | | | | | | | |
| 3/15/17 | | Brazilian Real | | Citibank N.A. London | | | 95,498 | | | | $ | 28,737 | | | | $ | 703 | |
| 3/15/17 | | Chinese Yuan Renminbi | | Citibank N.A. London | | | 341,588 | | | | | 48,089 | | | | | (668 | ) |
| 3/15/17 | | Colombian Peso | | Citibank N.A. London | | | 128,893,841 | | | | | 42,385 | | | | | (579 | ) |
| 3/15/17 | | Czech Koruna | | Citibank N.A. London | | | 106,185 | | | | | 4,153 | | | | | 14 | |
| 3/15/17 | | British Pound Sterling | | Citibank N.A. London | | | 60,858 | | | | | 75,143 | | | | | (2,344 | ) |
| 3/15/17 | | Hong Kong Dollar | | Citibank N.A. London | | | 20,271 | | | | | 2,615 | | | | | — | |
| 3/15/17 | | Indonesian Rupiah | | Citibank N.A. London | | | 417,211,765 | | | | | 30,558 | | | | | (503 | ) |
| 3/15/17 | | Indian Rupee | | Citibank N.A. London | | | 1,868,978 | | | | | 27,278 | | | | | (174 | ) |
| 3/15/17 | | Japanese Yen | | Citibank N.A. London | | | 367,328 | | | | | 3,155 | | | | | (5 | ) |
| 3/15/17 | | Mexican Peso | | Citibank N.A. London | | | 1,327,291 | | | | | 63,387 | | | | | (1,687 | ) |
| 3/15/17 | | Norwegian Krone | | Citibank N.A. London | | | 295,483 | | | | | 34,235 | | | | | (680 | ) |
| 3/15/17 | | New Zealand Dollar | | Citibank N.A. London | | | 7,116 | | | | | 4,932 | | | | | (9 | ) |
| 3/15/17 | | Philippine Peso | | Citibank N.A. London | | | 2,824,174 | | | | | 56,661 | | | | | 307 | |
| 3/15/17 | | Polish Zloty | | Citibank N.A. London | | | 196,994 | | | | | 47,013 | | | | | (252 | ) |
| 3/15/17 | | Singapore Dollar | | Citibank N.A. London | | | 97,483 | | | | | 67,290 | | | | | (1,168 | ) |
| 3/15/17 | | Thai Baht | | Citibank N.A. London | | | 240,533 | | | | | 6,714 | | | | | (2 | ) |
| 3/15/17 | | New Turkish Lira | | Citibank N.A. London | | | 50,259 | | | | | 14,022 | | | | | (232 | ) |
| 3/15/17 | | South African Rand | | Citibank N.A. London | | | 560,748 | | | | | 40,258 | | | | | (148 | ) |
| 3/16/17 | | Hungarian Forint | | Citibank N.A. London | | | 14,216,114 | | | | | 48,485 | | | | | 73 | |
| | | | | | | | | | | | | | | | | $ | (7,354 | ) |
| Sold | | | | | | | | | | | | | | | | | | |
| 3/15/17 | | Australian Dollar | | Citibank N.A. London | | | 70,959 | | | | $ | 51,114 | | | | $ | 2,098 | |
| 3/15/17 | | Canadian Dollar | | Citibank N.A. London | | | 130,456 | | | | | 97,250 | | | | | 2,532 | |
| 3/15/17 | | Swiss Franc | | Citibank N.A. London | | | 142,701 | | | | | 140,802 | | | | | 1,363 | |
| 3/15/17 | | Chilean Peso | | Citibank N.A. London | | | 11,227,559 | | | | | 16,675 | | | | | (77 | ) |
| 3/15/17 | | Chinese Yuan Renminbi | | Citibank N.A. London | | | 16,531 | | | | | 2,327 | | | | | (2 | ) |
| 3/15/17 | | Czech Koruna | �� | Citibank N.A. London | | | 1,851,810 | | | | | 72,424 | | | | | 1,073 | |
| 3/15/17 | | Euro | | Citibank N.A. London | | | 126,913 | | | | | 134,105 | | | | | 1,402 | |
| 3/15/17 | | British Pound Sterling | | Citibank N.A. London | | | 3,379 | | | | | 4,172 | | | | | (21 | ) |
| 3/15/17 | | Hong Kong Dollar | | Citibank N.A. London | | | 688,563 | | | | | 88,820 | | | | | (43 | ) |
| 3/15/17 | | Japanese Yen | | Citibank N.A. London | | | 4,849,486 | | | | | 41,650 | | | | | 711 | |
| 3/15/17 | | South Korean Won | | Citibank N.A. London | | | 8,960,418 | | | | | 7,420 | | | | | 275 | |
| 3/15/17 | | Norwegian Krone | | Citibank N.A. London | | | 26,786 | | | | | 3,103 | | | | | (8 | ) |
| 3/15/17 | | New Zealand Dollar | | Citibank N.A. London | | | 121,963 | | | | | 84,537 | | | | | 3,324 | |
| 3/15/17 | | Philippine Peso | | Citibank N.A. London | | | 119,111 | | | | | 2,390 | | | | | (11 | ) |
| 3/15/17 | | Russian Ruble | | Citibank N.A. London | | | 101,376 | | | | | 1,623 | | | | | (9 | ) |
| 3/15/17 | | Singapore Dollar | | Citibank N.A. London | | | 4,261 | | | | | 2,941 | | | | | (1 | ) |
| 3/15/17 | | Thai Baht | | Citibank N.A. London | | | 4,211,508 | | | | | 117,564 | | | | | 673 | |
| 3/15/17 | | New Turkish Lira | | Citibank N.A. London | | | 10,687 | | | | | 2,982 | | | | | 4 | |
| 3/15/17 | | Taiwan Dollar | | Citibank N.A. London | | | 972,328 | | | | | 30,015 | | | | | 698 | |
| 3/15/17 | | South African Rand | | Citibank N.A. London | | | 37,638 | | | | | 2,702 | | | | | 24 | |
| 3/16/17 | | Hungarian Forint | | Citibank N.A. London | | | 1,277,172 | | | | | 4,356 | | | | | (43 | ) |
| | | | | | | | | | | | | | | | | $ | 13,962 | |
See accompanying Notes to Financial Statements.
| December 31, 2016 | William Blair Funds | 109 |
Macro Allocation Fund
Portfolio of Investments, December 31, 2016 (all dollar amounts in thousands)
| Futures Contracts | | | | | | | | |
Number of
Contracts | | Description | | Expiration Date | | Local Currency | | Notional Amount
(Local,
in Thousands) | | Net Unrealized
Appreciation
(Depreciation) |
| Long | | | | | | | | | | | | | | |
| 48 | | Amsterdam Index | | January 2017 | | Euro | | | 4,638 | | | $ | 105 | |
| 313 | | CAC 40 Index | | January 2017 | | Euro | | | 15,221 | | | | 276 | |
| 1,446 | | IBEX 35 Index | | January 2017 | | Euro | | | 134,672 | | | | 2,840 | |
| 181 | | MSCI Taiwan Index | | January 2017 | | U.S. Dollar | | | 6,223 | | | | 86 | |
| 141 | | H-Shares Index | | January 2017 | | Hong Kong Dollar | | | 66,185 | | | | 67 | |
| 48 | | HANG SENG Index | | January 2017 | | Hong Kong Dollar | | | 52,709 | | | | 93 | |
| 1,844 | | MSCI Singapore ETS Index | | January 2017 | | Singapore Dollar | | | 58,971 | | | | (194 | ) |
| 209 | | KOSPI 200 Index | | March 2017 | | South Korean Won | | | 27,175,225 | | | | 890 | |
| 446 | | 10YR JGB Mini | | March 2017 | | Japanese Yen | | | 6,702,488 | | | | 24 | |
| 181 | | SPI 200 Index | | March 2017 | | Australian Dollar | | | 25,480 | | | | 427 | |
| 24 | | DAX Index | | March 2017 | | Euro | | | 6,879 | | | | 187 | |
| 9,073 | | EURO STOXX 600 Banks Index | | March 2017 | | Euro | | | 75,986 | | | | (2,206 | ) |
| 602 | | FTSE 100 Index | | March 2017 | | British Pound Sterling | | | 42,441 | | | | 1,265 | |
| 819 | | FTSE MIB Index | | March 2017 | | Euro | | | 78,645 | | | | 2,012 | |
| | | | | | | | | | | | | $ | 5,872 | |
| Short | | | | | | | | | | | | | | |
| 482 | | OMXS 30 Index | | January 2017 | | Swedish Krona | | | 73,216 | | | $ | 99 | |
| 12 | | EURO-BTP | | March 2017 | | Euro | | | 1,624 | | | | (37 | ) |
| 193 | | EURO-OAT* | | March 2017 | | Euro | | | 29,301 | | | | (483 | ) |
| 783 | | NIKKEI 225 Index | | March 2017 | | Japanese Yen | | | 7,465,905 | | | | (2,884 | ) |
| 241 | | TOPIX Index | | March 2017 | | Japanese Yen | | | 3,658,380 | | | | (1,155 | ) |
| 2,157 | | FTSE/JSE Top 40 Index | | March 2017 | | South African Rand | | | 955,681 | | | | 844 | |
| 386 | | S&P TSX 60 Index | | March 2017 | | Canadian Dollar | | | 69,241 | | | | (106 | ) |
| 940 | | EURO STOXX 50 Index | | March 2017 | | Euro | | | 30,804 | | | | (512 | ) |
| 2,265 | | MEX BOLSA Index | | March 2017 | | Mexican Peso | | | 1,037,008 | | | | 1,087 | |
| 747 | | Russell 2000 Mini Index | | March 2017 | | U.S. Dollar | | | 50,680 | | | | 119 | |
| 3,315 | | S&P 500 E Mini Index | | March 2017 | | U.S. Dollar | | | 370,650 | | | | 925 | |
| 566 | | 10YR Can Bond | | March 2017 | | Canadian Dollar | | | 77,842 | | | | 565 | |
| 819 | | 10YR US Treasury Notes* | | March 2017 | | U.S. Dollar | | | 101,786 | | | | 376 | |
| 133 | | Long Gilt | | March 2017 | | British Pound Sterling | | | 16,735 | | | | (348 | ) |
| 446 | | 5YR US Treasury Notes* | | March 2017 | | U.S. Dollar | | | 52,478 | | | | 206 | |
| | | | | | | | | | | | | $ | (1,304 | ) |
| * | Exposure to Futures Contract is achieved through the use of a swap contract with Credit Suisse. |
Centrally Cleared Interest Rate Swap
| Floating Rate Reference | | Pay/Receive
Floating Rate | | Fixed Rate | | | Maturity
Date | | | Cleared
Exchange | | Notional
Amount
(in thousands) | | Unrealized
Appreciation
(Depreciation) |
| 6 Month Swiss Franc LIBOR Rate | | Receive | | 0.000% | | December 2026 | | CME | | | 43,680 CHF | | $ | 1,710 | |
| | | | | | | | | | | | | | | | | | |
| Total Return Swaps | | | | | | | | | | | | | | | |
| Reference Entity | | Pay/Receive
Floating Rate | | Floating Rates | | Maturity
Dates | | Counterparty | | Notional
Amount
(in thousands) | | Unrealized
Appreciation
(Depreciation) |
| Euro STOXX Bank Gross Return Index | | Receive | | 3 Month EURIBOR minus 12 bp | | Mar 2017 | | Credit Suisse International | | | 7,836 | | $ | 159 | |
| Dow Jones US Telecommunications Total Return Index | | Receive | | 3 Month LIBOR minus 41 bp | | Mar 2017 | | Goldman Sachs International | | | 32,948 | | | (585 | ) |
| Dow Jones US Healthcare Total Return Index | | Receive | | 3 Month LIBOR plus 10 bp | | Mar 2017 | | Citibank N.A. | | | 24,763 | | | 293 | |
| Dow Jones US Technology Total Return Index | | Receive | | 3 Month LIBOR plus 10 bp | | Mar 2017 | | Citibank N.A. | | | 48,701 | | | 925 | |
| Consumer Discretionary Select Sector Total Return Index | | Receive | | 3 Month LIBOR minus 46 bp | | Mar 2017 | | Goldman Sachs International | | | 56,766 | | | 958 | |
See accompanying Notes to Financial Statements.
| 110 | Annual Report | December 31, 2016 |
Macro Allocation Fund
Portfolio of Investments, December 31, 2016 (all dollar amounts in thousands)
| Total Return Swaps (continued) | | | | | | | | | |
| Reference Entity | | Pay/Receive
Floating Rate | | Floating Rates | | Maturity
Dates | | Counterparty | | Notional
Amount
(in thousands) | | Unrealized
Appreciation
(Depreciation) |
| MSCI China Small Cap Index (Net) | | Pay | | 3 Month LIBOR plus 35 bp | | Dec 2017 | | Goldman Sachs International | | | 10,770 | | $ | (233 | ) |
| MSCI China Small Cap Index (Net) | | Pay | | 1 Month LIBOR plus 75 bp | | Mar 2017 | | Credit Suisse International | | | 3,068 | | | 238 | |
| MSCI China Small Cap Index (Net) | | Pay | | 1 Month LIBOR plus 20 bp - 40 bp | | May 2017 to Aug 2017 | | Citibank N.A. | | | 14,950 | | | 474 | |
| MSCI China Small Cap Index (Net) | | Pay | | 3 Month LIBOR plus 20 bp | | Dec 2017 | | Citibank N.A. | | | 6,597 | | | (257 | ) |
| MSCI Emerging Markets Small Cap (Net) | | Pay | | 3 Month LIBOR plus 81 bp | | Dec 2017 | | Credit Suisse International | | | 16,479 | | | 122 | |
| MSCI Emerging Markets Small Cap (Net) | | Pay | | 1 Month LIBOR plus 96 bp | | Mar 2017 | | Credit Suisse International | | | 13,655 | | | 1,456 | |
| MSCI Vietnam Daily Total Return Index | | Pay | | 3 Month LIBOR plus 100 bp | | Mar 2017 | | Goldman Sachs International | | | 8,293 | | | (123 | ) |
| Vietnam Equity Basket | | Pay | | 3 Month LIBOR plus 100 bp | | Mar 2017 | | Goldman Sachs International | | | 8,345 | | | 122 | |
| | | | | | | | | | | | | | $ | 3,549 | |
| Centrally Cleared Credit Default Swap | | | | | | | | | | |
| Reference Entity | | Buy/Sell
Protection | | | Fixed Deal
Pay Rate | | Maturity
Date | | Cleared Exchange | | Notional
Amount
(in thousands) | | Unrealized
Appreciation
(Depreciation) |
| iTRAXX Europe S26 | | Sell | | | 1.000 | % | | Dec 2021 | | ICE | | | $42,451 | | | $ | (58 | ) |
| iTRAXX Europe Crossover S26 | | Sell | | | 5.000 | % | | Dec 2021 | | ICE | | | 13,038 | | | | 160 | |
| | | | | | | | | | | | | | | | | $ | 102 | |
| | | | | | | | | | | | | | | | | | | |
| Variance Swap | | | | | | | | | | | | | | | | | | |
| Reference Entity | | Pay/Receive
Floating Rate | | | Variance
Strike Price | | Maturity
Date | | Counterparty | | Notional
Amount
(in thousands) | | Unrealized
Appreciation
(Depreciation) | |
| Euro Stoxx 50 | | Pay | | | 910.2289 | | Dec 2017 | | Citibank N.A. | | | 757 | | | $ | 4,775 | |
| | | | | | Total Net Unrealized Appreciation (Depreciation) on Swaps | | | $ | 10,136 | |
See accompanying Notes to Financial Statements.
| December 31, 2016 | William Blair Funds | 111 |
Statements of Assets and Liabilities
As of December 31, 2016 (dollar amounts in thousands)
| | | | | | Large Cap | | | Mid Cap | | | Mid Cap | |
| | | Growth | | | Growth | | | Growth | | | Value | |
| | | Fund | | | Fund | | | Fund | | | Fund | |
| Assets | | | | | | | | | | | | |
| Investments in securities, at cost | | $ | 480,335 | | | $ | 107,956 | | | $ | 119,239 | | | $ | 2,385 | |
| Investments in securities, at value | | $ | 579,584 | | | $ | 122,156 | | | $ | 134,349 | | | $ | 3,007 | |
| Cash | | | — | | | | — | | | | — | | | | 27 | |
| Receivable for securities sold | | | — | | | | 71 | | | | 2,260 | | | | — | |
| Receivable for fund shares sold | | | 435 | | | | 278 | | | | 80 | | | | 1 | |
| Receivable from Adviser | | | — | | | | 5 | | | | 8 | | | | 7 | |
| Dividend and interest receivable | | | 303 | | | | 33 | | | | 52 | | | | 5 | |
| Total assets | | | 580,322 | | | | 122,543 | | | | 136,749 | | | | 3,047 | |
| Liabilities | | | | | | | | | | | | | | | | |
| Payable for investment securities purchased | | | 1,698 | | | | — | | | | 836 | | | | — | |
| Payable for fund shares redeemed | | | 221 | | | | 84 | | | | 64 | | | | — | |
| Management fee payable | | | 373 | | | | 73 | | | | 113 | | | | 3 | |
| Distribution fee payable | | | 14 | | | | 3 | | | | 4 | | | | — | |
| Other payables and accrued expenses | | | 210 | | | | 48 | | | | 74 | | | | 35 | |
| Total liabilities | | | 2,516 | | | | 208 | | | | 1,091 | | | | 38 | |
| Net assets | | $ | 577,806 | | | $ | 122,335 | | | $ | 135,658 | | | $ | 3,009 | |
| Capital | | | | | | | | | | | | | | | | |
| Composition of net assets | | | | | | | | | | | | | | | | |
| Par value of shares of beneficial interest | | $ | 47 | | | $ | 11 | | | $ | 12 | | | $ | — | |
| Capital paid in excess of par value | | | 444,755 | | | | 108,201 | | | | 124,059 | | | | 2,328 | |
| Accumulated net investment income (loss) | | | — | | | | — | | | | — | | | | — | |
| Accumulated net realized gain (loss) | | | 33,755 | | | | (77 | ) | | | (3,523 | ) | | | 59 | |
| Net unrealized appreciation (depreciation) of investments and foreign currencies | | | 99,249 | | | | 14,200 | | | | 15,110 | | | | 622 | |
| Net assets | | $ | 577,806 | | | $ | 122,335 | | | $ | 135,658 | | | $ | 3,009 | |
| | | | | | | | | | | | | | | | | |
| Class N shares | | | | | | | | | | | | | | | | |
| Net assets | | $ | 62,936 | | | $ | 11,860 | | | $ | 16,234 | | | $ | 362 | |
| Shares outstanding | | | 5,514,642 | | | | 1,156,473 | | | | 1,519,217 | | | | 34,863 | |
| Net asset value per share | | $ | 11.41 | | | $ | 10.26 | | | $ | 10.69 | | | $ | 10.38 | |
| Class I shares | | | | | | | | | | | | | | | | |
| Net assets | | $ | 514,870 | | | $ | 110,475 | | | $ | 119,424 | | | $ | 2,647 | |
| Shares outstanding | | | 41,563,387 | | | | 10,325,120 | | | | 10,665,738 | | | | 255,414 | |
| Net asset value per share | | $ | 12.39 | | | $ | 10.70 | | | $ | 11.20 | | | $ | 10.36 | |
See accompanying Notes to Financial Statements.
| 112 | Annual Report | December 31, 2016 |
Statements of Operations
For the Year Ended December 31, 2016 (all amounts in thousands)
| | | | | | Large Cap | | | Mid Cap | | | Mid Cap | |
| | | Growth | | | Growth | | | Growth | | | Value | |
| | | Fund | | | Fund | | | Fund | | | Fund | |
| Investment income | | | | | | | | | | | | |
| Dividends | | $ | 7,907 | | | $ | 1,044 | | | $ | 1,252 | | | $ | 58 | |
| Interest | | | 3 | | | | — | | | | 1 | | | | 1 | |
| Total income | | | 7,910 | | | | 1,044 | | | | 1,253 | | | | 59 | |
| Expenses | | | | | | | | | | | | | | | | |
| Investment advisory fees | | | 5,384 | | | | 606 | | | | 1,516 | | | | 30 | |
| Distribution fees | | | 275 | | | | 30 | | | | 51 | | | | 2 | |
| Custodian fees | | | 41 | | | | 28 | | | | 45 | | | | 36 | |
| Transfer agent fees | | | 90 | | | | 14 | | | | 21 | | | | 1 | |
| Sub-transfer agent fees | | | | | | | | | | | | | | | | |
| Class N | | | 178 | | | | 15 | | | | 24 | | | | 1 | |
| Class I | | | 632 | | | | 49 | | | | 143 | | | | — | |
| Professional fees | | | 71 | | | | 34 | | | | 39 | | | | 27 | |
| Registration fees | | | 43 | | | | 35 | | | | 50 | | | | 30 | |
| Shareholder reporting fees | | | 20 | | | | 5 | | | | 32 | | | | — | |
| Trustee fees | | | 56 | | | | 5 | | | | 13 | | | | — | |
| Other expenses | | | 46 | | | | 6 | | | | 10 | | | | 4 | |
| Total expenses before expense limitation | | | 6,836 | | | | 827 | | | | 1,944 | | | | 131 | |
| Expenses waived or reimbursed by the Adviser | | | — | | | | (104 | ) | | | (217 | ) | | | (97 | ) |
| Net expenses | | | 6,836 | | | | 723 | | | | 1,727 | | | | 34 | |
| Net investment income (loss) | | | 1,074 | | | | 321 | | | | (474 | ) | | | 25 | |
| Realized and unrealized gain (loss) | | | | | | | | | | | | | | | | |
| Net realized gain (loss) on transactions from: | | | | | | | | | | | | | | | | |
| Investments in securities | | | 66,007 | | | | 1,326 | | | | (1,862 | ) | | | 227 | |
| Total net realized gain (loss) | | | 66,007 | | | | 1,326 | | | | (1,862 | ) | | | 227 | |
| Change in net unrealized appreciation (depreciation) of: | | | | | | | | | | | | | | | | |
| Investments in securities | | | (71,577 | ) | | | 1,381 | | | | 1,967 | | | | 214 | |
| Change in net unrealized appreciation (depreciation) | | | (71,577 | ) | | | 1,381 | | | | 1,967 | | | | 214 | |
| Net increase (decrease) in net assets resulting from operations | | $ | (4,496 | ) | | $ | 3,028 | | | $ | (369 | ) | | $ | 466 | |
See accompanying Notes to Financial Statements.
| December 31, 2016 | William Blair Funds | 113 |
Statements of Changes in Net Assets
For the Years Ended December 31, 2016 and 2015 (all amounts in thousands)
| | | | | | Large Cap | | | Mid Cap | | | Mid Cap | |
| | | Growth Fund | | | Growth Fund | | | Growth Fund | | | Value Fund | |
| | | 2016 | | | 2015 | | | 2016 | | | 2015 | | | 2016 | | | 2015 | | | 2016 | | | 2015 | |
| Operations | | | | | | | | | | | | | | | | | | | | | | | | |
| Net investment income (loss) | | $ | 1,074 | | | $ | (250 | ) | | $ | 321 | | | $ | (4 | ) | | $ | (474 | ) | | $ | (1,275 | ) | | $ | 25 | | | $ | 22 | |
| Net realized gain (loss) on investments, and other assets and liabilities | | | 66,007 | | | | 57,036 | | | | 1,326 | | | | 4,789 | | | | (1,862 | ) | | | 36,493 | | | | 227 | | | | 661 | |
| Change in net unrealized appreciation (depreciation) on investments, and other assets and liabilities | | | (71,577 | ) | | | (9,544 | ) | | | 1,381 | | | | (463 | ) | | | 1,967 | | | | (30,371 | ) | | | 214 | | | | (671 | ) |
| Net increase (decrease) in net assets resulting from operations | | | (4,496 | ) | | | 47,242 | | | | 3,028 | | | | 4,322 | | | | (369 | ) | | | 4,847 | | | | 466 | | | | 12 | |
| Distributions to shareholders from | | | | | | | | | | | | | | | | | | | | | | | | | | | | | | | | |
| Net investment income | | | | | | | | | | | | | | | | | | | | | | | | | | | | | | | | |
| Class N | | | — | | | | — | | | | (9 | ) | | | — | | | | — | | | | — | | | | (2 | ) | | | (2 | ) |
| Class I | | | (1,133 | ) | | | — | | | | (334 | ) | | | — | | | | — | | | | — | | | | (27 | ) | | | (10 | ) |
| Net realized gain | | | | | | | | | | | | | | | | | | | | | | | | | | | | | | | | |
| Class N | | | (5,224 | ) | | | (18,526 | ) | | | (98 | ) | | | (971 | ) | | | (912 | ) | | | (5,530 | ) | | | (30 | ) | | | (149 | ) |
| Class I | | | (38,810 | ) | | | (80,435 | ) | | | (863 | ) | | | (5,265 | ) | | | (6,417 | ) | | | (35,853 | ) | | | (218 | ) | | | (438 | ) |
| Total distributions | | | (45,167 | ) | | | (98,961 | ) | | | (1,304 | ) | | | (6,236 | ) | | | (7,329 | ) | | | (41,383 | ) | | | (277 | ) | | | (599 | ) |
| Capital stock transactions | | | | | | | | | | | | | | | | | | | | | | | | | | | | | | | | |
| Net proceeds from sale of shares | | | 75,891 | | | | 122,787 | | | | 75,429 | | | | 17,152 | | | | 20,647 | | | | 33,162 | | | | 1,094 | | | | 661 | |
| Shares issued in reinvestment of income dividends and capital gain distributions | | | 44,227 | | | | 95,837 | | | | 1,134 | | | | 5,376 | | | | 7,111 | | | | 39,576 | | | | 277 | | | | 573 | |
| Less cost of shares redeemed | | | (339,147 | ) | | | (281,210 | ) | | | (25,433 | ) | | | (10,742 | ) | | | (84,124 | ) | | | (176,266 | ) | | | (1,219 | ) | | | (1,747 | ) |
| Net increase (decrease) in net assets resulting from capital share transactions | | | (219,029 | ) | | | (62,586 | ) | | | 51,130 | | | | 11,786 | | | | (56,366 | ) | | | (103,528 | ) | | | 152 | | | | (513 | ) |
| Increase (decrease) in net assets | | | (268,692 | ) | | | (114,305 | ) | | | 52,854 | | | | 9,872 | | | | (64,064 | ) | | | (140,064 | ) | | | 341 | | | | (1,100 | ) |
| Net assets | | | | | | | | | | | | | | | | | | | | | | | | | | | | | | | | |
| Beginning of period | | | 846,498 | | | | 960,803 | | | | 69,481 | | | | 59,609 | | | | 199,722 | | | | 339,786 | | | | 2,668 | | | | 3,768 | |
| End of period | | $ | 577,806 | | | $ | 846,498 | | | $ | 122,335 | | | $ | 69,481 | | | $ | 135,658 | | | $ | 199,722 | | | $ | 3,009 | | | $ | 2,668 | |
| Accumulated net investment income (loss) at the end of the period | | $ | — | | | $ | — | | | $ | — | | | $ | — | | | $ | — | | | $ | — | | | $ | — | | | $ | 5 | |
See accompanying Notes to Financial Statements.
| 114 | Annual Report | December 31, 2016 |
Statements of Assets and Liabilities
As of December 31, 2016 (dollar amounts in thousands)
| | | Small-Mid | | | Small-Mid | | | Small Cap | | | Small Cap | |
| | | Cap Growth | | | Cap Value | | | Growth | | | Value | |
| | | Fund | | | Fund | | | Fund | | | Fund | |
| Assets | | | | | | | | | | | | |
| Investments in securities, at cost | | $ | 1,110,075 | | | $ | 2,527 | | | $ | 316,384 | | | $ | 523,810 | |
| Investments in securities, at value | | $ | 1,270,556 | | | $ | 3,391 | | | $ | 389,647 | | | $ | 705,993 | |
| Receivable for securities sold | | | 31,489 | | | | 103 | | | | 4,763 | | | | 8,880 | |
| Receivable for fund shares sold | | | 8,746 | | | | 14 | | | | 623 | | | | 2,047 | |
| Receivable from Adviser | | | 82 | | | | 11 | | | | — | | | | 12 | |
| Dividend and interest receivable | | | 325 | | | | 5 | | | | 104 | | | | 1,046 | |
| Total assets | | | 1,311,198 | | | | 3,524 | | | | 395,137 | | | | 717,978 | |
| Liabilities | | | | | | | | | | | | | | | | |
| Payable for investment securities purchased | | | 5,124 | | | | 5 | | | | 5,030 | | | | 2,386 | |
| Payable for fund shares redeemed | | | 42,052 | | | | 2 | | | | 619 | | | | 6,167 | |
| Payable to custodian | | | — | | | | 19 | | | | — | | | | — | |
| Management fee payable | | | 1,105 | | | | 3 | | | | 368 | | | | 666 | |
| Distribution fee payable | | | 42 | | | | — | | | | 25 | | | | 7 | |
| Other payables and accrued expenses | | | 298 | | | | 42 | | | | 197 | | | | 121 | |
| Total liabilities | | | 48,621 | | | | 71 | | | | 6,239 | | | | 9,347 | |
| Net assets | | $ | 1,262,577 | | | $ | 3,453 | | | $ | 388,898 | | | $ | 708,631 | |
| Capital | | | | | | | | | | | | | | | | |
| Composition of net assets | | | | | | | | | | | | | | | | |
| Par value of shares of beneficial interest | | $ | 63 | | | $ | — | | | $ | 15 | | | $ | 34 | |
| Capital paid in excess of par value | | | 1,103,158 | | | | 2,603 | | | | 305,422 | | | | 525,593 | |
| Accumulated net investment income (loss) | | | — | | | | — | | | | — | | | | — | |
| Accumulated net realized gain (loss) | | | (1,125 | ) | | | (14 | ) | | | 10,198 | | | | 821 | |
| Net unrealized appreciation (depreciation) of investments and foreign currencies | | | 160,481 | | | | 864 | | | | 73,263 | | | | 182,183 | |
| Net assets | | $ | 1,262,577 | | | $ | 3,453 | | | $ | 388,898 | | | $ | 708,631 | |
| | | | | | | | | | | | | | | | | |
| Class N shares | | | | | | | | | | | | | | | | |
| Net assets | | $ | 171,638 | | | $ | 267 | | | $ | 117,068 | | | $ | 33,359 | |
| Shares outstanding | | | 8,937,999 | | | | 18,367 | | | | 4,637,793 | | | | 1,653,137 | |
| Net asset value per share | | $ | 19.20 | | | $ | 14.53 | | | $ | 25.24 | | | $ | 20.18 | |
| Class I shares | | | | | | | | | | | | | | | | |
| Net assets | | $ | 1,090,939 | | | $ | 3,186 | | | $ | 271,830 | | | $ | 675,272 | |
| Shares outstanding | | | 54,483,480 | | | | 220,155 | | | | 9,944,201 | | | | 32,653,205 | |
| Net asset value per share | | $ | 20.02 | | | $ | 14.47 | | | $ | 27.34 | | | $ | 20.68 | |
See accompanying Notes to Financial Statements.
| December 31, 2016 | William Blair Funds | 115 |
Statements of Operations
For the Year Ended December 31, 2016 (all amounts in thousands)
| | | Small-Mid | | | Small-Mid | | | Small Cap | | | Small Cap | |
| | | Cap Growth | | | Cap Value | | | Growth | | | Value | |
| | | Fund | | | Fund | | | Fund | | | Fund | |
| Investment income | | | | | | | | | | | | |
| Dividends | | $ | 10,147 | | | $ | 67 | | | $ | 2,590 | | | $ | 10,438 | |
| Less foreign tax withheld | | | (32 | ) | | | — | | | | (10 | ) | | | — | |
| Interest | | | 11 | | | | — | | | | 3 | | | | 4 | |
| Total income | | | 10,126 | | | | 67 | | | | 2,583 | | | | 10,442 | |
| Expenses | | | | | | | | | | | | | | | | |
| Investment advisory fees | | | 12,281 | | | | 40 | | | | 3,985 | | | | 6,681 | |
| Distribution fees | | | 499 | | | | 2 | | | | 270 | | | | 80 | |
| Custodian fees | | | 38 | | | | 38 | | | | 35 | | | | 36 | |
| Transfer agent fees | | | 79 | | | | 1 | | | | 50 | | | | 33 | |
| Sub-transfer agent fees | | | | | | | | | | | | | | | | |
| Class N | | | 262 | | | | — | | | | 130 | | | | 40 | |
| Class I | | | 1,133 | | | | 2 | | | | 223 | | | | 783 | |
| Professional fees | | | 101 | | | | 35 | | | | 56 | | | | 58 | |
| Registration fees | | | 72 | | | | 36 | | | | 50 | | | | 37 | |
| Shareholder reporting fees | | | 212 | | | | — | | | | 73 | | | | 40 | |
| Trustee fees | | | 79 | | | | — | | | | 25 | | | | 40 | |
| Other expenses | | | 47 | | | | 5 | | | | 16 | | | | 55 | |
| Total expenses before expense limitation | | | 14,803 | | | | 159 | | | | 4,913 | | | | 7,883 | |
| Expenses waived or reimbursed by the Adviser | | | (817 | ) | | | (112 | ) | | | (117 | ) | | | (210 | ) |
| Net expenses | | | 13,986 | | | | 47 | | | | 4,796 | | | | 7,673 | |
| Net investment income (loss) | | | (3,860 | ) | | | 20 | | | | (2,213 | ) | | | 2,769 | |
| Realized and unrealized gain (loss) | | | | | | | | | | | | | | | | |
| Net realized gain (loss) on transactions from: | | | | | | | | | | | | | | | | |
| Investments in securities | | | 25,506 | | | | 159 | | | | 35,282 | (1) | | | 24,542 | |
| Redemptions in-kind | | | 52,031 | | | | — | �� | | | — | | | | — | |
| Total net realized gain (loss) | | | 77,537 | | | | 159 | | | | 35,282 | | | | 24,542 | |
| Change in net unrealized appreciation (depreciation) of: | | | | | | | | | | | | | | | | |
| Investments in securities | | | 12,814 | | | | 522 | | | | 30,352 | (2) | | | 117,767 | |
| Change in net unrealized appreciation (depreciation) | | | 12,814 | | | | 522 | | | | 30,352 | | | | 117,767 | |
| Net increase (decrease) in net assets resulting from operations | | $ | 86,491 | | | $ | 701 | | | $ | 63,421 | | | $ | 145,078 | |
| (1) | Includes $3,587 from companies deemed affiliated during the year. |
| (2) | Includes $2,483 from companies deemed affiliated during the year. |
See accompanying Notes to Financial Statements.
| 116 | Annual Report | December 31, 2016 |
Statements of Changes in Net Assets
For the Years Ended December 31, 2016 and 2015 (all amounts in thousands)
| | | Small-Mid | | | Small-Mid | | | Small Cap | | | Small Cap | |
| | | Cap Growth Fund | | | Cap Value Fund | | | Growth Fund | | | Value Fund | |
| | | 2016 | | | 2015 | | | 2016 | | | 2015 | | | 2016 | | | 2015 | | | 2016 | | | 2015 | |
| Operations | | | | | | | | | | | | | | | | | | | | | | | | |
| Net investment income (loss) | | $ | (3,860 | ) | | $ | (3,239 | ) | | $ | 20 | | | $ | 21 | | | $ | (2,213 | ) | | $ | (3,146 | ) | | $ | 2,769 | | | $ | 2,407 | |
| Net realized gain (loss) on investments, and other assets and liabilities | | | 77,537 | | | | 61,943 | | | | 159 | | | | 129 | | | | 35,282 | | | | 27,594 | | | | 24,542 | | | | 6,099 | |
| Change in net unrealized appreciation (depreciation) on investments, and other assets and liabilities | | | 12,814 | | | | (21,167 | ) | | | 522 | | | | (280 | ) | | | 30,352 | | | | (39,914 | ) | | | 117,767 | | | | (41,101 | ) |
| Net increase (decrease) in net assets resulting from operations | | | 86,491 | | | | 37,537 | | | | 701 | | | | (130 | ) | | | 63,421 | | | | (15,466 | ) | | | 145,078 | | | | (32,595 | ) |
| Distributions to shareholders from | | | | | | | | | | | | | | | | | | | | | | | | | | | | | | | | |
| Net investment income | | | | | | | | | | | | | | | | | | | | | | | | | | | | | | | | |
| Class N | | | — | | | | — | | | | (1 | ) | | | (1 | ) | | | — | | | | — | | | | (58 | ) | | | — | |
| Class I | | | — | | | | — | | | | (23 | ) | | | (10 | ) | | | — | | | | — | | | | (2,771 | ) | | | (1,363 | ) |
| Net realized gain | | | | | | | | | | | | | | | | | | | | | | | | | | | | | | | | |
| Class N | | | (5,332 | ) | | | (8,564 | ) | | | (10 | ) | | | (44 | ) | | | (6,573 | ) | | | (9,437 | ) | | | (1,334 | ) | | | (107 | ) |
| Class I | | | (28,097 | ) | | | (50,588 | ) | | | (129 | ) | | | (162 | ) | | | (14,099 | ) | | | (20,150 | ) | | | (26,512 | ) | | | (1,836 | ) |
| Total distributions | | | (33,429 | ) | | | (59,152 | ) | | | (163 | ) | | | (217 | ) | | | (20,672 | ) | | | (29,587 | ) | | | (30,675 | ) | | | (3,306 | ) |
| Capital stock transactions | | | | | | | | | | | | | | | | | | | | | | | | | | | | | | | | |
| Net proceeds from sale of shares | | | 533,654 | | | | 428,159 | | | | 640 | | | | 435 | | | | 51,636 | | | | 94,104 | | | | 133,395 | | | | 174,197 | |
| Shares issued in reinvestment of income dividends and capital gain distributions | | | 33,051 | | | | 57,336 | | | | 164 | | | | 136 | | | | 20,471 | | | | 28,974 | | | | 28,779 | | | | 3,045 | |
| Less cost of shares redeemed | | | (546,329 | ) | | | (151,577 | ) | | | (1,964 | ) | | | (502 | ) | | | (99,171 | ) | | | (217,254 | ) | | | (180,307 | ) | | | (114,166 | ) |
| Net increase (decrease) in net assets resulting from capital share transactions | | | 20,376 | | | | 333,918 | | | | (1,160 | ) | | | 69 | | | | (27,064 | ) | | | (94,176 | ) | | | (18,133 | ) | | | 63,076 | |
| Increase(decrease) in net assets | | | 73,438 | | | | 312,303 | | | | (622 | ) | | | (278 | ) | | | 15,685 | | | | (139,229 | ) | | | 96,270 | | | | 27,175 | |
| Net assets | | | | | | | | | | | | | | | | | | | | | | | | | | | | | | | | |
| Beginning of period | | | 1,189,139 | | | | 876,836 | | | | 4,075 | | | | 4,353 | | | | 373,213 | | | | 512,442 | | | | 612,361 | | | | 585,186 | |
| End of period | | $ | 1,262,577 | | | $ | 1,189,139 | | | $ | 3,453 | | | $ | 4,075 | | | $ | 388,898 | | | $ | 373,213 | | | $ | 708,631 | | | $ | 612,361 | |
| Accumulated net investment income (loss) at the end of the period | | $ | — | | | $ | — | | | $ | — | | | $ | 4 | | | $ | — | | | $ | — | | | $ | — | | | $ | 236 | |
See accompanying Notes to Financial Statements.
| December 31, 2016 | William Blair Funds | 117 |
Statements of Assets and Liabilities
As of December 31, 2016 (dollar amounts in thousands)
| | | | | | | | | | | | Institutional | |
| | | Global | | | International | | | International | | | International | |
| | | Leaders | | | Leaders | | | Equity | | | Equity | |
| | | Fund | | | Fund | | | Fund | | | Fund | |
| Assets | | | | | | | | | | | | |
| Investments in securities, at cost | | $ | 156,977 | | | $ | 239,540 | | | $ | 80,267 | | | $ | 15,244 | |
| Investments in securities, at value | | $ | 176,783 | | | $ | 252,439 | | | $ | 87,244 | | | $ | 16,573 | |
| Cash | | | — | | | | — | | | | 4 | | | | 1 | |
| Foreign currency, at value (cost $415; $1,182; $187; $50) | | | 414 | | | | 1,180 | | | | 186 | | | | 50 | |
| Receivable for securities sold | | | — | | | | 1,433 | | | | 20 | | | | 5 | |
| Receivable for fund shares sold | | | — | | | | 1,356 | | | | — | | | | — | |
| Receivable from Adviser or an affiliate | | | 23 | | | | 24 | | | | 14 | | | | 11 | |
| Dividend and interest receivable | | | 149 | | | | 290 | | | | 134 | | | | 33 | |
| Total assets | | | 177,369 | | | | 256,722 | | | | 87,602 | | | | 16,673 | |
| Liabilities | | | | | | | | | | | | | | | | |
| Payable for investment securities purchased | | | 403 | | | | 1,175 | | | | 116 | | | | 27 | |
| Payable for fund shares redeemed | | | 11 | | | | 15 | | | | — | | | | — | |
| Management fee payable | | | 150 | | | | 202 | | | | 65 | | | | 13 | |
| Shareholder administration fee payable | | | 7 | | | | 4 | | | | — | | | | — | |
| Distribution fee payable | | | 1 | | | | 1 | | | | 1 | | | | — | |
| Foreign capital gains tax liability | | | — | | | | 1 | | | | — | | | | — | |
| Other payables and accrued expenses | | | 66 | | | | 102 | | | | 83 | | | | 68 | |
| Total liabilities | | | 638 | | | | 1,500 | | | | 265 | | | | 108 | |
| Net assets | | $ | 176,731 | | | $ | 255,222 | | | $ | 87,337 | | | $ | 16,565 | |
| Capital | | | | | | | | | | | | | | | | |
| Composition of net assets | | | | | | | | | | | | | | | | |
| Par value of shares of beneficial interest | | $ | 15 | | | $ | 20 | | | $ | 6 | | | $ | 1 | |
| Capital paid in excess of par value | | | 159,039 | | | | 243,708 | | | | 157,009 | | | | 106,278 | |
| Accumulated net investment income (loss) | | | 488 | | | | (956 | ) | | | 816 | | | | (112 | ) |
| Accumulated net realized gain (loss) | | | (2,611 | ) | | | (429 | ) | | | (77,465 | ) | | | (90,929 | ) |
| Net unrealized appreciation (depreciation) of investments and foreign currencies | | | 19,800 | | | | 12,879 | | | | 6,971 | | | | 1,327 | |
| Net assets | | $ | 176,731 | | | $ | 255,222 | | | $ | 87,337 | | | $ | 16,565 | |
| Class N shares | | | | | | | | | | | | | | | | |
| Net assets | | $ | 5,760 | | | $ | 2,922 | | | $ | 2,954 | | | | — | |
| Shares outstanding | | | 496,400 | | | | 226,890 | | | | 215,956 | | | | — | |
| Net asset value per share | | $ | 11.60 | | | $ | 12.88 | | | $ | 13.68 | | | | — | |
| Class I shares | | | | | | | | | | | | | | | | |
| Net assets | | $ | 45,772 | | | $ | 30,944 | | | $ | 84,383 | | | | — | |
| Shares outstanding | | | 3,939,470 | | | | 2,395,167 | | | | 6,111,821 | | | | — | |
| Net asset value per share | | $ | 11.62 | | | $ | 12.92 | | | $ | 13.81 | | | | — | |
| Institutional Class shares | | | | | | | | | | | | | | | | |
| Net assets | | $ | 125,199 | | | $ | 221,356 | | | | — | | | $ | 16,565 | |
| Shares outstanding | | | 10,774,086 | | | | 17,138,983 | | | | — | | | | 1,398,687 | |
| Net asset value per share | | $ | 11.62 | | | $ | 12.92 | | | | — | | | $ | 11.84 | |
See accompanying Notes to Financial Statements.
| 118 | Annual Report | December 31, 2016 |
Statements of Operations
For the Year Ended December 31, 2016 (all amounts in thousands)
| | | | | | | | | | | | Institutional | |
| | | Global | | | International | | | International | | | International | |
| | | Leaders | | | Leaders | | | Equity | | | Equity | |
| | | Fund | | | Fund | | | Fund | | | Fund | |
| Investment income | | | | | | | | | | | | |
| Dividends | | $ | 3,020 | | | $ | 3,914 | | | $ | 1,917 | | | $ | 465 | |
| Less foreign tax withheld | | | (204 | ) | | | (352 | ) | | | (164 | ) | | | (39 | ) |
| Interest | | | 1 | | | | 2 | | | | 1 | | | | — | |
| Total income | | | 2,817 | | | | 3,564 | | | | 1,754 | | | | 426 | |
| Expenses | | | | | | | | | | | | | | | | |
| Investment advisory fees | | | 1,774 | | | | 1,823 | | | | 683 | | | | 142 | |
| Distribution fees | | | 14 | | | | 2 | | | | 7 | | | | — | |
| Shareholder administration fees | | | 77 | | | | 33 | | | | — | | | | — | |
| Custodian fees | | | 53 | | | | 66 | | | | 52 | | | | 48 | |
| Transfer agent fees | | | 8 | | | | 4 | | | | 3 | | | | — | |
| Sub-transfer agent fees | | | | | | | | | | | | | | | | |
| Class N | | | 6 | | | | 1 | | | | 3 | | | | — | |
| Class I | | | 24 | | | | 19 | | | | 59 | | | | — | |
| Professional fees | | | 54 | | | | 64 | | | | 67 | | | | 64 | |
| Registration fees | | | 47 | | | | 53 | | | | 34 | | | | 20 | |
| Shareholder reporting fees | | | 4 | | | | 1 | | | | 1 | | | | — | |
| Trustee fees | | | 12 | | | | 9 | | | | 4 | | | | 1 | |
| Other expenses | | | 14 | | | | 16 | | | | 6 | | | | 4 | |
| Total expenses before expense limitation | | | 2,087 | | | | 2,091 | | | | 919 | | | | 279 | |
| Expenses waived or reimbursed by the Adviser or an affiliate | | | (271 | ) | | | (246 | ) | | | (196 | ) | | | (122 | ) |
| Net expenses | | | 1,816 | | | | 1,845 | | | | 723 | | | | 157 | |
| Net investment income (loss) | | | 1,001 | | | | 1,719 | | | | 1,031 | | | | 269 | |
| Realized and unrealized gain (loss) | | | | | | | | | | | | | | | | |
| Net realized gain (loss) on transactions from: | | | | | | | | | | | | | | | | |
| Investments in securities, net of foreign taxes, if applicable | | | (1,893 | ) | | | (261 | ) | | | (2,405 | ) | | | (823 | ) |
| Foreign currency transactions | | | (45 | ) | | | (101 | ) | | | (60 | ) | | | (10 | ) |
| Total net realized gain (loss) | | | (1,938 | ) | | | (362 | ) | | | (2,465 | ) | | | (833 | ) |
| Change in net unrealized appreciation (depreciation) of: | | | | | | | | | | | | | | | | |
| Investments in securities | | | 2,131 | | | | 2,423 | | | | 1,793 | | | | 514 | |
| Foreign currency translations | | | 20 | | | | (7 | ) | | | 1 | | | | 1 | |
| Change in net unrealized appreciation (depreciation) | | | 2,151 | | | | 2,416 | | | | 1,794 | | | | 515 | |
| Net increase (decrease) in net assets resulting from operations | | $ | 1,214 | | | $ | 3,773 | | | $ | 360 | | | $ | (49 | ) |
See accompanying Notes to Financial Statements.
| December 31, 2016 | William Blair Funds | 119 |
Statements of Changes in Net Assets
For the Years Ended December 31, 2016 and 2015 (all amounts in thousands)
| | | Global
Leaders Fund | | | International
Leaders Fund | | | International
Equity Fund | | | Institutional
International
Equity Fund | |
| | | 2016 | | | 2015 | | | 2016 | | | 2015 | | | 2016 | | | 2015 | | | 2016 | | | 2015 | |
| Operations | | | | | | | | | | | | | | | | | | | | | | | | |
| Net investment income (loss) | | $ | 1,001 | | | $ | 848 | | | $ | 1,719 | | | $ | 857 | | | $ | 1,031 | | | $ | 875 | | | $ | 269 | | | $ | 194 | |
| Net realized gain (loss) on investments, and other assets and liabilities | | | (1,938 | ) | | | 7,126 | | | | (362 | ) | | | (149 | ) | | | (2,465 | ) | | | 1,894 | | | | (833 | ) | | | 417 | |
| Change in net unrealized appreciation (depreciation) on investments, and other assets and liabilities | | | 2,151 | | | | (3,415 | ) | | | 2,416 | | | | 4,684 | | | | 1,794 | | | | (1,349 | ) | | | 515 | | | | (426 | ) |
| Net increase (decrease) in net assets resulting from operations | | | 1,214 | | | | 4,559 | | | | 3,773 | | | | 5,392 | | | | 360 | | | | 1,420 | | | | (49 | ) | | | 185 | |
| Distributions to shareholders from | | | | | | | | | | | | | | | �� | | | | | | | | | | | | | | | | | |
| Net investment income | | | | | | | | | | | | | | | | | | | | | | | | | | | | | | | | |
| Class N | | | — | | | | (3 | ) | | | (23 | ) | | | (1 | ) | | | (29 | ) | | | (26 | ) | | | — | | | | — | |
| Class I | | | (124 | ) | | | (152 | ) | | | (293 | ) | | | (22 | ) | | | (823 | ) | | | (750 | ) | | | — | | | | — | |
| Institutional Class | | | (403 | ) | | | (552 | ) | | | (2,350 | ) | | | (323 | ) | | | — | | | | — | | | | (336 | ) | | | (156 | ) |
| Net realized gain | | | | | | | | | | | | | | | | | | | | | | | | | | | | | | | | |
| Class N | | | (27 | ) | | | (252 | ) | | | — | | | | (2 | ) | | | — | | | | — | | | | — | | | | — | |
| Class I | | | (206 | ) | | | (2,063 | ) | | | — | | | | (73 | ) | | | — | | | | — | | | | — | | | | — | |
| Institutional Class | | | (559 | ) | | | (6,144 | ) | | | — | | | | (578 | ) | | | — | | | | — | | | | — | | | | — | |
| Total distributions | | | (1,319 | ) | | | (9,166 | ) | | | (2,666 | ) | | | (999 | ) | | | (852 | ) | | | (776 | ) | | | (336 | ) | | | (156 | ) |
| Capital stock transactions | | | | | | | | | | | | | | | | | | | | | | | | | | | | | | | | |
| Net proceeds from sale of shares | | | 32,576 | | | | 41,785 | | | | 158,486 | | | | 24,052 | | | | 25,707 | | | | 5,655 | | | | 967 | | | | 2,425 | |
| Shares issued in reinvestment of income dividends and capital gain distributions | | | 1,244 | | | | 8,986 | | | | 1,783 | | | | 773 | | | | 780 | | | | 706 | | | | 336 | | | | 156 | |
| Less cost of shares redeemed | | | (45,952 | ) | | | (20,858 | ) | | | (22,232 | ) | | | (1,102 | ) | | | (2,564 | ) | | | (11,608 | ) | | | (383 | ) | | | (1,154 | ) |
| Net increase (decrease) in net assets resulting from capital share transactions | | | (12,132 | ) | | | 29,913 | | | | 138,037 | | | | 23,723 | | | | 23,923 | | | | (5,247 | ) | | | 920 | | | | 1,427 | |
| Increase (decrease) in net assets | | | (12,237 | ) | | | 25,306 | | | | 139,144 | | | | 28,116 | | | | 23,431 | | | | (4,603 | ) | | | 535 | | | | 1,456 | |
| Net assets | | | | | | | | | | | | | | | | | | | | | | | | | | | | | | | | |
| Beginning of period | | | 188,968 | | | | 163,662 | | | | 116,078 | | | | 87,962 | | | | 63,906 | | | | 68,509 | | | | 16,030 | | | | 14,574 | |
| End of period | | $ | 176,731 | | | $ | 188,968 | | | $ | 255,222 | | | $ | 116,078 | | | $ | 87,337 | | | $ | 63,906 | | | $ | 16,565 | | | $ | 16,030 | |
| Accumulated net investment income (loss) at the end of the period | | $ | 488 | | | $ | (40 | ) | | $ | (956 | ) | | $ | 92 | | | $ | 816 | | | $ | 586 | | | $ | (112 | ) | | $ | (62 | ) |
See accompanying Notes to Financial Statements.
| 120 | Annual Report | December 31, 2016 |
Statements of Assets and Liabilities
As of December 31, 2016 (dollar amounts in thousands)
| | | | | | Institutional | | | International | |
| | | International | | | International | | | Small Cap | |
| | | Growth | | | Growth | | | Growth | |
| | | Fund | | | Fund | | | Fund | |
| Assets | | | | | | | | | |
| Investments in securities, at cost | | $ | 2,781,661 | | | $ | 1,954,094 | | | $ | 484,459 | |
| Investment in affiliated companies, at cost | | | 102 | | | | 63 | | | | — | |
| Investments in securities, at value | | $ | 2,984,226 | | | $ | 2,081,665 | | | $ | 516,867 | |
| Investment in affiliated companies, at value | | | 164 | | | | 102 | | | | — | |
| Cash | | | 93 | | | | 64 | | | | — | |
| Foreign currency, at value (cost $51, $36, $52) | | | 51 | | | | 36 | | | | 52 | |
| Receivable for securities sold | | | 7,996 | | | | 5,940 | | | | 724 | |
| Receivable for fund shares sold | | | 4,110 | | | | 16,550 | | | | 446 | |
| Receivable from Adviser or an affiliate | | | — | | | | — | | | | 40 | |
| Dividend and interest receivable | | | 8,772 | | | | 3,864 | | | | 818 | |
| Total assets | | | 3,005,412 | | | | 2,108,221 | | | | 518,947 | |
| Liabilities | | | | | | | | | | | | |
| Payable for investment securities purchased | | | 11,663 | | | | 8,055 | | | | 1,436 | |
| Payable for fund shares redeemed | | | 8,899 | | | | 3,979 | | | | 242 | |
| Management fee payable | | | 2,555 | | | | 1,652 | | | | 435 | |
| Shareholder administration fee payable | | | — | | | | — | | | | 40 | |
| Distribution fee payable | | | 154 | | | | — | | | | 2 | |
| Foreign capital gains tax liability | | | 262 | | | | 113 | | | | — | |
| Other payables and accrued expenses | | | 634 | | | | 451 | | | | 159 | |
| Total liabilities | | | 24,167 | | | | 14,250 | | | | 2,314 | |
| Net assets | | $ | 2,981,245 | | | $ | 2,093,971 | | | $ | 516,633 | |
| Capital | | | | | | | | | | | | |
| Composition of net assets | | | | | | | | | | | | |
| Par value of shares of beneficial interest | | $ | 123 | | | $ | 144 | | | $ | 40 | |
| Capital paid in excess of par value | | | 3,205,605 | | | | 2,051,567 | | | | 487,164 | |
| Accumulated net investment income (loss) | | | 9,881 | | | | 13,670 | | | | (2,734 | ) |
| Accumulated net realized gain (loss) | | | (436,525 | ) | | | (98,769 | ) | | | (192 | ) |
| Net unrealized appreciation (depreciation) of investments and foreign currencies | | | 202,161 | | | | 127,359 | | | | 32,355 | |
| Net assets | | $ | 2,981,245 | | | $ | 2,093,971 | | | $ | 516,633 | |
| Class N shares | | | | | | | | | | | | |
| Net assets | | $ | 729,544 | | | | — | | | $ | 10,361 | |
| Shares outstanding | | | 30,571,311 | | | | — | | | | 805,330 | |
| Net asset value per share | | $ | 23.86 | | | | — | | | $ | 12.87 | |
| Class I shares | | | | | | | | | | | | |
| Net assets | | $ | 2,251,701 | | | | — | | | $ | 306,526 | |
| Shares outstanding | | | 92,207,650 | | | | — | | | | 23,570,043 | |
| Net asset value per share | | $ | 24.42 | | | | — | | | $ | 13.00 | |
| Institutional Class shares | | | | | | | | | | | | |
| Net assets | | | — | | | $ | 2,093,971 | | | $ | 199,746 | |
| Shares outstanding | | | — | | | | 143,931,501 | | | | 15,281,277 | |
| Net asset value per share | | | — | | | $ | 14.55 | | | $ | 13.07 | |
See accompanying Notes to Financial Statements.
| December 31, 2016 | William Blair Funds | 121 |
Statements of Operations
For the Year Ended December 31, 2016 (all amounts in thousands)
| | | | | | Institutional | | | International | |
| | | International | | | International | | | Small Cap | |
| | | Growth | | | Growth | | | Growth | |
| | | Fund | | | Fund | | | Fund | |
| Investment income | | | | | | | | | |
| Dividends | | $ | 82,104 | | | $ | 51,493 | | | $ | 13,298 | |
| Less foreign tax withheld | | | (7,926 | ) | | | (4,974 | ) | | | (1,111 | ) |
| Interest. | | | 9 | | | | 6 | | | | 2 | |
| Total income | | | 74,187 | | | | 46,525 | | | | 12,189 | |
| Expenses | | | | | | | | | | | | |
| Investment advisory fees | | | 32,534 | | | | 19,533 | | | | 5,519 | |
| Distribution fees | | | 1,999 | | | | — | | | | 27 | |
| Shareholder administration fees | | | — | | | | — | | | | 515 | |
| Custodian fees | | | 335 | | | | 240 | | | | 123 | |
| Transfer agent fees | | | 184 | | | | 57 | | | | 25 | |
| Sub-transfer agent fees | | | | | | | | | | | | |
| Class N | | | 1,056 | | | | — | | | | 12 | |
| Class I | | | 2,024 | | | | — | | | | 256 | |
| Professional fees | | | 307 | | | | 232 | | | | 112 | |
| Registration fees | | | 93 | | | | 23 | | | | 55 | |
| Shareholder reporting fees | | | 179 | | | | 46 | | | | 36 | |
| Trustee fees | | | 239 | | | | 153 | | | | 39 | |
| Other expenses | | | 123 | | | | 169 | | | | 23 | |
| Total expenses before expense limitation | | | 39,073 | | | | 20,453 | | | | 6,742 | |
| Expenses waived or reimbursed by the Adviser or an affiliate | | | — | | | | — | | | | (515 | ) |
| Net expenses | | | 39,073 | | | | 20,453 | | | | 6,227 | |
| Net investment income (loss) | | | 35,114 | | | | 26,072 | | | | 5,962 | |
| Realized and unrealized gain (loss) | | | | | | | | | | | | |
| Net realized gain (loss) on transactions from: | | | | | | | | | | | | |
| Investments in securities, net of foreign taxes, if applicable | | | (27,938 | )(1) | | | (51,315 | )(1) | | | 3,087 | |
| Redemptions in-kind | | | — | | | | 23,687 | | | | — | |
| Foreign currency transactions | | | (2,189 | ) | | | (1,606 | ) | | | (324 | ) |
| Total net realized gain (loss) | | | (30,127 | ) | | | (29,234 | ) | | | 2,763 | |
| Change in net unrealized appreciation (depreciation) of: | | | | | | | | | | | | |
| Investments in securities | | | (107,518 | )(2) | | | (62,876 | )(2) | | | (31,854 | ) |
| Foreign currency translations | | | (346 | ) | | | (86 | ) | | | 28 | |
| Change in net unrealized appreciation (depreciation) | | | (107,864 | ) | | | (62,962 | ) | | | (31,826 | ) |
| Net increase (decrease) in net assets resulting from operations | | $ | (102,877 | ) | | $ | (66,124 | ) | | $ | (23,101 | ) |
| (1) | Includes $1,574 and $978 related to an affiliated fund (William Blair China A-Share Fund, LLC) for International Growth Fund and Institutional International Growth Fund, respectively. |
| (2) | Includes $(1,630) and $(1,012) related to an affiliated fund (William Blair China A-Share Fund, LLC) for International Growth Fund and Institutional International Growth Fund, respectively. |
See accompanying Notes to Financial Statements.
| 122 | Annual Report | December 31, 2016 |
Statements of Changes in Net Assets
For the Years Ended December 31, 2016 and 2015 (all amounts in thousands)
| | | | | | Institutional | | | International | |
| | | International | | | International | | | Small Cap | |
| | | Growth Fund | | | Growth Fund | | | Growth Fund | |
| | | 2016 | | | 2015 | | | 2016 | | | 2015 | | | 2016 | | | 2015 | |
| Operations | | | | | | | | | | | | | | | | | | | | | | | | |
| Net investment income (loss) | | $ | 35,114 | | | $ | 35,683 | | | $ | 26,072 | | | $ | 28,606 | | | $ | 5,962 | | | $ | 4,240 | |
| Net realized gain (loss) on investments, and other assets and liabilities | | | (30,127 | ) | | | (23,531 | ) | | | (29,234 | ) | | | (30,439 | ) | | | 2,763 | | | | 18,659 | |
| Change in net unrealized appreciation (depreciation) on investments, and other assets and liabilities | | | (107,864 | ) | | | (14,462 | ) | | | (62,962 | ) | | | 6,930 | | | | (31,826 | ) | | | 36,257 | |
| Net increase (decrease) in net assets resulting from operations | | | (102,877 | ) | | | (2,310 | ) | | | (66,124 | ) | | | 5,097 | | | | (23,101 | ) | | | 59,156 | |
| Distributions to shareholders from | | | | | | | | | | | | | | | | | | | | | | | | |
| Net investment income | | | | | | | | | | | | | | | | | | | | | | | | |
| Class N | | | (10,938 | ) | | | (9,482 | ) | | | — | | | | — | | | | (5 | ) | | | (195 | ) |
| Class I | | | (40,501 | ) | | | (30,923 | ) | | | — | | | | — | | | | (1,063 | ) | | | (7,300 | ) |
| Institutional Class | | | — | | | | — | | | | (23,809 | ) | | | (13,779 | ) | | | (845 | ) | | | (4,603 | ) |
| Net realized gain | | | | | | | | | | | | | | | | | | | | | | | | |
| Class N | | | — | | | | — | | | | — | | | | — | | | | (2 | ) | | | (29 | ) |
| Class I | | | — | | | | — | | | | — | | | | — | | | | (57 | ) | | | (919 | ) |
| Institutional Class | | | — | | | | — | | | | — | | | | (15,858 | ) | | | (37 | ) | | | (557 | ) |
| Total distributions | | | (51,439 | ) | | | (40,405 | ) | | | (23,809 | ) | | | (29,637 | ) | | | (2,009 | ) | | | (13,603 | ) |
| Capital stock transactions | | | | | | | | | | | | | | | | | | | | | | | | |
| Net proceeds from sale of shares | | | 437,982 | | | | 837,025 | | | | 237,672 | | | | 297,180 | | | | 63,344 | | | | 78,346 | |
| Shares issued in reinvestment of income dividends and capital gain distributions | | | 48,138 | | | | 36,885 | | | | 22,693 | | | | 28,849 | | | | 1,827 | | | | 11,877 | |
| Less cost of shares redeemed | | | (1,029,303 | ) | | | (835,938 | ) | | | (412,093 | ) | | | (305,026 | ) | | | (98,028 | ) | | | (184,116 | ) |
| Net increase (decrease) in net assets resulting from capital share transactions | | | (543,183 | ) | | | 37,972 | | | | (151,728 | ) | | | 21,003 | | | | (32,857 | ) | | | (93,893 | ) |
| Increase (decrease) in net assets | | | (697,499 | ) | | | (4,743 | ) | | | (241,661 | ) | | | (3,537 | ) | | | (57,967 | ) | | | (48,340 | ) |
| Net assets | | | | | | | | | | | | | | | | | | | | | | | | |
| Beginning of period | | | 3,678,744 | | | | 3,683,487 | | | | 2,335,632 | | | | 2,339,169 | | | | 574,600 | | | | 622,940 | |
| End of period | | $ | 2,981,245 | | | $ | 3,678,744 | | | $ | 2,093,971 | | | $ | 2,335,632 | | | $ | 516,633 | | | $ | 574,600 | |
| Accumulated net investment income (loss) at the end of the period | | $ | 9,881 | | | $ | 21,204 | | | $ | 13,670 | | | $ | 7,048 | | | $ | (2,734 | ) | | $ | (7,282 | ) |
See accompanying Notes to Financial Statements.
| December 31, 2016 | William Blair Funds | 123 |
Statements of Assets and Liabilities
As of December 31, 2016 (dollar amounts in thousands)
| | | Emerging | | | Emerging | | | Emerging | |
| | | Markets | | | Markets | | | Markets | |
| | | Leaders | | | Growth | | | Small Cap | |
| | | Fund | | | Fund | | | Growth Fund | |
| Assets | | | | | | | | | |
| Investments in securities, at cost | | $ | 299,589 | | | $ | 874,426 | | | $ | 271,178 | |
| Investment in affiliated companies, at cost | | | — | | | | 125 | | | | — | |
| Investments in securities, at value | | $ | 305,577 | | | $ | 926,518 | | | $ | 285,217 | |
| Investment in affiliated companies, at value | | | — | | | | 201 | | | | — | |
| Foreign currency, at value (cost $—; $332; $21) | | | — | | | | 332 | | | | 21 | |
| Receivable for securities sold | | | 366 | | | | 7,432 | | | | 2,524 | |
| Receivable for fund shares sold | | | 141 | | | | 219 | | | | 1,180 | |
| Receivable from Adviser or an affiliate | | | 53 | | | | 13 | | | | 36 | |
| Dividend and interest receivable | | | 332 | | | | 827 | | | | 766 | |
| Total assets | | | 306,469 | | | | 935,542 | | | | 289,744 | |
| Liabilities | | | | | | | | | | | | |
| Payable for investment securities purchased | | | 436 | | | | 196 | | | | 350 | |
| Payable for fund shares redeemed | | | 28 | | | | 315 | | | | 5,778 | |
| Management fee payable | | | 287 | | | | 879 | | | | 273 | |
| Shareholder administration fee payable | | | 4 | | | | 13 | | | | 21 | |
| Distribution fee payable | | | 1 | | | | 2 | | | | 2 | |
| Foreign capital gains tax liability | | | — | | | | — | | | | 182 | |
| Other payables and accrued expenses | | | 210 | | | | 394 | | | | 276 | |
| Total liabilities | | | 966 | | | | 1,799 | | | | 6,882 | |
| Net assets | | $ | 305,503 | | | $ | 933,743 | | | $ | 282,862 | |
| Capital | | | | | | | | | | | | |
| Composition of net assets | | | | | | | | | | | | |
| Par value of shares of beneficial interest | | $ | 39 | | | $ | 84 | | | $ | 21 | |
| Capital paid in excess of par value | | | 326,255 | | | | 1,021,046 | | | | 307,658 | |
| Accumulated net investment income (loss) | | | (390 | ) | | | 4,148 | | | | (7,782 | ) |
| Accumulated net realized gain (loss) | | | (26,389 | ) | | | (143,713 | ) | | | (30,941 | ) |
| Net unrealized appreciation (depreciation) of investments and foreign currencies | | | 5,988 | | | | 52,178 | | | | 13,906 | |
| Net assets | | $ | 305,503 | | | $ | 933,743 | | | $ | 282,862 | |
| Class N shares | | | | | | | | | | | | |
| Net assets | | $ | 2,479 | | | $ | 8,488 | | | $ | 9,263 | |
| Shares outstanding | | | 316,154 | | | | 772,639 | | | | 674,670 | |
| Net asset value per share | | $ | 7.84 | | | $ | 10.99 | | | $ | 13.73 | |
| Class I shares | | | | | | | | | | | | |
| Net assets | | $ | 30,346 | | | $ | 93,668 | | | $ | 147,949 | |
| Shares outstanding | | | 3,857,496 | | | | 8,440,416 | | | | 10,742,348 | |
| Net asset value per share | | $ | 7.87 | | | $ | 11.10 | | | $ | 13.77 | |
| Institutional Class shares | | | | | | | | | | | | |
| Net assets | | $ | 272,678 | | | $ | 831,587 | | | $ | 125,650 | |
| Shares outstanding | | | 34,677,922 | | | | 74,368,343 | | | | 9,108,955 | |
| Net asset value per share | | $ | 7.86 | | | $ | 11.18 | | | $ | 13.79 | |
See accompanying Notes to Financial Statements.
| 124 | Annual Report | December 31, 2016 |
Statements of Operations
For the Year Ended December 31, 2016 (all amounts in thousands)
| | | | | | | | | Emerging | |
| | | Emerging | | | Emerging | | | Markets | |
| | | Markets | | | Markets | | | Small Cap | |
| | | Leaders | | | Growth | | | Growth | |
| | | Fund | | | Fund | | | Fund | |
| Investment income | | | | | | | | | |
| Dividends | | $ | 4,149 | | | $ | 20,028 | | | $ | 7,203 | |
| Less foreign tax withheld | | | (442 | ) | | | (2,265 | ) | | | (656 | ) |
| Interest | | | — | | | | 3 | | | | — | |
| Total income | | | 3,707 | | | | 17,766 | | | | 6,547 | |
| Expenses | | | | | | | | | | | | |
| Investment advisory fees | | | 2,444 | | | | 10,960 | | | | 3,297 | |
| Distribution fees | | | 4 | | | | 23 | | | | 26 | |
| Shareholder administration fees | | | 46 | | | | 169 | | | | 257 | |
| Custodian fees | | | 147 | | | | 443 | | | | 267 | |
| Transfer agent fees | | | 9 | | | | 40 | | | | 57 | |
| Sub-transfer agent fees | | | | | | | | | | | | |
| Class N | | | 1 | | | | 6 | | | | 12 | |
| Class I | | | 15 | | | | 75 | | | | 85 | |
| Professional fees | | | 136 | | | | 197 | | | | 165 | |
| Registration fees | | | 200 | | | | 56 | | | | 61 | |
| Shareholder reporting fees | | | 11 | | | | 11 | | | | 30 | |
| Trustee fees | | | 9 | | | | 61 | | | | 20 | |
| Other expenses | | | 17 | | | | 39 | | | | 29 | |
| Total expenses before expense limitation | | | 3,039 | | | | 12,080 | | | | 4,306 | |
| Expenses waived or reimbursed by the Adviser or an affiliate | | | (242 | ) | | | (169 | ) | | | (435 | ) |
| Net expenses | | | 2,797 | | | | 11,911 | | | | 3,871 | |
| Net investment income (loss) | | | 910 | | | | 5,855 | | | | 2,676 | |
| Realized and unrealized gain (loss) | | | | | | | | | | | | |
| Net realized gain (loss) on transactions from: | | | | | | | | | | | | |
| Investments in securities, net of foreign taxes, if applicable | | | (14,648 | ) | | | (77,113 | )(1) | | | (25,946 | ) |
| Foreign currency transactions | | | (865 | ) | | | (1,003 | ) | | | (893 | ) |
| Total net realized gain (loss) | | | (15,513 | ) | | | (78,116 | ) | | | (26,839 | ) |
| Change in net unrealized appreciation (depreciation) of: | | | | | | | | | | | | |
| Investments in securities | | | 12,085 | | | | 83,290 | (2) | | | 7,317 | |
| Foreign currency translations | | | 2 | | | | 14 | | | | 48 | |
| Change in net unrealized appreciation (depreciation) | | | 12,087 | | | | 83,304 | | | | 7,365 | |
| Net increase (decrease) in net assets resulting from operations | | $ | (2,516 | ) | | $ | 11,043 | | | $ | (16,798 | ) |
| (1) | Includes $1,931 related to an affiliated fund (William Blair China A-Share Fund, LLC). |
| (2) | Includes $(2,000) related to an affiliated fund (William Blair China A-Share Fund, LLC). |
See accompanying Notes to Financial Statements.
| December 31, 2016 | William Blair Funds | 125 |
Statements of Changes in Net Assets
For the Years Ended December 31, 2016 and 2015 (all amounts in thousands)
| | | | | | | | | Emerging Markets | |
| | | Emerging Markets | | | Emerging Markets | | | Small Cap | |
| | | Leaders Fund | | | Growth Fund | | | Growth Fund | |
| | 2016 | | | 2015 | | | 2016 | | | 2015 | | | 2016 | | | 2015 | |
| Operations | | | | | | | | | | | | | | | | | | |
| Net investment income (loss) | | $ | 910 | | | $ | 575 | | | $ | 5,855 | | | $ | 5,753 | | | $ | 2,676 | | | $ | 902 | |
| Net realized gain (loss) on investments, and other assets and liabilities | | | (15,513 | ) | | | (10,580 | ) | | | (78,116 | ) | | | (53,698 | ) | | | (26,839 | ) | | | 3,803 | |
| Change in net unrealized appreciation (depreciation) on investments, and other assets and liabilities | | | 12,087 | | | | (9,023 | ) | | | 83,304 | | | | (91,961 | ) | | | 7,365 | | | | (24,287 | ) |
| Net increase (decrease) in net assets resulting from operations | | | (2,516 | ) | | | (19,028 | ) | | | 11,043 | | | | (139,906 | ) | | | (16,798 | ) | | | (19,582 | ) |
| Distributions to shareholders from | | | | | | | | | | | | | | | | | | | | | | | | |
| Net investment income | | | | | | | | | | | | | | | | | | | | | | | | |
| Class N | | | — | | | | — | | | | (18 | ) | | | — | | | | (210 | ) | | | — | |
| Class I | | | (41 | ) | | | (105 | ) | | | (416 | ) | | | — | | | | (4,177 | ) | | | — | |
| Institutional Class | | | (513 | ) | | | (331 | ) | | | (4,354 | ) | | | — | | | | (3,339 | ) | | | (1 | ) |
| Net realized gain | | | | | | | | | | | | | | | | | | | | | | | | |
| Class N | | | — | | | | (2 | ) | | | — | | | | (107 | ) | | | — | | | | (474 | ) |
| Class I | | | — | | | | (44 | ) | | | — | | | | (1,427 | ) | | | — | | | | (6,262 | ) |
| Institutional Class | | | — | | | | (126 | ) | | | — | | | | (8,324 | ) | | | — | | | | (4,988 | ) |
| Total distributions | | | (554 | ) | | | (608 | ) | | | (4,788 | ) | | | (9,858 | ) | | | (7,726 | ) | | | (11,725 | ) |
| Capital stock transactions | | | | | | | | | | | | | | | | | | | | | | | | |
| Net proceeds from sale of shares | | | 242,042 | | | | 81,180 | | | | 375,603 | | | | 315,208 | | | | 61,779 | | | | 123,362 | |
| Shares issued in reinvestment of income dividends and capital gain distributions | | | 549 | | | | 549 | | | | 4,054 | | | | 8,609 | | | | 7,014 | | | | 9,559 | |
| Less cost of shares redeemed | | | (61,696 | ) | | | (40,597 | ) | | | (331,280 | ) | | | (280,776 | ) | | | (58,248 | ) | | | (58,676 | ) |
| Net increase (decrease) in net assets resulting from capital share transactions | | | 180,895 | | | | 41,132 | | | | 48,377 | | | | 43,041 | | | | 10,545 | | | | 74,245 | |
| Increase (decrease) in net assets | | | 177,825 | | | | 21,496 | | | | 54,632 | | | | (106,723 | ) | | | (13,979 | ) | | | 42,938 | |
| Net assets | | | | | | | | | | | | | | | | | | | | | | | | |
| Beginning of period | | | 127,678 | | | | 106,182 | | | | 879,111 | | | | 985,834 | | | | 296,841 | | | | 253,903 | |
| End of period | | $ | 305,503 | | | $ | 127,678 | | | $ | 933,743 | | | $ | 879,111 | | | $ | 282,862 | | | $ | 296,841 | |
| Accumulated net investment income (loss) at the end of the period | | $ | (390 | ) | | $ | 59 | | | $ | 4,148 | | | $ | 3,196 | | | $ | (7,782 | ) | | $ | (2,799 | ) |
See accompanying Notes to Financial Statements.
| 126 | Annual Report | December 31, 2016 |
Statements of Assets and Liabilities
As of December 31, 2016 (dollar amounts in thousands)
| | | | | | | | | Low | | | Macro | |
| | | Bond | | | Income | | | Duration | | | Allocation | |
| | | Fund | | | Fund | | | Fund | | | Fund | |
| Assets | | | | | | | | | | | | |
| Investments in securities, at cost | | $ | 526,363 | | | $ | 109,149 | | | $ | 283,937 | | | $ | 1,026,470 | |
| Investments in affiliated companies, at cost | | | — | | | | — | | | | — | | | | 55,937 | |
| Repurchase agreement, at cost | | | 4,667 | | | | 279 | | | | — | | | | 413,728 | |
| Investments in securities, at value | | $ | 532,696 | | | $ | 109,146 | | | $ | 283,113 | | | $ | 1,071,785 | |
| Investments in affiliated companies, at value | | | — | | | | — | | | | — | | | | 52,669 | |
| Repurchase agreement, at value | | | 4,667 | | | | 279 | | | | — | | | | 413,728 | |
| Receivable for securities sold | | | — | | | | — | | | | 15,033 | | | | 33,930 | |
| Receivable for fund shares sold | | | 2,865 | | | | 1,445 | | | | 3,742 | | | | 3,177 | |
| Receivable for futures variation margin | | | — | | | | — | | | | — | | | | 3,061 | |
| Receivable for variation margin on centrally cleared swaps | | | — | | | | — | | | | — | | | | 19 | |
| Receivable from Adviser or an affiliate | | | 69 | | | | — | | | | 22 | | | | 132 | |
| Dividend and interest receivable | | | 4,265 | | | | 632 | | | | 735 | | | | 3,115 | |
| Unrealized appreciation on swap contracts | | | — | | | | — | | | | — | | | | 8,324 | |
| Unrealized appreciation on forward foreign currency contracts | | | — | | | | — | | | | — | | | | 6,608 | |
| Total assets | | | 544,562 | | | | 111,502 | | | | 302,645 | | | | 1,596,548 | |
| Liabilities | | | | | | | | | | | | | | | | |
| Securities sold, not yet purchased (proceeds $—; $—; $15,033; $—) | | | — | | | | — | | | | 15,025 | | | | — | |
| Option written, at value (proceeds $—; $—; $—; $513) | | | — | | | | — | | | | — | | | | 900 | |
| Payable for variation margin on centrally cleared swaps | | | 4 | | | | — | | | | — | | | | — | |
| Payable for investment securities purchased | | | — | | | | — | | | | — | | | | 3,935 | |
| Payable for fund shares redeemed | | | 954 | | | | 559 | | | | 2,294 | | | | 9,228 | |
| Payable to custodian | | | — | | | | — | | | | 5,060 | | | | — | |
| Management fee payable | | | 136 | | | | 34 | | | | 73 | | | | 1,103 | |
| Shareholder administration fee payable | | | 56 | | | | — | | | | 30 | | | | 132 | |
| Distribution fee payable | | | 16 | | | | 7 | | | | 1 | | | | 14 | |
| Distributions payable to shareholders | | | 21 | | | | 5 | | | | 38 | | | | — | |
| Other payables and accrued expenses | | | 119 | | | | 27 | | | | 51 | | | | 318 | |
| Total liabilities | | | 1,306 | | | | 632 | | | | 22,572 | | | | 15,630 | |
| Net assets | | $ | 543,256 | | | $ | 110,870 | | | $ | 280,073 | | | $ | 1,580,918 | |
| Capital | | | | | | | | | | | | | | | | |
| Composition of net assets | | | | | | | | | | | | | | | | |
| Par value of shares of beneficial interest | | $ | 53 | | | $ | 13 | | | $ | 31 | | | $ | 139 | |
| Capital paid in excess of par value | | | 544,556 | | | | 118,312 | | | | 300,198 | | | | 1,749,215 | |
| Accumulated net investment income (loss) | | | 35 | | | | 10 | | | | 20 | | | | (6,584 | ) |
| Accumulated net realized gain (loss) | | | (7,557 | ) | | | (7,462 | ) | | | (19,360 | ) | | | (224,902 | ) |
| Net unrealized appreciation (depreciation) of investments and foreign currencies | | | 6,169 | | | | (3 | ) | | | (816 | ) | | | 63,050 | |
| Net assets | | $ | 543,256 | | | $ | 110,870 | | | $ | 280,073 | | | $ | 1,580,918 | |
| Class N shares | | | | | | | | | | | | | | | | |
| Net assets | | $ | 125,866 | | | $ | 52,710 | | | $ | 7,237 | | | $ | 61,376 | |
| Shares outstanding | | | 12,094,998 | | | | 5,947,999 | | | | 797,867 | | | | 5,410,589 | |
| Net asset value per share | | $ | 10.41 | | | $ | 8.86 | | | $ | 9.07 | | | $ | 11.34 | |
| Class I shares | | | | | | | | | | | | | | | �� | |
| Net assets | | $ | 322,174 | | | $ | 58,160 | | | $ | 219,714 | | | $ | 937,244 | |
| Shares outstanding | | | 31,278,896 | | | | 6,610,454 | | | | 24,230,478 | | | | 82,312,114 | |
| Net asset value per share | | $ | 10.30 | | | $ | 8.80 | | | $ | 9.07 | | | $ | 11.38 | |
| Institutional Class shares | | | | | | | | | | | | | | | | |
| Net assets | | $ | 95,216 | | | | — | | | $ | 53,122 | | | $ | 582,298 | |
| Shares outstanding | | | 9,251,575 | | | | — | | | | 5,856,352 | | | | 51,075,629 | |
| Net asset value per share | | $ | 10.29 | | | | — | | | $ | 9.07 | | | $ | 11.40 | |
See accompanying Notes to Financial Statements.
| December 31, 2016 | William Blair Funds | 127 |
Statements of Operations
For the Year Ended December 31, 2016 (all amounts in thousands)
| | | | | | | | | Low | | | Macro | |
| | | Bond | | | Income | | | Duration | | | Allocation | |
| | | Fund | | | Fund | | | Fund | | | Fund | |
| Investment income | | | | | | | | | | | | |
| Dividends | | $ | — | | | $ | — | | | $ | — | | | $ | 26,801 | (1) |
| Interest | | | 17,508 | | | | 2,559 | | | | 2,949 | | | | 1,480 | |
| Total income | | | 17,508 | | | | 2,559 | | | | 2,949 | | | | 28,281 | |
| Expenses | | | | | | | | | | | | | | | | |
| Investment advisory fees | | | 1,619 | | | | 373 | | | | 540 | | | | 13,699 | |
| Distribution fees | | | 216 | | | | 57 | | | | 11 | | | | 256 | |
| Shareholder administration fees | | | 660 | | | | — | | | | 226 | | | | 1,756 | |
| Custodian fees | | | 81 | | | | 44 | | | | 57 | | | | 136 | |
| Transfer agent fees | | | 52 | | | | 11 | | | | 11 | | | | 497 | |
| Sub-transfer agent fees | | | | | | | | | | | | | | | | |
| Class N | | | 210 | | | | 42 | | | | 9 | | | | 84 | |
| Class I | | | 183 | | | | 21 | | | | 54 | | | | 853 | |
| Professional fees | | | 56 | | | | 34 | | | | 39 | | | | 199 | |
| Registration fees | | | 77 | | | | 34 | | | | 43 | | | | 173 | |
| Shareholder reporting fees | | | 62 | | | | 8 | | | | 3 | | | | 79 | |
| Trustee fees | | | 33 | | | | 6 | | | | 9 | | | | 118 | |
| Other expenses | | | 22 | | | | 10 | | | | 14 | | | | 382 | |
| Total expenses before expense limitation | | | 3,271 | | | | 640 | | | | 1,016 | | | | 18,232 | |
| Expenses waived or reimbursed by the Adviser or an affiliate | | | (774 | ) | | | — | | | | (226 | ) | | | (1,756 | ) |
| Net expenses | | | 2,497 | | | | 640 | | | | 790 | | | | 16,476 | |
| Net investment income (loss) | | | 15,011 | | | | 1,919 | | | | 2,159 | | | | 11,805 | |
| Realized and unrealized gain (loss) | | | | | | | | | | | | | | | | |
| Net realized gain (loss) on transactions from: | | | | | | | | | | | | | | | | |
| Investments in securities | | | 608 | | | | 231 | | | | 85 | | | | 12,112 | (2) |
| Options | | | (95 | ) | | | (47 | ) | | | (95 | ) | | | (20,451 | ) |
| Futures contracts | | | — | | | | — | | | | — | | | | (71,523 | ) |
| Swaps | | | (247 | ) | | | — | | | | — | | | | (27,217 | ) |
| Forward foreign currency contracts | | | — | | | | — | | | | — | | | | 29,084 | |
| Foreign currency transactions | | | — | | | | — | | | | — | | | | (231 | ) |
| Total net realized gain (loss) | | | 266 | | | | 184 | | | | (10 | ) | | | (78,226 | ) |
| Change in net unrealized appreciation (depreciation) of: | | | | | | | | | | | | | | | | |
| Investments in securities | | | 8,561 | | | | 216 | | | | (325 | ) | | | 76,264 | (3) |
| Options | | | 93 | | | | 46 | | | | 93 | | | | 7,317 | |
| Futures contracts | | | — | | | | — | | | | — | | | | 1,940 | |
| Swaps | | | (128 | ) | | | — | | | | — | | | | 13,920 | |
| Forward foreign currency contracts | | | — | | | | — | | | | — | | | | 4,875 | |
| Foreign currency translations | | | — | | | | — | | | | — | | | | 221 | |
| Change in net unrealized appreciation (depreciation) | | | 8,526 | | | | 262 | | | | (232 | ) | | | 104,537 | |
| Net increase (decrease) in net assets resulting from operations | | $ | 23,803 | | | $ | 2,365 | | | $ | 1,917 | | | $ | 38,116 | |
| (1) | Includes $1,037 from companies deemed affiliated during the year. |
| (2) | Includes $(2,494) from companies deemed affiliated during the year. |
| (3) | Includes $3,552 from companies deemed affiliated during the year. |
See accompanying Notes to Financial Statements.
| 128 | Annual Report | December 31, 2016 |
Statements of Changes in Net Assets
For the Years Ended December 31, 2016 and 2015 (all amounts in thousands)
| | | | | | | | | | | | | | | Low Duration | | | Macro Allocation | |
| | | Bond Fund | | | Income Fund | | | Fund | | | Fund | |
| | | 2016 | | | 2015 | | | 2016 | | | 2015 | | | 2016 | | | 2015 | | | 2016 | | | 2015 | |
| Operations | | | | | | | | | | | | | | | | | | | | | | | | |
| Net investment income (loss) | | $ | 15,011 | | | $ | 9,519 | | | $ | 1,919 | | | $ | 1,862 | | | $ | 2,159 | | | $ | 1,409 | | | $ | 11,805 | | | $ | 10,368 | |
| Net realized gain (loss) on investments, and other assets and liabilities | | | 266 | | | | 514 | | | | 184 | | | | (88 | ) | | | (10 | ) | | | (652 | ) | | | (78,226 | ) | | | (107,732 | ) |
| Change in net unrealized appreciation (depreciation) on investments, and other assets and liabilities | | | 8,526 | | | | (11,340 | ) | | | 262 | | | | (1,268 | ) | | | (232 | ) | | | (267 | ) | | | 104,537 | | | | (40,618 | ) |
| Net increase (decrease) in net assets resulting from operations | | | 23,803 | | | | (1,307 | ) | | | 2,365 | | | | 506 | | | | 1,917 | | | | 490 | | | | 38,116 | | | | (137,982 | ) |
| Distributions to shareholders from | | | | | | | | | | | | | | | | | | | | | | | | | | | | | | | | |
| Net investment income | | | | | | | | | | | | | | | | | | | | | | | | | | | | | | | | |
| Class N | | | (5,237 | ) | | | (1,822 | ) | | | (1,079 | ) | | | (1,007 | ) | | | (149 | ) | | | (95 | ) | | | (1,182 | ) | | | (915 | ) |
| Class I | | | (11,452 | ) | | | (6,812 | ) | | | (1,868 | ) | | | (1,971 | ) | | | (3,331 | ) | | | (2,839 | ) | | | (21,809 | ) | | | (10,747 | ) |
| Institutional Class | | | (3,903 | ) | | | (3,598 | ) | | | — | | | | — | | | | (694 | ) | | | (1,185 | ) | | | (13,553 | ) | | | (4,368 | ) |
| Total distributions | | | (20,592 | ) | | | (12,232 | ) | | | (2,947 | ) | | | (2,978 | ) | | | (4,174 | ) | | | (4,119 | ) | | | (36,544 | ) | | | (16,030 | ) |
| Capital stock transactions | | | | | | | | | | | | | | | | | | | | | | | | | | | | | | | | |
| Net proceeds from sale of shares | | | 197,394 | | | | 300,131 | | | | 37,313 | | | | 24,005 | | | | 220,929 | | | | 47,534 | | | | 600,557 | | | | 1,559,297 | |
| Shares issued in reinvestment of income dividends and capital gain distributions | | | 18,617 | | | | 9,535 | | | | 2,760 | | | | 2,686 | | | | 3,628 | | | | 3,096 | | | | 34,074 | | | | 14,020 | |
| Less cost of shares redeemed | | | (156,760 | ) | | | (78,860 | ) | | | (24,285 | ) | | | (27,409 | ) | | | (73,939 | ) | | | (92,786 | ) | | | (787,172 | ) | | | (646,104 | ) |
| Net increase (decrease) in net assets resulting from capital share transactions | | | 59,251 | | | | 230,806 | | | | 15,788 | | | | (718 | ) | | | 150,618 | | | | (42,156 | ) | | | (152,541 | ) | | | 927,213 | |
| Increase (decrease) in net assets | | | 62,462 | | | | 217,267 | | | | 15,206 | | | | (3,190 | ) | | | 148,361 | | | | (45,785 | ) | | | (150,969 | ) | | | 773,201 | |
| Net assets | | | | | | | | | | | | | | | | | | | | | | | | | | | | | | | | |
| Beginning of period | | | 480,794 | | | | 263,527 | | | | 95,664 | | | | 98,854 | | | | 131,712 | | | | 177,497 | | | | 1,731,887 | | | | 958,686 | |
| End of period | | $ | 543,256 | | | $ | 480,794 | | | $ | 110,870 | | | $ | 95,664 | | | $ | 280,073 | | | $ | 131,712 | | | $ | 1,580,918 | | | $ | 1,731,887 | |
| Accumulated net investment income (loss) at the end of the period | | $ | 35 | | | $ | 24 | | | $ | 10 | | | $ | 10 | | | $ | 20 | | | $ | 22 | | | $ | (6,584 | ) | | $ | (10,874 | ) |
See accompanying Notes to Financial Statements.
| December 31, 2016 | William Blair Funds | 129 |
Notes to Financial Statements
(1) Organization
(a) Description of the Trust
William Blair Funds (the “Trust”) is a mutual fund registered under the Investment Company Act of 1940, as amended (the “1940 Act”), as an open-end management investment company. The Trust currently consists of the following twenty-two funds (the “Funds”), each with its own investment objective and policies. For each Fund, the number of shares authorized is unlimited.
| Domestic Equity Funds | International Equity Funds |
Growth
Large Cap Growth
Mid Cap Growth
Mid Cap Value
Small-Mid Cap Growth
Small-Mid Cap Value
Small Cap Growth
Small Cap Value Global Equity Fund Global Leaders Multi-Asset and Alternative Fund Macro Allocation | International Leaders
International Equity
Institutional International Equity
International Growth
Institutional International Growth
International Small Cap Growth
Emerging Markets Leaders
Emerging Markets Growth
Emerging Markets Small Cap Growth Fixed Income Funds Bond
Income
Low Duration |
Prior to July 1, 2015, William Blair & Company, L.L.C. (“WBC” or the “Distributor”) served as both the Trust’s investment adviser and the Trust’s principal underwriter and distributor. Effective July 1, 2015, WBC transferred the management agreement for the Trust to William Blair Investment Management, LLC (“WBIM”). There were no changes to the Funds’ portfolio management teams or principal investment strategies as a result of the transfer. Any reference to the “Adviser” prior to July 1, 2015 should be read to mean WBC; any reference to the “Adviser” subsequent to July 1, 2015 should be read to mean WBIM. WBC continues to serve as the principal underwriter and distributor of the Trust.
(b) Share Classes
Three different classes of shares currently exist: N, I and Institutional.
Class N shares are offered to the general public, either directly through the Trust’s distributor or through a select number of financial intermediaries. Class N shares are sold without any sales load, and carry an annual 12b-1 distribution fee (0.25% for the Domestic Equity, Global Equity, International Equity and Multi-Asset and Alternative Funds and 0.15% for the Fixed Income Funds), a sub-transfer agent fee that is not a fixed rate and may vary by Fund and class, and an annual shareholder administration fee (0.15% for Global Leaders, International Leaders, International Small Cap Growth, Emerging Markets Leaders, Emerging Markets Growth, Emerging Markets Small Cap Growth, Bond, Low Duration and Macro Allocation Funds). The shareholder administration fee is currently being waived. This waiver will not be removed without approval of the Board of Trustees.
Class I shares are offered to a limited group of investors. They do not carry any sales load or distribution fees and generally have lower ongoing expenses than Class N shares. Class I shares have a sub-transfer agent fee that is not a fixed rate and may vary by Fund and class, and an annual shareholder administration fee (0.15% for Global Leaders, International Leaders, International Small Cap Growth, Emerging Markets Leaders, Emerging Markets Growth, Emerging Markets Small Cap Growth, Bond, Low Duration and Macro Allocation Funds). The shareholder administration fee is currently being waived. This waiver will not be removed without approval of the Board of Trustees.
Institutional Class shares are offered to institutional investors, including but not limited to employee benefit plans, endowments, foundations, trusts and corporations, who are able to meet the share class’s high minimum investment requirement. The minimum initial investment required is $5 million. They do not carry any sales load, distribution fees or sub-transfer agents fees and generally have lower ongoing expenses than Class N and Class I shares.
| 130 | Annual Report | December 31, 2016 |
Sub-transfer agent fees: For Class N and Class I shares, the Funds may reimburse WBC for fees paid to intermediaries such as banks, broker-dealers, financial advisers or other financial institutions for sub-administration, sub-transfer agency and other services provided to investors whose shares of record are held in omnibus, other group accounts, retirement plans or accounts traded through registered securities clearing agents. These fees may vary based on, for example, the nature of services provided, but generally range up to 0.15% of the assets of the class serviced or maintained by the intermediary or up to $15 per sub-account maintained by the intermediary.
(c) Fund Objectives
The investment objectives of the Funds are as follows:
| Domestic Equity | Long-term capital appreciation. |
| Global Equity | Long-term capital appreciation. |
| International Equity | Long-term capital appreciation. |
| Fixed Income | High level of current income with relative stability of principal. |
| | (Maximize total return-Low Duration). |
| Multi-Asset and Alternative | Maximize long-term risk-adjusted total return. |
(2) Significant Accounting Policies
The following is a summary of the Trust’s significant accounting policies in effect during the periods covered by the financial statements, which are in accordance with U.S. generally accepted accounting principles, which includes the accounting and reporting guidelines under Accounting Standards Topic 946, Financial Services—Investment Companies.
(a) Investment income and transactions
Investment income, realized and unrealized gains and losses, and certain Fund level expenses and expense reductions, if any, are allocated based on the relative net assets of each class, except for certain class specific expenses, which are charged directly to the appropriate class. Differences in class expenses may result in the payment of different per share dividends by class. All share classes of the Funds have equal rights with respect to voting, subject to class specific arrangements.
Dividend income and expense are recorded on the ex-dividend date, except for those dividends from certain foreign securities that are recorded when the information is available.
Interest income is recorded on an accrual basis, adjusted for amortization of premium or accretion of discount. Variable rate bonds and floating rate notes earn interest at coupon rates that fluctuate at specific time intervals. The interest rates shown in the Portfolio of Investments for the Bond, Income, Low Duration and Macro Allocation Funds were the rates in effect on December 31, 2016. Put bonds may be redeemed at the discretion of the holder on specified dates prior to maturity.
Premiums and discounts are amortized and accreted on a straight-line basis for short-term investments and on an effective interest method for long-term investments.
Paydown gains and losses on mortgage-backed and asset-backed securities are treated as an adjustment to interest income. For the year ended December 31, 2016, the Bond, Income and Low Duration Funds recognized a reduction of interest income and a corresponding decrease of net realized loss of $5,803, $1,027 and $2,014, respectively (in thousands). This reclassification had no effect on the net asset value or the net assets of the Funds.
| December 31, 2016 | William Blair Funds | 131 |
The Funds do not isolate the portion of operations resulting from fluctuations in foreign currency exchange rates on investments from the fluctuations arising from changes in the value of securities held. Such currency fluctuations are included with the net realized and unrealized gain or loss from investments.
Reported net realized foreign currency gains or losses arise from disposition of foreign currency, the difference in the foreign exchange rates between the trade and settlement dates on securities transactions, and the difference between the amounts of dividends, interest and foreign withholding taxes recorded on the ex-date or accrual date and the U.S. dollar equivalent of the amounts actually received or paid. Net unrealized foreign exchange gains and losses arise from changes (due to the changes in the exchange rate) in the value of foreign currency and other assets and liabilities denominated in foreign currencies held at year end.
Security and shareholder transactions are accounted for no later than one business day following the trade date. However, for financial reporting purposes, security and shareholder transactions are accounted for on the trade date of the last business day of the reporting period. Realized gains and losses from securities transactions are recognized on a specifically identified cost basis.
Awards from class action litigation may be recorded as a reduction of cost. If the Funds no longer own the applicable securities, the proceeds are recorded as realized gains.
(b) Share Valuation and Distributions to Shareholders
Shares are sold and redeemed on a continuous basis at net asset value. The net asset value per share is determined separately for each class by dividing the Fund’s net assets attributable to that class by the number of shares of the class outstanding as of the close of regular trading on the New York Stock Exchange (the “NYSE”), which is generally 4:00 p.m. Eastern time, on each day the NYSE is open.
Distributions from net investment income, if any, for all Equity and Multi-Asset and Alternative Funds are declared and paid at least annually. Distributions from net investment income for the Bond, Income and Low Duration Funds are declared daily and paid monthly. Capital gain distributions, if any, for all Funds, are declared and paid at least annually in December. Distributions payable to shareholders are recorded on the ex-dividend date.
(c) Foreign Currency Translation
The Funds may invest in securities denominated in foreign currencies. As such, assets and liabilities denominated in foreign currencies are translated into U.S. dollar amounts at the current exchange rate on the date of valuation. The values of foreign investments, open forward foreign currency contracts, and cash denominated in foreign currencies are translated into U.S. dollars using a spot market rate of exchange as of the time of the determination of each Fund’s Net Asset Value, typically 4:00 p.m. Eastern time on days when there is regular trading on the NYSE. Payables and receivables for securities transactions, dividends, interest income and tax reclaims are translated into U.S. dollars using a spot market rate of exchange as of 4:00 p.m. Eastern time. Settlement of purchases and sales and dividend and interest receipts are translated into U.S. dollars using a spot market rate of exchange as of 11:00 a.m. Eastern time.
(d) Income Taxes
Each Fund intends to comply with the provisions of Subchapter M of the Internal Revenue Code, as amended (the “Code”) available to regulated investment companies. Each Fund intends to make the requisite distributions of income and capital gains to its shareholders sufficient to relieve it from all, or substantially all, federal income and excise taxes. No provision for federal income and excise taxes has been made.
Certain Funds may be subject to foreign income taxes imposed on realized gains on securities of issuers from certain foreign countries. Such taxes, if applicable, are included within net realized gain (loss) on transactions from investments in securities on the Statement of Operations.
Management has evaluated all of the uncertain tax positions of the Funds and has determined that no liability is required to be recorded in the financial statements.
The statute of limitations on the Funds’ prior three years tax returns remain open and the returns are subject to examination.
| 132 | Annual Report | December 31, 2016 |
Adjustments to the cost of investments for tax purposes are due to the deferred loss associated with current and prior year wash sales, income recognition from investments in real estate investment trusts and partnerships, and the Funds’ election to mark-to-market their investments in Passive Foreign Investment Companies (“PFICs”). The cost of investments for federal income tax purposes and related gross unrealized appreciation (depreciation) and net unrealized appreciation/(depreciation) at December 31, 2016, were as follows (in thousands):
| Fund | | Cost of
Investments | | | Gross
Unrealized
Appreciation | | Gross
Unrealized
Depreciation | | Net
Unrealized
Appreciation/
(Depreciation) |
| Growth | | $ | 481,416 | | | $ | 102,473 | | | $ | 4,305 | | | $ | 98,168 | |
| Large Cap Growth | | | 109,172 | | | | 14,760 | | | | 1,776 | | | | 12,984 | |
| Mid Cap Growth | | | 120,718 | | | | 17,429 | | | | 3,798 | | | | 13,631 | |
| Mid Cap Value | | | 2,427 | | | | 628 | | | | 48 | | | | 580 | |
| Small-Mid Cap Growth | | | 1,113,065 | | | | 181,182 | | | | 23,691 | | | | 157,491 | |
| Small-Mid Cap Value | | | 2,555 | | | | 884 | | | | 48 | | | | 836 | |
| Small Cap Growth | | | 320,726 | | | | 75,830 | | | | 6,909 | | | | 68,921 | |
| Small Cap Value | | | 526,850 | | | | 188,326 | | | | 9,183 | | | | 179,143 | |
| Global Leaders | | | 158,851 | | | | 20,587 | | | | 2,655 | | | | 17,932 | |
| International Leaders | | | 240,783 | | | | 17,090 | | | | 5,434 | | | | 11,656 | |
| International Equity | | | 80,974 | | | | 7,552 | | | | 1,282 | | | | 6,270 | |
| Institutional International Equity | | | 15,398 | | | | 1,474 | | | | 299 | | | | 1,175 | |
| International Growth | | | 2,795,186 | | | | 259,789 | | | | 70,585 | | | | 189,204 | |
| Institutional International Growth | | | 1,960,192 | | | | 171,577 | | | | 50,002 | | | | 121,575 | |
| International Small Cap Growth | | | 486,202 | | | | 51,726 | | | | 21,061 | | | | 30,665 | |
| Emerging Markets Leaders | | | 301,580 | | | | 13,042 | | | | 9,045 | | | | 3,997 | |
| Emerging Markets Growth | | | 894,229 | | | | 64,413 | | | | 31,923 | | | | 32,490 | |
| Emerging Markets Small Cap Growth | | | 276,054 | | | | 17,781 | | | | 8,618 | | | | 9,163 | |
| Bond | | | 531,165 | | | | 10,107 | | | | 3,909 | | | | 6,198 | |
| Income | | | 109,430 | | | | 947 | | | | 952 | | | | (5 | ) |
| Low Duration | | | 283,940 | | | | 453 | | | | 1,280 | | | | (827 | ) |
| Macro Allocation | | | 1,499,002 | | | | 61,844 | | | | 22,664 | | | | 39,180 | |
In addition, the Funds may periodically record reclassifications among certain capital accounts to reflect differences between financial reporting and income tax basis distributions. The reclassifications were reported in order to reflect the tax treatment for certain permanent differences that exist between income tax regulations and U.S. generally accepted accounting principles. The reclassifications generally relate to the tax treatment of net operating losses, Section 988 currency gains and losses, PFIC gains and losses, expiration of capital loss carryforward, paydown gains and losses, investments in real estate investment trusts and partnerships, redemptions in-kind, distribution reclassifications, income on derivatives, capital gain taxes, and utilization of earnings and profits distributed to shareholders on redemption of shares. These reclassifications have no impact on the net asset values of the Funds. Accordingly, at December 31, 2016, the following reclassifications were recorded (in thousands):
| December 31, 2016 | William Blair Funds | 133 |
| Fund | | Accumulated
Undistributed
Net Investment
Income (Loss) | | Accumulated
Undistributed
Net Realized
Gain/(Loss) | | Capital Paid
in Excess
of Par Value |
| Growth | | | $ | 59 | | | | $ | (58 | ) | | $ | (1 | ) |
| Large Cap Growth | | | | 22 | | | | | (20 | ) | | | (2 | ) |
| Mid Cap Growth | | | | 474 | | | | | (1 | ) | | | (473 | ) |
| Mid Cap Value | | | | (1 | ) | | | | (1 | ) | | | 2 | |
| Small-Mid Cap Growth | | | | 3,860 | | | | | (50,980 | ) | | | 47,120 | |
| Small-Mid Cap Value | | | | — | | | | | (47 | ) | | | 47 | |
| Small Cap Growth | | | | 2,213 | | | | | (2,123 | ) | | | (90 | ) |
| Small Cap Value | | | | (176 | ) | | | | 176 | | | | — | |
| Global Leaders | | | | 54 | | | | | (55 | ) | | | 1 | |
| International Leaders | | | | (101 | ) | | | | 100 | | | | 1 | |
| International Equity | | | | 51 | | | | | (51 | ) | | | — | |
| Institutional International Equity | | | | 17 | | | | | (18 | ) | | | 1 | |
| International Growth | | | | 5,002 | | | | | (5,003 | ) | | | 1 | |
| Institutional International Growth | | | | 4,359 | | | | | (25,337 | ) | | | 20,978 | |
| International Small Cap Growth | | | | 499 | | | | | (503 | ) | | | 4 | |
| Emerging Markets Leaders | | | | (805 | ) | | | | 862 | | | | (57 | ) |
| Emerging Markets Growth | | | | (115 | ) | | | | 114 | | | | 1 | |
| Emerging Markets Small Cap Growth | | | | 67 | | | | | 170 | | | | (237 | ) |
| Bond | | | | 5,592 | | | | | (5,576 | ) | | | (16 | ) |
| Income | | | | 1,028 | | | | | 13,431 | | | | (14,459 | ) |
| Low Duration | | | | 2,013 | | | | | (2,015 | ) | | | 2 | |
| Macro Allocation | | | | 29,029 | | | | | (29,029 | ) | | | — | |
The timing and characterization of certain income and capital gain distributions are determined annually in accordance with federal income tax regulations that may differ from U.S. generally accepted accounting principles. As a result, net investment income or loss and net realized gain or loss for a reporting period may differ from the amount distributed during such period.
Distributions from net realized gains for book purposes may include short-term capital gains, which are included as ordinary income for tax purposes. The tax character of distributions paid during 2016 and 2015 was as follows (in thousands):
| | | Distributions Paid in 2016 | | | Distributions Paid in 2015 | |
| | | Ordinary
Income | | | Long-Term
Capital Gains | | | Ordinary
Income | | | Long-Term
Capital Gains | |
| Fund | | Class N | | | Class I | | | Class N | | | Class I | | | Class N | | | Class I | | | Class N | | | Class I | |
| Growth | | $ | — | | | $ | 1,075 | | | $ | 5,224 | | | $ | 38,868 | | | $ | 416 | | | $ | 1,808 | | | $ | 18,110 | | | $ | 78,627 | |
| Large Cap Growth | | | 8 | | | | 313 | | | | 99 | | | | 884 | | | | 17 | | | | 89 | | | | 954 | | | | 5,176 | |
| Mid Cap Growth | | | — | | | | — | | | | 912 | | | | 6,417 | | | | — | | | | — | | | | 5,530 | | | | 35,853 | |
| Mid Cap Value | | | 2 | | | | 20 | | | | 30 | | | | 225 | | | | 2 | | | | 10 | | | | 149 | | | | 438 | |
| Small-Mid Cap Growth | | | — | | | | — | | | | 5,332 | | | | 28,097 | | | | 13 | | | | 75 | | | | 8,551 | | | | 50,513 | |
| Small-Mid Cap Value | | | 1 | | | | 24 | | | | 9 | | | | 129 | | | | 1 | | | | 10 | | | | 44 | | | | 162 | |
| Small Cap Growth | | | — | | | | — | | | | 6,573 | | | | 14,099 | | | | — | | | | — | | | | 9,437 | | | | 20,150 | |
| Small Cap Value | | | 105 | | | | 3,363 | | | | 1,287 | | | | 25,920 | | | | — | | | | 1,363 | | | | 107 | | | | 1,836 | |
| Global Leaders | | | — | | | | 124 | | | | 27 | | | | 206 | | | | 3 | | | | 152 | | | | 252 | | | | 2,063 | |
| International Leaders | | | 23 | | | | 293 | | | | — | | | | — | | | | 1 | | | | 22 | | | | 2 | | | | 73 | |
| International Equity | | | 29 | | | | 823 | | | | — | | | | — | | | | 26 | | | | 750 | | | | — | | | | — | |
| International Growth | | | 10,938 | | | | 40,501 | | | | — | | | | — | | | | 9,482 | | | | 30,923 | | | | — | | | | — | |
| International Small Cap Growth | | | 5 | | | | 1,063 | | | | 2 | | | | 57 | | | | 195 | | | | 7,300 | | | | 29 | | | | 919 | |
| | | |
| 134 | Annual Report | December 31, 2016 |
| | | Distributions Paid in 2016 | | | Distributions Paid in 2015 | |
| | | Ordinary | | | Long-Term | | | Ordinary | | | Long-Term | |
| | | Income | | | Capital Gains | | | Income | | | Capital Gains | |
| Fund | | | Class N | | | | Class I | | | | Class N | | | | Class I | | | | Class N | | | | Class I | | | | Class N | | | | Class I | |
| Emerging Markets Leaders | | $ | — | | | $ | 41 | | | | — | | | | — | | | $ | — | | | $ | 105 | | | $ | 2 | | | $ | 44 | |
| Emerging Markets Growth | | | 18 | | | | 416 | | | | — | | | | — | | | | — | | | | — | | | | 107 | | | | 1,427 | |
| Emerging Markets Small Cap Growth | | | 210 | | | | 4,177 | | | | — | | | | — | | | | — | | | | — | | | | 474 | | | | 6,262 | |
| Bond | | | 5,237 | | | | 11,452 | | | | — | | | | — | | | | 1,822 | | | | 6,812 | | | | — | | | | — | |
| Income | | | 1,079 | | | | 1,868 | | | | — | | | | — | | | | 1,007 | | | | 1,971 | | | | — | | | | — | |
| Low Duration | | | 149 | | | | 3,331 | | | | — | | | | — | | | | 95 | | | | 2,839 | | | | — | | | | — | |
| Macro Allocation | | | 1,182 | | | | 21,809 | | | | — | | | | — | | | | 915 | | | | 10,747 | | | | — | | | | — | |
| | | Distributions Paid in 2016 | | Distributions Paid in 2015 |
| | | Ordinary
Income | | Long-Term
Capital Gains | | Ordinary
Income | | Long-Term
Capital Gains |
| | | Institutional | | Institutional | | Institutional | | Institutional |
| Global Leaders | | $ | 403 | | | $ | 559 | | | $ | 552 | | | $ | 6,144 | |
| International Leaders | | | 2,350 | | | | — | | | | 323 | | | | 578 | |
| Institutional International Equity | | | 336 | | | | — | | | | 156 | | | | — | |
| Institutional International Growth | | | 23,809 | | | | — | | | | 13,779 | | | | 15,858 | |
| International Small Cap Growth | | | 845 | | | | 37 | | | | 4,603 | | | | 557 | |
| Emerging Markets Leaders | | | 513 | | | | — | | | | 331 | | | | 126 | |
| Emerging Markets Growth | | | 4,354 | | | | — | | | | — | | | | 8,324 | |
| Emerging Markets Small Cap Growth | | | 3,339 | | | | — | | | | 1 | | | | 4,988 | |
| Bond | | | 3,903 | | | | — | | | | 3,598 | | | | — | |
| Low Duration | | | 694 | | | | — | | | | 1,185 | | | | — | |
| Macro Allocation | | | 13,553 | | | | — | | | | 4,368 | | | | — | |
As of December 31, 2016, the components of distributable earnings on a tax basis were as follows (in thousands):
| Fund | | Undistributed
Ordinary Income | | Accumulated
Capital and
Other Losses | | Undistributed
Long-Term
Capital Gain | | Net Unrealized
Appreciation/
(Depreciation) |
| Growth | | $ | — | | | $ | — | | | $ | 34,836 | | | $ | 98,168 | |
| Large Cap Growth | | | — | | | | — | | | | 1,139 | | | | 12,984 | |
| Mid Cap Growth | | | — | | | | (2,044 | ) | | | — | | | | 13,631 | |
| Mid Cap Value | | | — | | | | — | | | | 101 | | | | 580 | |
| Small-Mid Cap Growth | | | — | | | | — | | | | 1,865 | | | | 157,491 | |
| Small-Mid Cap Value | | | — | | | | — | | | | 14 | | | | 836 | |
| Small Cap Growth | | | 2,967 | | | | — | | | | 11,573 | | | | 68,921 | |
| Small Cap Value | | | — | | | | — | | | | 3,861 | | | | 179,143 | |
| Global Leaders | | | 738 | | | | (986 | ) | | | — | | | | 17,925 | |
| International Leaders | | | 4 | | | | (146 | ) | | | — | | | | 11,636 | |
| International Equity | | | 1,249 | | | | (77,191 | ) | | | — | | | | 6,264 | |
| Institutional International Equity | | | — | | | | (90,887 | ) | | | — | | | | 1,173 | |
| International Growth | | | 15,222 | | | | (428,448 | ) | | | — | | | | 188,743 | |
| Institutional International Growth | | | 15,907 | | | | (94,978 | ) | | | — | | | | 121,331 | |
| International Small Cap Growth | | | — | | | | (2,137 | ) | | | 953 | | | | 30,613 | |
| Emerging Markets Leaders | | | — | | | | (24,790 | ) | | | — | | | | 3,999 | |
| Emerging Markets Growth | | | 4,992 | | | | (124,879 | ) | | | — | | | | 32,500 | |
| Emerging Markets Small Cap Growth | | | — | | | | (33,848 | ) | | | — | | | | 9,031 | |
| Bond | | | — | | | | (7,544 | ) | | | — | | | | 6,191 | |
| Income | | | 19 | | | | (7,460 | ) | | | — | | | | (14 | ) |
| Low Duration | | | 59 | | | | (19,396 | ) | | | — | | | | (819 | ) |
| Macro Allocation | | | 140 | | | | (224,190 | ) | | | — | | | | 55,614 | |
| | | |
| December 31, 2016 | William Blair Funds | 135 |
As of December 31, 2016, the Funds may have unused capital loss carryforwards available for federal income tax purposes to be applied against future capital gains, if any. Under current law, the Funds may carry forward net capital losses indefinitely to use to offset capital gains realized in future years. Previous law limited the carry forward of capital losses to the eight tax years following the year the capital loss was realized. If a Fund has capital losses that are subject to current law and also has capital losses subject to prior law, the losses realized under current law will be utilized to offset capital gains before any of the losses governed by prior law can be used. As a result of these ordering rules, capital losses realized under previous law may be more likely to expire unused. Capital losses realized under current law will carry forward retaining their classification as long-term or short-term losses; as compared to under prior law in which all capital losses were carried forward as short term capital losses.
The following table details the Funds’ available capital loss carryforwards as of December 31, 2016, the capital loss carryforwards utilized by the Funds in 2016, and the capital loss carryforwards that expired in 2016 (in thousands):
| | | Available Capital Loss Carryforwards | | | Capital Loss | | Capital Loss |
| | | Limited by Year of Expiration | | Unlimited | | Total | | | Carryforwards | | Carryforwards |
| Fund | | 2017 | | 2018 | | Short Term | | Long Term | | Available | | | Utilized in 2016 | | Expired in 2016 |
| Mid Cap Growth | | $ | — | | | $ | — | | | $ | 2,044 | | | $ | — | | | $ | 2,044 | | | $ | — | | | $ | — | |
| Global Leaders | | | — | | | | — | | | | 986 | | | | — | | | | 986 | | | | — | | | | — | |
| International Leaders | | | — | | | | — | | | | 146 | | | | — | | | | 146 | | | | — | | | | — | |
| International Equity | | | 74,815 | | | | — | | | | 2,376 | | | | — | | | | 77,191 | | | | — | | | | — | |
| Institutional International Equity | | | 90,030 | | | | — | | | | 571 | | | | 221 | | | | 90,822 | | | | — | | | | — | |
| International Growth | | | 358,606 | | | | — | | | | 69,842 | | | | — | | | | 428,448 | | | | — | | | | — | |
| Institutional International Growth | | | — | | | | — | | | | 94,978 | | | | — | | | | 94,978 | | | | — | | | | — | |
| Emerging Markets Leaders | | | — | | | | — | | | | 20,800 | | | | 1,697 | | | | 22,497 | | | | — | | | | — | |
| Emerging Markets Growth | | | — | | | | — | | | | 116,463 | | | | — | | | | 116,463 | | | | — | | | | — | |
| Emerging Markets Small Cap Growth | | | — | | | | — | | | | 19,850 | | | | — | | | | 19,850 | | | | — | | | | — | |
| Bond | | | — | | | | — | | | | 4,790 | | | | 1,778 | | | | 6,568 | | | | — | | | | — | |
| Income | | | 4,577 | | | | — | | | | 1,011 | | | | 1,690 | | | | 7,278 | | | | — | | | | 14,459 | |
| Low Duration | | | — | | | | 955 | | | | 9,113 | | | | 9,090 | | | | 19,158 | | | | — | | | | — | |
| Macro Allocation | | | — | | | | — | | | | 135,208 | | | | 61,095 | | | | 196,303 | | | | — | | | | — | |
In order to meet certain excise tax distribution requirements, the Funds are required to measure and distribute annually, net capital gains realized during a twelve month period ending October 31 and net investment income earned during a twelve month period ending December 31. In connection with this, the Funds are permitted for tax purposes to defer into their next fiscal year qualified late year losses. Qualified late year capital losses are any short term or long term capital losses incurred between November 1 and the end of their fiscal year, December 31, 2016. Qualified late year ordinary losses are comprised of losses related to foreign currency and PFICs incurred between November 1 and the end of their fiscal year, December 31, 2016.
As of December 31, 2016, the following Funds deferred, on a tax basis, qualified late year losses of (in thousands):
| | | Qualified Late Year Losses |
| Fund | | Ordinary
Income | | Net
Capital |
| Institutional International Equity | | $ | 18 | | | $ | 47 | |
| International Small Cap Growth | | | 2,137 | | | | — | |
| Emerging Markets Leaders | | | 354 | | | | 1,939 | |
| Emerging Markets Growth | | | — | | | | 8,416 | |
| Emerging Markets Small Cap Growth | | | 4,418 | | | | 9,580 | |
| Bond | | | 101 | | | | 854 | |
| Income | | | — | | | | 182 | |
| Low Duration | | | — | | | | 200 | |
| Macro Allocation | | | — | | | | 27,887 | |
| | | |
| 136 | Annual Report | December 31, 2016 |
(e) Repurchase Agreements
In a repurchase agreement, a Fund buys a security at one price and at the time of sale, the seller agrees to repurchase the security at a mutually agreed upon time and price (usually within seven days). The repurchase agreement thereby determines the yield during the purchaser’s holding period, while the seller’s obligation to repurchase is secured by the value of the underlying collateral. The Adviser monitors, on an ongoing basis, the value of the underlying collateral to ensure that the value always equals or exceeds the repurchase price plus accrued interest. Repurchase agreements may involve certain risks in the event of a default or insolvency of the other party to the agreement, including possible delays or restrictions upon a Fund’s ability to dispose of the underlying collateral. The risk to a Fund is limited to the ability of the seller to pay the agreed upon sum on the delivery date. In the event of default, a repurchase agreement provides that a Fund is entitled to sell the underlying collateral. The loss, if any, to a Fund will be the difference between the proceeds from the sale and the repurchase price. However, if bankruptcy proceedings are commenced with respect to the seller of the security, disposition of the collateral by the Fund may be delayed or limited. The Funds have master repurchase agreements which allow the Funds to offset amounts owed to a counterparty with amounts owed from the same counterparty, including any collateral, in the event the counterparty defaults. As of December 31, 2016, each Fund’s outstanding repurchase agreements, if any, and related collateral, are shown on the Fund’s Portfolio of Investments. Although no definitive creditworthiness criteria are used, the Adviser reviews the creditworthiness of the banks and non-bank dealers with which a Fund enters into repurchase agreements to evaluate those risks. A Fund may, for tax purposes, deem repurchase agreements collateralized by U.S. Government securities to be investments in U.S. Government securities.
(f) TBA Securities
The Fixed Income Funds may invest in mortgage pass-through securities eligible to be sold in the “to-be announced” market (“TBAs”). TBAs provide for the forward or delayed delivery of the underlying instrument with settlement up to 180 days. The term TBA comes from the fact that the specific mortgage-backed security that will be delivered to fulfill a TBA trade is not designated at the time the trade is made, but rather is generally announced 48 hours before the settlement date. When a Fund sells TBAs, it incurs a risk of loss because it could have to purchase the securities at a price that is higher than the price at which it sold the securities. A Fund generally has the ability to close out a TBA obligation on or before the settlement date, rather than take delivery of the security.
(g) Securities Sold, Not Yet Purchased
A Fund may sell a security it does not own in anticipation of a decline in the fair value of that security. When a fund sells a security short, it must borrow the security sold short and deliver it to the broker through which it made the short sale. A gain, limited to the price at which the fund sold the security short, or a loss, unlimited in size, will be recognized upon the termination of the short sale. A fund is also subject to the risk that it may be unable to reacquire a security to terminate a short position except at a price substantially in excess of the price it sold the security short.
(h) Use of Estimates
The preparation of financial statements in conformity with U.S. generally accepted accounting principles requires management to make estimates and assumptions that affect the amounts reported in the financial statements. Actual results may differ from those estimates.
(i) Indemnification
In the normal course of business, the Funds have entered into contracts in which the Funds agree to indemnify the other party or parties against various potential costs or liabilities. The Funds’ maximum exposure under these arrangements is unknown. No claim has been made for indemnification pursuant to any such agreement of the Funds.
(j) Redemption In-Kind
In accordance with the Trust’s prospectus, the Funds may distribute portfolio securities rather than cash as payment for a redemption of fund shares (in-kind redemption). For financial reporting purposes, the Fund recognizes a gain or loss on the transfer of securities depending on the value of those securities on the date of redemption. Gains and losses realized on in-kind redemptions may not be recognized for tax purposes and are reclassified from accumulated net realized gain (loss) to capital paid in excess of par value. During the year ended December 31, 2016, the Small-Mid Cap Growth and Institutional International Growth Funds redeemed in-kind fund share redemptions of $159,125 and $210,330 (in thousands), respectively, with securities rather than cash and recognized net realized gains of $52,031 and $23,687 (in thousands), respectively, on the securities distributed to shareholders.
| December 31, 2016 | William Blair Funds | 137 |
(3) Valuation
(a) Investment Valuation
The value of domestic equity securities, including exchange-traded funds, is determined by valuing securities traded on national securities markets or in the over-the-counter markets at the last sale price or, if applicable, the official closing price or, in the absence of a recent sale on the date of determination, at the mean between the last reported bid and ask prices.
The value of foreign equity securities is generally determined based upon the last sale price on the foreign exchange or market on which it is primarily traded and in the currency of that market as of the close of the appropriate exchange or, if there have been no sales during that day, at the mean between the last reported bid and ask prices. The Board of Trustees has determined that the passage of time between when the foreign exchanges or markets close and when the Funds compute their net asset values could cause the value of foreign equity securities to no longer be representative or accurate and, as a result, may necessitate that such securities be fair valued. Accordingly, for foreign equity securities, the Funds may use an independent pricing service to fair value price the security as of the close of regular trading on the NYSE. As a result, a Fund’s value for a security may be different from the last sale price (or the mean between the last reported bid and ask prices). As of December 31, 2016, fair valuation estimates for foreign equity securities were not obtained.
Fixed income securities are generally valued using evaluated prices provided by an independent pricing service. The evaluated prices are formed using various market inputs that the pricing service believes accurately represent the market value of a security at a particular point in time. The pricing service determines evaluated prices for fixed income securities using inputs including, but not limited to, recent transaction prices, dealer quotes, transaction prices for securities with similar characteristics, collateral characteristics, credit quality, payment history, liquidity and market conditions.
Repurchase agreements are valued at cost, which approximates fair value.
Option contracts on securities, currencies and other financial instruments traded on one or more exchanges are valued at their most recent sale price on the exchange on which they are traded most extensively. Option contracts on foreign indices are valued at the settlement price. Futures contracts (and options and swaps thereon) are valued at the most recent settlement price on the exchange on which they are traded most extensively. Forward foreign currency contracts are valued on the basis of the value of the underlying currencies at the prevailing currency exchange rate as supplied by an independent pricing service.
Over-the-Counter (“OTC”) swap contracts are valued by an independent pricing service. Depending on the product and the terms of the transaction, the independent pricing service may use a series of techniques, including simulation pricing models. The pricing models use inputs that are observed from actively quoted markets such as issuer details, indices, spreads, interest rates, yield curves, dividends and exchange rates.
Centrally cleared swaps listed or settled on a multilateral or trade facility platform, such as a registered exchange, are valued at the daily settlement price determined by the respective exchange. For centrally cleared credit default swaps the clearing facility requires its members to provide actionable price levels across complete term structures. These levels along with external third-party prices are used to produce daily settlement prices.
Investments in other investment funds that are not exchange-traded funds are valued at the underlying fund’s ending net asset value on the date of valuation.
Securities, and other assets, for which a market price is not available or is deemed unreliable (e.g., securities affected by unusual or extraordinary events, such as natural disasters or securities affected by market or economic events, such as bankruptcy filings), or the value of which is affected by a significant valuation event, are valued at a fair value as determined in good faith by, or under the direction of, the Board of Trustees and in accordance with the Valuation Procedures approved by the Board of Trustees. The value of fair valued securities may be different from the last sale price (or the mean between the last reported bid and ask prices), and there is no guarantee that a fair valued security will be sold at the price at which a Fund is carrying the security.
As of December 31, 2016, there were securities held in the International Growth and Institutional International Growth Funds requiring fair valuation pursuant to the Valuation Procedures approved by the Board of Trustees.
(b) Fair Value Measurements
Fair value is defined as the price that a Fund would receive upon selling a security in an orderly transaction to an independent buyer in the principal or most advantageous market for the investment. Various inputs are used in determining the value of a Fund’s investments. A three-tier hierarchy of inputs is used to classify fair value measurements for disclosure purposes. The three-tier hierarchy of inputs is summarized in the three broad levels listed below:
| 138 | Annual Report | December 31, 2016 |
| | • | Level 1—Quoted prices (unadjusted) in active markets for an identical security. |
| | | |
| | • | Level 2—Prices determined using other significant observable inputs. Observable inputs are inputs that other market participants would use in pricing a security. These may include quoted prices for similar securities, interest rates, prepayment speeds, credit risk, and others. In addition, other observable inputs such as foreign exchange rates, benchmark securities indices and foreign futures contracts may be utilized in the valuation of certain foreign securities when significant events occur between the last sale on the foreign securities exchange and the time at which the net asset value of the Fund is calculated. |
| | | |
| | • | Level 3—Prices determined using significant unobservable inputs. In situations where quoted prices or observable inputs are unavailable (for example, when there is little or no market activity for an investment), unobservable inputs may be used. Unobservable inputs reflect the Fund’s own assumptions about the factors market participants would use in pricing an investment, and would be based on the best information available. |
The inputs or methodology used for valuing an investment are not necessarily an indication of the risk associated with investing in those securities.
A description of the valuation technique applied to the Funds’ major categories of assets and liabilities measured at fair value on a recurring basis as follows:
Exchange-Traded Securities
Securities traded on a national securities exchange (or reported on the NASDAQ national market), including exchange-traded funds, are stated at the last reported sales price on the day of valuation. Other securities traded in the over-the-counter market and listed securities for which no sale was reported on that date are stated at the mean between the last reported bid and ask prices. To the extent these securities are actively traded and valuation adjustments are not applied, they are categorized as Level 1 of the fair value hierarchy. Securities traded on inactive markets or valued by reference to similar instruments are generally categorized as Level 2 of the fair value hierarchy.
Fixed Income Securities
Fixed income securities including corporate, convertible and municipal bonds and notes, U.S. government agencies, U.S. treasury obligations, sovereign issues, bank loans, convertible preferred securities, asset-backed securities and non-U.S. bonds are generally valued using evaluated prices provided by an independent pricing service. The evaluated prices are formed using various market inputs that the pricing service believes accurately represent the fair value of a security at a particular point in time. The pricing service determines evaluated prices for fixed income securities using inputs including, but not limited to, recent transaction prices, dealer quotes, transaction prices for securities with similar characteristics, collateral characteristics, credit quality, payment history, liquidity and market conditions. Securities that use similar valuation techniques and observable inputs as described above are categorized as Level 2 of the fair value hierarchy.
Short-Term Investments
Repurchase agreements are valued at cost, which approximates fair value. These investments are categorized as Level 2 of the fair value hierarchy.
Derivative Instruments
Listed derivatives, such as certain options and futures contracts, that are actively traded are valued based on quoted prices from the exchange on which they are traded most extensively and are categorized as Level 1 of the fair value hierarchy. OTC derivative contracts include forward foreign currency contracts, swap and certain option contracts related to interest rates, foreign currencies, credit standing of reference entities, equity prices, or commodity prices. Depending on the product and the terms of the transaction, the fair value of OTC derivative products can be modeled taking into account the counterparties’ creditworthiness and using a series of techniques, including simulation models. Many pricing models do not entail material subjectivity because the methodologies employed do not necessitate significant judgments and the pricing inputs are observed from actively quoted markets, as is the case of forward foreign currency contracts and interest rate swaps. A substantial majority of OTC derivative products valued by a Fund using pricing models fall into this category and are categorized as Level 2 of the fair value hierarchy.
Any transfers between Level 1 and Level 2 are disclosed, effective as of the beginning of the period, in the following tables with the reasons for the transfers disclosed in a note to the tables, if applicable. Transfer amounts are based on end of period values.
| December 31, 2016 | William Blair Funds | 139 |
As of December 31, 2016, the hierarchical input levels of securities in each Fund, segregated by security class or other financial instruments, are shown below (in thousands). There were no transfers between Levels as of December 31, 2016.
| Investments in securities | | Growth | | | Large Cap
Growth | | | Mid Cap
Growth | | | Mid Cap
Value | |
| Level 1—Quoted prices | | | | | | | | | | | | | | | | | | | | |
| Common Stocks | | $ | | 574,761 | | | $ | | 120,980 | | | $ | | 133,997 | | | $ | | 3,007 | |
| Level 2—Other significant observable inputs | | | | | | | | | | | | | | | | | | | | |
| Short-Term Investments | | | | 4,823 | | | | | 1,176 | | | | | 352 | | | | | — | |
| Level 3—Significant unobservable inputs | | | | | | | | | | | | | | | | | | | | |
| None | | | | — | | | | | — | | | | | — | | | | | — | |
| Total investments in securities | | $ | | 579,584 | | | $ | | 122,156 | | | $ | | 134,349 | | | $ | | 3,007 | |
| | | | | | | | | | | | | | | | | | | | | |
| Investments in securities | | Small-Mid
Cap Growth | | | Small-Mid
Cap Value | | | Small Cap
Growth | | | Small Cap
Value | |
| Level 1—Quoted prices | | | | | | | | | | | | | | | | | | | | |
| Common Stocks | | $ | | 1,220,539 | | | $ | | 3,391 | | | $ | | 363,303 | | | $ | | 685,343 | |
| Exchange-Traded Fund | | | | — | | | | | — | | | | | 9,584 | | | | | — | |
| Level 2—Other significant observable inputs | | | | | | | | | | | | | | | | | | | | |
| Short-Term Investments | | | | 50,017 | | | | | — | | | | | 16,760 | | | | | 20,650 | |
| Level 3—Significant unobservable inputs | | | | | | | | | | | | | | | | | | | | |
| None | | | | — | | | | | — | | | | | — | | | | | — | |
| Total investments in securities | | $ | | 1,270,556 | | | $ | | 3,391 | | | $ | | 389,647 | | | $ | | 705,993 | |
| Investments in securities | | Global
Leaders | | | International
Leaders | | | International
Equity | | | Institutional
International
Equity | | | International
Growth | |
| Level 1—Quoted prices | | | | | | | | | | | | | | | | | | | | | | | | | |
| Common Stocks | | $ | | 175,302 | | | $ | | 249,795 | | | $ | | 85,253 | | | $ | | 16,251 | | | $ | | 2,894,451 | |
| Preferred Stocks | | | | — | | | | | — | | | | | — | | | | | — | | | | | 42,475 | |
| Level 2—Other significant observable inputs | | | | | | | | | | | | | | | | | | | | | | | | | |
| Affiliated Fund | | | | — | | | | | — | | | | | — | | | | | — | | | | | 164 | |
| Common Stocks | | | | — | | | | | — | | | | | 611 | | | | | 116 | | | | | — | |
| Short-Term Investments | | | | 1,481 | | | | | 2,644 | | | | | 1,380 | | | | | 206 | | | | | 47,300 | |
| Level 3—Significant unobservable inputs | | | | | | | | | | | | | | | | | | | | | | | | | |
| Common Stocks | | | | — | | | | | — | | | | | — | | | | | — | | | | | — | |
| Total investments in securities | | $ | | 176,783 | | | $ | | 252,439 | | | $ | | 87,244 | | | $ | | 16,573 | | | $ | | 2,984,390 | |
| | | | | | | | | | | | | | | | |
| Investments in securities | | Institutional
International
Growth | | | International
Small Cap
Growth | | | Emerging
Markets
Leaders | | | Emerging
Markets
Growth | | | Emerging
Markets
Small Cap
Growth | |
| Level 1—Quoted prices | | | | | | | | | | | | | | | | | | | | | | | | | |
| Common Stocks | | $ | | 2,003,704 | | | $ | | 508,660 | | | $ | | 264,998 | | | $ | | 844,131 | | | $ | | 263,487 | |
| Preferred Stocks | | | | 29,337 | | | | | — | | | | | 20,804 | | | | | 40,906 | | | | | 4,352 | |
| Level 2—Other significant observable inputs | | | | | | | | | | | | | | | | | | | | | | | | | |
| Affiliated Fund | | | | 102 | | | | | — | | | | | — | | | | | 201 | | | | | — | |
| Common Stocks | | | | — | | | | | — | | | | | 10,376 | | | | | 37,583 | | | | | 17,217 | |
| Short-Term Investments | | | | 48,624 | | | | | 8,207 | | | | | 9,399 | | | | | 3,898 | | | | | 161 | |
| Level 3—Significant unobservable inputs | | | | | | | | | | | | | | | | | | | | | | | | | |
| Common Stocks | | | | — | | | | | — | | | | | — | | | | | — | | | | | — | |
| Total investments in securities | | $ | | 2,081,767 | | | $ | | 516,867 | | | $ | | 305,577 | | | $ | | 926,719 | | | $ | | 285,217 | |
| | | |
| 140 | Annual Report | December 31, 2016 |
| Investments in securities | | Bond | | | Income | | | Low
Duration | | | Macro
Allocation | |
| Assets | | | | | | | | | | | | | | | | |
| Level 1—Quoted Prices | | | | | | | | | | | | | | | | |
| Exchange-Traded Funds | | $ | — | | | $ | — | | | $ | — | | | $ | 950,306 | |
| Purchased Options | | | — | | | | — | | | | — | | | | 1,503 | |
| Level 2—Other significant observable inputs | | | | | | | | | | | | | | | | |
| Asset-Backed Securities | | | 12,306 | | | | 10,816 | | | | 67,468 | | | | — | |
| Commercial Paper | | | 5,000 | | | | — | | | | — | | | | — | |
| Corporate Obligation/Notes | | | 228,339 | | | | 36,759 | | | | 91,608 | | | | — | |
| Short-Term Investments | | | 4,667 | | | | 279 | | | | — | | | | 413,728 | |
| U.S. Government and U.S. Government Agency | | | 287,051 | | | | 61,571 | | | | 124,037 | | | | 136,665 | |
| Foreign Government | | | — | | | | — | | | | — | | | | 35,980 | |
| Level 3—Significant unobservable inputs | | | | | | | | | | | | | | | | |
| None | | | — | | | | — | | | | — | | | | — | |
| Liabilities | | | | | | | | | | | | | | | | |
| Level 1—Quoted Prices | | | | | | | | | | | | | | | | |
| Written Options | | | — | | | | — | | | | — | | | | (900 | ) |
| Level 2—Other significant observable inputs | | | | | | | | | | | | | | | | |
| None | | | — | | | | — | | | | — | | | | — | |
| Level 3—Significant unobservable inputs | | | | | | | | | | | | | | | | |
| None | | | — | | | | — | | | | — | | | | — | |
| Total investments in securities | | $ | 537,363 | | | $ | 109,425 | | | $ | 283,113 | | | $ | 1,537,282 | |
| Other financial instruments | | | | | | | | | | | | | | | | |
| Assets | | | | | | | | | | | | | | | | |
| Level 1—Quoted Prices | | | | | | | | | | | | | | | | |
| Futures Contracts | | $ | — | | | $ | — | | | $ | — | | | $ | 11,911 | |
| Level 2—Other significant observable inputs | | | | | | | | | | | | | | | | |
| Forward Foreign Currency Contracts | | | — | | | | — | | | | — | | | | 15,274 | |
| Futures Contracts | | | — | | | | — | | | | — | | | | 582 | |
| Swaps | | | — | | | | — | | | | — | | | | 11,392 | |
| Level 3—Significant unobservable inputs | | | | | | | | | | | | | | | | |
| None | | | — | | | | — | | | | — | | | | — | |
| Liabilities | | | | | | | | | | | | | | | | |
| Level 1—Quoted Prices | | | | | | | | | | | | | | | | |
| Futures Contracts | | | — | | | | — | | | | — | | | | (7,442 | ) |
| Level 2—Other significant observable inputs | | | | | | | | | | | | | | | | |
| Forward Foreign Currency Contracts | | | — | | | | — | | | | — | | | | (8,666 | ) |
| Futures Contracts | | | — | | | | — | | | | — | | | | (483 | ) |
| Swaps | | | (165 | ) | | | — | | | | — | | | | (1,256 | ) |
| U.S. Government Agency | | | — | | | | — | | | | (15,025 | ) | | | — | |
| Level 3—Significant unobservable inputs | | | | | | | | | | | | | | | | |
| None | | | — | | | | — | | | | — | | | | — | |
| Total Other Financial Instruments | | $ | (165 | ) | | $ | — | | | $ | (15,025 | ) | | $ | 21,312 | |
Level 1 Common Stocks are exchange-traded securities with a quoted price. See Portfolio of Investments for Sector Classification.
The fair value estimates for the Level 3 securities in the International Growth and Institutional International Growth Funds were determined in good faith by the Pricing Committee, pursuant to the Valuation Procedures approved by the Board of Trustees. There were various factors considered in reaching this fair value determination, including, but not limited to, the following: the type of security, the extent of public trading of the security, information obtained from a broker-dealer for the security, analysis of the company’s performance and market trends that influence its performance. Level 3 securities represented 0.00% and 0.00% as a percentage of net assets in the International Growth and Institutional International Growth Funds, respectively. The change in net unrealized gain (loss) related to those securities held at December 31, 2016 is included in the change in net unrealized appreciation (depreciation) of investments on the Statements of Operations.
| December 31, 2016 | William Blair Funds | 141 |
(4) Transactions with Affiliates
(a) Management and Expense Limitation Agreements
Each Fund has a management agreement with the Adviser for investment management, clerical, bookkeeping and administrative services. Each Fund pays the Adviser an annual fee, payable monthly, based on a specified percentage of its average daily net assets. A summary of the annual rates expressed as a percentage of average daily net assets is as follows:
| Domestic Equity Funds | | | |
| Growth | | | 0.75 | % |
| Large Cap Growth | | | 0.70 | % |
| Mid Cap Growth | | | 0.95 | % |
| Mid Cap Value | | | 0.95 | % |
| Small-Mid Cap Growth | | | 1.00 | % |
| Small-Mid Cap Value | | | 1.00 | % |
| Small Cap Growth | | | 1.10 | % |
| Small Cap Value | | | 1.10 | % |
| | | | | |
| Fixed Income Funds | | | | |
| Bond | | | 0.30 | % |
| Income1: | | | | |
| First $250 million | | | 0.25 | % |
| In excess of $250 million | | | 0.20 | % |
| Low Duration | | | 0.30 | % |
| | | | | |
| Multi-Asset and Alternative Fund | | | | |
| Macro Allocation | | | 0.80 | % |
| | | | | |
| Global Equity Fund | | | | |
| Global Leaders | | | 1.00 | % |
| International Equity Funds | | | | |
| International Leaders | | | 0.95 | % |
| International Equity: | | | | |
| First $250 million | | | 1.00 | % |
| In excess of $250 million | | | 0.90 | % |
| Institutional International Equity: | | | | |
| First $500 million | | | 0.90 | % |
| Next $500 million | | | 0.85 | % |
| In excess of $1 billion | | | 0.80 | % |
| International Growth: | | | | |
| First $250 million | | | 1.10 | % |
| Next $2.25 billion | | | 1.00 | % |
| Next $2.5 billion | | | 0.975 | % |
| Next $5 billion | | | 0.95 | % |
| Next $5 billion | | | 0.925 | % |
| In excess of $15 billion | | | 0.90 | % |
| Institutional International Growth: | | | | |
| First $500 million | | | 1.00 | % |
| Next $500 million | | | 0.95 | % |
| Next $1.5 billion | | | 0.90 | % |
| Next $2.5 billion | | | 0.875 | % |
| Next $5 billion | | | 0.85 | % |
| Next $5 billion | | | 0.825 | % |
| In excess of $15 billion | | | 0.80 | % |
| International Small Cap Growth | | | 1.00 | % |
| Emerging Markets Leaders | | | 1.10 | % |
| Emerging Markets Growth | | | 1.10 | % |
| Emerging Markets Small Cap Growth | | | 1.10 | % |
1 Management fee also includes a charge of 5% of gross income.
| 142 | Annual Report | December 31, 2016 |
Some of the Funds have also entered into an Amended and Restated Expense Limitation Agreement with the Adviser. Under the terms of the agreement, the Adviser will waive its management fee and/or reimburse a Fund for expenses in excess of the agreed upon rate. The amount the Adviser owes a Fund as of the reporting date is recorded as Receivable from Adviser on the Statements of Assets and Liabilities. The Adviser reimburses the Funds on a monthly basis. Under the terms of the agreement, the Adviser has agreed to waive its management fees and/or absorb other operating expenses through April 30, 2017, if total expenses for each class of the following Funds exceed the following rates (as a percentage of average daily net assets):
| | | Class N | | Class I | | Institutional Class |
| | | Effective
May 1, 2016
through
April 30, | | Effective
May 1, 2015
through
April 30, | | Effective
May 1, 2016
through
April 30, | | Effective
May 1, 2015
through
April 30, | | Effective
May 1, 2016
through
April 30, | | Effective
May 1, 2015
through
April 30, |
| Fund | | 2017 | | 2016 | | 2017 | | 2016 | | 2017 | | 2016 |
| Growth | | | N/A | | | N/A | | | N/A | | | N/A | | | N/A | | | N/A |
| Large Cap Growth | | | 1.05% | | | 1.05% | | | 0.80% | | | 0.80% | | | N/A | | | N/A |
| Mid Cap Growth | | | 1.30% | | | 1.30% | | | 1.05% | | | 1.05% | | | N/A | | | N/A |
| Mid Cap Value | | | 1.30% | | | 1.30% | | | 1.05% | | | 1.05% | | | N/A | | | N/A |
| Small-Mid Cap Growth | | | 1.35% | | | 1.35% | | | 1.10% | | | 1.10% | | | N/A | | | N/A |
| Small-Mid Cap Value | | | 1.35% | | | 1.35% | | | 1.10% | | | 1.10% | | | N/A | | | N/A |
| Small Cap Growth | | | 1.50% | | | 1.50% | | | 1.25% | | | 1.25% | | | N/A | | | N/A |
| Small Cap Value | | | 1.50% | | | 1.50% | | | 1.25% | | | 1.25% | | | N/A | | | N/A |
| Global Leaders | | | 1.40% | | | 1.40% | | | 1.15% | | | 1.15% | | | 1.00% | | | 1.00% |
| International Leaders | | | 1.35% | | | 1.35% | | | 1.10% | | | 1.10% | | | 0.95% | | | 0.95% |
| International Equity | | | 1.30% | | | 1.30% | | | 1.05% | | | 1.05% | | | N/A | | | N/A |
| Institutional International Equity | | | N/A | | | N/A | | | N/A | | | N/A | | | 1.00% | | | 1.00% |
| International Growth | | | 1.45% | | | 1.45% | | | 1.20% | | | 1.20% | | | N/A | | | N/A |
| Institutional International Growth | | | N/A | | | N/A | | | N/A | | | N/A | | | N/A | | | N/A |
| International Small Cap Growth | | | 1.65% | | | 1.65% | | | 1.40% | | | 1.40% | | | 1.25% | | | 1.25% |
| Emerging Markets Leaders | | | 1.65% | | | 1.65% | | | 1.40% | | | 1.40% | | | 1.25% | | | 1.25% |
| Emerging Markets Growth | | | 1.70% | | | 1.70% | | | 1.45% | | | 1.45% | | | 1.30% | | | 1.30% |
| Emerging Markets Small Cap Growth | | | 1.65% | | | 1.65% | | | 1.40% | | | 1.40% | | | 1.25% | | | 1.25% |
| Bond | | | 0.65% | | | 0.65% | | | 0.50% | | | 0.50% | | | 0.35% | | | 0.35% |
| Income | | | 0.85% | | | 0.85% | | | 0.70% | | | 0.70% | | | N/A | | | N/A |
| Low Duration | | | 0.70% | | | 0.70% | | | 0.55% | | | 0.55% | | | 0.40% | | | 0.40% |
| Macro Allocation | | | 1.35% | | | 1.35%(a) | | | 1.10% | | | 1.10%(a) | | | 0.95% | | | 0.95%(a) |
(a) Effective March 1, 2015 through April 30, 2016.
| December 31, 2016 | William Blair Funds | 143 |
For the year ended December 31, 2016, the fee waivers and/or reimbursements received by each Fund (including the expense limitation described above and the shareholder administration fee waiver described below) were as follows (in thousands):
| | | Fund | | | Class N | | | Class I | | | | |
| | | Level | | | Specific | | | Specific | | | Total | |
| Fund | | Waiver | | | Waiver | | | Waiver | | | Waiver | |
| Large Cap Growth | | $ | 40 | | | $ | 15 | | | $ | 49 | | | $ | 104 | |
| Mid Cap Growth | | | 50 | | | | 24 | | | | 143 | | | | 217 | |
| Mid Cap Value | | | 96 | | | | 1 | | | | — | | | | 97 | |
| Small-Mid Cap Growth | | | — | | | | 167 | | | | 650 | | | | 817 | |
| Small-Mid Cap Value | | | 110 | | | | — | | | | 2 | | | | 112 | |
| Small Cap Growth | | | — | | | | 59 | | | | 58 | | | | 117 | |
| Small Cap Value | | | — | | | | 9 | | | | 201 | | | | 210 | |
| Global Leaders | | | 194 | | | | 9 | | | | 68 | | | | 271 | |
| International Leaders | | | 213 | | | | 1 | | | | 32 | | | | 246 | |
| International Equity | | | 134 | | | | 3 | | | | 59 | | | | 196 | |
| Institutional International Equity | | | 122 | | | | — | | | | — | | | | 122 | |
| International Small Cap Growth | | | — | | | | 16 | | | | 499 | | | | 515 | |
| Emerging Markets Leaders | | | 196 | | | | 3 | | | | 43 | | | | 242 | |
| Emerging Markets Growth | | | — | | | | 14 | | | | 155 | | | | 169 | |
| Emerging Markets Small Cap Growth | | | 178 | | | | 16 | | | | 241 | | | | 435 | |
| Bond | | | 114 | | | | 216 | | | | 444 | | | | 774 | |
| Low Duration | | | — | | | | 11 | | | | 215 | | | | 226 | |
| Macro Allocation | | | — | | | | 153 | | | | 1,603 | | | | 1,756 | |
(b) Underwriting, Distribution Services, and Shareholder Administration Agreements
Pursuant to separate Underwriting and Distribution Agreements, WBC is the principal underwriter and distributor for the continuous offering of shares of the Trust and acts as agent of the Trust in the sale of its shares. The Underwriting Agreement provides that the Distributor will use its best efforts to distribute the Trust’s shares. The Distributor is not compensated under the Underwriting Agreement.
Each Fund, except the Institutional International Equity Fund and Institutional International Growth Fund, has a Distribution Agreement with WBC for distribution services to the Funds’ Class N shares. Each Fund pays WBC an annual fee, payable monthly, based on a specified percentage of its average daily net assets of Class N shares. The annual rate expressed as a percentage of average daily net assets for Class N is 0.25% for all Funds except the Bond, Income and Low Duration Funds, which is 0.15%. Pursuant to the Distribution Agreement, WBC enters into related selling group agreements with various firms at various rates for sales of the Funds’ Class N shares.
The Global Leaders, International Leaders, International Small Cap Growth, Emerging Markets Leaders, Emerging Markets Growth, Emerging Markets Small Cap Growth, Bond, Low Duration and Macro Allocation Funds have a Shareholder Administration Agreement with WBC to provide shareholder administration services to Class N and Class I shares. Class N and Class I shares of the Funds have agreed to pay an annual fee, payable monthly, of 0.15% of average daily net assets attributable to each class, respectively. Beginning in 2013, the SEC conducted a limited scope examination of a number of mutual fund sponsors, including WBC, regarding distribution and servicing of mutual fund shares through intermediaries. In November 2014, the SEC informed WBC that it had opened a non-public investigation with respect to shareholder administration fees paid by the applicable Funds. The investigation does not involve the investment management operations of the Funds. In December 2015, the SEC staff sent WBC a notification that staff intended to recommend an enforcement action against WBC to the SEC Commissioners (Wells Notice), and WBC has submitted a response. At this time, it is unclear whether or not the Commission will allow the matter to enter enforcement proceedings. While WBC believes that any possible claims made by the staff would be without merit, WBC cannot predict the outcome of any enforcement proceeding the SEC may choose to bring. The shareholder administration fee for each Fund is currently being waived by WBC. This waiver will not be removed without approval of the Board of Trustees.
| 144 | Annual Report | December 31, 2016 |
For the year ended December 31, 2016, the following shareholder administration fees were incurred and waived (in thousands):
| | | | | | | | | | | | | | | Net Total | |
| | | | | | | | | | | | | | | Shareholder | |
| | | | | | | | | | | | Total | | | Administration | |
| Fund | | Class N | | | Class I | | | Total | | | Waived | | | Fee | |
| Global Leaders | | $ | 9 | | | $ | 68 | | | $ | 77 | | | $ | 77 | | | | $— | |
| International Leaders | | | 1 | | | | 32 | | | | 33 | | | | 33 | | | | — | |
| International Small Cap Growth | | | 16 | | | | 499 | | | | 515 | | | | 515 | | | | — | |
| Emerging Markets Leaders | | | 3 | | | | 43 | | | | 46 | | | | 46 | | | | — | |
| Emerging Markets Growth | | | 14 | | | | 155 | | | | 169 | | | | 169 | | | | — | |
| Emerging Markets Small Cap Growth | | | 16 | | | | 241 | | | | 257 | | | | 257 | | | | — | |
| Bond | | | 216 | | | | 444 | | | | 660 | | | | 660 | | | | — | |
| Low Duration | | | 11 | | | | 215 | | | | 226 | | | | 226 | | | | — | |
| Macro Allocation | | | 153 | | | | 1,603 | | | | 1,756 | | | | 1,756 | | | | — | |
(5) Investment Transactions
Investment transactions, excluding U.S. government securities and securities whose maturities or expiration dates at the time of purchase were one year or less, for the year ended December 31, 2016, were as follows (in thousands):
| Fund | | Purchases | | | Sales | |
| Growth | | $ | 557,776 | | | $ | 812,472 | |
| Large Cap Growth | | | 87,663 | | | | 37,643 | |
| Mid Cap Growth | | | 94,492 | | | | 158,927 | |
| Mid Cap Value | | | 1,931 | | | | 2,026 | |
| Small-Mid Cap Growth | | | 785,196 | | | | 816,618 | |
| Small-Mid Cap Value | | | 1,760 | | | | 3,062 | |
| Small Cap Growth | | | 320,460 | | | | 375,877 | |
| Small Cap Value | | | 200,302 | | | | 251,227 | |
| Global Leaders | | | 131,245 | | | | 140,730 | |
| International Leaders | | | 244,985 | | | | 108,562 | |
| International Equity | | | 71,719 | | | | 47,856 | |
| Institutional International Equity | | | 12,523 | | | | 11,777 | |
| International Growth | | | 3,252,812 | | | | 3,738,214 | |
| Institutional International Growth | | | 2,162,997 | | | | 2,298,437 | |
| International Small Cap Growth | | | 396,051 | | | | 411,940 | |
| Emerging Markets Leaders | | | 462,171 | | | | 289,104 | |
| Emerging Markets Growth | | | 1,079,352 | | | | 1,030,658 | |
| Emerging Markets Small Cap Growth | | | 476,127 | | | | 465,799 | |
| Bond | | | 194,683 | | | | 87,484 | |
| Income | | | 52,059 | | | | 20,711 | |
| Low Duration | | | 330,004 | | | | 148,009 | |
| Macro Allocation | | | 509,300 | | | | 733,254 | |
Investment transactions in U.S. government securities whose maturities at the time of purchase were more than one year for the year ended December 31, 2016, were as follows (in thousands):
| Fund | | Purchases | | | Sales | |
| Bond | | $ | 6,401 | | | $ | 144 | |
| Income | | | 1,203 | | | | — | |
| Low Duration | | | — | | | | — | |
| | | |
| December 31, 2016 | William Blair Funds | 145 |
Transactions in written call and put options for Macro Allocation Fund for the year ended December 31, 2016 were as follows:
| | | # of
Contracts | | | Premium
(in thousands) | |
| Balance at December 31, 2015 | | | 4,746 | | | | $ | 652 | |
| Sales | | | 72,700 | | | | | 17,143 | |
| Closing Buys | | | (30,860 | ) | | | | (8,865 | ) |
| Assigned | | | (11 | ) | | | | (1 | ) |
| Expirations | | | (46,195 | ) | | | | (8,416 | ) |
| Balance at December 31, 2016 | | | 380 | | | | $ | 513 | |
(6) Financial Derivative Instruments
Each Fund may use derivative instruments to maintain liquidity, to provide hedging, or in anticipation of changes in the composition of its portfolio holdings or as otherwise provided in each Fund’s prospectus. Macro Allocation Fund may also use derivative instruments to obtain investment exposures. The derivative instruments held as of December 31, 2016, as disclosed in each Fund’s Portfolios of Investments, are representative of each Fund’s derivative instrument trading activity during the year ended December 31, 2016.
Derivative transactions carry counterparty risk as they are based on contracts between a Fund and the applicable counterparty. For exchange-traded or cleared derivative contracts, such counterparty risk is limited due to the role of the exchange or clearinghouse. OTC derivative contracts, however, are exposed to counterparty risk in the amount of unrealized gains, net of collateral held, for the duration of the contract.
Macro Allocation Fund is subject to certain netting arrangements through International Swaps and Derivatives Association, Inc. Master Agreements and Credit Support Annexes (“ISDAs”). The ISDAs maintain provisions for general obligations, representations, agreements, collateral and events of default or termination. The ISDAs cover certain OTC derivative securities entered into by Macro Allocation Fund with various counterparties and allow Macro Allocation Fund to close out and net its total exposure to a counterparty in the event of a default.
Futures Contracts
A futures contract provides for the future sale by one party and purchase by another party of a specified amount of a specific financial instrument for a specified price at a designated date, time and place. An index futures contract is an agreement pursuant to which the parties agree to take or make delivery of an amount of cash equal to the difference between the value of the index at the close of the last trading day of the contract and the price at which the index futures contract was originally written. If the offsetting purchase price is less than the original sale price, a Fund realizes a gain; if it is more, a Fund realizes a loss. Conversely, if the offsetting sale price is more than the original purchase price, a Fund realizes a gain; if it is less, a Fund realizes a loss. The transaction costs must also be included in these calculations. There can be no assurance, however, that a Fund will be able to enter into an offsetting transaction with respect to a particular futures contract at a particular time. If a Fund is not able to enter into an offsetting transaction, a Fund will continue to be required to maintain the margin deposits on the futures contract.
Upon entering into a futures contract, a Fund is required to pledge to the broker an amount of cash, U.S. government securities, or other liquid assets equal to a certain percentage of the contract amount (“initial margin deposit”). Futures contracts are marked to market daily and an appropriate payable or receivable for the change in value (“variation margin”) is recorded by a Fund and a cash payment is either made to or received from the broker. Futures held through swaps are marked to market daily, however, a Fund does not make or receive cash payments to/from the broker. Gains or losses are recognized but not considered realized until the contracts expire or are closed and are included in the Statement of Operations.
Options
The purchase or sale of an option by a Fund involves the payment or receipt of a premium by the investor and the corresponding right or obligation, as the case may be, either to purchase or sell the underlying security, commodity, or other instrument for a specific price at a certain time or during a certain period. Purchasing options involves the risk that the underlying instrument will not change price in the manner expected, so the investor loses its premium. Writing options involves potentially greater risk because the investor is exposed to the extent of the actual price movement in the underlying security rather than only the amount of the premium paid (which could result in a potentially unlimited loss). OTC options also involve counterparty credit risk. Purchased options are shown as an asset on the Statement of Assets and Liabilities and are included in Investments in securities. Premiums received for written options are shown as a liability on the Statement of Assets and Liabilities. Realized gains and losses on the sale, expiration or assignment of an option are disclosed on the Statement of Operations.
| 146 | Annual Report | December 31, 2016 |
Forward Foreign Currency Contracts
The Global Equity, International Equity and Multi-Asset and Alternative Funds may enter into forward foreign currency contracts. When entering into a forward foreign currency contract, a Fund agrees to receive or deliver a fixed quantity of foreign currency for an agreed-upon price on an agreed future date. A Fund’s net equity therein, representing unrealized gain or loss on the contracts as measured by the difference between the forward foreign exchange rates at the dates of entry into the contracts and the forward rates at the reporting date, is included in the Statement of Assets and Liabilities. Realized and unrealized gains and losses are included in the Statement of Operations. These instruments may involve market risk, credit risk, or both kinds of risks in excess of the amount recognized in the Statement of Assets and Liabilities. Risks arise from the possible inability of counterparties to meet the terms of their contracts and from the price movements in currencies.
Swap Contracts
Swap agreements may include total return, interest rate, securities index, commodity, security, currency exchange rate, credit default index, volatility and variance swaps. Swap agreements typically are two-party contracts entered into primarily by institutional investors for periods ranging from a few weeks to several years. Cleared swaps are transacted through futures commission merchants that are members of central clearing houses with the clearing house serving as a central counterparty similar to transactions in futures contracts. In a standard “swap” transaction, two parties agree to exchange the returns (or differentials in rates of return) earned or realized on particular predetermined investments or instruments. The gross returns to be exchanged or “swapped” between the parties are calculated with respect to a “notional amount” (i.e., the change in the value of a particular dollar amount invested at a particular interest rate, in a particular foreign currency, or in a “basket” of securities representing a particular index). Swap agreements are subject to the risk that the counterparty to the swap will default on its obligation to pay a Fund and the risk that a Fund will not be able to meet its obligations to pay the counterparty to the swap. Swap agreements may also involve fees, commissions or other costs that may reduce a Fund’s gains from a swap agreement or may cause a Fund to lose money. To the extent permitted by its investment policies and restrictions, a Fund may invest in the following types of swaps:
Credit Default Swaps—A Fund may invest in credit default swaps as a means of “buying” credit protection (i.e., attempting to mitigate the risk of default or credit quality deterioration in some portion of a Fund’s holdings) or “selling” credit protection (i.e., attempting to gain exposure to an underlying issuer’s credit quality characteristics without directly investing in that issuer). A credit default swap is a contract between a buyer and a seller of protection against a pre-defined credit event (e.g., a ratings downgrade or default) on an underlying reference obligation, which may be a single debt instrument or baskets or indices of securities. A Fund may be a buyer or seller of a credit default swap. As a seller of protection on credit default swap agreements, a Fund will generally receive from the buyer of protection a fixed rate of income throughout the term of the swap provided that there is no credit event. A Fund adds leverage to its portfolio because the Fund is subject to investment exposure on the notional amount of the swap. The maximum potential amount of future payments that a Fund as a seller of protection could be required to make under a credit default swap agreement equals the notional amount of the agreement. Notional amounts of each individual credit default swap agreement outstanding as of period end for which a Fund is the seller of protection are disclosed in Portfolio of Investments. These potential amounts would be partially offset by any recovery values of the respective referenced obligations, upfront payments received upon entering into the agreement, or net amounts received from the settlement of buy protection credit default swap agreements entered into by a Fund for the same referenced entity or entities. For credit default swap contracts on credit indices, the quoted market prices and resulting values serve as an indicator of the payment performance risk. Increasing market values, in absolute terms when compared to the notional amount of the swap, represent deterioration of the referenced entities’ credit soundness and a greater likelihood or risk of default or other credit event occurring as defined under the terms of the swap.
Interest Rate Swap—A Fund may invest in interest rate swaps to gain or mitigate exposure to changes in interest rates. Interest rate swap agreements involve a commitment between parties to pay either a fixed interest rate or a floating interest rate based on a notional amount of principal. The parties make payments at predetermined intervals throughout the life of the swap. As a payer, a Fund would make the fixed payment and receive the floating payment. As a receiver, a Fund would make the floating payment and receive the fixed payment.
Total Return Swap—A Fund may invest in total return swaps to gain or mitigate exposure to an underlying security, or securities. Total return swap agreements may involve commitments to pay interest in exchange for the return on the underlying security, or securities. At maturity, a net cash flow is exchanged between the parties based on the total return of the underlying security, or securities, less a financing rate. As a receiver, a Fund would receive a payment for a positive return and would make a payment for a negative return. As a payer, a Fund would make a payment for a positive return and would receive a payment for a negative return.
| December 31, 2016 | William Blair Funds | 147 |
Variance Swap—A Fund may invest in variance swaps in order to gain or mitigate its exposure to an underlying reference entity such as a broad based index. A variance swap is an agreement between two parties to exchange cash flows based on the measured variance of a reference entity. The payer agrees to exchange the fixed rate, or the variance strike price of the reference entity, to the receiver for the floating rate, or realized variance price of the reference entity. At the time the trade is originated, the agreed upon variance strike price is generally set so that the fair value of the swap is near zero. At maturity, a net cash flow is exchanged between the parties based on the difference between the final realized variance price of the swap and the variance strike price multiplied by the notional, or vega amount. As a receiver of the floating rate, a Fund would receive a payment if the final realized variance price is greater than the variance strike price and would make a payment if the final realized variance price is less than the variance strike price. As a payer of the floating rate, a Fund would receive a payment if the final realized variance price is less than the variance strike price and would make a payment if the final realized variance price is greater than the variance strike price.
The following table presents the value of financial derivative instruments, by primary risk exposure, as of December 31, 2016 and their respective location on the Statements of Assets and Liabilities (in thousands):
| | | Assets | | Liabilities |
| Primary Risk Exposure | | Statements of Assets
and Liabilities | | Value | | Statements of Assets
and Liabilities | | Value |
| Bond | | | | | | | | |
| Credit | | Receivable for variation margin on centrally cleared swaps | | $ — | | Payable for variation margin on centrally cleared swaps | | $ 165 |
| Macro Allocation | | | | | | | | |
| Credit | | Receivable for variation margin on centrally cleared swaps | | 160 | | Payable for variation margin on centrally cleared swaps | | 58 |
| Currency | | Unrealized appreciation on forward currency contracts | | 15,274 | | Unrealized depreciation on forward currency contracts | | 8,666 |
| Equity | | Investments in securities, at value | | 1,503 | | Options written, at value | | 900 |
| Equity | | Receivable for variation margin on futures | | 11,322 | | Payable for variation margin on futures | | 7,057 |
| Equity | | Unrealized appreciation on swap contract | | 9,522 | | Unrealized depreciation on swap contract | | 1,198 |
| Interest rate | | Receivable for variation margin on futures | | 1,171 | | Payable for variation margin on futures | | 868 |
| Interest rate | | Receivable for variation margin on centrally cleared swaps | | 1,710 | | Payable for variation margin on centrally cleared swaps | | — |
The table above includes cumulative appreciation/(depreciation) of exchange-traded and centrally cleared derivative contracts as reported in the Portfolio of Investments. Only variation margin receivable/payable on exchange-traded and centrally cleared derivative contracts is reported within the Statements of Assets and Liabilities.
| 148 | Annual Report | December 31, 2016 |
The following table indicates the effect of derivatives, by primary risk exposure, on the Statements of Operations for the year ended December 31, 2016 (in thousands):
| | | Realized Gain (Loss) | | | Change in Net Unrealized
Appreciation (Depreciation) | |
| Primary Risk Exposure | | Statements of Operations | | Value | | | Statements of Operations | | Value | |
| Bond | | | | | | | | | | | | |
| Interest rate | | Options | | $ | (95 | ) | | Options | | $ | 93 | |
| Credit | | Swaps | | | (247 | ) | | Swaps | | | (128 | ) |
| Income | | | | | | | | | | | | |
| Interest rate | | Options | | | (47 | ) | | Options | | | 46 | |
| Low Duration | | | | | | | | | | | | |
| Interest rate | | Options | | | (95 | ) | | Options | | | 93 | |
| Macro Allocation | | | | | | | | | | | | |
| Credit | | Swaps | | | 1,483 | | | Swaps | | | (56 | ) |
| Currency | | Forward foreign currency contracts | | | 29,084 | | | Forward foreign currency contracts | | | 4,875 | |
| Currency | | Options | | | 1,233 | | | Options | | | 1,355 | |
| Equity | | Futures contracts | | | (63,053 | ) | | Futures contracts | | | 1,168 | |
| Equity | | Options | | | (22,830 | ) | | Options | | | 5,166 | |
| Equity | | Swaps | | | (24,682 | ) | | Swaps | | | 11,470 | |
| Interest rate | | Futures contracts | | | (8,470 | ) | | Futures contracts | | | 772 | |
| Interest rate | | Options | | | 1,146 | | | Options | | | 796 | |
| Interest rate | | Swaps | | | (4,018 | ) | | Swaps | | | 2,506 | |
The following table indicates gross OTC derivative asset exposure, by investment type, included in the Statements of Assets and Liabilities at December 31, 2016 (in thousands):
| | | | | | | | | Net Amounts of | | | Gross Amounts Not Offset | | | | |
| | | | | | Gross Amounts | | | Assets | | | in the Statements | | | | |
| | | Gross | | | Offset in the | | | Presented in the | | | of Assets and Liabilities | | | | |
| | | Amounts of | | | Statements of | | | Statements of | | | | | Cash | | | | |
| | | Recognized | | | Assets and | | | Assets and | | | Financial | | Collateral | | | Net | |
| Description | | Assets | | | Liabilities | | | Liabilities | | | Instruments | | Received | | | Amount | |
| Macro Allocation | | | | | | | | | | | | | | | | | | | | | | | | |
| Citibank N.A. | | | | | | | | | | | | | | | | | | | | | | | | |
| Forward foreign currency contracts | | | $15,274 | | | | $(8,666 | ) | | | $6,608 | | | $ | — | | | $ | — | | | | $6,608 | |
| Swaps | | | 6,467 | | | | (257 | ) | | | 6,210 | | | | — | | | | — | | | | 6,210 | |
| Credit Suisse | | | | | | | | | | | | | | | | | | | | | | | | |
| Swaps | | | 1,975 | | | | — | | | | 1,975 | | | | — | | | | — | | | | 1,975 | |
| Goldman Sachs | | | | | | | | | | | | | | | | | | | | | | | | |
| Swaps | | | 1,080 | | | | (941 | ) | | | 139 | | | | — | | | | — | | | | 139 | |
The following table indicates gross OTC derivative liability exposure, by investment type, included in the Statements of Assets and Liabilities at December 31, 2016 (in thousands):
| | | | | | | | | Net Amounts of | | | Gross Amounts Not Offset | | | | |
| | | | | | Gross Amounts | | | Liabilities | | | in the Statements | | | | |
| | | Gross | | | Offset in the | | | Presented in the | | | of Assets and Liabilities | | | | |
| | | Amounts of | | | Statements of | | | Statements of | | | | | Cash | | | Net Amount | |
| | | Recognized | | | Assets and | | | Assets and | | | Financial | | Collateral | | | (not less | |
| Description | | Liabilities | | | Liabilities | | | Liabilities | | | Instruments | | Pledged | | | than zero) | |
| Macro Allocation | | | | | | | | | | | | | | | | | | | | | | | | |
| Citibank N.A. | | | | | | | | | | | | | | | | | | | | | | | | |
| Forward foreign currency contracts | | | $8,666 | | | | $(8,666 | ) | | $ | — | | | $ | — | | | $ | — | | | $ | — | |
| Swaps | | | 257 | | | | (257 | ) | | | — | | | | — | | | | — | | | | — | |
| Credit Suisse | | | | | | | | | | | | | | | | | | | | | | | | |
| Swaps | | | — | | | | — | | | | — | | | | — | | | | — | | | | — | |
| Goldman Sachs | | | | | | | | | | | | | | | | | | | | | | | | |
| Swaps | | | 941 | | | | (941 | ) | | | — | | | | — | | | | — | | | | — | |
| | | |
| December 31, 2016 | William Blair Funds | 149 |
(7) Fund Share Transactions
The following tables summarize the activity in capital shares of each Fund for the year ended December 31, 2016 (in thousands):
| | | Class N |
| | | Dollars | | | Shares |
| Fund | | Sales | | | Reinvest | | | Redemptions | | | Total | | | Sales | | | Reinvest | | | Redemptions | | | Total |
| Growth | | $ | 9,467 | | | | $ 5,146 | | | | $ 94,833 | | | $ | (80,220 | ) | | | 788 | | | | 443 | | | | 7,679 | | | | (6,448 | ) |
| Large Cap Growth | | | 4,864 | | | | 106 | | | | 3,803 | | | | 1,167 | | | | 491 | | | | 10 | | | | 374 | | | | 127 | |
| Mid Cap Growth | | | 4,539 | | | | 895 | | | | 13,379 | | | | (7,945 | ) | | | 406 | | | | 83 | | | | 1,195 | | | | (706 | ) |
| Mid Cap Value | | | 646 | | | | 32 | | | | 1,115 | | | | (437 | ) | | | 63 | | | | 3 | | | | 101 | | | | (35 | ) |
| Small-Mid Cap Growth | | | 113,600 | | | | 5,308 | | | | 126,533 | | | | (7,625 | ) | | | 6,197 | | | | 274 | | | | 6,683 | | | | (213 | ) |
| Small-Mid Cap Value | | | 125 | | | | 11 | | | | 809 | | | | (673 | ) | | | 9 | | | | 1 | | | | 60 | | | | (50 | ) |
| Small Cap Growth | | | 12,086 | | | | 6,495 | | | | 25,495 | | | | (6,914 | ) | | | 508 | | | | 256 | | | | 1,107 | | | | (344 | ) |
| Small Cap Value | | | 7,503 | | | | 1,379 | | | | 14,985 | | | | (6,103 | ) | | | 420 | | | | 68 | | | | 834 | | | | (346 | ) |
| Global Leaders | | | 1,161 | | | | 25 | | | | 1,045 | | | | 141 | | | | 102 | | | | 2 | | | | 91 | | | | 13 | |
| International Leaders | | | 2,880 | | | | 23 | | | | 296 | | | | 2,607 | | | | 219 | | | | 2 | | | | 23 | | | | 198 | |
| International Equity | | | 610 | | | | 28 | | | | 652 | | | | (14 | ) | | | 44 | | | | 2 | | | | 48 | | | | (2 | ) |
| International Growth | | | 123,169 | | | | 10,806 | | | | 379,107 | | | | (245,132 | ) | | | 5,287 | | | | 456 | | | | 16,222 | | | | (10,479 | ) |
| International Small Cap Growth | | | 1,426 | | | | 6 | | | | 1,941 | | | | (509 | ) | | | 111 | | | | — | | | | 147 | | | | (35 | ) |
| Emerging Markets Leaders | | | 4,956 | | | | — | | | | 4,133 | | | | 823 | | | | 628 | | | | — | | | | 519 | | | | 109 | |
| Emerging Markets Growth | | | 858 | | | | 16 | | | | 1,801 | | | | (927 | ) | | | 74 | | | | 1 | | | | 165 | | | | (91 | ) |
| Emerging Markets Small Cap Growth | | | 1,900 | | | | 209 | | | | 3,416 | | | | (1,307 | ) | | | 131 | | | | 15 | | | | 233 | | | | (88 | ) |
| Bond | | | 47,846 | | | | 5,196 | | | | 67,665 | | | | (14,623 | ) | | | 4,541 | | | | 491 | | | | 6,406 | | | | (1,373 | ) |
| Income | | | 26,745 | | | | 1,042 | | | | 7,630 | | | | 20,157 | | | | 2,982 | | | | 116 | | | | 853 | | | | 2,244 | |
| Low Duration | | | 10,021 | | | | 138 | | | | 5,546 | | | | 4,613 | | | | 1,094 | | | | 15 | | | | 607 | | | | 502 | |
| Macro Allocation | | | 17,989 | | | | 1,159 | | | | 108,539 | | | | (89,391 | ) | | | 1,604 | | | | 102 | | | | 9,603 | | | | (7,898 | ) |
| | | Class I |
| | | Dollars | | | Shares |
| Fund | | Sales | | | Reinvest | | | Redemptions | | | Total | | | Sales | | | Reinvest | | | Redemptions | | | Total |
| Growth | | $ | 66,424 | | | $ | 39,081 | | | $ | 244,314 | | | $ | (138,809 | ) | | | 5,099 | | | | 3,099 | | | | 18,262 | | | | (10,064 | ) |
| Large Cap Growth | | | 70,565 | | | | 1,028 | | | | 21,630 | | | | 49,963 | | | | 6,693 | | | | 94 | | | | 2,041 | | | | 4,746 | |
| Mid Cap Growth | | | 16,108 | | | | 6,216 | | | | 70,745 | | | | (48,421 | ) | | | 1,384 | | | | 547 | | | | 6,111 | | | | (4,180 | ) |
| Mid Cap Value | | | 448 | | | | 245 | | | | 104 | | | | 589 | | | | 42 | | | | 24 | | | | 10 | | | | 56 | |
| Small-Mid Cap Growth | | | 420,054 | | | | 27,743 | | | | 419,796 | | | | 28,001 | | | | 21,989 | | | | 1,375 | | | | 21,830 | | | | 1,535 | |
| Small-Mid Cap Value | | | 515 | | | | 153 | | | | 1,155 | | | | (487 | ) | | | 37 | | | | 11 | | | | 85 | | | | (37 | ) |
| Small Cap Growth | | | 39,550 | | | | 13,976 | | | | 73,676 | | | | (20,150 | ) | | | 1,629 | | | | 509 | | | | 3,002 | | | | (863 | ) |
| Small Cap Value | | | 125,892 | | | | 27,400 | | | | 165,322 | | | | (12,030 | ) | | | 6,790 | | | | 1,319 | | | | 9,363 | | | | (1,254 | ) |
| Global Leaders | | | 5,749 | | | | 326 | | | | 6,299 | | | | (224 | ) | | | 532 | | | | 28 | | | | 578 | | | | (17 | ) |
| International Leaders | | | 31,408 | | | | 263 | | | | 13,815 | | | | 17,856 | | | | 2,394 | | | | 21 | | | | 1,064 | | | | 1,352 | |
| International Equity | | | 25,097 | | | | 752 | | | | 1,912 | | | | 23,937 | | | | 1,839 | | | | 55 | | | | 138 | | | | 1,756 | |
| International Growth | | | 314,813 | | | | 37,332 | | | | 650,196 | | | | (298,051 | ) | | | 12,910 | | | | 1,540 | | | | 26,315 | | | | (11,865 | ) |
| International Small Cap Growth | | | 49,281 | | | | 957 | | | | 71,025 | | | | (20,787 | ) | | | 3,795 | | | | 75 | | | | 5,375 | | | | (1,505 | ) |
| Emerging Markets Leaders | | | 8,555 | | | | 37 | | | | 11,170 | | | | (2,578 | ) | | | 1,075 | | | | 5 | | | | 1,466 | | | | (386 | ) |
| Emerging Markets Growth | | | 21,878 | | | | 337 | | | | 57,207 | | | | (34,992 | ) | | | 1,950 | | | | 30 | | | | 5,441 | | | | (3,461 | ) |
| Emerging Markets Small Cap Growth | | | 43,213 | | | | 3,892 | | | | 47,652 | | | | (547 | ) | | | 2,935 | | | | 284 | | | | 3,380 | | | | (160 | ) |
| Bond | | | 138,784 | | | | 9,626 | | | | 64,741 | | | | 83,669 | | | | 13,339 | | | | 918 | | | | 6,186 | | | | 8,070 | |
| Income | | | 10,568 | | | | 1,718 | | | | 16,655 | | | | (4,369 | ) | | | 1,187 | | | | 193 | | | | 1,872 | | | | (491 | ) |
| Low Duration | | | 165,703 | | | | 2,839 | | | | 54,154 | | | | 114,388 | | | | 18,168 | | | | 311 | | | | 5,941 | | | | 12,539 | |
| Macro Allocation | | | 361,647 | | | | 19,375 | | | | 599,216 | | | | (218,194 | ) | | | 31,812 | | | | 1,704 | | | | 52,704 | | | | (19,188 | ) |
| 150 | Annual Report | December 31, 2016 |
| | | Institutional Class |
| | | Dollars | | | Shares |
| Fund | | Sales | | | Reinvest | | | Redemptions | | | Total | | | Sales | | | Reinvest | | | Redemptions | | | Total |
| Global Leaders | | $ | 25,666 | | | $ | 893 | | | $ | 38,608 | | | $ | (12,049 | ) | | | 2,298 | | | | 76 | | | | 3,467 | | | | (1,094 | ) |
| International Leaders | | | 124,198 | | | | 1,497 | | | | 8,121 | | | | 117,574 | | | | 9,710 | | | | 117 | | | | 612 | | | | 9,214 | |
| Institutional International Equity | | | 967 | | | | 336 | | | | 383 | | | | 920 | | | | 79 | | | | 29 | | | | 31 | | | | 77 | |
| Institutional International Growth | | | 237,672 | | | | 22,693 | | | | 412,093 | | | | (151,728 | ) | | | 16,189 | | | | 1,572 | | | | 28,755 | | | | (10,994 | ) |
| International Small Cap Growth | | | 12,637 | | | | 864 | | | | 25,062 | | | | (11,561 | ) | | | 964 | | | | 67 | | | | 1,860 | | | | (830 | ) |
| Emerging Markets Leaders | | | 228,531 | | | | 512 | | | | 46,393 | | | | 182,650 | | | | 28,514 | | | | 65 | | | | 5,946 | | | | 22,633 | |
| Emerging Markets Growth | | | 352,867 | | | | 3,701 | | | | 272,272 | | | | 84,296 | | | | 30,987 | | | | 332 | | | | 23,869 | | | | 7,451 | |
| Emerging Markets Small Cap Growth | | | 16,666 | | | | 2,913 | | | | 7,180 | | | | 12,399 | | | | 1,128 | | | | 212 | | | | 488 | | | | 852 | |
| Bond | | | 10,764 | | | | 3,795 | | | | 24,354 | | | | (9,795 | ) | | | 1,038 | | | | 363 | | | | 2,306 | | | | (905 | ) |
| Low Duration | | | 45,205 | | | | 651 | | | | 14,239 | | | | 31,617 | | | | 4,958 | | | | 71 | | | | 1,559 | | | | 3,469 | |
| Macro Allocation | | | 220,921 | | | | 13,540 | | | | 79,417 | | | | 155,044 | | | | 19,441 | | | | 1,190 | | | | 6,963 | | | | 13,669 | |
| | | Net Change in Net Assets Relating to Fund Share Activity |
| | | Dollars | | | Shares |
| Fund | | Sales | | | Reinvest | | | Redemptions | | | Total | | | Sales | | | Reinvest | | | Redemptions | | | Total |
| Growth | | $ | 75,891 | | | $ | 44,227 | | | $ | 339,147 | | | $ | (219,029 | ) | | | 5,887 | | | | 3,542 | | | | 25,941 | | | | (16,512 | ) |
| Large Cap Growth | | | 75,429 | | | | 1,134 | | | | 25,433 | | | | 51,130 | | | | 7,184 | | | | 104 | | | | 2,415 | | | | 4,873 | |
| Mid Cap Growth | | | 20,647 | | | | 7,111 | | | | 84,124 | | | | (56,366 | ) | | | 1,790 | | | | 630 | | | | 7,306 | | | | (4,886 | ) |
| Mid Cap Value | | | 1,094 | | | | 277 | | | | 1,219 | | | | 152 | | | | 105 | | | | 27 | | | | 111 | | | | 21 | |
| Small-Mid Cap Growth | | | 533,654 | | | | 33,051 | | | | 546,329 | | | | 20,376 | | | | 28,186 | | | | 1,649 | | | | 28,513 | | | | 1,322 | |
| Small-Mid Cap Value | | | 640 | | | | 164 | | | | 1,964 | | | | (1,160 | ) | | | 46 | | | | 12 | | | | 145 | | | | (87 | ) |
| Small Cap Growth | | | 51,636 | | | | 20,471 | | | | 99,171 | | | | (27,064 | ) | | | 2,137 | | | | 765 | | | | 4,109 | | | | (1,207 | ) |
| Small Cap Value | | | 133,395 | | | | 28,779 | | | | 180,307 | | | | (18,133 | ) | | | 7,210 | | | | 1,387 | | | | 10,197 | | | | (1,600 | ) |
| Global Leaders | | | 32,576 | | | | 1,244 | | | | 45,952 | | | | (12,132 | ) | | | 2,932 | | | | 106 | | | | 4,136 | | | | (1,098 | ) |
| International Leaders | | | 158,486 | | | | 1,783 | | | | 22,232 | | | | 138,037 | | | | 12,323 | | | | 140 | | | | 1,699 | | | | 10,764 | |
| International Equity | | | 25,707 | | | | 780 | | | | 2,564 | | | | 23,923 | | | | 1,883 | | | | 54 | | | | 183 | | | | 1,754 | |
| Institutional International Equity | | | 967 | | | | 336 | | | | 383 | | | | 920 | | �� | | 79 | | | | 29 | | | | 31 | | | | 77 | |
| International Growth | | | 437,982 | | | | 48,138 | | | | 1,029,303 | | | | (543,183 | ) | | | 18,197 | | | | 1,996 | | | | 42,537 | | | | (22,344 | ) |
| Institutional International Growth | | | 237,672 | | | | 22,693 | | | | 412,093 | | | | (151,728 | ) | | | 16,189 | | | | 1,572 | | | | 28,755 | | | | (10,994 | ) |
| International Small Cap Growth | | | 63,344 | | | | 1,827 | | | | 98,028 | | | | (32,857 | ) | | | 4,870 | | | | 142 | | | | 7,382 | | | | (2,370 | ) |
| Emerging Markets Leaders | | | 242,042 | | | | 549 | | | | 61,696 | | | | 180,895 | | | | 30,217 | | | | 70 | | | | 7,931 | | | | 22,356 | |
| Emerging Markets Growth | | | 375,603 | | | | 4,054 | | | | 331,280 | | | | 48,377 | | | | 33,011 | | | | 363 | | | | 29,475 | | | | 3,899 | |
| Emerging Markets Small Cap Growth | | | 61,779 | | | | 7,014 | | | | 58,248 | | | | 10,545 | | | | 4,194 | | | | 511 | | | | 4,101 | | | | 604 | |
| Bond | | | 197,394 | | | | 18,617 | | | | 156,760 | | | | 59,251 | | | | 18,918 | | | | 1,772 | | | | 14,898 | | | | 5,792 | |
| Income | | | 37,313 | | | | 2,760 | | | | 24,285 | | | | 15,788 | | | | 4,169 | | | | 309 | | | | 2,725 | | | | 1,753 | |
| Low Duration | | | 220,929 | | | | 3,628 | | | | 73,939 | | | | 150,618 | | | | 24,220 | | | | 397 | | | | 8,107 | | | | 16,510 | |
| Macro Allocation | | | 600,557 | | | | 34,074 | | | | 787,172 | | | | (152,541 | ) | | | 52,857 | | | | 2,996 | | | | 69,270 | | | | (13,417 | ) |
| December 31, 2016 | William Blair Funds | 151 |
The following tables summarize the activity in capital shares of each Fund for the year ended December 31, 2015 (in thousands):
| | | Class N |
| | | Dollars | | | Shares |
| Fund | | Sales | | | Reinvest | | | Redemptions | | | Total | | | Sales | | | Reinvest | | | Redemptions | | | Total |
| Growth | | $ | 20,920 | | | $ | 18,415 | | | $ | 155,588 | | | $ | (116,253 | ) | | | 1,510 | | | | 1,477 | | | | 11,153 | | | | (8,166 | ) |
| Large Cap Growth | | | 3,479 | | | | 966 | | | | 2,462 | | | | 1,983 | | | | 315 | | | | 96 | | | | 226 | | | | 185 | |
| Mid Cap Growth | | | 5,086 | | | | 4,873 | | | | 16,859 | | | | (6,900 | ) | | | 358 | | | | 436 | | | | 1,203 | | | | (409 | ) |
| Mid Cap Value | | | 632 | | | | 151 | | | | 127 | | | | 656 | | | | 50 | | | | 15 | | | | 10 | | | | 55 | |
| Small-Mid Cap Growth | | | 113,394 | | | | 8,500 | | | | 28,874 | | | | 93,020 | | | | 5,722 | | | | 460 | | | | 1,469 | | | | 4,713 | |
| Small-Mid Cap Value | | | 72 | | | | 7 | | | | 100 | | | | (21 | ) | | | 5 | | | | 1 | | | | 7 | | | | (1 | ) |
| Small Cap Growth | | | 11,167 | | | | 9,324 | | | | 41,312 | | | | (20,821 | ) | | | 440 | | | | 416 | | | | 1,662 | | | | (806 | ) |
| Small Cap Value | | | 5,971 | | | | 107 | | | | 10,763 | | | | (4,685 | ) | | | 344 | | | | 6 | | | | 616 | | | | (266 | ) |
| Global Leaders | | | 766 | | | | 246 | | | | 275 | | | | 737 | | | | 61 | | | | 21 | | | | 22 | | | | 60 | |
| International Leaders | | | 226 | | | | 2 | | | | 8 | | | | 220 | | | | 18 | | | | — | | | | 1 | | | | 17 | |
| International Equity | | | 279 | | | | 26 | | | | 830 | | | | (525 | ) | | | 19 | | | | 2 | | | | 57 | | | | (36 | ) |
| International Growth | | | 359,131 | | | | 9,388 | | | | 312,397 | | | | 56,122 | | | | 14,223 | | | | 378 | | | | 12,310 | | | | 2,291 | |
| International Small Cap Growth | | | 2,310 | | | | 205 | | | | 5,668 | | | | (3,153 | ) | | | 176 | | | | 15 | | | | 439 | | | | (248 | ) |
| Emerging Markets Leaders | | | 6,520 | | | | 2 | | | | 6,488 | | | | 34 | | | | 751 | | | | — | | | | 746 | | | | 5 | |
| Emerging Markets Growth | | | 2,105 | | | | 97 | | | | 3,386 | | | | (1,184 | ) | | | 164 | | | | 9 | | | | 289 | | | | (116 | ) |
| Emerging Markets Small Cap Growth | | | 5,302 | | | | 473 | | | | 3,847 | | | | 1,928 | | | | 319 | | | | 32 | | | | 240 | | | | 111 | |
| Bond | | | 137,843 | | | | 1,819 | | | | 14,345 | | | | 125,317 | | | | 13,112 | | | | 173 | | | | 1,372 | | | | 11,913 | |
| Income | | | 13,105 | | | | 972 | | | | 14,256 | | | | (179 | ) | | | 1,439 | | | | 107 | | | | 1,574 | | | | (28 | ) |
| Low Duration | | | 1,525 | | | | 49 | | | | 3,744 | | | | (2,170 | ) | | | 164 | | | | 5 | | | | 403 | | | | (234 | ) |
| Macro Allocation | | | 180,974 | | | | 898 | | | | 162,486 | | | | 19,386 | | | | 14,474 | | | | 79 | | | | 13,669 | | | | 884 | |
| | | Class I |
| | | Dollars | | | Shares |
| Fund | | Sales | | | Reinvest | | | Redemptions | | | Total | | | Sales | | | Reinvest | | | Redemptions | | | Total |
| Growth | | $ | 101,867 | | | $ | 77,422 | | | $ | 125,622 | | | $ | 53,667 | | | | 6,840 | | | | 5,761 | | | | 8,641 | | | | 3,960 | |
| Large Cap Growth | | | 13,673 | | | | 4,410 | | | | 8,280 | | | | 9,803 | | | | 1,213 | | | | 418 | | | | 736 | | | | 895 | |
| Mid Cap Growth | | | 28,076 | | | | 34,703 | | | | 159,407 | | | | (96,628 | ) | | | 1,907 | | | | 2,974 | | | | 10,676 | | | | (5,795 | ) |
| Mid Cap Value | | | 29 | | | | 422 | | | | 1,620 | | | | (1,169 | ) | | | 2 | | | | 43 | | | | 124 | | | | (79 | ) |
| Small-Mid Cap Growth | | | 314,765 | | | | 48,836 | | | | 122,703 | | | | 240,898 | | | | 15,422 | | | | 2,545 | | | | 6,027 | | | | 11,940 | |
| Small-Mid Cap Value | | | 363 | | | | 129 | | | | 402 | | | | 90 | | | | 27 | | | | 10 | | | | 30 | | | | 7 | |
| Small Cap Growth | | | 82,937 | | | | 19,650 | | | | 175,942 | | | | (73,355 | ) | | | 3,105 | | | | 816 | | | | 6,445 | | | | (2,524 | ) |
| Small Cap Value | | | 168,226 | | | | 2,938 | | | | 103,403 | | | | 67,761 | | | | 9,544 | | | | 173 | | | | 5,798 | | | | 3,919 | |
| Global Leaders | | | 11,928 | | | | 2,130 | | | | 19,402 | | | | (5,344 | ) | | | 963 | | | | 185 | | | | 1,586 | | | | (438 | ) |
| International Leaders | | | 4,408 | | | | 96 | | | | 1,095 | | | | 3,409 | | | | 340 | | | | 7 | | | | 83 | | | | 264 | |
| International Equity | | | 5,376 | | | | 680 | | | | 10,778 | | | | (4,722 | ) | | | 365 | | | | 49 | | | | 730 | | | | (316 | ) |
| International Growth | | | 477,894 | | | | 27,497 | | | | 523,541 | | | | (18,150 | ) | | | 17,911 | | | | 1,082 | | | | 19,687 | | | | (694 | ) |
| International Small Cap Growth | | | 62,196 | | | | 6,895 | | | | 116,983 | | | | (47,892 | ) | | | 4,698 | | | | 511 | | | | 8,807 | | | | (3,598 | ) |
| Emerging Markets Leaders | | | 15,832 | | | | 113 | | | | 5,667 | | | | 10,278 | | | | 1,800 | | | | 15 | | | | 709 | | | | 1,106 | |
| Emerging Markets Growth | | | 46,581 | | | | 1,207 | | | | 55,599 | | | | (7,811 | ) | | | 3,709 | | | | 109 | | | | 4,716 | | | | (898 | ) |
| Emerging Markets Small Cap Growth | | | 107,086 | | | | 4,486 | | | | 51,918 | | | | 59,654 | | | | 6,516 | | | | 302 | | | | 3,162 | | | | 3,656 | |
| Bond | | | 136,906 | | | | 4,457 | | | | 45,989 | | | | 95,374 | | | | 13,136 | | | | 426 | | | | 4,406 | | | | 9,156 | |
| Income | | | 10,900 | | | | 1,714 | | | | 13,153 | | | | (539 | ) | | | 1,216 | | | | 191 | | | | 1,466 | | | | (59 | ) |
| Low Duration | | | 41,356 | | | | 1,978 | | | | 38,076 | | | | 5,258 | | | | 4,452 | | | | 213 | | | | 4,113 | | | | 552 | |
| Macro Allocation | | | 1,054,314 | | | | 8,797 | | | | 456,003 | | | | 607,108 | | | | 85,643 | | | | 772 | | | | 38,103 | | | | 48,312 | |
| 152 | Annual Report | December 31, 2016 |
| | | Institutional Class |
| | | Dollars | | | Shares |
| Fund | | Sales | | | Reinvest | | | Redemptions | | | Total | | | Sales | | | Reinvest | | | Redemptions | | | Total |
| Global Leaders | | $ | 29,091 | | | $ | 6,610 | | | $ | 1,181 | | | $ | 34,520 | | | | 2,398 | | | | 574 | | | | 95 | | | | 2,877 | |
| International Leaders | | | 19,418 | | | | 675 | | | | (1 | ) | | | 20,094 | | | | 1,480 | | | | 53 | | | | — | | | | 1,533 | |
| Institutional International Equity | | | 2,425 | | | | 156 | | | | 1,154 | | | | 1,427 | | | | 187 | | | | 13 | | | | 91 | | | | 109 | |
| Institutional International Growth | | | 297,180 | | | | 28,849 | | | | 305,026 | | | | 21,003 | | | | 18,912 | | | | 1,922 | | | | 19,237 | | | | 1,597 | |
| International Small Cap Growth | | | 13,840 | | | | 4,777 | | | | 61,465 | | | | (42,848 | ) | | | 1,040 | | | | 352 | | | | 4,482 | | | | (3,090 | ) |
| Emerging Markets Leaders | | | 58,828 | | | | 434 | | | | 28,442 | | | | 30,820 | | | | 6,983 | | | | 56 | | | | 3,358 | | | | 3,681 | |
| Emerging Markets Growth | | | 266,522 | | | | 7,305 | | | | 221,791 | | | | 52,036 | | | | 22,032 | | | | 656 | | | | 17,376 | | | | 5,312 | |
| Emerging Markets Small Cap Growth | | | 10,974 | | | | 4,600 | | | | 2,911 | | | | 12,663 | | | | 660 | | | | 309 | | | | 186 | | | | 783 | |
| Bond | | | 25,382 | | | | 3,259 | | | | 18,526 | | | | 10,115 | | | | 2,443 | | | | 311 | | | | 1,756 | | | | 998 | |
| Low Duration | | | 4,653 | | | | 1,069 | | | | 50,966 | | | | (45,244 | ) | | | 497 | | | | 115 | | | | 5,489 | | | | (4,877 | ) |
| Macro Allocation | | | 324,009 | | | | 4,325 | | | | 27,615 | | | | 300,719 | | | | 26,463 | | | | 379 | | | | 2,365 | | | | 24,477 | |
| | | Net Change in Net Assets Relating to Fund Share Activity |
| | | Dollars | | | Shares |
| Fund | | Sales | | | Reinvest | | | Redemptions | | | Total | | | Sales | | | Reinvest | | | Redemptions | | | Total |
| Growth | | $ | 122,787 | | | $ | 95,837 | | | $ | 281,210 | | | $ | (62,586 | ) | | | 8,350 | | | | 7,238 | | | | 19,794 | | | | (4,206 | ) |
| Large Cap Growth | | | 17,152 | | | | 5,376 | | | | 10,742 | | | | 11,786 | | | | 1,528 | | | | 514 | | | | 962 | | | | 1,080 | |
| Mid Cap Growth | | | 33,162 | | | | 39,576 | | | | 176,266 | | | | (103,528 | ) | | | 2,265 | | | | 3,410 | | | | 11,879 | | | | (6,204 | ) |
| Mid Cap Value | | | 661 | | | | 573 | | | | 1,747 | | | | (513 | ) | | | 52 | | | | 58 | | | | 134 | | | | (24 | ) |
| Small-Mid Cap Growth | | | 428,159 | | | | 57,336 | | | | 151,577 | | | | 333,918 | | | | 21,144 | | | | 3,005 | | | | 7,496 | | | | 16,653 | |
| Small-Mid Cap Value | | | 435 | | | | 136 | | | | 502 | | | | 69 | | | | 32 | | | | 11 | | | | 37 | | | | 6 | |
| Small Cap Growth | | | 94,104 | | | | 28,974 | | | | 217,254 | | | | (94,176 | ) | | | 3,545 | | | | 1,232 | | | | 8,107 | | | | (3,330 | ) |
| Small Cap Value | | | 174,197 | | | | 3,045 | | | | 114,166 | | | | 63,076 | | | | 9,888 | | | | 179 | | | | 6,414 | | | | 3,653 | |
| Global Leaders | | | 41,785 | | | | 8,986 | | | | 20,858 | | | | 29,913 | | | | 3,422 | | | | 780 | | | | 1,703 | | | | 2,499 | |
| International Leaders | | | 24,052 | | | | 773 | | | | 1,102 | | | | 23,723 | | | | 1,838 | | | | 60 | | | | 84 | | | | 1,814 | |
| International Equity | | | 5,655 | | | | 706 | | | | 11,608 | | | | (5,247 | ) | | | 384 | | | | 51 | | | | 787 | | | | (352 | ) |
| Institutional International Equity | | | 2,425 | | | | 156 | | | | 1,154 | | | | 1,427 | | | | 187 | | | | 13 | | | | 91 | | | | 109 | |
| International Growth | | | 837,025 | | | | 36,885 | | | | 835,938 | | | | 37,972 | | | | 32,134 | | | | 1,460 | | | | 31,997 | | | | 1,597 | |
| Institutional International Growth | | | 297,180 | | | | 28,849 | | | | 305,026 | | | | 21,003 | | | | 18,912 | | | | 1,922 | | | | 19,237 | | | | 1,597 | |
| International Small Cap Growth | | | 78,346 | | | | 11,877 | | | | 184,116 | | | | (93,893 | ) | | | 5,914 | | | | 878 | | | | 13,728 | | | | (6,936 | ) |
| Emerging Markets Leaders | | | 81,180 | | | | 549 | | | | 40,597 | | | | 41,132 | | | | 9,534 | | | | 71 | | | | 4,813 | | | | 4,792 | |
| Emerging Markets Growth | | | 315,208 | | | | 8,609 | | | | 280,776 | | | | 43,041 | | | | 25,905 | | | | 774 | | | | 22,381 | | | | 4,298 | |
| Emerging Markets Small Cap Growth | | | 123,362 | | | | 9,559 | | | | 58,676 | | | | 74,245 | | | | 7,495 | | | | 643 | | | | 3,588 | | | | 4,550 | |
| Bond | | | 300,131 | | | | 9,535 | | | | 78,860 | | | | 230,806 | | | | 28,691 | | | | 910 | | | | 7,534 | | | | 22,067 | |
| Income | | | 24,005 | | | | 2,686 | | | | 27,409 | | | | (718 | ) | | | 2,655 | | | | 298 | | | | 3,040 | | | | (87 | ) |
| Low Duration | | | 47,534 | | | | 3,096 | | | | 92,786 | | | | (42,156 | ) | | | 5,113 | | | | 333 | | | | 10,005 | | | | (4,559 | ) |
| Macro Allocation | | | 1,559,297 | | | | 14,020 | | | | 646,104 | | | | 927,213 | | | | 126,580 | | | | 1,230 | | | | 54,137 | | | | 73,673 | |
| December 31, 2016 | William Blair Funds | 153 |
Financial Highlights
Growth Fund
| | | Class N | |
| | | Years Ended December 31, | |
| | | 2016 | | | 2015 | | | 2014 | | | 2013 | | | 2012 | |
| Net asset value, beginning of year | | $ | 12.52 | | | $ | 13.55 | | | $ | 14.79 | | | $ | 12.05 | | | $ | 10.73 | |
| Income (loss) from investment operations: | | | | | | | | | | | | | | | | | | | | |
| Net investment income (loss) | | | (0.02 | ) | | | (0.04 | ) | | | (0.07 | ) | | | (0.07 | ) | | | (0.01 | ) |
| Net realized and unrealized gain (loss) on investments | | | (0.08 | ) | | | 0.75 | | | | 1.03 | | | | 4.25 | | | | 1.69 | |
| Total from investment operations | | | (0.10 | ) | | | 0.71 | | | | 0.96 | | | | 4.18 | | | | 1.68 | |
| Less distributions from: | | | | | | | | | | | | | | | | | | | | |
| Net investment income | | | — | | | | — | | | | — | | | | — | | | | 0.00 | ^ |
| Net realized gain | | | 1.01 | | | | 1.74 | | | | 2.20 | | | | 1.44 | | | | 0.36 | |
| Total distributions | | | 1.01 | | | | 1.74 | | | | 2.20 | | | | 1.44 | | | | 0.36 | |
| Net asset value, end of year | | $ | 11.41 | | | $ | 12.52 | | | $ | 13.55 | | | $ | 14.79 | | | $ | 12.05 | |
| Total return (%) | | | (0.98 | ) | | | 5.31 | | | | 6.59 | | | | 35.00 | | | | 15.67 | |
| Ratios to average daily net assets (%): | | | | | | | | | | | | | | | | | | | | |
| Expenses | | | 1.21 | | | | 1.19 | | | | 1.18 | | | | 1.19 | | | | 1.20 | |
| Net investment income (loss) | | | (0.15 | ) | | | (0.29 | ) | | | (0.50 | ) | | | (0.51 | ) | | | (0.06 | ) |
| Class N net assets at end of year (in thousands) | | $ | 62,936 | | | $ | 149,754 | | | $ | 272,765 | | | $ | 291,326 | | | $ | 248,121 | |
| Portfolio turnover rate (%) | | | 79 | | | | 78 | | | | 100 | | | | 52 | | | | 73 | |
| | | Class I | |
| | | Years Ended December 31, | |
| | | 2016 | | | 2015 | | | 2014 | | | 2013 | | | 2012 | |
| Net asset value, beginning of year | | $ | 13.50 | | | $ | 14.43 | | | $ | 15.56 | | | $ | 12.58 | | | $ | 11.18 | |
| Income (loss) from investment operations: | | | | | | | | | | | | | | | | | | | | |
| Net investment income (loss) | | | 0.03 | | | | 0.01 | | | | (0.03 | ) | | | (0.03 | ) | | | 0.04 | |
| Net realized and unrealized gain (loss) on investments | | | (0.10 | ) | | | 0.80 | | | | 1.10 | | | | 4.45 | | | | 1.75 | |
| Total from investment operations | | | (0.07 | ) | | | 0.81 | | | | 1.07 | | | | 4.42 | | | | 1.79 | |
| Less distributions from: | | | | | | | | | | | | | | | | | | | | |
| Net investment income | | | 0.03 | | | | — | | | | — | | | | 0.00 | ^ | | | 0.03 | |
| Net realized gain | | | 1.01 | | | | 1.74 | | | | 2.20 | | | | 1.44 | | | | 0.36 | |
| Total distributions | | | 1.04 | | | | 1.74 | | | | 2.20 | | | | 1.44 | | | | 0.39 | |
| Net asset value, end of year | | $ | 12.39 | | | $ | 13.50 | | | $ | 14.43 | | | $ | 15.56 | | | $ | 12.58 | |
| Total return (%) | | | (0.69 | ) | | | 5.69 | | | | 6.96 | | | | 35.43 | | | | 16.03 | |
| Ratios to average daily net assets (%): | | | | | | | | | | | | | | | | | | | | |
| Expenses | | | 0.90 | | | | 0.89 | | | | 0.86 | | | | 0.85 | | | | 0.89 | |
| Net investment income (loss) | | | 0.20 | | | | 0.06 | | | | (0.20 | ) | | | (0.17 | ) | | | 0.30 | |
| Class I net assets at end of year (in thousands) | | $ | 514,870 | | | $ | 696,744 | | | $ | 688,038 | | | $ | 623,225 | | | $ | 468,124 | |
| Portfolio turnover rate (%) | | | 79 | | | | 78 | | | | 100 | | | | 52 | | | | 73 | |
| ^ | Amount is less than $0.005 per share. |
Note: Net investment income (loss) per share is based on the average shares outstanding during the year.
Performance cited represents past performance. Past performance does not guarantee future results and current performance may be lower or higher than the data quoted. Results shown are annual returns, which assume reinvestment of dividends and capital gains. Investment returns and principal will fluctuate and you may have a gain or loss when you sell shares. For the most current month-end performance information, please call 1-800-742-7272 or visit our Web site at www.williamblairfunds.com.
See accompanying Notes to Financial Statements.
| 154 | Annual Report | December 31, 2016 |
Financial Highlights
Large Cap Growth Fund
| | | Class N | |
| | | Years Ended December 31, | |
| | | 2016 | | | 2015 | | | 2014 | | | 2013 | | | 2012 | |
| Net asset value, beginning of year | | $ | 10.15 | | | $ | 10.46 | | | $ | 10.03 | | | $ | 8.14 | | | $ | 6.88 | |
| Income (loss) from investment operations: | | | | | | | | | | | | | | | | | | | | |
| Net investment income (loss) | | | 0.02 | | | | (0.02 | ) | | | (0.02 | ) | | | (0.03 | ) | | | (0.02 | ) |
| Net realized and unrealized gain (loss) on investments | | | 0.18 | | | | 0.75 | | | | 1.46 | | | | 2.70 | | | | 1.28 | |
| Total from investment operations | | | 0.20 | | | | 0.73 | | | | 1.44 | | | | 2.67 | | | | 1.26 | |
| Less distributions from: | | | | | | | | | | | | | | | | | | | | |
| Net investment income | | | 0.01 | | | | — | | | | — | | | | — | | | | — | |
| Net realized gain | | | 0.08 | | | | 1.04 | | | | 1.01 | | | | 0.78 | | | | — | |
| Total distributions | | | 0.09 | | | | 1.04 | | | | 1.01 | | | | 0.78 | | | | — | |
| Net asset value, end of year | | $ | 10.26 | | | $ | 10.15 | | | $ | 10.46 | | | $ | 10.03 | | | $ | 8.14 | |
| Total return (%) | | | 1.97 | | | | 7.04 | | | | 14.29 | | | | 33.00 | | | | 18.31 | |
| Ratios to average daily net assets (%): | | | | | | | | | | | | | | | | | | | | |
| Expenses, net of waivers and reimbursements | | | 1.05 | | | | 1.07 | | | | 1.13 | | | | 1.20 | | | | 1.20 | |
| Expenses, before waivers and reimbursements | | | 1.23 | | | | 1.28 | | | | 1.31 | | | | 1.46 | | | | 1.57 | |
| Net investment income (loss), net of waivers and reimbursements | | | 0.17 | | | | (0.22 | ) | | | (0.23 | ) | | | (0.36 | ) | | | (0.21 | ) |
| Net investment income (loss), before waivers and reimbursements | | | (0.01 | ) | | | (0.43 | ) | | | (0.41 | ) | | | (0.62 | ) | | | (0.58 | ) |
| Class N net assets at end of year (in thousands) | | $ | 11,860 | | | $ | 10,443 | | | $ | 8,831 | | | $ | 6,678 | | | $ | 4,238 | |
| Portfolio turnover rate (%) | | | 44 | | | | 38 | | | | 50 | | | | 48 | | | | 50 | |
| | | Class I | |
| | | Years Ended December 31, | |
| | | 2016 | | | 2015 | | | 2014 | | | 2013 | | | 2012 | |
| Net asset value, beginning of year | | $ | 10.58 | | | $ | 10.84 | | | $ | 10.33 | | | $ | 8.35 | | | $ | 7.03 | |
| Income (loss) from investment operations: | | | | | | | | | | | | | | | | | | | | |
| Net investment income (loss) | | | 0.04 | | | | (0.00 | )^ | | | 0.00 | ^ | | | (0.01 | ) | | | 0.00 | ^ |
| Net realized and unrealized gain (loss) on investments | | | 0.19 | | | | 0.78 | | | | 1.52 | | | | 2.77 | | | | 1.32 | |
| Total from investment operations | | | 0.23 | | | | 0.78 | | | | 1.52 | | | | 2.76 | | | | 1.32 | |
| Less distributions from: | | | | | | | | | | | | | | | | | | | | |
| Net investment income | | | 0.03 | | | | — | | | | — | | | | — | | | | — | |
| Net realized gain | | | 0.08 | | | | 1.04 | | | | 1.01 | | | | 0.78 | | | | — | |
| Total distributions | | | 0.11 | | | | 1.04 | | | | 1.01 | | | | 0.78 | | | | — | |
| Net asset value, end of year | | $ | 10.70 | | | $ | 10.58 | | | $ | 10.84 | | | $ | 10.33 | | | $ | 8.35 | |
| Total return (%) | | | 2.22 | | | | 7.26 | | | | 14.65 | | | | 33.24 | | | | 18.78 | |
| Ratios to average daily net assets (%): | | | | | | | | | | | | | | | | | | | | |
| Expenses, net of waivers and reimbursements | | | 0.80 | | | | 0.82 | | | | 0.88 | | | | 0.95 | | | | 0.95 | |
| Expenses, before waivers and reimbursements | | | 0.91 | | | | 0.95 | | | | 1.00 | | | | 1.11 | | | | 1.23 | |
| Net investment income (loss), net of waivers and reimbursements | | | 0.41 | | | | 0.03 | | | | 0.02 | | | | (0.11 | ) | | | 0.03 | |
| Net investment income (loss), before waivers and reimbursements | | | 0.30 | | | | (0.10 | ) | | | (0.10 | ) | | | (0.27 | ) | | | (0.25 | ) |
| Class I net assets at end of year (in thousands) | | $ | 110,475 | | | $ | 59,038 | | | $ | 50,778 | | | $ | 40,513 | | | $ | 24,175 | |
| Portfolio turnover rate (%) | | | 44 | | | | 38 | | | | 50 | | | | 48 | | | | 50 | |
| ^ | Amount is less than $0.005 per share. |
Note: Net investment income (loss) per share is based on the average shares outstanding during the year.
Performance cited represents past performance. Past performance does not guarantee future results and current performance may be lower or higher than the data quoted. Results shown are annual returns, which assume reinvestment of dividends and capital gains. Investment returns and principal will fluctuate and you may have a gain or loss when you sell shares. For the most current month-end performance information, please call 1-800-742-7272 or visit our Web site at www.williamblairfunds.com.
| December 31, 2016 | William Blair Funds | 155 |
Financial Highlights
Mid Cap Growth Fund
| | | Class N | |
| | | Years Ended December 31, | |
| | | 2016 | | | 2015 | | | 2014 | | | 2013 | | | 2012 | |
| Net asset value, beginning of year | | $ | 11.28 | | | $ | 14.20 | | | $ | 15.21 | | | $ | 12.65 | | | $ | 11.66 | |
| Income (loss) from investment operations: | | | | | | | | | | | | | | | | | | | | |
| Net investment income (loss) | | | (0.06 | ) | | | (0.09 | ) | | | (0.12 | ) | | | (0.13 | ) | | | (0.02 | ) |
| Net realized and unrealized gain (loss) on investments | | | 0.09 | | | | 0.04 | | | | 1.26 | | | | 3.74 | | | | 1.29 | |
| Total from investment operations | | | 0.03 | | | | (0.05 | ) | | | 1.14 | | | | 3.61 | | | | 1.27 | |
| Less distributions from: | | | | | | | | | | | | | | | | | | | | |
| Net investment income | | | — | | | | — | | | | — | | | | — | | | | — | |
| Net realized gain | | | 0.62 | | | | 2.87 | | | | 2.15 | | | | 1.05 | | | | 0.28 | |
| Total distributions | | | 0.62 | | | | 2.87 | | | | 2.15 | | | | 1.05 | | | | 0.28 | |
| Net asset value, end of year | | $ | 10.69 | | | $ | 11.28 | | | $ | 14.20 | | | $ | 15.21 | | | $ | 12.65 | |
| Total return (%) | | | 0.23 | | | | (0.20 | ) | | | 7.53 | | | | 28.77 | | | | 10.90 | |
| Ratios to average daily net assets (%): | | | | | | | | | | | | | | | | | | | | |
| Expenses, net of waivers and reimbursements | | | 1.30 | | | | 1.32 | | | | 1.35 | | | | 1.35 | | | | 1.35 | |
| Expenses, before waivers and reimbursements | | | 1.45 | | | | 1.43 | | | | 1.35 | | | | 1.42 | | | | 1.42 | |
| Net investment income (loss), net of waivers and reimbursements | | | (0.53 | ) | | | (0.65 | ) | | | (0.80 | ) | | | (0.90 | ) | | | (0.15 | ) |
| Net investment income (loss), before waivers and reimbursements | | | (0.68 | ) | | | (0.76 | ) | | | (0.80 | ) | | | (0.97 | ) | | | (0.22 | ) |
| Class N net assets at end of year (in thousands) | | $ | 16,234 | | | $ | 25,105 | | | $ | 37,413 | | | $ | 41,849 | | | $ | 40,940 | |
| Portfolio turnover rate (%) | | | 60 | | | | 65 | | | | 81 | | | | 83 | | | | 62 | |
| | | Class I | |
| | | Years Ended December 31, | |
| | | 2016 | | | 2015 | | | 2014 | | | 2013 | | | 2012 | |
| Net asset value, beginning of year | | $ | 11.76 | | | $ | 14.65 | | | $ | 15.58 | | | $ | 12.91 | | | $ | 11.87 | |
| Income (loss) from investment operations: | | | | | | | | | | | | | | | | | | | | |
| Net investment income (loss) | | | (0.03 | ) | | | (0.06 | ) | | | (0.09 | ) | | | (0.10 | ) | | | 0.03 | |
| Net realized and unrealized gain (loss) on investments | | | 0.09 | | | | 0.04 | | | | 1.31 | | | | 3.82 | | | | 1.31 | |
| Total from investment operations | | | 0.06 | | | | (0.02 | ) | | | 1.22 | | | | 3.72 | | | | 1.34 | |
| Less distributions from: | | | | | | | | | | | | | | | | | | | | |
| Net investment income | | | — | | | | — | | | | — | | | | — | | | | 0.02 | |
| Net realized gain | | | 0.62 | | | | 2.87 | | | | 2.15 | | | | 1.05 | | | | 0.28 | |
| Total distributions | | | 0.62 | | | | 2.87 | | | | 2.15 | | | | 1.05 | | | | 0.30 | |
| Net asset value, end of year | | $ | 11.20 | | | $ | 11.76 | | | $ | 14.65 | | | $ | 15.58 | | | $ | 12.91 | |
| Total return (%) | | | 0.48 | | | | 0.00 | | | | 7.87 | | | | 29.04 | | | | 11.30 | |
| Ratios to average daily net assets (%): | | | | | | | | | | | | | | | | | | | | |
| Expenses, net of waivers and reimbursements | | | 1.05 | | | | 1.07 | | | | 1.10 | | | | 1.10 | | | | 1.07 | |
| Expenses, before waivers and reimbursements | | | 1.18 | | | | 1.14 | | | | 1.10 | | | | 1.15 | | | | 1.07 | |
| Net investment income (loss), net of waivers and reimbursements | | | (0.26 | ) | | | (0.41 | ) | | | (0.55 | ) | | | (0.65 | ) | | | 0.19 | |
| Net investment income (loss), before waivers and reimbursements | | | (0.39 | ) | | | (0.48 | ) | | | (0.55 | ) | | | (0.70 | ) | | | 0.19 | |
| Class I net assets at end of year (in thousands) | | $ | 119,424 | | | $ | 174,617 | | | $ | 302,373 | | | $ | 385,779 | | | $ | 329,295 | |
| Portfolio turnover rate (%) | | | 60 | | | | 65 | | | | 81 | | | | 83 | | | | 62 | |
Note: Net investment income (loss) per share is based on the average shares outstanding during the year.
Performance cited represents past performance. Past performance does not guarantee future results and current performance may be lower or higher than the data quoted. Results shown are annual returns, which assume reinvestment of dividends and capital gains. Investment returns and principal will fluctuate and you may have a gain or loss when you sell shares. For the most current month-end performance information, please call 1-800-742-7272 or visit our Web site at www.williamblairfunds.com.
| 156 | Annual Report | December 31, 2016 |
Financial Highlights
Mid Cap Value Fund
| | | Class N | |
| | | Years Ended December 31, | |
| | | 2016 | | | 2015 | | | 2014 | | | 2013 | | | 2012 | |
| Net asset value, beginning of year | | $ | 9.92 | | | $ | 12.88 | | | $ | 13.39 | | | $ | 11.39 | | | $ | 10.48 | |
| Income (loss) from investment operations: | | | | | | | | | | | | | | | | | | | | |
| Net investment income (loss) | | | 0.05 | | | | 0.07 | | | | 0.03 | | | | 0.05 | | | | 0.08 | |
| Net realized and unrealized gain (loss) on investments | | | 1.39 | | | | (0.36 | ) | | | 1.40 | | | | 3.50 | | | | 1.34 | |
| Total from investment operations | | | 1.44 | | | | (0.29 | ) | | | 1.43 | | | | 3.55 | | | | 1.42 | |
| Less distributions from: | | | | | | | | | | | | | | | | | | | | |
| Net investment income | | | 0.05 | | | | 0.03 | | | | 0.04 | | | | 0.06 | | | | 0.08 | |
| Net realized gain | | | 0.93 | | | | 2.64 | | | | 1.90 | | | | 1.49 | | | | 0.43 | |
| Total distributions | | | 0.98 | | | | 2.67 | | | | 1.94 | | | | 1.55 | | | | 0.51 | |
| Net asset value, end of year | | $ | 10.38 | | | $ | 9.92 | | | $ | 12.88 | | | $ | 13.39 | | | $ | 11.39 | |
| Total return (%) | | | 14.49 | | | | (2.13 | ) | | | 10.83 | | | | 31.46 | | | | 13.54 | |
| Ratios to average daily net assets (%): | | | | | | | | | | | | | | | | | | | | |
| Expenses, net of waivers and reimbursements | | | 1.30 | | | | 1.32 | | | | 1.35 | | | | 1.35 | | | | 1.35 | |
| Expenses, before waivers and reimbursements | | | 4.47 | | | | 4.14 | | | | 3.77 | | | | 3.37 | | | | 3.40 | |
| Net investment income (loss), net of waivers and reimbursements | | | 0.50 | | | | 0.59 | | | | 0.23 | | | | 0.36 | | | | 0.70 | |
| Net investment income (loss), before waivers and reimbursements | | | (2.67 | ) | | | (2.23 | ) | | | (2.19 | ) | | | (1.66 | ) | | | (1.35 | ) |
| Class N net assets at end of year (in thousands) | | $ | 362 | | | $ | 694 | | | $ | 189 | | | $ | 232 | | | $ | 79 | |
| Portfolio turnover rate (%) | | | 62 | | | | 53 | | | | 33 | | | | 42 | | | | 63 | |
| | | Class I | |
| | | Years Ended December 31, | |
| | | 2016 | | | 2015 | | | 2014 | | | 2013 | | | 2012 | |
| Net asset value, beginning of year | | $ | 9.94 | | | $ | 12.88 | | | $ | 13.40 | | | $ | 11.39 | | | $ | 10.48 | |
| Income (loss) from investment operations: | | | | | | | | | | | | | | | | | | | | |
| Net investment income (loss) | | | 0.09 | | | | 0.08 | | | | 0.07 | | | | 0.08 | | | | 0.10 | |
| Net realized and unrealized gain (loss) on investments | | | 1.38 | | | | (0.32 | ) | | | 1.39 | | | | 3.51 | | | | 1.35 | |
| Total from investment operations | | | 1.47 | | | | (0.24 | ) | | | 1.46 | | | | 3.59 | | | | 1.45 | |
| Less distributions from: | | | | | | | | | | | | | | | | | | | | |
| Net investment income | | | 0.12 | | | | 0.06 | | | | 0.08 | | | | 0.09 | | | | 0.11 | |
| Net realized gain | | | 0.93 | | | | 2.64 | | | | 1.90 | | | | 1.49 | | | | 0.43 | |
| Total distributions | | | 1.05 | | | | 2.70 | | | | 1.98 | | | | 1.58 | | | | 0.54 | |
| Net asset value, end of year | | $ | 10.36 | | | $ | 9.94 | | | $ | 12.88 | | | $ | 13.40 | | | $ | 11.39 | |
| Total return (%) | | | 14.75 | | | | (1.73 | ) | | | 11.04 | | | | 31.82 | | | | 13.77 | |
| Ratios to average daily net assets (%): | | | | | | | | | | | | | | | | | | | | |
| Expenses, net of waivers and reimbursements | | | 1.05 | | | | 1.07 | | | | 1.10 | | | | 1.10 | | | | 1.10 | |
| Expenses, before waivers and reimbursements | | | 4.11 | | | | 3.77 | | | | 3.08 | | | | 3.04 | | | | 3.13 | |
| Net investment income (loss), net of waivers and reimbursements | | | 0.83 | | | | 0.65 | | | | 0.49 | | | | 0.59 | | | | 0.92 | |
| Net investment income (loss), before waivers and reimbursements | | | (2.23 | ) | | | (2.05 | ) | | | (1.49 | ) | | | (1.35 | ) | | | (1.11 | ) |
| Class I net assets at end of year (in thousands) | | $ | 2,647 | | | $ | 1,974 | | | $ | 3,579 | | | $ | 4,225 | | | $ | 4,058 | |
| Portfolio turnover rate (%) | | | 62 | | | | 53 | | | | 33 | | | | 42 | | | | 63 | |
Note: Net investment income (loss) per share is based on the average shares outstanding during the year.
Performance cited represents past performance. Past performance does not guarantee future results and current performance may be lower or higher than the data quoted. Results shown are annual returns, which assume reinvestment of dividends and capital gains. Investment returns and principal will fluctuate and you may have a gain or loss when you sell shares. For the most current month-end performance information, please call 1-800-742-7272 or visit our Web site at www.williamblairfunds.com.
| December 31, 2016 | William Blair Funds | 157 |
Financial Highlights
Small-Mid Cap Growth Fund
| | | Class N | |
| | | Years Ended December 31, | |
| | | 2016 | | | 2015 | | | 2014 | | | 2013 | | | 2012 | |
| Net asset value, beginning of year | | $ | 18.53 | | | $ | 18.72 | | | $ | 18.80 | | | $ | 14.21 | | | $ | 13.00 | |
| Income (loss) from investment operations: | | | | | | | | | | | | | | | | | | | | |
| Net investment income (loss) | | | (0.09 | ) | | | (0.10 | ) | | | (0.12 | ) | | | (0.15 | ) | | | 0.02 | |
| Net realized and unrealized gain (loss) on investments | | | 1.29 | | | | 0.93 | | | | 1.68 | | | | 6.01 | | | | 1.57 | |
| Total from investment operations | | | 1.20 | | | | 0.83 | | | | 1.56 | | | | 5.86 | | | | 1.59 | |
| Less distributions from: | | | | | | | | | | | | | | | | | | | | |
| Net investment income | | | — | | | | — | | | | — | | | | — | | | | 0.02 | |
| Net realized gain | | | 0.53 | | | | 1.02 | | | | 1.64 | | | | 1.27 | | | | 0.36 | |
| Total distributions | | | 0.53 | | | | 1.02 | | | | 1.64 | | | | 1.27 | | | | 0.38 | |
| Net asset value, end of year | | $ | 19.20 | | | $ | 18.53 | | | $ | 18.72 | | | $ | 18.80 | | | $ | 14.21 | |
| Total return (%) | | | 6.45 | | | | 4.47 | | | | 8.33 | | | | 41.49 | | | | 12.20 | |
| Ratios to average daily net assets (%): | | | | | | | | | | | | | | | | | | | | |
| Expenses, net of waivers and reimbursements | | | 1.35 | | | | 1.35 | | | | 1.35 | | | | 1.35 | | | | 1.35 | |
| Expenses, before waivers and reimbursements | | | 1.43 | | | | 1.42 | | | | 1.38 | | | | 1.46 | | | | 1.47 | |
| Net investment income (loss), net of waivers and reimbursements | | | (0.51 | ) | | | (0.51 | ) | | | (0.63 | ) | | | (0.88 | ) | | | 0.16 | |
| Net investment income (loss), before waivers and reimbursements | | | (0.59 | ) | | | (0.58 | ) | | | (0.66 | ) | | | (0.99 | ) | | | 0.04 | |
| Class N net assets at end of year (in thousands) | | $ | 171,638 | | | $ | 169,595 | | | $ | 83,047 | | | $ | 73,207 | | | $ | 42,015 | |
| Portfolio turnover rate (%) | | | 66 | | | | 44 | | | | 49 | | | | 53 | | | | 82 | |
| | | Class I | |
| | | Years Ended December 31, | |
| | | 2016 | | | 2015 | | | 2014 | | | 2013 | | | 2012 | |
| Net asset value, beginning of year | | $ | 19.25 | | | $ | 19.36 | | | $ | 19.34 | | | $ | 14.55 | | | $ | 13.32 | |
| Income (loss) from investment operations: | | | | | | | | | | | | | | | | | | | | |
| Net investment income (loss) | | | (0.05 | ) | | | (0.06 | ) | | | (0.08 | ) | | | (0.11 | ) | | | 0.07 | |
| Net realized and unrealized gain (loss) on investments | | | 1.35 | | | | 0.97 | | | | 1.74 | | | | 6.17 | | | | 1.58 | |
| Total from investment operations | | | 1.30 | | | | 0.91 | | | | 1.66 | | | | 6.06 | | | | 1.65 | |
| Less distributions from: | | | | | | | | | | | | | | | | | | | | |
| Net investment income | | | — | | | | — | | | | — | | | | — | | | | 0.06 | |
| Net realized gain | | | 0.53 | | | | 1.02 | | | | 1.64 | | | | 1.27 | | | | 0.36 | |
| Total distributions | | | 0.53 | | | | 1.02 | | | | 1.64 | | | | 1.27 | | | | 0.42 | |
| Net asset value, end of year | | $ | 20.02 | | | $ | 19.25 | | | $ | 19.36 | | | $ | 19.34 | | | $ | 14.55 | |
| Total return (%) | | | 6.72 | | | | 4.74 | | | | 8.62 | | | | 41.89 | | | | 12.36 | |
| Ratios to average daily net assets (%): | | | | | | | | | | | | | | | | | | | | |
| Expenses, net of waivers and reimbursements | | | 1.10 | | | | 1.10 | | | | 1.10 | | | | 1.10 | | | | 1.10 | |
| Expenses, before waivers and reimbursements | | | 1.16 | | | | 1.15 | | | | 1.15 | | | | 1.10 | | | | 1.20 | |
| Net investment income (loss), net of waivers and reimbursements | | | (0.28 | ) | | | (0.28 | ) | | | (0.38 | ) | | | (0.62 | ) | | | 0.48 | |
| Net investment income (loss), before waivers and reimbursements | | | (0.34 | ) | | | (0.33 | ) | | | (0.43 | ) | | | (0.62 | ) | | | 0.38 | ) |
| Class I net assets at end of year (in thousands) | | $ | 1,090,939 | | | $ | 1,019,544 | | | $ | 793,789 | | | $ | 617,374 | | | $ | 349,345 | |
| Portfolio turnover rate (%) | | | 66 | | | | 44 | | | | 49 | | | | 53 | | | | 82 | |
Note: Net investment income (loss) per share is based on the average shares outstanding during the year.
Performance cited represents past performance. Past performance does not guarantee future results and current performance may be lower or higher than the data quoted. Results shown are annual returns, which assume reinvestment of dividends and capital gains. Investment returns and principal will fluctuate and you may have a gain or loss when you sell shares. For the most current month-end performance information, please call 1-800-742-7272 or visit our Web site at www.williamblairfunds.com.
| 158 | Annual Report | December 31, 2016 |
Financial Highlights
Small-Mid Cap Value Fund
| | | Class N | |
| | | Years Ended December 31, | |
| | | 2016 | | | 2015 | | | 2014 | | | 2013 | | | 2012 | |
| Net asset value, beginning of year | | $ | 12.54 | | | $ | 13.63 | | | $ | 14.11 | | | $ | 11.29 | | | $ | 10.45 | |
| Income (loss) from investment operations: | | | | | | | | | | | | | | | | | | | | |
| Net investment income (loss) | | | 0.04 | | | | 0.04 | | | | 0.00 | ^ | | | 0.00 | ^ | | | 0.10 | |
| Net realized and unrealized gain (loss) on investments | | | 2.55 | | | | (0.47 | ) | | | 0.64 | | | | 4.06 | | | | 1.15 | |
| Total from investment operations | | | 2.59 | | | | (0.43 | ) | | | 0.64 | | | | 4.06 | | | | 1.25 | |
| Less distributions from: | | | | | | | | | | | | | | | | | | | | |
| Net investment income | | | 0.01 | | | | 0.01 | | | | — | | | | — | | | | 0.09 | |
| Net realized gain | | | 0.59 | | | | 0.65 | | | | 1.12 | | | | 1.24 | | | | 0.32 | |
| Total distributions | | | 0.60 | | | | 0.66 | | | | 1.12 | | | | 1.24 | | | | 0.41 | |
| Net asset value, end of year | | $ | 14.53 | | | $ | 12.54 | | | $ | 13.63 | | | $ | 14.11 | | | $ | 11.29 | |
| Total return (%) | | | 20.69 | | | | (3.13 | ) | | | 4.66 | | | | 36.29 | | | | 11.95 | |
| Ratios to average daily net assets (%): | | | | | | | | | | | | | | | | | | | | |
| Expenses, net of waivers and reimbursements | | | 1.35 | | | | 1.37 | | | | 1.40 | | | | 1.40 | | | | 1.40 | |
| Expenses, before waivers and reimbursements | | | 4.15 | | | | 3.93 | | | | 4.50 | | | | 4.50 | | | | 6.34 | |
| Net investment income (loss), net of waivers and reimbursements | | | 0.29 | | | | 0.27 | | | | 0.02 | | | | (0.04 | ) | | | 0.87 | |
| Net investment income (loss), before waivers and reimbursements | | | (2.51 | ) | | | (2.29 | ) | | | (3.08 | ) | | | (3.14 | ) | | | (4.07 | ) |
| Class N net assets at end of year (in thousands) | | $ | 267 | | | $ | 855 | | | $ | 946 | | | $ | 1,205 | | | $ | 950 | |
| Portfolio turnover rate (%) | | | 45 | | | | 35 | | | | 69 | | | | 61 | | | | 56 | |
| | | Class I | |
| | | Years Ended December 31, | |
| | | 2016 | | | 2015 | | | 2014 | | | 2013 | | | 2012 | |
| Net asset value, beginning of year | | $ | 12.54 | | | $ | 13.63 | | | $ | 14.12 | | | $ | 11.29 | | | $ | 10.45 | |
| Income (loss) from investment operations: | | | | | | | | | | | | | | | | | | | | |
| Net investment income (loss) | | | 0.08 | | | | 0.07 | | | | 0.05 | | | | 0.03 | | | | 0.13 | |
| Net realized and unrealized gain (loss) on investments | | | 2.55 | | | | (0.47 | ) | | | 0.63 | | | | 4.07 | | | | 1.15 | |
| Total from investment operations | | | 2.63 | | | | (0.40 | ) | | | 0.68 | | | | 4.10 | | | | 1.28 | |
| Less distributions from: | | | | | | | | | | | | | | | | | | | | |
| Net investment income | | | 0.11 | | | | 0.04 | | | | 0.05 | | | | 0.03 | | | | 0.12 | |
| Net realized gain | | | 0.59 | | | | 0.65 | | | | 1.12 | | | | 1.24 | | | | 0.32 | |
| Total distributions | | | 0.70 | | | | 0.69 | | | | 1.17 | | | | 1.27 | | | | 0.44 | |
| Net asset value, end of year | | $ | 14.47 | | | $ | 12.54 | | | $ | 13.63 | | | $ | 14.12 | | | $ | 11.29 | |
| Total return (%) | | | 21.00 | | | | (2.86 | ) | | | 4.96 | | | | 36.69 | | | | 12.22 | |
| Ratios to average daily net assets (%): | | | | | | | | | | | | | | | | | | | | |
| Expenses, net of waivers and reimbursements | | | 1.10 | | | | 1.12 | | | | 1.15 | | | | 1.15 | | | | 1.15 | |
| Expenses, before waivers and reimbursements | | | 3.92 | | | | 3.72 | | | | 4.16 | | | | 4.24 | | | | 5.88 | |
| Net investment income (loss), net of waivers and reimbursements | | | 0.62 | | | | 0.52 | | | | 0.36 | | | | 0.21 | | | | 1.12 | |
| Net investment income (loss), before waivers and reimbursements | | | (2.20 | ) | | | (2.08 | ) | | | (2.65 | ) | | | (2.88 | ) | | | (3.61 | ) |
| Class I net assets at end of year (in thousands) | | $ | 3,186 | | | $ | 3,220 | | | $ | 3,407 | | | $ | 2,073 | | | $ | 1,442 | |
| Portfolio turnover rate (%) | | | 45 | | | | 35 | | | | 69 | | | | 61 | | | | 56 | |
| ^ | Amount is less than $0.005 per share. |
Note: Net investment income (loss) per share is based on the average shares outstanding during the year.
Performance cited represents past performance. Past performance does not guarantee future results and current performance may be lower or higher than the data quoted. Results shown are annual returns, which assume reinvestment of dividends and capital gains. Investment returns and principal will fluctuate and you may have a gain or loss when you sell shares. For the most current month-end performance information, please call 1-800-742-7272 or visit our Web site at www.williamblairfunds.com.
| December 31, 2016 | William Blair Funds | 159 |
Financial Highlights
Small Cap Growth Fund
| | | Class N | |
| | | Years Ended December 31, | |
| | | 2016 | | | 2015 | | | 2014 | | | 2013 | | | 2012 | |
| Net asset value, beginning of year | | $ | 22.47 | | | $ | 25.61 | | | $ | 30.02 | | | $ | 23.68 | | | $ | 20.13 | |
| Income (loss) from investment operations: | | | | | | | | | | | | | | | | | | | | |
| Net investment income (loss) | | | (0.18 | ) | | | (0.22 | ) | | | (0.30 | ) | | | (0.26 | ) | | | (0.22 | ) |
| Net realized and unrealized gain (loss) on investments | | | 4.43 | | | | (0.93 | ) | | | 1.02 | | | | 12.52 | | | | 3.87 | |
| Total from investment operations | | | 4.25 | | | | (1.15 | ) | | | 0.72 | | | | 12.26 | | | | 3.65 | |
| Less distributions from: | | | | | | | | | | | | | | | | | | | | |
| Net investment income | | | — | | | | — | | | | — | | | | — | | | | — | |
| Net realized gain | | | 1.48 | | | | 1.99 | | | | 5.13 | | | | 5.92 | | | | 0.10 | |
| Total distributions | | | 1.48 | | | | 1.99 | | | | 5.13 | | | | 5.92 | | | | 0.10 | |
| Net asset value, end of year | | $ | 25.24 | | | $ | 22.47 | | | $ | 25.61 | | | $ | 30.02 | | | $ | 23.68 | |
| Total return (%) | | | 18.89 | | | | (4.44 | ) | | | 2.62 | | | | 52.76 | | | | 18.15 | |
| Ratios to average daily net assets (%): | | | | | | | | | | | | | | | | | | | | |
| Expenses, net of waivers and reimbursements | | | 1.50 | | | | 1.50 | | | | 1.50 | | | | 1.50 | | | | 1.50 | |
| Expenses, before waivers and reimbursements | | | 1.55 | | | | 1.59 | | | | 1.56 | | | | 1.57 | | | | 1.59 | |
| Net investment income (loss), net of waivers and reimbursements | | | (0.79 | ) | | | (0.85 | ) | | | (1.00 | ) | | | (0.87 | ) | | | (0.96 | ) |
| Net investment income (loss), before waivers and reimbursements | | | (0.84 | ) | | | (0.94 | ) | | | (1.06 | ) | | | (0.94 | ) | | | (1.05 | ) |
| Class N net assets at end of year (in thousands) | | $ | 117,068 | | | $ | 111,944 | | | $ | 148,201 | | | $ | 211,562 | | | $ | 130,382 | |
| Portfolio turnover rate (%) | | | 90 | | | | 91 | | | | 82 | | | | 91 | | | | 89 | |
| | | Class I | |
| | | Years Ended December 31, | |
| | | 2016 | | | 2015 | | | 2014 | | | 2013 | | | 2012 | |
| Net asset value, beginning of year | | $ | 24.17 | | | $ | 27.32 | | | $ | 31.61 | | | $ | 24.66 | | | $ | 20.91 | |
| Income (loss) from investment operations: | | | | | | | | | | | | | | | | | | | | |
| Net investment income (loss) | | | (0.13 | ) | | | (0.17 | ) | | | (0.23 | ) | | | (0.19 | ) | | | (0.16 | ) |
| Net realized and unrealized gain (loss) on investments | | | 4.78 | | | | (0.99 | ) | | | 1.07 | | | | 13.06 | | | | 4.01 | |
| Total from investment operations | | | 4.65 | | | | (1.16 | ) | | | 0.84 | | | | 12.87 | | | | 3.85 | |
| Less distributions from: | | | | | | | | | | | | | | | | | | | | |
| Net investment income | | | — | | | | — | | | | — | | | | — | | | | — | |
| Net realized gain | | | 1.48 | | | | 1.99 | | | | 5.13 | | | | 5.92 | | | | 0.10 | |
| Total distributions | | | 1.48 | | | | 1.99 | | | | 5.13 | | | | 5.92 | | | | 0.10 | |
| Net asset value, end of year | | $ | 27.34 | | | $ | 24.17 | | | $ | 27.32 | | | $ | 31.61 | | | $ | 24.66 | |
| Total return (%) | | | 19.22 | | | | (4.20 | ) | | | 2.87 | | | | 53.13 | | | | 18.43 | |
| Ratios to average daily net assets (%): | | | | | | | | | | | | | | | | | | | | |
| Expenses, net of waivers and reimbursements | | | 1.25 | | | | 1.25 | | | | 1.25 | | | | 1.25 | | | | 1.25 | |
| Expenses, before waivers and reimbursements | | | 1.27 | | | | 1.30 | | | | 1.30 | | | | 1.27 | | | | 1.35 | |
| Net investment income (loss), net of waivers and reimbursements | | | (0.54 | ) | | | (0.61 | ) | | | (0.75 | ) | | | (0.63 | ) | | | (0.71 | ) |
| Net investment income (loss), before waivers and reimbursements | | | (0.56 | ) | | | (0.66 | ) | | | (0.80 | ) | | | (0.65 | ) | | | (0.81 | ) |
| Class I net assets at end of year (in thousands) | | $ | 271,830 | | | $ | 261,269 | | | $ | 364,241 | | | $ | 415,797 | | | $ | 266,431 | |
| Portfolio turnover rate (%) | | | 90 | | | | 91 | | | | 82 | | | | 91 | | | | 89 | |
Note: Net investment income (loss) per share is based on the average shares outstanding during the year.
Performance cited represents past performance. Past performance does not guarantee future results and current performance may be lower or higher than the data quoted. Results shown are annual returns, which assume reinvestment of dividends and capital gains. Investment returns and principal will fluctuate and you may have a gain or loss when you sell shares. For the most current month-end performance information, please call 1-800-742-7272 or visit our Web site at www.williamblairfunds.com.
| 160 | Annual Report | December 31, 2016 |
Financial Highlights
Small Cap Value Fund
| | | Class N | |
| | | Years Ended December 31, | |
| | | 2016 | | | 2015 | | | 2014 | | | 2013 | | | 2012 | |
| Net asset value, beginning of year | | $ | 16.68 | | | $ | 17.76 | | | $ | 17.63 | | | $ | 13.65 | | | $ | 12.26 | |
| Income (loss) from investment operations: | | | | | | | | | | | | | | | | | | | | |
| Net investment income (loss) | | | 0.04 | | | | 0.02 | | | | (0.03 | ) | | | (0.05 | ) | | | 0.10 | |
| Net realized and unrealized gain (loss) on investments | | | 4.34 | | | | (1.05 | ) | | | 0.81 | | | | 5.32 | | | | 1.43 | |
| Total from investment operations | | | 4.38 | | | | (1.03 | ) | | | 0.78 | | | | 5.27 | | | | 1.53 | |
| Less distributions from: | | | | | | | | | | | | | | | | | | | | |
| Net investment income | | | 0.04 | | | | — | | | | — | | | | — | | | | 0.08 | |
| Net realized gain | | | 0.84 | | | | 0.05 | | | | 0.65 | | | | 1.29 | | | | 0.06 | |
| Total distributions | | | 0.88 | | | | 0.05 | | | | 0.65 | | | | 1.29 | | | | 0.14 | |
| Net asset value, end of year | | $ | 20.18 | | | $ | 16.68 | | | $ | 17.76 | | | $ | 17.63 | | | $ | 13.65 | |
| Total return (%) | | | 26.19 | | | | (5.77 | ) | | | 4.49 | | | | 38.91 | | | | 12.49 | |
| Ratios to average daily net assets (%): | | | | | | | | | | | | | | | | | | | | |
| Expenses, net of waivers and reimbursements | | | 1.50 | | | | 1.50 | | | | 1.50 | | | | 1.49 | | | | 1.43 | |
| Expenses, before waivers and reimbursements | | | 1.53 | | | | 1.54 | | | | 1.53 | | | | 1.55 | | | | 1.60 | |
| Net investment income (loss), net of waivers and reimbursements | | | 0.22 | | | | 0.14 | | | | (0.17 | ) | | | (0.33 | ) | | | 0.78 | |
| Net investment income (loss), before waivers and reimbursements | | | 0.19 | | | | 0.10 | | | | (0.20 | ) | | | (0.39 | ) | | | 0.61 | |
| Class N net assets at end of year (in thousands) | | $ | 33,359 | | | $ | 33,351 | | | $ | 40,223 | | | $ | 55,464 | | | $ | 39,084 | |
| Portfolio turnover rate (%) | | | 33 | | | | 30 | | | | 39 | | | | 51 | | | | 51 | |
| | | Class I | |
| | | Years Ended December 31, | |
| | | 2016 | | | 2015 | | | 2014 | | | 2013 | | | 2012 | |
| Net asset value, beginning of year | | $ | 17.08 | | | $ | 18.17 | | | $ | 18.00 | | | $ | 13.88 | | | $ | 12.47 | |
| Income (loss) from investment operations: | | | | | | | | | | | | | | | | | | | | |
| Net investment income (loss) | | | 0.09 | | | | 0.08 | | | | 0.02 | | | | (0.01 | ) | | | 0.14 | |
| Net realized and unrealized gain (loss) on investments | | | 4.44 | | | | (1.08 | ) | | | 0.82 | | | | 5.42 | | | | 1.45 | |
| Total from investment operations | | | 4.53 | | | | (1.00 | ) | | | 0.84 | | | | 5.41 | | | | 1.59 | |
| Less distributions from: | | | | | | | | | | | | | | | | | | | | |
| Net investment income | | | 0.09 | | | | 0.04 | | | | 0.02 | | | | 0.00 | ^ | | | 0.12 | |
| Net realized gain | | | 0.84 | | | | 0.05 | | | | 0.65 | | | | 1.29 | | | | 0.06 | |
| Total distributions | | | 0.93 | | | | 0.09 | | | | 0.67 | | | | 1.29 | | | | 0.18 | |
| Net asset value, end of year | | $ | 20.68 | | | $ | 17.08 | | | $ | 18.17 | | | $ | 18.00 | | | $ | 13.88 | |
| Total return (%) | | | 26.46 | | | | (5.47 | ) | | | 4.73 | | | | 39.31 | | | | 12.73 | |
| Ratios to average daily net assets (%): | | | | | | | | | | | | | | | | | | | | |
| Expenses, net of waivers and reimbursements | | | 1.25 | | | | 1.24 | | | | 1.23 | | | | 1.24 | | | | 1.18 | |
| Expenses, before waivers and reimbursements | | | 1.29 | | | | 1.24 | | | | 1.23 | | | | 1.25 | | | | 1.29 | |
| Net investment income (loss), net of waivers and reimbursements | | | 0.47 | | | | 0.43 | | | | 0.12 | | | | (0.07 | ) | | | 1.02 | |
| Net investment income (loss), before waivers and reimbursements | | | 0.43 | | | | 0.43 | | | | 0.12 | | | | (0.08 | ) | | | 0.91 | |
| Class I net assets at end of year (in thousands) | | $ | 675,272 | | | $ | 579,010 | | | $ | 544,963 | | | $ | 352,832 | | | $ | 196,184 | |
| Portfolio turnover rate (%) | | | 33 | | | | 30 | | | | 39 | | | | 51 | | | | 51 | |
| ^ | Amount is less than $0.005 per share. |
Note: Net investment income (loss) per share is based on the average shares outstanding during the year.
Performance cited represents past performance. Past performance does not guarantee future results and current performance may be lower or higher than the data quoted. Results shown are annual returns, which assume reinvestment of dividends and capital gains. Investment returns and principal will fluctuate and you may have a gain or loss when you sell shares. For the most current month-end performance information, please call 1-800-742-7272 or visit our Web site at www.williamblairfunds.com.
| December 31, 2016 | William Blair Funds | 161 |
Financial Highlights
Global Leaders Fund
| | | Class N | |
| | | Years Ended December 31, | |
| | | 2016 | | | 2015 | | | 2014 | | | 2013 | | | 2012 | |
| Net asset value, beginning of year | | $ | 11.58 | | | $ | 11.84 | | | $ | 11.43 | | | $ | 9.47 | | | $ | 8.10 | |
| Income (loss) from investment operations: | | | | | | | | | | | | | | | | | | | | |
| Net investment income (loss) | | | 0.03 | | | | 0.02 | | | | 0.02 | | | | 0.02 | | | | 0.03 | |
| Net realized and unrealized gain (loss) on investments | | | 0.04 | | | | 0.27 | | | | 0.41 | | | | 1.96 | | | | 1.37 | |
| Total from investment operations | | | 0.07 | | | | 0.29 | | | | 0.43 | | | | 1.98 | | | | 1.40 | |
| Less distributions from: | | | | | | | | | | | | | | | | | | | | |
| Net investment income | | | — | | | | 0.01 | | | | — | | | | 0.02 | | | | 0.03 | |
| Net realized gain | | | 0.05 | | | | 0.54 | | | | 0.02 | | | | — | | | | — | |
| Total distributions | | | 0.05 | | | | 0.55 | | | | 0.02 | | | | 0.02 | | | | 0.03 | |
| Net asset value, end of year | | $ | 11.60 | | | $ | 11.58 | | | $ | 11.84 | | | $ | 11.43 | | | $ | 9.47 | |
| Total return (%) | | | 0.62 | | | | 2.49 | | | | 3.76 | | | | 20.86 | | | | 17.25 | |
| Ratios to average daily net assets (%): | | | | | | | | | | | | | | | | | | | | |
| Expenses, net of waivers and reimbursements | | | 1.36 | | | | 1.39 | | | | 1.50 | | | | 1.50 | | | | 1.50 | |
| Expenses, before waivers and reimbursements | | | 1.62 | | | | 1.61 | | | | 1.62 | | | | 1.63 | | | | 1.84 | |
| Net investment income (loss), net of waivers and reimbursements | | | 0.23 | | | | 0.12 | | | | 0.16 | | | | 0.18 | | | | 0.29 | |
| Net investment income (loss), before waivers and reimbursements | | | (0.03 | ) | | | (0.10 | ) | | | 0.04 | | | | 0.05 | | | | (0.05 | ) |
| Class N net assets at end of year (in thousands) | | $ | 5,760 | | | $ | 5,588 | | | $ | 5,007 | | | $ | 6,403 | | | $ | 5,215 | |
| Portfolio turnover rate (%) | | | 75 | | | | 55 | | | | 60 | | | | 70 | | | | 73 | |
| | | Class I | |
| | | Years Ended December 31, | |
| | | 2016 | | | 2015 | | | 2014 | | | 2013 | | | 2012 | |
| Net asset value, beginning of year | | $ | 11.59 | | | $ | 11.85 | | | $ | 11.42 | | | $ | 9.47 | | | $ | 8.09 | |
| Income (loss) from investment operations: | | | | | | | | | | | | | | | | | | | | |
| Net investment income (loss) | | | 0.06 | | | | 0.06 | | | | 0.04 | | | | 0.04 | | | | 0.05 | |
| Net realized and unrealized gain (loss) on investments | | | 0.05 | | | | 0.26 | | | | 0.43 | | | | 1.95 | | | | 1.38 | |
| Total from investment operations | | | 0.11 | | | | 0.32 | | | | 0.47 | | | | 1.99 | | | | 1.43 | |
| Less distributions from: | | | | | | | | | | | | | | | | | | | | |
| Net investment income | | | 0.03 | | | | 0.04 | | | | 0.02 | | | | 0.04 | | | | 0.05 | |
| Net realized gain | | | 0.05 | | | | 0.54 | | | | 0.02 | | | | — | | | | — | |
| Total distributions | | | 0.08 | | | | 0.58 | | | | 0.04 | | | | 0.04 | | | | 0.05 | |
| Net asset value, end of year | | $ | 11.62 | | | $ | 11.59 | | | $ | 11.85 | | | $ | 11.42 | | | $ | 9.47 | |
| Total return (%) | | | 0.98 | | | | 2.77 | | | | 4.08 | | | | 21.05 | | | | 17.64 | |
| Ratios to average daily net assets (%): | | | | | | | | | | | | | | | | | | | | |
| Expenses, net of waivers and reimbursements | | | 1.05 | | | | 1.10 | | | | 1.25 | | | | 1.25 | | | | 1.25 | |
| Expenses, before waivers and reimbursements | | | 1.31 | | | | 1.32 | | | | 1.33 | | | | 1.35 | | | | 1.56 | |
| Net investment income (loss), net of waivers and reimbursements | | | 0.54 | | | | 0.45 | | | | 0.38 | | | | 0.40 | | | | 0.54 | |
| Net investment income (loss), before waivers and reimbursements | | | 0.28 | | | | 0.23 | | | | 0.30 | | | | 0.30 | | | | 0.23 | |
| Class I net assets at end of year (in thousands) | | $ | 45,772 | | | $ | 45,853 | | | $ | 52,090 | | | $ | 53,562 | | | $ | 45,757 | |
| Portfolio turnover rate (%) | | | 75 | | | | 55 | | | | 60 | | | | 70 | | | | 73 | |
Note: Net investment income (loss) per share is based on the average shares outstanding during the year.
Performance cited represents past performance. Past performance does not guarantee future results and current performance may be lower or higher than the data quoted. Results shown are annual returns, which assume reinvestment of dividends and capital gains. Investment returns and principal will fluctuate and you may have a gain or loss when you sell shares. For the most current month-end performance information, please call 1-800-742-7272 or visit our Web site at www.williamblairfunds.com.
| 162 | Annual Report | December 31, 2016 |
Financial Highlights
Global Leaders Fund
| | | Institutional Class | |
| | | Periods Ended December 31, | |
| | | 2016 | | | 2015 | | | 2014 | | | 2013 | | | 2012(a) | |
| Net asset value, beginning of year | | $ | 11.59 | | | $ | 11.85 | | | $ | 11.42 | | | $ | 9.47 | | | $ | 9.50 | |
| Income (loss) from investment operations: | | | | | | | | | | | | | | | | | | | | |
| Net investment income (loss) | | | 0.07 | | | | 0.06 | | | | 0.06 | | | | 0.04 | | | | 0.00 | ^ |
| Net realized and unrealized gain (loss) on investments | | | 0.05 | | | | 0.27 | | | | 0.43 | | | | 1.97 | | | | (0.03 | ) |
| Total from investment operations | | | 0.12 | | | | 0.33 | | | | 0.49 | | | | 2.01 | | | | (0.03 | ) |
| Less distributions from: | | | | | | | | | | | | | | | | | | | | |
| Net investment income | | | 0.04 | | | | 0.05 | | | | 0.04 | | | | 0.06 | | | | — | |
| Net realized gain | | | 0.05 | | | | 0.54 | | | | 0.02 | | | | — | | | | — | |
| Total distributions | | | 0.09 | | | | 0.59 | | | | 0.06 | | | | 0.06 | | | | — | |
| Net asset value, end of year | | $ | 11.62 | | | $ | 11.59 | | | $ | 11.85 | | | $ | 11.42 | | | $ | 9.47 | |
| Total return (%)* | | | 1.03 | | | | 2.85 | | | | 4.24 | | | | 21.23 | | | | (0.32 | ) |
| Ratios to average daily net assets (%):** | | | | | | | | | | | | | | | | | | | | |
| Expenses, net of waivers and reimbursements | | | 1.00 | | | | 1.03 | | | | 1.10 | | | | 1.10 | | | | 1.10 | |
| Expenses, before waivers and reimbursements | | | 1.11 | | | | 1.11 | | | | 1.13 | | | | 1.14 | | | | 1.26 | |
| Net investment income (loss), net of waivers and reimbursements | | | 0.59 | | | | 0.47 | | | | 0.51 | | | | 0.37 | | | | (0.91 | ) |
| Net investment income (loss), before waivers and reimbursements | | | 0.48 | | | | 0.39 | | | | 0.48 | | | | 0.33 | | | | (1.07 | ) |
| Institutional Class net assets at end of year (in thousands) | | $ | 125,199 | | | $ | 137,527 | | | $ | 106,565 | | | $ | 87,118 | | | $ | 16,022 | |
| Portfolio turnover rate (%)* | | | 75 | | | | 55 | | | | 60 | | | | 70 | | | | 73 | |
| (a) | For the period from December 19, 2012 (Commencement of Operations) to December 31, 2012. |
| * | Not annualized for periods less than a year. |
| ** | Annualized for periods less than a year. |
| ^ | Amount is less than $0.005 per share. |
Note: Net investment income (loss) per share is based on the average shares outstanding during the year.
Performance cited represents past performance. Past performance does not guarantee future results and current performance may be lower or higher than the data quoted. Results shown are annual returns, which assume reinvestment of dividends and capital gains. Investment returns and principal will fluctuate and you may have a gain or loss when you sell shares. For the most current month-end performance information, please call 1-800-742-7272 or visit our Web site at www.williamblairfunds.com.
| December 31, 2016 | William Blair Funds | 163 |
Financial Highlights
International Leaders Fund
| | | Class N | |
| | | Periods Ended December 31, | |
| | | 2016 | | | 2015 | | | 2014 | | | 2013 | | | 2012(a) | |
| Net asset value, beginning of year | | $ | 12.89 | | | $ | 12.25 | | | $ | 12.65 | | | $ | 10.81 | | | $ | 10.00 | |
| Income (loss) from investment operations: | | | | | | | | | | | | | | | | | | | | |
| Net investment income (loss) | | | 0.03 | | | | 0.07 | | | | 0.13 | | | | 0.03 | | | | 0.00 | ^ |
| Net realized and unrealized gain (loss) on investments | | | 0.08 | | | | 0.66 | | | | (0.47 | ) | | | 1.99 | | | | 0.82 | |
| Total from investment operations | | | 0.11 | | | | 0.73 | | | | (0.34 | ) | | | 2.02 | | | | 0.82 | |
| Less distributions from: | | | | | | | | | | | | | | | | | | | | |
| Net investment income | | | 0.12 | | | | 0.02 | | | | 0.06 | | | | 0.18 | | | | 0.01 | |
| Net realized gain | | | — | | | | 0.07 | | | | — | | | | — | | | | — | |
| Total distributions | | | 0.12 | | | | 0.09 | | | | 0.06 | | | | 0.18 | | | | 0.01 | |
| Net asset value, end of year | | $ | 12.88 | | | $ | 12.89 | | | $ | 12.25 | | | $ | 12.65 | | | $ | 10.81 | |
| Total return (%)* | | | 0.88 | | | | 6.01 | | | | (2.67 | ) | | | 18.75 | | | | 8.16 | |
| Ratios to average daily net assets (%):** | | | | | | | | | | | | | | | | | | | | |
| Expenses, net of waivers and reimbursements | | | 1.30 | | | | 1.24 | | | | 1.45 | | | | 1.45 | | | | 1.45 | |
| Expenses, before waivers and reimbursements | | | 1.56 | | | | 1.56 | | | | 1.59 | | | | 1.73 | | | | 4.98 | |
| Net investment income (loss), net of waivers and reimbursements | | | 0.24 | | | | 0.51 | | | | 1.00 | | | | 0.29 | | | | 0.00 | |
| Net investment income (loss), before waivers and reimbursements | | | (0.02 | ) | | | 0.19 | | | | 0.86 | | | | 0.01 | | | | (3.53 | ) |
| Class N net assets at end of year (in thousands) | | $ | 2,922 | | | $ | 377 | | | $ | 150 | | | $ | 154 | | | $ | 542 | |
| Portfolio turnover rate (%)* | | | 59 | | | | 29 | | | | 79 | | | | 73 | | | | 16 | |
| | | Class I | |
| | | Periods Ended December 31, | |
| | | 2016 | | | 2015 | | | 2014 | | | 2013 | | | 2012(a) | |
| Net asset value, beginning of year | | $ | 12.91 | | | $ | 12.25 | | | $ | 12.65 | | | $ | 10.81 | | | $ | 10.00 | |
| Income (loss) from investment operations: | | | | | | | | | | | | | | | | | | | | |
| Net investment income (loss) | | | 0.10 | | | | 0.10 | | | | 0.16 | | | | 0.12 | | | | 0.01 | |
| Net realized and unrealized gain (loss) on investments | | | 0.04 | | | | 0.65 | | | | (0.47 | ) | | | 1.94 | | | | 0.82 | |
| Total from investment operations | | | 0.14 | | | | 0.75 | | | | (0.31 | ) | | | 2.06 | | | | 0.83 | |
| Less distributions from: | | | | | | | | | | | | | | | | | | | | |
| Net investment income | | | 0.13 | | | | 0.02 | | | | 0.09 | | | | 0.22 | | | | 0.02 | |
| Net realized gain | | | — | | | | 0.07 | | | | — | | | | — | | | | — | |
| Total distributions | | | 0.13 | | | | 0.09 | | | | 0.09 | | | | 0.22 | | | | 0.02 | |
| Net asset value, end of year | | $ | 12.92 | | | $ | 12.91 | | | $ | 12.25 | | | $ | 12.65 | | | $ | 10.81 | |
| Total return (%)* | | | 1.10 | | | | 6.18 | | | | (2.43 | ) | | | 19.10 | | | | 8.26 | |
| Ratios to average daily net assets (%):** | | | | | | | | | | | | | | | | | | | | |
| Expenses, net of waivers and reimbursements | | | 1.04 | | | | 1.13 | | | | 1.20 | | | | 1.20 | | | | 1.20 | |
| Expenses, before waivers and reimbursements | | | 1.30 | | | | 1.46 | | | | 1.29 | | | | 1.40 | | | | 4.56 | |
| Net investment income (loss), net of waivers and reimbursements | | | 0.74 | | | | 0.75 | | | | 1.25 | | | | 1.06 | | | | 0.22 | |
| Net investment income (loss), before waivers and reimbursements | | | 0.48 | | | | 0.42 | | | | 1.16 | | | | 0.86 | | | | (3.14 | ) |
| Class I net assets at end of year (in thousands) | | $ | 30,944 | | | $ | 13,474 | | | $ | 9,561 | | | $ | 11,629 | | | $ | 4,336 | |
| Portfolio turnover rate (%)* | | | 59 | | | | 29 | | | | 79 | | | | 73 | | | | 16 | |
| (a) | For the period from August 16, 2012 (Commencement of Operations) to December 31, 2012. |
| * | Not annualized for periods less than a year. |
| ** | Annualized for periods less than a year. |
| ^ | Amount is less than $0.005 per share. |
Note: Net investment income (loss) per share is based on the average shares outstanding during the year.
Performance cited represents past performance. Past performance does not guarantee future results and current performance may be lower or higher than the data quoted. Results shown are annual returns, which assume reinvestment of dividends and capital gains. Investment returns and principal will fluctuate and you may have a gain or loss when you sell shares. For the most current month-end performance information, please call 1-800-742-7272 or visit our Web site at www.williamblairfunds.com.
| 164 | Annual Report | December 31, 2016 |
Financial Highlights
International Leaders Fund
| | | Institutional Class | |
| | | Periods Ended December 31, | |
| | | 2016 | | | 2015 | | | 2014 | | | 2013 | | | 2012(a) | |
| Net asset value, beginning of year | | $ | 12.90 | | | $ | 12.24 | | | $ | 12.65 | | | $ | 10.80 | | | $ | 10.24 | |
| Income (loss) from investment operations: | | | | | | | | | | | | | | | | | | | | |
| Net investment income (loss) | | | 0.12 | | | | 0.11 | | | | 0.17 | | | | 0.15 | | | | 0.00 | ^ |
| Net realized and unrealized gain (loss) on investments | | | 0.04 | | | | 0.66 | | | | (0.47 | ) | | | 1.94 | | | | 0.58 | |
| Total from investment operations | | | 0.16 | | | | 0.77 | | | | (0.30 | ) | | | 2.09 | | | | 0.58 | |
| Less distributions from: | | | | | | | | | | | | | | | | | | | | |
| Net investment income | | | 0.14 | | | | 0.04 | | | | 0.11 | | | | 0.24 | | | | 0.02 | |
| Net realized gain | | | — | | | | 0.07 | | | | — | | | | — | | | | — | |
| Total distributions | | | 0.14 | | | | 0.11 | | | | 0.11 | | | | 0.24 | | | | 0.02 | |
| Net asset value, end of year | | $ | 12.92 | | | $ | 12.90 | | | $ | 12.24 | | | $ | 12.65 | | | $ | 10.80 | |
| Total return (%)* | | | 1.25 | | | | 6.33 | | | | (2.34 | ) | | | 19.39 | | | | 5.67 | |
| Ratios to average daily net assets (%):** | | | | | | | | | | | | | | | | | | | | |
| Expenses, net of waivers and reimbursements | | | 0.95 | | | | 0.98 | | | | 1.05 | | | | 1.05 | | | | 1.05 | |
| Expenses, before waivers and reimbursements | | | 1.06 | | | | 1.15 | | | | 1.14 | | | | 1.25 | | | | 1.84 | |
| Net investment income (loss), net of waivers and reimbursements | | | 0.92 | | | | 0.88 | | | | 1.33 | | | | 1.31 | | | | 0.01 | |
| Net investment income (loss), before waivers and reimbursements | | | 0.81 | | | | 0.71 | | | | 1.24 | | | | 1.11 | | | | (0.78 | ) |
| Institutional Class net assets at end of year (in thousands) | | $ | 221,356 | | | $ | 102,227 | | | $ | 78,251 | | | $ | 56,991 | | | $ | 5,286 | |
| Portfolio turnover rate (%)* | | | 59 | | | | 29 | | | | 79 | | | | 73 | | | | 16 | |
| (a) | For the period from November 2, 2012 (Commencement of Operations) to December 31, 2012. |
| * | Not annualized for periods less than a year. |
| ** | Annualized for periods less than a year. |
| ^ | Amount is less than $0.005 per share. |
Note: Net investment income (loss) per share is based on the average shares outstanding during the year.
Performance cited represents past performance. Past performance does not guarantee future results and current performance may be lower or higher than the data quoted. Results shown are annual returns, which assume reinvestment of dividends and capital gains. Investment returns and principal will fluctuate and you may have a gain or loss when you sell shares. For the most current month-end performance information, please call 1-800-742-7272 or visit our Web site at www.williamblairfunds.com.
| December 31, 2016 | William Blair Funds | 165 |
Financial Highlights
International Equity Fund
| | | Class N | |
| | | Years Ended December 31, | |
| | | 2016 | | | 2015 | | | 2014 | | | 2013 | | | 2012 | |
| Net asset value, beginning of year | | $ | 13.85 | | | $ | 13.76 | | | $ | 14.28 | | | $ | 12.05 | | | $ | 10.56 | |
| Income (loss) from investment operations: | | | | | | | | | | | | | | | | | | | | |
| Net investment income (loss) | | | 0.18 | | | | 0.15 | | | | 0.16 | | | | 0.09 | | | | 0.11 | |
| Net realized and unrealized gain (loss) on investments | | | (0.22 | ) | | | 0.06 | | | | (0.60 | ) | | | 2.25 | | | | 1.75 | |
| Total from investment operations | | | (0.04 | ) | | | 0.21 | | | | (0.44 | ) | | | 2.34 | | | | 1.86 | |
| Less distributions from: | | | | | | | | | | | | | | | | | | | | |
| Net investment income | | | 0.13 | | | | 0.12 | | | | 0.08 | | | | 0.11 | | | | 0.37 | |
| Net realized gain | | | — | | | | — | | | | — | | | | — | | | | — | |
| Total distributions | | | 0.13 | | | | 0.12 | | | | 0.08 | | | | 0.11 | | | | 0.37 | |
| Net asset value, end of year | | $ | 13.68 | | | $ | 13.85 | | | $ | 13.76 | | | $ | 14.28 | | | $ | 12.05 | |
| Total return (%) | | | (0.27 | ) | | | 1.54 | | | | (3.09 | ) | | | 19.47 | | | | 17.57 | |
| Ratios to average daily net assets (%): | | | | | | | | | | | | | | | | | | | | |
| Expenses, net of waivers and reimbursements | | | 1.30 | | | | 1.32 | | | | 1.38 | | | | 1.45 | | | | 1.45 | |
| Expenses, before waivers and reimbursements | | | 1.60 | | | | 1.60 | | | | 1.56 | | | | 1.65 | | | | 1.71 | |
| Net investment income (loss), net of waivers and reimbursements | | | 1.30 | | | | 1.01 | | | | 1.11 | | | | 0.73 | | | | 0.95 | |
| Net investment income (loss), before waivers and reimbursements | | | 1.00 | | | | 0.73 | | | | 0.93 | | | | 0.53 | | | | 0.69 | |
| Class N net assets at end of year (in thousands) | | $ | 2,954 | | | $ | 3,020 | | | $ | 3,497 | | | $ | 4,307 | | | $ | 5,648 | |
| Portfolio turnover rate (%) | | | 70 | | | | 54 | | | | 73 | | | | 88 | | | | 80 | |
| | | Class I | |
| | | Years Ended December 31, | |
| | | 2016 | | | 2015 | | | 2014 | | | 2013 | | | 2012 | |
| Net asset value, beginning of year | | $ | 13.98 | | | $ | 13.91 | | | $ | 14.43 | | | $ | 12.18 | | | $ | 10.67 | |
| Income (loss) from investment operations: | | | | | | | | | | | | | | | | | | | | |
| Net investment income (loss) | | | 0.21 | | | | 0.18 | | | | 0.19 | | | | 0.14 | | | | 0.14 | |
| Net realized and unrealized gain (loss) on investments | | | (0.22 | ) | | | 0.07 | | | | (0.59 | ) | | | 2.26 | | | | 1.77 | |
| Total from investment operations | | | (0.01 | ) | | | 0.25 | | | | (0.40 | ) | | | 2.40 | | | | 1.91 | |
| Less distributions from: | | | | | | | | | | | | | | | | | | | | |
| Net investment income | | | 0.16 | | | | 0.18 | | | | 0.12 | | | | 0.15 | | | | 0.40 | |
| Net realized gain | | | — | | | | — | | | | — | | | | — | | | | — | |
| Total distributions | | | 0.16 | | | | 0.18 | | | | 0.12 | | | | 0.15 | | | | 0.40 | |
| Net asset value, end of year | | $ | 13.81 | | | $ | 13.98 | | | $ | 13.91 | | | $ | 14.43 | | | $ | 12.18 | |
| Total return (%) | | | (0.02 | ) | | | 1.80 | | | | (2.80 | ) | | | 19.74 | | | | 17.89 | |
| Ratios to average daily net assets (%): | | | | | | | | | | | | | | | | | | | | |
| Expenses, net of waivers and reimbursements | | | 1.05 | | | | 1.07 | | | | 1.13 | | | | 1.20 | | | | 1.20 | |
| Expenses, before waivers and reimbursements | | | 1.34 | | | | 1.34 | | | | 1.32 | | | | 1.41 | | | | 1.44 | |
| Net investment income (loss), net of waivers and reimbursements | | | 1.52 | | | | 1.26 | | | | 1.35 | | | | 1.07 | | | | 1.17 | |
| Net investment income (loss), before waivers and reimbursements | | | 1.23 | | | | 0.99 | | | | 1.16 | | | | 0.86 | | | | 0.93 | |
| Class I net assets at end of year (in thousands) | | $ | 84,383 | | | $ | 60,886 | | | $ | 65,012 | | | $ | 75,271 | | | $ | 64,536 | |
| Portfolio turnover rate (%) | | | 70 | | | | 54 | | | | 73 | | | | 88 | | | | 80 | |
Note: Net investment income (loss) per share is based on the average shares outstanding during the year.
Performance cited represents past performance. Past performance does not guarantee future results and current performance may be lower or higher than the data quoted. Results shown are annual returns, which assume reinvestment of dividends and capital gains. Investment returns and principal will fluctuate and you may have a gain or loss when you sell shares. For the most current month-end performance information, please call 1-800-742-7272 or visit our Web site at www.williamblairfunds.com.
| 166 | Annual Report | December 31, 2016 |
Financial Highlights
Institutional International Equity Fund
| | | Institutional Class | |
| | | Years Ended December 31, | |
| | | 2016 | | | 2015 | | | 2014 | | | 2013 | | | 2012 | |
| Net asset value, beginning of year | | $ | 12.12 | | | $ | 12.01 | | | $ | 12.70 | | | $ | 10.82 | | | $ | 9.27 | |
| Income (loss) from investment operations: | | | | | | | | | | | | | | | | | | | | |
| Net investment income (loss) | | | 0.20 | | | | 0.15 | | | | 0.21 | | | | 0.13 | | | | 0.13 | |
| Net realized and unrealized gain (loss) on investments | | | (0.24 | ) | | | 0.08 | | | | (0.65 | ) | | | 2.00 | | | | 1.57 | |
| Total from investment operations | | | (0.04 | ) | | | 0.23 | | | | (0.44 | ) | | | 2.13 | | | | 1.70 | |
| Less distributions from: | | | | | | | | | | | | | | | | | | | | |
| Net investment income | | | 0.24 | | | | 0.12 | | | | 0.25 | | | | 0.25 | | | | 0.15 | |
| Net realized gain | | | — | | | | — | | | | — | | | | — | | | | — | |
| Total distributions | | | 0.24 | | | | 0.12 | | | | 0.25 | | | | 0.25 | | | | 0.15 | |
| Net asset value, end of year | | $ | 11.84 | | | $ | 12.12 | | | $ | 12.01 | | | $ | 12.70 | | | $ | 10.82 | |
| Total return (%) | | | (0.27 | ) | | | 1.91 | | | | (3.50 | ) | | | 19.78 | | | | 18.31 | |
| Ratios to average daily net assets (%): | | | | | | | | | | | | | | | | | | | | |
| Expenses, net of waivers and reimbursements | | | 1.00 | | | | 1.00 | | | | 1.03 | | | | 1.10 | | | | 1.10 | |
| Expenses, before waivers and reimbursements | | | 1.77 | | | | 1.76 | | | | 1.63 | | | | 1.12 | | | | 1.16 | |
| Net investment income (loss), net of waivers and reimbursements | | | 1.69 | | | | 1.23 | | | | 1.61 | | | | 1.12 | | | | 1.28 | |
| Net investment income (loss), before waivers and reimbursements | | | 0.92 | | | | 0.47 | | | | 1.01 | | | | 1.10 | | | | 1.22 | |
| Institutional Class net assets at end of year (in thousands) | | $ | 16,565 | | | $ | 16,030 | | | $ | 14,574 | | | $ | 100,805 | | | $ | 109,690 | |
| Portfolio turnover rate (%) | | | 75 | | | | 54 | | | | 61 | | | | 84 | | | | 86 | |
Note: Net investment income (loss) per share is based on the average shares outstanding during the year.
Performance cited represents past performance. Past performance does not guarantee future results and current performance may be lower or higher than the data quoted. Results shown are annual returns, which assume reinvestment of dividends and capital gains. Investment returns and principal will fluctuate and you may have a gain or loss when you sell shares. For the most current month-end performance information, please call 1-800-742-7272 or visit our Web site at www.williamblairfunds.com.
| December 31, 2016 | William Blair Funds | 167 |
Financial Highlights
International Growth Fund
| | | Class N | |
| | | Years Ended December 31, | |
| | | 2016 | | | 2015 | | | 2014 | | | 2013 | | | 2012 | |
| Net asset value, beginning of year | | $ | 24.94 | | | $ | 25.24 | | | $ | 26.30 | | | $ | 22.43 | | | $ | 18.68 | |
| Income (loss) from investment operations: | | | | | | | | | | | | | | | | | | | | |
| Net investment income (loss) | | | 0.20 | | | | 0.18 | | | | 0.31 | | | | 0.27 | | | | 0.26 | |
| Net realized and unrealized gain (loss) on investments | | | (0.92 | ) | | | (0.25 | ) | | | (1.15 | ) | | | 3.89 | | | | 4.16 | |
| Total from investment operations | | | (0.72 | ) | | | (0.07 | ) | | | (0.84 | ) | | | 4.16 | | | | 4.42 | |
| Less distributions from: | | | | | | | | | | | | | | | | | | | | |
| Net investment income | | | 0.36 | | | | 0.23 | | | | 0.22 | | | | 0.29 | | | | 0.67 | |
| Net realized gain | | | — | | | | — | | | | — | | | | — | | | | — | |
| Total distributions | | | 0.36 | | | | 0.23 | | | | 0.22 | | | | 0.29 | | | | 0.67 | |
| Net asset value, end of year | | $ | 23.86 | | | $ | 24.94 | | | $ | 25.24 | | | $ | 26.30 | | | $ | 22.43 | |
| Total return (%) | | | (2.88 | ) | | | (0.27 | ) | | | (3.19 | ) | | | 18.57 | | | | 23.67 | |
| Ratios to average daily net assets (%): | | | | | | | | | | | | | | | | | | | | |
| Expenses | | | 1.43 | | | | 1.42 | | | | 1.44 | | | | 1.44 | | | | 1.44 | |
| Net investment income (loss) | | | 0.84 | | | | 0.71 | | | | 1.17 | | | | 1.13 | | | | 1.25 | |
| Class N net assets at end of year (in thousands) | | $ | 729,544 | | | $ | 1,023,588 | | | $ | 978,433 | | | $ | 1,418,083 | | | $ | 1,269,736 | |
| Portfolio turnover rate (%) | | | 101 | | | | 70 | | | | 79 | | | | 97 | | | | 81 | |
| | | Class I | |
| | | Years Ended December 31, | |
| | | 2016 | | | 2015 | | | 2014 | | | 2013 | | | 2012 | |
| Net asset value, beginning of year | | $ | 25.51 | | | $ | 25.82 | | | $ | 26.91 | | | $ | 22.94 | | | $ | 19.10 | |
| Income (loss) from investment operations: | | | | | | | | | | | | | | | | | | | | |
| Net investment income (loss) | | | 0.29 | | | | 0.27 | | | | 0.36 | | | | 0.35 | | | | 0.32 | |
| Net realized and unrealized gain (loss) on investments | | | (0.94 | ) | | | (0.28 | ) | | | (1.13 | ) | | | 3.99 | | | | 4.25 | |
| Total from investment operations | | | (0.65 | ) | | | (0.01 | ) | | | (0.77 | ) | | | 4.34 | | | | 4.57 | |
| Less distributions from: | | | | | | | | | | | | | | | | | | | | |
| Net investment income | | | 0.44 | | | | 0.30 | | | | 0.32 | | | | 0.37 | | | | 0.73 | |
| Net realized gain | | | — | | | | — | | | | — | | | | — | | | | — | |
| Total distributions | | | 0.44 | | | | 0.30 | | | | 0.32 | | | | 0.37 | | | | 0.73 | |
| Net asset value, end of year | | $ | 24.42 | | | $ | 25.51 | | | $ | 25.82 | | | $ | 26.91 | | | $ | 22.94 | |
| Total return (%) | | | (2.54 | ) | | | (0.03 | ) | | | (2.86 | ) | | | 18.96 | | | | 23.96 | |
| Ratios to average daily net assets (%): | | | | | | | | | | | | | | | | | | | | |
| Expenses | | | 1.13 | | | | 1.14 | | | | 1.14 | | | | 1.11 | | | | 1.15 | |
| Net investment income (loss) | | | 1.16 | | | | 1.02 | | | | 1.36 | | | | 1.43 | | | | 1.51 | |
| Class I net assets at end of year (in thousands) | | $ | 2,251,701 | | | $ | 2,655,156 | | | $ | 2,705,054 | | | $ | 2,877,541 | | | $ | 2,402,897 | |
| Portfolio turnover rate (%) | | | 101 | | | | 70 | | | | 79 | | | | 97 | | | | 81 | |
Note: Net investment income (loss) per share is based on the average shares outstanding during the year.
Performance cited represents past performance. Past performance does not guarantee future results and current performance may be lower or higher than the data quoted. Results shown are annual returns, which assume reinvestment of dividends and capital gains. Investment returns and principal will fluctuate and you may have a gain or loss when you sell shares. For the most current month-end performance information, please call 1-800-742-7272 or visit our Web site at www.williamblairfunds.com.
| 168 | Annual Report | December 31, 2016 |
Financial Highlights
Institutional International Growth Fund
| | | Institutional Class | |
| | | Years Ended December 31, | |
| | | 2016 | | | 2015 | | | 2014 | | | 2013 | | | 2012 | |
| Net asset value, beginning of year | | $ | 15.08 | | | $ | 15.26 | | | $ | 17.40 | | | $ | 14.89 | | | $ | 12.39 | |
| Income (loss) from investment operations: | | | | | | | | | | | | | | | | | | | | |
| Net investment income (loss) | | | 0.18 | | | | 0.19 | | | | 0.26 | | | | 0.25 | | | | 0.23 | |
| Net realized and unrealized gain (loss) on investments | | | (0.54 | ) | | | (0.18 | ) | | | (0.71 | ) | | | 2.56 | | | | 2.76 | |
| Total from investment operations | | | (0.36 | ) | | | 0.01 | | | | (0.45 | ) | | | 2.81 | | | | 2.99 | |
| Less distributions from: | | | | | | | | | | | | | | | | | | | | |
| Net investment income | | | 0.17 | | | | 0.09 | | | | 0.32 | | | | 0.30 | | | | 0.49 | |
| Net realized gain | | | — | | | | 0.10 | | | | 1.37 | | | | — | | | | — | |
| Total distributions | | | 0.17 | | | | 0.19 | | | | 1.69 | | | | 0.30 | | | | 0.49 | |
| Net asset value, end of year | | $ | 14.55 | | | $ | 15.08 | | | $ | 15.26 | | | $ | 17.40 | | | $ | 14.89 | |
| Total return (%) | | | (2.40 | ) | | | 0.09 | | | | (2.66 | ) | | | 18.90 | | | | 24.11 | |
| Ratios to average daily net assets (%): | | | | | | | | | | | | | | | | | | | | |
| Expenses | | | 0.98 | | | | 0.96 | | | | 0.97 | | | | 0.97 | | | | 0.98 | |
| Net investment income (loss) | | | 1.25 | | | | 1.18 | | | | 1.50 | | | | 1.58 | | | | 1.64 | |
| Institutional Class net assets at end of year (in thousands) | | $ | 2,093,971 | | | $ | 2,335,632 | | | $ | 2,339,169 | | | $ | 2,440,149 | | | $ | 1,974,130 | |
| Portfolio turnover rate (%) | | | 105 | | | | 70 | | | | 83 | | | | 97 | | | | 83 | |
Note: Net investment income (loss) per share is based on the average shares outstanding during the year.
Performance cited represents past performance. Past performance does not guarantee future results and current performance may be lower or higher than the data quoted. Results shown are annual returns, which assume reinvestment of dividends and capital gains. Investment returns and principal will fluctuate and you may have a gain or loss when you sell shares. For the most current month-end performance information, please call 1-800-742-7272 or visit our Web site at www.williamblairfunds.com.
| December 31, 2016 | William Blair Funds | 169 |
Financial Highlights
International Small Cap Growth Fund
| | | Class N | |
| | | Years Ended December 31, | |
| | | 2016 | | | 2015 | | | 2014 | | | 2013 | | | 2012 | |
| Net asset value, beginning of year | | $ | 13.50 | | | $ | 12.56 | | | $ | 16.08 | | | $ | 13.46 | | | $ | 11.36 | |
| Income (loss) from investment operations: | | | | | | | | | | | | | | | | | | | | |
| Net investment income (loss) | | | 0.10 | | | | 0.05 | | | | 0.03 | | | | 0.10 | | | | 0.08 | |
| Net realized and unrealized gain (loss) on investments | | | (0.72 | ) | | | 1.16 | | | | (1.38 | ) | | | 3.35 | | | | 2.27 | |
| Total from investment operations | | | (0.62 | ) | | | 1.21 | | | | (1.35 | ) | | | 3.45 | | | | 2.35 | |
| Less distributions from: | | | | | | | | | | | | | | | | | | | | |
| Net investment income | | | 0.01 | | | | 0.24 | | | | 0.18 | | | | 0.16 | | | | 0.25 | |
| Net realized gain | | | 0.00 | ^ | | | 0.03 | | | | 1.99 | | | | 0.67 | | | | — | |
| Total distributions | | | 0.01 | | | | 0.27 | | | | 2.17 | | | | 0.83 | | | | 0.25 | |
| Net asset value, end of year | | $ | 12.87 | | | $ | 13.50 | | | $ | 12.56 | | | $ | 16.08 | | | $ | 13.46 | |
| Total return (%) | | | (4.60 | ) | | | 9.67 | | | | (8.43 | ) | | | 25.80 | | | | 20.73 | |
| Ratios to average daily net assets (%): | | | | | | | | | | | | | | | | | | | | |
| Expenses, net of waivers and reimbursements | | | 1.44 | | | | 1.47 | | | | 1.58 | | | | 1.59 | | | | 1.61 | |
| Expenses, before waivers and reimbursements | | | 1.59 | | | | 1.62 | | | | 1.58 | | | | 1.59 | | | | 1.61 | |
| Net investment income (loss), net of waivers and reimbursements | | | 0.77 | | | | 0.34 | | | | 0.20 | | | | 0.67 | | | | 0.65 | |
| Net investment income (loss), before waivers and reimbursements | | | 0.62 | | | | 0.19 | | | | 0.20 | | | | 0.67 | | | | 0.65 | |
| Class N net assets at end of year (in thousands) | | $ | 10,361 | | | $ | 11,350 | | | $ | 13,676 | | | $ | 18,910 | | | $ | 14,771 | |
| Portfolio turnover rate (%) | | | 73 | | | | 90 | | | | 127 | | | | 111 | | | | 76 | |
| | | Class I | |
| | | Years Ended December 31, | |
| | | 2016 | | | 2015 | | | 2014 | | | 2013 | | | 2012 | |
| Net asset value, beginning of year | | $ | 13.65 | | | $ | 12.70 | | | $ | 16.23 | | | $ | 13.58 | | | $ | 11.46 | |
| Income (loss) from investment operations: | | | | | | | | | | | | | | | | | | | | |
| Net investment income (loss) | | | 0.14 | | | | 0.09 | | | | 0.09 | | | | 0.15 | | | | 0.12 | |
| Net realized and unrealized gain (loss) on investments | | | (0.75 | ) | | | 1.18 | | | | (1.40 | ) | | | 3.37 | | | | 2.30 | |
| Total from investment operations | | | (0.61 | ) | | | 1.27 | | | | (1.31 | ) | | | 3.52 | | | | 2.42 | |
| Less distributions from: | | | | | | | | | | | | | | | | | | | | |
| Net investment income | | | 0.04 | | | | 0.29 | | | | 0.23 | | | | 0.20 | | | | 0.30 | |
| Net realized gain | | | 0.00 | ^ | | | 0.03 | | | | 1.99 | | | | 0.67 | | | | — | |
| Total distributions | | | 0.04 | | | | 0.32 | | | | 2.22 | | | | 0.87 | | | | 0.30 | |
| Net asset value, end of year | | $ | 13.00 | | | $ | 13.65 | | | $ | 12.70 | | | $ | 16.23 | | | $ | 13.58 | |
| Total return (%) | | | (4.41 | ) | | | 10.00 | | | | (8.10 | ) | | | 26.11 | | | | 21.10 | |
| Ratios to average daily net assets (%): | | | | | | | | | | | | | | | | | | | | |
| Expenses, net of waivers and reimbursements | | | 1.15 | | | | 1.16 | | | | 1.28 | | | | 1.30 | | | | 1.30 | |
| Expenses, before waivers and reimbursements | | | 1.30 | | | | 1.31 | | | | 1.28 | | | | 1.30 | | | | 1.30 | |
| Net investment income (loss), net of waivers and reimbursements | | | 1.06 | | | | 0.66 | | | | 0.56 | | | | 0.96 | | | | 0.95 | |
| Net investment income (loss), before waivers and reimbursements | | | 0.91 | | | | 0.51 | | | | 0.56 | | | | 0.96 | | | | 0.95 | |
| Class I net assets at end of year (in thousands) | | $ | 306,526 | | | $ | 342,232 | | | $ | 364,161 | | | $ | 508,758 | | | $ | 359,557 | |
| Portfolio turnover rate (%) | | | 73 | | | | 90 | | | | 127 | | | | 111 | | | | 76 | |
| ^ | Amount is less than $0.005 per share. |
Note: Net investment income (loss) per share is based on the average shares outstanding during the year.
Performance cited represents past performance. Past performance does not guarantee future results and current performance may be lower or higher than the data quoted. Results shown are annual returns, which assume reinvestment of dividends and capital gains. Investment returns and principal will fluctuate and you may have a gain or loss when you sell shares. For the most current month-end performance information, please call 1-800-742-7272 or visit our Web site at www.williamblairfunds.com.
| 170 | Annual Report | December 31, 2016 |
Financial Highlights
International Small Cap Growth Fund
| | | Institutional Class | |
| | | Years Ended December 31, | |
| | | 2016 | | | 2015 | | | 2014 | | | 2013 | | | 2012 | |
| Net asset value, beginning of year | | $ | 13.72 | | | $ | 12.77 | | | $ | 16.32 | | | $ | 13.64 | | | $ | 11.51 | |
| Income (loss) from investment operations: | | | | | | | | | | | | | | | | | | | | |
| Net investment income (loss) | | | 0.15 | | | | 0.10 | | | | 0.12 | | | | 0.18 | | | | 0.15 | |
| Net realized and unrealized gain (loss) on investments | | | (0.74 | ) | | | 1.18 | | | | (1.41 | ) | | | 3.41 | | | | 2.31 | |
| Total from investment operations | | | (0.59 | ) | | | 1.28 | | | | (1.29 | ) | | | 3.59 | | | | 2.46 | |
| Less distributions from: | | | | | | | | | | | | | | | | | | | | |
| Net investment income | | | 0.06 | | | | 0.30 | | | | 0.27 | | | | 0.24 | | | | 0.33 | |
| Net realized gain | | | 0.00 | ^ | | | 0.03 | | | | 1.99 | | | | 0.67 | | | | — | |
| Total distributions | | | 0.06 | | | | 0.33 | | | | 2.26 | | | | 0.91 | | | | 0.33 | |
| Net asset value, end of year | | $ | 13.07 | | | $ | 13.72 | | | $ | 12.77 | | | $ | 16.32 | | | $ | 13.64 | |
| Total return (%) | | | (4.31 | ) | | | 10.03 | | | | (7.91 | ) | | | 26.49 | | | | 21.36 | |
| Ratios to average daily net assets (%): | | | | | | | | | | | | | | | | | | | | |
| Expenses | | | 1.07 | | | | 1.08 | | | | 1.06 | | | | 1.06 | | | | 1.08 | |
| Net investment income (loss), | | | 1.13 | | | | 0.76 | | | | 0.74 | | | | 1.20 | | | | 1.14 | |
| Institutional Class net assets at end of year (in thousands) | | $ | 199,746 | | | $ | 221,018 | | | $ | 245,103 | | | $ | 408,524 | | | $ | 345,180 | |
| Portfolio turnover rate (%) | | | 73 | | | | 90 | | | | 127 | | | | 111 | | | | 76 | |
| ^ | Amount is less than $0.005 per share. |
Note: Net investment income (loss) per share is based on the average shares outstanding during the year.
Performance cited represents past performance. Past performance does not guarantee future results and current performance may be lower or higher than the data quoted. Results shown are annual returns, which assume reinvestment of dividends and capital gains. Investment returns and principal will fluctuate and you may have a gain or loss when you sell shares. For the most current month-end performance information, please call 1-800-742-7272 or visit our Web site at www.williamblairfunds.com.
| December 31, 2016 | William Blair Funds | 171 |
Financial Highlights
Emerging Markets Leaders Fund
| | | Class N | |
| | | Years Ended December 31, | |
| | | 2016 | | | 2015 | | | 2014 | | | 2013 | | | 2012 | |
| Net asset value, beginning of year | | $ | 7.73 | | | $ | 9.06 | | | $ | 9.10 | | | $ | 9.20 | | | $ | 7.68 | |
| Income (loss) from investment operations: | | | | | | | | | | | | | | | | | | | | |
| Net investment income (loss) | | | 0.02 | | | | 0.02 | | | | 0.05 | | | | (0.02 | ) | | | 0.02 | |
| Net realized and unrealized gain (loss) on investments | | | 0.09 | | | | (1.34 | ) | | | 0.14 | | | | (0.05 | ) | | | 1.54 | |
| Total from investment operations | | | 0.11 | | | | (1.32 | ) | | | 0.19 | | | | (0.07 | ) | | | 1.56 | |
| Less distributions from: | | | | | | | | | | | | | | | | | | | | |
| Net investment income | | | — | | | | — | | | | 0.00 | ^ | | | 0.03 | | | | 0.04 | |
| Net realized gain | | | — | | | | 0.01 | | | | 0.23 | | | | — | | | | — | |
| Total distributions | | | — | | | | 0.01 | | | | 0.23 | | | | 0.03 | | | | 0.04 | |
| Net asset value, end of year | | $ | 7.84 | | | $ | 7.73 | | | $ | 9.06 | | | $ | 9.10 | | | $ | 9.20 | |
| Total return (%) | | | 1.42 | | | | (14.56 | ) | | | 2.17 | | | | (0.74 | ) | | | 20.37 | |
| Ratios to average daily net assets (%): | | | | | | | | | | | | | | | | | | | | |
| Expenses, net of waivers and reimbursements | | | 1.57 | | | | 1.64 | | | | 1.65 | | | | 1.65 | | | | 1.65 | |
| Expenses, before waivers and reimbursements | | | 1.81 | | | | 1.89 | | | | 1.82 | | | | 1.83 | | | | 2.10 | |
| Net investment income (loss), net of waivers and reimbursements | | | 0.29 | | | | 0.18 | | | | 0.51 | | | | (0.23 | ) | | | 0.26 | |
| Net investment income (loss), before waivers and reimbursements | | | 0.05 | | | | (0.07 | ) | | | 0.34 | | | | (0.41 | ) | | | (0.19 | ) |
| Class N net assets at end of year (in thousands) | | $ | 2,479 | | | $ | 1,599 | | | $ | 1,832 | | | $ | 1,959 | | | $ | 249 | |
| Portfolio turnover rate (%) | | | 135 | | | | 110 | | | | 131 | | | | 131 | | | | 94 | |
| | | Class I | |
| | | Years Ended December 31, | |
| | | 2016 | | | 2015 | | | 2014 | | | 2013 | | | 2012 | |
| Net asset value, beginning of year | | $ | 7.74 | | | $ | 9.08 | | | $ | 9.10 | | | $ | 9.18 | | | $ | 7.66 | |
| Income (loss) from investment operations: | | | | | | | | | | | | | | | | | | | | |
| Net investment income (loss) | | | 0.04 | | | | 0.05 | | | | 0.08 | | | | 0.05 | | | | 0.07 | |
| Net realized and unrealized gain (loss) on investments | | | 0.10 | | | | (1.36 | ) | | | 0.15 | | | | (0.10 | ) | | | 1.51 | |
| Total from investment operations | | | 0.14 | | | | (1.31 | ) | | | 0.23 | | | | (0.05 | ) | | | 1.58 | |
| Less distributions from: | | | | | | | | | | | | | | | | | | | | |
| Net investment income | | | 0.01 | | | | 0.02 | | | | 0.02 | | | | 0.03 | | | | 0.06 | |
| Net realized gain | | | — | | | | 0.01 | | | | 0.23 | | | | — | | | | — | |
| Total distributions | | | 0.01 | | | | 0.03 | | | | 0.25 | | | | 0.03 | | | | 0.06 | |
| Net asset value, end of year | | $ | 7.87 | | | $ | 7.74 | | | $ | 9.08 | | | $ | 9.10 | | | $ | 9.18 | |
| Total return (%) | | | 1.82 | | | | (14.37 | ) | | | 2.62 | | | | (0.60 | ) | | | 20.64 | |
| Ratios to average daily net assets (%): | | | | | | | | | | | | | | | | | | | | |
| Expenses, net of waivers and reimbursements | | | 1.30 | | | | 1.29 | | | | 1.40 | | | | 1.40 | | | | 1.40 | |
| Expenses, before waivers and reimbursements | | | 1.54 | | | | 1.54 | | | | 1.60 | | | | 1.58 | | | | 1.75 | |
| Net investment income (loss), net of waivers and reimbursements | | | 0.52 | | | | 0.53 | | | | 0.84 | | | | 0.51 | | | | 0.83 | |
| Net investment income (loss), before waivers and reimbursements | | | 0.28 | | | | 0.28 | | | | 0.64 | | | | 0.33 | | | | 0.48 | |
| Class I net assets at end of year (in thousands) | | $ | 30,346 | | | $ | 32,862 | | | $ | 28,475 | | | $ | 34,590 | | | $ | 25,628 | |
| Portfolio turnover rate (%) | | | 135 | | | | 110 | | | | 131 | | | | 131 | | | | 94 | |
| ^ | Amount is less than $0.005 per share. |
Note: Net investment income (loss) per share is based on the average shares outstanding during the year.
Performance cited represents past performance. Past performance does not guarantee future results and current performance may be lower or higher than the data quoted. Results shown are annual returns, which assume reinvestment of dividends and capital gains. Investment returns and principal will fluctuate and you may have a gain or loss when you sell shares. For the most current month-end performance information, please call 1-800-742-7272 or visit our Web site at www.williamblairfunds.com.
| 172 | Annual Report | December 31, 2016 |
Financial Highlights
Emerging Markets Leaders Fund
| | | Institutional Class | |
| | | Years Ended December 31, | |
| | | 2016 | | | 2015 | | | 2014 | | | 2013 | | | 2012 | |
| Net asset value, beginning of year | | $ | 7.74 | | | $ | 9.07 | | | $ | 9.10 | | | $ | 9.18 | | | $ | 7.65 | |
| Income (loss) from investment operations: | | | | | | | | | | | | | | | | | | | | |
| Net investment income (loss) | | | 0.03 | | | | 0.04 | | | | 0.08 | | | | 0.06 | | | | 0.08 | |
| Net realized and unrealized gain (loss) on investments | | | 0.10 | | | | (1.33 | ) | | | 0.16 | | | | (0.10 | ) | | | 1.52 | |
| Total from investment operations | | | 0.13 | | | | (1.29 | ) | | | 0.24 | | | | (0.04 | ) | | | 1.60 | |
| Less distributions from: | | | | | | | | | | | | | | | | | | | | |
| Net investment income | | | 0.01 | | | | 0.03 | | | | 0.04 | | | | 0.04 | | | | 0.07 | |
| Net realized gain | | | — | | | | 0.01 | | | | 0.23 | | | | — | | | | — | |
| Total distributions | | | 0.01 | | | | 0.04 | | | | 0.27 | | | | 0.04 | | | | 0.07 | |
| Net asset value, end of year | | $ | 7.86 | | | $ | 7.74 | | | $ | 9.07 | | | $ | 9.10 | | | $ | 9.18 | |
| Total return (%) | | | 1.74 | | | | (14.24 | ) | | | 2.68 | | | | (0.46 | ) | | | 20.97 | |
| Ratios to average daily net assets (%): | | | | | | | | | | | | | | | | | | | | |
| Expenses, net of waivers and reimbursements | | | 1.25 | | | | 1.25 | | | | 1.25 | | | | 1.25 | | | | 1.25 | |
| Expenses, before waivers and reimbursements | | | 1.34 | | | | 1.35 | | | | 1.42 | | | | 1.42 | | | | 1.59 | |
| Net investment income (loss), net of waivers and reimbursements | | | 0.39 | | | | 0.49 | | | | 0.83 | | | | 0.68 | | | | 0.90 | |
| Net investment income (loss), before waivers and reimbursements | | | 0.30 | | | | 0.39 | | | | 0.66 | | | | 0.51 | | | | 0.56 | |
| Institutional Class net assets at end of year (in thousands) | | $ | 272,678 | | | $ | 93,217 | | | $ | 75,875 | | | $ | 36,509 | | | $ | 43,102 | |
| Portfolio turnover rate (%) | | | 135 | | | | 110 | | | | 131 | | | | 131 | | | | 94 | |
Note: Net investment income (loss) per share is based on the average shares outstanding during the year.
Performance cited represents past performance. Past performance does not guarantee future results and current performance may be lower or higher than the data quoted. Results shown are annual returns, which assume reinvestment of dividends and capital gains. Investment returns and principal will fluctuate and you may have a gain or loss when you sell shares. For the most current month-end performance information, please call 1-800-742-7272 or visit our Web site at www.williamblairfunds.com.
| December 31, 2016 | William Blair Funds | 173 |
Financial Highlights
Emerging Markets Growth Fund
| | | Class N | |
| | | Years Ended December 31, | |
| | | 2016 | | | 2015 | | | 2014 | | | 2013 | | | 2012 | |
| Net asset value, beginning of year | | $ | 10.85 | | | $ | 12.91 | | | $ | 13.28 | | | $ | 13.40 | | | $ | 11.16 | |
| Income (loss) from investment operations: | | | | | | | | | | | | | | | | | | | | |
| Net investment income (loss) | | | 0.03 | | | | 0.04 | | | | 0.08 | | | | 0.05 | | | | 0.07 | |
| Net realized and unrealized gain (loss) on investments | | | 0.13 | | | | (1.98 | ) | | | 0.37 | | | | 0.09 | | | | 2.24 | |
| Total from investment operations | | | 0.16 | | | | (1.94 | ) | | | 0.45 | | | | 0.14 | | | | 2.31 | |
| Less distributions from: | | | | | | | | | | | | | | | | | | | | |
| Net investment income | | | 0.02 | | | | — | | | | 0.08 | | | | 0.01 | | | | 0.07 | |
| Net realized gain | | | — | | | | 0.12 | | | | 0.74 | | | | 0.25 | | | | — | |
| Total distributions | | | 0.02 | | | | 0.12 | | | | 0.82 | | | | 0.26 | | | | 0.07 | |
| Net asset value, end of year | | $ | 10.99 | | | $ | 10.85 | | | $ | 12.91 | | | $ | 13.28 | | | $ | 13.40 | |
| Total return (%) | | | 1.49 | | | | (15.03 | ) | | | 3.40 | | | | 1.05 | | | | 20.70 | |
| Ratios to average daily net assets (%): | | | | | | | | | | | | | | | | | | | | |
| Expenses, net of waivers and reimbursements | | | 1.50 | | | | 1.50 | | | | 1.64 | | | | 1.68 | | | | 1.69 | |
| Expenses, before waivers and reimbursements | | | 1.65 | | | | 1.65 | | | | 1.64 | | | | 1.68 | | | | 1.69 | |
| Net investment income (loss), net of waivers and reimbursements | | | 0.28 | | | | 0.33 | | | | 0.55 | | | | 0.39 | | | | 0.59 | |
| Net investment income (loss), before waivers and reimbursements | | | 0.13 | | | | 0.18 | | | | 0.55 | | | | 0.39 | | | | 0.59 | |
| Class N net assets at end of year (in thousands) | | $ | 8,488 | | | $ | 9,367 | | | $ | 12,638 | | | $ | 13,723 | | | $ | 16,724 | |
| Portfolio turnover rate (%) | | | 105 | | | | 121 | | | | 101 | | | | 118 | | | | 90 | |
| | | Class I | |
| | | Years Ended December 31, | |
| | | 2016 | | | 2015 | | | 2014 | | | 2013 | | | 2012 | |
| Net asset value, beginning of year | | $ | 10.96 | | | $ | 13.01 | | | $ | 13.38 | | | $ | 13.50 | | | $ | 11.25 | |
| Income (loss) from investment operations: | | | | | | | | | | | | | | | | | | | | |
| Net investment income (loss) | | | 0.06 | | | | 0.07 | | | | 0.11 | | | | 0.08 | | | | 0.11 | |
| Net realized and unrealized gain (loss) on investments | | | 0.13 | | | | (2.00 | ) | | | 0.37 | | | | 0.10 | | | | 2.25 | |
| Total from investment operations | | | 0.19 | | | | (1.93 | ) | | | 0.48 | | | | 0.18 | | | | 2.36 | |
| Less distributions from: | | | | | | | | | | | | | | | | | | | | |
| Net investment income | | | 0.05 | | | | — | | | | 0.11 | | | | 0.05 | | | | 0.11 | |
| Net realized gain | | | — | | | | 0.12 | | | | 0.74 | | | | 0.25 | | | | — | |
| Total distributions | | | 0.05 | | | | 0.12 | | | | 0.85 | | | | 0.30 | | | | 0.11 | |
| Net asset value, end of year | | $ | 11.10 | | | $ | 10.96 | | | $ | 13.01 | | | $ | 13.38 | | | $ | 13.50 | |
| Total return (%) | | | 1.73 | | | | (14.83 | ) | | | 3.65 | | | | 1.36 | | | | 21.01 | |
| Ratios to average daily net assets (%): | | | | | | | | | | | | | | | | | | | | |
| Expenses, net of waivers and reimbursements | | | 1.26 | | | | 1.25 | | | | 1.40 | | | | 1.41 | | | | 1.41 | |
| Expenses, before waivers and reimbursements | | | 1.41 | | | | 1.40 | | | | 1.40 | | | | 1.41 | | | | 1.41 | |
| Net investment income (loss), net of waivers and reimbursements | | | 0.53 | | | | 0.58 | | | | 0.79 | | | | 0.62 | | | | 0.86 | |
| Net investment income (loss), before waivers and reimbursements | | | 0.38 | | | | 0.43 | | | | 0.79 | | | | 0.62 | | | | 0.86 | |
| Class I net assets at end of year (in thousands) | | $ | 93,668 | | | $ | 130,491 | | | $ | 166,488 | | | $ | 152,588 | | | $ | 144,942 | |
| Portfolio turnover rate (%) | | | 105 | | | | 121 | | | | 101 | | | | 118 | | | | 90 | |
Note: Net investment income (loss) per share is based on the average shares outstanding during the year.
Performance cited represents past performance. Past performance does not guarantee future results and current performance may be lower or higher than the data quoted. Results shown are annual returns, which assume reinvestment of dividends and capital gains. Investment returns and principal will fluctuate and you may have a gain or loss when you sell shares. For the most current month-end performance information, please call 1-800-742-7272 or visit our Web site at www.williamblairfunds.com.
| 174 | Annual Report | December 31, 2016 |
Financial Highlights
Emerging Markets Growth Fund
| | | Institutional Class | |
| | | Years Ended December 31, | |
| | | 2016 | | | 2015 | | | 2014 | | | 2013 | | | 2012 | |
| Net asset value, beginning of year | | $ | 11.05 | | | $ | 13.09 | | | $ | 13.46 | | | $ | 13.59 | | | $ | 11.32 | |
| Income (loss) from investment operations: | | | | | | | | | | | | | | | | | | | | |
| Net investment income (loss) | | | 0.07 | | | | 0.08 | | | | 0.14 | | | | 0.12 | | | | 0.14 | |
| Net realized and unrealized gain (loss) on investments | | | 0.12 | | | | (2.00 | ) | | | 0.37 | | | | 0.08 | | | | 2.27 | |
| Total from investment operations | | | 0.19 | | | | (1.92 | ) | | | 0.51 | | | | 0.20 | | | | 2.41 | |
| Less distributions from: | | | | | | | | | | | | | | | | | | | | |
| Net investment income | | | 0.06 | | | | — | | | | 0.14 | | | | 0.08 | | | | 0.14 | |
| Net realized gain | | | — | | | | 0.12 | | | | 0.74 | | | | 0.25 | | | | — | |
| Total distributions | | | 0.06 | | | | 0.12 | | | | 0.88 | | | | 0.33 | | | | 0.14 | |
| Net asset value, end of year | | $ | 11.18 | | | $ | 11.05 | | | $ | 13.09 | | | $ | 13.46 | | | $ | 13.59 | |
| Total return (%) | | | 1.71 | | | | (14.67 | ) | | | 3.85 | | | | 1.49 | | | | 21.28 | |
| Ratios to average daily net assets (%): | | | | | | | | | | | | | | | | | | | | |
| Expenses | | | 1.19 | | | | 1.17 | | | | 1.18 | | | | 1.19 | | | | 1.20 | |
| Net investment income (loss) | | | 0.60 | | | | 0.61 | | | | 1.00 | | | | 0.87 | | | | 1.12 | |
| Institutional Class net assets at end of year (in thousands) | | $ | 831,587 | | | $ | 739,253 | | | $ | 806,708 | | | $ | 833,711 | | | $ | 802,571 | |
| Portfolio turnover rate (%) | | | 105 | | | | 121 | | | | 101 | | | | 118 | | | | 90 | |
Note: Net investment income (loss) per share is based on the average shares outstanding during the year.
Performance cited represents past performance. Past performance does not guarantee future results and current performance may be lower or higher than the data quoted. Results shown are annual returns, which assume reinvestment of dividends and capital gains. Investment returns and principal will fluctuate and you may have a gain or loss when you sell shares. For the most current month-end performance information, please call 1-800-742-7272 or visit our Web site at www.williamblairfunds.com.
| December 31, 2016 | William Blair Funds | 175 |
Financial Highlights
Emerging Markets Small Cap Growth Fund
| | | Class N | |
| | | Years Ended December 31, | |
| | | 2016 | | | 2015 | | | 2014 | | | 2013 | | | 2012 | |
| Net asset value, beginning of year | | $ | 14.84 | | | $ | 16.52 | | | $ | 15.12 | | | $ | 12.99 | | | $ | 9.73 | |
| Income (loss) from investment operations: | | | | | | | | | | | | | | | | | | | | |
| Net investment income (loss) | | | 0.09 | | | | (0.01 | ) | | | 0.04 | | | | 0.05 | | | | 0.06 | |
| Net realized and unrealized gain (loss) on investments | | | (0.88 | ) | | | (1.05 | ) | | | 2.13 | | | | 2.08 | | | | 3.27 | |
| Total from investment operations | | | (0.79 | ) | | | (1.06 | ) | | | 2.17 | | | | 2.13 | | | | 3.33 | |
| Less distributions from: | | | | | | | | | | | | | | | | | | | | |
| Net investment income | | | 0.32 | | | | — | | | | 0.03 | | | | — | | | | 0.07 | |
| Net realized gain | | | — | | | | 0.62 | | | | 0.74 | | | | 0.00 | ^ | | | — | |
| Total distributions | | | 0.32 | | | | 0.62 | | | | 0.77 | | | | 0.00 | ^ | | | 0.07 | |
| Net asset value, end of year | | $ | 13.73 | | | $ | 14.84 | | | $ | 16.52 | | | $ | 15.12 | | | $ | 12.99 | |
| Total return (%) | | | (5.33 | ) | | | (6.40 | ) | | | 14.41 | | | | 16.42 | | | | 34.23 | |
| Ratios to average daily net assets (%): | | | | | | | | | | | | | | | | | | | | |
| Expenses, net of waivers and reimbursements | | | 1.61 | | | | 1.65 | | | | 1.65 | | | | 1.65 | | | | 1.65 | |
| Expenses, before waivers and reimbursements | | | 1.82 | | | | 1.94 | | | | 1.74 | | | | 2.19 | | | | 4.76 | |
| Net investment income (loss), net of waivers and reimbursements | | | 0.62 | | | | (0.06 | ) | | | 0.21 | | | | 0.38 | | | | 0.56 | |
| Net investment income (loss), before waivers and reimbursements | | | 0.41 | | | | (0.35 | ) | | | 0.12 | | | | (0.16 | ) | | | (2.54 | ) |
| Class N net assets at end of year (in thousands) | | $ | 9,263 | | | $ | 11,306 | | | $ | 10,745 | | | $ | 9,313 | | | $ | 3,016 | |
| Portfolio turnover rate (%) | | | 157 | | | | 167 | | | | 124 | | | | 138 | | | | 78 | |
| | | Class I | |
| | | Years Ended December 31, | |
| | | 2016 | | | 2015 | | | 2014 | | | 2013 | | | 2012 | |
| Net asset value, beginning of year | | $ | 14.90 | | | $ | 16.52 | | | $ | 15.13 | | | $ | 12.99 | | | $ | 9.73 | |
| Income (loss) from investment operations: | | | | | | | | | | | | | | | | | | | | |
| Net investment income (loss) | | | 0.13 | | | | 0.05 | | | | 0.02 | | | | 0.05 | | | | 0.08 | |
| Net realized and unrealized gain (loss) on investments | | | (0.89 | ) | | | (1.05 | ) | | | 2.20 | | | | 2.12 | | | | 3.29 | |
| Total from investment operations | | | (0.76 | ) | | | (1.00 | ) | | | 2.22 | | | | 2.17 | | | | 3.37 | |
| Less distributions from: | | | | | | | | | | | | | | | | | | | | |
| Net investment income | | | 0.37 | | | | — | | | | 0.09 | | | | 0.03 | | | | 0.11 | |
| Net realized gain | | | — | | | | 0.62 | | | | 0.74 | | | | 0.00 | ^ | | | — | |
| Total distributions | | | 0.37 | | | | 0.62 | | | | 0.83 | | | | 0.03 | | | | 0.11 | |
| Net asset value, end of year | | $ | 13.77 | | | $ | 14.90 | | | $ | 16.52 | | | $ | 15.13 | | | $ | 12.99 | |
| Total return (%) | | | (5.11 | ) | | | (6.03 | ) | | | 14.73 | | | | 16.70 | | | | 34.62 | |
| Ratios to average daily net assets (%): | | | | | | | | | | | | | | | | | | | | |
| Expenses, net of waivers and reimbursements | | | 1.30 | | | | 1.31 | | | | 1.40 | | | | 1.40 | | | | 1.40 | |
| Expenses, before waivers and reimbursements | | | 1.51 | | | | 1.52 | | | | 1.49 | | | | 1.72 | | | | 4.40 | |
| Net investment income (loss), net of waivers and reimbursements | | | 0.87 | | | | 0.30 | | | | 0.15 | | | | 0.35 | | | | 0.70 | |
| Net investment income (loss), before waivers and reimbursements | | | 0.66 | | | | 0.09 | | | | 0.06 | | | | 0.03 | | | | (2.30 | ) |
| Class I net assets at end of year (in thousands) | | $ | 147,949 | | | $ | 162,375 | | | $ | 119,662 | | | $ | 58,123 | | | $ | 8,763 | |
| Portfolio turnover rate (%) | | | 157 | | | | 167 | | | | 124 | | | | 138 | | | | 78 | |
| ^ | Amount is less than $0.005 per share. |
Note: Net investment income (loss) per share is based on the average shares outstanding during the year.
Performance cited represents past performance. Past performance does not guarantee future results and current performance may be lower or higher than the data quoted. Results shown are annual returns, which assume reinvestment of dividends and capital gains. Investment returns and principal will fluctuate and you may have a gain or loss when you sell shares. For the most current month-end performance information, please call 1-800-742-7272 or visit our Web site at www.williamblairfunds.com.
| 176 | Annual Report | December 31, 2016 |
Financial Highlights
Emerging Markets Small Cap Growth Fund
| | | Institutional Class | |
| | | Periods Ended December 31, | |
| | | 2016 | | | 2015 | | | 2014 | | | 2013 | | | 2012(a) | |
| Net asset value, beginning of year | | $ | 14.92 | | | $ | 16.53 | | | $ | 15.14 | | | $ | 13.00 | | | $ | 12.79 | |
| Income (loss) from investment operations: | | | | | | | | | | | | | | | | | | | | |
| Net investment income (loss) | | | 0.14 | | | | 0.06 | | | | 0.06 | | | | 0.07 | | | | 0.00 | ^ |
| Net realized and unrealized gain (loss) on investments | | | (0.89 | ) | | | (1.05 | ) | | | 2.18 | | | | 2.11 | | | | 0.21 | |
| Total from investment operations | | | (0.75 | ) | | | (0.99 | ) | | | 2.24 | | | | 2.18 | | | | 0.21 | |
| Less distributions from: | | | | | | | | | | | | | | | | | | | | |
| Net investment income | | | 0.38 | | | | 0.00 | ^ | | | 0.11 | | | | 0.04 | | | | — | |
| Net realized gain | | | — | | | | 0.62 | | | | 0.74 | | | | 0.00 | ^ | | | — | |
| Total distributions | | | 0.38 | | | | 0.62 | | | | 0.85 | | | | 0.04 | | | | — | |
| Net asset value, end of year | | $ | 13.79 | | | $ | 14.92 | | | $ | 16.53 | | | $ | 15.14 | | | $ | 13.00 | |
| Total return (%)* | | | (5.05 | ) | | | (5.97 | ) | | | 14.85 | | | | 16.80 | | | | 1.64 | |
| Ratios to average daily net assets (%):** | | | | | | | | | | | | | | | | | | | | |
| Expenses, net of waivers and reimbursements | | | 1.25 | | | | 1.25 | | | | 1.25 | | | | 1.25 | | | | 1.25 | |
| Expenses, before waivers and reimbursements | | | 1.31 | | | | 1.31 | | | | 1.34 | | | | 1.56 | | | | 2.32 | |
| Net investment income (loss), net of waivers and reimbursements | | | 0.94 | | | | 0.34 | | | | 0.37 | | | | 0.47 | | | | (0.87 | ) |
| Net investment income (loss), before waivers and reimbursements | | | 0.88 | | | | 0.28 | | | | 0.28 | | | | 0.16 | | | | (1.93 | ) |
| Institutional Class net assets at end of year (in thousands) | | $ | 125,650 | | | $ | 123,160 | | | $ | 123,496 | | | $ | 91,663 | | | $ | 15,242 | |
| Portfolio turnover rate (%)* | | | 157 | | | | 167 | | | | 124 | | | | 138 | | | | 78 | |
| (a) | For the period from December 20, 2012 (Commencement of Operations) to December 31, 2012. |
| * | Not annualized for periods less than a year. |
| ** | Annualized for periods less than a year. |
| ^ | Amount is less than $0.005 per share. |
Note: Net investment income (loss) per share is based on the average shares outstanding during the year.
Performance cited represents past performance. Past performance does not guarantee future results and current performance may be lower or higher than the data quoted. Results shown are annual returns, which assume reinvestment of dividends and capital gains. Investment returns and principal will fluctuate and you may have a gain or loss when you sell shares. For the most current month-end performance information, please call 1-800-742-7272 or visit our Web site at www.williamblairfunds.com.
| December 31, 2016 | William Blair Funds | 177 |
Financial Highlights
Bond Fund
| | | Class N | |
| | | Years Ended December 31, | |
| | | 2016 | | | 2015 | | | 2014 | | | 2013 | | | 2012 | |
| Net asset value, beginning of year | | $ | 10.34 | | | $ | 10.74 | | | $ | 10.60 | | | $ | 11.28 | | | $ | 10.91 | |
| Income (loss) from investment operations: | | | | | | | | | | | | | | | | | | | | |
| Net investment income (loss) | | | 0.27 | | | | 0.27 | | | | 0.31 | | | | 0.32 | | | | 0.36 | |
| Net realized and unrealized gain (loss) on investments | | | 0.18 | | | | (0.29 | ) | | | 0.23 | | | | (0.47 | ) | | | 0.53 | |
| Total from investment operations | | | 0.45 | | | | (0.02 | ) | | | 0.54 | | | | (0.15 | ) | | | 0.89 | |
| Less distributions from: | | | | | | | | | | | | | | | | | | | | |
| Net investment income | | | 0.38 | | | | 0.38 | | | | 0.40 | | | | 0.42 | | | | 0.45 | |
| Net realized gain | | | — | | | | — | | | | 0.00 | ^ | | | 0.11 | | | | 0.07 | |
| Total distributions | | | 0.38 | | | | 0.38 | | | | 0.40 | | | | 0.53 | | | | 0.52 | |
| Net asset value, end of year | | $ | 10.41 | | | $ | 10.34 | | | $ | 10.74 | | | $ | 10.60 | | | $ | 11.28 | |
| Total return (%) | | | 4.40 | | | | (0.23 | ) | | | 5.10 | | | | (1.37 | ) | | | 8.33 | |
| Ratios to average daily net assets (%): | | | | | | | | | | | | | | | | | | | | |
| Expenses, net of waivers and reimbursements | | | 0.65 | | | | 0.61 | | | | 0.65 | | | | 0.65 | | | | 0.65 | |
| Expenses, before waivers and reimbursements | | | 0.82 | | | | 0.79 | | | | 0.85 | | | | 0.82 | | | | 0.81 | |
| Net investment income (loss), net of waivers and reimbursements | | | 2.60 | | | | 2.60 | | | | 2.90 | | | | 2.89 | | | | 3.25 | |
| Net investment income (loss), before waivers and reimbursements | | | 2.43 | | | | 2.42 | | | | 2.70 | | | | 2.72 | | | | 3.09 | |
| Class N net assets at end of year (in thousands) | | $ | 125,866 | | | $ | 139,303 | | | $ | 16,720 | | | $ | 11,389 | | | $ | 32,867 | |
| Portfolio turnover rate (%) | | | 17 | | | | 32 | | | | 35 | | | | 41 | | | | 25 | |
| | | | | | | | | | | | | | | | | | | | | |
| | | Class I | |
| | | Years Ended December 31, | |
| | | 2016 | | | 2015 | | | 2014 | | | 2013 | | | 2012 | |
| Net asset value, beginning of year | | $ | 10.24 | | | $ | 10.64 | | | $ | 10.49 | | | $ | 11.17 | | | $ | 10.80 | |
| Income (loss) from investment operations: | | | | | | | | | | | | | | | | | | | | |
| Net investment income (loss) | | | 0.30 | | | | 0.31 | | | | 0.33 | | | | 0.33 | | | | 0.38 | |
| Net realized and unrealized gain (loss) on investments | | | 0.16 | | | | (0.31 | ) | | | 0.23 | | | | (0.48 | ) | | | 0.52 | |
| Total from investment operations | | | 0.46 | | | | — | | | | 0.56 | | | | (0.15 | ) | | | 0.90 | |
| Less distributions from: | | | | | | | | | | | | | | | | | | | | |
| Net investment income | | | 0.40 | | | | 0.40 | | | | 0.41 | | | | 0.42 | | | | 0.46 | |
| Net realized gain | | | — | | | | — | | | | 0.00 | ^ | | | 0.11 | | | | 0.07 | |
| Total distributions | | | 0.40 | | | | 0.40 | | | | 0.41 | | | | 0.53 | | | | 0.53 | |
| Net asset value, end of year | | $ | 10.30 | | | $ | 10.24 | | | $ | 10.64 | | | $ | 10.49 | | | $ | 11.17 | |
| Total return (%) | | | 4.55 | | | | (0.05 | ) | | | 5.37 | | | | (1.28 | ) | | | 8.54 | |
| Ratios to average daily net assets (%): | | | | | | | | | | | | | | | | | | | | |
| Expenses, net of waivers and reimbursements | | | 0.41 | | | | 0.41 | | | | 0.50 | | | | 0.50 | | | | 0.50 | |
| Expenses, before waivers and reimbursements | | | 0.58 | | | | 0.59 | | | | 0.60 | | | | 0.58 | | | | 0.56 | |
| Net investment income (loss), net of waivers and reimbursements | | | 2.83 | | | | 2.93 | | | | 3.07 | | | | 3.05 | | | | 3.45 | |
| Net investment income (loss), before waivers and reimbursements | | | 2.66 | | | | 2.75 | | | | 2.97 | | | | 2.97 | | | | 3.39 | |
| Class I net assets at end of year (in thousands) | | $ | 322,174 | | | $ | 237,587 | | | $ | 149,466 | | | $ | 145,939 | | | $ | 172,836 | |
| Portfolio turnover rate (%) | | | 17 | | | | 32 | | | | 35 | | | | 41 | | | | 25 | |
| ^ | Amount is less than $0.005 per share. |
Note: Net investment income (loss) per share is based on the average shares outstanding during the year.
Performance cited represents past performance. Past performance does not guarantee future results and current performance may be lower or higher than the data quoted. Results shown are annual returns, which assume reinvestment of dividends and capital gains. Investment returns and principal will fluctuate and you may have a gain or loss when you sell shares. For the most current month-end performance information, please call 1-800-742-7272 or visit our Web site at www.williamblairfunds.com.
| 178 | Annual Report | December 31, 2016 |
Financial Highlights
Bond Fund
| | | Institutional Class | |
| | | Years Ended December 31, | |
| | | 2016 | | | 2015 | | | 2014 | | | 2013 | | | 2012 | |
| Net asset value, beginning of year | | $ | 10.23 | | | $ | 10.63 | | | $ | 10.48 | | | $ | 11.16 | | | $ | 10.80 | |
| Income (loss) from investment operations: | | | | | | | | | | | | | | | | | | | | |
| Net investment income (loss) | | | 0.30 | | | | 0.32 | | | | 0.34 | | | | 0.35 | | | | 0.40 | |
| Net realized and unrealized gain (loss) on investments | | | 0.17 | | | | (0.31 | ) | | | 0.23 | | | | (0.48 | ) | | | 0.51 | |
| Total from investment operations | | | 0.47 | | | | 0.01 | | | | 0.57 | | | | (0.13 | ) | | | 0.91 | |
| Less distributions from: | | | | | | | | | | | | | | | | | | | | |
| Net investment income | | | 0.41 | | | | 0.41 | | | | 0.42 | | | | 0.44 | | | | 0.48 | |
| Net realized gain | | | — | | | | — | | | | 0.00 | ^ | | | 0.11 | | | | 0.07 | |
| Total distributions | | | 0.41 | | | | 0.41 | | | | 0.42 | | | | 0.55 | | | | 0.55 | |
| Net asset value, end of year | | $ | 10.29 | | | $ | 10.23 | | | $ | 10.63 | | | $ | 10.48 | | | $ | 11.16 | |
| Total return (%) | | | 4.61 | | | | 0.01 | | | | 5.53 | | | | (1.13 | ) | | | 8.61 | |
| Ratios to average daily net assets (%): | | | | | | | | | | | | | | | | | | | | |
| Expenses, net of waivers and reimbursements | | | 0.35 | | | | 0.35 | | | | 0.35 | | | | 0.35 | | | | 0.35 | |
| Expenses, before waivers and reimbursements | | | 0.37 | | | | 0.38 | | | | 0.41 | | | | 0.39 | | | | 0.38 | |
| Net investment income (loss), net of waivers and reimbursements | | | 2.90 | | | | 3.01 | | | | 3.23 | | | | 3.19 | | | | 3.60 | |
| Net investment income (loss), before waivers and reimbursements | | | 2.88 | | | | 2.98 | | | | 3.17 | | | | 3.15 | | | | 3.57 | |
| Institutional Class net assets at end of year (in thousands) | | $ | 95,216 | | | $ | 103,904 | | | $ | 97,341 | | | $ | 87,527 | | | $ | 91,039 | |
| Portfolio turnover rate (%) | | | 17 | | | | 32 | | | | 35 | | | | 41 | | | | 25 | |
| ^ | Amount is less than $0.005 per share. |
Note: Net investment income (loss) per share is based on the average shares outstanding during the year.
Performance cited represents past performance. Past performance does not guarantee future results and current performance may be lower or higher than the data quoted. Results shown are annual returns, which assume reinvestment of dividends and capital gains. Investment returns and principal will fluctuate and you may have a gain or loss when you sell shares. For the most current month-end performance information, please call 1-800-742-7272 or visit our Web site at www.williamblairfunds.com.
| December 31, 2016 | William Blair Funds | 179 |
Financial Highlights
Income Fund
| | | Class N | |
| | | Years Ended December 31, | |
| | | 2016 | | | 2015 | | | 2014 | | | 2013 | | | 2012 | |
| Net asset value, beginning of year | | $ | 8.90 | | | $ | 9.12 | | | $ | 9.11 | | | $ | 9.55 | | | $ | 9.32 | |
| Income (loss) from investment operations: | | | | | | | | | | | | | | | | | | | | |
| Net investment income (loss) | | | 0.16 | | | | 0.15 | | | | 0.18 | | | | 0.20 | | | | 0.24 | |
| Net realized and unrealized gain (loss) on investments | | | 0.06 | | | | (0.11 | ) | | | 0.10 | | | | (0.35 | ) | | | 0.31 | |
| Total from investment operations | | | 0.22 | | | | 0.04 | | | | 0.28 | | | | (0.15 | ) | | | 0.55 | |
| Less distributions from: | | | | | | | | | | | | | | | | | | | | |
| Net investment income | | | 0.26 | | | | 0.26 | | | | 0.27 | | | | 0.29 | | | | 0.32 | |
| Net realized gain | | | — | | | | — | | | | — | | | | — | | | | — | |
| Total distributions | | | 0.26 | | | | 0.26 | | | | 0.27 | | | | 0.29 | | | | 0.32 | |
| Net asset value, end of year | | $ | 8.86 | | | $ | 8.90 | | | $ | 9.12 | | | $ | 9.11 | | | $ | 9.55 | |
| Total return (%) | | | 2.44 | | | | 0.39 | | | | 3.06 | | | | (1.61 | ) | | | 6.00 | |
| Ratios to average daily net assets (%): | | | | | | | | | | | | | | | | | | | | |
| Expenses, net of waivers and reimbursements | | | 0.79 | | | | 0.81 | | | | 0.84 | | | | 0.85 | | | | 0.83 | |
| Expenses, before waivers and reimbursements | | | 0.79 | | | | 0.81 | | | | 0.84 | | | | 1.03 | | | | 0.83 | |
| Net investment income (loss), net of waivers and reimbursements | | | 1.80 | | | | 1.71 | | | | 1.99 | | | | 2.13 | | | | 2.49 | |
| Net investment income (loss), before waivers and reimbursements | | | 1.80 | | | | 1.71 | | | | 1.99 | | | | 1.95 | | | | 2.49 | |
| Class N net assets at end of year (in thousands) | | $ | 52,710 | | | $ | 32,942 | | | $ | 34,020 | | | $ | 41,662 | | | $ | 68,947 | |
| Portfolio turnover rate (%) | | | 22 | | | | 21 | | | | 30 | | | | 41 | | | | 33 | |
| | | | | | | | | | | | | | | | | | | | | |
| | | Class I | |
| | | Years Ended December 31, | |
| | | 2016 | | | 2015 | | | 2014 | | | 2013 | | | 2012 | |
| Net asset value, beginning of year | | $ | 8.83 | | | $ | 9.05 | | | $ | 9.05 | | | $ | 9.48 | | | $ | 9.25 | |
| Income (loss) from investment operations: | | | | | | | | | | | | | | | | | | | | |
| Net investment income (loss) | | | 0.18 | | | | 0.18 | | | | 0.20 | | | | 0.21 | | | | 0.26 | |
| Net realized and unrealized gain (loss) on investments | | | 0.06 | | | | (0.12 | ) | | | 0.09 | | | | (0.34 | ) | | | 0.31 | |
| Total from investment operations | | | 0.24 | | | | 0.06 | | | | 0.29 | | | | (0.13 | ) | | | 0.57 | |
| Less distributions from: | | | | | | | | | | | | | | | | | | | | |
| Net investment income | | | 0.27 | | | | 0.28 | | | | 0.29 | | | | 0.30 | | | | 0.34 | |
| Net realized gain | | | — | | | | — | | | | — | | | | — | | | | — | |
| Total distributions | | | 0.27 | | | | 0.28 | | | | 0.29 | | | | 0.30 | | | | 0.34 | |
| Net asset value, end of year | | $ | 8.80 | | | $ | 8.83 | | | $ | 9.05 | | | $ | 9.05 | | | $ | 9.48 | |
| Total return (%) | | | 2.78 | | | | 0.63 | | | | 3.20 | | | | (1.41 | ) | | | 6.28 | |
| Ratios to average daily net assets (%): | | | | | | | | | | | | | | | | | | | | |
| Expenses, net of waivers and reimbursements | | | 0.57 | | | | 0.55 | | | | 0.59 | | | | 0.70 | | | | 0.58 | |
| Expenses, before waivers and reimbursements | | | 0.57 | | | | 0.55 | | | | 0.59 | | | | 0.77 | | | | 0.58 | |
| Net investment income (loss), net of waivers and reimbursements | | | 2.05 | | | | 1.97 | | | | 2.24 | | | | 2.30 | | | | 2.78 | |
| Net investment income (loss), before waivers and reimbursements | | | 2.05 | | | | 1.97 | | | | 2.24 | | | | 2.23 | | | | 2.78 | |
| Class I net assets at end of year (in thousands) | | $ | 58,160 | | | $ | 62,722 | | | $ | 64,834 | | | $ | 64,152 | | | $ | 72,830 | |
| Portfolio turnover rate (%) | | | 22 | | | | 21 | | | | 30 | | | | 41 | | | | 33 | |
Note: Net investment income (loss) per share is based on the average shares outstanding during the year.
Performance cited represents past performance. Past performance does not guarantee future results and current performance may be lower or higher than the data quoted. Results shown are annual returns, which assume reinvestment of dividends and capital gains. Investment returns and principal will fluctuate and you may have a gain or loss when you sell shares. For the most current month-end performance information, please call 1-800-742-7272 or visit our Web site at www.williamblairfunds.com.
| 180 | Annual Report | December 31, 2016 |
Financial Highlights
Low Duration Fund
| | | Class N | |
| | | Years Ended December 31, | |
| | | 2016 | | | 2015 | | | 2014 | | | 2013 | | | 2012 | |
| Net asset value, beginning of year | | $ | 9.16 | | | $ | 9.38 | | | $ | 9.52 | | | $ | 9.83 | | | $ | 9.82 | |
| Income (loss) from investment operations: | | | | | | | | | | | | | | | | | | | | |
| Net investment income (loss) | | | 0.09 | | | | 0.07 | | | | 0.11 | | | | 0.10 | | | | 0.13 | |
| Net realized and unrealized gain (loss) on investments | | | 0.02 | | | | (0.07 | ) | | | (0.00 | )^ | | | (0.16 | ) | | | 0.14 | |
| Total from investment operations | | | 0.11 | | | | — | | | | 0.11 | | | | (0.06 | ) | | | 0.27 | |
| Less distributions from: | | | | | | | | | | | | | | | | | | | | |
| Net investment income | | | 0.20 | | | | 0.22 | | | | 0.25 | | | | 0.25 | | | | 0.26 | |
| Net realized gain | | | — | | | | — | | | | — | | | | — | | | | — | |
| Total distributions | | | 0.20 | | | | 0.22 | | | | 0.25 | | | | 0.25 | | | | 0.26 | |
| Net asset value, end of year | | $ | 9.07 | | | $ | 9.16 | | | $ | 9.38 | | | $ | 9.52 | | | $ | 9.83 | |
| Total return (%) | | | 1.16 | | | | 0.01 | | | | 1.20 | | | | (0.62 | ) | | | 2.80 | |
| Ratios to average daily net assets (%): | | | | | | | | | | | | | | | | | | | | |
| Expenses, net of waivers and reimbursements | | | 0.68 | | | | 0.60 | | | | 0.70 | | | | 0.70 | | | | 0.70 | |
| Expenses, before waivers and reimbursements | | | 0.83 | | | | 0.77 | | | | 0.75 | | | | 0.71 | | | | 0.74 | |
| Net investment income (loss), net of waivers and reimbursements | | | 0.98 | | | | 0.71 | | | | 1.19 | | | | 1.06 | | | | 1.37 | |
| Net investment income (loss), before waivers and reimbursements | | | 0.83 | | | | 0.54 | | | | 1.14 | | | | 1.05 | | | | 1.33 | |
| Class N net assets at end of year (in thousands) | | $ | 7,237 | | | $ | 2,712 | | | $ | 4,969 | | | $ | 5,158 | | | $ | 11,216 | |
| Portfolio turnover rate (%) | | | 81 | | | | 106 | | | | 83 | | | | 56 | | | | 20 | |
| | | | | | | | | | | | | | | | | | | | | |
| | | Class I | |
| | | Years Ended December 31, | |
| | | 2016 | | | 2015 | | | 2014 | | | 2013 | | | 2012 | |
| Net asset value, beginning of year | | $ | 9.16 | | | $ | 9.37 | | | $ | 9.52 | | | $ | 9.83 | | | $ | 9.82 | |
| Income (loss) from investment operations: | | | | | | | | | | | | | | | | | | | | |
| Net investment income (loss) | | | 0.11 | | | | 0.08 | | | | 0.13 | | | | 0.12 | | | | 0.15 | |
| Net realized and unrealized gain (loss) on investments | | | 0.02 | | | | (0.05 | ) | | | (0.01 | ) | | | (0.17 | ) | | | 0.14 | |
| Total from investment operations | | | 0.13 | | | | 0.03 | | | | 0.12 | | | | (0.05 | ) | | | 0.29 | |
| Less distributions from: | | | | | | | | | | | | | | | | | | | | |
| Net investment income | | | 0.22 | | | | 0.24 | | | | 0.27 | | | | 0.26 | | | | 0.28 | |
| Net realized gain | | | — | | | | — | | | | — | | | | — | | | | — | |
| Total distributions | | | 0.22 | | | | 0.24 | | | | 0.27 | | | | 0.26 | | | | 0.28 | |
| Net asset value, end of year | | $ | 9.07 | | | $ | 9.16 | | | $ | 9.37 | | | $ | 9.52 | | | $ | 9.83 | |
| Total return (%) | | | 1.40 | | | | 0.30 | | | | 1.24 | | | | (0.47 | ) | | | 2.96 | |
| Ratios to average daily net assets (%): | | | | | | | | | | | | | | | | | | | | |
| Expenses, net of waivers and reimbursements | | | 0.44 | | | | 0.42 | | | | 0.55 | | | | 0.55 | | | | 0.55 | |
| Expenses, before waivers and reimbursements | | | 0.59 | | | | 0.59 | | | | 0.60 | | | | 0.56 | | | | 0.57 | |
| Net investment income (loss), net of waivers and reimbursements | | | 1.20 | | | | 0.87 | | | | 1.35 | | | | 1.24 | | | | 1.52 | |
| Net investment income (loss), before waivers and reimbursements | | | 1.05 | | | | 0.70 | | | | 1.30 | | | | 1.23 | | | | 1.50 | |
| Class I net assets at end of year (in thousands) | | $ | 219,714 | | | $ | 107,137 | | | $ | 104,433 | | | $ | 122,583 | | | $ | 157,213 | |
| Portfolio turnover rate (%) | | | 81 | | | | 106 | | | | 83 | | | | 56 | | | | 20 | |
| ^ | Amount is less than $0.005 per share. |
Note: Net investment income (loss) per share is based on the average shares outstanding during the year.
Performance cited represents past performance. Past performance does not guarantee future results and current performance may be lower or higher than the data quoted. Results shown are annual returns, which assume reinvestment of dividends and capital gains. Investment returns and principal will fluctuate and you may have a gain or loss when you sell shares. For the most current month-end performance information, please call 1-800-742-7272 or visit our Web site at www.williamblairfunds.com.
| December 31, 2016 | William Blair Funds | 181 |
Financial Highlights
Low Duration Fund
| | | Institutional Class | |
| | | Years Ended December 31, | |
| | | 2016 | | | 2015 | | | 2014 | | | 2013 | | | 2012 | |
| Net asset value, beginning of year | | $ | 9.16 | | | $ | 9.38 | | | $ | 9.53 | | | $ | 9.83 | | | $ | 9.83 | |
| Income (loss) from investment operations: | | | | | | | | | | | | | | | | | | | | |
| Net investment income (loss) | | | 0.11 | | | | 0.09 | | | | 0.14 | | | | 0.13 | | | | 0.17 | |
| Net realized and unrealized gain (loss) on investments | | | 0.02 | | | | (0.07 | ) | | | (0.01 | ) | | | (0.15 | ) | | | 0.12 | |
| Total from investment operations | | | 0.13 | | | | 0.02 | | | | 0.13 | | | | (0.02 | ) | | | 0.29 | |
| Less distributions from: | | | | | | | | | | | | | | | | | | | | |
| Net investment income | | | 0.22 | | | | 0.24 | | | | 0.28 | | | | 0.28 | | | | 0.29 | |
| Net realized gain | | | — | | | | — | | | | — | | | | — | | | | — | |
| Total distributions | | | 0.22 | | | | 0.24 | | | | 0.28 | | | | 0.28 | | | | 0.29 | |
| Net asset value, end of year | | $ | 9.07 | | | $ | 9.16 | | | $ | 9.38 | | | $ | 9.53 | | | $ | 9.83 | |
| Total return (%) | | | 1.43 | | | | 0.22 | | | | 1.40 | | | | (0.20 | ) | | | 3.01 | |
| Ratios to average daily net assets (%): | | | | | | | | | | | | | | | | | | | | |
| Expenses, net of waivers and reimbursements | | | 0.40 | | | | 0.40 | | | | 0.40 | | | | 0.39 | | | | 0.40 | |
| Expenses, before waivers and reimbursements | | | 0.40 | | | | 0.42 | | | | 0.43 | | | | 0.39 | | | | 0.41 | |
| Net investment income (loss), net of waivers and reimbursements | | | 1.25 | | | | 0.94 | | | | 1.45 | | | | 1.37 | | | | 1.68 | |
| Net investment income (loss), before waivers and reimbursements | | | 1.25 | | | | 0.92 | | | | 1.42 | | | | 1.37 | | | | 1.67 | |
| Institutional Class net assets at end of year (in thousands) | | $ | 53,122 | | | $ | 21,863 | | | $ | 68,095 | | | $ | 46,485 | | | $ | 118,401 | |
| Portfolio turnover rate (%) | | | 81 | | | | 106 | | | | 83 | | | | 56 | | | | 20 | |
Note: Net investment income (loss) per share is based on the average shares outstanding during the year.
Performance cited represents past performance. Past performance does not guarantee future results and current performance may be lower or higher than the data quoted. Results shown are annual returns, which assume reinvestment of dividends and capital gains. Investment returns and principal will fluctuate and you may have a gain or loss when you sell shares. For the most current month-end performance information, please call 1-800-742-7272 or visit our Web site at www.williamblairfunds.com.
| 182 | Annual Report | December 31, 2016 |
Financial Highlights
Macro Allocation Fund
| | | | | | | | | | | | Class N | |
| | | Periods Ended December 31, | | | Periods Ended October 31, | |
| | | 2016 | | | 2015 | | | 2014(b) | | | 2014 | | | 2013 | | | 2012(a) | |
| Net asset value, beginning of year | | $ | 11.32 | | | $ | 12.14 | | | $ | 13.07 | | | $ | 12.61 | | | $ | 11.28 | | | $ | 10.00 | |
| Income (loss) from investment operations: | | | | | | | | | | | | | | | | | | | | | | | | |
| Net investment income (loss) | | | 0.04 | | | | 0.04 | | | | 0.04 | | | | 0.02 | | | | 0.05 | | | | 0.11 | |
| Net realized and unrealized gain (loss) on investments | | | 0.19 | | | | (0.80 | ) | | | (0.31 | ) | | | 0.76 | | | | 1.59 | | | | 1.24 | |
| Total from investment operations | | | 0.23 | | | | (0.76 | ) | | | (0.27 | ) | | | 0.78 | | | | 1.64 | | | | 1.35 | |
| Less distributions from: | | | | | | | | | | | | | | | | | | | | | | | | |
| Net investment income | | | 0.21 | | | | 0.06 | | | | 0.66 | | | | 0.09 | | | | 0.11 | | | | 0.07 | |
| Net realized gain | | | — | | | | — | | | | — | | | | 0.23 | | | | 0.20 | | | | — | |
| Total distributions | | | 0.21 | | | | 0.06 | | | | 0.66 | | | | 0.32 | | | | 0.31 | | | | 0.07 | |
| Net asset value, end of year | | $ | 11.34 | | | $ | 11.32 | | | $ | 12.14 | | | $ | 13.07 | | | $ | 12.61 | | | $ | 11.28 | |
| Total return (%)* | | | 2.01 | | | | (6.24 | ) | | | (2.00 | ) | | | 6.34 | | | | 14.87 | | | | 13.61 | |
| Ratios to average daily net assets (%)**: | | | | | | | | | | | | | | | | | | | | | | | | |
| Expenses (excluding short dividend expense), net of waivers and reimbursements | | | 1.23 | | | | 1.27 | | | | 1.35 | | | | 1.35 | | | | 1.35 | | | | 1.35 | |
| Expenses, net of waivers and reimbursements | | | 1.23 | | | | 1.27 | | | | 1.38 | | | | 1.47 | | | | 1.49 | | | | 1.41 | |
| Expenses, before waivers and reimbursements | | | 1.38 | | | | 1.42 | | | | 1.46 | | | | 1.60 | | | | 1.78 | | | | 2.95 | |
| Net investment income (loss), net of waivers and reimbursements | | | 0.32 | | | | 0.32 | | | | 2.06 | | | | 0.20 | | | | 0.37 | | | | 1.18 | |
| Net investment income (loss), before waivers and reimbursements | | | 0.17 | | | | 0.17 | | | | 1.98 | | | | 0.07 | | | | 0.08 | | | | (0.36 | ) |
| Class N net assets at end of year (in thousands) | | $ | 61,376 | | | $ | 150,606 | | | $ | 150,778 | | | $ | 150,785 | | | $ | 97,498 | | | $ | 10,045 | |
| Portfolio turnover rate (%)* | | | 50 | | | | 34 | | | | 17 | | | | 59 | | | | 10 | | | | 40 | |
| | | | | | | | | | | | Class I | |
| | | Periods Ended December 31, | | | Periods Ended October 31, | |
| | | 2016 | | | 2015 | | | 2014(b) | | | 2014 | | | 2013 | | | 2012(a) | |
| Net asset value, beginning of year | | $ | 11.38 | | | $ | 12.22 | | | $ | 13.15 | | | $ | 12.66 | | | $ | 11.31 | | | $ | 10.00 | |
| Income (loss) from investment operations: | | | | | | | | | | | | | | | | | | | | | | | | |
| Net investment income (loss) | | | 0.08 | | | | 0.09 | | | | 0.05 | | | | 0.04 | | | | 0.07 | | | | 0.16 | |
| Net realized and unrealized gain (loss) on investments | | | 0.18 | | | | (0.82 | ) | | | (0.31 | ) | | | 0.78 | | | | 1.60 | | | | 1.22 | |
| Total from investment operations | | | 0.26 | | | | (0.73 | ) | | | (0.26 | ) | | | 0.82 | | | | 1.67 | | | | 1.38 | |
| Less distributions from: | | | | | | | | | | | | | | | | | | | | | | | | |
| Net investment income | | | 0.26 | | | | 0.11 | | | | 0.67 | | | | 0.10 | | | | 0.12 | | | | 0.07 | |
| Net realized gain | | | — | | | | — | | | | — | | | | 0.23 | | | | 0.20 | | | | — | |
| Total distributions | | | 0.26 | | | | 0.11 | | | | 0.67 | | | | 0.33 | | | | 0.32 | | | | 0.07 | |
| Net asset value, end of year | | $ | 11.38 | | | $ | 11.38 | | | $ | 12.22 | | | $ | 13.15 | | | $ | 12.66 | | | $ | 11.31 | |
| Total return (%)* | | | 2.26 | | | | (6.00 | ) | | | (1.94 | ) | | | 6.60 | | | | 15.06 | | | | 13.91 | |
| Ratios to average daily net assets (%)**: | | | | | | | | | | | | | | | | | | | | | | | | |
| Expenses (excluding short dividend expense), net of waivers and reimbursements | | | 0.97 | | | | 0.98 | | | | 1.07 | | | | 1.10 | | | | 1.10 | | | | 1.10 | |
| Expenses, net of waivers and reimbursements | | | 0.97 | | | | 0.99 | | | | 1.10 | | | | 1.22 | | | | 1.24 | | | | 1.18 | |
| Expenses, before waivers and reimbursements | | | 1.12 | | | | 1.14 | | | | 1.10 | | | | 1.27 | | | | 1.41 | | | | 2.94 | |
| Net investment income (loss), net of waivers and reimbursements | | | 0.67 | | | | 0.73 | | | | 2.33 | | | | 0.32 | | | | 0.62 | | | | 1.67 | |
| Net investment income (loss), before waivers and reimbursements | | | 0.52 | | | | 0.58 | | | | 2.33 | | | | 0.27 | | | | 0.45 | | | | (0.09 | ) |
| Class I net assets at end of year (in thousands) | | $ | 937,244 | | | $ | 1,155,051 | | | $ | 649,756 | | | $ | 617,531 | | | $ | 224,860 | | | $ | 23,095 | |
| Portfolio turnover rate (%)* | | | 50 | | | | 34 | | | | 17 | | | | 59 | | | | 10 | | | | 40 | |
| (a) | For the period from November 29, 2011 (Commencement of Operations) to October 31, 2012. |
| (b) | For the period from November 1, 2014 to December 31, 2014. |
| * | Not annualized for periods less than a year. |
| ** | Annualized for periods less than a year. |
Note: Net investment income (loss) per share is based on the average shares outstanding during the year.
Performance cited represents past performance. Past performance does not guarantee future results and current performance may be lower or higher than the data quoted. Results shown are annual returns, which assume reinvestment of dividends and capital gains. Investment returns and principal will fluctuate and you may have a gain or loss when you sell shares. For the most current month-end performance information, please call 1-800-742-7272 or visit our Web site at www.williamblairfunds.com.
| December 31, 2016 | William Blair Funds | 183 |
Financial Highlights
Macro Allocation Fund
| | | Institutional Class | |
| | | Periods Ended December 31, | | | Periods Ended
October 31, | |
| | | 2016 | | | 2015 | | | 2014(b) | | | 2014 | | | 2013(a) | |
| Net asset value, beginning of year | | $ | 11.39 | | | $ | 12.23 | | | $ | 13.16 | | | $ | 12.66 | | | $ | 12.63 | |
| Income (loss) from investment operations: | | | | | | | | | | | | | | | | | | | | |
| Net investment income (loss) | | | 0.09 | | | | 0.12 | | | | 0.05 | | | | 0.04 | | | | 0.00 | ^ |
| Net realized and unrealized gain (loss) on investments | | | 0.19 | | | | (0.84 | ) | | | (0.31 | ) | | | 0.79 | | | | 0.03 | |
| Total from investment operations | | | 0.28 | | | | (0.72 | ) | | | (0.26 | ) | | | 0.83 | | | | 0.03 | |
| Less distributions from: | | | | | | | | | | | | | | | | | | | | |
| Net investment income | | | 0.27 | | | | 0.12 | | | | 0.67 | | | | 0.10 | | | | — | |
| Net realized gain | | | — | | | | — | | | | — | | | | 0.23 | | | | — | |
| Total distributions | | | 0.27 | | | | 0.12 | | | | 0.67 | | | | 0.33 | | | | — | |
| Net asset value, end of year | | $ | 11.40 | | | $ | 11.39 | | | $ | 12.23 | | | $ | 13.16 | | | $ | 12.66 | |
| Total return (%)* | | | 2.44 | | | | (5.92 | ) | | | (1.91 | ) | | | 6.71 | | | | 0.24 | |
| Ratios to average daily net assets (%)**: | | | | | | | | | | | | | | | | | | | | |
| Expenses (excluding short dividend expense), net of waivers and reimbursements | | | 0.89 | | | | 0.90 | | | | 0.88 | | | | 0.93 | | | | 0.95 | |
| Expenses, net of waivers and reimbursements | | | 0.89 | | | | 0.90 | | | | 0.91 | | | | 1.05 | | | | 1.00 | |
| Expenses, before waivers and reimbursements | | | 0.89 | | | | 0.90 | | | | 0.91 | | | | 1.05 | | | | 1.11 | |
| Net investment income (loss), net of waivers and reimbursements | | | 0.81 | | | | 0.95 | | | | 2.54 | | | | 0.32 | | | | (0.99 | ) |
| Net investment income (loss), before waivers and reimbursements | | | 0.81 | | | | 0.95 | | | | 2.54 | | | | 0.32 | | | | (1.10 | ) |
| Institutional Class net assets at end of year (in thousands) | | $ | 582,298 | | | $ | 426,230 | | | $ | 158,152 | | | $ | 150,447 | | | $ | 5,014 | |
| Portfolio turnover rate (%)* | | | 50 | | | | 34 | | | | 17 | | | | 59 | | | | 10 | |
| (a) | For the period from October 21, 2013 (Commencement of Share Class) to October 31, 2013. |
| (b) | For the period from November 1, 2014 to December 31, 2014. |
| * | Not annualized for periods less than a year. |
| ** | Annualized for periods less than a year. |
| ^ | Amount is less than $0.005 per share. |
Note: Net investment income (loss) per share is based on the average shares outstanding during the year.
Performance cited represents past performance. Past performance does not guarantee future results and current performance may be lower or higher than the data quoted. Results shown are annual returns, which assume reinvestment of dividends and capital gains. Investment returns and principal will fluctuate and you may have a gain or loss when you sell shares. For the most current month-end performance information, please call 1-800-742-7272 or visit our Web site at www.williamblairfunds.com.
| 184 | Annual Report | December 31, 2016 |
REPORT OF INDEPENDENT REGISTERED PUBLIC ACCOUNTING FIRM
To the Board of Trustees and Shareholders of William Blair Funds
We have audited the accompanying statements of assets and liabilities, including the portfolios of investments, of the William Blair Funds (comprising, respectively, the Growth Fund, Large Cap Growth Fund, Mid Cap Growth Fund, Mid Cap Value Fund, Small-Mid Cap Growth Fund, Small-Mid Cap Value Fund, Small Cap Growth Fund, Small Cap Value Fund, Global Leaders Fund, International Leaders Fund, International Equity Fund, Institutional International Equity Fund, International Growth Fund, Institutional International Growth Fund, International Small Cap Growth Fund, Emerging Markets Leaders Fund, Emerging Markets Growth Fund, Emerging Markets Small Cap Growth Fund, Bond Fund, Income Fund, Low Duration Fund, and Macro Allocation Fund (collectively, the “Funds”)) as of December 31, 2016, and the related statements of operations for the year then ended, the statements of changes in net assets for each of the two years in the period then ended, and the financial highlights for the periods indicated therein. These financial statements and financial highlights are the responsibility of the Funds’ management. Our responsibility is to express an opinion on these financial statements and financial highlights based on our audits.
We conducted our audits in accordance with the standards of the Public Company Accounting Oversight Board (United States). Those standards require that we plan and perform the audit to obtain reasonable assurance about whether the financial statements and financial highlights are free of material misstatement. We were not engaged to perform an audit of the Funds’ internal control over financial reporting. Our audits included consideration of internal control over financial reporting as a basis for designing audit procedures that are appropriate in the circumstances, but not for the purpose of expressing an opinion on the effectiveness of the Funds’ internal control over financial reporting. Accordingly, we express no such opinion. An audit also includes examining, on a test basis, evidence supporting the amounts and disclosures in the financial statements and financial highlights, assessing the accounting principles used and significant estimates made by management, and evaluating the overall financial statement presentation. Our procedures included confirmation of securities owned as of December 31, 2016, by correspondence with the custodian and brokers or by other appropriate auditing procedures where replies from brokers were not received. We believe that our audits provide a reasonable basis for our opinion.
In our opinion, the financial statements and financial highlights referred to above present fairly, in all material respects, the financial position of each of the respective funds constituting the William Blair Funds at December 31, 2016, the results of their operations for the year then ended, the changes in their net assets for each of the two years in the period then ended, and the financial highlights for the periods indicated therein in conformity with U.S. generally accepted accounting principles.

Chicago, Illinois
February 23, 2017
| December 31, 2016 | William Blair Funds | 185 |
Trustees and Officers (Unaudited).† The trustees and officers of the William Blair Funds, their year of birth, their principal occupations during the last five years, their affiliations, if any, with William Blair, and other significant affiliations are set forth below. The address of each officer and trustee is 222 West Adams Street, Chicago, Illinois 60606.
| | | | | | | | | Number of | | |
| | | | | Term of | | | | Portfolios | | |
| | | | | Office and | | | | in Trust | | |
| | | Position(s) | | Length of | | Principal | | Complex | | |
| | | Held with | | Time | | Occupation(s) | | Overseen | | Other Directorships |
| Name and Year of Birth | | Trust | | Served(1) | | During Past 5 Years | | by Trustee | | Held by Trustee |
| Interested Trustees | | | | | | | | | | |
Michelle R. Seitz,
1965* | | Chairman of the Board of Holdings, L.P. Trustees and President | | Trustee since 2002; Chairman (since 2008); since 2010 and President since 2007 | | Partner, William Blair; Limited Partner, WBC Member, WBC GP L.L.P. (since November 2008); Director, William Blair International, Ltd. (U.K.) (since 2012) | | 22 | | Chairman, William Blair SICAV;
Director, William Blair MAS Ltd. |
Richard W. Smirl,
1967* | | Trustee and Senior Vice President | | Trustee since 2010 and Senior Vice President since 2008 | | Partner, William Blair; Limited Partner, WBC Holdings, L.P. (since 2008); Member, WBC GP L.L.P. (since November 2008); Director, William Blair International, Ltd. (U.K.) (since 2012) | | 22 | | Director, William Blair SICAV; Director, William Blair MAS Ltd. |
| Non-Interested Trustees | | | | | | | | | | |
Vann A. Avedisian,
19642 | | Trustee | | Since 2012 | | Principal, Highgate Holdings (hotel investments) (since 2009); formerly, co-founder and Managing Director, Oxford Capital Partners Inc. (1994 to 2006) | | 22 | | Potbelly Corporation (2001 to 2015) |
Kathleen T. Barr,
1955 | | Trustee | | Since 2013 | | Retired; formerly, President, Productive Capital Management, Inc. (registered investment adviser to public entities) and Owner, KT Barr Consulting, LLC (mutual fund and investment management consulting) (2010 to 2013); prior thereto, Chief Administrative Officer, Senior Vice President and Senior Managing Director of Allegiant Asset Management Company (merged with PNC Capital Advisors, LLC in 2009) (2004 to 2010); Chief Administrative Officer, Chief Compliance Officer and Senior Vice President of PNC Funds and PNC Advantage Funds (f/k/a Allegiant Funds) (2003 to 2010) | | 22 | | Council Member, Independent Directors Council; AmericaFirst Quantitative Funds (5 portfolios) (2012 to 2016) |
| † | William Blair Investment Management, LLC and William Blair & Company, L.L.C. are collectively referred to in this section as “William Blair”, each of which is a wholly owned subsidiary of WBC Holdings, L.P., which is wholly owned by certain William Blair employees (employee owners are referred to as ‘partners’). |
| * | Ms. Seitz and Mr. Smirl are interested persons of the Trust because they are partners of William Blair. |
See accompanying Notes to Financial Statements.
| 186 | Annual Report | December 31, 2016 |
| | | | | | | | | Number of | | |
| | | | | Term of | | | | Portfolios | | |
| | | | | Office and | | | | in Trust | | |
| | | Position(s) | | Length of | | Principal | | Complex | | |
| | | Held with | | Time | | Occupation(s) | | Overseen | | Other Directorships |
| Name and Year of Birth | | Trust | | Served(1) | | During Past 5 Years | | by Trustee | | Held by Trustee |
Daniel N. Leib,
19663 | | Trustee | | Since 2016 | | Chief Executive Officer, Donnelley Financial Solutions, Inc. (since 2016); formerly, Executive Vice President and Chief Financial Officer, (2011 to 2016) and Group Chief Financial Officer (2009 to 2011), R.R. Donnelley & Sons Company | | 22 | | None |
Phillip O. Peterson,
1944 | | Trustee | | Since 2007 | | Retired; formerly, President, Strong Mutual Funds (2004 to 2005); prior thereto, Partner, KPMG LLP (1981-2000) | | 22 | | The Hartford Group of Mutual Funds (68 portfolios); Symetra Mutual Funds Trust (variable annuity funds) (2012 to 2014) |
Donald J. Reaves,
19464 | | Trustee | | Since 2004 | | Retired; formerly, Chancellor of Winston-Salem State University (2007 to 2014) prior thereto, Vice President for Administration and Chief Financial Officer, University of Chicago (2002 to 2007) | | 22 | | American Student Assistance Corp., guarantor of student loans; Amica Mutual Insurance Company |
Donald L. Seeley,
1944 | | Trustee | | Since 2003 | | Retired; formerly, Director, Applied Investment Management Program, University of Arizona Department of Finance; prior thereto, Vice Chairman and Chief Financial Officer, True North Communications, Inc. (marketing communications and advertising firm) | | 22 | | Warnaco Group, Inc., intimate apparel, sportswear, and swimwear manufacturer (2005 to 2013); Beverly Enterprises, Inc., provider of elder care and rehabilitative services (2002 to 2006) |
Thomas J. Skelly,
1951 | | Trustee | | Since 2007 | | Advisory Board Member for various U.S. companies (since 2005); prior thereto, Managing Partner of various divisions at Accenture (1994-2004) | | 22 | | Mutual Trust Financial Group, provider of insurance and investment products; Advisory Board Member, First MetLife Insurance Company, NY chartered company for Metropolitan Life Insurance (2009-2016); Clayton Holdings, Inc., provider of information-based analytics, consulting and outsourced services to various financial institutions and investors (2007 to 2008) |
| (1) | Each Trustee serves until the election and qualification of a successor, or until death, resignation or retirement, or removal as provided in the Trust’s Declaration of Trust. Retirement for Non-Interested Trustees occurs no later than at the conclusion of the first regularly scheduled Board meeting of the calendar year that occurs after the earlier of (a) the Non-Interested Trustee’s 72nd birthday or (b) the 15th anniversary of the date that the Non-Interested Trustee became a member of the Board of Trustees. The Board of Trustees approved an exception to this retirement policy to defer the retirement of Mr. Seeley and Mr. Peterson until February 2018. |
| (2) | Mr. Avedisian served as a member of the Board of Directors of Potbelly Corporation (“Potbelly”) from 2001 to 2015. In October 2013, Potbelly completed an underwritten initial public offering of its common stock (the “Offering”). William Blair served as a member of the underwriting syndicate. At the time of the Offering, Mr. Avedisian, through entities he owns or controls, indirectly beneficially owned 1,607,448 shares of Potbelly common stock and warrants to purchase 241,704 shares of common stock representing approximately 8.9% of the shares before the Offering. Mr. Avedisian disclaimed beneficial ownership of the shares except to the extent of his pecuniary interest therein. Potbelly sold 8,474,869 shares and certain stockholders, including two entities affiliated with William Blair, sold 150,131 shares in the Offering at a price to the public of $14.00 per share. Neither Mr. Avedisian nor the entities he owns or controls was a selling stockholder in the Offering. A portion of the net proceeds received by Potbelly from the Offering was used to pay a previously declared cash dividend, in an aggregate amount of approximately $49.9 million, on Potbelly common and preferred shares outstanding immediately prior to the closing of the Offering, which included the outstanding shares indirectly beneficially owned by Mr. Avedisian, William Blair and the two entities affiliated with William Blair. |
See accompanying Notes to Financial Statements.
| December 31, 2016 | William Blair Funds | 187 |
| (3) | The Funds and William Blair use R.R. Donnelley & Sons Company (“RRD”) and Donnelley Financial Solutions, Inc. (“DFS”) for financial printing and other services. The Funds and William Blair paid RRD approximately $185,000 and $129,000 in 2015 and 2016, respectively, for the services provided. RRD’s revenue was over $11 billion in 2015. DFS is a newly formed public company resulting from a spinoff from RRD that was completed in 2016. The Funds and William Blair paid DFS approximately $11,000 for the period ended December 31, 2016 for the services provided. Mr. Leib, as former Executive Vice President and Chief Financial Officer of RRD, was not involved in any of the services provided to the Funds or William Blair and his compensation was not directly affected by the fees RRD received from the Funds and William Blair. Mr. Leib, as the Chief Executive Officer of DFS, is not involved in any of the services provided to the Funds or William Blair and his compensation is not directly affected by the fees DFS receives from the Funds and William Blair. |
| (4) | In his former role as Chief Financial Officer at the University of Chicago, Mr. Reaves had a working relationship with E. David Coolidge III, Vice Chairman of William Blair who is also a trustee of the University of Chicago. |
| | | | | Term of Office | | |
| | | Position(s) Held | | and Length of | | Principal Occupation(s) |
| Name and Year of Birth | | with Trust | | Time Served1 | | During Past 5 Years2 |
| | | | | | | |
| Officers | | | | | | |
Michael P. Balkin,
1959 | | Senior Vice President | | Since 2008 | | Partner, William Blair |
| | | | | | | |
Stephanie G. Braming,
1970 | | Senior Vice President | | Since 2014 | | Partner, William Blair |
| | | | | | | |
Karl W. Brewer,
1966 | | Senior Vice President | | Since 2000 | | Partner, William Blair |
| | | | | | | |
Thomas Clarke,
1968 | | Senior Vice President | | Since 2011 | | Partner, William Blair (since 2014); formerly, Associate, William Blair (2011-2014) |
| | | | | | | |
Daniel Crowe,
1972 | | Senior Vice President | | Since 2016 | | Partner, William Blair (since 2015); formerly, Associate, William Blair |
| | | | | | | |
Simon Fennell,
1969 | | Senior Vice President | | Since 2013 | | Partner, William Blair (since 2013); formerly, Associate, William Blair (2011-2013) |
| | | | | | | |
Andrew G. Flynn,
1961 | | Senior Vice President | | Since 2013 | | Partner, William Blair |
| | | | | | | |
David C. Fording,
1967 | | Senior Vice President | | Since 2006 | | Partner, William Blair |
| | | | | | | |
James S. Golan,
1961 | | Senior Vice President | | Since 2005 | | Partner, William Blair |
| | | | | | | |
Michael A. Jancosek,
1959 | | Senior Vice President | | Since 2000 | | Partner, William Blair |
| | | | | | | |
John F. Jostrand,
1954 | | Senior Vice President | | Since 1999 | | Partner, William Blair |
| | | | | | | |
Chad M. Kilmer,
1975 | | Senior Vice President | | Since 2006 | | Partner, William Blair |
| | | | | | | |
Robert C. Lanphier IV,
1956 | | Senior Vice President | | Since 2003 | | Partner, William Blair |
| | | | | | | |
Mark T. Leslie,
1967 | | Senior Vice President | | Since 2005 | | Partner, William Blair |
See accompanying Notes to Financial Statements.
| 188 | Annual Report | December 31, 2016 |
| | | | | Term of Office | | |
| | | Position(s) Held | | and Length of | | Principal Occupation(s) |
| Name and Year of Birth | | with Trust | | Time Served1 | | During Past 5 Years |
| | | | | | | |
Kenneth J. McAtamney,
1966 | | Senior Vice President | | Since 2008 | | Partner, William Blair |
| | | | | | | |
Todd M. McClone,
1968 | | Senior Vice President | | Since 2005 | | Partner, William Blair |
| | | | | | | |
David Merjan,
1960 | | Senior Vice President | | Since 2008 | | Partner, William Blair |
| | | | | | | |
David S. Mitchell,
1960 | | Senior Vice President | | Since 2003 | | Partner, William Blair |
| | | | | | | |
John C. Murphy,
1969 | | Senior Vice President | | Since 2014 | | Partner, William Blair |
| | | | | | | |
Casey K. Preyss,
1976 | | Senior Vice President | | Since 2015 | | Partner, William Blair |
| | | | | | | |
David P. Ricci,
1958 | | Senior Vice President | | Since 2006 | | Partner, William Blair |
| | | | | | | |
Ward D. Sexton,
1974 | | Senior Vice President | | Since 2016 | | Partner, William Blair |
| | | | | | | |
Brian D. Singer,
1960 | | Senior Vice President | | Since 2011 | | Partner, William Blair (since 2012); formerly, Associate, William Blair (2011-2012) |
| | | | | | | |
Jeffrey A. Urbina,
1955 | | Senior Vice President | | Since 1998 | | Partner, William Blair |
| | | | | | | |
Christopher T. Vincent,
1956 | | Senior Vice President | | Since 2002 | | Partner, William Blair |
| | | | | | | |
Paul J. Sularz,
1967 | | Vice President | | Since 2009 | | Associate, William Blair (2006-2012 and since 2014); Partner, William Blair (2012-2014) |
| | | | | | | |
Colette M. Garavalia,
1961 | | Treasurer | | Since 2000 | | Associate, William Blair |
| | | | | | | |
Andrew T. Pfau,
1970 | | Secretary | | Since 2009 | | Associate, William Blair |
| | | | | | | |
John M. Raczek,
1970 | | Assistant Treasurer | | Since 2010 | | Associate, William Blair |
| | | | | | | |
Walter R. Randall, Jr.,
1960 | | Chief Compliance Officer and Assistant Secretary | | Since 2009 | | Associate, William Blair |
| | | | | | | |
Robert J. Toner,
1967 | | Assistant Secretary | | Since 2016 | | Associate, William Blair (since 2015); formerly, Managing Director and Counsel, Wellington Management & Company LLP (2007-2015) |
| (1) | The Trust’s officers, except the Chief Compliance Officer, are elected annually by the Board of Trustees. The Trust’s Chief Compliance Officer is designated by the Board of Trustees and may only be removed by action of the Board of Trustees, including a majority of independent trustees. Length of Time Served for all officers indicates the year the individual became an officer of the Trust. |
The Statement of Additional Information for the William Blair Funds includes additional information about the trustees and is available without charge by calling 1-800-635-2886 (in Massachusetts 1-800-635-2840) or by writing the Fund.
See accompanying Notes to Financial Statements.
| December 31, 2016 | William Blair Funds | 189 |
(Unaudited)
Proxy Voting
A description of the policies and procedures that the Funds use to determine how to vote proxies relating to portfolio securities and information regarding how the Funds voted proxies relating to portfolio securities for the most recent 12-month period ended December 31 are available without charge, upon request, by calling 1-800-635-2886 (in Massachusetts 1-800-635-2840), at www.williamblairfunds.com and on the SEC’s website at http://www.sec.gov.
Quarterly Portfolio Schedules
Each Fund files its complete schedule of portfolio holdings with the SEC for the first and third fiscal quarters of each fiscal year (quarters ended March 31 and September 30) on Form N-Q. The Fund’s Forms N-Q are available on the SEC’s website at http://www.sec.gov and may be reviewed and copied at the SEC’s Public Reference Room in Washington, D.C. Information on the operation of the SEC’s Public Reference Room may be obtained by calling 1-800-SEC-0330.
Additional Federal Income Tax Information: (unaudited)
Under Section 852(b)(3)(C) of the Code, the Funds hereby designate the following amounts as capital gain dividends for the fiscal year ended December 31, 2016 (in thousands):
| Fund | | Capital Gain Dividend |
| Growth | | $ | 44,092 | |
| Large Cap Growth | | | 983 | |
| Mid Cap Growth | | | 7,329 | |
| Mid Cap Value | | | 255 | |
| Small-Mid Cap Growth | | | 33,429 | |
| Small-Mid Cap Value | | | 183 | |
| Small Cap Growth | | | 20,672 | |
| Small Cap Value | | | 27,207 | |
| Global Leaders | | | 792 | |
| International Small Cap Growth | | | 96 | |
| 190 | Annual Report | December 31, 2016 |
Useful Information About Your Report (Unaudited)
Please refer to this information when reviewing the Expense Example for each Fund.
Expense Example
As a shareholder of a Fund, you incur two types of costs: (1) transaction costs and (2) ongoing costs, including management fees, distribution (12b-1) fees (for Class N shares except for the Institutional International Growth Fund and the Institutional International Equity Fund), shareholder administration fees (for Class N and Class I shares of the Global Leaders Fund, the International Leaders Fund, the International Small Cap Growth Fund, the Emerging Markets Leaders Fund, the Emerging Markets Growth Fund, the Emerging Markets Small Cap Growth Fund, the Bond Fund, the Low Duration Fund and the Macro Allocation Fund) and other Fund expenses. The example is intended to help you understand your ongoing costs (in dollars) of investing in the Fund and to compare these costs with the ongoing costs of investing in other mutual funds. To do so, compare the Fund’s 5% hypothetical example with the 5% hypothetical examples that appear in the shareholder reports of other funds. The example is based on an investment of $1,000 invested at the beginning of the period and held for the entire six-month period from July 1, 2016 to December 31, 2016.
Actual Expenses
In each example, the first line for each share class in the table provides information about the actual account values and actual expenses. These expenses reflect the effect of any expense cap applicable to the share class during the period. Without this expense cap, the costs shown in the table would have been higher. You may use the information in this line, together with the amount you invested, to estimate the expenses that you paid over the period. Simply divide your account value by $1,000 (example, an $8,600 account value divided by $1,000 = 8.6), then multiply the result by the number in the first line under the heading entitled “Expenses Paid During the Period” to estimate the expenses you paid on your account during the period.
Hypothetical Example for Comparison Purposes
In each example, the second line for each share class in the table provides information about hypothetical account values and hypothetical expenses based on the Fund’s actual expense ratio and an assumed rate of return of 5% per year before expenses. This is not the Fund’s actual return. The hypothetical account values and expenses may not be used to estimate the actual ending account balance or expenses you paid for the period. You may use this information to compare the ongoing costs of investing in the Fund to other funds. To do so, compare this 5% hypothetical example with the 5% hypothetical examples that appear in the shareholder reports of other funds.
Please note that the expenses shown in both examples are meant to highlight your ongoing costs only and do not reflect any transactional costs or account type fees, such as IRA administration fees. These fees are fully described in the prospectus. Therefore, the second line of each share class in the table is useful in comparing ongoing costs only and will not help you determine the relative costs of owning different funds. In addition, if these transactional costs or account fees were included, your costs would have been higher.
| December 31, 2016 | William Blair Funds | 191 |
Fund Expenses (Unaudited)
| | | Beginning | | | Ending | | | Expenses Paid | | | | |
| | | Account Value | | | Account Value | | | During | | | Annualized | |
| Expense Example | | 7/1/2016 | | | 12/31/2016 | | | the Period (a) | | | Expense Ratio | |
| Growth Fund | | | | | | | | | | | | |
| Class N-actual return | | $1,000.00 | | | $1,009.54 | | | $6.11 | | | 1.21 | |
| Class N-hypothetical 5% return | | $1,000.00 | | | $1,043.92 | | | $6.22 | | | 1.21 | |
| Class I-actual return | | $1,000.00 | | | $1,011.06 | | | $4.55 | | | 0.90 | |
| Class I-hypothetical 5% return | | $1,000.00 | | | $1,045.48 | | | $4.63 | | | 0.90 | |
| Large Cap Growth Fund | | | | | | | | | | | | |
| Class N-actual return | | $1,000.00 | | | $1,023.76 | | | $5.34 | | | 1.05 | |
| Class N-hypothetical 5% return | | $1,000.00 | | | $1,044.72 | | | $5.40 | | | 1.05 | |
| Class I-actual return | | $1,000.00 | | | $1,025.14 | | | $4.07 | | | 0.80 | |
| Class I-hypothetical 5% return | | $1,000.00 | | | $1,045.98 | | | $4.11 | | | 0.80 | |
| Mid Cap Growth Fund | | | | | | | | | | | | |
| Class N-actual return | | $1,000.00 | | | $1,009.47 | | | $6.57 | | | 1.30 | |
| Class N-hypothetical 5% return | | $1,000.00 | | | $1,043.46 | | | $6.68 | | | 1.30 | |
| Class I-actual return | | $1,000.00 | | | $1,010.77 | | | $5.31 | | | 1.05 | |
| Class I-hypothetical 5% return | | $1,000.00 | | | $1,044.72 | | | $5.40 | | | 1.05 | |
| Mid Cap Value Fund | | | | | | | | | | | | |
| Class N-actual return | | $1,000.00 | | | $1,078.56 | | | $6.79 | | | 1.30 | |
| Class N-hypothetical 5% return | | $1,000.00 | | | $1,043.46 | | | $6.68 | | | 1.30 | |
| Class I-actual return | | $1,000.00 | | | $1,080.10 | | | $5.49 | | | 1.05 | |
| Class I-hypothetical 5% return | | $1,000.00 | | | $1,044.72 | | | $5.40 | | | 1.05 | |
| Small-Mid Cap Growth Fund | | | | | | | | | | | | |
| Class N-actual return | | $1,000.00 | | | $1,054.23 | | | $6.97 | | | 1.35 | |
| Class N-hypothetical 5% return | | $1,000.00 | | | $1,043.21 | | | $6.93 | | | 1.35 | |
| Class I-actual return | | $1,000.00 | | | $1,055.73 | | | $5.68 | | | 1.10 | |
| Class I-hypothetical 5% return | | $1,000.00 | | | $1,044.47 | | | $5.65 | | | 1.10 | |
| Small-Mid Cap Value Fund | | | | | | | | | | | | |
| Class N-actual return | | $1,000.00 | | | $1,137.13 | | | $7.25 | | | 1.35 | |
| Class N-hypothetical 5% return | | $1,000.00 | | | $1,043.21 | | | $6.93 | | | 1.35 | |
| Class I-actual return | | $1,000.00 | | | $1,138.31 | | | $5.91 | | | 1.10 | |
| Class I-hypothetical 5% return | | $1,000.00 | | | $1,044.47 | | | $5.65 | | | 1.10 | |
| Small Cap Growth Fund | | | | | | | | | | | | |
| Class N-actual return | | $1,000.00 | | | $1,144.07 | | | $8.08 | | | 1.50 | |
| Class N-hypothetical 5% return | | $1,000.00 | | | $1,042.46 | | | $7.70 | | | 1.50 | |
| Class I-actual return | | $1,000.00 | | | $1,145.71 | | | $6.74 | | | 1.25 | |
| Class I-hypothetical 5% return | | $1,000.00 | | | $1,043.72 | | | $6.42 | | | 1.25 | |
| Small Cap Value Fund | | | | | | | | | | | | |
| Class N-actual return | | $1,000.00 | | | $1,181.19 | | | $8.22 | | | 1.50 | |
| Class N-hypothetical 5% return | | $1,000.00 | | | $1,042.46 | | | $7.70 | | | 1.50 | |
| Class I-actual return | | $1,000.00 | | | $1,182.26 | | | $6.86 | | | 1.25 | |
| Class I-hypothetical 5% return | | $1,000.00 | | | $1,043.72 | | | $6.42 | | | 1.25 | |
| Global Leaders Fund | | | | | | | | | | | | |
| Class N-actual return | | $1,000.00 | | | $1,023.00 | | | $6.92 | | | 1.36 | |
| Class N-hypothetical 5% return | | $1,000.00 | | | $1,043.16 | | | $6.98 | | | 1.36 | |
| Class I-actual return | | $1,000.00 | | | $1,024.81 | | | $5.34 | | | 1.05 | |
| Class I-hypothetical 5% return | | $1,000.00 | | | $1,044.72 | | | $5.40 | | | 1.05 | |
| Institutional Class-actual return | | $1,000.00 | | | $1,025.34 | | | $5.14 | | | 1.00 | |
| Institutional Class-hypothetical 5% return | | $1,000.00 | | | $1,044.97 | | | $5.14 | | | 1.00 | |
| International Leaders Fund | | | | | | | | | | | | |
| Class N-actual return | | $1,000.00 | | | $1,023.11 | | | $6.61 | | | 1.30 | |
| Class N-hypothetical 5% return | | $1,000.00 | | | $1,043.46 | | | $6.68 | | | 1.30 | |
| Class I-actual return | | $1,000.00 | | | $1,024.48 | | | $5.29 | | | 1.04 | |
| Class I-hypothetical 5% return | | $1,000.00 | | | $1,044.77 | | | $5.35 | | | 1.04 | |
| Institutional Class-actual return | | $1,000.00 | | | $1,025.98 | | | $4.84 | | | 0.95 | |
| Institutional Class-hypothetical 5% return | | $1,000.00 | | | $1,045.22 | | | $4.88 | | | 0.95 | |
| 192 | Annual Report | December 31, 2016 |
Fund Expenses (Unaudited)
| | | Beginning | | | Ending | | | Expenses Paid | | | | |
| | | Account Value | | | Account Value | | | During | | | Annualized | |
| Expense Example | | 7/1/2016 | | | 12/31/2016 | | | the Period (a) | | | Expense Ratio | |
| International Equity Fund | | | | | | | | | | | | |
| Class N-actual return | | $1,000.00 | | | $1,016.41 | | | $6.59 | | | 1.30 | |
| Class N-hypothetical 5% return | | $1,000.00 | | | $1,043.46 | | | $6.68 | | | 1.30 | |
| Class I-actual return | | $1,000.00 | | | $1,017.99 | | | $5.33 | | | 1.05 | |
| Class I-hypothetical 5% return | | $1,000.00 | | | $1,044.72 | | | $5.40 | | | 1.05 | |
| Institutional International Equity Fund | | | | | | | | | | | | |
| Institutional Class-actual return | | $1,000.00 | | | $1,014.87 | | | $5.06 | | | 1.00 | |
| Institutional Class-hypothetical 5% return | | $1,000.00 | | | $1,044.97 | | | $5.14 | | | 1.00 | |
| International Growth Fund | | | | | | | | | | | | |
| Class N-actual return | | $1,000.00 | | | $1,009.71 | | | $7.22 | | | 1.43 | |
| Class N-hypothetical 5% return | | $1,000.00 | | | $1,042.81 | | | $7.34 | | | 1.43 | |
| Class I-actual return | | $1,000.00 | | | $1,011.49 | | | $5.71 | | | 1.13 | |
| Class I-hypothetical 5% return | | $1,000.00 | | | $1,044.32 | | | $5.81 | | | 1.13 | |
| Institutional International Growth Fund | | | | | | | | | | | | |
| Institutional Class-actual return | | $1,000.00 | | | $1,012.27 | | | $4.96 | | | 0.98 | |
| Institutional Class-hypothetical 5% return | | $1,000.00 | | | $1,045.07 | | | $5.04 | | | 0.98 | |
| International Small Cap Growth Fund | | | | | | | | | | | | |
| Class N-actual return | | $1,000.00 | | | $ 996.01 | | | $7.22 | | | 1.44 | |
| Class N-hypothetical 5% return | | $1,000.00 | | | $1,042.76 | | | $7.39 | | | 1.44 | |
| Class I-actual return | | $1,000.00 | | | $ 996.78 | | | $5.77 | | | 1.15 | |
| Class I-hypothetical 5% return | | $1,000.00 | | | $1,044.22 | | | $5.91 | | | 1.15 | |
| Institutional Class-actual return | | $1,000.00 | | | $ 997.64 | | | $5.37 | | | 1.07 | |
| Institutional Class-hypothetical 5% return | | $1,000.00 | | | $1,044.62 | | | $5.50 | | | 1.07 | |
| Emerging Markets Leaders Fund | | | | | | | | | | | | |
| Class N-actual return | | $1,000.00 | | | $ 971.50 | | | $7.78 | | | 1.57 | |
| Class N-hypothetical 5% return. | | $1,000.00 | | | $1,042.11 | | | $8.06 | | | 1.57 | |
| Class I-actual return | | $1,000.00 | | | $ 972.91 | | | $6.45 | | | 1.30 | |
| Class I-hypothetical 5% return | | $1,000.00 | | | $1,043.46 | | | $6.68 | | | 1.30 | |
| Institutional Class-actual return | | $1,000.00 | | | $ 972.17 | | | $6.20 | | | 1.25 | |
| Institutional Class-hypothetical 5% return | | $1,000.00 | | | $1,043.72 | | | $6.42 | | | 1.25 | |
| Emerging Markets Growth Fund | | | | | | | | | | | | |
| Class N-actual return | | $1,000.00 | | | $ 965.94 | | | $7.41 | | | 1.50 | |
| Class N-hypothetical 5% return | | $1,000.00 | | | $1,042.46 | | | $7.70 | | | 1.50 | |
| Class I-actual return | | $1,000.00 | | | $ 967.01 | | | $6.23 | | | 1.26 | |
| Class I-hypothetical 5% return | | $1,000.00 | | | $1,043.67 | | | $6.47 | | | 1.26 | |
| Institutional Class-actual return | | $1,000.00 | | | $ 967.17 | | | $5.88 | | | 1.19 | |
| Institutional Class-hypothetical 5% return | | $1,000.00 | | | $1,044.02 | | | $6.11 | | | 1.19 | |
| Emerging Markets Small Cap Growth Fund | | | | | | | | | | | | |
| Class N-actual return | | $1,000.00 | | | $ 938.44 | | | $7.84 | | | 1.61 | |
| Class N-hypothetical 5% return | | $1,000.00 | | | $1,041.91 | | | $8.26 | | | 1.61 | |
| Class I-actual return | | $1,000.00 | | | $ 940.08 | | | $6.34 | | | 1.30 | |
| Class I-hypothetical 5% return | | $1,000.00 | | | $1,043.46 | | | $6.68 | | | 1.30 | |
| Institutional Class-actual return | | $1,000.00 | | | $ 940.04 | | | $6.10 | | | 1.25 | |
| Institutional Class-hypothetical 5% return | | $1,000.00 | | | $1,043.72 | | | $6.42 | | | 1.25 | |
| Bond Fund | | | | | | | | | | | | |
| Class N-actual return | | $1,000.00 | | | $ 990.83 | | | $3.25 | | | 0.65 | |
| Class N-hypothetical 5% return | | $1,000.00 | | | $1,046.73 | | | $3.34 | | | 0.65 | |
| Class I-actual return | | $1,000.00 | | | $ 991.92 | | | $2.05 | | | 0.41 | |
| Class I-hypothetical 5% return | | $1,000.00 | | | $1,047.94 | | | $2.11 | | | 0.41 | |
| Institutional Class-actual return | | $1,000.00 | | | $ 992.22 | | | $1.75 | | | 0.35 | |
| Institutional Class-hypothetical 5% return | | $1,000.00 | | | $1,048.24 | | | $1.80 | | | 0.35 | |
| Income Fund | | | | | | | | | | | | |
| Class N-actual return | | $1,000.00 | | | $ 995.14 | | | $3.96 | | | 0.79 | |
| Class N-hypothetical 5% return | | $1,000.00 | | | $1,046.03 | | | $4.06 | | | 0.79 | |
| Class I-actual return | | $1,000.00 | | | $ 996.10 | | | $2.86 | | | 0.57 | |
| Class I-hypothetical 5% return | | $1,000.00 | | | $1,047.13 | | | $2.93 | | | 0.57 | |
| December 31, 2016 | William Blair Funds | 193 |
Fund Expenses (Unaudited)
| | | Beginning | | | Ending | | | Expenses Paid | | | | |
| | | Account Value | | | Account Value | | | During | | | Annualized | |
| Expense Example | | 7/1/2016 | | | 12/31/2016 | | | the Period (a) | | | Expense Ratio | |
| Low Duration Fund | | | | | | | | | | | | |
| Class N-actual return | | $1,000.00 | | | $1,000.33 | | | $3.42 | | | 0.68 | |
| Class N-hypothetical 5% | | $1,000.00 | | | $1,046.58 | | | $3.50 | | | 0.68 | |
| Class I-actual return | | $1,000.00 | | | $1,001.64 | | | $2.21 | | | 0.44 | |
| Class I-hypothetical 5% | | $1,000.00 | | | $1,047.79 | | | $2.26 | | | 0.44 | |
| Institutional Class-actual return | | $1,000.00 | | | $1,001.87 | | | $2.01 | | | 0.40 | |
| Institutional Class-hypothetical 5% return | | $1,000.00 | | | $1,047.99 | | | $2.06 | | | 0.40 | |
| Macro Allocation Fund | | | | | | | | | | | | |
| Class N-actual return | | $1,000.00 | | | $1,017.41 | | | $6.24 | | | 1.23 | |
| Class N-hypothetical 5% | | $1,000.00 | | | $1,043.82 | | | $6.32 | | | 1.23 | |
| Class I-actual return | | $1,000.00 | | | $1,018.12 | | | $4.92 | | | 0.97 | |
| Class I-hypothetical 5% | | $1,000.00 | | | $1,045.12 | | | $4.99 | | | 0.97 | |
| Institutional Class-actual return | | $1,000.00 | | | $1,018.99 | | | $4.52 | | | 0.89 | |
| Institutional Class-hypothetical 5% return | | $1,000.00 | | | $1,045.53 | | | $4.58 | | | 0.89 | |
| (a) | Expenses are equal to the annualized expense ratio, multiplied by the average account value over the period, multiplied by the number of days in the period, 184, and divided by 366 (to reflect the one-half year period). |
| 194 | Annual Report | December 31, 2016 |
| | BOARD OF TRUSTEES |
| | Vann A. Avedisian |
| | Principal, Highgate Holdings |
| | Kathleen T. Barr |
| | Retired Senior Managing Director, PNC Capital Advisors, LLC |
| | Daniel N. Leib |
| | Chief Executive Officer, Donnelley Financial Solutions, Inc. |
| | Phillip O. Peterson |
| | Retired Partner, KPMG LLP |
| | Donald J. Reaves |
| | Retired Chancellor, Winston-Salem State University |
| | Donald L. Seeley |
| | Retired Adjunct Lecturer and Director, University of Arizona Department of Finance |
| | Michelle R. Seitz, Chairman and President |
| | Partner, William Blair |
| | Thomas J. Skelly |
| | Retired Managing Partner, Accenture |
| | Richard W. Smirl, Senior Vice President |
| | Partner, William Blair |
| | Officers |
| | Michael P. Balkin, Senior Vice President |
| | Stephanie G. Braming, Senior Vice President |
| | Karl W. Brewer, Senior Vice President |
| | Thomas Clarke, Senior Vice President |
| | Daniel Crowe, Senior Vice President |
| | Simon Fennell, Senior Vice President |
| | Andrew G. Flynn, Senior Vice President |
| | David C. Fording, Senior Vice President |
| | James S. Golan, Senior Vice President |
| | Michael A. Jancosek, Senior Vice President |
| | John F. Jostrand, Senior Vice President |
| | Chad M. Kilmer, Senior Vice President |
| | Robert C. Lanphier, IV, Senior Vice President |
| | Mark T. Leslie, Senior Vice President |
| | Kenneth J. McAtamney, Senior Vice President |
| | Todd M. McClone, Senior Vice President |
| | David Merjan, Senior Vice President |
| | David S. Mitchell, Senior Vice President |
| | John C. Murphy, Senior Vice President |
| | Casey K. Preyss, Senior Vice President |
| | David P. Ricci, Senior Vice President |
| | Ward D. Sexton, Senior Vice President |
| | Brian D. Singer, Senior Vice President |
| | Jeffrey A. Urbina, Senior Vice President |
| | Christopher T. Vincent, Senior Vice President |
| | Paul J. Sularz, Vice President |
| | Colette M. Garavalia, Treasurer |
| | Andrew T. Pfau, Secretary |
| | John M. Raczek, Assistant Treasurer |
| | Walter R. Randall, Jr., Chief Compliance Officer and Assistant Secretary |
| | Robert J. Toner, Assistant Secretary |
| | Investment Adviser |
| | William Blair Investment Management, LLC |
| | Distributor |
| | William Blair & Company, L.L.C. |
| | Independent Registered Public Accounting Firm |
| | Ernst & Young LLP |
| | Legal Counsel |
| | Vedder Price P.C. |
| | Transfer Agent |
| | Boston Financial Data Services, Inc. |
| | P.O. Box 8506 |
| | Boston, MA 02266-8506 |
| | For customer assistance, call 1-800-635-2886 |
| | (Massachusetts 1-800-635-2840) |
| December 31, 2016 | William Blair Funds | 195 |
| | | | | | |
| | William Blair Funds | | |
| | | | | | |
| | | | | | |
| | | | | | |
| | DOMESTIC EQUITY | | GLOBAL EQUITY | | FIXED INCOME |
| | Growth Fund | | Global Leaders Fund | | Bond Fund |
| | Large Cap Growth Fund | | | | Income Fund |
| | Mid Cap Growth Fund | | INTERNATIONAL EQUITY | | Low Duration Fund |
| | Mid Cap Value Fund | | | |
| | Small-Mid Cap Growth Fund | | International Leaders Fund | | |
| | Small-Mid Cap Value Fund | | International Equity Fund | | MULTI-ASSET AND
ALTERNATIVE |
| | Small Cap Growth Fund | | Institutional International Equity Fund | |
| | Small Cap Value Fund | | International Growth Fund | | Macro Allocation Fund |
| | | | Institutional International Growth Fund | | |
| | | | International Small Cap Growth Fund | | |
| | | | Emerging Markets Leaders Fund | | |
| | | | Emerging Markets Growth Fund | | |
| | | | Emerging Markets Small Cap Growth Fund | | |
 | | © | William Blair & Company, L.L.C., distributor | |
| +1 800 742 7272 | | 222 West Adams Street | |
| williamblairfunds.com | | Chicago, Illinois 60606 | 00103188 |
As of the end of the period covered by this Form N-CSR, the Registrant has adopted a code of ethics that applies to its principal executive officer and principal financial officer. Such code of ethics is posted on the Registrant’s website: www.williamblairfunds.com. There were no amendments to or waivers of the code of ethics during the period covered by this report.
| Item 3. | Audit Committee Financial Expert |
The Registrant’s Board of Trustees has determined that the Registrant has at least one “audit committee financial expert” (as defined in Item 3 of Form N-CSR) serving on its Audit Committee. Mr. Phillip O. Peterson, the Registrant’s audit committee financial expert, is “independent” for purposes of Item 3 to Form N-CSR.
An “audit committee financial expert” is not an “expert” for any purpose, including for purposes of Section 11 of the Securities Act of 1933, as a result of being designated as an “audit committee financial expert.” Further, the designation of a person as an “audit committee financial expert” does not mean that the person has any greater duties, obligations, or liability than those imposed on the person without the “audit committee financial expert” designation. Similarly, the designation of a person as an “audit committee financial expert” does not affect the duties, obligations, or liability of any other member of the audit committee or Board of Trustees.
| Item 4. | Principal Accountant Fees and Services |
Audit Fees
For the fiscal years ended December 31, 2015 and 2016, Ernst & Young, LLP, the Registrant’s principal accountant (“E&Y”), billed the Registrant $719,700 and $684,300, respectively, for professional services rendered for the audit of the Registrant’s annual financial statements or services that are normally provided in connection with statutory and regulatory filings.
Audit-Related Fees
For the fiscal years ended December 31, 2015 and 2016, E&Y billed the Registrant $0 and $0, respectively, for assurance and related services that are reasonably related to the performance of the audit of the Registrant’s financial statements and that are not reported above, such as reviewing prospectuses, semiannual reports and SEC filings. For the fiscal years ended December 31, 2015 and 2016, E&Y provided no audit-related services to William Blair Investment Management, LLC, the Registrant’s investment advisor (“William Blair”) or any of its control affiliates that were for engagements directly related to the Registrant’s operations and financial reporting.
Tax Fees
For the fiscal years ended December 31, 2015 and 2016, E&Y billed the Registrant $311,900 and $205,850, respectively, for professional services rendered for tax compliance, tax advice and tax planning. Such services consisted of preparation of tax returns, year-end distribution review, qualifying dividend income analysis and computation of foreign tax credit pass-through. For the fiscal years ended December 31, 2015 and 2016, E&Y did not bill William Blair and its control affiliates for any services that were for engagements directly related to the Registrant’s operations and financial reporting.
All Other Fees
For the fiscal years ended December 31, 2015 and 2016, E&Y did not bill the Registrant for products and services other than the services reported above. For the fiscal year ended December 31, 2015 and 2016, E&Y provided no other services to William Blair or any of its control affiliates that were for engagements directly related to the Registrant’s operations and financial reporting.
Audit Committee Pre-Approval Policies and Procedures
Pursuant to Registrant’s Audit Committee Charter (the “Charter”), the Audit Committee is responsible for pre-approving any engagement of the principal accountant to provide non-prohibited services to the Registrant, including the fees and other compensation to be paid to the principal accountant, to the extent required by Rule 2-01(c)(7) of Regulation S-X. Pursuant to the Charter, the Audit Committee is also responsible for pre-approving any engagement of the principal accountant, including the fees and other compensation to be paid to the principal accountant, to provide non-audit services to the Registrant’s investment advisor (or any entity controlling, controlled by, or under common control with the adviser that provides ongoing services to the Registrant), if the engagement relates directly to the operations and financial reporting of the Registrant, to the extent required by Rule 2-01(c)(7) of Regulation S-X. The Chair of the Audit Committee may grant the pre-approval referenced above for non-prohibited and non-audit services. All such delegated pre-approvals will be presented to the Audit Committee no later than the next Audit Committee meeting.
| Item 5. | Audit Committee of Listed Registrants |
Not Applicable to this Registrant, insofar as the Registrant is not a listed company.
| Item 6. | Schedule of Investments |
See Schedule of Investments in Item 1.
| Item 7. | Disclosure of Proxy Voting Policies and Procedures for Closed-End Management Investment Companies |
Not applicable to this Registrant, insofar as the Registrant is not a closed-end management investment company.
| Item 8. | Portfolio Managers of Closed Investment Companies |
Not applicable to this Registrant, insofar as the Registrant is not a closed-end management investment company.
| Item 9. | Purchase of Equity Securities by Closed-End Management Investment Companies and Affiliated Purchasers |
Not applicable to this Registrant, insofar as the Registrant is not a closed-end management investment company.
| Item 10. | Submission of Matters to a Vote of Security Holders |
There have been no material changes to the procedures by which shareholders may recommend nominees to the Registrant’s Board of Trustees since the Registrant last provided disclosure in response to this item.
Controls and Procedures
(a) The Registrant’s principal executive and principal financial officer, or persons performing similar functions, have concluded that the Registrant’s Disclosure Controls and Procedures (as defined in Rule 30a-3(c) under the Investment Company Act of 1940, as amended (the “1940 Act”) (17 CFR 270.30a-3(c)) are effective, as of a date within 90 days of the filing date of this report that includes the disclosure required by this paragraph, based on their evaluation of these controls and procedures required by Rule 30a-3 (b) under the 1940 Act (17 CFR 270.30a-3(b) and Rules 13a-15(b) or 15d-15(b) under the Exchange Act (17 CFR 240.13a-15(b) or 240.15d-15(b)).
(b) There were no changes in the Registrant’s internal control over financial reporting (as defined in Rule 30a-3(d) under the 1940 Act (17 CFR 270.30a-3(d)) that occurred during the final quarter of the period covered by this report that has materially affected, or is reasonably likely to materially affect, the Registrant’s internal control over financial reporting.
12. (a) (1) Code of Ethics
Not applicable because it is posted on Registrant’s website.
12. (a) (2) (1)
Certification of Principal Executive Officer Required by Rule 30a-2(a) of the Investment Company Act
12. (a) (2) (2)
Certification of Principal Financial Officer Required by Rule 30a-2(a) of the Investment Company Act.
12. (a) (3)
Not applicable to this Registrant.
12. (b)
Certification of Chief Executive Officer and Certification of Chief Financial Officer Required by Rule 30a-2(b) of the Investment Company Act
Pursuant to the requirements of the Securities Exchange Act of 1934 and the Investment Company Act of 1940, the Registrant has duly caused this report to be signed on its behalf by the undersigned, thereunto duly authorized.
| | | William Blair Funds |
| | |
| | | /s/ Michelle R. Seitz |
| By: | | Michelle R. Seitz |
| | | President (Chief Executive Officer) |
Date: February 22, 2017
Pursuant to the requirements of the Securities Exchange Act of 1934 and the Investment Company Act of 1940, this report has been signed below by the following persons on behalf of the Registrant and in the capacities and on the dates indicated.
| | | /s/ Michelle R. Seitz |
| By: | | Michelle R. Seitz |
| | | President (Chief Executive Officer) |
Date: February 22, 2017
| | | /s/ Colette M. Garavalia |
| By: | | Colette M. Garavalia |
| | | Treasurer (Chief Financial Officer) |
Date: February 22, 2017