UNITED STATES
SECURITIES AND EXCHANGE COMMISSION
Washington, D.C. 20549
Form N-CSR
CERTIFIED SHAREHOLDER REPORT OF REGISTERED
MANAGEMENT INVESTMENT COMPANIES
Investment Company Act File Number 811-5344
William Blair Funds
(Exact name of registrant as specified in charter)
| 222 West Adams Street, Chicago, IL | | 60606 |
| (Address of principal executive offices) | | (Zip Code) |
Michelle R. Seitz
William Blair Funds
222 West Adams Street, Chicago, IL 60606
(Name and address of agent for service)
Registrant’s telephone number, including area code: 312-236-1600
Date of fiscal year end: December 31
Date of reporting period: December 31, 2015
Form N-CSR is to be used by management investment companies to file reports with the Commission not later than 10 days after the transmission to stockholders of any report that is required to be transmitted to stockholders under Rule 30e-1 under the Investment Company Act of 1940 (17 CFR 270.30e-1). The Commission may use the information provided on Form N-CSR in its regulatory, disclosure review, inspection, and policymaking roles.
A registrant is required to disclose the information specified by Form N-CSR, and the Commission will make this information public. A Registrant is not required to respond to the collection of information contained in Form N-CSR unless the form displays a currently valid Office of Management and Budget (“OMB”) control number. Please direct comments concerning the accuracy of the information collection burden estimates and any suggestions for reducing the burden to Secretary, Securities and Exchange Commission, 100 F Street, NE, Washington, DC 20549. The OMB has reviewed this collection of information under the clearance requirements of 44 U.S.C. (ss) 3507.
| Item 1. | February 25, 2016 Annual Reports transmitted to shareholders. |
 | |
| | |
| | |
| | |
| | |
| | December 31, 2015 |
William Blair Funds Annual Report | |
Table of Contents
| December 31, 2015 | William Blair Funds | 1 |
The views expressed in the commentary for each Fund reflect those of the portfolio management team only through the end of the period of the report as stated on the cover. The portfolio management team’s views are subject to change at any time based on market and other conditions and should not be construed as a recommendation. Statements involving predictions, assessments, analyses, or outlook for individual securities, industries, market sectors, and/or markets involve risks and uncertainties, and there is no guarantee they will come to pass.
This report is submitted for the general information of the shareholders of William Blair Funds. It is not authorized for distribution to prospective investors unless accompanied or preceded by a prospectus of William Blair Funds. Please carefully consider the Funds’ investment objectives, risks, charges, and expenses before investing. This and other information is contained in the Funds’ prospectus, which you may obtain by calling 1-800-742-7272. Read it carefully before you invest or send money.
| 2 | Annual Report | December 31, 2015 |
Performance as of December 31, 2015—Class N Shares (Unaudited)
| | | | | | | | | 10 yr | | | | Overall |
| | | | | | | | | (or since | | Inception | | Morningstar |
| | | 1 yr | | 3 yr | | 5 yr | | inception) | | Date | | Rating |
| | | | | | | | | | | | | |
| Growth Fund | | | | | | | | | | | | | | | | |
| Class N | | 5.31 | | | 14.86 | | | 11.44 | | | 8.01 | | | 3/20/1946 | | **** |
| Morningstar Large Growth | | 3.60 | | | 15.27 | | | 11.70 | | | 7.33 | | | | | Among 1,542 |
| Russell 3000® Growth Index | | 5.09 | | | 16.62 | | | 13.30 | | | 8.49 | | | | | Large Growth Funds |
| S&P 500® Index | | 1.38 | | | 15.13 | | | 12.57 | | | 7.31 | | | | | |
| | | | | | | | | | | | | | | | | |
| Large Cap Growth Fund | | | | | | | | | | | | | | | | |
| Class N | | 7.04 | | | 17.62 | | | 13.15 | | | 7.43 | | | 12/27/1999 | | **** |
| Morningstar Large Growth | | 3.60 | | | 15.27 | | | 11.70 | | | 7.33 | | | | | Among 1,542 |
| Russell 1000® Growth Index | | 5.67 | | | 16.83 | | | 13.53 | | | 8.53 | | | | | Large Growth Funds |
| | | | | | | | | | | | | | | | | |
| Large Cap Value Fund | | | | | | | | | | | | | | | | |
| Class N | | (5.70 | ) | | 10.83 | | | — | | | 11.68 | | | 10/24/2011 | | *** |
| Morningstar Large Value | | (4.05 | ) | | 11.63 | | | — | | | — | | | | | Among 1,190 |
| Russell 1000® Value Index | | (3.83 | ) | | 13.08 | | | — | | | 13.94 | | | | | Large Value Funds |
| | | | | | | | | | | | | | | | | |
| Mid Cap Growth Fund | | | | | | | | | | | | | | | | |
| Class N | | (0.20 | ) | | 11.39 | | | 9.27 | | | 7.55 | | | 2/1/2006 | | *** |
| Morningstar Mid-Cap Growth | | (0.95 | ) | | 12.82 | | | 9.59 | | | — | | | | | Among 644 |
| Russell Midcap® Growth Index | | (0.20 | ) | | 14.88 | | | 11.54 | | | 7.59 | | | | | Mid-Cap Growth Funds |
| | | | | | | | | | | | | | | | | |
| Mid Cap Value Fund | | | | | | | | | | | | | | | | |
| Class N | | (2.13 | ) | | 12.55 | | | 10.04 | | | 10.35 | | | 5/3/2010 | | **** |
| Morningstar Mid-Cap Value | | (5.41 | ) | | 11.50 | | | 9.06 | | | — | | | | | Among 407 |
| Russell Midcap® Value Index | | (4.78 | ) | | 13.40 | | | 11.25 | | | 11.21 | | | | | Mid-Cap Value Funds |
| | | | | | | | | | | | | | | | | |
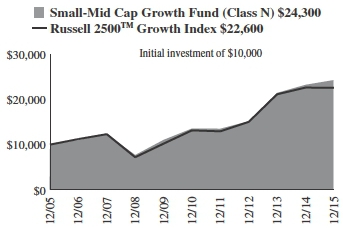
| Small-Mid Cap Growth Fund | | | | | | | | | | | | | | | | |
| Class N | | 4.47 | | | 16.99 | | | 12.37 | | | 9.27 | | | 12/29/2003 | | **** |
| Morningstar Mid-Cap Growth | | (0.95 | ) | | 12.82 | | | 9.59 | | | 7.16 | | | | | Among 644 |
| Russell 2500TM Growth Index | | (0.19 | ) | | 14.54 | | | 11.43 | | | 8.49 | | | | | Mid-Cap Growth Funds |
| | | | | | | | | | | | | | | | | |
| Small-Mid Cap Value Fund | | | | | | | | | | | | | | | | |
| Class N | | (3.13 | ) | | 11.38 | | | — | | | 12.60 | | | 12/15/2011 | | *** |
| Morningstar Small Blend | | (5.38 | ) | | 10.34 | | | — | | | — | | | | | Among 638 |
| Russell 2500® Value Index | | (5.49 | ) | | 10.51 | | | — | | | 13.62 | | | | | Small Blend Funds |
| | | | | | | | | | | | | | | | | |
| Small Cap Growth Fund | | | | | | | | | | | | | | | | |
| Class N | | (4.44 | ) | | 14.42 | | | 8.94 | | | 6.01 | | | 12/27/1999 | | *** |
| Morningstar Small Growth | | (2.41 | ) | | 12.20 | | | 9.40 | | | 7.14 | | | | | Among 660 |
| Russell 2000® Growth Index | | (1.38 | ) | | 14.28 | | | 10.67 | | | 7.95 | | | | | Small Growth Funds |
| | | | | | | | | | | | | | | | | |
| Small Cap Value Fund | | | | | | | | | | | | | | | | |
| Class N | | (5.77 | ) | | 11.00 | | | 7.44 | | | 7.28 | | | 12/23/1996 | | *** |
| Morningstar Small Blend | | (5.38 | ) | | 10.34 | | | 8.22 | | | 6.27 | | | | | Among 638 |
| Russell 2000® Value Index | | (7.47 | ) | | 9.06 | | | 7.67 | | | 5.57 | | | | | Small Blend Funds |
| | | | | | | | | | | | | | | | | |
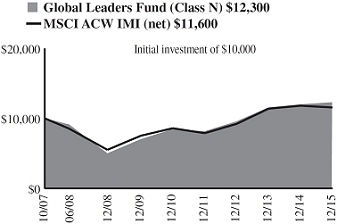
| Global Leaders Fund | | | | | | | | | | | | | | | | |
| Class N | | 2.49 | | | 8.72 | | | 7.78 | | | 2.55 | | | 10/15/2007 | | **** |
| Morningstar World Stock | | (1.69 | ) | | 8.26 | | | 6.51 | | | — | | | | | Among 984 |
| MSCI ACW IMI (net) | | (2.19 | ) | | 7.86 | | | 6.11 | | | 1.78 | | | | | World Stock Funds |
| December 31, 2015 | William Blair Funds | 3 |
Performance as of December 31, 2015—Class N Shares (Unaudited)—continued
| | | | | | | | | 10 yr | | | | Overall |
| | | | | | | | | (or since | | Inception | | Morningstar |
| | | 1 yr | | 3 yr | | 5 yr | | inception) | | Date | | Rating |
| | | | | | | | | | | | | |
| Global Small Cap Growth Fund | | | | | | | | | | | | | | | | |
| Class N | | 9.07 | | | — | | | — | | | 13.94 | | | 4/10/2013 | | Not rated. |
| Morningstar World Stock | | (1.69 | ) | | — | | | — | | | — | | | | | |
| MSCI ACW Small Cap Index (net) | | (1.04 | ) | | — | | | — | | | 6.43 | | | | | |
| | | | | | | | | | | | | | | | | |
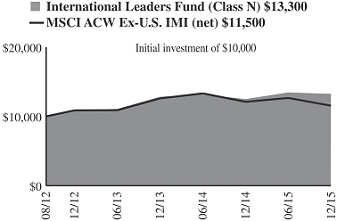
| International Leaders Fund | | | | | | | | | | | | | | | | |
| Class N | | 6.01 | | | 7.01 | | | — | | | 8.69 | | | 8/16/2012 | | **** |
| Morningstar Foreign Large Growth | | 0.95 | | | 4.94 | | | — | | | — | | | | | Among 323 |
| MSCI ACW Ex-U.S. IMI (net) | | (4.60 | ) | | 2.02 | | | — | | | 4.36 | | | | | Foreign Large Growth Funds |
| | | | | | | | | | | | | | | | | |
| International Equity Fund | | | | | | | | | | | | | | | | |
| Class N | | 1.54 | | | 5.54 | | | 3.79 | | | 2.52 | | | 5/24/2004 | | *** |
| Morningstar Foreign Large Growth | | 0.95 | | | 4.94 | | | 3.80 | | | 3.95 | | | | | Among 323 |
| MSCI World Ex-U.S. Index (net) | | (3.04 | ) | | 3.93 | | | 2.79 | | | 2.92 | | | | | Foreign Large Growth Funds |
| | | | | | | | | | | | | | | | | |
| International Growth Fund | | | | | | | | | | | | | | | | |
| Class N | | (0.27 | ) | | 4.61 | | | 3.89 | | | 3.66 | | | 10/1/1992 | | *** |
| Morningstar Foreign Large Growth | | 0.95 | | | 4.94 | | | 3.80 | | | 3.95 | | | | | Among 323 |
| MSCI ACW Ex-U.S. IMI (net) | | (4.60 | ) | | 2.02 | | | 1.27 | | | 3.18 | | | | | Foreign Large Growth Funds |
| | | | | | | | | | | | | | | | | |
| International Small Cap Growth Fund | | | | | | | | | | | | | | | | |
| Class N | | 9.67 | | | 8.11 | | | 6.02 | | | 5.67 | | | 11/1/2005 | | *** |
| Morningstar Foreign Small/Mid Growth | | 7.05 | | | 8.85 | | | 6.24 | | | 5.65 | | | | | Among 136 |
| MSCI ACW Small Cap Ex-U.S. Index (net) | | 2.60 | | | 5.64 | | | 2.63 | | | 4.97 | | | | | Foreign Small/Mid Growth Funds |
| | | | | | | | | | | | | | | | | |
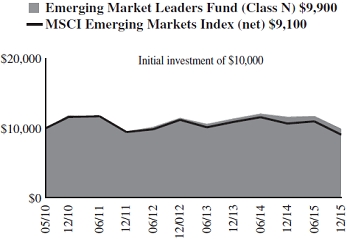
| Emerging Markets Leaders Fund | | | | | | | | | | | | | | | | |
| Class N | | (14.56 | ) | | (4.67 | ) | | (3.45 | ) | | (0.11 | ) | | 5/3/2010 | | **** |
| Morningstar Diversified Emerging Markets | | (13.79 | ) | | (5.69 | ) | | (4.45 | ) | | — | | | | | Among 578
Diversified Emerging Markets Funds |
| MSCI Emerging Markets Index (net) | | (14.92 | ) | | (6.76 | ) | | (4.81 | ) | | (1.71 | ) | | | | |
| | | | | | | | | | | | | | | | | |
| Emerging Markets Growth Fund | | | | | | | | | | | | | | | | |
| Class N | | (15.03 | ) | | (3.89 | ) | | (2.38 | ) | | 3.30 | | | 6/6/2005 | | **** |
| Morningstar Diversified Emerging Markets | | (13.79 | ) | | (5.69 | ) | | (4.45 | ) | | 3.19 | | | | | Among 578
Diversified Emerging Markets Funds |
| MSCI Emerging Markets IMI (net) | | (13.86 | ) | | (6.12 | ) | | (4.59 | ) | | 3.94 | | | | | |
| | | | | | | | | | | | | | | | | |
| Emerging Markets Small Cap Growth Fund | | | | | | | | | | | | | | | | |
| Class N | | (6.40 | ) | | 7.63 | | | — | | | 12.34 | | | 10/24/2011 | | ***** |
| Morningstar Diversified Emerging Markets | | (13.79 | ) | | (5.69 | ) | | — | | | — | | | | | Among 578
Diversified Emerging Markets Funds |
| MSCI Emerging Markets Small Cap Index (net) | | (6.85 | ) | | (1.67 | ) | | — | | | 2.05 | | | | | |
| | | | | | | | | | | | | | | | | |
| Bond Fund | | | | | | | | | | | | | | | | |
| Class N | | (0.23 | ) | | 1.13 | | | 3.77 | | | 4.91 | | | 5/1/2007 | | **** |
| Morningstar Intermediate-Term Bond | | (0.26 | ) | | 1.16 | | | 3.22 | | | — | | | | | Among 947 |
| Barclays U.S. Aggregate Bond Index | | 0.55 | | | 1.44 | | | 3.25 | | | 4.47 | | | | | Intermediate-Term Bond Funds |
| 4 | Annual Report | December 31, 2015 |
Performance as of December 31, 2015—Class N Shares (Unaudited)—continued
| | | | | | | | | 10 yr | | | | Overall |
| | | | | | | | | (or since | | Inception | | Morningstar |
| | | 1 yr | | 3 yr | | 5 yr | | inception) | | Date | | Rating |
| | | | | | | | | | | | | |
| Income Fund | | | | | | | | | | | | | | | | |
| Class N | | 0.39 | | | 0.60 | | | 2.57 | | | 3.12 | | | 10/1/1990 | | **** |
| Morningstar Short-Term Bond | | 0.19 | | | 0.54 | | | 1.49 | | | 2.86 | | | | | Among 493 |
Barclays Intermediate
Government/Credit Bond Index | | 1.07 | | | 1.10 | | | 2.58 | | | 4.04 | | | | | Short-Term Bond Funds |
| | | | | | | | | | | | | | | | | |
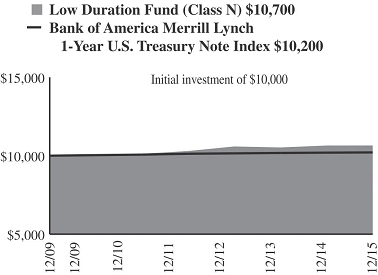
| Low Duration Fund | | | | | | | | | | | | | | | | |
| Class N | | 0.01 | | | 0.19 | | | 1.01 | | | 1.04 | | | 12/1/2009 | | *** |
| Morningstar Ultra Short Bond | | 0.17 | | | 0.34 | | | 0.70 | | | — | | | | | Among 124 |
Bank of America Merrill Lynch
1-Year U.S. Treasury Note Index | | 0.15 | | | 0.20 | | | 0.28 | | | 0.34 | | | | | Ultrashort Bond Funds |
| | | | | | | | | | | | | | | | | |
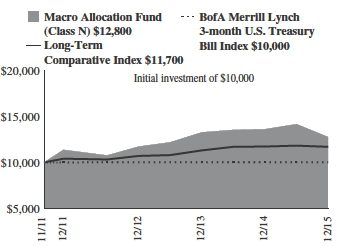
| Macro Allocation Fund | | | | | | | | | | | | | | | | |
| Class N | | (6.24 | ) | | 2.86 | | | — | | | 6.12 | | | 11/29/2011 | | **** |
| Morningstar Multialternative | | (2.58 | ) | | 1.66 | | | — | | | — | | | | | Among 240 |
Bank of America Merrill Lynch
3-Month U.S. Treasury Bill Index | | 0.05 | | | 0.05 | | | — | | | 0.07 | | | | | Multialternative Funds |
| Long-Term Comparative Index | | (0.27 | ) | | 3.00 | | | — | | | 3.89 | | | | | |
Performance cited represents past performance. Past performance does not guarantee future results and current performance may be lower or higher than the data quoted. Results shown are average annual total returns, which assume reinvestment of dividends and capital gains. Investment returns and principal will fluctuate and you may have a gain or a loss when you sell shares. For the most current month-end performance information, please call 1-800-742-7272, or visit our Web site at www.williamblairfunds.com. From time to time, the investment adviser may waive fees or reimburse expenses for the Fund. Without these waivers, performance would be lower. Investing in smaller companies involves special risks, including higher volatility and lower liquidity. International and emerging markets investing involves special risk considerations, including currency fluctuations, lower liquidity, economic and political risk. As interest rates rise, bond prices will fall and bond funds may become more volatile. Class N shares are available to the general public without a sales load.
Morningstar RatingsTM are as of 12/31/2015 and are subject to change every month. The ratings are based on a risk-adjusted return measure that accounts for variation in a fund’s monthly performance, placing more emphasis on downward variations and rewarding consistent performance. The top 10% of funds in each Category receive 5 stars, the next 22.5% receive 4 stars, the middle 35% receive 3 stars, the next 22.5% receive 2 stars, and the bottom 10% receive 1 star. The Overall Morningstar Rating for a fund is derived from a weighted-average of the performance figures associated with its three-, five- and ten-year (if applicable) Morningstar Rating metrics. The 3/5/10 year Morningstar ratings were as follows: Growth Fund ***/***/**** and Large Cap Growth Fund ****/****/***, out of 1,542/1,326/933 large growth funds; Large Cap Value Fund ***/NA/NA, out of 1,190/NA/NA large value funds; Mid Cap Growth Fund ***/***/NA and Small-Mid Cap Growth Fund *****/****/**** out of 644/577/431 mid-cap growth funds; Mid Cap Value Fund ****/****/NA, out of 407/343/NA mid-cap value funds; Small Cap Growth Fund ****/***/**, out of 660/588/423 small growth funds; Small-Mid Cap Value Fund ***/NA /NA and Small Cap Value Fund ***/**/**** out of 638/564/366 small blend funds; Global Leaders Fund ***/****/NA out of 984/781/NA world stock funds; International Equity Fund ****/***/**, International Growth Fund ***/***/***, and International Leaders Fund ****/NA/NA out of 323/288/189 foreign large growth funds; International Small Cap Growth Fund ***/***/*** out of 136/115/77 foreign small/mid growth funds; Emerging Markets Leaders Fund ****/****/NA, Emerging Markets Growth Fund ****/****/***, and Emerging Markets Small Cap Growth *****/NA/NA out of 578/386/172 diversified emerging markets funds; Bond Fund ***/****/NA out of 947/829/NA intermediate-term bond funds; Income Fund ***/*****/*** out of 493/406/278 short-term bond funds; Low Duration Fund **/****/NA out of 124/80/NA ultrashort bond funds; and Macro Allocation Fund ****/NA/NA out of 240/NA/NA multialternative funds.
Please carefully consider the Funds’ investment objectives, risks, charges, and expenses before investing. This and other information is contained in the Funds’ prospectus, which you may obtain by calling 1-800-742-7272. Read it carefully before you invest or send money.
| December 31, 2015 | William Blair Funds | 5 |
U.S. Growth Market Review and Outlook
Broadly, the domestic equity market modestly advanced over the first half of 2015 as strong consumer confidence, improving labor market health, and solid housing data suggested continued health of the U.S. economy. In addition, the equity market was supported by strong mergers and acquisitions (“M&A”) activity driven by healthy corporate balance sheets, the continued availability of cheap debt financing and a generally favorable market response to deal announcements. However, market volatility spiked late in the summer and downdrafts in August and September, driven by concerns of slowing growth in China and potential spillover effects for global economic growth, weighed significantly on market returns.
Volatility continued in the fourth quarter. Following third quarter weakness, the market rebounded strongly in October as investor fears were eased by the combination of better data out of China and continued solid U.S. economic data. In the U.S., steady improvement in employment, signs of acceleration in wage growth, low gas prices, and solid housing data bolstered consumer confidence. However, challenges in the manufacturing segment of the economy, in part due to weakness in energy and commodity-driven industries and exacerbated by weak exports related to a strong dollar, remained a concern. In December, Brent Crude Oil fell below $40 a barrel for the first time since the 2008 financial crisis. Moreover, credit spreads in both high yield and investment grade bonds widened over the course of the year, suggesting growing concerns over either a slowing economy or rising default risk, or both. While much of this was tied to highly indebted companies with exposure to global commodities, high yield spreads nevertheless bear monitoring.
After speculation through much of 2015 as to when the Federal Reserve (the “Fed”) would begin to raise interest rates, the Fed raised rates by 25 basis points in December, the first rate increase in nine years. While the move was largely anticipated by the market, there was an uptick in volatility surrounding the announcement as investors digested the dovish commentary that accompanied the rate hike and reiterated the Fed’s data-dependent stance on the trajectory of future monetary policy implementation. The Fed’s first move toward policy re-normalization along with the aforementioned pockets of weakness in the economy caused investors to question the durability of U.S. growth, especially given more challenged growth prospects abroad. These factors contributed to weaker equity markets in the final month of the year.
With the Fed’s first rate hike behind us, investor conversation has shifted to speculation around the pace at which the Fed will pursue monetary policy re-normalization. While policy mistakes on this front could pose a risk to economic growth, we also acknowledge that we remain in an environment of near-zero rates and accommodative fiscal policy in the U.S., as well as generally stimulative policies abroad. The Fed has set expectations for a gradual path of rising rates as it looks for progress toward its inflation target of 2%. We believe interest rates are likely to stay lower for longer due to economic risks abroad and the excess capacity currently present in many parts of the global economy today, both of which are likely to limit inflationary pressures relative to past cycles.
Among these risks, China remains notable. While the country tries to engineer a soft landing, structural headwinds remain as China faces a difficult transition from an industrial to a consumer-led economy. China’s trajectory on this front will have important implications for other emerging markets, particularly commodity-driven economies reliant on Chinese demand. With respect to energy and commodity markets in general, there could be further fallout in the space if the current supply and demand imbalances persist.
In terms of the market, we expect that the increased volatility observed in the second half of 2015 will continue into 2016, supported by the Fed’s data-dependent policy stance, China’s uncertain economic trajectory, the U.S. presidential election, and a more challenging backdrop for corporate earnings growth. Nearly seven years into an economic recovery and with profit margins near peak levels, we believe fundamentally driven earnings growth will be harder to achieve going-forward. That being said, the balance sheets of U.S. corporations generally remain healthy and the translation impact of foreign exchange headwinds appears to be largely behind them. Given our bias toward companies with durable long-term growth opportunities that trade at attractive valuations relative to those characteristics, we believe our style of investing is likely to be rewarded in this type of market environment.
| 6 | Annual Report | December 31, 2015 |
U.S. Value Market Review and Outlook
Broadly, the domestic equity markets modestly advanced over the first half of 2015 as strong consumer confidence, improving labor market health and solid business data helped overcome early economic disappointments and suggested continued health of the U.S. economy. In addition, the equity markets were supported by strong mergers and acquisitions (“M&A”) activity driven by healthy corporate balance sheets, the continued availability of cheap debt financing and a generally favorable market response to deal announcements. However, market volatility spiked late in the summer and market declines in August and September, driven by continued weak commodity prices and concerns of slowing growth in China, including potential spillover effects for global economic growth, weighed significantly on market returns for the year.
After most value benchmark indices posted consecutive quarters of negative returns, the domestic equity markets traded higher in the fourth quarter. October and November returns were driven by continued solid U.S. economic data as news of a lowering unemployment rate, signs of acceleration in wage growth, low gas prices, and solid housing data bolstered consumer confidence. While domestic economic data broadly continued to improve, dovish commentary early in the fourth quarter from the Federal Reserve (the “Fed”) helped propel domestic equity markets higher. In addition, improved economic data out of China, which many hope signals economic stabilization, helped support market gains early in the fourth quarter.
December returns were negatively impacted by continued weakness in commodities, highlighted by oil prices that fell below $40 per barrel for the first time since the 2008 financial crisis. While U.S. consumers continue to drive domestic economic expansion, disappointing industrial data contributed to market declines in December. Moreover, credit spreads in both high yield and investment grade bonds widened over the course of the year, suggesting rising concerns over either a slowing economy or rising default risk, or both. While much of the widening in credit spreads was tied to highly indebted companies with significant exposure to global commodities, high yield spreads nevertheless bear monitoring.
After much speculation in 2015 as to when the Fed would begin to raise interest rates, the Fed raised rates by 25 basis points in December, the first increase in nine years. While the move was largely anticipated by the market, there was an uptick in volatility surrounding the announcement as investors digested the dovish commentary that accompanied the rate hike and reiterated the Fed’s data-dependent stance on the trajectory of future monetary policy implementation. The Fed’s first move toward policy re-normalization, along with the aforementioned pockets of weakness in the economy, caused investors to question the durability of U.S. growth—especially given more challenged growth prospects abroad. These factors contributed to weaker equity markets in the final month of the year.
We continue to be constructive on the domestic equity markets and, absent a major global economic disruption, we expect U.S. economic expansion to continue at a slow and steady pace. With that said, we anticipate continued volatility in 2016 due to geopolitical tensions, concerns over a slowdown in China, the potential for further commodity weakness, the upcoming U.S. presidential election, and a more challenging backdrop for corporate earnings growth. Higher-quality companies typically outperform lower-quality companies when volatility rises, which should benefit our Funds given our higher-quality bias.
We believe that the Fed is less likely to raise rates into an uncertain U.S. and global economic growth backdrop, and temporary economic hiccups are likely to materialize that may delay future Fed rate increases. As the U.S. moves toward monetary policy normalization and many global central banks are following an accommodative policy, this policy divergence may amplify the strength of the U.S. dollar. Further strengthening of the dollar could offset accommodative policy measures in emerging and global markets. This scenario could stress global economic growth and ultimately disrupt the trajectory of the U.S. recovery. While we do not attempt to predict the timing or trajectory of future Fed rate increases, we believe rates will remain lower for longer than they otherwise would have due to economic risks abroad and the excess capacity that exists in many parts of the global economy today, both of which are likely to limit inflationary pressures.
Among these risks for the global economy, China remains important. While the country tries to engineer a soft landing, evident in its recent currency devaluation and supply side reforms, structural headwinds remain. China has been overly dependent on fixed asset investment in real estate, manufacturing capacity, and infrastructure to drive economic growth and faces a difficult transition from an industrial economy to a consumer-led economy. China’s trajectory on this front will have important implications for other emerging markets, particularly commodity-driven economies reliant on Chinese demand. With respect to energy and commodity markets risk, there could be further fallout in the space if the current supply and demand imbalances persist.
While we are cognizant of these macroeconomic variables, our focus remains on identifying attractive risk/reward opportunities based on individual company fundamentals. From our bottom-up perspective, we remain constructive on corporate earnings, albeit against a backdrop of lower revenue growth and increasing margin pressure from higher wages. As always, our focus remains on identifying quality companies at discount prices and corporate transformation opportunities, and we continue to find good ideas across sectors. Given our investment approach, we believe the Funds are well-suited to withstand a variety of market scenarios and add value over the long-term.
| December 31, 2015 | William Blair Funds | 7 |
| | Growth Fund |
| | |
| | The Growth Fund seeks long-term capital appreciation. |
| | |
| | AN OVERVIEW FROM THE PORTFOLIO MANAGERS |
| | |

David C. Fording 
John F. Jostrand | The William Blair Growth Fund (Class N shares) posted a 5.31% increase, net of fees, for the twelve months ended December 31, 2015. By comparison, the Fund’s benchmark index, the Russell 3000® Growth Index (the “Index”), increased 5.09%. The Fund’s outperformance relative to the Index for 2015 was driven by stock selection as style factors were mostly offsetting. Strong stock selection in Information Technology was a standout positive during the year. While we held many good performers, positions in Alphabet (formerly Google Inc.) and Vantiv were the top contributors to return within the sector. Amazon.com (Consumer Discretionary) was our largest individual contributor to return during the period while positions in Equifax (Industrials) and Bristol-Myers Squibb (Health Care) also added value. Alphabet outperformed on strong growth in both its core search business and in YouTube while Amazon.com outperformed on strong growth out of both its core e-commerce business and its rapidly growing AWS segment. Conversely, stock selection within Consumer Staples, including positions in Keurig Green Mountain and Mead Johnson Nutrition, detracted from 2015 relative performance. Keurig Green Mountain underperformed on disappointing business results for its hot platform and investor skepticism of the company’s launch strategy for the Keurig Kold platform. Other notable underperformers included Precision Castparts (Industrials), Encore Capital Group (Financials) and Borg Warner (Consumer Discretionary). Precision Castparts underperformed due to a reduction of inventory destocking by a major customer and a drop in orders following the collapse of oil prices. From a style perspective, increasing investor concerns about the sustainability of economic growth, given that we have likely moved past the mid-point of the current economic cycle, contributed to a gravitation toward more consistent growers and less sensitivity to valuation. As such, the Fund’s overweight to higher valuation stocks, an exposure driven by our typical bias toward less cyclical and more sustainable growers, was a modest tailwind during the period. At the same time, the Fund’s typical smaller-size profile relative to the Index worked against the Fund as large- and mega-cap stocks outperformed their small- and mid-cap counterparts by a considerable margin during the year. During 2015, the Fund participated in one initial public offering for Square Inc., which had a modest positive impact on performance. Please refer to the U.S. Growth Market Review and Outlook relating to the Fund on page 6. |
| 8 | Annual Report | December 31, 2015 |
Growth Fund
Performance Highlights (Unaudited)
| | | | | | |
| | | | | | |
| | | | | | |
| | | | | | |
| Average Annual Total Return at 12/31/2015 | | | | | |
| | | | | | |
| | | 1 Year | | 3 Year | | 5 Year | | 10 Year |
| Class N | | | 5.31 | % | | | 14.86 | % | | | 11.44 | % | | | 8.01 | % |
| Class I | | | 5.69 | | | | 15.25 | | | | 11.82 | | | | 8.36 | |
| Russell 3000® Growth Index | | | 5.09 | | | | 16.62 | | | | 13.30 | | | | 8.49 | |
| S&P 500® Index | | | 1.38 | | | | 15.13 | | | | 12.57 | | | | 7.31 | |
Performance cited represents past performance. Past performance does not guarantee future results and current performance may be lower or higher than the data quoted. Results shown are average annual returns, which assume reinvestment of dividends and capital gains. Investment returns and principal will fluctuate and you may have a gain or loss when you sell shares. For the most current month-end performance information, please call 1-800-742-7272, or visit our Web site at www.williamblairfunds.com. Class N shares are available to the general public without a sales load. Class I shares are available to certain institutional investors and advisory clients of William Blair Investment Management, LLC and William Blair & Company, L.L.C., without a sales load or distribution (12b-1) or service fees.
The performance highlights and graph presented above do not reflect the deduction of taxes that a shareholder would pay on fund distributions or the redemption of fund shares.
The Russell 3000® Growth Index consists of large, medium, and small capitalization companies with above average price-to-book ratios and forecasted growth rates. The index is weighted by market capitalization and large/medium/small companies make up approximately 80%/15%/5% of the index.
The S&P 500® Index indicates broad larger capitalization equity market performance.
This report identifies the Fund’s investments on December 31, 2015. These holdings are subject to change. Not all stocks in the Fund performed the same, nor is there any guarantee that these stocks will perform as well in the future. Market forecasts provided in this report may not necessarily come to pass.
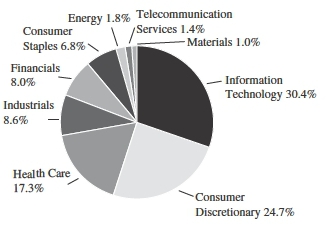
Sector Diversification (Unaudited)

The sector diversification shown is based on the total long-term securities.
| December 31, 2015 | William Blair Funds | 9 |
Growth Fund
Portfolio of Investments, December 31, 2015 (all dollar amounts in thousands)
| | | | | | | | |
| | | | | | | | |
| | Issuer | | Shares | | | Value | |
| | | | | | | | | | |
| | Common Stocks | | | | | | | | |
| | | | | | | | | | |
| | Information Technology—32.9% | | | | | | | | |
| * | Adobe Systems, Inc. | | | 144,300 | | | $ | 13,556 | |
| * | Akamai Technologies, Inc. | | | 103,999 | | | | 5,473 | |
| * | Alphabet, Inc. Class “C” | | | 44,738 | | | | 33,951 | |
| * | Alphabet, Inc. Class “A” | | | 43,180 | | | | 33,595 | |
| * | CoStar Group, Inc. | | | 50,357 | | | | 10,408 | |
| * | Facebook, Inc. | | | 226,900 | | | | 23,747 | |
| * | Guidewire Software, Inc. | | | 151,000 | | | | 9,084 | |
| | Mastercard, Inc. | | | 399,300 | | | | 38,876 | |
| | Microsoft Corporation | | | 372,900 | | | | 20,689 | |
| * | NeuStar, Inc. | | | 362,678 | | | | 8,693 | |
| * | Pandora Media, Inc. | | | 649,783 | | | | 8,714 | |
| * | Red Hat, Inc. | | | 233,306 | | | | 19,320 | |
| * | ServiceNow, Inc. | | | 80,900 | | | | 7,003 | |
| * | Square, Inc. | | | 397,255 | | | | 5,200 | |
| | Texas Instruments, Inc. | | | 349,500 | | | | 19,156 | |
| * | Vantiv, Inc. | | | 316,600 | | | | 15,013 | |
| * | Workday, Inc. | | | 77,200 | | | | 6,151 | |
| | | | | | | | | 278,629 | |
| | Consumer Discretionary—21.0% | | | | | | | | |
| * | Amazon.com, Inc. | | | 52,900 | | | | 35,755 | |
| | BorgWarner, Inc. | | | 343,700 | | | | 14,858 | |
| | Dollar General Corporation | | | 342,000 | | | | 24,580 | |
| | Lowe’s Cos., Inc. | | | 420,600 | | | | 31,982 | |
| | Newell Rubbermaid, Inc. | | | 387,400 | | | | 17,077 | |
| * | Sally Beauty Holdings, Inc. | | | 470,400 | | | | 13,119 | |
| * | Steven Madden, Ltd. | | | 196,100 | | | | 5,926 | |
| * | The Priceline Group, Inc. | | | 10,885 | | | | 13,878 | |
| | VF Corporation | | | 229,900 | | | | 14,311 | |
| | Williams-Sonoma, Inc. | | | 100,600 | | | | 5,876 | |
| | | | | | | | | 177,362 | |
| | Health Care—16.0% | | | | | | | | |
| * | Align Technology, Inc. | | | 176,800 | | | | 11,642 | |
| * | Biogen, Inc. | | | 53,500 | | | | 16,390 | |
| * | BioMarin Pharmaceutical, Inc. | | | 84,000 | | | | 8,800 | |
| | Bristol-Myers Squibb Co. | | | 450,100 | | | | 30,962 | |
| * | Cerner Corporation | | | 313,600 | | | | 18,869 | |
| * | Exact Sciences Corporation | | | 190,000 | | | | 1,754 | |
| | Gilead Sciences, Inc. | | | 230,570 | | | | 23,331 | |
| * | Medivation, Inc. | | | 108,244 | | | | 5,233 | |
| | Perrigo Co. plc† | | | 54,900 | | | | 7,944 | |
| | Shire plc-ADR | | | 49,100 | | | | 10,066 | |
| | | | | | | | | 134,991 | |
| | Industrials—14.9% | | | | | | | | |
| | AMETEK, Inc. | | | 331,900 | | | | 17,787 | |
| | Danaher Corporation | | | 196,800 | | | | 18,279 | |
| | Equifax, Inc. | | | 122,204 | | | | 13,610 | |
| | Rockwell Collins, Inc. | | | 137,200 | | | | 12,664 | |
| * | RPX Corporation | | | 140,677 | | | | 1,547 | |
| | Towers Watson & Co. | | | 113,400 | | | | 14,567 | |
| * | TransDigm Group, Inc. | | | 69,780 | | | | 15,941 | |
| | Union Pacific Corporation | | | 274,300 | | | | 21,450 | |
| | | | Shares or | | | | |
| | | | Principal | | | | |
| | Issuer | | Amount | | | Value | |
| | | | | | | | | | |
| | Common Stocks—(continued) | | | | | | | | |
| | | | | | | | | | |
| | Industrials—(continued) | | | | | | | | |
| * | Verisk Analytics, Inc. | | | 131,020 | | | $ | 10,073 | |
| | | | | | | | | 125,918 | |
| | Financials—9.5% | | | | | | | | |
| * | Affiliated Managers Group, Inc. | | | 79,200 | | | | 12,653 | |
| * | Encore Capital Group, Inc. | | | 258,021 | | | | 7,503 | |
| | Intercontinental Exchange, Inc. | | | 75,800 | | | | 19,425 | |
| * | Markit, Ltd.† | | | 441,063 | | | | 13,307 | |
| | Moody’s Corporation | | | 171,000 | | | | 17,158 | |
| * | Signature Bank | | | 69,800 | | | | 10,705 | |
| | | | | | | | | 80,751 | |
| | Energy—2.4% | | | | | | | | |
| | Schlumberger, Ltd.† | | | 184,200 | | | | 12,848 | |
| | Suncor Energy, Inc.† | | | 296,300 | | | | 7,644 | |
| | | | | | | | | 20,492 | |
| | Consumer Staples—2.0% | | | | | | | | |
| | Costco Wholesale Corporation | | | 106,000 | | | | 17,119 | |
| | Total Common Stocks—98.7%
(cost $664,436) | | | | | | | 835,262 | |
| | | | | | | | | | |
| | Repurchase Agreement | | | | | | | | |
| | Fixed Income Clearing Corporation, 0.030% dated 12/31/15, due 1/4/16, repurchase price $7,796, collateralized by U.S. Treasury Note, 2.375%, due 8/15/24 | | | $7,795 | | | | 7,795 | |
| | Total Repurchase Agreement—0.9%
(cost $7,795) | | | | | | | 7,795 | |
| | Total Investments—99.6%
(cost $672,231) | | | | | | | 843,057 | |
| | Cash and other assets, less liabilities—0.4% | | | | | | | 3,441 | |
| | Net assets—100.0% | | | | | | $ | 846,498 | |
ADR = American Depository Receipt
* Non-income producing securities
† = U.S. listed foreign security
See accompanying Notes to Financial Statements.
| 10 | Annual Report | December 31, 2015 |
| | Large Cap Growth Fund |
| | |
| | The Large Cap Growth Fund seeks long-term capital appreciation. |
| | |
| | AN OVERVIEW FROM THE PORTFOLIO MANAGERS |
| | |

James S. Golan 
David P. Ricci | The William Blair Large Cap Growth Fund (Class N shares) posted a 7.04% increase, net of fees, for the twelve months ended December 31, 2015. By comparison, the Fund’s benchmark index, the Russell 1000® Growth Index (the “Index”), increased 5.67%. The Fund’s outperformance during 2015 was driven by stock selection. Good stock selection within Consumer Discretionary and Information Technology contributed significantly to returns. Within Consumer Discretionary, top performers included Amazon.com, Home Depot, and O’Reilly Automotive, while within Information Technology, Alphabet (formerly Google Inc.) was a notable contributor. Alphabet outperformed on strong growth in both its core search business and in YouTube while Amazon.com outperformed on strong growth out of both its core e-commerce business and its rapidly growing AWS segment. In addition, the Fund benefited from strong performance from its position in Equifax (Industrials). Conversely, stock selection within Consumer Staples, including the Fund’s positions in Keurig Green Mountain and Mead Johnson Nutrition, detracted from 2015 performance. Keurig Green Mountain underperformed on disappointing business results for its hot platform and investor skepticism of the company’s launch strategy for the Keurig Kold platform. Other notable underperformers included Affiliated Managers Group (Financials), Union Pacific Corporation (Industrials), and Cerner Corporation (Health Care). Union Pacific Corporation underperformed due to lower coal and crude-by-rail volumes being transported over its railroad network. From a style perspective, increasing investor concerns about the sustainability of economic growth, given that we have likely moved past the mid-point of the current economic cycle, contributed to a gravitation toward more consistent growers and less sensitivity to valuation. As such, the Fund’s overweight to higher-valuation stocks, an exposure driven by our typical bias toward less cyclical and more sustainable growers, was a modest tailwind during the year. Please refer to the U.S. Growth Market Review and Outlook relating to the Fund on page 6. |
| December 31, 2015 | William Blair Funds | 11 |
Large Cap Growth Fund
Performance Highlights (Unaudited)
| Average Annual Total Return at 12/31/2015 |
| |
| | | 1 Year | | 3 Year | | 5 Year | | 10 Year |
| Class N | | | 7.04 | % | | | 17.62 | % | | | 13.15 | % | | | 7.43 | % |
| Class I | | | 7.26 | | | | 17.89 | | | | 13.42 | | | | 7.67 | |
| Russell 1000® Growth Index | | | 5.67 | | | | 16.83 | | | | 13.53 | | | | 8.53 | |
Performance cited represents past performance. Past performance does not guarantee future results and current performance may be lower or higher than the data quoted. Results shown are average annual total returns, which assume reinvestment of dividends and capital gains. Investment returns and principal will fluctuate and you may have a gain or loss when you sell shares. For the most current month-end performance information, please call 1-800-742-7272, or visit our Web site at www.williamblairfunds.com. From time to time, the investment adviser may waive fees or reimburse expenses for the Fund. Without these waivers/reimbursements, performance would be lower. Class N shares are available to the general public without a sales load. Class I shares are available to certain institutional investors and advisory clients of William Blair Investment Management, LLC and William Blair & Company, L.L.C., without a sales load or distribution (12b-1) or service fees.
The performance highlights and graph presented above do not reflect the deduction of taxes that a shareholder would pay on fund distributions or the redemption of fund shares.
The Russell 1000® Growth Index consists of large capitalization companies with above average price-to-book ratios and forecasted growth rates.
This report identifies the Fund’s investments on December 31, 2015. These holdings are subject to change. Not all stocks in the Fund performed the same, nor is there any guarantee that these stocks will perform as well in the future. Market forecasts provided in this report may not necessarily come to pass.
Sector Diversification (Unaudited)
The sector diversification shown is based on the total long-term securities.
| 12 | Annual Report | December 31, 2015 |
Large Cap Growth Fund
Portfolio of Investments, December 31, 2015 (all dollar amounts in thousands)
| | | | | | | | |
| | | | | | | | |
| | Issuer | | Shares | | | Value | |
| | | | | | | | | | |
| | Common Stocks | | | | | | | | |
| | | | | | | | | | |
| | Information Technology—29.8% | | | | | | | | |
| * | Adobe Systems, Inc. | | | 19,950 | | | $ | 1,874 | |
| * | Alphabet, Inc. Class “C” | | | 2,606 | | | | 1,978 | |
| * | Alphabet, Inc. Class “A” | | | 3,850 | | | | 2,995 | |
| | Apple, Inc. | | | 46,305 | | | | 4,874 | |
| * | Facebook, Inc. | | | 20,430 | | | | 2,138 | |
| | Mastercard, Inc. | | | 23,280 | | | | 2,267 | |
| * | Red Hat, Inc. | | | 28,170 | | | | 2,333 | |
| | Texas Instruments, Inc. | | | 41,530 | | | | 2,276 | |
| | | | | | | | | 20,735 | |
| | Consumer Discretionary—24.3% | | | | | | | | |
| * | Amazon.com, Inc. | | | 4,480 | | | | 3,028 | |
| | BorgWarner, Inc. | | | 34,270 | | | | 1,482 | |
| | Dollar General Corporation | | | 39,290 | | | | 2,824 | |
| * | O’Reilly Automotive, Inc. | | | 7,920 | | | | 2,007 | |
| | Starbucks Corporation | | | 17,510 | | | | 1,051 | |
| * | Tesla Motors, Inc. | | | 3,170 | | | | 761 | |
| | The Home Depot, Inc. | | | 27,590 | | | | 3,649 | |
| * | The Priceline Group, Inc. | | | 738 | | | | 941 | |
| | VF Corporation | | | 18,320 | | | | 1,140 | |
| | | | | | | | | 16,883 | |
| | Health Care—17.0% | | | | | | | | |
| * | Biogen, Inc. | | | 6,190 | | | | 1,896 | |
| | Bristol-Myers Squibb Co. | | | 32,640 | | | | 2,245 | |
| * | Cerner Corporation | | | 36,300 | | | | 2,184 | |
| * | IDEXX Laboratories, Inc. | | | 24,430 | | | | 1,782 | |
| | UnitedHealth Group, Inc. | | | 16,900 | | | | 1,988 | |
| | Zoetis, Inc. | | | 35,560 | | | | 1,704 | |
| | | | | | | | | 11,799 | |
| | Industrials—8.5% | | | | | | | | |
| | Danaher Corporation | | | 9,460 | | | | 879 | |
| * | TransDigm Group, Inc. | | | 6,840 | | | | 1,562 | |
| | Union Pacific Corporation | | | 27,530 | | | | 2,153 | |
| * | Verisk Analytics, Inc. | | | 16,900 | | | | 1,299 | |
| | | | | | | | | 5,893 | |
| | Financials—7.8% | | | | | | | | |
| * | Affiliated Managers Group, Inc. | | | 11,810 | | | | 1,887 | |
| | Citigroup, Inc. | | | 40,990 | | | | 2,121 | |
| | Moody’s Corporation | | | 14,280 | | | | 1,433 | |
| | | | | | | | | 5,441 | |
| | Consumer Staples—6.7% | | | | | | | | |
| * | Monster Beverage Corporation | | | 8,280 | | | | 1,233 | |
| | The Estee Lauder Cos., Inc. | | | 16,970 | | | | 1,494 | |
| | The Kroger Co. | | | 46,580 | | | | 1,949 | |
| | | | | | | | | 4,676 | |
| | Energy—1.8% | | | | | | | | |
| | Schlumberger, Ltd.† | | | 17,820 | | | | 1,243 | |
| | | | Shares or | | | | |
| | | | Principal | | | | |
| | Issuer | | Amount | | | Value | |
| | | | | | | | | | |
| | Common Stocks—(continued) | | | | | | | | |
| | | | | | | | | | |
| | Telecommunication Services—1.4% | | | | | | | | |
| * | SBA Communications Corporation | | | 9,120 | | | $ | 958 | |
| | Materials—1.0% | | | | | | | | |
| | PPG Industries, Inc. | | | 6,640 | | | | 656 | |
| | Total Common Stocks—98.3%
(cost $55,465) | | | | | | | 68,284 | |
| | | | | | | | | | |
| | Repurchase Agreement | | | | | | | | |
| | Fixed Income Clearing Corporation, 0.030% dated 12/31/15, due 1/4/16, repurchase price $740, collateralized by U.S. Treasury Note 2.375%, due 8/15/24 | | | $740 | | | | 740 | |
| | Total Repurchase Agreement—1.0%
(cost $740) | | | | | | | 740 | |
| | Total Investments—99.3%
(cost $56,205) | | | | | | | 69,024 | |
| | Cash and other assets, less liabilities—0.7% | | | | | | | 457 | |
| | Net assets—100.0% | | | | | | $ | 69,481 | |
* Non-income producing securities
† = U.S. listed foreign security
See accompanying Notes to Financial Statements.
| December 31, 2015 | William Blair Funds | 13 |
| | Large Cap Value Fund |
| | |
| | The Large Cap Value Fund seeks long-term capital appreciation. |
| | |
| | AN OVERVIEW FROM THE PORTFOLIO MANAGER |
| | |

David F. Hone | The William Blair Large Cap Value Fund (Class N shares) posted a 5.70% decrease, net of fees, for the twelve months ended December 31, 2015. By comparison, the Fund’s benchmark index, the Russell 1000® Value Index (the “Index”), decreased 3.83%. The Fund’s underperformance relative to the Index during 2015 was driven by stock selection. Performance within Industrials, the largest sector detractor from relative performance, was driven by a lack of exposure to Industrial Conglomerates and stock selection within Machinery, Road & Rail, and Aerospace & Defense within the sector. Energy was another meaningful sector detractor from relative performance as stock selection within Exploration & Production, coupled with an overweight to an underperforming segment, drove the underperformance within the sector. A lack of exposure to Storage & Transportation, the largest contributor at the sub-industry level, helped offset some of the negative relative returns within the sector. Consumer Staples was the largest sector contributor to relative performance as an overweight in Beverages and Tobacco, combined with positive stock selection within Food & Staples Retailing, drove sector returns. Looking specifically at stock selection, the Fund’s largest detractor from relative performance was Anadarko Petroleum (Energy). Anadarko is an independent exploration and production company. The underperformance was primarily due to continued weakness in the oil and gas markets. Other notable detractors included Devon Energy (Energy) and Kansas City Southern (Industrials). Offsetting these detractors were the Fund’s investments in Boston Scientific (Health Care), Molson Coors Brewing Company (Consumer Staples), and T-Mobile US (Telecommunications). T-Mobile US offers voice, messaging, and data services. The outperformance was due to continued strong new subscriber growth and speculation regarding the possible acquisition of the company. Please refer to the U.S. Value Market Review and Outlook relating to the Fund on page 7. |
| 14 | Annual Report | December 31, 2015 |
Large Cap Value Fund
Performance Highlights (Unaudited)
| Average Annual Total Return at 12/31/2015 |
| |
| | | | 1 Year | | | 3 Year | | | Since
Inception(a) |
| Class N | | | (5.70 | )% | | | 10.83 | % | | | 11.68 | % |
| Class I | | | (5.58 | ) | | | 11.04 | | | | 11.92 | |
| Russell 1000® Value Index | | | (3.83 | ) | | | 13.08 | | | | 13.94 | |
| (a) | For the period from October 24, 2011 (Commencement of Operations) to December 31, 2015. |
Performance cited represents past performance. Past performance does not guarantee future results and current performance may be lower or higher than the data quoted. Results shown are average annual total returns, which assume reinvestment of dividends and capital gains. Investment returns and principal will fluctuate and you may have a gain or loss when you sell shares. For the most current month-end performance information, please call 1-800-742-7272, or visit our Web site at www.williamblairfunds.com. From time to time, the investment adviser may waive fees or reimburse expenses for the Fund. Without these waivers/reimbursements, performance would be lower. Class N shares are available to the general public without a sales load. Class I shares are available to certain institutional investors and advisory clients of William Blair Investment Management, LLC and William Blair & Company, L.L.C., without a sales load or distribution (12b-1) or service fees.
The performance highlights and graph presented above do not reflect the deduction of taxes that a shareholder would pay on fund distributions or the redemption of fund shares.
The Russell 1000® Value Index consists of large capitalization companies with above average price-to-book ratios and forecasted growth rates.
This report identifies the Fund’s investments on December 31, 2015. These holdings are subject to change. Not all stocks in the Fund performed the same, nor is there any guarantee that these stocks will perform as well in the future. Market forecasts provided in this report may not necessarily come to pass.
Sector Diversification (Unaudited)
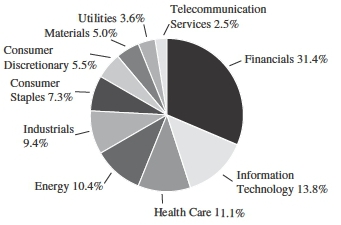
The sector diversification shown is based on the total long-term securities.
| December 31, 2015 | William Blair Funds | 15 |
Large Cap Value Fund
Portfolio of Investments, December 31, 2015 (all dollar amounts in thousands)
| | | | | | | | |
| | | | | | | | |
| | Issuer | | Shares | | | Value | |
| | | | | | | | | | |
| | Common Stocks | | | | | | | | |
| | | | | | | | | | |
| | Financials—31.1% | | | | | | | | |
| | American International Group, Inc. | | | 1,185 | | | $ | 73 | |
| | American Tower Corporation | | | 556 | | | | 54 | |
| | Bank of America Corporation | | | 6,450 | | | | 109 | |
| * | CBRE Group, Inc. | | | 1,064 | | | | 37 | |
| | Citigroup, Inc. | | | 2,077 | | | | 108 | |
| | Citizens Financial Group, Inc. | | | 2,336 | | | | 61 | |
| | CNA Financial Corporation | | | 877 | | | | 31 | |
| | Discover Financial Services | | | 597 | | | | 32 | |
| | JPMorgan Chase & Co. | | | 1,831 | | | | 121 | |
| | Lincoln National Corporation | | | 989 | | | | 50 | |
| | Morgan Stanley | | | 1,177 | | | | 37 | |
| | Regions Financial Corporation | | | 5,976 | | | | 57 | |
| | SunTrust Banks, Inc. | | | 1,563 | | | | 67 | |
| * | Synchrony Financial | | | 1,788 | | | | 54 | |
| | The Charles Schwab Corporation | | | 1,788 | | | | 59 | |
| | Zions Bancorporation | | | 1,392 | | | | 38 | |
| | | | | | | | | 988 | |
| | Information Technology—13.6% | | | | | | | | |
| | Belden, Inc. | | | 627 | | | | 30 | |
| | Broadcom Corporation | | | 654 | | | | 38 | |
| | Cisco Systems, Inc. | | | 3,345 | | | | 91 | |
| * | Citrix Systems, Inc. | | | 464 | | | | 35 | |
| | Corning, Inc. | | | 1,807 | | | | 33 | |
| | HP, Inc. | | | 1,907 | | | | 22 | |
| | Microsoft Corporation | | | 1,926 | | | | 107 | |
| | QUALCOMM, Inc. | | | 973 | | | | 49 | |
| * | VeriFone Systems, Inc. | | | 990 | | | | 28 | |
| | | | | | | | | 433 | |
| | Health Care—11.1% | | | | | | | | |
| | Baxalta, Inc. | | | 664 | | | | 26 | |
| * | Boston Scientific Corporation | | | 2,687 | | | | 49 | |
| | Cardinal Health, Inc. | | | 478 | | | | 43 | |
| * | Express Scripts Holding Co. | | | 531 | | | | 46 | |
| | Merck & Co., Inc. | | | 1,641 | | | | 87 | |
| | PerkinElmer, Inc. | | | 818 | | | | 44 | |
| | Zimmer Biomet Holdings, Inc. | | | 545 | | | | 56 | |
| | | | | | | | | 351 | |
| | Energy—10.3% | | | | | | | | |
| | Anadarko Petroleum Corporation | | | 853 | | | | 42 | |
| | Baker Hughes, Inc. | | | 1,155 | | | | 53 | |
| | Chevron Corporation | | | 794 | | | | 71 | |
| | Devon Energy Corporation | | | 944 | | | | 30 | |
| | Diamond Offshore Drilling, Inc. | | | 556 | | | | 12 | |
| | Exxon Mobil Corporation | | | 1,039 | | | | 81 | |
| | Hess Corporation | | | 786 | | | | 38 | |
| | | | | | | | | 327 | |
| | | | | | | | |
| | | | | | | | |
| | Issuer | | Shares | | | Value | |
| | | | | | | | | | |
| | Common Stocks—(continued) | | | | | | | | |
| | | | | | | | | | |
| | Industrials—9.3% | | | | | | | | |
| | FedEx Corporation | | | 215 | | | $ | 32 | |
| | Ingersoll-Rand plc† | | | 507 | | | | 28 | |
| | Kansas City Southern | | | 363 | | | | 27 | |
| * | SPX FLOW, Inc. | | | 591 | | | | 16 | |
| | Textron, Inc. | | | 1,615 | | | | 68 | |
| | The Boeing Co. | | | 275 | | | | 40 | |
| | Union Pacific Corporation | | | 331 | | | | 26 | |
| | United Technologies Corporation | | | 595 | | | | 57 | |
| | | | | | | | | 294 | |
| | Consumer Staples—7.2% | | | | | | | | |
| | General Mills, Inc. | | | 606 | | | | 35 | |
| | Molson Coors Brewing Co. | | | 450 | | | | 42 | |
| | Philip Morris International, Inc. | | | 1,056 | | | | 93 | |
| | Walgreens Boots Alliance, Inc. | | | 703 | | | | 60 | |
| | | | | | | | | 230 | |
| | Consumer Discretionary—5.5% | | | | | | | | |
| | Big Lots, Inc. | | | 583 | | | | 22 | |
| | Brunswick Corporation | | | 692 | | | | 35 | |
| * | Burlington Stores, Inc. | | | 515 | | | | 22 | |
| | CBS Corporation | | | 657 | | | | 31 | |
| | Delphi Automotive plc† | | | 419 | | | | 36 | |
| * | MGM Resorts International | | | 1,228 | | | | 28 | |
| | | | | | | | | 174 | |
| | Materials—5.0% | | | | | | | | |
| | Alcoa, Inc. | | | 3,186 | | | | 31 | |
| | EI du Pont de Nemours & Co. | | | 550 | | | | 37 | |
| * | Owens-Illinois, Inc. | | | 2,496 | | | | 44 | |
| | Valspar Corporation | | | 571 | | | | 47 | |
| | | | | | | | | 159 | |
| | Utilities—3.6% | | | | | | | | |
| | NextEra Energy, Inc. | | | 681 | | | | 71 | |
| | WEC Energy Group, Inc. | | | 858 | | | | 44 | |
| | | | | | | | | 115 | |
| | Telecommunication Services—2.5% | | | | | | | | |
| * | T-Mobile US, Inc. | | | 1,499 | | | | 58 | |
| | Verizon Communications, Inc. | | | 449 | | | | 21 | |
| | | | | | | | | 79 | |
| | Total Common Stocks—99.2%
(cost $2,776) | | | | | | | 3,150 | |
| | Total Investments—99.2%
(cost $2,776) | | | | | | | 3,150 | |
| | Cash and other assets, less liabilities—0.8% | | | | | | | 26 | |
| | Net assets—100.0% | | | | | | $ | 3,176 | |
* Non-income producing securities
† = U.S. listed foreign security
See accompanying Notes to Financial Statements.
| 16 | Annual Report | December 31, 2015 |
| | Mid Cap Growth Fund |
| | |
| | The Mid Cap Growth Fund seeks long-term capital appreciation. |
| | |
| | AN OVERVIEW FROM THE PORTFOLIO MANAGERS |
| | |
 Robert C. Lanphier, IV 
David P. Ricci 
Daniel Crowe | The William Blair Mid Cap Growth Fund (Class N shares) posted a 0.20% decrease, net of fees, for the twelve months ended December 31, 2015. By comparison, the Fund’s benchmark index, the Russell Midcap® Growth Index (the “Index”), decreased 0.20%. The Fund performed in line with the Index during 2015, with results driven by stock selection and a modest style benefit. From a stock selection standpoint, Information Technology and Industrials were areas of strength. Within Information Technology, Vantiv and Genpact were top contributors to relative performance and within Industrials, Equifax and the Fund’s typical bias toward business services companies drove strong results. Vantiv operates in the payment processing industry as a merchant acquirer and benefited from strong business results in 2015, with particularly strong growth in areas such as e-commerce and integrated payments. Other notable contributors included Airgas (Materials) and BioMarin Pharmaceutical (Health Care). Airgas is a leader in the industrial gas industry and its agreement to be acquired for a significant premium during the fourth quarter drove outperformance. In terms of negatives, Polaris Industries (Consumer Discretionary), Affiliated Managers Group (Financials), Old Dominion Freight Line (Industrials), and Michael Kors Holdings (Consumer Discretionary) were among the Fund’s top detractors. Polaris Industries underperformed due to increasing competitive threats in the off road vehicle market and weaker demand in regions heavily impacted by the collapse of U.S. energy and agricultural markets. Consumer Staples was also an area of weakness, in part due to the Fund’s position in Keurig Green Mountain. Keurig Green Mountain underperformed on disappointing business results for its hot platform and investor skepticism of the company’s launch strategy for the Keurig Kold platform. From a style perspective, increasing investor concerns about the sustainability of economic growth, given that we have likely moved past the mid-point of the current economic cycle, contributed to a gravitation toward more consistent growers and underperformance from the lowest P/E stocks in the Index. As such, the Fund’s overweight to higher valuation stocks, an exposure driven by our typical bias toward less cyclical and more sustainable growers, was a modest tailwind during the year. Please refer to the U.S. Growth Market Review and Outlook relating to the Fund on page 6. |
| December 31, 2015 | William Blair Funds | 17 |
Mid Cap Growth Fund
Performance Highlights (Unaudited)
| Average Annual Total Return at 12/31/2015 |
| | | | | |
| | | | 1 Year | | | 3 Year | | | 5 Year | | | Since
Inception(a) |
| Class N | | | (0.20 | )% | | | 11.39 | % | | | 9.27 | % | | | 7.55 | % |
| Class I | | | 0.00 | | | | 11.66 | | | | 9.55 | | | | 7.84 | |
| Russell Midcap® Growth | | | | | | | | | | | | | | | | |
| Index | | | (0.20 | ) | | | 14.88 | | | | 11.54 | | | | 7.59 | |
| | | | | | | | | | | | | | | | | |
| (a) | For the period from February 1, 2006 (Commencement of Operations) to December 31, 2015. |
Performance cited represents past performance. Past performance does not guarantee future results and current performance may be lower or higher than the data quoted. Results shown are average annual total returns, which assume reinvestment of dividends and capital gains. Investment returns and principal will fluctuate and you may have a gain or loss when you sell shares. For the most current month-end performance information, please call 1-800-742-7272, or visit our Web site at www.williamblairfunds.com. Investing in medium capitalization companies involves special risks, including higher volatility and lower liquidity. Medium capitalization stocks are also more sensitive to purchase/sale transactions and changes in the issuer’s financial condition. From time to time, the investment adviser may waive fees or reimburse expenses for the Fund. Without these waivers/reimbursements, performance would be lower. Class N shares are available to the general public without a sales load. Class I shares are available to certain institutional investors and advisory clients of William Blair Investment Management, LLC and William Blair & Company, L.L.C., without a sales load or distribution (12b-1) or service fees.
The performance highlights and graph presented above do not reflect the deduction of taxes that a shareholder would pay on fund distributions or the redemption of fund shares.
The Russell Midcap® Growth Index is an index that is constructed to provide a comprehensive and unbiased barometer of the mid-cap growth market.
This report identifies the Fund’s investments on December 31, 2015. These holdings are subject to change. Not all stocks in the Fund performed the same, nor is there any guarantee that these stocks will perform as well in the future. Market forecasts provided in this report may not necessarily come to pass.
Sector Diversification (Unaudited)

The sector diversification shown is based on the total long-term securities.
| 18 | Annual Report | December 31, 2015 |
Mid Cap Growth Fund
Portfolio of Investments, December 31, 2015 (all dollar amounts in thousands)
| | | | | | | | |
| | | | | | | | |
| | Issuer | | Shares | | | Value | |
| | | | | | | | |
| | Common Stocks | | | | | | | | |
| | | | | | | | | | |
| | Consumer Discretionary—25.0% | | | | | | | | |
| | BorgWarner, Inc. | | | 144,943 | | | $ | 6,266 | |
| | Brunswick Corporation | | | 78,900 | | | | 3,985 | |
| | *Chipotle Mexican Grill, Inc. | | | 3,325 | | | | 1,595 | |
| | Dollar General Corporation | | | 97,565 | | | | 7,012 | |
| | Hanesbrands, Inc. | | | 168,600 | | | | 4,962 | |
| | L Brands, Inc. | | | 28,100 | | | | 2,693 | |
| | Newell Rubbermaid, Inc. | | | 101,600 | | | | 4,479 | |
| * | O’Reilly Automotive, Inc. | | | 13,634 | | | | 3,455 | |
| | Polaris Industries, Inc. | | | 45,730 | | | | 3,930 | |
| | Ross Stores, Inc. | | | 87,100 | | | | 4,687 | |
| * | Sally Beauty Holdings, Inc. | | | 74,901 | | | | 2,089 | |
| | Six Flags Entertainment Corporation | | | 53,680 | | | | 2,949 | |
| | Williams-Sonoma, Inc. | | | 32,127 | | | | 1,877 | |
| | | | | | | | | 49,979 | |
| | Industrials—19.1% | | | | | | | | |
| | AMETEK, Inc. | | | 72,958 | | | | 3,910 | |
| | Carlisle Cos., Inc. | | | 39,800 | | | | 3,530 | |
| | Equifax, Inc. | | | 36,000 | | | | 4,009 | |
| * | Old Dominion Freight Line, Inc. | | | 118,886 | | | | 7,023 | |
| | Rockwell Collins, Inc. | | | 59,070 | | | | 5,452 | |
| * | The Middleby Corporation | | | 24,970 | | | | 2,693 | |
| | Towers Watson & Co. | | | 30,490 | | | | 3,917 | |
| * | TransDigm Group, Inc. | | | 13,200 | | | | 3,016 | |
| * | Verisk Analytics, Inc. | | | 60,980 | | | | 4,688 | |
| | | | | | | | | 38,238 | |
| | Information Technology—18.3% | | | | | | | | |
| * | Akamai Technologies, Inc. | | | 30,179 | | | | 1,588 | |
| | Booz Allen Hamilton Holding Corporation | | | 73,100 | | | | 2,255 | |
| * | CoStar Group, Inc. | | | 22,577 | | | | 4,667 | |
| * | Genpact, Ltd.† | | | 217,252 | | | | 5,427 | |
| * | Guidewire Software, Inc. | | | 64,620 | | | | 3,888 | |
| * | IPG Photonics Corporation | | | 18,724 | | | | 1,669 | |
| | MAXIMUS, Inc. | | | 46,117 | | | | 2,594 | |
| * | Pandora Media, Inc. | | | 173,404 | | | | 2,325 | |
| * | Red Hat, Inc. | | | 69,730 | | | | 5,774 | |
| * | Trimble Navigation, Ltd. | | | 91,700 | | | | 1,967 | |
| * | Vantiv, Inc. | | | 92,424 | | | | 4,383 | |
| | | | | | | | | 36,537 | |
| | Health Care—17.8% | | | | | | | | |
| * | Align Technology, Inc. | | | 53,680 | | | | 3,535 | |
| * | BioMarin Pharmaceutical, Inc. | | | 25,542 | | | | 2,676 | |
| * | Centene Corporation | | | 24,848 | | | | 1,635 | |
| * | Cerner Corporation | | | 87,600 | | | | 5,271 | |
| * | IDEXX Laboratories, Inc. | | | 44,340 | | | | 3,233 | |
| * | Medivation, Inc. | | | 53,848 | | | | 2,603 | |
| * | Mednax, Inc. | | | 79,260 | | | | 5,680 | |
| * | Mettler-Toledo International, Inc. | | | 11,120 | | | | 3,771 | |
| Perrigo Co. plc† | | | 20,800 | | | | 3,010 | |
| * | Sirona Dental Systems, Inc. | | | 37,010 | | | | 4,055 | |
| | | | | | | | | 35,469 | |
| | | | | | | | |
| | | | | | | | |
| | Issuer | | Shares | | | Value | |
| | | | | | | | |
| | Common Stocks—(continued) | | | | | | | | |
| | | | | | | | | | |
| | Financials—12.4% | | | | | | | | |
| * | Affiliated Managers Group, Inc. | | | 35,655 | | | $ | 5,696 | |
| | Intercontinental Exchange, Inc. | | | 24,100 | | | | 6,176 | |
| | LPL Financial Holdings, Inc. | | | 62,091 | | | | 2,648 | |
| | Moody’s Corporation | | | 51,900 | | | | 5,208 | |
| * | Signature Bank | | | 33,120 | | | | 5,079 | |
| | | | | | | | | 24,807 | |
| | Telecommunication Services—2.3% | | | | | | | | |
| * | SBA Communications Corporation | | | 43,750 | | | | 4,597 | |
| | Materials—2.2% | | | | | | | | |
| | Vulcan Materials Co. | | | 47,000 | | | | 4,464 | |
| | Consumer Staples—1.4% | | | | | | | | |
| * | Monster Beverage Corporation | | | 18,210 | | | | 2,712 | |
| | Energy—0.8% | | | | | | | | |
| * | Concho Resources, Inc. | | | 16,820 | | | | 1,562 | |
| | Total Common Stocks—99.3%
(cost $185,222) | | | | | | | 198,365 | |
| | Total Investments—99.3%
(cost $185,222) | | | | | | | 198,365 | |
| | Cash and other assets, less liabilities—0.7% | | | | | | | 1,357 | |
| | Net assets—100.0% | | | | | | $ | 199,722 | |
| * | Non-income producing securities |
| † | = U.S. listed foreign security |
See accompanying Notes to Financial Statements.
| December 31, 2015 | William Blair Funds | 19 |
| | Mid Cap Value Fund |
| | |
| | The Mid Cap Value Fund seeks long-term capital appreciation. |
| | |
| | AN OVERVIEW FROM THE PORTFOLIO MANAGERS |
| | |
 Chad M. Kilmer 
Mark T. Leslie 
David S. Mitchell | The William Blair Mid Cap Value Fund (Class N shares) posted a 2.13% decrease, net of fees, for the twelve months ended December 31, 2015. By comparison, the Fund’s benchmark index, the Russell Midcap® Value Index (the “Index”), decreased 4.78%. The Fund’s outperformance relative to the Index during 2015 was driven by strong stock selection across all sectors. Broadly speaking, from a style perspective, an underweight to slower-growth companies and a higher-quality bias provided tailwinds for the Fund’s relative outperformance. Energy, which was the worst performing sector of the market for the year, was the largest contributor to relative returns for the Fund due to stock selection. Within the sector, the acquisition of Cameron International, an Oilfield Services company, and the lack of exposure to the Storage & Transportation and Coal & Consumables each contributed to relative returns. Within Utilities, relative outperformance was driven by strong stock selection within the sector and a lack of exposure to Independent Power Producers. Consumer Staples and Health Care, the best two performing sectors of the market, were notable contributors to performance driven by stock selection within Food Retail and Health Care Services. Looking specifically at stock selection, the Fund’s largest contributor to relative performance was Kroger (Consumer Staples). Kroger operates retail food and drug stores throughout the United States, along with its convenience stores, supermarket fuel centers, and processing plants used to make private-label goods. The company continues to report solid earnings and margin improvement that beat estimates and increased forward guidance. Other notable contributors to relative performance included Cigna Corp (Health Care) and Omnicare (Health Care). Offsetting these contributors were the Fund’s investments in Belden (Technology), Whiting Petroleum (Energy), and Carpenter Technology Corporation (Materials). Whiting Petroleum is an independent oil and gas company engaged in acquisition, development, production and exploration activities primarily in the Permian Basin, Rocky Mountains, Mid-Continent, Gulf Coast and Michigan regions of the United States. The stock traded lower with other Energy stocks given the underlying weakness in oil prices. Please refer to the U.S. Value Market Review and Outlook relating to the Fund on page 7. |
| 20 | Annual Report | December 31, 2015 |
Mid Cap Value Fund
Performance Highlights (Unaudited)
| Average Annual Total Return at 12/31/2015 |
| |
| | | 1 Year | | 3 Year | | 5 Year | | Since
Inception(a) |
| Class N | | | (2.13 | )% | | | 12.55 | % | | | 10.04 | % | | | 10.35 | % |
| Class I | | | (1.73 | ) | | | 12.88 | | | | 10.30 | | | | 10.63 | |
| Russell Midcap® Value Index | | | (4.78 | ) | | | 13.40 | | | | 11.25 | | | | 11.21 | |
| | | |
| (a) | For the period from May 3, 2010 (Commencement of Operations) to December 31, 2015. |
Performance cited represents past performance. Past performance does not guarantee future results and current performance may be lower or higher than the data quoted. Results shown are average annual total returns, which assume reinvestment of dividends and capital gains. Investment returns and principal will fluctuate and you may have a gain or loss when you sell shares. For the most current month-end performance information, please call 1-800-742-7272, or visit our Web site at www.williamblairfunds.com. Investing in smaller and medium capitalization companies involves special risks, including higher volatility and lower liquidity. Medium capitalization stocks are also more sensitive to purchase/sale transactions and changes in the issuer’s financial condition. From time to time, the investment adviser may waive fees or reimburse expenses for the Fund. Without these waivers/reimbursements, performance would be lower. Class N shares are available to the general public without a sales load. Class I shares are available to certain institutional investors and advisory clients of William Blair Investment Management, LLC and William Blair & Company, L.L.C., without a sales load or distribution (12b-1) or service fees.
The performance highlights and graph presented above do not reflect the deduction of taxes that a shareholder would pay on fund distributions or the redemption of fund shares.
The Russell Midcap® Value Index consists of midcap-capitalization companies with below average price-to-book ratios and forecasted growth rates.
This report identifies the Fund’s investments on December 31, 2015. These holdings are subject to change. Not all stocks in the Fund performed the same, nor is there any guarantee that these stocks will perform as well in the future. Market forecasts provided in this report may not necessarily come to pass.
Sector Diversification (Unaudited)

The sector diversification shown is based on the total long-term securities.
| December 31, 2015 | William Blair Funds | 21 |
Mid Cap Value Fund
Portfolio of Investments, December 31, 2015 (all dollar amounts in thousands)
| | | | | | | | |
| | | | | | | | |
| | Issuer | | Shares | | | Value | |
| | | | | | | | |
| | Common Stocks | | | | | | | | |
| | | | | | | | | | |
| | Financials—35.4% | | | | | | | | |
| | Allied World Assurance Co. Holdings, Ltd.† | | | 819 | | | $ | 30 | |
| | American Campus Communities, Inc. | | | 923 | | | | 38 | |
| | Ameriprise Financial, Inc. | | | 232 | | | | 25 | |
| * | Arch Capital Group, Ltd.† | | | 462 | | | | 32 | |
| | Assured Guaranty, Ltd.† | | | 923 | | | | 24 | |
| | Camden Property Trust | | | 452 | | | | 35 | |
| | DDR Corporation | | | 1,716 | | | | 29 | |
| | Douglas Emmett, Inc. | | | 1,240 | | | | 39 | |
| * | E*TRADE Financial Corporation | | | 928 | | | | 28 | |
| | East West Bancorp, Inc. | | | 962 | | | | 40 | |
| * | Equity Commonwealth | | | 508 | | | | 14 | |
| | Essex Property Trust, Inc. | | | 153 | | | | 37 | |
| | FNF Group | | | 804 | | | | 28 | |
| * | Forest City Enterprises, Inc. | | | 1,389 | | | | 30 | |
| | General Growth Properties, Inc. | | | 1,187 | | | | 32 | |
| | Hanover Insurance Group, Inc. | | | 441 | | | | 36 | |
| | Hartford Financial Services Group, Inc. | | | 891 | | | | 39 | |
| | Host Hotels & Resorts, Inc. | | | 1,174 | | | | 18 | |
| | Jones Lang LaSalle, Inc. | | | 265 | | | | 42 | |
| | Northern Trust Corporation | | | 612 | | | | 44 | |
| | PacWest Bancorp | | | 810 | | | | 35 | |
| | Pebblebrook Hotel Trust | | | 546 | | | | 15 | |
| | Principal Financial Group, Inc. | | | 689 | | | | 31 | |
| | Prologis, Inc. | | | 647 | | | | 28 | |
| * | Signature Bank | | | 163 | | | | 25 | |
| | SL Green Realty Corporation | | | 407 | | | | 46 | |
| | SunTrust Banks, Inc. | | | 1,240 | | | | 53 | |
| | Taubman Centers, Inc. | | | 311 | | | | 24 | |
| | Ventas, Inc. | | | 518 | | | | 29 | |
| | Zions Bancorporation | | | 679 | | | | 19 | |
| | | | | | | | | 945 | |
| | Utilities—12.2% | | | | | | | | |
| | American Water Works Co., Inc. | | | 688 | | | | 41 | |
| | Atmos Energy Corporation | | | 559 | | | | 35 | |
| | CMS Energy Corporation | | | 1,062 | | | | 39 | |
| | Eversource Energy | | | 690 | | | | 35 | |
| | FirstEnergy Corporation | | | 842 | | | | 27 | |
| | Pinnacle West Capital Corporation | | | 468 | | | | 30 | |
| | Sempra Energy | | | 375 | | | | 35 | |
| | WEC Energy Group, Inc. | | | 850 | | | | 44 | |
| | Xcel Energy, Inc. | | | 1,142 | | | | 41 | |
| | | | | | | | | 327 | |
| | Industrials—9.7% | | | | | | | | |
| | Carlisle Cos., Inc. | | | 309 | | | | 27 | |
| | Flowserve Corporation | | | 301 | | | | 13 | |
| | Fortune Brands Home & Security, Inc. | | | 475 | | | | 26 | |
| | Hubbell, Inc. | | | 335 | | | | 34 | |
| | Ingersoll-Rand plc† | | | 608 | | | | 34 | |
| | Kansas City Southern | | | 297 | | | | 22 | |
| | KAR Auction Services, Inc. | | | 910 | | | | 34 | |
| | The Toro Co. | | | 508 | | | | 37 | |
| | Wabtec Corporation | | | 454 | | | | 32 | |
| | | | | | | | | 259 | |
| | Information Technology—9.6% | | | | | | | | |
| | Belden, Inc. | | | 823 | | | | 39 | |
| * | Cadence Design Systems, Inc. | | | 2,306 | | | | 48 | |
| * | CommScope Holding Co., Inc. | | | 1,159 | | | | 30 | |
| | | | | | | | |
| | | | | | | | |
| | Issuer | | Shares | | | Value | |
| | | | | | | | |
| | Common Stocks—(continued) | | | | | | | | |
| | | | | | | | | | |
| | Information Technology—(continued) | | | | | | | | |
| * | Genpact, Ltd.† | | | 1,493 | | | $ | 37 | |
| | Juniper Networks, Inc. | | | 1,359 | | | | 37 | |
| | TE Connectivity, Ltd.† | | | 540 | | | | 35 | |
| * | Trimble Navigation, Ltd. | | | 1,335 | | | | 29 | |
| | | | | | | | | 255 | |
| | Energy—8.4% | | | | | | | | |
| * | Cameron International Corporation | | | 540 | | | | 34 | |
| | Cimarex Energy Co. | | | 255 | | | | 23 | |
| * | Gulfport Energy Corporation | | | 760 | | | | 18 | |
| | Hess Corporation | | | 380 | | | | 18 | |
| * | Memorial Resource Development Corporation | | | 1,829 | | | | 29 | |
| | Noble Energy, Inc. | | | 874 | | | | 29 | |
| | Patterson-UTI Energy, Inc. | | | 1,646 | | | | 25 | |
| | Pioneer Natural Resources Co. | | | 205 | | | | 26 | |
| | Rowan Cos. plc† | | | 810 | | | | 14 | |
| * | Whiting Petroleum Corporation | | | 819 | | | | 8 | |
| | | | | | | | | 224 | |
| | Consumer Discretionary—7.7% | | | | | | | | |
| | Autoliv, Inc. | | | 239 | | | | 30 | |
| | Brunswick Corporation | | | 287 | | | | 14 | |
| | Darden Restaurants, Inc. | | | 469 | | | | 30 | |
| | Foot Locker, Inc. | | | 217 | | | | 14 | |
| | Lennar Corporation | | | 612 | | | | 30 | |
| | Newell Rubbermaid, Inc. | | | 723 | | | | 32 | |
| * | The Michaels Cos., Inc. | | | 1,109 | | | | 24 | |
| | VF Corporation | | | 494 | | | | 31 | |
| | | | | | | | | 205 | |
| | Health Care—7.3% | | | | | | | | |
| | CIGNA Corporation | | | 174 | | | | 26 | |
| * | Hologic, Inc. | | | 881 | | | | 34 | |
| * | Mednax, Inc. | | | 598 | | | | 43 | |
| * | Mettler-Toledo International, Inc. | | | 134 | | | | 45 | |
| | Zimmer Biomet Holdings, Inc. | | | 466 | | | | 48 | |
| | | | | | | | | 196 | |
| | Consumer Staples—5.2% | | | | | | | | |
| | ConAgra Foods, Inc. | | | 810 | | | | 34 | |
| | Ingredion, Inc. | | | 462 | | | | 45 | |
| | The Kroger Co. | | | 1,441 | | | | 60 | |
| | | | | | | | | 139 | |
| | Materials—4.5% | | | | | | | | |
| | Carpenter Technology Corporation | | | 800 | | | | 24 | |
| | Eastman Chemical Co. | | | 530 | | | | 36 | |
| | FMC Corporation | | | 627 | | | | 25 | |
| | Steel Dynamics, Inc. | | | 1,929 | | | | 34 | |
| | | | | | | | | 119 | |
| | Total Common Stocks—100.0%
(cost $2,261) | | | | | | | 2,669 | |
| | Total Investments—100.0%
(cost $2,261) | | | | | | | 2,669 | |
| | Liabilities, plus cash and other assets—0.0% | | | | | | | (1 | ) |
| | Net assets—100.0% | | | | | | $ | 2,668 | |
| | † | = U.S. listed foreign security |
| | * | Non-income producing securities |
See accompanying Notes to Financial Statements.
| 22 | Annual Report | December 31, 2015 |
| | Small-Mid Cap Growth Fund |
| | |
| | The Small-Mid Cap Growth Fund seeks long-term capital appreciation. |
| | |
| | AN OVERVIEW FROM THE PORTFOLIO MANAGERS |
 Karl W. Brewer 
Robert C. Lanphier, IV 
Daniel Crowe | The William Blair Small-Mid Cap Growth Fund (Class N shares) posted a 4.47% increase, net of fees, for the twelve months ended December 31, 2015. By comparison, the Fund’s benchmark index, the Russell 2500TM Growth Index (the “Index”), decreased 0.19%. The Fund’s outperformance during 2015 was driven by stock selection and a favorable style tailwind. From a style perspective, the Fund’s overweight exposure to less volatile stocks positively contributed to the Fund’s relative performance. The Fund typically gravitates toward companies with more consistent business models, whose stocks generally held up better amid the volatility and modestly negative market returns that characterized 2015. Related to this, our typical bias toward companies with larger market capitalizations within the small-mid cap universe provided a tailwind as larger-cap stocks outperformed in the year. From a stock selection standpoint, Information Technology, and Consumer Discretionary were areas of strength. j2 Global was a top contributor within Information Technology and Six Flags Entertainment was a standout within Consumer Discretionary. Our top performing individual holdings for the year were Ligand Pharmaceuticals (Health Care), ABIOMED (Health Care) and FirstService Corp (Financials). Ligand Pharmaceuticals outperformed both the market and other Biotechnology stocks due to strong results for its current royalty-generating assets and in anticipation of several upcoming clinical milestones that could be further catalysts for growth. ABIOMED’s strong business results and accelerating revenue growth suggest the clinical adoption of the company’s Impella products is gaining momentum, which has driven outperformance of the stock. Conversely, our top detractors for the year included FXCM Inc. (Financials), Exact Sciences Corporation (Health Care), Polaris Industries (Consumer Discretionary), Encore Capital Group (Financials) and First Cash Financial Services (Financials). FXCM, an online foreign exchange trading solution provider, meaningfully underperformed after a historically unprecedented move in the Swiss Franc impaired client positions and forced the company into a dilutive financing arrangement. Exact Sciences’ underperformance was largely due to the US Preventative Services Task Force’s decision to not grant a rating for the company’s Cologuard test that would have eased the way for broad-based reimbursement coverage by commercial managed care companies. Please refer to the U.S. Growth Market Review and Outlook relating to the Fund on page 6. |
| December 31, 2015 | William Blair Funds | 23 |
Small-Mid Cap Growth Fund
Performance Highlights (Unaudited)
| Average Annual Total Return at 12/31/2015 |
| |
| | | | 1 Year | | | 3 Year | | | 5 Year | | | 10 Year |
| Class N | | | 4.47 | % | | | 16.99 | % | | | 12.37 | % | | | 9.27 | % |
| Class I | | | 4.74 | | | | 17.30 | | | | 12.65 | | | | 9.55 | |
| Russell 2500TM Growth Index | | | (0.19 | ) | | | 14.54 | | | | 11.43 | | | | 8.49 | |
Performance cited represents past performance. Past performance does not guarantee future results and current performance may be lower or higher than the data quoted. Results shown are average annual total returns, which assume reinvestment of dividends and capital gains. Investment returns and principal will fluctuate and you may have a gain or loss when you sell shares. For the most current month-end performance information, please call 1-800-742-7272, or visit our Web site at www.williamblairfunds.com. Investing in smaller and medium capitalization companies involves special risks, including higher volatility and lower liquidity. Smaller and medium capitalization stocks are also more sensitive to purchase/sale transactions and changes in the issuer’s financial condition. From time to time, the investment adviser may waive fees or reimburse expenses for the Fund. Without these waivers/reimbursements, performance would be lower. Class N shares are available to the general public without a sales load. Class I shares are available to certain institutional investors and advisory clients of William Blair Investment Management, LLC and William Blair & Company, L.L.C., without a sales load or distribution (12b-1) or service fees.
The performance highlights and graph presented above do not reflect the deduction of taxes that a shareholder would pay on fund distributions or the redemption of fund shares.
The Russell 2500TM Growth Index measures the performance of those Russell 2500 companies with above average price-to-book ratios and forecasted growth rates.
This report identifies the Fund’s investments on December 31, 2015. These holdings are subject to change. Not all stocks in the Fund performed the same, nor is there any guarantee that these stocks will perform as well in the future. Market forecasts provided in this report may not necessarily come to pass.
Sector Diversification (Unaudited)

The sector diversification shown is based on the total long-term securities.
| 24 | Annual Report | December 31, 2015 |
Small-Mid Cap Growth Fund
Portfolio of Investments, December 31, 2015 (all dollar amounts in thousands)
| | | | | | | | |
| | | | | | | | |
| | Issuer | | Shares | | | Value | |
| | | | | | | | |
| | Common Stocks | | | | | | | | |
| | | | | | | | | | |
| | Information Technology—21.5% | | | | | | | | |
| * | ANSYS, Inc. | | | 234,300 | | | $ | 21,673 | |
| | Booz Allen Hamilton Holding Corporation | | | 695,668 | | | | 21,461 | |
| * | CoStar Group, Inc. | | | 109,810 | | | | 22,697 | |
| * | Cvent, Inc. | | | 432,600 | | | | 15,102 | |
| * | Gartner, Inc. | | | 224,300 | | | | 20,344 | |
| * | Guidewire Software, Inc. | | | 537,334 | | | | 32,326 | |
| j2 Global, Inc. | | | 327,185 | | | | 26,934 | |
| | MAXIMUS, Inc. | | | 316,706 | | | | 17,815 | |
| * | NeuStar, Inc. | | | 739,521 | | | | 17,726 | |
| * | Pandora Media, Inc. | | | 573,573 | | | | 7,691 | |
| * | Tyler Technologies, Inc. | | | 110,000 | | | | 19,175 | |
| * | Vantiv, Inc. | | | 445,430 | | | | 21,122 | |
| * | WNS Holdings, Ltd.-ADR | | | 374,020 | | | | 11,666 | |
| | | | | | | | 255,732 | |
| | Health Care—20.7% | | | | | | | | |
| * | ABIOMED, Inc. | | | 150,938 | | | | 13,627 | |
| * | Align Technology, Inc. | | | 317,703 | | | | 20,921 | |
| * | Cambrex Corporation | | | 363,800 | | | | 17,131 | |
| * | Centene Corporation | | | 183,810 | | | | 12,096 | |
| * | Exact Sciences Corporation | | | 1,067,177 | | | | 9,850 | |
| * | ExamWorks Group, Inc. | | | 291,200 | | | | 7,746 | |
| HealthSouth Corporation | | | 590,484 | | | | 20,555 | |
| * | IDEXX Laboratories, Inc. | | | 200,422 | | | | 14,615 | |
| * | Ligand Pharmaceuticals, Inc. | | | 231,159 | | | | 25,062 | |
| * | Medivation, Inc. | | | 285,304 | | | | 13,792 | |
| * | Mednax, Inc. | | | 347,200 | | | | 24,880 | |
| * | Mettler-Toledo International, Inc. | | | 74,900 | | | | 25,401 | |
| * | Quintiles Transnational Holdings, Inc. | | | 290,700 | | | | 19,959 | |
| * | Sirona Dental Systems, Inc. | | | 184,253 | | | | 20,189 | |
| | | | | | | | 245,824 | |
| | Consumer Discretionary—16.6% | | | | | | | | |
| * | 2U, Inc. | | | 448,755 | | | | 12,556 | |
| | Brunswick Corporation | | | 220,432 | | | | 11,134 | |
| | Choice Hotels International, Inc. | | | 342,036 | | | | 17,242 | |
| | Drew Industries, Inc. | | | 240,000 | | | | 14,614 | |
| * | Jarden Corporation | | | 405,675 | | | | 23,172 | |
| | Polaris Industries, Inc. | | | 170,300 | | | | 14,637 | |
| * | Sally Beauty Holdings, Inc. | | | 532,600 | | | | 14,854 | |
| * | ServiceMaster Global Holdings, Inc. | | | 373,608 | | | | 14,660 | |
| | Six Flags Entertainment Corporation | | | 511,386 | | | | 28,096 | |
| | Tractor Supply Co. | | | 178,300 | | | | 15,245 | |
| * | Ulta Salon Cosmetics & Fragrance, Inc. | | | 116,700 | | | | 21,589 | |
| | Williams-Sonoma, Inc. | | | 170,700 | | | | 9,971 | |
| | | | | | | | | 197,770 | |
| | Financials—16.0% | | | | | | | | |
| * | Affiliated Managers Group, Inc. | | | 145,709 | | | | 23,278 | |
| | CBOE Holdings, Inc. | | | 369,500 | | | | 23,981 | |
| * | Colliers International Group, Inc.† | | | 290,393 | | | | 12,937 | |
| * | Encore Capital Group, Inc. | | | 386,171 | | | | 11,230 | |
| | FactSet Research Systems, Inc. | | | 91,544 | | | | 14,882 | |
| * | First Cash Financial Services, Inc. | | | 278,065 | | | | 10,408 | |
| | | | | | | | |
| | | | | | | | |
| | Issuer | | Shares | | | Value | |
| | | | | | | | |
| | Common Stocks—(continued) | | | | | | | | |
| | | | | | | | | | |
| | Financials—(continued) | | | | | | | | |
| * | FirstService Corporation† | | | 537,797 | | | $ | 21,743 | |
| | Jones Lang LaSalle, Inc. | | | 108,541 | | | | 17,351 | |
| | Lazard, Ltd.† | | | 369,200 | | | | 16,618 | |
| | OM Asset Management plc† | | | 619,738 | | | | 9,501 | |
| * | Signature Bank | | | 123,300 | | | | 18,911 | |
| | Virtu Financial, Inc. | | | 405,702 | | | | 9,185 | |
| | | | | | | | | 190,025 | |
| | Industrials—13.1% | | | | | | | | |
| | CEB, Inc. | | | 268,328 | | | | 16,473 | |
| | Healthcare Services Group, Inc. | | | 416,932 | | | | 14,538 | |
| | Hexcel Corporation | | | 345,300 | | | | 16,039 | |
| * | Huron Consulting Group, Inc. | | | 207,409 | | | | 12,320 | |
| | Manpowergroup, Inc. | | | 184,050 | | | | 15,514 | |
| * | Old Dominion Freight Line, Inc. | | | 382,971 | | | | 22,622 | |
| * | Stericycle, Inc. | | | 98,370 | | | | 11,863 | |
| * | The Middleby Corporation | | | 151,872 | | | | 16,383 | |
| | The Toro Co. | | | 185,400 | | | | 13,547 | |
| | Towers Watson & Co. | | | 12,804 | | | | 1,645 | |
| * | TransDigm Group, Inc. | | | 64,675 | | | | 14,775 | |
| | | | | | | | | 155,719 | |
| | Materials—4.6% | | | | | | | | |
| | Ball Corporation | | | 165,349 | | | | 12,026 | |
| | Celanese Corporation | | | 305,900 | | | | 20,596 | |
| | International Flavors & Fragrances, Inc. | | | 187,800 | | | | 22,468 | |
| | | | | | | | | 55,090 | |
| | Consumer Staples—2.5% | | | | | | | | |
| | Nu Skin Enterprises, Inc. | | | 370,652 | | | | 14,044 | |
| | WD-40 Co. | | | 163,200 | | | | 16,100 | |
| | | | | | | | | 30,144 | |
| | Telecommunication Services—1.8% | | | | | | | | |
| * | SBA Communications Corporation | | | 202,000 | | | | 21,224 | |
| | Energy—1.6% | | | | | | | | |
| * | Carrizo Oil & Gas, Inc. | | | 230,500 | | | | 6,818 | |
| * | Diamondback Energy, Inc. | | | 176,400 | | | | 11,801 | |
| | | | | | | | | 18,619 | |
| | Total Common Stocks—98.4%
(cost $1,022,480) | | | | | | | 1,170,147 | |
See accompanying Notes to Financial Statements.
| December 31, 2015 | William Blair Funds | 25 |
Small-Mid Cap Growth Fund
Portfolio of Investments, December 31, 2015 (all dollar amounts in thousands)
| Issuer | | Principal Amount | | | Value | |
| | | | | | | | | |
| Repurchase Agreement | | | | | | | | |
| | | | | | | | | |
| Fixed Income Clearing Corporation, 0.030% dated 12/31/15, due 1/4/16, repurchase price $22,916, collateralized by U.S. Treasury Note 2.375%, due 8/15/24 | | | $22,916 | | | $ | 22,916 | |
Total Repurchase Agreement—1.9%
(cost $22,916) | | | | | | | 22,916 | |
Total Investments—100.3%
(cost $1,045,396) | | | | | | | 1,193,063 | |
| Liabilities, plus cash and other assets—(0.3)% | | | | | | | (3,924 | ) |
| Net assets—100.0% | | | | | | $ | 1,189,139 | |
ADR = American Depository Receipt
* Non-income producing securities
† = U.S. listed foreign security
See accompanying Notes to Financial Statements.
| 26 | Annual Report | December 31, 2015 |
| | | Small-Mid Cap Value Fund |
| | | |
| | | The Small-Mid Cap Value Fund seeks long-term capital appreciation. |
| | | |
| | | AN OVERVIEW FROM THE PORTFOLIO MANAGERS |
| | | |

Chad M. Kilmer 
Mark T. Leslie | | The William Blair Small-Mid Cap Value Fund (Class N shares) posted a 3.13% decrease, net of fees, for the twelve months ended December 31, 2015. By comparison, the Fund’s benchmark index, the Russell 2500TM Value Index (the “Index”), decreased 5.49%. The Fund’s higher-quality bias and underweight to slower-growth companies contributed to its outperformance relative to the Index during 2015. Strong stock selection across nearly every sector contributed to the relative outperformance for the year with the largest contributions coming from Financials and Technology. Within Financials, stock selection within Regional Banks, Capital Markets, and REITS all contributed to the outperformance within the sector. The outperformance in Technology was a result of strong stock selection, particularly within IT Services and Internet Software & Services. The only sector that detracted from relative performance for the year was Consumer Discretionary, as stock selection within Footwear was the most significant drag on performance. Looking specifically at stock selection, the Fund’s largest contributor to relative performance was Inphi (Technology). Inphi is a fabless semiconductor company that provides high-speed analog semiconductor solutions for the communications and computing markets. The company is seeing strong momentum with new products and the company is aligned with high priority spending trends. Other contributors included j2 Global (Technology) and Bank of the Ozarks (Financials). Offsetting these contributors were the Fund’s investments in Helix Energy Solutions (Energy), Belden (Technology), and GasLog (Energy). Helix is an energy service company providing deepwater contracting services to the energy market. The stock underperformed as operating results continue to be pressured by utilization declines in its major business segments, primarily, Well Intervention. Please refer to the U.S. Value Market Review and Outlook relating to the Fund on page 7. |
| | | |
 | | |
| | | |
| David S. Mitchell | | |
| December 31, 2015 | William Blair Funds | 27 |
Small-Mid Cap Value Fund
Performance Highlights (Unaudited)
| Average Annual Total Return at 12/31/2015 |
| |
| | | | | | | | | Since |
| | | 1 Year | | 3 Year | | Inception(a) |
| Class N | | | (3.13 | )% | | | 11.38 | % | | | 12.60 | % |
| Class I | | | (2.86 | ) | | | 11.70 | | | | 12.91 | |
| Russell 2500TM Value Index | | | (5.49 | ) | | | 10.51 | | | | 13.62 | |
| (a) | For the period from December 15, 2011 (Commencement of Operations) to December 31, 2015. |
Performance cited represents past performance. Past performance does not guarantee future results and current performance may be lower or higher than the data quoted. Results shown are average annual total returns, which assume reinvestment of dividends and capital gains. Investment returns and principal will fluctuate and you may have a gain or loss when you sell shares. For the most current month-end performance information, please call 1-800-742-7272, or visit our Web site at www.williamblairfunds.com. Investing in smaller and medium capitalization companies involves special risks, including higher volatility and lower liquidity. Smaller and medium capitalization stocks are also more sensitive to purchase/sale transactions and changes in the issuer’s financial condition. From time to time, the investment adviser may waive fees or reimburse expenses for the Fund. Without these waivers/reimbursements, performance would be lower. Class N shares are available to the general public without a sales load. Class I shares are available to certain institutional investors and advisory clients of William Blair Investment Management, LLC and William Blair & Company, L.L.C., without a sales load or distribution (12b-1) or service fees.
The performance highlights and graph presented above do not reflect the deduction of taxes that a shareholder would pay on fund distributions or the redemption of fund shares.
Russell 2500TM Value Index consists of midcap-capitalization companies with below average price-to-book ratios and forecasted growth rates.
This report identifies the Fund’s investments on December 31, 2015. These holdings are subject to change. Not all stocks in the Fund performed the same, nor is there any guarantee that these stocks will perform as well in the future. Market forecasts provided in this report may not necessarily come to pass.
Sector Diversification (Unaudited)

The sector diversification shown is based on the total long-term securities.
| 28 | Annual Report | December 31, 2015 |
Small-Mid Cap Value Fund
Portfolio of Investments, December 31, 2015 (all dollar amounts in thousands)
| | Issuer | | Shares | | | Value | |
| | | | | | | | | | |
| | Common Stocks | | | | | | | | |
| | | | | | | | | | |
| | Financials—38.7% | | | | | | | | |
| | Acadia Realty Trust | | | 1,040 | | | $ | 34 | |
| | Allied World Assurance Co. Holdings, Ltd.† | | | 1,179 | | | | 44 | |
| | American Assets Trust, Inc. | | | 979 | | | | 38 | |
| | American Campus Communities, Inc. | | | 909 | | | | 38 | |
| * | Arch Capital Group, Ltd.† | | | 765 | | | | 53 | |
| | Assured Guaranty, Ltd.† | | | 1,411 | | | | 37 | |
| | Bank of the Ozarks, Inc. | | | 624 | | | | 31 | |
| | Boston Private Financial Holdings, Inc. | | | 1,302 | | | | 15 | |
| | Camden Property Trust | | | 671 | | | | 52 | |
| | CNO Financial Group, Inc. | | | 1,737 | | | | 33 | |
| | DDR Corporation | | | 1,914 | | | | 32 | |
| | Douglas Emmett, Inc. | | | 1,531 | | | | 48 | |
| * | E*TRADE Financial Corporation | | | 1,814 | | | | 54 | |
| * | Eagle Bancorp, Inc. | | | 604 | | | | 30 | |
| | East West Bancorp, Inc. | | | 1,248 | | | | 52 | |
| | EastGroup Properties, Inc. | | | 591 | | | | 33 | |
| | Education Realty Trust, Inc. | | | 907 | | | | 34 | |
| | EPR Properties | | | 541 | | | | 32 | |
| * | Equity Commonwealth | | | 767 | | | | 21 | |
| | First American Financial Corporation | | | 1,110 | | | | 40 | |
| | FirstMerit Corporation | | | 1,245 | | | | 23 | |
| * | Forest City Enterprises, Inc. | | | 1,589 | | | | 35 | |
| | Glacier Bancorp, Inc. | | | 1,515 | | | | 40 | |
| | Hanover Insurance Group, Inc. | | | 606 | | | | 49 | |
| | Highwoods Properties, Inc. | | | 738 | | | | 32 | |
| | Home BancShares, Inc. | | | 730 | | | | 30 | |
| | Iberiabank Corporation | | | 592 | | | | 33 | |
| | Jones Lang LaSalle, Inc. | | | 329 | | | | 53 | |
| | LaSalle Hotel Properties | | | 1,047 | | | | 26 | |
| | PacWest Bancorp | | | 1,015 | | | | 44 | |
| | Pebblebrook Hotel Trust | | | 995 | | | | 28 | |
| | Prosperity Bancshares, Inc. | | | 465 | | | | 22 | |
| | Radian Group, Inc. | | | 2,422 | | | | 32 | |
| | Renasant Corporation | | | 848 | | | | 29 | |
| | Selective Insurance Group, Inc. | | | 1,206 | | | | 40 | |
| * | Signature Bank | | | 264 | | | | 40 | |
| | SL Green Realty Corporation | | | 355 | | | | 40 | |
| | Sunstone Hotel Investors, Inc. | | | 2,198 | | | | 27 | |
| | Taubman Centers, Inc. | | | 528 | | | | 41 | |
| | Umpqua Holdings Corporation | | | 1,449 | | | | 23 | |
| * | Western Alliance Bancorp | | | 881 | | | | 32 | |
| | WSFS Financial Corporation | | | 1,627 | | | | 53 | |
| | Yadkin Financial Corporation | | | 994 | | | | 25 | |
| | Zions Bancorporation | | | 1,031 | | | | 28 | |
| | | | | | | | | 1,576 | |
| | Industrials—13.2% | | | | | | | | |
| | Barnes Group, Inc. | | | 797 | | | | 28 | |
| | Carlisle Cos., Inc. | | | 420 | | | | 37 | |
| | CIRCOR International, Inc. | | | 453 | | | | 19 | |
| | Curtiss-Wright Corporation | | | 449 | | | | 31 | |
| | EMCOR Group, Inc. | | | 790 | | | | 38 | |
| | Flowserve Corporation | | | 441 | | | | 19 | |
| | Fortune Brands Home & Security, Inc. | | | 632 | | | | 35 | |
| * | FTI Consulting, Inc. | | | 659 | | | | 23 | |
| | Issuer | | Shares | | | Value | |
| | | | | | | | | | |
| | Common Stocks—(continued) | | | | | | | | |
| | | | | | | | | | |
| | Industrials—(continued) | | | | | | | | |
| | G&K Services, Inc. | | | 519 | | | $ | 33 | |
| | Hubbell, Inc. | | | 394 | | | | 40 | |
| | Interface, Inc. | | | 1,747 | | | | 33 | |
| | KAR Auction Services, Inc. | | | 1,119 | | | | 41 | |
| * | Lydall, Inc. | | | 686 | | | | 24 | |
| | Matson, Inc. | | | 857 | | | | 37 | |
| | Standex International Corporation | | | 292 | | | | 24 | |
| | The Toro Co. | | | 562 | | | | 41 | |
| | Wabtec Corporation | | | 502 | | | | 36 | |
| | | | | | | | | 539 | |
| | Information Technology—10.1% | | | | | | | | |
| * | Acxiom Corporation | | | 3,346 | | | | 70 | |
| | Belden, Inc. | | | 1,027 | | | | 49 | |
| | Booz Allen Hamilton Holding Corporation | | | 1,150 | | | | 36 | |
| * | Cadence Design Systems, Inc. | | | 2,993 | | | | 62 | |
| * | Genpact, Ltd.† | | | 2,266 | | | | 57 | |
| * | Inphi Corporation | | | 1,787 | | | | 48 | |
| | j2 Global, Inc. | | | 769 | | | | 63 | |
| | Littelfuse, Inc. | | | 238 | | | | 25 | |
| | | | | | | | | 410 | |
| | Consumer Discretionary—9.7% | | | | | | | | |
| | Autoliv, Inc. | | | 304 | | | | 38 | |
| | Brunswick Corporation | | | 426 | | | | 21 | |
| | CalAtlantic Group, Inc. | | | 523 | | | | 20 | |
| | Children’s Place, Inc. | | | 547 | | | | 30 | |
| | Dana Holding Corporation | | | 1,159 | | | | 16 | |
| | Ethan Allen Interiors, Inc. | | | 759 | | | | 21 | |
| * | Express, Inc. | | | 2,028 | | | | 35 | |
| * | Genesco, Inc. | | | 408 | | | | 23 | |
| * | Krispy Kreme Doughnuts, Inc. | | | 2,718 | | | | 41 | |
| | Lennar Corporation | | | 688 | | | | 34 | |
| | Meredith Corporation | | | 687 | | | | 30 | |
| * | The Michaels Cos., Inc. | | | 977 | | | | 22 | |
| | Vail Resorts, Inc. | | | 348 | | | | 45 | |
| | Wolverine World Wide, Inc. | | | 1,105 | | | | 18 | |
| | | | | | | | | 394 | |
| | Utilities—8.7% | | | | | | | | |
| | ALLETE, Inc. | | | 418 | | | | 21 | |
| | American Water Works Co., Inc. | | | 752 | | | | 45 | |
| | Atmos Energy Corporation | | | 760 | | | | 48 | |
| | CMS Energy Corporation | | | 1,324 | | | | 48 | |
| | IDACORP, Inc. | | | 607 | | | | 41 | |
| | Pinnacle West Capital Corporation | | | 558 | | | | 36 | |
| | PNM Resources, Inc. | | | 1,032 | | | | 32 | |
| | Portland General Electric Co. | | | 729 | | | | 27 | |
| | Southwest Gas Corporation | | | 571 | | | | 31 | |
| | The Laclede Group, Inc. | | | 469 | | | | 28 | |
| | | | | | | | | 357 | |
| | Health Care—5.7% | | | | | | | | |
| | CONMED Corporation | | | 518 | | | | 23 | |
| * | Greatbatch, Inc. | | | 646 | | | | 34 | |
| | HealthSouth Corporation | | | 954 | | | | 33 | |
See accompanying Notes to Financial Statements.
| December 31, 2015 | William Blair Funds | 29 |
Small-Mid Cap Value Fund
Portfolio of Investments, December 31, 2015 (all dollar amounts in thousands)
| | Issuer | | Shares | | | Value | |
| | | | | | | | | | |
| | Common Stocks—(continued) | | | | | | | | |
| | | | | | | | | | |
| | Health Care—(continued) | | | | | | | | |
| * | Hologic, Inc. | | | 655 | | | $ | 25 | |
| * | Magellan Health, Inc. | | | 356 | | | | 22 | |
| * | Mednax, Inc. | | | 664 | | | | 48 | |
| * | Mettler-Toledo International, Inc. | | | 135 | | | | 46 | |
| | | | | | | | | 231 | |
| | Energy—5.1% | | | | | | | | |
| | Archrock, Inc. | | | 1,126 | | | | 9 | |
| * | Exterran Corporation | | | 567 | | | | 9 | |
| | GasLog, Ltd.† | | | 1,964 | | | | 16 | |
| * | Gulfport Energy Corporation | | | 952 | | | | 23 | |
| * | Helix Energy Solutions Group, Inc. | | | 2,813 | | | | 15 | |
| * | Memorial Resource Development Corporation | | | 2,749 | | | | 44 | |
| | Patterson-UTI Energy, Inc. | | | 1,591 | | | | 24 | |
| * | PDC Energy, Inc. | | | 558 | | | | 30 | |
| * | TETRA Technologies, Inc. | | | 4,111 | | | | 31 | |
| * | Whiting Petroleum Corporation | | | 929 | | | | 9 | |
| | | | | | | | | 210 | |
| | Materials—4.8% | | | | | | | | |
| | Carpenter Technology Corporation | | | 664 | | | | 20 | |
| | FMC Corporation | | | 521 | | | | 20 | |
| | Minerals Technologies, Inc. | | | 633 | | | | 29 | |
| | PolyOne Corporation | | | 1,310 | | | | 42 | |
| | Sensient Technologies Corporation | | | 511 | | | | 32 | |
| | Silgan Holdings, Inc. | | | 446 | | | | 24 | |
| | Steel Dynamics, Inc. | | | 1,509 | | | | 27 | |
| | | | | | | | | 194 | |
| | Consumer Staples—2.5% | | | | | | | | |
| * | Darling Ingredients, Inc. | | | 1,313 | | | | 14 | |
| | Ingredion, Inc. | | | 568 | | | | 54 | |
| | J&J Snack Foods Corporation | | | 292 | | | | 34 | |
| | | | | | | | | 102 | |
| | Total Common Stocks—98.5%
(cost $3,671) | | | | | | | 4,013 | |
| | Total Investments—98.5%
(cost $3,671) | | | | | | | 4,013 | |
| | Cash and other assets, less liabilities—1.5% | | | | | | | 62 | |
| | Net assets—100.0% | | | | | | $ | 4,075 | |
† = U.S. listed foreign security
* Non-income producing securities
See accompanying Notes to Financial Statements.
| 30 | Annual Report | December 31, 2015 |
| | | Small Cap Growth Fund |
| | | |
| | | The Small Cap Growth Fund seeks long-term capital appreciation. |
| | | |
| | | AN OVERVIEW FROM THE PORTFOLIO MANAGERS |
| | | |

Michael P. Balkin 
Karl W. Brewer | | The William Blair Small Cap Growth Fund (Class N shares) posted a 4.44% decrease, net of fees, for the twelve months ended December 31, 2015. By comparison, the Fund’s benchmark index, the Russell 2000® Growth Index (the “Index”), decreased 1.38%. The Fund’s underperformance relative to the Index during 2015 was driven by stock selection and headwinds to its investment style. From a style perspective, our typical contrarian bias worked against the Fund as the market favored momentum-oriented stocks during most of the year. Additionally, our typical underweight exposure to Biotechnology, given the highly speculative nature of many companies within the industry, was a headwind due to the strong performance of the industry. From a stock specific standpoint, Health Care stock selection was disappointing, in part due to its position in Spectranetics. The Fund’s top individual detractors for the year included FXCM Inc. (Financials), CAI International (Industrials), Tuesday Morning Corporation (Consumer Discretionary), and Acacia Research Corporation (Industrials). FXCM, an online foreign exchange trading solution provider, meaningfully underperformed after a historically unprecedented move in the Swiss Franc impaired client positions and forced the company into a dilutive financing arrangement. CAI International provides intermodal freight container leasing services and underperformed due to lower lease utilization rates and pricing pressure in the resale market for used containers. The Fund’s top individual contributors to relative performance were Ligand Pharmaceuticals (Health Care) and ABIOMED (Health Care). Ligand Pharmaceuticals outperformed both the market and other Biotechnology stocks due to strong results for its current royalty-generating assets and in anticipation of several upcoming clinical milestones that could be further catalysts for growth. ABIOMED’s strong business results and accelerating revenue growth suggest the clinical adoption of the company’s Impella products is gaining momentum, which has driven outperformance of the stock. Other significant contributors to relative performance included MaxLinear (Information Technology), FirstService Corp (Financials), and Six Flags Entertainment (Consumer Discretionary). Please refer to the U.S. Growth Market Review and Outlook relating to the Fund on page 6. |
| December 31, 2015 | William Blair Funds | 31 |
Small Cap Growth Fund
Performance Highlights (Unaudited)
| Average Annual Total Return at 12/31/2015 |
| | | | | | | | | |
| | | 1 Year | | 3 Year | | 5 Year | | 10 Year |
| Class N | | | (4.44 | )% | | | 14.42 | % | | | 8.94 | % | | | 6.01 | % |
| Class I | | | (4.20 | ) | | | 14.70 | | | | 9.20 | | | | 6.30 | |
| Russell 2000® Growth Index | | | (1.38 | ) | | | 14.28 | | | | 10.67 | | | | 7.95 | |
Performance cited represents past performance. Past performance does not guarantee future results and current performance may be lower or higher than the data quoted. Results shown are average annual total returns, which assume reinvestment of dividends and capital gains. Investment returns and principal will fluctuate and you may have a gain or loss when you sell shares. For the most current month-end performance information, please call 1-800-742-7272, or visit our Web site at www.williamblairfunds.com. Investing in smaller companies involves special risks, including higher volatility and lower liquidity. Smaller capitalization stocks are also more sensitive to purchase/sale transactions and changes in the issuer’s financial condition. From time to time, the investment adviser may waive fees or reimburse expenses for the Fund. Without these waivers/reimbursements, performance would be lower. Class N shares are available to the general public without a sales load. Class I shares are available to certain institutional investors and advisory clients of William Blair Investment Management, LLC and William Blair & Company, L.L.C., without a sales load or distribution (12b-1) or service fees.
The performance highlights and graph presented above do not reflect the deduction of taxes that a shareholder would pay on fund distributions or the redemption of fund shares.
The Russell 2000® Growth Index is an unmanaged composite of the smallest 2000 stocks of the Russell 3000® Growth Index.
This report identifies the Fund’s investments on December 31, 2015. These holdings are subject to change. Not all stocks in the Fund performed the same, nor is there any guarantee that these stocks will perform as well in the future. Market forecasts provided in this report may not necessarily come to pass.
Sector Diversification (Unaudited)

The sector diversification shown is based on the total long-term securities.
| 32 | Annual Report | December 31, 2015 |
Small Cap Growth Fund
Portfolio of Investments, December 31, 2015 (all dollar amounts in thousands)
| | Issuer | | Shares | | | Value | |
| | | | | | | | | | |
| | Common Stocks | | | | | | | | |
| | | | | | | | | | |
| | Information Technology—25.3% | | | | | | | | |
| * | Acxiom Corporation | | | 210,860 | | | $ | 4,411 | |
| * | Callidus Software, Inc. | | | 445,567 | | | | 8,274 | |
| * | Fleetmatics Group plc† | | | 53,410 | | | | 2,713 | |
| * | Guidewire Software, Inc. | | | 124,346 | | | | 7,481 | |
| * | Hortonworks, Inc. | | | 236,930 | | | | 5,189 | |
| * | Inphi Corporation | | | 91,960 | | | | 2,485 | |
| | j2 Global, Inc. | | | 132,051 | | | | 10,870 | |
| | MAXIMUS, Inc. | | | 23,281 | | | | 1,310 | |
| * | MaxLinear, Inc. | | | 484,741 | | | | 7,140 | |
| * | NeuStar, Inc. | | | 380,428 | | | | 9,119 | |
| * | OSI Systems, Inc. | | | 60,834 | | | | 5,394 | |
| * | Pandora Media, Inc. | | | 250,700 | | | | 3,362 | |
| * | Q2 Holdings, Inc. | | | 103,140 | | | | 2,720 | |
| * | Quotient Technology, Inc. | | | 348,704 | | | | 2,378 | |
| | TeleTech Holdings, Inc. | | | 109,948 | | | | 3,069 | |
| * | Tyler Technologies, Inc. | | | 16,730 | | | | 2,916 | |
| * | Ultimate Software Group, Inc. | | | 22,602 | | | | 4,419 | |
| * | USA Technologies, Inc. | | | 1,193,580 | | | | 3,676 | |
| * | WNS Holdings, Ltd.-ADR | | | 161,864 | | | | 5,048 | |
| * | Xactly Corporation | | | 288,651 | | | | 2,462 | |
| | | | | | | | | 94,436 | |
| | Health Care—22.0% | | | | | | | | |
| * | ABIOMED, Inc. | | | 74,090 | | | | 6,689 | |
| * | Accelerate Diagnostics, Inc. | | | 182,489 | | | | 3,922 | |
| * | Air Methods Corporation | | | 186,700 | | | | 7,828 | |
| * | Akorn, Inc. | | | 167,400 | | | | 6,246 | |
| * | AtriCure, Inc. | | | 207,543 | | | | 4,657 | |
| * | Cambrex Corporation | | | 95,175 | | | | 4,482 | |
| * | Connecture, Inc. | | | 149,866 | | | | 541 | |
| * | Exact Sciences Corporation | | | 126,060 | | | | 1,164 | |
| * | ExamWorks Group, Inc. | | | 278,544 | | | | 7,409 | |
| | HealthSouth Corporation | | | 214,695 | | | | 7,473 | |
| | LeMaitre Vascular, Inc. | | | 228,195 | | | | 3,936 | |
| * | Ligand Pharmaceuticals, Inc. | | | 58,810 | | | | 6,376 | |
| * | Novadaq Technologies, Inc.† | | | 277,600 | | | | 3,537 | |
| * | NxStage Medical, Inc. | | | 280,456 | | | | 6,145 | |
| * | Repligen Corporation | | | 88,260 | | | | 2,497 | |
| | Trinity Biotech plc-ADR | | | 414,060 | | | | 4,869 | |
| * | Zeltiq Aesthetics, Inc. | | | 153,180 | | | | 4,370 | |
| | | | | | | | | 82,141 | |
| | Industrials—13.9% | | | | | | | | |
| * | CAI International, Inc. | | | 422,207 | | | | 4,256 | |
| | CEB, Inc. | | | 41,970 | | | | 2,577 | |
| * | Franklin Covey Co. | | | 285,489 | | | | 4,779 | |
| * | GP Strategies Corporation | | | 187,750 | | | | 4,714 | |
| | Healthcare Services Group, Inc. | | | 232,230 | | | | 8,098 | |
| | Hexcel Corporation | | | 127,620 | | | | 5,928 | |
| * | Hudson Technologies, Inc. | | | 1,681,784 | | | | 4,995 | |
| * | Huron Consulting Group, Inc. | | | 81,739 | | | | 4,855 | |
| * | ICF International, Inc. | | | 161,341 | | | | 5,737 | |
| | John Bean Technologies Corporation | | | 80,895 | | | | 4,031 | |
| * | RPX Corporation | | | 185,027 | | | | 2,035 | |
| | | | | | | | | 52,005 | |
| | Issuer | | Shares | | | Value | |
| | | | | | | | | | |
| | Common Stocks—(continued) | | | | | | | | |
| | | | | | | | | | |
| | Consumer Discretionary—13.7% | | | | | | | | |
| * | 2U, Inc. | | | 73,820 | | | $ | 2,066 | |
| | Choice Hotels International, Inc. | | | 132,530 | | | | 6,681 | |
| * | Five Below, Inc. | | | 86,350 | | | | 2,772 | |
| * | IMAX Corporation† | | | 185,911 | | | | 6,607 | |
| | Interval Leisure Group, Inc. | | | 185,999 | | | | 2,903 | |
| | Monro Muffler Brake, Inc. | | | 29,421 | | | | 1,948 | |
| | Six Flags Entertainment Corporation | | | 223,832 | | | | 12,297 | |
| * | Steven Madden, Ltd. | | | 107,960 | | | | 3,263 | |
| * | U.S. Auto Parts Network, Inc. | | | 1,647,409 | | | | 4,843 | |
| * | Universal Electronics, Inc. | | | 150,162 | | | | 7,711 | |
| | | | | | | | | 51,091 | |
| | Financials—12.0% | | | | | | | | |
| * | BofI Holding, Inc. | | | 188,040 | | | | 3,958 | |
| * | Colliers International Group, Inc.† | | | 118,673 | | | | 5,287 | |
| * | Cowen Group, Inc. | | | 839,914 | | | | 3,217 | |
| * | Encore Capital Group, Inc. | | | 106,916 | | | | 3,109 | |
| * | First Cash Financial Services, Inc. | | | 146,936 | | | | 5,500 | |
| * | FirstService Corporation† | | | 210,373 | | | | 8,506 | |
| | OM Asset Management plc† | | | 436,290 | | | | 6,688 | |
| | Pinnacle Financial Partners, Inc. | | | 50,990 | | | | 2,619 | |
| | Virtu Financial, Inc. | | | 252,622 | | | | 5,719 | |
| | | | | | | | | 44,603 | |
| | Consumer Staples—4.5% | | | | | | | | |
| * | Herbalife, Ltd.† | | | 49,800 | | | | 2,670 | |
| | Nu Skin Enterprises, Inc. | | | 162,185 | | | | 6,145 | |
| | WD-40 Co. | | | 81,631 | | | | 8,053 | |
| | | | | | | | | 16,868 | |
| | Materials—2.0% | | | | | | | | |
| * | Headwaters, Inc. | | | 211,612 | | | | 3,570 | |
| * | Stillwater Mining Co. | | | 441,276 | | | | 3,782 | |
| | | | | | | | | 7,352 | |
| | Telecommunication Services—1.7% | | | | | | | | |
| * | ORBCOMM, Inc. | | | 865,982 | | | | 6,270 | |
| | | | | | | | | | |
| | Energy—1.6% | | | | | | | | |
| * | Carrizo Oil & Gas, Inc. | | | 72,553 | | | | 2,146 | |
| * | Gulfport Energy Corporation | | | 60,507 | | | | 1,487 | |
| * | Hornbeck Offshore Services, Inc. | | | 107,810 | | | | 1,072 | |
| | SM Energy Co. | | | 67,260 | | | | 1,322 | |
| | | | | | | | | 6,027 | |
| | Total Common Stocks—96.7%
(cost $317,893) | | | | | | | 360,793 | |
| | | | | | | | | | |
| | Exchange-Traded Fund | | | | | | | | |
| | iShares Russell 2000 Growth Index Fund | | | 15,600 | | | | 2,175 | |
| | Total Exchange-Traded Fund—0.6%
(cost $2,164) | | | | | | | 2,175 | |
See accompanying Notes to Financial Statements.
| December 31, 2015 | William Blair Funds | 33 |
Small Cap Growth Fund
Portfolio of Investments, December 31, 2015 (all dollar amounts in thousands)
| | | | | | | | |
| | | | Principal | | | |
| | Issuer | | Amount | | | Value | |
| | | | | | | | | | |
| | Repurchase Agreement | | | | | | | | |
| | Fixed Income Clearing Corporation, 0.030% dated 12/31/15, due 1/4/16, repurchase price $9,567, collateralized by FNMA, 2.625%, due 9/6/24 | | | $9,567 | | | $ | 9,567 | |
| | Total Repurchase Agreement—2.5%
(cost $9,567) | | | | | | | 9,567 | |
| | Total Investments—99.8%
(cost $329,624) | | | | | | | 372,535 | |
| | Cash and other assets, less liabilities—0.2% | | | | | | | 678 | |
| | Net assets—100.0% | | | | | | $ | 373,213 | |
ADR = American Depository Receipt
* Non-income producing securities
† = U.S. listed foreign security
If a fund’s portfolio holdings represent ownership of 5% or more of the voting securities of a company, the company is deemed to be an affiliate as defined in the Investment Company Act of 1940, as amended. The Fund had the following transactions during the year ended December 31, 2015 with companies deemed affiliated during the year or at December 31, 2015.
| | | | Share Activity | | Year Ended December 31, 2015 |
| | Security Name | | Balance
12/31/2014 | | Purchases | | Sales | | Balance
12/31/2015 | | Value | | Dividend
Income | | Net realized
gain (loss) | | Change in net
unrealized
appreciation
(depreciation) |
| | ᴫHudson Technologies, Inc. | | | 1,711,704 | | | | 361,811 | | | | 391,731 | | | | 1,681,784 | | | | $ | 4,995 | | | | $ | — | | | | $ | (330 | ) | | | $ | (1,163 | ) |
| | | | | | | | | | | | | | | | | | | | | $ | 4,995 | | | | $ | — | | | | $ | (330 | ) | | | $ | (1,163 | ) |
ᴫ = Affiliated company at December 31, 2015. The Fund’s total value in companies deemed to be affiliated at December 31, 2015 was $4,995.
See accompanying Notes to Financial Statements.
| 34 | Annual Report | December 31, 2015 |
| | | Small Cap Value Fund |
| | | |
| | | The Small Cap Value Fund seeks long-term capital appreciation. |
| | | |
| | | AN OVERVIEW FROM THE PORTFOLIO MANAGERS |
| | | |
 Chad M. Kilmer  Mark T. Leslie | | The William Blair Small Cap Value Fund (Class N shares) posted a 5.77% decrease, net of fees, for the twelve months ended December 31, 2015. By comparison, the Fund’s benchmark index, the Russell 2000® Value Index (the “Index”), decreased 7.47%. The Fund’s outperformance relative to the Index during 2015 was driven by strong stock selection across most sectors. Broadly speaking, from a style perspective, the Fund’s higher-quality bias, larger market cap, and higher-growth profile relative to the Index provided tailwinds during the period. At the sector level, Financials and Materials were the most significant contributors to relative performance. Strong stock selection within Regional Banks, Insurance, and REITs drove relative outperformance within Financials. Outperformance within Materials was due to the Fund’s acquisition of RTI International Metals early in the year and a lack of exposure to more commodity exposed companies, mainly steel. The Fund’s lack of exposure to Biotechnology and Pharmaceuticals resulted in relative underperformance within Health Care, the only positive performing sector for the year. Looking specifically at stock selection, the Fund’s largest contributor to relative performance was Inphi (Technology). Inphi is a fabless semiconductor company that provides high-speed analog semiconductor solutions for the communications and computing markets. Outperformance for the year was due to solid earnings driven by strong momentum with new products that are aligned with high priority spending trends. Other notable contributors included Bank of the Ozarks (Financials) and Western Alliance Bancorp (Financials). Offsetting these contributors were the Fund’s investments in FXCM (Financials), Helix Energy Solutions (Energy), and Northwest Pipe (Industrials). Helix Energy Solutions is an energy service company providing deepwater contracting services to the energy market. The stock underperformed as operating results continue to be pressured by utilization declines in its major business segments, primarily, Well Intervention. Please refer to the U.S. Value Market Review and Outlook relating to the Fund on page 7. |
| | | |
 | | |
| | | |
| David S. Mitchell | | |
| December 31, 2015 | William Blair Funds | 35 |
Small Cap Value Fund
Performance Highlights (Unaudited)
| Average Annual Total Return at 12/31/2015 |
| | | | | | | | | |
| | | 1 Year | | 3 Year | | 5 Year | | 10 Year |
| Class N | | | (5.77 | )% | | | 11.00 | % | | | 7.44 | % | | | 7.28 | % |
| Class I | | | (5.47 | ) | | | 11.31 | | | | 7.73 | | | | 7.53 | |
| Russell 2000® Value Index | | | (7.47 | ) | | | 9.06 | | | | 7.67 | | | | 5.57 | |
Performance cited represents past performance. Past performance does not guarantee future results and current performance may be lower or higher than the data quoted. Results shown are average annual total returns, which assume reinvestment of dividends and capital gains. Investment returns and principal will fluctuate and you may have a gain or loss when you sell shares. For the most current month-end performance information, please call 1-800-742-7272, or visit our Web site at www.williamblairfunds.com. Investing in smaller companies involves special risks, including higher volatility and lower liquidity. Smaller capitalization stocks are also more sensitive to purchase/sale transactions and changes in the issuer’s financial condition. From time to time, the investment adviser may waive fees or reimburse expenses for the Fund. Without these waivers/reimbursements, performance would be lower. Class N shares are available to the general public without a sales load. Class I shares are available to certain institutional investors and advisory clients of William Blair Investment Management, LLC and William Blair & Company, L.L.C., without a sales load or distribution (12b-1) or service fees.
The performance highlights and graph presented above do not reflect the deduction of taxes that a shareholder would pay on fund distributions or the redemption of fund shares.
The Russell 2000® Value Index consists of small-capitalization companies with below average price-to-book ratios and forecasted growth rates.
This report identifies the Fund’s investments on December 31, 2015. These holdings are subject to change. Not all stocks in the Fund performed the same, nor is there any guarantee that these stocks will perform as well in the future. Market forecasts provided in this report may not necessarily come to pass.
Sector Diversification (Unaudited)
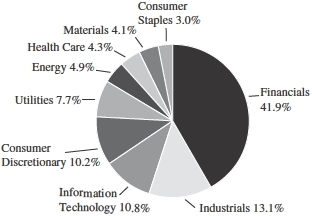
The sector diversification shown is based on the total long-term securities.
| 36 | Annual Report | December 31, 2015 |
Small Cap Value Fund
Portfolio of Investments, December 31, 2015 (all dollar amounts in thousands)
| | Issuer | | Shares | | | Value | |
| | | | | | | | | | |
| | Common Stocks | | | | | | | | |
| | | | | | | | | | |
| | Financials—40.5% | | | | | | | | |
| | Acadia Realty Trust | | | 266,530 | | | $ | 8,835 | |
| | American Assets Trust, Inc. | | | 191,990 | | | | 7,363 | |
| | American Campus Communities, Inc. | | | 195,435 | | | | 8,079 | |
| | Bank of the Ozarks, Inc. | | | 129,975 | | | | 6,429 | |
| | Berkshire Hills Bancorp, Inc. | | | 188,230 | | | | 5,479 | |
| | Boston Private Financial Holdings, Inc. | | | 308,290 | | | | 3,496 | |
| * | Cascade Bancorp | | | 726,305 | | | | 4,409 | |
| | CNO Financial Group, Inc. | | | 489,530 | | | | 9,345 | |
| | CoBiz Financial, Inc. | | | 602,029 | | | | 8,079 | |
| | Douglas Emmett, Inc. | | | 271,750 | | | | 8,473 | |
| * | Eagle Bancorp, Inc. | | | 156,225 | | | | 7,885 | |
| | EastGroup Properties, Inc. | | | 88,844 | | | | 4,941 | |
| | Education Realty Trust, Inc. | | | 215,541 | | | | 8,165 | |
| | EPR Properties | | | 124,235 | | | | 7,262 | |
| * | Equity Commonwealth | | | 115,885 | | | | 3,213 | |
| | First American Financial Corporation | | | 195,955 | | | | 7,035 | |
| | FirstMerit Corporation | | | 313,825 | | | | 5,853 | |
| * | Forest City Enterprises, Inc. | | | 251,395 | | | | 5,513 | |
| | Glacier Bancorp, Inc. | | | 312,780 | | | | 8,298 | |
| | Hanover Insurance Group, Inc. | | | 99,490 | | | | 8,093 | |
| | Highwoods Properties, Inc. | | | 166,935 | | | | 7,278 | |
| | Home BancShares, Inc. | | | 165,890 | | | | 6,722 | |
| | Iberiabank Corporation | | | 125,800 | | | | 6,928 | |
| | LaSalle Hotel Properties | | | 218,090 | | | | 5,487 | |
| | National Bank Holdings Corporation | | | 186,250 | | | | 3,980 | |
| | PacWest Bancorp | | | 196,143 | | | | 8,454 | |
| | Pebblebrook Hotel Trust | | | 221,429 | | | | 6,204 | |
| | Prosperity Bancshares, Inc. | | | 119,225 | | | | 5,706 | |
| | Radian Group, Inc. | | | 493,285 | | | | 6,605 | |
| | Renasant Corporation | | | 228,635 | | | | 7,867 | |
| * | Safeguard Scientifics, Inc. | | | 298,791 | | | | 4,335 | |
| | Selective Insurance Group, Inc. | | | 227,275 | | | | 7,632 | |
| | Sunstone Hotel Investors, Inc. | | | 425,425 | | | | 5,314 | |
| | Umpqua Holdings Corporation | | | 365,605 | | | | 5,813 | |
| * | Western Alliance Bancorp | | | 208,380 | | | | 7,473 | |
| | WSFS Financial Corporation | | | 284,490 | | | | 9,206 | |
| | Yadkin Financial Corporation | | | 275,925 | | | | 6,945 | |
| | | | | | | | | 248,194 | |
| | Industrials—12.7% | | | | | | | | |
| | Barnes Group, Inc. | | | 166,880 | | | | 5,906 | |
| | CIRCOR International, Inc. | | | 106,280 | | | | 4,480 | |
| | Curtiss-Wright Corporation | | | 95,402 | | | | 6,535 | |
| | EMCOR Group, Inc. | | | 159,816 | | | | 7,678 | |
| * | FTI Consulting, Inc. | | | 113,065 | | | | 3,919 | |
| | G&K Services, Inc. | | | 145,951 | | | | 9,180 | |
| | Interface, Inc. | | | 375,964 | | | | 7,196 | |
| | Kadant, Inc. | | | 129,018 | | | | 5,239 | |
| * | Lydall, Inc. | | | 134,821 | | | | 4,783 | |
| | Matson, Inc. | | | 151,900 | | | | 6,475 | |
| * | Northwest Pipe Co. | | | 253,960 | | | | 2,842 | |
| | Standex International Corporation | | | 71,095 | | | | 5,912 | |
| | The Toro Co. | | | 103,355 | | | | 7,552 | |
| | | | | | | | | 77,697 | |
| | Issuer | | Shares | | | Value | |
| | | | | | | | | | |
| | Common Stocks—(continued) | | | | | | | | |
| | | | | | | | | | |
| | Information Technology—10.5% | | | | | | | | |
| * | Acxiom Corporation | | | 566,137 | | | $ | 11,844 | |
| | Belden, Inc. | | | 155,345 | | | | 7,407 | |
| | Booz Allen Hamilton Holding Corporation | | | 219,992 | | | | 6,787 | |
| * | Cadence Design Systems, Inc. | | | 455,600 | | | | 9,481 | |
| * | Inphi Corporation | | | 291,170 | | | | 7,867 | |
| * | Intralinks Holdings, Inc. | | | 512,119 | | | | 4,645 | |
| | j2 Global, Inc. | | | 116,720 | | | | 9,608 | |
| | Littelfuse, Inc. | | | 61,784 | | | | 6,611 | |
| | | | | | | | | 64,250 | |
| | Consumer Discretionary—9.9% | | | | | | | | |
| | Brunswick Corporation | | | 64,415 | | | | 3,254 | |
| | CalAtlantic Group, Inc. | | | 117,017 | | | | 4,437 | |
| * | Cavco Industries, Inc. | | | 36,590 | | | | 3,048 | |
| | Children’s Place, Inc. | | | 110,870 | | | | 6,120 | |
| | Dana Holding Corporation | | | 285,325 | | | | 3,937 | |
| | Ethan Allen Interiors, Inc. | | | 147,704 | | | | 4,109 | |
| * | Express, Inc. | | | 340,135 | | | | 5,878 | |
| * | Genesco, Inc. | | | 72,765 | | | | 4,135 | |
| * | Krispy Kreme Doughnuts, Inc. | | | 536,945 | | | | 8,092 | |
| | Meredith Corporation | | | 120,270 | | | | 5,202 | |
| | Vail Resorts, Inc. | | | 68,695 | | | | 8,792 | |
| | Wolverine World Wide, Inc. | | | 223,935 | | | | 3,742 | |
| | | | | | | | | 60,746 | |
| | Utilities—7.5% | | | | | | | | |
| | ALLETE, Inc. | | | 122,980 | | | | 6,251 | |
| | Chesapeake Utilities Corporation | | | 69,050 | | | | 3,919 | |
| | IDACORP, Inc. | | | 116,069 | | | | 7,893 | |
| | PNM Resources, Inc. | | | 259,581 | | | | 7,935 | |
| | Portland General Electric Co. | | | 190,425 | | | | 6,926 | |
| | Southwest Gas Corporation | | | 131,440 | | | | 7,250 | |
| | The Laclede Group, Inc. | | | 97,720 | | | | 5,805 | |
| | | | | | | | | 45,979 | |
| | Energy—4.8% | | | | | | | | |
| | Archrock, Inc. | | | 234,900 | | | | 1,767 | |
| * | Exterran Corporation | | | 197,000 | | | | 3,162 | |
| | GasLog, Ltd.† | | | 322,905 | | | | 2,680 | |
| * | Helix Energy Solutions Group, Inc. | | | 518,135 | | | | 2,725 | |
| * | Memorial Resource Development Corporation | | | 414,350 | | | | 6,692 | |
| * | PDC Energy, Inc. | | | 95,840 | | | | 5,116 | |
| * | Ring Energy, Inc. | | | 359,196 | | | | 2,532 | |
| * | TETRA Technologies, Inc. | | | 615,955 | | | | 4,632 | |
| | | | | | | | | 29,306 | |
| | Health Care—4.2% | | | | | | | | |
| | CONMED Corporation | | | 150,335 | | | | 6,622 | |
| * | Greatbatch, Inc. | | | 173,405 | | | | 9,104 | |
| | HealthSouth Corporation | | | 159,105 | | | | 5,538 | |
| * | Magellan Health, Inc. | | | 70,575 | | | | 4,352 | |
| | | | | | | | | 25,616 | |
See accompanying Notes to Financial Statements.
| December 31, 2015 | William Blair Funds | 37 |
Small Cap Value Fund
Portfolio of Investments, December 31, 2015 (all dollar amounts in thousands)
| | | | Shares or | | | | |
| | | | Principal | | | | |
| | Issuer | | Amount | | | Value | |
| | | | | | | | | | |
| | Common Stocks-—(continued) | | | | | | | | |
| | | | | | | | | | |
| | Materials—4.0% | | | | | | | | |
| | Minerals Technologies, Inc. | | | 114,110 | | | $ | 5,233 | |
| | PolyOne Corporation | | | 206,084 | | | | 6,545 | |
| | Sensient Technologies Corporation | | | 107,220 | | | | 6,736 | |
| | Silgan Holdings, Inc. | | | 111,330 | | | | 5,981 | |
| | | | | | | | | 24,495 | |
| | Consumer Staples—2.9% | | | | | | | | |
| * | Darling Ingredients, Inc. | | | 352,345 | | | | 3,706 | |
| | J&J Snack Foods Corporation | | | 72,142 | | | | 8,417 | |
| | SpartanNash Co. | | | 256,594 | | | | 5,553 | |
| | | | | | | | | 17,676 | |
| | Total Common Stocks—97.0%
(cost $529,543) | | | | | | | 593,959 | |
| | | | | | | | | | |
| | Repurchase Agreement | | | | | | | | |
| | Fixed Income Clearing Corporation, 0.030% dated 12/31/15, due 1/4/16, repurchase price $16,367, collateralized by U.S. Treasury Note, 2.375%, due 8/15/24 | | | $16,367 | | | | 16,367 | |
| | Total Repurchase Agreement—2.7%
(cost $16,367) | | | | | | | 16,367 | |
| | Total Investments—99.7%
(cost $545,910) | | | | | | | 610,326 | |
| | Cash and other assets, less liabilities—0.3% | | | | | | | 2,035 | |
| | Net assets—100.0% | | | | | | $ | 612,361 | |
* Non-income producing securities
† = U.S. listed foreign security
See accompanying Notes to Financial Statements.
| 38 | Annual Report | December 31, 2015 |
Global Markets Review and Outlook
Global investors are unlikely to look back fondly on 2015, having been whipsawed by periods of significant volatility throughout the year. The list of concerns was seemingly endless and well documented by the financial press: anemic global growth, U.S. monetary policy normalization, geopolitical risks, U.S. dollar strength, emerging markets fragility, commodity price weakness, China’s fluctuations, and policy uncertainty. In this volatile environment, the MSCI ACWI IMI (net) ended the year down 2.19% in U.S. dollar-denominated terms. In local currency terms, the MSCI ACWI IMI (net) Index was in positive territory (+1.39%), highlighting the impact of dollar strength. U.S. equities outpaced non-U.S. developed and emerging markets equities. Despite oscillating between record highs and steep downturns, the U.S. market ended the year relatively unchanged (MSCI U.S. IMI Index +0.03%). The flat performance was reflective of the subdued corporate earnings environment to a large extent, with weaker profit growth resulting from dollar appreciation and falling oil prices. European equity performance stood in sharp contrast to the U.S. equity market, benefiting from currency depreciation and cheap oil, in addition to central bank policy stimulus. The MSCI Europe ex-U.K. IMI advanced 9.81% in local terms, but only 0.66% in USD terms for 2015. Within Japan (MSCI Japan IMI Index +10.52% USD), corporate earnings were also supported by a favorable policy backdrop and expectations for continued currency weakness, bolstering exports. While Japan’s lackluster economic performance led many market observers to question the effectiveness of stimulus measures, progress at the micro level in the form of improved corporate governance and shareholder return generation was encouraging.
Emerging markets equities were buffeted by record capital outflows and currency weakness amid ongoing concerns about slowing growth, geopolitical risks, commodity demand, U.S. interest rates, and debt sustainability. Increased tensions in the Middle East and the spiraling political scandal in Brazil compounded investor anxiety. The MSCI EM IMI (net) fell 13.86% in USD terms for the year. Latin America was the worst performing emerging markets (“EM”) region, hampered by Brazil’s 41.94% decline. The Brazilian real bore the brunt of EM risk aversion in 2015, losing nearly two-thirds of its value against the U.S. dollar amid a toxic mix of recession, double-digit inflation, rising interest rates, and political scandal. The EMEA (Europe, the Middle East and Africa) region fared marginally better, supported by a rebound in Russia equities (+4.64%), although South Africa (-25.91%), Turkey (-31.36%), and broad Middle East weakness were significant offsets. Emerging Asia held up the best among the three EM regions (Latin America, EMEA, and Emerging Asia), due to more modest losses for India (-4.69%) and Korea (-3.94%). The MSCI China IMI (net), which excludes domestic A-share listings, fell 6.42% for the year. In contrast, the MSCI China A Index (net) posted a 12-month gain of 7.08%, despite falling 30.61% in the third quarter. Needless to say, it was an eventful year for China equity market participants, who endured a violent correction, unconventional policy intervention measures, and the largest currency devaluation in 20 years.
From a global sector perspective, Healthcare, Consumer Staples, Consumer Discretionary, and Information Technology were the top performers in 2015, reflecting relatively favorable earnings trends in the weaker growth environment. The resources sectors—Energy, Materials, and Utilities—were the worst performing sectors in 2015, hindered by oversupply conditions and waning Chinese demand. From a size perspective, small-cap stocks outside of the U.S. significantly outpaced their mid/large-cap counterparts in 2015. Small cap leadership was particularly pronounced in Europe, the U.K., Japan, and Emerging Asia during the year.
Our outlook for the year cannot help but be influenced by the market volatility we have experienced in the early weeks of 2016. Many of the concerns that depressed market returns in 2015 have been exacerbated in the first week of the year, particularly those related to Chinese growth and policy, unsettling not just the Chinese stock market but currency and stock markets around the world.
One area of our focus is the strength of the U.S. dollar and related implications of the reversal of the Federal Reserve’s extraordinary monetary stimulus. We believe the period of rapid U.S. dollar appreciation is behind us and we anticipate greater currency stabilization, with a strong but no longer strengthening dollar. It is also likely that we will see inflation pick up in the U.S. at some point as the decline in energy prices subsides. These are likely to have implications within U.S. sector leadership, as well as stem further pressure on many emerging markets.
We have long argued that emerging markets should be increasingly viewed as a heterogeneous group of countries, containing a heterogeneous group of companies. We believe more opportunities will be apparent during the coming year, and a cyclical emerging market recovery is not unrealistic despite the prevailing negative sentiment. Mexico and Taiwan look particularly interesting.
We also believe that demand prospects around the world may pick up, particularly in Europe-albeit off of a low base. Thus, global GDP growth of +3% does not appear altogether unrealistic. European markets have favored a defensive tilt, and this could reverse as we see stronger domestic activity. The high return, highly-valued defensive areas of the European markets
| December 31, 2015 | William Blair Funds | 39 |
Global Markets Review and Outlook
could be vulnerable to profit taking. Elsewhere, we are focused on continued improvement of Japanese corporate performance driving profit growth and earnings revisions ahead of most major regions. Japan was the strongest performing major market in 2015 (in U.S. dollar terms) and may continue to perform well given the potential for profit growth and reasonable valuations. It should be noted that further Japanese corporate success is not predicated on additional Yen weakening from year-end levels.
In conclusion, we continue to employ a fundamental research-driven investment process that seeks to identify high quality, growth-oriented companies with strong operating performance. We believe that strong corporate performance is the foundation of superior long-term investment returns.
| 40 | Annual Report | December 31, 2015 |
| | Global Leaders Fund |
| | |
| | The Global Leaders Fund seeks long-term capital appreciation. |
| | |
| | AN OVERVIEW FROM THE PORTFOLIO MANAGERS |
| | |

Kenneth J. McAtamney 
Andrew G. Flynn | The William Blair Global Leaders Fund (Class N shares) posted a 2.49% increase, net of fees, for the twelve months ended December 31, 2015. By comparison, the Fund’s benchmark index, the MSCI All Country World IMI Index (net) (the “Index”), decreased 2.19%. The Fund’s performance during 2015 benefited from favorable style tailwinds, as higher-quality, growth-oriented companies with relatively strong earnings trends and price momentum generally outperformed on a global basis. Stock selection was strong across most sectors and regions during the year. From a sector perspective, Information Technology (“IT”) stock selection was the leading contributor. The overweightings to Consumer Discretionary, Healthcare, and IT versus the Index, and underweightings to Energy, Materials, and Utilities versus the Index were also positive contributors. Within IT, the emphasis on internet software & services and IT services companies was beneficial. Technology services company Capgemini (France) performed strongly during the year, bolstered by improvement in North America and its European outsourcing business, and the earnings accretive acquisition of U.S.-based iGate. These positive effects were partially mitigated by the Fund’s underweighting to Consumer Staples and the modest overweighting to Industrials. From a regional perspective, Europe ex-U.K. stock selection was the leading contributor to 2015 performance, benefiting from relative strength in European Consumer Discretionary, Healthcare, Financials and IT holdings. In contrast, stock selection in Latin America detracted from performance, but the impact was mitigated by the large underweight position. Within Latin America, Panama-based airline Copa Holdings and Brazilian education company Kroton Educacional suffered deteriorating business trends and were liquidated earlier in the year. Please refer to the Global Markets Review and Outlook relating to the Fund on page 39. |
| December 31, 2015 | William Blair Funds | 41 |
Global Leaders Fund
Performance Highlights (Unaudited)
| Average Annual Total Return at 12/31/2015 |
| |
| | | | 1 Year | | | 3 Year | | | 5 Year | | | Since
Inception |
| Class N(a) | | | 2.49 | % | | | 8.72 | % | | | 7.78 | % | | | 2.55 | % |
| Class I(a) | | | 2.77 | | | | 9.00 | | | | 8.06 | | | | 2.83 | |
| MSCI ACW IMI (net)(a) | | | (2.19 | ) | | | 7.86 | | | | 6.11 | | | | 1.78 | |
| Institutional Class(b) | | | 2.85 | | | | 9.13 | | | | — | | | | 8.91 | |
| MSCI ACW IMI (net)(b) | | | (2.19 | ) | | | 7.86 | | | | — | | | | 7.65 | |
| | | | | | | | | | | | | | | | | |
| (a) | Since inception is for the period from October 15, 2007 (Commencement of Operations) to December 31, 2015. |
| (b) | Since inception is for the period from December 19, 2012 (Commencement of Operations) to December 31, 2015. |
Performance cited represents past performance. Past performance does not guarantee future results and current performance may be lower or higher than the data quoted. Results shown are average annual total returns, which assume reinvestment of dividends and capital gains. Investment returns and principal will fluctuate and you may have a gain or loss when you sell shares. For the most current month-end performance information, please call 1-800-742-7272, or visit our Web site at www.williamblairfunds.com. Investing in smaller and medium capitalization companies involves special risks, including higher volatility and lower liquidity. Smaller and medium capitalization stocks are also more sensitive to purchase/sale transactions and changes in the issuer’s financial condition. International investing involves special risk considerations, including currency fluctuations, lower liquidity, economic and political risk. From time to time, the investment adviser may waive fees or reimburse expenses for the Fund. Without these waivers/reimbursements, performance would be lower. Class N shares are available to the general public without a sales load. Class I shares are available to certain institutional investors and advisory clients of William Blair Investment Management, LLC and William Blair & Company, L.L.C., without a sales load or distribution fees (12b-1). Institutional Class shares are available to institutional investors without a sales load or distribution (12b-1) or service fees.
The performance highlights and graph presented above do not reflect the deduction of taxes that a shareholder would pay on fund distributions or the redemption of fund shares.
The Morgan Stanley Capital International (MSCI) All Country World (ACW) Investable Market Index (IMI) (net) is a free float-adjusted market capitalization weighted index that is designed to measure the equity market of developed and emerging markets. This series approximates the minimum possible dividend reinvestment.
This report identifies the Fund’s investments on December 31, 2015. These holdings are subject to change. Not all stocks in the Fund performed the same, nor is there any guarantee that these stocks will perform as well in the future. Market forecasts provided in this report may not necessarily come to pass.
Sector Diversification (Unaudited)
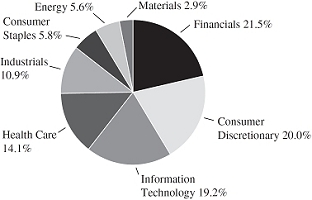
The sector diversification shown is based on the total long-term securities.
| 42 | Annual Report | December 31, 2015 |
Global Leaders Fund
Portfolio of Investments, December 31, 2015 (all dollar amounts in thousands)
| | | | | | | | |
| | | | | | | | |
| | Issuer | | Shares | | | Value | |
| | | | | | | | | | |
| | Common Stocks | | | | | | | | |
| | | | | | | | | | |
| | Western Hemisphere—47.9% | | | | | | | | |
| | Canada—5.2% | | | | | | | | |
| | Alimentation Couche Tard, Inc. Class “B” (Food & staples retailing) | | | 63,515 | | | $ | 2,796 | |
| | Brookfield Asset Management, Inc. Class “A” (Real estate management & development)† | | | 72,610 | | | | 2,289 | |
| | Intact Financial Corporation (Insurance) | | | 31,861 | | | | 2,042 | |
| | Suncor Energy, Inc. (Oil, gas & consumable fuels) | | | 104,816 | | | | 2,706 | |
| | | | | | | | | 9,833 | |
| | United States—42.7% | | | | | | | | |
| * | Affiliated Managers Group, Inc. (Capital markets) | | | 15,111 | | | | 2,414 | |
| * | Align Technology, Inc. (Health care equipment & supplies) | | | 33,841 | | | | 2,229 | |
| * | Alphabet, Inc. Class “A” (Internet software & services) | | | 5,778 | | | | 4,495 | |
| * | ANSYS, Inc. (Software) | | | 21,485 | | | | 1,987 | |
| | Bristol-Myers Squibb Co. (Pharmaceuticals) | | | 51,607 | | | | 3,550 | |
| | Brunswick Corporation (Leisure products) | | | 53,177 | | | | 2,686 | |
| * | Centene Corporation (Health care providers & services) | | | 49,753 | | | | 3,274 | |
| * | CoStar Group, Inc. (Internet software & services) | | | 5,888 | | | | 1,217 | |
| | Costco Wholesale Corporation (Food & staples retailing) | | | 14,768 | | | | 2,385 | |
| | Danaher Corporation (Industrial conglomerates) | | | 28,735 | | | | 2,669 | |
| | EOG Resources, Inc. (Oil, gas & consumable fuels) | | | 19,988 | | | | 1,415 | |
| * | Facebook, Inc. (Internet software & services) | | | 23,691 | | | | 2,480 | |
| | General Electric Co. (Industrial conglomerates) | | | 114,212 | | | | 3,558 | |
| | Gilead Sciences, Inc. (Biotechnology) | | | 37,236 | | | | 3,768 | |
| | Intercontinental Exchange, Inc. (Diversified financial services) | | | 9,928 | | | | 2,544 | |
| | Jones Lang LaSalle, Inc. (Real estate management & development) | | | 20,194 | | | | 3,228 | |
| | Lazard, Ltd. (Capital markets)† | | | 62,558 | | | | 2,816 | |
| | Mastercard, Inc. (IT services) | | | 36,071 | | | | 3,512 | |
| | Moody’s Corporation (Diversified financial services) | | | 24,258 | | | | 2,434 | |
| * | O’Reilly Automotive, Inc. (Specialty retail) | | | 6,907 | | | | 1,750 | |
| * | Old Dominion Freight Line, Inc. (Road & rail) | | | 25,925 | | | | 1,531 | |
| | Pioneer Natural Resources Co. (Oil, gas & consumable fuels) | | | 8,118 | | | | 1,018 | |
| | PPG Industries, Inc. (Chemicals) | | | 30,830 | | | | 3,047 | |
| * | PRA Group, Inc. (Consumer finance) | | | 36,054 | | | | 1,251 | |
| * | Red Hat, Inc. (Software) | | | 25,820 | | | | 2,138 | |
| | Schlumberger, Ltd. (Energy equipment & services)† | | | 35,754 | | | | 2,494 | |
| | The Home Depot, Inc. (Specialty retail) | | | 44,100 | | | | 5,832 | |
| * | The Middleby Corporation (Machinery) | | | 9,296 | | | | 1,003 | |
| | | | | | | | |
| | | | | | | | |
| | Issuer | | Shares | | | Value | |
| | | | | | | | | | |
| | Common Stocks—(continued) | | | | | | | | |
| | | | | | | | | | |
| | Western Hemisphere—(continued) | | | | | | | | |
| | United States—(continued) | | | | | | | | |
| | The Sherwin-Williams Co. (Chemicals) | | | 8,972 | | | $ | 2,329 | |
| | The Walt Disney Co. (Media) | | | 24,157 | | | | 2,538 | |
| | VF Corporation (Textiles, apparel & luxury goods) | | | 25,480 | | | | 1,586 | |
| | Williams-Sonoma, Inc. (Specialty retail) | | | 25,936 | | | | 1,515 | |
| | | | | | | | | 80,693 | |
| | | | | | | | | | |
| | Europe, Mid-East—19.1% | | | | | | | | |
| | Denmark—1.5% | | | | | | | | |
| | Novo Nordisk A/S Class “B” (Pharmaceuticals) | | | 49,844 | | | | 2,903 | |
| | France—3.9% | | | | | | | | |
| | Cap Gemini S.A. (IT services) | | | 50,907 | | | | 4,736 | |
| | Valeo S.A. (Auto components) | | | 16,772 | | | | 2,598 | |
| | | | | | | | | 7,334 | |
| | Germany—2.7% | | | | | | | | |
| | Bayerische Motoren Werke AG (Automobiles) | | | 24,129 | | | | 2,560 | |
| | Continental AG (Auto components) | | | 10,158 | | | | 2,479 | |
| | | | | | | | | 5,039 | |
| | Ireland—1.6% | | | | | | | | |
| | Shire plc (Pharmaceuticals) | | | 43,489 | | | | 3,012 | |
| | Israel—2.4% | | | | | | | | |
| | Teva Pharmaceutical Industries, Ltd.-ADR (Pharmaceuticals) | | | 68,948 | | | | 4,526 | |
| | Netherlands—3.2% | | | | | | | | |
| * | NXP Semiconductor N.V. (Semiconductors & semiconductor equipment)† | | | 37,906 | | | | 3,193 | |
| | Royal Dutch Shell plc Class “A” (Oil, gas & consumable fuels) | | | 119,344 | | | | 2,736 | |
| | | | | | | | | 5,929 | |
| | Sweden—2.5% | | | | | | | | |
| | Assa Abloy AB Class “B” (Building products) | | | 98,167 | | | | 2,070 | |
| | Atlas Copco AB Class “A” (Machinery) | | | 108,597 | | | | 2,681 | |
| | | | | | | | | 4,751 | |
| | Switzerland—1.3% | | | | | | | | |
| | Partners Group Holding AG (Capital markets) | | | 6,894 | | | | 2,486 | |
| | | | | | | | | | |
| | Japan—10.0% | | | | | | | | |
| | Daikin Industries, Ltd. (Building products) | | | 36,500 | | | | 2,703 | |
| | Fuji Heavy Industries, Ltd. (Automobiles) | | | 101,500 | | | | 4,245 | |
| | Hoya Corporation (Health care equipment & supplies) | | | 67,200 | | | | 2,785 | |
| | Kao Corporation (Personal products) | | | 48,200 | | | | 2,508 | |
| | Keyence Corporation (Electronic equipment, instruments & components) | | | 2,800 | | | | 1,563 | |
| | ORIX Corporation (Diversified financial services) | | | 194,300 | | | | 2,773 | |
| | Shimano, Inc. (Leisure products) | | | 15,100 | | | | 2,344 | |
| | | | | | | | | 18,921 | |
See accompanying Notes to Financial Statements.
| December 31, 2015 | William Blair Funds | 43 |
Global Leaders Fund
Portfolio of Investments, December 31, 2015 (all dollar amounts in thousands)
| | | | | | | | |
| | | | | | | | |
| | Issuer | | Shares | | | Value | |
| | | | | | | | | | |
| | Common Stocks—(continued) | | | | | | | | |
| | | | | | | | | | |
| | United Kingdom—9.0% | | | | | | | | |
| | ARM Holdings plc (Semiconductors & semiconductor equipment) | | | 59,644 | | | $ | 913 | |
| | Compass Group plc (Hotels, restaurants & leisure) | | | 196,022 | | | | 3,395 | |
| | easyJet plc (Airlines) | | | 120,992 | | | | 3,104 | |
| | Prudential plc (Insurance) | | | 148,725 | | | | 3,357 | |
| | Reckitt Benckiser Group plc (Household products) | | | 32,077 | | | | 2,970 | |
| | WPP plc (Media) | | | 144,374 | | | | 3,327 | |
| | | | | | | | | 17,066 | |
| | | | | | | | | | |
| | Emerging Asia—7.9% | | | | | | | | |
| | China—4.2% | | | | | | | | |
| * | Baidu, Inc.-ADR (Internet software & services) | | | 14,002 | | | | 2,647 | |
| | China Overseas Land & Investment, Ltd. (Real estate management & development) | | | 806,000 | | | | 2,818 | |
| | Tencent Holdings, Ltd. (Internet software & services) | | | 124,800 | | | | 2,459 | |
| | | | | | | | | 7,924 | |
| | India—1.6% | | | | | | | | |
| | HDFC Bank, Ltd.-ADR (Banks) | | | 47,378 | | | | 2,919 | |
| | Taiwan—2.1% | | | | | | | | |
| | Taiwan Semiconductor Manufacturing Co., Ltd.-ADR (Semiconductors & semiconductor equipment) | | | 177,700 | | | | 4,043 | |
| | | | | | | | | | |
| | Asia—3.4% | | | | | | | | |
| | Australia—1.8% | | | | | | | | |
| | Macquarie Group, Ltd. (Capital markets) | | | 57,212 | | | | 3,451 | |
| | Hong Kong—1.6% | | | | | | | | |
| | AIA Group, Ltd. (Insurance) | | | 480,800 | | | | 2,891 | |
| | | | | | | | | | |
| | Emerging Europe, Mid-East, Africa—0.4% | | | | | | | | |
| | South Africa—0.4% | | | | | | | | |
| | Bidvest Group, Ltd. (Industrial conglomerates) | | | 39,057 | | | | 829 | |
| | Total Common Stocks—97.7%
(cost $166,875) | | | | | | | 184,550 | |
| | | | | | | | |
| | Issuer | | Principal
Amount | | | Value | |
| | | | | | | | | | |
| | Repurchase Agreement | | | | | | | | |
| | Fixed Income Clearing Corporation, 0.030% dated 12/31/15, due 1/4/16, repurchase price $2,827, collateralized by FNMA, 2.625%, due 9/6/24 | | | $2,827 | | | $ | 2,827 | |
| | Total Repurchase Agreement—1.5%
(cost $2,827) | | | | | | | 2,827 | |
| | Total Investments—99.2%
(cost $169,702) | | | | | | | 187,377 | |
| | Cash and other assets, less liabilities—0.8% | | | | | | | 1,591 | |
| | Net assets—100.0% | | | | | | $ | 188,968 | |
ADR = American Depository Receipt
† = U.S. listed foreign security
* Non-income producing securities
For securities primarily traded on exchanges or markets that close before the close of regular trading on the New York Stock Exchange, the Fund may use an independent pricing service to fair value price the securities pursuant to Valuation Procedures approved by the Board of Trustees.
At December 31, 2015, the Fund’s Portfolio of Investments includes the following industry categories (as a percentage of long-term investments):
| Financials | | | 21.5 | % |
| Consumer Discretionary | | | 20.0 | % |
| Information Technology | | | 19.2 | % |
| Health Care | | | 14.1 | % |
| Industrials | | | 10.9 | % |
| Consumer Staples | | | 5.8 | % |
| Energy | | | 5.6 | % |
| Materials | | | 2.9 | % |
| Total | | | 100.0 | % |
At December 31, 2015, the Fund’s Portfolio of Investments includes the following currency categories (as a percentage of long-term investments):
| U.S. Dollar | | | 54.4 | % |
| British Pound Sterling | | | 10.9 | % |
| Japanese Yen | | | 10.2 | % |
| Euro | | | 8.2 | % |
| Hong Kong Dollar | | | 4.4 | % |
| Canadian Dollar | | | 4.1 | % |
| Swedish Krona | | | 2.6 | % |
| Australian Dollar | | | 1.9 | % |
| Danish Krone | | | 1.6 | % |
| Swiss Franc | | | 1.3 | % |
| All Other Currencies | | | 0.4 | % |
| Total | | | 100.0 | % |
See accompanying Notes to Financial Statements.
| 44 | Annual Report | December 31, 2015 |
| | Global Small Cap Growth Fund (In Liquidation) |
| | |
| | The Global Small Cap Growth Fund seeks long-term capital appreciation. |
| | |
| | AN OVERVIEW FROM THE PORTFOLIO MANAGERS |
| | |

Andrew G. Flynn | The William Blair Global Small Cap Growth Fund (Class N shares) posted a 9.07% increase, net of fees, for the twelve months ended December 31, 2015. By comparison, the Fund’s benchmark index, the MSCI All Country World (ACW) Small Cap Index (net) (the “Index”), decreased 1.04%. The Fund’s outperformance relative to the Index was supported by favorable stock selection across most sectors, combined with positive sector allocation effects. The Fund’s overweighting to, and stock selection in, Consumer Discretionary were notable contributors, with particular strength in U.S. holdings. Notable contributors in the sector were Wayfair Inc., Vail Resorts Inc., and 2U Inc. These positive effects were, however, moderated by allocation and stock selection within Consumer Staples. From a stock selection perspective notable detractors were Sprouts Farmers Market (United States) and Avi Ltd. (South Africa). Another notable detractor was Kose Corporation (Japan), which performed strongly after the Fund exited the holding earlier in the year. Please refer to the Global Markets Review and Outlook relating to the Fund on page 39. As disclosed in Note 1(a) in the Notes to Financial Statements, the Fund was terminated on January 15, 2016, at which time all outstanding shares of the Fund were redeemed. |
| December 31, 2015 | William Blair Funds | 45 |
Global Small Cap Growth Fund (In Liquidation)
Performance Highlights (Unaudited)
| Average Annual Total Return at 12/31/2015 |
| | | 1 Year | | Since
Inception(a) |
| Class N | | | 9.07 | % | | | 13.94 | % |
| Class I | | | 9.48 | | | | 14.31 | |
| MSCI ACW Small Cap Index (net) | | | (1.04 | ) | | | 6.43 | |
| | | | | | | | | |
| (a) | For the period from April 10, 2013 (Commencement of Operations) to December 31, 2015. |
Performance cited represents past performance. Past performance does not guarantee future results and current performance may be lower or higher than the data quoted. Results shown are average annual total returns, which assume reinvestment of dividends and capital gains. Investment returns and principal will fluctuate and you may have a gain or loss when you sell shares. For the most current month-end performance information, please call 1-800-742-7272, or visit our Web site at www.williamblairfunds.com. Investing in smaller and medium capitalization companies involves special risks, including higher volatility and lower liquidity. Smaller and medium capitalization stocks are also more sensitive to purchase/sale transactions and changes in the issuer’s financial condition. International investing involves special risk considerations, including currency fluctuations, lower liquidity, economic and political risk. From time to time, the investment adviser may waive fees or reimburse expenses to the Fund. Without these waivers/reimbursements, performance would be lower. Class N shares are available to the general public without a sales load. Class I shares are available to certain institutional investors and advisory clients of William Blair Investment Management, LLC and William Blair & Company, L.L.C., without a sales load or distribution (12b-1) fees.
The performance highlights and graph presented above do not reflect the deduction of taxes that a shareholder would pay on fund distributions or the redemption of fund shares.
The Morgan Stanley Capital International (MSCI) All Country World (ACW) Small Cap Index (net) is a free float-adjusted market capitalization index designed to measure global developed and emerging market small capitalization equity performance. The Index is unmanaged, does not incur fees or expenses, and cannot be invested in directly.
This report identifies the Fund’s investments on December 31, 2015. These holdings are subject to change. Not all stocks in the Fund performed the same, nor is there any guarantee that these stocks will perform as well in the future. Market forecasts provided in this report may not necessarily come to pass.
Sector Diversification (Unaudited)

The sector diversification shown is based on the total long-term securities.
| 46 | Annual Report | December 31, 2015 |
Global Small Cap Growth Fund (In Liquidation)
Portfolio of Investments, December 31, 2015 (all dollar amounts in thousands)
| | | | | | | | |
| | | | | | | | |
| | Issuer | | Shares | | | Value | |
| | | | | | | | | | |
| | Common Stocks | | | | | | | | |
| | | | | | | | | | |
| | Western Hemisphere—42.4% | | | | | | | | |
| | | | | | | | | | |
| | Canada—1.6% | | | | | | | | |
| | Linamar Corporation (Auto components) | | | 1,902 | | | $ | 103 | |
| * | Raging River Exploration, Inc. (Oil, gas & consumable fuels) | | | 16,451 | | | | 99 | |
| | WestJet Airlines, Ltd. (Airlines) | | | 6,458 | | | | 95 | |
| | | | | | | | | 297 | |
| | United States—40.8% | | | | | | | | |
| * | 2U, Inc. (Diversified consumer services) | | | 5,361 | | | | 150 | |
| * | ABIOMED, Inc. (Health care equipment & supplies) | | | 1,430 | | | | 129 | |
| * | Align Technology, Inc. (Health care equipment & supplies) | | | 1,949 | | | | 128 | |
| * | AMN Healthcare Services, Inc. (Health care providers & services) | | | 4,415 | | | | 137 | |
| | Booz Allen Hamilton Holding Corporation (IT services) | | | 7,172 | | | | 221 | |
| | Brunswick Corporation (Leisure products) | | | 4,622 | | | | 233 | |
| * | Cambrex Corporation (Life sciences tools & services) | | | 3,902 | | | | 184 | |
| * | Carrizo Oil & Gas, Inc. (Oil, gas & consumable fuels) | | | 3,017 | | | | 89 | |
| | CEB, Inc. (Professional services) | | | 3,299 | | | | 203 | |
| | Choice Hotels International, Inc. (Hotels, restaurants & leisure) | | | 5,304 | | | | 267 | |
| * | Cvent, Inc. (Internet software & services) | | | 6,705 | | | | 234 | |
| * | Demandware, Inc. (Internet software & services) | | | 2,111 | | | | 114 | |
| * | Diamondback Energy, Inc. (Oil, gas & consumable fuels) | | | 1,613 | | | | 108 | |
| | Drew Industries, Inc. (Auto components) | | | 4,409 | | | | 268 | |
| * | Encore Capital Group, Inc. (Consumer finance) | | | 2,536 | | | | 74 | |
| | Gentex Corporation (Auto components) | | | 7,553 | | | | 121 | |
| * | Gentherm, Inc. (Auto components) | | | 2,598 | | | | 123 | |
| | HealthSouth Corporation (Health care providers & services) | | | 5,632 | | | | 196 | |
| | Hexcel Corporation (Aerospace & defense) | | | 2,703 | | | | 126 | |
| * | Hortonworks, Inc. (Internet software & services) | | | 6,964 | | | | 152 | |
| * | Huron Consulting Group, Inc. (Professional services) | | | 2,924 | | | | 174 | |
| | j2 Global, Inc. (Internet software & services) | | | 3,336 | | | | 275 | |
| * | Manhattan Associates, Inc. (Software) | | | 2,058 | | | | 136 | |
| | MarketAxess Holdings, Inc. (Diversified financial services) | | | 2,281 | | | | 255 | |
| | MAXIMUS, Inc. (IT services) | | | 4,369 | | | | 246 | |
| * | Oil States International, Inc. (Energy equipment & services) | | | 4,090 | | | | 111 | |
| * | Repligen Corporation (Biotechnology) | | | 3,838 | | | | 109 | |
| * | ServiceMaster Global Holdings, Inc. (Diversified consumer services) | | | 5,203 | | | | 204 | |
| * | Sirona Dental Systems, Inc. (Health care equipment & supplies) | | | 2,004 | | | | 220 | |
| | | | | | | | |
| | | | | | | | |
| | Issuer | | Shares | | | Value | |
| | | | | | | | | | |
| | Common Stocks—(continued) | | | | | | | | |
| | | | | | | | | | |
| | Western Hemisphere—(continued) | | | | | | | | |
| | United States—(continued) | | | | | | | | |
| | Six Flags Entertainment Corporation (Hotels, restaurants & leisure) | | | 2,479 | | | $ | 136 | |
| * | Team Health Holdings, Inc. (Health care providers & services) | | | 3,337 | | | | 146 | |
| | Texas Roadhouse, Inc. (Hotels, restaurants & leisure) | | | 4,056 | | | | 145 | |
| | The Toro Co. (Machinery) | | | 3,150 | | | | 230 | |
| * | Tyler Technologies, Inc. (Software) | | | 1,274 | | | | 222 | |
| | UniFirst Corporation (Commercial services & supplies) | | | 2,005 | | | | 209 | |
| | Vail Resorts, Inc. (Hotels, restaurants & leisure) | | | 2,532 | | | | 324 | |
| | Virtu Financial, Inc. Class “A” (Capital markets) | | | 7,678 | | | | 174 | |
| | Watsco, Inc. (Trading companies & distributors) | | | 1,416 | | | | 166 | |
| * | Wayfair, Inc. Class “A” (Internet & catalog retail) | | | 4,820 | | | | 230 | |
| | WD-40 Co. (Household products) | | | 1,827 | | | | 180 | |
| | West Pharmaceutical Services, Inc. (Health care equipment & supplies) | | | 2,286 | | | | 138 | |
| * | Zeltiq Aesthetics, Inc. (Health care equipment & supplies) | | | 4,040 | | | | 115 | |
| * | Zoe’s Kitchen, Inc. (Hotels, restaurants & leisure) | | | 4,158 | | | | 116 | |
| | | | | | | | | 7,518 | |
| | | | | | | | | | |
| | Europe, Mid-East—24.8% | | | | | | | | |
| | Belgium—0.6% | | | | | | | | |
| | Melexis N.V. (Semiconductors & semiconductor equipment) | | | 2,064 | | | | 112 | |
| | Denmark—1.0% | | | | | | | | |
| | Royal Unibrew A/S (Beverages) | | | 4,506 | | | | 184 | |
| | Finland—0.7% | | | | | | | | |
| | Huhtamaki Oyj (Containers & packaging) | | | 3,413 | | | | 124 | |
| | France—3.0% | | | | | | | | |
| | Ipsen S.A. (Pharmaceuticals) | | | 2,664 | | | | 177 | |
| | Metropole Television S.A. (Media) | | | 6,973 | | | | 120 | |
| * | UBISOFT Entertainment (Software) | | | 8,986 | | | | 260 | |
| | | | | | | | | 557 | |
| | Germany—4.1% | | | | | | | | |
| | Aareal Bank AG (Thrifts & mortgage finance) | | | 3,727 | | | | 118 | |
| | Aurelius AG (Capital markets) | | | 3,346 | | | | 175 | |
| | CTS Eventim AG & Co KGaA (Media) | | | 3,650 | | | | 146 | |
| | GRENKELEASING AG (Diversified financial services) | | | 973 | | | | 195 | |
| | Norma Group SE (Machinery) | | | 2,172 | | | | 121 | |
| | | | | | | | | 755 | |
| | Ireland—2.3% | | | | | | | | |
| | Beazley plc (Insurance) | | | 36,319 | | | | 209 | |
| | Paddy Power plc (Hotels, restaurants & leisure) | | | 1,592 | | | | 213 | |
| | | | | | | | | 422 | |
See accompanying Notes to Financial Statements.
| December 31, 2015 | William Blair Funds | 47 |
Global Small Cap Growth Fund (In Liquidation)
Portfolio of Investments, December 31, 2015 (all dollar amounts in thousands)
| | | | | | | | |
| | | | | | | | |
| | Issuer | | Shares | | | Value | |
| | | | | | | | | | |
| | Common Stocks—(continued) | | | | | | | | |
| | | | | | | | | | |
| | Europe, Mid-East—(continued) | | | | | | | | |
| | Israel—1.0% | | | | | | | | |
| | Elbit Systems, Ltd. (Aerospace & defense) | | | 2,095 | | | $ | 185 | |
| | Italy—7.1% | | | | | | | | |
| | Anima Holding SpA-144A (Capital markets) | | | 14,064 | | | | 123 | |
| | Banca IFIS SpA (Diversified financial services) | | | 6,687 | | | | 210 | |
| | Brembo SpA (Auto components) | | | 3,007 | | | | 146 | |
| | De’Longhi SpA (Household durables) | | | 5,236 | | | | 157 | |
| | DiaSorin SpA (Health care equipment & supplies) | | | 2,725 | | | | 143 | |
| | FinecoBank Banca Fineco SpA (Banks) | | | 18,353 | | | | 152 | |
| | Moncler SpA (Textiles, apparel & luxury goods) | | | 7,395 | | | | 104 | |
| | Recordati SpA (Pharmaceuticals) | | | 5,267 | | | | 138 | |
| | Salvatore Ferragamo Italia SpA (Textiles, apparel & luxury goods) | | | 5,281 | | | | 125 | |
| | | | | | | | | 1,298 | |
| | Luxembourg—1.1% | | | | | | | | |
| | Grand City Properties S.A. (Real estate management & development) | | | 9,001 | | | | 209 | |
| | Sweden—3.1% | | | | | | | | |
| | Hexpol AB (Chemicals) | | | 11,538 | | | | 124 | |
| * | NetEnt AB (Internet software & services) | | | 3,305 | | | | 194 | |
| | Nolato AB Class “B” (Industrial conglomerates) | | | 8,335 | | | | 254 | |
| | | | | | | | | 572 | |
| | Switzerland—0.8% | | | | | | | | |
| | VZ Holding AG (Capital markets) | | | 504 | | | | 149 | |
| | | | | | | | | | |
| | United Kingdom—12.8% | | | | | | | | |
| | Close Brothers Group plc (Capital markets) | | | 6,855 | | | | 135 | |
| | Domino’s Pizza Group plc (Hotels, restaurants & leisure) | | | 9,506 | | | | 147 | |
| | Essentra plc (Chemicals) | | | 8,254 | | | | 101 | |
| | Halma plc (Electronic equipment, instruments & components) | | | 18,271 | | | | 233 | |
| | Hays plc (Professional services) | | | 60,725 | | | | 131 | |
| | Howden Joinery Group plc (Specialty retail) | | | 25,787 | | | | 200 | |
| | IG Group Holdings plc (Diversified financial services) | | | 10,025 | | | | 119 | |
| | Inchcape plc (Distributors) | | | 10,395 | | | | 120 | |
| | Jupiter Fund Management plc (Capital markets) | | | 19,159 | | | | 128 | |
| | M&C Saatchi plc (Media) | | | 22,737 | | | | 109 | |
| | Moneysupermarket.com Group plc (Internet software & services) | | | 28,704 | | | | 155 | |
| | OM Asset Management plc (Capital markets)† | | | 9,748 | | | | 149 | |
| | Scapa Group plc (Chemicals) | | | 48,014 | | | | 152 | |
| | Spirax-Sarco Engineering plc (Machinery) | | | 2,243 | | | | 109 | |
| | Ted Baker plc (Textiles, apparel & luxury goods) | | | 2,917 | | | | 129 | |
| | | | | | | | |
| | | | | | | | |
| | Issuer | | Shares | | | Value | |
| | | | | | | | | | |
| | Common Stocks—(continued) | | | | | | | | |
| | | | | | | | | | |
| | United Kingdom—(continued) | | | | | | | | |
| | Victrex plc (Chemicals) | | | 4,301 | | | $ | 114 | |
| | Workspace Group plc (Real estate investment trusts (REITs)) | | | 9,024 | | | | 128 | |
| | | | | | | | | 2,359 | |
| | | | | | | | | | |
| | Japan—8.0% | | | | | | | | |
| | Hoshizaki Electric Co., Ltd. (Machinery) | | | 1,800 | | | | 113 | |
| | Meitec Corporation (Professional services) | | | 6,500 | | | | 225 | |
| | Nihon Kohden Corporation (Health care equipment & supplies) | | | 4,600 | | | | 112 | |
| | Nihon M&A Center, Inc. (Professional services) | | | 3,400 | | | | 166 | |
| | Nissan Chemical Industries, Ltd. (Chemicals) | | | 8,100 | | | | 186 | |
| | Relo Holdings, Inc. (Real estate management & development) | | | 1,200 | | | | 147 | |
| | Resorttrust, Inc. (Hotels, restaurants & leisure) | | | 4,900 | | | | 131 | |
| | Sato Holdings Corporation (Commercial services & supplies) | | | 7,700 | | | | 154 | |
| | Tsubakimoto Chain Co. (Machinery) | | | 16,000 | | | | 125 | |
| | Zenkoku Hosho Co., Ltd. (Diversified financial services) | | | 3,300 | | | | 110 | |
| | | | | | | | | 1,469 | |
| | | | | | | | | | |
| | Asia—3.9% | | | | | | | | |
| | Australia—2.5% | | | | | | | | |
| | DuluxGroup, Ltd. (Chemicals) | | | 29,340 | | | | 142 | |
| | Magellan Financial Group, Ltd. (Capital markets) | | | 9,837 | | | | 195 | |
| | The Star Entertainment Grp, Ltd. (Hotels, restaurants & leisure) | | | 33,701 | | | | 125 | |
| | | | | | | | | 462 | |
| | Singapore—1.4% | | | | | | | | |
| | ComfortDelGro Corporation, Ltd. (Road & rail) | | | 59,000 | | | | 127 | |
| | SATS, Ltd. (Transportation infrastructure) | | | 52,000 | | | | 141 | |
| | | | | | | | | 268 | |
| | | | | | | | | | |
| | Emerging Asia—3.2% | | | | | | | | |
| | China—0.9% | | | | | | | | |
| | Hollysys Automation Technologies, Ltd. (Electronic equipment, instruments & components)† | | | 7,784 | | | | 173 | |
| | Philippines—1.3% | | | | | | | | |
| | Megaworld Corporation (Real estate management & development) | | | 1,246,000 | | | | 112 | |
| | Security Bank Corporation (Banks) | | | 43,670 | | | | 132 | |
| | | | | | | | | 244 | |
| | Taiwan—1.0% | | | | | | | | |
| | Voltronic Power Technology Corporation (Electrical equipment) | | | 12,000 | | | | 179 | |
See accompanying Notes to Financial Statements.
| 48 | Annual Report | December 31, 2015 |
Global Small Cap Growth Fund (In Liquidation)
Portfolio of Investments, December 31, 2015 (all dollar amounts in thousands)
| | | | | | | | |
| | | | | | | | |
| | Issuer | | Shares | | | Value | |
| | | | | | | | | | |
| | Common Stocks—(continued) | | | | | | | | |
| | | | | | | | | | |
| | Emerging Latin America—2.3% | | | | | | | | |
| | Mexico—2.3% | | | | | | | | |
| * | Credito Real S.A.B. de C.V. (Consumer finance) | | | 65,195 | | | $ | 165 | |
| | Gentera S.A.B. de C.V. (Consumer finance) | | | 70,600 | | | | 136 | |
| * | Grupo Aeroportuario del Centro Norte S.A.B. de C.V. (Transportation infrastructure) | | | 25,900 | | | | 126 | |
| | | | | | | | | 427 | |
| | | | | | | | | | |
| | Emerging Europe, Mid-East, Africa—0.6% | | | | | | | | |
| | Turkey—0.6% | | | | | | | | |
| | Turkiye Sinai Kalkinma Bankasi A.S. (Banks) | | | 210,224 | | | | 110 | |
| | Total Common Stocks—98.0%
(cost $16,083) | | | | | | | 18,073 | |
| | | | | | | | |
| | Issuer | | Principal
Amount | | | Value | |
| | | | | | | | | | |
| | Repurchase Agreement | | | | | | | | |
| | Fixed Income Clearing Corporation, 0.030% dated 12/31/15, due 1/4/16, repurchase price $393, collateralized by FNMA, 2.625%, due 9/6/24 | | | $393 | | | $ | 393 | |
| | Total Repurchase Agreement—2.1%
(cost $393) | | | | | | | 393 | |
| | Total Investments—100.1%
(cost $16,476) | | | | | | | 18,466 | |
| | Liabilities, plus cash and other assets—(0.1)% | | | | | | | (22 | ) |
| | Net assets—100.0% | | | | | | $ | 18,444 | |
* Non-income producing securities
† = U.S. listed foreign security
For securities primarily traded on exchanges or markets that close before the close of regular trading on the New York Stock Exchange, the Fund may use an independent pricing service to fair value price the securities pursuant to Valuation Procedures approved by the Board of Trustees.
At December 31, 2015, the Fund’s Portfolio of Investments includes the following industry categories (as a percentage of long-term investments):
| Consumer Discretionary | | | 24.2 | % |
| Financials | | | 21.1 | % |
| Industrials | | | 18.6 | % |
| Information Technology | | | 15.1 | % |
| Health Care | | | 11.5 | % |
| Materials | | | 5.2 | % |
| Energy | | | 2.3 | % |
| Consumer Staples | | | 2.0 | % |
| Total | | | 100.0 | % |
At December 31, 2015, the Fund’s Portfolio of Investments includes the following currency categories (as a percentage of long-term investments):
| U.S. Dollar | | | 43.4 | % |
| Euro | | | 18.1 | % |
| British Pound Sterling | | | 13.4 | % |
| Japanese Yen | | | 8.1 | % |
| Swedish Krona | | | 3.2 | % |
| Australian Dollar | | | 2.6 | % |
| Mexican Peso | | | 2.4 | % |
| Canadian Dollar | | | 1.6 | % |
| Singapore Dollar | | | 1.5 | % |
| Philippine Peso | | | 1.3 | % |
| Israeli Shekel | | | 1.0 | % |
| Danish Krone | | | 1.0 | % |
| All Other Currencies | | | 2.4 | % |
| Total | | | 100.0 | % |
See accompanying Notes to Financial Statements.
| December 31, 2015 | William Blair Funds | 49 |
| | International Leaders Fund |
| | |
| | The International Leaders Fund seeks long-term capital appreciation. |
| | |
| | AN OVERVIEW FROM THE PORTFOLIO MANAGERS |
| | |

Kenneth J. McAtamney 
Simon Fennell | The William Blair International Leaders Fund (Class N shares) posted a 6.01% increase, net of fees, for the twelve months ended December 31, 2015. By comparison, the Fund’s benchmark index, the MSCI All Country World ex-U.S. IMI Index (net) (the “Index”), decreased 4.60%. The Fund’s performance relative to the Index during 2015 benefited from favorable style tailwinds, as higher-quality, growth-oriented companies with relatively strong earnings trends and price momentum generally outperformed on a global basis. Stock selection was strong across most sectors and regions during the year. From a sector perspective, Financials stock selection was the leading contributor. The Fund’s overweightings to Consumer Discretionary, Healthcare, and Information Technology (“IT”), and underweightings to Energy, Materials, and Telecommunication Services (“Telecom”) were also positive. Within Financials, stock selection was most beneficial within banks and capital markets. Although the Fund’s underweighting to banks in favor of insurance was favorable amid the low interest rate environment. HDFC Bank (India) was a leading contributor, benefiting from strong growth in retail loans and digital initiatives that drove higher market share. These positive effects were partially mitigated by the Fund’s Consumer Staples underweighting and Telecom stock selection. Within Telecom, Telenor (Norway) detracted from performance as it derives significant revenue from several emerging markets-based countries and its share price was adversely impacted by handset subsidies in Thailand and broader emerging markets earnings weakness. From a regional perspective, Europe ex-U.K. stock selection was the leading contributor to 2015 performance, benefiting from relative strength in European Consumer Discretionary, Healthcare, Financials and IT holdings. In contrast, stock selection in Latin America detracted from relative performance, but the impact was mitigated by the large underweight position. The Fund’s underweightings to the Developed Asia ex-Japan and Emerging Asia regions also detracted. Please refer to the Global Markets Review and Outlook relating to the Fund on page 39. |
| 50 | Annual Report | December 31, 2015 |
International Leaders Fund
Performance Highlights (Unaudited)
| Average Annual Total Return at 12/31/2015 |
| |
| | | 1 Year | | 3 Year | | Since
Inception |
| Class N(a) | | | 6.01 | % | | | 7.01 | % | | | 8.69 | % |
| Class I(a) | | | 6.18 | | | | 7.25 | | | | 8.94 | |
| MSCI ACW Ex-U.S. IMI (net)(a) | | | (4.60 | ) | | | 2.02 | | | | 4.36 | |
| Institutional Class(b) | | | 6.33 | | | | 7.43 | | | | 8.91 | |
| MSCI ACW Ex-U.S. IMI (net)(b) | | | (4.60 | ) | | | 2.02 | | | | 3.42 | |
| | |
| (a) | Since inception is for the period from August 16, 2012 (Commencement of Operations) to December 31, 2015. |
| (b) | Since inception is for the period from November 2, 2012 (Commencement of Operations) to December 31, 2015. |
Performance cited represents past performance. Past performance does not guarantee future results and current performance may be lower or higher than the data quoted. Results shown are average annual returns, which assume reinvestment of dividends and capital gains. Investment returns and principal will fluctuate and you may have a gain or loss when you sell shares. For the most current month-end performance information, please call 1-800-742-7272, or visit our Web site at www.williamblairfunds.com. From time to time the investment adviser may waive fees or reimburse expenses for the Fund. Without these waivers/reimbursements, performance would be lower. International investing involves special risk considerations, including currency fluctuations, lower liquidity, economic and political risk. Class N shares are available to the general public without a sales load. Class I shares are available to certain institutional investors and advisory clients of William Blair Investment Management, LLC and William Blair & Company, L.L.C., without a sales load or distribution (12b-1) fees. Institutional Class shares are available to institutional investors without a sales load or distribution (12b-1) or service fees.
The performance highlights presented above do not reflect the deduction of taxes that a shareholder would pay on fund distributions or the redemption of fund shares.
The Morgan Stanley Capital International (MSCI) All Country World (ACW) Ex-U.S. Investable Market Index (IMI) (net) is a free float-adjusted market capitalization weighted index that is designed to measure the equity market performance of developed and emerging markets, excluding the United States. This series approximates the minimum possible dividend reinvestment.
This report identifies the Fund’s investments on December 31, 2015. These holdings are subject to change. Not all stocks in the Fund performed the same, nor is there any guarantee that these stocks will perform as well in the future. Market forecasts provided in this report may not necessarily come to pass.
Sector Diversification (Unaudited)

The sector diversification shown is based on the total long-term securities.
| December 31, 2015 | William Blair Funds | 51 |
International Leaders Fund
Portfolio of Investments, December 31, 2015 (all dollar amounts in thousands)
| | | | | | | | |
| | | | | | | | |
| | Issuer | | Shares | | | Value | |
| | |
| | Common Stocks | | | | | | | | |
| | | | | | | | | | |
| | Europe, Mid-East—33.4% | | | | | | | | |
| | Denmark—1.8% | | | | | | | | |
| | Novo Nordisk A/S Class “B” (Pharmaceuticals) | | | 36,407 | | | $ | 2,120 | |
| | Finland—1.8% | | | | | | | | |
| | Sampo Oyj Class “A” (Insurance) | | | 40,955 | | | | 2,092 | |
| | France—7.9% | | | | | | | | |
| | Cap Gemini S.A. (IT services) | | | 30,537 | | | | 2,841 | |
| | JCDecaux S.A. (Media) | | | 39,312 | | | | 1,508 | |
| | Safran S.A. (Aerospace & defense) | | | 22,497 | | | | 1,550 | |
| | Total S.A. (Oil, gas & consumable fuels) | | | 32,541 | | | | 1,459 | |
| | Valeo S.A. (Auto components) | | | 11,427 | | | | 1,770 | |
| | | | | | | | | 9,128 | |
| | Germany—4.2% | | | | | | | | |
| | Bayerische Motoren Werke AG (Automobiles) | | | 16,156 | | | | 1,714 | |
| | Continental AG (Auto components) | | | 9,286 | | | | 2,266 | |
| | Rational AG (Machinery) | | | 1,863 | | | | 850 | |
| | | | | | | | | 4,830 | |
| | Ireland—2.2% | | | | | | | | |
| | Ryanair Holdings plc-ADR (Airlines) | | | 29,205 | | | | 2,525 | |
| | Israel—2.8% | | | | | | | | |
| | Teva Pharmaceutical Industries, Ltd.-ADR (Pharmaceuticals) | | | 49,664 | | | | 3,260 | |
| | Italy—2.2% | | | | | | | | |
| | Intesa Sanpaolo SpA (Banks) | | | 768,593 | | | | 2,579 | |
| | Netherlands—2.9% | | | | | | | | |
| * | NXP Semiconductor N.V. (Semiconductors & semiconductor equipment)† | | | 27,091 | | | | 2,282 | |
| | Royal Dutch Shell plc Class “A” (Oil, gas & consumable fuels) | | | 46,142 | | | | 1,058 | |
| | | | | | | | | 3,340 | |
| | Spain—1.4% | | | | | | | | |
| | Amadeus IT Holding S.A. Class “A” (IT services) | | | 37,637 | | | | 1,664 | |
| | Sweden—2.4% | | | | | | | | |
| | Atlas Copco AB Class “A” (Machinery) | | | 53,956 | | | | 1,332 | |
| | Hexagon AB Class “B” (Electronic equipment, instruments & components) | | | 39,810 | | | | 1,485 | |
| | | | | | | | | 2,817 | |
| | Switzerland—3.8% | | | | | | | | |
| * | Actelion, Ltd. (Biotechnology) | | | 17,106 | | | | 2,384 | |
| | Partners Group Holding AG (Capital markets) | | | 5,551 | | | | 2,002 | |
| | | | | | | | | 4,386 | |
| | Japan—20.8% | | | | | | | | |
| | Astellas Pharma, Inc. (Pharmaceuticals) | | | 125,300 | | | | 1,805 | |
| | Daikin Industries, Ltd. (Building products) | | | 25,600 | | | | 1,896 | |
| | FANUC Corporation (Machinery) | | | 9,100 | | | | 1,596 | |
| | Fuji Heavy Industries, Ltd. (Automobiles) | | | 58,959 | | | | 2,466 | |
| | | | | | | | |
| | | | | | | | |
| | Issuer | | Shares | | | Value | |
| | |
| | Common Stocks—(continued) | | | | | | | | |
| | | | | | | | | | |
| | Japan—(continued) | | | | | | | | |
| | Hoya Corporation (Health care equipment & supplies) | | | 44,300 | | | $ | 1,836 | |
| | Kao Corporation (Personal products) | | | 33,800 | | | | 1,759 | |
| | Keyence Corporation (Electronic equipment, instruments & components) | | | 3,100 | | | | 1,730 | |
| | Makita Corporation (Machinery) | | | 24,900 | | | | 1,456 | |
| | Murata Manufacturing Co., Ltd. (Electronic equipment, instruments & components) | | | 11,400 | | | | 1,666 | |
| | Nitori Holdings Co., Ltd. (Specialty retail) | | | 16,200 | | | | 1,379 | |
| | ORIX Corporation (Diversified financial services) | | | 139,300 | | | | 1,988 | |
| | Shimano, Inc. (Leisure products) | | | 11,700 | | | | 1,816 | |
| | SMC Corporation (Machinery) | | | 3,600 | | | | 952 | |
| | Sumitomo Mitsui Financial Group, Inc. (Banks) | | | 47,600 | | | | 1,824 | |
| | | | | | | | | 24,169 | |
| | | | | | | | | | |
| | United Kingdom—16.3% | | | | | | | | |
| | ARM Holdings plc (Semiconductors & semiconductor equipment) | | | 49,477 | | | | 758 | |
| | Compass Group plc (Hotels, restaurants & leisure) | | | 165,636 | | | | 2,869 | |
| | IG Group Holdings plc (Diversified financial services) | | | 115,051 | | | | 1,361 | |
| | InterContinental Hotels Group plc (Hotels,restaurants & leisure) | | | 39,734 | | | | 1,557 | |
| | Prudential plc (Insurance) | | | 85,868 | | | | 1,938 | |
| | Reckitt Benckiser Group plc (Household products) | | | 21,946 | | | | 2,032 | |
| | RELX plc (Media) | | | 130,730 | | | | 2,307 | |
| | St James’s Place plc (Insurance) | | | 100,144 | | | | 1,488 | |
| | Wolseley plc (Trading companies & distributors) | | | 38,195 | | | | 2,079 | |
| | WPP plc (Media) | | | 109,850 | | | | 2,531 | |
| | | | | | | | | 18,920 | |
| | | | | | | | | | |
| | Emerging Asia—14.7% | | | | | | | | |
| | China—6.9% | | | | | | | | |
| * | Baidu, Inc.-ADR (Internet software & services) | | | 6,828 | | | | 1,291 | |
| | China Overseas Land & Investment, Ltd. (Real estate management & development) | | | 574,000 | | | | 2,007 | |
| | Lenovo Group, Ltd. (Technology hardware, storage & peripherals) | | | 1,192,000 | | | | 1,211 | |
| | NetEase, Inc.-ADR (Internet software & services) | | | 10,982 | | | | 1,990 | |
| | Tencent Holdings, Ltd. (Internet software & services) | | | 79,700 | | | | 1,570 | |
| | | | | | | | | 8,069 | |
| | India—3.8% | | | | | | | | |
| | Hero MotoCorp, Ltd. (Automobiles) | | | 41,600 | | | | 1,690 | |
| | Housing Development Finance Corporation, Ltd. (Thrifts & mortgage finance) | | | 78,275 | | | | 1,495 | |
| * | Tata Motors, Ltd.-ADR (Automobiles) | | | 43,593 | | | | 1,285 | |
| | | | | | | | | 4,470 | |
See accompanying Notes to Financial Statements.
| 52 | Annual Report | December 31, 2015 |
International Leaders Fund
Portfolio of Investments, December 31, 2015 (all dollar amounts in thousands)
| | | | | | | | |
| | | | | | |
| | Issuer | | Shares | | | Value | |
| | |
| | Common Stocks—(continued) | | | | | | | | |
| | | | | | | | | | |
| | Emerging Asia—(continued) | | | | | | | | |
| | South Korea—1.7% | | | | | | | | |
| | Samsung Electronics Co., Ltd. (Technology hardware, storage & peripherals) | | | 1,806 | | | $ | 1,941 | |
| | Taiwan—2.3% | | | | | | | | |
| | Taiwan Semiconductor Manufacturing Co., Ltd. (Semiconductors & semiconductor equipment) | | | 606,000 | | | | 2,638 | |
| | | | | | | | | | |
| | Canada—5.1% | | | | | | | | |
| | Alimentation Couche Tard, Inc. Class “B” (Food & staples retailing) | | | 50,107 | | | | 2,206 | |
| | Brookfield Asset Management, Inc. Class “A” (Real estate management & development)† | | | 77,947 | | | | 2,458 | |
| | Suncor Energy, Inc. (Oil, gas & consumable fuels) | | | 49,607 | | | | 1,280 | |
| | | | | | | | | 5,944 | |
| | | | | | | | | | |
| | Asia—4.0% | | | | | | | | |
| | Australia—2.1% | | | | | | | | |
| | Macquarie Group, Ltd. (Capital markets) | | | 41,196 | | | | 2,485 | |
| | Hong Kong—1.9% | | | | | | | | |
| | AIA Group, Ltd. (Insurance) | | | 356,800 | | | | 2,145 | |
| | | | | | | | | | |
| | Emerging Europe, Mid-East, Africa—1.5% | | | | | | | | |
| | South Africa—1.5% | | | | | | | | |
| | Bidvest Group, Ltd. (Industrial conglomerates) | | | 52,334 | | | | 1,111 | |
| | Discovery, Ltd. (Insurance) | | | 67,113 | | | | 577 | |
| | | | | | | | | 1,688 | |
| | Total Common Stocks—95.8%
(cost $100,734) | | | | | | | 111,210 | |
| | | | | | | | |
| | | | Principal | | | |
| | Issuer | | Amount | | | Value | |
| | |
| | Repurchase Agreement | | | | | | | | |
| | Fixed Income Clearing Corporation, 0.030% dated 12/31/15, due 1/4/16, repurchase price $4,150, collateralized by U.S Treasury Note, 2.375%, due 8/15/24 | | | $4,150 | | | $ | 4,150 | |
| | Total Repurchase Agreement—3.6%
(cost $4,150) | | | | | | | 4,150 | |
| | Total Investments—99.4%
(cost $104,884) | | | | | | | 115,360 | |
| | Cash and other assets, less liabilities—0.6% | | | | | | | 718 | |
| | Net assets—100.0% | | | | | | $ | 116,078 | |
ADR = American Depository Receipt
* Non-income producing securities
† = U.S. listed foreign security
For securities primarily traded on exchanges or markets that close before the close of regular trading on the New York Stock Exchange, the Fund may use an independent pricing service to fair value price the securities pursuant to Valuation Procedures approved by the Board of Trustees.
At December 31, 2015, the Fund’s Portfolio of Investments includes the following industry categories (as a percentage of long-term investments):
| Financials | | | 23.8 | % |
| Consumer Discretionary | | | 22.6 | % |
| Information Technology | | | 20.7 | % |
| Industrials | | | 13.8 | % |
| Health Care | | | 10.3 | % |
| Consumer Staples | | | 5.4 | % |
| Energy | | | 3.4 | % |
| Total | | | 100.0 | % |
At December 31, 2015, the Fund’s Portfolio of Investments includes the following currency categories (as a percentage of long-term investments):
| Japanese Yen | | | 21.7 | % |
| Euro | | | 19.2 | % |
| British Pound Sterling | | | 17.0 | % |
| U.S. Dollar | | | 13.6 | % |
| Hong Kong Dollar | | | 6.2 | % |
| Swiss Franc | | | 4.0 | % |
| Canadian Dollar | | | 3.1 | % |
| Indian Rupee | | | 2.9 | % |
| Swedish Krona | | | 2.5 | % |
| New Taiwan Dollar | | | 2.4 | % |
| Australian Dollar | | | 2.2 | % |
| Danish Krone | | | 1.9 | % |
| South Korean Won | | | 1.8 | % |
| South African Rand | | | 1.5 | % |
| Total | | | 100.0 | % |
See accompanying Notes to Financial Statements.
| December 31, 2015 | William Blair Funds | 53 |
| | International Equity Fund |
| | |
| | The International Equity Fund seeks long-term capital appreciation. |
| | |
| | AN OVERVIEW FROM THE PORTFOLIO MANAGERS |
| | |

David Merjan 
John C. Murphy | The William Blair International Equity Fund (Class N shares) posted a 1.54% increase, net of fees, for the twelve months ended December 31, 2015. By comparison, the Fund’s benchmark index, the MSCI World ex-U.S. Index (net) (the “Index”), decreased 3.04%. The Fund’s performance during 2015 was broadly supported by our emphasis on higher-quality, growth-oriented companies. From a sector perspective, Financials stock selection was the leading contributor for the year, bolstered by bank, diversified financial services, and insurance holdings. HDFC Bank (India) was a leading contributor, benefiting from strong growth in retail loans and digital initiatives that drove higher market share. Insurance company AIA Group (Hong Kong) was another notable contributor, benefiting from favorable new business trends despite a volatile macroeconomic environment in Emerging Asia. Consumer Discretionary, Consumer Staples, Industrials, and Information Technology (“IT”) stock selection were also primary contributors to the Fund’s performance. Overall sector positioning was also beneficial—primarily the Fund’s overweightings to Industrials and IT versus the Index, and underweightings to Materials and Energy versus the Index. These positive effects helped to offset poor stock selection in Energy and Materials. Canadian exploration & production companies Enerplus and Canadian Natural Resources were key detractors, hampered by lower oil and gas selling prices. Within Materials, mining company Rio Tinto (U.K.) was hurt by declines in the iron ore price. Swiss-based agricultural chemical company Syngenta suffered from weaker sales and management’s rejection of a takeover offer from U.S.-based seed company Monsanto. From a regional perspective, stock selection was strongest in Europe ex-U.K. and Developed Asia, partially offset by the underweightings to both regions. The overweighting to Canada also detracted from relative performance. Please refer to the Global Markets Review and Outlook relating to the Fund on page 39. |
| 54 | Annual Report | December 31, 2015 |
International Equity Fund
Performance Highlights (Unaudited)
| | | | | | | |
| Average Annual Total Return at 12/31/2015 | | | | | | |
| | | | | | | | | | | | | |
| | | 1 Year | | 3 Year | | 5 Year | | 10 Year |
| Class N | | | 1.54 | % | | | 5.54 | % | | | 3.79 | % | | | 2.52 | % |
| Class I | | | 1.80 | | | | 5.81 | | | | 4.05 | | | | 2.77 | |
| MSCI World Ex-U.S. Index (net) | | | (3.04 | ) | | | 3.93 | | | | 2.79 | | | | 2.92 | |
Performance cited represents past performance. Past performance does not guarantee future results and current performance may be lower or higher than the data quoted. Results shown are average annual returns, which assume reinvestment of dividends and capital gains. Investment returns and principal will fluctuate and you may have a gain or loss when you sell shares. For the most current month-end performance information, please call 1-800-742-7272, or visit our Web site at www.williamblairfunds.com. From time to time the investment adviser may waive fees or reimburse expenses for the Fund. Without these waivers/reimbursements, performance would be lower. International investing involves special risk considerations, including currency fluctuations, lower liquidity, economic and political risk. Class N shares are available to the general public without a sales load. Class I shares are available to certain institutional investors and advisory clients of William Blair Investment Management, LLC and William Blair & Company, L.L.C., without a sales load or distribution (12b-1) or service fees.
The performance highlights and graph presented above do not reflect the deduction of taxes that a shareholder would pay on fund distributions or the redemption of fund shares.
The Morgan Stanley Capital International (MSCI) World Ex-U.S. Index (net) is a free float-adjusted market capitalization weighted index that is designed to measure the equity market performance of developed markets, excluding the United States. This series approximates the minimum possible dividend reinvestment.
This report identifies the Fund’s investments on December 31, 2015. These holdings are subject to change. Not all stocks in the Fund performed the same, nor is there any guarantee that these stocks will perform as well in the future. Market forecasts provided in this report may not necessarily come to pass.
Sector Diversification (Unaudited)

The sector diversification shown is based on the total long-term securities.
| December 31, 2015 | William Blair Funds | 55 |
International Equity Fund
Portfolio of Investments, December 31, 2015 (all dollar amounts in thousands)
| | | | | | | | | | |
| | | | | | | | | | |
| | Issuer | | Shares | | | Value | |
| | | | | | | | | | |
| | Common Stocks | | | | | | | | |
| | | | | | | | | | |
| | Europe—33.4% | | | | | | | | |
| | Belgium—2.9% | | | | | | | | |
| | Anheuser-Busch InBev N.V. (Beverages) | | | 8,086 | | | $ | 1,005 | |
| | UCB S.A. (Pharmaceuticals) | | | 9,519 | | | | 861 | |
| | | | | | | | | 1,866 | |
| | Denmark—1.1% | | | | | | | | |
| | Novo Nordisk A/S Class “B” (Pharmaceuticals) | | | 12,475 | | | | 726 | |
| | Finland—1.0% | | | | | | | | |
| | Kone Oyj Class “B” (Machinery) | | | 15,149 | | | | 645 | |
| | France—7.6% | | | | | | | | |
| | AXA S.A. (Insurance) | | | 27,713 | | | | 760 | |
| | BNP Paribas S.A. (Banks) | | | 16,490 | | | | 936 | |
| | Cap Gemini S.A. (IT services) | | | 6,798 | | | | 632 | |
| | Essilor International S.A. (Health care equipment & supplies) | | | 4,895 | | | | 612 | |
| | Total S.A. (Oil, gas & consumable fuels) | | | 22,257 | | | | 998 | |
| | Veolia Environnement S.A. (Multi-utilities) | | | 39,631 | | | | 942 | |
| | | | | | | | | 4,880 | |
| | Germany—5.6% | | | | | | | | |
| | BASF SE (Chemicals) | | | 7,234 | | | | 556 | |
| | Bayerische Motoren Werke AG (Automobiles) | | | 5,594 | | | | 594 | |
| | Continental AG (Auto components) | | | 3,817 | | | | 932 | |
| | Fresenius SE & Co. KGaA (Health care providers & services) | | | 10,616 | | | | 761 | |
| | Infineon Technologies AG (Semiconductors & semiconductor equipment) | | | 49,566 | | | | 727 | |
| | | | | | | | | 3,570 | |
| | Italy—1.2% | | | | | | | | |
| | Intesa Sanpaolo SpA (Banks) | | | 220,018 | | | | 738 | |
| | Netherlands—6.1% | | | | | | | | |
| * | NXP Semiconductor N.V. (Semiconductors & semiconductor equipment)† | | | 7,412 | | | | 625 | |
| | Royal Dutch Shell plc Class “A” (Oil, gas & consumable fuels) | | | 42,796 | | | | 981 | |
| * | Sensata Technologies Holding N.V. (Electrical equipment)† | | | 16,398 | | | | 755 | |
| | Unilever N.V. (Personal products) | | | 35,110 | | | | 1,530 | |
| | | | | | | | | 3,891 | |
| | Spain—1.3% | | | | | | | | |
| | Industria de Diseno Textil S.A. (Specialty retail) | | | 24,614 | | | | 848 | |
| | Sweden—2.5% | | | | | | | | |
| | Assa Abloy AB Class “B” (Building products) | | | 38,574 | | | | 814 | |
| | Atlas Copco AB Class “A” (Machinery) | | | 32,014 | | | | 790 | |
| | | | | | | | | 1,604 | |
| | Switzerland—4.1% | | | | | | | | |
| | Cie Financiere Richemont S.A. (Textiles, apparel & luxury goods) | | | 9,610 | | | | 692 | |
| | Nestle S.A. (Food products) | | | 6,368 | | | | 474 | |
| | | | | | | | |
| | | | | | | | |
| | Issuer | | Shares | | | Value | |
| | | | | | | | | | |
| | Common Stocks—(continued) | | | | | | | | |
| | | | | | | | | | |
| | Europe—(continued) | | | | | | | | |
| | Switzerland—(continued) | | | | | | | | |
| | Novartis AG (Pharmaceuticals) | | | 11,363 | | | $ | 985 | |
| | Roche Holding AG (Pharmaceuticals) | | | 1,654 | | | | 456 | |
| | | | | | | | | 2,607 | |
| | | | | | | | | | |
| | United Kingdom—30.3% | | | | | | | | |
| | Ashtead Group plc (Trading companies & distributors) | | | 44,586 | | | | 735 | |
| | Babcock International Group plc (Commercial services & supplies) | | | 55,752 | | | | 835 | |
| | Bunzl plc (Trading companies & distributors) | | | 18,013 | | | | 501 | |
| | Capita plc (Professional services) | | | 44,920 | | | | 800 | |
| | Compass Group plc (Hotels, restaurants & leisure) | | | 97,633 | | | | 1,691 | |
| | Diageo plc (Beverages) | | | 33,719 | | | | 923 | |
| | easyJet plc (Airlines) | | | 21,355 | | | | 548 | |
| | Experian plc (Professional services) | | | 54,105 | | | | 958 | |
| | InterContinental Hotels Group plc (Hotels, restaurants & leisure) | | | 15,954 | | | | 625 | |
| | Legal & General Group plc (Insurance) | | | 264,647 | | | | 1,045 | |
| | Lloyds Banking Group plc (Banks) | | | 774,444 | | | | 834 | |
| | Next plc (Multiline retail) | | | 4,306 | | | | 463 | |
| | Prudential plc (Insurance) | | | 41,786 | | | | 943 | |
| | Reckitt Benckiser Group plc (Household products) | | | 15,437 | | | | 1,429 | |
| | Regus plc (Commercial services & supplies) | | | 125,137 | | | | 615 | |
| | RELX plc (Media) | | | 66,762 | | | | 1,178 | |
| | Rio Tinto plc (Metals & mining) | | | 39,985 | | | | 1,167 | |
| | Schroders plc (Capital markets) | | | 21,895 | | | | 961 | |
| | Travis Perkins plc (Trading companies & distributors) | | | 23,780 | | | | 692 | |
| | UBM plc (Media) | | | 56,843 | | | | 441 | |
| | Wolseley plc (Trading companies & distributors) | | | 18,309 | | | | 996 | |
| | WPP plc (Media) | | | 43,058 | | | | 992 | |
| | | | | | | | | 19,372 | |
| | | | | | | | | | |
| | Japan—19.7% | | | | | | | | |
| | Astellas Pharma, Inc. (Pharmaceuticals) | | | 38,400 | | | | 553 | |
| | Daikin Industries, Ltd. (Building products) | | | 6,418 | | | | 475 | |
| | FANUC Corporation (Machinery) | | | 4,361 | | | | 765 | |
| | Fuji Heavy Industries, Ltd. (Automobiles) | | | 22,072 | | | | 923 | |
| | Hitachi Capital Corporation (Consumer finance) | | | 19,500 | | | | 531 | |
| | Hoya Corporation (Health care equipment & supplies) | | | 17,364 | | | | 720 | |
| | Japan Exchange Group, Inc. (Diversified financial services) | | | 43,800 | | | | 696 | |
| | Kao Corporation (Personal products) | | | 14,589 | | | | 759 | |
| | Keyence Corporation (Electronic equipment, instruments & components) | | | 1,205 | | | | 673 | |
| | Mitsubishi UFJ Financial Group, Inc. (Banks) | | | 149,200 | | | | 940 | |
See accompanying Notes to Financial Statements.
| 56 | Annual Report | December 31, 2015 |
International Equity Fund
Portfolio of Investments, December 31, 2015 (all dollar amounts in thousands)
| | | | | | | | |
| | | | | | | | |
| | Issuer | | Shares | | | Value | |
| | | | | | | | | | |
| | Common Stocks—(continued) | | | | | | | | |
| | | | | | | | | | |
| | Japan—(continued) | | | | | | | | |
| | Murata Manufacturing Co., Ltd. (Electronic equipment, instruments & components) | | | 4,100 | | | $ | 599 | |
| | Nihon M&A Center, Inc. (Professional services) | | | 8,470 | | | | 413 | |
| | Nippon Prologis REIT, Inc. (Real estate investment trusts (REITs)) | | | 253 | | | | 460 | |
| | Obic Co., Ltd. (IT services) | | | 8,174 | | | | 438 | |
| | ORIX Corporation (Diversified financial services) | | | 57,829 | | | | 825 | |
| | SCSK Corporation (IT services) | | | 20,963 | | | | 852 | |
| | Seino Holdings Co., Ltd. (Road & rail) | | | 33,383 | | | | 352 | |
| | Shimano, Inc. (Leisure products) | | | 3,700 | | | | 574 | |
| | Sumitomo Mitsui Financial Group, Inc. (Banks) | | | 17,800 | | | | 682 | |
| | Suruga Bank, Ltd. (Banks) | | | 17,394 | | | | 364 | |
| | | | | | | | | 12,594 | |
| | | | | | | | | | |
| | Canada—8.6% | | | | | | | | |
| | Alimentation Couche Tard, Inc. Class “B” (Food & staples retailing) | | | 18,625 | | | | 820 | |
| | Brookfield Asset Management, Inc. Class “A” (Real estate management & development)† | | | 20,398 | | | | 643 | |
| | Canadian National Railway Co. (Road & rail)† | | | 14,890 | | | | 832 | |
| | Canadian Natural Resources, Ltd. (Oil, gas & consumable fuels) | | | 39,374 | | | | 860 | |
| | CI Financial Corporation (Capital markets) | | | 20,769 | | | | 459 | |
| | Enerplus Corporation (Oil, gas & consumable fuels) | | | 139,946 | | | | 480 | |
| | Intact Financial Corporation (Insurance) | | | 7,065 | | | | 453 | |
| | The Toronto-Dominion Bank (Banks)† | | | 23,910 | | | | 937 | |
| | | | | | | | | 5,484 | |
| | | | | | | | | | |
| | Emerging Asia—4.2% | | | | | | | | |
| | China—0.6% | | | | | | | | |
| | China Everbright International, Ltd. (Commercial services & supplies) | | | 305,765 | | | | 393 | |
| | India—1.2% | | | | | | | | |
| | HDFC Bank, Ltd.-ADR (Banks) | | | 12,628 | | | | 778 | |
| | Taiwan—2.4% | | | | | | | | |
| | Largan Precision Co., Ltd. (Electronic equipment, instruments & components) | | | 6,000 | | | | 415 | |
| | MediaTek, Inc. (Semiconductors & semiconductor equipment) | | | 56,000 | | | | 426 | |
| | Taiwan Semiconductor Manufacturing Co., Ltd.-ADR (Semiconductors & semiconductor equipment) | | | 28,938 | | | | 658 | |
| | | | | | | | | 1,499 | |
| | | | | | | | | | |
| | Asia—1.8% | | | | | | | | |
| | Hong Kong—1.8% | | | | | | | | |
| | AIA Group, Ltd. (Insurance) | | | 186,186 | | | | 1,119 | |
| | Total Common Stocks—98.0%
(cost $57,430) | | | | | | | 62,614 | |
| | | | | | | | |
| | | | Principal | | | | |
| | Issuer | | Amount | | | Value | |
| | | | | | | | |
| | Repurchase Agreement | | | | | | | | |
| | Fixed Income Clearing Corporation, 0.030% dated 12/31/15, due 1/4/16, repurchase price $953, collateralized by U.S. Treasury Note, 2.375%, due 8/15/24 | | | $953 | | | $ | 953 | |
| | Total Repurchase Agreement—1.5%
(cost $953) | | | | | | | 953 | |
| | Total Investments—99.5%
(cost $58,383) | | | | | | | 63,567 | |
| | Cash and other assets, less liabilities—0.5% | | | | | | | 339 | |
| | Net assets—100.0% | | | | | | $ | 63,906 | |
ADR = American Depository Receipt
* Non-income producing securities
† = U.S. listed foreign security
For securities primarily traded on exchanges or markets that close before the close of regular trading on the New York Stock Exchange, the Fund may use an independent pricing service to fair value price the securities pursuant to Valuation Procedures approved by the Board of Trustees.
At December 31, 2015, the Fund’s Portfolio of Investments includes the following industry categories (as a percentage of long-term investments):
| Financials | | | 24.1 | % |
| Industrials | | | 20.6 | % |
| Consumer Discretionary | | | 15.9 | % |
| Consumer Staples | | | 11.1 | % |
| Information Technology | | | 9.7 | % |
| Health Care | | | 9.1 | % |
| Energy | | | 5.3 | % |
| Materials | | | 2.7 | % |
| Utilities | | | 1.5 | % |
| Total | | | 100.0 | % |
At December 31, 2015, the Fund’s Portfolio of Investments includes the following currency categories (as a percentage of long-term investments):
| British Pound Sterling | | | 30.9 | % |
| Euro | | | 24.0 | % |
| Japanese Yen | | | 20.1 | % |
| U.S. Dollar | | | 8.4 | % |
| Canadian Dollar | | | 4.9 | % |
| Swiss Franc | | | 4.2 | % |
| Swedish Krona | | | 2.6 | % |
| Hong Kong Dollar | | | 2.4 | % |
| New Taiwan Dollar | | | 1.3 | % |
| Danish Krone | | | 1.2 | % |
| Total | | | 100.0 | % |
See accompanying Notes to Financial Statements.
| December 31, 2015 | William Blair Funds | 57 |
| | Institutional International Equity Fund |
| | |
| | The Institutional International Equity Fund seeks long-term capital appreciation. |
| | |
| | AN OVERVIEW FROM THE PORTFOLIO MANAGERS |
| | |
David Merjan
John C. Murphy | The William Blair Institutional International Equity Fund posted a 1.91% increase, net of fees, for the twelve months ended December 31, 2015. By comparison, the Fund’s benchmark index, the MSCI World ex-U.S. Index (net) (the “Index”), decreased 3.04%. The Fund’s performance during 2015 was broadly supported by our emphasis on higher-quality, growth-oriented companies. From a sector perspective, Financials stock selection was the leading contributor for the year, bolstered by bank, diversified financial services, and insurance holdings. HDFC Bank (India) was a leading contributor, benefiting from strong growth in retail loans and digital initiatives that drove higher market share. Insurance company AIA Group (Hong Kong) was another notable contributor, benefiting from favorable new business trends despite a volatile macroeconomic environment in Emerging Asia. Consumer Discretionary, Consumer Staples, Industrials, and Information Technology (“IT”) stock selection were also significant contributors to the Fund’s performance. Overall sector positioning was also beneficial—primarily the Fund’s overweightings to Industrials and IT versus the Index, and underweightings to Materials and Energy versus the Index. These positive effects helped to offset poor stock selection in Energy and Materials. Canadian exploration & production companies Enerplus and Canadian Natural Resources were key detractors, hampered by lower oil and gas selling prices. Within Materials, mining company Rio Tinto (U.K.) was hurt by declines in the iron ore price. Swiss-based agricultural chemical company Syngenta suffered from weaker sales and management’s rejection of a takeover offer from U.S.-based seed company Monsanto. From a regional perspective, stock selection was strongest in Europe ex-U.K. and Developed Asia, partially offset by the underweightings to both regions. The overweighting to Canada also detracted from relative performance. Please refer to the Global Markets Review and Outlook relating to the Fund on page 39. |
| 58 | Annual Report | December 31, 2015 |
Institutional International Equity Fund
Performance Highlights (Unaudited)
| Average Annual Total Return at 12/31/2015 |
| | | | | | | | | | | | | |
| | | 1 Year | | 3 Year | | 5 Year | | 10 Year |
| Institutional Class | | | 1.91 | % | | | 5.61 | % | | | 4.14 | % | | | 2.67 | % |
| MSCI World Ex-U.S. Index (net) | | | (3.04 | ) | | | 3.93 | | | | 2.79 | | | | 2.92 | |
Performance cited represents past performance. Past performance does not guarantee future results and current performance may be lower or higher than the data quoted. Results shown are average annual returns, which assume reinvestment of dividends and capital gains. Investment returns and principal will fluctuate and you may have a gain or loss when you sell shares. For the most current month end performance information, please call 1-800-742-7272, or visit our Web site at www.williamblairfunds.com. From time to time, the investment adviser may waive fees or reimburse expenses for the Fund. Without these waivers/reimbursements, performance would be lower. International investing involves special risk considerations, including currency fluctuations, lower liquidity, economic and political risk. Shares of the Fund are available without a sales load or distribution (12b-1) or service fees.
The performance highlights and graph presented above do not reflect the deduction of taxes that a shareholder would pay on fund distributions or the redemption of fund shares.
The Morgan Stanley Capital International (MSCI) World Ex-U.S. Index (net) is a free float-adjusted market capitalization weighted index that is designed to measure the equity market performance of developed markets, excluding the United States. This series approximates the minimum possible dividend reinvestment.
This report identifies the Fund’s investments on December 31, 2015. These holdings are subject to change. Not all stocks in the Fund performed the same, nor is there any guarantee that these stocks will perform as well in the future. Market forecasts provided in this report may not necessarily come to pass.
Sector Diversification (Unaudited)

The sector diversification shown is based on the total long-term securities.
| December 31, 2015 | William Blair Funds | 59 |
Institutional International Equity Fund
Portfolio of Investments, December 31, 2015 (all dollar amounts in thousands)
| | | | | | | | |
| | | | | | | | |
| | Issuer | | Shares | | | Value | |
| | | | | | | | | | |
| | Common Stocks | | | | | | | | |
| | | | | | | | | | |
| | Europe—34.3% | | | | | | | | |
| | Belgium—3.0% | | | | | | | | |
| | Anheuser-Busch InBev N.V. (Beverages) | | | 2,046 | | | $ | 254 | |
| | UCB S.A. (Pharmaceuticals) | | | 2,408 | | | | 218 | |
| | | | | | | | | 472 | |
| | Denmark—1.2% | | | | | | | | |
| | Novo Nordisk A/S Class “B” (Pharmaceuticals) | | | 3,204 | | | | 187 | |
| | Finland—1.0% | | | | | | | | |
| | Kone Oyj Class ’‘B’’ (Machinery) | | | 3,904 | | | | 166 | |
| | France—7.7% | | | | | | | | |
| | AXA S.A. (Insurance) | | | 7,010 | | | | 192 | |
| | BNP Paribas S.A. (Banks) | | | 4,171 | | | | 237 | |
| | Cap Gemini S.A. (IT services) | | | 1,721 | | | | 160 | |
| | Essilor International S.A. (Health care equipment & supplies) | | | 1,239 | | | | 155 | |
| | Total S.A. (Oil, gas & consumable fuels) | | | 5,650 | | | | 253 | |
| | Veolia Environnement S.A. (Multi-utilities) | | | 10,025 | | | | 238 | |
| | | | | | | | | 1,235 | |
| | Germany—5.7% | | | | | | | | |
| | BASF SE (Chemicals) | | | 1,858 | | | | 143 | |
| | Bayerische Motoren Werke AG (Automobiles) | | | 1,437 | | | | 153 | |
| | Continental AG (Auto components) | | | 980 | | | | 239 | |
| | Fresenius SE & Co. KGaA (Health care providers & services) | | | 2,726 | | | | 195 | |
| | Infineon Technologies AG (Semiconductors & semiconductor equipment) | | | 12,728 | | | | 187 | |
| | | | | | | | | 917 | |
| | Italy—1.2% | | | | | | | | |
| | Intesa Sanpaolo SpA (Banks) | | | 56,505 | | | | 190 | |
| | Netherlands—6.1% | | | | | | | | |
| * | NXP Semiconductor N.V. (Semiconductors & semiconductor equipment)† | | | 1,874 | | | | 158 | |
| | Royal Dutch Shell plc Class “A” (Oil, gas & consumable fuels) | | | 10,846 | | | | 249 | |
| * | Sensata Technologies Holding N.V. (Electrical equipment)† | | | 4,148 | | | | 191 | |
| | Unilever N.V. (Personal products) | | | 8,882 | | | | 387 | |
| | | | | | | | | 985 | |
| | Spain—1.3% | | | | | | | | |
| | Industria de Diseno Textil S.A. (Specialty retail) | | | 6,226 | | | | 214 | |
| | Sweden—2.6% | | | | | | | | |
| | Assa Abloy AB Class “B” (Building products) | | | 9,907 | | | | 209 | |
| | Atlas Copco AB Class “A” (Machinery) | | | 8,222 | | | | 203 | |
| | | | | | | | | 412 | |
| | Switzerland—4.5% | | | | | | | | |
| | Cie Financiere Richemont S.A. (Textiles, apparel & luxury goods) | | | 2,468 | | | | 178 | |
| | Nestle S.A. (Food products) | | | 1,635 | | | | 122 | |
| | Novartis AG (Pharmaceuticals) | | | 2,926 | | | | 253 | |
| | | | | | | | |
| | | | | | | | |
| | Issuer | | Shares | | | Value | |
| | | | | | | | |
| | Common Stocks—(continued) | | | | | | |
| | | | | | | | |
| | Europe—(continued) | | | | | | |
| | Switzerland—(continued) | | | | | | |
| | Roche Holding AG (Pharmaceuticals) | | | 608 | | | $ | 168 | |
| | | | | | | | | 721 | |
| | | | | | | | | | |
| | United Kingdom—30.6% | | | | | | | | |
| | Ashtead Group plc (Trading companies & distributors) | | | 11,307 | | | | 186 | |
| | Babcock International Group plc (Commercial services & supplies) | | | 14,102 | | | | 211 | |
| | Bunzl plc (Trading companies & distributors) | | | 4,556 | | | | 127 | |
| | Capita plc (Professional services) | | | 11,363 | | | | 202 | |
| | Compass Group plc (Hotels, restaurants & leisure) | | | 24,696 | | | | 428 | |
| | Diageo plc (Beverages) | | | 8,526 | | | | 233 | |
| | easyJet plc (Airlines) | | | 5,399 | | | | 138 | |
| | Experian plc (Professional services) | | | 13,686 | | | | 242 | |
| | InterContinental Hotels Group plc (Hotels, restaurants & leisure) | | | 4,035 | | | | 158 | |
| | Legal & General Group plc (Insurance) | | | 67,092 | | | | 265 | |
| | Lloyds Banking Group plc (Banks) | | | 195,895 | | | | 211 | |
| | Next plc (Multiline retail) | | | 1,089 | | | | 117 | |
| | Prudential plc (Insurance) | | | 10,570 | | | | 239 | |
| | Reckitt Benckiser Group plc (Household products) | | | 3,905 | | | | 362 | |
| | Regus plc (Commercial services & supplies) | | | 31,737 | | | | 156 | |
| | RELX plc (Media) | | | 16,881 | | | | 298 | |
| | Rio Tinto plc (Metals & mining) | | | 10,133 | | | | 296 | |
| | Schroders plc (Capital markets) | | | 5,544 | | | | 243 | |
| | Travis Perkins plc (Trading companies & distributors) | | | 6,030 | | | | 175 | |
| | UBM plc (Media) | | | 14,378 | | | | 112 | |
| | Wolseley plc (Trading companies & distributors) | | | 4,631 | | | | 252 | |
| | WPP plc (Media) | | | 10,892 | | | | 251 | |
| | | | | | | | | 4,902 | |
| | | | | | | | | | |
| | Japan—20.1% | | | | | | | | |
| | Astellas Pharma, Inc. (Pharmaceuticals) | | | 9,838 | | | | 142 | |
| | Daikin Industries, Ltd. (Building products) | | | 1,606 | | | | 119 | |
| | FANUC Corporation (Machinery) | | | 1,100 | | | | 193 | |
| | Fuji Heavy Industries, Ltd. (Automobiles) | | | 5,700 | | | | 238 | |
| | Hitachi Capital Corporation (Consumer finance) | | | 5,000 | | | | 136 | |
| | Hoya Corporation (Health care equipment & supplies) | | | 4,500 | | | | 187 | |
| | Japan Exchange Group, Inc. (Diversified financial services) | | | 11,200 | | | | 178 | |
| | Kao Corporation (Personal products) | | | 3,700 | | | | 193 | |
| | Keyence Corporation (Electronic equipment, instruments & components) | | | 300 | | | | 167 | |
| | Mitsubishi UFJ Financial Group, Inc. (Banks) | | | 38,300 | | | | 241 | |
See accompanying Notes to Financial Statements.
| 60 | Annual Report | December 31, 2015 |
Institutional International Equity Fund
Portfolio of Investments, December 31, 2015 (all dollar amounts in thousands)
| | | | | | | | |
| | | | | | | | |
| | Issuer | | Shares | | | Value | |
| | | | | |
| | Common Stocks—(continued) | | | | | | |
| | | | | |
| | Japan—(continued) | | | | | | | | |
| | Murata Manufacturing Co., Ltd. (Electronic equipment, instruments & components) | | | 1,100 | | | $ | 161 | |
| | Nihon M&A Center, Inc. (Professional services) | | | 2,200 | | | | 107 | |
| | Nippon Prologis REIT, Inc. (Real estate investment trusts (REITs)) | | | 65 | | | | 118 | |
| | Obic Co., Ltd. (IT services) | | | 2,100 | | | | 113 | |
| | ORIX Corporation (Diversified financial services) | | | 14,812 | | | | 211 | |
| | SCSK Corporation (IT services) | | | 5,383 | | | | 219 | |
| | Seino Holdings Co., Ltd. (Road & rail) | | | 8,826 | | | | 93 | |
| | Shimano, Inc. (Leisure products) | | | 900 | | | | 140 | |
| | Sumitomo Mitsui Financial Group, Inc. (Banks) | | | 4,600 | | | | 176 | |
| | Suruga Bank, Ltd. (Banks) | | | 4,268 | | | | 89 | |
| | | | | | | | | 3,221 | |
| | | | | | | | | | |
| | Canada—8.6% | | | | | | | | |
| | Alimentation Couche Tard, Inc. Class “B” (Food & staples retailing) | | | 4,711 | | | | 207 | |
| | Brookfield Asset Management, Inc. Class “A” (Real estate management & development)† | | | 5,172 | | | | 163 | |
| | Canadian National Railway Co. (Road & rail)† | | | 3,766 | | | | 210 | |
| | Canadian Natural Resources, Ltd. (Oil, gas & consumable fuels) | | | 9,960 | | | | 218 | |
| | CI Financial Corporation (Capital markets) | | | 5,254 | | | | 116 | |
| | Enerplus Corporation (Oil, gas & consumable fuels) | | | 35,147 | | | | 121 | |
| | Intact Financial Corporation (Insurance) | | | 1,787 | | | | 115 | |
| | The Toronto-Dominion Bank (Banks)† | | | 6,048 | | | | 237 | |
| | | | | | | | | 1,387 | |
| | | | | | | | | | |
| | Emerging Asia—4.0% | | | | | | | | |
| | China—0.6% | | | | | | | | |
| | China Everbright International, Ltd. (Commercial services & supplies) | | | 77,037 | | | | 99 | |
| | India—1.2% | | | | | | | | |
| | HDFC Bank, Ltd.-ADR (Banks) | | | 3,194 | | | | 197 | |
| | Taiwan—2.2% | | | | | | | | |
| | Largan Precision Co., Ltd. (Electronic equipment, instruments & components) | | | 1,000 | | | | 69 | |
| | MediaTek, Inc. (Semiconductors & semiconductor equipment) | | | 14,000 | | | | 106 | |
| | Taiwan Semiconductor Manufacturing Co., Ltd.-ADR (Semiconductors & semiconductor equipment) | | | 7,344 | | | | 167 | |
| | | | | | | | | 342 | |
| | | | | | | | | | |
| | Asia—1.8% | | | | | | | | |
| | Hong Kong—1.8% | | | | | | | | |
| | AIA Group, Ltd. (Insurance) | | | 47,071 | | | | 283 | |
| | Total Common Stocks—99.4%
(cost $15,115) | | | | | | | 15,930 | |
| | | | | | | | |
| | | | Principal | | | | |
| | Issuer | | Amount | | | Value | |
| | | | | | | | | | |
| | Repurchase Agreement | | | | | | | | |
| | Fixed Income Clearing Corporation, 0.030% dated 12/31/15, due 1/4/16, repurchase price $119, collateralized by FNMA, 2.625%, due 9/6/24 | | $ | 119 | | | $ | 119 | |
| | Total Repurchase Agreement—0.7%
(cost $119) | | | | | | | 119 | |
| | Total Investments—100.1%
(cost $15,234) | | | | | | | 16,049 | |
| | Liabilities, plus cash and other assets—(0.1)% | | | | | | | (19 | ) |
| | Net assets—100.0% | | | | | | $ | 16,030 | |
ADR = American Depository Receipt
* Non-income producing securities
† = U.S. listed foreign security
For securities primarily traded on exchanges or markets that close before the close of regular trading on the New York Stock Exchange, the Fund may use an independent pricing service to fair value price the securities pursuant to Valuation Procedures approved by the Board of Trustees.
At December 31, 2015, the Fund’s Portfolio of Investments includes the following industry categories (as a percentage of long-term investments):
| Financials | | | 24.0 | % |
| Industrials | | | 20.6 | % |
| Consumer Discretionary | | | 15.9 | % |
| Consumer Staples | | | 11.0 | % |
| Information Technology | | | 9.5 | % |
| Health Care | | | 9.4 | % |
| Energy | | | 5.3 | % |
| Materials | | | 2.8 | % |
| Utilities | | | 1.5 | % |
| Total | | | 100.0 | % |
At December 31, 2015, the Fund’s Portfolio of Investments includes the following currency categories (as a percentage of long-term investments):
| British Pound Sterling | | | 30.8 | % |
| Euro | | | 24.0 | % |
| Japanese Yen | | | 20.2 | % |
| U.S. Dollar | | | 8.3 | % |
| Canadian Dollar | | | 4.9 | % |
| Swiss Franc | | | 4.5 | % |
| Swedish Krona | | | 2.6 | % |
| Hong Kong Dollar | | | 2.4 | % |
| Danish Krone | | | 1.2 | % |
| New Taiwan Dollar | | | 1.1 | % |
| Total | | | 100.0 | % |
See accompanying Notes to Financial Statements.
| December 31, 2015 | William Blair Funds | 61 |
| | International Growth Fund |
| | |
| | The International Growth Fund seeks long-term capital appreciation. |
| | |
| | AN OVERVIEW FROM THE PORTFOLIO MANAGERS |
| | |
 Jeffrey A. Urbina 
Simon Fennell 
Stephanie G. Braming | The William Blair International Growth Fund (Class N shares) posted a 0.27% decrease, net of fees, for the twelve months ended December 31, 2015. By comparison, the Fund’s benchmark index, the MSCI All Country World ex-U.S. IMI Index (net) (the “Index”), decreased 4.60%. The Fund’s outperformance relative to Index during 2015 benefited from favorable style tailwinds, as higher-quality, growth-oriented companies with relatively strong earnings trends and price momentum generally outperformed on a global basis. Stock selection was strong across most sectors and regions during the year. From a sector perspective, Financials and Consumer Discretionary stock selection were leading contributors to relative performance. The Fund’s overweightings to Consumer Discretionary and Information Technology, and underweightings to Energy and Materials were also positive. Within Financials, stock selection was positive across all industries, and the underweighting to banks was favorable amid the low interest rate environment. Insurance company AXA (France) was a leading contributor, benefiting from solid business trends and stable capital coverage despite macroeconomic volatility. Within Consumer Discretionary, Japanese automaker Fuji Heavy Industries and U.K. media company ITV were notable contributors. Fuji Heavy benefitted from positive sales trends and its plans to expand their production capacity in North America where it has been straining to meet record demand for Subaru vehicles, in addition to an increased dividend payout. ITV was supported by favorable growth in its production studios business and audience share gains. These positive effects were partially mitigated by Consumer Staples stock selection, as Latin American beverage company Ambev declined on broad macroeconomic weakness, despite posting solid volume growth in its core Brazilian beer business. Energy stock selection also detracted, hampered by oil pipeline company Enbridge (Canada) and exploration & production company Canadian Natural Resources. From a regional perspective, Europe ex-U.K. stock selection was the leading contributor to 2015 performance, benefiting from relative strength in European Consumer Discretionary, Healthcare, Financials and Technology holdings. In contrast, stock selection in Emerging EMEA (Europe, the Middle East and Africa) and Latin America detracted, but these effects were mitigated by the Fund’s underweight positions. Please refer to the Global Markets Review and Outlook relating to the Fund on page 39. |
| 62 | Annual Report | December 31, 2015 |
International Growth Fund
Performance Highlights (Unaudited)
Average Annual Total Return at 12/31/2015
| | | | | | | | | | |
| | | 1 Year | | 3 Year | | 5 Year | | 10 Year | |
| Class N | | | (0.27 | )% | | | 4.61 | % | | | 3.89 | % | | | 3.66 | % | |
| Class I | | | (0.03 | ) | | | 4.92 | | | | 4.19 | | | | 3.97 | | |
| MSCI ACW Ex-U.S. IMI (net) | | | (4.60 | ) | | | 2.02 | | | | 1.27 | | | | 3.18 | | |
Performance cited represents past performance. Past performance does not guarantee future results and current performance may be lower or higher than the data quoted. Results shown are average annual total returns, which assume reinvestment of dividends and capital gains. Investment returns and principal will fluctuate and you may have a gain or loss when you sell shares. For the most current month-end performance information, please call 1-800-742-7272, or visit our Web site at www.williamblairfunds.com. From time to time, the investment adviser may waive fees or reimburse expenses for the Fund. Without these waivers/reimbursements, performance would be lower. International investing involves special risk considerations, including currency fluctuations, lower liquidity, economic and political risk. Class N shares are available to the general public without a sales load. Class I shares are available to certain institutional investors and advisory clients of William Blair Investment Management, LLC and William Blair & Company, L.L.C., without a sales load or distribution (12b-1) or service fees.
The performance highlights and graph presented above do not reflect the deduction of taxes that a shareholder would pay on fund distributions or the redemption of fund shares.
The Morgan Stanley Capital International (MSCI) All Country World (ACW) Ex-U.S. Investable Market Index (IMI) (net) is a free float-adjusted market capitalization weighted index that is designed to measure the equity market performance of developed and emerging markets, excluding the United States. This series approximates the minimum possible dividend reinvestment.
This report identifies the Fund’s investments on December 31, 2015. These holdings are subject to change. Not all stocks in the Fund performed the same, nor is there any guarantee that these stocks will perform as well in the future. Market forecasts provided in this report may not necessarily come to pass.
Sector Diversification (Unaudited)

The sector diversification shown is based on the total long-term securities.
| December 31, 2015 | William Blair Funds | 63 |
International Growth Fund
Portfolio of Investments, December 31, 2015 (all dollar amounts in thousands)
| | | | | | | | |
| | | | | | | | |
| | Issuer | | Shares | | | Value | |
| | | | | | | | | | |
| | Common Stocks | | | | | | | | |
| | | | | | | | | | |
| | Europe, Mid-East—37.3% | | | | | | | | |
| | Belgium—1.1% | | | | | | | | |
| | KBC Groep N.V. (Banks) | | | 487,276 | | | $ | 30,539 | |
| * | Telenet Group Holding N.V. (Media) | | | 192,448 | | | | 10,409 | |
| | | | | | | | | 40,948 | |
| | Denmark—2.0% | | | | | | | | |
| | DSV A/S (Road & rail) | | | 136,350 | | | | 5,395 | |
| | Novo Nordisk A/S Class “B” (Pharmaceuticals) | | | 337,057 | | | �� | 19,628 | |
| | Novozymes A/S Class “B” (Chemicals) | | | 257,349 | | | | 12,389 | |
| | Pandora A/S (Textiles, apparel & luxury goods) | | | 199,460 | | | | 25,327 | |
| | Vestas Wind Systems A/S (Electrical equipment) | | | 129,675 | | | | 9,136 | |
| | | | | | | | | 71,875 | |
| | Finland—1.9% | | | | | | | | |
| | Elisa Oyj (Diversified telecommunication services) | | | 199,920 | | | | 7,559 | |
| | Kone Oyj Class ’‘B’’ (Machinery) | | | 433,337 | | | | 18,446 | |
| | Sampo Oyj Class ’‘A’’ (Insurance) | | | 850,691 | | | | 43,451 | |
| | | | | | | | | 69,456 | |
| | France—8.4% | | | | | | | | |
| | AXA S.A. (Insurance) | | | 2,058,989 | | | | 56,455 | |
| | Cap Gemini S.A. (IT services) | | | 397,868 | | | | 37,012 | |
| | Christian Dior SE (Textiles, apparel & luxury goods) | | | 94,184 | | | | 16,044 | |
| | Essilor International S.A. (Health care equipment & supplies) | | | 115,753 | | | | 14,473 | |
| | Hermes International (Textiles, apparel & luxury goods) | | | 31,445 | | | | 10,653 | |
| | Orpea (Health care providers & services) | | | 71,730 | | | | 5,751 | |
| | Rubis SCA (Gas utilities) | | | 25,079 | | | | 1,906 | |
| | Safran S.A. (Aerospace & defense) | | | 349,422 | | | | 24,064 | |
| | Technicolor S.A. (Media) | | | 236,713 | | | | 1,924 | |
| | Thales S.A. (Aerospace & defense) | | | 151,770 | | | | 11,397 | |
| | Total S.A. (Oil, gas & consumable fuels) | | | 1,116,595 | | | | 50,073 | |
| | Unibail-Rodamco SE (Real estate investment trusts (REITs)) | | | 50,885 | | | | 12,962 | |
| | Valeo S.A. (Auto components) | | | 243,812 | | | | 37,771 | |
| | Veolia Environnement S.A. (Multi-utilities) | | | 1,175,107 | | | | 27,923 | |
| | | | | | | | | 308,408 | |
| | Germany—5.2% | | | | | | | | |
| | Bayerische Motoren Werke AG (Automobiles) | | | 293,272 | | | | 31,116 | |
| | Brenntag AG (Trading companies & distributors) | | | 288,748 | | | | 15,150 | |
| | Continental AG (Auto components) | | | 180,897 | | | | 44,144 | |
| | Deutsche Wohnen AG (Real estate management & development) | | | 290,485 | | | | 8,086 | |
| | Evonik Industries AG (Chemicals) | | | 230,859 | | | | 7,681 | |
| | Gerresheimer AG (Life sciences tools & services) | | | 70,834 | | | | 5,557 | |
| | ProSiebenSat.1 Media SE (Media) | | | 576,186 | | | | 29,283 | |
| | SAP SE (Software) | | | 186,767 | | | | 14,894 | |
| | | | | | | | |
| | | | | | | | |
| | Issuer | | Shares | | | Value | |
| | | | | | | | | | |
| | Common Stocks—(continued) | | | | | | | | |
| | | | | | | | | | |
| | Europe, Mid-East—(continued) | | | | | | | | |
| | Germany—(continued) | | | | | | | | |
| | TUI AG (Hotels, restaurants & leisure) | | | 1,045,402 | | | $ | 19,070 | |
| | Vonovia SE (Real estate management & development) | | | 260,687 | | | | 8,088 | |
| * | Zalando SE-144A (Internet & catalog retail) | | | 223,753 | | | | 8,851 | |
| | | | | | | | | 191,920 | |
| | Ireland—1.1% | | | | | | | | |
| * | ICON plc (Life sciences tools & services)† | | | 260,333 | | | | 20,228 | |
| | Kingspan Group plc (Building products) | | | 304,322 | | | | 8,040 | |
| | Smurfit Kappa Group plc (Containers & packaging) | | | 507,810 | | | | 12,991 | |
| | | | | | | | | 41,259 | |
| | Israel—2.4% | | | | | | | | |
| * | Check Point Software Technologies, Ltd. (Software)† | | | 398,631 | | | | 32,440 | |
| | Teva Pharmaceutical Industries, Ltd.— ADR (Pharmaceuticals) | | | 867,883 | | | | 56,968 | |
| | | | | | | | | 89,408 | |
| | Italy—2.4% | | | | | | | | |
| | Azimut Holding SpA (Capital markets) | | | 470,284 | | | | 11,786 | |
| | Banca Generali SpA (Capital markets) | | | 464,919 | | | | 14,743 | |
| | Intesa Sanpaolo SpA (Banks) | | | 16,383,525 | | | | 54,981 | |
| * | Yoox Net-A—Porter Group SpA (Internet & catalog retail) | | | 185,003 | | | | 6,946 | |
| | | | | | | | | 88,456 | |
| | | | | | | | | | |
| | Luxembourg—0.3% | | | | | | | | |
| | Eurofins Scientific SE (Life sciences tools & services) | | | 29,922 | | | | 10,466 | |
| | Netherlands—2.5% | | | | | | | | |
| * | NXP Semiconductor N.V. (Semiconductors & semiconductor equipment)† | | | 382,780 | | | | 32,249 | |
| | Royal Dutch Shell plc Class “A” (Oil, gas & consumable fuels) | | | 1,620,167 | | | | 37,142 | |
| | Wolters Kluwer N.V. (Media) | | | 664,991 | | | | 22,378 | |
| | | | | | | | | 91,769 | |
| | Norway—0.5% | | | | | | | | |
| | Gjensidige Forsikring ASA (Insurance) | | | 315,214 | | | | 5,060 | |
| | Telenor ASA (Diversified telecommunication services) | | | 886,430 | | | | 14,851 | |
| | | | | | | | | 19,911 | |
| | Portugal—0.4% | | | | | | | | |
| | Jeronimo Martins SGPS S.A. (Food & staples retailing) | | | 806,390 | | | | 10,512 | |
| | NOS SGPS S.A. (Media) | | | 704,590 | | | | 5,548 | |
| | | | | | | | | 16,060 | |
| | Spain—3.0% | | | | | | | | |
| | Amadeus IT Holding S.A. Class “A” (IT services) | | | 758,010 | | | | 33,515 | |
| | Banco Bilbao Vizcaya Argentaria S.A. (Banks) | | | 3,306,072 | | | | 24,213 | |
| | Bankinter S.A. (Banks) | | | 2,183,871 | | | | 15,531 | |
See accompanying Notes to Financial Statements.
| 64 | Annual Report | December 31, 2015 |
International Growth Fund
Portfolio of Investments, December 31, 2015 (all dollar amounts in thousands)
| | | | | | | | |
| | | | | | | | |
| | Issuer | | Shares | | | Value | |
| | | | | | | | | | |
| | Common Stocks—(continued) | | | | | | | | |
| | | | | | | | | | |
| | Europe, Mid-East—(continued) | | | | | | | | |
| | Spain—(continued) | | | | | | | | |
| * | Distribuidora Internacional de Alimentacion S.A. (Food & staples retailing) | | | 1,381,287 | | | $ | 8,172 | |
| | Industria de Diseno Textil S.A. (Specialty retail) | | | 645,840 | | | | 22,242 | |
| | Viscofan S.A. (Food products) | | | 86,876 | | | | 5,253 | |
| | | | | | | | | 108,926 | |
| | Sweden—2.0% | | | | | | | | |
| | Assa Abloy AB Class “B” (Building products) | | | 780,636 | | | | 16,461 | |
| | Atlas Copco AB Class “A” (Machinery) | | | 1,239,965 | | | | 30,612 | |
| | BillerudKorsnas AB (Containers & packaging) | | | 183,850 | | | | 3,424 | |
| | Hexpol AB (Chemicals) | | | 585,232 | | | | 6,316 | |
| | Intrum Justitia AB (Commercial services & supplies) | | | 181,992 | | | | 6,222 | |
| | Swedbank AB Class “A” (Banks) | | | 447,144 | | | | 9,910 | |
| | | | | | | | | 72,945 | |
| | Switzerland—4.1% | | | | | | | | |
| * | Actelion, Ltd. (Biotechnology) | | | 193,866 | | | | 27,020 | |
| | Cie Financiere Richemont S.A. (Textiles, apparel & luxury goods) | | | 278,054 | | | | 20,016 | |
| * | Clariant AG (Chemicals) | | | 900,380 | | | | 17,089 | |
| * | Lonza Group AG (Life sciences tools & services) | | | 94,262 | | | | 15,350 | |
| * | Luxoft Holding, Inc. (IT services)† | | | 79,482 | | | | 6,130 | |
| | Nestle S.A. (Food products) | | | 400,521 | | | | 29,811 | |
| | Partners Group Holding AG (Capital markets) | | | 84,294 | | | | 30,403 | |
| | Straumann Holding AG (Health care equipment & supplies) | | | 19,501 | | | | 5,938 | |
| | | | | | | | | 151,757 | |
| | | | | | | | | | |
| | Japan—19.2% | | | | | | | | |
| | Alps Electric Co., Ltd. (Electronic equipment, instruments & components) | | | 303,500 | | | | 8,371 | |
| | Casio Computer Co., Ltd. (Household durables) | | | 584,300 | | | | 13,840 | |
| | Daicel Corporation (Chemicals) | | | 874,200 | | | | 13,194 | |
| | Daifuku Co., Ltd. (Machinery) | | | 356,026 | | | | 6,146 | |
| | Daikin Industries, Ltd. (Building products) | | | 370,500 | | | | 27,437 | |
| | Daiwa House Industry Co., Ltd. (Real estate management & development) | | | 686,400 | | | | 20,005 | |
| | FANUC Corporation (Machinery) | | | 111,000 | | | | 19,467 | |
| | Fuji Electric Co., Ltd. (Electrical equipment) | | | 1,235,000 | | | | 5,251 | |
| | Fuji Heavy Industries, Ltd. (Automobiles) | | | 1,466,300 | | | | 61,326 | |
| | Haseko Corporation (Household durables) | | | 453,100 | | | | 5,082 | |
| | Hitachi Capital Corporation (Consumer finance) | | | 171,000 | | | | 4,659 | |
| | Hoya Corporation (Health care equipment & supplies) | | | 995,300 | | | | 41,246 | |
| | IT Holdings Corporation (IT services) | | | 241,100 | | | | 5,582 | |
| | Japan Tobacco, Inc. (Tobacco) | | | 664,200 | | | | 24,707 | |
| | | | | | | | |
| | | | | | | | |
| | Issuer | | Shares | | | Value | |
| | | | | | | | | | |
| | Common Stocks—(continued) | | | | | | | | |
| | | | | | | | | | |
| | Japan—(continued) | | | | | | | | |
| | Kao Corporation (Personal products) | | | 390,000 | | | $ | 20,296 | |
| | KDDI Corporation (Wireless telecommunication services) | | | 1,144,900 | | | | 30,043 | |
| | Keyence Corporation (Electronic equipment, instruments & components) | | | 49,900 | | | | 27,849 | |
| | M3, Inc. (Health care technology) | | | 381,800 | | | | 8,011 | |
| | Makita Corporation (Machinery) | | | 178,400 | | | | 10,434 | |
| | Mitsubishi UFJ Financial Group, Inc. (Banks) | | | 4,246,600 | | | | 26,749 | |
| | Murata Manufacturing Co., Ltd. (Electronic equipment, instruments & components) | | | 326,100 | | | | 47,669 | |
| | Nissan Chemical Industries, Ltd. (Chemicals) | | | 280,900 | | | | 6,471 | |
| | Nitori Holdings Co., Ltd. (Specialty retail) | | | 68,200 | | | | 5,805 | |
| | Nomura Research Institute, Ltd. (IT services) | | | 487,300 | | | | 18,933 | |
| | ORIX Corporation (Diversified financial services) | | | 3,878,100 | | | | 55,351 | |
| | Pola Orbis Holdings, Inc. (Personal products) | | | 80,800 | | | | 5,391 | |
| | Sawai Pharmaceutical Co., Ltd. (Pharmaceuticals) | | | 70,000 | | | | 4,840 | |
| | SCSK Corporation (IT services) | | | 199,500 | | | | 8,108 | |
| | Secom Co., Ltd. (Commercial services & supplies) | | | 143,000 | | | | 9,803 | |
| | Shionogi & Co., Ltd. (Pharmaceuticals) | | | 470,600 | | | | 21,546 | |
| | Sumitomo Mitsui Financial Group, Inc. (Banks) | | | 1,197,900 | | | | 45,905 | |
| | Suruga Bank, Ltd. (Banks) | | | 857,000 | | | | 17,918 | |
| | Sysmex Corporation (Health care equipment & supplies) | | | 114,500 | | | | 7,459 | |
| | Tadano, Ltd. (Machinery) | | | 616,000 | | | | 7,565 | |
| | Taisei Corporation (Construction & engineering) | | | 2,626,000 | | | | 17,478 | |
| | Temp Holdings Co., Ltd. (Professional services) | | | 377,100 | | | | 5,914 | |
| | Tokio Marine Holdings, Inc. (Insurance) | | | 585,500 | | | | 22,953 | |
| | Trend Micro, Inc. (Software) | | | 165,200 | | | | 6,776 | |
| | Tsuruha Holdings, Inc. (Food & staples retailing) | | | 106,400 | | | | 9,304 | |
| | | | | | | | | 704,884 | |
| | | | | | | | | | |
| | United Kingdom—15.5% | | | | | | | | |
| | Berkeley Group Holdings plc (Household durables) | | | 299,036 | | | | 16,258 | |
| | BT Group plc (Diversified telecommunication services) | | | 5,974,173 | | | | 41,543 | |
| | Bunzl plc (Trading companies & distributors) | | | 617,308 | | | | 17,154 | |
| | Capita plc (Professional services) | | | 827,080 | | | | 14,729 | |
| | Compass Group plc (Hotels, restaurants & leisure) | | | 1,683,634 | | | | 29,164 | |
| | Derwent London plc (Real estate investment trusts (REITs)) | | | 177,933 | | | | 9,632 | |
| | easyJet plc (Airlines) | | | 1,395,296 | | | | 35,791 | |
See accompanying Notes to Financial Statements.
| December 31, 2015 | William Blair Funds | 65 |
International Growth Fund
Portfolio of Investments, December 31, 2015 (all dollar amounts in thousands)
| | | | | | | | |
| | | | | | | | |
| | Issuer | | Shares | | | Value | |
| | | | | | | | | | |
| | Common Stocks—(continued) | | | | | | | | |
| | | | | | | | | | |
| | United Kingdom—(continued) | | | | | | | | |
| | Halma plc (Electronic equipment, instruments & components) | | | 556,396 | | | $ | 7,095 | |
| | Hiscox, Ltd. (Insurance) | | | 625,548 | | | | 9,720 | |
| | Inchcape plc (Distributors) | | | 739,132 | | | | 8,554 | |
| | InterContinental Hotels Group plc (Hotels, restaurants & leisure) | | | 410,482 | | | | 16,084 | |
| | Intertek Group plc (Professional services) | | | 131,495 | | | | 5,383 | |
| | ITV plc (Media) | | | 10,450,899 | | | | 42,615 | |
| | Micro Focus International plc (Software) | | | 303,894 | | | | 7,146 | |
| | Next plc (Multiline retail) | | | 239,059 | | | | 25,692 | |
| | Provident Financial plc (Consumer finance) | | | 386,524 | | | | 19,186 | |
| | Prudential plc (Insurance) | | | 2,284,686 | | | | 51,565 | |
| | Reckitt Benckiser Group plc (Household products) | | | 198,879 | | | | 18,415 | |
| | RELX plc (Media) | | | 1,278,898 | | | | 22,568 | |
| | Schroders plc (Capital markets) | | | 223,792 | | | | 9,818 | |
| | SSE plc (Electric utilities) | | | 611,457 | | | | 13,774 | |
| | Taylor Wimpey plc (Household durables) | | | 3,608,567 | | | | 10,804 | |
| | The Sage Group plc (Software) | | | 1,101,094 | | | | 9,796 | |
| | UBM plc (Media) | | | 703,254 | | | | 5,458 | |
| | Unilever plc (Personal products) | | | 1,298,470 | | | | 56,019 | |
| | WH Smith plc (Specialty retail) | | | 213,710 | | | | 5,573 | |
| | Whitbread plc (Hotels, restaurants & leisure) | | | 249,269 | | | | 16,173 | |
| | Wolseley plc (Trading companies & distributors) | | | 269,336 | | | | 14,655 | |
| | WPP plc (Media) | | | 1,275,264 | | | | 29,384 | |
| | | | | | | | | 569,748 | |
| | | | | | | | | | |
| | Emerging Asia—11.5% | | | | | | | | |
| | China—5.3% | | | | | | | | |
| * | Alibaba Group Holding, Ltd.—ADR (Internet software & services) | | | 154,251 | | | | 12,536 | |
| * | Baidu, Inc.-ADR (Internet software & services) | | | 104,391 | | | | 19,734 | |
| | China Overseas Land & Investment, Ltd. (Real estate management & development) | | | 6,950,000 | | | | 24,303 | |
| | China Resources Land, Ltd. (Real estate management & development) | | | 6,826,000 | | | | 19,905 | |
| | China Vanke Co., Ltd. Class “H” (Real estate management & development)**§ | | | 5,760,200 | | | | 17,020 | |
| | ENN Energy Holdings, Ltd. (Gas utilities) | | | 1,902,000 | | | | 10,099 | |
| | Geely Automobile Holdings, Ltd. (Automobiles) | | | 10,555,000 | | | | 5,625 | |
| | NetEase, Inc.—ADR (Internet software & services) | | | 98,302 | | | | 17,816 | |
| | Ping An Insurance Group Co. of China, Ltd. Class “H” (Insurance) | | | 7,353,000 | | | | 40,702 | |
| | Tencent Holdings, Ltd. (Internet software & services) | | | 1,401,600 | | | | 27,616 | |
| | | | | | | | | 195,356 | |
| | India—1.5% | | | | | | | | |
| | Axis Bank, Ltd. (Banks) | | | 1,753,066 | | | | 11,918 | |
| | HDFC Bank, Ltd. (Banks) | | | 955,180 | | | | 15,617 | |
| | | | | | | | |
| | | | | | | | |
| | Issuer | | Shares | | | Value | |
| | | | | | | | | | |
| | Common Stocks—(continued) | | | | | | | | |
| | | | | | | | | | |
| | Emerging Asia—(continued) | | | | | | | | |
| | India—(continued) | | | | | | | | |
| | Housing Development Finance Corporation, Ltd. (Thrifts & mortgage finance) | | | 570,187 | | | $ | 10,890 | |
| | Maruti Suzuki India, Ltd. (Automobiles) | | | 154,337 | | | | 10,778 | |
| | Yes Bank, Ltd. (Banks) | | | 475,134 | | | | 5,214 | |
| | | | | | | | | 54,417 | |
| | Indonesia—0.2% | | | | | | | | |
| | PT Bank Central Asia Tbk (Banks) | | | 7,871,100 | | | | 7,594 | |
| | South Korea—1.8% | | | | | | | | |
| * | Amorepacific Corporation (Personal products) | | | 19,147 | | | | 6,769 | |
| * | LG Chem, Ltd. (Chemicals) | | | 31,440 | | | | 8,808 | |
| | Samsung Electronics Co., Ltd. (Technology hardware, storage & peripherals) | | | 39,019 | | | | 41,929 | |
| * | SK Hynix, Inc. (Semiconductors & semiconductor equipment) | | | 363,810 | | | | 9,541 | |
| | | | | | | | | 67,047 | |
| | Taiwan—2.7% | | | | | | | | |
| | Catcher Technology Co., Ltd. (Technology hardware, storage & peripherals) | | | 1,169,000 | | | | 9,823 | |
| | Delta Electronics, Inc. (Electronic equipment, instruments & components) | | | 2,670,106 | | | | 12,640 | |
| | Fubon Financial Holding Co., Ltd. (Diversified financial services) | | | 8,204,000 | | | | 11,239 | |
| | Largan Precision Co., Ltd. (Electronic equipment, instruments & components) | | | 101,000 | | | | 6,980 | |
| | MediaTek, Inc. (Semiconductors & semiconductor equipment) | | | 942,000 | | | | 7,170 | |
| | Taiwan Semiconductor Manufacturing Co., Ltd.—ADR (Semiconductors & semiconductor equipment) | | | 2,170,630 | | | | 49,382 | |
| | | | | | | | | 97,234 | |
| | | | | | | | | | |
| | Asia—4.9% | | | | | | | | |
| | Australia—1.3% | | | | | | | | |
| | Challenger, Ltd. (Diversified financial services) | | | 800,465 | | | | 5,086 | |
| | Flight Centre Travel Group Ltd. (Hotels, restaurants & leisure) | | | 193,094 | | | | 5,613 | |
| | LendLease Group (Real estate management & development) | | | 625,992 | | | | 6,505 | |
| | Macquarie Group, Ltd. (Capital markets) | | | 514,195 | | | | 31,014 | |
| | | | | | | | | 48,218 | |
| | Hong Kong—2.6% | | | | | | | | |
| | AIA Group, Ltd. (Insurance) | | | 12,808,000 | | | | 77,013 | |
| * | China High Precision Automation Group, Ltd. (Electronic equipment, instruments & components)**§ | | | 6,597,000 | | | | 17 | |
| | Techtronic Industries Co., Ltd. (Household durables) | | | 4,462,500 | | | | 18,195 | |
| | | | | | | | | 95,225 | |
See accompanying Notes to Financial Statements.
| 66 | Annual Report | December 31, 2015 |
International Growth Fund
Portfolio of Investments, December 31, 2015 (all dollar amounts in thousands)
| | | | | | | | |
| | | | | | | | |
| | | | | | | | |
| | Issuer | | Shares | | | Value | |
| | | | | | | | | | |
| | Common Stocks—(continued) | | | | | | | | |
| | | | | | | | | | |
| | Asia—(continued) | | | | | | | | |
| | Singapore—1.0% | | | | | | | | |
| | DBS Group Holdings, Ltd. (Banks) | | | 1,848,100 | | | $ | 21,754 | |
| | Singapore Telecommunications, Ltd. (Diversified telecommunication services) | | | 6,675,500 | | | | 17,278 | |
| | | | | | | | | 39,032 | |
| | | | | | | | | | |
| | Canada—4.7% | | | | | | | | |
| | Alimentation Couche Tard, Inc. Class “B” (Food & staples retailing) | | | 408,135 | | | | 17,966 | |
| | Brookfield Asset Management, Inc. Class “A” (Real estate management & development)† | | | 945,515 | | | | 29,812 | |
| | CI Financial Corporation (Capital markets) | | | 896,575 | | | | 19,828 | |
| | Constellation Software, Inc. (Software) | | | 16,136 | | | | 6,727 | |
| | Dollarama, Inc. (Multiline retail) | | | 222,841 | | | | 12,874 | |
| | Enbridge, Inc. (Oil, gas & consumable fuels) | | | 778,159 | | | | 25,869 | |
| | Intact Financial Corporation (Insurance) | | | 163,682 | | | | 10,490 | |
| | Suncor Energy, Inc. (Oil, gas & consumable fuels) | | | 931,545 | | | | 24,048 | |
| | The Toronto-Dominion Bank (Banks) | | | 630,912 | | | | 24,731 | |
| | | | | | | | | 172,345 | |
| | | | | | | | | | |
| | Emerging Europe, Mid-East, Africa—1.7% | | | | | | | | |
| | Russia—0.1% | | | | | | | | |
| * | Yandex N.V. Class “A” (Internet software & services)† | | | 329,570 | | | | 5,181 | |
| | South Africa—1.4% | | | | | | | | |
| | Bidvest Group, Ltd. (Industrial conglomerates) | | | 349,340 | | | �� | 7,414 | |
| | Naspers, Ltd. (Media) | | | 179,121 | | | | 24,555 | |
| | Steinhoff International Holdings N.V. (Household durables) | | | 4,082,929 | | | | 20,727 | |
| | | | | | | | | 52,696 | |
| | United Arab Emirates—0.2% | | | | | | | | |
| | Dubai Islamic Bank PJSC (Banks) | | | 3,245,647 | | | | 5,461 | |
| | | | | | | | | | |
| | Emerging Latin America—1.6% | | | | | | | | |
| | Brazil—0.9% | | | | | | | | |
| | AMBEV S.A.—ADR (Beverages) | | | 5,748,534 | | | | 25,638 | |
| | BB Seguridade Participacoes S.A. (Insurance) | | | 1,409,000 | | | | 8,665 | |
| | | | | | | | | 34,303 | |
| | Mexico—0.4% | | | | | | | | |
| | Arca Continental S.A.B. de C.V. (Beverages) | | | 1,078,994 | | | | 6,554 | |
| | Fomento Economico Mexicano S.A.B. de C.V.—ADR (Beverages) | | | 83,581 | | | | 7,719 | |
| | | | | | | | | 14,273 | |
| | Peru—0.3% | | | | | | | | |
| | Credicorp, Ltd. (Banks)† | | | 93,000 | | | | 9,051 | |
| | | | | | | | |
| | | | Shares or | | | | |
| | | | Principal | | | | |
| | Issuer | | Amount | | | Value | |
| | | | | | | | | | |
| | Common Stocks—(continued) | | | | | | | | |
| | Total Common Stocks—96.4%
(cost $3,236,178) | | | | | | $ | 3,545,629 | |
| | | | | | | | | | |
| | Preferred Stock | | | | | | | | |
| | Brazil—0.2% | | | | | | | | |
| | Itau Unibanco Holding S.A. (Banks) | | | 955,600 | | | | 6,360 | |
| | Total Preferred Stock—0.2%
(cost $7,358) | | | | | | | 6,360 | |
| | | | | | | | | | |
| | Affiliated Fund | | | | | | | | |
| | China—0.1% | | | | | | | | |
| | William Blair China A-Share Fund, LLC**§ | | | 223,614 | | | | 3,928 | |
| | Total Affiliated Fund—0.1%
(cost $2,236) | | | | | | | 3,928 | |
| | | | | | | | | | |
| | Repurchase Agreement | | | | | | | | |
| | Fixed Income Clearing Corporation,
0.030% dated 12/31/15, due 1/4/16,
repurchase price $113,846, collateralized
by FNMA, 2.625%, due 9/6/24, and
U.S. Treasury Note, 2.375%,
due 8/15/24 | | | $113,846 | | | | 113,846 | |
| | Total Repurchase Agreement—3.1%
(cost $113,846) | | | | | | | 113,846 | |
| | Total Investments—99.8%
(cost $3,359,618) | | | | | | | 3,669,763 | |
| | Cash and other assets, less liabilities—0.2% | | | | | | | 8,981 | |
| | Net assets—100.0% | | | | | | $ | 3,678,744 | |
ADR = American Depository Receipt
* Non-income producing securities
† = U.S. listed foreign security
** = Fair valued pursuant to Valuation Procedures approved by the Board of Trustees. These holdings represent 0.57% of the Fund’s net assets at December 31, 2015.
§ = Deemed illiquid pursuant to Liquidity Procedures approved by the Board of Trustees. These holdings represent 0.57% of the Fund’s net assets at December 31, 2015.
For securities primarily traded on exchanges or markets that close before the close of regular trading on the New York Stock Exchange, the Fund may use an independent pricing service to fair value price the securities pursuant to Valuation Procedures approved by the Board of Trustees.
See accompanying Notes to Financial Statements.
| December 31, 2015 | William Blair Funds | 67 |
International Growth Fund
Portfolio of Investments, December 31, 2015 (all dollar amounts in thousands)
At December 31, 2015, the Fund’s Portfolio of Investments includes the following industry categories (as a percentage of long-term investments):
| Financials | | | 29.2 | % |
| Consumer Discretionary | | | 20.5 | % |
| Information Technology | | | 15.0 | % |
| Industrials | | | 9.8 | % |
| Health Care | | | 7.4 | % |
| Consumer Staples | | | 7.1 | % |
| Energy | | | 3.9 | % |
| Telecommunication Services | | | 3.1 | % |
| Materials | | | 2.5 | % |
| Utilities | | | 1.5 | % |
| Total | | | 100.0 | % |
At December 31, 2015, the Fund’s Portfolio of Investments includes the following currency categories (as a percentage of long-term investments):
| Euro | | | 25.7 | % |
| Japanese Yen | | | 19.8 | % |
| British Pound Sterling | | | 16.0 | % |
| U.S. Dollar | | | 9.3 | % |
| Hong Kong Dollar | | | 6.8 | % |
| Swiss Franc | | | 4.1 | % |
| Canadian Dollar | | | 4.0 | % |
| Swedish Krona | | | 2.1 | % |
| Danish Krone | | | 2.0 | % |
| South Korean Won | | | 1.9 | % |
| Indian Rupee | | | 1.5 | % |
| South African Rand | | | 1.5 | % |
| Australian Dollar | | | 1.4 | % |
| New Taiwan Dollar | | | 1.3 | % |
| Singapore Dollar | | | 1.1 | % |
| All Other Currencies | | | 1.5 | % |
| Total | | | 100.0 | % |
As of December 31, 2015, the Fund invested in William Blair China A-Share Fund, LLC, an affiliated fund. There are no unfunded commitments to the affiliated fund. The Fund may redeem its investment weekly, but is subject to monthly repatriation and other redemption restrictions imposed on the William Blair China A-Share Fund, LLC by the Chinese government.
| | | Share Activity | | Year ended December 31, 2015 |
| | | | | | | | | | | | | | | | | Change in net |
| | | | | | | | | | | | | | | | | unrealized |
| | | Balance | | | | | | Balance | | | | Dividend | | Net realized | | appreciation |
| Fund Name | | 12/31/2014 | | Purchases | | Sales | | 12/31/2015 | | Value | | Income | | gain (loss) | | (depreciation) |
| William Blair China A-Share Fund, LLC | | 2,202,200 | | — | | 1,978,586 | | 223,614 | | $3,928 | | $— | | $18,124 | | $(9,385) |
See accompanying Notes to Financial Statements.
| 68 | Annual Report | December 31, 2015 |
| | | Institutional International Growth Fund |
| | | |
| | | The Institutional International Growth Fund seeks long-term capital appreciation. |
| | | |
| | | AN OVERVIEW FROM THE PORTFOLIO MANAGERS |
| | | |
 Jeffrey A. Urbina 
Simon Fennell 
Stephanie G. Braming | | The William Blair Institutional International Growth Fund (Class N shares) posted a 0.09% increase, net of fees, for the twelve months ended December 31, 2015. By comparison, the Fund’s benchmark index, the MSCI All Country World ex-U.S. IMI Index (net) (the “Index”), decreased 4.60%. The Fund’s outperformance relative to Index during 2015 benefited from favorable style tailwinds, as higher-quality, growth-oriented companies with relatively strong earnings trends and price momentum generally outperformed on a global basis. Stock selection was strong across most sectors and regions during the year. From a sector perspective, Financials and Consumer Discretionary stock selection were leading contributors to relative performance. The Fund’s overweightings to Consumer Discretionary and Information Technology, and underweightings to Energy and Materials were also positive. Within Financials, stock selection was positive across all industries, and the underweighting to banks was favorable amid the low interest rate environment. Insurance company AXA (France) was a leading contributor, benefiting from solid business trends and stable capital coverage despite macroeconomic volatility. Within Consumer Discretionary, Japanese automaker Fuji Heavy Industries and U.K. media company ITV were notable contributors. Fuji Heavy benefitted from positive sales trends and its plans to expand their production capacity in North America where it has been straining to meet record demand for Subaru vehicles, in addition to an increased dividend payout. ITV was supported by favorable growth in its production studios business and audience share gains. These positive effects were partially mitigated by Consumer Staples stock selection, as Latin American beverage company Ambev declined on broad macroeconomic weakness, despite posting solid volume growth in its core Brazilian beer business. Energy stock selection also detracted, hampered by oil pipeline company Enbridge (Canada) and exploration & production company Canadian Natural Resources. From a regional perspective, Europe ex-U.K. stock selection was the leading contributor to 2015 performance, benefiting from relative strength in European Consumer Discretionary, Healthcare, Financials and Technology holdings. In contrast, stock selection in Emerging EMEA (Europe, the Middle East and Africa) and Latin America detracted, but these effects were mitigated by the Fund’s underweight positions. Please refer to the Global Markets Review and Outlook relating to the Fund on page 39. |
| December 31, 2015 | William Blair Funds | 69 |
Institutional International Growth Fund
Performance Highlights (Unaudited)
| |
| Average Annual Total Return at 12/31/2015 |
| |
| | | 1 Year | | 3 Year | | 5 Year | | 10 Year |
| Institutional Class | | | 0.09 | % | | | 5.02 | % | | | 4.42 | % | | | 4.11 | % |
| MSCI ACW Ex-U.S. IMI (net) | | | (4.60 | ) | | | 2.02 | | | | 1.27 | | | | 3.18 | |
Performance cited represents past performance. Past performance does not guarantee future results and current performance may be lower or higher than the data quoted. Results shown are average annual returns, which assume reinvestment of dividends and capital gains. Investment returns and principal will fluctuate and you may have a gain or loss when you sell shares. For the most current month-end performance information, please call 1-800-742-7272, or visit our Web site at www.williamblairfunds.com. International investing involves special risk considerations, including currency fluctuations, lower liquidity, economic and political risk. Shares of the Fund are available without a sales load or distribution (12b-1) or service fees.
The performance highlights and graph presented above do not reflect the deduction of taxes that a shareholder would pay on fund distributions or the redemption of fund shares.
The Morgan Stanley Capital International (MSCI) All Country World (ACW) Ex-U.S. Investable Market Index (IMI) (net) is a free float-adjusted market capitalization weighted index that is designed to measure the equity market performance of developed and emerging markets, excluding the United States. This series approximates the minimum possible dividend reinvestment.
This report identifies the Fund’s investments on December 31, 2015. These holdings are subject to change. Not all stocks in the Fund performed the same, nor is there any guarantee that these stocks will perform as well in the future. Market forecasts provided in this report may not necessarily come to pass.
Sector Diversification (Unaudited)
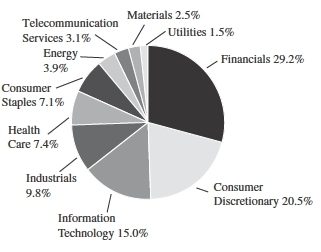
The sector diversification shown is based on the total long-term securities.
| 70 | Annual Report | December 31, 2015 |
Institutional International Growth Fund
Portfolio of Investments, December 31, 2015 (all dollar amounts in thousands)
| | | | | | | | |
| | | | | | | | |
| | Issuer | | Shares | | | Value | |
| | | | | | | | | | |
| | Common Stocks | | | | | | | | |
| | | | | | | | | | |
| | Europe, Mid-East—37.4% | | | | | | | | |
| | Belgium—1.1% | | | | | | | | |
| | KBC Groep N.V. (Banks) | | | 309,235 | | | $ | 19,380 | |
| * | Telenet Group Holding N.V. (Media) | | | 122,131 | | | | 6,606 | |
| | | | | | | | | 25,986 | |
| | Denmark—2.0% | | | | | | | | |
| | DSV A/S (Road & rail) | | | 86,550 | | | | 3,424 | |
| | Novo Nordisk A/S Class “B” (Pharmaceuticals) | | | 213,903 | | | | 12,456 | |
| | Novozymes A/S Class “B” (Chemicals) | | | 163,319 | | | | 7,863 | |
| | Pandora A/S (Textiles, apparel & luxury goods) | | | 126,581 | | | | 16,073 | |
| | Vestas Wind Systems A/S (Electrical equipment) | | | 84,125 | | | | 5,927 | |
| | | | | | | | | 45,743 | |
| | Finland—1.9% | | | | | | | | |
| | Elisa Oyj (Diversified telecommunication services) | | | 126,873 | | | | 4,797 | |
| | Kone Oyj Class “B” (Machinery) | | | 275,005 | | | | 11,706 | |
| | Sampo Oyj Class “A” (Insurance) | | | 539,866 | | | | 27,575 | |
| | | | | | | | | 44,078 | |
| | France—8.4% | | | | | | | | |
| | AXA S.A. (Insurance) | | | 1,306,676 | | | | 35,827 | |
| | Cap Gemini S.A. (IT services) | | | 252,495 | | | | 23,489 | |
| | Christian Dior SE (Textiles, apparel & luxury goods) | | | 59,771 | | | | 10,182 | |
| | Essilor International S.A. (Health care equipment & supplies) | | | 74,473 | | | | 9,311 | |
| | Hermes International (Textiles, apparel & luxury goods) | | | 19,956 | | | | 6,761 | |
| | Orpea (Health care providers & services) | | | 45,521 | | | | 3,650 | |
| | Rubis SCA (Gas utilities) | | | 16,156 | | | | 1,228 | |
| | Safran S.A. (Aerospace & defense) | | | 221,750 | | | | 15,271 | |
| | Technicolor S.A. (Media) | | | 152,953 | | | | 1,243 | |
| | Thales S.A. (Aerospace & defense) | | | 96,316 | | | | 7,233 | |
| | Total S.A. (Oil, gas & consumable fuels) | | | 708,614 | | | | 31,778 | |
| | Unibail-Rodamco SE (Real estate investment trusts (REITs)) | | | 32,292 | | | | 8,226 | |
| | Valeo S.A. (Auto components) | | | 154,728 | | | | 23,970 | |
| | Veolia Environnement S.A. (Multi-utilities) | | | 745,747 | | | | 17,720 | |
| | | | | | | | | 195,889 | |
| | Germany—5.3% | | | | | | | | |
| | Bayerische Motoren Werke AG (Automobiles) | | | 190,677 | | | | 20,231 | |
| | Brenntag AG (Trading companies & distributors) | | | 183,245 | | | | 9,614 | |
| | Continental AG (Auto components) | | | 114,801 | | | | 28,015 | |
| | Deutsche Wohnen AG (Real estate management & development) | | | 184,348 | | | | 5,132 | |
| | Evonik Industries AG (Chemicals) | | | 146,508 | | | | 4,874 | |
| | Gerresheimer AG (Life sciences tools & services) | | | 44,953 | | | | 3,527 | |
| | ProSiebenSat.1 Media SE (Media) | | | 365,659 | | | | 18,583 | |
| | SAP SE (Software) | | | 120,315 | | | | 9,595 | |
| | | | | | | | |
| | | | | | | | |
| | Issuer | | Shares | | | Value | |
| | | | | | | | | | |
| | Common Stocks—(continued) | | | | | | | | |
| | | | | | | | | | |
| | Europe, Mid-East—(continued) | | | | | | | | |
| | Germany—(continued) | | | | | | | | |
| | TUI AG (Hotels, restaurants & leisure) | | | 663,434 | | | $ | 12,102 | |
| | Vonovia SE (Real estate management & development) | | | 165,438 | | | | 5,133 | |
| * | Zalando SE-144A (Internet & catalog retail) | | | 141,998 | | | | 5,617 | |
| | | | | | | | | 122,423 | |
| | Ireland—1.1% | | | | | | | | |
| * | ICON plc (Life sciences tools & services)† | | | 165,213 | | | | 12,837 | |
| | Kingspan Group plc (Building products) | | | 193,129 | | | | 5,102 | |
| | Smurfit Kappa Group plc (Containers & packaging) | | | 322,267 | | | | 8,245 | |
| | | | | | | | | 26,184 | |
| | Israel—2.4% | | | | | | | | |
| * | Check Point Software Technologies, Ltd. (Software)† | | | 252,980 | | | | 20,588 | |
| | Teva Pharmaceutical Industries, Ltd.—ADR (Pharmaceuticals) | | | 550,776 | | | | 36,153 | |
| | | | | | | | | 56,741 | |
| | Italy—2.4% | | | | | | | | |
| | Azimut Holding SpA (Capital markets) | | | 298,452 | | | | 7,480 | |
| | Banca Generali SpA (Capital markets) | | | 295,047 | | | | 9,356 | |
| | Intesa Sanpaolo SpA (Banks) | | | 10,397,318 | | | | 34,892 | |
| * | Yoox Net-A—Porter Group SpA (Internet & catalog retail) | | | 117,407 | | | | 4,408 | |
| | | | | | | | | 56,136 | |
| | Luxembourg—0.3% | | | | | | | | |
| | Eurofins Scientific SE (Life sciences tools & services) | | | 18,989 | | | | 6,642 | |
| | Netherlands—2.5% | | | | | | | | |
| * | NXP Semiconductor N.V. (Semiconductors & semiconductor equipment)† | | | 242,920 | | | | 20,466 | |
| | Royal Dutch Shell plc Class “A” (Oil, gas & consumable fuels) | | | 1,028,191 | | | | 23,571 | |
| | Wolters Kluwer N.V. (Media) | | | 422,017 | | | | 14,202 | |
| | | | | | | | | 58,239 | |
| | Norway—0.5% | | | | | | | | |
| | Gjensidige Forsikring ASA (Insurance) | | | 200,041 | | | | 3,211 | |
| | Telenor ASA (Diversified telecommunication services) | | | 562,546 | | | | 9,425 | |
| | | | | | | | | 12,636 | |
| | Portugal—0.4% | | | | | | | | |
| | Jeronimo Martins SGPS S.A. (Food & staples retailing) | | | 511,752 | | | | 6,671 | |
| | NOS SGPS S.A. (Media) | | | 447,147 | | | | 3,521 | |
| | | | | | | | | 10,192 | |
| | Spain—3.0% | | | | | | | | |
| | Amadeus IT Holding S.A. Class “A” (IT services) | | | 481,049 | | | | 21,269 | |
| | Banco Bilbao Vizcaya Argentaria S.A. (Banks) | | | 2,098,100 | | | | 15,366 | |
| | Bankinter S.A. (Banks) | | | 1,385,929 | | | | 9,856 | |
See accompanying Notes to Financial Statements.
| December 31, 2015 | William Blair Funds | 71 |
Institutional International Growth Fund
Portfolio of Investments, December 31, 2015 (all dollar amounts in thousands)
| | | | | | | | |
| | | | | | | | |
| | Issuer | | Shares | | | Value | |
| | | | | | | | | | |
| | Common Stocks—(continued) | | | | | | | | |
| | | | | | | | | | |
| | Europe, Mid-East—(continued) | | | | | | | | |
| | Spain—(continued) | | | | | | | | |
| * | Distribuidora Internacional de Alimentacion S.A. (Food & staples retailing) | | | 876,593 | | | $ | 5,186 | |
| | Industria de Diseno Textil S.A. (Specialty retail) | | | 409,863 | | | | 14,115 | |
| | Viscofan S.A. (Food products) | | | 55,133 | | | | 3,334 | |
| | | | | | | | | 69,126 | |
| | Sweden—2.0% | | | | | | | | |
| | Assa Abloy AB Class “B” (Building products) | | | 495,408 | | | | 10,446 | |
| | Atlas Copco AB Class “A” (Machinery) | | | 786,907 | | | | 19,427 | |
| | BillerudKorsnas AB (Containers & packaging) | | | 117,995 | | | | 2,197 | |
| | Hexpol AB (Chemicals) | | | 371,400 | | | | 4,008 | |
| | Intrum Justitia AB (Commercial services & supplies) | | | 115,496 | | | | 3,949 | |
| | Swedbank AB Class “A” (Banks) | | | 283,766 | | | | 6,290 | |
| | | | | | | | | 46,317 | |
| | Switzerland—4.1% | | | | | | | | |
| * | Actelion, Ltd. (Biotechnology) | | | 123,031 | | | | 17,148 | |
| | Cie Financiere Richemont S.A. (Textiles, apparel & luxury goods) | | | 176,459 | | | | 12,702 | |
| * | Clariant AG (Chemicals) | | | 571,399 | | | | 10,845 | |
| * | Lonza Group AG (Life sciences tools & services) | | | 59,821 | | | | 9,741 | |
| * | Luxoft Holding, Inc. (IT services)† | | | 50,441 | | | | 3,890 | |
| | Nestle S.A. (Food products) | | | 254,179 | | | | 18,919 | |
| | Partners Group Holding AG (Capital markets) | | | 53,494 | | | | 19,294 | |
| | Straumann Holding AG (Health care equipment & supplies) | | | 12,376 | | | | 3,769 | |
| | | | | | | | | 96,308 | |
| | Japan—19.1% | | | | | | | | |
| | Alps Electric Co., Ltd. (Electronic equipment, instruments & components) | | | 192,600 | | | | 5,312 | |
| | Casio Computer Co., Ltd. (Household durables) | | | 370,800 | | | | 8,783 | |
| | Daicel Corporation (Chemicals) | | | 554,800 | | | | 8,373 | |
| | Daifuku Co., Ltd. (Machinery) | | | 226,000 | | | | 3,902 | |
| | Daikin Industries, Ltd. (Building products) | | | 235,100 | | | | 17,410 | |
| | Daiwa House Industry Co., Ltd. (Real estate management & development) | | | 435,600 | | | | 12,695 | |
| | FANUC Corporation (Machinery) | | | 70,500 | | | | 12,364 | |
| | Fuji Electric Co., Ltd. (Electrical equipment) | | | 784,000 | | | | 3,333 | |
| | Fuji Heavy Industries, Ltd. (Automobiles) | | | 930,600 | | | | 38,921 | |
| | Haseko Corporation (Household durables) | | | 287,500 | | | | 3,224 | |
| | Hitachi Capital Corporation (Consumer finance) | | | 108,500 | | | | 2,956 | |
| | Hoya Corporation (Health care equipment & supplies) | | | 631,700 | | | | 26,178 | |
| | IT Holdings Corporation (IT services) | | | 153,000 | | | | 3,543 | |
| | Japan Tobacco, Inc. (Tobacco) | | | 421,500 | | | | 15,679 | |
| | | | | | | | |
| | | | | | | | |
| | Issuer | | Shares | | | Value | |
| | | | | | | | | | |
| | Common Stocks—(continued) | | | | | | | | |
| | | | | | | | | | |
| | Japan—(continued) | | | | | | | | |
| | Kao Corporation (Personal products) | | | 247,500 | | | $ | 12,880 | |
| | KDDI Corporation (Wireless telecommunication services) | | | 726,600 | | | | 19,067 | |
| | Keyence Corporation (Electronic equipment, instruments & components) | | | 31,600 | | | | 17,636 | |
| | M3, Inc. (Health care technology) | | | 242,300 | | | | 5,084 | |
| | Makita Corporation (Machinery) | | | 113,200 | | | | 6,621 | |
| | Mitsubishi UFJ Financial Group, Inc. (Banks) | | | 2,695,000 | | | | 16,976 | |
| | Murata Manufacturing Co., Ltd. (Electronic equipment, instruments & components) | | | 206,900 | | | | 30,244 | |
| | Nissan Chemical Industries, Ltd. (Chemicals) | | | 178,200 | | | | 4,105 | |
| | Nitori Holdings Co., Ltd. (Specialty retail) | | | 43,300 | | | | 3,685 | |
| | Nomura Research Institute, Ltd. (IT services) | | | 309,300 | | | | 12,017 | |
| | ORIX Corporation (Diversified financial services) | | | 2,461,100 | | | | 35,126 | |
| | Pola Orbis Holdings, Inc. (Personal products) | | | 51,300 | | | | 3,423 | |
| | Sawai Pharmaceutical Co., Ltd. (Pharmaceuticals) | | | 45,200 | | | | 3,125 | |
| | SCSK Corporation (IT services) | | | 126,600 | | | | 5,145 | |
| | Secom Co., Ltd. (Commercial services & supplies) | | | 90,700 | | | | 6,218 | |
| | Shionogi & Co., Ltd. (Pharmaceuticals) | | | 298,600 | | | | 13,671 | |
| | Sumitomo Mitsui Financial Group, Inc. (Banks) | | | 760,200 | | | | 29,132 | |
| | Suruga Bank, Ltd. (Banks) | | | 544,000 | | | | 11,374 | |
| | Sysmex Corporation (Health care equipment & supplies) | | | 72,700 | | | | 4,736 | |
| | Tadano, Ltd. (Machinery) | | | 391,000 | | | | 4,802 | |
| | Taisei Corporation (Construction & engineering) | | | 1,666,000 | | | | 11,089 | |
| | Temp Holdings Co., Ltd. (Professional services) | | | 239,800 | | | | 3,761 | |
| | Tokio Marine Holdings, Inc. (Insurance) | | | 371,600 | | | | 14,568 | |
| | Trend Micro, Inc. (Software) | | | 104,900 | | | | 4,303 | |
| | Tsuruha Holdings, Inc. (Food & staples retailing) | | | 67,600 | | | | 5,911 | |
| | | | | | | | | 447,372 | |
| | | | | | | | | | |
| | United Kingdom—15.5% | | | | | | | | |
| | Berkeley Group Holdings plc (Household durables) | | | 189,774 | | | | 10,318 | |
| | BT Group plc (Diversified telecommunication services) | | | 3,791,332 | | | | 26,364 | |
| | Bunzl plc (Trading companies & distributors) | | | 391,756 | | | | 10,886 | |
| | Capita plc (Professional services) | | | 524,882 | | | | 9,347 | |
| | Compass Group plc (Hotels, restaurants & leisure) | | | 1,068,468 | | | | 18,508 | |
| | Derwent London plc (Real estate investment trusts (REITs)) | | | 112,920 | | | | 6,113 | |
| | easyJet plc (Airlines) | | | 885,483 | | | | 22,714 | |
See accompanying Notes to Financial Statements.
| 72 | Annual Report | December 31, 2015 |
Institutional International Growth Fund
Portfolio of Investments, December 31, 2015 (all dollar amounts in thousands)
| | | | | | | | |
| | | | | | | | |
| | Issuer | | Shares | | | Value | |
| | | | | | | | | | |
| | Common Stocks—(continued) | | | | | | | | |
| | | | | | | | | | |
| | United Kingdom—(continued) | | | | | | | | |
| | Halma plc (Electronic equipment, instruments & components) | | | 353,100 | | | $ | 4,503 | |
| | Hiscox, Ltd. (Insurance) | | | 396,985 | | | | 6,168 | |
| | Inchcape plc (Distributors) | | | 469,068 | | | | 5,428 | |
| | InterContinental Hotels Group plc (Hotels, restaurants & leisure) | | | 260,500 | | | | 10,207 | |
| | Intertek Group plc (Professional services) | | | 84,709 | | | | 3,468 | |
| | ITV plc (Media) | | | 6,632,353 | | | | 27,044 | |
| | Micro Focus International plc (Software) | | | 192,857 | | | | 4,535 | |
| | Next plc (Multiline retail) | | | 151,712 | | | | 16,304 | |
| | Provident Financial plc (Consumer finance) | | | 245,296 | | | | 12,176 | |
| | Prudential plc (Insurance) | | | 1,449,908 | | | | 32,724 | |
| | Reckitt Benckiser Group plc (Household products) | | | 126,213 | | | | 11,687 | |
| | RELX plc (Media) | | | 811,615 | | | | 14,322 | |
| | Schroders plc (Capital markets) | | | 142,023 | | | | 6,231 | |
| | SSE plc (Electric utilities) | | | 388,043 | | | | 8,741 | |
| | Taylor Wimpey plc (Household durables) | | | 2,290,070 | | | | 6,857 | |
| | The Sage Group plc (Software) | | | 698,777 | | | | 6,217 | |
| | UBM plc (Media) | | | 446,299 | | | | 3,464 | |
| | Unilever plc (Personal products) | | | 824,035 | | | | 35,551 | |
| | WH Smith plc (Specialty retail) | | | 135,625 | | | | 3,537 | |
| | Whitbread plc (Hotels, restaurants & leisure) | | | 158,191 | | | | 10,263 | |
| | Wolseley plc (Trading companies & distributors) | | | 170,926 | | | | 9,300 | |
| | WPP plc (Media) | | | 809,308 | | | | 18,648 | |
| | | | | | | | | 361,625 | |
| | | | | | | | | | |
| | Emerging Asia—11.5% | | | | | | | | |
| | China—5.3% | | | | | | | | |
| * | Alibaba Group Holding, Ltd.—ADR (Internet software & services) | | | 97,891 | | | | 7,956 | |
| * | Baidu, Inc.—ADR (Internet software & services) | | | 66,249 | | | | 12,524 | |
| | China Overseas Land & Investment, Ltd. (Real estate management & development) | | | 4,410,000 | | | | 15,421 | |
| | China Resources Land, Ltd. (Real estate management & development) | | | 4,332,000 | | | | 12,632 | |
| | China Vanke Co., Ltd. Class “H” (Real estate management & development)**§ | | | 3,672,400 | | | | 10,851 | |
| | ENN Energy Holdings, Ltd. (Gas utilities) | | | 1,206,000 | | | | 6,403 | |
| | Geely Automobile Holdings, Ltd. (Automobiles) | | | 6,700,000 | | | | 3,570 | |
| | NetEase, Inc.—ADR (Internet software & services) | | | 62,385 | | | | 11,307 | |
| | Ping An Insurance Group Co. of China, Ltd. Class “H” (Insurance) | | | 4,666,500 | | | | 25,831 | |
| | Tencent Holdings, Ltd. (Internet software & services) | | | 889,500 | | | | 17,526 | |
| | | | | | | | | 124,021 | |
| | India—1.5% | | | | | | | | |
| | Axis Bank, Ltd. (Banks) | | | 1,112,531 | | | | 7,563 | |
| | | | | | | | |
| | | | | | | | |
| | Issuer | | Shares | | | Value | |
| | | | | | | | | | |
| | Common Stocks—(continued) | | | | | | | | |
| | | | | | | | | | |
| | Emerging Asia—(continued) | | | | | | | | |
| | India—(continued) | | | | | | | | |
| | HDFC Bank, Ltd. (Banks) | | | 606,176 | | | $ | 9,911 | |
| | Housing Development Finance Corporation, Ltd. (Thrifts & mortgage finance) | | | 361,852 | | | | 6,911 | |
| | Maruti Suzuki India, Ltd. (Automobiles) | | | 97,945 | | | | 6,840 | |
| | Yes Bank, Ltd. (Banks) | | | 301,529 | | | | 3,309 | |
| | | | | | | | | 34,534 | |
| | Indonesia—0.2% | | | | | | | | |
| | PT Bank Central Asia Tbk (Banks) | | | 4,995,200 | | | | 4,820 | |
| | South Korea—1.8% | | | | | | | | |
| * | Amorepacific Corporation (Personal products) | | | 12,151 | | | | 4,295 | |
| * | LG Chem, Ltd. (Chemicals) | | | 20,253 | | | | 5,674 | |
| | Samsung Electronics Co., Ltd. (Technology hardware, storage & peripherals) | | | 24,762 | | | | 26,609 | |
| * | SK Hynix, Inc. (Semiconductors & semiconductor equipment) | | | 230,880 | | | | 6,055 | |
| | | | | | | | | 42,633 | |
| | Taiwan—2.7% | | | | | | | | |
| | Catcher Technology Co., Ltd. (Technology hardware, storage & peripherals) | | | 742,000 | | | | 6,235 | |
| | Delta Electronics, Inc. (Electronic equipment, instruments & components) | | | 1,693,382 | | | | 8,016 | |
| | Fubon Financial Holding Co., Ltd. (Diversified financial services) | | | 5,207,000 | | | | 7,133 | |
| | Largan Precision Co., Ltd. (Electronic equipment, instruments & components) | | | 64,000 | | | | 4,423 | |
| | MediaTek, Inc. (Semiconductors & semiconductor equipment) | | | 607,000 | | | | 4,620 | |
| | Taiwan Semiconductor Manufacturing Co., Ltd.—ADR (Semiconductors & semiconductor equipment) | | | 1,377,526 | | | | 31,339 | |
| | | | | | | | | 61,766 | |
| | | | | | | | | | |
| | Asia—4.9% | | | | | | | | |
| | Australia—1.3% | | | | | | | | |
| | Challenger, Ltd. (Diversified financial services) | | | 507,991 | | | | 3,228 | |
| | Flight Centre Travel Group Ltd. (Hotels, restaurants & leisure) | | | 122,542 | | | | 3,562 | |
| | LendLease Group (Real estate management & development) | | | 397,267 | | | | 4,128 | |
| | Macquarie Group, Ltd. (Capital markets) | | | 326,319 | | | | 19,682 | |
| | | | | | | | | 30,600 | |
| | Hong Kong—2.6% | | | | | | | | |
| | AIA Group, Ltd. (Insurance) | | | 8,128,200 | | | | 48,874 | |
| * | China High Precision Automation Group, Ltd. (Electronic equipment, instruments & components)**§ | | | 3,373,000 | | | | 9 | |
| | Techtronic Industries Co., Ltd. (Household durables) | | | 2,832,000 | | | | 11,547 | |
| | | | | | | | | 60,430 | |
See accompanying Notes to Financial Statements.
| December 31, 2015 | William Blair Funds | 73 |
Institutional International Growth Fund
Portfolio of Investments, December 31, 2015 (all dollar amounts in thousands)
| | | | | | | | |
| | | | | | | | |
| | | | | | | | |
| | Issuer | | Shares | | | Value | |
| | | | | | | | | | |
| | Common Stocks—(continued) | | | | | | | | |
| | | | | | | | | | |
| | Asia—(continued) | | | | | | | | |
| | Singapore—1.0% | | | | | | | | |
| | DBS Group Holdings, Ltd. (Banks) | | | 1,172,800 | | | $ | 13,805 | |
| | Singapore Telecommunications, Ltd. (Diversified telecommunication services) | | | 4,236,400 | | | | 10,965 | |
| | | | | | | | | 24,770 | |
| | | | | | | | | | |
| | Canada—4.7% | | | | | | | | |
| | Alimentation Couche Tard, Inc. Class “B” (Food & staples retailing) | | | 258,618 | | | | 11,384 | |
| | Brookfield Asset Management, Inc. Class “A” (Real estate management & development)† | | | 600,043 | | | | 18,920 | |
| | CI Financial Corporation (Capital markets) | | | 566,804 | | | | 12,535 | |
| | Constellation Software, Inc. (Software) | | | 10,240 | | | | 4,269 | |
| | Dollarama, Inc. (Multiline retail) | | | 141,420 | | | | 8,170 | |
| | Enbridge, Inc. (Oil, gas & consumable fuels) | | | 493,835 | | | | 16,417 | |
| | Intact Financial Corporation (Insurance) | | | 103,876 | | | | 6,657 | |
| | Suncor Energy, Inc. (Oil, gas & consumable fuels) | | | 591,177 | | | | 15,261 | |
| | The Toronto-Dominion Bank (Banks) | | | 400,390 | | | | 15,695 | |
| | | | | | | | | 109,308 | |
| | | | | | | | | | |
| | Emerging Europe, Mid-East, Africa—1.7% | | | | | | | | |
| | Russia—0.1% | | | | | | | | |
| * | Yandex N.V. Class “A” (Internet software & services)† | | | 209,152 | | | | 3,288 | |
| | South Africa—1.4% | | | | | | | | |
| | Bidvest Group, Ltd. (Industrial conglomerates) | | | 221,698 | | | | 4,705 | |
| | Naspers, Ltd. (Media) | | | 113,674 | | | | 15,583 | |
| | Steinhoff International Holdings N.V. (Household durables) | | | 2,591,110 | | | | 13,154 | |
| | | | | | | | | 33,442 | |
| | United Arab Emirates—0.2% | | | | | | | | |
| | Dubai Islamic Bank PJSC (Banks) | | | 2,059,754 | | | | 3,465 | |
| | | | | | | | | | |
| | Emerging Latin America—1.6% | | | | | | | | |
| | Brazil—0.9% | | | | | | | | |
| | AMBEV S.A.—ADR (Beverages) | | | 3,648,137 | | | | 16,271 | |
| | BB Seguridade Participacoes S.A. (Insurance) | | | 894,200 | | | | 5,499 | |
| | | | | | | | | 21,770 | |
| | Mexico—0.4% | | | | | | | | |
| | Arca Continental S.A.B. de C.V. (Beverages) | | | 684,752 | | | | 4,160 | |
| | Fomento Economico Mexicano S.A.B. de C.V.—ADR (Beverages) | | | 53,042 | | | | 4,898 | |
| | | | | | | | | 9,058 | |
| | | | | | | | |
| | Issuer | | Shares or
Principal
Amount | | | Value | |
| | | | | | | | | | |
| | Common Stocks—(continued) | | | | | | | | |
| | | | | | | | | | |
| | Peru—0.3% | | | | | | | | |
| | Credicorp, Ltd. (Banks)† | | | 59,020 | | | $ | 5,744 | |
| | Total Common Stocks—96.4%
(cost $2,061,218) | | | | | | | 2,251,286 | |
| | | | | | | | | | |
| | Preferred Stock | | | | | | | | |
| | Brazil—0.1% | | | | | | | | |
| | Itau Unibanco Holding S.A. (Banks) | | | 606,400 | | | | 4,036 | |
| | Total Preferred Stock—0.1%
(cost $4,669) | | | | | | | 4,036 | |
| | | | | | | | | | |
| | Affiliated Fund | | | | | | | | |
| | China—0.1% | | | | | | | | |
| | William Blair China A-Share Fund, LLC**§ | | | 138,952 | | | | 2,441 | |
| | Total Affiliated Fund—0.1%
(cost $1,390) | | | | | | | 2,441 | |
| | | | | | | | | | |
| | Repurchase Agreement | | | | | | | | |
| | Fixed Income Clearing Corporation, 0.030% dated 12/31/15, due 1/4/16, repurchase price $74,149, collateralized by FNMA, 2.625%, due 9/6/24 | | | $74,149 | | | | 74,149 | |
| | Total Repurchase Agreement—3.2%
(cost $74,149) | | | | | | | 74,149 | |
| | Total Investments—99.8%
(cost $2,141,426) | | | | | | | 2,331,912 | |
| | Cash and other assets, less liabilities—0.2% | | | | | | | 3,720 | |
| | Net assets—100.0% | | | | | | $ | 2,335,632 | |
ADR = American Depository Receipt
* Non-income producing securities
† = U.S. listed foreign security
** = Fair valued pursuant to Valuation Procedures approved by the Board of Trustees. These holdings represent 0.57% of the Fund’s net assets at December 31, 2015.
§ = Deemed illiquid pursuant to Liquidity Procedures approved by the Board of Trustees. These holdings represent 0.57% of the Fund’s net assets at December 31, 2015.
For securities primarily traded on exchanges or markets that close before the close of regular trading on the New York Stock Exchange, the Fund may use an independent pricing service to fair value price the securities pursuant to Valuation Procedures approved by the Board of Trustees.
See accompanying Notes to Financial Statements.
| 74 | Annual Report | December 31, 2015 |
Institutional International Growth Fund
Portfolio of Investments, December 31, 2015 (all dollar amounts in thousands)
At December 31, 2015, the Fund’s Portfolio of Investments includes the following industry categories (as a percentage of long-term investments):
| Financials | | | 29.2 | % |
| Consumer Discretionary | | | 20.5 | % |
| Information Technology | | | 15.0 | % |
| Industrials | | | 9.8 | % |
| Health Care | | | 7.4 | % |
| Consumer Staples | | | 7.1 | % |
| Energy | | | 3.9 | % |
| Telecommunication Services | | | 3.1 | % |
| Materials | | | 2.5 | % |
| Utilities | | | 1.5 | % |
| Total | | | 100.0 | % |
At December 31, 2015, the Fund’s Portfolio of Investments includes the following currency categories (as a percentage of long-term investments):
| Euro | | | 25.8 | % |
| Japanese Yen | | | 19.8 | % |
| British Pound Sterling | | | 16.0 | % |
| U.S. Dollar | | | 9.2 | % |
| Hong Kong Dollar | | | 6.8 | % |
| Swiss Franc | | | 4.1 | % |
| Canadian Dollar | | | 4.0 | % |
| Swedish Krona | | | 2.1 | % |
| Danish Krone | | | 2.0 | % |
| South Korean Won | | | 1.9 | % |
| Indian Rupee | | | 1.5 | % |
| South African Rand | | | 1.5 | % |
| Australian Dollar | | | 1.4 | % |
| New Taiwan Dollar | | | 1.3 | % |
| Singapore Dollar | | | 1.1 | % |
| All Other Currencies | | | 1.5 | % |
| Total | | | 100.0 | % |
As of December 31, 2015, the Fund invested in William Blair China A-Share Fund, LLC, an affiliated fund. There are no unfunded commitments to the affiliated fund. The Fund may redeem its investment weekly, but is subject to monthly repatriation and other redemption restrictions imposed on the William Blair China A-Share Fund, LLC by the Chinese government.
| | | Share Activity | | | Year ended December 31, 2015 |
| Fund Name | | Balance
12/31/2014 | | | Purchases | | | | Sales | | | | Balance
12/31/2015 | | | Value | | | Dividend
Income | | Net realized
gain (loss) | | Change in net
unrealized
appreciation
(depreciation) | |
| William Blair China A-Share Fund, LLC | | | 1,183,400 | | | | — | | | | 1,044,448 | | | | 138,952 | | | | $2,441 | | | $— | | $9,106 | | | $(4,902) | |
See accompanying Notes to Financial Statements.
| December 31, 2015 | William Blair Funds | 75 |
| | International Small Cap Growth Fund |
| | |
| | The International Small Cap Growth Fund seeks long-term capital appreciation. |
| | |
| | AN OVERVIEW FROM THE PORTFOLIO MANAGERS |
| | |
 Jeffrey A. Urbina 
Andrew G. Flynn 
Stephanie G. Braming | The William Blair International Small Cap Growth Fund (Class N shares) posted a 9.67% increase, net of fees, for the twelve months ended December 31, 2015. By comparison, the Fund’s benchmark index, the MSCI All Country World ex-U.S. Small Cap Index (net) (the “Index”), increased 2.60%. Our emphasis on high-quality growth companies was a broad contributor to relative performance during 2015, as higher-quality companies with strong earnings trends led the market. From a sector perspective, the Fund’s overweighting to, and stock selection in, Consumer Discretionary were key drivers of outperformance. Restaurant and leisure holdings such as Domino’s Pizza Group (U.K.) and Ireland-based gaming company Paddy Power were notable contributors within the Consumer Discretionary sector. Household durables holdings such as Casio Computer (Japan), Haseko (Japan) and De’Longhi (Italy) also contributed. Stock selection was positive across several other sectors, including Materials, as the emphasis on specialty chemicals companies at the expense of metals & mining exposure benefited results. The Financials sector was the other notable area of strength during the period, led by capital markets, real estate and diversified financial services holdings. From a regional perspective, the Fund’s overweighting and stock selection in the Europe ex-U.K. region was the leading contributor. These positive effects were partially offset by Consumer Staples stock selection. Discount food retailer Distribuidora Internacional de Alimentacion’s (Spain) share price declined amid tougher trading conditions in Iberia and concerns about its Latin America business due to the weaker macroeconomic environment. Energy stock selection also detracted from relative performance, although the impact was mitigated by the Fund’s underweighted position. Canadian Energy Services & Technology was the largest detractor within the sector, hampered by a sharp decline in drilling activity. The underweightings to Industrials, Information Technology, and Materials also detracted. Canadian stock selection was negatively impacted by energy holdings and WestJet Airlines, which was hampered by concerns about the carrier’s exposure to Alberta’s oil-driven economy, coupled with Canadian dollar weakness. Emerging Asia stock selection also weighed negatively on relative performance. Within Emerging Asia, Quality Houses (Thailand) suffered share price deterioration due to Thailand economic weakness and the strict mortgage lending environment. Chinese infant formula company Biostime International was another notable regional detractor, as gross margins came under pressure due to higher discounting and increased competition. Please refer to the Global Markets Review and Outlook relating to the Fund on page 39. |
| 76 | Annual Report | December 31, 2015 |
International Small Cap Growth Fund
Performance Highlights (Unaudited)
| Average Annual Total Return at 12/31/2015 |
| |
| | | | 1 Year | | | 3 Year | | | 5 Year | | 10 Year |
| Class N | | | 9.67 | % | | | 8.11 | % | | | 6.02 | % | | | 5.67 | % |
| Class I | | | 10.00 | | | | 8.43 | | | | 6.36 | | | | 6.01 | |
| Institutional Class | | | 10.03 | | | | 8.62 | | | | 6.58 | | | | 6.20 | |
| MSCI ACW Ex-U.S. Small Cap Index (net) | | | 2.60 | | | | 5.64 | | | | 2.63 | | | | 4.97 | |
Performance cited represents past performance. Past performance does not guarantee future results and current performance may be lower or higher than the data quoted. Results shown are average annual returns, which assume reinvestment of dividends and capital gains. Investment returns and principal will fluctuate and you may have a gain or loss when you sell shares. For the most current month-end performance information, please call 1-800-742-7272, or visit our Web site at www.williamblairfunds.com. From time to time, the investment adviser may waive fees or reimburse expenses for the Fund. Without these waivers/reimbursements, performance would be lower. Smaller capitalization stocks are also more sensitive to purchase/sale transactions and changes in the issuer’s financial condition. International investing involves special risk considerations, including currency fluctuations, lower liquidity, economic and political risk. Class N shares are available to the general public without a sales load. Class I shares are available to certain institutional investors and advisory clients of William Blair Investment Management, LLC and William Blair & Company, L.L.C., without a sales load or distribution (12b-1) fees. Institutional Class shares are available to institutional investors without a sales load or distribution (12b-1) or service fees.
The performance highlights and graph presented above do not reflect the deduction of taxes that a shareholder would pay on fund distributions or the redemption of fund shares.
The Morgan Stanley Capital International (MSCI) All Country World (ACW) Ex-U.S. Small Cap Index (net) is a free float-adjusted market capitalization weighted index that is designed to measure the equity market performance of small capitalization developed and emerging markets, excluding the United States. This series approximates the minimum possible dividend reinvestment.
This report identifies the Fund’s investments on December 31, 2015. These holdings are subject to change. Not all stocks in the Fund performed the same, nor is there any guarantee that these stocks will perform as well in the future. Market forecasts provided in this report may not necessarily come to pass.
Sector Diversification (Unaudited)

The sector diversification shown is based on the total long-term securities.
| December 31, 2015 | William Blair Funds | 77 |
International Small Cap Growth Fund
Portfolio of Investments, December 31, 2015 (all dollar amounts in thousands)
| | | | | | | | |
| | | | | | | | |
| | Issuer | | Shares | | | Value | |
| | | | | | | | | | |
| | Common Stocks | | | | | | | | |
| | | | | | | | | | |
| | Europe, Mid-East—33.2% | | | | | | | | |
| | Denmark—1.0% | | | | | | | | |
| | Royal Unibrew A/S (Beverages) | | | 145,159 | | | $ | 5,921 | |
| | Finland—0.7% | | | | | | | | |
| | Huhtamaki Oyj (Containers & packaging) | | | 116,987 | | | | 4,259 | |
| | France—5.5% | | | | | | | | |
| | Alten S.A. (IT services) | | | 68,255 | | | | 3,962 | |
| | Ipsen S.A. (Pharmaceuticals) | | | 111,137 | | | | 7,368 | |
| | Korian S.A. (Health care providers & services) | | | 65,326 | | | | 2,391 | |
| | Metropole Television S.A. (Media) | | | 211,651 | | | | 3,643 | |
| | Orpea (Health care providers & services) | | | 35,887 | | | | 2,878 | |
| | Rubis SCA (Gas utilities) | | | 11,294 | | | | 858 | |
| | Technicolor S.A. (Media) | | | 131,776 | | | | 1,071 | |
| | Teleperformance (Professional services) | | | 67,098 | | | | 5,651 | |
| * | UBISOFT Entertainment (Software) | | | 134,123 | | | | 3,887 | |
| | | | | | | | | 31,709 | |
| | Germany—4.6% | | | | | | | | |
| | Aareal Bank AG (Thrifts & mortgage finance) | | | 158,104 | | | | 5,007 | |
| | Aurelius AG (Capital markets) | | | 145,047 | | | | 7,585 | |
| | CTS Eventim AG & Co KGaA (Media) | | | 85,825 | | | | 3,427 | |
| | Gerresheimer AG (Life sciences tools & services) | | | 55,712 | | | | 4,370 | |
| | Norma Group SE (Machinery) | | | 105,330 | | | | 5,855 | |
| | | | | | | | | 26,244 | |
| | Ireland—4.7% | | | | | | | | |
| | Beazley plc (Insurance) | | | 1,298,746 | | | | 7,480 | |
| * | ICON plc (Life sciences tools & services)† | | | 100,142 | | | | 7,781 | |
| | Irish Continental Group plc (Marine) | | | 477,798 | | | | 2,811 | |
| | Kingspan Group plc (Building products) | | | 209,755 | | | | 5,542 | |
| | Paddy Power plc (Hotels, restaurants & leisure) | | | 26,241 | | | | 3,511 | |
| | | | | | | | | 27,125 | |
| | Israel—1.8% | | | | | | | | |
| | Elbit Systems, Ltd. (Aerospace & defense) | | | 84,455 | | | | 7,441 | |
| | Frutarom Industries, Ltd. (Chemicals) | | | 55,134 | | | | 2,961 | |
| | | | | | | | | 10,402 | |
| | Italy—7.6% | | | | | | | | |
| | Anima Holding SpA—144A (Capital markets) | | | 421,483 | | | | 3,673 | |
| | Banca IFIS SpA (Diversified financial services) | | | 132,101 | | | | 4,139 | |
| | Brembo SpA (Auto components) | | | 110,033 | | | | 5,343 | |
| * | Cerved Information Solutions SpA (Diversified financial services) | | | 716,692 | | | | 5,997 | |
| | De’Longhi SpA (Household durables) | | | 142,347 | | | | 4,280 | |
| | DiaSorin SpA (Health care equipment & supplies) | | | 54,545 | | | | 2,872 | |
| | FinecoBank Banca Fineco SpA (Banks) | | | 477,148 | | | | 3,954 | |
| | Industria Macchine Automatiche SpA (Machinery) | | | 94,733 | | | | 4,941 | |
| | Recordati SpA (Pharmaceuticals) | | | 140,332 | | | | 3,674 | |
| * | Yoox Net-A-Porter Group SpA (Internet & catalog retail) | | | 127,491 | | | | 4,787 | |
| | | | | | | | | 43,660 | |
| | | | | | | | |
| | | | | | | | |
| | Issuer | | Shares | | | Value | |
| | | | | | | | | | |
| | Common Stocks—(continued) | | | | | | | | |
| | | | | | | | | | |
| | Europe, Mid-East—(continued) | | | | | | | | |
| | Luxembourg—1.0% | | | | | | | | |
| | Grand City Properties S.A. (Real estate management & development) | | | 239,623 | | | $ | 5,570 | |
| | Spain—1.7% | | | | | | | | |
| * | Distribuidora Internacional de Alimentacion S.A. (Food & staples retailing) | | | 780,563 | | | | 4,618 | |
| | Viscofan S.A. (Food products) | | | 88,914 | | | | 5,376 | |
| | | | | | | | | 9,994 | |
| | Sweden—2.8% | | | | | | | | |
| | BillerudKorsnas AB (Containers & packaging) | | | 125,328 | | | | 2,334 | |
| | Hexpol AB (Chemicals) | | | 329,192 | | | | 3,553 | |
| | Intrum Justitia AB (Commercial services & supplies) | | | 113,443 | | | | 3,878 | |
| | Loomis AB Class “B” (Commercial services & supplies) | | | 106,675 | | | | 3,343 | |
| * | NetEnt AB (Internet software & services) | | | 47,851 | | | | 2,803 | |
| | | | | | | | | 15,911 | |
| | Switzerland—1.8% | | | | | | | | |
| * | Leonteq AG (Capital markets) | | | 16,318 | | | | 2,371 | |
| * | Luxoft Holding, Inc. (IT services)† | | | 41,317 | | | | 3,187 | |
| | Straumann Holding AG (Health care equipment & supplies) | | | 14,661 | | | | 4,464 | |
| | | | | | | | | 10,022 | |
| | |
| | Japan—19.4% | | | | | | | | |
| | ABC-Mart, Inc. (Specialty retail) | | | 52,300 | | | | 2,894 | |
| | Casio Computer Co., Ltd. (Household durables) | | | 279,700 | | | | 6,625 | |
| | Daicel Corporation (Chemicals) | | | 528,100 | | | | 7,970 | |
| | Daiichikosho Co., Ltd. (Media) | | | 110,600 | | | | 4,421 | |
| | Fuji Electric Co., Ltd. (Electrical equipment) | | | 1,089,000 | | | | 4,630 | |
| | Haseko Corporation (Household durables) | | | 618,400 | | | | 6,935 | |
| | Hitachi Capital Corporation (Consumer finance) | | | 207,400 | | | | 5,651 | |
| | Hitachi Kokusai Electric, Inc. (Communications equipment) | | | 188,000 | | | | 2,592 | |
| | Hoshizaki Electric Co., Ltd. (Machinery) | | | 39,000 | | | | 2,453 | |
| | IT Holdings Corporation (IT services) | | | 217,700 | | | | 5,041 | |
| | M3, Inc. (Health care technology) | | | 154,800 | | | | 3,248 | |
| | Meitec Corporation (Professional services) | | | 123,800 | | | | 4,280 | |
| | Nihon Kohden Corporation (Health care equipment & supplies) | | | 62,900 | | | | 1,539 | |
| | Nihon M&A Center, Inc. (Professional services) | | | 96,900 | | | | 4,724 | |
| | Nissan Chemical Industries, Ltd. (Chemicals) | | | 304,800 | | | | 7,022 | |
| | NS Solutions Corporation (IT services) | | | 170,000 | | | | 3,918 | |
| | OSG Corporation (Machinery) | | | 203,500 | | | | 3,892 | |
| | Pigeon Corporation (Household products) | | | 98,800 | | | | 2,437 | |
| | Resorttrust, Inc. (Hotels, restaurants & leisure) | | | 140,800 | | | | 3,754 | |
| | Sato Holdings Corporation (Commercial services & supplies) | | | 103,000 | | | | 2,057 | |
| | Sawai Pharmaceutical Co., Ltd. (Pharmaceuticals) | | | 47,600 | | | | 3,291 | |
See accompanying Notes to Financial Statements.
| 78 | Annual Report | December 31, 2015 |
International Small Cap Growth Fund
Portfolio of Investments, December 31, 2015 (all dollar amounts in thousands)
| | | | | | | | |
| | | | | | | | |
| | Issuer | | Shares | | | Value | |
| | | | | | | | | | |
| | Common Stocks—(continued) | | | | | | | | |
| | | | | | | | | | |
| | Japan—(continued) | | | | | | | | |
| | Skylark Co., Ltd. (Hotels, restaurants & leisure) | | | 300,000 | | | $ | 3,916 | |
| | Temp Holdings Co., Ltd. (Professional services) | | | 187,400 | | | | 2,939 | |
| | The Hiroshima Bank, Ltd. (Banks) | | | 1,250,000 | | | | 7,207 | |
| | Tsubakimoto Chain Co. (Machinery) | | | 561,000 | | | | 4,378 | |
| | Zenkoku Hosho Co., Ltd. (Diversified financial services) | | | 103,700 | | | | 3,473 | |
| | | | | | | | | 111,287 | |
| | | | | | | | | | |
| | United Kingdom—16.8% | | | | | | | | |
| | Bellway plc (Household durables) | | | 113,021 | | | | 4,725 | |
| | Berendsen plc (Commercial services & supplies) | | | 228,312 | | | | 3,632 | |
| | Cineworld Group plc (Media) | | | 506,390 | | | | 4,199 | |
| | Close Brothers Group plc (Capital markets) | | | 235,967 | | | | 4,651 | |
| | Domino’s Pizza Group plc (Hotels, restaurants & leisure) | | | 329,236 | | | | 5,106 | |
| | Great Portland Estates plc (Real estate investment trusts (REITs)) | | | 259,530 | | | | 3,168 | |
| | Halma plc (Electronic equipment, instruments & components) | | | 301,360 | | | | 3,843 | |
| | Howden Joinery Group plc (Specialty retail) | | | 615,847 | | | | 4,780 | |
| | IG Group Holdings plc (Diversified financial services) | | | 238,606 | | | | 2,823 | |
| | Inchcape plc (Distributors) | | | 570,649 | | | | 6,604 | |
| | Jupiter Fund Management plc (Capital markets) | | | 711,644 | | | | 4,739 | |
| | Man Group plc (Capital markets) | | | 1,412,726 | | | | 3,655 | |
| | Micro Focus International plc (Software) | | | 270,361 | | | | 6,357 | |
| | Moneysupermarket.com Group plc (Internet software & services) | | | 898,216 | | | | 4,860 | |
| | OneSavings Bank plc (Thrifts & mortgage finance) | | | 463,198 | | | | 2,415 | |
| | Provident Financial plc (Consumer finance) | | | 53,662 | | | | 2,664 | |
| | Rightmove plc (Media) | | | 50,679 | | | | 3,082 | |
| | Senior plc (Aerospace & defense) | | | 684,124 | | | | 2,317 | |
| | SSP Group plc (Hotels, restaurants & leisure) | | | 881,293 | | | | 4,222 | |
| | Ted Baker plc (Textiles, apparel & luxury goods) | | | 67,981 | | | | 2,994 | |
| | The Restaurant Group plc (Hotels, | | | | | | | | |
| | restaurants & leisure) | | | 358,417 | | | | 3,622 | |
| | The UNITE Group plc (Real estate management & development) | | | 596,779 | | | | 5,771 | |
| | Victrex plc (Chemicals) | | | 130,357 | | | | 3,467 | |
| | Workspace Group plc (Real estate investment trusts (REITs)) | | | 216,445 | | | | 3,058 | |
| | | | | | | | | 96,754 | |
| | | | | | | | | | |
| | Emerging Asia—10.4% | | | | | | | | |
| | China—5.2% | | | | | | | | |
| | Beijing Capital International Airport Co., Ltd. Class “H” (Transportation infrastructure) | | | 4,038,000 | | | | 4,361 | |
| * | China Biologic Products, Inc. (Biotechnology) | | | 38,308 | | | | 5,457 | |
| | | | | | | | |
| | | | | | | | |
| | Issuer | | Shares | | | Value | |
| | | | | | | | | | |
| | Common Stocks—(continued) | | | | | | | | |
| | | | | | | | | | |
| | Emerging Asia-—(continued) | | | | | | | | |
| | China—(continued) | | | | | | | | |
| | China Lodging Group, Ltd.—ADR (Hotels, restaurants & leisure) | | | 81,282 | | | $ | 2,541 | |
| | Hollysys Automation Technologies, Ltd. (Electronic equipment, instruments & components)† | | | 192,842 | | | | 4,277 | |
| | Shenzhou International Group Holdings, Ltd. (Textiles, apparel & luxury goods) | | | 801,000 | | | | 4,605 | |
| | Sino Biopharmaceutical, Ltd. (Pharmaceuticals) | | | 4,806,000 | | | | 4,366 | |
| | Travelsky Technology, Ltd. Class “H” (IT services) | | | 2,546,000 | | | | 4,205 | |
| | | | | | | | | 29,812 | |
| | India—1.7% | | | | | | | | |
| | Indiabulls Housing Finance, Ltd. (Thrifts & mortgage finance) | | | 260,998 | | | | 2,888 | |
| | Yes Bank, Ltd. (Banks) | | | 602,750 | | | | 6,614 | |
| | | | | | | | | 9,502 | |
| | South Korea—1.2% | | | | | | | | |
| * | Kangwon Land, Inc. (Hotels, restaurants & leisure) | | | 99,950 | | | | 3,273 | |
| * | KEPCO Plant Service & Engineering Co., Ltd. (Commercial services & supplies) | | | 50,233 | | | | 3,813 | |
| | | | | | | | | 7,086 | |
| | Taiwan—1.7% | | | | | | | | |
| | Advantech Co., Ltd. (Technology hardware, storage & peripherals) | | | 325,000 | | | | 2,092 | |
| | E.Sun Financial Holding Co., Ltd. (Banks) | | | 8,683,769 | | | | 5,063 | |
| | Novatek Microelectronics Corporation (Semiconductors & semiconductor equipment) | | | 685,000 | | | | 2,690 | |
| | | | | | | | | 9,845 | |
| | Thailand—0.6% | | | | | | | | |
| | Minor International PCL (Hotels, restaurants & leisure) | | | 3,145,200 | | | | 3,168 | |
| | |
| | Asia—8.0% | | | | | | | | |
| | Australia—4.9% | | | | | | | | |
| | Domino’s Pizza Enterprises, Ltd. (Hotels, restaurants & leisure) | | | 80,934 | | | | 3,406 | |
| | DuluxGroup, Ltd. (Chemicals) | | | 1,338,604 | | | | 6,487 | |
| | Magellan Financial Group, Ltd. (Capital markets) | | | 398,726 | | | | 7,915 | |
| | Orora, Ltd. (Containers & packaging) | | | 2,401,403 | | | | 3,937 | |
| | The Star Entertainment Grp, Ltd. (Hotels, restaurants & leisure) | | | 1,693,574 | | | | 6,269 | |
| | | | | | | | | 28,014 | |
| | Hong Kong—0.7% | | | | | | | | |
| | Man Wah Holdings, Ltd. (Household durables) | | | 3,292,000 | | | | 3,874 | |
| | | | | | | | | | |
| | New Zealand—0.6% | | | | | | | | |
| | Fisher & Paykel Healthcare Corp., Ltd. (Health care equipment & supplies) | | | 623,889 | | | | 3,798 | |
See accompanying Notes to Financial Statements.
| December 31, 2015 | William Blair Funds | 79 |
International Small Cap Growth Fund
Portfolio of Investments, December 31, 2015 (all dollar amounts in thousands)
| | | | | | | | |
| | | | | | | | |
| | Issuer | | Shares | | | Value | |
| | | | | | | | | | |
| | Common Stocks—(continued) | | | | | | | | |
| | | | | | | | | | |
| | Asia—(continued) | | | | | | | | |
| | Singapore—1.8% | | | | | | | | |
| | ComfortDelGro Corporation, Ltd. (Road & rail) | | | 2,519,000 | | | $ | 5,418 | |
| | SATS, Ltd. (Transportation infrastructure) | | | 1,755,000 | | | | 4,753 | |
| | | | | | | | | 10,171 | |
| | | | | | | | | | |
| | Emerging Latin America—3.4% | | | | | | | | |
| | Mexico—3.4% | | | | | | | | |
| | Alsea S.A.B. de C.V. (Hotels, restaurants & leisure) | | | 892,830 | | | | 3,108 | |
| | Gentera S.A.B. de C.V. (Consumer finance) | | | 2,498,200 | | | | 4,805 | |
| | Gruma S.A.B. de C.V. Class “B” (Food products) | | | 356,600 | | | | 5,017 | |
| | Grupo Aeroportuario del Sureste S.A.B. de C.V.—ADR (Transportation infrastructure) | | | 27,911 | | | | 3,926 | |
| * | Promotora y Operadora de Infraestructura S.A.B. de C.V. (Construction & engineering) | | | 234,800 | | | | 2,765 | |
| | | | | | | | | 19,621 | |
| | |
| | Canada—3.0% | | | | | | | | |
| | Canadian Energy Services & Technology Corporation (Energy equipment & services) | | | 627,255 | | | | 1,759 | |
| | Linamar Corporation (Auto components) | | | 126,241 | | | | 6,818 | |
| | Peyto Exploration & Development Corporation (Oil, gas & consumable fuels) | | | 129,414 | | | | 2,326 | |
| * | Raging River Exploration, Inc. (Oil, gas & consumable fuels) | | | 398,352 | | | | 2,409 | |
| | WestJet Airlines, Ltd. (Airlines) | | | 150,177 | | | | 2,199 | |
| | Whitecap Resources, Inc. (Oil, gas & consumable fuels) | | | 279,796 | | | | 1,834 | |
| | | | | | | | | 17,345 | |
| | |
| | Emerging Europe, Mid-East, Africa—2.0% | | | | | | | | |
| | Hungary—0.2% | | | | | | | | |
| | Richter Gedeon Nyrt (Pharmaceuticals) | | | 54,819 | | | | 1,039 | |
| | South Africa-1.0% | | | | | | | | |
| | Clicks Group, Ltd. (Food & staples retailing) | | | 492,649 | | | | 2,835 | |
| | Rand Merchant Insurance Holdings, Ltd. (Insurance) | | | 822,744 | | | | 2,059 | |
| | Resilient REIT, Ltd. (Real estate investment trusts (REITs)) | | | 86,627 | | | | 647 | |
| | | | | | | | | 5,541 | |
| | Turkey—0.8% | | | | | | | | |
| | Ford Otomotiv Sanayi A.S. (Automobiles) | | | 295,124 | | | | 3,064 | |
| | Turkiye Sinai Kalkinma Bankasi A.S. (Banks) | | | 3,340,072 | | | | 1,741 | |
| | | | | | | | | 4,805 | |
| | Total Common Stocks—96.2%
(cost $488,217) | | | | | | | 552,479 | |
| | | | | | | | |
| | | | Principal | | | | |
| | Issuer | | Amount | | | Value | |
| | | | | | | | |
| | Repurchase Agreement | | | | | | | | |
| | Fixed Income Clearing Corporation, 0.030% dated 12/31/15, due 1/4/16, repurchase price $20,131, collateralized by U.S.Treasury Note, 2.375%, due 8/15/24 | | | $20,131 | | | $ | 20,131 | |
| | Total Repurchase Agreement—3.5%
(cost $20,131) | | | | | | | 20,131 | |
| | Total Investments—99.7%
(cost $508,348) | | | | | | | 572,610 | |
| | Cash and other assets, less liabilities—0.3% | | | | | | | 1,990 | |
| | Net assets—100.0% | | | | | | $ | 574,600 | |
ADR = American Depository Receipt
* Non-income producing securities
† = U.S. listed foreign security
For securities primarily traded on exchanges or markets that close before the close of regular trading on the New York Stock Exchange, the Fund may use an independent pricing service to fair value price the securities pursuant to Valuation Procedures approved by the Board of Trustees.
At December 31, 2015, the Fund’s Portfolio of Investments includes the following industry categories (as a percentage of long-term investments):
| Consumer Discretionary | | | 24.3 | % |
| Financials | | | 22.9 | % |
| Industrials | | | 18.5 | % |
| Health Care | | | 10.6 | % |
| Information Technology | | | 9.7 | % |
| Materials | | | 7.6 | % |
| Consumer Staples | | | 4.7 | % |
| Energy | | | 1.5 | % |
| Utilities | | | 0.2 | % |
| Total | | | 100.0 | % |
See accompanying Notes to Financial Statements.
| 80 | Annual Report | December 31, 2015 |
International Small Cap Growth Fund
Portfolio of Investments, December 31, 2015
At December 31, 2015, the Fund’s Portfolio of Investments includes the following currency categories (as a percentage of long-term investments):
| Euro | | | 24.1 | % |
| Japanese Yen | | | 20.2 | % |
| British Pound Sterling | | | 18.9 | % |
| Australian Dollar | | | 5.1 | % |
| U.S. Dollar | | | 4.9 | % |
| Hong Kong Dollar | | | 3.9 | % |
| Canadian Dollar | | | 3.1 | % |
| Swedish Krona | | | 2.9 | % |
| Mexican Peso | | | 2.8 | % |
| Israeli Shekel | | | 1.9 | % |
| Singapore Dollar | | | 1.8 | % |
| New Taiwan Dollar | | | 1.8 | % |
| Indian Rupee | | | 1.7 | % |
| South Korean Won | | | 1.3 | % |
| Swiss Franc | | | 1.2 | % |
| Danish Krone | | | 1.1 | % |
| South African Rand | | | 1.0 | % |
| All Other Currencies | | | 2.3 | % |
| Total | | | 100.0 | % |
See accompanying Notes to Financial Statements.
| December 31, 2015 | William Blair Funds | 81 |
| | Emerging Markets Leaders Fund |
| | |
| | The Emerging Markets Leaders Fund seeks long-term capital appreciation. |
| | |
| | AN OVERVIEW FROM THE PORTFOLIO MANAGERS |
| | |
 Todd M. McClone  Jeffrey A. Urbina | The William Blair Emerging Markets Leaders Fund (Class N shares) posted a 14.56% decrease, net of fees, for the twelve months ended December 31, 2015. By comparison, the Fund’s benchmark index, the MSCI Emerging Markets Index (net) (the “Index”), decreased 14.92%. While the Fund’s absolute performance was negative in 2015, the Fund outperformed the Index. The Fund’s 2015 outperformance relative to the Index was primarily from Financials, Consumer Discretionary, Industrials, and Materials stock selection, combined with favorable sector positioning. Within Financials, bank and real estate holdings were significant contributors. HDFC Bank (India) was a leading contributor, benefiting from strong growth in retail loans and digital initiatives that drove its market share higher. Real estate developer China Overseas Land & Investment’s share price was supported by healthy trends in property sales and rental income, in addition to the government’s policy easing measures. In contrast, Healthcare stock selection was a key detractor for the year, as pharmaceutical holdings such as Aspen Pharmacare (South Africa) and Kalbe Farma (Thailand) suffered significant share price declines due to weaker operating trends. Telecommunication Services and Energy stock selection were also weak, but the effects were mitigated by the Fund’s large underweight positions in both sectors. Within the Information Technology sector, semiconductor holdings were detractors in 2015; notably MediaTek (Taiwan) and SK Hynix (Korea). From a country perspective, relative performance in 2015 was primarily enhanced by stock selection in China and the Fund’s overweighting to India, which helped to offset the negative impact of the Fund’s overweighting to Brazil and underweightings to Korea, Taiwan, and Russia. Please refer to the Global Markets Review and Outlook relating to the Fund on page 39. |
| 82 | Annual Report | December 31, 2015 |
Emerging Markets Leaders Fund
Performance Highlights (Unaudited)
| |
| |
| Average Annual Total Return at 12/31/2015 |
| | | 1 Year | | 3 Year | | 5 Year | | Since
Inception |
| Class N(b) | | | (14.56 | )% | | | (4.67 | )% | | | (3.45 | )% | | | (0.11 | )% |
| MSCI Emerging Markets | | | | | | | | | | | | | | | | |
| Index – (net)(b) | | | (14.92 | ) | | | (6.76 | ) | | | (4.81 | ) | | | (1.71 | ) |
| Class I(a) | | | (14.37 | ) | | | (4.41 | ) | | | (3.20 | ) | | | (1.37 | ) |
| Institutional Class(a) | | | (14.24 | ) | | | (4.30 | ) | | | (3.07 | ) | | | (1.23 | ) |
| MSCI Emerging Markets | | | | | | | | | | | | | | | | |
| Index (net)(a) | | | (14.92 | ) | | | (6.76 | ) | | | (4.81 | ) | | | (1.81 | ) |
| (a) | Since inception is for the period from March 26, 2008 (Commencement of Operations) to December 31, 2015. |
| (b) | Since inception is for the period from May 3, 2010 (Commencement of Operations) to December 31, 2015. |
Performance cited represents past performance. Past performance does not guarantee future results and current performance may be lower or higher than the data quoted. Results shown are average annual total returns, which assume reinvestment of dividends and capital gains. Investment returns and principal will fluctuate and you may have a gain or loss when you sell shares. For the most current month-end performance information, please call 1-800-742-7272, or visit our Web site at www.williamblairfunds.com. International investing involves special risk considerations, including currency fluctuations, lower liquidity, economic and political risk. From time to time, the investment adviser may waive fees or reimburse expenses for the Fund. Without these waivers/reimbursements, performance would be lower. Class N shares are available to the general public without a sales load. Class I shares are available to certain institutional investors and advisory clients of William Blair Investment Management, LLC and William Blair & Company, L.L.C., without a sales load or distribution (12b-1) fees. Institutional Class shares are available to institutional investors without a sales load or distribution (12b-1) or service fees.
The performance highlights and graph presented above do not reflect the deduction of taxes that a shareholder would pay on fund distributions or the redemption of fund shares.
The Morgan Stanley Capital International (MSCI) Emerging Markets Index (net) is a free float-adjusted market-capitalization-weighted index that is designed to measure equity market performance of emerging markets. This series approximates the minimum possible dividend reinvestment.
This report identifies the Fund’s investments on December 31, 2015. These holdings are subject to change. Not all stocks in the Fund performed the same, nor is there any guarantee that these stocks will perform as well in the future. Market forecasts provided in this report may not necessarily come to pass.
Sector Diversification (Unaudited)
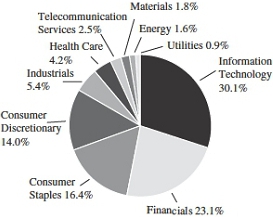
The sector diversification shown is based on the total long-term securities.
| December 31, 2015 | William Blair Funds | 83 |
Emerging Markets Leaders Fund
Portfolio of Investments, December 31, 2015 (all dollar amounts in thousands)
| | | | | | | | |
| | | | | | | | |
| | Issuer | | Shares | | | Value | |
| | | | | | | | | | |
| | Common Stocks | | | | | | | | |
| | | | | | | | | | |
| | Emerging Asia—69.5% | | | | | | | | |
| | China—24.6% | | | | | | | | |
| * | Alibaba Group Holding, Ltd.—ADR | | | | | | | | |
| | (Internet software & services) | | | 56,138 | | | $ | 4,562 | |
| * | Baidu, Inc.—ADR (Internet software
services) | | | 13,677 | | | | 2,586 | |
| | China Mengniu Dairy Co., Ltd.
(Food products) | | | 352,000 | | | | 574 | |
| | China Overseas Land & Investment, Ltd.
(Real estate management & development) | | | 1,074,000 | | | | 3,756 | |
| | CNOOC, Ltd. (Oil, gas & consumable fuels) | | | 1,205,000 | | | | 1,255 | |
| * | Ctrip.com International, Ltd.—ADR
(Internet & catalog retail) | | | 26,590 | | | | 1,232 | |
| * | Dali Foods Group Co., Ltd.—144A
(Food products) | | | 2,216,500 | | | | 1,258 | |
| | ENN Energy Holdings, Ltd. (Gas utilities) | | | 218,000 | | | | 1,158 | |
| | Great Wall Motor Co., Ltd. Class “H” (Automobiles) | | | 2,136,000 | | | | 2,494 | |
| | NetEase, Inc.—ADR (Internet software & services) | | | 10,894 | | | | 1,974 | |
| | Ping An Insurance Group Co. of China, Ltd.
Class “H” (Insurance) | | | 802,000 | | | | 4,439 | |
| | Sinopharm Group Co., Ltd. Class “H”
(Health care providers & services) | | | 163,200 | | | | 655 | |
| | Tencent Holdings, Ltd. (Internet software & services) | | | 276,000 | | | | 5,438 | |
| | | | | | | | | 31,381 | |
| | India—15.7% | | | | | | | | |
| | Asian Paints, Ltd. (Chemicals) | | | 127,989 | | | | 1,707 | |
| | Axis Bank, Ltd. (Banks) | | | 281,162 | | | | 1,911 | |
| | Bharti Infratel, Ltd. (Wireless
telecommunication services) | | | 343,475 | | | | 2,210 | |
| | HCL Technologies, Ltd. (IT services) | | | 40,672 | | | | 528 | |
| | HDFC Bank, Ltd. (Banks) | | | 137,091 | | | | 2,241 | |
| | Hindustan Unilever, Ltd.
(Household products) | | | 51,993 | | | | 677 | |
| | Housing Development Finance Corporation,
Ltd. (Thrifts & mortgage finance) | | | 107,637 | | | | 2,056 | |
| | Infosys, Ltd. (IT services) | | | 121,671 | | | | 2,036 | |
| | Lupin, Ltd. (Pharmaceuticals) | | | 49,048 | | | | 1,358 | |
| | Maruti Suzuki India, Ltd. (Automobiles) | | | 21,056 | | | | 1,471 | |
| * | Tata Motors, Ltd. (Automobiles) | | | 659,229 | | | | 3,902 | |
| | | | | | | | | 20,097 | |
| | Indonesia—3.1% | | | | | | | | |
| | PT Bank Rakyat Indonesia Persero Tbk
(Banks) | | | 2,737,500 | | | | 2,269 | |
| | PT Kalbe Farma Tbk (Pharmaceuticals) | | | 7,766,000 | | | | 744 | |
| | PT Telekomunikasi Indonesia Persero Tbk
(Diversified telecommunication services) | | | 4,417,100 | | | | 995 | |
| | | | | | | | | 4,008 | |
| | Malaysia—0.6% | | | | | | | | |
| | IHH Healthcare Bhd (Health care providers
& services) | | | 464,700 | | | | 712 | |
| | | | | | | | |
| | | | | | | | |
| | Issuer | | Shares | | | Value | |
| | | | | | | | | | |
| | Common Stocks—(continued) | | | | | | | | |
| | | | | | | | | | |
| | Emerging Asia—(continued) | | | | | | | | |
| | Philippines—1.1% | | | | | | | | |
| | SM Prime Holdings, Inc. (Real estate
management & development) | | | 1,374,900 | | | $ | 634 | |
| | Universal Robina Corporation
(Food products) | | | 204,660 | | | | 809 | |
| | | | | | | | | 1,443 | |
| | South Korea—11.4% | | | | | | | | |
| * | Amorepacific Corporation (Personal products) | | | 4,273 | | | | 1,511 | |
| * | Coway Co., Ltd. (Household durables) | | | 16,275 | | | | 1,167 | |
| * | LG Chem, Ltd. (Chemicals) | | | 2,087 | | | | 585 | |
| * | LG Household & Health Care, Ltd.
(Household products) | | | 4,493 | | | | 4,023 | |
| | Samsung Electronics Co., Ltd. (Technology
hardware, storage & peripherals) | | | 4,442 | | | | 4,773 | |
| * | SK Hynix, Inc. (Semiconductors &
semiconductor equipment) | | | 94,040 | | | | 2,466 | |
| | | | | | | | | 14,525 | |
| | Taiwan—8.9% | | | | | | | | |
| | Delta Electronics, Inc. (Electronic equipment,
instruments & components) | | | 378,009 | | | | 1,790 | |
| | Fubon Financial Holding Co., Ltd.
(Diversified financial services) | | | 1,084,000 | | | | 1,485 | |
| | Largan Precision Co., Ltd. (Electronic
equipment, instruments & components) | | | 32,000 | | | | 2,211 | |
| | MediaTek, Inc. (Semiconductors &
semiconductor equipment) | | | 83,000 | | | | 632 | |
| | Taiwan Semiconductor Manufacturing Co.,
Ltd.—ADR (Semiconductors &
semiconductor equipment) | | | 230,078 | | | | 5,234 | |
| | | | | | | | | 11,352 | |
| | Thailand—4.1% | | | | | | | | |
| | Airports of Thailand PCL (Transportation
infrastructure) | | | 242,900 | | | | 2,336 | |
| | Bangkok Dusit Medical Services PCL Class “F”
(Health care providers & services) | | | 1,689,900 | | | | 1,047 | |
| | CP ALL PCL (Food & staples retailing) | | | 1,032,500 | | | | 1,126 | |
| | Kasikornbank PCL (Banks) | | | 169,400 | | | | 704 | |
| | | | | | | | | 5,213 | |
| | | | | | | | | | |
| | Emerging Europe, Mid-East, Africa—15.9% | | | | | | | | |
| | Czech Republic—0.5% | | | | | | | | |
| | Komercni banka A.S. (Banks) | | | 2,885 | | | | 574 | |
| | Russia—2.9% | | | | | | | | |
| | Magnit PJSC—GDR (Food & staples retailing) | | | 34,312 | | | | 1,380 | |
| * | Mail.Ru Group, Ltd.—GDR (Internet software & services) | | | 102,558 | | | | 2,313 | |
| | | | | | | | | 3,693 | |
See accompanying Notes to Financial Statements.
| 84 | Annual Report | December 31, 2015 |
Emerging Markets Leaders Fund
Portfolio of Investments, December 31, 2015 (all dollar amounts in thousands)
| | | | | | | | |
| | | | | | | | |
| | Issuer | | Shares | | | Value | |
| | | | | | | | | | |
| | Common Stocks—(continued) | | | | | | | | |
| | | | | | | | | | |
| | Emerging Europe, Mid-East, Africa—(continued) | | |
| | South Africa—7.6% | | | | | | | | |
| * | Aspen Pharmacare Holdings, Ltd.
(Pharmaceuticals) | | | 37,888 | | | $ | 758 | |
| | Bidvest Group, Ltd.
(Industrial conglomerates) | | | 57,214 | | | | 1,214 | |
| | Discovery, Ltd. (Insurance) | | | 87,329 | | | | 751 | |
| | Naspers, Ltd. (Media) | | | 31,547 | | | | 4,325 | |
| | Steinhoff International Holdings N.V.
(Household durables) | | | 397,765 | | | | 2,019 | |
| | Woolworths Holdings, Ltd.
(Multiline retail) | | | 95,873 | | | | 621 | |
| | | | | | | | | 9,688 | |
| | Turkey—2.2% | | | | | | | | |
| | BIM Birlesik Magazalar A.S.
(Food & staples retailing) | | | 63,113 | | | | 1,111 | |
| | KOC Holding A.S.
(Industrial conglomerates) | | | 463,264 | | | | 1,736 | |
| | | | | | | | | 2,847 | |
| | United Arab Emirates—2.7% | | | | | | | | |
| | DP World, Ltd.
(Transportation infrastructure) | | | 49,276 | | | | 1,001 | |
| * | Emaar Malls Group PJSC (Real estate
management & development) | | | 873,037 | | | | 656 | |
| | Emaar Properties PJSC (Real estate
management & development) | | | 675,168 | | | | 1,046 | |
| | First Gulf Bank PJSC (Banks) | | | 200,714 | | | | 691 | |
| | | | | | | | | 3,394 | |
| | | | | | | | | | |
| | Emerging Latin America—13.1% | | | | | | | | |
| | Brazil—6.4% | | | | | | | | |
| | AMBEV S.A.—ADR (Beverages) | | | 516,892 | | | | 2,305 | |
| | BB Seguridade Participacoes S.A.
(Insurance) | | | 271,600 | | | | 1,670 | |
| | BRF S.A. (Food products) | | | 42,600 | | | | 596 | |
| | CETIP S.A. — Mercados Organizados
(Capital markets) | | | 77,600 | | | | 736 | |
| | Cielo S.A. (IT services) | | | 142,600 | | | | 1,211 | |
| | Lojas Renner S.A. (Multiline retail) | | | 92,900 | | | | 402 | |
| | Ultrapar Participacoes S.A. (Oil, gas &
consumable fuels) | | | 47,900 | | | | 732 | |
| | WEG S.A. (Machinery) | | | 147,400 | | | | 557 | |
| | | | | | | | | 8,209 | |
| | Chile—0.7% | | | | | | | | |
| | Banco Santander Chile—ADR (Banks) | | | 51,587 | | | | 910 | |
| | Mexico—4.9% | | | | | | | | |
| | Fomento Economico Mexicano S.A.B. de C.V.—ADR (Beverages) | | | 14,728 | | | | 1,360 | |
| | Grupo Financiero Inbursa S.A.B. de C.V. Class “O” (Banks) | | | 511,400 | | | | 926 | |
| | Wal-Mart de Mexico S.A.B. de C.V. (Food & staples retailing) | | | 1,554,500 | | | | 3,924 | |
| | | | | | | | | 6,210 | |
| | | | | | | | |
| | Issuer | | Shares or
Principal
Amount | | | Value | |
| | | | | | | | |
| | Common Stocks—(continued) | | | | |
| | | | | | | | |
| | Emerging Latin America-—(continued) | | | | |
| | Peru—1.1% | | | | | | |
| | Credicorp, Ltd. (Banks)† | | | 14,588 | | | $ | 1,419 | |
| | Total Common Stocks-98.5%
(cost $131,772) | | | | | | | 125,675 | |
| | | | | | | | | | |
| | Repurchase Agreement | | | | | | | | |
| | Fixed Income Clearing Corporation, 0.030% dated 12/31/15, due 1/4/16, repurchase price $1,820, collateralized by FNMA, 2.625%, due 9/6/24 | | | $1,820 | | | | 1,820 | |
| | Total Repurchase Agreement—1.4%
(cost $1,820) | | | | | | | 1,820 | |
| | Total Investments—99.9%
(cost $133,592) | | | | | | | 127,495 | |
| | Cash and other assets, less liabilities—0.1% | | | | | | | 183 | |
| | Net assets—100.0% | | | | | | $ | 127,678 | |
ADR = American Depository Receipt
GDR = Global Depository Receipt
* Non-income producing securities
† = U.S. listed foreign security
For securities primarily traded on exchanges or markets that close before the close of regular trading on the New York Stock Exchange, the Fund may use an independent pricing service to fair value price the securities pursuant to Valuation Procedures approved by the Board of Trustees.
At December 31, 2015, the Fund’s Portfolio of Investments includes the following industry categories (as a percentage of long- term investments):
| Information Technology | | | 30.1 | % |
| Financials | | | 23.1 | % |
| Consumer Staples | | | 16.4 | % |
| Consumer Discretionary | | | 14.0 | % |
| Industrials | | | 5.4 | % |
| Health Care | | | 4.2 | % |
| Telecommunication Services | | | 2.5 | % |
| Materials | | | 1.8 | % |
| Energy | | | 1.6 | % |
| Utilities | | | 0.9 | % |
| Total | | | 100.0 | % |
See accompanying Notes to Financial Statements.
| December 31, 2015 | William Blair Funds | 85 |
Emerging Markets Leaders Fund
Portfolio of Investments, December 31, 2015
At December 31, 2015, the Fund’s Portfolio of Investments includes the following currency categories (as a percentage of long-term investments):
| U.S. Dollar | �� | | 20.9 | % |
| Hong Kong Dollar | | | 16.7 | % |
| Indian Rupee | | | 16.0 | % |
| South Korean Won | | | 11.6 | % |
| South African Rand | | | 7.7 | % |
| New Taiwan Dollar | | | 4.9 | % |
| Brazilian Real | | | 4.7 | % |
| Thai Baht | | | 4.1 | % |
| Mexican Peso | | | 3.9 | % |
| Indonesian Rupiah | | | 3.2 | % |
| Turkish Lira | | | 2.3 | % |
| UAE Dirham | | | 1.9 | % |
| Philippine Peso | | | 1.1 | % |
| All Other Currencies | | | 1.0 | % |
| Total | | | 100.0 | % |
See accompanying Notes to Financial Statements.
| 86 | Annual Report | December 31, 2015 |
| | Emerging Markets Growth Fund |
| | |
| | The Emerging Markets Growth Fund seeks long-term capital appreciation. |
| | |
| | AN OVERVIEW FROM THE PORTFOLIO MANAGERS |
| | |

Todd M. McClone 
Jeffrey A. Urbina 
Casey K. Preyss | The William Blair Emerging Markets Growth Fund (Class N shares) posted a 15.03% decrease, net of fees, for the twelve months ended December 31, 2015. By comparison, the Fund’s benchmark index, the MSCI Emerging Markets IMI Index (net) (the “Index”), decreased 13.86%. The Fund’s underperformance relative to the Index during 2015 was primarily driven by stock selection in the Information Technology sector, as semiconductor holdings lagged amid a cyclical industry downturn. Taiwan-based MediaTek’s share price came under pressure during the year due to increasing pricing pressure and intensified competition amid decelerating smartphone growth. SK Hynix (Korea) was another key detractor, hampered by a weak DRAM (dynamic random access memory) pricing environment. Healthcare and Consumer Discretionary stock selection also lagged. Within Healthcare, pharmaceutical holdings such as Aspen Pharmacare (South Africa) and Kalbe Farma (Thailand) suffered significant share price declines due to weaker operating trends. Energy stock selection in 2015 was also weak, but the effects were mitigated by the Fund’s large underweight position. Offsetting these negative effects were Financials, Materials, and Utilities stock selection. Within Financials, bank and real estate holdings were significant contributors. HDFC Bank (India) was a leading contributor, benefiting from strong growth in retail loans and digital initiatives that drove its market share higher. Real estate developers China Overseas Land & Investment and China Vanke’s share prices were supported by improving sales and rental income, in addition to the government’s policy easing measures. The overweighting and stock selection in Consumer Staples were also positive in 2015, benefiting from the position in LG Household & Health Care (Korea). LG Household and Health Care benefitted from positive financial results led by its cosmetics division, with improving fundamentals in the household and beverage businesses. From a country perspective, relative performance was primarily enhanced by stock selection in China and the overweighting to India throughout the year, which helped to offset the negative impacts of the Fund’s overweightings to Brazil and underweightings to Korea and Taiwan. Please refer to the Global Markets Review and Outlook relating to the Fund on page 39. |
| | |
| December 31, 2015 | William Blair Funds | 87 |
Emerging Markets Growth Fund
Performance Highlights (Unaudited)
| |
| Average Annual Total Return at 12/31/2015 |
| |
| | | 1 Year | | 3 Year | | 5 Year | | 10 Year |
| Class N | | | (15.03 | )% | | | (3.89 | )% | | | (2.38 | )% | | | 3.30 | % |
| Class I | | | (14.83 | ) | | | (3.64 | ) | | | (2.12 | ) | | | 3.56 | |
| Institutional Class | | | (14.67 | ) | | | (3.47 | ) | | | (1.92 | ) | | | 3.74 | |
| MSCI Emerging Markets IMI (net) | | | (13.86 | ) | | | (6.12 | ) | | | (4.59 | ) | | | 3.94 | |
Performance cited represents past performance. Past performance does not guarantee future results and current performance may be lower or higher than the data quoted. Results shown are average annual returns, which assume reinvestment of dividends and capital gains. Investment returns and principal will fluctuate and you may have a gain or loss when you sell shares. For the most current month-end performance information, please call 1-800-742-7272, or visit our Web site at www.williamblairfunds.com. From time to time, the investment adviser may waive fees or reimburse expenses for the Fund. Without these waivers/reimbursements, performance would be lower. International investing involves special risk considerations, including currency fluctuations, lower liquidity, economic and political risk. Class N shares are available to the general public without a sales load. Class I shares are available to certain institutional investors and advisory clients of William Blair Investment Management, LLC and William Blair & Company, L.L.C., without a sales load or distribution (12b-1) fees. Institutional Class shares are available to institutional investors without a sales load or distribution (12b-1) or service fees.
The performance highlights and graph presented above do not reflect the deduction of taxes that a shareholder would pay on fund distributions or the redemption of fund shares.
The Morgan Stanley Capital International (MSCI) Emerging Markets Investable Market Index (IMI) (net) is a free float-adjusted market capitalization weighted index that is designed to measure the equity market performance of emerging markets. This series approximates the minimum possible dividend reinvestment.
This report identifies the Fund’s investments on December 31, 2015. These holdings are subject to change. Not all stocks in the Fund performed the same, nor is there any guarantee that these stocks will perform as well in the future. Market forecasts provided in this report may not necessarily come to pass.
Sector Diversification (Unaudited)
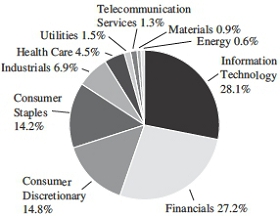
The sector diversification shown is based on the total long-term securities.
| 88 | Annual Report | December 31, 2015 |
Emerging Markets Growth Fund
Portfolio of Investments, December 31, 2015 (all dollar amounts in thousands)
| | | | | | | | |
| | | | | | | | |
| | Issuer | | Shares | | | Value | |
| | | | | | | | |
| | Common Stocks | | | | | | | | |
| | | | | | | | | | |
| | Emerging Asia—69.1% | | | | | | | | |
| | China—24.1% | | | | | | | | |
| * | Alibaba Group Holding, Ltd.—ADR
(Internet software & services) | | | 331,889 | | | $ | 26,973 | |
| | ANTA Sports Products, Ltd. (Textiles,
apparel & luxury goods) | | | 911,000 | | | | 2,504 | |
| | AviChina Industry & Technology Co., Ltd.
Class “H” (Aerospace & defense) | | | 3,208,000 | | | | 2,525 | |
| * | Baidu, Inc.—ADR (Internet software &
services) | | | 94,349 | | | | 17,836 | |
| * | Beijing Enterprises Water Group, Ltd.
(Water utilities) | | | 7,414,000 | | | | 5,214 | |
| | China Everbright International, Ltd.
(Commercial services & supplies) | | | 3,425,000 | | | | 4,397 | |
| | China Mengniu Dairy Co., Ltd.
(Food products) | | | 2,038,000 | | | | 3,324 | |
| | China Overseas Land & Investment, Ltd.
(Real estate management & development) | | | 4,250,000 | | | | 14,861 | |
| | China Vanke Co., Ltd. Class “H” (Real estate
management & development)**§ | | | 5,339,850 | | | | 15,778 | |
| * | Ctrip.com International, Ltd.—ADR
(Hotels, restaurants & leisure) | | | 137,849 | | | | 6,387 | |
| * | Dali Foods Group Co., Ltd.-144A
(Food products) | | | 6,666,500 | | | | 3,785 | |
| | Geely Automobile Holdings, Ltd.
(Automobiles) | | | 6,180,000 | | | | 3,293 | |
| | Great Wall Motor Co., Ltd. Class “H”
(Automobiles) | | | 7,468,500 | | | | 8,721 | |
| | Huaneng Renewables Corporation, Ltd.
Class “H” (Independent power &
renewable electricity producers) | | | 16,865,932 | | | | 5,049 | |
| | NetEase, Inc.—ADR (Internet software &
services) | | | 70,978 | | | | 12,864 | |
| | Ping An Insurance Group Co. of China, Ltd.
Class “H” (Insurance) | | | 4,520,000 | | | | 25,020 | |
| * | Semiconductor Manufacturing International
Corporation (Semiconductors &
semiconductor equipment) | | | 50,968,000 | | | | 5,195 | |
| | Shanghai Fosun Pharmaceutical Group Co.,
Ltd. Class “H” (Pharmaceuticals) | | | 296,500 | | | | 859 | |
| | Shenzhou International Group Holdings, Ltd.
(Textiles, apparel & luxury goods) | | | 455,000 | | | | 2,615 | |
| | Sino Biopharmaceutical, Ltd.
(Pharmaceuticals) | | | 2,600,000 | | | | 2,362 | |
| | Sinopharm Group Co., Ltd. Class “H”
(Health care providers & services) | | | 828,800 | | | | 3,326 | |
| | Tencent Holdings, Ltd. (Internet software
& services) | | | 1,623,760 | | | | 31,993 | |
| | Xinjiang Goldwind Science & Technology
Co., Ltd. Class “H” (Electrical equipment) | | | 2,107,200 | | | | 4,046 | |
| | Xinyi Solar Holdings, Ltd. (Semiconductors
& semiconductor equipment) | | | 8,064,000 | | | | 3,288 | |
| | | | | | | | | 212,215 | |
| | | | | | | | |
| | | | | | | | |
| | Issuer | | Shares | | | Value | |
| | | | | | | | | | |
| | Common Stocks—(continued) | | | | | | | | |
| | | | | | | | | | |
| | Emerging Asia—(continued) | | | | | | | | |
| | India—15.0% | | | | | | | | |
| | Adani Ports & Special Economic Zone, Ltd.
(Transportation infrastructure) | | | 605,157 | | | $ | 2,385 | |
| | Apollo Hospitals Enterprise, Ltd.
(Health care providers & services) | | | 118,694 | | | | 2,627 | |
| | Asian Paints, Ltd. (Chemicals) | | | 297,961 | | | | 3,975 | |
| | Aurobindo Pharma, Ltd. (Pharmaceuticals) | | | 329,439 | | | | 4,355 | |
| | Bharti Infratel, Ltd.
(Wireless telecommunication services) | | | 706,161 | | | | 4,543 | |
| | Britannia Industries, Ltd. (Food products) | | | 100,202 | | | | 4,514 | |
| | Dabur India, Ltd. (Personal products) | | | 703,863 | | | | 2,940 | |
| | Eicher Motors, Ltd. (Machinery) | | | 7,935 | | | | 2,021 | |
| | HDFC Bank, Ltd. (Banks) | | | 989,900 | | | | 16,185 | |
| | Hindustan Unilever, Ltd.
(Household products) | | | 367,768 | | | | 4,787 | |
| | Housing Development Finance Corporation, Ltd.
(Thrifts & mortgage finance) | | | 750,626 | | | | 14,336 | |
| | IndusInd Bank, Ltd. (Banks) | | | 648,299 | | | | 9,447 | |
| | Infosys, Ltd. (IT services) | | | 878,490 | | | | 14,700 | |
| | Lupin, Ltd. (Pharmaceuticals) | | | 276,260 | | | | 7,651 | |
| | Maruti Suzuki India, Ltd. (Automobiles) | | | 60,073 | | | | 4,195 | |
| | Motherson Sumi Systems, Ltd.
(Auto components) | | | 1,171,703 | | | | 5,202 | |
| * | Tata Motors, Ltd. (Automobiles) | | | 3,126,573 | | | | 18,507 | |
| | Yes Bank, Ltd. (Banks) | | | 831,251 | | | | 9,121 | |
| | | | | | | | | 131,491 | |
| | Indonesia—3.7% | | | | | | | | |
| | PT Astra International Tbk (Automobiles) | | | 13,152,900 | | | | 5,725 | |
| | PT Bank Rakyat Indonesia Persero Tbk
(Banks) | | | 16,552,221 | | | | 13,718 | |
| | PT Kalbe Farma Tbk (Pharmaceuticals) | | | 18,066,015 | | | | 1,730 | |
| | PT Lippo Karawaci Tbk (Real estate
management & development) | | | 24,055,400 | | | | 1,806 | |
| | PT Matahari Department Store Tbk
(Multiline retail) | | | 1,810,000 | | | | 2,311 | |
| | PT Telekomunikasi Indonesia Persero Tbk
(Diversified telecommunication services) | | | 30,409,200 | | | | 6,850 | |
| | | | | | | | | 32,140 | |
| | Malaysia—0.3% | | | | | | | | |
| | IHH Healthcare Bhd (Health care providers
& services) | | | 1,678,000 | | | | 2,572 | |
| | Philippines—2.1% | | | | | | | | |
| | Ayala Land, Inc. (Real estate management
& development) | | | 8,830,000 | | | | 6,465 | |
| | BDO Unibank, Inc. (Banks) | | | 2,990,880 | | | | 6,674 | |
| | International Container Terminal Services, Inc.
(Transportation infrastructure) | | | 947,690 | | | | 1,416 | |
| | Universal Robina Corporation (Food products) | | | 1,059,900 | | | | 4,189 | |
| | | | | | | | | 18,744 | |
See accompanying Notes to Financial Statements.
| December 31, 2015 | William Blair Funds | 89 |
Emerging Markets Growth Fund
Portfolio of Investments, December 31, 2015 (all dollar amounts in thousands)
| | | | | | | | |
| | | | | | | | |
| | Issuer | | Shares | | | Value | |
| | | | | | | | | | |
| | Common Stocks—(continued) | | | | | | | | |
| | | | | | | | | | |
| | Emerging Asia—(continued) | | | | | | | | |
| | South Korea—10.1% | | | | | | | | |
| * | Amorepacific Corporation
(Personal products) | | | 20,899 | | | $ | 7,388 | |
| * | Coway Co., Ltd. (Household durables) | | | 60,225 | | | | 4,319 | |
| * | Hotel Shilla Co., Ltd. (Specialty retail) | | | 21,494 | | | | 1,417 | |
| * | Kangwon Land, Inc. (Hotels, restaurants & leisure) | | | 131,380 | | | | 4,303 | |
| * | LG Chem, Ltd. (Chemicals) | | | 14,481 | | | | 4,057 | |
| * | LG Household & Health Care, Ltd. (Household products) | | | 20,769 | | | | 18,598 | |
| | Medy-Tox, Inc. (Biotechnology) | | | 5,528 | | | | 2,418 | |
| | Samsung Electronics Co., Ltd. (Technology hardware, storage & peripherals) | | | 31,045 | | | | 33,360 | |
| * | SK Hynix, Inc. (Semiconductors & semiconductor equipment) | | | 484,970 | | | | 12,718 | |
| | | | | | | | | 88,578 | |
| | Taiwan—10.3% | | | | | | | | |
| | Advantech Co., Ltd. (Technology hardware, storage & peripherals) | | | 986,145 | | | | 6,350 | |
| | Cub Elecparts, Inc. (Auto components) | | | 249,168 | | | | 2,981 | |
| | Delta Electronics, Inc. (Electronic equipment, instruments & components) | | | 2,597,868 | | | | 12,298 | |
| | E.Sun Financial Holding Co., Ltd. (Banks) | | | 8,653,146 | | | | 5,045 | |
| | Eclat Textile Co., Ltd. (Textiles, apparel & luxury goods) | | | 282,000 | | | | 3,893 | |
| | Feng TAY Enterprise Co., Ltd. (Textiles, apparel & luxury goods) | | | 390,000 | | | | 1,995 | |
| | Fubon Financial Holding Co., Ltd. (Diversified financial services) | | | 2,912,560 | | | | 3,990 | |
| | Largan Precision Co., Ltd. (Electronic equipment, instruments & components) | | | 130,000 | | | | 8,984 | |
| | MediaTek, Inc. (Semiconductors & semiconductor equipment) | | | 824,000 | | | | 6,272 | |
| | Taiwan Semiconductor Manufacturing Co., Ltd.-ADR (Semiconductors & semiconductor equipment) | | | 1,319,166 | | | | 30,011 | |
| | Taiwan Semiconductor Manufacturing Co., Ltd. (Semiconductors & semiconductor equipment) | | | 2,060,000 | | | | 8,968 | |
| | | | | | | | | 90,787 | |
| | Thailand—3.5% | | | | | | | | |
| | Airports of Thailand PCL (Transportation infrastructure) | | | 784,800 | | | | 7,546 | |
| | Bangkok Dusit Medical Services PCL Class “F” (Health care providers & services) | | | 8,155,800 | | | | 5,054 | |
| | Central Pattana PCL (Real estate management & development) | | | 3,681,200 | | | | 4,808 | |
| | CP ALL PCL (Food & staples retailing) | | | 4,847,500 | | | | 5,288 | |
| | Kasikornbank PCL (Banks) | | | 1,365,800 | | | | 5,674 | |
| | Thai Beverage PCL (Beverages) | | | 5,484,500 | | | | 2,669 | |
| | | | | | | | | 31,039 | |
| | | | | | | | |
| | | | | | | | |
| | Issuer | | Shares | | | Value | |
| | | | | | | | | | |
| | Common Stocks—(continued) | | | | | | | | |
| | | | | | | | | | |
| | Emerging Latin America—15.5% | | | | | | | | |
| | Argentina—0.5% | | | | | | | | |
| | MercadoLibre, Inc.
(Internet software & services) | | | 34,774 | | | $ | 3,976 | |
| | Brazil—6.0% | | | | | | | | |
| | AMBEV S.A.—ADR (Beverages) | | | 4,498,355 | | | | 20,063 | |
| | BB Seguridade Participacoes S.A. (Insurance) | | | 992,900 | | | | 6,106 | |
| | BRF S.A. (Food products) | | | 294,800 | | | | 4,128 | |
| | CETIP S.A. — Mercados Organizados (Capital markets) | | | 526,919 | | | | 4,995 | |
| | Cielo S.A. (IT services) | | | 732,800 | | | | 6,222 | |
| | Lojas Renner S.A. (Multiline retail) | | | 633,000 | | | | 2,736 | |
| | Raia Drogasil S.A. (Food & staples retailing) | | | 344,700 | | | | 3,091 | |
| | Ultrapar Participacoes S.A. (Oil, gas & consumable fuels) | | | 186,400 | | | | 2,848 | |
| | WEG S.A. (Machinery) | | | 572,780 | | | | 2,164 | |
| | | | | | | | | 52,353 | |
| | Chile—1.0% | | | | | | | | |
| | Banco Santander Chile—ADR (Banks) | | | 260,889 | | | | 4,602 | |
| | S.A.C.I. Falabella (Multiline retail) | | | 723,722 | | | | 4,617 | |
| | | | | | | | | 9,219 | |
| | Mexico—7.0% | | | | | | | | |
| | Fibra Uno Administracion S.A. de C.V. (Real estate investment trusts (REITs)) | | | 2,983,069 | | | | 6,576 | |
| | Fomento Economico Mexicano S.A.B. de C.V.—ADR (Beverages) | | | 101,459 | | | | 9,370 | |
| | Grupo Aeroportuario del Pacifico S.A.B.de C.V. Class “B” (Transportation infrastructure) | | | 294,100 | | | | 2,598 | |
| | Grupo Aeroportuario del Sureste S.A.B. de C.V.—ADR (Transportation infrastructure) | | | 31,240 | | | | 4,394 | |
| | Grupo Financiero Inbursa S.A.B. de C.V. Class “O” (Banks) | | | 1,562,900 | | | | 2,830 | |
| | Grupo Financiero Santander Mexico S.A.B. de C.V. (Banks) | | | 1,653,700 | | | | 2,896 | |
| | Infraestructura Energetica Nova S.A.B. de C.V. (Gas utilities) | | | 667,400 | | | | 2,788 | |
| | Nemak S.A.B. de C.V.-144A (Auto components) | | | 2,768,500 | | | | 3,744 | |
| * | Promotora y Operadora de Infraestructura S.A.B. de C.V. (Construction & engineering) | | | 370,200 | | | | 4,359 | |
| | Wal-Mart de Mexico S.A.B. de C.V. (Food & staples retailing) | | | 8,752,000 | | | | 22,090 | |
| | | | | | | | | 61,645 | |
| | Peru—1.0% | | | | | | | | |
| | Credicorp, Ltd. (Banks)† | | | 92,549 | | | | 9,007 | |
| | | | | | | | | | |
| | Emerging Europe, Mid-East, Africa—12.3% | | | | | | | | |
| | Czech Republic—0.3% | | | | | | | | |
| | Komercni banka A.S. (Banks) | | | 14,092 | | | | 2,805 | |
| | Qatar—0.5% | | | | | | | | |
| | Qatar National Bank S.A.Q. (Banks) | | | 97,579 | | | | 4,689 | |
See accompanying Notes to Financial Statements.
| 90 | Annual Report | December 31, 2015 |
Emerging Markets Growth Fund
Portfolio of Investments, December 31, 2015 (all dollar amounts in thousands)
| | | | | | | | |
| | | | | | | | |
| | Issuer | | Shares | | | Value | |
| | | | | | | | | | |
| | Common Stocks—(continued) | | | | | | | | |
| | | | | | | | | | |
| | Emerging Europe, Mid-East, Africa-—(continued) | | | | | | | | |
| | Russia—0.5% | | | | | | | | |
| | Magnit PJSC-GDR (Food & staples retailing) | | | 96,863 | | | $ | 3,896 | |
| | South Africa—5.8% | | | | | | | | |
| * | Aspen Pharmacare Holdings, Ltd. (Pharmaceuticals) | | | 316,432 | | | | 6,332 | |
| | Bidvest Group, Ltd. (Industrial conglomerates) | | | 162,422 | | | | 3,447 | |
| | Discovery, Ltd. (Insurance) | | | 314,719 | | | | 2,706 | |
| | FirstRand, Ltd. (Diversified financial services) | | | 1,555,387 | | | | 4,261 | |
| | Naspers, Ltd. (Media) | | | 189,347 | | | | 25,957 | |
| | Sanlam, Ltd. (Insurance) | | | 632,017 | | | | 2,474 | |
| | Steinhoff International Holdings N.V. (Household durables) | | | 1,170,273 | | | | 5,941 | |
| | | | | | | | | 51,118 | |
| | Turkey—2.3% | | | | | | | | |
| | BIM Birlesik Magazalar A.S. (Food & staples retailing) | | | 173,890 | | | | 3,062 | |
| | KOC Holding A.S. (Industrial conglomerates) | | | 2,310,259 | | | | 8,658 | |
| | TAV Havalimanlari Holding A.S. (Transportation infrastructure) | | | 378,023 | | | | 2,358 | |
| | Tofas Turk Otomobil Fabrikasi A.S. (Automobiles) | | | 514,364 | | | | 3,342 | |
| * | Tupras Turkiye Petrol Rafinerileri A.S. (Oil, gas & consumable fuels) | | | 99,985 | | | | 2,386 | |
| | | | | | | | | 19,806 | |
| | United Arab Emirates—2.9% | | | | | | | | |
| | Air Arabia PJSC (Airlines) | | | 6,125,455 | | | | 2,268 | |
| | DP World, Ltd. (Transportation infrastructure) | | | 276,086 | | | | 5,605 | |
| | Dubai Islamic Bank PJSC (Banks) | | | 2,241,406 | | | | 3,771 | |
| * | Emaar Malls Group PJSC (Real estate management & development) | | | 4,334,178 | | | | 3,257 | |
| | Emaar Properties PJSC (Real estate management & development) | | | 4,748,578 | | | | 7,356 | |
| | First Gulf Bank PJSC (Banks) | | | 960,677 | | | | 3,309 | |
| | | | | | | | | 25,566 | |
| | Total Common Stocks—96.9%
(cost $883,702) | | | | | | | 851,646 | |
| | | | | | | | | | |
| | Preferred Stock | | | | | | | | |
| | Brazil—1.3% | | | | | | | | |
| | Itau Unibanco Holding S.A. (Banks) | | | 1,725,700 | | | | 11,485 | |
| | Total Preferred Stock—1.3%
(cost $12,627) | | | | | | | 11,485 | |
| | | | | | | | | | |
| | Affiliated Fund | | | | | | | | |
| | | | | | | | | | |
| | Emerging Asia—0.5% | | | | | | | | |
| | China—0.5% | | | | | | | | |
| | William Blair China A-Share Fund, LLC**§ | | | 274,339 | | | | 4,819 | |
| | Total Affiliated Fund—0.5%
(cost $2,743) | | | | | | | 4,819 | |
| | | | | | | | |
| | | | Principal | | | | |
| | Issuer | | Amount | | | Value | |
| | | | | | | | | | |
| | Repurchase Agreement | | | | | | | | |
| | Fixed Income Clearing Corporation, 0.030% dated 12/31/15, due 1/4/16, repurchase price $11,079, collateralized by FNMA, 2.625%, due 9/6/24 | | | $11,079 | | | $ | 11,079 | |
| | Total Repurchase Agreement—1.3%
(cost $11,079) | | | | | | | 11,079 | |
| | Total Investments—100.0%
(cost $910,151) | | | | | | | 879,029 | |
| | Cash and other assets,
less liabilities—0.0% | | | | | | | 82 | |
| | Net assets—100.0% | | | | | | $ | 879,111 | |
ADR = American Depository Receipt
GDR = Global Depository Receipt
* Non-income producing securities
** = Fair valued pursuant to Valuation Procedures approved by the Board of Trustees. These holdings represent 2.34% of the Fund’s net assets at December 31, 2015.
§ = Deemed illiquid pursuant to Liquidity Procedures approved by the Board of Trustees. These holdings represent 2.34% of the Fund’s net assets at December 31, 2015.
† = U.S. listed foreign security
For securities primarily traded on exchanges or markets that close before the close of regular trading on the New York Stock Exchange, the Fund may use an independent pricing service to fair value price the securities pursuant to Valuation Procedures approved by the Board of Trustees.
See accompanying Notes to Financial Statements.
| December 31, 2015 | William Blair Funds | 91 |
Emerging Markets Growth Fund
Portfolio of Investments, December 31, 2015 (all dollar amounts in thousands)
At December 31, 2015, the Fund’s Portfolio of Investments includes the following industry categories (as a percentage of long-term investments):
| Information Technology | | | 28.1 | % |
| Financials | | | 27.2 | % |
| Consumer Discretionary | | | 14.8 | % |
| Consumer Staples | | | 14.2 | % |
| Industrials | | | 6.9 | % |
| Health Care | | | 4.5 | % |
| Utilities | | | 1.5 | % |
| Telecommunication Services | | | 1.3 | % |
| Materials | | | 0.9 | % |
| Energy | | | 0.6 | % |
| Total | | | 100.0 | % |
At December 31, 2015, the Fund’s Portfolio of Investments includes the following currency categories (as a percentage of long-term investments):
| U.S. Dollar | | | 18.4 | % |
| Hong Kong Dollar | | | 17.1 | % |
| Indian Rupee | | | 15.1 | % |
| South Korean Won | | | 10.2 | % |
| New Taiwan Dollar | | | 7.0 | % |
| South African Rand | | | 5.9 | % |
| Mexican Peso | | | 5.5 | % |
| Brazilian Real | | | 5.0 | % |
| Indonesian Rupiah | | | 3.7 | % |
| Thai Baht | | | 3.3 | % |
| UAE Dirham | | | 2.3 | % |
| Turkish Lira | | | 2.3 | % |
| Philippine Peso | | | 2.2 | % |
| All Other Currencies | | | 2.0 | % |
| Total | | | 100.0 | % |
As of December 31, 2015, the Fund invested in William Blair China A-Share Fund, LLC, an affiliated fund. There are no unfunded commitments to the affiliated fund and the Fund may redeem its investment weekly, but is subject to monthly repatriation and other redemption restrictions imposed on the William Blair China A-Share Fund, LLC by the Chinese government.
| | | Share Activity | | Year Ended December 31, 2015 |
| | | | | | | | | | | | | | | | | | | | | | | | Change in net | |
| | | | | | | | | | | | | | | | | | | | | | | | unrealized | |
| | | | Balance | | | | | | | | | | Balance | | | | | | Dividend | | Net realized | | appreciation | |
| Fund Name | | | 12/31/2014 | | | Purchases | | | Sales | | | 12/31/2015 | | | | Value | | | Income | | gain (loss) | | (depreciation) | |
| William Blair China A-Share Fund, LLC | | | 2,362,400 | | | | — | | | | 2,088,061 | | | | 274,339 | | | | $4,819 | | | | $— | | | | $18,280 | | | | $(9,807) | |
See accompanying Notes to Financial Statements.
| 92 | Annual Report | December 31, 2015 |
| | Emerging Markets Small Cap Growth Fund |
| | |
| | The Emerging Markets Small Cap Growth Fund seeks long-term capital appreciation. |
| | |
| | AN OVERVIEW FROM THE PORTFOLIO MANAGERS |
| | |

Todd M. McClone 
Jeffrey A. Urbina | The William Blair Emerging Markets Small Cap Growth Fund (Class N shares) posted a 6.40% decrease, net of fees, for the twelve months ended December 31, 2015. By comparison, the Fund’s benchmark index, the MSCI Emerging Markets Small Cap Index (net) (the “Index”), decreased 6.85%. While the Fund’s absolute performance was negative in 2015, the Fund outperformed the Index. The Fund’s outperformance relative to the Index during 2015 was driven by positive stock selection across most sectors and countries, as well as favorable sector positioning. From a sector perspective, Consumer Discretionary, Industrials, and Materials stock selection were the primary contributors to relative performance versus the Index. Exposures to Korean travel and home furnishings companies Hana Tour Service and Hanssem, respectively, were key sources of strength in the Consumer Discretionary sector. Taiwan-based apparel manufacturers Eclat Textile and Makalot Industrial were also significant contributors. Materials sector performance was enhanced by good stock selection in the chemicals and construction materials industries, combined with the exclusion of metals & mining companies. These positive effects were partially mitigated by weak stock selection in the Financials, Healthcare, and Information Technology sectors. Within Financials, real estate holdings were the primary source of weakness. Indonesia property developer Pakuwon Jati’s share price was hampered by broad macroeconomic growth concerns and earnings that fell short of expectations due in part to foreign exchange losses on unhedged debt. Philippines developer Robinsons Land also detracted from relative performance due to deteriorating earnings trends and investor uncertainty about the company’s ability to meet its aggressive project timeline. Within Healthcare, Chinese pharmaceutical holdings Luye Pharma Group and China Medical System were notable detractors. Luye Pharma was hampered by its termination of a proposed acquisition that was viewed favorably by investors, resulting in an uncertain outlook as Luye’s research and development pipeline became its primary growth driver. China Medical System’s share price was hurt by drug pricing pressures given the company’s focus on higher-priced imported drugs. From a country perspective, Korea and Taiwan stock selection were the leading contributors for 2015, but the positive effects were moderated by the Fund’s underweightings to both countries. The overweightings and stock selection in India and Mexico were also notable contributors, while Chinese stock selection was a primary detractor. Please refer to the Global Markets Review and Outlook relating to the Fund on page 39. |
| | |
| December 31, 2015 | William Blair Funds | 93 |
Emerging Markets Small Cap Growth Fund
Performance Highlights (Unaudited)
| |
| Average Annual Total Return at 12/31/2015 |
| | | | 1 Year | | | 3 Year | | | Since
Inception |
| Class N(a) | | | (6.40 | )% | | | 7.63 | % | | | 12.34 | % |
| Class I(a) | | | (6.03 | ) | | | 7.96 | | | | 12.67 | |
| MSCI Emerging Markets Small Cap Index (net)(a) | | | (6.85 | ) | | | (1.67 | ) | | | 2.05 | |
| Institutional Class(b) | | | (5.97 | ) | | | 8.05 | | | | 8.54 | |
| MSCI Emerging Markets Small Cap Index (net)(b) | | | (6.85 | ) | | | (1.67 | ) | | | (1.19 | ) |
| (a) | Since inception is for the period from October 24, 2011 (Commencement of Operations) to December 31, 2015. |
| (b) | Since inception is for the period from December 20, 2012 (Commencement of Operations) to December 31, 2015. |
Performance cited represents past performance. Past performance does not guarantee future results and current performance may be lower or higher than the data quoted. Results shown are average annual returns, which assume reinvestment of dividends and capital gains. Investment returns and principal will fluctuate and you may have a gain or loss when you sell shares. For the most current month-end performance information, please call 1-800-742-7272, or visit our Web site at www.williamblairfunds.com. From time to time, the investment adviser may waive fees or reimburse expenses for the Fund. Without these waivers/reimbursements, performance would be lower. International investing involves special risk considerations, including currency fluctuations, lower liquidity, economic and political risk. Smaller capitalization stocks are also more sensitive to purchase/sale transactions and changes in the issuer’s financial condition. Class N shares are available to the general public without a sales load. Class I shares are available to certain institutional investors and advisory clients of William Blair Investment Management, LLC and William Blair & Company, L.L.C., without a sales load or distribution (12b-1) fees. Institutional Class shares are available to institutional investors without a sales load or distribution (12b-1) or service fees.
The performance highlights and graph presented above do not reflect the deduction of taxes that a shareholder would pay on fund distributions or the redemption of fund shares.
The Morgan Stanley Capital International (MSCI) Emerging Markets Small Cap Index (net) is a free float-adjusted market capitalization weighted index that is designed to measure the equity market performance of emerging markets. This series approximates the minimum possible dividend reinvestment.
This report identifies the Fund’s investments on December 31, 2015. These holdings are subject to change. Not all stocks in the Fund performed the same, nor is there any guarantee that these stocks will perform as well in the future. Market forecasts provided in this report may not necessarily come to pass.
Sector Diversification (Unaudited)
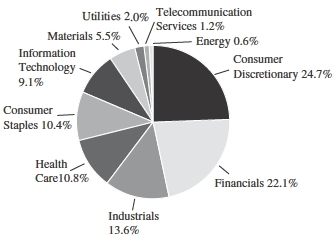
The sector diversification shown is based on the total long-term securities.
| 94 | Annual Report | December 31, 2015 |
Emerging Markets Small Cap Growth Fund
Portfolio of Investments, December 31, 2015 (all dollar amounts in thousands)
| | | | | | | | |
| | | | | | | | |
| | Issuer | | Shares | | | Value | |
| | |
| | Common Stocks | | | | | | |
| | |
| | Emerging Asia—78.8% | | | | | | | | |
| | China—22.5% | | | | | | | | |
| | Anta Sports Products, Ltd. (Textiles, apparel & luxury goods) | | | 758,000 | | | $ | 2,083 | |
| | Beijing Capital International Airport Co., Ltd. Class “H” (Transportation infrastructure) | | | 2,266,000 | | | | 2,447 | |
| * | Beijing Enterprises Water Group, Ltd. (Water utilities) | | | 1,614,000 | | | | 1,135 | |
| | Bloomage BioTechnology Corporation, Ltd. (Chemicals) | | | 602,500 | | | | 1,493 | |
| | Boer Power Holdings, Ltd. (Electrical equipment) | | | 1,188,000 | | | | 2,143 | |
| * | CAR, Inc. (Road & rail) | | | 577,000 | | | | 956 | |
| * | China Biologic Products, Inc. (Biotechnology) | | | 25,519 | | | | 3,635 | |
| | China Everbright International, Ltd. (Commercial services & supplies) | | | 554,700 | | | | 712 | |
| | China Lilang, Ltd. (Textiles, apparel & luxury goods) | | | 1,158,000 | | | | 858 | |
| | China Lodging Group, Ltd.—ADR (Hotels, restaurants & leisure) | | | 56,857 | | | | 1,777 | |
| * | China Taiping Insurance Holdings Co., Ltd. (Insurance) | | | 1,209,800 | | | | 3,754 | |
| * | China Traditional Chinese Medicine Co., Ltd. (Pharmaceuticals) | | | 2,058,000 | | | | 1,410 | |
| | Chongqing Rural Commercial Bank Co., Ltd. Class “H” (Banks) | | | 4,749,000 | | | | 2,880 | |
| | Cosmo Lady China Holdings Co., Ltd.—144A (Textiles, apparel & luxury goods) | | | 1,404,000 | | | | 1,176 | |
| | CT Environmental Group, Ltd. (Water utilities) | | | 10,398,000 | | | | 3,448 | |
| | Geely Automobile Holdings, Ltd. (Automobiles) | | | 7,085,000 | | | | 3,776 | |
| | Hollysys Automation Technologies, Ltd. (Electronic equipment, instruments & components)† | | | 38,813 | | | | 861 | |
| | KWG Property Holding, Ltd. (Real estate management & development) | | | 3,458,000 | | | | 2,561 | |
| * | Noah Holdings, Ltd.-ADR (Capital markets) | | | 88,348 | | | | 2,468 | |
| | PAX Global Technology, Ltd. (Electronic equipment, instruments & components) | | | 1,958,000 | | | | 2,019 | |
| | Shenzhou International Group Holdings, Ltd. (Textiles, apparel & luxury goods) | | | 848,000 | | | | 4,875 | |
| | Silergy Corporation (Semiconductors & semiconductor equipment) | | | 167,000 | | | | 1,729 | |
| | Sino Biopharmaceutical, Ltd. (Pharmaceuticals) | | | 3,837,000 | | | | 3,485 | |
| * | Sound Global, Ltd. (Water utilities)**§ | | | 1,824,000 | | | | 1,294 | |
| * | TAL Education Group-ADR (Diversified consumer services) | | | 89,948 | | | | 4,180 | |
| | Travelsky Technology, Ltd. Class “H” (IT services) | | | 1,301,000 | | | | 2,149 | |
| | Wasion Group Holdings, Ltd. (Electronic equipment, instruments & components) | | | 1,810,000 | | | | 1,868 | |
| | Xinjiang Goldwind Science & Technology Co., Ltd. Class “H” (Electrical equipment) | | | 1,058,400 | | | | 2,032 | |
| | | | | | | | |
| | | | | | | | |
| | Issuer | | Shares | | | Value | |
| | | | | | | | |
| | Common Stocks—(continued) | | | | | | |
| | | | | | | | |
| | Emerging Asia—(continued) | | | | | | |
| | China—(continued) | | | | | | |
| | Xinyi Solar Holdings, Ltd. (Semiconductors & semiconductor equipment) | | | 8,904,000 | | | $ | 3,631 | |
| | | | | | | | | 66,835 | |
| | Hong Kong—1.1% | | | | | | | | |
| * | IMAX China Holding, Inc.-144A (Media) | | | 307,000 | | | | 2,179 | |
| | Shenzhen Investment, Ltd. (Real estate management & development) | | | 2,240,000 | | | | 1,046 | |
| | | | | | | | | 3,225 | |
| | India—18.5% | | | | | | | | |
| | Alembic Pharmaceuticals, Ltd. (Pharmaceuticals) | | | 156,041 | | | | 1,635 | |
| | Apollo Hospitals Enterprise, Ltd. (Health care providers & services) | | | 87,139 | | | | 1,929 | |
| | Aurobindo Pharma, Ltd. (Pharmaceuticals) | | | 206,683 | | | | 2,733 | |
| | Bajaj Finance, Ltd. (Consumer finance) | | | 37,407 | | | | 3,399 | |
| | Berger Paints India, Ltd. (Chemicals) | | | 501,483 | | | | 2,024 | |
| | Blue Dart Express, Ltd. (Air freight & logistics) | | | 19,397 | | | | 1,979 | |
| | Britannia Industries, Ltd. (Food products) | | | 13,799 | | | | 622 | |
| | Dabur India, Ltd. (Personal products) | | | 385,269 | | | | 1,609 | |
| * | Dish TV India, Ltd. (Media) | | | 931,443 | | | | 1,433 | |
| | Emami, Ltd. (Personal products) | | | 20,373 | | | | 307 | |
| | Finolex Industries, Ltd. (Chemicals) | | | 190,673 | | | | 869 | |
| | Godrej Consumer Products, Ltd. (Personal products) | | | 94,993 | | | | 1,900 | |
| | Gruh Finance, Ltd. (Thrifts & mortgage finance) | | | 645,286 | | | | 2,663 | |
| | Havells India, Ltd. (Electrical equipment) | | | 504,854 | | | | 2,327 | |
| | Indiabulls Housing Finance, Ltd. (Thrifts & mortgage finance) | | | 137,776 | | | | 1,524 | |
| | IndusInd Bank, Ltd. (Banks) | | | 153,959 | | | | 2,243 | |
| * | InterGlobe Aviation, Ltd.—144A (Airlines) | | | 16,196 | | | | 303 | |
| | Kajaria Ceramics, Ltd. (Building products) | | | 160,135 | | | | 2,372 | |
| | LIC Housing Finance, Ltd. (Thrifts & mortgage finance) | | | 486,551 | | | | 3,746 | |
| | Marico, Ltd. | | | 622,030 | | | | 2,124 | |
| | Max India, Ltd. (Insurance) | | | 183,450 | | | | 1,408 | |
| | Oracle Financial Services Software, Ltd. (Software) | | | 23,002 | | | | 1,294 | |
| | PI Industries, Ltd. (Chemicals) | | | 152,099 | | | | 1,496 | |
| | Repco Home Finance, Ltd. (Consumer finance) | | | 191,306 | | | | 1,988 | |
| | Sadbhav Engineering, Ltd. (Construction & engineering) | | | 291,975 | | | | 1,505 | |
| * | SKS Microfinance, Ltd. (Consumer finance) | | | 142,244 | | | | 1,071 | |
| | Supreme Industries, Ltd. (Chemicals) | | | 150,805 | | | | 1,557 | |
| | Torrent Pharmaceuticals, Ltd. (Pharmaceuticals) | | | 116,024 | | | | 2,552 | |
| | Voltas, Ltd. (Construction & engineering) | | | 410,010 | | | | 2,020 | |
| | Yes Bank, Ltd. (Banks) | | | 223,148 | | | | 2,449 | |
| | | | | | | | | 55,081 | |
See accompanying Notes to Financial Statements.
| December 31, 2015 | William Blair Funds | 95 |
Emerging Markets Small Cap Growth Fund
Portfolio of Investments, December 31, 2015 (all dollar amounts in thousands)
| | | | | | | | |
| | | | | | | | |
| | Issuer | | Shares | | | Value | |
| | |
| | Common Stocks—(continued) | | | | | | |
| | |
| | Emerging Asia—(continued) | | | | | | | | |
| | Indonesia—2.9% | | | | | | | | |
| | PT Ciputra Development Tbk (Real estate management & development) | | | 12,285,500 | | | $ | 1,301 | |
| | PT Indofood CBP Sukses Makmur Tbk (Food products) | | | 919,000 | | | | 898 | |
| | PT Matahari Department Store Tbk (Multiline retail) | | | 1,797,500 | | | | 2,295 | |
| | PT Pakuwon Jati Tbk (Real estate management & development) | | | 43,302,500 | | | | 1,558 | |
| | PT Summarecon Agung Tbk (Real estate management & development) | | | 9,741,100 | | | | 1,166 | |
| | PT Surya Citra Media Tbk (Media) | | | 5,681,300 | | | | 1,278 | |
| | | | | | | | | 8,496 | |
| | Malaysia—0.8% | | | | | | | | |
| | Globetronics Technology Bhd (Semiconductors & semiconductor equipment) | | | 568,300 | | | | 860 | |
| | Inari Amertron Bhd (Electronic equipment, instruments & components) | | | 665,800 | | | | 710 | |
| | My EG Services Bhd (IT services) | | | 765,700 | | | | 771 | |
| | | | | | | | | 2,341 | |
| | Pakistan—2.3% | | | | | | | | |
| | D.G. Khan Cement Co., Ltd. (Construction materials) | | | 1,639,000 | | | | 2,305 | |
| | Engro Fertilizers, Ltd. (Chemicals) | | | 858,500 | | | | 691 | |
| * | Engro Foods, Ltd. (Food products) | | | 1,517,500 | | | | 2,126 | |
| | Lucky Cement, Ltd. (Construction materials) | | | 224,200 | | | | 1,055 | |
| | Maple Leaf Cement Factory, Ltd. (Construction materials) | | | 1,029,621 | | | | 734 | |
| | | | | | | | | 6,911 | |
| | Philippines—2.9% | | | | | | | | |
| | D&L Industries, Inc. (Chemicals) | | | 3,124,900 | | | | 608 | |
| | GT Capital Holdings, Inc. (Diversified financial services) | | | 61,665 | | | | 1,730 | |
| | Robinsons Land Corporation (Real estate management & development) | | | 3,103,100 | | | | 1,814 | |
| | Robinsons Retail Holdings, Inc. (Food & staples retailing) | | | 48,550 | | | | 65 | |
| | Security Bank Corporation (Banks) | | | 536,650 | | | | 1,619 | |
| | Universal Robina Corporation (Food products) | | | 553,000 | | | | 2,186 | |
| | Vista Land & Lifescapes, Inc. (Real estate management & development) | | | 4,482,700 | | | | 493 | |
| | | | | | | | | 8,515 | |
| | South Korea—9.9% | | | | | | | | |
| | BGF retail Co., Ltd. (Food & staples retailing) | | | 16,267 | | | | 2,379 | |
| | Cell Biotech Co., Ltd. (Biotechnology) | | | 1,288 | | | | 63 | |
| | Cosmax, Inc. (Personal products) | | | 10,875 | | | | 1,706 | |
| | Hana Tour Service, Inc. (Hotels, restaurants & leisure) | | | 20,440 | | | | 2,005 | |
| | Hanssem Co., Ltd. (Household durables) | | | 14,140 | | | | 2,792 | |
| | InBody Co., Ltd. (Health care equipment & supplies) | | | 57,677 | | | | 2,853 | |
| | | | | | | | |
| | | | | | | | |
| | Issuer | | Shares | | | Value | |
| | |
| | Common Stocks—(continued) | | | | | | |
| | |
| | Emerging Asia—(continued) | | | | | | | | |
| | South Korea—(continued) | | | | | | | | |
| | Kangwon Land, Inc. (Hotels, restaurants & leisure) | | | 91,340 | | | $ | 2,991 | |
| | KEPCO Plant Service & Engineering Co., Ltd. (Commercial services & supplies) | | | 25,340 | | | | 1,923 | |
| | Korea Investment Holdings Co., Ltd. (Capital markets) | | | 65,690 | | | | 2,776 | |
| | Korea Kolmar Co., Ltd. (Personal products) | | | 30,399 | | | | 2,460 | |
| | Medy-Tox, Inc. (Biotechnology) | | | 8,471 | | | | 3,705 | |
| | Modetour Network, Inc. (Hotels, restaurants & leisure) | | | 55,462 | | | | 1,594 | |
| | OCI Materials Co., Ltd. (Chemicals) | | | 21,796 | | | | 2,164 | |
| | | | | | | | | 29,411 | |
| | Taiwan—13.4% | | | | | | | | |
| | Advantech Co., Ltd. (Technology hardware, storage & peripherals) | | | 187,000 | | | | 1,204 | |
| | Cleanaway Co., Ltd. (Commercial services & supplies) | | | 234,000 | | | | 1,243 | |
| | Cub Elecparts, Inc. (Auto components) | | | 180,080 | | | | 2,155 | |
| | E.Sun Financial Holding Co., Ltd. (Banks) | | | 6,851,611 | | | | 3,995 | |
| | Eclat Textile Co., Ltd. (Textiles, apparel & luxury goods) | | | 77,000 | | | | 1,063 | |
| | Ennoconn Corporation (Technology hardware, storage & peripherals) | | | 96,000 | | | | 1,087 | |
| | Feng TAY Enterprise Co., Ltd. (Textiles, apparel & luxury goods) | | | 339,000 | | | | 1,734 | |
| | Ginko International Co., Ltd. (Health care equipment & supplies) | | | 112,000 | | | | 1,483 | |
| | Hota Industrial Manufacturing Co., Ltd. (Auto components) | | | 705,000 | | | | 2,597 | |
| | Kung Long Batteries Industrial Co., Ltd. (Electrical equipment) | | | 238,000 | | | | 956 | |
| | Macauto Industrial Co., Ltd. (Auto components) | | | 300,000 | | | | 1,525 | |
| | Makalot Industrial Co., Ltd. (Textiles, apparel & luxury goods) | | | 248,601 | | | | 1,763 | |
| | Novatek Microelectronics Corporation (Semiconductors & semiconductor equipment) | | | 469,000 | | | | 1,842 | |
| | Poya Co., Ltd. (Multiline retail) | | | 162,100 | | | | 1,500 | |
| | Shin Zu Shing Co., Ltd. (Machinery) | | | 578,000 | | | | 2,226 | |
| | Sinbon Electronics Co., Ltd. (Electronic equipment, instruments & components) | | | 799,000 | | | | 1,494 | |
| | Sporton International, Inc. (Professional services) | | | 482,757 | | | | 2,962 | |
| | St Shine Optical Co., Ltd. (Health care equipment & supplies) | | | 172,000 | | | | 3,461 | |
| | Taiwan Paiho, Ltd. (Textiles, apparel & luxury goods) | | | 1,144,000 | | | | 2,536 | |
| | Tung Thih Electronic Co., Ltd. (Auto components) | | | 103,600 | | | | 1,009 | |
| | Voltronic Power Technology Corporation (Electrical equipment) | | | 126,103 | | | | 1,879 | |
| | | | | | | | | 39,714 | |
See accompanying Notes to Financial Statements.
| 96 | Annual Report | December 31, 2015 |
Emerging Markets Small Cap Growth Fund
Portfolio of Investments, December 31, 2015 (all dollar amounts in thousands)
| | | | | | | | |
| | | | | | | | |
| | Issuer | | Shares | | | Value | |
| | |
| | Common Stocks—(continued) | | | | | | |
| | |
| | Emerging Asia—(continued) | | | | | | | | |
| | Thailand—4.5% | | | | | | | | |
| | Beauty Community PCL (Specialty retail) | | | 15,935,500 | | | $ | 2,546 | |
| | Central Plaza Hotel PCL (Hotels, restaurants & leisure) | | | 1,842,000 | | | | 2,252 | |
| | Delta Electronics Thailand PCL (Electronic equipment, instruments & components) | | | 441,100 | | | | 938 | |
| | KCE Electronics PCL (Electronic equipment, instruments & components) | | | 1,506,100 | | | | 2,930 | |
| | Minor International PCL (Hotels, restaurants & leisure) | | | 2,800,101 | | | | 2,821 | |
| | Srisawad Power 1979 PCL Class “F” (Consumer finance) | | | 1,471,200 | | | | 1,952 | |
| | | | | | | | | 13,439 | |
| | | | | | | | | | |
| | Emerging Europe, Mid-East, Africa—10.4% | | | | | | | | |
| | Hungary—0.4% | | | | | | | | |
| | Richter Gedeon Nyrt (Pharmaceuticals) | | | 60,895 | | | | 1,154 | |
| | Kenya—0.7% | | | | | | | | |
| | Safaricom, Ltd. (Wireless telecommunication services) | | | 13,284,400 | | | | 2,091 | |
| | Poland—1.1% | | | | | | | | |
| | Eurocash S.A. (Food & staples retailing) | | | 183,781 | | | | 2,272 | |
| | KRUK S.A. (Consumer finance) | | | 19,463 | | | | 863 | |
| | | | | | | | | 3,135 | |
| | Qatar—0.5% | | | | | | | | |
| | Al Meera Consumer Goods Co. (Food & staples retailing) | | | 26,553 | | | | 1,604 | |
| | South Africa—4.2% | | | | | | | | |
| | AVI, Ltd. (Food products) | | | 302,497 | | | | 1,513 | |
| | Capitec Bank Holdings, Ltd. (Banks) | | | 28,401 | | | | 989 | |
| | Cashbuild, Ltd. (Specialty retail) | | | 62,181 | | | | 1,206 | |
| | Clicks Group, Ltd. (Food & staples retailing) | | | 338,118 | | | | 1,946 | |
| | EOH Holdings, Ltd. (IT services) | | | 135,897 | | | | 1,186 | |
| | Famous Brands, Ltd. (Hotels, restaurants & leisure) | | | 109,278 | | | | 919 | |
| | Mr Price Group, Ltd. (Specialty retail) | | | 73,324 | | | | 948 | |
| | Nampak, Ltd. (Containers & packaging) | | | 634,047 | | | | 1,019 | |
| | PSG Group, Ltd. (Diversified financial services) | | | 58,728 | | | | 849 | |
| | Resilient REIT, Ltd. (Real estate investment trusts (REITs)) | | | 65,998 | | | | 493 | |
| | Telkom S.A. SOC, Ltd. (Diversified telecommunication services) | | | 313,170 | | | | 1,303 | |
| | | | | | | | | 12,371 | |
| | Turkey—2.5% | | | | | | | | |
| | Arcelik A.S. (Household durables) | | | 234,772 | | | | 1,124 | |
| | TAV Havalimanlari Holding A.S. (Transportation infrastructure) | | | 133,546 | | | | 833 | |
| | Tofas Turk Otomobil Fabrikasi A.S. (Automobiles) | | | 544,455 | | | | 3,538 | |
| * | Tupras Turkiye Petrol Rafinerileri A.S. (Oil, gas & consumable fuels) | | | 79,486 | | | | 1,897 | |
| | | | | | | | | 7,392 | |
| | | | | | | | |
| | | | | | | | |
| | Issuer | | Shares | | | Value | |
| | |
| | Common Stocks—(continued) | | | | | | |
| | |
| | Emerging Europe, Mid-East, Africa—(continued) | | | | | | | | |
| | United Arab Emirates—1.0% | | | | | | | | |
| * | Emaar Malls Group PJSC (Real estate management & development) | | | 2,065,583 | | | $ | 1,552 | |
| | NMC Health plc (Health care providers & services) | | | 114,907 | | | | 1,424 | |
| | | | | | | | | 2,976 | |
| | | | | | | | | | |
| | Emerging Latin America—9.3% | | | | | | | | |
| | Brazil—1.1% | | | | | | | | |
| | Lojas Renner S.A. (Multiline retail) | | | 164,100 | | | | 709 | |
| | Raia Drogasil S.A. (Food & staples retailing) | | | 176,000 | | | | 1,579 | |
| | Valid Solucoes e Servicos de Seguranca em Meios de Pagamento e Identificacao S.A (Commercial services & supplies) | | | 84,321 | | | | 906 | |
| | | | | | | | | 3,194 | |
| | Mexico—8.2% | | | | | | | | |
| | Alsea S.A.B. de C.V. (Hotels, restaurants & leisure) | | | 851,300 | | | | 2,963 | |
| | Banregio Grupo Financiero S.A.B. de C.V. (Banks) | | | 651,008 | | | | 3,325 | |
| * | Controladora Vuela Cia de Aviacion S.A.B. de C.V.—ADR (Airlines) | | | 106,739 | | | | 1,832 | |
| | Credito Real S.A.B. de C.V. SOFOM E.R. (Consumer finance) | | | 1,232,659 | | | | 3,126 | |
| | Gruma S.A.B. de C.V. Class “B” (Food products) | | | 106,300 | | | | 1,496 | |
| * | Grupo Aeroportuario del Centro Norte S.A.B. de C.V. (Transportation infrastructure) | | | 641,709 | | | | 3,125 | |
| | Grupo Aeroportuario del Pacifico S.A.B. de C.V. Class “B” (Transportation infrastructure) | | | 352,800 | | | | 3,117 | |
| | Grupo Financiero Santander Mexico S.A.B. de C.V. (Banks) | | | 549,501 | | | | 962 | |
| | Grupo Lala S.A.B. de C.V. (Food products) | | | 640,490 | | | | 1,482 | |
| | Nemak S.A.B. de C.V.—144A (Auto components) | | | 1,569,200 | | | | 2,122 | |
| * | Unifin Financiera SAPI de C.V. SOFOM E.N.R. (Consumer finance) | | | 294,200 | | | | 911 | |
| | | | | | | | | 24,461 | |
| | Total Common Stocks—98.5%
(cost $285,624) | | | | | | | 292,346 | |
See accompanying Notes to Financial Statements.
| December 31, 2015 | William Blair Funds | 97 |
Emerging Markets Small Cap Growth Fund
Portfolio of Investments, December 31, 2015 (all dollar amounts in thousands)
| | | | | | | | |
| | | | Principal | | | | |
| | Issuer | | Amount | | | Value | |
| | |
| | Repurchase Agreement | | | | | | | | |
| | Fixed Income Clearing Corporation, 0.030% dated 12/31/15, due 1/4/16, repurchase price $1,128, collateralized by FNMA, 2.625%, due 9/6/24 | | | $1,128 | | | $ | 1,128 | |
| | Total Repurchase Agreement—0.4%
(cost $1,128) | | | | | | | 1,128 | |
| | Total Investments—98.9%
(cost $286,752) | | | | | | | 293,474 | |
| | Cash and other assets, less liabilities—1.1% | | | | | | | 3,367 | |
| | Net assets—100.0% | | | | | | $ | 296,841 | |
ADR = American Depository Receipt
* Non-income producing securities
† = U.S. listed foreign security
** = Fair valued pursuant to Valuation Procedures approved by the Board of Trustees. This holding represents 0.44% of the Fund’s net assets at December 31, 2015.
§ = Deemed illiquid pursuant to Liquidity Procedures approved by the Board of Trustees. This holding represents 0.44% of the Fund’s net assets at December 31, 2015.
For securities primarily traded on exchanges or markets that close before the close of regular trading on the New York Stock Exchange, the Fund may use an independent pricing service to fair value price the securities pursuant to Valuation Procedures approved by the Board of Trustees.
At December 31, 2015, the Fund’s Portfolio of Investments includes the following industry categories (as a percentage of long-term investments):
| Consumer Discretionary | | | 24.7 | % |
| Financials | | | 22.1 | % |
| Industrials | | | 13.6 | % |
| Health Care | | | 10.8 | % |
| Consumer Staples | | | 10.4 | % |
| Information Technology | | | 9.1 | % |
| Materials | | | 5.5 | % |
| Utilities | | | 2.0 | % |
| Telecommunication Services | | | 1.2 | % |
| Energy | | | 0.6 | % |
| Total | | | 100.0 | % |
At December 31, 2015, the Fund’s Portfolio of Investments includes the following currency categories (as a percentage of long-term investments):
| Hong Kong Dollar | | | 19.0 | % |
| Indian Rupee | | | 18.8 | % |
| New Taiwan Dollar | | | 14.2 | % |
| South Korean Won | | | 10.1 | % |
| Mexican Peso | | | 7.7 | % |
| U.S. Dollar | | | 5.0 | % |
| Thai Baht | | | 4.6 | % |
| South African Rand | | | 4.2 | % |
| Philippine Peso | | | 2.9 | % |
| Indonesian Rupiah | | | 2.9 | % |
| Turkish Lira | | | 2.5 | % |
| Pakistan Rupee | | | 2.4 | % |
| Brazilian Real | | | 1.1 | % |
| All Other Currencies | | | 4.6 | % |
| Total | | | 100.0 | % |
See accompanying Notes to Financial Statements.
| 98 | Annual Report | December 31, 2015 |
Fixed Income Market Review and Outlook
The capital markets experienced mixed results during calendar year 2015. Stocks achieved sub-par performance. The broad U.S. stock market returned 0.48%. Large-cap stocks outperformed small-cap stocks; large-cap stocks returned 1.38% while small-cap stocks returned -4.41%. International stocks generated negative returns; developed markets returned -0.81%, while emerging markets stocks declined 14.92%. Investment-grade, U.S. dollar-denominated bonds gained 0.55% during the year.
The first half of 2015 was relatively quiet, but the second half of the year was marked by an increase in volatility. A number of the factors weighed on the markets during the volatile third quarter, including concerns over growth in China, declines in commodity prices, and monetary policy in the U.S. However, riskier assets rebounded during the fourth quarter and helped to mark a reversal of the broad-based weakness experienced during the third quarter of the year.
Two of the world’s largest economies appeared to be at the forefront of investors’ attention: the U.S. and China. In the U.S., the economy appeared to have continued to improve, with growth of roughly 2%, the unemployment rate declining to 5.0%, and inflationary pressures benign. The Federal Reserve (the “Fed”) deemed it appropriate to tighten monetary policy by raising the target range of the Federal Funds rate by 25 basis points to 0.25 – 0.50%. Meanwhile, there were concerns over the implications of what slowing Chinese growth means for the global economy. Chinese stocks posted significant declines during 2015. In addition, many market participants attributed the weakness in commodity prices to concerns that conditions in China will weaken the demand for commodities. Commodity prices weakened throughout the year; oil prices declined significantly to end the year at $37/barrel, and broader-based commodity indexes revealed a near-continuous decline in prices during the second half of 2015.
As mentioned, the Federal Open Market Committee (“FOMC”) raised interest rates in December 2015 for the first time since 2006. By doing so, the U.S. exited the zero interest rate policy that has been in place since December 2008. The FOMC’s statement cited expanding economic activity, strong labor market conditions, and confidence that inflationary pressures will rise as the reasons behind the policy decision. The FOMC also stated that it expected the pace of interest rate increases to be gradual. This stance was reflected in the markets following the policy decision, as market-implied probabilities suggested the FOMC will embark on a series of four 25 basis points hike during calendar year 2016.
Fixed income market liquidity continues to garner significant attention. The concerns surround a scenario where large-scale redemptions force pooled fixed income funds to accept liquidity at prices below where the securities were valued on a mark-to-market basis. These concerns are magnified by two structural changes to the fixed income markets that have occurred over the past ten years. First, dealer banks have less ability to use their firms’ capital to make markets for fixed income securities, so the dealers adjust prices in an attempt to match buyers and sellers. Second, pooled fixed income investment vehicles that promise daily or second-by-second liquidity (mutual funds and exchange-traded funds, respectively) have grown in importance. We believe that price volatility will continue to manifest itself during periods of increased redemption activity in such a regime. We do note that while pooled investment funds have grown in prominence, they still represent less than 25% of the holders of corporate bonds, and there remains significant demand for fixed income securities from investors that do not mark their positions daily, including pension funds seeking to de-risk their plans, insurance companies, and foreign investors seeking incremental yield.
Some of these concerns over fixed income market liquidity came to fruition during the fourth quarter of 2015 when a large high-yield mutual fund announced that it was suspending redemptions and liquidating the Fund. The fund had invested in lower-quality and less-liquid high yield bonds. In the immediate aftermath of the announcement, the high yield bond market declined, with lower-quality segments of the market suffering the worst.
During 2015, the Barclays U.S. Aggregate Index returned 0.55%. Interest rates rose marginally during the year. Mortgage-backed securities (“MBS”) earned similar returns to Treasuries after adjusting for duration. Within the MBS market, higher-coupon 30- and 15-year pools generated the strongest gains on a duration-adjusted basis. High-grade corporate bonds also trailed Treasuries after adjusting for the effects of duration. One bright spot within the credit market was Financials, as the sector posted gains after adjusting for duration. High yield and emerging market-related corporate bonds generated negative total returns on an absolute and duration-adjusted basis.
We believe that the FOMC will stick to its plan to raise the Federal Funds rate gradually throughout 2016. Growth and employment in the U.S. has improved; estimates indicate that GDP grew by 2.0 – 2.5% in real terms during 2015, and the unemployment rate declined to 5.0%. However, inflationary pressures have weakened. Commodity prices declined, price indexes such as the Consumer Price Index and Personal Consumption Expenditures Price Index showed that inflation was below the FOMC’s stated target range of 2.0% – 2.5%, and forward-looking, market-implied inflation expectations decreased below the target range. We believe that the FOMC will pay careful attention to its price stability objective when they decide whether to further raise the Federal Funds rate to ensure that doing so will not spur disinflationary pressures.
| December 31, 2015 | William Blair Funds | 99 |
Fixed Income Market Review and Outlook
We believe that interest rate volatility may persist in the short-term as taxable fixed income fund flows remain elevated. These fund flows have been large in magnitude and have impacted long-term Treasury securities and the spread sectors. We believe that one byproduct of this volatility will be that opportunities will emerge in the spread sectors (corporate and mortgage-backed securities) at favorable valuation levels.
We believe that spread sectors are poised to lead the market over the longer term. Corporate risk premiums are at levels above their longer-term averages, and risk premiums of higher-coupon segments of the agency MBS market remain attractive. In addition, we believe Treasuries are likely to struggle as the FOMC embarks on a tightening cycle.
We believe that higher-coupon segments (coupon rates of 5.0% and above for 30-year) of the agency MBS market offer compelling value. These segments of the agency MBS market offer attractive spreads and a defensive duration profile. The key risk of these securities is that the underlying borrowers are in-the-money to refinance their loan. We believe this risk can be mitigated by focusing on pools comprised of borrowers that do not have the economic incentive to refinance their loans, namely, low-loan balance pools.
We believe that the corporate bond market remains attractive. Although fundamentals have recently deteriorated, valuations have also increased. We observed an increase in leverage among industrial companies over the past year as companies secured financing at low nominal yields in the robust new issue market for corporate bonds. Corporate risk spreads have adjusted to reflect these changes, and we find current valuation levels to be appealing. We remain concerned about idiosyncratic risks, including shareholder-friendly activities such as leveraged finance mergers and acquisitions, large share repurchases, and special dividends. Importantly, we do not believe the fixed income market will enter a period of excessive leveraged buyout activity.
| 100 | Annual Report | December 31, 2015 |
| | Bond Fund |
| | |
| | The Bond Fund seeks to outperform the Barclays Capital U.S. Aggregate Bond Index by maximizing total return through a combination of income and capital appreciation. |
| | |
| | AN OVERVIEW FROM THE PORTFOLIO MANAGERS |
| | |
 Christopher T. Vincent 
Paul J. Sularz | The William Blair Bond Fund (Class N shares) posted a 0.23% decrease, net of fees, for the twelve months ended December 31, 2015. By comparison, the Fund’s benchmark, the Barclays U.S. Aggregate Bond Index (the “Index”), increased 0.55%. There were a couple of factors that detracted from the Fund’s relative performance during the period. Sector allocation detracted from relative performance, as the Fund was underweight to fixed-rate Treasury securities, which outperformed mortgage-backed and corporate securities. An allocation to U.S. Treasury Inflation-Protected Securities impacted relative performance negatively, as market-implied inflation expectations declined during the year. Some corporate bonds in the energy and materials sectors detracted from performance, as those sectors lagged the broad market as oil and other commodity prices declined during the year. Finally, positions in bonds of Brazilian issuers Odebrecht and Petrobras negatively impacted relative performance as the Brazilian government continued its investigation into corruption that included executives from each company. A couple of factors contributed to the Fund’s relative performance during the year. The Fund’s high yield corporate bonds impacted results favorably. Within the sector, positions in bonds issued by Credit Suisse Group, Standard Pacific Corp., and Goodyear Tire & Rubber Company were among the Fund holdings that performed well. Security selection of mortgage-backed securities also positively impacted relative performance. The Fund favored higher-coupon segments of the 30-year market, and that segment performed well during 2015. Finally, the Fund experienced positive selection results of investment-grade corporate bonds, in part due to the Fund’s overweight to bonds issued by financial institutions. Please refer to the Fixed Income Market Review and Outlook relating to the Fund on page 99. |
| December 31, 2015 | William Blair Funds | 101 |
Bond Fund
Performance Highlights (Unaudited)
| Average Annual Total Return at 12/31/2015 |
| |
| | | 1 Year | | 3 Year | | 5 Year | | Since
Inception(a) |
| Class N | | | (0.23 | )% | | | 1.13 | % | | | 3.77 | % | | | 4.91 | % |
| Class I | | | (0.05 | ) | | | 1.31 | | | | 3.97 | | | | 5.08 | |
| Institutional Class | | | 0.01 | | | | 1.43 | | | | 4.10 | | | | 5.23 | |
| Barclays U.S. Aggregate Bond Index | | | 0.55 | | | | 1.44 | | | | 3.25 | | | | 4.47 | |
| (a) | For the period from May 1, 2007 (Commencement of Operations) to December 31, 2015. |
Performance cited represents past performance. Past performance does not guarantee future results and current performance may be lower or higher than the data quoted. Results shown are average annual total returns, which assume reinvestment of dividends and capital gains. Investment returns and principal will fluctuate and you may have a gain or loss when you sell shares. For the most current month-end performance information, please call 1-800-742-7272, or visit our Web site at www.williamblairfunds.com. From time to time, the investment adviser may waive fees or reimburse expenses for the Fund. Without these waivers/reimbursements, performance would be lower. Class N shares are available to the general public without a sales load. Class I shares are available to certain institutional investors and advisory clients of William Blair Investment Management, LLC and William Blair & Company, L.L.C., without a sales load or distribution (12b-1) fees. Institutional Class shares are available to institutional investors without a sales load or distribution (12b-1) or service fees.
The performance highlights and graph presented above do not reflect the deduction of taxes that a shareholder would pay on fund distributions or the redemption of fund shares.
The Barclays U.S. Aggregate Bond Index indicates broad intermediate government/corporate bond market performance.
This report identifies the Fund’s investments on December 31, 2015. These holdings are subject to change. Not all investments in the Fund performed the same, nor is there any guarantee that these investments will perform as well in the future. Market forecasts provided in this report may not necessarily come to pass.
Sector Diversification (Unaudited)
The sector diversification shown is based on the total investments.
| 102 | Annual Report | December 31, 2015 |
Bond Fund
Portfolio of Investments, December 31, 2015 (all dollar amounts in thousands)
| | | | | | | | |
| | Issuer | | Principal
Amount | | | Value | |
| | | | | | | | | | |
| | U.S. Government and U.S. Government Agency—51.8% | |
| | U.S. Treasury Inflation Indexed Notes/Bonds—5.7% | | | | | | | | |
| | U.S. Treasury Inflation Indexed Note, 1.875%, due 7/15/19 | | $ | 4,456 | | | $ | 4,728 | |
| | U.S. Treasury Inflation Indexed Bond, 3.875%, due 4/15/29 | | | 16,638 | | | | 22,637 | |
| | Total U.S. Treasury Inflation Indexed Notes/Bonds | | | | | | | 27,365 | |
| | U.S. Treasury—0.6% | | | | | | | | |
| | U.S. Treasury Strip Principal, 0.000%, due 5/15/20 | | | 3,100 | | | | 2,875 | |
| | Government National Mortgage Association (GNMA)—0.4% | | | | | | | | |
| | #623162, 6.500%, due 7/15/18 | | | 16 | | | | 16 | |
| | #589335, 6.500%, due 10/15/22 | | | 26 | | | | 30 | |
| | #357322, 7.000%, due 9/15/23 | | | 9 | | | | 10 | |
| | #616250, 6.000%, due 2/15/24 | | | 3 | | | | 4 | |
| | #509405, 7.500%, due 8/15/29 | | | 1 | | | | 1 | |
| | GNR 2004-2 M5, 4.891%, due 7/16/34 | | | 28 | | | | 29 | |
| | #699118, 6.000%, due 9/15/38 | | | 1,853 | | | | 2,080 | |
| | Total GNMA Mortgage Obligations | | | | | | | 2,170 | |
| | Federal Home Loan Mortgage Corp. (FHLMC)—14.4% | | | | | | | | |
| | #G12258, 6.000%, due 8/1/16 | | | 1 | | | | 1 | |
| | #J04096, 6.500%, due 1/1/17 | | | 3 | | | | 3 | |
| | #E90398, 7.000%, due 5/1/17 | | | 12 | | | | 13 | |
| | #G11549, 7.000%, due 7/1/17 | | | 1 | | | | 1 | |
| | #G90027, 6.000%, due 11/17/17 | | | 3 | | | | 3 | |
| | #G30093, 7.000%, due 12/1/17 | | | 4 | | | | 4 | |
| | #O20005, 6.500%, due 1/1/18 | | | 3 | | | | 4 | |
| | #E96940, 4.500%, due 6/1/18 | | | 20 | | | | 21 | |
| | #B13747, 5.000%, due 4/1/19 | | | 266 | | | | 280 | |
| | #G30254, 6.500%, due 5/1/19 | | | 5 | | | | 5 | |
| | #G11697, 5.500%, due 4/1/20 | | | 471 | | | | 495 | |
| | #G12113, 5.500%, due 5/1/21 | | | 424 | | | | 455 | |
| | #J02986, 6.500%, due 7/1/21 | | | 17 | | | | 19 | |
| | #G30255, 7.000%, due 7/1/21 | | | 4 | | | | 4 | |
| | #G30243, 6.000%, due 12/1/21 | | | 5 | | | | 5 | |
| | #G12720, 5.500%, due 6/1/22 | | | 48 | | | | 52 | |
| | #D95621, 6.500%, due 7/1/22 | | | 30 | | | | 35 | |
| | #G14150, 4.500%, due 4/1/26 | | | 2,238 | | | | 2,405 | |
| | #J16051, 4.500%, due 7/1/26 | | | 1,004 | | | | 1,075 | |
| | #G02183, 6.500%, due 3/1/30 | | | 32 | | | | 37 | |
| | #G01728, 7.500%, due 7/1/32 | | | 137 | | | | 168 | |
| | #C01385, 6.500%, due 8/1/32 | | | 112 | | | | 130 | |
| | #G01551, 6.000%, due 4/1/33 | | | 2,496 | | | | 2,849 | |
| | #C01623, 5.500%, due 9/1/33 | | | 140 | | | | 156 | |
| | #A15039, 5.500%, due 10/1/33 | | | 2 | | | | 3 | |
| | #A17603, 5.500%, due 1/1/34 | | | 2,339 | | | | 2,654 | |
| | #G01705, 5.500%, due 6/1/34 | | | 987 | | | | 1,130 | |
| | #G01843, 6.000%, due 6/1/35 | | | 26 | | | | 29 | |
| | #G02141, 6.000%, due 3/1/36 | | | 695 | | | | 794 | |
| | #A62179, 6.000%, due 6/1/37 | | | 293 | | | | 334 | |
| | #G03711, 6.000%, due 6/1/37 | | | 986 | | | | 1,123 | |
| | | | | | | | |
| | Issuer | | Principal
Amount | | | Value | |
| | | | | | | | | | |
| | U.S. Government and U.S. Government Agency—(continued) | |
| | Federal Home Loan Mortgage Corp. (FHLMC)—(continued) | | | | | | | | |
| | #A63539, 6.000%, due 7/1/37 | | $ | 377 | | | $ | 428 | |
| | #A62858, 6.500%, due 7/1/37 | | | 153 | | | | 174 | |
| | #G03170, 6.500%, due 8/1/37 | | | 319 | | | | 364 | |
| | #A66843, 6.500%, due 10/1/37 | | | 1,045 | | | | 1,218 | |
| | #G04053, 5.500%, due 3/1/38 | | | 723 | | | | 816 | |
| | #A78138, 5.500%, due 6/1/38 | | | 435 | | | | 489 | |
| | #G04466, 5.500%, due 7/1/38 | | | 19,832 | | | | 22,597 | |
| | #G04544, 6.000%, due 8/1/38 | | | 907 | | | | 1,038 | |
| | #A81799, 6.500%, due 9/1/38 | | | 733 | | | | 835 | |
| | #G05723, 6.500%, due 11/1/38 | | | 1,873 | | | | 2,135 | |
| | #A86143, 5.000%, due 5/1/39 | | | 66 | | | | 73 | |
| | #G05810, 5.000%, due 2/1/40 | | | 17,661 | | | | 19,782 | |
| | #G05875, 5.500%, due 2/1/40 | | | 879 | | | | 993 | |
| | #G06017, 5.500%, due 6/1/40 | | | 221 | | | | 249 | |
| | #C03665, 9.000%, due 4/1/41 | | | 893 | | | | 1,097 | |
| | #G06583, 5.000%, due 6/1/41 | | | 2,222 | | | | 2,489 | |
| | Total FHLMC Mortgage Obligations | | | | | | | 69,064 | |
| | Federal National Mortgage Association (FNMA)—30.7% | | | | | | | | |
| | #679247, 7.000%, due 8/1/17 | | | 2 | | | | 2 | |
| | #683100, 5.500%, due 2/1/18 | | | 93 | | | | 96 | |
| | #689612, 5.000%, due 5/1/18 | | | 43 | | | | 45 | |
| | #695910, 5.000%, due 5/1/18 | | | 113 | | | | 117 | |
| | #697593, 5.000%, due 5/1/18 | | | 99 | | | | 103 | |
| | #704049, 5.500%, due 5/1/18 | | | 220 | | | | 226 | |
| | #735357, 5.500%, due 5/1/18 | | | 294 | | | | 304 | |
| | #735003, 5.500%, due 7/1/18 | | | 303 | | | | 313 | |
| | #251960, 6.000%, due 9/1/18 | | | 2 | | | | 2 | |
| | #745498, 7.000%, due 11/1/18 | | | 179 | | | | 183 | |
| | #770395, 5.000%, due 4/1/19 | | | 3 | | | | 3 | |
| | #788424, 5.500%, due 9/1/19 | | | 18 | | | | 19 | |
| | #835563, 7.000%, due 10/1/20 | | | 16 | | | | 17 | |
| | #900725, 6.000%, due 8/1/21 | | | 40 | | | | 44 | |
| | #893325, 7.000%, due 9/1/21 | | | 15 | | | | 16 | |
| | #735104, 7.000%, due 5/1/22 | | | 2 | | | | 2 | |
| | #949589, 5.500%, due 8/1/22 | | | 3,141 | | | | 3,406 | |
| | #949592, 6.000%, due 8/1/22 | | | 4,942 | | | | 5,436 | |
| | #889342, 5.000%, due 3/1/23 | | | 57 | | | | 61 | |
| | #AA2924, 4.500%, due 4/1/24 | | | 286 | | | | 307 | |
| | #931299, 4.500%, due 6/1/24 | | | 661 | | | | 707 | |
| | #AC1848, 4.500%, due 9/1/24 | | | 415 | | | | 448 | |
| | #AC5410, 4.500%, due 10/1/24 | | | 327 | | | | 351 | |
| | #932095, 4.000%, due 11/1/24 | | | 1,542 | | | | 1,648 | |
| | #932100, 4.500%, due 11/1/24 | | | 277 | | | | 298 | |
| | #AC9560, 5.000%, due 1/1/25 | | | 1,987 | | | | 2,147 | |
| | #AD8164, 4.000%, due 8/1/25 | | | 683 | | | | 733 | |
| | #AB1459, 4.000%, due 9/1/25 | | | 302 | | | | 323 | |
| | #255956, 5.500%, due 10/1/25 | | | 21 | | | | 23 | |
| | #AH2671, 4.000%, due 1/1/26 | | | 1,238 | | | | 1,328 | |
| | #AI4872, 4.500%, due 6/1/26 | | | 444 | | | | 479 | |
| | #AL2851, 4.000%, due 8/1/26 | | | 2,144 | | | | 2,293 | |
| | #AI9811, 4.500%, due 8/1/26 | | | 271 | | | | 292 | |
| | #AJ3203, 4.000%, due 10/1/26 | | | 119 | | | | 128 | |
| | #AJ7724, 4.000%, due 12/1/26 | | | 926 | | | | 989 | |
See accompanying Notes to Financial Statements.
| December 31, 2015 | William Blair Funds | 103 |
Bond Fund
Portfolio of Investments, December 31, 2015 (all dollar amounts in thousands)
| | | | | | | | |
| | Issuer | | Principal
Amount | | | Value | |
| | | | | | | | | | |
| | U.S. Government and U.S. Government Agency—(continued) | |
| | Federal National Mortgage Association (FNMA)—(continued) | | | | | | | | |
| | #AJ9402, 4.000%, due 12/1/26 | | $ | 1,311 | | | $ | 1,406 | |
| | #AK7384, 4.000%, due 3/1/27 | | | 1,096 | | | | 1,172 | |
| | #AB4818, 4.000%, due 4/1/27 | | | 690 | | | | 735 | |
| | #AL2590, 4.000%, due 7/1/27 | | | 4,793 | | | | 5,126 | |
| | #AV6413, 4.000%, due 2/1/29 | | | 3,502 | | | | 3,732 | |
| | #252925, 7.500%, due 12/1/29 | | | 1 | | | | 2 | |
| | #535977, 6.500%, due 4/1/31 | | | 10 | | | | 11 | |
| | #253907, 7.000%, due 7/1/31 | | | 2 | | | | 2 | |
| | #587849, 6.500%, due 11/1/31 | | | 14 | | | | 16 | |
| | #545437, 7.000%, due 2/1/32 | | | 63 | | | | 75 | |
| | #545759, 6.500%, due 7/1/32 | | | 580 | | | | 673 | |
| | #545869, 6.500%, due 7/1/32 | | | 1,850 | | | | 2,130 | |
| | #678007, 6.000%, due 9/1/32 | | | 9 | | | | 10 | |
| | #670385, 6.500%, due 9/1/32 | | | 870 | | | | 996 | |
| | #254548, 5.500%, due 12/1/32 | | | 61 | | | | 68 | |
| | #677290, 6.000%, due 1/1/33 | | | 2,639 | | | | 3,037 | |
| | #684601, 6.000%, due 3/1/33 | | | 629 | | | | 722 | |
| | #703391, 5.000%, due 5/1/33 | | | 196 | | | | 220 | |
| | #708993, 5.000%, due 6/1/33 | | | 32 | | | | 36 | |
| | #730131, 5.000%, due 8/1/33 | | | 62 | | | | 70 | |
| | #741850, 5.500%, due 9/1/33 | | | 706 | | | | 803 | |
| | #739243, 6.000%, due 9/1/33 | | | 724 | | | | 829 | |
| | #739331, 6.000%, due 9/1/33 | | | 392 | | | | 450 | |
| | #555800, 5.500%, due 10/1/33 | | | 69 | | | | 77 | |
| | #555946, 5.500%, due 11/1/33 | | | 508 | | | | 581 | |
| | #756153, 5.500%, due 11/1/33 | | | 696 | | | | 790 | |
| | #AL3455, 5.500%, due 11/1/33 | | | 8,052 | | | | 9,214 | |
| | #725017, 5.500%, due 12/1/33 | | | 64 | | | | 73 | |
| | #AL3380, 5.500%, due 1/1/34 | | | 1,018 | | | | 1,165 | |
| | #763798, 5.500%, due 3/1/34 | | | 103 | | | | 116 | |
| | #725611, 5.500%, due 6/1/34 | | | 137 | | | | 154 | |
| | #783786, 5.500%, due 7/1/34 | | | 133 | | | | 152 | |
| | #786546, 6.000%, due 7/1/34 | | | 277 | | | | 318 | |
| | #787816, 6.000%, due 7/1/34 | | | 409 | | | | 470 | |
| | #745563, 5.500%, due 8/1/34 | | | 781 | | | | 887 | |
| | #794474, 6.000%, due 10/1/34 | | | 54 | | | | 62 | |
| | #745092, 6.500%, due 7/1/35 | | | 444 | | | | 523 | |
| | #357944, 6.000%, due 9/1/35 | | | 27 | | | | 31 | |
| | #829306, 6.000%, due 9/1/35 | | | 309 | | | | 351 | |
| | #836140, 5.500%, due 10/1/35 | | | 67 | | | | 77 | |
| | #843487, 6.000%, due 10/1/35 | | | 123 | | | | 141 | |
| | #849191, 6.000%, due 1/1/36 | | | 172 | | | | 197 | |
| | #745349, 6.500%, due 2/1/36 | | | 407 | | | | 482 | |
| | #888305, 7.000%, due 3/1/36 | | | 13 | | | | 15 | |
| | #895637, 6.500%, due 5/1/36 | | | 111 | | | | 127 | |
| | #831540, 6.000%, due 6/1/36 | | | 36 | | | | 41 | |
| | #745802, 6.000%, due 7/1/36 | | | 202 | | | | 232 | |
| | #886220, 6.000%, due 7/1/36 | | | 397 | | | | 456 | |
| | #AL3449, 6.000%, due 7/1/36 | | | 2,012 | | | | 2,315 | |
| | #893318, 6.500%, due 8/1/36 | | | 43 | | | | 51 | |
| | #831926, 6.000%, due 12/1/36 | | | 12 | | | | 13 | |
| | #902974, 6.000%, due 12/1/36 | | | 296 | | | | 336 | |
| | #909480, 6.000%, due 2/1/37 | | | 324 | | | | 370 | |
| | #888418, 5.500%, due 5/1/37 | | | 1,547 | | | | 1,769 | |
| | #938440, 6.000%, due 7/1/37 | | | 129 | | | | 147 | |
| | #928561, 6.000%, due 8/1/37 | | | 274 | | | | 315 | |
| | Issuer | | NRSRO
Rating
(unaudited) | | Principal
Amount | | | Value | |
| | | | | | | | | | | | |
| | U.S. Government and U.S. Government Agency—(continued) | | | |
| | Federal National Mortgage Association (FNMA)—(continued) | | | | | | | | | | |
| | #948689, 6.000%, due 8/1/37 | | | | $ | 246 | | | $ | 281 | |
| | #888703, 6.500%, due 8/1/37 | | | | | 5,316 | | | | 6,229 | |
| | #946646, 6.000%, due 9/1/37 | | | | | 88 | | | | 101 | |
| | #888967, 6.000%, due 12/1/37 | | | | | 919 | | | | 1,057 | |
| | #AL0904, 5.500%, due 1/1/38 | | | | | 71 | | | | 80 | |
| | #889371, 6.000%, due 1/1/38 | | | | | 4,559 | | | | 5,232 | |
| | #889385, 6.000%, due 2/1/38 | | | | | 210 | | | | 241 | |
| | #962058, 6.500%, due 3/1/38 | | | | | 1,708 | | | | 1,995 | |
| | #934006, 6.500%, due 9/1/38 | | | | | 494 | | | | 568 | |
| | #986856, 6.500%, due 9/1/38 | | | | | 252 | | | | 288 | |
| | #AL5817, 6.000%, due 11/1/38 | | | | | 1,889 | | | | 2,169 | |
| | #991911, 7.000%, due 11/1/38 | | | | | 288 | | | | 333 | |
| | #AL3775, 5.000%, due 1/1/39 | | | | | 2,245 | | | | 2,525 | |
| | #AA7611, 5.000%, due 5/1/39 | | | | | 1,060 | | | | 1,192 | |
| | #AA8443, 5.000%, due 6/1/39 | | | | | 241 | | | | 272 | |
| | #AA8587, 5.500%, due 7/1/39 | | | | | 4,149 | | | | 4,710 | |
| | #931492, 6.000%, due 7/1/39 | | | | | 218 | | | | 251 | |
| | #AA6898, 6.000%, due 7/1/39 | | | | | 816 | | | | 939 | |
| | #931801, 5.000%, due 8/1/39 | | | | | 975 | | | | 1,092 | |
| | #AC1619, 5.500%, due 8/1/39 | | | | | 576 | | | | 651 | |
| | #AD0315, 6.500%, due 8/1/39 | | | | | 3,629 | | | | 4,151 | |
| | #AC0505, 5.500%, due 9/1/39 | | | | | 467 | | | | 535 | |
| | #932279, 5.000%, due 12/1/39 | | | | | 112 | | | | 126 | |
| | #AC9569, 5.000%, due 2/1/40 | | | | | 1,907 | | | | 2,152 | |
| | #932638, 5.000%, due 3/1/40 | | | | | 209 | | | | 233 | |
| | #932751, 5.000%, due 4/1/40 | | | | | 4,800 | | | | 5,416 | |
| | #AE0082, 5.000%, due 5/1/40 | | | | | 591 | | | | 660 | |
| | #AB1146, 5.000%, due 6/1/40 | | | | | 124 | | | | 139 | |
| | #AD7531, 5.500%, due 6/1/40 | | | | | 296 | | | | 339 | |
| | #AD8810, 5.500%, due 6/1/40 | | | | | 723 | | | | 827 | |
| | #AB1200, 5.500%, due 7/1/40 | | | | | ,488 | | | | 1,686 | |
| | #AD7137, 5.500%, due 7/1/40 | | | | | 5,509 | | | | 6,305 | |
| | #AH0955, 5.000%, due 12/1/40 | | | | | 6,234 | | | | 7,011 | |
| | #AL0028, 5.000%, due 2/1/41 | | | | | 3,073 | | | | 3,443 | |
| | #AL5815, 5.500%, due 4/1/41 | | | | | 4,078 | | | | 4,667 | |
| | #AI6071, 5.000%, due 6/1/41 | | | | | 2,261 | | | | 2,546 | |
| | #AL0672, 5.000%, due 7/1/41 | | | | | 3,605 | | | | 4,068 | |
| | #AL0913, 6.000%, due 7/1/41 | | | | | 2,739 | | | | 3,093 | |
| | #AK2733, 5.000%, due 2/1/42 | | | | | 2,437 | | | | 2,750 | |
| | Total FNMA Mortgage Obligations | | | | | | | | | 147,611 | |
| | | | | | | | | | | | |
| | Asset-Backed Securities—3.4% | | | | | | | | | | |
| | Hertz Vehicle Financing LLC—144A, 2013-1A, Tranche B1,
1.860%, 8/25/17 | | Baa1 | | | 3,450 | | | | 3,438 | |
| | GE Capital Credit Card Master Note Trust, 2012-6, Tranche B,
1.830%, 8/17/20 | | AA+ | | | 3,000 | | | | 3,002 | |
| | American Express Credit Account Master Trust, 2008-2, Tranche A,
1.591%, 9/15/20, VRN | | AAA | | | 4,800 | | | | 4,895 | |
| | Centre Point Funding LLC—144A, 2012-2A, Tranche 1,
2.610%, 8/20/21 | | Baa2 | | | 3,180 | | | | 3,141 | |
See accompanying Notes to Financial Statements.
| 104 | Annual Report | December 31, 2015 |
Bond Fund
Portfolio of Investments, December 31, 2015 (all dollar amounts in thousands)
| | Issuer | | NRSRO
Rating
(unaudited) | | Principal
Amount | | | Value | |
| | | | | | | | | | | | |
| | Asset-Backed Securities—(continued) | | | | | | | | | | |
| | SLM Private Education Loan Trust—144A, 2011-A, Tranche A3, 2.831%, 1/15/43, VRN | | AAA | | | $2,000 | | | $ | 2,062 | |
| | Total Asset-Backed Securities | | | | | | | | | 16,538 | |
| | | | | | | | | | | | |
| | Corporate Obligations—40.6% | | | | | | | | | | |
| | Penske Truck Leasing Co. L.P.—144A,
3.750%, due 5/11/17 | | BBB+ | | | 3,000 | | | | 3,062 | |
| | Toll Brothers Finance Corporation,
8.910%, due 10/15/17 | | BBB- | | | 1,050 | | | | 1,176 | |
| | Morgan Stanley,
6.625%, due 4/1/18 | | A | | | 3,400 | | | | 3,730 | |
| | The Goldman Sachs Group, Inc.,
1.522%, due 4/30/18, VRN | | A | | | 3,744 | | | | 3,763 | |
| | Bank of America Corporation,
6.875%, due 11/15/18 | | A | | | 1,100 | | | | 1,237 | |
| | Glencore Funding LLC—144A,
1.681%, due 1/15/19, VRN | | BBB | | | 1,500 | | | | 1,242 | |
| | Petrobras Global Finance BV,
2.461%, due 1/15/19, VRN | | BB+ | | | 4,000 | | | | 3,050 | |
| | CSX Corporation,
7.375%, due 2/1/19 | | BBB+ | | | 1,870 | | | | 2,142 | |
| | Cemex S.A.B. de C.V.—144A,
5.875%, due 3/25/19 | | BB- | | | 3,000 | | | | 2,865 | |
| | Baidu, Inc.,
2.750%, due 6/9/19 | | A | | | 1,707 | | | | 1,700 | |
| | Roper Industries, Inc.,
6.250%, due 9/1/19 | | BBB | | | 1,850 | | | | 2,054 | |
| | Republic Services, Inc.,
5.500%, due 9/15/19 | | BBB+ | | | 1,725 | | | | 1,899 | |
| | Boston Properties L.P.,
5.875%, due 10/15/19 | | A- | | | 4,000 | | | | 4,444 | |
| | Toll Brothers Finance Corporation,
6.750%, due 11/1/19 | | BBB- | | | 500 | | | | 553 | |
| | Ford Motor Credit Co. LLC,
8.125%, due 1/15/20 | | BBB- | | | 4,000 | | | | 4,715 | |
| | Georgia-Pacific LLC-144A,
5.400%, due 11/1/20 | | A+ | | | 4,000 | | | | 4,417 | |
| | United Continental Holdings, Inc.,
6.000%, due 12/1/20 | | BB- | | | 2,500 | | | | 2,598 | |
| | JBS USA LLC / JBS USA Finance, Inc.—144A,
7.250%, due 6/1/21 | | BB+ | | | 3,000 | | | | 2,992 | |
| | O’Reilly Automotive, Inc.,
4.625%, due 9/15/21 | | BBB+ | | | 2,855 | | | | 3,045 | |
| | Fresenius Medical Care US Finance II, Inc.—144A,
5.875%, due 1/31/22 | BB+ | | | 1,200 | | | | 1,290 | |
| | Post Holdings, Inc.,
7.375%, due 2/15/22 | | B | | | 3,000 | | | | 3,139 | |
| | Ball Corporation,
5.000%, due 3/15/22 | | BB+ | | | 2,500 | | | | 2,562 | |
| | Masco Corporation,
5.950%, due 3/15/22 | | BBB | | | 3,800 | | | | 4,113 | |
| | United Rentals North America, Inc.,
7.625%, due 4/15/22 | | BB- | | | 2,500 | | | | 2,684 | |
| | Discover Financial Services,
5.200%, due 4/27/22 | | BBB+ | | | 3,000 | | | | 3,212 | |
| | Issuer | | NRSRO
Rating
(unaudited) | | Principal
Amount | | | Value | |
| | | | | | | | | | | | |
| | Corporate Obligations—(continued) | | | | | | | | | | |
| | The Goodyear Tire & Rubber Co.,
7.000%, due 5/15/22 | | BB | | | $2,000 | | | $ | 2,147 | |
| | Triumph Group, Inc.,
5.250%, due 6/1/22 | | Ba3 | | | 2,000 | | | | 1,620 | |
| | Penske Automotive Group, Inc.,
5.750%, due 10/1/22 | | B+ | | | 1,500 | | | | 1,549 | |
| | American Axle & Manufacturing, Inc.,
6.625%, due 10/15/22 | | BB- | | | 3,000 | | | | 3,150 | |
| | Jones Lang LaSalle, Inc.,
4.400%, due 11/15/22 | | BBB+ | | | 1,750 | | | | 1,797 | |
| | Jaguar Land Rover Automotive plc—144A,
5.625%, due 2/1/23 | | BB | | | 3,225 | | | | 3,269 | |
| | Wyndham Worldwide Corporation,
3.900%, due 3/1/23 | | BBB- | | | 3,500 | | | | 3,411 | |
| | MGM Resorts International,
6.000%, due 3/15/23 | | BB | | | 3,000 | | | | 2,985 | |
| | Avis Budget Car Rental LLC,
5.500%, due 4/1/23 | | B+ | | | 2,500 | | | | 2,516 | |
| | Toll Brothers Finance Corporation,
4.375%, due 4/15/23 | | BBB- | | | 1,300 | | | | 1,268 | |
| | Wells Fargo & Co.,
4.480%, due 1/16/24 | | A+ | | | 3,000 | | | | 3,158 | |
| | Fibria Overseas Finance, Ltd.,
5.250%, due 5/12/24 | | BBB- | | | 3,500 | | | | 3,334 | |
| | BRF S.A.—144A,
4.750%, due 5/22/24 | | BBB | | | 2,000 | | | | 1,845 | |
| | Banco Inbursa S.A. Institucion de Banca Multiple-144A,
4.125%, due 6/6/24 | | BBB+ | | | 2,000 | | | | 1,885 | |
| | Grupo Bimbo S.A.B. de C.V.— 144A,
3.875%, due 6/27/24 | BBB | | | 2,000 | | | | 1,951 | |
| | Synchrony Financial,
4.250%, due 8/15/24 | | BBB- | | | 4,250 | | | | 4,200 | |
| | HSBC Holdings plc,
6.375%, due 9/17/24, VRN | | BBB | | | 3,500 | | | | 3,461 | |
| | BNP Paribas S.A.,
4.250%, due 10/15/24 | | A | | | 3,000 | | | | 2,976 | |
| | Owens Corning,
4.200%, due 12/1/24 | | BBB- | | | 3,200 | | | | 3,120 | |
| | Credit Suisse Group AG—144A,
6.250%, due 12/18/24, VRN | | BB+ | | | 2,000 | | | | 2,005 | |
| | USG Corp.—144A,
5.500%, due 3/1/25 | | BB+ | | | 3,000 | | | | 3,056 | |
| | Valeant Pharmaceuticals International, Inc.—144A,
6.125%, due 4/15/25 | | B1 | | | 1,500 | | | | 1,343 | |
| | Embraer Netherlands Finance BV,
5.050%, due 6/15/25 | | BBB | | | 3,000 | | | | 2,737 | |
| | Seagate HDD Cayman—144A,
4.875%, due 6/1/27 | | BBB- | | | 2,000 | | | | 1,538 | |
| | The Kroger Co.,
8.000%, due 9/15/29 | | BBB | | | 1,173 | | | | 1,587 | |
| | Comcast Corporation,
6.450%, due 3/15/37 | | A- | | | 4,000 | | | | 4,988 | |
| | JPMorgan Chase & Co.,
6.400%, due 5/15/38 | | A+ | | | 3,500 | | | | 4,470 | |
See accompanying Notes to Financial Statements.
| December 31, 2015 | William Blair Funds | 105 |
Bond Fund
Portfolio of Investments, December 31, 2015 (all dollar amounts in thousands)
| | Issuer | | NRSRO
Rating
(unaudited) | | Principal
Amount | | | Value | |
| | | | | | | | | | | | |
| | Corporate Obligations—(continued) | | | | | | | | | | |
| | Philip Morris International, Inc.,
6.375%, due 5/16/38 | | A | | | $2,175 | | | $ | 2,749 | |
| | Burlington Northern Santa Fe LLC,
5.750%, due 5/1/40 | | A3 | | | 3,495 | | | | 3,926 | |
| | Petroleos Mexicanos,
6.500%, due 6/2/41 | | BBB+ | | | 2,500 | | | | 2,174 | |
| | Express Scripts Holding Co.,
6.125%, due 11/15/41 | | BBB+ | | | 4,000 | | | | 4,561 | |
| | Gilead Sciences, Inc.,
5.650%, due 12/1/41 | | A- | | | 4,000 | | | | 4,567 | |
| | Citigroup, Inc.,
5.875%, due 1/30/42 | | A | | | 4,000 | | | | 4,606 | |
| | Bank of America Corporation,
5.875%, due 2/7/42 | | A | | | 4,000 | | | | 4,685 | |
| | Odebrecht Finance Ltd.—144A,
7.125%, due 6/26/42 | | BBB- | | | 2,000 | | | | 1,035 | |
| | American International Group, Inc.,
4.500%, due 7/16/44 | | A- | | | 3,500 | | | | 3,249 | |
| | Mexichem S.A.B. de C.V.— 144A,
5.875%, due 9/17/44 | | BBB | | | 3,500 | | | | 2,949 | |
| | Northrop Grumman Corporation,
3.850%, due 4/15/45 | | BBB+ | | | 4,500 | | | | 4,061 | |
| | ERP Operating L.P.,
4.500%, due 6/1/45 | | A- | | | 3,500 | | | | 3,570 | |
| | PepsiCo, Inc.,
4.450%, due 4/14/46 | | A1 | | | 4,500 | | | | 4,660 | |
| | AT&T, Inc.,
4.750%, due 5/15/46 | | A- | | | 4,500 | | | | 4,136 | |
| | Microsoft Corporation,
4.750%, due 11/3/55 | | AAA | | | 4,950 | | | | 5,141 | |
| | Total Corporate Obligations | | | | | | | | | 195,119 | |
| | Total Long-Term Investments—95.8%
(cost $462,969) | | | | | | | | | 460,742 | |
| | Issuer | | Principal
Amount or
Contracts | | | Value | |
| | | | | | | | | | |
| | Repurchase Agreement | | | | | | | | |
| | Fixed Income Clearing Corporation, 0.030% dated 12/31/15, due 1/4/16, repurchase price $15,197, collateralized by U.S. Treasury Note, 2.375%, due 8/15/24 | | | $15,197 | | | $ | 15,197 | |
| | Total Repurchase Agreement-3.2%
(cost $15,197) | | | | | | | 15,197 | |
| | | | | | | | | | |
| | U.S. Government and U.S. Government Agency | | | | | | | | |
| | U.S. Treasury Bill, 0.073%, due 1/14/16(a) | | | $200 | | | | 200 | |
| | Total U.S. Government and U.S. Government Agency—0.0%
(cost $200) | | | | | | | 200 | |
| | | | | | | | | | |
| | Purchased Option—0.0% | | | | | | | | |
| | Eurodollar Future, September 2016, Strike $97, PUT | | | 300 | | | | 2 | |
| | Total Purchased Option—0.0%
(cost $95) | | | | | | | 2 | |
| | Total Investments—99.0%
(cost $478,461) | | | | | | | 476,141 | |
| | Cash and other assets, less liabilities—1.0% | | | | | | | 4,653 | |
| | Net assets—100.0% | | | | | | $ | 480,794 | |
NRSRO = Nationally Recognized Statistical Rating Organization—The credit quality ratings of the securities in the Fund reflect the highest category rating by any of Fitch Ratings, Moody’s Investors Service Inc., or Standard & Poor’s, a division of the McGraw-Hill Companies, Inc.
The obligations of certain U.S. Government-sponsored securities are neither issued nor guaranteed by the U.S. Treasury.
VRN = Variable Rate Note
(a) Security, or portion of security, is segregated as collateral for the credit default swap aggregating a total value of $157.
Centrally Cleared Credit Default Swap
| Reference Entity | | Buy/Sell
Protection | | Fixed Deal
Pay Rate | | Maturity
Date | | Cleared Exchange | | Notional
Amount | | Unrealized
Appreciation
(Depreciation) |
| CDX.IG-25 | | Buy | | 1.000% | | December 2020 | | CME | | $15,000 | | $(37) |
See accompanying Notes to Financial Statements.
| 106 | Annual Report | December 31, 2015 |
| | Income Fund |
| | |
| | The Income Fund seeks a high level of current income with relative stability of principal. |
| | |
| | AN OVERVIEW FROM THE PORTFOLIO MANAGER |
| | |
 Christopher T. Vincent | The William Blair Income Fund (Class N shares) increased 0.39%, net of fees, for the twelve months ended December 31, 2015. By comparison, the Fund’s benchmark, the Barclays Intermediate Government/Credit Bond Index (the “Index”), increased 1.07%. A couple of factors contributed to the Fund’s underperformance relative to the Index during the year. The Fund’s interest rate positioning detracted from performance. The Fund maintained a defensive duration posture, and this impacted results negatively because interest rates did not rise enough to hamper total returns significantly. An allocation to U.S. Treasury Inflation-Protected Securities impacted relative performance negatively, as market-implied inflation expectations declined during the year. Finally, positions in bonds of Brazilian issuers Odebrecht and Petrobras negatively impacted relative performance as the Brazilian government continued its investigation into corruption that included executives from each company. There were a couple of factors that contributed to relative performance during 2015. Security selection of mortgage-backed securities was additive to results. The Fund favored higher-coupon segments of the 30- and 15-year markets, and those higher-coupon segments performed well during 2015. Finally, the Fund experienced positive selection results of investment-grade corporate bonds, in part due to the Fund’s overweight to bonds issued by financial institutions. Positions that performed well included bonds issued by Toll Brothers, Georgia-Pacific, Masco Corporation, Citigroup, Jones Lang LaSalle, and Simon Property Group. Please refer to the Fixed Income Market Review and Outlook relating to the Fund on page 99. |
| December 31, 2015 | William Blair Funds | 107 |
Income Fund
Performance Highlights (Unaudited)
Average Annual Total Return at 12/31/2015
| | | 1 Year | | 3 Year | | 5 Year | | 10 Year |
| Class N | | | 0.39 | % | | | 0.60 | % | | | 2.57 | % | | | 3.12 | % |
| Class I | | | 0.63 | | | | 0.80 | | | | 2.80 | | | | 3.32 | |
| Barclays Intermediate Government/Credit Bond Index | | | 1.07 | | | | 1.10 | | | | 2.58 | | | | 4.04 | |
Performance cited represents past performance. Past performance does not guarantee future results and current performance may be lower or higher than the data quoted. Results shown are average annual total returns, which assume reinvestment of dividends and capital gains. Investment returns and principal will fluctuate and you may have a gain or loss when you sell shares. For the most current month-end performance information, please call 1-800-742-7272, or visit our Web site at www.williamblairfunds.com. From time to time, the investment adviser may waive fees or reimburse expenses for the Fund. Without these waivers/reimbursements, performance would be lower. Class N shares are available to the general public without a sales load. Class I shares are available to certain institutional investors and advisory clients of William Blair Investment Management, LLC and William Blair & Company, L.L.C., without a sales load or distribution (12b-1) or service fees.
The performance highlights and graph presented above do not reflect the deduction of taxes that a shareholder would pay on fund distributions or the redemption of fund shares.
The Barclays Intermediate Government/Credit Bond Index indicates broad intermediate government/corporate bond market performance.
This report identifies the Fund’s investments on December 31, 2015. These holdings are subject to change. Not all investments in the Fund performed the same, nor is there any guarantee that these investments will perform as well in the future. Market forecasts provided in this report may not necessarily come to pass.
Sector Diversification (Unaudited)
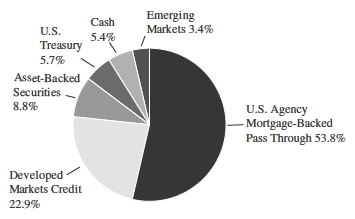
The sector diversification shown is based on the total investments.
| 108 | Annual Report | December 31, 2015 |
Income Fund
Portfolio of Investments, December 31, 2015 (all dollar amounts in thousands)
| | | | | | | |
| Issuer | | Principal
Amount | | | Value | |
| U.S. Government and U.S. Government Agency—59.4% | |
| U.S. Treasury Inflation Indexed Notes/Bonds—4.8% | | | | | | | | |
| U.S. Treasury Inflation Indexed Note, 1.875%, due 7/15/19 | | $ | 1,114 | | | $ | 1,182 | |
| U.S. Treasury Inflation Indexed Note, 1.125%, due 1/15/21 | | | 3,262 | | | | 3,366 | |
| Total U.S. Treasury Inflation Indexed Notes/Bonds | | | | | | | 4,548 | |
| U.S. Treasury—1.0% | | | | | | | | |
| U.S. Treasury Strip Principal, 0.000%, due 5/15/20 | | | 1,000 | | | | 927 | |
| Government National Mortgage Association (GNMA)—0.0% | | | | | | | | |
| #780405, 9.500%, due 11/15/17 | | | 7 | | | | 7 | |
| #357322, 7.000%, due 9/15/23 | | | 33 | | | | 36 | |
| Total GNMA Mortgage Obligations | | | | | | | 43 | |
| Federal Home Loan Mortgage Corp. (FHLMC)—10.1% | | | | | | | | |
| #E90398, 7.000%, due 5/1/17 | | | 84 | | | | 86 | |
| #E97112, 4.000%, due 5/1/18 | | | 38 | | | | 40 | |
| #D95621, 6.500%, due 7/1/22 | | | 792 | | | | 903 | |
| #J13022, 4.000%, due 9/1/25 | | | 588 | | | | 625 | |
| #J16051, 4.500%, due 7/1/26 | | | 1,151 | | | | 1,233 | |
| #A17603, 5.500%, due 1/1/34 | | | 819 | | | | 930 | |
| #A45790, 7.500%, due 5/1/35 | | | 140 | | | | 161 | |
| #G02141, 6.000%, due 3/1/36 | | | 348 | | | | 398 | |
| #G03201, 6.500%, due 6/1/37 | | | 216 | | | | 246 | |
| #A66843, 6.500%, due 10/1/37 | | | 378 | | | | 441 | |
| #A81799, 6.500%, due 9/1/38 | | | 411 | | | | 468 | |
| #G06964, 5.500%, due 11/1/38 | | | 1,250 | | | | 1,421 | |
| #G05875, 5.500%, due 2/1/40 | | | 176 | | | | 199 | |
| #C03665, 9.000%, due 4/1/41 | | | 433 | | | | 532 | |
| #G06583, 5.000%, due 6/1/41 | | | 1,749 | | | | 1,959 | |
| Total FHLMC Mortgage Obligations | | | | | | | 9,642 | |
| Federal National Mortgage Association (FNMA)—43.5% | | | | | | | | |
| #576553, 8.000%, due 2/1/16 | | | 2 | | | | 2 | |
| #735569, 8.000%, due 10/1/16 | | | 4 | | | | 4 | |
| #643217, 6.500%, due 6/1/17 | | | 33 | | | | 34 | |
| #679247, 7.000%, due 8/1/17 | | | 93 | | | | 95 | |
| #695910, 5.000%, due 5/1/18 | | | 117 | | | | 122 | |
| #740847, 6.000%, due 10/1/18 | | | 65 | | | | 67 | |
| #323501, 6.500%, due 1/1/19 | | | 24 | | | | 27 | |
| #751313, 5.000%, due 3/1/19 | | | 138 | | | | 146 | |
| #852864, 7.000%, due 7/1/20 | | | 434 | | | | 460 | |
| #458147, 10.000%, due 8/15/20 | | | 52 | | | | 55 | |
| #835563, 7.000%, due 10/1/20 | | | 168 | | | | 179 | |
| #831430, 5.500%, due 3/1/21 | | | 276 | | | | 294 | |
| #735574, 8.000%, due 3/1/22 | | | 136 | | | | 146 | |
| #679253, 6.000%, due 10/1/22 | | | 369 | | | | 418 | |
| FNR G93-19 SH, 11.234%, due 4/25/23, VRN | | | 11 | | | | 16 | |
| #982878, 4.500%, due 5/1/23 | | | 249 | | | | 267 | |
| | | | | | | |
| Issuer | | Principal
Amount | | | Value | |
| U.S. Government and U.S. Government Agency—(continued) | |
| Federal National Mortgage Association (FNMA)—(continued) | |
| #AA6066, 4.000%, due 5/1/24 | | $ | 946 | | | $ | 1,008 | |
| #AC5124, 4.000%, due 11/1/24 | | | 807 | | | | 866 | |
| #932095, 4.000%, due 11/1/24 | | | 4,362 | | | | 4,663 | |
| #932100, 4.500%, due 11/1/24 | | | 1,058 | | | | 1,138 | |
| #AC6257, 4.000%, due 12/1/24 | | | 897 | | | | 962 | |
| #AC0596, 4.000%, due 12/1/24 | | | 232 | | | | 247 | |
| #AD4073, 4.000%, due 5/1/25 | | | 118 | | | | 126 | |
| #935995, 4.000%, due 6/1/25 | | | 117 | | | | 125 | |
| #AD4677, 4.000%, due 6/1/25 | | | 791 | | | | 837 | |
| #AE1176, 4.000%, due 8/1/25 | | | 333 | | | | 355 | |
| #255956, 5.500%, due 10/1/25 | | | 63 | | | | 70 | |
| #AL2851, 4.000%, due 8/1/26 | | | 2,680 | | | | 2,867 | |
| #AI9811, 4.500%, due 8/1/26 | | | 509 | | | | 548 | |
| #AJ3203, 4.000%, due 10/1/26 | | | 1,189 | | | | 1,277 | |
| #AJ7724, 4.000%, due 12/1/26 | | | 988 | | | | 1,055 | |
| #256639, 5.000%, due 2/1/27 | | | 12 | | | | 14 | |
| #AB4818, 4.000%, due 4/1/27 | | | 2,133 | | | | 2,275 | |
| #AL2590, 4.000%, due 7/1/27 | | | 1,699 | | | | 1,816 | |
| #806458, 8.000%, due 6/1/28 | | | 151 | | | | 171 | |
| #880155, 8.500%, due 7/1/29 | | | 220 | | | | 255 | |
| #797846, 7.000%, due 3/1/32 | | | 117 | | | | 123 | |
| #745519, 8.500%, due 5/1/32 | | | 159 | | | | 187 | |
| #654674, 6.500%, due 9/1/32 | | | 64 | | | | 73 | |
| #733897, 6.500%, due 12/1/32 | | | 241 | | | | 271 | |
| #688034, 5.500%, due 3/1/33 | | | 185 | | | | 212 | |
| #254693, 5.500%, due 4/1/33 | | | 10 | | | | 11 | |
| #555531, 5.500%, due 6/1/33 | | | 99 | | | | 112 | |
| #711736, 5.500%, due 6/1/33 | | | 110 | | | | 126 | |
| #555591, 5.500%, due 7/1/33 | | | 16 | | | | 18 | |
| #762505, 5.500%, due 11/1/33 | | | 158 | | | | 179 | |
| #AL3455, 5.500%, due 11/1/33 | | | 2,365 | | | | 2,706 | |
| #776964, 5.000%, due 4/1/34 | | | 445 | | | | 499 | |
| #725424, 5.500%, due 4/1/34 | | | 103 | | | | 116 | |
| #824463, 5.500%, due 7/1/35 | | | 208 | | | | 231 | |
| #888884, 5.500%, due 12/1/35 | | | 212 | | | | 240 | |
| #AL3449, 6.000%, due 7/1/36 | | | 1,150 | | | | 1,323 | |
| #886220, 6.000%, due 7/1/36 | | | 283 | | | | 325 | |
| #888703, 6.500%, due 8/1/37 | | | 1,139 | | | | 1,334 | |
| #928658, 6.500%, due 9/1/37 | | | 39 | | | | 46 | |
| #889385, 6.000%, due 2/1/38 | | | 491 | | | | 562 | |
| #962058, 6.500%, due 3/1/38 | | | 591 | | | | 690 | |
| #AL5817, 6.000%, due 11/1/38 | | | 1,157 | | | | 1,328 | |
| #991911, 7.000%, due 11/1/38 | | | 184 | | | | 213 | |
| #AA8587, 5.500%, due 7/1/39 | | | 951 | | | | 1,079 | |
| #AD0315, 6.500%, due 8/1/39 | | | 383 | | | | 438 | |
| #AC3237, 5.000%, due 10/1/39 | | | 175 | | | | 195 | |
| #AC6156, 5.500%, due 11/1/39 | | | 2,389 | | | | 2,757 | |
| #AC9569, 5.000%, due 2/1/40 | | | 254 | | | | 287 | |
| #AB1200, 5.500%, due 7/1/40 | | | 496 | | | | 562 | |
| #AL0028, 5.000%, due 2/1/41 | | | 1,311 | | | | 1,469 | |
| #AL5815, 5.500%, due 4/1/41 | | | 816 | | | | 933 | |
| Total FNMA Mortgage Obligations | | | | | | | 41,652 | |
See accompanying Notes to Financial Statements.
| December 31, 2015 | William Blair Funds | 109 |
Income Fund
Portfolio of Investments, December 31, 2015 (all dollar amounts in thousands)
| | Issuer | | NRSRO
Rating
(unaudited) | | Principal
Amount | | | Value | |
| | | | | | | | | | |
| | Asset-Backed Securities—8.8% | | | | | | | | | | |
| | Hertz Vehicle Financing LLC—144A,
2013-1A, Tranche B1,
1.860%, 8/25/17 | | Baa1 | | | $1,000 | | | $ | 997 | |
| | Nissan Master Owner Trust
Receivables, 2013-A, Tranche A,
0.631%, 2/15/18, VRN | | Aaa | | | 1,000 | | | | 1,000 | |
| | Harley-Davidson Motorcycle Trust,
2014-1, Tranche A2B,
0.501%, 4/15/18, VRN | | AAA | | | 226 | | | | 225 | |
| | Harley-Davidson Motorcycle Trust,
2015-2, Tranche A2B,
0.581%, 1/15/19, VRN | | AAA | | | 1,733 | | | | 1,730 | |
| | Citibank Credit Card Issuance Trust,
2008-A2, Tranche A2,
1.570%, 1/23/20, VRN | | AAA | | | 1,225 | | | | 1,244 | |
| | GE Capital Credit Card Master Note
Trust, 2012-6, Tranche B,
1.830%, 8/17/20 | | AA+ | | | 1,705 | | | | 1,706 | |
| | American Express Credit Account
Master Trust, 2008-2, Tranche A,
1.591%, 9/15/20, VRN | | AAA | | | 1,000 | | | | 1,020 | |
| | SLM Private Education Loan Trust—
144A, 2011-A, Tranche A3,
2.831%, 1/15/43, VRN | | AAA | | | 500 | | | | 516 | |
| | Total Asset-Backed Securities | | | | | | | | | 8,438 | |
| | | | | | | | | | | | |
| | Corporate Obligations—26.1% | | | | | | | | | | |
| | JPMorgan Chase & Co.,
6.125%, due 6/27/17 | | A | | | 800 | | | | 847 | |
| | Macquarie Group Ltd.-144A,
4.875%, due 8/10/17 | | A3 | | | 1,000 | | | | 1,035 | |
| | Morgan Stanley,
6.625%, due 4/1/18 | | A | | | 1,000 | | | | 1,097 | |
| | The Goldman Sachs Group, Inc.,
1.522%, due 4/30/18, VRN | | A | | | 1,000 | | | | 1,005 | |
| | Bank of America Corporation,
6.875%, due 11/15/18 | | A | | | 1,000 | | | | 1,124 | |
| | Honeywell International, Inc.,
5.000%, due 2/15/19 | | A | | | 750 | | | | 822 | |
| | Burlington Northern Santa Fe LLC,
4.700%, due 10/1/19 | | A3 | | | 750 | | | | 812 | |
| | Boston Properties L.P.,
5.875%, due 10/15/19 | | A- | | | 1,000 | | | | 1,111 | |
| | Petroleos Mexicanos,
6.000%, due 3/5/20 | | BBB+ | | | 500 | | | | 521 | |
| | PepsiCo, Inc.,
2.150%, due 10/14/20 | | A1 | | | 900 | | | | 897 | |
| | Georgia-Pacific LLC-144A,
5.400%, due 11/1/20 | | A+ | | | 1,000 | | | | 1,104 | |
| | Simon Property Group L.P.,
4.375%, due 3/1/21 | | A | | | 750 | | | | 814 | |
| | Capital One Financial Corporation,
4.750%, due 7/15/21 | | A- | | | 1,000 | | | | 1,084 | |
| | General Electric Capital Corporation,
4.650%, due 10/17/21 | | AA+ | | | 1,000 | | | | 1,108 | |
| | Gilead Sciences, Inc.,
4.400%, due 12/1/21 | | A- | | | 1,000 | | | | 1,081 | |
| | Masco Corporation,
5.950%, due 3/15/22 | | BBB | | | 750 | | | | 812 | |
| | Issuer | | NRSRO
Rating
(unaudited) | | Principal
Amount/
Contracts | | | Value | |
| | | | | | | | | | |
| | Corporate Obligations—(continued) | | | |
| | American International Group, Inc.,
4.875%, due 6/1/22 | | A- | | | $1,000 | | | $ | 1,081 | |
| | Jones Lang LaSalle, Inc.,
4.400%, due 11/15/22 | | BBB+ | | | 658 | | | | 676 | |
| | Wyndham Worldwide Corporation,
3.900%, due 3/1/23 | | BBB- | | | 750 | | | | 731 | |
| | Toll Brothers Finance Corporation,
4.375%, due 4/15/23 | | BBB- | | | 850 | | | | 829 | |
| | Wells Fargo & Co.,
4.480%, due 1/16/24 | | A+ | | | 1,000 | | | | 1,053 | |
| | Fibria Overseas Finance, Ltd.,
5.250%, due 5/12/24 | | BBB- | | | 750 | | | | 714 | |
| | BRF S.A.-144A,
4.750%, due 5/22/24 | | BBB | | | 750 | | | | 692 | |
| | Grupo Bimbo S.A.B. de C.V.-144A,
3.875%, due 6/27/24 | | BBB | | | 750 | | | | 732 | |
| | Synchrony Financial,
4.250%, due 8/15/24 | | BBB- | | | 700 | | | | 692 | |
| | BNP Paribas S.A.,
4.250%, due 10/15/24 | | A | | | 500 | | | | 496 | |
| | Embraer Netherlands Finance BV,
5.050%, due 6/15/25 | | BBB | | | 600 | | | | 547 | |
| | Seagate HDD Cayman-144A,
4.875%, due 6/1/27 | | BBB- | | | 500 | | | | 384 | |
| | Crown Castle Towers LLC-144A,
6.113%, due 1/15/40 | | A2 | | | 1,000 | | | | 1,094 | |
| | Total Corporate Obligations | | | | | | | | | 24,995 | |
| | Total Long-Term Investments—94.3%
(cost $90,464) | | | | | | | | | 90,245 | |
| | | | | | | | | | | | |
| | Repurchase Agreement | | | | | | | | | | |
| | Fixed Income Clearing Corporation, 0.030% dated 12/31/15, due 1/4/16, repurchase price $5,007, collateralized by FNMA, 2.625%, due 9/6/24 | | | | | 5,007 | | | | 5,007 | |
| | Total Repurchase Agreement—5.3%
(cost $5,007) | | | | | | | | | 5,007 | |
| | | | | | | | | | | | |
| | Purchased Option—0.0% | | | | | | | | | | |
| | Eurodollar Future, September 2016, Strike $97, PUT | | | | | 150 | | | | 1 | |
| | Total Purchased Option—0.0%
(cost $47) | | | | | | | | | 1 | |
| | Total Investments—99.6%
(cost $95,518) | | | | | | | | | 95,253 | |
| | Cash and other assets, less liabilities—0.4% | | | | | | | | | 411 | |
| | Net assets—100.0% | | | | | | | | $ | 95,664 | |
VRN = Variable Rate Note
NRSRO = Nationally Recognized Statistical Rating Organization—The credit quality ratings of the securities in the Fund reflect the highest category rating by any of Fitch Ratings, Moody’s Investors Service Inc., or Standard & Poor’s, a division of the McGraw-Hill Companies, Inc.
The obligations of certain U.S. Government-sponsored securities are neither issued nor guaranteed by the U.S. Treasury.
See accompanying Notes to Financial Statements.
| 110 | Annual Report | December 31, 2015 |
| | Low Duration Fund |
| | |
| | The Low Duration Fund seeks to maximize total return. Total return includes both income and capital appreciation. |
| | |
| | AN OVERVIEW FROM THE PORTFOLIO MANAGERS |
| | |
Christopher T. Vincent
Paul J. Sularz | The William Blair Low Duration Fund (Class N shares) returned 0.01%, net of fees, for the twelve months ended December 31, 2015. By comparison, the Fund’s benchmark, the Bank of America Merrill Lynch 1-Year U.S. Treasury Note Index (the “Index”), returned 0.15%. The Fund’s underperformance relative to the Index during the year was primarily due to the result of the Fund’s expenses. Additionally, the Fund hedged a portion of its interest rate risk exposure, and those hedges reduced relative performance. However, the Fund’s interest rate positioning contributed to relative performance during the period. The Fund’s selection results from investing in a combination of agency mortgage-backed securities, asset-backed securities, and high-quality corporate bonds also contributed to relative performance. Please refer to the Fixed Income Market Review and Outlook relating to the Fund on page 99. |
| December 31, 2015 | William Blair Funds | 111 |
Low Duration Fund
Performance Highlights (Unaudited)
| |
| Average Annual Total Return at 12/31/2015 |
| |
| | | 1 Year | | 3 Year | | 5 Year | | Since
Inception(a) |
| Class N | | | 0.01 | % | | | 0.19 | % | | | 1.01 | % | | | 1.04 | % |
| Class I | | | 0.30 | | | | 0.36 | | | | 1.19 | | | | 1.19 | |
| Institutional Class | | | 0.22 | | | | 0.47 | | | | 1.30 | | | | 1.33 | |
| Bank of America Merrill Lynch 1-Year U.S. Treasury Note Index | | | 0.15 | | | | 0.20 | | | | 0.28 | | | | 0.34 | |
| (a) | For the period from December 1, 2009 (Commencement of Operations) to December 31, 2015. |
Performance cited represents past performance. Past performance does not guarantee future results and current performance may be lower or higher than the data quoted. Results shown are average annual total returns, which assume reinvestment of dividends and capital gains. Investment returns and principal will fluctuate and you may have a gain or loss when you sell shares. For the most current month-end performance information, please call 1-800-742-7272, or visit our Web site at www.williamblairfunds.com. From time to time, the investment adviser may waive fees or reimburse expenses for the Fund. Without these waivers/reimbursements, performance would be lower. Class N shares are available to the general public without a sales load. Class I shares are available to certain institutional investors and advisory clients of William Blair Investment Management, LLC and William Blair & Company, L.L.C., without a sales load or distribution (12b-1) fees. Institutional Class shares are available to institutional investors without a sales load or distribution (12b-1) or service fees.
The performance highlights and graph presented above do not reflect the deduction of taxes that a shareholder would pay on fund distributions or the redemption of fund shares.
The Bank of America Merrill Lynch 1-Year U.S. Treasury Note Index is comprised of a single U.S. Treasury Note issue purchased at the beginning of the month and held for a full month. Each month the index is rebalanced and the issue selected is the outstanding U.S. Treasury Note that matures closest to, but not beyond one year from the rebalancing date.
This report identifies the Fund’s investments on December 31, 2015. These holdings are subject to change. Not all investments in the Fund performed the same, nor is there any guarantee that these investments will perform as well in the future. Market forecasts provided in this report may not necessarily come to pass.
Sector Diversification (Unaudited)
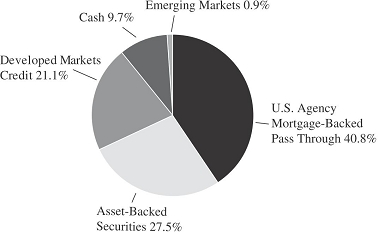
The sector diversification shown is based on the total investments.
| 112 | Annual Report | December 31, 2015 |
Low Duration Fund
Portfolio of Investments, December 31, 2015 (all dollar amounts in thousands)
| | | | | | | |
| | | Principal | | | |
| Issuer | | Amount | | | Value | |
| | | | | |
| U.S. Government and U.S. Government Agency—48.2% | |
| Government National Mortgage Association (GNMA)—0.0% | | | | | | | | |
| GNR 2011-24 VA, 3.500%, due 2/20/16 | | | $64 | | | $ | 64 | |
| Federal Home Loan Mortgage Corp. (FHLMC)—15.8% | | | | | | | | |
| #E95760, 4.500%, due 4/1/18 | | | 5 | | | | 5 | |
| #E99582, 5.000%, due 9/1/18 | | | 10 | | | | 11 | |
| #B11362, 5.500%, due 12/1/18 | | | 23 | | | | 24 | |
| #B11849, 5.500%, due 1/1/19 | | | 62 | | | | 64 | |
| #B13870, 4.500%, due 5/1/19 | | | 50 | | | | 52 | |
| #G11604, 5.000%, due 7/1/19 | | | 60 | | | | 63 | |
| #G11596, 5.500%, due 8/1/19 | | | 52 | | | | 55 | |
| #G11605, 5.500%, due 9/1/19 | | | 28 | | | | 29 | |
| #J02537, 5.000%, due 9/1/20 | | | 48 | | | | 50 | |
| #G11836, 5.500%, due 12/1/20 | | | 15 | | | | 16 | |
| #G12113, 5.500%, due 5/1/21 | | | 150 | | | | 161 | |
| #E02322, 5.500%, due 5/1/22 | | | 32 | | | | 34 | |
| #G13124, 6.000%, due 12/1/22 | | | 105 | | | | 116 | |
| #J06871, 5.500%, due 1/1/23 | | | 92 | | | | 98 | |
| #J08450, 5.500%, due 7/1/23 | | | 43 | | | | 47 | |
| #J08703, 5.500%, due 9/1/23 | | | 87 | | | | 94 | |
| #J10351, 4.000%, due 7/1/24 | | | 174 | | | | 186 | |
| #C00351, 8.000%, due 7/1/24 | | | 62 | | | | 74 | |
| #J10600, 4.000%, due 8/1/24 | | | 11 | | | | 12 | |
| #G13695, 4.000%, due 9/1/24 | | | 743 | | | | 792 | |
| #J11208, 5.000%, due 11/1/24 | | | 104 | | | | 112 | |
| #G00363, 8.000%, due 6/1/25 | | | 93 | | | | 105 | |
| #J12853, 4.000%, due 8/1/25 | | | 111 | | | | 118 | |
| #C80329, 8.000%, due 8/1/25 | | | 20 | | | | 23 | |
| #J14491, 4.000%, due 2/1/26 | | | 3,790 | | | | 4,035 | |
| #J16051, 4.500%, due 7/1/26 | | | 2,513 | | | | 2,692 | |
| #G30348, 6.000%, due 7/1/27 | | | 1,346 | | | | 1,539 | |
| #G04424, 6.000%, due 6/1/38 | | | 91 | | | | 102 | |
| #G04778, 6.000%, due 7/1/38 | | | 113 | | | | 130 | |
| #G04544, 6.000%, due 8/1/38 | | | 454 | | | | 519 | |
| #G04687, 6.000%, due 9/1/38 | | | 124 | | | | 142 | |
| #G04745, 6.000%, due 9/1/38 | | | 63 | | | | 72 | |
| #A81799, 6.500%, due 9/1/38 | | | 386 | | | | 440 | |
| #G06085, 6.500%, due 9/1/38 | | | 16 | | | | 18 | |
| #G06964, 5.500%, due 11/1/38 | | | 3,646 | | | | 4,146 | |
| #G05723, 6.500%, due 11/1/38 | | | 1,703 | | | | 1,941 | |
| #G06017, 5.500%, due 6/1/40 | | | 1,443 | | | | 1,628 | |
| #4122, Tranche FP, 0.731%, due 10/15/42, VRN | | | 1,005 | | | | 1,010 | |
| Total FHLMC Mortgage Obligations | | | | | | | 20,755 | |
| Federal National Mortgage Association (FNMA)—32.4% | | | | | | | | |
| #672953, 5.000%, due 12/1/17 | | | 8 | | | | 8 | |
| #888979, 6.000%, due 12/1/17 | | | 2 | | | | 2 | |
| #678938, 5.500%, due 2/1/18 | | | 42 | | | | 43 | |
| #695838, 5.500%, due 4/1/18 | | | 20 | | | | 21 | |
| #697593, 5.000%, due 5/1/18 | | | 66 | | | | 69 | |
| #656573, 5.000%, due 6/1/18 | | | 50 | | | | 52 | |
| #709848, 5.000%, due 6/1/18 | | | 40 | | | | 42 | |
| #705741, 5.000%, due 6/1/18 | | | 36 | | | | 37 | |
| | | | | | | |
| | | Principal | | | | |
| Issuer | | Amount | | | Value | |
| | | | | | | | | |
| U.S. Government and U.S. Government Agency—(continued) | |
| Federal National Mortgage Association (FNMA)—(continued) | | | | | | | | |
| #728715, 5.000%, due 7/1/18 | | | $91 | | | $ | 94 | |
| #711991, 5.000%, due 8/1/18 | | | 52 | | | | 53 | |
| #257378, 5.000%, due 9/1/18 | | | 11 | | | | 12 | |
| #743183, 5.000%, due 10/1/18 | | | 23 | | | | 24 | |
| #749596, 5.000%, due 11/1/18 | | | 90 | | | | 94 | |
| #753866, 6.000%, due 12/1/18 | | | 140 | | | | 146 | |
| #761246, 5.000%, due 1/1/19 | | | 117 | | | | 123 | |
| #766059, 5.500%, due 2/1/19 | | | 100 | | | | 104 | |
| #766276, 5.000%, due 3/1/19 | | | 294 | | | | 309 | |
| #751313, 5.000%, due 3/1/19 | | | 61 | | | | 64 | |
| #779363, 5.000%, due 6/1/19 | | | 28 | | | | 29 | |
| #785259, 5.000%, due 8/1/19 | | | 114 | | | | 121 | |
| #788424, 5.500%, due 9/1/19 | | | 73 | | | | 76 | |
| #761489, 5.500%, due 9/1/19 | | | 65 | | | | 68 | |
| #725953, 5.000%, due 10/1/19 | | | 37 | | | | 39 | |
| #745877, 5.000%, due 1/1/20 | | | 81 | | | | 86 | |
| #357865, 5.000%, due 7/1/20 | | | 76 | | | | 81 | |
| #888105, 5.000%, due 8/1/20 | | | 6 | | | | 6 | |
| #357978, 5.000%, due 9/1/20 | | | 93 | | | | 99 | |
| #745735, 5.000%, due 3/1/21 | | | 312 | | | | 333 | |
| #879607, 5.500%, due 4/1/21 | | | 50 | | | | 53 | |
| #831497, 6.000%, due 4/1/21 | | | 168 | | | | 180 | |
| #831525, 5.500%, due 6/1/21 | | | 64 | | | | 69 | |
| #880993, 6.000%, due 1/1/22 | | | 13 | | | | 13 | |
| #972934, 5.500%, due 2/1/23 | | | 172 | | | | 187 | |
| #889342, 5.000%, due 3/1/23 | | | 61 | | | | 65 | |
| #982878, 4.500%, due 5/1/23 | | | 225 | | | | 241 | |
| #889670, 5.500%, due 6/1/23 | | | 65 | | | | 71 | |
| #555734, 5.000%, due 7/1/23 | | | 471 | | | | 518 | |
| #AE0011, 5.500%, due 9/1/23 | | | 80 | | | | 86 | |
| #747339, 5.500%, due 10/1/23 | | | 256 | | | | 285 | |
| #934808, 4.500%, due 3/1/24 | | | 112 | | | | 119 | |
| #AA4519, 4.500%, due 3/1/24 | | | 786 | | | | 837 | |
| #AA5028, 4.500%, due 4/1/24 | | | 195 | | | | 209 | |
| #AA5999, 4.500%, due 5/1/24 | | | 1,301 | | | | 1,393 | |
| #190988, 9.000%, due 6/1/24 | | | 54 | | | | 59 | |
| #AC6600, 4.500%, due 11/1/24 | | | 48 | | | | 52 | |
| #AL3422, 5.000%, due 1/1/25 | | | 770 | | | | 834 | |
| #AE1176, 4.000%, due 8/1/25 | | | 375 | | | | 400 | |
| #AI4856, 4.500%, due 6/1/26 | | | 1,649 | | | | 1,766 | |
| #AI4872, 4.500%, due 6/1/26 | | | 67 | | | | 72 | |
| #AL2851, 4.000%, due 8/1/26 | | | 2,144 | | | | 2,293 | |
| #AL2590, 4.000%, due 7/1/27 | | | 2,831 | | | | 3,027 | |
| #759336, 6.000%, due 1/1/34 | | | 1,765 | | | | 2,031 | |
| #AL3449, 6.000%, due 7/1/36 | | | 1,839 | | | | 2,117 | |
| #886762, 7.000%, due 9/1/36 | | | 412 | | | | 466 | |
| #831926, 6.000%, due 12/1/36 | | | 769 | | | | 874 | |
| #899057, 6.000%, due 3/1/37 | | | 87 | | | | 99 | |
| #928574, 6.000%, due 7/1/37 | | | 162 | | | | 183 | |
| #948637, 6.500%, due 8/1/37 | | | 523 | | | | 599 | |
| #888703, 6.500%, due 8/1/37 | | | 4,253 | | | | 4,983 | |
| #889371, 6.000%, due 1/1/38 | | | 1,042 | | | | 1,196 | |
| #965534, 6.000%, due 1/1/38 | | | 63 | | | | 71 | |
| #889385, 6.000%, due 2/1/38 | | | 701 | | | | 804 | |
| #975649, 6.000%, due 7/1/38 | | | 162 | | | | 185 | |
| #889987, 5.500%, due 8/1/38 | | | 112 | | | | 127 | |
See accompanying Notes to Financial Statements.
| December 31, 2015 | William Blair Funds | 113 |
Low Duration Fund
Portfolio of Investments, December 31, 2015 (all dollar amounts in thousands)
| | | NRSRO | | | | | | | |
| | | Rating | | | Principal | | | | |
| Issuer | | (unaudited) | | | Amount | | | Value | |
| | | | | | | | | | | | | |
| U.S. Government and U.S. Government Agency—(continued) | | | | | |
| Federal National Mortgage Association (FNMA)—(continued) | | | | | | | | | | | | |
| #AA8706, 5.500%, due 6/1/39 | | | | | | | $2,965 | | | $ | 3,393 | |
| #AD0315, 6.500%, due 8/1/39 | | | | | | | 832 | | | | 952 | |
| #AC3270, 5.500%, due 9/1/39 | | | | | | | 1,885 | | | | 2,175 | |
| #AD3360, 5.500%, due 5/1/40 | | | | | | | 2,302 | | | | 2,634 | |
| #AL5815, 5.500%, due 4/1/41 | | | | | | | 4,078 | | | | 4,667 | |
| Total FNMA Mortgage Obligations | | | | | | | | | | | 42,620 | |
| | | | | | | | | | | | | |
| Asset-Backed Securities—27.4% | | | | | | | | | | | | |
| Nissan Auto Lease Trust, 2014-A, Tranche A2B, 0.491%, 9/15/16, VRN | | | Aaa | | | | 561 | | | | 561 | |
| Mercedes Benz Auto Lease Trust, 2014—A, Tranche A3, 0.680%, 12/15/16 | | | AAA | | | | 383 | | | | 383 | |
| Ally Auto Receivables Trust, 2014-1, Tranche A2, 0.480%, 2/15/17 | | | AAA | | | | 26 | | | | 26 | |
| BMW Vehicle Owner Trust, 2014-A, Tranche A2, 0.530%, 4/25/17 | | | Aaa | | | | 67 | | | | 67 | |
Nissan Auto Receivables 2013-A Owner Trust, 2013-A, Tranche A3,
0.500%, 5/15/17 | | | Aaa | | | | 125 | | | | 125 | |
CNH Equipment Trust, 2014-B, Tranche A2,
0.480%, 8/15/17 | | | AAA | | | | 193 | | | | 193 | |
Volvo Financial Equipment LLC— 144A, 2015-1A, Tranche A2,
0.950%, 11/15/17 | | | Aaa | | | | 991 | | | | 990 | |
Ford Credit Floorplan Master Owner Trust A, 2013-1, Tranche A2,
0.711%, 1/15/18, VRN | | | AAA | | | | 2,200 | | | | 2,200 | |
Nissan Master Owner Trust Receivables, 2013-A, Tranche A,
0.631%, 2/15/18, VRN | | | Aaa | | | | 2,500 | | | | 2,500 | |
World Omni Master Owner Trust—144A, 2013-1, Tranche A,
0.681%, 2/15/18, VRN | | | Aaa | | | | 1,000 | | | | 1,000 | |
Ford Credit Auto Owner Trust 2015-B, 2015-B, Tranche A2B,
0.561%, 3/15/18, VRN | | | Aaa | | | | 1,332 | | | | 1,332 | |
Harley-Davidson Motorcycle Trust, 2014-1, Tranche A2B,
0.501%, 4/15/18, VRN | | | AAA | | | | 526 | | | | 526 | |
Discover Card Execution Note Trust, 2013-A2, Tranche A2,
0.690%, 8/15/18 | | | AAA | | | | 500 | | | | 500 | |
Ford Credit Floorplan Master Owner Trust A, 2013-5, Tranche A2,
0.801%, 9/15/18, VRN | | | AAA | | | | 200 | | | | 200 | |
Citibank Credit Card Issuance Trust, 2006-A8, Tranche A8,
0.361%, 12/17/18, VRN | | | AAA | | | | 200 | | | | 199 | |
| | | | NRSRO | | | | | | | |
| | | | Rating | | | Principal | | | | |
| | Issuer | | (unaudited) | | | Amount | | | Value | |
| | | | | | | | | | | | | | |
| | Asset-Backed Securities—(continued) | | | | | | | | | | | | |
| | Harley-Davidson Motorcycle Trust, 2015-2, Tranche A2B,
0.581%, 1/15/19, VRN | | | AAA | | | $ | 1,651 | | | $ | 1,648 | |
| | Capital One Multi-Asset Execution Trust, 2013-A2, Tranche A2,
0.511%, 2/15/19, VRN | | | AAA | | | | 2,000 | | | | 2,000 | |
| | Discover Card Master Trust, 2012-A4, Tranche A,
0.796%, 11/15/19, VRN | | | AAA | | | | 2,000 | | | | 2,001 | |
| | Bank of America Credit Card Trust, 2007-A11, Tranche A11,
0.401%, 12/15/19, VRN | | | AAA | | | | 915 | | | | 910 | |
| | Capital One Multi-Asset Execution Trust, 2007-A2, Tranche A2,
0.411%, 12/16/19, VRN | | | AAA | | | | 715 | | | | 713 | |
| | Citibank Credit Card Issuance Trust, 2008-A2, Tranche A2,
1.570%, 1/23/20, VRN | | | AAA | | | | 2,880 | | | | 2,924 | |
| | Mercedes-Benz Master Owner Trust—144A, 2015-BA, Tranche A,
0.711%, 4/15/20, VRN | | | Aaa | | | | 1,500 | | | | 1,492 | |
| | Citibank Credit Card Issuance Trust, 2013-A2, Tranche A2,
0.698%, 5/26/20, VRN | | | AAA | | | | 1,900 | | | | 1,895 | |
| | Chase Issuance Trust, 2013-A6, Tranche A6,
0.751%, 7/15/20, VRN | | | AAA | | | | 1,820 | | | | 1,821 | |
| | Discover Card Execution Note Trust, 2015-A1, Tranche A1,
0.681%, 8/17/20, VRN | | | AAA | | | | 1,950 | | | | 1,947 | |
| | American Express Credit Account Master Trust, 2008-2, Tranche A,
1.591%, 9/15/20, VRN | | | AAA | | | | 2,000 | | | | 2,040 | |
| | Bank of America Credit Card Trust, 2014-A1, Tranche A,
0.711%, 6/15/21, VRN | | | AAA | | | | 1,000 | | | | 999 | |
| | MBNA Credit Card Master Note Trust, 2004-A3, Tranche A3,
0.591%, 8/16/21, VRN | | | AAA | | | | 515 | | | | 512 | |
| | Capital One Multi-Asset Execution Trust, 2014-A3, Tranche A3,
0.711%, 1/18/22, VRN | | | AAA | | | | 750 | | | | 747 | |
| | SLM Student Loan Trust, 2008-4, Tranche A4,
1.970%, 7/25/22, VRN | | | Aaa | | | | 930 | | | | 936 | |
| | Sierra Timeshare 2012-2 Receivables Funding LLC—144A, 2012-2A, Tranche A,
2.380%, 3/20/29 | | | A+ | | | | 343 | | | | 343 | |
| | SLM Private Education Loan Trust—144A, 2011-A, Tranche A3,
2.831%, 1/15/43, VRN | | | AAA | | | | 2,250 | | | | 2,320 | |
| | Total Asset-Backed Securities | | | | | | | | | | | 36,050 | |
See accompanying Notes to Financial Statements.
| 114 | Annual Report | December 31, 2015 |
Low Duration Fund
Portfolio of Investments, December 31, 2015 (all dollar amounts in thousands)
| | | | NRSRO | | | | | | | |
| | | | Rating | | | Principal | | | | |
| | Issuer | | (unaudited) | | | Amount | | | Value | |
| | | | | | | | | | | | | | |
| | Corporate Obligations—21.9% | | | | | | | | | | | | |
| | Bank of America Corporation,
1.406%, due 3/22/16, VRN | | | A | | | | $1,000 | | | | $1,000 | |
| | HSBC Finance Corporation,
0.844%, due 6/1/16, VRN | | | A+ | | | | 1,500 | | | | 1,497 | |
| | Macquarie Bank Ltd.—144A,
0.962%, due 6/15/16, VRN | | | A | | | | 1,400 | | | | 1,399 | |
| | Verizon Communications, Inc.,
2.042%, due 9/15/16, VRN | | | A- | | | | 1,000 | | | | 1,006 | |
| | Bayer US Finance LLC—144A,
0.573%, due 10/7/16, VRN | | | A- | | | | 1,000 | | | | 1,000 | |
| | Fifth Third Bancorp,
0.990%, due 12/20/16, VRN | | | A- | | | | 1,000 | | | | 996 | |
| | Capital One Bank USA NA,
0.859%, due 2/13/17, VRN | | | A- | | | | 1,500 | | | | 1,494 | |
| | JPMorgan Chase & Co.,
0.882%, due 2/15/17, VRN | | | A+ | | | | 1,000 | | | | 1,000 | |
| | Barclays Bank plc,
0.944%, due 2/17/17, VRN | | | A2 | | | | 1,620 | | | | 1,620 | |
| | Nissan Motor Acceptance Corp.—44A,
0.972%, due 3/3/17, VRN | | | A- | | | | 1,500 | | | | 1,497 | |
| | Citigroup, Inc.,
1.027%, due 3/10/17, VRN | | | A | | | | 1,500 | | | | 1,497 | |
| | Mizuho Bank Ltd.—144A,
0.747%, due 4/16/17, VRN | | | A1 | | | | 1,000 | | | | 997 | |
| | Tencent Holdings Ltd.—144A,
2.000%, due 5/2/17 | | | A+ | | | | 1,200 | | | | 1,202 | |
| | American Express Credit Corporation,
0.722%, due 6/5/17, VRN | | | A+ | | | | 1,000 | | | | 995 | |
| | Standard Chartered plc—144A,
0.802%, due 9/8/17, VRN | | | Aa3 | | | | 2,000 | | | | 1,981 | |
| | Royal Bank of Canada,
0.581%, due 10/13/17, VRN | | | AA | | | | 1,725 | | | | 1,720 | |
| | Canadian National Railway Co.,
0.532%, due 11/14/17, VRN | | | A | | | | 500 | | | | 496 | |
| | General Electric Capital Corporation,
0.952%, due 12/7/17, VRN | | | AA+ | | | | 500 | | | | 498 | |
| | Wells Fargo & Co.,
0.946%, due 4/23/18, VRN | | | AA- | | | | 1,000 | | | | 1,000 | |
| | Morgan Stanley,
1.600%, due 4/25/18, VRN | | | A | | | | 2,000 | | | | 2,022 | |
| | The Goldman Sachs Group, Inc.,
1.522%, due 4/30/18, VRN | | | A | | | | 2,000 | | | | 2,010 | |
| | KeyBank NA,
0.934%, due 6/1/18, VRN | | | A- | | | | 1,200 | | | | 1,198 | |
| | PNC Bank NA,
0.834%, due 6/1/18, VRN | | | A+ | | | | 800 | | | | 797 | |
| | Total Corporate Obligations | | | | | | | | | | | 28,922 | |
| | Total Long-Term Investments—97.5%
(cost $128,914) | | | | | | | | | | | 128,411 | |
| | | | Principal | | | | |
| | | | Amount/ | | | | |
| | Issuer | | Contracts | | | Value | |
| | | | | | | | | | |
| | Repurchase Agreement | | | | | | | | |
| | Fixed Income Clearing Corporation, 0.030% dated 12/31/15, due 1/4/16, repurchase price $1,422, collateralized by FNMA, 2.625%, due 9/6/24 | | | $1,422 | | | $ | 1,422 | |
| | Total Repurchase Agreement—1.1%
(cost $1,422) | | | | | | | 1,422 | |
| | | | | | | | | | |
| | Purchased Option—0.0% | | | | | | | | |
| | Eurodollar Future, September 2016, Strike $97, PUT | | | 300 | | | | 2 | |
| | Total Purchased Option—0.0%
(cost $95) | | | | | | | 2 | |
| | Total Investments—98.6%
(cost $130,431) | | | | | | | 129,835 | |
| | | | | | | | | | |
| | Securities Sold Short, Not Yet Purchased | | | | | | | | |
| | | | | | | | | | |
| | U.S. Government and U.S. Government Agency—(7.7)% | |
| | Federal National Mortgage Association (FNMA)—(7.7)% | | | | | | | | |
| | TBA, 2.500%, due 1/1/31 | | | $(10,000 | ) | | | (10,080 | ) |
| | Total Securities Sold Short, Not Yet Purchased—(7.7)%
(proceeds $10,092) | | | | | | | (10,080 | ) |
| | Cash and other assets, less liabilities—9.1% | | | | | | | 11,957 | |
| | Net assets—100.0% | | | | | | $ | 131,712 | |
NRSRO = Nationally Recognized Statistical Rating Organization—The credit quality ratings of the securities in the Fund reflect the highest category rating by any of Fitch Ratings, Moody’s Investors Service Inc., or Standard & Poor’s, a division of the McGraw-Hill Companies, Inc.
The obligations of certain U.S. Government-sponsored securities are neither issued nor guaranteed by the U.S. Treasury.
VRN = Variable Rate Note
TBA = To Be Announced—TBAs are mortgage-backed securities traded under delayed delivery commitments, settling after December 31, 2015. The term TBA comes from the fact that the specific mortgage-backed security that will be delivered to fulfill a TBA trade is not designated at the time the trade is made.
See accompanying Notes to Financial Statements.
| December 31, 2015 | William Blair Funds | 115 |
| | Macro Allocation Fund |
| | |
| | AN OVERVIEW FROM THE PORTFOLIO MANAGERS |
| | |

Brian D. Singer 
Thomas Clarke | The William Blair Macro Allocation Fund (Class N shares) posted a 6.24% decrease, net of fees, for the twelve months ended December 31, 2015. By comparison, the Fund’s primary benchmark index, the Bank of America Merrill Lynch 3-Month U.S. Treasury Bill Index, increased 0.05%. The Fund saw negative contributions from both its market-oriented strategies and its currency-oriented strategies during the year. Detractors from market-oriented exposures included the Fund’s positioning within U.S. equity and generally long exposures within emerging market equities. From currency-oriented exposures, negative impacts arose from long exposures to the Malaysian ringgit and the Columbian peso. The Fund’s market-oriented strategies benefited from an aggregate long exposure to equities within Europe as well as from a moderately long exposure to U.S. sovereign debt. The Fund’s currency-oriented strategies were helped by short exposures to the euro and the New Zealand dollar. |
| 116 | Annual Report | December 31, 2015 |
Macro Allocation Fund
Performance Highlights (Unaudited)
| Average Annual Total Return at 12/31/2015 |
| | | | | | | | | | | Since |
| | | 1 Year | | 3 Year | | Inception |
| Class N(a) | | | (6.24 | )% | | | 2.86 | % | | | 6.12 | % |
| Class I(a) | | | (6.00 | ) | | | 3.10 | | | | 6.38 | |
| BofA Merrill Lynch 3-Month U.S. Treasury Bill Index(a) | | | 0.05 | | | | 0.05 | | | | 0.07 | |
| Long-Term Comparative Index(a) | | | (0.27 | ) | | | 3.00 | | | | 3.89 | |
| Institutional Class(b) | | | (5.92 | ) | | | — | | | | (0.59 | ) |
| BofA Merrill Lynch 3-Month U.S. Treasury Bill Index(b) | | | 0.05 | | | | — | | | | 0.11 | |
| Long-Term Comparative Index(b) | | | (0.27 | ) | | | — | | | | 1.90 | |
| (a) | For the period from November 29, 2011 (Commencement of Operations) to December 31, 2015. |
| (b) | For the period from October 21, 2013 (Commencement of Operations) to December 31, 2015. |
Performance cited represents past performance. Past performance does not guarantee future results and current performance may be lower or higher than the data quoted. Results shown are average annual total returns, which assume reinvestment of dividends and capital gains. Investment returns and principal will fluctuate and you may have a gain or loss when you sell shares. For the most current month-end performance information, please call 1-800-742-7272, or visit our Web site at www.williamblairfunds.com. The Fund involves a high level of risk and may not be appropriate for everyone. You could lose money by investing in the Fund. There can be no assurance that the Fund’s investment objective will be achieved or that the Fund’s investment strategies will be successful. The Fund is not a complete investment program. From time to time, the investment adviser may waive fees or reimburse expenses for the Fund. Without these waivers/reimbursements, performance would be lower. Class N shares are available to the general public without a sales load. Class I shares are available to certain institutional investors and advisory clients of William Blair Investment Management, LLC and William Blair & Company, L.L.C., without a sales load or distribution fee (12b-1 fee). Institutional Class shares are available to institutional investors without a sales load or distribution (12b-1) or service fees.
The performance highlights and graph presented above do not reflect the deduction of taxes that a shareholder would pay on fund distributions or the redemption of fund shares.
The Bank of America (“BofA”) Merrill Lynch 3-Month U.S. Treasury Bill Index measures total return on cash, including price and interest income, based on short-term government Treasury Bills of about 90-day maturity. The Index is unmanaged, does not incur fees or expenses, and cannot be invested in directly.
The Long-Term Comparative Index return is comprised of the following indices: 40% Barclays Capital U.S. Aggregate Index, 30% Morgan Stanley Capital International (MSCI) All Country World Index (net), and 30% BofA Merrill Lynch 3-month U.S. Treasury Bill Index.
This report identifies the Fund’s investments on December 31, 2015. These holdings are subject to change. Not all investments in the Fund performed the same, nor is there any guarantee that these investments will perform as well in the future. Market forecasts provided in this report may not necessarily come to pass.
Portfolio Allocation (Unaudited)
The table below provides the allocation of the Fund’s holdings as a percent of net assets as of December 31, 2015.
| Category | | | % |
| Equity Exchange-Traded Funds | | | 49.5 | % |
| Fixed Income Exchange-Traded Funds | | | 15.3 | % |
| U.S. Government | | | 9.0 | % |
| Purchased Options | | | 0.3 | % |
| Repurchase Agreements | | | 22.1 | % |
| Written Option | | | 0.0 | % |
| Cash and Other Assets, Less Liabilities | | | 3.8 | % |
| Net Assets | | | 100.0 | % |
| December 31, 2015 | William Blair Funds | 117 |
Macro Allocation Fund
Portfolio of Investments, December 31, 2015 (all dollar amounts in thousands)
| | | | Shares or | | | | |
| | | | Principal | | | | |
| | Issuer | | Amount | | | Value | |
| | |
| | Exchange-Traded Funds—64.8% | | | | | | | | |
| | Equity Exchange-Traded Funds—49.5% | | | | | | | | |
| | Consumer Staples Select Sector SPDR Fund | | | 189,400 | | | $ | 9,563 | |
| | Energy Select Sector SPDR Fund | | | 212,000 | | | | 12,837 | |
| | Global X FTSE Greece 20 ETF | | | 1,987,000 | | | | 15,817 | |
| | iShares Global Energy ETF(a) | | | 596,000 | | | | 16,676 | |
| | iShares MSCI Brazil Capped ETF | | | 338,000 | | | | 6,990 | |
| | iShares MSCI India ETF | | | 1,005,000 | | | | 27,678 | |
| | iShares MSCI Japan ETF(a) | | | 2,396,000 | | | | 29,039 | |
| | iShares MSCI Switzerland Capped ETF | | | 510,000 | | | | 15,830 | |
| | iShares Russell 1000 Growth ETF | | | 313,000 | | | | 31,137 | |
| | iShares Russell 1000 Value ETF | | | 2,227,000 | | | | 217,934 | |
| | Market Vectors Russia ETF | | | 2,137,000 | | | | 31,307 | |
| | SPDR S&P 500 ETF Trust | | | 1,983,000 | | | | 404,314 | |
| | SPDR S&P Emerging Markets Small Cap ETF | | | 280,000 | | | | 10,559 | |
| | Utilities Select Sector SPDR Fund | | | 647,000 | | | | 28,002 | |
| | Total Equity Exchange-Traded Funds | | | | | | | 857,683 | |
| | Fixed Income Exchange-Traded Funds—15.3% | | | | |
| | iShares iBoxx $ Investment Grade Corporate Bond ETF | | | 1,701,000 | | | | 193,931 | |
| | SPDR Barclays High Yield Bond ETF | | | 1,653,000 | | | | 56,053 | |
| | WisdomTree Emerging Markets Local | | | | | | | | |
| | Debt Fund ETF | | | 415,000 | | | | 14,226 | |
| | Total Fixed Income Exchange-Traded Funds | | | | | | | 264,210 | |
| | Total Exchange-Traded Funds—64.8%
(cost $1,154,801) | | | | | | | 1,121,893 | |
| | | | | | | | | | |
| | Repurchase Agreement—22.1% | | | | | | | | |
| | Fixed Income Clearing Corporation, 0.030% dated 12/31/15, due 1/4/16, repurchase price $382,338, collateralized by U.S. Treasury Note, 2.375%, due 8/15/24 | | | $382,337 | | | | 382,337 | |
| | Total Repurchase Agreement—22.1%
(cost $382,337) | | | | | | | 382,337 | |
| | | | | | | | | | |
| | U.S. Government—9.0% | | | | | | | | |
| | U.S. Treasury Bill,
0.021%, due 1/7/16 | | | 12,000 | | | | 12,000 | |
| | U.S. Treasury Bill,
0.082%, due 2/4/16(b) | | | 12,000 | | | | 11,999 | |
| | U.S. Treasury Bill,
0.092%, due 3/3/16(b) | | | 12,000 | | | | 11,998 | |
| | U.S. Treasury Bill,
0.163%, due 3/31/16(a) (b) | | | 12,000 | | | | 11,995 | |
| | U.S. Treasury Bill,
0.247%, due 4/28/16(a) (b) | | | 12,000 | | | | 11,990 | |
| | U.S. Treasury Bill,
0.373%, due 5/26/16(b) | | | 12,000 | | | | 11,982 | |
| | U.S. Treasury Bill,
0.458%, due 6/23/16(a) (b) | | | 12,000 | | | | 11,974 | |
| | U.S. Treasury Bill,
0.503%, due 7/21/16(a) (b) | | | 12,000 | | | | 11,967 | |
| | U.S. Treasury Bill,
0.524%, due 8/18/16(a) (b) | | | 12,000 | | | | 11,960 | |
| | | | Principal | | | | |
| | | | Amount/ | | | | |
| | Issuer | | Contracts | | | Value | |
| | |
| | U.S. Government—(continued) | | | | | | | | |
| | U.S. Treasury Bill,
0.506%, due 9/15/16(a) (b) | | | $12,000 | | | $ | 11,957 | |
| | U.S. Treasury Bill,
0.507%, due 10/13/16(a) (b) | | | 12,000 | | | | 11,952 | |
| | U.S. Treasury Bill,
0.519%, due 11/10/16(a) | | | 12,000 | | | | 11,947 | |
| | U.S. Treasury Bill,
0.603%, due 12/8/16(a) (b) | | | 12,000 | | | | 11,933 | |
| | Total U.S. Government—9.0%
(cost $155,707) | | | | | | | 155,654 | |
| | | | | | | | | | |
| | Purchased Options—0.3% | | | | | | | | |
| | Euro STOXX 50 Index, January 2016, Strike 3,375 EUR, CALL | | | 5,750 | | | | 1,163 | |
| | FTSE 100 Index, January 2016, Strike 6,150 GBP, CALL | | | 970 | | | | 2,009 | |
| | IBEX 35 Index, January 2016, Strike 10,200 EUR, CALL | | | 13,851 | | | | 153 | |
| | KOSPI 200 Index, January 2016, Strike 245 KRW, CALL | | | 359,924,000 | | | | 271 | |
| | JPY CALL/AUD PUT, January 2016, Strike 86.94 | | | 13,031,575,000 | | | | 653 | |
| | S&P 500 Index, January 2016, Strike $2,030, PUT | | | 900 | | | | 2,025 | |
| | US 10 YR, January 2016, Strike $124.5, PUT | | | 2,200 | | | | 310 | |
| | Total Purchased Options—0.3%
(cost $15,935) | | | | | | | 6,584 | |
| | Total Investments in Securities—96.2%
(cost $1,708,780) | | | | | | | 1,666,468 | |
| | | | | | | | | | |
| | Written Option | | | | | | | | |
| | iShares iBoxx High Yield Core, January 2016, Strike $80, PUT | | | (4,746 | ) | | | (261 | ) |
| | Total Written Option—0.0%
(proceeds $652) | | | | | | | (261 | ) |
| | Cash and other assets, less liabilities—3.8% | | | | | | | 65,680 | |
| | Net assets—100.0% | | | | | | $ | 1,731,887 | |
(a) Security, or portion of security, is segregated as collateral for OTC swap contracts and a written option aggregating a total value of $24,241.
(b) Security, or portion of security, is pledged as collateral for the credit default swap and to cover initial margin requirements on open futures contracts aggregating a total value of $66,884.
See accompanying Notes to Financial Statements.
| 118 | Annual Report | December 31, 2015 |
Macro Allocation Fund
Portfolio of Investments, December 31, 2015 (all dollar amounts in thousands)
If a fund’s portfolio holdings represent ownership of 5% or more of the voting securities of a company, the company is deemed to be an affiliate as defined in the Investment Company Act of 1940, as amended. The Fund had the following transactions during the year ended December 31, 2015 with companies deemed affiliated during the year or at December 31, 2015.
| | | | Share Activity | | Year Ended December 31, 2015 |
| | Security Name | | Balance
12/31/2014 | | Purchases | | Sales | | Balance
12/31/2015 | | Value | | Dividend
Income | | Net realized
gain (loss) | | Change in net
unrealized
appreciation
(depreciation) |
| ᴫ | Global X FTSE Greece 20 ETF | | | — | | | | 1,987,000 | | | | — | | | | 1,987,000 | | | | $ | 15,817 | | | | $ | 241 | | | | $ | — | | | | $ | (3,564 | ) |
| | Guggenheim China Small Cap ETF | | | 957,000 | | | | 117,000 | | | | 1,074,000 | | | | — | | | | | — | | | | | — | | | | | (711 | ) | | | | (222 | ) |
| | SPDR S&P Emerging Markets Small Cap ETF | | | 438,000 | | | | 198,000 | | | | 356,000 | | | | 280,000 | | | | | 10,559 | | | | | 412 | | | | | (2,384 | ) | | | | (1,373 | ) |
| | | | | | | | | | | | | | | | | | | | | $ | 26,376 | | | | $ | 653 | | | | $ | (3,095 | ) | | | $ | (5,159 | ) |
ᴫ = Affiliated company at December 31, 2015. The Fund’s total value in companies deemed to be affiliated at December 31, 2015 was $15,817.
Forward Foreign Currency Contracts
Settlement
Date | | Deliver/Receive | | Counterparty | | Local Currency
(in thousands) | | Current Value | | Net Unrealized
Appreciation
(Depreciation) |
| Purchased | | | | | | | | | | | | | | | | |
| 3/16/16 | | Brazilian Real | | Citibank N.A. London | | | 235,639 | | | $ | 58,067 | | | $ | (2,525 | ) |
| 3/16/16 | | Chinese Yuan Renminbi | | Citibank N.A. London | | | 552,102 | | | | 83,427 | | | | (674 | ) |
| 3/16/16 | | Colombian Peso | | Citibank N.A. London | | | 156,564,391 | | | | 48,891 | | | | 1,291 | |
| 3/16/16 | | Hong Kong Dollar | | Citibank N.A. London | | | 53,223 | | | | 6,872 | | | | 1 | |
| 3/16/16 | | Hungarian Forint | | Citibank N.A. London | | | 15,638,284 | | | | 53,823 | | | | (369 | ) |
| 3/16/16 | | Indonesian Rupiah | | Citibank N.A. London | | | 1,753,583,870 | | | | 123,776 | | | | 1,481 | |
| 3/16/16 | | Indian Rupee | | Citibank N.A. London | | | 6,870,711 | | | | 102,614 | | | | 1,159 | |
| 3/16/16 | | Mexican Peso | | Citibank N.A. London | | | 768,915 | | | | 44,368 | | | | (436 | ) |
| 3/16/16 | | Malaysian Ringgit | | Citibank N.A. London | | | 310,347 | | | | 71,791 | | | | (1,105 | ) |
| 3/16/16 | | New Zealand Dollar | | Citibank N.A. London | | | 16,821 | | | | 11,451 | | | | (20 | ) |
| 3/16/16 | | Polish Zloty | | Citibank N.A. London | | | 183,134 | | | | 46,616 | | | | 536 | |
| 3/16/16 | | Russian Ruble | | Citibank N.A. London | | | 2,751,733 | | | | 36,899 | | | | (1,574 | ) |
| 3/16/16 | | New Turkish Lira | | Citibank N.A. London | | | 50,259 | | | | 16,863 | | | | 43 | |
| 3/16/16 | | South African Rand | | Citibank N.A. London | | | 420,830 | | | | 26,826 | | | | (385 | ) |
| | | | | | | | | | | | | | | $ | (2,577 | ) |
| Sold | | | | | | | | | | | | | | | | |
| 3/16/16 | | Australian Dollar | | Citibank N.A. London | | | 24,105 | | | $ | 17,498 | | | $ | (3 | ) |
| 3/16/16 | | Swiss Franc | | Citibank N.A. London | | | 186,058 | | | | 186,377 | | | | 2,666 | |
| 3/16/16 | | Czech Koruna | | Citibank N.A. London | | | 1,917,406 | | | | 77,289 | | | | 906 | |
| 3/16/16 | | Euro | | Citibank N.A. London | | | 166,368 | | | | 181,158 | | | | 1,621 | |
| 3/16/16 | | British Pound Sterling | | Citibank N.A. London | | | 39,956 | | | | 58,911 | | | | 1,555 | |
| 3/16/16 | | Hong Kong Dollar | | Citibank N.A. London | | | 413,984 | | | | 53,449 | | | | (15 | ) |
| 3/16/16 | | Indonesian Rupiah | | Citibank N.A. London | | | 87,228,167 | | | | 6,157 | | | | (1 | ) |
| 3/16/16 | | Japanese Yen | | Citibank N.A. London | | | 3,494,863 | | | | 29,133 | | | | (273 | ) |
| 3/16/16 | | New Zealand Dollar | | Citibank N.A. London | | | 221,168 | | | | 150,557 | | | | (1,821 | ) |
| 3/16/16 | | Thai Baht | | Citibank N.A. London | | | 4,636,505 | | | | 128,606 | | | | (362 | ) |
| 3/16/16 | | Taiwan Dollar | | Citibank N.A. London | | | 245,758 | | | | 7,450 | | | | 37 | |
| | | | | | | | | | | | | | | $ | 4,310 | |
See accompanying Notes to Financial Statements.
| December 31, 2015 | William Blair Funds | 119 |
Macro Allocation Fund
Portfolio of Investments, December 31, 2015 (all dollar amounts in thousands)
Futures Contracts
Number of
Contracts | | Description | | Expiration Date | | Local Currency | | Notional Amount
(Local,
in thousands) | | Net Unrealized
Appreciation
(Depreciation) |
| Long | | | | | | | | | | | | | | |
| 240 | | Amsterdam Index | | January 2016 | | Euro | | | 21,209 | | | $ | 503 | |
| 660 | | IBEX 35 Index | | January 2016 | | Euro | | | 62,873 | | | | (504 | ) |
| 90 | | HANG SENG Index | | January 2016 | | Hong Kong Dollar | | | 98,595 | | | | 35 | |
| 2,020 | | MSCI Singapore ETS Index | | January 2016 | | Singapore Dollar | | | 65,367 | | | | 710 | |
| 325 | | MSCI Taiwan Index | | January 2016 | | U.S. Dollar | | | 9,893 | | | | 9 | |
| 164 | | KOSPI 200 Index | | March 2016 | | South Korean Won | | | 19,716,900 | | | | 17 | |
| 275 | | SPI 200 Index | | March 2016 | | Australian Dollar | | | 36,142 | | | | 1,376 | |
| 100 | | EURO STOXX 50 Index | | March 2016 | | Euro | | | 3,282 | | | | 55 | |
| 305 | | FTSE 100 Index | | March 2016 | | British Pound Sterling | | | 18,904 | | | | 1,299 | |
| 660 | | FTSE MIB Index | | March 2016 | | Euro | | | 70,759 | | | | 1,348 | |
| 280 | | 5YR US Treasury Notes* | | March 2016 | | U.S. Dollar | | | 33,130 | | | | (62 | ) |
| | | | | | | | | | | | | $ | 4,786 | |
| Short | | | | | | | | | | | | | | |
| 190 | | CAC 40 Index | | January 2016 | | Euro | | | 8,813 | | | $ | (176 | ) |
| 335 | | H-Shares Index | | January 2016 | | Hong Kong Dollar | | | 162,559 | | | | 183 | |
| 30 | | EURO-BTP | | March 2016 | | Euro | | | 4,138 | | | | 53 | |
| 275 | | Euro-OAT* | | March 2016 | | Euro | | | 41,264 | | | | 659 | |
| 90 | | German Euro Bund* | | March 2016 | | Euro | | | 14,213 | | | | 225 | |
| 360 | | NIKKEI 225 Index | | March 2016 | | Japanese Yen | | | 3,396,600 | | | | 1,028 | |
| 220 | | 10YR JGB Mini | | March 2016 | | Japanese Yen | | | 3,279,320 | | | | (90 | ) |
| 2,385 | | FTSE 40 Index | | March 2016 | | South African Rand | | | 1,103,587 | | | | (2,891 | ) |
| 155 | | S&P TSX 60 Index | | March 2016 | | Canadian Dollar | | | 23,588 | | | | (139 | ) |
| 155 | | DAX Index | | March 2016 | | Euro | | | 41,741 | | | | (1,714 | ) |
| 660 | | Russell 2000 Mini Index | | March 2016 | | U.S. Dollar | | | 74,679 | | | | 704 | |
| 4,400 | | S&P 500 E Mini Index | | March 2016 | | U.S. Dollar | | | 447,788 | | | | 1,256 | |
| 700 | | 10YR Can Bond | | March 2016 | | Canadian Dollar | | | 98,693 | | | | (1,540 | ) |
| 455 | | 10YR US Treasury Notes* | | March 2016 | | U.S. Dollar | | | 57,287 | | | | 198 | |
| 130 | | Long Gilt | | March 2016 | | British Pound Sterling | | | 15,180 | | | | 86 | |
| | | | | | | | | | | | | $ | (2,158 | ) |
* Exposure to Futures Contract is achieved through the use of a swap contract with Credit Suisse.
Interest Rate Swap
| Floating Rate Reference | | Pay/Receive
Floating Rate | | Fixed Rates | | Maturity
Dates | | Counterparty | | Notional
Amount
(in thousands) | | Unrealized
Appreciation
(Depreciation) |
| 6 Month Swiss Franc LIBOR Rate | | Receive | | | 1.250 | % | | June 2025 | | Credit Suisse International | | 55,010 CHF | | $ | (850 | ) |
| 6 Month Swiss Franc LIBOR Rate | | Receive | | | 1.250 | % | | June 2025 | | Goldman Sachs International | | 4,200 CHF | | | 54 | |
| | | | | | | | | | | | | | | $ | (796 | ) |
See accompanying Notes to Financial Statements.
| 120 | Annual Report | December 31, 2015 |
Macro Allocation Fund
Portfolio of Investments, December 31, 2015 (all dollar amounts in thousands)
Total Return Swaps
| Reference Entity | | Pay/Receive
Floating Rate | | Floating Rates | | Maturity
Dates | | Counterparty | | Notional
Amount
(in thousands) | | | Unrealized
Appreciation
(Depreciation) |
| Consumer Discretionary Select Sector Total Return Index | | Receive | | 3 Month LIBOR
minus 40 bp | | Feb 2016 | | Goldman Sachs International | | | $48,080 | | | | $ | 1,596 | |
| Dow Jones US Health Care Total Return Index | | Receive | | 3 Month LIBOR
minus 28 bp | | Feb 2016 | | Goldman Sachs International | | | 28,663 | | | | | (268 | ) |
Dow Jones US Telecommunications
Total Return Index | |
Receive | | 3 Month LIBOR
minus 44 bp | |
Feb 2016 | | Goldman Sachs
International | | | 37,841 | | | | | (638 | ) |
MSCI China Small Cap
Index (Net) | |
Pay | | 1 Month LIBOR
plus 30 bp–40 bp | | Feb 2016 to
May 2016 | | Credit Suisse
International | | | 16,854 | | | | | (1,292 | ) |
MSCI China Small Cap
Index (Net) | |
Pay | | 1 Month LIBOR
plus 125 bp | | Aug 2016 to
Nov 2016 | | Goldman Sachs
International | | | 20,123 | | | | | (310 | ) |
MSCI China Small Cap
Index (Net) | |
Pay | | 1 Month LIBOR
plus 20 bp | |
Dec 2016 | |
Citibank N.A. | | | 7,042 | | | | | 60 | |
MSCI Emerging Markets
Small Cap (Net) | |
Pay | | 1 Month LIBOR
plus 110 bp–115 bp | | Aug 2016 to
Sep 2016 | | Goldman Sachs
International | | | 4,161 | | | | | (475 | ) |
MSCI Emerging Markets
Small Cap (Net) | |
Pay | | 1 Month LIBOR
plus 94 bp | |
Nov 2016 | | Credit Suisse
International | | | 18,095 | | | | | (667 | ) |
MSCI Vietnam Daily
Total Return Index | |
Pay | | 3 Month LIBOR
plus 100 bp | | Feb 2016 | | Goldman Sachs
International | | | 19,523 | | | | | (75 | ) |
| Vietnam Equity Basket | | Pay | | 3 Month LIBOR
plus 100 bp | | Feb 2016 | | Goldman Sachs
International | | | 19,647 | | | | | (1,077 | ) |
| | | | | | | | | | | | | | | | $ | (3,146 | ) |
| Centrally Cleared Credit Default Swap | | | | | | | | |
| Reference Entity | | Buy/Sell
Protection | | Fixed Deal Pay Rate | | Maturity
Date | | Cleared Exchange | | Notional
Amount
(in thousands) | | Unrealized
Appreciation
(Depreciation) |
| iTRAXX Europe Crossover S24 | | Sell | | 5.000 | % | | December 2020 | | ICE | | 15,895 EUR | | | $ | 158 | |
| | | | | | | | | | | | | | | | | |
| | | | | Total Net Unrealized Appreciation (Depreciation) on Swaps | | | $ | (3,784 | ) |
See accompanying Notes to Financial Statements.
| December 31, 2015 | William Blair Funds | 121 |
Statements of Assets and Liabilities
As of December 31, 2015 (dollar amounts in thousands)
| | | Growth
Fund | | | Large Cap
Growth
Fund | | | Large Cap
Value
Fund | | | Mid Cap
Growth
Fund | |
| Assets | | | | | | | | | | | | | | | | | |
| Investments in securities, at cost | | $ | 672,231 | | | $ | 56,205 | | | | $ | 2,776 | | | $ | 185,222 | |
| Investments in securities, at value | | $ | 843,057 | | | $ | 69,024 | | | | $ | 3,150 | | | $ | 198,365 | |
| Receivable for securities sold | | | 3,796 | | | | — | | | | | 64 | | | | 5,956 | |
| Receivable for fund shares sold | | | 1,214 | | | | 665 | | | | | — | | | | 208 | |
| Receivable from Adviser | | | — | | | | 7 | | | | | 10 | | | | 21 | |
| Dividend and interest receivable | | | 423 | | | | 31 | | | | | 4 | | | | 22 | |
| Total assets | | | 848,490 | | | | 69,727 | | | | | 3,228 | | | | 204,572 | |
| Liabilities | | | | | | | | | | | | | | | | | |
| Payable for investment securities purchased | | | — | | | | — | | | | | — | | | | 134 | |
| Payable for fund shares redeemed | | | 1,148 | | | | 154 | | | | | 9 | | | | 837 | |
| Payable to custodian | | | — | | | | — | | | | | 8 | | | | 3,591 | |
| Management fee payable | | | 543 | | | | 41 | | | | | 2 | | | | 171 | |
| Distribution fee payable | | | 35 | | | | 2 | | | | | — | | | | 6 | |
| Other payables and accrued expenses | | | 266 | | | | 49 | | | | | 33 | | | | 111 | |
| Total liabilities | | | 1,992 | | | | 246 | | | | | 52 | | | | 4,850 | |
| Net assets | | $ | 846,498 | | | $ | 69,481 | | | | $ | 3,176 | | | $ | 199,722 | |
| Capital | | | | | | | | | | | | | | | | | |
| Composition of net assets | | | | | | | | | | | | | | | | | |
| Par value of shares of beneficial interest | | $ | 64 | | | $ | 7 | | | | $ | — | | | $ | 17 | |
| Capital paid in excess of par value | | | 663,768 | | | | 57,077 | | | | | 2,801 | | | | 180,893 | |
| Accumulated net investment income (loss) | | | — | | | | — | | | | | 1 | | | | — | |
| Accumulated net realized gain (loss) | | | 11,840 | | | | (422 | ) | | | | — | | | | 5,669 | |
| Net unrealized appreciation (depreciation) of investments and foreign currencies | | | 170,826 | | | | 12,819 | | | | | 374 | | | | 13,143 | |
| Net assets | | $ | 846,498 | | | $ | 69,481 | | | | $ | 3,176 | | | $ | 199,722 | |
| Class N shares | | | | | | | | | | | | | | | | | |
| Net assets | | $ | 149,754 | | | $ | 10,443 | | | | $ | 1,151 | | | $ | 25,105 | |
| Shares outstanding | | | 11,962,708 | | | | 1,029,001 | | | | | 103,101 | | | | 2,225,464 | |
| Net asset value per share | | $ | 12.52 | | | $ | 10.15 | | | | $ | 11.17 | | | $ | 11.28 | |
| Class I shares | | | | | | | | | | | | | | | | | |
| Net assets | | $ | 696,744 | | | $ | 59,038 | | | | $ | 2,025 | | | $ | 174,617 | |
| Shares outstanding | | | 51,627,413 | | | | 5,579,164 | | | | | 181,503 | | | | 14,845,906 | |
| Net asset value per share | | $ | 13.50 | | | $ | 10.58 | | | | $ | 11.15 | | | $ | 11.76 | |
See accompanying Notes to Financial Statements.
| 122 | Annual Report | December 31, 2015 |
Statements of Operations
For the Year Ended December 31, 2015 (all amounts in thousands)
| | | Growth
Fund | | | Large Cap
Growth
Fund | | | Large Cap
Value
Fund | | | Mid Cap
Growth
Fund | |
| Investment income | | | | | | | | | | | | | | | | | | | | |
| Dividends | | | $ | 8,307 | | | | $ | 551 | | | | $ | 75 | | | | $ | 1,943 | |
| Less foreign tax withheld | | | | (30 | ) | | | | — | | | | | — | | | | | — | |
| Total income | | | | 8,277 | | | | | 551 | | | | | 75 | | | | | 1,943 | |
| Expenses | | | | | | | | | | | | | | | | | | | | |
| Investment advisory fees | | | | 6,651 | | | | | 455 | | | | | 29 | | | | | 2,788 | |
| Distribution fees | | | | 561 | | | | | 24 | | | | | 3 | | | | | 86 | |
| Custodian fees | | | | 35 | | | | | 28 | | | | | 31 | | | | | 47 | |
| Transfer agent fees | | | | 116 | | | | | 11 | | | | | 3 | | | | | 25 | |
| Sub-transfer agent fees | | | | | | | | | | | | | | | | | | | | |
| Class N | | | | 321 | | | | | 14 | | | | | 1 | | | | | 52 | |
| Class I | | | | 620 | | | | | 40 | | | | | 1 | | | | | 287 | |
| Professional fees | | | | 75 | | | | | 32 | | | | | 30 | | | | | 43 | |
| Registration fees | | | | 39 | | | | | 33 | | | | | 36 | | | | | 17 | |
| Shareholder reporting fees | | | | 23 | | | | | 4 | | | | | 2 | | | | | 47 | |
| Trustee fees | | | | 46 | | | | | 3 | | | | | — | | | | | 18 | |
| Other expenses | | | | 40 | | | | | 7 | | | | | 5 | | | | | 19 | |
| Total expenses before expense limitation | | | | 8,527 | | | | | 651 | | | | | 141 | | | | | 3,429 | |
| Expenses waived or reimbursed by the Adviser | | | | — | | | | | (96 | ) | | | | (104 | ) | | | | (211 | ) |
| Net expenses | | | | 8,527 | | | | | 555 | | | | | 37 | | | | | 3,218 | |
| Net investment income (loss) | | | | (250 | ) | | | | (4 | ) | | | | 38 | | | | | (1,275 | ) |
| Realized and unrealized gain (loss) | | | | | | | | | | | | | | | | | | | | |
| Net realized gain (loss) on transactions from: | | | | | | | | | | | | | | | | | | | | |
| Investments in securities | | | | 57,036 | | | | | 4,789 | | | | | 323 | | | | | 36,493 | |
| Total net realized gain (loss) | | | | 57,036 | | | | | 4,789 | | | | | 323 | | | | | 36,493 | |
| Change in net unrealized appreciation (depreciation) of: | | | | | | | | | | | | | | | | | | | | |
| Investments in securities | | | | (9,544 | ) | | | | (463 | ) | | | | (584 | ) | | | | (30,371 | ) |
| Change in net unrealized appreciation (depreciation) | | | | (9,544 | ) | | | | (463 | ) | | | | (584 | ) | | | | (30,371 | ) |
| Net increase (decrease) in net assets resulting from operations | | | $ | 47,242 | | | | $ | 4,322 | | | | $ | (223 | ) | | | $ | 4,847 | |
See accompanying Notes to Financial Statements.
| December 31, 2015 | William Blair Funds | 123 |
Statements of Changes in Net Assets
For the Years Ended December 31, 2015 and 2014 (all amounts in thousands)
| | | Growth Fund | | | Large Cap
Growth Fund | | | Large Cap
Value Fund | | | Mid Cap
Growth Fund | |
| | | 2015 | | | 2014 | | | 2015 | | | 2014 | | | 2015 | | | 2014 | | | 2015 | | | 2014 | |
| Operations | | | | | | | | | | | | | | | | | | | | | | | | | | | | | | | | | | | | |
| Net investment income (loss) | | $ | (250 | ) | | $ | (2,652 | ) | | | $ | (4 | ) | | | $ | (10 | ) | | | $ | 38 | | | | $ | 41 | | | $ | (1,275 | ) | | $ | (2,292 | ) |
| Net realized gain (loss) on investments, and other assets and liabilities | | | 57,036 | | | | 160,635 | | | | | 4,789 | | | | | 5,646 | | | | | 323 | | | | | 422 | | | | 36,493 | | | | 54,804 | |
| Change in net unrealized appreciation (depreciation) on investments, and other assets and liabilities | | | (9,544 | ) | | | (98,071 | ) | | | | (463 | ) | | | | 1,780 | | | | | (584 | ) | | | | (57 | ) | | | (30,371 | ) | | | (23,846 | ) |
| Net increase (decrease) in net assets resulting from operations | | | 47,242 | | | | 59,912 | | | | | 4,322 | | | | | 7,416 | | | | | (223 | ) | | | | 406 | | | | 4,847 | | | | 28,666 | |
| Distributions to shareholders from | | | | | | | | | | | | | | | | | | | | | | | | | | | | | | | | | | | | |
| Net investment income | | | | | | | | | | | | | | | | | | | | | | | | | | | | | | | | | | | | |
| Class N | | | — | | | | — | | | | | — | | | | | — | | | | | (9 | ) | | | | (11 | ) | | | — | | | | — | |
| Class I | | | — | | | | — | | | | | — | | | | | — | | | | | (25 | ) | | | | (32 | ) | | | — | | | | — | |
| Net realized gain | | | | | | | | | | | | | | | | | | | | | | | | | | | | | | | | | | | | |
| Class N | | | (18,526 | ) | | | (38,561 | ) | | | | (971 | ) | | | | (766 | ) | | | | (124 | ) | | | | (127 | ) | | | (5,530 | ) | | | (4,943 | ) |
| Class I | | | (80,435 | ) | | | (92,382 | ) | | | | (5,265 | ) | | | | (4,395 | ) | | | | (230 | ) | | | | (281 | ) | | | (35,853 | ) | | | (43,297 | ) |
| Total distributions | | | (98,961 | ) | | | (130,943 | ) | | | | (6,236 | ) | | | | (5,161 | ) | | | | (388 | ) | | | | (451 | ) | | | (41,383 | ) | | | (48,240 | ) |
| Capital stock transactions | | | | | | | | | | | | | | | | | | | | | | | | | | | | | | | | | | | | |
| Net proceeds from sale of shares | | | 122,787 | | | | 168,221 | | | | | 17,152 | | | | | 12,804 | | | | | 188 | | | | | 329 | | | | 33,162 | | | | 47,300 | |
| Shares issued in reinvestment of income dividends and capital gain distributions | | | 95,837 | | | | 122,205 | | | | | 5,376 | | | | | 4,464 | | | | | 358 | | | | | 424 | | | | 39,576 | | | | 46,677 | |
| Less cost of shares redeemed | | | (281,210 | ) | | | (173,143 | ) | | | | (10,742 | ) | | | | (7,105 | ) | | | | (1,380 | ) | | | | (1,194 | ) | | | (176,266 | ) | | | (162,245 | ) |
| Net increase (decrease) in net assets resulting from capital share transactions | | | (62,586 | ) | | | 117,283 | | | | | 11,786 | | | | | 10,163 | | | | | (834 | ) | | | | (441 | ) | | | (103,528 | ) | | | (68,268 | ) |
| Increase (decrease) in net assets | | | (114,305 | ) | | | 46,252 | | | | | 9,872 | | | | | 12,418 | | | | | (1,445 | ) | | | | (486 | ) | | | (140,064 | ) | | | (87,842 | ) |
| Net assets | | | | | | | | | | | | | | | | | | | | | | | | | | | | | | | | | | | | |
| Beginning of period | | | 960,803 | | | | 914,551 | | | | | 59,609 | | | | | 47,191 | | | | | 4,621 | | | | | 5,107 | | | | 339,786 | | | | 427,628 | |
| End of period | | $ | 846,498 | | | $ | 960,803 | | | | $ | 69,481 | | | | $ | 59,609 | | | | $ | 3,176 | | | | $ | 4,621 | | | $ | 199,722 | | | $ | 339,786 | |
| Accumulated net investment income (loss) at the end of the period | | $ | — | | | $ | — | | | | $ | — | | | | $ | — | | | | $ | 1 | | | | $ | — | | | $ | — | | | $ | — | |
See accompanying Notes to Financial Statements.
| 124 | Annual Report | December 31, 2015 |
Statements of Assets and Liabilities
As of December 31, 2015 (dollar amounts in thousands)
| | | Mid Cap
Value
Fund | | | Small-Mid
Cap
Growth
Fund | | | Small-Mid
Cap
Value
Fund | | | Small Cap
Growth
Fund | |
| Assets | | | | | | | | | | | | | | | | | | |
| Investments in securities, at cost | | | $ | 2,261 | | | $ | 1,045,396 | | | | $ | 3,671 | | | $ | 324,746 | |
| Investments in affiliated companies, at cost | | | | — | | | | — | | | | | — | | | | 4,878 | |
| Investments in securities, at value | | | $ | 2,669 | | | $ | 1,193,063 | | | | $ | 4,013 | | | $ | 367,540 | |
| Investments in affiliated companies, at value | | | | — | | | | — | | | | | — | | | | 4,995 | |
| Receivable for securities sold | | | | 144 | | | | 11,231 | | | | | 65 | | | | 1,496 | |
| Receivable for fund shares sold | | | | 1 | | | | 16,291 | | | | | 38 | | | | 914 | |
| Receivable from Adviser | | | | 4 | | | | 122 | | | | | 16 | | | | 11 | |
| Dividend and interest receivable | | | | 5 | | | | 429 | | | | | 9 | | | | 102 | |
| Total assets | | | | 2,823 | | | | 1,221,136 | | | | | 4,141 | | | | 375,058 | |
| Liabilities | | | | | | | | | | | | | | | | | | |
| Payable for securities purchased | | | | 28 | | | | 25,079 | | | | | — | | | | 763 | |
| Payable for fund shares redeemed | | | | 9 | | | | 5,485 | | | | | — | | | | 478 | |
| Payable to custodian | | | | 84 | | | | — | | | | | 25 | | | | — | |
| Management fee payable | | | | 2 | | | | 993 | | | | | 4 | | | | 355 | |
| Distribution fee payable | | | | — | | | | 35 | | | | | — | | | | 24 | |
| Other payables and accrued expenses | | | | 32 | | | | 405 | | | | | 37 | | | | 225 | |
| Total liabilities | | | | 155 | | | | 31,997 | | | | | 66 | | | | 1,845 | |
| Net assets | | | $ | 2,668 | | | $ | 1,189,139 | | | | $ | 4,075 | | | $ | 373,213 | |
| Capital | | | | | | | | | | | | | | | | | | |
| Composition of net assets | | | | | | | | | | | | | | | | | | |
| Par value of shares of beneficial interest | | | $ | — | | | $ | 61 | | | | $ | 1 | | | $ | 16 | |
| Capital paid in excess of par value | | | | 2,174 | | | | 1,035,664 | | | | | 3,715 | | | | 332,575 | |
| Accumulated net investment income (loss) | | | | 5 | | | | — | | | | | 4 | | | | — | |
| Accumulated net realized gain (loss) | | | | 81 | | | | 5,747 | | | | | 13 | | | | (2,289 | ) |
| Net unrealized appreciation (depreciation) of investments and foreign currencies | | | | 408 | | | | 147,667 | | | | | 342 | | | | 42,911 | |
| Net assets | | | $ | 2,668 | | | $ | 1,189,139 | | | | $ | 4,075 | | | $ | 373,213 | |
| Class N shares | | | | | | | | | | | | | | | | | | |
| Net assets | | | $ | 694 | | | $ | 169,595 | | | | $ | 855 | | | $ | 111,944 | |
| Shares outstanding | | | | 69,924 | | | | 9,150,488 | | | | | 68,149 | | | | 4,981,302 | |
| Net asset value per share | | | $ | 9.92 | | | $ | 18.53 | | | | $ | 12.54 | | | $ | 22.47 | |
| Class I shares | | | | | | | | | | | | | | | | | | |
| Net assets | | | $ | 1,974 | | | $ | 1,019,544 | | | | $ | 3,220 | | | $ | 261,269 | |
| Shares outstanding | | | | 198,648 | | | | 52,949,184 | | | | | 256,658 | | | | 10,808,035 | |
| Net asset value per share | | | $ | 9.94 | | | $ | 19.25 | | | | $ | 12.54 | | | $ | 24.17 | |
See accompanying Notes to Financial Statements.
| December 31, 2015 | William Blair Funds | 125 |
Statements of Operations
For the Year Ended December 31, 2015 (all amounts in thousands)
| | | Mid Cap
Value
Fund | | | Small-Mid
Cap
Growth
Fund | | | Small-Mid
Cap
Value
Fund | | | Small Cap
Growth
Fund | |
| Investment income | | | | | | | | | | | | | | | | | | | | |
| Dividends | | | $ | 58 | | | | $ | 8,544 | | | | $ | 71 | | | | $ | 2,967 | |
| Less foreign tax withheld | | | | — | | | | | (44 | ) | | | | — | | | | | (18 | ) |
| Total income | | | | 58 | | | | | 8,500 | | | | | 71 | | | | | 2,949 | |
| Expenses | | | | | | | | | | | | | | | | | | | | |
| Investment advisory fees | | | | 32 | | | | | 10,379 | | | | | 43 | | | | | 5,064 | |
| Distribution fees | | | | 1 | | | | | 323 | | | | | 2 | | | | | 340 | |
| Custodian fees | | | | 32 | | | | | 40 | | | | | 38 | | | | | 46 | |
| Transfer agent fees | | | | 1 | | | | | 61 | | | | | 1 | | | | | 71 | |
| Sub-transfer agent fees | | | | | | | | | | | | | | | | | | | | |
| Class N | | | | 1 | | | | | 172 | | | | | — | | | | | 196 | |
| Class I | | | | — | | | | | 942 | | | | | 2 | | | | | 331 | |
| Professional fees | | | | 26 | | | | | 79 | | | | | 34 | | | | | 59 | |
| Registration fees | | | | 31 | | | | | 71 | | | | | 37 | | | | | 48 | |
| Shareholder reporting fees | | | | — | | | | | 103 | | | | | — | | | | | 165 | |
| Trustee fees | | | | — | | | | | 42 | | | | | — | | | | | 26 | |
| Other expenses | | | | 3 | | | | | 34 | | | | | 5 | | | | | 26 | |
| Total expenses before expense limitation | | | | 127 | | | | | 12,246 | | | | | 162 | | | | | 6,372 | |
| Expenses waived or reimbursed by the Adviser | | | | (91 | ) | | | | (507 | ) | | | | (112 | ) | | | | (277 | ) |
| Net expenses | | | | 36 | | | | | 11,739 | | | | | 50 | | | | | 6,095 | |
| Net investment income (loss) | | | | 22 | | | | | (3,239 | ) | | | | 21 | | | | | (3,146 | ) |
| Realized and unrealized gain (loss) | | | | | | | | | | | | | | | | | | | | |
| Net realized gain (loss) on transactions from: | | | | | | | | | | | | | | | | | | | | |
| Investments in securities | | | | 661 | | | | | 61,943 | | | | | 129 | | | | | 27,594 | (1) |
| Total net realized gain (loss) | | | | 661 | | | | | 61,943 | | | | | 129 | | | | | 27,594 | |
| Change in net unrealized appreciation (depreciation) of: | | | | | | | | | | | | | | | | | | | | |
| Investments in securities | | | | (671 | ) | | | | (21,167 | ) | | | | (280 | ) | | | | (39,914 | )(2) |
| Change in net unrealized appreciation (depreciation) | | | | (671 | ) | | | | (21,167 | ) | | | | (280 | ) | | | | (39,914 | ) |
| Net increase (decrease) in net assets resulting from operations | | | $ | 12 | | | | $ | 37,537 | | | | $ | (130 | ) | | | $ | (15,466 | ) |
(1) Includes $(330) from companies deemed affiliated during the year or at December 31, 2015.
(2) Includes $(1,163) from companies deemed affiliated during the year or at December 31, 2015.
See accompanying Notes to Financial Statements.
| 126 | Annual Report | December 31, 2015 |
Statements of Changes in Net Assets
For the Years Ended December 31, 2015 and 2014 (all amounts in thousands)
| | | Mid Cap
Value Fund | | | Small-Mid
Cap Growth Fund | | | Small-Mid
Cap Value Fund | | | Small Cap
Growth Fund | |
| | | 2015 | | | 2014 | | | 2015 | | | 2014 | | | 2015 | | | 2014 | | | 2015 | | | 2014 | |
| Operations | | | | | | | | | | | | | | | | | | | | | | | | | | | | | | | | | | | | |
| Net investment income (loss) | | | $ | 22 | | | | $ | 21 | | | $ | (3,239 | ) | | $ | (2,965 | ) | | | $ | 21 | | | | $ | 9 | | | $ | (3,146 | ) | | $ | (4,620 | ) |
| Net realized gain (loss) on investments, and other assets and liabilities | | | | 661 | | | | | 468 | | | | 61,943 | | | | 67,816 | | | | | 129 | | | | | 361 | | | | 27,594 | | | | 73,574 | |
| Change in net unrealized appreciation (depreciation) on investments, and other assets and liabilities | | | | (671 | ) | | | | (89 | ) | | | (21,167 | ) | | | (675 | ) | | | | (280 | ) | | | | (182 | ) | | | (39,914 | ) | | | (56,321 | ) |
| Net increase (decrease) in net assets resulting from operations | | | | 12 | | | | | 400 | | | | 37,537 | | | | 64,176 | | | | | (130 | ) | | | | 188 | | | | (15,466 | ) | | | 12,633 | |
| Distributions to shareholders from | | | | | | | | | | | | | | | | | | | | | | | | | | | | | | | | | | | | |
| Net investment income | | | | | | | | | | | | | | | | | | | | | | | | | | | | | | | | | | | | |
| Class N | | | | (2 | ) | | | | (1 | ) | | | — | | | | — | | | | | (1 | ) | | | | — | | | | — | | | | — | |
| Class I | | | | (10 | ) | | | | (21 | ) | | | — | | | | — | | | | | (10 | ) | | | | (12 | ) | | | — | | | | — | |
| Net realized gain | | | | | | | | | | | | | | | | | | | | | | | | | | | | | | | | | | | | |
| Class N | | | | (149 | ) | | | | (24 | ) | | | (8,564 | ) | | | (6,031 | ) | | | | (44 | ) | | | | (76 | ) | | | (9,437 | ) | | | (25,936 | ) |
| Class I | | | | (438 | ) | | | | (471 | ) | | | (50,588 | ) | | | (62,751 | ) | | | | (162 | ) | | | | (266 | ) | | | (20,150 | ) | | | (59,140 | ) |
| Total distributions | | | | (599 | ) | | | | (517 | ) | | | (59,152 | ) | | | (68,782 | ) | | | | (217 | ) | | | | (354 | ) | | | (29,587 | ) | | | (85,076 | ) |
| Capital stock transactions | | | | | | | | | | | | | | | | | | | | | | | | | | | | | | | | | | | | |
| Net proceeds from sale of shares | | | | 661 | | | | | 49 | | | | 428,159 | | | | 295,395 | | | | | 435 | | | | | 2,169 | | | | 94,104 | | | | 100,914 | |
| Shares issued in reinvestment of income dividends and capital gain distributions | | | | 573 | | | | | 412 | | | | 57,336 | | | | 66,503 | | | | | 136 | | | | | 214 | | | | 28,974 | | | | 82,817 | |
| Less cost of shares redeemed | | | | (1,747 | ) | | | | (1,033 | ) | | | (151,577 | ) | | | (171,037 | ) | | | | (502 | ) | | | | (1,142 | ) | | | (217,254 | ) | | | (226,205 | ) |
| Net increase (decrease) in net assets resulting from capital share transactions | | | | (513 | ) | | | | (572 | ) | | | 333,918 | | | | 190,861 | | | | | 69 | | | | | 1,241 | | | | (94,176 | ) | | | (42,474 | ) |
| Increase (decrease) in net assets | | | | (1,100 | ) | | | | (689 | ) | | | 312,303 | | | | 186,255 | | | | | (278 | ) | | | | 1,075 | | | | (139,229 | ) | | | (114,917 | ) |
| Net assets | | | | | | | | | | | | | | | | | | | | | | | | | | | | | | | | | | | | |
| Beginning of period | | | | 3,768 | | | | | 4,457 | | | | 876,836 | | | | 690,581 | | | | | 4,353 | | | | | 3,278 | | | | 512,442 | | | | 627,359 | |
| End of period | | | $ | 2,668 | | | | $ | 3,768 | | | $ | 1,189,139 | | | $ | 876,836 | | | | $ | 4,075 | | | | $ | 4,353 | | | $ | 373,213 | | | $ | 512,442 | |
| Accumulated net investment income (loss) at the end of the period | | | $ | 5 | | | | $ | — | | | $ | — | | | $ | — | | | | $ | 4 | | | | $ | — | | | $ | — | | | $ | — | |
See accompanying Notes to Financial Statements.
| December 31, 2015 | William Blair Funds | 127 |
Statements of Assets and Liabilities
As of December 31, 2015 (dollar amounts in thousands)
| | | Small Cap
Value Fund | | | Global
Leaders
Fund | | | Global
Small Cap
Growth Fund
(In Liquidation) | | | International
Leaders
Fund | |
| Assets | | | | | | | | | | | | | | | | | | |
| Investments in securities, at cost | | $ | 545,910 | | | $ | 169,702 | | | | $ | 16,476 | | | | $ | 104,884 | |
| Investments in securities, at value | | $ | 610,326 | | | $ | 187,377 | | | | $ | 18,466 | | | | $ | 115,360 | |
| Cash | | | — | | | | 7 | | | | | — | | | | | 7 | |
| Foreign currency, at value (cost $— ; $241; $5; $24) | | | — | | | | 223 | | | | | 5 | | | | | 24 | |
| Receivable for securities sold | | | 637 | | | | 1,256 | | | | | 28 | | | | | 310 | |
| Receivable for fund shares sold | | | 1,786 | | | | 151 | | | | | 1 | | | | | 401 | |
| Receivable from Adviser | | | 1 | | | | 23 | | | | | 18 | | | | | 17 | |
| Dividend and interest receivable | | | 1,413 | | | | 172 | | | | | 27 | | | | | 133 | |
| Total assets | | | 614,163 | | | | 189,209 | | | | | 18,545 | | | | | 116,252 | |
| Liabilities | | | | | | | | | | | | | | | | | | |
| Payable for investment securities purchased | | | 926 | | | | — | | | | | — | | | | | — | |
| Payable for fund shares redeemed | | | 142 | | | | 6 | | | | | 8 | | | | | — | |
| Management fee payable | | | 584 | | | | 161 | | | | | 17 | | | | | 92 | |
| Shareholder administration fee payable | | | — | | | | 7 | | | | | 3 | | | | | 2 | |
| Distribution fee payable | | | 7 | | | | 1 | | | | | — | | | | | — | |
| Foreign capital gains tax liability | | | — | | | | — | | | | | — | | | | | 2 | |
| Other payables and accrued expenses | | | 143 | | | | 66 | | | | | 73 | | | | | 78 | |
| Total liabilities | | | 1,802 | | | | 241 | | | | | 101 | | | | | 174 | |
| Net assets | | $ | 612,361 | | | $ | 188,968 | | | | $ | 18,444 | | | | $ | 116,078 | |
| Capital | | | | | | | | | | | | | | | | | | |
| Composition of net assets | | | | | | | | | | | | | | | | | | |
| Par value of shares of beneficial interest | | $ | 36 | | | $ | 16 | | | | $ | 1 | | | | $ | 9 | |
| Capital paid in excess of par value | | | 543,724 | | | | 171,169 | | | | | 13,384 | | | | | 105,681 | |
| Accumulated net investment income (loss) | | | 236 | | | | (40 | ) | | | | (165 | ) | | | | 92 | |
| Accumulated net realized gain (loss) | | | 3,949 | | | | 174 | | | | | 3,235 | | | | | (167 | ) |
| Net unrealized appreciation (depreciation) of investments and foreign currencies | | | 64,416 | | | | 17,649 | | | | | 1,989 | | | | | 10,463 | |
| Net assets | | $ | 612,361 | | | $ | 188,968 | | | | $ | 18,444 | | | | $ | 116,078 | |
| Class N shares | | | | | | | | | | | | | | | | | | |
| Net assets | | $ | 33,351 | | | $ | 5,588 | | | | $ | 761 | | | | $ | 377 | |
| Shares outstanding | | | 1,999,248 | | | | 482,636 | | | | | 59,000 | | | | | 29,235 | |
| Net asset value per share | | $ | 16.68 | | | $ | 11.58 | | | | $ | 12.89 | | | | $ | 12.89 | |
| Class I shares | | | | | | | | | | | | | | | | | | |
| Net assets | | $ | 579,010 | | | $ | 45,853 | | | | $ | 17,683 | | | | $ | 13,474 | |
| Shares outstanding | | | 33,906,978 | | | | 3,956,642 | | | | | 1,365,766 | | | | | 1,043,729 | |
| Net asset value per share | | $ | 17.08 | | | $ | 11.59 | | | | $ | 12.95 | | | | $ | 12.91 | |
| Institutional Class shares | | | | | | | | | | | | | | | | | | |
| Net assets | | | — | | | $ | 137,527 | | | | | — | | | | $ | 102,227 | |
| Shares outstanding | | | — | | | | 11,866,752 | | | | | — | | | | | 7,924,018 | |
| Net asset value per share | | | — | | | $ | 11.59 | | | | | — | | | | $ | 12.90 | |
See accompanying Notes to Financial Statements.
| 128 | Annual Report | December 31, 2015 |
Statements of Operations
For the Year Ended December 31, 2015 (all amounts in thousands)
| | | Small Cap
Value Fund | | | Global
Leaders
Fund | | | Global
Small Cap
Growth Fund
(In Liquidation) | | | International
Leaders
Fund | |
| Investment income | | | | | | | | | | | | | | | | | | | | |
| Dividends | | | $ | 9,758 | | | | $ | 3,021 | | | | $ | 832 | | | | $ | 2,018 | |
| Less foreign tax withheld | | | | — | | | | | (207 | ) | | | | (52 | ) | | | | (166 | ) |
| Total income | | | | 9,758 | | | | | 2,814 | | | | | 780 | | | | | 1,852 | |
| Expenses | | | | | | | | | | | | | | | | | | | | |
| Investment advisory fees | | | | 6,423 | | | | | 1,853 | | | | | 501 | | | | | 945 | |
| Distribution fees | | | | 92 | | | | | 14 | | | | | 2 | | | | | 1 | |
| Shareholder administration fees | | | | — | | | | | 87 | | | | | 75 | | | | | 19 | |
| Custodian fees | | | | 36 | | | | | 58 | | | | | 65 | | | | | 57 | |
| Transfer agent fees | | | | 38 | | | | | 12 | | | | | 19 | | | | | 2 | |
| Sub-transfer agent fees | | | | | | | | | | | | | | | | | | | | |
| Class N | | | | 51 | | | | | 6 | | | | | 2 | | | | | — | |
| Class I | | | | 522 | | | | | 33 | | | | | 3 | | | | | 20 | |
| Professional fees | | | | 55 | | | | | 61 | | | | | 68 | | | | | 74 | |
| Registration fees | | | | 36 | | | | | 47 | | | | | 56 | | | | | 51 | |
| Shareholder reporting fees | | | | 54 | | | | | 1 | | | | | 2 | | | | | — | |
| Trustee fees | | | | 29 | | | | | 8 | | | | | 2 | | | | | 4 | |
| Other expenses | | | | 28 | | | | | 15 | | | | | 7 | | | | | 12 | |
| Total expenses before expense limitation | | | | 7,364 | | | | | 2,195 | | | | | 802 | | | | | 1,185 | |
| Expenses waived or reimbursed by the Adviser | | | | (13 | ) | | | | (229 | ) | | | | (168 | ) | | | | (190 | ) |
| Net expenses | | | | 7,351 | | | | | 1,966 | | | | | 634 | | | | | 995 | |
| Net investment income (loss) | | | | 2,407 | | | | | 848 | | | | | 146 | | | | | 857 | |
| Realized and unrealized gain (loss) | | | | | | | | | | | | | | | | | | | | |
| Net realized gain (loss) on transactions from: | | | | | | | | | | | | | | | | | | | | |
| Investments in securities, net of foreign capital gains taxes, if applicable | | | | 6,099 | | | | | 7,215 | | | | | 4,297 | | | | | (115 | ) |
| Foreign currency transactions | | | | — | | | | | (89 | ) | | | | (63 | ) | | | | (34 | ) |
| Total net realized gain (loss) | | | | 6,099 | | | | | 7,126 | | | | | 4,234 | | | | | (149 | ) |
| Change in net unrealized appreciation (depreciation) of: | | | | | | | | | | | | | | | | | | | | |
| Investments in securities | | | | (41,101 | ) | | | | (3,409 | ) | | | | (113 | ) | | | | 4,617 | |
| Foreign currency translations | | | | — | | | | | (6 | ) | | | | 37 | | | | | 67 | |
| Change in net unrealized appreciation (depreciation) | | | | (41,101 | ) | | | | (3,415 | ) | | | | (76 | ) | | | | 4,684 | |
| Net increase (decrease) in net assets resulting from operations | | | $ | (32,595 | ) | | | $ | 4,559 | | | | $ | 4,304 | | | | $ | 5,392 | |
See accompanying Notes to Financial Statements.
| December 31, 2015 | William Blair Funds | 129 |
Statements of Changes in Net Assets
For the Years Ended December 31, 2015 and 2014 (all amounts in thousands)
| | | Small Cap
Value Fund | | | Global
Leaders Fund | | | Global
Small Cap
Growth Fund
(In Liquidation) | | | International
Leaders Fund | |
| | | 2015 | | | 2014 | | | 2015 | | | 2014 | | | 2015 | | | 2014 | | | 2015 | | | 2014 | |
| Operations | | | | | | | | | | | | | | | | | | | | | | | | | | | | | | | | | | | | |
| Net investment income (loss) | | $ | 2,407 | | | $ | 519 | | | $ | 848 | | | $ | 695 | | | | $ | 146 | | | | $ | (57 | ) | | | $ | 857 | | | | $ | 1,122 | |
| Net realized gain (loss) on investments, and other assets and liabilities | | | 6,099 | | | | 24,178 | | | | 7,126 | | | | 7,314 | | | | | 4,234 | | | | | 1,914 | | | | | (149 | ) | | | | 1,690 | |
| Change in net unrealized appreciation (depreciation) on investments, and other assets and liabilities | | | (41,101 | ) | | | 4,446 | | | | (3,415 | ) | | | (1,694 | ) | | | | (76 | ) | | | | (415 | ) | | | | 4,684 | | | | | (4,687 | ) |
| Net increase (decrease) in net assets resulting from operations | | | (32,595 | ) | | | 29,143 | | | | 4,559 | | | | 6,315 | | | | | 4,304 | | | | | 1,442 | | | | | 5,392 | | | | | (1,875 | ) |
| Distributions to shareholders from | | | | | | | | | | | | | | | | | | | | | | | | | | | | | | | | | | | | |
| Net investment income | | | | | | | | | | | | | | | | | | | | | | | | | | | | | | | | | | | | |
| Class N | | | — | | | | — | | | | (3 | ) | | | — | | | | | (11 | ) | | | | — | | | | | (1 | ) | | | | (1 | ) |
| Class I | | | (1,363 | ) | | | (610 | ) | | | (152 | ) | | | (75 | ) | | | | (327 | ) | | | | — | | | | | (22 | ) | | | | (72 | ) |
| Institutional Class | | | — | | | | — | | | | (552 | ) | | | (301 | ) | | | | — | | | | | — | | | | | (323 | ) | | | | (746 | ) |
| Net realized gain | | | | | | | | | | | | | | | | | | | | | | | | | | | | | | | | | | | | |
| Class N | | | (107 | ) | | | (1,435 | ) | | | (252 | ) | | | (8 | ) | | | | (16 | ) | | | | (25 | ) | | | | (2 | ) | | | | — | |
| Class I | | | (1,836 | ) | | | (18,791 | ) | | | (2,063 | ) | | | (85 | ) | | | | (441 | ) | | | | (1,623 | ) | | | | (73 | ) | | | | — | |
| Institutional Class | | | — | | | | — | | | | (6,144 | ) | | | (165 | ) | | | | — | | | | | — | | | | | (578 | ) | | | | — | |
| Total distributions | | | (3,306 | ) | | | (20,836 | ) | | | (9,166 | ) | | | (634 | ) | | | | (795 | ) | | | | (1,648 | ) | | | | (999 | ) | | | | (819 | ) |
| Capital stock transactions | | | | | | | | | | | | | | | | | | | | | | | | | | | | | | | | | | | | |
| Net proceeds from sale of shares | | | 174,197 | | | | 291,841 | | | | 41,785 | | | | 53,874 | | | | | 13,920 | | | | | 26,372 | | | | | 24,052 | | | | | 26,388 | |
| Shares issued in reinvestment of income dividends and capital gain distributions | | | 3,045 | | | | 19,104 | | | | 8,986 | | | | 567 | | | | | 642 | | | | | 576 | | | | | 773 | | | | | 243 | |
| Less cost of shares redeemed | | | (114,166 | ) | | | (142,362 | ) | | | (20,858 | ) | | | (43,543 | ) | | | | (42,755 | ) | | | | (1,039 | ) | | | | (1,102 | ) | | | | (4,749 | ) |
| Net increase (decrease) in net assets resulting from capital share transactions | | | 63,076 | | | | 168,583 | | | | 29,913 | | | | 10,898 | | | | | (28,193 | ) | | | | 25,909 | | | | | 23,723 | | | | | 21,882 | |
| Increase (decrease) in net assets | | | 27,175 | | | | 176,890 | | | | 25,306 | | | | 16,579 | | | | | (24,684 | ) | | | | 25,703 | | | | | 28,116 | | | | | 19,188 | |
| Net assets | | | | | | | | | | | | | | | | | | | | | | | | | | | | | | | | | | | | |
| Beginning of period | | | 585,186 | | | | 408,296 | | | | 163,662 | | | | 147,083 | | | | | 43,128 | | | | | 17,425 | | | | | 87,962 | | | | | 68,774 | |
| End of period | | $ | 612,361 | | | $ | 585,186 | | | $ | 188,968 | | | $ | 163,662 | | | | $ | 18,444 | | | | $ | 43,128 | | | | $ | 116,078 | | | | $ | 87,962 | |
| Accumulated net investment income (loss) at the end of the period | | $ | 236 | | | $ | — | | | $ | (40 | ) | | $ | 6 | | | | $ | (165 | ) | | | $ | (45 | ) | | | $ | 92 | | | | $ | (385 | ) |
See accompanying Notes to Financial Statements.
| 130 | Annual Report | December 31, 2015 |
Statements of Assets and Liabilities
As of December 31, 2015 (dollar amounts in thousands)
| | | International
Equity Fund | | | Institutional
International
Equity Fund | | | International
Growth
Fund | | | Institutional
International
Growth
Fund | |
| Assets | | | | | | | | | | | | | | | | | | |
| Investments in securities, at cost | | | $ | 58,383 | | | | $ | 15,234 | | | $ | 3,357,382 | | | $ | 2,140,036 | |
| Investment in affiliated fund, at cost | | | | — | | | | | — | | | | 2,236 | | | | 1,390 | |
| Investments in securities, at value | | | $ | 63,567 | | | | $ | 16,049 | | | $ | 3,665,835 | | | $ | 2,329,471 | |
| Investment in affiliated fund, at value | | | | — | | | | | — | | | | 3,928 | | | | 2,441 | |
| Cash | | | | 5 | | | | | 1 | | | | 100 | | | | 63 | |
| Foreign currency, at value (cost $44; $14; $415; $518) | | | | 43 | | | | | 14 | | | | 415 | | | | 518 | |
| Receivable for securities sold | | | | — | | | | | — | | | | 4,008 | | | | 2,535 | |
| Receivable for fund shares sold | | | | 930 | | | | | — | | | | 16,060 | | | | 4,615 | |
| Receivable from Adviser | | | | 14 | | | | | 11 | | | | — | | | | — | |
| Dividend and interest receivable | | | | 129 | | | | | 35 | | | | 8,468 | | | | 3,893 | |
| Total assets | | | | 64,688 | | | | | 16,110 | | | | 3,698,814 | | | | 2,343,536 | |
| Liabilities | | | | | | | | | | | | | | | | | | |
| Payable for investment securities purchased | | | | 638 | | | | | 7 | | | | 5,359 | | | | 3,465 | |
| Payable for fund shares redeemed | | | | 16 | | | | | — | | | | 9,912 | | | | 2,277 | |
| Management fee payable | | | | 53 | | | | | 12 | | | | 3,152 | | | | 1,866 | |
| Distribution fee payable | | | | 1 | | | | | — | | | | 225 | | | | — | |
| Other payables and accrued expenses | | | | 74 | | | | | 61 | | | | 1,422 | | | | 296 | |
| Total liabilities | | | | 782 | | | | | 80 | | | | 20,070 | | | | 7,904 | |
| Net assets | | | $ | 63,906 | | | | $ | 16,030 | | | $ | 3,678,744 | | | $ | 2,335,632 | |
| Capital | | | | | | | | | | | | | | | | | | |
| Composition of net assets | | | | | | | | | | | | | | | | | | |
| Par value of shares of beneficial interest | | | $ | 5 | | | | $ | 1 | | | $ | 145 | | | $ | 155 | |
| Capital paid in excess of par value | | | | 133,087 | | | | | 105,357 | | | | 3,748,765 | | | | 2,182,306 | |
| Accumulated net investment income (loss) | | | | 586 | | | | | (62 | ) | | | 21,204 | | | | 7,048 | |
| Accumulated net realized gain (loss) | | | | (74,949 | ) | | | | (90,078 | ) | | | (401,395 | ) | | | (44,198 | ) |
| Net unrealized appreciation (depreciation) of investments and foreign currencies | | | | 5,177 | | | | | 812 | | | | 310,025 | | | | 190,321 | |
| Net assets | | | $ | 63,906 | | | | $ | 16,030 | | | $ | 3,678,744 | | | $ | 2,335,632 | |
| Class N shares | | | | | | | | | | | | | | | | | | |
| Net assets | | | $ | 3,020 | | | | | — | | | $ | 1,023,588 | | | | — | |
| Shares outstanding | | | | 218,067 | | | | | — | | | | 41,050,215 | | | | — | |
| Net asset value per share | | | $ | 13.85 | | | | | — | | | $ | 24.94 | | | | — | |
| Class I shares | | | | | | | | | | | | | | | | | | |
| Net assets | | | $ | 60,886 | | | | | — | | | $ | 2,655,156 | | | | — | |
| Shares outstanding | | | | 4,356,284 | | | | | — | | | | 104,073,211 | | | | — | |
| Net asset value per share | | | $ | 13.98 | | | | | — | | | $ | 25.51 | | | | — | |
| Institutional Class shares | | | | | | | | | | | | | | | | | | |
| Net assets | | | | — | | | | $ | 16,030 | | | | — | | | $ | 2,335,632 | |
| Shares outstanding | | | | — | | | | | 1,322,089 | | | | — | | | | 154,926,068 | |
| Net asset value per share | | | | — | | | | $ | 12.12 | | | | — | | | $ | 15.08 | |
See accompanying Notes to Financial Statements.
| December 31, 2015 | William Blair Funds | 131 |
Statements of Operations
For the Year Ended December 31, 2015 (all amounts in thousands)
| | | International
Equity Fund | | | Institutional
International
Equity Fund | | | International
Growth
Fund | | | Institutional
International
Growth
Fund | |
| Investment income | | | | | | | | | | | | | | | | | | | | |
| Dividends | | | $ | 1,774 | | | | $ | 384 | | | | $ | 90,394 | | | | $ | 57,147 | |
| Less foreign tax withheld | | | | (142 | ) | | | | (32 | ) | | | | (8,301 | ) | | | | (5,242 | ) |
| Total income | | | | 1,632 | | | | | 352 | | | | | 82,093 | | | | | 51,905 | |
| Expenses | | | | | | | | | | | | | | | | | | | | |
| Investment advisory fees | | | | 700 | | | | | 142 | | | | | 38,286 | | | | | 22,490 | |
| Distribution fees | | | | 9 | | | | | — | | | | | 2,590 | | | | | — | |
| Custodian fees | | | | 53 | | | | | 51 | | | | | 373 | | | | | 270 | |
| Transfer agent fees | | | | 4 | | | | | — | | | | | 231 | | | | | 49 | |
| Sub-transfer agent fees | | | | | | | | | | | | | | | | | | | | |
| Class N | | | | 4 | | | | | — | | | | | 1,318 | | | | | — | |
| Class I | | | | 75 | | | | | — | | | | | 2,516 | | | | | — | |
| Professional fees | | | | 58 | | | | | 57 | | | | | 312 | | | | | 221 | |
| Registration fees | | | | 31 | | | | | 22 | | | | | 104 | | | | | 35 | |
| Shareholder reporting fees | | | | 1 | | | | | — | | | | | 321 | | | | | 20 | |
| Trustee fees | | | | 4 | | | | | 1 | | | | | 196 | | | | | 120 | |
| Other expenses | | | | 8 | | | | | 5 | | | | | 163 | | | | | 94 | |
| Total expenses before expense limitation | | | | 947 | | | | | 278 | | | | | 46,410 | | | | | 23,299 | |
| Expenses waived or reimbursed by the Adviser | | | | (190 | ) | | | | (120 | ) | | | | — | | | | | — | |
| Net expenses | | | | 757 | | | | | 158 | | | | | 46,410 | | | | | 23,299 | |
| Net investment income (loss) | | | | 875 | | | | | 194 | | | | | 35,683 | | | | | 28,606 | |
| Realized and unrealized gain (loss) | | | | | | | | | | | | | | | | | | | | |
| Net realized gain (loss) on transactions from: | | | | | | | | | | | | | | | | | | | | |
| Investments in securities, net of foreign capital gains taxes, if applicable | | | | 1,926 | | | | | 423 | | | | | (20,024 | )(1) | | | | (28,210 | )(1) |
| Foreign currency transactions | | | | (32 | ) | | | | (6 | ) | | | | (3,507 | ) | | | | (2,229 | ) |
| Total net realized gain (loss) | | | | 1,894 | | | | | 417 | | | | | (23,531 | ) | | | | (30,439 | ) |
| Change in net unrealized appreciation (depreciation) of: | | | | | | | | | | | | | | | | | | | | |
| Investments in securities | | | | (1,353 | ) | | | | (428 | ) | | | | (17,154 | )(2) | | | | 5,125 | (2) |
| Foreign currency translations | | | | 4 | | | | | 2 | | | | | 2,692 | | | | | 1,805 | |
| Change in net unrealized appreciation (depreciation) | | | | (1,349 | ) | | | | (426 | ) | | | | (14,462 | ) | | | | 6,930 | |
| Net increase (decrease) in net assets resulting from operations | | | $ | 1,420 | | | | $ | 185 | | | | $ | (2,310 | ) | | | $ | 5,097 | |
(1) Includes $18,124 and $9,106 related to an affiliated fund (William Blair China A-Share Fund, LLC) for International Growth Fund and Institutional International Growth Fund, respectively.
(2) Includes $(9,385) and $(4,902) related to an affiliated fund (William Blair China A-Share Fund, LLC) for International Growth Fund and Institutional International Growth Fund, respectively.
See accompanying Notes to Financial Statements.
| 132 | Annual Report | December 31, 2015 |
Statements of Changes in Net Assets
For the Years Ended December 31, 2015 and 2014 (all amounts in thousands)
| | | International
Equity Fund | | | Institutional
International
Equity Fund | | | International
Growth Fund | | | Institutional
International
Growth Fund | |
| | | 2015 | | | 2014 | | | 2015 | | | 2014 | | | 2015 | | | 2014 | | | 2015 | | | 2014 | |
| Operations | | | | | | | | | | | | | | | | | | | | | | | | | | | | | | | | |
| Net investment income (loss) | | $ | 875 | | | $ | 1,045 | | | $ | 194 | | | $ | 370 | | | $ | 35,683 | | | $ | 52,083 | | | $ | 28,606 | | | $ | 35,796 | |
| Net realized gain (loss) on investments, and other assets and liabilities | | | 1,894 | | | | 6,632 | | | | 417 | | | | 18,138 | | | | (23,531 | ) | | | 416,906 | | | | (30,439 | ) | | | 199,722 | |
| Change in net unrealized appreciation (depreciation) on investments, and other assets and liabilities | | | (1,349 | ) | | | (9,783 | ) | | | (426 | ) | | | (19,690 | ) | | | (14,462 | ) | | | (579,470 | ) | | | 6,930 | | | | (304,800 | ) |
| Net increase (decrease) in net assets resulting from operations | | | 1,420 | | | | (2,106 | ) | | | 185 | | | | (1,182 | ) | | | (2,310 | ) | | | (110,481 | ) | | | 5,097 | | | | (69,282 | ) |
| Distributions to shareholders from | | | | | | | | | | | | | | | | | | | | | | | | | | | | | | | | |
| Net investment income | | | | | | | | | | | | | | | | | | | | | | | | | | | | | | | | |
| Class N | | | (26 | ) | | | (21 | ) | | | — | | | | — | | | | (9,482 | ) | | | (8,591 | ) | | | — | | | | — | |
| Class I | | | (750 | ) | | | (576 | ) | | | — | | | | — | | | | (30,923 | ) | | | (33,318 | ) | | | — | | | | — | |
| Institutional Class | | | — | | | | — | | | | (156 | ) | | | (293 | ) | | | — | | | | — | | | | (13,779 | ) | | | (44,638 | ) |
| Net realized gain | | | | | | | | | | | | | | | | | | | | | | | | | | | | | | | | |
| Class N | | | — | | | | — | | | | — | | | | — | | | | — | | | | — | | | | — | | | | — | |
| Class I | | | — | | | | — | | | | — | | | | — | | | | — | | | | — | | | | — | | | | — | |
| Institutional Class | | | — | | | | — | | | | — | | | | — | | | | — | | | | — | | | | (15,858 | ) | | | (189,453 | ) |
| Total distributions | | | (776 | ) | | | (597 | ) | | | (156 | ) | | | (293 | ) | | | (40,405 | ) | | | (41,909 | ) | | | (29,637 | ) | | | (234,091 | ) |
| Capital stock transactions | | | | | | | | | | | | | | | | | | | | | | | | | | | | | | | | |
| Net proceeds from sale of shares | | | 5,655 | | | | 1,780 | | | | 2,425 | | | | — | | | | 837,025 | | | | 722,959 | | | | 297,180 | | | | 338,472 | |
| Shares issued in reinvestment of income dividends and capital gain distributions | | | 706 | | | | 543 | | | | 156 | | | | 293 | | | | 36,885 | | | | 37,862 | | | | 28,849 | | | | 227,055 | |
| Less cost of shares redeemed | | | (11,608 | ) | | | (10,689 | ) | | | (1,154 | ) | | | (85,049 | ) | | | (835,938 | ) | | | (1,220,568 | ) | | | (305,026 | ) | | | (363,134 | ) |
| Net increase (decrease) in net assets resulting from capital share transactions | | | (5,247 | ) | | | (8,366 | ) | | | 1,427 | | | | (84,756 | ) | | | 37,972 | | | | (459,747 | ) | | | 21,003 | | | | 202,393 | |
| Increase (decrease) in net assets | | | (4,603 | ) | | | (11,069 | ) | | | 1,456 | | | | (86,231 | ) | | | (4,743 | ) | | | (612,137 | ) | | | (3,537 | ) | | | (100,980 | ) |
| Net assets | | | | | | | | | | | | | | | | | | | | | | | | | | | | | | | | |
| Beginning of period | | | 68,509 | | | | 79,578 | | | | 14,574 | | | | 100,805 | | | | 3,683,487 | | | | 4,295,624 | | | | 2,339,169 | | | | 2,440,149 | |
| End of period | | $ | 63,906 | | | $ | 68,509 | | | $ | 16,030 | | | $ | 14,574 | | | $ | 3,678,744 | | | $ | 3,683,487 | | | $ | 2,335,632 | | | $ | 2,339,169 | |
| Accumulated net investment income (loss) at the end of the period | | $ | 586 | | | $ | 491 | | | $ | (62 | ) | | $ | (99 | ) | | $ | 21,204 | | | $ | 22,829 | | | $ | 7,048 | | | $ | (9,291 | ) |
See accompanying Notes to Financial Statements.
| December 31, 2015 | William Blair Funds | 133 |
Statements of Assets and Liabilities
As of December 31, 2015 (dollar amounts in thousands)
| | | International
Small Cap
Growth Fund | | | Emerging
Markets
Leaders
Fund | | | Emerging
Markets
Growth
Fund | | | Emerging
Markets
Small Cap
Growth Fund | |
| Assets | | | | | | | | | | | | | | | | | | |
| Investments in securities, at cost | | | $ | 508,348 | | | $ | 133,592 | | | $ | 907,408 | | | | $ | 286,752 | |
| Investment in affiliated fund, at cost | | | | — | | | | — | | | | 2,743 | | | | | — | |
| Investments in securities, at value | | | $ | 572,610 | | | $ | 127,495 | | | $ | 874,210 | | | | $ | 293,474 | |
| Investment in affiliated fund, at value | | | | — | | | | — | | | | 4,819 | | | | | — | |
| Foreign currency, at value (cost $2,243; $469; $2,252; $3,349) | | | | 2,231 | | | | 469 | | | | 2,250 | | | | | 3,351 | |
| Receivable for securities sold | | | | 411 | | | | 135 | | | | 1,611 | | | | | 2,318 | |
| Receivable for fund shares sold | | | | 856 | | | | 1,052 | | | | 1,542 | | | | | 2,683 | |
| Receivable from Adviser | | | | 46 | | | | 15 | | | | 18 | | | | | 49 | |
| Dividend and interest receivable | | | | 693 | | | | 73 | | | | 469 | | | | | 114 | |
| Total assets | | | | 576,847 | | | | 129,239 | | | | 884,919 | | | | | 301,989 | |
| Liabilities | | | | | | | | | | | | | | | | | | |
| Payable for investment securities purchased | | | | 1,108 | | | | 494 | | | | 3,115 | | | | | 3,701 | |
| Payable for fund shares redeemed | | | | 366 | | | | 841 | | | | 1,567 | | | | | 722 | |
| Management fee payable | | | | 495 | | | | 120 | | | | 832 | | | | | 272 | |
| Shareholder administration fee payable | | | | 46 | | | | 5 | | | | 18 | | | | | 21 | |
| Distribution fee payable | | | | 2 | | | | — | | | | 2 | | | | | 2 | |
| Foreign capital gains tax liability | | | | 27 | | | | — | | | | — | | | | | 181 | |
| Other payables and accrued expenses | | | | 203 | | | | 101 | | | | 274 | | | | | 249 | |
| Total liabilities | | | | 2,247 | | | | 1,561 | | | | 5,808 | | | | | 5,148 | |
| Net assets | | | $ | 574,600 | | | $ | 127,678 | | | $ | 879,111 | | | | $ | 296,841 | |
| Capital | | | | | | | | | | | | | | | | | | |
| Composition of net assets | | | | | | | | | | | | | | | | | | |
| Par value of shares of beneficial interest | | | $ | 42 | | | $ | 16 | | | $ | 80 | | | | $ | 20 | |
| Capital paid in excess of par value | | | | 520,015 | | | | 145,440 | | | | 972,672 | | | | | 297,351 | |
| Accumulated net investment income (loss) | | | | (7,282 | ) | | | 59 | | | | 3,196 | | | | | (2,799 | ) |
| Accumulated net realized gain (loss) | | | | (2,356 | ) | | | (11,738 | ) | | | (65,711 | ) | | | | (4,272 | ) |
| Net unrealized appreciation (depreciation) of investments and foreign currencies | | | | 64,181 | | | | (6,099 | ) | | | (31,126 | ) | | | | 6,541 | |
| Net assets | | | $ | 574,600 | | | $ | 127,678 | | | $ | 879,111 | | | | $ | 296,841 | |
| Class N shares | | | | | | | | | | | | | | | | | | |
| Net assets | | | $ | 11,350 | | | $ | 1,599 | | | $ | 9,367 | | | | $ | 11,306 | |
| Shares outstanding | | | | 840,740 | | | | 206,866 | | | | 863,075 | | | | | 761,760 | |
| Net asset value per share | | | $ | 13.50 | | | $ | 7.73 | | | $ | 10.85 | | | | $ | 14.84 | |
| Class I shares | | | | | | | | | | | | | | | | | | |
| Net assets | | | $ | 342,232 | | | $ | 32,862 | | | $ | 130,491 | | | | $ | 162,375 | |
| Shares outstanding | | | | 25,075,034 | | | | 4,243,472 | | | | 11,900,993 | | | | | 10,903,164 | |
| Net asset value per share | | | $ | 13.65 | | | $ | 7.74 | | | $ | 10.96 | | | | $ | 14.90 | |
| Institutional Class shares | | | | | | | | | | | | | | | | | | |
| Net assets | | | $ | 221,018 | | | $ | 93,217 | | | $ | 739,253 | | | | $ | 123,160 | |
| Shares outstanding | | | | 16,110,360 | | | | 12,044,909 | | | | 66,917,585 | | | | | 8,257,384 | |
| Net asset value per share | | | $ | 13.72 | | | $ | 7.74 | | | $ | 11.05 | | | | $ | 14.92 | |
See accompanying Notes to Financial Statements.
| 134 | Annual Report | December 31, 2015 |
Statements of Operations
For the Year Ended December 31, 2015 (all amounts in thousands)
| | | International
Small Cap
Growth
Fund | | | Emerging
Markets
Leaders
Fund | | | Emerging
Markets
Growth
Fund | | | Emerging
Markets
Small Cap
Growth
Fund | |
| Investment income | | | | | | | | | | | | | | | | | | | |
| Dividends | | | $ | 12,247 | | | | $ | 2,260 | | | $ | 19,215 | | | | $ | 5,286 | |
| Less foreign tax withheld | | | | (1,034 | ) | | | | (220 | ) | | | (2,057 | ) | | | | (533 | ) |
| Total income | | | | 11,213 | | | | | 2,040 | | | | 17,158 | | | | | 4,753 | |
| Expenses | | | | | | | | | | | | | | | | | | | |
| Investment advisory fees | | | | 6,139 | | | | | 1,273 | | | | 10,543 | | | | | 3,267 | |
| Distribution fees | | | | 30 | | | | | 5 | | | | 31 | | | | | 30 | |
| Shareholder administration fees | | | | 569 | | | | | 54 | | | | 268 | | | | | 250 | |
| Custodian fees | | | | 153 | | | | | 113 | | | | 380 | | | | | 303 | |
| Transfer agent fees | | | | 28 | | | | | 12 | | | | 47 | | | | | 43 | |
| Sub-transfer agent fees | | | | | | | | | | | | | | | | | | | |
| Class N | | | | 17 | | | | | 3 | | | | 9 | | | | | 28 | |
| Class I | | | | 299 | | | | | 12 | | | | 122 | | | | | 92 | |
| Professional fees | | | | 102 | | | | | 91 | | | | 130 | | | | | 162 | |
| Registration fees | | | | 57 | | | | | 43 | | | | 54 | | | | | 59 | |
| Shareholder reporting fees | | | | 67 | | | | | 16 | | | | — | | | | | 17 | |
| Trustee fees | | | | 38 | | | | | 5 | | | | 48 | | | | | 12 | |
| Other expenses | | | | 43 | | | | | 11 | | | | 41 | | | | | 18 | |
| Total expenses before expense limitation | | | | 7,542 | | | | | 1,638 | | | | 11,673 | | | | | 4,281 | |
| Expenses waived or reimbursed by the Adviser | | | | (569 | ) | | | | (173 | ) | | | (268 | ) | | | | (430 | ) |
| Net expenses | | | | 6,973 | | | | | 1,465 | | | | 11,405 | | | | | 3,851 | |
| Net investment income (loss) | | | | 4,240 | | | | | 575 | | | | 5,753 | | | | | 902 | |
| Realized and unrealized gain (loss) | | | | | | | | | | | | | | | | | | | |
| Net realized gain (loss) on transactions from: | | | | | | | | | | | | | | | | | | | |
| Investments in securities, net of foreign capital gains taxes, if applicable | | | | 19,344 | | | | | (10,400 | ) | | | (52,040 | )(1) | | | | 4,964 | |
| Foreign currency transactions | | | | (685 | ) | | | | (180 | ) | | | (1,658 | ) | | | | (1,161 | ) |
| Total net realized gain (loss) | | | | 18,659 | | | | | (10,580 | ) | | | (53,698 | ) | | | | 3,803 | |
| Change in net unrealized appreciation (depreciation) of: | | | | | | | | | | | | | | | | | | | |
| Investments in securities | | | | 35,682 | | | | | (9,186 | ) | | | (94,295 | )(2) | | | | (26,559 | ) |
| Foreign currency translations | | | | 575 | | | | | 163 | | | | 2,334 | | | | | 2,272 | |
| Change in net unrealized appreciation (depreciation) | | | | 36,257 | | | | | (9,023 | ) | | | (91,961 | ) | | | | (24,287 | ) |
| Net increase (decrease) in net assets resulting from operations | | | $ | 59,156 | | | | $ | (19,028 | ) | | $ | (139,906 | ) | | | $ | (19,582 | ) |
(1) Includes $18,280 related to an affiliated fund (William Blair China A-Share Fund, LLC).
(2) Includes $(9,807) related to an affiliated fund (William Blair China A-Share Fund, LLC).
See accompanying Notes to Financial Statements.
| December 31, 2015 | William Blair Funds | 135 |
Statements of Changes in Net Assets
For the Years Ended December 31, 2015 and 2014 (all amounts in thousands)
| | | International Small
Cap Growth Fund | | | Emerging Markets
Leaders Fund | | | Emerging Markets
Growth Fund | | | Emerging Markets
Small Cap
Growth Fund | |
| | | 2015 | | | 2014 | | | 2015 | | | 2014 | | | 2015 | | | 2014 | | | 2015 | | | 2014 | |
| Operations | | | | | | | | | | | | | | | | | | | | | | | | | | | | | | | | |
| Net investment income (loss) | | $ | 4,240 | | | $ | 5,384 | | | $ | 575 | | | $ | 633 | | | $ | 5,753 | | | $ | 9,183 | | | $ | 902 | | | $ | 562 | |
| Net realized gain (loss) on investments, and other assets and liabilities | | | 18,659 | | | | 68,350 | | | | (10,580 | ) | | | 2,776 | | | | (53,698 | ) | | | 57,548 | | | | 3,803 | | | | 19,077 | |
| Change in net unrealized appreciation (depreciation) on investments, and other assets and liabilities | | | 36,257 | | | | (142,863 | ) | | | (9,023 | ) | | | (3,517 | ) | | | (91,961 | ) | | | (37,456 | ) | | | (24,287 | ) | | | 7,112 | |
| Net increase (decrease) in net assets resulting from operations | | | 59,156 | | | | (69,129 | ) | | | (19,028 | ) | | | (108 | ) | | | (139,906 | ) | | | 29,275 | | | | (19,582 | ) | | | 26,751 | |
| Distributions to shareholders from | | | | | | | | | | | | | | | | | | | | | | | | | | | | | | | | |
| Net investment income | | | | | | | | | | | | | | | | | | | | | | | | | | | | | | | | |
| Class N | | | (195 | ) | | | (164 | ) | | | — | | | | — | | | | — | | | | (72 | ) | | | — | | | | (16 | ) |
| Class I | | | (7,300 | ) | | | (6,193 | ) | | | (105 | ) | | | (69 | ) | | | — | | | | (1,383 | ) | | | — | | | | (584 | ) |
| Institutional Class | | | (4,603 | ) | | | (4,459 | ) | | | (331 | ) | | | (303 | ) | | | — | | | | (8,124 | ) | | | (1 | ) | | | (767 | ) |
| Net realized gain | | | | | | | | | | | | | | | | | | | | | | | | | | | | | | | | |
| Class N | | | (29 | ) | | | (1,818 | ) | | | (2 | ) | | | (33 | ) | | | (107 | ) | | | (690 | ) | | | (474 | ) | | | (433 | ) |
| Class I | | | (919 | ) | | | (53,418 | ) | | | (44 | ) | | | (718 | ) | | | (1,427 | ) | | | (8,947 | ) | | | (6,262 | ) | | | (4,971 | ) |
| Institutional Class | | | (557 | ) | | | (32,680 | ) | | | (126 | ) | | | (1,894 | ) | | | (8,324 | ) | | | (41,802 | ) | | | (4,988 | ) | | | (5,350 | ) |
| Total distributions | | | (13,603 | ) | | | (98,732 | ) | | | (608 | ) | | | (3,017 | ) | | | (9,858 | ) | | | (61,018 | ) | | | (11,725 | ) | | | (12,121 | ) |
| Capital stock transactions | | | | | | | | | | | | | | | | | | | | | | | | | | | | | | | | |
| Net proceeds from sale of shares | | | 78,346 | | | | 158,782 | | | | 81,180 | | | | 57,003 | | | | 315,208 | | | | 196,777 | | | | 123,362 | | | | 96,155 | |
| Shares issued in reinvestment of income dividends and capital gain distributions | | | 11,877 | | | | 83,789 | | | | 549 | | | | 2,742 | | | | 8,609 | | | | 52,055 | | | | 9,559 | | | | 9,684 | |
| Less cost of shares redeemed | | | (184,116 | ) | | | (387,962 | ) | | | (40,597 | ) | | | (23,496 | ) | | | (280,776 | ) | | | (231,277 | ) | | | (58,676 | ) | | | (25,665 | ) |
| Net increase (decrease) in net assets resulting from capital share transactions | | | (93,893 | ) | | | (145,391 | ) | | | 41,132 | | | | 36,249 | | | | 43,041 | | | | 17,555 | | | | 74,245 | | | | 80,174 | |
| Increase (decrease) in net assets | | | (48,340 | ) | | | (313,252 | ) | | | 21,496 | | | | 33,124 | | | | (106,723 | ) | | | (14,188 | ) | | | 42,938 | | | | 94,804 | |
| Net assets | | | | | | | | | | | | | | | | | | | | | | | | | | | | | | | | |
| Beginning of period | | | 622,940 | | | | 936,192 | | | | 106,182 | | | | 73,058 | | | | 985,834 | | | | 1,000,022 | | | | 253,903 | | | | 159,099 | |
| End of period | | $ | 574,600 | | | $ | 622,940 | | | $ | 127,678 | | | $ | 106,182 | | | $ | 879,111 | | | $ | 985,834 | | | $ | 296,841 | | | $ | 253,903 | |
| Accumulated net investment income (loss) at the end of the period | | $ | (7,282 | ) | | $ | (5,614 | ) | | $ | 59 | | | $ | (230 | ) | | $ | 3,196 | | | $ | (3,688 | ) | | $ | (2,799 | ) | | $ | (1,853 | ) |
See accompanying Notes to Financial Statements.
| 136 | Annual Report | December 31, 2015 |
Statements of Assets and Liabilities
As of December 31, 2015 (dollar amounts in thousands)
| | | Bond
Fund | | | Income
Fund | | | Low
Duration
Fund | | | Macro
Allocation
Fund | |
| Assets | | | | | | | | | | | | | | | | |
| Investments in securities, at cost | | $ | 463,264 | | | $ | 90,511 | | | $ | 129,009 | | | $ | 1,307,062 | |
| Investments in affiliated companies, at cost | | | — | | | | — | | | | — | | | | 19,381 | |
| Repurchase agreement, at cost | | | 15,197 | | | | 5,007 | | | | 1,422 | | | | 382,337 | |
| Investments in securities, at value | | $ | 460,944 | | | $ | 90,246 | | | $ | 128,413 | | | $ | 1,268,314 | |
| Investments in affiliated companies, at value | | | — | | | | — | | | | — | | | | 15,817 | |
| Repurchase agreement, at value | | | 15,197 | | | | 5,007 | | | | 1,422 | | | | 382,337 | |
| Cash | | | — | | | | — | | | | — | | | | 67,867 | |
| Receivable for securities sold | | | — | | | | — | | | | 10,092 | | | | — | |
| Receivable for fund shares sold | | | 2,909 | | | | 612 | | | | 2,019 | | | | 11,841 | |
| Receivable for variation margin on futures | | | — | | | | — | | | | — | | | | 5,560 | |
| Receivable for variation margin on centrally cleared swaps | | | — | | | | — | | | | — | | | | 3 | |
| Receivable from Adviser | | | 57 | | | | — | | | | 18 | | | | 170 | |
| Dividend and interest receivable | | | 3,389 | | | | 469 | | | | 305 | | | | 2,965 | |
| Unrealized appreciation on swap contracts | | | — | | | | — | | | | — | | | | 60 | |
| Unrealized appreciation on forward foreign currency contracts | | | — | | | | — | | | | — | | | | 1,733 | |
| Total assets | | | 482,496 | | | | 96,334 | | | | 142,269 | | | | 1,756,667 | |
| Liabilities | | | | | | | | | | | | | | | | |
| Securities sold, not yet purchased (proceeds $— ; $— ; $10,092 ; $—) | | | — | | | | — | | | | 10,080 | | | | — | |
| Option written, at value (proceeds $— ; $— ; $— ; $652) | | | — | | | | — | | | | — | | | | 261 | |
| Payable for fund shares redeemed | | | 1,282 | | | | 563 | | | | 328 | | | | 12,696 | |
| Swap premium received | | | — | | | | — | | | | — | | | | 5,866 | |
| Unrealized depreciation on swap contracts | | | — | | | | — | | | | — | | | | 4,002 | |
| Management fee payable | | | 120 | | | | 27 | | | | 34 | | | | 1,190 | |
| Shareholder administration fee payable | | | 47 | | | | — | | | | 14 | | | | 170 | |
| Distribution fee payable | | | 18 | | | | 4 | | | | — | | | | 36 | |
| Distributions payable to shareholders | | | 107 | | | | 3 | | | | 43 | | | | — | |
| Other payables and accrued expenses | | | 128 | | | | 73 | | | | 58 | | | | 559 | |
| Total liabilities | | | 1,702 | | | | 670 | | | | 10,557 | | | | 24,780 | |
| Net assets | | $ | 480,794 | | | $ | 95,664 | | | $ | 131,712 | | | $ | 1,731,887 | |
| Capital | | | | | | | | | | | | | | | | |
| Composition of net assets | | | | | | | | | | | | | | | | |
| Par value of shares of beneficial interest | | $ | 47 | | | $ | 11 | | | $ | 14 | | | $ | 152 | |
| Capital paid in excess of par value | | | 485,327 | | | | 116,985 | | | | 149,595 | | | | 1,901,743 | |
| Accumulated net investment income (loss) | | | 24 | | | | 10 | | | | 22 | | | | (10,874 | ) |
| Accumulated net realized gain (loss) | | | (2,247 | ) | | | (21,077 | ) | | | (17,335 | ) | | | (117,647 | ) |
| Net unrealized appreciation (depreciation) of investments and foreign currencies | | | (2,357 | ) | | | (265 | ) | | | (584 | ) | | | (41,487 | ) |
| Net assets | | $ | 480,794 | | | $ | 95,664 | | | $ | 131,712 | | | $ | 1,731,887 | |
| Class N shares | | | | | | | | | | | | | | | | |
| Net assets | | $ | 139,303 | | | $ | 32,942 | | | $ | 2,712 | | | $ | 150,606 | |
| Shares outstanding | | | 13,468,692 | | | | 3,703,406 | | | | 295,956 | | | | 13,308,491 | |
| Net asset value per share | | $ | 10.34 | | | $ | 8.90 | | | $ | 9.16 | | | $ | 11.32 | |
| Class I shares | | | | | | | | | | | | | | | | |
| Net assets | | $ | 237,587 | | | $ | 62,722 | | | $ | 107,137 | | | $ | 1,155,051 | |
| Shares outstanding | | | 23,207,736 | | | | 7,102,341 | | | | 11,692,059 | | | | 101,500,055 | |
| Net asset value per share | | $ | 10.24 | | | $ | 8.83 | | | $ | 9.16 | | | $ | 11.38 | |
| Institutional Class shares | | | | | | | | | | | | | | | | |
| Net assets | | $ | 103,904 | | | | — | | | $ | 21,863 | | | $ | 426,230 | |
| Shares outstanding | | | 10,157,364 | | | | — | | | | 2,385,995 | | | | 37,407,939 | |
| Net asset value per share | | $ | 10.23 | | | | — | | | $ | 9.16 | | | $ | 11.39 | |
See accompanying Notes to Financial Statements.
| December 31, 2015 | William Blair Funds | 137 |
Statements of Operations
For the Year Ended December 31, 2015 (all amounts in thousands)
| | | Bond
Fund | | | Income
Fund | | | Low
Duration
Fund | | | Macro
Allocation
Fund | |
| Investment income | | | | | | | | | | | | | | | | | | | | |
| Dividends | | | $ | — | | | | $ | — | | | | $ | — | | | | $ | 24,954 | (1) |
| Interest | | | | 10,905 | | | | | 2,506 | | | | | 2,079 | | | | | 301 | |
| Total income | | | | 10,905 | | | | | 2,506 | | | | | 2,079 | | | | | 25,255 | |
| Expenses | | | | | | | | | | | | | | | | | | | | |
| Investment advisory fees | | | | 982 | | | | | 371 | | | | | 479 | | | | | 11,699 | |
| Distribution fees | | | | 79 | | | | | 53 | | | | | 6 | | | | | 520 | |
| Shareholder administration fees | | | | 352 | | | | | — | | | | | 172 | | | | | 1,785 | |
| Custodian fees | | | | 69 | | | | | 45 | | | | | 68 | | | | | 147 | |
| Transfer agent fees | | | | 43 | | | | | 17 | | | | | 17 | | | | | 353 | |
| Sub-transfer agent fees | | | | | | | | | | | | | | | | | | | | |
| Class N | | | | 57 | | | | | 51 | | | | | 2 | | | | | 268 | |
| Class I | | | | 104 | | | | | 22 | | | | | 25 | | | | | 979 | |
| Professional fees | | | | 55 | | | | | 33 | | | | | 44 | | | | | 273 | |
| Registration fees | | | | 59 | | | | | 35 | | | | | 45 | | | | | 134 | |
| Shareholder reporting fees | | | | 8 | | | | | 4 | | | | | — | | | | | 149 | |
| Trustee fees | | | | 14 | | | | | 5 | | | | | 8 | | | | | 53 | |
| Other expenses | | | | 17 | | | | | 8 | | | | | 12 | | | | | 312 | |
| Total expenses before expense limitation | | | | 1,839 | | | | | 644 | | | | | 878 | | | | | 16,672 | |
| Expenses waived or reimbursed by the Adviser | | | | (453 | ) | | | | — | | | | | (208 | ) | | | | (1,785 | ) |
| Net expenses | | | | 1,386 | | | | | 644 | | | | | 670 | | | | | 14,887 | |
| Net investment income (loss) | | | | 9,519 | | | | | 1,862 | | | | | 1,409 | | | | | 10,368 | |
| Realized and unrealized gain (loss) | | | | | | | | | | | | | | | | | | | | |
| Net realized gain (loss) on transactions from: | | | | | | | | | | | | | | | | | | | | |
| Investments in securities | | | | 618 | | | | | (28 | ) | | | | (531 | ) | | | | (30,907 | )(2) |
| Options | | | | (121 | ) | | | | (60 | ) | | | | (121 | ) | | | | (10,114 | ) |
| Futures contracts | | | | — | | | | | — | | | | | — | | | | | (8,670 | ) |
| Swaps | | | | 17 | | | | | — | | | | | — | | | | | (47,497 | ) |
| Forward foreign currency contracts | | | | — | | | | | — | | | | | — | | | | | (8,735 | ) |
| Foreign currency transactions | | | | — | | | | | — | | | | | — | | | | | (1,809 | ) |
| Total net realized gain (loss) | | | | 514 | | | | | (88 | ) | | | | (652 | ) | | | | (107,732 | ) |
| Change in net unrealized appreciation (depreciation) of: | | | | | | | | | | | | | | | | | | | | |
| Investments in securities | | | | (11,369 | ) | | | | (1,293 | ) | | | | (316 | ) | | | | (44,065 | )(3) |
| Options | | | | 49 | | | | | 25 | | | | | 49 | | | | | (7,713 | ) |
| Futures contracts | | | | — | | | | | — | | | | | — | | | | | 4,953 | |
| Swaps | | | | (20 | ) | | | | — | | | | | — | | | | | 11,813 | |
| Forward foreign currency contracts | | | | — | | | | | — | | | | | — | | | | | (5,467 | ) |
| Foreign currency translations | | | | — | | | | | — | | | | | — | | | | | (139 | ) |
| Change in net unrealized appreciation (depreciation) | | | | (11,340 | ) | | | | (1,268 | ) | | | | (267 | ) | | | | (40,618 | ) |
| Net increase (decrease) in net assets resulting from operations | | | $ | (1,307 | ) | | | $ | 506 | | | | $ | 490 | | | | $ | (137,982 | ) |
(1) Includes $653 from companies deemed affiliated during the year or at December 31, 2015.
(2) Includes $(3,095) from companies deemed affiliated during the year or at December 31, 2015.
(3) Includes $(5,159) from companies deemed affiliated during the year or at December 31, 2015.
See accompanying Notes to Financial Statements.
| 138 | Annual Report | December 31, 2015 |
Statements of Changes in Net Assets
For the Years Ended December 31, 2015 and 2014 (all amounts in thousands)
| | | Bond Fund | | | Income Fund | | | Low Duration Fund | | | Macro Allocation Fund | |
| | | 2015 | | | 2014 | | | 2015 | | | 2014 | | | 2015 | | | 2014 | | | 2015 | | | 2014(a) | | | 2014(b) | |
| Operations | | | | | | | | | | | | | | | | | | | | | | | | | | | | | | | | | | | | |
| Net investment income (loss) | | $ | 9,519 | | | $ | 8,066 | | | $ | 1,862 | | | $ | 2,155 | | | $ | 1,409 | | | $ | 2,236 | | | $ | 10,368 | | | $ | 3,622 | | | $ | 1,769 | |
| Net realized gain (loss) on investments, and other assets and liabilities | | | 514 | | | | 1,868 | | | | (88 | ) | | | 864 | | | | (652 | ) | | | (639 | ) | | | (107,732 | ) | | | 16,476 | | | | 9,286 | |
| Change in net unrealized appreciation (depreciation) on investments, and other assets and liabilities | | | (11,340 | ) | | | 3,438 | | | | (1,268 | ) | | | 157 | | | | (267 | ) | | | 471 | | | | (40,618 | ) | | | (38,838 | ) | | | 28,167 | |
| Net increase (decrease) in net assets resulting from operations | | | (1,307 | ) | | | 13,372 | | | | 506 | | | | 3,176 | | | | 490 | | | | 2,068 | | | | (137,982 | ) | | | (18,740 | ) | | | 39,222 | |
| Distributions to shareholders from | | | | | | | | | | | | | | | | | | | | | | | | | | | | | | | | | | | | |
| Net investment income | | | | | | | | | | | | | | | | | | | | | | | | | | | | | | | | | | | | |
| Class N | | | (1,822 | ) | | | (463 | ) | | | (1,007 | ) | | | (1,089 | ) | | | (95 | ) | | | (138 | ) | | | (915 | ) | | | (7,774 | ) | | | (868 | ) |
| Class I | | | (6,812 | ) | | | (5,570 | ) | | | (1,971 | ) | | | (1,984 | ) | | | (2,839 | ) | | | (3,119 | ) | | | (10,747 | ) | | | (32,682 | ) | | | (1,927 | ) |
| Institutional Class | | | (3,598 | ) | | | (3,958 | ) | | | — | | | | — | | | | (1,185 | ) | | | (1,371 | ) | | | (4,368 | ) | | | (8,256 | ) | | | (41 | ) |
| Net realized gain | | | | | | | | | | | | | | | | | | | | | | | | | | | | | | | | | | | | |
| Class N | | | — | | | | — | | | | — | | | | — | | | | — | | | | — | | | | — | | | | — | | | | (2,106 | ) |
| Class I | | | — | | | | (3 | ) | | | — | | | | — | | | | — | | | | — | | | | — | | | | — | | | | (4,366 | ) |
| Institutional Class | | | — | | | | (2 | ) | | | — | | | | — | | | | — | | | | — | | | | — | | | | — | | | | (89 | ) |
| Total distributions | | | (12,232 | ) | | | (9,996 | ) | | | (2,978 | ) | | | (3,073 | ) | | | (4,119 | ) | | | (4,628 | ) | | | (16,030 | ) | | | (48,712 | ) | | | (9,397 | ) |
| Capital stock transactions | | | | | | | | | | | | | | | | | | | | | | | | | | | | | | | | | | | | |
| Net proceeds from sale of shares | | | 300,131 | | | | 59,547 | | | | 24,005 | | | | 19,953 | | | | 47,534 | | | | 82,798 | | | | 1,559,297 | | | | 140,703 | | | | 760,807 | |
| Shares issued in reinvestment of income dividends and capital gain distributions | | | 9,535 | | | | 7,797 | | | | 2,686 | | | | 2,700 | | | | 3,096 | | | | 3,419 | | | | 14,020 | | | | 33,755 | | | | 6,241 | |
| Less cost of shares redeemed | | | (78,860 | ) | | | (52,048 | ) | | | (27,409 | ) | | | (29,716 | ) | | | (92,786 | ) | | | (80,386 | ) | | | (646,104 | ) | | | (67,083 | ) | | | (205,482 | ) |
| Net increase (decrease) in net assets resulting from capital share transactions | | | 230,806 | | | | 15,296 | | | | (718 | ) | | | (7,063 | ) | | | (42,156 | ) | | | 5,831 | | | | 927,213 | | | | 107,375 | | | | 561,566 | |
| Increase (decrease) in net assets | | | 217,267 | | | | 18,672 | | | | (3,190 | ) | | | (6,960 | ) | | | (45,785 | ) | | | 3,271 | | | | 773,201 | | | | 39,923 | | | | 591,391 | |
| Net assets | | | | | | | | | | | | | | | | | | | | | | | | | | | | | | | | | | | | |
| Beginning of period | | | 263,527 | | | | 244,855 | | | | 98,854 | | | | 105,814 | | | | 177,497 | | | | 174,226 | | | | 958,686 | | | | 918,763 | | | | 327,372 | |
| End of period | | $ | 480,794 | | | $ | 263,527 | | | $ | 95,664 | | | $ | 98,854 | | | $ | 131,712 | | | $ | 177,497 | | | $ | 1,731,887 | | | $ | 958,686 | | | $ | 918,763 | |
| Accumulated net investment income (loss) at the end of the period | | $ | 24 | | | $ | 2 | | | $ | 10 | | | $ | 10 | | | $ | 22 | | | $ | — | | | $ | (10,874 | ) | | $ | 4,123 | | | $ | 17,367 | |
(a) For the period from November 1, 2014 to December 31, 2014. On October 31, 2014, the Board of Trustees approved a change in the Macro Allocation Fund’s fiscal year end from October 31 to December 31.
(b) For the year ended October 31, 2014.
See accompanying Notes to Financial Statements.
| December 31, 2015 | William Blair Funds | 139 |
Notes to Financial Statements
(1) Organization
(a) Description of the Trust
William Blair Funds (the “Trust”) is a mutual fund registered under the Investment Company Act of 1940 (the “1940 Act”), as amended, as an open-end management investment company. The Trust currently consists of the following twenty-four funds (the “Funds”), each with its own investment objective and policies. For each Fund, the number of shares authorized is unlimited.
Domestic Equity Funds
Growth
Large Cap Growth
Large Cap Value
Mid Cap Growth
Mid Cap Value
Small-Mid Cap Growth
Small-Mid Cap Value
Small Cap Growth
Small Cap Value
Global Equity Funds
Global Leaders
Global Small Cap Growth
Multi-Asset and Alternative Fund
Macro Allocation
International Equity Funds
International Leaders
International Equity
Institutional International Equity
International Growth
Institutional International Growth
International Small Cap Growth
Emerging Markets Leaders
Emerging Markets Growth
Emerging Markets Small Cap Growth
Fixed Income Funds
Bond
Income
Low Duration
Prior to July 1, 2015, William Blair & Company, L.L.C. (“WBC” or the “Distributor”) served as both the Trust’s investment adviser and the Trust’s principal underwriter and distributor. Effective July 1, 2015, WBC transferred the management agreement for the Trust to William Blair Investment Management, LLC (“WBIM”). There were no changes to the Funds’ portfolio management teams or principal investment strategies as a result of the transfer. Any reference to the “Adviser” prior to July 1, 2015 should be read to mean WBC; any reference to the “Adviser” subsequent to July 1, 2015 should be read to mean WBIM. WBC continues to serve as the principal underwriter and distributor of the Trust.
On October 27, 2015, upon the recommendation of the Adviser, the Fund’s Board of Trustees determined that it was in the best interest of Global Small Cap Growth Fund to redeem all shares of Global Small Cap Growth Fund outstanding on January 15, 2016, and then to terminate Global Small Cap Growth Fund. Global Small Cap Growth Fund was terminated on January 15, 2016, at which time all outstanding shares of Global Small Cap Growth Fund were redeemed.
(b) Share Classes
Three different classes of shares currently exist: N, I and Institutional.
Class N shares are offered to the general public, either directly through the Trust’s distributor or through a select number of financial intermediaries. Class N shares are sold without any sales load, and carry an annual 12b-1 distribution fee (0.25% for the Domestic Equity, Global Equity, International Equity and Multi-Asset and Alternative Funds and 0.15% for the Fixed Income Funds), a sub-transfer agent fee that is not a fixed rate and may vary by Fund and class, and an annual shareholder administration fee (0.15% for Global Leaders, Global Small Cap Growth, International Leaders, International Small Cap Growth, Emerging Markets Leaders, Emerging Markets Growth, Emerging Markets Small Cap Growth, Bond, Low Duration and Macro Allocation Funds). The shareholder administration fee is currently being waived. This waiver will not be removed without approval of the Board of Trustees.
Class I shares are offered to a limited group of investors. They do not carry any sales load or distribution fees and generally have lower ongoing expenses than the Class N shares. Class I shares have a sub-transfer agent fee that is not a fixed rate and may vary by Fund and class, and an annual shareholder administration fee (0.15% for Global Leaders, Global Small Cap Growth, International Leaders, International Small Cap Growth, Emerging Markets Leaders, Emerging Markets Growth, Emerging Markets Small Cap Growth, Bond, Low Duration and Macro Allocation Funds). The shareholder administration fee is currently being waived. This waiver will not be removed without approval of the Board of Trustees.
| 140 | Annual Report | December 31, 2015 |
Institutional Class shares are offered to institutional investors, including but not limited to employee benefit plans, endowments, foundations, trusts and corporations, who are able to meet the share class’s high minimum investment requirement. The minimum initial investment required is $5 million.
Sub-transfer agent fees: For Class N and Class I shares, the Funds may reimburse WBC for fees paid to intermediaries such as banks, broker-dealers, financial advisers or other financial institutions for sub-administration, sub-transfer agency and other services provided to investors whose shares are held of record in omnibus, other group accounts, retirement plans or accounts traded through registered securities clearing agents. These fees may vary based on, for example, the nature of services provided, but generally range up to 0.15% of the assets of the class serviced or maintained by the intermediary or up to $15 per sub-account maintained by the intermediary.
(c) Fund Objectives
The investment objectives of the Funds are as follows:
| Domestic Equity | Long-term capital appreciation. |
| Global Equity | Long-term capital appreciation. |
| International Equity | Long-term capital appreciation. |
| Fixed Income | High level of current income with relative stability of principal. |
| | (Maximize total return-Low Duration). |
| Multi-Asset and Alternative | Maximize long-term risk-adjusted total return. |
(2) Significant Accounting Policies
The following is a summary of the Trust’s significant accounting policies in effect during the periods covered by the financial statements, which are in accordance with U.S. generally accepted accounting principles, which includes the accounting and reporting guidelines under Accounting Standards Topic 946, Financial Services—Investment Companies.
(a) Investment income and transactions
Investment income, realized and unrealized gains and losses, and certain Fund level expenses and expense reductions, if any, are allocated based on the relative net assets of each class, except for certain class specific expenses, which are charged directly to the appropriate class. Differences in class expenses may result in the payment of different per share dividends by class. All share classes of the Funds have equal rights with respect to voting, subject to class specific arrangements.
Dividend income and expense are recorded on the ex-dividend date, except for those dividends from certain foreign securities that are recorded when the information is available.
Interest income is recorded on an accrual basis, adjusted for amortization of premium or accretion of discount. Variable rate bonds and floating rate notes earn interest at coupon rates that fluctuate at specific time intervals. The interest rates shown in the Portfolio of Investments for the Bond, Income, Low Duration and Macro Allocation Funds were the rates in effect on December 31, 2015. Put bonds may be redeemed at the discretion of the holder on specified dates prior to maturity.
Premiums and discounts are amortized and accreted on a straight-line basis for short-term investments and on an effective interest method for long-term investments.
Paydown gains and losses on mortgage-backed and asset-backed securities are treated as an adjustment to interest income. For the year ended December 31, 2015, the Bond, Income and Low Duration Funds recognized a reduction of interest income and a decrease of net realized loss of $2,889, $1,117 and $2,725, respectively (in thousands). This reclassification had no effect on the net asset value or the net assets of the Funds.
| December 31, 2015 | William Blair Funds | 141 |
The Funds do not isolate that portion of the results of operations resulting from changes in foreign exchange rates on investments from the fluctuations arising from changes in value of securities held. Such fluctuations are included with the net realized and unrealized gain or loss from investments.
Reported net realized foreign currency gains or losses arise from disposition of foreign currency, the difference in the foreign exchange rates between the trade and settlement dates on securities transactions, and the difference between the amounts of dividends, interest and foreign withholding taxes recorded on the ex-date or accrual date and the U.S. dollar equivalent of the amounts actually received or paid. Net unrealized foreign exchange gains and losses arise from changes (due to the changes in the exchange rate) in the value of foreign currency and other assets and liabilities denominated in foreign currencies held at year end.
Security and shareholder transactions are accounted for no later than one business day following the trade date. However, for financial reporting purposes, security and shareholder transactions are accounted for on the trade date of the last business day of the reporting period. Realized gains and losses from securities transactions are recognized on a specifically identified cost basis.
Awards from class action litigation may be recorded as a reduction of cost. If the Funds no longer own the applicable securities, the proceeds are recorded as realized gains.
(b) Share Valuation and Distributions to Shareholders
Shares are sold and redeemed on a continuous basis at net asset value. The net asset value per share is determined separately for each class by dividing the Fund’s net assets attributable to that class by the number of shares of the class outstanding as of the close of regular trading on the New York Stock Exchange (the “NYSE”), which is generally 4:00 p.m. Eastern time, on each day the NYSE is open.
Distributions from net investment income, if any, for all Equity and Multi-Asset and Alternative Funds are declared and paid at least annually. Distributions from net investment income for the Bond, Income and Low Duration Funds are declared daily and paid monthly. Capital gain distributions, if any, for all Funds, are declared and paid at least annually in December. Distributions payable to shareholders are recorded on the ex-dividend date.
(c) Foreign Currency Translation
The Funds may invest in securities denominated in foreign currencies. As such, assets and liabilities denominated in foreign currencies are translated into U.S. dollar amounts at the current exchange rate on the date of valuation. The values of foreign investments, open forward foreign currency contracts, and cash denominated in foreign currencies are translated into U.S. dollars using a spot market rate of exchange as of the time of the determination of each Fund’s Net Asset Value, typically 4:00 p.m. Eastern time on days when there is regular trading on the NYSE. Payables and receivables for securities transactions, dividends, interest income and tax reclaims are translated into U.S. dollars using a spot market rate of exchange as of 4:00 p.m. Eastern time. Settlement of purchases and sales and dividend and interest receipts are translated into U.S. dollars using a spot market rate of exchange as of 11:00 a.m. Eastern time.
(d) Income Taxes
Each Fund intends to comply with the provisions of Subchapter M of the Internal Revenue Code available to regulated investment companies. Each Fund intends to make the requisite distributions of income and capital gains to its shareholders sufficient to relieve it from all, or substantially all, federal income and excise taxes. No provision for federal income and excise taxes has been made.
Certain Funds may be subject to foreign income taxes imposed on realized gains on securities of issuers from certain foreign countries. Such taxes, if applicable, are included within net realized gain (loss) on transactions from investments in securities on the Statement of Operations.
Management has evaluated all of the uncertain tax positions of the Funds and has determined that no liability is required to be recorded in the financial statements.
The statute of limitations on the Funds’ prior three years tax returns remain open and the returns are subject to examination.
| 142 | Annual Report | December 31, 2015 |
Adjustments to the cost of investments for tax purposes are due to the deferred loss associated with current and prior year wash sales, income recognition from investments in real estate investment trusts and partnerships, and the Funds’ election to mark-to-market their investments in Passive Foreign Investment Companies (“PFICs”). The cost of investments for federal income tax purposes and related gross unrealized appreciation (depreciation) and net unrealized appreciation/(depreciation) at December 31, 2015, were as follows (in thousands):
| Fund | |
Cost of
Investments | |
Gross
Unrealized
Appreciation | |
Gross
Unrealized
Depreciation | | Net
Unrealized
Appreciation/
(Depreciation) |
| Growth | | | $ 674,018 | | | | $181,635 | | | | $ 12,596 | | | | $169,039 | |
| Large Cap Growth | | | 56,383 | | | | 13,925 | | | | 1,284 | | | | 12,641 | |
| Large Cap Value | | | 2,809 | | | | 503 | | | | 162 | | | | 341 | |
| Mid Cap Growth | | | 186,883 | | | | 20,531 | | | | 9,049 | | | | 11,482 | |
| Mid Cap Value | | | 2,289 | | | | 514 | | | | 134 | | | | 380 | |
| Small-Mid Cap Growth | | | 1,047,797 | | | | 186,598 | | | | 41,332 | | | | 145,266 | |
| Small-Mid Cap Value | | | 3,686 | | | | 579 | | | | 252 | | | | 327 | |
| Small Cap Growth | | | 336,048 | | | | 60,321 | | | | 23,834 | | | | 36,487 | |
| Small Cap Value | | | 548,221 | | | | 95,632 | | | | 33,527 | | | | 62,105 | |
| Global Leaders | | | 170,338 | | | | 22,859 | | | | 5,820 | | | | 17,039 | |
| Global Small Cap Growth | | | 16,703 | | | | 2,540 | | | | 777 | | | | 1,763 | |
| International Leaders | | | 105,490 | | | | 13,491 | | | | 3,621 | | | | 9,870 | |
| International Equity | | | 58,746 | | | | 8,466 | | | | 3,645 | | | | 4,821 | |
| Institutional International Equity | | | 15,344 | | | | 1,693 | | | | 988 | | | | 705 | |
| International Growth | | | 3,378,689 | | | | 449,626 | | | | 158,552 | | | | 291,074 | |
| Institutional International Growth | | | 2,155,207 | | | | 276,912 | | | | 100,207 | | | | 176,705 | |
| International Small Cap Growth | | | 516,683 | | | | 77,313 | | | | 21,386 | | | | 55,927 | |
| Emerging Markets Leaders | | | 136,594 | | | | 6,046 | | | | 15,145 | | | | (9,099 | ) |
| Emerging Markets Growth | | | 925,539 | | | | 48,683 | | | | 95,193 | | | | (46,510 | ) |
| Emerging Markets Small Cap Growth | | | 292,508 | | | | 15,333 | | | | 14,367 | | | | 966 | |
| Bond | | | 478,472 | | | | 5,761 | | | | 8,092 | | | | (2,331 | ) |
| Income | | | 95,518 | | | | 976 | | | | 1,241 | | | | (265 | ) |
| Low Duration | | | 130,435 | | | | 348 | | | | 948 | | | | (600 | ) |
| Macro Allocation | | | 1,713,032 | | | | 10,953 | | | | 57,517 | | | | (46,564 | ) |
In addition, the Funds may periodically record reclassifications among certain capital accounts to reflect differences between financial reporting and income tax basis distributions. The reclassifications were reported in order to reflect the tax treatment for certain permanent differences that exist between income tax regulations and U.S. generally accepted accounting principles. The reclassifications generally relate to net operating losses, Section 988 currency gains and losses, PFIC gains and losses, expiration of capital loss carryforward, paydown gains and losses, investments in real estate investment trusts and partnerships, and utilization of earnings and profits distributed to shareholders on redemption of shares. These reclassifications have no impact on the net asset values of the Funds. Accordingly, at December 31, 2015, the following reclassifications were recorded (in thousands):
| December 31, 2015 | William Blair Funds | 143 |
| Fund | | Accumulated
Undistributed
Net Investment
Income (Loss) | | Accumulated
Undistributed
Net Realized
Gain/(Loss) | |
Capital Paid
in Excess
of Par Value |
| Growth | | | $ 250 | | | | $ 118 | | | | $ (368 | ) |
| Large Cap Growth | | | 4 | | | | (4 | ) | | | — | |
| Large Cap Value | | | (3 | ) | | | 3 | | | | — | |
| Mid Cap Growth | | | 1,275 | | | | 13 | | | | (1,288 | ) |
| Mid Cap Value | | | (5 | ) | | | 4 | | | | 1 | |
| Small-Mid Cap Growth | | | 3,239 | | | | 513 | | | | (3,752 | ) |
| Small-Mid Cap Value | | | (6 | ) | | | 7 | | | | (1 | ) |
| Small Cap Growth | | | 3,146 | | | | 193 | | | | (3,339 | ) |
| Small Cap Value | | | (808 | ) | | | 808 | | | | — | |
| Global Leaders | | | (187 | ) | | | 187 | | | | — | |
| Global Small Cap Growth | | | 72 | | | | (799 | ) | | | 727 | |
| International Leaders | | | (34 | ) | | | 34 | | | | — | |
| International Equity | | | (4 | ) | | | 3 | | | | 1 | |
| Institutional International Equity | | | (1 | ) | | | 3 | | | | (2 | ) |
| International Growth | | | 3,097 | | | | (3,097 | ) | | | — | |
| Institutional International Growth | | | 1,512 | | | | (1,512 | ) | | | — | |
| International Small Cap Growth | | | 6,190 | | | | (6,188 | ) | | | (2 | ) |
| Emerging Markets Leaders | | | 150 | | | | (147 | ) | | | (3 | ) |
| Emerging Markets Growth | | | 1,131 | | | | (1,134 | ) | | | 3 | |
| Emerging Markets Small Cap Growth | | | (1,847 | ) | | | 2,305 | | | | (458 | ) |
| Bond | | | 2,735 | | | | (2,734 | ) | | | (1 | ) |
| Income | | | 1,116 | | | | 8,074 | | | | (9,190 | ) |
| Low Duration | | | 2,732 | | | | (2,732 | ) | | | — | |
| Macro Allocation | | | (9,335 | ) | | | 9,335 | | | | — | |
The timing and characterization of certain income and capital gain distributions are determined annually in accordance with federal income tax regulations that may differ from U.S. generally accepted accounting principles. As a result, net investment income or loss and net realized gain or loss for a reporting period may differ from the amount distributed during such period.
Distributions from net realized gains for book purposes may include short-term capital gains, which are included as ordinary income for tax purposes. The tax character of distributions paid during 2015 and 2014 was as follows (in thousands):
| | | Distributions Paid in 2015 | | | Distributions Paid in 2014 | |
| | | Ordinary | | | Long-Term | | | Ordinary | | | Long-Term | |
| | | Income | | | Capital Gains | | | Income | | | Capital Gains | |
| Fund | | Class N | | | Class I | | | Class N | | | Class I | | | Class N | | | Class I | | | Class N | | | Class I | |
| Growth | | | $ 416 | | | | $ 1,808 | | | | $18,110 | | | | $78,627 | | | | $2,675 | | | | $ 6,408 | | | | $35,886 | | | | $85,974 | |
| Large Cap Growth | | | 17 | | | | 89 | | | | 954 | | | | 5,176 | | | | 60 | | | | 342 | | | | 706 | | | | 4,053 | |
| Large Cap Value | | | 9 | | | | 25 | | | | 124 | | | | 230 | | | | 19 | | | | 50 | | | | 119 | | | | 263 | |
| Mid Cap Growth | | | — | | | | — | | | | 5,530 | | | | 35,853 | | | | — | | | | — | | | | 4,943 | | | | 43,297 | |
| Mid Cap Value | | | 2 | | | | 10 | | | | 149 | | | | 438 | | | | 2 | | | | 50 | | | | 23 | | | | 442 | |
| Small-Mid Cap Growth | | | 13 | | | | 75 | | | | 8,551 | | | | 50,513 | | | | — | | | | — | | | | 6,031 | | | | 62,751 | |
| Small-Mid Cap Value | | | 1 | | | | 10 | | | | 44 | | | | 162 | | | | 12 | | | | 54 | | | | 64 | | | | 224 | |
| Small Cap Growth | | | — | | | | — | | | | 9,437 | | | | 20,150 | | | | 940 | | | | 2,145 | | | | 24,996 | | | | 56,995 | |
| Small Cap Value | | | — | | | | 1,363 | | | | 107 | | | | 1,836 | | | | 34 | | | | 1,020 | | | | 1,401 | | | | 18,381 | |
| Global Leaders | | | 3 | | | | 152 | | | | 252 | | | | 2,063 | | | | — | | | | 75 | | | | 8 | | | | 85 | |
| Global Small Cap Growth | | | 11 | | | | 319 | | | | 16 | | | | 449 | | | | 5 | | | | 422 | | | | 19 | | | | 1,202 | |
| International Leaders | | | 1 | | | | 22 | | | | 2 | | | | 73 | | | | 1 | | | | 71 | | | | — | | | | 1 | |
| International Equity | | | 26 | | | | 750 | | | | — | | | | — | | | | 21 | | | | 576 | | | | — | | | | — | |
| International Growth | | | 9,482 | | | | 30,923 | | | | — | | | | — | | | | 8,591 | | | | 33,318 | | | | — | | | | — | |
| International Small Cap Growth | | | 195 | | | | 7,300 | | | | 29 | | | | 919 | | | | 153 | | | | 5,751 | | | | 1,829 | | | | 53,860 | |
| 144 | Annual Report | December 31, 2015 |
| | | Distributions Paid in 2015 | | | Distributions Paid in 2014 | |
| | | Ordinary | | | Long-Term | | | Ordinary | | | Long-Term | |
| | | Income | | | Capital Gains | | | Income | | | Capital Gains | |
| Fund | | Class N | | | Class I | | | Class N | | | Class I | | | Class N | | | Class I | | | Class N | | | Class I | |
| Emerging Markets Leaders | | | $ — | | | | $ 105 | | | | $ 2 | | | | $ 44 | | | | $ — | | | | $ 69 | | | | $ 33 | | | | $ 718 | |
| Emerging Markets Growth | | | — | | | | — | | | | 107 | | | | 1,427 | | | | 75 | | | | 1,350 | | | | 688 | | | | 8,980 | |
| Emerging Markets Small Cap Growth | | | — | | | | — | | | | 474 | | | | 6,262 | | | | 15 | | | | 558 | | | | 434 | | | | 4,997 | |
| Bond | | | 1,822 | | | | 6,812 | | | | — | | | | — | | | | 463 | | | | 5,570 | | | | — | | | | 3 | |
| Income | | | 1,007 | | | | 1,971 | | | | — | | | | — | | | | 1,089 | | | | 1,984 | | | | — | | | | — | |
| Low Duration | | | 95 | | | | 2,839 | | | | — | | | | — | | | | 138 | | | | 3,119 | | | | — | | | | — | |
| Macro Allocation | | | 915 | | | | 10,747 | | | | — | | | | — | | | | 7,774 | | | | 32,682 | | | | — | | | | — | |
| | | Distributions Paid in 2015 | | Distributions Paid in 2014 |
| | | Ordinary | | Long-Term | | Ordinary | | Long-Term |
| | | Income | | Capital Gains | | Income | | Capital Gains |
| | | Institutional | | Institutional | | Institutional | | Institutional |
| Global Leaders | | $ | 552 | | | $ | 6,144 | | | $ | 301 | | | $ | 165 | |
| International Leaders | | | 323 | | | | 578 | | | | 738 | | | | 8 | |
| Institutional International Equity | | | 156 | | | | — | | | | 293 | | | | — | |
| Institutional International Growth | | | 13,779 | | | | 15,858 | | | | 47,484 | | | | 186,607 | |
| International Small Cap Growth | | | 4,603 | | | | 557 | | | | 4,140 | | | | 32,999 | |
| Emerging Markets Leaders | | | 331 | | | | 126 | | | | 303 | | | | 1,894 | |
| Emerging Markets Growth | | | — | | | | 8,324 | | | | 7,711 | | | | 42,214 | |
| Emerging Markets Small Cap Growth | | | 1 | | | | 4,988 | | | | 732 | | | | 5,385 | |
| Bond | | | 3,598 | | | | — | | | | 3,958 | | | | 2 | |
| Low Duration | | | 1,185 | | | | — | | | | 1,371 | | | | — | |
| Macro Allocation | | | 4,368 | | | | — | | | | 8,256 | | | | — | |
As of December 31, 2015, the components of distributable earnings on a tax basis were as follows (in thousands):
| | | | Accumulated | | Undistributed | | Net Unrealized |
| | Undistributed | | Capital and | | Long-Term | | Appreciation/ |
| Fund | | Ordinary Income | | Other Losses | | Capital Gain | | (Depreciation) |
| Growth | | $ | — | | | $ | — | | | $ | 13,627 | | | $ | 169,039 | |
| Large Cap Growth | | | 57 | | | | (301 | ) | | | — | | | | 12,641 | |
| Large Cap Value | | | 1 | | | | — | | | | 33 | | | | 341 | |
| Mid Cap Growth | | | — | | | | — | | | | 7,330 | | | | 11,482 | |
| Mid Cap Value | | | 6 | | | | — | | | | 108 | | | | 380 | |
| Small-Mid Cap Growth | | | — | | | | — | | | | 8,148 | | | | 145,266 | |
| Small-Mid Cap Value | | | 4 | | | | — | | | | 28 | | | | 327 | |
| Small Cap Growth | | | — | | | | — | | | | 4,135 | | | | 36,487 | |
| Small Cap Value | | | 237 | | | | — | | | | 6,259 | | | | 62,105 | |
| Global Leaders | | | — | | | | (23 | ) | | | 794 | | | | 17,012 | |
| Global Small Cap Growth | | | — | | | | — | | | | 3,299 | | | | 1,760 | |
| International Leaders | | | 595 | | | | (65 | ) | | | — | | | | 9,858 | |
| International Equity | | | 850 | | | | (74,849 | ) | | | — | | | | 4,813 | |
| Institutional International Equity | | | 2 | | | | (90,033 | ) | | | — | | | | 703 | |
| International Growth | | | 34,033 | | | | (395,163 | ) | | | — | | | | 290,964 | |
| Institutional International Growth | | | 14,993 | | | | (38,368 | ) | | | — | | | | 176,546 | |
| International Small Cap Growth | | | — | | | | (1,400 | ) | | | 96 | | | | 55,847 | |
| Emerging Markets Leaders | | | 77 | | | | (8,757 | ) | | | — | | | | (9,098 | ) |
| Emerging Markets Growth | | | 4,462 | | | | (51,589 | ) | | | — | | | | (46,514 | ) |
| Emerging Markets Small Cap Growth | | | — | | | | (2,116 | ) | | | 796 | | | | 790 | |
| Bond | | | 2 | | | | (2,339 | ) | | | — | | | | (2,243 | ) |
| Income | | | 15 | | | | (21,125 | ) | | | — | | | | (219 | ) |
| Low Duration | | | 65 | | | | (17,424 | ) | | | — | | | | (495 | ) |
| Macro Allocation | | | — | | | | (122,596 | ) | | | — | | | | (47,412 | ) |
| December 31, 2015 | William Blair Funds | 145 |
As of December 31, 2015, the Funds have unused capital loss carryforwards available for federal income tax purposes to be applied against future capital gains, if any. If not applied, the carryforwards will expire as follows (in thousands):
| Fund | | 2016 | | | 2017 | | | 2018 | | | Total | |
| International Equity | | $ | — | | | $ | 74,815 | | | $ | — | | | $ | 74,815 | |
| Institutional International Equity | | | — | | | | 90,030 | | | | — | | | | 90,030 | |
| International Growth | | | — | | | | 358,606 | | | | — | | | | 358,606 | |
| Income | | | 14,459 | | | | 4,577 | | | | — | | | | 19,036 | |
| Low Duration | | | — | | | | — | | | | 955 | | | | 955 | |
Income Fund had $9,190 (in thousands) of capital loss carryforward that expired in 2015 unused.
Under current law, the Funds may carry forward net capital losses indefinitely to use to offset capital gains realized in future years. Previous law limited the carry forward of capital losses to the eight tax years following the year the capital loss was realized. If a Fund has capital losses that are subject to current law and also has capital losses subject to prior law, the losses realized under current law will be utilized to offset capital gains before any of the losses governed by prior law can be used. As a result of these ordering rules, capital losses realized under previous law may be more likely to expire unused. Capital losses realized under current law will carry forward retaining their classification as long-term or short-term losses; as compared to under prior law in which all capital losses were carried forward as short term capital losses.
As of December 31, 2015, the Funds incurred the following capital losses which will not expire (in thousands):
| | | Short- | | | Long- | |
| Fund | | Term | | | Term | |
| International Leaders | | $ | 65 | | | $ | — | |
| International Growth | | | 36,557 | | | | — | |
| Institutional International Growth | | | 34,229 | | | | — | |
| Emerging Markets Leaders | | | 5,694 | | | | — | |
| Emerging Markets Growth | | | 27,954 | | | | — | |
| Bond | | | 1,545 | | | | 794 | |
| Income | | | 787 | | | | 1,194 | |
| Low Duration | | | 8,090 | | | | 8,099 | |
| Macro Allocation | | | 75,778 | | | | 37,778 | |
In order to meet certain excise tax distribution requirements, the Funds are required to measure and distribute annually, net capital gains realized during a twelve month period ending October 31 and net investment income earned during a twelve month period ending December 31. In connection with this, the Funds are permitted for tax purposes to defer into their next fiscal year qualified late year losses. Qualified late year capital losses are any short term or long term capital losses incurred between November 1 and the end of their fiscal year, December 31, 2015. Qualified late year ordinary losses are comprised of losses related to foreign currency and PFICs incurred between November 1 and the end of their fiscal year, December 31, 2015.
As of December 31, 2015, the following Funds deferred, on a tax basis, qualified late year losses of (in thousands):
| | | Qualified Late Year Losses |
| | | Ordinary | | Short-Term | | Long-Term |
| Fund | | Income | | Capital | | Capital |
| Large Cap Growth | | $ | — | | | $ | 141 | | | | $ 160 | |
| Global Leaders | | | 23 | | | | — | | | | — | |
| International Equity | | | — | | | | 34 | | | | — | |
| Institutional International Equity | | | 3 | | | | — | | | | — | |
| Institutional International Growth | | | — | | | | 4,139 | | | | — | |
| International Small Cap Growth | | | 1,400 | | | | — | | | | — | |
| Emerging Markets Leaders | | | — | | | | 2,797 | | | | 266 | |
| Emerging Markets Growth | | | — | | | | 20,829 | | | | 2,806 | |
| Emerging Markets Small Cap Growth | | | — | | | | 2,116 | | | | — | |
| Income | | | — | | | | 75 | | | | 33 | |
| Low Duration | | | — | | | | 115 | | | | 165 | |
| Macro Allocation | | | 9,040 | | | | — | | | | — | |
| 146 | Annual Report | December 31, 2015 |
(e) Repurchase Agreements
In a repurchase agreement, a Fund buys a security at one price and at the time of sale, the seller agrees to repurchase the security at a mutually agreed upon time and price (usually within seven days). The repurchase agreement thereby determines the yield during the purchaser’s holding period, while the seller’s obligation to repurchase is secured by the value of the underlying collateral. The Adviser monitors, on an ongoing basis, the value of the underlying collateral to ensure that the value always equals or exceeds the repurchase price plus accrued interest. Repurchase agreements may involve certain risks in the event of a default or insolvency of the other party to the agreement, including possible delays or restrictions upon a Fund’s ability to dispose of the underlying collateral. The risk to a Fund is limited to the ability of the seller to pay the agreed upon sum on the delivery date. In the event of default, a repurchase agreement provides that a Fund is entitled to sell the underlying collateral. The loss, if any, to a Fund will be the difference between the proceeds from the sale and the repurchase price. However, if bankruptcy proceedings are commenced with respect to the seller of the security, disposition of the collateral by the Fund may be delayed or limited. The Funds have master repurchase agreements which allow the Funds to offset amounts owed to a counterparty with amounts owed from the same counterparty, including any collateral, in the event the counterparty defaults. As of December 31, 2015, each Fund’s outstanding repurchase agreements, if any, and related collateral, are shown on the Fund’s Portfolio of Investments. Although no definitive creditworthiness criteria are used, the Adviser reviews the creditworthiness of the banks and non-bank dealers with which a Fund enters into repurchase agreements to evaluate those risks. A Fund may, for tax purposes, deem repurchase agreements collateralized by U.S. Government securities to be investments in U.S. Government securities.
(f) TBA Securities
The Fixed Income Funds may invest in mortgage pass-through securities eligible to be sold in the “to-be announced” market (“TBAs”). TBAs provide for the forward or delayed delivery of the underlying instrument with settlement up to 180 days. The term TBA comes from the fact that the specific mortgage-backed security that will be delivered to fulfill a TBA trade is not designated at the time the trade is made, but rather is generally announced 48 hours before the settlement date. When a Fund sells TBAs, it incurs a risk of loss because it could have to purchase the securities at a price that is higher than the price at which it sold the securities. A Fund generally has the ability to close out a TBA obligation on or before the settlement date, rather than take delivery of the security.
(g) Securities Sold, Not Yet Purchased
Certain Funds may sell a security it does not own in anticipation of a decline in the fair value of that security. When a fund sells a security short, it must borrow the security sold short and deliver it to the broker through which it made the short sale. A gain, limited to the price at which the fund sold the security short, or a loss, unlimited in size, will be recognized upon the termination of the short sale. A fund is also subject to the risk that it may be unable to reacquire a security to terminate a short position except at a price substantially in excess of the price it sold the security short.
(h) Use of Estimates
The preparation of financial statements in conformity with U.S. generally accepted accounting principles requires management to make estimates and assumptions that affect the amounts reported in the financial statements. Actual results may differ from those estimates.
(i) Indemnification
In the normal course of business, the Funds have entered into contracts in which the Funds agree to indemnify the other party or parties against various potential costs or liabilities. The Funds’ maximum exposure under these arrangements is unknown. No claim has been made for indemnification pursuant to any such agreement of the Funds.
(j) Recent Accounting Pronouncement
In May 2015, the Financial Accounting Standards Board (“FASB”) issued Accounting Standards Update No. 2015-07 (“ASU 2015-07”) Fair Value Measurement (Topic 820): Disclosures for Investments in Certain Entities That Calculate Net Asset Value per Share (or Its Equivalent). ASU 2015-07 removes the requirement to categorize within the fair value hierarchy all investments for which fair value is measured using net asset value per share as a practical expedient. For public business entities, ASU 2015-07 is effective for fiscal years beginning after December 15, 2015 and interim periods within those years. Management is currently evaluating the implications of ASU 2015-07 and its impact on financial statement disclosures.
| December 31, 2015 | William Blair Funds | 147 |
(3) Valuation
(a) Investment Valuation
The value of domestic equity securities, including exchange-traded funds, is determined by valuing securities traded on national securities markets or in the over-the-counter markets at the last sale price or, if applicable, the official closing price or, in the absence of a recent sale on the date of determination, at the mean between the last reported bid and ask prices.
The value of foreign equity securities is generally determined based upon the last sale price on the foreign exchange or market on which it is primarily traded and in the currency of that market as of the close of the appropriate exchange or, if there have been no sales during that day, at the mean between the last reported bid and ask prices. The Board of Trustees has determined that the passage of time between when the foreign exchanges or markets close and when the Funds compute their net asset values could cause the value of foreign equity securities to no longer be representative or accurate and, as a result, may necessitate that such securities be fair valued. Accordingly, for foreign equity securities, the Funds may use an independent pricing service to fair value price the security as of the close of regular trading on the NYSE. As a result, a Fund’s value for a security may be different from the last sale price (or the mean between the last reported bid and ask prices).
Fixed-income securities are generally valued using evaluated prices provided by an independent pricing service. The evaluated prices are formed using various market inputs that the pricing service believes accurately represent the market value of a security at a particular point in time. The pricing service determines evaluated prices for fixed-income securities using inputs including, but not limited to, recent transaction prices, dealer quotes, transaction prices for securities with similar characteristics, collateral characteristics, credit quality, payment history, liquidity and market conditions.
Repurchase agreements are valued at cost, which approximates fair value.
Option contracts on securities, currencies and other financial instruments traded on one or more exchanges are valued at their most recent sale price on the exchange on which they are traded most extensively. Option contracts on foreign indices are valued at the settlement price. Futures contracts (and options and swaps thereon) are valued at the most recent settlement price on the exchange on which they are traded most extensively. Forward foreign currency contracts are valued on the basis of the value of the underlying currencies at the prevailing currency exchange rate as supplied by an independent pricing service.
Over-the-Counter (“OTC”) swap contracts are valued by an independent pricing service. Depending on the product and the terms of the transaction, the independent pricing service may use a series of techniques, including simulation pricing models. The pricing models use inputs that are observed from actively quoted markets such as issuer details, indices, spreads, interest rates, yield curves, dividends and exchange rates.
Centrally cleared swaps listed or settled on a multilateral or trade facility platform, such as a registered exchange, are valued at the daily settlement price determined by the respective exchange. For centrally cleared credit default swaps the clearing facility requires its members to provide actionable price levels across complete term structures. These levels along with external third-party prices are used to produce daily settlement prices.
Investments in other investment funds that are not exchange-traded funds are valued at the underlying fund’s ending net asset value on the date of valuation.
Securities, and other assets, for which a market price is not available or is deemed unreliable (e.g., securities affected by unusual or extraordinary events, such as natural disasters or securities affected by market or economic events, such as bankruptcy filings), or the value of which is affected by a significant valuation event, are valued at a fair value as determined in good faith by, or under the direction of, the Board of Trustees and in accordance with the Valuation Procedures approved by the Board of Trustees. The value of fair valued securities may be different from the last sale price (or the mean between the last reported bid and ask prices), and there is no guarantee that a fair valued security will be sold at the price at which a Fund is carrying the security.
As of December 31, 2015, there were securities held in the International Growth, Institutional International Growth and Emerging Markets Small Cap Growth Funds requiring fair valuation pursuant to the Valuation Procedures.
(b) Fair Value Measurements
Fair value is defined as the price that a Fund would receive upon selling a security in an orderly transaction to an independent buyer in the principal or most advantageous market for the investment. Various inputs are used in determining the value of a Fund’s investments. A three-tier hierarchy of inputs is used to classify fair value measurements for disclosure purposes. The three-tier hierarchy of inputs is summarized in the three broad levels listed below:
| | • | Level 1—Quoted prices (unadjusted) in active markets for an identical security. |
| 148 | Annual Report | December 31, 2015 |
| | • | Level 2—Prices determined using other significant observable inputs. Observable inputs are inputs that other market participants would use in pricing a security. These may include quoted prices for similar securities, interest rates, prepayment speeds, credit risk, and others. In addition, other observable inputs such as foreign exchange rates, benchmark securities indices and foreign futures contracts may be utilized in the valuation of certain foreign securities when significant events occur between the last sale on the foreign securities exchange and the time the net asset value of the Fund is calculated. |
| | | |
| | • | Level 3—Prices determined using significant unobservable inputs. In situations where quoted prices or observable inputs are unavailable (for example, when there is little or no market activity for an investment), unobservable inputs may be used. Unobservable inputs reflect the Fund’s own assumptions about the factors market participants would use in pricing an investment, and would be based on the best information available. |
The inputs or methodology used for valuing an investment are not necessarily an indication of the risk associated with investing in those securities. For example, money market securities are valued using amortized cost, in accordance with rules under the 1940 Act. Generally, amortized cost approximates the current fair value of a security, but since the value is not obtained from a quoted price in an active market, such securities are reflected as Level 2.
A description of the valuation technique applied to the Fund’s major categories of assets and liabilities measured at fair value on a recurring basis as follows:
Exchange-Traded Securities
Securities traded on a national securities exchange (or reported on the NASDAQ national market), including exchange-traded funds, are stated at the last reported sales price on the day of valuation. Other securities traded in the over-the-counter market and listed securities for which no sale was reported on that date are stated at the mean between the last reported bid and ask prices. To the extent these securities are actively traded and valuation adjustments are not applied, they are categorized as Level 1 of the fair value hierarchy. Securities traded on inactive markets or valued by reference to similar instruments are generally categorized as Level 2 of the fair value hierarchy.
Fixed-Income Securities
Fixed-income securities including corporate, convertible and municipal bonds and notes, U.S. government agencies, U.S. treasury obligations, sovereign issues, bank loans, convertible preferred securities and non-U.S. bonds are generally valued using evaluated prices provided by an independent pricing service. The evaluated prices are formed using various market inputs that the pricing service believes accurately represent the fair value of a security at a particular point in time. The pricing service determines evaluated prices for fixed-income securities using inputs including, but not limited to, recent transaction prices, dealer quotes, transaction prices for securities with similar characteristics, collateral characteristics, credit quality, payment history, liquidity and market conditions. Securities that use similar valuation techniques and observable inputs as described above are categorized as Level 2 of the fair value hierarchy.
Short-Term Investments
Repurchase agreements are valued at cost, which approximates fair value. These investments are categorized as Level 2 of the fair value hierarchy.
Derivative Instruments
Listed derivatives, such as certain options and futures contracts, that are actively traded are valued based on quoted prices from the exchange on which they are traded most extensively and are categorized as Level 1 of the fair value hierarchy. OTC derivative contracts include forward foreign currency contracts, swap and certain option contracts related to interest rates, foreign currencies, credit standing of reference entities, equity prices, or commodity prices. Depending on the product and the terms of the transaction, the fair value of OTC derivative products can be modeled taking into account the counterparties’ creditworthiness and using a series of techniques, including simulation models. Many pricing models do not entail material subjectivity because the methodologies employed do not necessitate significant judgments and the pricing inputs are observed from actively quoted markets, as is the case of forward foreign currency contracts and interest rate swaps. A substantial majority of OTC derivative products valued by a Fund using pricing models fall into this category and are categorized as Level 2 of the fair value hierarchy.
Any transfers between Level 1 and Level 2 are disclosed, effective as of the beginning of the period, in the following tables with the reasons for the transfers disclosed in a note to the tables, if applicable. Transfer amounts are based on end of period values.
| December 31, 2015 | William Blair Funds | 149 |
As of December 31, 2015, the hierarchical input levels of securities in each Fund, segregated by security class or other financial instruments, are as follows (in thousands):
| | | | | Large Cap | | | Large Cap | | | Mid Cap | | | Mid Cap | |
| Investments in securities | | Growth | | | Growth | | | Value | | | Growth | | | Value | |
| Level 1—Quoted prices | | | | | | | | | | | | | | | | | | | | |
| Common Stocks | | $ | 835,262 | | | | $ 68,284 | | | | $ 3,150 | | | $ | 198,365 | | | | $2,669 | |
| Level 2—Other significant observable inputs | | | | | | | | | | | | | | | | | | | | |
| Short-Term Investments | | | 7,795 | | | | 740 | | | | — | | | | — | | | | — | |
| Level 3—Significant unobservable inputs | | | | | | | | | | | | | | | | | | | | |
| None | | | — | | | | — | | | | — | | | | — | | | | — | |
| Total investments in securities | | $ | 843,057 | | | | $ 69,024 | | | | $ 3,150 | | | $ | 198,365 | | | | $2,669 | |
| | | Small-Mid | | | Small-Mid | | | Small Cap | | | Small Cap | |
| Investments in securities | | Cap Growth | | | Cap Value | | | Growth | | | Value | |
| Level 1—Quoted prices | | | | | | | | | | | | | | | | |
| Common Stocks | | | $ 1,170,147 | | | | $ 4,013 | | | | $360,793 | | | | $593,959 | |
| Exchange-Traded Fund | | | — | | | | — | | | | 2,175 | | | | — | |
| Level 2—Other significant observable inputs | | | | | | | | | | | | | | | | |
| Short-Term Investments | | | 22,916 | | | | — | | | | 9,567 | | | | 16,367 | |
| Level 3—Significant unobservable inputs | | | | | | | | | | | | | | | | |
| None | | | — | | | | — | | | | — | | | | — | |
| Total investments in securities | | | $ 1,193,063 | | | | $ 4,013 | | | | $372,535 | | | | $610,326 | |
| | | | | | | Global | | | | | | | | | | Institutional | | | | | |
| | | Global | | Small Cap | | International | | International | | International | | International | |
| Investments in securities | | Leaders | | Growth | | Leaders | | Equity | | Equity | | Growth | |
| Level 1—Quoted prices | | | | | | | | | | | | | | | | | | | | | | | | | |
| Common Stocks | | | $ | 184,550 | | | $ | 18,073 | | | $ | 111,210 | | | $ | 62,614 | | | $ | 15,930 | | | $ | 3,528,592 | |
| Preferred Stock | | | | — | | | | — | | | | — | | | | — | | | | — | | | | 6,360 | |
| Level 2—Other significant observable inputs | | | | | | | | | | | | | | | | | | | | | | | | | |
| Affiliated Fund | | | | — | | | | — | | | | — | | | | — | | | | — | | | | 3,928 | |
| Common Stocks | | | | — | | | | — | | | | — | | | | — | | | | — | | | | 17,020 | |
| Short-Term Investments | | | | 2,827 | | | | 393 | | | | 4,150 | | | | 953 | | | | 119 | | | | 113,846 | |
| Level 3—Significant unobservable inputs | | | | | | | | | | | | | | | | | | | | | | | | | |
| Common Stocks | | | | — | | | | — | | | | — | | | | — | | | | — | | | | 17 | |
| Total investments in securities | | | $ | 187,377 | | | $ | 18,466 | | | $ | 115,360 | | | $ | 63,567 | | | $ | 16,049 | | | $ | 3,669,763 | |
| Level 1 and Level 2 transfers | | | | | | | | | | | | | | | | | | | | | | | | | |
| Transfers from Level 1 to Level 2 | | | $ | — | | | $ | — | | | $ | — | | | $ | — | | | $ | — | | | $ | — | |
| Transfers from Level 2 to Level 1 (a) | | | | 57,747 | | | | 4,857 | | | | 74,608 | | | | 34,993 | | | | 8,911 | | | | 2,035,707 | |
| | | | | | | | | | | | | | | Emerging | |
| | | Institutional | | | International | | | Emerging | | | Emerging | | | Markets | |
| | | International | | | Small Cap | | | Markets | | | Markets | | | Small Cap | |
| Investments in securities | | Growth | | | Growth | | | Leaders | | | Growth | | | Growth | |
| Level 1—Quoted prices | | | | | | | | | | | | | | | | | | | | | | | | | |
| Common Stocks | | | $ | 2,240,426 | | | | $ | 549,311 | | | | $ | 121,166 | | | | $ | 813,172 | | | | $ | 277,613 | |
| Preferred Stock | | | | 4,036 | | | | | — | | | | | — | | | | | 11,485 | | | | | — | |
| Level 2—Other significant observable inputs | | | | | | | | | | | | | | | | | | | | | | | | | |
| Affiliated Fund | | | | 2,441 | | | | | — | | | | | — | | | | | 4,819 | | | | | — | |
| Common Stocks | | | | 10,851 | | | | | 3,168 | | | | | 4,509 | | | | | 38,474 | | | | | 13,439 | |
| Short-Term Investments | | | | 74,149 | | | | | 20,131 | | | | | 1,820 | | | | | 11,079 | | | | | 1,128 | |
| Level 3—Significant unobservable inputs | | | | | | | | | | | | | | | | | | | | | | | | | |
| Common Stocks | | | | 9 | | | | | — | | | | | — | | | | | — | | | | | 1,294 | |
| Total investments in securities | | | $ | 2,331,912 | | | | $ | 572,610 | | | | $ | 127,495 | | | | $ | 879,029 | | | | $ | 293,474 | |
| Level 1 and Level 2 transfers | | | | | | | | | | | | | | | | | | | | | | | | | |
| Transfers from Level 1 to Level 2 | | | $ | — | | | | $ | — | | | | $ | — | | | | $ | — | | | | $ | — | |
| Transfers from Level 2 to Level 1 (a) | | | | 1,292,485 | | | | | 215,324 | | | | | 64,320 | | | | | 405,483 | | | | | 96,481 | |
| 150 | Annual Report | December 31, 2015 |
| | | | | | | Low | | | Macro | |
| Investments in securities | | Bond | | | Income | | | Duration | | | Allocation | |
| Assets | | | | | | | | | | | | | | | | |
| Level 1—Quoted Prices | | | | | | | | | | | | | | | | |
| Exchange-Traded Funds | | $ | — | | | $ | — | | | $ | — | | | $ | 1,121,893 | |
| Purchased Options | | | 2 | | | | 1 | | | | 2 | | | | 5,507 | |
| Level 2—Other significant observable inputs | | | | | | | | | | | | | | | | |
| Asset-Backed Securities | | | 16,538 | | | | 8,438 | | | | 36,050 | | | | — | |
| Corporate Obligation/Notes | | | 195,119 | | | | 24,995 | | | | 28,922 | | | | — | |
| Purchased Options | | | — | | | | — | | | | — | | | | 1,077 | |
| Short-Term Investments | | | 15,197 | | | | 5,007 | | | | 1,422 | | | | 382,337 | |
| U.S. Government and U.S. Government Agency | | | 249,285 | | | | 56,812 | | | | 63,439 | | | | 155,654 | |
| Level 3—Significant unobservable inputs | | | | | | | | | | | | | | | | |
| None | | | — | | | | — | | | | — | | | | — | |
| Liabilities | | | | | | | | | | | | | | | | |
| Level 1 - Quoted Prices | | | | | | | | | | | | | | | | |
| Written Options | | | — | | | | — | | | | — | | | | (261 | ) |
| Level 2 - Other significant observable inputs | | | | | | | | | | | | | | | | |
| None | | | — | | | | — | | | | — | | | | — | |
| Level 3 - Significant unobservable inputs | | | | | | | | | | | | | | | | |
| None | | | — | | | | — | | | | — | | | | — | |
| Total investments in securities | | $ | 476,141 | | | $ | 95,253 | | | $ | 129,835 | | | $ | 1,666,207 | |
| Other financial instruments | | | | | | | | | | | | | | | | |
| Assets | | | | | | | | | | | | | | | | |
| Level 1—Quoted Prices | | | | | | | | | | | | | | | | |
| Futures Contracts | | $ | — | | | $ | — | | | $ | — | | | $ | 8,662 | |
| Level 2—Other significant observable inputs | | | | | | | | | | | | | | | | |
| Forward Foreign Currency Contracts | | | — | | | | — | | | | — | | | | 11,296 | |
| Futures Contracts | | | — | | | | — | | | | — | | | | 1,082 | |
| Swaps | | | — | | | | — | | | | — | | | | 1,868 | |
| Level 3—Significant unobservable inputs | | | | | | | | | | | | | | | | |
| None | | | — | | | | — | | | | — | | | | — | |
| Liabilities | | | | | | | | | | | | | | | | |
| Level 1—Quoted Prices | | | | | | | | | | | | | | | | |
| Futures Contracts | | | — | | | | — | | | | — | | | | (7,054 | ) |
| Level 2—Other significant observable inputs | | | | | | | | | | | | | | | | |
| Forward Foreign Currency Contracts | | | — | | | | — | | | | — | | | | (9,563 | ) |
| Futures Contracts | | | — | | | | — | | | | — | | | | (62 | ) |
| Swaps | | | (37 | ) | | | — | | | | — | | | | (5,652 | ) |
| U.S Government and U.S. Government Agency | | | — | | | | — | | | | (10,080 | ) | | | — | |
| Level 3—Significant unobservable inputs | | | | | | | | | | | | | | | | |
| None | | | — | | | | — | | | | — | | | | — | |
| Total other financial instruments | | $ | (37 | ) | | $ | — | | | $ | (10,080) | | | $ | 577 | |
| (a) | Fair valuation estimates were obtained from the Funds’ pricing vendor and applied to certain foreign securities at December 31, 2014, but not at December 31, 2015. |
Level 1 Common Stocks are exchange-traded securities with a quoted price. See Portfolio of Investments for Sector Classification.
The fair value estimates for the Level 3 securities in the International Growth, Institutional International Growth and Emerging Markets Small Cap Growth Funds were determined in good faith by the Pricing Committee, pursuant to the Valuation Procedures approved by the Board of Trustees. There were various factors considered in reaching this fair value determination, including, but not limited to, the following: the type of security, the extent of public trading of the security, information obtained from a broker-dealer for the security, analysis of the company’s performance and market trends that influence its performance. Level 3 securities represented 0.00%, 0.00%, and 0.44% as a percentage of net assets in the International Growth, Institutional International Growth and Emerging Markets Small Cap Growth Funds, respectively. The change in net unrealized gain (loss) related to those securities held at December 31, 2015 is included in the change in net unrealized appreciation (depreciation) of investments on the Statements of Operations.
| December 31, 2015 | William Blair Funds | 151 |
(4) Transactions with Affiliates
(a) Management and Expense Limitation Agreements
Each Fund has a management agreement with the Adviser for investment management, clerical, bookkeeping and administrative services. Each Fund pays the Adviser an annual fee, payable monthly, based on a specified percentage of its average daily net assets. A summary of the annual rates expressed as a percentage of average daily net assets is as follows:
| Domestic Equity Funds | | | |
| Growth | | | 0.75 | % |
| Large Cap Growth | | | 0.70 | % |
| Large Cap Value | | | 0.70 | % |
| Mid Cap Growth | | | 0.95 | % |
| Mid Cap Value | | | 0.95 | % |
| Small-Mid Cap Growth | | | 1.00 | % |
| Small-Mid Cap Value | | | 1.00 | % |
| Small Cap Growth | | | 1.10 | % |
| Small Cap Value | | | 1.10 | % |
| | | | | |
| Fixed Income Funds | | | | |
| Bond | | | 0.30 | % |
| Income1: | | | | |
| First $250 million | | | 0.25 | % |
| In excess of $250 million | | | 0.20 | % |
| Low Duration | | | 0.30 | % |
| | | | | |
| Multi-Asset and Alternative Fund | | | | |
| Macro Allocation | | | 0.80 | % |
| | | | | |
| Global Equity Funds | | | | |
| Global Leaders | | | 1.00 | % |
| Global Small Cap Growth | | | 1.00 | % |
| International Equity Funds | | | |
| International Leaders | | | 0.95 | % |
| International Equity: | | | | |
| First $250 million | | | 1.00 | % |
| In excess of $250 million | | | 0.90 | % |
| Institutional International Equity: | | | | |
| First $500 million | | | 0.90 | % |
| Next $500 million | | | 0.85 | % |
| In excess of $1 billion | | | 0.80 | % |
| International Growth2: | | | | |
| First $250 million | | | 1.10 | % |
| Next $2.25 billion | | | 1.00 | % |
| Next $2.5 billion | | | 0.975 | % |
| Next $5 billion | | | 0.95 | % |
| Next $5 billion | | | 0.925 | % |
| In excess of $15 billion | | | 0.90 | % |
| Institutional International Growth: | | | | |
| First $500 million | | | 1.00 | % |
| Next $500 million | | | 0.95 | % |
| Next $1.5 billion | | | 0.90 | % |
| Next $2.5 billion | | | 0.875 | % |
| Next $5 billion | | | 0.85 | % |
| Next $5 billion | | | 0.825 | % |
| In excess of $15 billion | | | 0.80 | % |
| International Small Cap Growth | | | 1.00 | % |
| Emerging Markets Leaders | | | 1.10 | % |
| Emerging Markets Growth | | | 1.10 | % |
| Emerging Markets Small Cap Growth | | | 1.10 | % |
| 1 | Management fee also includes a charge of 5% of gross income. |
| 2 | Prior to May 1, 2015, the International Growth Fund paid a management fee at a rate of 1.10% of the first $250 million of the Fund’s average daily net assets; plus 1.00% of the next $4.75 billion of the Fund’s average daily net assets; plus 0.95% of the next $5 billion of the Fund’s average daily net assets; plus 0.925% of the next $5 billion of the Fund’s average daily net assets; plus 0.90% of the Fund’s average daily net assets over $15 billion. Effective May 1, 2015, the management fee paid to the Adviser was reduced to 1.10% of the first $250 million of the Fund’s average daily net assets; plus 1.00% of the next $2.25 billion of the Fund’s average daily net assets; plus 0.975% of the next $2.5 billion of the Fund’s average daily net assets; plus 0.95% of the next $5 billion of the Fund’s average daily net assets; plus 0.925% of the next $5 billion of the Fund’s average daily net assets; plus 0.90% of the Fund’s average daily net assets over $15 billion. |
| 152 | Annual Report | December 31, 2015 |
Some of the Funds have also entered into an Amended and Restated Expense Limitation Agreement with the Adviser. Under the terms of the agreement, the Adviser will waive its management fee and/or reimburse a Fund for expenses in excess of the agreed upon rate. The amount the Adviser owes a Fund as of the reporting date is recorded as Receivable from Adviser on the Statements of Assets and Liabilities. The Adviser reimburses the Funds on a monthly basis. Under the terms of the agreement, the Adviser has agreed to waive its management fees and/or absorb other operating expenses through April 30, 2016, if total expenses for each class of the following Funds exceed the following rates (as a percentage of average daily net assets):
| | | Class N | | Class I | | Institutional Class |
| Fund | | Effective
May 1, 2015
through
April 30,
2016 | | Effective
May 1, 2014
through
April 30,
2015 | | Effective
May 1, 2015
through
April 30,
2016 | | Effective
May 1, 2014
through
April 30,
2015 | | Effective
May 1, 2015
through
April 30,
2016 | | Effective
May 1, 2014
through
April 30,
2015 |
| Growth | | | N/A | | | | N/A | | | | N/A | | | | N/A | | | | N/A | | | | N/A | |
| Large Cap Growth | | | 1.05 | % | | | 1.10 | % | | | 0.80 | % | | | 0.85 | % | | | N/A | | | | N/A | |
| Large Cap Value | | | 1.05 | % | | | 1.10 | % | | | 0.80 | % | | | 0.85 | % | | | N/A | | | | N/A | |
| Mid Cap Growth | | | 1.30 | % | | | 1.35 | % | | | 1.05 | % | | | 1.10 | % | | | N/A | | | | N/A | |
| Mid Cap Value | | | 1.30 | % | | | 1.35 | % | | | 1.05 | % | | | 1.10 | % | | | N/A | | | | N/A | |
| Small-Mid Cap Growth | | | 1.35 | % | | | 1.35 | % | | | 1.10 | % | | | 1.10 | % | | | N/A | | | | N/A | |
| Small-Mid Cap Value | | | 1.35 | % | | | 1.40 | % | | | 1.10 | % | | | 1.15 | % | | | N/A | | | | N/A | |
| Small Cap Growth | | | 1.50 | % | | | 1.50 | % | | | 1.25 | % | | | 1.25 | % | | | N/A | | | | N/A | |
| Small Cap Value | | | 1.50 | % | | | 1.50 | % | | | 1.25 | % | | | 1.25 | % | | | N/A | | | | N/A | |
| Global Leaders | | | 1.40 | % | | | 1.50 | % | | | 1.15 | % | | | 1.25 | % | | | 1.00 | % | | | 1.10 | % |
| Global Small Cap Growth | | | 1.65 | % | | | 1.65 | % | | | 1.40 | % | | | 1.40 | % | | | 1.25 | % | | | 1.25 | % |
| International Leaders | | | 1.35 | % | | | 1.45 | % | | | 1.10 | % | | | 1.20 | % | | | 0.95 | % | | | 1.05 | % |
| International Equity | | | 1.30 | % | | | 1.35 | % | | | 1.05 | % | | | 1.10 | % | | | N/A | | | | N/A | |
| Institutional International Equity | | | N/A | | | | N/A | | | | N/A | | | | N/A | | | | 1.00 | % | | | 1.00 | % |
| International Growth | | | 1.45 | % | | | 1.45 | % | | | 1.20 | % | | | 1.20 | % | | | N/A | | | | N/A | |
| Institutional International Growth | | | N/A | | | | N/A | | | | N/A | | | | N/A | | | | N/A | | | | N/A | |
| International Small Cap Growth | | | 1.65 | % | | | 1.65 | % | | | 1.40 | % | | | 1.40 | % | | | 1.25 | % | | | 1.25 | % |
| Emerging Markets Leaders | | | 1.65 | % | | | 1.65 | % | | | 1.40 | % | | | 1.40 | % | | | 1.25 | % | | | 1.25 | % |
| Emerging Markets Growth | | | 1.70 | % | | | 1.70 | % | | | 1.45 | % | | | 1.45 | % | | | 1.30 | % | | | 1.30 | % |
| Emerging Markets Small Cap Growth | | | 1.65 | % | | | 1.65 | % | | | 1.40 | % | | | 1.40 | % | | | 1.25 | % | | | 1.25 | % |
| Bond | | | 0.65 | % | | | 0.65 | % | | | 0.50 | % | | | 0.50 | % | | | 0.35 | % | | | 0.35 | % |
| Income | | | 0.85 | % | | | 0.85 | % | | | 0.70 | % | | | 0.70 | % | | | N/A | | | | N/A | |
| Low Duration | | | 0.70 | % | | | 0.70 | % | | | 0.55 | % | | | 0.55 | % | | | 0.40 | % | | | 0.40 | % |
| Macro Allocation | | | 1.35 | %(a) | | | 1.35 | %(b) | | | 1.10 | %(a) | | | 1.10 | %(b) | | | 0.95 | %(a) | | | 0.95 | %(b) |
| (a) | Effective March 1, 2015 through April 30, 2016. |
| (b) | Effective March 1, 2014 through February 28, 2015. |
| December 31, 2015 | William Blair Funds | 153 |
For the year ended December 31, 2015, the fee waivers and/or reimbursements for each Fund (includes the expense limitation described above and the shareholder administration fee waiver described below) were as follows (in thousands):
| Fund | | Fund
Level
Waiver | | | Class N
Specific
Waiver | | | Class I
Specific
Waiver | | | Total
Waiver | |
| Large Cap Growth | | | $ 42 | | | | $ 14 | | | | $ 40 | | | | $ 96 | |
| Large Cap Value | | | 102 | | | | 1 | | | | 1 | | | | 104 | |
| Mid Cap Growth | | | — | | | | 37 | | | | 174 | | | | 211 | |
| Mid Cap Value | | | 90 | | | | 1 | | | | — | | | | 91 | |
| Small-Mid Cap Growth | | | — | | | | 98 | | | | 409 | | | | 507 | |
| Small-Mid Cap Value | | | 110 | | | | — | | | | 2 | | | | 112 | |
| Small Cap Growth | | | — | | | | 123 | | | | 154 | | | | 277 | |
| Small Cap Value | | | — | | | | 13 | | | | — | | | | 13 | |
| Global Leaders | | | 142 | | | | 8 | | | | 79 | | | | 229 | |
| Global Small Cap Growth | | | 92 | | | | 2 | | | | 74 | | | | 168 | |
| International Leaders | | | 170 | | | | — | | | | 20 | | | | 190 | |
| International Equity | | | 114 | | | | 4 | | | | 72 | | | | 190 | |
| Institutional International Equity | | | 120 | | | | — | | | | — | | | | 120 | |
| International Small Cap Growth | | | — | | | | 18 | | | | 551 | | | | 569 | |
| Emerging Markets Leaders | | | 119 | | | | 3 | | | | 51 | | | | 173 | |
| Emerging Markets Growth | | | — | | | | 19 | | | | 249 | | | | 268 | |
| Emerging Markets Small Cap Growth | | | 169 | | | | 28 | | | | 233 | | | | 430 | |
| Bond | | | 100 | | | | 81 | | | | 272 | | | | 453 | |
| Low Duration | | | 36 | | | | 6 | | | | 166 | | | | 208 | |
| Macro Allocation | | | — | | | | 312 | | | | 1,473 | | | | 1,785 | |
(b) Underwriting, Distribution Services, and Shareholder Administration Agreements
Pursuant to separate Underwriting and Distribution Agreements, WBC is the principal underwriter and distributor for the continuous offering of shares of the Trust and acts as agent of the Trust in the sale of its shares. The Underwriting Agreement provides that the Distributor will use its best efforts to distribute the Trust’s shares. The Distributor is not compensated under the Underwriting Agreement.
Each Fund, except the Institutional International Equity Fund and Institutional International Growth Fund, has a Distribution Agreement with WBC for distribution services to the Funds’ Class N shares. Each Fund pays WBC an annual fee, payable monthly, based on a specified percentage of its average daily net assets of Class N shares. The annual rate expressed as a percentage of average daily net assets for Class N is 0.25% for all Funds except the Bond, Income and Low Duration Funds, which is 0.15%. Pursuant to the Distribution Agreement, WBC enters into related selling group agreements with various firms at various rates for sales of the Funds’ Class N shares.
The Global Leaders, Global Small Cap Growth, International Leaders, International Small Cap Growth, Emerging Markets Leaders, Emerging Markets Growth, Emerging Markets Small Cap Growth, Bond, Low Duration and Macro Allocation Funds have a Shareholder Administration Agreement with WBC to provide shareholder administration services to Class N and Class I shares. Class N and Class I shares of the Funds have agreed to pay an annual fee, payable monthly, of 0.15% of average daily net assets attributable to each class, respectively. Beginning in 2013, the SEC conducted a limited scope examination of a number of mutual fund sponsors, including WBC, regarding distribution and servicing of mutual fund shares through intermediaries. In November 2014, the SEC informed WBC that it had opened a non-public investigation with respect to shareholder administration fees paid by the applicable Funds. The investigation does not involve the investment management operations of the Funds. Recently, the SEC staff sent WBC a notification that staff intended to recommend an enforcement action against WBC to the SEC Commissioners (Wells Notice), and WBC has submitted a response. At this time, it is unclear whether or not the Commission will allow the matter to enter enforcement proceedings. While WBC believes that any possible claims made by the staff would be without merit, WBC cannot predict the outcome of any enforcement proceeding the SEC may choose to bring. In light of the preliminary concerns expressed by the SEC staff, the shareholder administration fee for each Fund is currently being waived by WBC. This waiver will not be removed without approval of the Board of Trustees.
| 154 | Annual Report | December 31, 2015 |
For the year ended December 31, 2015, the following shareholder administration fees were incurred and waived (in thousands):
| Fund | | Class N | | | Class I | | | Total | | | Total
Waived | | | Net Total
Shareholder
Administration
Fee | |
| Global Leaders | | $ | 8 | | | $ | 79 | | | $ | 87 | | | $ | 87 | | | | $— | |
| Global Small Cap Growth | | | 1 | | | | 74 | | | | 75 | | | | 75 | | | | — | |
| International Leaders | | | — | | | | 19 | | | | 19 | | | | 19 | | | | — | |
| International Small Cap Growth | | | 18 | | | | 551 | | | | 569 | | | | 569 | | | | — | |
| Emerging Markets Leaders | | | 3 | | | | 51 | | | | 54 | | | | 54 | | | | — | |
| Emerging Markets Growth | | | 19 | | | | 249 | | | | 268 | | | | 268 | | | | — | |
| Emerging Markets Small Cap Growth | | | 17 | | | | 233 | | | | 250 | | | | 250 | | | | — | |
| Bond | | | 80 | | | | 272 | | | | 352 | | | | 352 | | | | — | |
| Low Duration | | | 6 | | | | 166 | | | | 172 | | | | 172 | | | | — | |
| Macro Allocation | | | 312 | | | | 1,473 | | | | 1,785 | | | | 1,785 | | | | — | |
(5) Investment Transactions
Investment transactions, excluding money market instruments, repurchase agreements and U.S. government securities for the year ended December 31, 2015, were as follows (in thousands):
| Fund | | Purchases | | | Sales | |
| Growth | | $ | 676,149 | | | $ | 840,830 | |
| Large Cap Growth | | | 28,970 | | | | 24,001 | |
| Large Cap Value | | | 1,806 | | | | 2,987 | |
| Mid Cap Growth | | | 186,017 | | | | 322,750 | |
| Mid Cap Value | | | 1,727 | | | | 2,767 | |
| Small-Mid Cap Growth | | | 703,594 | | | | 445,592 | |
| Small-Mid Cap Value | | | 1,495 | | | | 1,671 | |
| Small Cap Growth | | | 404,400 | | | | 529,927 | |
| Small Cap Value | | | 220,094 | | | | 168,054 | |
| Global Leaders | | | 119,583 | | | | 98,862 | |
| Global Small Cap Growth | | | 38,340 | | | | 66,409 | |
| International Leaders | | | 48,150 | | | | 28,269 | |
| International Equity | | | 36,333 | | | | 40,995 | |
| Institutional International Equity | | | 9,959 | | | | 8,209 | |
| International Growth | | | 2,599,563 | | | | 2,616,152 | |
| Institutional International Growth | | | 1,649,044 | | | | 1,660,472 | |
| International Small Cap Growth | | | 541,367 | | | | 662,003 | |
| Emerging Markets Leaders | | | 164,668 | | | | 123,788 | |
| Emerging Markets Growth | | | 1,170,865 | | | | 1,128,319 | |
| Emerging Markets Small Cap Growth | | | 543,234 | | | | 483,204 | |
| Bond | | | 362,007 | | | | 113,870 | |
| Income | | | 31,828 | | | | 20,766 | |
| Low Duration | | | 183,790 | | | | 178,241 | |
| Macro Allocation | | | 936,200 | | | | 288,069 | |
Transactions in written call and put options for the Macro Allocation Fund for the year ended December 31, 2015 were as follows:
| | | # of
Contracts | | | Premium
(in thousands) | |
| Balance at December 31, 2014 | | | | 3,800 | | | | $ | 820 | |
| Sales | | | | 78,594 | | | | | 20,237 | |
| Closing Buys | | | | (72,748 | ) | | | | (19,706 | ) |
| Expirations | | | | (4,900 | ) | | | | (699 | ) |
| Exercised | | | | — | | | | | — | |
| Balance at December 31, 2015 | | | | 4,746 | | | | $ | 652 | |
| December 31, 2015 | William Blair Funds | 155 |
(6) Financial Derivative Instruments
Each Fund may use derivative instruments to maintain liquidity, to provide hedging, or in anticipation of changes in the composition of its portfolio holdings or as otherwise provided in each Fund’s prospectus. The Macro Allocation Fund may also use derivative instruments to obtain investment exposures. The derivative instruments held as of December 31, 2015, as disclosed in each Fund’s Portfolios of Investments, are representative of each Fund’s derivative instrument trading activity during the year ended December 31, 2015.
Derivative transactions carry counterparty risk as they are based on contracts between a Fund and the applicable counterparty. For exchange-traded or cleared derivative contracts, such counterparty risk is limited due to the role of the exchange or clearinghouse. OTC derivative contracts, however, are exposed to counterparty risk in the amount of unrealized gains, net of collateral held, for the duration of the contract.
The Macro Allocation Fund is subject to certain netting arrangements through International Swaps and Derivatives Association, Inc. Master Agreements and Credit Support Annexes (“ISDAs”). The ISDAs maintain provisions for general obligations, representations, agreements, collateral and events of default or termination. The ISDAs cover certain OTC derivative securities entered into by Macro Allocation Fund with various counterparties and allow the Macro Allocation Fund to close out and net its total exposure to a counterparty in the event of a default.
Futures Contracts
A futures contract provides for the future sale by one party and purchase by another party of a specified amount of a specific financial instrument for a specified price at a designated date, time and place. An index futures contract is an agreement pursuant to which the parties agree to take or make delivery of an amount of cash equal to the difference between the value of the index at the close of the last trading day of the contract and the price at which the index futures contract was originally written. If the offsetting purchase price is less than the original sale price, a Fund realizes a gain; if it is more, a Fund realizes a loss. Conversely, if the offsetting sale price is more than the original purchase price, a Fund realizes a gain; if it is less, a Fund realizes a loss. The transaction costs must also be included in these calculations. There can be no assurance, however, that a Fund will be able to enter into an offsetting transaction with respect to a particular futures contract at a particular time. If a Fund is not able to enter into an offsetting transaction, a Fund will continue to be required to maintain the margin deposits on the futures contract.
Upon entering into a futures contract, a Fund is required to pledge to the broker an amount of cash, U.S. government securities, or other liquid assets equal to a certain percentage of the contract amount (“initial margin deposit”). Futures contracts are marked to market daily and an appropriate payable or receivable for the change in value (“variation margin”) is recorded by a Fund and a cash payment is either made to or received from the broker. Futures held through swaps are marked to market daily, however, a Fund does not make or receive cash payments to/from the broker. Gains or losses are recognized but not considered realized until the contracts expire or are closed and are included in the Statement of Operations.
Options
The purchase or sale of an option by a Fund involves the payment or receipt of a premium by the investor and the corresponding right or obligation, as the case may be, either to purchase or sell the underlying security, commodity, or other instrument for a specific price at a certain time or during a certain period. Purchasing options involves the risk that the underlying instrument will not change price in the manner expected, so the investor loses its premium. Writing options involves potentially greater risk because the investor is exposed to the extent of the actual price movement in the underlying security rather than only the amount of the premium paid (which could result in a potentially unlimited loss). OTC options also involve counterparty credit risk. Purchased options are shown as an asset on the Statement of Assets and Liabilities and are included in Investments in securities. Premiums received for written options are shown as a liability on the Statement of Assets and Liabilities. Realized gains and losses on the sale, expiration or assignment of an option are disclosed on the Statement of Operations.
Forward Foreign Currency Contracts
The Global Equity, International Equity and Multi-Asset and Alternative Funds may enter into forward foreign currency contracts. When entering into a forward foreign currency contract, a Fund agrees to receive or deliver a fixed quantity of foreign currency for an agreed-upon price on an agreed future date. A Fund’s net equity therein, representing unrealized gain or loss on the contracts as measured by the difference between the forward foreign exchange rates at the dates of entry into the contracts and the forward rates at the reporting date, is included in the Statement of Assets and Liabilities. Realized and unrealized gains and losses are included in the Statement of Operations. These instruments may involve market risk, credit risk, or both kinds of risks in excess of the amount recognized in the Statement of Assets and Liabilities. Risks arise from the possible inability of counterparties to meet the terms of their contracts and from the price movements in currencies.
| 156 | Annual Report | December 31, 2015 |
Swap Contracts
Swap agreements may include total return, interest rate, securities index, commodity, security, currency exchange rate, credit default index, volatility and variance swaps. Swap agreements typically are two-party contracts entered into primarily by institutional investors for periods ranging from a few weeks to several years. Cleared swaps are transacted through futures commission merchants that are members of central clearing houses with the clearing house serving as a central counterparty similar to transactions in futures contracts. In a standard “swap” transaction, two parties agree to exchange the returns (or differentials in rates of return) earned or realized on particular predetermined investments or instruments. The gross returns to be exchanged or “swapped” between the parties are calculated with respect to a “notional amount” (i.e., the change in the value of a particular dollar amount invested at a particular interest rate, in a particular foreign currency, or in a “basket” of securities representing a particular index). Swap agreements are subject to the risk that the counterparty to the swap will default on its obligation to pay a Fund and the risk that a Fund will not be able to meet its obligations to pay the counterparty to the swap. Swap agreements may also involve fees, commissions or other costs that may reduce a Fund’s gains from a swap agreement or may cause a Fund to lose money.
Credit Default Swaps—A Fund may invest in credit default swaps as a means of “buying” credit protection (i.e., attempting to mitigate the risk of default or credit quality deterioration in some portion of a Fund’s holdings) or “selling” credit protection (i.e., attempting to gain exposure to an underlying issuer’s credit quality characteristics without directly investing in that issuer). A credit default swap is a contract between a buyer and a seller of protection against a pre-defined credit event (e.g., a ratings downgrade or default) on an underlying reference obligation, which may be a single debt instrument or baskets or indices of securities. A Fund may be a buyer or seller of a credit default swap. As a seller of protection on credit default swap agreements, a Fund will generally receive from the buyer of protection a fixed rate of income throughout the term of the swap provided that there is no credit event. A Fund adds leverage to its portfolio because the Fund is subject to investment exposure on the notional amount of the swap. The maximum potential amount of future payments that a Fund as a seller of protection could be required to make under a credit default swap agreement equals the notional amount of the agreement. Notional amounts of each individual credit default swap agreement outstanding as of period end for which a Fund is the seller of protection are disclosed in Portfolio of Investments. These potential amounts would be partially offset by any recovery values of the respective referenced obligations, upfront payments received upon entering into the agreement, or net amounts received from the settlement of buy protection credit default swap agreements entered into by a Fund for the same referenced entity or entities. For credit default swap contracts on credit indices, the quoted market prices and resulting values serve as an indicator of the payment performance risk. Increasing market values, in absolute terms when compared to the notional amount of the swap, represent deterioration of the referenced entities’ credit soundness and a greater likelihood or risk of default or other credit event occurring as defined under the terms of the swap.
Interest Rate Swap—A Fund may invest in interest rate swaps to gain or mitigate exposure to changes in interest rates. Interest rate swap agreements involve a commitment between parties to pay either a fixed interest rate or a floating interest rate based on a notional amount of principal. The parties make payments at predetermined intervals throughout the life of the swap. As a payer, a Fund would make the fixed payment and receive the floating payment. As a receiver, a Fund would make the floating payment and receive the fixed payment.
Total Return Swap—A Fund may invest in total return swaps to gain or mitigate exposure to an underlying security, or securities. Total return swap agreements may involve commitments to pay interest in exchange for the return on the underlying security, or securities. At maturity, a net cash flow is exchanged between the parties based on the total return of the underlying security, or securities, less a financing rate. As a receiver, a Fund would receive a payment for a positive return and would make a payment for a negative return. As a payer, a Fund would make a payment for a positive return and would receive a payment for a negative return.
Variance Swap—A Fund may invest in variance swaps in order to gain or mitigate its exposure to an underlying reference entity such as a broad based index. A variance swap is an agreement between two parties to exchange cash flows based on the measured variance of a reference entity. The payer agrees to exchange the fixed rate, or the variance strike price of the reference entity, to the receiver for the floating rate, or realized variance price of the reference entity. At the time the trade is originated, the agreed upon variance strike price is generally set so that the fair value of the swap is near zero. At maturity, a net cash flow is exchanged between the parties based on the difference between the final realized variance price of the swap and the variance strike price multiplied by the notional, or vega amount. As a receiver of the floating rate, a Fund would receive a payment if the final realized variance price is greater than the variance strike price and would make a payment if the final realized variance price is less than the variance strike price. As a payer of the floating rate, a Fund would receive a payment if the final realized variance price is less than the variance strike price and would make a payment if the final realized variance price is greater than the variance strike price.
| December 31, 2015 | William Blair Funds | 157 |
The following table presents the value of financial derivative instruments, by primary risk exposure, as of December 31, 2015 and their respective location on the Statements of Assets and Liabilities (in thousands):
| | | Assets | | | Liabilities | |
| Primary Risk Exposure | | Statements of Assets
and Liabilities | | Value | | | Statements of Assets
and Liabilities | | Value | |
| Bond | | | | | | | | | | | | |
| Interest rate | | Investments in securities, at value | | $ | 2 | | | None | | $ | — | |
| Credit | | Receivable for variation margin on centrally cleared swaps | | | — | | | Payable for variation margin on centrally cleared swaps | | | 37 | |
| Income | | | | | | | | | | | | |
| Interest rate | | Investments in securities, at value | | | 1 | | | None | | | — | |
| Low Duration | | | | | | | | | | | | |
| Interest rate | | Investments in securities, at value | | | 2 | | | None | | | — | |
| Macro Allocation | | | | | | | | | | | | |
| Credit | | Receivable for variation margin on centrally cleared swaps | | | 158 | | | Payable for variation margin on centrally cleared swaps | | | — | |
| Currency | | Investments in securities, at value | | | 653 | | | Options written, at value | | | — | |
| Currency | | Unrealized appreciation on forward currency contracts | | | 11,296 | | | Unrealized depreciation on forward currency contracts | | | 9,563 | |
| Equity | | Investments in securities, at value | | | 5,621 | | | Options written, at value | | | — | |
| Equity | | Receivable for variation margin on futures | | | 8,523 | | | Payable for variation margin on futures | | | 5,424 | |
| Equity | | Unrealized appreciation on swap contract | | | 1,656 | | | Unrealized depreciation on swap contract | | | 4,802 | |
| Interest rate | | Investments in securities, at value | | | 310 | | | Options written, at value | | | 261 | |
| Interest rate | | Receivable for variation margin on futures | | | 1,221 | | | Payable for variation margin on futures | | | 1,692 | |
| Interest rate | | Unrealized appreciation on swap contract | | | 54 | | | Unrealized depreciation on swap contract | | | 850 | |
| 158 | Annual Report | December 31, 2015 |
The following table indicates the effect of derivatives, by primary risk exposure, on the Statements of Operations for the year ended December 31, 2015 (in thousands):
| | | Realized Gain (Loss) | | | Change in Net Unrealized
Appreciation (Depreciation) | |
| Primary Risk Exposure | | Statements of Operations | | Value | | | Statements of Operations | | Value | |
| Bond | | | | | | | | | | | | |
| Interest Rate | | Options | | $ | (121 | ) | | Options | | $ | 49 | |
| Credit | | Swaps | | | 17 | | | Swaps | | | (20 | ) |
| Income | | | | | | | | | | | | |
| Interest Rate | | Options | | | (60 | ) | | Options | | | 25 | |
| Low Duration | | | | | | | | | | | | |
| Interest Rate | | Options | | | (121 | ) | | Options | | | 49 | |
| Macro Allocation | | | | | | | | | | | | |
| Credit | | Swaps | | | 4 | | | Swaps | | | 173 | |
| Currency | | Forward foreign currency contracts | | | (8,735 | ) | | Forward foreign currency contracts | | | (5,467 | ) |
| Currency | | Options | | | 4,506 | | | Options | | | (1,602 | ) |
| Equity | | Futures Contracts | | | (5,612 | ) | | Futures Contracts | | | 1,509 | |
| Equity | | Options | | | (14,620 | ) | | Options | | | (5,316 | ) |
| Equity | | Swaps | | | (43,692 | ) | | Swaps | | | 10,264 | |
| Interest rate | | Futures Contracts | | | (3,058 | ) | | Futures Contracts | | | 3,444 | |
| Interest Rate | | Options | | | — | | | Options | | | (795 | ) |
| Interest Rate | | Swaps | | | (3,809 | ) | | Swaps | | | 1,376 | |
The following table indicates gross OTC derivative asset exposure, by investment type, included in the Statements of Assets and Liabilities at December 31, 2015 (in thousands):
| | | Gross | | | Gross Amounts
Offset in the | | | Net Amounts of
Assets
Presented in the | | | Gross Amounts Not Offset
in the Statements
of Assets and Liabilities | | | | |
| Description | | Amounts of
Recognized
Assets | | | Statements of
Assets and
Liabilities | | | Statements of
Assets and
Liabilities | | | Financial
Instruments | | | Cash
Collateral
Received | | | Net
Amount | |
| Macro Allocation | | | | | | | | | | | | | | | | | | | | | | | | |
| Citibank N.A. | | | | | | | | | | | | | | | | | | | | | | | | |
| Forward foreign currency contracts | | $ | 11,296 | | | $ | (9,563 | ) | | $ | 1,733 | | | $ | — | | | $ | — | | | $ | 1,733 | |
| Option | | | 653 | | | | — | | | | 653 | | | | — | | | | — | | | | 653 | |
| Swaps | | | 60 | | | | — | | | | 60 | | | | — | | | | — | | | | 60 | |
| Credit Suisse | | | | | | | | | | | | | | | | | | | | | | | | |
| Option | | | 153 | | | | — | | | | 153 | | | | — | | | | — | | | | 153 | |
| Goldman Sachs | | | | | | | | | | | | | | | | | | | | | | | | |
| Option | | | 271 | | | | — | | | | 271 | | | | — | | | | — | | | | 271 | |
| Swaps | | | 1,650 | | | | (1,650 | ) | | | — | | | | — | | | | — | | | | — | |
The following table indicates gross OTC derivative liability exposure, by investment type, included in the Statements of Assets and Liabilities at December 31, 2015 (in thousands):
| | | Gross | | | Gross Amounts
Offset in the | | | Net Amounts of
Liabilities
Presented in the | | | Gross Amounts Not Offset
in the Statements
of Assets and Liabilities | | | | |
| Description | | Amounts of
Recognized
Liabilities | | | Statements of
Assets and
Liabilities | | | Statements of
Assets and
Liabilities | | | Financial
Instruments | | | Cash
Collateral
Pledged | | | Net Amount
(not less
than zero) | |
| Macro Allocation | | | | | | | | | | | | | | | | | | | | | | | | |
| Citibank N.A. | | | | | | | | | | | | | | | | | | | | | | | | |
| Forward foreign currency contracts | | | $9,563 | | | | $(9,563 | ) | | | $ — | | | | $ — | | | | $ — | | | | $ — | |
| Credit Suisse | | | | | | | | | | | | | | | | | | | | | | | | |
| Swaps | | | 2,809 | | | | — | | | | $2,809 | | | | 12,047 | | | | — | | | | — | |
| Goldman Sachs | | | | | | | | | | | | | | | | | | | | | | | | |
| Swaps | | | 2,843 | | | | (1,650 | ) | | | $1,193 | | | | 2,773 | | | | — | | | | — | |
| December 31, 2015 | William Blair Funds | 159 |
(7) Fund Share Transactions
The following tables summarizes the activity in capital shares of each Fund for the year ended December 31, 2015 (in thousands):
| | | Class N |
| | | Dollars | | | Shares |
| Fund | | Sales | | | Reinvest | | | Redemptions | | | Total | | | Sales | | | Reinvest | | | Redemptions | | | Total |
| Growth | | $ | 20,920 | | | | $18,415 | | | | $155,588 | | | $ | (116,253 | ) | | | 1,510 | | | | 1,477 | | | | 11,153 | | | | (8,166 | ) |
| Large Cap Growth | | | 3,479 | | | | 966 | | | | 2,462 | | | | 1,983 | | | | 315 | | | | 96 | | | | 226 | | | | 185 | |
| Large Cap Value | | | 169 | | | | 123 | | | | 371 | | | | (79 | ) | | | 13 | | | | 11 | | | | 28 | | | | (4 | ) |
| Mid Cap Growth | | | 5,086 | | | | 4,873 | | | | 16,859 | | | | (6,900 | ) | | | 358 | | | | 436 | | | | 1,203 | | | | (409 | ) |
| Mid Cap Value | | | 632 | | | | 151 | | | | 127 | | | | 656 | | | | 50 | | | | 15 | | | | 10 | | | | 55 | |
| Small-Mid Cap Growth | | | 113,394 | | | | 8,500 | | | | 28,874 | | | | 93,020 | | | | 5,722 | | | | 460 | | | | 1,469 | | | | 4,713 | |
| Small-Mid Cap Value | | | 72 | | | | 7 | | | | 100 | | | | (21 | ) | | | 5 | | | | 1 | | | | 7 | | | | (1 | ) |
| Small Cap Growth | | | 11,167 | | | | 9,324 | | | | 41,312 | | | | (20,821 | ) | | | 440 | | | | 416 | | | | 1,662 | | | | (806 | ) |
| Small Cap Value | | | 5,971 | | | | 107 | | | | 10,763 | | | | (4,685 | ) | | | 344 | | | | 6 | | | | 616 | | | | (266 | ) |
| Global Leaders | | | 766 | | | | 246 | | | | 275 | | | | 737 | | | | 61 | | | | 21 | | | | 22 | | | | 60 | |
| Global Small Cap Growth | | | 460 | | | | 27 | | | | 345 | | | | 142 | | | | 35 | | | | 2 | | | | 26 | | | | 11 | |
| International Leaders | | | 226 | | | | 2 | | | | 8 | | | | 220 | | | | 18 | | | | — | | | | 1 | | | | 17 | |
| International Equity | | | 279 | | | | 26 | | | | 830 | | | | (525 | ) | | | 19 | | | | 2 | | | | 57 | | | | (36 | ) |
| International Growth | | | 359,131 | | | | 9,388 | | | | 312,397 | | | | 56,122 | | | | 14,223 | | | | 378 | | | | 12,310 | | | | 2,291 | |
| International Small Cap Growth | | | 2,310 | | | | 205 | | | | 5,668 | | | | (3,153 | ) | | | 176 | | | | 15 | | | | 439 | | | | (248 | ) |
| Emerging Markets Leaders | | | 6,520 | | | | 2 | | | | 6,488 | | | | 34 | | | | 751 | | | | — | | | | 746 | | | | 5 | |
| Emerging Markets Growth | | | 2,105 | | | | 97 | | | | 3,386 | | | | (1,184 | ) | | | 164 | | | | 9 | | | | 289 | | | | (116 | ) |
| Emerging Markets Small Cap Growth | | | 5,302 | | | | 473 | | | | 3,847 | | | | 1,928 | | | | 319 | | | | 32 | | | | 240 | | | | 111 | |
| Bond | | | 137,843 | | | | 1,819 | | | | 14,345 | | | | 125,317 | | | | 13,112 | | | | 173 | | | | 1,372 | | | | 11,913 | |
| Income | | | 13,105 | | | | 972 | | | | 14,256 | | | | (179 | ) | | | 1,439 | | | | 107 | | | | 1,574 | | | | (28 | ) |
| Low Duration | | | 1,525 | | | | 49 | | | | 3,744 | | | | (2,170 | ) | | | 164 | | | | 5 | | | | 403 | | | | (234 | ) |
| Macro Allocation | | | 180,974 | | | | 898 | | | | 162,486 | | | | 19,386 | | | | 14,474 | | | | 79 | | | | 13,669 | | | | 884 | |
| | | Class I |
| | | Dollars | | | Shares |
| Fund | | Sales | | | Reinvest | | | Redemptions | | | Total | | | Sales | | | Reinvest | | | Redemptions | | | Total |
| Growth | | $ | 101,867 | | | | $77,422 | | | | $125,622 | | | $ | 53,667 | | | | 6,840 | | | | 5,761 | | | | 8,641 | | | | 3,960 | |
| Large Cap Growth | | | 13,673 | | | | 4,410 | | | | 8,280 | | | | 9,803 | | | | 1,213 | | | | 418 | | | | 736 | | | | 895 | |
| Large Cap Value | | | 19 | | | | 235 | | | | 1,009 | | | | (755 | ) | | | 2 | | | | 21 | | | | 78 | | | | (55 | ) |
| Mid Cap Growth | | | 28,076 | | | | 34,703 | | | | 159,407 | | | | (96,628 | ) | | | 1,907 | | | | 2,974 | | | | 10,676 | | | | (5,795 | ) |
| Mid Cap Value | | | 29 | | | | 422 | | | | 1,620 | | | | (1,169 | ) | | | 2 | | | | 43 | | | | 124 | | | | (79 | ) |
| Small-Mid Cap Growth | | | 314,765 | | | | 48,836 | | | | 122,703 | | | | 240,898 | | | | 15,422 | | | | 2,545 | | | | 6,027 | | | | 11,940 | |
| Small-Mid Cap Value | | | 363 | | | | 129 | | | | 402 | | | | 90 | | | | 27 | | | | 10 | | | | 30 | | | | 7 | |
| Small Cap Growth | | | 82,937 | | | | 19,650 | | | | 175,942 | | | | (73,355 | ) | | | 3,105 | | | | 816 | | | | 6,445 | | | | (2,524 | ) |
| Small Cap Value | | | 168,226 | | | | 2,938 | | | | 103,403 | | | | 67,761 | | | | 9,544 | | | | 173 | | | | 5,798 | | | | 3,919 | |
| Global Leaders | | | 11,928 | | | | 2,130 | | | | 19,402 | | | | (5,344 | ) | | | 963 | | | | 185 | | | | 1,586 | | | | (438 | ) |
| Global Small Cap Growth | | | 13,460 | | | | 615 | | | | 42,410 | | | | (28,335 | ) | | | 1,041 | | | | 47 | | | | 3,193 | | | | (2,105 | ) |
| International Leaders | | | 4,408 | | | | 96 | | | | 1,095 | | | | 3,409 | | | | 340 | | | | 7 | | | | 83 | | | | 264 | |
| International Equity | | | 5,376 | | | | 680 | | | | 10,778 | | | | (4,722 | ) | | | 365 | | | | 49 | | | | 730 | | | | (316 | ) |
| International Growth | | | 477,894 | | | | 27,497 | | | | 523,541 | | | | (18,150 | ) | | | 17,911 | | | | 1,082 | | | | 19,687 | | | | (694 | ) |
| International Small Cap Growth | | | 62,196 | | | | 6,895 | | | | 116,983 | | | | (47,892 | ) | | | 4,698 | | | | 511 | | | | 8,807 | | | | (3,598 | ) |
| Emerging Markets Leaders | | | 15,832 | | | | 113 | | | | 5,667 | | | | 10,278 | | | | 1,800 | | | | 15 | | | | 709 | | | | 1,106 | |
| Emerging Markets Growth | | | 46,581 | | | | 1,207 | | | | 55,599 | | | | (7,811 | ) | | | 3,709 | | | | 109 | | | | 4,716 | | | | (898 | ) |
| Emerging Markets Small Cap Growth | | | 107,086 | | | | 4,486 | | | | 51,918 | | | | 59,654 | | | | 6,516 | | | | 302 | | | | 3,162 | | | | 3,656 | |
| Bond | | | 136,906 | | | | 4,457 | | | | 45,989 | | | | 95,374 | | | | 13,136 | | | | 426 | | | | 4,406 | | | | 9,156 | |
| Income | | | 10,900 | | | | 1,714 | | | | 13,153 | | | | (539 | ) | | | 1,216 | | | | 191 | | | | 1,466 | | | | (59 | ) |
| Low Duration | | | 41,356 | | | | 1,978 | | | | 38,076 | | | | 5,258 | | | | 4,452 | | | | 213 | | | | 4,113 | | | | 552 | |
| Macro Allocation | | | 1,054,314 | | | | 8,797 | | | | 456,003 | | | | 607,108 | | | | 85,643 | | | | 772 | | | | 38,103 | | | | 48,312 | |
| 160 | Annual Report | December 31, 2015 |
| | | Institutional Class |
| | | Dollars | | | Shares |
| Fund | | Sales | | | Reinvest | | | Redemptions | | | Total | | | Sales | | | Reinvest | | | Redemptions | | | Total |
| Global Leaders | | $ | 29,091 | | | | $6,610 | | | | $ 1,181 | | | $ | 34,520 | | | | 2,398 | | | | 574 | | | | 95 | | | | 2,877 | |
| International Leaders | | | 19,418 | | | | 675 | | | | (1 | ) | | | 20,094 | | | | 1,480 | | | | 53 | | | | — | | | | 1,533 | |
| Institutional International Equity | | | 2,425 | | | | 156 | | | | 1,154 | | | | 1,427 | | | | 187 | | | | 13 | | | | 91 | | | | 109 | |
| Institutional International Growth | | | 297,180 | | | | 28,849 | | | | 305,026 | | | | 21,003 | | | | 18,912 | | | | 1,922 | | | | 19,237 | | | | 1,597 | |
| International Small Cap Growth | | | 13,840 | | | | 4,777 | | | | 61,465 | | | | (42,848 | ) | | | 1,040 | | | | 352 | | | | 4,482 | | | | (3,090 | ) |
| Emerging Markets Leaders | | | 58,828 | | | | 434 | | | | 28,442 | | | | 30,820 | | | | 6,983 | | | | 56 | | | | 3,358 | | | | 3,681 | |
| Emerging Markets Growth | | | 266,522 | | | | 7,305 | | | | 221,791 | | | | 52,036 | | | | 22,032 | | | | 656 | | | | 17,376 | | | | 5,312 | |
| Emerging Markets Small Cap Growth | | | 10,974 | | | | 4,600 | | | | 2,911 | | | | 12,663 | | | | 660 | | | | 309 | | | | 186 | | | | 783 | |
| Bond | | | 25,382 | | | | 3,259 | | | | 18,526 | | | | 10,115 | | | | 2,443 | | | | 311 | | | | 1,756 | | | | 998 | |
| Low Duration | | | 4,653 | | | | 1,069 | | | | 50,966 | | | | (45,244 | ) | | | 497 | | | | 115 | | | | 5,489 | | | | (4,877 | ) |
| Macro Allocation | | | 324,009 | | | | 4,325 | | | | 27,615 | | | | 300,719 | | | | 26,463 | | | | 379 | | | | 2,365 | | | | 24,477 | |
| | | Net Change in Net Assets Relating to Fund Share Activity |
| | | Dollars | | | Shares |
| Fund | | Sales | | | Reinvest | | | Redemptions | | | Total | | | Sales | | | Reinvest | | | Redemptions | | | Total |
| Growth | | | $ 122,787 | | | | $95,837 | | | | $281,210 | | | | $ (62,586 | ) | | | 8,350 | | | | 7,238 | | | | 19,794 | | | | (4,206 | ) |
| Large Cap Growth | | | 17,152 | | | | 5,376 | | | | 10,742 | | | | 11,786 | | | | 1,528 | | | | 514 | | | | 962 | | | | 1,080 | |
| Large Cap Value | | | 188 | | | | 358 | | | | 1,380 | | | | (834 | ) | | | 15 | | | | 32 | | | | 106 | | | | (59 | ) |
| Mid Cap Growth | | | 33,162 | | | | 39,576 | | | | 176,266 | | | | (103,528 | ) | | | 2,265 | | | | 3,410 | | | | 11,879 | | | | (6,204 | ) |
| Mid Cap Value | | | 661 | | | | 573 | | | | 1,747 | | | | (513 | ) | | | 52 | | | | 58 | | | | 134 | | | | (24 | ) |
| Small-Mid Cap Growth | | | 428,159 | | | | 57,336 | | | | 151,577 | | | | 333,918 | | | | 21,144 | | | | 3,005 | | | | 7,496 | | | | 16,653 | |
| Small-Mid Cap Value | | | 435 | | | | 136 | | | | 502 | | | | 69 | | | | 32 | | | | 11 | | | | 37 | | | | 6 | |
| Small Cap Growth | | | 94,104 | | | | 28,974 | | | | 217,254 | | | | (94,176 | ) | | | 3,545 | | | | 1,232 | | | | 8,107 | | | | (3,330 | ) |
| Small Cap Value | | | 174,197 | | | | 3,045 | | | | 114,166 | | | | 63,076 | | | | 9,888 | | | | 179 | | | | 6,414 | | | | 3,653 | |
| Global Leaders | | | 41,785 | | | | 8,986 | | | | 20,858 | | | | 29,913 | | | | 3,422 | | | | 780 | | | | 1,703 | | | | 2,499 | |
| Global Small Cap Growth | | | 13,920 | | | | 642 | | | | 42,755 | | | | (28,193 | ) | | | 1,076 | | | | 49 | | | | 3,219 | | | | (2,094 | ) |
| International Leaders | | | 24,052 | | | | 773 | | | | 1,102 | | | | 23,723 | | | | 1,838 | | | | 60 | | | | 84 | | | | 1,814 | |
| International Equity | | | 5,655 | | | | 706 | | | | 11,608 | | | | (5,247 | ) | | | 384 | | | | 51 | | | | 787 | | | | (352 | ) |
| Institutional International Equity | | | 2,425 | | | | 156 | | | | 1,154 | | | | 1,427 | | | | 187 | | | | 13 | | | | 91 | | | | 109 | |
| International Growth | | | 837,025 | | | | 36,885 | | | | 835,938 | | | | 37,972 | | | | 32,134 | | | | 1,460 | | | | 31,997 | | | | 1,597 | |
| Institutional International Growth | | | 297,180 | | | | 28,849 | | | | 305,026 | | | | 21,003 | | | | 18,912 | | | | 1,922 | | | | 19,237 | | | | 1,597 | |
| International Small Cap Growth | | | 78,346 | | | | 11,877 | | | | 184,116 | | | | (93,893 | ) | | | 5,914 | | | | 878 | | | | 13,728 | | | | (6,936 | ) |
| Emerging Markets Leaders | | | 81,180 | | | | 549 | | | | 40,597 | | | | 41,132 | | | | 9,534 | | | | 71 | | | | 4,813 | | | | 4,792 | |
| Emerging Markets Growth | | | 315,208 | | | | 8,609 | | | | 280,776 | | | | 43,041 | | | | 25,905 | | | | 774 | | | | 22,381 | | | | 4,298 | |
| Emerging Markets Small Cap Growth | | | 123,362 | | | | 9,559 | | | | 58,676 | | | | 74,245 | | | | 7,495 | | | | 643 | | | | 3,588 | | | | 4,550 | |
| Bond | | | 300,131 | | | | 9,535 | | | | 78,860 | | | | 230,806 | | | | 28,691 | | | | 910 | | | | 7,534 | | | | 22,067 | |
| Income | | | 24,005 | | | | 2,686 | | | | 27,409 | | | | (718 | ) | | | 2,655 | | | | 298 | | | | 3,040 | | | | (87 | ) |
| Low Duration | | | 47,534 | | | | 3,096 | | | | 92,786 | | | | (42,156 | ) | | | 5,113 | | | | 333 | | | | 10,005 | | | | (4,559 | ) |
| Macro Allocation | | | 1,559,297 | | | | 14,020 | | | | 646,104 | | | | 927,213 | | | | 126,580 | | | | 1,230 | | | | 54,137 | | | | 73,673 | |
| December 31, 2015 | William Blair Funds | 161 |
The following tables summarizes the activity in capital shares of each Fund for the year ended December 31, 2014 (in thousands):
| | | Class N |
| | | Dollars | | | Shares |
| Fund | | Sales | | | Reinvest | | | Redemptions | | | Total | | | Sales | | | Reinvest | | | Redemptions | | | Total |
| Growth | | | $ 31,769 | | | | $38,364 | | | | $ 67,646 | | | $ | 2,487 | | | | 2,133 | | | | 2,844 | | | | 4,552 | | | | 425 | |
| Large Cap Growth | | | 1,924 | | | | 760 | | | | 801 | | | | 1,883 | | | | 183 | | | | 72 | | | | 78 | | | | 177 | |
| Large Cap Value | | | 176 | | | | 131 | | | | 460 | | | | (153 | ) | | | 13 | | | | 10 | | | | 32 | | | | (9 | ) |
| Mid Cap Growth | | | 7,467 | | | | 4,305 | | | | 14,065 | | | | (2,293 | ) | | | 494 | | | | 304 | | | | 916 | | | | (118 | ) |
| Mid Cap Value | | | 10 | | | | 25 | | | | 73 | | | | (38 | ) | | | 1 | | | | 2 | | | | 5 | | | | (2 | ) |
| Small-Mid Cap Growth | | | 39,843 | | | | 5,936 | | | | 35,973 | | | | 9,806 | | | | 2,127 | | | | 317 | | | | 1,901 | | | | 543 | |
| Small-Mid Cap Value | | | 68 | | | | 12 | | | | 305 | | | | (225 | ) | | | 5 | | | | 1 | | | | 21 | | | | (15 | ) |
| Small Cap Growth | | | 25,046 | | | | 25,674 | | | | 91,030 | | | | (40,310 | ) | | | 846 | | | | 1,015 | | | | 3,121 | | | | (1,260 | ) |
| Small Cap Value | | | 9,135 | | | | 1,424 | | | | 26,250 | | | | (15,691 | ) | | | 522 | | | | 82 | | | | 1,485 | | | | (881 | ) |
| Global Leaders | | | 482 | | | | 8 | | | | 2,092 | | | | (1,602 | ) | | | 41 | | | | 1 | | | | 179 | | | | (137 | ) |
| Global Small Cap Growth | | | 576 | | | | 24 | | | | 208 | | | | 392 | | | | 46 | | | | 2 | | | | 17 | | | | 31 | |
| International Leaders | | | 18 | | | | — | | | | 17 | | | | 1 | | | | 1 | | | | — | | | | 1 | | | | — | |
| International Equity | | | 149 | | | | 21 | | | | 845 | | | | (675 | ) | | | 10 | | | | 2 | | | | 60 | | | | (48 | ) |
| International Growth | | | 151,647 | | | | 8,469 | | | | 567,333 | | | | (407,217 | ) | | | 5,859 | | | | 333 | | | | 21,360 | | | | (15,168 | ) |
| International Small Cap Growth | | | 3,098 | | | | 1,836 | | | | 6,812 | | | | (1,878 | ) | | | 208 | | | | 146 | | | | 441 | | | | (87 | ) |
| Emerging Markets Leaders | | | 2,361 | | | | 24 | | | | 2,404 | | | | (19 | ) | | | 254 | | | | 2 | | | | 269 | | | | (13 | ) |
| Emerging Markets Growth | | | 961 | | | | 600 | | | | 2,362 | | | | (801 | ) | | | 71 | | | | 47 | | | | 173 | | | | (55 | ) |
| Emerging Markets Small Cap Growth | | | 15,026 | | | | 446 | | | | 15,349 | | | | 123 | | | | 920 | | | | 28 | | | | 913 | | | | 35 | |
| Bond | | | 8,599 | | | | 442 | | | | 3,830 | | | | 5,211 | | | | 797 | | | | 41 | | | | 357 | | | | 481 | |
| Income | | | 7,606 | | | | 1,016 | | | | 16,330 | | | | (7,708 | ) | | | 829 | | | | 111 | | | | 1,782 | | | | (842 | ) |
| Low Duration | | | 1,876 | | | | 56 | | | | 2,039 | | | | (107 | ) | | | 199 | | | | 6 | | | | 217 | | | | (12 | ) |
| Macro Allocation (a) | | | 16,779 | | | | 7,675 | | | | 13,673 | | | | 10,781 | | | | 1,332 | | | | 639 | | | | 1,085 | | | | 886 | |
| Macro Allocation (b) | | | 152,928 | | | | 2,968 | | | | 109,094 | | | | 46,802 | | | | 12,151 | | | | 241 | | | | 8,583 | | | | 3,809 | |
| | | Class I |
| | | Dollars | | | Shares |
| Fund | | Sales | | | Reinvest | | | Redemptions | | | Total | | | Sales | | | Reinvest | | | Redemptions | | | Total |
| Growth | | $ | 136,452 | | | | $83,841 | | | | $105,497 | | | $ | 114,796 | | | | 8,531 | | | | 5,835 | | | | 6,741 | | | | 7,625 | |
| Large Cap Growth | | | 10,880 | | | | 3,704 | | | | 6,304 | | | | 8,280 | | | | 998 | | | | 341 | | | | 575 | | | | 764 | |
| Large Cap Value | | | 153 | | | | 293 | | | | 734 | | | | (288 | ) | | | 10 | | | | 22 | | | | 52 | | | | (20 | ) |
| Mid Cap Growth | | | 39,833 | | | | 42,372 | | | | 148,180 | | | | (65,975 | ) | | | 2,561 | | | | 2,894 | | | | 9,573 | | | | (4,118 | ) |
| Mid Cap Value | | | 39 | | | | 387 | | | | 960 | | | | (534 | ) | | | 4 | | | | 30 | | | | 71 | | | | (37 | ) |
| Small-Mid Cap Growth | | | 255,552 | | | | 60,567 | | | | 135,064 | | | | 181,055 | | | | 12,889 | | | | 3,132 | | | | 6,930 | | | | 9,091 | |
| Small-Mid Cap Value | | | 2,101 | | | | 202 | | | | 837 | | | | 1,466 | | | | 146 | | | | 15 | | | | 58 | | | | 103 | |
| Small Cap Growth | | | 75,868 | | | | 57,143 | | | | 135,175 | | | | (2,164 | ) | | | 2,433 | | | | 2,119 | | | | 4,372 | | | | 180 | |
| Small Cap Value | | | 282,706 | | | | 17,680 | | | | 116,112 | | | | 184,274 | | | | 15,870 | | | | 987 | | | | 6,474 | | | | 10,383 | |
| Global Leaders | | | 3,392 | | | | 155 | | | | 6,905 | | | | (3,358 | ) | | | 293 | | | | 13 | | | | 602 | | | | (296 | ) |
| Global Small Cap Growth | | | 25,796 | | | | 552 | | | | 831 | | | | 25,517 | | | | 2,077 | | | | 45 | | | | 67 | | | | 2,055 | |
| International Leaders | | | 770 | | | | 72 | | | | 2,634 | | | | (1,792 | ) | | | 62 | | | | 6 | | | | 207 | | | | (139 | ) |
| International Equity | | | 1,631 | | | | 522 | | | | 9,844 | | | | (7,691 | ) | | | 115 | | | | 37 | | | | 695 | | | | (543 | ) |
| International Growth | | | 571,312 | | | | 29,393 | | | | 653,235 | | | | (52,530 | ) | | | 21,072 | | | | 1,131 | | | | 24,369 | | | | (2,166 | ) |
| International Small Cap Growth | | | 101,871 | | | | 46,099 | | | | 190,903 | | | | (42,933 | ) | | | 6,462 | | | | 3,619 | | | | 12,746 | | | | (2,665 | ) |
| Emerging Markets Leaders | | | 3,054 | | | | 543 | | | | 9,540 | | | | (5,943 | ) | | | 327 | | | | 61 | | | | 1,049 | | | | (661 | ) |
| Emerging Markets Growth | | | 33,599 | | | | 8,779 | | | | 24,068 | | | | 18,310 | | | | 2,457 | | | | 681 | | | | 1,747 | | | | 1,391 | |
| Emerging Markets Small Cap Growth | | | 59,395 | | | | 3,664 | | | | 6,200 | | | | 56,859 | | | | 3,551 | | | | 226 | | | | 371 | | | | 3,406 | |
| Bond | | | 24,075 | | | | 3,775 | | | | 26,212 | | | | 1,638 | | | | 2,256 | | | | 353 | | | | 2,466 | | | | 143 | |
| Income | | | 12,347 | | | | 1,684 | | | | 13,386 | | | | 645 | | | | 1,358 | | | | 185 | | | | 1,472 | | | | 71 | |
| Low Duration | | | 34,535 | | | | 2,010 | | | | 52,964 | | | | (16,419 | ) | | | 3,656 | | | | 213 | | | | 5,602 | | | | (1,733 | ) |
| Macro Allocation (a) | | | 112,136 | | | | 18,740 | | | | 53,316 | | | | 77,560 | | | | 8,904 | | | | 1,550 | | | | 4,228 | | | | 6,226 | |
| Macro Allocation (b) | | | 466,290 | | | | 3,143 | | | | 96,388 | | | | 373,045 | | | | 36,494 | | | | 254 | | | | 7,541 | | | | 29,207 | |
| 162 | Annual Report | December 31, 2015 |
| | | Institutional Class |
| | | Dollars | | | Shares |
| Fund | | Sales | | | Reinvest | | | Redemptions | | | Total | | | Sales | | | Reinvest | | | Redemptions | | | Total |
| Global Leaders | | $ | 50,000 | | | $ | 404 | | | | $ 34,546 | | | $ | 15,858 | | | | 4,295 | | | | 34 | | | | 2,964 | | | | 1,365 | |
| International Leaders | | | 25,600 | | | | 171 | | | | 2,098 | | | | 23,673 | | | | 2,039 | | | | 14 | | | | 168 | | | | 1,885 | |
| Institutional International Equity | | | — | | | | 293 | | | | 85,049 | | | | (84,756 | ) | | | — | | | | 24 | | | | 6,746 | | | | (6,722 | ) |
| Institutional International Growth | | | 338,472 | | | | 227,055 | | | | 363,134 | | | | 202,393 | | | | 19,547 | | | | 14,783 | | | | 21,209 | | | | 13,121 | |
| International Small Cap Growth | | | 53,813 | | | | 35,854 | | | | 190,247 | | | | (100,580 | ) | | | 3,360 | | | | 2,801 | | | | 11,999 | | | | (5,838 | ) |
| Emerging Markets Leaders | | | 51,588 | | | | 2,175 | | | | 11,552 | | | | 42,211 | | | | 5,352 | | | | 242 | | | | 1,243 | | | | 4,351 | |
| Emerging Markets Growth | | | 162,217 | | | | 42,676 | | | | 204,847 | | | | 46 | | | | 11,405 | | | | 3,288 | | | | 15,033 | | | | (340 | ) |
| Emerging Markets Small Cap Growth | | | 21,734 | | | | 5,574 | | | | 4,116 | | | | 23,192 | | | | 1,326 | | | | 342 | | | | 249 | | | | 1,419 | |
| Bond | | | 26,873 | | | | 3,580 | | | | 22,006 | | | | 8,447 | | | | 2,538 | | | | 336 | | | | 2,063 | | | | 811 | |
| Low Duration | | | 46,387 | | | | 1,353 | | | | 25,383 | | | | 22,357 | | | | 4,926 | | | | 143 | | | | 2,687 | | | | 2,382 | |
| Macro Allocation (a) | | | 11,788 | | | | 7,340 | | | | 94 | | | | 19,034 | | | | 904 | | | | 607 | | | | 8 | | | | 1,503 | |
| Macro Allocation (b) | | | 141,589 | | | | 130 | | | | — | | | | 141,719 | | | | 11,022 | | | | 11 | | | | — | | | | 11,033 | |
| | | Net Change in Net Assets Relating to Fund Share Activity |
| | | Dollars | | | Shares |
| Fund | | Sales | | | Reinvest | | | Redemptions | | | Total | | | Sales | | | Reinvest | | | Redemptions | | | Total |
| Growth | | $ | 168,221 | | | $ | 122,205 | | | | $ 173,143 | | | $ | 117,283 | | | | 10,664 | | | | 8,679 | | | | 11,293 | | | | 8,050 | |
| Large Cap Growth | | | 12,804 | | | | 4,464 | | | | 7,105 | | | | 10,163 | | | | 1,181 | | | | 413 | | | | 653 | | | | 941 | |
| Large Cap Value | | | 329 | | | | 424 | | | | 1,194 | | | | (441 | ) | | | 23 | | | | 32 | | | | 84 | | | | (29 | ) |
| Mid Cap Growth | | | 47,300 | | | | 46,677 | | | | 162,245 | | | | (68,268 | ) | | | 3,055 | | | | 3,198 | | | | 10,489 | | | | (4,236 | ) |
| Mid Cap Value | | | 49 | | | | 412 | | | | 1,033 | | | | (572 | ) | | | 5 | | | | 32 | | | | 76 | | | | (39 | ) |
| Small-Mid Cap Growth | | | 295,395 | | | | 66,503 | | | | 171,037 | | | | 190,861 | | | | 15,016 | | | | 3,449 | | | | 8,831 | | | | 9,634 | |
| Small-Mid Cap Value | | | 2,169 | | | | 214 | | | | 1,142 | | | | 1,241 | | | | 151 | | | | 16 | | | | 79 | | | | 88 | |
| Small Cap Growth | | | 100,914 | | | | 82,817 | | | | 226,205 | | | | (42,474 | ) | | | 3,279 | | | | 3,134 | | | | 7,493 | | | | (1,080 | ) |
| Small Cap Value | | | 291,841 | | | | 19,104 | | | | 142,362 | | | | 168,583 | | | | 16,392 | | | | 1,069 | | | | 7,959 | | | | 9,502 | |
| Global Leaders | | | 53,874 | | | | 567 | | | | 43,543 | | | | 10,898 | | | | 4,629 | | | | 48 | | | | 3,745 | | | | 932 | |
| Global Small Cap Growth | | | 26,372 | | | | 576 | | | | 1,039 | | | | 25,909 | | | | 2,123 | | | | 47 | | | | 84 | | | | 2,086 | |
| International Leaders | | | 26,388 | | | | 243 | | | | 4,749 | | | | 21,882 | | | | 2,102 | | | | 20 | | | | 376 | | | | 1,746 | |
| International Equity | | | 1,780 | | | | 543 | | | | 10,689 | | | | (8,366 | ) | | | 125 | | | | 39 | | | | 755 | | | | (591 | ) |
| Institutional International Equity | | | — | | | | 293 | | | | 85,049 | | | | (84,756 | ) | | | — | | | | 24 | | | | 6,746 | | | | (6,722 | ) |
| International Growth | | | 722,959 | | | | 37,862 | | | | 1,220,568 | | | | (459,747 | ) | | | 26,931 | | | | 1,464 | | | | 45,729 | | | | (17,334 | ) |
| Institutional International Growth | | | 338,472 | | | | 227,055 | | | | 363,134 | | | | 202,393 | | | | 19,547 | | | | 14,783 | | | | 21,209 | | | | 13,121 | |
| International Small Cap Growth | | | 158,782 | | | | 83,789 | | | | 387,962 | | | | (145,391 | ) | | | 10,030 | | | | 6,566 | | | | 25,186 | | | | (8,590 | ) |
| Emerging Markets Leaders | | | 57,003 | | | | 2,742 | | | | 23,496 | | | | 36,249 | | | | 5,933 | | | | 305 | | | | 2,561 | | | | 3,677 | |
| Emerging Markets Growth | | | 196,777 | | | | 52,055 | | | | 231,277 | | | | 17,555 | | | | 13,933 | | | | 4,016 | | | | 16,953 | | | | 996 | |
| Emerging Markets Small Cap Growth | | | 96,155 | | | | 9,684 | | | | 25,665 | | | | 80,174 | | | | 5,797 | | | | 596 | | | | 1,533 | | | | 4,860 | |
| Bond | | | 59,547 | | | | 7,797 | | | | 52,048 | | | | 15,296 | | | | 5,591 | | | | 730 | | | | 4,886 | | | | 1,435 | |
| Income | | | 19,953 | | | | 2,700 | | | | 29,716 | | | | (7,063 | ) | | | 2,187 | | | | 296 | | | | 3,254 | | | | (771 | ) |
| Low Duration | | | 82,798 | | | | 3,419 | | | | 80,386 | | | | 5,831 | | | | 8,781 | | | | 362 | | | | 8,506 | | | | 637 | |
| Macro Allocation (a) | | | 140,703 | | | | 33,755 | | | | 67,083 | | | | 107,375 | | | | 11,140 | | | | 2,796 | | | | 5,321 | | | | 8,615 | |
| Macro Allocation (b) | | | 760,807 | | | | 6,241 | | | | 205,482 | | | | 561,566 | | | | 59,667 | | | | 506 | | | | 16,124 | | | | 44,049 | |
| (a) | For the period from November 1, 2014 to December 31, 2014. |
| (b) | For the year ended October 31, 2014. |
| December 31, 2015 | William Blair Funds | 163 |
Financial Highlights
Growth Fund
| | | Class N | |
| | | Years Ended December 31, | |
| | | 2015 | | | 2014 | | | 2013 | | | 2012 | | | 2011 | |
| Net asset value, beginning of year | | $ | 13.55 | | | $ | 14.79 | | | $ | 12.05 | | | $ | 10.73 | | | $ | 11.28 | |
| Income (loss) from investment operations: | | | | | | | | | | | | | | | | | | | | |
| Net investment income (loss) | | | (0.04 | ) | | | (0.07 | ) | | | (0.07 | ) | | | (0.01 | ) | | | (0.04 | ) |
| Net realized and unrealized gain (loss) on investments | | | 0.75 | | | | 1.03 | | | | 4.25 | | | | 1.69 | | | | (0.19 | ) |
| Total from investment operations | | | 0.71 | | | | 0.96 | | | | 4.18 | | | | 1.68 | | | | (0.23 | ) |
| Less distributions from: | | | | | | | | | | | | | | | | | | | | |
| Net investment income | | | — | | | | — | | | | — | | | | 0.00 | ^ | | | — | |
| Net realized gain | | | 1.74 | | | | 2.20 | | | | 1.44 | | | | 0.36 | | | | 0.32 | |
| Total distributions | | | 1.74 | | | | 2.20 | | | | 1.44 | | | | 0.36 | | | | 0.32 | |
| Net asset value, end of year | | $ | 12.52 | | | $ | 13.55 | | | $ | 14.79 | | | $ | 12.05 | | | $ | 10.73 | |
| Total return (%) | | | 5.31 | | | | 6.59 | | | | 35.00 | | | | 15.67 | | | | (1.93 | ) |
| Ratios to average daily net assets (%): | | | | | | | | | | | | | | | | | | | | |
| Expenses | | | 1.19 | | | | 1.18 | | | | 1.19 | | | | 1.20 | | | | 1.21 | |
| Net investment income (loss) | | | (0.29 | ) | | | (0.50 | ) | | | (0.51 | ) | | | (0.06 | ) | | | (0.37 | ) |
| Class N net assets at end of year (in thousands) | | $ | 149,754 | | | $ | 272,765 | | | $ | 291,326 | | | $ | 248,121 | | | $ | 204,476 | |
| Portfolio turnover rate (%) | | | 78 | | | | 100 | | | | 52 | | | | 73 | | | | 59 | |
| | | Class I | |
| | | Years Ended December 31, | |
| | | 2015 | | | 2014 | | | 2013 | | | 2012 | | | 2011 | |
| Net asset value, beginning of year | | $ | 14.43 | | | $ | 15.56 | | | $ | 12.58 | | | $ | 11.18 | | | $ | 11.71 | |
| Income (loss) from investment operations: | | | | | | | | | | | | | | | | | | | | |
| Net investment income (loss) | | | 0.01 | | | | (0.03 | ) | | | (0.03 | ) | | | 0.04 | | | | 0.00 | ^ |
| Net realized and unrealized gain (loss) on investments | | | 0.80 | | | | 1.10 | | | | 4.45 | | | | 1.75 | | | | (0.20 | ) |
| Total from investment operations | | | 0.81 | | | | 1.07 | | | | 4.42 | | | | 1.79 | | | | (0.20 | ) |
| Less distributions from: | | | | | | | | | | | | | | | | | | | | |
| Net investment income | | | — | | | | — | | | | 0.00 | ^ | | | 0.03 | | | | 0.01 | |
| Net realized gain | | | 1.74 | | | | 2.20 | | | | 1.44 | | | | 0.36 | | | | 0.32 | |
| Total distributions | | | 1.74 | | | | 2.20 | | | | 1.44 | | | | 0.39 | | | | 0.33 | |
| Net asset value, end of year | | $ | 13.50 | | | $ | 14.43 | | | $ | 15.56 | | | $ | 12.58 | | | $ | 11.18 | |
| Total return (%) | | | 5.69 | | | | 6.96 | | | | 35.43 | | | | 16.03 | | | | (1.60 | ) |
| Ratios to average daily net assets (%): | | | | | | | | | | | | | | | | | | | | |
| Expenses | | | 0.89 | | | | 0.86 | | | | 0.85 | | | | 0.89 | | | | 0.86 | |
| Net investment income (loss) | | | 0.06 | | | | (0.20 | ) | | | (0.17 | ) | | | 0.30 | | | | (0.03 | ) |
| Class I net assets at end of year (in thousands) | | $ | 696,744 | | | $ | 688,038 | | | $ | 623,225 | | | $ | 468,124 | | | $ | 362,266 | |
| Portfolio turnover rate (%) | | | 78 | | | | 100 | | | | 52 | | | | 73 | | | | 59 | |
| ^ | Amount is less than $0.005 per share. |
Note: Net investment income (loss) per share is based on the average shares outstanding during the year.
Performance cited represents past performance. Past performance does not guarantee future results and current performance may be lower or higher than the data quoted. Results shown are annual returns, which assume reinvestment of dividends and capital gains. Investment returns and principal will fluctuate and you may have a gain or loss when you sell shares. For the most current month-end performance information, please call 1-800-742-7272 or visit our Web site at www.williamblairfunds.com.
See accompanying Notes to Financial Statements.
| 164 | Annual Report | December 31, 2015 |
Financial Highlights
Large Cap Growth Fund
| | | Class N | |
| | | Years Ended December 31, | |
| | | 2015 | | | 2014 | | | 2013 | | | 2012 | | | 2011 | |
| Net asset value, beginning of year | | $ | 10.46 | | | $ | 10.03 | | | $ | 8.14 | | | $ | 6.88 | | | $ | 7.14 | |
| Income (loss) from investment operations: | | | | | | | | | | | | | | | | | | | | |
| Net investment income (loss) | | | (0.02 | ) | | | (0.02 | ) | | | (0.03 | ) | | | (0.02 | ) | | | (0.01 | ) |
| Net realized and unrealized gain (loss) on investments | | | 0.75 | | | | 1.46 | | | | 2.70 | | | | 1.28 | | | | (0.25 | ) |
| Total from investment operations | | | 0.73 | | | | 1.44 | | | | 2.67 | | | | 1.26 | | | | (0.26 | ) |
| Less distributions from: | | | | | | | | | | | | | | | | | | | | |
| Net investment income | | | — | | | | — | | | | — | | | | — | | | | — | |
| Net realized gain | | | 1.04 | | | | 1.01 | | | | 0.78 | | | | — | | | | — | |
| Total distributions | | | 1.04 | | | | 1.01 | | | | 0.78 | | | | — | | | | — | |
| Net asset value, end of year | | $ | 10.15 | | | $ | 10.46 | | | $ | 10.03 | | | $ | 8.14 | | | $ | 6.88 | |
| Total return (%) | | | 7.04 | | | | 14.29 | | | | 33.00 | | | | 18.31 | | | | (3.64 | ) |
| Ratios to average daily net assets (%): | | | | | | | | | | | | | | | | | | | | |
| Expenses, net of waivers and reimbursements | | | 1.07 | | | | 1.13 | | | | 1.20 | | | | 1.20 | | | | 1.20 | |
| Expenses, before waivers and reimbursements | | | 1.28 | | | | 1.31 | | | | 1.46 | | | | 1.57 | | | | 1.51 | |
| Net investment income (loss), net of waivers and reimbursements | | | (0.22 | ) | | | (0.23 | ) | | | (0.36 | ) | | | (0.21 | ) | | | (0.13 | ) |
| Net investment income (loss), before waivers and reimbursements | | | (0.43 | ) | | | (0.41 | ) | | | (0.62 | ) | | | (0.58 | ) | | | (0.44 | ) |
| Class N net assets at end of year (in thousands) | | $ | 10,443 | | | $ | 8,831 | | | $ | 6,678 | | | $ | 4,238 | | | $ | 3,387 | |
| Portfolio turnover rate (%) | | | 38 | | | | 50 | | | | 48 | | | | 50 | | | | 67 | |
| | | Class I | |
| | | Years Ended December 31, | |
| | | 2015 | | | 2014 | | | 2013 | | | 2012 | | | 2011 | |
| Net asset value, beginning of year | | $ | 10.84 | | | $ | 10.33 | | | $ | 8.35 | | | $ | 7.03 | | | $ | 7.30 | |
| Income (loss) from investment operations: | | | | | | | | | | | | | | | | | | | | |
| Net investment income (loss) | | | (0.00 | )^ | | | 0.00 | ^ | | | (0.01 | ) | | | 0.00 | ^ | | | 0.01 | |
| Net realized and unrealized gain (loss) on investments | | | 0.78 | | | | 1.52 | | | | 2.77 | | | | 1.32 | | | | (0.27 | ) |
| Total from investment operations | | | 0.78 | | | | 1.52 | | | | 2.76 | | | | 1.32 | | | | (0.26 | ) |
| Less distributions from: | | | | | | | | | | | | | | | | | | | | |
| Net investment income | | | — | | | | — | | | | — | | | | — | | | | 0.01 | |
| Net realized gain | | | 1.04 | | | | 1.01 | | | | 0.78 | | | | — | | | | — | |
| Total distributions | | | 1.04 | | | | 1.01 | | | | 0.78 | | | | — | | | | 0.01 | |
| Net asset value, end of year | | $ | 10.58 | | | $ | 10.84 | | | $ | 10.33 | | | $ | 8.35 | | | $ | 7.03 | |
| Total return (%) | | | 7.26 | | | | 14.65 | | | | 33.24 | | | | 18.78 | | | | (3.54 | ) |
| Ratios to average daily net assets (%): | | | | | | | | | | | | | | | | | | | | |
| Expenses, net of waivers and reimbursements | | | 0.82 | | | | 0.88 | | | | 0.95 | | | | 0.95 | | | | 0.95 | |
| Expenses, before waivers and reimbursements | | | 0.95 | | | | 1.00 | | | | 1.11 | | | | 1.23 | | | | 1.16 | |
| Net investment income (loss), net of waivers and reimbursements | | | 0.03 | | | | 0.02 | | | | (0.11 | ) | | | 0.03 | | | | 0.11 | |
| Net investment income (loss), before waivers and reimbursements | | | (0.10 | ) | | | (0.10 | ) | | | (0.27 | ) | | | (0.25 | ) | | | (0.10 | ) |
| Class I net assets at end of year (in thousands) | | $ | 59,038 | | | $ | 50,778 | | | $ | 40,513 | | | $ | 24,175 | | | $ | 21,562 | |
| Portfolio turnover rate (%) | | | 38 | | | | 50 | | | | 48 | | | | 50 | | | | 67 | |
| ^ | Amount is less than $0.005 per share. |
Note: Net investment income (loss) per share is based on the average shares outstanding during the year.
Performance cited represents past performance. Past performance does not guarantee future results and current performance may be lower or higher than the data quoted. Results shown are annual returns, which assume reinvestment of dividends and capital gains. Investment returns and principal will fluctuate and you may have a gain or loss when you sell shares. For the most current month-end performance information, please call 1-800-742-7272 or visit our Web site at www.williamblairfunds.com.
| December 31, 2015 | William Blair Funds | 165 |
Financial Highlights
Large Cap Value Fund
| | | Class N | |
| | | Periods Ended December 31, | |
| | | 2015 | | | 2014 | | | 2013 | | | 2012 | | | 2011(a) | |
| Net asset value, beginning of year | | $ | 13.41 | | | $ | 13.69 | | | $ | 11.54 | | | $ | 9.95 | | | $ | 10.00 | |
| Income (loss) from investment operations: | | | | | | | | | | | | | | | | | | | | |
| Net investment income (loss) | | | 0.10 | | | | 0.10 | | | | 0.09 | | | | 0.11 | | | | 0.03 | |
| Net realized and unrealized gain (loss) on investments | | | (0.88 | ) | | | 1.04 | | | | 3.70 | | | | 1.57 | | | | (0.05 | ) |
| Total from investment operations | | | (0.78 | ) | | | 1.14 | | | | 3.79 | | | | 1.68 | | | | (0.02 | ) |
| Less distributions from: | | | | | | | | | | | | | | | | | | | | |
| Net investment income | | | 0.10 | | | | 0.11 | | | | 0.08 | | | | 0.09 | | | | 0.03 | |
| Net realized gain | | | 1.36 | | | | 1.31 | | | | 1.56 | | | | — | | | | 0.00 | ^ |
| Total distributions | | | 1.46 | | | | 1.42 | | | | 1.64 | | | | 0.09 | | | | 0.03 | |
| Net asset value, end of year | | $ | 11.17 | | | $ | 13.41 | | | $ | 13.69 | | | $ | 11.54 | | | $ | 9.95 | |
| Total return (%)* | | | (5.70 | ) | | | 8.35 | | | | 33.23 | | | | 16.92 | | | | (0.19 | ) |
| Ratios to average daily net assets (%):** | | | | | | | | | | | | | | | | | | | | |
| Expenses, net of waivers and reimbursements | | | 1.07 | | | | 1.13 | | | | 1.20 | | | | 1.20 | | | | 1.20 | |
| Expenses, before waivers and reimbursements | | | 3.65 | | | | 3.12 | | | | 3.44 | | | | 4.25 | | | | 7.83 | |
| Net investment income (loss), net of waivers and reimbursements | | | 0.76 | | | | 0.71 | | | | 0.64 | | | | 0.96 | | | | 1.41 | |
| Net investment income (loss), before waivers and reimbursements | | | (1.82 | ) | | | (1.28 | ) | | | (1.60 | ) | | | (2.09 | ) | | | (5.22 | ) |
| Class N net assets at end of year (in thousands) | | $ | 1,151 | | | $ | 1,438 | | | $ | 1,604 | | | $ | 1,416 | | | $ | 998 | |
| Portfolio turnover rate (%)* | | | 45 | | | | 37 | | | | 83 | | | | 20 | | | | 5 | |
| | | Class I | |
| | | Periods Ended December 31, | |
| | | 2015 | | | 2014 | | | 2013 | | | 2012 | | | 2011(a) | |
| Net asset value, beginning of year | | $ | 13.42 | | | $ | 13.70 | | | $ | 11.55 | | | $ | 9.95 | | | $ | 10.00 | |
| Income (loss) from investment operations: | | | | | | | | | | | | | | | | | | | | |
| Net investment income (loss) | | | 0.13 | | | | 0.14 | | | | 0.12 | | | | 0.14 | | | | 0.03 | |
| Net realized and unrealized gain (loss) on investments | | | (0.89 | ) | | | 1.04 | | | | 3.70 | | | | 1.58 | | | | (0.05 | ) |
| Total from investment operations | | | (0.76 | ) | | | 1.18 | | | | 3.82 | | | | 1.72 | | | | (0.02 | ) |
| Less distributions from: | | | | | | | | | | | | | | | | | | | | |
| Net investment income | | | 0.15 | | | | 0.15 | | | | 0.11 | | | | 0.12 | | | | 0.03 | |
| Net realized gain | | | 1.36 | | | | 1.31 | | | | 1.56 | | | | — | | | | 0.00 | ^ |
| Total distributions | | | 1.51 | | | | 1.46 | | | | 1.67 | | | | 0.12 | | | | 0.03 | |
| Net asset value, end of year | | $ | 11.15 | | | $ | 13.42 | | | $ | 13.70 | | | $ | 11.55 | | | $ | 9.95 | |
| Total return (%)* | | | (5.58 | ) | | | 8.65 | | | | 33.47 | | | | 17.28 | | | | (0.19 | ) |
| Ratios to average daily net assets (%):** | | | | | | | | | | | | | | | | | | | | |
| Expenses, net of waivers and reimbursements | | | 0.82 | | | | 0.89 | | | | 0.95 | | | | 0.95 | | | | 0.95 | |
| Expenses, before waivers and reimbursements | | | 3.34 | | | | 2.87 | | | | 3.06 | | | | 4.06 | | | | 7.58 | |
| Net investment income (loss), net of waivers and reimbursements | | | 1.00 | | | | 0.95 | | | | 0.90 | | | | 1.22 | | | | 1.66 | |
| Net investment income (loss), before waivers and reimbursements | | | (1.52 | ) | | | (1.03 | ) | | | (1.21 | ) | | | (1.89 | ) | | | (4.97 | ) |
| Class I net assets at end of year (in thousands) | | $ | 2,025 | | | $ | 3,183 | | | $ | 3,503 | | | $ | 2,429 | | | $ | 1,455 | |
| Portfolio turnover rate (%)* | | | 45 | | | | 37 | | | | 83 | | | | 20 | | | | 5 | |
| (a) | For the period from October 24, 2011 (Commencement of Operations) to December 31, 2011. |
| * | Not annualized for periods less than a year. |
| ** | Annualized for periods less than a year. |
| ^ | Amount is less than $0.005 per share. |
Note: Net investment income (loss) per share is based on the average shares outstanding during the year.
Performance cited represents past performance. Past performance does not guarantee future results and current performance may be lower or higher than the data quoted. Results shown are annual returns, which assume reinvestment of dividends and capital gains. Investment returns and principal will fluctuate and you may have a gain or loss when you sell shares. For the most current month-end performance information, please call 1-800-742-7272 or visit our Web site at www.williamblairfunds.com.
| 166 | Annual Report | December 31, 2015 |
Financial Highlights
Mid Cap Growth Fund
| | | Class N | |
| | | Years Ended December 31, | |
| | | 2015 | | | 2014 | | | 2013 | | | 2012 | | | 2011 | |
| Net asset value, beginning of year | | $ | 14.20 | | | $ | 15.21 | | | $ | 12.65 | | | $ | 11.66 | | | $ | 12.50 | |
| Income (loss) from investment operations: | | | | | | | | | | | | | | | | | | | | |
| Net investment income (loss) | | | (0.09 | ) | | | (0.12 | ) | | | (0.13 | ) | | | (0.02 | ) | | | (0.08 | ) |
| Net realized and unrealized gain (loss) on investments | | | 0.04 | | | | 1.26 | | | | 3.74 | | | | 1.29 | | | | 0.25 | |
| Total from investment operations | | | (0.05 | ) | | | 1.14 | | | | 3.61 | | | | 1.27 | | | | 0.17 | |
| Less distributions from: | | | | | | | | | | | | | | | | | | | | |
| Net investment income | | | — | | | | — | | | | — | | | | — | | | | — | |
| Net realized gain | | | 2.87 | | | | 2.15 | | | | 1.05 | | | | 0.28 | | | | 1.01 | |
| Total distributions | | | 2.87 | | | | 2.15 | | | | 1.05 | | | | 0.28 | | | | 1.01 | |
| Net asset value, end of year | | $ | 11.28 | | | $ | 14.20 | | | $ | 15.21 | | | $ | 12.65 | | | $ | 11.66 | |
| Total return (%) | | | (0.20 | ) | | | 7.53 | | | | 28.77 | | | | 10.90 | | | | 1.65 | |
| Ratios to average daily net assets (%): | | | | | | | | | | | | | | | | | | | | |
| Expenses, net of waivers and reimbursements | | | 1.32 | | | | 1.35 | | | | 1.35 | | | | 1.35 | | | | 1.35 | |
| Expenses, before waivers and reimbursements | | | 1.43 | | | | 1.35 | | | | 1.42 | | | | 1.42 | | | | 1.43 | |
| Net investment income (loss), net of waivers and reimbursements | | | (0.65 | ) | | | (0.80 | ) | | | (0.90 | ) | | | (0.15 | ) | | | (0.65 | ) |
| Net investment income (loss), before waivers and reimbursements | | | (0.76 | ) | | | (0.80 | ) | | | (0.97 | ) | | | (0.22 | ) | | | (0.73 | ) |
| Class N net assets at end of year (in thousands) | | $ | 25,105 | | | $ | 37,413 | | | $ | 41,849 | | | $ | 40,940 | | | $ | 30,093 | |
| Portfolio turnover rate (%) | | | 65 | | | | 81 | | | | 83 | | | | 62 | | | | 70 | |
| | | Class I | |
| | | Years Ended December 31, | |
| | | 2015 | | | 2014 | | | 2013 | | | 2012 | | | 2011 | |
| Net asset value, beginning of year | | $ | 14.65 | | | $ | 15.58 | | | $ | 12.91 | | | $ | 11.87 | | | $ | 12.68 | |
| Income (loss) from investment operations: | | | | | | | | | | | | | | | | | | | | |
| Net investment income (loss) | | | (0.06 | ) | | | (0.09 | ) | | | (0.10 | ) | | | 0.03 | | | | (0.05 | ) |
| Net realized and unrealized gain (loss) on investments | | | 0.04 | | | | 1.31 | | | | 3.82 | | | | 1.31 | | | | 0.25 | |
| Total from investment operations | | | (0.02 | ) | | | 1.22 | | | | 3.72 | | | | 1.34 | | | | 0.20 | |
| Less distributions from: | | | | | | | | | | | | | | | | | | | | |
| Net investment income | | | — | | | | — | | | | — | | | | 0.02 | | | | — | |
| Net realized gain | | | 2.87 | | | | 2.15 | | | | 1.05 | | | | 0.28 | | | | 1.01 | |
| Total distributions | | | 2.87 | | | | 2.15 | | | | 1.05 | | | | 0.30 | | | | 1.01 | |
| Net asset value, end of year | | $ | 11.76 | | | $ | 14.65 | | | $ | 15.58 | | | $ | 12.91 | | | $ | 11.87 | |
| Total return (%) | | | 0.00 | | | | 7.87 | | | | 29.04 | | | | 11.30 | | | | 1.86 | |
| Ratios to average daily net assets (%): | | | | | | | | | | | | | | | | | | | | |
| Expenses, net of waivers and reimbursements | | | 1.07 | | | | 1.10 | | | | 1.10 | | | | 1.07 | | | | 1.10 | |
| Expenses, before waivers and reimbursements | | | 1.14 | | | | 1.10 | | | | 1.15 | | | | 1.07 | | | | 1.13 | |
| Net investment income (loss), net of waivers and reimbursements | | | (0.41 | ) | | | (0.55 | ) | | | (0.65 | ) | | | 0.19 | | | | (0.42 | ) |
| Net investment income (loss), before waivers and reimbursements | | | (0.48 | ) | | | (0.55 | ) | | | (0.70 | ) | | | 0.19 | | | | (0.45 | ) |
| Class I net assets at end of year (in thousands) | | $ | 174,617 | | | $ | 302,373 | | | $ | 385,779 | | | $ | 329,295 | | | $ | 115,661 | |
| Portfolio turnover rate (%) | | | 65 | | | | 81 | | | | 83 | | | | 62 | | | | 70 | |
Note: Net investment income (loss) per share is based on the average shares outstanding during the year.
Performance cited represents past performance. Past performance does not guarantee future results and current performance may be lower or higher than the data quoted. Results shown are annual returns, which assume reinvestment of dividends and capital gains. Investment returns and principal will fluctuate and you may have a gain or loss when you sell shares. For the most current month-end performance information, please call 1-800-742-7272 or visit our Web site at www.williamblairfunds.com.
| December 31, 2015 | William Blair Funds | 167 |
Financial Highlights
Mid Cap Value Fund
| | | Class N | |
| | | Years Ended December 31, | |
| | | 2015 | | | 2014 | | | 2013 | | | 2012 | | | 2011 | |
| Net asset value, beginning of year | | $ | 12.88 | | | $ | 13.39 | | | $ | 11.39 | | | $ | 10.48 | | | $ | 10.75 | |
| Income (loss) from investment operations: | | | | | | | | | | | | | | | | | | | | |
| Net investment income (loss) | | | 0.07 | | | | 0.03 | | | | 0.05 | | | | 0.08 | | | | 0.12 | |
| Net realized and unrealized gain (loss) on investments | | | (0.36 | ) | | | 1.40 | | | | 3.50 | | | | 1.34 | | | | (0.17 | ) |
| Total from investment operations | | | (0.29 | ) | | | 1.43 | | | | 3.55 | | | | 1.42 | | | | (0.05 | ) |
| Less distributions from: | | | | | | | | | | | | | | | | | | | | |
| Net investment income | | | 0.03 | | | | 0.04 | | | | 0.06 | | | | 0.08 | | | | 0.09 | |
| Net realized gain | | | 2.64 | | | | 1.90 | | | | 1.49 | | | | 0.43 | | | | 0.13 | |
| Total distributions | | | 2.67 | | | | 1.94 | | | | 1.55 | | | | 0.51 | | | | 0.22 | |
| Net asset value, end of year | | $ | 9.92 | | | $ | 12.88 | | | $ | 13.39 | | | $ | 11.39 | | | $ | 10.48 | |
| Total return (%) | | | (2.13 | ) | | | 10.83 | | | | 31.46 | | | | 13.54 | | | | (0.34 | ) |
| Ratios to average daily net assets (%): | | | | | | | | | | | | | | | | | | | | |
| Expenses, net of waivers and reimbursements | | | 1.32 | | | | 1.35 | | | | 1.35 | | | | 1.35 | | | | 1.35 | |
| Expenses, before waivers and reimbursements | | | 4.14 | | | | 3.77 | | | | 3.37 | | | | 3.40 | | | | 3.85 | |
| Net investment income (loss), net of waivers and reimbursements | | | 0.59 | | | | 0.23 | | | | 0.36 | | | | 0.70 | | | | 1.15 | |
| Net investment income (loss), before waivers and reimbursements | | | (2.23 | ) | | | (2.19 | ) | | | (1.66 | ) | | | (1.35 | ) | | | (1.35 | ) |
| Class N net assets at end of year (in thousands) | | $ | 694 | | | $ | 189 | | | $ | 232 | | | $ | 79 | | | $ | 58 | |
| Portfolio turnover rate (%) | | | 53 | | | | 33 | | | | 42 | | | | 63 | | | | 69 | |
| | | Class I | |
| | | Years Ended December 31, | |
| | | 2015 | | | 2014 | | | 2013 | | | 2012 | | | 2011 | |
| Net asset value, beginning of year | | $ | 12.88 | | | $ | 13.40 | | | $ | 11.39 | | | $ | 10.48 | | | $ | 10.76 | |
| Income (loss) from investment operations: | | | | | | | | | | | | | | | | | | | | |
| Net investment income (loss) | | | 0.08 | | | | 0.07 | | | | 0.08 | | | | 0.10 | | | | 0.13 | |
| Net realized and unrealized gain (loss) on investments | | | (0.32 | ) | | | 1.39 | | | | 3.51 | | | | 1.35 | | | | (0.17 | ) |
| Total from investment operations | | | (0.24 | ) | | | 1.46 | | | | 3.59 | | | | 1.45 | | | | (0.04 | ) |
| Less distributions from: | | | | | | | | | | | | | | | | | | | | |
| Net investment income | | | 0.06 | | | | 0.08 | | | | 0.09 | | | | 0.11 | | | | 0.11 | |
| Net realized gain | | | 2.64 | | | | 1.90 | | | | 1.49 | | | | 0.43 | | | | 0.13 | |
| Total distributions | | | 2.70 | | | | 1.98 | | | | 1.58 | | | | 0.54 | | | | 0.24 | |
| Net asset value, end of year | | $ | 9.94 | | | $ | 12.88 | | | $ | 13.40 | | | $ | 11.39 | | | $ | 10.48 | |
| Total return (%) | | | (1.73 | ) | | | 11.04 | | | | 31.82 | | | | 13.77 | | | | (0.25 | ) |
| Ratios to average daily net assets (%): | | | | | | | | | | | | | | | | | | | | |
| Expenses, net of waivers and reimbursements | | | 1.07 | | | | 1.10 | | | | 1.10 | | | | 1.10 | | | | 1.10 | |
| Expenses, before waivers and reimbursements | | | 3.77 | | | | 3.08 | | | | 3.04 | | | | 3.13 | | | | 3.60 | |
| Net investment income (loss), net of waivers and reimbursements | | | 0.65 | | | | 0.49 | | | | 0.59 | | | | 0.92 | | | | 1.20 | |
| Net investment income (loss), before waivers and reimbursements | | | (2.05 | ) | | | (1.49 | ) | | | (1.35 | ) | | | (1.11 | ) | | | (1.30 | ) |
| Class I net assets at end of year (in thousands) | | $ | 1,974 | | | $ | 3,579 | | | $ | 4,225 | | | $ | 4,058 | | | $ | 4,515 | |
| Portfolio turnover rate (%) | | | 53 | | | | 33 | | | | 42 | | | | 63 | | | | 69 | |
Note: Net investment income (loss) per share is based on the average shares outstanding during the year.
Performance cited represents past performance. Past performance does not guarantee future results and current performance may be lower or higher than the data quoted. Results shown are annual returns, which assume reinvestment of dividends and capital gains. Investment returns and principal will fluctuate and you may have a gain or loss when you sell shares. For the most current month-end performance information, please call 1-800-742-7272 or visit our Web site at www.williamblairfunds.com.
| 168 | Annual Report | December 31, 2015 |
Financial Highlights
Small-Mid Cap Growth Fund
| | | Class N | |
| | | Years Ended December 31, | |
| | | 2015 | | | 2014 | | | 2013 | | | 2012 | | | 2011 | |
| Net asset value, beginning of year | | $ | 18.72 | | | $ | 18.80 | | | $ | 14.21 | | | $ | 13.00 | | | $ | 14.40 | |
| Income (loss) from investment operations: | | | | | | | | | | | | | | | | | | | | |
| Net investment income (loss) | | | (0.10 | ) | | | (0.12 | ) | | | (0.15 | ) | | | 0.02 | | | | (0.11 | ) |
| Net realized and unrealized gain (loss) on investments | | | 0.93 | | | | 1.68 | | | | 6.01 | | | | 1.57 | | | | 0.03 | |
| Total from investment operations | | | 0.83 | | | | 1.56 | | | | 5.86 | | | | 1.59 | | | | (0.08 | ) |
| Less distributions from: | | | | | | | | | | | | | | | | | | | | |
| Net investment income | | | — | | | | — | | | | — | | | | 0.02 | | | | — | |
| Net realized gain | | | 1.02 | | | | 1.64 | | | | 1.27 | | | | 0.36 | | | | 1.32 | |
| Total distributions | | | 1.02 | | | | 1.64 | | | | 1.27 | | | | 0.38 | | | | 1.32 | |
| Net asset value, end of year | | $ | 18.53 | | | $ | 18.72 | | | $ | 18.80 | | | $ | 14.21 | | | $ | 13.00 | |
| Total return (%) | | | 4.47 | | | | 8.33 | | | | 41.49 | | | | 12.20 | | | | (0.27 | ) |
| Ratios to average daily net assets (%): | | | | | | | | | | | | | | | | | | | | |
| Expenses, net of waivers and reimbursements | | | 1.35 | | | | 1.35 | | | | 1.35 | | | | 1.35 | | | | 1.35 | |
| Expenses, before waivers and reimbursements | | | 1.42 | | | | 1.38 | | | | 1.46 | | | | 1.47 | | | | 1.46 | |
| Net investment income (loss), net of waivers and reimbursements | | | (0.51 | ) | | | (0.63 | ) | | | (0.88 | ) | | | 0.16 | | | | (0.77 | ) |
| Net investment income (loss), before waivers and reimbursements | | | (0.58 | ) | | | (0.66 | ) | | | (0.99 | ) | | | 0.04 | | | | (0.88 | ) |
| Class N net assets at end of year (in thousands) | | $ | 169,595 | | | $ | 83,047 | | | $ | 73,207 | | | $ | 42,015 | | | $ | 34,123 | |
| Portfolio turnover rate (%) | | | 44 | | | | 49 | | | | 53 | | | | 82 | | | | 76 | |
| | | Class I | |
| | | Years Ended December 31, | |
| | | 2015 | | | 2014 | | | 2013 | | | 2012 | | | 2011 | |
| Net asset value, beginning of year | | $ | 19.36 | | | $ | 19.34 | | | $ | 14.55 | | | $ | 13.32 | | | $ | 14.68 | |
| Income (loss) from investment operations: | | | | | | | | | | | | | | | | | | | | |
| Net investment income (loss) | | | (0.06 | ) | | | (0.08 | ) | | | (0.11 | ) | | | 0.07 | | | | (0.08 | ) |
| Net realized and unrealized gain (loss) on investments | | | 0.97 | | | | 1.74 | | | | 6.17 | | | | 1.58 | | | | 0.04 | |
| Total from investment operations | | | 0.91 | | | | 1.66 | | | | 6.06 | | | | 1.65 | | | | (0.04 | ) |
| Less distributions from: | | | | | | | | | | | | | | | | | | | | |
| Net investment income | | | — | | | | — | | | | — | | | | 0.06 | | | | — | |
| Net realized gain | | | 1.02 | | | | 1.64 | | | | 1.27 | | | | 0.36 | | | | 1.32 | |
| Total distributions | | | 1.02 | | | | 1.64 | | | | 1.27 | | | | 0.42 | | | | 1.32 | |
| Net asset value, end of year | | $ | 19.25 | | | $ | 19.36 | | | $ | 19.34 | | | $ | 14.55 | | | $ | 13.32 | |
| Total return (%) | | | 4.74 | | | | 8.62 | | | | 41.89 | | | | 12.36 | | | | 0.01 | |
| Ratios to average daily net assets (%): | | | | | | | | | | | | | | | | | | | | |
| Expenses, net of waivers and reimbursements | | | 1.10 | | | | 1.10 | | | | 1.10 | | | | 1.10 | | | | 1.10 | |
| Expenses, before waivers and reimbursements | | | 1.15 | | | | 1.15 | | | | 1.10 | | | | 1.20 | | | | 1.12 | |
| Net investment income (loss), net of waivers and reimbursements | | | (0.28 | ) | | | (0.38 | ) | | | (0.62 | ) | | | 0.48 | | | | (0.54 | ) |
| Net investment income (loss), before waivers and reimbursements | | | (0.33 | ) | | | (0.43 | ) | | | (0.62 | ) | | | 0.38 | | | | (0.56 | ) |
| Class I net assets at end of year (in thousands) | | $ | 1,019,544 | | | $ | 793,789 | | | $ | 617,374 | | | $ | 349,345 | | | $ | 219,474 | |
| Portfolio turnover rate (%) | | | 44 | | | | 49 | | | | 53 | | | | 82 | | | | 76 | |
Note: Net investment income (loss) per share is based on the average shares outstanding during the year.
Performance cited represents past performance. Past performance does not guarantee future results and current performance may be lower or higher than the data quoted. Results shown are annual returns, which assume reinvestment of dividends and capital gains. Investment returns and principal will fluctuate and you may have a gain or loss when you sell shares. For the most current month-end performance information, please call 1-800-742-7272 or visit our Web site at www.williamblairfunds.com.
| December 31, 2015 | William Blair Funds | 169 |
Financial Highlights
Small-Mid Cap Value Fund
| | | Class N | |
| | | Periods Ended December 31, | |
| | | 2015 | | | 2014 | | | 2013 | | | 2012 | | | 2011(a) | |
| Net asset value, beginning of year | | $ | 13.63 | | | $ | 14.11 | | | $ | 11.29 | | | $ | 10.45 | | | $ | 10.00 | |
| Income (loss) from investment operations: | | | | | | | | | | | | | | | | | | | | |
| Net investment income (loss) | | | 0.04 | | | | 0.00 | ^ | | | 0.00 | ^ | | | 0.10 | | | | 0.00 | ^ |
| Net realized and unrealized gain (loss) on investments | | | (0.47 | ) | | | 0.64 | | | | 4.06 | | | | 1.15 | | | | 0.45 | |
| Total from investment operations | | | (0.43 | ) | | | 0.64 | | | | 4.06 | | | | 1.25 | | | | 0.45 | |
| Less distributions from: | | | | | | | | | | | | | | | | | | | | |
| Net investment income | | | 0.01 | | | | — | | | | — | | | | 0.09 | | | | — | |
| Net realized gain | | | 0.65 | | | | 1.12 | | | | 1.24 | | | | 0.32 | | | | — | |
| Total distributions | | | 0.66 | | | | 1.12 | | | | 1.24 | | | | 0.41 | | | | — | |
| Net asset value, end of year | | $ | 12.54 | | | $ | 13.63 | | | $ | 14.11 | | | $ | 11.29 | | | $ | 10.45 | |
| Total return (%)* | | | (3.13 | ) | | | 4.66 | | | | 36.29 | | | | 11.95 | | | | 4.50 | |
| Ratios to average daily net assets (%):** | | | | | | | | | | | | | | | | | | | | |
| Expenses, net of waivers and reimbursements | | | 1.37 | | | | 1.40 | | | | 1.40 | | | | 1.40 | | | | 1.40 | |
| Expenses, before waivers and reimbursements | | | 3.93 | | | | 4.50 | | | | 4.50 | | | | 6.34 | | | | 18.68 | |
| Net investment income (loss), net of waivers and reimbursements | | | 0.27 | | | | 0.02 | | | | (0.04 | ) | | | 0.87 | | | | 0.53 | |
| Net investment income (loss), before waivers and reimbursements | | | (2.29 | ) | | | (3.08 | ) | | | (3.14 | ) | | | (4.07 | ) | | | (16.75 | ) |
| Class N net assets at end of year (in thousands) | | $ | 855 | | | $ | 946 | | | $ | 1,205 | | | $ | 950 | | | $ | 860 | |
| Portfolio turnover rate (%)* | | | 35 | | | | 69 | | | | 61 | | | | 56 | | | | 1 | |
| | | Class I | |
| | | Periods Ended December 31, | |
| | | 2015 | | | 2014 | | | 2013 | | | 2012 | | | 2011(a) | |
| Net asset value, beginning of year | | $ | 13.63 | | | $ | 14.12 | | | $ | 11.29 | | | $ | 10.45 | | | $ | 10.00 | |
| Income (loss) from investment operations: | | | | | | | | | | | | | | | | | | | | |
| Net investment income (loss) | | | 0.07 | | | | 0.05 | | | | 0.03 | | | | 0.13 | | | | 0.00 | ^ |
| Net realized and unrealized gain (loss) on investments | | | (0.47 | ) | | | 0.63 | | | | 4.07 | | | | 1.15 | | | | 0.45 | |
| Total from investment operations | | | (0.40 | ) | | | 0.68 | | | | 4.10 | | | | 1.28 | | | | 0.45 | |
| Less distributions from: | | | | | | | | | | | | | | | | | | | | |
| Net investment income | | | 0.04 | | | | 0.05 | | | | 0.03 | | | | 0.12 | | | | — | |
| Net realized gain | | | 0.65 | | | | 1.12 | | | | 1.24 | | | | 0.32 | | | | — | |
| Total distributions | | | 0.69 | | | | 1.17 | | | | 1.27 | | | | 0.44 | | | | — | |
| Net asset value, end of year | | $ | 12.54 | | | $ | 13.63 | | | $ | 14.12 | | | $ | 11.29 | | | $ | 10.45 | |
| Total return (%)* | | | (2.86 | ) | | | 4.96 | | | | 36.69 | | | | 12.22 | | | | 4.50 | |
| Ratios to average daily net assets (%):** | | | | | | | | | | | | | | | | | | | | |
| Expenses, net of waivers and reimbursements | | | 1.12 | | | | 1.15 | | | | 1.15 | | | | 1.15 | | | | 1.15 | |
| Expenses, before waivers and reimbursements | | | 3.72 | | | | 4.16 | | | | 4.24 | | | | 5.88 | | | | 18.43 | |
| Net investment income (loss), net of waivers and reimbursements | | | 0.52 | | | | 0.36 | | | | 0.21 | | | | 1.12 | | | | 0.79 | |
| Net investment income (loss), before waivers and reimbursements | | | (2.08 | ) | | | (2.65 | ) | | | (2.88 | ) | | | (3.61 | ) | | | (16.49 | ) |
| Class I net assets at end of year (in thousands) | | $ | 3,220 | | | $ | 3,407 | | | $ | 2,073 | | | $ | 1,442 | | | $ | 1,296 | |
| Portfolio turnover rate (%)* | | | 35 | | | | 69 | | | | 61 | | | | 56 | | | | 1 | |
| (a) | For the period from December 15, 2011 (Commencement of Operations) to December 31, 2011. |
| * | Not annualized for periods less than a year. |
| ** | Annualized for periods less than a year. |
| ^ | Amount is less than $0.005 per share. |
Note: Net investment income (loss) per share is based on the average shares outstanding during the year.
Performance cited represents past performance. Past performance does not guarantee future results and current performance may be lower or higher than the data quoted. Results shown are annual returns, which assume reinvestment of dividends and capital gains. Investment returns and principal will fluctuate and you may have a gain or loss when you sell shares. For the most current month-end performance information, please call 1-800-742-7272 or visit our Web site at www.williamblairfunds.com.
| 170 | Annual Report | December 31, 2015 |
Financial Highlights
Small Cap Growth Fund
| | | Class N | |
| | | Years Ended December 31, | |
| | | 2015 | | | 2014 | | | 2013 | | | 2012 | | | 2011 | |
| Net asset value, beginning of year | | $ | 25.61 | | | $ | 30.02 | | | $ | 23.68 | | | $ | 20.13 | | | $ | 23.22 | |
| Income (loss) from investment operations: | | | | | | | | | | | | | | | | | | | | |
| Net investment income (loss) | | | (0.22 | ) | | | (0.30 | ) | | | (0.26 | ) | | | (0.22 | ) | | | (0.28 | ) |
| Net realized and unrealized gain (loss) on investments | | | (0.93 | ) | | | 1.02 | | | | 12.52 | | | | 3.87 | | | | (2.81 | ) |
| Total from investment operations | | | (1.15 | ) | | | 0.72 | | | | 12.26 | | | | 3.65 | | | | (3.09 | ) |
| Less distributions from: | | | | | | | | | | | | | | | | | | | | |
| Net investment income | | | — | | | | — | | | | — | | | | — | | | | — | |
| Net realized gain | | | 1.99 | | | | 5.13 | | | | 5.92 | | | | 0.10 | | | | — | |
| Total distributions | | | 1.99 | | | | 5.13 | | | | 5.92 | | | | 0.10 | | | | — | |
| Net asset value, end of year | | $ | 22.47 | | | $ | 25.61 | | | $ | 30.02 | | | $ | 23.68 | | | $ | 20.13 | |
| Total return (%) | | | (4.44 | ) | | | 2.62 | | | | 52.76 | | | | 18.15 | | | | (13.31 | ) |
| Ratios to average daily net assets (%): | | | | | | | | | | | | | | | | | | | | |
| Expenses, net of waivers and reimbursements | | | 1.50 | | | | 1.50 | | | | 1.50 | | | | 1.50 | | | | 1.50 | |
| Expenses, before waivers and reimbursements | | | 1.59 | | | | 1.56 | | | | 1.57 | | | | 1.59 | | | | 1.59 | |
| Net investment income (loss), net of waivers and reimbursements | | | (0.85 | ) | | | (1.00 | ) | | | (0.87 | ) | | | (0.96 | ) | | | (1.25 | ) |
| Net investment income (loss), before waivers and reimbursements | | | (0.94 | ) | | | (1.06 | ) | | | (0.94 | ) | | | (1.05 | ) | | | (1.34 | ) |
| Class N net assets at end of year (in thousands) | | $ | 111,944 | | | $ | 148,201 | | | $ | 211,562 | | | $ | 130,382 | | | $ | 202,341 | |
| Portfolio turnover rate (%) | | | 91 | | | | 82 | | | | 91 | | | | 89 | | | | 97 | |
| | | Class I | |
| | | Years Ended December 31, | |
| | | 2015 | | | 2014 | | | 2013 | | | 2012 | | | 2011 | |
| Net asset value, beginning of year | | $ | 27.32 | | | $ | 31.61 | | | $ | 24.66 | | | $ | 20.91 | | | $ | 24.07 | |
| Income (loss) from investment operations: | | | | | | | | | | | | | | | | | | | | |
| Net investment income (loss) | | | (0.17 | ) | | | (0.23 | ) | | | (0.19 | ) | | | (0.16 | ) | | | (0.23 | ) |
| Net realized and unrealized gain (loss) on investments | | | (0.99 | ) | | | 1.07 | | | | 13.06 | | | | 4.01 | | | | (2.93 | ) |
| Total from investment operations | | | (1.16 | ) | | | 0.84 | | | | 12.87 | | | | 3.85 | | | | (3.16 | ) |
| Less distributions from: | | | | | | | | | | | | | | | | | | | | |
| Net investment income | | | — | | | | — | | | | — | | | | — | | | | — | |
| Net realized gain | | | 1.99 | | | | 5.13 | | | | 5.92 | | | | 0.10 | | | | — | |
| Total distributions | | | 1.99 | | | | 5.13 | | | | 5.92 | | | | 0.10 | | | | — | |
| Net asset value, end of year | | $ | 24.17 | | | $ | 27.32 | | | $ | 31.61 | | | $ | 24.66 | | | $ | 20.91 | |
| Total return (%) | | | (4.20 | ) | | | 2.87 | | | | 53.13 | | | | 18.43 | | | | (13.13 | ) |
| Ratios to average daily net assets (%): | | | | | | | | | | | | | | | | | | | | |
| Expenses, net of waivers and reimbursements | | | 1.25 | | | | 1.25 | | | | 1.25 | | | | 1.25 | | | | 1.25 | |
| Expenses, before waivers and reimbursements | | | 1.30 | | | | 1.30 | | | | 1.27 | | | | 1.35 | | | | 1.35 | |
| Net investment income (loss), net of waivers and reimbursements | | | (0.61 | ) | | | (0.75 | ) | | | (0.63 | ) | | | (0.71 | ) | | | (1.00 | ) |
| Net investment income (loss), before waivers and reimbursements | | | (0.66 | ) | | | (0.80 | ) | | | (0.65 | ) | | | (0.81 | ) | | | (1.10 | ) |
| Class I net assets at end of year (in thousands) | | $ | 261,269 | | | $ | 364,241 | | | $ | 415,797 | | | $ | 266,431 | | | $ | 352,397 | |
| Portfolio turnover rate (%) | | | 91 | | | | 82 | | | | 91 | | | | 89 | | | | 97 | |
Note: Net investment income (loss) per share is based on the average shares outstanding during the year.
Performance cited represents past performance. Past performance does not guarantee future results and current performance may be lower or higher than the data quoted. Results shown are annual returns, which assume reinvestment of dividends and capital gains. Investment returns and principal will fluctuate and you may have a gain or loss when you sell shares. For the most current month-end performance information, please call 1-800-742-7272 or visit our Web site at www.williamblairfunds.com.
| December 31, 2015 | William Blair Funds | 171 |
Financial Highlights
Small Cap Value Fund
| | | Class N | |
| | | Years Ended December 31, | |
| | | 2015 | | | 2014 | | | 2013 | | | 2012 | | | 2011 | |
| Net asset value, beginning of year | | $ | 17.76 | | | $ | 17.63 | | | $ | 13.65 | | | $ | 12.26 | | | $ | 13.71 | |
| Income (loss) from investment operations: | | | | | | | | | | | | | | | | | | | | |
| Net investment income (loss) | | | 0.02 | | | | (0.03 | ) | | | (0.05 | ) | | | 0.10 | | | | 0.00 | ^ |
| Net realized and unrealized gain (loss) on investments | | | (1.05 | ) | | | 0.81 | | | | 5.32 | | | | 1.43 | | | | (0.97 | ) |
| Total from investment operations | | | (1.03 | ) | | | 0.78 | | | | 5.27 | | | | 1.53 | | | | (0.97 | ) |
| Less distributions from: | | | | | | | | | | | | | | | | | | | | |
| Net investment income | | | — | | | | — | | | | — | | | | 0.08 | | | | 0.02 | |
| Net realized gain | | | 0.05 | | | | 0.65 | | | | 1.29 | | | | 0.06 | | | | 0.46 | |
| Return of capital | | | — | | | | — | | | | — | | | | — | | | | 0.00 | ^ |
| Total distributions | | | 0.05 | | | | 0.65 | | | | 1.29 | | | | 0.14 | | | | 0.48 | |
| Net asset value, end of year | | $ | 16.68 | | | $ | 17.76 | | | $ | 17.63 | | | $ | 13.65 | | | $ | 12.26 | |
| Total return (%) | | | (5.77 | ) | | | 4.49 | | | | 38.91 | | | | 12.49 | | | | (6.95 | ) |
| Ratios to average daily net assets (%): | | | | | | | | | | | | | | | | | | | | |
| Expenses, net of waivers and reimbursements | | | 1.50 | | | | 1.50 | | | | 1.49 | | | | 1.43 | | | | 1.38 | |
| Expenses, before waivers and reimbursements | | | 1.54 | | | | 1.53 | | | | 1.55 | | | | 1.60 | | | | 1.60 | |
| Net investment income (loss), net of waivers and reimbursements | | | 0.14 | | | | (0.17 | ) | | | (0.33 | ) | | | 0.78 | | | | (0.01 | ) |
| Net investment income (loss), before waivers and reimbursements | | | 0.10 | | | | (0.20 | ) | | | (0.39 | ) | | | 0.61 | | | | (0.23 | ) |
| Class N net assets at end of year (in thousands) | | $ | 33,351 | | | $ | 40,223 | | | $ | 55,464 | | | $ | 39,084 | | | $ | 40,712 | |
| Portfolio turnover rate (%) | | | 30 | | | | 39 | | | | 51 | | | | 51 | | | | 65 | |
| | | Class I | |
| | | Years Ended December 31, | |
| | | 2015 | | | 2014 | | | 2013 | | | 2012 | | | 2011 | |
| Net asset value, beginning of year | | $ | 18.17 | | | $ | 18.00 | | | $ | 13.88 | | | $ | 12.47 | | | $ | 13.93 | |
| Income (loss) from investment operations: | | | | | | | | | | | | | | | | | | | | |
| Net investment income (loss) | | | 0.08 | | | | 0.02 | | | | (0.01 | ) | | | 0.14 | | | | 0.03 | |
| Net realized and unrealized gain (loss) on investments | | | (1.08 | ) | | | 0.82 | | | | 5.42 | | | | 1.45 | | | | (0.98 | ) |
| Total from investment operations | | | (1.00 | ) | | | 0.84 | | | | 5.41 | | | | 1.59 | | | | (0.95 | ) |
| Less distributions from: | | | | | | | | | | | | | | | | | | | | |
| Net investment income | | | 0.04 | | | | 0.02 | | | | 0.00 | ^ | | | 0.12 | | | | 0.03 | |
| Net realized gain | | | 0.05 | | | | 0.65 | | | | 1.29 | | | | 0.06 | | | | 0.46 | |
| Return of capital | | | — | | | | — | | | | — | | | | — | | | | 0.02 | |
| Total distributions | | | 0.09 | | | | 0.67 | | | | 1.29 | | | | 0.18 | | | | 0.51 | |
| Net asset value, end of year | | $ | 17.08 | | | $ | 18.17 | | | $ | 18.00 | | | $ | 13.88 | | | $ | 12.47 | |
| Total return (%) | | | (5.47 | ) | | | 4.73 | | | | 39.31 | | | | 12.73 | | | | (6.68 | ) |
| Ratios to average daily net assets (%): | | | | | | | | | | | | | | | | | | | | |
| Expenses, net of waivers and reimbursements | | | 1.24 | | | | 1.23 | | | | 1.24 | | | | 1.18 | | | | 1.14 | |
| Expenses, before waivers and reimbursements | | | 1.24 | | | | 1.23 | | | | 1.25 | | | | 1.29 | | | | 1.30 | |
| Net investment income (loss), net of waivers and reimbursements | | | 0.43 | | | | 0.12 | | | | (0.07 | ) | | | 1.02 | | | | 0.26 | |
| Net investment income (loss), before waivers and reimbursements | | | 0.43 | | | | 0.12 | | | | (0.08 | ) | | | 0.91 | | | | 0.10 | |
| Class I net assets at end of year (in thousands) | | $ | 579,010 | | | $ | 544,963 | | | $ | 352,832 | | | $ | 196,184 | | | $ | 190,686 | |
| Portfolio turnover rate (%) | | | 30 | | | | 39 | | | | 51 | | | | 51 | | | | 65 | |
| ^ | Amount is less than $0.005 per share. |
Note: Net investment income (loss) per share is based on the average shares outstanding during the year.
Performance cited represents past performance. Past performance does not guarantee future results and current performance may be lower or higher than the data quoted. Results shown are annual returns, which assume reinvestment of dividends and capital gains. Investment returns and principal will fluctuate and you may have a gain or loss when you sell shares. For the most current month-end performance information, please call 1-800-742-7272 or visit our Web site at www.williamblairfunds.com.
| 172 | Annual Report | December 31, 2015 |
Financial Highlights
Global Leaders Fund
| | | Class N | |
| | | Years Ended December 31, | |
| | | 2015 | | | 2014 | | | 2013 | | | 2012 | | | 2011 | |
| Net asset value, beginning of year | | $ | 11.84 | | | $ | 11.43 | | | $ | 9.47 | | | $ | 8.10 | | | $ | 8.40 | |
| Income (loss) from investment operations: | | | | | | | | | | | | | | | | | | | | |
| Net investment income (loss) | | | 0.02 | | | | 0.02 | | | | 0.02 | | | | 0.03 | | | | 0.02 | |
| Net realized and unrealized gain (loss) on investments | | | 0.27 | | | | 0.41 | | | | 1.96 | | | | 1.37 | | | | (0.31 | ) |
| Total from investment operations | | | 0.29 | | | | 0.43 | | | | 1.98 | | | | 1.40 | | | | (0.29 | ) |
| Less distributions from: | | | | | | | | | | | | | | | | | | | | |
| Net investment income | | | 0.01 | | | | — | | | | 0.02 | | | | 0.03 | | | | 0.01 | |
| Net realized gain | | | 0.54 | | | | 0.02 | | | | — | | | | — | | | | — | |
| Total distributions | | | 0.55 | | | | 0.02 | | | | 0.02 | | | | 0.03 | | | | 0.01 | |
| Net asset value, end of year | | $ | 11.58 | | | $ | 11.84 | | | $ | 11.43 | | | $ | 9.47 | | | $ | 8.10 | |
| Total return (%) | | | 2.49 | | | | 3.76 | | | | 20.86 | | | | 17.25 | | | | (3.47 | ) |
| Ratios to average daily net assets (%): | | | | | | | | | | | | | | | | | | | | |
| Expenses, net of waivers and reimbursements | | | 1.39 | | | | 1.50 | | | | 1.50 | | | | 1.50 | | | | 1.50 | |
| Expenses, before waivers and reimbursements | | | 1.61 | | | | 1.62 | | | | 1.63 | | | | 1.84 | | | | 1.82 | |
| Net investment income (loss), net of waivers and reimbursements | | | 0.12 | | | | 0.16 | | | | 0.18 | | | | 0.29 | | | | 0.29 | |
| Net investment income (loss), before waivers and reimbursements | | | (0.10 | ) | | | 0.04 | | | | 0.05 | | | | (0.05 | ) | | | (0.03 | ) |
| Class N net assets at end of year (in thousands) | | $ | 5,588 | | | $ | 5,007 | | | $ | 6,403 | | | $ | 5,215 | | | $ | 3,740 | |
| Portfolio turnover rate (%) | | | 55 | | | | 60 | | | | 70 | | | | 73 | | | | 75 | |
| | | Class I | |
| | | Years Ended December 31, | |
| | | 2015 | | | 2014 | | | 2013 | | | 2012 | | | 2011 | |
| Net asset value, beginning of year | | $ | 11.85 | | | $ | 11.42 | | | $ | 9.47 | | | $ | 8.09 | | | $ | 8.40 | |
| Income (loss) from investment operations: | | | | | | | | | | | | | | | | | | | | |
| Net investment income (loss) | | | 0.06 | | | | 0.04 | | | | 0.04 | | | | 0.05 | | | | 0.04 | |
| Net realized and unrealized gain (loss) on investments | | | 0.26 | | | | 0.43 | | | | 1.95 | | | | 1.38 | | | | (0.31 | ) |
| Total from investment operations | | | 0.32 | | | | 0.47 | | | | 1.99 | | | | 1.43 | | | | (0.27 | ) |
| Less distributions from: | | | | | | | | | | | | | | | | | | | | |
| Net investment income | | | 0.04 | | | | 0.02 | | | | 0.04 | | | | 0.05 | | | | 0.04 | |
| Net realized gain | | | 0.54 | | | | 0.02 | | | | — | | | | — | | | | — | |
| Total distributions | | | 0.58 | | | | 0.04 | | | | 0.04 | | | | 0.05 | | | | 0.04 | |
| Net asset value, end of year | | $ | 11.59 | | | $ | 11.85 | | | $ | 11.42 | | | $ | 9.47 | | | $ | 8.09 | |
| Total return (%) | | | 2.77 | | | | 4.08 | | | | 21.05 | | | | 17.64 | | | | (3.26 | ) |
| Ratios to average daily net assets (%): | | | | | | | | | | | | | | | | | | | | |
| Expenses, net of waivers and reimbursements | | | 1.10 | | | | 1.25 | | | | 1.25 | | | | 1.25 | | | | 1.25 | |
| Expenses, before waivers and reimbursements | | | 1.32 | | | | 1.33 | | | | 1.35 | | | | 1.56 | | | | 1.55 | |
| Net investment income (loss), net of waivers and reimbursements | | | 0.45 | | | | 0.38 | | | | 0.40 | | | | 0.54 | | | | 0.52 | |
| Net investment income (loss), before waive3and reimbursements | | | 0.23 | | | | 0.30 | | | | 0.30 | | | | 0.23 | | | | 0.22 | |
| Class I net assets at end of year (in thousands) | | $ | 45,853 | | | $ | 52,090 | | | $ | 53,562 | | | $ | 45,757 | | | $ | 38,834 | |
| Portfolio turnover rate (%) | | | 55 | | | | 60 | | | | 70 | | | | 73 | | | | 75 | |
Note: Net investment income (loss) per share is based on the average shares outstanding during the year.
Performance cited represents past performance. Past performance does not guarantee future results and current performance may be lower or higher than the data quoted. Results shown are annual returns, which assume reinvestment of dividends and capital gains. Investment returns and principal will fluctuate and you may have a gain or loss when you sell shares. For the most current month-end performance information, please call 1-800-742-7272 or visit our Web site at www.williamblairfunds.com.
| December 31, 2015 | William Blair Funds | 173 |
Financial Highlights
Global Leaders Fund
| | | Institutional Class | |
| | | Periods Ended December 31, | |
| | | 2015 | | | 2014 | | | 2013 | | | 2012(a) | |
| Net asset value, beginning of year | | $ | 11.85 | | | $ | 11.42 | | | $ | 9.47 | | | $ | 9.50 | |
| Income (loss) from investment operations: | | | | | | | | | | | | | | | | |
| Net investment income (loss) | | | 0.06 | | | | 0.06 | | | | 0.04 | | | | 0.00 | ^ |
| Net realized and unrealized gain (loss) on investments | | | 0.27 | | | | 0.43 | | | | 1.97 | | | | (0.03 | ) |
| Total from investment operations | | | 0.33 | | | | 0.49 | | | | 2.01 | | | | (0.03 | ) |
| Less distributions from: | | | | | | | | | | | | | | | | |
| Net investment income | | | 0.05 | | | | 0.04 | | | | 0.06 | | | | — | |
| Net realized gain | | | 0.54 | | | | 0.02 | | | | — | | | | — | |
| Total distributions | | | 0.59 | | | | 0.06 | | | | 0.06 | | | | — | |
| Net asset value, end of year | | $ | 11.59 | | | $ | 11.85 | | | $ | 11.42 | | | $ | 9.47 | |
| Total return (%)* | | | 2.85 | | | | 4.24 | | | | 21.23 | | | | (0.32 | ) |
| Ratios to average daily net assets (%):** | | | | | | | | | | | | | | | | |
| Expenses, net of waivers and reimbursements | | | 1.03 | | | | 1.10 | | | | 1.10 | | | | 1.10 | |
| Expenses, before waivers and reimbursements | | | 1.11 | | | | 1.13 | | | | 1.14 | | | | 1.26 | |
| Net investment income (loss), net of waivers and reimbursements | | | 0.47 | | | | 0.51 | | | | 0.37 | | | | (0.91 | ) |
| Net investment income (loss), before waivers and reimbursements | | | 0.39 | | | | 0.48 | | | | 0.33 | | | | (1.07 | ) |
| Institutional Class net assets at end of year (in thousands) | | $ | 137,527 | | | $ | 106,565 | | | $ | 87,118 | | | $ | 16,022 | |
| Portfolio turnover rate (%)* | | | 55 | | | | 60 | | | | 70 | | | | 73 | |
| (a) | For the period from December 19, 2012 (Commencement of Operations) to December 31, 2012. |
| * | Not annualized for periods less than a year. |
| ** | Annualized for periods less than a year. |
| ^ | Amount is less than $0.005 per share. |
Note: Net investment income (loss) per share is based on the average shares outstanding during the year.
Performance cited represents past performance. Past performance does not guarantee future results and current performance may be lower or higher than the data quoted. Results shown are annual returns, which assume reinvestment of dividends and capital gains. Investment returns and principal will fluctuate and you may have a gain or loss when you sell shares. For the most current month-end performance information, please call 1-800-742-7272 or visit our Web site at www.williamblairfunds.com.
| 174 | Annual Report | December 31, 2015 |
Financial Highlights
Global Small Cap Growth Fund (In Liquidation)
| | | Class N | |
| | | Periods Ended December 31, | |
| | | 2015 | | | 2014 | | | 2013(a) | |
| Net asset value, beginning of year | | $ | 12.20 | | | $ | 12.14 | | | $ | 10.00 | |
| Income (loss) from investment operations: | | | | | | | | | | | | |
| Net investment income (loss) | | | (0.02 | ) | | | (0.05 | ) | | | (0.02 | ) |
| Net realized and unrealized gain (loss) on investments | | | 1.12 | | | | 0.64 | | | | 2.49 | |
| Total from investment operations | | | 1.10 | | | | 0.59 | | | | 2.47 | |
| Less distributions from: | | | | | | | | | | | | |
| Net investment income | | | 0.17 | | | | — | | | | — | |
| Net realized gain | | | 0.24 | | | | 0.53 | | | | 0.33 | |
| Total distributions | | | 0.41 | | | | 0.53 | | | | 0.33 | |
| Net asset value, end of year | | $ | 12.89 | | | $ | 12.20 | | | $ | 12.14 | |
| Total return (%)* | | | 9.07 | | | | 4.93 | | | | 24.75 | |
| Ratios to average daily net assets (%):** | | | | | | | | | | | | |
| Expenses, net of waivers and reimbursements | | | 1.65 | | | | 1.65 | | | | 1.65 | |
| Expenses, before waivers and reimbursements | | | 2.07 | | | | 2.07 | | | | 2.47 | |
| Net investment income (loss), net of waivers and reimbursements | | | (0.15 | ) | | | (0.42 | ) | | | (0.23 | ) |
| Net investment income (loss), before waivers and reimbursements | | | (0.57 | ) | | | (0.84 | ) | | | (1.05 | ) |
| Class N net assets at end of year (in thousands) | | $ | 761 | | | $ | 591 | | | $ | 203 | |
| Portfolio turnover rate (%)* | | | 81 | | | | 117 | | | | 86 | |
| | | Class I | |
| | | Periods Ended December 31, | |
| | | 2015 | | | 2014 | | | 2013(a) | |
| Net asset value, beginning of year | | $ | 12.26 | | | $ | 12.16 | | | $ | 10.00 | |
| Income (loss) from investment operations: | | | | | | | | | | | | |
| Net investment income (loss) | | | 0.04 | | | | (0.02 | ) | | | (0.00 | )^ |
| Net realized and unrealized gain (loss) on investments | | | 1.12 | | | | 0.65 | | | | 2.50 | |
| Total from investment operations | | | 1.16 | | | | 0.63 | | | | 2.50 | |
| Less distributions from: | | | | | | | | | | | | |
| Net investment income | | | 0.23 | | | | — | | | | 0.01 | |
| Net realized gain | | | 0.24 | | | | 0.53 | | | | 0.33 | |
| Total distributions | | | 0.47 | | | | 0.53 | | | | 0.34 | |
| Net asset value, end of year | | $ | 12.95 | | | $ | 12.26 | | | $ | 12.16 | |
| Total return (%)* | | | 9.48 | | | | 5.26 | | | | 25.00 | |
| Ratios to average daily net assets (%):** | | | | | | | | | | | | |
| Expenses, net of waivers and reimbursements | | | 1.26 | | | | 1.40 | | | | 1.40 | |
| Expenses, before waivers and reimbursements | | | 1.59 | | | | 1.81 | | | | 2.20 | |
| Net investment income (loss), net of waivers and reimbursements | | | 0.30 | | | | (0.18 | ) | | | 0.03 | |
| Net investment income (loss), before waivers and reimbursements | | | (0.03 | ) | | | (0.59 | ) | | | (0.77 | ) |
| Class I net assets at end of year (in thousands) | | $ | 17,683 | | | $ | 42,537 | | | $ | 17,222 | |
| Portfolio turnover rate (%)* | | | 81 | | | | 117 | | | | 86 | |
| (a) | For the period from April 10, 2013 (Commencement of Operations) to December 31, 2013. |
| * | Not annualized for periods less than a year. |
| ** | Annualized for periods less than a year. |
| ^ | Amount is less than $0.005 per share. |
Note: Net investment income (loss) per share is based on the average shares outstanding during the year.
Performance cited represents past performance. Past performance does not guarantee future results and current performance may be lower or higher than the data quoted. Results shown are annual returns, which assume reinvestment of dividends and capital gains. Investment returns and principal will fluctuate and you may have a gain or loss when you sell shares. For the most current month-end performance information, please call 1-800-742-7272 or visit our Web site at www.williamblairfunds.com.
| December 31, 2015 | William Blair Funds | 175 |
Financial Highlights
International Leaders Fund
| | | Class N | |
| | | Periods Ended December 31, | |
| | | 2015 | | | 2014 | | | 2013 | | | 2012(a) | |
| Net asset value, beginning of year | | $ | 12.25 | | | $ | 12.65 | | | $ | 10.81 | | | $ | 10.00 | |
| Income (loss) from investment operations: | | | | | | | | | | | | | | | | |
| Net investment income (loss) | | | 0.07 | | | | 0.13 | | | | 0.03 | | | | 0.00 | ^ |
| Net realized and unrealized gain (loss) on investments | | | 0.66 | | | | (0.47 | ) | | | 1.99 | | | | 0.82 | |
| Total from investment operations | | | 0.73 | | | | (0.34 | ) | | | 2.02 | | | | 0.82 | |
| Less distributions from: | | | | | | | | | | | | | | | | |
| Net investment income | | | 0.02 | | | | 0.06 | | | | 0.18 | | | | 0.01 | |
| Net realized gain | | | 0.07 | | | | — | | | | — | | | | — | |
| Total distributions | | | 0.09 | | | | 0.06 | | | | 0.18 | | | | 0.01 | |
| Net asset value, end of year | | $ | 12.89 | | | $ | 12.25 | | | $ | 12.65 | | | $ | 10.81 | |
| Total return (%)* | | | 6.01 | | | | (2.67 | ) | | | 18.75 | | | | 8.16 | |
| Ratios to average daily net assets (%):** | | | | | | | | | | | | | | | | |
| Expenses, net of waivers and reimbursements | | | 1.24 | | | | 1.45 | | | | 1.45 | | | | 1.45 | |
| Expenses, before waivers and reimbursements | | | 1.56 | | | | 1.59 | | | | 1.73 | | | | 4.98 | |
| Net investment income (loss), net of waivers and reimbursements | | | 0.51 | | | | 1.00 | | | | 0.29 | | | | 0.00 | |
| Net investment income (loss), before waivers and reimbursements | | | 0.19 | | | | 0.86 | | | | 0.01 | | | | (3.53 | ) |
| Class N net assets at end of year (in thousands) | | $ | 377 | | | $ | 150 | | | $ | 154 | | | $ | 542 | |
| Portfolio turnover rate (%)* | | | 29 | | | | 79 | | | | 73 | | | | 16 | |
| | | Class I | |
| | | Periods Ended December 31, | |
| | | 2015 | | | 2014 | | | 2013 | | | 2012(a) | |
| Net asset value, beginning of year | | $ | 12.25 | | | $ | 12.65 | | | $ | 10.81 | | | $ | 10.00 | |
| Income (loss) from investment operations: | | | | | | | | | | | | | | | | |
| Net investment income (loss) | | | 0.10 | | | | 0.16 | | | | 0.12 | | | | 0.01 | |
| Net realized and unrealized gain (loss) on investments | | | 0.65 | | | | (0.47 | ) | | | 1.94 | | | | 0.82 | |
| Total from investment operations | | | 0.75 | | | | (0.31 | ) | | | 2.06 | | | | 0.83 | |
| Less distributions from: | | | | | | | | | | | | | | | | |
| Net investment income | | | 0.02 | | | | 0.09 | | | | 0.22 | | | | 0.02 | |
| Net realized gain | | | 0.07 | | | | — | | | | — | | | | — | |
| Total distributions | | | 0.09 | | | | 0.09 | | | | 0.22 | | | | 0.02 | |
| Net asset value, end of year | | $ | 12.91 | | | $ | 12.25 | | | $ | 12.65 | | | $ | 10.81 | |
| Total return (%)* | | | 6.18 | | | | (2.43 | ) | | | 19.10 | | | | 8.26 | |
| Ratios to average daily net assets (%):** | | | | | | | | | | | | | | | | |
| Expenses, net of waivers and reimbursements | | | 1.13 | | | | 1.20 | | | | 1.20 | | | | 1.20 | |
| Expenses, before waivers and reimbursements | | | 1.46 | | | | 1.29 | | | | 1.40 | | | | 4.56 | |
| Net investment income (loss), net of waivers and reimbursements | | | 0.75 | | | | 1.25 | | | | 1.06 | | | | 0.22 | |
| Net investment income (loss), before waivers and reimbursements | | | 0.42 | | | | 1.16 | | | | 0.86 | | | | (3.14 | ) |
| Class I net assets at end of year (in thousands) | | $ | 13,474 | | | $ | 9,561 | | | $ | 11,629 | | | $ | 4,336 | |
| Portfolio turnover rate (%)* | | | 29 | | | | 79 | | | | 73 | | | | 16 | |
| (a) | For the period from August 16, 2012 (Commencement of Operations) to December 31, 2012. |
| * | Not annualized for periods less than a year. |
| ** | Annualized for periods less than a year. |
| ^ | Amount is less than $0.005 per share. |
Note: Net investment income (loss) per share is based on the average shares outstanding during the year.
Performance cited represents past performance. Past performance does not guarantee future results and current performance may be lower or higher than the data quoted. Results shown are annual returns, which assume reinvestment of dividends and capital gains. Investment returns and principal will fluctuate and you may have a gain or loss when you sell shares. For the most current month-end performance information, please call 1-800-742-7272 or visit our Web site at www.williamblairfunds.com.
| 176 | Annual Report | December 31, 2015 |
Financial Highlights
International Leaders Fund
| | | Institutional Class | |
| | | Periods Ended December 31, | |
| | | 2015 | | | 2014 | | | 2013 | | | 2012(a) | |
| Net asset value, beginning of year | | $ | 12.24 | | | $ | 12.65 | | | $ | 10.80 | | | $ | 10.24 | |
| Income (loss) from investment operations: | | | | | | | | | | | | | | | | |
| Net investment income (loss) | | | 0.11 | | | | 0.17 | | | | 0.15 | | | | 0.00 | ^ |
| Net realized and unrealized gain (loss) on investments | | | 0.66 | | | | (0.47 | ) | | | 1.94 | | | | 0.58 | |
| Total from investment operations | | | 0.77 | | | | (0.30 | ) | | | 2.09 | | | | 0.58 | |
| Less distributions from: | | | | | | | | | | | | | | | | |
| Net investment income | | | 0.04 | | | | 0.11 | | | | 0.24 | | | | 0.02 | |
| Net realized gain | | | 0.07 | | | | — | | | | — | | | | — | |
| Total distributions | | | 0.11 | | | | 0.11 | | | | 0.24 | | | | 0.02 | |
| Net asset value, end of year | | $ | 12.90 | | | $ | 12.24 | | | $ | 12.65 | | | $ | 10.80 | |
| Total return (%)* | | | 6.33 | | | | (2.34 | ) | | | 19.39 | | | | 5.67 | |
| Ratios to average daily net assets (%):** | | | | | | | | | | | | | | | | |
| Expenses, net of waivers and reimbursements | | | 0.98 | | | | 1.05 | | | | 1.05 | | | | 1.05 | |
| Expenses, before waivers and reimbursements | | | 1.15 | | | | 1.14 | | | | 1.25 | | | | 1.84 | |
| Net investment income (loss), net of waivers and reimbursements | | | 0.88 | | | | 1.33 | | | | 1.31 | | | | 0.01 | |
| Net investment income (loss), before waivers and reimbursements | | | 0.71 | | | | 1.24 | | | | 1.11 | | | | (0.78 | ) |
| Institutional Class net assets at end of year (in thousands) | | $ | 102,227 | | | $ | 78,251 | | | $ | 56,991 | | | $ | 5,286 | |
| Portfolio turnover rate (%)* | | | 29 | | | | 79 | | | | 73 | | | | 16 | |
| (a) | For the period from November 2, 2012 (Commencement of Operations) to December 31, 2012. |
| * | Not annualized for periods less than a year. |
| ** | Annualized for periods less than a year. |
| ^ | Amount is less than $0.005 per share. |
Note: Net investment income (loss) per share is based on the average shares outstanding during the year.
Performance cited represents past performance. Past performance does not guarantee future results and current performance may be lower or higher than the data quoted. Results shown are annual returns, which assume reinvestment of dividends and capital gains. Investment returns and principal will fluctuate and you may have a gain or loss when you sell shares. For the most current month-end performance information, please call 1-800-742-7272 or visit our Web site at www.williamblairfunds.com.
| December 31, 2015 | William Blair Funds | 177 |
Financial Highlights
International Equity Fund
| | | Class N | |
| | | Years Ended December 31, | |
| | | 2015 | | | 2014 | | | 2013 | | | 2012 | | | 2011 | |
| Net asset value, beginning of year | | $ | 13.76 | | | $ | 14.28 | | | $ | 12.05 | | | $ | 10.56 | | | $ | 12.12 | |
| Income (loss) from investment operations: | | | | | | | | | | | | | | | | | | | | |
| Net investment income (loss) | | | 0.15 | | | | 0.16 | | | | 0.09 | | | | 0.11 | | | | 0.13 | |
| Net realized and unrealized gain (loss) on investments | | | 0.06 | | | | (0.60 | ) | | | 2.25 | | | | 1.75 | | | | (1.69 | ) |
| Total from investment operations | | | 0.21 | | | | (0.44 | ) | | | 2.34 | | | | 1.86 | | | | (1.56 | ) |
| Less distributions from: | | | | | | | | | | | | | | | | | | | | |
| Net investment income | | | 0.12 | | | | 0.08 | | | | 0.11 | | | | 0.37 | | | | — | |
| Net realized gain | | | — | | | | — | | | | — | | | | — | | | | — | |
| Total distributions | | | 0.12 | | | | 0.08 | | | | 0.11 | | | | 0.37 | | | | — | |
| Net asset value, end of year | | $ | 13.85 | | | $ | 13.76 | | | $ | 14.28 | | | $ | 12.05 | | | $ | 10.56 | |
| Total return (%) | | | 1.54 | | | | (3.09 | ) | | | 19.47 | | | | 17.57 | | | | (12.87 | ) |
| Ratios to average daily net assets (%): | | | | | | | | | | | | | | | | | | | | |
| Expenses, net of waivers and reimbursements | | | 1.32 | | | | 1.38 | | | | 1.45 | | | | 1.45 | | | | 1.45 | |
| Expenses, before waivers and reimbursements | | | 1.60 | | | | 1.56 | | | | 1.65 | | | | 1.71 | | | | 1.60 | |
| Net investment income (loss), net of waivers and reimbursements | | | 1.01 | | | | 1.11 | | | | 0.73 | | | | 0.95 | | | | 1.09 | |
| Net investment income (loss), before waivers and reimbursements | | | 0.73 | | | | 0.93 | | | | 0.53 | | | | 0.69 | | | | 0.94 | |
| Class N net assets at end of year (in thousands) | | $ | 3,020 | | | $ | 3,497 | | | $ | 4,307 | | | $ | 5,648 | | | $ | 6,773 | |
| Portfolio turnover rate (%) | | | 54 | | | | 73 | | | | 88 | | | | 80 | | | | 99 | |
| | | Class I | |
| | | Years Ended December 31, | |
| | | 2015 | | | 2014 | | | 2013 | | | 2012 | | | 2011 | |
| Net asset value, beginning of year | | $ | 13.91 | | | $ | 14.43 | | | $ | 12.18 | | | $ | 10.67 | | | $ | 12.22 | |
| Income (loss) from investment operations: | | | | | | | | | | | | | | | | | | | | |
| Net investment income (loss) | | | 0.18 | | | | 0.19 | | | | 0.14 | | | | 0.14 | | | | 0.17 | |
| Net realized and unrealized gain (loss) on investments | | | 0.07 | | | | (0.59 | ) | | | 2.26 | | | | 1.77 | | | | (1.72 | ) |
| Total from investment operations | | | 0.25 | | | | (0.40 | ) | | | 2.40 | | | | 1.91 | | | | (1.55 | ) |
| Less distributions from: | | | | | | | | | | | | | | | | | | | | |
| Net investment income | | | 0.18 | | | | 0.12 | | | | 0.15 | | | | 0.40 | | | | — | |
| Net realized gain | | | — | | | | — | | | | — | | | | — | | | | — | |
| Total distributions | | | 0.18 | | | | 0.12 | | | | 0.15 | | | | 0.40 | | | | — | |
| Net asset value, end of year | | $ | 13.98 | | | $ | 13.91 | | | $ | 14.43 | | | $ | 12.18 | | | $ | 10.67 | |
| Total return (%) | | | 1.80 | | | | (2.80 | ) | | | 19.74 | | | | 17.89 | | | | (12.68 | ) |
| Ratios to average daily net assets (%): | | | | | | | | | | | | | | | | | | | | |
| Expenses, net of waivers and reimbursements | | | 1.07 | | | | 1.13 | | | | 1.20 | | | | 1.20 | | | | 1.20 | |
| Expenses, before waivers and reimbursements | | | 1.34 | | | | 1.32 | | | | 1.41 | | | | 1.44 | | | | 1.33 | |
| Net investment income (loss), net of waivers and reimbursements | | | 1.26 | | | | 1.35 | | | | 1.07 | | | | 1.17 | | | | 1.43 | |
| Net investment income (loss), before waivers and reimbursements | | | 0.99 | | | | 1.16 | | | | 0.86 | | | | 0.93 | | | | 1.30 | |
| Class I net assets at end of year (in thousands) | | $ | 60,886 | | | $ | 65,012 | | | $ | 75,271 | | | $ | 64,536 | | | $ | 68,884 | |
| Portfolio turnover rate (%) | | | 54 | | | | 73 | | | | 88 | | | | 80 | | | | 99 | |
Note: Net investment income (loss) per share is based on the average shares outstanding during the year.
Performance cited represents past performance. Past performance does not guarantee future results and current performance may be lower or higher than the data quoted. Results shown are annual returns, which assume reinvestment of dividends and capital gains. Investment returns and principal will fluctuate and you may have a gain or loss when you sell shares. For the most current month-end performance information, please call 1-800-742-7272 or visit our Web site at www.williamblairfunds.com.
| 178 | Annual Report | December 31, 2015 |
Financial Highlights
Institutional International Equity Fund
| | | Institutional Class | |
| | | Years Ended December 31, | |
| | | 2015 | | | 2014 | | | 2013 | | | 2012 | | | 2011 | |
| Net asset value, beginning of year | | $ | 12.01 | | | $ | 12.70 | | | $ | 10.82 | | | $ | 9.27 | | | $ | 10.78 | |
| Income (loss) from investment operations: | | | | | | | | | | | | | | | | | | | | |
| Net investment income (loss) | | | 0.15 | | | | 0.21 | | | | 0.13 | | | | 0.13 | | | | 0.16 | |
| Net realized and unrealized gain (loss) on investments | | | 0.08 | | | | (0.65 | ) | | | 2.00 | | | | 1.57 | | | | (1.47 | ) |
| Total from investment operations | | | 0.23 | | | | (0.44 | ) | | | 2.13 | | | | 1.70 | | | | (1.31 | ) |
| Less distributions from: | | | | | | | | | | | | | | | | | | | | |
| Net investment income | | | 0.12 | | | | 0.25 | | | | 0.25 | | | | 0.15 | | | | 0.20 | |
| Net realized gain | | | — | | | | — | | | | — | | | | — | | | | — | |
| Total distributions | | | 0.12 | | | | 0.25 | | | | 0.25 | | | | 0.15 | | | | 0.20 | |
| Net asset value, end of year | | $ | 12.12 | | | $ | 12.01 | | | $ | 12.70 | | | $ | 10.82 | | | $ | 9.27 | |
| Total return (%) | | | 1.91 | | | | (3.50 | ) | | | 19.78 | | | | 18.31 | | | | (12.12 | ) |
| Ratios to average daily net assets (%): | | | | | | | | | | | | | | | | | | | | |
| Expenses, net of waivers and reimbursements | | | 1.00 | | | | 1.03 | | | | 1.10 | | | | 1.10 | | | | 1.10 | |
| Expenses, before waivers and reimbursements | | | 1.76 | | | | 1.63 | | | | 1.12 | | | | 1.16 | | | | 1.10 | |
| Net investment income (loss), net of waivers and reimbursements | | | 1.23 | | | | 1.61 | | | | 1.12 | | | | 1.28 | | | | 1.48 | |
| Net investment income (loss), before waivers and reimbursements | | | 0.47 | | | | 1.01 | | | | 1.10 | | | | 1.22 | | | | 1.48 | |
| Institutional Class net assets at end of year (in thousands) | | $ | 16,030 | | | $ | 14,574 | | | $ | 100,805 | | | $ | 109,690 | | | $ | 111,474 | |
| Portfolio turnover rate (%) | | | 54 | | | | 61 | | | | 84 | | | | 86 | | | | 91 | |
Note: Net investment income (loss) per share is based on the average shares outstanding during the year.
Performance cited represents past performance. Past performance does not guarantee future results and current performance may be lower or higher than the data quoted. Results shown are annual returns, which assume reinvestment of dividends and capital gains. Investment returns and principal will fluctuate and you may have a gain or loss when you sell shares. For the most current month-end performance information, please call 1-800-742-7272 or visit our Web site at www.williamblairfunds.com.
| December 31, 2015 | William Blair Funds | 179 |
Financial Highlights
International Growth Fund
| | | Class N | |
| | | Years Ended December 31, | |
| | | 2015 | | | 2014 | | | 2013 | | | 2012 | | | 2011 | |
| Net asset value, beginning of year | | $ | 25.24 | | | $ | 26.30 | | | $ | 22.43 | | | $ | 18.68 | | | $ | 21.85 | |
| Income (loss) from investment operations: | | | | | | | | | | | | | | | | | | | | |
| Net investment income (loss) | | | 0.18 | | | | 0.31 | | | | 0.27 | | | | 0.26 | | | | 0.26 | |
| Net realized and unrealized gain (loss) on investments | | | (0.25 | ) | | | (1.15 | ) | | | 3.89 | | | | 4.16 | | | | (3.43 | ) |
| Total from investment operations | | | (0.07 | ) | | | (0.84 | ) | | | 4.16 | | | | 4.42 | | | | (3.17 | ) |
| Less distributions from: | | | | | | | | | | | | | | | | | | | | |
| Net investment income | | | 0.23 | | | | 0.22 | | | | 0.29 | | | | 0.67 | | | | — | |
| Net realized gain | | | — | | | | — | | | | — | | | | — | | | | — | |
| Total distributions | | | 0.23 | | | | 0.22 | | | | 0.29 | | | | 0.67 | | | | — | |
| Net asset value, end of year | | $ | 24.94 | | | $ | 25.24 | | | $ | 26.30 | | | $ | 22.43 | | | $ | 18.68 | |
| Total return (%) | | | (0.27 | ) | | | (3.19 | ) | | | 18.57 | | | | 23.67 | | | | (14.51 | ) |
| Ratios to average daily net assets (%): | | | | | | | | | | | | | | | | | | | | |
| Expenses, net of waivers and reimbursements | | | 1.42 | | | | 1.44 | | | | 1.44 | | | | 1.44 | | | | 1.45 | |
| Expenses, before waivers and reimbursements | | | 1.42 | | | | 1.44 | | | | 1.44 | | | | 1.44 | | | | 1.46 | |
| Net investment income (loss), net of waivers and reimbursements | | | 0.71 | | | | 1.17 | | | | 1.13 | | | | 1.25 | | | | 1.22 | |
| Net investment income (loss), before waivers and reimbursements | | | 0.71 | | | | 1.17 | | | | 1.13 | | | | 1.25 | | | | 1.21 | |
| Class N net assets at end of year (in thousands) | | $ | 1,023,588 | | | $ | 978,433 | | | $ | 1,418,083 | | | $ | 1,269,736 | | | $ | 1,277,534 | |
| Portfolio turnover rate (%) | | | 70 | | | | 79 | | | | 97 | | | | 81 | | | | 103 | |
| | | Class I | |
| | | Years Ended December 31, | |
| | | 2015 | | | 2014 | | | 2013 | | | 2012 | | | 2011 | |
| Net asset value, beginning of year | | $ | 25.82 | | | $ | 26.91 | | | $ | 22.94 | | | $ | 19.10 | | | $ | 22.34 | |
| Income (loss) from investment operations: | | | | | | | | | | | | | | | | | | | | |
| Net investment income (loss) | | | 0.27 | | | | 0.36 | | | | 0.35 | | | | 0.32 | | | | 0.30 | |
| Net realized and unrealized gain (loss) on investments | | | (0.28 | ) | | | (1.13 | ) | | | 3.99 | | | | 4.25 | | | | (3.48 | ) |
| Total from investment operations | | | (0.01 | ) | | | (0.77 | ) | | | 4.34 | | | | 4.57 | | | | (3.18 | ) |
| Less distributions from: | | | | | | | | | | | | | | | | | | | | |
| Net investment income | | | 0.30 | | | | 0.32 | | | | 0.37 | | | | 0.73 | | | | 0.06 | |
| Net realized gain | | | — | | | | — | | | | — | | | | — | | | | — | |
| Total distributions | | | 0.30 | | | | 0.32 | | | | 0.37 | | | | 0.73 | | | | 0.06 | |
| Net asset value, end of year | | $ | 25.51 | | | $ | 25.82 | | | $ | 26.91 | | | $ | 22.94 | | | $ | 19.10 | |
| Total return (%) | | | (0.03 | ) | | | (2.86 | ) | | | 18.96 | | | | 23.96 | | | | (14.23 | ) |
| Ratios to average daily net assets (%): | | | | | | | | | | | | | | | | | | | | |
| Expenses | | | 1.14 | | | | 1.14 | | | | 1.11 | | | | 1.15 | | | | 1.15 | |
| Net investment income (loss) | | | 1.02 | | | | 1.36 | | | | 1.43 | | | | 1.51 | | | | 1.40 | |
| Class I net assets at end of year (in thousands) | | $ | 2,655,156 | | | $ | 2,705,054 | | | $ | 2,877,541 | | | $ | 2,402,897 | | | $ | 1,951,368 | |
| Portfolio turnover rate (%) | | | 70 | | | | 79 | | | | 97 | | | | 81 | | | | 103 | |
Note: Net investment income (loss) per share is based on the average shares outstanding during the year.
Performance cited represents past performance. Past performance does not guarantee future results and current performance may be lower or higher than the data quoted. Results shown are annual returns, which assume reinvestment of dividends and capital gains. Investment returns and principal will fluctuate and you may have a gain or loss when you sell shares. For the most current month-end performance information, please call 1-800-742-7272 or visit our Web site at www.williamblairfunds.com.
| 180 | Annual Report | December 31, 2015 |
Financial Highlights
Institutional International Growth Fund
| | | Institutional Class | |
| | | Years Ended December 31, | |
| | | 2015 | | | 2014 | | | 2013 | | | 2012 | | | 2011 | |
| Net asset value, beginning of year | | $ | 15.26 | | | $ | 17.40 | | | $ | 14.89 | | | $ | 12.39 | | | $ | 14.37 | |
| Income (loss) from investment operations: | | | | | | | | | | | | | | | | | | | | |
| Net investment income (loss) | | | 0.19 | | | | 0.26 | | | | 0.25 | | | | 0.23 | | | | 0.21 | |
| Net realized and unrealized gain (loss) on investments | | | (0.18 | ) | | | (0.71 | ) | | | 2.56 | | | | 2.76 | | | | (2.17 | ) |
| Total from investment operations | | | 0.01 | | | | (0.45 | ) | | | 2.81 | | | | 2.99 | | | | (1.96 | ) |
| Less distributions from: | | | | | | | | | | | | | | | | | | | | |
| Net investment income | | | 0.09 | | | | 0.32 | | | | 0.30 | | | | 0.49 | | | | 0.02 | |
| Net realized gain | | | 0.10 | | | | 1.37 | | | | — | | | | — | | | | — | |
| Total distributions | | | 0.19 | | | | 1.69 | | | | 0.30 | | | | 0.49 | | | | 0.02 | |
| Net asset value, end of year | | $ | 15.08 | | | $ | 15.26 | | | $ | 17.40 | | | $ | 14.89 | | | $ | 12.39 | |
| Total return (%) | | | 0.09 | | | | (2.66 | ) | | | 18.90 | | | | 24.11 | | | | (13.66 | ) |
| Ratios to average daily net assets (%): | | | | | | | | | | | | | | | | | | | | |
| Expenses | | | 0.96 | | | | 0.97 | | | | 0.97 | | | | 0.98 | | | | 0.99 | |
| Net investment income (loss) | | | 1.18 | | | | 1.50 | | | | 1.58 | | | | 1.64 | | | | 1.51 | |
| Institutional Class net assets at end of year (in thousands) | | $ | 2,335,632 | | | $ | 2,339,169 | | | $ | 2,440,149 | | | $ | 1,974,130 | | | $ | 1,542,594 | |
| Portfolio turnover rate (%) | | | 70 | | | | 83 | | | | 97 | | | | 83 | | | | 111 | |
Note: Net investment income (loss) per share is based on the average shares outstanding during the year.
Performance cited represents past performance. Past performance does not guarantee future results and current performance may be lower or higher than the data quoted. Results shown are annual returns, which assume reinvestment of dividends and capital gains. Investment returns and principal will fluctuate and you may have a gain or loss when you sell shares. For the most current month-end performance information, please call 1-800-742-7272 or visit our Web site at www.williamblairfunds.com.
| December 31, 2015 | William Blair Funds | 181 |
Financial Highlights
International Small Cap Growth Fund
| | | Class N | |
| | | Years Ended December 31, | |
| | | 2015 | | | 2014 | | | 2013 | | | 2012 | | | 2011 | |
| Net asset value, beginning of year | | $ | 12.56 | | | $ | 16.08 | | | $ | 13.46 | | | $ | 11.36 | | | $ | 13.07 | |
| Income (loss) from investment operations: | | | | | | | | | | | | | | | | | | | | |
| Net investment income (loss) | | | 0.05 | | | | 0.03 | | | | 0.10 | | | | 0.08 | | | | 0.07 | |
| Net realized and unrealized gain (loss) on investments | | | 1.16 | | | | (1.38 | ) | | | 3.35 | | | | 2.27 | | | | (1.66 | ) |
| Total from investment operations | | | 1.21 | | | | (1.35 | ) | | | 3.45 | | | | 2.35 | | | | (1.59 | ) |
| Less distributions from: | | | | | | | | | | | | | | | | | | | | |
| Net investment income | | | 0.24 | | | | 0.18 | | | | 0.16 | | | | 0.25 | | | | 0.12 | |
| Net realized gain | | | 0.03 | | | | 1.99 | | | | 0.67 | | | | — | | | | — | |
| Total distributions | | | 0.27 | | | | 2.17 | | | | 0.83 | | | | 0.25 | | | | 0.12 | |
| Net asset value, end of year | | $ | 13.50 | | | $ | 12.56 | | | $ | 16.08 | | | $ | 13.46 | | | $ | 11.36 | |
| Total return (%) | | | 9.67 | | | | (8.43 | ) | | | 25.80 | | | | 20.73 | | | | (12.16 | ) |
| Ratios to average daily net assets (%): | | | | | | | | | | | | | | | | | | | | |
| Expenses, net of waivers and reimbursements | | | 1.47 | | | | 1.58 | | | | 1.59 | | | | 1.61 | | | | 1.64 | |
| Expenses, before waivers and reimbursements | | | 1.62 | | | | 1.58 | | | | 1.59 | | | | 1.61 | | | | 1.64 | |
| Net investment income (loss), net of waivers and reimbursements | | | 0.34 | | | | 0.20 | | | | 0.67 | | | | 0.65 | | | | 0.55 | |
| Net investment income (loss), before waivers and reimbursements | | | 0.19 | | | | 0.20 | | | | 0.67 | | | | 0.65 | | | | 0.55 | |
| Class N net assets at end of year (in thousands) | | $ | 11,350 | | | $ | 13,676 | | | $ | 18,910 | | | $ | 14,771 | | | $ | 18,991 | |
| Portfolio turnover rate (%) | | | 90 | | | | 127 | | | | 111 | | | | 76 | | | | 85 | |
| | | Class I | |
| | | Years Ended December 31, | |
| | | 2015 | | | 2014 | | | 2013 | | | 2012 | | | 2011 | |
| Net asset value, beginning of year | | $ | 12.70 | | | $ | 16.23 | | | $ | 13.58 | | | $ | 11.46 | | | $ | 13.19 | |
| Income (loss) from investment operations: | | | | | | | | | | | | | | | | | | | | |
| Net investment income (loss) | | | 0.09 | | | | 0.09 | | | | 0.15 | | | | 0.12 | | | | 0.12 | |
| Net realized and unrealized gain (loss) on investments | | | 1.18 | | | | (1.40 | ) | | | 3.37 | | | | 2.30 | | | | (1.69 | ) |
| Total from investment operations | | | 1.27 | | | | (1.31 | ) | | | 3.52 | | | | 2.42 | | | | (1.57 | ) |
| Less distributions from: | | | | | | | | | | | | | | | | | | | | |
| Net investment income | | | 0.29 | | | | 0.23 | | | | 0.20 | | | | 0.30 | | | | 0.16 | |
| Net realized gain | | | 0.03 | | | | 1.99 | | | | 0.67 | | | | — | | | | — | |
| Total distributions | | | 0.32 | | | | 2.22 | | | | 0.87 | | | | 0.30 | | | | 0.16 | |
| Net asset value, end of year | | $ | 13.65 | | | $ | 12.70 | | | $ | 16.23 | | | $ | 13.58 | | | $ | 11.46 | |
| Total return (%) | | | 10.00 | | | | (8.10 | ) | | | 26.11 | | | | 21.10 | | | | (11.84 | ) |
| Ratios to average daily net assets (%): | | | | | | | | | | | | | | | | | | | | |
| Expenses, net of waivers and reimbursements | | | 1.16 | | | | 1.28 | | | | 1.30 | | | | 1.30 | | | | 1.28 | |
| Expenses, before waivers and reimbursements | | | 1.31 | | | | 1.28 | | | | 1.30 | | | | 1.30 | | | | 1.28 | |
| Net investment income (loss), net of waivers and reimbursements | | | 0.66 | | | | 0.56 | | | | 0.96 | | | | 0.95 | | | | 0.92 | |
| Net investment income (loss), before waivers and reimbursements | | | 0.51 | | | | 0.56 | | | | 0.96 | | | | 0.95 | | | | 0.92 | |
| Class I net assets at end of year (in thousands) | | $ | 342,232 | | | $ | 364,161 | | | $ | 508,758 | | | $ | 359,557 | | | $ | 364,574 | |
| Portfolio turnover rate (%) | | | 90 | | | | 127 | | | | 111 | | | | 76 | | | | 85 | |
Note: Net investment income (loss) per share is based on the average shares outstanding during the year.
Performance cited represents past performance. Past performance does not guarantee future results and current performance may be lower or higher than the data quoted. Results shown are annual returns, which assume reinvestment of dividends and capital gains. Investment returns and principal will fluctuate and you may have a gain or loss when you sell shares. For the most current month-end performance information, please call 1-800-742-7272 or visit our Web site at www.williamblairfunds.com.
| 182 | Annual Report | December 31, 2015 |
Financial Highlights
International Small Cap Growth Fund
| | | Institutional Class | |
| | | Years Ended December 31, | |
| | | 2015 | | | 2014 | | | 2013 | | | 2012 | | | 2011 | |
| Net asset value, beginning of year | | $ | 12.77 | | | $ | 16.32 | | | $ | 13.64 | | | $ | 11.51 | | | $ | 13.24 | |
| Income (loss) from investment operations: | | | | | | | | | | | | | | | | | | | | |
| Net investment income (loss) | | | 0.10 | | | | 0.12 | | | | 0.18 | | | | 0.15 | | | | 0.14 | |
| Net realized and unrealized gain (loss) on investments | | | 1.18 | | | | (1.41 | ) | | | 3.41 | | | | 2.31 | | | | (1.68 | ) |
| Total from investment operations | | | 1.28 | | | | (1.29 | ) | | | 3.59 | | | | 2.46 | | | | (1.54 | ) |
| Less distributions from: | | | | | | | | | | | | | | | | | | | | |
| Net investment income | | | 0.30 | | | | 0.27 | | | | 0.24 | | | | 0.33 | | | | 0.19 | |
| Net realized gain | | | 0.03 | | | | 1.99 | | | | 0.67 | | | | — | | | | — | |
| Total distributions | | | 0.33 | | | | 2.26 | | | | 0.91 | | | | 0.33 | | | | 0.19 | |
| Net asset value, end of year | | $ | 13.72 | | | $ | 12.77 | | | $ | 16.32 | | | $ | 13.64 | | | $ | 11.51 | |
| Total return (%) | | | 10.03 | | | | (7.91 | ) | | | 26.49 | | | | 21.36 | | | | (11.60 | ) |
| Ratios to average daily net assets (%): | | | | | | | | | | | | | | | | | | | | |
| Expenses | | | 1.08 | | | | 1.06 | | | | 1.06 | | | | 1.08 | | | | 1.08 | |
| Net investment income (loss) | | | 0.76 | | | | 0.74 | | | | 1.20 | | | | 1.14 | | | | 1.10 | |
| Institutional Class net assets at end of year (in thousands) | | $ | 221,018 | | | $ | 245,103 | | | $ | 408,524 | | | $ | 345,180 | | | $ | 334,656 | |
| Portfolio turnover rate (%) | | | 90 | | | | 127 | | | | 111 | | | | 76 | | | | 85 | |
Note: Net investment income (loss) per share is based on the average shares outstanding during the year.
Performance cited represents past performance. Past performance does not guarantee future results and current performance may be lower or higher than the data quoted. Results shown are annual returns, which assume reinvestment of dividends and capital gains. Investment returns and principal will fluctuate and you may have a gain or loss when you sell shares. For the most current month-end performance information, please call 1-800-742-7272 or visit our Web site at www.williamblairfunds.com.
| December 31, 2015 | William Blair Funds | 183 |
Financial Highlights
Emerging Markets Leaders Fund
| | | Class N | |
| | | Years Ended December 31, | |
| | | 2015 | | | 2014 | | | 2013 | | | 2012 | | | 2011 | |
| Net asset value, beginning of year | | $ | 9.06 | | | $ | 9.10 | | | $ | 9.20 | | | $ | 7.68 | | | $ | 10.34 | |
| Income (loss) from investment operations: | | | | | | | | | | | | | | | | | | | | |
| Net investment income (loss) | | | 0.02 | | | | 0.05 | | | | (0.02 | ) | | | 0.02 | | | | 0.04 | |
| Net realized and unrealized gain (loss) on investments | | | (1.34 | ) | | | 0.14 | | | | (0.05 | ) | | | 1.54 | | | | (2.08 | ) |
| Total from investment operations | | | (1.32 | ) | | | 0.19 | | | | (0.07 | ) | | | 1.56 | | | | (2.04 | ) |
| Less distributions from: | | | | | | | | | | | | | | | | | | | | |
| Net investment income | | | — | | | | 0.00 | ^ | | | 0.03 | | | | 0.04 | | | | — | |
| Net realized gain | | | 0.01 | | | | 0.23 | | | | — | | | | — | | | | 0.62 | |
| Total distributions | | | 0.01 | | | | 0.23 | | | | 0.03 | | | | 0.04 | | | | 0.62 | |
| Net asset value, end of year | | $ | 7.73 | | | $ | 9.06 | | | $ | 9.10 | | | $ | 9.20 | | | $ | 7.68 | |
| Total return (%) | | | (14.56 | ) | | | 2.17 | | | | (0.74 | ) | | | 20.37 | | | | (19.55 | ) |
| Ratios to average daily net assets (%): | | | | | | | | | | | | | | | | | | | | |
| Expenses, net of waivers and reimbursements | | | 1.64 | | | | 1.65 | | | | 1.65 | | | | 1.65 | | | | 1.65 | |
| Expenses, before waivers and reimbursements | | | 1.89 | | | | 1.82 | | | | 1.83 | | | | 2.10 | | | | 1.83 | |
| Net investment income (loss), net of waivers and reimbursements | | | 0.18 | | | | 0.51 | | | | (0.23 | ) | | | 0.26 | | | | 0.44 | |
| Net investment income (loss), before waivers and reimbursements | | | (0.07 | ) | | | 0.34 | | | | (0.41 | ) | | | (0.19 | ) | | | 0.26 | |
| Class N net assets at end of year (in thousands) | | $ | 1,599 | | | $ | 1,832 | | | $ | 1,959 | | | $ | 249 | | | $ | 46 | |
| Portfolio turnover rate (%) | | | 110 | | | | 131 | | | | 131 | | | | 94 | | | | 142 | |
| | | Class I | |
| | | Years Ended December 31, | |
| | | 2015 | | | 2014 | | | 2013 | | | 2012 | | | 2011 | |
| Net asset value, beginning of year | | $ | 9.08 | | | $ | 9.10 | | | $ | 9.18 | | | $ | 7.66 | | | $ | 10.35 | |
| Income (loss) from investment operations: | | | | | | | | | | | | | | | | | | | | |
| Net investment income (loss) | | | 0.05 | | | | 0.08 | | | | 0.05 | | | | 0.07 | | | | 0.06 | |
| Net realized and unrealized gain (loss) on investments | | | (1.36 | ) | | | 0.15 | | | | (0.10 | ) | | | 1.51 | | | | (2.08 | ) |
| Total from investment operations | | | (1.31 | ) | | | 0.23 | | | | (0.05 | ) | | | 1.58 | | | | (2.02 | ) |
| Less distributions from: | | | | | | | | | | | | | | | | | | | | |
| Net investment income | | | 0.02 | | | | 0.02 | | | | 0.03 | | | | 0.06 | | | | 0.05 | |
| Net realized gain | | | 0.01 | | | | 0.23 | | | | — | | | | — | | | | 0.62 | |
| Return of capital | | | — | | | | — | | | | — | | | | — | | | | 0.00 | ^ |
| Total distributions | | | 0.03 | | | | 0.25 | | | | 0.03 | | | | 0.06 | | | | 0.67 | |
| Net asset value, end of year | | $ | 7.74 | | | $ | 9.08 | | | $ | 9.10 | | | $ | 9.18 | | | $ | 7.66 | |
| Total return (%) | | | (14.37 | ) | | | 2.62 | | | | (0.60 | ) | | | 20.64 | | | | (19.34 | ) |
| Ratios to average daily net assets (%): | | | | | | | | | | | | | | | | | | | | |
| Expenses, net of waivers and reimbursements | | | 1.29 | | | | 1.40 | | | | 1.40 | | | | 1.40 | | | | 1.40 | |
| Expenses, before waivers and reimbursements | | | 1.54 | | | | 1.60 | | | | 1.58 | | | | 1.75 | | | | 1.58 | |
| Net investment income (loss), net of waivers and reimbursements | | | 0.53 | | | | 0.84 | | | | 0.51 | | | | 0.83 | | | | 0.69 | |
| Net investment income (loss), before waivers and reimbursements | | | 0.28 | | | | 0.64 | | | | 0.33 | | | | 0.48 | | | | 0.51 | |
| Class I net assets at end of year (in thousands) | | $ | 32,862 | | | $ | 28,475 | | | $ | 34,590 | | | $ | 25,628 | | | $ | 21,610 | |
| Portfolio turnover rate (%) | | | 110 | | | | 131 | | | | 131 | | | | 94 | | | | 142 | |
| ^ | Amount is less than $0.005 per share. |
Note: Net investment income (loss) per share is based on the average shares outstanding during the year.
Performance cited represents past performance. Past performance does not guarantee future results and current performance may be lower or higher than the data quoted. Results shown are annual returns, which assume reinvestment of dividends and capital gains. Investment returns and principal will fluctuate and you may have a gain or loss when you sell shares. For the most current month-end performance information, please call 1-800-742-7272 or visit our Web site at www.williamblairfunds.com.
| 184 | Annual Report | December 31, 2015 |
Financial Highlights
Emerging Markets Leaders Fund
| | | Institutional Class | |
| | | Years Ended December 31, | |
| | | 2015 | | | 2014 | | | 2013 | | | 2012 | | | 2011 | |
| Net asset value, beginning of year | | $ | 9.07 | | | $ | 9.10 | | | $ | 9.18 | | | $ | 7.65 | | | $ | 10.35 | |
| Income (loss) from investment operations: | | | | | | | | | | | | | | | | | | | | |
| Net investment income (loss) | | | 0.04 | | | | 0.08 | | | | 0.06 | | | | 0.08 | | | | 0.09 | |
| Net realized and unrealized gain (loss) on investments | | | (1.33 | ) | | | 0.16 | | | | (0.10 | ) | | | 1.52 | | | | (2.10 | ) |
| Total from investment operations | | | (1.29 | ) | | | 0.24 | | | | (0.04 | ) | | | 1.60 | | | | (2.01 | ) |
| Less distributions from: | | | | | | | | | | | | | | | | | | | | |
| Net investment income | | | 0.03 | | | | 0.04 | | | | 0.04 | | | | 0.07 | | | | 0.06 | |
| Net realized gain | | | 0.01 | | | | 0.23 | | | | — | | | | — | | | | 0.63 | |
| Return of capital | | | — | | | | — | | | | — | | | | — | | | | 0.00 | ^ |
| Total distributions | | | 0.04 | | | | 0.27 | | | | 0.04 | | | | 0.07 | | | | 0.69 | |
| Net asset value, end of year | | $ | 7.74 | | | $ | 9.07 | | | $ | 9.10 | | | $ | 9.18 | | | $ | 7.65 | |
| Total return (%) | | | (14.24 | ) | | | 2.68 | | | | (0.46 | ) | | | 20.97 | | | | (19.30 | ) |
| Ratios to average daily net assets (%): | | | | | | | | | | | | | | | | | | | | |
| Expenses, net of waivers and reimbursements | | | 1.25 | | | | 1.25 | | | | 1.25 | | | | 1.25 | | | | 1.25 | |
| Expenses, before waivers and reimbursements | | | 1.35 | | | | 1.42 | | | | 1.42 | | | | 1.59 | | | | 1.41 | |
| Net investment income (loss), net of waivers and reimbursements | | | 0.49 | | | | 0.83 | | | | 0.68 | | | | 0.90 | | | | 0.90 | |
| Net investment income (loss), before waivers and reimbursements | | | 0.39 | | | | 0.66 | | | | 0.51 | | | | 0.56 | | | | 0.74 | |
| Institutional Class net assets at end of year (in thousands) | | $ | 93,217 | | | $ | 75,875 | | | $ | 36,509 | | | $ | 43,102 | | | $ | 26,166 | |
| Portfolio turnover rate (%) | | | 110 | | | | 131 | | | | 131 | | | | 94 | | | | 142 | |
| ^ | Amount is less than $0.005 per share. |
Note: Net investment income (loss) per share is based on the average shares outstanding during the year.
Performance cited represents past performance. Past performance does not guarantee future results and current performance may be lower or higher than the data quoted. Results shown are annual returns, which assume reinvestment of dividends and capital gains. Investment returns and principal will fluctuate and you may have a gain or loss when you sell shares. For the most current month-end performance information, please call 1-800-742-7272 or visit our Web site at www.williamblairfunds.com.
| December 31, 2015 | William Blair Funds | 185 |
Financial Highlights
Emerging Markets Growth Fund
| | | Class N | |
| | | Years Ended December 31, | |
| | | 2015 | | | 2014 | | | 2013 | | | 2012 | | | 2011 | |
| Net asset value, beginning of year | | $ | 12.91 | | | $ | 13.28 | | | $ | 13.40 | | | $ | 11.16 | | | $ | 15.76 | |
| Income (loss) from investment operations: | | | | | | | | | | | | | | | | | | | | |
| Net investment income (loss) | | | 0.04 | | | | 0.08 | | | | 0.05 | | | | 0.07 | | | | 0.07 | |
| Net realized and unrealized gain (loss) on investments | | | (1.98 | ) | | | 0.37 | | | | 0.09 | | | | 2.24 | | | | (2.84 | ) |
| Total from investment operations | | | (1.94 | ) | | | 0.45 | | | | 0.14 | | | | 2.31 | | | | (2.77 | ) |
| Less distributions from: | | | | | | | | | | | | | | | | | | | | |
| Net investment income | | | — | | | | 0.08 | | | | 0.01 | | | | 0.07 | | | | — | |
| Net realized gain | | | 0.12 | | | | 0.74 | | | | 0.25 | | | | — | | | | 1.83 | |
| Total distributions | | | 0.12 | | | | 0.82 | | | | 0.26 | | | | 0.07 | | | | 1.83 | |
| Net asset value, end of year | | $ | 10.85 | | | $ | 12.91 | | | $ | 13.28 | | | $ | 13.40 | | | $ | 11.16 | |
| Total return (%) | | | (15.03 | ) | | | 3.40 | | | | 1.05 | | | | 20.70 | | | | (17.29 | ) |
| Ratios to average daily net assets (%): | | | | | | | | | | | | | | | | | | | | |
| Expenses, net of waivers and reimbursements | | | 1.50 | | | | 1.64 | | | | 1.68 | | | | 1.69 | | | | 1.68 | |
| Expenses, before waivers and reimbursements | | | 1.65 | | | | 1.64 | | | | 1.68 | | | | 1.69 | | | | 1.68 | |
| Net investment income (loss), net of waivers and reimbursements | | | 0.33 | | | | 0.55 | | | | 0.39 | | | | 0.59 | | | | 0.48 | |
| Net investment income (loss), before waivers and reimbursements | | | 0.18 | | | | 0.55 | | | | 0.39 | | | | 0.59 | | | | 0.48 | |
| Class N net assets at end of year (in thousands) | | $ | 9,367 | | | $ | 12,638 | | | $ | 13,723 | | | $ | 16,724 | | | $ | 17,474 | |
| Portfolio turnover rate (%) | | | 121 | | | | 101 | | | | 118 | | | | 90 | | | | 104 | |
| | | Class I | |
| | | Years Ended December 31, | |
| | | 2015 | | | 2014 | | | 2013 | | | 2012 | | | 2011 | |
| Net asset value, beginning of year | | $ | 13.01 | | | $ | 13.38 | | | $ | 13.50 | | | $ | 11.25 | | | $ | 15.87 | |
| Income (loss) from investment operations: | | | | | | | | | | | | | | | | | | | | |
| Net investment income (loss) | | | 0.07 | | | | 0.11 | | | | 0.08 | | | | 0.11 | | | | 0.11 | |
| Net realized and unrealized gain (loss) on investments | | | (2.00 | ) | | | 0.37 | | | | 0.10 | | | | 2.25 | | | | (2.85 | ) |
| Total from investment operations | | | (1.93 | ) | | | 0.48 | | | | 0.18 | | | | 2.36 | | | | (2.74 | ) |
| Less distributions from: | | | | | | | | | | | | | | | | | | | | |
| Net investment income | | | — | | | | 0.11 | | | | 0.05 | | | | 0.11 | | | | 0.05 | |
| Net realized gain | | | 0.12 | | | | 0.74 | | | | 0.25 | | | | — | | | | 1.83 | |
| Total distributions | | | 0.12 | | | | 0.85 | | | | 0.30 | | | | 0.11 | | | | 1.88 | |
| Net asset value, end of year | | $ | 10.96 | | | $ | 13.01 | | | $ | 13.38 | | | $ | 13.50 | | | $ | 11.25 | |
| Total return (%) | | | (14.83 | ) | | | 3.65 | | | | 1.36 | | | | 21.01 | | | | (17.00 | ) |
| Ratios to average daily net assets (%): | | | | | | | | | | | | | | | | | | | | |
| Expenses, net of waivers and reimbursements | | | 1.25 | | | | 1.40 | | | | 1.41 | | | | 1.41 | | | | 1.38 | |
| Expenses, before waivers and reimbursements | | | 1.40 | | | | 1.40 | | | | 1.41 | | | | 1.41 | | | | 1.38 | |
| Net investment income (loss), net of waivers and reimbursements | | | 0.58 | | | | 0.79 | | | | 0.62 | | | | 0.86 | | | | 0.77 | |
| Net investment income (loss), before waivers and reimbursements | | | 0.43 | | | | 0.79 | | | | 0.62 | | | | 0.86 | | | | 0.77 | |
| Class I net assets at end of year (in thousands) | | $ | 130,491 | | | $ | 166,488 | | | $ | 152,588 | | | $ | 144,942 | | | $ | 124,739 | |
| Portfolio turnover rate (%) | | | 121 | | | | 101 | | | | 118 | | | | 90 | | | | 104 | |
Note: Net investment income (loss) per share is based on the average shares outstanding during the year.
Performance cited represents past performance. Past performance does not guarantee future results and current performance may be lower or higher than the data quoted. Results shown are annual returns, which assume reinvestment of dividends and capital gains. Investment returns and principal will fluctuate and you may have a gain or loss when you sell shares. For the most current month-end performance information, please call 1-800-742-7272 or visit our Web site at www.williamblairfunds.com.
| 186 | Annual Report | December 31, 2015 |
Financial Highlights
Emerging Markets Growth Fund
| | | Institutional Class | |
| | | Years Ended December 31, | |
| | | 2015 | | | 2014 | | | 2013 | | | 2012 | | | 2011 | |
| Net asset value, beginning of year | | $ | 13.09 | | | $ | 13.46 | | | $ | 13.59 | | | $ | 11.32 | | | $ | 15.96 | |
| Income (loss) from investment operations: | | | | | | | | | | | | | | | | | | | | |
| Net investment income (loss) | | | 0.08 | | | | 0.14 | | | | 0.12 | | | | 0.14 | | | | 0.14 | |
| Net realized and unrealized gain (loss) on investments | | | (2.00 | ) | | | 0.37 | | | | 0.08 | | | | 2.27 | | | | (2.87 | ) |
| Total from investment operations | | | (1.92 | ) | | | 0.51 | | | | 0.20 | | | | 2.41 | | | | (2.73 | ) |
| Less distributions from: | | | | | | | | | | | | | | | | | | | | |
| Net investment income | | | — | | | | 0.14 | | | | 0.08 | | | | 0.14 | | | | 0.08 | |
| Net realized gain | | | 0.12 | | | | 0.74 | | | | 0.25 | | | | — | | | | 1.83 | |
| Total distributions | | | 0.12 | | | | 0.88 | | | | 0.33 | | | | 0.14 | | | | 1.91 | |
| Net asset value, end of year | | $ | 11.05 | | | $ | 13.09 | | | $ | 13.46 | | | $ | 13.59 | | | $ | 11.32 | |
| Total return (%) | | | (14.67 | ) | | | 3.85 | | | | 1.49 | | | | 21.28 | | | | (16.82 | ) |
| Ratios to average daily net assets (%): | | | | | | | | | | | | | | | | | | | | |
| Expenses | | | 1.17 | | | | 1.18 | | | | 1.19 | | | | 1.20 | | | | 1.19 | |
| Net investment income (loss) | | | 0.61 | | | | 1.00 | | | | 0.87 | | | | 1.12 | | | | 0.93 | |
| Institutional Class net assets at end of year (in thousands) | | $ | 739,253 | | | $ | 806,708 | | | $ | 833,711 | | | $ | 802,571 | | | $ | 675,633 | |
| Portfolio turnover rate (%) | | | 121 | | | | 101 | | | | 118 | | | | 90 | | | | 104 | |
Note: Net investment income (loss) per share is based on the average shares outstanding during the year.
Performance cited represents past performance. Past performance does not guarantee future results and current performance may be lower or higher than the data quoted. Results shown are annual returns, which assume reinvestment of dividends and capital gains. Investment returns and principal will fluctuate and you may have a gain or loss when you sell shares. For the most current month-end performance information, please call 1-800-742-7272 or visit our Web site at www.williamblairfunds.com.
| December 31, 2015 | William Blair Funds | 187 |
Financial Highlights
Emerging Markets Small Cap Growth Fund
| | | Class N | |
| | | Periods Ended December 31, | |
| | | 2015 | | | 2014 | | | 2013 | | | 2012 | | | 2011(a) | |
| Net asset value, beginning of year | | $ | 16.52 | | | $ | 15.12 | | | $ | 12.99 | | | $ | 9.73 | | | $ | 10.00 | |
| Income (loss) from investment operations: | | | | | | | | | | | | | | | | | | | | |
| Net investment income (loss) | | | (0.01 | ) | | | 0.04 | | | | 0.05 | | | | 0.06 | | | | 0.00 | ^ |
| Net realized and unrealized gain (loss) on investments | | | (1.05 | ) | | | 2.13 | | | | 2.08 | | | | 3.27 | | | | (0.27 | ) |
| Total from investment operations | | | (1.06 | ) | | | 2.17 | | | | 2.13 | | | | 3.33 | | | | (0.27 | ) |
| Less distributions from: | | | | | | | | | | | | | | | | | | | | |
| Net investment income | | | — | | | | 0.03 | | | | — | | | | 0.07 | | | | — | |
| Net realized gain | | | 0.62 | | | | 0.74 | | | | 0.00 | ^ | | | — | | | | — | |
| Total distributions | | | 0.62 | | | | 0.77 | | | | 0.00 | ^ | | | 0.07 | | | | — | |
| Net asset value, end of year | | $ | 14.84 | | | $ | 16.52 | | | $ | 15.12 | | | $ | 12.99 | | | $ | 9.73 | |
| Total return (%)* | | | (6.40 | ) | | | 14.41 | | | | 16.42 | | | | 34.23 | | | | (2.70 | ) |
| Ratios to average daily net assets (%):** | | | | | | | | | | | | | | | | | | | | |
| Expenses, net of waivers and reimbursements | | | 1.65 | | | | 1.65 | | | | 1.65 | | | | 1.65 | | | | 1.65 | |
| Expenses, before waivers and reimbursements | | | 1.94 | | | | 1.74 | | | | 2.19 | | | | 4.76 | | | | 9.53 | |
| Net investment income (loss), net of waivers and reimbursements | | | (0.06 | ) | | | 0.21 | | | | 0.38 | | | | 0.56 | | | | 0.08 | |
| Net investment income (loss), before waivers and reimbursements | | | (0.35 | ) | | | 0.12 | | | | (0.16 | ) | | | (2.54 | ) | | | (7.80 | ) |
| Class N net assets at end of year (in thousands) | | $ | 11,306 | | | $ | 10,745 | | | $ | 9,313 | | | $ | 3,016 | | | $ | 1,012 | |
| Portfolio turnover rate (%)* | | | 167 | | | | 124 | | | | 138 | | | | 78 | | | | 17 | |
| | | Class I | |
| | | Periods Ended December 31, | |
| | | 2015 | | | 2014 | | | 2013 | | | 2012 | | | 2011(a) | |
| Net asset value, beginning of year | | $ | 16.52 | | | $ | 15.13 | | | $ | 12.99 | | | $ | 9.73 | | | $ | 10.00 | |
| Income (loss) from investment operations: | | | | | | | | | | | | | | | | | | | | |
| Net investment income (loss) | | | 0.05 | | | | 0.02 | | | | 0.05 | | | | 0.08 | | | | 0.01 | |
| Net realized and unrealized gain (loss) on investments | | | (1.05 | ) | | | 2.20 | | | | 2.12 | | | | 3.29 | | | | (0.28 | ) |
| Total from investment operations | | | (1.00 | ) | | | 2.22 | | | | 2.17 | | | | 3.37 | | | | (0.27 | ) |
| Less distributions from: | | | | | | | | | | | | | | | | | | | | |
| Net investment income | | | — | | | | 0.09 | | | | 0.03 | | | | 0.11 | | | | — | |
| Net realized gain | | | 0.62 | | | | 0.74 | | | | 0.00 | ^ | | | — | | | | — | |
| Total distributions | | | 0.62 | | | | 0.83 | | | | 0.03 | | | | 0.11 | | | | — | |
| Net asset value, end of year | | $ | 14.90 | | | $ | 16.52 | | | $ | 15.13 | | | $ | 12.99 | | | $ | 9.73 | |
| Total return (%)* | | | (6.03 | ) | | | 14.73 | | | | 16.70 | | | | 34.62 | | | | (2.70 | ) |
| Ratios to average daily net assets (%):** | | | | | | | | | | | | | | | | | | | | |
| Expenses, net of waivers and reimbursements | | | 1.31 | | | | 1.40 | | | | 1.40 | | | | 1.40 | | | | 1.40 | |
| Expenses, before waivers and reimbursements | | | 1.52 | | | | 1.49 | | | | 1.72 | | | | 4.40 | | | | 9.28 | |
| Net investment income (loss), net of waivers and reimbursements | | | 0.30 | | | | 0.15 | | | | 0.35 | | | | 0.70 | | | | 0.33 | |
| Net investment income (loss), before waivers and reimbursements | | | 0.09 | | | | 0.06 | | | | 0.03 | | | | (2.30 | ) | | | (7.55 | ) |
| Class I net assets at end of year (in thousands) | | $ | 162,375 | | | $ | 119,662 | | | $ | 58,123 | | | $ | 8,763 | | | $ | 2,260 | |
| Portfolio turnover rate (%)* | | | 167 | | | | 124 | | | | 138 | | | | 78 | | | | 17 | |
| (a) | For the period from October 24, 2011 (Commencement of Operations) to December 31, 2011. |
| * | Not annualized for periods that are less than a year. |
| ** | Annualized for periods that are less than a year. |
| ^ | Amount is less than $0.005 per share. |
Note: Net investment income (loss) per share is based on the average shares outstanding during the year.
Performance cited represents past performance. Past performance does not guarantee future results and current performance may be lower or higher than the data quoted. Results shown are annual returns, which assume reinvestment of dividends and capital gains. Investment returns and principal will fluctuate and you may have a gain or loss when you sell shares. For the most current month-end performance information, please call 1-800-742-7272 or visit our Web site at www.williamblairfunds.com.
| 188 | Annual Report | December 31, 2015 |
Financial Highlights
Emerging Markets Small Cap Growth Fund
| | | Institutional Class | |
| | | Periods Ended December 31, | |
| | | 2015 | | | 2014 | | | 2013 | | | 2012(a) | |
| Net asset value, beginning of year | | $ | 16.53 | | | $ | 15.14 | | | $ | 13.00 | | | $ | 12.79 | |
| Income (loss) from investment operations: | | | | | | | | | | | | | | | | |
| Net investment income (loss) | | | 0.06 | | | | 0.06 | | | | 0.07 | | | | 0.00 | ^ |
| Net realized and unrealized gain (loss) on investments | | | (1.05 | ) | | | 2.18 | | | | 2.11 | | | | 0.21 | |
| Total from investment operations | | | (0.99 | ) | | | 2.24 | | | | 2.18 | | | | 0.21 | |
| Less distributions from: | | | | | | | | | | | | | | | | |
| Net investment income | | | 0.00 | ^ | | | 0.11 | | | | 0.04 | | | | — | |
| Net realized gain | | | 0.62 | | | | 0.74 | | | | 0.00 | ^ | | | — | |
| Total distributions | | | 0.62 | | | | 0.85 | | | | 0.04 | | | | — | |
| Net asset value, end of year | | $ | 14.92 | | | $ | 16.53 | | | $ | 15.14 | | | $ | 13.00 | |
| Total return (%)* | | | (5.97 | ) | | | 14.85 | | | | 16.80 | | | | 1.64 | |
| Ratios to average daily net assets (%):** | | | | | | | | | | | | | | | | |
| Expenses, net of waivers and reimbursements | | | 1.25 | | | | 1.25 | | | | 1.25 | | | | 1.25 | |
| Expenses, before waivers and reimbursements | | | 1.31 | | | | 1.34 | | | | 1.56 | | | | 2.32 | |
| Net investment income (loss), net of waivers and reimbursements | | | 0.34 | | | | 0.37 | | | | 0.47 | | | | (0.87 | ) |
| Net investment income (loss), before waivers and reimbursements | | | 0.28 | | | | 0.28 | | | | 0.16 | | | | (1.93 | ) |
| Institutional Class net assets at end of year (in thousands) | | $ | 123,160 | | | $ | 123,496 | | | $ | 91,663 | | | $ | 15,242 | |
| Portfolio turnover rate (%)* | | | 167 | | | | 124 | | | | 138 | | | | 78 | |
| (a) | For the period from December 20, 2012 (Commencement of Operations) to December 31, 2012. |
| * | Not annualized for periods less than a year. |
| ** | Annualized for periods less than a year. |
| ^ | Amount is less than $0.005 per share. |
Note: Net investment income (loss) per share is based on the average shares outstanding during the year.
Performance cited represents past performance. Past performance does not guarantee future results and current performance may be lower or higher than the data quoted. Results shown are annual returns, which assume reinvestment of dividends and capital gains. Investment returns and principal will fluctuate and you may have a gain or loss when you sell shares. For the most current month-end performance information, please call 1-800-742-7272 or visit our Web site at www.williamblairfunds.com.
| December 31, 2015 | William Blair Funds | 189 |
Financial Highlights
Bond Fund
| | | Class N | |
| | | Years Ended December 31, | |
| | | 2015 | | | 2014 | | | 2013 | | | 2012 | | | 2011 | |
| Net asset value, beginning of year | | $ | 10.74 | | | $ | 10.60 | | | $ | 11.28 | | | $ | 10.91 | | | $ | 10.70 | |
| Income (loss) from investment operations: | | | | | | | | | | | | | | | | | | | | |
| Net investment income (loss) | | | 0.27 | | | | 0.31 | | | | 0.32 | | | | 0.36 | | | | 0.43 | |
| Net realized and unrealized gain (loss) on investments | | | (0.29 | ) | | | 0.23 | | | | (0.47 | ) | | | 0.53 | | | | 0.34 | |
| Total from investment operations | | | (0.02 | ) | | | 0.54 | | | | (0.15 | ) | | | 0.89 | | | | 0.77 | |
| Less distributions from: | | | | | | | | | | | | | | | | | | | | |
| Net investment income | | | 0.38 | | | | 0.40 | | | | 0.42 | | | | 0.45 | | | | 0.47 | |
| Net realized gain | | | — | | | | 0.00 | ^ | | | 0.11 | | | | 0.07 | | | | 0.09 | |
| Total distributions | | | 0.38 | | | | 0.40 | | | | 0.53 | | | | 0.52 | | | | 0.56 | |
| Net asset value, end of year | | $ | 10.34 | | | $ | 10.74 | | | $ | 10.60 | | | $ | 11.28 | | | $ | 10.91 | |
| Total return (%) | | | (0.23 | ) | | | 5.10 | | | | (1.37 | ) | | | 8.33 | | | | 7.41 | |
| Ratios to average daily net assets (%): | | | | | | | | | | | | | | | | | | | | |
| Expenses, net of waivers and reimbursements | | | 0.61 | | | | 0.65 | | | | 0.65 | | | | 0.65 | | | | 0.65 | |
| Expenses, before waivers and reimbursements | | | 0.79 | | | | 0.85 | | | | 0.82 | | | | 0.81 | | | | 0.76 | |
| Net investment income (loss), net of waivers and reimbursements | | | 2.60 | | | | 2.90 | | | | 2.89 | | | | 3.25 | | | | 3.97 | |
| Net investment income (loss), before waivers and reimbursements | | | 2.42 | | | | 2.70 | | | | 2.72 | | | | 3.09 | | | | 3.86 | |
| Class N net assets at end of year (in thousands) | | $ | 139,303 | | | $ | 16,720 | | | $ | 11,389 | | | $ | 32,867 | | | $ | 8,345 | |
| Portfolio turnover rate (%) | | | 32 | | | | 35 | | | | 41 | | | | 25 | | | | 28 | |
| | | Class I | |
| | | Years Ended December 31, | |
| | | 2015 | | | 2014 | | | 2013 | | | 2012 | | | 2011 | |
| Net asset value, beginning of year | | $ | 10.64 | | | $ | 10.49 | | | $ | 11.17 | | | $ | 10.80 | | | $ | 10.59 | |
| Income (loss) from investment operations: | | | | | | | | | | | | | | | | | | | | |
| Net investment income (loss) | | | 0.31 | | | | 0.33 | | | | 0.33 | | | | 0.38 | | | | 0.45 | |
| Net realized and unrealized gain (loss) on investments | | | (0.31 | ) | | | 0.23 | | | | (0.48 | ) | | | 0.52 | | | | 0.33 | |
| Total from investment operations | | | — | | | | 0.56 | | | | (0.15 | ) | | | 0.90 | | | | 0.78 | |
| Less distributions from: | | | | | | | | | | | | | | | | | | | | |
| Net investment income | | | 0.40 | | | | 0.41 | | | | 0.42 | | | | 0.46 | | | | 0.48 | |
| Net realized gain | | | — | | | | 0.00 | ^ | | | 0.11 | | | | 0.07 | | | | 0.09 | |
| Total distributions | | | 0.40 | | | | 0.41 | | | | 0.53 | | | | 0.53 | | | | 0.57 | |
| Net asset value, end of year | | $ | 10.24 | | | $ | 10.64 | | | $ | 10.49 | | | $ | 11.17 | | | $ | 10.80 | |
| Total return (%) | | | (0.05 | ) | | | 5.37 | | | | (1.28 | ) | | | 8.54 | | | | 7.62 | |
| Ratios to average daily net assets (%): | | | | | | | | | | | | | | | | | | | | |
| Expenses, net of waivers and reimbursements | | | 0.41 | | | | 0.50 | | | | 0.50 | | | | 0.50 | | | | 0.50 | |
| Expenses, before waivers and reimbursements | | | 0.59 | | | | 0.60 | | | | 0.58 | | | | 0.56 | | | | 0.55 | |
| Net investment income (loss), net of waivers and reimbursements | | | 2.93 | | | | 3.07 | | | | 3.05 | | | | 3.45 | | | | 4.17 | |
| Net investment income (loss), before waivers and reimbursements | | | 2.75 | | | | 2.97 | | | | 2.97 | | | | 3.39 | | | | 4.12 | |
| Class I net assets at end of year (in thousands) | | $ | 237,587 | | | $ | 149,466 | | | $ | 145,939 | | | $ | 172,836 | | | $ | 154,224 | |
| Portfolio turnover rate (%) | | | 32 | | | | 35 | | | | 41 | | | | 25 | | | | 28 | |
| ^ | Amount is less than $0.005 per share. |
Note: Net investment income (loss) per share is based on the average shares outstanding during the year.
Performance cited represents past performance. Past performance does not guarantee future results and current performance may be lower or higher than the data quoted. Results shown are annual returns, which assume reinvestment of dividends and capital gains. Investment returns and principal will fluctuate and you may have a gain or loss when you sell shares. For the most current month-end performance information, please call 1-800-742-7272 or visit our Web site at www.williamblairfunds.com.
| 190 | Annual Report | December 31, 2015 |
Financial Highlights
Bond Fund
| | | Institutional Class | |
| | | Years Ended December 31, | |
| | | 2015 | | | 2014 | | | 2013 | | | 2012 | | | 2011 | |
| Net asset value, beginning of year | | $ | 10.63 | | | $ | 10.48 | | | $ | 11.16 | | | $ | 10.80 | | | $ | 10.58 | |
| Income (loss) from investment operations: | | | | | | | | | | | | | | | | | | | | |
| Net investment income (loss) | | | 0.32 | | | | 0.34 | | | | 0.35 | | | | 0.40 | | | | 0.45 | |
| Net realized and unrealized gain (loss) on investments | | | (0.31 | ) | | | 0.23 | | | | (0.48 | ) | | | 0.51 | | | | 0.36 | |
| Total from investment operations | | | 0.01 | | | | 0.57 | | | | (0.13 | ) | | | 0.91 | | | | 0.81 | |
| Less distributions from: | | | | | | | | | | | | | | | | | | | | |
| Net investment income | | | 0.41 | | | | 0.42 | | | | 0.44 | | | | 0.48 | | | | 0.50 | |
| Net realized gain | | | — | | | | 0.00 | ^ | | | 0.11 | | | | 0.07 | | | | 0.09 | |
| Total distributions | | | 0.41 | | | | 0.42 | | | | 0.55 | | | | 0.55 | | | | 0.59 | |
| Net asset value, end of year | | $ | 10.23 | | | $ | 10.63 | | | $ | 10.48 | | | $ | 11.16 | | | $ | 10.80 | |
| Total return (%) | | | 0.01 | | | | 5.53 | | | | (1.13 | ) | | | 8.61 | | | | 7.88 | |
| Ratios to average daily net assets (%): | | | | | | | | | | | | | | | | | | | | |
| Expenses, net of waivers and reimbursements | | | 0.35 | | | | 0.35 | | | | 0.35 | | | | 0.35 | | | | 0.35 | |
| Expenses, before waivers and reimbursements | | | 0.38 | | | | 0.41 | | | | 0.39 | | | | 0.38 | | | | 0.39 | |
| Net investment income (loss), net of waivers and reimbursements | | | 3.01 | | | | 3.23 | | | | 3.19 | | | | 3.60 | | | | 4.24 | |
| Net investment income (loss), before waivers and reimbursements | | | 2.98 | | | | 3.17 | | | | 3.15 | | | | 3.57 | | | | 4.20 | |
| Institutional Class net assets at end of year (in thousands) | | $ | 103,904 | | | $ | 97,341 | | | $ | 87,527 | | | $ | 91,039 | | | $ | 69,447 | |
| Portfolio turnover rate (%) | | | 32 | | | | 35 | | | | 41 | | | | 25 | | | | 28 | |
| ^ | Amount is less than $0.005 per share. |
Note: Net investment income (loss) per share is based on the average shares outstanding during the year.
Performance cited represents past performance. Past performance does not guarantee future results and current performance may be lower or higher than the data quoted. Results shown are annual returns, which assume reinvestment of dividends and capital gains. Investment returns and principal will fluctuate and you may have a gain or loss when you sell shares. For the most current month-end performance information, please call 1-800-742-7272 or visit our Web site at www.williamblairfunds.com.
| December 31, 2015 | William Blair Funds | 191 |
Financial Highlights
Income Fund
| | | Class N | |
| | | Years Ended December 31, | |
| | | 2015 | | | 2014 | | | 2013 | | | 2012 | | | 2011 | |
| Net asset value, beginning of year | | $ | 9.12 | | | $ | 9.11 | | | $ | 9.55 | | | $ | 9.32 | | | $ | 9.22 | |
| Income (loss) from investment operations: | | | | | | | | | | | | | | | | | | | | |
| Net investment income (loss) | | | 0.15 | | | | 0.18 | | | | 0.20 | | | | 0.24 | | | | 0.32 | |
| Net realized and unrealized gain (loss) on investments | | | (0.11 | ) | | | 0.10 | | | | (0.35 | ) | | | 0.31 | | | | 0.15 | |
| Total from investment operations | | | 0.04 | | | | 0.28 | | | | (0.15 | ) | | | 0.55 | | | | 0.47 | |
| Less distributions from: | | | | | | | | | | | | | | | | | | | | |
| Net investment income | | | 0.26 | | | | 0.27 | | | | 0.29 | | | | 0.32 | | | | 0.37 | |
| Net realized gain | | | — | | | | — | | | | — | | | | — | | | | — | |
| Total distributions | | | 0.26 | | | | 0.27 | | | | 0.29 | | | | 0.32 | | | | 0.37 | |
| Net asset value, end of year | | $ | 8.90 | | | $ | 9.12 | | | $ | 9.11 | | | $ | 9.55 | | | $ | 9.32 | |
| Total return (%) | | | 0.39 | | | | 3.06 | | | | (1.61 | ) | | | 6.00 | | | | 5.21 | |
| Ratios to average daily net assets (%): | | | | | | | | | | | | | | | | | | | | |
| Expenses, net of waivers and reimbursements | | | 0.81 | | | | 0.84 | | | | 0.85 | | | | 0.83 | | | | 0.85 | |
| Expenses, before waivers and reimbursements | | | 0.81 | | | | 0.84 | | | | 1.03 | | | | 0.83 | | | | 0.91 | |
| Net investment income (loss), net of waivers and reimbursements | | | 1.71 | | | | 1.99 | | | | 2.13 | | | | 2.49 | | | | 3.40 | |
| Net investment income (loss), before waivers and reimbursements | | | 1.71 | | | | 1.99 | | | | 1.95 | | | | 2.49 | | | | 3.34 | |
| Class N net assets at end of year (in thousands) | | $ | 32,942 | | | $ | 34,020 | | | $ | 41,662 | | | $ | 68,947 | | | $ | 44,802 | |
| Portfolio turnover rate (%) | | | 21 | | | | 30 | | | | 41 | | | | 33 | | | | 39 | |
| | | Class I | |
| | | Years Ended December 31, | |
| | | 2015 | | | 2014 | | | 2013 | | | 2012 | | | 2011 | |
| Net asset value, beginning of year | | $ | 9.05 | | | $ | 9.05 | | | $ | 9.48 | | | $ | 9.25 | | | $ | 9.15 | |
| Income (loss) from investment operations: | | | | | | | | | | | | | | | | | | | | |
| Net investment income (loss) | | | 0.18 | | | | 0.20 | | | | 0.21 | | | | 0.26 | | | | 0.34 | |
| Net realized and unrealized gain (loss) on investments | | | (0.12 | ) | | | 0.09 | | | | (0.34 | ) | | | 0.31 | | | | 0.15 | |
| Total from investment operations | | | 0.06 | | | | 0.29 | | | | (0.13 | ) | | | 0.57 | | | | 0.49 | |
| Less distributions from: | | | | | | | | | | | | | | | | | | | | |
| Net investment income | | | 0.28 | | | | 0.29 | | | | 0.30 | | | | 0.34 | | | | 0.39 | |
| Net realized gain | | | — | | | | — | | | | — | | | | — | | | | — | |
| Total distributions | | | 0.28 | | | | 0.29 | | | | 0.30 | | | | 0.34 | | | | 0.39 | |
| Net asset value, end of year | | $ | 8.83 | | | $ | 9.05 | | | $ | 9.05 | | | $ | 9.48 | | | $ | 9.25 | |
| Total return (%) | | | 0.63 | | | | 3.20 | | | | (1.41 | ) | | | 6.28 | | | | 5.46 | |
| Ratios to average daily net assets (%): | | | | | | | | | | | | | | | | | | | | |
| Expenses, net of waivers and reimbursements | | | 0.55 | | | | 0.59 | | | | 0.70 | | | | 0.58 | | | | 0.64 | |
| Expenses, before waivers and reimbursements | | | 0.55 | | | | 0.59 | | | | 0.77 | | | | 0.58 | | | | 0.64 | |
| Net investment income (loss), net of waivers and reimbursements | | | 1.97 | | | | 2.24 | | | | 2.30 | | | | 2.78 | | | | 3.66 | |
| Net investment income (loss), before waivers and reimbursements | | | 1.97 | | | | 2.24 | | | | 2.23 | | | | 2.78 | | | | 3.66 | |
| Class I net assets at end of year (in thousands) | | $ | 62,722 | | | $ | 64,834 | | | $ | 64,152 | | | $ | 72,830 | | | $ | 67,183 | |
| Portfolio turnover rate (%) | | | 21 | | | | 30 | | | | 41 | | | | 33 | | | | 39 | |
Note: Net investment income (loss) per share is based on the average shares outstanding during the year.
Performance cited represents past performance. Past performance does not guarantee future results and current performance may be lower or higher than the data quoted. Results shown are annual returns, which assume reinvestment of dividends and capital gains. Investment returns and principal will fluctuate and you may have a gain or loss when you sell shares. For the most current month-end performance information, please call 1-800-742-7272 or visit our Web site at www.williamblairfunds.com.
| 192 | Annual Report | December 31, 2015 |
Financial Highlights
Low Duration Fund
| | | Class N | |
| | | Years Ended December 31, | |
| | | 2015 | | | 2014 | | | 2013 | | | 2012 | | | 2011 | |
| Net asset value, beginning of year | | $ | 9.38 | | | $ | 9.52 | | | $ | 9.83 | | | $ | 9.82 | | | $ | 9.90 | |
| Income (loss) from investment operations: | | | | | | | | | | | | | | | | | | | | |
| Net investment income (loss) | | | 0.07 | | | | 0.11 | | | | 0.10 | | | | 0.13 | | | | 0.15 | |
| Net realized and unrealized gain (loss) on investments | | | (0.07 | ) | | | (0.00 | )^ | | | (0.16 | ) | | | 0.14 | | | | 0.02 | |
| Total from investment operations | | | — | | | | 0.11 | | | | (0.06 | ) | | | 0.27 | | | | 0.17 | |
| Less distributions from: | | | | | | | | | | | | | | | | | | | | |
| Net investment income | | | 0.22 | | | | 0.25 | | | | 0.25 | | | | 0.26 | | | | 0.25 | |
| Net realized gain | | | — | | | | — | | | | — | | | | — | | | | — | |
| Total distributions | | | 0.22 | | | | 0.25 | | | | 0.25 | | | | 0.26 | | | | 0.25 | |
| Net asset value, end of year | | $ | 9.16 | | | $ | 9.38 | | | $ | 9.52 | | | $ | 9.83 | | | $ | 9.82 | |
| Total return (%) | | | 0.01 | | | | 1.20 | | | | (0.62 | ) | | | 2.80 | | | | 1.73 | |
| Ratios to average daily net assets (%): | | | | | | | | | | | | | | | | | | | | |
| Expenses, net of waivers and reimbursements | | | 0.60 | | | | 0.70 | | | | 0.70 | | | | 0.70 | | | | 0.70 | |
| Expenses, before waivers and reimbursements | | | 0.77 | | | | 0.75 | | | | 0.71 | | | | 0.74 | | | | 0.73 | |
| Net investment income (loss), net of waivers and reimbursements | | | 0.71 | | | | 1.19 | | | | 1.06 | | | | 1.37 | | | | 1.52 | |
| Net investment income (loss), before waivers and reimbursements | | | 0.54 | | | | 1.14 | | | | 1.05 | | | | 1.33 | | | | 1.49 | |
| Class N net assets at end of year (in thousands) | | $ | 2,712 | | | $ | 4,969 | | | $ | 5,158 | | | $ | 11,216 | | | $ | 6,260 | |
| Portfolio turnover rate (%) | | | 106 | | | | 83 | | | | 56 | | | | 20 | | | | 43 | |
| | | Class I | |
| | | Years Ended December 31, | |
| | | 2015 | | | 2014 | | | 2013 | | | 2012 | | | 2011 | |
| Net asset value, beginning of year | | $ | 9.37 | | | $ | 9.52 | | | $ | 9.83 | | | $ | 9.82 | | | $ | 9.89 | |
| Income (loss) from investment operations: | | | | | | | | | | | | | | | | | | | | |
| Net investment income (loss) | | | 0.08 | | | | 0.13 | | | | 0.12 | | | | 0.15 | | | | 0.17 | |
| Net realized and unrealized gain (loss) on investments | | | (0.05 | ) | | | (0.01 | ) | | | (0.17 | ) | | | 0.14 | | | | 0.02 | |
| Total from investment operations | | | 0.03 | | | | 0.12 | | | | (0.05 | ) | | | 0.29 | | | | 0.19 | |
| Less distributions from: | | | | | | | | | | | | | | | | | | | | |
| Net investment income | | | 0.24 | | | | 0.27 | | | | 0.26 | | | | 0.28 | | | | 0.26 | |
| Net realized gain | | | — | | | | — | | | | — | | | | — | | | | — | |
| Total distributions | | | 0.24 | | | | 0.27 | | | | 0.26 | | | | 0.28 | | | | 0.26 | |
| Net asset value, end of year | | $ | 9.16 | | | $ | 9.37 | | | $ | 9.52 | | | $ | 9.83 | | | $ | 9.82 | |
| Total return (%) | | | 0.30 | | | | 1.24 | | | | (0.47 | ) | | | 2.96 | | | | 1.99 | |
| Ratios to average daily net assets (%): | | | | | | | | | | | | | | | | | | | | |
| Expenses, net of waivers and reimbursements | | | 0.42 | | | | 0.55 | | | | 0.55 | | | | 0.55 | | | | 0.55 | |
| Expenses, before waivers and reimbursements | | | 0.59 | | | | 0.60 | | | | 0.56 | | | | 0.57 | | | | 0.58 | |
| Net investment income (loss), net of waivers and reimbursements | | | 0.87 | | | | 1.35 | | | | 1.24 | | | | 1.52 | | | | 1.67 | |
| Net investment income (loss), before waivers and reimbursements | | | 0.70 | | | | 1.30 | | | | 1.23 | | | | 1.50 | | | | 1.64 | |
| Class I net assets at end of year (in thousands) | | $ | 107,137 | | | $ | 104,433 | | | $ | 122,583 | | | $ | 157,213 | | | $ | 82,828 | |
| Portfolio turnover rate (%) | | | 106 | | | | 83 | | | | 56 | | | | 20 | | | | 43 | |
| ^ | Amount is less than $0.005 per share. |
Note: Net investment income (loss) per share is based on the average shares outstanding during the year.
Performance cited represents past performance. Past performance does not guarantee future results and current performance may be lower or higher than the data quoted. Results shown are annual returns, which assume reinvestment of dividends and capital gains. Investment returns and principal will fluctuate and you may have a gain or loss when you sell shares. For the most current month-end performance information, please call 1-800-742-7272 or visit our Web site at www.williamblairfunds.com.
| December 31, 2015 | William Blair Funds | 193 |
Financial Highlights
Low Duration Fund
| | | Institutional Class | |
| | | Years Ended December 31, | |
| | | 2015 | | | 2014 | | | 2013 | | | 2012 | | | 2011 | |
| Net asset value, beginning of year | | $ | 9.38 | | | $ | 9.53 | | | $ | 9.83 | | | $ | 9.83 | | | $ | 9.90 | |
| Income (loss) from investment operations: | | | | | | | | | | | | | | | | | | | | |
| Net investment income (loss) | | | 0.09 | | | | 0.14 | | | | 0.13 | | | | 0.17 | | | | 0.18 | |
| Net realized and unrealized gain (loss) on investments | | | (0.07 | ) | | | (0.01 | ) | | | (0.15 | ) | | | 0.12 | | | | 0.03 | |
| Total from investment operations | | | 0.02 | | | | 0.13 | | | | (0.02 | ) | | | 0.29 | | | | 0.21 | |
| Less distributions from: | | | | | | | | | | | | | | | | | | | | |
| Net investment income | | | 0.24 | | | | 0.28 | | | | 0.28 | | | | 0.29 | | | | 0.28 | |
| Net realized gain | | | — | | | | — | | | | — | | | | — | | | | — | |
| Total distributions | | | 0.24 | | | | 0.28 | | | | 0.28 | | | | 0.29 | | | | 0.28 | |
| Net asset value, end of year | | $ | 9.16 | | | $ | 9.38 | | | $ | 9.53 | | | $ | 9.83 | | | $ | 9.83 | |
| Total return (%) | | | 0.22 | | | | 1.40 | | | | (0.20 | ) | | | 3.01 | | | | 2.14 | |
| Ratios to average daily net assets (%): | | | | | | | | | | | | | | | | | | | | |
| Expenses, net of waivers and reimbursements | | | 0.40 | | | | 0.40 | | | | 0.39 | | | | 0.40 | | | | 0.40 | |
| Expenses, before waivers and reimbursements | | | 0.42 | | | | 0.43 | | | | 0.39 | | | | 0.41 | | | | 0.42 | |
| Net investment income (loss), net of waivers and reimbursements | | | 0.94 | | | | 1.45 | | | | 1.37 | | | | 1.68 | | | | 1.81 | |
| Net investment income (loss), before waivers and reimbursements | | | 0.92 | | | | 1.42 | | | | 1.37 | | | | 1.67 | | | | 1.79 | |
| Institutional Class net assets at end of year (in thousands) | | $ | 21,863 | | | $ | 68,095 | | | $ | 46,485 | | | $ | 118,401 | | | $ | 68,059 | |
| Portfolio turnover rate (%) | | | 106 | | | | 83 | | | | 56 | | | | 20 | | | | 43 | |
Note: Net investment income (loss) per share is based on the average shares outstanding during the year.
Performance cited represents past performance. Past performance does not guarantee future results and current performance may be lower or higher than the data quoted. Results shown are annual returns, which assume reinvestment of dividends and capital gains. Investment returns and principal will fluctuate and you may have a gain or loss when you sell shares. For the most current month-end performance information, please call 1-800-742-7272 or visit our Web site at www.williamblairfunds.com.
| 194 | Annual Report | December 31, 2015 |
Financial Highlights
Macro Allocation Fund
| | | Class N | |
| | | Periods Ended December 31, | | | Periods Ended October 31, | |
| | | 2015 | | | 2014(b) | | | 2014 | | | 2013 | | | 2012(a) | |
| Net asset value, beginning of year | | $ | 12.14 | | | $ | 13.07 | | | $ | 12.61 | | | $ | 11.28 | | | $ | 10.00 | |
| Income (loss) from investment operations: | | | | | | | | | | | | | | | | | | | | |
| Net investment income (loss) | | | 0.04 | | | | 0.04 | | | | 0.02 | | | | 0.05 | | | | 0.11 | |
| Net realized and unrealized gain (loss) on investments | | | (0.80 | ) | | | (0.31 | ) | | | 0.76 | | | | 1.59 | | | | 1.24 | |
| Total from investment operations | | | (0.76 | ) | | | (0.27 | ) | | | 0.78 | | | | 1.64 | | | | 1.35 | |
| Less distributions from: | | | | | | | | | | | | | | | | | | | | |
| Net investment income | | | 0.06 | | | | 0.66 | | | | 0.09 | | | | 0.11 | | | | 0.07 | |
| Net realized gain | | | — | | | | — | | | | 0.23 | | | | 0.20 | | | | — | |
| Total distributions | | | 0.06 | | | | 0.66 | | | | 0.32 | | | | 0.31 | | | | 0.07 | |
| Net asset value, end of year | | $ | 11.32 | | | $ | 12.14 | | | $ | 13.07 | | | $ | 12.61 | | | $ | 11.28 | |
| Total return (%)* | | | (6.24 | ) | | | (2.00 | ) | | | 6.34 | | | | 14.87 | | | | 13.61 | |
| Ratios to average daily net assets (%)**: | | | | | | | | | | | | | | | | | | | | |
| Expenses (excluding short dividend expense), net of waivers and reimbursements | | | 1.27 | | | | 1.35 | | | | 1.35 | | | | 1.35 | | | | 1.35 | |
| Expenses, net of waivers and reimbursements | | | 1.27 | | | | 1.38 | | | | 1.47 | | | | 1.49 | | | | 1.41 | |
| Expenses, before waivers and reimbursements | | | 1.42 | | | | 1.46 | | | | 1.60 | | | | 1.78 | | | | 2.95 | |
| Net investment income (loss), net of waivers and reimbursements | | | 0.32 | | | | 2.06 | | | | 0.20 | | | | 0.37 | | | | 1.18 | |
| Net investment income (loss), before waivers and reimbursements | | | 0.17 | | | | 1.98 | | | | 0.07 | | | | 0.08 | | | | (0.36 | ) |
| Class N net assets at end of year (in thousands) | | $ | 150,606 | | | $ | 150,778 | | | $ | 150,785 | | | $ | 97,498 | | | $ | 10,045 | |
| Portfolio turnover rate (%)* | | | 34 | | | | 17 | | | | 59 | | | | 10 | | | | 40 | |
| | | Class I | |
| | | Periods Ended December 31, | | | Periods Ended October 31, | |
| | | 2015 | | | 2014(b) | | | 2014 | | | 2013 | | | 2012(a) | |
| Net asset value, beginning of year | | $ | 12.22 | | | $ | 13.15 | | | $ | 12.66 | | | $ | 11.31 | | | $ | 10.00 | |
| Income (loss) from investment operations: | | | | | | | | | | | | | | | | | | | | |
| Net investment income (loss) | | | 0.09 | | | | 0.05 | | | | 0.04 | | | | 0.07 | | | | 0.16 | |
| Net realized and unrealized gain (loss) on investments | | | (0.82 | ) | | | (0.31 | ) | | | 0.78 | | | | 1.60 | | | | 1.22 | |
| Total from investment operations | | | (0.73 | ) | | | (0.26 | ) | | | 0.82 | | | | 1.67 | | | | 1.38 | |
| Less distributions from: | | | | | | | | | | | | | | | | | | | | |
| Net investment income | | | 0.11 | | | | 0.67 | | | | 0.10 | | | | 0.12 | | | | 0.07 | |
| Net realized gain | | | — | | | | — | | | | 0.23 | | | | 0.20 | | | | — | |
| Total distributions | | | 0.11 | | | | 0.67 | | | | 0.33 | | | | 0.32 | | | | 0.07 | |
| Net asset value, end of year | | $ | 11.38 | | | $ | 12.22 | | | $ | 13.15 | | | $ | 12.66 | | | $ | 11.31 | |
| Total return (%)* | | | (6.00 | ) | | | (1.94 | ) | | | 6.60 | | | | 15.06 | | | | 13.91 | |
| Ratios to average daily net assets (%)**: | | | | | | | | | | | | | | | | | | | | |
| Expenses (excluding short dividend expense), net of waivers and reimbursements | | | 0.98 | | | | 1.07 | | | | 1.10 | | | | 1.10 | | | | 1.10 | |
| Expenses, net of waivers and reimbursements | | | 0.99 | | | | 1.10 | | | | 1.22 | | | | 1.24 | | | | 1.18 | |
| Expenses, before waivers and reimbursements | | | 1.14 | | | | 1.10 | | | | 1.27 | | | | 1.41 | | | | 2.94 | |
| Net investment income (loss), net of waivers and reimbursements | | | 0.73 | | | | 2.33 | | | | 0.32 | | | | 0.62 | | | | 1.67 | |
| Net investment income (loss), before waivers and reimbursements | | | 0.58 | | | | 2.33 | | | | 0.27 | | | | 0.45 | | | | (0.09 | ) |
| Class I net assets at end of year (in thousands) | | $ | 1,155,051 | | | $ | 649,756 | | | $ | 617,531 | | | $ | 224,860 | | | $ | 23,095 | |
| Portfolio turnover rate (%)* | | | 34 | | | | 17 | | | | 59 | | | | 10 | | | | 40 | |
| (a) | For the period from November 29, 2011 (Commencement of Operations) to October 31, 2012. |
| (b) | For the period from November 1, 2014 to December 31, 2014. |
| * | Not annualized for periods less than a year. |
| ** | Annualized for periods less than a year. |
Note: Net investment income (loss) per share is based on the average shares outstanding during the year.
Performance cited represents past performance. Past performance does not guarantee future results and current performance may be lower or higher than the data quoted. Results shown are annual returns, which assume reinvestment of dividends and capital gains. Investment returns and principal will fluctuate and you may have a gain or loss when you sell shares. For the most current month-end performance information, please call 1-800-742-7272 or visit our Web site at www.williamblairfunds.com.
| December 31, 2015 | William Blair Funds | 195 |
Financial Highlights
Macro Allocation Fund
| | | Institutional Class | |
| | | | | | | | | Periods Ended | |
| | | Periods Ended December 31, | | | October 31, | |
| | | 2015 | | | 2014(b) | | | 2014 | | | 2013(a) | |
| Net asset value, beginning of year | | $ | 12.23 | | | $ | 13.16 | | | $ | 12.66 | | | $ | 12.63 | |
| Income (loss) from investment operations: | | | | | | | | | | | | | | | | |
| Net investment income (loss) | | | 0.12 | | | | 0.05 | | | | 0.04 | | | | 0.00 | ^ |
| Net realized and unrealized gain (loss) on investments | | | (0.84 | ) | | | (0.31 | ) | | | 0.79 | | | | 0.03 | |
| Total from investment operations | | | (0.72 | ) | | | (0.26 | ) | | | 0.83 | | | | 0.03 | |
| Less distributions from: | | | | | | | | | | | | | | | | |
| Net investment income | | | 0.12 | | | | 0.67 | | | | 0.10 | | | | — | |
| Net realized gain | | | — | | | | — | | | | 0.23 | | | | — | |
| Total distributions. | | | 0.12 | | | | 0.67 | | | | 0.33 | | | | — | |
| Net asset value, end of year | | $ | 11.39 | | | $ | 12.23 | | | $ | 13.16 | | | $ | 12.66 | |
| Total return (%)* | | | (5.92 | ) | | | (1.91 | ) | | | 6.71 | | | | 0.24 | |
| Ratios to average daily net assets (%)**: | | | | | | | | | | | | | | | | |
| Expenses (excluding short dividend expense), net of waivers and reimbursements | | | 0.90 | | | | 0.88 | | | | 0.93 | | | | 0.95 | |
| Expenses, net of waivers and reimbursements | | | 0.90 | | | | 0.91 | | | | 1.05 | | | | 1.00 | |
| Expenses, before waivers and reimbursements | | | 0.90 | | | | 0.91 | | | | 1.05 | | | | 1.11 | |
| Net investment income (loss), net of waivers and reimbursements | | | 0.95 | | | | 2.54 | | | | 0.32 | | | | (0.99 | ) |
| Net investment income (loss), before waivers and reimbursements | | | 0.95 | | | | 2.54 | | | | 0.32 | | | | (1.10 | ) |
| Institutional Class net assets at end of year (in thousands) | | $ | 426,230 | | | $ | 158,152 | | | $ | 150,447 | | | $ | 5,014 | |
| Portfolio turnover rate (%)* | | | 34 | | | | 17 | | | | 59 | | | | 10 | |
| (a) | For the period from October 21, 2013 (Commencement of Share Class) to October 31, 2013. |
| (b) | For the period from November 1, 2014 to December 31, 2014. |
| * | Not annualized for periods less than a year. |
| ** | Annualized for periods less than a year. |
| ^ | Amount is less than $0.005 per share. |
Note: Net investment income (loss) per share is based on the average shares outstanding during the year.
Performance cited represents past performance. Past performance does not guarantee future results and current performance may be lower or higher than the data quoted. Results shown are annual returns, which assume reinvestment of dividends and capital gains. Investment returns and principal will fluctuate and you may have a gain or loss when you sell shares. For the most current month-end performance information, please call 1-800-742-7272 or visit our Web site at www.williamblairfunds.com.
| 196 | Annual Report | December 31, 2015 |
REPORT OF INDEPENDENT REGISTERED PUBLIC ACCOUNTING FIRM
To the Board of Trustees and Shareholders of William Blair Funds
We have audited the accompanying statements of assets and liabilities, including the portfolios of investments, of the William Blair Funds (comprising, respectively, the Growth Fund, Large Cap Growth Fund, Large Cap Value Fund, Mid Cap Growth Fund, Mid Cap Value Fund, Small-Mid Cap Growth Fund, Small-Mid Cap Value Fund, Small Cap Growth Fund, Small Cap Value Fund, Global Leaders Fund, Global Small Cap Growth Fund (in liquidation), International Leaders Fund, International Equity Fund, Institutional International Equity Fund, International Growth Fund, Institutional International Growth Fund, International Small Cap Growth Fund, Emerging Markets Leaders Fund, Emerging Markets Growth Fund, Emerging Markets Small Cap Growth Fund, Bond Fund, Income Fund, Low Duration Fund, and Macro Allocation Fund (collectively, the “Funds”)) as of December 31, 2015, and the related statements of operations, statements of changes in net assets, and the financial highlights for the periods indicated therein. These financial statements and financial highlights are the responsibility of the Funds’ management. Our responsibility is to express an opinion on these financial statements and financial highlights based on our audits.
We conducted our audits in accordance with the standards of the Public Company Accounting Oversight Board (United States). Those standards require that we plan and perform the audits to obtain reasonable assurance about whether the financial statements and financial highlights are free of material misstatement. We were not engaged to perform an audit of the Funds’ internal control over financial reporting. Our audits included consideration of internal control over financial reporting as a basis for designing audit procedures that are appropriate in the circumstances, but not for the purpose of expressing an opinion on the effectiveness of the Funds’ internal control over financial reporting. Accordingly, we express no such opinion. An audit also includes examining, on a test basis, evidence supporting the amounts and disclosures in the financial statements and financial highlights, assessing the accounting principles used and significant estimates made by management, and evaluating the overall financial statement presentation. Our procedures included confirmation of securities owned as of December 31, 2015, by correspondence with the custodian and brokers or by other appropriate auditing procedures where replies from brokers were not received. We believe that our audits provide a reasonable basis for our opinion.
In our opinion, the financial statements and financial highlights referred to above present fairly, in all material respects, the financial position of each of the respective funds constituting the William Blair Funds at December 31, 2015, the results of their operations, the changes in their net assets, and the financial highlights for the periods indicated therein in conformity with U.S. generally accepted accounting principles.

Chicago, Illinois
February 25, 2016
| December 31, 2015 | William Blair Funds | 197 |
Trustees and Officers (Unaudited).† The trustees and officers of the William Blair Funds, their year of birth, their principal occupations during the last five years, their affiliations, if any, with William Blair, and other significant affiliations are set forth below. The address of each officer and trustee is 222 West Adams Street, Chicago, Illinois 60606.
| | | | | | | | | Number of | | |
| | | | | Term of | | | | Portfolios | | |
| | | | | Office and | | | | in Trust | | |
| | | Position(s) | | Length of | | Principal | | Complex | | |
| | | Held with | | Time | | Occupation(s) | | Overseen | | Other Directorships |
| Name and Year of Birth | | Trust | | Served | | During Past 5 Years | | by Trustee | | Held by Trustee |
| | | | | | | | | | | |
| Interested Trustees | | | | | | | | | | |
Michelle R. Seitz,
1965* | | Chairman of the Board of Trustees and President | | Trustee since 2002; Chairman since 2010 and President since 2007 | | Partner, William Blair: Limited Partner, WBC Holdings, L.P. (since 2008); Member, WBC GP L.L.P. (since November 2008); Director, William Blair International, Ltd. (U.K.) (since 2012) | | 25 | | Chairman, William Blair SICAV; Director, William Blair MAS Ltd.; Financial Accounting Foundation (FAF) |
Richard W. Smirl,
1967* | | Trustee and Senior Vice President | | Trustee since 2010 and Senior Vice President since 2008 | | Partner, William Blair; Limited Partner, WBC Holdings, L.P. (since 2008); Director, William Blair International, Ltd. (U.K.) (since 2012) | | 25 | | Director, William Blair SICAV; Director, William Blair MAS Ltd. |
| Non-Interested Trustees | | | | | | | | |
Vann A. Avedisian,
19642 | | Trustee | | Since 2012 | | Principal, Highgate Holdings (hotel investments) since 2009; formerly co-founder and Managing Director, Oxford Capital Partners Inc., 1994 to 2006 | | 25 | | Potbelly Corporation |
Kathleen T. Barr,
1955 | | Trustee | | Since 2013 | | Retired; formerly, President, Productive Capital Management, Inc. (registered investment adviser to public entities) and Owner, KT Barr Consulting, LLC (mutual fund and investment management consulting) 2010 to 2013; prior thereto, Chief Administrative Officer, Senior Vice President and Senior Managing Director of Allegiant Asset Management Company (merged with PNC Capital Advisors, LLC in 2009) from 2004 to 2010; Chief Administrative Officer, Chief Compliance Officer and Senior Vice President of PNC Funds and PNC Advantage Funds (f/k/a Allegiant Funds) from 2003 to 2010 | | 25 | | AmericaFirst Quantitative Funds (5 portfolios) |
| † | William Blair Investment Management, LLC and William Blair & Company, L.L.C. are collectively referred to in this section as “William Blair”, each of which is a wholly owned subsidiary of WBC Holdings, L.P., which is wholly owned by certain William Blair employees (employee owners are referred to as ‘partners’). |
| * | Ms. Seitz and Mr. Smirl are interested persons of the Trust because of their positions at William Blair. |
See accompanying Notes to Financial Statements.
| 198 | Annual Report | December 31, 2015 |
| | | | | | | | | Number of | | |
| | | | | Term of | | | | Portfolios | | |
| | | | | Office and | | | | in Trust | | |
| | | Position(s) | | Length of | | Principal | | Complex | | |
| | | Held with | | Time | | Occupation(s) | | Overseen | | Other Directorships |
| Name and Year of Birth | | Trust | | Served1 | | During Past 5 Years | | by Trustee | | Held by Trustee |
Phillip O. Peterson,
1944 | | Trustee | | Since 2007 | | Retired; formerly, President, Strong Mutual Funds, 2004 to 2005; formerly, Partner, KPMG LLP | | 25 | | The Hartford Group of Mutual Funds (66 portfolios); Symetra Mutual Funds Trust (variable annuity funds) (2012 to 2014) |
Donald J. Reaves,
19463 | | Trustee | | Since 2004 | | Retired; formerly, Chancellor of Winston-Salem State University, 2007 to 2014; prior thereto, Vice President for Administration and Chief Financial Officer, University of Chicago, 2002 to 2007 | | 25 | | American Student Assistance Corp., guarantor of student loans; Amica Mutual Insurance Company |
Donald L. Seeley,
1944 | | Trustee | | Since 2003 | | Retired; formerly Director, Applied Investment Management Program, University of Arizona Department of Finance; prior thereto, Vice Chairman and Chief Financial Officer, True North Communications, Inc. (marketing communications and advertising firm) | | 25 | | Warnaco Group, Inc., intimate apparel, sportswear, and swimwear manufacturer (2005 to 2013); Beverly Enterprises, Inc., provider of elder care and rehabilitative services (2002 to 2006) |
Thomas J. Skelly,
1951 | | Trustee | | Since 2007 | | Advisory Board Member for various U.S. companies; prior to 2005, Managing Partner of various divisions at Accenture | | 25 | | Mutual Trust Financial Group, provider of insurance and investment products; Board Member, First MetLife Insurance Company, NY chartered company for Metropolitan Life Insurance; Clayton Holdings, Inc., provider of information-based analytics, consulting and outsourced services to various financial institutions and investors (2007 to 2008) |
| (1) | Each Trustee serves until the election and qualification of a successor, or until death, resignation or retirement, or removal as provided in the Trust’s Declaration of Trust. Retirement for Non-Interested Trustees occurs no later than at the conclusion of the first regularly scheduled Board meeting of the calendar year that occurs after the earlier of (a) the Non-Interested Trustee’s 72nd birthday or (b) the 15th anniversary of the date that the Non-Interested Trustee became a member of the Board of Trustees. |
| (2) | Mr. Avedisian has served as a member of the Board of Directors of Potbelly Corporation (“Potbelly”) since September 2001. In October 2013, Potbelly completed an underwritten initial public offering of its common stock (the “Offering”). William Blair served as a member of the underwriting syndicate. At the time of the Offering, Mr. Avedisian, through entities he owns or controls, indirectly beneficially owned 1,607,448 shares of Potbelly common stock and warrants to purchase 241,704 shares of common stock representing approximately 8.9% of the shares before the Offering. Mr. Avedisian disclaimed beneficial ownership of the shares except to the extent of his pecuniary interest therein. Potbelly sold 8,474,869 shares and certain stockholders, including two entities affiliated with William Blair, sold 150,131 shares in the Offering at a price to the public of $14.00 per share. Neither Mr. Avedisian nor the entities he owns or controls was a selling stockholder in the Offering. A portion of the net proceeds received by Potbelly from the Offering was used to pay a previously declared cash dividend, in an aggregate amount of approximately $49.9 million, on Potbelly common and preferred shares outstanding immediately prior to the closing of the Offering, which included the outstanding shares indirectly beneficially owned by Mr. Avedisian, William Blair and the two entities affiliated with William Blair. |
| (3) | In his former role as chief financial officer at the University of Chicago, Mr. Reaves had a working relationship with E. David Coolidge III, Vice Chairman of William Blair who is also a trustee of the University of Chicago. |
See accompanying Notes to Financial Statements.
| December 31, 2015 | William Blair Funds | 199 |
| | | | | | Term of Office | | |
| | | Position(s) Held | | | and Length of | | Principal Occupation(s) |
| Name and Year of Birth | | with Trust | | | Time Served1 | | During Past 5 Years2 |
| | | | | | | |
| Officers | | | | | | |
| | | | | | | |
| Michael P. Balkin, | | Senior Vice President | | Since 2008 | | Partner, William Blair |
| 1959 | | | | | | |
| | | | | | | |
| Stephanie G. Braming, | | Senior Vice President | | Since 2014 | | Partner, William Blair |
| 1970 | | | | | | |
| | | | | | | |
| Karl W. Brewer, | | Senior Vice President | | Since 2000 | | Partner, William Blair |
| 1966 | | | | | | |
| | | | | | | |
Thomas Clarke,
1968 | | Senior Vice President | | Since 2011 | | Partner, William Blair (since 2014); prior thereto, Associate, William Blair (2011-2014); Managing Partner, Singer Partners, LLC (2009-2011) |
| | | | | | | |
Daniel Crowe,
1972 | | Senior Vice President | | Since 2015 | | Partner, William Blair (since 2011); prior thereto, Associate, William Blair |
| | | | | | | |
Simon Fennell,
1969 | | Senior Vice President | | Since 2013 | | Partner, William Blair (since 2013); prior thereto, Associate, William Blair (2011-2013); Goldman Sachs (1997-2011) |
| | | | | | | |
| Andrew G. Flynn, | | Senior Vice President | | Since 2013 | | Partner, William Blair |
| 1961 | | | | | | |
| | | | | | | |
| David C. Fording, | | Senior Vice President | | Since 2006 | | Partner, William Blair |
| 1967 | | | | | | |
| | | | | | | |
| James S. Golan, | | Senior Vice President | | Since 2005 | | Partner, William Blair |
| 1961 | | | | | | |
| | | | | | | |
| Michael A. Jancosek, | | Senior Vice President | | Since 2000 | | Partner, William Blair |
| 1959 | | | | | | |
| | | | | | | |
| John F. Jostrand, | | Senior Vice President | | Since 1999 | | Partner, William Blair |
| 1954 | | | | | | |
| | | | | | | |
Chad M. Kilmer,
1975 | | Senior Vice President | | Since 2006 | | Partner, William Blair (since 2011); prior thereto, Associate, William Blair |
| | | | | | | |
| Robert C. Lanphier IV, | | Senior Vice President | | Since 2003 | | Partner, William Blair |
| 1956 | | | | | | |
| | | | | | | |
| Mark T. Leslie, | | Senior Vice President | | Since 2005 | | Partner, William Blair |
| 1967 | | | | | | |
| | | | | | | |
| Kenneth J. McAtamney, | | Senior Vice President | | Since 2008 | | Partner, William Blair |
| 1966 | | | | | | |
| | | | | | | |
| Todd M. McClone, | | Senior Vice President | | Since 2005 | | Partner, William Blair |
| 1968 | | | | | | |
| | | | | | | |
| David Merjan, | | Senior Vice President | | Since 2008 | | Partner, William Blair |
| 1960 | | | | | | |
| | | | | | | |
| David S. Mitchell, | | Senior Vice President | | Since 2003 | | Partner, William Blair |
| 1960 | | | | | | |
| | | | | | | |
| John C. Murphy, | | Senior Vice President | | Since 2014 | | Partner, William Blair |
| 1969 | | | | | | |
| | | | | | | |
| Casey K. Preyss, | | Senior Vice President | | Since 2015 | | Partner, William Blair |
| 1976 | | | | | | |
See accompanying Notes to Financial Statements.
| 200 | Annual Report | December 31, 2015 |
| | | | | Term of Office | | |
| | | Position(s) Held | | | and Length of | | Principal Occupation(s) |
| Name and Year of Birth | | with Trust | | | Time Served1 | | During Past 5 Years |
| | | | | | | |
| David P. Ricci, | | Senior Vice President | | Since 2006 | | Partner, William Blair |
| 1958 | | | | | | |
| | | | | | | |
Brian D. Singer,
1960 | | Senior Vice President | | Since 2011 | | Partner, William Blair (since 2012); prior thereto, Associate, William Blair (2011-2012), Managing Partner, Singer Partners, LLC (2009-2011) |
| | | | | | | |
| Jeffrey A. Urbina, | | Senior Vice President | | Since 1998 | | Partner, William Blair |
| 1955 | | | | | | |
| | | | | | | |
| Christopher T. Vincent, | | Senior Vice President | | Since 2002 | | Partner, William Blair |
| 1956 | | | | | | |
| | | | | | | |
David F. Hone,
1967 | | Vice President | | Since 2011 | | Associate, William Blair (since 2011); prior thereto, Portfolio Manager—Large Cap Value, Deutsche Asset Management (2002-2010) |
| | | | | | | |
Paul J. Sularz,
1967 | | Vice President | | Since 2009 | | Associate, William Blair (2006-2012 and since 2014); Partner, William Blair (2012-2014) |
| | | | | | | |
| Colette M. Garavalia, | | Treasurer | | Since 2000 | | Associate, William Blair |
| 1961 | | | | | | |
| | | | | | | |
| Andrew T. Pfau, | | Secretary | | Since 2009 | | Associate, William Blair |
| 1970 | | | | | | |
| | | | | | | |
| John M. Raczek, | | Assistant Treasurer | | Since 2010 | | Associate, William Blair |
| 1970 | | | | | | |
| | | | | | | |
Walter R. Randall, Jr.,
1960 | | Chief Compliance Officer and Assistant Secretary | | Since 2009 | | Associate, William Blair |
| (1) | The Trust’s officers, except the Chief Compliance Officer, are elected annually by the Board of Trustees. The Trust’s Chief Compliance Officer is designated by the Board of Trustees and may only be removed by action of the Board of Trustees, including a majority of independent trustees. Length of Time Served for all officers indicates the year the individual became an officer of the Trust. |
The Statement of Additional Information for the William Blair Funds includes additional information about the trustees and is available without charge by calling 1-800-635-2886 (in Massachusetts 1-800-635-2840) or by writing the Fund.
See accompanying Notes to Financial Statements.
| December 31, 2015 | William Blair Funds | 201 |
(Unaudited)
Proxy Voting
A description of the policies and procedures that the Funds use to determine how to vote proxies relating to portfolio securities and information regarding how the Funds voted proxies relating to portfolio securities for the most recent 12-month period ended December 31 are available without charge, upon request, by calling 1-800-635-2886 (in Massachusetts 1-800-635-2840), at www.williamblairfunds.com and on the SEC’s website at http://www.sec.gov.
Quarterly Portfolio Schedules
Each Fund files its complete schedule of portfolio holdings with the SEC for the first and third fiscal quarters of each fiscal year (quarters ended March 31 and September 30) on Form N-Q. The Fund’s Forms N-Q are available on the SEC’s website at http://www.sec.gov and may be reviewed and copied at the SEC’s Public Reference Room in Washington, D.C. Information on the operation of the SEC’s Public Reference Room may be obtained by calling 1-800-SEC-0330.
Additional Federal Income Tax Information: (unaudited)
Under Section 852(b)(3)(C) of the Code, the Funds hereby designate the following amounts as capital gain dividends for the fiscal year ended December 31, 2015 (in thousands):
| Fund | | Capital Gain Dividend |
| Growth | | $ | 96,737 | |
| Large Cap Growth | | | 6,130 | |
| Large Cap Value | | | 354 | |
| Mid Cap Growth | | | 41,383 | |
| Mid Cap Value | | | 587 | |
| Small-Mid Cap Growth | | | 59,064 | |
| Small-Mid Cap Value | | | 206 | |
| Small Cap Growth | | | 29,587 | |
| Small Cap Value | | | 1,943 | |
| Global Leaders | | | 8,459 | |
| Global Small Cap Growth | | | 457 | |
| International Leaders | | | 653 | |
| Institutional International Growth | | | 15,858 | |
| International Small Cap Growth | | | 1,505 | |
| Emerging Markets Leaders | | | 172 | |
| Emerging Markets Growth | | | 9,858 | |
| Emerging Markets Small Cap Growth | | | 11,724 | |
| 202 | Annual Report | December 31, 2015 |
Useful Information About Your Report (Unaudited)
Please refer to this information when reviewing the Expense Example for each Fund.
Expense Example
As a shareholder of a Fund, you incur two types of costs: (1) transaction costs and (2) ongoing costs, including management fees, distribution (12b-1) fees (for Class N shares except for the Institutional International Growth Fund and the Institutional International Equity Fund), shareholder administration fees (for Class N and Class I shares of the Global Leaders Fund, the Global Small Cap Growth Fund, the International Leaders Fund, the International Small Cap Growth Fund, the Emerging Markets Leaders Fund, the Emerging Markets Growth Fund, the Emerging Markets Small Cap Growth Fund, the Bond Fund, the Low Duration Fund and the Macro Allocation Fund) and other Fund expenses. The example is intended to help you understand your ongoing costs (in dollars) of investing in the Fund and to compare these costs with the ongoing costs of investing in other mutual funds. To do so, compare the Fund’s 5% hypothetical example with the 5% hypothetical examples that appear in the shareholder reports of other funds. The example is based on an investment of $1,000 invested at the beginning of the period and held for the entire six-month period from July 1, 2015 to December 31, 2015.
Actual Expenses
In each example, the first line for each share class in the table provides information about the actual account values and actual expenses. These expenses reflect the effect of any expense cap applicable to the share class during the period. Without this expense cap, the costs shown in the table would have been higher. You may use the information in this line, together with the amount you invested, to estimate the expenses that you paid over the period. Simply divide your account value by $1,000 (example, an $8,600 account value divided by $1,000 = 8.6), then multiply the result by the number in the first line under the heading entitled “Expenses Paid During the Period” to estimate the expenses you paid on your account during the period.
Hypothetical Example for Comparison Purposes
In each example, the second line for each share class in the table provides information about hypothetical account values and hypothetical expenses based on the Fund’s actual expense ratio and an assumed rate of return of 5% per year before expenses. This is not the Fund’s actual return. The hypothetical account values and expenses may not be used to estimate the actual ending account balance or expenses you paid for the period. You may use this information to compare the ongoing costs of investing in the Fund to other funds. To do so, compare this 5% hypothetical example with the 5% hypothetical examples that appear in the shareholder reports of other funds.
Please note that the expenses shown in both examples are meant to highlight your ongoing costs only and do not reflect any transactional costs or account type fees, such as IRA Fiduciary Administration fees. These fees are fully described in the prospectus. Therefore, the second line of each share class in the table is useful in comparing ongoing costs only and will not help you determine the relative costs of owning different funds. In addition, if these transactional costs or account fees were included, your costs would have been higher.
| December 31, 2015 | William Blair Funds | 203 |
Fund Expenses (Unaudited)
| | | Beginning | | Ending | | Expenses Paid | | |
| | | Account Value | | Account Value | | During | | Annualized |
| Expense Example | | 7/1/2015 | | 12/31/2015 | | the Period (a) | | Expense Ratio |
| Growth Fund | | | | | | | | | | | | | | | | |
| Class N-actual return | | $ | 1,000.00 | | | $ | 1,022.18 | | | $ | 6.07 | | | | 1.19 | % |
| Class N-hypothetical 5% return | | $ | 1,000.00 | | | $ | 1,044.00 | | | $ | 6.13 | | | | 1.19 | |
| Class I-actual return | | $ | 1,000.00 | | | $ | 1,024.20 | | | $ | 4.54 | | | | 0.89 | |
| Class I-hypothetical 5% return | | $ | 1,000.00 | | | $ | 1,045.51 | | | $ | 4.59 | | | | 0.89 | |
| Large Cap Growth Fund | | | | | | | | | | | | | | | | |
| Class N-actual return | | $ | 1,000.00 | | | $ | 1,012.35 | | | $ | 5.43 | | | | 1.07 | |
| Class N-hypothetical 5% return | | $ | 1,000.00 | | | $ | 1,044.61 | | | $ | 5.51 | | | | 1.07 | |
| Class I-actual return | | $ | 1,000.00 | | | $ | 1,012.76 | | | $ | 4.16 | | | | 0.82 | |
| Class I-hypothetical 5% return | | $ | 1,000.00 | | | $ | 1,045.87 | | | $ | 4.23 | | | | 0.82 | |
| Large Cap Value Fund | | | | | | | | | | | | | | | | |
| Class N-actual return | | $ | 1,000.00 | | | $ | 952.18 | | | $ | 5.27 | | | | 1.07 | |
| Class N-hypothetical 5% return | | $ | 1,000.00 | | | $ | 1,044.61 | | | $ | 5.51 | | | | 1.07 | |
| Class I-actual return | | $ | 1,000.00 | | | $ | 952.77 | | | $ | 4.04 | | | | 0.82 | |
| Class I-hypothetical 5% return | | $ | 1,000.00 | | | $ | 1,045.87 | | | $ | 4.23 | | | | 0.82 | |
| Mid Cap Growth Fund | | | | | | | | | | | | | | | | |
| Class N-actual return | | $ | 1,000.00 | | | $ | 953.67 | | | $ | 6.50 | | | | 1.32 | |
| Class N-hypothetical 5% return | | $ | 1,000.00 | | | $ | 1,043.35 | | | $ | 6.80 | | | | 1.32 | |
| Class I-actual return | | $ | 1,000.00 | | | $ | 955.06 | | | $ | 5.27 | | | | 1.07 | |
| Class I-hypothetical 5% return | | $ | 1,000.00 | | | $ | 1,044.61 | | | $ | 5.51 | | | | 1.07 | |
| Mid Cap Value Fund | | | | | | | | | | | | | | | | |
| Class N-actual return | | $ | 1,000.00 | | | $ | 956.38 | | | $ | 6.51 | | | | 1.32 | |
| Class N-hypothetical 5% return | | $ | 1,000.00 | | | $ | 1,043.35 | | | $ | 6.80 | | | | 1.32 | |
| Class I-actual return | | $ | 1,000.00 | | | $ | 958.12 | | | $ | 5.28 | | | | 1.07 | |
| Class I-hypothetical 5% return | | $ | 1,000.00 | | | $ | 1,044.61 | | | $ | 5.51 | | | | 1.07 | |
| Small-Mid Cap Growth Fund | | | | | | | | | | | | | | | | |
| Class N-actual return | | $ | 1,000.00 | | | $ | 959.14 | | | $ | 6.67 | | | | 1.35 | |
| Class N-hypothetical 5% return | | $ | 1,000.00 | | | $ | 1,043.19 | | | $ | 6.95 | | | | 1.35 | |
| Class I-actual return | | $ | 1,000.00 | | | $ | 960.53 | | | $ | 5.44 | | | | 1.10 | |
| Class I-hypothetical 5% return | | $ | 1,000.00 | | | $ | 1,044.45 | | | $ | 5.67 | | | | 1.10 | |
| Small-Mid Cap Value Fund | | | | | | | | | | | | | | | | |
| Class N-actual return | | $ | 1,000.00 | | | $ | 950.57 | | | $ | 6.74 | | | | 1.37 | |
| Class N-hypothetical 5% return | | $ | 1,000.00 | | | $ | 1,043.09 | | | $ | 7.06 | | | | 1.37 | |
| Class I-actual return | | $ | 1,000.00 | | | $ | 951.89 | | | $ | 5.51 | | | | 1.12 | |
| Class I-hypothetical 5% return | | $ | 1,000.00 | | | $ | 1,044.35 | | | $ | 5.77 | | | | 1.12 | |
| Small Cap Growth Fund | | | | | | | | | | | | | | | | |
| Class N-actual return | | $ | 1,000.00 | | | $ | 925.20 | | | $ | 7.28 | | | | 1.50 | |
| Class N-hypothetical 5% return | | $ | 1,000.00 | | | $ | 1,042.44 | | | $ | 7.72 | | | | 1.50 | |
| Class I-actual return | | $ | 1,000.00 | | | $ | 926.44 | | | $ | 6.07 | | | | 1.25 | |
| Class I-hypothetical 5% return | | $ | 1,000.00 | | | $ | 1,043.70 | | | $ | 6.44 | | | | 1.25 | |
| Small Cap Value Fund | | | | | | | | | | | | | | | | |
| Class N-actual return | | $ | 1,000.00 | | | $ | 935.44 | | | $ | 7.32 | | | | 1.50 | |
| Class N-hypothetical 5% return | | $ | 1,000.00 | | | $ | 1,042.44 | | | $ | 7.72 | | | | 1.50 | |
| Class I-actual return | | $ | 1,000.00 | | | $ | 937.04 | | | $ | 6.05 | | | | 1.24 | |
| Class I-hypothetical 5% return | | $ | 1,000.00 | | | $ | 1,043.75 | | | $ | 6.39 | | | | 1.24 | |
| Global Leaders Fund | | | | | | | | | | | | | | | | |
| Class N-actual return | | $ | 1,000.00 | | | $ | 977.82 | | | $ | 6.93 | | | | 1.39 | |
| Class N-hypothetical 5% return | | $ | 1,000.00 | | | $ | 1,042.99 | | | $ | 7.16 | | | | 1.39 | |
| Class I-actual return | | $ | 1,000.00 | | | $ | 979.78 | | | $ | 5.49 | | | | 1.10 | |
| Class I-hypothetical 5% return | | $ | 1,000.00 | | | $ | 1,044.45 | | | $ | 5.67 | | | | 1.10 | |
| Institutional Class-actual return | | $ | 1,000.00 | | | $ | 979.70 | | | $ | 5.31 | | | | 1.03 | |
| Institutional Class-hypothetical 5% return | | $ | 1,000.00 | | | $ | 1,044.81 | | | $ | 5.31 | | | | 1.03 | |
| Global Small Cap Growth Fund (In Liquidation) | | | | | | | | | | | | | | | | |
| Class N-actual return | | $ | 1,000.00 | | | $ | 995.22 | | | $ | 8.30 | | | | 1.65 | |
| Class N-hypothetical 5% return | | $ | 1,000.00 | | | $ | 1,041.68 | | | $ | 8.49 | | | | 1.65 | |
| Class I-actual return | | $ | 1,000.00 | | | $ | 997.95 | | | $ | 6.35 | | | | 1.26 | |
| Class I-hypothetical 5% return | | $ | 1,000.00 | | | $ | 1,043.65 | | | $ | 6.49 | | | | 1.26 | |
| 204 | Annual Report | December 31, 2015 |
Fund Expenses (Unaudited)
| | | Beginning | | Ending | | Expenses Paid | | |
| | | Account Value | | Account Value | | During | | Annualized |
| Expense Example | | 7/1/2015 | | 12/31/2015 | | the Period (a) | | Expense Ratio |
| International Leaders Fund | | | | | | | | | | | | | | | | |
| Class N-actual return | | $ | 1,000.00 | | | $ | 984.56 | | | $ | 6.20 | | | | 1.24 | % |
| Class N-hypothetical 5% return | | $ | 1,000.00 | | | $ | 1,043.75 | | | $ | 6.39 | | | | 1.24 | |
| Class I-actual return | | $ | 1,000.00 | | | $ | 985.35 | | | $ | 5.65 | | | | 1.13 | |
| Class I-hypothetical 5% return | | $ | 1,000.00 | | | $ | 1,044.30 | | | $ | 5.82 | | | | 1.13 | |
| Institutional Class-actual return | | $ | 1,000.00 | | | $ | 986.01 | | | $ | 4.91 | | | | 0.98 | |
| Institutional Class-hypothetical 5% return | | $ | 1,000.00 | | | $ | 1,045.06 | | | $ | 5.05 | | | | 0.98 | |
| International Equity Fund | | | | | | | | | | | | | | | | |
| Class N-actual return | | $ | 1,000.00 | | | $ | 954.99 | | | $ | 6.50 | | | | 1.32 | |
| Class N-hypothetical 5% return | | $ | 1,000.00 | | | $ | 1,043.35 | | | $ | 6.80 | | | | 1.32 | |
| Class I-actual return | | $ | 1,000.00 | | | $ | 956.11 | | | $ | 5.28 | | | | 1.07 | |
| Class I-hypothetical 5% return | | $ | 1,000.00 | | | $ | 1,044.61 | | | $ | 5.51 | | | | 1.07 | |
| Institutional International Equity Fund | | | | | | | | | | | | | | | | |
| Institutional Class-actual return | | $ | 1,000.00 | | | $ | 956.24 | | | $ | 4.93 | | | | 1.00 | |
| Institutional Class-hypothetical 5% return | | $ | 1,000.00 | | | $ | 1,044.96 | | | $ | 5.15 | | | | 1.00 | |
| International Growth Fund | | | | | | | | | | | | | | | | |
| Class N-actual return | | $ | 1,000.00 | | | $ | 940.63 | | | $ | 6.95 | | | | 1.42 | |
| Class N-hypothetical 5% return | | $ | 1,000.00 | | | $ | 1,042.84 | | | $ | 7.31 | | | | 1.42 | |
| Class I-actual return | | $ | 1,000.00 | | | $ | 941.69 | | | $ | 5.58 | | | | 1.14 | |
| Class I-hypothetical 5% return | | $ | 1,000.00 | | | $ | 1,044.25 | | | $ | 5.87 | | | | 1.14 | |
| Institutional International Growth Fund | | | | | | | | | | | | | | | | |
| Institutional Class-actual return | | $ | 1,000.00 | | | $ | 942.85 | | | $ | 4.70 | | | | 0.96 | |
| Institutional Class-hypothetical 5% return | | $ | 1,000.00 | | | $ | 1,045.16 | | | $ | 4.95 | | | | 0.96 | |
| International Small Cap Growth Fund | | | | | | | | | | | | | | | | |
| Class N-actual return | | $ | 1,000.00 | | | $ | 1,025.64 | | | $ | 7.51 | | | | 1.47 | |
| Class N-hypothetical 5% return | | $ | 1,000.00 | | | $ | 1,042.59 | | | $ | 7.57 | | | | 1.47 | |
| Class I-actual return | | $ | 1,000.00 | | | $ | 1,027.94 | | | $ | 5.93 | | | | 1.16 | |
| Class I-hypothetical 5% return | | $ | 1,000.00 | | | $ | 1,044.15 | | | $ | 5.98 | | | | 1.16 | |
| Institutional Class-actual return | | $ | 1,000.00 | | | $ | 1,027.89 | | | $ | 5.52 | | | | 1.08 | |
| Institutional Class-hypothetical 5% return | | $ | 1,000.00 | | | $ | 1,044.56 | | | $ | 5.57 | | | | 1.08 | |
| Emerging Markets Leaders Fund | | | | | | | | | | | | | | | | |
| Class N-actual return | | $ | 1,000.00 | | | $ | 845.95 | | | $ | 7.63 | | | | 1.64 | |
| Class N-hypothetical 5% return | | $ | 1,000.00 | | | $ | 1,041.73 | | | $ | 8.44 | | | | 1.64 | |
| Class I-actual return | | $ | 1,000.00 | | | $ | 846.97 | | | $ | 6.01 | | | | 1.29 | |
| Class I-hypothetical 5% return | | $ | 1,000.00 | | | $ | 1,043.50 | | | $ | 6.64 | | | | 1.29 | |
| Institutional Class-actual return | | $ | 1,000.00 | | | $ | 848.20 | | | $ | 5.82 | | | | 1.25 | |
| Institutional Class-hypothetical 5% return | | $ | 1,000.00 | | | $ | 1,043.70 | | | $ | 6.44 | | | | 1.25 | |
| Emerging Markets Growth Fund | | | | | | | | | | | | | | | | |
| Class N-actual return | | $ | 1,000.00 | | | $ | 829.81 | | | $ | 6.92 | | | | 1.50 | |
| Class N-hypothetical 5% return | | $ | 1,000.00 | | | $ | 1,042.44 | | | $ | 7.72 | | | | 1.50 | |
| Class I-actual return | | $ | 1,000.00 | | | $ | 831.22 | | | $ | 5.77 | | | | 1.25 | |
| Class I-hypothetical 5% return | | $ | 1,000.00 | | | $ | 1,043.70 | | | $ | 6.44 | | | | 1.25 | |
| Institutional Class-actual return | | $ | 1,000.00 | | | $ | 831.74 | | | $ | 5.40 | | | | 1.17 | |
| Institutional Class-hypothetical 5% return | | $ | 1,000.00 | | | $ | 1,044.10 | | | $ | 6.03 | | | | 1.17 | |
| Emerging Markets Small Cap Growth Fund | | | | | | | | | | | | | | | | |
| Class N-actual return | | $ | 1,000.00 | | | $ | 886.63 | | | $ | 7.85 | | | | 1.65 | |
| Class N-hypothetical 5% return | | $ | 1,000.00 | | | $ | 1,041.68 | | | $ | 8.49 | | | | 1.65 | |
| Class I-actual return | | $ | 1,000.00 | | | $ | 888.56 | | | $ | 6.24 | | | | 1.31 | |
| Class I-hypothetical 5% return | | $ | 1,000.00 | | | $ | 1,043.40 | | | $ | 6.75 | | | | 1.31 | |
| Institutional Class-actual return | | $ | 1,000.00 | | | $ | 889.18 | | | $ | 5.95 | | | | 1.25 | |
| Institutional Class-hypothetical 5% return | | $ | 1,000.00 | | | $ | 1,043.70 | | | $ | 6.44 | | | | 1.25 | |
| Bond Fund | | | | | | | | | | | | | | | | |
| Class N-actual return | | $ | 1,000.00 | | | $ | 994.29 | | | $ | 3.07 | | | | 0.61 | |
| Class N-hypothetical 5% return | | $ | 1,000.00 | | | $ | 1,046.92 | | | $ | 3.15 | | | | 0.61 | |
| Class I-actual return | | $ | 1,000.00 | | | $ | 996.10 | | | $ | 2.06 | | | | 0.41 | |
| Class I-hypothetical 5% return | | $ | 1,000.00 | | | $ | 1,047.93 | | | $ | 2.12 | | | | 0.41 | |
| Institutional Class-actual return | | $ | 1,000.00 | | | $ | 996.41 | | | $ | 1.76 | | | | 0.35 | |
| Institutional Class-hypothetical 5% return | | $ | 1,000.00 | | | $ | 1,048.24 | | | $ | 1.81 | | | | 0.35 | |
| December 31, 2015 | William Blair Funds | 205 |
Fund Expenses (Unaudited)
| | | Beginning | | Ending | | Expenses Paid | | |
| | | Account Value | | Account Value | | During | | Annualized |
| Expense Example | | 7/1/2015 | | 12/31/2015 | | the Period (a) | | Expense Ratio |
| Income Fund | | | | | | | | | | | | | | | | |
| Class N-actual return | | $ | 1,000.00 | | | $ | 997.69 | | | $ | 4.08 | | | | 0.81 | % |
| Class N-hypothetical 5% return | | $ | 1,000.00 | | | $ | 1,045.92 | | | $ | 4.18 | | | | 0.81 | |
| Class I-actual return | | $ | 1,000.00 | | | $ | 998.98 | | | $ | 2.77 | | | | 0.55 | |
| Class I-hypothetical 5% return | | $ | 1,000.00 | | | $ | 1,047.23 | | | $ | 2.84 | | | | 0.55 | |
| Low Duration Fund | | | | | | | | | | | | | | | | |
| Class N-actual return | | $ | 1,000.00 | | | $ | 999.55 | | | $ | 3.02 | | | | 0.60 | |
| Class N-hypothetical 5% | | $ | 1,000.00 | | | $ | 1,046.98 | | | $ | 3.10 | | | | 0.60 | |
| Class I-actual return | | $ | 1,000.00 | | | $ | 1,000.56 | | | $ | 2.12 | | | | 0.42 | |
| Class I-hypothetical 5% | | $ | 1,000.00 | | | $ | 1,047.88 | | | $ | 2.17 | | | | 0.42 | |
| Institutional Class-actual return | | $ | 1,000.00 | | | $ | 1,000.70 | | | $ | 2.02 | | | | 0.40 | |
| Institutional Class-hypothetical 5% return | | $ | 1,000.00 | | | $ | 1,047.98 | | | $ | 2.06 | | | | 0.40 | |
| Macro Allocation Fund | | | | | | | | | | | | | | | | |
| Class N-actual return | | $ | 1,000.00 | | | $ | 901.22 | | | $ | 6.09 | | | | 1.27 | |
| Class N-hypothetical 5% | | $ | 1,000.00 | | | $ | 1,043.60 | | | $ | 6.54 | | | | 1.27 | |
| Class I-actual return | | $ | 1,000.00 | | | $ | 902.31 | | | $ | 4.70 | | | | 0.98 | |
| Class I-hypothetical 5% | | $ | 1,000.00 | | | $ | 1,045.01 | | | $ | 5.05 | | | | 0.98 | |
| Institutional Class-actual return | | $ | 1,000.00 | | | $ | 902.43 | | | $ | 4.32 | | | | 0.90 | |
| Institutional Class-hypothetical 5% return | | $ | 1,000.00 | | | $ | 1,045.46 | | | $ | 4.64 | | | | 0.90 | |
| (a) | Expenses are equal to the annualized expense ratio, multiplied by the average account value over the period, multiplied by the number of days in the period, 184, and divided by 365 (to reflect the one-half year period). |
| 206 | Annual Report | December 31, 2015 |
| | BOARD OF TRUSTEES |
| | Vann A. Avedisian |
| | Principal, Highgate Holdings |
| | Kathleen T. Barr |
| | Retired Senior Managing Director, PNC Capital Advisors, LLC |
| | Phillip O. Peterson |
| | Retired Partner, KPMG LLP |
| | Donald J. Reaves |
| | Retired Chancellor, Winston-Salem State University |
| | Donald L. Seeley |
| | Retired Adjunct Lecturer and Director, University of Arizona Department of Finance |
| | Michelle R. Seitz, Chairman and President |
| | Partner, William Blair |
| | Thomas J. Skelly |
| | Retired Managing Partner, Accenture |
| | Richard W. Smirl, Senior Vice President |
| | Partner, William Blair |
| | Officers |
| | Michael P. Balkin, Senior Vice President |
| | Stephanie G. Braming, Senior Vice President |
| | Karl W. Brewer, Senior Vice President |
| | Thomas Clarke, Senior Vice President |
| | Daniel Crowe, Senior Vice President |
| | Simon Fennell, Senior Vice President |
| | Andrew G. Flynn, Senior Vice President |
| | David C. Fording, Senior Vice President |
| | James S. Golan, Senior Vice President |
| | Michael A. Jancosek, Senior Vice President |
| | John F. Jostrand, Senior Vice President |
| | Chad M. Kilmer, Senior Vice President |
| | Robert C. Lanphier, IV, Senior Vice President |
| | Mark T. Leslie, Senior Vice President |
| | Kenneth J. McAtamney, Senior Vice President |
| | Todd M. McClone, Senior Vice President |
| | David Merjan, Senior Vice President |
| | David S. Mitchell, Senior Vice President |
| | John C. Murphy, Senior Vice President |
| | Casey K. Preyss, Senior Vice President |
| | David P. Ricci, Senior Vice President |
| | Brian D. Singer, Senior Vice President |
| | Jeffrey A. Urbina, Senior Vice President |
| | Christopher T. Vincent, Senior Vice President |
| | David F. Hone, Vice President |
| | Paul J. Sularz, Vice President |
| | Colette M. Garavalia, Treasurer |
| | Andrew T. Pfau, Secretary |
| | John M. Raczek, Assistant Treasurer |
| | Walter R. Randall, Jr., Chief Compliance Officer and Assistant Secretary |
| | Investment Adviser |
| | William Blair Investment Management, LLC |
| | Distributor |
| | William Blair & Company, L.L.C. |
| | Independent Registered Public Accounting Firm |
| | Ernst & Young LLP |
| | Legal Counsel |
| | Vedder Price P.C. |
| | Transfer Agent |
| | Boston Financial Data Services, Inc. |
| | P.O. Box 8506 |
| | Boston, MA 02266-8506 |
| | For customer assistance, call 1-800-635-2886 |
| | (Massachusetts 1-800-635-2840) |
| December 31, 2015 | William Blair Funds | 207 |
| | | | | | |
| | William Blair Funds | | |
| | | | | | |
| | | | | | |
| | DOMESTIC EQUITY | | GLOBAL EQUITY | | FIXED-INCOME |
| | Growth Fund | | Global Leaders Fund | | Bond Fund |
| | Large Cap Growth Fund | | Global Small Cap Growth Fund | | Income Fund |
| | Large Cap Value Fund | | | | Low Duration Fund |
| | Mid Cap Growth Fund | | INTERNATIONAL EQUITY | | |
| | Mid Cap Value Fund | | International Leaders Fund | | MULTI-ASSET AND |
| | Small-Mid Cap Growth Fund | | International Equity Fund | | ALTERNATIVE |
| | Small-Mid Cap Value Fund | | Institutional International Equity Fund | | Macro Allocation Fund |
| | Small Cap Growth Fund | | International Growth Fund | | |
| | Small Cap Value Fund | | Institutional International Growth Fund | | |
| | | | International Small Cap Growth Fund | | |
| | | | Emerging Markets Leaders Fund | | |
| | | | Emerging Markets Growth Fund | | |
| | | | Emerging Markets Small Cap Growth Fund | | |
 | | © | William Blair & Company, L.L.C., distributor | |
| +1 800 742 7272 | | 222 West Adams Street | |
| williamblairfunds.com | | Chicago, Illinois 60606 | 00103188 |
As of the end of the period covered by this Form N-CSR, the Registrant has adopted a code of ethics that applies to its principal executive officer and principal financial officer. Such code of ethics is posted on the Registrant’s website: www.williamblairfunds.com. There were no amendments to or waivers of the code of ethics during the period covered by this report.
| Item 3. | Audit Committee Financial Expert |
The Registrant’s Board of Trustees has determined that the Registrant has at least one “audit committee financial expert” (as defined in Item 3 of Form N-CSR) serving on its Audit Committee. Mr. Phillip O. Peterson, the Registrant’s audit committee financial expert, is “independent” for purposes of Item 3 to Form N-CSR.
An “audit committee financial expert” is not an “expert” for any purpose, including for purposes of Section 11 of the Securities Act of 1933, as a result of being designated as an “audit committee financial expert.” Further, the designation of a person as an “audit committee financial expert” does not mean that the person has any greater duties, obligations, or liability than those imposed on the person without the “audit committee financial expert” designation. Similarly, the designation of a person as an “audit committee financial expert” does not affect the duties, obligations, or liability of any other member of the audit committee or Board of Trustees.
| Item 4. | Principal Accountant Fees and Services |
Audit Fees
For the fiscal years ended December 31, 2014 and 2015, Ernst & Young, LLP, the Registrant’s principal accountant (“E&Y”), billed the Registrant $708,600 and $719,700, respectively, for professional services rendered for the audit of the Registrant’s annual financial statements or services that are normally provided in connection with statutory and regulatory filings.
Audit-Related Fees
For the fiscal years ended December 31, 2014 and 2015, E&Y billed the Registrant $0 and $0, respectively, for assurance and related services that are reasonably related to the performance of the audit of the Registrant’s financial statements and that are not reported above, such as reviewing prospectuses, semiannual reports and SEC filings. For the fiscal years ended December 31, 2014 and 2015, E&Y provided no audit-related services to William Blair Investment Management, LLC, the Registrant’s investment advisor (“William Blair”) or any of its control affiliates that were for engagements directly related to the Registrant’s operations and financial reporting.
Tax Fees
For the fiscal years ended December 31, 2014 and 2015, E&Y billed the Registrant $256,150 and $311,900, respectively, for professional services rendered for tax compliance, tax advice and tax planning. Such services consisted of preparation of tax returns, year-end distribution review, qualifying dividend income analysis and computation of foreign tax credit pass-through. For the fiscal years ended December 31, 2014 and 2015, E&Y did not bill William Blair and its control affiliates for any services that were for engagements directly related to the Registrant’s operations and financial reporting.
All Other Fees
For the fiscal years ended December 31, 2014 and 2015, E&Y did not bill the Registrant for products and services other than the services reported above. For the fiscal year ended December 31, 2014 and 2015, E&Y provided no other services to William Blair or any of its control affiliates that were for engagements directly related to the Registrant’s operations and financial reporting.
Audit Committee Pre-Approval Policies and Procedures
Pursuant to Registrant’s Audit Committee Charter (the “Charter”), the Audit Committee is responsible for pre-approving any engagement of the principal accountant to provide non-prohibited services to the Registrant, including the fees and other compensation to be paid to the principal accountant, to the extent required by Rule 2-01(c)(7) of Regulation S-X. Pursuant to the Charter, the Audit Committee is also responsible for pre-approving any engagement of the principal accountant, including the fees and other compensation to be paid to the principal accountant, to provide non-audit services to the Registrant’s investment advisor (or any entity controlling, controlled by, or under common control with the adviser that provides ongoing services to the Registrant), if the engagement relates directly to the operations and financial reporting of the Registrant, to the extent required by Rule 2-01(c)(7) of Regulation S-X. The Chair of the Audit Committee may grant the pre-approval referenced above for non-prohibited and non-audit services. All such delegated pre-approvals will be presented to the Audit Committee no later than the next Audit Committee meeting.
| Item 5. | Audit Committee of Listed Registrants |
Not Applicable to this Registrant, insofar as the Registrant is not a listed company.
| Item 6. | Schedule of Investments |
See Schedule of Investments in Item 1.
| Item 7. | Disclosure of Proxy Voting Policies and Procedures for Closed-End Management Investment Companies |
Not applicable to this Registrant, insofar as the Registrant is not a closed-end management investment company.
| Item 8. | Portfolio Managers of Closed Investment Companies |
Not applicable to this Registrant, insofar as the Registrant is not a closed-end management investment company.
| Item 9. | Purchase of Equity Securities by Closed-End Management Investment Companies and Affiliated Purchasers |
Not applicable to this Registrant, insofar as the Registrant is not a closed-end management investment company.
| Item 10. | Submission of Matters to a Vote of Security Holders |
There have been no material changes to the procedures by which shareholders may recommend nominees to the Registrant’s Board of Trustees since the Registrant last provided disclosure in response to this item.
Controls and Procedures
(a) The Registrant’s principal executive and principal financial officer, or persons performing similar functions, have concluded that the Registrant’s Disclosure Controls and Procedures (as defined in Rule 30a-3(c) under the Investment Company Act of 1940, as amended (the “1940 Act”) (17 CFR 270.30a-3(c)) are effective, as of a date within 90 days of the filing date of this report that includes the disclosure required by this paragraph, based on their evaluation of these controls and procedures required by Rule 30a-3 (b) under the 1940 Act (17 CFR 270.30a-3(b) and Rules 13a-15(b) or 15d-15(b) under the Exchange Act (17 CFR 240.13a-15(b) or 240.15d-15(b)).
(b) There were no changes in the Registrant’s internal control over financial reporting (as defined in Rule 30a-3(d) under the 1940 Act (17 CFR 270.30a-3(d)) that occurred during the final quarter of the period covered by this report that has materially affected, or is reasonably likely to materially affect, the Registrant’s internal control over financial reporting.
12. (a) (1) Code of Ethics
Not applicable because it is posted on Registrant’s website.
12. (a) (2) (1)
Certification of Principal Executive Officer Required by Rule 30a-2(a) of the Investment Company Act
12. (a) (2) (2)
Certification of Principal Financial Officer Required by Rule 30a-2(a) of the Investment Company Act.
12. (a) (3)
Not applicable to this Registrant.
12. (b)
Certification of Chief Executive Officer and Certification of Chief Financial Officer Required by Rule 30a-2(b) of the Investment Company Act
Pursuant to the requirements of the Securities Exchange Act of 1934 and the Investment Company Act of 1940, the Registrant has duly caused this report to be signed on its behalf by the undersigned, thereunto duly authorized.
| | | William Blair Funds |
| | |
| | | /s/ Michelle R. Seitz |
| By: | | Michelle R. Seitz |
| | | President (Chief Executive Officer) |
Date: February 25, 2016
Pursuant to the requirements of the Securities Exchange Act of 1934 and the Investment Company Act of 1940, this report has been signed below by the following persons on behalf of the Registrant and in the capacities and on the dates indicated.
| | | /s/ Michelle R. Seitz |
| By: | | Michelle R. Seitz |
| | | President (Chief Executive Officer) |
Date: February 25, 2016
| | | /s/ Colette M. Garavalia |
| By: | | Colette M. Garavalia |
| | | Treasurer (Chief Financial Officer) |
Date: February 25, 2016