UNITED STATES
SECURITIES AND EXCHANGE COMMISSION
Washington, D.C. 20549
Form N-CSR
CERTIFIED SHAREHOLDER REPORT OF REGISTERED
MANAGEMENT INVESTMENT COMPANIES
Investment Company Act File Number 811-5344
William Blair Funds
(Exact name of registrant as specified in charter)
| 150 North Riverside Plaza, Chicago, IL | | 60606 |
| (Address of principal executive offices) | | (Zip Code) |
Stephanie G. Braming, Principal Executive Officer
William Blair Funds
150 North Riverside Plaza, Chicago, IL 60606
(Name and address of agent for service)
Registrant’s telephone number, including area code: 312-236-1600
Date of fiscal year end: December 31
Date of reporting period: December 31, 2018
Form N-CSR is to be used by management investment companies to file reports with the Commission not later than 10 days after the transmission to stockholders of any report that is required to be transmitted to stockholders under Rule 30e-1 under the Investment Company Act of 1940 (17 CFR 270.30e-1). The Commission may use the information provided on Form N-CSR in its regulatory, disclosure review, inspection, and policymaking roles.
A registrant is required to disclose the information specified by Form N-CSR, and the Commission will make this information public. A Registrant is not required to respond to the collection of information contained in Form N-CSR unless the form displays a currently valid Office of Management and Budget (“OMB”) control number. Please direct comments concerning the accuracy of the information collection burden estimates and any suggestions for reducing the burden to Secretary, Securities and Exchange Commission, 100 F Street, NE, Washington, DC 20549. The OMB has reviewed this collection of information under the clearance requirements of 44 U.S.C. (ss) 3507.
Item 1. December 31, 2018 Annual Reports transmitted to shareholders.
 | |
| | |
| | |
| | |
| | |
| | December 31, 2018 |
William Blair Funds Annual Report | |
| | IMPORTANT NOTE: Beginning on January 1, 2021, as permitted by regulations adopted by the Securities and Exchange Commission, paper copies of the William Blair Funds’ (the “Funds”) annual and semi-annual shareholder reports will no longer be sent by mail, unless you specifically request paper copies of the shareholder reports from the Funds or from your financial intermediary, such as a broker-dealer or bank. Instead, shareholder reports will be available on the Funds’ website (https://www.williamblairfunds.com/investor_services/prospectus_reports_forms.fs), and you will be notified by mail each time a report is posted and provided with a website link to access the report. If you already elected to receive shareholder reports electronically, you will not be affected by this change and you need not take any action. You may elect to receive shareholder reports and other communications from the Funds electronically by notifying your financial intermediary or, if you are a direct investor, by calling 1-800-635-2886. You may elect to receive all future shareholder reports in paper free of charge. You can inform your financial intermediary that you wish to continue receiving paper copies of your shareholder reports, or if you are a direct investor, by calling 1-800-635-2886. Your election to receive reports in paper will apply to all Funds you hold directly or through your financial intermediary, as applicable. | | |
| | |
| | |
| December 31, 2018 | William Blair Funds | 1 |
The views expressed in the commentary for each Fund reflect those of the portfolio management team only through the end of the period of the report as stated on the cover. The portfolio management team’s views are subject to change at any time based on market and other conditions and should not be construed as a recommendation. Statements involving predictions, assessments, analyses, or outlook for individual securities, industries, market sectors, and/or markets involve risks and uncertainties, and there is no guarantee they will come to pass.
This report is submitted for the general information of the shareholders of William Blair Funds. It is not authorized for distribution to prospective Fund investors unless accompanied or preceded by the Fund’s prospectus. Please carefully consider a Fund’s investment objectives, risks, charges, and expenses before investing. This and other information is contained in the Fund’s prospectus, which you may obtain by calling 1-800-742-7272. Read it carefully before you invest or send money.
| 2 | Annual Report | December 31, 2018 |
Performance as of December 31, 2018—Class N Shares (Unaudited)
| | | | | | | | | 10 yr | | | | Overall |
| | | | | | | | | (or since | | Inception | | Morningstar |
| | | 1 yr | | | 3 yr | | | 5 yr | | | inception) | | Date | | Rating |
| | | | | | | | | | | | | |
| Growth Fund | | | | | | | | | | | | | | | | |
| Class N | | 5.10 | | | 8.97 | | | 7.75 | | | 13.42 | | | 3/20/1946 | | *** |
| Morningstar Large Growth | | (2.09 | ) | | 8.98 | | | 8.16 | | | 13.74 | | | | | Among 1,247 |
| Russell 3000®Growth Index | | (2.12 | ) | | 10.85 | | | 9.99 | | | 15.15 | | | | | Large Growth Funds |
| S&P 500®Index | | (4.38 | ) | | 9.26 | | | 8.49 | | | 13.12 | | | | | |
| | | | | | | | | | | | | | | | | |
| Large Cap Growth Fund | | | | | | | | | | | | | | | | |
| Class N | | 4.96 | | | 11.89 | | | 11.38 | | | 14.77 | | | 12/27/1999 | | ***** |
| Morningstar Large Growth | | (2.09 | ) | | 8.98 | | | 8.16 | | | 13.74 | | | | | Among 1,247 |
| Russell 1000®Growth Index | | (1.51 | ) | | 11.15 | | | 10.40 | | | 15.29 | | | | | Large Growth Funds |
| | | | | | | | | | | | | | | | | |
| Mid Cap Growth Fund | | | | | | | | | | | | | | | | |
| Class N | | (1.20 | ) | | 6.18 | | | 5.14 | | | 12.14 | | | 2/1/2006 | | *** |
| Morningstar Mid-Cap Growth | | (6.65 | ) | | 7.27 | | | 5.61 | | | 13.16 | | | | | Among 542 |
| Russell Midcap®Growth Index | | (4.75 | ) | | 8.59 | | | 7.42 | | | 15.12 | | | | | Mid-Cap Growth Funds |
| | | | | | | | | | | | | | | | | |
| Small-Mid Cap Growth Fund | | | | | | | | | | | | | | | | |
| Class N | | (2.29 | ) | | 10.17 | | | 8.64 | | | 15.51 | | | 12/29/2003 | | **** |
| Morningstar Mid-Cap Growth | | (6.65 | ) | | 7.27 | | | 5.61 | | | 13.16 | | | | | Among 542 |
| Russell 2500TMGrowth Index | | (7.47 | ) | | 8.11 | | | 6.19 | | | 14.76 | | | | | Mid-Cap Growth Funds |
| | | | | | | | | | | | | | | | | |
| Small-Mid Cap Value Fund | | | | | | | | | | | | | | | | |
| Class N | | (15.32 | ) | | 3.85 | | | 2.58 | | | 8.79 | | | 12/15/2011 | | *** |
| Morningstar Small Blend | | (12.72 | ) | | 5.90 | | | 3.20 | | | — | | | | | Among 644 |
| Russell 2500TMValue Index | | (12.36 | ) | | 6.59 | | | 4.16 | | | 10.57 | | | | | Small Blend Funds |
| | | | | | | | | | | | | | | | | |
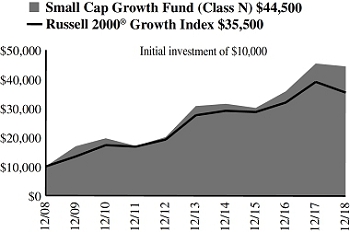
| Small Cap Growth Fund | | | | | | | | | | | | | | | | |
| Class N | | (2.14 | ) | | 13.81 | | | 7.65 | | | 16.11 | | | 12/27/1999 | | ***** |
| Morningstar Small Growth | | (5.76 | ) | | 8.47 | | | 5.12 | | | 13.36 | | | | | Among 583 |
| Russell 2000®Growth Index | | (9.31 | ) | | 7.24 | | | 5.13 | | | 13.52 | | | | | Small Growth Funds |
| | | | | | | | | | | | | | | | | |
| Small Cap Value Fund | | | | | | | | | | | | | | | | |
| Class N | | (15.93 | ) | | 4.50 | | | 2.36 | | | 10.44 | | | 12/23/1996 | | ** |
| Morningstar Small Blend | | (12.72 | ) | | 5.90 | | | 3.20 | | | 11.60 | | | | | Among 644 |
| Russell 2000®Value Index | | (12.86 | ) | | 7.37 | | | 3.61 | | | 10.40 | | | | | Small Blend Funds |
| | | | | | | | | | | | | | | | | |
| Global Leaders Fund | | | | | | | | | | | | | | | | |
| Class N | | (8.23 | ) | | 6.36 | | | 5.05 | | | 11.48 | | | 10/15/2007 | | **** |
| Morningstar World Large Stock | | (9.64 | ) | | 5.69 | | | 3.72 | | | 9.33 | | | | | Among 729 |
| MSCI ACW IMI (net) | | (10.08 | ) | | 6.49 | | | 4.17 | | | 9.74 | | | | | World Large Stock Funds |
| | | | | | | | | | | | | | | | | |
| International Leaders Fund | | | | | | | | | | | | | | | | |
| Class N | | (12.70 | ) | | 4.52 | | | 3.33 | | | 6.71 | | | 8/16/2012 | | **** |
| Morningstar Foreign Large Growth | | (14.08 | ) | | 3.21 | | | 1.38 | | | — | | | | | Among 364 |
| MSCI ACW Ex-U.S. IMI (net) | | (14.76 | ) | | 4.39 | | | 0.85 | | | 4.37 | | | | | Foreign Large Growth Funds |
| December 31, 2018 | William Blair Funds | 3 |
Performance as of December 31, 2018—Class N Shares (Unaudited)—continued
| | | | | | | | | 10 yr | | | | Overall |
| | | | | | | | | (or since | | Inception | | Morningstar |
| | | 1 yr | | | 3 yr | | | 5 yr | | | inception) | | Date | | Rating |
| | | | | | | | | | | | | |
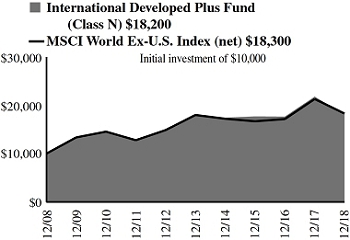
| International Developed Plus Fund | | | | | | | | | | | | | | | | |
| Class N | | (16.68 | ) | | 0.85 | | | 0.18 | | | 6.16 | | | 5/24/2004 | | ** |
| Morningstar Foreign Large Growth | | (14.08 | ) | | 3.21 | | | 1.38 | | | 7.43 | | | | | Among 364 |
| MSCI World Ex-U.S. Index (net) | | (14.09 | ) | | 3.11 | | | 0.34 | | | 6.24 | | | | | Foreign Large Growth Funds |
| | | | | | | | | | | | | | | | | |
| International Growth Fund | | | | | | | | | | | | | | | | |
| Class N | | (18.00 | ) | | 0.93 | | | (0.14 | ) | | 7.84 | | | 10/1/1992 | | *** |
| Morningstar Foreign Large Growth | | (14.08 | ) | | 3.21 | | | 1.38 | | | 7.43 | | | | | Among 364 |
| MSCI ACW Ex-U.S. IMI (net) | | (14.76 | ) | | 4.39 | | | 0.85 | | | 6.97 | | | | | Foreign Large Growth Funds |
| | | | | | | | | | | | | | | | | |
| International Small Cap Growth Fund | | | | | | | | | | | | | | | | |
| Class N | | (24.48 | ) | | (1.62 | ) | | (0.89 | ) | | 9.70 | | | 11/1/2005 | | ** |
| Morningstar Foreign Small/Mid Growth | | (18.34 | ) | | 2.73 | | | 2.11 | | | 10.87 | | | | | Among 109 |
| MSCI ACW Ex-U.S. Small Cap Index (net) | | (18.20 | ) | | 3.82 | | | 1.96 | | | 10.02 | | | | | Foreign Small/Mid Growth Funds |
| | | | | | | | | | | | | | | | | |
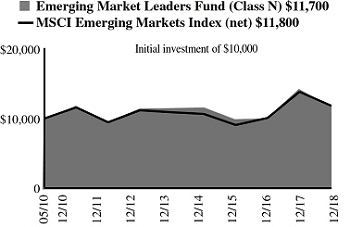
| Emerging Markets Leaders Fund | | | | | | | | | | | | | | | | |
| Class N | | (17.73 | ) | | 5.74 | | | 0.63 | | | 1.87 | | | 5/3/2010 | | *** |
| Morningstar Diversified Emerging Markets | | (16.07 | ) | | 6.99 | | | 0.53 | | | — | | | | | Among 708 |
| MSCI Emerging Markets Index (net) | | (14.58 | ) | | 9.25 | | | 1.65 | | | 1.95 | | | | | Diversified Emerging Markets Funds |
| | | | | | | | | | | | | | | | | |
| Emerging Markets Growth Fund | | | | | | | | | | | | | | | | |
| Class N | | (21.61 | ) | | 5.72 | | | 0.75 | | | 8.44 | | | 6/6/2005 | | *** |
| Morningstar Diversified Emerging Markets | | (16.07 | ) | | 6.99 | | | 0.53 | | | 7.61 | | | | | Among 708 |
| MSCI Emerging Markets IMI (net) | | (15.05 | ) | | 8.51 | | | 1.56 | | | 8.24 | | | | | Diversified Emerging Markets Funds |
| | | | | | | | | | | | | | | | | |
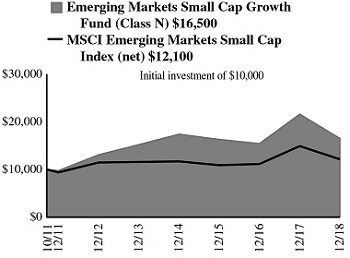
| Emerging Markets Small Cap Growth Fund | | | | | | | | | | | | | | | | |
| Class N | | (23.57 | ) | | 0.45 | | | 1.65 | | | 7.22 | | | 10/24/2011 | | *** |
| Morningstar Diversified Emerging Markets | | (16.07 | ) | | 6.99 | | | 0.53 | | | — | | | | | Among 708 |
| MSCI Emerging Markets Small Cap Index (net) | | (18.59 | ) | | 3.68 | | | 0.95 | | | 2.72 | | | | | Diversified Emerging Markets Funds |
| | | | | | | | | | | | | | | | | |
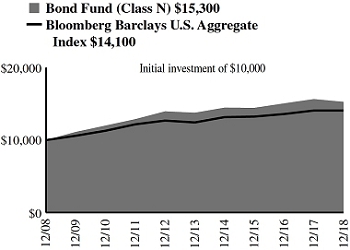
| Bond Fund | | | | | | | | | | | | | | | | |
| Class N | | (2.42 | ) | | 1.89 | | | 2.09 | | | 4.31 | | | 5/1/2007 | | *** |
| Morningstar Intermediate-Term Bond | | (0.50 | ) | | 2.15 | | | 2.27 | | | 4.31 | | | | | Among 876 |
| Bloomberg Barclays U.S. Aggregate Index | | 0.01 | | | 2.06 | | | 2.52 | | | 3.48 | | | | | Intermediate-Term Bond Funds |
| | | | | | | | | | | | | | | | | |
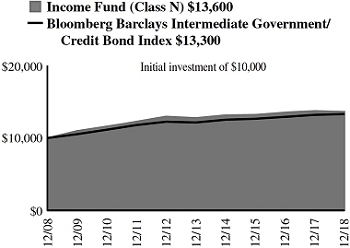
| Income Fund | | | | | | | | | | | | | | | | |
| Class N | | (0.86 | ) | | 1.00 | | | 1.29 | | | 3.15 | | | 10/1/1990 | | *** |
| Morningstar Short-Term Bond | | 0.92 | | | 1.66 | | | 1.25 | | | 2.65 | | | | | Among 472 |
| Bloomberg Barclays Intermediate Government/Credit Bond Index | | 0.88 | | | 1.70 | | | 1.86 | | | 2.90 | | | | | Short-Term Bond Funds |
| 4 | Annual Report | December 31, 2018 |
Performance as of December 31, 2018—Class N Shares (Unaudited)—continued
| | | | | | | | | 10 yr | | | | Overall |
| | | | | | | | | (or since | | Inception | | Morningstar |
| | | 1 yr | | | 3 yr | | | 5 yr | | | inception) | | Date | | Rating |
| | | | | | | | | | | | | |
| Low Duration Fund | | | | | | | | | | | | |
| Class N | | 0.80 | | | 0.94 | | | 0.80 | | | 1.01 | | | 12/1/2009 | | ** |
| Morningstar Ultrashort Bond | | 1.61 | | | 1.47 | | | 0.99 | | | — | | | | | Among 145 |
| Bank of America Merrill Lynch 1-Year U.S. Treasury Note Index | | 1.86 | | | 1.06 | | | 0.70 | | | 0.58 | | | | | Ultrashort Bond Funds |
| | | | | | | | | | | | | | | | | |
| Macro Allocation Fund | | | | | | | | | | | | | | | | |
| Class N | | (1.30 | ) | | 1.89 | | | 0.34 | | | 4.31 | | | 11/29/2011 | | *** |
| Morningstar Multialternative | | (4.03 | ) | | 1.30 | | | 0.67 | | | — | | | | | Among 290 |
| Bank of America Merrill Lynch 3-Month U.S. Treasury Bill Index | | 1.87 | | | 1.02 | | | 0.63 | | | 0.47 | | | | | Multialternative Funds |
Performance cited represents past performance. Past performance does not guarantee future results and current performance may be lower or higher than the data quoted.Results shown are average annual total returns, which assume reinvestment of dividends and capital gains. Investment returns and principal will fluctuate and you may have a gain or a loss when you sell shares.For the most current month-end performance information, please call 1-800-742-7272, or visit our Web site atwww.williamblairfunds.com. From time to time, the investment adviser may waive fees or reimburse expenses for the Fund. Without these waivers, performance would be lower. Investing in smaller companies involves special risks, including higher volatility and lower liquidity. International and emerging markets investing involves special risk considerations, including currency fluctuations, lower liquidity, economic and political risk. As interest rates rise, bond prices will typically fall and bond funds may become more volatile.Class N shares are available to the general public without a sales load.
Morningstar RatingsTM are as of 12/31/2018 and are subject to change every month. The ratings are based on a risk-adjusted return measure that accounts for variation in a fund’s monthly performance, placing more emphasis on downward variations and rewarding consistent performance. The top 10% of funds in each Category receive 5 stars, the next 22.5% receive 4 stars, the middle 35% receive 3 stars, the next 22.5% receive 2 stars, and the bottom 10% receive 1 star. The Overall Morningstar Rating for a fund is derived from a weighted-average of the performance figures associated with its three-, five- and ten-year (if applicable) Morningstar Rating metrics. The 3/5/10 year Morningstar ratings were as follows: Growth Fund ***/***/*** and Large Cap Growth Fund *****/*****/**** out of 1,247/1,107/799 large growth funds; Mid Cap Growth Fund ***/***/*** and Small-Mid Cap Growth Fund ****/****/**** out of 542/489/341 mid-cap growth funds; Small Cap Growth Fund *****/*****/****, out of 583/516/391 small growth funds; Small-Mid Cap Value Fund **/***/NA and Small Cap Value Fund **/**/** out of 644/541/393 small blend funds; Global Leaders Fund ***/****/**** out of 729/618/360 world large stock funds; International Developed Plus Fund **/**/**, International Growth Fund **/**/***, and International Leaders Fund ****/****/NA out of 364/315/228 foreign large growth funds; International Small Cap Growth Fund */**/*** out of 109/95/59 foreign small/mid growth funds; Emerging Markets Leaders Fund **/***/****, Emerging Markets Growth Fund **/***/****, and Emerging Markets Small Cap Growth */****/NA out of 708/533/238 diversified emerging markets funds; Bond Fund ***/***/*** out of 876/767/560 intermediate-term bond funds; Income Fund **/***/**** out of 472/405/263 short-term bond funds; Low Duration Fund **/**/NA out of 145/122/NA ultrashort bond funds; and Macro Allocation Fund ***/***/NA out of 290/179/NA multialternative funds.
Please carefully consider a Fund’s investment objectives, risks, charges, and expenses before investing. This and other information is contained in the Fund’s prospectus, which you may obtain by calling 1-800-742-7272. Read it carefully before you invest or send money.
| December 31, 2018 | William Blair Funds | 5 |
U.S. Growth Market Review and Outlook
Substantially negative fourth quarter equity returns erased prior 2018 gains and U.S. equity indices ended the year in negative territory. Larger cap indices fared better than small-cap indices, as the S&P 500 Index narrowly avoided bear market territory and the Russell 2000 Index declined more than 20% from its 2018 peak.
After starting the year with a continuation of 2017 strength, the market sold off and volatility spiked amid concerns of the economy overheating, rising input costs and elevated valuations. Following the selloff in the first quarter, rising equity returns for the second and third quarters were primarily driven by strong corporate earnings coupled with modest valuation expansion as investor confidence in the durability of the U.S. economic expansion increased. Investors appeared to largely dismiss concerns about an escalating trade war with China and a flattening yield curve, which has sometimes preceded an economic slowdown. Through the first three quarters of 2018, returns for U.S. growth indices were robust and many ended the third quarter at or near all-time highs.
In a sharp reversal, equities declined in the fourth quarter as risks that had been opaque came into focus. This was at least partially triggered by Federal Reserve (the “Fed”) Chairman Powell’s comments in October that the federal funds rate was “a long way from neutral.” Fundamentally, corporate earnings trends continued to be positive, supported by corporate tax cuts and a healthy U.S. economy. Companies in the S&P 500 Index, in aggregate, posted year-over-year earnings growth in excess of 25% for the third consecutive quarter. However, consensus estimates for fourth quarter and 2019 earnings growth were revised downward and valuation multiples contracted significantly. At the same time, oil prices collapsed and the yield curve flattened further. At the core of the reversal in market sentiment was investor concern surrounding U.S. political dysfunction, unresolved trade tensions with China, monetary tightening by the Fed, softer housing market data and a weaker economic backdrop outside of the U.S. As market participants focused on this expanding list of uncertainties, volatility rose and equity prices declined markedly, eliminating prior 2018 gains.
After nearly a decade of economic and stock market expansion, investor focus appears to have shifted toward risks that could derail these expansions. Notably, after raising the federal funds rate four times in 2018, the Fed has communicated the potential for additional increases in 2019, while at the same time continuing to shrink its balance sheet, further tightening monetary policy. If too aggressive, both actions could provide a headwind to growth in 2019, most notably in housing where higher mortgage rates could impact home sales. Also prominent is the risk of continued political uncertainty, both in the U.S. and abroad. 2018 ended with a partial shutdown of the federal government, emblematic of the political gridlock that could continue into 2019 given the balance of power in Congress. Moreover, uncertainty with respect to Chinese tariff negotiations could thwart corporate productivity in the U.S., while escalation to an all-out trade war would have significant ramifications on global growth.
In reflection of the concerns above, U.S. equity market valuation multiples contracted significantly during the fourth quarter. At the same time, consensus earnings growth estimates were revised downward, likely in anticipation of a deceleration in U.S. economic growth, fading fiscal stimulus and pressure on margins including higher interest rates, input prices and wages. That being said, positive profit growth is still expected for 2019, albeit at a more moderate pace than the strong earnings growth witnessed in the first three quarters of 2018. While volatility may persist, the reset in both valuations and investor expectations leaves the market with room for upside in the event of positive surprises on the China trade front or an eventual pause in the Fed interest rate hike cycle. We continue to focus our efforts on identifying durable businesses with sustainable growth opportunities that are underappreciated by the market. We believe a portfolio of companies with these characteristics will be rewarded in a variety of economic and market environments.
| 6 | Annual Report | December 31, 2018 |
U.S. Value Market Review and Outlook
Sharply negative fourth quarter equity returns erased prior 2018 gains and U.S. equity indices ended the year in negative territory. Larger cap indices fared better than small- or mid cap-indices as the S&P 500 Index narrowly avoided bear market territory and the Russell 2000 Index declined more than 20% from its 2018 peak.
After a start to the year that included a spike in volatility amid concerns about rising input costs and elevated valuations, returns for the second and third quarters reflected a healthy domestic economy and strong corporate performance. Investors appeared to largely dismiss concerns about an escalating trade war and a flattening yield curve, which has sometimes preceded an economic slowdown.
In a sharp reversal, equities declined dramatically in the fourth quarter. The market selloff was initially triggered by concerns about rising interest rates and inflationary pressure; risks that had previously been disregarded were now being priced into the market. Fundamentally, corporate earnings trends continued to be positive, supported by corporate tax cuts and a healthy U.S. economy. However, over the course of the fourth quarter, concerns that growth may have peaked overshadowed another solid corporate earnings period as consensus estimates for fourth quarter and 2019 earnings growth were revised downward and valuation multiples contracted significantly. At the same time, oil prices collapsed, the yield curve flattened further, and investors worried that softer than expected housing data may be the canary in the coal mine and indicate future weakness in the domestic economy. At the core of the reversal in market sentiment was investor concern surrounding continued and increasing U.S. political dysfunction, unresolved trade tensions with China, continued monetary tightening by the Federal Reserve (the “Fed”), and a weaker economic backdrop outside of the U.S. As market participants focused in on this expanding list of uncertainties, volatility rose and equity prices declined markedly, wiping out prior 2018 gains.
After nearly a decade of economic and stock market expansion, investor focus appears to have shifted back toward risks that could derail these expansions. Notably, after raising the federal funds rate four times in 2018, the Fed has communicated the potential for additional increases in 2019, while at the same time continuing to shrink its balance sheet, further tightening monetary policy. If too aggressive, both actions could provide a headwind to growth in 2019. Also prominent is the risk of continued political uncertainty, both in the U.S. and abroad. 2018 ended with a partial shutdown of the federal government, emblematic of the political gridlock that could continue into 2019 given the balance of power in Congress. Moreover, uncertainty with respect to Chinese tariff negotiations could thwart corporate productivity in the U.S. Likewise, escalation to an all-out trade war would have significant ramifications on domestic and global growth.
In reflection of the concerns above, U.S. equity market valuation multiples contracted significantly during the fourth quarter. At the same time, consensus earnings growth estimates were revised downward, likely in anticipation of a deceleration in U.S. economic growth, fading fiscal stimulus, and risks to margins including higher interest rates, input prices and wages. That being said, positive profit growth is still expected for 2019, albeit at a more moderate pace than previously witnessed in the first three quarters of 2018. Despite the absence of deterioration in fundamentals, valuation multiples and expectations have come down, leaving us constructive on equity markets as we look ahead. We continue to be concerned about rising input costs and are focused on owning companies that have pricing power and are able to mitigate inflationary pressures via new products and price increases. As always, our focus remains on identifying quality companies at discount prices and corporate transformation opportunities, and we continue to find good ideas across sectors. Given our investment approach, we believe the portfolio is well-suited to withstand a variety of market scenarios and add value over the long term.
| December 31, 2018 | William Blair Funds | 7 |
| | Growth Fund |
| | |
| | The Growth Fund seeks long-term capital appreciation. |
| | |
| | AN OVERVIEW FROM THE PORTFOLIO MANAGER |
| | |

David C. Fording | The William Blair Growth Fund (Class N shares) posted a 5.10% increase, net of fees, for the twelve months ended December 31, 2018. By comparison, the Fund’s benchmark index, the Russell 3000® Growth Index (the “Index”), decreased 2.12%. For the year, the Fund materially outperformed the Index driven by both positive stock selection and a style tailwind. Stock selection was positive across many sectors, but was most pronounced in Information Technology and Health Care. Within Information Technology, a top contributor to the Fund’s performance was Red Hat, Inc., which announced in the fourth quarter that it was being acquired by International Business Machines Corporation (IBM). Mastercard, Inc. and Microsoft Corporation were also top contributors within Information Technology. Within Health Care, Veeva Systems, Inc., a cloud-based software and data solutions provider primarily for the life sciences industry, was the top contributor due to accelerated growth within its content management software solution called “Vault,” an increasingly significant source of revenue for the company. Animal healthcare company Zoetis, Inc. was also a top contributor within the sector. From a style perspective, the Fund’s higher valuation exposure, driven by a bias for companies with higher and more sustainable growth, was a tailwind. In terms of detractors, BWX Technologies, Inc., the sole-source provider of nuclear propulsion systems for the U.S. Navy, was the top detractor for the year after the company disclosed new information that indicated a materially longer build time for naval nuclear power units than was previously appreciated by investors broadly. Weight Watchers International, Inc., a global wellness and weight management company, was also a top detractor primarily due to lower-than-expected revenue growth late in the year. Other top detractors were Hilton Grand Vacations, Inc. (Consumer Discretionary), Monster Beverage Corporation (Consumer Staples) and Raytheon Co. (Industrials). Please refer to the U.S. Growth Market Review and Outlook relating to the Fund on page 6. |
| 8 | Annual Report | December 31, 2018 |
Growth Fund
Performance Highlights (Unaudited)
| Average Annual Total Return through 12/31/2018 |
| | | 1 Year | | 3 Year | | 5 Year | | 10 Year |
| Class N | | | 5.10 | % | | | 8.97 | % | | | 7.75 | % | | | 13.42 | % |
| Class I | | | 5.42 | | | | 9.28 | | | | 8.09 | | | | 13.78 | |
| Russell 3000®Growth Index | | | (2.12 | ) | | | 10.85 | | | | 9.99 | | | | 15.15 | |
| S&P 500®Index | | | (4.38 | ) | | | 9.26 | | | | 8.49 | | | | 13.12 | |
Performance cited represents past performance. Past performance does not guarantee future results and current performance may be lower or higher than the data quoted. Results shown are average annual returns, which assume reinvestment of dividends and capital gains. Investment returns and principal will fluctuate and you may have a gain or loss when you sell shares. For the most current month-end performance information, please call 1-800-742-7272, or visit our Web site atwww.williamblairfunds.com. From time to time, the investment adviser may waive fees or reimburse expenses for the Fund. Without these waivers/reimbursements, performance would be lower. Class N shares are available to the general public without a sales load. Class I shares are available to certain institutional investors, and advisory clients of William Blair & Company, L.L.C., without a sales load or distribution (12b-1) or service fees.
The performance highlights and graph presented above do not reflect the deduction of taxes that a shareholder would pay on fund distributions or the redemption of fund shares.
The Russell 3000®Growth Index consists of large, medium, and small capitalization companies with above average price-to-book ratios and forecasted growth rates. The index is weighted by market capitalization and large/medium/small companies make up approximately 80%/15%/5% of the index.
The S&P 500®Index indicates broad larger capitalization equity market performance.
This report identifies the Fund’s investments on December 31, 2018. These holdings are subject to change. Not all stocks in the Fund performed the same, nor is there any guarantee that these stocks will perform as well in the future. Market forecasts provided in this report may not necessarily come to pass.
Sector Diversification (Unaudited)

The sector diversification shown is based on the total long-term securities.
| December 31, 2018 | William Blair Funds | 9 |
Growth Fund
Portfolio of Investments, December 31, 2018(all dollar amounts in thousands)
| | | | | | | | |
| | | | | | | | |
| | Issuer | | Shares | | | Value | |
| | | | | | | | | | |
| | Common Stocks | | | | | | | | |
| | Information Technology—29.2% | | | | | | | | |
| * | Adobe Systems, Inc. | | | 14,192 | | | $ | 3,211 | |
| * | Arista Networks, Inc. | | | 7,902 | | | | 1,665 | |
| | Booz Allen Hamilton Holding Corporation | | | 74,895 | | | | 3,376 | |
| | Dolby Laboratories, Inc. | | | 53,623 | | | | 3,316 | |
| | Genpact, Ltd.† | | | 85,233 | | | | 2,300 | |
| * | Guidewire Software, Inc. | | | 17,740 | | | | 1,423 | |
| | Mastercard, Inc. Class “A” | | | 49,027 | | | | 9,249 | |
| * | MaxLinear, Inc. | | | 92,329 | | | | 1,625 | |
| | Microsoft Corporation | | | 170,547 | | | | 17,322 | |
| | National Instruments Corporation | | | 47,253 | | | | 2,144 | |
| * | Pure Storage, Inc. | | | 173,917 | | | | 2,797 | |
| * | Red Hat, Inc. | | | 26,304 | | | | 4,620 | |
| * | Rogers Corporation | | | 10,725 | | | | 1,062 | |
| | Sabre Corporation | | | 148,371 | | | | 3,211 | |
| | Texas Instruments, Inc. | | | 40,399 | | | | 3,818 | |
| * | Worldpay, Inc. Class “A” | | | 62,993 | | | | 4,815 | |
| | | | | | | | | 65,954 | |
| | Consumer Discretionary—17.1% | | | | | | | | |
| * | Amazon.com, Inc. | | | 9,273 | | | | 13,928 | |
| * | Burlington Stores, Inc. | | | 20,643 | | | | 3,358 | |
| | Domino’s Pizza, Inc. | | | 10,402 | | | | 2,580 | |
| * | Grand Canyon Education, Inc. | | | 31,045 | | | | 2,985 | |
| * | Hilton Grand Vacations, Inc. | | | 85,314 | | | | 2,251 | |
| * | Laureate Education, Inc. | | | 132,680 | | | | 2,022 | |
| | Starbucks Corporation | | | 69,267 | | | | 4,461 | |
| * | Ulta Salon Cosmetics & Fragrance, Inc. | | | 16,531 | | | | 4,047 | |
| | Vail Resorts, Inc. | | | 5,483 | | | | 1,156 | |
| * | Weight Watchers International, Inc. | | | 46,285 | | | | 1,784 | |
| | | | | | | | | 38,572 | |
| | Health Care—14.8% | | | | | | | | |
| | Agilent Technologies, Inc. | | | 50,559 | | | | 3,411 | |
| * | Codexis, Inc. | | | 77,331 | | | | 1,291 | |
| * | Inogen, Inc. | | | 8,467 | | | | 1,051 | |
| * | Ligand Pharmaceuticals, Inc. | | | 7,741 | | | | 1,051 | |
| * | Portola Pharmaceuticals, Inc. | | | 45,076 | | | | 880 | |
| | Stryker Corporation | | | 28,707 | | | | 4,500 | |
| | Teleflex, Inc. | | | 12,660 | | | | 3,272 | |
| | UnitedHealth Group, Inc. | | | 38,786 | | | | 9,662 | |
| * | Veeva Systems, Inc. | | | 25,884 | | | | 2,312 | |
| | West Pharmaceutical Services, Inc. | | | 22,611 | | | | 2,217 | |
| | Zoetis, Inc. | | | 42,576 | | | | 3,642 | |
| | | | | | | | | 33,289 | |
| | Industrials—11.4% | | | | | | | | |
| | BWX Technologies, Inc. | | | 102,102 | | | | 3,903 | |
| * | Copart, Inc. | | | 86,765 | | | | 4,146 | |
| * | CoStar Group, Inc. | | | 10,338 | | | | 3,487 | |
| | Healthcare Services Group, Inc. | | | 62,655 | | | | 2,518 | |
| | Luxfer Holdings plc† | | | 55,075 | | | | 971 | |
| | Raytheon Co. | | | 30,723 | | | | 4,711 | |
| * | The Middleby Corporation | | | 25,481 | | | | 2,618 | |
| * | Verisk Analytics, Inc. | | | 29,690 | | | | 3,237 | |
| | | | | | | | | 25,591 | |
| | | | | | | | |
| | | | | | | | |
| | Issuer | | Shares | | | Value | |
| | | | | | | | | | |
| | Common Stocks—(continued) | | | | | | | | |
| | Communication Services—9.8% | | | | | | | | |
| | Activision Blizzard, Inc. | | | 55,397 | | | $ | 2,580 | |
| * | Alphabet, Inc. Class “A” | | | 14,805 | | | | 15,471 | |
| * | Cars.com, Inc. | | | 46,850 | | | | 1,007 | |
| * | Live Nation Entertainment, Inc. | | | 62,977 | | | | 3,101 | |
| | | | | | | | | 22,159 | |
| | Consumer Staples—6.8% | | | | | | | | |
| | Costco Wholesale Corporation | | | 22,820 | | | | 4,649 | |
| | The Coca-Cola Co. | | | 148,775 | | | | 7,044 | |
| | The Estee Lauder Cos., Inc. Class “A” | | | 28,707 | | | | 3,735 | |
| | | | | | | | | 15,428 | |
| | Financials—5.7% | | | | | | | | |
| | East West Bancorp, Inc. | | | 34,351 | | | | 1,496 | |
| * | Encore Capital Group, Inc. | | | 52,817 | | | | 1,241 | |
| | Intercontinental Exchange, Inc. | | | 90,152 | | | | 6,791 | |
| | The Progressive Corporation | | | 55,478 | | | | 3,347 | |
| | | | | | | | | 12,875 | |
| | Materials—4.1% | | | | | | | | |
| | Ball Corporation | | | 111,762 | | | | 5,139 | |
| | Linde plc† | | | 26,368 | | | | 4,114 | |
| | | | | | | | | 9,253 | |
| | Energy—0.9% | | | | | | | | |
| | Cameco Corporation† | | | 182,626 | | | | 2,073 | |
| | Total Common Stocks—99.8%
(cost $170,713) | | | | | | | 225,194 | |
| | Total Investments—99.8%
(cost $170,713) | | | | | | | 225,194 | |
| | Cash and other assets, less liabilities—0.2% | | | | | | | 482 | |
| | Net assets—100.0% | | | | | | $ | 225,676 | |
* = Non-income producing security
† = U.S. listed foreign security
See accompanying Notes to Financial Statements.
| 10 | Annual Report | December 31, 2018 |
| | Large Cap Growth Fund |
| | |
| | The Large Cap Growth Fund seeks long-term capital appreciation. |
| | |
| | AN OVERVIEW FROM THE PORTFOLIO MANAGERS |
| | |

James S. Golan 
David P. Ricci | The William Blair Large Cap Growth Fund (Class N shares) posted a 4.96% increase, net of fees, for the twelve months ended December 31, 2018. By comparison, the Fund’s benchmark index, the Russell 1000®Growth Index (the “Index”), decreased 1.51%. For the year, the Fund materially outperformed the Index driven by both strong stock selection and a style tailwind. Stock selection was positive across many sectors, but was most pronounced in Information Technology, Health Care and Consumer Discretionary. Within Information Technology, a top contributor to the Fund’s performance was open source software provider Red Hat, Inc., which announced in the fourth quarter that it was being acquired by International Business Machines Corporation (IBM). Mastercard, Inc. and Adobe Systems, Inc. were other top contributors within Information Technology. Within Health Care, animal healthcare company Zoetis, Inc. was a top contributor after reporting solid business results throughout the year. Within Consumer Discretionary, Amazon.com was a top contributor. From a style perspective, the Fund’s higher valuation exposure, driven by a bias for companies with higher and more sustainable growth, was a tailwind. In terms of detractors, Monster Beverage Corporation was the top detractor for the year as the company underperformed early in the year due to international distributors reducing inventory and later in the year as gross margins came under pressure from higher input and transportation costs. Video game retailer Activision Blizzard, Inc., was also a top detractor as shares declined after management reaffirmed full-year guidance, which disappointed investors who were anticipating a strong beat and raise from the company. Other top detractors were Raytheon Co. (Industrials), SBA Communications Corporation (Real Estate) and Equifax, Inc. (Industrials). Please refer to the U.S. Growth Market Review and Outlook relating to the Fund on page 6. |
| December 31, 2018 | William Blair Funds | 11 |
Large Cap Growth Fund
Performance Highlights (Unaudited)
| Average Annual Total Return through 12/31/2018 |
| | | 1 Year | | 3 Year | | 5 Year | | 10 Year |
| Class N | | | 4.96 | % | | | 11.89 | % | | | 11.38 | % | | | 14.77 | % |
| Class I | | | 5.21 | | | | 12.19 | | | | 11.67 | | | | 15.06 | |
| Russell 1000®Growth Index | | | (1.51 | ) | | | 11.15 | | | | 10.40 | | | | 15.29 | |
Performance cited represents past performance. Past performance does not guarantee future results and current performance may be lower or higher than the data quoted. Results shown are average annual total returns, which assume reinvestment of dividends and capital gains. Investment returns and principal will fluctuate and you may have a gain or loss when you sell shares. For the most current month-end performance information, please call 1-800-742-7272, or visit our Web site atwww.williamblairfunds.com. From time to time, the investment adviser may waive fees or reimburse expenses for the Fund. Without these waivers/reimbursements, performance would be lower. Class N shares are available to the general public without a sales load. Class I shares are available to certain institutional investors, and advisory clients of William Blair & Company, L.L.C., without a sales load or distribution (12b-1) or service fees.
The performance highlights and graph presented above do not reflect the deduction of taxes that a shareholder would pay on fund distributions or the redemption of fund shares.
The Russell 1000®Growth Index consists of large capitalization companies with above average price-to-book ratios and forecasted growth rates.
This report identifies the Fund’s investments on December 31, 2018. These holdings are subject to change. Not all stocks in the Fund performed the same, nor is there any guarantee that these stocks will perform as well in the future. Market forecasts provided in this report may not necessarily come to pass.
Sector Diversification (Unaudited)
The sector diversification shown is based on the total long-term securities.
| 12 | Annual Report | December 31, 2018 |
Large Cap Growth Fund
Portfolio of Investments, December 31, 2018(all dollar amounts in thousands)
| | | | | | | | |
| | | | | | | | |
| | Issuer | | Shares | | | Value | |
| | | | | | | | | | |
| | Common Stocks | | | | | | | | |
| | Information Technology—28.2% | | | | | | | | |
| | Accenture plc† | | | 42,210 | | | $ | 5,952 | |
| * | Adobe, Inc. | | | 20,150 | | | | 4,559 | |
| | Intuit, Inc. | | | 25,540 | | | | 5,028 | |
| | Mastercard, Inc. | | | 29,390 | | | | 5,544 | |
| | Microsoft Corporation | | | 147,010 | | | | 14,932 | |
| * | PayPal Holdings, Inc. | | | 65,410 | | | | 5,500 | |
| * | Red Hat, Inc. | | | 24,480 | | | | 4,300 | |
| | Texas Instruments, Inc. | | | 49,370 | | | | 4,665 | |
| | | | | | | | | 50,480 | |
| | Health Care—17.0% | | | | | | | | |
| | Abbott Laboratories | | | 58,830 | | | | 4,255 | |
| * | ABIOMED, Inc. | | | 8,550 | | | | 2,779 | |
| * | Biogen, Inc. | | | 5,530 | | | | 1,664 | |
| | Stryker Corporation | | | 32,210 | | | | 5,049 | |
| | UnitedHealth Group, Inc. | | | 34,150 | | | | 8,507 | |
| * | Veeva Systems, Inc. | | | 28,390 | | | | 2,536 | |
| | Zoetis, Inc. | | | 66,550 | | | | 5,693 | |
| | | | | | | | | 30,483 | |
| | Communication Services—13.8% | | | | | | | | |
| | Activision Blizzard, Inc. | | | 77,350 | | | | 3,602 | |
| * | Alphabet, Inc. Class “A” | | | 9,150 | | | | 9,561 | |
| * | Alphabet, Inc. Class “C” | | | 3,986 | | | | 4,128 | |
| * | Live Nation Entertainment, Inc. | | | 81,540 | | | | 4,016 | |
| * | Netflix, Inc. | | | 12,710 | | | | 3,402 | |
| | | | | | | | | 24,709 | |
| | Consumer Discretionary—12.7% | | | | | | | | |
| * | Amazon.com, Inc. | | | 8,750 | | | | 13,142 | |
| | McDonald’s Corporation | | | 28,900 | | | | 5,132 | |
| | Starbucks Corporation | | | 68,830 | | | | 4,433 | |
| | | | | | | | | 22,707 | |
| | Industrials—11.0% | | | | | | | | |
| * | Copart, Inc. | | | 106,650 | | | | 5,096 | |
| | Equifax, Inc. | | | 25,790 | | | | 2,402 | |
| | Fortive Corporation | | | 42,130 | | | | 2,850 | |
| | Raytheon Co. | | | 33,060 | | | | 5,070 | |
| * | Verisk Analytics, Inc. | | | 38,960 | | | | 4,248 | |
| | | | | | | | | 19,666 | |
| | Consumer Staples—7.0% | | | | | | | | |
| * | Monster Beverage Corporation | | | 98,990 | | | | 4,872 | |
| | The Coca-Cola Co. | | | 88,330 | | | | 4,183 | |
| | The Estee Lauder Cos., Inc. Class “A” | | | 25,880 | | | | 3,367 | |
| | | | | | | | | 12,422 | |
| | Financials—5.5% | | | | | | | | |
| | Intercontinental Exchange, Inc. | | | 70,290 | | | | 5,295 | |
| | The Progressive Corporation | | | 76,580 | | | | 4,620 | |
| | | | | | | | | 9,915 | |
| | Issuer | | Shares or
Principal
Amount | | | Value | |
| | | | | | | | | | |
| | Common Stocks—(continued) | | | | | | | | |
| | Materials—3.0% | | | | | | | | |
| | Linde plc† | | | 33,860 | | | $ | 5,284 | |
| | Energy—0.9% | | | | | | | | |
| | EOG Resources, Inc. | | | 19,300 | | | | 1,683 | |
| | Total Common Stocks—99.1%
(cost $140,407) | | | | | | | 177,349 | |
| | | | | | | | | | |
| | Repurchase Agreement | | | | | | | | |
| | Fixed Income Clearing Corporation, 0.500% dated 12/31/18, due 1/2/19, repurchase price $784, collateralized by Federal Home Loan Mortgage Corporation, 3.750%, due 3/27/19 | | | $784 | | | | 784 | |
| | Total Repurchase Agreement—0.4%
(cost $784) | | | | | | | 784 | |
| | Total Investments—99.5%
(cost $141,191) | | | | | | | 178,133 | |
| | Cash and other assets, less liabilities—0.5% | | | | | | | 827 | |
| | Net assets—100.0% | | | | | | $ | 178,960 | |
† = U.S. listed foreign security
* = Non-income producing security
See accompanying Notes to Financial Statements.
| December 31, 2018 | William Blair Funds | 13 |
| | Mid Cap Growth Fund |
| | |
| | The Mid Cap Growth Fund seeks long-term capital appreciation. |
| | |
| | AN OVERVIEW FROM THE PORTFOLIO MANAGERS |
| | |

Daniel Crowe 
Robert C. Lanphier, IV | The William Blair Mid Cap Growth Fund (Class N shares) posted a 1.20% decrease, net of fees, for the twelve months ended December 31, 2018. By comparison, the Fund’s benchmark index, the Russell Midcap®Growth Index (the “Index”), decreased 4.75%. For the year, the Fund materially outperformed the Index driven by both stock selection and style tailwinds. Stock selection was positive across many sectors, most notably Health Care, which included positions in ABIOMED, Inc. and Veeva Systems, Inc. ABIOMED, which develops, manufactures and markets advanced medical technologies designed to assist or replace the pumping function of a failing heart, outperformed as its Impella heart pump is becoming the standard of care for acute heart failure patients. Veeva Systems, a cloud-based software and data solutions provider primarily for the life sciences industry, outperformed on strong growth of its content management software solution called “Vault,” an increasingly significant source of revenue for the company. Other top contributors were Ball Corporation (Materials), Domino’s Pizza, Inc. (Consumer Discretionary) and Copart, Inc. (Industrials). From a style perspective, the Fund’s higher valuation exposure, which is driven by a bias for companies with higher and more sustainable growth, provided a tailwind. This dynamic was most evident in the first quarter as investors digested the potential for inflation-related cost pressures on businesses and our portfolio of companies with unique value propositions and above average pricing flexibility was rewarded. Additionally, our emphasis on companies with less volatile fundamentals was a tailwind, which was most prominent during the market selloff in the fourth quarter. In terms of detractors, BWX Technologies, Inc., the sole-source provider of nuclear propulsion systems for the U.S. Navy, was a top detractor after the company disclosed new information that indicated a materially longer build time for naval nuclear power units than was previously appreciated by investors broadly. Consumer packaged goods food company Conagra Brands, Inc. (Consumer Staples) was also a top detractor after the company acquired Pinnacle Foods, Inc. and subsequently experienced a growth slowdown in the recently acquired business. Other top detractors were Parsley Energy, Inc. (Energy), Mohawk Industries, Inc. (Consumer Discretionary) and The Middleby Corporation (Industrials). Please refer to the U.S. Growth Market Review and Outlook relating to the Fund on page 6. |
| 14 | Annual Report | December 31, 2018 |
Mid Cap Growth Fund
Performance Highlights (Unaudited)
| Average Annual Total Return through 12/31/2018 |
| | | 1 Year | | 3 Year | | 5 Year | | 10 Year |
| Class N | | | (1.20 | )% | | | 6.18 | % | | | 5.14 | % | | | 12.14 | % |
| Class I | | | (0.86 | ) | | | 6.47 | | | | 5.42 | | | | 12.44 | |
| Russell Midcap® Growth Index | | | (4.75 | ) | | | 8.59 | | | | 7.42 | | | | 15.12 | |
Performance cited represents past performance. Past performance does not guarantee future results and current performance may be lower or higher than the data quoted. Results shown are average annual total returns, which assume reinvestment of dividends and capital gains. Investment returns and principal will fluctuate and you may have a gain or loss when you sell shares. For the most current month-end performance information, please call 1-800-742-7272, or visit our Web site atwww.williamblairfunds.com. Investing in medium capitalization companies involves special risks, including higher volatility and lower liquidity. Medium capitalization stocks are also more sensitive to purchase/sale transactions and changes in the issuer’s financial condition. From time to time, the investment adviser may waive fees or reimburse expenses for the Fund. Without these waivers/reimbursements, performance would be lower. Class N shares are available to the general public without a sales load. Class I shares are available to certain institutional investors, and advisory clients of William Blair & Company, L.L.C., without a sales load or distribution (12b-1) or service fees.
The performance highlights and graph presented above do not reflect the deduction of taxes that a shareholder would pay on fund distributions or the redemption of fund shares.
The Russell Midcap®Growth Index is an index that is constructed to provide a comprehensive and unbiased barometer of the mid-cap growth market.
This report identifies the Fund’s investments on December 31, 2018. These holdings are subject to change. Not all stocks in the Fund performed the same, nor is there any guarantee that these stocks will perform as well in the future. Market forecasts provided in this report may not necessarily come to pass.
Sector Diversification (Unaudited)
The sector diversification shown is based on the total long-term securities.
| December 31, 2018 | William Blair Funds | 15 |
Mid Cap Growth Fund
Portfolio of Investments, December 31, 2018(all dollar amounts in thousands)
| | | | | | | | |
| | | | | | | | |
| | Issuer | | Shares | | | Value | |
| | | | | | | | | | |
| | Common Stocks | | | | | | | | |
| | Information Technology—26.2% | | | | | | | | |
| * | Arista Networks, Inc. | | | 6,595 | | | $ | 1,389 | |
| | Booz Allen Hamilton Holding Corporation | | | 36,669 | | | | 1,653 | |
| | Dolby Laboratories, Inc. | | | 10,160 | | | | 628 | |
| | Global Payments, Inc. | | | 12,890 | | | | 1,329 | |
| * | GoDaddy, Inc. | | | 19,365 | | | | 1,271 | |
| * | Guidewire Software, Inc. | | | 7,418 | | | | 595 | |
| | j2 Global, Inc. | | | 7,870 | | | | 546 | |
| | Microchip Technology, Inc. | | | 11,845 | | | | 852 | |
| * | Pure Storage, Inc. | | | 38,670 | | | | 622 | |
| * | Red Hat, Inc. | | | 4,825 | | | | 847 | |
| | Sabre Corporation | | | 44,948 | | | | 973 | |
| * | Take-Two Interactive Software, Inc. | | | 7,605 | | | | 783 | |
| * | Ultimate Software Group, Inc. | | | 2,380 | | | | 583 | |
| * | WEX, Inc. | | | 7,830 | | | | 1,097 | |
| * | Worldpay, Inc. Class “A” | | | 20,029 | | | | 1,531 | |
| | | | | | | | | 14,699 | |
| | Industrials—17.9% | | | | | | | | |
| | BWX Technologies, Inc. | | | 34,229 | | | | 1,309 | |
| * | Copart, Inc. | | | 28,055 | | | | 1,340 | |
| * | CoStar Group, Inc. | | | 4,284 | | | | 1,445 | |
| | Equifax, Inc. | | | 14,550 | | | | 1,355 | |
| | Fortive Corporation | | | 18,890 | | | | 1,278 | |
| * | The Middleby Corporation | | | 10,860 | | | | 1,116 | |
| * | Verisk Analytics, Inc. | | | 6,670 | | | | 727 | |
| | Waste Connections, Inc.† | | | 10,515 | | | | 781 | |
| | Xylem, Inc. | | | 10,630 | | | | 709 | |
| | | | | | | | | 10,060 | |
| | Health Care—17.1% | | | | | | | | |
| * | ABIOMED, Inc. | | | 2,495 | | | | 811 | |
| | Agilent Technologies, Inc. | | | 16,715 | | | | 1,128 | |
| * | Align Technology, Inc. | | | 2,730 | | | | 572 | |
| * | Centene Corporation | | | 10,123 | | | | 1,167 | |
| * | DexCom, Inc. | | | 7,125 | | | | 854 | |
| | Encompass Health Corporation | | | 16,745 | | | | 1,033 | |
| * | IDEXX Laboratories, Inc. | | | 3,135 | | | | 583 | |
| * | Mettler-Toledo International, Inc. | | | 2,245 | | | | 1,270 | |
| | Teleflex, Inc. | | | 4,695 | | | | 1,213 | |
| * | Veeva Systems, Inc. | | | 10,451 | | | | 933 | |
| | | | | | | | | 9,564 | |
| | Consumer Discretionary—14.3% | | | | | | | | |
| | Aptiv plc† | | | 9,975 | | | | 614 | |
| * | CarMax, Inc. | | | 8,740 | | | | 548 | |
| | Domino’s Pizza, Inc. | | | 2,900 | | | | 719 | |
| | Ross Stores, Inc. | | | 21,350 | | | | 1,776 | |
| | Six Flags Entertainment Corporation | | | 17,430 | | | | 970 | |
| * | Ulta Salon Cosmetics & Fragrance, Inc. | | | 6,565 | | | | 1,608 | |
| | Vail Resorts, Inc. | | | 4,955 | | | | 1,045 | |
| * | Wayfair, Inc. | | | 8,460 | | | | 762 | |
| | | | | | | | | 8,042 | |
| | Issuer | | Shares or
Principal
Amount | | | Value | |
| | | | | | | | | | |
| | Common Stocks—(continued) | | | | | | | | |
| | Financials—8.5% | | | | | | | | |
| | Arthur J Gallagher & Co. | | | 18,300 | | | $ | 1,349 | |
| | Cboe Global Markets, Inc. | | | 15,965 | | | | 1,562 | |
| | East West Bancorp, Inc. | | | 23,210 | | | | 1,010 | |
| * | SVB Financial Group | | | 4,415 | | | | 838 | |
| | | | | | | | | 4,759 | |
| | Materials—7.8% | | | | | | | | |
| * | Axalta Coating Systems, Ltd.† | | | 24,810 | | | | 581 | |
| | Ball Corporation | | | 42,780 | | | | 1,967 | |
| | Celanese Corporation | | | 7,440 | | | | 669 | |
| | Vulcan Materials Co. | | | 11,790 | | | | 1,165 | |
| | | | | | | | | 4,382 | |
| | Communication Services—2.6% | | | | | | | | |
| * | Live Nation Entertainment, Inc. | | | 29,985 | | | | 1,477 | |
| | Energy—1.3% | | | | | | | | |
| * | Parsley Energy, Inc. | | | 46,570 | | | | 744 | |
| | Consumer Staples—1.3% | | | | | | | | |
| | Conagra Brands, Inc. | | | 34,400 | | | | 735 | |
| | Real Estate—1.1% | | | | | | | | |
| * | SBA Communications Corporation | | | 3,755 | | | | 608 | |
| | Total Common Stocks—98.1%
(cost $52,004) | | | | | | | 55,070 | |
| | | | | | | | | | |
| | Repurchase Agreement | | | | | | | | |
| | Fixed Income Clearing Corporation, 0.500% dated 12/31/18, due 1/2/19, repurchase price $1,187, collateralized by U.S. Treasury Bond, 3.625%, due 2/15/44 | | | $1,187 | | | | 1,187 | |
| | Total Repurchase Agreement—2.1%
(cost $1,187) | | | | | | | 1,187 | |
| | Total Investments—100.2%
(cost $53,191) | | | | | | | 56,257 | |
| | Liabilities, plus cash and other assets—(0.2)% | | | | | | | (140 | ) |
| | Net assets—100.0% | | | | | | $ | 56,117 | |
* = Non-income producing security
† = U.S. listed foreign security
See accompanying Notes to Financial Statements.
| 16 | Annual Report | December 31, 2018 |
| | Small-Mid Cap Growth Fund |
| | |
| | The Small-Mid Cap Growth Fund seeks long-term capital appreciation. |
| | |
| | AN OVERVIEW FROM THE PORTFOLIO MANAGERS |
| | |

Daniel Crowe 
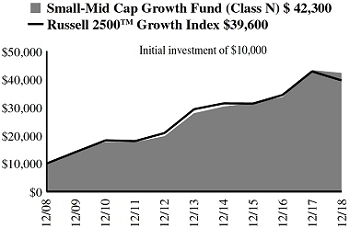
Robert C. Lanphier, IV | The William Blair Small-Mid Cap Growth Fund (Class N shares) posted a 2.29% decrease, net of fees, for the twelve months ended December 31, 2018. By comparison, the Fund’s benchmark index, the Russell 2500™ Growth Index (the “Index”), decreased 7.47%. For the year, the Fund materially outperformed the Index driven by both strong stock selection and a style tailwind. Positive stock selection was most pronounced in Health Care and Industrials, and top individual contributors to the Fund’s performance for the period were Health Care holdings DexCom, Inc. and ABIOMED, Inc. Shares of DexCom, a medical device company focused on continuous glucose monitoring (CGM), advanced on strong demand for its best-in-class CGM devices. ABIOMED, which develops, manufactures and markets advanced medical technologies designed to assist or replace the pumping function of a failing heart, outperformed as its Impella heart pump is becoming the standard of care for acute heart failure patients. Other notable contributors to relative returns during the period were Health Care holdings Glaukos Corporation and Veeva Systems, Inc. and Consumer Discretionary holding Domino’s Pizza, Inc. From a style perspective, the Fund’s bias in favor of companies with sustainable growth was a tailwind. This dynamic was most evident in the first quarter as investors digested the potential for inflation-related cost pressures on businesses and our portfolio of companies with unique value propositions and above average pricing flexibility was rewarded. In addition, the Fund’s larger cap bias relative to the Index was a tailwind as stocks in the larger end of our universe outperformed, most notably in the third quarter. In terms of 2018 detractors, stock-specific weakness in Information Technology, including Rogers Corporation and Coherent, Inc., and Financials, including Bank OZK and Encore Capital Group, Inc., dampened relative returns. Shares of advanced materials company Rogers Corporation declined during the period as operational challenges, strong product demand against limited manufacturing capacity and rising raw material costs dampened margins. Bank OZK, a regional bank with a specialized commercial real estate team, underperformed in part due to increasing construction costs and charge-offs related to two of its real estate loans. Also among top detractors for the year was Industrials holding BWX Technologies, Inc., the sole-source provider of nuclear propulsion systems for the U.S. Navy, which declined after the company disclosed new information that indicated a materially longer build time for Naval nuclear power units than was previously appreciated by investors broadly. Please refer to the U.S. Growth Market Review and Outlook relating to the Fund on page 6. |
| December 31, 2018 | William Blair Funds | 17 |
Small-Mid Cap Growth Fund
Performance Highlights (Unaudited)
| Average Annual Total Return through 12/31/2018 |
| | | 1 Year | | 3 Year | | 5 Year | | 10 Year |
| Class N | | | (2.29 | )% | | | 10.17 | % | | | 8.64 | % | | | 15.51 | % |
| Class I | | | (2.06 | ) | | | 10.45 | | | | 8.92 | | | | 15.81 | |
| Russell 2500TMGrowth Index | | | (7.47 | ) | | | 8.11 | | | | 6.19 | | | | 14.76 | |
Performance cited represents past performance. Past performance does not guarantee future results and current performance may be lower or higher than the data quoted. Results shown are average annual total returns, which assume reinvestment of dividends and capital gains. Investment returns and principal will fluctuate and you may have a gain or loss when you sell shares. For the most current month-end performance information, please call 1-800-742-7272, or visit our Web site atwww.williamblairfunds.com. Investing in smaller and medium capitalization companies involves special risks, including higher volatility and lower liquidity. Smaller and medium capitalization stocks are also more sensitive to purchase/sale transactions and changes in the issuer’s financial condition. From time to time, the investment adviser may waive fees or reimburse expenses for the Fund. Without these waivers/reimbursements, performance would be lower. Class N shares are available to the general public without a sales load. Class I shares are available to certain institutional investors, and advisory clients of William Blair & Company, L.L.C., without a sales load or distribution (12b-1) or service fees.
The performance highlights and graph presented above do not reflect the deduction of taxes that a shareholder would pay on fund distributions or the redemption of fund shares.
The Russell 2500TMGrowth Index measures the performance of those Russell 2500 companies with above average price-to-book ratios and forecasted growth rates.
This report identifies the Fund’s investments on December 31, 2018. These holdings are subject to change. Not all stocks in the Fund performed the same, nor is there any guarantee that these stocks will perform as well in the future. Market forecasts provided in this report may not necessarily come to pass.
Sector Diversification (Unaudited)
The sector diversification shown is based on the total long-term securities.
| 18 | Annual Report | December 31, 2018 |
Small-Mid Cap Growth Fund
Portfolio of Investments, December 31, 2018(all dollar amounts in thousands)
| | | | | | | | |
| | | | | | | | |
| | Issuer | | Shares | | | Value | |
| | | | | | | | | | |
| | Common Stocks | | | | | | | | |
| | Industrials—21.3% | | | | | | | | |
| | BWX Technologies, Inc. | | | 1,443,636 | | | $ | 55,190 | |
| * | Copart, Inc. | | | 1,517,415 | | | | 72,502 | |
| * | CoStar Group, Inc. | | | 194,416 | | | | 65,584 | |
| * | Genesee & Wyoming, Inc. | | | 363,500 | | | | 26,906 | |
| | Healthcare Services Group, Inc. | | | 969,920 | | | | 38,971 | |
| | HEICO Corporation | | | 648,288 | | | | 40,842 | |
| | Ritchie Bros Auctioneers, Inc.† | | | 836,813 | | | | 27,381 | |
| * | SiteOne Landscape Supply, Inc. | | | 337,263 | | | | 18,641 | |
| * | Teledyne Technologies, Inc. | | | 217,209 | | | | 44,978 | |
| * | The Middleby Corporation | | | 358,905 | | | | 36,870 | |
| | The Toro Co. | | | 284,024 | | | | 15,871 | |
| | TransUnion | | | 774,340 | | | | 43,983 | |
| * | Trex Co., Inc. | | | 420,400 | | | | 24,955 | |
| | | | | | | | | 512,674 | |
| | Information Technology—20.5% | | | | | | | | |
| * | 2U, Inc. | | | 389,300 | | | | 19,356 | |
| * | Aspen Technology, Inc. | | | 336,000 | | | | 27,613 | |
| | Booz Allen Hamilton Holding Corporation | | | 1,325,043 | | | | 59,720 | |
| * | Euronet Worldwide, Inc. | | | 566,098 | | | | 57,957 | |
| * | Fortinet, Inc. | | | 428,800 | | | | 30,200 | |
| * | GoDaddy, Inc. | | | 575,120 | | | | 37,739 | |
| * | Guidewire Software, Inc. | | | 286,091 | | | | 22,953 | |
| | j2 Global, Inc. | | | 324,983 | | | | 22,547 | |
| * | MaxLinear, Inc. | | | 603,534 | | | | 10,622 | |
| | National Instruments Corporation | | | 652,945 | | | | 29,631 | |
| * | Nice, Ltd.—ADR | | | 266,003 | | | | 28,784 | |
| * | Novanta, Inc.† | | | 251,826 | | | | 15,865 | |
| * | Pure Storage, Inc. | | | 2,254,481 | | | | 36,252 | |
| * | Rogers Corporation | | | 360,575 | | | | 35,719 | |
| | Sabre Corporation | | | 1,315,900 | | | | 28,476 | |
| * | WEX, Inc. | | | 200,653 | | | | 28,104 | |
| | | | | | | | | 491,538 | |
| | Health Care—20.2% | | | | | | | | |
| * | Cambrex Corporation | | | 600,926 | | | | 22,691 | |
| * | Catalent, Inc. | | | 1,011,969 | | | | 31,553 | |
| * | DexCom, Inc. | | | 322,520 | | | | 38,638 | |
| | Encompass Health Corporation | | | 743,027 | | | | 45,845 | |
| * | Exact Sciences Corporation | | | 582,324 | | | | 36,745 | |
| * | Glaukos Corporation | | | 616,121 | | | | 34,607 | |
| * | Horizon Pharma plc† | | | 1,635,578 | | | | 31,959 | |
| * | Inogen, Inc. | | | 147,000 | | | | 18,253 | |
| * | Insulet Corporation | | | 515,900 | | | | 40,921 | |
| * | Ligand Pharmaceuticals, Inc. | | | 238,649 | | | | 32,385 | |
| * | Penumbra, Inc. | | | 194,100 | | | | 23,719 | |
| * | Portola Pharmaceuticals, Inc. | | | 590,700 | | | | 11,530 | |
| | Teleflex, Inc. | | | 187,425 | | | | 48,446 | |
| * | Veeva Systems, Inc. | | | 558,473 | | | | 49,883 | |
| | West Pharmaceutical Services, Inc. | | | 196,264 | | | | 19,240 | |
| | | | | | | | | 486,415 | |
| | Consumer Discretionary—12.5% | | | | | | | | |
| * | Adtalem Global Education, Inc. | | | 1,107,144 | | | | 52,390 | |
| * | Burlington Stores, Inc. | | | 302,900 | | | | 49,273 | |
| | Domino’s Pizza, Inc. | | | 151,480 | | | | 37,566 | |
| * | Grand Canyon Education, Inc. | | | 424,199 | | | | 40,782 | |
| * | Hilton Grand Vacations, Inc. | | | 747,599 | | | | 19,729 | |
| | Six Flags Entertainment Corporation | | | 629,777 | | | | 35,034 | |
| * | Universal Electronics, Inc. | | | 325,155 | | | | 8,220 | |
| | Issuer | | Shares or
Principal
Amount | | | Value | |
| | | | | | | | | | |
| | Common Stocks—(continued) | | | | | | | | |
| | Consumer Discretionary—(continued) | | | | | | | | |
| | Vail Resorts, Inc. | | | 198,096 | | | $ | 41,763 | |
| * | Weight Watchers International, Inc. | | | 422,200 | | | | 16,276 | |
| | | | | | | | | 301,033 | |
| | Materials—6.8% | | | | | | | | |
| * | Axalta Coating Systems, Ltd.† | | | 824,511 | | | | 19,310 | |
| | Ball Corporation | | | 1,319,559 | | | | 60,673 | |
| | Celanese Corporation | | | 391,858 | | | | 35,256 | |
| | Martin Marietta Materials, Inc. | | | 284,019 | | | | 48,814 | |
| | | | | | | | | 164,053 | |
| | Financials—6.7% | | | | | | | | |
| | BrightSphere Investment Group plc† | | | 1,051,276 | | | | 11,228 | |
| | Cboe Global Markets, Inc. | | | 614,356 | | | | 60,102 | |
| | East West Bancorp, Inc. | | | 309,521 | | | | 13,473 | |
| * | Encore Capital Group, Inc. | | | 715,927 | | | | 16,824 | |
| | FirstCash, Inc. | | | 472,083 | | | | 34,155 | |
| | Virtu Financial, Inc. | | | 969,237 | | | | 24,968 | |
| | | | | | | | | 160,750 | |
| | Communication Services—2.9% | | | | | | | | |
| | Cable One, Inc. | | | 20,022 | | | | 16,420 | |
| * | Live Nation Entertainment, Inc. | | | 1,055,485 | | | | 51,983 | |
| | | | | | | | | 68,403 | |
| | Real Estate—2.5% | | | | | | | | |
| | Colliers International Group, Inc.† | | | 233,945 | | | | 12,876 | |
| | FirstService Corporation† | | | 351,498 | | | | 24,071 | |
| | Jones Lang LaSalle, Inc. | | | 190,081 | | | | 24,064 | |
| | | | | | | | | 61,011 | |
| | Consumer Staples—1.6% | | | | | | | | |
| | Lamb Weston Holdings, Inc. | | | 283,025 | | | | 20,819 | |
| | Nu Skin Enterprises, Inc. | | | 299,022 | | | | 18,339 | |
| | | | | | | | | 39,158 | |
| | Energy—1.1% | | | | | | | | |
| * | Centennial Resource Development, Inc. | | | 986,400 | | | | 10,870 | |
| * | Parsley Energy, Inc. | | | 895,536 | | | | 14,311 | |
| | | | | | | | | 25,181 | |
| | Total Common Stocks—96.1%
(cost $2,257,435) | | | | | | | 2,310,216 | |
| | | | | | | | | | |
| | Repurchase Agreement | | | | | | | | |
| | Fixed Income Clearing Corporation, 0.500% dated 12/31/18, due 1/2/19, repurchase price $63,065, collateralized by U.S. Treasury Bond, 3.750%, due 11/15/43 | | | $63,063 | | | | 63,063 | |
| | Total Repurchase Agreement—2.6%
(cost $63,063) | | | | | | | 63,063 | |
| | Total Investments—98.7%
(cost $2,320,498) | | | | | | | 2,373,279 | |
| | Cash and other assets, less liabilities—1.3% | | | | | | | 30,691 | |
| | Net assets—100.0% | | | | | | $ | 2,403,970 | |
ADR = American Depository Receipt
* = Non-income producing security
† = U.S. listed foreign security
See accompanying Notes to Financial Statements.
| December 31, 2018 | William Blair Funds | 19 |
| | Small-Mid Cap Value Fund |
| | |
| | The Small-Mid Cap Value Fund seeks long-term capital appreciation. |
| | |
| | AN OVERVIEW FROM THE PORTFOLIO MANAGERS |
| | |

Chad M. Kilmer 
Mark T. Leslie 
David S. Mitchell | The William Blair Small-Mid Cap Value Fund (Class N shares) posted a 15.32% decrease, net of fees, for the twelve months ended December 31, 2018. By comparison, the Fund’s benchmark index, the Russell 2500™ Value Index (the “Index”), decreased 12.36%. The Fund’s underperformance relative to the Index was driven by stock selection. At the sector level, the most significant detractor from relative performance was Financials due to stock selection within Banks, Insurance and a lack of exposure to Mortgage REITs. The Fund’s relative underperformance within Energy, the worst performing sector of the market, was the result of stock selection that was evenly split between Oil, Gas & Consumable Fuels and Equipment & Services. The Fund’s relative underperformance within Industrials was driven by stock selection that was fairly broad-based within the sector, but led by Machinery as end-of-cycle concerns generally overshadowed positive corporate earnings earlier in the year. Consumer Discretionary was the largest sector contributor to relative performance, primarily due to strong stock selection within Leisure Facilities and Education Services. The Fund’s relative outperformance within Information Technology was the result of strong stock selection within IT Services. Within Real Estate, broad-based stock selection within REITs drove the Fund’s relative outperformance within the sector. Looking specifically at stock selection, the Fund’s largest detractors from relative performance were Forum Energy Technologies, Inc. (Energy), Patterson-UTI Energy, Inc. (Energy), and Parsley Energy, Inc. (Energy). Offsetting these detractors were investments in LiveRamp Holdings, Inc. (Technology), lululemon athletica Inc. (Consumer Discretionary), and CSRA Inc. (Technology). Please refer to the U.S. Value Market Review and Outlook relating to the Fund on page 7. |
| 20 | Annual Report | December 31, 2018 |
Small-Mid Cap Value Fund
Performance Highlights (Unaudited)
| Average Annual Total Return through 12/31/2018 |
| | | 1 Year | | 3 Year | | 5 Year | | Since
Inception(a) |
| Class N | | | (15.32 | )% | | | 3.85 | % | | | 2.58 | % | | | 8.79 | % |
| Class I | | | (15.03 | ) | | | 4.13 | | | | 2.86 | | | | 9.09 | |
| Russell 2500TM Value Index | | | (12.36 | ) | | | 6.59 | | | | 4.16 | | | | 10.57 | |
| | |
| (a) | Since inception is for the period from December 15, 2011 (Commencement of Operations) to December 31, 2018. |
Performance cited represents past performance. Past performance does not guarantee future results and current performance may be lower or higher than the data quoted. Results shown are average annual total returns, which assume reinvestment of dividends and capital gains. Investment returns and principal will fluctuate and you may have a gain or loss when you sell shares. For the most current month-end performance information, please call 1-800-742-7272, or visit our Web site atwww.williamblairfunds.com. Investing in smaller and medium capitalization companies involves special risks, including higher volatility and lower liquidity. Smaller and medium capitalization stocks are also more sensitive to purchase/sale transactions and changes in the issuer’s financial condition. From time to time, the investment adviser may waive fees or reimburse expenses for the Fund. Without these waivers/reimbursements, performance would be lower. Class N shares are available to the general public without a sales load. Class I shares are available to certain institutional investors, and advisory clients of William Blair & Company, L.L.C., without a sales load or distribution (12b-1) or service fees.
The performance highlights and graph presented above do not reflect the deduction of taxes that a shareholder would pay on fund distributions or the redemption of fund shares.
The Russell 2500TMValue Index consists of small to mid-capitalization companies with below average price-to-book ratios and forecasted growth rates.
This report identifies the Fund’s investments on December 31, 2018. These holdings are subject to change. Not all stocks in the Fund performed the same, nor is there any guarantee that these stocks will perform as well in the future. Market forecasts provided in this report may not necessarily come to pass.
Sector Diversification (Unaudited)
The sector diversification shown is based on the total long-term securities.
| December 31, 2018 | William Blair Funds | 21 |
Small-Mid Cap Value Fund
Portfolio of Investments, December 31, 2018(all dollar amounts in thousands)
| | | | | | | | |
| | | | | | | | |
| | Issuer | | Shares | | | Value | |
| | | | | | | | | | |
| | Common Stocks | | | | | | | | |
| | Financials—21.6% | | | | | | | | |
| | American Financial Group, Inc. | | | 185 | | | $ | 17 | |
| | CNO Financial Group, Inc. | | | 805 | | | | 12 | |
| | E*TRADE Financial Corporation | | | 343 | | | | 15 | |
| | East West Bancorp, Inc. | | | 441 | | | | 19 | |
| | First American Financial Corporation | | | 308 | | | | 14 | |
| | FNB Corporation | | | 1,581 | | | | 16 | |
| | Hancock Whitney Corporation | | | 409 | | | | 14 | |
| | Hanover Insurance Group, Inc. | | | 194 | | | | 23 | |
| | Home BancShares, Inc. | | | 1,112 | | | | 18 | |
| | Iberiabank Corporation | | | 317 | | | | 20 | |
| | National Bank Holdings Corporation | | | 559 | | | | 17 | |
| | PacWest Bancorp | | | 849 | | | | 28 | |
| | Radian Group, Inc. | | | 1,251 | | | | 20 | |
| | Selective Insurance Group, Inc. | | | 364 | | | | 22 | |
| | Sterling Bancorp | | | 1,188 | | | | 20 | |
| * | SVB Financial Group | | | 90 | | | | 17 | |
| | Umpqua Holdings Corporation | | | 913 | | | | 15 | |
| | Voya Financial, Inc. | | | 556 | | | | 22 | |
| * | Western Alliance Bancorp | | | 376 | | | | 15 | |
| | WSFS Financial Corporation | | | 466 | | | | 18 | |
| | | | | | | | | 362 | |
| | Real Estate—16.5% | | | | | | | | |
| | Acadia Realty Trust | | | 844 | | | | 20 | |
| | American Assets Trust, Inc. | | | 627 | | | | 25 | |
| | American Campus Communities, Inc. | | | 758 | | | | 31 | |
| | Camden Property Trust | | | 239 | | | | 21 | |
| | Columbia Property Trust, Inc. | | | 1,162 | | | | 23 | |
| | Douglas Emmett, Inc. | | | 658 | | | | 22 | |
| | EPR Properties | | | 378 | | | | 24 | |
| | Equity Commonwealth | | | 690 | | | | 21 | |
| | Equity LifeStyle Properties, Inc. | | | 221 | | | | 22 | |
| | Healthcare Realty Trust, Inc. | | | 907 | | | | 26 | |
| | Pebblebrook Hotel Trust | | | 730 | | | | 21 | |
| | Terreno Realty Corporation | | | 608 | | | | 21 | |
| | | | | | | | | 277 | |
| | Industrials—14.1% | | | | | | | | |
| | Acuity Brands, Inc. | | | 189 | | | | 22 | |
| | Alaska Air Group, Inc. | | | 387 | | | | 24 | |
| | Brady Corporation | | | 701 | | | | 31 | |
| * | Gardner Denver Holdings, Inc. | | | 987 | | | | 20 | |
| | GrafTech International, Ltd. | | | 1,425 | | | | 16 | |
| | IDEX Corporation | | | 222 | | | | 28 | |
| | Jacobs Engineering Group, Inc. | | | 411 | | | | 24 | |
| | Old Dominion Freight Line, Inc. | | | 140 | | | | 17 | |
| | Snap-on, Inc. | | | 167 | | | | 24 | |
| | The Toro Co. | | | 542 | | | | 30 | |
| | | | | | | | | 236 | |
| | Information Technology—9.8% | | | | | | | | |
| | Avnet, Inc. | | | 486 | | | | 17 | |
| | Belden, Inc. | | | 361 | | | | 15 | |
| | Booz Allen Hamilton Holding Corporation | | | 504 | | | | 23 | |
| * | Cadence Design Systems, Inc. | | | 559 | | | | 24 | |
| | j2 Global, Inc. | | | 359 | | | | 25 | |
| | | | | | | | |
| | | | | | | | |
| | Issuer | | Shares | | | Value | |
| | | | | | | | |
| | Common Stocks—(continued) | | | | | | | | |
| | Information Technology—(continued) | | | | | | | | |
| * | LiveRamp Holdings, Inc. | | | 517 | | | $ | 20 | |
| | MAXIMUS, Inc. | | | 372 | | | | 24 | |
| * | SolarWinds Corporation | | | 1,203 | | | | 17 | |
| | | | | | | | | 165 | |
| | Consumer Discretionary—8.2% | | | | | | | | |
| * | Adtalem Global Education, Inc. | | | 439 | | | | 21 | |
| | Churchill Downs, Inc. | | | 76 | | | | 18 | |
| | Dunkin’ Brands Group, Inc. | | | 262 | | | | 17 | |
| | Service Corporation International | | | 519 | | | | 21 | |
| | Vail Resorts, Inc. | | | 134 | | | | 28 | |
| * | Weight Watchers International, Inc. | | | 279 | | | | 11 | |
| | Wolverine World Wide, Inc. | | | 661 | | | | 21 | |
| | | | | | | | | 137 | |
| | Utilities—7.4% | | | | | | | | |
| | Alliant Energy Corporation | | | 472 | | | | 20 | |
| | Aqua America, Inc. | | | 699 | | | | 24 | |
| | Atmos Energy Corporation | | | 274 | | | | 25 | |
| | IDACORP, Inc. | | | 215 | | | | 20 | |
| | ONE Gas, Inc. | | | 250 | | | | 20 | |
| | UGI Corporation | | | 272 | | | | 15 | |
| | | | | | | | | 124 | |
| | Health Care—5.7% | | | | | | | | |
| | CONMED Corporation | | | 190 | | | | 12 | |
| | Encompass Health Corporation | | | 390 | | | | 24 | |
| * | Hologic, Inc. | | | 581 | | | | 24 | |
| * | Magellan Health, Inc. | | | 182 | | | | 11 | |
| | PerkinElmer, Inc. | | | 309 | | | | 24 | |
| | | | | | | | | 95 | |
| | Energy—5.6% | | | | | | | | |
| * | Forum Energy Technologies, Inc. | | | 1,713 | | | | 7 | |
| * | Parsley Energy, Inc. | | | 982 | | | | 16 | |
| | Patterson-UTI Energy, Inc. | | | 1,241 | | | | 13 | |
| | Range Resources Corporation | | | 1,665 | | | | 16 | |
| | Targa Resources Corporation | | | 632 | | | | 23 | |
| * | WPX Energy, Inc. | | | 1,784 | | | | 20 | |
| | | | | | | | | 95 | |
| | Materials—5.2% | | | | | | | | |
| | Carpenter Technology Corporation | | | 478 | | | | 17 | |
| | FMC Corporation | | | 221 | | | | 16 | |
| | Minerals Technologies, Inc. | | | 233 | | | | 12 | |
| | PolyOne Corporation | | | 522 | | | | 15 | |
| | Sensient Technologies Corporation | | | 208 | | | | 12 | |
| | Steel Dynamics, Inc. | | | 517 | | | | 15 | |
| | | | | | | | | 87 | |
| | Consumer Staples—3.8% | | | | | | | | |
| | Ingredion, Inc. | | | 185 | | | | 17 | |
| | J&J Snack Foods Corporation | | | 121 | | | | 17 | |
| | Lamb Weston Holdings, Inc. | | | 408 | | | | 30 | |
| | | | | | | | | 64 | |
See accompanying Notes to Financial Statements.
| 22 | Annual Report | December 31, 2018 |
Small-Mid Cap Value Fund
Portfolio of Investments, December 31, 2018(all dollar amounts in thousands)
| | | | | | | | |
| | | | | | | | |
| | Issuer | | Shares | | | Value | |
| | | | | | | | | | |
| | Common Stocks—(continued) | | | | | | | | |
| | Communication Services—1.1% | | | | | | | | |
| | The Interpublic Group of Cos., Inc. | | | 913 | | | $ | 19 | |
| | Total Common Stocks—99.0%
(cost $1,679) | | | | | | | 1,661 | |
| | Total Investments—99.0%
(cost $1,679) | | | | | | | 1,661 | |
| | Cash and other assets, less liabilities—1.0% | | | | | | | 18 | |
| | Net assets—100.0% | | | | | | $ | 1,679 | |
* = Non-income producing security
See accompanying Notes to Financial Statements.
| December 31, 2018 | William Blair Funds | 23 |
| | Small Cap Growth Fund |
| | |
| | The Small Cap Growth Fund seeks long-term capital appreciation. |
| | |
| | AN OVERVIEW FROM THE PORTFOLIO MANAGERS |
| | |

Michael P. Balkin 
Ward D. Sexton | The William Blair Small Cap Growth Fund (Class N shares) posted a 2.14% decrease, net of fees, for the twelve months ended December 31, 2018. By comparison, the Fund’s benchmark index, the Russell 2000® Growth Index (the “Index”), decreased 9.31%. For the year, the Fund materially outperformed the Index driven by strong stock selection. Positive stock selection was most pronounced in Health Care and Industrials, where, in aggregate, the Fund’s holdings significantly outperformed their sector peers. Top individual contributors to the Fund’s performance for the period were Codexis, Inc. (Health Care) and Virtu Financial, Inc. (Financials). Shares of protein engineering company Codexis advanced due to better-than-expected revenue growth and an announced partnership with Nestlé Health Science that represents a significant revenue growth opportunity for the company. Electronic market maker Virtu Financial outperformed in part due to heightened volatility, predominantly in the first and fourth quarters, which positively impacts Virtu’s transaction revenues. Other notable contributors to relative returns were Glaukos Corporation (Health Care), LivePerson, Inc. (Information Technology) and Etsy, Inc. (Consumer Discretionary). Conversely, top detractors for 2018 included Golden Entertainment, Inc. (Consumer Discretionary) and Encore Capital Group, Inc. (Financials). Following significant outperformance in 2017, Golden Entertainment, which owns and operates several casinos and a distributed gaming business, underperformed due to the company’s plans for increased capital spending and results that suggested the company would be more susceptible to a downturn in Las Vegas than some investors had appreciated. Shares of debt management and recovery solutions provider Encore Capital Group declined in reaction to the company’s increased commitment to the European/UK market and on investor concern that the collections environment could become more challenging if the economy weakens. Other detractors included Universal Electronics, Inc. (Consumer Discretionary), BWX Technologies, Inc. (Industrials) and GreenSky, Inc. (Information Technology). Please refer to the U.S. Growth Market Review and Outlook relating to the Fund on page 6. |
| 24 | Annual Report | December 31, 2018 |
Small Cap Growth Fund
Performance Highlights (Unaudited)
| Average Annual Total Return through 12/31/2018 |
| | | 1 Year | | 3 Year | | 5 Year | | 10 Year |
| Class N | | | (2.14 | )% | | | 13.81 | % | | | 7.65 | % | | | 16.11 | % |
| Class I | | | (1.88 | ) | | | 14.10 | | | | 7.92 | | | | 16.42 | |
| Russell 2000®Growth Index | | | (9.31 | ) | | | 7.24 | | | | 5.13 | | | | 13.52 | |
Performance cited represents past performance. Past performance does not guarantee future results and current performance may be lower or higher than the data quoted. Results shown are average annual total returns, which assume reinvestment of dividends and capital gains. Investment returns and principal will fluctuate and you may have a gain or loss when you sell shares. For the most current month-end performance information, please call 1-800-742-7272, or visit our Web site atwww.williamblairfunds.com. Investing in smaller companies involves special risks, including higher volatility and lower liquidity. Smaller capitalization stocks are also more sensitive to purchase/sale transactions and changes in the issuer’s financial condition. From time to time, the investment adviser may waive fees or reimburse expenses for the Fund. Without these waivers/reimbursements, performance would be lower. Class N shares are available to the general public without a sales load. Class I shares are available to certain institutional investors, and advisory clients of William Blair & Company, L.L.C., without a sales load or distribution (12b-1) or service fees.
The performance highlights and graph presented above do not reflect the deduction of taxes that a shareholder would pay on fund distributions or the redemption of fund shares.
The Russell 2000®Growth Index is an unmanaged composite of the smallest 2000 stocks of the Russell 3000®Growth Index.
This report identifies the Fund’s investments on December 31, 2018. These holdings are subject to change. Not all stocks in the Fund performed the same, nor is there any guarantee that these stocks will perform as well in the future. Market forecasts provided in this report may not necessarily come to pass.
Sector Diversification (Unaudited)
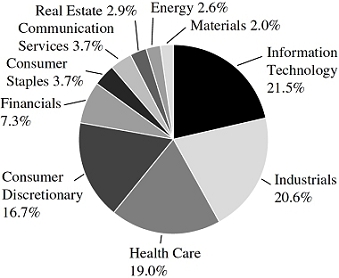
The sector diversification shown is based on the total long-term securities.
| December 31, 2018 | William Blair Funds | 25 |
Small Cap Growth Fund
Portfolio of Investments, December 31, 2018(all dollar amounts in thousands)
| | | | | | | | |
| | | | | | | | |
| | Issuer | | Shares | | | Value | |
| | | | | | | | | | |
| | Common Stocks | | | | | | | | |
| | Information Technology—21.4% | | | | | | | | |
| * | 2U, Inc. | | | 119,500 | | | $ | 5,941 | |
| * | Agilysys, Inc. | | | 614,570 | | | | 8,813 | |
| * | Carbon Black, Inc. | | | 441,290 | | | | 5,922 | |
| * | EPAM Systems, Inc. | | | 63,854 | | | | 7,408 | |
| * | Euronet Worldwide, Inc. | | | 90,410 | | | | 9,256 | |
| * | Guidewire Software, Inc. | | | 86,537 | | | | 6,943 | |
| | j2 Global, Inc. | | | 137,502 | | | | 9,540 | |
| | Littelfuse, Inc. | | | 31,633 | | | | 5,424 | |
| * | LivePerson, Inc. | | | 375,977 | | | | 7,091 | |
| * | MaxLinear, Inc. | | | 403,839 | | | | 7,108 | |
| * | Nice, Ltd.—ADR | | | 53,023 | | | | 5,738 | |
| * | Nuance Communications, Inc. | | | 436,850 | | | | 5,779 | |
| * | Pure Storage, Inc. | | | 483,666 | | | | 7,777 | |
| * | RealPage, Inc. | | | 120,851 | | | | 5,824 | |
| * | Rogers Corporation | | | 52,815 | | | | 5,232 | |
| * | SolarWinds Corporation | | | 438,100 | | | | 6,059 | |
| * | Varonis Systems, Inc. | | | 156,920 | | | | 8,301 | |
| * | WNS Holdings, Ltd.—ADR | | | 147,112 | | | | 6,070 | |
| | | | | | | | | 124,226 | |
| | Industrials—20.5% | | | | | | | | |
| | Albany International Corporation | | | 111,595 | | | | 6,967 | |
| | Armstrong World Industries, Inc. | | | 118,763 | | | | 6,913 | |
| * | Blue Bird Corporation | | | 488,521 | | | | 8,886 | |
| | BWX Technologies, Inc. | | | 252,729 | | | | 9,662 | |
| * | Casella Waste Systems, Inc. | | | 264,670 | | | | 7,541 | |
| | Douglas Dynamics, Inc. | | | 227,077 | | | | 8,150 | |
| | ESCO Technologies, Inc. | | | 85,336 | | | | 5,628 | |
| * | Genesee & Wyoming, Inc. | | | 84,147 | | | | 6,228 | |
| | Healthcare Services Group, Inc. | | | 262,677 | | | | 10,554 | |
| | John Bean Technologies Corporation | | | 35,626 | | | | 2,528 | |
| | Luxfer Holdings plc† | | | 328,475 | | | | 5,791 | |
| * | Mercury Systems, Inc. | | | 136,846 | | | | 6,471 | |
| | Ritchie Bros Auctioneers, Inc.† | | | 239,605 | | | | 7,840 | |
| * | SiteOne Landscape Supply, Inc. | | | 78,778 | | | | 4,354 | |
| | The Brink’s Co. | | | 157,200 | | | | 10,163 | |
| * | Trex Co., Inc. | | | 112,790 | | | | 6,695 | |
| * | Willdan Group, Inc. | | | 132,754 | | | | 4,644 | |
| | | | | | | | | 119,015 | |
| | Health Care—18.9% | | | | | | | | |
| * | Amedisys, Inc. | | | 40,580 | | | | 4,752 | |
| * | Cambrex Corporation | | | 197,389 | | | | 7,453 | |
| * | Catalent, Inc. | | | 212,698 | | | | 6,632 | |
| * | Codexis, Inc. | | | 458,208 | | | | 7,652 | |
| * | CryoLife, Inc. | | | 213,347 | | | | 6,055 | |
| | Encompass Health Corporation | | | 124,907 | | | | 7,707 | |
| * | Glaukos Corporation | | | 148,811 | | | | 8,359 | |
| * | Hanger, Inc. | | | 395,880 | | | | 7,502 | |
| * | Horizon Pharma plc† | | | 384,721 | | | | 7,517 | |
| * | Inogen, Inc. | | | 58,780 | | | | 7,299 | |
| * | Inspire Medical Systems, Inc. | | | 120,250 | | | | 5,081 | |
| * | Intersect ENT, Inc. | | | 220,813 | | | | 6,222 | |
| * | LHC Group, Inc. | | | 74,005 | | | | 6,948 | |
| * | Ligand Pharmaceuticals, Inc. | | | 62,539 | | | | 8,486 | |
| * | Portola Pharmaceuticals, Inc. | | | 334,660 | | | | 6,533 | |
| | Simulations Plus, Inc. | | | 252,680 | | | | 5,028 | |
| | | | | | | | | 109,226 | |
| | | | | | | | |
| | | | | | | | |
| | Issuer | | Shares | | | Value | |
| | | | | | | | | | |
| | Common Stocks—(continued) | | | | | | | | |
| | Consumer Discretionary—16.6% | | | | | | | | |
| * | Adtalem Global Education, Inc. | | | 170,683 | | | $ | 8,077 | |
| * | Aspen Group, Inc. | | | 691,670 | | | | 3,790 | |
| * | At Home Group, Inc. | | | 233,860 | | | | 4,364 | |
| * | Boot Barn Holdings, Inc. | | | 482,648 | | | | 8,220 | |
| | Dave & Buster’s Entertainment, Inc. | | | 145,320 | | | | 6,475 | |
| | Dine Brands Global, Inc. | | | 68,030 | | | | 4,581 | |
| * | Etsy, Inc. | | | 126,224 | | | | 6,005 | |
| * | Gentherm, Inc. | | | 142,313 | | | | 5,690 | |
| * | Grand Canyon Education, Inc. | | | 77,583 | | | | 7,459 | |
| * | Hilton Grand Vacations, Inc. | | | 326,444 | | | | 8,615 | |
| * | Laureate Education, Inc. | | | 734,283 | | | | 11,190 | |
| | Lithia Motors, Inc. | | | 78,179 | | | | 5,967 | |
| | Six Flags Entertainment Corporation | | | 87,783 | | | | 4,883 | |
| * | Universal Electronics, Inc. | | | 158,533 | | | | 4,008 | |
| * | Weight Watchers International, Inc. | | | 170,140 | | | | 6,559 | |
| | | | | | | | | 95,883 | |
| | Financials—7.2% | | | | | | | | |
| * | Encore Capital Group, Inc. | | | 284,398 | | | | 6,683 | |
| | FirstCash, Inc. | | | 108,168 | | | | 7,826 | |
| | Glacier Bancorp, Inc. | | | 153,975 | | | | 6,101 | |
| | Home BancShares, Inc. | | | 368,214 | | | | 6,017 | |
| | Meta Financial Group, Inc. | | | 40,404 | | | | 783 | |
| * | Triumph Bancorp, Inc. | | | 157,338 | | | | 4,673 | |
| | Virtu Financial, Inc. | | | 379,854 | | | | 9,785 | |
| | | | | | | | | 41,868 | |
| | Communication Services—3.7% | | | | | | | | |
| | Cable One, Inc. | | | 10,830 | | | | 8,882 | |
| * | Cars.com, Inc. | | | 227,678 | | | | 4,895 | |
| * | ORBCOMM, Inc. | | | 923,975 | | | | 7,632 | |
| | | | | | | | | 21,409 | |
| | Consumer Staples—3.7% | | | | | | | | |
| | Calavo Growers, Inc. | | | 36,101 | | | | 2,634 | |
| * | Darling Ingredients, Inc. | | | 228,870 | | | | 4,404 | |
| | Nu Skin Enterprises, Inc. | | | 108,498 | | | | 6,654 | |
| * | Primo Water Corporation | | | 543,103 | | | | 7,609 | |
| | | | | | | | | 21,301 | |
| | Real Estate—2.9% | | | | | | | | |
| | Colliers International Group, Inc.† | | | 98,414 | | | | 5,417 | |
| | CoreSite Realty Corporation | | | 60,874 | | | | 5,310 | |
| | FirstService Corporation† | | | 90,267 | | | | 6,181 | |
| | | | | | | | | 16,908 | |
| | Energy—2.5% | | | | | | | | |
| * | Callon Petroleum Co. | | | 412,673 | | | | 2,678 | |
| | Cameco Corporation† | | | 574,110 | | | | 6,516 | |
| * | Carrizo Oil & Gas, Inc. | | | 170,712 | | | | 1,927 | |
| * | Centennial Resource Development, Inc. | | | 326,740 | | | | 3,601 | |
| | | | | | | | | 14,722 | |
| | Materials—2.0% | | | | | | | | |
| | Eagle Materials, Inc. | | | 71,310 | | | | 4,352 | |
| | Orion Engineered Carbons S.A.† | | | 274,222 | | | | 6,932 | |
| | | | | | | | | 11,284 | |
| | Total Common Stocks—99.4%
(cost $576,293) | | | | | | | 575,842 | |
See accompanying Notes to Financial Statements.
| 26 | Annual Report | December 31, 2018 |
Small Cap Growth Fund
Portfolio of Investments, December 31, 2018(all dollar amounts in thousands)
| | | | | | | | |
| | | | Principal | | | | |
| | Issuer | | Amount | | | Value | |
| | | | | | | | | | |
| | Repurchase Agreement | | | | | | | | |
| | Fixed Income Clearing Corporation, 0.500% dated 12/31/18, due 1/2/19, repurchase price $21,360, collateralized by Federal Home Loan Mortgage Corporation, 3.750%, due 3/27/19, and U.S. Treasury Bonds, 3.375%-3.750%, due 11/15/43-5/15/44 | | | $21,360 | | | $ | 21,360 | |
| | Total Repurchase Agreement—3.7%
(cost $21,360) | | | | | | | 21,360 | |
| | Total Investments—103.1%
(cost $597,653) | | | | | | | 597,202 | |
| | Liabilities, plus cash and other assets—(3.1)% | | | | | | | (17,895 | ) |
| | Net assets—100.0% | | | | | | $ | 579,307 | |
ADR = American Depository Receipt
* = Non-income producing security
† = U.S. listed foreign security
See accompanying Notes to Financial Statements.
| December 31, 2018 | William Blair Funds | 27 |
| | Small Cap Value Fund |
| | |
| | The Small Cap Value Fund seeks long-term capital appreciation. |
| | |
| | AN OVERVIEW FROM THE PORTFOLIO MANAGERS |
| | |

Chad M. Kilmer 
Mark T. Leslie 
David S. Mitchell | The William Blair Small Cap Value Fund (Class N shares) posted a 15.93% decrease, net of fees, for the twelve months ended December 31, 2018. By comparison, the Fund’s benchmark index, the Russell 2000® Value Index (the “Index”), decreased 12.86%. The Fund’s underperformance relative to the Index was driven by stock selection, which more than offset positive tailwinds from the Fund’s bias in favor of higher quality and larger market cap stocks within its small cap universe. At the sector level, the most significant detractor from the Fund’s performance was Financials due to stock selection within Banks, Insurance and a lack of exposure to Mortgage REITs. The Fund’s relative underperformance within Industrials was largely driven by stock selection within Machinery, as end-of-cycle concerns generally overshadowed positive corporate earnings earlier in the year. Within Consumer Discretionary, the Fund’s relative underperformance was due to a lack of exposure to Specialty Retail and stock selection within Casinos & Gaming, Auto Parts & Equipment, and Automobiles. Information Technology was the largest contributor to the Fund’s relative performance primarily due to strong stock selection within IT Services. The Fund’s relative outperformance within Health Care was driven by strong stock selection within Health Care Equipment and Health Care Facilities, which more than offset negative contribution from the Fund’s lack of exposure to Biotechnology and Pharmaceutical stocks. Looking specifically at stock selection, the Fund’s largest detractors from relative performance were Halcon Resources Corporation (Energy), Dana Inc. (Consumer Discretionary), and Extraction Oil & Gas, Inc. (Energy). Offsetting these detractors were investments in Integer Holdings Corporation (Health Care), LiveRamp Holdings, Inc. (Tech), and Encompass Health Corporation (Health Care). Please refer to the U.S. Value Market Review and Outlook relating to the Fund on page 7. |
| 28 | Annual Report | December 31, 2018 |
Small Cap Value Fund
Performance Highlights (Unaudited)
| Average Annual Total Return through 12/31/2018 |
| | | 1 Year | | 3 Year | | 5 Year | | 10 Year |
| Class N | | | (15.93 | )% | | | 4.50 | % | | | 2.36 | % | | | 10.44 | % |
| Class I | | | (15.74 | ) | | | 4.75 | | | | 2.62 | | | | 10.72 | |
| Russell 2000®Value Index | | | (12.86 | ) | | | 7.37 | | | | 3.61 | | | | 10.40 | |
Performance cited represents past performance. Past performance does not guarantee future results and current performance may be lower or higher than the data quoted. Results shown are average annual total returns, which assume reinvestment of dividends and capital gains. Investment returns and principal will fluctuate and you may have a gain or loss when you sell shares. For the most current month-end performance information, please call 1-800-742-7272, or visit our Web site atwww.williamblairfunds.com. Investing in smaller companies involves special risks, including higher volatility and lower liquidity. Smaller capitalization stocks are also more sensitive to purchase/sale transactions and changes in the issuer’s financial condition. From time to time, the investment adviser may waive fees or reimburse expenses for the Fund. Without these waivers/reimbursements, performance would be lower. Class N shares are available to the general public without a sales load. Class I shares are available to certain institutional investors, and advisory clients of William Blair & Company, L.L.C., without a sales load or distribution (12b-1) or service fees.
The performance highlights and graph presented above do not reflect the deduction of taxes that a shareholder would pay on fund distributions or the redemption of fund shares.
The Russell 2000®Value Index consists of small-capitalization companies with below average price-to-book ratios and forecasted growth rates.
This report identifies the Fund’s investments on December 31, 2018. These holdings are subject to change. Not all stocks in the Fund performed the same, nor is there any guarantee that these stocks will perform as well in the future. Market forecasts provided in this report may not necessarily come to pass.
Sector Diversification (Unaudited)
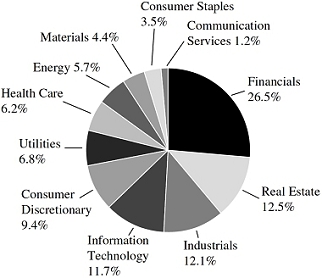
The sector diversification shown is based on the total long-term securities.
| December 31, 2018 | William Blair Funds | 29 |
Small Cap Value Fund
Portfolio of Investments, December 31, 2018(all dollar amounts in thousands)
| | | | | | | | |
| | | | | | | | |
| | Issuer | | Shares | | | Value | |
| | | | | | | | | | |
| | Common Stocks | | | | | | | | |
| | Financials—25.6% | | | | | | | | |
| | Banc of California, Inc. | | | 241,755 | | | $ | 3,218 | |
| | Banner Corporation | | | 115,383 | | | | 6,171 | |
| | Boston Private Financial Holdings, Inc. | | | 390,194 | | | | 4,124 | |
| | CNO Financial Group, Inc. | | | 235,710 | | | | 3,507 | |
| | CVB Financial Corporation | | | 203,359 | | | | 4,114 | |
| | FNB Corporation | | | 561,768 | | | | 5,528 | |
| | Glacier Bancorp, Inc. | | | 128,687 | | | | 5,098 | |
| | Hancock Whitney Corporation | | | 176,855 | | | | 6,128 | |
| | Hanover Insurance Group, Inc. | | | 67,214 | | | | 7,848 | |
| | Home BancShares, Inc. | | | 399,970 | | | | 6,535 | |
| | Iberiabank Corporation | | | 105,209 | | | | 6,763 | |
| | National Bank Holdings Corporation | | | 186,329 | | | | 5,752 | |
| | OceanFirst Financial Corporation | | | 235,708 | | | | 5,306 | |
| | PacWest Bancorp | | | 152,670 | | | | 5,081 | |
| | Radian Group, Inc. | | | 421,935 | | | | 6,903 | |
| | Renasant Corporation | | | 181,696 | | | | 5,484 | |
| | Sandy Spring Bancorp, Inc. | | | 132,213 | | | | 4,143 | |
| * | Seacoast Banking Corporation of Florida | | | 229,963 | | | | 5,984 | |
| | Selective Insurance Group, Inc. | | | 114,276 | | | | 6,964 | |
| | Sterling Bancorp | | | 412,160 | | | | 6,805 | |
| | Umpqua Holdings Corporation | | | 253,644 | | | | 4,033 | |
| * | Western Alliance Bancorp | | | 134,530 | | | | 5,313 | |
| | WSFS Financial Corporation | | | 126,571 | | | | 4,798 | |
| | | | | | | | | 125,600 | |
| | Real Estate—12.1% | | | | | | | | |
| | Acadia Realty Trust | | | 239,840 | | | | 5,699 | |
| | Agree Realty Corporation | | | 93,720 | | | | 5,541 | |
| | American Assets Trust, Inc. | | | 199,832 | | | | 8,027 | |
| | Columbia Property Trust, Inc. | | | 301,310 | | | | 5,830 | |
| | Equity Commonwealth | | | 154,785 | | | | 4,645 | |
| | Healthcare Realty Trust, Inc. | | | 255,861 | | | | 7,277 | |
| | Highwoods Properties, Inc. | | | 146,626 | | | | 5,673 | |
| | Pebblebrook Hotel Trust | | | 167,587 | | | | 4,744 | |
| | Sunstone Hotel Investors, Inc. | | | 367,620 | | | | 4,783 | |
| | Terreno Realty Corporation | | | 204,873 | | | | 7,205 | |
| | | | | | | | | 59,424 | |
| | Industrials—11.6% | | | | | | | | |
| | Acuity Brands, Inc. | | | 32,350 | | | | 3,719 | |
| | Brady Corporation | | | 205,716 | | | | 8,940 | |
| * | Continental Building Products, Inc. | | | 153,821 | | | | 3,915 | |
| | ESCO Technologies, Inc. | | | 69,314 | | | | 4,571 | |
| * | Gardner Denver Holdings, Inc. | | | 202,755 | | | | 4,146 | |
| | GrafTech International, Ltd. | | | 339,644 | | | | 3,886 | |
| | Interface, Inc. | | | 243,426 | | | | 3,469 | |
| | Kadant, Inc. | | | 48,370 | | | | 3,940 | |
| | Matson, Inc. | | | 118,305 | | | | 3,788 | |
| | Moog, Inc. | | | 65,400 | | | | 5,067 | |
| * | Saia, Inc. | | | 64,976 | | | | 3,627 | |
| | Simpson Manufacturing Co., Inc. | | | 86,362 | | | | 4,675 | |
| | The Timken Co. | | | 94,425 | | | | 3,524 | |
| | | | | | | | | 57,267 | |
| | | | | | | | |
| | | | | | | | |
| | Issuer | | Shares | | | Value | |
| | | | | | | | | | |
| | Common Stocks—(continued) | | | | | | | | |
| | Information Technology—11.3% | | | | | | | | |
| | Avnet, Inc. | | | 141,890 | | | $ | 5,122 | |
| | Belden, Inc. | | | 127,477 | | | | 5,325 | |
| | Booz Allen Hamilton Holding Corporation | | | 106,838 | | | | 4,815 | |
| * | Ciena Corporation | | | 172,420 | | | | 5,847 | |
| * | Inphi Corporation | | | 157,889 | | | | 5,076 | |
| | j2 Global, Inc. | | | 94,225 | | | | 6,537 | |
| * | LiveRamp Holdings, Inc. | | | 150,030 | | | | 5,796 | |
| * | Semtech Corporation | | | 121,530 | | | | 5,575 | |
| * | SolarWinds Corporation | | | 345,250 | | | | 4,775 | |
| * | Viavi Solutions, Inc. | | | 667,499 | | | | 6,708 | |
| | | | | | | | | 55,576 | |
| | Consumer Discretionary—9.0% | | | | | | | | |
| | Abercrombie & Fitch Co. | | | 206,280 | | | | 4,136 | |
| * | Adtalem Global Education, Inc. | | | 131,166 | | | | 6,207 | |
| * | Cavco Industries, Inc. | | | 29,205 | | | | 3,808 | |
| | Churchill Downs, Inc. | | | 20,015 | | | | 4,883 | |
| | Dana, Inc. | | | 292,343 | | | | 3,985 | |
| | Dave & Buster’s Entertainment, Inc. | | | 107,020 | | | | 4,769 | |
| * | Penn National Gaming, Inc. | | | 247,095 | | | | 4,653 | |
| * | TopBuild Corporation | | | 84,649 | | | | 3,809 | |
| * | Weight Watchers International, Inc. | | | 70,640 | | | | 2,723 | |
| | Wolverine World Wide, Inc. | | | 172,926 | | | | 5,514 | |
| | | | | | | | | 44,487 | |
| | Utilities—6.6% | | | | | | | | |
| | ALLETE, Inc. | | | 75,580 | | | | 5,761 | |
| | Chesapeake Utilities Corporation | | | 42,125 | | | | 3,425 | |
| | IDACORP, Inc. | | | 63,590 | | | | 5,918 | |
| | ONE Gas, Inc. | | | 77,492 | | | | 6,168 | |
| | PNM Resources, Inc. | | | 137,855 | | | | 5,664 | |
| | South Jersey Industries, Inc. | | | 196,305 | | | | 5,457 | |
| | | | | | | | | 32,393 | |
| | Health Care—6.0% | | | | | | | | |
| | CONMED Corporation | | | 122,642 | | | | 7,874 | |
| | Encompass Health Corporation | | | 137,151 | | | | 8,462 | |
| * | Integer Holdings Corporation | | | 122,843 | | | | 9,368 | |
| * | Magellan Health, Inc. | | | 67,314 | | | | 3,829 | |
| | | | | | | | | 29,533 | |
| | Energy—5.5% | | | | | | | | |
| | Archrock, Inc. | | | 480,888 | | | | 3,602 | |
| * | Callon Petroleum Co. | | | 665,464 | | | | 4,319 | |
| * | Extraction Oil & Gas, Inc. | | | 447,735 | | | | 1,921 | |
| * | Forum Energy Technologies, Inc. | | | 359,455 | | | | 1,485 | |
| * | Halcon Resources Corporation | | | 829,585 | | | | 1,410 | |
| * | Newpark Resources, Inc. | | | 515,754 | | | | 3,543 | |
| * | PDC Energy, Inc. | | | 119,618 | | | | 3,560 | |
| | Range Resources Corporation | | | 356,230 | | | | 3,409 | |
| | Solaris Oilfield Infrastructure, Inc. | | | 296,616 | | | | 3,586 | |
| | | | | | | | | 26,835 | |
See accompanying Notes to Financial Statements.
| 30 | Annual Report | December 31, 2018 |
Small Cap Value Fund
Portfolio of Investments, December 31, 2018(all dollar amounts in thousands)
| | | | Shares or | | | | |
| | | | Principal | | | | |
| | Issuer | | Amount | | | Value | |
| | | | | | | | | | |
| | Common Stocks—(continued) | | | | | | | | |
| | Materials—4.2% | | | | | | | | |
| | Carpenter Technology Corporation | | | 119,116 | | | $ | 4,242 | |
| | Minerals Technologies, Inc. | | | 78,603 | | | | 4,035 | |
| | PolyOne Corporation | | | 138,059 | | | | 3,949 | |
| | Sensient Technologies Corporation | | | 83,137 | | | | 4,643 | |
| | Silgan Holdings, Inc. | | | 159,303 | | | | 3,763 | |
| | | | | | | | | 20,632 | |
| | Consumer Staples—3.4% | | | | | | | | |
| * | Darling Ingredients, Inc. | | | 333,358 | | | | 6,414 | |
| | J&J Snack Foods Corporation | | | 50,688 | | | | 7,329 | |
| | SpartanNash Co. | | | 173,513 | | | | 2,981 | |
| | | | | | | | | 16,724 | |
| | Communication Services—1.2% | | | | | | | | |
| | Meredith Corporation | | | 109,135 | | | | 5,668 | |
| | Total Common Stocks—96.5%
(cost $447,009) | | | | | | | 474,139 | |
| | | | | | | | | | |
| | Repurchase Agreement | | | | | | | | |
| | Fixed Income Clearing Corporation, 0.500% dated 12/31/18, due 1/2/19, repurchase price $9,978, collateralized by U.S. Treasury Bond, 3.625%, due 2/15/44 | | | $9,977 | | | | 9,977 | |
| | Total Repurchase Agreement—2.0%
(cost $9,977) | | | | | | | 9,977 | |
| | Total Investments—98.5%
(cost $456,986) | | | | | | | 484,116 | |
| | Cash and other assets, less liabilities—1.5% | | | | | | | 7,399 | |
| | Net assets—100.0% | | | | | | $ | 491,515 | |
* = Non-income producing security
See accompanying Notes to Financial Statements.
| December 31, 2018 | William Blair Funds | 31 |
Global Markets Review and Outlook
Heightened concerns about slowing global growth, rising interest rates and tighter liquidity conditions contributed to the broad sell-off across global equity markets in the fourth quarter of 2018. The sharp decline in global equities during the fourth quarter (-13.28% for the MSCI All Country World Index (ACWI) Investable Market Index (“IMI”) in U.S. Dollar (“USD”) terms) wiped out positive gains during the first three quarters of 2018 and sent indices firmly into negative territory. For the calendar year, the MSCI ACWI IMI returned -10.08%.
The final weeks of 2018 were nothing short of dramatic, punctuated by the U.S. political dispute over the budget, which ultimately resulted in the partial federal government shutdown. Investors were also rattled by the increasingly volatile nature of U.S.-China relations, including the arrest of Huawei Technologies’ CFO on suspicion of violating U.S. sanctions against Iran, further complicating the trade war outlook.
U.S. equities significantly outperformed non-U.S. developed and emerging markets for most of 2018. This divergence came to an abrupt end after U.S. equities fell -13.52% in the fourth quarter — the worst quarterly performance since 3Q2011, erasing year-to-date gains as measured by the S&P 500, which lost 4.39% for the calendar year. The majority of U.S. equity underperformance occurred in December due to concerns of higher interest rates and renewed political turmoil ahead of the new congressional session. From a sector perspective, U.S. energy stocks declined the most (-25.77% during the fourth quarter and -20.11% during the year as measured by the MSCI USA IMI Index as the West Texas Intermediate (“WTI”) oil price plunged over 40% to as low as $42 per barrel in December.
European and UK equities underperformed other developed market regions during 2018 on concerns over slowing economic growth, political turmoil in Italy, and increasing Brexit uncertainty ahead of the March 29, 2019 deadline for withdrawal from the European Union. Uncertainty surrounding not only the terms of Brexit, but the continuation of Brexit itself, weighed more heavily on domestically oriented UK sectors such as real estate and weighed on small cap companies more broadly. Amid this difficult backdrop, the MSCI Europe ex-UK IMI declined 15.72% and the MSCI UK IMI fell 15.04% in USD terms.
Despite strong relative performance in the fourth quarter, emerging markets lagged developed markets in 2018, falling 15.05% as measured by the MSCI Emerging Markets IMI. Buffeting investors were heightened geopolitical tensions, the strengthening U.S. dollar, and signs of a slowdown within China. Accordingly, emerging market countries that lagged the most in 2018 were those with larger current account deficits and dollar-denominated debt such as Argentina (-50.79%), Turkey (-41.32%) and South Africa (-24.71%).
These headwinds began to moderate in the final months of the year as the U.S. dollar and oil prices began to weaken, and as the geopolitical backdrop improved. Within Brazil, for example, optimism towards the newly elected government and pension reform prospects supported investor sentiment. The significant decline in oil prices contributed to gains for Indonesia and India on hopes of moderating inflation prospects, given both countries’ dependency on oil imports.
As we begin 2019, surveys suggest that momentum in global growth continued to decelerate through the tail end of last year. Specifically, purchasing manager surveys continue to point to deceleration in the pace of industrial orders growth and subsequent industrial production growth. As the impact of highly simulative fiscal policy unveiled at the beginning of 2018 begins to dissipate, the U.S. economy is likely to slow to 2 to 2.5% growth, from the high of 4.2% in Q2 2018.
At the same time, we continue to expect the divergence in economic growth rates between the U.S. and other economies to begin to normalize. If the rest of the world continues to see economic growth at the current pace while the U.S. economy slows, the growth wedge, and by extension the substantial outperformance of U.S. markets vis-à-vis the rest of the world, is likely to moderate.
In Europe, near-term indicators of industrial activity continue to decelerate. At the same time, employment and income growth together with corporate balance sheets suggest support for domestic demand growth comparable to the 2018 rate. Italian budget woes have subsided, at least for now. While Brexit uncertainty remains an overhang, we believe the UK Parliament will seek to avoid near-term economic disruption.
The exceptionally strong U.S. economy and rising U.S. bond yields supported the U.S. dollar in 2018, contributing to a challenging year for emerging market economies. Looking ahead, these emerging market headwinds are likely to subside. Further, in the final quarter of 2018, the price of crude oil declined by one-third, significantly easing constraints on emerging market economies, as many are large energy importers.
| 32 | Annual Report | December 31, 2018 |
Global Markets Review and Outlook (continued)
The likelihood of a U.S.-China trade deal and de-escalation of tariff wars has risen as of the beginning of 2019. Later in 2019 or in 2020, the U.S. is likely to become a sizeable exporter of liquefied natural gas (“LNG”) and petroleum products, for which it needs to find consumers and which will be more expensive because of rising shipping costs driven by strong global LNG demand. China is the largest and fastest growing consumer of such products. Thus, the economic rationale for a trade deal is substantial and imminent.
Last year, China implemented significant and widespread changes in its tax structure, especially individual income taxes. We expect that reducing taxes for households is likely to support consumer demand in China. We are not expecting China to implement a large stimulus, but slow monetary, fiscal and regulatory policy changes have been made to keep growth steady. China’s most recent reduction of the reserve ratio requirement for banks, the fifth reduction in the past year, is noteworthy in its size. The reserve ratio for large banks now stands at 13.5%, down from 17% a year ago.
Recent positioning adjustments within our ACWI-oriented strategies generally reflect our incrementally less cautious outlook on emerging markets. Within our dedicated emerging markets strategies, we have added positions in Brazil and maintained overweighted positions in India. Within China, we continue to emphasize domestically oriented consumer, healthcare and technology companies that we believe are well positioned to benefit from the economy’s ongoing transition to a consumption and services-driven growth model.
| December 31, 2018 | William Blair Funds | 33 |
| | Global Leaders Fund |
| | |
| | The Global Leaders Fund seeks long-term capital appreciation. |
| | |
| | AN OVERVIEW FROM THE PORTFOLIO MANAGERS |
| | |

Andrew G. Flynn 
Kenneth J. McAtamney | The William Blair Global Leaders Fund (Class N shares) posted an 8.23% decrease, net of fees, for the twelve months ended December 31, 2018. By comparison, the Fund’s benchmark index, the MSCI All Country World IMI Index (net) (the “Index”), decreased 10.08%. Calendar year outperformance versus the Index was primarily driven by positive stock selection across most sectors. The Materials, Health Care and Consumer Staples sectors were the largest sources of relative return from a stock selection perspective. Within Materials, Nissan Chemical Corp., the innovative Japanese producer of niche chemicals for the electronics, agriculture, and pharmaceutical industries, contributed to the Fund’s results as the company continued to post solid growth in the context of the challenging smartphone/display market. Nissan Chemical has a leading position in its core products and a track record of innovation supported by its commitment to high levels of research and development. Within Health Care, UnitedHealth Group, Inc., the best-of-breed operator in the U.S.-managed care industry, was an additional source of the Fund’s outperformance as the company’s stable earnings profile was rewarded in a difficult market environment. Within the Consumer Staples sector, The Estee Lauder Cos., Inc. increased the Fund’s relative returns. We expect the company to benefit from the rapid growth of newly acquired brands, the continued expansion in specialty retail and online channels, and strong growth from China and travel retail. Partially offsetting these effects was an underweight in the Consumer Staples and Utilities sectors, coupled with negative stock selection within the Energy sector. Within Energy, Halliburton Company’s share price declined along with the price of oil, and the Fund exited this position during the fourth quarter in order to reduce oil and gas exposure. Please refer to the Global Markets Review and Outlook relating to the Fund beginning on page 32. |
| 34 | Annual Report | December 31, 2018 |
Global Leaders Fund
Performance Highlights (Unaudited)
| Average Annual Total Return through 12/31/2018 |
| | | 1 Year | | 3 Year | | 5 Year | | 10 Year | | Since
Inception |
| Class N | | | (8.23 | )% | | | 6.36 | % | | | 5.05 | % | | | 11.48 | % | | | — | |
| Class I | | | (8.06 | ) | | | 6.66 | | | | 5.35 | | | | 11.77 | | | | — | |
| MSCI ACW IMI (net) | | | (10.08 | ) | | | 6.49 | | | | 4.17 | | | | 9.74 | | | | — | |
| Institutional Class(a) | | | (7.99 | ) | | | 6.72 | | | | 5.44 | | | | — | | | | 7.82 | % |
| MSCI ACW IMI (net)(a) | | | (10.08 | ) | | | 6.49 | | | | 4.17 | | | | — | | | | 7.07 | |
| | |
| (a) | Since inception is for the period from December 19, 2012 (Commencement of Operations) to December 31, 2018. |
Performance cited represents past performance. Past performance does not guarantee future results and current performance may be lower or higher than the data quoted. Results shown are average annual total returns, which assume reinvestment of dividends and capital gains. Investment returns and principal will fluctuate and you may have a gain or loss when you sell shares. For the most current month-end performance information, please call 1-800-742-7272, or visit our Web site atwww.williamblairfunds.com. Investing in smaller and medium capitalization companies involves special risks, including higher volatility and lower liquidity. Smaller and medium capitalization stocks are also more sensitive to purchase/sale transactions and changes in the issuer’s financial condition. International investing involves special risk considerations, including currency fluctuations, lower liquidity, economic and political risk. From time to time, the investment adviser may waive fees or reimburse expenses for the Fund. Without these waivers/reimbursements, performance would be lower. Class N shares are available to the general public without a sales load. Class I shares are available to certain institutional investors, and advisory clients of William Blair & Company, L.L.C., without a sales load or distribution fees (12b-1). Institutional Class shares are available to institutional investors without a sales load or distribution (12b-1) or service fees.
The performance highlights and graph presented above do not reflect the deduction of taxes that a shareholder would pay on fund distributions or the redemption of fund shares.
The Morgan Stanley Capital International (MSCI) All Country World (ACW) Investable Market Index (IMI) (net) is a free float-adjusted market capitalization weighted index that is designed to measure the equity market of developed and emerging markets. This index approximates the minimum possible dividend reinvestment by deducting for the highest possible withholding tax rates of those markets.
This report identifies the Fund’s investments on December 31, 2018. These holdings are subject to change. Not all stocks in the Fund performed the same, nor is there any guarantee that these stocks will perform as well in the future. Market forecasts provided in this report may not necessarily come to pass.
Sector Diversification (Unaudited)
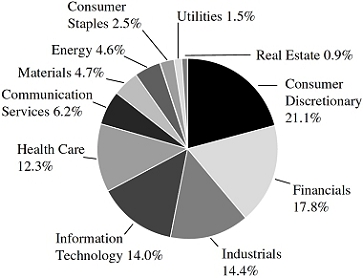
The sector diversification shown is based on the total long-term securities.
| December 31, 2018 | William Blair Funds | 35 |
Global Leaders Fund
Portfolio of Investments, December 31, 2018(all dollar amounts in thousands)
| | | | | | | | |
| | | | | | | | |
| | Issuer | | Shares | | | Value | |
| | | | | | | | | | |
| | Common Stocks | | | | | | | | |
| | | | | | | | | | |
| | Western Hemisphere—56.5% | | | | | | | | |
| | Canada—2.8% | | | | | | | | |
| | Brookfield Asset Management, Inc. Class “A” (Capital markets)† | | | 69,025 | | | $ | 2,647 | |
| | Suncor Energy, Inc. (Oil, gas & consumable fuels) | | | 75,623 | | | | 2,112 | |
| | | | | | | | | 4,759 | |
| | United States—53.7% | | | | | | | | |
| * | ABIOMED, Inc. (Health care equipment & supplies) | | | 2,713 | | | | 882 | |
| * | Adobe, Inc. (Software) | | | 13,025 | | | | 2,947 | |
| * | Align Technology, Inc. (Health care equipment & supplies) | | | 5,611 | | | | 1,175 | |
| * | Alphabet, Inc. Class “A” (Interactive Media & Services) | | | 4,920 | | | | 5,141 | |
| * | Amazon.com, Inc. (Internet & direct marketing retail) | | | 3,228 | | | | 4,848 | |
| | BlackRock, Inc. (Capital markets) | | | 7,772 | | | | 3,053 | |
| | Carnival Corporation (Hotels, restaurants & leisure)† | | | 49,017 | | | | 2,417 | |
| * | CoStar Group, Inc. (Professional services) | | | 3,785 | | | | 1,277 | |
| | Domino’s Pizza, Inc. (Hotels, restaurants & leisure) | | | 9,242 | | | | 2,292 | |
| | EOG Resources, Inc. (Oil, gas & consumable fuels) | | | 22,653 | | | | 1,976 | |
| * | Facebook, Inc. Class “A” (Interactive Media & Services) | | | 20,264 | | | | 2,656 | |
| | Fifth Third Bancorp (Banks) | | | 92,845 | | | | 2,185 | |
| * | Guidewire Software, Inc. (Software) | | | 10,964 | | | | 880 | |
| * | Illumina, Inc. (Life sciences tools & services) | | | 2,985 | | | | 895 | |
| | Intercontinental Exchange, Inc. (Capital markets) | | | 41,287 | | | | 3,110 | |
| * | Intuitive Surgical, Inc. (Health care equipment & supplies) | | | 3,258 | | | | 1,560 | |
| | JPMorgan Chase & Co. (Banks) | | | 32,728 | | | | 3,195 | |
| | Mastercard, Inc. Class “A” (IT services) | | | 19,071 | | | | 3,598 | |
| | NextEra Energy, Inc. (Electric utilities) | | | 14,664 | | | | 2,549 | |
| | Pioneer Natural Resources Co. (Oil, gas & consumable fuels) | | | 7,961 | | | | 1,047 | |
| | Prologis, Inc. (Equity REIT) | | | 27,025 | | | | 1,587 | |
| | Raytheon Co. (Aerospace & defense) | | | 19,352 | | | | 2,968 | |
| | Roper Technologies, Inc. (Industrial conglomerates) | | | 9,525 | | | | 2,539 | |
| * | salesforce.com, Inc. (Software) | | | 21,469 | | | | 2,941 | |
| | Southwest Airlines Co. (Airlines) | | | 20,367 | | | | 947 | |
| | The Boeing Co. (Aerospace & defense) | | | 10,626 | | | | 3,427 | |
| | The Estee Lauder Cos., Inc. Class “A” (Personal products) | | | 24,845 | | | | 3,232 | |
| | The Goldman Sachs Group, Inc. (Capital markets) | | | 10,373 | | | | 1,733 | |
| | The Home Depot, Inc. (Specialty retail) | | | 19,429 | | | | 3,338 | |
| | Thermo Fisher Scientific, Inc. (Life sciences tools & services) | | | 12,357 | | | | 2,765 | |
| * | Ulta Salon Cosmetics & Fragrance, Inc. (Specialty retail) | | | 8,279 | | | | 2,027 | |
| | | | | | | | |
| | | | | | | | |
| | Issuer | | Shares | | | Value | |
| | | | | | | | | | |
| | Common Stocks—(continued) | | | | | | | | |
| | | | | | | | | | |
| | Western Hemisphere—(continued) | | | | | | | | |
| | United States—(continued) | | | | | | | | |
| | Union Pacific Corporation (Road & rail) | | | 24,835 | | | $ | 3,433 | |
| | UnitedHealth Group, Inc. (Health care providers & services) | | | 18,242 | | | | 4,544 | |
| | Vail Resorts, Inc. (Hotels, restaurants & leisure) | | | 9,180 | | | | 1,935 | |
| * | Weight Watchers International, Inc. (Diversified consumer services) | | | 25,531 | | | | 984 | |
| * | Worldpay, Inc. Class “A” (IT services) | | | 39,010 | | | | 2,981 | |
| | Zoetis, Inc. (Pharmaceuticals) | | | 30,230 | | | | 2,586 | |
| | | | | | | | | 91,650 | |
| | | | | | | | | | |
| | Europe—12.4% | | | | | | | | |
| | Denmark—1.5% | | | | | | | | |
| | Chr Hansen Holding A/S (Chemicals) | | | 15,007 | | | | 1,328 | |
| | DSV A/S (Road & rail) | | | 18,107 | | | | 1,192 | |
| | | | | | | | | 2,520 | |
| | France—1.7% | | | | | | | | |
| | LVMH Moet Hennessy Louis Vuitton SE (Textiles, apparel & luxury goods) | | | 10,107 | | | | 2,990 | |
| | Germany—2.0% | | | | | | | | |
| | Infineon Technologies AG (Semiconductors & semiconductor equipment) | | | 86,239 | | | | 1,716 | |
| | MTU Aero Engines AG (Aerospace & defense) | | | 9,237 | | | | 1,676 | |
| | | | | | | | | 3,392 | |
| | Ireland—0.9% | | | | | | | | |
| | Allegion plc (Building products)† | | | 18,661 | | | | 1,488 | |
| | Netherlands—1.5% | | | | | | | | |
| | Royal Dutch Shell plc Class “A” (Oil, gas & consumable fuels) | | | 85,505 | | | | 2,513 | |
| | Sweden—2.1% | | | | | | | | |
| | Atlas Copco AB Class “A” (Machinery) | | | 65,191 | | | | 1,549 | |
| | Hexagon AB Class “B” (Electronic equipment, instruments & components) | | | 44,560 | | | | 2,051 | |
| | | | | | | | | 3,600 | |
| | Switzerland—2.7% | | | | | | | | |
| * | Lonza Group AG (Life sciences tools & services) | | | 9,315 | | | | 2,414 | |
| | Partners Group Holding AG (Capital markets) | | | 3,567 | | | | 2,163 | |
| | | | | | | | | 4,577 | |
| | | | | | | | | | |
| | Emerging Asia—8.5% | | | | | | | | |
| | China—4.9% | | | | | | | | |
| * | Alibaba Group Holding, Ltd.—ADR (Internet & direct marketing retail) | | | 24,819 | | | | 3,402 | |
| | Huazhu Group, Ltd.—ADR (Hotels, restaurants & leisure) | | | 35,845 | | | | 1,026 | |
| | Shenzhou International Group Holdings, Ltd. (Textiles, apparel & luxury goods) | | | 119,000 | | | | 1,349 | |
See accompanying Notes to Financial Statements.
| 36 | Annual Report | December 31, 2018 |
Global Leaders Fund
Portfolio of Investments, December 31, 2018(all dollar amounts in thousands)
| | | | | | | |
| | | | | | | |
| Issuer | | Shares | | | Value | |
| | | | | | | | | |
| Common Stocks—(continued) | | | | | | | | |
| | | | | | | | | |
| Emerging Asia—(continued) | | | | | | | | |
| China—(continued) | | | | | | | | |
| Tencent Holdings, Ltd. (Interactive Media & Services) | | | 65,000 | | | $ | 2,606 | |
| | | | | | | | 8,383 | |
| India—1.6% | | | | | | | | |
| HDFC Bank, Ltd.—ADR (Banks) | | | 25,919 | | | | 2,685 | |
| Taiwan—2.0% | | | | | | | | |
| Taiwan Semiconductor Manufacturing Co., Ltd.—ADR (Semiconductors & semiconductor equipment) | | | 92,119 | | | | 3,400 | |
| | | | | | | | | |
| Japan—7.6% | | | | | | | | |
| Daikin Industries, Ltd. (Building products) | | | 18,400 | | | | 1,963 | |
| Keyence Corporation (Electronic equipment, instruments & components) | | | 5,600 | | | | 2,845 | |
| M3, Inc. (Health care technology) | | | 46,900 | | | | 631 | |
| MISUMI Group, Inc. (Machinery) | | | 34,000 | | | | 719 | |
| Nihon M&A Center, Inc. (Professional services) | | | 43,200 | | | | 873 | |
| Nissan Chemical Corp. (Chemicals) | | | 25,900 | | | | 1,361 | |
| ORIX Corporation (Diversified financial services) | | | 137,400 | | | | 2,013 | |
| Shin-Etsu Chemical Co., Ltd. (Chemicals) | | | 23,200 | | | | 1,807 | |
| ZOZO Inc. (Internet & direct marketing retail) | | | 44,500 | | | | 816 | |
| | | | | | | | 13,028 | |
| | | | | | | | | |
| Asia—7.3% | | | | | | | | |
| Australia—4.0% | | | | | | | | |
| Aristocrat Leisure, Ltd. (Hotels, restaurants & leisure) | | | 67,719 | | | | 1,042 | |
| CSL, Ltd. (Biotechnology) | | | 23,844 | | | | 3,110 | |
| Macquarie Group, Ltd. (Capital markets) | | | 35,275 | | | | 2,699 | |
| | | | | | | | 6,851 | |
| Hong Kong—3.3% | | | | | | | | |
| AIA Group, Ltd. (Insurance) | | | 410,200 | | | | 3,405 | |
| Galaxy Entertainment Group, Ltd. (Hotels, restaurants & leisure) | | | 341,000 | | | | 2,168 | |
| | | | | | | | 5,573 | |
| | | | | | | | | |
| United Kingdom—5.8% | | | | | | | | |
| Aptiv plc (Auto components)† | | | 26,759 | | | | 1,648 | |
| BHP Group plc (Metals & mining) | | | 110,560 | | | | 2,327 | |
| Burford Capital, Ltd. (Capital markets) | | | 43,097 | | | | 910 | |
| Compass Group plc (Hotels, restaurants & leisure) | | | 146,636 | | | | 3,084 | |
| Fevertree Drinks plc (Beverages) | | | 32,942 | | | | 923 | |
| Victrex plc (Chemicals) | | | 36,651 | | | | 1,069 | |
| | | | | | | | 9,961 | |
Total Common Stocks—98.1%
(cost $146,381) | | | | | | | 167,370 | |
| | | | | | | |
| Issuer | | Principal
Amount | | | Value | |
| | | | | | | | | |
| Repurchase Agreement | | | | | | | | |
| Fixed Income Clearing Corporation, 0.500% dated 12/31/18, due 1/2/19, repurchase price $3,648, collateralized by U.S. Treasury Bond, 3.625%, due 8/15/43 | | | $3,648 | | | $ | 3,648 | |
Total Repurchase Agreement—2.1%
(cost $3,648) | | | | | | | 3,648 | |
Total Investments—100.2%
(cost $150,029) | | | | | | | 171,018 | |
| Liabilities, plus cash and other assets—(0.2)% | | | | | | | (318 | ) |
| Net assets—100.0% | | | | | | $ | 170,700 | |
ADR = American Depository Receipt
REIT = Real Estate Investment Trust
† = U.S. listed foreign security
* = Non-income producing security
For securities primarily traded on exchanges or markets that close before the close of regular trading on the New York Stock Exchange, the Fund may use an independent pricing service to fair value price the securities pursuant to Valuation Procedures approved by the Board of Trustees.
At December 31, 2018, the Fund’s Portfolio of Investments includes the following industry categories (as a percentage of long-term investments):
| Consumer Discretionary | | | 21.1 | % |
| Financials | | | 17.8 | % |
| Industrials | | | 14.4 | % |
| Information Technology | | | 14.0 | % |
| Health Care | | | 12.3 | % |
| Communication Services | | | 6.2 | % |
| Materials | | | 4.7 | % |
| Energy | | | 4.6 | % |
| Consumer Staples | | | 2.5 | % |
| Utilities | | | 1.5 | % |
| Real Estate | | | 0.9 | % |
| Total | | | 100.0 | % |
At December 31, 2018, the Fund’s Portfolio of Investments includes the following currency categories (as a percentage of long-term investments):
| U.S. Dollar | | | 64.5 | % |
| Japanese Yen | | | 7.8 | % |
| Hong Kong Dollar | | | 5.7 | % |
| Euro | | | 5.3 | % |
| British Pound Sterling | | | 5.0 | % |
| Australian Dollar | | | 4.1 | % |
| Swiss Franc | | | 2.7 | % |
| Swedish Krona | | | 2.1 | % |
| Danish Krone | | | 1.5 | % |
| Canadian Dollar | | | 1.3 | % |
| Total | | | 100.0 | % |
See accompanying Notes to Financial Statements.
| December 31, 2018 | William Blair Funds | 37 |
| | International Leaders Fund |
| | |
| | The International Leaders Fund seeks long-term capital appreciation. |
| | |
| | AN OVERVIEW FROM THE PORTFOLIO MANAGERS |
| | |

Simon Fennell 
Kenneth J. McAtamney | The William Blair International Leaders Fund (Class N shares) posted a 12.70% decrease, net of fees, for the twelve months ended December 31, 2018. By comparison, the Fund’s benchmark index, the MSCI All Country World ex-U.S. IMI Index (net) (the “Index”), decreased 14.76%. Calendar year outperformance versus the Index was primarily driven by positive stock selection across most sectors. The Consumer Staples, Financials and Materials sectors were the most significant sources of relative return from a stock selection perspective. Within Consumer Staples, Shiseido Co., Ltd. propelled relative performance. Shiseido is the largest cosmetics company in Japan and fifth largest in the world. We expect a continued rebound in earnings growth after a ten-year period of operational underperformance and market share loss. New management has reformed the organizational structure to place more responsibility in the hands of local managers, improved strategy execution, accelerated product development, and concentrated Shiseido’s investment on prestige brands. This strategy started to bear fruit in 2017 as Shiseido’s operating momentum improved, leading the company to dramatically outpace revenues and earnings estimates. Macquarie Group, Ltd., a leading global asset manager, capital provider, and investment bank within the Financials sector was an additional source of outperformance for the Fund. The company posted solid results during the fourth quarter with net profit increasing 5% year-over-year, ahead of consensus. Within the Materials sector, BHP Billiton plc was the top contributor to the Fund’s performance, as the diversified mining company continues to reduce the debt on its balance sheet and return capital to shareholders. Partially offsetting these effects was an underweight to the Consumer Staples and Utilities sectors, coupled with negative stock selection within the Energy sector. Within Energy, Tenaris, S.A., the global leader in seamless pipe used for drilling oil and gas wells, detracted from the Fund’s performance. Concerns around the growth rate of upstream drilling in the Permian Basin due to limited pipeline capacity in the midstream segment and the potential impact from tariffs weighed on near-term sentiment. While the growth rate of the Permian is the main focus of investors, other U.S. shale basins and international onshore and offshore exposures are important for Tenaris’s growth outlook. Longer-term we continue to expect higher upstream activity levels to drive better than expected volume growth at Tenaris, and we believe the stock is attractively valued. Please refer to the Global Markets Review and Outlook relating to the Fund beginning on page 32. |
| 38 | Annual Report | December 31, 2018 |
International Leaders Fund
Performance Highlights (Unaudited)
| Average Annual Total Return through 12/31/2018 |
| | | 1 Year | | 3 Year | | 5 Year | | Since
Inception |
| Class N(a) | | | (12.70 | )% | | | 4.52 | % | | | 3.33 | % | | | 6.71 | % |
| Class I(a) | | | (12.45 | ) | | | 4.80 | | | | 3.58 | | | | 6.98 | |
| MSCI ACW Ex-U.S. IMI (net)(a) | | | (14.76 | ) | | | 4.39 | | | | 0.85 | | | | 4.37 | |
| Institutional Class(b) | | | (12.38 | ) | | | 4.89 | | | | 3.68 | | | | 6.93 | |
| MSCI ACW Ex-U.S. IMI (net)(b) | | | (14.76 | ) | | | 4.39 | | | | 0.85 | | | | 3.89 | |
| | |
| (a) | Since inception is for the period from August 16, 2012 (Commencement of Operations) to December 31, 2018. |
| (b) | Since inception is for the period from November 2, 2012 (Commencement of Operations) to December 31, 2018. |
Performance cited represents past performance. Past performance does not guarantee future results and current performance may be lower or higher than the data quoted. Results shown are average annual returns, which assume reinvestment of dividends and capital gains. Investment returns and principal will fluctuate and you may have a gain or loss when you sell shares. For the most current month-end performance information, please call 1-800-742-7272, or visit our Web site atwww.williamblairfunds.com. Investing in smaller and medium capitalization companies involves special risks, including higher volatility and lower liquidity. Smaller and medium capitalization stocks are also more sensitive to purchase/sale transactions and changes in the issuer’s financial condition. International investing involves special risk considerations, including currency fluctuations, lower liquidity, economic and political risk. From time to time the investment adviser may waive fees or reimburse expenses for the Fund. Without these waivers/reimbursements, performance would be lower. Class N shares are available to the general public without a sales load. Class I shares are available to certain institutional investors, and advisory clients of William Blair & Company, L.L.C., without a sales load or distribution (12b-1) fees. Institutional Class shares are available to institutional investors without a sales load or distribution (12b-1) or service fees.
The performance highlights presented above do not reflect the deduction of taxes that a shareholder would pay on fund distributions or the redemption of fund shares.
The Morgan Stanley Capital International (MSCI) All Country World (ACW) Ex-U.S. Investable Market Index (IMI) (net) is a free float-adjusted market capitalization weighted index that is designed to measure the equity market performance of developed and emerging markets, excluding the United States. This index approximates the minimum possible dividend reinvestment by deducting for the highest possible withholding tax rates of those markets.
This report identifies the Fund’s investments on December 31, 2018. These holdings are subject to change. Not all stocks in the Fund performed the same, nor is there any guarantee that these stocks will perform as well in the future. Market forecasts provided in this report may not necessarily come to pass.
Sector Diversification (Unaudited)
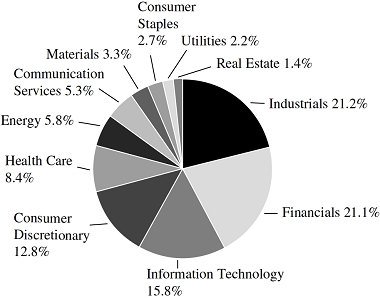
The sector diversification shown is based on the total long-term securities.
| December 31, 2018 | William Blair Funds | 39 |
International Leaders Fund
Portfolio of Investments, December 31, 2018(all dollar amounts in thousands)
| | | | | | | | |
| | | | | | | | |
| | Issuer | | Shares | | | Value | |
| | | | | | | | | | |
| | Common Stocks | | | | | | | | |
| | | | | | | | | | |
| | Europe—41.2% | | | | | | | | |
| | Belgium—1.6% | | | | | | | | |
| | KBC Group N.V. (Banks) | | | 103,839 | | | $ | 6,743 | |
| | Denmark—3.9% | | | | | | | | |
| | Coloplast A/S Class “B” (Health care equipment & supplies) | | | 77,058 | | | | 7,154 | |
| | Orsted A/S (Electric utilities) | | | 130,433 | | | | 8,721 | |
| | | | | | | | | 15,875 | |
| | France—11.1% | | | | | | | | |
| | Airbus SE (Aerospace & defense) | | | 86,823 | | | | 8,352 | |
| | Arkema S.A. (Chemicals) | | | 38,580 | | | | 3,313 | |
| | Capgemini SE (IT services) | | | 76,004 | | | | 7,559 | |
| | LVMH Moet Hennessy Louis Vuitton SE (Textiles, apparel & luxury goods) | | | 31,505 | | | | 9,320 | |
| | Safran S.A. (Aerospace & defense) | | | 82,212 | | | | 9,928 | |
| | Total S.A. (Oil, gas & consumable fuels) | | | 130,232 | | | | 6,891 | |
| | | | | | | | | 45,363 | |
| | Germany—4.0% | | | | | | | | |
| | Infineon Technologies AG (Semiconductors & semiconductor equipment) | | | 211,398 | | | | 4,206 | |
| | Rational AG (Machinery) | | | 8,079 | | | | 4,591 | |
| | SAP SE (Software) | | | 74,953 | | | | 7,466 | |
| | | | | | | | | 16,263 | |
| | Ireland—1.7% | | | | | | | | |
| | Kingspan Group plc (Building products) | | | 164,664 | | | | 7,052 | |
| | Luxembourg—0.8% | | | | | | | | |
| | Tenaris S.A. (Energy equipment & services) | | | 291,021 | | | | 3,148 | |
| | Netherlands—4.4% | | | | | | | | |
| * | Adyen N.V. (IT services) | | | 2,822 | | | | 1,536 | |
| | Koninklijke Philips N.V. (Health care equipment & supplies) | | | 244,507 | | | | 8,665 | |
| | Royal Dutch Shell plc Class “A” (Oil, gas & consumable fuels) | | | 272,271 | | | | 8,003 | |
| | | | | | | | | 18,204 | |
| | Spain—4.0% | | | | | | | | |
| | ACS Actividades de Construccion y Servicios S.A. (Construction & engineering) | | | 199,383 | | | | 7,728 | |
| | Amadeus IT Group S.A. (IT services) | | | 123,401 | | | | 8,602 | |
| | | | | | | | | 16,330 | |
| | Sweden—2.6% | | | | | | | | |
| | Atlas Copco AB Class “A” (Machinery) | | | 192,165 | | | | 4,564 | |
| | Hexagon AB Class “B” (Electronic equipment, instruments & components) | | | 136,597 | | | | 6,288 | |
| | | | | | | | | 10,852 | |
| | Switzerland—7.1% | | | | | | | | |
| | Geberit AG (Building products) | | | 13,648 | | | | 5,308 | |
| * | Lonza Group AG (Life sciences tools & services) | | | 34,004 | | | | 8,812 | |
| | Partners Group Holding AG (Capital markets) | | | 10,841 | | | | 6,574 | |
| | | | | | | | |
| | | | | | | | |
| | Issuer | | Shares | | | Value | |
| | | | | | | | | | |
| | Common Stocks—(continued) | | | | | | | | |
| | Switzerland—(continued) | | | | | | | | |
| | Sika AG (Chemicals) | | | 16,479 | | | $ | 2,089 | |
| * | Temenos AG (Software) | | | 54,222 | | | | 6,504 | |
| | | | | | | | | 29,287 | |
| | | | | | | | | | |
| | United Kingdom—12.8% | | | | | | | | |
| | BHP Group plc (Metals & mining) | | | 360,815 | | | | 7,596 | |
| | Compass Group plc (Hotels, restaurants & leisure) | | | 407,902 | | | | 8,579 | |
| | Experian plc (Professional services) | | | 352,974 | | | | 8,571 | |
| | Ferguson plc (Trading companies & distributors) | | | 91,825 | | | | 5,872 | |
| | London Stock Exchange Group plc (Capital markets) | | | 105,774 | | | | 5,476 | |
| | RELX plc (Professional services) | | | 353,841 | | | | 7,290 | |
| | Segro plc (Equity REIT) | | | 719,382 | | | | 5,397 | |
| | St James’s Place plc (Capital markets) | | | 301,536 | | | | 3,628 | |
| | | | | | | | | 52,409 | |
| | | | | | | | | | |
| | Emerging Asia—11.2% | | | | | | | | |
| | China—6.9% | | | | | | | | |
| * | Alibaba Group Holding, Ltd.—ADR (Internet & direct marketing retail) | | | 54,428 | | | | 7,460 | |
| | China Merchants Bank Co., Ltd. Class “H” (Banks) | | | 2,064,500 | | | | 7,567 | |
| | NetEase, Inc.—ADR (Entertainment) | | | 25,432 | | | | 5,986 | |
| | Tencent Holdings, Ltd. (Interactive Media & Services) | | | 185,500 | | | | 7,438 | |
| | | | | | | | | 28,451 | |
| | India—1.8% | | | | | | | | |
| | Housing Development Finance Corporation, Ltd. (Thrifts & mortgage finance) | | | 254,737 | | | | 7,170 | |
| | Taiwan—2.5% | | | | | | | | |
| | Taiwan Semiconductor Manufacturing Co., Ltd. (Semiconductors & semiconductor equipment) | | | 1,409,000 | | | | 10,337 | |
| | | | | | | | | | |
| | Canada—10.7% | | | | | | | | |
| | Brookfield Asset Management, Inc. Class “A” (Capital markets)† | | | 221,301 | | | | 8,487 | |
| | Canadian National Railway Co. (Road & rail) | | | 128,185 | | | | 9,494 | |
| | Dollarama, Inc. (Multiline retail) | | | 168,341 | | | | 4,004 | |
| | Rogers Communications, Inc. Class “B” (Wireless telecommunication services) | | | 146,178 | | | | 7,491 | |
| | Suncor Energy, Inc. (Oil, gas & consumable fuels) | | | 175,161 | | | | 4,892 | |
| | The Toronto-Dominion Bank (Banks) | | | 187,570 | | | | 9,323 | |
| | | | | | | | | 43,691 | |
| | | | | | | | | | |
| | Japan—10.3% | | | | | | | | |
| | Daikin Industries, Ltd. (Building products) | | | 55,700 | | | | 5,943 | |
See accompanying Notes to Financial Statements.
| 40 | Annual Report | December 31, 2018 |
International Leaders Fund
Portfolio of Investments, December 31, 2018(all dollar amounts in thousands)
| Issuer | | Shares or
Principal
Amount | | | Value | |
| | | | | | | | | |
| Common Stocks—(continued) | | | | | | | | |
| | | | | | | | | |
| Japan—(continued) | | | | | | | | |
| Keyence Corporation (Electronic equipment, instruments & components) | | | 20,400 | | | $ | 10,363 | |
| Nitori Holdings Co., Ltd. (Specialty retail) | | | 46,500 | | | | 5,825 | |
| ORIX Corporation (Diversified financial services) | | | 497,600 | | | | 7,289 | |
| Shiseido Co., Ltd. (Personal products) | | | 120,400 | | | | 7,571 | |
| Suzuki Motor Corporation (Automobiles) | | | 106,800 | | | | 5,425 | |
| | | | | | | | 42,416 | |
| | | | | | | | | |
| Asia—9.8% | | | | | | | | |
| Australia—5.2% | | | | | | | | |
| Aristocrat Leisure, Ltd. (Hotels, restaurants & leisure) | | | 252,319 | | | | 3,881 | |
| CSL, Ltd. (Biotechnology) | | | 66,989 | | | | 8,737 | |
| Macquarie Group, Ltd. (Capital markets) | | | 113,661 | | | | 8,698 | |
| | | | | | | | 21,316 | |
| Hong Kong—4.6% | | | | | | | | |
| AIA Group, Ltd. (Insurance) | | | 1,535,400 | | | | 12,745 | |
| Galaxy Entertainment Group, Ltd. (Hotels, restaurants & leisure) | | | 964,000 | | | | 6,131 | |
| | | | | | | | 18,876 | |
| | | | | | | | | |
| Emerging Europe, Mid-East, Africa—0.8% | | | | | | | | |
| South Africa—0.8% | | | | | | | | |
| Bid Corporation, Ltd. (Food & staples retailing) | | | 175,388 | | | | 3,230 | |
Total Common Stocks—96.8%
(cost $381,986) | | | | | | | 397,013 | |
| | | | | | | | | |
| Repurchase Agreement | | | | | | | | |
| Fixed Income Clearing Corporation, 0.500% dated 12/31/18, due 1/2/19, repurchase price $12,363, collateralized by U.S. Treasury Bond, 3.625%, due 8/15/43 | | | $12,363 | | | | 12,363 | |
Total Repurchase Agreement—3.0%
(cost $12,363) | | | | | | | 12,363 | |
Total Investments—99.8%
(cost $394,349) | | | | | | | 409,376 | |
| Cash and other assets, less liabilities—0.2% | | | | | | | 623 | |
| Net assets—100.0% | | | | | | $ | 409,999 | |
ADR = American Depository Receipt
* = Non-income producing security
† = U.S. listed foreign security
For securities primarily traded on exchanges or markets that close before the close of regular trading on the New York Stock Exchange, the Fund may use an independent pricing service to fair value price the securities pursuant to Valuation Procedures approved by the Board of Trustees.
At December 31, 2018, the Fund’s Portfolio of Investments includes the following industry categories (as a percentage of long-term investments):
| Industrials | | | 21.2 | % |
| Financials | | | 21.1 | % |
| Information Technology | | | 15.8 | % |
| Consumer Discretionary | | | 12.8 | % |
| Health Care | | | 8.4 | % |
| Energy | | | 5.8 | % |
| Communication Services | | | 5.3 | % |
| Materials | | | 3.3 | % |
| Consumer Staples | | | 2.7 | % |
| Utilities | | | 2.2 | % |
| Real Estate | | | 1.4 | % |
| Total | | | 100.0 | % |
At December 31, 2018, the Fund’s Portfolio of Investments includes the following currency categories (as a percentage of long-term investments):
| Euro | | | 28.5 | % |
| British Pound Sterling | | | 13.2 | % |
| Japanese Yen | | | 10.7 | % |
| Canadian Dollar | | | 8.9 | % |
| Hong Kong Dollar | | | 8.5 | % |
| Swiss Franc | | | 7.4 | % |
| U.S. Dollar | | | 5.5 | % |
| Australian Dollar | | | 5.4 | % |
| Danish Krone | | | 4.0 | % |
| Swedish Krona | | | 2.7 | % |
| New Taiwan Dollar | | | 2.6 | % |
| Indian Rupee | | | 1.8 | % |
| All Other Currencies | | | 0.8 | % |
| Total | | | 100.0 | % |
See accompanying Notes to Financial Statements.
| December 31, 2018 | William Blair Funds | 41 |
| | International Developed Plus Fund |
| | |
| | The International Developed Plus Fund seeks long-term capital appreciation. |
| | |
| | AN OVERVIEW FROM THE PORTFOLIO MANAGERS |
| | |

David Merjan 
John C. Murphy | The William Blair International Developed Plus Fund (Class N shares) posted a 16.68% decrease, net of fees, for the twelve months ended December 31, 2018. By comparison, the Fund’s benchmark index, the MSCI World ex-U.S. Index (net) (the “Index”), decreased 14.09%. Calendar year underperformance versus the Index was primarily driven by negative stock selection effects across most sectors. Stock selection within the Materials sector was particularly weak, with Lundin Mining Corporation and Boliden AB detracting from the Fund’s relative performance. Lundin is a geographically diverse, mid-tier upstream copper company. The share price was hampered by lower volumes at its Candelaria mine and weaker metals prices during the period. Given that it lacks the size to tackle large scale greenfield projects, Lundin has focused on targeted acquisitions where it can extract value through asset optimization. Lundin purchased the Candelaria mine, one of its flagship assets in northern Chile, from Freeport in 2014. Lundin also has been able to develop potential expansion projects through exploration. Partially offsetting these effects was positive stock selection within the Financials and Consumer Staples sectors. Within Financials, Hong Kong-based insurer AIA Group, Ltd. propelled the Fund’s relative results. The company continues to benefit from strong demand for its insurance products, underpinned by dual secular tailwinds of increased penetration of the insurance market and rising affluence in Asia. We believe that AIA’s distribution and innovation advantages relative to peers should continue to position it for strong growth prospectively. Within Consumer Staples, UK-based Diageo plc bolstered performance. Diageo is the leading global alcoholic beverages company with a 29% share of premium spirits by volume worldwide. It owns the Guinness beer brand and has exposure to the champagne and cognac markets through a 34% stake in Moët Hennessy. Diageos’ share price was supported by better-than-expected financial results and a £2 billion share repurchase program that resulted in better-than-expected share price gains. Please refer to the Global Markets Review and Outlook relating to the Fund beginning on page 32. |
| 42 | Annual Report | December 31, 2018 |
International Developed Plus Fund
Performance Highlights (Unaudited)
| Average Annual Total Return through 12/31/2018 |
| | | 1 Year | | 3 Year | | 5 Year | | 10 Year |
| Class N | | | (16.68 | )% | | | 0.85 | % | | | 0.18 | % | | | 6.16 | % |
| Class I | | | (16.47 | ) | | | 1.10 | | | | 0.44 | | | | 6.42 | |
| MSCI World Ex-U.S. Index (net) | | | (14.09 | ) | | | 3.11 | | | | 0.34 | | | | 6.24 | |
Performance cited represents past performance. Past performance does not guarantee future results and current performance may be lower or higher than the data quoted. Results shown are average annual returns, which assume reinvestment of dividends and capital gains. Investment returns and principal will fluctuate and you may have a gain or loss when you sell shares. For the most current month-end performance information, please call 1-800-742-7272, or visit our Web site atwww.williamblairfunds.com. Investing in smaller and medium capitalization companies involves special risks, including higher volatility and lower liquidity. Smaller and medium capitalization stocks are also more sensitive to purchase/sale transactions and changes in the issuer’s financial condition. International investing involves special risk considerations, including currency fluctuations, lower liquidity, economic and political risk. From time to time the investment adviser may waive fees or reimburse expenses for the Fund. Without these waivers/reimbursements, performance would be lower. Class N shares are available to the general public without a sales load. Class I shares are available to certain institutional investors, and advisory clients of William Blair & Company, L.L.C., without a sales load or distribution (12b-1) or service fees.
The performance highlights and graph presented above do not reflect the deduction of taxes that a shareholder would pay on fund distributions or the redemption of fund shares.
The Morgan Stanley Capital International (MSCI) World Ex-U.S. Index (net) is a free float-adjusted market capitalization weighted index that is designed to measure the equity market performance of developed markets, excluding the United States. This index approximates the minimum possible dividend reinvestment by deducting for the highest possible withholding tax rates of those markets.
This report identifies the Fund’s investments on December 31, 2018. These holdings are subject to change. Not all stocks in the Fund performed the same, nor is there any guarantee that these stocks will perform as well in the future. Market forecasts provided in this report may not necessarily come to pass.
Sector Diversification (Unaudited)
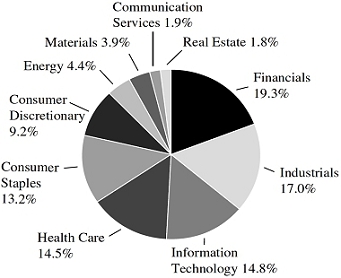
The sector diversification shown is based on the total long-term securities.
| December 31, 2018 | William Blair Funds | 43 |
International Developed Plus Fund
Portfolio of Investments, December 31, 2018(all dollar amounts in thousands)
| | | | | | | | |
| | | | | | | | |
| | Issuer | | Shares | | | Value | |
| | | | | | | | | | |
| | Common Stocks | | | | | | | | |
| | | | | | | | | | |
| | Europe—32.5% | | | | | | | | |
| | Denmark—1.3% | | | | | | | | |
| | DSV A/S (Road & rail) | | | 17,411 | | | $ | 1,147 | |
| | France—6.0% | | | | | | | | |
| | Airbus SE (Aerospace & defense) | | | 13,125 | | | | 1,263 | |
| | Capgemini SE (IT services) | | | 15,396 | | | | 1,531 | |
| | LVMH Moet Hennessy Louis Vuitton SE (Textiles, apparel & luxury goods) | | | 6,185 | | | | 1,830 | |
| | Safran S.A. (Aerospace & defense) | | | 5,826 | | | | 703 | |
| | | | | | | | | 5,327 | |
| | Germany—7.2% | | | | | | | | |
| | Infineon Technologies AG (Semiconductors & semiconductor equipment) | | | 41,193 | | | | 820 | |
| | MTU Aero Engines AG (Aerospace & defense) | | | 13,880 | | | | 2,519 | |
| * | QIAGEN N.V. (Life sciences tools & services)† | | | 38,239 | | | | 1,317 | |
| | SAP SE (Software) | | | 17,362 | | | | 1,729 | |
| | | | | | | | | 6,385 | |
| | Ireland—3.6% | | | | | | | | |
| | Accenture plc Class “A” (IT services)† | | | 8,644 | | | | 1,219 | |
| | Kerry Group plc Class “A” (Food products) | | | 20,169 | | | | 1,999 | |
| | | | | | | | | 3,218 | |
| | Netherlands—2.9% | | | | | | | | |
| * | Adyen N.V. (IT services) | | | 781 | | | | 425 | |
| | Royal Dutch Shell plc Class “A” (Oil, gas & consumable fuels) | | | 73,422 | | | | 2,158 | |
| | | | | | | | | 2,583 | |
| | Sweden—2.6% | | | | | | | | |
| | Atlas Copco AB Class “A” (Machinery) | | | 45,053 | | | | 1,070 | |
| | Boliden AB (Metals & mining) | | | 58,078 | | | | 1,258 | |
| | | | | | | | | 2,328 | |
| | Switzerland—8.9% | | | | | | | | |
| | Geberit AG (Building products) | | | 3,813 | | | | 1,483 | |
| | Novartis AG (Pharmaceuticals) | | | 20,711 | | | | 1,771 | |
| | Partners Group Holding AG (Capital markets) | | | 3,594 | | | | 2,179 | |
| | Straumann Holding AG (Health care equipment & supplies) | | | 2,180 | | | | 1,371 | |
| | Tecan Group AG (Life sciences tools & services) | | | 5,269 | | | | 1,023 | |
| | | | | | | | | 7,827 | |
| | | | | | | | | | |
| | United Kingdom—22.4% | | | | | | | | |
| | AstraZeneca plc (Pharmaceuticals) | | | 51,340 | | | | 3,843 | |
| | Compass Group plc (Hotels, restaurants & leisure) | | | 176,165 | | | | 3,705 | |
| | Diageo plc (Beverages) | | | 98,637 | | | | 3,514 | |
| | Halma plc (Electronic equipment, instruments & components) | | | 85,878 | | | | 1,493 | |
| | Legal & General Group plc (Insurance) | | | 353,434 | | | | 1,041 | |
| | | | | | | | |
| | | | | | | | |
| | Issuer | | Shares | | | Value | |
| | | | | | | | | | |
| | Common Stocks—(continued) | | | | | | | | |
| | | | | | | | | | |
| | United Kingdom—(continued) | | | | | | | | |
| | Prudential plc (Insurance) | | | 107,851 | | | $ | 1,927 | |
| | Rio Tinto plc (Metals & mining) | | | 21,523 | | | | 1,023 | |
| | Unilever N.V. (Personal products) | | | 59,904 | | | | 3,255 | |
| | | | | | | | | 19,801 | |
| | | | | | | | | | |
| | Japan—13.1% | | | | | | | | |
| | Daikin Industries, Ltd. (Building products) | | | 20,318 | | | | 2,168 | |
| | Digital Arts, Inc. (Software) | | | 11,400 | | | | 634 | |
| | Harmonic Drive Systems, Inc. (Machinery) | | | 16,300 | | | | 448 | |
| | Hoya Corporation (Health care equipment & supplies) | | | 23,200 | | | | 1,400 | |
| | Keyence Corporation (Electronic equipment, instruments & components) | | | 3,900 | | | | 1,981 | |
| | Nihon M&A Center, Inc. (Professional services) | | | 45,480 | | | | 920 | |
| | Shimadzu Corporation (Electronic equipment, instruments & components) | | | 10,300 | | | | 204 | |
| | Shiseido Co., Ltd. (Personal products) | | | 16,700 | | | | 1,050 | |
| | Tokio Marine Holdings, Inc. (Insurance) | | | 33,000 | | | | 1,577 | |
| | Yakult Honsha Co., Ltd. (Food products) | | | 16,600 | | | | 1,169 | |
| | | | | | | | | 11,551 | |
| | | | | | | | | | |
| | Canada—10.4% | | | | | | | | |
| | Canadian National Railway Co. (Road & rail)† | | | 32,361 | | | | 2,398 | |
| | Enerplus Corporation (Oil, gas & consumable fuels) | | | 191,871 | | �� | | 1,493 | |
| | Lundin Mining Corporation (Metals & mining) | | | 224,341 | | | | 927 | |
| | Rogers Communications, Inc. Class “B” (Wireless telecommunication services) | | | 30,957 | | | | 1,586 | |
| | The Toronto-Dominion Bank (Banks)† | | | 56,651 | | | | 2,817 | |
| | | | | | | | | 9,221 | |
| | | | | | | | | | |
| | Emerging Asia—7.1% | | | | | | | | |
| | China—2.4% | | | | | | | | |
| * | Alibaba Group Holding, Ltd.—ADR (Internet & direct marketing retail) | | | 15,606 | | | | 2,139 | |
| | India—2.1% | | | | | | | | |
| | HDFC Bank, Ltd.—ADR (Banks) | | | 18,481 | | | | 1,914 | |
| | Taiwan—2.6% | | | | | | | | |
| | Taiwan Semiconductor Manufacturing Co., Ltd.—ADR (Semiconductors & semiconductor equipment) | | | 61,474 | | | | 2,269 | |
| | | | | | | | | | |
| | Asia—6.9% | | | | | | | | |
| | Australia—3.2% | | | | | | | | |
| | CSL, Ltd. (Biotechnology) | | | 10,146 | | | | 1,323 | |
| | Goodman Group (Equity REIT) | | | 198,746 | | | | 1,487 | |
| | | | | | | | | 2,810 | |
See accompanying Notes to Financial Statements.
| 44 | Annual Report | December 31, 2018 |
International Developed Plus Fund
Portfolio of Investments, December 31, 2018(all dollar amounts in thousands)
| Issuer | | Shares or
Principal
Amount | | | Value | |
| | | | | | | | | |
| Common Stocks—(continued) | | | | | | | | |
| | | | | | | | | |
| Asia—(continued) | | | | | | | | |
| Hong Kong—3.7% | | | | | | | | |
| AIA Group, Ltd. (Insurance) | | | 400,386 | | | $ | 3,324 | |
| | | | | | | | | |
| Emerging Latin America—1.4% | | | | | | | | |
| Peru—1.4% | | | | | | | | |
| Credicorp, Ltd. (Banks)† | | | 5,598 | | | | 1,241 | |
Total Common Stocks—93.8%
(cost $79,362) | | | | | | | 83,085 | |
| | | | | | | | | |
| Repurchase Agreement | | | | | | | | |
| Fixed Income Clearing Corporation, 0.500% dated 12/31/18, due 1/2/19, repurchase price $3,981, collateralized by Federal Home Loan Mortgage Corporation, 3.750%, due 3/27/19 | | | $3,981 | | | | 3,981 | |
Total Repurchase Agreement—4.5%
(cost $3,981) | | | | | | | 3,981 | |
Total Investments—98.3%
(cost $83,343) | | | | | | | 87,066 | |
| Cash and other assets, less liabilities—1.7% | | | | | | | 1,515 | |
| Net assets—100.0% | | | | | | $ | 88,581 | |
ADR = American Depository Receipt
REIT = Real Estate Investment Trust
* = Non-income producing security
† = U.S. listed foreign security
For securities primarily traded on exchanges or markets that close before the close of regular trading on the New York Stock Exchange, the Fund may use an independent pricing service to fair value price the securities pursuant to Valuation Procedures approved by the Board of Trustees.
At December 31, 2018, the Fund’s Portfolio of Investments includes the following industry categories (as a percentage of long-term investments):
| Financials | | | 19.3 | % |
| Industrials | | | 17.0 | % |
| Information Technology | | | 14.8 | % |
| Health Care | | | 14.5 | % |
| Consumer Staples | | | 13.2 | % |
| Consumer Discretionary | | | 9.2 | % |
| Energy | | | 4.4 | % |
| Materials | | | 3.9 | % |
| Communication Services | | | 1.9 | % |
| Real Estate | | | 1.8 | % |
| Total | | | 100.0 | % |
At December 31, 2018, the Fund’s Portfolio of Investments includes the following currency categories (as a percentage of long-term investments):
| Euro | | | 22.0 | % |
| British Pound Sterling | | | 19.9 | % |
| U.S. Dollar | | | 18.4 | % |
| Japanese Yen | | | 13.9 | % |
| Swiss Franc | | | 9.4 | % |
| Canadian Dollar | | | 4.8 | % |
| Hong Kong Dollar | | | 4.0 | % |
| Australian Dollar | | | 3.4 | % |
| Swedish Krona | | | 2.8 | % |
| Danish Krone | | | 1.4 | % |
| Total | | | 100.0 | % |
See accompanying Notes to Financial Statements.
| December 31, 2018 | William Blair Funds | 45 |
| | Institutional International Developed Plus Fund |
| | |
| | The Institutional International Developed Plus Fund seeks long-term capital appreciation. |
| | |
| | AN OVERVIEW FROM THE PORTFOLIO MANAGERS |
| | |
 David Merjan | The William Blair Institutional International Developed Plus Fund posted a 15.12% decrease, net of fees, for the twelve months ended December 31, 2018. By comparison, the Fund’s benchmark index, the MSCI World ex-U.S. Index (net) (the “Index”), decreased 14.09%. Calendar year underperformance versus the Index was primarily driven by negative stock selection effects across most sectors. Stock selection within the Materials sector was particularly weak, with Lundin Mining Corporation and Boliden AB detracting from the Fund’s relative performance. Lundin is a geographically diverse, mid-tier upstream copper company. The share price was hampered by lower volumes at its Candelaria mine and weaker metals prices during the period. Given that it lacks the size to tackle large scale greenfield projects, Lundin has focused on targeted acquisitions where it can extract value through asset optimization. Lundin purchased the Candelaria mine, one of its flagship assets in northern Chile, from Freeport in 2014. Lundin also has been able to develop potential expansion projects through exploration. |
| | |
 John C. Murphy | Partially offsetting these effects was positive stock selection within the Financials and Consumer Staples sectors. Within Financials, Hong Kong-based insurer AIA Group, Ltd. propelled the Fund’s relative results. The company continues to benefit from strong demand for its insurance products, underpinned by dual secular tailwinds of increased penetration of the insurance market and rising affluence in Asia. We believe that AIA’s distribution and innovation advantages relative to peers should continue to position it for strong growth prospectively. Within Consumer Staples, UK-based Diageo plc bolstered performance. Diageo is the leading global alcoholic beverages company with a 29% share of premium spirits by volume worldwide. It owns the Guinness beer brand and has exposure to the champagne and cognac markets through a 34% stake in Moët Hennessy. Diageos’ share price was supported by better-than-expected financial results and a £2 billion share repurchase program that resulted in better-than-expected share price gains. Please refer to the Global Markets Review and Outlook relating to the Fund beginning on page 32. |
| 46 | Annual Report | December 31, 2018 |
Institutional International Developed Plus Fund
Performance Highlights (Unaudited)
| Average Annual Total Return through 12/31/2018 |
| | | 1 Year | | 3 Year | | 5 Year | | 10 Year |
| Institutional International Developed Plus Fund | | | (15.12 | )% | | | 1.70 | % | | | 0.68 | % | | | 6.67 | % |
| MSCI World Ex-U.S. Index (net) | | | (14.09 | ) | | | 3.11 | | | | 0.34 | | | | 6.24 | |
During the first quarter of 2018, the Fund received a litigation settlement that positively impacted the Fund’s performance. This was a one-time event that is not likely to be repeated. With the passage of time the impact of this settlement on the Fund’s performance is likely to diminish.
Performance cited represents past performance. Past performance does not guarantee future results and current performance may be lower or higher than the data quoted. Results shown are average annual returns, which assume reinvestment of dividends and capital gains. Investment returns and principal will fluctuate and you may have a gain or loss when you sell shares. For the most current month end performance information, please call 1-800-742-7272, or visit our Web site atwww.williamblairfunds.com. Investing in smaller and medium capitalization companies involves special risks, including higher volatility and lower liquidity. Smaller and medium capitalization stocks are also more sensitive to purchase/sale transactions and changes in the issuer’s financial condition. International investing involves special risk considerations, including currency fluctuations, lower liquidity, economic and political risk. From time to time, the investment adviser may waive fees or reimburse expenses for the Fund. Without these waivers/reimbursements, performance would be lower. Shares of the Fund are available without a sales load or distribution (12b-1) or service fees.
The performance highlights and graph presented above do not reflect the deduction of taxes that a shareholder would pay on fund distributions or the redemption of fund shares.
The Morgan Stanley Capital International (MSCI) World Ex-U.S. Index (net) is a free float-adjusted market capitalization weighted index that is designed to measure the equity market performance of developed markets, excluding the United States. This index approximates the minimum possible dividend reinvestment by deducting for the highest possible withholding tax rates of those markets.
This report identifies the Fund’s investments on December 31, 2018. These holdings are subject to change. Not all stocks in the Fund performed the same, nor is there any guarantee that these stocks will perform as well in the future. Market forecasts provided in this report may not necessarily come to pass.
Sector Diversification (Unaudited)

The sector diversification shown is based on the total long-term securities.
| December 31, 2018 | William Blair Funds | 47 |
Institutional International Developed Plus Fund
Portfolio of Investments, December 31, 2018(all dollar amounts in thousands)
| | | | | | | | |
| | | | | | | | |
| | Issuer | | Shares | | | Value | |
| | | | | | | | | | |
| | Common Stocks | | | | | | | | |
| | | | | | | | | | |
| | Europe—32.8% | | | | | | | | |
| | Denmark—1.3% | | | | | | | | |
| | DSV A/S (Road & rail) | | | 3,200 | | | $ | 211 | |
| | France—6.1% | | | | | | | | |
| | Airbus SE (Aerospace & defense) | | | 2,420 | | | | 233 | |
| | Capgemini SE (IT services) | | | 2,820 | | | | 280 | |
| | LVMH Moet Hennessy Louis Vuitton SE (Textiles, apparel & luxury goods) | | | 1,146 | | | | 339 | |
| | Safran S.A. (Aerospace & defense) | | | 1,056 | | | | 128 | |
| | | | | | | | | 980 | |
| | Germany—7.3% | | | | | | | | |
| | Infineon Technologies AG (Semiconductors & semiconductor equipment) | | | 7,552 | | | | 150 | |
| | MTU Aero Engines AG (Aerospace & defense) | | | 2,584 | | | | 469 | |
| * | QIAGEN N.V. (Life sciences tools & services)† | | | 7,018 | | | | 242 | |
| | SAP SE (Software) | | | 3,205 | | | | 319 | |
| | | | | | | | | 1,180 | |
| | Ireland—3.7% | | | | | | | | |
| | Accenture plc Class “A’’ (IT services)† | | | 1,584 | | | | 223 | |
| | Kerry Group plc Class “A” (Food products) | | | 3,664 | | | | 363 | |
| | | | | | | | | 586 | |
| | Netherlands—2.9% | | | | | | | | |
| * | Adyen N.V. (IT services) | | | 142 | | | | 77 | |
| | Royal Dutch Shell plc Class “A” (Oil, gas & consumable fuels) | | | 13,426 | | | | 395 | |
| | | | | | | | | 472 | |
| | Sweden—2.6% | | | | | | | | |
| | Atlas Copco AB Class “A” (Machinery) | | | 8,224 | | | | 195 | |
| | Boliden AB (Metals & mining) | | | 10,588 | | | | 230 | |
| | | | | | | | | 425 | |
| | Switzerland—8.9% | | | | | | | | |
| | Geberit AG (Building products) | | | 701 | | | | 273 | |
| | Novartis AG (Pharmaceuticals) | | | 3,795 | | | | 324 | |
| | Partners Group Holding AG (Capital markets) | | | 660 | | | | 400 | |
| | Straumann Holding AG (Health care equipment & supplies) | | | 398 | | | | 250 | |
| | Tecan Group AG (Life sciences tools & services) | | | 967 | | | | 188 | |
| | | | | | | | | 1,435 | |
| | | | | | | | | | |
| | United Kingdom—22.4% | | | | | | | | |
| | AstraZeneca plc (Pharmaceuticals) | | | 9,432 | | | | 706 | |
| | Compass Group plc (Hotels, restaurants & leisure) | | | 32,268 | | | | 678 | |
| | Diageo plc (Beverages) | | | 18,062 | | | | 643 | |
| | Halma plc (Electronic equipment, instruments & components) | | | 15,740 | | | | 274 | |
| | Legal & General Group plc (Insurance) | | | 64,758 | | | | 191 | |
| | Prudential plc (Insurance) | | | 19,581 | | | | 350 | |
| | | | | | | | | | |
| | | | | | | | | | |
| | Issuer | | Shares | | | Value | |
| | | | | | | | | | |
| | Common Stocks—(continued) | | | | | | | | |
| | | | | | | | | | |
| | United Kingdom—(continued) | | | | | | | | |
| | Rio Tinto plc (Metals & mining) | | | 3,846 | | | $ | 183 | |
| | Unilever N.V. (Personal products) | | | 11,025 | | | | 599 | |
| | | | | | | | | 3,624 | |
| | | | | | | | | | |
| | Japan—12.8% | | | | | | | | |
| | Daikin Industries, Ltd. (Building products) | | | 3,706 | | | | 395 | |
| | Digital Arts, Inc. (Software) | | | 2,100 | | | | 117 | |
| | Harmonic Drive Systems, Inc. (Machinery) | | | 2,900 | | | | 80 | |
| | Hoya Corporation (Health care equipment & supplies) | | | 4,300 | | | | 259 | |
| | Keyence Corporation (Electronic equipment, instruments & components) | | | 600 | | | | 305 | |
| | Nihon M&A Center, Inc. (Professional services) | | | 8,200 | | | | 166 | |
| | Shimadzu Corporation (Electronic equipment, instruments & components) | | | 1,900 | | | | 38 | |
| | Shiseido Co., Ltd. (Personal products) | | | 3,100 | | | | 195 | |
| | Tokio Marine Holdings, Inc. (Insurance) | | | 6,100 | | | | 291 | |
| | Yakult Honsha Co., Ltd. (Food products) | | | 3,100 | | | | 218 | |
| | | | | | | | | 2,064 | |
| | | | | | | | | | |
| | Canada—10.4% | | | | | | | | |
| | Canadian National Railway Co. (Road & rail)† | | | 5,875 | | | | 435 | |
| | Enerplus Corporation (Oil, gas & consumable fuels) | | | 35,155 | | | | 274 | |
| | Lundin Mining Corporation (Metals & mining) | | | 40,977 | | | | 169 | |
| | Rogers Communications, Inc. Class “B” (Wireless telecommunication services) | | | 5,672 | | | | 291 | |
| | The Toronto-Dominion Bank (Banks)† | | | 10,398 | | | | 517 | |
| | | | | | | | | 1,686 | |
| | | | | | | | | | |
| | Emerging Asia—7.2% | | | | | | | | |
| | China—2.4% | | | | | | | | |
| * | Alibaba Group Holding, Ltd.—ADR (Internet & direct marketing retail) | | | 2,872 | | | | 394 | |
| | India—2.2% | | | | | | | | |
| | HDFC Bank, Ltd.—ADR (Banks) | | | 3,402 | | | | 352 | |
| | Taiwan—2.6% | | | | | | | | |
| | Taiwan Semiconductor Manufacturing Co., Ltd.—ADR (Semiconductors & semiconductor equipment) | | | 11,267 | | | | 416 | |
| | | | | | | | | | |
| | Asia—6.9% | | | | | | | | |
| | Australia—3.2% | | | | | | | | |
| | CSL, Ltd. (Biotechnology) | | | 1,857 | | | | 242 | |
| | Goodman Group (Equity REIT) | | | 36,426 | | | | 274 | |
| | | | | | | | | 516 | |
| | Hong Kong—3.7% | | | | | | | | |
| | AIA Group, Ltd. (Insurance) | | | 72,671 | | | | 603 | |
See accompanying Notes to Financial Statements.
| 48 | Annual Report | December 31, 2018 |
Institutional International Developed Plus Fund
Portfolio of Investments, December 31, 2018(all dollar amounts in thousands)
| | Issuer | | Shares or
Principal
Amount | | | Value | |
| | | | | | | | | | |
| | Common Stocks—(continued) | | | | | | | | |
| | | | | | | | | | |
| | Emerging Latin America—1.4% | | | | | | | | |
| | Peru—1.4% | | | | | | | | |
| | Credicorp, Ltd. (Banks)† | | | 1,000 | | | $ | 222 | |
| | Total Common Stocks—93.9%
(cost $14,439) | | | | | | | 15,166 | |
| | | | | | | | | | |
| | Repurchase Agreement | | | | | | | | |
| | Fixed Income Clearing Corporation, 0.500% dated 12/31/18, due 1/2/19, repurchase price $776, collateralized by Federal Home Loan Mortgage Corporation, 3.750%, due 3/27/19 | | | $776 | | | | 776 | |
| | Total Repurchase Agreement—4.8%
(cost $776) | | | | | | | 776 | |
| | Total Investments—98.7%
(cost $15,215) | | | | | | | 15,942 | |
| | Cash and other assets, less liabilities—1.3% | | | | | | | 213 | |
| | Net assets—100.0% | | | | | | $ | 16,155 | |
ADR = American Depository Receipt
REIT = Real Estate Investment Trust
* = Non-income producing security
† = U.S. listed foreign security
For securities primarily traded on exchanges or markets that close before the close of regular trading on the New York Stock Exchange, the Fund may use an independent pricing service to fair value price the securities pursuant to Valuation Procedures approved by the Board of Trustees.
At December 31, 2018, the Fund’s Portfolio of Investments includes the following industry categories (as a percentage of long-term investments):
| Financials | | | 19.4 | % |
| Industrials | | | 17.0 | % |
| Health Care | | | 14.6 | % |
| Information Technology | | | 14.5 | % |
| Consumer Staples | | | 13.3 | % |
| Consumer Discretionary | | | 9.3 | % |
| Energy | | | 4.4 | % |
| Materials | | | 3.8 | % |
| Communication Services | | | 1.9 | % |
| Real Estate | | | 1.8 | % |
| Total | | | 100.0 | % |
At December 31, 2018, the Fund’s Portfolio of Investments includes the following currency categories (as a percentage of long-term investments):
| Euro | | | 22.1 | % |
| British Pound Sterling | | | 19.9 | % |
| U.S. Dollar | | | 18.5 | % |
| Japanese Yen | | | 13.6 | % |
| Swiss Franc | | | 9.5 | % |
| Canadian Dollar | | | 4.8 | % |
| Hong Kong Dollar | | | 4.0 | % |
| Australian Dollar | | | 3.4 | % |
| Swedish Krona | | | 2.8 | % |
| Danish Krone | | | 1.4 | % |
| Total | | | 100.0 | % |
See accompanying Notes to Financial Statements.
| December 31, 2018 | William Blair Funds | 49 |
| | International Growth Fund |
| | |
| | The International Growth Fund seeks long-term capital appreciation. |
| | |
| | AN OVERVIEW FROM THE PORTFOLIO MANAGERS |
| | |

Simon Fennell 
Kenneth J. McAtamney | The William Blair International Growth Fund (Class N shares) posted an 18.00% decrease, net of fees, for the twelve months ended December 31, 2018. By comparison, the Fund’s benchmark index, the MSCI All Country World ex-U.S. IMI Index (net) (the “Index”), decreased 14.76%. Calendar year underperformance versus the Index was driven by a combination of negative sector allocation and stock selection effects which occurred during the fourth quarter. An overweight allocation to the Information Technology sector, coupled with below average stock selection within the Communication Services and Materials sectors weighed on the Fund’s relative performance. Within the Communication Services sector, Nintendo Co., Ltd. hampered relative returns. Nintendo is the Japanese provider of hardware and software for gaming. The company’s main product is the Switch, released in March 2017. While we believe Nintendo will continue to leverage its extensive library of intellectual property and produce more hit games over the medium term, the company saw an increase in both hardware and third party software sales relative to higher margin proprietary software sales, which weighed on the share price. Within the Materials sector, France-based chemicals company Arkema S.A. detracted from performance. The company reported third quarter EBITDA that was in-line versus consensus, but volume growth was flat, which disappointed investors. Some of the drag on Arkema’s share performance in the first half of 2018 was due to the impact of rail strikes in France. Concerns about slowing automotive and construction end market demand also weighed on investor sentiment. Partially offsetting these effects was the Fund’s underweight allocation to the Materials sector, coupled with above average stock selection within the Financials sector. Within Financials, PT Bank Central Asia Tbk propelled relative performance. PT Bank Central Asia is a leading retail and payment settlement bank in Indonesia and has the most extensive branch and electronic delivery network among the country’s banks. Hong Kong-based insurer AIA Group, Ltd. also bolstered performance. The company continues to benefit from strong demand for its insurance products. AIA continues to benefit from the dual secular tailwinds of increased penetration of the insurance market and rising affluence in Asia. We believe that its distribution and innovation advantages relative to peers should continue to position it for strong growth prospectively. Please refer to the Global Markets Review and Outlook relating to the Fund beginning on page 32. |
| 50 | Annual Report | December 31, 2018 |
International Growth Fund
Performance Highlights (Unaudited)
| Average Annual Total Return through 12/31/2018 |
| | | 1 Year | | 3 Year | | 5 Year | | 10 Year |
| Class N | | | (18.00 | )% | | | 0.93 | % | | | (0.14 | )% | | | 7.84 | % |
| Class I | | | (17.73 | ) | | | 1.26 | | | | 0.16 | | | | 8.16 | |
| MSCI ACW Ex-U.S. IMI (net) | | | (14.76 | ) | | | 4.39 | | | | 0.85 | | | | 6.97 | |
Performance cited represents past performance. Past performance does not guarantee future results and current performance may be lower or higher than the data quoted. Results shown are average annual total returns, which assume reinvestment of dividends and capital gains. Investment returns and principal will fluctuate and you may have a gain or loss when you sell shares. For the most current month-end performance information, please call 1-800-742-7272, or visit our Web site atwww.williamblairfunds.com. Investing in smaller and medium capitalization companies involves special risks, including higher volatility and lower liquidity. Smaller and medium capitalization stocks are also more sensitive to purchase/sale transactions and changes in the issuer’s financial condition. International investing involves special risk considerations, including currency fluctuations, lower liquidity, economic and political risk. From time to time, the investment adviser may waive fees or reimburse expenses for the Fund. Without these waivers/reimbursements, performance would be lower. Class N shares are available to the general public without a sales load. Class I shares are available to certain institutional investors, and advisory clients of William Blair & Company, L.L.C., without a sales load or distribution (12b-1) or service fees.
The performance highlights and graph presented above do not reflect the deduction of taxes that a shareholder would pay on fund distributions or the redemption of fund shares.
The Morgan Stanley Capital International (MSCI) All Country World (ACW) Ex-U.S. Investable Market Index (IMI) (net) is a free float-adjusted market capitalization weighted index that is designed to measure the equity market performance of developed and emerging markets, excluding the United States. This index approximates the minimum possible dividend reinvestment by deducting for the highest possible withholding tax rates of those markets.
This report identifies the Fund’s investments on December 31, 2018. These holdings are subject to change. Not all stocks in the Fund performed the same, nor is there any guarantee that these stocks will perform as well in the future. Market forecasts provided in this report may not necessarily come to pass.
Sector Diversification (Unaudited)
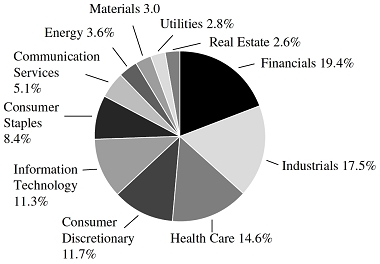
The sector diversification shown is based on the total long-term securities.
| December 31, 2018 | William Blair Funds | 51 |
International Growth Fund
Portfolio of Investments, December 31, 2018(all dollar amounts in thousands)
| | | | | | | | | | |
| | | | | | | | | | |
| | Issuer | | Shares | | | Value | |
| | | | | | | | | | |
| | Common Stocks | | | | | | | | |
| | | | | | | | | | |
| | Europe, Mid-East—37.5% | | | | | | | | |
| | Belgium—1.0% | | | | | | | | |
| | KBC Group N.V. (Banks) | | | 321,323 | | | $ | 20,867 | |
| | Denmark—2.8% | | | | | | | | |
| | Ambu A/S Class “B” (Health care equipment & supplies) | | | 104,718 | | | | 2,517 | |
| | Coloplast A/S Class “B” (Health care equipment & supplies) | | | 147,357 | | | | 13,681 | |
| | DSV A/S (Road & rail) | | | 242,611 | | | | 15,979 | |
| | Orsted A/S (Electric utilities) | | | 293,053 | | | | 19,594 | |
| | Royal Unibrew A/S (Beverages) | | | 67,625 | | | | 4,659 | |
| | Tryg A/S (Insurance) | | | 128,300 | | | | 3,227 | |
| | | | | | | | | 59,657 | |
| | Finland—0.7% | | | | | | | | |
| | Neste Oyj (Oil, gas & consumable fuels) | | | 204,677 | | | | 15,797 | |
| | France—11.9% | | | | | | | | |
| | Airbus SE (Aerospace & defense) | | | 289,538 | | | | 27,853 | |
| | Arkema S.A. (Chemicals) | | | 138,914 | | | | 11,931 | |
| | Capgemini SE (IT services) | | | 192,643 | | | | 19,158 | |
| | Dassault Systemes SE (Software) | | | 133,837 | | | | 15,902 | |
| | Hermes International (Textiles, apparel & luxury goods) | | | 13,986 | | | | 7,769 | |
| | Ipsen S.A. (Pharmaceuticals) | | | 42,469 | | | | 5,491 | |
| | Kering S.A. (Textiles, apparel & luxury goods) | | | 41,748 | | | | 19,688 | |
| | L’Oreal S.A. (Personal products) | | | 110,750 | | | | 25,531 | |
| | Nexity S.A. (Real estate management & development) | | | 76,509 | | | | 3,454 | |
| | Orpea (Health care providers & services) | | | 60,551 | | | | 6,190 | |
| | Rubis SCA (Gas utilities) | | | 80,285 | | | | 4,312 | |
| | Safran S.A. (Aerospace & defense) | | | 222,498 | | | | 26,869 | |
| | Teleperformance (Professional services) | | | 59,810 | | | | 9,566 | |
| | Thales S.A. (Aerospace & defense) | | | 164,947 | | | | 19,277 | |
| | Total S.A. (Oil, gas & consumable fuels) | | | 389,567 | | | | 20,612 | |
| | Veolia Environnement S.A. (Multi-utilities) | | | 1,144,765 | | | | 23,550 | |
| * | Worldline S.A. (IT services) | | | 64,155 | | | | 3,102 | |
| | | | | | | | | 250,255 | |
| | Germany—5.0% | | | | | | | | |
| | Carl Zeiss Meditec AG (Health care equipment & supplies) | | | 46,334 | | | | 3,626 | |
| | KION Group AG (Machinery) | | | 70,137 | | | | 3,562 | |
| | MTU Aero Engines AG (Aerospace & defense) | | | 111,144 | | | | 20,171 | |
| | Norma Group SE (Machinery) | | | 49,457 | | | | 2,447 | |
| | Puma SE (Textiles, apparel & luxury goods) | | | 11,767 | | | | 5,757 | |
| * | QIAGEN N.V. (Life sciences tools & services)† | | | 357,184 | | | | 12,305 | |
| | SAP SE (Software) | | | 193,132 | | | | 19,236 | |
| | Vonovia SE (Real estate management & development) | | | 494,821 | | | | 22,445 | |
| | Washtec AG (Machinery) | | | 21,325 | | | | 1,476 | |
| | Wirecard AG (IT services) | | | 90,389 | | | | 13,753 | |
| | | | | | | | | 104,778 | |
| | | | | | | | | | |
| | | | | | | | | | |
| | Issuer | | Shares | | | Value | |
| | | | | | | | | | |
| | Common Stocks—(continued) | | | | | | | | |
| | | | | | | | | | |
| | Europe, Mid-East—(continued) | | | | | | | | |
| | Ireland—1.0% | | | | | | | | |
| * | ICON plc (Life sciences tools & services)† | | | 97,112 | | | $ | 12,548 | |
| | Kingspan Group plc (Building products) | | | 182,340 | | | | 7,809 | |
| | | | | | | | | 20,357 | |
| | Israel—0.2% | | | | | | | | |
| * | Wix.com, Ltd. (IT services)† | | | 56,346 | | | | 5,090 | |
| | Italy—2.3% | | | | | | | | |
| | Banca Generali SpA (Capital markets) | | | 195,637 | | | | 4,064 | |
| | Enel SpA (Electric utilities) | | | 1,837,430 | | | | 10,619 | |
| | Ferrari N.V. (Automobiles) | | | 83,799 | | | | 8,332 | |
| | FinecoBank Banca Fineco SpA (Banks) | | | 613,629 | | | | 6,171 | |
| | Interpump Group SpA (Machinery) | | | 134,920 | | | | 4,019 | |
| | Moncler SpA (Textiles, apparel & luxury goods) | | | 117,361 | | | | 3,890 | |
| | Recordati SpA (Pharmaceuticals) | | | 220,465 | | | | 7,651 | |
| | Technogym SpA (Leisure products) | | | 323,064 | | | | 3,465 | |
| | | | | | | | | 48,211 | |
| | Luxembourg—0.5% | | | | | | | | |
| | Eurofins Scientific SE (Life sciences tools & services) | | | 11,982 | | | | 4,476 | |
| | Tenaris S.A. (Energy equipment & services) | | | 520,561 | | | | 5,630 | |
| | | | | | | | | 10,106 | |
| | Netherlands—4.0% | | | | | | | | |
| | ASML Holding N.V. (Semiconductors & semiconductor equipment) | | | 68,124 | | | | 10,706 | |
| | Euronext N.V. (Capital markets) | | | 52,343 | | | | 3,017 | |
| | Koninklijke Philips N.V. (Health care equipment & supplies) | | | 588,131 | | | | 20,842 | |
| | Royal Dutch Shell plc Class “A” (Oil, gas & consumable fuels) | | | 1,003,104 | | | | 29,485 | |
| | Wolters Kluwer N.V. (Professional services) | | | 324,351 | | | | 19,198 | |
| | | | | | | | | 83,248 | |
| | Norway—0.2% | | | | | | | | |
| | TGS Nopec Geophysical Co. ASA (Energy equipment & services) | | | 133,351 | | | | 3,220 | |
| | Spain—1.9% | | | | | | | | |
| | ACS Actividades de Construccion y Servicios S.A. (Construction & engineering) | | | 350,857 | | | | 13,600 | |
| | Amadeus IT Group S.A. (IT services) | | | 245,998 | | | | 17,148 | |
| | Bankinter S.A. (Banks) | | | 1,037,745 | | | | 8,344 | |
| | | | | | | | | 39,092 | |
| | Sweden—1.6% | | | | | | | | |
| | Alfa Laval AB (Machinery) | | | 305,451 | | | | 6,536 | |
| | Fabege AB (Real estate management & development) | | | 351,527 | | | | 4,686 | |
| | Hexagon AB Class “B” (Electronic equipment, instruments & components) | | | 329,029 | | | | 15,147 | |
See accompanying Notes to Financial Statements.
| 52 | Annual Report | December 31, 2018 |
International Growth Fund
Portfolio of Investments, December 31, 2018(all dollar amounts in thousands)
| | | | | | | | |
| | | | | | | | |
| | Issuer | | Shares | | | Value | |
| | | | | | | | | | |
| | Common Stocks—(continued) | | | | | | | | |
| | | | | | | | | | |
| | Europe, Mid-East—(continued) | | | | | | | | |
| | Sweden—(continued) | | | | | | | | |
| | Nolato AB Class “B” (Industrial conglomerates) | | | 47,795 | | | $ | 1,976 | |
| * | Swedish Orphan Biovitrum AB (Biotechnology) | | | 292,234 | | | | 6,364 | |
| | | | | | | | | 34,709 | |
| | Switzerland—4.4% | | | | | | | | |
| | Belimo Holding AG (Building products) | | | 552 | | | | 2,213 | |
| | Logitech International S.A. (Technology hardware, storage & peripherals) | | | 206,482 | | | | 6,495 | |
| * | Lonza Group AG (Life sciences tools & services) | | | 116,251 | | | | 30,124 | |
| | Novartis AG (Pharmaceuticals) | | | 439,448 | | | | 37,574 | |
| | Partners Group Holding AG (Capital markets) | | | 27,066 | | | | 16,412 | |
| | | | | | | | | 92,818 | |
| | | | | | | | | | |
| | United Kingdom—17.2% | | | | | | | | |
| | 3i Group plc (Capital markets) | | | 824,691 | | | | 8,130 | |
| | Abcam plc (Biotechnology) | | | 210,115 | | | | 2,919 | |
| | AstraZeneca plc (Pharmaceuticals) | | | 502,063 | | | | 37,583 | |
| | AVEVA Group plc (Software) | | | 161,437 | | | | 4,979 | |
| | Beazley plc (Insurance) | | | 833,337 | | | | 5,348 | |
| | Big Yellow Group plc (Equity REIT) | | | 406,197 | | | | 4,522 | |
| | Burford Capital, Ltd. (Capital markets) | | | 161,772 | | | | 3,415 | |
| | Carnival plc (Hotels, restaurants & leisure) | | | 351,736 | | | | 16,870 | |
| | Close Brothers Group plc (Capital markets) | | | 163,470 | | | | 3,000 | |
| | Compass Group plc (Hotels, restaurants & leisure) | | | 1,716,693 | | | | 36,104 | |
| | Croda International plc (Chemicals) | | | 172,124 | | | | 10,278 | |
| | Diageo plc (Beverages) | | | 609,566 | | | | 21,716 | |
| | Electrocomponents plc (Electronic equipment, instruments & components) | | | 308,748 | | | | 1,994 | |
| | Experian plc (Professional services) | | | 752,992 | | | | 18,283 | |
| | Fevertree Drinks plc (Beverages) | | | 149,756 | | | | 4,197 | |
| | Greggs plc (Hotels, restaurants & leisure) | | | 342,913 | | | | 5,533 | |
| | Halma plc (Electronic equipment, instruments & components) | | | 556,381 | | | | 9,673 | |
| | Hiscox, Ltd. (Insurance) | | | 504,466 | | | | 10,423 | |
| | Intermediate Capital Group plc (Capital markets) | | | 468,996 | | | | 5,589 | |
| | Intertek Group plc (Professional services) | | | 110,416 | | | | 6,755 | |
| | Kindred Group plc (Hotels, restaurants & leisure) | | | 480,591 | | | | 4,425 | |
| | London Stock Exchange Group plc (Capital markets) | | | 274,265 | | | | 14,200 | |
| | Melrose Industries plc (Electrical equipment) | | | 4,242,340 | | | | 8,860 | |
| | RELX plc (Professional services) | | | 1,196,461 | | | | 24,652 | |
| | Renishaw plc (Electronic equipment, instruments & components) | | | 71,048 | | | | 3,840 | |
| | Rentokil Initial plc (Commercial services & supplies) | | | 2,661,201 | | | | 11,438 | |
| | | | | | | | | | |
| | | | | | | | | | |
| | Issuer | | Shares | | | Value | |
| | | | | | | | | | |
| | Common Stocks—(continued) | | | | | | | | |
| | | | | | | | | | |
| | United Kingdom—(continued) | | | | | | | | |
| | Rotork plc (Machinery) | | | 1,497,115 | | | $ | 4,725 | |
| | Segro plc (Equity REIT) | | | 1,477,423 | | | | 11,084 | |
| | Spirax-Sarco Engineering plc (Machinery) | | | 98,180 | | | | 7,809 | |
| | Synthomer plc (Chemicals) | | | 189,252 | | | | 862 | |
| | The Weir Group plc (Machinery) | | | 301,527 | | | | 4,988 | |
| | Unilever N.V. (Personal products) | | | 684,773 | | | | 37,205 | |
| | Victrex plc (Chemicals) | | | 224,076 | | | | 6,535 | |
| �� | WH Smith plc (Specialty retail) | | | 218,165 | | | | 4,783 | |
| | | | | | | | | 362,717 | |
| | | | | | | | | | |
| | Japan—14.2% | | | | | | | | |
| | Asahi Intecc Co., Ltd. (Health care equipment & supplies) | | | 159,800 | | | | 6,765 | |
| | Daikin Industries, Ltd. (Building products) | | | 152,800 | | | | 16,304 | |
| | Hoshizaki Corporation (Machinery) | | | 90,300 | | | | 5,503 | |
| | Hoya Corporation (Health care equipment & supplies) | | | 356,100 | | | | 21,492 | |
| | Keyence Corporation (Electronic equipment, instruments & components) | | | 55,400 | | | | 28,144 | |
| | M3, Inc. (Health care technology) | | | 468,900 | | | | 6,306 | |
| | MISUMI Group, Inc. (Machinery) | | | 326,200 | | | | 6,902 | |
| | MonotaRO Co., Ltd. (Trading companies & distributors) | | | 205,500 | | | | 5,096 | |
| | Nichias Corporation (Building products) | | | 151,900 | | | | 2,607 | |
| | Nihon M&A Center, Inc. (Professional services) | | | 243,800 | | | | 4,929 | |
| | Nintendo Co., Ltd. (Entertainment) | | | 63,800 | | | | 17,046 | |
| | Nitori Holdings Co., Ltd. (Specialty retail) | | | 51,200 | | | | 6,414 | |
| | Nomura Research Institute, Ltd. (IT services) | | | 147,600 | | | | 5,488 | |
| | ORIX Corporation (Diversified financial services) | | | 1,188,600 | | | | 17,411 | |
| | Sankyu, Inc. (Road & rail) | | | 90,220 | | | | 4,095 | |
| | Shimadzu Corporation (Electronic equipment, instruments & components) | | | 268,100 | | | | 5,318 | |
| | Shionogi & Co., Ltd. (Pharmaceuticals) | | | 277,000 | | | | 15,848 | |
| | Shiseido Co., Ltd. (Personal products) | | | 348,200 | | | | 21,895 | |
| | Taisei Corporation (Construction & engineering) | | | 188,700 | | | | 8,100 | |
| | TechnoPro Holdings, Inc. (Professional services) | | | 168,400 | | | | 6,952 | |
| | Terumo Corporation (Health care equipment & supplies) | | | 398,700 | | | | 22,640 | |
| | TIS, Inc. (IT services) | | | 180,300 | | | | 7,115 | |
| | Tokio Marine Holdings, Inc. (Insurance) | | | 632,900 | | | | 30,235 | |
| | Topcon Corporation (Electronic equipment, instruments & components) | | | 297,500 | | | | 3,971 | |
| | Welcia Holdings Co., Ltd. (Food & staples retailing) | | | 74,200 | | | | 3,358 | |
| | Yakult Honsha Co., Ltd. (Food products) | | | 160,500 | | | | 11,305 | |
| | Zenkoku Hosho Co., Ltd. (Diversified financial services) | | | 112,000 | | | | 3,520 | |
| | ZOZO Inc. (Internet & direct marketing retail) | | | 212,200 | | | | 3,891 | |
| | | | | | | | | 298,650 | |
See accompanying Notes to Financial Statements.
| December 31, 2018 | William Blair Funds | 53 |
International Growth Fund
Portfolio of Investments, December 31, 2018(all dollar amounts in thousands)
| | | | | | | | |
| | | | | | | | |
| | Issuer | | Shares | | | Value | |
| | | | | | | | | | |
| | Common Stocks—(continued) | | | | | | | | |
| | | | | | | | | | |
| | Emerging Asia—12.5% | | | | | | | | |
| | China—6.5% | | | | | | | | |
| * | Alibaba Group Holding, Ltd.—ADR (Internet & direct marketing retail) | | | 235,814 | | | $ | 32,323 | |
| * | China Mengniu Dairy Co., Ltd. (Food products) | | | 2,225,000 | | | | 6,933 | |
| | China Merchants Bank Co., Ltd. Class “H” (Banks) | | | 4,384,500 | | | | 16,070 | |
| * | Li Ning Co., Ltd. (Textiles, apparel & luxury goods) | | | 4,532,000 | | | | 4,862 | |
| | NetEase, Inc.—ADR (Entertainment) | | | 38,582 | | | | 9,081 | |
| | Ping An Insurance Group Co. of China, Ltd. Class “H” (Insurance) | | | 3,116,500 | | | | 27,521 | |
| | Shenzhou International Group Holdings, Ltd. (Textiles, apparel & luxury goods) | | | 707,000 | | | | 8,013 | |
| | Tencent Holdings, Ltd. (Interactive Media & Services) | | | 825,500 | | | | 33,102 | |
| | | | | | | | | 137,905 | |
| | India—2.0% | | | | | | | | |
| | HDFC Bank, Ltd. (Banks) | | | 369,818 | | | | 11,240 | |
| | Hexaware Technologies, Ltd. (IT services) | | | 641,814 | | | | 3,054 | |
| | Hindustan Unilever, Ltd. (Household products) | | | 327,135 | | | | 8,518 | |
| | Maruti Suzuki India, Ltd. (Automobiles) | | | 78,936 | | | | 8,426 | |
| | Motherson Sumi Systems, Ltd. (Auto components) | | | 1,374,154 | | | | 3,283 | |
| | Pidilite Industries, Ltd. (Chemicals) | | | 244,583 | | | | 3,884 | |
| | Titan Co., Ltd. (Textiles, apparel & luxury goods) | | | 348,332 | | | | 4,628 | |
| | | | | | | | | 43,033 | |
| | Indonesia—1.5% | | | | | | | | |
| | PT Astra International Tbk (Automobiles) | | | 11,047,800 | | | | 6,319 | |
| | PT Bank Central Asia Tbk (Banks) | | | 13,544,000 | | | | 24,488 | |
| | | | | | | | | 30,807 | |
| | South Korea—0.6% | | | | | | | | |
| | Hotel Shilla Co., Ltd. (Specialty retail) | | | 47,929 | | | | 3,286 | |
| * | Samsung SDI Co., Ltd. (Electronic equipment, instruments & components) | | | 46,484 | | | | 9,124 | |
| | | | | | | | | 12,410 | |
| | Taiwan—1.5% | | | | | | | | |
| | Eclat Textile Co., Ltd. (Textiles, apparel & luxury goods) | | | 317,000 | | | | 3,589 | |
| | Taiwan Semiconductor Manufacturing Co., Ltd.—ADR (Semiconductors & semiconductor equipment) | | | 753,120 | | | | 27,798 | |
| | | | | | | | | 31,387 | |
| | Thailand—0.4% | | | | | | | | |
| | Airports of Thailand PCL (Transportation infrastructure) | | | 2,198,300 | | | | 4,338 | |
| | Bangkok Dusit Medical Services PCL Class “F” (Health care providers & services) | | | 5,190,600 | | | | 3,953 | |
| | | | | | | | | 8,291 | |
| | | | | | | | | | |
| | | | | | | | | | |
| | Issuer | | Shares | | | Value | |
| | | | | | | | | | |
| | Common Stocks—(continued) | | | | | | | | |
| | | | | | | | | | |
| | Asia—6.8% | | | | | | | | |
| | Australia—4.1% | | | | | | | | |
| | Aristocrat Leisure, Ltd. (Hotels, restaurants & leisure) | | | 497,733 | | | $ | 7,657 | |
| | BHP Billiton, Ltd. (Metals & mining) | | | 1,182,641 | | | | 28,513 | |
| | Costa Group Holdings, Ltd. (Food products) | | | 600,233 | | | | 3,137 | |
| | CSL, Ltd. (Biotechnology) | | | 163,025 | | | | 21,261 | |
| | Goodman Group (Equity REIT) | | | 1,015,556 | | | | 7,604 | |
| | Macquarie Group, Ltd. (Capital markets) | | | 235,991 | | | | 18,060 | |
| | | | | | | | | 86,232 | |
| | Hong Kong—2.7% | | | | | | | | |
| | AIA Group, Ltd. (Insurance) | | | 5,209,800 | | | | 43,246 | |
| * | China High Precision Automation Group, Ltd. (Electronic equipment, instruments & components)**§ | | | 6,597,000 | | | | — | |
| | Galaxy Entertainment Group, Ltd. (Hotels, restaurants & leisure) | | | 1,957,000 | | | | 12,446 | |
| | | | | | | | | 55,692 | |
| | | | | | | | | | |
| | Canada—6.6% | | | | | | | | |
| | Alimentation Couche-Tard, Inc. Class “B” (Food & staples retailing) | | | 393,592 | | | | 19,579 | |
| | Brookfield Asset Management, Inc. Class “A” (Capital markets)† | | | 588,114 | | | | 22,554 | |
| | Canadian National Railway Co. (Road & rail) | | | 270,727 | | | | 20,051 | |
| | Finning International, Inc. (Trading companies & distributors) | | | 141,969 | | | | 2,475 | |
| * | Lululemon Athletica, Inc. (Textiles, apparel & luxury goods) | | | 95,544 | | | | 11,619 | |
| | Rogers Communications, Inc. Class “B” (Wireless telecommunication services) | | | 753,731 | | | | 38,625 | |
| | The Bank of NT Butterfield & Son, Ltd. (Banks)† | | | 67,260 | | | | 2,108 | |
| | The Toronto-Dominion Bank (Banks) | | | 417,462 | | | | 20,751 | |
| | | | | | | | | 137,762 | |
| | | | | | | | | | |
| | Emerging Europe, Mid-East, Africa—1.8% |
| | Russia—0.5% | | | | | | | | |
| | Globaltrans Investment plc—GDR (Road & rail) | | | 250,900 | | | | 2,273 | |
| * | Yandex N.V. Class “A” (Interactive Media & Services)† | | | 284,199 | | | | 7,773 | |
| | | | | | | | | 10,046 | |
| | South Africa—0.9% | | | | | | | | |
| | Bid Corporation, Ltd. (Food & staples retailing) | | | 188,342 | | | | 3,469 | |
| | Bidvest Group, Ltd. (Industrial conglomerates) | | | 188,342 | | | | 2,708 | |
| | Mr. Price Group, Ltd. (Specialty retail) | | | 389,841 | | | | 6,670 | |
| | RMB Holdings, Ltd. (Diversified financial services) | | | 1,178,881 | | | | 6,465 | |
| | | | | | | | | 19,312 | |
See accompanying Notes to Financial Statements.
| 54 | Annual Report | December 31, 2018 |
International Growth Fund
Portfolio of Investments, December 31, 2018(all dollar amounts in thousands)
| | | | | | | | |
| | | | | | | | |
| | Issuer | | Shares | | | Value | |
| | | | | | | | | | |
| | Common Stocks—(continued) | | | | | | | | |
| | | | | | | | | | |
| | Emerging Europe, Mid-East, Africa—(continued) |
| | United Arab Emirates—0.4% | | | | | | | | |
| | First Abu Dhabi Bank PJSC (Banks) | | | 1,489,584 | | | $ | 5,718 | |
| | NMC Health plc (Health care providers & services) | | | 104,298 | | | | 3,637 | |
| | | | | | | | | 9,355 | |
| | | | | | | | | | |
| | Emerging Latin America—1.7% | | | | | | | | |
| | Brazil—0.9% | | | | | | | | |
| | B3 S.A. - Brasil Bolsa Balcao (Capital markets) | | | 1,075,100 | | | | 7,437 | |
| | Localiza Rent a Car S.A. (Road & rail) | | | 391,300 | | | | 3,004 | |
| | Lojas Renner S.A. (Multiline retail) | | | 281,500 | | | | 3,079 | |
| | M Dias Branco S.A. (Food products) | | | 415,700 | | | | 4,591 | |
| | Via Varejo S.A. (Specialty retail) | | | 1,662,521 | | | | 1,883 | |
| | | | | | | | | 19,994 | |
| | Peru—0.8% | | | | | | | | |
| | Credicorp, Ltd. (Banks)† | | | 72,932 | | | | 16,167 | |
| | Total Common Stocks—98.3%
(cost $2,055,361) | | | | | | | 2,067,965 | |
| | | | | | | | | | |
| | Preferred Stock | | | | | | | | |
| | Brazil—1.1% | | | | | | | | |
| | Itau Unibanco Holding S.A. (Banks) | | | 2,508,800 | | | | 22,979 | |
| | Total Preferred Stock—1.1%
(cost $21,226) | | | | | | | 22,979 | |
| | Total Investments—99.4%
(cost $2,076,587) | | | | | | | 2,090,944 | |
| | Cash and other assets, less liabilities—0.6% | | | | | | | 12,400 | |
| | Net assets—100.0% | | | | | | $ | 2,103,344 | |
* = Non-income producing security
† = U.S. listed foreign security
** = Fair valued pursuant to Valuation Procedures approved by the Board of Trustees. This holding represents 0.00% of the Fund’s net assets at December 31, 2018.
§ = Deemed illiquid pursuant to Liquidity Procedures approved by the Board of Trustees. This holding represents 0.00% of the Fund’s net assets at December 31, 2018.
ADR = American Depository Receipt
GDR = Global Depository Receipt
REIT = Real Estate Investment Trust
For securities primarily traded on exchanges or markets that close before the close of regular trading on the New York Stock Exchange, the Fund may use an independent pricing service to fair value price the securities pursuant to Valuation Procedures approved by the Board of Trustees.
At December 31, 2018, the Fund’s Portfolio of Investments includes the following industry categories (as a percentage of long-term investments):
| Financials | | | 19.4 | % |
| Industrials | | | 17.5 | % |
| Health Care | | | 14.6 | % |
| Consumer Discretionary | | | 11.7 | % |
| Information Technology | | | 11.3 | % |
| Consumer Staples | | | 8.4 | % |
| Communication Services | | | 5.1 | % |
| Energy | | | 3.6 | % |
| Materials | | | 3.0 | % |
| Utilities | | | 2.8 | % |
| Real Estate | | | 2.6 | % |
| Total | | | 100.0 | % |
At December 31, 2018, the Fund’s Portfolio of Investments includes the following currency categories (as a percentage of long-term investments):
| Euro | | | 28.9 | % |
| British Pound Sterling | | | 15.5 | % |
| Japanese Yen | | | 14.3 | % |
| U.S. Dollar | | | 7.7 | % |
| Hong Kong Dollar | | | 7.3 | % |
| Canadian Dollar | | | 4.9 | % |
| Swiss Franc | | | 4.4 | % |
| Australian Dollar | | | 4.1 | % |
| Danish Krone | | | 2.8 | % |
| Indian Rupee | | | 2.1 | % |
| Brazilian Real | | | 2.1 | % |
| Swedish Krona | | | 1.9 | % |
| Indonesian Rupiah | | | 1.5 | % |
| All Other Currencies | | | 2.5 | % |
| Total | | | 100.0 | % |
See accompanying Notes to Financial Statements.
| December 31, 2018 | William Blair Funds | 55 |
| | Institutional International Growth Fund |
| | |
| | The Institutional International Growth Fund seeks long-term capital appreciation. |
| | |
| | AN OVERVIEW FROM THE PORTFOLIO MANAGERS |
| | |

Simon Fennell 
Kenneth J. McAtamney | The William Blair Institutional International Growth Fund posted a 17.50% decrease, net of fees, for the twelve months ended December 31, 2018. By comparison, the Fund’s benchmark index, the MSCI All Country World ex-U.S. IMI Index (net) (the “Index”), decreased 14.76%. Calendar year underperformance versus the Index was driven by a combination of negative sector allocation and stock selection effects which occurred during the fourth quarter. An overweight allocation to the Information Technology sector, coupled with below average stock selection within the Communication Services and Materials sectors weighed on the Fund’s relative performance. Within the Communication Services sector, Nintendo Co., Ltd. hampered relative returns. Nintendo is the Japanese provider of hardware and software for gaming. The company’s main product is the Switch, released in March 2017. While we believe Nintendo will continue to leverage its extensive library of intellectual property and produce more hit games over the medium term, the company saw an increase in both hardware and third party software sales relative to higher margin proprietary software sales, which weighed on the share price. Within the Materials sector, France-based chemicals company Arkema S.A. detracted from performance. The company reported third quarter EBITDA that was in-line versus consensus, but volume growth was flat, which disappointed investors. Some of the drag on Arkema’s share performance in the first half of 2018 was due to the impact of rail strikes in France. Concerns about slowing automotive and construction end market demand also weighed on investor sentiment. Partially offsetting these effects was the Fund’s underweight allocation to the Materials sector, coupled with above average stock selection within the Financials sector. Within Financials, PT Bank Central Asia Tbk propelled relative performance. PT Bank Central Asia is a leading retail and payment settlement bank in Indonesia and has the most extensive branch and electronic delivery network among the country’s banks. Hong Kong-based insurer AIA Group, Ltd. also bolstered performance. The company continues to benefit from strong demand for its insurance products. AIA continues to benefit from the dual secular tailwinds of increased penetration of the insurance market and rising affluence in Asia. We believe that its distribution and innovation advantages relative to peers should continue to position it for strong growth prospectively. Please refer to the Global Markets Review and Outlook relating to the Fund beginning on page 32. |
| 56 | Annual Report | December 31, 2018 |
Institutional International Growth Fund
Performance Highlights (Unaudited)
| Average Annual Total Return through 12/31/2018 |
| | | 1 Year | | 3 Year | | 5 Year | | 10 Year |
| Institutional International Growth Fund | | | (17.50 | )% | | | 1.41 | % | | | 0.32 | % | | | 8.31 | % |
| MSCI ACW Ex-U.S. IMI (net) | | | (14.76 | ) | | | 4.39 | | | | 0.85 | | | | 6.97 | |
Performance cited represents past performance. Past performance does not guarantee future results and current performance may be lower or higher than the data quoted. Results shown are average annual returns, which assume reinvestment of dividends and capital gains. Investment returns and principal will fluctuate and you may have a gain or loss when you sell shares. For the most current month-end performance information, please call 1-800-742-7272, or visit our Web site atwww.williamblairfunds.com. From time to time, the investment adviser may waive fees or reimburse expenses for the Fund. Without these waivers/reimbursements, performance would be lower. Investing in smaller and medium capitalization companies involves special risks, including higher volatility and lower liquidity. Smaller and medium capitalization stocks are also more sensitive to purchase/sale transactions and changes in the issuer’s financial condition. International investing involves special risk considerations, including currency fluctuations, lower liquidity, economic and political risk. Shares of the Fund are available without a sales load or distribution (12b-1) or service fees.
The performance highlights and graph presented above do not reflect the deduction of taxes that a shareholder would pay on fund distributions or the redemption of fund shares.
The Morgan Stanley Capital International (MSCI) All Country World (ACW) Ex-U.S. Investable Market Index (IMI) (net) is a free float-adjusted market capitalization weighted index that is designed to measure the equity market performance of developed and emerging markets, excluding the United States. This index approximates the minimum possible dividend reinvestment by deducting for the highest possible withholding tax rates of those markets.
This report identifies the Fund’s investments on December 31, 2018. These holdings are subject to change. Not all stocks in the Fund performed the same, nor is there any guarantee that these stocks will perform as well in the future. Market forecasts provided in this report may not necessarily come to pass.
Sector Diversification (Unaudited)

The sector diversification shown is based on the total long-term securities.
| December 31, 2018 | William Blair Funds | 57 |
Institutional International Growth Fund
Portfolio of Investments, December 31, 2018(all dollar amounts in thousands)
| | | | | | | | |
| | | | | | | | |
| | Issuer | | Shares | | | Value | |
| | | | | | | | | | |
| | Common Stocks | | | | | | | | |
| | | | | | | | | | |
| | Europe, Mid-East—37.1% | | | | | | | | |
| | Belgium—1.0% | | | | | | | | |
| | KBC Group N.V. (Banks) | | | 270,323 | | | $ | 17,555 | |
| | Denmark—2.8% | | | | | | | | |
| | Ambu A/S Class “B” (Health care equipment & supplies) | | | 87,116 | | | | 2,093 | |
| | Coloplast A/S Class “B” (Health care equipment & supplies) | | | 123,404 | | | | 11,457 | |
| | DSV A/S (Road & rail) | | | 203,174 | | | | 13,382 | |
| | Orsted A/S (Electric utilities) | | | 245,416 | | | | 16,409 | |
| | Royal Unibrew A/S (Beverages) | | | 56,632 | | | | 3,902 | |
| | Tryg A/S (Insurance) | | | 107,444 | | | | 2,702 | |
| | | | | | | | | 49,945 | |
| | Finland—0.7% | | | | | | | | |
| | Neste Oyj (Oil, gas & consumable fuels) | | | 171,406 | | | | 13,229 | |
| | France—11.8% | | | | | | | | |
| | Airbus SE (Aerospace & defense) | | | 243,584 | | | | 23,432 | |
| | Arkema S.A. (Chemicals) | | | 116,866 | | | | 10,037 | |
| | Capgemini SE (IT services) | �� | | 162,067 | | | | 16,118 | |
| | Dassault Systemes SE (Software) | | | 112,595 | | | | 13,378 | |
| | Hermes International (Textiles, apparel & luxury goods) | | | 11,766 | | | | 6,535 | |
| | Ipsen S.A. (Pharmaceuticals) | | | 35,728 | | | | 4,620 | |
| | Kering S.A. (Textiles, apparel & luxury goods) | | | 35,122 | | | | 16,563 | |
| | L’Oreal S.A. (Personal products) | | | 93,172 | | | | 21,478 | |
| | Nexity S.A. (Real estate management & development) | | | 64,365 | | | | 2,906 | |
| | Orpea (Health care providers & services) | | | 50,941 | | | | 5,207 | |
| | Rubis SCA (Gas utilities) | | | 67,543 | | | | 3,628 | |
| | Safran S.A. (Aerospace & defense) | | | 187,183 | | | | 22,605 | |
| | Teleperformance (Professional services) | | | 50,317 | | | | 8,048 | |
| | Thales S.A. (Aerospace & defense) | | | 138,767 | | | | 16,217 | |
| | Total S.A. (Oil, gas & consumable fuels) | | | 327,736 | | | | 17,341 | |
| | Veolia Environnement S.A. (Multi-utilities) | | | 963,071 | | | | 19,812 | |
| * | Worldline S.A. (IT services) | | | 53,973 | | | | 2,610 | |
| | | | | | | | | 210,535 | |
| | Germany—4.9% | | | | | | | | |
| | Carl Zeiss Meditec AG (Health care equipment & supplies) | | | 38,802 | | | | 3,037 | |
| | KION Group AG (Machinery) | | | 58,736 | | | | 2,983 | |
| | MTU Aero Engines AG (Aerospace & defense) | | | 93,077 | | | | 16,892 | |
| | Norma Group SE (Machinery) | | | 40,898 | | | | 2,023 | |
| | Puma SE (Textiles, apparel & luxury goods) | | | 9,854 | | | | 4,821 | |
| * | QIAGEN N.V. (Life sciences tools & services)† | | | 300,493 | | | | 10,352 | |
| | SAP SE (Software) | | | 161,738 | | | | 16,109 | |
| | Vonovia SE (Real estate management & development) | | | 414,387 | | | | 18,797 | |
| | Washtec AG (Machinery) | | | 17,518 | | | | 1,212 | |
| | Wirecard AG (IT services) | | | 75,696 | | | | 11,518 | |
| | | | | | | | | 87,744 | |
| | | | | | | | |
| | | | | | | | |
| | Issuer | | Shares | | | Value | |
| | | | | | | | | | |
| | Common Stocks—(continued) | | | | | | | | |
| | | | | | | | | | |
| | Europe, Mid-East—(continued) | | | | | | | | |
| | Ireland—1.0% | | | | | | | | |
| * | ICON plc (Life sciences tools & services)† | | | 81,698 | | | $ | 10,556 | |
| | Kingspan Group plc (Building products) | | | 153,400 | | | | 6,570 | |
| | | | | | | | | 17,126 | |
| | Israel—0.2% | | | | | | | | |
| * | Wix.com, Ltd. (IT services)† | | | 47,403 | | | | 4,282 | |
| | Italy—2.3% | | | | | | | | |
| | Banca Generali SpA (Capital markets) | | | 163,836 | | | | 3,403 | |
| | Enel SpA (Electric utilities) | | | 1,538,751 | | | | 8,893 | |
| | Ferrari N.V. (Automobiles) | | | 70,177 | | | | 6,978 | |
| | FinecoBank Banca Fineco SpA (Banks) | | | 513,882 | | | | 5,168 | |
| | Interpump Group SpA (Machinery) | | | 112,989 | | | | 3,366 | |
| | Moncler SpA (Textiles, apparel & luxury goods) | | | 98,284 | | | | 3,258 | |
| | Recordati SpA (Pharmaceuticals) | | | 184,628 | | | | 6,407 | |
| | Technogym SpA (Leisure products) | | | 270,549 | | | | 2,901 | |
| | | | | | | | | 40,374 | |
| | Luxembourg—0.5% | | | | | | | | |
| | Eurofins Scientific SE (Life sciences tools & services) | | | 10,014 | | | | 3,741 | |
| | Tenaris S.A. (Energy equipment & services) | | | 435,943 | | | | 4,715 | |
| | | | | | | | | 8,456 | |
| | Netherlands—3.9% | | | | | | | | |
| | ASML Holding N.V. (Semiconductors & semiconductor equipment) | | | 57,311 | | | | 9,006 | |
| | Euronext N.V. (Capital markets) | | | 44,036 | | | | 2,538 | |
| | Koninklijke Philips N.V. (Health care equipment & supplies) | | | 494,785 | | | | 17,534 | |
| | Royal Dutch Shell plc Class “A” (Oil, gas & consumable fuels) | | | 843,894 | | | | 24,806 | |
| | Wolters Kluwer N.V. (Professional services) | | | 272,871 | | | | 16,151 | |
| | | | | | | | | 70,035 | |
| | Norway—0.2% | | | | | | | | |
| | TGS Nopec Geophysical Co. ASA (Energy equipment & services) | | | 108,893 | | | | 2,630 | |
| | Spain—1.8% | | | | | | | | |
| | ACS Actividades de Construccion y Servicios S.A. (Construction & engineering) | | | 295,170 | | | | 11,441 | |
| | Amadeus IT Group S.A. (IT services) | | | 206,954 | | | | 14,426 | |
| | Bankinter S.A. (Banks) | | | 873,037 | | | | 7,020 | |
| | | | | | | | | 32,887 | |
| | Sweden—1.6% | | | | | | | | |
| | Alfa Laval AB (Machinery) | | | 255,799 | | | | 5,474 | |
| | Fabege AB (Real estate management & development) | | | 294,385 | | | | 3,925 | |
| | Hexagon AB Class “B” (Electronic equipment, instruments & components) | | | 275,545 | | | | 12,685 | |
| | Nolato AB Class “B” (Industrial conglomerates) | | | 39,524 | | | | 1,634 | |
See accompanying Notes to Financial Statements.
| 58 | Annual Report | December 31, 2018 |
Institutional International Growth Fund
Portfolio of Investments, December 31, 2018(all dollar amounts in thousands)
| | | | | | | | |
| | | | | | | | |
| | Issuer | | Shares | | | Value | |
| | | | | | | | | | |
| | Common Stocks—(continued) | | | | | | | | |
| | | | | | | | | | |
| | Europe, Mid-East—(continued) | | | | | | | | |
| | Sweden—(continued) | | | | | | | | |
| * | Swedish Orphan Biovitrum AB (Biotechnology) | | | 244,731 | | | $ | 5,329 | |
| | | | | | | | | 29,047 | |
| | Switzerland—4.4% | | | | | | | | |
| | Belimo Holding AG (Building products) | | | 456 | | | | 1,828 | |
| | Logitech International S.A. (Technology hardware, storage & peripherals) | | | 172,918 | | | | 5,440 | |
| * | Lonza Group AG (Life sciences tools & services) | | | 97,354 | | | | 25,227 | |
| | Novartis AG (Pharmaceuticals) | | | 368,015 | | | | 31,466 | |
| | Partners Group Holding AG (Capital markets) | | | 22,666 | | | | 13,744 | |
| | | | | | | | | 77,705 | |
| | | | | | | | | | |
| | United Kingdom—17.1% | | | | | | | | |
| | 3i Group plc (Capital markets) | | | 693,798 | | | | 6,839 | |
| | Abcam plc (Biotechnology) | | | 174,549 | | | | 2,425 | |
| | AstraZeneca plc (Pharmaceuticals) | | | 422,377 | | | | 31,618 | |
| | AVEVA Group plc (Software) | | | 135,814 | | | | 4,189 | |
| | Beazley plc (Insurance) | | | 701,072 | | | | 4,499 | |
| | Big Yellow Group plc (Equity REIT) | | | 341,726 | | | | 3,805 | |
| | Burford Capital, Ltd. (Capital markets) | | | 136,096 | | | | 2,873 | |
| | Carnival plc (Hotels, restaurants & leisure) | | | 295,910 | | | | 14,193 | |
| | Close Brothers Group plc (Capital markets) | | | 137,525 | | | | 2,524 | |
| | Compass Group plc (Hotels, restaurants & leisure) | | | 1,444,224 | | | | 30,373 | |
| | Croda International plc (Chemicals) | | | 144,805 | | | | 8,647 | |
| | Diageo plc (Beverages) | | | 512,818 | | | | 18,269 | |
| | Electrocomponents plc (Electronic equipment, instruments & components) | | | 252,147 | | | | 1,628 | |
| | Experian plc (Professional services) | | | 633,479 | | | | 15,382 | |
| | Fevertree Drinks plc (Beverages) | | | 125,987 | | | | 3,531 | |
| | Greggs plc (Hotels, restaurants & leisure) | | | 288,487 | | | | 4,655 | |
| | Halma plc (Electronic equipment, instruments & components) | | | 468,074 | | | | 8,138 | |
| | Hiscox, Ltd. (Insurance) | | | 424,398 | | | | 8,769 | |
| | Intermediate Capital Group plc (Capital markets) | | | 394,558 | | | | 4,702 | |
| | Intertek Group plc (Professional services) | | | 92,891 | | | | 5,683 | |
| | Kindred Group plc (Hotels, restaurants & leisure) | | | 402,470 | | | | 3,705 | |
| | London Stock Exchange Group plc (Capital markets) | | | 230,734 | | | | 11,946 | |
| | Melrose Industries plc (Electrical equipment) | | | 3,569,008 | | | | 7,454 | |
| | RELX plc (Professional services) | | | 1,006,562 | | | | 20,739 | |
| | Renishaw plc (Electronic equipment, instruments & components) | | | 59,772 | | | | 3,230 | |
| | Rentokil Initial plc (Commercial services & supplies) | | | 2,238,822 | | | | 9,622 | |
| | Rotork plc (Machinery) | | | 1,259,497 | | | | 3,975 | |
| | Segro plc (Equity REIT) | | | 1,242,930 | | | | 9,325 | |
| | Spirax-Sarco Engineering plc (Machinery) | | | 82,597 | | | | 6,569 | |
| | | | | | | | |
| | | | | | | | |
| | Issuer | | Shares | | | Value | |
| | | | | | | | | | |
| | Common Stocks—(continued) | | | | | | | | |
| | | | | | | | | | |
| | United Kingdom—(continued) | | | | | | | | |
| | Synthomer plc (Chemicals) | | | 152,429 | | | $ | 694 | |
| | The Weir Group plc (Machinery) | | | 253,670 | | | | 4,197 | |
| | Unilever N.V. (Personal products) | | | 576,087 | | | | 31,300 | |
| | Victrex plc (Chemicals) | | | 188,511 | | | | 5,498 | |
| | WH Smith plc (Specialty retail) | | | 183,538 | | | | 4,024 | |
| | | | | | | | | 305,020 | |
| | Japan—14.0% | | | | | | | | |
| | Asahi Intecc Co., Ltd. (Health care equipment & supplies) | | | 133,800 | | | | 5,664 | |
| | Daikin Industries, Ltd. (Building products) | | | 128,000 | | | | 13,658 | |
| | Hoshizaki Corporation (Machinery) | | | 75,600 | | | | 4,608 | |
| | Hoya Corporation (Health care equipment & supplies) | | | 298,200 | | | | 17,997 | |
| | Keyence Corporation (Electronic equipment, instruments & components) | | | 46,400 | | | | 23,572 | |
| | M3, Inc. (Health care technology) | | | 392,700 | | | | 5,281 | |
| | MISUMI Group, Inc. (Machinery) | | | 273,200 | | | | 5,780 | |
| | MonotaRO Co., Ltd. (Trading companies & distributors) | | | 172,100 | | | | 4,268 | |
| | Nichias Corporation (Building products) | | | 124,800 | | | | 2,142 | |
| | Nihon M&A Center, Inc. (Professional services) | | | 204,200 | | | | 4,129 | |
| | Nintendo Co., Ltd. (Entertainment) | | | 53,400 | | | | 14,268 | |
| | Nitori Holdings Co., Ltd. (Specialty retail) | | | 42,900 | | | | 5,374 | |
| | Nomura Research Institute, Ltd. (IT services) | | | 123,600 | | | | 4,595 | |
| | ORIX Corporation (Diversified financial services) | | | 995,400 | | | | 14,581 | |
| | Sankyu, Inc. (Road & rail) | | | 75,560 | | | | 3,430 | |
| | Shimadzu Corporation (Electronic equipment, instruments & components) | | | 222,600 | | | | 4,415 | |
| | Shionogi & Co., Ltd. (Pharmaceuticals) | | | 232,000 | | | | 13,274 | |
| | Shiseido Co., Ltd. (Personal products) | | | 291,600 | | | | 18,336 | |
| | Taisei Corporation (Construction & engineering) | | | 158,000 | | | | 6,782 | |
| | TechnoPro Holdings, Inc. (Professional services) | | | 141,000 | | | | 5,821 | |
| | Terumo Corporation (Health care equipment & supplies) | | | 333,900 | | | | 18,961 | |
| | TIS, Inc. (IT services) | | | 151,000 | | | | 5,958 | |
| | Tokio Marine Holdings, Inc. (Insurance) | | | 530,000 | | | | 25,319 | |
| | Topcon Corporation (Electronic equipment, instruments & components) | | | 249,200 | | | | 3,326 | |
| | Welcia Holdings Co., Ltd. (Food & staples retailing) | | | 62,100 | | | | 2,810 | |
| | Yakult Honsha Co., Ltd. (Food products) | | | 134,400 | | | | 9,466 | |
| | Zenkoku Hosho Co., Ltd. (Diversified financial services) | | | 93,800 | | | | 2,948 | |
| | ZOZO Inc. (Internet & direct marketing retail) | | | 177,700 | | | | 3,259 | |
| | | | | | | | | 250,022 | |
See accompanying Notes to Financial Statements.
| December 31, 2018 | William Blair Funds | 59 |
Institutional International Growth Fund
Portfolio of Investments, December 31, 2018(all dollar amounts in thousands)
| | | | | | | | |
| | | | | | | | |
| | Issuer | | Shares | | | Value | |
| | | | | | | | |
| | Common Stocks—(continued) | | | | | | | | |
| | | | | | | | | | |
| | Emerging Asia—12.4% | | | | | | | | |
| | China—6.5% | | | | | | | | |
| * | Alibaba Group Holding, Ltd.—ADR (Internet & direct marketing retail) | | | 198,386 | | | $ | 27,193 | |
| * | China Mengniu Dairy Co., Ltd. (Food products) | | | 1,872,000 | | | | 5,833 | |
| | China Merchants Bank Co., Ltd. Class “H” (Banks) | | | 3,688,500 | | | | 13,519 | |
| * | Li Ning Co., Ltd. (Textiles, apparel & luxury goods) | | | 3,813,000 | | | | 4,090 | |
| | NetEase, Inc.—ADR (Entertainment) | | | 32,458 | | | | 7,640 | |
| | Ping An Insurance Group Co. of China, Ltd. Class “H” (Insurance) | | | 2,622,000 | | | | 23,155 | |
| | Shenzhou International Group Holdings, Ltd. (Textiles, apparel & luxury goods) | | | 594,000 | | | | 6,732 | |
| | Tencent Holdings, Ltd. (Interactive Media & Services) | | | 694,400 | | | | 27,845 | |
| | | | | | | | | 116,007 | |
| | India—2.0% | | | | | | | | |
| | HDFC Bank, Ltd. (Banks) | | | 311,122 | | | | 9,456 | |
| | Hexaware Technologies, Ltd. (IT services) | | | 539,947 | | | | 2,569 | |
| | Hindustan Unilever, Ltd. (Household products) | | | 275,213 | | | | 7,166 | |
| | Maruti Suzuki India, Ltd. (Automobiles) | | | 66,408 | | | | 7,088 | |
| | Motherson Sumi Systems, Ltd. (Auto components) | | | 1,156,052 | | | | 2,762 | |
| | Pidilite Industries, Ltd. (Chemicals) | | | 205,763 | | | | 3,268 | |
| | Titan Co., Ltd. (Textiles, apparel & luxury goods) | | | 293,045 | | | | 3,894 | |
| | | | | | | | | 36,203 | |
| | Indonesia—1.4% | | | | | | | | |
| | PT Astra International Tbk (Automobiles) | | | 9,252,000 | | | | 5,292 | |
| | PT Bank Central Asia Tbk (Banks) | | | 11,342,300 | | | | 20,507 | |
| | | | | | | | | 25,799 | |
| | South Korea—0.6% | | | | | | | | |
| | Hotel Shilla Co., Ltd. (Specialty retail) | | | 40,138 | | | | 2,752 | |
| * | Samsung SDI Co., Ltd. (Electronic equipment, instruments & components) | | | 38,928 | | | | 7,640 | |
| | | | | | | | | 10,392 | |
| | Taiwan—1.5% | | | | | | | | |
| | Eclat Textile Co., Ltd. (Textiles, apparel & luxury goods) | | | 265,000 | | | | 3,000 | |
| | Taiwan Semiconductor Manufacturing Co., Ltd.—ADR (Semiconductors & semiconductor equipment) | | | 633,587 | | | | 23,386 | |
| | | | | | | | | 26,386 | |
| | Thailand—0.4% | | | | | | | | |
| | Airports of Thailand PCL (Transportation infrastructure) | | | 1,841,000 | | | | 3,633 | |
| | Bangkok Dusit Medical Services PCL Class “F” (Health care providers & services) | | | 4,346,800 | | | | 3,311 | |
| | | | | | | | | 6,944 | |
| | | | | | | | |
| | | | | | | | |
| | Issuer | | Shares | | | Value | |
| | | | | | | | |
| | Common Stocks—(continued) | | | | | | | | |
| | | | | | | | | | |
| | Asia—6.7% | | | | | | | | |
| | Australia—4.1% | | | | | | | | |
| | Aristocrat Leisure, Ltd. (Hotels, restaurants & leisure) | | | 418,734 | | | $ | 6,441 | |
| | BHP Billiton, Ltd. (Metals & mining) | | | 994,935 | | | | 23,988 | |
| | Costa Group Holdings, Ltd. (Food products) | | | 498,633 | | | | 2,606 | |
| | CSL, Ltd. (Biotechnology) | | | 137,150 | | | | 17,887 | |
| | Goodman Group (Equity REIT) | | | 854,370 | | | | 6,397 | |
| | Macquarie Group, Ltd. (Capital markets) | | | 198,535 | | | | 15,193 | |
| | | | | | | | | 72,512 | |
| | Hong Kong—2.6% | | | | | | | | |
| | AIA Group, Ltd. (Insurance) | | | 4,382,863 | | | | 36,382 | |
| * | China High Precision Automation Group, Ltd. (Electronic equipment, instruments & components)**§ | | | 3,373,000 | | | | — | |
| | Galaxy Entertainment Group, Ltd. (Hotels, restaurants & leisure) | | | 1,647,000 | | | | 10,474 | |
| | | | | | | | | 46,856 | |
| | | | | | | | | | |
| | Canada—6.5% | | | | | | | | |
| | Alimentation Couche-Tard, Inc. Class “B” (Food & staples retailing) | | | 331,122 | | | | 16,471 | |
| | Brookfield Asset Management, Inc. Class “A” (Capital markets)† | | | 494,770 | | | | 18,975 | |
| | Canadian National Railway Co. (Road & rail) | | | 227,758 | | | | 16,868 | |
| | Finning International, Inc. (Trading companies & distributors) | | | 117,938 | | | | 2,056 | |
| * | Lululemon Athletica, Inc. (Textiles, apparel & luxury goods) | | | 80,379 | | | | 9,775 | |
| | Rogers Communications, Inc. Class “B” (Wireless telecommunication services) | | | 634,101 | | | | 32,495 | |
| | The Bank of NT Butterfield & Son, Ltd. (Banks)† | | | 55,875 | | | | 1,752 | |
| | The Toronto-Dominion Bank (Banks) | | | 351,204 | | | | 17,457 | |
| | | | | | | | | 115,849 | |
| | | | | | | | | | |
| | Emerging Europe, Mid-East, Africa—1.8% | | | | | | | | |
| | Russia—0.5% | | | | | | | | |
| | Globaltrans Investment plc—GDR (Road & rail) | | | 204,905 | | | | 1,857 | |
| * | Yandex N.V. Class “A” (Interactive Media & Services)† | | | 239,091 | | | | 6,539 | |
| | | | | | | | | 8,396 | |
| | South Africa—0.9% | | | | | | | | |
| | Bid Corporation, Ltd. (Food & staples retailing) | | | 158,449 | | | | 2,918 | |
| | Bidvest Group, Ltd. (Industrial conglomerates) | | | 158,449 | | | | 2,278 | |
| | Mr. Price Group, Ltd. (Specialty retail) | | | 327,966 | | | | 5,611 | |
| | RMB Holdings, Ltd. (Diversified financial services) | | | 991,773 | | | | 5,439 | |
| | | | | | | | | 16,246 | |
See accompanying Notes to Financial Statements.
| 60 | Annual Report | December 31, 2018 |
Institutional International Growth Fund
Portfolio of Investments, December 31, 2018(all dollar amounts in thousands)
| | | | Shares or | | | | |
| | | | Principal | | | | |
| | Issuer | | Amount | | | Value | |
| | | | | | | | |
| | Common Stocks—(continued) | | | | | | | | |
| | | | | | | | | | |
| | Emerging Europe, Mid-East, Africa—(continued) | | | | | | | | |
| | United Arab Emirates—0.4% | | | | | | | | |
| | First Abu Dhabi Bank PJSC (Banks) | | | 1,253,161 | | | $ | 4,810 | |
| | NMC Health plc (Health care providers & services) | | | 87,744 | | | | 3,060 | |
| | | | | | | | | 7,870 | |
| | | | | | | | | | |
| | Emerging Latin America—1.7% | | | | | | | | |
| | Brazil—0.9% | | | | | | | | |
| | B3 S.A. - Brasil Bolsa Balcao (Capital markets) | | | 900,300 | | | | 6,228 | |
| | Localiza Rent a Car S.A. (Road & rail) | | | 325,200 | | | | 2,496 | |
| | Lojas Renner S.A. (Multiline retail) | | | 236,100 | | | | 2,583 | |
| | M Dias Branco S.A. (Food products) | | | 348,200 | | | | 3,845 | |
| | Via Varejo S.A. (Specialty retail) | | | 1,383,077 | | | | 1,567 | |
| | | | | | | | | 16,719 | |
| | Peru—0.8% | | | | | | | | |
| | Credicorp, Ltd. (Banks)† | | | 61,356 | | | | 13,601 | |
| | Total Common Stocks—97.3%
(cost $1,737,868) | | | | | | | 1,736,372 | |
| | | | | | | | | | |
| | Preferred Stock | | | | | | | | |
| | Brazil—1.1% | | | | | | | | |
| | Itau Unibanco Holding S.A. (Banks) | | | 2,101,050 | | | | 19,245 | |
| | Total Preferred Stock—1.1%
(cost $17,896) | | | | | | | 19,245 | |
| | | | | | | | | | |
| | Repurchase Agreement | | | | | | | | |
| | Fixed Income Clearing Corporation, 0.500% dated 12/31/18, due 1/2/19, repurchase price $26,434, collateralized by U.S. Treasury Bond, 3.750%, due 11/15/43 | | | $26,433 | | | | 26,433 | |
| | Total Repurchase Agreement—1.5%
(cost $26,433) | | | | | | | 26,433 | |
| | Total Investments—99.9%
(cost $1,782,197) | | | | | | | 1,782,050 | |
| | Cash and other assets, less liabilities—0.1% | | | | | | | 2,385 | |
| | Net assets—100.0% | | | | | | $ | 1,784,435 | |
ADR = American Depository Receipt
GDR = Global Depository Receipt
REIT = Real Estate Investment Trust
* = Non-income producing security
† = U.S. listed foreign security
** = Fair valued pursuant to Valuation Procedures approved by the Board of Trustees. This holding represents 0.00% of the Fund’s net assets at December 31, 2018.
§ = Deemed illiquid pursuant to Liquidity Procedures approved by the Board of Trustees. This holding represents 0.00% of the Fund’s net assets at December 31, 2018.
For securities primarily traded on exchanges or markets that close before the close of regular trading on the New York Stock Exchange, the Fund may use an independent pricing service to fair value price the securities pursuant to Valuation Procedures approved by the Board of Trustees.
At December 31, 2018, the Fund’s Portfolio of Investments includes the following industry categories (as a percentage of long-term investments):
| Financials | | | 19.4 | % |
| Industrials | | | 17.5 | % |
| Health Care | | | 14.6 | % |
| Consumer Discretionary | | | 11.7 | % |
| Information Technology | | | 11.3 | % |
| Consumer Staples | | | 8.4 | % |
| Communication Services | | | 5.1 | % |
| Energy | | | 3.6 | % |
| Materials | | | 3.0 | % |
| Utilities | | | 2.8 | % |
| Real Estate | | | 2.6 | % |
| Total | | | 100.0 | % |
At December 31, 2018, the Fund’s Portfolio of Investments includes the following currency categories (as a percentage of long-term investments):
| Euro | | | 29.0 | % |
| British Pound Sterling | | | 15.6 | % |
| Japanese Yen | | | 14.2 | % |
| U.S. Dollar | | | 7.7 | % |
| Hong Kong Dollar | | | 7.3 | % |
| Canadian Dollar | | | 4.9 | % |
| Swiss Franc | | | 4.4 | % |
| Australian Dollar | | | 4.1 | % |
| Danish Krone | | | 2.8 | % |
| Indian Rupee | | | 2.1 | % |
| Brazilian Real | | | 2.0 | % |
| Swedish Krona | | | 1.9 | % |
| Indonesian Rupiah | | | 1.5 | % |
| All Other Currencies | | | 2.5 | % |
| Total | | | 100.0 | % |
See accompanying Notes to Financial Statements.
| December 31, 2018 | William Blair Funds | 61 |
| | International Small Cap Growth Fund |
| | |
| | The International Small Cap Growth Fund seeks long-term capital appreciation. |
| | |
| | AN OVERVIEW FROM THE PORTFOLIO MANAGERS |
| | |

Simon Fennell 
Andrew G. Flynn | The William Blair International Small Cap Growth Fund (Class N shares) posted a 24.48% decrease, net of fees, for the twelve months ended December 31, 2018. By comparison, the Fund’s benchmark index, the MSCI All Country World ex-U.S. Small Cap Index (net) (the “Index”), decreased 18.20%. Calendar year performance was adversely impacted by the difficult fourth quarter. From a sector attribution perspective, the Fund’s stock selection effects for the 12 month period were weakest within Consumer Discretionary and Energy. Within Consumer Discretionary, MGM China Holdings, Ltd. is a leading developer, owner and operator of gaming and lodging resorts in the Greater China region, including properties in Macau and Cotai. The share price came under pressure during the year amid slowing China gaming revenues which prompted negative revisions to consensus earnings estimates across the industry. Although MGM’s new Cotai property experienced weaker than expected growth, its important VIP and premium mass businesses were beginning to show improving volumes in the fourth quarter. Within Energy, Canadian oil services company CES Energy Solutions Corporation was the largest detractor from the Fund’s performance. The company’s unique drilling fluids and focus on customer service have enabled it to gain significant market share in Canada. However, the share price was hampered by the weaker oil price environment in the first nine months of the year, and higher costs which led to weaker than expected earnings. Partially offsetting these effects was strong stock selection within the Materials sector. Japanese company Nissan Chemical Corp. was a top contributor to the Fund’s performance, benefiting from revenue growth in specialty chemical products including alignment films for smartphones and Fluralaner (flea and tick medicine for pets). Information Technology stock selection was also positive for the year, bolstered by Israel-based Wix.com, Ltd. Wix is the clear leader in do-it-yourself website development and is benefiting from underlying growth in internet-based small businesses. The company has built a reputation for consistent outperformance, yet is still in the early innings of broadening monetization and scale. The share price was bolstered by strong operating momentum at the company, evidenced by consensus-beating revenue growth of 40% on a year-over-year basis for the third quarter. Please refer to the Global Markets Review and Outlook relating to the Fund beginning on page 32. |
| 62 | Annual Report | December 31, 2018 |
International Small Cap Growth Fund
Performance Highlights (Unaudited)
| Average Annual Total Return through 12/31/2018 |
| | | 1 Year | | 3 Year | | 5 Year | | 10 Year |
| Class N | | | (24.48 | )% | | | (1.62 | )% | | | (0.89 | )% | | | 9.70 | % |
| Class I | | | (24.29 | ) | | | (1.34 | ) | | | (0.59 | ) | | | 10.02 | |
| Institutional Class | | | (24.19 | ) | | | (1.26 | ) | | | (0.50 | ) | | | 10.20 | |
| MSCI ACW Ex-U.S. Small Cap Index (net) | | | (18.20 | ) | | | 3.82 | | | | 1.96 | | | | 10.02 | |
Performance cited represents past performance. Past performance does not guarantee future results and current performance may be lower or higher than the data quoted. Results shown are average annual returns, which assume reinvestment of dividends and capital gains. Investment returns and principal will fluctuate and you may have a gain or loss when you sell shares. For the most current month-end performance information, please call 1-800-742-7272, or visit our Web site atwww.williamblairfunds.com. From time to time, the investment adviser may waive fees or reimburse expenses for the Fund. Without these waivers/reimbursements, performance would be lower. Investing in smaller companies involves special risks, including higher volatility and lower liquidity. Smaller capitalization stocks are also more sensitive to purchase/sale transactions and changes in the issuer’s financial condition. International investing involves special risk considerations, including currency fluctuations, lower liquidity, economic and political risk. Class N shares are available to the general public without a sales load. Class I shares are available to certain institutional investors, and advisory clients of William Blair & Company, L.L.C., without a sales load or distribution (12b-1) fees. Institutional Class shares are available to institutional investors without a sales load or distribution (12b-1) or service fees.
The performance highlights and graph presented above do not reflect the deduction of taxes that a shareholder would pay on fund distributions or the redemption of fund shares.
The Morgan Stanley Capital International (MSCI) All Country World (ACW) Ex-U.S. Small Cap Index (net) is a free float-adjusted market capitalization weighted index that is designed to measure the equity market performance of small capitalization developed and emerging markets, excluding the United States. This index approximates the minimum possible dividend reinvestment by deducting for the highest possible withholding tax rates of those markets.
This report identifies the Fund’s investments on December 31, 2018. These holdings are subject to change. Not all stocks in the Fund performed the same, nor is there any guarantee that these stocks will perform as well in the future. Market forecasts provided in this report may not necessarily come to pass.
Sector Diversification (Unaudited)

The sector diversification shown is based on the total long-term securities.
| December 31, 2018 | William Blair Funds | 63 |
International Small Cap Growth Fund
Portfolio of Investments, December 31, 2018(all dollar amounts in thousands)
| | | | | | | | |
| | | | | | | | |
| | Issuer | | Shares | | | Value | |
| | | | | | | | | | |
| | Common Stocks | | | | | | | | |
| | | | | | | | | | |
| | Europe, Mid-East—32.5% | | | | | | | | |
| | Austria—0.5% | | | | | | | | |
| | Schoeller-Bleckmann Oilfield Equipment AG (Energy equipment & services) | | | 27,462 | | | $ | 1,805 | |
| | Belgium—1.7% | | | | | | | | |
| | Melexis N.V. (Semiconductors & semiconductor equipment) | | | 33,051 | | | | 1,928 | |
| | Warehouses De Pauw CVA (Equity REIT) | | | 28,786 | | | | 3,799 | |
| | | | | | | | | 5,727 | |
| | Denmark—2.4% | | | | | | | | |
| | Royal Unibrew A/S (Beverages) | | | 85,710 | | | | 5,905 | |
| | Tryg A/S (Insurance) | | | 91,316 | | | | 2,297 | |
| | | | | | | | | 8,202 | |
| | Finland—0.9% | | | | | | | | |
| | DNA Oyj (Diversified telecommunication services) | | | 162,752 | | | | 3,185 | |
| | Foroe Islands—0.7% | | | | | | | | |
| | Bakkafrost P/F (Food products) | | | 48,841 | | | | 2,391 | |
| | France—5.3% | | | | | | | | |
| | Alten S.A. (IT services) | | | 67,088 | | | | 5,588 | |
| | Nexity S.A. (Real estate management & development) | | | 87,438 | | | | 3,947 | |
| | Rubis SCA (Gas utilities) | | | 87,923 | | | | 4,723 | |
| * | Worldline S.A. (IT services) | | | 79,821 | | | | 3,859 | |
| | | | | | | | | 18,117 | |
| | Germany—3.9% | | | | | | | | |
| | AURELIUS Equity Opportunities SE & Co KGaA (Capital markets) | | | 60,568 | | | | 2,201 | |
| | CTS Eventim AG & Co KGaA (Entertainment) | | | 126,855 | | | | 4,735 | |
| | GRENKE AG (Diversified financial services) | | | 38,988 | | | | 3,315 | |
| | Norma Group SE (Machinery) | | | 59,533 | | | | 2,945 | |
| | | | | | | | | 13,196 | |
| | Israel—1.9% | | | | | | | | |
| | Elbit Systems, Ltd. (Aerospace & defense) | | | 20,911 | | | | 2,398 | |
| | Mizrahi Tefahot Bank, Ltd. (Banks) | | | 146,718 | | | | 2,478 | |
| * | Wix.com, Ltd. (IT services)† | | | 17,414 | | | | 1,573 | |
| | | | | | | | | 6,449 | |
| | Italy—2.8% | | | | | | | | |
| | Amplifon SpA (Health care providers & services) | | | 179,018 | | | | 2,882 | |
| | Autogrill SpA (Hotels, restaurants & leisure) | | | 194,129 | | | | 1,637 | |
| | Brunello Cucinelli SpA (Textiles, apparel & luxury goods) | | | 67,543 | | | | 2,326 | |
| | Cerved Group SpA (Diversified financial services) | | | 325,244 | | | | 2,666 | |
| | | | | | | | | 9,511 | |
| | Jersey—0.9% | | | | | | | | |
| | Sanne Group plc (Capital markets) | | | 399,445 | | | | 2,958 | |
| | | | | | | | |
| | | | | | | | |
| | Issuer | | Shares | | | Value | |
| | | | | | | | | | |
| | Common Stocks—(continued) | | | | | | | | |
| | | | | | | | | | |
| | Europe, Mid-East—(continued) | | | | | | | | |
| | Netherlands—2.7% | | | | | | | | |
| * | Basic-Fit N.V. (Hotels, restaurants & leisure) | | | 85,075 | | | $ | 2,529 | |
| | Euronext N.V. (Capital markets) | | | 113,286 | | | | 6,529 | |
| | | | | | | | | 9,058 | |
| | Norway—0.6% | | | | | | | | |
| | TGS Nopec Geophysical Co. ASA (Energy equipment & services) | | | 86,543 | | | | 2,090 | |
| | Sweden—6.1% | | | | | | | | |
| | Dometic Group AB (Auto components) | | | 151,006 | | | | 937 | |
| | Evolution Gaming Group AB (Hotels, restaurants & leisure) | | | 90,296 | | | | 5,191 | |
| | Indutrade AB (Trading companies & distributors) | | | 228,030 | | | | 5,290 | |
| | Nibe Industrier AB Class “B” (Building products) | | | 173,516 | | | | 1,780 | |
| | Nolato AB Class “B” (Industrial conglomerates) | | | 35,522 | | | | 1,469 | |
| * | Swedish Orphan Biovitrum AB (Biotechnology) | | | 127,170 | | | | 2,769 | |
| | Thule Group AB (Leisure products) | | | 181,933 | | | | 3,327 | |
| | | | | | | | | 20,763 | |
| | Switzerland—2.1% | | | | | | | | |
| * | Galenica AG (Pharmaceuticals) | | | 44,620 | | | | 1,965 | |
| * | Kardex AG (Machinery) | | | 17,401 | | | | 2,007 | |
| | Tecan Group AG (Life sciences tools & services) | | | 16,617 | | | | 3,226 | |
| | | | | | | | | 7,198 | |
| | | | | | | | | | |
| | Japan—18.6% | | | | | | | | |
| | Asahi Intecc Co., Ltd. (Health care equipment & supplies) | | | 104,200 | | | | 4,411 | |
| | Benefit One, Inc. (Professional services) | | | 84,000 | | | | 2,587 | |
| | Digital Arts, Inc. (Software) | | | 33,700 | | | | 1,876 | |
| | en-japan, Inc. (Professional services) | | | 42,100 | | | | 1,312 | |
| | Harmonic Drive Systems, Inc. (Machinery) | | | 27,500 | | | | 755 | |
| | Kose Corporation (Personal products) | | | 13,900 | | | | 2,189 | |
| | Maeda Corporation (Construction & engineering) | | | 386,600 | | | | 3,622 | |
| | Matsumotokiyoshi Holdings Co., Ltd. (Food & staples retailing) | | | 160,200 | | | | 4,918 | |
| | Meitec Corporation (Professional services) | | | 48,000 | | | | 1,955 | |
| | Nihon M&A Center, Inc. (Professional services) | | | 177,300 | | | | 3,585 | |
| | Nihon Unisys, Ltd. (IT services) | | | 245,300 | | | | 5,485 | |
| | PALTAC Corporation (Distributors) | | | 112,400 | | | | 5,322 | |
| | Park24 Co., Ltd. (Commercial services & supplies) | | | 111,500 | | | | 2,455 | |
| | Sankyu, Inc. (Road & rail) | | | 43,620 | | | | 1,980 | |
| | Stanley Electric Co., Ltd. (Auto components) | | | 77,800 | | | | 2,193 | |
| | TechnoPro Holdings, Inc. (Professional services) | | | 52,200 | | | | 2,155 | |
See accompanying Notes to Financial Statements.
| | | |
| 64 | Annual Report | December 31, 2018 |
International Small Cap Growth Fund
Portfolio of Investments, December 31, 2018(all dollar amounts in thousands)
| | | | | | | | |
| | | | | | | | |
| | Issuer | | Shares | | | Value | |
| | | | | | | | | | |
| | Common Stocks—(continued) | | | | | | | | |
| | | | | | | | | | |
| | Japan—(continued) | | | | | | | | |
| | TIS, Inc. (IT services) | | | 126,100 | | | $ | 4,976 | |
| | Tokyo Century Corporation (Diversified financial services) | | | 100,300 | | | | 4,420 | |
| | Topcon Corporation (Electronic equipment, instruments & components) | | | 158,700 | | | | 2,118 | |
| | United Arrows, Ltd. (Specialty retail) | | | 97,900 | | | | 3,140 | |
| | Welcia Holdings Co., Ltd. (Food & staples retailing) | | | 45,200 | | | | 2,046 | |
| | | | | | | | | 63,500 | |
| | | | | | | | | | |
| | United Kingdom—17.7% | | | | | | | | |
| | Abcam plc (Biotechnology) | | | 251,246 | | | | 3,491 | |
| * | Avast plc (Software) | | | 861,226 | | | | 3,118 | |
| | AVEVA Group plc (Software) | | | 113,772 | | | | 3,509 | |
| | Beazley plc (Insurance) | | | 1,012,069 | | | | 6,495 | |
| | Big Yellow Group plc (Equity REIT) | | | 226,914 | | | | 2,527 | |
| | Burford Capital, Ltd. (Capital markets) | | | 156,027 | | | | 3,293 | |
| | Diploma plc (Trading companies & distributors) | | | 247,572 | | | | 3,818 | |
| | Domino’s Pizza Group plc (Hotels, restaurants & leisure) | | | 802,774 | | | | 2,385 | |
| | Electrocomponents plc (Electronic equipment, instruments & components) | | | 581,873 | | | | 3,757 | |
| | Fevertree Drinks plc (Beverages) | | | 88,372 | | | | 2,477 | |
| | Hill & Smith Holdings plc (Metals & mining) | | | 154,124 | | | | 2,357 | |
| | Intermediate Capital Group plc (Capital markets) | | | 145,676 | | | | 1,736 | |
| | Rotork plc (Machinery) | | | 820,706 | | | | 2,590 | |
| | Scapa Group plc (Chemicals) | | | 387,000 | | | | 1,514 | |
| | Softcat plc (IT services) | | | 149,891 | | | | 1,124 | |
| | SSP Group plc (Hotels, restaurants & leisure) | | | 658,882 | | | | 5,437 | |
| | The UNITE Group plc (Equity REIT) | | | 452,341 | | | | 4,647 | |
| | Victrex plc (Chemicals) | | | 93,806 | | | | 2,736 | |
| | Workspace Group plc (Equity REIT) | | | 325,406 | | | | 3,291 | |
| | | | | | | | | 60,302 | |
| | | | | | | | | | |
| | Asia—8.7% | | | | | | | | |
| | Australia—5.3% | | | | | | | | |
| | Bingo Industries, Ltd. (Commercial services & supplies) | | | 948,246 | | | | 1,239 | |
| | Corporate Travel Management, Ltd. (Hotels, restaurants & leisure) | | | 154,524 | | | | 2,334 | |
| | Costa Group Holdings, Ltd. (Food products) | | | 747,901 | | | | 3,909 | |
| | DuluxGroup, Ltd. (Chemicals) | | | 750,987 | | | | 3,470 | |
| | Orora, Ltd. (Containers & packaging) | | | 1,801,901 | | | | 3,896 | |
| | SmartGroup Corporation, Ltd. (Commercial services & supplies) | | | 248,336 | | | | 1,553 | |
| | The Star Entertainment Group, Ltd. (Hotels, restaurants & leisure) | | | 483,154 | | | | 1,552 | |
| | | | | | | | | 17,953 | |
| | | | | | | | |
| | | | | | | | |
| | Issuer | | Shares | | | Value | |
| | | | | | | | | | |
| | Common Stocks—(continued) | | | | | | | | |
| | | | | | | | | | |
| | Asia—(continued) | | | | | | | | |
| | Hong Kong—0.8% | | | | | | | | |
| | MGM China Holdings, Ltd. (Hotels, restaurants & leisure) | | | 1,571,600 | | | $ | 2,637 | |
| | New Zealand—2.6% | | | | | | | | |
| | Fisher & Paykel Healthcare Corp., Ltd. (Health care equipment & supplies) | | | 296,754 | | | | 2,589 | |
| | Ryman Healthcare, Ltd. (Health care providers & services) | | | 348,582 | | | | 2,513 | |
| | Spark New Zealand, Ltd. (Diversified telecommunication services) | | | 1,396,876 | | | | 3,891 | |
| | | | | | | | | 8,993 | |
| | | | | | | | | | |
| | Emerging Asia—8.1% | | | | | | | | |
| | Cambodia—1.2% | | | | | | | | |
| | NagaCorp, Ltd. (Hotels, restaurants & leisure) | | | 3,596,000 | | | | 3,867 | |
| | China—2.8% | | | | | | | | |
| | Huazhu Group, Ltd.—ADR (Hotels, restaurants & leisure) | | | 58,270 | | | | 1,668 | |
| | Kingsoft Corporation, Ltd. (Software) | | | 1,159,000 | | | | 1,670 | |
| * | Li Ning Co., Ltd. (Textiles, apparel & luxury goods) | | | 4,115,000 | | | | 4,414 | |
| | Travelsky Technology, Ltd. Class “H” (IT services) | | | 734,000 | | | | 1,879 | |
| | | | | | | | | 9,631 | |
| | India—1.2% | | | | | | | | |
| | Crompton Greaves Consumer Electricals, Ltd. (Household durables) | | | 761,661 | | | | 2,499 | |
| | Cyient, Ltd. (Software) | | | 182,036 | | | | 1,619 | |
| | | | | | | | | 4,118 | |
| | Taiwan—2.3% | | | | | | | | |
| | Chailease Holding Co., Ltd. (Diversified financial services) | | | 843,200 | | | | 2,658 | |
| | Eclat Textile Co., Ltd. (Textiles, apparel & luxury goods) | | | 284,000 | | | | 3,216 | |
| | Feng TAY Enterprise Co., Ltd. (Textiles, apparel & luxury goods) | | | 347,000 | | | | 1,981 | |
| | | | | | | | | 7,855 | |
| | Thailand—0.6% | | | | | | | | |
| | Tisco Financial Group PCL (Banks) | | | 863,200 | | | | 2,074 | |
| | | | | | | | | | |
| | Emerging Latin America—5.0% | | | | | | | | |
| | Argentina—1.2% | | | | | | | | |
| | *Globant S.A. (Software)† | | | 75,286 | | | | 4,240 | |
| | Brazil—2.1% | | | | | | | | |
| | CVC Brasil Operadora e Agencia de Viagens S.A. (Hotels, restaurants & leisure) | | | 194,100 | | | | 3,064 | |
| | Localiza Rent a Car S.A. (Road & rail) | | | 542,885 | | | | 4,167 | |
| | | | | | | | | 7,231 | |
See accompanying Notes to Financial Statements.
| | | |
| December 31, 2018 | William Blair Funds | 65 |
International Small Cap Growth Fund
Portfolio of Investments, December 31, 2018(all dollar amounts in thousands)
| | | | | | | | |
| | | | | | | | |
| | Issuer | | Shares | | | Value | |
| | | | | | | | | | |
| | Common Stocks—(continued) | | | | | | | | |
| | | | | | | | | | |
| | Emerging Latin America—(continued) |
| | Mexico—1.7% | | | | | | | | |
| | Grupo Aeroportuario del Centro Norte S.A.B. de C.V. (Transportation infrastructure) | | | 413,000 | | | $ | 1,971 | |
| | Grupo Aeroportuario del Sureste S.A.B. de C.V.—ADR (Transportation infrastructure) | | | 24,581 | | | | 3,702 | |
| | | | | | | | | 5,673 | |
| | | | | | | | | | |
| | Canada—4.3% | | | | | | | | |
| | CES Energy Solutions Corporation (Energy equipment & services) | | | 368,772 | | | | 851 | |
| | Enerplus Corporation (Oil, gas & consumable fuels) | | | 250,994 | | | | 1,953 | |
| | Finning International, Inc. (Trading companies & distributors) | | | 202,452 | | | | 3,529 | |
| | Parkland Fuel Corporation (Oil, gas & consumable fuels) | | | 107,838 | | | | 2,792 | |
| | Reliance Worldwide Corporation, Ltd. (Building products) | | | 552,570 | | | | 1,732 | |
| | The Bank of NT Butterfield & Son, Ltd. (Banks)† | | | 56,889 | | | | 1,783 | |
| | Toromont Industries, Ltd. (Trading companies & distributors) | | | 46,732 | | | | 1,857 | |
| | | | | | | | | 14,497 | |
| | | | | | | | | | |
| | Emerging Europe, Mid-East, Africa—3.1% |
| | South Africa—3.1% | | | | | | | | |
| | AVI, Ltd. (Food products) | | | 545,710 | | | | 3,856 | |
| | Bidvest Group, Ltd. (Industrial conglomerates) | | | 216,777 | | | | 3,117 | |
| | Clicks Group, Ltd. (Food & staples retailing) | | | 267,717 | | | | 3,562 | |
| | | | | | | | | 10,535 | |
| | Total Common Stocks—98.0%
(cost $365,601) | | | | | | | 333,756 | |
| | Total Investments—98.0%
(cost $365,601) | | | | | | | 333,756 | |
| | Cash and other assets, less liabilities—2.0% | | | | | | | 6,968 | |
| | Net assets—100.0% | | | | | | $ | 340,724 | |
ADR = American Depository Receipt
REIT = Real Estate Investment Trust
* = Non-income producing security
† = U.S. listed foreign security
For securities primarily traded on exchanges or markets that close before the close of regular trading on the New York Stock Exchange, the Fund may use an independent pricing service to fair value price the securities pursuant to Valuation Procedures approved by the Board of Trustees.
At December 31, 2018, the Fund’s Portfolio of Investments includes the following industry categories (as a percentage of long-term investments):
| | | | | |
| Industrials | | | 19.6 | % |
| Consumer Discretionary | | | 18.5 | % |
| Information Technology | | | 14.5 | % |
| Financials | | | 13.5 | % |
| Consumer Staples | | | 9.4 | % |
| Health Care | | | 7.1 | % |
| Real Estate | | | 5.5 | % |
| Materials | | | 4.2 | % |
| Communication Services | | | 3.5 | % |
| Energy | | | 2.8 | % |
| Utilities | | | 1.4 | % |
| Total | | | 100.0 | % |
At December 31, 2018, the Fund’s Portfolio of Investments includes the following currency categories (as a percentage of long-term investments):
| | | | | |
| Japanese Yen | | | 19.0 | % |
| British Pound Sterling | | | 18.9 | % |
| Euro | | | 18.2 | % |
| Swedish Krona | | | 6.2 | % |
| Australian Dollar | | | 5.9 | % |
| Hong Kong Dollar | | | 4.3 | % |
| U.S. Dollar | | | 3.9 | % |
| Canadian Dollar | | | 3.3 | % |
| South African Rand | | | 3.2 | % |
| New Zealand Dollar | | | 2.7 | % |
| Danish Krone | | | 2.5 | % |
| New Taiwan Dollar | | | 2.3 | % |
| Brazilian Real | | | 2.2 | % |
| Swiss Franc | | | 2.2 | % |
| Israeli Shekel | | | 1.5 | % |
| Norwegian Krone | | | 1.3 | % |
| Indian Rupee | | | 1.2 | % |
| All Other Currencies | | | 1.2 | % |
| Total | | | 100.0 | % |
See accompanying Notes to Financial Statements.
| | | |
| 66 | Annual Report | December 31, 2018 |
| | |
| | Emerging Markets Leaders Fund |
| | |
| | The Emerging Markets Leaders Fund seeks long-term capital appreciation. |
| | |
| | AN OVERVIEW FROM THE PORTFOLIO MANAGERS |
| | |

Todd M. McClone 
John C. Murphy | The William Blair Emerging Markets Leaders Fund (Class N shares) posted a 17.73% decrease, net of fees, for the twelve months ended December 31, 2018. By comparison, the Fund’s benchmark index, the MSCI Emerging Markets Index (net) (the “Index”), decreased 14.58%. Calendar year underperformance versus the Index was driven by style headwinds, as low valuation stocks outperformed growth-oriented stocks, especially in the second half of the year. From a sector perspective, the Fund’s relative underperformance was driven by negative results in the Energy, Consumer Staples and Industrials sectors. Within Energy, stock selection detracted from performance as Argentine oil company YPF S.A. declined amid weak volume growth, broad Argentine market weakness and currency depreciation. Within Consumer Staples, both sector overweighting and stock selection detracted from relative returns. Raia Drogasil, S.A., the Brazilian drugstore chain, weighed on performance as earnings trailed market expectations. Within Industrials, Turkish industrial conglomerate KOC Holdings A.S. was a drag on performance, amid the weak Turkish equity market and lira currency depreciation. Partially offsetting these effects was positive stock selection within the Financials sector. HDFC Bank, Ltd. was a top contributor to performance within Financials. HDFC is the leading private sector bank in India. It reported solid fiscal second quarter results in October, supporting the share price, which advanced 9.8% in USD terms during the fourth quarter. Pre-tax profit increased 21% year-over-year, which was in line with consensus estimates and driven by strength in key metrics: credit quality, top line growth, and lower expenses. We believe HDFC is well positioned to continue to grow profitability given its strong liquidity, recent capital raise and underwriting and marketing prowess. Please refer to the Global Markets Review and Outlook relating to the Fund beginning on page 32. |
| December 31, 2018 | William Blair Funds | 67 |
Emerging Markets Leaders Fund
Performance Highlights (Unaudited)
| Average Annual Total Return through 12/31/2018 |
| | | 1 Year | | 3 Year | | 5 Year | | 10 Year | | Since
Inception |
| Class N(a) | | (17.73 | )% | | 5.74 | % | | 0.63 | % | | — | | | 1.87 | % |
| MSCI Emerging Markets Index (net)(a) | | (14.58 | ) | | 9.25 | | | 1.65 | | | — | | | 1.95 | |
| Class I | | (17.45 | ) | | 6.05 | | | 0.94 | | | 8.38 | | | — | |
| Institutional Class | | (17.46 | ) | | 6.08 | | | 1.00 | | | 8.51 | | | — | |
| MSCI Emerging Markets Index (net) | | (14.58 | ) | | 9.25 | | | 1.65 | | | 8.02 | | | — | |
| | |
| (a) | Since inception is for the period from May 3, 2010 (Commencement of Operations) to December 31, 2018. |
Performance cited represents past performance. Past performance does not guarantee future results and current performance may be lower or higher than the data quoted. Results shown are average annual total returns, which assume reinvestment of dividends and capital gains. Investment returns and principal will fluctuate and you may have a gain or loss when you sell shares. For the most current month-end performance information, please call 1-800-742-7272, or visit our Web site atwww.williamblairfunds.com. International investing involves special risk considerations, including currency fluctuations, lower liquidity, economic and political risk. These risks may be magnified when investing in emerging markets. From time to time, the investment adviser may waive fees or reimburse expenses for the Fund. Without these waivers/reimbursements, performance would be lower. Class N shares are available to the general public without a sales load. Class I shares are available to certain institutional investors, and advisory clients of William Blair & Company, L.L.C., without a sales load or distribution (12b-1) fees. Institutional Class shares are available to institutional investors without a sales load or distribution (12b-1) or service fees.
The performance highlights and graph presented above do not reflect the deduction of taxes that a shareholder would pay on fund distributions or the redemption of fund shares.
The Morgan Stanley Capital International (MSCI) Emerging Markets Index (net) is a free float-adjusted market-capitalization-weighted index that is designed to measure equity market performance of emerging markets. This index approximates the minimum possible dividend reinvestment by deducting for the highest possible withholding tax rates of those markets.
This report identifies the Fund’s investments on December 31, 2018. These holdings are subject to change. Not all stocks in the Fund performed the same, nor is there any guarantee that these stocks will perform as well in the future. Market forecasts provided in this report may not necessarily come to pass.
Sector Diversification (Unaudited)
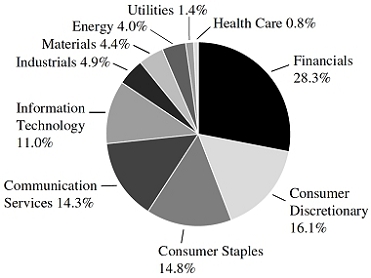
The sector diversification shown is based on the total long-term securities.
| 68 | Annual Report | December 31, 2018 |
Emerging Markets Leaders Fund
Portfolio of Investments, December 31, 2018(all dollar amounts in thousands)
| | | | | | | | |
| | | | | | | | |
| | Issuer | | Shares | | | Value | |
| | | | | | |
| | Common Stocks | | | | | | | | |
| | | | | | | | | | |
| | Emerging Asia—69.8% | | | | | | | | |
| | Australia—0.8% | | | | | | | | |
| | Oil Search, Ltd. (Oil, gas & consumable fuels) | | | 322,772 | | | $ | 1,628 | |
| | China—30.4% | | | | | | | | |
| * | Alibaba Group Holding, Ltd. —ADR (Internet & direct marketing retail) | | | 84,089 | | | | 11,526 | |
| | ANTA Sports Products, Ltd. (Textiles, apparel & luxury goods) | | | 424,000 | | | | 2,033 | |
| | Autohome, Inc.—ADR (Interactive Media & Services) | | | 31,797 | | | | 2,488 | |
| | China International Travel Service Corporation, Ltd. Class “A” (Hotels, restaurants & leisure) | | | 390,856 | | | | 3,427 | |
| | CNOOC, Ltd. (Oil, gas & consumable fuels) | | | 2,186,000 | | | | 3,378 | |
| | ENN Energy Holdings, Ltd. (Gas utilities) | | | 307,200 | | | | 2,725 | |
| * | Haier Electronics Group Co., Ltd. (Household durables) | | | 1,196,000 | | | | 2,942 | |
| | Huazhu Group, Ltd.—ADR (Hotels, restaurants & leisure) | | | 91,388 | | | | 2,616 | |
| | Jiangsu Hengrui Medicine Co., Ltd. Class “A” (Pharmaceuticals) | | | 190,160 | | | | 1,461 | |
| | Kweichow Moutai Co., Ltd. Class “A” (Beverages) | | | 42,659 | | | | 3,666 | |
| | NetEase, Inc.—ADR (Entertainment) | | | 6,072 | | | | 1,429 | |
| | Ping An Insurance Group Co. of China, Ltd. Class “H” (Insurance) | | | 585,000 | | | | 5,166 | |
| | Shenzhou International Group Holdings, Ltd. (Textiles, apparel & luxury goods) | | | 289,200 | | | | 3,278 | |
| | Sunny Optical Technology Group Co., Ltd. (Electronic equipment, instruments & components) | | | 80,000 | | | | 711 | |
| * | TAL Education Group—ADR (Diversified consumer services) | | | 44,876 | | | | 1,197 | |
| | Tencent Holdings, Ltd. (Interactive Media & Services) | | | 312,400 | | | | 12,527 | |
| | | | | | | | | 60,570 | |
| | India—17.1% | | | | | | | | |
| | Asian Paints, Ltd. (Chemicals) | | | 104,882 | | | | 2,057 | |
| | Bajaj Finance, Ltd. (Consumer finance) | | | 80,130 | | | | 3,031 | |
| | Britannia Industries, Ltd. (Food products) | | | 46,120 | | | | 2,061 | |
| | HDFC Bank, Ltd. (Banks) | | | 113,747 | | | | 3,457 | |
| | HDFC Bank, Ltd.—ADR (Banks) | | | 7,836 | | | | 812 | |
| | HDFC Standard Life Insurance Co. Ltd. (Insurance) | | | 350,834 | | | | 1,944 | |
| | Hindustan Unilever, Ltd. (Household products) | | | 73,405 | | | | 1,911 | |
| | Housing Development Finance Corporation, Ltd. (Thrifts & mortgage finance) | | | 141,060 | | | | 3,970 | |
| | IndusInd Bank, Ltd. (Banks) | | | 126,789 | | | | 2,905 | |
| | Infosys, Ltd. (IT services) | | | 421,503 | | | | 3,982 | |
| | Maruti Suzuki India, Ltd. (Automobiles) | | | 18,688 | | | | 1,995 | |
| | MRF, Ltd. (Auto components) | | | 2,072 | | | | 1,983 | |
| | | | | | | | |
| | | | | | | | |
| | Issuer | | Shares | | | Value | |
| | | | | | | | |
| | Common Stocks—(continued) | | | | | | | | |
| | | | | | | | | | |
| | Emerging Asia—(continued) | | | | | | | | |
| | India—(continued) | | | | | | | | |
| | Petronet LNG, Ltd. (Oil, gas & consumable fuels) | | | 461,050 | | | $ | 1,477 | |
| | UPL, Ltd. (Chemicals) | | | 224,987 | | | | 2,444 | |
| | | | | | | | | 34,029 | |
| | Indonesia—5.4% | | | | | | | | |
| | PT Bank Rakyat Indonesia Persero Tbk (Banks) | | | 17,029,700 | | | | 4,335 | |
| | PT Telekomunikasi Indonesia Persero Tbk (Diversified telecommunication services) | | | 14,964,000 | | | | 3,902 | |
| | PT Unilever Indonesia Tbk (Household products) | | | 765,500 | | | | 2,417 | |
| | | | | | | | | 10,654 | |
| | South Korea—3.6% | | | | | | | | |
| | LG Household & Health Care, Ltd. (Personal products) | | | 2,451 | | | | 2,418 | |
| | Samsung Electronics Co., Ltd. (Technology hardware, storage & peripherals) | | | 137,551 | | | | 4,771 | |
| | | | | | | | | 7,189 | |
| | Taiwan—8.7% | | | | | | | | |
| | E.Sun Financial Holding Co., Ltd. (Banks) | | | 2,950,000 | | | | 1,929 | |
| | Taiwan Semiconductor Manufacturing Co., Ltd.—ADR (Semiconductors & semiconductor equipment) | | | 317,807 | | | | 11,730 | |
| | Uni-President Enterprises Corporation (Food products) | | | 1,629,000 | | | | 3,700 | |
| | | | | | | | | 17,359 | |
| | Thailand—3.8% | | | | | | | | |
| | Airports of Thailand PCL (Transportation infrastructure) | | | 1,950,100 | | | | 3,848 | |
| | CP ALL PCL (Food & staples retailing) | | | 1,710,600 | | | | 3,612 | |
| | | | | | | | | 7,460 | |
| | | | | | | | | | |
| | Emerging Latin America—14.3% | | | | | | | | |
| | Argentina—0.6% | | | | | | | | |
| | YPF S.A.—ADR (Oil, gas & consumable fuels) | | | 95,720 | | | | 1,281 | |
| | Brazil—5.6% | | | | | | | | |
| | AMBEV S.A.—ADR (Beverages) | | | 567,741 | | | | 2,225 | |
| | B3 S.A.—Brasil Bolsa Balcao (Capital markets) | | | 403,000 | | | | 2,788 | |
| | BB Seguridade Participacoes S.A. (Insurance) | | | 340,100 | | | | 2,421 | |
| | Raia Drogasil S.A. (Food & staples retailing) | | | 190,700 | | | | 2,812 | |
| | WEG S.A. (Machinery) | | | 211,600 | | | | 958 | |
| | | | | | | | | 11,204 | |
| | Chile—1.1% | | | | | | | | |
| | Sociedad Quimica y Minera de Chile S.A.—ADR (Chemicals) | | | 54,438 | | | | 2,085 | |
See accompanying Notes to Financial Statements.
| December 31, 2018 | William Blair Funds | 69 |
Emerging Markets Leaders Fund
Portfolio of Investments, December 31, 2018(all dollar amounts in thousands)
| | | | | | | | |
| | | | | | | | |
| | Issuer | | Shares | | | Value | |
| | | | | | | | | | |
| | Common Stocks—(continued) | | | | | | | | |
| | | | | | | | | | |
| | Emerging Latin America—(continued) | | | | | | | | |
| | Mexico—4.0% | | | | | | | | |
| | Grupo Aeroportuario del Pacifico S.A.B. de C.V. Class “B” (Transportation infrastructure) | | | 324,800 | | | $ | 2,647 | |
| | Grupo Financiero Banorte S.A.B. de C.V. Class “O” (Banks) | | | 688,900 | | | | 3,363 | |
| | Wal-Mart de Mexico S.A.B. de C.V. (Food & staples retailing) | | | 753,500 | | | | 1,916 | |
| | | | | | | | | 7,926 | |
| | Peru—3.0% | | | | | | | | |
| | Credicorp, Ltd. (Banks)† | | | 18,713 | | | | 4,148 | |
| | Southern Copper Corporation (Metals & mining) | | | 59,009 | | | | 1,816 | |
| | | | | | | | | 5,964 | |
| | | | | | | | | | |
| | Emerging Europe, Mid-East, Africa—10.4% | | | | | | | | |
| | Hungary—1.8% | | | | | | | | |
| | OTP Bank Nyrt (Banks) | | | 87,042 | | | | 3,507 | |
| | Russia—1.3% | | | | | | | | |
| * | Yandex N.V. Class “A” (Interactive Media & Services)† | | | 96,002 | | | | 2,626 | |
| | South Africa—7.3% | | | | | | | | |
| | Bid Corporation, Ltd. (Food & staples retailing) | | | 93,915 | | | | 1,730 | |
| | Bidvest Group, Ltd. (Industrial conglomerates) | | | 142,402 | | | | 2,047 | |
| | Capitec Bank Holdings, Ltd. (Banks) | | | 41,628 | | | | 3,235 | |
| | FirstRand, Ltd. (Diversified financial services) | | | 599,330 | | | | 2,731 | |
| | Naspers, Ltd. (Media) | | | 23,247 | | | | 4,673 | |
| | | | | | | | | 14,416 | |
| | Total Common Stocks—94.5%
(cost $191,035) | | | | | | | 187,898 | |
| | | | | | | | | | |
| | Preferred Stock | | | | | | | | |
| | Brazil—2.6% | | | | | | | | |
| | Itau Unibanco Holding S.A. (Banks) | | | 555,925 | | | | 5,092 | |
| | | | | | | | | | |
| | Total Preferred Stock—2.6%
(cost $3,499) | | | | | | | 5,092 | |
| | | | | | | | |
| | | | Principal | | | | |
| | Issuer | | Amount | | | Value | |
| | | | | | | | |
| | Repurchase Agreement | | | | | | |
| | Fixed Income Clearing Corporation, 0.500% dated 12/31/18, due 1/2/19, repurchase price $6,073, collateralized by U.S. Treasury Bond, 3.625%, due 8/15/43 | | $ | 6,073 | | | $ | 6,073 | |
| | Total Repurchase Agreement—3.0%
(cost $6,073) | | | | | | | 6,073 | |
| | Total Investments—100.1%
(cost $200,607) | | | | | | | 199,063 | |
| | Liabilities, plus cash and other assets—(0.1)% | | | | | | | (149 | ) |
| | Net assets—100.0% | | | | | | $ | 198,914 | |
ADR = American Depository Receipt
* = Non-income producing security
† = U.S. listed foreign security
For securities primarily traded on exchanges or markets that close before the close of regular trading on the New York Stock Exchange, the Fund may use an independent pricing service to fair value price the securities pursuant to Valuation Procedures approved by the Board of Trustees.
At December 31, 2018, the Fund’s Portfolio of Investments includes the following industry categories (as a percentage of long-term investments):
| Financials | | 28.3% |
| Consumer Discretionary | | 16.1% |
| Consumer Staples | | 14.8% |
| Communication Services | | 14.3% |
| Information Technology | | 11.0% |
| Industrials | | 4.9% |
| Materials | | 4.4% |
| Energy | | 4.0% |
| Utilities | | 1.4% |
| Health Care | | 0.8% |
| Total | | 100.0% |
At December 31, 2018, the Fund’s Portfolio of Investments includes the following currency categories (as a percentage of long-term investments):
| U.S. Dollar | | 23.8% |
| Indian Rupee | | 17.2% |
| Hong Kong Dollar | | 17.0% |
| South African Rand | | 7.5% |
| Brazilian Real | | 7.3% |
| Indonesian Rupiah | | 5.5% |
| Yuan Renminbi | | 4.4% |
| Mexican Peso | | 4.1% |
| Thai Baht | | 3.9% |
| South Korean Won | | 3.7% |
| New Taiwan Dollar | | 2.9% |
| Hungarian Forint | | 1.8% |
| All Other Currencies | | 0.9% |
| Total | | 100.0% |
See accompanying Notes to Financial Statements.
| 70 | Annual Report | December 31, 2018 |
| | | Emerging Markets Growth Fund |
| | | |
| | | The Emerging Markets Growth Fund seeks long-term capital appreciation. |
| | | |
| | | AN OVERVIEW FROM THE PORTFOLIO MANAGERS |
| | | |

Todd M. McClone 
Casey K. Preyss | | The William Blair Emerging Markets Growth Fund (Class N shares) posted a 21.61% decrease, net of fees, for the twelve months ended December 31, 2018. By comparison, the Fund’s benchmark index, the MSCI Emerging Markets IMI Index (net) (the “Index”), decreased 15.05%. Calendar year underperformance versus the Index was partly driven by style headwinds as low valuation stocks outperformed growth-oriented stocks, especially in the second half of the year. From a sector perspective, the Energy, Consumer Discretionary and Information Technology sectors were the most notable detractors from the Fund’s performance. Stock selection detracted from the Fund’s performance in Energy mainly due to outperforming companies in the Index that the Fund did not own. Consumer Discretionary and Information Technology detracted from performance due to the Fund’s overweightings to, and stock selection within, those sectors. Within Consumer Discretionary, Maruti Suzuki India, Ltd., the Indian car manufacturer, underperformed as the company experienced weakening demand and lower margins due to higher costs, promotional discounts and currency headwinds. Within the Information Technology sector, Sunny Optical Technology Group Co., Ltd., the Chinese camera lens and modules manufacturer, declined on the back of weak operating trends and broad market rotation away from higher valuation technology stocks. Partially offsetting these effects was an overweight to the Financials sector and positive stock selection within the Health Care sector. Within Health Care, CSPC Pharmaceutical Group, Ltd. contributed to the Fund’s relative results. The share price rallied in the first half of the year fueled by the company’s strong operating momentum, but lost ground in the second half amid regulatory headwinds in the form of government mandated drug price cuts. Please refer to the Global Markets Review and Outlook relating to the Fund beginning on page 32. |
| December 31, 2018 | William Blair Funds | 71 |
Emerging Markets Growth Fund
Performance Highlights (Unaudited)
| Average Annual Total Return through 12/31/2018 |
| | | 1 Year | | 3 Year | | 5 Year | | 10 Year |
| Class N | | | (21.61 | )% | | | 5.72 | % | | | 0.75 | % | | | 8.44 | % |
| Class I | | | (21.37 | ) | | | 5.99 | | | | 1.00 | | | | 8.72 | |
| Institutional Class | | | (21.29 | ) | | | 6.07 | | | | 1.12 | | | | 8.87 | |
| MSCI Emerging Markets IMI (net) | | | (15.05 | ) | | | 8.51 | | | | 1.56 | | | | 8.24 | |
Performance cited represents past performance. Past performance does not guarantee future results and current performance may be lower or higher than the data quoted. Results shown are average annual returns, which assume reinvestment of dividends and capital gains. Investment returns and principal will fluctuate and you may have a gain or loss when you sell shares. For the most current month-end performance information, please call 1-800-742-7272, or visit our Web site atwww.williamblairfunds.com. From time to time, the investment adviser may waive fees or reimburse expenses for the Fund. Without these waivers/reimbursements, performance would be lower. International investing involves special risk considerations, including currency fluctuations, lower liquidity, economic and political risk. These risks may be magnified when investing in emerging markets. Class N shares are available to the general public without a sales load. Class I shares are available to certain institutional investors, and advisory clients of William Blair & Company, L.L.C., without a sales load or distribution (12b-1) fees. Institutional Class shares are available to institutional investors without a sales load or distribution (12b-1) or service fees.
The performance highlights and graph presented above do not reflect the deduction of taxes that a shareholder would pay on fund distributions or the redemption of fund shares.
The Morgan Stanley Capital International (MSCI) Emerging Markets Investable Market Index (IMI) (net) is a free float-adjusted market capitalization weighted index that is designed to measure the equity market performance of emerging markets. This index approximates the minimum possible dividend reinvestment by deducting for the highest possible withholding tax rates of those markets.
This report identifies the Fund’s investments on December 31, 2018. These holdings are subject to change. Not all stocks in the Fund performed the same, nor is there any guarantee that these stocks will perform as well in the future. Market forecasts provided in this report may not necessarily come to pass.
Sector Diversification (Unaudited)

The sector diversification shown is based on the total long-term securities.
| 72 | Annual Report | December 31, 2018 |
Emerging Markets Growth Fund
Portfolio of Investments, December 31, 2018(all dollar amounts in thousands)
| | | | | | | | |
| | | | | | | | |
| | Issuer | | Shares | | | Value | |
| | | | | | | | |
| | Common Stocks | | | | | | | | |
| | | | | | | | | | |
| | Emerging Asia—68.7% | | | | | | | | |
| | China—25.2% | | | | | | | | |
| * | 58.com, Inc.—ADR (Interactive Media & Services) | | | 53,256 | | | $ | 2,887 | |
| * | Alibaba Group Holding, Ltd.—ADR (Internet & direct marketing retail) | | | 237,323 | | | | 32,530 | |
| | ANTA Sports Products, Ltd. (Textiles, apparel & luxury goods) | | | 1,036,000 | | | | 4,968 | |
| | China Communications Services Corporation, Ltd. Class “H” (Diversified telecommunication services) | | | 4,570,000 | | | | 3,782 | |
| | China International Travel Service Corporation, Ltd. Class “A” (Hotels, restaurants & leisure) | | | 630,985 | | | | 5,533 | |
| * | China Mengniu Dairy Co., Ltd. (Food products) | | | 1,755,000 | | | | 5,469 | |
| | China Merchants Bank Co., Ltd. Class “H” (Banks) | | | 4,475,000 | | | | 16,402 | |
| | Dali Foods Group Co., Ltd. (Food products) | | | 2,461,000 | | | | 1,820 | |
| | ENN Energy Holdings, Ltd. (Gas utilities) | | | 461,000 | | | | 4,089 | |
| | Foshan Haitian Flavouring & Food Co., Ltd. Class “A” (Food products) | | | 474,913 | | | | 4,759 | |
| | Guangdong Investment, Ltd. (Water utilities) | | | 1,714,000 | | | | 3,314 | |
| | Huazhu Group, Ltd.—ADR (Hotels, restaurants & leisure) | | | 182,596 | | | | 5,228 | |
| | Kingdee International Software Group Co., Ltd. (Software) | | | 2,664,000 | | | | 2,354 | |
| | Kweichow Moutai Co., Ltd. Class “A” (Beverages) | | | 43,248 | | | | 3,716 | |
| * | Li Ning Co., Ltd. (Textiles, apparel & luxury goods) | | | 2,087,500 | | | | 2,239 | |
| | Ping An Insurance Group Co. of China, Ltd. Class “H” (Insurance) | | | 2,643,000 | | | | 23,340 | |
| | Shanghai International Airport Co., Ltd. Class “A” (Transportation infrastructure) | | | 357,874 | | | | 2,646 | |
| | Shenzhou International Group Holdings, Ltd. (Textiles, apparel & luxury goods) | | | 931,000 | | | | 10,552 | |
| | SSY Group, Ltd. (Pharmaceuticals) | | | 1,390,000 | | | | 1,029 | |
| | Tencent Holdings, Ltd. (Interactive Media & Services) | | | 890,760 | | | | 35,719 | |
| * | Tencent Music Entertainment Group—ADR (Software) | | | 271,043 | | | | 3,583 | |
| * | Weibo Corporation—ADR (Interactive Media & Services) | | | 49,106 | | | | 2,869 | |
| * | Wuxi Biologics Cayman, Inc. (Life sciences tools & services) | | | 108,000 | | | | 692 | |
| * | Xiabuxiabu Catering Management China Holdings Co. Ltd. (Hotels, restaurants & leisure) | | | 817,500 | | | | 1,290 | |
| | Yihai International Holding, Ltd. (Food products) | | | 925,000 | | | | 2,261 | |
| | Zhejiang Supor Co., Ltd. Class “A” (Household durables) | | | 511,728 | | | | 3,913 | |
| | | | | | | | | 186,984 | |
| | | | | | | | |
| | | | | | | | |
| | Issuer | | Shares | | | Value | |
| | | | | | | | |
| | Common Stocks—(continued) | | | | | | | | |
| | | | | | | | | | |
| | Emerging Asia—(continued) | | | | | | | | |
| | India—18.1% | | | | | | | | |
| | Asian Paints, Ltd. (Chemicals) | | | 255,456 | | | $ | 5,009 | |
| | Bajaj Finance, Ltd. (Consumer finance) | | | 319,392 | | | | 12,082 | |
| | Biocon, Ltd. (Biotechnology) | | | 251,246 | | | | 2,264 | |
| | Britannia Industries, Ltd. (Food products) | | | 136,182 | | | | 6,086 | |
| | Dabur India, Ltd. (Personal products) | | | 513,877 | | | | 3,165 | |
| | Godrej Consumer Products, Ltd. (Personal products) | | | 271,332 | | | | 3,152 | |
| | Havells India, Ltd. (Electrical equipment) | | | 376,454 | | | | 3,729 | |
| * | HDFC Asset Management Co. Ltd. (Capital markets) | | | 77,136 | | | | 1,652 | |
| | HDFC Bank, Ltd. (Banks) | | | 753,432 | | | | 22,899 | |
| | HDFC Standard Life Insurance Co. Ltd. (Insurance) | | | 673,246 | | | | 3,730 | |
| | Hindustan Unilever, Ltd. (Household products) | | | 433,644 | | | | 11,291 | |
| | Housing Development Finance Corporation, Ltd. (Thrifts & mortgage finance) | | | 678,078 | | | | 19,085 | |
| | IndusInd Bank, Ltd. (Banks) | | | 184,741 | | | | 4,233 | |
| | Infosys, Ltd. (IT services) | | | 850,243 | | | | 8,033 | |
| | Marico, Ltd. (Personal products) | | | 360,419 | | | | 1,934 | |
| | Nestle India, Ltd. (Food products) | | | 27,165 | | | | 4,318 | |
| | Page Industries, Ltd. (Textiles, apparel & luxury goods) | | | 4,766 | | | | 1,708 | |
| | Pidilite Industries, Ltd. (Chemicals) | | | 157,472 | | | | 2,501 | |
| | Tata Consultancy Services, Ltd. (IT services) | | | 435,586 | | | | 11,822 | |
| | Torrent Pharmaceuticals, Ltd. (Pharmaceuticals) | | | 79,747 | | | | 2,023 | |
| | UPL, Ltd. (Chemicals) | | | 316,893 | | | | 3,442 | |
| | | | | | | | | 134,158 | |
| | Indonesia—3.7% | | | | | | | | |
| | PT Astra International Tbk (Automobiles) | | | 10,289,400 | | | | 5,885 | |
| | PT Bank Central Asia Tbk (Banks) | | | 5,292,700 | | | | 9,570 | |
| | PT Bank Rakyat Indonesia Persero Tbk (Banks) | | | 29,949,005 | | | | 7,623 | |
| | PT Gudang Garam Tbk (Tobacco) | | | 458,100 | | | | 2,664 | |
| | PT United Tractors Tbk (Oil, gas & consumable fuels) | | | 901,200 | | | | 1,714 | |
| | | | | | | | | 27,456 | |
| | Malaysia—1.4% | | | | | | | | |
| | Hartalega Holdings Bhd (Health care equipment & supplies) | | | 1,275,600 | | | | 1,895 | |
| | Public Bank Bhd (Banks) | | | 1,445,300 | | | | 8,660 | |
| | | | | | | | | 10,555 | |
| | Philippines—0.8% | | | | | | | | |
| | Ayala Land, Inc. (Real estate management & development) | | | 4,801,000 | | | | 3,707 | |
| | Jollibee Foods Corporation (Hotels, restaurants & leisure) | | | 392,170 | | | | 2,176 | |
| | | | | | | | | 5,883 | |
See accompanying Notes to Financial Statements.
| December 31, 2018 | William Blair Funds | 73 |
Emerging Markets Growth Fund
Portfolio of Investments, December 31, 2018(all dollar amounts in thousands)
| | | | | | | | |
| | | | | | | | |
| | Issuer | | Shares | | | Value | |
| | | | | | | | |
| | Common Stocks—(continued) | | | | | | | | |
| | | | | | | | | | |
| | Emerging Asia—(continued) | | | | | | | | |
| | South Korea—5.7% | | | | | | | | |
| | Douzone Bizon Co., Ltd. (Software) | | | 42,706 | | | $ | 1,986 | |
| | Fila Korea, Ltd. (Textiles, apparel & luxury goods) | | | 54,970 | | | | 2,636 | |
| | Korea Investment Holdings Co., Ltd. (Capital markets) | | | 39,946 | | | | 2,130 | |
| | LG Household & Health Care, Ltd. (Personal products) | | | 5,085 | | | | 5,018 | |
| | Macquarie Korea Infrastructure Fund (Capital markets) | | | 315,218 | | | | 2,624 | |
| | Samsung Electronics Co., Ltd. (Technology hardware, storage & peripherals) | | | 524,166 | | | | 18,180 | |
| * | Samsung SDI Co., Ltd. (Electronic equipment, instruments & components) | | | 25,770 | | | | 5,058 | |
| * | SK Hynix, Inc. (Semiconductors & semiconductor equipment) | | | 80,048 | | | | 4,340 | |
| | | | | | | | | 41,972 | |
| | Taiwan—9.0% | | | | | | | | |
| | Chailease Holding Co., Ltd. (Diversified financial services) | | | 727,380 | | | | 2,293 | |
| | E.Sun Financial Holding Co., Ltd. (Banks) | | | 11,326,171 | | | | 7,406 | |
| | Eclat Textile Co., Ltd. (Textiles, apparel & luxury goods) | | | 167,000 | | | | 1,891 | |
| | Feng TAY Enterprise Co., Ltd. (Textiles, apparel & luxury goods) | | | 324,000 | | | | 1,850 | |
| | Makalot Industrial Co., Ltd. (Textiles, apparel & luxury goods) | | | 338,000 | | | | 1,869 | |
| | President Chain Store Corporation (Food & staples retailing) | | | 1,165,000 | | | | 11,788 | |
| | Taiwan Semiconductor Manufacturing Co., Ltd. (Semiconductors & semiconductor equipment) | | | 1,967,000 | | | | 14,431 | |
| | Taiwan Semiconductor Manufacturing Co., Ltd.—ADR (Semiconductors & semiconductor equipment) | | | 619,528 | | | | 22,867 | |
| | TCI Co., Ltd. (Personal products) | | | 125,616 | | | | 2,121 | |
| | | | | | | | | 66,516 | |
| | Thailand—4.2% | | | | | | | | |
| | Airports of Thailand PCL (Transportation infrastructure) | | | 4,392,300 | | | | 8,667 | |
| | Bangkok Dusit Medical Services PCL Class “F” (Health care providers & services) | | | 9,168,600 | | | | 6,983 | |
| | Bangkok Expressway & Metro PCL (Transportation infrastructure) | | | 6,814,800 | | | | 2,030 | |
| | Central Pattana PCL (Real estate management & development) | | | 1,718,200 | | | | 3,945 | |
| | CP ALL PCL (Food & staples retailing) | | | 2,004,900 | | | | 4,233 | |
| | Home Product Center PCL (Specialty retail) | | | 8,077,900 | | | | 3,771 | |
| | Muangthai Capital PCL (Consumer finance) | | | 999,800 | | | | 1,505 | |
| | | | | | | | | 31,134 | |
| | | | | | | | |
| | | | | | | | |
| | Issuer | | Shares | | | Value | |
| | | | | | | | |
| | Common Stocks—(continued) | | | | | | | | |
| | | | | | | | | | |
| | Emerging Asia—(continued) | | | | | | | | |
| | Vietnam—0.6% | | | | | | | | |
| * | Hoa Phat Group JSC (Metals & mining) | | | 4 | | | $ | — | |
| | Vietjet Aviation JSC (Airlines) | | | 317,344 | | | | 1,642 | |
| * | Vincom Retail JSC (Real estate management & development) | | | 1,186,021 | | | | 1,426 | |
| * | Vingroup JSC (Real estate management & development) | | | 426,848 | | | | 1,754 | |
| | | | | | | | | 4,822 | |
| | Emerging Latin America—16.3% | | | | | | | | |
| | Argentina—0.3% | | | | | | | | |
| * | Globant S.A. (Software)† | | | 39,959 | | | | 2,251 | |
| | Brazil—9.2% | | | | | | | | |
| | B3 S.A. - Brasil Bolsa Balcao (Capital markets) | | | 1,883,900 | | | | 13,032 | |
| | BK Brasil Operacao e Assessoria a Restaurantes S.A. (Hotels, restaurants & leisure) | | | 256,900 | | | | 1,371 | |
| | CVC Brasil Operadora e Agencia de Viagens S.A. (Hotels, restaurants & leisure) | | | 171,100 | | | | 2,701 | |
| | Energisa S.A. (Electric utilities) | | | 265,575 | | | | 2,542 | |
| | Engie Brasil Energia S.A. (Independent power & renewable electricity producers) | | | 297,950 | | | | 2,538 | |
| | Iguatemi Empresa de Shopping Centers S.A. (Real estate management & development) | | | 217,900 | | | | 2,339 | |
| | IRB Brasil Resseguros S.A. (Insurance) | | | 289,000 | | | | 6,223 | |
| | Localiza Rent a Car S.A. (Road & rail) | | | 1,287,220 | | | | 9,881 | |
| | Lojas Renner S.A. (Multiline retail) | | | 1,072,400 | | | | 11,732 | |
| | Magazine Luiza S.A. (Multiline retail) | | | 114,800 | | | | 5,363 | |
| | Multiplan Empreendimentos Imobiliarios S.A. (Real estate management & development) | | | 381,400 | | | | 2,392 | |
| * | Rumo S.A. (Road & rail) | | | 619,100 | | | | 2,716 | |
| | Sul America S.A. (Insurance) | | | 173,800 | | | | 1,282 | |
| | WEG S.A. (Machinery) | | | 852,720 | | | | 3,859 | |
| | | | | | | | | 67,971 | |
| | Chile—1.2% | | | | | | | | |
| | Banco Santander Chile—ADR (Banks) | | | 306,834 | | | | 9,174 | |
| | Mexico—4.2% | | | | | | | | |
| | Grupo Aeroportuario del Centro Norte S.A.B. de C.V. (Transportation infrastructure) | | | 329,500 | | | | 1,573 | |
| | Grupo Aeroportuario del Sureste S.A.B. de C.V.—ADR (Transportation infrastructure) | | | 10,745 | | | | 1,618 | |
| | Grupo Financiero Banorte S.A.B. de C.V. Class “O” (Banks) | | | 2,534,300 | | | | 12,371 | |
| | Megacable Holdings S.A.B. de C.V. (Media) | | | 363,000 | | | | 1,625 | |
| | Wal-Mart de Mexico S.A.B. de C.V. (Food & staples retailing) | | | 5,504,200 | | | | 13,999 | |
| | | | | | | | | 31,186 | |
| | Peru—1.4% | | | | | | | | |
| | Credicorp, Ltd. (Banks)† | | | 45,388 | | | | 10,061 | |
See accompanying Notes to Financial Statements.
| 74 | Annual Report | December 31, 2018 |
Emerging Markets Growth Fund
Portfolio of Investments, December 31, 2018(all dollar amounts in thousands)
| | | | | | | | |
| | | | | | | | |
| | Issuer | | Shares | | | Value | |
| | | | | | | | |
| | Common Stocks—(continued) | | | | | | | | |
| | | | | | | | | | |
| | Emerging Europe, Mid-East, Africa—10.9% | | | | | | | | |
| | Czech Republic—0.3% | | | | | | | | |
| | Moneta Money Bank A.S. (Banks) | | | 752,506 | | | $ | 2,429 | |
| | Greece—0.3% | | | | | | | | |
| | JUMBO S.A. (Specialty retail) | | | 142,387 | | | | 2,075 | |
| | Hungary—1.7% | | | | | | | | |
| | OTP Bank Nyrt (Banks) | | | 304,637 | | | | 12,274 | |
| | Kenya—0.2% | | | | | | | | |
| | Safaricom plc (Wireless telecommunication services) | | | 8,223,554 | | | | 1,795 | |
| | Poland—0.4% | | | | | | | | |
| * | CD Projekt S.A. (Entertainment) | | | 37,985 | | | | 1,478 | |
| * | Dino Polska S.A. (Food & staples retailing) | | | 70,664 | | | | 1,810 | |
| | | | | | | | | 3,288 | |
| | Romania—0.3% | | | | | | | | |
| | Banca Transilvania S.A. (Banks) | | | 4,456,495 | | | | 2,200 | |
| | South Africa—5.9% | | | | | | | | |
| | Bidvest Group, Ltd. (Industrial conglomerates) | | | 178,202 | | | | 2,562 | |
| | Capitec Bank Holdings, Ltd. (Banks) | | | 80,827 | | | | 6,281 | |
| | Clicks Group, Ltd. (Food & staples retailing) | | | 274,650 | | | | 3,655 | |
| | FirstRand, Ltd. (Diversified financial services) | | | 1,728,306 | | | | 7,875 | |
| | JSE, Ltd. (Capital markets) | | | 157,538 | | | | 1,813 | |
| | Mr. Price Group, Ltd. (Specialty retail) | | | 217,729 | | | | 3,725 | |
| | Naspers, Ltd. (Media) | | | 73,034 | | | | 14,682 | |
| | Sanlam, Ltd. (Insurance) | | | 530,633 | | | | 2,943 | |
| | | | | | | | | 43,536 | |
| | Turkey—0.4% | | | | | | | | |
| | BIM Birlesik Magazalar A.S. (Food & staples retailing) | | | 160,894 | | | | 2,645 | |
| | United Arab Emirates—1.4% | | | | | | | | |
| | DP World, Ltd. (Transportation infrastructure)† | | | 103,270 | | | | 1,766 | |
| | First Abu Dhabi Bank PJSC (Banks) | | | 1,567,102 | | | | 6,017 | |
| | NMC Health plc (Health care providers & services) | | | 71,721 | | | | 2,501 | |
| | | | | | | | | 10,284 | |
| | Total Common Stocks—95.9%
(cost $675,913) | | | | | | | 710,649 | |
| | | | | | | | | | |
| | Preferred Stock | | | | | | | | |
| | Brazil—2.1% | | | | | | | | |
| | Itau Unibanco Holding S.A. (Banks) | | | 1,668,790 | | | | 15,285 | |
| | Total Preferred Stock—2.1%
(cost $16,526) | | | | | | | 15,285 | |
| | | | | | | | |
| | Issuer | | Principal
Amount | | | Value | |
| | | | | | | | |
| | Repurchase Agreement | | | | | | | | |
| | Fixed Income Clearing Corporation, 0.500% dated 12/31/18, due 1/2/19, repurchase price $7,093, collateralized by U.S. Treasury Bond, 3.625%, due 2/15/44 | | | $7,092 | | | $ | 7,092 | |
| | Total Repurchase Agreement—0.9%
(cost $7,092) | | | | | | | 7,092 | |
| | Total Investments—98.9%
(cost $699,531) | | | | | | | 733,026 | |
| | Cash and other assets, less liabilities—1.1% | | | | | | | 7,945 | |
| | Net assets—100.0% | | | | | | $ | 740,971 | |
ADR = American Depository Receipt
* = Non-income producing security
† = U.S. listed foreign security
For securities primarily traded on exchanges or markets that close before the close of regular trading on the New York Stock Exchange, the Fund may use an independent pricing service to fair value price the securities pursuant to Valuation Procedures approved by the Board of Trustees.
At December 31, 2018, the Fund’s Portfolio of Investments includes the following industry categories (as a percentage of long-term investments):
| Financials | | | 35.2 | % |
| Consumer Discretionary | | | 15.8 | % |
| Consumer Staples | | | 13.2 | % |
| Information Technology | | | 13.1 | % |
| Communication Services | | | 8.9 | % |
| Industrials | | | 5.9 | % |
| Health Care | | | 2.4 | % |
| Real Estate | | | 2.1 | % |
| Utilities | | | 1.7 | % |
| Materials | | | 1.5 | % |
| Energy | | | 0.2 | % |
| Total | | | 100.0 | % |
At December 31, 2018, the Fund’s Portfolio of Investments includes the following currency categories (as a percentage of long-term investments):
| Indian Rupee | | | 18.5 | % |
| Hong Kong Dollar | | | 16.4 | % |
| U.S. Dollar | | | 13.1 | % |
| Brazilian Real | | | 11.5 | % |
| New Taiwan Dollar | | | 6.0 | % |
| South African Rand | | | 6.0 | % |
| South Korean Won | | | 5.8 | % |
| Thai Baht | | | 4.3 | % |
| Mexican Peso | | | 4.1 | % |
| Indonesian Rupiah | | | 3.8 | % |
| Yuan Renminbi | | | 2.8 | % |
| Hungarian Forint | | | 1.7 | % |
| Malaysian Ringgit | | | 1.4 | % |
| All Other Currencies | | | 4.6 | % |
| Total | | | 100.0 | % |
See accompanying Notes to Financial Statements.
| December 31, 2018 | William Blair Funds | 75 |
| | Emerging Markets Small Cap Growth Fund |
| | |
| | The Emerging Markets Small Cap Growth Fund seeks long-term capital appreciation. |
| | |
| | AN OVERVIEW FROM THE PORTFOLIO MANAGERS |
| | |

Todd M. McClone 
Casey K. Preyss | The William Blair Emerging Markets Small Cap Growth Fund (Class N shares) posted a 23.57% decrease, net of fees, for the twelve months ended December 31, 2018. By comparison, the Fund’s benchmark index, the MSCI Emerging Markets Small Cap Index (net) (the “Index”), decreased 18.59%. Calendar year underperformance versus the Index was partly driven by style headwinds, as low valuation stocks outperformed growth-oriented stocks, especially in the second half of the year. From a sector perspective, the Consumer Discretionary, Financials and Real Estate sectors were the largest detractors from the Fund’s relative returns. Within the Consumer Discretionary sector, negative stock selection for the overall sector and the Fund’s auto components overweighting early in the year amid weak auto demand and trade war dynamics hindered performance. Within Financials, the Fund’s overweighting to banks and negative overall stock selection also dampened relative performance. In particular, the Argentine bank, Grupo Supervielle S.A., weighed on results due to the sharp Argentine peso depreciation, broad market weakness and a deteriorated fundamental outlook. Within Real Estate, Chinese real estate companies KWG Property Holdings Limited and CIFI Holdings (Group) Co. Ltd detracted from performance due to weak demand, a negative pricing environment and regulatory headwinds. Partially offsetting these effects was strong relative performance in the Information Technology and Consumer Staples sectors. Within Consumer Staples, shares of TCI Co., Ltd., a Taiwanese original design manufacturer of health food and skincare products, advanced significantly during the year on accelerating operating momentum, fueled by product innovation and growth potential in China. Within Information Technology, Yageo Corporation, the Taiwanese passive components manufacturer, propelled relative results. Yageo’s share price rallied in the first part of the year amid favorable industry dynamics, including tight supply and strong demand in passive components. Please refer to the Global Markets Review and Outlook relating to the Fund beginning on page 32. |
| | | |
| 76 | Annual Report | December 31, 2018 |
Emerging Markets Small Cap Growth Fund
Performance Highlights (Unaudited)
| Average Annual Total Return through 12/31/2018 |
| | | | | | | | | | | | Since |
| | | 1 Year | | 3 Year | | 5 Year | | Inception |
| Class N(a) | | | (23.57 | )% | | | 0.45 | % | | | 1.65 | % | | | 7.22 | % |
| Class I(a) | | | (23.31 | ) | | | 0.75 | | | | 1.97 | | | | 7.53 | |
| MSCI Emerging Markets Small Cap Index (net)(a) | | | (18.59 | ) | | | 3.68 | | | | 0.95 | | | | 2.72 | |
| Institutional Class(b) | | | (23.24 | ) | | | 0.82 | | | | 2.05 | | | | 4.63 | |
| MSCI Emerging Markets Small Cap Index (net)(b) | | | (18.59 | ) | | | 3.68 | | | | 0.95 | | | | 1.20 | |
| | |
| (a) | Since inception is for the period from October 24, 2011 (Commencement of Operations) to December 31, 2018. |
| (b) | Since inception is for the period from December 20, 2012 (Commencement of Operations) to December 31, 2018. |
Performance cited represents past performance. Past performance does not guarantee future results and current performance may be lower or higher than the data quoted. Results shown are average annual returns, which assume reinvestment of dividends and capital gains. Investment returns and principal will fluctuate and you may have a gain or loss when you sell shares. For the most current month-end performance information, please call 1-800-742-7272, or visit our Web site atwww.williamblairfunds.com. From time to time, the investment adviser may waive fees or reimburse expenses for the Fund. Without these waivers/reimbursements, performance would be lower. International investing involves special risk considerations, including currency fluctuations, lower liquidity, economic and political risk. These risks may be magnified when investing in emerging markets. Smaller capitalization stocks are also more sensitive to purchase/sale transactions and changes in the issuer’s financial condition. Class N shares are available to the general public without a sales load. Class I shares are available to certain institutional investors, and advisory clients of William Blair & Company, L.L.C., without a sales load or distribution (12b-1) fees. Institutional Class shares are available to institutional investors without a sales load or distribution (12b-1) or service fees.
The performance highlights and graph presented above do not reflect the deduction of taxes that a shareholder would pay on fund distributions or the redemption of fund shares.
The Morgan Stanley Capital International (MSCI) Emerging Markets Small Cap Index (net) is a free float-adjusted market capitalization index that is designed to measure the equity market performance of emerging markets. This index approximates the minimum possible dividend reinvestment by deducting for the highest possible withholding tax rates of those markets.
This report identifies the Fund’s investments on December 31, 2018. These holdings are subject to change. Not all stocks in the Fund performed the same, nor is there any guarantee that these stocks will perform as well in the future. Market forecasts provided in this report may not necessarily come to pass.
Sector Diversification (Unaudited)
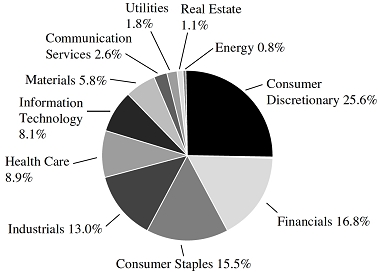
The sector diversification shown is based on the total long-term securities.
| | | |
| December 31, 2018 | William Blair Funds | 77 |
Emerging Markets Small Cap Growth Fund
Portfolio of Investments, December 31, 2018(all dollar amounts in thousands)
| | | | | | | | |
| | | | | | | | |
| | Issuer | | Shares | | | Value | |
| | | | | | | | | | |
| | Common Stocks | | | | | | | | |
| | | | | | | | | | |
| | Emerging Asia—73.2% | | | | | | | | |
| | Cambodia—0.9% | | | | | | | | |
| | NagaCorp, Ltd. (Hotels, restaurants & leisure) | | | 2,254,000 | | | $ | 2,424 | |
| | China—15.7% | | | | | | | | |
| * | A-Living Services Co. Ltd. Class “H” (Commercial services & supplies) | | | 1,561,000 | | | | 2,117 | |
| | By-health Co., Ltd. Class “A” (Personal products) | | | 576,491 | | | | 1,427 | |
| * | China Education Group Holdings, Ltd. (Diversified consumer services) | | | 2,775,000 | | | | 3,402 | |
| | China Everbright Greentech Ltd. (Independent power & renewable electricity producers) | | | 817,554 | | | | 582 | |
| | China Suntien Green Energy Corporation, Ltd. Class “H” (Oil, gas & consumable fuels) | | | 8,607,000 | | | | 2,209 | |
| | China Water Affairs Group, Ltd. (Water utilities) | | | 1,164,000 | | | | 1,246 | |
| | Chongqing Zhifei Biological Products Co., Ltd. Class “A” (Biotechnology) | | | 123,003 | | | | 694 | |
| | Dali Foods Group Co., Ltd. (Food products) | | | 4,171,000 | | | | 3,084 | |
| | Fu Shou Yuan International Group, Ltd. (Diversified consumer services) | | | 1,678,000 | | | | 1,264 | |
| * | Health and Happiness H&H International Holdings, Ltd. (Food products) | | | 443,500 | | | | 2,532 | |
| | Hua Hong Semiconductor Ltd. (Semiconductors & semiconductor equipment) | | | 1,063,600 | | | | 1,970 | |
| | Huazhu Group, Ltd.—ADR (Hotels, restaurants & leisure) | | | 49,301 | | | | 1,412 | |
| | JNBY Design, Ltd. (Textiles, apparel & luxury goods) | | | 1,189,000 | | | | 1,667 | |
| | Kingdee International Software Group Co., Ltd. (Software) | | | 640,000 | | | | 566 | |
| * | Li Ning Co., Ltd. (Textiles, apparel & luxury goods) | | | 1,541,000 | | | | 1,653 | |
| * | Noah Holdings, Ltd.—ADR (Capital markets) | | | 71,981 | | | | 3,118 | |
| * | Ping An Healthcare and Technology Co. Ltd. (Health care technology) | | | 124,900 | | | | 440 | |
| | SSY Group, Ltd. (Pharmaceuticals) | | | 1,130,000 | | | | 837 | |
| | Toly Bread Co., Ltd. Class “A” (Food products) | | | 118,500 | | | | 779 | |
| * | Towngas China Co., Ltd. (Gas utilities) | | | 1,007,000 | | | | 747 | |
| * | Wuxi Biologics Cayman, Inc. (Life sciences tools & services) | | | 193,500 | | | | 1,239 | |
| | Yihai International Holding, Ltd. (Food products) | | | 1,575,000 | | | | 3,850 | |
| | Zhejiang Supor Co., Ltd. Class “A” (Household durables) | | | 526,008 | | | | 4,022 | |
| | Zhejiang Weixing New Building Materials Co., Ltd. Class “A” (Chemicals) | | | 1,154,697 | | | | 2,609 | |
| | | | | | | | | 43,466 | |
| | | | | | | | |
| | | | | | | | |
| | Issuer | | Shares | | | Value | |
| | | | | | | | | | |
| | Common Stocks—(continued) | | | | | | | | |
| | | | | | | | | | |
| | Emerging Asia—(continued) | | | | | | | | |
| | India—24.9% | | | | | | | | |
| | Aarti Industries (Chemicals) | | | 108,689 | | | $ | 2,250 | |
| | Astral Poly Technik, Ltd. (Building products) | | | 238,202 | | | | 3,838 | |
| | Bandhan Bank Ltd. (Banks) | | | 139,016 | | | | 1,097 | |
| | Bata India, Ltd. (Textiles, apparel & luxury goods) | | | 156,072 | | | | 2,524 | |
| | Berger Paints India, Ltd. (Chemicals) | | | 770,785 | | | | 3,644 | |
| | Biocon, Ltd. (Biotechnology) | | | 426,045 | | | | 3,838 | |
| | City Union Bank, Ltd. (Banks) | | | 629,296 | | | | 1,744 | |
| | Colgate-Palmolive India, Ltd. (Personal products) | | | 88,190 | | | | 1,708 | |
| | Cyient, Ltd. (Software) | | | 63,006 | | | | 560 | |
| | Endurance Technologies Ltd. (Auto components) | | | 88,634 | | | | 1,612 | |
| | Escorts, Ltd. (Machinery) | | | 101,172 | | | | 1,023 | |
| | Graphite India, Ltd. (Electrical equipment) | | | 163,933 | | | | 1,770 | |
| | Gruh Finance, Ltd. (Thrifts & mortgage finance) | | | 799,093 | | | | 3,623 | |
| | Havells India, Ltd. (Electrical equipment) | | | 370,821 | | | | 3,673 | |
| * | HDFC Asset Management Co. Ltd. (Capital markets) | | | 30,197 | | | | 647 | |
| | Info Edge India, Ltd. (Interactive Media & Services) | | | 50,215 | | | | 1,031 | |
| | InterGlobe Aviation, Ltd. (Airlines) | | | 133,560 | | | | 2,228 | |
| | Ipca Laboratories, Ltd. (Pharmaceuticals) | | | 193,393 | | | | 2,216 | |
| | KEI Industries, Ltd. (Electrical equipment) | | | 218,302 | | | | 1,123 | |
| | Larsen & Toubro Infotech Ltd. (IT services) | | | 38,385 | | | | 947 | |
| | Mahanagar Gas, Ltd. (Gas utilities) | | | 177,926 | | | | 2,292 | |
| | Marico, Ltd. (Personal products) | | | 610,145 | | | | 3,274 | |
| | Minda Industries, Ltd. (Auto components) | | | 194,937 | | | | 901 | |
| | NIIT Technologies, Ltd. (Software) | | | 124,801 | | | | 2,053 | |
| | Page Industries, Ltd. (Textiles, apparel & luxury goods) | | | 3,578 | | | | 1,283 | |
| | Pidilite Industries, Ltd. (Chemicals) | | | 180,900 | | | | 2,873 | |
| | PVR, Ltd. (Entertainment) | | | 29,977 | | | | 687 | |
| | Radico Khaitan, Ltd. (Beverages) | | | 550,494 | | | | 3,162 | |
| | RBL Bank Ltd. (Banks) | | | 243,349 | | | | 2,004 | |
| | Sterlite Technologies, Ltd. (Communications equipment) | | | 312,177 | | | | 1,313 | |
| | Sundram Fasteners, Ltd. (Auto components) | | | 158,518 | | | | 1,210 | |
| | The Phoenix Mills, Ltd. (Real estate management & development) | | | 223,588 | | | | 1,803 | |
| | Torrent Pharmaceuticals, Ltd. (Pharmaceuticals) | | | 60,155 | | | | 1,526 | |
| | V-Mart Retail, Ltd. (Multiline retail) | | | 23,941 | | | | 890 | |
| | VIP Industries, Ltd. (Textiles, apparel & luxury goods) | | | 339,978 | | | | 2,522 | |
| | | | | | | | | 68,889 | |
| | Indonesia—6.0% | | | | | | | | |
| | PT Ace Hardware Indonesia Tbk (Specialty retail) | | | 39,759,400 | | | | 4,120 | |
| | PT Bank Negara Indonesia Persero Tbk (Banks) | | | 6,514,800 | | | | 3,987 | |
See accompanying Notes to Financial Statements.
| | | |
| 78 | Annual Report | December 31, 2018 |
Emerging Markets Small Cap Growth Fund
Portfolio of Investments, December 31, 2018(all dollar amounts in thousands)
| | | | | | | | |
| | | | | | | | |
| | Issuer | | Shares | | | Value | |
| | | | | | | | | | |
| | Common Stocks—(continued) | | | | | | | | |
| | | | | | | | | | |
| | Emerging Asia—(continued) | | | | | | | | |
| | Indonesia—(continued) | | | | | | | | |
| | PT Charoen Pokphand Indonesia Tbk (Food products) | | | 6,184,100 | | | $ | 3,107 | |
| | PT Gudang Garam Tbk (Tobacco) | | | 291,600 | | | | 1,696 | |
| | PT Indofood CBP Sukses Makmur Tbk (Food products) | | | 3,465,600 | | | | 2,518 | |
| | PT Pakuwon Jati Tbk (Real estate management & development) | | | 31,043,000 | | | | 1,338 | |
| | | | | | | | | 16,766 | |
| | Malaysia—3.5% | | | | | | | | |
| | Hartalega Holdings Bhd (Health care equipment & supplies) | | | 2,384,000 | | | | 3,542 | |
| | Hong Leong Bank Bhd (Banks) | | | 825,800 | | | | 4,076 | |
| | Top Glove Corporation Bhd (Health care equipment & supplies) | | | 1,477,100 | | | | 2,002 | |
| | | | | | | | | 9,620 | |
| | Philippines—0.8% | | | | | | | | |
| | Bloomberry Resorts Corporation (Hotels, restaurants & leisure) | | | 4,348,500 | | | | 778 | |
| | Jollibee Foods Corporation (Hotels, restaurants & leisure) | | | 270,080 | | | | 1,499 | |
| | | | | | | | | 2,277 | |
| | South Korea—7.8% | | | | | | | | |
| * | Cafe24 Corporation (IT services) | | | 14,160 | | | | 1,394 | |
| | Cosmax, Inc. (Personal products) | | | 25,568 | | | | 2,979 | |
| | Dentium Co., Ltd. (Health care equipment & supplies) | | | 22,942 | | | | 1,182 | |
| | Douzone Bizon Co., Ltd. (Software) | | | 45,422 | | | | 2,113 | |
| | Fila Korea, Ltd. (Textiles, apparel & luxury goods) | | | 130,185 | | | | 6,242 | |
| * | JYP Entertainment Corporation (Entertainment) | | | 111,914 | | | | 3,034 | |
| | Koh Young Technology, Inc. (Semiconductors & semiconductor equipment) | | | 9,391 | | | | 694 | |
| | Korea Investment Holdings Co., Ltd. (Capital markets) | | | 11,028 | | | | 588 | |
| | Macquarie Korea Infrastructure Fund | | | 132,347 | | | | 1,102 | |
| | POSCO Chemtech Co., Ltd. (Construction materials) | | | 41,794 | | | | 2,386 | |
| | | | | | | | | 21,714 | |
| | Taiwan—9.1% | | | | | | | | |
| | ASMedia Technology, Inc. (Semiconductors & semiconductor equipment) | | | 103,000 | | | | 1,676 | |
| | ASPEED Technology, Inc. (Semiconductors & semiconductor equipment) | | | 93,000 | | | | 1,779 | |
| | Chailease Holding Co., Ltd. (Diversified financial services) | | | 700,300 | | | | 2,208 | |
| | Chroma ATE, Inc. (Electronic equipment, instruments & components) | | | 240,000 | | | | 921 | |
| | Eclat Textile Co., Ltd. (Textiles, apparel & luxury goods) | | | 141,000 | | | | 1,596 | |
| | | | | | | | |
| | | | | | | | |
| | Issuer | | Shares | | | Value | |
| | | | | | | | | | |
| | Common Stocks—(continued) | | | | | | | | |
| | | | | | | | | | |
| | Emerging Asia—(continued) | | | | | | | | |
| | Taiwan—(continued) | | | | | | | | |
| | Feng TAY Enterprise Co., Ltd. (Textiles, apparel & luxury goods) | | | 743,000 | | | $ | 4,242 | |
| | Globalwafers Co., Ltd. (Semiconductors & semiconductor equipment) | | | 141,000 | | | | 1,287 | |
| | Makalot Industrial Co., Ltd. (Textiles, apparel & luxury goods) | | | 309,000 | | | | 1,709 | |
| | Parade Technologies, Ltd. (Semiconductors & semiconductor equipment) | | | 104,000 | | | | 1,455 | |
| | Sinbon Electronics Co., Ltd. (Electronic equipment, instruments & components) | | | 807,000 | | | | 2,174 | |
| | TCI Co., Ltd. (Personal products) | | | 326,343 | | | | 5,510 | |
| | Voltronic Power Technology Corporation (Electrical equipment) | | | 42,000 | | | | 734 | |
| | | | | | | | | 25,291 | |
| | Thailand—4.1% | | | | | | | | |
| | Bangkok Chain Hospital PCL (Health care providers & services) | | | 6,048,200 | | | | 3,102 | |
| | Bangkok Expressway & Metro PCL (Transportation infrastructure) | | | 7,034,100 | | | | 2,096 | |
| | Home Product Center PCL (Specialty retail) | | | 8,466,200 | | | | 3,952 | |
| | Muangthai Capital PCL | | | 1,400,900 | | | | 2,108 | |
| | | | | | | | | 11,258 | |
| | Vietnam—0.4% | | | | | | | | |
| * | Hoa Phat Group JSC (Metals & mining) | | | 848,782 | | | | 1,133 | |
| | | | | | | | | | |
| | Emerging Latin America—17.7% | | | | | | | | |
| | Argentina—0.6% | | | | | | | | |
| * | Globant S.A. (Software)† | | | 28,123 | | | | 1,584 | |
| | Brazil—15.7% | | | | | | | | |
| | Arezzo Industria e Comercio S.A. (Textiles, apparel & luxury goods) | | | 84,800 | | | | 1,205 | |
| * | Azul S.A.—ADR (Airlines) | | | 107,926 | | | | 2,989 | |
| | BK Brasil Operacao e Assessoria a Restaurantes S.A. (Hotels, restaurants & leisure) | | | 206,200 | | | | 1,100 | |
| | Construtora Tenda S.A. (Household durables) | | | 420,536 | | | | 3,482 | |
| | CVC Brasil Operadora e Agencia de Viagens S.A. (Hotels, restaurants & leisure) | | | 245,600 | | | | 3,877 | |
| | IRB Brasil Resseguros S.A. (Insurance) | | | 366,800 | | | | 7,899 | |
| | Localiza Rent a Car S.A. (Road & rail) | | | 655,095 | | | | 5,028 | |
| | Magazine Luiza S.A. (Multiline retail) | | | 154,400 | | | | 7,213 | |
| * | Notre Dame Intermedica Participacoes S.A. (Health care providers & services) | | | 420,300 | | | | 3,154 | |
| * | Rumo S.A. (Road & rail) | | | 702,200 | | | | 3,080 | |
| | Sul America S.A. (Insurance) | | | 216,600 | | | | 1,598 | |
| | Tegma Gestao Logistica S.A. (Road & rail) | | | 405,900 | | | | 2,880 | |
| | | | | | | | | 43,505 | |
See accompanying Notes to Financial Statements.
| | | |
| December 31, 2018 | William Blair Funds | 79 |
Emerging Markets Small Cap Growth Fund
Portfolio of Investments, December 31, 2018(all dollar amounts in thousands)
| | | | | | | | |
| | | | | | | | |
| | Issuer | | Shares | | | Value | |
| | | | | | | | | | |
| | Common Stocks—(continued) | | | | | | | | |
| | | | | | | | | | |
| | Emerging Latin America—(continued) | | | | | | | | |
| | Mexico—1.4% | | | | | | | | |
| | Banco del Bajio S.A. (Banks) | | | 1,134,562 | | | $ | 2,208 | |
| | Grupo Aeroportuario del Sureste S.A.B. de C.V.—ADR (Transportation infrastructure) | | | 5,652 | | | | 851 | |
| | Grupo Cementos de Chihuahua S.A.B. de C.V. (Construction materials) | | | 134,600 | | | | 691 | |
| | | | | | | | | 3,750 | |
| | | | | | | | | | |
| | Emerging Europe, Mid-East, Africa—8.4% | | | | | | | | |
| | Czech Republic—0.5% | | | | | | | | |
| | Moneta Money Bank A.S. (Banks) | | | 415,604 | | | | 1,341 | |
| | Kenya—0.9% | | | | | | | | |
| | Safaricom, Ltd. (Wireless telecommunication services) | | | 11,262,400 | | | | 2,459 | |
| | Poland—1.2% | | | | | | | | |
| * | Dino Polska S.A. (Food & staples retailing) | | | 129,820 | | | | 3,325 | |
| | Romania—1.0% | | | | | | | | |
| | Banca Transilvania S.A. (Banks) | | | 5,711,685 | | | | 2,819 | |
| | Russia—0.3% | | | | | | | | |
| | TCS Group Holding plc-GDR (Banks) | | | 57,297 | | | | 892 | |
| | South Africa—3.5% | | | | | | | | |
| | AVI, Ltd. (Food products) | | | 214,446 | | | | 1,515 | |
| | Capitec Bank Holdings, Ltd. (Banks) | | | 37,302 | | | | 2,899 | |
| | Clicks Group, Ltd. (Food & staples retailing) | | | 190,370 | | | | 2,533 | |
| | Mr Price Group, Ltd. (Specialty retail) | | | 113,210 | | | | 1,937 | |
| | Santam, Ltd. (Insurance) | | | 40,362 | | | | 832 | |
| | | | | | | | | 9,716 | |
| | Turkey—0.6% | | | | | | | | |
| | Arcelik A.S. (Household durables) | | | 574,527 | | | | 1,714 | |
| | United Arab Emirates—0.4% | | | | | | | | |
| | NMC Health plc (Health care providers & services) | | | 31,180 | | | | 1,087 | |
| | Total Common Stocks—99.3%
(cost $266,069) | | | | | | | 275,030 | |
| | | | | | | | |
| | | | | | | | |
| | Issuer | | Shares | | | Value | |
| | | | | | | | |
| | Preferred Stocks | | | | | | | | |
| | Brazil—1.1% | | | | | | | | |
| | Metalurgica Gerdau S.A. (Metals & mining) | | | 241,500 | | | $ | 433 | |
| | Randon Participacoes S.A. (Machinery) | | | 1,104,950 | | | | 2,640 | |
| | | | | | | | | 3,073 | |
| | Total Preferred Stocks—1.1%
(cost $2,736) | | | | | | | 3,073 | |
| | Total Investments—100.4%
(cost $268,805) | | | | | | | 278,103 | |
| | Liabilities, plus cash and other assets—(0.4)% | | | | | | | (1,168 | ) |
| | Net assets—100.0% | | | | | | $ | 276,935 | |
ADR = American Depository Receipt
GDR = Global Depository Receipt
* = Non-income producing security
† = U.S. listed foreign security
For securities primarily traded on exchanges or markets that close before the close of regular trading on the New York Stock Exchange, the Fund may use an independent pricing service to fair value price the securities pursuant to Valuation Procedures approved by the Board of Trustees.
See accompanying Notes to Financial Statements.
| | | |
| 80 | Annual Report | December 31, 2018 |
Emerging Markets Small Cap Growth Fund
Portfolio of Investments, December 31, 2018
At December 31, 2018, the Fund’s Portfolio of Investments includes the following industry categories (as a percentage of long-term investments):
| | | | | |
| Consumer Discretionary | | | 25.6 | % |
| Financials | | | 16.8 | % |
| Consumer Staples | | | 15.5 | % |
| Industrials | | | 13.0 | % |
| Health Care | | | 8.9 | % |
| Information Technology | | | 8.1 | % |
| Materials | | | 5.8 | % |
| Communication Services | | | 2.6 | % |
| Utilities | | | 1.8 | % |
| Real Estate | | | 1.1 | % |
| Energy | | | 0.8 | % |
| Total | | | 100.0 | % |
At December 31, 2018, the Fund’s Portfolio of Investments includes the following currency categories (as a percentage of long-term investments):
| | | | | |
| Indian Rupee | | | 24.8 | % |
| Brazilian Real | | | 15.7 | % |
| Hong Kong Dollar | | | 11.4 | % |
| New Taiwan Dollar | | | 9.1 | % |
| South Korean Won | | | 7.8 | % |
| Indonesian Rupiah | | | 6.0 | % |
| Thai Baht | | | 4.1 | % |
| U.S. Dollar | | | 3.9 | % |
| South African Rand | | | 3.5 | % |
| Malaysian Ringgit | | | 3.5 | % |
| Yuan Renminbi | | | 3.4 | % |
| Polish Zloty | | | 1.2 | % |
| Mexican Peso | | | 1.0 | % |
| Romanian Leu | | | 1.0 | % |
| All Other Currencies | | | 3.6 | % |
| Total | | | 100.0 | % |
See accompanying Notes to Financial Statements.
| | | |
| December 31, 2018 | William Blair Funds | 81 |
Fixed Income Market Review and Outlook
The Bloomberg Barclays U.S. Aggregate Bond Index (the “Index”) returned +0.01% during 2018. As interest rates rose, risk spreads widened over the course of the year. Fixed-rate U.S. Treasuries outperformed corporate and agency mortgage-backed securities (“MBSs”) after controlling for the effects of duration.
The Federal Open Market Committee (“FOMC”) increased the target range of the federal funds rate four times during 2018, by 0.25% each time. The FOMC has now hiked rates nine times since 2015 when the federal funds rate was near the zero lower bound. At the end of 2018, the fed funds futures market carried an implied probability that the FOMC will not change the target range of the federal funds rate during 2019.
The FOMC continued to execute its plan to shrink the Federal Reserve’s (the “Fed”) balance sheet during 2018. Beginning in October, the FOMC permitted the balance sheet to shrink by no more than $50 billion per-month. At the $50 billion per-month pace of reduction, the FOMC was no longer required to purchase agency mortgage-backed securities.
While the FOMC’s policy decisions influenced the markets during 2018, technical factors also impacted segments of the bond market. In the beginning of 2018, U.S. corporate tax reform and repatriation of cash created heavy demand for U.S. money market instruments and simultaneous selling pressure of securities tied to the London Interbank Offering Rate (“LIBOR”) as cash held in offshore accounts came back to U.S. money market funds. The U.S. Treasury’s pattern of bond issuance also influenced the market, as issuance was concentrated on short- and intermediate-term maturities that put upward pressure on corresponding interest rates. This issuance pattern likely contributed to the flattening yield curve experienced during the year. Finally, long-term fixed income mutual funds experienced sustained outflows during the fourth quarter of the year, and those outflows created selling pressure within segments of the bond market that increased risk spreads. These technical pressures impacted the market by increasing implied volatility and widening risk spreads.
U.S. Treasury Inflation-Protected Securities (“TIPS”) underperformed fixed-rate Treasuries during 2018, as market-implied breakeven inflation rates decreased to levels below the FOMC’s stated objective of 2.0% to 2.5% per year.
Agency MBSs generated positive total returns during 2018. The best-performing segments of the market were higher-coupon 30-year pools (coupons of 6.0% and 6.5%). 30-year pools with coupons of 5.5% or less earned positive total returns but underperformed similar-duration U.S. Treasuries.
Corporate bonds of all tenors, credit qualities, and sectors underperformed similar-maturity Treasury instruments during the year. Only high-quality, short-term corporate bonds generated positive total returns. All other segments of the corporate bond market experienced negative total returns during the year. High yield corporate bonds underperformed investment-grade corporate bonds during the year.
We believe that the FOMC will be measured in its decisions to increase the target range of the federal funds rate in 2019. The U.S. economy is growing; forecasters predict a real GDP growth rate of approximately 3.0% during 2019. In addition, the U.S. labor market is adding jobs and the unemployment rate is at 3.8% as of December 2018. Estimates of wage inflation are roughly 3.9%, while estimates of core personal consumption expenditures (“PCEs”) have been roughly 1.9%. Macroeconomic theory predicts that a robust labor market creates wage inflation, which in turns spurs broader inflation. We believe that the FOMC will not raise the federal funds rate if these inflationary pressures deteriorate.
We believe that the FOMC’s plans to reduce the size of the Fed’s balance sheet will continue to be executed with little disruption to the markets. We believe this is attributable, in part, to strong communication efforts, adequate advance notice, and the absence of security sales to reduce the balance sheet since the balance sheet is being reduced solely through maturities and paydowns. However, we believe the lower-coupon MBSs that were purchased by the Fed will underperform higher-coupon alternatives when the FOMC ends its campaign of purchasing agency MBSs.
As previously stated, TIPS currently have market-implied breakeven inflation rates that are below the FOMC’s stated target range of 2.0% to 2.5%. We believe TIPS are an attractive alternative to fixed-rate Treasuries to mitigate the effects of rising rates driven by accelerating inflationary pressures.
We believe that spread sectors remain attractive relative to Treasuries over the intermediate- to long-term. Corporate risk premiums are at levels above their longer-term averages, and we believe there are now attractive opportunities after risk spreads increased during the year. Risk premiums of higher-coupon segments of the agency MBS market remain attractive. In addition,
| | | |
| 82 | Annual Report | December 31, 2018 |
Fixed Income Market Review and Outlook (continued)
we believe U.S. Treasuries in general are likely to underperform as the Fed’s balance sheet is reduced and if the FOMC further increases the federal funds rate
We believe that higher-coupon segments (30-year coupon rates of 5.0% and above) of the agency MBS market offer compelling value. These segments of the agency MBS market offer attractive spreads and a defensive duration profile. The key risk of these securities is that the underlying borrowers are “in-the-money” to refinance their loan. We believe this risk can be mitigated by focusing on pools comprised of borrowers that do not have the economic incentive to refinance their loans: low-loan balance pools.
We believe there are opportunities in the corporate bond market, as risk spreads have increased to levels above the Bloomberg Barclays U.S. Corporate Bond Index’s longer-term average. We remain concerned about company-specific risks, including shareholder-friendly activities such as leveraged finance mergers and acquisitions, large share repurchases, and special dividends. Importantly, we do not believe the market will enter a period of excessive leveraged buyout activity.
| | | |
| December 31, 2018 | William Blair Funds | 83 |
| | Bond Fund |
| | |
| | The Bond Fund seeks to outperform the Bloomberg Barclays U.S. Aggregate Index by maximizing total return through a combination of income and capital appreciation. |
| | |
| | AN OVERVIEW FROM THE PORTFOLIO MANAGERS |
| | |

Paul J. Sularz 
Christopher T. Vincent | The William Blair Bond Fund (Class N shares) returned -2.42%, net of fees, for the twelve months ended December 31, 2018. By comparison, the Fund’s benchmark index, the Bloomberg Barclays U.S. Aggregate Index (the “Index”), returned 0.01%. Multiple factors detracted from the Fund’s performance relative to the Index during the year. The Fund’s sector positioning detracted from results, as the Fund was underweight fixed-rate U.S. Treasuries and overweight corporate bonds and agency mortgage-backed securities. The Fund’s overweight to investment-grade corporate bonds with longer maturities and exposure to BB-rated high yield corporate bonds detracted from the Fund’s performance. An allocation to U.S. Treasury Inflation-Protected Securities (TIPS) detracted from results. A position in corporate bonds issued by Abbvie, Inc. negatively impacted the Fund’s relative performance during the year. The Fund experienced positive selection results from its holdings in corporate bonds issued by AT&T, Inc., JBS USA LUX SA, Verizon Communications, Inc., Union Pacific Corporation, and McDonald’s Corporation. Please refer to the Fixed Income Market Review and Outlook relating to the Fund beginning on page 82 for additional information. |
| 84 | Annual Report | December 31, 2018 |
Bond Fund
Performance Highlights (Unaudited)
| Average Annual Total Return through 12/31/2018 |
| |
| | | 1 Year | | 3 Year | | 5 Year | | 10 Year |
| Class N | | | (2.42 | )% | | | 1.89 | % | | | 2.09 | % | | | 4.31 | % |
| Class I | | | (2.31 | ) | | | 2.08 | | | | 2.30 | | | | 4.50 | |
| Institutional Class | | | (2.26 | ) | | | 2.15 | | | | 2.38 | | | | 4.61 | |
| Bloomberg Barclays U.S. Aggregate Index | | | 0.01 | | | | 2.06 | | | | 2.52 | | | | 3.48 | |
Performance cited represents past performance. Past performance does not guarantee future results and current performance may be lower or higher than the data quoted. Results shown are average annual total returns, which assume reinvestment of dividends and capital gains. Investment returns and principal will fluctuate and you may have a gain or loss when you sell shares. For the most current month-end performance information, please call 1-800-742-7272, or visit our Web site atwww.williamblairfunds.com. From time to time, the investment adviser may waive fees or reimburse expenses for the Fund. Without these waivers/reimbursements, performance would be lower. Class N shares are available to the general public without a sales load. Class I shares are available to certain institutional investors, and advisory clients of William Blair & Company, L.L.C., without a sales load or distribution (12b-1) fees. Institutional Class shares are available to institutional investors without a sales load or distribution (12b-1) or service fees.
The performance highlights and graph presented above do not reflect the deduction of taxes that a shareholder would pay on fund distributions or the redemption of fund shares.
The Bloomberg Barclays U.S. Aggregate Index indicates broad intermediate government/corporate bond market performance.
This report identifies the Fund’s investments on December 31, 2018. These holdings are subject to change. Not all investments in the Fund performed the same, nor is there any guarantee that these investments will perform as well in the future. Market forecasts provided in this report may not necessarily come to pass.
Sector Diversification (Unaudited)
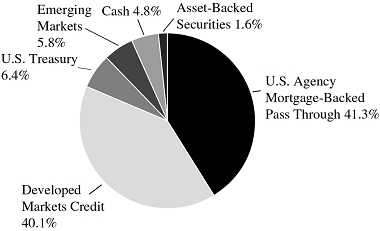
The sector diversification shown is based on the total investments.
| December 31, 2018 | William Blair Funds | 85 |
Bond Fund
Portfolio of Investments, December 31, 2018(all dollar amounts in thousands)
| | | | | | | | |
| | | | Principal | | | | |
| | Issuer | | Amount | | | Value | |
| | | | | | | | | | |
| | U.S. Government and U.S. Government Agency—52.5% |
| | U.S. Treasury Inflation Indexed Notes/Bonds—6.3% |
| | U.S. Treasury Inflation Indexed Bond,
3.875%, due 4/15/29 | | $ | 20,766 | | | $ | 26,455 | |
| | U.S. Treasury—0.1% | | | | | | | | |
| | U.S. Treasury Floating Rate Note,
3M Treasury money market yield + 0.070%, 2.551%, due 4/30/19(a) | | | 500 | | | | 500 | |
| | Federal Home Loan Mortgage Corp. (FHLMC)—13.8% | | | | | | | | |
| | #B13747, 5.000%, due 4/1/19 | | | 7 | | | | 7 | |
| | #J02986, 6.500%, due 7/1/21 | | | 7 | | | | 7 | |
| | #G12720, 5.500%, due 6/1/22 | | | 15 | | | | 15 | |
| | #D95621, 6.500%, due 7/1/22 | | | 324 | | | | 335 | |
| | #G14150, 4.500%, due 4/1/26 | | | 1,014 | | | | 1,053 | |
| | #J16051, 4.500%, due 7/1/26 | | | 585 | | | | 607 | |
| | #G02210, 7.000%, due 12/1/28 | | | 48 | | | | 54 | |
| | #G02183, 6.500%, due 3/1/30 | | | 12 | | | | 13 | |
| | #G01728, 7.500%, due 7/1/32 | | | 78 | | | | 92 | |
| | #C01385, 6.500%, due 8/1/32 | | | 62 | | | | 71 | |
| | #C01623, 5.500%, due 9/1/33 | | | 72 | | | | 78 | |
| | #A15039, 5.500%, due 10/1/33 | | | 2 | | | | 2 | |
| | #A17603, 5.500%, due 1/1/34 | | | 1,645 | | | | 1,781 | |
| | #G01843, 6.000%, due 6/1/35 | | | 14 | | | | 15 | |
| | #G03711, 6.000%, due 6/1/37 | | | 457 | | | | 503 | |
| | #G04126, 6.000%, due 6/1/37 | | | 1,378 | | | | 1,513 | |
| | #A62858, 6.500%, due 7/1/37 | | | 78 | | | | 91 | |
| | #G03170, 6.500%, due 8/1/37 | | | 146 | | | | 165 | |
| | #A66843, 6.500%, due 10/1/37 | | | 629 | | | | 728 | |
| | #G07837, 6.500%, due 2/1/38 | | | 2,049 | | | | 2,354 | |
| | #G04053, 5.500%, due 3/1/38 | | | 567 | | | | 614 | |
| | #A78138, 5.500%, due 6/1/38 | | | 231 | | | | 249 | |
| | #G04641, 6.000%, due 6/1/38 | | | 1,070 | | | | 1,172 | |
| | #G04466, 5.500%, due 7/1/38 | | | 11,629 | | | | 12,600 | |
| | #G04544, 6.000%, due 8/1/38 | | | 617 | | | | 674 | |
| | #A81799, 6.500%, due 9/1/38 | | | 348 | | | | 378 | |
| | #G06964, 5.500%, due 11/1/38 | | | 1,679 | | | | 1,818 | |
| | #G05723, 6.500%, due 11/1/38 | | | 942 | | | | 1,087 | |
| | #G60366, 6.000%, due 10/1/39 | | | 12,444 | | | | 13,663 | |
| | #G05875, 5.500%, due 2/1/40 | | | 433 | | | | 467 | |
| | #G61450, 6.000%, due 4/1/40 | | | 12,227 | | | | 13,576 | |
| | #G61050, 5.500%, due 3/1/41 | | | 464 | | | | 500 | |
| | #C03665, 9.000%, due 4/1/41 | | | 406 | | | | 467 | |
| | #G06583, 5.000%, due 6/1/41 | | | 1,336 | | | | 1,433 | |
| | Total FHLMC Mortgage Obligations | | | | | | | 58,182 | |
| | Federal National Mortgage Association (FNMA)—32.3% | | | | | | | | |
| | #788424, 5.500%, due 9/1/19 | | | 1 | | | | 1 | |
| | #900725, 6.000%, due 8/1/21 | | | 14 | | | | 14 | |
| | #893325, 7.000%, due 9/1/21 | | | 4 | | | | 4 | |
| | #949589, 5.500%, due 8/1/22 | | | 1,159 | | | | 1,193 | |
| | #949592, 6.000%, due 8/1/22 | | | 1,800 | | | | 1,866 | |
| | #AC5410, 4.500%, due 10/1/24 | | | 215 | | | | 223 | |
| | #AL8529, 6.000%, due 11/1/24 | | | 2,705 | | | | 2,815 | |
| | #AC9560, 5.000%, due 1/1/25 | | | 869 | | | | 903 | |
| | #255956, 5.500%, due 10/1/25 | | | 10 | | | | 11 | |
| | | | | | | | |
| | | | Principal | | | | |
| | Issuer | | Amount | | | Value | |
| | | | | | | | | | |
| | U.S. Government and U.S. Government Agency—(continued) |
| | Federal National Mortgage Association (FNMA)—(continued) |
| | #AL2853, 4.500%, due 6/1/26 | | $ | 4,438 | | | $ | 4,607 | |
| | #AL9730, 4.500%, due 2/1/27 | | | 1,399 | | | | 1,452 | |
| | #AL2134, 4.000%, due 7/1/27 | | | 211 | | | | 217 | |
| | #AL9857, 4.000%, due 2/1/29 | | | 8,296 | | | | 8,512 | |
| | #252925, 7.500%, due 12/1/29 | | | 1 | | | | 1 | |
| | #AD0729, 7.500%, due 12/1/30 | | | 7,408 | | | | 8,566 | |
| | #535977, 6.500%, due 4/1/31 | | | 6 | | | | 6 | |
| | #253907, 7.000%, due 7/1/31 | | | 1 | | | | 1 | |
| | #545339, 6.500%, due 11/1/31 | | | 31 | | | | 35 | |
| | #587849, 6.500%, due 11/1/31 | | | 7 | | | | 8 | |
| | #618547, 6.500%, due 11/1/31 | | | 3,816 | | | | 4,254 | |
| | #545437, 7.000%, due 2/1/32 | | | 36 | | | | 41 | |
| | #545759, 6.500%, due 7/1/32 | | | 311 | | | | 351 | |
| | #545869, 6.500%, due 7/1/32 | | | 1,040 | | | | 1,170 | |
| | #670385, 6.500%, due 9/1/32 | | | 475 | | | | 531 | |
| | #254548, 5.500%, due 12/1/32 | | | 31 | | | | 33 | |
| | #703391, 5.000%, due 5/1/33 | | | 106 | | | | 113 | |
| | #708993, 5.000%, due 6/1/33 | | | 20 | | | | 22 | |
| | #730131, 5.000%, due 8/1/33 | | | 46 | | | | 49 | |
| | #741850, 5.500%, due 9/1/33 | | | 349 | | | | 377 | |
| | #555800, 5.500%, due 10/1/33 | | | 34 | | | | 37 | |
| | #756153, 5.500%, due 11/1/33 | | | 396 | | | | 428 | |
| | #AL3455, 5.500%, due 11/1/33 | | | 4,886 | | | | 5,297 | |
| | #AL3401, 5.500%, due 2/1/34 | | | 952 | | | | 1,031 | |
| | #763798, 5.500%, due 3/1/34 | | | 61 | | | | 66 | |
| | #725611, 5.500%, due 6/1/34 | | | 74 | | | | 80 | |
| | #745563, 5.500%, due 8/1/34 | | | 443 | | | | 478 | |
| | #794474, 6.000%, due 10/1/34 | | | 36 | | | | 39 | |
| | #745092, 6.500%, due 7/1/35 | | | 244 | | | | 276 | |
| | #357944, 6.000%, due 9/1/35 | | | 12 | | | | 13 | |
| | #AD0979, 7.500%, due 10/1/35 | | | 57 | | | | 66 | |
| | #745349, 6.500%, due 2/1/36 | | | 209 | | | | 244 | |
| | #888305, 7.000%, due 3/1/36 | | | 8 | | | | 9 | |
| | #895637, 6.500%, due 5/1/36 | | | 54 | | | | 61 | |
| | #831540, 6.000%, due 6/1/36 | | | 16 | | | | 18 | |
| | #893318, 6.500%, due 8/1/36 | | | 8 | | | | 8 | |
| | #310037, 6.500%, due 10/1/36 | | | 132 | | | | 151 | |
| | #831926, 6.000%, due 12/1/36 | | | 453 | | | | 494 | |
| | #902974, 6.000%, due 12/1/36 | | | 118 | | | | 127 | |
| | #AB0265, 6.000%, due 2/1/37 | | | 10,168 | | | | 11,221 | |
| | #938440, 6.000%, due 7/1/37 | | | 73 | | | | 80 | |
| | #948689, 6.000%, due 8/1/37 | | | 132 | | | | 142 | |
| | #888703, 6.500%, due 8/1/37 | | | 3,099 | | | | 3,616 | |
| | #888530, 7.500%, due 8/1/37 | | | 927 | | | | 1,093 | |
| | #AL6411, 7.000%, due 12/1/37 | | | 1,993 | | | | 2,242 | |
| | #AL0904, 5.500%, due 1/1/38 | | | 96 | | | | 104 | |
| | #889371, 6.000%, due 1/1/38 | | | 2,263 | | | | 2,503 | |
| | #962058, 6.500%, due 3/1/38 | | | 1,033 | | | | 1,185 | |
| | #934006, 6.500%, due 9/1/38 | | | 260 | | | | 304 | |
| | #986856, 6.500%, due 9/1/38 | | | 103 | | | | 118 | |
| | #991911, 7.000%, due 11/1/38 | | | 112 | | | | 120 | |
| | #AL3775, 5.000%, due 1/1/39 | | | 1,334 | | | | 1,428 | |
| | #AD0752, 7.000%, due 1/1/39 | | | 508 | | | | 604 | |
| | #AA7611, 5.000%, due 5/1/39 | | | 571 | | | | 611 | |
| | #AA8443, 5.000%, due 6/1/39 | | | 150 | | | | 161 | |
| | #AC1619, 5.500%, due 8/1/39 | | | 347 | | | | 374 | |
| | #AD0315, 6.500%, due 8/1/39 | | | 1,637 | | | | 1,864 | |
See accompanying Notes to Financial Statements.
| 86 | Annual Report | December 31, 2018 |
Bond Fund
Portfolio of Investments, December 31, 2018(all dollar amounts in thousands)
| | | | NRSRO | | | | | | |
| | | | Rating | | Principal | | | | |
| | Issuer | | (unaudited) | | Amount | | | Value | |
| | | | | | | | | | | | |
| | U.S. Government and U.S. Government Agency—(continued) |
| | Federal National Mortgage Association (FNMA)—(continued) |
| | #AC9569, 5.000%, due 2/1/40 | | | | $ | 1,214 | | | $ | 1,301 | |
| | #AD0761, 5.000%, due 2/1/40 | | | | | 189 | | | | 202 | |
| | #AD1594, 5.000%, due 2/1/40 | | | | | 195 | | | | 209 | |
| | #932751, 5.000%, due 4/1/40 | | | | | 2,708 | | | | 2,902 | |
| | #AD7137, 5.500%, due 7/1/40 | | | | | 3,473 | | | | 3,764 | |
| | #BM1689, 5.500%, due 8/1/40 | | | | | 2,855 | | | | 3,092 | |
| | #AH5585, 5.000%, due 2/1/41 | | | | | 127 | | | | 137 | |
| | #AI1201, 5.500%, due 4/1/41 | | | | | 4,262 | | | | 4,544 | |
| | #AL5815, 5.500%, due 4/1/41 | | | | | 3,488 | | | | 3,783 | |
| | #BM3525, 6.000%, due 4/1/41 | | | | | 12,237 | | | | 13,541 | |
| | #AI6071, 5.000%, due 6/1/41 | | | | | 1,220 | | | | 1,307 | |
| | #AI4222, 5.000%, due 7/1/41 | | | | | 93 | | | | 99 | |
| | #AL0672, 5.000%, due 7/1/41 | | | | | 2,124 | | | | 2,277 | |
| | #AL0913, 6.000%, due 7/1/41 | | | | | 1,269 | | | | 1,394 | |
| | #AL9226, 5.500%, due 12/1/41 | | | | | 14,322 | | | | 15,531 | |
| | #AL9225, 6.000%, due 1/1/42 | | | | | 6,379 | | | | 7,055 | |
| | #AK2733, 5.000%, due 2/1/42 | | | | | 1,423 | | | | 1,524 | |
| | Total FNMA Mortgage Obligations | | | | | | | | | 136,731 | |
| | | | | | | | | | | | |
| | Asset-Backed Securities—1.6% | | | | | | | | | | |
| | Tesla Auto Lease Trust—144A, 2018-A, Tranche D,
3.300%, 5/20/20 | | Baa2 | | | 500 | | | | 499 | |
| | Centre Point Funding LLC—144A, 2012-2A, Tranche 1,
2.610%, 8/20/21 | | Baa1 | | | 1,437 | | | | 1,418 | |
| | SLM Private Education Loan Trust—144A, 2011-A, Tranche A3,
1M USD LIBOR + 2.500%, 4.955%, 1/15/43, VRN | | AAA | | | 4,868 | | | | 4,935 | |
| | Total Asset-Backed Securities | | | | | | | | | 6,852 | |
| | | | | | | | | | | | |
| | Corporate Obligations—45.9% | | | | | | | | | | |
| | Ford Motor Credit Co. LLC,
8.125%, due 1/15/20 | | BBB | | | 4,000 | | | | 4,154 | |
| | UBS Group Funding Switzerland AG,
5 year USD ICE Swap + 5.497%, 6.875%, due 3/22/21, VRN | | BBB- | | | 2,000 | | | | 2,007 | |
| | JBS USA LUX SA / JBS USA Finance, Inc.—144A,
7.250%, due 6/1/21 | | BB- | | | 3,000 | | | | 3,030 | |
| | Fresenius Medical Care US Finance II, Inc.—144A,
5.875%, due 1/31/22 | | BBB- | | | 2,460 | | | | 2,566 | |
| | Masco Corporation,
5.950%, due 3/15/22 | | BBB | | | 4,050 | | | | 4,295 | |
| | Discover Financial Services,
5.200%, due 4/27/22 | | BBB+ | | | 3,000 | | | | 3,115 | |
| | Jones Lang LaSalle, Inc.,
4.400%, due 11/15/22 | | BBB+ | | | 3,900 | | | | 3,943 | |
| | Navient Corporation,
5.500%, due 1/25/23 | | BB | | | 2,000 | | | | 1,758 | |
| | Toll Brothers Finance Corporation,
4.375%, due 4/15/23 | | BBB- | | | 4,500 | | | | 4,241 | |
| | Itau Unibanco Holding S.A.—144A,
5.125%, due 5/13/23 | | Ba3 | | | 2,500 | | | | 2,515 | |
| | | | NRSRO | | | | | | |
| | | | Rating | | Principal | | | | |
| | Issuer | | (unaudited) | | Amount | | | Value | |
| | | | | | | | | | | | |
| | Corporate Obligations—(continued) |
| | Wells Fargo & Co.,
4.480%, due 1/16/24 | | A | | $ | 4,250 | | | $ | 4,306 | |
| | Lennar Corporation,
4.500%, due 4/30/24 | | BBB- | | | 2,450 | | | | 2,321 | |
| | Banco Inbursa S.A. Institucion de Banca Multiple—144A,
4.125%, due 6/6/24 | | BBB+ | | | 2,500 | | | | 2,369 | |
| | Grupo Bimbo S.A.B. de C.V.—144A,
3.875%, due 6/27/24 | | BBB | | | 2,500 | | | | 2,461 | |
| | Iron Mountain, Inc.,
5.750%, due 8/15/24 | | B | | | 675 | | | | 643 | |
| | SBA Communications Corporation,
4.875%, due 9/1/24 | | BB- | | | 2,500 | | | | 2,359 | |
| | HSBC Holdings plc,
5 year USD ICE Swap + 3.705%, 6.375%, due 9/17/24, VRN | | BBB | | | 5,000 | | | | 4,662 | |
| | JPMorgan Chase & Co.,
3M USD LIBOR + 3.330%, 6.100%, due 10/1/24, VRN | | Baa2 | | | 4,265 | | | | 4,244 | |
| | Owens Corning,
4.200%, due 12/1/24 | | BBB | | | 4,500 | | | | 4,470 | |
| | Cemex S.A.B. de C.V.—144A,
5.700%, due 1/11/25 | | BB | | | 3,000 | | | | 2,884 | |
| | Centene Corporation,
4.750%, due 1/15/25 | | BB+ | | | 2,000 | | | | 1,915 | |
| | Booz Allen Hamilton, Inc.—144A,
5.125%, due 5/1/25 | | B+ | | | 3,000 | | | | 2,865 | |
| | DaVita, Inc.,
5.000%, due 5/1/25 | | Ba3 | | | 2,500 | | | | 2,278 | |
| | Simon Property Group L.P.,
3.300%, due 1/15/26 | | A | | | 4,500 | | | | 4,342 | |
| | Penske Automotive Group, Inc.,
5.500%, due 5/15/26 | | Ba3 | | | 2,200 | | | | 2,054 | |
| | Vale Overseas, Ltd.,
6.250%, due 8/10/26 | | BBB+ | | | 3,000 | | | | 3,247 | |
| | Post Holdings, Inc.—144A,
5.000%, due 8/15/26 | | B+ | | | 3,000 | | | | 2,745 | |
| | United Rentals North America, Inc.,
5.875%, due 9/15/26 | | BB | | | 2,500 | | | | 2,366 | |
| | Xylem, Inc.,
3.250%, due 11/1/26 | | BBB | | | 2,225 | | | | 2,118 | |
| | Netflix, Inc.,
4.375%, due 11/15/26 | | BB- | | | 2,000 | | | | 1,820 | |
| | Glencore Funding LLC—144A,
4.000%, due 3/27/27 | | BBB+ | | | 5,000 | | | | 4,560 | |
| | Hess Corporation,
4.300%, due 4/1/27 | | BBB- | | | 4,500 | | | | 4,130 | |
| | The Chemours Co.,
5.375%, due 5/15/27 | | BB- | | | 3,000 | | | | 2,715 | |
| | Sirius XM Radio, Inc.—144A,
5.000%, due 8/1/27 | | BB | | | 2,500 | | | | 2,294 | |
| | Lear Corporation,
3.800%, due 9/15/27 | | BBB- | | | 3,000 | | | | 2,745 | |
| | Motorola Solutions, Inc.,
4.600%, due 2/23/28 | | BBB- | | | 4,500 | | | | 4,408 | |
| | The Kroger Co.,
8.000%, due 9/15/29 | | Baa1 | | | 4,100 | | | | 5,064 | |
| | Yum! Brands, Inc.,
6.875%, due 11/15/37 | | B+ | | | 3,000 | | | | 2,955 | |
See accompanying Notes to Financial Statements.
| December 31, 2018 | William Blair Funds | 87 |
Bond Fund
Portfolio of Investments, December 31, 2018(all dollar amounts in thousands)
| | | | NRSRO | | | | | | |
| | | | Rating | | Principal | | | | |
| | Issuer | | (unaudited) | | Amount | | | Value | |
| | | | | | | | | | | | |
| | Corporate Obligations—(continued) |
| | ConocoPhillips,
6.500%, due 2/1/39 | | A | | $ | 3,500 | | | $ | 4,339 | |
| | Petroleos Mexicanos,
6.500%, due 6/2/41 | | BBB+ | | | 2,500 | | | | 2,076 | |
| | Express Scripts Holding Co.,
6.125%, due 11/15/41 | | A- | | | 4,200 | | | | 4,719 | |
| | Citigroup, Inc.,
5.875%, due 1/30/42 | | A | | | 4,000 | | | | 4,536 | |
| | Bank of America Corporation,
5.875%, due 2/7/42 | | A+ | | | 4,000 | | | | 4,652 | |
| | Cox Communications, Inc.—144A,
4.700%, due 12/15/42 | | BBB+ | | | 4,300 | | | | 3,799 | |
| | Mexichem S.A.B. de C.V.—144A,
5.875%, due 9/17/44 | | BBB | | | 3,500 | | | | 3,164 | |
| | AbbVie, Inc.,
4.700%, due 5/14/45 | | A- | | | 4,500 | | | | 4,107 | |
| | ERP Operating L.P.,
4.500%, due 6/1/45 | | A | | | 4,500 | | | | 4,528 | |
| | The Goldman Sachs Group, Inc.,
4.750%, due 10/21/45 | | A | | | 3,500 | | | | 3,338 | |
| | Apple, Inc.,
4.650%, due 2/23/46 | | AA+ | | | 3,500 | | | | 3,714 | |
| | PepsiCo, Inc.,
4.450%, due 4/14/46 | | A+ | | | 3,500 | | | | 3,664 | |
| | Verizon Communications, Inc.,
4.125%, due 8/15/46 | | A- | | | 4,000 | | | | 3,543 | |
| | Brookfield Finance, Inc.,
4.700%, due 9/20/47 | | A- | | | 5,000 | | | | 4,615 | |
| | CVS Health Corporation,
5.050%, due 3/25/48 | | BBB | | | 4,500 | | | | 4,393 | |
| | Microsoft Corporation,
4.750%, due 11/3/55 | | AAA | | | 3,500 | | | | 3,929 | |
| | AT&T, Inc.,
5.700%, due 3/1/57 | | A- | | | 4,500 | | | | 4,445 | |
| | Comcast Corporation,
4.950%, due 10/15/58 | | A- | | | 2,000 | | | | 2,039 | |
| | Corning, Inc.,
5.850%, due 11/15/68 | | BBB+ | | | 4,400 | | | | 4,470 | |
| | Petrobras Global Finance BV,
6.850%, due 6/5/15 | | Ba2 | | | 3,325 | | | | 2,983 | |
| | Total Corporate Obligations | | | | | | | | | 194,017 | |
| | Total Long-Term Investments—100.0%
(cost $436,240) | | | | | | | | | 422,737 | |
| | Total Investments—100.0%
(cost $436,240) | | | | | | | | | 422,737 | |
| | | | | | | | | | |
| | | | | | Principal | | | | |
| | Issuer | | | | Amount | | | Value | |
| | | | | | | | | | | | |
| | Securities Sold, Not Yet Purchased | | | | | | | | | | |
| | | | | | | | | | | | |
| | U.S. Government Agency—(4.6)% | | | | | | | | | | |
| | Federal National Mortgage Association (FNMA)—(4.6)% | | | | | | | | | | |
| | TBA, 3.000%, due 1/1/49 | | | | $ | (20,000 | ) | | $ | (19,496 | ) |
| | Total Securities Sold, Not Yet Purchased—(4.6)%
(proceeds $19,193) | | | | | | | | | (19,496 | ) |
| | Cash and other assets, less liabilities—4.6% | | | | | | | | | 19,305 | |
| | Net assets—100.0% | | | | | | | | $ | 422,546 | |
The obligations of certain U.S. Government-sponsored securities are neither issued nor guaranteed by the U.S. Treasury.
144A = Security exempt from registration under Rule 144A of the Securities Act of 1933. These securities may be resold in transactions exempt from registration, normally to qualified institutional buyers.
NRSRO = Nationally Recognized Statistical Rating Organization—The credit quality ratings of the securities in the Fund reflect the highest category rating by any of Fitch Ratings, Moody’s Investors Service Inc., or Standard & Poor’s, a division of the McGraw-Hill Companies, Inc.
TBA = To Be Announced—TBAs are mortgage-backed securities traded under delayed delivery commitments, settling after December 31, 2018. The term TBA comes from the fact that the specific mortgage-backed security that will be delivered to fulfill a TBA trade is not designated at the time the trade is made.
VRN = Variable Rate Note
(a) Security, or a portion of security, is segregated as collateral for the centrally cleared credit default swap, aggregating a total of $256.
Centrally Cleared Credit Default Swaps
| | | | | | | | | | | | | | | Upfront | | | | |
| | | | | | | | | | | | | Notional | | Payment | | | | Unrealized |
| | | Buy/Sell | | Fixed Deal | | Payment | | Maturity | | Cleared | | Amount | | Paid | | | | Appreciation |
| Reference Entity | | Protection | | Pay Rate | | Frequency | | Date | | Exchange | | (in thousands) | | (Received) | | Value | | (Depreciation) |
| | | | | | | | | December | | Intercontinental | | | | | | | | |
| CDX.IG-31 | | Buy | | 1.000% | | 3M | | 2023 | | Exchange | | $25,000 | | (423) | | (147) | | $276 |
See accompanying Notes to Financial Statements.
| 88 | Annual Report | December 31, 2018 |
| | Income Fund |
| | |
| | The Income Fund seeks a high level of current income with relative stability of principal. |
| | |
| | AN OVERVIEW FROM THE PORTFOLIO MANAGER |
| | |

Christopher T. Vincent | The William Blair Income Fund (Class N shares) returned -0.86%, net of fees, for the twelve months ended December 31, 2018. By comparison, the Fund’s benchmark index, the Bloomberg Barclays Intermediate Government/Credit Bond Index (the “Index”), returned 0.88%. Multiple factors detracted from the Fund’s performance relative to the Index during the year. The Fund’s sector positioning detracted from results, as the Fund was underweight fixed-rate U.S. Treasuries and overweight agency mortgage-backed securities. An allocation to U.S. Treasury Inflation-Protected Securities (TIPS) detracted from the Fund’s results. Positions in corporate bonds issued by Toll Brothers Finance Corporation and Abbvie, Inc. negatively impacted the Fund’s relative performance during the year. The Fund experienced favorable security selection results from its holdings of corporate bonds domiciled in emerging markets. In particular, a position in bonds issued by Vale Overseas, Ltd. contributed to results. Please refer to the Fixed Income Market Review and Outlook relating to the Fund beginning on page 82 for additional information. |
| December 31, 2018 | William Blair Funds | 89 |
Income Fund
Performance Highlights (Unaudited)
| Average Annual Total Return through 12/31/2018 |
| | | | | | | | | | | | | |
| | | 1 Year | | 3 Year | | 5 Year | | 10 Year |
| Class N | | | (0.86 | )% | | | 1.00 | % | | | 1.29 | % | | | 3.15 | % |
| Class I | | | (0.69 | ) | | | 1.25 | | | | 1.51 | | | | 3.36 | |
| Bloomberg Barclays Intermediate Government/Credit Bond Index | | | 0.88 | | | | 1.70 | | | | 1.86 | | | | 2.90 | |
Performance cited represents past performance. Past performance does not guarantee future results and current performance may be lower or higher than the data quoted. Results shown are average annual total returns, which assume reinvestment of dividends and capital gains. Investment returns and principal will fluctuate and you may have a gain or loss when you sell shares. For the most current month-end performance information, please call 1-800-742-7272, or visit our Web site atwww.williamblairfunds.com. From time to time, the investment adviser may waive fees or reimburse expenses for the Fund. Without these waivers/reimbursements, performance would be lower. Class N shares are available to the general public without a sales load. Class I shares are available to certain institutional investors, and advisory clients of William Blair & Company, L.L.C., without a sales load or distribution (12b-1) or service fees.
The performance highlights and graph presented above do not reflect the deduction of taxes that a shareholder would pay on fund distributions or the redemption of fund shares.
The Bloomberg Barclays Intermediate Government/Credit Bond Index indicates broad intermediate government/corporate bond market performance.
This report identifies the Fund’s investments on December 31, 2018. These holdings are subject to change. Not all investments in the Fund performed the same, nor is there any guarantee that these investments will perform as well in the future. Market forecasts provided in this report may not necessarily come to pass.
Sector Diversification (Unaudited)

The sector diversification shown is based on the total investments.
| 90 | Annual Report | December 31, 2018 |
Income Fund
Portfolio of Investments, December 31, 2018(all dollar amounts in thousands)
| | | | | | | | |
| | Issuer | | Principal
Amount | | | Value | |
| | | | | | | | | | |
| | U.S. Government and U.S. Government Agency—61.4% | | | | | |
| | U.S. Treasury Inflation Indexed Notes/Bonds—3.1% | | | | | | |
| | U.S. Treasury Inflation Indexed Bond,
3.875%, due 4/15/29 | | $ | 1,384 | | | $ | 1,763 | |
| | Federal Home Loan Mortgage Corp. (FHLMC)—13.5% | | | | | |
| | #J05444, 6.000%, due 8/1/22 | | | 22 | | | | 22 | |
| | #E02388, 6.000%, due 9/1/22 | | | 35 | | | | 36 | |
| | #E02490, 6.000%, due 4/1/23 | | | 41 | | | | 42 | |
| | #J13022, 4.000%, due 9/1/25 | | | 345 | | | | 354 | |
| | #G14150, 4.500%, due 4/1/26 | | | 96 | | | | 100 | |
| | #J16051, 4.500%, due 7/1/26 | | | 660 | | | | 686 | |
| | #A17603, 5.500%, due 1/1/34 | | | 476 | | | | 516 | |
| | #G01705, 5.500%, due 6/1/34 | | | 888 | | | | 962 | |
| | #A45790, 7.500%, due 5/1/35 | | | 89 | | | | 97 | |
| | #G04126, 6.000%, due 6/1/37 | | | 210 | | | | 230 | |
| | #G03201, 6.500%, due 6/1/37 | | | 128 | | | | 146 | |
| | #A66843, 6.500%, due 10/1/37 | | | 201 | | | | 233 | |
| | #G04564, 6.000%, due 12/1/37 | | | 184 | | | | 203 | |
| | #A81799, 6.500%, due 9/1/38 | | | 195 | | | | 212 | |
| | #G05566, 5.500%, due 12/1/38 | | | 118 | | | | 127 | |
| | #G60366, 6.000%, due 10/1/39 | | | 928 | | | | 1,019 | |
| | #G05875, 5.500%, due 2/1/40 | | | 87 | | | | 93 | |
| | #G61450, 6.000%, due 4/1/40 | | | 1,191 | | | | 1,323 | |
| | #C03665, 9.000%, due 4/1/41 | | | 197 | | | | 226 | |
| | #G06583, 5.000%, due 6/1/41 | | | 1,052 | | | | 1,128 | |
| | Total FHLMC Mortgage Obligations | | | | | | | 7,755 | |
| | Federal National Mortgage Association(FNMA)—44.8% | | | | | | | | |
| | #751313, 5.000%, due 3/1/19 | | | 2 | | | | 2 | |
| | #458147, 10.000%, due 8/15/20 | | | 1 | | | | 1 | |
| | #880991, 5.500%, due 1/1/22 | | | 44 | | | | 45 | |
| | #735574, 8.000%, due 3/1/22 | | | 35 | | | | 36 | |
| | FNR G93-19 SH, 1M LIBOR + 56.169%, 11.234%, due 4/25/23, VRN | | | 11 | | | | 12 | |
| | #982885, 5.000%, due 5/1/23 | | | 203 | | | | 212 | |
| | #AL0955, 6.000%, due 5/1/23 | | | 103 | | | | 105 | |
| | #933985, 5.500%, due 8/1/23 | | | 112 | | | | 115 | |
| | #AL8529, 6.000%, due 11/1/24 | | | 2,306 | | | | 2,399 | |
| | #255956, 5.500%, due 10/1/25 | | | 30 | | | | 32 | |
| | #AH0971, 4.000%, due 12/1/25 | | | 335 | | | | 343 | |
| | #AL2853, 4.500%, due 6/1/26 | | | 574 | | | | 596 | |
| | #AJ6954, 4.000%, due 11/1/26 | | | 151 | | | | 155 | |
| | #AL9730, 4.500%, due 2/1/27 | | | 1,119 | | | | 1,161 | |
| | #256639, 5.000%, due 2/1/27 | | | 6 | | | | 6 | |
| | #806458, 8.000%, due 6/1/28 | | | 77 | | | | 84 | |
| | #AL9857, 4.000%, due 2/1/29 | | | 6,526 | | | | 6,696 | |
| | #880155, 8.500%, due 7/1/29 | | | 182 | | | | 204 | |
| | #797846, 7.000%, due 3/1/32 | | | 43 | | | | 44 | |
| | #745519, 8.500%, due 5/1/32 | | | 51 | | | | 58 | |
| | #654674, 6.500%, due 9/1/32 | | | 35 | | | | 38 | |
| | #254693, 5.500%, due 4/1/33 | | | 5 | | | | 6 | |
| | #555531, 5.500%, due 6/1/33 | | | 50 | | | | 54 | |
| | #711736, 5.500%, due 6/1/33 | | | 72 | | | | 78 | |
| | #555591, 5.500%, due 7/1/33 | | | 8 | | | | 9 | |
| | #AL3455, 5.500%, due 11/1/33 | | | 1,435 | | | | 1,556 | |
| | #776964, 5.000%, due 4/1/34 | | | 243 | | | | 260 | |
| | Issuer | | NRSRO
Rating
(unaudited) | | Principal
Amount | | | Value | |
| | | | | | | | | | | | |
| | U.S. Government and U.S. Government Agency—(continued) | |
| | Federal National Mortgage Association (FNMA)—(continued) | |
| | #725424, 5.500%, due 4/1/34 | | | | $ | 54 | | | $ | 58 | |
| | #888884, 5.500%, due 12/1/35 | | | | | 117 | | | | 126 | |
| | #888703, 6.500%, due 8/1/37 | | | | | 655 | | | | 764 | |
| | #928658, 6.500%, due 9/1/37 | | | | | 21 | | | | 23 | |
| | #AL6411, 7.000%, due 12/1/37 | | | | | 638 | | | | 717 | |
| | #962058, 6.500%, due 3/1/38 | | | | | 334 | | | | 383 | |
| | #991911, 7.000%, due 11/1/38 | | | | | 72 | | | | 77 | |
| | #AC9569, 5.000%, due 2/1/40 | | | | | 162 | | | | 173 | |
| | #BM1689, 5.500%, due 8/1/40 | | | | | 386 | | | | 418 | |
| | #AL5815, 5.500%, due 4/1/41 | | | | | 498 | | | | 540 | |
| | #BM3525, 6.000%, due 4/1/41 | | | | | 1,086 | | | | 1,202 | |
| | #AL9226, 5.500%, due 12/1/41 | | | | | 4,526 | | | | 4,908 | |
| | #AL9225, 6.000%, due 1/1/42 | | | | | 1,754 | | | | 1,940 | |
| | Total FNMA Mortgage Obligations | | | | | | | | | 25,636 | |
| | | | | | | | | | | | |
| | Asset-Backed Securities—3.5% | | | | | | | | | | |
| | Capital One Multi-Asset Execution Trust, 2016-A1, Tranche A1,
1M LIBOR + 0.450%, 2.905%, 2/15/22, VRN | | AAA | | | 500 | | | | 500 | |
| | Chase Issuance Trust, 2018-A1, Tranche A1,
1M USD LIBOR + 0.200%, 2.655%, 4/17/23, VRN | | AAA | | | 500 | | | | 499 | |
| | Verizon Owner Trust, 2018-A, Tranche A1B,
1M USD LIBOR + 0.240%, 2.710%, 4/20/23, VRN | | AAA | | | 500 | | | | 500 | |
| | SLM Private Education Loan Trust—144A, 2011-A, Tranche A3,
1M USD LIBOR + 2.500%, 4.955%, 1/15/43, VRN | | AAA | | | 487 | | | | 494 | |
| | Total Asset-Backed Securities | | | | | | | | | 1,993 | |
| | | | | | | | | | | | |
| | Corporate Obligations—33.5% | | | | | | | | | | |
| | JPMorgan Chase & Co.,
3M USD LIBOR + 3.320%,
5.000%, due 7/1/19, VRN | | Baa2 | | | 500 | | | | 483 | |
| | Burlington Northern Santa Fe LLC,
4.700%, due 10/1/19 | | A+ | | | 650 | | | | 658 | |
| | Citigroup, Inc.,
2.450%, due 1/10/20 | | A | | | 650 | | | | 645 | |
| | Branch Banking & Trust Co.,
3M USD LIBOR + 0.450%,
2.886%, due 1/15/20, VRN | | A1 | | | 500 | | | | 500 | |
| | Petroleos Mexicanos,
6.000%, due 3/5/20 | | BBB+ | | | 400 | | | | 408 | |
| | American Express Credit Corporation,
3M USD LIBOR + 0.730%,
3.419%, due 5/26/20, VRN | | A2 | | | 500 | | | | 501 | |
| | Georgia-Pacific LLC—144A,
5.400%, due 11/1/20 | | A+ | | | 600 | | | | 622 | |
| | Mitsubishi UFJ Financial Group, Inc.,
2.950%, due 3/1/21 | | A1 | | | 575 | | | | 569 | |
See accompanying Notes to Financial Statements.
| December 31, 2018 | William Blair Funds | 91 |
Income Fund
Portfolio of Investments, December 31, 2018(all dollar amounts in thousands)
| | Issuer | | NRSRO
Rating
(unaudited) | | Principal
Amount | | | Value | |
| | | | | | | | | | | | |
| | Corporate Obligations—(continued) | | | | | | |
| | HSBC Holdings plc,
3M USD LIBOR + 2.240%,
5.007%, due 3/8/21, VRN | | AA- | | $ | 500 | | | $ | 512 | |
| | Westpac Banking Corporation,
3M USD LIBOR + 1.000%,
3.618%, due 5/13/21, VRN | | AA- | | | 500 | | | | 504 | |
| | Chevron Corporation,
3M USD LIBOR + 0.950%,
3.579%, due 5/16/21, VRN | | AA | | | 500 | | | | 506 | |
| | The Charles Schwab Corporation,
3M LIBOR + 0.320%,
2.966%, due 5/21/21, VRN | | A | | | 500 | | | | 498 | |
| | Capital One Financial Corporation,
4.750%, due 7/15/21 | | A- | | | 650 | | | | 667 | |
| | Apple, Inc.,
1.550%, due 8/4/21 | | AA+ | | | 650 | | | | 631 | |
| | Verizon Communications, Inc.,
3.500%, due 11/1/21 | | A- | | | 650 | | | | 657 | |
| | Lloyds Banking Group plc,
3.000%, due 1/11/22 | | A+ | | | 500 | | | | 484 | |
| | Bancolombia S.A.,
5.125%, due 9/11/22 | | BBB- | | | 400 | | | | 403 | |
| | Jones Lang LaSalle, Inc.,
4.400%, due 11/15/22 | | BBB+ | | | 625 | | | | 632 | |
| | Toll Brothers Finance Corporation,
4.375%, due 4/15/23 | | BBB- | | | 400 | | | | 377 | |
| | Ryder System, Inc.,
3.750%, due 6/9/23 | | A- | | | 500 | | | | 497 | |
| | Wells Fargo & Co.,
4.480%, due 1/16/24 | | A | | | 650 | | | | 659 | |
| | The Goldman Sachs Group, Inc.,
4.000%, due 3/3/24 | | A | | | 650 | | | | 642 | |
| | Grupo Bimbo S.A.B. de C.V.—144A,
3.875%, due 6/27/24 | | BBB | | | 500 | | | | 492 | |
| | BNP Paribas S.A.,
4.250%, due 10/15/24 | | A | | | 650 | | | | 643 | |
| | AbbVie, Inc.,
3.600%, due 5/14/25 | | A- | | | 650 | | | | 624 | |
| | ERP Operating L.P.,
3.375%, due 6/1/25 | | A | | | 650 | | | | 639 | |
| | Intercontinental Exchange, Inc.,
3.750%, due 12/1/25 | | A | | | 650 | | | | 654 | |
| | Simon Property Group L.P.,
3.300%, due 1/15/26 | | A | | | 650 | | | | 627 | |
| | ConocoPhillips Co.,
4.950%, due 3/15/26 | | A | | | 650 | | | | 696 | |
| | Brookfield Finance, Inc.,
4.250%, due 6/2/26 | | A- | | | 650 | | | | 638 | |
| | Vale Overseas, Ltd.,
6.250%, due 8/10/26 | | BBB+ | | | 450 | | | | 487 | |
| | Amazon.com, Inc.,
3.150%, due 8/22/27 | | AA- | | | 650 | | | | 628 | |
| | Motorola Solutions, Inc.,
4.600%, due 2/23/28 | | BBB- | | | 400 | | | | 392 | |
| | The Kroger Co.,
8.000%, due 9/15/29 | | Baa1 | | | 500 | | | | 618 | |
| | Total Corporate Obligations | | | | | | | | | 19,193 | |
| | Total Long-Term Investments—98.4%
(cost $58,178) | | | | | | | | | 56,340 | |
| | | | | | | | |
| | Issuer | | Principal
Amount | | | Value | |
| | | | | | | | | | |
| | Repurchase Agreement | | | | | | | | |
| | Fixed Income Clearing Corporation, 0.500% dated 12/31/18, due 1/2/19, repurchase price $903, collateralized by Federal Home Loan Mortgage Corporation, 3.750%, due 3/27/19 | | $ | 903 | | | $ | 903 | |
| | Total Repurchase Agreement—1.6%
(cost $903) | | | | | | | 903 | |
| | | | | | | | | | |
| | Commercial Paper | | | | | | | | |
| | Chariot Funding LLC,
2.434%, due 1/2/19 | | | 400 | | | | 400 | |
| | Total Commercial Paper—0.7%
(cost $400) | | | | | | | 400 | |
| | Total Investments—100.7%
(cost $59,481) | | | | | | | 57,643 | |
| | | | | | | | | | |
| | Securities Sold, Not Yet Purchased | | | | | | | | |
| | | | | | | | | | |
| | U.S. Government Agency—(8.5)% | | | | | | | | |
| | Federal National Mortgage Association(FNMA)—(8.5)% | | | | | | | | |
| | TBA, 2.500%, due 1/1/34 | | | (5,000 | ) | | | (4,883 | ) |
| | Total Securities Sold, Not Yet Purchased—(8.5)%
(proceeds $4,839) | | | | | | | (4,883 | ) |
| | Cash and other assets, less liabilities—7.8% | | | | | | | 4,455 | |
| | Net assets—100.0% | | | | | | $ | 57,215 | |
The obligations of certain U.S. Government-sponsored securities are neither issued nor guaranteed by the U.S. Treasury.
144A = Security exempt from registration under Rule 144A of the Securities Act of 1933. These securities may be resold in transactions exempt from registration, normally to qualified institutional buyers.
NRSRO = Nationally Recognized Statistical Rating Organization—The credit quality ratings of the securities in the Fund reflect the highest category rating by any of Fitch Ratings, Moody’s Investors Service Inc., or Standard & Poor’s, a division of the McGraw-Hill Companies, Inc.
TBA = To Be Announced—TBAs are mortgage-backed securities traded under delayed delivery commitments, settling after December 31, 2018. The term TBA comes from the fact that the specific mortgage-backed security that will be delivered to fulfill a TBA trade is not designated at the time the trade is made.
VRN = Variable Rate Note
See accompanying Notes to Financial Statements.
| 92 | Annual Report | December 31, 2018 |
| | Low Duration Fund |
| | |
| | The Low Duration Fund seeks to maximize total return. Total return includes both income and capital appreciation. |
| | |
| | AN OVERVIEW FROM THE PORTFOLIO MANAGERS |
| | |

Paul J. Sularz 
Christopher T. Vincent | The William Blair Low Duration Fund (Class N shares) returned 0.80%, net of fees, for the twelve months ended December 31, 2018. By comparison, the Fund’s benchmark index, the Bank of America/Merrill Lynch 1-Year U.S. Treasury Note Index (the “Index”), returned 1.86%. Multiple factors detracted from the Fund’s performance relative to the Index during the year. The Fund had slightly more interest rate exposure than the Index, which detracted from the Fund’s results as interest rates rose throughout the year. The Fund’s holdings in agency mortgage-backed securities experienced gains during the year but underperformed relative to the Index. The Fund’s holdings in floating-rate corporate bonds and asset-backed securities contributed to relative performance during the year. Please refer to the Fixed Income Market Review and Outlook relating to the Fund beginning on page 82 for additional information. |
| December 31, 2018 | William Blair Funds | 93 |
Low Duration Fund
Performance Highlights (Unaudited)
| Average Annual Total Return through 12/31/2018 |
| | | | | | | | | | | | | |
| | | 1 Year | | 3 Year | | 5 Year | | Since
Inception(a) |
| Class N | | | 0.80 | % | | | 0.94 | % | | | 0.80 | % | | | 1.01 | % |
| Class I | | | 1.12 | | | | 1.14 | | | | 0.99 | | | | 1.18 | |
| Institutional Class | | | 1.15 | | | | 1.18 | | | | 1.03 | | | | 1.28 | |
| Bank of America Merrill Lynch 1-Year U.S. Treasury Note Index | | | 1.86 | | | | 1.06 | | | | 0.70 | | | | 0.58 | |
| | |
| (a) | Since inception is for the period from December 1, 2009 (Commencement of Operations) to December 31, 2018. |
Performance cited represents past performance. Past performance does not guarantee future results and current performance may be lower or higher than the data quoted. Results shown are average annual total returns, which assume reinvestment of dividends and capital gains. Investment returns and principal will fluctuate and you may have a gain or loss when you sell shares. For the most current month-end performance information, please call 1-800-742-7272, or visit our Web site atwww.williamblairfunds.com. From time to time, the investment adviser may waive fees or reimburse expenses for the Fund. Without these waivers/reimbursements, performance would be lower. Class N shares are available to the general public without a sales load. Class I shares are available to certain institutional investors, and advisory clients of William Blair & Company, L.L.C., without a sales load or distribution (12b-1) fees. Institutional Class shares are available to institutional investors without a sales load or distribution (12b-1) or service fees.
The performance highlights and graph presented above do not reflect the deduction of taxes that a shareholder would pay on fund distributions or the redemption of fund shares.
The Bank of America Merrill Lynch 1-Year U.S. Treasury Note Index is comprised of a single U.S. Treasury Note issue purchased at the beginning of the month and held for a full month. Each month the index is rebalanced and the issue selected is the outstanding U.S. Treasury Note that matures closest to, but not beyond one year from the rebalancing date.
This report identifies the Fund’s investments on December 31, 2018. These holdings are subject to change. Not all investments in the Fund performed the same, nor is there any guarantee that these investments will perform as well in the future. Market forecasts provided in this report may not necessarily come to pass.
Sector Diversification (Unaudited)

The sector diversification shown is based on the total investments.
| 94 | Annual Report | December 31, 2018 |
Low Duration Fund
Portfolio of Investments, December 31, 2018(all dollar amounts in thousands)
| | | | | | | | |
| | Issuer | | Principal
Amount | | | Value | |
| | | | | | | | | | |
| | U.S. Government and U.S. Government Agency—51.3% | |
| | Federal Home Loan Mortgage Corp.(FHLMC)—14.3% | | | | | | | | |
| | #B13870, 4.500%, due 5/1/19 | | $ | 2 | | | $ | 2 | |
| | #G11604, 5.000%, due 7/1/19 | | | 1 | | | | 1 | |
| | #G11596, 5.500%, due 8/1/19 | | | 2 | | | | 2 | |
| | #B17294, 5.000%, due 11/1/19 | | | 15 | | | | 15 | |
| | #B19222, 4.500%, due 4/1/20 | | | 18 | | | | 18 | |
| | #J02537, 5.000%, due 9/1/20 | | | 9 | | | | 9 | |
| | #G11836, 5.500%, due 12/1/20 | | | 4 | | | | 4 | |
| | #E02322, 5.500%, due 5/1/22 | | | 14 | | | | 14 | |
| | #G12725, 6.000%, due 6/1/22 | | | 65 | | | | 66 | |
| | #G13124, 6.000%, due 12/1/22 | | | 150 | | | | 155 | |
| | #J06871, 5.500%, due 1/1/23 | | | 30 | | | | 31 | |
| | #J08450, 5.500%, due 7/1/23 | | | 19 | | | | 20 | |
| | #J08703, 5.500%, due 9/1/23 | | | 35 | | | | 36 | |
| | #C00351, 8.000%, due 7/1/24 | | | 31 | | | | 33 | |
| | #J11208, 5.000%, due 11/1/24 | | | 47 | | | | 48 | |
| | #G00363, 8.000%, due 6/1/25 | | | 48 | | | | 52 | |
| | #C80329, 8.000%, due 8/1/25 | | | 11 | | | | 12 | |
| | #G04821, 8.500%, due 7/1/31 | | | 1,608 | | | | 1,914 | |
| | #G07837, 6.500%, due 2/1/38 | | | 1,112 | | | | 1,277 | |
| | #G04424, 6.000%, due 6/1/38 | | | 383 | | | | 421 | |
| | #G04641, 6.000%, due 6/1/38 | | | 1,254 | | | | 1,374 | |
| | #A81372, 6.000%, due 8/1/38 | | | 208 | | | | 229 | |
| | #G04687, 6.000%, due 9/1/38 | | | 52 | | | | 58 | |
| | #G04745, 6.000%, due 9/1/38 | | | 192 | | | | 212 | |
| | #A81799, 6.500%, due 9/1/38 | | | 183 | | | | 199 | |
| | #G06085, 6.500%, due 9/1/38 | | | 50 | | | | 55 | |
| | #G05723, 6.500%, due 11/1/38 | | | 856 | | | | 988 | |
| | #G61450, 6.000%, due 4/1/40 | | | 6,415 | | | | 7,122 | |
| | #4122, Tranche FP,
1M LIBOR + 0.400%, 2.855%, due 10/15/42, VRN | | | 652 | | | | 652 | |
| | Total FHLMC Mortgage Obligations | | | | | | | 15,019 | |
| | Federal National Mortgage Association(FNMA)—37.0% | | | | | | | | |
| | #766059, 5.500%, due 2/1/19 | | | 1 | | | | 1 | |
| | #766276, 5.000%, due 3/1/19 | | | 4 | | | | 4 | |
| | #751313, 5.000%, due 3/1/19 | | | 1 | | | | 1 | |
| | #779363, 5.000%, due 6/1/19 | | | 1 | | | | 1 | |
| | #785259, 5.000%, due 8/1/19 | | | 9 | | | | 9 | |
| | #761530, 5.500%, due 8/1/19 | | | 11 | | | | 11 | |
| | #788424, 5.500%, due 9/1/19 | | | 4 | | | | 4 | |
| | #761489, 5.500%, due 9/1/19 | | | 6 | | | | 6 | |
| | #725953, 5.000%, due 10/1/19 | | | 3 | | | | 3 | |
| | #357865, 5.000%, due 7/1/20 | | | 16 | | | | 16 | |
| | #879607, 5.500%, due 4/1/21 | | | 11 | | | | 11 | |
| | #831497, 6.000%, due 4/1/21 | | | 50 | | | | 51 | |
| | #831525, 5.500%, due 6/1/21 | | | 16 | | | | 17 | |
| | #880993, 6.000%, due 1/1/22 | | | 3 | | | | 3 | |
| | #888982, 6.000%, due 12/1/22 | | | 68 | | | | 71 | |
| | #972934, 5.500%, due 2/1/23 | | | 95 | | | | 97 | |
| | #889670, 5.500%, due 6/1/23 | | | 20 | | | | 20 | |
| | #AE0011, 5.500%, due 9/1/23 | | | 22 | | | | 23 | |
| | #995395, 6.000%, due 12/1/23 | | | 56 | | | | 57 | |
| | #190988, 9.000%, due 6/1/24 | | | 14 | | | | 14 | |
| | Issuer | | NRSRO
Rating
(unaudited) | | Principal
Amount | | | Value | |
| | | | | | | | | | | | |
| | U.S. Government and U.S. Government Agency—(continued) | |
| | Federal National Mortgage Association (FNMA)—(continued) | |
| | #AL8529, 6.000%, due 11/1/2 | | | | $ | 8,888 | | | $ | 9,250 | |
| | #AL2853, 4.500%, due 6/1/26 | | | | | 1,731 | | | | 1,797 | |
| | #AL9730, 4.500%, due 2/1/27 | | | | | 1,678 | | | | 1,742 | |
| | #AL9857, 4.000%, due 2/1/29 | | | | | 2,458 | | | | 2,522 | |
| | #555933, 7.000%, due 6/1/32 | | | | | 441 | | | | 491 | |
| | #886762, 7.000%, due 9/1/36 | | | | | 253 | | | | 296 | |
| | #948637, 6.500%, due 8/1/37 | | | | | 251 | | | | 285 | |
| | #888703, 6.500%, due 8/1/37 | | | | | 2,445 | | | | 2,853 | |
| | #888530, 7.500%, due 8/1/37 | | | | | 1,853 | | | | 2,187 | |
| | #AL6411, 7.000%, due 12/1/37 | | | | | 1,993 | | | | 2,241 | |
| | #AD0100, 7.000%, due 12/1/38 | | | | | 606 | | | | 695 | |
| | #AD0315, 6.500%, due 8/1/39 | | | | | 376 | | | | 427 | |
| | #AE0934, 6.500%, due 10/1/39 | | | | | 1,995 | | | | 2,286 | |
| | #BM3525, 6.000%, due 4/1/41 | | | | | 3,909 | | | | 4,326 | |
| | #AL9226, 5.500%, due 12/1/41 | | | | | 3,378 | | | | 3,663 | |
| | #AL9225, 6.000%, due 1/1/42 | | | | | 3,190 | | | | 3,528 | |
| | Total FNMA Mortgage Obligations | | | | | | | | | 39,009 | |
| | | | | | | | | | | | |
| | Asset-Backed Securities—18.1% | | | | | | | | | | |
| | Tesla Auto Lease Trust—144A, 2018-A, Tranche A,
2.320%, 12/20/19 | | Aaa | | | 205 | | | | 205 | |
| | GM Financial Automobile Leasing Trust, 2017-3, Tranche A2B,
1M USD LIBOR + 0.240%, 2.710%, 1/21/20, VRN | | Aaa | | | 207 | | | | 207 | |
| | Ford Credit Auto Owner Trust, 2017-B, Tranche A2B,
1M USD LIBOR + 0.070%, 2.525%, 5/15/20, VRN | | AAA | | | 281 | | | | 281 | |
| | Nissan Auto Lease Trust, 2018-A, Tranche A2B,
1M USD LIBOR + 0.150%, 2.605%, 2/16/21, VRN | | AAA | | | 1,500 | | | | 1,501 | |
| | Chase Issuance Trust, 2016-A1, Tranche A, 1M LIBOR + 0.410%, 2.865%, 5/15/21, VRN | | AAA | | | 1,024 | | | | 1,025 | |
| | Bank of America Credit Card Trust, 2014-A1, Tranche A,
1M LIBOR + 0.380%, 2.835%, 6/15/21, VRN | | AAA | | | 1,000 | | | | 1,000 | |
| | GM Financial Consumer Automobile Receivables Trust, 2018-3, Tranche A2B,
1M USD LIBOR +0.110%, 2.565%, 7/16/21, VRN | | AAA | | | 2,000 | | | | 2,001 | |
| | MBNA Credit Card Master Note Trust, 2004-A3, Tranche A3,
1M LIBOR + 0.260%, 2.715%, 8/16/21, VRN | | AAA | | | 1,500 | | | | 1,500 | |
| | Ford Credit Auto Owner Trust, 2018-B, Tranche A2B,
1M USD LIBOR +0.120%, 2.575%, 9/15/21, VRN | | Aaa | | | 650 | | | | 650 | |
See accompanying Notes to Financial Statements.
| December 31, 2018 | William Blair Funds | 95 |
Low Duration Fund
Portfolio of Investments, December 31, 2018(all dollar amounts in thousands)
| | Issuer | | NRSRO
Rating
(unaudited) | | Principal
Amount | | | Value | |
| | | | | | | | | | | | |
| | Asset-Backed Securities—(continued) | | | | | | | |
| | American Express Credit Account Master Trust, 2014-1, Tranche A,
1M LIBOR + 0.370%, 2.825%, 12/15/21, VRN | | AAA | | $ | 1,000 | | | $ | 1,001 | |
| | Capital One Multi-Asset Execution Trust, 2014-A3, Tranche A3,
1M LIBOR + 0.380%, 2.835%, 1/18/22, VRN | | AAA | | | 1,110 | | | | 1,110 | |
| | PFS Financing Corporation—144A, 2018-A, Tranche A,
1M USD LIBOR +0.400%, 2.855%, 2/15/22, VRN | | AAA | | | 1,500 | | | | 1,499 | |
| | Verizon Owner Trust—144A,
2017-3A, Tranche A1B,
1M USD LIBOR +0.270%, 2.740%, 4/20/22, VRN | | AAA | | | 1,500 | | | | 1,501 | |
| | Mercedes-Benz Master Owner Trust—144A, 2017-BA, Tranche A,
1M LIBOR + 0.420%, 2.875%, 5/16/22, VRN | | Aaa | | | 2,280 | | | | 2,281 | |
| | GMF Floorplan Owner Revolving Trust—144A, 2017-2, Tranche A2,
1M USD LIBOR +0.430%, 2.885%, 7/15/22, VRN | | Aaa | | | 1,000 | | | | 999 | |
| | SLM Private Education Loan Trust—144A, 2011-A, Tranche A3,
1M USD LIBOR + 2.500%, 4.955%, 1/15/43, VRN | | AAA | | | 2,288 | | | | 2,319 | |
| | Total Asset-Backed Securities | | | | | | | | | 19,080 | |
| | | | | | | | | | | | |
| | Corporate Obligations—29.4% | | | | | | | | | | |
| | Mondelez International Holdings Netherlands BV—144A,
3M USD LIBOR + 0.610%, 3.119%, due 10/28/19, VRN | | A3 | | | 1,750 | | | | 1,749 | |
| | Daimler Finance North America LLC—144A,
3M USD LIBOR + 0.620%, 3.140%, due 10/30/19, VRN | | A | | | 1,600 | | | | 1,602 | |
| | Citigroup, Inc.,
3M USD LIBOR + 0.790%, 3.204%, due 1/10/20, VRN | | A | | | 1,750 | | | | 1,753 | |
| | Branch Banking & Trust Co.,
3M USD LIBOR + 0.450%, 2.886%, due 1/15/20, VRN | | A1 | | | 1,700 | | | | 1,699 | |
| | Capital One Financial Corporation,
3M USD LIBOR + 0.760%, 3.378%, due 5/12/20, VRN | | A- | | | 1,750 | | | | 1,750 | |
| | Diageo Capital plc,
3M USD LIBOR +0.240%, 2.880%, due 5/18/20, VRN | | A- | | | 750 | | | | 747 | |
| | Harley-Davidson Financial Services, Inc.—144A,
3M USD LIBOR +0.500%, 3.146%, due 5/21/20, VRN | | A | | | 1,000 | | | | 999 | |
| | Issuer | | NRSRO
Rating
(unaudited) | | Principal
Amount | | | Value | |
| | | | | | | | | | | | |
| | Corporate Obligations—(continued) | | | | | | |
| | National Australia Bank Ltd.—144A,
3M USD LIBOR + 0.510%, 3.187%, due 5/22/20, VRN | | AA- | | $ | 1,750 | | | $ | 1,750 | |
| | John Deere Capital Corporation,
3M USD LIBOR + 0.290%, 3.114%, due 6/22/20, VRN | | A | | | 1,000 | | | | 1,000 | |
| | Nissan Motor Acceptance Corp.—144A,
3M USD LIBOR + 0.390%, 2.826%, due 7/13/20, VRN | | A | | | 1,250 | | | | 1,241 | |
| | Caterpillar Financial Services Corporation,
3M USD LIBOR +0.290%, 3.026%, due 9/4/20, VRN | | A | | | 1,000 | | | | 997 | |
| | Apple, Inc.,
3M USD LIBOR + 1.130%, 3.807%, due 2/23/21, VRN | | AA+ | | | 1,000 | | | | 1,016 | |
| | JPMorgan Chase & Co.,
3M USD LIBOR + 1.480%, 4.218%, due 3/1/21, VRN | | AA- | | | 1,750 | | | | 1,773 | |
| | Wells Fargo & Co.,
3M USD LIBOR + 1.340%, 4.076%, due 3/4/21, VRN | | A+ | | | 1,750 | | | | 1,769 | |
| | HSBC Holdings plc,
3M USD LIBOR + 2.240%, 5.007%, due 3/8/21, VRN | | AA- | | | 1,750 | | | | 1,793 | |
| | Bank of America Corporation,
3M USD LIBOR + 1.420%, 3.870%, due 4/19/21, VRN | | A+ | | | 1,000 | | | | 1,014 | |
| | The Goldman Sachs Group, Inc.,
3M USD LIBOR + 1.360%, 3.850%, due 4/23/21, VRN | | A | | | 1,000 | | | | 1,008 | |
| | Westpac Banking Corporation,
3M USD LIBOR + 1.000%, 3.618%, due 5/13/21, VRN | | AA- | | | 1,750 | | | | 1,763 | |
| | The Charles Schwab Corporation,
3M USD LIBOR +0.320%, 2.966%, due 5/21/21, VRN | | A | | | 1,000 | | | | 996 | |
| | The Toronto-Dominion Bank,
3M USD LIBOR +0.430%, 3.201%, due 6/11/21, VRN | | Aa1 | | | 1,000 | | | | 995 | |
| | Barclays plc,
3M USD LIBOR + 2.110%, 4.728%, due 8/10/21, VRN | | A | | | 1,750 | | | | 1,765 | |
| | KeyBank NA,
3M USD LIBOR + 0.810%, 3.463%, due 11/22/21, VRN | | A- | | | 1,750 | | | | 1,746 | |
| | Total Corporate Obligations | | | | | | | | | 30,925 | |
| | Total Long-Term Investments—98.8% (cost $106,040) | | | | | | | | | 104,033 | |
See accompanying Notes to Financial Statements.
| 96 | Annual Report | December 31, 2018 |
Low Duration Fund
Portfolio of Investments, December 31, 2018(all dollar amounts in thousands)
| | | | | | | | |
| | Issuer | | Principal
Amount | | | Value | |
| | | | | | | | | | |
| | Repurchase Agreement | | | | | | | | |
| | Fixed Income Clearing Corporation, 0.500% dated 12/31/18, due 1/2/19, repurchase price $1,457, collateralized by U.S. Treasury Bond, 3.625%, due 8/15/43 | | $ | 1,457 | | | $ | 1,457 | |
| | Total Repurchase Agreement—1.4%
(cost $1,457) | | | | | | | 1,457 | |
| | | | | | | | | | |
| | Commercial Paper | | | | | | | | |
| | Chariot Funding LLC,
2.434%, due 1/2/19 | | | 675 | | | | 675 | |
| | Total Commercial Paper—0.6%
(cost $675) | | | | | | | 675 | |
| | Total Investments—100.8%
(cost $108,172) | | | | | | | 106,165 | |
| | | | | | | | | | |
| | Securities Sold, Not Yet Purchased | | | | | | | | |
| | | | | | | | | | |
| | U.S. Government Agency | | | | | | | | |
| | Federal National Mortgage Association(FNMA)—(13.9)% | | | | | | | | |
| | TBA, 2.500%, due 1/1/34 | | | (15,000 | ) | | | (14,650 | ) |
| | Total Securities Sold, Not Yet Purchased—(13.9)%
(proceeds $14,517) | | | | | | | (14,650 | ) |
| | Cash and other assets, less liabilities—13.1% | | | | | | | 13,851 | |
| | Net assets—100.0% | | | | | | $ | 105,366 | |
The obligations of certain U.S. Government-sponsored securities are neither issued nor guaranteed by the U.S. Treasury.
144A = Security exempt from registration under Rule 144A of the Securities Act of 1933. These securities may be resold in transactions exempt from registration, normally to qualified institutional buyers.
NRSRO = Nationally Recognized Statistical Rating Organization—The credit quality ratings of the securities in the Fund reflect the highest category rating by any of Fitch Ratings, Moody’s Investors Service Inc., or Standard & Poor’s, a division of the McGraw-Hill Companies, Inc.
TBA = To Be Announced—TBAs are mortgage-backed securities traded under delayed delivery commitments, settling after December 31, 2018. The term TBA comes from the fact that the specific mortgage-backed security that will be delivered to fulfill a TBA trade is not designated at the time the trade is made.
VRN = Variable Rate Note
See accompanying Notes to Financial Statements.
| December 31, 2018 | William Blair Funds | 97 |
| | Macro Allocation Fund |
| | |
| | AN OVERVIEW FROM THE PORTFOLIO MANAGERS |
| | |
 Thomas Clarke 
Brian D. Singer | The William Blair Macro Allocation Fund (Class N shares) posted a 1.30% decrease, net of fees, for the twelve months ended December 31, 2018. By comparison, the Fund’s benchmark index, the Bank of America/Merrill Lynch 3-Month U.S. Treasury Bill Index (the “Index”), increased 1.87%. The Fund had negative performance from its market strategy (i.e., equity and fixed income) and positive performance from its currency strategy. Detractors from the Fund’s market-oriented exposures included long exposure to European equities as well as sector positioning within U.S. equities. The Fund’s exposures within emerging markets equities contributed to performance, specifically long exposure to Brazilian equities and short exposures to Mexican and South African equities. Within the Fund’s currency strategy, short exposure to the euro and New Zealand dollar and long exposure to the Mexican peso contributed to performance, while long exposures to the Turkish lira, British pound, and Russian ruble detracted from performance. Looking forward, global risk assets are mildly attractive in the aggregate; however, the near-term macro environment presents thematic and geopolitical headwinds, dampening their attractiveness. The Fund remains cautiously positioned in respect of systematic market exposure (beta) and overall strategy risk. Instead, the Fund is taking more risk in relative market opportunities (long one country or sector and short another) and in its currency strategy. The Fund’s market strategy is moderately long of equities, with long exposures within emerging markets and, to a lesser extent, developed European markets, while maintaining short positions in Canadian and Japanese equity markets. The market strategy is also slightly short of fixed income securities, largely in European government bonds. Within currencies, the Fund’s strategy remains long of emerging market currencies such as the Philippine peso, Turkish lira, and Indian rupee, and the largest short exposures are in the Thai baht, Swiss franc, and U.S. dollar. |
| 98 | Annual Report | December 31, 2018 |
Macro Allocation Fund
Performance Highlights (Unaudited)
| Average Annual Total Return through 12/31/2018 |
| | | | | | | | | Since |
| | | 1 Year | | 3 Year | | 5 Year | | Inception |
| Class N(a) | | | (1.30 | )% | | | 1.89 | % | | | 0.34 | % | | | 4.31 | % |
| Class I(a) | | | (1.08 | ) | | | 2.19 | | | | 0.62 | | | | 4.59 | |
| BofA Merrill Lynch 3-Month U.S. Treasury Bill Index(a) | | | 1.87 | | | | 1.02 | | | | 0.63 | | | | 0.47 | |
| Institutional Class(b) | | | (0.94 | ) | | | 2.30 | | | | 0.73 | | | | 1.07 | |
| BofA Merrill Lynch 3-Month U.S. Treasury Bill Index(b) | | | 1.87 | | | | 1.02 | | | | 0.63 | | | | 0.61 | |
| (a) | Since inception is for the period from November 29, 2011 (Commencement of Operations) to December 31, 2018. |
| | |
| (b) | Since inception is for the period from October 21, 2013 (Commencement of Operations) to December 31, 2018. |
Performance cited represents past performance. Past performance does not guarantee future results and current performance may be lower or higher than the data quoted. Results shown are average annual total returns, which assume reinvestment of dividends and capital gains. Investment returns and principal will fluctuate and you may have a gain or loss when you sell shares. For the most current month-end performance information, please call 1-800-742-7272, or visit our Web site atwww.williamblairfunds.com. The Fund involves a high level of risk and may not be appropriate for everyone. You could lose money by investing in the Fund. There can be no assurance that the Fund’s investment objective will be achieved or that the Fund’s investment strategies will be successful. The Fund is not a complete investment program. From time to time, the investment adviser may waive fees or reimburse expenses for the Fund. Without these waivers/reimbursements, performance would be lower. Class N shares are available to the general public without a sales load. Class I shares are available to certain institutional investors, and advisory clients of William Blair & Company, L.L.C., without a sales load or distribution fee (12b-1 fee). Institutional Class shares are available to institutional investors without a sales load or distribution (12b-1) or service fees.
The performance highlights and graph presented above do not reflect the deduction of taxes that a shareholder would pay on fund distributions or the redemption of fund shares.
The Bank of America (“BofA”) Merrill Lynch 3-Month U.S. Treasury Bill Index measures total return on cash, including price and interest income, based on short-term government Treasury Bills of about 90-day maturity. The Index is unmanaged, does not incur fees or expenses, and cannot be invested in directly.
This report identifies the Fund’s investments on December 31, 2018. These holdings are subject to change. Not all investments in the Fund performed the same, nor is there any guarantee that these investments will perform as well in the future. Market forecasts provided in this report may not necessarily come to pass.
Portfolio Allocation (Unaudited)
The table below provides the allocation of the Fund’s holdings as a percent of net assets as of December 31, 2018.
| | | % of net |
| Category | | assets |
| Equity Exchange-Traded Funds | | | 58.7 | % |
| Fixed Income Exchange-Traded Funds | | | 4.2 | |
| Common Stocks | | | 0.0 | |
| Foreign Government Bond | | | 2.2 | |
| Repurchase Agreement | | | 7.9 | |
| U.S. Government | | | 24.4 | |
| Purchased Options | | | 0.3 | |
| Cash and Other Assets, Less Liabilities | | | 2.3 | |
| Net Assets | | | 100.0 | % |
See accompanying Notes to Financial Statements.
| December 31, 2018 | William Blair Funds | 99 |
Macro Allocation Fund
Portfolio of Investments, December 31, 2018(all dollar amounts in thousands)
| | | | Shares or | | | | |
| | | | Principal | | | | |
| | Issuer | | Amount | | | Value | |
| | | | | | | | |
| | Exchange-Traded Funds—62.9% | | | | | | | | |
| | Equity Exchange-Traded Funds—58.7% | | | | | | | | |
| | Consumer Staples Select Sector SPDR Fund | | | 167,100 | | | $ | 8,485 | |
| | Dragon Capital—Vietnam Enterprise Investments, Ltd. Class “C”§ | | | 3,259,947 | | | | 18,989 | |
| | Energy Select Sector SPDR Fund | | | 180,000 | | | | 10,323 | |
| | Global X MSCI Greece ETF | | | 2,434,000 | | | | 16,795 | |
| | iShares Core MSCI Emerging Markets ETF | | | 751,000 | | | | 35,410 | |
| | iShares MSCI Brazil ETF | | | 1,207,000 | | | | 46,107 | |
| | iShares MSCI India ETF | | | 336,700 | | | | 11,225 | |
| | iShares MSCI Malaysia ETF | | | 292,100 | | | | 8,696 | |
| | iShares Russell 1000 Value ETF | | | 735,300 | | | | 81,655 | |
| | SPDR S&P 500 ETF Trust | | | 1,171,800 | | | | 292,856 | |
| | Utilities Select Sector SPDR Fund | | | 169,200 | | | | 8,954 | |
| | VanEck Vectors Russia ETF | | | 96,200 | | | | 1,804 | |
| | Total Equity Exchange-Traded Funds | | | | | | | 541,299 | |
| | Fixed Income Exchange-Traded Funds—4.2% | | | | | | | | |
| | iShares iBoxx $ Investment Grade Corporate Bond ETF | | | 246,300 | | | | 27,788 | |
| | SPDR Bloomberg Barclays High Yield Bond ETF | | | 324,100 | | | | 10,886 | |
| | Total Fixed Income Exchange-Traded Funds | | | | | | | 38,674 | |
| | Total Exchange-Traded Funds—62.9%
(cost $587,944) | | | | | | | 579,973 | |
| | | | | | | | | | |
| | Common Stocks—0.0% | | | | | | | | |
| | | | | | | | | | |
| | Argentina—0.0% | | | | | | | | |
| * | Cablevision Holding S.A.—GDR (Media)† § | | | 51,204 | | | | 324 | |
| * | Grupo Clarin S.A. Class B,—GDR (Media)† § | | | 22,587 | | | | 60 | |
| | Total Argentina | | | | | | | 384 | |
| | Total Common Stocks—0.0%
(cost $1,555) | | | | | | | 384 | |
| | | | | | | | | | |
| | Foreign Government Bond—2.2% | | | | | | | | |
| | | | | | | | | | |
| | Malaysia | | | | | | | | |
| | Malaysia Government Bond, 3.492%, due 3/31/20 | | MYR | 82,420 | | | | 19,946 | |
| | Total Foreign Government Bond—2.2%
(cost $20,072) | | | | | | | 19,946 | |
| | | | | | | | | | |
| | Repurchase Agreement—7.9% | | | | | | | | |
| | Fixed Income Clearing Corporation, 0.500% dated 12/31/18, due 1/2/19, repurchase price $72,618, collateralized by U.S. Treasury Bonds, 3.625%-3.750%, due 8/15/43-11/15/43 | | $ | 72,616 | | | | 72,616 | |
| | Total Repurchase Agreement—7.9%
(cost $72,616) | | | | | | | 72,616 | |
| | | | | | | | |
| | | | Principal | | | | |
| | Issuer | | Amount | | | Value | |
| | | | | | | | |
| | U.S. Government—24.4% | | | | | | | | |
| | U.S. Treasury Bill, 1.188%, due 1/3/19 | | $ | 23,000 | | | $ | 22,998 | |
| | U.S. Treasury Bill, 1.799%, due 1/31/19 | | | 23,000 | | | | 22,958 | |
| | U.S. Treasury Bill, 2.008%, due 2/28/19 | | | 23,000 | | | | 22,913 | |
| | U.S. Treasury Bill, 2.055%, due 3/28/19(a) | | | 23,000 | | | | 22,871 | |
| | U.S. Treasury Bill, 2.212%, due 4/25/19 | | | 23,000 | | | | 22,827 | |
| | U.S. Treasury Bill, 2.289%, due 5/23/19 | | | 23,000 | | | | 22,782 | |
| | U.S. Treasury Bill, 2.342%, due 6/20/19(a) | | | 23,000 | | | | 22,737 | |
| | U.S. Treasury Bill, 2.391%, due 7/18/19 | | | 23,000 | | | | 22,689 | |
| | U.S. Treasury Bill, 2.418%, due 8/15/19(a) | | | 23,000 | | | | 22,639 | |
| | U.S. Treasury Bill, 2.526%, due 9/12/19 | | | 5,000 | | | | 4,912 | |
| | U.S. Treasury Bill, 2.661%, due 10/10/19(b) | | | 5,000 | | | | 4,902 | |
| | U.S. Treasury Bill, 2.736%, due 11/7/19 | | | 5,000 | | | | 4,891 | |
| | U.S. Treasury Bill, 2.727%, due 12/5/19 | | | 5,000 | | | | 4,882 | |
| | Total U.S. Government—24.4%
(cost $225,101) | | | | | | | 225,001 | |
| | Total Purchased Options—0.3%
(cost $3,277) | | | | | | | 2,356 | |
| | Total Investments in Securities—97.7%
(cost $910,565) | | | | | | | 900,276 | |
| | Cash and other assets, less liabilities—2.3% | | | | | | | 21,542 | |
| | Net assets—100.0% | | | | | | $ | 921,818 | |
* = Non-income producing security
† = U.S. listed foreign security
GDR = Global Depository Receipt
§ = Deemed illiquid pursuant to Liquidity Procedures approved by the Board of Trustees. These holdings represent 2.10% of the Fund’s net assets at December 31, 2018.
(a) Security, or portion of security, is segregated as collateral for centrally cleared swaps and to cover initial margin requirements on open futures contracts aggregating a total value of $40,762 (in thousands).
(b) Security, or portion of security, is pledged as collateral for OTC swap contracts and OTC options aggregating a total value of $3,289 (in thousands).
For securities primarily traded on exchanges or markets that close before the close of regular trading on the New York Stock Exchange, the Fund may use an independent pricing service to fair value price the securities pursuant to Valuation Procedures approved by the Board of Trustees.
See accompanying Notes to Financial Statements.
| 100 | Annual Report | December 31, 2018 |
Macro Allocation Fund
Portfolio of Investments, December 31, 2018(all dollar amounts in thousands)
Purchased Options Contracts
| | | | | | | | | | | | | | | | Premiums | | |
| | | | | | Exercise | | | | | | | | | | Paid | | Unrealized |
| | | | | | Price/ | | Expiration | | Number of | | | Notional | | | Market | | (Received) | | Appreciation/ |
| Description | | Counterparty | | | FX Rate | | Date | | Contracts | | | Amount | | | Value | | by Fund | | (Depreciation) |
| Calls | | | | | | | | | | | | | | | | | | |
| Call USD/Put CNY | | Citibank N.A. | | | 7.075 | | 01/03/19 | | | 44,787,703 | | | | $ | 44,788 | | | | $ | — | | | | $ | 300 | | | | $ | (300 | ) |
| Call USD/Put INR | | Citibank N.A. | | | 75.560 | | 01/03/19 | | | 43,766,292 | | | | | 43,766 | | | | | — | | | | | 384 | | | | | (384 | ) |
| Call USD/Put PHP | | Citibank N.A. | | | 55.555 | | 01/04/19 | | | 44,715,993 | | | | | 44,716 | | | | | — | | | | | 250 | | | | | (250 | ) |
| Call USD/Put INR | | Citibank N.A. | | | 75.760 | | 04/15/19 | | | 41,682,590 | | | | | 41,683 | | | | | 102 | | | | | 366 | | | | | (264 | ) |
| Call USD/Put CNY | | Citibank N.A. | | | 7.118 | | 04/16/19 | | | 42,381,849 | | | | | 42,382 | | | | | 146 | | | | | 277 | | | | | (131 | ) |
| Call USD/Put PHP | | Citibank N.A. | | | 54.870 | | 04/16/19 | | | 42,115,400 | | | | | 42,115 | | | | | 111 | | | | | 266 | | | | | (155 | ) |
| | | | | | | | | | | | | | | | | | | | $ | 359 | | | | $ | 1,843 | | | | $ | (1,484 | ) |
| Puts | | | | | | | | | | | | | | | | | | | | | | | | | | | | | | | |
| | | Credit Suisse | | | | | | | | | | | | | | | | | | | | | | | | | | | | | |
| Euro STOXX 50 Index | | International | | | 2,750 | | 03/15/19 | | | 1,250 | | | | EUR | 34,375 | | | | | 727 | | | | $ | 573 | | | | $ | 154 | |
| iShares iBoxx $ High Yield Bond | | Exchange Traded | | | 79 | | 03/15/19 | | | 11,440 | | | | $ | 90,376 | | | | | 1,270 | | | | | 861 | | | | | 409 | |
| | | | | | | | | | | | | | | | | | | | $ | 1,997 | | | | $ | 1,434 | | | | $ | 563 | |
| Total Purchased Options Contracts | | | | | | | | | | | | | | | | | | | $ | 2,356 | | | | $ | 3,277 | | | | $ | (921 | ) |
Forward Foreign Currency Contracts
| | | | | | | | | USD (Base) | | | | Net Unrealized | |
| Settlement | | | | | | Local Currency | | Purchased | | Current | | Appreciation | |
| Date | | Deliver/Receive | | Counterparty | | (in thousands) | | or Sold | | Value | | (Depreciation) | |
| Purchased | | | | | | | | | | | | | | | | | | | |
| 1/16/19 | | New Turkish Lira | | Citibank N.A. London | | 495,224 | | $ | 91,378 | | | $ | 92,850 | | | | $ | 1,472 | |
| 3/20/19 | | Brazilian Real | | Citibank N.A. London | | 3,983 | | | 1,027 | | | | 1,022 | | | | | (5 | ) |
| 3/20/19 | | British Pound Sterling | | Citibank N.A. London | | 22,239 | | | 28,245 | | | | 28,451 | | | | | 206 | |
| 3/20/19 | | Chinese Yuan Renminbi | | Citibank N.A. London | | 13,837 | | | 2,009 | | | | 2,012 | | | | | 3 | |
| 3/20/19 | | Colombian Peso | | Citibank N.A. London | | 56,011,012 | | | 17,628 | | | | 17,185 | | | | | (443 | ) |
| 3/20/19 | | Czech Koruna | | Citibank N.A. London | | 38,609 | | | 1,724 | | | | 1,723 | | | | | (1 | ) |
| 3/20/19 | | Euro | | Citibank N.A. London | | 3,874 | | | 4,467 | | | | 4,467 | | | | | — | |
| 3/20/19 | | Hong Kong Dollar | | Citibank N.A. London | | 19,625 | | | 2,513 | | | | 2,512 | | | | | (1 | ) |
| 3/20/19 | | Hungarian Forint | | Citibank N.A. London | | 462,444 | | | 1,659 | | | | 1,659 | | | | | — | |
| 3/20/19 | | Indian Rupee | | Citibank N.A. London | | 3,622,840 | | | 49,769 | | | | 51,658 | | | | | 1,889 | |
| 3/20/19 | | Indonesian Rupiah | | Citibank N.A. London | | 43,062,364 | | | 2,973 | | | | 2,960 | | | | | (13 | ) |
| 3/20/19 | | Israeli Shekel | | Citibank N.A. London | | 4,184 | | | 1,127 | | | | 1,126 | | | | | (1 | ) |
| 3/20/19 | | Japanese Yen | | Citibank N.A. London | | 6,458,204 | | | 57,426 | | | | 59,266 | | | | | 1,840 | |
| 3/20/19 | | Mexican Peso | | Citibank N.A. London | | 1,829,305 | | | 89,976 | | | | 91,983 | | | | | 2,007 | |
| 3/20/19 | | New Zealand Dollar | | Citibank N.A. London | | 3,960 | | | 2,662 | | | | 2,661 | | | | | (1 | ) |
| 3/20/19 | | Philippine Peso | | Citibank N.A. London | | 5,696,487 | | | 107,688 | | | | 108,084 | | | | | 396 | |
| 3/20/19 | | Polish Zloty | | Citibank N.A. London | | 107,656 | | | 28,505 | | | | 28,819 | | | | | 314 | |
| 3/20/19 | | Russian Ruble | | Citibank N.A. London | | 1,661,614 | | | 24,802 | | | | 23,626 | | | | | (1,176 | ) |
| 3/20/19 | | Singapore Dollar | | Citibank N.A. London | | 85,021 | | | 62,090 | | | | 62,489 | | | | | 399 | |
| 3/20/19 | | South African Rand | | Citibank N.A. London | | 511,327 | | | 35,844 | | | | 35,215 | | | | | (629 | ) |
| 3/20/19 | | South Korean Won | | Citibank N.A. London | | 3,035,407 | | | 2,735 | | | | 2,733 | | | | | (2 | ) |
| 3/20/19 | | Swedish Krona | | Citibank N.A. London | | 428,456 | | | 47,419 | | | | 48,640 | | | | | 1,221 | |
| 3/20/19 | | Swiss Franc | | Citibank N.A. London | | 3,364 | | | 3,447 | | | | 3,447 | | | | | — | |
| 3/20/19 | | Taiwan Dollar | | Citibank N.A. London | | 72,894 | | | 2,405 | | | | 2,400 | | | | | (5 | ) |
| 3/20/19 | | Thai Baht | | Citibank N.A. London | | 148,675 | | | 4,618 | | | | 4,576 | | | | | (42 | ) |
| | | | | | | | | | | | | | | | | | $ | 7,428 | |
See accompanying Notes to Financial Statements.
| December 31, 2018 | William Blair Funds | 101 |
Macro Allocation Fund
Portfolio of Investments, December 31, 2018(all dollar amounts in thousands)
Forward Foreign Currency Contracts
| | | | | | | | | USD (Base) | | | | Net Unrealized | |
| Settlement | | | | | | Local Currency | | Purchased | | Current | | Appreciation | |
| Date | | Deliver/Receive | | Counterparty | | (in thousands) | | or Sold | | Value | | (Depreciation) | |
| Sold | | | | | | | | | | | | | | | | |
| 1/16/19 | | New Turkish Lira | | Citibank N.A. London | | 19,677 | | $ | 3,686 | | | $ | 3,689 | | | | $ | (3 | ) |
| 3/20/19 | | Australian Dollar | | Citibank N.A. London | | 51,622 | | | 37,262 | | | | 36,407 | | | | | 855 | |
| 3/20/19 | | Brazilian Real | | Citibank N.A. London | | 82,250 | | | 21,235 | | | | 21,103 | | | | | 132 | |
| 3/20/19 | | British Pound Sterling | | Citibank N.A. London | | 1,320 | | | 1,689 | | | | 1,689 | | | | | — | |
| 3/20/19 | | Chinese Yuan Renminbi | | Citibank N.A. London | | 343,513 | | | 49,782 | | | | 49,948 | | | | | (166 | ) |
| 3/20/19 | | Colombian Peso | | Citibank N.A. London | | 4,738,495 | | | 1,452 | | | | 1,454 | | | | | (2 | ) |
| 3/20/19 | | Czech Koruna | | Citibank N.A. London | | 973,175 | | | 42,917 | | | | 43,423 | | | | | (506 | ) |
| 3/20/19 | | Euro | | Citibank N.A. London | | 66,502 | | | 76,218 | | | | 76,686 | | | | | (468 | ) |
| 3/20/19 | | Hong Kong Dollar | | Citibank N.A. London | | 231,409 | | | 29,654 | | | | 29,620 | | | | | 34 | |
| 3/20/19 | | Hungarian Forint | | Citibank N.A. London | | 5,411,916 | | | 19,210 | | | | 19,417 | | | | | (207 | ) |
| 3/20/19 | | Indian Rupee | | Citibank N.A. London | | 99,124 | | | 1,412 | | | | 1,413 | | | | | (1 | ) |
| 3/20/19 | | Indonesian Rupiah | | Citibank N.A. London | | 855,636,072 | | | 57,946 | | | | 58,810 | | | | | (864 | ) |
| 3/20/19 | | Israeli Shekel | | Citibank N.A. London | | 105,352 | | | 28,289 | | | | 28,344 | | | | | (55 | ) |
| 3/20/19 | | Japanese Yen | | Citibank N.A. London | | 261,036 | | | 2,395 | | | | 2,396 | | | | | (1 | ) |
| 3/20/19 | | Mexican Peso | | Citibank N.A. London | | 100,087 | | | 5,031 | | | | 5,033 | | | | | (2 | ) |
| 3/20/19 | | New Zealand Dollar | | Citibank N.A. London | | 99,919 | | | 68,557 | | | | 67,156 | | | | | 1,401 | |
| 3/20/19 | | Philippine Peso | | Citibank N.A. London | | 224,518 | | | 4,258 | | | | 4,260 | | | | | (2 | ) |
| 3/20/19 | | Polish Zloty | | Citibank N.A. London | | 9,184 | | | 2,457 | | | | 2,458 | | | | | (1 | ) |
| 3/20/19 | | Russian Ruble | | Citibank N.A. London | | 73,088 | | | 1,044 | | | | 1,039 | | | | | 5 | |
| 3/20/19 | | Singapore Dollar | | Citibank N.A. London | | 3,350 | | | 2,461 | | | | 2,462 | | | | | (1 | ) |
| 3/20/19 | | South African Rand | | Citibank N.A. London | | 28,188 | | | 1,940 | | | | 1,941 | | | | | (1 | ) |
| 3/20/19 | | South Korean Won | | Citibank N.A. London | | 49,507,315 | | | 44,097 | | | | 44,574 | | | | | (477 | ) |
| 3/20/19 | | Swedish Krona | | Citibank N.A. London | | 25,556 | | | 2,900 | | | | 2,901 | | | | | (1 | ) |
| 3/20/19 | | Swiss Franc | | Citibank N.A. London | | 84,450 | | | 85,803 | | | | 86,536 | | | | | (733 | ) |
| 3/20/19 | | Taiwan Dollar | | Citibank N.A. London | | 1,753,479 | | | 57,347 | | | | 57,733 | | | | | (386 | ) |
| 3/20/19 | | Thai Baht | | Citibank N.A. London | | 3,740,272 | | | 114,325 | | | | 115,108 | | | | | (783 | ) |
| | | | | | | | | | | | | | | | | | $ | (2,233 | ) |
| Total net unrealized appreciation on forward foreign currency contracts | | | | | | | | | | | $ | 5,195 | |
See accompanying Notes to Financial Statements.
| 102 | Annual Report | December 31, 2018 |
Macro Allocation Fund
Portfolio of Investments, December 31, 2018(all dollar amounts in thousands)
Futures Contracts
| | | | | | | | | Notional Value | | Notional | | | | | Net Unrealized |
| Number of | | | | | | | | (Local, | | Amount | | | Value | | Appreciation |
| Contracts | | Description | | Expiration Date | | Local Currency | | in Thousands) | | (USD) | | | (USD) | | (Depreciation) |
| Long | | | | | | | | | | | | | | | | | | |
| 617 | | | CAC 40 Index | | January 2019 | | Euro | | 29,175 | | $ | 34,206 | | | $ | 33,427 | | | | $ | (779 | ) |
| 386 | | | IBEX 35 Index | | January 2019 | | Euro | | 32,876 | | | 38,475 | | | | 37,668 | | | | | (807 | ) |
| 1,450 | | | MSCI Singapore ETS Index | | January 2019 | | Singapore Dollar | | 49,547 | | | 36,201 | | | | 36,352 | | | | | 151 | |
| 21 | | | NIKKEI 225 Index | | March 2019 | | Japanese Yen | | 209,318 | | | 2,025 | | | | 1,910 | | | | | (115 | ) |
| 225 | | | KOSPI 200 Index | | March 2019 | | South Korean Won | | 14,737,500 | | | 13,250 | | | | 13,208 | | | | | (42 | ) |
| 48 | | | DAX Index | | March 2019 | | Euro | | 12,674 | | | 14,768 | | | | 14,521 | | | | | (247 | ) |
| 3,480 | | | EURO STOXX 600 Banks Index | | March 2019 | | Euro | | 22,707 | | | 27,152 | | | | 26,017 | | | | | (1,135 | ) |
| 170 | | | FTSE 100 Index | | March 2019 | | British Pound Sterling | | 11,320 | | | 14,421 | | | | 14,429 | | | | | 8 | |
| 10 | | | SPI 200 Index | | March 2019 | | Australian Dollar | | 1,390 | | | 982 | | | | 979 | | | | | (3 | ) |
| | | | | | | | | | | | | | | | | | | | | $ | (2,969 | ) |
| Short | | | | | | | | | | | | | | | | | | | | | | |
| 113 | | | Amsterdam Index | | January 2019 | | Euro | | 11,022 | | $ | 12,818 | | | $ | 12,629 | | | | $ | 189 | |
| 102 | | | OMXS 30 Index | | January 2019 | | Swedish Krona | | 14,364 | | | 1,687 | | | | 1,621 | | | | | 66 | |
| 134 | | | MSCI Taiwan Index | | January 2019 | | U.S. Dollar | | 4,816 | | | 4,723 | | | | 4,816 | | | | | (93 | ) |
| 57 | | | HANG SENG Index | | January 2019 | | Hong Kong Dollar | | 73,684 | | | 9,293 | | | | 9,410 | | | | | (117 | ) |
| 217 | | | HSCEI Future | | January 2019 | | Hong Kong Dollar | | 109,607 | | | 13,857 | | | | 13,997 | | | | | (140 | ) |
| 134 | | | TOPIX Index | | March 2019 | | Japanese Yen | | 2,001,290 | | | 19,764 | | | | 18,259 | | | | | 1,505 | |
| 262 | | | S&P TSX 60 Index | | March 2019 | | Canadian Dollar | | 44,923 | | | 33,059 | | | | 32,905 | | | | | 154 | |
| 1,712 | | | EURO STOXX 50 Index | | March 2019 | | Euro | | 50,915 | | | 59,756 | | | | 58,336 | | | | | 1,420 | |
| 2,536 | | | S&P 500 E Mini Index | | March 2019 | | U.S. Dollar | | 317,659 | | | 325,006 | | | | 317,659 | | | | | 7,347 | |
| 334 | | | S&P E Mini Index | | March 2019 | | U.S. Dollar | | 18,028 | | | 19,033 | | | | 18,028 | | | | | 1,005 | |
| 293 | | | XAK Technology | | March 2019 | | U.S. Dollar | | 18,228 | | | 18,569 | | | | 18,228 | | | | | 341 | |
| 159 | | | XAV Health Care | | March 2019 | | U.S. Dollar | | 13,779 | | | 13,888 | | | | 13,779 | | | | | 109 | |
| 324 | | | XAY Cons Discret | | March 2019 | | U.S. Dollar | | 32,322 | | | 32,963 | | | | 32,322 | | | | | 641 | |
| 103 | | | 10YR Can Bond | | March 2019 | | Canadian Dollar | | 14,087 | | | 9,989 | | | | 10,319 | | | | | (330 | ) |
| 694 | | | FTSE/JSE Top 40 Index | | March 2019 | | South African Rand | | 326,583 | | | 21,836 | | | | 22,699 | | | | | (863 | ) |
| 93 | | | Long Gilt | | March 2019 | | British Pound Sterling | | 11,455 | | | 14,488 | | | | 14,600 | | | | | (112 | ) |
| | | | | | | | | | | | | | | | | | | | | $ | 11,122 | |
| Total net unrealized appreciation (depreciation) on futures contracts | | | | | | | | $ | 8,153 | |
Centrally Cleared Interest Rate Swap
| | | | | | | | | | | | | | | | Upfront | | | | | |
| | | | | | | Pay/Receive | | | | | | Notional | | | Payment | | | | Unrealized | |
| Floating Rate | | Pay/Receive | | Fixed | | Payment | | Maturity | | Cleared | | Amount | | | Paid | | | | Appreciation | |
| Reference | | Floating Rate | | Rate | | Frequency | | Date | | Exchange | | (in thousands) | | | (Received) | | Value | | (Depreciation) | |
| SEK 3M STIBOR | | Receive | | 1.330% | | 1YR/3M | | March 2029 | | LCH | | SEK 141,810 | | | $— | | $(243) | | | $(243) | |
Centrally Cleared Credit Default Swap
| | | | | | | | | | | | | | | | Upfront | | | | | |
| | | | | | | | | | | | | Notional | | | Payment | | | | Unrealized | |
| Reference | | Buy/Sell | | Fixed Deal | | Payment | | Maturity | | Cleared | | Amount | | | Paid | | | | Appreciation | |
| Entity | | Protection | | Pay Rate | | Frequency | | Date | | Exchange | | (in thousands) | | | (Received) | | Value | | (Depreciation) | |
| iTRAXX | | | | | | | | December | | Intercontinental | | | | | | | | | | |
| Europe S30 | | Sell | | 1.000% | | 3M | | 2023 | | Exchange | | EUR 17,617 | | | $241 | | $123 | | | $(118) | |
See accompanying Notes to Financial Statements.
| December 31, 2018 | William Blair Funds | 103 |
Macro Allocation Fund
Portfolio of Investments, December 31, 2018(all dollar amounts in thousands)
Total Return Swaps
| | | Pay/ | | | | | | | | | | | | | | | | |
| | | Receive | | | | | | | | Notional | | | | | | | Unrealized | |
| Reference | | Floating | | | | Maturity | | | | Amount | | | | Market | | | Appreciation | |
| Entity | | Rate | | Floating Rates | | Dates | | Counterparty | | (in thousands) | | | | Value | | | (Depreciation) | |
| 10YR T-Note Future | | Receive | | 0 bp | | Feb 2019 | | Credit Suisse International | | $ | 7,391 | | | | $ | (174 | ) | | | $ | (174 | ) |
| 5YR T-Note Future | | Receive | | 0 bp | | Feb 2019 | | Credit Suisse International | | | 11,052 | | | | | (188 | ) | | | | (188 | ) |
| CSI 300 Net Total Return Index | | Pay | | 3 Month LIBOR minus 600 bp | | Sep 2019 | | Credit Suisse International | | | 19,407 | | | | | (914 | ) | | | | (914 | ) |
| Euro Bund Future | | Receive | | 0 bp | | Mar 2019 | | Credit Suisse International | | EUR | 40,922 | | | | | (332 | ) | | | | (332 | ) |
| MSCI Emerging Markets Indonesia Net Total Return Index | | Pay | | 3 Month LIBOR plus 40 bp | | Mar 2019 | | Citibank N.A. | | $ | 17,421 | | | | | 110 | | | | | 110 | |
| MSCI Emerging Markets India Net Total Return Index | | Pay | | 3 Month LIBOR minus 21 bp | | Dec 2019 | | Goldman Sachs International | | | 17,140 | | | | | 828 | | | | | 828 | |
| MSCI International Mexico Net Index | | Receive | | 3 Month LIBOR | | Mar 2019 | | Goldman Sachs International | | | 27,653 | | | | | (163 | ) | | | | (163 | ) |
| Swiss Market Index (Total Return) | | Receive | | 3 Month CHF LIBOR plus 130 bp | | Mar 2019 | | Goldman Sachs International | | CHF | 12,137 | | | | | (20 | ) | | | | (20 | ) |
| | | | | | | | | | | | | | | | | | | | | $ | (853 | ) |
| | | | | | | Total Net Unrealized Appreciation (Depreciation) on Swaps | | | | $ | (1,214 | ) |
See accompanying Notes to Financial Statements.
| 104 | Annual Report | December 31, 2018 |
Statements of Assets and Liabilities
As of December 31, 2018(dollar amounts in thousands)
| | | Growth
Fund | | | Large Cap
Growth
Fund | | | Mid Cap
Growth
Fund | |
| Assets | | | | | | | | | | | | |
| Investments in securities, at cost | | $ | 170,713 | | | $ | 141,191 | | | $ | 53,191 | |
| Investments in securities, at value | | $ | 225,194 | | | $ | 178,133 | | | $ | 56,257 | |
| Receivable for securities sold | | | 2,876 | | | | — | | | | — | |
| Receivable for fund shares sold | | | 293 | | | | 1,049 | | | | 88 | |
| Receivable from Adviser | | | 2 | | | | 26 | | | | 23 | |
| Dividend and interest receivable | | | 59 | | | | 46 | | | | 15 | |
| Total assets | | | 228,424 | | | | 179,254 | | | | 56,383 | |
| Liabilities | | | | | | | | | | | | |
| Payable for fund shares redeemed | | | 1,882 | | | | 93 | | | | 148 | |
| Payable to custodian | | | 608 | | | | — | | | | — | |
| Management fee payable | | | 165 | | | | 110 | | | | 47 | |
| Distribution fee payable | | | 9 | | | | 9 | | | | 1 | |
| Other payables and accrued expenses | | | 84 | | | | 82 | | | | 70 | |
| Total liabilities | | | 2,748 | | | | 294 | | | | 266 | |
| Net assets | | $ | 225,676 | | | $ | 178,960 | | | $ | 56,117 | |
| Capital | | | | | | | | | | | | |
| Composition of net assets | | | | | | | | | | | | |
| Paid in capital | | $ | 164,357 | | | $ | 139,504 | | | $ | 51,025 | |
| Total distributable earnings (loss) | | | 61,319 | | | | 39,456 | | | | 5,092 | |
| Net assets | | $ | 225,676 | | | $ | 178,960 | | | $ | 56,117 | |
| Class N shares | | | | | | | | | | | | |
| Net assets | | $ | 38,370 | | | $ | 41,361 | | | $ | 4,944 | |
| Shares outstanding | | | 4,852,583 | | | | 3,449,279 | | | | 557,055 | |
| Net asset value per share | | $ | 7.91 | | | $ | 11.99 | | | $ | 8.87 | |
| Class I shares | | | | | | | | | | | | |
| Net assets | | $ | 187,306 | | | $ | 137,599 | | | $ | 51,173 | |
| Shares outstanding | | | 20,257,831 | | | | 10,869,237 | | | | 5,360,340 | |
| Net asset value per share | | $ | 9.25 | | | $ | 12.66 | | | $ | 9.55 | |
See accompanying Notes to Financial Statements.
| December 31, 2018 | William Blair Funds | 105 |
Statements of Operations
For the Year Ended December 31, 2018(all amounts in thousands)
| | | Growth
Fund | | | Large Cap
Growth
Fund | | | Mid Cap
Growth
Fund | |
| Investment income | | | | | | | | | | | | | | |
| Dividends | | $ | 2,826 | | | | $ | 1,899 | | | | $ | 478 | |
| Less foreign tax withheld | | | (2 | ) | | | | — | | | | | — | |
| Interest | | | 8 | | | | | 6 | | | | | 4 | |
| Total income | | | 2,832 | | | | | 1,905 | | | | | 482 | |
| Expenses | | | | | | | | | | | | | | |
| Investment advisory fees | | | 2,484 | | | | | 1,508 | | | | | 625 | |
| Distribution fees | | | 106 | | | | | 94 | | | | | 15 | |
| Custodian fees | | | 48 | | | | | 56 | | | | | 51 | |
| Transfer agent fees | | | 61 | | | | | 25 | | | | | 12 | |
| Sub-transfer agent fees | | | | | | | | | | | | | | |
| Class N | | | 59 | | | | | 57 | | | | | 8 | |
| Class I | | | 247 | | | | | 181 | | | | | 80 | |
| Professional fees | | | 51 | | | | | 42 | | | | | 35 | |
| Registration fees | | | 37 | | | | | 35 | | | | | 36 | |
| Shareholder reporting fees | | | 22 | | | | | 20 | | | | | 1 | |
| Trustee fees | | | 33 | | | | | 14 | | | | | 8 | |
| Other expenses | | | 3 | | | | | 18 | | | | | 7 | |
| Total expenses before expense limitation | | | 3,151 | | | | | 2,050 | | | | | 878 | |
| Expenses waived or reimbursed by the Adviser | | | (8 | ) | | | | (231 | ) | | | | (216 | ) |
| Net expenses | | | 3,143 | | | | | 1,819 | | | | | 662 | |
| Net investment income (loss) | | | (311 | ) | | | | 86 | | | | | (180 | ) |
| Realized and unrealized gain (loss) | | | | | | | | | | | | | | |
| Net realized gain (loss) on transactions from: | | | | | | | | | | | | | | |
| Investments in securities | | | 81,637 | | | | | 32,604 | | | | | 13,079 | |
| Total net realized gain (loss) | | | 81,637 | | | | | 32,604 | | | | | 13,079 | |
| Change in net unrealized appreciation (depreciation) of: | | | | | | | | | | | | | | |
| Investments in securities | | | (49,663 | ) | | | | (17,587 | ) | | | | (12,543 | ) |
| Change in net unrealized appreciation (depreciation) | | | (49,663 | ) | | | | (17,587 | ) | | | | (12,543 | ) |
| Net increase (decrease) in net assets resulting from operations | | $ | 31,663 | | | | $ | 15,103 | | | | $ | 356 | |
See accompanying Notes to Financial Statements.
| 106 | Annual Report | December 31, 2018 |
Statements of Changes in Net Assets
For the Years Ended December 31, 2018 and 2017(all amounts in thousands)
| | | Growth Fund | | | Large Cap
Growth Fund | | | Mid Cap
Growth Fund | |
| | | 2018 | | | 2017 | | | 2018 | | | 2017 | | | 2018 | | | 2017 | |
| Operations | | | | | | | | | | | | | | | | | | | | | | | | |
| Net investment income (loss) | | $ | (311 | ) | | $ | 372 | | | $ | 86 | | | $ | 157 | | | $ | (180 | ) | | $ | (455 | ) |
| Net realized gain (loss) on investments, and other assets and liabilities | | | 81,637 | | | | 93,613 | | | | 32,604 | | | | 3,192 | | | | 13,079 | | | | 20,258 | |
| Change in net unrealized appreciation (depreciation) on investments, and other assets and liabilities | | | (49,663 | ) | | | 4,895 | | | | (17,587 | ) | | | 40,329 | | | | (12,543 | ) | | | 499 | |
| Net increase (decrease) in net assets resulting from operations | | | 31,663 | | | | 98,880 | | | | 15,103 | | | | 43,678 | | | | 356 | | | | 20,302 | |
| Distributions to shareholders from1 | | | | | | | | | | | | | | | | | | | | | | | | |
| Class N | | | (12,048 | ) | | | — | | | | (6,522 | ) | | | — | | | | (982 | ) | | | — | |
| Class I | | | (51,103 | ) | | | — | | | | (20,739 | ) | | | — | | | | (9,097 | ) | | | — | |
| Net investment income | | | | | | | | | | | | | | | | | | | | | | | | |
| Class I | | | N/A | | | $ | — | | | | N/A | | | $ | — | | | | N/A | | | $ | — | |
| Class I | | | N/A | | | | (366 | ) | | | N/A | | | | — | | | | N/A | | | | — | |
| Net realized gain | | | | | | | | | | | | | | | | | | | | | | | | |
| Class N | | | N/A | | | | (10,662 | ) | | | N/A | | | | (146 | ) | | | N/A | | | | (986 | ) |
| Class I | | | N/A | | | | (83,448 | ) | | | N/A | | | | (993 | ) | | | N/A | | | | (10,476 | ) |
| Total distributions | | | (63,151 | ) | | | (94,476 | ) | | | (27,261 | ) | | | (1,139 | ) | | | (10,079 | ) | | | (11,462 | ) |
| Capital stock transactions | | | | | | | | | | | | | | | | | | | | | | | | |
| Proceeds from sale of shares | | | 42,834 | | | | 28,218 | | | | 60,009 | | | | 62,963 | | | | 10,781 | | | | 10,841 | |
| Shares issued in reinvestment of income dividends and capital gain distributions | | | 60,277 | | | | 91,558 | | | | 23,837 | | | | 1,030 | | | | 9,695 | | | | 11,050 | |
| Less cost of shares redeemed | | | (199,681 | ) | | | (348,252 | ) | | | (96,291 | ) | | | (25,304 | ) | | | (32,171 | ) | | | (88,854 | ) |
| Net increase (decrease) in net assets resulting from capital share transactions | | | (96,570 | ) | | | (228,476 | ) | | | (12,445 | ) | | | 38,689 | | | | (11,695 | ) | | | (66,963 | ) |
| Increase (decrease) in net assets | | | (128,058 | ) | | | (224,072 | ) | | | (24,603 | ) | | | 81,228 | | | | (21,418 | ) | | | (58,123 | ) |
| Net assets | | | | | | | | | | | | | | | | | | | | | | | | |
| Beginning of period | | | 353,734 | | | | 577,806 | | | | 203,563 | | | | 122,335 | | | | 77,535 | | | | 135,658 | |
| End of period | | $ | 225,676 | | | $ | 353,734 | | | $ | 178,960 | | | $ | 203,563 | | | $ | 56,117 | | | $ | 77,535 | |
| Accumulated net investment income (loss) at the end of the period1 | | | N/A | | | $ | 6 | | | | N/A | | | $ | 157 | | | | N/A | | | $ | — | |
| 1 | The presentation of distribution to shareholders and accumulated net investment income (loss) have been updated to reflect the changes prescribed in amendments to Regulation S-X as disclosed in Note 2(k) to the Financial Statements. |
See accompanying Notes to Financial Statements.
| December 31, 2018 | William Blair Funds | 107 |
Statements of Assets and Liabilities
As of December 31, 2018(dollar amounts in thousands)
| | | Small-Mid
Cap Growth
Fund | | | Small-Mid
Cap Value
Fund | | | Small Cap
Growth
Fund | | | Small Cap
Value
Fund | |
| Assets | | | | | | | | | | | | | | | | | | |
| Investments in securities, at cost | | | $ | 2,320,498 | | | | $ | 1,679 | | | $ | 597,653 | | | $ | 456,986 | |
| Investments in securities, at value | | | $ | 2,373,279 | | | | $ | 1,661 | | | $ | 597,202 | | | $ | 484,116 | |
| Receivable for securities sold | | | | — | | | | | 51 | | | | 1,544 | | | | 5,519 | |
| Receivable for fund shares sold | | | | 40,591 | | | | | 3 | | | | 5,512 | | | | 2,146 | |
| Receivable from Adviser | | | | 334 | | | | | 15 | | | | 37 | | | | 43 | |
| Dividend and interest receivable | | | | 616 | | | | | 3 | | | | 218 | | | | 860 | |
| Total assets | | | | 2,414,820 | | | | | 1,733 | | | | 604,513 | | | | 492,684 | |
| Liabilities | | | | | | | | | | | | | | | | | | |
| Payable for investment securities purchased | | | | — | | | | | — | | | | 14,588 | | | | — | |
| Payable for fund shares redeemed | | | | 7,909 | | | | | — | | | | 9,743 | | | | 528 | |
| Payable to custodian | | | | — | | | | | 9 | | | | — | | | | — | |
| Management fee payable | | | | 2,102 | | | | | 2 | | | | 604 | | | | 483 | |
| Distribution fee payable | | | | 95 | | | | | — | | | | 41 | | | | 4 | |
| Other payables and accrued expenses | | | | 744 | | | | | 43 | | | | 230 | | | | 154 | |
| Total liabilities | | | | 10,850 | | | | | 54 | | | | 25,206 | | | | 1,169 | |
| Net assets | | | $ | 2,403,970 | | | | $ | 1,679 | | | $ | 579,307 | | | $ | 491,515 | |
| Capital | | | | | | | | | | | | | | | | | | |
| Composition of net assets | | | | | | | | | | | | | | | | | | |
| Paid in capital | | | $ | 2,349,251 | | | | $ | 1,756 | | | $ | 580,312 | | | $ | 465,589 | |
| Total distributable earnings (loss) | | | | 54,719 | | | | | (77 | ) | | | (1,005 | ) | | | 25,926 | |
| Net assets | | | $ | 2,403,970 | | | | $ | 1,679 | | | $ | 579,307 | | | $ | 491,515 | |
| Class N shares | | | | | | | | | | | | | | | | | | |
| Net assets | | | $ | 424,865 | | | | $ | 234 | | | $ | 169,074 | | | $ | 16,381 | |
| Shares outstanding | | | | 20,263,077 | | | | | 25,136 | | | | 7,276,726 | | | | 1,089,043 | |
| Net asset value per share | | | $ | 20.97 | | | | $ | 9.31 | | | $ | 23.23 | | | $ | 15.04 | |
| Class I shares | | | | | | | | | | | | | | | | | | |
| Net assets | | | $ | 1,979,105 | | | | $ | 1,445 | | | $ | 410,233 | | | $ | 475,134 | |
| Shares outstanding | | | | 89,451,224 | | | | | 156,616 | | | | 15,783,928 | | | | 30,647,557 | |
| Net asset value per share | | | $ | 22.12 | | | | $ | 9.23 | | | $ | 25.99 | | | $ | 15.50 | |
See accompanying Notes to Financial Statements.
| 108 | Annual Report | December 31, 2018 |
Statements of Operations
For the Year Ended December 31, 2018(all amounts in thousands)
| | | Small-Mid
Cap Growth
Fund | | | Small-Mid
Cap Value
Fund | | | Small Cap
Growth
Fund | | | Small Cap
Value
Fund | |
| Investment income | | | | | | | | | | | | | | | | | | | | |
| Dividends | | | $ | 15,156 | | | | $ | 42 | | | | $ | 3,687 | | | | $ | 10,346 | |
| Less foreign tax withheld | | | | (92 | ) | | | | — | | | | | (55 | ) | | | | — | |
| Interest | | | | 187 | | | | | — | | | | | 56 | | | | | 31 | |
| Total income | | | | 15,251 | | | | | 42 | | | | | 3,688 | | | | | 10,377 | |
| Expenses | | | | | | | | | | | | | | | | | | | | |
| Investment advisory fees | | | | 24,057 | | | | | 23 | | | | | 6,710 | | | | | 6,874 | |
| Distribution fees | | | | 1,138 | | | | | 1 | | | | | 469 | | | | | 65 | |
| Custodian fees | | | | 54 | | | | | 46 | | | | | 56 | | | | | 53 | |
| Transfer agent fees | | | | 191 | | | | | 1 | | | | | 52 | | | | | 52 | |
| Sub-transfer agent fees | | | | | | | | | | | | | | | | | | | | |
| Class N | | | | 687 | | | | | — | | | | | 269 | | | | | 38 | |
| Class I | | | | 2,299 | | | | | 1 | | | | | 428 | | | | | 837 | |
| Professional fees | | | | 158 | | | | | 30 | | | | | 57 | | | | | 67 | |
| Registration fees | | | | 93 | | | | | 37 | | | | | 58 | | | | | 39 | |
| Shareholder reporting fees | | | | 320 | | | | | 3 | | | | | 24 | | | | | 81 | |
| Trustee fees | | | | 146 | | | | | 1 | | | | | 40 | | | | | 55 | |
| Other expenses | | | | 91 | | | | | 7 | | | | | 29 | | | | | 29 | |
| Total expenses before expense limitation | | | | 29,234 | | | | | 150 | | | | | 8,192 | | | | | 8,190 | |
| Expenses waived or reimbursed by the Adviser | | | | (1,630 | ) | | | | (126 | ) | | | | (85 | ) | | | | (313 | ) |
| Net expenses | | | | 27,604 | | | | | 24 | | | | | 8,107 | | | | | 7,877 | |
| Net investment income (loss) | | | | (12,353 | ) | | | | 18 | | | | | (4,419 | ) | | | | 2,500 | |
| Realized and unrealized gain (loss) | | | | | | | | | | | | | | | | | | | | |
| Net realized gain (loss) on transactions from: | | | | | | | | | | | | | | | | | | | | |
| Investments in securities | | | | 177,265 | | | | | 479 | | | | | 78,793 | | | | | 61,842 | |
| Redemptions in-kind | | | | 11,209 | | | | | — | | | | | 2,300 | | | | | — | |
| Total net realized gain (loss) | | | | 188,474 | | | | | 479 | | | | | 81,093 | | | | | 61,842 | |
| Change in net unrealized appreciation (depreciation) of: | | | | | | | | | | | | | | | | | | | | |
| Investments in securities | | | | (287,618 | ) | | | | (852 | ) | | | | (111,007 | ) | | | | (157,546 | ) |
| Change in net unrealized appreciation (depreciation) | | | | (287,618 | ) | | | | (852 | ) | | | | (111,007 | ) | | | | (157,546 | ) |
| Net increase (decrease) in net assets resulting from operations | | | $ | (111,497 | ) | | | $ | (355 | ) | | | $ | (34,333 | ) | | | $ | (93,204 | ) |
See accompanying Notes to Financial Statements.
| December 31, 2018 | William Blair Funds | 109 |
Statements of Changes in Net Assets
For the Years Ended December 31, 2018 and 2017(all amounts in thousands)
| | | Small-Mid
Cap Growth Fund | | | Small-Mid
Cap Value Fund | | | Small Cap
Growth Fund | | | Small Cap
Value Fund | |
| | | 2018 | | | 2017 | | | 2018 | | | 2017 | | | 2018 | | | 2017 | | | 2018 | | | 2017 | |
| Operations | | | | | | | | | | | | | | | | | | | | | | | | | | | | | | | | | | |
| Net investment income (loss) | | $ | (12,353 | ) | | $ | (8,378 | ) | | | $ | 18 | | | | $ | 17 | | | $ | (4,419 | ) | | $ | (3,241 | ) | | $ | 2,500 | | | $ | 1,911 | |
| Net realized gain (loss) on investments, and other assets and liabilities | | | 188,474 | | | | 227,204 | | | | | 479 | | | | | 339 | | | | 81,093 | | | | 72,283 | | | | 61,842 | | | | 47,593 | |
| Change in net unrealized appreciation (depreciation) on investments, and other assets and liabilities | | | (287,618 | ) | | | 179,918 | | | | | (852 | ) | | | | (30 | ) | | | (111,007 | ) | | | 37,293 | | | | (157,546 | ) | | | 2,493 | |
| Net increase (decrease) in net assets resulting from operations | | | (111,497 | ) | | | 398,744 | | | | | (355 | ) | | | | 326 | | | | (34,333 | ) | | | 106,335 | | | | (93,204 | ) | | | 51,997 | |
| Distributions to shareholders from1 | | | | | | | | | | | | | | | | | | | | | | | | | | | | | | | | | | |
| Class N | | | (37,426 | ) | | | — | | | | | (59 | ) | | | | — | | | | (23,655 | ) | | | — | | | | (2,248 | ) | | | — | |
| Class I | | | (160,129 | ) | | | — | | | | | (381 | ) | | | | — | | | | (47,224 | ) | | | — | | | | (57,005 | ) | | | — | |
| Net investment income | | | | | | | | | | | | | | | | | | | | | | | | | | | | | | | | | | |
| Class N | | | N/A | | | | — | | | | | N/A | | | | | — | | | | N/A | | | | — | | | | N/A | | | | — | |
| Class I | | | N/A | | | | — | | | | | N/A | | | | | (12 | ) | | | N/A | | | | — | | | | N/A | | | | (1,332 | ) |
| Net realized gain | | | | | | | | | | | | | | | | | | | | | | | | | | | | | | | | | | |
| Class N | | | N/A | | | | (11,906 | ) | | | | N/A | | | | | (28 | ) | | | N/A | | | | (23,520 | ) | | | N/A | | | | (2,098 | ) |
| Class I | | | N/A | | | | (81,736 | ) | | | | N/A | | | | | (320 | ) | | | N/A | | | | (49,518 | ) | | | N/A | | | | (46,240 | ) |
| Total distributions | | | (197,555 | ) | | | (93,642 | ) | | | | (440 | ) | | | | (360 | ) | | | (70,879 | ) | | | (73,038 | ) | | | (59,253 | ) | | | (49,670 | ) |
| Capital stock transactions | | | | | | | | | | | | | | | | | | | | | | | | | | | | | | | | | | |
| Proceeds from sale of shares | | | 1,291,881 | | | | 639,389 | | | | | 488 | | | | | 628 | | | | 326,138 | | | | 127,343 | | | | 71,840 | | | | 95,517 | |
| Shares issued in reinvestment of income dividends and capital gain distributions | | | 193,965 | | | | 92,785 | | | | | 439 | | | | | 360 | | | | 70,242 | | | | 72,609 | | | | 58,395 | | | | 47,791 | |
| Less cost of shares redeemed | | | (577,832 | ) | | | (494,845 | ) | | | | (2,096 | ) | | | | (764 | ) | | | (201,271 | ) | | | (132,737 | ) | | | (160,283 | ) | | | (180,246 | ) |
| Net increase (decrease) in net assets resulting from capital share transactions | | | 908,014 | | | | 237,329 | | | | | (1,169 | ) | | | | 224 | | | | 195,109 | | | | 67,215 | | | | (30,048 | ) | | | (36,938 | ) |
| Increase (decrease) in net assets | | | 598,962 | | | | 542,431 | | | | | (1,964 | ) | | | | 190 | | | | 89,897 | | | | 100,512 | | | | (182,505 | ) | | | (34,611 | ) |
| Net assets | | | | | | | | | | | | | | | | | | | | | | | | | | | | | | | | | | |
| Beginning of period | | | 1,805,008 | | | | 1,262,577 | | | | | 3,643 | | | | | 3,453 | | | | 489,410 | | | | 388,898 | | | | 674,020 | | | | 708,631 | |
| End of period | | $ | 2,403,970 | | | $ | 1,805,008 | | | | $ | 1,679 | | | | $ | 3,643 | | | $ | 579,307 | | | $ | 489,410 | | | $ | 491,515 | | | $ | 674,020 | |
| Accumulated net investment income (loss) at the end of the period1 | | | N/A | | | $ | — | | | | | N/A | | | | $ | 2 | | | | N/A | | | $ | — | | | | N/A | | | $ | — | |
| 1 | The presentation of distribution to shareholders and accumulated net investment income (loss) have been updated to reflect the changes prescribed in amendments to Regulation S-X as disclosed in Note 2(k) to the Financial Statements. |
See accompanying Notes to Financial Statements.
| 110 | Annual Report | December 31, 2018 |
Statements of Assets and Liabilities
As of December 31, 2018(dollar amounts in thousands)
| | | Global
Leaders
Fund | | | International
Leaders
Fund | | | International
Developed
Plus Fund | | | Institutional
International
Developed
Plus Fund | |
| Assets | | | | | | | | | | | | | | | | | | | |
| Investments in securities, at cost | | $ | 150,029 | | | | $ | 394,349 | | | | $ | 83,343 | | | | $ | 15,215 | |
| Investments in securities, at value | | $ | 171,018 | | | | $ | 409,376 | | | | $ | 87,066 | | | | $ | 15,942 | |
| Cash | | | — | | | | | 37 | | | | | — | | | | | — | |
| Foreign currency, at value (cost $—; $907; $—; $—) | | | — | | | | | 907 | | | | | — | | | | | — | |
| Receivable for securities sold | | | 409 | | | | | 2,550 | | | | | 1,555 | | | | | 246 | |
| Receivable for fund shares sold | | | 7 | | | | | 1,671 | | | | | — | | | | | — | |
| Receivable from Adviser | | | 7 | | | | | 6 | | | | | 20 | | | | | 14 | |
| Dividend and interest receivable | | | 164 | | | | | 413 | | | | | 170 | | | | | 31 | |
| Total assets | | | 171,605 | | | | | 414,960 | | | | | 88,811 | | | | | 16,233 | |
| Liabilities | | | | | | | | | | | | | | | | | | | |
| Payable for investment securities purchased | | | 591 | | | | | 1,438 | | | | | — | | | | | — | |
| Payable for fund shares redeemed | | | 100 | | | | | 3,066 | | | | | 29 | | | | | — | |
| Payable to custodian | | | — | | | | | — | | | | | 22 | | | | | — | |
| Management fee payable | | | 139 | | | | | 318 | | | | | 69 | | | | | 13 | |
| Distribution fee payable | | | 2 | | | | | 2 | | | | | — | | | | | — | |
| Foreign capital gains tax liability | | | — | | | | | 14 | | | | | — | | | | | — | |
| Other payables and accrued expenses | | | 73 | | | | | 123 | | | | | 110 | | | | | 65 | |
| Total liabilities | | | 905 | | | | | 4,961 | | | | | 230 | | | | | 78 | |
| Net assets | | $ | 170,700 | | | | $ | 409,999 | | | | $ | 88,581 | | | | $ | 16,155 | |
| Capital | | | | | | | | | | | | | | | | | | | |
| Composition of net assets | | | | | | | | | | | | | | | | | | | |
| Paid in capital | | $ | 150,712 | | | | $ | 398,918 | | | | $ | 85,897 | | | | $ | 15,672 | |
| Total distributable earnings (loss) | | | 19,988 | | | | | 11,081 | | | | | 2,684 | | | | | 483 | |
| Net assets | | $ | 170,700 | | | | $ | 409,999 | | | | $ | 88,581 | | | | $ | 16,155 | |
| Class N shares | | | | | | | | | | | | | | | | | | | |
| Net assets | | $ | 7,225 | | | | $ | 8,715 | | | | $ | 1,794 | | | | | — | |
| Shares outstanding | | | 630,153 | | | | | 631,412 | | | | | 132,275 | | | | | — | |
| Net asset value per share | | $ | 11.47 | | | | $ | 13.80 | | | | $ | 13.56 | | | | | — | |
| Class I shares | | | | | | | | | | | | | | | | | | | |
| Net assets | | $ | 83,790 | | | | $ | 76,382 | | | | $ | 86,787 | | | | | — | |
| Shares outstanding | | | 7,305,992 | | | | | 5,520,758 | | | | | 6,352,882 | | | | | — | |
| Net asset value per share | | $ | 11.47 | | | | $ | 13.84 | | | | $ | 13.66 | | | | | — | |
| Institutional Class shares | | | | | | | | | | | | | | | | | | | |
| Net assets | | $ | 79,685 | | | | $ | 324,902 | | | | | — | | | | $ | 16,155 | |
| Shares outstanding | | | 6,946,104 | | | | | 23,490,829 | | | | | — | | | | | 1,353,066 | |
| Net asset value per share | | $ | 11.47 | | | | $ | 13.83 | | | | | — | | | | $ | 11.94 | |
See accompanying Notes to Financial Statements.
| December 31, 2018 | William Blair Funds | 111 |
Statements of Operations
For the Year Ended December 31, 2018(all amounts in thousands)
| | | Global
Leaders
Fund | | | International
Leaders
Fund | | | International
Developed
Plus Fund | | | Institutional
International
Developed
Plus Fund | |
| Investment income | | | | | | | | | | | | | | | | | | | |
| Dividends | | $ | 2,944 | | | | $ | 9,571 | | | | $ | 2,666 | | | | $ | 443 | |
| Less foreign tax withheld | | | (151 | ) | | | | (886 | ) | | | | (274 | ) | | | | (45 | ) |
| Interest | | | 10 | | | | | 38 | | | | | 9 | | | | | 2 | |
| Total income | | | 2,803 | | | | | 8,723 | | | | | 2,401 | | | | | 400 | |
| Expenses | | | | | | | | | | | | | | | | | | | |
| Investment advisory fees | | | 1,852 | | | | | 3,859 | | | | | 1,031 | | | | | 168 | |
| Distribution fees | | | 21 | | | | | 25 | | | | | 7 | | | | | — | |
| Custodian fees | | | 68 | | | | | 98 | | | | | 63 | | | | | 55 | |
| Transfer agent fees | | | 10 | | | | | 19 | | | | | 5 | | | | | 1 | |
| Sub-transfer agent fees | | | | | | | | | | | | | | | | | | | |
| Class N | | | 12 | | | | | 15 | | | | | 3 | | | | | — | |
| Class I | | | 46 | | | | | 62 | | | | | 124 | | | | | — | |
| Professional fees | | | 57 | | | | | 78 | | | | | 57 | | | | | 51 | |
| Registration fees | | | 48 | | | | | 58 | | | | | 34 | | | | | 20 | |
| Shareholder reporting fees | | | 7 | | | | | 14 | | | | | 4 | | | | | 1 | |
| Trustee fees | | | 16 | | | | | 29 | | | | | 9 | | | | | 1 | |
| Other expenses | | | 18 | | | | | 29 | | | | | 12 | | | | | 4 | |
| Total expenses before expense limitation | | | 2,155 | | | | | 4,286 | | | | | 1,349 | | | | | 301 | |
| Expenses waived or reimbursed by the Adviser | | | (165 | ) | | | | (186 | ) | | | | (221 | ) | | | | (134 | ) |
| Net expenses | | | 1,990 | | | | | 4,100 | | | | | 1,128 | | | | | 167 | |
| Net investment income (loss) | | | 813 | | | | | 4,623 | | | | | 1,273 | | | | | 233 | |
| Realized and unrealized gain (loss) | | | | | | | | | | | | | | | | | | | |
| Net realized gain (loss) on transactions from: | | | | | | | | | | | | | | | | | | | |
| Investments in securities, net of foreign taxes, if applicable | | | 28,332 | | | | | 6,873 | | | | | 432 | | | | | 410 | |
| Foreign currency transactions | | | (51 | ) | | | | (128 | ) | | | | (27 | ) | | | | (5 | ) |
| Total net realized gain (loss) | | | 28,281 | | | | | 6,745 | | | | | 405 | | | | | 405 | |
| Change in net unrealized appreciation (depreciation) of: | | | | | | | | | | | | | | | | | | | |
| Investments in securities | | | (39,538 | ) | | | | (70,726 | ) | | | | (19,919 | ) | | | | (3,522 | ) |
| Foreign currency translations | | | (1 | ) | | | | 1 | | | | | (6 | ) | | | | (1 | ) |
| Change in net unrealized appreciation (depreciation) | | | (39,539 | ) | | | | (70,725 | ) | | | | (19,925 | ) | | | | (3,523 | ) |
| Net increase (decrease) in net assets resulting from operations | | $ | (10,445 | ) | | | $ | (59,357 | ) | | | $ | (18,247 | ) | | | $ | (2,885 | ) |
See accompanying Notes to Financial Statements.
| 112 | Annual Report | December 31, 2018 |
Statements of Changes in Net Assets
For the Years Ended December 31, 2018 and 2017(all amounts in thousands)
| | | Global
Leaders Fund | | | International
Leaders Fund | | | International
Developed
Plus Fund | | | Institutional
International
Developed
Plus Fund | |
| | | 2018 | | | 2017 | | | 2018 | | | 2017 | | | 2018 | | | 2017 | | | 2018 | | | 2017 | |
| Operations | | | | | | | | | | | | | | | | | | | | | | | | | | |
| Net investment income (loss) | | $ | 813 | | | $ | 1,399 | | | $ | 4,623 | | | $ | 3,738 | | | $ | 1,273 | | | $ | 964 | | | | $ | 233 | | | | $ | 206 | |
| Net realized gain (loss) on investments, and other assets and liabilities | | | 28,281 | | | | 10,326 | | | | 6,745 | | | | 7,160 | | | | 405 | | | | 3,974 | | | | | 405 | | | | | 679 | |
| Change in net unrealized appreciation (depreciation) on investments, and other assets and liabilities | | | (39,539 | ) | | | 40,729 | | | | (70,725 | ) | | | 72,854 | | | | (19,925 | ) | | | 16,673 | | | | | (3,523 | ) | | | | 2,922 | |
| Net increase (decrease) in net assets resulting from operations | | | (10,445 | ) | | | 52,454 | | | | (59,357 | ) | | | 83,752 | | | | (18,247 | ) | | | 21,611 | | | | | (2,885 | ) | | | | 3,807 | |
| Distributions to shareholders from1 | | | | | | | | | | | | | | | | | | | | | | | | | | | | | | | | | | |
| Class N | | | (1,089 | ) | | | — | | | | (312 | ) | | | — | | | | (37 | ) | | | — | | | | | — | | | | | — | |
| Class I | | | (13,017 | ) | | | — | | | | (3,051 | ) | | | — | | | | (2,203 | ) | | | — | | | | | — | | | | | — | |
| Institutional Class | | | (12,002 | ) | | | — | | | | (13,274 | ) | | | — | | | | — | | | | — | | | | | (554 | ) | | | | — | |
| Net investment income | | | | | | | | | | | | | | | | | | | | | | | | | | | | | | | | | | |
| Class N | | | N/A | | | | (50 | ) | | | N/A | | | | (117 | ) | | | N/A | | | | (55 | ) | | | | N/A | | | | | — | |
| Class I | | | N/A | | | | (566 | ) | | | N/A | | | | (844 | ) | | | N/A | | | | (2,202 | ) | | | | N/A | | | | | — | |
| Institutional Class | | | N/A | | | | (1,427 | ) | | | N/A | | | | (4,501 | ) | | | N/A | | | | — | | | | | N/A | | | | | (212 | ) |
| Net realized gain | | | | | | | | | | | | | | | | | | | | | | | | | | | | | | | | | | |
| Class N | | | N/A | | | | (236 | ) | | | N/A | | | | (71 | ) | | | N/A | | | | — | | | | | N/A | | | | | — | |
| Class I | | | N/A | | | | (1,911 | ) | | | N/A | | | | (437 | ) | | | N/A | | | | — | | | | | N/A | | | | | — | |
| Institutional Class | | | N/A | | | | (4,506 | ) | | | N/A | | | | (2,201 | ) | | | N/A | | | | — | | | | | N/A | | | | | — | |
| Total distributions | | | (26,108 | ) | | | (8,696 | ) | | | (16,637 | ) | | | (8,171 | ) | | | (2,240 | ) | | | (2,257 | ) | | | | (554 | ) | | | | (212 | ) |
| Capital stock transactions | | | | | | | | | | | | | | | | | | | | | | | | | | | | | | | | | | |
| Proceeds from sale of shares | | | 46,840 | | | | 8,432 | | | | 153,690 | | | | 70,308 | | | | 799 | | | | 22,611 | | | | | — | | | | | 150 | |
| Shares issued in reinvestment of income dividends and capital gain distributions | | | 25,924 | | | | 8,355 | | | | 15,804 | | | | 6,325 | | | | 2,156 | | | | 2,153 | | | | | 554 | | | | | 212 | |
| Less cost of shares redeemed | | | (76,860 | ) | | | (25,927 | ) | | | (62,329 | ) | | | (28,608 | ) | | | (14,626 | ) | | | (10,716 | ) | | | | (50 | ) | | | | (1,432 | ) |
| Net increase (decrease) in net assets resulting from capital share transactions | | | (4,096 | ) | | | (9,140 | ) | | | 107,165 | | | | 48,025 | | | | (11,671 | ) | | | 14,048 | | | | | 504 | | | | | (1,070 | ) |
| Increase (decrease) in net assets | | | (40,649 | ) | | | 34,618 | | | | 31,171 | | | | 123,606 | | | | (32,158 | ) | | | 33,402 | | | | | (2,935 | ) | | | | 2,525 | |
| Net assets | | | | | | | | | | | | | | | | | | | | | | | | | | | | | | | | | | |
| Beginning of period | | | 211,349 | | | | 176,731 | | | | 378,828 | | | | 255,222 | | | | 120,739 | | | | 87,337 | | | | | 19,090 | | | | | 16,565 | |
| End of period | | $ | 170,700 | | | $ | 211,349 | | | $ | 409,999 | | | $ | 378,828 | | | $ | 88,581 | | | $ | 120,739 | | | | $ | 16,155 | | | | $ | 19,090 | |
| Accumulated net investment income (loss) at the end of the period1 | | | N/A | | | $ | 17 | | | | N/A | | | $ | (2,608 | ) | | | N/A | | | $ | (323 | ) | | | | N/A | | | | $ | (97 | ) |
| 1 | The presentation of distribution to shareholders and accumulated net investment income (loss) have been updated to reflect the changes prescribed in amendments to Regulation S-X as disclosed in Note 2(k) to the Financial Statements. |
See accompanying Notes to Financial Statements.
| December 31, 2018 | William Blair Funds | 113 |
Statements of Assets and Liabilities
As of December 31, 2018(dollar amounts in thousands)
| | | International
Growth
Fund | | | Institutional
International
Growth
Fund | | | International
Small Cap
Growth
Fund | |
| Assets | | | | | | | | | | | | | | |
| Investments in securities, at cost | | | $ | 2,076,587 | | | $ | 1,782,197 | | | | $ | 365,601 | |
| Investments in securities, at value | | | $ | 2,090,944 | | | $ | 1,782,050 | | | | $ | 333,756 | |
| Cash | | | | — | | | | 66 | | | | | — | |
| Foreign currency, at value (cost $—; $458; $54) | | | | — | | | | 458 | | | | | 54 | |
| Receivable for securities sold | | | | 25,535 | | | | 6,037 | | | | | 9,971 | |
| Receivable for fund shares sold | | | | 4,716 | | | | 17,055 | | | | | 2,220 | |
| Receivable from Adviser | | | | — | | | | — | | | | | 2 | |
| Dividend and interest receivable | | | | 4,958 | | | | 3,446 | | | | | 707 | |
| Total assets | | | | 2,126,153 | | | | 1,809,112 | | | | | 346,710 | |
| Liabilities | | | | | | | | | | | | | | |
| Payable for investment securities purchased | | | | 1,816 | | | | 22,826 | | | | | 255 | |
| Payable for fund shares redeemed | | | | 10,432 | | | | 72 | | | | | 2,718 | |
| Payable to custodian | | | | 7,646 | | | | — | | | | | 2,488 | |
| Management fee payable | | | | 1,934 | | | | 1,433 | | | | | 326 | |
| Distribution fee payable | | | | 105 | | | | — | | | | | 1 | |
| Other payables and accrued expenses | | | | 876 | | | | 346 | | | | | 198 | |
| Total liabilities | | | | 22,809 | | | | 24,677 | | | | | 5,986 | |
| Net assets | | | $ | 2,103,344 | | | $ | 1,784,435 | | | | $ | 340,724 | |
| Capital | | | | | | | | | | | | | | |
| Composition of net assets | | | | | | | | | | | | | | |
| Paid in capital | | | $ | 2,123,303 | | | $ | 1,826,818 | | | | $ | 393,821 | |
| Total distributable earnings (loss) | | | | (19,959 | ) | | | (42,383 | ) | | | | (53,097 | ) |
| Net assets | | | $ | 2,103,344 | | | $ | 1,784,435 | | | | $ | 340,724 | |
| Class N shares | | | | | | | | | | | | | | |
| Net assets | | | $ | 456,533 | | | | — | | | | $ | 3,440 | |
| Shares outstanding | | | | 19,812,775 | | | | — | | | | | 332,212 | |
| Net asset value per share | | | $ | 23.04 | | | | — | | | | $ | 10.36 | |
| Class I shares | | | | | | | | | | | | | | |
| Net assets | | | $ | 1,646,811 | | | | — | | | | $ | 165,451 | |
| Shares outstanding | | | | 69,898,184 | | | | — | | | | | 15,833,030 | |
| Net asset value per share | | | $ | 23.56 | | | | — | | | | $ | 10.45 | |
| Institutional Class shares | | | | | | | | | | | | | | |
| Net assets | | | | — | | | $ | 1,784,435 | | | | $ | 171,833 | |
| Shares outstanding | | | | — | | | | 133,177,902 | | | | | 16,362,404 | |
| Net asset value per share | | | | — | | | $ | 13.40 | | | | $ | 10.50 | |
See accompanying Notes to Financial Statements.
| 114 | Annual Report | December 31, 2018 |
Statements of Operations
For the Year Ended December 31, 2018(all amounts in thousands)
| | | International
Growth
Fund | | | Institutional
International
Growth
Fund | | | International
Small Cap
Growth
Fund | |
| Investment income | | | | | | | | | | | | |
| Dividends | | | $ | 63,548 | | | | $ | 47,943 | | | | $ | 10,702 | |
| Less foreign tax withheld | | | | (6,508 | ) | | | | (4,913 | ) | | | | (929 | ) |
| Interest | | | | 104 | | | | | 97 | | | | | 47 | |
| Total income | | | | 57,144 | | | | | 43,127 | | | | | 9,820 | |
| Expenses | | | | | | | | | | | | | | | |
| Investment advisory fees | | | | 28,846 | | | | | 20,312 | | | | | 5,556 | |
| Distribution fees | | | | 1,716 | | | | | — | | | | | 14 | |
| Custodian fees | | | | 326 | | | | | 263 | | | | | 139 | |
| Transfer agent fees | | | | 181 | | | | | 81 | | | | | 32 | |
| Sub-transfer agent fees | | | | | | | | | | | | | | | |
| Class N | | | | 1,037 | | | | | — | | | | | 8 | |
| Class I | | | | 1,713 | | | | | — | | | | | 309 | |
| Professional fees | | | | 270 | | | | | 223 | | | | | 99 | |
| Registration fees | | | | 39 | | | | | 25 | | | | | 53 | |
| Shareholder reporting fees | | | | 251 | | | | | 7 | | | | | 46 | |
| Trustee fees | | | | 254 | | | | | 184 | | | �� | | 47 | |
| Other expenses | | | | 80 | | | | | 69 | | | | | 26 | |
| Total expenses before expense limitation | | | | 34,713 | | | | | 21,164 | | | | | 6,329 | |
| Expenses waived or reimbursed by the Adviser | | | | (36 | ) | | | | — | | | | | — | |
| Net expenses | | | | 34,677 | | | | | 21,164 | | | | | 6,329 | |
| Net investment income (loss) | | | | 22,467 | | | | | 21,963 | | | | | 3,491 | |
| Realized and unrealized gain (loss) | | | | | | | | | | | | | | | |
| Net realized gain (loss) on transactions from: | | | | | | | | | | | | | | | |
| Investments in securities, net of foreign taxes, if applicable | | | | 134,767 | | | | | 100,635 | | | | | 16,807 | |
| Foreign currency transactions | | | | (2,095 | ) | | | | (1,669 | ) | | | | (590 | ) |
| Total net realized gain (loss) | | | | 132,672 | | | | | 98,966 | | | | | 16,217 | |
| Change in net unrealized appreciation (depreciation) of: | | | | | | | | | | | | | | | |
| Investments in securities | | | | (663,337 | ) | | | | (497,994 | ) | | | | (159,946 | ) |
| Foreign currency translations | | | | 1,797 | | | | | 1,410 | | | | | 320 | |
| Change in net unrealized appreciation (depreciation) | | | | (661,540 | ) | | | | (496,584 | ) | | | | (159,626 | ) |
| Net increase (decrease) in net assets resulting from operations | | | $ | (506,401 | ) | | | $ | (375,655 | ) | | | $ | (139,918 | ) |
See accompanying Notes to Financial Statements.
| December 31, 2018 | William Blair Funds | 115 |
Statements of Changes in Net Assets
For the Years Ended December 31, 2018 and 2017(all amounts in thousands)
| | | | | | Institutional | | | International | |
| | | International | | | International | | | Small Cap | |
| | | Growth Fund | | | Growth Fund | | | Growth Fund | |
| | 2018 | | | 2017 | | | 2018 | | | 2017 | | | 2018 | | | 2017 | |
| Operations | | | | | | | | | | | | | | | | | | |
| Net investment income (loss) | | $ | 22,467 | | | $ | 31,589 | | | $ | 21,963 | | | $ | 27,430 | | | $ | 3,491 | | | $ | 5,395 | |
| Net realized gain (loss) on investments, and other assets and liabilities | | | 132,672 | | | | 302,999 | | | | 98,966 | | | | 175,181 | | | | 16,217 | | | | 58,596 | |
| Change in net unrealized appreciation (depreciation) on investments, and other assets and liabilities | | | (661,540 | ) | | | 473,662 | | | | (496,584 | ) | | | 369,046 | | | | (159,626 | ) | | | 95,412 | |
| Net increase (decrease) in net assets resulting from operations | | | (506,401 | ) | | | 808,250 | | | | (375,655 | ) | | | 571,657 | | | | (139,918 | ) | | | 159,403 | |
| Distributions to shareholders from1 | | | | | | | | | | | | | | | | | | | | | | | | |
| Class N | | | (39,208 | ) | | | — | | | | — | | | | — | | | | (462 | ) | | | — | |
| Class I | | | (145,771 | ) | | | — | | | | — | | | | — | | | | (25,473 | ) | | | — | |
| Institutional Class | | | — | | | | — | | | | (186,678 | ) | | | — | | | | (21,100 | ) | | | — | |
| Net investment income | | | | | | | | | | | | | | | | | | | | | | | | |
| Class N | | | N/A | | | | (9,771 | ) | | | N/A | | | | — | | | | N/A | | | | (118 | ) |
| Class I | | | N/A | | | | (36,754 | ) | | | N/A | | | | — | | | | N/A | | | | (8,043 | ) |
| Institutional Class | | | N/A | | | | — | | | | N/A | | | | (54,743 | ) | | | N/A | | | | (6,106 | ) |
| Net realized gain | | | | | | | | | | | | | | | | | | | | | | | | |
| Class N | | | N/A | | | | — | | | | N/A | | | | — | | | | N/A | | | | (428 | ) |
| Class I | | | N/A | | | | — | | | | N/A | | | | — | | | | N/A | | | | (23,404 | ) |
| Institutional Class | | | N/A | | | | — | | | | N/A | | | | (39,224 | ) | | | N/A | | | | (17,151 | ) |
| Total distributions | | | (184,979 | ) | | | (46,525 | ) | | | (186,678 | ) | | | (93,967 | ) | | | (47,035 | ) | | | (55,250 | ) |
| Capital stock transactions | | | | | | | | | | | | | | | | | | | | | | | | |
| Proceeds from sale of shares | | | 309,595 | | | | 246,035 | | | | 268,610 | | | | 192,850 | | | | 95,395 | | | | 58,793 | |
| Shares issued in reinvestment of income dividends and capital gain distributions | | | 172,803 | | | | 43,593 | | | | 180,253 | | | | 90,689 | | | | 40,939 | | | | 50,424 | |
| Less cost of shares redeemed | | | (826,740 | ) | | | (893,532 | ) | | | (432,394 | ) | | | (524,901 | ) | | | (210,410 | ) | | | (128,250 | ) |
| Net increase (decrease) in net assets resulting from capital share transactions | | | (344,342 | ) | | | (603,904 | ) | | | 16,469 | | | | (241,362 | ) | | | (74,076 | ) | | | (19,033 | ) |
| Increase (decrease) in net assets | | | (1,035,722 | ) | | | 157,821 | | | | (545,864 | ) | | | 236,328 | | | | (261,029 | ) | | | 85,120 | |
| Net assets | | | | | | | | | | | | | | | | | | | | | | | | |
| Beginning of period | | | 3,139,066 | | | | 2,981,245 | | | | 2,330,299 | | | | 2,093,971 | | | | 601,753 | | | | 516,633 | |
| End of period | | $ | 2,103,344 | | | $ | 3,139,066 | | | $ | 1,784,435 | | | $ | 2,330,299 | | | $ | 340,724 | | | $ | 601,753 | |
| Accumulated net investment income (loss) at the end of the period1 | | | N/A | | | $ | (1,201 | ) | | | N/A | | | $ | (13,283 | ) | | | N/A | | | $ | (10,409 | ) |
| 1 | The presentation of distribution to shareholders and accumulated net investment income (loss) have been updated to reflect the changes prescribed in amendments to Regulation S-X as disclosed in Note 2(k) to the Financial Statements. |
See accompanying Notes to Financial Statements.
| 116 | Annual Report | December 31, 2018 |
Statements of Assets and Liabilities
As of December 31, 2018(dollar amounts in thousands)
| | | Emerging | | | Emerging | | | Emerging | |
| | | Markets | | | Markets | | | Markets | |
| | | Leaders | | | Growth | | | Small Cap | |
| | Fund | | | Fund | | | Growth Fund | |
| Assets | | | | | | | | | |
| Investments in securities, at cost | | $ | 200,607 | | | $ | 699,531 | | | | $ | 268,805 | |
| Investments in securities, at value | | $ | 199,063 | | | $ | 733,026 | | | | $ | 278,103 | |
| Foreign currency, at value (cost $—; $11; $1,097) | | | — | | | | 11 | | | | 1,097 | |
| Receivable for securities sold | | | — | | | | 2,715 | | | | 5,488 | |
| Receivable for fund shares sold | | | 189 | | | | 11,524 | | | | 1,190 | |
| Dividend and interest receivable | | | 381 | | | | 572 | | | | | 783 | |
| Total assets | | | 199,633 | | | | 747,848 | | | | 286,661 | |
| Liabilities | | | | | | | | | | | | |
| Payable for investment securities purchased | | | 311 | | | | 5,256 | | | | 1,544 | |
| Payable for fund shares redeemed | | | 8 | | | | 592 | | | | 1,742 | |
| Payable to custodian | | | — | | | | — | | | | 5,739 | |
| Management fee payable | | | 210 | | | | 671 | | | | 302 | |
| Distribution fee payable | | | — | | | | 2 | | | | 2 | |
| Foreign capital gains tax liability | | | 28 | | | | — | | | | — | |
| Other payables and accrued expenses | | | 162 | | | | 356 | | | | | 397 | |
| Total liabilities | | | 719 | | | | 6,877 | | | | | 9,726 | |
| Net assets | | $ | 198,914 | | | $ | 740,971 | | | | $ | 276,935 | |
| Capital | | | | | | | | | | | | |
| Composition of net assets | | | | | | | | | | | | |
| Paid in capital | | $ | 205,650 | | | $ | 723,799 | | | | $ | 316,133 | |
| Total distributable earnings (loss) | | | (6,736 | ) | | | 17,172 | | | | | (39,198 | ) |
| Net assets | | $ | 198,914 | | | $ | 740,971 | | | | $ | 276,935 | |
| Class N shares | | | | | | | | | | | | |
| Net assets | | $ | 2,239 | | | $ | 7,103 | | | $ | 8,977 | |
| Shares outstanding | | | 271,141 | | | | 637,451 | | | | 642,844 | |
| Net asset value per share | | $ | 8.26 | | | $ | 11.14 | | | $ | 13.96 | |
| Class I shares | | | | | | | | | | | | |
| Net assets | | $ | 34,786 | | | $ | 79,427 | | | $ | 169,770 | |
| Shares outstanding | | | 4,205,343 | | | | 7,059,396 | | | | 12,097,539 | |
| Net asset value per share | | $ | 8.27 | | | $ | 11.25 | | | $ | 14.03 | |
| Institutional Class shares | | | | | | | | | | | | |
| Net assets | | $ | 161,889 | | | $ | 654,441 | | | $ | 98,188 | |
| Shares outstanding | | | 19,597,174 | | | | 57,675,456 | | | | 6,985,504 | |
| Net asset value per share | | $ | 8.26 | | | $ | 11.35 | | | $ | 14.06 | |
See accompanying Notes to Financial Statements.
| December 31, 2018 | William Blair Funds | 117 |
Statements of Operations
For the Year Ended December 31, 2018(all amounts in thousands)
| | | | | | | | | Emerging | |
| | | Emerging | | | Emerging | | | Markets | |
| | | Markets | | | Markets | | | Small Cap | |
| | | Leaders | | | Growth | | | Growth | |
| | Fund | | | Fund | | | Fund | |
| Investment income | | | | | | | | | |
| Dividends | | | $ | 8,472 | | | | $ | 19,761 | | | | $ | 7,312 | |
| Less foreign tax withheld | | | (911 | ) | | | (2,368 | ) | | | (585 | ) |
| Interest | | | | 18 | | | | | 52 | | | | | 18 | |
| Total income | | | 7,579 | | | | 17,445 | | | | 6,745 | |
| Expenses | | | | | | | | | | | | |
| Investment advisory fees | | | 4,371 | | | | 11,681 | | | | 4,903 | |
| Distribution fees | | | 6 | | | | 24 | | | | 30 | |
| Custodian fees | | | 155 | | | | 447 | | | | 371 | |
| Transfer agent fees | | | 17 | | | | 49 | | | | 93 | |
| Sub-transfer agent fees | | | | | | | | | | | | |
| Class N | | | 4 | | | | 8 | | | | 17 | |
| Class I | | | 30 | | | | 95 | | | | 204 | |
| Professional fees | | | 123 | | | | 220 | | | | 249 | |
| Registration fees | | | 32 | | | | 62 | | | | 66 | |
| Shareholder reporting fees | | | 18 | | | | 5 | | | | 68 | |
| Trustee fees | | | 34 | | | | 99 | | | | 33 | |
| Other expenses | | | | 32 | | | | | 51 | | | | | 27 | |
| Total expenses before expense limitation | | | 4,822 | | | | 12,741 | | | | 6,061 | |
| Expenses waived or reimbursed by the Adviser | | | | — | | | | | — | | | | | (247 | ) |
| Net expenses | | | | 4,822 | | | | | 12,741 | | | | | 5,814 | |
| Net investment income (loss) | | | 2,757 | | | | 4,704 | | | | 931 | |
| Realized and unrealized gain (loss) | | | | | | | | | | | | |
| Net realized gain (loss) on transactions from: | | | | | | | | | | | | |
| Investments in securities, net of foreign taxes, if applicable | | | 14,142 | | | | 139,566 | | | | (39,523 | ) |
| Redemptions in-kind | | | 24,681 | | | | — | | | | — | |
| Foreign currency transactions | | | | (514 | ) | | | | (2,583 | ) | | | | (1,280 | ) |
| Total net realized gain (loss) | | | 38,309 | | | | 136,983 | | | | (40,803 | ) |
| Change in net unrealized appreciation (depreciation) of: | | | | | | | | | | | | |
| Investments in securities | | | (116,085 | ) | | | (374,370 | ) | | | (86,368 | ) |
| Foreign currency translations | | | | (32 | ) | | | | 5,149 | | | | | 4,384 | |
| Change in net unrealized appreciation (depreciation) | | | | (116,117 | ) | | | | (369,221 | ) | | | | (81,984 | ) |
| Net increase (decrease) in net assets resulting from operations | | | $ | (75,051 | ) | | | $ | (227,534 | ) | | | $ | (121,856 | ) |
See accompanying Notes to Financial Statements.
| 118 | Annual Report | December 31, 2018 |
Statements of Changes in Net Assets
For the Years Ended December 31, 2018 and 2017(all amounts in thousands)
| | | | | | | | | | | | | | | Emerging Markets | |
| | | Emerging Markets | | | Emerging Markets | | | Small Cap | |
| | | Leaders Fund | | | Growth Fund | | | Growth Fund | |
| | 2018 | | | 2017 | | | 2018 | | | 2017 | | | 2018 | | | 2017 | |
| Operations | | | | | | | | | | | | | | | | | | | | | | | | |
| Net investment income (loss) | | $ | 2,757 | | | $ | 1,292 | | | $ | 4,704 | | | $ | 1,937 | | | $ | 931 | | | $ | 1,951 | |
| Net realized gain (loss) on investments, and other assets and liabilities | | | 38,309 | | | | 26,835 | | | | 136,983 | | | | 119,365 | | | | (40,803 | ) | | | 46,298 | |
| Change in net unrealized appreciation (depreciation) on investments, and other assets and liabilities | | | (116,117 | ) | | | 108,551 | | | | (369,221 | ) | | | 350,540 | | | | (81,984 | ) | | | 77,357 | |
| Net increase (decrease) in net assets resulting from operations | | | (75,051 | ) | | | 136,678 | | | | (227,534 | ) | | | 471,842 | | | | (121,856 | ) | | | 125,606 | |
| Distributions to shareholders from1 | | | | | | | | | | | | | | | | | | | | | | | | |
| Class N | | | (179 | ) | | | — | | | | (966 | ) | | | — | | | | (201 | ) | | | — | |
| Class I | | | (3,674 | ) | | | — | | | | (11,141 | ) | | | — | | | | (4,413 | ) | | | — | |
| Institutional Class | | | (16,113 | ) | | | — | | | | (81,475 | ) | | | — | | | | (2,353 | ) | | | — | |
| Net investment income | | | | | | | | | | | | | | | | | | | | | | | | |
| Class N | | | N/A | | | | (12 | ) | | | N/A | | | | (77 | ) | | | N/A | | | | (391 | ) |
| Class I | | | N/A | | | | (327 | ) | | | N/A | | | | (1,188 | ) | | | N/A | | | | (8,028 | ) |
| Institutional Class | | | N/A | | | | (3,069 | ) | | | N/A | | | | (11,908 | ) | | | N/A | | | | (4,880 | ) |
| Net realized gain | | | | | | | | | | | | | | | | | | | | | | | | |
| Class N | | | N/A | | | | — | | | | N/A | | | | — | | | | N/A | | | | (35 | ) |
| Class I | | | N/A | | | | — | | | | N/A | | | | — | | | | N/A | | | | (651 | ) |
| Institutional Class | | | N/A | | | | — | | | | N/A | | | | — | | | | N/A | | | | (389 | ) |
| Total distributions | | | (19,966 | ) | | | (3,408 | ) | | | (93,582 | ) | | | (13,173 | ) | | | (6,967 | ) | | | (14,374 | ) |
| Capital stock transactions | | | | | | | | | | | | | | | | | | | | | | | | |
| Proceeds from sale of shares | | | 45,869 | | | | 77,729 | | | | 228,271 | | | | 320,170 | | | | 157,577 | | | | 130,660 | |
| Shares issued in reinvestment of income dividends and capital gain distributions | | | 19,766 | | | | 3,396 | | | | 81,112 | | | | 11,322 | | | | 6,516 | | | | 13,084 | |
| Less cost of shares redeemed | | | (249,616 | ) | | | (41,986 | ) | | | (566,109 | ) | | | (405,091 | ) | | | (222,964 | ) | | | (73,209 | ) |
| Net increase (decrease) in net assets resulting from capital share transactions | | | (183,981 | ) | | | 39,139 | | | | (256,726 | ) | | | (73,599 | ) | | | (58,871 | ) | | | 70,535 | |
| Increase (decrease) in net assets | | | (278,998 | ) | | | 172,409 | | | | (577,842 | ) | | | 385,070 | | | | (187,694 | ) | | | 181,767 | |
| Net assets | | | | | | | | | | | | | | | | | | | | | | | | |
| Beginning of period | | | 477,912 | | | | 305,503 | | | | 1,318,813 | | | | 933,743 | | | | 464,629 | | | | 282,862 | |
| End of period | | $ | 198,914 | | | $ | 477,912 | | | $ | 740,971 | | | $ | 1,318,813 | | | $ | 276,935 | | | $ | 464,629 | |
| Accumulated net investment income (loss) at the endof the period1 | | | N/A | | | $ | (2,593 | ) | | | N/A | | | $ | (4,010 | ) | | | N/A | | | $ | (10,376 | ) |
| 1 | The presentation of distribution to shareholders and accumulated net investment income (loss) have been updated to reflect the changes prescribed in amendments to Regulation S-X as disclosed in Note 2(k) to the Financial Statements. |
See accompanying Notes to Financial Statements.
| December 31, 2018 | William Blair Funds | 119 |
Statements of Assets and Liabilities
As of December 31, 2018(dollar amounts in thousands)
| | | | | | | | | Low | | | Macro | |
| | | Bond | | | Income | | | Duration | | | Allocation | |
| | Fund | | | Fund | | | Fund | | | Fund | |
| Assets | | | | | | | | | | | | |
| Investments in securities, at cost | | $ | 436,240 | | | $ | 59,481 | | | $ | 108,172 | | | $ | 910,565 | |
| Investments in securities, at value | | $ | 422,737 | | | $ | 57,643 | | | $ | 106,165 | | | $ | 900,276 | |
| Cash | | | — | | | | — | | | | — | | | | 10,369 | |
| Foreign currency, at value (cost $—; $—; $—; $572) | | | — | | | | — | | | | — | | | | 572 | |
| Receivable for securities sold | | | 25,270 | | | | 4,839 | | | | 14,517 | | | | 17,984 | |
| Receivable for fund shares sold | | | 1,508 | | | | 212 | | | | 9 | | | | 17,222 | |
| Receivable for variation margin on centrally cleared swaps | | | — | | | | — | | | | — | | | | 18 | |
| Receivable from Adviser | | | — | | | | 2 | | | | 11 | | | | — | |
| Dividend and interest receivable | | | 3,753 | | | | 348 | | | | 410 | | | | 2,371 | |
| Unrealized appreciation on swap contracts | | | — | | | | — | | | | — | | | | 938 | |
| Unrealized appreciation on forward foreign currency contracts | | | — | | | | — | | | | — | | | | 12,174 | |
| Total assets | | | 453,268 | | | | 63,044 | | | | 121,112 | | | | 961,924 | |
| Liabilities | | | | | | | | | | | | | | | | |
| Security sold, not yet purchased (proceeds $19,193; $4,839; $14,517; $—) | | | 19,496 | | | | 4,883 | | | | 14,650 | | | | — | |
| Payable for futures variation margin | | | — | | | | — | | | | — | | | | 6,040 | |
| Payable for variation margin on centrally cleared swaps | | | 7 | | | | — | | | | — | | | | — | |
| Payable for investment securities purchased | | | — | | | | — | | | | — | | | | 13,060 | |
| Payable for fund shares redeemed | | | 5,108 | | | | 461 | | | | 288 | | | | 4,835 | |
| Payable to custodian | | | 5,729 | | | | 400 | | | | 675 | | | | — | |
| Cash received as collateral, due to broker | | | — | | | | — | | | | — | | | | 6,442 | |
| Unrealized depreciation on swap contracts | | | — | | | | — | | | | — | | | | 1,791 | |
| Unrealized depreciation on forward foreign currency contracts | | | — | | | | — | | | | — | | | | 6,979 | |
| Management fee payable | | | 155 | | | | 20 | | | | 27 | | | | 673 | |
| Distribution fee payable | | | 9 | | | | 3 | | | | — | | | | 6 | |
| Distributions payable to shareholders | | | 88 | | | | 4 | | | | 55 | | | | — | |
| Other payables and accrued expenses | | | 130 | | | | 58 | | | | 51 | | | | 280 | |
| Total liabilities | | | 30,722 | | | | 5,829 | | | | 15,746 | | | | 40,106 | |
| Net assets | | $ | 422,546 | | | $ | 57,215 | | | $ | 105,366 | | | $ | 921,818 | |
| Capital | | | | | | | | | | | | | | | | |
| Composition of net assets | | | | | | | | | | | | | | | | |
| Paid in capital | | $ | 458,303 | | | $ | 64,742 | | | $ | 132,992 | | | $ | 1,074,180 | |
| Total distributable earnings (loss) | | | (35,757 | ) | | | (7,527 | ) | | | (27,626 | ) | | | (152,362 | ) |
| Net assets | | $ | 422,546 | | | $ | 57,215 | | | $ | 105,366 | | | $ | 921,818 | |
| Class N shares | | | | | | | | | | | | | | | | |
| Net assets | | $ | 70,253 | | | $ | 22,422 | | | $ | 1,661 | | | $ | 43,463 | |
| Shares outstanding | | | 7,206,253 | | | | 2,681,576 | | | | 190,809 | | | | 3,810,774 | |
| Net asset value per share | | $ | 9.75 | | | $ | 8.36 | | | $ | 8.70 | | | $ | 11.41 | |
| Class I shares | | | | | | | | | | | | | | | | |
| Net assets | | $ | 281,442 | | | $ | 34,793 | | | $ | 56,120 | | | $ | 486,543 | |
| Shares outstanding | | | 29,176,358 | | | | 4,190,528 | | | | 6,452,103 | | | | 42,751,225 | |
| Net asset value per share | | $ | 9.65 | | | $ | 8.30 | | | $ | 8.70 | | | $ | 11.38 | |
| Institutional Class shares | | | | | | | | | | | | | | | | |
| Net assets | | $ | 70,851 | | | | — | | | $ | 47,585 | | | $ | 391,812 | |
| Shares outstanding | | | 7,349,005 | | | | — | | | | 5,467,400 | | | | 34,427,801 | |
| Net asset value per share | | $ | 9.64 | | | | — | | | $ | 8.70 | | | $ | 11.38 | |
See accompanying Notes to Financial Statements.
| 120 | Annual Report | December 31, 2018 |
Statements of Operations
For the Year Ended December 31, 2018(all amounts in thousands)
| | | | | | | | | Low | | | Macro | |
| | | Bond | | | Income | | | Duration | | | Allocation | |
| | Fund | | | Fund | | | Fund | | | Fund | |
| Investment income | | | | | | | | | | | | |
| Dividends | | $ | — | | | $ | — | | | $ | — | | | $ | 16,986 | |
| Interest | | | 19,103 | | | | 1,990 | | | | 4,282 | | | | 5,936 | |
| Total income | | | 19,103 | | | | 1,990 | | | | 4,282 | | | | 22,922 | |
| Expenses | | | | | | | | | | | | | | | | |
| Investment advisory fees | | | 1,550 | | | | 275 | | | | 511 | | | �� | 9,337 | |
| Distribution fees | | | 125 | | | | 45 | | | | 3 | | | | 87 | |
| Custodian fees | | | 92 | | | | 55 | | | | 69 | | | | 199 | |
| Transfer agent fees | | | 71 | | | | 9 | | | | 10 | | | | 296 | |
| Sub-transfer agent fees | | | | | | | | | | | | | | | | |
| Class N | | | 130 | | | | 45 | | | | 3 | | | | 50 | |
| Class I | | | 284 | | | | 16 | | | | 29 | | | | 563 | |
| Professional fees | | | 63 | | | | 38 | | | | 43 | | | | 184 | |
| Registration fees | | | 64 | | | | 15 | | | | 40 | | | | 80 | |
| Shareholder reporting fees | | | 62 | | | | 12 | | | | 5 | | | | 78 | |
| Trustee fees | | | 45 | | | | 8 | | | | 20 | | | | 117 | |
| Other expenses | | | 26 | | | | 10 | | | | 21 | | | | 240 | |
| Total expenses before expense limitation | | | 2,512 | | | | 528 | | | | 754 | | | | 11,231 | |
| Expenses waived or reimbursed by the Adviser | | | (70 | ) | | | (19 | ) | | | (123 | ) | | | — | |
| Net expenses | | | 2,442 | | | | 509 | | | | 631 | | | | 11,231 | |
| Net investment income (loss) | | | 16,661 | | | | 1,481 | | | | 3,651 | | | | 11,691 | |
| Realized and unrealized gain (loss) | | | | | | | | | | | | | | | | |
| Net realized gain (loss) on transactions from: | | | | | | | | | | | | | | | | |
| Investments in securities | | | (3,965 | ) | | | (654 | ) | | | (1,308 | ) | | | 74,589 | |
| Options | | | — | | | | — | | | | — | | | | (4,360 | ) |
| Futures contracts | | | — | | | | — | | | | — | | | | (21,099 | ) |
| Swaps | | | (189 | ) | | | — | | | | — | | | | 9,079 | |
| Forward foreign currency contracts | | | — | | | | — | | | | — | | | | 20,328 | |
| Foreign currency transactions | | | — | | | | — | | | | — | | | | (106 | ) |
| Total net realized gain (loss) | | | (4,154 | ) | | | (654 | ) | | | (1,308 | ) | | | 78,431 | |
| Change in net unrealized appreciation (depreciation) of: | | | | | | | | | | | | | | | | |
| Investments in securities | | | (25,523 | ) | | | (1,488 | ) | | | (410 | ) | | | (131,960 | ) |
| Options | | | — | | | | — | | | | — | | | | (431 | ) |
| Futures contracts | | | — | | | | — | | | | — | | | | 23,458 | |
| Swaps | | | 322 | | | | — | | | | — | | | | (6,338 | ) |
| Forward foreign currency contracts | | | — | | | | — | | | | — | | | | 5,230 | |
| Foreign currency translations | | | — | | | | — | | | | — | | | | 135 | |
| Change in net unrealized appreciation (depreciation) | | | (25,201 | ) | | | (1,488 | ) | | | (410 | ) | | | (109,906 | ) |
| Net increase (decrease) in net assets resulting from operations | | $ | (12,694 | ) | | $ | (661 | ) | | $ | 1,933 | | | $ | (19,784 | ) |
See accompanying Notes to Financial Statements.
| December 31, 2018 | William Blair Funds | 121 |
Statements of Changes in Net Assets
For the Years Ended December 31, 2018 and 2017(all amounts in thousands)
| | | Bond Fund | | | Income Fund | | | Low Duration Fund | | | Macro Allocation Fund | |
| Operations | | 2018 | | | 2017 | | | 2018 | | | 2017 | | | 2018 | | | 2017 | | | 2018 | | | 2017 | |
| Net investment income (loss) | | $ | 16,661 | | | $ | 15,301 | | | $ | 1,481 | | | $ | 1,994 | | | $ | 3,651 | | | $ | 3,799 | | | $ | 11,691 | | | $ | 14,153 | |
| Net realized gain (loss) on investments, and other assets and liabilities | | | (4,154 | ) | | | 1,364 | | | | (654 | ) | | | 81 | | | | (1,308 | ) | | | (343 | ) | | | 78,431 | | | | 17,469 | |
| Change in net unrealized appreciation (depreciation) on investments, and other assets and liabilities | | | (25,201 | ) | | | 5,503 | | | | (1,488 | ) | | | (391 | ) | | | (410 | ) | | | (914 | ) | | | (109,906 | ) | | | 48,676 | |
| Net increase (decrease) in net assets resulting from operations | | | (12,694 | ) | | | 22,168 | | | | (661 | ) | | | 1,684 | | | | 1,933 | | | | 2,542 | | | | (19,784 | ) | | | 80,298 | |
| Distributions to shareholders from1 | | | | | | | | | | | | | | | | | | | | | | | | | | | | | | | | |
| Class N | | | (3,412 | ) | | | — | | | | (993 | ) | | | — | | | | (62 | ) | | | — | | | | (675 | ) | | | — | |
| Class I | | | (14,892 | ) | | | — | | | | (1,404 | ) | | | — | | | | (2,632 | ) | | | — | | | | (15,790 | ) | | | — | |
| Institutional Class | | | (3,657 | ) | | | — | | | | — | | | | — | | | | (3,226 | ) | | | — | | | | (13,220 | ) | | | — | |
| Net investment income | | | | | | | | | | | | | | | | | | | | | | | | | | | | | | | | |
| Class N | | | N/A | | | | (3,978 | ) | | | N/A | | | | (1,426 | ) | | | N/A | | | | (96 | ) | | | N/A | | | | (260 | ) |
| Class I | | | N/A | | | | (14,049 | ) | | | N/A | | | | (1,849 | ) | | | N/A | | | | (4,594 | ) | | | N/A | | | | (8,252 | ) |
| Institutional Class | | | N/A | | | | (3,890 | ) | | | N/A | | | | — | | | | N/A | | | | (2,290 | ) | | | N/A | | | | (6,654 | ) |
| Total distributions | | | (21,961 | ) | | | (21,917 | ) | | | (2,397 | ) | | | (3,275 | ) | | | (5,920 | ) | | | (6,980 | ) | | | (29,685 | ) | | | (15,166 | ) |
| Capital stock transactions | | | | | | | | | | | | | | | | | | | | | | | | | | | | | | | | |
| Proceeds from sale of shares | | | 117,343 | | | | 159,870 | | | | 10,624 | | | | 19,220 | | | | 16,290 | | | | 141,778 | | | | 301,576 | | | | 305,541 | |
| Shares issued in reinvestment of income dividends and capital gain distributions | | | 20,114 | | | | 20,161 | | | | 2,283 | | | | 3,136 | | | | 5,084 | | | | 6,334 | | | | 25,916 | | | | 13,878 | |
| Less cost of shares redeemed | | | (240,011 | ) | | | (163,783 | ) | | | (43,412 | ) | | | (40,857 | ) | | | (145,098 | ) | | | (190,670 | ) | | | (664,845 | ) | | | (656,829 | ) |
| Net increase (decrease) in net assets resulting from capital share transactions | | | (102,554 | ) | | | 16,248 | | | | (30,505 | ) | | | (18,501 | ) | | | (123,724 | ) | | | (42,558 | ) | | | (337,353 | ) | | | (337,410 | ) |
| Increase(decrease) in net assets | | | (137,209 | ) | | | 16,499 | | | | (33,563 | ) | | | (20,092 | ) | | | (127,711 | ) | | | (46,996 | ) | | | (386,822 | ) | | | (272,278 | ) |
| Net assets | | | | | | | | | | | | | | | | | | | | | | | | | | | | | | | | |
| Beginning of period | | | 559,755 | | | | 543,256 | | | | 90,778 | | | | 110,870 | | | | 233,077 | | | | 280,073 | | | | 1,308,640 | | | | 1,580,918 | |
| End of period | | $ | 422,546 | | | $ | 559,755 | | | $ | 57,215 | | | $ | 90,778 | | | $ | 105,366 | | | $ | 233,077 | | | $ | 921,818 | | | $ | 1,308,640 | |
| Accumulated net investment income (loss) at the end of the period1 | | | N/A | | | $ | 43 | | | | N/A | | | $ | 11 | | | | N/A | | | $ | 9 | | | | N/A | | | $ | 867 | |
| 1 | The presentation of distribution to shareholders and accumulated net investment income (loss) have been updated to reflect the changes prescribed in amendments to Regulation S-X as disclosed in Note 2(k) to the Financial Statements. |
See accompanying Notes to Financial Statements.
| 122 | Annual Report | December 31, 2018 |
Notes to Financial Statements
(1) Organization
(a) Description of the Trust
William Blair Funds (the “Trust”) is a mutual fund registered under the Investment Company Act of 1940, as amended (the “1940 Act”), as an open-end management investment company. The Trust currently consists of the following twenty-one funds (the “Funds”), each with its own investment objective and policies. For each Fund, the number of shares authorized is unlimited.
| Domestic Equity Funds | International Equity Funds |
| Growth | International Leaders |
| Large Cap Growth | International Developed Plus |
| Mid Cap Growth | Institutional International Developed Plus |
| Small-Mid Cap Growth | International Growth |
| Small-Mid Cap Value | Institutional International Growth |
| Small Cap Growth | International Small Cap Growth |
| Small Cap Value | Emerging Markets Leaders |
| | Emerging Markets Growth |
| Global Equity Fund | Emerging Markets Small Cap Growth |
| Global Leaders | |
| | |
| Multi-Asset and Alternative Fund | Fixed Income Funds |
| Macro Allocation | Bond |
| | Income |
| | Low Duration |
William Blair Investment Management, LLC (the “Adviser”) serves as the Trust’s investment adviser. William Blair & Company, L.L.C. (“WBC” or the “Distributor”), an affiliate of the Adviser, serves as the Trust’s principal underwriter and distributor.
(b) Share Classes
Three different classes of shares currently exist: N, I and Institutional.
Class Nshares are offered to the general public, either directly through the Trust’s distributor or through a select number of financial intermediaries. Class N shares are sold without any sales load and carry an annual 12b-1 distribution fee at a fixed rate (0.25% for the Domestic Equity, Global Equity, International Equity and Multi-Asset and Alternative Funds and 0.15% for the Fixed Income Funds as discussed inNote 4(b) – Transactions with Affiliates – Underwriting Distribution Services and Shareholder Administration Agreements) and a sub-transfer agent fee that is not a fixed rate and may vary by Fund and class, as discussed below.
Class Ishares are offered to a limited group of investors, either directly through the Trust’s distributor or through a select number of financial intermediaries. They do not carry any sales load or distribution fees and generally have lower ongoing expenses than Class N shares. Class I shares have a sub-transfer agent fee that is not a fixed rate and may vary by Fund and class, as discussed below.
Institutional Classshares are offered to institutional investors, including but not limited to employee benefit plans, endowments, foundations, trusts and corporations, who are able to meet the share class’s high minimum investment requirement. The minimum initial investment required is generally $5 million, subject to certain exceptions. Institutional Class shares do not carry any sales load, distribution fees or sub-transfer agents fees and generally have lower ongoing expenses than Class N and Class I shares.
Sub-transfer agent fees:For Class N and Class I shares, the Funds may reimburse WBC for fees paid to intermediaries such as banks, broker-dealers, financial advisers or other financial institutions for sub-administration, sub-transfer agency and other services provided to investors whose shares of record are held in omnibus, other group accounts, retirement plans or accounts traded through registered securities clearing agents. These fees may vary based on, for example, the nature of services provided, but generally range up to 0.15% of the assets of the class serviced or maintained by the intermediary or up to $15 per sub-account maintained by the intermediary, depending on the method by which the intermediary charges for the services.
| December 31, 2018 | William Blair Funds | 123 |
Notes to Financial Statements
(c) Fund Objectives
The investment objectives of the Funds are as follows:
| Domestic Equity Funds | Long-term capital appreciation. |
| Global Equity Funds | Long-term capital appreciation. |
| International Equity Funds | Long-term capital appreciation. |
| Bond Fund | Outperform the Bloomberg Barclays U.S. Aggregate Index by maximizing total return through a combination of income and capital appreciation. |
| Income Fund | High level of current income with relative stability of principal. |
| Low Duration Fund | Maximize total return. Total return includes both income and capital appreciation. |
| Macro Allocation Fund | Maximize long-term risk-adjusted total return. |
(2) Significant Accounting Policies
The following is a summary of the Trust’s significant accounting policies in effect during the periods covered by the financial statements, which are in accordance with U.S. generally accepted accounting principles (“US GAAP”), which includes the accounting and reporting guidelines under Accounting Standards Topic 946,Financial Services—Investment Companies.
(a) Investment income and transactions
Investment income, realized and unrealized gains and losses, and certain Fund level expenses and expense reductions, if any, are allocated based on the relative net assets of each class, except for certain class specific expenses, which are charged directly to the appropriate class. Differences in class expenses may result in the payment of different per share dividends by class. All share classes of the Funds have equal rights with respect to voting, subject to class specific arrangements.
Dividend income and expenses are recorded on the ex-dividend date, except for those dividends from certain foreign securities that are recorded when the information is available.
Interest income is recorded on an accrual basis, adjusted for amortization of premium or accretion of discount. Variable rate bonds and floating rate notes earn interest at coupon rates that fluctuate at specific time intervals. The interest rates shown in the Portfolio of Investments for the Bond, Income, Low Duration and Macro Allocation Funds were the rates in effect on December 31, 2018. Put bonds may be redeemed at the discretion of the holder on specified dates prior to maturity.
Premiums and discounts are amortized and accreted on a straight-line basis for short-term investments and on an effective interest method for long-term investments.
Paydown gains and losses on mortgage-backed and asset-backed securities are treated as an adjustment to interest income. For the year ended December 31, 2018, the Bond, Income and Low Duration Funds recognized a reduction of interest income and a corresponding increase in net realized gain of $5,491, $916 and $2,266, respectively (in thousands). This reclassification had no effect on the net increase (decrease) in net assets resulting from operations, net asset value or the net assets of the Funds.
| 124 | Annual Report | December 31, 2018 |
Notes to Financial Statements
The Funds do not isolate the portion of operations resulting from fluctuations in foreign currency exchange rates on investments from the fluctuations arising from changes in the value of securities held. Such currency fluctuations are included with the net realized and unrealized gain or loss from investments.
Reported net realized foreign currency gains or losses arise from disposition of foreign currency, the difference in the foreign exchange rates between the trade and settlement dates on securities transactions, and the difference between the amounts of dividends, interest and foreign withholding taxes recorded on the ex-date or accrual date and the U.S. dollar equivalent of the amounts actually received or paid. Net unrealized foreign exchange gains and losses arise from changes (due to the changes in the exchange rate) in the value of foreign currency and other assets and liabilities denominated in foreign currencies held at period end.
For financial reporting purposes, security and shareholder transactions are recorded on trade date in accordance with US GAAP. Realized gains and losses from securities transactions are recognized on a specifically identified cost basis.
Awards from class action litigation may be recorded as a reduction of cost. If the Funds no longer own the applicable securities, the proceeds are recorded as realized gains.
(b) Share Valuation and Distributions to Shareholders
Shares are sold and redeemed on a continuous basis at net asset value. The net asset value per share is determined separately for each class by dividing the Fund’s net assets attributable to that class by the number of shares of the class outstanding as of the close of regular trading on the New York Stock Exchange (the “NYSE”), which is generally 4:00 p.m. Eastern time, on each day the NYSE is open.
Distributions from net investment income, if any, for all Equity and Multi-Asset and Alternative Funds are declared and paid at least annually. Distributions from net investment income for the Fixed Income Funds are declared daily and paid monthly. Capital gain distributions, if any, for all Funds, are declared and paid at least annually in December. Distributions payable to shareholders are recorded on the ex-dividend date.
(c) Foreign Currency Translation
The Funds may invest in securities denominated in foreign currencies. As such, assets and liabilities denominated in foreign currencies are translated into U.S. dollar amounts at the current exchange rate on the date of valuation. The values of foreign investments, open forward foreign currency contracts, and cash denominated in foreign currencies are translated into U.S. dollars using a spot market rate of exchange as of the time of the determination of each Fund’s net asset value, typically 4:00 p.m. Eastern time on days when there is regular trading on the NYSE. Payables and receivables for securities transactions, dividends, interest income and tax reclaims are translated into U.S. dollars using a spot market rate of exchange as of 4:00 p.m. Eastern time. Settlement of purchases and sales and dividend and interest receipts are translated into U.S. dollars using a spot market rate of exchange as of 11:00 a.m. Eastern time.
(d) Income Taxes
Each Fund intends to comply with the provisions of Subchapter M of the Internal Revenue Code of 1986, as amended (the “Code”), in order to qualify as regulated investment companies. Each Fund intends to make the requisite distributions of income and capital gains to its shareholders sufficient to relieve it from all, or substantially all, federal income and excise taxes. No provision for federal income and excise taxes has been made.
Certain Funds may be subject to foreign income taxes imposed on realized gains on securities of issuers from certain foreign countries. Such taxes, if applicable, are included within Net realized gain (loss) on transactions from Investments in securities in the Statement of Operations.
Management has evaluated all of the uncertain tax positions of the Funds and has determined that no liability is required to be recorded in the financial statements.
The statute of limitations on the Funds’ tax returns for the prior three years remains open and the returns are subject to examination.
| December 31, 2018 | William Blair Funds | 125 |
Notes to Financial Statements
Adjustments to the cost of investments for tax purposes may be due to the deferred loss associated with current and prior year wash sales, income recognition from investments in real estate investment trusts and partnerships, and the Funds’ election to mark-to-market their investments in Passive Foreign Investment Companies (“PFICs”). The cost of investments, including derivatives, for federal income tax purposes and related gross unrealized appreciation (depreciation) and net unrealized appreciation/(depreciation) at December 31, 2018, were as follows (in thousands):
| Fund | | Cost of
Investments | | Gross
Unrealized Appreciation | | Gross
Unrealized Depreciation | | Net
Unrealized
Appreciation/ (Depreciation) |
| Growth | | $ | 171,483 | | | $ | 63,645 | | | $ | 9,934 | | | $ | 53,711 | |
| Large Cap Growth | | | 141,567 | | | | 41,374 | | | | 4,808 | | | | 36,566 | |
| Mid Cap Growth | | | 53,475 | | | | 7,873 | | | | 5,091 | | | | 2,782 | |
| Small-Mid Cap Growth | | | 2,327,105 | | | | 256,170 | | | | 209,996 | | | | 46,174 | |
| Small-Mid Cap Value | | | 1,711 | | | | 157 | | | | 207 | | | | (50 | ) |
| Small Cap Growth | | | 601,769 | | | | 58,923 | | | | 63,490 | | | | (4,567 | ) |
| Small Cap Value | | | 460,953 | | | | 76,449 | | | | 53,286 | | | | 23,163 | |
| Global Leaders | | | 151,915 | | | | 28,335 | | | | 9,232 | | | | 19,103 | |
| International Leaders | | | 398,611 | | | | 32,413 | | | | 21,648 | | | | 10,765 | |
| International Developed Plus | | | 83,543 | | | | 8,860 | | | | 5,337 | | | | 3,523 | |
| Institutional International Developed Plus | | | 15,238 | | | | 1,648 | | | | 944 | | | | 704 | |
| International Growth | | | 2,088,102 | | | | 168,752 | | | | 165,910 | | | | 2,842 | |
| Institutional International Growth | | | 1,791,063 | | | | 138,415 | | | | 147,428 | | | | (9,013 | ) |
| International Small Cap Growth | | | 371,213 | | | | 18,615 | | | | 56,072 | | | | (37,457 | ) |
| Emerging Markets Leaders | | | 203,129 | | | | 15,275 | | | | 19,341 | | | | (4,066 | ) |
| Emerging Markets Growth | | | 713,442 | | | | 50,683 | | | | 31,099 | | | | 19,584 | |
| Emerging Markets Small Cap Growth | | | 278,701 | | | | 14,443 | | | | 15,041 | | | | (598 | ) |
| Bond | | | 436,403 | | | | 4,228 | | | | 18,196 | | | | (13,968 | ) |
| Income | | | 59,480 | | | | 74 | | | | 1,956 | | | | (1,882 | ) |
| Low Duration | | | 108,172 | | | | 68 | | | | 2,208 | | | | (2,140 | ) |
| Macro Allocation | | | 915,051 | | | | 22,689 | | | | 41,067 | | | | (18,378 | ) |
In addition, the Funds may periodically record reclassifications among certain capital accounts to reflect differences between financial reporting and income tax basis distributions. The reclassifications were reported in order to reflect the tax treatment for certain permanent differences that exist between income tax regulations and US GAAP. The reclassifications generally relate to the tax treatment of net operating losses, expiration of capital loss carryforwards, redemptions in-kind, and utilization of earnings and profits distributed to shareholders on redemption of shares. These reclassifications have no impact on the net asset values or the net assets of the Funds. Accordingly, at December 31, 2018 (the Funds’ most recent fiscal year end), the following reclassifications were recorded (in thousands):
| 126 | Annual Report | December 31, 2018 |
Notes to Financial Statements
| Fund | | Paid in
Capital | | Total
Distributable
Earnings
(Loss) |
| Growth | | $ | 19,805 | | | $ | (19,805 | ) |
| Large Cap Growth | | | 5,048 | | | | (5,048 | ) |
| Mid Cap Growth | | | 2,417 | | | | (2,417 | ) |
| Small-Mid Cap Growth | | | 31,047 | | | | (31,047 | ) |
| Small-Mid Cap Value | | | 98 | | | | (98 | ) |
| Small Cap Growth | | | 12,551 | | | | (12,551 | ) |
| Small Cap Value | | | 6,948 | | | | (6,948 | ) |
| Global Leaders | | | 4,894 | | | | (4,894 | ) |
| International Leaders | | | — | | | | — | |
| International Developed Plus | | | — | | | | — | |
| Institutional International Developed Plus | | | (11 | ) | | | 11 | |
| International Growth | | | 18 | | | | (18 | ) |
| Institutional International Growth | | | — | | | | — | |
| International Small Cap Growth | | | (274 | ) | | | 274 | |
| Emerging Markets Leaders | | | 24,198 | | | | (24,198 | ) |
| Emerging Markets Growth | | | 32,994 | | | | (32,994 | ) |
| Emerging Markets Small Cap Growth | | | (3,217 | ) | | | 3,217 | |
| Bond | | | — | | | | — | |
| Income | | | — | | | | — | |
| Low Duration | | | (955 | ) | | | 955 | |
| Macro Allocation | | | — | | | | — | |
The timing and characterization of certain income and capital gain distributions are determined annually in accordance with federal income tax regulations that may differ from US GAAP. As a result, net investment income or loss and net realized gain or loss for a reporting period may differ from the amount distributed during such period.
Distributions from net realized gains for book purposes may include short-term capital gains, which are included as ordinary income for tax purposes. The tax character of distributions paid during 2018 and 2017 was as follows (in thousands):
| | | Distributions Paid in 2018 | | | Distributions Paid in 2017 | |
| | | Ordinary | | | Long-Term | | | Ordinary | | | Long-Term | |
| | | Income | | | Capital Gains | | | Income | | | Capital Gains | |
| Fund | | Class N | | | Class I | | | Class N | | | Class I | | | Class N | | | Class I | | | Class N | | | Class I | |
| Growth | | $ | 815 | | | $ | 3,461 | | | $ | 11,233 | | | $ | 47,642 | | | $ | 351 | | | $ | 3,113 | | | $ | 10,311 | | | $ | 80,701 | |
| Large Cap Growth | | | 503 | | | | 1,744 | | | | 6,019 | | | | 18,995 | | | | — | | | | — | | | | 146 | | | | 993 | |
| Mid Cap Growth | | | — | | | | — | | | | 982 | | | | 9,097 | | | | — | | | | — | | | | 986 | | | | 10,476 | |
| Small-Mid Cap Growth | | | 576 | | | | 2,467 | | | | 36,850 | | | | 157,662 | | | | — | | | | — | | | | 11,906 | | | | 81,736 | |
| Small-Mid Cap Value | | | 11 | | | | 75 | | | | 47 | | | | 307 | | | | — | | | | 12 | | | | 28 | | | | 320 | |
| Small Cap Growth | | | 2,543 | | | | 5,077 | | | | 21,112 | | | | 42,147 | | | | 4,158 | | | | 8,754 | | | | 19,362 | | | | 40,764 | |
| Small Cap Value | | | — | | | | 1,274 | | | | 2,248 | | | | 55,731 | | | | 46 | | | | 2,095 | | | | 2,057 | | | | 45,472 | |
| Global Leaders | | | 107 | | | | 1,617 | | | | 982 | | | | 11,400 | | | | 71 | | | | 739 | | | | 215 | | | | 1,738 | |
| International Leaders | | | 37 | | | | 672 | | | | 275 | | | | 2,379 | | | | 117 | | | | 844 | | | | 71 | | | | 437 | |
| International Developed Plus | | | 23 | | | | 1,522 | | | | 14 | | | | 681 | | | | 55 | | | | 2,202 | | | | — | | | | — | |
| International Growth | | | 2,365 | | | | 19,058 | | | | 36,843 | | | | 126,713 | | | | 9,771 | | | | 36,754 | | | | — | | | | — | |
| International Small Cap Growth | | | 61 | | | | 4,260 | | | | 402 | | | | 21,212 | | | | 121 | | | | 8,233 | | | | 425 | | | | 23,214 | |
| December 31, 2018 | William Blair Funds | 127 |
Notes to Financial Statements
| | | Distributions Paid in 2018 | | | Distributions Paid in 2017 | |
| | | Ordinary | | | Long-Term | | | Ordinary | | | Long-Term | |
| | | Income | | | Capital Gains | | | Income | | | Capital Gains | |
| Fund | | Class N | | | Class I | | | Class N | | | Class I | | | Class N | | | Class I | | | Class N | | | Class I | |
| Emerging Markets Leaders | | $ | 15 | | | $ | 477 | | | $ | 164 | | | $ | 3,197 | | | $ | 12 | | | $ | 327 | | | $ | — | | | $ | — | |
| Emerging Markets Growth | | | 69 | | | | 1,152 | | | | 897 | | | | 9,989 | | | | 77 | | | | 1,188 | | | | — | | | | — | |
| Emerging Markets Small Cap Growth | | | — | | | | 303 | | | | 201 | | | | 4,110 | | | | 391 | | | | 8,028 | | | | 35 | | | | 651 | |
| Bond | | | 3,412 | | | | 14,892 | | | | — | | | | — | | | | 3,978 | | | | 14,049 | | | | — | | | | — | |
| Income | | | 993 | | | | 1,404 | | | | — | | | | — | | | | 1,426 | | | | 1,849 | | | | — | | | | — | |
| Low Duration | | | 62 | | | | 2,632 | | | | — | | | | — | | | | 96 | | | | 4,594 | | | | — | | | | — | |
| Macro Allocation | | | 675 | | | | 15,790 | | | | — | | | | — | | | | 260 | | | | 8,252 | | | | — | | | | — | |
| | | Distributions Paid in 2018 | | Distributions Paid in 2017 |
| | | Ordinary | | Long-Term | | Ordinary | | Long-Term |
| | | Income | | Capital Gains | | Income | | Capital Gains |
| | | Institutional | | Institutional | | Institutional | | Institutional |
| Global Leaders | | $ | 1,539 | | | $ | 10,463 | | | $ | 1,836 | | | $ | 4,097 | |
| International Leaders | | | 3,148 | | | | 10,126 | | | | 4,501 | | | | 2,201 | |
| Institutional International Developed Plus | | | 554 | | | | — | | | | 212 | | | | — | |
| Institutional International Growth | | | 20,298 | | | | 166,380 | | | | 54,743 | | | | 39,224 | |
| International Small Cap Growth | | | 3,872 | | | | 17,228 | | | | 6,246 | | | | 17,011 | |
| Emerging Markets Leaders | | | 2,228 | | | | 13,885 | | | | 3,069 | | | | — | |
| Emerging Markets Growth | | | 9,103 | | | | 72,372 | | | | 11,908 | | | | — | |
| Emerging Markets Small Cap Growth | | | 257 | | | | 2,096 | | | | 4,880 | | | | 389 | |
| Bond | | | 3,657 | | | | — | | | | 3,890 | | | | — | |
| Low Duration | | | 3,226 | | | | — | | | | 2,290 | | | | — | |
| Macro Allocation | | | 13,220 | | | | — | | | | 6,654 | | | | — | |
As of December 31, 2018, the components of distributable earnings on a tax basis were as follows (in thousands):
| | | Undistributed | | Accumulated | | Undistributed | | Net Unrealized | | |
| | | Ordinary | | Capital and | | Long-Term | | Appreciation/ | | |
| Fund | | Income | | Other Losses | | Capital Gain | | (Depreciation) | | Total |
| Growth | | $ | 876 | | | $ | — | | | $ | 6,732 | | | $ | 53,711 | | | $ | 61,319 | |
| Large Cap Growth | | | 86 | | | | (924 | ) | | | 3,728 | | | | 36,566 | | | | 39,456 | |
| Mid Cap Growth | | | 50 | | | | — | | | | 2,260 | | | | 2,782 | | | | 5,092 | |
| Small-Mid Cap Growth | | | — | | | | — | | | | 8,545 | | | | 46,174 | | | | 54,719 | |
| Small-Mid Cap Value | | | 5 | | | | (32 | ) | | | — | | | | (50 | ) | | | (77 | ) |
| Small Cap Growth | | | — | | | | (7,883 | ) | | | 11,445 | | | | (4,567 | ) | | | (1,005 | ) |
| Small Cap Value | | | 487 | | | | — | | | | 2,276 | | | | 23,163 | | | | 25,926 | |
| Global Leaders | | | 70 | | | | (719 | ) | | | 1,532 | | | | 19,105 | | | | 19,988 | |
| International Leaders | | | 354 | | | | (32 | ) | | | — | | | | 10,759 | | | | 11,081 | |
| International Developed Plus | | | — | | | | (854 | ) | | | — | | | | 3,538 | | | | 2,684 | |
| Institutional International Developed Plus | | | — | | | | (226 | ) | | | — | | | | 709 | | | | 483 | |
| International Growth | | | 16,855 | | | | (39,676 | ) | | | — | | | | 2,862 | | | | (19,959 | ) |
| Institutional International Growth | | | — | | | | (33,348 | ) | | | — | | | | (9,035 | ) | | | (42,383 | ) |
| International Small Cap Growth | | | — | | | | (15,671 | ) | | | — | | | | (37,426 | ) | | | (53,097 | ) |
| Emerging Markets Leaders | | | 1,130 | | | | (3,768 | ) | | | — | | | | (4,098 | ) | | | (6,736 | ) |
| Emerging Markets Growth | | | 4,115 | | | | (6,519 | ) | | | — | | | | 19,576 | | | | 17,172 | |
| Emerging Markets Small Cap Growth | | | — | | | | (38,594 | ) | | | — | | | | (604 | ) | | | (39,198 | ) |
| Bond | | | 353 | | | | (22,047 | ) | | | — | | | | (13,975 | ) | | | (35,669 | ) |
| Income | | | 15 | | | | (5,656 | ) | | | — | | | | (1,882 | ) | | | (7,523 | ) |
| Low Duration | | | 61 | | | | (25,492 | ) | | | — | | | | (2,140 | ) | | | (27,571 | ) |
| Macro Allocation | | | 16,690 | | | | (150,674 | ) | | | — | | | | (18,378 | ) | | | (152,362 | ) |
| 128 | Annual Report | December 31, 2018 |
Notes to Financial Statements
As of December 31, 2018, the Funds may have unused capital loss carryforwards available for federal income tax purposes to be applied against future capital gains, if any. Under current law, the Funds may carry forward net capital losses indefinitely to use to offset capital gains realized in future years. The following table details the Funds’ available capital loss carryforwards as of December 31, 2018, the capital loss carryforwards utilized by the Funds in 2018, and the capital loss carryforwards that expired in 2018 (in thousands):
| | | | | | | | | Capital Loss | | Capital Loss |
| | | Available Capital Loss Carryforwards | | Carryforwards | | Carryforwards |
| Fund | | Short Term | | Long Term | | Total | | Utilized in 2018 | | Expired in 2018 |
| Institutional International Developed Plus | | $ | 91 | | | $ | — | | | $ | 91 | | | $ | 122 | | | $ | — | |
| Emerging Markets Growth | | | — | | | | — | | | | — | | | | 21,948 | | | | — | |
| Emerging Markets Small Cap Growth | | | 38,594 | | | | — | | | | 38,594 | | | | — | | | | — | |
| Bond | | | 10,433 | | | | 11,614 | | | | 22,047 | | | | — | | | | — | |
| Income | | | 2,100 | | | | 3,556 | | | | 5,656 | | | | — | | | | — | |
| Low Duration | | | 11,653 | | | | 13,839 | | | | 25,492 | | | | — | | | | 955 | |
| Macro Allocation | | | 150,674 | | | | — | | | | 150,674 | | | | 67,739 | | | | — | |
In order to meet certain excise tax distribution requirements, the Funds are required to measure and distribute annually, net capital gains realized during a twelve month period ending October 31 and net investment income earned during a twelve month period ending December 31. In connection with this, the Funds are permitted for tax purposes to defer into their next fiscal year qualified late year losses. Qualified late year capital losses are any short term or long term capital losses incurred between November 1 and the end of their fiscal year, December 31, 2018. Qualified late year ordinary losses are comprised of losses related to foreign currency and PFICs incurred between November 1 and the end of their fiscal year, December 31, 2018.
As of December 31, 2018, the following Funds deferred, on a tax basis, qualified late year losses of (in thousands):
| | | Qualified Late Year Losses |
| | | Ordinary | | Net |
| Fund | | Income | | Capital |
| Large Cap Growth | | $ | — | | | $ | 924 | |
| Small-Mid Cap Value | | | — | | | | 32 | |
| Small Cap Growth | | | — | | | | 7,883 | |
| Global Leaders | | | — | | | | 719 | |
| International Leaders | | | — | | | | 32 | |
| International Developed Plus | | | 120 | | | | 734 | |
| Institutional International Developed Plus | | | 26 | | | | 109 | |
| International Growth | | | — | | | | 39,676 | |
| Institutional International Growth | | | 1,197 | | | | 32,151 | |
| International Small Cap Growth | | | 2,349 | | | | 13,322 | |
| Emerging Markets Leaders | | | — | | | | 3,768 | |
| Emerging Markets Growth | | | — | | | | 6,519 | |
(e) Repurchase Agreements
In a repurchase agreement, a Fund buys a security at one price and at the time of sale, the seller agrees to repurchase the security at a mutually agreed upon time and price (usually within seven days). The repurchase agreement thereby determines the yield during the purchaser’s holding period, while the seller’s obligation to repurchase is secured by the value of the underlying collateral. The Adviser monitors, on an ongoing basis, the value of the underlying collateral to ensure that the value always equals or exceeds the repurchase price plus accrued interest. Repurchase agreements may involve certain risks in the event of a default or insolvency of the other party to the agreement, including possible delays or restrictions upon a Fund’s ability to dispose of the underlying collateral. The risk to a Fund is limited to the ability of the seller to pay the agreed upon sum on the delivery date. In the event of default, a repurchase agreement provides that a Fund is entitled to sell the underlying collateral. The loss, if any, to a Fund will be the difference between the proceeds from the sale and the repurchase price. However, if bankruptcy proceedings are commenced with respect to the seller of the security, disposition of the collateral by the Fund may be delayed or limited. The Funds have master repurchase agreements which allow the Funds to offset amounts owed to a counterparty with amounts owed from the same counterparty, including any collateral, in the event the counterparty defaults. As of December 31, 2018, each Fund’s outstanding repurchase agreements, if any, and related collateral, are shown on the Fund’s Portfolio of Investments. Although no definitive creditworthiness criteria are used, the Adviser reviews the creditworthiness of the banks and non-bank dealers with
| December 31, 2018 | William Blair Funds | 129 |
Notes to Financial Statements
which a Fund enters into repurchase agreements to evaluate those risks. A Fund may, for tax purposes, deem repurchase agreements collateralized by U.S. Government securities to be investments in U.S. Government securities.
(f) TBA Securities
The Fixed Income Funds may invest in mortgage pass-through securities eligible to be sold in the “to-be announced” market (“TBAs”). TBAs provide for the forward or delayed delivery of the underlying instrument with settlement in up to 180 days. The term TBA comes from the fact that the specific mortgage-backed security that will be delivered to fulfill a TBA trade is not designated at the time the trade is made, but rather is generally announced 48 hours before the settlement date. A Fund generally has the ability to close out a TBA obligation on or before the settlement date, rather than take delivery of the security. When a Fund sells TBAs, it incurs risks similar to those incurred in short sales. For example, when a Fund sells TBAs without owning or having the right to obtain the deliverable securities it incurs a risk of loss because it could have to purchase the securities at a price that is higher than the price at which it sold the securities.
(g) Securities Sold, Not Yet Purchased
A Fund may sell a security it does not own (known as selling a security short) in anticipation of a decline in the fair value of that security. When a Fund sells a security short, it must borrow the security sold short and deliver it to the broker through which it made the short sale. A gain, limited to the price at which the fund sold the security short, or a loss, unlimited in size, will be recognized upon the termination of the short sale. A Fund is also subject to the risk that it may be unable to acquire a security to terminate a short position except at a price substantially in excess of the price at which it sold the security short.
(h) Use of Estimates
The preparation of financial statements in conformity with US GAAP requires management to make estimates and assumptions that affect the amounts reported in the financial statements. Actual results may differ from those estimates.
(i) Indemnification
In the normal course of business, the Funds have entered into contracts in which the Funds agree to indemnify the other party or parties against various potential costs or liabilities. The Funds’ maximum exposure under these arrangements is unknown. No claim has been made for indemnification pursuant to any such agreement of the Funds.
(j) Redemption In-Kind
In accordance with the Trust’s prospectus, the Funds may distribute portfolio securities rather than cash as payment for a redemption of Fund shares (in-kind redemption). For financial reporting purposes, the Fund recognizes a gain or loss on the transfer of securities depending on the value of those securities on the date of redemption. Gains and losses realized on in-kind redemptions may not be recognized for tax purposes and are reclassified from accumulated net realized gain (loss) to capital paid in excess of par value. During the year ended December 31, 2018, the Small-Mid Cap Growth, Small Cap Growth and Emerging Markets Leaders Funds redeemed $34,789, $6,298 and $180,043 (in thousands), respectively, of Fund shares in-kind rather than with cash and recognized net realized gains of $11,209, $2,300 and $24,681 (in thousands), respectively, on the securities distributed to shareholders.
(k) Recent Accounting Pronouncements
In August 2018, the Financial Accounting Standards Board (the “FASB”) issued Accounting Standards Update 2018-13—Fair Value Measurement (Topic 820): Disclosure Framework—Changes to the Disclosure Requirements for Fair Value Measurement(“ASU 2018-13”), which introduces new fair value disclosure requirements as well as eliminates and modifies certain existing fair value disclosure requirements. ASU 2018-13 is effective for all entities for fiscal years and interim periods within those fiscal years beginning after December 15, 2019, however, early adoption is permitted. Management evaluated the impact and has elected to early adopt ASU 2018-13 effective December 31, 2018, which did not have a material impact on the financial statements.
In August 2018, the Securities and Exchange Commission (“SEC”) issued a final rule onDisclosure Update and Simplification(the “Rule”). The Rule contains amendments to certain financial statements presentation, particularly the presentation of components of net assets in the Statements of Assets and Liabilities and distributions on the Statements of Changes in Net Assets, and eliminates the requirement to disclose accumulated undistributed net investment income (loss) on the Statements of Changes in Net Assets. The amended rules are effective for interim and annual reports filed with the SEC on or after November 5,
| 130 | Annual Report | December 31, 2018 |
Notes to Financial Statements
2018 (the Rule effective date). As of December 31, 2018, the Funds have adopted this Rule, which did not have a material impact on the financial statements.
(3) Valuation
(a) Investment Valuation
The value of domestic equity securities, including exchange-traded funds, is determined by valuing securities traded on national securities markets or in the over-the-counter markets at the last sale price or, if applicable, the official closing price or, in the absence of a recent sale on the date of determination, at the mean between the last reported bid and ask prices.
The value of foreign equity securities is generally determined based upon the last sale price on the foreign exchange or market on which it is primarily traded and in the currency of that market as of the close of the appropriate exchange or, if there have been no sales during that day, at the mean between the last reported bid and ask prices. The Board of Trustees has determined that the passage of time between when the foreign exchanges or markets close and when the Funds compute their net asset values could cause the value of foreign equity securities to no longer be representative or accurate and, as a result, may necessitate that such securities be fair valued. Accordingly, for foreign equity securities, the Funds may use an independent pricing service to fair value price the security as of the close of regular trading on the NYSE. As a result, a Fund’s value for a foreign security may be different from the last sale price (or the mean between the last reported bid and ask prices). As of December 31, 2018, fair valuation estimates for foreign equity securities were not obtained.
Fixed income securities are generally valued using evaluated prices provided by an independent pricing service. The evaluated prices are formed using various market inputs that the pricing service believes accurately represent the market value of a security at a particular point in time. The pricing service determines evaluated prices for fixed income securities using inputs including, but not limited to, recent transaction prices for such securities, dealer quotes, transaction prices for other securities with similar characteristics, collateral characteristics, credit quality, payment history, liquidity and market conditions.
Repurchase agreements are valued at cost, which approximates fair value.
Option contracts on securities, currencies and other financial instruments traded on one or more exchanges are valued at their most recent sale price on the exchange on which they are traded most extensively. Option contracts on foreign indices are valued at the settlement price. If there were no sales that day or if no settlement price is available, such option contracts are valued at the mean between the last reported bid and ask prices. Option contracts traded in the Over-the-Counter (“OTC”) market shall be valued by an independent pricing service. Futures contracts are valued at the most recent settlement price on the exchange on which they are traded most extensively, or if no settlement price is available, at the last sale price as of the close of the exchange. Forward foreign currency contracts are valued on the basis of the value of the underlying currencies at the prevailing currency exchange rate as supplied by an independent pricing service.
Swaps that are centrally cleared through an exchange are valued at the most recent settlement price provided by the exchange on which they are cleared. Total return swaps on equities, equity baskets, indices and other financial instruments are valued by an independent pricing service, or if unavailable, based on the security’s or instrument’s underlying reference asset. All other swap contracts are valued by an independent pricing service. Depending on the product and the terms of the transaction, the independent pricing service may use a series of techniques, including simulation pricing models. The pricing models use inputs that are observed from actively quoted markets such as issuer details, indices, spreads, interest rates, yield curves, dividends and exchange rates.
Securities, and other assets, for which a market price is not available or is deemed unreliable (e.g., securities affected by unusual or extraordinary events, such as natural disasters or securities affected by market or economic events, such as bankruptcy filings), or the value of which is affected by a significant valuation event, are valued at a fair value as determined in good faith by, or under the direction of, the Board of Trustees and in accordance with the Valuation Procedures approved by the Board of Trustees. The value of these fair valued securities may be different from the last sale price (or the mean between the last reported bid and ask prices), and there is no guarantee that a fair valued security will be sold at the price at which a Fund is carrying the security.
As of December 31, 2018, there were securities held in the International Growth and Institutional International Growth Funds for which a reliable market price was not available and that were fair valued pursuant to the Valuation Procedures approved by the Board of Trustees.
(b) Fair Value Measurements
Fair value is defined as the price that a Fund would receive upon selling a security in an orderly transaction to an independent buyer in the principal or most advantageous market for the investment. Various inputs are used in determining the value of a
| December 31, 2018 | William Blair Funds | 131 |
Notes to Financial Statements
Fund’s investments. A three-tier hierarchy of inputs is used to classify fair value measurements for disclosure purposes. The three-tier hierarchy of inputs is summarized in the three broad levels listed below:
| | • | Level 1—Quoted prices (unadjusted) in active markets for an identical security. |
| | | |
| | • | Level 2—Prices determined using other significant observable inputs. Observable inputs are inputs that other market participants would use in pricing a security. These may include quoted prices for similar securities, interest rates, prepayment speeds, credit risk, and others. In addition, other observable inputs such as foreign exchange rates, benchmark securities indices and foreign futures contracts may be utilized in the valuation of certain foreign securities when significant events occur between the last sale on the foreign securities exchange and the time at which the net asset value of the Fund is calculated. |
| | | |
| | • | Level 3—Prices determined using significant unobservable inputs. In situations where quoted prices or observable inputs are unavailable (for example, when there is little or no market activity for an investment), unobservable inputs may be used. Unobservable inputs reflect the Fund’s own assumptions about the factors market participants would use in pricing an investment, and are based on the best information available. |
The inputs or methodology used for valuing an investment are not necessarily an indication of the risk associated with investing in those securities.
A description of the valuation methodologies applied to the Funds’ major categories of assets and liabilities measured at fair value on a recurring basis is as follows:
Exchange-Traded Securities
Securities traded on a national securities exchange (or reported on the NASDAQ national market), including exchange-traded funds, are stated at the last reported sales price on the day of valuation. Other securities traded in the over-the-counter market and listed securities for which no sale was reported on that date are stated at the mean between the last reported bid and ask prices. To the extent these securities are actively traded and valuation adjustments are not applied, they are categorized as Level 1 of the fair value hierarchy. Securities traded on inactive markets or valued by reference to similar instruments are generally categorized as Level 2 of the fair value hierarchy.
Fixed Income Securities
Fixed income securities including corporate, convertible and municipal bonds and notes, U.S. government agency obligations, U.S. treasury obligations, sovereign issues, bank loans, convertible preferred securities, asset-backed securities and non-U.S. bonds are generally valued using evaluated prices provided by an independent pricing service. The evaluated prices are formed using various market inputs that the pricing service believes accurately represent the fair value of a security at a particular point in time. The pricing service determines evaluated prices for fixed income securities using inputs including, but not limited to, recent transaction prices for such securities, dealer quotes, transaction prices for other securities with similar characteristics, collateral characteristics, credit quality, payment history, liquidity and market conditions. Securities that use similar valuation techniques and observable inputs as described above are categorized as Level 2 of the fair value hierarchy.
Short-Term Investments
Repurchase agreements and commercial paper are valued at cost, which approximates fair value. These investments are categorized as Level 2 of the fair value hierarchy.
Derivative Instruments
Listed derivatives, such as certain options and futures contracts, that are actively traded are valued based on quoted prices from the exchange on which they are traded most extensively and are categorized as Level 1 of the fair value hierarchy. OTC derivative contracts include forward foreign currency contracts, swap and certain option contracts related to interest rates, foreign currencies, the credit standing of reference entities, equity prices, or commodity prices. Depending on the product and the terms of the transaction, the fair value of OTC derivative products can be modeled by independent pricing services taking into account the counterparties’ creditworthiness and using a series of techniques, including simulation models. Many pricing models do not entail material subjectivity because the methodologies employed do not necessitate significant judgments and the pricing inputs are observed from actively quoted markets, as is the case of forward foreign currency contracts and interest rate swaps. A substantial majority of OTC derivative products valued by a Fund using pricing models fall into this category and are categorized as Level 2 of the fair value hierarchy.
| 132 | Annual Report | December 31, 2018 |
Notes to Financial Statements
As of December 31, 2018, the value of securities and other assets, segregated by their hierarchical input levels used in determining fair value and by security class or other financial instruments, are shown below (in thousands).
| Investments in securities | | | | | | | | | | | | Growth | | | Large Cap
Growth | | | Mid Cap
Growth | |
| Level 1—Quoted prices | | | | | | | | | | | | | | | | | | | | | | | | | |
| Common Stocks | | | | | | | | | | | | | $ | 225,194 | | | | $ | 177,349 | | | | $ | 55,070 | |
| Level 2—Other significant observable inputs | | | | | | | | | | | | | | | | | | | | | | | | | |
| Short-Term Investments | | | | | | | | | | | | | | — | | | | | 784 | | | | | 1,187 | |
| Level 3—Significant unobservable inputs | | | | | | | | | | | | | | | | | | | | | | | | | |
| None | | | | | | | | | | | | | | — | | | | | — | | | | | — | |
| Total investments in securities | | | | | | | | | | | | | $ | 225,194 | | | | $ | 178,133 | | | | $ | 56,257 | |
| | | | | | | | | | | | | | | | | | | | | | | | | | |
| Investments in securities | | | | | | | Small-Mid
Cap Growth | | | Small-Mid
Cap Value | | | Small Cap
Growth | | | Small Cap
Value | |
| Level 1—Quoted prices | | | | | | | | | | | | | | | | | | | | | | | | | |
| Common Stocks | | | | | | | | $ | 2,310,216 | | | | $ | 1,661 | | | | $ | 575,842 | | | | $ | 474,139 | |
| Level 2—Other significant observable inputs | | | | | | | | | | | | | | | | | | | | | | | | | |
| Short-Term Investments | | | | | | | | | 63,063 | | | | | — | | | | | 21,360 | | | | | 9,977 | |
| Level 3—Significant unobservable inputs | | | | | | | | | | | | | | | | | | | | | | | | | |
| None | | | | | | | | | — | | | | | — | | | | | — | | | | | — | |
| Total investments in securities | | | | | | | | $ | 2,373,279 | | | | $ | 1,661 | | | | $ | 597,202 | | | | $ | 484,116 | |
| | | | | | | | | | | | | | | | | | | | | | | | | | |
| Investments in securities | | Global
Leaders | | | International
Leaders | | | International
Developed
Plus | | | Institutional
International
Developed
Plus | | | International
Growth | |
| Level 1—Quoted prices | | | | | | | | | | | | | | | | | | | | | | | | | |
| Common Stocks | | | $ | 167,370 | | | | $ | 397,013 | | | | $ | 83,085 | | | | $ | 15,166 | | | | $ | 2,059,674 | |
| Preferred Stocks | | | | — | | | | | — | | | | | — | | | | | — | | | | | 22,979 | |
| Level 2—Other significant observable inputs | | | | | | | | | | | | | | | | | | | | | | | | | |
| Common Stocks | | | | — | | | | | — | | | | | — | | | | | — | | | | | 8,291 | |
| Short-Term Investments | | | | 3,648 | | | | | 12,363 | | | | | 3,981 | | | | | 776 | | | | | — | |
| Level 3—Significant unobservable inputs | | | | | | | | | | | | | | | | | | | | | | | | | |
| Common Stocks | | | | — | | | | | — | | | | | — | | | | | — | | | | | — | |
| Total investments in securities | | | $ | 171,018 | | | | $ | 409,376 | | | | $ | 87,066 | | | | $ | 15,942 | | | | $ | 2,090,944 | |
| | | | | | | | | | | | | | | | | | | | | | | | | | |
| Investments in securities | | Institutional
International
Growth | | | International
Small Cap
Growth | | | Emerging
Markets
Leaders | | | Emerging
Markets
Growth | | | Emerging
Markets
Small Cap
Growth | |
| Level 1—Quoted prices | | | | | | | | | | | | | | | | | | | | | | | | | |
| Common Stocks | | | $ | 1,729,428 | | | | $ | 331,682 | | | | $ | 180,438 | | | | $ | 679,515 | | | | $ | 263,772 | |
| Preferred Stocks | | | | 19,245 | | | | | — | | | | | 5,092 | | | | | 15,285 | | | | | 3,073 | |
| Level 2—Other significant observable inputs | | | | | | | | | | | | | | | | | | | | | | | | | |
| Common Stocks | | | | 6,944 | | | | | 2,074 | | | | | 7,460 | | | | | 31,134 | | | | | 11,258 | |
| Short-Term Investments | | | | 26,433 | | | | | — | | | | | 6,073 | | | | | 7,092 | | | | | — | |
| Level 3—Significant unobservable inputs | | | | | | | | | | | | | | | | | | | | | | | | | |
| Common Stocks | | | | — | | | | | — | | | | | — | | | | | — | | | | | — | |
| Total investments in securities | | | $ | 1,782,050 | | | | $ | 333,756 | | | | $ | 199,063 | | | | $ | 733,026 | | | | $ | 278,103 | |
| December 31, 2018 | William Blair Funds | 133 |
Notes to Financial Statements
| Investments in securities | | Bond | | | Income | | | Low
Duration | | | Macro
Allocation | |
| Assets | | | | | | | | | | | | | | | | |
| Level 1—Quoted Prices | | | | | | | | | | | | | | | | |
| Common Stocks | | $ | — | | | $ | — | | | $ | — | | | $ | 384 | |
| Exchange-Traded Funds | | | — | | | | — | | | | — | | | | 579,973 | |
| Purchased Options | | | — | | | | — | | | | — | | | | 1,270 | |
| Level 2—Other significant observable inputs | | | | | | | | | | | | | | | | |
| Asset-Backed Securities | | | 6,852 | | | | 1,993 | | | | 19,080 | | | | — | |
| Commercial Paper | | | — | | | | 400 | | | | 675 | | | | — | |
| Corporate Obligation/Notes | | | 194,017 | | | | 19,193 | | | | 30,925 | | | | — | |
| Foreign Government | | | — | | | | — | | | | — | | | | 19,946 | |
| Purchased Options | | | — | | | | — | | | | — | | | | 1,086 | |
| Short-Term Investments | | | — | | | | 903 | | | | 1,457 | | | | 72,616 | |
| U.S. Government and U.S. Agency | | | 221,868 | | | | 35,154 | | | | 54,028 | | | | 225,001 | |
| Level 3—Significant unobservable inputs | | | | | | | | | | | | | | | | |
| None | | | — | | | | — | | | | — | | | | — | |
| Liabilities | | | | | | | | | | | | | | | | |
| Level 1—Quoted Prices | | | | | | | | | | | | | | | | |
| None | | | — | | | | — | | | | — | | | | — | |
| Level 2—Other significant observable inputs | | | | | | | | | | | | | | | | |
| None | | | — | | | | — | | | | — | | | | — | |
| Level 3—Significant unobservable inputs | | | | | | | | | | | | | | | | |
| None | | | — | | | | — | | | | — | | | | — | |
| Total investments in securities | | $ | 422,737 | | | $ | 57,643 | | | $ | 106,165 | | | $ | 900,276 | |
| | | | | | | | | | | | | | | | | |
| Other financial instruments | | | | | | | | | | | | | | | | |
| | | | | | | | | | | | | | | | | |
| Assets | | | | | | | | | | | | | | | | |
| Level 1—Quoted Prices | | | | | | | | | | | | | | | | |
| Futures Contracts | | $ | — | | | $ | — | | | $ | — | | | $ | 12,936 | |
| Level 2—Other significant observable inputs | | | | | | | | | | | | | | | | |
| Forward Foreign Currency Contracts | | | — | | | | — | | | | — | | | | 12,174 | |
| Swaps | | | 276 | | | | — | | | | — | | | | 938 | |
| Level 3—Significant unobservable inputs | | | | | | | | | | | | | | | | |
| None | | | — | | | | — | | | | — | | | | — | |
| Liabilities | | | | | | | | | | | | | | | | |
| Level 1—Quoted Prices | | | | | | | | | | | | | | | | |
| Futures Contracts | | | — | | | | — | | | | — | | | | (4,783 | ) |
| Level 2—Other significant observable inputs | | | | | | | | | | | | | | | | |
| Forward Foreign Currency Contracts | | | — | | | | — | | | | — | | | | (6,979 | ) |
| Swaps | | | — | | | | — | | | | — | | | | (2,152 | ) |
| U.S. Government Agency | | | (19,496 | ) | | | (4,883 | ) | | | (14,650 | ) | | | — | |
| Level 3—Significant unobservable inputs | | | | | | | | | | | | | | | | |
| None | | | — | | | | — | | | | — | | | | — | |
| Total Other Financial Instruments | | $ | (19,220 | ) | | $ | (4,883 | ) | | $ | (14,650 | ) | | $ | 12,134 | |
Level 1 Common Stocks are exchange-traded securities with a quoted price. See Portfolio of Investments for Sector Classification.
The fair value estimates for the Level 3 securities in the International Growth and Institutional International Growth Funds were determined in good faith by the Pricing Committee, pursuant to the Valuation Procedures approved by the Board of Trustees. There were various factors considered in reaching these fair value determinations, including, but not limited to, the following: the type of security, the extent of public trading of the security, information obtained from a broker-dealer for the security, and analysis of the company’s performance and market trends that influence its performance. Level 3 securities represented 0.00% and 0.00% as a percentage of net assets in the International Growth and Institutional International Growth Funds, respectively. The change in net unrealized gain (loss) related to those securities held at December 31, 2018 is included in the Change in net unrealized appreciation (depreciation) of Investments in the Statements of Operations.
| 134 | Annual Report | December 31, 2018 |
Notes to Financial Statements
(4) Transactions with Affiliates
(a) Management and Expense Limitation Agreements
Each Fund has a management agreement with the Adviser for investment management, clerical, bookkeeping and administrative services. Each Fund pays the Adviser an annual management fee, which is accrued daily and paid monthly, based on a specified percentage of the Fund’s average daily net assets. Each Fund’s annual management fee rate is as follows:
| Domestic Equity Funds | | | | |
| Growth | | | 0.75 | % |
| Large Cap Growth | | | 0.70 | % |
| Mid Cap Growth | | | 0.95 | % |
| Small-Mid Cap Growth | | | 1.00 | % |
| Small-Mid Cap Value | | | 1.00 | % |
| Small Cap Growth | | | 1.10 | % |
| Small Cap Value | | | 1.10 | % |
| | | | | |
| Fixed Income Funds | | | | |
| Bond | | | 0.30 | % |
| Income1: | | | | |
| First $250 million | | | 0.25 | % |
| In excess of $250 million | | | 0.20 | % |
| Low Duration | | | 0.30 | % |
| | | | | |
| Multi-Asset and Alternative Fund | | | | |
| Macro Allocation | | | 0.80 | % |
| | | | | |
| Global Equity Fund | | | | |
| Global Leaders2 | | | 0.95 | % |
| International Equity Funds | | | | |
| International Leaders3 | | | 0.90 | % |
| International Developed Plus4 | | | 0.90 | % |
| Institutional International Developed Plus: | | | | |
| First $500 million | | | 0.90 | % |
| Next $500 million | | | 0.85 | % |
| In excess of $1 billion | | | 0.80 | % |
| International Growth: | | | | |
| First $250 million | | | 1.10 | % |
| Next $2.25 billion | | | 1.00 | % |
| Next $2.5 billion | | | 0.975 | % |
| Next $5 billion | | | 0.95 | % |
| Next $5 billion | | | 0.925 | % |
| In excess of $15 billion | | | 0.90 | % |
| Institutional International Growth: | | | | |
| First $500 million | | | 1.00 | % |
| Next $500 million | | | 0.95 | % |
| Next $1.5 billion | | | 0.90 | % |
| Next $2.5 billion | | | 0.875 | % |
| Next $5 billion | | | 0.85 | % |
| Next $5 billion | | | 0.825 | % |
| In excess of $15 billion | | | 0.80 | % |
| International Small Cap Growth | | | 1.00 | % |
| Emerging Markets Leaders | | | 1.10 | % |
| Emerging Markets Growth | | | 1.10 | % |
| Emerging Markets Small Cap Growth | | | 1.10 | % |
| 1 | Management fee also includes a charge of 5% of gross income. |
| 2 | Prior to May 1, 2018, the Global Leaders Fund paid a management fee at a rate of 1.00% of the Fund’s average daily net assets. Effective May 1, 2018, the management fee paid to the Adviser was reduced to 0.95%. |
| 3 | Prior to May 1, 2018, the International Leaders Fund paid a management fee at a rate of 0.95% of the Fund’s average daily net assets. Effective May 1, 2018, the management fee paid to the Adviser was reduced to 0.90%. |
| 4 | Prior to May 1, 2018, the International Developed Plus Fund paid a management fee at a rate of 1.00% of the first $250 million of the Fund’s average daily net assets; plus 0.90% of the Fund’s average daily net assets over $250 million. Effective May 1, 2018, the management fee paid to the Adviser was reduced to 0.90% of the Fund’s average daily net assets. |
| December 31, 2018 | William Blair Funds | 135 |
Notes to Financial Statements
The Funds have also entered into an Amended and Restated Expense Limitation Agreement with the Adviser. Under the terms of the agreement, the Adviser will waive its management fee and/or reimburse a Fund for certain operating expenses, subject to certain excluded expenses, in excess of the agreed upon rate through April 30, 2019. The amount the Adviser owes a Fund as of the reporting date is recorded as Receivable from Adviser in the Statements of Assets and Liabilities. The Adviser reimburses the Funds on a monthly basis. The Adviser will waive fees and/or reimburse expenses to the extent that the total operating expenses for the stated class of the Funds, subject to certain excluded expenses, exceed the following rates (as a percentage of average daily net assets):
| | | Class N | | Class I | | Institutional Class |
| Fund | | Effective
May 1, 2018
through
April 30,
2019 | | Effective
May 1, 2017
through
April 30,
2018 | | Effective
May 1, 2018
through
April 30,
2019 | | Effective
May 1, 2017
through
April 30,
2018 | | Effective
May 1, 2018
through
April 30,
2019 | | Effective
May 1, 2017
through
April 30,
2018 |
| Growth | | | 1.20 | % | | | 1.20 | % | | | 0.95 | % | | | 0.95 | % | | | N/A | | | | N/A | |
| Large Cap Growth | | | 1.05 | % | | | 1.05 | % | | | 0.80 | % | | | 0.80 | % | | | N/A | | | | N/A | |
| Mid Cap Growth | | | 1.20 | % | | | 1.30 | % | | | 0.95 | % | | | 1.05 | % | | | N/A | | | | N/A | |
| Small-Mid Cap Growth | | | 1.35 | % | | | 1.35 | % | | | 1.10 | % | | | 1.10 | % | | | N/A | | | | N/A | |
| Small-Mid Cap Value | | | 1.25 | % | | | 1.35 | % | | | 1.00 | % | | | 1.10 | % | | | N/A | | | | N/A | |
| Small Cap Growth | | | 1.50 | % | | | 1.50 | % | | | 1.25 | % | | | 1.25 | % | | | N/A | | | | N/A | |
| Small Cap Value | | | 1.50 | % | | | 1.50 | % | | | 1.25 | % | | | 1.25 | % | | | N/A | | | | N/A | |
| Global Leaders | | | 1.30 | % | | | 1.40 | % | | | 1.05 | % | | | 1.15 | % | | | 1.00 | % | | | 1.00 | % |
| International Leaders | | | 1.25 | % | | | 1.35 | % | | | 1.00 | % | | | 1.10 | % | | | 0.95 | % | | | 0.95 | % |
| International Developed Plus | | | 1.25 | % | | | 1.30 | % | | | 1.00 | % | | | 1.05 | % | | | N/A | | | | N/A | |
| Institutional International Developed Plus | | | N/A | | | | N/A | | | | N/A | | | | N/A | | | | 0.90 | % | | | 0.90 | % |
| International Growth | | | 1.45 | % | | | 1.45 | % | | | 1.20 | % | | | 1.20 | % | | | N/A | | | | N/A | |
| Institutional International Growth | | | N/A | | | | N/A | | | | N/A | | | | N/A | | | | 1.05 | % | | | 1.05 | % |
| International Small Cap Growth | | | 1.55 | % | | | 1.65 | % | | | 1.30 | % | | | 1.40 | % | | | 1.25 | % | | | 1.25 | % |
| Emerging Markets Leaders | | | 1.55 | % | | | 1.65 | % | | | 1.30 | % | | | 1.40 | % | | | 1.25 | % | | | 1.25 | % |
| Emerging Markets Growth | | | 1.60 | % | | | 1.70 | % | | | 1.35 | % | | | 1.45 | % | | | 1.30 | % | | | 1.30 | % |
| Emerging Markets Small Cap Growth | | | 1.55 | % | | | 1.65 | % | | | 1.30 | % | | | 1.40 | % | | | 1.25 | % | | | 1.25 | % |
| Bond | | | 0.60 | % | | | 0.65 | % | | | 0.45 | % | | | 0.50 | % | | | 0.40 | % | | | 0.35 | % |
| Income | | | 0.85 | % | | | 0.85 | % | | | 0.70 | % | | | 0.70 | % | | | N/A | | | | N/A | |
| Low Duration | | | 0.55 | % | | | 0.65 | % | | | 0.40 | % | | | 0.50 | % | | | 0.35 | % | | | 0.35 | % |
| Macro Allocation | | | 1.25 | % | | | 1.35 | % | | | 1.00 | % | | | 1.10 | % | | | 0.95 | % | | | 0.95 | % |
| 136 | Annual Report | December 31, 2018 |
Notes to Financial Statements
For the year ended December 31, 2018, the fee waivers and/or expense reimbursements received by each Fund were as follows (in thousands):
| Fund | | Fund
Level
Waiver | | | Class N
Specific
Waiver | | | Class I
Specific
Waiver | | | Total
Waiver | |
| Growth | | | $— | | | | $8 | | | | $— | | | | $8 | |
| Large Cap Growth | | | — | | | | 57 | | | | 174 | | | | 231 | |
| Mid Cap Growth | | | 128 | | | | 8 | | | | 80 | | | | 216 | |
| Small-Mid Cap Growth | | | — | | | | 427 | | | | 1,203 | | | | 1,630 | |
| Small-Mid Cap Value | | | 125 | | | | — | | | | 1 | | | | 126 | |
| Small Cap Growth | | | — | | | | 85 | | | | — | | | | 85 | |
| Small Cap Value | | | — | | | | 15 | | | | 298 | | | | 313 | |
| Global Leaders | | | 161 | | | | 4 | | | | — | | | | 165 | |
| International Leaders | | | 179 | | | | 7 | | | | — | | | | 186 | |
| International Developed Plus | | | 94 | | | | 3 | | | | 124 | | | | 221 | |
| Institutional International Developed Plus | | | 134 | | | | — | | | | — | | | | 134 | |
| International Growth | | | — | | | | 36 | | | | — | | | | 36 | |
| Institutional International Growth | | | — | | | | — | | | | — | | | | — | |
| International Small Cap Growth | | | — | | | | — | | | | — | | | | — | |
| Emerging Markets Leaders | | | — | | | | — | | | | — | | | | — | |
| Emerging Markets Growth | | | — | | | | — | | | | — | | | | — | |
| Emerging Markets Small Cap Growth | | | 240 | | | | 7 | | | | — | | | | 247 | |
| Bond | | | 13 | | | | 57 | | | | — | | | | 70 | |
| Income | | | — | | | | 19 | | | | — | | | | 19 | |
| Low Duration | | | 122 | | | | 1 | | | | — | | | | 123 | |
| Macro Allocation | | | — | | | | — | | | | — | | | | — | |
(b) Underwriting, Distribution Services, and Shareholder Administration Agreements
Pursuant to separate Underwriting and Distribution Agreements, WBC is the principal underwriter and distributor for the continuous offering of shares of the Trust and acts as agent of the Trust in the sale of its shares. The Underwriting Agreement provides that the Distributor will use its best efforts to distribute the Trust’s shares. The Distributor is not compensated under the Underwriting Agreement.
Each Fund, except the Institutional International Developed Plus Fund and Institutional International Growth Fund, has a Distribution Agreement with WBC for distribution services to the Funds’ Class N shares. Each Fund pays WBC an annual fee, payable monthly, based on a specified percentage of its average daily net assets of Class N shares. The annual rate expressed as a percentage of average daily net assets for Class N is 0.25% for all Funds except the Bond, Income and Low Duration Funds, which is 0.15%. Pursuant to the Distribution Agreement, WBC enters into related selling group agreements with various firms at various rates for sales of the Funds’ Class N shares.
The Global Leaders, International Leaders, International Small Cap Growth, Emerging Markets Leaders, Emerging Markets Growth, Emerging Markets Small Cap Growth, Bond, Low Duration and Macro Allocation Funds have a Shareholder Administration Agreement with WBC to provide shareholder administration services to Class N and Class I shares. Class N and Class I shares of the Funds previously agreed to pay an annual fee, payable monthly, of 0.15% of average daily net assets attributable to each class, respectively, all of which had been waived by WBC since January 2015. Effective January 1, 2018, the fee was reduced to 0.00%. WBC has provided, and continues to provide, shareholder administration services pursuant to the Shareholder Administration Agreements.
| December 31, 2018 | William Blair Funds | 137 |
Notes to Financial Statements
(5) Investment Transactions
Investment transactions, excluding U.S. government securities and securities whose maturities or expiration dates at the time of purchase were one year or less, for the year ended December 31, 2018, were as follows (in thousands):
| Fund | | Purchases | | | Sales | |
| Growth | | $ | 150,449 | | | $ | 309,491 | |
| Large Cap Growth | | | 100,927 | | | | 144,880 | |
| Mid Cap Growth | | | 37,162 | | | | 59,843 | |
| Small-Mid Cap Growth | | | 1,726,288 | | | | 1,071,359 | |
| Small-Mid Cap Value | | | 2,444 | | | | 3,993 | |
| Small Cap Growth | | | 558,692 | | | | 432,921 | |
| Small Cap Value | | | 342,140 | | | | 452,119 | |
| Global Leaders | | | 91,786 | | | | 121,752 | |
| International Leaders | | | 222,871 | | | | 135,796 | |
| International Developed Plus | | | 69,178 | | | | 83,087 | |
| Institutional International Developed Plus | | | 12,257 | | | | 12,303 | |
| International Growth | | | 2,214,047 | | | | 2,688,584 | |
| Institutional International Growth | | | 1,757,420 | | | | 1,918,247 | |
| International Small Cap Growth | | | 471,554 | | | | 580,964 | |
| Emerging Markets Leaders | | | 204,494 | | | | 402,274 | |
| Emerging Markets Growth | | | 1,180,930 | | | | 1,525,355 | |
| Emerging Markets Small Cap Growth | | | 811,762 | | | | 871,978 | |
| Bond | | | 205,393 | | | | 238,747 | |
| Income | | | 71,831 | | | | 90,103 | |
| Low Duration | | | 225,022 | | | | 328,531 | |
| Macro Allocation | | | 294,206 | | | | 605,733 | |
Investment transactions in U.S. government securities whose maturities at the time of purchase were greater than one year for the year ended December 31, 2018, were as follows (in thousands):
| Fund | | Purchases | | | Sales | |
| Bond | | $ | — | | | $ | 3,463 | |
| Income | | | 2,336 | | | | 2,975 | |
| Low Duration | | | — | | | | — | |
| Macro Allocation | | | 4,867 | | | | — | |
| 138 | Annual Report | December 31, 2018 |
Notes to Financial Statements
(6) Financial Derivative Instruments
Each Fund may use derivative instruments to maintain liquidity, to provide hedging, or in anticipation of changes in the composition of its portfolio holdings or as otherwise provided in each Fund’s prospectus. Macro Allocation Fund may also use derivative instruments to obtain investment exposures. The derivative instruments held as of December 31, 2018, as disclosed in each Fund’s Portfolios of Investments, are representative of each Fund’s derivative instrument trading activity during the year ended December 31, 2018.
Derivative transactions carry counterparty risk as they are based on contracts between a Fund and the applicable counterparty. For exchange-traded or cleared derivative contracts, such counterparty risk is limited due to the role of the exchange or clearinghouse. OTC derivative contracts, however, are exposed to counterparty risk in the amount of unrealized gains, net of collateral held, for the duration of the contract.
Macro Allocation Fund is subject to certain netting arrangements through International Swaps and Derivatives Association, Inc. Master Agreements and Credit Support Annexes (“ISDAs”). The ISDAs maintain provisions for general obligations, representations, agreements, collateral and events of default or termination. The ISDAs cover certain OTC derivative securities entered into by Macro Allocation Fund with various counterparties and allow Macro Allocation Fund to close out and net its total exposure to a counterparty in the event of a default.
Futures Contracts
A futures contract provides for the future sale by one party and purchase by another party of a specified amount of a specific financial instrument for a specified price at a designated date, time and place. An index futures contract is an agreement pursuant to which the parties agree to take or make delivery of an amount of cash equal to the difference between the value of the index at the close of the last trading day of the contract and the price at which the index futures contract was originally written. A futures contract can be closed out prior to delivery by entering into an offsetting transaction in a matching futures contract. Although the value of an index might be a function of the value of certain specified securities, no physical delivery of those securities is made. If the offsetting purchase price is less than the original sale price, a Fund realizes a gain; if it is more, a Fund realizes a loss. Conversely, if the offsetting sale price is more than the original purchase price, a Fund realizes a gain; if it is less, a Fund realizes a loss. The transaction costs must also be included in these calculations. There can be no assurance, however, that a Fund will be able to enter into an offsetting transaction with respect to a particular futures contract at a particular time. If a Fund is not able to enter into an offsetting transaction, a Fund will continue to be required to maintain the margin deposits on the futures contract.
Upon entering into a futures contract, a Fund is required to pledge to the broker an amount of cash, U.S. government securities, or other liquid assets equal to a certain percentage of the contract amount (“initial margin deposit”). Futures contracts are marked to market daily and an appropriate payable or receivable for the change in value (“variation margin”) is recorded by a Fund and a cash payment is either made to or received from the broker each day. Gains or losses on futures contracts are recognized but not considered realized until the contracts expire or are closed and are included in the Statement of Operations.
Options
The purchase or sale of an option by a Fund involves the payment or receipt of a premium by the investor and the corresponding right or obligation, as the case may be, either to purchase or sell the underlying security, commodity, or other instrument for a specific price at a certain time or during a certain period. Purchasing options involves the risk that the underlying instrument will not change price in the manner expected, so the investor loses its premium. Writing options involves potentially greater risk because the investor is exposed to the extent of the actual price movement in the underlying security rather than only the amount of the premium paid (which could result in a potentially unlimited loss). OTC options also involve counterparty credit risk. Purchased options are shown as an asset in the Statement of Assets and Liabilities and are included in Investments in securities. Premiums received for written options are shown as a liability in the Statement of Assets and Liabilities. Realized gains and losses on the sale, expiration or assignment of an option are disclosed in the Statement of Operations.
Forward Foreign Currency Contracts
The Global Equity, International Equity and Multi-Asset and Alternative Funds may enter into forward foreign currency contracts. When entering into a forward foreign currency contract, a Fund agrees to receive or deliver a fixed quantity of foreign currency for an agreed-upon price on an agreed future date. A Fund’s net equity therein, representing unrealized gain or loss on the contracts as measured by the difference between the forward foreign exchange rates at the dates of entry into the contracts and
| December 31, 2018 | William Blair Funds | 139 |
Notes to Financial Statements
the forward rates at the reporting date, is included in the Statement of Assets and Liabilities as unrealized appreciation/depreciation on forward foreign currency contracts. Realized and unrealized gains and losses are included in the Statement of Operations. These instruments may involve market risk, credit risk, or both kinds of risks in excess of the amount recognized in the Statement of Assets and Liabilities. Risks arise from the possible inability of counterparties to meet the terms of their contracts and from the price movements in currencies.
Swap Contracts
Swap agreements may include total return, interest rate, securities index, commodity, security, currency exchange rate, credit default index, volatility and variance swaps. Cleared swaps are transacted through futures commission merchants that are members of central clearing houses with the clearing house serving as a central counterparty similar to transactions in futures contracts. In a standard “swap” transaction, two parties agree to exchange the returns (or differentials in rates of return) earned or realized on particular predetermined investments or instruments. The gross returns to be exchanged or “swapped” between the parties are calculated with respect to a “notional amount” (i.e., the change in the value of a particular dollar amount invested, for example, at a particular interest rate, in a particular foreign currency, or in a “basket” of securities representing a particular index). Swap agreements are subject to the risk that the counterparty to the swap will default on its obligation to pay a Fund and the risk that a Fund will not be able to meet its obligations to pay the counterparty to the swap. Swap agreements may also involve fees, commissions or other costs that may reduce a Fund’s gains from a swap agreement or may cause a Fund to lose money. To the extent permitted by its investment policies and restrictions, a Fund may invest in the following types of swaps:
Credit Default Swaps—A Fund may invest in credit default swaps as a means of “buying” credit protection (i.e., attempting to mitigate the risk of default or credit quality deterioration in some portion of a Fund’s holdings) or “selling” credit protection (i.e., attempting to gain exposure to an underlying issuer’s credit quality characteristics without directly investing in that issuer). A credit default swap is a contract between a buyer and a seller of protection against a pre-defined credit event (e.g., a ratings downgrade or default) on an underlying reference obligation, which may be a single debt instrument or baskets or indices of securities. A Fund may be a buyer or seller of a credit default swap. As a seller of protection on credit default swap agreements, a Fund will generally receive from the buyer of protection a fixed rate of income throughout the term of the swap provided that there is no credit event. A Fund adds leverage to its portfolio because the Fund is subject to investment exposure on the notional amount of the swap. The maximum potential amount of future payments that a Fund as a seller of protection could be required to make under a credit default swap agreement equals the notional amount of the agreement. Notional amounts of each individual credit default swap agreement outstanding as of the period end for which a Fund is the seller of protection are disclosed in the Fund’s Portfolio of Investments. These potential amounts would be partially offset by any recovery values of the respective referenced obligations, upfront payments received upon entering into the agreement, or net amounts received from the settlement of buy protection credit default swap agreements entered into by the same Fund for the same referenced entity or entities. For credit default swap contracts on credit indices, the quoted market prices and resulting values serve as an indicator of the payment performance risk. Increasing market values, in absolute terms when compared to the notional amount of the swap, typically represent deterioration of the referenced entities’ credit soundness and a greater likelihood or risk of default or other credit event occurring as defined under the terms of the swap.
Interest Rate Swap—A Fund may invest in interest rate swaps to gain or mitigate exposure to changes in interest rates. Interest rate swap agreements involve a commitment between parties to pay either a fixed interest rate or a floating interest rate based on a notional amount of principal. The parties make payments at predetermined intervals throughout the life of the swap. As a payer, a Fund would make the fixed payment and receive the floating payment. As a receiver, a Fund would make the floating payment and receive the fixed payment.
Total Return Swap—A Fund may invest in total return swaps to gain or mitigate exposure to an underlying security, or securities. Total return swap agreements may involve commitments to pay interest in exchange for the return on the underlying security, or securities. At maturity, a net cash flow is exchanged between the parties based on the total return of the underlying security, or securities, less a financing rate. As a receiver in the transaction, a Fund would receive a payment for a positive return and would make a payment for a negative return. As a payer in the transaction, a Fund would make a payment for a positive return and would receive a payment for a negative return.
Variance Swap—A Fund may invest in variance swaps in order to gain or mitigate its exposure to an underlying reference entity such as a broad based index. A variance swap is an agreement between two parties to exchange cash flows based on the measured variance of a reference entity. The payer agrees to exchange the fixed rate, which is the variance strike price of the reference
| 140 | Annual Report | December 31, 2018 |
Notes to Financial Statements
entity, to the receiver for the floating rate, which is the realized variance price of the reference entity. At the time the trade is originated, the agreed upon variance strike price is generally set so that the fair value of the swap is near zero. At maturity, a net cash flow is exchanged between the parties based on the difference between the final realized variance price of the swap and the variance strike price multiplied by the notional, or vega amount. As a receiver of the floating rate, a Fund would receive a payment if the final realized variance price is greater than the variance strike price and would make a payment if the final realized variance price is less than the variance strike price. As a payer of the floating rate, a Fund would receive a payment if the final realized variance price is less than the variance strike price and would make a payment if the final realized variance price is greater than the variance strike price.
The following table presents the value of financial derivative instruments, by Fund and primary risk exposure, as of December 31, 2018, and their respective location in the Statements of Assets and Liabilities (in thousands):
| | | Assets | | | Liabilities | |
Fund and
Primary Risk Exposure | | Statements of Assets
and Liabilities | | Value | | | Statements of Assets
and Liabilities | | Value | |
| Bond | | | | | | | | | | | | |
| Credit | | Receivable for variation margin on centrally cleared swaps | | $ | 276 | | | Payable for variation margin on centrally cleared swaps | | $ | — | |
| Macro Allocation | | | | | | | | | | | | |
| Credit | | Receivable for variation margin on centrally cleared swaps | | | — | | | Payable for variation margin on centrally cleared swaps | | | 118 | |
| Currency | | Unrealized appreciation on forward foreign currency contracts | | | 12,174 | | | Unrealized depreciation on forward foreign currency contracts | | | 6,979 | |
| Currency | | Investments in securities, at value | | | 359 | | | Options written, at value | | | — | |
| Equity | | Receivable for variation margin on futures | | | 12,936 | | | Payable for variation margin on futures | | | 4,341 | |
| Equity | | Investments in securities, at value | | | 727 | | | Options written, at value | | | — | |
| Equity | | Unrealized appreciation on swap contracts | | | 938 | | | Unrealized depreciation on swap contracts | | | 1,097 | |
| Interest rate | | Investments in securities, at value | | | 1,270 | | | Options written, at value | | | — | |
| Interest rate | | Unrealized appreciation on swap contracts | | | — | | | Unrealized depreciation on swap contracts | | | 694 | |
| Interest rate | | Receivable for variation margin on futures | | | — | | | Payable for variation margin on futures | | | 442 | |
| Interest rate | | Receivable for variation margin on centrally cleared swaps | | | — | | | Payable for variation margin on centrally cleared swaps | | | 243 | |
The table above includes cumulative appreciation/(depreciation) on futures contracts and centrally cleared swaps as reported in the applicable Fund’s Portfolio of Investments. Variation margin receivable/payable on futures contracts and centrally cleared swaps is reported within the Statements of Assets and Liabilities.
| December 31, 2018 | William Blair Funds | 141 |
Notes to Financial Statements
The following table indicates the effect of derivatives, by Fund and primary risk exposure, in the Statements of Operations for the year ended December 31, 2018 (in thousands):
| | �� | Realized Gain (Loss) | | Change in Net Unrealized
Appreciation (Depreciation) |
Fund and
Primary Risk Exposure | | Statements of Operations | | Value | | | Statements of Operations | | Value | |
| Bond | | | | | | | | | | | | |
| Credit | | Swaps | | $ | (189 | ) | | Swaps | | $ | 322 | |
| Macro Allocation | | | | | | | | | | | | |
| Credit | | Swaps | | | 64 | | | Swaps | | | (241 | ) |
| Currency | | Forward foreign currency contracts | | | 20,328 | | | Forward foreign currency contracts | | | 5,230 | |
| Currency | | Options | | | 2,632 | | | Options | | | (1,484 | ) |
| Equity | | Futures contracts | | | (21,114 | ) | | Futures contracts | | | 23,998 | |
| Equity | | Options | | | (684 | ) | | Options | | | 376 | |
| Equity | | Swaps | | | 8,463 | | | Swaps | | | (4,732 | ) |
| Interest rate | | Futures contracts | | | 15 | | | Futures contracts | | | (540 | ) |
| Interest rate | | Options | | | (6,308 | ) | | Options | | | 677 | |
| Interest rate | | Swaps | | | 552 | | | Swaps | | | (1,365 | ) |
The following table is a summary by counterparty of the derivative instruments and collateral pledged/(received) included in the Macro Allocation Fund’s Statement of Assets and Liabilities at December 31, 2018 (in thousands):
| | | Financial Derivative Assets | | Financial Derivative Liabilities | | | | | | |
| Counterparty | | Forward
Foreign
Currency
Contracts | | Purchased
Options | | Swaps | | Total | | Forward
Foreign
Currency
Contracts | | Swaps | | Total | | Net
Market
Value | | Collateral
Pledged
(Received) | | Net
Exposure |
| Citibank N.A. | | $ | 12,174 | | | $ | 359 | | | $ | 110 | | | $ | 12,643 | | | $ | (6,979 | ) | | $ | — | | | $ | (6,979 | ) | | $ | 5,664 | | | $ | (5,664 | ) | | $ | — | |
| Credit Suisse | | | — | | | | 727 | | | | — | | | | 727 | | | | — | | | | (1,608 | ) | | | (1,608 | ) | | | (881 | ) | | | 3,289 | | | | 2,408 | |
| Goldman Sachs | | | — | | | | — | | | | 828 | | | | 828 | | | | — | | | | (183 | ) | | | (183 | ) | | | 645 | | | | (645 | ) | | | — | |
| | | $ | 12,174 | | | $ | 1,086 | | | $ | 938 | | | $ | 14,198 | | | $ | (6,979 | ) | | $ | (1,791 | ) | | $ | (8,770 | ) | | $ | 5,428 | | | $ | (3,020 | ) | | $ | 2,408 | |
The net exposure represents the amount due from the counterparty in the event of default. Any net exposure is generally due to changes in market value of the underlying derivative instruments on the last day of the period as timing of collateral movement occurs the following day. For Credit Suisse, the collateral pledged is due to initial margin requirements of approximately $2,334 (in thousands) for total return swaps on futures and $955 (in thousands) for the net market value of all OTC swaps and OTC options. The table does not include additional collateral received in the amounts of $128 (in thousands) and $5 (in thousands) for Citibank N.A. and Goldman Sachs, respectively.
| 142 | Annual Report | December 31, 2018 |
Notes to Financial Statements
(7) Fund Share Transactions
The following tables summarize the activity in capital shares of each Fund for the year ended December 31, 2018 (in thousands):
| | | Class N | |
| | | Dollars | | | Shares | |
| Fund | | Sales | | | Reinvest | | | Redemptions | | | Total | | | Sales | | | Reinvest | | | Redemptions | | | Total | |
| Growth | | $ | 23,472 | | | $ | 11,875 | | | $ | 21,376 | | | $ | 13,971 | | | | 2,069 | | | | 1,409 | | | | 2,022 | | | | 1,456 | |
| Large Cap Growth | | | 29,850 | | | | 6,475 | | | | 14,335 | | | | 21,990 | | | | 2,017 | | | | 509 | | | | 994 | | | | 1,532 | |
| Mid Cap Growth | | | 708 | | | | 913 | | | | 1,816 | | | | (195 | ) | | | 60 | | | | 98 | | | | 165 | | | | (7 | ) |
| Small-Mid Cap Growth | | | 380,723 | | | | 37,279 | | | | 163,129 | | | | 254,873 | | | | 15,220 | | | | 1,679 | | | | 6,431 | | | | 10,468 | |
| Small-Mid Cap Value | | | 113 | | | | 58 | | | | 122 | | | | 49 | | | | 7 | | | | 6 | | | | 8 | | | | 5 | |
| Small Cap Growth | | | 123,547 | | | | 23,316 | | | | 86,965 | | | | 59,898 | | | | 4,080 | | | | 939 | | | | 3,187 | | | | 1,832 | |
| Small Cap Value | | | 5,677 | | | | 2,217 | | | | 14,925 | | | | (7,031 | ) | | | 281 | | | | 138 | | | | 782 | | | | (363 | ) |
| Global Leaders | | | 1,661 | | | | 1,030 | | | | 1,425 | | | | 1,266 | | | | 109 | | | | 85 | | | | 98 | | | | 96 | |
| International Leaders | | | 3,308 | | | | 312 | | | | 2,911 | | | | 709 | | | | 200 | | | | 22 | | | | 181 | | | | 41 | |
| International Developed Plus | | | 210 | | | | 37 | | | | 1,229 | | | | (982 | ) | | | 12 | | | | 3 | | | | 77 | | | | (62 | ) |
| International Growth | | | 108,982 | | | | 38,814 | | | | 295,580 | | | | (147,784 | ) | | | 3,862 | | | | 1,621 | | | | 10,783 | | | | (5,300 | ) |
| International Small Cap Growth | | | 239 | | | | 429 | | | | 1,644 | | | | (976 | ) | | | 17 | | | | 40 | | | | 130 | | | | (73 | ) |
| Emerging Markets Leaders | | | 4,063 | | | | 179 | | | | 4,196 | | | | 46 | | | | 410 | | | | 21 | | | | 410 | | | | 21 | |
| Emerging Markets Growth | | | 1,881 | | | | 889 | | | | 2,909 | | | | (139 | ) | | | 116 | | | | 79 | | | | 205 | | | | (10 | ) |
| Emerging Markets Small Cap Growth | | | 3,416 | | | | 201 | | | | 6,551 | | | | (2,934 | ) | | | 198 | | | | 14 | | | | 377 | | | | (165 | ) |
| Bond | | | 23,108 | | | | 3,396 | | | | 34,380 | | | | (7,876 | ) | | | 2,284 | | | | 340 | | | | 3,453 | | | | (829 | ) |
| Income | | | 2,428 | | | | 983 | | | | 19,283 | | | | (15,872 | ) | | | 286 | | | | 116 | | | | 2,264 | | | | (1,862 | ) |
| Low Duration | | | 1,165 | | | | 56 | | | | 1,495 | | | | (274 | ) | | | 132 | | | | 6 | | | | 169 | | | | (31 | ) |
| Macro Allocation | | | 22,540 | | | | 666 | | | | 19,962 | | | | 3,244 | | | | 1,959 | | | | 59 | | | | 1,710 | | | | 308 | |
| | | | | | | | | | | | | | | | | | | | | | | | | | | | | | | | | |
| | | Class I | |
| | | Dollars | | | Shares | |
| Fund | | Sales | | | Reinvest | | | Redemptions | | | Total | | | Sales | | | Reinvest | | | Redemptions | | | Total | |
| Growth | | $ | 19,362 | | | $ | 48,402 | | | $ | 178,305 | | | $ | (110,541 | ) | | | 1,521 | | | | 4,909 | | | | 13,868 | | | | (7,438 | ) |
| Large Cap Growth | | | 30,159 | | | | 17,362 | | | | 81,956 | | | | (34,435 | ) | | | 1,958 | | | | 1,293 | | | | 5,120 | | | | (1,869 | ) |
| Mid Cap Growth | | | 10,073 | | | | 8,782 | | | | 30,355 | | | | (11,500 | ) | | | 806 | | | | 873 | | | | 2,485 | | | | (806 | ) |
| Small-Mid Cap Growth | | | 911,158 | | | | 156,686 | | | | 414,703 | | | | 653,141 | | | | 34,323 | | | | 6,690 | | | | 15,937 | | | | 25,076 | |
| Small-Mid Cap Value | | | 375 | | | | 381 | | | | 1,974 | | | | (1,218 | ) | | | 27 | | | | 39 | | | | 145 | | | | (79 | ) |
| Small Cap Growth | | | 202,591 | | | | 46,926 | | | | 114,306 | | | | 135,211 | | | | 6,183 | | | | 1,690 | | | | 3,677 | | | | 4,196 | |
| Small Cap Value | | | 66,163 | | | | 56,178 | | | | 145,358 | | | | (23,017 | ) | | | 3,311 | | | | 3,405 | | | | 7,213 | | | | (497 | ) |
| Global Leaders | | | 41,290 | | | | 12,892 | | | | 9,995 | | | | 44,187 | | | | 2,836 | | | | 1,066 | | | | 722 | | | | 3,180 | |
| International Leaders | | | 56,269 | | | | 2,896 | | | | 28,827 | | | | 30,338 | | | | 3,554 | | | | 202 | | | | 1,902 | | | | 1,854 | |
| International Developed Plus | | | 589 | | | | 2,119 | | | | 13,397 | | | | (10,689 | ) | | | 36 | | | | 150 | | | | 843 | | | | (657 | ) |
| International Growth | | | 200,613 | | | | 133,989 | | | | 531,160 | | | | (196,558 | ) | | | 6,692 | | | | 5,473 | | | | 18,564 | | | | (6,399 | ) |
| International Small Cap Growth | | | 82,715 | | | | 19,411 | | | | 169,747 | | | | (67,621 | ) | | | 5,533 | | | | 1,796 | | | | 13,158 | | | | (5,829 | ) |
| Emerging Markets Leaders | | | 9,820 | | | | 3,475 | | | | 14,210 | | | | (915 | ) | | | 917 | | | | 412 | | | | 1,420 | | | | (91 | ) |
| Emerging Markets Growth | | | 26,970 | | | | 10,009 | | | | 49,600 | | | | (12,621 | ) | | | 1,675 | | | | 876 | | | | 3,405 | | | | (854 | ) |
| Emerging Markets Small Cap Growth | | | 101,685 | | | | 4,171 | | | | 141,110 | | | | (35,254 | ) | | | 5,901 | | | | 296 | | | | 9,187 | | | | (2,990 | ) |
| Bond | | | 89,791 | | | | 13,105 | | | | 182,485 | | | | (79,589 | ) | | | 9,041 | | | | 1,324 | | | | 18,497 | | | | (8,132 | ) |
| Income | | | 8,196 | | | | 1,300 | | | | 24,129 | | | | (14,633 | ) | | | 976 | | | | 154 | | | | 2,848 | | | | (1,718 | ) |
| Low Duration | | | 9,060 | | | | 2,567 | | | | 84,883 | | | | (73,256 | ) | | | 1,029 | | | | 291 | | | | 9,591 | | | | (8,271 | ) |
| Macro Allocation | | | 204,410 | | | | 14,124 | | | | 483,628 | | | | (265,094 | ) | | | 17,377 | | | | 1,250 | | | | 41,548 | | | | (22,921 | ) |
| December 31, 2018 | William Blair Funds | 143 |
Notes to Financial Statements
| | | Institutional Class | |
| | | Dollars | | | Shares | |
| Fund | | Sales | | | Reinvest | | | Redemptions | | | Total | | | Sales | | | Reinvest | | | Redemptions | | | Total | |
| Global Leaders | | $ | 3,889 | | | $ | 12,002 | | | $ | 65,440 | | | $ | (49,549 | ) | | | 268 | | | | 993 | | | | 4,170 | | | | (2,909 | ) |
| International Leaders | | | 94,113 | | | | 12,596 | | | | 30,591 | | | | 76,118 | | | | 5,729 | | | | 881 | | | | 1,917 | | | | 4,693 | |
| Institutional International Developed Plus | | | — | | | | 554 | | | | 50 | | | | 504 | | | | — | | | | 45 | | | | 4 | | | | 41 | |
| Institutional International Growth | | | 268,610 | | | | 180,253 | | | | 432,394 | | | | 16,469 | | | | 15,659 | | | | 12,959 | | | | 24,320 | | | | 4,298 | |
| International Small Cap Growth | | | 12,441 | | | | 21,099 | | | | 39,019 | | | | (5,479 | ) | | | 833 | | | | 1,941 | | | | 2,717 | | | | 57 | |
| Emerging Markets Leaders | | | 31,986 | | | | 16,112 | | | | 231,210 | | | | (183,112 | ) | | | 2,961 | | | | 1,911 | | | | 23,818 | | | | (18,946 | ) |
| Emerging Markets Growth | | | 199,420 | | | | 70,214 | | | | 513,600 | | | | (243,966 | ) | | | 14,257 | | | | 6,095 | | | | 34,162 | | | | (13,810 | ) |
| Emerging Markets Small Cap Growth | | | 52,476 | | | | 2,144 | | | | 75,303 | | | | (20,683 | ) | | | 2,989 | | | | 152 | | | | 5,051 | | | | (1,910 | ) |
| Bond | | | 4,444 | | | | 3,613 | | | | 23,146 | | | | (15,089 | ) | | | 448 | | | | 366 | | | | 2,364 | | | | (1,550 | ) |
| Low Duration | | | 6,065 | | | | 2,461 | | | | 58,720 | | | | (50,194 | ) | | | 687 | | | | 279 | | | | 6,709 | | | | (5,743 | ) |
| Macro Allocation | | | 74,626 | | | | 11,126 | | | | 161,255 | | | | (75,503 | ) | | | 6,351 | | | | 985 | | | | 13,863 | | | | (6,527 | ) |
| | | | | | | | | | | | | | | | | | | | | | | | | | | | | | | | | |
| | | Net Change in Net Assets Relating to Fund Share Activity | |
| | | Dollars | | | Shares | |
| Fund | | Sales | | | Reinvest | | | Redemptions | | | Total | | | Sales | | | Reinvest | | | Redemptions | | | Total | |
| Growth | | $ | 42,834 | | | $ | 60,277 | | | | $199,681 | | | $ | (96,570 | ) | | | 3,590 | | | | 6,318 | | | | 15,890 | | | | (5,982 | ) |
| Large Cap Growth | | | 60,009 | | | | 23,837 | | | | 96,291 | | | | (12,445 | ) | | | 3,975 | | | | 1,802 | | | | 6,114 | | | | (337 | ) |
| Mid Cap Growth | | | 10,781 | | | | 9,695 | | | | 32,171 | | | | (11,695 | ) | | | 866 | | | | 971 | | | | 2,650 | | | | (813 | ) |
| Small-Mid Cap Growth | | | 1,291,881 | | | | 193,965 | | | | 577,832 | | | | 908,014 | | | | 49,543 | | | | 8,369 | | | | 22,368 | | | | 35,544 | |
| Small-Mid Cap Value | | | 488 | | | | 439 | | | | 2,096 | | | | (1,169 | ) | | | 34 | | | | 45 | | | | 153 | | | | (74 | ) |
| Small Cap Growth | | | 326,138 | | | | 70,242 | | | | 201,271 | | | | 195,109 | | | | 10,263 | | | | 2,629 | | | | 6,864 | | | | 6,028 | |
| Small Cap Value | | | 71,840 | | | | 58,395 | | | | 160,283 | | | | (30,048 | ) | | | 3,592 | | | | 3,543 | | | | 7,995 | | | | (860 | ) |
| Global Leaders | | | 46,840 | | | | 25,924 | | | | 76,860 | | | | (4,096 | ) | | | 3,213 | | | | 2,144 | | | | 4,990 | | | | 367 | |
| International Leaders | | | 153,690 | | | | 15,804 | | | | 62,329 | | | | 107,165 | | | | 9,483 | | | | 1,105 | | | | 4,000 | | | | 6,588 | |
| International Developed Plus | | | 799 | | | | 2,156 | | | | 14,626 | | | | (11,671 | ) | | | 48 | | | | 153 | | | | 920 | | | | (719 | ) |
| Institutional International Developed Plus | | | — | | | | 554 | | | | 50 | | | | 504 | | | | — | | | | 45 | | | | 4 | | | | 41 | |
| International Growth | | | 309,595 | | | | 172,803 | | | | 826,740 | | | | (344,342 | ) | | | 10,554 | | | | 7,094 | | | | 29,347 | | | | (11,699 | ) |
| Institutional International Growth | | | 268,610 | | | | 180,253 | | | | 432,394 | | | | 16,469 | | | | 15,659 | | | | 12,959 | | | | 24,320 | | | | 4,298 | |
| International Small Cap Growth | | | 95,395 | | | | 40,939 | | | | 210,410 | | | | (74,076 | ) | | | 6,383 | | | | 3,777 | | | | 16,005 | | | | (5,845 | ) |
| Emerging Markets Leaders | | | 45,869 | | | | 19,766 | | | | 249,616 | | | | (183,981 | ) | | | 4,288 | | | | 2,344 | | | | 25,648 | | | | (19,016 | ) |
| Emerging Markets Growth | | | 228,271 | | | | 81,112 | | | | 566,109 | | | | (256,726 | ) | | | 16,048 | | | | 7,050 | | | | 37,772 | | | | (14,674 | ) |
| Emerging Markets Small Cap Growth | | | 157,577 | | | | 6,516 | | | | 222,964 | | | | (58,871 | ) | | | 9,088 | | | | 462 | | | | 14,615 | | | | (5,065 | ) |
| Bond | | | 117,343 | | | | 20,114 | | | | 240,011 | | | | (102,554 | ) | | | 11,773 | | | | 2,030 | | | | 24,314 | | | | (10,511 | ) |
| Income | | | 10,624 | | | | 2,283 | | | | 43,412 | | | | (30,505 | ) | | | 1,262 | | | | 270 | | | | 5,112 | | | | (3,580 | ) |
| Low Duration | | | 16,290 | | | | 5,084 | | | | 145,098 | | | | (123,724 | ) | | | 1,848 | | | | 576 | | | | 16,469 | | | | (14,045 | ) |
| Macro Allocation | | | 301,576 | | | | 25,916 | | | | 664,845 | | | | (337,353 | ) | | | 25,687 | | | | 2,294 | | | | 57,121 | | | | (29,140 | ) |
| 144 | Annual Report | December 31, 2018 |
Notes to Financial Statements
The following tables summarize the activity in capital shares of each Fund for the year ended December 31, 2017 (in thousands):
| | | Class N | |
| | | Dollars | | | Shares | |
| Fund | | Sales | | | Reinvest | | | Redemptions | | | Total | | | Sales | | | Reinvest | | | Redemptions | | | Total | |
| Growth | | $ | 2,767 | | | $ | 10,496 | | | $ | 41,517 | | | $ | (28,254 | ) | | | 220 | | | | 1,026 | | | | 3,364 | | | | (2,118 | ) |
| Large Cap Growth | | | 12,606 | | | | 146 | | | | 3,699 | | | | 9,053 | | | | 1,059 | | | | 11 | | | | 309 | | | | 761 | |
| Mid Cap Growth | | | 1,284 | | | | 919 | | | | 13,722 | | | | (11,519 | ) | | | 113 | | | | 85 | | | | 1,153 | | | | (955 | ) |
| Small-Mid Cap Growth | | | 87,018 | | | | 11,824 | | | | 76,905 | | | | 21,937 | | | | 3,871 | | | | 514 | | | | 3,528 | | | | 857 | |
| Small-Mid Cap Value | | | 19 | | | | 28 | | | | 27 | | | | 20 | | | | 2 | | | | 2 | | | | 2 | | | | 2 | |
| Small Cap Growth | | | 66,284 | | | | 23,270 | | | | 69,840 | | | | 19,714 | | | | 2,362 | | | | 884 | | | | 2,439 | | | | 807 | |
| Small Cap Value | | | 4,125 | | | | 2,069 | | | | 10,395 | | | | (4,201 | ) | | | 203 | | | | 104 | | | | 508 | | | | (201 | ) |
| Global Leaders | | | 1,070 | | | | 279 | | | | 780 | | | | 569 | | | | 78 | | | | 19 | | | | 59 | | | | 38 | |
| International Leaders | | | 6,217 | | | | 188 | | | | 1,194 | | | | 5,211 | | | | 432 | | | | 12 | | | | 81 | | | | 363 | |
| International Developed Plus | | | 691 | | | | 55 | | | | 1,088 | | | | (342 | ) | | | 45 | | | | 3 | | | | 70 | | | | (22 | ) |
| International Growth | | | 50,070 | | | | 9,669 | | | | 210,605 | | | | (150,866 | ) | | | 1,863 | | | | 324 | | | | 7,645 | | | | (5,458 | ) |
| International Small Cap Growth | | | 708 | | | | 513 | | | | 7,355 | | | | (6,134 | ) | | | 50 | | | | 34 | | | | 484 | | | | (400 | ) |
| Emerging Markets Leaders | | | 2,641 | | | | 12 | | | | 3,440 | | | | (787 | ) | | | 271 | | | | 1 | | | | 338 | | | | (66 | ) |
| Emerging Markets Growth | | | 682 | | | | 70 | | | | 2,510 | | | | (1,758 | ) | | | 49 | | | | 4 | | | | 179 | | | | (126 | ) |
| Emerging Markets Small Cap Growth | | | 5,081 | | | | 423 | | | | 2,964 | | | | 2,540 | | | | 295 | | | | 24 | | | | 186 | | | | 133 | |
| Bond | | | 20,164 | | | | 3,940 | | | | 66,445 | | | | (42,341 | ) | | | 1,934 | | | | 378 | | | | 6,372 | | | | (4,060 | ) |
| Income | | | 8,700 | | | | 1,377 | | | | 22,470 | | | | (12,393 | ) | | | 986 | | | | 156 | | | | 2,546 | | | | (1,404 | ) |
| Low Duration | | | 786 | | | | 85 | | | | 6,068 | | | | (5,197 | ) | | | 87 | | | | 9 | | | | 672 | | | | (576 | ) |
| Macro Allocation | | | 8,704 | | | | 257 | | | | 31,131 | | | | (22,170 | ) | | | 745 | | | | 22 | | | | 2,675 | | | | (1,908 | ) |
| | | | | | | | | | | | | | | | | | | | | | | | | | | | | | | | | |
| | | Class I | |
| | | Dollars | | | Shares | |
| Fund | | Sales | | | Reinvest | | | Redemptions | | | Total | | | Sales | | | Reinvest | | | Redemptions | | | Total | |
| Growth | | $ | 25,451 | | | $ | 81,062 | | | $ | 306,735 | | | $ | (200,222 | ) | | | 1,915 | | | | 7,067 | | | | 22,849 | | | | (13,867 | ) |
| Large Cap Growth | | | 50,357 | | | | 884 | | | | 21,605 | | | | 29,636 | | | | 4,124 | | | | 63 | | | | 1,774 | | | | 2,413 | |
| Mid Cap Growth | | | 9,557 | | | | 10,131 | | | | 75,132 | | | | (55,444 | ) | | | 795 | | | | 886 | | | | 6,181 | | | | (4,500 | ) |
| Small-Mid Cap Growth | | | 552,371 | | | | 80,961 | | | | 417,940 | | | | 215,392 | | | | 24,056 | | | | 3,359 | | | | 17,523 | | | | 9,892 | |
| Small-Mid Cap Value | | | 609 | | | | 332 | | | | 737 | | | | 204 | | | | 42 | | | | 24 | | | | 50 | | | | 16 | |
| Small Cap Growth | | | 61,059 | | | | 49,339 | | | | 62,897 | | | | 47,501 | | | | 2,010 | | | | 1,702 | | | | 2,068 | | | | 1,644 | |
| Small Cap Value | | | 91,392 | | | | 45,722 | | | | 169,851 | | | | (32,737 | ) | | | 4,386 | | | | 2,237 | | | | 8,131 | | | | (1,508 | ) |
| Global Leaders | | | 4,803 | | | | 2,421 | | | | 4,692 | | | | 2,532 | | | | 369 | | | | 169 | | | | 351 | | | | 187 | |
| International Leaders | | | 25,424 | | | | 1,177 | | | | 9,441 | | | | 17,160 | | | | 1,779 | | | | 73 | | | | 580 | | | | 1,272 | |
| International Developed Plus | | | 21,920 | | | | 2,098 | | | | 9,628 | | | | 14,390 | | | | 1,398 | | | | 128 | | | | 628 | | | | 898 | |
| International Growth | | | 195,965 | | | | 33,924 | | | | 682,927 | | | | (453,038 | ) | | | 7,092 | | | | 1,111 | | | | 24,114 | | | | (15,911 | ) |
| International Small Cap Growth | | | 49,384 | | | | 26,655 | | | | 104,367 | | | | (28,328 | ) | | | 3,353 | | | | 1,752 | | | | 7,013 | | | | (1,908 | ) |
| Emerging Markets Leaders | | | 12,824 | | | | 317 | | | | 8,364 | | | | 4,777 | | | | 1,302 | | | | 30 | | | | 893 | | | | 439 | |
| Emerging Markets Growth | | | 16,176 | | | | 1,017 | | | | 23,951 | | | | (6,758 | ) | | | 1,115 | | | | 65 | | | | 1,707 | | | | (527 | ) |
| Emerging Markets Small Cap Growth | | | 94,539 | | | | 8,107 | | | | 31,293 | | | | 71,353 | | | | 5,769 | | | | 453 | | | | 1,876 | | | | 4,346 | |
| Bond | | | 134,250 | | | | 12,422 | | | | 84,447 | | | | 62,225 | | | | 13,010 | | | | 1,203 | | | | 8,184 | | | | 6,029 | |
| Income | | | 10,520 | | | | 1,759 | | | | 18,387 | | | | (6,108 | ) | | | 1,201 | | | | 201 | | | | 2,103 | | | | (701 | ) |
| Low Duration | | | 84,636 | | | | 4,341 | | | | 174,620 | | | | (85,643 | ) | | | 9,393 | | | | 483 | | | | 19,383 | | | | (9,507 | ) |
| Macro Allocation | | | 214,907 | | | | 7,674 | | | | 417,802 | | | | (195,221 | ) | | | 18,321 | | | | 651 | | | | 35,612 | | | | (16,640 | ) |
| December 31, 2018 | William Blair Funds | 145 |
Notes to Financial Statements
| | | Institutional Class | |
| | | Dollars | | | Shares | |
| Fund | | Sales | | | Reinvest | | | Redemptions | | | Total | | | Sales | | | Reinvest | | | Redemptions | | | Total | |
| Global Leaders | | $ | 2,559 | | | $ | 5,655 | | | $ | 20,455 | | | $ | (12,241 | ) | | | 198 | | | | 394 | | | | 1,511 | | | | (919 | ) |
| International Leaders | | | 38,667 | | | | 4,960 | | | | 17,973 | | | | 25,654 | | | | 2,552 | | | | 307 | | | | 1,200 | | | | 1,659 | |
| Institutional International Developed Plus | | | 150 | | | | 212 | | | | 1,432 | | | | (1,070 | ) | | | 10 | | | | 15 | | | | 112 | | | | (87 | ) |
| Institutional International Growth | | | 192,850 | | | | 90,689 | | | | 524,901 | | | | (241,362 | ) | | | 11,839 | | | | 5,115 | | | | 32,006 | | | | (15,052 | ) |
| International Small Cap Growth | | | 8,701 | | | | 23,256 | | | | 16,528 | | | | 15,429 | | | | 558 | | | | 1,520 | | | | 1,054 | | | | 1,024 | |
| Emerging Markets Leaders | | | 62,264 | | | | 3,067 | | | | 30,182 | | | | 35,149 | | | | 6,513 | | | | 288 | | | | 2,936 | | | | 3,865 | |
| Emerging Markets Growth | | | 303,312 | | | | 10,235 | | | | 378,630 | | | | (65,083 | ) | | | 22,768 | | | | 645 | | | | 26,296 | | | | (2,883 | ) |
| Emerging Markets Small Cap Growth | | | 31,040 | | | | 4,554 | | | | 38,952 | | | | (3,358 | ) | | | 1,822 | | | | 254 | | | | 2,289 | | | | (213 | ) |
| Bond | | | 5,456 | | | | 3,799 | | | | 12,891 | | | | (3,636 | ) | | | 530 | | | | 368 | | | | 1,251 | | | | (353 | ) |
| Low Duration | | | 56,356 | | | | 1,908 | | | | 9,982 | | | | 48,282 | | | | 6,253 | | | | 213 | | | | 1,112 | | | | 5,354 | |
| Macro Allocation | | | 81,930 | | | | 5,947 | | | | 207,896 | | | | (120,019 | ) | | | 6,962 | | | | 504 | | | | 17,587 | | | | (10,121 | ) |
| | | | | | | | | | | | | | | | | | | | | | | | | | | | | | | | | |
| | | Net Change in Net Assets Relating to Fund Share Activity | |
| | | Dollars | | | Shares | |
| Fund | | Sales | | | Reinvest | | | Redemptions | | | Total | | | Sales | | | Reinvest | | | Redemptions | | | Total | |
| Growth | | $ | 28,218 | | | $ | 91,558 | | | $ | 348,252 | | | $ | (228,476 | ) | | | 2,135 | | | | 8,093 | | | | 26,213 | | | | (15,985 | ) |
| Large Cap Growth | | | 62,963 | | | | 1,030 | | | | 25,304 | | | | 38,689 | | | | 5,183 | | | | 74 | | | | 2,083 | | | | 3,174 | |
| Mid Cap Growth | | | 10,841 | | | | 11,050 | | | | 88,854 | | | | (66,963 | ) | | | 908 | | | | 971 | | | | 7,334 | | | | (5,455 | ) |
| Small-Mid Cap Growth | | | 639,389 | | | | 92,785 | | | | 494,845 | | | | 237,329 | | | | 27,927 | | | | 3,873 | | | | 21,051 | | | | 10,749 | |
| Small-Mid Cap Value | | | 628 | | | | 360 | | | | 764 | | | | 224 | | | | 44 | | | | 26 | | | | 52 | | | | 18 | |
| Small Cap Growth | | | 127,343 | | | | 72,609 | | | | 132,737 | | | | 67,215 | | | | 4,372 | | | | 2,586 | | | | 4,507 | | | | 2,451 | |
| Small Cap Value | | | 95,517 | | | | 47,791 | | | | 180,246 | | | | (36,938 | ) | | | 4,589 | | | | 2,341 | | | | 8,639 | | | | (1,709 | ) |
| Global Leaders | | | 8,432 | | | | 8,355 | | | | 25,927 | | | | (9,140 | ) | | | 645 | | | | 582 | | | | 1,921 | | | | (694 | ) |
| International Leaders | | | 70,308 | | | | 6,325 | | | | 28,608 | | | | 48,025 | | | | 4,763 | | | | 392 | | | | 1,861 | | | | 3,294 | |
| International Developed Plus | | | 22,611 | | | | 2,153 | | | | 10,716 | | | | 14,048 | | | | 1,443 | | | | 131 | | | | 698 | | | | 876 | |
| Institutional International Developed Plus | | | 150 | | | | 212 | | | | 1,432 | | | | (1,070 | ) | | | 10 | | | | 15 | | | | 112 | | | | (87 | ) |
| International Growth | | | 246,035 | | | | 43,593 | | | | 893,532 | | | | (603,904 | ) | | | 8,955 | | | | 1,435 | | | | 31,759 | | | | (21,369 | ) |
| Institutional International Growth | | | 192,850 | | | | 90,689 | | | | 524,901 | | | | (241,362 | ) | | | 11,839 | | | | 5,115 | | | | 32,006 | | | | (15,052 | ) |
| International Small Cap Growth | | | 58,793 | | | | 50,424 | | | | 128,250 | | | | (19,033 | ) | | | 3,961 | | | | 3,306 | | | | 8,551 | | | | (1,284 | ) |
| Emerging Markets Leaders | | | 77,729 | | | | 3,396 | | | | 41,986 | | | | 39,139 | | | | 8,086 | | | | 319 | | | | 4,167 | | | | 4,238 | |
| Emerging Markets Growth | | | 320,170 | | | | 11,322 | | | | 405,091 | | | | (73,599 | ) | | | 23,932 | | | | 714 | | | | 28,182 | | | | (3,536 | ) |
| Emerging Markets Small Cap Growth | | | 130,660 | | | | 13,084 | | | | 73,209 | | | | 70,535 | | | | 7,886 | | | | 731 | | | | 4,351 | | | | 4,266 | |
| Bond | | | 159,870 | | | | 20,161 | | | | 163,783 | | | | 16,248 | | | | 15,474 | | | | 1,949 | | | | 15,807 | | | | 1,616 | |
| Income | | | 19,220 | | | | 3,136 | | | | 40,857 | | | | (18,501 | ) | | | 2,187 | | | | 357 | | | | 4,649 | | | | (2,105 | ) |
| Low Duration | | | 141,778 | | | | 6,334 | | | | 190,670 | | | | (42,558 | ) | | | 15,733 | | | | 705 | | | | 21,167 | | | | (4,729 | ) |
| Macro Allocation | | | 305,541 | | | | 13,878 | | | | 656,829 | | | | (337,410 | ) | | | 26,028 | | | | 1,177 | | | | 55,874 | | | | (28,669 | ) |
(8) Subsequent Events
The Funds have evaluated subsequent events through the date of issuance of the Funds’ financial statements and have determined there is no impact to the Funds’ financial statements.
| 146 | Annual Report | December 31, 2018 |
Financial Highlights— For a share outstanding throughout each period
Growth Fund
| | | Class N | |
| | | Years Ended December 31, | |
| | | 2018 | | | 2017 | | | 2016 | | | 2015 | | | 2014 | |
| Net asset value, beginning of year | | $ | 10.27 | | | $ | 11.41 | | | $ | 12.52 | | | $ | 13.55 | | | $ | 14.79 | |
| Income (loss) from investment operations: | | | | | | | | | | | | | | | | | | | | |
| Net investment income (loss) | | | (0.04 | ) | | | (0.02 | ) | | | (0.02 | ) | | | (0.04 | ) | | | (0.07 | ) |
| Net realized and unrealized gain (loss) on investments | | | 0.75 | | | | 2.78 | | | | (0.08 | ) | | | 0.75 | | | | 1.03 | |
| Total from investment operations | | | 0.71 | | | | 2.76 | | | | (0.10 | ) | | | 0.71 | | | | 0.96 | |
| Less distributions from: | | | | | | | | | | | | | | | | | | | | |
| Net investment income | | | — | | | | — | | | | — | | | | — | | | | — | |
| Net realized gain | | | 3.07 | | | | 3.90 | | | | 1.01 | | | | 1.74 | | | | 2.20 | |
| Total distributions | | | 3.07 | | | | 3.90 | | | | 1.01 | | | | 1.74 | | | | 2.20 | |
| Net asset value, end of year | | $ | 7.91 | | | $ | 10.27 | | | $ | 11.41 | | | $ | 12.52 | | | $ | 13.55 | |
| Total return (%) | | | 5.10 | | | | 24.35 | | | | (0.98 | ) | | | 5.31 | | | | 6.59 | |
| Ratios to average daily net assets (%): | | | | | | | | | | | | | | | | | | | | |
| Expenses, before waivers and reimbursements | | | 1.22 | | | | 1.20 | | | | 1.21 | | | | 1.19 | | | | 1.18 | |
| Expenses, net of waivers and reimbursements | | | 1.20 | | | | 1.20 | | | | 1.21 | | | | 1.19 | | | | 1.18 | |
| Net investment income (loss), before waivers and reimbursements | | | (0.36 | ) | | | (0.14 | ) | | | (0.15 | ) | | | (0.29 | ) | | | (0.50 | ) |
| Net investment income (loss), net of waivers and reimbursements | | | (0.34 | ) | | | (0.14 | ) | | | (0.15 | ) | | | (0.29 | ) | | | (0.50 | ) |
| Class N net assets at the end of the year (in thousands) | | $ | 38,370 | | | $ | 34,886 | | | $ | 62,936 | | | $ | 149,754 | | | $ | 272,765 | |
| Portfolio turnover rate (%) | | | 46 | | | | 38 | | | | 79 | | | | 78 | | | | 100 | |
| | | | | | | | | | | | | | | | | | | | | |
| | | Class I | |
| | | Years Ended December 31, | |
| | | | 2018 | | | | 2017 | | | | 2016 | | | | 2015 | | | | 2014 | |
| Net asset value, beginning of year | | $ | 11.51 | | | $ | 12.39 | | | $ | 13.50 | | | $ | 14.43 | | | $ | 15.56 | |
| Income (loss) from investment operations: | | | | | | | | | | | | | | | | | | | | |
| Net investment income (loss) | | | (0.01 | ) | | | 0.02 | | | | 0.03 | | | | 0.01 | | | | (0.03 | ) |
| Net realized and unrealized gain (loss) on investments | | | 0.82 | | | | 3.02 | | | | (0.10 | ) | | | 0.80 | | | | 1.10 | |
| Total from investment operations | | | 0.81 | | | | 3.04 | | | | (0.07 | ) | | | 0.81 | | | | 1.07 | |
| Less distributions from: | | | | | | | | | | | | | | | | | | | | |
| Net investment income | | | 0.00 | ^ | | | 0.02 | | | | 0.03 | | | | — | | | | — | |
| Net realized gain | | | 3.07 | | | | 3.90 | | | | 1.01 | | | | 1.74 | | | | 2.20 | |
| Total distributions | | | 3.07 | | | | 3.92 | | | | 1.04 | | | | 1.74 | | | | 2.20 | |
| Net asset value, end of year | | $ | 9.25 | | | $ | 11.51 | | | $ | 12.39 | | | $ | 13.50 | | | $ | 14.43 | |
| Total return (%) | | | 5.42 | | | | 24.64 | | | | (0.69 | ) | | | 5.69 | | | | 6.96 | |
| Ratios to average daily net assets (%): | | | | | | | | | | | | | | | | | | | | |
| Expenses | | | 0.91 | | | | 0.92 | | | | 0.90 | | | | 0.89 | | | | 0.86 | |
| Net investment income (loss) | | | (0.06 | ) | | | 0.12 | | | | 0.20 | | | | 0.06 | | | | (0.20 | ) |
| Class I net assets at the end of the year (in thousands) | | $ | 187,306 | | | $ | 318,848 | | | $ | 514,870 | | | $ | 696,744 | | | $ | 688,038 | |
| Portfolio turnover rate (%) | | | 46 | | | | 38 | | | | 79 | | | | 78 | | | | 100 | |
| ^ | Amount is less than $0.005 per share. |
Note: Net investment income (loss) per share is based on the average shares outstanding during the year.
Performance cited represents past performance. Past performance does not guarantee future results and current performance may be lower or higher than the data quoted. Results shown are annual returns, which assume reinvestment of dividends and capital gains. Investment returns and principal will fluctuate and you may have a gain or loss when you sell shares. For the most current month-end performance information, please call 1-800-742-7272 or visit our Web site atwww.williamblairfunds.com.
See accompanying Notes to Financial Statements.
| December 31, 2018 | William Blair Funds | 147 |
Financial Highlights— For a share outstanding throughout each period
Large Cap Growth Fund
| | | Class N | |
| | | Years Ended December 31, | |
| | | 2018 | | | 2017 | | | 2016 | | | 2015 | | | 2014 | |
| Net asset value, beginning of year | | $ | 13.35 | | | $ | 10.26 | | | $ | 10.15 | | | $ | 10.46 | | | $ | 10.03 | |
| Income (loss) from investment operations: | | | | | | | | | | | | | | | | | | | | |
| Net investment income (loss) | | | (0.02 | ) | | | (0.02 | ) | | | 0.02 | | | | (0.02 | ) | | | (0.02 | ) |
| Net realized and unrealized gain (loss) on investments | | | 0.81 | | | | 3.19 | | | | 0.18 | | | | 0.75 | | | | 1.46 | |
| Total from investment operations | | | 0.79 | | | | 3.17 | | | | 0.20 | | | | 0.73 | | | | 1.44 | |
| Less distributions from: | | | | | | | | | | | | | | | | | | | | |
| Net investment income | | | — | | | | — | | | | 0.01 | | | | — | | | | — | |
| Net realized gain | | | 2.15 | | | | 0.08 | | | | 0.08 | | | | 1.04 | | | | 1.01 | |
| Total distributions | | | 2.15 | | | | 0.08 | | | | 0.09 | | | | 1.04 | | | | 1.01 | |
| Net asset value, end of year | | $ | 11.99 | | | $ | 13.35 | | | $ | 10.26 | | | $ | 10.15 | | | $ | 10.46 | |
| Total return (%) | | | 4.96 | | | | 30.88 | | | | 1.97 | | | | 7.04 | | | | 14.29 | |
| Ratios to average daily net assets (%): | | | | | | | | | | | | | | | | | | | | |
| Expenses, before waivers and reimbursements | | | 1.21 | | | | 1.19 | | | | 1.23 | | | | 1.28 | | | | 1.31 | |
| Expenses, net of waivers and reimbursements | | | 1.05 | | | | 1.05 | | | | 1.05 | | | | 1.07 | | | | 1.13 | |
| Net investment income (loss), before waivers and reimbursements | | | (0.33 | ) | | | (0.27 | ) | | | (0.01 | ) | | | (0.43 | ) | | | (0.41 | ) |
| Net investment income (loss), net of waivers and reimbursements | | | (0.17 | ) | | | (0.13 | ) | | | 0.17 | | | | (0.22 | ) | | | (0.23 | ) |
| Class N net assets at the end of the year (in thousands) | | $ | 41,361 | | | $ | 25,604 | | | $ | 11,860 | | | $ | 10,443 | | | $ | 8,831 | |
| Portfolio turnover rate (%) | | | 47 | | | | 29 | | | | 44 | | | | 38 | | | | 50 | |
| | | | | | | | | | | | | | | | | | | | | |
| | | Class I | |
| | | Years Ended December 31, | |
| | | | 2018 | | | | 2017 | | | | 2016 | | | | 2015 | | | | 2014 | |
| Net asset value, beginning of year | | $ | 13.97 | | | $ | 10.70 | | | $ | 10.58 | | | $ | 10.84 | | | $ | 10.33 | |
| Income (loss) from investment operations: | | | | | | | | | | | | | | | | | | | | |
| Net investment income (loss) | | | 0.01 | | | | 0.02 | | | | 0.04 | | | | (0.00 | )^ | | | 0.00 | ^ |
| Net realized and unrealized gain (loss) on investments | | | 0.85 | | | | 3.33 | | | | 0.19 | | | | 0.78 | | | | 1.52 | |
| Total from investment operations | | | 0.86 | | | | 3.35 | | | | 0.23 | | | | 0.78 | | | | 1.52 | |
| Less distributions from: | | | | | | | | | | | | | | | | | | | | |
| Net investment income | | | 0.02 | | | | — | | | | 0.03 | | | | — | | | | — | |
| Net realized gain | | | 2.15 | | | | 0.08 | | | | 0.08 | | | | 1.04 | | | | 1.01 | |
| Total distributions | | | 2.17 | | | | 0.08 | | | | 0.11 | | | | 1.04 | | | | 1.01 | |
| Net asset value, end of year | | $ | 12.66 | | | $ | 13.97 | | | $ | 10.70 | | | $ | 10.58 | | | $ | 10.84 | |
| Total return (%) | | | 5.21 | | | | 31.29 | | | | 2.22 | | | | 7.26 | | | | 14.65 | |
| Ratios to average daily net assets (%): | | | | | | | | | | | | | | | | | | | | |
| Expenses, before waivers and reimbursements | | | 0.90 | | | | 0.90 | | | | 0.91 | | | | 0.95 | | | | 1.00 | |
| Expenses, net of waivers and reimbursements | | | 0.80 | | | | 0.80 | | | | 0.80 | | | | 0.82 | | | | 0.88 | |
| Net investment income (loss), before waivers and reimbursements | | | (0.01 | ) | | | 0.03 | | | | 0.30 | | | | (0.10 | ) | | | (0.10 | ) |
| Net investment income (loss), net of waivers and reimbursements | | | 0.09 | | | | 0.13 | | | | 0.41 | | | | 0.03 | | | | 0.02 | |
| Class I net assets at the end of the year (in thousands) | | $ | 137,599 | | | $ | 177,959 | | | $ | 110,475 | | | $ | 59,038 | | | $ | 50,778 | |
| Portfolio turnover rate (%) | | | 47 | | | | 29 | | | | 44 | | | | 38 | | | | 50 | |
| ^ | Amount is less than $0.005 per share. |
Note: Net investment income (loss) per share is based on the average shares outstanding during the year.
Performance cited represents past performance. Past performance does not guarantee future results and current performance may be lower or higher than the data quoted. Results shown are annual returns, which assume reinvestment of dividends and capital gains. Investment returns and principal will fluctuate and you may have a gain or loss when you sell shares. For the most current month-end performance information, please call 1-800-742-7272 or visit our Web site atwww.williamblairfunds.com.
| 148 | Annual Report | December 31, 2018 |
Financial Highlights— For a share outstanding throughout each period
Mid Cap Growth Fund
| | | Class N | |
| | | Years Ended December 31, | |
| | | 2018 | | | 2017 | | | 2016 | | | 2015 | | | 2014 | |
| Net asset value, beginning of year | | $ | 10.92 | | | $ | 10.69 | | | $ | 11.28 | | | $ | 14.20 | | | $ | 15.21 | |
| Income (loss) from investment operations: | | | | | | | | | | | | | | | | | | | | |
| Net investment income (loss) | | | (0.06 | ) | | | (0.08 | ) | | | (0.06 | ) | | | (0.09 | ) | | | (0.12 | ) |
| Net realized and unrealized gain (loss) on investments | | | 0.03 | | | | 2.29 | | | | 0.09 | | | | 0.04 | | | | 1.26 | |
| Total from investment operations | | | (0.03 | ) | | | 2.21 | | | | 0.03 | | | | (0.05 | ) | | | 1.14 | |
| Less distributions from: | | | | | | | | | | | | | | | | | | | | |
| Net investment income | | | — | | | | — | | | | — | | | | — | | | | — | |
| Net realized gain | | | 2.02 | | | | 1.98 | | | | 0.62 | | | | 2.87 | | | | 2.15 | |
| Total distributions | | | 2.02 | | | | 1.98 | | | | 0.62 | | | | 2.87 | | | | 2.15 | |
| Net asset value, end of year | | $ | 8.87 | | | $ | 10.92 | | | $ | 10.69 | | | $ | 11.28 | | | $ | 14.20 | |
| Total return (%) | | | (1.20 | ) | | | 20.88 | | | | 0.23 | | | | (0.20 | ) | | | 7.53 | |
| Ratios to average daily net assets (%): | | | | | | | | | | | | | | | | | | | | |
| Expenses, before waivers and reimbursements | | | 1.57 | | | | 1.49 | | | | 1.45 | | | | 1.43 | | | | 1.35 | |
| Expenses, net of waivers and reimbursements | | | 1.23 | | | | 1.30 | | | | 1.30 | | | | 1.32 | | | | 1.35 | |
| Net investment income (loss), before waivers and reimbursements | | | (0.85 | ) | | | (0.84 | ) | | | (0.68 | ) | | | (0.76 | ) | | | (0.80 | ) |
| Net investment income (loss), net of waivers and reimbursements | | | (0.51 | ) | | | (0.65 | ) | | | (0.53 | ) | | | (0.65 | ) | | | (0.80 | ) |
| Class N net assets at the end of the year (in thousands) | | $ | 4,944 | | | $ | 6,166 | | | $ | 16,234 | | | $ | 25,105 | | | $ | 37,413 | |
| Portfolio turnover rate (%) | | | 58 | | | | 59 | | | | 60 | | | | 65 | | | | 81 | |
| | | | | | | | | | | | | | | | | | | | | |
| | | Class I | |
| | | Years Ended December 31, | |
| | | | 2018 | | | | 2017 | | | | 2016 | | | | 2015 | | | | 2014 | |
| Net asset value, beginning of year | | $ | 11.57 | | | $ | 11.20 | | | $ | 11.76 | | | $ | 14.65 | | | $ | 15.58 | |
| Income (loss) from investment operations: | | | | | | | | | | | | | | | | | | | | |
| Net investment income (loss) | | | (0.03 | ) | | | (0.05 | ) | | | (0.03 | ) | | | (0.06 | ) | | | (0.09 | ) |
| Net realized and unrealized gain (loss) on investments | | | 0.03 | | | | 2.40 | | | | 0.09 | | | | 0.04 | | | | 1.31 | |
| Total from investment operations | | | — | | | | 2.35 | | | | 0.06 | | | | (0.02 | ) | | | 1.22 | |
| Less distributions from: | | | | | | | | | | | | | | | | | | | | |
| Net investment income | | | — | | | | — | | | | — | | | | — | | | | — | |
| Net realized gain | | | 2.02 | | | | 1.98 | | | | 0.62 | | | | 2.87 | | | | 2.15 | |
| Total distributions | | | 2.02 | | | | 1.98 | | | | 0.62 | | | | 2.87 | | | | 2.15 | |
| Net asset value, end of year | | $ | 9.55 | | | $ | 11.57 | | | $ | 11.20 | | | $ | 11.76 | | | $ | 14.65 | |
| Total return (%) | | | (0.86 | ) | | | 21.18 | | | | 0.48 | | | | 0.00 | | | | 7.87 | |
| Ratios to average daily net assets (%): | | | | | | | | | | | | | | | | | | | | |
| Expenses, before waivers and reimbursements | | | 1.31 | | | | 1.23 | | | | 1.18 | | | | 1.14 | | | | 1.10 | |
| Expenses, net of waivers and reimbursements | | | 0.98 | | | | 1.05 | | | | 1.05 | | | | 1.07 | | | | 1.10 | |
| Net investment income (loss), before waivers and reimbursements | | | (0.58 | ) | | | (0.58 | ) | | | (0.39 | ) | | | (0.48 | ) | | | (0.55 | ) |
| Net investment income (loss), net of waivers and reimbursements | | | (0.25 | ) | | | (0.40 | ) | | | (0.26 | ) | | | (0.41 | ) | | | (0.55 | ) |
| Class I net assets at the end of the year (in thousands) | | $ | 51,173 | | | $ | 71,369 | | | $ | 119,424 | | | $ | 174,617 | | | $ | 302,373 | |
| Portfolio turnover rate (%) | | | 58 | | | | 59 | | | | 60 | | | | 65 | | | | 81 | |
Note: Net investment income (loss) per share is based on the average shares outstanding during the year.
Performance cited represents past performance. Past performance does not guarantee future results and current performance may be lower or higher than the data quoted. Results shown are annual returns, which assume reinvestment of dividends and capital gains. Investment returns and principal will fluctuate and you may have a gain or loss when you sell shares. For the most current month-end performance information, please call 1-800-742-7272 or visit our Web site atwww.williamblairfunds.com.
| December 31, 2018 | William Blair Funds | 149 |
Financial Highlights— For a share outstanding throughout each period
Small-Mid Cap Growth Fund
| | | Class N | |
| | | Years Ended December 31, | |
| | | 2018 | | | 2017 | | | 2016 | | | 2015 | | | 2014 | |
| Net asset value, beginning of year | | $ | 23.36 | | | $ | 19.20 | | | $ | 18.53 | | | $ | 18.72 | | | $ | 18.80 | |
| Income (loss) from investment operations: | | | | | | | | | | | | | | | | | | | | |
| Net investment income (loss) | | | (0.18 | ) | | | (0.16 | ) | | | (0.09 | ) | | | (0.10 | ) | | | (0.12 | ) |
| Net realized and unrealized gain (loss) on investments | | | (0.25 | ) | | | 5.62 | | | | 1.29 | | | | 0.93 | | | | 1.68 | |
| Total from investment operations | | | (0.43 | ) | | | 5.46 | | | | 1.20 | | | | 0.83 | | | | 1.56 | |
| Less distributions from: | | | | | | | | | | | | | | | | | | | | |
| Net investment income | | | — | | | | — | | | | — | | | | — | | | | — | |
| Net realized gain | | | 1.96 | | | | 1.30 | | | | 0.53 | | | | 1.02 | | | | 1.64 | |
| Total distributions | | | 1.96 | | | | 1.30 | | | | 0.53 | | | | 1.02 | | | | 1.64 | |
| Net asset value, end of year | | $ | 20.97 | | | $ | 23.36 | | | $ | 19.20 | | | $ | 18.53 | | | $ | 18.72 | |
| Total return (%) | | | (2.29 | ) | | | 28.57 | | | | 6.45 | | | | 4.47 | | | | 8.33 | |
| Ratios to average daily net assets (%): | | | | | | | | | | | | | | | | | | | | |
| Expenses, before waivers and reimbursements | | | 1.44 | | | | 1.43 | | | | 1.43 | | | | 1.42 | | | | 1.38 | |
| Expenses, net of waivers and reimbursements | | | 1.35 | | | | 1.35 | | | | 1.35 | | | | 1.35 | | | | 1.35 | |
| Net investment income (loss), before waivers and reimbursements | | | (0.81 | ) | | | (0.82 | ) | | | (0.59 | ) | | | (0.58 | ) | | | (0.66 | ) |
| Net investment income (loss), net of waivers and reimbursements | | | (0.72 | ) | | | (0.74 | ) | | | (0.51 | ) | | | (0.51 | ) | | | (0.63 | ) |
| Class N net assets at the end of the year (in thousands) | | $ | 424,865 | | | $ | 228,828 | | | $ | 171,638 | | | $ | 169,595 | | | $ | 83,047 | |
| Portfolio turnover rate (%) | | | 46 | | | | 64 | | | | 66 | | | | 44 | | | | 49 | |
| | | | | | | | | | | | | | | | | | | | | |
| | | Class I | |
| | | Years Ended December 31, | |
| | | | 2018 | | | | 2017 | | | | 2016 | | | | 2015 | | | | 2014 | |
| Net asset value, beginning of year | | $ | 24.48 | | | $ | 20.02 | | | $ | 19.25 | | | $ | 19.36 | | | $ | 19.34 | |
| Income (loss) from investment operations: | | | | | | | | | | | | | | | | | | | | |
| Net investment income (loss) | | | (0.12 | ) | | | (0.11 | ) | | | (0.05 | ) | | | (0.06 | ) | | | (0.08 | ) |
| Net realized and unrealized gain (loss) on investments | | | (0.28 | ) | | | 5.87 | | | | 1.35 | | | | 0.97 | | | | 1.74 | |
| Total from investment operations | | | (0.40 | ) | | | 5.76 | | | | 1.30 | | | | 0.91 | | | | 1.66 | |
| Less distributions from: | | | | | | | | | | | | | | | | | | | | |
| Net investment income | | | — | | | | — | | | | — | | | | — | | | | — | |
| Net realized gain | | | 1.96 | | | | 1.30 | | | | 0.53 | | | | 1.02 | | | | 1.64 | |
| Total distributions | | | 1.96 | | | | 1.30 | | | | 0.53 | | | | 1.02 | | | | 1.64 | |
| Net asset value, end of year | | $ | 22.12 | | | $ | 24.48 | | | $ | 20.02 | | | $ | 19.25 | | | $ | 19.36 | |
| Total return (%) | | | (2.06 | ) | | | 28.90 | | | | 6.72 | | | | 4.74 | | | | 8.62 | |
| Ratios to average daily net assets (%): | | | | | | | | | | | | | | | | | | | | |
| Expenses, before waivers and reimbursements. | | | 1.16 | | | | 1.16 | | | | 1.16 | | | | 1.15 | | | | 1.15 | |
| Expenses, net of waivers and reimbursements | | | 1.10 | | | | 1.10 | | | | 1.10 | | | | 1.10 | | | | 1.10 | |
| Net investment income (loss), before waivers and reimbursements | | | (0.53 | ) | | | (0.55 | ) | | | (0.34 | ) | | | (0.33 | ) | | | (0.43 | ) |
| Net investment income (loss), net of waivers and reimbursements | | | (0.47 | ) | | | (0.49 | ) | | | (0.28 | ) | | | (0.28 | ) | | | (0.38 | ) |
| Class I net assets at the end of the year (in thousands) | | $ | 1,979,105 | | | $ | 1,576,180 | | | $ | 1,090,939 | | | $ | 1,019,544 | | | $ | 793,789 | |
| Portfolio turnover rate (%) | | | 46 | | | | 64 | | | | 66 | | | | 44 | | | | 49 | |
Note: Net investment income (loss) per share is based on the average shares outstanding during the year.
Performance cited represents past performance. Past performance does not guarantee future results and current performance may be lower or higher than the data quoted. Results shown are annual returns, which assume reinvestment of dividends and capital gains. Investment returns and principal will fluctuate and you may have a gain or loss when you sell shares. For the most current month-end performance information, please call 1-800-742-7272 or visit our Web site atwww.williamblairfunds.com.
| 150 | Annual Report | December 31, 2018 |
Financial Highlights— For a share outstanding throughout each period
Small-Mid Cap Value Fund
| | | | Class N | |
| | | | Years Ended December 31, | |
| | | | 2018 | | | 2017 | | | 2016 | | | 2015 | | | 2014 | |
| Net asset value, beginning of year | | | $ | 14.31 | | | $ | 14.53 | | | $ | 12.54 | | | $ | 13.63 | | | $ | 14.11 | |
| Income (loss) from investment operations: | | | | | | | | | | | | | | | | | | | | | |
| Net investment income (loss) | | | | 0.09 | | | | 0.04 | | | | 0.04 | | | | 0.04 | | | | 0.00 | ^ |
| Net realized and unrealized gain (loss) on investments | | | | (2.08 | ) | | | 1.33 | | | | 2.55 | | | | (0.47 | ) | | | 0.64 | |
| Total from investment operations | | | | (1.99 | ) | | | 1.37 | | | | 2.59 | | | | (0.43 | ) | | | 0.64 | |
| Less distributions from: | | | | | | | | | | | | | | | | | | | | | |
| Net investment income | | | | 0.03 | | | | 0.02 | | | | 0.01 | | | | 0.01 | | | | — | |
| Net realized gain | | | | 2.98 | | | | 1.57 | | | | 0.59 | | | | 0.65 | | | | 1.12 | |
| Total distributions | | | | 3.01 | | | | 1.59 | | | | 0.60 | | | | 0.66 | | | | 1.12 | |
| Net asset value, end of year | | | $ | 9.31 | | | $ | 14.31 | | | $ | 14.53 | | | $ | 12.54 | | | $ | 13.63 | |
| Total return (%) | | | | (15.32 | ) | | | 9.59 | | | | 20.69 | | | | (3.13 | ) | | | 4.66 | |
| Ratios to average daily net assets (%): | | | | | | | | | | | | | | | | | | | | | |
| Expenses, before waivers and reimbursements | | | | 6.88 | | | | 4.83 | | | | 4.15 | | | | 3.93 | | | | 4.50 | |
| Expenses, net of waivers and reimbursements | | | | 1.28 | | | | 1.35 | | | | 1.35 | | | | 1.37 | | | | 1.40 | |
| Net investment income (loss), before waivers and reimbursements | | | | (4.97 | ) | | | (3.21 | ) | | | (2.51 | ) | | | (2.29 | ) | | | (3.08 | ) |
| Net investment income (loss), net of waivers and reimbursements | | | | 0.63 | | | | 0.27 | | | | 0.29 | | | | 0.27 | | | | 0.02 | |
| Class N net assets at the end of the year (in thousands) | | | $ | 234 | | | $ | 284 | | | $ | 267 | | | $ | 855 | | | $ | 946 | |
| Portfolio turnover rate (%) | | | | 104 | | | | 70 | | | | 45 | | | | 35 | | | | 69 | |
| | | | | | | | | | | | | | | | | | | | | | |
| | | | Class I | |
| | | | Years Ended December 31, | |
| | | | | 2018 | | | | 2017 | | | | 2016 | | | | 2015 | | | | 2014 | |
| Net asset value, beginning of year | | | $ | 14.24 | | | $ | 14.47 | | | $ | 12.54 | | | $ | 13.63 | | | $ | 14.12 | |
| Income (loss) from investment operations: | | | | | | | | | | | | | | | | | | | | | |
| Net investment income (loss) | | | | 0.11 | | | | 0.07 | | | | 0.08 | | | | 0.07 | | | | 0.05 | |
| Net realized and unrealized gain (loss) on investments | | | | (2.06 | ) | | | 1.33 | | | | 2.55 | | | | (0.47 | ) | | | 0.63 | |
| Total from investment operations | | | | (1.95 | ) | | | 1.40 | | | | 2.63 | | | | (0.40 | ) | | | 0.68 | |
| Less distributions from: | | | | | | | | | | | | | | | | | | | | | |
| Net investment income | | | | 0.08 | | | | 0.06 | | | | 0.11 | | | | 0.04 | | | | 0.05 | |
| Net realized gain | | | | 2.98 | | | | 1.57 | | | | 0.59 | | | | 0.65 | | | | 1.12 | |
| Total distributions | | | | 3.06 | | | | 1.63 | | | | 0.70 | | | | 0.69 | | | | 1.17 | |
| Net asset value, end of year | | | $ | 9.23 | | | $ | 14.24 | | | $ | 14.47 | | | $ | 12.54 | | | $ | 13.63 | |
| Total return (%) | | | | (15.03 | ) | | | 9.84 | | | | 21.00 | | | | (2.86 | ) | | | 4.96 | |
| Ratios to average daily net assets (%): | | | | | | | | | | | | | | | | | | | | | |
| Expenses, before waivers and reimbursements | | | | 6.54 | | | | 4.55 | | | | 3.92 | | | | 3.72 | | | | 4.16 | |
| Expenses, net of waivers and reimbursements | | | | 1.03 | | | | 1.10 | | | | 1.10 | | | | 1.12 | | | | 1.15 | |
| Net investment income (loss), before waivers and reimbursements | | | | (4.69 | ) | | | (2.94 | ) | | | (2.20 | ) | | | (2.08 | ) | | | (2.65 | ) |
| Net investment income (loss), net of waivers and reimbursements | | | | 0.82 | | | | 0.51 | | | | 0.62 | | | | 0.52 | | | | 0.36 | |
| Class I net assets at the end of the year (in thousands) | | | $ | 1,445 | | | $ | 3,359 | | | $ | 3,186 | | | $ | 3,220 | | | $ | 3,407 | |
| Portfolio turnover rate (%) | | | | 104 | | | | 70 | | | | 45 | | | | 35 | | | | 69 | |
| ^ | Amount is less than $0.005 per share. |
Note: Net investment income (loss) per share is based on the average shares outstanding during the year.
Performance cited represents past performance. Past performance does not guarantee future results and current performance may be lower or higher than the data quoted. Results shown are annual returns, which assume reinvestment of dividends and capital gains. Investment returns and principal will fluctuate and you may have a gain or loss when you sell shares. For the most current month-end performance information, please call 1-800-742-7272 or visit our Web site atwww.williamblairfunds.com.
| December 31, 2018 | William Blair Funds | 151 |
Financial Highlights— For a share outstanding throughout each period
Small Cap Growth Fund
| | | | Class N | |
| | | | Years Ended December 31, | |
| | | | 2018 | | | 2017 | | | 2016 | | | 2015 | | | 2014 | |
| Net asset value, beginning of year | | | $ | 26.87 | | | $ | 25.24 | | | $ | 22.47 | | | $ | 25.61 | | | $ | 30.02 | |
| Income (loss) from investment operations: | | | | | | | | | | | | | | | | | | | | | |
| Net investment income (loss) | | | | (0.27 | ) | | | (0.25 | ) | | | (0.18 | ) | | | (0.22 | ) | | | (0.30 | ) |
| Net realized and unrealized gain (loss) on investments | | | | (0.10 | ) | | | 6.88 | | | | 4.43 | | | | (0.93 | ) | | | 1.02 | |
| Total from investment operations | | | | (0.37 | ) | | | 6.63 | | | | 4.25 | | | | (1.15 | ) | | | 0.72 | |
| Less distributions from: | | | | | | | | | | | | | | | | | | | | | |
| Net investment income | | | | — | | | | — | | | | — | | | | — | | | | — | |
| Net realized gain | | | | 3.27 | | | | 5.00 | | | | 1.48 | | | | 1.99 | | | | 5.13 | |
| Total distributions | | | | 3.27 | | | | 5.00 | | | | 1.48 | | | | 1.99 | | | | 5.13 | |
| Net asset value, end of year | | | $ | 23.23 | | | $ | 26.87 | | | $ | 25.24 | | | $ | 22.47 | | | $ | 25.61 | |
| Total return (%) | | | | (2.14 | ) | | | 26.70 | | | | 18.89 | | | | (4.44 | ) | | | 2.62 | |
| Ratios to average daily net assets (%): | | | | | | | | | | | | | | | | | | | | | |
| Expenses, before waivers and reimbursements | | | | 1.55 | | | | 1.54 | | | | 1.55 | | | | 1.59 | | | | 1.56 | |
| Expenses, net of waivers and reimbursements | | | | 1.50 | | | | 1.50 | | | | 1.50 | | | | 1.50 | | | | 1.50 | |
| Net investment income (loss), before waivers and reimbursements | | | | (0.94 | ) | | | (0.93 | ) | | | (0.84 | ) | | | (0.94 | ) | | | (1.06 | ) |
| Net investment income (loss), net of waivers and reimbursements | | | | (0.89 | ) | | | (0.89 | ) | | | (0.79 | ) | | | (0.85 | ) | | | (1.00 | ) |
| Class N net assets at the end of the year (in thousands) | | | $ | 169,074 | | | $ | 146,291 | | | $ | 117,068 | | | $ | 111,944 | | | $ | 148,201 | |
| Portfolio turnover rate (%) | | | | 74 | | | | 81 | | | | 90 | | | | 91 | | | | 82 | |
| | | | | | | | | | | | | | | | | | | | | | |
| | | | Class I | |
| | | | Years Ended December 31, | |
| | | | | 2018 | | | | 2017 | | | | 2016 | | | | 2015 | | | | 2014 | |
| Net asset value, beginning of year | | | $ | 29.61 | | | $ | 27.34 | | | $ | 24.17 | | | $ | 27.32 | | | $ | 31.61 | |
| Income (loss) from investment operations: | | | | | | | | | | | | | | | | | | | | | |
| Net investment income (loss) | | | | (0.21 | ) | | | (0.20 | ) | | | (0.13 | ) | | | (0.17 | ) | | | (0.23 | ) |
| Net realized and unrealized gain (loss) on investments | | | | (0.14 | ) | | | 7.47 | | | | 4.78 | | | | (0.99 | ) | | | 1.07 | |
| Total from investment operations | | | | (0.35 | ) | | | 7.27 | | | | 4.65 | | | | (1.16 | ) | | | 0.84 | |
| Less distributions from: | | | | | | | | | | | | | | | | | | | | | |
| Net investment income | | | | — | | | | — | | | | — | | | | — | | | | — | |
| Net realized gain | | | | 3.27 | | | | 5.00 | | | | 1.48 | | | | 1.99 | | | | 5.13 | |
| Total distributions | | | | 3.27 | | | | 5.00 | | | | 1.48 | | | | 1.99 | | | | 5.13 | |
| Net asset value, end of year | | | $ | 25.99 | | | $ | 29.61 | | | $ | 27.34 | | | $ | 24.17 | | | $ | 27.32 | |
| Total return (%) | | | | (1.88 | ) | | | 26.99 | | | | 19.22 | | | | (4.20 | ) | | | 2.87 | |
| Ratios to average daily net assets (%): | | | | | | | | | | | | | | | | | | | | | |
| Expenses, before waivers and reimbursements | | | | 1.25 | | | | 1.25 | | | | 1.27 | | | | 1.30 | | | | 1.30 | |
| Expenses, net of waivers and reimbursements | | | | 1.25 | | | | 1.25 | | | | 1.25 | | | | 1.25 | | | | 1.25 | |
| Net investment income (loss), before waivers and reimbursements | | | | (0.65 | ) | | | (0.64 | ) | | | (0.56 | ) | | | (0.66 | ) | | | (0.80 | ) |
| Net investment income (loss), net of waivers and reimbursements | | | | (0.65 | ) | | | (0.64 | ) | | | (0.54 | ) | | | (0.61 | ) | | | (0.75 | ) |
| Class I net assets at the end of the year (in thousands) | | | $ | 410,233 | | | $ | 343,119 | | | $ | 271,830 | | | $ | 261,269 | | | $ | 364,241 | |
| Portfolio turnover rate (%) | | | | 74 | | | | 81 | | | | 90 | | | | 91 | | | | 82 | |
Note: Net investment income (loss) per share is based on the average shares outstanding during the year.
Performance cited represents past performance. Past performance does not guarantee future results and current performance may be lower or higher than the data quoted. Results shown are annual returns, which assume reinvestment of dividends and capital gains. Investment returns and principal will fluctuate and you may have a gain or loss when you sell shares. For the most current month-end performance information, please call 1-800-742-7272 or visit our Web site atwww.williamblairfunds.com.
| 152 | Annual Report | December 31, 2018 |
Financial Highlights — For a share outstanding throughout each period
Small Cap Value Fund
| | | | Class N | |
| | | | Years Ended December 31, | |
| | | | 2018 | | | 2017 | | | 2016 | | | 2015 | | | 2014 | |
| Net asset value, beginning of year | | | $ | 20.15 | | | $ | 20.18 | | | $ | 16.68 | | | $ | 17.76 | | | $ | 17.63 | |
| Income (loss) from investment operations: | | | | | | | | | | | | | | | | | | | | | |
| Net investment income (loss) | | | | 0.03 | | | | 0.01 | | | | 0.04 | | | | 0.02 | | | | (0.03 | ) |
| Net realized and unrealized gain (loss) on investments | | | | (3.12 | ) | | | 1.50 | | | | 4.34 | | | | (1.05 | ) | | | 0.81 | |
| Total from investment operations | | | | (3.09 | ) | | | 1.51 | | | | 4.38 | | | | (1.03 | ) | | | 0.78 | |
| Less distributions from: | | | | | | | | | | | | | | | | | | | | | |
| Net investment income | | | | — | | | | — | | | | 0.04 | | | | — | | | | — | |
| Net realized gain | | | | 2.02 | | | | 1.54 | | | | 0.84 | | | | 0.05 | | | | 0.65 | |
| Total distributions | | | | 2.02 | | | | 1.54 | | | | 0.88 | | | | 0.05 | | | | 0.65 | |
| Net asset value, end of year | | | $ | 15.04 | | | $ | 20.15 | | | $ | 20.18 | | | $ | 16.68 | | | $ | 17.76 | |
| Total return (%) | | | | (15.93 | ) | | | 7.57 | | | | 26.19 | | | | (5.77 | ) | | | 4.49 | |
| Ratios to average daily net assets (%): | | | | | | | | | | | | | | | | | | | | | |
| Expenses, before waivers and reimbursements | | | | 1.56 | | | | 1.55 | | | | 1.53 | | | | 1.54 | | | | 1.53 | |
| Expenses, net of waivers and reimbursements | | | | 1.50 | | | | 1.50 | | | | 1.50 | | | | 1.50 | | | | 1.50 | |
| Net investment income (loss), before waivers and reimbursements | | | | 0.08 | | | | (0.01 | ) | | | 0.19 | | | | 0.10 | | | | (0.20 | ) |
| Net investment income (loss), net of waivers and reimbursements | | | | 0.14 | | | | 0.04 | | | | 0.22 | | | | 0.14 | | | | (0.17 | ) |
| Class N net assets at the end of the year (in thousands) | | | $ | 16,381 | | | $ | 29,271 | | | $ | 33,359 | | | $ | 33,351 | | | $ | 40,223 | |
| Portfolio turnover rate (%) | | | | 56 | | | | 38 | | | | 33 | | | | 30 | | | | 39 | |
| | | | | | | | | | | | | | | | | | | | | | |
| | | | Class I | |
| | | | Years Ended December 31, | |
| | | | | 2018 | | | | 2017 | | | | 2016 | | | | 2015 | | | | 2014 | |
| Net asset value, beginning of year | | | $ | 20.70 | | | $ | 20.68 | | | $ | 17.08 | | | $ | 18.17 | | | $ | 18.00 | |
| Income (loss) from investment operations: | | | | | | | | | | | | | | | | | | | | | |
| Net investment income (loss) | | | | 0.08 | | | | 0.06 | | | | 0.09 | | | | 0.08 | | | | 0.02 | |
| Net realized and unrealized gain (loss) on investments | | | | (3.21 | ) | | | 1.54 | | | | 4.44 | | | | (1.08 | ) | | | 0.82 | |
| Total from investment operations | | | | (3.13 | ) | | | 1.60 | | | | 4.53 | | | | (1.00 | ) | | | 0.84 | |
| Less distributions from: | | | | | | | | | | | | | | | | | | | | | |
| Net investment income | | | | 0.05 | | | | 0.04 | | | | 0.09 | | | | 0.04 | | | | 0.02 | |
| Net realized gain | | | | 2.02 | | | | 1.54 | | | | 0.84 | | | | 0.05 | | | | 0.65 | |
| Total distributions | | | | 2.07 | | | | 1.58 | | | | 0.93 | | | | 0.09 | | | | 0.67 | |
| Net asset value, end of year | | | $ | 15.50 | | | $ | 20.70 | | | $ | 20.68 | | | $ | 17.08 | | | $ | 18.17 | |
| Total return (%) | | | | (15.74 | ) | | | 7.85 | | | | 26.46 | | | | (5.47 | ) | | | 4.73 | |
| Ratios to average daily net assets (%): | | | | | | | | | | | | | | | | | | | | | |
| Expenses, before waivers and reimbursements | | | | 1.30 | | | | 1.29 | | | | 1.29 | | | | 1.24 | | | | 1.23 | |
| Expenses, net of waivers and reimbursements | | | | 1.25 | | | | 1.25 | | | | 1.25 | | | | 1.24 | | | | 1.23 | |
| Net investment income (loss), before waivers and reimbursements | | | | 0.36 | | | | 0.25 | | | | 0.43 | | | | 0.43 | | | | 0.12 | |
| Net investment income (loss), net of waivers and reimbursements | | | | 0.41 | | | | 0.29 | | | | 0.47 | | | | 0.43 | | | | 0.12 | |
| Class I net assets at the end of the year (in thousands) | | | $ | 475,134 | | | $ | 644,749 | | | $ | 675,272 | | | $ | 579,010 | | | $ | 544,963 | |
| Portfolio turnover rate (%) | | | | 56 | | | | 38 | | | | 33 | | | | 30 | | | | 39 | |
Note: Net investment income (loss) per share is based on the average shares outstanding during the year.
Performance cited represents past performance. Past performance does not guarantee future results and current performance may be lower or higher than the data quoted. Results shown are annual returns, which assume reinvestment of dividends and capital gains. Investment returns and principal will fluctuate and you may have a gain or loss when you sell shares. For the most current month-end performance information, please call 1-800-742-7272 or visit our Web site atwww.williamblairfunds.com.
| December 31, 2018 | William Blair Funds | 153 |
Financial Highlights— For a share outstanding throughout each period
Global Leaders Fund
| | | | Class N | |
| | | | Years Ended December 31, | |
| | | | 2018 | | | 2017 | | | 2016 | | | 2015 | | | 2014 | |
| Net asset value, beginning of year | | | $ | 14.53 | | | $ | 11.60 | | | $ | 11.58 | | | $ | 11.84 | | | $ | 11.43 | |
| Income (loss) from investment operations: | | | | | | | | | | | | | | | | | | | | | |
| Net investment income (loss) | | | | 0.02 | | | | 0.05 | | | | 0.03 | | | | 0.02 | | | | 0.02 | |
| Net realized and unrealized gain (loss) on investments | | | | (1.12 | ) | | | 3.46 | | | | 0.04 | | | | 0.27 | | | | 0.41 | |
| Total from investment operations | | | | (1.10 | ) | | | 3.51 | | | | 0.07 | | | | 0.29 | | | | 0.43 | |
| Less distributions from: | | | | | | | | | | | | | | | | | | | | | |
| Net investment income | | | | — | | | | 0.10 | | | | — | | | | 0.01 | | | | — | |
| Net realized gain | | | | 1.96 | | | | 0.48 | | | | 0.05 | | | | 0.54 | | | | 0.02 | |
| Total distributions | | | | 1.96 | | | | 0.58 | | | | 0.05 | | | | 0.55 | | | | 0.02 | |
| Net asset value, end of year | | | $ | 11.47 | | | $ | 14.53 | | | $ | 11.60 | | | $ | 11.58 | | | $ | 11.84 | |
| Total return (%) | | | | (8.23 | ) | | | 30.31 | | | | 0.62 | | | | 2.49 | | | | 3.76 | |
| Ratios to average daily net assets (%): | | | | | | | | | | | | | | | | | | | | | |
| Expenses, before waivers and reimbursements | | | | 1.47 | | | | 1.63 | | | | 1.62 | | | | 1.61 | | | | 1.62 | |
| Expenses, net of waivers and reimbursements | | | | 1.33 | | | | 1.37 | | | | 1.36 | | | | 1.39 | | | | 1.50 | |
| Net investment income (loss), before waivers and reimbursements | | | | (0.01 | ) | | | 0.09 | | | | (0.03 | ) | | | (0.10 | ) | | | 0.04 | |
| Net investment income (loss), net of waivers and reimbursements | | | | 0.13 | | | | 0.35 | | | | 0.23 | | | | 0.12 | | | | 0.16 | |
| Class N net assets at the end of the year (in thousands) | | | $ | 7,225 | | | $ | 7,761 | | | $ | 5,760 | | | $ | 5,588 | | | $ | 5,007 | |
| Portfolio turnover rate (%) | | | | 49 | | | | 41 | | | | 75 | | | | 55 | | | | 60 | |
| | | | | | | | | | | | | | | | | | | | | | |
| | | | Class I | |
| | | | Years Ended December 31, | |
| | | | | 2018 | | | | 2017 | | | | 2016 | | | | 2015 | | | | 2014 | |
| Net asset value, beginning of year | | | $ | 14.56 | | | $ | 11.62 | | | $ | 11.59 | | | $ | 11.85 | | | $ | 11.42 | |
| Income (loss) from investment operations: | | | | | | | | | | | | | | | | | | | | | |
| Net investment income (loss) | | | | 0.06 | | | | 0.09 | | | | 0.06 | | | | 0.06 | | | | 0.04 | |
| Net realized and unrealized gain (loss) on investments | | | | (1.13 | ) | | | 3.47 | | | | 0.05 | | | | 0.26 | | | | 0.43 | |
| Total from investment operations | | | | (1.07 | ) | | | 3.56 | | | | 0.11 | | | | 0.32 | | | | 0.47 | |
| Less distributions from: | | | | | | | | | | | | | | | | | | | | | |
| Net investment income | | | | 0.06 | | | | 0.14 | | | | 0.03 | | | | 0.04 | | | | 0.02 | |
| Net realized gain | | | | 1.96 | | | | 0.48 | | | | 0.05 | | | | 0.54 | | | | 0.02 | |
| Total distributions | | | | 2.02 | | | | 0.62 | | | | 0.08 | | | | 0.58 | | | | 0.04 | |
| Net asset value, end of year | | | $ | 11.47 | | | $ | 14.56 | | | $ | 11.62 | | | $ | 11.59 | | | $ | 11.85 | |
| Total return (%) | | | | (8.06 | ) | | | 30.69 | | | | 0.98 | | | | 2.77 | | | | 4.08 | |
| Ratios to average daily net assets (%): | | | | | | | | | | | | | | | | | | | | | |
| Expenses, before waivers and reimbursements | | | | 1.15 | | | | 1.33 | | | | 1.31 | | | | 1.32 | | | | 1.33 | |
| Expenses, net of waivers and reimbursements | | | | 1.07 | | | | 1.07 | | | | 1.05 | | | | 1.10 | | | | 1.25 | |
| Net investment income (loss), before waivers and reimbursements | | | | 0.31 | | | | 0.39 | | | | 0.28 | | | | 0.23 | | | | 0.30 | |
| Net investment income (loss), net of waivers and reimbursements | | | | 0.39 | | | | 0.65 | | | | 0.54 | | | | 0.45 | | | | 0.38 | |
| Class I net assets at the end of the year (in thousands) | | | $ | 83,790 | | | $ | 60,067 | | | $ | 45,772 | | | $ | 45,853 | | | $ | 52,090 | |
| Portfolio turnover rate (%) | | | | 49 | | | | 41 | | | | 75 | | | | 55 | | | | 60 | |
Note: Net investment income (loss) per share is based on the average shares outstanding during the year.
Performance cited represents past performance. Past performance does not guarantee future results and current performance may be lower or higher than the data quoted. Results shown are annual returns, which assume reinvestment of dividends and capital gains. Investment returns and principal will fluctuate and you may have a gain or loss when you sell shares. For the most current month-end performance information, please call 1-800-742-7272 or visit our Web site atwww.williamblairfunds.com.
| 154 | Annual Report | December 31, 2018 |
Financial Highlights— For a share outstanding throughout each period
Global Leaders Fund
| | | | Institutional Class | |
| | | | Years Ended December 31, | |
| | | | 2018 | | | 2017 | | | 2016 | | | 2015 | | | 2014 | |
| Net asset value, beginning of year | | | $ | 14.56 | | | $ | 11.62 | | | $ | 11.59 | | | $ | 11.85 | | | $ | 11.42 | |
| Income (loss) from investment operations: | | | | | | | | | | | | | | | | | | | | | |
| Net investment income (loss) | | | | 0.07 | | | | 0.10 | | | | 0.07 | | | | 0.06 | | | | 0.06 | |
| Net realized and unrealized gain (loss) on investments | | | | (1.13 | ) | | | 3.47 | | | | 0.05 | | | | 0.27 | | | | 0.43 | |
| Total from investment operations | | | | (1.06 | ) | | | 3.57 | | | | 0.12 | | | | 0.33 | | | | 0.49 | |
| Less distributions from: | | | | | | | | | | | | | | | | | | | | | |
| Net investment income | | | | 0.07 | | | | 0.15 | | | | 0.04 | | | | 0.05 | | | | 0.04 | |
| Net realized gain | | | | 1.96 | | | | 0.48 | | | | 0.05 | | | | 0.54 | | | | 0.02 | |
| Total distributions | | | | 2.03 | | | | 0.63 | | | | 0.09 | | | | 0.59 | | | | 0.06 | |
| Net asset value, end of year | | | $ | 11.47 | | | $ | 14.56 | | | $ | 11.62 | | | $ | 11.59 | | | $ | 11.85 | |
| Total return (%) | | | | (7.99 | ) | | | 30.78 | | | | 1.03 | | | | 2.85 | | | | 4.24 | |
| Ratios to average daily net assets (%): | | | | | | | | | | | | | | | | | | | | | |
| Expenses, before waivers and reimbursements | | | | 1.08 | | | | 1.10 | | | | 1.11 | | | | 1.11 | | | | 1.13 | |
| Expenses, net of waivers and reimbursements | | | | 1.00 | | | | 1.00 | | | | 1.00 | | | | 1.03 | | | | 1.10 | |
| Net investment income (loss), before waivers and reimbursements | | | | 0.39 | | | | 0.65 | | | | 0.48 | | | | 0.39 | | | | 0.48 | |
| Net investment income (loss), net of waivers and reimbursements | | | | 0.47 | | | | 0.75 | | | | 0.59 | | | | 0.47 | | | | 0.51 | |
| Institutional Class net assets at the end of the year (in thousands) | | | $ | 79,685 | | | $ | 143,521 | | | $ | 125,199 | | | $ | 137,527 | | | $ | 106,565 | |
| Portfolio turnover rate (%) | | | | 49 | | | | 41 | | | | 75 | | | | 55 | | | | 60 | |
Note: Net investment income (loss) per share is based on the average shares outstanding during the year.
Performance cited represents past performance. Past performance does not guarantee future results and current performance may be lower or higher than the data quoted. Results shown are annual returns, which assume reinvestment of dividends and capital gains. Investment returns and principal will fluctuate and you may have a gain or loss when you sell shares. For the most current month-end performance information, please call 1-800-742-7272 or visit our Web site atwww.williamblairfunds.com.
| December 31, 2018 | William Blair Funds | 155 |
Financial Highlights— For a share outstanding throughout each period
International Leaders Fund
| | | | Class N | |
| | | | Years Ended December 31, | |
| | | | 2018 | | | 2017 | | | 2016 | | | 2015 | | | 2014 | |
| Net asset value, beginning of year | | | $ | 16.37 | | | $ | 12.88 | | | $ | 12.89 | | | $ | 12.25 | | | $ | 12.65 | |
| Income (loss) from investment operations: | | | | | | | | | | | | | | | | | | | | | |
| Net investment income (loss) | | | | 0.13 | | | | 0.11 | | | | 0.03 | | | | 0.07 | | | | 0.13 | |
| Net realized and unrealized gain (loss) on investments | | | | (2.19 | ) | | | 3.70 | | | | 0.08 | | | | 0.66 | | | | (0.47 | ) |
| Total from investment operations | | | | (2.06 | ) | | | 3.81 | | | | 0.11 | | | | 0.73 | | | | (0.34 | ) |
| Less distributions from: | | | | | | | | | | | | | | | | | | | | | |
| Net investment income | | | | 0.06 | | | | 0.20 | | | | 0.12 | | | | 0.02 | | | | 0.06 | |
| Net realized gain | | | | 0.45 | | | | 0.12 | | | | — | | | | 0.07 | | | | — | |
| Total distributions | | | | 0.51 | | | | 0.32 | | | | 0.12 | | | | 0.09 | | | | 0.06 | |
| Net asset value, end of year | | | $ | 13.80 | | | $ | 16.37 | | | $ | 12.88 | | | $ | 12.89 | | | $ | 12.25 | |
| Total return (%) | | | | (12.70 | ) | | | 29.65 | | | | 0.88 | | | | 6.01 | | | | (2.67 | ) |
| Ratios to average daily net assets (%): | | | | | | | | | | | | | | | | | | | | | |
| Expenses, before waivers and reimbursements | | | | 1.39 | | | | 1.59 | | | | 1.56 | | | | 1.56 | | | | 1.59 | |
| Expenses, net of waivers and reimbursements | | | | 1.28 | | | | 1.35 | | | | 1.30 | | | | 1.24 | | | | 1.45 | |
| Net investment income (loss), before waivers and reimbursements | | | | 0.70 | | | | 0.48 | | | | (0.02 | ) | | | 0.19 | | | | 0.86 | |
| Net investment income (loss), net of waivers and reimbursements | | | | 0.81 | | | | 0.72 | | | | 0.24 | | | | 0.51 | | | | 1.00 | |
| Class N net assets at the end of the year (in thousands) | | | $ | 8,715 | | | $ | 9,651 | | | $ | 2,922 | | | $ | 377 | | | $ | 150 | |
| Portfolio turnover rate (%) | | | | 33 | | | | 41 | | | | 59 | | | | 29 | | | | 79 | |
| | | | | | | | | | | | | | | | | | | | | | |
| | | | Class I | |
| | | | Years Ended December 31, | |
| | | | | 2018 | | | | 2017 | | | | 2016 | | | | 2015 | | | | 2014 | |
| Net asset value, beginning of year | | | $ | 16.44 | | | $ | 12.92 | | | $ | 12.91 | | | $ | 12.25 | | | $ | 12.65 | |
| Income (loss) from investment operations: | | | | | | | | | | | | | | | | | | | | | |
| Net investment income (loss) | | | | 0.17 | | | | 0.16 | | | | 0.10 | | | | 0.10 | | | | 0.16 | |
| Net realized and unrealized gain (loss) on investments | | | | (2.19 | ) | | | 3.71 | | | | 0.04 | | | | 0.65 | | | | (0.47 | ) |
| Total from investment operations | | | | (2.02 | ) | | | 3.87 | | | | 0.14 | | | | 0.75 | | | | (0.31 | ) |
| Less distributions from: | | | | | | | | | | | | | | | | | | | | | |
| Net investment income | | | | 0.13 | | | | 0.23 | | | | 0.13 | | | | 0.02 | | | | 0.09 | |
| Net realized gain | | | | 0.45 | | | | 0.12 | | | | — | | | | 0.07 | | | | — | |
| Total distributions | | | | 0.58 | | | | 0.35 | | | | 0.13 | | | | 0.09 | | | | 0.09 | |
| Net asset value, end of year | | | $ | 13.84 | | | $ | 16.44 | | | $ | 12.92 | | | $ | 12.91 | | | $ | 12.25 | |
| Total return (%) | | | | (12.45 | ) | | | 30.05 | | | | 1.10 | | | | 6.18 | | | | (2.43 | ) |
| Ratios to average daily net assets (%): | | | | | | | | | | | | | | | | | | | | | |
| Expenses, before waivers and reimbursements | | | | 1.07 | | | | 1.28 | | | | 1.30 | | | | 1.46 | | | | 1.29 | |
| Expenses, net of waivers and reimbursements | | | | 1.03 | | | | 1.05 | | | | 1.04 | | | | 1.13 | | | | 1.20 | |
| Net investment income (loss), before waivers and reimbursements | | | | 1.02 | | | | 0.86 | | | | 0.48 | | | | 0.42 | | | | 1.16 | |
| Net investment income (loss), net of waivers and reimbursements | | | | 1.06 | | | | 1.09 | | | | 0.74 | | | | 0.75 | | | | 1.25 | |
| Class I net assets at the end of the year (in thousands) | | | $ | 76,382 | | | $ | 60,279 | | | $ | 30,944 | | | $ | 13,474 | | | $ | 9,561 | |
| Portfolio turnover rate (%) | | | | 33 | | | | 41 | | | | 59 | | | | 29 | | | | 79 | |
Note: Net investment income (loss) per share is based on the average shares outstanding during the year.
Performance cited represents past performance. Past performance does not guarantee future results and current performance may be lower or higher than the data quoted. Results shown are annual returns, which assume reinvestment of dividends and capital gains. Investment returns and principal will fluctuate and you may have a gain or loss when you sell shares. For the most current month-end performance information, please call 1-800-742-7272 or visit our Web site atwww.williamblairfunds.com.
| 156 | Annual Report | December 31, 2018 |
Financial Highlights— For a share outstanding throughout each period
International Leaders Fund
| | | | Institutional Class | |
| | | | Years Ended December 31, | |
| | | | 2018 | | | 2017 | | | 2016 | | | 2015 | | | 2014 | |
| Net asset value, beginning of year | | | $ | 16.43 | | | $ | 12.92 | | | $ | 12.90 | | | $ | 12.24 | | | $ | 12.65 | |
| Income (loss) from investment operations: | | | | | | | | | | | | | | | | | | | | | |
| Net investment income (loss) | | | | 0.18 | | | | 0.18 | | | | 0.12 | | | | 0.11 | | | | 0.17 | |
| Net realized and unrealized gain (loss) on investments | | | | (2.19 | ) | | | 3.70 | | | | 0.04 | | | | 0.66 | | | | (0.47 | ) |
| Total from investment operations | | | | (2.01 | ) | | | 3.88 | | | | 0.16 | | | | 0.77 | | | | (0.30 | ) |
| Less distributions from: | | | | | | | | | | | | | | | | | | | | | |
| Net investment income | | | | 0.14 | | | | 0.25 | | | | 0.14 | | | | 0.04 | | | | 0.11 | |
| Net realized gain | | | | 0.45 | | | | 0.12 | | | | — | | | | 0.07 | | | | — | |
| Total distributions | | | | 0.59 | | | | 0.37 | | | | 0.14 | | | | 0.11 | | | | 0.11 | |
| Net asset value, end of year | | | $ | 13.83 | | | $ | 16.43 | | | $ | 12.92 | | | $ | 12.90 | | | $ | 12.24 | |
| Total return (%) | | | | (12.38 | ) | | | 30.08 | | | | 1.25 | | | | 6.33 | | | | (2.34 | ) |
| Ratios to average daily net assets (%): | | | | | | | | | | | | | | | | | | | | | |
| Expenses, before waivers and reimbursements | | | | 0.99 | | | | 1.03 | | | | 1.06 | | | | 1.15 | | | | 1.14 | |
| Expenses, net of waivers and reimbursements | | | | 0.95 | | | | 0.95 | | | | 0.95 | | | | 0.98 | | | | 1.05 | |
| Net investment income (loss), before waivers and reimbursements | | | | 1.07 | | | | 1.10 | | | | 0.81 | | | | 0.71 | | | | 1.24 | |
| Net investment income (loss), net of waivers and reimbursements | | | | 1.11 | | | | 1.18 | | | | 0.92 | | | | 0.88 | | | | 1.33 | |
| Institutional Class net assets at the end of the year (in thousands) | | | $ | 324,902 | | | $ | 308,898 | | | $ | 221,356 | | | $ | 102,227 | | | $ | 78,251 | |
| Portfolio turnover rate (%) | | | | 33 | | | | 41 | | | | 59 | | | | 29 | | | | 79 | |
Note: Net investment income (loss) per share is based on the average shares outstanding during the year.
Performance cited represents past performance. Past performance does not guarantee future results and current performance may be lower or higher than the data quoted. Results shown are annual returns, which assume reinvestment of dividends and capital gains. Investment returns and principal will fluctuate and you may have a gain or loss when you sell shares. For the most current month-end performance information, please call 1-800-742-7272 or visit our Web site atwww.williamblairfunds.com.
| December 31, 2018 | William Blair Funds | 157 |
Financial Highlights— For a share outstanding throughout each period
International Developed Plus Fund
| | | Class N | |
| | | Years Ended December 31, | |
| | | 2018 | | | 2017 | | | 2016 | | | 2015 | | | 2014 | |
| Net asset value, beginning of year | | $ | 16.60 | | | $ | 13.68 | | | $ | 13.85 | | | $ | 13.76 | | | $ | 14.28 | |
| Income (loss) from investment operations: | | | | | | | | | | | | | | | | | | | | |
| Net investment income (loss) | | | 0.17 | | | | 0.12 | | | | 0.18 | | | | 0.15 | | | | 0.16 | |
| Net realized and unrealized gain (loss) on investments | | | (2.93 | ) | | | 3.08 | | | | (0.22 | ) | | | 0.06 | | | | (0.60 | ) |
| Total from investment operations | | | (2.76 | ) | | | 3.20 | | | | (0.04 | ) | | | 0.21 | | | | (0.44 | ) |
| Less distributions from: | | | | | | | | | | | | | | | | | | | | |
| Net investment income | | | 0.17 | | | | 0.28 | | | | 0.13 | | | | 0.12 | | | | 0.08 | |
| Net realized gain | | | 0.11 | | | | — | | | | — | | | | — | | | | — | |
| Total distributions | | | 0.28 | | | | 0.28 | | | | 0.13 | | | | 0.12 | | | | 0.08 | |
| Net asset value, end of year | | $ | 13.56 | | | $ | 16.60 | | | $ | 13.68 | | | $ | 13.85 | | | $ | 13.76 | |
| Total return (%) | | | (16.68 | ) | | | 23.43 | | | | (0.27 | ) | | | 1.54 | | | | (3.09 | ) |
| Ratios to average daily net assets (%): | | | | | | | | | | | | | | | | | | | | |
| Expenses, before waivers and reimbursements | | | 1.48 | | | | 1.54 | | | | 1.60 | | | | 1.60 | | | | 1.56 | |
| Expenses, net of waivers and reimbursements | | | 1.27 | | | | 1.30 | | | | 1.30 | | | | 1.32 | | | | 1.38 | |
| Net investment income (loss), before waivers and reimbursements | | | 0.83 | | | | 0.54 | | | | 1.00 | | | | 0.73 | | | | 0.93 | |
| Net investment income (loss), net of waivers and reimbursements | | | 1.04 | | | | 0.78 | | | | 1.30 | | | | 1.01 | | | | 1.11 | |
| Class N net assets at the end of the year (in thousands) | | $ | 1,794 | | | $ | 3,219 | | | $ | 2,954 | | | $ | 3,020 | | | $ | 3,497 | |
| Portfolio turnover rate (%) | | | 65 | | | | 80 | | | | 70 | | | | 54 | | | | 73 | |
| | | | | | | | | | | | | | | | | | | | | |
| | | Class I | |
| | | Years Ended December 31, | |
| | | 2018 | | | 2017 | | | 2016 | | | 2015 | | | 2014 | |
| Net asset value, beginning of year | | $ | 16.76 | | | $ | 13.81 | | | $ | 13.98 | | | $ | 13.91 | | | $ | 14.43 | |
| Income (loss) from investment operations: | | | | | | | | | | | | | | | | | | | | |
| Net investment income (loss) | | | 0.19 | | | | 0.15 | | | | 0.21 | | | | 0.18 | | | | 0.19 | |
| Net realized and unrealized gain (loss) on investments | | | (2.94 | ) | | | 3.12 | | | | (0.22 | ) | | | 0.07 | | | | (0.59 | ) |
| Total from investment operations | | | (2.75 | ) | | | 3.27 | | | | (0.01 | ) | | | 0.25 | | | | (0.40 | ) |
| Less distributions from: | | | | | | | | | | | | | | | | | | | | |
| Net investment income | | | 0.24 | | | | 0.32 | | | | 0.16 | | | | 0.18 | | | | 0.12 | |
| Net realized gain | | | 0.11 | | | | — | | | | — | | | | — | | | | — | |
| Total distributions | | | 0.35 | | | | 0.32 | | | | 0.16 | | | | 0.18 | | | | 0.12 | |
| Net asset value, end of year | | $ | 13.66 | | | $ | 16.76 | | | $ | 13.81 | | | $ | 13.98 | | | $ | 13.91 | |
| Total return (%) | | | (16.47 | ) | | | 23.72 | | | | (0.02 | ) | | | 1.80 | | | | (2.80 | ) |
| Ratios to average daily net assets (%): | | | | | | | | | | | | | | | | | | | | |
| Expenses, before waivers and reimbursements | | | 1.22 | | | | 1.26 | | | | 1.34 | | | | 1.34 | | | | 1.32 | |
| Expenses, net of waivers and reimbursements | | | 1.02 | | | | 1.05 | | | | 1.05 | | | | 1.07 | | | | 1.13 | |
| Net investment income (loss), before waivers and reimbursements | | | 0.96 | | | | 0.72 | | | | 1.23 | | | | 0.99 | | | | 1.16 | |
| Net investment income (loss), net of waivers and reimbursements | | | 1.16 | | | | 0.93 | | | | 1.52 | | | | 1.26 | | | | 1.35 | |
| Class I net assets at the end of the year (in thousands) | | $ | 86,787 | | | $ | 117,520 | | | $ | 84,383 | | | $ | 60,886 | | | $ | 65,012 | |
| Portfolio turnover rate (%) | | | 65 | | | | 80 | | | | 70 | | | | 54 | | | | 73 | |
Note: Net investment income (loss) per share is based on the average shares outstanding during the year.
Performance cited represents past performance. Past performance does not guarantee future results and current performance may be lower or higher than the data quoted. Results shown are annual returns, which assume reinvestment of dividends and capital gains. Investment returns and principal will fluctuate and you may have a gain or loss when you sell shares. For the most current month-end performance information, please call 1-800-742-7272 or visit our Web site atwww.williamblairfunds.com.
| 158 | Annual Report | December 31, 2018 |
Financial Highlights— For a share outstanding throughout each period
Institutional International Developed Plus Fund
| | | Institutional Class | |
| | | Years Ended December 31, | |
| | | 2018 | | | 2017 | | | 2016 | | | 2015 | | | 2014 | |
| Net asset value, beginning of year | | $ | 14.55 | | | $ | 11.84 | | | $ | 12.12 | | | $ | 12.01 | | | $ | 12.70 | |
| Income (loss) from investment operations: | | | | | | | | | | | | | | | | | | | | |
| Net investment income (loss) | | | 0.18 | | | | 0.16 | | | | 0.20 | | | | 0.15 | | | | 0.21 | |
| Net realized and unrealized gain (loss) on investments | | | (2.37 | ) | | | 2.71 | | | | (0.24 | ) | | | 0.08 | | | | (0.65 | ) |
| Total from investment operations | | | (2.19 | ) | | | 2.87 | | | | (0.04 | ) | | | 0.23 | | | | (0.44 | ) |
| Less distributions from: | | | | | | | | | | | | | | | | | | | | |
| Net investment income | | | 0.42 | | | | 0.16 | | | | 0.24 | | | | 0.12 | | | | 0.25 | |
| Net realized gain | | | — | | | | — | | | | — | | | | — | | | | — | |
| Total distributions | | | 0.42 | | | | 0.16 | | | | 0.24 | | | | 0.12 | | | | 0.25 | |
| Net asset value, end of year | | $ | 11.94 | | | $ | 14.55 | | | $ | 11.84 | | | $ | 12.12 | | | $ | 12.01 | |
| Total return (%) | | | (15.12 | ) | | | 24.28 | | | | (0.27 | ) | | | 1.91 | | | | (3.50 | ) |
| Ratios to average daily net assets (%): | | | | | | | | | | | | | | | | | | | | |
| Expenses, before waivers and reimbursements | | | 1.62 | | | | 1.68 | | | | 1.77 | | | | 1.76 | | | | 1.63 | |
| Expenses, net of waivers and reimbursements | | | 0.90 | | | | 0.93 | | | | 1.00 | | | | 1.00 | | | | 1.03 | |
| Net investment income (loss), before waivers and reimbursements | | | 0.53 | | | | 0.41 | | | | 0.92 | | | | 0.47 | | | | 1.01 | |
| Net investment income (loss), net of waivers and reimbursements | | | 1.25 | | | | 1.16 | | | | 1.69 | | | | 1.23 | | | | 1.61 | |
| Institutional Class net assets at the end of the year (in thousands) | | $ | 16,155 | | | $ | 19,090 | | | $ | 16,565 | | | $ | 16,030 | | | $ | 14,574 | |
| Portfolio turnover rate (%) | | | 68 | | | | 73 | | | | 75 | | | | 54 | | | | 61 | |
Note: Net investment income (loss) per share is based on the average shares outstanding during the year.
Performance cited represents past performance. Past performance does not guarantee future results and current performance may be lower or higher than the data quoted. Results shown are annual returns, which assume reinvestment of dividends and capital gains. Investment returns and principal will fluctuate and you may have a gain or loss when you sell shares. For the most current month-end performance information, please call 1-800-742-7272 or visit our Web site atwww.williamblairfunds.com.
| December 31, 2018 | William Blair Funds | 159 |
Financial Highlights— For a share outstanding throughout each period
International Growth Fund
| | | Class N | |
| | | Years Ended December 31, | |
| | | 2018 | | | 2017 | | | 2016 | | | 2015 | | | 2014 | |
| Net asset value, beginning of year | | $ | 30.41 | | | $ | 23.86 | | | $ | 24.94 | | | $ | 25.24 | | | $ | 26.30 | |
| Income (loss) from investment operations: | | | | | | | | | | | | | | | | | | | | |
| Net investment income (loss) | | | 0.16 | | | | 0.21 | | | | 0.20 | | | | 0.18 | | | | 0.31 | |
| Net realized and unrealized gain (loss) on investments | | | (5.56 | ) | | | 6.73 | | | | (0.92 | ) | | | (0.25 | ) | | | (1.15 | ) |
| Total from investment operations | | | (5.40 | ) | | | 6.94 | | | | (0.72 | ) | | | (0.07 | ) | | | (0.84 | ) |
| Less distributions from: | | | | | | | | | | | | | | | | | | | | |
| Net investment income | | | 0.12 | | | | 0.39 | | | | 0.36 | | | | 0.23 | | | | 0.22 | |
| Net realized gain | | | 1.85 | | | | — | | | | — | | | | — | | | | — | |
| Total distributions | | | 1.97 | | | | 0.39 | | | | 0.36 | | | | 0.23 | | | | 0.22 | |
| Net asset value, end of year | | $ | 23.04 | | | $ | 30.41 | | | $ | 23.86 | | | $ | 24.94 | | | $ | 25.24 | |
| Total return (%) | | | (18.00 | ) | | | 29.11 | | | | (2.88 | ) | | | (0.27 | ) | | | (3.19 | ) |
| Ratios to average daily net assets (%): | | | | | | | | | | | | | | | | | | | | |
| Expenses, before waivers and reimbursements | | | 1.46 | | | | 1.47 | | | | 1.43 | | | | 1.42 | | | | 1.44 | |
| Expenses, net of waivers and reimbursements | | | 1.45 | | | | 1.45 | | | | 1.43 | | | | 1.42 | | | | 1.44 | |
| Net investment income (loss), before waivers and reimbursements | | | 0.54 | | | | 0.76 | | | | 0.84 | | | | 0.71 | | | | 1.17 | |
| Net investment income (loss), net of waivers and reimbursements | | | 0.55 | | | | 0.78 | | | | 0.84 | | | | 0.71 | | | | 1.17 | |
| Class N net assets at the end of the year (in thousands) | | $ | 456,533 | | | $ | 763,740 | | | $ | 729,544 | | | $ | 1,023,588 | | | $ | 978,433 | |
| Portfolio turnover rate (%) | | | 78 | | | | 82 | | | | 101 | | | | 70 | | | | 79 | |
| | | | | | | | | | | | | | | | | | | | | |
| | | Class I | |
| | | Years Ended December 31, | |
| | | 2018 | | | 2017 | | | 2016 | | | 2015 | | | 2014 | |
| Net asset value, beginning of year | | $ | 31.13 | | | $ | 24.42 | | | $ | 25.51 | | | $ | 25.82 | | | $ | 26.91 | |
| Income (loss) from investment operations: | | | | | | | | | | | | | | | | | | | | |
| Net investment income (loss) | | | 0.26 | | | | 0.30 | | | | 0.29 | | | | 0.27 | | | | 0.36 | |
| Net realized and unrealized gain (loss) on investments | | | (5.70 | ) | | | 6.89 | | | | (0.94 | ) | | | (0.28 | ) | | | (1.13 | ) |
| Total from investment operations | | | (5.44 | ) | | | 7.19 | | | | (0.65 | ) | | | (0.01 | ) | | | (0.77 | ) |
| Less distributions from: | | | | | | | | | | | | | | | | | | | | |
| Net investment income | | | 0.28 | | | | 0.48 | | | | 0.44 | | | | 0.30 | | | | 0.32 | |
| Net realized gain | | | 1.85 | | | | — | | | | — | | | | — | | | | — | |
| Total distributions | | | 2.13 | | | | 0.48 | | | | 0.44 | | | | 0.30 | | | | 0.32 | |
| Net asset value, end of year | | $ | 23.56 | | | $ | 31.13 | | | $ | 24.42 | | | $ | 25.51 | | | $ | 25.82 | |
| Total return (%) | | | (17.73 | ) | | | 29.49 | | | | (2.54 | ) | | | (0.03 | ) | | | (2.86 | ) |
| Ratios to average daily net assets (%): | | | | | | | | | | | | | | | | | | | | |
| Expenses | | | 1.13 | | | | 1.14 | | | | 1.13 | | | | 1.14 | | | | 1.14 | |
| Net investment income (loss) | | | 0.86 | | | | 1.08 | | | | 1.16 | | | | 1.02 | | | | 1.36 | |
| Class I net assets at the end of the year (in thousands) | | $ | 1,646,811 | | | $ | 2,375,326 | | | $ | 2,251,701 | | | $ | 2,655,156 | | | $ | 2,705,054 | |
| Portfolio turnover rate (%) | | | 78 | | | | 82 | | | | 101 | | | | 70 | | | | 79 | |
Note: Net investment income (loss) per share is based on the average shares outstanding during the year.
Performance cited represents past performance. Past performance does not guarantee future results and current performance may be lower or higher than the data quoted. Results shown are annual returns, which assume reinvestment of dividends and capital gains. Investment returns and principal will fluctuate and you may have a gain or loss when you sell shares. For the most current month-end performance information, please call 1-800-742-7272 or visit our Web site atwww.williamblairfunds.com.
| 160 | Annual Report | December 31, 2018 |
Financial Highlights— For a share outstanding throughout each period
Institutional International Growth Fund
| | | Institutional Class | |
| | | Years Ended December 31, | |
| | | 2018 | | | 2017 | | | 2016 | | | 2015 | | | 2014 | |
| Net asset value, beginning of year | | $ | 18.08 | | | $ | 14.55 | | | $ | 15.08 | | | $ | 15.26 | | | $ | 17.40 | |
| Income (loss) from investment operations: | | | | | | | | | | | | | | | | | | | | |
| Net investment income (loss) | | | 0.18 | | | | 0.21 | | | | 0.18 | | | | 0.19 | | | | 0.26 | |
| Net realized and unrealized gain (loss) on investments | | | (3.29 | ) | | | 4.07 | | | | (0.54 | ) | | | (0.18 | ) | | | (0.71 | ) |
| Total from investment operations | | | (3.11 | ) | | | 4.28 | | | | (0.36 | ) | | | 0.01 | | | | (0.45 | ) |
| Less distributions from: | | | | | | | | | | | | | | | | | | | | |
| Net investment income | | | 0.17 | | | | 0.44 | | | | 0.17 | | | | 0.09 | | | | 0.32 | |
| Net realized gain | | | 1.40 | | | | 0.31 | | | | — | | | | 0.10 | | | | 1.37 | |
| Total distributions | | | 1.57 | | | | 0.75 | | | | 0.17 | | | | 0.19 | | | | 1.69 | |
| Net asset value, end of year | | $ | 13.40 | | | $ | 18.08 | | | $ | 14.55 | | | $ | 15.08 | | | $ | 15.26 | |
| Total return (%) | | | (17.50 | ) | | | 29.53 | | | | (2.40 | ) | | | 0.09 | | | | (2.66 | ) |
| Ratios to average daily net assets (%): | | | | | | | | | | | | | | | | | | | | |
| Expenses | | | 0.97 | | | | 0.97 | | | | 0.98 | | | | 0.96 | | | | 0.97 | |
| Net investment income (loss) | | | 1.01 | | | | 1.22 | | | | 1.25 | | | | 1.18 | | | | 1.50 | |
| Institutional Class net assets at the end of the year (in thousands) | | $ | 1,784,435 | | | $ | 2,330,299 | | | $ | 2,093,971 | | | $ | 2,335,632 | | | $ | 2,339,169 | |
| Portfolio turnover rate (%) | | | 82 | | | | 84 | | | | 105 | | | | 70 | | | | 83 | |
Note: Net investment income (loss) per share is based on the average shares outstanding during the year.
Performance cited represents past performance. Past performance does not guarantee future results and current performance may be lower or higher than the data quoted. Results shown are annual returns, which assume reinvestment of dividends and capital gains. Investment returns and principal will fluctuate and you may have a gain or loss when you sell shares. For the most current month-end performance information, please call 1-800-742-7272 or visit our Web site atwww.williamblairfunds.com.
| December 31, 2018 | William Blair Funds | 161 |
Financial Highlights— For a share outstanding throughout each period
International Small Cap Growth Fund
| | | Class N | |
| | | Years Ended December 31, | |
| | | 2018 | | | 2017 | | | 2016 | | | 2015 | | | 2014 | |
| Net asset value, beginning of year | | $ | 15.49 | | | $ | 12.87 | | | $ | 13.50 | | | $ | 12.56 | | | $ | 16.08 | |
| Income (loss) from investment operations: | | | | | | | | | | | | | | | | | | | | |
| Net investment income (loss) | | | 0.04 | | | | 0.12 | | | | 0.10 | | | | 0.05 | | | | 0.03 | |
| Net realized and unrealized gain (loss) on investments | | | (3.78 | ) | | | 3.98 | | | | (0.72 | ) | | | 1.16 | | | | (1.38 | ) |
| Total from investment operations | | | (3.74 | ) | | | 4.10 | | | | (0.62 | ) | | | 1.21 | | | | (1.35 | ) |
| Less distributions from: | | | | | | | | | | | | | | | | | | | | |
| Net investment income | | | 0.08 | | | | 0.32 | | | | 0.01 | | | | 0.24 | | | | 0.18 | |
| Net realized gain | | | 1.31 | | | | 1.16 | | | | 0.00 | ^ | | | 0.03 | | | | 1.99 | |
| Total distributions | | | 1.39 | | | | 1.48 | | | | 0.01 | | | | 0.27 | | | | 2.17 | |
| Net asset value, end of year | | $ | 10.36 | | | $ | 15.49 | | | $ | 12.87 | | | $ | 13.50 | | | $ | 12.56 | |
| Total return (%) | | | (24.48 | ) | | | 32.17 | | | | (4.60 | ) | | | 9.67 | | | | (8.43 | ) |
| Ratios to average daily net assets (%): | | | | | | | | | | | | | | | | | | | | |
| Expenses, before waivers and reimbursements | | | 1.48 | | | | 1.62 | | | | 1.59 | | | | 1.62 | | | | 1.58 | |
| Expenses, net of waivers and reimbursements | | | 1.48 | | | | 1.47 | | | | 1.44 | | | | 1.47 | | | | 1.58 | |
| Net investment income (loss), before waivers and reimbursements | | | 0.29 | | | | 0.70 | | | | 0.62 | | | | 0.19 | | | | 0.20 | |
| Net investment income (loss), net of waivers and reimbursements | | | 0.29 | | | | 0.85 | | | | 0.77 | | | | 0.34 | | | | 0.20 | |
| Class N net assets at the end of the year (in thousands) | | $ | 3,440 | | | $ | 6,275 | | | $ | 10,361 | | | $ | 11,350 | | | $ | 13,676 | |
| Portfolio turnover rate (%) | | | 88 | | | | 64 | | | | 73 | | | | 90 | | | | 127 | |
| | | | | | | | | | | | | | | | | | | | | |
| | | Class I | |
| | | Years Ended December 31, | |
| | | 2018 | | | 2017 | | | 2016 | | | 2015 | | | 2014 | |
| Net asset value, beginning of year | | $ | 15.65 | | | $ | 13.00 | | | $ | 13.65 | | | $ | 12.70 | | | $ | 16.23 | |
| Income (loss) from investment operations: | | | | | | | | | | | | | | | | | | | | |
| Net investment income (loss) | | | 0.09 | | | | 0.14 | | | | 0.14 | | | | 0.09 | | | | 0.09 | |
| Net realized and unrealized gain (loss) on investments | | | (3.84 | ) | | | 4.07 | | | | (0.75 | ) | | | 1.18 | | | | (1.40 | ) |
| Total from investment operations | | | (3.75 | ) | | | 4.21 | | | | (0.61 | ) | | | 1.27 | | | | (1.31 | ) |
| Less distributions from: | | | | | | | | | | | | | | | | | | | | |
| Net investment income | | | 0.14 | | | | 0.40 | | | | 0.04 | | | | 0.29 | | | | 0.23 | |
| Net realized gain | | | 1.31 | | | | 1.16 | | | | 0.00 | ^ | | | 0.03 | | | | 1.99 | |
| Total distributions | | | 1.45 | | | | 1.56 | | | | 0.04 | | | | 0.32 | | | | 2.22 | |
| Net asset value, end of year | | $ | 10.45 | | | $ | 15.65 | | | $ | 13.00 | | | $ | 13.65 | | | $ | 12.70 | |
| Total return (%) | | | (24.29 | ) | | | 32.70 | | | | (4.41 | ) | | | 10.00 | | | | (8.10 | ) |
| Ratios to average daily net assets (%): | | | | | | | | | | | | | | | | | | | | |
| Expenses, before waivers and reimbursements | | | 1.18 | | | | 1.31 | | | | 1.30 | | | | 1.31 | | | | 1.28 | |
| Expenses, net of waivers and reimbursements | | | 1.18 | | | | 1.16 | | | | 1.15 | | | | 1.16 | | | | 1.28 | |
| Net investment income (loss), before waivers and reimbursements | | | 0.60 | | | | 0.77 | | | | 0.91 | | | | 0.51 | | | | 0.56 | |
| Net investment income (loss), net of waivers and reimbursements | | | 0.60 | | | | 0.92 | | | | 1.06 | | | | 0.66 | | | | 0.56 | |
| Class I net assets at the end of the year (in thousands) | | $ | 165,451 | | | $ | 338,920 | | | $ | 306,526 | | | $ | 342,232 | | | $ | 364,161 | |
| Portfolio turnover rate (%) | | | 88 | | | | 64 | | | | 73 | | | | 90 | | | | 127 | |
| ^ | Amount is less than $0.005 per share. |
Note: Net investment income (loss) per share is based on the average shares outstanding during the year.
Performance cited represents past performance. Past performance does not guarantee future results and current performance may be lower or higher than the data quoted. Results shown are annual returns, which assume reinvestment of dividends and capital gains. Investment returns and principal will fluctuate and you may have a gain or loss when you sell shares. For the most current month-end performance information, please call 1-800-742-7272 or visit our Web site atwww.williamblairfunds.com.
| 162 | Annual Report | December 31, 2018 |
Financial Highlights— For a share outstanding throughout each period
International Small Cap Growth Fund
| | | Institutional Class | |
| | | Years Ended December 31, | |
| | | 2018 | | | 2017 | | | 2016 | | | 2015 | | | 2014 | |
| Net asset value, beginning of year | | $ | 15.73 | | | $ | 13.07 | | | $ | 13.72 | | | $ | 12.77 | | | $ | 16.32 | |
| Income (loss) from investment operations: | | | | | | | | | | | | | | | | | | | | |
| Net investment income (loss) | | | 0.10 | | | | 0.15 | | | | 0.15 | | | | 0.10 | | | | 0.12 | |
| Net realized and unrealized gain (loss) on investments | | | (3.85 | ) | | | 4.08 | | | | (0.74 | ) | | | 1.18 | | | | (1.41 | ) |
| Total from investment operations | | | (3.75 | ) | | | 4.23 | | | | (0.59 | ) | | | 1.28 | | | | (1.29 | ) |
| Less distributions from: | | | | | | | | | | | | | | | | | | | | |
| Net investment income | | | 0.17 | | | | 0.41 | | | | 0.06 | | | | 0.30 | | | | 0.27 | |
| Net realized gain | | | 1.31 | | | | 1.16 | | | | 0.00 | ^ | | | 0.03 | | | | 1.99 | |
| Total distributions | | | 1.48 | | | | 1.57 | | | | 0.06 | | | | 0.33 | | | | 2.26 | |
| Net asset value, end of year | | $ | 10.50 | | | $ | 15.73 | | | $ | 13.07 | | | $ | 13.72 | | | $ | 12.77 | |
| Total return (%) | | | (24.19 | ) | | | 32.70 | | | | (4.31 | ) | | | 10.03 | | | | (7.91 | ) |
| Ratios to average daily net assets (%): | | | | | | | | | | | | | | | | | | | | |
| Expenses | | | 1.08 | | | | 1.08 | | | | 1.07 | | | | 1.08 | | | | 1.06 | |
| Net investment income (loss) | | | 0.67 | | | | 0.99 | | | | 1.13 | | | | 0.76 | | | | 0.74 | |
| Institutional Class net assets at the end of the year (in thousands) | | $ | 171,833 | | | $ | 256,558 | | | $ | 199,746 | | | $ | 221,018 | | | $ | 245,103 | |
| Portfolio turnover rate (%) | | | 88 | | | | 64 | | | | 73 | | | | 90 | | | | 127 | |
| ^ | Amount is less than $0.005 per share. |
Note: Net investment income (loss) per share is based on the average shares outstanding during the year.
Performance cited represents past performance. Past performance does not guarantee future results and current performance may be lower or higher than the data quoted. Results shown are annual returns, which assume reinvestment of dividends and capital gains. Investment returns and principal will fluctuate and you may have a gain or loss when you sell shares. For the most current month-end performance information, please call 1-800-742-7272 or visit our Web site atwww.williamblairfunds.com.
| December 31, 2018 | William Blair Funds | 163 |
Financial Highlights— For a share outstanding throughout each period
Emerging Markets Leaders Fund
| | | Class N | |
| | | Years Ended December 31, | |
| | | 2018 | | | 2017 | | | 2016 | | | 2015 | | | 2014 | |
| Net asset value, beginning of year | | $ | 11.06 | | | $ | 7.84 | | | $ | 7.73 | | | $ | 9.06 | | | $ | 9.10 | |
| Income (loss) from investment operations: | | | | | | | | | | | | | | | | | | | | |
| Net investment income (loss) | | | 0.03 | | | | 0.01 | | | | 0.02 | | | | 0.02 | | | | 0.05 | |
| Net realized and unrealized gain (loss) on investments | | | (1.97 | ) | | | 3.26 | | | | 0.09 | | | | (1.34 | ) | | | 0.14 | |
| Total from investment operations | | | (1.94 | ) | | | 3.27 | | | | 0.11 | | | | (1.32 | ) | | | 0.19 | |
| Less distributions from: | | | | | | | | | | | | | | | | | | | | |
| Net investment income | | | 0.07 | | | | 0.05 | | | | — | | | | — | | | | 0.00 | ^ |
| Net realized gain | | | 0.79 | | | | — | | | | — | | | | 0.01 | | | | 0.23 | |
| Total distributions | | | 0.86 | | | | 0.05 | | | | — | | | | 0.01 | | | | 0.23 | |
| Net asset value, end of year | | $ | 8.26 | | | $ | 11.06 | | | $ | 7.84 | | | $ | 7.73 | | | $ | 9.06 | |
| Total return (%) | | | (17.73 | ) | | | 41.68 | | | | 1.42 | | | | (14.56 | ) | | | 2.17 | |
| Ratios to average daily net assets (%): | | | | | | | | | | | | | | | | | | | | |
| Expenses, before waivers and reimbursements | | | 1.60 | | | | 1.62 | | | | 1.81 | | | | 1.89 | | | | 1.82 | |
| Expenses, net of waivers and reimbursements | | | 1.58 | | | | 1.47 | | | | 1.57 | | | | 1.64 | | | | 1.65 | |
| Net investment income (loss), before waivers and reimbursements | | | 0.27 | | | | (0.01 | ) | | | 0.05 | | | | (0.07 | ) | | | 0.34 | |
| Net investment income (loss), net of waivers and reimbursements | | | 0.29 | | | | 0.14 | | | | 0.29 | | | | 0.18 | | | | 0.51 | |
| Class N net assets at the end of the year (in thousands) | | $ | 2,239 | | | $ | 2,766 | | | $ | 2,479 | | | $ | 1,599 | | | $ | 1,832 | |
| Portfolio turnover rate (%) | | | 52 | | | | 59 | | | | 135 | | | | 110 | | | | 131 | |
| | | | | | | | | | | | | | | | | | | | | |
| | | Class I | |
| | | Years Ended December 31, | |
| | | 2018 | | | 2017 | | | 2016 | | | 2015 | | | 2014 | |
| Net asset value, beginning of year | | $ | 11.09 | | | $ | 7.87 | | | $ | 7.74 | | | $ | 9.08 | | | $ | 9.10 | |
| Income (loss) from investment operations: | | | | | | | | | | | | | | | | | | | | |
| Net investment income (loss) | | | 0.06 | | | | 0.02 | | | | 0.04 | | | | 0.05 | | | | 0.08 | |
| Net realized and unrealized gain (loss) on investments | | | (1.97 | ) | | | 3.27 | | | | 0.10 | | | | (1.36 | ) | | | 0.15 | |
| Total from investment operations | | | (1.91 | ) | | | 3.29 | | | | 0.14 | | | | (1.31 | ) | | | 0.23 | |
| Less distributions from: | | | | | | | | | | | | | | | | | | | | |
| Net investment income | | | 0.12 | | | | 0.07 | | | | 0.01 | | | | 0.02 | | | | 0.02 | |
| Net realized gain | | | 0.79 | | | | — | | | | — | | | | 0.01 | | | | 0.23 | |
| Total distributions | | | 0.91 | | | | 0.07 | | | | 0.01 | | | | 0.03 | | | | 0.25 | |
| Net asset value, end of year | | $ | 8.27 | | | $ | 11.09 | | | $ | 7.87 | | | $ | 7.74 | | | $ | 9.08 | |
| Total return (%) | | | (17.45 | ) | | | 41.89 | | | | 1.82 | | | | (14.37 | ) | | | 2.62 | |
| Ratios to average daily net assets (%): | | | | | | | | | | | | | | | | | | | | |
| Expenses, before waivers and reimbursements | | | 1.27 | | | | 1.40 | | | | 1.54 | | | | 1.54 | | | | 1.60 | |
| Expenses, net of waivers and reimbursements | | | 1.27 | | | | 1.25 | | | | 1.30 | | | | 1.29 | | | | 1.40 | |
| Net investment income (loss), before waivers and reimbursements | | | 0.58 | | | | 0.09 | | | | 0.28 | | | | 0.28 | | | | 0.64 | |
| Net investment income (loss), net of waivers and reimbursements | | | 0.58 | | | | 0.24 | | | | 0.52 | | | | 0.53 | | | | 0.84 | |
| Class I net assets at the end of the year (in thousands) | | $ | 34,786 | | | $ | 47,666 | | | $ | 30,346 | | | $ | 32,862 | | | $ | 28,475 | |
| Portfolio turnover rate (%) | | | 52 | | | | 59 | | | | 135 | | | | 110 | | | | 131 | |
| ^ | Amount is less than $0.005 per share. |
Note: Net investment income (loss) per share is based on the average shares outstanding during the year.
Performance cited represents past performance. Past performance does not guarantee future results and current performance may be lower or higher than the data quoted. Results shown are annual returns, which assume reinvestment of dividends and capital gains. Investment returns and principal will fluctuate and you may have a gain or loss when you sell shares. For the most current month-end performance information, please call 1-800-742-7272 or visit our Web site atwww.williamblairfunds.com.
| 164 | Annual Report | December 31, 2018 |
Financial Highlights— For a share outstanding throughout each period
Emerging Markets Leaders Fund
| | | Institutional Class | |
| | | Years Ended December 31, | |
| | | 2018 | | | 2017 | | | 2016 | | | 2015 | | | 2014 | |
| Net asset value, beginning of year | | $ | 11.09 | | | $ | 7.86 | | | $ | 7.74 | | | $ | 9.07 | | | $ | 9.10 | |
| Income (loss) from investment operations: | | | | | | | | | | | | | | | | | | | | |
| Net investment income (loss) | | | 0.07 | | | | 0.03 | | | | 0.03 | | | | 0.04 | | | | 0.08 | |
| Net realized and unrealized gain (loss) on investments | | | (1.98 | ) | | | 3.28 | | | | 0.10 | | | | (1.33 | ) | | | 0.16 | |
| Total from investment operations | | | (1.91 | ) | | | 3.31 | | | | 0.13 | | | | (1.29 | ) | | | 0.24 | |
| Less distributions from: | | | | | | | | | | | | | | | | | | | | |
| Net investment income | | | 0.13 | | | | 0.08 | | | | 0.01 | | | | 0.03 | | | | 0.04 | |
| Net realized gain | | | 0.79 | | | | — | | | | — | | | | 0.01 | | | | 0.23 | |
| Total distributions | | | 0.92 | | | | 0.08 | | | | 0.01 | | | | 0.04 | | | | 0.27 | |
| Net asset value, end of year | | $ | 8.26 | | | $ | 11.09 | | | $ | 7.86 | | | $ | 7.74 | | | $ | 9.07 | |
| Total return (%) | | | (17.46 | ) | | | 42.15 | | | | 1.74 | | | | (14.24 | ) | | | 2.68 | |
| Ratios to average daily net assets (%): | | | | | | | | | | | | | | | | | | | | |
| Expenses, before waivers and reimbursements | | | 1.20 | | | | 1.19 | | | | 1.34 | | | | 1.35 | | | | 1.42 | |
| Expenses, net of waivers and reimbursements | | | 1.20 | | | | 1.19 | | | | 1.25 | | | | 1.25 | | | | 1.25 | |
| Net investment income (loss), before waivers and reimbursements | | | 0.71 | | | | 0.33 | | | | 0.30 | | | | 0.39 | | | | 0.66 | |
| Net investment income (loss), net of waivers and reimbursements | | | 0.71 | | | | 0.33 | | | | 0.39 | | | | 0.49 | | | | 0.83 | |
| Institutional Class net assets at the end of the year (in thousands) | | $ | 161,889 | | | $ | 427,480 | | | $ | 272,678 | | | $ | 93,217 | | | $ | 75,875 | |
| Portfolio turnover rate (%) | | | 52 | | | | 59 | | | | 135 | | | | 110 | | | | 131 | |
Note: Net investment income (loss) per share is based on the average shares outstanding during the year.
Performance cited represents past performance. Past performance does not guarantee future results and current performance may be lower or higher than the data quoted. Results shown are annual returns, which assume reinvestment of dividends and capital gains. Investment returns and principal will fluctuate and you may have a gain or loss when you sell shares. For the most current month-end performance information, please call 1-800-742-7272 or visit our Web site atwww.williamblairfunds.com.
| December 31, 2018 | William Blair Funds | 165 |
Financial Highlights— For a share outstanding throughout each period
Emerging Markets Growth Fund
| | | Class N | |
| | | Years Ended December 31, | |
| | | 2018 | | | 2017 | | | 2016 | | | 2015 | | | 2014 | |
| Net asset value, beginning of year | | $ | 16.20 | | | $ | 10.99 | | | $ | 10.85 | | | $ | 12.91 | | | $ | 13.28 | |
| Income (loss) from investment operations: | | | | | | | | | | | | | | | | | | | | |
| Net investment income (loss) | | | 0.01 | | | | (0.02 | ) | | | 0.03 | | | | 0.04 | | | | 0.08 | |
| Net realized and unrealized gain (loss) on investments | | | (3.49 | ) | | | 5.35 | | | | 0.13 | | | | (1.98 | ) | | | 0.37 | |
| Total from investment operations | | | (3.48 | ) | | | 5.33 | | | | 0.16 | | | | (1.94 | ) | | | 0.45 | |
| Less distributions from: | | | | | | | | | | | | | | | | | | | | |
| Net investment income | | | 0.11 | | | | 0.12 | | | | 0.02 | | | | — | | | | 0.08 | |
| Net realized gain | | | 1.47 | | | | — | | | | — | | | | 0.12 | | | | 0.74 | |
| Total distributions | | | 1.58 | | | | 0.12 | | | | 0.02 | | | | 0.12 | | | | 0.82 | |
| Net asset value, end of year | | $ | 11.14 | | | $ | 16.20 | | | $ | 10.99 | | | $ | 10.85 | | | $ | 12.91 | |
| Total return (%) | | | (21.61 | ) | | | 48.53 | | | | 1.49 | | | | (15.03 | ) | | | 3.40 | |
| Ratios to average daily net assets (%): | | | | | | | | | | | | | | | | | | | | |
| Expenses, before waivers and reimbursements | | | 1.52 | | | | 1.65 | | | | 1.65 | | | | 1.65 | | | | 1.64 | |
| Expenses, net of waivers and reimbursements | | | 1.52 | | | | 1.50 | | | | 1.50 | | | | 1.50 | | | | 1.64 | |
| Net investment income (loss), before waivers and reimbursements | | | 0.09 | | | | (0.29 | ) | | | 0.13 | | | | 0.18 | | | | 0.55 | |
| Net investment income (loss), net of waivers and reimbursements | | | 0.09 | | | | (0.14 | ) | | | 0.28 | | | | 0.33 | | | | 0.55 | |
| Class N net assets at the end of the year (in thousands) | | $ | 7,103 | | | $ | 10,479 | | | $ | 8,488 | | | $ | 9,367 | | | $ | 12,638 | |
| Portfolio turnover rate (%) | | | 113 | | | | 91 | | | | 105 | | | | 121 | | | | 101 | |
| | | | | | | | | | | | | | | | | | | | | |
| | | Class I | |
| | | Years Ended December 31, | |
| | | 2018 | | | 2017 | | | 2016 | | | 2015 | | | 2014 | |
| Net asset value, beginning of year | | $ | 16.36 | | | $ | 11.10 | | | $ | 10.96 | | | $ | 13.01 | | | $ | 13.38 | |
| Income (loss) from investment operations: | | | | | | | | | | | | | | | | | | | | |
| Net investment income (loss) | | | 0.05 | | | | 0.01 | | | | 0.06 | | | | 0.07 | | | | 0.11 | |
| Net realized and unrealized gain (loss) on investments | | | (3.52 | ) | | | 5.40 | | | | 0.13 | | | | (2.00 | ) | | | 0.37 | |
| Total from investment operations | | | (3.47 | ) | | | 5.41 | | | | 0.19 | | | | (1.93 | ) | | | 0.48 | |
| Less distributions from: | | | | | | | | | | | | | | | | | | | | |
| Net investment income | | | 0.17 | | | | 0.15 | | | | 0.05 | | | | — | | | | 0.11 | |
| Net realized gain | | | 1.47 | | | | — | | | | — | | | | 0.12 | | | | 0.74 | |
| Total distributions | | | 1.64 | | | | 0.15 | | | | 0.05 | | | | 0.12 | | | | 0.85 | |
| Net asset value, end of year | | $ | 11.25 | | | $ | 16.36 | | | $ | 11.10 | | | $ | 10.96 | | | $ | 13.01 | |
| Total return (%) | | | (21.37 | ) | | | 48.83 | | | | 1.73 | | | | (14.83 | ) | | | 3.65 | |
| Ratios to average daily net assets (%): | | | | | | | | | | | | | | | | | | | | |
| Expenses, before waivers and reimbursements | | | 1.27 | | | | 1.42 | | | | 1.41 | | | | 1.40 | | | | 1.40 | |
| Expenses, net of waivers and reimbursements | | | 1.27 | | | | 1.27 | | | | 1.26 | | | | 1.25 | | | | 1.40 | |
| Net investment income (loss), before waivers and reimbursements | | | 0.34 | | | | (0.07 | ) | | | 0.38 | | | | 0.43 | | | | 0.79 | |
| Net investment income (loss), net of waivers and reimbursements | | | 0.34 | | | | 0.08 | | | | 0.53 | | | | 0.58 | | | | 0.79 | |
| Class I net assets at the end of the year (in thousands) | | $ | 79,427 | | | $ | 129,481 | | | $ | 93,668 | | | $ | 130,491 | | | $ | 166,488 | |
| Portfolio turnover rate (%) | | | 113 | | | | 91 | | | | 105 | | | | 121 | | | | 101 | |
Note: Net investment income (loss) per share is based on the average shares outstanding during the year.
Performance cited represents past performance. Past performance does not guarantee future results and current performance may be lower or higher than the data quoted. Results shown are annual returns, which assume reinvestment of dividends and capital gains. Investment returns and principal will fluctuate and you may have a gain or loss when you sell shares. For the most current month-end performance information, please call 1-800-742-7272 or visit our Web site atwww.williamblairfunds.com.
| 166 | Annual Report | December 31, 2018 |
Financial Highlights— For a share outstanding throughout each period
Emerging Markets Growth Fund
| | | Institutional Class | |
| | | Years Ended December 31, | |
| | | 2018 | | | 2017 | | | 2016 | | | 2015 | | | 2014 | |
| Net asset value, beginning of year | | $ | 16.49 | | | $ | 11.18 | | | $ | 11.05 | | | $ | 13.09 | | | $ | 13.46 | |
| Income (loss) from investment operations: | | | | | | | | | | | | | | | | | | | | |
| Net investment income (loss) | | | 0.07 | | | | 0.02 | | | | 0.07 | | | | 0.08 | | | | 0.14 | |
| Net realized and unrealized gain (loss) on investments | | | (3.56 | ) | | | 5.46 | | | | 0.12 | | | | (2.00 | ) | | | 0.37 | |
| Total from investment operations | | | (3.49 | ) | | | 5.48 | | | | 0.19 | | | | (1.92 | ) | | | 0.51 | |
| Less distributions from: | | | | | | | | | | | | | | | | | | | | |
| Net investment income | | | 0.18 | | | | 0.17 | | | | 0.06 | | | | — | | | | 0.14 | |
| Net realized gain | | | 1.47 | | | | — | | | | — | | | | 0.12 | | | | 0.74 | |
| Total distributions | | | 1.65 | | | | 0.17 | | | | 0.06 | | | | 0.12 | | | | 0.88 | |
| Net asset value, end of year | | $ | 11.35 | | | $ | 16.49 | | | $ | 11.18 | | | $ | 11.05 | | | $ | 13.09 | |
| Total return (%) | | | (21.29 | ) | | | 49.06 | | | | 1.71 | | | | (14.67 | ) | | | 3.85 | |
| Ratios to average daily net assets (%): | | | | | | | | | | | | | | | | | | | | |
| Expenses | | | 1.19 | | | | 1.17 | | | | 1.19 | | | | 1.17 | | | | 1.18 | |
| Net investment income (loss) | | | 0.46 | | | | 0.17 | | | | 0.60 | | | | 0.61 | | | | 1.00 | |
| Institutional Class net assets at the end of the year (in thousands) | | $ | 654,441 | | | $ | 1,178,853 | | | $ | 831,587 | | | $ | 739,253 | | | $ | 806,708 | |
| Portfolio turnover rate (%) | | | 113 | | | | 91 | | | | 105 | | | | 121 | | | | 101 | |
Note: Net investment income (loss) per share is based on the average shares outstanding during the year.
Performance cited represents past performance. Past performance does not guarantee future results and current performance may be lower or higher than the data quoted. Results shown are annual returns, which assume reinvestment of dividends and capital gains. Investment returns and principal will fluctuate and you may have a gain or loss when you sell shares. For the most current month-end performance information, please call 1-800-742-7272 or visit our Web site atwww.williamblairfunds.com.
| December 31, 2018 | William Blair Funds | 167 |
Financial Highlights— For a share outstanding throughout each period
Emerging Markets Small Cap Growth Fund
| | | Class N | |
| | | Years Ended December 31, | |
| | | 2018 | | | 2017 | | | 2016 | | | 2015 | | | 2014 | |
| Net asset value, beginning of year | | $ | 18.66 | | | $ | 13.73 | | | $ | 14.84 | | | $ | 16.52 | | | $ | 15.12 | |
| Income (loss) from investment operations: | | | | | | | | | | | | | | | | | | | | |
| Net investment income (loss) | | | (0.02 | ) | | | 0.01 | | | | 0.09 | | | | (0.01 | ) | | | 0.04 | |
| Net realized and unrealized gain (loss) on investments | | | (4.38 | ) | | | 5.46 | | | | (0.88 | ) | | | (1.05 | ) | | | 2.13 | |
| Total from investment operations | | | (4.40 | ) | | | 5.47 | | | | (0.79 | ) | | | (1.06 | ) | | | 2.17 | |
| Less distributions from: | | | | | | | | | | | | | | | | | | | | |
| Net investment income | | | — | | | | 0.50 | | | | 0.32 | | | | — | | | | 0.03 | |
| Net realized gain | | | 0.30 | | | | 0.04 | | | | — | | | | 0.62 | | | | 0.74 | |
| Total distributions | | | 0.30 | | | | 0.54 | | | | 0.32 | | | | 0.62 | | | | 0.77 | |
| Net asset value, end of year | | $ | 13.96 | | | $ | 18.66 | | | $ | 13.73 | | | $ | 14.84 | | | $ | 16.52 | |
| Total return (%) | | | (23.57 | ) | | | 40.09 | | | | (5.33 | ) | | | (6.40 | ) | | | 14.41 | |
| Ratios to average daily net assets (%): | | | | | | | | | | | | | | | | | | | | |
| Expenses, before waivers and reimbursements | | | 1.70 | | | | 1.83 | | | | 1.82 | | | | 1.94 | | | | 1.74 | |
| Expenses, net of waivers and reimbursements | | | 1.58 | | | | 1.64 | | | | 1.61 | | | | 1.65 | | | | 1.65 | |
| Net investment income (loss), before waivers and reimbursements | | | (0.22 | ) | | | (0.11 | ) | | | 0.41 | | | | (0.35 | ) | | | 0.12 | |
| Net investment income (loss), net of waivers and reimbursements | | | (0.10 | ) | | | 0.08 | | | | 0.62 | | | | (0.06 | ) | | | 0.21 | |
| Class N net assets at the end of the year (in thousands) | | $ | 8,977 | | | $ | 15,082 | | | $ | 9,263 | | | $ | 11,306 | | | $ | 10,745 | |
| Portfolio turnover rate (%) | | | 187 | | | | 183 | | | | 157 | | | | 167 | | | | 124 | |
| | | | | | | | | | | | | | | | | | | | | |
| | | Class I | |
| | | Years Ended December 31, | |
| | | 2018 | | | 2017 | | | 2016 | | | 2015 | | | 2014 | |
| Net asset value, beginning of year | | $ | 18.73 | | | $ | 13.77 | | | $ | 14.90 | | | $ | 16.52 | | | $ | 15.13 | |
| Income (loss) from investment operations: | | | | | | | | | | | | | | | | | | | | |
| Net investment income (loss) | | | 0.03 | | | | 0.08 | | | | 0.13 | | | | 0.05 | | | | 0.02 | |
| Net realized and unrealized gain (loss) on investments | | | (4.41 | ) | | | 5.47 | | | | (0.89 | ) | | | (1.05 | ) | | | 2.20 | |
| Total from investment operations | | | (4.38 | ) | | | 5.55 | | | | (0.76 | ) | | | (1.00 | ) | | | 2.22 | |
| Less distributions from: | | | | | | | | | | | | | | | | | | | | |
| Net investment income | | | 0.02 | | | | 0.55 | | | | 0.37 | | | | — | | | | 0.09 | |
| Net realized gain | | | 0.30 | | | | 0.04 | | | | — | | | | 0.62 | | | | 0.74 | |
| Total distributions | | | 0.32 | | | | 0.59 | | | | 0.37 | | | | 0.62 | | | | 0.83 | |
| Net asset value, end of year | | $ | 14.03 | | | $ | 18.73 | | | $ | 13.77 | | | $ | 14.90 | | | $ | 16.52 | |
| Total return (%) | | | (23.31 | ) | | | 40.53 | | | | (5.11 | ) | | | (6.03 | ) | | | 14.73 | |
| Ratios to average daily net assets (%): | | | | | | | | | | | | | | | | | | | | |
| Expenses, before waivers and reimbursements | | | 1.38 | | | | 1.50 | | | | 1.51 | | | | 1.52 | | | | 1.49 | |
| Expenses, net of waivers and reimbursements | | | 1.33 | | | | 1.31 | | | | 1.30 | | | | 1.31 | | | | 1.40 | |
| Net investment income (loss), before waivers and reimbursements | | | 0.13 | | | | 0.30 | | | | 0.66 | | | | 0.09 | | | | 0.06 | |
| Net investment income (loss), net of waivers and reimbursements | | | 0.18 | | | | 0.49 | | | | 0.87 | | | | 0.30 | | | | 0.15 | |
| Class I net assets at the end of the year (in thousands) | | $ | 169,770 | | | $ | 282,620 | | | $ | 147,949 | | | $ | 162,375 | | | $ | 119,662 | |
| Portfolio turnover rate (%) | | | 187 | | | | 183 | | | | 157 | | | | 167 | | | | 124 | |
Note: Net investment income (loss) per share is based on the average shares outstanding during the year.
Performance cited represents past performance. Past performance does not guarantee future results and current performance may be lower or higher than the data quoted. Results shown are annual returns, which assume reinvestment of dividends and capital gains. Investment returns and principal will fluctuate and you may have a gain or loss when you sell shares. For the most current month-end performance information, please call 1-800-742-7272 or visit our Web site atwww.williamblairfunds.com.
| 168 | Annual Report | December 31, 2018 |
Financial Highlights— For a share outstanding throughout each period
Emerging Markets Small Cap Growth Fund
| | | Institutional Class | |
| | | Years Ended December 31, | |
| | | 2018 | | | 2017 | | | 2016 | | | 2015 | | | 2014 | |
| Net asset value, beginning of year | | $ | 18.76 | | | $ | 13.79 | | | $ | 14.92 | | | $ | 16.53 | | | $ | 15.14 | |
| Income (loss) from investment operations: | | | | | | | | | | | | | | | | | | | | |
| Net investment income (loss) | | | 0.05 | | | | 0.10 | | | | 0.14 | | | | 0.06 | | | | 0.06 | |
| Net realized and unrealized gain (loss) on investments | | | (4.41 | ) | | | 5.47 | | | | (0.89 | ) | | | (1.05 | ) | | | 2.18 | |
| Total from investment operations | | | (4.36 | ) | | | 5.57 | | | | (0.75 | ) | | | (0.99 | ) | | | 2.24 | |
| Less distributions from: | | | | | | | | | | | | | | | | | | | | |
| Net investment income | | | 0.04 | | | | 0.56 | | | | 0.38 | | | | 0.00 | ^ | | | 0.11 | |
| Net realized gain | | | 0.30 | | | | 0.04 | | | | — | | | | 0.62 | | | | 0.74 | |
| Total distributions | | | 0.34 | | | | 0.60 | | | | 0.38 | | | | 0.62 | | | | 0.85 | |
| Net asset value, end of year | | $ | 14.06 | | | $ | 18.76 | | | $ | 13.79 | | | $ | 14.92 | | | $ | 16.53 | |
| Total return (%) | | | (23.24 | ) | | | 40.62 | | | | (5.05 | ) | | | (5.97 | ) | | | 14.85 | |
| Ratios to average daily net assets (%): | | | | | | | | | | | | | | | | | | | | |
| Expenses, before waivers and reimbursements | | | 1.30 | | | | 1.29 | | | | 1.31 | | | | 1.31 | | | | 1.34 | �� |
| Expenses, net of waivers and reimbursements | | | 1.25 | | | | 1.25 | | | | 1.25 | | | | 1.25 | | | | 1.25 | |
| Net investment income (loss), before waivers and reimbursements | | | 0.22 | | | | 0.53 | | | | 0.88 | | | | 0.28 | | | | 0.28 | |
| Net investment income (loss), net of waivers and reimbursements | | | 0.27 | | | | 0.57 | | | | 0.94 | | | | 0.34 | | | | 0.37 | |
| Institutional Class net assets at the end of the year (in thousands) | | $ | 98,188 | | | $ | 166,927 | | | $ | 125,650 | | | $ | 123,160 | | | $ | 123,496 | |
| Portfolio turnover rate (%) | | | 187 | | | | 183 | | | | 157 | | | | 167 | | | | 124 | |
| ^ | Amount is less than $0.005 per share. |
Note: Net investment income (loss) per share is based on the average shares outstanding during the year.
Performance cited represents past performance. Past performance does not guarantee future results and current performance may be lower or higher than the data quoted. Results shown are annual returns, which assume reinvestment of dividends and capital gains. Investment returns and principal will fluctuate and you may have a gain or loss when you sell shares. For the most current month-end performance information, please call 1-800-742-7272 or visit our Web site atwww.williamblairfunds.com.
| December 31, 2018 | William Blair Funds | 169 |
Financial Highlights— For a share outstanding throughout each period
Bond Fund
| | | Class N | |
| | | Years Ended December 31, | |
| | | 2018 | | | 2017 | | | 2016 | | | 2015 | | | 2014 | |
| Net asset value, beginning of year | | $ | 10.41 | | | $ | 10.41 | | | $ | 10.34 | | | $ | 10.74 | | | $ | 10.60 | |
| Income (loss) from investment operations: | | | | | | | | | | | | | | | | | | | | |
| Net investment income (loss) | | | 0.31 | | | | 0.27 | | | | 0.27 | | | | 0.27 | | | | 0.31 | |
| Net realized and unrealized gain (loss) on investments | | | (0.56 | ) | | | 0.12 | | | | 0.18 | | | | (0.29 | ) | | | 0.23 | |
| Total from investment operations | | | (0.25 | ) | | | 0.39 | | | | 0.45 | | | | (0.02 | ) | | | 0.54 | |
| Less distributions from: | | | | | | | | | | | | | | | | | | | | |
| Net investment income | | | 0.41 | | | | 0.39 | | | | 0.38 | | | | 0.38 | | | | 0.40 | |
| Net realized gain | | | — | | | | — | | | | — | | | | — | | | | 0.00 | ^ |
| Total distributions | | | 0.41 | | | | 0.39 | | | | 0.38 | | | | 0.38 | | | | 0.40 | |
| Net asset value, end of year | | $ | 9.75 | | | $ | 10.41 | | | $ | 10.41 | | | $ | 10.34 | | | $ | 10.74 | |
| Total return (%) | | | (2.42 | ) | | | 3.83 | | | | 4.40 | | | | (0.23 | ) | | | 5.10 | |
| Ratios to average daily net assets (%): | | | | | | | | | | | | | | | | | | | | |
| Expenses, before waivers and reimbursements | | | 0.69 | | | | 0.82 | | | | 0.82 | | | | 0.79 | | | | 0.85 | |
| Expenses, net of waivers and reimbursements | | | 0.62 | | | | 0.65 | | | | 0.65 | | | | 0.61 | | | | 0.65 | |
| Net investment income (loss), before waivers and reimbursements | | | 3.01 | | | | 2.40 | | | | 2.43 | | | | 2.42 | | | | 2.70 | |
| Net investment income (loss), net of waivers and reimbursements | | | 3.08 | | | | 2.57 | | | | 2.60 | | | | 2.60 | | | | 2.90 | |
| Class N net assets at the end of the year (in thousands) | | $ | 70,253 | | | $ | 83,662 | | | $ | 125,866 | | | $ | 139,303 | | | $ | 16,720 | |
| Portfolio turnover rate (%) | | | 40 | | | | 17 | | | | 17 | | | | 32 | | | | 35 | |
| | | | | | | | | | | | | | | | | | | | | |
| | | Class I | |
| | | Years Ended December 31, | |
| | | 2018 | | | 2017 | | | 2016 | | | 2015 | | | 2014 | |
| Net asset value, beginning of year | | $ | 10.31 | | | $ | 10.30 | | | $ | 10.24 | | | $ | 10.64 | | | $ | 10.49 | |
| Income (loss) from investment operations: | | | | | | | | | | | | | | | | | | | | |
| Net investment income (loss) | | | 0.32 | | | | 0.29 | | | | 0.30 | | | | 0.31 | | | | 0.33 | |
| Net realized and unrealized gain (loss) on investments | | | (0.56 | ) | | | 0.13 | | | | 0.16 | | | | (0.31 | ) | | | 0.23 | |
| Total from investment operations | | | (0.24 | ) | | | 0.42 | | | | 0.46 | | | | — | | | | 0.56 | |
| Less distributions from: | | | | | | | | | | | | | | | | | | | | |
| Net investment income | | | 0.42 | | | | 0.41 | | | | 0.40 | | | | 0.40 | | | | 0.41 | |
| Net realized gain | | | — | | | | — | | | | — | | | | — | | | | 0.00 | ^ |
| Total distributions | | | 0.42 | | | | 0.41 | | | | 0.40 | | | | 0.40 | | | | 0.41 | |
| Net asset value, end of year | | $ | 9.65 | | | $ | 10.31 | | | $ | 10.30 | | | $ | 10.24 | | | $ | 10.64 | |
| Total return (%) | | | (2.31 | ) | | | 4.16 | | | | 4.55 | | | | (0.05 | ) | | | 5.37 | |
| Ratios to average daily net assets (%): | | | | | | | | | | | | | | | | | | | | |
| Expenses, before waivers and reimbursements | | | 0.46 | | | | 0.60 | | | | 0.58 | | | | 0.59 | | | | 0.60 | |
| Expenses, net of waivers and reimbursements | | | 0.46 | | | | 0.43 | | | | 0.41 | | | | 0.41 | | | | 0.50 | |
| Net investment income (loss), before waivers and reimbursements | | | 3.24 | | | | 2.62 | | | | 2.66 | | | | 2.75 | | | | 2.97 | |
| Net investment income (loss), net of waivers and reimbursements | | | 3.24 | | | | 2.79 | | | | 2.83 | | | | 2.93 | | | | 3.07 | |
| Class I net assets at the end of the year (in thousands) | | $ | 281,442 | | | $ | 384,464 | | | $ | 322,174 | | | $ | 237,587 | | | $ | 149,466 | |
| Portfolio turnover rate (%) | | | 40 | | | | 17 | | | | 17 | | | | 32 | | | | 35 | |
| ^ | Amount is less than $0.005 per share. |
Note: Net investment income (loss) per share is based on the average shares outstanding during the year.
Performance cited represents past performance. Past performance does not guarantee future results and current performance may be lower or higher than the data quoted. Results shown are annual returns, which assume reinvestment of dividends and capital gains. Investment returns and principal will fluctuate and you may have a gain or loss when you sell shares. For the most current month-end performance information, please call 1-800-742-7272 or visit our Web site atwww.williamblairfunds.com.
| 170 | Annual Report | December 31, 2018 |
Financial Highlights— For a share outstanding throughout each period
Bond Fund
| | | Institutional Class | |
| | | Years Ended December 31, | |
| | | 2018 | | | 2017 | | | 2016 | | | 2015 | | | 2014 | |
| Net asset value, beginning of year | | $ | 10.30 | | | $ | 10.29 | | | $ | 10.23 | | | $ | 10.63 | | | $ | 10.48 | |
| Income (loss) from investment operations: | | | | | | | | | | | | | | | | | | | | |
| Net investment income (loss) | | | 0.33 | | | | 0.30 | | | | 0.30 | | | | 0.32 | | | | 0.34 | |
| Net realized and unrealized gain (loss) on investments | | | (0.56 | ) | | | 0.13 | | | | 0.17 | | | | (0.31 | ) | | | 0.23 | |
| Total from investment operations | | | (0.23 | ) | | | 0.43 | | | | 0.47 | | | | 0.01 | | | | 0.57 | |
| Less distributions from: | | | | | | | | | | | | | | | | | | | | |
| Net investment income | | | 0.43 | | | | 0.42 | | | | 0.41 | | | | 0.41 | | | | 0.42 | |
| Net realized gain | | | — | | | | — | | | | — | | | | — | | | | 0.00 | ^ |
| Total distributions | | | 0.43 | | | | 0.42 | | | | 0.41 | | | | 0.41 | | | | 0.42 | |
| Net asset value, end of year | | $ | 9.64 | | | $ | 10.30 | | | $ | 10.29 | | | $ | 10.23 | | | $ | 10.63 | |
| Total return (%) | | | (2.26 | ) | | | 4.24 | | | | 4.61 | | | | 0.01 | | | | 5.53 | |
| Ratios to average daily net assets (%): | | | | | | | | | | | | | | | | | | | | |
| Expenses, before waivers and reimbursements | | | 0.38 | | | | 0.37 | | | | 0.37 | | | | 0.38 | | | | 0.41 | |
| Expenses, net of waivers and reimbursements | | | 0.38 | | | | 0.35 | | | | 0.35 | | | | 0.35 | | | | 0.35 | |
| Net investment income (loss), before waivers and reimbursements | | | 3.32 | | | | 2.85 | | | | 2.88 | | | | 2.98 | | | | 3.17 | |
| Net investment income (loss), net of waivers and reimbursements | | | 3.32 | | | | 2.87 | | | | 2.90 | | | | 3.01 | | | | 3.23 | |
| Institutional Class net assets at the end of the year (in thousands) | | $ | 70,851 | | | $ | 91,629 | | | $ | 95,216 | | | $ | 103,904 | | | $ | 97,341 | |
| Portfolio turnover rate (%) | | | 40 | | | | 17 | | | | 17 | | | | 32 | | | | 35 | |
| ^ | Amount is less than $0.005 per share. |
Note: Net investment income (loss) per share is based on the average shares outstanding during the year.
Performance cited represents past performance. Past performance does not guarantee future results and current performance may be lower or higher than the data quoted. Results shown are annual returns, which assume reinvestment of dividends and capital gains. Investment returns and principal will fluctuate and you may have a gain or loss when you sell shares. For the most current month-end performance information, please call 1-800-742-7272 or visit our Web site atwww.williamblairfunds.com.
| December 31, 2018 | William Blair Funds | 171 |
Financial Highlights— For a share outstanding throughout each period
Income Fund
| | | Class N | |
| | | Years Ended December 31, | |
| | | 2018 | | | 2017 | | | 2016 | | | 2015 | | | 2014 | |
| Net asset value, beginning of year | | $ | 8.72 | | | $ | 8.86 | | | $ | 8.90 | | | $ | 9.12 | | | $ | 9.11 | |
| Income (loss) from investment operations: | | | | | | | | | | | | | | | | | | | | |
| Net investment income (loss) | | | 0.17 | | | | 0.16 | | | | 0.16 | | | | 0.15 | | | | 0.18 | |
| Net realized and unrealized gain (loss) on investments | | | (0.25 | ) | | | (0.03 | ) | | | 0.06 | | | | (0.11 | ) | | | 0.10 | |
| Total from investment operations | | | (0.08 | ) | | | 0.13 | | | | 0.22 | | | | 0.04 | | | | 0.28 | |
| Less distributions from: | | | | | | | | | | | | | | | | | | | | |
| Net investment income | | | 0.28 | | | | 0.27 | | | | 0.26 | | | | 0.26 | | | | 0.27 | |
| Net realized gain | | | — | | | | — | | | | — | | | | — | | | | — | |
| Total distributions | | | 0.28 | | | | 0.27 | | | | 0.26 | | | | 0.26 | | | | 0.27 | |
| Net asset value, end of year | | $ | 8.36 | | | $ | 8.72 | | | $ | 8.86 | | | $ | 8.90 | | | $ | 9.12 | |
| Total return (%) | | | (0.86 | ) | | | 1.46 | | | | 2.44 | | | | 0.39 | | | | 3.06 | |
| Ratios to average daily net assets (%): | | | | | | | | | | | | | | | | | | | | |
| Expenses, before waivers and reimbursements | | | 0.91 | | | | 0.88 | | | | 0.79 | | | | 0.81 | | | | 0.84 | |
| Expenses, net of waivers and reimbursements | | | 0.85 | | | | 0.85 | | | | 0.79 | | | | 0.81 | | | | 0.84 | |
| Net investment income (loss), before waivers and reimbursements | | | 1.96 | | | | 1.77 | | | | 1.80 | | | | 1.71 | | | | 1.99 | |
| Net investment income (loss), net of waivers and reimbursements | | | 2.02 | | | | 1.80 | | | | 1.80 | | | | 1.71 | | | | 1.99 | |
| Class N net assets at the end of the year (in thousands) | | $ | 22,422 | | | $ | 39,625 | | | $ | 52,710 | | | $ | 32,942 | | | $ | 34,020 | |
| Portfolio turnover rate (%) | | | 97 | | | | 37 | | | | 22 | | | | 21 | | | | 30 | |
| | | | | | | | | | | | | | | | | | | | | |
| | | Class I | |
| | | Years Ended December 31, | |
| | | 2018 | | | 2017 | �� | | 2016 | | | 2015 | | | 2014 | |
| Net asset value, beginning of year | | $ | 8.66 | | | $ | 8.80 | | | $ | 8.83 | | | $ | 9.05 | | | $ | 9.05 | |
| Income (loss) from investment operations: | | | | | | | | | | | | | | | | | | | | |
| Net investment income (loss) | | | 0.19 | | | | 0.18 | | | | 0.18 | | | | 0.18 | | | | 0.20 | |
| Net realized and unrealized gain (loss) on investments | | | (0.25 | ) | | | (0.03 | ) | | | 0.06 | | | | (0.12 | ) | | | 0.09 | |
| Total from investment operations | | | (0.06 | ) | | | 0.15 | | | | 0.24 | | | | 0.06 | | | | 0.29 | |
| Less distributions from: | | | | | | | | | | | | | | | | | | | | |
| Net investment income | | | 0.30 | | | | 0.29 | | | | 0.27 | | | | 0.28 | | | | 0.29 | |
| Net realized gain | | | — | | | | — | | | | — | | | | — | | | | — | |
| Total distributions | | | 0.30 | | | | 0.29 | | | | 0.27 | | | | 0.28 | | | | 0.29 | |
| Net asset value, end of year | | $ | 8.30 | | | $ | 8.66 | | | $ | 8.80 | | | $ | 8.83 | | | $ | 9.05 | |
| Total return (%) | | | (0.69 | ) | | | 1.68 | | | | 2.78 | | | | 0.63 | | | | 3.20 | |
| Ratios to average daily net assets (%): | | | | | | | | | | | | | | | | | | | | |
| Expenses | | | 0.65 | | | | 0.62 | | | | 0.57 | | | | 0.55 | | | | 0.59 | |
| Net investment income (loss) | | | 2.22 | | | | 2.03 | | | | 2.05 | | | | 1.97 | | | | 2.24 | |
| Class I net assets at the end of the year (in thousands) | | $ | 34,793 | | | $ | 51,153 | | | $ | 58,160 | | | $ | 62,722 | | | $ | 64,834 | |
| Portfolio turnover rate (%) | | | 97 | | | | 37 | | | | 22 | | | | 21 | | | | 30 | |
Note: Net investment income (loss) per share is based on the average shares outstanding during the year.
Performance cited represents past performance. Past performance does not guarantee future results and current performance may be lower or higher than the data quoted. Results shown are annual returns, which assume reinvestment of dividends and capital gains. Investment returns and principal will fluctuate and you may have a gain or loss when you sell shares. For the most current month-end performance information, please call 1-800-742-7272 or visit our Web site atwww.williamblairfunds.com.
| 172 | Annual Report | December 31, 2018 |
Financial Highlights— For a share outstanding throughout each period
Low Duration Fund
| | | Class N | |
| | | Years Ended December 31, | |
| | | 2018 | | | 2017 | | | 2016 | | | 2015 | | | 2014 | |
| Net asset value, beginning of year | | $ | 8.92 | | | $ | 9.07 | | | $ | 9.16 | | | $ | 9.38 | | | $ | 9.52 | |
| Income (loss) from investment operations: | | | | | | | | | | | | | | | | | | | | |
| Net investment income (loss) | | | 0.17 | | | | 0.11 | | | | 0.09 | | | | 0.07 | | | | 0.11 | |
| Net realized and unrealized gain (loss) on investments | | | (0.10 | ) | | | (0.04 | ) | | | 0.02 | | | | (0.07 | ) | | | (0.00 | )^ |
| Total from investment operations | | | 0.07 | | | | 0.07 | | | | 0.11 | | | | — | | | | 0.11 | |
| Less distributions from: | | | | | | | | | | | | | | | | | | | | |
| Net investment income | | | 0.29 | | | | 0.22 | | | | 0.20 | | | | 0.22 | | | | 0.25 | |
| Net realized gain | | | — | | | | — | | | | — | | | | — | | | | — | |
| Total distributions | | | 0.29 | | | | 0.22 | | | | 0.20 | | | | 0.22 | | | | 0.25 | |
| Net asset value, end of year | | $ | 8.70 | | | $ | 8.92 | | | $ | 9.07 | | | $ | 9.16 | | | $ | 9.38 | |
| Total return (%) | | | 0.80 | | | | 0.84 | | | | 1.16 | | | | 0.01 | | | | 1.20 | |
| Ratios to average daily net assets (%): | | | | | | | | | | | | | | | | | | | | |
| Expenses, before waivers and reimbursements | | | 0.72 | | | | 0.79 | | | | 0.83 | | | | 0.77 | | | | 0.75 | |
| Expenses, net of waivers and reimbursements | | | 0.58 | | | | 0.61 | | | | 0.68 | | | | 0.60 | | | | 0.70 | |
| Net investment income (loss), before waivers and reimbursements | | | 1.83 | | | | 1.04 | | | | 0.83 | | | | 0.54 | | | | 1.14 | |
| Net investment income (loss), net of waivers and reimbursements | | | 1.97 | | | | 1.22 | | | | 0.98 | | | | 0.71 | | | | 1.19 | |
| Class N net assets at the end of the year (in thousands) | | $ | 1,661 | | | $ | 1,979 | | | $ | 7,237 | | | $ | 2,712 | | | $ | 4,969 | |
| Portfolio turnover rate (%) | | | 122 | | | | 109 | | | | 81 | | | | 106 | | | | 83 | |
| | | | | | | | | | | | | | | | | | | | | |
| | | Class I | |
| | | Years Ended December 31, | |
| | | 2018 | | | 2017 | | | 2016 | | | 2015 | | | 2014 | |
| Net asset value, beginning of year | | $ | 8.91 | | | $ | 9.07 | | | $ | 9.16 | | | $ | 9.37 | | | $ | 9.52 | |
| Income (loss) from investment operations: | | | | | | | | | | | | | | | | | | | | |
| Net investment income (loss) | | | 0.19 | | | | 0.13 | | | | 0.11 | | | | 0.08 | | | | 0.13 | |
| Net realized and unrealized gain (loss) on investments | | | (0.09 | ) | | | (0.05 | ) | | | 0.02 | | | | (0.05 | ) | | | (0.01 | ) |
| Total from investment operations | | | 0.10 | | | | 0.08 | | | | 0.13 | | | | 0.03 | | | | 0.12 | |
| Less distributions from: | | | | | | | | | | | | | | | | | | | | |
| Net investment income | | | 0.31 | | | | 0.24 | | | | 0.22 | | | | 0.24 | | | | 0.27 | |
| Net realized gain | | | — | | | | — | | | | — | | | | — | | | | — | |
| Total distributions | | | 0.31 | | | | 0.24 | | | | 0.22 | | | | 0.24 | | | | 0.27 | |
| Net asset value, end of year | | $ | 8.70 | | | $ | 8.91 | | | $ | 9.07 | | | $ | 9.16 | | | $ | 9.37 | |
| Total return (%) | | | 1.12 | | | | 0.91 | | | | 1.40 | | | | 0.30 | | | | 1.24 | |
| Ratios to average daily net assets (%): | | | | | | | | | | | | | | | | | | | | |
| Expenses, before waivers and reimbursements | | | 0.46 | | | | 0.59 | | | | 0.59 | | | | 0.59 | | | | 0.60 | |
| Expenses, net of waivers and reimbursements | | | 0.39 | | | | 0.41 | | | | 0.44 | | | | 0.42 | | | | 0.55 | |
| Net investment income (loss), before waivers and reimbursements | | | 2.05 | | | | 1.27 | | | | 1.05 | | | | 0.70 | | | | 1.30 | |
| Net investment income (loss), net of waivers and reimbursements | | | 2.12 | | | | 1.45 | | | | 1.20 | | | | 0.87 | | | | 1.35 | |
| Class I net assets at the end of the year (in thousands) | | $ | 56,120 | | | $ | 131,186 | | | $ | 219,714 | | | $ | 107,137 | | | $ | 104,433 | |
| Portfolio turnover rate (%) | | | 122 | | | | 109 | | | | 81 | | | | 106 | | | | 83 | |
| ^ | Amount is less than $0.005 per share. |
Note: Net investment income (loss) per share is based on the average shares outstanding during the year.
Performance cited represents past performance. Past performance does not guarantee future results and current performance may be lower or higher than the data quoted. Results shown are annual returns, which assume reinvestment of dividends and capital gains. Investment returns and principal will fluctuate and you may have a gain or loss when you sell shares. For the most current month-end performance information, please call 1-800-742-7272 or visit our Web site atwww.williamblairfunds.com.
| December 31, 2018 | William Blair Funds | 173 |
Financial Highlights— For a share outstanding throughout each period
Low Duration Fund
| | | Institutional Class | |
| | | Years Ended December 31, | |
| | | 2018 | | | 2017 | | | 2016 | | | 2015 | | | 2014 | |
| Net asset value, beginning of year | | $ | 8.91 | | | $ | 9.07 | | | $ | 9.16 | | | $ | 9.38 | | | $ | 9.53 | |
| Income (loss) from investment operations: | | | | | | | | | | | | | | | | | | | | |
| Net investment income (loss) | | | 0.19 | | | | 0.14 | | | | 0.11 | | | | 0.09 | | | | 0.14 | |
| Net realized and unrealized gain (loss) on investments | | | (0.09 | ) | | | (0.05 | ) | | | 0.02 | | | | (0.07 | ) | | | (0.01 | ) |
| Total from investment operations | | | 0.10 | | | | 0.09 | | | | 0.13 | | | | 0.02 | | | | 0.13 | |
| Less distributions from: | | | | | | | | | | | | | | | | | | | | |
| Net investment income | | | 0.31 | | | | 0.25 | | | | 0.22 | | | | 0.24 | | | | 0.28 | |
| Net realized gain | | | — | | | | — | | | | — | | | | — | | | | — | |
| Total distributions | | | 0.31 | | | | 0.25 | | | | 0.22 | | | | 0.24 | | | | 0.28 | |
| Net asset value, end of year | | $ | 8.70 | | | $ | 8.91 | | | $ | 9.07 | | | $ | 9.16 | | | $ | 9.38 | |
| Total return (%) | | | 1.15 | | | | 0.96 | | | | 1.43 | | | | 0.22 | | | | 1.40 | |
| Ratios to average daily net assets (%): | | | | | | | | | | | | | | | | | | | | |
| Expenses, before waivers and reimbursements | | | 0.42 | | | | 0.40 | | | | 0.40 | | | | 0.42 | | | | 0.43 | |
| Expenses, net of waivers and reimbursements | | | 0.35 | | | | 0.37 | | | | 0.40 | | | | 0.40 | | | | 0.40 | |
| Net investment income (loss), before waivers and reimbursements | | | 2.10 | | | | 1.48 | | | | 1.25 | | | | 0.92 | | | | 1.42 | |
| Net investment income (loss), net of waivers and reimbursements | | | 2.17 | | | | 1.51 | | | | 1.25 | | | | 0.94 | | | | 1.45 | |
| Institutional Class net assets at the end of the year (in thousands) | | $ | 47,585 | | | $ | 99,912 | | | $ | 53,122 | | | $ | 21,863 | | | $ | 68,095 | |
| Portfolio turnover rate (%) | | | 122 | | | | 109 | | | | 81 | | | | 106 | | | | 83 | |
Note: Net investment income (loss) per share is based on the average shares outstanding during the year.
Performance cited represents past performance. Past performance does not guarantee future results and current performance may be lower or higher than the data quoted. Results shown are annual returns, which assume reinvestment of dividends and capital gains. Investment returns and principal will fluctuate and you may have a gain or loss when you sell shares. For the most current month-end performance information, please call 1-800-742-7272 or visit our Web site atwww.williamblairfunds.com.
| 174 | Annual Report | December 31, 2018 |
Financial Highlights— For a share outstanding throughout each period
Macro Allocation Fund
| | | Class N | |
| | | | | | | | | | | | | | | | | | Year Ended | |
| | | Periods Ended December 31, | | | October 31, | |
| | | 2018 | | | 2017 | | | 2016 | | | 2015 | | | 2014(a) | | | 2014 | |
| Net asset value, beginning of year | | $ | 11.84 | | | $ | 11.34 | | | $ | 11.32 | | | $ | 12.14 | | | $ | 13.07 | | | $ | 12.61 | |
| Income (loss) from investment operations: | | | | | | | | | | | | | | | | | | | | | | | | |
| Net investment income (loss) | | | 0.08 | | | | 0.06 | | | | 0.04 | | | | 0.04 | | | | 0.04 | | | | 0.02 | |
| Net realized and unrealized gain (loss) on investments | | | (0.24 | ) | | | 0.51 | | | | 0.19 | | | | (0.80 | ) | | | (0.31 | ) | | | 0.76 | |
| Total from investment operations | | | (0.16 | ) | | | 0.57 | | | | 0.23 | | | | (0.76 | ) | | | (0.27 | ) | | | 0.78 | |
| Less distributions from: | | | | | | | | | | | | | | | | | | | | | | | | |
| Net investment income | | | 0.27 | | | | 0.07 | | | | 0.21 | | | | 0.06 | | | | 0.66 | | | | 0.09 | |
| Net realized gain | | | — | | | | — | | | | — | | | | — | | | | — | | | | 0.23 | |
| Total distributions | | | 0.27 | | | | 0.07 | | | | 0.21 | | | | 0.06 | | | | 0.66 | | | | 0.32 | |
| Net asset value, end of year | | $ | 11.41 | | | $ | 11.84 | | | $ | 11.34 | | | $ | 11.32 | | | $ | 12.14 | | | $ | 13.07 | |
| Total return (%)* | | | (1.30 | ) | | | 5.06 | | | | 2.01 | | | | (6.24 | ) | | | (2.00 | ) | | | 6.34 | |
| Ratios to average daily net assets (%)**: | | | | | | | | | | | | | | | | | | | | | | | | |
| Expenses, before waivers and reimbursements | | | 1.30 | | | | 1.52 | | | | 1.38 | | | | 1.42 | | | | 1.46 | | | | 1.60 | |
| Expenses, net of waivers and reimbursements | | | 1.30 | | | | 1.37 | | | | 1.23 | | | | 1.27 | | | | 1.38 | | | | 1.47 | |
| Expenses (excluding interest or short dividend expense), net of waivers and reimbursements | | | 1.28 | | | | 1.31 | | | | 1.23 | | | | 1.27 | | | | 1.35 | | | | 1.35 | |
| Net investment income (loss), before waivers and reimbursements | | | 0.66 | | | | 0.35 | | | | 0.17 | | | | 0.17 | | | | 1.98 | | | | 0.07 | |
| Net investment income (loss), net of waivers and reimbursements | | | 0.66 | | | | 0.50 | | | | 0.32 | | | | 0.32 | | | | 2.06 | | | | 0.20 | |
| Class N net assets at the end of the year (in thousands) | | $ | 43,463 | | | $ | 41,483 | | | $ | 61,376 | | | $ | 150,606 | | | $ | 150,778 | | | $ | 150,785 | |
| Portfolio turnover rate (%)* | | | 36 | | | | 43 | | | | 50 | | | | 34 | | | | 17 | | | | 59 | |
| | | | | | | | | | | | | | | | | | | | | | | | | |
| | | Class I | |
| | | | | | | | | | | | | | | | | | Year Ended | |
| | | Periods Ended December 31, | | | October 31, | |
| | | 2018 | | | 2017 | | | 2016 | | | 2015 | | | 2014(a) | | | 2014 | |
| Net asset value, beginning of year | | $ | 11.88 | | | $ | 11.38 | | | $ | 11.38 | | | $ | 12.22 | | | $ | 13.15 | | | $ | 12.66 | |
| Income (loss) from investment operations: | | | | | | | | | | | | | | | | | | | | | | | | |
| Net investment income (loss) | | | 0.11 | | | | 0.11 | | | | 0.08 | | | | 0.09 | | | | 0.05 | | | | 0.04 | |
| Net realized and unrealized gain (loss) on investments | | | (0.24 | ) | | | 0.51 | | | | 0.18 | | | | (0.82 | ) | | | (0.31 | ) | | | 0.78 | |
| Total from investment operations | | | (0.13 | ) | | | 0.62 | | | | 0.26 | | | | (0.73 | ) | | | (0.26 | ) | | | 0.82 | |
| Less distributions from: | | | | | | | | | | | | | | | | | | | | | | | | |
| Net investment income | | | 0.37 | | | | 0.12 | | | | 0.26 | | | | 0.11 | | | | 0.67 | | | | 0.10 | |
| Net realized gain | | | — | | | | — | | | | — | | | | — | | | | — | | | | 0.23 | |
| Total distributions | | | 0.37 | | | | 0.12 | | | | 0.26 | | | | 0.11 | | | | 0.67 | | | | 0.33 | |
| Net asset value, end of year | | $ | 11.38 | | | $ | 11.88 | | | $ | 11.38 | | | $ | 11.38 | | | $ | 12.22 | | | $ | 13.15 | |
| Total return (%)* | | | (1.08 | ) | | | 5.50 | | | | 2.26 | | | | (6.00 | ) | | | (1.94 | ) | | | 6.60 | |
| Ratios to average daily net assets (%)**: | | | | | | | | | | | | | | | | | | | | | | | | |
| Expenses, before waivers and reimbursements | | | 0.99 | | | | 1.17 | | | | 1.12 | | | | 1.14 | | | | 1.10 | | | | 1.27 | |
| Expenses, net of waivers and reimbursements | | | 0.99 | | | | 1.02 | | | | 0.97 | | | | 0.99 | | | | 1.10 | | | | 1.22 | |
| Expenses (excluding interest or short dividend expense), net of waivers and reimbursements | | | 0.97 | | | | 0.96 | | | | 0.97 | | | | 0.98 | | | | 1.07 | | | | 1.10 | |
| Net investment income (loss), before waivers and reimbursements | | | 0.95 | | | | 0.75 | | | | 0.52 | | | | 0.58 | | | | 2.33 | | | | 0.27 | |
| Net investment income (loss), net of waivers and reimbursements | | | 0.95 | | | | 0.90 | | | | 0.67 | | | | 0.73 | | | | 2.33 | | | | 0.32 | |
| Class I net assets at the end of the year (in thousands) | | $ | 486,543 | | | $ | 780,075 | | | $ | 937,244 | | | $ | 1,155,051 | | | $ | 649,756 | | | $ | 617,531 | |
| Portfolio turnover rate (%)* | | | 36 | | | | 43 | | | | 50 | | | | 34 | | | | 17 | | | | 59 | |
| (a) | For the period November 1, 2014 to December 31, 2014. |
| * | Rates are not annualized for periods that are less than a year. |
| ** | Rates are annualized for periods that are less than a year. |
Note: Net investment income (loss) per share is based on the average shares outstanding during the year.
Performance cited represents past performance. Past performance does not guarantee future results and current performance may be lower or higher than the data quoted. Results shown are annual returns, which assume reinvestment of dividends and capital gains. Investment returns and principal will fluctuate and you may have a gain or loss when you sell shares. For the most current month-end performance information, please call 1-800-742-7272 or visit our Web site atwww.williamblairfunds.com.
| December 31, 2018 | William Blair Funds | 175 |
Financial Highlights— For a share outstanding throughout each period
Macro Allocation Fund
| | | Institutional Class | |
| | | | | | | | | | | | | | | | | | Year Ended | |
| | | Periods Ended December 31, | | | October 31, | |
| | | 2018 | | | 2017 | | | 2016 | | | 2015 | | | 2014(a) | | | 2014 | |
| Net asset value, beginning of year | | $ | 11.89 | | | $ | 11.40 | | | $ | 11.39 | | | $ | 12.23 | | | $ | 13.16 | | | $ | 12.66 | |
| Income (loss) from investment operations: | | | | | | | | | | | | | | | | | | | | | | | | |
| Net investment income (loss) | | | 0.13 | | | | 0.12 | | | | 0.09 | | | | 0.12 | | | | 0.05 | | | | 0.04 | |
| Net realized and unrealized gain (loss) on investments | | | (0.24 | ) | | | 0.51 | | | | 0.19 | | | | (0.84 | ) | | | (0.31 | ) | | | 0.79 | |
| Total from investment operations | | | (0.11 | ) | | | 0.63 | | | | 0.28 | | | | (0.72 | ) | | | (0.26 | ) | | | 0.83 | |
| Less distributions from: | | | | | | | | | | | | | | | | | | | | | | | | |
| Net investment income | | | 0.40 | | | | 0.14 | | | | 0.27 | | | | 0.12 | | | | 0.67 | | | | 0.10 | |
| Net realized gain | | | — | | | | — | | | | — | | | | — | | | | — | | | | 0.23 | |
| Total distributions | | | 0.40 | | | | 0.14 | | | | 0.27 | | | | 0.12 | | | | 0.67 | | | | 0.33 | |
| Net asset value, end of year | | $ | 11.38 | | | $ | 11.89 | | | $ | 11.40 | | | $ | 11.39 | | | $ | 12.23 | | | $ | 13.16 | |
| Total return (%)* | | | (0.94 | ) | | | 5.51 | | | | 2.44 | | | | (5.92 | ) | | | (1.91 | ) | | | 6.71 | |
| Ratios to average daily net assets (%)**: | | | | | | | | | | | | | | | | | | | | | | | | |
| Expenses, before waivers and reimbursements | | | 0.91 | | | | 0.92 | | | | 0.89 | | | | 0.90 | | | | 0.91 | | | | 1.05 | |
| Expenses, net of waivers and reimbursements | | | 0.91 | | | | 0.92 | | | | 0.89 | | | | 0.90 | | | | 0.91 | | | | 1.05 | |
| Expenses (excluding interest or short dividend expense), net of waivers and reimbursements | | | 0.89 | | | | 0.86 | | | | 0.89 | | | | 0.90 | | | | 0.88 | | | | 0.93 | |
| Net investment income (loss), before waivers and reimbursements | | | 1.10 | | | | 1.04 | | | | 0.81 | | | | 0.95 | | | | 2.54 | | | | 0.32 | |
| Net investment income (loss), net of waivers and reimbursements | | | 1.10 | | | | 1.04 | | | | 0.81 | | | | 0.95 | | | | 2.54 | | | | 0.32 | |
| Institutional Class net assets at the end of the year (in thousands) | | $ | 391,812 | | | $ | 487,082 | | | $ | 582,298 | | | $ | 426,230 | | | $ | 158,152 | | | $ | 150,447 | |
| Portfolio turnover rate (%)* | | | 36 | | | | 43 | | | | 50 | | | | 34 | | | | 17 | | | | 59 | |
| (a) | For the period November 1, 2014 to December 31, 2014. |
| * | Rates are not annualized for periods that are less than a year. |
| ** | Rates are annualized for periods that are less than a year. |
Note: Net investment income (loss) per share is based on the average shares outstanding during the year.
Performance cited represents past performance. Past performance does not guarantee future results and current performance may be lower or higher than the data quoted. Results shown are annual returns, which assume reinvestment of dividends and capital gains. Investment returns and principal will fluctuate and you may have a gain or loss when you sell shares. For the most current month-end performance information, please call 1-800-742-7272 or visit our Web site atwww.williamblairfunds.com.
| 176 | Annual Report | December 31, 2018 |
REPORT OF INDEPENDENT REGISTERED PUBLIC ACCOUNTING FIRM
To the Shareholders and the Board of Trustees of William Blair Funds
Opinion on the Financial Statements
We have audited the accompanying statements of assets and liabilities of the William Blair Funds (the “Trust”) (comprising the Growth Fund, Large Cap Growth Fund, Mid Cap Growth Fund, Small-Mid Cap Growth Fund, Small-Mid Cap Value Fund, Small Cap Growth Fund, Small Cap Value Fund, Global Leaders Fund, International Leaders Fund, International Developed Plus Fund, Institutional International Developed Plus Fund, International Growth Fund, Institutional International Growth Fund, International Small Cap Growth Fund, Emerging Markets Leaders Fund, Emerging Markets Growth Fund, Emerging Markets Small Cap Growth Fund, Bond Fund, Income Fund, Low Duration Fund, and Macro Allocation Fund (collectively referred to as the “Funds”)), including the portfolios of investments, as of December 31, 2018, and the related statements of operations, changes in net assets, and the financial highlights for each of the periods indicated in the table below and the related notes (collectively referred to as the “financial statements”). In our opinion, the financial statements present fairly, in all material respects, the financial position of each of the Funds comprising the William Blair Funds at December 31, 2018, and the results of their operations, changes in net assets, and financial highlights for each of the periods indicated in the table below, in conformity with U.S. generally accepted accounting principles.
| William Blair Funds | Statement
of operations | Statements
of changes
in net assets | Financial
highlights |
Growth Fund
Large Cap Growth Fund
Mid Cap Growth Fund
Small-Mid Cap Growth Fund
Small-Mid Cap Value Fund
Small Cap Growth Fund
Small Cap Value Fund
Global Leaders Fund
International Leaders Fund
International Developed Plus Fund
Institutional International Developed Plus Fund
International Growth Fund
Institutional International Growth Fund
International Small Cap Growth Fund
Emerging Markets Leaders Fund
Emerging Markets Growth Fund
Emerging Markets Small Cap Growth Fund
Bond Fund
Income Fund
Low Duration Fund | For the year ended
December 31, 2018 | For each of the two years in the period ended December 31, 2018 | For each of the five years in the period ended December 31, 2018 |
| Macro Allocation Fund | For the year ended
December 31, 2018 | For each of the two years in the period ended December 31, 2018 | For each of four years in the period ended December 31, 2018 and the period from November 1, 2014 through December 31, 2014, and for the year ended October 31, 2014 |
| December 31, 2018 | William Blair Funds | 177 |
Basis for Opinion
These financial statements are the responsibility of the Trust’s management. Our responsibility is to express an opinion on each of the Funds’ financial statements based on our audits. We are a public accounting firm registered with the Public Company Accounting Oversight Board (United States) (“PCAOB”) and are required to be independent with respect to the Trust in accordance with the U.S. federal securities laws and the applicable rules and regulations of the Securities and Exchange Commission and the PCAOB.
We conducted our audits in accordance with the standards of the PCAOB. Those standards require that we plan and perform the audit to obtain reasonable assurance about whether the financial statements are free of material misstatement, whether due to error or fraud. The Trust is not required to have, nor were we engaged to perform, an audit of the Trust’s internal control over financial reporting. As part of our audits we are required to obtain an understanding of internal control over financial reporting but not for the purpose of expressing an opinion on the effectiveness of the Trust’s internal control over financial reporting. Accordingly, we express no such opinion.
Our audits included performing procedures to assess the risks of material misstatement of the financial statements, whether due to error or fraud, and performing procedures that respond to those risks. Such procedures included examining, on a test basis, evidence regarding the amounts and disclosures in the financial statements. Our procedures included confirmation of securities owned as of December 31, 2018, by correspondence with the custodian and brokers or by other appropriate auditing procedures where replies from brokers were not received. Our audits also included evaluating the accounting principles used and significant estimates made by management, as well as evaluating the overall presentation of the financial statements. We believe that our audits provide a reasonable basis for our opinion.

We have served as the auditor of one or more William Blair investment companies since 1989.
Chicago, Illinois
February 27, 2019
| 178 | Annual Report | December 31, 2018 |
Trustees and Officers (Unaudited).†The trustees and officers of the William Blair Funds, their year of birth, their principal occupations during the last five years, their affiliations, if any, with William Blair, and their other significant affiliations are set forth below. The address of each officer and trustee is 150 North Riverside Plaza, Chicago, Illinois 60606.
| Name and Year of Birth | | Position(s)
Held with
Trust | | Term of
Office(1)and
Length of
Time
Served | | Principal
Occupation(s)
During Past 5 Years | | Number of
Portfolios
in Trust
Complex
Overseen
by Trustee | | Other Directorships
Held by Trustee |
| Interested Trustees | | | | | | | | |
Stephanie G. Braming,
1970(2) | | Chairman of the Board and President, previously Senior Vice President | | Chairman of the Board and President since 2018, and Senior Vice President 2014-2018 | | Global Head of Investment Management since 2017, portfolio manager (2014– 2017) and Partner, William Blair | | 21 | | Chairman, William Blair SICAV; Director, William Blair MAS Ltd. |
Arthur J. Simon,
1954(2) | | Trustee | | Since 2018 | | General Counsel and Partner, William Blair | | 21 | | Director, William Blair SICAV; Director, William Blair MAS Ltd. |
| | | | | | | | | |
| Non-Interested Trustees | | | | | | | | |
Vann A. Avedisian,
1964(3) | | Trustee | | Since 2012 | | Principal, Highgate Holdings (hotel investments) (since 2009); formerly, co-founder and Managing Director, Oxford Capital Partners Inc. (1994 to 2006) | | 21 | | Potbelly Corporation (2001 to 2015) |
Kathleen T. Barr,
1955 | | Trustee | | Since 2013 | | Retired; formerly, President, Productive Capital Management, Inc. (registered investment adviser to public entities) and Owner, KT Barr Consulting, LLC (mutual fund and investment management consulting) (2010 to 2013); prior thereto, Chief Administrative Officer, Senior Vice President and Senior Managing Director of Allegiant Asset Management Company (merged with PNC Capital Advisors, LLC in 2009) (2004 to 2010); Chief Administrative Officer, Chief Compliance Officer and Senior Vice President of PNC Funds and PNC Advantage Funds (f/k/a Allegiant Funds) (2003 to 2010) | | 21 | | Trustee, Professionally Managed Portfolios (since 2018); Council Member, Independent Directors Council; AmericaFirst Quantitative Funds (5 portfolios) (2012 to 2016) |
| † | William Blair Investment Management, LLC and William Blair & Company, L.L.C. are collectively referred to in this section as “William Blair”, each of which is a wholly owned subsidiary of WBC Holdings, L.P., which is wholly owned by certain William Blair employees (employee owners are referred to as ‘partners’). |
| December 31, 2018 | William Blair Funds | 179 |
| Name and Year of Birth | | Position(s)
Held with
Trust | | Term of
Office(1)and
Length of
Time
Served | | Principal
Occupation(s)
During Past 5 Years | | Number of
Portfolios
in Trust
Complex
Overseen
by Trustee | | Other Directorships
Held by Trustee |
Daniel N. Leib,
1966(4) | | Trustee | | Since 2016 | | Chief Executive Officer, Donnelley Financial Solutions, Inc. (since 2016); formerly, Executive Vice President and Chief Financial Officer, (2011 to 2016) and Group Chief Financial Officer (2009 to 2011), R.R. Donnelley & Sons Company | | 21 | | None |
Donald J. Reaves,
1946(5) | | Trustee | | Since 2004 | | Retired; formerly, Chancellor of Winston-Salem State University (2007 to 2014); prior thereto, Vice President for Administration and Chief Financial Officer, University of Chicago (2002 to 2007) | | 21 | | American Student Assistance Corp., guarantor of student loans; Amica Mutual Insurance Company |
Thomas J. Skelly,
1951 | | Trustee | | Since 2007 | | Advisory Board Member for various U.S. companies (since 2005); formerly, Managing Partner of various divisions at Accenture (1994-2004) | | 21 | | Mutual Trust Financial Group, provider of insurance and investment products |
Steven R. Zenz,
1954 | | Trustee | | Since 2018 | | Consultant, Steven R. Zenz Consulting LLC (merger and acquisition transactions and SEC reporting and filings) (since 2011); formerly, Partner, KPMG LLP (1987-2010)(6) | | 21 | | Frankly Inc. (technology products and services for media industry) (since 2016); RedBrick Health Corporation (health care technology for employee wellness) (2015-2018); Insignia Systems, Inc. (in-store advertising services for consumer packaged goods manufacturers) (since 2013) |
| (1) | Each Trustee serves until the election and qualification of a successor, or until death, resignation or retirement, or removal as provided in the Trust’s Declaration of Trust. Retirement for Non-Interested Trustees occurs no later than at the conclusion of the first regularly scheduled Board meeting of the calendar year that occurs after the earlier of (a) the Non-Interested Trustee’s 72nd birthday or (b) the 15th anniversary of the date that the Non-Interested Trustee became a member of the Board of Trustees. |
| (2) | Ms. Braming and Mr. Simon are interested persons of the Trust because they are partners of William Blair, and with respect to Ms. Braming also due to her position as an officer of the Trust. |
| (3) | Mr. Avedisian served as a member of the Board of Directors of Potbelly Corporation (“Potbelly”) from 2001 to 2015. In October 2013, Potbelly completed an underwritten initial public offering of its common stock (the “Offering”). William Blair served as a member of the underwriting syndicate. At the time of the Offering, Mr. Avedisian, through entities he owns or controls, indirectly beneficially owned 1,607,448 shares of Potbelly common stock and warrants to purchase 241,704 shares of common stock representing approximately 8.9% of the shares before the Offering. Mr. Avedisian disclaimed beneficial ownership of the shares except to the extent of his pecuniary interest therein. Potbelly sold 8,474,869 shares and certain stockholders, including two entities affiliated with William Blair, sold 150,131 shares in the Offering at a price to the public of $14.00 per share. Neither Mr. Avedisian nor the entities he owns or controls was a selling stockholder in the Offering. A portion of the net proceeds received by Potbelly from the Offering was used to pay a previously declared cash dividend, in an aggregate amount of approximately $49.9 million, on Potbelly common and preferred shares outstanding immediately prior to the closing of the Offering, which included the outstanding shares indirectly beneficially owned by Mr. Avedisian, William Blair and two entities affiliated with William Blair. |
| (4) | The Funds and William Blair use Donnelley Financial Solutions, Inc. (“DFS”), formerly a company of R.R. Donnelley & Sons Company (“RRD”), for financial printing and other services. DFS was formed as a spin-off from RRD in October 2016 and is a public company. The Funds and William Blair in the aggregate paid DFS approximately $11,000 for the period from spin-off through December 31, 2016 and $172,000 in 2017 for the services provided. DFS’s revenue was approximately $221 million for the period from spin-off through December 31, 2016 and was $1 billion in 2017. Mr. Leib, as the Chief Executive Officer of DFS, is not directly involved in any of the services provided to the Funds or William Blair and his compensation is not materially affected by the fees DFS receives from the Funds and William Blair. The Funds and William Blair engaged RRD for financial printing and other services prior to the spin-off and the amounts involved were not material. Mr. Leib, as former Executive Vice President and Chief Financial Officer of RRD, was not directly involved in any of the services provided to the Funds or William Blair and his compensation was not materially affected by the fees RRD received from the Funds and William Blair. |
| (5) | In his former role as Chief Financial Officer at the University of Chicago, Mr. Reaves had a working relationship with E. David Coolidge III, Vice Chairman of William Blair who is also a trustee of the University of Chicago. |
| (6) | The Funds engage KPMG to provide foreign tax services in Taiwan. KPMG does not provide audit or audit-related services to the Funds. Mr. Zenz is a former partner of KPMG and receives pension/retirement funds from KPMG. |
| 180 | Annual Report | December 31, 2018 |
| Name and Year of Birth | | Position(s) Held
with Trust | | | Term of Office(1)
and Length of
Time Served | | | Principal Occupation(s)
During Past 5 Years |
| | | | | | | | |
| Officers | | | | | | |
| | | | | | | |
Michael P. Balkin,
1959 | | Senior Vice President | | Since 2008 | | Partner, William Blair |
| | | | | | | |
Thomas Clarke,
1968 | | Senior Vice President | | Since 2011 | | Partner, William Blair (since 2014); formerly, Associate, William Blair (2011-2014) |
| | | | | | | |
Daniel Crowe,
1972 | | Senior Vice President | | Since 2016 | | Partner, William Blair (since 2015); formerly, Associate, William Blair |
| | | | | | | |
Simon Fennell,
1969 | | Senior Vice President | | Since 2013 | | Partner, William Blair (since 2013); formerly, Associate, William Blair (2011-2013) |
| | | | | | | |
Andrew G. Flynn,
1961 | | Senior Vice President | | Since 2013 | | Partner, William Blair |
| | | | | | | |
David C. Fording,
1967 | | Senior Vice President | | Since 2006 | | Partner, William Blair |
| | | | | | | |
James S. Golan,
1961 | | Senior Vice President | | Since 2005 | | Partner, William Blair |
| | | | | | | |
Michael A. Jancosek,
1959 | | Senior Vice President | | Since 2000 | | Partner, William Blair |
| | | | | | | |
Chad M. Kilmer,
1975 | | Senior Vice President | | Since 2006 | | Partner, William Blair |
| | | | | | | |
Robert C. Lanphier IV,
1956 | | Senior Vice President | | Since 2003 | | Partner, William Blair |
| | | | | | | |
Mark T. Leslie,
1967 | | Senior Vice President | | Since 2005 | | Partner, William Blair |
| | | | | | | |
Kenneth J. McAtamney,
1966 | | Senior Vice President | | Since 2008 | | Partner, William Blair |
| | | | | | | |
Todd M. McClone,
1968 | | Senior Vice President | | Since 2005 | | Partner, William Blair |
| | | | | | | |
David Merjan,
1960 | | Senior Vice President | | Since 2008 | | Partner, William Blair |
| | | | | | | |
David S. Mitchell,
1960 | | Senior Vice President | | Since 2003 | | Partner, William Blair |
| | | | | | | |
John C. Murphy,
1969 | | Senior Vice President | | Since 2014 | | Partner, William Blair |
| | | | | | | |
Casey K. Preyss,
1976 | | Senior Vice President | | Since 2015 | | Partner, William Blair |
| | | | | | | |
David P. Ricci,
1958 | | Senior Vice President | | Since 2006 | | Partner, William Blair |
| | | | | | | |
Ward D. Sexton,
1974 | | Senior Vice President | | Since 2016 | | Partner, William Blair |
| | | | | | | |
Brian D. Singer,
1960 | | Senior Vice President | | Since 2011 | | Partner, William Blair |
| | | | | | | |
Christopher T. Vincent,
1956 | | Senior Vice President | | Since 2002 | | Partner, William Blair |
| December 31, 2018 | William Blair Funds | 181 |
| Name and Year of Birth | | Position(s) Held
with Trust | | | Term of Office(1)
and Length of
Time Served | | | Principal Occupation(s)
During Past 5 Years |
| | | | | | | |
Lisa D. Rusch,
1970 | | Vice President | | Since 2018 | | Associate, William Blair |
| | | | | | | |
Paul J. Sularz,
1967 | | Vice President | | Since 2009 | | Associate, William Blair (2006-2012 and since 2014); Partner, William Blair (2012-2014) |
| | | | | | | |
Colette M. Garavalia,
1961 | | Treasurer | | Since 2000 | | Associate, William Blair |
| | | | | | | |
Andrew T. Pfau,
1970 | | Secretary | | Since 2009 | | Associate, William Blair |
| | | | | | | |
John M. Raczek,
1970 | | Assistant Treasurer | | Since 2010 | | Associate, William Blair |
| | | | | | | |
Walter R. Randall, Jr.,
1960 | | Chief Compliance Officer and Assistant Secretary | | Since 2009 | | Associate, William Blair |
| | | | | | | |
Robert J. Toner,
1967 | | Assistant Secretary | | Since 2016 | | Associate, William Blair (since 2015); formerly, Managing Director and Counsel, Wellington Management & Company LLP (2007-2015) |
| (1) | The Trust’s officers, except the Chief Compliance Officer, are elected annually by the Board of Trustees. The Trust’s Chief Compliance Officer is designated by the Board of Trustees and may only be removed by action of the Board of Trustees, including a majority of independent trustees. Length of Time Served for all officers indicates the year the individual became an officer of the Trust. |
The Statement of Additional Information for the William Blair Funds includes additional information about the trustees and is available without charge by calling 1-800-635-2886 (in Massachusetts 1-800-635-2840) or by writing the Fund.
| 182 | Annual Report | December 31, 2018 |
(Unaudited)
Proxy Voting
A description of the policies and procedures that the Funds use to determine how to vote proxies relating to portfolio securities and information regarding how the Funds voted proxies relating to portfolio securities for the most recent 12-month period ended December 31 are available without charge, upon request, by calling 1-800-635-2886 (in Massachusetts 1-800-635-2840), atwww.williamblairfunds.com and on the SEC’s website athttp://www.sec.gov.
Quarterly Portfolio Schedules
Each Fund files its complete schedule of portfolio holdings with the SEC for the first and third fiscal quarters of each fiscal year (quarters ended March 31 and September 30) on Form N-PORT. The Funds’ Forms N-PORT are available on the SEC’s website athttp://www.sec.gov.
Additional Federal Income Tax Information: (unaudited)
Under Section 852(b)(3)(C) of the Code, the Funds hereby designate the following amounts as capital gain dividends for the fiscal year ended December 31, 2018 (in thousands):
| Fund | | Capital Gain Dividend |
| Growth | | $ | 78,680 | |
| Large Cap Growth | | | 30,062 | |
| Mid Cap Growth | | | 12,496 | |
| Small-Mid Cap Growth | | | 224,256 | |
| Small-Mid Cap Value | | | 451 | |
| Small Cap Growth | | | 73,556 | |
| Small Cap Value | | | 64,927 | |
| Global Leaders | | | 27,739 | |
| International Leaders | | | 12,780 | |
| International Developed Plus | | | 695 | |
| International Growth | | | 163,556 | |
| Institutional International Growth | | | 166,380 | |
| International Small Cap Growth | | | 38,842 | |
| Emerging Markets Leaders | | | 17,246 | |
| Emerging Markets Growth | | | 116,253 | |
| Emerging Markets Small Cap Growth | | | 6,407 | |
| December 31, 2018 | William Blair Funds | 183 |
Useful Information About Your Report (Unaudited)
Please refer to this information when reviewing the Expense Example for each Fund.
Expense Example
As a shareholder of a Fund, you incur two types of costs: (1) transaction costs and (2) ongoing costs, including management fees, distribution (12b-1) fees (for Class N shares except for the Institutional International Growth Fund and the Institutional International Developed Plus Fund) and other Fund expenses. The example is intended to help you understand your ongoing costs (in dollars) of investing in the Fund and to compare these costs with the ongoing costs of investing in other mutual funds. To do so, compare the Fund’s 5% hypothetical example with the 5% hypothetical examples that appear in the shareholder reports of other funds. The example is based on an investment of $1,000 invested at the beginning of the period and held for the entire six-month period from July 1, 2018 to December 31, 2018.
Actual Expenses
In each example, the first line for each share class in the table provides information about theactualaccount values andactualexpenses. These expenses reflect the effect of any expense cap applicable to the share class during the period. Without this expense cap, the costs shown in the table would have been higher. You may use the information in this line, together with the amount you invested, to estimate the expenses that you paid over the period. Simply divide your account value by $1,000 (example, an $8,600 account value divided by $1,000 = 8.6), then multiply the result by the number in the first line under the heading entitled “Expenses Paid During the Period” to estimate the expenses you paid on your account during the period.
Hypothetical Example for Comparison Purposes
In each example, the second line for each share class in the table provides information abouthypotheticalaccount values andhypotheticalexpenses based on the Fund’s actual expense ratio and an assumed rate of return of 5% per year before expenses. This is not the Fund’s actual return. The hypothetical account values and expenses may not be used to estimate your actual ending account balance or the expenses you paid for the period. You may use this information to compare the ongoing costs of investing in the Fund to the costs of investing in other funds. To do so, compare this 5% hypothetical example with the 5% hypothetical examples that appear in the shareholder reports of other funds.
Please note that the expenses shown in both examples are meant to highlight your ongoing costs only and do not reflect any transactional costs or account type fees, such as IRA administration fees. These fees are discussed in the prospectus. Therefore, the second line of each share class in the table is useful in comparing ongoing costs only and will not help you determine the relative costs of owning different funds. In addition, if these transactional costs or account fees were included, your costs would have been higher.
| 184 | Annual Report | December 31, 2018 |
Fund Expenses (Unaudited)
| | | Beginning | | Ending | | Expenses Paid | | |
| | | Account Value | | Account Value | | During | | Annualized |
| Expense Example | | 7/1/2018 | | 12/31/2018 | | the Period (a) | | Expense Ratio |
| Growth Fund | | | | | | | | | | | | | | | | |
| Class N-actual return | | $ | 1,000.00 | | | $ | 932.14 | | | | $5.84 | | | | 1.20 | % |
| Class N-hypothetical 5% return | | $ | 1,000.00 | | | $ | 1,043.95 | | | | $6.18 | | | | 1.20 | |
| Class I-actual return | | $ | 1,000.00 | | | $ | 933.38 | | | | $4.43 | | | | 0.91 | |
| Class I-hypothetical 5% return | | $ | 1,000.00 | | | $ | 1,045.41 | | | | $4.69 | | | | 0.91 | |
| Large Cap Growth Fund | | | | | | | | | | | | | | | | |
| Class N-actual return | | $ | 1,000.00 | | | $ | 934.81 | | | | $5.12 | | | | 1.05 | |
| Class N-hypothetical 5% return | | $ | 1,000.00 | | | $ | 1,044.71 | | | | $5.41 | | | | 1.05 | |
| Class I-actual return | | $ | 1,000.00 | | | $ | 936.21 | | | | $3.90 | | | | 0.80 | |
| Class I-hypothetical 5% return | | $ | 1,000.00 | | | $ | 1,045.97 | | | | $4.13 | | | | 0.80 | |
| Mid Cap Growth Fund | | | | | | | | | | | | | | | | |
| Class N-actual return | | $ | 1,000.00 | | | $ | 885.05 | | | | $5.70 | | | | 1.20 | |
| Class N-hypothetical 5% return | | $ | 1,000.00 | | | $ | 1,043.95 | | | | $6.18 | | | | 1.20 | |
| Class I-actual return | | $ | 1,000.00 | | | $ | 887.09 | | | | $4.52 | | | | 0.95 | |
| Class I-hypothetical 5% return | | $ | 1,000.00 | | | $ | 1,045.21 | | | | $4.90 | | | | 0.95 | |
| Small-Mid Cap Growth Fund | | | | | | | | | | | | | | | | |
| Class N-actual return | | $ | 1,000.00 | | | $ | 882.33 | | | | $6.41 | | | | 1.35 | |
| Class N-hypothetical 5% return | | $ | 1,000.00 | | | $ | 1,043.19 | | | | $6.95 | | | | 1.35 | |
| Class I-actual return | | $ | 1,000.00 | | | $ | 883.09 | | | | $5.22 | | | | 1.10 | |
| Class I-hypothetical 5% return | | $ | 1,000.00 | | | $ | 1,044.45 | | | | $5.67 | | | | 1.10 | |
| Small-Mid Cap Value Fund | | | | | | | | | | | | | | | | |
| Class N-actual return | | $ | 1,000.00 | | | $ | 839.74 | | | | $5.80 | | | | 1.25 | |
| Class N-hypothetical 5% return | | $ | 1,000.00 | | | $ | 1,043.70 | | | | $6.44 | | | | 1.25 | |
| Class I-actual return | | $ | 1,000.00 | | | $ | 841.38 | | | | $4.64 | | | | 1.00 | |
| Class I-hypothetical 5% return | | $ | 1,000.00 | | | $ | 1,044.96 | | | | $5.15 | | | | 1.00 | |
| Small Cap Growth Fund | | | | | | | | | | | | | | | | |
| Class N-actual return | | $ | 1,000.00 | | | $ | 847.91 | | | | $6.99 | | | | 1.50 | |
| Class N-hypothetical 5% return | | $ | 1,000.00 | | | $ | 1,042.44 | | | | $7.72 | | | | 1.50 | |
| Class I-actual return | | $ | 1,000.00 | | | $ | 849.06 | | | | $5.83 | | | | 1.25 | |
| Class I-hypothetical 5% return | | $ | 1,000.00 | | | $ | 1,043.70 | | | | $6.44 | | | | 1.25 | |
| Small Cap Value Fund | | | | | | | | | | | | | | | | |
| Class N-actual return | | $ | 1,000.00 | | | $ | 831.59 | | | | $6.92 | | | | 1.50 | |
| Class N-hypothetical 5% return | | $ | 1,000.00 | | | $ | 1,042.44 | | | | $7.72 | | | | 1.50 | |
| Class I-actual return | | $ | 1,000.00 | | | $ | 832.59 | | | | $5.77 | | | | 1.25 | |
| Class I-hypothetical 5% return | | $ | 1,000.00 | | | $ | 1,043.70 | | | | $6.44 | | | | 1.25 | |
| Global Leaders Fund | | | | | | | | | | | | | | | | |
| Class N-actual return | | $ | 1,000.00 | | | $ | 863.07 | | | | $6.10 | | | | 1.30 | |
| Class N-hypothetical 5% return | | $ | 1,000.00 | | | $ | 1,043.45 | | | | $6.70 | | | | 1.30 | |
| Class I-actual return | | $ | 1,000.00 | | | $ | 863.68 | | | | $4.93 | | | | 1.05 | |
| Class I-hypothetical 5% return | | $ | 1,000.00 | | | $ | 1,044.71 | | | | $5.41 | | | | 1.05 | |
| Institutional Class-actual return | | $ | 1,000.00 | | | $ | 863.70 | | | | $4.70 | | | | 1.00 | |
| Institutional Class-hypothetical 5% return | | $ | 1,000.00 | | | $ | 1,044.96 | | | | $5.15 | | | | 1.00 | |
| International Leaders Fund | | | | | | | | | | | | | | | | |
| Class N-actual return | | $ | 1,000.00 | | | $ | 863.99 | | | | $5.87 | | | | 1.25 | |
| Class N-hypothetical 5% return | | $ | 1,000.00 | | | $ | 1,043.70 | | | | $6.44 | | | | 1.25 | |
| Class I-actual return | | $ | 1,000.00 | | | $ | 865.54 | | | | $4.70 | | | | 1.00 | |
| Class I-hypothetical 5% return | | $ | 1,000.00 | | | $ | 1,044.96 | | | | $5.15 | | | | 1.00 | |
| Institutional Class-actual return | | $ | 1,000.00 | | | $ | 865.68 | | | | $4.47 | | | | 0.95 | |
| Institutional Class-hypothetical 5% return | | $ | 1,000.00 | | | $ | 1,045.21 | | | | $4.90 | | | | 0.95 | |
| International Developed Plus Fund | | | | | | | | | | | | | | | | |
| Class N-actual return | | $ | 1,000.00 | | | $ | 855.33 | | | | $5.85 | | | | 1.25 | |
| Class N-hypothetical 5% return | | $ | 1,000.00 | | | $ | 1,043.70 | | | | $6.44 | | | | 1.25 | |
| Class I-actual return | | $ | 1,000.00 | | | $ | 856.22 | | | | $4.68 | | | | 1.00 | |
| Class I-hypothetical 5% return | | $ | 1,000.00 | | | $ | 1,044.96 | | | | $5.15 | | | | 1.00 | |
| December 31, 2018 | William Blair Funds | 185 |
Fund Expenses (Unaudited)
| | | Beginning | | Ending | | Expenses Paid | | |
| | | Account Value | | Account Value | | During | | Annualized |
| Expense Example | | 7/1/2018 | | 12/31/2018 | | the Period (a) | | Expense Ratio |
| Institutional International Developed Plus Fund | | | | | | | | | | | | | | | | |
| Institutional Class-actual return | | $ | 1,000.00 | | | $ | 857.04 | | | | $4.21 | | | | 0.90 | % |
| Institutional Class-hypothetical 5% return | | $ | 1,000.00 | | | $ | 1,045.46 | | | | $4.64 | | | | 0.90 | |
| International Growth Fund | | | | | | | | | | | | | | | | |
| Class N-actual return | | $ | 1,000.00 | | | $ | 834.86 | | | | $6.71 | | | | 1.45 | |
| Class N-hypothetical 5% return | | $ | 1,000.00 | | | $ | 1,042.69 | | | | $7.47 | | | | 1.45 | |
| Class I-actual return | | $ | 1,000.00 | | | $ | 836.44 | | | | $5.23 | | | | 1.13 | |
| Class I-hypothetical 5% return | | $ | 1,000.00 | | | $ | 1,044.30 | | | | $5.82 | | | | 1.13 | |
| Institutional International Growth Fund | | | | | | | | | | | | | | | | |
| Institutional Class-actual return | | $ | 1,000.00 | | | $ | 838.42 | | | | $4.49 | | | | 0.97 | |
| Institutional Class-hypothetical 5% return | | $ | 1,000.00 | | | $ | 1,045.11 | | | | $5.00 | | | | 0.97 | |
| International Small Cap Growth Fund | | | | | | | | | | | | | | | | |
| Class N-actual return | | $ | 1,000.00 | | | $ | 788.86 | | | | $6.67 | | | | 1.48 | |
| Class N-hypothetical 5% return | | $ | 1,000.00 | | | $ | 1,042.54 | | | | $7.62 | | | | 1.48 | |
| Class I-actual return | | $ | 1,000.00 | | | $ | 789.34 | | | | $5.32 | | | | 1.18 | |
| Class I-hypothetical 5% return | | $ | 1,000.00 | | | $ | 1,044.05 | | | | $6.08 | | | | 1.18 | |
| Institutional Class-actual return | | $ | 1,000.00 | | | $ | 789.72 | | | | $4.87 | | | | 1.08 | |
| Institutional Class-hypothetical 5% return | | $ | 1,000.00 | | | $ | 1,044.56 | | | | $5.57 | | | | 1.08 | |
| Emerging Markets Leaders Fund | | | | | | | | | | | | | | | | |
| Class N-actual return | | $ | 1,000.00 | | | $ | 884.24 | | | | $7.36 | | | | 1.55 | |
| Class N-hypothetical 5% return | | $ | 1,000.00 | | | $ | 1,042.19 | | | | $7.98 | | | | 1.55 | |
| Class I-actual return | | $ | 1,000.00 | | | $ | 885.36 | | | | $6.04 | | | | 1.27 | |
| Class I-hypothetical 5% return | | $ | 1,000.00 | | | $ | 1,043.60 | | | | $6.54 | | | | 1.27 | |
| Institutional Class-actual return | | $ | 1,000.00 | | | $ | 885.22 | | | | $5.70 | | | | 1.20 | |
| Institutional Class-hypothetical 5% return | | $ | 1,000.00 | | | $ | 1,043.95 | | | | $6.18 | | | | 1.20 | |
| Emerging Markets Growth Fund | | | | | | | | | | | | | | | | |
| Class N-actual return | | $ | 1,000.00 | | | $ | 846.03 | | | | $7.07 | | | | 1.52 | |
| Class N-hypothetical 5% return | | $ | 1,000.00 | | | $ | 1,042.34 | | | | $7.82 | | | | 1.52 | |
| Class I-actual return | | $ | 1,000.00 | | | $ | 847.47 | | | | $5.91 | | | | 1.27 | |
| Class I-hypothetical 5% return | | $ | 1,000.00 | | | $ | 1,043.60 | | | | $6.54 | | | | 1.27 | |
| Institutional Class-actual return | | $ | 1,000.00 | | | $ | 847.81 | | | | $5.54 | | | | 1.19 | |
| Institutional Class-hypothetical 5% return | | $ | 1,000.00 | | | $ | 1,044.00 | | | | $6.13 | | | | 1.19 | |
| Emerging Markets Small Cap Growth Fund | | | | | | | | | | | | | | | | |
| Class N-actual return | | $ | 1,000.00 | | | $ | 844.43 | | | | $7.21 | | | | 1.55 | |
| Class N-hypothetical 5% return | | $ | 1,000.00 | | | $ | 1,042.19 | | | | $7.98 | | | | 1.55 | |
| Class I-actual return | | $ | 1,000.00 | | | $ | 845.99 | | | | $6.05 | | | | 1.30 | |
| Class I-hypothetical 5% return | | $ | 1,000.00 | | | $ | 1,043.45 | | | | $6.70 | | | | 1.30 | |
| Institutional Class-actual return | | $ | 1,000.00 | | | $ | 846.04 | | | | $5.82 | | | | 1.25 | |
| Institutional Class-hypothetical 5% return | | $ | 1,000.00 | | | $ | 1,043.70 | | | | $6.44 | | | | 1.25 | |
| Bond Fund | | | | | | | | | | | | | | | | |
| Class N-actual return | | $ | 1,000.00 | | | $ | 998.79 | | | | $3.02 | | | | 0.60 | |
| Class N-hypothetical 5% return | | $ | 1,000.00 | | | $ | 1,046.98 | | | | $3.10 | | | | 0.60 | |
| Class I-actual return | | $ | 1,000.00 | | | $ | 999.32 | | | | $2.27 | | | | 0.45 | |
| Class I-hypothetical 5% return | | $ | 1,000.00 | | | $ | 1,047.73 | | | | $2.32 | | | | 0.45 | |
| Institutional Class-actual return | | $ | 1,000.00 | | | $ | 999.58 | | | | $1.92 | | | | 0.38 | |
| Institutional Class-hypothetical 5% return | | $ | 1,000.00 | | | $ | 1,048.08 | | | | $1.96 | | | | 0.38 | |
| Income Fund | | | | | | | | | | | | | | | | |
| Class N-actual return | | $ | 1,000.00 | | | $ | 1,002.79 | | | | $4.29 | | | | 0.85 | |
| Class N-hypothetical 5% return | | $ | 1,000.00 | | | $ | 1,045.72 | | | | $4.38 | | | | 0.85 | |
| Class I-actual return | | $ | 1,000.00 | | | $ | 1,003.59 | | | | $3.28 | | | | 0.65 | |
| Class I-hypothetical 5% return | | $ | 1,000.00 | | | $ | 1,046.72 | | | | $3.35 | | | | 0.65 | |
| Low Duration Fund | | | | | | | | | | | | | | | | |
| Class N-actual return | | $ | 1,000.00 | | | $ | 1,005.17 | | | | $2.78 | | | | 0.55 | |
| Class N-hypothetical 5% | | $ | 1,000.00 | | | $ | 1,047.23 | | | | $2.84 | | | | 0.55 | |
| Class I-actual return | | $ | 1,000.00 | | | $ | 1,007.22 | | | | $1.97 | | | | 0.39 | |
| Class I-hypothetical 5% | | $ | 1,000.00 | | | $ | 1,048.03 | | | | $2.01 | | | | 0.39 | |
| Institutional Class-actual return | | $ | 1,000.00 | | | $ | 1,007.34 | | | | $1.77 | | | | 0.35 | |
| Institutional Class-hypothetical 5% return | | $ | 1,000.00 | | | $ | 1,048.24 | | | | $1.81 | | | | 0.35 | |
| 186 | Annual Report | December 31, 2018 |
Fund Expenses (Unaudited)
| | | Beginning | | Ending | | Expenses Paid | | |
| | | Account Value | | Account Value | | During | | Annualized |
| Expense Example | | 7/1/2018 | | 12/31/2018 | | the Period (a) | | Expense Ratio |
| Macro Allocation Fund | | | | | | | | | | | | | | | | |
| Class N-actual return | | $ | 1,000.00 | | | $ | 1,003.12 | | | | $6.41 | | | | 1.27 | % |
| Class N-hypothetical 5% | | $ | 1,000.00 | | | $ | 1,043.60 | | | | $6.54 | | | | 1.27 | |
| Class I-actual return | | $ | 1,000.00 | | | $ | 1,004.38 | | | | $5.00 | | | | 0.99 | |
| Class I-hypothetical 5% | | $ | 1,000.00 | | | $ | 1,045.01 | | | | $5.10 | | | | 0.99 | |
| Institutional Class-actual return | | $ | 1,000.00 | | | $ | 1,004.94 | | | | $4.60 | | | | 0.91 | |
| Institutional Class-hypothetical 5% return | | $ | 1,000.00 | | | $ | 1,045.41 | | | | $4.69 | | | | 0.91 | |
| (a) | Expenses are equal to the annualized expense ratio, multiplied by the average account value over the period, multiplied by the number of days in the period, 184, and divided by 365 (to reflect the one-half year period). |
| December 31, 2018 | William Blair Funds | 187 |
| | BOARD OF TRUSTEES |
| | |
| | Vann A. Avedisian Principal, Highgate Holdings Kathleen T. Barr Retired Senior Managing Director, PNC Capital Advisors, LLC Stephanie G. Braming, Chairman and President Partner, William Blair Daniel N. Leib Chief Executive Officer, Donnelley Financial Solutions, Inc. Donald J. Reaves Retired Chancellor, Winston-Salem State University Arthur J. Simon Partner, William Blair Thomas J. Skelly Retired Managing Partner, Accenture Steven R. Zenz Retired Partner, KPMG LLP |
| | Officers |
| | Michael P. Balkin, Senior Vice President Thomas Clarke, Senior Vice President Daniel Crowe, Senior Vice President Simon Fennell, Senior Vice President Andrew G. Flynn, Senior Vice President David C. Fording, Senior Vice President James S. Golan, Senior Vice President Michael A. Jancosek, Senior Vice President Chad M. Kilmer, Senior Vice President Robert C. Lanphier, IV, Senior Vice President Mark T. Leslie, Senior Vice President Kenneth J. McAtamney, Senior Vice President Todd M. McClone, Senior Vice President David Merjan, Senior Vice President David S. Mitchell, Senior Vice President John C. Murphy, Senior Vice President Casey K. Preyss, Senior Vice President David P. Ricci, Senior Vice President Ward D. Sexton, Senior Vice President Brian D. Singer, Senior Vice President Christopher T. Vincent, Senior Vice President Lisa D. Rusch, Vice President Paul J. Sularz, Vice President Colette M. Garavalia, Treasurer Andrew T. Pfau, Secretary John M. Raczek, Assistant Treasurer Walter R. Randall, Jr., Chief Compliance Officer and Assistant Secretary Robert J. Toner, Assistant Secretary Investment Adviser William Blair Investment Management, LLC Distributor William Blair & Company, L.L.C. Independent Registered Public Accounting Firm Ernst & Young LLP Legal Counsel Vedder Price P.C. Transfer Agent DST Asset Manager Solutions, Inc. (formerly known as Boston Financial Data Services, Inc.) For customer assistance, call 1-800-635-2886 P.O. Box 219137 Kansas City, Missouri 64121-9137 |
| 188 | Annual Report | December 31, 2018 |
| | | | | | |
| | William Blair Funds | | |
| | | | | | |
| | | | | | |
| | DOMESTIC EQUITY | | GLOBAL EQUITY | | FIXED INCOME |
| | Growth Fund | | Global Leaders Fund | | Bond Fund |
| | Large Cap Growth Fund | | | | Income Fund |
| | Mid Cap Growth Fund | | INTERNATIONAL EQUITY | | Low Duration Fund |
| | Small-Mid Cap Growth Fund | | International Leaders Fund | | |
| | Small-Mid Cap Value Fund | | International Developed Plus Fund | | MULTI-ASSET AND |
| | Small Cap Growth Fund | | Institutional International Developed Plus Fund | | ALTERNATIVE |
| | Small Cap Value Fund | | International Growth Fund | | Macro Allocation Fund |
| | | | Institutional International Growth Fund | | |
| | | | International Small Cap Growth Fund | | |
| | | | Emerging Markets Leaders Fund | | |
| | | | Emerging Markets Growth Fund | | |
| | | | Emerging Markets Small Cap Growth Fund | | |
 | | © | William Blair & Company, L.L.C., distributor | |
| +1 800 742 7272 | | 150 North Riverside Plaza | |
| williamblairfunds.com | | Chicago, Illinois 60606 | 00103188 |
(a) Registrant has adopted a code of ethics (the “Code”) that applies to its principal executive officer and principal financial officer (the “Covered Officers”).
(b) No disclosures are required pursuant to this Item 2(b).
(c) During the period covered by the report, registrant did not make any amendment to a provision of the Code.
(d) During the period covered by the report, registrant did not grant any waivers, including implicit waivers, from the provisions of the Code.
(e) Not applicable.
(f) A copy of the Code is filed as Exhibit 13(a)(1) to this Form N-CSR.
| Item 3. | Audit Committee Financial Expert |
The Registrant’s Board of Trustees has determined that the Registrant has at least one “audit committee financial expert” (as defined in Item 3 of Form N-CSR) serving on its Audit Committee. Mr. Daniel N. Leib, the Registrant’s audit committee financial expert, is “independent” for purposes of Item 3 to Form N-CSR.
An “audit committee financial expert” is not an “expert” for any purpose, including for purposes of Section 11 of the Securities Act of 1933, as a result of being designated as an “audit committee financial expert.” Further, the designation of a person as an “audit committee financial expert” does not mean that the person has any greater duties, obligations, or liability than those imposed on the person without the “audit committee financial expert” designation. Similarly, the designation of a person as an “audit committee financial expert” does not affect the duties, obligations, or liability of any other member of the audit committee or Board of Trustees.
| Item 4. | Principal Accountant Fees and Services |
Audit Fees
For the fiscal years ended December 31, 2017 and 2018, Ernst & Young, LLP, the Registrant’s principal accountant (“E&Y”), billed the Registrant $663,600 and $663,600, respectively, for professional services rendered for the audit of the Registrant’s annual financial statements or services that are normally provided in connection with statutory and regulatory filings.
Audit-Related Fees
For the fiscal years ended December 31, 2017 and 2018, E&Y billed the Registrant $0 and $0, respectively, for assurance and related services that are reasonably related to the performance of the audit of the Registrant’s financial statements and that are not reported above. For the fiscal years ended December 31, 2017 and 2018, E&Y provided no audit-related services to William Blair Investment Management, LLC, the Registrant’s investment advisor (“William Blair”) or any of its control affiliates that were for engagements directly related to the Registrant’s operations and financial reporting.
Tax Fees
For the fiscal years ended December 31, 2017 and 2018, E&Y billed the Registrant $239,900 and $210,190, respectively, for professional services rendered for tax compliance, tax advice and tax planning. Such services consisted of preparation of tax returns, year-end distribution review, qualifying dividend income analysis and review of year-end tax reporting. For the fiscal years ended December 31, 2017 and 2018, E&Y did not bill William Blair and its control affiliates for any services that were for engagements directly related to the Registrant’s operations and financial reporting.
All Other Fees
For the fiscal years ended December 31, 2017 and 2018, E&Y did not bill the Registrant for products and services other than the services reported above. For the fiscal year ended December 31, 2017 and 2018, E&Y provided no other services to William Blair or any of its control affiliates that were for engagements directly related to the Registrant’s operations and financial reporting.
Audit Committee Pre-Approval Policies and Procedures
Pursuant to the Registrant’s Audit Committee Charter (the “Charter”), the Audit Committee is responsible for pre-approving any engagement of the principal accountant to provide non-prohibited services to the Registrant, including the fees and other compensation to be paid to the principal accountant, to the extent required by Rule 2-01(c)(7) of Regulation S-X. Pursuant to the Charter, the Audit Committee is also responsible for pre-approving any engagement of the principal accountant, including the fees and other compensation to be paid to the principal accountant, to provide non-audit services to the Registrant’s investment advisor (or any entity controlling, controlled by, or under common control with the adviser that provides ongoing services to the Registrant), if the engagement relates directly to the operations and financial reporting of the Registrant, to the extent required by Rule 2-01(c)(7) of Regulation S-X. The Chair of the Audit Committee may grant the pre-approval referenced above for non-prohibited and non-audit services. All such delegated pre-approvals will be presented to the Audit Committee no later than the next Audit Committee meeting. None of the Audit-Related and Tax Services billed by E&Y for the fiscal years ended December 31, 2017 and 2018 discussed above were approved by the Audit Committee pursuant to a waiver of these Pre-Approval Policies and Procedures.
Non-Audit Fees
For the fiscal years ended December 31, 2017 and 2018, E&Y billed the Trust $239,900 and $210,190, respectively, in non-audit fees (tax services). For the same periods, E&Y billed the Adviser and its control affiliates $0 and $0, respectively, in non-audit fees.
| Item 5. | Audit Committee of Listed Registrants |
Not Applicable to this Registrant, insofar as the Registrant is not a listed company.
| Item 6. | Schedule of Investments |
See Schedule of Investments in Item 1.
| Item 7. | Disclosure of Proxy Voting Policies and Procedures for Closed-End Management Investment Companies |
Not applicable to this Registrant, insofar as the Registrant is not a closed-end management investment company.
| Item 8. | Portfolio Managers of Closed Investment Companies |
Not applicable to this Registrant, insofar as the Registrant is not a closed-end management investment company.
| Item 9. | Purchase of Equity Securities by Closed-End Management Investment Companies and Affiliated Purchasers |
Not applicable to this Registrant, insofar as the Registrant is not a closed-end management investment company.
| Item 10. | Submission of Matters to a Vote of Security Holders |
There have been no material changes to the procedures by which shareholders may recommend nominees to the Registrant’s Board of Trustees since the Registrant last provided disclosure in response to this item.
Controls and Procedures
(a) The Registrant’s principal executive and principal financial officer, or persons performing similar functions, have concluded that the Registrant’s Disclosure Controls and Procedures (as defined in Rule 30a-3(c) under the Investment Company Act of 1940, as amended (the “1940 Act”) (17 CFR 270.30a-3(c)) are effective, as of a date within 90 days of the filing date of this report that includes the disclosure required by this paragraph, based on their evaluation of these controls and procedures required by Rule 30a-3 (b) under the 1940 Act (17 CFR 270.30a-3(b) and Rules 13a-15(b) or 15d-15(b) under the Exchange Act (17 CFR 240.13a-15(b) or 240.15d-15(b)).
(b) There were no changes in the Registrant’s internal control over financial reporting (as defined in Rule 30a-3(d) under the 1940 Act (17 CFR 270.30a-3(d)) that occurred during the final quarter of the period covered by this report that has materially affected, or is reasonably likely to materially affect, the Registrant’s internal control over financial reporting.
| Item 12. | Disclosure of Securities Lending Activities for Closed-End Management Investment Companies |
Not applicable to this Registrant, insofar as the Registrant is not a closed-end management investment company.
13. (a) (1) Code of Ethics
13. (a) (2) (1)
Certification of Principal Executive Officer Required by Rule 30a-2(a) of the Investment Company Act is filed as an exhibit hereto.
13. (a) (2) (2)
Certification of Principal Financial Officer Required by Rule 30a-2(a) of the Investment Company Act is filed as an exhibit hereto.
13. (a) (3)
Not applicable to this Registrant.
13. (b)
Certifications of the Principal Executive Officer and Principal Financial Officer of the issuer as required by Rule 30a-2(b) of the Investment Company Act of 1940 are filed as exhibits hereto.
SIGNATURES
Pursuant to the requirements of the Securities Exchange Act of 1934 and the Investment Company Act of 1940, the Registrant has duly caused this report to be signed on its behalf by the undersigned, thereunto duly authorized.
| | | William Blair Funds |
| | |
| | | /s/ Stephanie G. Braming |
| By: | | Stephanie G. Braming |
| | | President (Principal Executive Officer) |
Date: February 28, 2019
Pursuant to the requirements of the Securities Exchange Act of 1934 and the Investment Company Act of 1940, this report has been signed below by the following persons on behalf of the Registrant and in the capacities and on the dates indicated.
| | | /s/ Stephanie G. Braming |
| By: | | Stephanie G. Braming |
| | | President (Principal Executive Officer) |
Date: February 28, 2019
| | | /s/ Colette M. Garavalia |
| By: | | Colette M. Garavalia |
| | | Treasurer (Principal Financial Officer) |
Date: February 28, 2019