| | |
| UNITED STATES
SECURITIES AND EXCHANGE COMMISSION |
| | |
| CERTIFIED SHAREHOLDER REPORT OF REGISTERED
MANAGEMENT INVESTMENT COMPANIES
|
| | |
| Investment Company Act file number: | (811-05346) |
| | |
| Exact name of registrant as specified in charter: | Putnam Variable Trust |
| | |
| Address of principal executive offices: | One Post Office Square, Boston, Massachusetts 02109 |
| | |
| Name and address of agent for service: | Robert T. Burns, Vice President
One Post Office Square
Boston, Massachusetts 02109 |
| | |
| Copy to: | Bryan Chegwidden, Esq.
Ropes & Gray LLP
1211 Avenue of the Americas
New York, New York 10036 |
| | |
| Registrant's telephone number, including area code: | (617) 292-1000 |
| | |
| Date of fiscal year end: | December 31, 2016 |
| | |
| Date of reporting period: | January 1, 2016 — June 30, 2016 |
| | |
|
Item 1. Report to Stockholders: | |
| | |
| The following is a copy of the report transmitted to stockholders pursuant to Rule 30e-1 under the Investment Company Act of 1940: | |
Message from the Trustees
Dear Shareholder:
As summer comes to a close, we note that despite multiple headwinds and uncertainties both at home and overseas, the overall trajectory of the equity markets has been somewhat positive so far in 2016.
It is heartening that markets have recovered from various international and domestic challenges. We know volatile markets can be unsettling, but if recent events are any indication, we believe it is important not to overreact to short-term developments and to focus instead on the long term.
We believe the global environment continues to be supportive of stocks. Central banks around the world stand ready to add more stimulus and liquidity, if necessary, while the underpinnings of the U.S. economy remain solid, in our view. Overseas, higher hurdles to growth exist, but we believe that market gyrations may present investment opportunities. Within fixed income, yields have fallen — and in some cases have gone further into negative territory — as investors seek safety from turbulent markets, notably after the United Kingdom’s vote to depart the European Union.
At Putnam, our portfolio managers seek positive returns in every kind of market environment, backed by our network of global analysts and their own experience navigating changing conditions. They, and we, share a deep conviction that an active approach based on fundamental research can play a valuable role in your portfolio. In the following pages, you will find an overview of your fund’s performance for the reporting period ended June 30, 2016, as well as an outlook for the coming months.
As always, it may be helpful for you to consult with your financial advisor, who can assist you in determining if your portfolio remains aligned with your long-term goals, time horizon, and tolerance for risk.
Thank you for investing with Putnam.
Performance summary (as of 6/30/16)
Investment objective
Capital appreciation
Net asset value June 30, 2016
| |
| Class IA: $16.77 | Class IB: $16.35 |
|
Total return at net asset value
| | | |
| | | | MSCI World Health |
| (as of 6/30/16) | Class IA shares* | Class IB shares* | Care Index (ND)† |
|
| 6 months | –7.44% | –7.56% | –1.61% |
|
| 1 year | –11.66 | –11.90 | –4.60 |
|
| 5 years | 96.37 | 93.90 | 92.20 |
| Annualized | 14.45 | 14.16 | 13.96 |
|
| 10 years | 155.20 | 148.87 | 133.40 |
| Annualized | 9.82 | 9.55 | 8.85 |
|
| Life | 232.57 | 219.03 | — |
| Annualized | 6.84 | 6.59 | — |
|
For a portion of the periods, the fund had expense limitations, without which returns would have been lower.
*Class inception date: April 30, 1998.
†The fund’s benchmark, the MSCI World Health Care Index (ND), was introduced on 1/1/01, which post-dates the inception of the fund’s class IA shares.
The MSCI World Health Care Index (ND) is a free float-adjusted market capitalization weighted index that is designed to measure the equity market performance of developed markets in the health-care sector.
Data represent past performance. Past performance does not guarantee future results. More recent returns may be less or more than those shown. Investment return and principal value will fluctuate, and you may have a gain or a loss when you sell your shares. Performance information does not reflect any deduction for taxes a shareholder may owe on fund distributions or on the redemption of fund shares. All total return figures are at net asset value and exclude contract charges and expenses, which are added to the variable annuity contracts to determine total return at unit value. Had these charges and expenses been reflected, performance would have been lower. For more recent performance, contact your variable annuity provider who can provide you with performance that reflects the charges and expenses at your contract level.
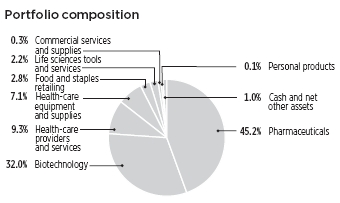
Allocations are shown as a percentage of the fund’s net assets. Cash and net other assets, if any, represent the market value weights of cash, derivatives, short-term securities, and other unclassified assets in the portfolio. Summary information may differ from the portfolio schedule included in the financial statements due to the inclusion of derivative securities, any interest accruals, the exclusion of as-of trades, if any, the use of different classifications of securities for presentation purposes, and rounding. Holdings and allocations may vary over time.
|
| Putnam VT Global Health Care Fund 1 |
Report from your fund’s managers
How was the environment for health-care investing during the six-month reporting period ended June 30, 2016?
Conditions became more challenging for the sector, as health-care stocks worldwide endured declines after an extended period of advances. Losses were most pronounced in the biotechnology industry, due to a number of challenges, such as risk aversion, profit taking, and pricing pressure. Investors, nervous about volatility, avoided the sector in favor of more defensive areas of the market. In addition, many biotech stocks declined as investors sold them to take profits after a long run of strong performance. And pricing pressure — driven by payers such as insurance companies seeking to lower prices to help manage costs for their clients — dampened profit margins for biotech companies. Pricing also drew more attention as the U.S. presidential election approached and candidates debated prescription drug affordability. Also during the reporting period, the broader stock market dealt with significant volatility.
Could you highlight some stocks that helped fund performance for the period?
The top contributor was the fund’s investment in Tesaro, a biotechnology company that specializes in cancer treatment. The stock advanced considerably after reports of positive results for a late-stage trial of Niraparib, a treatment for recurring ovarian cancer.
Another biotechnology company, Medivation, also contributed to fund performance during the period. We believe that the primary reason this stock performed well was Medivation’s potential as a takeover target. In our view, Medivation’s expertise in oncology would be very attractive to larger pharmaceutical or biotechnology companies looking to expand their cancer-treatment franchises. Medivation announced that it has signed confidentiality agreements with other companies, which is typically a sign of acquisition planning, in our view.
What are some holdings that detracted from returns during the period?
The top detractor for the period was the stock of Allergan, which was a top performer in the fund’s previous fiscal year. This pharmaceutical company has experienced solid revenue growth and we believe it remains an attractive investment. The stock’s decline during this reporting period is due almost entirely to investor disappointment after Allergan’s planned merger with Pfizer was terminated in April.
Among the top detractors for the period was Perrigo, an Ireland-based specialty pharmaceutical company. The stock struggled as investors became increasingly disappointed with Perrigo’s decision to acquire Omega Pharma, a Belgium-based consumer health-care company. In addition, Perrigo experienced weakness in its generics business, which resulted in lower growth prospects for the company. We subsequently sold our position in Perrigo during the period.
What is your outlook for the health-care sector?
Although health-care stocks faced headwinds in the past six months, we believe a number of trends may support continued growth across the sector over the longer term. Companies of all sizes have been developing breakthrough drugs and treatments, and we have been seeing impressive levels of innovation.
One issue we are monitoring is increased competitive pressure among generic drug companies, which has led to some earnings weakness. At the close of the period, this appeared to be stabilizing. As for the pricing pressure on pharmaceutical and biotechnology companies, we believe that much depends on the results of the U.S. presidential election, yet, any drug price legislation would likely take years to be implemented, as it would require congressional approval. In the meantime, however, we believe that media attention on election issues could continue to have a negative impact on health-care stocks in the coming months.
The views expressed in this report are exclusively those of Putnam Management and are subject to change. They are not meant as investment advice. Please note that the holdings discussed in this report may not have been held by the fund for the entire period. Portfolio composition is subject to review in accordance with the fund’s investment strategy and may vary in the future.
Consider these risks before investing: International investing involves currency, economic, and political risks. Emerging-market securities carry illiquidity and volatility risks. Investments in small and/or midsize companies increase the risk of greater price fluctuations. The health-care industries may be affected by technological obsolescence, changes in regulatory approval policies for drugs, medical devices or procedures, and changes in governmental and private payment systems. The fund concentrates on a limited group of industries and is non-diversified. Because the fund may invest in fewer issuers, it is vulnerable to common economic forces and may result in greater losses and volatility. Growth stocks may be more susceptible to earnings disappointments, and value stocks may fail to rebound. The use of short selling may result in losses if the securities appreciate in value. Risks associated with derivatives include increased investment exposure (which may be considered leverage) and, in the case of over-the-counter instruments, the potential inability to terminate or sell derivatives positions and the potential failure of the other party to the instrument to meet its obligations. Stock prices may fall or fail to rise over time for several reasons, including general financial market conditions and factors related to a specific company or industry. You can lose money by investing in the fund.
|
| 2 Putnam VT Global Health Care Fund |
Your fund’s managers

Portfolio Manager Kelsey Chen, Ph.D., joined Putnam in 2000 and has been in the investment industry since 1999.

Portfolio Manager Isabel Buccellati joined Putnam in 2012 and has been in the investment industry since 1994.
In addition to Kelsey and Isabel, your fund’s portfolio is managed by Samuel Cox.
Your fund’s managers may also manage other accounts advised by Putnam Management or an affiliate, including retail mutual fund counterparts to the funds in Putnam Variable Trust.
|
| Putnam VT Global Health Care Fund 3 |
Understanding your fund’s expenses
As an investor in a variable annuity product that invests in a registered investment company, you pay ongoing expenses, such as management fees, distribution fees (12b-1 fees), and other expenses. In the most recent six-month period, your fund’s expenses were limited; had expenses not been limited, they would have been higher. Using the following information, you can estimate how these expenses affect your investment and compare them with the expenses of other funds. You may also pay one-time transaction expenses, which are not shown in this section and would result in higher total expenses. Charges and expenses at the insurance company separate account level are not reflected. For more information, see your fund’s prospectus or talk to your financial representative.
Review your fund’s expenses
The two left-hand columns of the Expenses per $1,000 table show the expenses you would have paid on a $1,000 investment in your fund from 1/1/16 to 6/30/16. They also show how much a $1,000 investment would be worth at the close of the period, assuming actual returns and expenses. To estimate the ongoing expenses you paid over the period, divide your account value by $1,000, then multiply the result by the number in the first line for the class of shares you own.
Compare your fund’s expenses with those of other funds
The two right-hand columns of the Expenses per $1,000 table show your fund’s expenses based on a $1,000 investment, assuming a hypothetical 5% annualized return. You can use this information to compare the ongoing expenses (but not transaction expenses or total costs) of investing in the fund with those of other funds. All shareholder reports of mutual funds and funds serving as variable annuity vehicles will provide this information to help you make this comparison. Please note that you cannot use this information to estimate your actual ending account balance and expenses paid during the period.
Expense ratios
| | |
| | Class IA | Class IB |
|
| Total annual operating expenses for the fiscal year | | |
| ended 12/31/15 | 0.75% | 1.00% |
|
| Annualized expense ratio for the six-month period | | |
| ended 6/30/16 | 0.77% | 1.02% |
|
Fiscal-year expense information in this table is taken from the most recent prospectus, is subject to change, and may differ from that shown for the annualized expense ratio and in the financial highlights of this report.
Expenses are shown as a percentage of average net assets.
Expenses per $1,000
| | | | | | | | |
| | | Expenses and value for a | | Expenses and value for a |
| | | $1,000 investment, assuming | | $1,000 investment, assuming a |
| | | actual returns for the 6 months | | hypothetical 5% annualized return |
| | | ended 6/30/16 | | | | for the 6 months ended 6/30/16 |
|
| | | Class IA | | Class IB | | Class IA | | Class IB |
|
| Expenses paid | | | | | | | | |
| per $1,000*† | | $3.69 | | $4.88 | | $3.87 | | $5.12 |
|
| Ending value | | | | | | | | |
| (after expenses) | | $925.60 | | $924.40 | | $1,021.03 | | $1,019.79 |
|
*Expenses for each share class are calculated using the fund’s annualized expense ratio for each class, which represents the ongoing expenses as a percentage of average net assets for the six months ended 6/30/16. The expense ratio may differ for each share class.
†Expenses based on actual returns are calculated by multiplying the expense ratio by the average account value for the period; then multiplying the result by the number of days in the period; and then dividing that result by the number of days in the year. Expenses based on a hypothetical 5% return are calculated by multiplying the expense ratio by the average account value for the six-month period; then multiplying the result by the number of days in the six-month period; and then dividing that result by the number of days in the year.
|
| 4 Putnam VT Global Health Care Fund |
The fund’s portfolio 6/30/16 (Unaudited)
| | |
| COMMON STOCKS (98.5%)* | Shares | Value |
|
| Biotechnology (31.8%) | | |
| AbbVie, Inc. | 54,464 | $3,371,866 |
|
| Acceleron Pharma, Inc. † | 12,300 | 417,954 |
|
| Adaptimmune Therapeutics PLC ADR | | |
| (United Kingdom) † | 5,096 | 41,532 |
|
| Alkermes PLC † | 10,000 | 432,200 |
|
| AMAG Pharmaceuticals, Inc. † S | 17,110 | 409,271 |
|
| Amgen, Inc. | 38,855 | 5,911,788 |
|
| Applied Genetic Technologies Corp. † | 33,241 | 469,695 |
|
| Bellicum Pharmaceuticals, Inc. † S | 2,800 | 36,288 |
|
| Biogen, Inc. † | 14,000 | 3,385,480 |
|
| BioMarin Pharmaceutical, Inc. † | 24,000 | 1,867,200 |
|
| Blueprint Medicines Corp. † | 9,800 | 198,450 |
|
| Catabasis Pharmaceuticals, Inc. † S | 11,785 | 43,605 |
|
| Celgene Corp. † | 84,600 | 8,344,098 |
|
| Cellectis SA ADR (France) † | 3,938 | 104,711 |
|
| ChemoCentryx, Inc. † S | 20,112 | 90,303 |
|
| China Biologic Products, Inc. (China) † | 3,597 | 382,433 |
|
| Cidara Therapeutics, Inc. † | 9,880 | 101,863 |
|
| Circassia Pharmaceuticals PLC (United Kingdom) † | 27,007 | 36,606 |
|
| Conatus Pharmaceuticals, Inc. † | 18,999 | 39,138 |
|
| Concert Pharmaceuticals, Inc. † | 16,300 | 183,049 |
|
| CytomX Therapeutics, Inc. (acquired 6/12/15, | | |
| cost $883,992) (Private) † ∆∆ F | 94,594 | 966,278 |
|
| CytomX Therapeutics, Inc. † S | 32,621 | 333,224 |
|
| Gilead Sciences, Inc. | 111,200 | 9,276,304 |
|
| Grifols SA ADR (Spain) | 53,100 | 885,177 |
|
| Immune Design Corp. † S | 22,638 | 184,726 |
|
| Inovio Pharmaceuticals, Inc. † S | 15,600 | 144,144 |
|
| Keryx Biopharmaceuticals, Inc. † S | 66,700 | 441,554 |
|
| Kite Pharma, Inc. † S | 4,550 | 227,500 |
|
| Medivation, Inc. † | 56,900 | 3,431,070 |
|
| Merrimack Pharmaceuticals, Inc. † S | 56,666 | 305,430 |
|
| Neuralstem, Inc. † S | 52,149 | 15,175 |
|
| OncoGenex Pharmaceutical, Inc. † | 5,000 | 5,000 |
|
| Portola Pharmaceuticals, Inc. † | 16,031 | 378,332 |
|
| PTC Therapeutics, Inc. † S | 21,851 | 153,394 |
|
| Shire PLC (United Kingdom) | 46,095 | 2,838,505 |
|
| Shire PLC ADR (United Kingdom) | 103 | 18,960 |
|
| Sorrento Therapeutics, Inc. † S | 20,800 | 116,480 |
|
| TESARO, Inc. † S | 50,301 | 4,227,799 |
|
| Tokai Pharmaceuticals, Inc. † S | 6,500 | 35,815 |
|
| Trevena, Inc. † | 48,557 | 305,909 |
|
| Trillium Therapeutics, Inc. (Canada) † | 9,868 | 88,615 |
|
| Ultragenyx Pharmaceutical, Inc. † | 6,474 | 316,643 |
|
| uniQure NV (Netherlands) † | 29,378 | 216,516 |
|
| Verastem, Inc. † | 39,114 | 50,848 |
|
| Vertex Pharmaceuticals, Inc. † | 9,900 | 851,598 |
|
| Vitae Pharmaceuticals, Inc. † | 13,647 | 147,251 |
|
| | | 51,829,777 |
| Commercial services and supplies (0.3%) | | |
| Stericycle, Inc. † | 4,200 | 437,304 |
|
| | | 437,304 |
| Food and staples retail (2.7%) | | |
| AIN Holdings, Inc. (Japan) | 12,900 | 998,345 |
|
| CVS Health Corp. | 36,500 | 3,494,510 |
|
| | | 4,492,855 |
| | |
| COMMON STOCKS (98.5%)* cont. | Shares | Value |
|
| Health-care equipment and supplies (7.1%) | | |
| Baxter International, Inc. | 16,096 | $727,861 |
|
| Boston Scientific Corp. † | 76,800 | 1,794,816 |
|
| C.R. Bard, Inc. | 10,300 | 2,422,148 |
|
| Cooper Cos., Inc. (The) | 3,300 | 566,181 |
|
| Edwards Lifesciences Corp. † | 8,200 | 817,786 |
|
| Innocoll Holdings PLC (Ireland) † | 71,267 | 392,681 |
|
| Intuitive Surgical, Inc. † | 1,500 | 992,115 |
|
| Medtronic PLC | 43,200 | 3,748,464 |
|
| Unilife Corp. † S | 6,186 | 20,352 |
|
| Zosano Pharma Corp. † | 38,962 | 51,430 |
|
| | | 11,533,834 |
| Health-care providers and services (9.3%) | | |
| Aetna, Inc. | 27,900 | 3,407,427 |
|
| AmerisourceBergen Corp. | 12,900 | 1,023,228 |
|
| Anthem, Inc. | 12,100 | 1,589,214 |
|
| Cigna Corp. | 17,500 | 2,239,825 |
|
| Diplomat Pharmacy, Inc. † | 6,472 | 226,520 |
|
| Express Scripts Holding Co. † | 39,710 | 3,010,018 |
|
| Fresenius Medical Care AG & Co., KGaA (Germany) | 7,813 | 676,025 |
|
| Sinopharm Group Co. (China) | 34,800 | 167,674 |
|
| UnitedHealth Group, Inc. | 19,700 | 2,781,640 |
|
| | | 15,121,571 |
| Health-care technology (—%) | | |
| HTG Molecular Diagnostics, Inc. † | 9,201 | 23,923 |
|
| | | 23,923 |
| Life sciences tools and services (2.1%) | | |
| Agilent Technologies, Inc. | 36,100 | 1,601,396 |
|
| Morphosys AG (Germany) † | 940 | 39,206 |
|
| Thermo Fisher Scientific, Inc. | 12,600 | 1,861,776 |
|
| | | 3,502,378 |
| Personal products (0.1%) | | |
| Synutra International, Inc. † | 38,676 | 147,356 |
|
| | | 147,356 |
| Pharmaceuticals (45.1%) | | |
| Achaogen, Inc. † | 11,900 | 45,101 |
|
| Aerie Pharmaceuticals, Inc. † S | 30,964 | 544,966 |
|
| Allergan PLC † | 45,801 | 10,584,153 |
|
| Aspen Pharmacare Holdings, Ltd. (South Africa) | 25,434 | 629,638 |
|
| Assembly Biosciences, Inc. † | 36,331 | 201,637 |
|
| Astellas Pharma, Inc. (Japan) | 182,000 | 2,848,171 |
|
| AstraZeneca PLC (United Kingdom) | 74,350 | 4,425,981 |
|
| Aurobindo Pharma, Ltd. (India) | 43,911 | 482,823 |
|
| Bayer AG (Germany) | 20,878 | 2,100,581 |
|
| Bristol-Myers Squibb Co. | 88,900 | 6,538,595 |
|
| Carbylan Therapeutics, Inc. † | 59,324 | 39,308 |
|
| Corium International, Inc. † S | 32,294 | 112,060 |
|
| Eli Lilly & Co. | 66,200 | 5,213,250 |
|
| Endo International PLC † | 17,830 | 277,970 |
|
| Flex Pharma, Inc. † | 1,700 | 17,357 |
|
| GlaxoSmithKline PLC (United Kingdom) | 96,133 | 2,066,695 |
|
| Hua Han Health Industry Holdings, Ltd. (China) S | 1,000,800 | 89,919 |
|
| Jazz Pharmaceuticals PLC † | 2,100 | 296,751 |
|
| Johnson & Johnson | 47,300 | 5,737,489 |
|
| Marinus Pharmaceuticals, Inc. † | 28,993 | 36,821 |
|
| Medicines Co. (The) † | 19,600 | 659,148 |
|
| Merck & Co., Inc. | 87,500 | 5,040,875 |
|
| Mylan NV † | 68,600 | 2,966,264 |
|
| Neos Therapeutics, Inc. † S | 21,179 | 196,541 |
|
| Nippon Shinyaku Co., Ltd. (Japan) | 12,700 | 665,263 |
|
|
| Putnam VT Global Health Care Fund 5 |
| | | | |
| COMMON STOCKS (98.5%)* cont. | | Shares | Value |
|
| Pharmaceuticals cont. | | | | |
| Novartis AG (Switzerland) | | 61,013 | $5,019,160 |
|
| Pfizer, Inc. | | | 106,803 | 3,760,534 |
|
| Roche Holding AG (Switzerland) | | 12,874 | 3,399,130 |
|
| Sanofi (France) | | | 57,631 | 4,844,343 |
|
| Shionogi & Co., Ltd. (Japan) | | 30,600 | 1,664,185 |
|
| Sihuan Pharmaceutical Holdings Group, Ltd. (China) | 405,000 | 77,762 |
|
| Tetraphase Pharmaceuticals, Inc. † | | 7,379 | 31,730 |
|
| Teva Pharmaceutical Industries, Ltd. ADR (Israel) | 31,606 | 1,587,569 |
|
| Zoetis, Inc. | | | 28,847 | 1,369,079 |
|
| | | | | 73,570,849 |
| | | | | |
| Total common stocks (cost $114,603,141) | | | $160,659,847 |
| | | | |
| |
| CONVERTIBLE PREFERRED STOCKS (0.6%)* | | Shares | Value |
|
| Ovid Therapeutics, Inc. 144A Ser. B, 8.00% | | | |
| (acquired 8/13/15, cost $478,414) (Private) † ∆∆ F | 76,792 | $430,573 |
|
| Teva Pharmaceutical Industries, Ltd. | | | |
| 7.00% cv. pfd. (Israel) | | | 609 | 508,211 |
|
| Total convertible preferred stocks (cost $1,087,414) | | $938,784 |
| | | |
| |
| WARRANTS (—%)* † | Expiration date | Strike price | Warrants | Value |
|
| Neuralstem, Inc. Ser. J | | | | |
| (acquired 1/3/14, | | | | |
| cost $0.00) ∆∆ F | 1/3/19 | $3.64 | 26,644 | $— |
|
| Total warrants (cost $—) | | | $— |
| | | | |
| |
| SHORT-TERM INVESTMENTS (4.9%) | | Shares | Value |
|
| Putnam Cash Collateral Pool, LLC 0.64% d | | 6,386,105 | $6,386,105 |
|
| Putnam Short Term Investment Fund 0.47% L | | 1,601,489 | 1,601,489 |
|
| Total short-term investments (cost $7,987,594) | | $7,987,594 |
| | | |
| Total investments (cost $123,678,149) | | | $169,586,225 |
Key to holding’s abbreviations
|
| ADR | American Depository Receipts: represents ownership of foreign |
| securities on deposit with a custodian bank |
Notes to the fund’s portfolio
Unless noted otherwise, the notes to the fund’s portfolio are for the close of the fund’s reporting period, which ran from January 1, 2016 through June 30, 2016 (the reporting period). Within the following notes to the portfolio, references to “ASC 820” represent Accounting Standards Codification 820 Fair Value Measurements and Disclosures and references to “OTC”, if any, represent over-the-counter.
* Percentages indicated are based on net assets of $163,077,015.
† This security is non-income-producing.
∆∆ This security is restricted with regard to public resale. The total fair value of this security and any other restricted securities (excluding 144A securities), if any, held at the close of the reporting period was $1,396,851 or 0.8.% of net assets.
d Affiliated company. See Note 1 to the financial statements regarding securities lending. The rate quoted in the security description is the annualized 7-day yield of the fund at the close of the reporting period.
F This security is valued by Putnam Management at fair value following procedures approved by the Trustees. Securities may be classified as Level 2 or Level 3 for ASC 820 based on the securities’ valuation inputs. At the close of the reporting period, fair value pricing was also used for certain foreign securities in the portfolio (Note 1).
L Affiliated company (Note 5). The rate quoted in the security description is the annualized 7-day yield of the fund at the close of the reporting period.
S Security on loan, in part or in entirety, at the close of the reporting period (Note 1).
At the close of the reporting period, the fund maintained liquid assets totaling $56,589 to cover certain derivative contracts.
Unless otherwise noted, the rates quoted in Short-term investments security descriptions represent the weighted average yield to maturity.
144A after the name of an issuer represents securities exempt from registration under Rule 144A under the Securities Act of 1933, as amended. These securities may be resold in transactions exempt from registration, normally to qualified institutional buyers.
|
| DIVERSIFICATION BY COUNTRY⌂ |
|
Distribution of investments by country of risk at the close of the reporting period, excluding collateral received, if any (as a percentage of Portfolio Value):
| | | | |
| United States | 77.1% | | Germany | 1.7% |
| |
|
| United Kingdom | 5.8 | | Israel | 1.3 |
| |
|
| Switzerland | 5.2 | | Spain | 0.5 |
| |
|
| Japan | 3.8 | | Other | 1.6 |
| |
|
| France | 3.0 | | Total | 100.0% |
| | |
⌂ Methodology differs from that used for purposes of complying with the fund’s policy regarding investments in securities of foreign issuers, as discussed further in the fund’s prospectus.
FORWARD CURRENCY CONTRACTS at 6/30/16 (aggregate face value $8,808,998) (Unaudited)
| | | | | | |
| | | | | | | Unrealized |
| | | Contract | Delivery | | Aggregate | appreciation/ |
| Counterparty | Currency | type | date | Value | face value | (depreciation) |
|
| Bank of America N.A. | | | | | | |
|
| | Euro | Buy | 9/21/16 | $3,002,695 | $3,026,756 | $(24,061) |
|
| Citibank, N.A. | | | | | | |
|
| | Danish Krone | Buy | 9/21/16 | 1,402,952 | 1,412,143 | (9,191) |
|
| Credit Suisse International | | | | | | |
|
| | Japanese Yen | Buy | 8/18/16 | 1,669,443 | 1,618,890 | 50,553 |
|
| HSBC Bank USA, National Association | | | | | | |
|
| | Australian Dollar | Buy | 7/21/16 | 1,342,834 | 1,368,276 | (25,442) |
|
| JPMorgan Chase Bank N.A. | | | | | | |
|
| | Swiss Franc | Buy | 9/21/16 | 1,398,843 | 1,382,933 | 15,910 |
|
| Total | | | | | | $7,769 |
|
| 6 Putnam VT Global Health Care Fund |
ASC 820 establishes a three-level hierarchy for disclosure of fair value measurements. The valuation hierarchy is based upon the transparency of inputs to the valuation of the fund’s investments. The three levels are defined as follows:
Level 1: Valuations based on quoted prices for identical securities in active markets.
Level 2: Valuations based on quoted prices in markets that are not active or for which all significant inputs are observable, either directly or indirectly.
Level 3: Valuations based on inputs that are unobservable and significant to the fair value measurement.
The following is a summary of the inputs used to value the fund’s net assets as of the close of the reporting period:
| | | | |
| | | | | Valuation inputs | |
|
| Investments in securities: | | Level 1 | Level 2 | Level 3 |
|
| Common stocks*: | | | | |
|
| Consumer staples | | $3,641,866 | $998,345 | $— |
|
| Health care | | 122,544,387 | 32,071,667 | 966,278 |
|
| Industrials | | 437,304 | — | — |
|
| Total common stocks | | 126,623,557 | 33,070,012 | 966,278 |
|
| Convertible preferred stocks | | — | 508,211 | 430,573 |
|
| Warrants | | — | — | — |
|
| Short-term investments | | 1,601,489 | 6,386,105 | — |
|
| Totals by level | | $128,225,046 | $39,964,328 | $1,396,851 |
|
| |
| | | | | Valuation inputs | |
|
| Other financial instruments: | | Level 1 | Level 2 | Level 3 |
|
| Forward currency contracts | | $— | $7,769 | $— |
|
| Totals by level | | $— | $7,769 | $— |
|
During the reporting period, transfers within the fair value hierarchy, if any (other than certain transfers involving non-U.S. equity securities as described in Note 1), did not represent, in the aggregate, more than 1% of the fund’s net assets measured as of the end of the period. Transfers are accounted for using the end of period pricing valuation method.
The following is a reconciliation of Level 3 assets as of the close of the reporting period:
| | | | | | | | | |
| | | | | Change in net | | | | | |
| | | Accrued | | unrealized | | | | | |
| Investments in | Balance as of | discounts/ | Realized | appreciation/ | Cost of | Proceeds | Total transfers | Total transfers | Balance as of |
| securities: | 12/31/15 | premiums | gain/(loss) | (depreciation)# | purchases | from sales | into Level 3† | out of Level 3† | 6/30/16 |
|
| Common stocks*: | | | | | | | | | |
|
| Health care | $1,776,759 | $— | $— | $(810,481) | $— | $— | $— | $— | $966,278 |
|
| Total common stocks | $1,776,759 | — | — | $(810,481) | — | — | — | — | $966,278 |
|
| Convertible preferred stocks | $430,573 | — | — | — | — | — | — | — | $430,573 |
|
| Totals | $2,207,332 | $— | $— | $(810,481) | $— | $— | $— | $— | $1,396,851 |
|
* Common stock classifications are presented at the sector level, which may differ from the fund’s portfolio presentation.
† Transfers during the reporting period are accounted for using the end of period market value and did not represent, in the aggregate, more than 1% of the fund’s net assets measured as of the end of the period.
# Includes $810,481 related to Level 3 securities still held at period end. Total change in unrealized appreciation/(depreciation) for securities (including Level 1 and Level 2) can be found in the Statement of operations.
The accompanying notes are an integral part of these financial statements.
|
| Putnam VT Global Health Care Fund 7 |
Statement of assets and liabilities
6/30/16 (Unaudited)
| |
| Assets | |
|
| Investment in securities, at value, including $6,454,572 of securities on loan (Note 1): | |
|
| Unaffiliated issuers (identified cost $115,690,555) | $161,598,631 |
|
| Affi liated issuers (identified cost $7,987,594) (Notes 1 and 5) | 7,987,594 |
|
| Cash | 1 |
|
| Foreign currency (cost $1,220) (Note 1) | 1,183 |
|
| Dividends, interest and other receivables | 152,002 |
|
| Receivable for shares of the fund sold | 52,916 |
|
| Receivable for investments sold | 342 |
|
| Foreign tax reclaim | 96,244 |
|
| Unrealized appreciation on forward currency contracts (Note 1) | 66,463 |
|
| Total assets | 169,955,376 |
| |
| Liabilities | |
|
| Payable for shares of the fund repurchased | 185,327 |
|
| Payable for compensation of Manager (Note 2) | 82,926 |
|
| Payable for custodian fees (Note 2) | 4,403 |
|
| Payable for investor servicing fees (Note 2) | 17,535 |
|
| Payable for Trustee compensation and expenses (Note 2) | 78,150 |
|
| Payable for administrative services (Note 2) | 653 |
|
| Payable for distribution fees (Note 2) | 22,622 |
|
| Unrealized depreciation on forward currency contracts (Note 1) | 58,694 |
|
| Collateral on securities loaned, at value (Note 1) | 6,386,105 |
|
| Other accrued expenses | 41,946 |
|
| Total liabilities | 6,878,361 |
| | |
| Net assets | $163,077,015 |
| |
| Represented by | |
|
| Paid-in capital (Unlimited shares authorized) (Notes 1 and 4) | $112,985,868 |
|
| Undistributed net investment income (Note 1) | 703,512 |
|
| Accumulated net realized gain on investments and foreign currency transactions (Note 1) | 3,471,723 |
|
| Net unrealized appreciation of investments and assets and liabilities in foreign currencies | 45,915,912 |
|
| Total — Representing net assets applicable to capital shares outstanding | $163,077,015 |
| |
| Computation of net asset value Class IA | |
|
| Net assets | $51,547,810 |
|
| Number of shares outstanding | 3,073,435 |
|
| Net asset value, offering price and redemption price per share (net assets divided by number of shares outstanding) | $16.77 |
|
| Computation of net asset value Class IB | |
|
| Net assets | $111,529,205 |
|
| Number of shares outstanding | 6,819,834 |
|
| Net asset value, offering price and redemption price per share (net assets divided by number of shares outstanding) | $16.35 |
|
The accompanying notes are an integral part of these financial statements.
|
| 8 Putnam VT Global Health Care Fund |
Statement of operations
Six months ended 6/30/16 (Unaudited)
| |
| Investment income | |
|
| Dividends (net of foreign tax of $90,165) | $1,552,363 |
|
| Interest (including interest income of $3,005 from investments in affiliated issuers) (Note 5) | 3,110 |
|
| Securities lending (Note 1) | 76,931 |
|
| Total investment income | 1,632,404 |
| |
| Expenses | |
|
| Compensation of Manager (Note 2) | 522,641 |
|
| Investor servicing fees (Note 2) | 58,788 |
|
| Custodian fees (Note 2) | 8,193 |
|
| Trustee compensation and expenses (Note 2) | 7,149 |
|
| Distribution fees (Note 2) | 142,032 |
|
| Administrative services (Note 2) | 1,928 |
|
| Other | 46,344 |
|
| Fees waived and reimbursed by Manager (Note 2) | (2,091) |
|
| Total expenses | 784,984 |
| | |
| Expense reduction (Note 2) | (1,907) |
|
| Net expenses | 783,077 |
| | |
| Net investment income | 849,327 |
| | |
| Net realized gain on investments (Notes 1 and 3) | 3,699,033 |
|
| Net realized gain on foreign currency transactions (Note 1) | 502,338 |
|
| Net unrealized depreciation of assets and liabilities in foreign currencies during the period | (158,719) |
|
| Net unrealized depreciation of investments during the period | (20,357,170) |
|
| Net loss on investments | (16,314,518) |
| | |
| Net decrease in net assets resulting from operations | $(15,465,191) |
Statement of changes in net assets
| | |
| | Six months ended | Year ended |
| | 6/30/16* | 12/31/15 |
|
| Increase (decrease) in net assets | | |
|
| Operations: | | |
|
| Net investment income | $849,327 | $788,820 |
|
| Net realized gain on investments and foreign currency transactions | 4,201,371 | 18,269,985 |
|
| Net unrealized depreciation of investments and assets and liabilities in foreign currencies | (20,515,889) | (5,895,891) |
|
| Net increase (decrease) in net assets resulting from operations | (15,465,191) | 13,162,914 |
|
| Distributions to shareholders (Note 1): | | |
|
| Net realized short-term gain on investments | | |
|
| Class IA | (510,026) | (1,519,820) |
|
| Class IB | (1,119,361) | (3,011,171) |
|
| From net realized long-term gain on investments | | |
|
| Class IA | (5,653,513) | (3,496,773) |
|
| Class IB | (12,407,837) | (6,928,045) |
|
| Increase (decrease) from capital share transactions (Note 4) | (58,184) | 24,764,072 |
|
| Total increase (decrease) in net assets | (35,214,112) | 22,971,177 |
|
| Net assets: | | |
|
| Beginning of period | 198,291,127 | 175,319,950 |
|
| End of period (including distributions in excess of net investment income of $703,512 and undistributed net investment income of | | |
| $145,815, respectively) | $163,077,015 | $198,291,127 |
|
* Unaudited.
The accompanying notes are an integral part of these financial statements.
|
| Putnam VT Global Health Care Fund 9 |
Financial highlights (For a common share outstanding throughout the period)
| | | | | | | | | | | | | | | | | | | | | | | | | | |
| INVESTMENT OPERATIONS: | LESS DISTRIBUTIONS: | RATIOS AND SUPPLEMENTAL DATA: |
|
| Period ended | | Net asset value, beginning of period | | Net investment income (loss)a | | Net realized and unrealized gain (loss) on investments | | Total from investment operations | | From net investment income | | From net realized gain on investments | | Total distributions | | Net asset value, end of period | | Total return at net asset value (%)b,c | | Net assets, end of period (in thousands) | | Ratio of expenses to average net assets (%)b,d | | Ratio of net investment income (loss) to average net assets (%) | | Portfolio turnover (%) |
|
| Class IA | | | | | | | | | | | | | | | | | | | | | | | | | | |
|
| 6/30/16† | | $20.52 | | .10 | | (1.71) | | (1.61) | | — | | (2.14) | | (2.14) | | $16.77 | | (7.44)* | | $51,548 | | .38*e | | .59*e | | 7* |
|
| 12/31/15 | | 20.52 | | .12 | | 1.57 | | 1.69 | | — | | (1.69) | | (1.69) | | 20.52 | | 8.06 | | 63,810 | | .75 | | .57 | | 16 |
|
| 12/31/14 | | 17.75 | | .14 | | 4.42 | | 4.56 | | (.06) | | (1.73) | | (1.79) | | 20.52 | | 27.96 | | 61,107 | | .79 | | .74 | | 27 |
|
| 12/31/13 | | 13.11 | | .15 | | 5.17 | | 5.32 | | (.20) | | (.48) | | (.68) | | 17.75 | | 41.98 | | 53,545 | | .82 | | .97 | | 30 |
|
| 12/31/12 | | 11.85 | | .17 | | 2.36 | | 2.53 | | (.20) | | (1.07) | | (1.27) | | 13.11 | | 22.57 | | 42,239 | | .84 | | 1.38 | | 30 |
|
| 12/31/11 | | 12.40 | | .15 | | (.23) | | (.08) | | (.14) | | (.33) | | (.47) | | 11.85 | | (.89) | | 39,802 | | .84 | | 1.17 | | 31 |
|
| Class IB | | | | | | | | | | | | | | | | | | | | | | | | | | |
|
| 6/30/16† | | $20.09 | | .08 | | (1.68) | | (1.60) | | — | | (2.14) | | (2.14) | | $16.35 | | (7.56)* | | $111,529 | | .51*e | | .47*e | | 7* |
|
| 12/31/15 | | 20.17 | | .06 | | 1.55 | | 1.61 | | — | | (1.69) | | (1.69) | | 20.09 | | 7.79 | | 134,481 | | 1.00 | | .31 | | 16 |
|
| 12/31/14 | | 17.48 | | .09 | | 4.35 | | 4.44 | | (.02) | | (1.73) | | (1.75) | | 20.17 | | 27.64 | | 114,213 | | 1.04 | | .49 | | 27 |
|
| 12/31/13 | | 12.92 | | .11 | | 5.10 | | 5.21 | | (.17) | | (.48) | | (.65) | | 17.48 | | 41.66 | | 90,726 | | 1.07 | | .71 | | 30 |
|
| 12/31/12 | | 11.69 | | .14 | | 2.33 | | 2.47 | | (.17) | | (1.07) | | (1.24) | | 12.92 | | 22.27 | | 66,503 | | 1.09 | | 1.13 | | 30 |
|
| 12/31/11 | | 12.24 | | .11 | | (.23) | | (.12) | | (.10) | | (.33) | | (.43) | | 11.69 | | (1.18) | | 59,024 | | 1.09 | | .92 | | 31 |
|
* Not annualized.
† Unaudited.
a Per share net investment income (loss) has been determined on the basis of the weighted average number of shares outstanding during the period.
b The charges and expenses at the insurance company separate account level are not reflected.
c Total return assumes dividend reinvestment.
d Includes amounts paid through expense offset and brokerage/service arrangements, if any (Note 2). Also excludes acquired fund fees and expenses, if any.
e Reflects a voluntary waiver of certain fund expenses in effect during the period. As a result of such waivers, the expenses of each class reflect a reduction of less than .01% as a percentage of average net assets per share for each class (Note 2).
The accompanying notes are an integral part of these financial statements.
|
| 10 Putnam VT Global Health Care Fund |
Notes to financial statements 6/30/16 (Unaudited)
Within the following Notes to financial statements, references to “State Street” represent State Street Bank and Trust Company, references to “the SEC” represent the Securities and Exchange Commission, references to “Putnam Management” represent Putnam Investment Management, LLC, the fund’s manager, an indirect wholly-owned subsidiary of Putnam Investments, LLC and references to “OTC”, if any, represent over-the-counter. Unless otherwise noted, the “reporting period” represents the period from January 1, 2016 through June 30, 2016.
Putnam VT Global Health Care Fund (the fund) is a non-diversified series of Putnam Variable Trust (the Trust), a Massachusetts business trust registered under the Investment Company Act of 1940, as amended, as an open-end management investment company. The goal of the fund is to seek capital appreciation. For this non-diversified fund concentrating in the health care industries, the fund invests mainly in common stocks (growth or value stocks or both) of large and midsize companies worldwide that Putnam Management believes have favorable investment potential. Under normal circumstances, Putnam Management invests at least 80% of the fund’s net assets in securities of companies in the health care industries. This policy may be changed only after 60 days’ notice to shareholders. Potential investments include companies that manufacture health care supplies or provide health care-related services, and companies in the research, development, production and marketing of pharmaceuticals and biotechnology products. The fund may purchase stocks of companies with stock prices that reflect a value lower than that which Putnam Management places on the company. Putnam Management may also consider other factors that it believes will cause the stock price to rise. Putnam Management may consider, among other factors, a company’s valuation, financial strength, growth potential, competitive position in its industry, projected future earnings, cash flows and dividends when deciding whether to buy or sell investments. The fund may also use derivatives, such as futures, options, certain foreign currency transactions, warrants and swap contracts, for both hedging and non-hedging purposes, and may engage in short sales of securities.
The fund offers class IA and class IB shares of beneficial interest. Class IA shares are offered at net asset value and are not subject to a distribution fee. Class IB shares are offered at net asset value and pay an ongoing distribution fee, which is identified in Note 2.
In the normal course of business, the fund enters into contracts that may include agreements to indemnify another party under given circumstances. The fund’s maximum exposure under these arrangements is unknown as this would involve future claims that may be, but have not yet been, made against the fund. However, the fund’s management team expects the risk of material loss to be remote.
The fund has entered into contractual arrangements with an investment adviser, administrator, distributor, shareholder servicing agent and custodian, who each provide services to the fund. Unless expressly stated otherwise, shareholders are not parties to, or intended beneficiaries of these contractual arrangements, and these contractual arrangements are not intended to create any shareholder right to enforce them against the service providers or to seek any remedy under them against the service providers, either directly or on behalf of the fund.
Under the fund’s Declaration of Trust, any claims asserted against or on behalf of the Putnam Funds, including claims against Trustees and Officers, must be brought in state and federal courts located within the Commonwealth of Massachusetts.
Note 1 — Significant accounting policies
The following is a summary of significant accounting policies consistently followed by the fund in the preparation of its financial statements. The preparation of financial statements is in conformity with accounting principles generally accepted in the United States of America and requires management to make estimates and assumptions that affect the reported amounts of assets and liabilities in the financial statements and the reported amounts of increases and decreases in net assets from operations. Actual results could differ from those estimates. Subsequent events after the Statement of assets and liabilities date through the date that the financial statements were issued have been evaluated in the preparation of the financial statements.
Investment income, realized and unrealized gains and losses and expenses of the fund are borne pro-rata based on the relative net assets of each class to the total net assets of the fund, except that each class bears expenses unique to that class (including the distribution fees applicable to such classes). Each class votes as a class only with respect to its own distribution plan or other matters on which a class vote is required by law or determined by the Trustees. If the fund were liquidated, shares of each class would receive their pro-rata share of the net assets of the fund. In addition, the Trustees declare separate dividends on each class of shares.
Security valuation Portfolio securities and other investments are valued using policies and procedures adopted by the Board of Trustees. The Trustees have formed a Pricing Committee to oversee the implementation of these procedures and have delegated responsibility for valuing the fund’s assets in accordance with these procedures to Putnam Management. Putnam Management has established an internal Valuation Committee that is responsible for making fair value determinations, evaluating the effectiveness of the pricing policies of the fund and reporting to the Pricing Committee.
Investments for which market quotations are readily available are valued at the last reported sales price on their principal exchange, or official closing price for certain markets, and are classified as Level 1 securities under Accounting Standards Codification 820 Fair Value Measurements and Disclosures (ASC 820). If no sales are reported, as in the case of some securities that are traded OTC, a security is valued at its last reported bid price and is generally categorized as a Level 2 security.
Investments in open-end investment companies (excluding exchange-traded funds), if any, which can be classified as Level 1 or Level 2 securities, are valued based on their net asset value. The net asset value of such investment companies equals the total value of their assets less their liabilities and divided by the number of their outstanding shares.
Many securities markets and exchanges outside the U.S. close prior to the scheduled close of the New York Stock Exchange and therefore the closing prices for securities in such markets or on such exchanges may not fully reflect events that occur after such close but before the scheduled close of the New York Stock Exchange. Accordingly, on certain days, the fund will fair value foreign equity securities taking into account multiple factors including movements in the U.S. securities markets, currency valuations and comparisons to the valuation of American Depository Receipts, exchange-traded funds and futures contracts. These securities, which would generally be classified as Level 1 securities, will be transferred to Level 2 of the fair value hierarchy when they are valued at fair value. The number of days on which fair value prices will be used will depend on market activity and it is possible that fair value prices will be used by the fund to a significant extent. At the close of the reporting period, fair value pricing was used for certain foreign securities in the portfolio. Securities quoted in foreign currencies, if any, are translated into U.S. dollars at the current exchange rate. Short-term securities with remaining maturities of 60 days or less are valued using an independent pricing service approved by the Trustees, and are classified as Level 2 securities.
To the extent a pricing service or dealer is unable to value a security or provides a valuation that Putnam Management does not believe accurately reflects the security’s fair value, the security will be valued at fair value by Putnam Management in accordance with policies and procedures approved by the Trustees. Certain investments, including certain restricted and illiquid securities and derivatives, are also valued at fair value following procedures approved by the Trustees. These valuations consider such factors as significant market or specific security events such as interest rate or credit quality changes, various relationships with other securities, discount rates, U.S. Treasury, U.S. swap and credit yields, index levels, convexity exposures, recovery rates, sales and other multiples and resale restrictions. These securities are classified as Level 2 or as Level 3 depending on the priority of the significant inputs.
To assess the continuing appropriateness of fair valuations, the Valuation Committee reviews and affirms the reasonableness of such valuations on a regular basis after considering all relevant information that is reasonably available. Such valuations and procedures are reviewed periodically by the Trustees. The fair value of securities is generally determined as the amount that the fund could reasonably expect to realize from an orderly disposition of such securities over a reasonable period of time. By its nature, a fair value price is
|
| Putnam VT Global Health Care Fund 11 |
a good faith estimate of the value of a security in a current sale and does not reflect an actual market price, which may be different by a material amount.
Security transactions and related investment income Security transactions are recorded on the trade date (the date the order to buy or sell is executed). Gains or losses on securities sold are determined on the identified cost basis.
Interest income, net of any applicable withholding taxes, is recorded on the accrual basis. Dividend income, net of any applicable withholding taxes, is recognized on the ex-dividend date except that certain dividends from foreign securities, if any, are recognized as soon as the fund is informed of the ex-dividend date. Non-cash dividends, if any, are recorded at the fair value of the securities received. Dividends representing a return of capital or capital gains, if any, are reflected as a reduction of cost and/or as a realized gain. All premiums/discounts are amortized/accreted on a yield-to-maturity basis.
Foreign currency translation The accounting records of the fund are maintained in U.S. dollars. The fair value of foreign securities, currency holdings, and other assets and liabilities is recorded in the books and records of the fund after translation to U.S. dollars based on the exchange rates on that day. The cost of each security is determined using historical exchange rates. Income and withholding taxes are translated at prevailing exchange rates when earned or incurred. The fund does not isolate that portion of realized or unrealized gains or losses resulting from changes in the foreign exchange rate on investments from fluctuations arising from changes in the market prices of the securities. Such gains and losses are included with the net realized and unrealized gain or loss on investments. Net realized gains and losses on foreign currency transactions represent net realized exchange gains or losses on closed forward currency contracts, disposition of foreign currencies, currency gains and losses realized between the trade and settlement dates on securities transactions and the difference between the amount of investment income and foreign withholding taxes recorded on the fund’s books and the U.S. dollar equivalent amounts actually received or paid. Net unrealized appreciation and depreciation of assets and liabilities in foreign currencies arise from changes in the value of open forward currency contracts and assets and liabilities other than investments at the period end, resulting from changes in the exchange rate.
Forward currency contracts The fund buys and sells forward currency contracts, which are agreements between two parties to buy and sell currencies at a set price on a future date. These contracts are used to hedge foreign exchange risk.
The U.S. dollar value of forward currency contracts is determined using current forward currency exchange rates supplied by a quotation service. The fair value of the contract will fluctuate with changes in currency exchange rates. The contract is marked to market daily and the change in fair value is recorded as an unrealized gain or loss. The fund records a realized gain or loss equal to the difference between the value of the contract at the time it was opened and the value at the time it was closed when the contract matures or by delivery of the currency. The fund could be exposed to risk if the value of the currency changes unfavorably, if the counterparties to the contracts are unable to meet the terms of their contracts or if the fund is unable to enter into a closing position. Risks may exceed amounts recognized on the Statement of assets and liabilities.
Forward currency contracts outstanding at period end, if any, are listed after the fund’s portfolio.
Master agreements The fund is a party to ISDA (International Swaps and Derivatives Association, Inc.) Master Agreements (Master Agreements) with certain counterparties that govern OTC derivative and foreign exchange contracts entered into from time to time. The Master Agreements may contain provisions regarding, among other things, the parties’ general obligations, representations, agreements, collateral requirements, events of default and early termination. With respect to certain counterparties, in accordance with the terms of the Master Agreements, collateral posted to the fund is held in a segregated account by the fund’s custodian and, with respect to those amounts which can be sold or repledged, is presented in the fund’s portfolio.
Collateral pledged by the fund is segregated by the fund’s custodian and identified in the fund’s portfolio. Collateral can be in the form of cash or debt securities issued by the U.S. Government or related agencies or other securities as agreed to by the fund and the applicable counterparty. Collateral requirements are determined based on the fund’s net position with each counterparty.
Termination events applicable to the fund may occur upon a decline in the fund’s net assets below a specified threshold over a certain period of time. Termination events applicable to counterparties may occur upon a decline in the counterparty’s long-term and short-term credit ratings below a specified level. In each case, upon occurrence, the other party may elect to terminate early and cause settlement of all derivative and foreign exchange contracts outstanding, including the payment of any losses and costs resulting from such early termination, as reasonably determined by the terminating party. Any decision by one or more of the fund’s counterparties to elect early termination could impact the fund’s future derivative activity.
At the close of the reporting period, the fund had a net liability position of $58,694 on open derivative contracts subject to the Master Agreements. There was no collateral posted by the fund at period end for these agreements.
Securities lending The fund may lend securities, through its agent, to qualified borrowers in order to earn additional income. The loans are collateralized by cash in an amount at least equal to the fair value of the securities loaned. The fair value of securities loaned is determined daily and any additional required collateral is allocated to the fund on the next business day. The remaining maturities of the securities lending transactions are considered overnight and continuous. The risk of borrower default will be borne by the fund’s agent; the fund will bear the risk of loss with respect to the investment of the cash collateral. Income from securities lending is included in investment income on the Statement of operations. Cash collateral is invested in Putnam Cash Collateral Pool, LLC, a limited liability company managed by an affiliate of Putnam Management. Investments in Putnam Cash Collateral Pool, LLC are valued at its closing net asset value each business day. There are no management fees charged to Putnam Cash Collateral Pool, LLC. At the close of the reporting period, the fund received cash collateral of $6,386,105 and the value of securities loaned amounted to $6,454,572.
Interfund lending The fund, along with other Putnam funds, may participate in an interfund lending program pursuant to an exemptive order issued by the SEC. This program allows the fund to borrow from or lend to other Putnam funds that permit such transactions. Interfund lending transactions are subject to each fund’s investment policies and borrowing and lending limits. Interest earned or paid on the interfund lending transaction will be based on the average of certain current market rates. During the reporting period, the fund did not utilize the program.
Lines of credit The fund participates, along with other Putnam funds, in a $392.5 million syndicated unsecured committed line of credit provided by State Street ($292.5 million) and Northern Trust Company ($100 million) and a $235.5 million unsecured uncommitted line of credit provided by State Street. Borrowings may be made for temporary or emergency purposes, including the funding of shareholder redemption requests and trade settlements. Interest is charged to the fund based on the fund’s borrowing at a rate equal to the higher of (1) the Federal Funds rate and (2) the overnight LIBOR plus 1.25% for the committed line of credit and the Federal Funds rate plus 1.30% for the uncommitted line of credit. A closing fee equal to 0.04% of the committed line of credit and 0.04% of the uncommitted line of credit has been paid by the participating funds. In addition, a commitment fee of 0.16% per annum on any unutilized portion of the committed line of credit is allocated to the participating funds based on their relative net assets and paid quarterly. During the reporting period, the fund had no borrowings against these arrangements.
Federal taxes It is the policy of the fund to distribute all of its taxable income within the prescribed time period and otherwise comply with the provisions of the Internal Revenue Code of 1986, as amended (the Code), applicable to regulated investment companies.
The fund is subject to the provisions of Accounting Standards Codification 740 Income Taxes (ASC 740). ASC 740 sets forth a minimum threshold for financial statement recognition of the benefit of a tax position taken or expected to be taken in a tax return. The fund did not have a liability to record for any unrecognized tax benefits in the accompanying financial statements. No provision has been made for federal taxes on income, capital gains or unrealized appreciation on securities held nor for excise tax on income and capital gains. Each of the fund’s federal tax returns for the prior three fiscal years remains subject to examination by the Internal Revenue Service.
The fund may also be subject to taxes imposed by governments of countries in which it invests. Such taxes are generally based on either income or gains earned or repatriated. The fund accrues and applies such taxes to net investment income, net realized gains and net unrealized gains as income and/or capital gains are earned. In some cases, the fund may be entitled to reclaim all or a portion of such taxes, and such reclaim amounts, if any, are reflected as an asset on the fund’s books. In many cases, however, the fund may not receive such amounts for an extended period of time, depending on the country of investment.
|
| 12 Putnam VT Global Health Care Fund |
The aggregate identified cost on a tax basis is $124,013,690, resulting in gross unrealized appreciation and depreciation of $57,355,167 and $11,782,632, respectively, or net unrealized appreciation of $45,572,535.
Distributions to shareholders Distributions to shareholders from net investment income are recorded by the fund on the ex-dividend date. Distributions from capital gains, if any, are recorded on the ex-dividend date and paid at least annually. The amount and character of income and gains to be distributed are determined in accordance with income tax regulations, which may differ from generally accepted accounting principles. Dividend sources are estimated at the time of declaration. Actual results may vary. Any non-taxable return of capital cannot be determined until final tax calculations are completed after the end of the fund’s fiscal year. Reclassifications are made to the fund’s capital accounts to reflect income and gains available for distribution (or available capital loss carryovers) under income tax regulations.
Expenses of the Trust Expenses directly charged or attributable to any fund will be paid from the assets of that fund. Generally, expenses of the Trust will be allocated among and charged to the assets of each fund on a basis that the Trustees deem fair and equitable, which may be based on the relative assets of each fund or the nature of the services performed and relative applicability to each fund.
Beneficial interest At the close of the reporting period, insurance companies or their separate accounts were record owners of all but a de minimis number of the shares of the fund. Approximately 35.4% of the fund is owned by accounts of one insurance company.
Note 2 — Management fee, administrative services and other transactions
The fund pays Putnam Management a management fee (based on the fund’s average net assets and computed and paid monthly) at annual rates that may vary based on the average of the aggregate net assets of all open-end funds sponsored by Putnam Management (excluding net assets of funds that are invested in, or that are invested in by, other Putnam funds to the extent necessary to avoid “double counting” of those assets). Such annual rates may vary as follows:
| |
| 0.780% | of the first $5 billion, |
| 0.730% | of the next $5 billion, |
| 0.680% | of the next $10 billion, |
| 0.630% | of the next $10 billion, |
| 0.580% | of the next $50 billion, |
| 0.560% | of the next $50 billion, |
| 0.550% | of the next $100 billion and |
| 0.545% | of any excess thereafter. |
For the reporting period, the management fee represented an effective rate (excluding the impact from any expense waivers in effect) of 0.312% of the fund’s average net assets.
Putnam Management has contractually agreed, through April 30, 2018, to waive fees or reimburse the fund’s expenses to the extent necessary to limit the cumulative expenses of the fund, exclusive of brokerage, interest, taxes, investment-related expenses, extraordinary expenses, acquired fund fees and expenses and payments under the fund’s investor servicing contract, investment management contract and distribution plans, on a fiscal year-to-date basis to an annual rate of 0.20% of the fund’s average net assets over such fiscal year-to-date period. During the reporting period, the fund’s expenses were not reduced as a result of this limit.
Putnam Management may from time to time voluntarily undertake to waive fees and/or reimburse certain fund expenses. Any such waiver or reimbursement would be voluntary and may be modified or discontinued by Putnam Management at any time without notice. For the reporting period, Putnam Management voluntarily waived $2,091.
Putnam Investments Limited (PIL), an affiliate of Putnam Management, is authorized by the Trustees to manage a separate portion of the assets of the fund as determined by Putnam Management from time to time. Putnam Management pays a quarterly sub-management fee to PIL for its services at an annual rate of 0.35% of the average net assets of the portion of the fund managed by PIL. Prior to April 1, 2016, Putnam Management paid a quarterly sub-management fee to PIL for its services at an annual rate of 0.175% of the average net assets of the portion of the fund managed by PIL.
The Putnam Advisory Company, LLC (PAC), an affiliate of Putnam Management, is authorized by the Trustees to manage a separate portion of the assets of the fund, as designated from time to time by Putnam Management or PIL. PAC did not manage any portion of the assets of the fund during the reporting period. If Putnam Management or PIL were to engage the services of PAC, Putnam Management or PIL, as applicable, would pay a quarterly sub-advisory fee to PAC for its services at the annual rate of 0.35% of the average net assets of the portion of the fund’s assets for which PAC is engaged as sub-adviser.
The fund reimburses Putnam Management an allocated amount for the compensation and related expenses of certain officers of the fund and their staff who provide administrative services to the fund. The aggregate amount of all such reimbursements is determined annually by the Trustees.
Custodial functions for the fund’s assets are provided by State Street. Custody fees are based on the fund’s asset level, the number of its security holdings and transaction volumes.
Putnam Investor Services, Inc., an affiliate of Putnam Management, provides investor servicing agent functions to the fund. Putnam Investor Services, Inc. was paid a monthly fee for investor servicing at an annual rate of 0.07% of the fund’s average daily net assets. During the reporting period, the expenses for each class of shares related to investor servicing fees were as follows:
| |
| Class IA | $18,807 |
| Class IB | 39,981 |
|
| Total | $58,788 |
The fund has entered into expense offset arrangements with Putnam Investor Services, Inc. and State Street whereby Putnam Investor Services, Inc.’s and State Street’s fees are reduced by credits allowed on cash balances. The fund also reduced expenses through brokerage/service arrangements. For the reporting period, the fund’s expenses were reduced by $2 under the expense offset arrangements and by $1,905 under the brokerage/service arrangements.
Each Independent Trustee of the fund receives an annual Trustee fee, of which $122, as a quarterly retainer, has been allocated to the fund, and an additional fee for each Trustees meeting attended. Trustees also are reimbursed for expenses they incur relating to their services as Trustees.
The fund has adopted a Trustee Fee Deferral Plan (the Deferral Plan) which allows the Trustees to defer the receipt of all or a portion of Trustees fees payable on or after July 1, 1995. The deferred fees remain invested in certain Putnam funds until distribution in accordance with the Deferral Plan.
The fund has adopted an unfunded noncontributory defined benefit pension plan (the Pension Plan) covering all Trustees of the fund who have served as a Trustee for at least five years and were first elected prior to 2004. Benefits under the Pension Plan are equal to 50% of the Trustee’s average annual attendance and retainer fees for the three years ended December 31, 2005. The retirement benefit is payable during a Trustee’s lifetime, beginning the year following retirement, for the number of years of service through December 31, 2006. Pension expense for the fund is included in Trustee compensation and expenses in the Statement of operations. Accrued pension liability is included in Payable for Trustee compensation and expenses in the Statement of assets and liabilities. The Trustees have terminated the Pension Plan with respect to any Trustee first elected after 2003.
The fund has adopted a distribution plan (the Plan) with respect to its class IB shares pursuant to Rule 12b-1 under the Investment Company Act of 1940. The purpose of the Plan is to compensate Putnam Retail Management Limited Partnership, an indirect wholly-owned subsidiary of Putnam Investments, LLC, for services provided and expenses incurred in distributing shares of the fund. The Plan provides for payment by the fund to Putnam Retail Management Limited Partnership at an annual rate of up to 0.35% of the average net assets attributable to the fund’s class IB shares. The Trustees have approved payment by the fund at an annual rate of 0.25% of the average net assets attributable to the fund’s class IB shares. During the reporting period, the class specific expenses related to distribution fees were as follows:
|
| Putnam VT Global Health Care Fund 13 |
Note 3 — Purchases and sales of securities
During the reporting period, the cost of purchases and the proceeds from sales, excluding short-term investments, were as follows:
| | |
| | Cost of purchases | Proceeds from sales |
|
| Investments in securities (Long-term) | $11,965,751 | $28,210,330 |
|
| U.S. government securities (Long-term) | — | — |
|
| Total | $11,965,751 | $28,210,330 |
|
The fund may purchase or sell investments from or to other Putnam funds in the ordinary course of business, which can reduce the fund’s transaction costs, at prices determined in accordance with SEC requirements and policies approved by the Trustees. During the reporting period, purchases or sales from or to other Putnam funds, if any, did not represent more than 5% of the fund’s total cost of purchases and/or total proceeds from sales.
Note 4 — Capital shares
At the close of the reporting period, there were an unlimited number of shares of beneficial interest authorized. Subscriptions and redemptions are presented at the omnibus level. Transactions in capital shares were as follows:
| | | | | | | | |
| | | Class IA shares | | | Class IB shares | |
| | Six months ended 6/30/16 | Year ended 12/31/15 | Six months ended 6/30/16 | Year ended 12/31/15 |
| |
|
| | Shares | Amount | Shares | Amount | Shares | Amount | Shares | Amount |
|
| Shares sold | 49,565 | $892,796 | 316,034 | $6,746,676 | 229,767 | $3,908,775 | 1,487,717 | $30,887,297 |
|
| Shares issued in connection with | | | | | | | | |
| reinvestment of distributions | 381,880 | 6,163,539 | 239,227 | 5,016,593 | 858,870 | 13,527,198 | 483,190 | 9,939,216 |
|
| | 431,445 | 7,056,335 | 555,261 | 11,763,269 | 1,088,637 | 17,435,973 | 1,970,907 | 40,826,513 |
|
| Shares repurchased | (467,621) | (8,176,983) | (423,943) | (8,786,126) | (962,466) | (16,373,509) | (940,434) | (19,039,584) |
|
| Net increase (decrease) | (36,176) | $(1,120,648) | 131,318 | $2,977,143 | 126,171 | $1,062,464 | 1,030,473 | $21,786,929 |
|
Note 5 — Affiliated transactions
Transactions during the reporting period with Putnam Short Term Investment Fund, which is under common ownership and control, were as follows:
| | | | | |
| | Fair value at the beginning of | | | | Fair value at the end of the |
| Name of affiliate | the reporting period | Purchase cost | Sale proceeds | Investment income | reporting period |
|
| Putnam Short Term Investment Fund* | $3,338,748 | $16,444,886 | $18,182,145 | $3,005 | $1,601,489 |
|
| Total | $3,338,748 | $16,444,886 | $18,182,145 | $3,005 | $1,601,489 |
|
* Management fees charged to Putnam Short Term Investment Fund have been waived by Putnam Management.
Note 6 — Market, credit and other risks
In the normal course of business, the fund trades financial instruments and enters into financial transactions where risk of potential loss exists due to changes in the market (market risk) or failure of the contracting party to the transaction to perform (credit risk). The fund may be exposed to additional credit risk that an institution or other entity with which the fund has unsettled or open transactions will default. Investments in foreign securities involve certain risks, including those related to economic instability, unfavorable political developments, and currency fluctuations. The fund concentrates a majority of its investments in the health sector, which involves more risk than a fund that invests more broadly.
Note 7 — Summary of derivative activity
The volume of activity for the reporting period for any derivative type that was held during the period is listed below and was based on an average of the holdings at the end of each fiscal quarter:
| |
| Forward currency contracts (contract amount) | $8,800,000 |
|
| Warrants (number of warrants) | 27,000 |
|
The following is a summary of the fair value of derivative instruments as of the close of the reporting period:
Fair value of derivative instruments as of the close of the reporting period
| | | | |
| | Asset derivatives | Liability derivatives |
|
| Derivatives not accounted | | | | |
| for as hedging instruments | Statement of assets and | | Statement of assets and | |
| under ASC 815 | liabilities location | Fair value | liabilities location | Fair value |
|
| Foreign exchange contracts | Receivables | $66,463 | Payables | $58,694 |
|
| Total | | $66,463 | | $58,694 |
|
|
| 14 Putnam VT Global Health Care Fund |
The following is a summary of realized and change in unrealized gains or losses of derivative instruments in the Statement of operations for the reporting period (see Note 1):
Amount of realized gain or (loss) on derivatives recognized in net gain or (loss) on investments
| | |
| Derivatives not accounted for as hedging instruments | | |
| under ASC 815 | Forward currency contracts | Total |
|
| Foreign exchange contracts | $528,828 | $528,828 |
|
| Total | $528,828 | $528,828 |
|
Change in unrealized appreciation or (depreciation) on derivatives recognized in net gain or (loss) on investments
| | |
| Derivatives not accounted for as hedging instruments | | |
| under ASC 815 | Forward currency contracts | Total |
|
| Foreign exchange contracts | $(166,197) | $(166,197) |
|
| Total | $(166,197) | $(166,197) |
|
Note 8 — Offsetting of financial and derivative assets and liabilities
The following table summarizes any derivatives, repurchase agreements and reverse repurchase agreements, at the end of the reporting period, that are subject to an enforceable master netting agreement or similar agreement. For securities lending transactions or borrowing transactions associated with securities sold short, if any, see Note 1. For financial reporting purposes, the fund does not offset financial assets and financial liabilities that are subject to the master netting agreements in the Statement of assets and liabilities.
| | | | | | |
| | | | Credit Suisse | HSBC Bank USA, | JPMorgan Chase | |
| | Bank of America N.A. | Citibank, N.A. | International | National Association | Bank N.A. | Total |
|
| Assets: | | | | | | |
|
| Forward currency contracts# | $— | $— | $50,553 | $— | $15,910 | $66,463 |
|
| Total Assets | $— | $— | $50,553 | $— | $15,910 | $66,463 |
|
| Liabilities: | | | | | | |
|
| Forward currency contracts# | 24,061 | 9,191 | — | 25,442 | — | 58,694 |
|
| Total Liabilities | $24,061 | $9,191 | $— | $25,442 | $— | $58,694 |
|
| Total Financial and Derivative Net Assets | $(24,061) | $(9,191) | $50,553 | $(25,442) | $15,910 | $7,769 |
|
| Total collateral received (pledged)† ## | $— | $— | $— | $— | $— | |
|
| Net amount | $(24,061) | $(9,191) | $50,553 | $(25,442) | $15,910 | |
|
†Additional collateral may be required from certain brokers based on individual agreements.
# Covered by master netting agreement (Note 1).
## Any over-collateralization of total financial and derivative net assets is not shown. Collateral may include amounts related to unsettled agreements.
|
| Putnam VT Global Health Care Fund 15 |
Trustee approval of management contract
General conclusions
The Board of Trustees of The Putnam Funds oversees the management of each fund and, as required by law, determines annually whether to approve the continuance of your fund’s management contract with Putnam Investment Management, LLC (“Putnam Management”), the sub-management contract with respect to your fund between Putnam Management and its affiliate, Putnam Investments Limited (“PIL”), and the sub-advisory contract among Putnam Management, PIL, and another affiliate, The Putnam Advisory Company (“PAC”). The Board, with the assistance of its Contract Committee, requests and evaluates all information it deems reasonably necessary under the circumstances in connection with its annual contract review. The Contract Committee consists solely of Trustees who are not “interested persons” (as this term is defined in the Investment Company Act of 1940, as amended (the “1940 Act”)) of The Putnam Funds (“Independent Trustees”).
At the outset of the review process, members of the Board’s independent staff and independent legal counsel discussed with representatives of Putnam Management the annual contract review materials furnished to the Contract Committee during the course of the previous year’s review, identifying possible changes in these materials that might be necessary or desirable for the coming year. Following these discussions and in consultation with the Contract Committee, the Independent Trustees’ independent legal counsel requested that Putnam Management and its affiliates furnish specified information, together with any additional information that Putnam Management considered relevant, to the Contract Committee. Over the course of several months ending in June 2016, the Contract Committee met on a number of occasions with representatives of Putnam Management, and separately in executive session, to consider the information that Putnam Management provided, as well as supplemental information provided in response to an additional request made by the Contract Committee. Throughout this process, the Contract Committee was assisted by the members of the Board’s independent staff and by independent legal counsel for The Putnam Funds and the Independent Trustees.
In May 2016, the Contract Committee met in executive session to discuss and consider its recommendations with respect to the continuance of the contracts. At the Trustees’ June 24, 2016 meeting, the Contract Committee met in executive session with the other Independent Trustees to review a summary of the key financial, performance and other data that the Contract Committee considered in the course of its review. The Contract Committee then presented its written report, which summarized the key factors that the Committee had considered and set forth its recommendations. The Contract Committee then recommended, and the Independent Trustees approved, the continuance of your fund’s management, sub-management and sub-advisory contracts, effective July 1, 2016. (Because PIL and PAC are affiliates of Putnam Management and Putnam Management remains fully responsible for all services provided by PIL and PAC, the Trustees have not attempted to evaluate PIL or PAC as separate entities, and all subsequent references to Putnam Management below should be deemed to include reference to PIL and PAC as necessary or appropriate in the context.)
The Independent Trustees’ approval was based on the following conclusions:
• That the fee schedule in effect for your fund represented reasonable compensation in light of the nature and quality of the services being provided to the fund, the fees paid by competitive funds, the costs incurred by Putnam Management in providing services to the fund, and the continued application of certain reductions and waivers noted below; and
• That the fee schedule in effect for your fund represented an appropriate sharing between fund shareholders and Putnam Management of such economies of scale as may exist in the management of the fund at current asset levels.
These conclusions were based on a comprehensive consideration of all information provided to the Trustees and were not the result of any single factor. Some of the factors that figured particularly in the Trustees’ deliberations and how the Trustees considered these factors are described below, although individual Trustees may have evaluated the information presented differently, giving different weights to various factors. It is also important to recognize that the management arrangements for your fund and the other Putnam funds are the result of many years of review and discussion between the Independent Trustees and Putnam Management, that some aspects of the arrangements may receive greater scrutiny in some years than others, and that the Trustees’ conclusions may be based, in part, on their consideration of fee arrangements in previous years. For example, with some minor exceptions, the funds’ current fee arrangements under the management contracts were first implemented at the beginning of 2010 following extensive review by the Contract Committee and discussions with representatives of Putnam Management, as well as approval by shareholders.
Management fee schedules and total expenses
The Trustees reviewed the management fee schedules in effect for all Putnam funds, including fee levels and breakpoints. The Trustees also reviewed the total expenses of each Putnam fund, recognizing that in most cases management fees represented the major, but not the sole, determinant of total costs to shareholders. (In a few instances, funds have implemented so-called “all-in” management fees covering substantially all routine fund operating costs.)
In reviewing fees and expenses, the Trustees generally focus their attention on material changes in circumstances — for example, changes in assets under management, changes in a fund’s investment style, changes in Putnam Management’s operating costs or profitability, or changes in competitive practices in the mutual fund industry — that suggest that consideration of fee changes might be warranted. The Trustees concluded that the circumstances did not indicate that changes to the management fee structure for your fund would be appropriate at this time.
Under its management contract, your fund has the benefit of breakpoints in its management fee schedule that provide shareholders with economies of scale in the form of reduced fee rates as assets under management in the Putnam family of funds increase. The Trustees concluded that the fee schedule in effect for your fund represented an appropriate sharing of economies of scale between fund shareholders and Putnam Management.
As in the past, the Trustees also focused on the competitiveness of each fund’s total expense ratio. In order to support the effort to have fund expenses meet competitive standards, the Trustees and Putnam
|
| 16 Putnam VT Global Health Care Fund |
Management have implemented a contractual expense limitation applicable to specified open-end funds, including your fund, of 20 basis points on so-called “other expenses” (i.e., all expenses exclusive of management fees, distribution fees, investor servicing fees, investment-related expenses, interest, taxes, brokerage commissions, acquired fund fees and expenses and extraordinary expenses). This expense limitation attempts to maintain competitive expense levels for the funds. Most funds, including your fund, had sufficiently low expenses that this expense limitation was not operative during their fiscal years ending in 2015. Putnam Management has agreed to maintain this expense limitation until at least April 30, 2018. Putnam Management’s support for this expense limitation arrangement was an important factor in the Trustees’ decision to approve the continuance of your fund’s management, sub-management and sub-advisory contracts.
The Trustees reviewed comparative fee and expense information for a custom group of competitive funds selected by Lipper Inc. (“Lipper”). This comparative information included your fund’s percentile ranking for effective management fees and total expenses (excluding any applicable 12b-1 fee), which provides a general indication of your fund’s relative standing. In the custom peer group, your fund ranked in the first quintile in effective management fees (determined for your fund and the other funds in the custom peer group based on fund asset size and the applicable contractual management fee schedule) and in the first quintile in total expenses (excluding any applicable 12b-1 fees) as of December 31, 2015. The first quintile represents the least expensive funds and the fifth quintile the most expensive funds. The fee and expense data reported by Lipper as of December 31, 2015 reflected the most recent fiscal year-end data available in Lipper’s database at that time.
In connection with their review of fund management fees and total expenses, the Trustees also reviewed the costs of the services provided and the profits realized by Putnam Management and its affiliates from their contractual relationships with the funds. This information included trends in revenues, expenses and profitability of Putnam Management and its affiliates relating to the investment management, investor servicing and distribution services provided to the funds. In this regard, the Trustees also reviewed an analysis of Putnam Management’s revenues, expenses and profitability, allocated on a fund-by-fund basis, with respect to the funds’ management, distribution, and investor servicing contracts. For each fund, the analysis presented information about revenues, expenses and profitability for each of the agreements separately and for the agreements taken together on a combined basis. The Trustees concluded that, at current asset levels, the fee schedules in place represented reasonable compensation for the services being provided and represented an appropriate sharing between fund shareholders and Putnam Management of such economies of scale as may exist in the management of the Putnam funds at that time.
The information examined by the Trustees as part of their annual contract review for the Putnam funds included information regarding fees charged by Putnam Management and its affiliates to institutional clients such as defined benefit pension plans, college endowments, sub-advised third-party mutual funds, and the like. This information included comparisons of those fees with fees charged to the Putnam funds, as well as an assessment of the differences in the services provided to these different types of clients. The Trustees observed that the differences in fee rates between these clients and the Putnam funds are by no means uniform when examined by individual asset sectors, suggesting that differences in the pricing of investment management services to these types of clients may reflect, among other things, historical competitive forces operating in separate markets. The Trustees considered the fact that in many cases fee rates across different asset classes are higher on average for mutual funds than for institutional clients, as well as the differences between the services that Putnam Management provides to the Putnam funds and those that it provides to its other clients. The Trustees did not rely on these comparisons to any significant extent in concluding that the management fees paid by your fund are reasonable.
Investment performance
The quality of the investment process provided by Putnam Management represented a major factor in the Trustees’ evaluation of the quality of services provided by Putnam Management under your fund’s management contract. The Trustees were assisted in their review of the Putnam funds’ investment process and performance by the work of the investment oversight committees of the Trustees, which meet on a regular basis with the funds’ portfolio teams and with the Chief Investment Officer and other senior members of Putnam Management’s Investment Division throughout the year. The Trustees concluded that Putnam Management generally provides a high-quality investment process — based on the experience and skills of the individuals assigned to the management of fund portfolios, the resources made available to them, and in general Putnam Management’s ability to attract and retain high-quality personnel — but also recognized that this does not guarantee favorable investment results for every fund in every time period.
The Trustees considered that 2015 was a year of mixed performance results for the Putnam funds, with generally strong results for the international equity, global sector and global asset allocation funds, but generally disappointing results for the U.S. and small-cap equity, Spectrum and fixed income funds. They noted that the longer-term performance of the Putnam funds generally continued to be strong, exemplified by the fact that the Putnam funds were ranked by the Barron’s/Lipper Fund Families survey as the 18th-best performing mutual fund complex out of 58 complexes for the five-year period ended December 31, 2015. They also noted, however, the disappointing investment performance of some funds for periods ended December 31, 2015 and considered information provided by Putnam Management regarding the factors contributing to the underperformance and actions being taken to improve the performance of these particular funds. The Trustees indicated their intention to continue to monitor performance trends to assess the effectiveness of these efforts and to evaluate whether additional actions to address areas of underperformance are warranted.
For purposes of evaluating investment performance, the Trustees generally focus on a competitive industry ranking of each fund’s total net return over a one-year, three-year and five-year period. For a number of Putnam funds with relatively unique investment mandates for which meaningful competitive performance rankings are not considered to be available, the Trustees evaluated performance based on their total gross and net returns and, in most cases, comparisons of those returns with the returns of selected investment benchmarks. In the case of your fund, the Trustees considered information about your fund’s total return and its performance relative to its benchmark over the one-year, three-year and five-year periods ended December 31, 2015. Your fund’s class IA shares’ return net of fees and expenses was
|
| Putnam VT Global Health Care Fund 17 |
positive and exceeded the return of its benchmark over the one-year, three-year and five-year periods. (When considering performance information, shareholders should be mindful that past performance is not a guarantee of future results.)
The Trustees also considered Putnam Management’s continued efforts to support fund performance through initiatives including structuring compensation for portfolio managers and research analysts to enhance accountability for fund performance, emphasizing accountability in the portfolio management process, and affirming its commitment to a fundamental-driven approach to investing. The Trustees noted further that Putnam Management continued to strengthen its fundamental research capabilities by adding new investment personnel.
Brokerage and soft-dollar allocations; investor servicing
The Trustees considered various potential benefits that Putnam Management may receive in connection with the services it provides under the management contract with your fund. These include benefits related to brokerage allocation and the use of soft dollars, whereby a portion of the commissions paid by a fund for brokerage may be used to acquire research services that are expected to be useful to Putnam Management in managing the assets of the fund and of other clients. Subject to policies established by the Trustees, soft dollars generated by these means are used primarily to acquire brokerage and research services (including third-party research and market data) that enhance Putnam Management’s investment capabilities and supplement Putnam Management’s internal research efforts. However, the Trustees noted that a portion of available soft dollars continues to be used to pay fund expenses. The Trustees indicated their continued intent to monitor regulatory and industry developments in this area with the assistance of their Brokerage Committee and also indicated their continued intent to monitor the allocation of the Putnam funds’ brokerage in order to ensure that the principle of seeking best price and execution remains paramount in the portfolio trading process.
Putnam Management may also receive benefits from payments that the funds make to Putnam Management’s affiliates for investor or distribution services. In conjunction with the annual review of your fund’s management, sub-management and sub-advisory contracts, the Trustees reviewed your fund’s investor servicing agreement with Putnam Investor Services, Inc. (“PSERV”) and its distributor’s contracts and distribution plans with Putnam Retail Management Limited Partnership (“PRM”), both of which are affiliates of Putnam Management. The Trustees concluded that the fees payable by the funds to PSERV and PRM, as applicable, for such services are reasonable in relation to the nature and quality of such services, the fees paid by competitive funds, and the costs incurred by PSERV and PRM, as applicable, in providing such services.
|
| 18 Putnam VT Global Health Care Fund |
|
| This page intentionally left blank. |
|
| Putnam VT Global Health Care Fund 19 |
|
| This page intentionally left blank. |
|
| 20 Putnam VT Global Health Care Fund |
Other important information
Proxy voting
Putnam is committed to managing our mutual funds in the best interests of our shareholders. The Putnam funds’ proxy voting guidelines and procedures, as well as information regarding how your fund voted proxies relating to portfolio securities during the 12-month period ended June 30, 2016, are available in the Individual Investors section of putnam.com and on the Securities and Exchange Commission’s [SEC] website, www.sec.gov. If you have questions about finding forms on the SEC’s website, you may call the SEC at 1-800-SEC-0330. You may also obtain the Putnam funds’ proxy voting guidelines and procedures at no charge by calling Putnam’s Shareholder Services at 1-800-225-1581.
Fund portfolio holdings
Each Putnam VT fund will file a complete schedule of its portfolio holdings with the SEC for the first and third quarters of each fiscal year on Form N-Q. Shareholders may obtain the fund’s Form N-Q on the SEC’s website at www.sec.gov. In addition, the fund’s Form N-Q may be reviewed and copied at the SEC’s Public Reference Room in Washington, D.C. You may call the SEC at 1-800-SEC-0330 for information about the SEC’s website or the operation of the Public Reference Room.
Fund information
| | |
| Investment Manager | Investor Servicing Agent | Trustees |
| Putnam Investment Management, LLC | Putnam Investor Services, Inc. | Jameson A. Baxter, Chair |
| One Post Office Square | Mailing address: | Liaquat Ahamed |
| Boston, MA 02109 | P.O. Box 8383 | Ravi Akhoury |
| Boston, MA 02266-8383 | Barbara M. Baumann |
| Investment Sub-Advisors | 1-800-225-1581 | Robert J. Darretta |
| Putnam Investments Limited | | Katinka Domotorffy |
| 57–59 St James’s Street | Custodian | John A. Hill |
| London, England SW1A 1LD | State Street Bank and Trust Company | Paul L. Joskow |
| | | Kenneth R. Leibler |
| The Putnam Advisory Company, LLC | Legal Counsel | Robert E. Patterson |
| One Post Office Square | Ropes & Gray LLP | George Putnam, III |
| Boston, MA 02109 | | Robert L. Reynolds |
| | | W. Thomas Stephens |
| Marketing Services | | |
| Putnam Retail Management | | |
| One Post Office Square | | |
| Boston, MA 02109 | | |
The fund’s Statement of Additional Information contains additional information about the fund’s Trustees and is available without charge upon request by calling 1-800-225-1581.
|
| Putnam VT Global Health Care Fund 21 |
| | |
| | | |
| This report has been prepared for the shareholders | | H507 |
| of Putnam VT Global Health Care Fund. | VTSA008 301627 8/16 |
| |
| Item 3. Audit Committee Financial Expert: |
| |
| Item 4. Principal Accountant Fees and Services: |
| |
| Item 5. Audit Committee of Listed Registrants |
| |
| Item 6. Schedule of Investments: |
| |
| The registrant's schedule of investments in unaffiliated issuers is included in the report to shareholders in Item 1 above. |
| |
| Item 7. Disclosure of Proxy Voting Policies and Procedures For Closed-End Management Investment Companies: |
| |
| Item 8. Portfolio Managers of Closed-End Investment Companies |
| |
| Item 9. Purchases of Equity Securities by Closed-End Management Investment Companies and Affiliated Purchasers: |
| |
| Item 10. Submission of Matters to a Vote of Security Holders: |
| |
| Item 11. Controls and Procedures: |
| |
| (a) The registrant's principal executive officer and principal financial officer have concluded, based on their evaluation of the effectiveness of the design and operation of the registrant's disclosure controls and procedures as of a date within 90 days of the filing date of this report, that the design and operation of such procedures are generally effective to provide reasonable assurance that information required to be disclosed by the registrant in this report is recorded, processed, summarized and reported within the time periods specified in the Commission's rules and forms. |
| |
| (b) Changes in internal control over financial reporting: Not applicable |
| |
| (a)(2) Separate certifications for the principal executive officer and principal financial officer of the registrant as required by Rule 30a-2(a) under the Investment Company Act of 1940, as amended, are filed herewith. |
| |
| (b) The certifications required by Rule 30a-2(b) under the Investment Company Act of 1940, as amended, are filed herewith. |
| |
| By (Signature and Title): |
| |
| /s/ Janet C. Smith
Janet C. Smith
Principal Accounting Officer
|
| |
| Pursuant to the requirements of the Securities Exchange Act of 1934 and the Investment Company Act of 1940, this report has been signed below by the following persons on behalf of the registrant and in the capacities and on the dates indicated. |
| |
| By (Signature and Title): |
| |
| /s/ Jonathan S. Horwitz
Jonathan S. Horwitz
Principal Executive Officer
|
| |
| By (Signature and Title): |
| |
| /s/ Steven D. Krichmar
Steven D. Krichmar
Principal Financial Officer
|